Les doubles nationaux. Enquête sur les nouveaux entrepreneurs au Maroc
Upload
khangminh22Category
view
1download
0
HAL Id: tel-00717376https://tel.archives-ouvertes.fr/tel-00717376
Submitted on 12 Jul 2012
HAL is a multi-disciplinary open accessarchive for the deposit and dissemination of sci-entific research documents, whether they are pub-lished or not. The documents may come fromteaching and research institutions in France orabroad, or from public or private research centers.
L’archive ouverte pluridisciplinaire HAL, estdestinée au dépôt et à la diffusion de documentsscientifiques de niveau recherche, publiés ou non,émanant des établissements d’enseignement et derecherche français ou étrangers, des laboratoirespublics ou privés.
Formation et propriétés de materiaux HydroxydesDoubles Lamellaires bi-intercalés
Yongjun Feng
To cite this version:Yongjun Feng. Formation et propriétés de materiaux Hydroxydes Doubles Lamellaires bi-intercalés.Agrégats Moléculaires et Atomiques [physics.atm-clus]. Université Blaise Pascal - Clermont-FerrandII, 2006. Français. �NNT : 2006CLF21708�. �tel-00717376�
UNIVERSITE BLAISE PASCAL (U.F.R. de Recherche Scientifique et Technique)
ECOLE DOCTORALE DES SCIENCES FONDAMENTALES
THESE
Présentée pour obtenir le grade de
DOCTEUR D'UNIVERSITE (Spécialité : Chimie, Sciences des Matériaux)
Par
Yongjun FENG
Formation and Properties
of Second-stage Layered Double Hydroxide Materials.
Soutenue publiquement le 7 Decembre 2006, devant la commission d'examen : Président : Prof. D. O’Hare Oxford University, Angleterre
Rapport eur: Dr. P. RABU Université Louis Pasteur, Strasbourg
Prof. D. G. EVANS Beijing University of Chemical Technology,
Chine
Examinateurs : Prof. P. MALFREYT Université Blaise Pascal, Clermont-Ferrand
Dr. B. LANSON Université Joseph Fourier, Grenoble
Dr. F. LEROUX Université Blaise Pascal, Clermont-Ferrand
Dr. C. TAVIOT-GUEHO Université Blaise Pascal, Clermont-Ferrand

ACKNOWLEDGMENTS
My sincere thanks are given to my advisor Dr. Christine TAVIOT-GUEHO for
her guidance, support, time, encouragement and comments from the beginning to the
end of my thesis work.
I would like to express my special appreciation to Prof. D. O’Hare for his fruitful
collaboration allowing me to obtain the Energy-dispersive X-ray Diffraction data, to
Prof. D. G. Evans and Dr. P. Rabu for their helpful comments and constructive reports.
I would also like to thank the other members of my graduate committee: Prof. P.
Malfreyt, Dr. B. Lanson and especially Dr. F. Leroux for his productive discussions
and his helpful advice during my studies. Additionally, I am greatly indebted to Dr. G.
R. Williams for his kind help and his patient discussions on the data analysis of
Energy-dispersive X-ray Diffraction.
Thanks are also extended to all the members in Inorganic Materials Laboratory
(LMI) in Blaise Pascal University for their kindness and help: Prof. C. Forano, Prof. A.
de Roy, Prof. M. de Roy, Dr. V. Prevot. I really appreciate the help from my friends,
especially Erwan Geraud and Jairo Tronto with whom I have spent a nice time.
I owes special thanks to all the people who have dedicated part of their time to
help me with the instrumentation needed to complete my thesis: J. Cellier (PXRD), Dr.
D. Talor (EDXRD in Daresbury Laboratory, UK) and Mr. A. Neild (EDXRD in
Daresbury Laboratory, UK).
I also thank Professor X. Duan at Beijing University of Chemical Technology in
China for his advice and encouragement.
A very, very special thanks goes to my dear wife Xiaoyan for all the support,
time and patience she has given me to accomplish my thesis. I would also like to
especially thank my family for all the support and time they have endured me
throughout my studies.
This thesis has been made possible in part to due to the financial support from
the region Council of Auvergne in France.
Yongjun FENG
AUBIERE, FRANCE
December 10, 2006
Contents
I
Contents
Introduction .................................................................................................................... І
Chapter 1 An Introduction to Layered Double Hydroxides and Staging
in Lamellar Materials……………………………………….....……..1
I. Generalities on Layered Double Hydroxides...……………………………….....2
1.1 Structural Considerations………………………………………….2
1.2 Synthesis Routes of LDH...................................................................9
1.2.1 Direct coprecipitation method…...…………………….…......10
1.2.2 Anion-exchange method……………………………..…..…...11
1.2.3 Other methods………………………………………………....13
1.3 Structural Characterization of LDH……………………………...14
1.3.1 Powder X-ray Diffraction (PXRD)…………………………....14
1.3.1.1 Basic structural information from PXRD patterns…..….....15
1.3.1.2 Rietveld refinement……………………………..……....17
1.3.1.3 DIFFaX simulations…………………………………............17
1.3.1.4 The electron density distribution…………………..........18
1.3.2 Microscopy……………………………………….………….....21
1.3.2.1 Scanning Electron Microscopy (SEM) and Transmission
Electron Microscopy (TEM)……………………..….…21
1.3.2.2 Fluorescence microscopy……………………………….23
1.3.2.3 Atomic Force Microscopy (AFM)……..……………….24
1.3.3 X-ray Absorption Spectroscopy (XAS)……………..............26
1.3.4 Infrared and Raman spectroscopy………………………….27
1.3.5 Nuclear Magnetic Resonance (NMR)…………....................28
1.3.6 Molecular modeling and structure simulations……………29
1.4 Applications of LDH……………………………………………….33
1.4.1 Catalysis……………………………………………………….34
1.4.2 Sorbent for pollutant………………………………………….34
Contents
II
1.4.3 Vector/drug release……………………………………...........35
1.4.4 Stabilizer in polymer……………………………………….….35
1.4.5 Nanoreactor…………………………………………………....36
II. Staging Phenomenon…………….………………………………………………..36 1.5 Staging Structure…………………………………………………...36
1.6 Staging Compounds……………………………………………….39
1.6.1 Staging graphite intercalation compounds………………....39
1.6.2 Layered dichalcogenides staging compounds……………..41
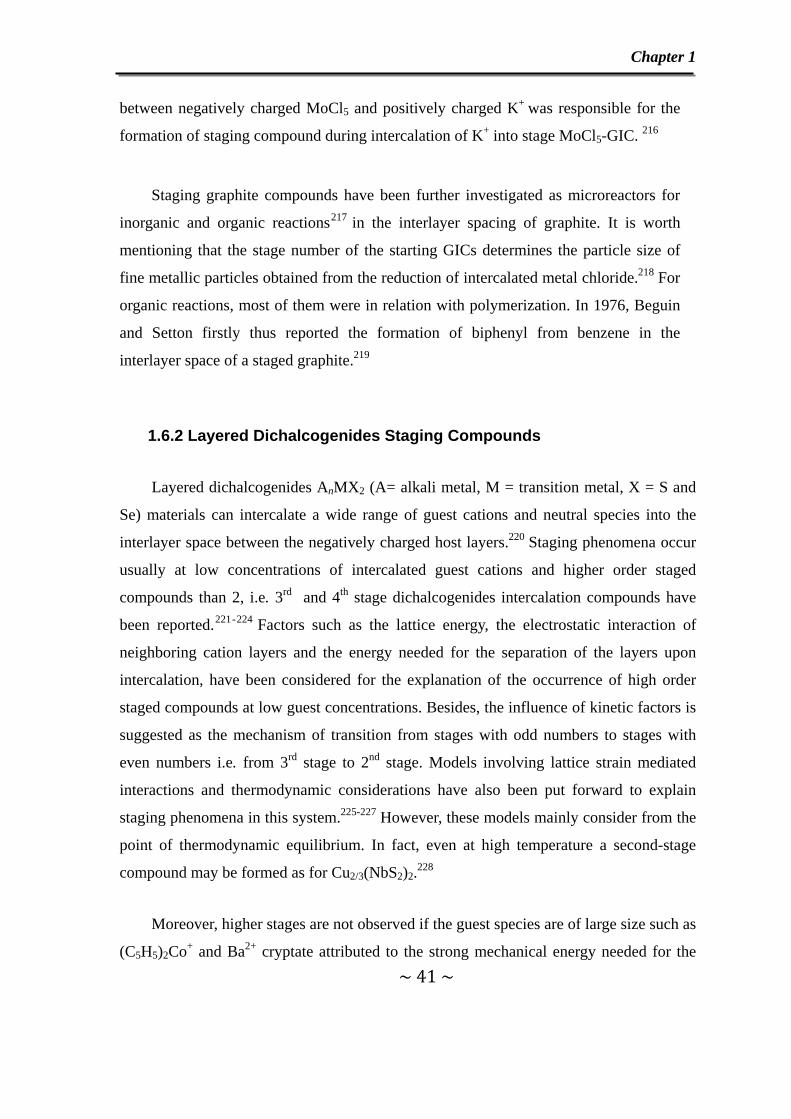
1.6.3 Fluorohectorite clay staging compounds………...…………42
1.6.4 Staging layered double hydroxides compounds…………...44
1.7 In Situ Energy-dispersive X-ray Diffraction…………………....49
1.7.1 Experimental setup…………………………………………....52
1.7.2 Data and kinetic analysis…………..………………………....53
1.8 References…………………………………………………………...55
Chapter 2 Factors Influencing Staging during Anion-exchange Reaction
in [Zn2Cr(OH)6]X·nH2O and [Zn2Al(OH)6]Cl·nH2O Layered
Double Hydroxides…………………………………………………...63
2.1 Introduction………………………………………………………….64
2.2 Experimental details……………...……………………………......65
2.2.1 Synthesis of the host materials…….……………………......65
2.2.2 Time-resolved in situ energy-dispersive X-ray diffraction
(EDXRD) measurements…………………..……….…….….67
2.2.3 Kinetic analysis of EDXRD data…………...………………...69
2.2.4 Powder X-ray diffraction………...……………………...…….69
2.3 Anion-exchange Reaction of Cl- Anions by Tartrate or
Succinate Anions in Zn2Cr-Cl and Zn2Al-Cl LDHs…………...70
2.3.1 Formation of second-stage intermediates………………......70
2.3.1.1 In Zn2Cr-Cl system…..………….…….………………...70
Contents
III
2.3.1.2 In Zn2Al-Cl system…..………………………..…….…..75
2.3.2 Effect of the addition rate of the incoming anions on the
observation of second-stage intermediates…………...........77
2.3.3 Kinetic analysis…………………………………………..........79
2.3.4 Refinement of Zn2Cr-Tart/Cl second-stage intermediate….81
2.4 Effect of nature of initial interlayer anions (X) and incoming
anions on the formation of second-stage intermediate.……83
2.4.1 Inorganic-inorganic exchange reactions: Cl- anions by CO32-,
SO42- and [Fe(CN)6]3- anions in Zn2Cr-LDH………………..84
2.4.2 Organic-inorganic exchange reactions in Zn2Cr-LDH..…..87
2.4.2.1 Cl- anions exchanged by adipate anions………………...87
2.4.2.2 Tartrate anions exchanged by Cl- and CO32-
anions....………………………………….…………......89
2.5 Conclusions…………………………………………………….…...92
2.6 References……………………………………………………….......92
Chapter 3 Selective Anion-Exchange Properties of Second-Stage
Layered Double Hydroxides ............................................................ 94
3.1 Introduction……………………………………………….………....95
3.2 Experimental Section……………………………………………....95
3.2.1 Time-resolved in situ energy-dispersive X-ray diffraction
(EDXRD) measurements....…………………………………..95
3.2.2 Data analysis…..………………………………………………96
3.2.3 Powder X-ray diffraction…………………………………..….96
3.3 Formation and Isolation of Second-Stage Zn2Cr-Succ/Cl and
Zn2Cr-Tart/Cl Materials……………………..……………………..97
3.4 Anion-exchange Properties of Second-stage Materials…......99
3.4.1 Exchange reactions with adipate anions……………………99
3.4.2 Exchange reactions with fluoride anions…..……………....105
Contents
IV
3.5 Conclusions……………………………………………………......107
3.6 References…………………………………………………………108
Chapter 4 Staging Behaviors of Styrene-4-sulfonate Anions and
Ferricyanide Anions in Layered Double
Hydroxides………………………………………………………..109
I. Exchange reaction with VBS……………………………………………………110
4.1 Introduction………………..…………………………………….....110
4.2 Experimental…………………………….……………………........113
4.2.1 Synthesis and characterization of host materials..............113
4.2.2 In situ EDXRD measurements………………………….…115
4.2.3 In situ HTXRD measurement………………………………115
4.3 Exchange of Cl- Anions in Zn2Cr-Cl and Zn2Al-Cl by VBS
Anions……………………………………………………………….116
4.4 Exchange Reaction of Zn2Cr-Tart/Cl with VBS Anions….....118
4.5 Exchange Reaction of Zn2Al-VBS with CO32-
Anions……………………………………………………………….121
4.6 In Situ Thermal Polymerization of Zn2Cr-VBS/Cl Second-stage
Compound………………………………………………….………124
II. Exchange Reaction with [Fe(CN)6]3- Ferricyanide Anions ………………..125
4.7 Introduction………………………………………………………...125
4.8 In situ EDXRD measurements…………………………………..126
4.9 Exchange Reaction of Cl- Anions in Zn2Cr-Cl by Ferricyanide
Anions……………………………………………………………….126
4.10 Exchange Reaction of Ferricyanide Anions with
Zn2Cr-Tart…………………………………………………………..129
4.11 Exchange reaction of Zn2Cr-Tart/Cl with Ferricyanide
Anions ……………………………………………………………..130
4.12 Conclusions……………………………………………………...131
Contents
V
4.13 References……………………………………………………......131
Conclusion…………………………………………………………………………133

Introduction
~ I ~
Introduction

Introduction
~ II ~
The anion exchange properties of Layered Double Hydroxides (LDH) described
by the general formula [M2+
1-xM3+
x(OH)2]Am-
x/m·nH2O allow for the preparation of a
wide range of host-guest assemblies. Of particular interest are the organic-inorganic
hybrids LDH owing to their large fields of potential applications as catalyst, adsorbent
for pollutants, nanofiller in polymer, vector for biological molecules...1-8
Up to until a
few years ago, most of the articles concerned with organic/inorganic anion exchanged
LDH generally described the fully exchanged phases and only a few studies were
reported on the anion-exchanged forms obtained at partial exchange rates probably
because phase segregation was generally admitted for the exchange process in LDH
system.
In recent years, the technological and experimental advances in energy dispersive
X-ray diffraction using synchrotron X-ray sources have provided new possibilities for
studying solid-state reactions. In particular, O’Hare et al. have shown the interest of
this technique in the intercalation chemistry of layered materials.9-12
In this way, these
authors have demonstrated the ability of LiAl2(OH)6Cl·2H2O to form second-stage
intermediates during the exchange reaction with a series of dicarboxylate anions.12
Such LDH heterostructures with alternate interlayer spaces occupied by two
different anions offer new perspectives for LDH intercalation chemistry, particularly in
1 D. G. Evans and R. C. T. Slade, Struct. Bond., 2006, 119, 1.
2 B. Ballarin, M. Gazzano, R. Seeber,; D. Tonelli and A. Vaccari, J. Elect. Chem., 1998, 445, 27.
3 L. Van der Ven, M. L. M. Van Gemert, L. F. Batenburg, L. F. Keern, L. H. Gielgens, T. P. M. Koster
and H. R. Fischer, Appl. Clay. Sci., 2000, 17, 25.
4 Y. J. Feng, D. Q Li., Y. Wang, D. G. Evans and X. Duan, Polym. Degrad. and Stabil., 2006, 91, 789.
5 J. Inacio, C. Taviot-Guého, C. Forano and J. P. Besse, Appl. Clay Sci., 2001, 18, 255.
6 F. Leroux, J. Nanosci. Nanotech., 2006, 6(2), 303.
7 F. Leroux and C. Taviot-Gueho, J. Mater. Chem., 2005, 15 (35-36), 3628.
8 J. H. Choy, S. Y. Kwak, Y. J. Jeong, J. Portier and J. S. Park, Angew. Chem. Int. Ed., 2000, 39, 4042.
9 G. R. Williams and D. O’Hare, Chem. Mater., 2005, 17, 2632
10 G. R. Williams, thesis, 2005, Oxford University
11 G. R. Williams, A. J. Norquist and D. O’Hare, Chem. Mater., 2004, 16, 975.
12 G. R. Williams and D. O’Hare, Chem. Mater., 2005, 17, 2632.
Introduction
~ III ~
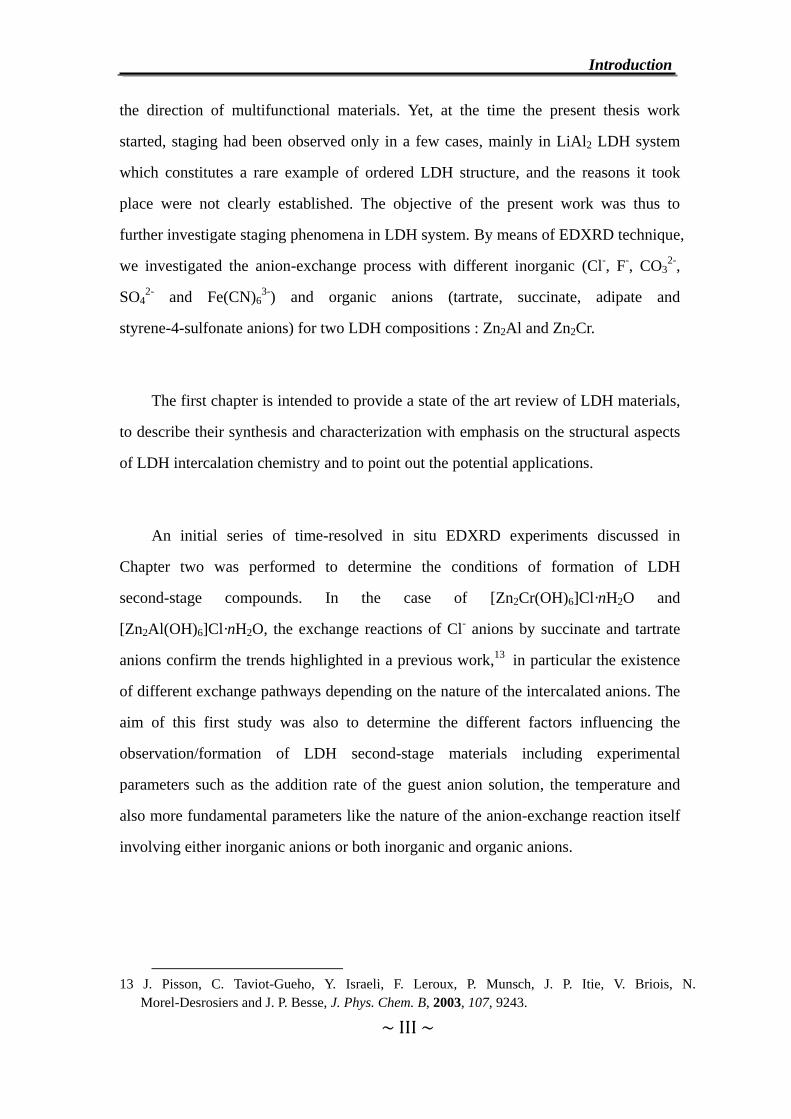
the direction of multifunctional materials. Yet, at the time the present thesis work
started, staging had been observed only in a few cases, mainly in LiAl2 LDH system
which constitutes a rare example of ordered LDH structure, and the reasons it took
place were not clearly established. The objective of the present work was thus to
further investigate staging phenomena in LDH system. By means of EDXRD technique,
we investigated the anion-exchange process with different inorganic (Cl-, F
-, CO3
2-,
SO42-
and Fe(CN)63-
) and organic anions (tartrate, succinate, adipate and
styrene-4-sulfonate anions) for two LDH compositions : Zn2Al and Zn2Cr.
The first chapter is intended to provide a state of the art review of LDH materials,
to describe their synthesis and characterization with emphasis on the structural aspects
of LDH intercalation chemistry and to point out the potential applications.
An initial series of time-resolved in situ EDXRD experiments discussed in
Chapter two was performed to determine the conditions of formation of LDH
second-stage compounds. In the case of [Zn2Cr(OH)6]Cl·nH2O and
[Zn2Al(OH)6]Cl·nH2O, the exchange reactions of Cl- anions by succinate and tartrate
anions confirm the trends highlighted in a previous work,13
in particular the existence
of different exchange pathways depending on the nature of the intercalated anions. The
aim of this first study was also to determine the different factors influencing the
observation/formation of LDH second-stage materials including experimental
parameters such as the addition rate of the guest anion solution, the temperature and
also more fundamental parameters like the nature of the anion-exchange reaction itself
involving either inorganic anions or both inorganic and organic anions.
13 J. Pisson, C. Taviot-Gueho, Y. Israeli, F. Leroux, P. Munsch, J. P. Itie, V. Briois, N.
Morel-Desrosiers and J. P. Besse, J. Phys. Chem. B, 2003, 107, 9243.
Introduction
~ IV ~
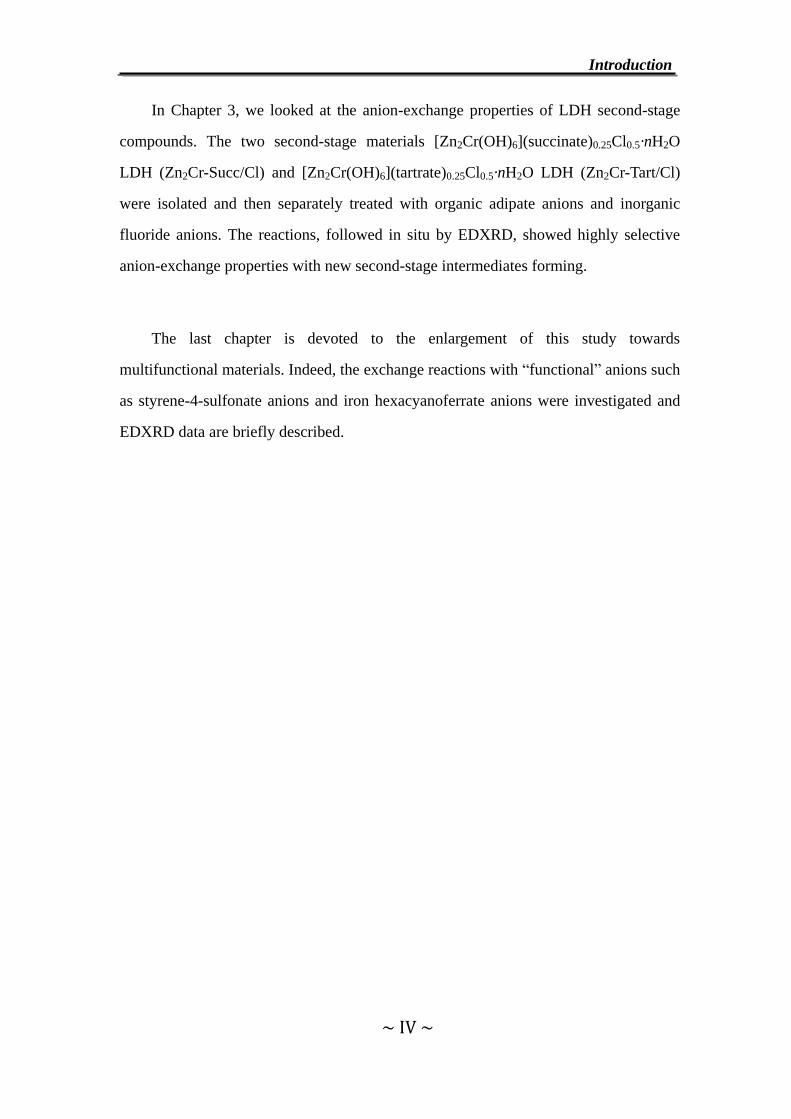
In Chapter 3, we looked at the anion-exchange properties of LDH second-stage
compounds. The two second-stage materials [Zn2Cr(OH)6](succinate)0.25Cl0.5·nH2O
LDH (Zn2Cr-Succ/Cl) and [Zn2Cr(OH)6](tartrate)0.25Cl0.5·nH2O LDH (Zn2Cr-Tart/Cl)
were isolated and then separately treated with organic adipate anions and inorganic
fluoride anions. The reactions, followed in situ by EDXRD, showed highly selective
anion-exchange properties with new second-stage intermediates forming.
The last chapter is devoted to the enlargement of this study towards
multifunctional materials. Indeed, the exchange reactions with “functional” anions such
as styrene-4-sulfonate anions and iron hexacyanoferrate anions were investigated and
EDXRD data are briefly described.

Chapter 1
~ 1 ~
Chapter 1 An Introduction to
Layered Double Hydroxides and
Staging in Lamellar Materials

Chapter 1
~ 2 ~
I. Generalities on Layered Double Hydroxides
1.1 Structural Considerations
Layered double hydroxides (LDH), also called anionic clays, are host-guest
layered materials1-3. Yet, contrary to cationic clays, LDH materials are quite rare in
nature. Most of LDH are synthetic phases and their structure resembles the naturally
occurring mineral Hydrotalcite [Mg6Al2(OH)16]CO3·4H2O, first discovered in 1842 and
first prepared as a synthetic material in 1942 by Feitknecht4, 5. However, the detailed
structural features of LDH were not understood until the late 1960’s by Allmann6,
Taylor7 and their co-workers.
LDH materials are mostly described by the general formula [M2+1-xM3+
x
(OH)2]Am-x/m·nH2O, abbreviated hereafter as M2+
RM3+-A, where M2+ and M3+ are
divalent and trivalent cations, respectively, A is an anion of valence m and R = 1-x/x is
the M2+/ M3+ molar ratio (x = M3+/(M3++M2+)). The structure of LDH hydroxide layers
is derived from that of brucite, Mg(OH)2, which consists of M(OH)6 octahedral units
sharing four edges and three vertices and thus forming infinite layers with neutral
charge. In LDH, a partial replacement of divalent cations by trivalent cations occurs
resulting in a net positive charge, compensated by Am- negative anions present in the
interlayer space and surrounded by water molecules.
The main features of Hydrotalcite-like LDH are a large chemical variation and a
random distribution of cations within the hydroxide layers. All divalent positive metal
ions from Mg2+ to Zn2+ with an ionic radius in the range 0.65 - 0.80 Å and all transition
metal trivalent ions (except Ti3+) with an ionic radius in the range 0.62 – 0.69 Å (with
the main exception of Al3+: 0.50 Å) can enter into the composition of LDH hydroxide
layers. Divalent and trivalent cations of close radius values enable a joint replacement
and a larger chemical variation, and therefore a highly tunable layer charge density.
Chapter 1
~ 3 ~
LDH materials consisting of more than two different cations in the sheets have been
reported such as (Cu0.4Zn0.6)6M2(OH)16CO3·4H2O (M = Al, Cr and Ga) 8, Ni-Al-M-CO3
(M=Cr or Fe) 9 , CuxNiyMg2-x-yAl-CO310 and [FeⅡ
1-x-yMgyFeⅢ
x(OH)2]-(OH)x·nH2O. 11
Note that the larger mean cation radius leads to the higher flattened degree of the
octahedral environment of metal cations along the stacking direction compared with the
regular polyhedron and then results to the lower layer thickness and the larger distance
between metal cations. For example, by the comparison of Zn3Al and Zn2Cr based
LDHs, the mean metal radius increases from 0.68 Å to 0.72 Å while the hydroxide
layer thickness decreases from 2.071 Å to 2.020 Å and the mean cation distance from
3.083 Å to 3.120 Å.12
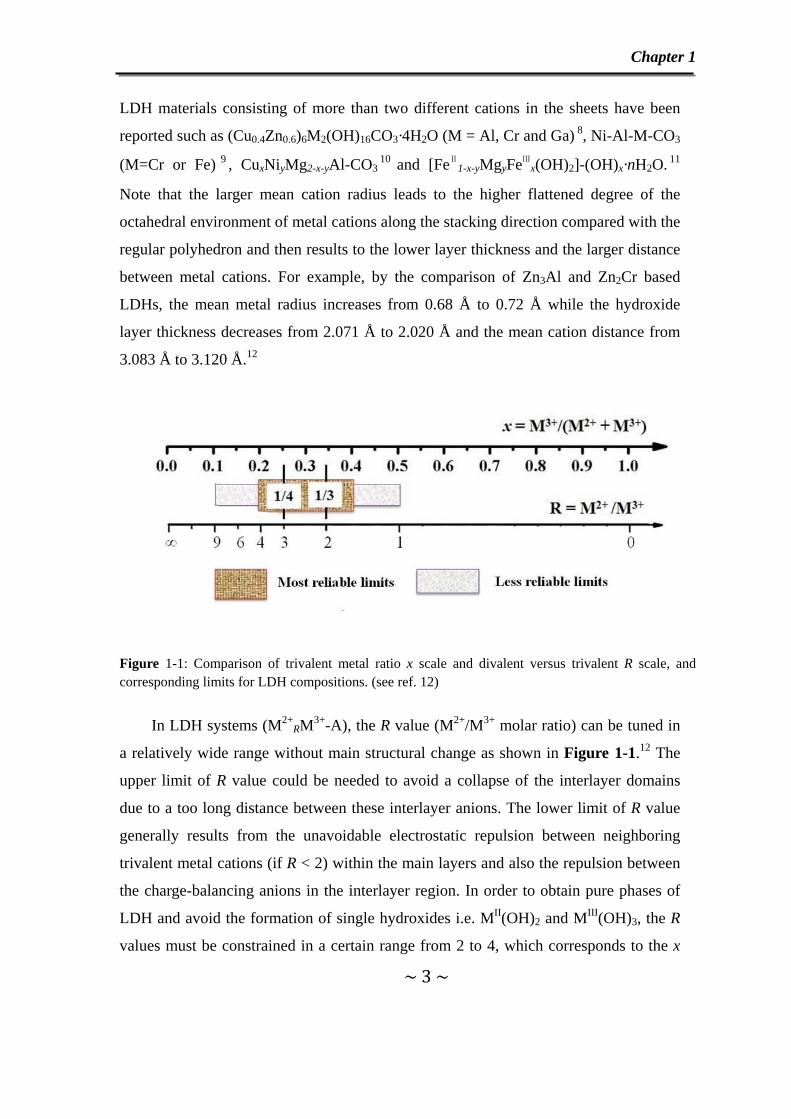
Figure 1-1: Comparison of trivalent metal ratio x scale and divalent versus trivalent R scale, and corresponding limits for LDH compositions. (see ref. 12)
In LDH systems (M2+RM3+-A), the R value (M2+/M3+ molar ratio) can be tuned in
a relatively wide range without main structural change as shown in Figure 1-1.12 The
upper limit of R value could be needed to avoid a collapse of the interlayer domains
due to a too long distance between these interlayer anions. The lower limit of R value
generally results from the unavoidable electrostatic repulsion between neighboring
trivalent metal cations (if R < 2) within the main layers and also the repulsion between
the charge-balancing anions in the interlayer region. In order to obtain pure phases of
LDH and avoid the formation of single hydroxides i.e. MII(OH)2 and MIII(OH)3, the R
values must be constrained in a certain range from 2 to 4, which corresponds to the x
Chapter 1
~ 4 ~
value varying from 0.33 to 0.20. Yet, a wider range of R values has been reported: for
MgRGa-CO3, 1.8 ≤ R ≤ 12.9 (0.072 ≤ x ≤ 0.357)13as well as for [FeⅡ
2FeⅢ
2(OH)8]-CO3,
R = 1 (x = 0.5)14. While in other cases, a unique R value can only be stabilized, for
example, R =2 for Cu2Cr15, Zn2Cr16 and Ca2Al 17LDH and R= 1/2 in LiAl2 LDH18.
A great number of anions including inorganic anions and organic anions as
presented below could occupy the interlayer region of LDH. The amount of the anions
in the interlayer spacing is directly related to the charge density of the hydroxide layers
which can be controlled by the M2+/M3+ ratio whereas their arrangement depends on
the interlayer packing related to the layer charge density as well as the anion size and
the presence of water molecules; additional parameters such as the preparation route
and the synthesis temperature may also influence the interlayer arrangement, especially
in the case of organic intercalated molecule. The positive charge density (dcharge) of the
hydroxide layers can be calculated as follows19:
1 · · sin 60°⁄⁄ Equation 1-1
where S unit charge is the area per unit charge, e is the charge of an electron, x is the
mole fraction of the trivalent cation in the brucite-like layer, M3+/(M2++M3+) and a is
the cell parameter of hexagonal unit cell.
i) inorganic anions: halide ions (F-, Cl-, Br- and I-); small oxo anions (CO32-, NO3
-,
ClO4-, SO4
2-, S2O32- and CrO4
2-, etc.); inorganic coordination compounds (NiCl42-, CoCl4
2-,
Fe(CN)63- and Fe(CN)6
4-, etc.); silicate anion (SiO(OH)3-).
ii) polyoxometalates: [Mo7O24]6-, [V10O28]6-, [H2W12O40]6-, [PV3W9O40]6-,
[SiV3W9O40]7-, [BVW11O40]7- and [SiW11O39]8-, etc.
iii) organic anions: (di)carboxylates (adipate, oxalate, succinate, benzoate, phthalate,
terephthalate, p-methylbenzoate and p-hydroxybenzoate, etc.); anionic surfactants (alkyl
sulfonates, alkyl sulfates, etc.); metallomacrocycles (Co(II) or Cu(II) phthalocyanine
Chapter 1
~ 5 ~
tetrasulfonate, Mn(III)-meso-tetrakis-(2, 6-dichloro-3-sulfonato-phenyl)porphyrin, etc.);
anionic polymer (polyacrylate, polyacrylonitrile, polyaniline, polyvinylsulfonate,
polystyrenesulfonate and polyaspartate, etc.).
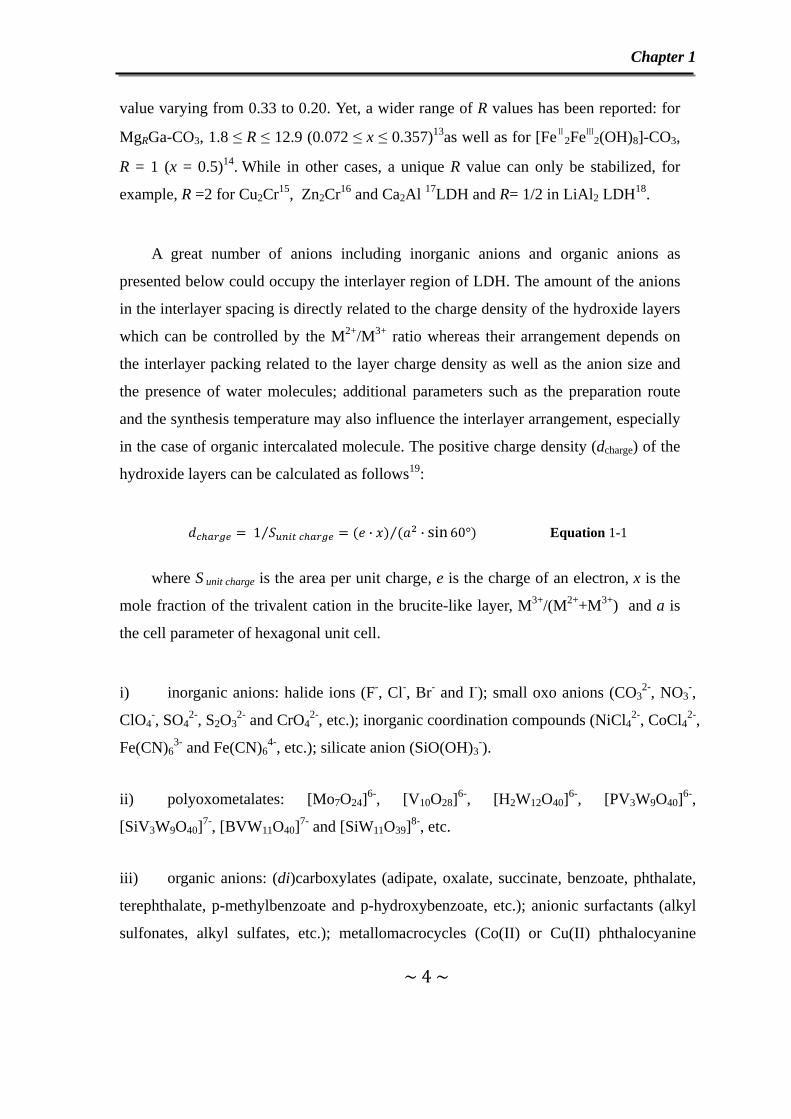
Figure 1-2: Variation of anionic exchange capacity (meq/100g) as a function of the amount of trivalent cation reported per formula weight (ref. 20).
The anionic exchange capacity (AEC, meq/100 g) of LDH is expressed in terms of
millimoles of positive charge within the hydroxide layers per 100 gram of LDH based on
the theoretical formula [MII1-xMIII(OH)2]A-m
x/m·nH2O and depends on the amount of
trivalent cations (x value in the general formula) present in the hydroxide layer. As
reported for some LDH compositions in Figure 1-220, the values range from 200 to 450
meq/100g corresponding to the range of x value from ca. 0.33 to 0.20. For comparison,
cationic clays present usually limited ionic exchange capacity close to 100 meq/100 g
associated to average area per charge of 70 Å2/charge. In the case of LDH materials, the
average area per charge is much smaller with values from 25 to 40 Å2/charge. This
explains the differences observed in their intercalation and exfoliation chemistry.
Chapter 1
~ 6 ~
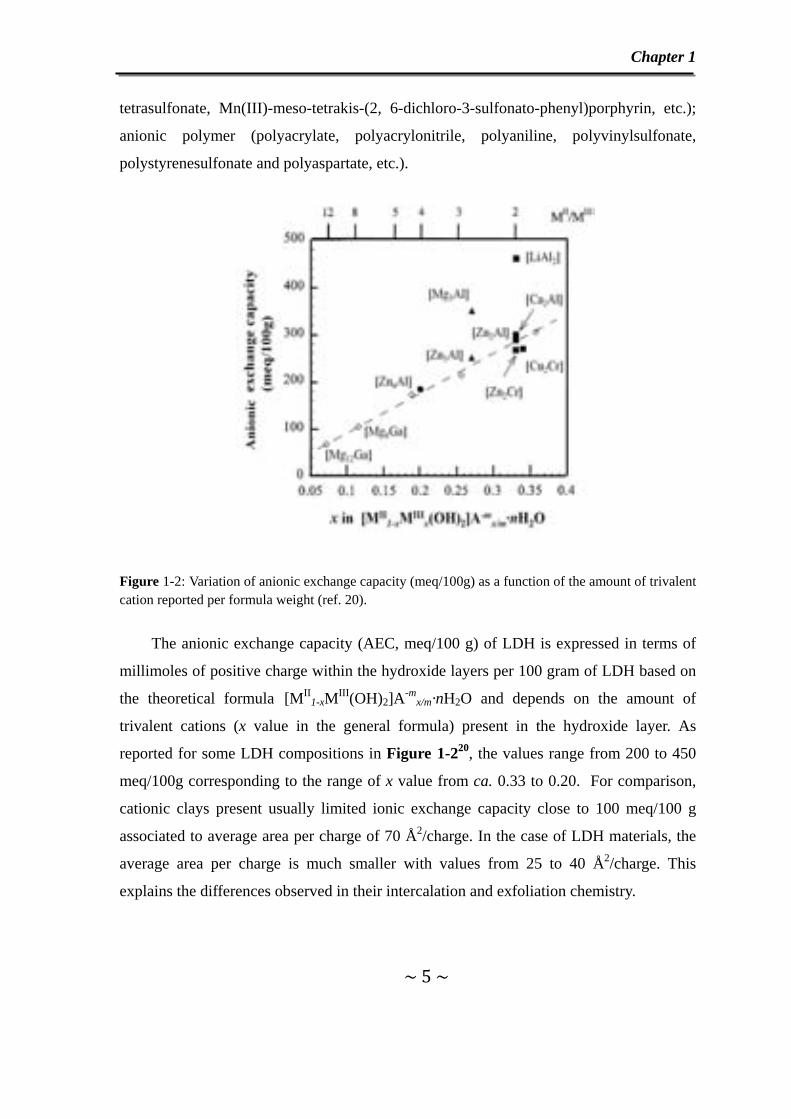
Figure 1-3: (a) Stacking sequence in Hydrotalcite ([Mg6Al2(OH)16]CO3·4H2O) with rhombohedral symmetry (ref. 21). (b) position of interstitial atoms between the hydroxide layers. Gallery height can be calculated by subtracting the layer thickness (~4.8 Å) from the basal spacing (c’). (ref. 22)
Synthetic LDH materials generally crystallize in the space group 3 adopting the
same structure as the Hydrotalcite mineral [Mg6Al2(OH)16]CO3·4H2O (Figure 1-3(a)).
The hydroxide layers of Hydrotalcite are stacked with three layers per unit cell in
rhombohedral symmetry. The parameters of the unit cell for Hydrotalcite are: a = 3.05 Å
and c = 3c’= 22.81 Å (c’ = 7.603 Å). 21 The distribution of the metal cations in the
hydroxide layers is disordered. The carbonate anions and interstitial water molecules are
likewise randomly located in the interlayer region. The oxygen atoms of the water
molecules and of the carbonate anions are distributed approximately closely around the
symmetry axes that pass through the hydroxyl groups of adjacent brucite-like layers
(Figure 1-3 (b)).22 Preferential location of interlayer oxygen atoms could be found at
about 0.56 Å radial distance from the three-fold axes.
Owing to their lamellar character and the disordered cationic distribution within the
hydroxide layers, synthetic LDH materials are generally microcrystalline powders and
structural studies are performed by Rietveld refinement of powder X-ray diffraction
diagrams.
Chapter 1
~ 7 ~
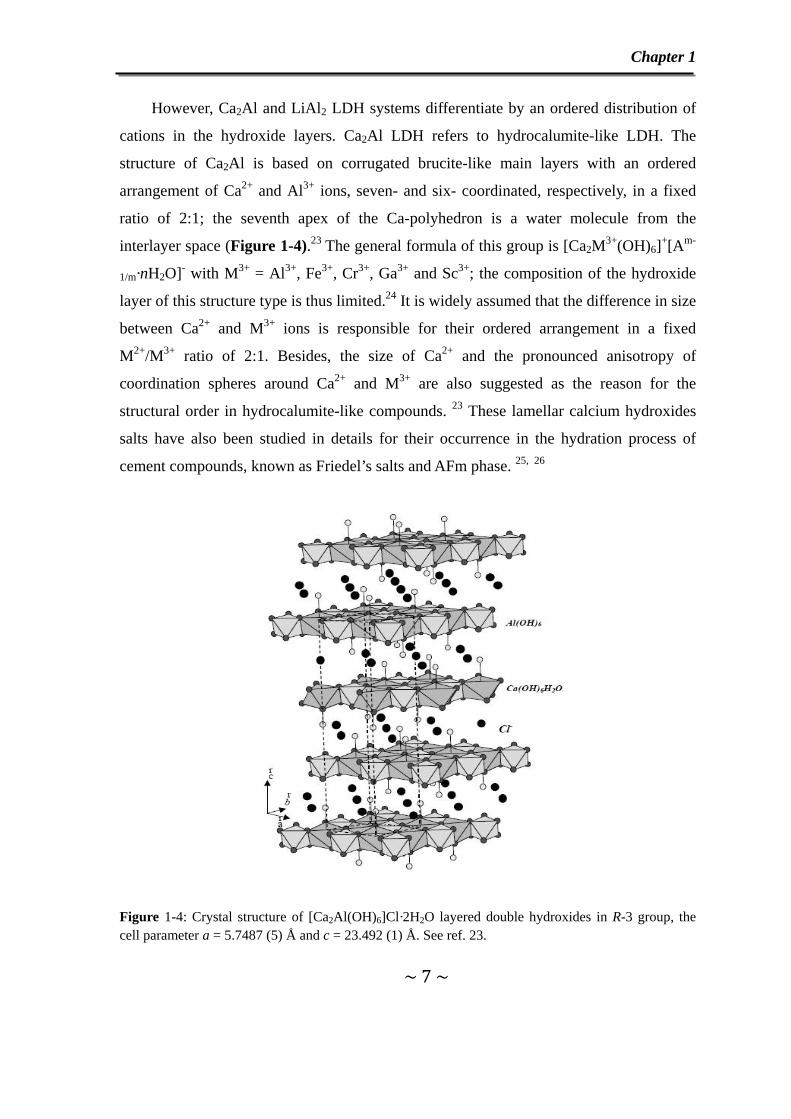
However, Ca2Al and LiAl2 LDH systems differentiate by an ordered distribution of
cations in the hydroxide layers. Ca2Al LDH refers to hydrocalumite-like LDH. The
structure of Ca2Al is based on corrugated brucite-like main layers with an ordered
arrangement of Ca2+ and Al3+ ions, seven- and six- coordinated, respectively, in a fixed
ratio of 2:1; the seventh apex of the Ca-polyhedron is a water molecule from the
interlayer space (Figure 1-4).23 The general formula of this group is [Ca2M3+(OH)6]+[Am-
1/m·nH2O]- with M3+ = Al3+, Fe3+, Cr3+, Ga3+ and Sc3+; the composition of the hydroxide
layer of this structure type is thus limited.24 It is widely assumed that the difference in size
between Ca2+ and M3+ ions is responsible for their ordered arrangement in a fixed
M2+/M3+ ratio of 2:1. Besides, the size of Ca2+ and the pronounced anisotropy of
coordination spheres around Ca2+ and M3+ are also suggested as the reason for the
structural order in hydrocalumite-like compounds. 23 These lamellar calcium hydroxides
salts have also been studied in details for their occurrence in the hydration process of
cement compounds, known as Friedel’s salts and AFm phase. 25, 26
Figure 1-4: Crystal structure of [Ca2Al(OH)6]Cl·2H2O layered double hydroxides in R-3 group, the cell parameter a = 5.7487 (5) Å and c = 23.492 (1) Å. See ref. 23.
Chapter 1
~ 8 ~
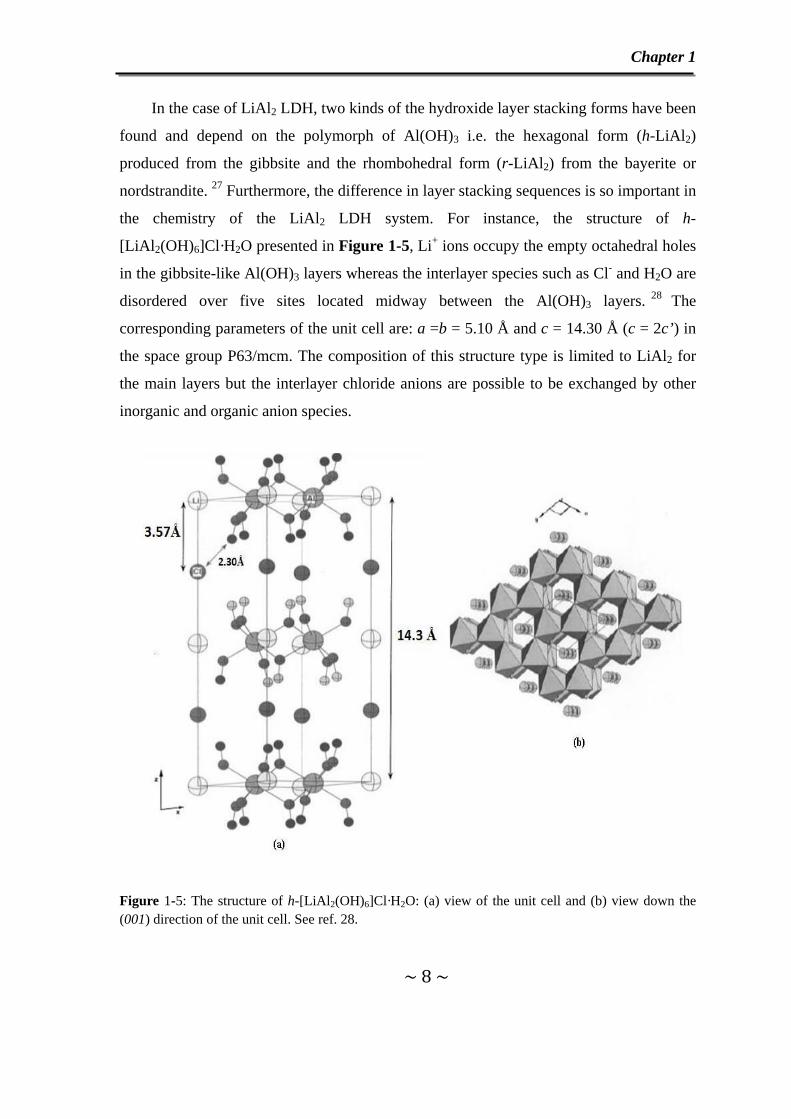
In the case of LiAl2 LDH, two kinds of the hydroxide layer stacking forms have been
found and depend on the polymorph of Al(OH)3 i.e. the hexagonal form (h-LiAl2)
produced from the gibbsite and the rhombohedral form (r-LiAl2) from the bayerite or
nordstrandite. 27 Furthermore, the difference in layer stacking sequences is so important in
the chemistry of the LiAl2 LDH system. For instance, the structure of h-
[LiAl2(OH)6]Cl·H2O presented in Figure 1-5, Li+ ions occupy the empty octahedral holes
in the gibbsite-like Al(OH)3 layers whereas the interlayer species such as Cl- and H2O are
disordered over five sites located midway between the Al(OH)3 layers. 28 The
corresponding parameters of the unit cell are: a =b = 5.10 Å and c = 14.30 Å (c = 2c’) in
the space group P63/mcm. The composition of this structure type is limited to LiAl2 for
the main layers but the interlayer chloride anions are possible to be exchanged by other
inorganic and organic anion species.
Figure 1-5: The structure of h-[LiAl2(OH)6]Cl·H2O: (a) view of the unit cell and (b) view down the (001) direction of the unit cell. See ref. 28.
Chapter 1
~ 9 ~
1.2 Synthesis Routes of LDH
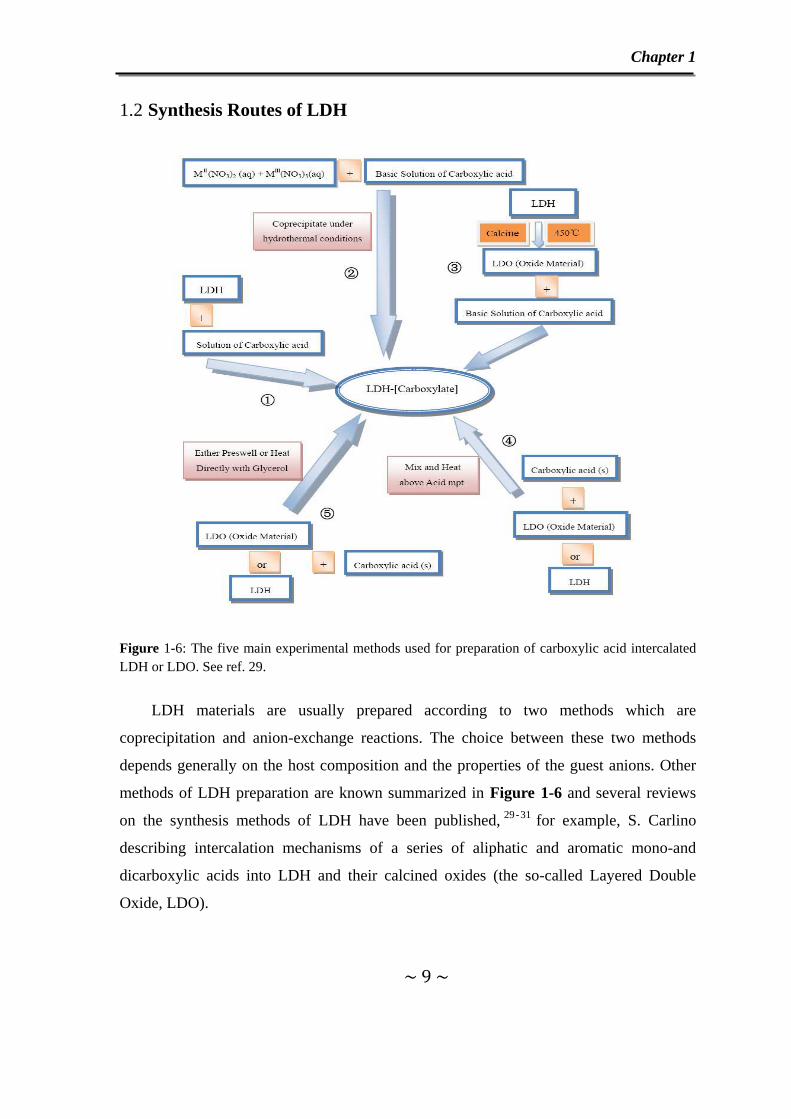
Figure 1-6: The five main experimental methods used for preparation of carboxylic acid intercalated LDH or LDO. See ref. 29.
LDH materials are usually prepared according to two methods which are
coprecipitation and anion-exchange reactions. The choice between these two methods
depends generally on the host composition and the properties of the guest anions. Other
methods of LDH preparation are known summarized in Figure 1-6 and several reviews
on the synthesis methods of LDH have been published, 29-31 for example, S. Carlino
describing intercalation mechanisms of a series of aliphatic and aromatic mono-and
dicarboxylic acids into LDH and their calcined oxides (the so-called Layered Double
Oxide, LDO).
Chapter 1
~ 10 ~
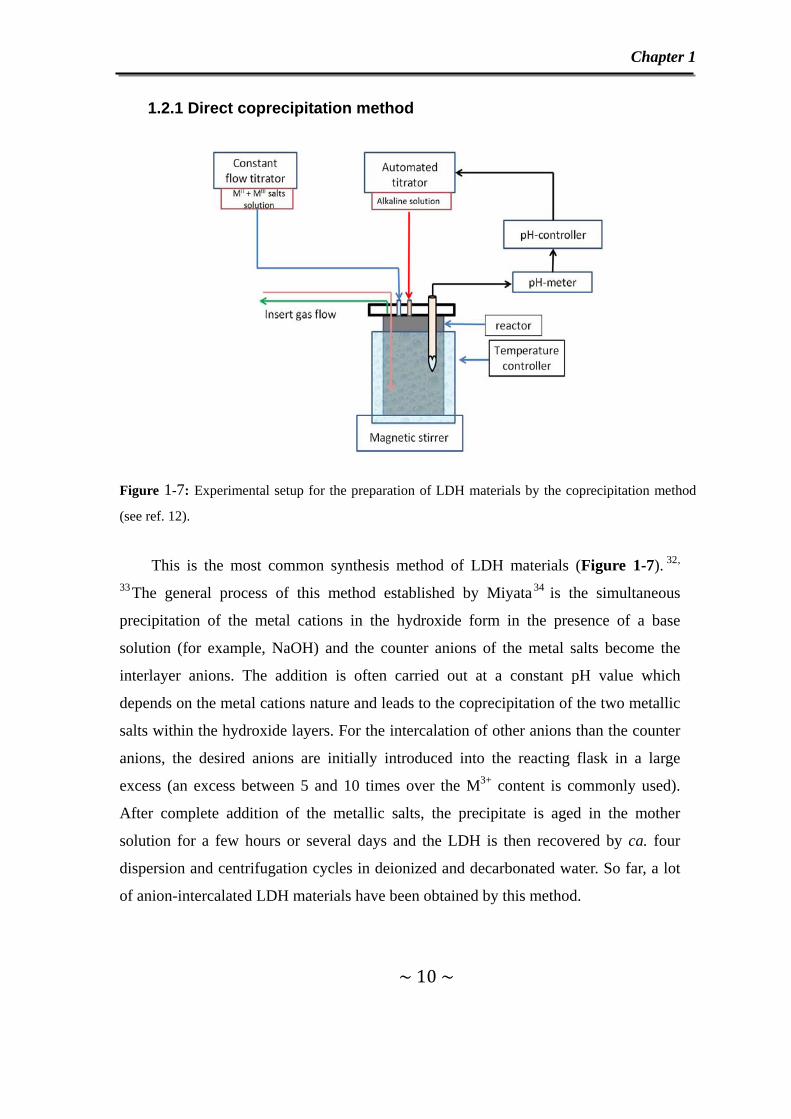
1.2.1 Direct coprecipitation method
Figure 1-7: Experimental setup for the preparation of LDH materials by the coprecipitation method
(see ref. 12).
This is the most common synthesis method of LDH materials (Figure 1-7). 32,
33The general process of this method established by Miyata34 is the simultaneous
precipitation of the metal cations in the hydroxide form in the presence of a base
solution (for example, NaOH) and the counter anions of the metal salts become the
interlayer anions. The addition is often carried out at a constant pH value which
depends on the metal cations nature and leads to the coprecipitation of the two metallic
salts within the hydroxide layers. For the intercalation of other anions than the counter
anions, the desired anions are initially introduced into the reacting flask in a large
excess (an excess between 5 and 10 times over the M3+ content is commonly used).
After complete addition of the metallic salts, the precipitate is aged in the mother
solution for a few hours or several days and the LDH is then recovered by ca. four
dispersion and centrifugation cycles in deionized and decarbonated water. So far, a lot
of anion-intercalated LDH materials have been obtained by this method.

Chapter 1
~ 11 ~
The mechanism of coprecipitation method relies upon the condensation of hexa-
aqua complexes in solution in order to form the brucite-like layers with a distribution
of both metallic cations and with solvated interlayer anions. 12 In order to obtain well
crystallized LDH phases, some of the experimental parameters should be particularly
controlled and optimized such as the pH, the temperature, the concentration of both
metallic salts, the concentration of alkaline solution, the addition rate of reactants as
well as the aging time and temperature of the precipitate.
1.2.2 Anion-exchange method
This method is based on the anion exchanged properties of LDH. The general
process of this method can be described as following:
· · /
Based on the mass action law, working in excess of incoming anions ( will favor the
exchange reaction of outcoming anions (Am-) to generate the fully exchanged phase
· / .
Anion exchange properties of LDH depend on LDH affinity towards outcoming and
incoming anions. By comparing the equilibrium constant of exchange reactions between
monovalent anions and divalent anions, Miyata proposed an order of anion selectivity:
OH- > F- > Cl- >Br- > NO3- > I- and CO3
2- > C10H4N2O8S2- (Naphthol Yellow S) > SO42-.
These results suggest for example that NO3- anions are easily displaced by OH- anions of
higher affinity towards the metal hydroxide layers. This trend was later confirmed by
microcalorimetric measurement. 35 Yamaoka et al. 36 also gave a comparative list for
divalent oxoanions: HPO42-, HAsO4
2- > CrO42- > SO4
2- >MoO42-. Based on these
observations, chloride and nitrate containing LDH are often used as precursors for anion-
exchange reactions, and one should avoid carbonate or hydroxyl phase. The exchange
process may be limited by the expansion of the interlayer space to accommodate large
size anions. In this case, spaced LDH precursors intercalated with lauryl sulfate, p-
Chapter 1
~ 12 ~
toluenesufonate, terephthalate, 2, 5-dihydroxy-1, 4- benzendisulfonate, 1, 5-
naphthalenedisulfonate anions can be used as reported for the preparation of oxometalates
anions-containing LDH as reported. 37, 38 An extended use of this guest displaced method
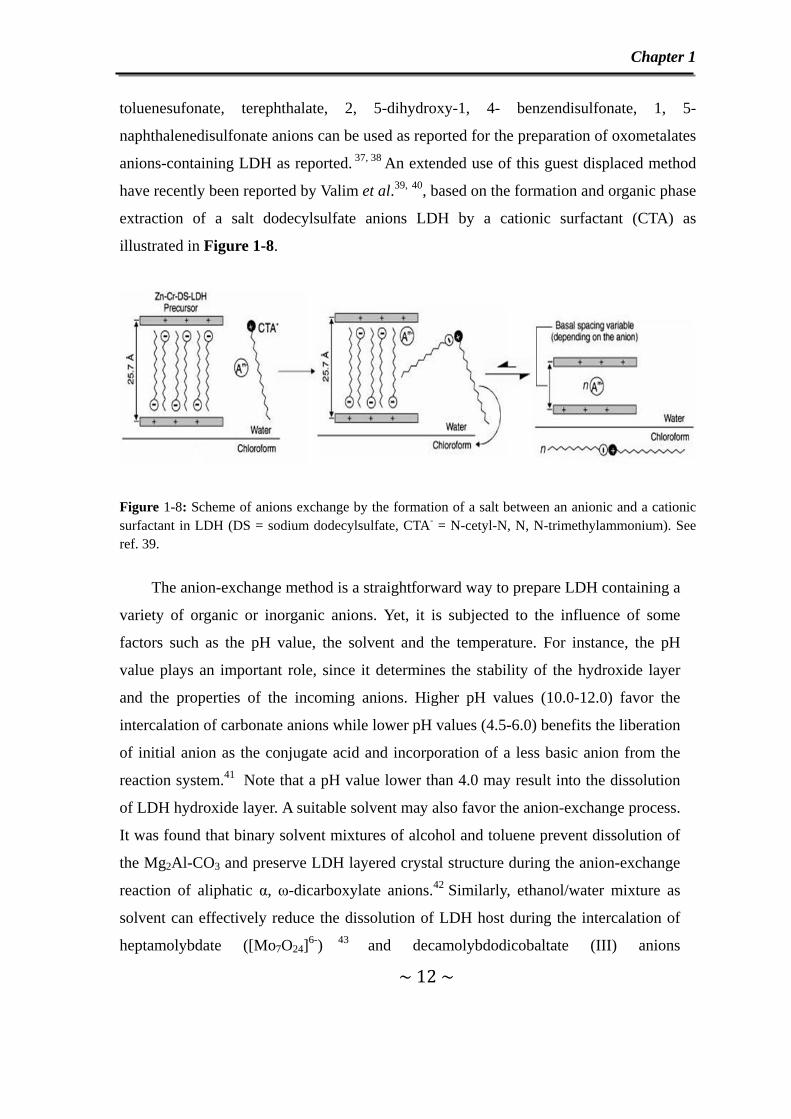
have recently been reported by Valim et al.39, 40, based on the formation and organic phase
extraction of a salt dodecylsulfate anions LDH by a cationic surfactant (CTA) as
illustrated in Figure 1-8.
Figure 1-8: Scheme of anions exchange by the formation of a salt between an anionic and a cationic surfactant in LDH (DS = sodium dodecylsulfate, CTA- = N-cetyl-N, N, N-trimethylammonium). See ref. 39.
The anion-exchange method is a straightforward way to prepare LDH containing a
variety of organic or inorganic anions. Yet, it is subjected to the influence of some
factors such as the pH value, the solvent and the temperature. For instance, the pH
value plays an important role, since it determines the stability of the hydroxide layer
and the properties of the incoming anions. Higher pH values (10.0-12.0) favor the
intercalation of carbonate anions while lower pH values (4.5-6.0) benefits the liberation
of initial anion as the conjugate acid and incorporation of a less basic anion from the
reaction system.41 Note that a pH value lower than 4.0 may result into the dissolution
of LDH hydroxide layer. A suitable solvent may also favor the anion-exchange process.
It was found that binary solvent mixtures of alcohol and toluene prevent dissolution of
the Mg2Al-CO3 and preserve LDH layered crystal structure during the anion-exchange
reaction of aliphatic α, ω-dicarboxylate anions.42 Similarly, ethanol/water mixture as
solvent can effectively reduce the dissolution of LDH host during the intercalation of
heptamolybdate ([Mo7O24]6-) 43 and decamolybdodicobaltate (III) anions
Chapter 1
~ 13 ~
([H4Co2Mo10O38]6-) 44 into MgRAl-LDH (1.27 ≤ R ≤ 3.0). Finally, O’Hare et al. also
found that the mixed ethanol/water solvent may also improve the crystallinity and
decrease the production of Al(OH)3 as an undesired product during the exchange
reaction involving all isomers of both pyridinecarboxylate and toluate in
[LiAl2(OH)6]Cl·H2O.45 In the other hand, to some extent, higher reaction temperatures
favor the exchange reaction by lowering activation energy.
1.2.3 Other methods
The reconstruction of the LDH phase from calcined LDH derivatives (LDO) is
reported as an alternative method for the preparation of hybrid LDH 46 and has also been
largely used for the incorporation of bulky anions such as polyoxometalates anions.47, 48
This method is more complicated compared with coprecipitation and anion-exchange
methods. The calcination temperature and the composition of the hydroxide layers are the
key factors influencing the reconstruction process.49, 50 However, it is still difficult to
avoid the existence of carbonate anions due to the high affinity towards the mixed oxide51
and the production of some amorphous phases due to uncomplete reconstruction.
The hydrothermal method carried out in an autoclave under autogenous pressure
is usually applied as a postsynthesis hydrothermal treatment to improve the crystallinity
of LDH. 52 In a few occasions, this method was found effective for the intercalation of
lower affinity anions.53
The salt-oxide method 54 is based on the slow addition of a solution of trivalent
metal salt (acidic species i.e. CrCl3, AlCl3) on an aqueous suspension of the divalent metal
oxide (basic species i.e. CuO, ZnO). The LDH phase is formed along the slow dissolution
of divalent oxide and the reaction can be written as follows:
MIIO MIIICl 1 H O MII MIII OH Cl · H O MIICl .

Chapter 1
~ 14 ~
For instance, Zn2Cr-Cl, Zn2Al-Cl and Cu2Cr-Cl LDH compounds have been prepared via
this method. 55
1.3 Structural Characterization of LDH
The structural characterization of LDH often suffers from the poor crystallinity of
the powders. Hence, together with powder X-ray diffraction (PXRD) technique,
microscopy, X-ray Absorption Spectroscopy (XAS), Infrared (IR), Raman, Nuclear
Magnetic Resonance (NMR) spectroscopies and Molecular Dynamic (MD) simulations
are often used as complementary techniques to get a better view of LDH structure
(Figure 1-9).
Figure 1-9: Possible structural information provided by different characterization technique.56
1.3.1 Powder X-ray Diffraction (PXRD)
Only a few minerals can be obtained in the form of single crystals and most of
synthetic LDH are randomly oriented powders. Consequently, powder X-ray diffraction
(PXRD) remains the main analytical technique for the structural characterization of
LDH.

Chapter 1
~ 15 ~
1.3.1.1 Basic structural information from PXRD patterns
As presented in Figure 1-10,57 the typical features of PXRD patterns of all LDH
are the presence of sharp and intense lines at low 2θ angle values corresponding to the
basal 00l reflections, and less intense lines at higher angular values corresponding to
01l, 10l and 11l reflections. As said before, the patterns are generally indexed on the
basis of an hexagonal unit cell in the space group 3 and then the unit cell
parameters can be gained: a = b = 2d110 and c = 3 d003.
Figure 1-10: Powder X-ray diffraction patterns of a synthetic Hydrotalcite [Mg6Al2(OH)16] (CO3)·4H2O (see ref. 57).
The 003 reflection corresponds to the interlayer distance d003 i.e. d-spacing and is
equal to the gallery height plus the host hydroxide layer thickness of approximately 4.8
Å. Actually this value corresponds to the interlayer distance in brucite Mg(OH)2 thus
including the hydroxide layer thickness and the hydrogen bond distance between
successive hydroxide layers. On the other hand, the structural study by neutron
diffraction of Zn2Al-CO3 led to an hydroxide layer thickness of 3.9 Å including
hydrogen atoms of OH groups.58 Generally, the LDH hydroxide layer thickness is
Chapter 1
~ 16 ~
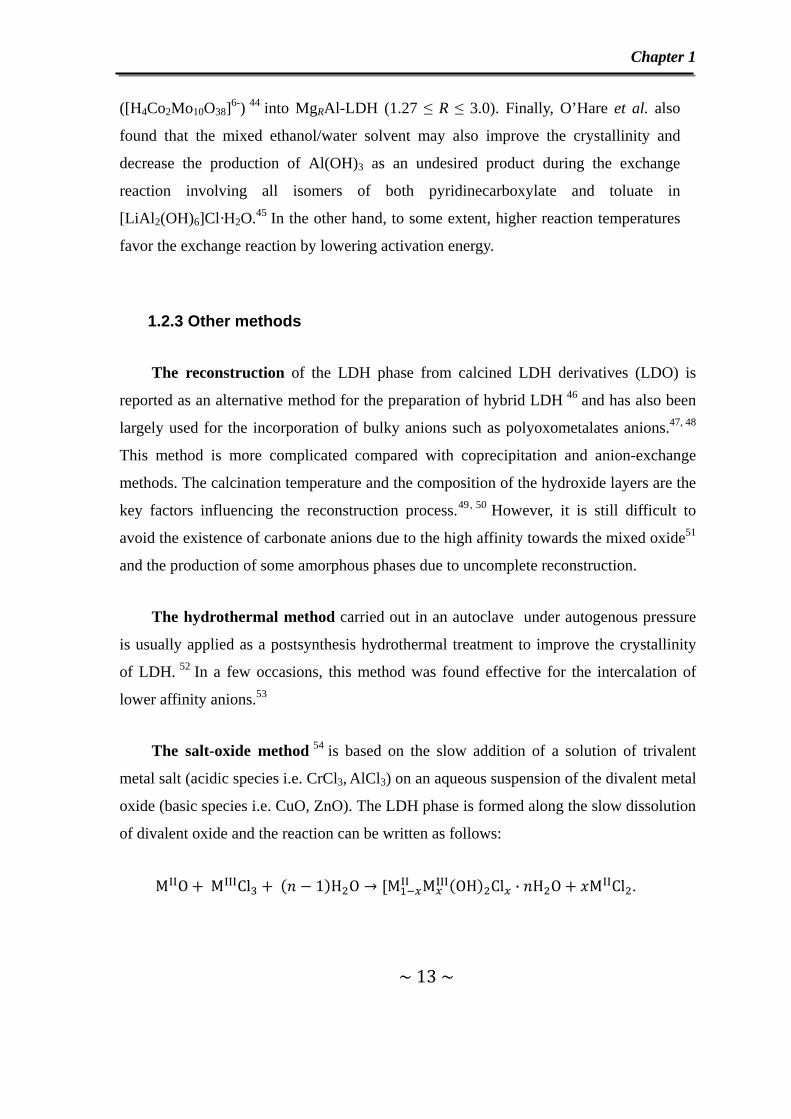
relatively constant, little changes are observed as a function of cation composition. On
the contrary, the gallery height depends on the size and orientation of the anion, 59-61 as
well as on the layer charge density i.e. x value determining the interlayer packing
(Figure 1-11 (a))62-64 and for some anions, on the degree of hydration65-67.
Figure 1-11: Variation of the hexagonal unit cell parameters of ZnAl-CO3 and MgAl-CO3 LDH with x value (M3+/ (M2++M3+)). (ref. 3)
The 110 reflection can be used to estimate the a parameter of the unit cell, which
corresponds to the distance between adjacent metallic cations within the hydroxide
layers. It depends on the metal ionic radius (r(M2+) and r(M3+)) and the x value
(Figure 1-11 (b)) according to the following equation68:
√2 1 Equation 1-2
In these conditions, from the position of d110, the x value can be determined.
Chapter 1
~ 17 ~
1.3.1.2 Rietveld Refinement
The presence of broad and asymmetric diffraction lines due to simultaneous effect of
small particle size (coherently diffracting domains) and lattice strains in the crystallite
(structural defects, stacking faults) often hinder the structural analysis of LDH from the
PXRD patterns. Because of these difficulties in calculating and interpreting the X-ray data,
some imprecise results on the chemical features and the non-stoichiometric nature of
LDH can be obtained.
A few structural studies based on the Rietveld refinement of PXRD patterns have
been reported so far, for LDH intercalated with inorganic anions such as Cl- 69and
CO32- 70. The crystal chemistry of LDH has been studied in details by Belloto et al.
According to these authors, the disordered distribution of metal cations in LDH
hydroxide layers originates from the compression of the layer. The absence of long
range order comes from the already close OH-OH approach which prevents the layer
distortions brought about the ordering process. In these conditions, long range ordering
in LDH can happen only with cations of similar ionic radius as observed for Mg2Ga-
CO3. 70
1.3.1.3 DIFFaX simulations
DIFFaX (Diffracted Intensities From Faulted Xtals) method intends to interpret the
patterns resulting from randomized stacking sequences.71 In the case of LDH compounds,
DIFFaX simulations of LDH have shown that the structural disorder contributes to the
excessive and non-uniform broadening of diffraction lines and different types of disorder
lead to the broadening of different sequences of reflection peaks. 72 - 74 For example,
stacking faults broaden the h0l/0kl reflections, interstratification selectively broadens the
00l reflections and turbostratic disorder broadens the 0kl reflections. The occurrence of
faults can be quantified by a “fault probability” (FP) between the rhombohedral and the
hexagonal stacking. For instance, in the case of Mg5Ga-CO3, a FP value of 0.6 was
Chapter 1
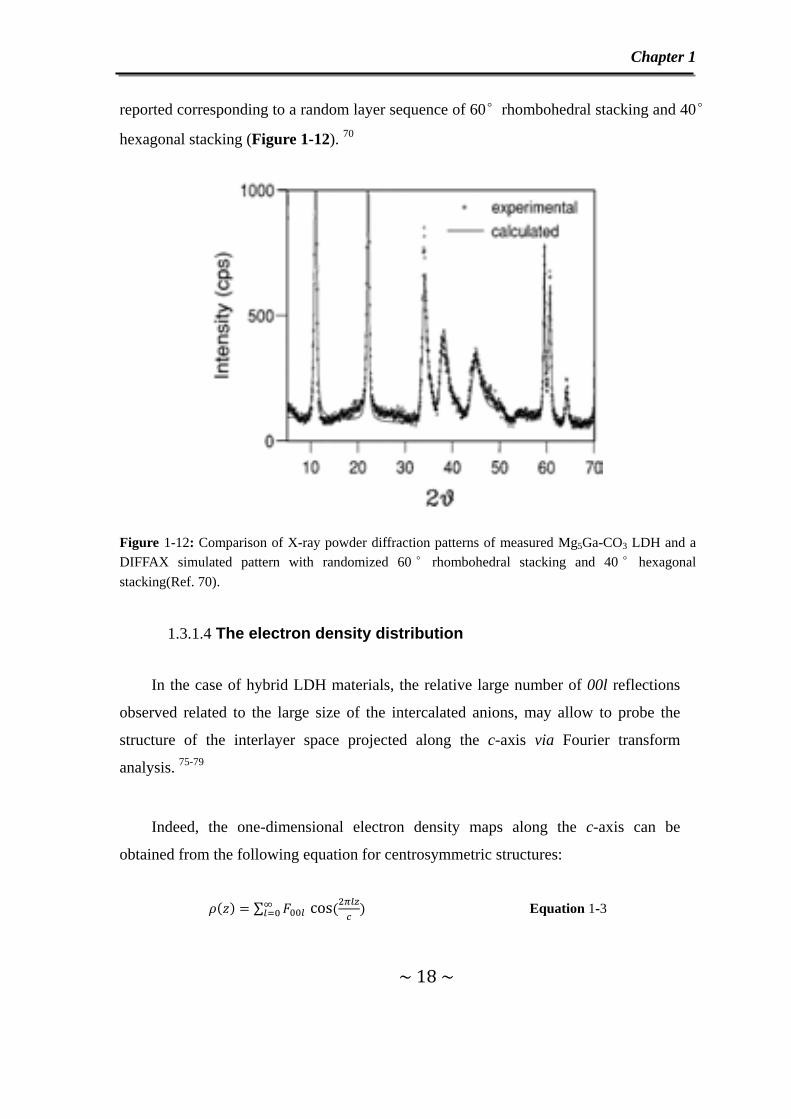
~ 18 ~
reported corresponding to a random layer sequence of 60°rhombohedral stacking and 40°
hexagonal stacking (Figure 1-12). 70
Figure 1-12: Comparison of X-ray powder diffraction patterns of measured Mg5Ga-CO3 LDH and a DIFFAX simulated pattern with randomized 60 ° rhombohedral stacking and 40 ° hexagonal stacking(Ref. 70).
1.3.1.4 The electron density distribution
In the case of hybrid LDH materials, the relative large number of 00l reflections
observed related to the large size of the intercalated anions, may allow to probe the
structure of the interlayer space projected along the c-axis via Fourier transform
analysis. 75-79
Indeed, the one-dimensional electron density maps along the c-axis can be
obtained from the following equation for centrosymmetric structures:
∑ cos Equation 1-3
Chapter 1
~ 19 ~
and 00 I 00 , where l, F00l, c, , and I are the peak numbers (00l)
of the diffraction order, the structure factors of the 00l reflections, the layer distance in c
direction, the phase and peak areas, respectively. The F00l factors were derived from the
intensities of a series corresponding 00l reflection peaks corrected for Lorentz-
polarization effects. The sign of the structure factor is obtained from the scattering
contributions of the layers, assuming that the contribution of the intercalated anions is
relatively small.
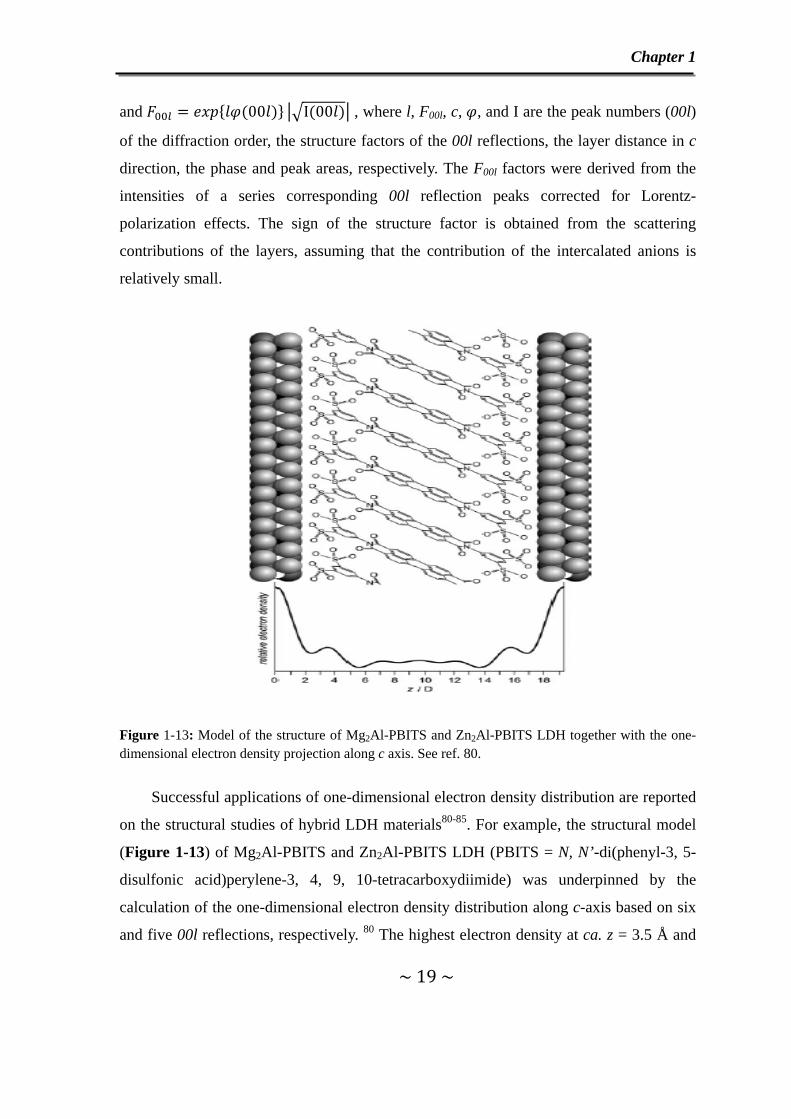
Figure 1-13: Model of the structure of Mg2Al-PBITS and Zn2Al-PBITS LDH together with the one-dimensional electron density projection along c axis. See ref. 80.
Successful applications of one-dimensional electron density distribution are reported
on the structural studies of hybrid LDH materials80-85. For example, the structural model
(Figure 1-13) of Mg2Al-PBITS and Zn2Al-PBITS LDH (PBITS = N, N’-di(phenyl-3, 5-
disulfonic acid)perylene-3, 4, 9, 10-tetracarboxydiimide) was underpinned by the
calculation of the one-dimensional electron density distribution along c-axis based on six
and five 00l reflections, respectively. 80 The highest electron density at ca. z = 3.5 Å and
Chapter 1
~ 20 ~
15.5 Å results from the sulfate groups containing the most electron-rich atoms and the
lowest electron density at ca. z = 5.5 Å and 13.5 Å is assigned to the N-C single bond.
The broad region of medium electron density in the middle gallery is caused by the
aromatic systems.
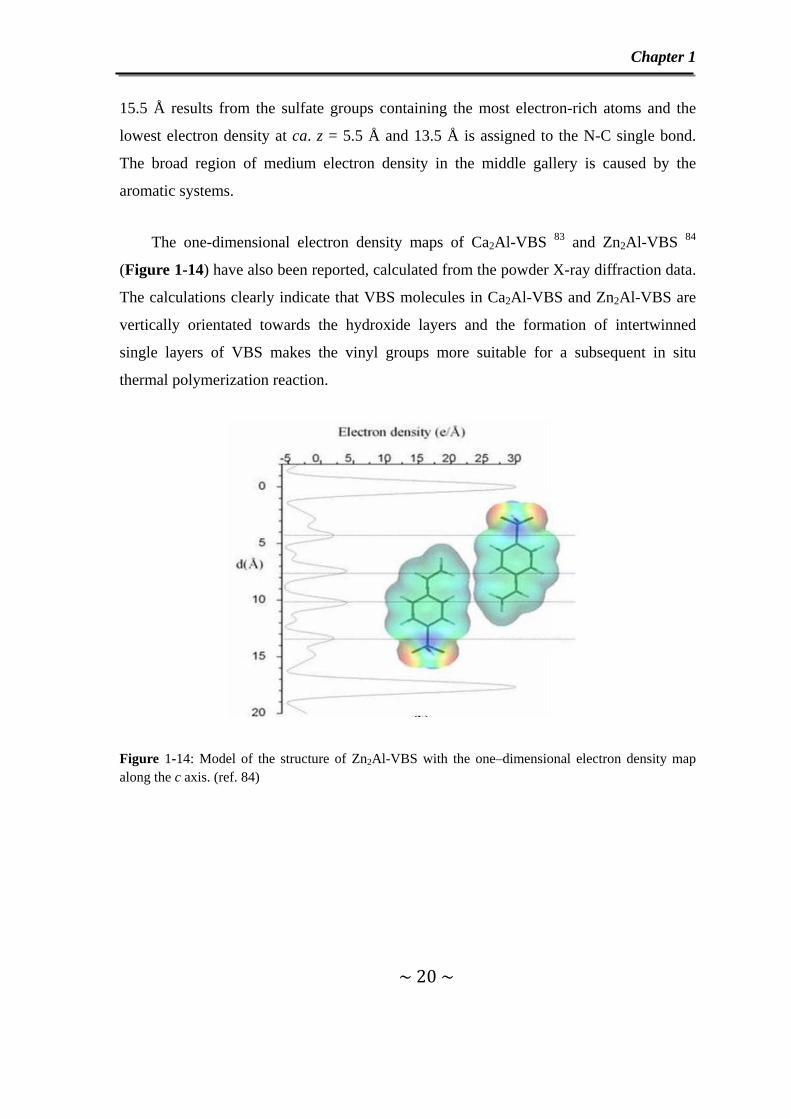
The one-dimensional electron density maps of Ca2Al-VBS 83 and Zn2Al-VBS 84
(Figure 1-14) have also been reported, calculated from the powder X-ray diffraction data.
The calculations clearly indicate that VBS molecules in Ca2Al-VBS and Zn2Al-VBS are
vertically orientated towards the hydroxide layers and the formation of intertwinned
single layers of VBS makes the vinyl groups more suitable for a subsequent in situ
thermal polymerization reaction.
Figure 1-14: Model of the structure of Zn2Al-VBS with the one–dimensional electron density map along the c axis. (ref. 84)
Chapter 1
~ 21 ~
1.3.2 Microscopy
1.3.2.1 Scanning electron microscopy (SEM) and transmission electron micro-scopy (TEM)
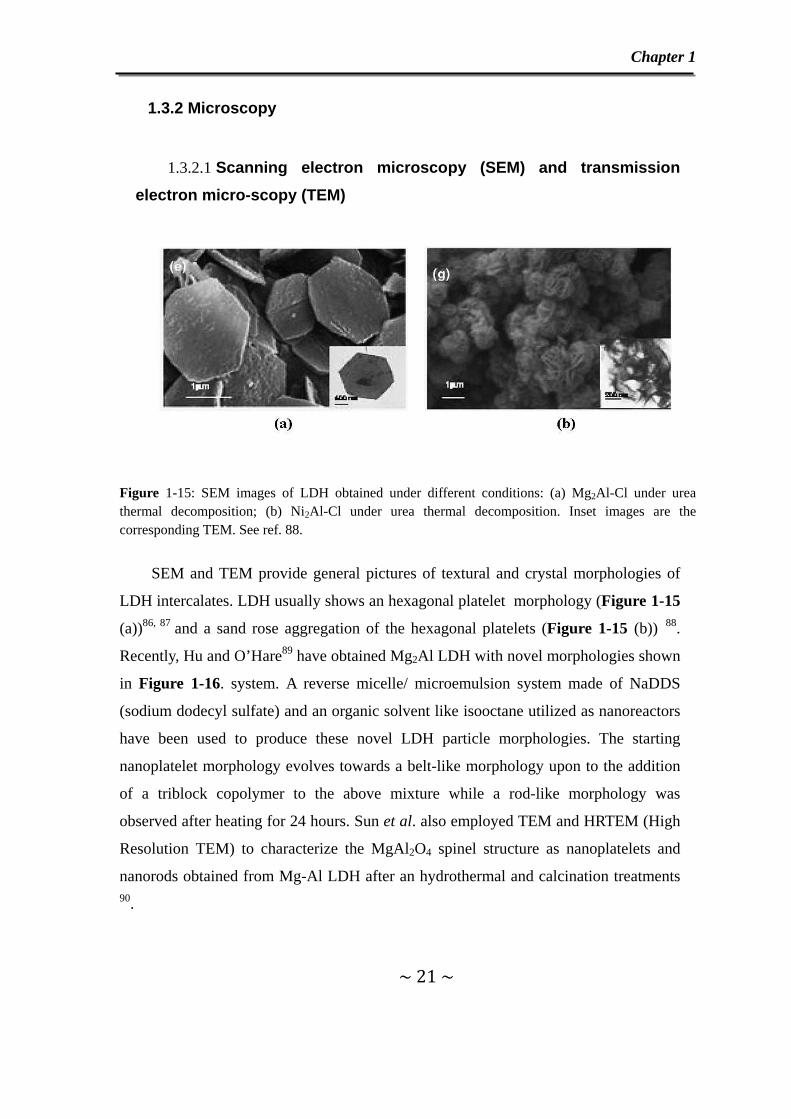
Figure 1-15: SEM images of LDH obtained under different conditions: (a) Mg2Al-Cl under urea thermal decomposition; (b) Ni2Al-Cl under urea thermal decomposition. Inset images are the corresponding TEM. See ref. 88.
SEM and TEM provide general pictures of textural and crystal morphologies of
LDH intercalates. LDH usually shows an hexagonal platelet morphology (Figure 1-15
(a))86, 87 and a sand rose aggregation of the hexagonal platelets (Figure 1-15 (b)) 88.
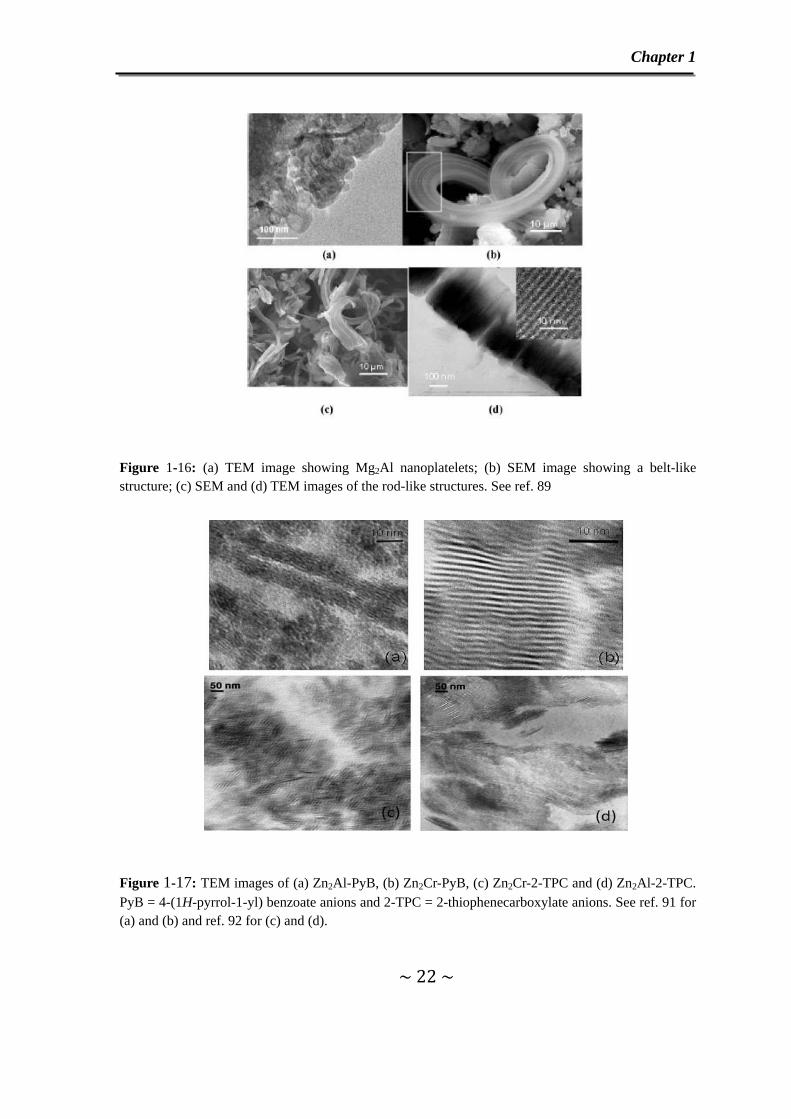
Recently, Hu and O’Hare89 have obtained Mg2Al LDH with novel morphologies shown
in Figure 1-16. system. A reverse micelle/ microemulsion system made of NaDDS
(sodium dodecyl sulfate) and an organic solvent like isooctane utilized as nanoreactors
have been used to produce these novel LDH particle morphologies. The starting
nanoplatelet morphology evolves towards a belt-like morphology upon to the addition
of a triblock copolymer to the above mixture while a rod-like morphology was
observed after heating for 24 hours. Sun et al. also employed TEM and HRTEM (High
Resolution TEM) to characterize the MgAl2O4 spinel structure as nanoplatelets and
nanorods obtained from Mg-Al LDH after an hydrothermal and calcination treatments 90.
Chapter 1
~ 22 ~
Figure 1-16: (a) TEM image showing Mg2Al nanoplatelets; (b) SEM image showing a belt-like structure; (c) SEM and (d) TEM images of the rod-like structures. See ref. 89
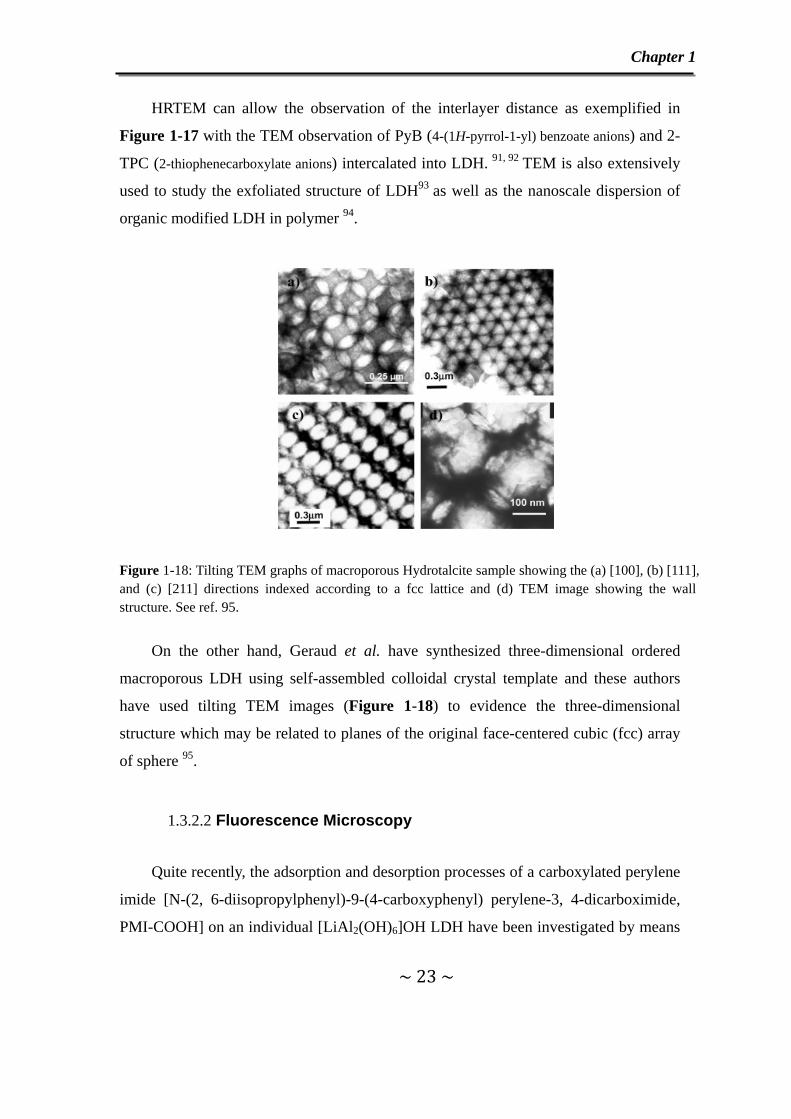
Figure 1-17: TEM images of (a) Zn2Al-PyB, (b) Zn2Cr-PyB, (c) Zn2Cr-2-TPC and (d) Zn2Al-2-TPC. PyB = 4-(1H-pyrrol-1-yl) benzoate anions and 2-TPC = 2-thiophenecarboxylate anions. See ref. 91 for (a) and (b) and ref. 92 for (c) and (d).
Chapter 1
~ 23 ~
HRTEM can allow the observation of the interlayer distance as exemplified in
Figure 1-17 with the TEM observation of PyB (4-(1H-pyrrol-1-yl) benzoate anions) and 2-
TPC (2-thiophenecarboxylate anions) intercalated into LDH. 91, 92 TEM is also extensively
used to study the exfoliated structure of LDH93 as well as the nanoscale dispersion of
organic modified LDH in polymer 94.
Figure 1-18: Tilting TEM graphs of macroporous Hydrotalcite sample showing the (a) [100], (b) [111], and (c) [211] directions indexed according to a fcc lattice and (d) TEM image showing the wall structure. See ref. 95.
On the other hand, Geraud et al. have synthesized three-dimensional ordered
macroporous LDH using self-assembled colloidal crystal template and these authors
have used tilting TEM images (Figure 1-18) to evidence the three-dimensional
structure which may be related to planes of the original face-centered cubic (fcc) array
of sphere 95.
1.3.2.2 Fluorescence Microscopy
Quite recently, the adsorption and desorption processes of a carboxylated perylene
imide [N-(2, 6-diisopropylphenyl)-9-(4-carboxyphenyl) perylene-3, 4-dicarboximide,
PMI-COOH] on an individual [LiAl2(OH)6]OH LDH have been investigated by means
Chapter 1
~ 24 ~
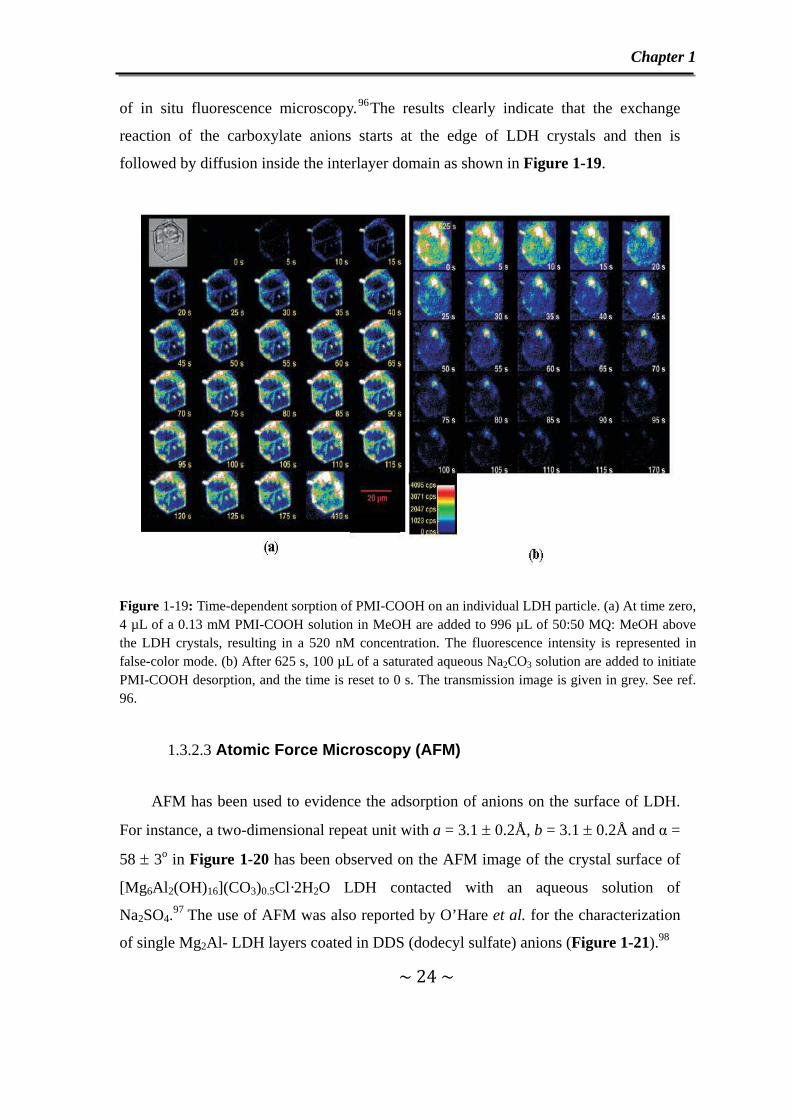
of in situ fluorescence microscopy.96The results clearly indicate that the exchange
reaction of the carboxylate anions starts at the edge of LDH crystals and then is
followed by diffusion inside the interlayer domain as shown in Figure 1-19.
Figure 1-19: Time-dependent sorption of PMI-COOH on an individual LDH particle. (a) At time zero, 4 µL of a 0.13 mM PMI-COOH solution in MeOH are added to 996 µL of 50:50 MQ: MeOH above the LDH crystals, resulting in a 520 nM concentration. The fluorescence intensity is represented in false-color mode. (b) After 625 s, 100 µL of a saturated aqueous Na2CO3 solution are added to initiate PMI-COOH desorption, and the time is reset to 0 s. The transmission image is given in grey. See ref. 96.
1.3.2.3 Atomic Force Microscopy (AFM)
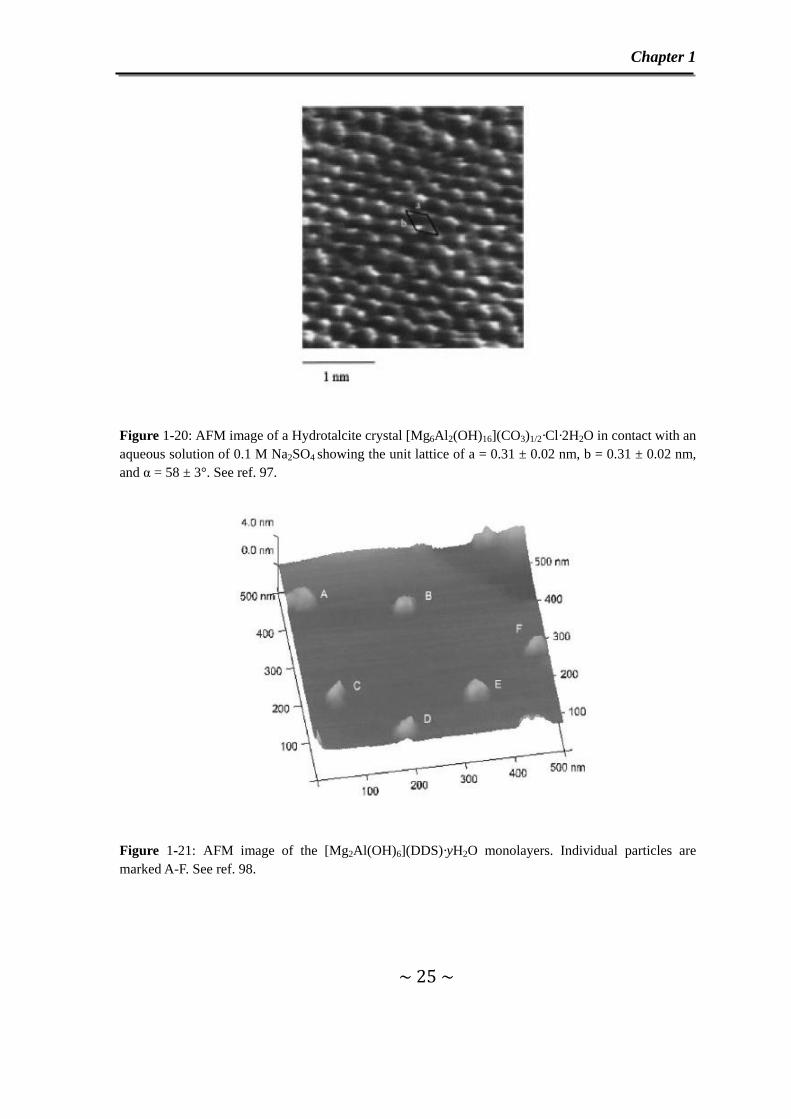
AFM has been used to evidence the adsorption of anions on the surface of LDH.
For instance, a two-dimensional repeat unit with a = 3.1 ± 0.2Å, b = 3.1 ± 0.2Å and α =
58 ± 3o in Figure 1-20 has been observed on the AFM image of the crystal surface of
[Mg6Al2(OH)16](CO3)0.5Cl·2H2O LDH contacted with an aqueous solution of
Na2SO4.97 The use of AFM was also reported by O’Hare et al. for the characterization
of single Mg2Al- LDH layers coated in DDS (dodecyl sulfate) anions (Figure 1-21).98
Chapter 1
~ 25 ~
Figure 1-20: AFM image of a Hydrotalcite crystal [Mg6Al2(OH)16](CO3)1/2·Cl·2H2O in contact with an aqueous solution of 0.1 M Na2SO4 showing the unit lattice of a = 0.31 ± 0.02 nm, b = 0.31 ± 0.02 nm, and α = 58 ± 3°. See ref. 97.
Figure 1-21: AFM image of the [Mg2Al(OH)6](DDS)·yH2O monolayers. Individual particles are marked A-F. See ref. 98.
Chapter 1
~ 26 ~
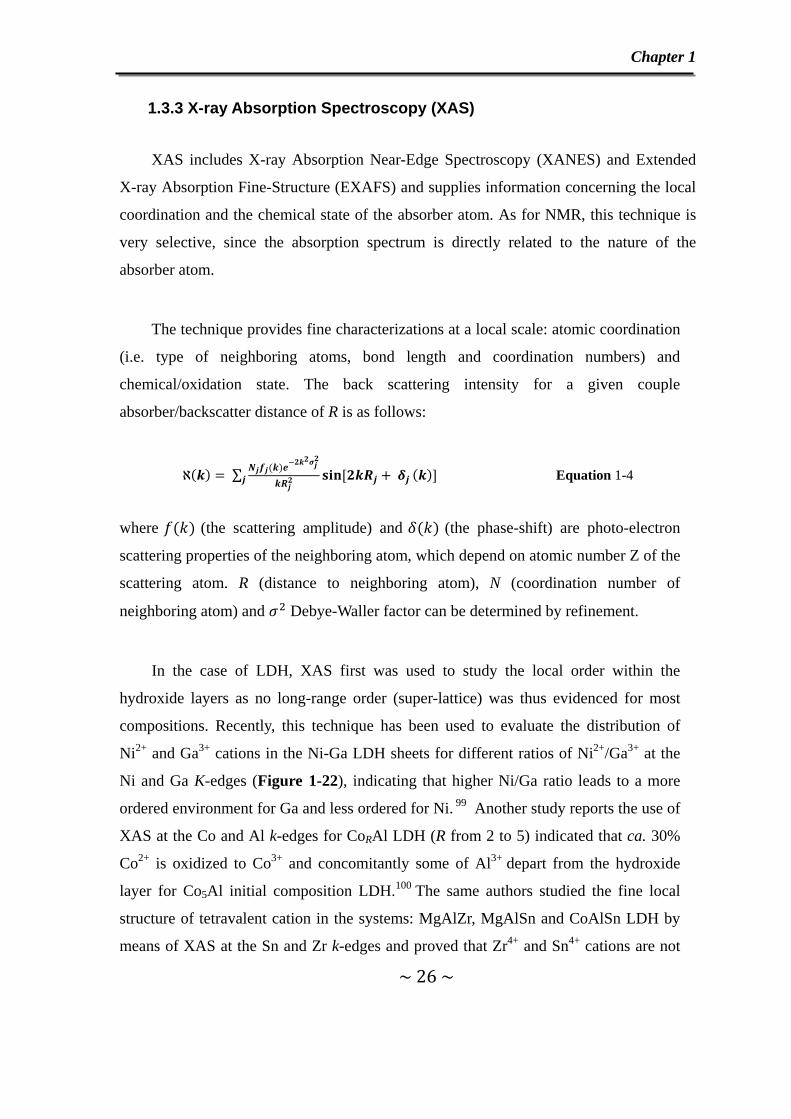
1.3.3 X-ray Absorption Spectroscopy (XAS)
XAS includes X-ray Absorption Near-Edge Spectroscopy (XANES) and Extended
X-ray Absorption Fine-Structure (EXAFS) and supplies information concerning the local
coordination and the chemical state of the absorber atom. As for NMR, this technique is
very selective, since the absorption spectrum is directly related to the nature of the
absorber atom.
The technique provides fine characterizations at a local scale: atomic coordination
(i.e. type of neighboring atoms, bond length and coordination numbers) and
chemical/oxidation state. The back scattering intensity for a given couple
absorber/backscatter distance of R is as follows:
∑ Equation 1-4
where (the scattering amplitude) and (the phase-shift) are photo-electron
scattering properties of the neighboring atom, which depend on atomic number Z of the
scattering atom. R (distance to neighboring atom), N (coordination number of
neighboring atom) and Debye-Waller factor can be determined by refinement.
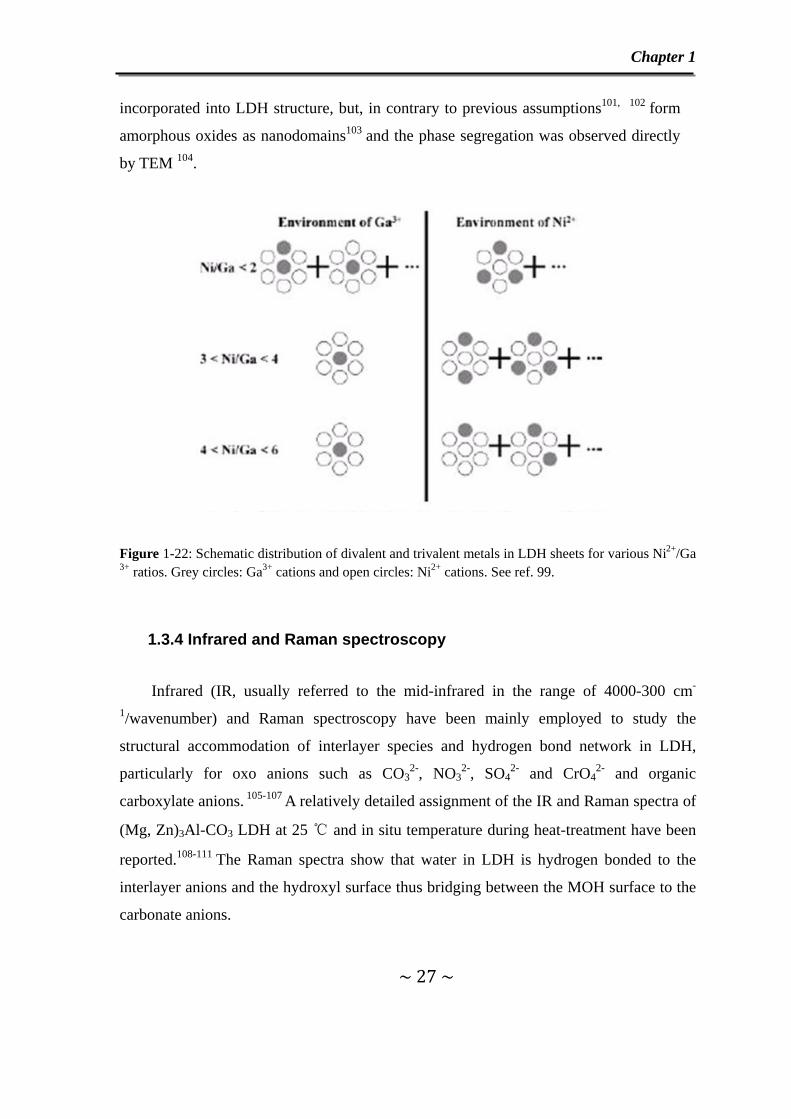
In the case of LDH, XAS first was used to study the local order within the
hydroxide layers as no long-range order (super-lattice) was thus evidenced for most
compositions. Recently, this technique has been used to evaluate the distribution of
Ni2+ and Ga3+ cations in the Ni-Ga LDH sheets for different ratios of Ni2+/Ga3+ at the
Ni and Ga K-edges (Figure 1-22), indicating that higher Ni/Ga ratio leads to a more
ordered environment for Ga and less ordered for Ni. 99 Another study reports the use of
XAS at the Co and Al k-edges for CoRAl LDH (R from 2 to 5) indicated that ca. 30%
Co2+ is oxidized to Co3+ and concomitantly some of Al3+ depart from the hydroxide
layer for Co5Al initial composition LDH.100 The same authors studied the fine local
structure of tetravalent cation in the systems: MgAlZr, MgAlSn and CoAlSn LDH by
means of XAS at the Sn and Zr k-edges and proved that Zr4+ and Sn4+ cations are not
Chapter 1
~ 27 ~
incorporated into LDH structure, but, in contrary to previous assumptions101, 102 form
amorphous oxides as nanodomains103 and the phase segregation was observed directly
by TEM 104.
Figure 1-22: Schematic distribution of divalent and trivalent metals in LDH sheets for various Ni2+/Ga 3+ ratios. Grey circles: Ga3+ cations and open circles: Ni2+ cations. See ref. 99.
1.3.4 Infrared and Raman spectroscopy
Infrared (IR, usually referred to the mid-infrared in the range of 4000-300 cm-
1/wavenumber) and Raman spectroscopy have been mainly employed to study the
structural accommodation of interlayer species and hydrogen bond network in LDH,
particularly for oxo anions such as CO32-, NO3
2-, SO42- and CrO4
2- and organic
carboxylate anions. 105-107 A relatively detailed assignment of the IR and Raman spectra of
(Mg, Zn)3Al-CO3 LDH at 25 ℃ and in situ temperature during heat-treatment have been
reported.108-111 The Raman spectra show that water in LDH is hydrogen bonded to the
interlayer anions and the hydroxyl surface thus bridging between the MOH surface to the
carbonate anions.

Chapter 1
~ 28 ~
Figure 1-23: Three Near-IR spectral regions of interest for M3Al-CO3 (M = Mg, Zn or Ni) LDH. See ref. 113.
Compared to the mid-infrared, Near-IR (NIR, 12500-4000 cm-1) has the higher
sensitivity to the OH group environment and has been widely used to study other clay
minerals i.e. kaolinite and montmorillonite.112 On the contrary, there are only few reports
of NIR for LDH characterization. Frost et al. consider three NIR spectral regions
regarding MII3Al-CO3 (M = Mg, Zn or Ni) as presented in Figure 1-23 with a net
distribution between the hydroxyl bands of the water and those from M-OH units.113
These authors also indicate that NIR would be a potential tool to better understand the
interactions between the hydroxyl surface and the interlayer anions.
1.3.5 Nuclear Magnetic Resonance (NMR)
Nuclear magnetic resonance (NMR) spectroscopy is an effective technique in
studying the structural environments and dynamical behavior due to its unique ability
to simultaneously probe element-specific local structure with high resolution and to
investigate atomic and molecular motion. 114-116 NMR has been widely used to study
inorganic LDH interlayered anions such as 13CO32- 117, 118, 1, 2H2O 119, 35Cl- 119, 120,
15NO3- 120, 77SeO4
2- and 77SeO32- 121,H5B3O8
2- and H4B4O92- (11B)122 and organic
anions such as carboxylate anions123-127 and amino acids128 as well as 27Al and 24Mg
ions within the hydroxide layers 129. On the other hand, for organic intercalates, NMR
spectra enable a distinction to be made between dissociated and undissociated

Chapter 1
~ 29 ~
carboxylate anions by means of the accurate calculation of the chemical shifts.118
Furthermore, F. Leroux et al. have used 13C NMR to study the in situ polymerization of
the vinyl benzene sulfonate anions in the interlayer of Ca2Al LDH, evidenced by the
disappearance of the vinyl bond in 200 ℃.130
1.3.6 Molecular modeling and structure simulations
Understanding and predicting the properties of LDH require the exact knowledge
of their structure. However, as already said in the previous sections, LDH compounds
are polycrystalline materials. Because of structural disorder and small particle size, X-
ray reflections tend to be broad and structural refinements from PXRD data have
provided only limited resolutions. Consequently, interlayer arrangements are often
postulated from the interlayer spacing determined from PXRD patterns, compared to
the optimized minimum energy geometry of the free ion molecule. It is well known that
interlayer arrangements depend strongly on the interlayer water content, the size of the
intercalated guest and the charge density of the hydroxide layers influencing the
packing of the interlayer region. Even the amount of interlayer water is difficult to
determined since some water molecules are also on LDH particle surfaces and are
indistinguishable from interlayer water in thermal analysis. Other techniques such as
FT-IR, Raman, EXAF and NMR spectroscopes etc. have been widely used to
characterize LDH (see previous sections) but these give limited information about
arrangement of guests within the interlayer space. Therefore, for most LDH, the
arrangement of interlayer anions and water molecules is not well understood and the
structure of hydroxide layer is still under discussion. As a consequence, molecular
modeling methods have been increasingly used in the past decade to simulate LDH
structure and to better understand the interlamellar arrangement of intercalated organic
molecules. 131-141
The application of any computational molecular modeling techniques requires the
use of interactomic potentials (force fields) that accurately account for the interactions
Chapter 1
~ 30 ~
of all atoms in the modeled system. Yet, because of the structural disorder of most LDH,
the force field parameterization is often not optimal and only qualitative or semi-
qualitative structural information are obtained. On the other hand, the well ordered and
well known structures of LiAl2(OH)6Cl·H2O132 and Ca2Al(OH)6Cl·2H2O133 were
successfully reproduced by molecular modeling providing accurate set of potentials
then used to simulate and better understand structures which have still not been
resolved.
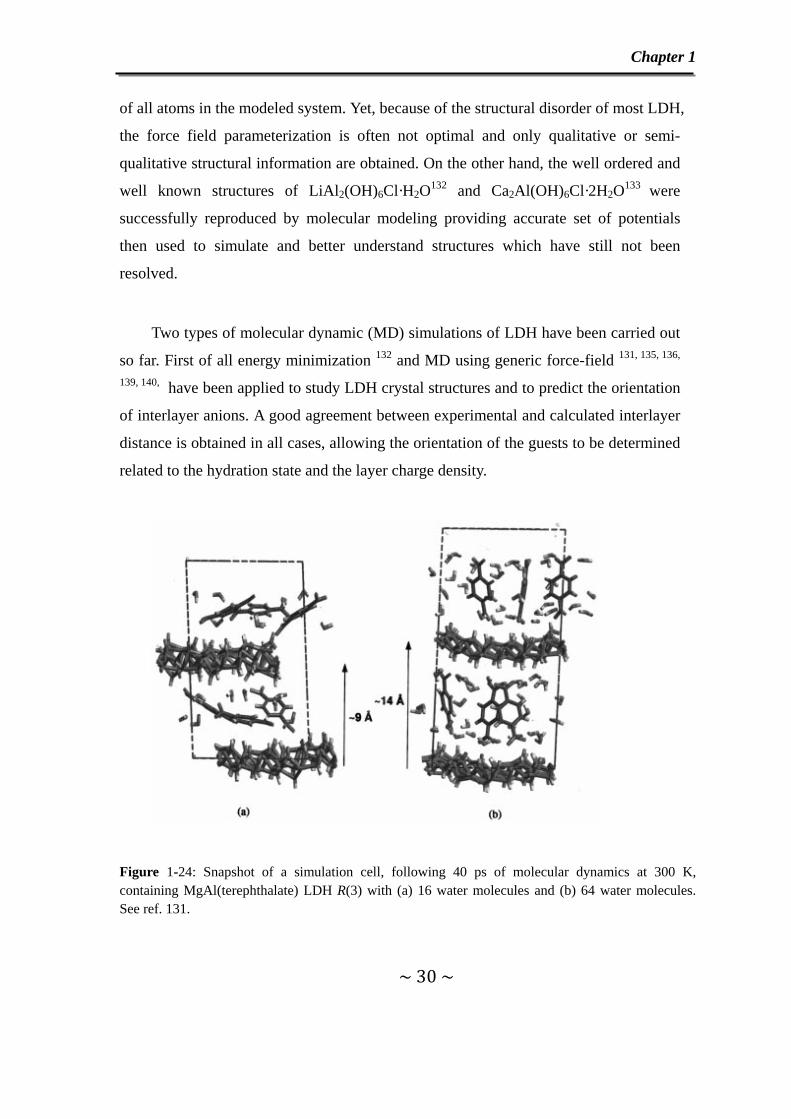
Two types of molecular dynamic (MD) simulations of LDH have been carried out
so far. First of all energy minimization 132 and MD using generic force-field 131, 135, 136,
139, 140, have been applied to study LDH crystal structures and to predict the orientation
of interlayer anions. A good agreement between experimental and calculated interlayer
distance is obtained in all cases, allowing the orientation of the guests to be determined
related to the hydration state and the layer charge density.
Figure 1-24: Snapshot of a simulation cell, following 40 ps of molecular dynamics at 300 K, containing MgAl(terephthalate) LDH R(3) with (a) 16 water molecules and (b) 64 water molecules. See ref. 131.
Chapter 1
~ 31 ~
One of these studies has retained our attention since it concerns the phenomenon
of interstratification in MgRAl-terephthalate LDH interpreted by the authors as an
alternation of collapsed (dehydrated) and expanded (hydrated) interlayers. 135 MD
simulations predict a gradual expansion of the interlayer accompanied by a change in
the orientation of terephthalate anions from almost horizontal to vertical as the number
of interlayer water molecules included in the simulation increased as presented in
Figure 1-24. For high water content and layer charge, an interlayer separation of 14.0
Å is formed which corresponds to a vertical orientation of the terephthalate anions with
respect to the hydroxide layers. For low water content and layer charge, an interlayer
separation of 8.4 Å is obtained corresponding to a horizontal orientation of
terephthalate. During cycles of dehydration-rehydration, PXRD indeed indicates the
presence of the 14.0 Å and 8.4 Å units which coexist in varying proportions depending
on the layer charge density and water content; in certain cases, a 22.4 Å interstratified
phase is observed consisting of a regular alternation of 14.0 Å and 8.4 Å interlayers.
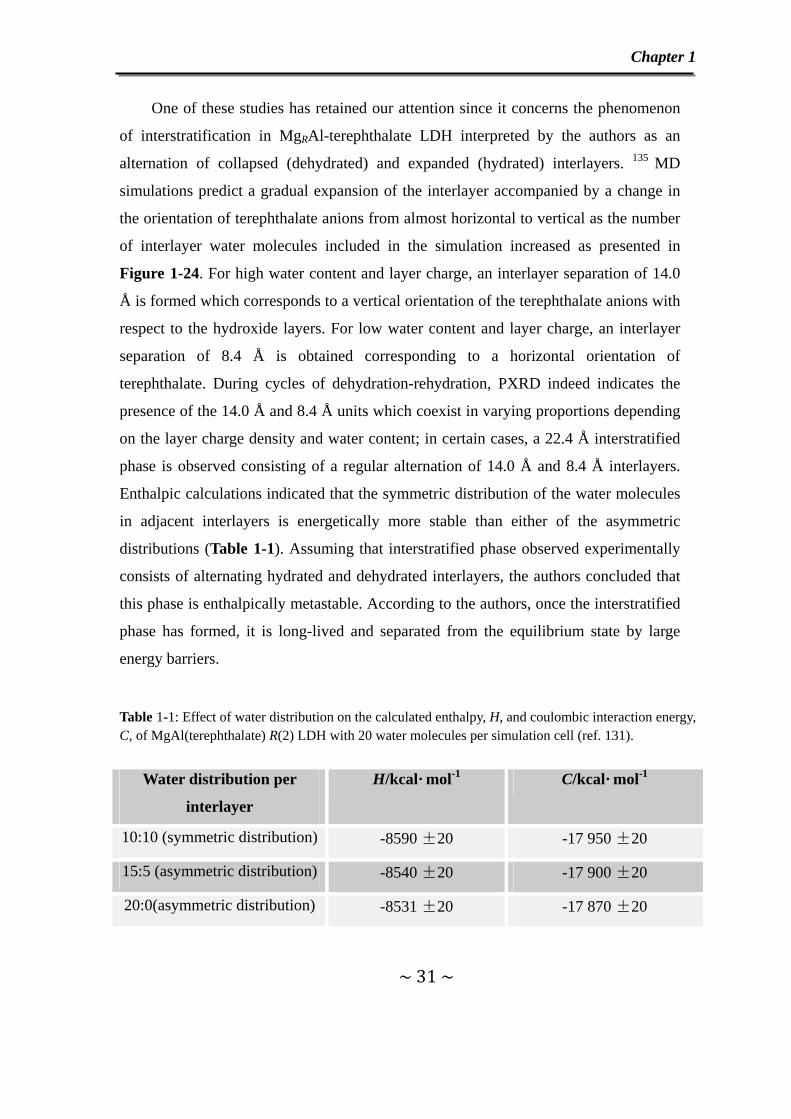
Enthalpic calculations indicated that the symmetric distribution of the water molecules
in adjacent interlayers is energetically more stable than either of the asymmetric
distributions (Table 1-1). Assuming that interstratified phase observed experimentally
consists of alternating hydrated and dehydrated interlayers, the authors concluded that
this phase is enthalpically metastable. According to the authors, once the interstratified
phase has formed, it is long-lived and separated from the equilibrium state by large
energy barriers.
Table 1-1: Effect of water distribution on the calculated enthalpy, H, and coulombic interaction energy, C, of MgAl(terephthalate) R(2) LDH with 20 water molecules per simulation cell (ref. 131).
Water distribution per
interlayer
H/kcal· mol-1 C/kcal· mol-1
10:10 (symmetric distribution) -8590 ±20 -17 950 ±20
15:5 (asymmetric distribution) -8540 ±20 -17 900 ±20
20:0(asymmetric distribution) -8531 ±20 -17 870 ±20

Chapter 1
~ 32 ~
Figure 1-25: A snapshot of the simulation of hydrocalumite/water interface at 25 ℃. Octahedra portray Al layers. Small spheres are Ca; larger spheres are Cl. See ref. 133.
Other MD studies use the CLAYFF force field approach suitable for the simulation
of hydrated and multicomponent mineral systems and their interface with aqueous
solution. A main difference with other MD is that all atoms are considered complete
movable allowing a more accurate representation of the dynamics of such phenomena as
hydrogen bonding, adsorption and surface complexation. Using CLAYFF, Kalinichev et
al. have studied the structure of hydrocalumite Ca2Al(OH)6Cl·2H2O also known as
Friedel’s salt in cement chemistry and determined the dynamical behavior of Cl- and H2O
molecules in the interlayer space and on the particle surface (Figure 1-25). 133 In contrast
to the highly ordered arrangement of the interlayer water molecules deduced from the
single crystal structure refinement, the simulations reveal significant dynamic disorder in
water orientations. At all temperatures between -100 and +300 ℃, the water molecules
undergo libration around an axis perpendicular to the layers. This result in breaking and
reformation of hydrogen bonds with the neighboring Cl- anions is in total agreement with 35Cl NMR measurement. Besides, different coefficients of Cl- anions and water molecules
were calculated (Table 1-2). The diffusion coefficient of Cl- anions as an outer-sphere

Chapter 1
~ 33 ~
surface complex is at least 10 times that of interlayer Cl- anions but is about an order of
magnitude less than that of Cl- in solution.
Table 1-2: Calculated diffusion coefficients of interlayer and surface species (cm2/s). see ref. 133.
Cl- H2O Interlayer <<10-7 <<10-7
Surface (inner sphere) 8.1 ×10⁻⁷ 5.0 ×10⁻⁶ Surface (outer sphere) 2.6 ×10⁻⁶ 1.3 ×10⁻⁵
Bulk NaCl solution 1.1 ×10⁻⁵ 1.8 ×10⁻⁵
1.4 Applications of LDH
Figure 1-26: Possible applications of LDH materials. See ref. 142.
On the basis of their structure and properties, a wide range of technologically
important applications have been identified for LDH materials and summarized in Figure
1-26. 142 Recently, several reviews have been devoted to the applications of LDH as
Chapter 1
~ 34 ~
catalyst or catalyst supports, sorbent for pollutant, vector for biological molecules,
electrochemical sensors and filler in polymers.143-145
1.4.1 Catalysis
By far, the most important potential application of LDH is in the field of heterogeous
basic catalysis due to their basic properties and the formation of homogeneous and stable
dispersion of metal ion. Mixed metal oxides obtained by thermal decomposition of LDH
can promote base-catalyzed reactions such as polymerization146 , condensation147 and
alkylation148. LDH can also be used as catalyst support for hydrogenation and stream
reforming catalysts149, 150. On the other hand, the catalytic activity of uncalcined LDH
has been scarcely studied owing to the low thermal stability of the layered structure and
to the low specific surface area. Yet, they have been found to catalyze the halide-exchange
reaction between alkyl halide. 151
1.4.2 Sorbent for pollutant
The anion-exchange capacity of LDH higher than that of cationic clays makes
them promising materials for the elimination of ecologically undesirable inorganic and
organic anions. The removal of chromate152, 153, nitrate, phosphate, arsenate or vanadate
anions154, 155 as well as humic substances156, 157and radioactive elements158, 159 from
contaminated water or waste streams by LDH have been demonstrated. Also numerous
papers have reported the use of LDH or their calcined derivatives as organic
contaminate adsorbents such as the adsorption of phenolic compounds160 , 161 and
pesticides162-165.

Chapter 1
~ 35 ~
1.4.3 Vector/drug release
Hydrotalcite Mg6Al2(OH)16CO3·4H2O is known to be an effective antacids,166 but
other bio-applications were recently reported. Many common nonsteroidal anti-
inflammatory drugs167-171 such as Diclofenac, Ibuprofen, Gemfibrozil and Naproxen
have been incorporated in the interlayer space of LDH compounds via anion-exchange
reaction as well as bio-related polymers and large bio-macromolecules such as
polyaspartate172, alginate173 and DNA174. Apart from a chemical curiosity, the drug
intercalated LDH hybrids as a controlled drug-release system could control the point of
release and pharmokinetic profile by tuning the desired composition in the host layers.
Besides, the host layers improve the long-term stability and storage since these drug
molecules are isolated from the environment by the hydroxide layers. Another
application largely described by Choy et al. in the literature is the use of LDH as DNA
delivery system. Indeed, these authors have shown that LDH can protect DNA from
degradation and the charge neutralization enhances the transfer of DNA-LDH hybrid
into mammalian cells through endocytosic.175
1.4.4 Filler in polymer
LDH can enhance the mechanical properties, gas permeability and be of interest in
polymer electrolyte. The incorporation of polymer between LDH galleries proceeds via
different pathways such as coprecipitation, exchange176, in situ polymerization177. The
latter method presents the advantage to tune the tactility and the molecular weight of
the generated polymer by varying the layer charge density and the particle size of the
host structure, respectively. 20, 178, 179 A large variety of LDH/polymer systems can thus
be obtained, thermally more stable than the pristine inorganic compound leading to
potential applications in fire-retardant composites.180 LDH/polymer nanocomposites
can also be served as LDH inorganic fillers dispersed into a polymer. 179 For example,
nanoparticles of Zn3Al-dodecyl sulfate dispersed in the linear low density polyethylene
(LLDPE) were found to enhance the thermal and mechanical properties of pure LLDPE. 181
Chapter 1
~ 36 ~
1.4.5 Nanoreactor
LDH can also provide a confinement for the organic moiety suitable after a
charring process to the formation of high surface area (2300 m2· g-1) carbonaceous
materials, using the interleaved monomers and polymers between the hydroxide layers
of LDH as carbonaceous source.182 Furthermore, a variety of nanoparticles such as Co,
Ni, Pt, PbS, etc. have been prepared using LDH materials (Li2Al, MgRAl, Ni0.7Al and
Co0.7Al etc.) as a nanoreactor intercalated with complex anions containing the desired
metal: [M(EDTA)]2- (M = Co2+, Ni2+), [Pt(OH)6]2- and [Pb(S2O3)2]2-.183-185 With this
method, it is possible to avoid the aggregation and the formation of well dispersed
nanoparticle was indeed observed.
II. Staging Phenomenon
1.5 Staging Structure
The study of multifunctional hybrid materials combining organic and inorganic
structures is an emerging research area offering numerous scientific and technological
benefits. Lamellar hosts are considered as promising with respect to this multifunctional
character due to the possible synergetic effect between the host and the guest in the
interlayer region. The functions of stabilization and protection can be viewed as
synergetic effects as reported for the incorporation of organic chromophores with optical
functions such as color, fluorescence, or nonlinear optical properties in inorganic hosts
like zeolite 186 and LDH 82.
Layered inorganic materials such as hydroxide based compounds M2(OH)3A·2H2O
(M = Co and Cr, A = anions),187-190 bimetallic oxalate compounds [cation][MIIMIII(ox)3]
(MII = Mn, Fe, Co and Cu; MIII = Cr and Fe),191 Zirconium phosphate,192 phosphonate 193,
194 have been used to prepare nanoscale organic-inorganic layered complexes in efforts to
Chapter 1
~ 37 ~
develop new functional materials with co-operative phenomena between the organic and
the inorganic layers.
Some studies on the effects of the intercalation into layered hosts of species of
interest in the field of magnetism, non-linear optics sensing devices and molecular
recognition, can be found in the recent reviews. 195 - 199 In this respect, the staging
phenomenon as encountered in a few occasions in clay minerals with a stacking of two or
more kinds of layers, is a promising way to increase the multifunctional character of
layered materials. Staging phenomena originally refer to intercalation on graphite system
and it is often viewed as a way to reduce the energy barrier to an intercalation reaction.
The literature describing graphite intercalation reactions contains numerous examples of
staging intermediates involving the intercalation of every nth layer corresponding to the
nth stage compound. Such a staging phenomenon has also been observed but only on a
few occasions for transition metal dichalcogenides. In clay minerals, this phenomenon is
referred to interstratification and represents the stacking of different kinds of layers. Only
a few cases of staging have been reported in clay minerals and the scarcity of this
phenomenon in other lamellar hosts than graphite has been rationalized theoretically
mainly in terms of stiffness of the host planes.
Theoretical models of staging typically divide the host lattices into three classes
from single atom layers like graphite to rigid many atom thick layers as found in clays,
transition metal dichalcogenides belonging to the intermediate class. 200 The staging
phenomena were first studied on graphite materials and two classical models of staging
for graphite system, proposed by Rüdorff 201, 202, and Daumas-Hérold 203, 204 are proposed
(Figure 1-27(a) and (b), respectively).205 The former is hardly considered as it cannot
interpret transformations from odd to even stages without a deintercalation-intercalation
process. Owing to the scarcity of staging phenomena in lamellar materials other than
graphite, the lack of staging observation has often been explained due to the rigidity of
host planes206, 207. Daumas-Hérold thus imagined staging resulting from guest species
diffusion towards the crystal center and only possible for flexible layers like the single-
carbon honeycomb sheets of graphite. The order of staging is defined as the number of
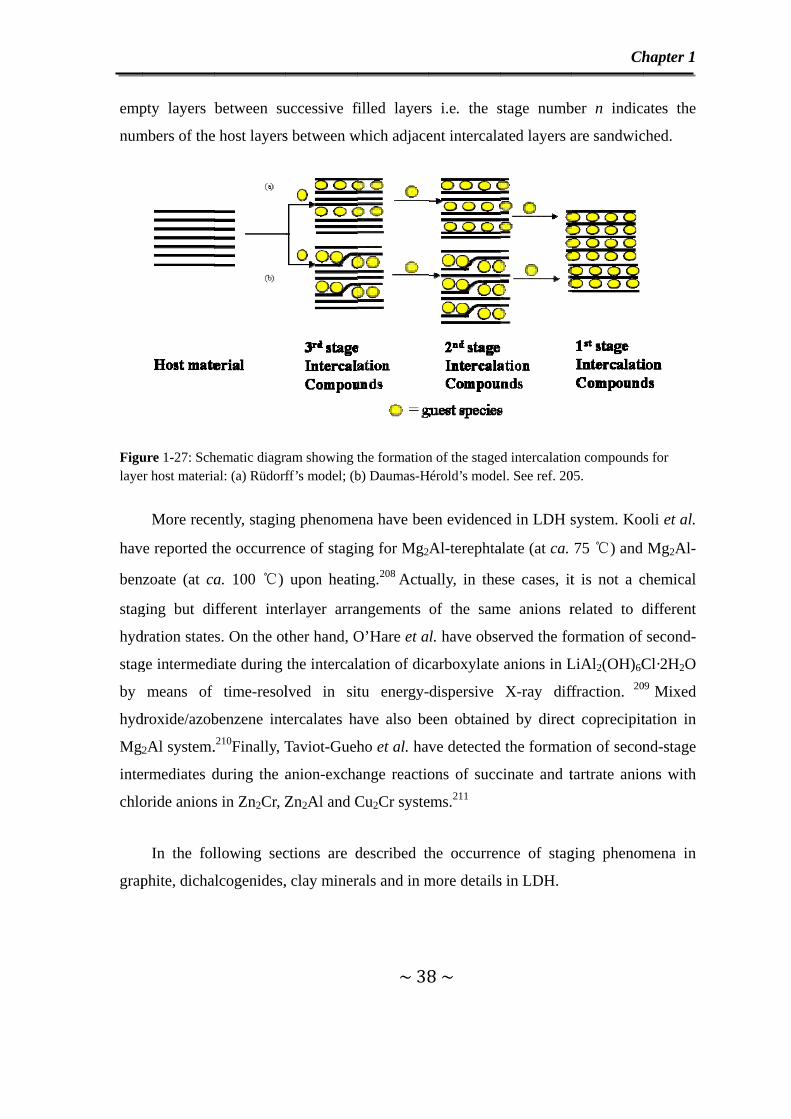
emp
num
Figulayer
have
benz
stag
hyd
stag
by
hyd
Mg2
inte
chlo
grap
pty layers b
mbers of the
ure 1-27: Schr host materia
More rece
e reported t
zoate (at ca
ging but di
dration state
ge intermedi
means of
droxide/azob
2Al system.
ermediates d
oride anions
In the fol
phite, dicha
between su
e host layers
hematic diagraal: (a) Rüdorf
ently, stagin
the occurren
a. 100 ℃)
ifferent inte
s. On the ot
iate during
time-resol
benzene int
.210Finally, T
during the a
s in Zn2Cr, Z
llowing sec
alcogenides,
uccessive fi
s between w
ram showing tff’s model; (b
ng phenome
nce of stagi
upon heati
erlayer arra
ther hand, O
the intercal
lved in sit
tercalates ha
Taviot-Gueh
anion-excha
Zn2Al and C
ctions are d
, clay miner
~ 38
filled layers
which adjace
the formationb) Daumas-H
ena have bee
ing for Mg2A
ing.208 Actu
angements
O’Hare et a
lation of dic
tu energy-
ave also be
ho et al. hav
ange reactio
Cu2Cr syste
described th
rals and in m
8 ~
s i.e. the s
ent intercala
n of the stageHérold’s mode
en evidence
Al-terephta
ually, in the
of the sam
l. have obse
carboxylate
dispersive
een obtaine
ve detected
ons of succ
ems.211
he occurren
more details
stage numb
ated layers a
d intercalatioel. See ref. 20
ed in LDH s
alate (at ca.
ese cases, it
me anions r
erved the fo
anions in L
X-ray diff
ed by direct
d the formati
cinate and t
nce of stag
s in LDH.
Ch
ber n indic
are sandwic
on compound05.
system. Koo
75 ℃) and
t is not a c
related to d
ormation of
LiAl2(OH)6C
ffraction. 20
t coprecipit
ion of secon
tartrate anio
ging phenom
hapter 1
ates the
ched.
s for
oli et al.
Mg2Al-
chemical
different
f second-
Cl·2H2O 09 Mixed
tation in
nd-stage
ons with
mena in

1.6
Figu
wea
inte
grap
gue
met
phy
and
inte
stro
GIC
Staging C
1.6.1 Stag
ure 1-28: Stru
Graphite i
ak van der
erlayer spac
phite interc
st species su
tal halides,
ysics, materi
d the degree
ercalates and
ong inorgani
C while wea
Compoun
ging Grap
ucture of grap
is an allotro
Waals for
ce of 3.35Å
calation com
uch as alkal
metal oxid
ial science
e of intercal
d by the co
ic acids i.e.
ak acid like
nds
phite Interc
phite, formed
ope form of
rces along
Å (d0, c/2) i
mpounds (G
li metals, al
des and acid
and electro
lation are l
onditions of
. HNO3, H2
CH3COOH
~ 39
calation C
d by AB stack
f carbon co
the c-axis
in Figure 1
GICs) have
lkaline earth
ds for appl
onic and ele
argely dete
f oxidation o
2SO4 and H
H or H3BO3
9 ~
Compound
king of graphe
onsisting of
in a stagg
1-28.212 Sinc
been obtain
h metals, ra
lications in
ectrical eng
ermined by
of the graph
HClO4 form
are not inte
ds
ene sheets. Se
graphene l
gered array
ce 1841, a
ined with a
are earth ele
many field
gineering. 21
the acidic p
hite matrix.
m highly satu
ercalated int
Ch
ee ref. 212.
layers stack
y with the
great numb
a wide varie
ements, halo
ds i.e. chem12 The feasi
properties o
.213 For exa
urated first-
to graphite a
hapter 1
ked by
basic
ber of
ety of
ogens,
mistry,
ibility
of the
ample,
-stage
at all.

FiguCirc
of th
mod
corr
spac
spec
also
stag
H2S
the
forc
the
forc
ure 1-29: Thcles represent
The occur
he graphite
del of stagin
responds to
ces; in the o
cies. The la
o includes h
ge compoun
SO4 into n-1
calculated i
ces between
intercalatio
ce being str
he schematicFeCl3 specie
rrence of sta
e sheets (sin
ng. Two kin
o interlamel
other type, a
atter class r
higher stage
nds. For ex
1 vacant int
intensities o
n FeCl3 and
on process i
ronger than
c of the bi-ines and dot line
aging struct
ngle layer of
nds of stag
lar spaces o
alternate int
refers to gr
than second
xample, Miz
terlayers in
of the X-ray
H2SO4 laye
in term of
n the forme
~ 40
ntercalation pes present H2
tures in grap
f carbon ato
ing structur
occupied by
terlayer spa
raphite bi-in
d stage com
zutani et a
stage n Fe
y diffraction
ers and betw
the minimu
er. On the o
0 ~
process of HSO4. See ref.
phite is attr
om) accordi
res are obse
y guest spe
aces are occu
ntercalation
mpounds suc
al. studied t
eCl3-GIC (n
n lines.215 Th
ween two ad
um repulsio
other hand,
H2SO4 into st 215.
ributed to th
ding to the D
erved in gr
ecies and ad
upied by tw
n compound
ch as third,
the intercal
n = 4, 5 and
hey found t
djacent H2S
on (Figure
, the electro
Ch
tage 4-6 FeC
he flexible n
Daumas-Hé
raphite: one
djacent to e
wo different
ds (GBCs),2
fourth even
lation proce
d 6) accordi
that the repu
SO4 layers g
1-29), the
ostatic attra
hapter 1
Cl3-GICs.
nature
érold’s
e type
empty
guest 214 but
n sixth
ess of
ing to
ulsion
govern
latter
action
Chapter 1
~ 41 ~
between negatively charged MoCl5 and positively charged K+ was responsible for the
formation of staging compound during intercalation of K+ into stage MoCl5-GIC. 216
Staging graphite compounds have been further investigated as microreactors for
inorganic and organic reactions217 in the interlayer spacing of graphite. It is worth
mentioning that the stage number of the starting GICs determines the particle size of
fine metallic particles obtained from the reduction of intercalated metal chloride.218 For
organic reactions, most of them were in relation with polymerization. In 1976, Beguin
and Setton firstly thus reported the formation of biphenyl from benzene in the
interlayer space of a staged graphite.219
1.6.2 Layered Dichalcogenides Staging Compounds
Layered dichalcogenides AnMX2 (A= alkali metal, M = transition metal, X = S and
Se) materials can intercalate a wide range of guest cations and neutral species into the
interlayer space between the negatively charged host layers.220 Staging phenomena occur
usually at low concentrations of intercalated guest cations and higher order staged
compounds than 2, i.e. 3rd and 4th stage dichalcogenides intercalation compounds have
been reported.221-224 Factors such as the lattice energy, the electrostatic interaction of
neighboring cation layers and the energy needed for the separation of the layers upon
intercalation, have been considered for the explanation of the occurrence of high order
staged compounds at low guest concentrations. Besides, the influence of kinetic factors is
suggested as the mechanism of transition from stages with odd numbers to stages with
even numbers i.e. from 3rd stage to 2nd stage. Models involving lattice strain mediated
interactions and thermodynamic considerations have also been put forward to explain
staging phenomena in this system.225-227 However, these models mainly consider from the
point of thermodynamic equilibrium. In fact, even at high temperature a second-stage
compound may be formed as for Cu2/3(NbS2)2.228
Moreover, higher stages are not observed if the guest species are of large size such as
(C5H5)2Co+ and Ba2+ cryptate attributed to the strong mechanical energy needed for the
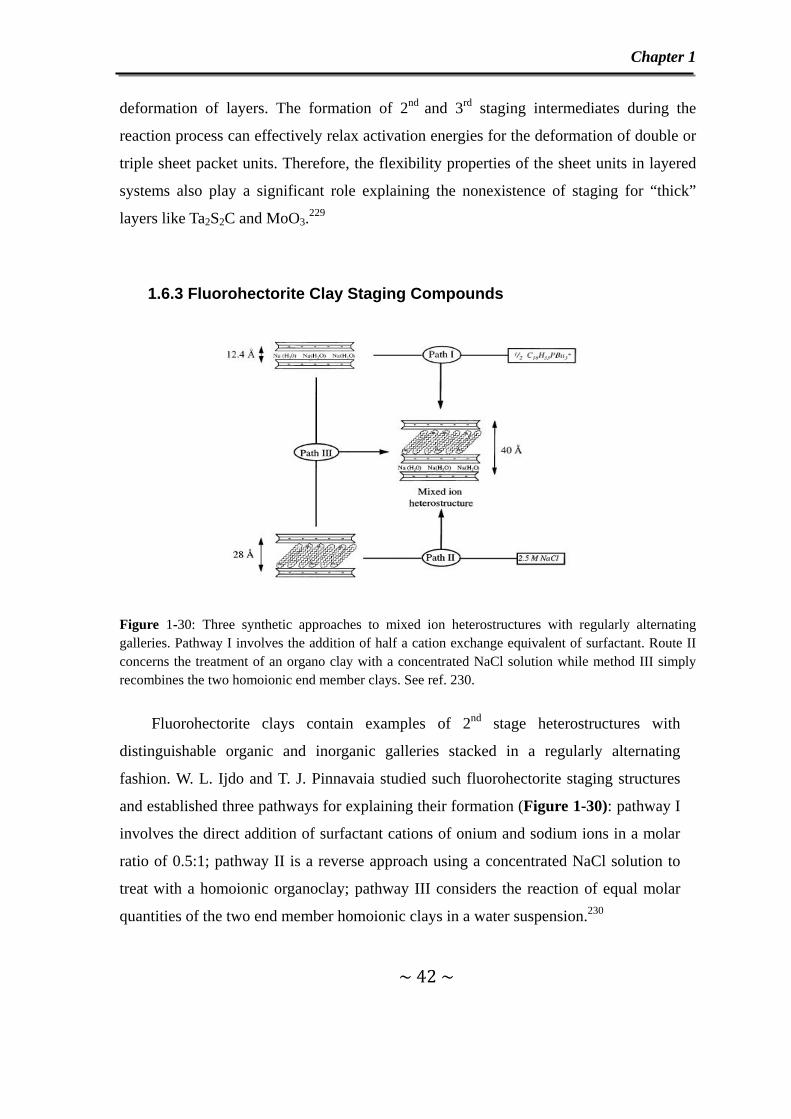
Chapter 1
~ 42 ~
deformation of layers. The formation of 2nd and 3rd staging intermediates during the
reaction process can effectively relax activation energies for the deformation of double or
triple sheet packet units. Therefore, the flexibility properties of the sheet units in layered
systems also play a significant role explaining the nonexistence of staging for “thick”
layers like Ta2S2C and MoO3.229
1.6.3 Fluorohectorite Clay Staging Compounds
Figure 1-30: Three synthetic approaches to mixed ion heterostructures with regularly alternating galleries. Pathway І involves the addition of half a cation exchange equivalent of surfactant. Route II concerns the treatment of an organo clay with a concentrated NaCl solution while method III simply recombines the two homoionic end member clays. See ref. 230.
Fluorohectorite clays contain examples of 2nd stage heterostructures with
distinguishable organic and inorganic galleries stacked in a regularly alternating
fashion. W. L. Ijdo and T. J. Pinnavaia studied such fluorohectorite staging structures
and established three pathways for explaining their formation (Figure 1-30): pathway I
involves the direct addition of surfactant cations of onium and sodium ions in a molar
ratio of 0.5:1; pathway II is a reverse approach using a concentrated NaCl solution to
treat with a homoionic organoclay; pathway III considers the reaction of equal molar
quantities of the two end member homoionic clays in a water suspension.230
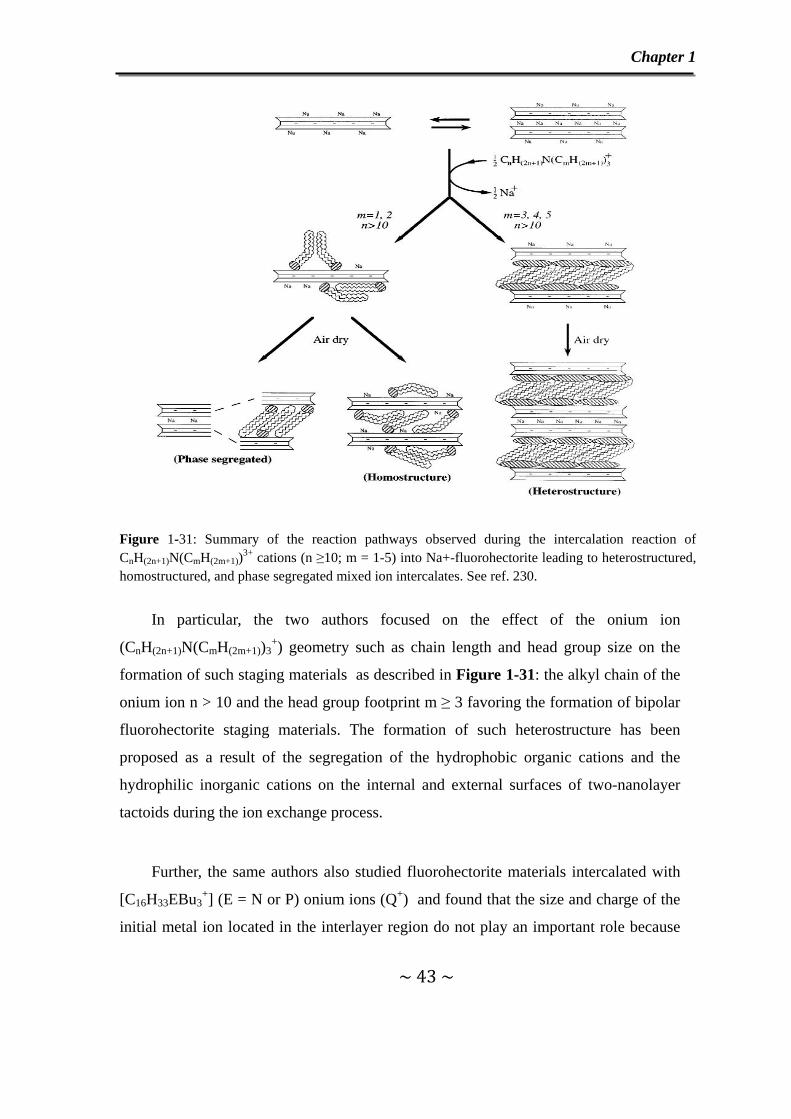
Chapter 1
~ 43 ~
Figure 1-31: Summary of the reaction pathways observed during the intercalation reaction of CnH(2n+1)N(CmH(2m+1))3+ cations (n ≥10; m = 1-5) into Na+-fluorohectorite leading to heterostructured, homostructured, and phase segregated mixed ion intercalates. See ref. 230.
In particular, the two authors focused on the effect of the onium ion
(CnH(2n+1)N(CmH(2m+1))3+) geometry such as chain length and head group size on the
formation of such staging materials as described in Figure 1-31: the alkyl chain of the
onium ion n > 10 and the head group footprint m ≥ 3 favoring the formation of bipolar
fluorohectorite staging materials. The formation of such heterostructure has been
proposed as a result of the segregation of the hydrophobic organic cations and the
hydrophilic inorganic cations on the internal and external surfaces of two-nanolayer
tactoids during the ion exchange process.
Further, the same authors also studied fluorohectorite materials intercalated with
[C16H33EBu3+] (E = N or P) onium ions (Q+) and found that the size and charge of the
initial metal ion located in the interlayer region do not play an important role because
Chapter 1
~ 44 ~
this kind of heterostructure formation is not limited to Na+ only but also available for
other inorganic exchange cations such as Ca2+, Ba2+, Al3+ and Ce3+ ions. 231 When the
fraction of onium ions is in the range from 0.33 to 0.50, there is no formation of 3rd
stage phase as expected but a 2nd stage phase with alternate interlayers occupied by Na+
ions and a mixture of onium ions and Na+ ions as depicted in Figure 1-32.
Figure 1-32: Schematic illustrations of gallery stacking patters in heterostructured mixed onium ion (Q+)-inorganic (Na+) ion fluorohectorites: (A) regularly alternating galleries of segregated onium and inorganic ions at fQ = 0.50 (fQ = Q+/(Q+ + Na+), mol/mol); (B) regularly alternating galleries of homoionic Na+ and alloylike mixed ion (Na+, Q+) galleries at onium ion compositions in the range 0.33 ≤ fQ ≤ 0.50. See ref. 231.
1.6.4 Staging Layered Double Hydroxides Compounds
The phenomenon of interstratification in anionic clays was first reported in 1987
by Drits et al. who described the structure of a mixed carbonate and sulfate LDH, a
mineral phase consisting of alternating carbonate and sulfate interlayers. 232, 233
In 1998, by means of in situ energy-dispersive X-ray diffraction (EDXRD)
technique O’Hare et al. discovered that the intercalation of a variety of dicarboxylate
anions (succinate, adipate, fumarate, maleate, L-maleate, phthalate and terephthalate)
into LiAl2(OH)6Cl·2H2O (hexagonal form, h-LiAl2-Cl) proceeds via the formation of a
second-stage intermediate with alternate interlayer spaces occupied by different anions,
the initial anions i.e. Cl- and the incoming organic anions. 209 Data for the intercalation
of succinate anions into h-LiAl2-Cl are shown in Figure 1-33. The intermediate decay
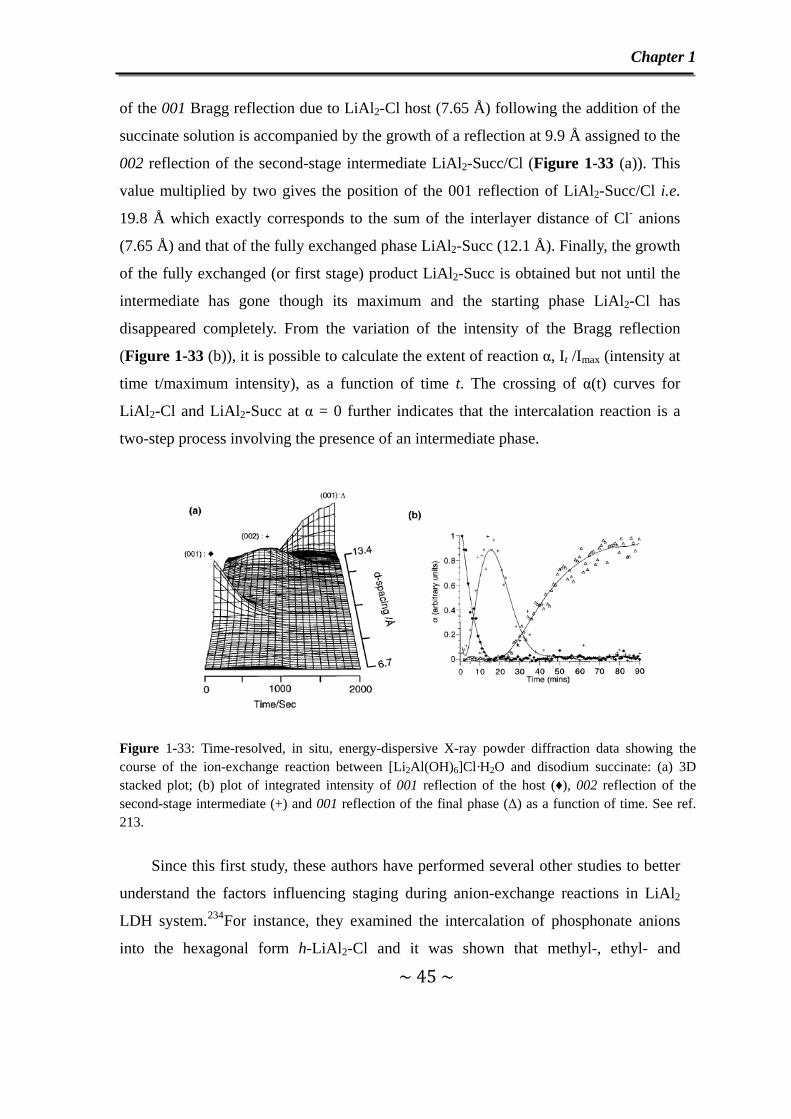
Chapter 1
~ 45 ~
of the 001 Bragg reflection due to LiAl2-Cl host (7.65 Å) following the addition of the
succinate solution is accompanied by the growth of a reflection at 9.9 Å assigned to the
002 reflection of the second-stage intermediate LiAl2-Succ/Cl (Figure 1-33 (a)). This
value multiplied by two gives the position of the 001 reflection of LiAl2-Succ/Cl i.e.
19.8 Å which exactly corresponds to the sum of the interlayer distance of Cl- anions
(7.65 Å) and that of the fully exchanged phase LiAl2-Succ (12.1 Å). Finally, the growth
of the fully exchanged (or first stage) product LiAl2-Succ is obtained but not until the
intermediate has gone though its maximum and the starting phase LiAl2-Cl has
disappeared completely. From the variation of the intensity of the Bragg reflection
(Figure 1-33 (b)), it is possible to calculate the extent of reaction α, It /Imax (intensity at
time t/maximum intensity), as a function of time t. The crossing of α(t) curves for
LiAl2-Cl and LiAl2-Succ at α = 0 further indicates that the intercalation reaction is a
two-step process involving the presence of an intermediate phase.
Figure 1-33: Time-resolved, in situ, energy-dispersive X-ray powder diffraction data showing the course of the ion-exchange reaction between [Li2Al(OH)6]Cl·H2O and disodium succinate: (a) 3D stacked plot; (b) plot of integrated intensity of 001 reflection of the host (♦), 002 reflection of the second-stage intermediate (+) and 001 reflection of the final phase (Δ) as a function of time. See ref. 213.
Since this first study, these authors have performed several other studies to better
understand the factors influencing staging during anion-exchange reactions in LiAl2
LDH system.234For instance, they examined the intercalation of phosphonate anions
into the hexagonal form h-LiAl2-Cl and it was shown that methyl-, ethyl- and
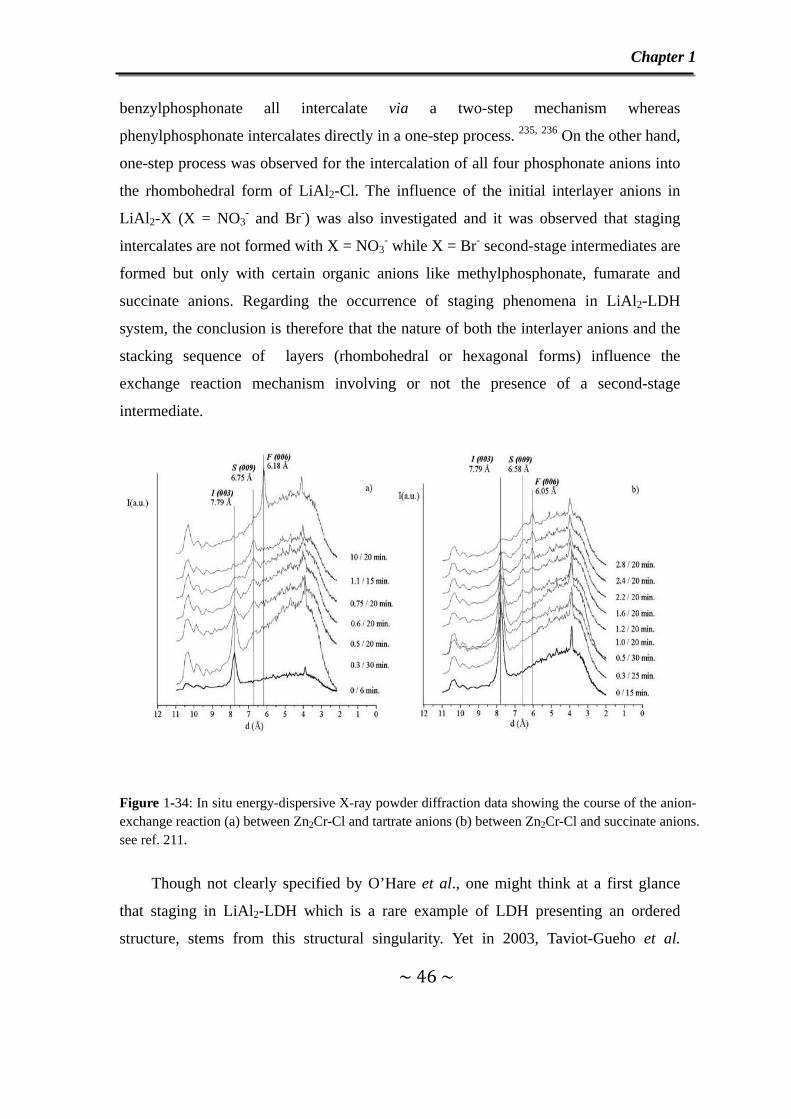
Chapter 1
~ 46 ~
benzylphosphonate all intercalate via a two-step mechanism whereas
phenylphosphonate intercalates directly in a one-step process. 235, 236 On the other hand,
one-step process was observed for the intercalation of all four phosphonate anions into
the rhombohedral form of LiAl2-Cl. The influence of the initial interlayer anions in
LiAl2-X (X = NO3- and Br-) was also investigated and it was observed that staging
intercalates are not formed with X = NO3- while X = Br- second-stage intermediates are
formed but only with certain organic anions like methylphosphonate, fumarate and
succinate anions. Regarding the occurrence of staging phenomena in LiAl2-LDH
system, the conclusion is therefore that the nature of both the interlayer anions and the
stacking sequence of layers (rhombohedral or hexagonal forms) influence the
exchange reaction mechanism involving or not the presence of a second-stage
intermediate.
Figure 1-34: In situ energy-dispersive X-ray powder diffraction data showing the course of the anion-exchange reaction (a) between Zn2Cr-Cl and tartrate anions (b) between Zn2Cr-Cl and succinate anions. see ref. 211.
Though not clearly specified by O’Hare et al., one might think at a first glance
that staging in LiAl2-LDH which is a rare example of LDH presenting an ordered
structure, stems from this structural singularity. Yet in 2003, Taviot-Gueho et al.

Chapter 1
~ 47 ~
showed that Zn2Al-Cl, Zn2Cr-Cl and Cu2Cr-Cl (disordered LDH) also undergo staged
intercalation reactions with succinate and tartrate anions. 211 Again by means of in situ
EDXRD technique, the formation of second-stage intermediate was evidenced in all
cases (Figure 1-34). However, depending on the nature of the organic anions, two
exchange pathways were identified. For tartrate exchange, the mechanism resembles
that reported by O’Hare et al. with LiAl2-LDH 209 since the fully exchanged material is
not observed until the intermediate has gone through its maximum and the chloride
precursor has disappeared completely. For succinate exchange, the final product of
intercalation and the second-stage intermediate simultaneously appear. Dried under
vacuum, Zn2Cr-Tart/Cl second-stage material undergoes a contraction of the
interlamellar space associated with a reorientation of the tartrate anions in a flat
position after the removal of interlayer water molecules. The contraction of the
interlamellar distance observed ca. 2.9 Å is that expected for two different interlayer
contents i.e. occupied by Cl- and tartrate anions alternatively thus excluding the
formation of interstratified phases associated with two different orientations of the
same anion as reported for terephthalate anions in Mg2Al-LDH (Figure 1-35) 208. This
example points out the eventual difficulty in attributing 2nd stage compounds arising
from either “conformational” or “chemical” staging.
Regarding the occurrence of staging in LDH system, these authors suggested a
segregation between organic and inorganic anions since staging has never been
observed with mixed inorganic anion LDH. Therefore, second-stage intermediates
would be a peculiarity of organic/inorganic systems resulting from a segregation
between organic and inorganic anions.

Chapter 1
~ 48 ~
Figure 1-35: Proposed model for structural changes occurring during the heat treatment and loss of the interlayer water of Mg2Al-Terephthalate at (a) 25 ℃, (b) 100 ℃ and (c) 200 ℃. See ref. 208.
Based on these studies, second-stage intercalates in LDH systems have only been
seen to occur as intermediates during intercalation reactions. However, the literature
contains one example of second-stage intercalate obtained by direct coprecipitation
reported by Iyi et al. 210 These authors observed the formation of mixed
hydroxide/azobenzene intercalate for Mg2Al-LDH associated with the formation of
bipolar two-nanolayer tactoids; the hydrophobic binding effect and the size of organic
anions combined with the layer charge density of LDH hydroxide layers would exclude
the inorganic anions from the interlayer space leading to the formation of bipolar two-
layer nanoparticles; staging structures are then formed upon stacking of the so-called
tactoids during the drying steps as depicted in Figure 1-36.
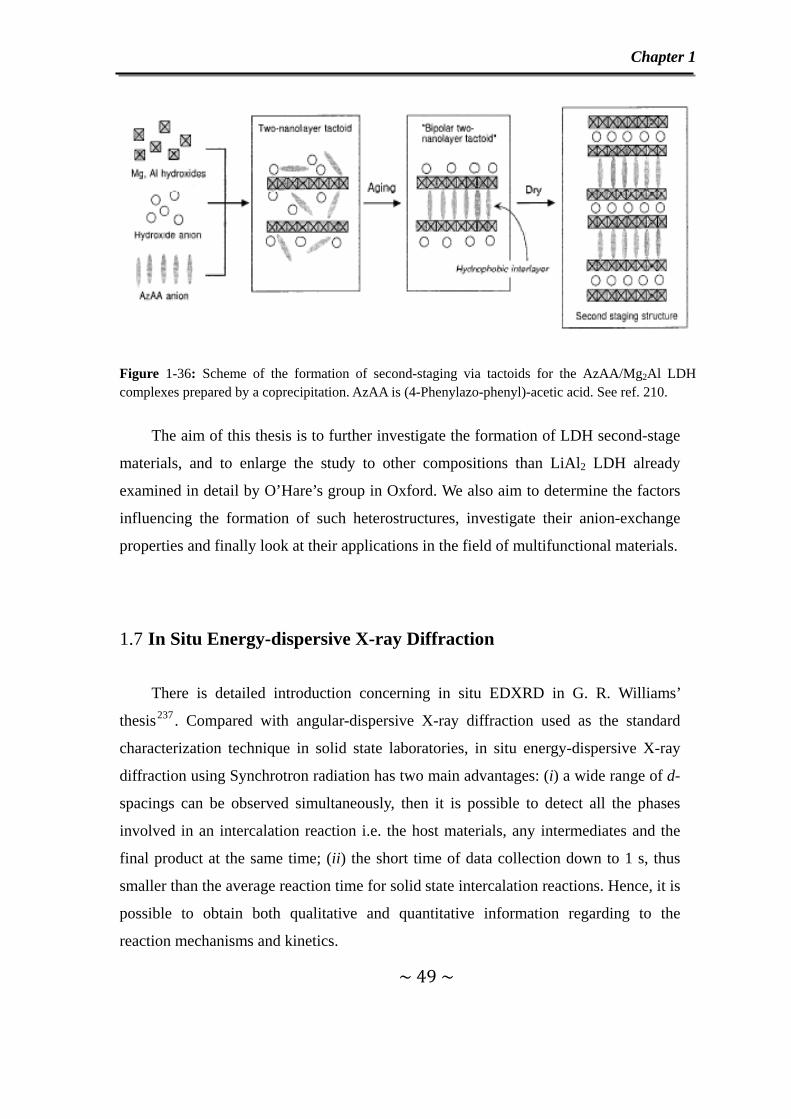
Chapter 1
~ 49 ~
Figure 1-36: Scheme of the formation of second-staging via tactoids for the AzAA/Mg2Al LDH complexes prepared by a coprecipitation. AzAA is (4-Phenylazo-phenyl)-acetic acid. See ref. 210.
The aim of this thesis is to further investigate the formation of LDH second-stage
materials, and to enlarge the study to other compositions than LiAl2 LDH already
examined in detail by O’Hare’s group in Oxford. We also aim to determine the factors
influencing the formation of such heterostructures, investigate their anion-exchange
properties and finally look at their applications in the field of multifunctional materials.
1.7 In Situ Energy-dispersive X-ray Diffraction
There is detailed introduction concerning in situ EDXRD in G. R. Williams’
thesis237. Compared with angular-dispersive X-ray diffraction used as the standard
characterization technique in solid state laboratories, in situ energy-dispersive X-ray
diffraction using Synchrotron radiation has two main advantages: (i) a wide range of d-
spacings can be observed simultaneously, then it is possible to detect all the phases
involved in an intercalation reaction i.e. the host materials, any intermediates and the
final product at the same time; (ii) the short time of data collection down to 1 s, thus
smaller than the average reaction time for solid state intercalation reactions. Hence, it is
possible to obtain both qualitative and quantitative information regarding to the
reaction mechanisms and kinetics.

Chapter 1
~ 50 ~
Figure 1-37: Synthesis of long chain ammonium intercalates of MnPS3: (i) MnPS3 (150 mg) + C12TMABr (1 mmol) in 5 cm3 water at 120 ℃, (ii) MnPS3 (150 mg) + C16TMABr (1 mmol) in 5 cm3 water at 120 ℃. See ref. 238.
EDXRD has been used to perform in situ kinetic studies on the intercalation of a
variety of guest species in host layered materials as reviewed by O’Hare et al.238. For
example, the kinetic studies on the intercalation of cations (K+, PyH+ (Py = C5H5N),
NMe4+) and the long chain ammonium ions i.e. dodecyltrimethylammonium (C12TMA),
hexadecyltrimethylammonium (C16TMA) and octadecyltrimethylammonium (C18TMA)
into MnPS3 lamellar host (in Figure 1-37) have been investigated, as well as the
intercalation of cobaltocene, Co(η-C5H5)2, into the layered dichalcogenides ZrS2, 2H-
SnS2, 2H-SnSe2, 2H-TaS2, 2H-NbS2, 1T-TaS2 and TiS2.239 In this latter case, it was found
that the rate of intercalation is independent on the initial Co(η-C5H5)2 concentration over
a wide concentration range. On the other hand, the rate of intercalation of the lithium salts
(LiX; X = Cl, Br, NO3 and OH) into Gibbsite (γ-Al(OH)3) during the formation of LiAl2-
X LDH and LiAl2-SO4 LDH have been determined by EDXRD. Finally, the in situ
EDXRD spectra recorded following the addition of an aqueous solution of
hexadecyltrimethylammonium chloride (C16H33N+Me3Cl-) to kanemite (NaHSi2O5·3H2O)
at 70 ℃ showed that a layered phase formed at the initial step later transforms into a
silicate-organic mesophase which is a precursor to the hexagonal mesoporous silicate
(FSM-16) as described in Figure 1-38.
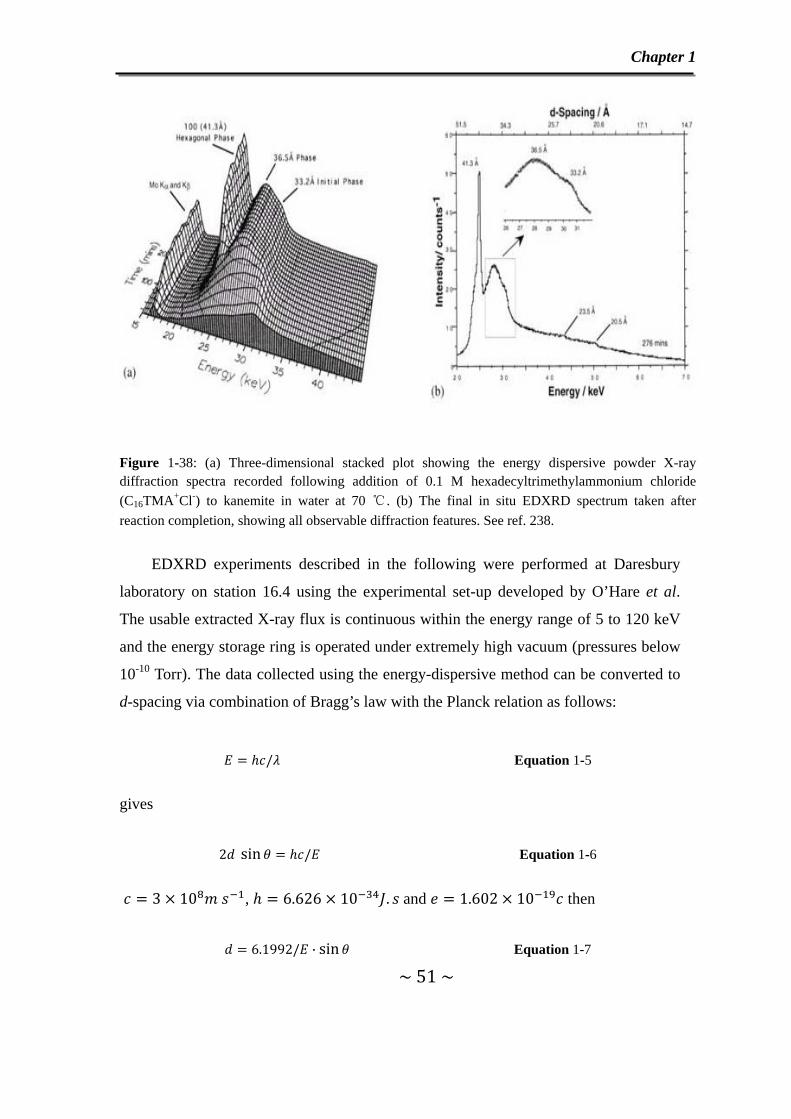
Chapter 1
~ 51 ~
Figure 1-38: (a) Three-dimensional stacked plot showing the energy dispersive powder X-ray diffraction spectra recorded following addition of 0.1 M hexadecyltrimethylammonium chloride (C16TMA+Cl-) to kanemite in water at 70 ℃. (b) The final in situ EDXRD spectrum taken after reaction completion, showing all observable diffraction features. See ref. 238.
EDXRD experiments described in the following were performed at Daresbury
laboratory on station 16.4 using the experimental set-up developed by O’Hare et al.
The usable extracted X-ray flux is continuous within the energy range of 5 to 120 keV
and the energy storage ring is operated under extremely high vacuum (pressures below
10-10 Torr). The data collected using the energy-dispersive method can be converted to
d-spacing via combination of Bragg’s law with the Planck relation as follows:
/ Equation 1-5
gives
2 sin / Equation 1-6
3 10 , 6.626 10 . and 1.602 10 then
6.1992/ · sin Equation 1-7
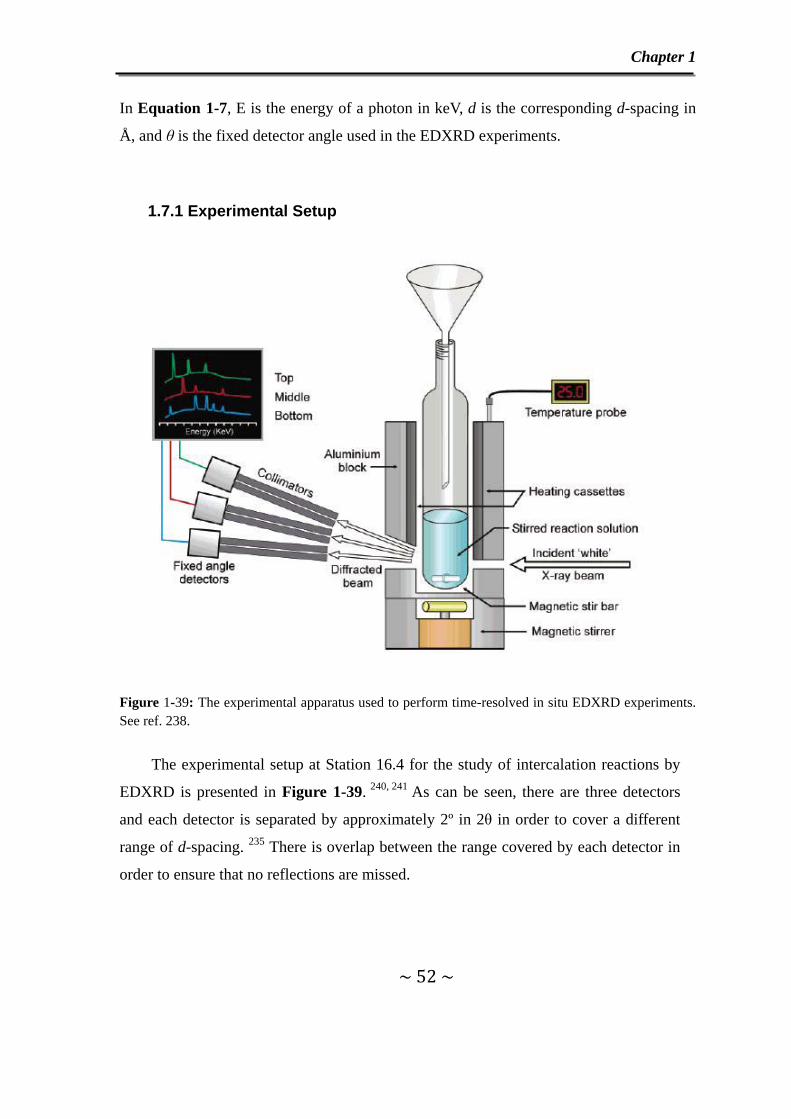
Chapter 1
~ 52 ~
In Equation 1-7, E is the energy of a photon in keV, d is the corresponding d-spacing in
Å, and θ is the fixed detector angle used in the EDXRD experiments.
1.7.1 Experimental Setup
Figure 1-39: The experimental apparatus used to perform time-resolved in situ EDXRD experiments. See ref. 238.
The experimental setup at Station 16.4 for the study of intercalation reactions by
EDXRD is presented in Figure 1-39. 240, 241 As can be seen, there are three detectors
and each detector is separated by approximately 2º in 2θ in order to cover a different
range of d-spacing. 235 There is overlap between the range covered by each detector in
order to ensure that no reflections are missed.
Chapter 1
~ 53 ~
The equipment has been successfully used by O’Hare et al. for studying a number
of intercalation reactions such as the intercalation of carboxylate and phosphonate
anions into LiAl2-LDH and the intercalation of sulfates drugs and agrochemicals into a
variety of materials i.e. Li2Al-Cl 242, 243and Ca2Al-NO3 244.
1.7.2 Data and Kinetic Analysis
An automated Gaussian fitting routine is used to obtain the peak integrated areas of
the Bragg reflections Ihkl.245 These values are subsequently converted into the extent of
reaction α at time t defined as:
/ Equation 1-8
where is the area of a given hkl peak at a certain time t and is the
maximum area of this peak.
Information on reaction mechanism can be deduced from the shape of plot246.
For solid state reaction, the kinetic equation of Avrami and Erofe’ev is the most
commonly employed and expressed as follows:
1 exp Equation 1-9
where is the rate constant and n is the so-called Avrami exponent. The Sharp and
Hancock expression corresponding to the Log-linearized form of the Avrami and Erofe’ev
equation247:
ln ln 1 ln ln Equation 1-10
is used to calculate the values of k and n. If there is a linear relationship between
ln ln 1 and ln , the value of is the gradient of the line and the value of can
be obtained from the ordinate intercept. Avrami exponent can be used to describe the
reaction mechanisms involved and possible values for intercalation into a layered host are
summarized in Table 1-3 248. Yet, the interpretation of these values can be difficult, and a
given value does not unequivocally allow the determination of the reaction mechanism.

Chapter 1
~ 54 ~
For a layered host, nucleation sites are the edges of the crystallite from which guest
anions enter the interlayer space and the nuclei growth corresponds to the diffusion of
guest molecules into the interlayer region in two dimensions (λ = 2). Consequently,
nucleation rate (β) may be either phase boundary controlled (the rate is limited by the
expansion of interlayer space to accommodate the guest) or diffusion controlled (the rate
is controlled by the diffusion of guest anions in the interlayer region).
Table 1-3: Nuclei growth models possible for intercalation into a layered double host. See ref. 248.
Dimension of growth (λ)
Nucleation rate ( )
Exponent value Phase boundary
controlled (n)
Diffusion
controlled (m) 1 Deceleratory 1-2 0.5-1.5 2 Zero
(instantaneous) 2 1
2 Deceleratory 2-3 1-2 *for phase boundary controlled process, n= /2 ; for diffusion controlled
process, n= .
On the other hand, there is the other possibility that the guest species enter the
interlayer regions as soon as they reach the layer edges. The whole reaction proceeds
purely diffusion controlled process and different models exist summarized in Table 1-4
used to describe such diffusion processes in various dimensions249.
Table 1-4: Possible equations describing diffusion controlled reactions. See ref. 248.
Growth Equation
One-dimension diffusion
Two-dimension diffusion 1 ln 1
Three-dimension diffusion 1 1

Chapter 1
~ 55 ~
1.8 References
1 V. Rives (ed) Layered Double Hydroxides: Present and Future. 2001, Nova Science Publishers, New York.
2 A. I. Khan, D. O’Hare, J. Mater. Chem., 2002, 12, 3191. 3 D. G. Evans and R. C. T. Slade, Struct. Bond., 2006, 119. 1. 4 F. Feitknecht, Helv. Chim. Acta., 1942, 25, 131. 5 F. Feitknecht, Helv. Chim. Acta., 1942, 25, 555. 6 R. Allamnn, Acta. Cryst. B, 1968, 24, 972. 7 H. F. W. Taylor, Miner. Mag., 1969, 37, 338. 8 J. G. Nunan, P. B. Himelfarb, R. G. Herman, K. Klier, C. E. Bogdan and G. W. Simmons, Inorg.
Chem., 1989, 28, 3868. 9 F. Kooli, K. Kosuge and A. Tsunashima, J. Solid State Chem., 1995, 118, 285. 10 Y. J. Feng, D. Q. Li, C. X. Li, Z. H. Wang, D. G. Evans and X. Duan, Acta Chimica Sinica, 2003,
61, 78. 11 J. W. Boclair, P. S. Braterman, Chem. Mater., 1999, 11, 298. 12 A. De Roy, Mol. Cryst. Liq. Cryst., 1998, 311, 173. 13 E. Lopez-Salinas, M. Garcia-Sanchez, J. A. Montoya, D. R. Acosta, J. A. Abasolo and I. Schifter,
Langmuir, 1997, 13, 4748. 14 L. Legrand, M. Abdelmoula, A. Géhin, A. Chausé and J. M. R. Génin, Electrochim. Acta, 2001,
46(12), 1815. 15 C. Bigey, C. Depege, A. de Roy and J. P. Besse, J. Phys. Ⅳ, 1997, 7, 949. 16 K. J. Martin and T. J. Pinnavaia, J. Am. Chem. Soc., 1986, 108, 541. 17 R. Allmann, N. Jb. Miner. Mh., 1977, 136. 18 C. J. Serna, J. L. Rendon and J. E. Iglesias, Clays Clay Miner., 1982, 30 (3), 180. 19 J. H. Choy and Y. H. Son, Bull. Korean Chem. Soc., 2004, 25, 122. 20 F. Leroux and J. P. Besse, Chem. Mater., 2001, 13, 3507. 21 R. Allmann, Chimia, 1970, 24, 99. 22 H. F. W. Taylor, Miner. Mag., 1973, 39, 377. 23 I. Rousselot, C. Taviot-Gueho, F. Leroux, P. Leone, P. Palvadeau and J. P. Besse, J. Solid State
Chem., 2002, 167, 137. 24 A. G. Kalinichev and R. J. Kirkpatrick, Chem. Mater., 2002, 14, 3539. 25 V. Fernon, A. Vichot, P. Colombet, H. van Damme and F. Begin, Mater. Sci. Forums, 1994, 152-153,
307. 26 H. Kuzel and H. Baier, Eur. J. Mineral., 1996, 8, 129. 27 A. M. Fogg, A. J. Freij and G. M. Parkinson, Chem. Mater., 2002, 14, 232. 28 A. V. Besserguenev, A. M. Fogg, R. J. Francis, S. J. Price and D. O’Hare, Chem. Mater., 1997, 9,
241. 29 S. Carlino, Solid State Ionics, 1997, 98, 73. 30 S. P. Newsman and W. Jones, New J. Chem., 1998, 22, 105. 31 V. Rives and M. A. Ulibarri, Coordi., Chem. Rev., 1999, 181, 61. 32 W. Reichle, Solid State Ionics, 1986, 22, 135. 33 W. Reichle, J. Catal., 1985, 94, 547.

Chapter 1
~ 56 ~
34 S. Miyata, Clays Clay Miner., 1983, 11, 305. 35 Y. Israeli, C. Taviot-Guého, J. P. Besse, J. P. Morel and N. Morel-Desrosiers, J. Chem. Soc. Dalton
Trans., 2000, 5, 791. 36 T. Yamaoka, M. Abe and M. Tsuji, Mater. Res. Bull., 1989, 24, 1183. 37 M. A. Drezdon, U S patent, 1987, 4 774 212 . 38 M. A. Drezdon, Inorg. Chem., 1988, 27(25), 4628. 39 E. L. Crepaldi, P. C. Pavan and J. B. Valim, Chem. Commun., 1999, 155. 40 E. L. Crepaldi, P. C. Pavan and J. B. Valim, J. Mater. Chem., 2000, 10, 1337. 41 A. De Roy, C. Forano and J. P. Besse, in Layered Double Hydroxides: Present and Future, edited
by V. Rives (Nova Science Publishers, Inc., New York),2001, 1. 42 J. H. Lee, S. W. Rhee and D. Y. Jung, Chem. Mater., 2004, 16, 3774. 43 T. Hibino and A. Tsunashima, Chem. Mater., 1997, 9, 2082. 44 J. J. Bravo-Suarez, E. A. Paez-Mozo and S. T. Oyama, Chem. Mater., 2004, 16, 1214. 45 L.X. Lei, R. P. Vijayan and D. O’Hare, J. Mater. Chem., 2001, 11(12), 3276. 46 T. Sato and A. Okuwaki, Solid State Ionics, 1991, 45 (1-2), 43. 47 K. Chibwe and W. Jones, J. Chem. Soc., Chem. Commun., 1989, 926. 48 E. Narita, P. Kaviratna and T. J. Pinnavaia, Chem. Lett., 1991, 805. 49 T. Sato, H. Fujita, T. Endo, M. Shimada and A. Tsunashima, React. Solids, 1988, 5, 219. 50 F. Kooli, V. Rives and M. A. Ulibarri, Mater. Sci. Forum, 1994, 152-153, 375. 51 W. Kagunya, M. Chibwe and W. Jones, Mol. Cryst. Liq. Cryst., 1994, 244, 155. 52 M. R. Kang, H. M. Lim, S. C. Lee. S.H. Lee and K. J. Kim, Adv. Technol. Mater. Mater. Process.,
2004, 6(2), 218. 53 M. Ogawa and S. Asai, Chem. Mater., 2000, 12, 3253. 54 H. P. Boehm, J. Steinle and C. Vieweger, Angew. Chem. Int. Ed. Engl., 1977, 16, 265. 55 K. El Malki, A. De Roy and J. P. Besse, Eur. J. Solid State Inorg. Chem., 1989, t26, 339. 56 V. Prevot, Thesis, Blaise Pascal University, 1999. 57 T. S. Stanimirova, G. Kirov and E. Dinolova, Mat. Sic. Lett., 2001, 20, 453. 58 H. Roussel, Thesis, Blaise Pascal University, 1999. 59 S. P. Newman and W. Jones, New J. Chem., 1998, 22, 105. 60 A. De Roy, J.P. Besse and P. Bondot, Mat. Res. Bull., 1985, 20, 1091. 61 T. Sato, T. Wakabayashi and M. Shimada, Ind. Eng. Chem., Prod. Res. Dev., 1986, 25, 89. 62 G. Mascolo and O. Marino, Miner. Mag., 1980, 43, 619. 63 G. Mascolo, O. Marino and A. Cantarelli, Trans. J. Brif. Ceram., 1980, 79, 6. 64 T. Sate, H. Fujita, T. Endo and M. Shimada, React. of Solids, 1988, 5, 219. 65 V. Prevot, C. Forano and J. P. Bess, Inorg. Chem., 1998, 37, 4293. 66 G. J. Ross and H. Kodama, Amer. Min., 1967, 52, 1037. 67 G. W. Brindley and S. Kikkawa, Clays Clay Miner., 1980, 28, 87. 68 G. W. Brindley and S. Kikkawa, Am. Miner., 1979, 64, 836. 69 A. Ennadi, A. Legrouri, A. De Roy and J. P. Besse, J. Solid State Chem., 2000, 152, 568. 70 M. Bellotto, B. Rebours, O. Clause, J. Lynch, D. Bazin and E. Elkaim, J. Phys. Chem., 1996, 100,
8527. 71 H. Dittrich and M. Wohlfahrt-Mehrens, Int. J. Inorg. Mater., 2001, 3, 1137. 72 G. S. Thomas and P. V. Kamath, J. Chem. Sci., 2006, 118(1), 127. 73 A. V. Radha, C. Shivakumara and P. V. Kamath, Clays Clay Miner., 2005, 53(5), 520.

Chapter 1
~ 57 ~
74 G. S. Thomas, M. Rajamathi and P. V. Kamath, Clays Clay Miner., 2004, 52(6), 693. 75 Y. J. Liu, J. L. Schindler, D. C. DeGroot, C. R. Kannewurf, W. Hirpo and W. G. Kanatzidis, Chem.
Mater., 1996, 8, 825. 76 X. Zhang and M. M. Lerne, Chem. Mater., 1999, 11, 1100. 77 X. Zeng and G. Ungar, Polymer, 1998, 19, 4523. 78 T. Adach, H. Takahashi, K. Ohki and I. Hatta, Biophys. J., 1995, 68, 1850. 79 T. Itho, N. Ohta, T. Schichi, T. Yui and K. Tagaki, Langmuir, 2003, 19, 9120. 80 J. Bauer, P. Behrens, M. Speckbacher and H. Langhals, Adv. Funct. Mater., 2003, 13(3), 241. 81 G. Renaudin, F. Kubel, J. P. Rivera and M. François, Cem. Concr. Res., 1999, 29, 1937. 82 El M. Moujahid, F. Leroux and J. P. Besse, J. Mater. Chem., 2002, 12, 3324. 83 F. Leroux and C. Taviot-Guého, J. Mater. Chem., 2005, 15, 3628. 84 W. K. Kuks and Y. D. Huh, J. Mater. Chem., 1997, 7, 1933. 85 T. Itoh, T. Shichi, T. Yui, H. Tahahashi, Y. Inui and K. Takagi, J. Phys. Chem. B, 2005, 109, 3199. 86 W. T. Reichle, Solid State Ionics, 1986, 22, 135. 87 J. M. Fernandez, C. Barriga, M. A. Ulibarri, F. M. Labajos and V. Rives, J. Mater. Chem., 1994, 4,
1117. 88 S. Vial, V. Prevot and C. Forano, J. Phys. Chem. Solids, 2006, 67, 1048. 89 G. Hu and D. O’Hare, J. Am. Chem. Soc., 2005, 127, 17808. 90 G. B. Sun, L. N. Sun, H. Wen, Z. Q. Jia, K. L. Huang and C. W. Hu, J. Phys. Chem. B, 2006, 110,
13375. 91 J. Tronto, F. Leroux, E. L. Crepaldi, Z. Naal, S. I. Klein and J. B. Valim, J. Phys. Chem. Solids,
2006, 67, 968. 92 J. Tronto, K. C. Sanchez, E. L. Crepaldi, Z. Naal, S. I. Klein and J. B. Valim, J. Phys. Chem. Solids,
2004, 65, 493. 93 L. Z. Qiu, W. Chen and B. J. Qu, Polymer, 2006, 47. 922. 94 L. C. Du, B. J. Qu, Y. Z. Meng and Q. Zhu, Compos. Sci. Tech., 2006, 66, 913. 95 E. Geraud, C. Prevot, J. Ghanbaja and F. Leroux, Chem. Mater., 2006, 18, 238. 96 M. B. J. Roeffaers, B. F. Sels, D. Loos, C. Kohl, K. Mullen, P. A. Jacobs, J. Hofkens and D. E. De
Vos, Chem. Phys. Chem., 2005, 6, 2295. 97 K. Yao, M. Taniguchi, M. Nakata, M. Takahashi and A. Yamagishi, Langmuir, 1998, 14, 2410. 98 G. Hu, N. Wang, D. O’Hare and J. Davis, Chem. Commun., 2006, 287. 99 G. Defontaine, L. J. Michot, I. Bihannic, J. Ghanbaja and V. Briois, Langmuir, 2004, 20, 11213. 100 F. Leroux, E. M. Moujahid, C. Taviot-Guého and J. P. Besse, Solid State Sci., 2001, 3, 81. 101 S. Velu, V. Ramaswamy, A. Ramani, B. M. Chanda and S. Sivasanker, Chem. Commun., 1997,
2107. 102 S. Velu, K. Suzuki, M. Okazaki, T. Osaki, S. Tomura, and T. Ohashi, Chem. Mater., 1999, 11, 2163. 103 M. Intissar, J. C. Jumas, J. P. Besse, and F. Leroux, Chem. Mater., 2003, 15, 4625. 104 M. Intissar, F. Malherbe, V. Prevot and F. Leroux, J. Colloid Interface Sci., 2006, 299, 747. 105 J. T. Kloprogge and R. L. Frost, J. Solid State Chem., 1999, 146, 506. 106 H. Zhang, K. Zou, S.-H. Guo and X. Duan, J. Solid State Chem., 2006, 179 (6), 792. 107 J. Perez-Ramirez, G. Mul and J. A. Moulijn, Vibra. Spec., 2001, 27, 75. 108 T. J. Kloprogge, R. L. Frost., Phys. Chem. Chem. Phys., 1999, 1, 1641. 109 T. J. Kloprogge and R. L. Frost, Appl. Catal. A, 1999, 184, 61.
Chapter 1
~ 58 ~
110 T. E. Johnson, W. Martens, R. L. Frost, Z. Ding and J. T. Kloprogge, J. Raman Spectrosc., 2002, 33, 604.
111 R. L. Frost, M. L. Weier and J. T. Kloprogge, J. Raman Spectrosc., 2003, 34, 760. 112 S. Petit, A. Decarreau, F. Martin and R. Buchet, Phys. Chem. Miner., 2004, 31, 585. 113 R. L. Frost, Z. Ding and J. T. Kloprogge, Canad. J. Analy. Sci. Spectrosc., 2000, 45 (4), 96. 114 Y. Kim, R. J. Kirkpatrick and R. T. Cygan, Geochem. Cosmochim. Acta, 1996, 60, 4059. 115 R. J. Kirkpatrick, Y. Ping, X. Q. Hou and Y. Kim, Am. Mingeral., 1999, 84, 1186. 116 X. Q. Hou, R. J. Kirkpatrick, Y. Ping, D. Moore and Y. Kim, Am. Mineral., 2000, 85, 173. 117 A. Van der Pol, B. L. Mojet, E. Van de Ven and E. de Boer, J. Phys. Chem., 1994, 98, 4050. 118 S. Carlino and M. J. Hudson, J. Mater. Chem., 1994, 4, 99. 119 G. Marcelin, N. J. Stockhausen, J. F. M. Post and A. Schutz, J. Phys. Chem., 1989, 93, 4646. 120 J. Dupuis, J. P. Battut, Z. Fawal and H. Hajjimohamad, Solid State Inoincs, 1990, 42, 251. 121 X. Q. Hou and R. J. Kirkpatrick, Chem. Mater., 2000, 12, 1890. 122 M. del Arco, S. Gutierrez, C. Martin, V. Rives and J. Rocha, J. Solid State Chem., 2000, 151, 272. 123 R. S. Maxwell, R. K. Kukkadapu, J. E. Amonette and H. Cho, J. Phys. Chem. B, 1999, 103, 5197. 124 S. Carlino and M. J. Hudson, J. Mater. Chem., 1995, 5, 1433. 125 H. Nakayama, S. Hirami and M. Tsuhaka, Chem. Lett., 2004, 33 (6), 712. 126 S. Gago, M. Pillinger, T. M. Santos and I. S. Goncalves, Ceramics, 2004, 48 (4), 155. 127 L. Mohanambe and S. Vasudevan, J. Chem. Sci., 2006, 118 (1), 105. 128 H. Nakayama, N. Wada and M. Tsuhako, Inter. J. Pharm., 2004, 269 (2), 469. 129 K. J. D. Mackenzie, R. H. Meinhold, B. L. Sherriff and Z. Xu, J. Mater. Chem., 1993, 1263. 130 L. Vieille, C. Taviot-Gueho, J. P. Besse and F. Leroux, Chem. Mater., 2003, 15, 4369. 131 S. P. Newsman, S. J. Williams, P. V. Coveney and W. Jones, J. Phys. Chem. B, 1998, 102, 6710. 132 A. M. Fogg, A. L. Rohl, G. M. Parkinson and D. O’Hare, Chem. Mater., 1999, 11, 1194. 133 A. G. Kalinichey, R. J. Kirkpatrick and R. T. Cygan, Am. Mineral., 2000, 85, 1046. 134 J. W. Wang, A. G. Kalinichey, R. J. Kirkpatrick and X. Q. Hou, Chem. Mater., 2001, 13, 145. 135 S. P. Newsman, T. D. Cristina and P. V. Coveney, Langmuir, 2002, 18, 2933. 136 H. C. Greenwell, W. Jones, S. P. Newsman and P. V. Coveney, J. Mol. Struct., 2003, 647, 75. 137 R. T. Cygan, J. J. Liang and A. G. Kalinichev, J. Phys. Chem. B, 2004, 108, 1255. 138 G. M. Lombardo. G. C. Pappalardo, F. Punzo, F. Costantino, U. Constantino and M. Sisani, Eur. J.
Inorg. Chem., 2005, 5026. 139 L. Mohanambe and S. Vasudevan, Langmuir, 2005, 21, 10735. 140 L. Mohanambe and S. Vasudevan, J. Phys. Chem. B, 2005, 109, 15651. 141 P. P. Kumar, A. G. Kalinichev and R. J. Kirkpatrick, J. Phys. Chem. B, 2006, 110(9), 3841. 142 F. Li and X. Duan, Struct. Bond., 2006, 119, 193. 143 F. Cavani, F. Trifiro and A. Vaccari, Cataly. Today, 1991, 11, 173. 144 D. G. Evans and X. Duan, Chem. Commun., 2006, 485. 145 G. R. Williams and D. O’Hare, J. Mater. Chem., 2006, 16, 1. 146 T. Nakatsuka, H. Kawasaki, S. Yamashita and S. Kohjiya, Bull. Chem. Soc. Japan, 1979, 52, 2449. 147 W. T. Reichle, J. Catal., 1980, 63, 295. 148 B. M. Choudary, M. L. Kantam, V. Neeraja, K. K. Rao, F. Figuras and L. Delmotte, Green Chem.,
2001, 3, 257. 149 F. Basile, G. Fornasari, E. Poluzzi and A. Vaccari, Appl. Clay Sci., 1998, 13, 329.
Chapter 1
~ 59 ~
150 J. Barrault, A. Derouault, G. Courtois. J. M. Maissant, J. C. Dupin, C. Guimon, H. Martinez and E. Dumitriu, Appl. Catal. A, 2004, 262, 43.
151 B. F. Sels, D. E. De Vos and P. A. Jacobs, Cataly. Rev., 2001, 43 (4), 443. 152 B. Houri, A. Legrouri, C. Forano and J. P. Besse, Czech. Chem. Commun., 1998, 63, 732. 153 S. W. Rhee, M. J. Kang, H. Kim and C. H. Moo, Environ. Technol., 1997, 18, 231. 154 L. M. Parker, N. B. Milestone and R. H. Newman, Ind. Eng. Chem. Res., 1995, 34, 1196. 155 F. Kovanda, E. Kovacsova and D. Kolousek, Collect. Czech. Chem. Commun., 1999, 64, 1517. 156 S. Amin and G. G. Jayson, Water Res., 1996, 30, 299. 157 Y. Seida and Y. Nakano, Water Res., 2000, 34(5), 1487. 158 G. Fetter, E. Ramos, M. T. Olguin, P. Bosch, T. Lopez and S. Bulbulian, J. Radioanal. Nucl.
Chem., 1997, 222, 63. 159 M. J. Kang, S. W. Rhee, H. Moon, V. Neck and Th. Fanghanel, Radiochim. Acta, 1996, 75, 169. 160 M. C. Hermosin, I. Pavlovic, M. A. Ulibarri and J. Cornejo, J. Environ. Sci. Health, Part A, 1993,
28(9), 1875. 161 M. C. Hermosin and J. Cornejo, J. Environ. Qual., 1993, 22(2), 325. 162 Y. Seida and Y. Nakano, Water Res., 2000, 34(5), 1487. 163 R. Celis, W. C. Koskinen, A. M. Cecchi, G. A. Bresnahan, M. J. Carrisoza, M. A. Ulibarri, I.
Pavlovic and M. C. Hermosin, J. Enviorn. Sci. Health, Part B, 1999, 34, 929. 164 M. V. Villa, M. J. Sanchez-Martin and M. Sanchez-Camazano, J. Environ. Sci. Health, Part B,
1999, 34, 509. 165 J. Inacio, C. Taviot-Gueho, C. Forano and J. P. Besse, Appl. Clay Sci., 2001, 18, 255. 166 C. J. Serna, J. L. White and S. L. Hern, J. Pharm. Sci., 1978, 67(3), 324. 167 A. I. Khan, L. Lei, A. J. Norquist and D. O’Hare, Chem. Commun., 2001, 2342. 168 G. Fardella, L. Perioli, U. Costantino, M. Nocchetti, V. Ambrogi and G. Grandolini, Proc. Int.
Symp. Controlled Release Bioact. Mater., 1997, 1033. 169 V. Ambrogi, G. Fardella, G. Grandolini and L. Perioli, Int. J. Pharm., 2001, 220, 23. 170 M. D. Arco, E. Cebadera, S. Gutierrez, C. Martin, M. J. Montero, V. Rives, J. Rocha and M. A.
Sevilla, J. Pharm. Sci., 2004, 93 (6), 1649. 171 V. Ambrogi, G. Fardella, G. Grandolini, L. Perioli and M. C. Tiralti, Pharm. Sci. Technol., 2002, 3
(3), 1. 172 C. O. Oriakhi, I. V. Farr and M. M. Lerner, J. Mater. Chem., 1996, 6, 103. 173 D. Margarita, L. B. Mar, A. Pilar, F. Leroux and R. H. Eduardo, Chem. Mater., 2005, 17(8), 1969. 174 F. Leroux, M. Ben Belkacem, G. Guyot, C. Taviot-Gueho, P. Leone, L. Cario, L. Desigaux and B.
Pitard, Mat. Res. Soc. Symp., 2005, 847, 223. 175 J. H. Choy, S. Y. Kwak, Y. J. Jeong and J. S. Park, Angew. Chem. Int. Ed., 2000, 39 (22), 4042. 176 L. Vieille, C. Taviot-Gueho, J. P. Besse and F. Leroux, Chem. Mater., 2003, 15, 4369. 177 L. Vieille, El M. Moujahid, C. Taviot-Gueho, J. Cellier, J. P. Besse and F. Leroux, J. Phys. Chem.
Solids, 2004, 65, 385. 178 F. Leroux, J. Nanosci. Nanotechno., 2006, 6(2), 303. 179 F. Leroux and C. Taviot-Gueho, J. Mater. Chem., 2005, 15, 3628. 180 D. G. Evans and X. Duan, Chem. Commun., 2006, 485. 181 W. Chen and B. J. Qu, J. Mater. Chem., 2004, 14, 1705. 182 F. Leroux, El M. Moujahid, C. Roland-Swanson, L. Vieille, C. Taviot-Gueho, J. P. Besse, E.
Raymundo-Pinero, F. Beguin, Mat. Res. Soc. Symp., 2005, 847, 195.
Chapter 1
~ 60 ~
183 E. V. Starikova, V. P. Isupov, K. A. Tarasov, L. E. Chupakhina and M. M. Yulikov, J. Struct. Chem., 2004, 45, S115.
184 A. V. Lukashin, M. V. Chernysheva, A. A. Vertegel and Yu. D. Tret’yakov, Dokl. Chem. (Engl. Transl.), 2003, 388 (1-3), 19.
185 A. V. Lukashin, A. A. Eliseev, N. G. Zhuraleva, S. V. Kalinin, A. A. Verfetel and Yu. D. Tret’yakov, Dokl. Chem. (Engl. Transl.), 2002, 383 (4-6), 93.
186 G. Schulz-Ekloff, D. Wohrle, B. Van Duffel and R. A. Schoonheydt, Microporous Mesoporous Mater., 2002, 51, 91.
187 P. Radu, S. Rouba, V. Laget, C. Hornick and M. Drillon, J. Chem. Soc., Chem. Commun., 1996, 1107.
188 V. Laget, C. Hornick, P. Rabu, M. Drillon, and R. Ziessel, Coord. Chem. Rev., 1998, 178, 1533. 189 V. Laget, C. Hornick, P. Rabu, M. Drillon, P. Turek and R. Ziessel, Adv. Mater., 1998, 10 (13),
1024. 190 P. Rabu, Z. L. Huang, C. Hornick and M. Drillon, Synth. Metals, 2001, 122, 509. 191 S. Decurtins, R. Pellaux, A. Hauser, M. E. Von Arx, in O. Kahn (Ed.), Magnetism: A
Superamolecular Function, NATO ASI Series, Vol. C8484, Kluwer Academic Publishers, Dordrecht, 1996, P. 487.
192 H. N. Kim, S. W. Keller, T. E. Mallouk and J. Schmitt, Chem. Mater., 1997, 9, 1414. 193 S. W. Keller, H. N. Kim and T. E. Mallouk, J. Am. Chem. Soc., 1994, 116, 8817. 194 D. M. Kaschak and T. E. Mallouk, J. Am. Chem. Soc., 1996, 118, 4222. 195 C. Sanchez and P. Gomez-Romero (Ed.), Functional Hybrid Materials, Wiley-VCH publishers,
2004. 196 C. N. R. Rao, J. Mater. Chem., 1999, 9, 1. 197 A. P. Alivisatos, P. F. Barbara, A. W. Vastleman, J. Chang, D. A. Dixon, M. L. Klein, G. L.
McLendon, J. S. Miller, M. A. Ratner, P. J. Rossky, S. I. Stupp and M. E. Thompson, Adv. Mater., 1998, 10 (16), 1297.
198 R. J. Cava, F. J. DiSalvo, L. E. Brus, K. R. Dunbar, C. B. Gorman, S. M. Haile, L. V. Interrante, J. L. Musfeldt, A. Navrotsky, R. G. Nuzzo, W. E. Pickett, A. P. Wilkinson, C. Ahn, J. W. Allen, P. C. Burns, G. Ceder, C. E. D. Chidsey, W. Clegg, E. Coronado, H. J. Dai, M. W. Deem, B. S. Dunn, G. Galli, A. J. Jacobson, M. Kanatzidis, W. B. Lin, A. Manthiram, M. Mrssich, D. J. Norris, A. J. Nozik, X. G. Peng, C. Rawn, D. Rolison, D. J. Singh, B. H. Toby, S. Tolbert, U. B. Wiesner, P. M. Woodward and P. D. Yang, Progress Solid State Chem., 2002, 30, 1.
199 A. D. Pomogailo and V. N. Kestelman (ED.), Metallopolymer Nanocomposites, Springer publisher, 2005.
200 S. A. Solin, J. Mol. Catal., 1984, 27, 293. 201 W. Rüdorff, Z. Phys. Chem., 1940, 45, 42. 202 W. Rüdorff , Chimia, 1965, 19, 489. 203 N. Daumas and A. Hérold, C. R. Acad. Sci. Paris C, 1969, 268, 373. 204 N. Daumas and A. Hérold, Synth. Met., 1988, 23, 27. 205 A. M. Fogg, J. S. Dunn and D. O’Hare, Chem. Mater., 1998, 10, 356. 206 J. C. Schon, D. Alder and G. Dresselhaus, J. Phys. C: Solid State Phys., 1988, 21, 5595. 207 S. A. Solin, J. Mol. Catal,. 1987, 27, 293. 208 F. Kooli, I. C. Chisem, M. Vucelic and W. Jones, Chem. Mater., 1996, 8, 1969. 209 A. M. Fogg, J. S. Dunn and D. O’Hare, Chem. Mater., 1998, 10, 356.

Chapter 1
~ 61 ~
210 N. Iyi, K. Kurashima and T. Fujita, Chem. Mater., 2002, 14, 583. 211 J. Pisson, C. Taviot-Gueho, Y. Israeli, F. Leroux, P. Munsch, J. P. Itie, V. Briois, N. Morel-
Desrosiers and J. P. Besse, J. Phys. Chem. B, 2003, 107, 9243. 212 T. Enoki, M. Endo and M. Suzuki, Graphite Intercalation Compounds and Applications, Oxford
University press US, April 1 2003. 213 N. E. Sorokina, I. V. Nikol’skaye, S. G. Ionov and V. V. Avdeev, Russ. Chem. Bull., 2005, 54, 1749. 214 H. Shiyama, Synth. Met. 2000, 114, 1-15. 215 Y. Mizutani, T. Abe, M. Asano and T. Harada, J. Mater. Res., 1993, 8, 1586. 216 Y. Murkami, T. Kishimoto, H. Suematsu, R. Nishitani, Y. Sasaki and Y. Nishina, Synth. Met., 1989,
34, 205. 217 H. Shioyama, Y. Wakukawa and Y. Sawada, Mol. Cryst. Liq. Cryst., 1998, 310, 69. 218 T. Baker, Chem. Ind., 1982, 18, 698. 219 F. Beguin and R. Setton, J. Chem. Soc., Chem. Commun., 1976, 611. 220 R. Schöllhorn, Pure & Appl. Chem., 1984, 56(12), 1739. 221 J. Rouxel, in Intercalated Layered Materials, edited by F. Lévy, D. Reidel, Dordrecht, 1979, p201. 222 R. Schöllhorn, in Physics of Intercalation Compounds, edited by L. Pietronero and E. Tosatti,
Springer Verlag, Berlin/New York, 1981, p33. 223 C. Riekel, H. G. Rezink and R. Schöllhorn, J. Solid State Chem., 1979, 29, 323. 224 T. Hibma, J. Solid State Chem., 1980, 34, 97. 225 W. R. Mc Kinnon and R. R. Haering, Solid State Ionics, 1980, 1, 111. 226 J. R. Dahn, W. R. Mc Kinnon and R. R. Haering, Can. J. Phys., 1980, 15, 208; J. R. Dahn and R.
R. Haering, Solid State Commun., 1981, 40, 245. 227 S. A. Safran, Phys. Rev. Lett., 1980, 44, 937; Synth. Met., 1980, 2, 1. 228 W. Thulke, Thesis, Universität Kiel, 1984. 229 R. Schöllhorn and W. Schmucker, Z. Naturforsch, 1975, 30b, 975. 230 W. L. Ijdo and T. J. Pinnavaia, J. Solid State Chem., 1998, 139, 281. 231 W. L. Ijdo and T. J. Pinnavaia, Chem. Mater., 1999, 11, 3227. 232 V. A. Drits, T. N. Sokolova, G. V. Sokolova and V. I. Cherkashin, Clays Clay Miner., 1987, 35 (6),
401. 233 A. S. Bookin, V. I. Cherkashin and V. A. Drits, Clays Clay Miner., 1993, 41, 558. 234 G. R. Williams and D. O’Hare, Chem. Mater., 2005, 17, 2632. 235 G. R. Williams, A. J. Norquist and D. O’Hare, Chem. Commun., 2003, 1816. 236 G. R. Williams, A. J. Norquist and D. O’Hare, Chem. Mater., 2004, 16, 975. 237 G. R.Williams, Thesis, University of Oxford, 2005, September. 238 D. O’Hare, J. S. O. Evans, A. Fogg and S. O’Brien, Polyhedron, 2000, 19, 297. 239 J. S. O. Evans, S. J. Price, H. V. Wong and D. O’Hare, J. Am. Chem. Soc., 1998, 120, 10837. 240 J. S. O. Evans, R. J. Francis, D. O’Hare, S. J. Price, S. M. Clarke, J. Flaherty, J. Gordon, A. Nield
and C. C. Tang, Rev. Sci. Instrum., 1995, 66, 2442. 241 S. M. Clarke, A. Neild, T. Rathbone, J. Flaherty, C. C. Tang, J. S. O. Evans, R. J. Francis and D.
O’Hare, Nucl. Ins. Methods, 1995, 97, 98. 242 A. M. Fogg, J. S. Dunn, S. G. Shyu, D. R. Cary and D. O’Hare, Chem. Mater., 1998, 10, 351. 243 L. Lei, R. P. Vijayan and D. O’Hare, J. Mater. Chem., 2001, 11, 3276. 244 F. Millange, R. I. Walton, L. Lei and D. O’Hare, Chem. Mater., 2000, 12, 1990. 245 S. M. Clark, J. Appl. Crystallogr., 1995, 28, 646.

Chapter 1
~ 62 ~
246 J. H. Sharp, G. W. Brindley and B. N. N. Achar, J. Am. Ceram. Soc., 1966, 49, 379. 247 J. D. Hancock and J. H. Sharp, J. Am. Ceram. Soc., 1972, 55, 74. 248 G. R. Williams, A. I. Khan and D. O’Hare, Struct. Bond., 2006, 119, 161. 249 W. Jander, Z. Anorg. Chem., 1927, 163, 1927.
Chapter 2
~ 63 ~
Chapter 2 Factors Influencing
Staging during Anion-exchange
Reaction in [Zn2Cr(OH)6]X·nH2O
and [Zn2Al(OH)6]Cl·nH2O Layered
Double Hydroxides

Chapter 2
~ 64 ~
2.1 Introduction
Recently, the mechanism by which intercalation occurs in layered hosts acquired a
renewed of interest with the development of multifunctional materials. In the same time,
the technological and experimental advances in energy-dispersive powder X-ray
diffraction (EDXRD) with synchrotron X-ray sources have provided new possibilities for
the study of solid-state reaction kinetics.1 This technique allows the simultaneous
observation of a wide range of d-spacings for all possible species involving the
intercalation reaction such as the host, any intermediate phase and the product.
Particularly, the markedly higher intensity over conventional laboratory X-ray source
makes it possible the acquisition of good quality spectra on time scale of seconds, hence
the kinetic study of fast intercalation reactions.2 A wide variety of intercalation reactions
have been investigated using EDXRD (see Chapter 1). 3-9
By means of EDXRD, in collaboration with D. O’Hare and co-workers, we intend to
develop a better understanding of LDH anion-exchange mechanisms and to determine the
factors influencing the formation of LDH second-stage intermediate. 1, 10-14 EDXRD
technique allows reactions to be continuously monitored in situ and detailed structural
data can be collected.
The work described in this chapter builds on previous work performed by C.
Taviot-Gueho and co-workers14, 15and seeks for the conditions that prevail for the
formation of LDH second-stage compounds. In the first part, the exchange reactions of
chloride (Cl-) anions by tartrate (-O2C(CHOH)2CO2-)/succinate (-O2C(CH2)2CO2
-) anions
in Zn2Cr-Cl and Zn2Al-Cl were investigated by means of EDXRD. The aims here are to
further confirm the formation of the second-stage intermediates between tartrate/succinate
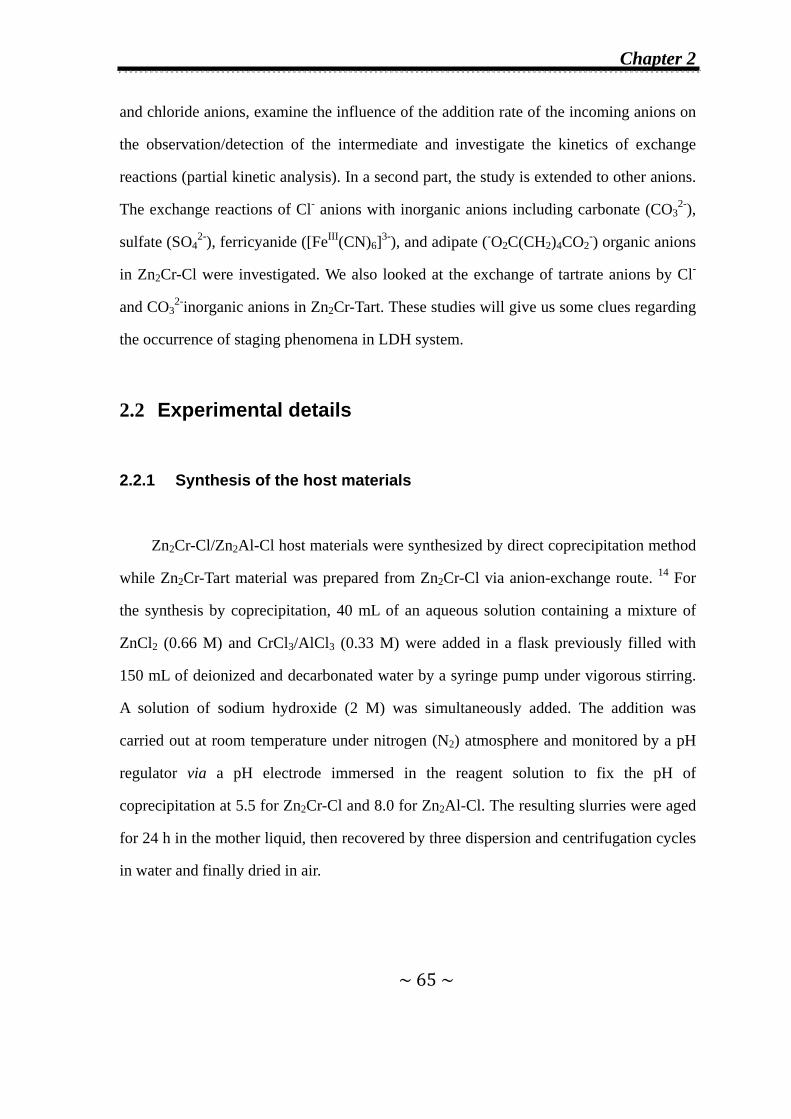
Chapter 2
~ 65 ~
and chloride anions, examine the influence of the addition rate of the incoming anions on
the observation/detection of the intermediate and investigate the kinetics of exchange
reactions (partial kinetic analysis). In a second part, the study is extended to other anions.
The exchange reactions of Cl- anions with inorganic anions including carbonate (CO32-),
sulfate (SO42-), ferricyanide ([FeIII(CN)6]3-), and adipate (-O2C(CH2)4CO2
-) organic anions
in Zn2Cr-Cl were investigated. We also looked at the exchange of tartrate anions by Cl-
and CO32-inorganic anions in Zn2Cr-Tart. These studies will give us some clues regarding
the occurrence of staging phenomena in LDH system.
2.2 Experimental details
2.2.1 Synthesis of the host materials
Zn2Cr-Cl/Zn2Al-Cl host materials were synthesized by direct coprecipitation method
while Zn2Cr-Tart material was prepared from Zn2Cr-Cl via anion-exchange route. 14 For
the synthesis by coprecipitation, 40 mL of an aqueous solution containing a mixture of
ZnCl2 (0.66 M) and CrCl3/AlCl3 (0.33 M) were added in a flask previously filled with
150 mL of deionized and decarbonated water by a syringe pump under vigorous stirring.
A solution of sodium hydroxide (2 M) was simultaneously added. The addition was
carried out at room temperature under nitrogen (N2) atmosphere and monitored by a pH
regulator via a pH electrode immersed in the reagent solution to fix the pH of
coprecipitation at 5.5 for Zn2Cr-Cl and 8.0 for Zn2Al-Cl. The resulting slurries were aged
for 24 h in the mother liquid, then recovered by three dispersion and centrifugation cycles
in water and finally dried in air.
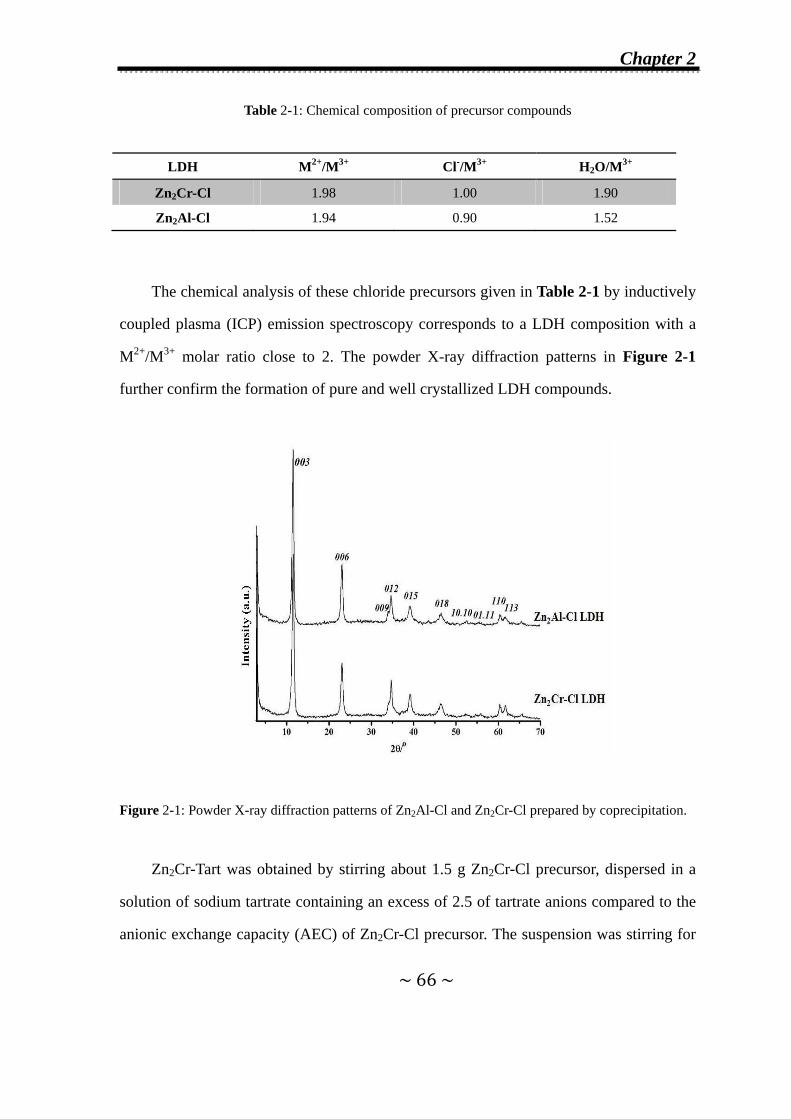
Chapter 2
~ 66 ~
Table 2-1: Chemical composition of precursor compounds
LDH M2+/M3+ Cl-/M3+ H2O/M3+
Zn2Cr-Cl 1.98 1.00 1.90
Zn2Al-Cl 1.94 0.90 1.52
The chemical analysis of these chloride precursors given in Table 2-1 by inductively
coupled plasma (ICP) emission spectroscopy corresponds to a LDH composition with a
M2+/M3+ molar ratio close to 2. The powder X-ray diffraction patterns in Figure 2-1
further confirm the formation of pure and well crystallized LDH compounds.
Figure 2-1: Powder X-ray diffraction patterns of Zn2Al-Cl and Zn2Cr-Cl prepared by coprecipitation.
Zn2Cr-Tart was obtained by stirring about 1.5 g Zn2Cr-Cl precursor, dispersed in a
solution of sodium tartrate containing an excess of 2.5 of tartrate anions compared to the
anionic exchange capacity (AEC) of Zn2Cr-Cl precursor. The suspension was stirring for
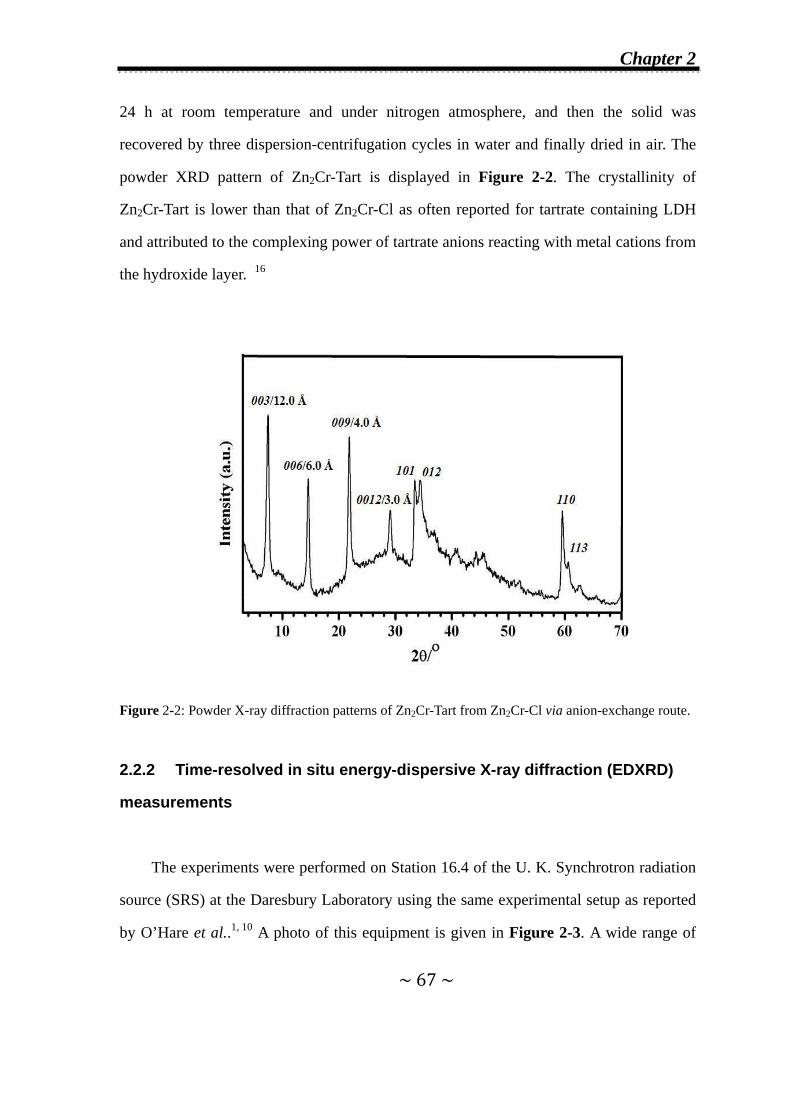
Chapter 2
~ 67 ~
24 h at room temperature and under nitrogen atmosphere, and then the solid was
recovered by three dispersion-centrifugation cycles in water and finally dried in air. The
powder XRD pattern of Zn2Cr-Tart is displayed in Figure 2-2. The crystallinity of
Zn2Cr-Tart is lower than that of Zn2Cr-Cl as often reported for tartrate containing LDH
and attributed to the complexing power of tartrate anions reacting with metal cations from
the hydroxide layer. 16
Figure 2-2: Powder X-ray diffraction patterns of Zn2Cr-Tart from Zn2Cr-Cl via anion-exchange route.
2.2.2 Time-resolved in situ energy-dispersive X-ray diffraction (EDXRD)
measurements
The experiments were performed on Station 16.4 of the U. K. Synchrotron radiation
source (SRS) at the Daresbury Laboratory using the same experimental setup as reported
by O’Hare et al..1, 10 A photo of this equipment is given in Figure 2-3. A wide range of
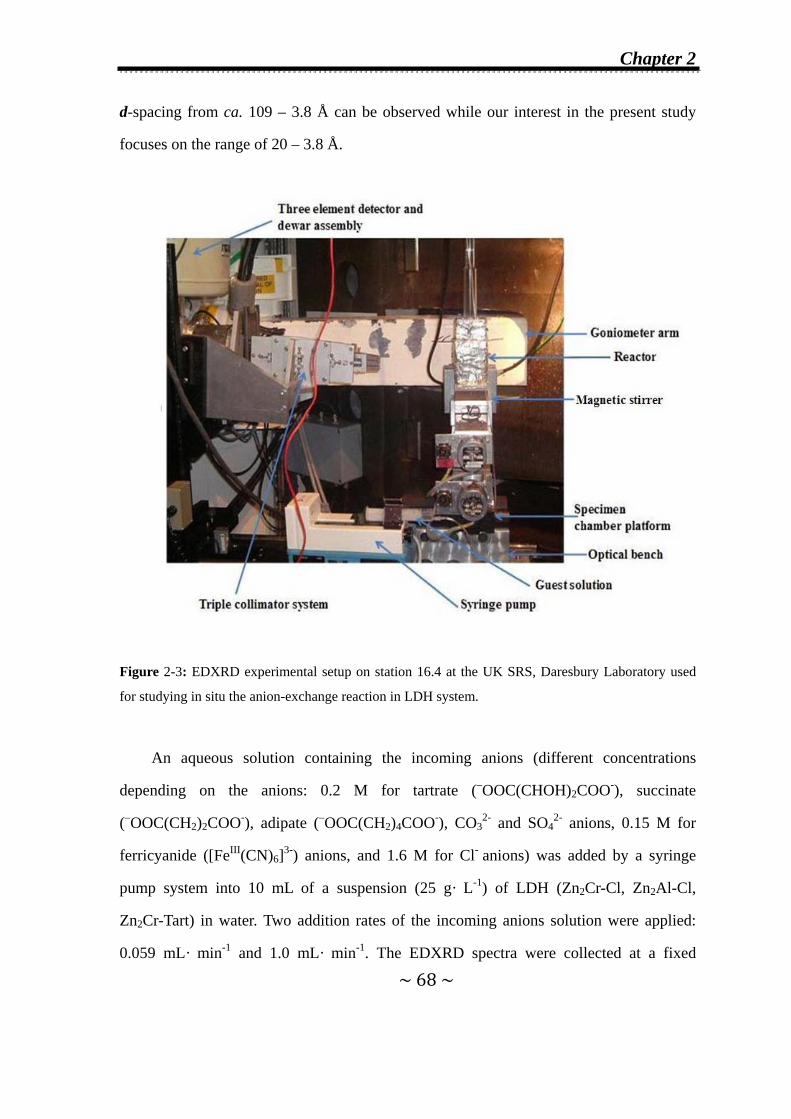
Chapter 2
~ 68 ~
d-spacing from ca. 109 – 3.8 Å can be observed while our interest in the present study
focuses on the range of 20 – 3.8 Å.
Figure 2-3: EDXRD experimental setup on station 16.4 at the UK SRS, Daresbury Laboratory used
for studying in situ the anion-exchange reaction in LDH system.
An aqueous solution containing the incoming anions (different concentrations
depending on the anions: 0.2 M for tartrate (–OOC(CHOH)2COO-), succinate
(–OOC(CH2)2COO-), adipate (–OOC(CH2)4COO-), CO32- and SO4
2- anions, 0.15 M for
ferricyanide ([FeIII(CN)6]3-) anions, and 1.6 M for Cl- anions) was added by a syringe
pump system into 10 mL of a suspension (25 g· L-1) of LDH (Zn2Cr-Cl, Zn2Al-Cl,
Zn2Cr-Tart) in water. Two addition rates of the incoming anions solution were applied:
0.059 mL· min-1 and 1.0 mL· min-1. The EDXRD spectra were collected at a fixed
Chapter 2
~ 69 ~
detector angle of 1.625 o (2θ) with an acquisition time varying from 10 s to 60 s
depending on the crystallinity of the system. The amount of incoming anions added into
the suspension as a function of time was converted into a theoretical exchange rate based
on the AEC of LDH starting phase. The EDXRD data collected by the program “PINCER”
were converted into an available format for input into the Xfit peak profiling program
using the program DLConverter.
2.2.3 Kinetic analysis of EDXRD data
The Xfit program was used to obtain the peak integrated areas of the Bragg reflections
Ihkl, considering Gaussian curves.17 These values were subsequently converted into the
extent of reaction α at time t defined as:
/ (1)
where is the area of a given hkl peak at a certain time t and is the
maximum area of this peak.
Information on reaction mechanism can be deduced from the kinetic equation of
Avrami and Erofe’ev and the corresponding parameters (the rate constant) and n
(Avrami exponent) were calculated based on the Sharp and Hancock method18. The
detailed analysis and kinetic models are introduced in Section 1.7.2.
2.2.4 Powder X-ray diffraction (PXRD).
A Philips X-Pert Pro diffractometer was used for the X-ray diffraction analysis of the
powders. The diffractometer was equipped with a Cu X-ray tube, graphite
monochromator and Ar-filled proportional counter. Divergence and receiving slits were
1/16° and 1 mm, respectively. Powders were back-loaded in an aluminum sample holder
Chapter 2
~ 70 ~
to produce a good sample surface and avoid preferential orientation effects. Data were
collected in a step mode with a step size of 0.03° (2θ) and a counting time of 10 sec/step.
2.3 Anion-exchange Reaction of Cl- Anions by Tartrate or
Succinate Anions in Zn2Cr-Cl and Zn2Al-Cl LDHs
2.3.1 Formation of second-stage intermediates
2.3.1.1 In Zn2Cr-Cl system
The exchange reactions in LDH system occur very vapidly; in a few minutes at room
temperature we observed the formation of the fully exchanged phase. So, in order to study
these reactions in detail, it is necessary to slow down the reaction rate by adding the anion
solution in a dropwise manner. However, this slow addition of guest anions prevents a full
quantitative kinetic analysis of the data.
Figure 2-4 shows the anion-exchange reaction of Zn2Cr-Cl with tartrate anions for a
slow addition (0.059 mL · min-1) of the tartrate anion solution (0.2 M). Individual spectra
were collected with an acquisition time of 60 s. The amount of guest anions added in the
suspension of Zn2Cr-Cl is converted into a theoretical anion exchange capacity (AEC)
given on the right scale.
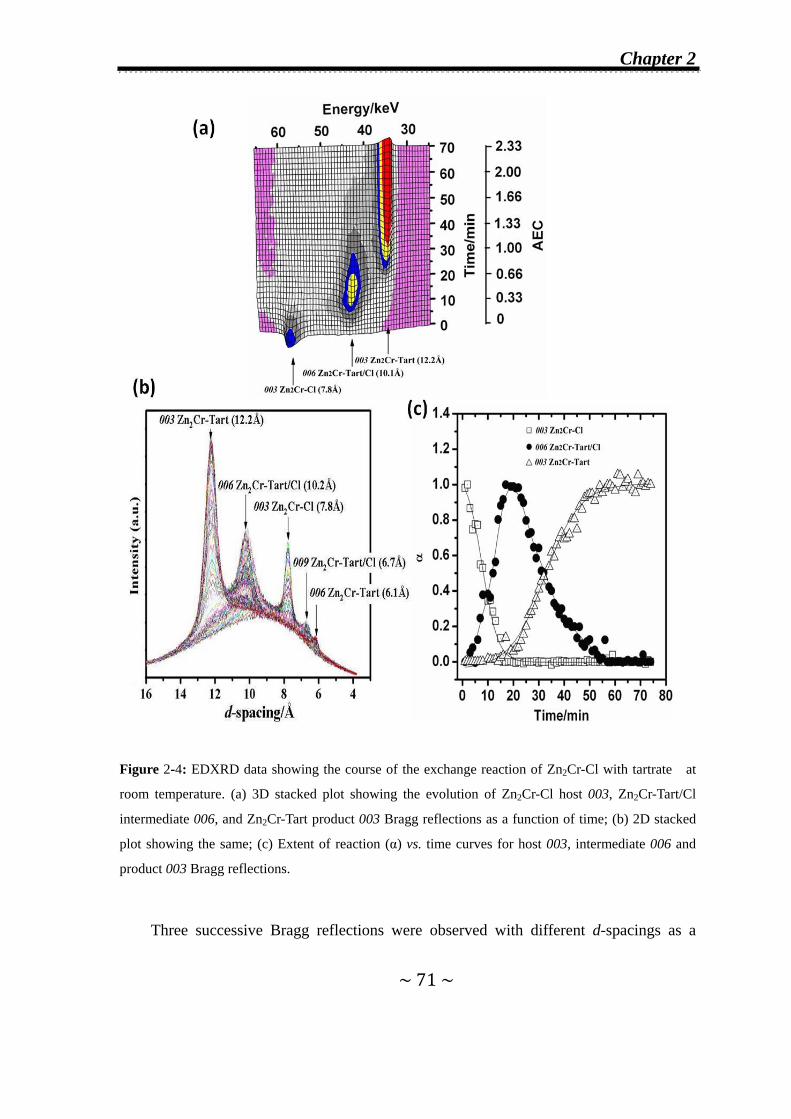
Chapter 2
~ 71 ~
Figure 2-4: EDXRD data showing the course of the exchange reaction of Zn2Cr-Cl with tartrate at
room temperature. (a) 3D stacked plot showing the evolution of Zn2Cr-Cl host 003, Zn2Cr-Tart/Cl
intermediate 006, and Zn2Cr-Tart product 003 Bragg reflections as a function of time; (b) 2D stacked
plot showing the same; (c) Extent of reaction (α) vs. time curves for host 003, intermediate 006 and
product 003 Bragg reflections.
Three successive Bragg reflections were observed with different d-spacings as a
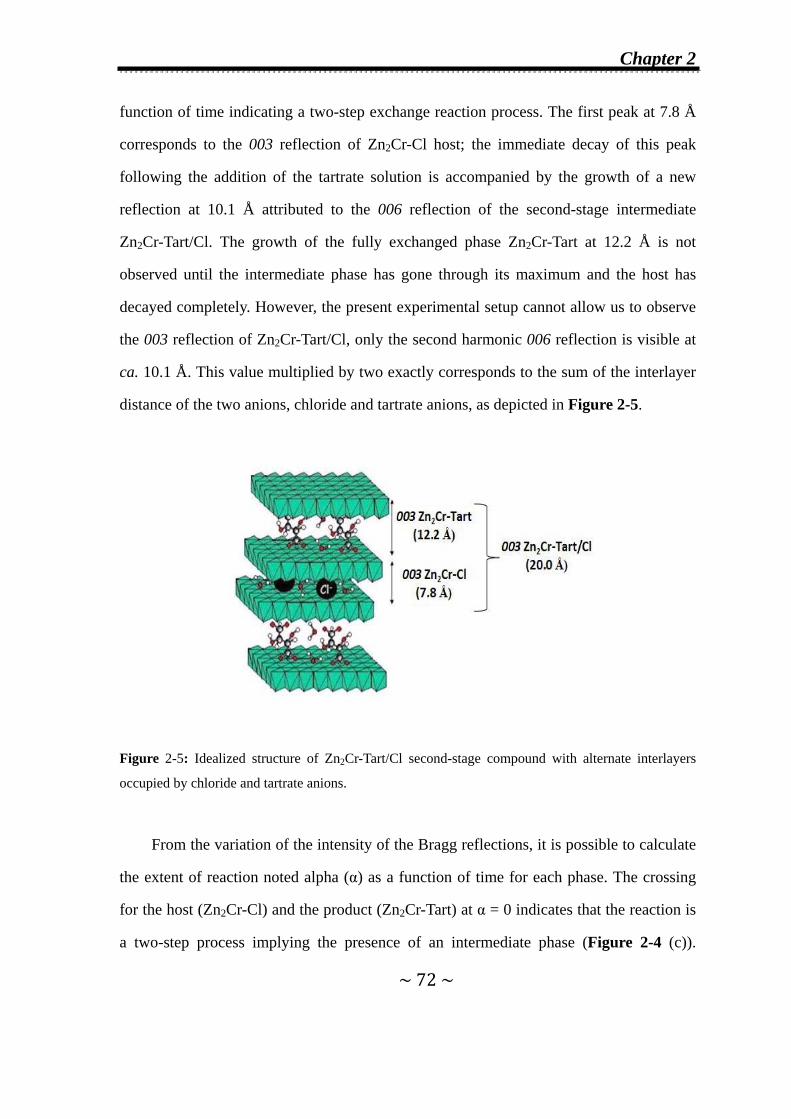
Chapter 2
~ 72 ~
function of time indicating a two-step exchange reaction process. The first peak at 7.8 Å
corresponds to the 003 reflection of Zn2Cr-Cl host; the immediate decay of this peak
following the addition of the tartrate solution is accompanied by the growth of a new
reflection at 10.1 Å attributed to the 006 reflection of the second-stage intermediate
Zn2Cr-Tart/Cl. The growth of the fully exchanged phase Zn2Cr-Tart at 12.2 Å is not
observed until the intermediate phase has gone through its maximum and the host has
decayed completely. However, the present experimental setup cannot allow us to observe
the 003 reflection of Zn2Cr-Tart/Cl, only the second harmonic 006 reflection is visible at
ca. 10.1 Å. This value multiplied by two exactly corresponds to the sum of the interlayer
distance of the two anions, chloride and tartrate anions, as depicted in Figure 2-5.
Figure 2-5: Idealized structure of Zn2Cr-Tart/Cl second-stage compound with alternate interlayers
occupied by chloride and tartrate anions.
From the variation of the intensity of the Bragg reflections, it is possible to calculate
the extent of reaction noted alpha (α) as a function of time for each phase. The crossing
for the host (Zn2Cr-Cl) and the product (Zn2Cr-Tart) at α = 0 indicates that the reaction is
a two-step process implying the presence of an intermediate phase (Figure 2-4 (c)).

Chapter 2
~ 73 ~
Besides, the crossing at α = 0.5 for the intermediate (Zn2Cr-Tart/Cl) and the product
curves as well as for the intermediate and the product curves indicates a conversion of the
host to the intermediate followed by the conversion of the intermediate to the product.
Figure 2-6: EDXRD data showing the course of the exchange reaction of Zn2Cr-Cl with succinate at
room temperature. (a) 3D stacked plot showing the evolution of Zn2Cr-Cl host 003, Zn2Cr-Succ/Cl
intermediate 006, and Zn2Cr-Succ product 003 Bragg reflections as a function of time and (b) extent of
reaction vs. time curves for host 003, intermediate 006 and product 003 Bragg reflections. The guest
succinate anion solution (0.2 M) was added at a rate of 0.059 mL· min-1.
Figure 2-6 shows the intercalation of succinate anions into Zn2Cr-Cl. Three Bragg
reflections are again observed at 7.8 Å 003 Zn2Cr-Cl, 10.1 Å 006 Zn2Cr-Succ/Cl and 12.0
Å 003 Zn2Cr-Succ. However, in this case, the fully exchanged phase is observed almost at
the same time as the second-stage intermediate, suggesting parallel processes with a route
probably going through the intermediate as well as a direct transformation from the host
to the fully exchanged phase. This result is different from that observed by O’Hare et al.10
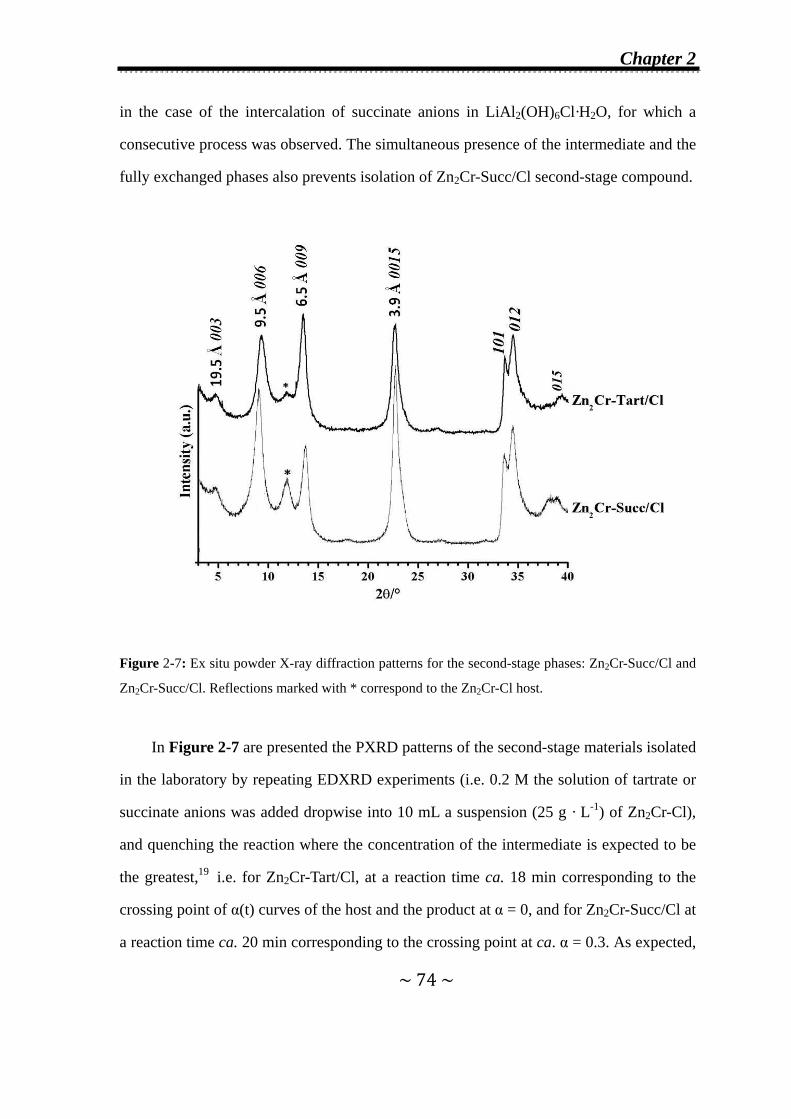
Chapter 2
~ 74 ~
in the case of the intercalation of succinate anions in LiAl2(OH)6Cl·H2O, for which a
consecutive process was observed. The simultaneous presence of the intermediate and the
fully exchanged phases also prevents isolation of Zn2Cr-Succ/Cl second-stage compound.
Figure 2-7: Ex situ powder X-ray diffraction patterns for the second-stage phases: Zn2Cr-Succ/Cl and
Zn2Cr-Succ/Cl. Reflections marked with * correspond to the Zn2Cr-Cl host.
In Figure 2-7 are presented the PXRD patterns of the second-stage materials isolated
in the laboratory by repeating EDXRD experiments (i.e. 0.2 M the solution of tartrate or
succinate anions was added dropwise into 10 mL a suspension (25 g · L-1) of Zn2Cr-Cl),
and quenching the reaction where the concentration of the intermediate is expected to be
the greatest,19 i.e. for Zn2Cr-Tart/Cl, at a reaction time ca. 18 min corresponding to the
crossing point of α(t) curves of the host and the product at α = 0, and for Zn2Cr-Succ/Cl at
a reaction time ca. 20 min corresponding to the crossing point at ca. α = 0.3. As expected,
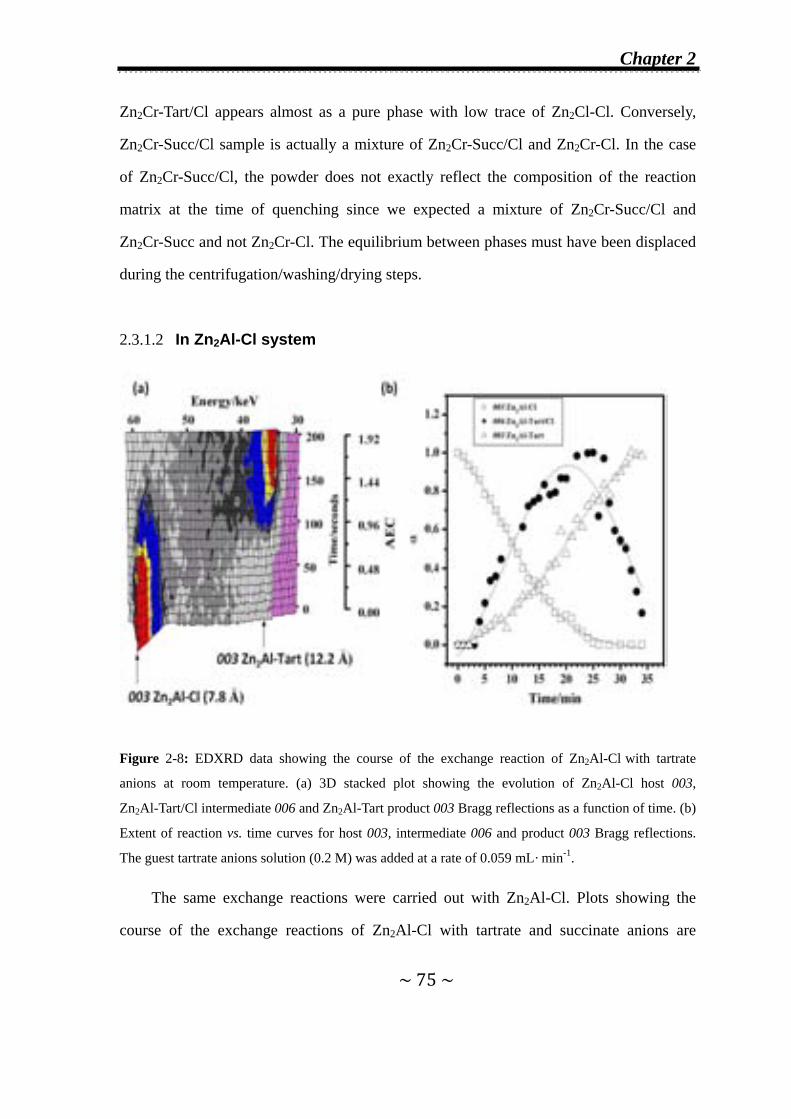
Chapter 2
~ 75 ~
Zn2Cr-Tart/Cl appears almost as a pure phase with low trace of Zn2Cl-Cl. Conversely,
Zn2Cr-Succ/Cl sample is actually a mixture of Zn2Cr-Succ/Cl and Zn2Cr-Cl. In the case
of Zn2Cr-Succ/Cl, the powder does not exactly reflect the composition of the reaction
matrix at the time of quenching since we expected a mixture of Zn2Cr-Succ/Cl and
Zn2Cr-Succ and not Zn2Cr-Cl. The equilibrium between phases must have been displaced
during the centrifugation/washing/drying steps.
2.3.1.2 In Zn2Al-Cl system
Figure 2-8: EDXRD data showing the course of the exchange reaction of Zn2Al-Cl with tartrate
anions at room temperature. (a) 3D stacked plot showing the evolution of Zn2Al-Cl host 003,
Zn2Al-Tart/Cl intermediate 006 and Zn2Al-Tart product 003 Bragg reflections as a function of time. (b)
Extent of reaction vs. time curves for host 003, intermediate 006 and product 003 Bragg reflections.
The guest tartrate anions solution (0.2 M) was added at a rate of 0.059 mL· min-1.
The same exchange reactions were carried out with Zn2Al-Cl. Plots showing the
course of the exchange reactions of Zn2Al-Cl with tartrate and succinate anions are
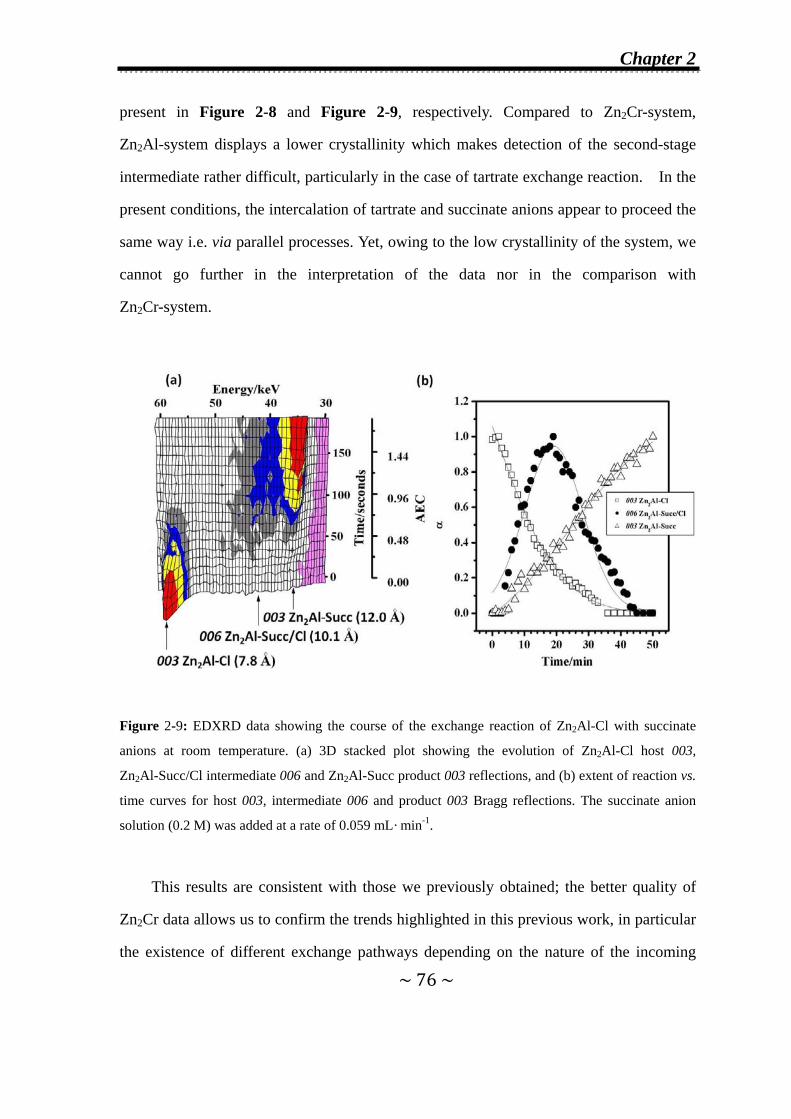
Chapter 2
~ 76 ~
present in Figure 2-8 and Figure 2-9, respectively. Compared to Zn2Cr-system,
Zn2Al-system displays a lower crystallinity which makes detection of the second-stage
intermediate rather difficult, particularly in the case of tartrate exchange reaction. In the
present conditions, the intercalation of tartrate and succinate anions appear to proceed the
same way i.e. via parallel processes. Yet, owing to the low crystallinity of the system, we
cannot go further in the interpretation of the data nor in the comparison with
Zn2Cr-system.
Figure 2-9: EDXRD data showing the course of the exchange reaction of Zn2Al-Cl with succinate
anions at room temperature. (a) 3D stacked plot showing the evolution of Zn2Al-Cl host 003,
Zn2Al-Succ/Cl intermediate 006 and Zn2Al-Succ product 003 reflections, and (b) extent of reaction vs.
time curves for host 003, intermediate 006 and product 003 Bragg reflections. The succinate anion
solution (0.2 M) was added at a rate of 0.059 mL· min-1.
This results are consistent with those we previously obtained; the better quality of
Zn2Cr data allows us to confirm the trends highlighted in this previous work, in particular
the existence of different exchange pathways depending on the nature of the incoming

Chapter 2
~ 77 ~
organic anions.
2.3.2 Effect of the addition rate of the incoming anions on the observation
of second-stage intermediates
In Figure 2-10, are compared the exchange reactions of tartrate anions with
Zn2Cr-Cl conducted at two different addition rates:
(a) Slow addition rate of 0.059 mL · min-1 with acquisition time of 60 s;
(b) High addition rate of 1.0 mL · min-1 with acquisition time of 10 s.
For the high addition rate, EDXRD patterns are less resolved and the intermediate and the
product appear almost at the same time. For the lower addition rate, the second-stage
intermediate has reached its maximum after ca. 18 min which corresponds to a theoretical
anion exchange level of 0.60 AEC, while the fully exchanged phase is the only phase
present after 50 min i.e. 1.65 AEC. For the high addition rate, the maximum intensity for
Zn2Cr-Tart/Cl is observed after ca. 1.8 min i.e. 1.03 AEC and for the product after 4 min
i.e. 2.28 AEC. These measurements clearly show that the rate of the exchange reaction is
dependent on the addition rate of the guest anion solution. One can say that the exchange
reaction in LDH system occur very rapidly in a few minutes and to study these reactions
in detail, observe and eventually isolate intermediate phases, it is necessary to add the
incoming anion solution dropwise at a low addition rate. This experimental constraint on
the addition rate prevents a full quantitative kinetic analysis of the data. However,
assuming a rather negligible effect on the reaction rate for the high addition rate of 1.0
mL · min-1, we attempted to extract kinetic information from the α(t) plots recorded in
these conditions.
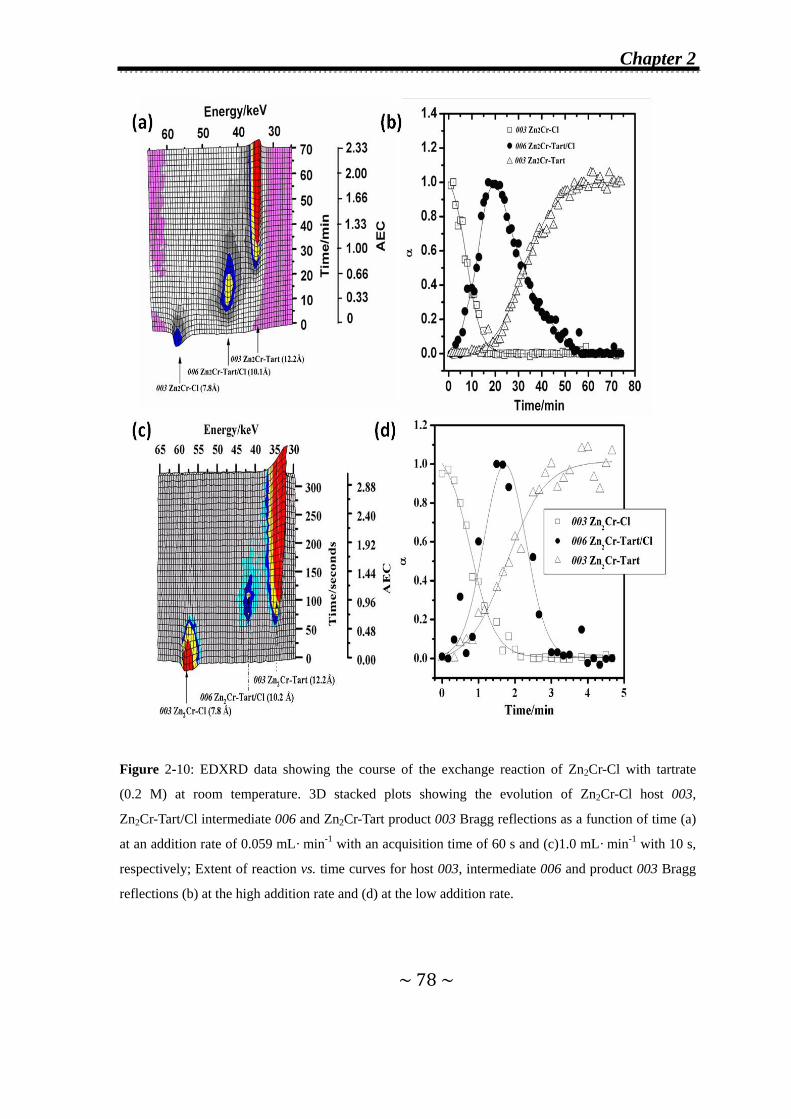
Chapter 2
~ 78 ~
Figure 2-10: EDXRD data showing the course of the exchange reaction of Zn2Cr-Cl with tartrate
(0.2 M) at room temperature. 3D stacked plots showing the evolution of Zn2Cr-Cl host 003,
Zn2Cr-Tart/Cl intermediate 006 and Zn2Cr-Tart product 003 Bragg reflections as a function of time (a)
at an addition rate of 0.059 mL· min-1 with an acquisition time of 60 s and (c)1.0 mL· min-1 with 10 s,
respectively; Extent of reaction vs. time curves for host 003, intermediate 006 and product 003 Bragg
reflections (b) at the high addition rate and (d) at the low addition rate.
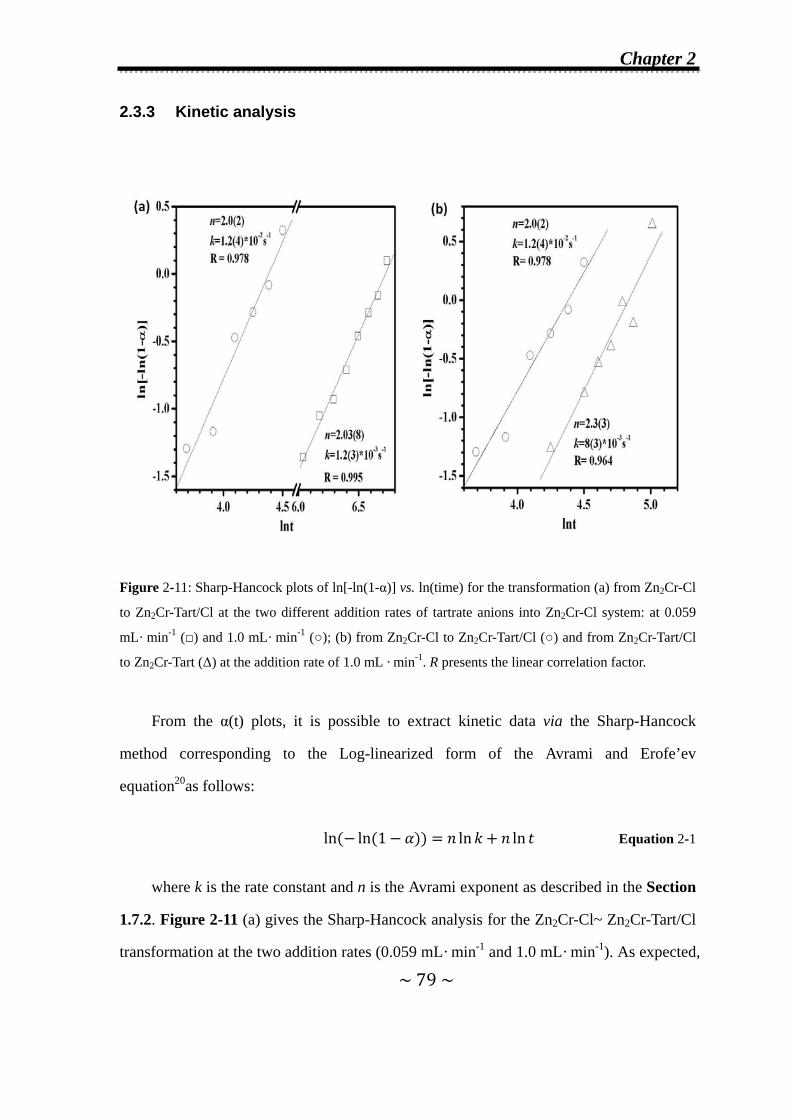
Chapter 2
~ 79 ~
2.3.3 Kinetic analysis
Figure 2-11: Sharp-Hancock plots of ln[-ln(1-α)] vs. ln(time) for the transformation (a) from Zn2Cr-Cl
to Zn2Cr-Tart/Cl at the two different addition rates of tartrate anions into Zn2Cr-Cl system: at 0.059
mL· min-1 (□) and 1.0 mL· min-1 (○); (b) from Zn2Cr-Cl to Zn2Cr-Tart/Cl (○) and from Zn2Cr-Tart/Cl
to Zn2Cr-Tart (Δ) at the addition rate of 1.0 mL · min-1. R presents the linear correlation factor.
From the α(t) plots, it is possible to extract kinetic data via the Sharp-Hancock
method corresponding to the Log-linearized form of the Avrami and Erofe’ev
equation20as follows:
ln ln 1 ln ln Equation 2-1
where k is the rate constant and n is the Avrami exponent as described in the Section
1.7.2. Figure 2-11 (a) gives the Sharp-Hancock analysis for the Zn2Cr-Cl~ Zn2Cr-Tart/Cl
transformation at the two addition rates (0.059 mL· min-1 and 1.0 mL· min-1). As expected,
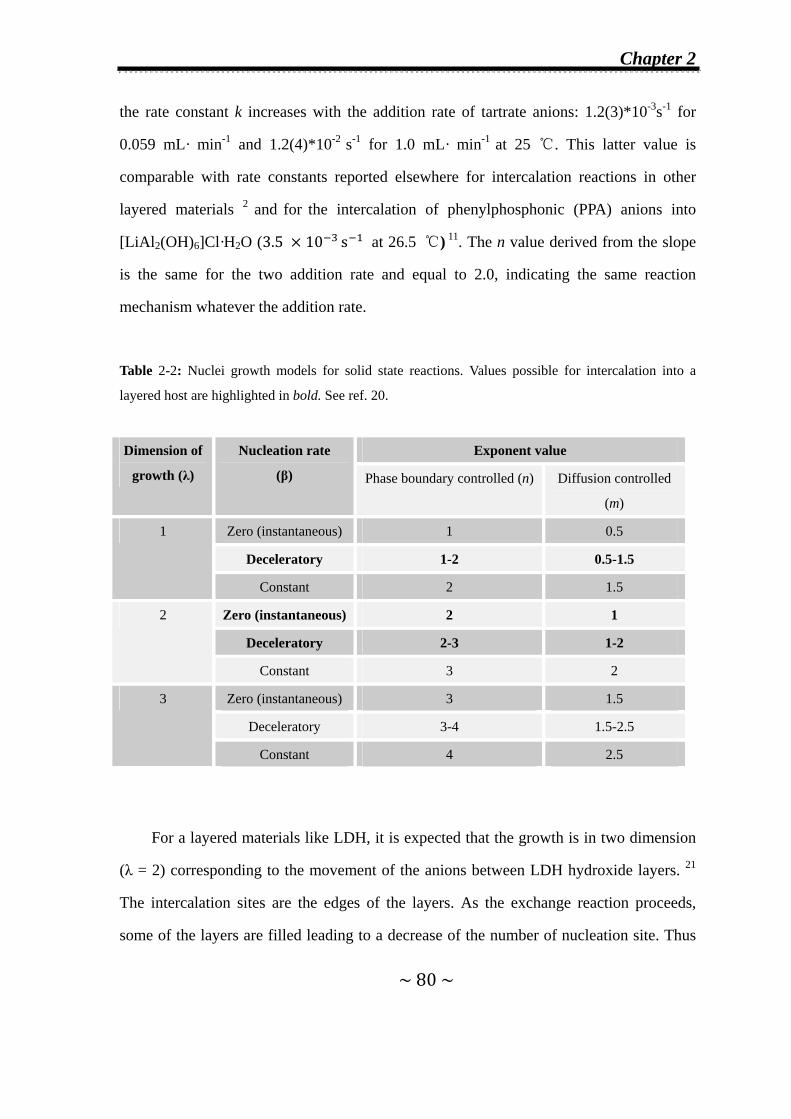
Chapter 2
~ 80 ~
the rate constant k increases with the addition rate of tartrate anions: 1.2(3)*10-3s-1 for
0.059 mL· min-1 and 1.2(4)*10-2 s-1 for 1.0 mL· min-1 at 25 ℃. This latter value is
comparable with rate constants reported elsewhere for intercalation reactions in other
layered materials 2 and for the intercalation of phenylphosphonic (PPA) anions into
[LiAl2(OH)6]Cl·H2O (3.5 10 s at 26.5 ℃) 11. The n value derived from the slope
is the same for the two addition rate and equal to 2.0, indicating the same reaction
mechanism whatever the addition rate.
Table 2-2: Nuclei growth models for solid state reactions. Values possible for intercalation into a
layered host are highlighted in bold. See ref. 20.
Dimension of
growth (λ)
Nucleation rate
(β)
Exponent value
Phase boundary controlled (n) Diffusion controlled
(m)
1 Zero (instantaneous) 1 0.5
Deceleratory 1-2 0.5-1.5
Constant 2 1.5
2 Zero (instantaneous) 2 1
Deceleratory 2-3 1-2
Constant 3 2
3 Zero (instantaneous) 3 1.5
Deceleratory 3-4 1.5-2.5
Constant 4 2.5
For a layered materials like LDH, it is expected that the growth is in two dimension
(λ = 2) corresponding to the movement of the anions between LDH hydroxide layers. 21
The intercalation sites are the edges of the layers. As the exchange reaction proceeds,
some of the layers are filled leading to a decrease of the number of nucleation site. Thus
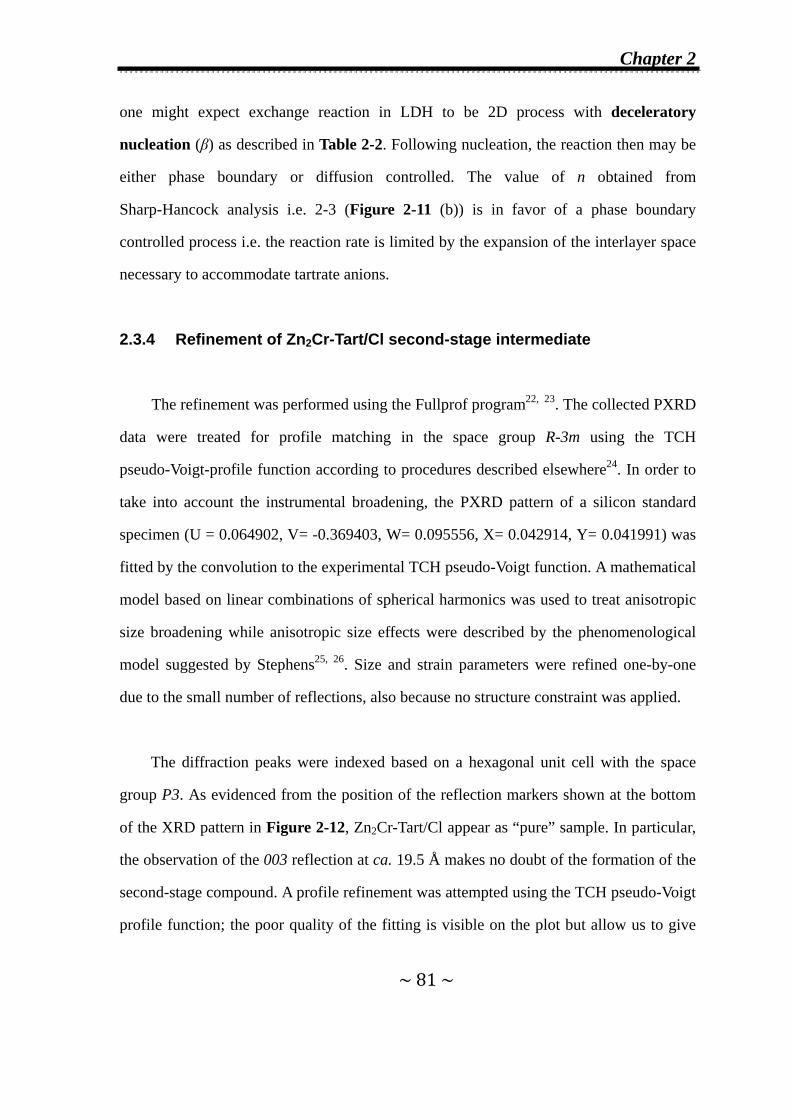
Chapter 2
~ 81 ~
one might expect exchange reaction in LDH to be 2D process with deceleratory
nucleation (β) as described in Table 2-2. Following nucleation, the reaction then may be
either phase boundary or diffusion controlled. The value of n obtained from
Sharp-Hancock analysis i.e. 2-3 (Figure 2-11 (b)) is in favor of a phase boundary
controlled process i.e. the reaction rate is limited by the expansion of the interlayer space
necessary to accommodate tartrate anions.
2.3.4 Refinement of Zn2Cr-Tart/Cl second-stage intermediate
The refinement was performed using the Fullprof program22, 23. The collected PXRD
data were treated for profile matching in the space group R-3m using the TCH
pseudo-Voigt-profile function according to procedures described elsewhere24. In order to
take into account the instrumental broadening, the PXRD pattern of a silicon standard
specimen (U = 0.064902, V= -0.369403, W= 0.095556, X= 0.042914, Y= 0.041991) was
fitted by the convolution to the experimental TCH pseudo-Voigt function. A mathematical
model based on linear combinations of spherical harmonics was used to treat anisotropic
size broadening while anisotropic size effects were described by the phenomenological
model suggested by Stephens25, 26. Size and strain parameters were refined one-by-one
due to the small number of reflections, also because no structure constraint was applied.
The diffraction peaks were indexed based on a hexagonal unit cell with the space
group P3. As evidenced from the position of the reflection markers shown at the bottom
of the XRD pattern in Figure 2-12, Zn2Cr-Tart/Cl appear as “pure” sample. In particular,
the observation of the 003 reflection at ca. 19.5 Å makes no doubt of the formation of the
second-stage compound. A profile refinement was attempted using the TCH pseudo-Voigt
profile function; the poor quality of the fitting is visible on the plot but allow us to give
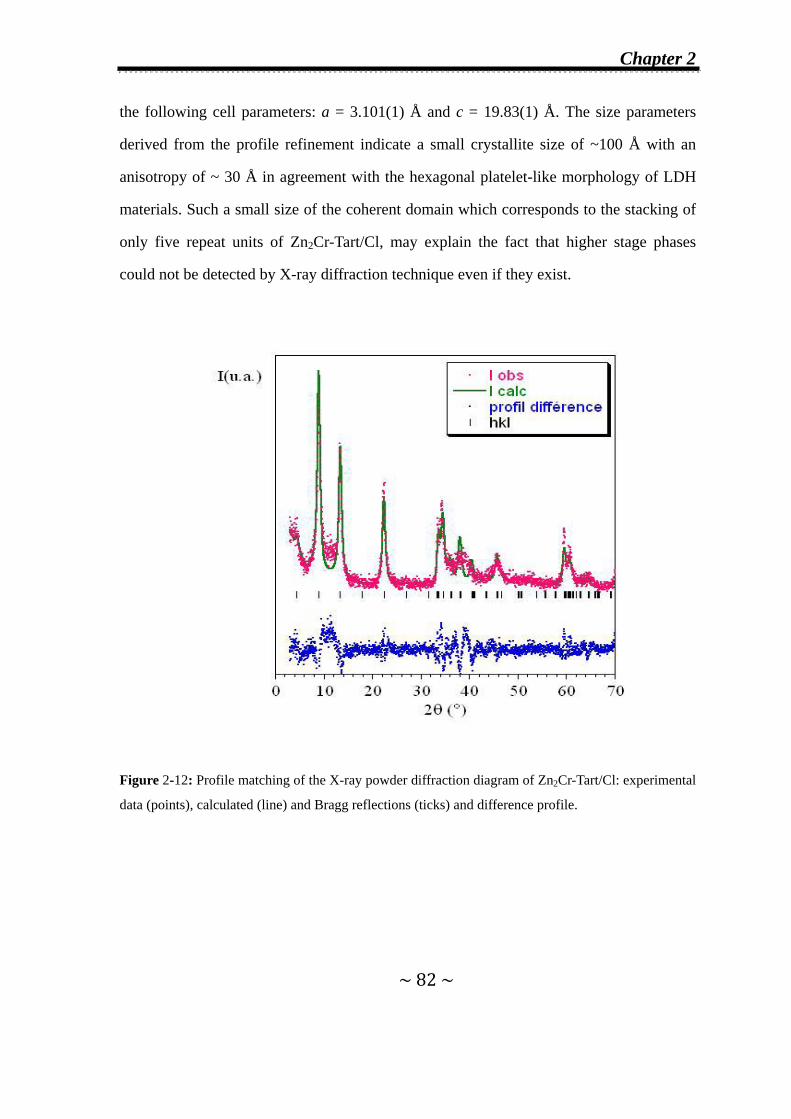
Chapter 2
~ 82 ~
the following cell parameters: a = 3.101(1) Å and c = 19.83(1) Å. The size parameters
derived from the profile refinement indicate a small crystallite size of ~100 Å with an
anisotropy of ~ 30 Å in agreement with the hexagonal platelet-like morphology of LDH
materials. Such a small size of the coherent domain which corresponds to the stacking of
only five repeat units of Zn2Cr-Tart/Cl, may explain the fact that higher stage phases
could not be detected by X-ray diffraction technique even if they exist.
Figure 2-12: Profile matching of the X-ray powder diffraction diagram of Zn2Cr-Tart/Cl: experimental
data (points), calculated (line) and Bragg reflections (ticks) and difference profile.
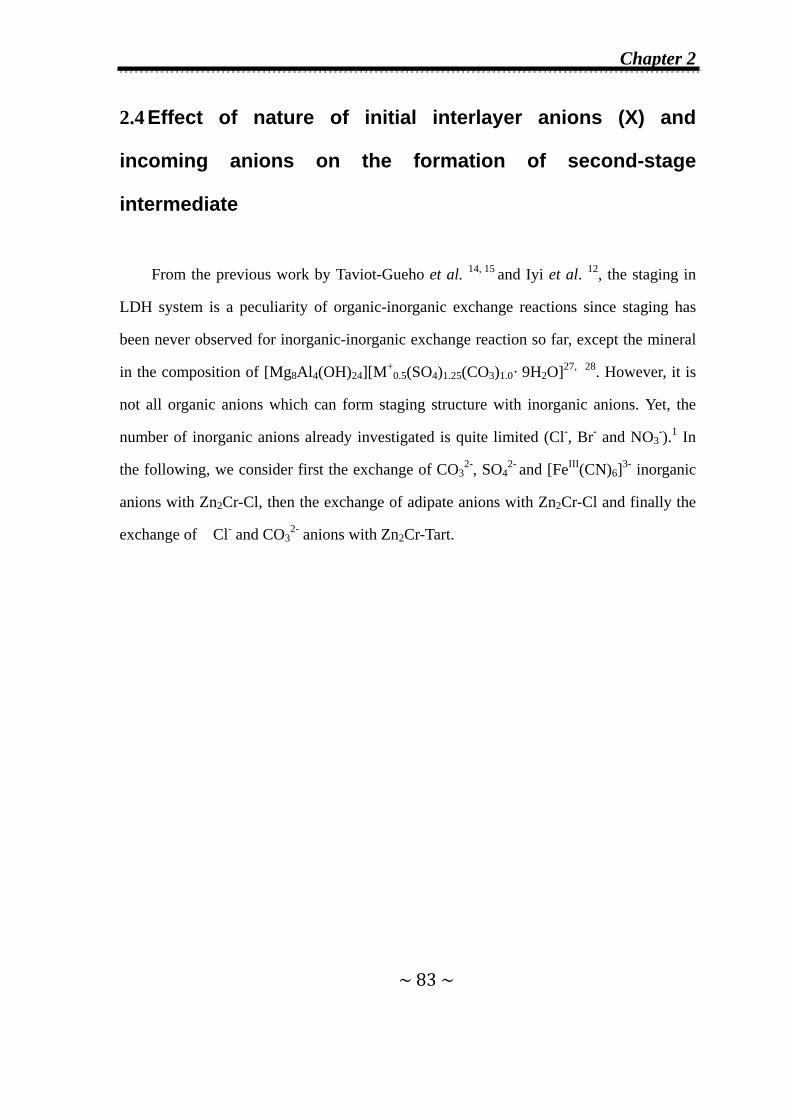
Chapter 2
~ 83 ~
2.4 Effect of nature of initial interlayer anions (X) and
incoming anions on the formation of second-stage
intermediate
From the previous work by Taviot-Gueho et al. 14, 15 and Iyi et al. 12, the staging in
LDH system is a peculiarity of organic-inorganic exchange reactions since staging has
been never observed for inorganic-inorganic exchange reaction so far, except the mineral
in the composition of [Mg8Al4(OH)24][M+0.5(SO4)1.25(CO3)1.0· 9H2O]27, 28. However, it is
not all organic anions which can form staging structure with inorganic anions. Yet, the
number of inorganic anions already investigated is quite limited (Cl-, Br- and NO3-).1 In
the following, we consider first the exchange of CO32-, SO4
2- and [FeIII(CN)6]3- inorganic
anions with Zn2Cr-Cl, then the exchange of adipate anions with Zn2Cr-Cl and finally the
exchange of Cl- and CO32- anions with Zn2Cr-Tart.
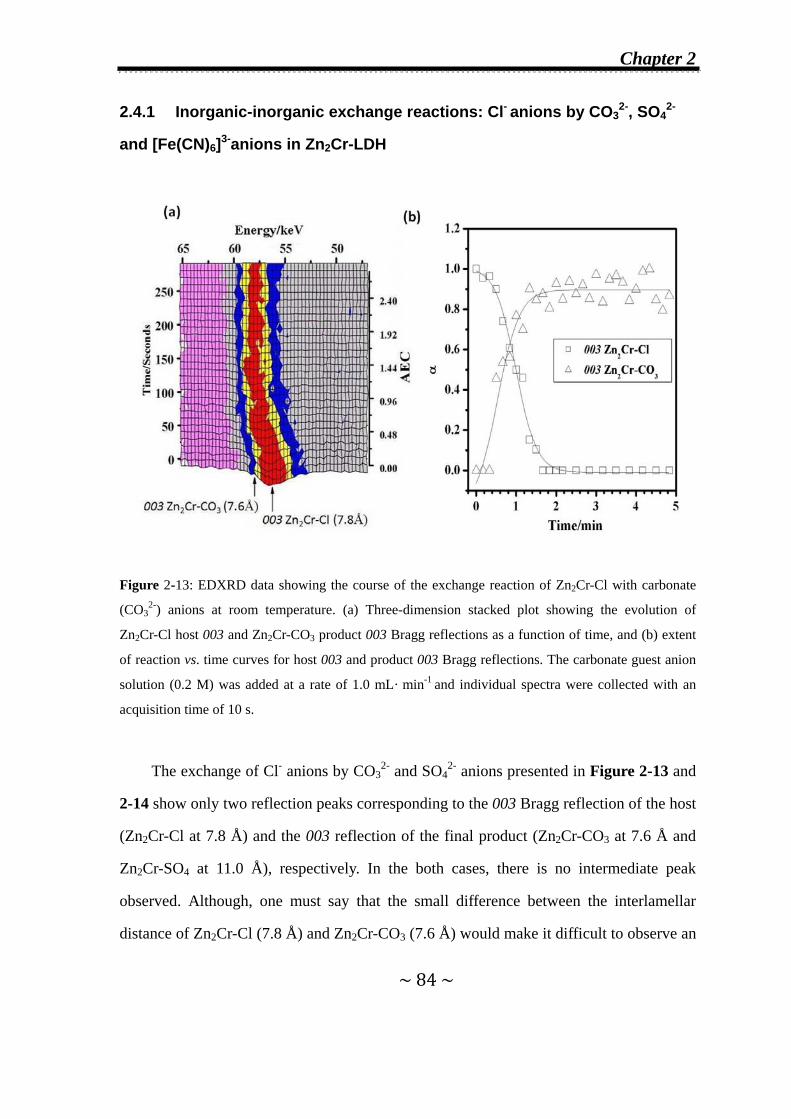
Chapter 2
~ 84 ~
2.4.1 Inorganic-inorganic exchange reactions: Cl- anions by CO32-, SO4
2-
and [Fe(CN)6]3-anions in Zn2Cr-LDH
Figure 2-13: EDXRD data showing the course of the exchange reaction of Zn2Cr-Cl with carbonate
(CO32-) anions at room temperature. (a) Three-dimension stacked plot showing the evolution of
Zn2Cr-Cl host 003 and Zn2Cr-CO3 product 003 Bragg reflections as a function of time, and (b) extent
of reaction vs. time curves for host 003 and product 003 Bragg reflections. The carbonate guest anion
solution (0.2 M) was added at a rate of 1.0 mL· min-1 and individual spectra were collected with an
acquisition time of 10 s.
The exchange of Cl- anions by CO32- and SO4
2- anions presented in Figure 2-13 and
2-14 show only two reflection peaks corresponding to the 003 Bragg reflection of the host
(Zn2Cr-Cl at 7.8 Å) and the 003 reflection of the final product (Zn2Cr-CO3 at 7.6 Å and
Zn2Cr-SO4 at 11.0 Å), respectively. In the both cases, there is no intermediate peak
observed. Although, one must say that the small difference between the interlamellar
distance of Zn2Cr-Cl (7.8 Å) and Zn2Cr-CO3 (7.6 Å) would make it difficult to observe an

Chapter 2
~ 85 ~
intermediate compound if it existed. However, the intersection of α(t) curves again occurs
at α ≈ 0.6 in Figure 2-13 (b), thus confirming the occurrence of a one-step process. The
d-value of Zn2Cr-SO4 at 11.0 Å is consistent with data reported elsewhere29 and observed
at very high humidity (RH > 50%).
Figure 2-14: EDXRD data showing the course of the exchange reaction of Zn2Cr-Cl with sulfate
anions (SO42-) at room temperature. (a) 3D stacked plot and (b) extent of reaction vs. time curves
showing the evolution of Zn2Cr-Cl 003 and Zn2Cr-SO4 003 Bragg reflections as a function of time.
The sulfate anion solution (0.2 M) was added at a rate of 0.059 mL· min-1.
Figure 2-15 shows the exchange reaction of Cl- anions by [FeIII(CN)6]3- anions in
Zn2Cr-Cl. Only two Bragg reflection peaks were detected at 7.8 Å corresponding to 003
Zn2Cr-Cl (the host) and at 10.88 Å assigned to 003 Zn2Cr-Fe(CN)6, a value close to 11.1
Å generally reported for hexacyanoferrate-containing LDH.30, 31Similarly, the α(t) curves
for Zn2Cr-Cl and Zn2Cr-Fe(CN)6 cross at α ≈ 0.5, indicating a direct conversion from the
host to the fully exchanged phase.
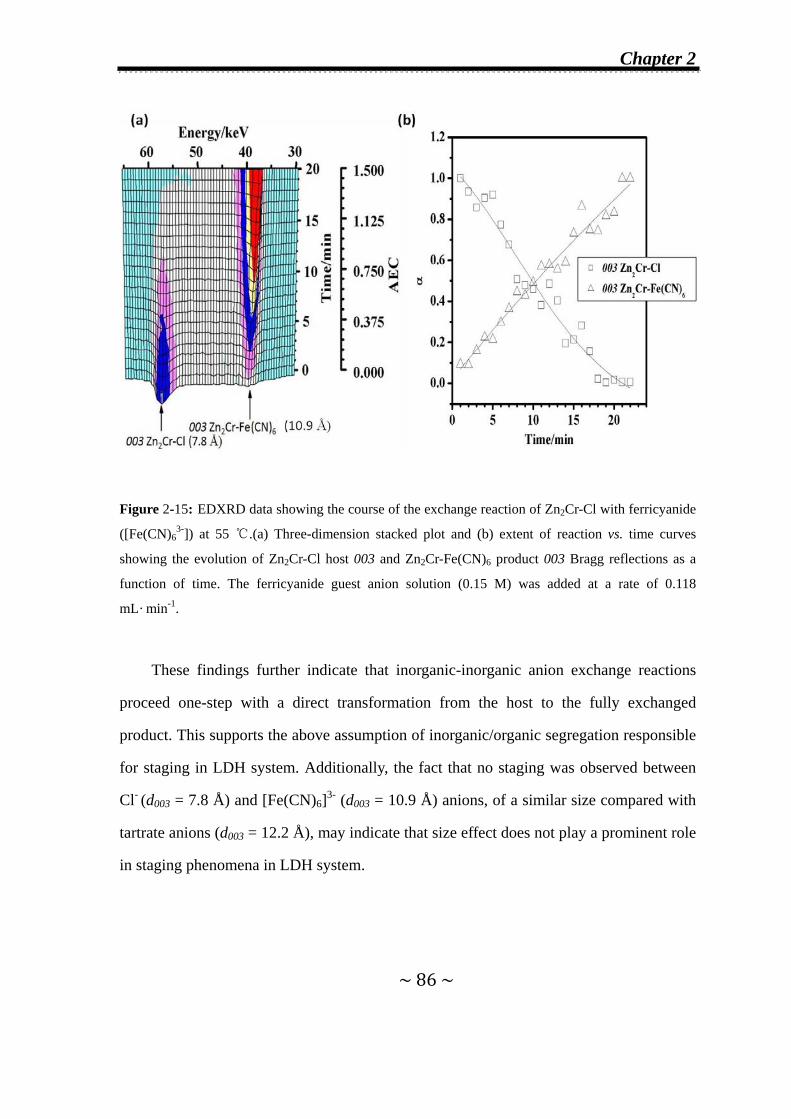
Chapter 2
~ 86 ~
Figure 2-15: EDXRD data showing the course of the exchange reaction of Zn2Cr-Cl with ferricyanide
([Fe(CN)63-]) at 55 ℃.(a) Three-dimension stacked plot and (b) extent of reaction vs. time curves
showing the evolution of Zn2Cr-Cl host 003 and Zn2Cr-Fe(CN)6 product 003 Bragg reflections as a
function of time. The ferricyanide guest anion solution (0.15 M) was added at a rate of 0.118
mL· min-1.
These findings further indicate that inorganic-inorganic anion exchange reactions
proceed one-step with a direct transformation from the host to the fully exchanged
product. This supports the above assumption of inorganic/organic segregation responsible
for staging in LDH system. Additionally, the fact that no staging was observed between
Cl- (d003 = 7.8 Å) and [Fe(CN)6]3- (d003 = 10.9 Å) anions, of a similar size compared with
tartrate anions (d003 = 12.2 Å), may indicate that size effect does not play a prominent role
in staging phenomena in LDH system.

Chapter 2
~ 87 ~
2.4.2 Organic-inorganic exchange reactions in Zn2Cr-LDH
2.4.2.1 Cl- anions exchanged by adipate anions
Figure 2-16: EDXRD data showing the course of the exchange reaction of adipate (-O2C(CH2)4CO2-)
with Zn2Cr-Cl at room temperature. (a) Three-dimensional stacked plot showing the evolution of
Zn2Cr-Cl host 003 and Zn2Cr-Adip product 003 Bragg reflections as a function of time. and (b) extent
of reaction vs. time curves for host 003 and product 003 Bragg reflections. The adipate guest anion
solution (0.2 M) was added at a rate of 0.059 mL· min-1.
Figure 2-16 shows the exchange reaction of Cl- anions by adipate anions in
Zn2Cr-Cl. Again only two Bragg reflections are observed, at 7.8 Å assigned to the 003
reflection of the host Zn2Cr-Cl and at 14.1 Å corresponding to the 003 reflection of the
first stage product Zn2Cr-Adip. The crossing point of the α(t) curves for the host and the
first stage product occurs at α ≈ 0.4 (Figure 2-16 (b)) indicating a direct transformation
from the host to the product. However, ex situ powder X-ray diffraction patterns
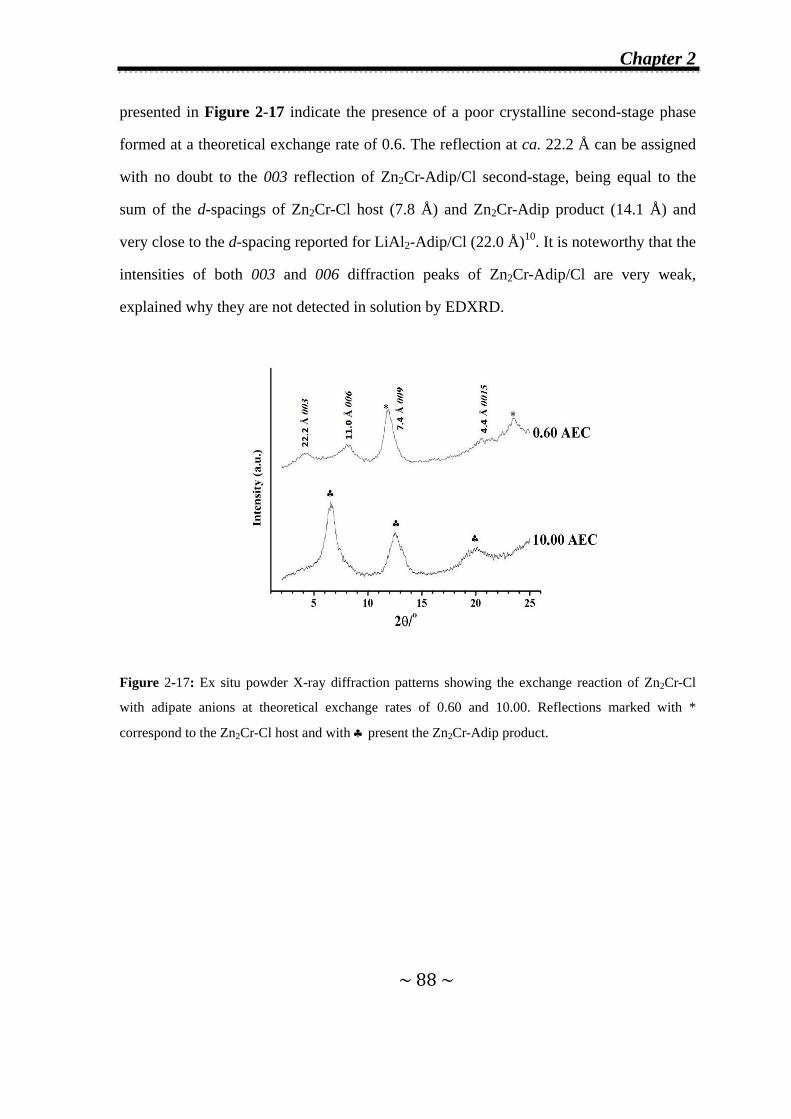
Chapter 2
~ 88 ~
presented in Figure 2-17 indicate the presence of a poor crystalline second-stage phase
formed at a theoretical exchange rate of 0.6. The reflection at ca. 22.2 Å can be assigned
with no doubt to the 003 reflection of Zn2Cr-Adip/Cl second-stage, being equal to the
sum of the d-spacings of Zn2Cr-Cl host (7.8 Å) and Zn2Cr-Adip product (14.1 Å) and
very close to the d-spacing reported for LiAl2-Adip/Cl (22.0 Å)10. It is noteworthy that the
intensities of both 003 and 006 diffraction peaks of Zn2Cr-Adip/Cl are very weak,
explained why they are not detected in solution by EDXRD.
Figure 2-17: Ex situ powder X-ray diffraction patterns showing the exchange reaction of Zn2Cr-Cl
with adipate anions at theoretical exchange rates of 0.60 and 10.00. Reflections marked with *
correspond to the Zn2Cr-Cl host and with ♣ present the Zn2Cr-Adip product.
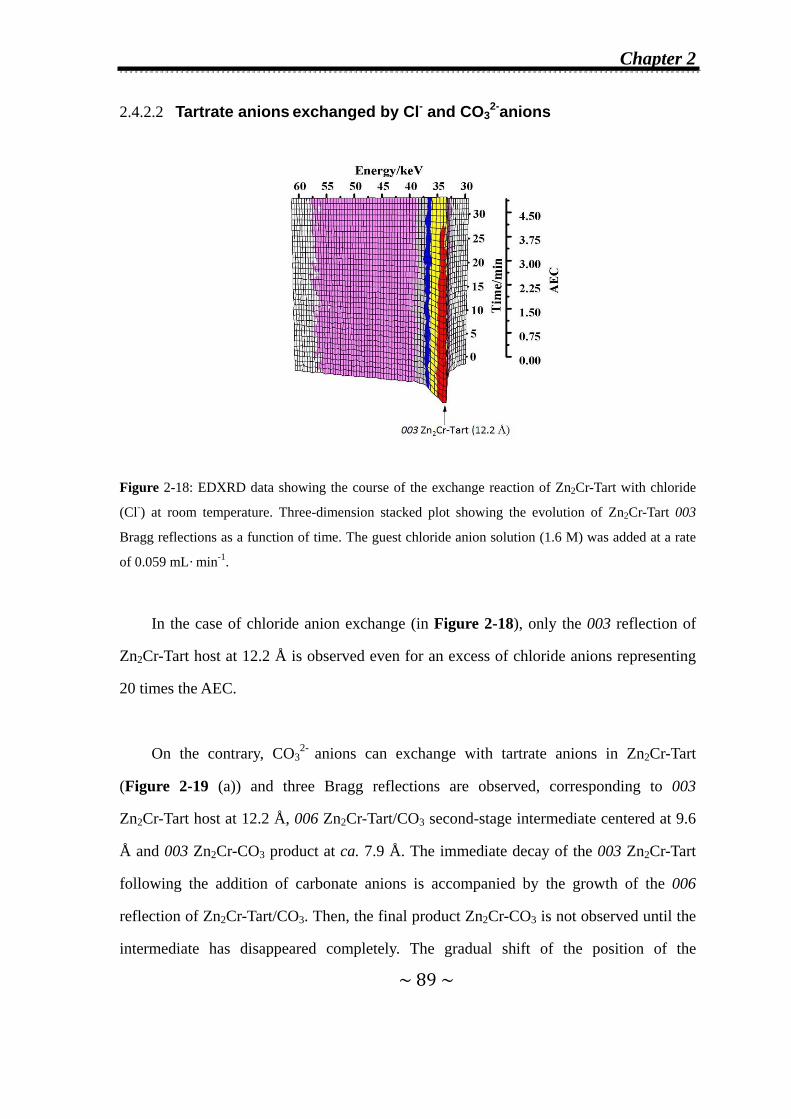
Chapter 2
~ 89 ~
2.4.2.2 Tartrate anions exchanged by Cl- and CO32-anions
Figure 2-18: EDXRD data showing the course of the exchange reaction of Zn2Cr-Tart with chloride
(Cl-) at room temperature. Three-dimension stacked plot showing the evolution of Zn2Cr-Tart 003
Bragg reflections as a function of time. The guest chloride anion solution (1.6 M) was added at a rate
of 0.059 mL· min-1.
In the case of chloride anion exchange (in Figure 2-18), only the 003 reflection of
Zn2Cr-Tart host at 12.2 Å is observed even for an excess of chloride anions representing
20 times the AEC.
On the contrary, CO32- anions can exchange with tartrate anions in Zn2Cr-Tart
(Figure 2-19 (a)) and three Bragg reflections are observed, corresponding to 003
Zn2Cr-Tart host at 12.2 Å, 006 Zn2Cr-Tart/CO3 second-stage intermediate centered at 9.6
Å and 003 Zn2Cr-CO3 product at ca. 7.9 Å. The immediate decay of the 003 Zn2Cr-Tart
following the addition of carbonate anions is accompanied by the growth of the 006
reflection of Zn2Cr-Tart/CO3. Then, the final product Zn2Cr-CO3 is not observed until the
intermediate has disappeared completely. The gradual shift of the position of the
Chapter 2
~ 90 ~
intermediate peak from 10.2 Å to 8.56 Å upon carbonate-tartrate exchange may be
explained by a variation of the number of the layers intercalated by CO32- as reported for
staged fluorohectorite clays32. In this case, we assume the existence of staging of higher
order than 2, which has never been reported so far. In Figure 2-19 (b) are presented the
α(t) curves for the 003 reflection of Zn2Cr-Tart host and the 003 reflection of Zn2Cr-CO3
final product; owing to the variation of the interlayer distance for 006 the intermediate, it
was impossible to obtain the corresponding α(t) curve. The intersection point at α = 0
confirms the existence of Zn2Cr-Tart/CO3 intermediate. EDXRD measurements were
repeated in the laboratory. The PXRD patterns of Zn2Cr-Tart/CO3 isolated after 15 min
(Figure 2-20 (a)) and 25 min (Figure 2-20 (b)). They appear as pure phases but with a
different cell parameter c. This is in total agreement with a variation of the number of
layer intercalated by CO32- anions as described above. For the sample after 15 min
(Figure 2-20 (a)), the cell parameter c is equal to 2 9.5 = 19.0 Å ≈ 12.0 (d003,
Tart) + 7.5 (d003, CO32-) in agreement with the 006 Bragg reflection of a second-stage
phase Zn2Cr-Tart/CO3; for the sample obtained after 25 min (Figure 2-20 (b)), the cell
parameter c can be assumed as 27 Å 3 9.0 6.6 4 = 12.0 (d003, Tart) + 7.5
(d003, CO32-) + 7.5 (d003, CO3
2-) indicating a possible third stage phase Zn2Cr-
CO3/Tart/CO3.

Chapter 2
~ 91 ~
Figure 2-19: EDXRD data showing the course of the exchange reaction of carbonate anions with
Zn2Cr-Tart at room temperature. (a) Three-dimension stacked plot showing the evolution of Zn2Cr-Tart
host 003, Zn2Cr-Tart/CO3 intermediate 006 and Zn2Cr-CO3 product 003 Bragg reflections as a function
of time; (b) extent of reaction vs. time curves for host 003 and product 003 Bragg reflections. The
carbonate guest anion solution (0.2 M) was added at a rate of 0.059 mL· min-1.
Figure 2-20: Ex situ powder X-ray diffraction patterns for the host Zn2Cr-Tart, the intermediate
Zn2Cr-Tart/CO3 ((a) quenched at 15 min, (b) quenched at 25 min) and the fully exchanged product
Zn2Cr-CO3.
Chapter 2
~ 92 ~
2.5 Conclusions
These results show that the observation of LDH second-stage intermediate during
anion-exchange reactions by means of in situ EDXRD technique depends on the addition
rate applied for the incoming guest anion solution. A slow addition rate of guest anions
delays the exchange reaction making it possible to observe and isolate second-stage
compounds. The formation of LDH second-stage is determined by the nature of both
initial and incoming guest anions. No staging was observed for the exchange of Cl- anions
by CO32-, SO4
2- and [FeIII(CN)6]3-i.e. for purely inorganic exchange reactions. These
results provide other evidences for the previous assumption 12 we made on the occurrence
of staging phenomena as a result of inorganic/organic separation, though not all organic
anions can form staging with inorganic anions.
2.6 References
1 G. R. Williams and D. O’Hare, Chem. Mater., 2005, 17, 2632. 2 J. S. O. Evans, S. J. Price, H.-V. Wong and D. O’Hare, J. Am. Chem. Soc., 1998, 120, 10837 3 F. Rey, G. Sankar, J. M. Thomas, P. A. Barrett, D. W. Lewis, C. R. A. Catlow, S. M. Clark and G. N.
Greaves, Chem. Mater., 1995, 7, 1435. 4 F. Rey, G. Sankar, J. M. Thomas, P. A. Barrett, D. W. Lewis, C. R. A. Catlow and G. N. Greaves,
Chem. Mater., 1996, 8, 590. 5 S. J. Price, J. S. O. Evans, R. J. Francis and D. O’Hare, Adv. Mater., 1996, 8, 582. 6 A. T. Davies, G. Sankar, C. R. A. Catlow and S. M. Clark, J. Phys. Chem. B, 1997, 101, 10115. 7 R. I. Walton, T. Loiseau, D. O’Hare and G. Ferey, Chem. Mater., 1999, 11, 3201. 8 R. I. Walton, A. J. Norquist, S. Neeraj, S. Natarajan, C. N. R. Rao, J. S. O. Evans, R. J. Francis and
D. O’Hare, Chem. Commun., 2001, 19, 1990. 9 A. J. Norquist and D. O’Hare, J. Am. Chem. Soc., 2004, 126, 6673. 10 A. M. Fogg, J. S. Dunn and D. O’Hare, Chem. Mater., 1998, 10, 356. 11 G. R. Williams, A. J. Norquist and D. O’Hare, Chem. Mater., 2004, 16, 975. 12 N. Iyi, K. Kurashima and T. Fujita, Chem. Mater., 2002, 14, 583. 13 F. Kooli, I. C. Chisem, M. Vucelic and W. Jones, Chem. Mater., 1996, 8, 1969.
Chapter 2
~ 93 ~
14 J. Pisson, C. Taviot-Gueho, Y. Israeli, F. Leroux, P. Munsch, J. P. Itie, V. Briois, N. Morel-Desrosiers and J. P. Besse, J. Phys. Chem. B, 2003, 107, 9243.
15 C. Taviot-Gueho, F. Leroux, C. Payen and J. P. Besse, Appl. Clay Sci., 2005, 28, 111. 16 V. Prevot, C. Forano and J. P. Besse, Inorg. Chem., 1998, 37, 4293. 17 S. M. Clark, J. Appl. Crystallogr., 1995, 28, 646. 18 J. D. Hancock and J. H. Sharp, J. Am. Ceram. Soc., 1972, 55, 74. 19 S. M. Clark, J. Appl. Cryst., 1995, 28, 646. 20 J. D. Hancock and J. H. Sharp, J. Am. Ceram. Soc., 1972, 55, 74. 21 G. R. Williams, A. I. Khan and D. O’Hare, Struct. Bond., 2006, 119, 161. 22 J. Rodriguez-Carvajal, “FULLPROF: A program for Rietveld Refinement and Pattern Matching
Analysis”, Abstract of the Satelitte Meeting on Powder Diffraction of the XVth Congress International Union of Crystallogrphy Toulouse, France (1990), p127.
23 J. Rodriguez-Carvajal, Fullprof computer program ; http//www-llb.cea.fr/. 24 P. Thompson, D. E. Cox and J. B. Hastings, J. Appl. Cryst.,1987, 20, 79. 25 J. Rodriguez-Carvajal, Newsletter of the Powder Diffraction Commission of the International
Union of Crystallography 2001, n.26, 12. 26 P. W. Stephen, J. Appl. Crystallogr., 1999, 32, 281. 27 V. A. Drits, T. N. Sokolova, G. V. Sokolova and V. I. Cherkashin, Clays Clay Miner., 1987, 35, 401. 28 A. S. Bookin, V. I. Cherkashin and V. A. Drits, Clays Clay Miner., 1993, 41, 558. 29 K. El Malki, A. de Roy and J. P. Besse, Eur. J. Solid State Inorg. Chem., 1989, 26, 339. 30 I. Carpani, M. Berrettoni, M. Giorgetti, and D. Tonelli, J. Phys. Chem. B, 2006, 110, 7265. 31 I. Carpani, M. Berrettoni, B. Ballarin, M. Giorgetti, E. Scavetta, D. Tonelli, Solid State Ionics,
2004, 168, 167. 32 W. L. Ijdo and T. J. Pinnavaia, J. Solid State Chem., 1998, 139, 281.
Chapter 3
~ 94 ~
Chapter 3 Selective
Anion-Exchange Properties of
Second-Stage Layered Double
Hydroxides

Chapter 3
~ 95 ~
3.1 Introduction
LDH second-stage materials consist of regularly stacked organic and inorganic gallery
sequences. Combining the hydrophobic and hydrophilic properties of organic and inorganic
LDH intercalates in a single heterostructured phase will produce amphiphilic materials,
which may have novel anion-exchange properties.
The aim of the study described in this chapter was thus to investigate the
anion-exchange properties of the second-stage intermediate phases, i.e. [Zn2Cr(OH)6]Cl0.5-
(succinate)0.25·nH2O (Zn2Cr-Succ/Cl) and [Zn2Cr(OH)6]Cl0.5(tartrate)0.25·nH2O
(Zn2Cr-Tart/Cl), which were isolated under the conditions described in the Chapter 2. The
two second-stage materials as starting phases were separately treated with adipate and
fluoride anions and the reactions were monitored by time-resolved, in situ, energy-dispersive
X-ray diffraction (EDXRD), using the same setup as presented in Chapter 2. Selective
anion-exchange reactions were observed as a result of the difference in the polarity between
the two successive interlayer spaces.
3.2 Experimental Section
3.2.1 Time-resolved in situ energy-dispersive X-ray diffraction (EDXRD)
measurements
EDXRD experimental setup is the same as described in Section 2.2.2. The reactions
were conducted in glass ampules contained within a temperature-controlled block; individual
spectra were collected at a fixed detector angle of (2θ) 1.625°, with acquisition times ranging
from 10 s to 60 s. In a typical experiment, a solution of the guest species (at a concentration
of 0.15 or 0.2 M for adipate/-O2C(CH2)4CO2 -anions, and 0.4 M for fluoride anions) was
Chapter 3
~ 96 ~
added dropwise to 10 mL of a suspension of the LDH (25 g· L-1
) at a rate of 0.046 or 0.059
mL· min-1
using a syringe pump. Spectra were thus recorded at different anion/LDH ratios in
solution converted into theoretical exchange rates expressed in AEC (anionic exchange
capacity) of the starting phase.
In chapter 2, a better crystallinity was observed in the case of the Zn2Cr system, which
led us to choose this composition for the present work; the synthesis and chemical
composition of Zn2Cr-Cl are given in Section 2.2.1 close to Zn2Cr(OH)6Cl·2H2O (356.26
g· mol-1).
3.2.2 Data analysis
An automated Gaussian fitting routine was used to obtain the peak areas of the Bragg
reflections.1 These values are then converted to the extent of reaction at time t. The latter is
defined as α(t) = Ihkl(t)/Ihkl(max), where Ihkl(t) is the area of a given peak at time t, and
Ihkl(max) is the maximum area of this peak.
3.2.3 Powder X-ray diffraction
Quenched compositions were analyzed in our laboratory by PXRD after centrifugation
and drying in order to get more structural information. The powder X-ray diffraction patterns
were recorded on an X’Pert Pro Philips diffractometer using Cu Kα radiation, as described in
Section 2.2.4.
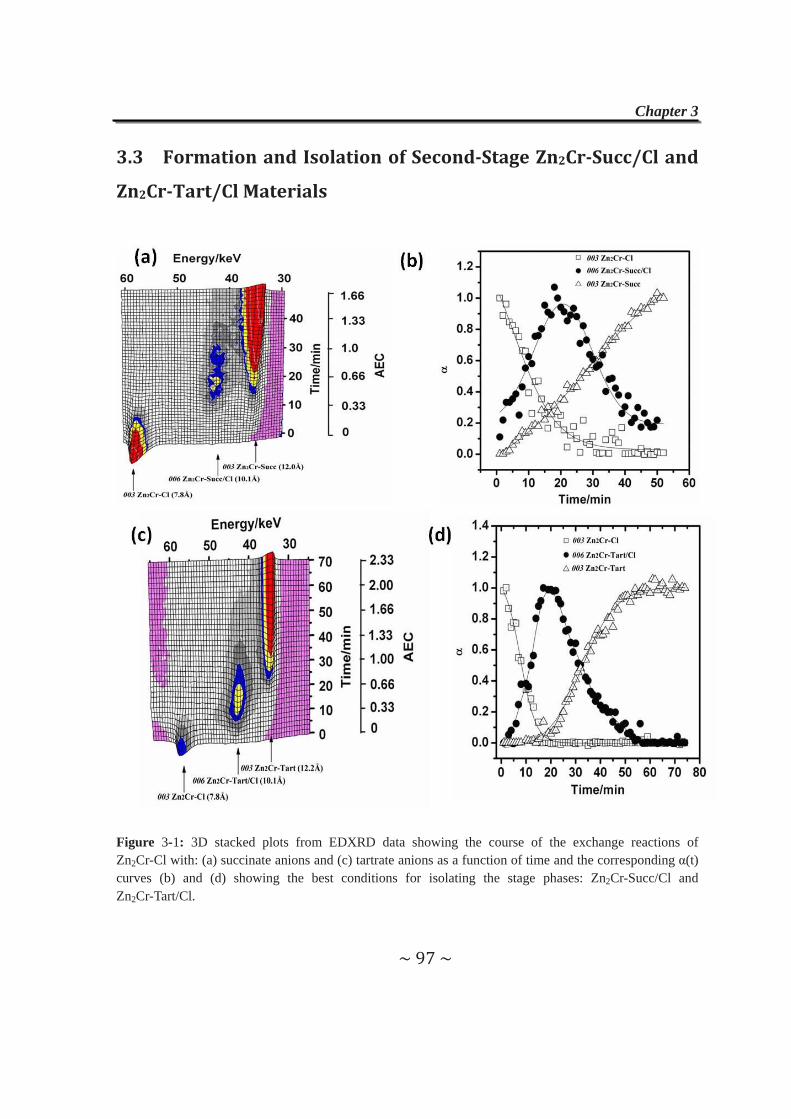
Chapter 3
~ 97 ~
3.3 Formation and Isolation of SecondStage Zn2CrSucc/Cl and
Zn2CrTart/Cl Materials
Figure 3-1: 3D stacked plots from EDXRD data showing the course of the exchange reactions of Zn2Cr-Cl with: (a) succinate anions and (c) tartrate anions as a function of time and the corresponding α(t) curves (b) and (d) showing the best conditions for isolating the stage phases: Zn2Cr-Succ/Cl and Zn2Cr-Tart/Cl.
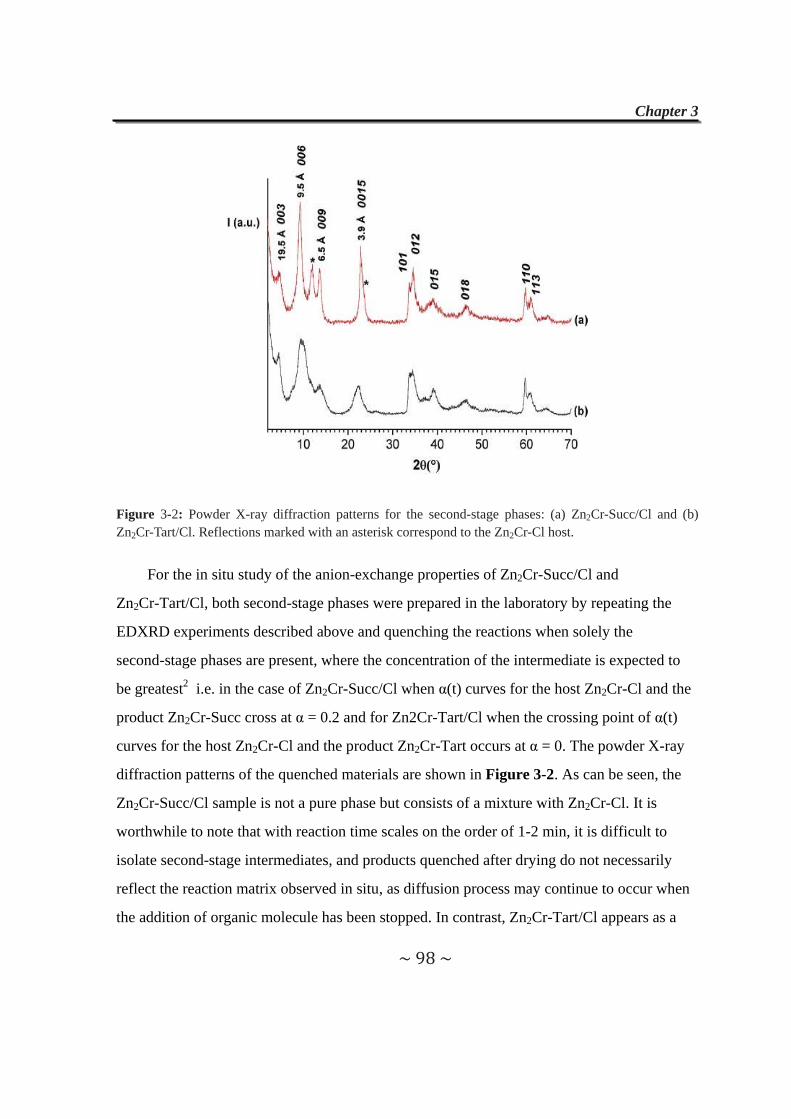
Chapter 3
~ 98 ~
Figure 3-2: Powder X-ray diffraction patterns for the second-stage phases: (a) Zn2Cr-Succ/Cl and (b) Zn2Cr-Tart/Cl. Reflections marked with an asterisk correspond to the Zn2Cr-Cl host.
For the in situ study of the anion-exchange properties of Zn2Cr-Succ/Cl and
Zn2Cr-Tart/Cl, both second-stage phases were prepared in the laboratory by repeating the
EDXRD experiments described above and quenching the reactions when solely the
second-stage phases are present, where the concentration of the intermediate is expected to
be greatest2 i.e. in the case of Zn2Cr-Succ/Cl when α(t) curves for the host Zn2Cr-Cl and the
product Zn2Cr-Succ cross at α = 0.2 and for Zn2Cr-Tart/Cl when the crossing point of α(t)
curves for the host Zn2Cr-Cl and the product Zn2Cr-Tart occurs at α = 0. The powder X-ray
diffraction patterns of the quenched materials are shown in Figure 3-2. As can be seen, the
Zn2Cr-Succ/Cl sample is not a pure phase but consists of a mixture with Zn2Cr-Cl. It is
worthwhile to note that with reaction time scales on the order of 1-2 min, it is difficult to
isolate second-stage intermediates, and products quenched after drying do not necessarily
reflect the reaction matrix observed in situ, as diffusion process may continue to occur when
the addition of organic molecule has been stopped. In contrast, Zn2Cr-Tart/Cl appears as a
Chapter 3
~ 99 ~
pure phase. Another very important point is the detection of the 003 reflection at ca. 19.5 Å
in each case, providing irrefutable proof that second-stage materials are really formed.
3.4 Anionexchange Properties of Secondstage Materials
The as-prepared second-stage materials (Zn2Cr-Succ/Cl and Zn2Cr-Tart/Cl) were then
resuspended in water (25 g · L-1), and EDXRD experiments were performed to follow the
exchange reactions with adipate and fluoride anions, under the same conditions as those
described in Chapter 2.
In our first attempts, we successively monitored in one experiment the the formation of
Zn2Cr-Succ/Cl or Zn2Cr-Tart/Cl intermediates followed by the exchange reactions with
fluoride or adipate anions. Yet, under these conditions, the crystallinity of the system
decreased dramatically and it was impossible to analyze the data. This failure can be
attributed to a combination of factors: first, a dilution factor, which makes detection difficult,
and second, a competition between anions in solution, which may hinder their intercalation.
Plots showing the time evolution of the exchange reactions with adipate anions are
presented in Figure 3-3 for Zn2Cr-Succ/Cl, Figure 3-4 ( at room temperature) and Figure
3-5 (at 55 ℃) for Zn2Cr-Tart/Cl, respectively, and those corresponding to the exchange with
fluoride anions are presented in Figure 3-6 and Figure 3-7. In all cases, the reactions are
observed to proceed in two steps and new second-stage intermediate phases are identified
that result from the selective replacement of either succinate or tartrate anions by adipate
anions, or Cl- anions by F-anions. The exchange reactions are described in details in the
following sections.
3.4.1 Exchange reactions with adipate anions
For the exchange reaction of adipate anions with Zn2Cr-Succ/Cl host (panels a and b of
Figure 3-3), a crystalline intermediate phase was detected at ca. 12.2 Å that can be assigned
Chapter 3
~ 100 ~
to a new second-stage intermediate, Zn2Cr-Adip/Cl. This phase has alternate layers occupied
by chloride and adipate anions, and hence has a predicted basal spacing d003 =7.8 +14.1=21.9
Å, and hence a d006 of ca. 11 Å. This latter value is slightly different from that observed (12.2
Å), but the low crystallinity of Zn2Cr-Adip/Cl intermediate makes the determination of the
exact position of the Bragg reflection rather difficult. Additionally, the poor crystallinity and
the partial overlap between Bragg reflections complicate the integration of the diffraction
intensities, thus explaining the relatively poor resolution for α-time curves.
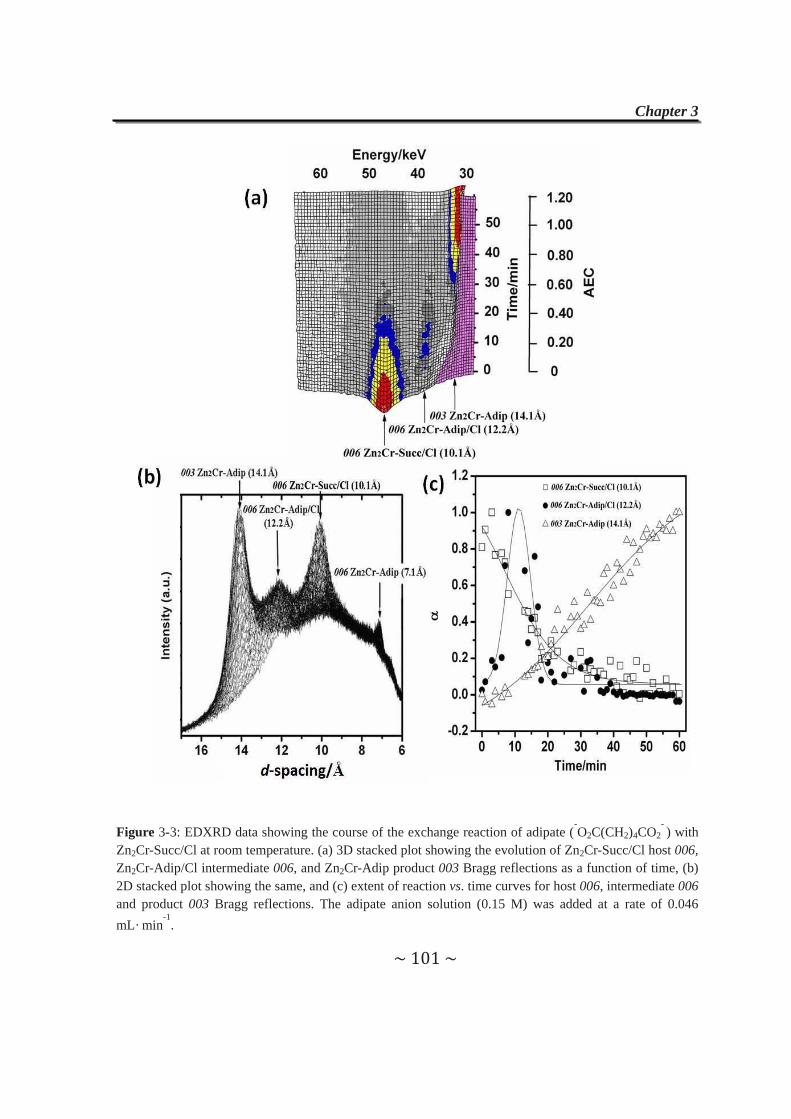
Chapter 3
~ 101 ~
Figure 3-3: EDXRD data showing the course of the exchange reaction of adipate (-O2C(CH2)4CO2
- ) with
Zn2Cr-Succ/Cl at room temperature. (a) 3D stacked plot showing the evolution of Zn2Cr-Succ/Cl host 006, Zn2Cr-Adip/Cl intermediate 006, and Zn2Cr-Adip product 003 Bragg reflections as a function of time, (b) 2D stacked plot showing the same, and (c) extent of reaction vs. time curves for host 006, intermediate 006 and product 003 Bragg reflections. The adipate anion solution (0.15 M) was added at a rate of 0.046 mL· min
-1.
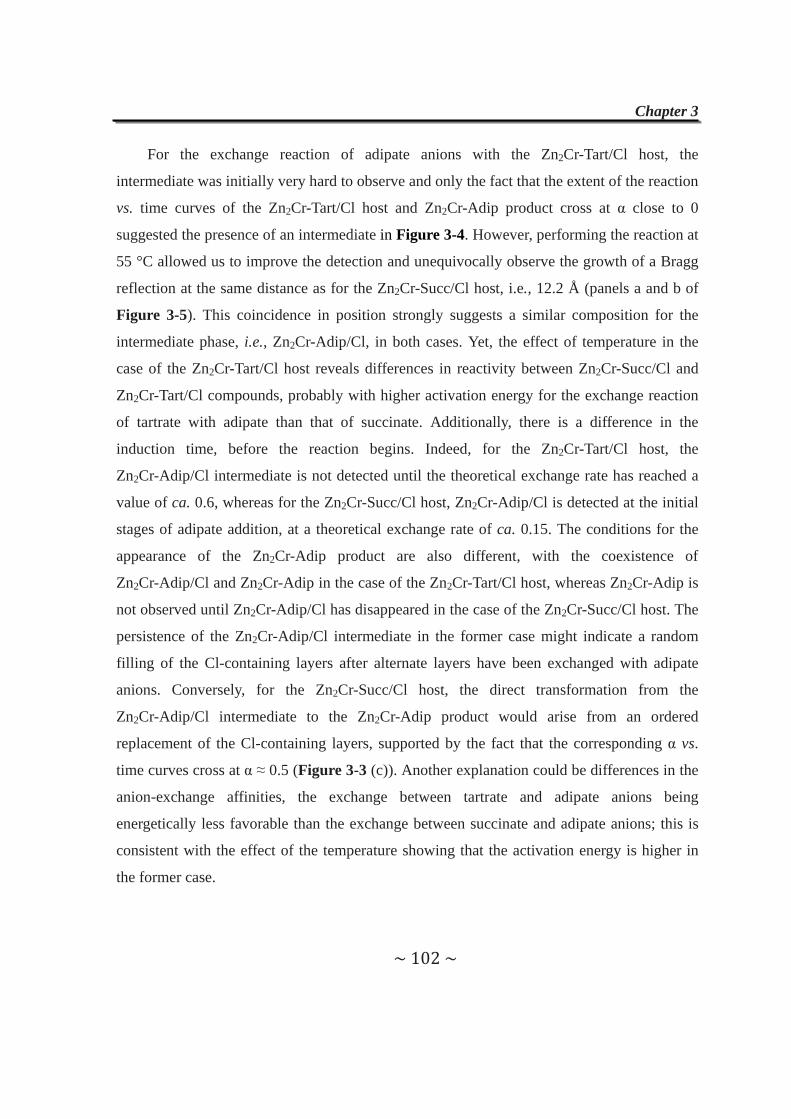
Chapter 3
~ 102 ~
For the exchange reaction of adipate anions with the Zn2Cr-Tart/Cl host, the
intermediate was initially very hard to observe and only the fact that the extent of the reaction
vs. time curves of the Zn2Cr-Tart/Cl host and Zn2Cr-Adip product cross at α close to 0
suggested the presence of an intermediate in Figure 3-4. However, performing the reaction at
55 °C allowed us to improve the detection and unequivocally observe the growth of a Bragg
reflection at the same distance as for the Zn2Cr-Succ/Cl host, i.e., 12.2 Å (panels a and b of
Figure 3-5). This coincidence in position strongly suggests a similar composition for the
intermediate phase, i.e., Zn2Cr-Adip/Cl, in both cases. Yet, the effect of temperature in the
case of the Zn2Cr-Tart/Cl host reveals differences in reactivity between Zn2Cr-Succ/Cl and
Zn2Cr-Tart/Cl compounds, probably with higher activation energy for the exchange reaction
of tartrate with adipate than that of succinate. Additionally, there is a difference in the
induction time, before the reaction begins. Indeed, for the Zn2Cr-Tart/Cl host, the
Zn2Cr-Adip/Cl intermediate is not detected until the theoretical exchange rate has reached a
value of ca. 0.6, whereas for the Zn2Cr-Succ/Cl host, Zn2Cr-Adip/Cl is detected at the initial
stages of adipate addition, at a theoretical exchange rate of ca. 0.15. The conditions for the
appearance of the Zn2Cr-Adip product are also different, with the coexistence of
Zn2Cr-Adip/Cl and Zn2Cr-Adip in the case of the Zn2Cr-Tart/Cl host, whereas Zn2Cr-Adip is
not observed until Zn2Cr-Adip/Cl has disappeared in the case of the Zn2Cr-Succ/Cl host. The
persistence of the Zn2Cr-Adip/Cl intermediate in the former case might indicate a random
filling of the Cl-containing layers after alternate layers have been exchanged with adipate
anions. Conversely, for the Zn2Cr-Succ/Cl host, the direct transformation from the
Zn2Cr-Adip/Cl intermediate to the Zn2Cr-Adip product would arise from an ordered
replacement of the Cl-containing layers, supported by the fact that the corresponding α vs.
time curves cross at α ≈ 0.5 (Figure 3-3 (c)). Another explanation could be differences in the
anion-exchange affinities, the exchange between tartrate and adipate anions being
energetically less favorable than the exchange between succinate and adipate anions; this is
consistent with the effect of the temperature showing that the activation energy is higher in
the former case.
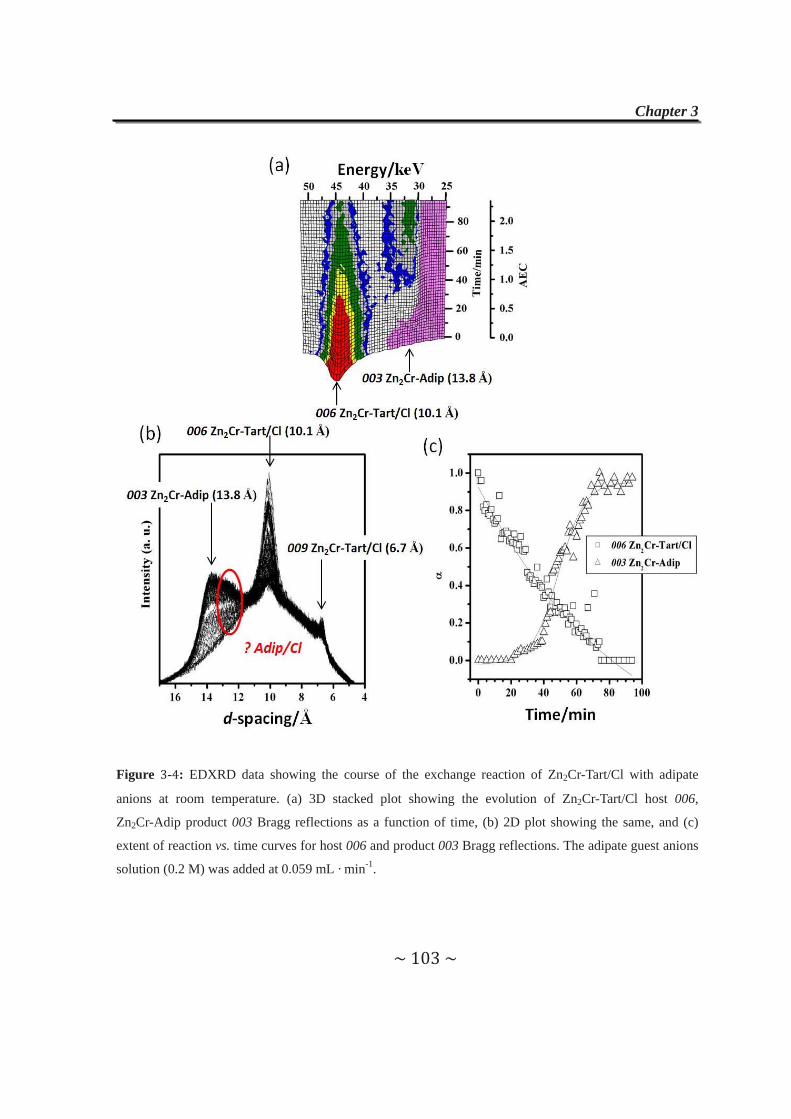
Chapter 3
~ 103 ~
Figure 3-4: EDXRD data showing the course of the exchange reaction of Zn2Cr-Tart/Cl with adipate
anions at room temperature. (a) 3D stacked plot showing the evolution of Zn2Cr-Tart/Cl host 006,
Zn2Cr-Adip product 003 Bragg reflections as a function of time, (b) 2D plot showing the same, and (c)
extent of reaction vs. time curves for host 006 and product 003 Bragg reflections. The adipate guest anions
solution (0.2 M) was added at 0.059 mL · min-1.
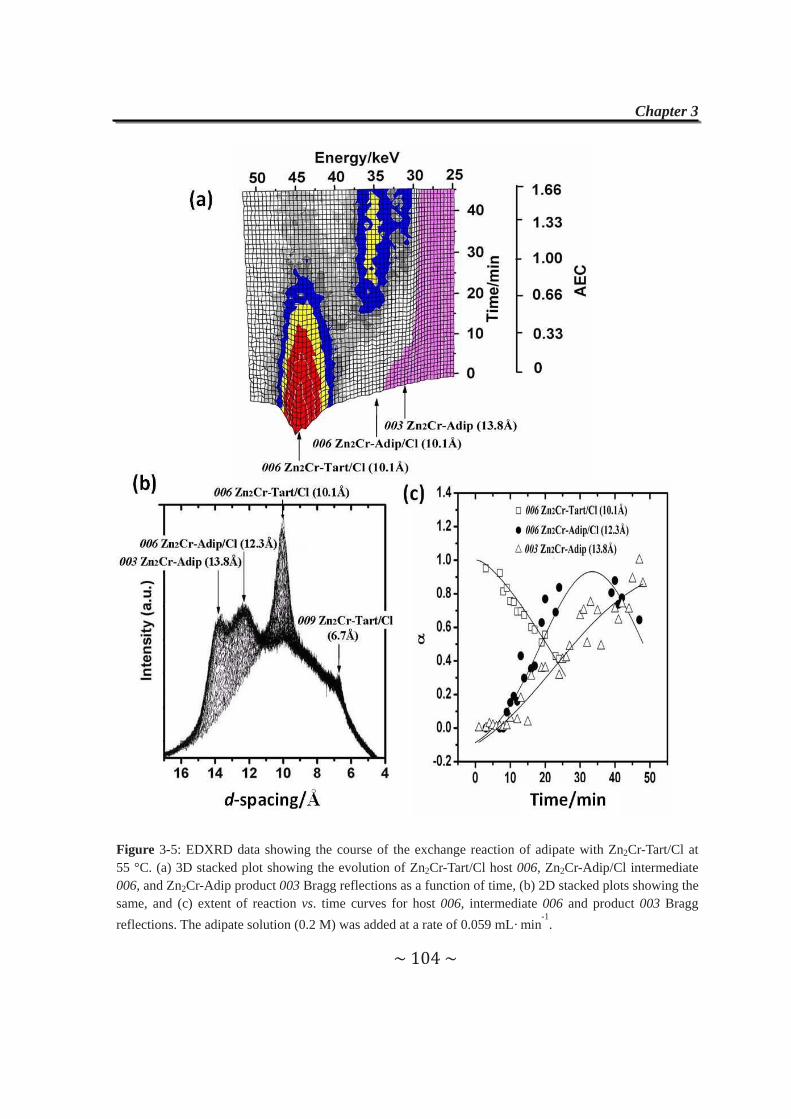
Chapter 3
~ 104 ~
Figure 3-5: EDXRD data showing the course of the exchange reaction of adipate with Zn2Cr-Tart/Cl at 55 °C. (a) 3D stacked plot showing the evolution of Zn2Cr-Tart/Cl host 006, Zn2Cr-Adip/Cl intermediate 006, and Zn2Cr-Adip product 003 Bragg reflections as a function of time, (b) 2D stacked plots showing the same, and (c) extent of reaction vs. time curves for host 006, intermediate 006 and product 003 Bragg reflections. The adipate solution (0.2 M) was added at a rate of 0.059 mL· min
-1.

Chapter 3
~ 105 ~
3.4.2 Exchange reactions with fluoride anions
Figure 3-6: Time-resolved diffraction data showing the course of the exchange reaction of fluoride with Zn2Cr-Succ/Cl at room temperature. (a) 3D stacked plot showing the evolution of Zn2Cr-Succ/Cl host 006 and intermediate Zn2Cr-Adip/F 006 Bragg reflections as a function of time and (b) extent of reaction vs. time curves for host and intermediate 006 Bragg reflections. The fluoride anion solution (0.4 M) was added at a rate of 0.046 mL· min
-1. Inset figure gives the powder X-ray diffraction pattern of the final solid
recovered after centrifugation and drying.

Chapter 3
~ 106 ~
Figure 3-7: EDXRD data showing the course of the exchange reaction of fluoride with Zn2Cr-Tart/Cl at room temperature. (a) 3D stacked plot showing the evolution of Zn2Cr-Tart/Cl host 006 and Zn2Cr-Adip/F intermediate 006 Bragg reflections as a function of time and (b) extent of reaction vs. time curves for host and intermediate 006 Bragg reflections. The fluoride anion solution (0.4 M) was added at a rate of 0.059 mL· min
-1.
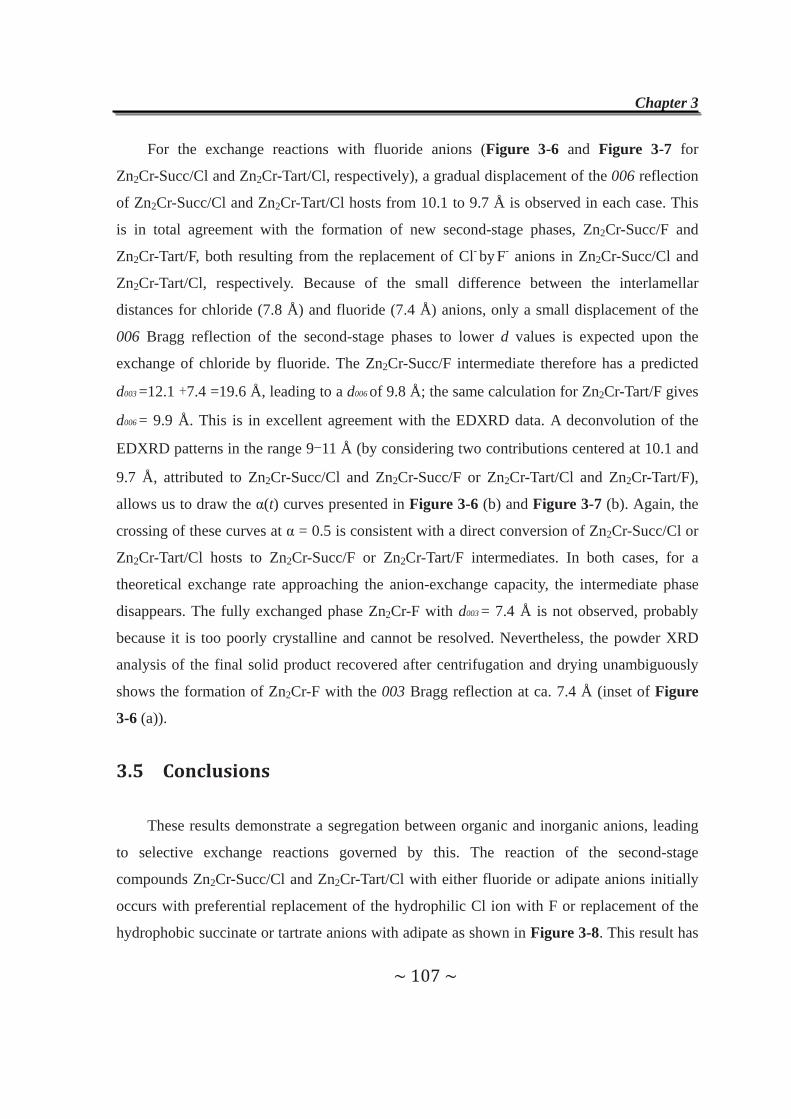
Chapter 3
~ 107 ~
For the exchange reactions with fluoride anions (Figure 3-6 and Figure 3-7 for
Zn2Cr-Succ/Cl and Zn2Cr-Tart/Cl, respectively), a gradual displacement of the 006 reflection
of Zn2Cr-Succ/Cl and Zn2Cr-Tart/Cl hosts from 10.1 to 9.7 Å is observed in each case. This
is in total agreement with the formation of new second-stage phases, Zn2Cr-Succ/F and
Zn2Cr-Tart/F, both resulting from the replacement of Cl- by F- anions in Zn2Cr-Succ/Cl and
Zn2Cr-Tart/Cl, respectively. Because of the small difference between the interlamellar
distances for chloride (7.8 Å) and fluoride (7.4 Å) anions, only a small displacement of the
006 Bragg reflection of the second-stage phases to lower d values is expected upon the
exchange of chloride by fluoride. The Zn2Cr-Succ/F intermediate therefore has a predicted
d003 =12.1 +7.4 =19.6 Å, leading to a d006 of 9.8 Å; the same calculation for Zn2Cr-Tart/F gives
d006 = 9.9 Å. This is in excellent agreement with the EDXRD data. A deconvolution of the
EDXRD patterns in the range 9-11 Å (by considering two contributions centered at 10.1 and
9.7 Å, attributed to Zn2Cr-Succ/Cl and Zn2Cr-Succ/F or Zn2Cr-Tart/Cl and Zn2Cr-Tart/F),
allows us to draw the α(t) curves presented in Figure 3-6 (b) and Figure 3-7 (b). Again, the
crossing of these curves at α = 0.5 is consistent with a direct conversion of Zn2Cr-Succ/Cl or
Zn2Cr-Tart/Cl hosts to Zn2Cr-Succ/F or Zn2Cr-Tart/F intermediates. In both cases, for a
theoretical exchange rate approaching the anion-exchange capacity, the intermediate phase
disappears. The fully exchanged phase Zn2Cr-F with d003 = 7.4 Å is not observed, probably
because it is too poorly crystalline and cannot be resolved. Nevertheless, the powder XRD
analysis of the final solid product recovered after centrifugation and drying unambiguously
shows the formation of Zn2Cr-F with the 003 Bragg reflection at ca. 7.4 Å (inset of Figure
3-6 (a)).
3.5 Conclusions
These results demonstrate a segregation between organic and inorganic anions, leading
to selective exchange reactions governed by this. The reaction of the second-stage
compounds Zn2Cr-Succ/Cl and Zn2Cr-Tart/Cl with either fluoride or adipate anions initially
occurs with preferential replacement of the hydrophilic Cl ion with F or replacement of the
hydrophobic succinate or tartrate anions with adipate as shown in Figure 3-8. This result has
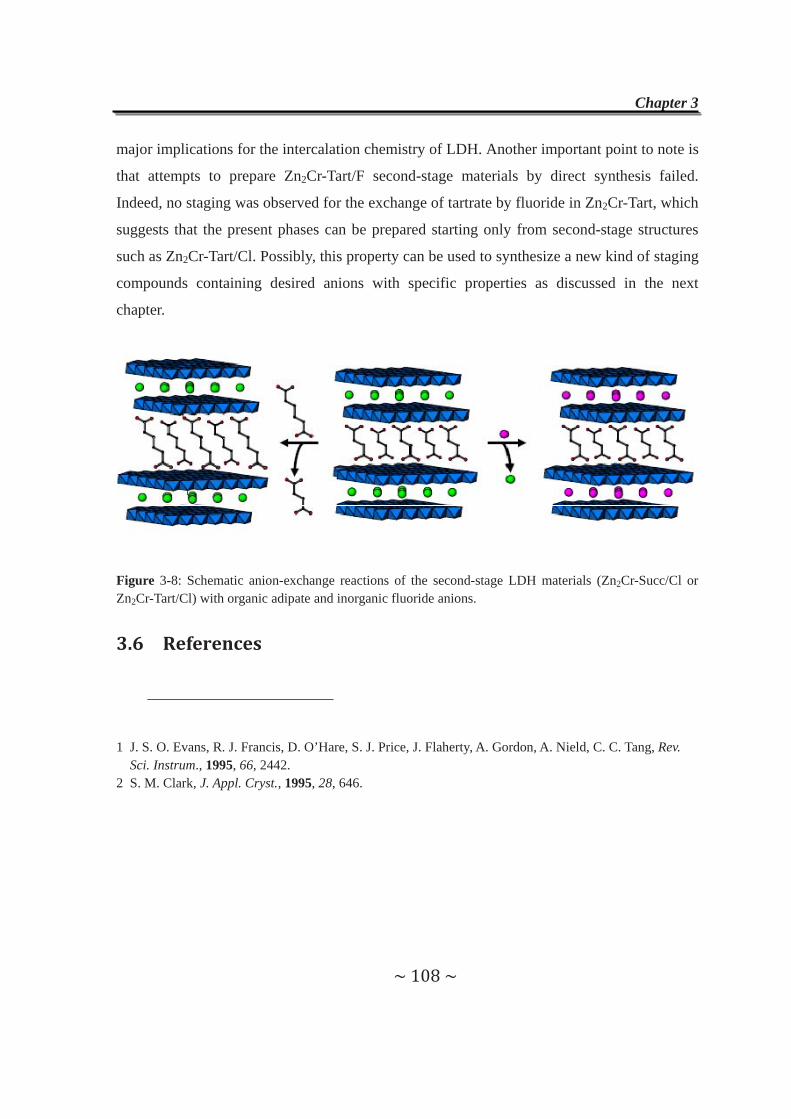
Chapter 3
~ 108 ~
major implications for the intercalation chemistry of LDH. Another important point to note is
that attempts to prepare Zn2Cr-Tart/F second-stage materials by direct synthesis failed.
Indeed, no staging was observed for the exchange of tartrate by fluoride in Zn2Cr-Tart, which
suggests that the present phases can be prepared starting only from second-stage structures
such as Zn2Cr-Tart/Cl. Possibly, this property can be used to synthesize a new kind of staging
compounds containing desired anions with specific properties as discussed in the next
chapter.
Figure 3-8: Schematic anion-exchange reactions of the second-stage LDH materials (Zn2Cr-Succ/Cl or Zn2Cr-Tart/Cl) with organic adipate and inorganic fluoride anions.
3.6 References
1 J. S. O. Evans, R. J. Francis, D. O’Hare, S. J. Price, J. Flaherty, A. Gordon, A. Nield, C. C. Tang, Rev. Sci. Instrum., 1995, 66, 2442.
2 S. M. Clark, J. Appl. Cryst., 1995, 28, 646.
Chapter 4
~ 109 ~
Chapter 4 Staging Behaviors of
Styrene-4-sulfonate Anions and
Ferricyanide Anions in Layered
Double Hydroxides
Chapter 4
~ 110 ~
As already said several times in this manuscript, the formation of LDH
heterostructures is of major interest for future developments in LDH intercalation
chemistry, particularly in the direction of multifunctional materials.
For this purpose, the intercalation of vinyl benzene sulfonate (VBS) monomer and
hexacyanometal complex (Fe(CN)63-) into Zn2Cr-Cl or Zn2Al-Cl first stage phases and
Zn2Cr-Tart/Cl second-stage compound have been investigated using time resolved, in situ
energy-dispersive synchrotron X-ray diffraction (EDXRD).
I. Exchange reaction with VBS
4.1 Introduction
In the past two decades, a lot of attention has been devoted to the study of
nanocomposites built from the assembly of a lamellar inorganic host structure and a
polymer.1-6 These systems may find applications in a large number of fields such as those
emphasizing the mechanical enhancement, gas permeably, fire-retardant or membrane. 7-9
LDH-polymer assemblies have been largely studied in our group by F. Leroux et
al.10, 11. The incorporation of polymer into LDH can be achieved via different synthesis
routes. An interesting route is the in situ thermal polymerization of pre-intercalated
monomers as reported for aspartate into Mg2Al, 12 anilimine sulfonate into Cu2Cr 13
and more recently VBS into Zn2Al LDH 14-16.
In this latter case, the in situ polymerization upon a thermal treatment at 200 ℃ was
evidenced by in situ high temperature powder X-ray diffraction (HTXRD) with a
contraction of the lamellar structure from d003 = 18.04 Å to 14.46 Å (Figure 4-1) and by
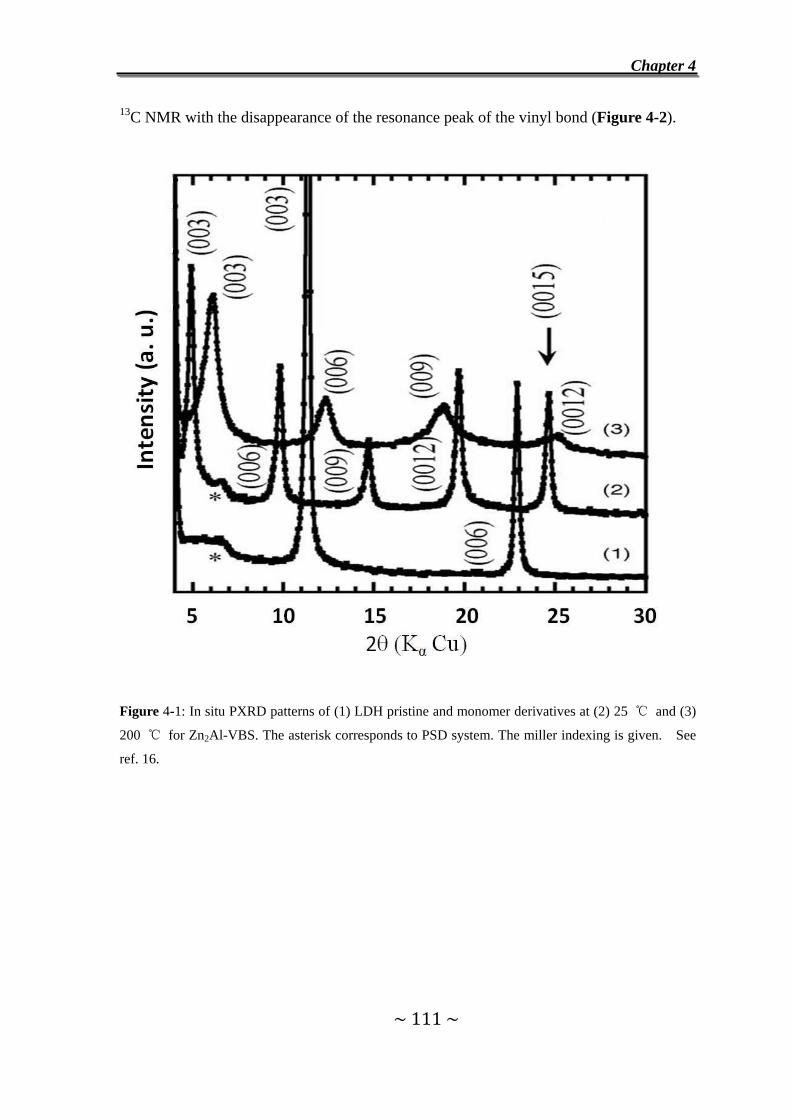
Chapter 4
~ 111 ~
13C NMR with the disappearance of the resonance peak of the vinyl bond (Figure 4-2).
Figure 4-1: In situ PXRD patterns of (1) LDH pristine and monomer derivatives at (2) 25 ℃ and (3)
200 ℃ for Zn2Al-VBS. The asterisk corresponds to PSD system. The miller indexing is given. See
ref. 16.
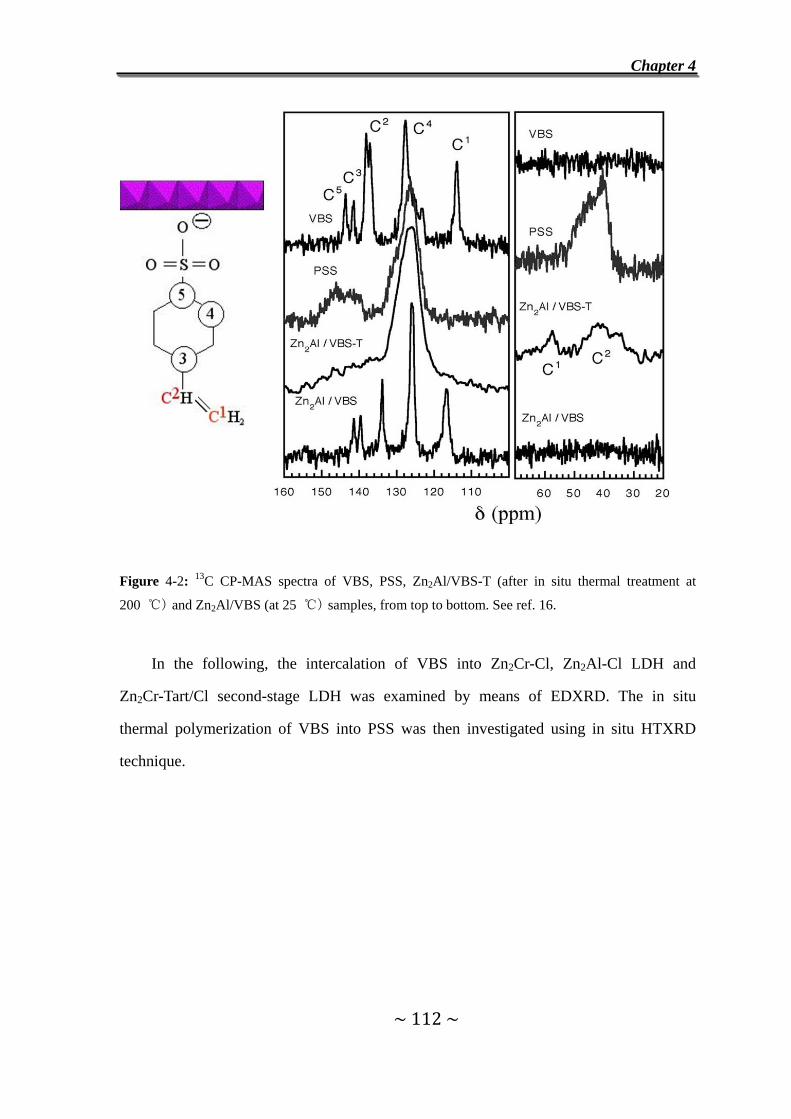
Chapter 4
~ 112 ~
Figure 4-2: 13C CP-MAS spectra of VBS, PSS, Zn2Al/VBS-T (after in situ thermal treatment at
200 ℃) and Zn2Al/VBS (at 25 ℃) samples, from top to bottom. See ref. 16.
In the following, the intercalation of VBS into Zn2Cr-Cl, Zn2Al-Cl LDH and
Zn2Cr-Tart/Cl second-stage LDH was examined by means of EDXRD. The in situ
thermal polymerization of VBS into PSS was then investigated using in situ HTXRD
technique.
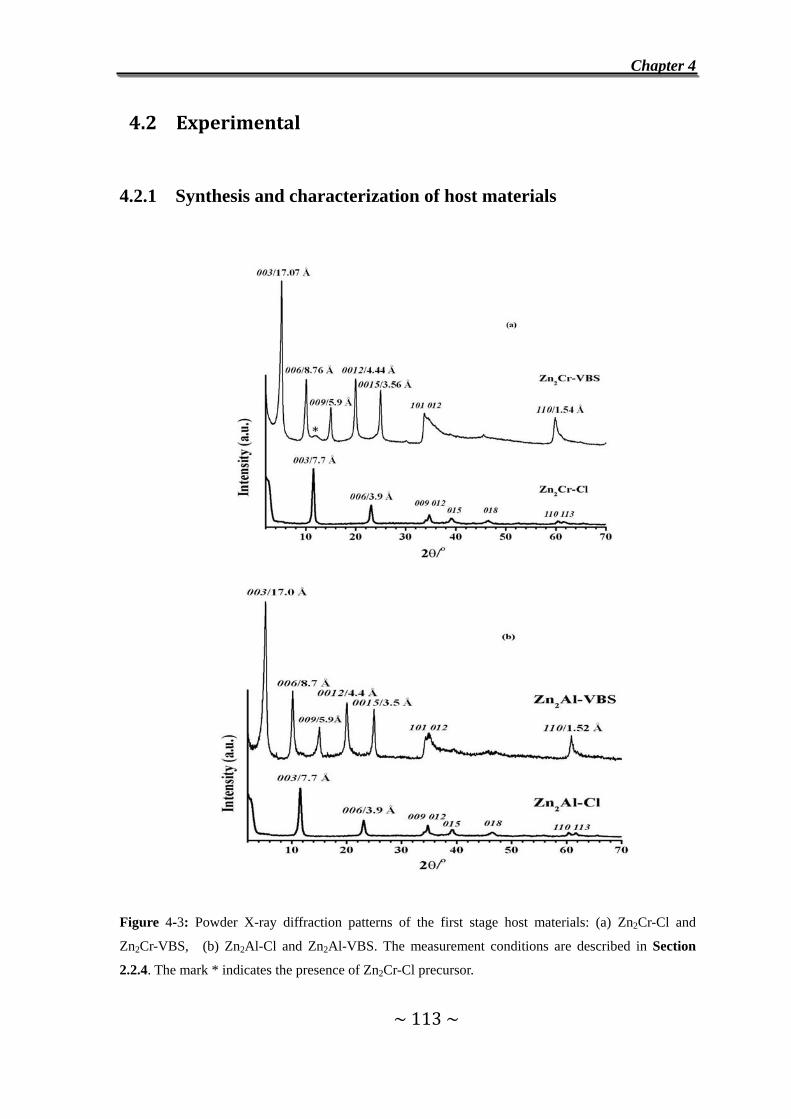
Chapter 4
~ 113 ~
4.2 Experimental
4.2.1 Synthesis and characterization of host materials
Figure 4-3: Powder X-ray diffraction patterns of the first stage host materials: (a) Zn2Cr-Cl and
Zn2Cr-VBS, (b) Zn2Al-Cl and Zn2Al-VBS. The measurement conditions are described in Section
2.2.4. The mark * indicates the presence of Zn2Cr-Cl precursor.
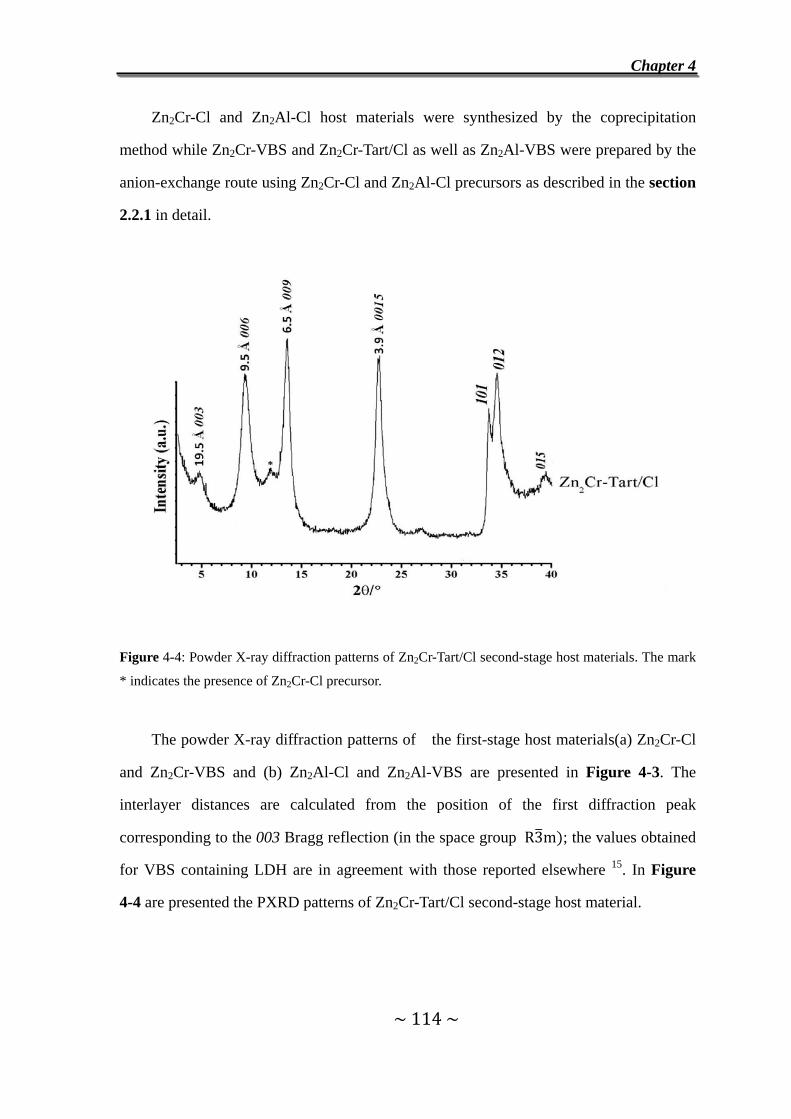
Chapter 4
~ 114 ~
Zn2Cr-Cl and Zn2Al-Cl host materials were synthesized by the coprecipitation
method while Zn2Cr-VBS and Zn2Cr-Tart/Cl as well as Zn2Al-VBS were prepared by the
anion-exchange route using Zn2Cr-Cl and Zn2Al-Cl precursors as described in the section
2.2.1 in detail.
Figure 4-4: Powder X-ray diffraction patterns of Zn2Cr-Tart/Cl second-stage host materials. The mark
* indicates the presence of Zn2Cr-Cl precursor.
The powder X-ray diffraction patterns of the first-stage host materials(a) Zn2Cr-Cl
and Zn2Cr-VBS and (b) Zn2Al-Cl and Zn2Al-VBS are presented in Figure 4-3. The
interlayer distances are calculated from the position of the first diffraction peak
corresponding to the 003 Bragg reflection (in the space group R3m ; the values obtained
for VBS containing LDH are in agreement with those reported elsewhere 15. In Figure
4-4 are presented the PXRD patterns of Zn2Cr-Tart/Cl second-stage host material.
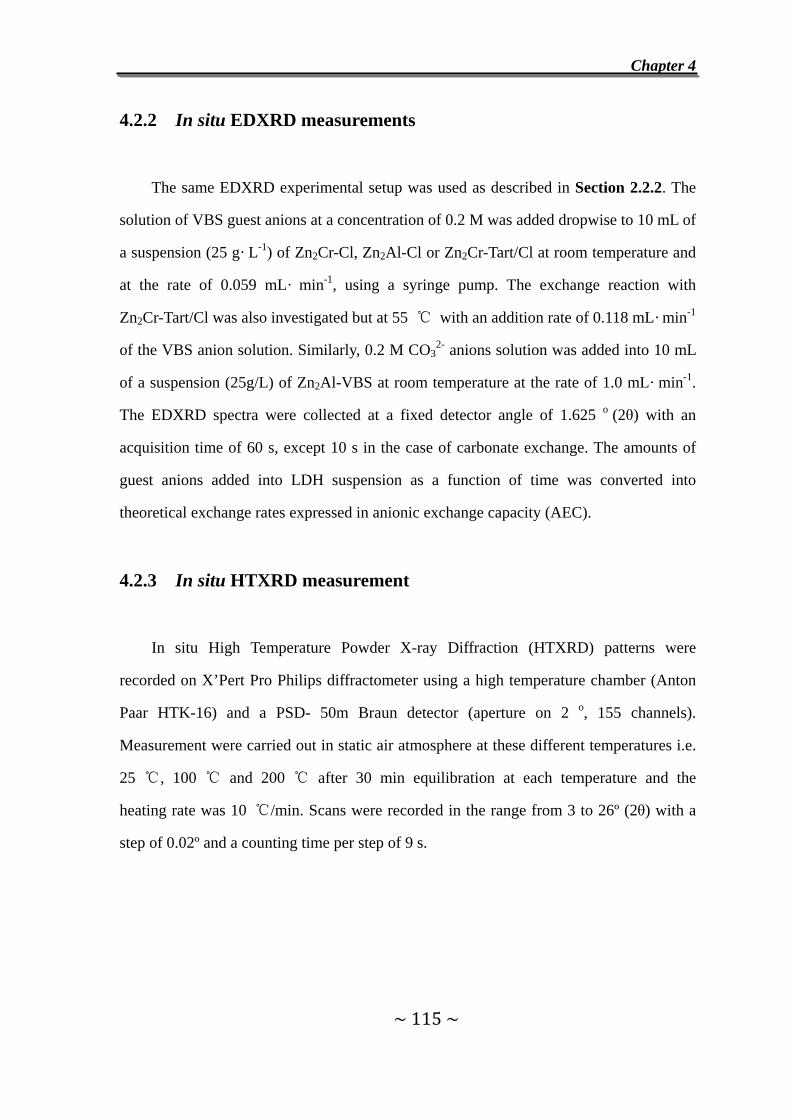
Chapter 4
~ 115 ~
4.2.2 In situ EDXRD measurements
The same EDXRD experimental setup was used as described in Section 2.2.2. The
solution of VBS guest anions at a concentration of 0.2 M was added dropwise to 10 mL of
a suspension (25 g· L-1) of Zn2Cr-Cl, Zn2Al-Cl or Zn2Cr-Tart/Cl at room temperature and
at the rate of 0.059 mL· min-1, using a syringe pump. The exchange reaction with
Zn2Cr-Tart/Cl was also investigated but at 55 ℃ with an addition rate of 0.118 mL· min-1
of the VBS anion solution. Similarly, 0.2 M CO32- anions solution was added into 10 mL
of a suspension (25g/L) of Zn2Al-VBS at room temperature at the rate of 1.0 mL· min-1.
The EDXRD spectra were collected at a fixed detector angle of 1.625 o (2θ) with an
acquisition time of 60 s, except 10 s in the case of carbonate exchange. The amounts of
guest anions added into LDH suspension as a function of time was converted into
theoretical exchange rates expressed in anionic exchange capacity (AEC).
4.2.3 In situ HTXRD measurement
In situ High Temperature Powder X-ray Diffraction (HTXRD) patterns were
recorded on X’Pert Pro Philips diffractometer using a high temperature chamber (Anton
Paar HTK-16) and a PSD- 50m Braun detector (aperture on 2 o, 155 channels).
Measurement were carried out in static air atmosphere at these different temperatures i.e.
25 ℃, 100 ℃ and 200 ℃ after 30 min equilibration at each temperature and the
heating rate was 10 ℃/min. Scans were recorded in the range from 3 to 26º (2θ) with a
step of 0.02º and a counting time per step of 9 s.
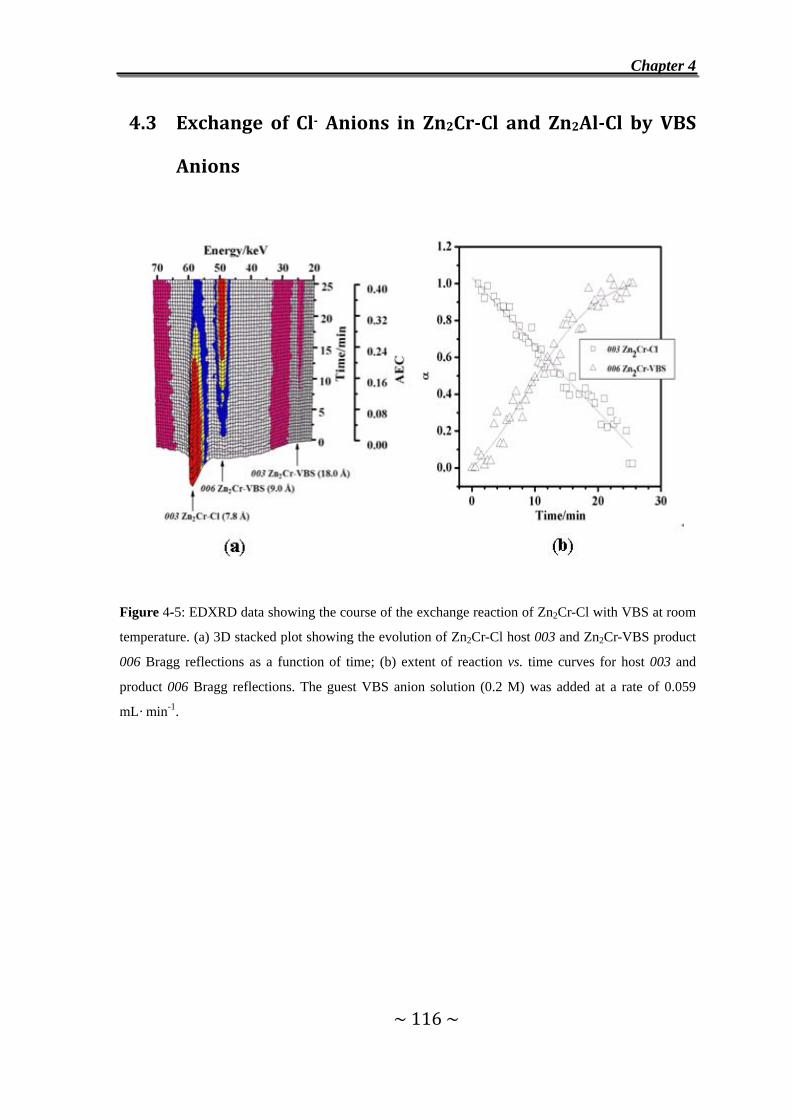
Chapter 4
~ 116 ~
4.3 Exchange of Cl Anions in Zn2CrCl and Zn2AlCl by VBS
Anions
Figure 4-5: EDXRD data showing the course of the exchange reaction of Zn2Cr-Cl with VBS at room
temperature. (a) 3D stacked plot showing the evolution of Zn2Cr-Cl host 003 and Zn2Cr-VBS product
006 Bragg reflections as a function of time; (b) extent of reaction vs. time curves for host 003 and
product 006 Bragg reflections. The guest VBS anion solution (0.2 M) was added at a rate of 0.059
mL· min-1.
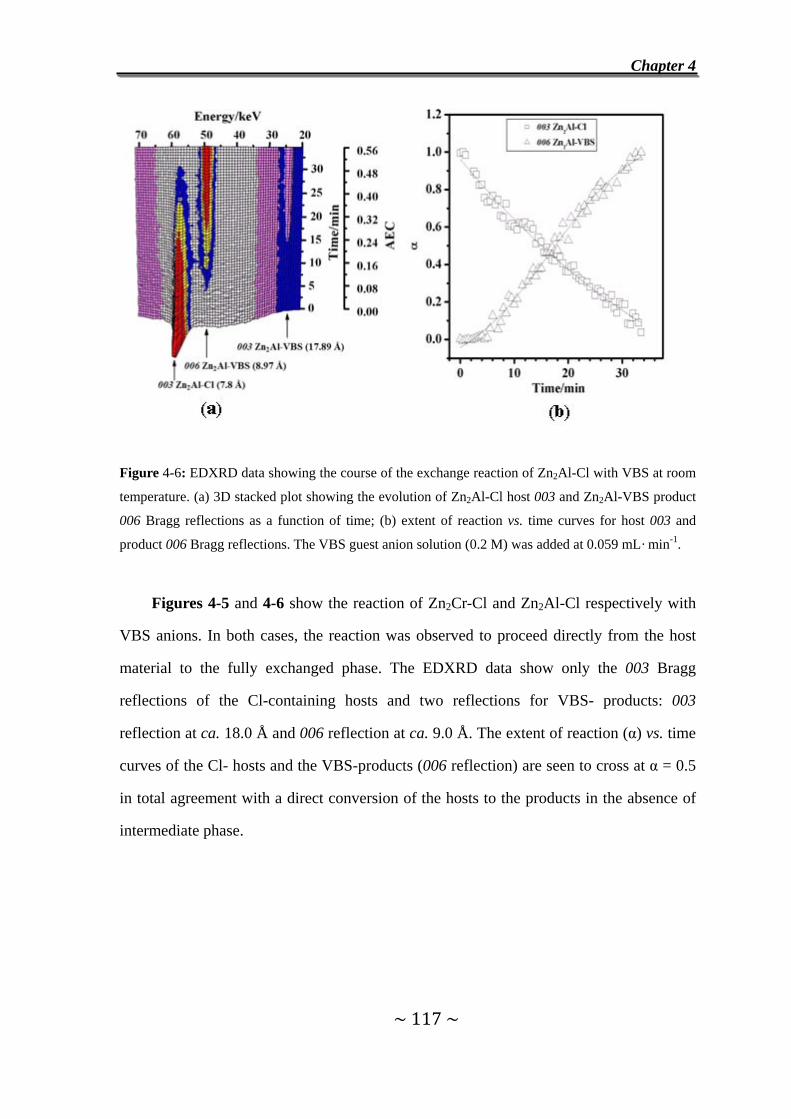
Chapter 4
~ 117 ~
Figure 4-6: EDXRD data showing the course of the exchange reaction of Zn2Al-Cl with VBS at room
temperature. (a) 3D stacked plot showing the evolution of Zn2Al-Cl host 003 and Zn2Al-VBS product
006 Bragg reflections as a function of time; (b) extent of reaction vs. time curves for host 003 and
product 006 Bragg reflections. The VBS guest anion solution (0.2 M) was added at 0.059 mL· min-1.
Figures 4-5 and 4-6 show the reaction of Zn2Cr-Cl and Zn2Al-Cl respectively with
VBS anions. In both cases, the reaction was observed to proceed directly from the host
material to the fully exchanged phase. The EDXRD data show only the 003 Bragg
reflections of the Cl-containing hosts and two reflections for VBS- products: 003
reflection at ca. 18.0 Å and 006 reflection at ca. 9.0 Å. The extent of reaction (α) vs. time
curves of the Cl- hosts and the VBS-products (006 reflection) are seen to cross at α = 0.5
in total agreement with a direct conversion of the hosts to the products in the absence of
intermediate phase.
Chapter 4
~ 118 ~
4.4 Exchange Reaction of Zn2CrTart/Cl with VBS Anions
Figure 4-7: EDXRD data showing the course of the exchange reaction of Zn2Cr-Tart/Cl with VBS at
room temperature. (a) 3D stacked plot showing the evolution of Zn2Cr-Tart/Cl host 006 and
Zn2Cr-VBS product 006 Bragg reflection as a function of time, (b) 2D stacked plot showing the same,
(c) extent of reaction vs. time curves for host 006 and product 006 Bragg reflections. The VBS guest
anion solution (0.2 M) was added at 0.059 mL· min-1.
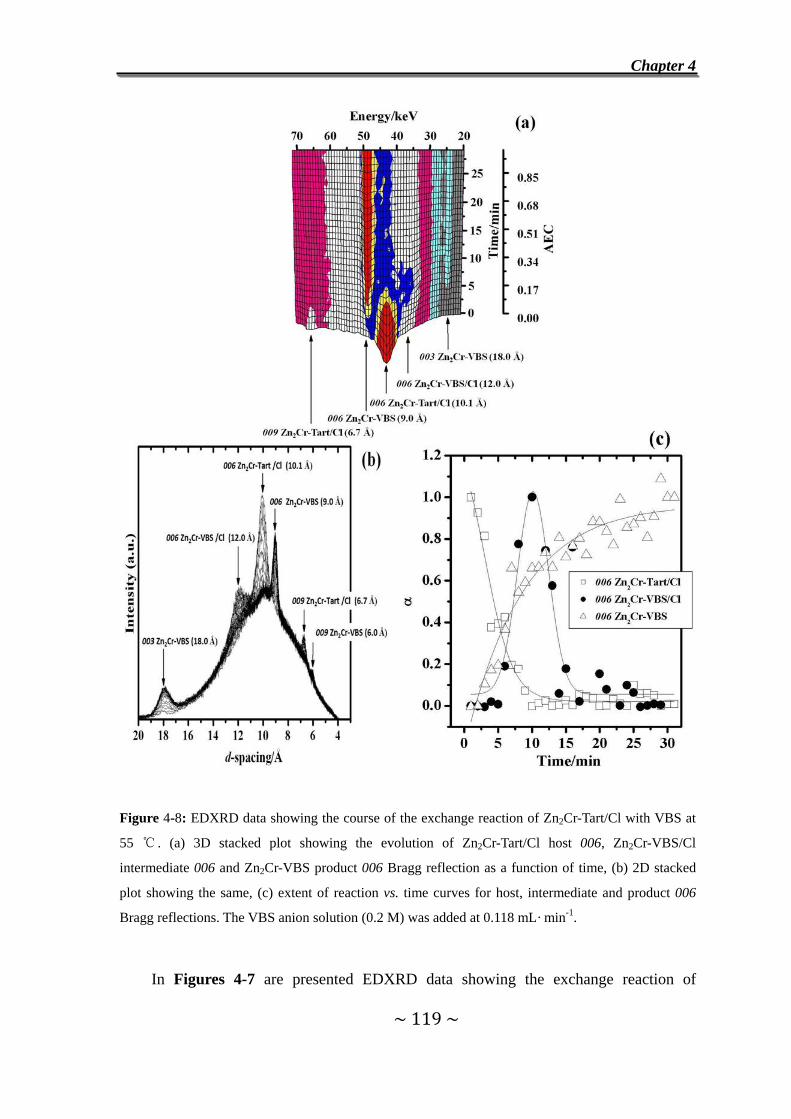
Chapter 4
~ 119 ~
Figure 4-8: EDXRD data showing the course of the exchange reaction of Zn2Cr-Tart/Cl with VBS at
55 ℃ . (a) 3D stacked plot showing the evolution of Zn2Cr-Tart/Cl host 006, Zn2Cr-VBS/Cl
intermediate 006 and Zn2Cr-VBS product 006 Bragg reflection as a function of time, (b) 2D stacked
plot showing the same, (c) extent of reaction vs. time curves for host, intermediate and product 006
Bragg reflections. The VBS anion solution (0.2 M) was added at 0.118 mL· min-1.
In Figures 4-7 are presented EDXRD data showing the exchange reaction of
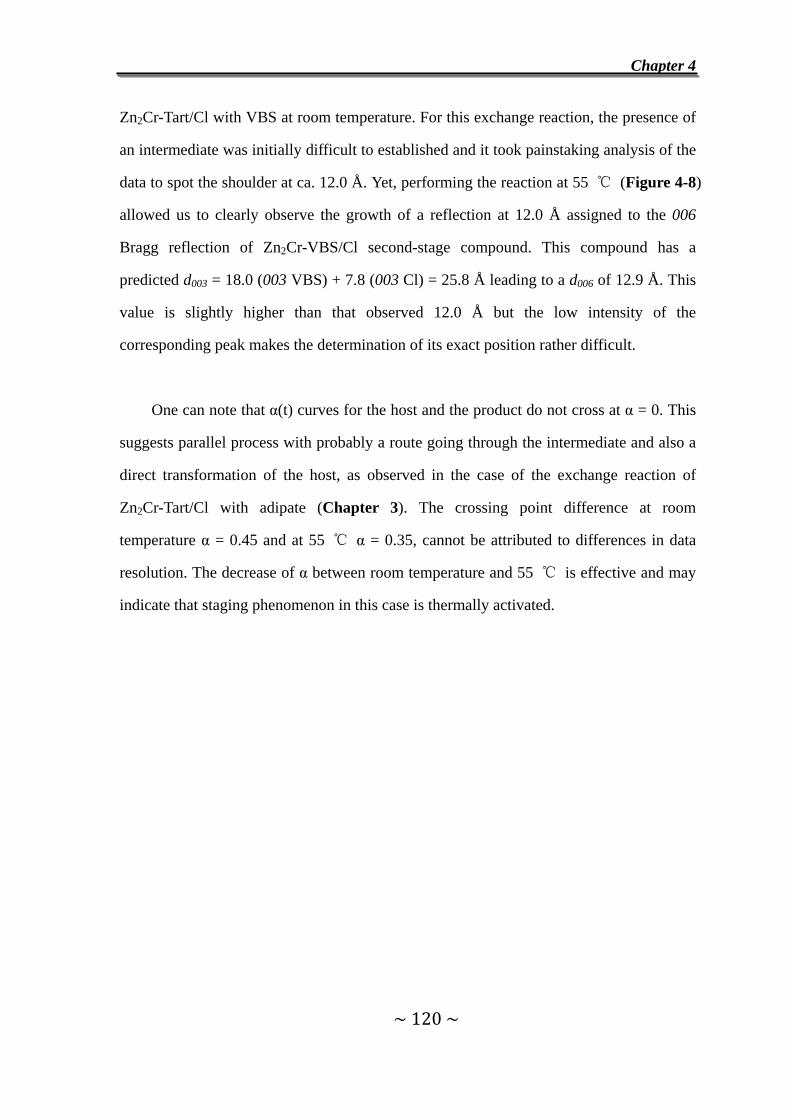
Chapter 4
~ 120 ~
Zn2Cr-Tart/Cl with VBS at room temperature. For this exchange reaction, the presence of
an intermediate was initially difficult to established and it took painstaking analysis of the
data to spot the shoulder at ca. 12.0 Å. Yet, performing the reaction at 55 ℃ (Figure 4-8)
allowed us to clearly observe the growth of a reflection at 12.0 Å assigned to the 006
Bragg reflection of Zn2Cr-VBS/Cl second-stage compound. This compound has a
predicted d003 = 18.0 (003 VBS) + 7.8 (003 Cl) = 25.8 Å leading to a d006 of 12.9 Å. This
value is slightly higher than that observed 12.0 Å but the low intensity of the
corresponding peak makes the determination of its exact position rather difficult.
One can note that α(t) curves for the host and the product do not cross at α = 0. This
suggests parallel process with probably a route going through the intermediate and also a
direct transformation of the host, as observed in the case of the exchange reaction of
Zn2Cr-Tart/Cl with adipate (Chapter 3). The crossing point difference at room
temperature α = 0.45 and at 55 ℃ α = 0.35, cannot be attributed to differences in data
resolution. The decrease of α between room temperature and 55 ℃ is effective and may
indicate that staging phenomenon in this case is thermally activated.
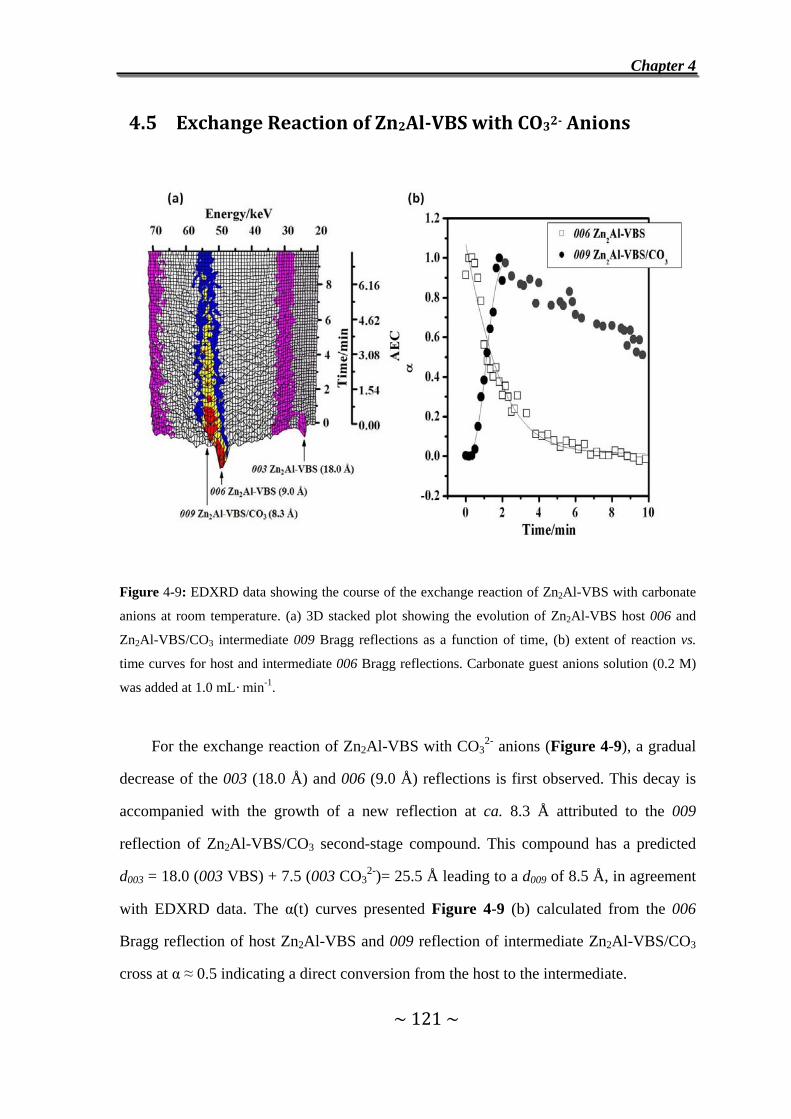
Chapter 4
~ 121 ~
4.5 Exchange Reaction of Zn2AlVBS with CO32 Anions
Figure 4-9: EDXRD data showing the course of the exchange reaction of Zn2Al-VBS with carbonate
anions at room temperature. (a) 3D stacked plot showing the evolution of Zn2Al-VBS host 006 and
Zn2Al-VBS/CO3 intermediate 009 Bragg reflections as a function of time, (b) extent of reaction vs.
time curves for host and intermediate 006 Bragg reflections. Carbonate guest anions solution (0.2 M)
was added at 1.0 mL· min-1.
For the exchange reaction of Zn2Al-VBS with CO32- anions (Figure 4-9), a gradual
decrease of the 003 (18.0 Å) and 006 (9.0 Å) reflections is first observed. This decay is
accompanied with the growth of a new reflection at ca. 8.3 Å attributed to the 009
reflection of Zn2Al-VBS/CO3 second-stage compound. This compound has a predicted
d003 = 18.0 (003 VBS) + 7.5 (003 CO32-)= 25.5 Å leading to a d009 of 8.5 Å, in agreement
with EDXRD data. The α(t) curves presented Figure 4-9 (b) calculated from the 006
Bragg reflection of host Zn2Al-VBS and 009 reflection of intermediate Zn2Al-VBS/CO3
cross at α ≈ 0.5 indicating a direct conversion from the host to the intermediate.
Chapter 4
~ 122 ~
After 2 min, corresponding to a theoretical exchange rate of 1.54, the reflection of
the intermediate becomes very weak and one can consider that it is disappearing.
However, the fully exchanged phase was not observed probably because it is too low
crystalline.
Figure 4-10: Ex situ PXRD data showing the course of the exchange reaction of Zn2Al-VBS with
CO32- for intercalation products obtained at different theoretical exchange rates.
The same exchange reaction was repeated in the laboratory and quenched products
obtained at different theoretical exchange rate were analyzed by PXRD; the patterns are
given in Figure 4-10. The interlayer distance for Zn2Al-VBS as a powder sample d003
=17.2 Å differs a little from that in solution d003 = 18.0 Å and this difference can be easily
explained by a larger amount of interlayer water molecules for the water-suspended
sample.
Contrary to EDXRD experiments, the formation of the fully exchanged phase
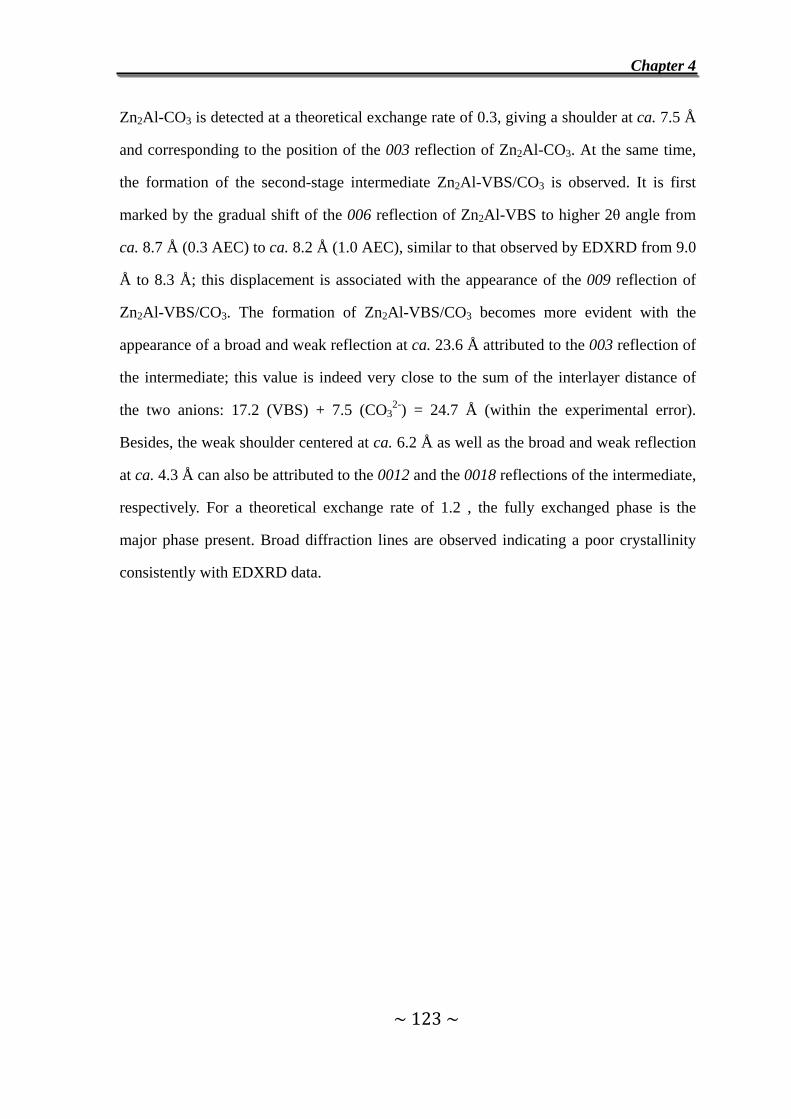
Chapter 4
~ 123 ~
Zn2Al-CO3 is detected at a theoretical exchange rate of 0.3, giving a shoulder at ca. 7.5 Å
and corresponding to the position of the 003 reflection of Zn2Al-CO3. At the same time,
the formation of the second-stage intermediate Zn2Al-VBS/CO3 is observed. It is first
marked by the gradual shift of the 006 reflection of Zn2Al-VBS to higher 2θ angle from
ca. 8.7 Å (0.3 AEC) to ca. 8.2 Å (1.0 AEC), similar to that observed by EDXRD from 9.0
Å to 8.3 Å; this displacement is associated with the appearance of the 009 reflection of
Zn2Al-VBS/CO3. The formation of Zn2Al-VBS/CO3 becomes more evident with the
appearance of a broad and weak reflection at ca. 23.6 Å attributed to the 003 reflection of
the intermediate; this value is indeed very close to the sum of the interlayer distance of
the two anions: 17.2 (VBS) + 7.5 (CO32-) = 24.7 Å (within the experimental error).
Besides, the weak shoulder centered at ca. 6.2 Å as well as the broad and weak reflection
at ca. 4.3 Å can also be attributed to the 0012 and the 0018 reflections of the intermediate,
respectively. For a theoretical exchange rate of 1.2 , the fully exchanged phase is the
major phase present. Broad diffraction lines are observed indicating a poor crystallinity
consistently with EDXRD data.
Chapter 4
~ 124 ~
4.6 In Situ Thermal Polymerization of Zn2CrVBS/Cl
Secondstage Compound
Figure 4-11: Powder X-ray diffraction patterns of Zn2Cr-Tart, Zn2Cr-Tart/Cl, Zn2Cr-VBS/Cl and
Zn2Cr-VBS compounds in the HTK experiments: (a) 25 ℃; (b) 200 ℃. The mark * indicates the
presence of Zn2Cr-Cl.
Based on the previous reports concerning the conditions of in situ thermal
polymerization of Zn2Al-VBS, 15 high temperature in situ XRD experiments were carried
out at 25 ℃ to 200 ℃ on Zn2Cr-VBS/Cl second-stage material. Zn2Cr-VBS/Cl was
prepared in the laboratory by repeating the EDXRD experiment at 55 ℃. As can be seen
in Figure 4-11 (a), Zn2Cr-VBS/Cl is not a pure phase but consists of a mixture of
Zn2Cr-VBS/Cl, Zn2Cr-Tart/Cl and Zn2Cr-VBS. Therefore, the thermal behavior of
Zn2Cr-VBS/Cl is compared to those of Zn2Cr-Tart/Cl and Zn2Cr-VBS as shown in Figure
4- 11 (b).
Chapter 4
~ 125 ~
In the case of Zn2Cr-VBS, the thermal treatment at 200 ℃ leads to a contraction of
the interlayer distance from ca. 17.6 Å (Zn2Cr-VBS) to 13.9 Å (Zn2Cr-PSS). This
contraction is close to that reported for the in situ thermal polymerization process of
Zn2Al-VBS, from 18.2 Å to 14.5 Å. In the same time, the 006 reflection of Zn2Cr-VBS/Cl
is shifted to higher 2θ angle from 12.2 Å to 9.4 Å. This contraction is a little smaller than
that expected i.e. 10.2 Å ( 13.9 d 7.5 Å for the 006 reflection of
Zn2Cr-PSS/Cl. Zn2Cr-Tart/Cl host also shows a contraction from 9.5 Å to 8.1 Å
corresponding to the reorientation of the tartrate anions in a flat position after the removal
of interlayer water molecules.
II Exchange Reaction with [Fe(CN)6]3 Ferricyanide Anions
4.7 Introduction
The intercalation of hexacyanoferrate (II) and (III) into LDH is of interest for several
reasons. First, it has implication in electrochemistry with the formation of LDH modified
electrodes able to perform electron transfer, energy conversion and molecular recognition
functions.17-19 On the other hand, hexacyanoferrate intercalated LDH form rare examples
of pillared LDH, these anions acting as pillaring species creating interlayer microporosity.
For instance, Mg3.3Al-Fe(CN)6 LDH displays a Langmuir surface area of 499 m2· g-1
originated from pores smaller than 0.71 nm. 20 Finally, hexacyanoferrate anions are also
magnetic species. 21
This wide range of properties associated with the intercalation of hexacyanoferrate
anions into LDH can also be used as different probes to gain further insight into the
process taking place in the interlayer space i.e. staging phenomena. In the following, are
Chapter 4
~ 126 ~
described the anion-exchange reaction of Zn2Cr-Cl, Zn2Cr-Tart and Zn2Cr-Tart/Cl with
[Fe(CN)6]3- investigated by means of EDXRD.
4.8 In situ EDXRD measurements
The solution of hexacyanoferrate guest anions was added dropwise to 10 mL of
suspension (25 g· L-1) of LDH at 55 ℃ at a rate of 0.118 mL· min-1 and a concentration
0.15 M in the case of Zn2Cr-Cl host, 0.035 mL· min-1 and 0.075 M in the case of
Zn2Cr-Tart and Zn2Cr-Tart/Cl hosts. The EDXRD spectra were collected at a fixed
detector angle of 1.625 º (2θ) with acquisition time of 60 s.
4.9 Exchange Reaction of Cl Anions in Zn2CrCl by
Ferricyanide Anions
Figure 4-12 shows the course of the exchange reaction of Zn2Cr-Cl with
ferricyanide anions. Only two reflection peaks were observed at a d-value of 7.8 Å
corresponding to the 003 reflection of Zn2Cr-Cl host and 10. 9 Å assigned to the 003
reflection of the fully exchanged phase Zn2Cr-Fe(CN)6. The latter value is close to those
reported elsewhere for Mg2Cr-LDH (10.45 Å) 22 , Mg1.5Al-LDH (11.10 Å) 22 and
Mg2Fe(III)-LDH (10.8 Å) 23. The size of the ferricyanide anions is close to 11 Å along
the C4 axis, 8.7 Å along the C2 axis and 6.51 Å along the C3 axis. 24 The present gallery
height (6.1 Å) means that the ferricyanide anions are oriented with the C3 axis
perpendicular to the hydroxide sheets.
Furthermore, the crossing point in α(t) curves occurring at α = 0.5 (Figure 4-12 (c))
confirms the one-step process with a direct transformation from the host to the product.
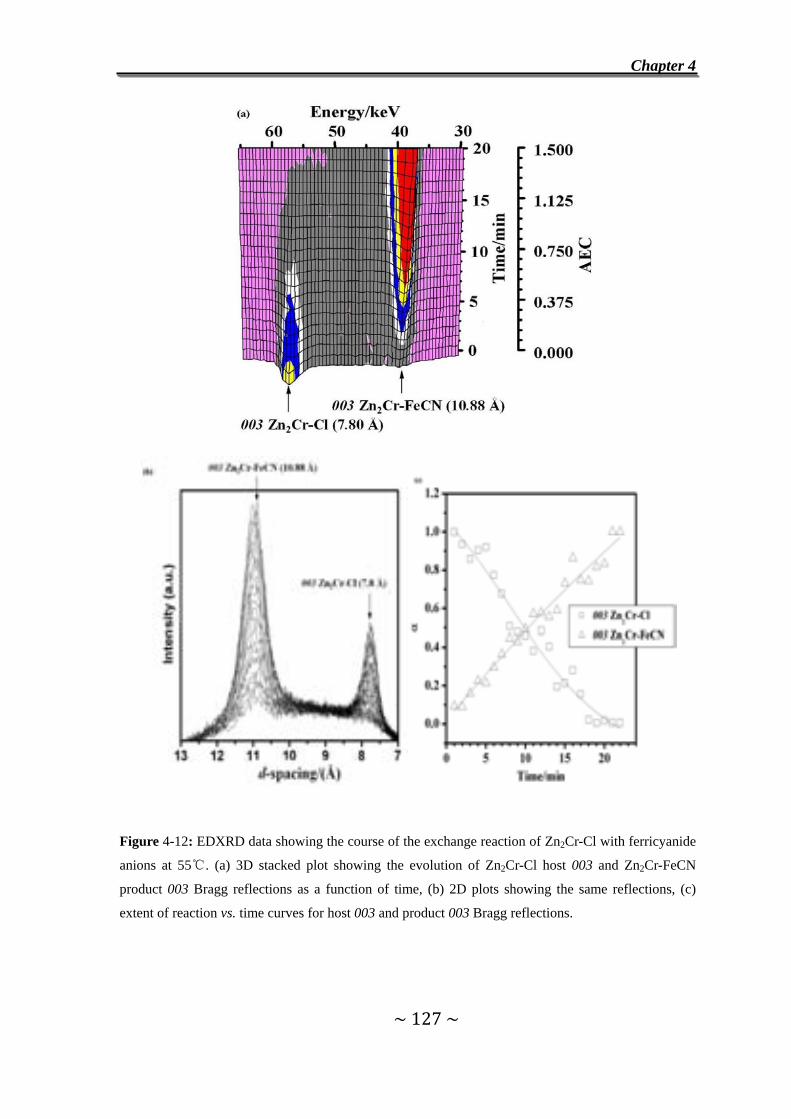
Chapter 4
~ 127 ~
Figure 4-12: EDXRD data showing the course of the exchange reaction of Zn2Cr-Cl with ferricyanide
anions at 55℃. (a) 3D stacked plot showing the evolution of Zn2Cr-Cl host 003 and Zn2Cr-FeCN
product 003 Bragg reflections as a function of time, (b) 2D plots showing the same reflections, (c)
extent of reaction vs. time curves for host 003 and product 003 Bragg reflections.
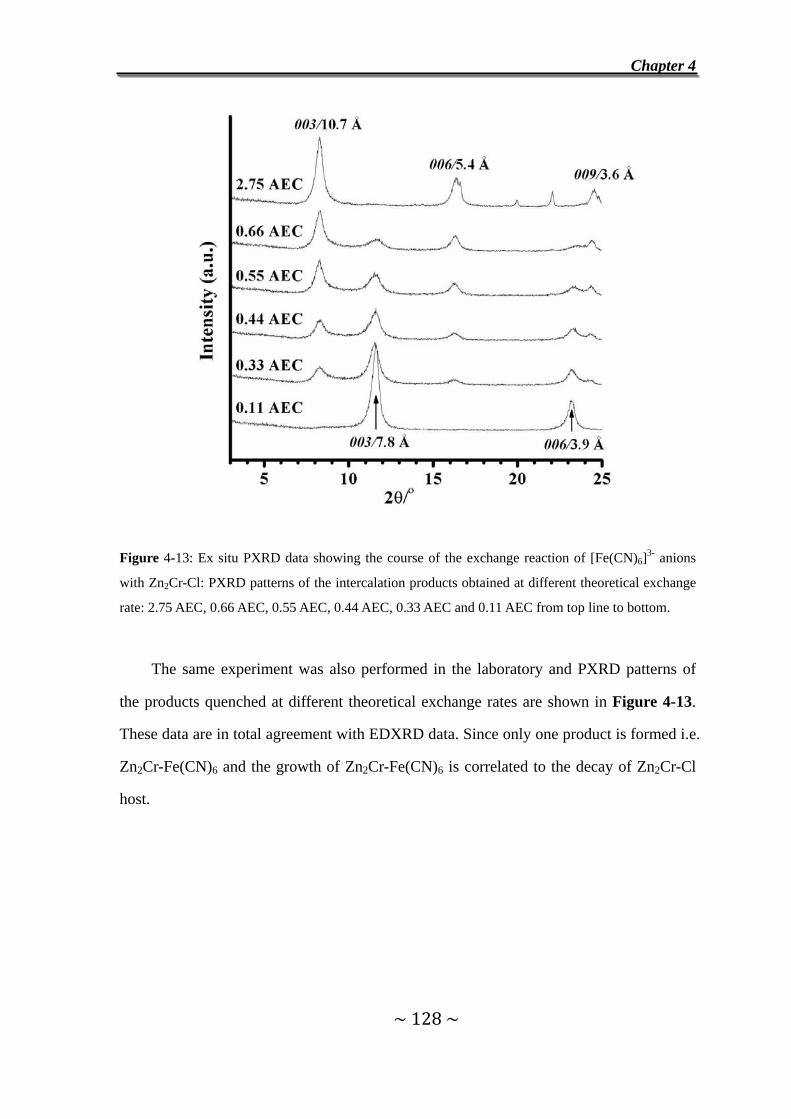
Chapter 4
~ 128 ~
Figure 4-13: Ex situ PXRD data showing the course of the exchange reaction of [Fe(CN)6]3- anions
with Zn2Cr-Cl: PXRD patterns of the intercalation products obtained at different theoretical exchange
rate: 2.75 AEC, 0.66 AEC, 0.55 AEC, 0.44 AEC, 0.33 AEC and 0.11 AEC from top line to bottom.
The same experiment was also performed in the laboratory and PXRD patterns of
the products quenched at different theoretical exchange rates are shown in Figure 4-13.
These data are in total agreement with EDXRD data. Since only one product is formed i.e.
Zn2Cr-Fe(CN)6 and the growth of Zn2Cr-Fe(CN)6 is correlated to the decay of Zn2Cr-Cl
host.

Chapter 4
~ 129 ~
4.10 Exchange Reaction of Ferricyanide Anions with
Zn2CrTart
Figure 4-14: EDXRD data showing the course of the exchange reaction of Zn2Cr-Tart with
ferricyanide anions at 55 ℃. (a) 3D stacked plot showing the evolution of Zn2Cr-Tart host 003 and
Zn2Cr-FeCN product 003 Bragg reflections as a function of time. (b) extent of reaction vs. time curves
for host 003, intermediate 006 and product 003 Bragg reflections. The guest ferricyanide anions
solution (0.075 M) was added at a rate of 0.035 mL · min-1.
For the exchange reaction of Zn2Cr-Tart with ferricyanide, a gradual displacement of
the 003 reflection of Zn2Cr-Tart from 12.0 Å to 11.2 Å is observed (Figure 4-14). This
last value is that expected for Zn2Cr-Fe(CN)6. A deconvolution of the EDXRD patterns
was first attempted by considering two contributions centered at 12.0 Å and 11.2 Å
(Figure 4-14 (a)). A better Figure 4-14 (b) was obtained by considering an additional
peak at 11.6 Å corresponding to the 006 reflection of Zn2Cr-Tart/Fe(CN)6. This peak has
a predicted d003 = 12.00 Å + 11.2 Å = 23.2 Å and hence a d006 of ca. 11.6 Å.
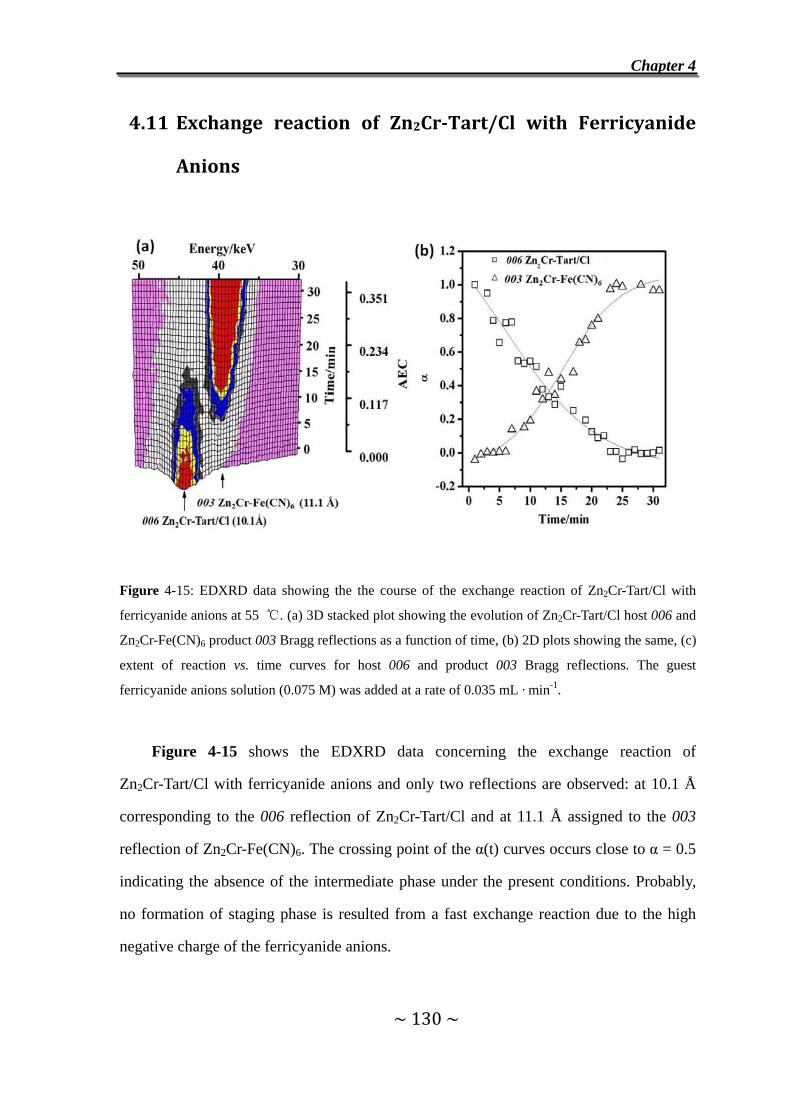
Chapter 4
~ 130 ~
4.11 Exchange reaction of Zn2CrTart/Cl with Ferricyanide
Anions
Figure 4-15: EDXRD data showing the the course of the exchange reaction of Zn2Cr-Tart/Cl with
ferricyanide anions at 55 ℃. (a) 3D stacked plot showing the evolution of Zn2Cr-Tart/Cl host 006 and
Zn2Cr-Fe(CN)6 product 003 Bragg reflections as a function of time, (b) 2D plots showing the same, (c)
extent of reaction vs. time curves for host 006 and product 003 Bragg reflections. The guest
ferricyanide anions solution (0.075 M) was added at a rate of 0.035 mL · min-1.
Figure 4-15 shows the EDXRD data concerning the exchange reaction of
Zn2Cr-Tart/Cl with ferricyanide anions and only two reflections are observed: at 10.1 Å
corresponding to the 006 reflection of Zn2Cr-Tart/Cl and at 11.1 Å assigned to the 003
reflection of Zn2Cr-Fe(CN)6. The crossing point of the α(t) curves occurs close to α = 0.5
indicating the absence of the intermediate phase under the present conditions. Probably,
no formation of staging phase is resulted from a fast exchange reaction due to the high
negative charge of the ferricyanide anions.
Chapter 4
~ 131 ~
4.12 Conclusions
The exchange reaction of VBS with Zn2Cr-Cl, Zn2Al-Cl first stage LDH and
Zn2Cr-Tart/Cl second-stage LDH, were investigated by means of EDXRD as well as the
exchange reaction of CO32- with Zn2Al-VBS. The formation of Zn2Cr-VBS/Cl and
Zn2Al-VBS/CO3 second-stage intermediates was observed.
Zn2Cr-VBS/Cl was obtained by reacting Zn2Cr-Tart/Cl with VBS, while it is not
formed during the anion-exchange reaction of Zn2Cr-Cl with VBS. This may indicate that
the present phase can only be prepared starting from a second-stage structure such as
Zn2Cr-Tart/Cl. On the other hand, a preliminary study allowed us to observe the in situ
thermal polymerization of VBS in Zn2Cr-VBS/Cl leading to Zn2Cr-PSS/Cl.
The exchange reaction of ferricyanide anions with Zn2Cr-Cl, Zn2Cr-Tart and
Zn2Cr-Tart/Cl LDH materials were investigated by means of EDXRD. The formation of
Zn2Cr-Tart/Fe(CN)6 second-stage intermediate was observed by reacting Zn2Cr-Tart with
ferricyanide anions.
4.13 References
1 K. Tokuoka, M. Senna and H. Kung, J. Mater. Sci., 1986, 21 (2), 493. 2 F. Leroux, J. Nanosci. Nanotech., 2006, 6(2), 303. 3 A. D. Pomogailo, Russ. Chem. Rev., 2000, 69 (1), 53. 4 K. H. Haas and K. Rose, Rev. Adv. Mater. Sci., 2003, 5, 47. 5 K. G. Sharp, Adv. Mater., 1998, 10 (15), 1243. 6 A. M. Herring, Poly. Rev., 2006, 46 (3), 245. 7 C. Taviot-Gueho and F. Leroux, Struct. Bond., 2006, 119, 121. 8 D. G. Evans and X. Duan, Chem. Commun., 2006, 485. 9 J. Q. Wang and W. K. Chow, J. Appl. Poly. Sci., 2005, 97 (1), 366.

Chapter 4
~ 132 ~
10 F. Leroux and C. Taviot-Gueho, J. Mater. Chem., 2005, 15 (35-36), 3628. 11 F. Leroux and J. P. Besse, Interface Sci. Technolog., 2004, 1, 459. 12 N. T. Whilton, P. J. Vickers and S. Mann, J. Mater. Chem., 1997, 7, 1623. 13 El M. Moujahid, M. Dubois, J. P. Besse and F. Leroux, Chem. Mater., 2002, 14, 3799. 14 El M. Moujahid and J. P. Besse, J. Mater. Chem., 2002, 12, 3324. 15 L. Vieille, El M. Moujahid, C. Taviot-Guého, J. Cellier, J. P. Besse and F. Leroux, J. Phys. Chem.
Solids, 2004, 65, 385. 16 El M. Moujahid, F. Leroux, M. Dubois and J. P. Besse, C. R. Chimie, 2003, 6, 259. 17 R. L. Frost, A. W. Musumeci, J. Bouzaid, M. O. Adebajo, W. N. Marteus and J. T. Kloprogge, J.
Solid State Chem., 2005, 178, 1940. 18 J. W. Boclais, P. S. Braterman, B. D. Brister, Z. Wang and F. Yaibery, J. Solid State Chem., 2001,
161, 249. 19 K. Yao, M. Taniguchi, M. Nakata, M. Takakaski and A. Yamagiski, Langmuir, 1998, 14, 2410. 20 H. Nijs, M. de Bock and E. F. Vansant, Microporous Mesoporous Mater., 1999, 30, 243. 21 M. T. Hisvonen, A. P. Jauho, T. E. Katila and K. J. Riski, Phys. Rev. B, 1977, 15 (3), 1445 22 A. S. Prakash, P. V. Kamath and M. S. Hegde, Mater. Res. Bull., 2000, 35, 2189. 23 W. Q. Meng, F. Li, D. G. Evans and X. Duan, J. Mater. Sci., 2004, 39, 4655. 24 J. M. Fernandez, M. A. Ulibarri, F. M. Labajoss and V. Rives, J. Mater. Chem., 1998, 8, 2507.

Conclusion
~ 133 ~
Conclusion
Conclusion
~ 134 ~
This thesis work has been devoted to the study of the anion exchange reaction
mechanism for two LDH host compositions namely Zn2Cr and Zn2Al and for a series
of inorganic namely Cl-, F
-, CO3
2-, SO4
2- and Fe(CN)6
3- and organic anions (tartrate,
succinate, adipate and styrene-4-sulfonate VBS anions). Monitoring the process in
situ by means of energy dispersive X-ray diffraction reveals two reactions
mechanisms: either anion exchange reaction occurs in a one-step direct transformation
from the host to the fully-exchanged phase or the reaction proceeds via a second-stage
intermediate with alternating interlayer occupied by two different anions and then
conversion to the first stage.
The aim of this work was first to determine the factors influencing staging. One
important remark concerns the high rate of these reactions, typically with a half-time
of 1-2 minutes. Therefore, in order to study these reactions in details and detect the
presence of intermediate phases, it was necessary to slow down the reaction by adding
the guest anion solution in a dropwise manner.
A general trend is that inorganic-inorganic anion exchange reactions occur in a
one-step process while inorganic-organic exchanges often proceed via a second-stage
intermediate. This leads us to suggest that staging occurs partly as a result of
organic-inorganic separation. Yet, one must keep in mind that staging is not observed
for all organic anions (for instance, in the case of the exchange of chloride anions by
VBS anions) indicating that other factors must be considered such as the anion size,
the solvatation and the affinity for different anions. Concerning this last parameter, we
believed in a correlation between the occurrence of a two-step process and the
difficulty of exchange of the initial anion, as established by O’Hare et al. in the case

Conclusion
~ 135 ~
of LiAl2 system.1 Indeed, microcalorimetric measurements reported elsewhere
2, 3
clearly indicate that chloride anions are easier to replace by inorganic anions such as
sulfate, carbonate or ferricyanide anions than by organic anions like tartrate or
succinate anions. In these conditions, the exchange of chloride anions by inorganic
anions occurs in one stage while staging is needed to overcome the energy barrier in
the case of organic anions. On the other hand, the fact that the formation of second
and first-stage products obeys either a consecutive process with the formation of
second-stage intermediates and then conversion into fully exchanged phases or
parallel processes with a route going through the intermediate as well as a direct
transformation of the host, may be attributed also to differences in anion affinities.
Indeed, a rapid and consecutive process is observed for anions relatively easy to
replace while low and parallel processes take place for anions difficult to replace; this
interpretation is supported by the enhancing effect of temperature on the formation of
second-stage intermediates indicating higher activation energies in this latter case.
However, another explanation given by O’Hare et al. might be that consecutive
processes would arise from an ordered replacement of interlayer anions while a
random replacement would lead to parallel processes. 1
The kinetic of the exchange reaction of chloride anions in Zn2Cr-Cl with tartrate
anions was examined. A rate constant k of 1.2(4)*10-2
s-1
at 25 ℃ was obtained for a
addition rate 1.0 mL· min-1
of the tartrate anion solution. This value is comparable
with rate constants reported elsewhere for intercalation reactions in other layered
1 G. R. Williams and D. O’Hare, Chem. Mater., 2005, 17, 2632.
2 Y. Israeli, C. Taviot-Guého, J. P. Besse, J. P. Morel and N. Morel-Desrosiers, J. Chem. Soc.
Dalton Trans., 2000, 5, 791.
3 N. Morel-Desrosiers, J. Pisson, Y. Israeli, C. Taviot-Gueho, J.-P. Besse and J.-P. Morel, J Mater.
Chem., 2003, 13, 2583.

Conclusion
~ 136 ~
materials.4
The anion exchange reaction in LDH system is expected to be a 2D
processes with deceleratory nucleation. The Avrami exponent value n obtained from
Sharp-Hancock analysis i.e. 2-3 is in favor of a phase boundary controlled process i.e.
the reaction rate is limited by the expansion of the interlayer space necessary to
accommodate tartrate anions.
An important result of this study is the formation of intermediate phases of
higher-order staging than 2 during the exchange reaction of CO32-
anions with
Zn2Cr-Tart, since only LDH second-stage intermediates have been reported so far.
The gradual variation of the interlayer distance of the intermediate product clearly
indicates a variation of the number of the interlayer spaces concerned with the
exchange process. Of course this result must be further confirmed by means of
HRTEM technique to better characterize the intermediate compositions. On the other
hand, one may think that for the other anion-exchange reactions examined here, the
high rate of these reactions is likely to prevent the observation of higher-staging than
2, if existing.
In a second step, we went further by examining the anion exchange properties
of these second-stage intermediates. Selective anion-exchange reactions were
observed that were a result of the segregation between organic and inorganic anions.
Indeed, the reaction of Zn2Cr-Succ/Cl and Zn2Cr-Tart/Cl second-stage compounds
with either fluoride or adipate anions initially occurs with preferential replacement of
the hydrophilic Cl ion with F, or of the organic succinate or tartrate anions with
adipate leading to the formation of new second-stage intermediates Zn2Cr-Succ/F and
4 J. S. O. Evans, S. J. Price, H.-V. Wong and D. O’Hare, J. Am. Chem. Soc., 1998, 120, 10837.

Conclusion
~ 137 ~
Zn2Cr-Tart/F or Zn2Cr-Adip/Cl. Because of this great selectivity, new heterostructures
can be formed that may not be achieved starting from a first-stage product. Indeed,
attempts to prepare Zn2Cr-Tart/F second stage materials from respectively the
exchange Zn2Cr-Tart with fluoride anions failed, suggesting that the present phases
can be obtained starting only from Zn2Cr-Tart/Cl second-stage structure.
Such amphiphilic heterostructures should find applications in many fields as ion
exchangers, adsorbent for environmental remediation, nanolayer reinforcements in
hybrid organic-inorganic polymer composite. Compared to first-stage LDH, these
LDH heterostructures may give access to multifunctional properties. Preliminary
measurements have been reported showing the formation of VBS
(styrene-4-sulfonate)/ Cl and tartrate/ferricyanide heterostructures. In the former case,
the in situ thermal polymerization of VBS into PSS was evidenced by means of in situ
high temperature powder X-ray diffraction. On the other hand, magnetic
measurements on Zn2M-Tart/Fe(CN)6 (M: Al, Cr) sample are underway to
characterize the effect of either the lamellar sequestration and/or the alternative
location on the dimensionality of the properties.
Copyright © 2022 FDOKUMEN