Laminar Film Condensation From Moist Air In Vertical Tubes ...
Upload
independentCategory
view
1download
0
ACPD13, 8333–8386, 2013
Nucleation-CCNevaluation
D. M. Westervelt et al.
Title Page
Abstract Introduction
Conclusions References
Tables Figures
J I
J I
Back Close
Full Screen / Esc
Printer-friendly Version
Interactive Discussion
Discussion
Paper
|D
iscussionP
aper|
Discussion
Paper
|D
iscussionP
aper|
Atmos. Chem. Phys. Discuss., 13, 8333–8386, 2013www.atmos-chem-phys-discuss.net/13/8333/2013/doi:10.5194/acpd-13-8333-2013© Author(s) 2013. CC Attribution 3.0 License.
EGU Journal Logos (RGB)
Advances in Geosciences
Open A
ccess
Natural Hazards and Earth System
Sciences
Open A
ccess
Annales Geophysicae
Open A
ccess
Nonlinear Processes in Geophysics
Open A
ccess
Atmospheric Chemistry
and Physics
Open A
ccess
Atmospheric Chemistry
and Physics
Open A
ccess
Discussions
Atmospheric Measurement
Techniques
Open A
ccess
Atmospheric Measurement
Techniques
Open A
ccess
Discussions
Biogeosciences
Open A
ccess
Open A
ccess
BiogeosciencesDiscussions
Climate of the Past
Open A
ccess
Open A
ccess
Climate of the Past
Discussions
Earth System Dynamics
Open A
ccess
Open A
ccess
Earth System Dynamics
Discussions
GeoscientificInstrumentation
Methods andData Systems
Open A
ccess
GeoscientificInstrumentation
Methods andData Systems
Open A
ccess
Discussions
GeoscientificModel Development
Open A
ccess
Open A
ccess
GeoscientificModel Development
Discussions
Hydrology and Earth System
Sciences
Open A
ccess
Hydrology and Earth System
Sciences
Open A
ccess
Discussions
Ocean Science
Open A
ccess
Open A
ccess
Ocean ScienceDiscussions
Solid Earth
Open A
ccess
Open A
ccess
Solid EarthDiscussions
The Cryosphere
Open A
ccess
Open A
ccess
The CryosphereDiscussions
Natural Hazards and Earth System
Sciences
Open A
ccess
Discussions
This discussion paper is/has been under review for the journal Atmospheric Chemistryand Physics (ACP). Please refer to the corresponding final paper in ACP if available.
Formation and growth of nucleatedparticles into cloud condensation nuclei:model-measurement comparisonD. M. Westervelt1, J. R. Pierce2, I. Riipinen1,3, W. Trivitayanurak4, A. Hamed5,6,M. Kulmala7, A. Laaksonen6,8, S. Decesari9, and P. J. Adams1
1Center for Atmospheric Particle Studies (CAPS), Carnegie Mellon University, Pittsburgh, PA,USA2Department Atmospheric Science, Colorado State University, Fort Collins, CO, USA3Department of Applied Environmental Science, University of Stockholm, Stockholm, Sweden4Department of Highways, Bangkok, Thailand5Department of Applied Physics, University of Eastern Finland, Kuopio, Finland6Leibniz Institute for Tropospheric Research, Department of Physics, Leipzig, Germany7Department of Physics, University of Helsinki, Helsinki, Finland8Finnish Meteorological Institute, Helsinki, Finland9Institute of Atmospheric Sciences and Climate, Italian National Research Council(ISAC-CNR), Bologna, Italy
8333

ACPD13, 8333–8386, 2013
Nucleation-CCNevaluation
D. M. Westervelt et al.
Title Page
Abstract Introduction
Conclusions References
Tables Figures
J I
J I
Back Close
Full Screen / Esc
Printer-friendly Version
Interactive Discussion
Discussion
Paper
|D
iscussionP
aper|
Discussion
Paper
|D
iscussionP
aper|
Received: 4 March 2013 – Accepted: 11 March 2013 – Published: 27 March 2013
Correspondence to: P. J. Adams ([email protected])
Published by Copernicus Publications on behalf of the European Geosciences Union.
8334

ACPD13, 8333–8386, 2013
Nucleation-CCNevaluation
D. M. Westervelt et al.
Title Page
Abstract Introduction
Conclusions References
Tables Figures
J I
J I
Back Close
Full Screen / Esc
Printer-friendly Version
Interactive Discussion
Discussion
Paper
|D
iscussionP
aper|
Discussion
Paper
|D
iscussionP
aper|
Abstract
Aerosol nucleation occurs frequently in the atmosphere and is an important source ofparticle number. Observations suggest that nucleated particles are capable of growingto sufficiently large sizes that they act as cloud condensation nuclei (CCN), but someglobal models have reported that CCN concentrations are only modestly sensitive to5
large changes in nucleation rates. Here we present a novel approach for using long-term size distribution observations to evaluate a global aerosol model’s ability to predictformation rates of CCN from nucleation and growth events. We derive from observa-tions at five locations nucleation-relevant metrics such as nucleation rate of particles atdiameter of 3 nm (J3), diameter growth rate (GR), particle survival probability (SP), con-10
densation and coagulation sinks, and CCN formation rate (J100). These quantities arealso derived for a global microphysical model, GEOS-Chem-TOMAS, and compared tothe observations on a daily basis. Using GEOS-Chem-TOMAS, we simulate nucleationevents predicted by ternary (with a 10−5 tuning factor) or activation nucleation over oneyear and find that the model slightly understates the observed annual-average CCN15
formation, but by no more than 50 % in the ternary simulations. At the two locationsexpected to be most impacted by large-scale regional nucleation, Hyytiala and SanPietro Capofiume, predicted annual-average CCN formation rates are within 34 % and2 % of the observations, respectively. Model-predicted annual-average growth ratesare within 25 % across all sites but also show a slight tendency to underestimate the20
observations, at least in the ternary nucleation simulations. On days that the growingnucleation mode reaches 100 nm, median single-day survival probabilities to 100 nmfor the model and measurements range from less than 1 % to 6 % across the five lo-cations we considered; however, this does not include particles that may eventuallygrow to 100 nm after the first day. This detailed exploration of new particle formation25
and growth dynamics adds support to the use of global models as tools for assessingthe contribution of microphysical processes such as nucleation to the total number andCCN budget.
8335

ACPD13, 8333–8386, 2013
Nucleation-CCNevaluation
D. M. Westervelt et al.
Title Page
Abstract Introduction
Conclusions References
Tables Figures
J I
J I
Back Close
Full Screen / Esc
Printer-friendly Version
Interactive Discussion
Discussion
Paper
|D
iscussionP
aper|
Discussion
Paper
|D
iscussionP
aper|
1 Introduction
Atmospheric aerosols are known to perturb climate in several ways. The largest currentuncertainty in climate forcing is the aerosol indirect effect (AIE), which is broken downinto the cloud albedo effect and the lifetime effect (Twomey, 1977; Albrecht, 1989).With increasing aerosols, a subset of which act as cloud condensation nuclei (CCN),5
brighter and potentially longer-lived clouds are formed. In order for aerosols to exertthese influences on clouds, they are either introduced into the atmosphere by directemission or gas-to-particle conversion (nucleation) where they may grow to sufficientlylarge sizes to act as CCN (Kerminen et al., 2005; Pierce and Adams, 2007; Kuang etal., 2009). A competition between condensational growth and coagulational loss de-10
termines a particle’s survival probability during growth through a certain size range(Fig. 1). Although subject to the same dynamic processes, the fates of particles formedvia primary emission and nucleation can be quite different. Stable clusters of nucleatingsulfuric acid vapor are typically 1 nm in size, which is much smaller than typical primaryemission size ranges (Kulmala et al., 2000, 2004; Makela et al., 1997; Vehkamaki et al.,15
2004). As a result, in order for particles formed via nucleation to act as CCN, they mustgrow by condensation while avoiding loss by coagulation for a longer amount of timeand through a larger range of sizes than primary emissions. Since freshly nucleatedparticles are small, they are highly diffusive and prone to collide with pre-existing parti-cles. Therefore, coagulation is very efficient between fresh nuclei and larger particles,20
compounding the increased time that nucleated particles require to grow to CCN sizes.Ambient measurements presented in Kuang et al. (2009) highlight the importance ofcoagulation as at least 80 % of the nucleated particles on average are lost by coagu-lation before the nucleation mode reached CCN sizes in the cases that they studied,even during days with high growth rates.25
Recent work has suggested there is a potential discrepancy between aerosol mod-els and observations, and between multiple aerosol models themselves, regarding thenumber of CCN formed from nucleated particles. For example, the aforementioned
8336

ACPD13, 8333–8386, 2013
Nucleation-CCNevaluation
D. M. Westervelt et al.
Title Page
Abstract Introduction
Conclusions References
Tables Figures
J I
J I
Back Close
Full Screen / Esc
Printer-friendly Version
Interactive Discussion
Discussion
Paper
|D
iscussionP
aper|
Discussion
Paper
|D
iscussionP
aper|
Kuang et al. (2009) study reported survival probabilities up to 20 % for measured nu-cleation events in Atlanta, GA and suggested inaccuracies in model-predicted organiccondensation growth rates as a possible explanation for the difference with the modelresults of Pierce and Adams (2009b). Pierce and Adams (2009b) showed low proba-bilities (10 % or less) of particles growing to CCN sizes when nucleation parameteriza-5
tions were active in the simulations. Using a global aerosol model, they also found thatglobal CCN concentrations are more responsive to uncertainties in primary emissionsthan uncertainties in nucleation, reporting a 12 % global average CCN sensitivity whenvarying the nucleation rate by six orders of magnitude. Moreover, the low sensitivitywas attributed to decreasing survival probabilities with increasing nucleation rates due10
to increased coagulation and decreased growth rates at faster nucleation rates. In theextreme case of fast ternary nucleation rates of Napari et al. (2002), particle survivalprobabilities were on the order of 10−8.
The differing outcomes between models and measurements as well as between dif-ferent models are likely caused by several factors. First, models including the one em-15
ployed in Pierce and Adams (2009b) may suffer from the lack of a robust nucleationtheory. As will be explained, observed nucleation events cannot fully be explained bytheory. Secondly, observational studies are often limited to a single location and a shortlength of time, and may focus on dramatic growth events that are not necessarily rep-resentative of the longer climatology. Global models, on the other hand, typically report20
averages over the entire troposphere including the free troposphere. Third, models mayalso be inaccurate in secondary organic aerosol (SOA) formation, which is essentialfor the growth of nucleated particles to CCN sizes (Kulmala et al., 2004; Kuang et al.,2009; Riipinen et al., 2011). The most recent estimates of the SOA budget have con-strained it to fall within 50 to 230 Tg SOA yr−1 (Spracklen et al., 2011), although other25
studies have reported ranges as low as 12–70 Tg SOA yr−1 (Kanakidou et al., 2005).Fourth, the metrics of comparison between measurements and models are often notthe same, making a side-by-side comparison erroneous or difficult. This is especiallytrue in model-model comparisons of the contribution of nucleation to CCN, in which the
8337
ACPD13, 8333–8386, 2013
Nucleation-CCNevaluation
D. M. Westervelt et al.
Title Page
Abstract Introduction
Conclusions References
Tables Figures
J I
J I
Back Close
Full Screen / Esc
Printer-friendly Version
Interactive Discussion
Discussion
Paper
|D
iscussionP
aper|
Discussion
Paper
|D
iscussionP
aper|
problem is rooted in the difference between the fractional contribution of nucleation toCCN (e.g. Merikanto et al., 2009) and the sensitivity of CCN to changes in nucleation(e.g. Pierce et al., 2009b).
The science behind nucleation theory is not well understood and many plausible yetnot fully robust formulations have been proposed. The importance of sulfuric acid as5
a primary nucleating species has been confirmed (Berndt et al., 2005; Kuang et al.,2008; Sipila et al., 2010; Vuollekoski et al., 2010; Weber et al., 1996). Additional ev-idence has shown that low volatility organic vapors (Paasonen et al., 2010; Zhang etal., 2004), amines (Bzdek et al., 2010; Kurten et al., 2008; Kirkby et al., 2011), andammonia (Ball et al., 1999; Erupe et al., 2010; Kirkby et al., 2011) may also play signif-10
icant roles in the initial steps of atmospheric nucleation. Binary and ternary homoge-nous nucleation theories have been proposed to explain nucleation rates on a globalscale in the atmosphere. Binary homogenous nucleation involves the supersaturationof solutions of sulfuric acid and water in a binary system (Vehkamaki et al., 2002).Ternary homogenous nucleation, such as the parameterization proposed by Napari15
et al. (2002), adds a third nucleating species, typically ammonia (NH3). The originalternary formulation of Napari et al. (2002) showed high biases in predictions of nu-cleation rates and aerosol number concentrations (Merikanto et al., 2007; Jung et al.,2008). A modified version with a globally constant nucleation rate tuning factor of 10−5
has been incorporated into a regional aerosol model and shows reasonable agreement20
(Jung et al., 2010) with observations. Other possible nucleation parameterizations in-clude empirical methods such as activation nucleation (Kulmala et al., 2000), whichis often applied in the planetary boundary layer (PBL) in conjunction with the binaryscheme of Vehkamaki et al. (2002) in the free troposphere.
Adding to the poor understanding of atmospheric nucleation is the role of charged25
particles. Recently, Yu and Turco (2011) reviewed previous findings and suggested a100 % contribution of ions to new particle formation at Hyytiala. However, other stud-ies have found no greater than a 10 % contribution of ion nucleation to aerosol for-mation rates in similar continental boundary layer environments (Gagne et al., 2008,
8338
ACPD13, 8333–8386, 2013
Nucleation-CCNevaluation
D. M. Westervelt et al.
Title Page
Abstract Introduction
Conclusions References
Tables Figures
J I
J I
Back Close
Full Screen / Esc
Printer-friendly Version
Interactive Discussion
Discussion
Paper
|D
iscussionP
aper|
Discussion
Paper
|D
iscussionP
aper|
2010; Laakso et al., 2007; Manninen et al., 2009). Kirkby et al. (2011) showed thation-induced binary nucleation is not likely to play a role in boundary layer nucleationbut may be important for the free troposphere at temperatures around 250 K. Kazil etal. (2010) suggested that ions may play an important role in nucleation in the marineboundary layer; however, to our knowledge this has not been explored yet by observa-5
tions.Freshly formed nuclei have very short lifetimes in the atmosphere (less than a few
hours for 1–5 nm particles in the boundary layer) due to loss by coagulation with largerparticles. Thus, they must grow quickly to larger sizes if they are to influence CCN con-centrations. Once nuclei are formed, growth is typically dominated by condensation of10
sulfuric acid vapor and low volatility organic vapors. At some locations, organic conden-sation accounts for nearly the entire aerosol growth rate (Kuang et al., 2009; Riipinenet al., 2011). Diameter growth rates from 3 to 25 nm during nucleation events in 2007 atHyytiala, Finland have a median value around 2 or 3 nm h−1, although median rates upto 9 nm h−1 have been reported for a continental location in South Africa (Vakkari et al.,15
2011). Coagulational growth of nucleated particles can also occur when similar-sizedsmall nuclei interact with each other, although this self-coagulation is much smaller thancondensation growth and can generally be ignored (Dal Maso et al., 2002; Kerminenand Kulmala, 2002; Stolzenburg et al., 2005). More commonly, coagulation scavengingoccurs, which is the dominant sink of freshly formed nuclei compared to deposition, but20
is highly dependent on atmospheric conditions (Pierce and Adams, 2007). Understand-ing the growth and loss processes, which make up a particle’s survival probability, is themost important step in understanding the contribution of nucleation events to aerosolnumber and CCN concentrations.
To date, modeling studies aiming to quantify CCN formation from nucleation have25
been limited by a lack of detailed evaluation of modeling output against ambient obser-vations and have suffered from the nonlinear nature of aerosol microphysics when mak-ing sensitivity calculations. Because of feedbacks on condensation and coagulation,the common methodology of “turning off” nucleation as a control experiment against
8339

ACPD13, 8333–8386, 2013
Nucleation-CCNevaluation
D. M. Westervelt et al.
Title Page
Abstract Introduction
Conclusions References
Tables Figures
J I
J I
Back Close
Full Screen / Esc
Printer-friendly Version
Interactive Discussion
Discussion
Paper
|D
iscussionP
aper|
Discussion
Paper
|D
iscussionP
aper|
a nucleation-active simulation is useful for sensitivity calculations but is not equal to afractional contribution of nucleation to CCN. Studies have reported CCN sensitivities tonucleation ranging from 3–60 % (Yu and Luo, 2009; Makkonen et al., 2009; Merikantoet al., 2009; Spracklen et al., 2010; Wang and Penner, 2009). Each of these studiesused different models and often significantly different inputs, assumptions, and metrics5
for assessing CCN sensitivity, making model intercomparison difficult. In particular, thedomain over which nucleation is changed (boundary layer or free troposphere), CCNactivation scheme, and the definition of what counts as a “nucleated” particle can in-fluence results significantly. For example, Pierce and Adams (2009b) chose binary andternary nucleation as the two endpoints for a sensitivity study, whereas others such10
as Spracklen et al. (2008) turn nucleation off entirely in a global model as a controlagainst simulations with any particular active nucleation theory. Spracklen et al. (2008)found the influence of nucleation on CCN(0.2 %) to be as low as 3 % and as largeas 20 %. However, these values refer only to the sensitivity of CCN to activation nu-cleation in the boundary layer. Merikanto et al. (2009) found that 45 % of CCN(0.2 %)15
originate from nucleation, although they note that most of that (35 % of CCN) comesfrom the free and upper troposphere and not the boundary layer. Yu and Luo (2009),who found the highest contribution to CCN of all of the studies, assumed that 5 % of thesulfate formed in plumes on sub-grid spatial scales (e.g. Stevens et al., 2012) existsin the nucleation mode and counts towards the nucleation contribution to CCN. Other20
cited studies include only regional-scale (i.e. grid-scale resolved) nucleation events inthe nucleation contribution. Additionally, the aerosol microphysics model employed inYu and Luo (2009) used a fixed lognormal mode to prescribe primary organic aerosolsize, resulting in a simplified treatment of the coagulation of nucleation particles withlarger, primary particles. Varying treatments of particle activation into CCN may also25
play a role. For example, Makkonen et al. (2009) use the ECHAM5-HAM cloud dropletactivation scheme and report CCN enhancements of up to 50 % in the boundary layerbetween activation and binary nucleation. That version of ECHAM5-HAM used a clouddroplet activation scheme that allows nucleated particles to become CCN active as
8340

ACPD13, 8333–8386, 2013
Nucleation-CCNevaluation
D. M. Westervelt et al.
Title Page
Abstract Introduction
Conclusions References
Tables Figures
J I
J I
Back Close
Full Screen / Esc
Printer-friendly Version
Interactive Discussion
Discussion
Paper
|D
iscussionP
aper|
Discussion
Paper
|D
iscussionP
aper|
soon as they grow to 35 nm wet radius and treats all particles larger than 35 nm wetradius as equal for purposes of activation. This translates to roughly a 50 nm dry activa-tion diameter, a value that may tend to overstate the impact of nucleation on CCN for-mation. Finally, Wang and Penner (2009) use the IMPACT aerosol model incorporatedinto the NCAR CCSM3 to determine a 5.3 % enhancement in CCN due to nucleation.5
The Makkonen et al. (2009) study and the Yu and Luo (2009) study show the highestCCN sensitivity to nucleation but also use very different assumptions in terms of activa-tion scheme and what counts as nucleation. The works of Spracklen et al. (2008; 2010)and Merikanto et al. (2009) find free troposphere nucleation to be a major source oftheir nucleated particles growing to CCN, something that the Pierce and Adams (2009)10
study does not explicitly test. Bearing in mind the differences in the reported calcula-tions, the 3–60 % range in CCN sensitivity to nucleation may be more apparent thanreal. Although the diversity of simulations is useful, we suspect that models would agreemore closely with each other when using a consistent basis of comparison. In partic-ular, omitting the Makkonen et al. (2009) and Yu and Luo (2009) studies, the range of15
influence of boundary layer nucleation on CCN is much narrower.Therefore, it is necessary to perform detailed comparisons between models and
observations to assess whether models are indeed biased or whether discrepanciesare more apparent than real. Quantifying survival probability and CCN formation effi-cacy can be done with both ambient data and modeling output. Here we build upon20
previous studies to show how size distribution observations can be used to infer CCNformation rates from nucleation on a long-term (one year) basis. The result is an obser-vational constraint on the overall CCN formation from single-day nucleation and growthevents. In this paper, we analyze ambient measurements and model output and calcu-late relevant nucleation metrics such as the nucleation rate, growth rate, condensation25
and coagulation sink, survival probably, and CCN formation. We present an evaluationof model results by comparing to the nucleation metrics calculated for ambient mea-surements. We recommend that future modeling studies of nucleation and CCN usethese similar metrics to allow for straightforward comparisons between models and
8341

ACPD13, 8333–8386, 2013
Nucleation-CCNevaluation
D. M. Westervelt et al.
Title Page
Abstract Introduction
Conclusions References
Tables Figures
J I
J I
Back Close
Full Screen / Esc
Printer-friendly Version
Interactive Discussion
Discussion
Paper
|D
iscussionP
aper|
Discussion
Paper
|D
iscussionP
aper|
with observations. Uncertainties in nucleation theories and growth mechanisms dictatethat global aerosol microphysics models must be evaluated against nucleation-relevantobservations in order to be used in a predictive capacity.
2 Models and analysis
2.1 GEOS-Chem5
The Goddard Earth Observing System global chemical transport model (GEOS-Chem)version 8.2.2 is used for this study (Bey et al., 2001; http://geos-chem.org/). The versionof GEOS meteorological fields used was either GEOS-3 or GEOS-5, as required by thesimulation period (Table 1). In all simulations, 4◦ latitude by 5◦ longitude resolution isused with 30 vertical sigma-coordinate layers extending from the surface to 0.01 hPa.10
GEOS-Chem v8.2.2 contains all of the features described in Trivitayanurak et al. (2008)with the following updates. Anthropogenic emissions are treated with the EmissionsDatabase for Global Atmospheric Research (EDGAR) inventory but are often overwrit-ten by a number of regional inventories (Olivier et al., 1996). These regional inventoriesinclude Big Bend Regional Aerosol and Visibility Observational Study (BRAVO) emis-15
sions inventory for Mexico and southwestern US, Criteria Air Contaminants (CAC) foranthropogenic emissions over Canada (http://www.ec.gc.ca/inrp-npri/), the Coopera-tive Programme for Monitoring and Evaluation of the Long-range Transmission of AirPollutants in Europe (EMEP), EPA National Emissions Inventory (NEI) for the UnitedStates (http://www.epa.gov/oar/data/neidb.html), and the Streets inventory for Asian20
emissions (Kuhns et al., 2003; Auvray and Bey, 2005; Streets et al., 2003). Biogenicemissions in the model follow the MEGAN database, and biomass burning emissionsuse the Global Fire Emissions Database version 2 (GFEDv2) (Randerson et al., 2006;Guenther et al., 2006). NOx emissions from aircraft, lightning, and soil are consideredin the global model. Shipping SOx emissions are considered within EDGAR and EMEP.25
8342

ACPD13, 8333–8386, 2013
Nucleation-CCNevaluation
D. M. Westervelt et al.
Title Page
Abstract Introduction
Conclusions References
Tables Figures
J I
J I
Back Close
Full Screen / Esc
Printer-friendly Version
Interactive Discussion
Discussion
Paper
|D
iscussionP
aper|
Discussion
Paper
|D
iscussionP
aper|
2.2 TwO-Moment Aerosol Sectional (TOMAS) algorithm
Aerosol microphysics calculations are performed with the TwO Moment Aerosol Sec-tional algorithm (TOMAS), which is hosted by the GEOS-Chem global chemical trans-port model. TOMAS was introduced as a standard component of GEOS-Chem in ver-sion 8.2.2 and 8.3.1 and is available for download (http://www.geos-chem.org). Ad-5
vantages of the TOMAS algorithm and GEOS-Chem implementation include the factthat all aerosol species have explicit, interactive microphysics and TOMAS conservesnumber concentrations allowing calculation of aerosol number budgets. Generally, weemploy the work of Trivitayanurk et al. (2008) with the organic aerosol additions ofPierce et al. (2007), the dust additions of Lee et al. (2009), and the nucleation imple-10
mentations of Pierce and Adams (2009a). TOMAS is a modular algorithm that containscodes to calculate the effects of nucleation, coagulation, condensation/evaporation,cloud processing, size-resolved dry and wet deposition, and emissions on the num-ber and mass size distribution of aerosols (Adams and Seinfeld, 2002; Tzivion et al.,1987). The aerosols are split up into 9 chemical species including sulfate, sea salt,15
hydrophilic and hydrophobic organic carbon, externally and internally mixed elemen-tal carbon, mineral dust, ammonium, and aerosol water. Each component is trackedacross 40 logarithmically spaced size sections or “bins” with a range of 1.1 nm to 10µm. Size-resolved deposition, coagulation, condensation, and cloud processing are un-changed from Trivitayanurak et al. (2008). Primary sulfate aerosol emissions are 1 %20
of anthropogenic SO2 emissions emissions and use the size distributions describedin Adams and Seinfeld (2003). Sea salt emissions are treated in the same manneras in Trivitayanurak et al. (2008). Organic aerosols were not included in Trivitayanuraket al. (2008) but are included in the present work and described in the next section.Advection, chemistry, and deposition have remained largely unchanged from the work25
of Trivitayanurak et al. (2008), although periodic minor updates in both advection andchemistry (e.g. newer reaction rate constants and photolysis constants) have been im-plemented into successive versions of GEOS-Chem.
8343

ACPD13, 8333–8386, 2013
Nucleation-CCNevaluation
D. M. Westervelt et al.
Title Page
Abstract Introduction
Conclusions References
Tables Figures
J I
J I
Back Close
Full Screen / Esc
Printer-friendly Version
Interactive Discussion
Discussion
Paper
|D
iscussionP
aper|
Discussion
Paper
|D
iscussionP
aper|
Activation to cloud condensation nuclei is based on Kohler theory (Raymond andPandis, 2003), which is incorporated via look-up tables that take percent compositionof sulfate, sea salt, organic carbon and insoluble material as inputs and yield criticalactivation diameters at various supersaturations as output. Below we highlight somerecent additions to GEOS-Chem-TOMAS.5
2.2.1 Organic aerosol
Carbonaceous aerosols are configured in a similar manner to Pierce et al. (2007). Or-ganic aerosol is divided into four sub-categories: externally mixed EC, internally mixedEC, hydrophobic OC, and hydrophilic OC. The contributions of each of the organiccategories to CCN activity is represented using the single, lumped, hygroscopicity pa-10
rameter (κ) of Petters and Kreidenweis (2007). We assume a constant OM : OC ratio of1.8 for all emissions and for ambient organic aerosol (El-Zanan et al., 2005; Zhang etal., 2005). The effect of organic aerosol on surface tension depression (Facchini et al.,1999; Nenes et al., 2002) in activating cloud drops is not considered. The timescaleof conversion of hydrophobic to hydrophilic aerosol was 1.5 days. Conversion from15
externally mixed to internally mixed EC uses this same timescale.Secondary organic aerosol (SOA) is considered to be entirely non-volatile and does
not react or partition between the aerosol and gas phase. Instead, SOA production inTOMAS is calculated as 10 % of global monoterpene emissions, resulting in approxi-mately 19 Tg yr−1 of SOA. The SOA condenses to all particles based on their Fuchs20
surface area (Pandis et al., 1991). Although there is overwhelming evidence for thethermodynamic partitioning of semi-volatile organic aerosols (Donahue et al., 2006),the non-volatile, kinetic condensation SOA treatment used here is simple and per-formed well in earlier nucleation studies that compared to observed aerosol numberconcentrations and growth rates (Riipinen et al., 2010; Pierce et al., 2011).25
8344

ACPD13, 8333–8386, 2013
Nucleation-CCNevaluation
D. M. Westervelt et al.
Title Page
Abstract Introduction
Conclusions References
Tables Figures
J I
J I
Back Close
Full Screen / Esc
Printer-friendly Version
Interactive Discussion
Discussion
Paper
|D
iscussionP
aper|
Discussion
Paper
|D
iscussionP
aper|
2.2.2 Nucleation
Several changes have been made to the treatment of nucleation in GEOS-Chem-TOMAS since Trivitayanurak et al. (2008). Gas-phase sulfuric acid concentrations arenow calculated using a pseudo-steady state approach for each time step (Pierce andAdams, 2009a). Nucleation is treated using either ternary nucleation (Napari et al.,5
2002) with a 10−5 tuning factor or activation nucleation (Sihto et al., 2006) with an Afactor of 2×10⁻⁶ s−1. We have chosen an A in the range found to be most atmospher-ically applicable based on measurements in the continental boundary layer (Sihto etal., 2006; Riipinen et al., 2007), however results are somewhat sensitive to the A factorchoice within reasonable bounds (Spracklen et al., 2009). The lower boundary on the10
size distribution of 1.1 nm allows for explicit simulation of the dynamics of fresh nuclei.The model saves size distributions at 30 min time steps at each of the five locations forcomparison against highly time resolved ambient measurements.
2.3 Ambient measurements
Table 1 outlines the five locations where we have obtained size distribution data; Pitts-15
burgh, Hyytiala, Atlanta, St. Louis, and San Pietro Capofiume (also referred to as PoValley from this point forward). These locations span a range of conditions, makingthe set a good test for a global aerosol microphysics model. For instance, growth atHyytiala is dominated by organic condensation (Riipinen et al., 2011), whereas at Pitts-burgh, sulfuric acid condensation is the leading mechanism for particle growth (Jung20
et al., 2010). Urban, polluted continental, and clean continental sites are represented,although the fact that 3 out of 5 sites are urban complicates comparison with a globalmodel. At each of the sites, size distribution measurements were made for at leastone continuous year with either a Scanning Mobility Particle Sizer (SMPS) or Differen-tial Mobility Particle Sizer (DMPS). Sulfuric acid measurements were made at Hyytiala25
using a Chemical Ionization Mass Spectrometer (CIMS) (Petaja et al., 2008). Time res-olution in the size distribution observations was typically finer than in the model output
8345

ACPD13, 8333–8386, 2013
Nucleation-CCNevaluation
D. M. Westervelt et al.
Title Page
Abstract Introduction
Conclusions References
Tables Figures
J I
J I
Back Close
Full Screen / Esc
Printer-friendly Version
Interactive Discussion
Discussion
Paper
|D
iscussionP
aper|
Discussion
Paper
|D
iscussionP
aper|
as all sites recorded measurements in no longer than 15 min intervals. Analysis of boththe ambient measurements and model output used the same procedure for calculatingnucleation relevant quantities (e.g. growth rates and survival probabilities) from sizedistribution data (see Sect. 2.5).
2.4 Simulations5
Simulations were performed over a time period coinciding with the times that the obser-vations were taken. This ability to perform near real time simulations is a strength of theassimilated meteorology employed by GEOS-Chem. Each of the years of comparisonare listed in Table 1. For Hyytiala, the year of comparison used is 2007. The Pittsburgh,Po Valley, Atlanta, and St. Louis measurement periods were all several years earlier10
ranging from 1999 to 2003. For each location, two simulations were performed reflect-ing the two nucleation schemes tested: ternary nucleation (Napari et al., 2002) with a10−5 tuning factor and activation nucleation (Sihto et al., 2006) in the boundary layercoupled with binary nucleation (Vehkamaki et al., 2002) elsewhere. Thus, in total weran 10 simulations for 14 months, which includes 2 months of model spinup. For each15
model grid cell corresponding to the location of the measurements, number size distri-bution and sulfuric acid concentration output was saved for analysis and comparisonwith measurements.
2.5 Nuclei fate analysis and CCN formation potential
To calculate nucleation rates and infer the fates of nucleated particles, we have modi-20
fied a series of nucleation dynamics codes for Hyytiala data referenced in Dal Maso etal. (2005). These codes, which have been modified slightly for use with TOMAS outputand other ambient datasets, calculate the following: formation rates of 3 nm particles,diameter growth rates, condensational and coagulational sinks, absolute number con-centration, particle survival probability, formation rates of 50 and 100 nm particles, and25
steady-state cloud condensation nuclei concentrations attributable to nucleation and
8346

ACPD13, 8333–8386, 2013
Nucleation-CCNevaluation
D. M. Westervelt et al.
Title Page
Abstract Introduction
Conclusions References
Tables Figures
J I
J I
Back Close
Full Screen / Esc
Printer-friendly Version
Interactive Discussion
Discussion
Paper
|D
iscussionP
aper|
Discussion
Paper
|D
iscussionP
aper|
growth events. The original Dal Maso et al. (2005) nucleation code relied mostly onvisual inspection of the nucleation events to determine start points and end points ofthe growing diameter trajectory. We have modified the code such that the ambiguity ofvisual determination is eliminated as the start and end points are now automated. Thefollowing sections outline the method of calculation for each of these metrics.5
2.5.1 Frequency of events
For nucleation event frequency, our methods are similar to those outlined in Dal Masoet al. (2005). The evolution of the particle size distribution over the course of the day(“banana plot”, Fig. 2) reveals some features that we use to identify nucleation events.First, a distinctly new nucleation mode (1–25 nm) of particles must appear in the size10
distribution. Secondly, the new mode must last at least 2 h and show signs of growth.Figure 2 shows example measured and modeled nucleation events. For example, atabout 14:00 UTC at Pittsburgh, PA, on 16 April 2002, a large number of 3 nm particleswere measured to appear and subsequently grow as evidenced by the red contours(black dashed line) moving up in both diameter space and time.15
2.5.2 Formation rate and growth rate
Formation rate (or nucleation rate) of 3 nm particles (J3) is calculated from the timederivative of nucleation mode number concentration (N3−25) with a coagulation correc-tion (Fcoag) representing scavenging of small particles by pre-existing aerosol (Eq. 1)and a condensation correction (Fgrowth) accounting for growth of particles out of the size20
range by condensation. Although the flux of particles out of the size range (Fgrowth) termis often neglected because particles may not grow beyond 25 nm during the nucleationburst (Dal Maso et al., 2005), we have included it here. The values of J3 are averagedover 24 h periods for consistency in comparisons (more details in Sect. 2.5.4). There-fore, all else being equal, a longer nucleation event will result in a higher average J325
value for that day compared to a shorter event. This facilitates subsequent analysis of
8347

ACPD13, 8333–8386, 2013
Nucleation-CCNevaluation
D. M. Westervelt et al.
Title Page
Abstract Introduction
Conclusions References
Tables Figures
J I
J I
Back Close
Full Screen / Esc
Printer-friendly Version
Interactive Discussion
Discussion
Paper
|D
iscussionP
aper|
Discussion
Paper
|D
iscussionP
aper|
the particle number budget and avoids the need for a semi-arbitrary determination ofprecisely when the nucleation event began and ended.
J3 =dN3−25
dt+ Fcoag + Fgrowth (1)
The size distribution function is integrated over the 3–25 nm size range to get the ab-solute number concentrations, which vary with time. The coagulation correction is the5
product of the 3–25 nm number concentration and the corresponding coagulation sink(described in Sect. 2.5.3) for a particular larger size, integrated across all particleslarger than 25 nm. Zhang et al. (2010a, b) compared observed nucleation rates at At-lanta to various model parameterizations in a similar manner as we have summarizedhere.10
Diameter growth rates (GR) are calculated by considering the peak of the size dis-tribution at 3 nm and 25 nm. We make a linear fit to the maximum value of the sizedistribution as it varies over time. The slope of the fitted line is the diameter growthrate. An additional growth rate is calculated for the 25 to 100 nm and 25 to 50 nm sizeranges for purposes of the condensational growth timescale calculation, explained in15
Sect. 2.5.3. Since the growth rate does not vary much within the nucleation or Aitkenmode for the modeled and measured nucleation events, this assumption is justified.
2.5.3 Coagulation and condensation sinks
Calculation of coagulational and condensational growth is adapted from the Probabil-ity of Ultrafine Growth (PUG) model, introduced by Pierce and Adams (2007). Loss of20
small nuclei by collisions with larger, pre-existing aerosol is the major pathway prevent-ing growth of nucleated particles to Aitken mode and larger sizes. The frequency ofcoagulational loss, CoagS (s−1), of particles of size i to a larger size j is dependent ona coagulation coefficient (Ki j ) and the number concentration in the larger size range,Nj (Eq. 2). Coagulation of particles of the same size is represented by the first term in25
Eq. (2). The CoagS term is both size and time dependent. In our calculations, we set8348

ACPD13, 8333–8386, 2013
Nucleation-CCNevaluation
D. M. Westervelt et al.
Title Page
Abstract Introduction
Conclusions References
Tables Figures
J I
J I
Back Close
Full Screen / Esc
Printer-friendly Version
Interactive Discussion
Discussion
Paper
|D
iscussionP
aper|
Discussion
Paper
|D
iscussionP
aper|
the initial size to either 1 or 3 nm (the lower size cutoff of the model and measurements,respectively) and calculate coagulation coefficients for all particles larger than size i .The coagulation coefficient is based on Fuchs equation (Seinfeld and Pandis, 2006).
CoagSi =12Ki iNi +
max∑j=i+1
Ki jNj (2)
The condensation sink describes the first-order rate of uptake of sulfuric acid or other5
condensable vapors to aerosols (Eq. 3). In the kinetic regime, the condensation sink isproportional to surface area and is proportional to particle diameter in the continuumregime.
CS = 2πDmax∑i=1
βiDpiNi (3)
In Eq. (3), the condensation sink (CS) is calculated from the gas-phase diffusion con-10
stant (D), particle diameter in size bin i (Dpi ), number concentration in size i (Ni ), andthe transition regime (connecting the kinetic and continuum regimes) correction factorβi , which is dependent on the Knudsen number (Seinfeld and Pandis, 2006). The con-densational growth timescale, not to be confused with condensation sink, is the timeit takes for a particle to grow to a size of interest. The coagulation timescale is the in-15
verse of the coagulation sink for a given size range. These two timescales (Eqs. 4 and5) are required for the survival probability calculation (Sect. 2.5.4). In physical terms,the timescales represent the amount of time it takes for particles in size range k togrow or be lost to larger sizes.
τcondk,k+1 =
Dp,k+1 −Dp,k
GRk,k+1(4)20
8349

ACPD13, 8333–8386, 2013
Nucleation-CCNevaluation
D. M. Westervelt et al.
Title Page
Abstract Introduction
Conclusions References
Tables Figures
J I
J I
Back Close
Full Screen / Esc
Printer-friendly Version
Interactive Discussion
Discussion
Paper
|D
iscussionP
aper|
Discussion
Paper
|D
iscussionP
aper|
τcoagk =
1
12K (Dp,k ,Dp,k)Nk +
kmax∑j=k+1
K (Dp,k ,Dp,j )Nj
(5)
In Eq. (5), similar to Eq. (2), the first term in the denominator represents self-coagulation of particles in the same size bin. The second term represents coagulationwith particles in larger size bins, up to the model or measurement maximum size, kmax.5
2.5.4 Survival probability and CCN formation
We define survival probability as the ratio of particle fluxes at the initial point of growth(typically J3) and the CCN-relevant size or endpoint of growth (Jn, with n = 50 or100 nm typically). Figure 1 highlights the sources and sinks of particles throughout nu-clei growth. Within our analysis, survival probability (SP) is calculated using two inter-10
mediate calculations of coagulational loss and condensational growth timescales. Bothtimescales (Eqs. 4 and 5), are calculated for nucleation mode as it grows with time.Similar to Kuang et al. (2009), we calculated a single survival probability for each nu-cleation event corresponding to the trajectory of particles following the maximum valueof the nucleation mode (dashed line in Fig. 2). Thus, for each timestep (30 min for the15
model, shorter for measurements) the instantaneous coagulational loss and conden-sational growth timescales are calculated. The overall survival probability, shown in Eq.(6), from size m to n (here, 3 to 100 nm or 3 to 50 nm), is calculated as the product ofindividual probabilities across smaller size ranges, represented by the exponential terminside of the product in Eq. (6). In physical terms, this method calculates the probability20
of nuclei growth from one discrete size (or section for model output) to the next largestsize. Taking the product of these individual probabilities yields a survival probabilityfrom fresh nuclei to CCN-relevant sizes.
8350

ACPD13, 8333–8386, 2013
Nucleation-CCNevaluation
D. M. Westervelt et al.
Title Page
Abstract Introduction
Conclusions References
Tables Figures
J I
J I
Back Close
Full Screen / Esc
Printer-friendly Version
Interactive Discussion
Discussion
Paper
|D
iscussionP
aper|
Discussion
Paper
|D
iscussionP
aper|
SPm,n =n−1∏k=m
exp
−τcondk,k+1
τcoagk
(6)
The formation rate of 100 nm particles (J100) is calculated as the 3 nm formation ratemultiplied by the survival probability from 3 to 100 nm (Eq. 7). Likewise, J50is calcu-lated as J3 multiplied by the survival probability to 50 nm. These two particle sizes arewithin the range of typical activation diameters for CCN concentrations. Although this5
method does not consider particle composition, under typical supersaturations, manyparticles of 50 or 100 nm in size will activate to CCN (Seinfeld and Pandis, 2005).For atmospheric conditions most typical for the indirect effect, stratiform clouds andmixed inorganic-organic particles, the 100 nm size is probably the most appropriateCCN surrogate (Seinfeld and Pandis, 2005). However, because few nucleation and10
growth events reach the 100 nm cutoff (n = 100 in Eq. 7) on the same day, an analysisfocusing on the 100 nm cutoff necessarily excludes a large number of useful observa-tions. Therefore, we also compare survival results for 50 nm (n = 50) between modeland observations, which is still CCN relevant and includes a larger number of events(see Table 5).15
Jn = SP3−nJ3 (7)
Because of large uncertainty and a lack of constraints on CCN lifetimes in the obser-vations, it is difficult to convert our CCN formation results into absolute CCN concen-trations. In the real atmosphere, a reasonable range might be between 1 and 7 days(Twomey and Wojciechowski, 1969). Clearly, this factor of 7 can be the determining20
factor for the CCN concentrations from nucleation and the corresponding fractionalcontribution to total CCN. We therefore leave our results as CCN formation rates ascalculated by Eq. (7).
8351

ACPD13, 8333–8386, 2013
Nucleation-CCNevaluation
D. M. Westervelt et al.
Title Page
Abstract Introduction
Conclusions References
Tables Figures
J I
J I
Back Close
Full Screen / Esc
Printer-friendly Version
Interactive Discussion
Discussion
Paper
|D
iscussionP
aper|
Discussion
Paper
|D
iscussionP
aper|
3 Results
Figure 2 shows sample boundary layer nucleation events in the ternary nucleationmodel and in the ambient observations. At Pittsburgh on 16 April, strong growth to80 nm is seen in the observations and in the ternary model. Figures 3 and 4 showresults for new particle formation event frequency, both on a yearly and monthly ba-5
sis. Figures 5–9 are cumulative distribution functions of nucleation and growth metricsfrom the year of simulations and observations separated by each site. The quantitieschosen for model-measurement comparison are formation rate (J3), growth rate (GR),survival probability from 3 nm to 50 and 100 nm (SP50 and SP100,respectively), and 50and 100 nm particle formation rates (J50 and J100). Each point in the CDF of a given10
nucleation metric represents one nucleation event (or one day) for that specific metric.These plots include only data and model output from the subset of days that are cat-egorized as nucleation events according to the methodology described in Sect. 2.5.1.For the CCN formation rate and survival probability panels of the CDF figures, dayswhere the nucleation mode does not grow to the particular cutoff size (50 or 100 nm)15
are not included in the figure. The number of these days for each site in the modeland the observations can be seen in Table 5. All formation rates (J3, J50, and J100) areaveraged over 24 h, as is explained in Sect. 2.5.4. They are, therefore, somewhat lowerthan instantaneous rates that may be more familiar to some researchers. For Hyytiala,where additional measurements are available, Figs. 10 and 11 add a few more metrics20
such as condensation sink, sulfuric acid concentrations, and speciated growth rates.Figure 12 summaries the biases in each nucleation metric for each site for each nucle-ation theory, ternary (with a 10−5 tuning factor) and activation.
3.1 Overview of model-measurement comparison results by location
At each site, event frequency (Fig. 3) is predicted well by both the ternary and acti-25
vation model cases. The bars represent number of events and the percentages overthe bars represent the number of specific days that are correctly modelled as either
8352

ACPD13, 8333–8386, 2013
Nucleation-CCNevaluation
D. M. Westervelt et al.
Title Page
Abstract Introduction
Conclusions References
Tables Figures
J I
J I
Back Close
Full Screen / Esc
Printer-friendly Version
Interactive Discussion
Discussion
Paper
|D
iscussionP
aper|
Discussion
Paper
|D
iscussionP
aper|
events or non-events. Among the five stations, the scaled ternary simulation missesthe exact number of events over the year by as few as 2 days and as many as 27days. The ternary simulation underpredicts at Pittsburgh and Hyytiala but overpredictsat the other three sites. The largest discrepancies come in the overprediction at St.Louis and Atlanta. These two locations are generally “urban background” sites that are5
difficult for the coarse-resolution model to represent accurately. Despite these difficul-ties, the model is able to get within 25 % and 18 % of the observed frequency of eventsat St. Louis and Atlanta, respectively. The activation simulation tends to be more in-accurate than the ternary simulation (off by 7 to 75 days across the five stations) andis also mixed in its underprediction and overprediction. The biggest model error (7510
days overprediction) comes at Atlanta, where the activation nucleation theory performsmuch worse than the scaled ternary simulation.
The numbers above the bars in Fig. 3 show the percentage of exact days that arecorrectly modelled as either events or non-events. Again, the model does best at Pitts-burgh and Hyytiala, where about 64 % and 62 % out of the 365 days in the year are15
accurately modeled as event or non-events. For these predictions to be accurate, sev-eral prior model quantities not shown here, such as precipitation, cloud cover, andsulfur dioxide concentrations, must also be accurately predicted.
Figure 4 shows the seasonal breakdown of events on a month by month basis. Ingeneral, the model shows mixed performance in following the seasonal trend, with20
Hyytiala showing the closest correlation (R = 0.83, ternary). The model performs betterhere than any other site, which may be because the activation nucleation parameteri-zation was developed with data from Hyytiala, although the scaled ternary formulationalso performs well here. Additionally, spatial homogeneity and the lack of strong localsources at Hyytiala also probably play a role. For models with coarse spatial resolution,25
spatially homogenous sites such as Hyytiala make for ideal comparisons. Another pos-sibility is the use of the more recent GEOS-5 meteorological fields at Hyytiala, whichwere not used at any of the other sites. At Pittsburgh (R = 0.23, ternary), events areoverpredicted in the early winter months (January–March), but underpredicted in the
8353

ACPD13, 8333–8386, 2013
Nucleation-CCNevaluation
D. M. Westervelt et al.
Title Page
Abstract Introduction
Conclusions References
Tables Figures
J I
J I
Back Close
Full Screen / Esc
Printer-friendly Version
Interactive Discussion
Discussion
Paper
|D
iscussionP
aper|
Discussion
Paper
|D
iscussionP
aper|
fall months (September–November). Overprediction in the early winter months appearsto be a common theme among other locations as well. The model does quite well in thespring and summer months, with near exact prediction in April and May at Pittsburgh.Results for June in Pittsburgh are missing because of instrument failure and data loss.St. Louis and Atlanta show surprisingly similar behavior in the model; nucleation events5
are at maximum in the winter and minimum during the summer months. This behav-ior appears to be occurring at other locations within the model as well and is at leastsomewhat representative of observed seasonal trends at Atlanta and St. Louis (R ∼ 0.6for both, ternary). Although one might expect nucleation primarily in the summertimedue to enhanced photochemical activity and greater availability of biogenic VOC pre-10
cursors, colder temperatures favor nucleation in the wintertime (Dal Maso et al., 2005).At Hyytiala Pittsburgh, and Po Valley the strong nucleation in spring and fall may resultfrom the balance between these two factors. Seasonal variations in prevailing wind di-rection, boundary layer height and cloudiness may also be important in some locations(Jaatinen et al., 2009). The observed seasonal cycle of nucleation is an important test15
of the models that requires further attention.Figures 5 through 9 show the modelled and measured comparisons for each of the
nucleation and growth metrics. Each figure contains comparisons for one year of nu-cleation events at a specific location: Pittsburgh, Hyytiala, Atlanta, St. Louis, and PoValley. Tables 2 and 3 show the median and mean values of each metric. Table 420
shows mean, median, and log-mean normalized biases (LMNB, the average number oforders-of-magnitude error) for additional modelled and measured quantities ([H2SO4],CS, CoagS) at Hyytiala. Table 5 shows total number of events at each site as well asthe subset of those events in which particles grew to the cutoff diameters of 50 and100 nm.25
As an example of the model-measurement comparison cumulative distribution func-tions (CDF), Fig. 5 shows results for Pittsburgh. Cumulative frequency is plotted againstthe specific nucleation metric for the observations, scaled ternary simulation, andactivation simulation. Overall, both the ternary and activation model agree well with
8354

ACPD13, 8333–8386, 2013
Nucleation-CCNevaluation
D. M. Westervelt et al.
Title Page
Abstract Introduction
Conclusions References
Tables Figures
J I
J I
Back Close
Full Screen / Esc
Printer-friendly Version
Interactive Discussion
Discussion
Paper
|D
iscussionP
aper|
Discussion
Paper
|D
iscussionP
aper|
observations at Pittsburgh (red trace in Fig. 5), as evidenced by the tight agreementin the CDFs and values of means and medians (Tables 2 and 3). For example, themedian growth rate of 2.8 nm h−1 at Pittsburgh is accurately predicted by the ternarymodel (3.1 nm h−1) and activation (3.2 nm h−1). Median 3 nm formation rates (J3) areunderpredicted by almost a factor of 3 in the scaled ternary simulation but only by 22 %5
in the activation simulation. The accurate survival probability (SP100) prediction at Pitts-burgh (Fig. 5f) benefits from an underprediction in coagulation frequency, although themodel fails to capture the strongest survival events. This is consistent with the tail ofthe growth rate CDF (panel B), in which a few events reach upwards of 18 nm h−1 in theobservations but never surpass ∼12 nm h−1 in the two model scenarios. The modelled10
formation rates of CCN-sized particles (panels C and E) are generally in agreementwith the measurements. However, some deviations exist, particularly with the activa-tion and binary coupled nucleation simulation, which fails to predict the observed 50 nmformation rate (J50) throughout most of the distribution. Additionally, both mechanismsfail at predictions of 100 nm formation rates (J100) at values of about 0.005 cm−3 s−1
15
and lower (panel E). It should be noted, however, that these are among the weakernucleation and growth events that are being underpredicted. For values larger than0.005 cm−3 s−1, nucleation will contribute appreciable amounts of CCN to the total bud-get, and the model largely is accurate in this regime.
Figures 6 through 9 show the comparisons of the same metrics at Hyytiala, Atlanta,20
St. Louis, and the Po Valley. One particularly interesting result is the modelled and mea-sured growth rates at Hyytiala (Fig. 6b). Despite a relatively simple treatment of SOA inthe global model, growth rates at the organic-dominated location are not severly under-predicted by TOMAS with either the ternary or activation nucleation schemes. Medianmodelled values are 1.7 nm h−1 and 2.0 nm h−1 compared to 2.8 nm h−1 observed. Al-25
though we are on the lower end of expected global SOA formation (19 Tg yr−1), thecompletely non-volatile treatment of organics favors condensation onto the freshly nu-cleated particles (Riipinen et al., 2011). These inaccuracies may offset one anotherand result in modelled growth rates closer to observed. The growth rate in the model is
8355

ACPD13, 8333–8386, 2013
Nucleation-CCNevaluation
D. M. Westervelt et al.
Title Page
Abstract Introduction
Conclusions References
Tables Figures
J I
J I
Back Close
Full Screen / Esc
Printer-friendly Version
Interactive Discussion
Discussion
Paper
|D
iscussionP
aper|
Discussion
Paper
|D
iscussionP
aper|
driven mainly by organic condensation and not by sulfuric acid (Fig. 11). Additionally,the good model performance at Hyytiala may be because it is a biogenic SOA domi-nated site, which is probably better represented in the global model when comparedto anthropogenic SOA. Section 3.3 has additional comments on the speciated growthrate results, summarized for all of the five locations in Fig. 11.5
In the comparisons for Atlanta in Fig. 7, we see worse model-measurement agree-ment than at Hyytiala or Pittsburgh, particularly in the formation rates in panels A andC. Formation rates of 100 nm particles are underpredicted by up to a factor of 5 andthe discrepancy is similar for 3 and 50 nm formation. Figure 8 shows that comparisonsat St. Louis are also worse than Hyytiala or Pittsburgh for most metrics, especially the10
formation rate comparisons (panels C and E) which are generally underpredicted bythe model by as much as a factor of 2. Finally, Fig. 9 (Po Valley) has some of the high-est observed growth rates, and both nucleation simulations in the model capture thiswell (Fig. 9b). Accordingly, this site is also on the high end of survival probability and100 nm formation rate (J100). This is consistent with Laaksonen et al. (2005), which15
found fast growth, high survival and high CCN formation at San Pietro Capofiume, Italy(Po Valley).
3.2 Sulfuric acid, condensation sink, and coagulation sink
Sulfuric acid measurements were available at Hyytiala, and the comparison with modelvalues is shown in Fig. 10a along with condensation sink (panel B) and coagulation20
sink (panel C). Table 4 shows summary statistics for these extra nucleation met-rics. Only daily maximum sulfuric acid values are plotted in panel A. Included areboth nucleation event and non-event days in all three plots. Generally, sulfuric acidis accurately predicted in the ternary model as the median values agree within about40 %. However, for the concentrations characteristic of nucleation events (approach-25
ing 106 molecules cm−3 and larger), both model scenarios overpredict the observedvalues by at least a factor of three, as evidenced by the large differences in meanvalues but not medians (indicating a skewed distribution). Shown in Fig. 10b is the
8356

ACPD13, 8333–8386, 2013
Nucleation-CCNevaluation
D. M. Westervelt et al.
Title Page
Abstract Introduction
Conclusions References
Tables Figures
J I
J I
Back Close
Full Screen / Esc
Printer-friendly Version
Interactive Discussion
Discussion
Paper
|D
iscussionP
aper|
Discussion
Paper
|D
iscussionP
aper|
comparison between model and measured condensation sink. The modelled conden-sation sink is biased slightly low in the activation simulation (see Table 4), which mayreflect a weakness in the model’s representation of pre-existing, background accumu-lation mode aerosol. However, this small bias does not seem to be strong enoughto compromise many of our nucleation metric evaluations. In the scaled ternary sim-5
ulation, CS is skewed higher in the model, especially at larger condensation sinks,perhaps indicating a strong feedback between nucleation rates and condensation sink.Panel C of Fig. 10 is the CDF of coagulational sink of 3 nm particles. The ternary andactivation simulations show fair agreement with small positive bias. The differencesin model-measurement agreement between the condensation and coagulation sinks10
are due to the growing nucleation mode making a significant contribution to the con-densation sink (particularly in the ternary simulations) but a smaller contribution to thecoagulation sink (only particles larger than the growing nucleation mode contribute tothe coagulation sink).
3.3 Contributions of organics to modelled and measured particle growth15
We also analyzed the relative contributions of sulfuric acid and low volatility organicvapors to the growth of nucleated particles in order to test whether the model underpre-dicts the SOA contribution to the growth rate. Figure 11 shows the annually averagedspeciated growth rate for all sites. Sulfuric acid measurements were only available tous at Hyytiala. As a result, only observations at Hyytiala are broken down by organic or20
sulfuric acid growth. Total (nonspeciated) growth rate is instead plotted for the four othersites (yellow bars with green stripes in Fig. 11). The measurements at Hyytiala and themodel at most locations (Hyytiala, St. Louis, Po Valley, and Atlanta) show a strong or-ganic component in what is condensing and causing particle growth. Sulfuric acid isnot particularly an important component of the growth rate at Hyytiala, but is more im-25
portant for nucleation rates and frequency of events. This is consistent with findings inRiipinen et al. (2011). In contrast, Pittsburgh is the only site where more than 50 % ofthe growth rate is due to sulfuric acid and not organics. This is realistic for Pittsburgh,
8357

ACPD13, 8333–8386, 2013
Nucleation-CCNevaluation
D. M. Westervelt et al.
Title Page
Abstract Introduction
Conclusions References
Tables Figures
J I
J I
Back Close
Full Screen / Esc
Printer-friendly Version
Interactive Discussion
Discussion
Paper
|D
iscussionP
aper|
Discussion
Paper
|D
iscussionP
aper|
a location heavily impacted by power plant emissions (Stanier et al., 2004). Althoughorganics contribute the majority of the growth rate at Atlanta, St. Louis, and Po Valley,still roughly 30–40 % of the growth rate appears to result from sulfuric acid condensa-tion. This is likely not realistic for Atlanta in particular, which shows a strong organicsignature in the growth rate (Kuang et al., 2009). For the Po Valley, recent observations5
suggest a larger contribution of organics than predicted by the model (Paasonen et al.,2010), although these measurements refer to three case studies with very high growthrates (9.5 nm h−1). Though we cannot make definitive statements without additionaldata, it appears as if the model might modestly underpredict organic condensation inat least some locations, Atlanta in particular. It is possible that a missing source of SOA10
is potentially causing this underprediction. However, the model underpredicts organiccondensation only slightly at Hyytiala, which is the only location where we can make avalid comparison. Organic condensation has been shown to contribute up to 90 % ofgrowth rates at Mexico City (Smith et al., 2008), a level that is achieved at Hyytiala butnot any of our other 4 test locations.15
4 Conclusions
We have presented a novel approach for evaluating aerosol models against observa-tions of boundary layer nucleation, growth and CCN formation. Despite limitations inthe nucleation and SOA parameterizations used in the model, we find that the globalmodel, GEOS-Chem-TOMAS, does an acceptable job of reproducing observed bound-20
ary layer nucleation and growth events at the locations used in this study. A strength ofthe approach is that it compares a large number of nucleation and growth metrics (J3,GR, coagulation and condensation sinks, etc.), which should help isolate individualprocesses biasing model predictions. The methodology presented for analyzing sizedistribution data applies to both measured and modelled size distribution output, and25
should be a useful tool for future studies. It builds on earlier methods presented in DalMaso et al. (2005) and survival probability analysis in Pierce and Adams (2007), Kuang
8358

ACPD13, 8333–8386, 2013
Nucleation-CCNevaluation
D. M. Westervelt et al.
Title Page
Abstract Introduction
Conclusions References
Tables Figures
J I
J I
Back Close
Full Screen / Esc
Printer-friendly Version
Interactive Discussion
Discussion
Paper
|D
iscussionP
aper|
Discussion
Paper
|D
iscussionP
aper|
et al. (2009), and Kerminen et al. (2005). In addition, we have advanced the analysisperformed by these previous authors by (1) analyzing longer datasets to get a clima-tology of nucleation-relevant parameters and (2) estimating the survival probability andCCN formation rates (Eqs. 6 and 7). Together, these steps allow for a broader exam-ination of nucleation events within the context of global CCN formation. We apply the5
method to 5 datasets and corresponding model runs with two sets of commonly usednucleation parameterizations.
Figure 12 summarizes our model-measurement comparison succinctly. For each siteand each metric, we plot the log-mean-normalized bias value (LMNB). LMNB is the av-erage number of orders of magnitude error, e.g. a value of −0.3 means that the model10
underpredicts the measurements by about a factor of 2. It is clear that the model tendsto underpredict most metrics as all but 10 of the bars in Fig. 12 fall at or below thedashed zero bias line. However, model predictions of quantities such as event fre-quency, nucleation rate, growth rate, and particle survival to CCN are within a factorof 2 when compared to quantities inferred directly from observations. More often, bi-15
ases are within 50 % (for example, growth rates at Pittsburgh and Hyytiala, green andred bars in Fig. 12). Rarely, factor of 5 or larger discrepancies are observed, as is thecase with nucleation rates (J3) at Atlanta and St. Louis (yellow and brown bars) wherethe model cannot resolve the sub-grid chemistry and physics in these urban locations.Given the gaps in our knowledge of nucleation and secondary organic aerosol, the20
modelled aerosol dynamics, SOA treatment, and nucleation theories perform reason-ably well.
Median and mean survival probabilities to 100 nm (within a single day) are no morethan six percent in the model and the measurements. Although this seems to be indisagreement with other observational studies that report survival probabilities of up to25
20 and 25 % (Kuang et al., 2009; Pierce et al., 2012), those studies did not consider along enough climatology of nucleation events including more “ordinary” events that donot yield fast enough growth rates. In contrast, more nucleation events reach the 50 nmcutoff and survival probabilities span the entire range from 0 to 1, as is expected.
8359

ACPD13, 8333–8386, 2013
Nucleation-CCNevaluation
D. M. Westervelt et al.
Title Page
Abstract Introduction
Conclusions References
Tables Figures
J I
J I
Back Close
Full Screen / Esc
Printer-friendly Version
Interactive Discussion
Discussion
Paper
|D
iscussionP
aper|
Discussion
Paper
|D
iscussionP
aper|
Growth rates were shown to be mostly dominated by organic species in both the modeland the measurements at Hyytiala. Condensation and coagulation sinks were bothoverpredicted and underpredicted in the model cases, although not by a large enoughamount to significantly impact the nucleation metric calculations.
The overall success of the model does not imply that the current parameterizations5
are accurate representations of the real chemistry, only that the model tends to getan acceptable result on average. A better understanding of the nucleation mechanismshould, in principle, lead to better model skill. Model predictions may benefit from for-tuitous “error cancelling”. For example, the model may underestimate how much sec-ondary organic material is available for condensation, but we treat secondary organic10
aerosol as non-volatile, which maximizes how much material will remain in the con-densed phase and cause particles to grow (Riipinen et al., 2011). Additionally, modelpredictions benefit from buffering in the aerosol microphysics system. For example, anoverprediction of nucleation would contribute to an overprediction of condensation andcoagulation sinks, which lead to lower growth rates, faster coagulational loss rates and15
lower survival probabilities. Thus, the formation of CCN-sized particles from nucleation(which is the product of the nucleation rate and survival probability) generally has lesserror than the error in the nucleation rate itself.
Because the model accuracy was found to be reasonable across the metrics formost locations, our results provide justification for the use of global models as tools for20
assessing the role of nucleation in the particle number and CCN budgets. We leaveimproved CCN contribution estimates and sensitivity studies for future work, which cannow utilize the tested and evaluated GEOS-Chem-TOMAS global aerosol model. Thegenerality of our conclusions would benefit from more detailed measurements in manyparts of the atmosphere. Future modelling studies will especially benefit from long-term25
nucleation observations at rural or background locations, which provide ideal test con-ditions for coarse resolution global aerosol models. Lastly, since these results dependon long-term ground observations, we reiterate that the contributions of nucleation toCCN derived here reflect only the effect of nucleation and growth in the boundary layer.
8360

ACPD13, 8333–8386, 2013
Nucleation-CCNevaluation
D. M. Westervelt et al.
Title Page
Abstract Introduction
Conclusions References
Tables Figures
J I
J I
Back Close
Full Screen / Esc
Printer-friendly Version
Interactive Discussion
Discussion
Paper
|D
iscussionP
aper|
Discussion
Paper
|D
iscussionP
aper|
Models (Pierce et al., 2009b) and observations (Clarke et al., 1999) suggest that nu-cleation is frequent in the free troposphere and that they may contribute more to CCNthan boundary layer nucleation (Merikanto et al., 2009).
Acknowledgements. This research was pursued with funds from the US Environmental Pro-tection Agency under EPA Agreement RD-83337401-0. We would like to thank the Markku Kul-5
mala research group for access to data (HYY). We would also like to thank Peter McMurry (ATL,STL), Ari Laaksonen (SPC), and Spyros Pandis (PGH) for access to their datasets. We alsothank Peter McMurry and Stefano Decesari for helpful comments on the manuscript. Finally,we would like to thank Tuuka Petaja for the sulfuric acid measurements at Hyytiala.
References10
Adams, P. J. and Seinfeld, J. H.: Predicting global aerosol size distributions in general circulationmodels, J. Geophys. Res.-Atmos., 107, 4370, doi:10.1029/2001jd001010, 2002.
Albrecht, B.: Aerosols, Cloud Microphysics, and Fractional Cloudiness, Science, 245, 1227–1230, doi:10.1126/science.245.4923.1227, 1989.
Auvray, M. and Bey, I.: Long-range transport to Europe: Seasonal variations and implications for15
the European ozone budget, J. Geophys. Res., 110, D11303, doi:10.1029/2004JD005503,2005.
Ball, S. M., Hanson, D. R., Eisele, F. L., and McMurry, P. H.: Laboratory studies of particlenucleation: Initial results for H2SO4, H2O, and NH3 vapors, J. Geophys. Res., 104, 23709–23718, doi:199910.1029/1999JD900411, 1999.20
Berndt, T., Boge, O., Stratmann, F., Heintzenberg, J., and Kulmala, M.: Rapid Forma-tion of Sulfuric Acid Particles at Near-Atmospheric Conditions, Science, 307, 698–700,doi:10.1126/science.1104054, 2005.
Bey, I., Jacob, D. J., Yantosca, R. M., Logan, J. A., Field, B. D., Fiore, A. M., Li, Q. B., Liu,H. G. Y., Mickley, L. J., and Schultz, M. G.: Global modeling of tropospheric chemistry with25
assimilated meteorology: Model description and evaluation, J. Geophys. Res., 106, 23073–23095, 2001.
Bzdek, B. R., Ridge, D. P., and Johnston, M. V.: Amine exchange into ammonium bisulfate andammonium nitrate nuclei, Atmos. Chem. Phys., 10, 3495–3503, doi:10.5194/acp-10-3495-2010, 2010.30
8361

ACPD13, 8333–8386, 2013
Nucleation-CCNevaluation
D. M. Westervelt et al.
Title Page
Abstract Introduction
Conclusions References
Tables Figures
J I
J I
Back Close
Full Screen / Esc
Printer-friendly Version
Interactive Discussion
Discussion
Paper
|D
iscussionP
aper|
Discussion
Paper
|D
iscussionP
aper|
Clarke, A. D., Eisele, F., Kapustin, V. N., Moore, K., Tanner, D., Mauldin, L., Litchy, M.,Lienert, B., Carroll, M. A., and Albercook, G.: Nucleation in the equatorial free tropo-sphere: Favorable environments during PEM-Tropics, J. Geophys. Res., 104, 5735–5744,doi:10.1029/98JD02303, 1999.
Dal Maso, M., Kulmala, M., Lehtinen, K. E. J., Makela, J. M., Aalto, P., and O’Dowd, C. D.:5
Condensation and coagulation sinks and formation of nucleation mode particles in coastaland boreal forest boundary layers, J. Geophys. Res., 107, 8097, doi:10.1029/2001JD001053,2002.
Dal Maso, M., Kulmala, M., Riipinen, I., Wagner, R., Hussein, T., Aalto, P. P., and Lehtinen,K. E. J.: Formation and growth of fresh atmospheric aerosols: eight years of aerosol size10
distribution data from SMEAR II, Hyytiala, Finland, Boreal Env. Res., 10, 323–336, 2005.Donahue, N. M., Robinson, A. L., Stanier, C. O., and Pandis, S. N.: Coupled Partitioning,
Dilution, and Chemical Aging of Semivolatile Organics, Env. Sci. Tech., 40, 2635–2643,doi:10.1021/es052297c, 2006.
Erupe, M. E., Benson, D. R., Li, J., Young, L., Verheggen, B., Al-Refai. M., Tahboub, O., Cun-15
ningham, C., Frimpong, F., Viggiano, A. A., and Lee, S.: Correlation of aerosol nucleationrate with sulfuric acid and ammonia in Kent, Ohio: An atmospheric observation, J. Geophys.Res., 115, D23216, doi:10.1029/2010JD013942, 2010.
Facchini, M. C., Mircea, M., Fuzzi, S., and Charlson, R. J.: Cloud albedo enhancement bysurface-active organic solutes in growing droplets, Nature, 401, 257–259, 1999.20
Gagne, S., Laakso, L., Petaja, T., Kerminen, V., and Kulmala, M.: Analysis of one year of IonDMPS data from the SMEAR II station, Finland, Tellus B, 60, 318–329, doi:10.1111/j.1600-0889.2008.00347.x, 2008.
Gagne, S., Nieminen, T., Kurten, T., Manninen, H. E., Petaja, T., Laakso, L., Kerminen, V.-M.,Boy, M., and Kulmala, M.: Factors influencing the contribution of ion-induced nucleation in a25
boreal forest, Finland, Atmos. Chem. Phys., 10, 3743–3757, doi:10.5194/acp-10-3743-2010,2010a.
Gong, Y., Hu, M., Cheng, Y., Su, H., Yue, D., Liu, F., Wiedensohler, A., Wang, Z., Kalesse, H.,Liu, S., Wu, F., Xiao, K., Mi, P., and Zhang, Y.: Competition of coagulation sink and sourcerate: New particle formation in the Pearl River Delta of China, Atmos. Environ., 54, 3278–30
3285, doi:10.1016/j.atmosenv.2010.05.049, 2010b.Guenther, A., Karl, T., Harley, P., Wiedinmyer, C., Palmer, P. I., and Geron, C.: Estimates
of global terrestrial isoprene emissions using MEGAN (Model of Emissions of Gases and
8362

ACPD13, 8333–8386, 2013
Nucleation-CCNevaluation
D. M. Westervelt et al.
Title Page
Abstract Introduction
Conclusions References
Tables Figures
J I
J I
Back Close
Full Screen / Esc
Printer-friendly Version
Interactive Discussion
Discussion
Paper
|D
iscussionP
aper|
Discussion
Paper
|D
iscussionP
aper|
Aerosols from Nature), Atmos. Chem. Phys., 6, 3181–3210, doi:10.5194/acp-6-3181-2006,2006.
Hand, J. L., Kreidenweis, S. M., Sherman, D. E., Collett Jr., J. R., Hering, S. V., Day, D. E.,and Malm, W. C.: Aerosol size distributions and visibility estimates during the Big Bend re-gional aerosol and visibility observational (BRAVO) study, Atmos. Environ., 36, 5043–5055,5
doi:10.1016/S1352-2310(02)00568-X, 2002.Jaatinen, A., Hamed, A., Joutsensaari, J., Mikkonen, S., Birmili, W., Wehner, B., Spindler, G.,
Wiedensohler, A., Decesari, S., Mircea, M., Facchini, M. C., Junninen, H., Kulmala, M., Lehti-nen, K. E. J., and Laaksonen, A.: A comparison of new particle formation events in theboundary layer at three different sites in Europe, Boreal Env. Res., 14, 481–498, 2009.10
Jung, J., Fountoukis, C., Adams, P. J., and Pandis, S. N.: Simulation of in situ ultrafine particleformation in the eastern United States using PMCAMx-UF, J. Geophys. Res., 115, D03203,doi:10.1029/2009JD012313, 2010.
Jung, J. G., Pandis, S. N., and Adams, P. J.: Evaluation of nucleation theories in a sulfur-richenvironment, Aerosol Sci. Tech., 45, 495–504, 2008.15
Kanakidou, M., Seinfeld, J. H., Pandis, S. N., Barnes, I., Dentener, F. J., Facchini, M. C., VanDingenen, R., Ervens, B., Nenes, A., Nielsen, C. J., Swietlicki, E., Putaud, J. P., Balkanski, Y.,Fuzzi, S., Horth, J., Moortgat, G. K., Winterhalter, R., Myhre, C. E. L., Tsigaridis, K., Vignati,E., Stephanou, E. G., and Wilson, J.: Organic aerosol and global climate modelling: a review,Atmos. Chem. Phys., 5, 1053–1123, doi:10.5194/acp-5-1053-2005, 2005.20
Kazil, J., Stier, P., Zhang, K., Quaas, J., Kinne, S., O’Donnell, D., Rast, S., Esch, M., Fer-rachat, S., Lohmann, U., and Feichter, J.: Aerosol nucleation and its role for clouds andEarth’s radiative forcing in the aerosol-climate model ECHAM5-HAM, Atmos. Chem. Phys.,10, 10733–10752, doi:10.5194/acp-10-10733-2010, 2010.
Kerminen, V.-M. and Kulmala, M: Analytical formulae connecting the “real” and the “apparent”25
nucleation rate and the nuclei number concentration for atmospheric nucleation events, J.Aerosol Sci., 33, 609–622, doi:10.1016/S0021-8502(01)00194-X, 2002.
Kerminen, V.-M., Lihavainen, H., Komppula, M., Viisanen, Y., and Kulmala, M.: Direct observa-tional evidence linking atmospheric aerosol formation and cloud droplet activation, Geophys.Res. Lett., 32, L14803, doi:10.1029/2005GL023130, 2005.30
Kuang, C., McMurry, P. H., McCormick, A. V., and Eisele, F. L.: Dependence of nucleation rateson sulfuric acid vapor concentration in diverse atmospheric locations. J. Geophys. Res., 113,D10209, doi:10.1029/2007JD009253, 2008.
8363

ACPD13, 8333–8386, 2013
Nucleation-CCNevaluation
D. M. Westervelt et al.
Title Page
Abstract Introduction
Conclusions References
Tables Figures
J I
J I
Back Close
Full Screen / Esc
Printer-friendly Version
Interactive Discussion
Discussion
Paper
|D
iscussionP
aper|
Discussion
Paper
|D
iscussionP
aper|
Kuang, C., McMurry, P. H., and McCormick, A. V.: Determination of cloud condensation nucleiproduction from measured new particle formation events, Geophys. Res. Lett., 36, L09822,doi:10.1029/2009GL037584, 2009.
Kulmala, M., Pirjola, L., and Makela, J. M.: Stable sulphate clusters as a source of new atmo-spheric particles, Nature, 404, 66–69, doi:10.1038/35003550, 2000.5
Kulmala, M., Vehkamaki, H., Petaja, T., Dal Maso, M., Lauri, A., Kerminen, V. M., Birmili, W.,and McMurry, P. H.: Formation and growth rates of ultrafine atmospheric particles: a reviewof observations, J. Aerosol Sci., 35, 143–176, doi:10.1016/j.jaerosci.2003.10.003, 2004.
Kulmala, M., Riipinen, I., Sipila, M., Manninen, H. E., Petaja, T., Junninen, H., Maso, M. D.,Mordas, G., Mirme, A., Vana, M., Hirsikko, A., Laakso, L., Harrison, R. M., Hanson, I. Le-10
ung, C., Lehtinen, K. E., and Kerminen, V. M.: Toward Direct Measurement of AtmosphericNucleation, Science, 318, 89–92, doi:10.1126/science.1144124, 2007.
Kurten, T., Loukonen, V., Vehkamaki, H., and Kulmala, M.: Amines are likely to enhance neu-tral and ion-induced sulfuric acid-water nucleation in the atmosphere more effectively thanammonia, Atmos. Chem. Phys., 8, 4095–4103, doi:10.5194/acp-8-4095-2008, 2008.15
Laakso, L., Gagne, S., Petaja, T., Hirsikko, A., Aalto, P. P., Kulmala, M., and Kerminen, V.-M.: Detecting charging state of ultra-fine particles: instrumental development and ambientmeasurements, Atmos. Chem. Phys., 7, 1333–1345, doi:10.5194/acp-7-1333-2007, 2007.
Laaksonen, A., Hamed, A., Joutsensaari, J., Hiltunen, L., Cavalli, F., Junkermann, W.,Asmi, A. Fuzzi, S., and Facchini, M. C.: Cloud condensation nucleus production20
from nucleation events at a highly polluted region, Geophys. Res. Lett., 32, L06812,doi:10.1029/2004GL022092, 2005.
Lee, Y. H., Chen, K., and Adams, P. J.: Development of a global model of mineral dust aerosolmicrophysics, Atmos. Chem. Phys., 9, 2441–2458, doi:10.5194/acp-9-2441-2009, 2009.
Makela, J. M., Aalto, P., Jokinen, V., Pohja, T., Nissinen, A., Palmroth, S., Markkanen,25
T., Seitsonen, K., Lihavainen, H., and Kulmala, M.: Observations of ultrafine aerosolparticle formation and growth in boreal forest, Geophys. Res. Lett., 24, 1219–1222,doi:199710.1029/97GL00920, 1997.
Makkonen, R., Asmi, A., Korhonen, H., Kokkola, H., Jarvenoja, S., Raisanen, P., Lehtinen, K.E. J., Laaksonen, A., Kerminen, V.-M., Jarvinen, H., Lohmann, U., Bennartz, R., Feichter,30
J., and Kulmala, M.: Sensitivity of aerosol concentrations and cloud properties to nucleationand secondary organic distribution in ECHAM5-HAM global circulation model, Atmos. Chem.Phys., 9, 1747–1766, doi:10.5194/acp-9-1747-2009, 2009.
8364

ACPD13, 8333–8386, 2013
Nucleation-CCNevaluation
D. M. Westervelt et al.
Title Page
Abstract Introduction
Conclusions References
Tables Figures
J I
J I
Back Close
Full Screen / Esc
Printer-friendly Version
Interactive Discussion
Discussion
Paper
|D
iscussionP
aper|
Discussion
Paper
|D
iscussionP
aper|
Manninen, H. E., Nieminen, T., Riipinen, I., Yli-Juuti, T., Gagne, S., Asmi, E., Aalto, P. P.,Petaja, T., Kerminen, V.-M., and Kulmala, M.: Charged and total particle formation and growthrates during EUCAARI 2007 campaign in Hyytiala, Atmos. Chem. Phys., 9, 4077–4089,doi:10.5194/acp-9-4077-2009, 2009.
Merikanto, J., Napari, I., Vehkamaki, H., Anttila, T., and Kulmala, M.: New parameterization of5
sulfuric acid-ammonia-water ternary nucleation rates at tropospheric conditions, J. Geophys.Res., 112, D15207, doi:200710.1029/2006JD007977, 2007.
Merikanto, J., Spracklen, D. V., Mann, G. W., Pickering, S. J., and Carslaw, K. S.: Impact ofnucleation on global CCN, Atmos. Chem. Phys., 9, 8601–8616, doi:10.5194/acp-9-8601-2009, 2009.10
Napari, I., Kulmala, M., and Vehkamaki, H.: Ternary nucleation of inorganic acids, ammonia,and water, J. Chem. Phys., 117, 8418–8425, doi:10.1063/1.1511722, 2002.
Nenes, A., Charlson, R. J., Facchini, M. C., Kulmala, M., Laaksonen, A., and Seinfeld, J. H.:Can chemical effects on cloud droplet number rival the first indirect effect?, Geophys. Res.Lett., 29, 1848, doi:10.1029/2002GL015295, 2002.15
Olivier, J. G. J., Bouwman, A. F., Van der Maas, C. W. M., Berdowski, J. J. M., Veldt, C., Bloos,J. P. J., Visschedijk, A. J. H., Zandveld, P. Y. J., and Haverlag, J. L.: Description of EDGARVersion 2.0: A set of global emission inventories of greenhouse gases and ozone-depletingsubstances for all anthropogenic and most natural sources on a per country basis and on1×1 grid. National Institute of Public Health and the Environment (RIVM) report no. 77106020
002. Netherlands Organization for Applied Scientific Research (TNO), 1996.Paasonen, P., Nieminen, T., Asmi, E., Manninen, H. E., Petaja, T., Plass-Dulmer, C., Flentje, H.,
Birmili, W., Wiedensohler, A., Horrak, U., Metzger, A., Hamed, A., Laaksonen, A., Facchini,M. C., Kerminen, V.-M., and Kulmala, M.: On the roles of sulphuric acid and low-volatilityorganic vapours in the initial steps of atmospheric new particle formation, Atmos. Chem.25
Phys., 10, 11223–11242, doi:10.5194/acp-10-11223-2010, 2010.Pandis, S. N., Baltensperger, U., Wolfenbarger, J. K., and Seinfeld, J. H.: Inversion of
aerosol data from the epiphaniometer, J. Aerosol Sci., 22, 417–428, doi:10.1016/0021-8502(91)90002-Y, 1991.
Petaja, T., Mauldin, III, R. L., Kosciuch, E., McGrath, J., Nieminen, T., Paasonen, P., Boy, M.,30
Adamov, A., Kotiaho, T., and Kulmala, M.: Sulfuric acid and OH concentrations in a borealforest site, Atmos. Chem. Phys., 9, 7435–7448, doi:10.5194/acp-9-7435-2009, 2009.
8365

ACPD13, 8333–8386, 2013
Nucleation-CCNevaluation
D. M. Westervelt et al.
Title Page
Abstract Introduction
Conclusions References
Tables Figures
J I
J I
Back Close
Full Screen / Esc
Printer-friendly Version
Interactive Discussion
Discussion
Paper
|D
iscussionP
aper|
Discussion
Paper
|D
iscussionP
aper|
Pierce, J. R. and Adams, P. J.: Efficiency of cloud condensation nuclei formation from ultrafineparticles, Atmos. Chem. Phys., 7, 1367–1379, doi:10.5194/acp-7-1367-2007, 2007.
Pierce, J. R. and Adams, P. J.: A Computationally Efficient Aerosol Nucleation/ Con-densation Method: Pseudo-Steady-State Sulfuric Acid, Aerosol Sci. Tech., 43, 216,doi:10.1080/02786820802587896, 2009a.5
Pierce, J. R. and Adams, P. J.: Uncertainty in global CCN concentrations from uncer-tain aerosol nucleation and primary emission rates, Atmos. Chem. Phys., 9, 1339–1356,doi:10.5194/acp-9-1339-2009, 2009b.
Pierce, J. R., Chen, K., and Adams, P. J.: Contribution of primary carbonaceous aerosol tocloud condensation nuclei: processes and uncertainties evaluated with a global aerosol mi-10
crophysics model, Atmos. Chem. Phys., 7, 5447–5466, doi:10.5194/acp-7-5447-2007, 2007.Pierce, J. R., Riipinen, I., Kulmala, M., Ehn, M., Petaja, T., Junninen, H., Worsnop, D. R., and
Donahue, N. M.: Quantification of the volatility of secondary organic compounds in ultrafineparticles during nucleation events, Atmos. Chem. Phys., 11, 9019–9036, doi:10.5194/acp-11-9019-2011, 2011.15
Pierce, J. R., Leaitch, W. R., Liggio, J., Westervelt, D. M., Wainwright, C. D., Abbatt, J. P. D.,Ahlm, L., Al-Basheer, W., Cziczo, D. J., Hayden, K. L., Lee, A. K. Y., Li, S.-M., Russell, L. M.,Sjostedt, S. J., Strawbridge, K. B., Travis, M., Vlasenko, A., Wentzell, J. J. B., Wiebe, H. A.,Wong, J. P. S., and Macdonald, A. M.: Nucleation and condensational growth to CCN sizesduring a sustained pristine biogenic SOA event in a forested mountain valley, Atmos. Chem.20
Phys., 12, 3147–3163, doi:10.5194/acp-12-3147-2012, 2012.Raymond, T. M. and Pandis, S. N.: Formation of cloud droplets by multicomponent organic
particles, J. Geophys. Res., 108, 4469, doi:10.1029/2003JD003503, 2003.Riipinen, I., Sihto, S.-L., Kulmala, M., Arnold, F., Dal Maso, M., Birmili, W., Saarnio, K., Teinila,
K., Kerminen, V.-M., Laaksonen, A., and Lehtinen, K. E. J.: Connections between atmo-25
spheric sulphuric acid and new particle formation during QUEST III–IV campaigns in Hei-delberg and Hyytiala, Atmos. Chem. Phys., 7, 1899–1914, doi:10.5194/acp-7-1899-2007,2007.
Riipinen, I., Pierce, J. R., Yli-Juuti, T., Nieminen, T., Hakkinen, S., Ehn, M., Junninen, H., Lehti-palo, K., Petaja, T., Slowik, J., Chang, R., Shantz, N. C., Abbatt, J., Leaitch, W. R., Kerminen,30
V.-M., Worsnop, D. R., Pandis, S. N., Donahue, N. M., and Kulmala, M.: Organic condensa-tion: a vital link connecting aerosol formation to cloud condensation nuclei (CCN) concentra-tions, Atmos. Chem. Phys., 11, 3865–3878, doi:10.5194/acp-11-3865-2011, 2011.
8366

ACPD13, 8333–8386, 2013
Nucleation-CCNevaluation
D. M. Westervelt et al.
Title Page
Abstract Introduction
Conclusions References
Tables Figures
J I
J I
Back Close
Full Screen / Esc
Printer-friendly Version
Interactive Discussion
Discussion
Paper
|D
iscussionP
aper|
Discussion
Paper
|D
iscussionP
aper|
Seinfeld, J. H. and Pandis, S. N.: Atmospheric Chemistry and Physics – From Air Pollution toClimate Change (2nd Edition), John Wiley & Sons, 2006.
Sihto, S.-L., Kulmala, M., Kerminen, V.-M., Dal Maso, M., Petaja, T., Riipinen, I., Korhonen,H., Arnold, F., Janson, R., Boy, M., Laaksonen, A., and Lehtinen, K. E. J.: Atmospheric sul-phuric acid and aerosol formation: implications from atmospheric measurements for nucle-5
ation and early growth mechanisms, Atmos. Chem. Phys., 6, 4079–4091, doi:10.5194/acp-6-4079-2006, 2006.
Sipila, M., Berndt, T., Petaja, T., Brus, D., Vanhanen, J., Stratmann, F., Patokoski, J., Mauldin,R. L., Hyvarinen, A.-P., Lihavainen, H., and Kulmala, M.: The Role of Sulfuric Acid in Atmo-spheric Nucleation, Science, 327, 1243–1246, doi:10.1126/science.1180315, 2010.10
Smith, J. N., Dunn, M. J., VanReken, T. M., Iida, K., Stolzenburg, M. R., McMurry, P. H., andHuey, L. G.: Chemical composition of atmospheric nanoparticles formed from nucleation inTecamac, Mexico: Evidence for an important role for organic species in nanoparticle growth,Geophys. Res. Lett., 35, L04808, doi:200810.1029/2007GL032523, 2008.
Spracklen, D. V., Carslaw, K. S., Merikanto, J., Mann, G. W., Reddington, C. L., Pickering, S.,15
Ogren, J. A., Andrews, E., Baltensperger, U., Weingartner, E., Boy, M., Kulmala, M., Laakso,L., Lihavainen, H., Kivekas, N., Komppula, M., Mihalopoulos, N., Kouvarakis, G., Jennings,S. G., O’Dowd, C., Birmili, W., Wiedensohler, A., Weller, R., Gras, J., Laj, P., Sellegri, K.,Bonn, B., Krejci, R., Laaksonen, A., Hamed, A., Minikin, A., Harrison, R. M., Talbot, R.,and Sun, J.: Explaining global surface aerosol number concentrations in terms of primary20
emissions and particle formation, Atmos. Chem. Phys., 10, 4775–4793, doi:10.5194/acp-10-4775-2010, 2010.
Spracklen, D. V., Jimenez, J. L., Carslaw, K. S., Worsnop, D. R., Evans, M. J., Mann, G. W.,Zhang, Q., Canagaratna, M. R., Allan, J., Coe, H., McFiggans, G., Rap, A., and Forster,P.: Aerosol mass spectrometer constraint on the global secondary organic aerosol budget,25
Atmos. Chem. Phys., 11, 12109–12136, doi:10.5194/acp-11-12109-2011, 2011.Stanier, C., Khlystov, A., and Pandis, S. N.: Nucleation Events during the Pittsburgh Air Quality
Study: Description and Relation to Key Meteorological, Gas Phase, and Aerosol Parameters,Aerosol Sci. Tech., 38, 253–264, 2004.
Stevens, R. G., Pierce, J. R., Brock, C. A., Reed, M. K., Crawford, J. H., Holloway, J. S., Ry-30
erson, T. B., Huey, L. G., and Nowak, J. B.: Nucleation and growth of sulfate aerosol incoal-fired power plant plumes: sensitivity to background aerosol and meteorology, Atmos.Chem. Phys., 12, 189–206, doi:10.5194/acp-12-189-2012, 2012.
8367

ACPD13, 8333–8386, 2013
Nucleation-CCNevaluation
D. M. Westervelt et al.
Title Page
Abstract Introduction
Conclusions References
Tables Figures
J I
J I
Back Close
Full Screen / Esc
Printer-friendly Version
Interactive Discussion
Discussion
Paper
|D
iscussionP
aper|
Discussion
Paper
|D
iscussionP
aper|
Stolzenburg, M. R., McMurry, P. H., Sakurai, H., Smith, J. N., Mauldin III, R. L., Eisele, F. L.,and Clement, C. F.: Growth rates of freshly nucleated atmospheric particles in Atlanta, J.Geophys. Res., 110, D22S05, doi:10.1029/2005JD005935, 2005.
Streets, D. G., Bond, T. C., Carmichael, G. R., Fernandes, S. D., Fu, Q., He, D., Klimont,Z., Nelson, S. M., Tsai, N. Y., Wang, M. Q., Woo, J.-H., and Yarber, K. F.: An inventory of5
gaseous and primary aerosol emissions in Asia in the year 2000, J. Geophys. Res., 108,8809, doi:10.1029/2002JD003093, 2003.
Trivitayanurak, W., Adams, P. J., Spracklen, D. V., and Carslaw, K. S.: Tropospheric aerosol mi-crophysics simulation with assimilated meteorology: model description and intermodel com-parison, Atmos. Chem. Phys., 8, 3149–3168, doi:10.5194/acp-8-3149-2008, 2008.10
Twomey, S. A.: Pollution and Cloud Albedo, Eos T. Am. Geophys. Un., 58, 797–797, 1977.Twomey, S. and Wojciechowski, T. A.: Observations of the geographical variation of cloud nu-
clei, J. Atmos. Sci., 26, 648–651, 1969.Tzivion (Tzitzvashvili), S., Feingold, G., and Levin, Z.: An Efficient Numerical Solution to
the Stochastic Collection Equation, J. Atmos. Sci., 44, 3139–3149, doi:10.1175/1520-15
0469(1987)044¡3139:AENSTT¿2.0.CO;2, 1987.Vakkari, V., Laakso, H., Kulmala, M., Laaksonen, A., Mabaso, D., Molefe, M., Kgabi, N., and
Laakso, L.: New particle formation events in semi-clean South African savannah, Atmos.Chem. Phys., 11, 3333–3346, doi:10.5194/acp-11-3333-2011, 2011.
Vehkamaki, H., Kulmala, M., Napari, I., Lehtinen, K. E. J., Timmreck, C., Noppel, M.,20
and Laaksonen, A.: An improved parameterization for sulfuric acid-water nucleationrates for tropospheric and stratospheric conditions, J. Geophys. Res., 107, 4622,doi:10.1029/2002JD002184, 2002.
Vehkamaki, H., Napari, I., Kulmala, M., and Noppel, M.: Stable ammonium bisul-fate clusters in the atmosphere, Phys. Rev. Lett., 93, 148501-1–148501-4,25
doi:10.1103/PhysRevLett.93.148501, 2004.Vuollekoski, H., Nieminen, T., Paasonen, P., Sihto, S.-L., Boy, M., Manninen, H., Lehtinen,
K., Kerminen, V.-M., and Kulmala, M.: Atmospheric nucleation and initial steps of particlegrowth: Numerical comparison of different theories and hypotheses, Atmos. Res., 98, 229–236, doi:10.1016/j.atmosres.2010.04.007, 2010.30
Wang, M. and Penner, J. E.: Aerosol indirect forcing in a global model with particle nucleation,Atmos. Chem. Phys., 9, 239–260, doi:10.5194/acp-9-239-2009, 2009.
8368

ACPD13, 8333–8386, 2013
Nucleation-CCNevaluation
D. M. Westervelt et al.
Title Page
Abstract Introduction
Conclusions References
Tables Figures
J I
J I
Back Close
Full Screen / Esc
Printer-friendly Version
Interactive Discussion
Discussion
Paper
|D
iscussionP
aper|
Discussion
Paper
|D
iscussionP
aper|
Weber, R. J., Marti, J., McMurry, P. H., Eisele, F. L., Tanner, D. J., and Jefferson, A.: Measuredatmospheric new particle formation rates: implications for nucleation mechanisms, Chem.Eng. Comm., 151, 53–64, 1996.
Wu, Z. J., Hu, M., Yue, D. L., Wehner, B., and Wiedensohler, A.: Evolution of particle numbersize distribution in an urban atmosphere during episodes of heavy pollution and newparticle5
formation, Sci. China Earth Sci., 54, 1772–1778, doi:10.1007/s11430-011-4227-9, 2011.Yu, F. and Luo, G.: Simulation of particle size distribution with a global aerosol model: contri-
bution of nucleation to aerosol and CCN number concentrations, Atmos. Chem. Phys., 9,7691–7710, doi:10.5194/acp-9-7691-2009, 2009.
Yu, F. and Turco, R. P.: The size-dependent charge fraction of sub-3-nm particles as a key diag-10
nostic of competitive nucleation mechanisms under atmospheric conditions, Atmos. Chem.Phys., 11, 9451–9463, doi:10.5194/acp-11-9451-2011, 2011.
Zhang, R., Suh, I., Zhao, J., Zhang, D., Fortner, E. C., Tie, X., Molina, L. T., and Molina, M. J.:Atmospheric New Particle Formation Enhanced by Organic Acids, Science, 304, 1487–1490,doi:10.1126/science.1095139, 2004.15
Zhang, Y., Liu, P., Liu, X.-H., Jacobson, M. Z., McMurry, P. H., Fang, Q., Bhave, P. V.,Yu, S., and Schere, K. L.: A comparative study of homogeneous nucleation parameter-izations, Part II. 3-D Model simulations and evaluation, J. Geophys Res., 115, D20213,doi:10.1029/2010JD014151, 2010a.
Zhang, Y., McMurry, P. H., Fang, Q., and Jacobson, M. Z.: A comparative study of homoge-20
neous nucleation parameterizations, Part I. Examination and evaluation of the formulations,J. Geophys. Res., 115, D20212, doi:10.1029/2010JD014150, 2010b.
8369

ACPD13, 8333–8386, 2013
Nucleation-CCNevaluation
D. M. Westervelt et al.
Title Page
Abstract Introduction
Conclusions References
Tables Figures
J I
J I
Back Close
Full Screen / Esc
Printer-friendly Version
Interactive Discussion
Discussion
Paper
|D
iscussionP
aper|
Discussion
Paper
|D
iscussionP
aper|
Table 1. Locations for model comparison.
MeteorologicalSimulated year fields Data reference
Pittsburgh, USA (PGH) Jul 2001–Jun 2002 GEOS3 Stanier et al. (2004)Hyytiala, Finland (HYY) Jan 2007–Jan 2008 GEOS5 Dal Maso et al. (2004)Atlanta, USA (ATL) Jan 1999–Jan 2000 GEOS3 Woo et al. (2001)St. Louis, USA (STL) Jan 2002–Jan 2003 GEOS3 Qian et al. (2007)San Pietro Capiofume, Italy (SPC) Apr 2002–Mar 2003 GEOS3 Laaksonen et al. (2005)
8370

ACPD13, 8333–8386, 2013
Nucleation-CCNevaluation
D. M. Westervelt et al.
Title Page
Abstract Introduction
Conclusions References
Tables Figures
J I
J I
Back Close
Full Screen / Esc
Printer-friendly Version
Interactive Discussion
Discussion
Paper
|D
iscussionP
aper|
Discussion
Paper
|D
iscussionP
aper|
Table 2. Median values for each metric for each site. O = observed, T = ternary simulation, A= activation simulation.
Pittsburgh Hyytiala Atlanta St. Louis Po Valley
O T A O T A O T A O T A O T A
J3 (cm−3 s−1) 0.32 0.12 0.16 0.5 0.17 0.13 0.09 0.01 0.01 2.4 0.8 0.6 0.55 1.9 0.98GR (nm h−1) 2.8 3.1 3.2 2.8 1.5 1.8 2.4 2.6 2.8 2.8 3.1 3.5 5.8 4.6 5.8SP50 (%) 40 15 7 61 39 42 80 20 10 42 50 21 31 23 20J50 (cm−3 s−1) 0.1 0.09 0.04 0.089 0.044 0.025 0.05 0.006 0.004 0.45 0.2 0.12 0.16 0.12 0.11SP100 (%) 1.7 1.7 1.1 1.8 1.7 1.7 2.3 1.4 0.6 1.1 5.5 2.1 4 2.5 2.4J100 (cm−3 s−1) 0.0037 0.001 0.0007 0.004 0.02 0.013 0.0008 0.0007 0.0009 0.009 0.004 0.002 0.18 0.047 0.045
8371

ACPD13, 8333–8386, 2013
Nucleation-CCNevaluation
D. M. Westervelt et al.
Title Page
Abstract Introduction
Conclusions References
Tables Figures
J I
J I
Back Close
Full Screen / Esc
Printer-friendly Version
Interactive Discussion
Discussion
Paper
|D
iscussionP
aper|
Discussion
Paper
|D
iscussionP
aper|
Table 3. Mean values for each metric for each site. O = observed, T = ternary simulation, A =activation simulation.
Pittsburgh Hyytiala Atlanta St. Louis Po Valley
O T A O T A O T A O T A O T A
J3 (cm−3 s−1) 0.58 1.5 0.71 2.5 5.2 1.6 0.69 0.10 0.03 8.7 10.6 2.3 6.3 2.9 3.4GR (nm h−1) 3.9 3.7 3.7 2.8 1.7 2.0 3.8 3.5 3.6 4.2 3.5 4.7 6.9 5.1 6.1SP50 (%) 37 33 22 55 46 43 67 30 18 46 47 33 34 27 30J50 (cm−3 s−1) 0.11 0.034 0.011 0.23 0.82 0.1 0.177 0.048 0.071 1.6 1.2 0.3 0.39 1.7 1.0SP100 (%) 2.4 1.8 1.6 2.6 2.5 2.2 3.7 2 1.2 1.8 4.8 3.3 4.4 3.1 3.8J100 (cm−3 s−1) 0.006 0.009 0.004 0.021 0.011 0.002 0.006 0.004 0.002 0.046 0.024 0.006 0.34 0.66 0.4
8372

ACPD13, 8333–8386, 2013
Nucleation-CCNevaluation
D. M. Westervelt et al.
Title Page
Abstract Introduction
Conclusions References
Tables Figures
J I
J I
Back Close
Full Screen / Esc
Printer-friendly Version
Interactive Discussion
Discussion
Paper
|D
iscussionP
aper|
Discussion
Paper
|D
iscussionP
aper|
Table 4. Mean, median, and bias values for three nucleation metrics specific to Hyytiala (dueto data availability). O = observed, T = ternary simulation, A = activation simulation.
[H2SO4] (105 molec cm−3) CS (10−3 s−1) CoagS (10−3 s−1)
O T A O T A O T A
Mean 4.34 12.8 18.8 1.78 2.49 1.46 10.8 6.4 7.4Median 1.9 1.2 1.7 1.75 2.10 1.23 7.5 5.0 5.8LMNB (unitless) – −0.12 0.15 – 0.00048 −0.018 – −0.218 −0.109
8373

ACPD13, 8333–8386, 2013
Nucleation-CCNevaluation
D. M. Westervelt et al.
Title Page
Abstract Introduction
Conclusions References
Tables Figures
J I
J I
Back Close
Full Screen / Esc
Printer-friendly Version
Interactive Discussion
Discussion
Paper
|D
iscussionP
aper|
Discussion
Paper
|D
iscussionP
aper|
Table 5. Mean values for nucleation event numbers for each site. O = observed, T = ternarysimulation, A = activation simulation.
Pittsburgh Hyytiala Atlanta St. Louis Po Valley
O T A O T A O T A O T A O T A
Number of total events 109 104 137 107 95 100 108 135 138 102 121 177 145 147 141Number of growth events to 50 nm 42 37 36 55 33 46 33 47 43 32 27 29 65 53 64Number of growth events to 100 nm 13 10 18 19 10 13 17 11 9 17 18 13 40 39 49
8374

ACPD13, 8333–8386, 2013
Nucleation-CCNevaluation
D. M. Westervelt et al.
Title Page
Abstract Introduction
Conclusions References
Tables Figures
J I
J I
Back Close
Full Screen / Esc
Printer-friendly Version
Interactive Discussion
Discussion
Paper
|D
iscussionP
aper|
Discussion
Paper
|D
iscussionP
aper|
Fig. 1. Dynamics of new particle formation from vapour to cloud droplet. Two competing pro-cesses determining the fate of freshly formed atmospheric nuclei are condensational growth(eventually forming CCN) or coagulational scavenging, which results in the loss of the nuclei.
8375
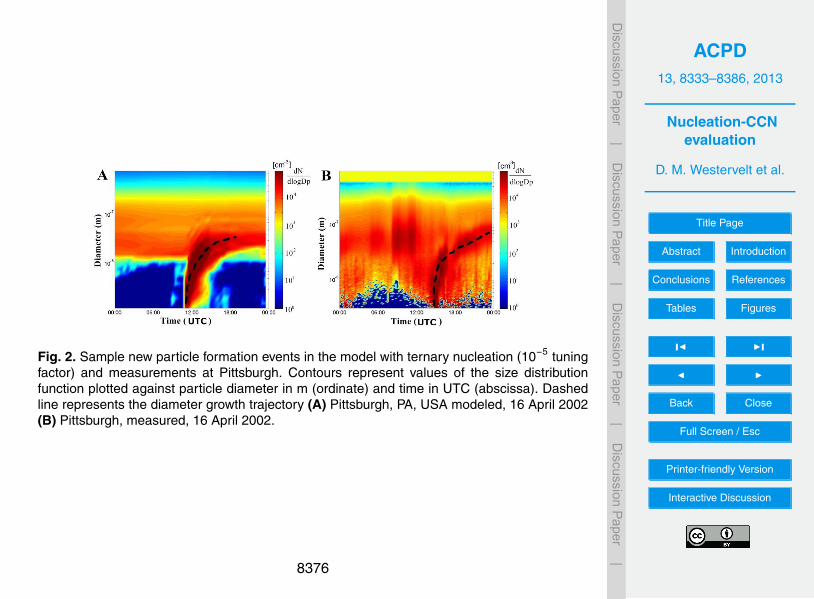
ACPD13, 8333–8386, 2013
Nucleation-CCNevaluation
D. M. Westervelt et al.
Title Page
Abstract Introduction
Conclusions References
Tables Figures
J I
J I
Back Close
Full Screen / Esc
Printer-friendly Version
Interactive Discussion
Discussion
Paper
|D
iscussionP
aper|
Discussion
Paper
|D
iscussionP
aper|
38
1
Figure 2: Sample new particle formation events in the model with ternary nucleation (10-5
2
tuning factor) and measurements at Pittsburgh. Contours represent values of the size 3
distribution function plotted against particle diameter in m (ordinate) and time in UTC 4
(abscissa). Dashed line represents the diameter growth trajectory (A) Pittsburgh, PA, USA 5
modeled, April 16, 2002 (B) Pittsburgh, measured, April 16 2002. 6
7
8
9
10
11
12
13
14
Fig. 2. Sample new particle formation events in the model with ternary nucleation (10−5 tuningfactor) and measurements at Pittsburgh. Contours represent values of the size distributionfunction plotted against particle diameter in m (ordinate) and time in UTC (abscissa). Dashedline represents the diameter growth trajectory (A) Pittsburgh, PA, USA modeled, 16 April 2002(B) Pittsburgh, measured, 16 April 2002.
8376

ACPD13, 8333–8386, 2013
Nucleation-CCNevaluation
D. M. Westervelt et al.
Title Page
Abstract Introduction
Conclusions References
Tables Figures
J I
J I
Back Close
Full Screen / Esc
Printer-friendly Version
Interactive Discussion
Discussion
Paper
|D
iscussionP
aper|
Discussion
Paper
|D
iscussionP
aper|
39
1
Figure 3: New particle formation event frequency for one year across the five datasets and 2
simulations. Observations are in red, ternary with a 10-5
tuning factor nucleation simulation is 3
in blue, and activation nucleation simulation is in green. Numbers above the ternary and 4
activation columns represent the percentage of matching events or non-events for the two 5
model cases compared to observations. 6
Fig. 3. New particle formation event frequency for one year across the five datasets and sim-ulations. Observations are in red, ternary with a 10−5 tuning factor nucleation simulation is inblue, and activation nucleation simulation is in green. Numbers above the ternary and activationcolumns represent the percentage of matching events or non-events for the two model casescompared to observations.
8377

ACPD13, 8333–8386, 2013
Nucleation-CCNevaluation
D. M. Westervelt et al.
Title Page
Abstract Introduction
Conclusions References
Tables Figures
J I
J I
Back Close
Full Screen / Esc
Printer-friendly Version
Interactive Discussion
Discussion
Paper
|D
iscussionP
aper|
Discussion
Paper
|D
iscussionP
aper|
40
1
Figure 4: New particle formation event frequency as a function of month for the five datasets 2
and simulations. Observations are in red, ternary nucleation model (with a 10-5
tuning factor) 3
is in blue, and activation nucleation is in green. Data is missing in June at PGH due to SMPS 4
malfunction. 5
6
Fig. 4. New particle formation event frequency as a function of month for the five datasets andsimulations. Observations are in red, ternary nucleation model (with a 10−5 tuning factor) isin blue, and activation nucleation is in green. Data is missing in June at PGH due to SMPSmalfunction.
8378

ACPD13, 8333–8386, 2013
Nucleation-CCNevaluation
D. M. Westervelt et al.
Title Page
Abstract Introduction
Conclusions References
Tables Figures
J I
J I
Back Close
Full Screen / Esc
Printer-friendly Version
Interactive Discussion
Discussion
Paper
|D
iscussionP
aper|
Discussion
Paper
|D
iscussionP
aper|
Fig. 5. Cumulative distribution function (CDF) of modelled and measured nucleation metrics atPittsburgh (PGH). Twenty-four hour averaged nucleation rate (J3) is shown in (A), growth ratefor event-lengths in (B), 50 nm particle formation rate (J50) in panel (C), survival probability to50 nm (SP3−50) in (D), 100 nm particle formation rate (J100) in panel (E), and survival probabilityto 100 nm (SP3−100) in panel (F). Descriptive statistics for these distributions can be found inTables 2–3.
8379

ACPD13, 8333–8386, 2013
Nucleation-CCNevaluation
D. M. Westervelt et al.
Title Page
Abstract Introduction
Conclusions References
Tables Figures
J I
J I
Back Close
Full Screen / Esc
Printer-friendly Version
Interactive Discussion
Discussion
Paper
|D
iscussionP
aper|
Discussion
Paper
|D
iscussionP
aper|
Fig. 6. Cumulative distribution function (CDF) of modelled and measured nucleation metricsat Hyytiala (HYY). Twenty-four hour nucleation rate (J3) is shown in (A), growth rate for event-lengths in (B), 50 nm particle formation rate (J50) in (C), survival probability to 50 nm (SP3−50)in (D), 100 nm particle formation rate (J100) in (E), and survival probability to 100 nm (SP3−100)in panel (F). Descriptive statistics for these distributions can be found in Tables 2–3.
8380

ACPD13, 8333–8386, 2013
Nucleation-CCNevaluation
D. M. Westervelt et al.
Title Page
Abstract Introduction
Conclusions References
Tables Figures
J I
J I
Back Close
Full Screen / Esc
Printer-friendly Version
Interactive Discussion
Discussion
Paper
|D
iscussionP
aper|
Discussion
Paper
|D
iscussionP
aper|
Fig. 7. Cumulative distribution function (CDF) of modelled and measured nucleation metricsat Atlanta (ATL). Twenty-four hour averaged nucleation rate (J3) is shown in (A), growth ratefor event-lengths in (B), 50 nm particle formation rate (J50) in (C), survival probability to 50 nm(SP3−50) in (D), 100 nm particle formation rate (J100) in (E), and survival probability to 100 nm(SP3−100) in (F). Descriptive statistics for these distributions can be found in Tables 2–3.
8381

ACPD13, 8333–8386, 2013
Nucleation-CCNevaluation
D. M. Westervelt et al.
Title Page
Abstract Introduction
Conclusions References
Tables Figures
J I
J I
Back Close
Full Screen / Esc
Printer-friendly Version
Interactive Discussion
Discussion
Paper
|D
iscussionP
aper|
Discussion
Paper
|D
iscussionP
aper|
Fig. 8. Cumulative distribution function (CDF) of modelled and measured nucleation metricsat St. Louis (STL). Twenty-four hour averaged nucleation rate (J3) is shown in (A), growth ratefor event-lengths in (B), 50 nm particle formation rate (J50) in (C), survival probability to 50 nm(SP3−50) in (D), 100 nm particle formation rate (J100) in (E), and survival probability to 100 nm(SP3−100) in (F). Descriptive statistics for these distributions can be found in Tables 2–3.
8382

ACPD13, 8333–8386, 2013
Nucleation-CCNevaluation
D. M. Westervelt et al.
Title Page
Abstract Introduction
Conclusions References
Tables Figures
J I
J I
Back Close
Full Screen / Esc
Printer-friendly Version
Interactive Discussion
Discussion
Paper
|D
iscussionP
aper|
Discussion
Paper
|D
iscussionP
aper|
Fig. 9. Cumulative distribution function (CDF) of modelled and measured nucleation metricsat San Pietro Capofiume, Po Valley (SPC). Twenty-four hour averaged nucleation rate (J3) isshown in (A), growth rate for event-lengths in (B), 50 nm particle formation rate (J50) in (C),survival probability to 50 nm (SP3−50) in (D), 100 nm particle formation rate (J100) in (E), andsurvival probability to 100 nm (SP3−100) in (F). Descriptive statistics for these distributions canbe found in Tables 2–3.
8383

ACPD13, 8333–8386, 2013
Nucleation-CCNevaluation
D. M. Westervelt et al.
Title Page
Abstract Introduction
Conclusions References
Tables Figures
J I
J I
Back Close
Full Screen / Esc
Printer-friendly Version
Interactive Discussion
Discussion
Paper
|D
iscussionP
aper|
Discussion
Paper
|D
iscussionP
aper|
Fig. 10. Additional nucleation metrics at Hyytiala for the ternary (with 10−5 tuning factor) andactivation models and the measurements. Panel (A) shows the maximum daily sulfuric acidconcentration. Panel (B) is a cumulative distribution function (CDF) of modelled and measuredcondensation sink values. Panel (C) shows the CDF of coagulation sink for 3 nm particles.
8384

ACPD13, 8333–8386, 2013
Nucleation-CCNevaluation
D. M. Westervelt et al.
Title Page
Abstract Introduction
Conclusions References
Tables Figures
J I
J I
Back Close
Full Screen / Esc
Printer-friendly Version
Interactive Discussion
Discussion
Paper
|D
iscussionP
aper|
Discussion
Paper
|D
iscussionP
aper|
48
1
Figure 11: Annually averaged growth rate as a function of condensing vapour chemical 2
species, either low volatility organics or sulfuric acid, for observations and model (ternary 3
nucleation with 10-5
tuning factor simulation) results at each of the five locations. Green 4
shading represents organic condensation and yellow represents sulfuric acid. Sulfuric acid 5
measurements (and therefore speciation analyses) were only available at Hyytiälä for the 6
simulated time periods. For these sites without measurements, total growth rate is plotted 7
without knowledge of breakdown between condensing vapour (yellow with green shading). 8
Units are in nm hr-1
9
10
11
12
13
14
15
16
Fig. 11. Annually averaged growth rate as a function of condensing vapour chemical species,either low volatility organics or sulfuric acid, for observations and model (ternary nucleation with10−5 tuning factor simulation) results at each of the five locations. Green shading representsorganic condensation and yellow represents sulfuric acid. Sulfuric acid measurements (andtherefore speciation analyses) were only available at Hyytiala for the simulated time periods. Forthese sites without measurements, total growth rate is plotted without knowledge of breakdownbetween condensing vapour (yellow with green shading). Units are in nm h−1.
8385

ACPD13, 8333–8386, 2013
Nucleation-CCNevaluation
D. M. Westervelt et al.
Title Page
Abstract Introduction
Conclusions References
Tables Figures
J I
J I
Back Close
Full Screen / Esc
Printer-friendly Version
Interactive Discussion
Discussion
Paper
|D
iscussionP
aper|
Discussion
Paper
|D
iscussionP
aper|
49
1
2
3
4
5
Figure 12: Log-mean normalized bias (LMNB) values for each metric and each site. See text 6
for explanation and definition of LMNB. 7
8
9
10
Fig. 12. Log-mean normalized bias (LMNB) values for each metric and each site. See text forexplanation and definition of LMNB.
8386
Copyright © 2022 FDOKUMEN