Cloud condensation nuclei from biomass burning during the Amazonian dry-to-wet transition season
11
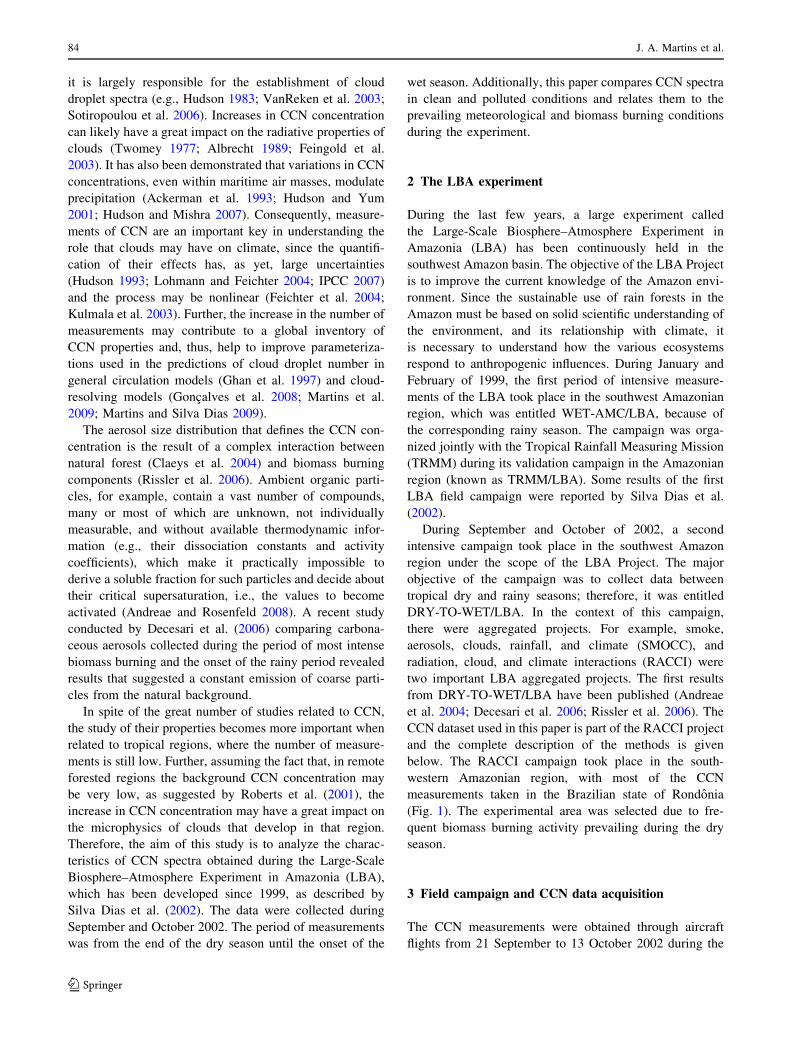
ORIGINAL PAPER Cloud condensation nuclei from biomass burning during the Amazonian dry-to-wet transition season Jorge Alberto Martins Fa ´bio Luiz T. Gonc ¸alves Carlos A. Morales Gilberto F. Fisch Francisco Geraldo M. Pinheiro Joa ˜o Bosco V. Leal Ju ´ nior Carlos J. Oliveira Emerson M. Silva Jose ´ Carlos P. Oliveira Alexandre A. Costa Maria Assunc ¸a ˜o F. Silva Dias Received: 12 March 2007 / Accepted: 9 January 2009 / Published online: 5 February 2009 Ó Springer-Verlag 2009 Abstract Aircraft measurements of cloud condensation nuclei (CCN) during the Large-Scale Biosphere–Atmo- sphere Experiment in Amazonia (LBA) were conducted over the Southwestern Amazon region in September– October 2002, to emphasize the dry-to-wet transition sea- son. The CCN concentrations were measured for values within the range 0.1–1.0% of supersaturation. The CCN concentration inside the boundary layer revealed a general decreasing trend during the transition from the end of the dry season to the onset of the wet season. Clean and pol- luted areas showed large differences. The differences were not so strong at high levels in the troposphere and there was evidence supporting the semi-direct aerosol effect in suppressing convection through the evaporation of clouds by aerosol absorption. The measurements also showed a diurnal cycle following biomass burning activity. Although biomass burning was the most important source of CCN, it was seen as a source of relatively efficient CCN, since the increase was significant only at high supersaturations. 1 Introduction From a global scale perspective, clouds and precipitation in the Amazonian region are a tropical heat source strongly coupled to other tropical heat sources (Gandu and Silva Dias 1998). Together with dynamic and thermodynamic processes, the cloud condensation nuclei (CCN) concen- tration has an important role in the establishment of the magnitude of this source. As an example, Cifelli et al. (2002) shows that, during the wet season of the Amazonian region, different cloud microphysics properties were asso- ciated with the convection when different wind regimes were observed. According to Silva Dias et al. (2002), the picture may be seen as an interrelation of processes on different scales, starting from a large-scale forcing. During the dry season, the atmosphere evolves to a more complex picture, since biomass burning injects a surprising amount of aerosols and gases that strongly interact with cloud and precipitation. The magnitude of this impact has not yet been estimated, but there is enough evidence of its effect (Crutzen and Andreae 1990; Rosenfeld 1999; Roberts et al. 2001; Hudson and Yum 2001, 2002; Yum and Hudson 2002; Sherwood 2002). The assessment of the biomass burning impact requires measurements of those properties that modify clouds and precipitation. CCN concentration is probably the most important factor in determining cloud microphysics properties, since J. A. Martins (&) Universidade Tecnolo ´gica Federal do Parana ´, Londrina, PR, Brazil e-mail: [email protected] F. L. T. Gonc ¸alves C. A. Morales M. A. F. Silva Dias Universidade de Sa ˜o Paulo, Sa ˜o Paulo, SP, Brazil G. F. Fisch Centro Te ´cnico Aeroespacial, Sa ˜o Jose ´ dos Campos, SP, Brazil F. G. M. Pinheiro J. B. V. Leal Ju ´nior C. J. Oliveira E. M. Silva A. A. Costa Universidade Estadual do Ceara ´, Fortaleza, CE, Brazil J. C. P. Oliveira Universidade Federal do Ceara ´, Fortaleza, CE, Brazil A. A. Costa Fundac ¸a ˜o Cearense de Meterologia e Recursos Hı ´dricos, Fortaleza, CE, Brazil M. A. F. Silva Dias Centro de Previsa ˜o de Tempo e Estudos Clima ´ticos, Cachoeira Paulista, SP, Brazil 123 Meteorol Atmos Phys (2009) 104:83–93 DOI 10.1007/s00703-009-0019-6
-
Upload
independent -
Category
Documents
-
view
2 -
download
0
Transcript of Cloud condensation nuclei from biomass burning during the Amazonian dry-to-wet transition season

ORIGINAL PAPER
Cloud condensation nuclei from biomass burning duringthe Amazonian dry-to-wet transition season
Jorge Alberto Martins Æ Fabio Luiz T. Goncalves Æ Carlos A. Morales Æ Gilberto F. Fisch ÆFrancisco Geraldo M. Pinheiro Æ Joao Bosco V. Leal Junior Æ Carlos J. Oliveira ÆEmerson M. Silva Æ Jose Carlos P. Oliveira Æ Alexandre A. Costa Æ Maria Assuncao F. Silva Dias
Received: 12 March 2007 / Accepted: 9 January 2009 / Published online: 5 February 2009
� Springer-Verlag 2009
Abstract Aircraft measurements of cloud condensation
nuclei (CCN) during the Large-Scale Biosphere–Atmo-
sphere Experiment in Amazonia (LBA) were conducted
over the Southwestern Amazon region in September–
October 2002, to emphasize the dry-to-wet transition sea-
son. The CCN concentrations were measured for values
within the range 0.1–1.0% of supersaturation. The CCN
concentration inside the boundary layer revealed a general
decreasing trend during the transition from the end of the
dry season to the onset of the wet season. Clean and pol-
luted areas showed large differences. The differences were
not so strong at high levels in the troposphere and there
was evidence supporting the semi-direct aerosol effect in
suppressing convection through the evaporation of clouds
by aerosol absorption. The measurements also showed a
diurnal cycle following biomass burning activity. Although
biomass burning was the most important source of CCN, it
was seen as a source of relatively efficient CCN, since the
increase was significant only at high supersaturations.
1 Introduction
From a global scale perspective, clouds and precipitation in
the Amazonian region are a tropical heat source strongly
coupled to other tropical heat sources (Gandu and Silva
Dias 1998). Together with dynamic and thermodynamic
processes, the cloud condensation nuclei (CCN) concen-
tration has an important role in the establishment of the
magnitude of this source. As an example, Cifelli et al.
(2002) shows that, during the wet season of the Amazonian
region, different cloud microphysics properties were asso-
ciated with the convection when different wind regimes
were observed. According to Silva Dias et al. (2002), the
picture may be seen as an interrelation of processes on
different scales, starting from a large-scale forcing. During
the dry season, the atmosphere evolves to a more complex
picture, since biomass burning injects a surprising amount
of aerosols and gases that strongly interact with cloud and
precipitation. The magnitude of this impact has not yet
been estimated, but there is enough evidence of its effect
(Crutzen and Andreae 1990; Rosenfeld 1999; Roberts et al.
2001; Hudson and Yum 2001, 2002; Yum and Hudson
2002; Sherwood 2002). The assessment of the biomass
burning impact requires measurements of those properties
that modify clouds and precipitation.
CCN concentration is probably the most important
factor in determining cloud microphysics properties, since
J. A. Martins (&)
Universidade Tecnologica Federal do Parana,
Londrina, PR, Brazil
e-mail: [email protected]
F. L. T. Goncalves � C. A. Morales � M. A. F. Silva Dias
Universidade de Sao Paulo, Sao Paulo, SP, Brazil
G. F. Fisch
Centro Tecnico Aeroespacial, Sao Jose dos Campos, SP, Brazil
F. G. M. Pinheiro � J. B. V. Leal Junior �C. J. Oliveira � E. M. Silva � A. A. Costa
Universidade Estadual do Ceara, Fortaleza, CE, Brazil
J. C. P. Oliveira
Universidade Federal do Ceara, Fortaleza, CE, Brazil
A. A. Costa
Fundacao Cearense de Meterologia e Recursos Hıdricos,
Fortaleza, CE, Brazil
M. A. F. Silva Dias
Centro de Previsao de Tempo e Estudos Climaticos,
Cachoeira Paulista, SP, Brazil
123
Meteorol Atmos Phys (2009) 104:83–93
DOI 10.1007/s00703-009-0019-6
it is largely responsible for the establishment of cloud
droplet spectra (e.g., Hudson 1983; VanReken et al. 2003;
Sotiropoulou et al. 2006). Increases in CCN concentration
can likely have a great impact on the radiative properties of
clouds (Twomey 1977; Albrecht 1989; Feingold et al.
2003). It has also been demonstrated that variations in CCN
concentrations, even within maritime air masses, modulate
precipitation (Ackerman et al. 1993; Hudson and Yum
2001; Hudson and Mishra 2007). Consequently, measure-
ments of CCN are an important key in understanding the
role that clouds may have on climate, since the quantifi-
cation of their effects has, as yet, large uncertainties
(Hudson 1993; Lohmann and Feichter 2004; IPCC 2007)
and the process may be nonlinear (Feichter et al. 2004;
Kulmala et al. 2003). Further, the increase in the number of
measurements may contribute to a global inventory of
CCN properties and, thus, help to improve parameteriza-
tions used in the predictions of cloud droplet number in
general circulation models (Ghan et al. 1997) and cloud-
resolving models (Goncalves et al. 2008; Martins et al.
2009; Martins and Silva Dias 2009).
The aerosol size distribution that defines the CCN con-
centration is the result of a complex interaction between
natural forest (Claeys et al. 2004) and biomass burning
components (Rissler et al. 2006). Ambient organic parti-
cles, for example, contain a vast number of compounds,
many or most of which are unknown, not individually
measurable, and without available thermodynamic infor-
mation (e.g., their dissociation constants and activity
coefficients), which make it practically impossible to
derive a soluble fraction for such particles and decide about
their critical supersaturation, i.e., the values to become
activated (Andreae and Rosenfeld 2008). A recent study
conducted by Decesari et al. (2006) comparing carbona-
ceous aerosols collected during the period of most intense
biomass burning and the onset of the rainy period revealed
results that suggested a constant emission of coarse parti-
cles from the natural background.
In spite of the great number of studies related to CCN,
the study of their properties becomes more important when
related to tropical regions, where the number of measure-
ments is still low. Further, assuming the fact that, in remote
forested regions the background CCN concentration may
be very low, as suggested by Roberts et al. (2001), the
increase in CCN concentration may have a great impact on
the microphysics of clouds that develop in that region.
Therefore, the aim of this study is to analyze the charac-
teristics of CCN spectra obtained during the Large-Scale
Biosphere–Atmosphere Experiment in Amazonia (LBA),
which has been developed since 1999, as described by
Silva Dias et al. (2002). The data were collected during
September and October 2002. The period of measurements
was from the end of the dry season until the onset of the
wet season. Additionally, this paper compares CCN spectra
in clean and polluted conditions and relates them to the
prevailing meteorological and biomass burning conditions
during the experiment.
2 The LBA experiment
During the last few years, a large experiment called
the Large-Scale Biosphere–Atmosphere Experiment in
Amazonia (LBA) has been continuously held in the
southwest Amazon basin. The objective of the LBA Project
is to improve the current knowledge of the Amazon envi-
ronment. Since the sustainable use of rain forests in the
Amazon must be based on solid scientific understanding of
the environment, and its relationship with climate, it
is necessary to understand how the various ecosystems
respond to anthropogenic influences. During January and
February of 1999, the first period of intensive measure-
ments of the LBA took place in the southwest Amazonian
region, which was entitled WET-AMC/LBA, because of
the corresponding rainy season. The campaign was orga-
nized jointly with the Tropical Rainfall Measuring Mission
(TRMM) during its validation campaign in the Amazonian
region (known as TRMM/LBA). Some results of the first
LBA field campaign were reported by Silva Dias et al.
(2002).
During September and October of 2002, a second
intensive campaign took place in the southwest Amazon
region under the scope of the LBA Project. The major
objective of the campaign was to collect data between
tropical dry and rainy seasons; therefore, it was entitled
DRY-TO-WET/LBA. In the context of this campaign,
there were aggregated projects. For example, smoke,
aerosols, clouds, rainfall, and climate (SMOCC), and
radiation, cloud, and climate interactions (RACCI) were
two important LBA aggregated projects. The first results
from DRY-TO-WET/LBA have been published (Andreae
et al. 2004; Decesari et al. 2006; Rissler et al. 2006). The
CCN dataset used in this paper is part of the RACCI project
and the complete description of the methods is given
below. The RACCI campaign took place in the south-
western Amazonian region, with most of the CCN
measurements taken in the Brazilian state of Rondonia
(Fig. 1). The experimental area was selected due to fre-
quent biomass burning activity prevailing during the dry
season.
3 Field campaign and CCN data acquisition
The CCN measurements were obtained through aircraft
flights from 21 September to 13 October 2002 during the
84 J. A. Martins et al.
123
dry-to-wet transition season. The flights were carried out at
the southwestern part of the Amazonian Basin, including
the Brazilian states of Acre, Amazonas, Mato Grosso, and
Rondonia (Fig. 1). An additional flight from Ceara state
(close to the Atlantic coast) to Rondonia on 21 September
was included in the analysis. Clean atmospheric conditions
were observed in the states of Acre and Amazonas, while
intense biomass burning activities were reported in
Rondonia and Mato Grosso. The flight measurements were
conducted with an Embraer-Bandeirante aircraft, as
described by Almeida et al. (1992). The main instruments
used during the flights provided the following variables:
CCN spectrum, cloud and rain drop spectra, cloud liquid
water content, temperature, dew point temperature, pres-
sure, and GPS positioning.
The CCN concentration is the variable analyzed in this
study. A static thermal-gradient chamber was used to obtain
the CCN supersaturation spectra (Oliveira and Vali 1995).
The chamber operates at supersaturation values decided by
the user. During the campaign, four values of supersaturation
were selected for each air sample: 0.2, 0.3, 0.5, and 0.7%,
although not all of these values were available for all flights.
The system was controlled by a computer, which allowed the
storage of the data. A video camera was used to capture the
pictures of the growing droplets inside the chamber.
Calibration was performed comparing the detector
signals with visual counts of the number of droplets
developing in the chamber. The CCN concentration was
found to be proportional to the detector output. During the
activation and growth of droplets, the time of the peak
signal corresponds well to the time at which the droplet
count is a maximum within the sample volume. The use of
an average output signal over a period bracketing the mean
position of the peak is a slightly better measure of droplet
concentrations than the peak value. The calibration equa-
tions used to obtain the data were derived by Oliveira and
Vali (1995), where additional information about the cali-
bration procedure can be found.
Considering the aircraft velocity and the time necessary
for a full cycle, each measurement represents a typical
distance of 5 km. Table 1 shows a summary of the flights
conducted during the LBA campaign, from 21 September
to 13 October, with respective initial and final local times
(LT). When two or more flights were conducted on the
same day, different letters were used in order to identify
each one. About 40 flight hours were performed during this
campaign.
Although biomass burning emissions were present dur-
ing most of the flights, the average CCN concentrations
analyzed in this work were not made within the smoke
plumes but, rather, in the air that might go into the clouds.
The measurements associated with clouds that develop
above the fires would bias the data. Sometimes, the CCN
concentration within smoke plumes reach ten times the
background values. Therefore, the analysis includes only
CCN concentrations in clean and polluted background
atmospheric conditions prevailing in that region and is the
subject of the following discussion.
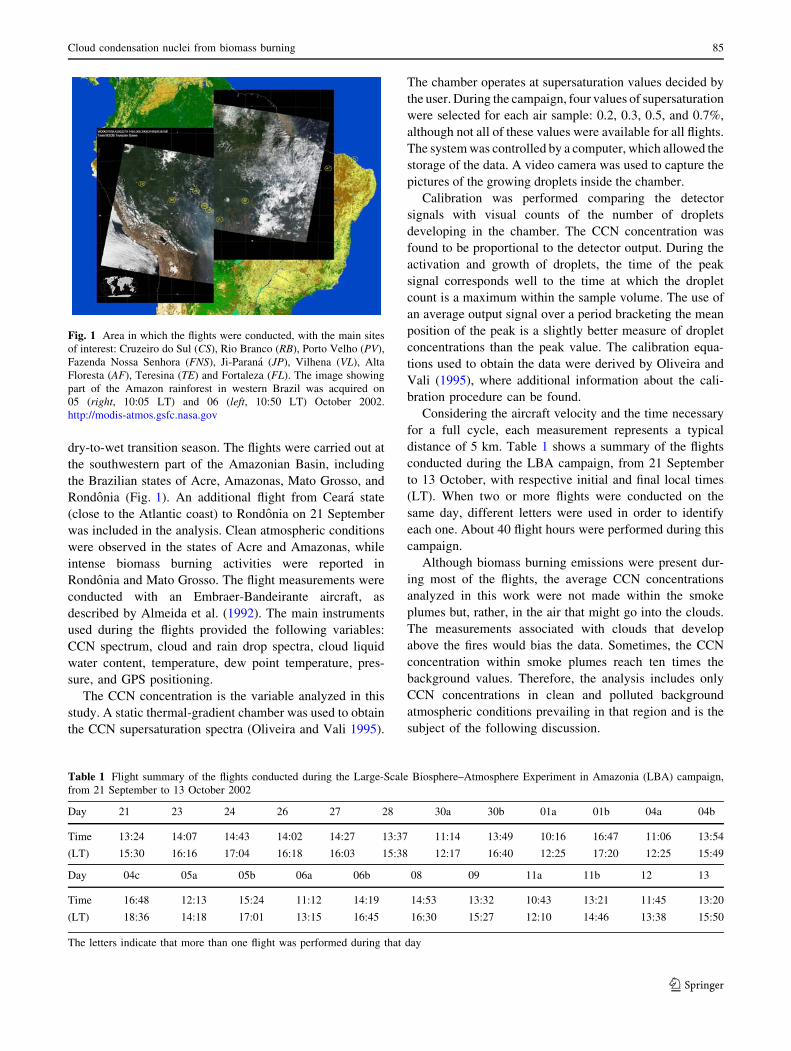
Fig. 1 Area in which the flights were conducted, with the main sites
of interest: Cruzeiro do Sul (CS), Rio Branco (RB), Porto Velho (PV),
Fazenda Nossa Senhora (FNS), Ji-Parana (JP), Vilhena (VL), Alta
Floresta (AF), Teresina (TE) and Fortaleza (FL). The image showing
part of the Amazon rainforest in western Brazil was acquired on
05 (right, 10:05 LT) and 06 (left, 10:50 LT) October 2002.
http://modis-atmos.gsfc.nasa.gov
Table 1 Flight summary of the flights conducted during the Large-Scale Biosphere–Atmosphere Experiment in Amazonia (LBA) campaign,
from 21 September to 13 October 2002
Day 21 23 24 26 27 28 30a 30b 01a 01b 04a 04b
Time 13:24 14:07 14:43 14:02 14:27 13:37 11:14 13:49 10:16 16:47 11:06 13:54
(LT) 15:30 16:16 17:04 16:18 16:03 15:38 12:17 16:40 12:25 17:20 12:25 15:49
Day 04c 05a 05b 06a 06b 08 09 11a 11b 12 13
Time 16:48 12:13 15:24 11:12 14:19 14:53 13:32 10:43 13:21 11:45 13:20
(LT) 18:36 14:18 17:01 13:15 16:45 16:30 15:27 12:10 14:46 13:38 15:50
The letters indicate that more than one flight was performed during that day
Cloud condensation nuclei from biomass burning 85
123
4 Results and discussion
As will be shown, the atmospheric variables analyzed
during the transition period show strong variability, which
can be generally related to the large-scale circulation
characteristics, local rainfall events, and sampling in dif-
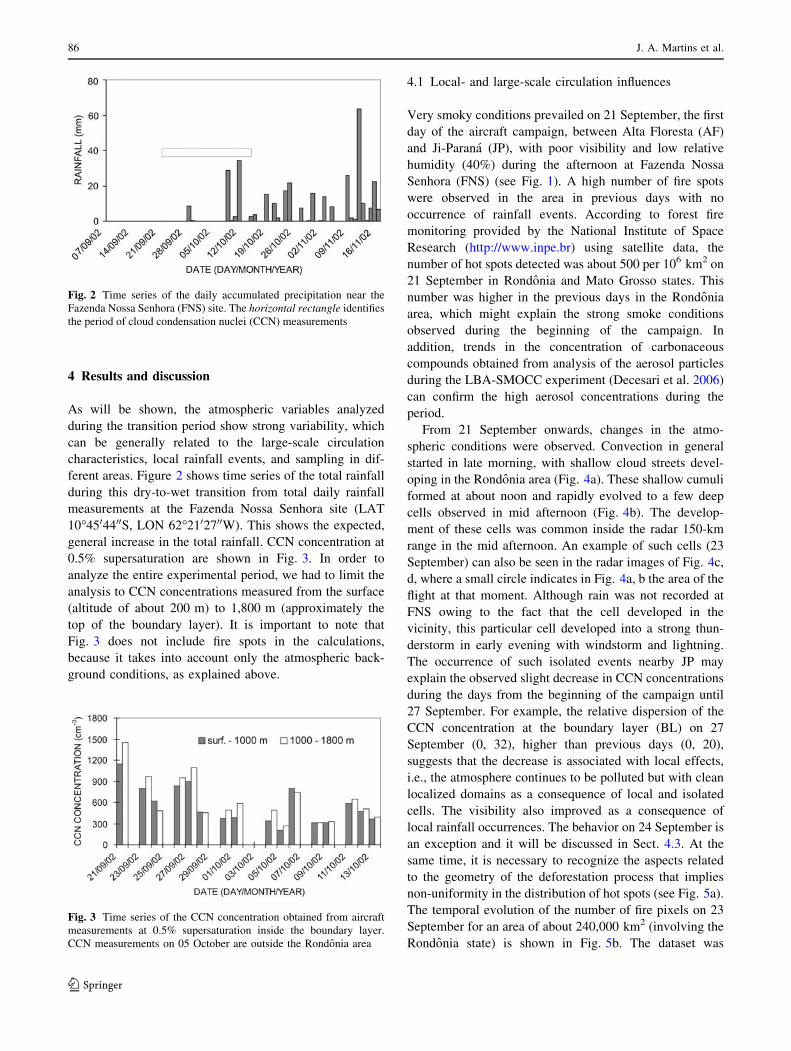
ferent areas. Figure 2 shows time series of the total rainfall
during this dry-to-wet transition from total daily rainfall
measurements at the Fazenda Nossa Senhora site (LAT
10�4504400S, LON 62�2102700W). This shows the expected,
general increase in the total rainfall. CCN concentration at
0.5% supersaturation are shown in Fig. 3. In order to
analyze the entire experimental period, we had to limit the
analysis to CCN concentrations measured from the surface
(altitude of about 200 m) to 1,800 m (approximately the
top of the boundary layer). It is important to note that
Fig. 3 does not include fire spots in the calculations,
because it takes into account only the atmospheric back-
ground conditions, as explained above.
4.1 Local- and large-scale circulation influences
Very smoky conditions prevailed on 21 September, the first
day of the aircraft campaign, between Alta Floresta (AF)
and Ji-Parana (JP), with poor visibility and low relative
humidity (40%) during the afternoon at Fazenda Nossa
Senhora (FNS) (see Fig. 1). A high number of fire spots
were observed in the area in previous days with no
occurrence of rainfall events. According to forest fire
monitoring provided by the National Institute of Space
Research (http://www.inpe.br) using satellite data, the
number of hot spots detected was about 500 per 106 km2 on
21 September in Rondonia and Mato Grosso states. This
number was higher in the previous days in the Rondonia
area, which might explain the strong smoke conditions
observed during the beginning of the campaign. In
addition, trends in the concentration of carbonaceous
compounds obtained from analysis of the aerosol particles
during the LBA-SMOCC experiment (Decesari et al. 2006)
can confirm the high aerosol concentrations during the
period.
From 21 September onwards, changes in the atmo-
spheric conditions were observed. Convection in general
started in late morning, with shallow cloud streets devel-
oping in the Rondonia area (Fig. 4a). These shallow cumuli
formed at about noon and rapidly evolved to a few deep
cells observed in mid afternoon (Fig. 4b). The develop-
ment of these cells was common inside the radar 150-km
range in the mid afternoon. An example of such cells (23
September) can also be seen in the radar images of Fig. 4c,
d, where a small circle indicates in Fig. 4a, b the area of the
flight at that moment. Although rain was not recorded at
FNS owing to the fact that the cell developed in the
vicinity, this particular cell developed into a strong thun-
derstorm in early evening with windstorm and lightning.
The occurrence of such isolated events nearby JP may
explain the observed slight decrease in CCN concentrations
during the days from the beginning of the campaign until
27 September. For example, the relative dispersion of the
CCN concentration at the boundary layer (BL) on 27
September (0, 32), higher than previous days (0, 20),
suggests that the decrease is associated with local effects,
i.e., the atmosphere continues to be polluted but with clean
localized domains as a consequence of local and isolated
cells. The visibility also improved as a consequence of
local rainfall occurrences. The behavior on 24 September is
an exception and it will be discussed in Sect. 4.3. At the
same time, it is necessary to recognize the aspects related
to the geometry of the deforestation process that implies
non-uniformity in the distribution of hot spots (see Fig. 5a).
The temporal evolution of the number of fire pixels on 23
September for an area of about 240,000 km2 (involving the
Rondonia state) is shown in Fig. 5b. The dataset was
Fig. 2 Time series of the daily accumulated precipitation near the
Fazenda Nossa Senhora (FNS) site. The horizontal rectangle identifies
the period of cloud condensation nuclei (CCN) measurements
Fig. 3 Time series of the CCN concentration obtained from aircraft
measurements at 0.5% supersaturation inside the boundary layer.
CCN measurements on 05 October are outside the Rondonia area
86 J. A. Martins et al.
123
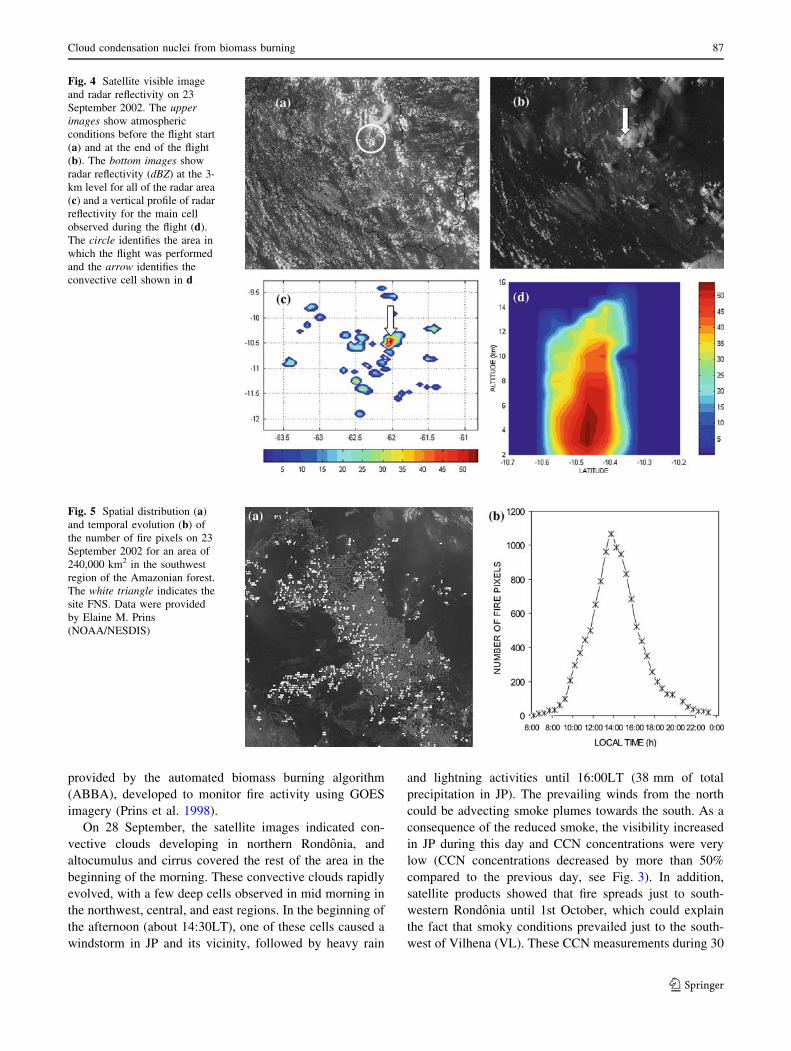
provided by the automated biomass burning algorithm
(ABBA), developed to monitor fire activity using GOES
imagery (Prins et al. 1998).
On 28 September, the satellite images indicated con-
vective clouds developing in northern Rondonia, and
altocumulus and cirrus covered the rest of the area in the
beginning of the morning. These convective clouds rapidly
evolved, with a few deep cells observed in mid morning in
the northwest, central, and east regions. In the beginning of
the afternoon (about 14:30LT), one of these cells caused a
windstorm in JP and its vicinity, followed by heavy rain
and lightning activities until 16:00LT (38 mm of total
precipitation in JP). The prevailing winds from the north
could be advecting smoke plumes towards the south. As a
consequence of the reduced smoke, the visibility increased
in JP during this day and CCN concentrations were very
low (CCN concentrations decreased by more than 50%
compared to the previous day, see Fig. 3). In addition,
satellite products showed that fire spreads just to south-
western Rondonia until 1st October, which could explain
the fact that smoky conditions prevailed just to the south-
west of Vilhena (VL). These CCN measurements during 30
Fig. 4 Satellite visible image
and radar reflectivity on 23
September 2002. The upperimages show atmospheric
conditions before the flight start
(a) and at the end of the flight
(b). The bottom images show
radar reflectivity (dBZ) at the 3-
km level for all of the radar area
(c) and a vertical profile of radar
reflectivity for the main cell
observed during the flight (d).
The circle identifies the area in
which the flight was performed
and the arrow identifies the
convective cell shown in d
Fig. 5 Spatial distribution (a)
and temporal evolution (b) of
the number of fire pixels on 23
September 2002 for an area of
240,000 km2 in the southwest
region of the Amazonian forest.
The white triangle indicates the
site FNS. Data were provided
by Elaine M. Prins
(NOAA/NESDIS)
Cloud condensation nuclei from biomass burning 87
123

September and the first days of October were conducted far
from JP and their characteristics will be discussed in Sect.
4.2.
Two mesoscale convective systems developed on 07
October in western Mato Grosso and traveled westward,
reaching JP during the night, accumulating more than
50 mm of precipitation in some specific sites. The sys-
tems were followed by a large area of stratiform rain that
lasted throughout the morning and early afternoon in the
west part of Rondonia. Even though there was advection
of air masses, scavenging by rain might explain the low
CCN concentrations observed in this case. As a result of
rainfall activity, the lowest CCN concentration in the JP
area was observed since the beginning of the campaign
(note that CS showed values lower than JP when com-
pared with any day of the campaign). CCN concentrations
of about 300 cm-3 were found on 08 and 09 October (see
Fig. 3). The mesoscale convective systems observed on
07/08 October can be seen as the beginning of the tran-
sition to the wet season. A strong decrease of the CCN
concentration was observed to be associated with the
passage of these systems and low CCN concentra-
tions were predominant afterwards. Smoke advected to
Rondonia and, together with some local fires, can explain
the increase in CCN concentrations on 11 October (dou-
ble when compared to 09 October). During the following
days, the sky was clear with good visibility and shallow
cumulus developed around noon. These clouds subse-
quently evolved into deep convective cells in different
times between late afternoon and early evening.
4.2 Horizontal sampling
During some flights, the aircraft maintained the same
altitude for hundreds of kilometers, which provided
excellent horizontal averages of CCN concentrations dur-
ing the experiment. Likewise, CCN spectra obtained from
these flights revealed interesting time and space variability
features, as shown in Fig. 6. The flight from Fortaleza (FL)
to JP on 21 September passed through Teresina (TE) and
AF and constitutes a good example of this variability. It
demonstrates the transitions among different regions, as
well as different air mass characteristics. During this flight,
the aircraft flew across maritime (close to FL), continental
(TE area), and polluted air masses (nearby AF). The first
part of the flight (FL–TE) was very close to the Atlantic
Ocean and was influenced by easterly maritime air masses
associated with the trade winds. For example, the average
CCN concentration at 0.5% supersaturation was 131 ±
42 cm-3. In the second part of the flight (TE–AF), the
results were completely different and a variety of air
masses were associated with the measurements. The
average CCN concentration was 418 ± 206 cm-3 and the
high variance shows a transition toward a more polluted
region. The high CCN concentrations (744 ± 107 cm-3)
associated with the final part of the flight (AF–JP) suggest
that the flight occurred under intense biomass burning
activity, as discussed above. The altitude in each part of the
flight was very similar (around 2,760 m), with almost no
vertical variations. The CCN spectra for this flight can be
observed in Fig. 6a.
The flights on 30 September were performed in the
region between JP and VL. Clouds on 29 and 30 Sep-
tember developed in a relatively clean atmosphere with
just a few hot spots at the JP area. The flight JP–VL
(1,600 m high, 11:14–12:17 LT, flight a in Table 1) was
conducted at the top of the boundary layer (BL), when the
emission started, while the flight VL–JP (2,600 m, 13:49–
16:40 LT, flight b in Table 1) was performed above the
BL after prolonged emissions. Despite the similar spectra
observed in both flights (Fig. 6b), it should be noted,
however, that differences in flight altitudes (the CCN
concentration decreases with altitude above BL) could
mask some possible association with a diurnal cycle in
CCN concentrations as a consequence of the biomass
burning.
CCN measurements were performed between JP and AF
on 01 October. There were no thunderstorms in the area
between the two cities during the afternoon and atmo-
spheric conditions were clear, with only light smoke. Fires
were observed from satellite images just to the south of the
JP–AF line. The airplane crossed a Pyro-cumulus at the
south of AF, which developed in wet soil conditions,
probably as a result of the intense convection observed
during the previous day. Flight JP–AF (3,100 m high,
approximately 11:00 LT, flight a in Table 1) performed on
this day showed lower CCN concentrations than flight AF–
JP (3,400 m high, 5 h later, flight b in Table 1), in spite of
the fact that this later flight was performed at a higher
altitude (Fig. 6c). However, the first flight occurred during
the morning (when biomass burning activity was starting)
and the latter occurred during the afternoon (after pro-
longed aerosol emissions). Both flights had similar
trajectories.
Flights were performed in the western Amazon region
(see Fig. 1) near Cruzeiro do Sul (CS), passing through
Porto Velho (PV) and Rio Branco (RB) during 04, 05, and
06 October. Light to moderate smoky conditions were
observed during the flights to western Amazonia on 04
October (see Fig. 6d, all three flights around 2,700 m). The
three flights on 04 October were conducted at approxi-
mately 11:06 LT (flight a in Table 1), 13:54 LT (flight b in
Table 1), and 16:48 LT (flight c in Table 1). During the
flight CS–JP on 06 October, many fires were detected
randomly distributed in the Rondonia area, but, unfortu-
nately, there is no CCN data available on this flight.
88 J. A. Martins et al.
123
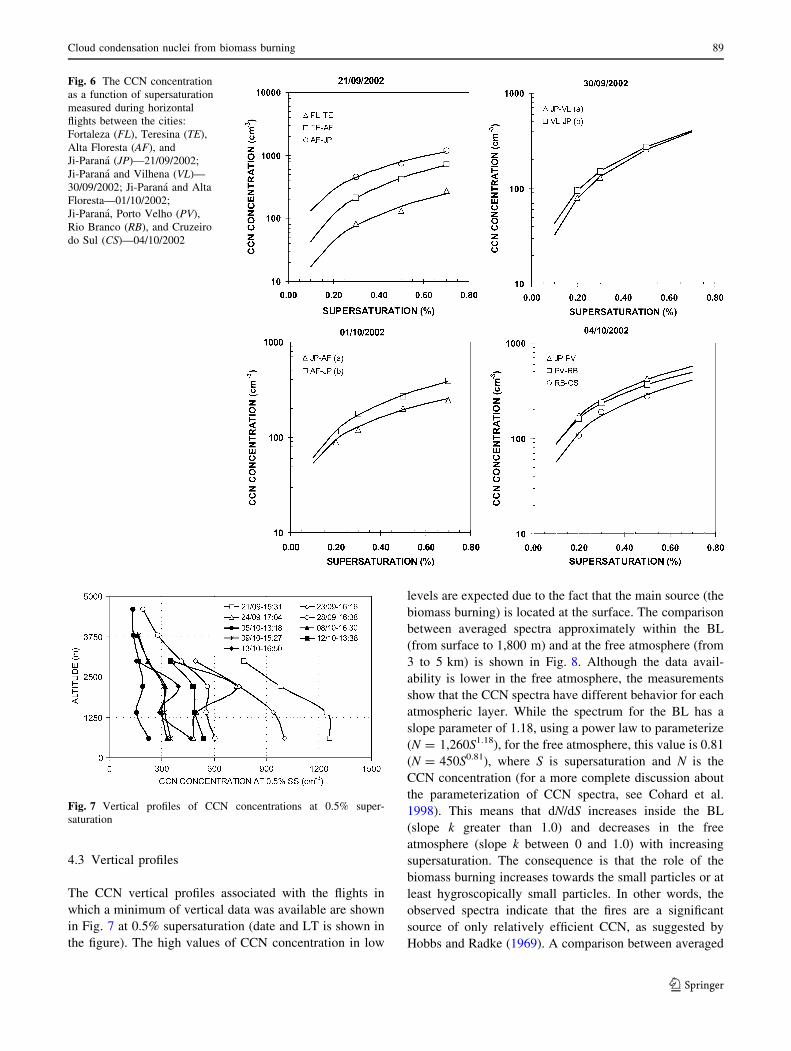
4.3 Vertical profiles
The CCN vertical profiles associated with the flights in
which a minimum of vertical data was available are shown
in Fig. 7 at 0.5% supersaturation (date and LT is shown in
the figure). The high values of CCN concentration in low
levels are expected due to the fact that the main source (the
biomass burning) is located at the surface. The comparison
between averaged spectra approximately within the BL
(from surface to 1,800 m) and at the free atmosphere (from
3 to 5 km) is shown in Fig. 8. Although the data avail-
ability is lower in the free atmosphere, the measurements
show that the CCN spectra have different behavior for each
atmospheric layer. While the spectrum for the BL has a
slope parameter of 1.18, using a power law to parameterize
(N = 1,260S1.18), for the free atmosphere, this value is 0.81
(N = 450S0.81), where S is supersaturation and N is the
CCN concentration (for a more complete discussion about
the parameterization of CCN spectra, see Cohard et al.
1998). This means that dN/dS increases inside the BL
(slope k greater than 1.0) and decreases in the free
atmosphere (slope k between 0 and 1.0) with increasing
supersaturation. The consequence is that the role of the
biomass burning increases towards the small particles or at
least hygroscopically small particles. In other words, the
observed spectra indicate that the fires are a significant
source of only relatively efficient CCN, as suggested by
Hobbs and Radke (1969). A comparison between averaged
Fig. 6 The CCN concentration
as a function of supersaturation
measured during horizontal
flights between the cities:
Fortaleza (FL), Teresina (TE),
Alta Floresta (AF), and
Ji-Parana (JP)—21/09/2002;
Ji-Parana and Vilhena (VL)—
30/09/2002; Ji-Parana and Alta
Floresta—01/10/2002;
Ji-Parana, Porto Velho (PV),
Rio Branco (RB), and Cruzeiro
do Sul (CS)—04/10/2002
Fig. 7 Vertical profiles of CCN concentrations at 0.5% super-
saturation
Cloud condensation nuclei from biomass burning 89
123
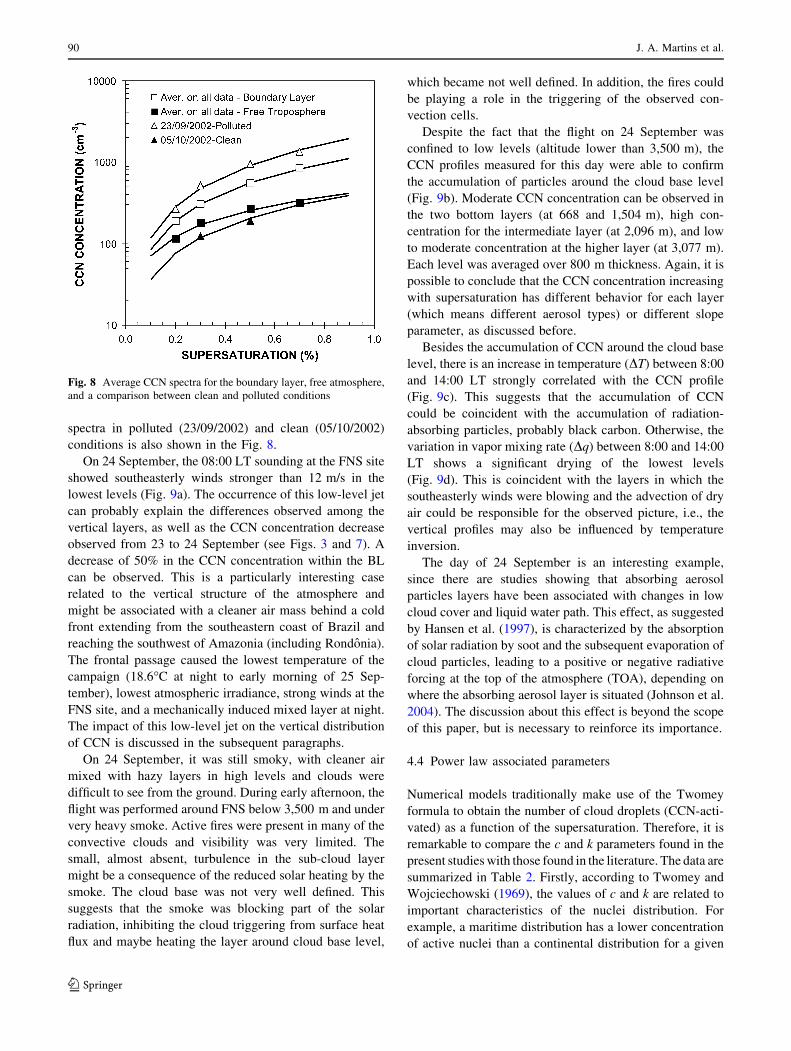
spectra in polluted (23/09/2002) and clean (05/10/2002)
conditions is also shown in the Fig. 8.
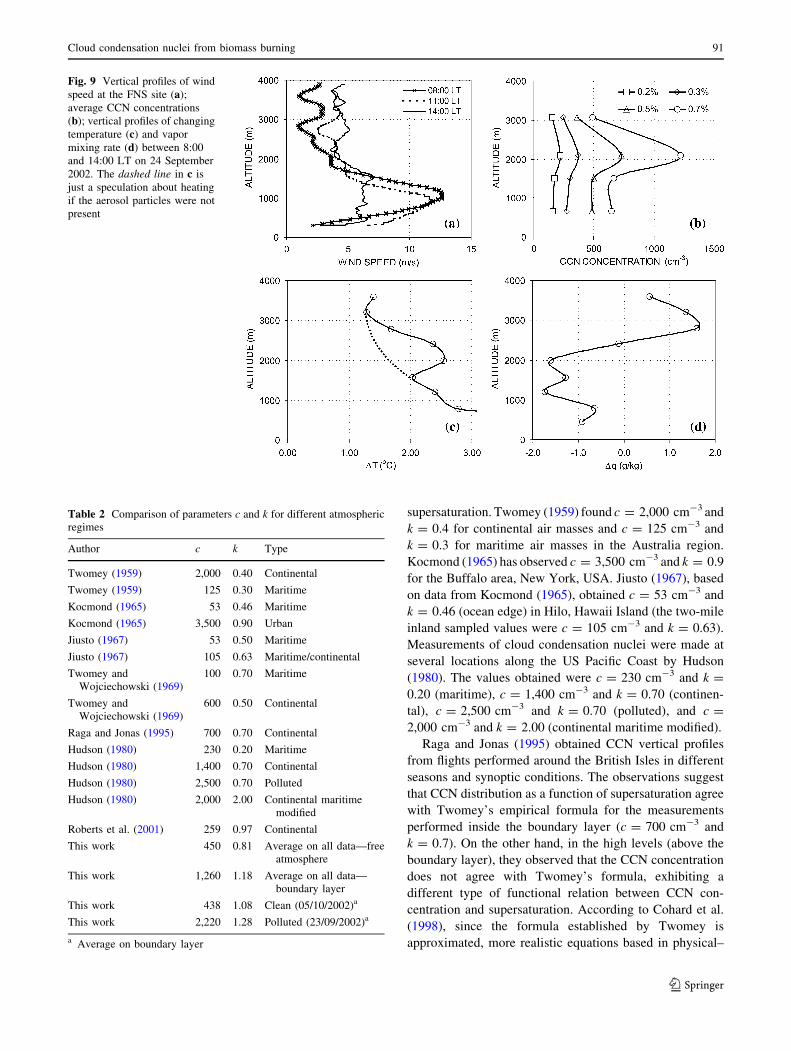
On 24 September, the 08:00 LT sounding at the FNS site
showed southeasterly winds stronger than 12 m/s in the
lowest levels (Fig. 9a). The occurrence of this low-level jet
can probably explain the differences observed among the
vertical layers, as well as the CCN concentration decrease
observed from 23 to 24 September (see Figs. 3 and 7). A
decrease of 50% in the CCN concentration within the BL
can be observed. This is a particularly interesting case
related to the vertical structure of the atmosphere and
might be associated with a cleaner air mass behind a cold
front extending from the southeastern coast of Brazil and
reaching the southwest of Amazonia (including Rondonia).
The frontal passage caused the lowest temperature of the
campaign (18.6�C at night to early morning of 25 Sep-
tember), lowest atmospheric irradiance, strong winds at the
FNS site, and a mechanically induced mixed layer at night.
The impact of this low-level jet on the vertical distribution
of CCN is discussed in the subsequent paragraphs.
On 24 September, it was still smoky, with cleaner air
mixed with hazy layers in high levels and clouds were
difficult to see from the ground. During early afternoon, the
flight was performed around FNS below 3,500 m and under
very heavy smoke. Active fires were present in many of the
convective clouds and visibility was very limited. The
small, almost absent, turbulence in the sub-cloud layer
might be a consequence of the reduced solar heating by the
smoke. The cloud base was not very well defined. This
suggests that the smoke was blocking part of the solar
radiation, inhibiting the cloud triggering from surface heat
flux and maybe heating the layer around cloud base level,
which became not well defined. In addition, the fires could
be playing a role in the triggering of the observed con-
vection cells.
Despite the fact that the flight on 24 September was
confined to low levels (altitude lower than 3,500 m), the
CCN profiles measured for this day were able to confirm
the accumulation of particles around the cloud base level
(Fig. 9b). Moderate CCN concentration can be observed in
the two bottom layers (at 668 and 1,504 m), high con-
centration for the intermediate layer (at 2,096 m), and low
to moderate concentration at the higher layer (at 3,077 m).
Each level was averaged over 800 m thickness. Again, it is
possible to conclude that the CCN concentration increasing
with supersaturation has different behavior for each layer
(which means different aerosol types) or different slope
parameter, as discussed before.
Besides the accumulation of CCN around the cloud base
level, there is an increase in temperature (DT) between 8:00
and 14:00 LT strongly correlated with the CCN profile
(Fig. 9c). This suggests that the accumulation of CCN
could be coincident with the accumulation of radiation-
absorbing particles, probably black carbon. Otherwise, the
variation in vapor mixing rate (Dq) between 8:00 and 14:00
LT shows a significant drying of the lowest levels
(Fig. 9d). This is coincident with the layers in which the
southeasterly winds were blowing and the advection of dry
air could be responsible for the observed picture, i.e., the
vertical profiles may also be influenced by temperature
inversion.
The day of 24 September is an interesting example,
since there are studies showing that absorbing aerosol
particles layers have been associated with changes in low
cloud cover and liquid water path. This effect, as suggested
by Hansen et al. (1997), is characterized by the absorption
of solar radiation by soot and the subsequent evaporation of
cloud particles, leading to a positive or negative radiative
forcing at the top of the atmosphere (TOA), depending on
where the absorbing aerosol layer is situated (Johnson et al.
2004). The discussion about this effect is beyond the scope
of this paper, but is necessary to reinforce its importance.
4.4 Power law associated parameters
Numerical models traditionally make use of the Twomey
formula to obtain the number of cloud droplets (CCN-acti-
vated) as a function of the supersaturation. Therefore, it is
remarkable to compare the c and k parameters found in the
present studies with those found in the literature. The data are
summarized in Table 2. Firstly, according to Twomey and
Wojciechowski (1969), the values of c and k are related to
important characteristics of the nuclei distribution. For
example, a maritime distribution has a lower concentration
of active nuclei than a continental distribution for a given
Fig. 8 Average CCN spectra for the boundary layer, free atmosphere,
and a comparison between clean and polluted conditions
90 J. A. Martins et al.
123
supersaturation. Twomey (1959) found c = 2,000 cm-3 and
k = 0.4 for continental air masses and c = 125 cm-3 and
k = 0.3 for maritime air masses in the Australia region.
Kocmond (1965) has observed c = 3,500 cm-3 and k = 0.9
for the Buffalo area, New York, USA. Jiusto (1967), based
on data from Kocmond (1965), obtained c = 53 cm-3 and
k = 0.46 (ocean edge) in Hilo, Hawaii Island (the two-mile
inland sampled values were c = 105 cm-3 and k = 0.63).
Measurements of cloud condensation nuclei were made at
several locations along the US Pacific Coast by Hudson
(1980). The values obtained were c = 230 cm-3 and k =
0.20 (maritime), c = 1,400 cm-3 and k = 0.70 (continen-
tal), c = 2,500 cm-3 and k = 0.70 (polluted), and c =
2,000 cm-3 and k = 2.00 (continental maritime modified).
Raga and Jonas (1995) obtained CCN vertical profiles
from flights performed around the British Isles in different
seasons and synoptic conditions. The observations suggest
that CCN distribution as a function of supersaturation agree
with Twomey’s empirical formula for the measurements
performed inside the boundary layer (c = 700 cm-3 and
k = 0.7). On the other hand, in the high levels (above the
boundary layer), they observed that the CCN concentration
does not agree with Twomey’s formula, exhibiting a
different type of functional relation between CCN con-
centration and supersaturation. According to Cohard et al.
(1998), since the formula established by Twomey is
approximated, more realistic equations based in physical–
Fig. 9 Vertical profiles of wind
speed at the FNS site (a);
average CCN concentrations
(b); vertical profiles of changing
temperature (c) and vapor
mixing rate (d) between 8:00
and 14:00 LT on 24 September
2002. The dashed line in c is
just a speculation about heating
if the aerosol particles were not
present
Table 2 Comparison of parameters c and k for different atmosphericregimes
Author c k Type
Twomey (1959) 2,000 0.40 Continental
Twomey (1959) 125 0.30 Maritime
Kocmond (1965) 53 0.46 Maritime
Kocmond (1965) 3,500 0.90 Urban
Jiusto (1967) 53 0.50 Maritime
Jiusto (1967) 105 0.63 Maritime/continental
Twomey andWojciechowski (1969)
100 0.70 Maritime
Twomey andWojciechowski (1969)
600 0.50 Continental
Raga and Jonas (1995) 700 0.70 Continental
Hudson (1980) 230 0.20 Maritime
Hudson (1980) 1,400 0.70 Continental
Hudson (1980) 2,500 0.70 Polluted
Hudson (1980) 2,000 2.00 Continental maritimemodified
Roberts et al. (2001) 259 0.97 Continental
This work 450 0.81 Average on all data—freeatmosphere
This work 1,260 1.18 Average on all data—boundary layer
This work 438 1.08 Clean (05/10/2002)a
This work 2,220 1.28 Polluted (23/09/2002)a
a Average on boundary layer
Cloud condensation nuclei from biomass burning 91
123
chemical properties of the aerosol distribution should be
used to fit the measured CCN spectra. However, this
requires information about these properties that are not
frequently available.
Roberts et al. (2001) found CCN concentrations for the
rainy season to be very close to that found in clean con-
ditions of the LBA-SMOCC campaign. Their results
correspond to the first measurements of CCN in the
Amazon Basin and showed values more typical of near-
marine locations (182 and 267 cm-3, respectively, at
supersaturations of 0.5 and 1.0%). The data presented in
this work show CCN concentrations of about 300 cm-3
characterizing the 08 and 09 October clean days, and even
lower values for 05 October (204 cm-3 at 0.5% supersat-
uration). In this case, the measurements were performed in
the clean air at the western part of the Amazon, defined by
Andreae et al. (2004) as green ocean in their conceptual
model about precipitation regimes.
5 Conclusions
In this paper, we have shown the characteristics of cloud
condensation nuclei (CCN) spectra observed in the Ama-
zonian region during the dry-to-wet transition period, which
is linked to biomass burning emissions. Measurements were
performed during a field campaign of the Large-Scale Bio-
sphere–Atmosphere Experiment in Amazonia (LBA)
Project in September and October of 2002.
It is possible to verify that there is a general decrease of
the CCN concentrations from the end of the dry season to
the onset of the wet season. In addition, the comparison
between clean and polluted areas shows at least five times
larger CCN concentrations over polluted areas. During the
dry period, the results also suggested a CCN concentration
diurnal cycle, following the biomass burning, which
accumulates high concentrations mainly inside the atmo-
spheric boundary layer.
There was some evidence suggesting the accumulation
of aerosol particles around the cloud base level, at least on
some days during the biomass burning season. This rein-
forces the fact that an increase in CCN concentration from
biomass burning may be directly associated with the
simultaneous increase in black carbon particles, which
could directly alter the vertical distribution of heating. If
black carbon and CCN are spatially correlated, this means
that there would be a competition between effects associ-
ated with absorbing particles and CCN in the context of
biomass burning.
Differences between clean and polluted supersaturation
spectra can be seen as an indicator that biomass burning is
more efficient at producing mainly small particles or large
particles, but with small soluble fraction.
Further investigation on the role of CCN under conditions
of intense biomass burning needs to incorporate physically
based parameterizations able to represent the aerosol system
as a whole. Besides the fact that this procedure can reduce the
uncertainties associated with the modeling predictions, it is
necessary to recognize that these first studies were performed
in the Amazonian region during the dry season, where
burning activities prevailed. There is, however, no infor-
mation available about the CCN and cloud properties of a
forested region during the dry season not influenced by
anthropogenic emissions. Besides the documentation of the
characteristics associated with an environment highly
influenced by human activities, it is necessary to rediscover
the previously predominant conditions.
The results concerning the spatial and temporal vari-
ability in the c and k parameters allow us to conclude that
clouds cannot be definitively parameterized in a simplified
way. If the activation spectra contain all of the necessary
information on the ability of an aerosol population to
nucleate cloud droplets, as pointed by Cohard et al. (1998),
the knowledge of the c and k parameters on a global scale
would be very useful to reduce the current uncertainties in
the global models. Although a mechanism of the activation
of cloud droplets based on the power law could be seen as
very simple, it could be able to represent important
regional characteristics not captured by the current global
circulation models.
Acknowledgments This study was supported by the Conselho
Nacional de Desenvolvimento Cientıfico e Tecnologico (CNPq), Fi-
nanciadora de Estudos e Projetos (FINEP), and Fundacao de Amparo
a Pesquisa do Estado de Sao Paulo (FAPESP).
References
Ackerman AS, Toon OB, Hobbs PV (1993) Dissipation of marine
stratiform clouds and collapse of the marine boundary layer due
to the depletion of cloud condensation nuclei by clouds. Science
262:226–229
Albrecht B (1989) Aerosols, cloud microphysics, and fractional
cloudiness. Science 245:1227–1230
Almeida FC, Munroe GW, Morales CAR, Pereira MC, Barros FA,
Sampaio AJC, Oliveira JCP (1992) An instrumented aircraft for
tropical precipitation physics research: description and opportu-
nity. WMP Report 19:145–150
Andreae MO, Rosenfeld D (2008) Aerosol–cloud–precipitation
interactions. Part 1. The nature and sources of cloud-active
aerosols. Earth Sci Rev 89:13–41
Andreae MO, Rosenfeld D, Artaxo P, Costa AA, Frank GP, Longo
KM, Silva Dias MAF (2004) Smoking rain clouds over the
Amazon. Science 303:1337–1342
Cifelli R, Petersen WA, Carey LD, Rutledge SA, Silva Dias MAF
(2002) Radar observations of the kinematic, microphysical, and
precipitation characteristics of two MCSs in TRMM LBA. J
Geophys Res 107:44.1–44.16
Claeys M, Graham B, Vas G, Wang W, Vermeylen R, Pashynska V,
Cafmeyer J, Guyon P, Andreae MO, Artaxo P, Maenhaut W
92 J. A. Martins et al.
123

(2004) Formation of secondary organic aerosols through photo-
oxidation of isoprene. Science 303:1173–1176
Cohard J-M, Pinty J-P, Bedos C (1998) Extending Twomey’s
analytical estimate of nucleated cloud droplet concentration
from CCN spectra. J Atmos Sci 55:3348–3357
Crutzen PJ, Andreae MO (1990) Biomass burning in the tropics:
impact on atmospheric chemistry and biogeochemical cycles.
Science 250:1669–1678
Decesari S, Fuzzi S, Facchini C, Mircea M, Emblico L, Cavalli F,
Maenhaut W, Chi X, Schkolnik G, Falkovich A, Rudich Y,
Claeys M, Pashynska V, Vas G, Kourtchev I, Vermeylen R,
Hoffer A, Andreae MO, Tagliavini E, Moretti F, Artaxo P (2006)
Characterization of the organic composition of aerosols from
Rondonia, Brazil, during the LBA-SMOCC 2002 experiment
and its representation through model compounds. Atmos Chem
Phys 6:375–402
Feichter J, Roeckner E, Lohmann U, Liepert B (2004) Nonlinear
aspects of the climate response to greenhouse gas and aerosol
forcing. J Clim 17:2384–2398
Feingold G, Eberhard WL, Veron DE, Previdi M (2003) First
measurements of the Twomey indirect effect using ground-based
remote sensors. Geophys Res Lett 30:20.1–20.4
Gandu AW, Silva Dias PL (1998) Impact of tropical heat sources on
the South American tropospheric upper circulation and subsi-
dence. J Geophys Res 103D6:6001–6015
Ghan SJ, Leung LR, Easter RC, Abdul-Hazzak H (1997) Prediction of
cloud droplet number in a general circulation model. J Geophys
Res 102:21777–21794
Goncalves FLT, Martins JA, Silva Dias MAF (2008) Shape parameter
analysis using cloud spectra and gamma functions in the
numerical modeling RAMS during LBA Project at Amazonian
region, Brazil. Atmos Res 89:1–11
Hansen JE, Sato M, Ruedy R (1997) Radiative forcing and climate
response. J Geophys Res 102:6831–6864
Hobbs PV, Radke LF (1969) Cloud condensation nuclei from a
simulated forest fire. Science 163:279–280
Hudson JG (1980) Relationship between fog condensation nuclei and
fog microstructure. J Atmos Sci 37:1854–1867
Hudson JG (1983) Effects of CCN on stratus clouds. J Atmos Sci
40:480–486
Hudson JG (1993) Cloud condensation nuclei. J Appl Meteor 32:596–
607
Hudson JG, Mishra S (2007) Relationships between CCN and cloud
microphysics variations in clean maritime air. Geophys Res Lett
34:L16804. doi:10.1029/2007GL030044
Hudson JG, Yum SS (2001) Maritime–continental drizzle contrasts in
small cumuli. J Atmos Sci 58:915–926
Hudson JG, Yum SS (2002) Cloud condensation nuclei spectra and
polluted and clean clouds over the Indian Ocean. J Geophys Res
107(D19):8022. doi:10.1029/2001JD000829
Intergovernmental Panel on Climate Change (IPCC) (2007) Climate
change 2007: scientific basis. Fourth assessment report of the
Intergovernmental Panel on Climate Change, Cambridge
Jiusto JE (1967) Aerosol and cloud microphysics measurements in
Hawaii. Tellus 19:359–368
Johnson BT, Shine KP, Forster PM (2004) The semi-direct aerosol
effect: impact of absorbing aerosols on marine stratocumulus. Q
J R Meteorol Soc 130:1407–1422
Kocmond W (1965) Investigation of warm fog properties and fog
modification concepts. Annual report, GAL report no. RM-1788-
P-9, RM-1788-P-10
Kulmala M, Suni T, Lehtinen KEJ, Dal Maso M, Boy M, Reissell A,
Rannik U, Aalto P, Keronen P, Hakola H, Back J, Hoffmann T,
Vesala T, Hari P (2003) A new feedback mechanism linking
forests, aerosols, and climate. Atmos Chem Phys Discuss
3:6093–6107
Lohmann U, Feichter J (2004) Global indirect aerosol effects:
a review. Atmos Chem Phys Discuss 4:7561–7614
Martins JA, Silva Dias MAF (2009) The impact of smoke from forest
fires on the spectral dispersion of cloud droplet size distributions
in the Amazonian region. Environ Res Lett 4:015002. doi:
10.1088/1748-9326/4/1/015002
Martins JA, Silva Dias MAF, Goncalves FLT (2009) Impact of
biomass burning aerosols on precipitation in the Amazon: a
modeling case study. J Geophys Res 114:D02207. doi:10.1029/
2007JD009587
Oliveira JCP, Vali G (1995) Calibration of a photoelectric cloud
condensation nucleus counter. Atmos Res 38:237–248
Prins EM, Feltz JM, Menzel WP, Ward DE (1998) An overview of
GOES-8 diurnal fire and smoke results for SCAR-B and 1995 fire
season in South America. J Geophys Res 103(D24):31821–31836
Raga GB, Jonas PR (1995) Vertical distribution of aerosol particles
and CCN in clear air around the British Isles. Atmos Environ
29:673–684
Rissler J, Vestin A, Swietlicki E, Fisch G, Zhou J, Artaxo P, Andreae
MO (2006) Size distribution and hygroscopic properties of
aerosol particles from dry-season biomass burning in Amazonia.
Atmos Chem Phys 6:471–491
Roberts GC, Andreae MO, Zhou J, Artaxo P (2001) Cloud
condensation nuclei in the Amazon Basin: ‘‘Marine’’ conditions
over a continent? Geophys Res Lett 28:2807–2810
Rosenfeld D (1999) TRMM observed first direct evidence of smoke
from forest fires inhibiting rainfall. Geophys Res Lett 26:3105–
3108
Sherwood S (2002) A microphysical connection among biomass
burning, cumulus clouds, and stratospheric moisture. Science
295:1272–1275
Silva Dias MAF, Rutledge S, Kabat P, Silva Dias PL, Nobre C, Fisch
G, Dolman AJ, Zipser E, Garstang M, Manzi AO, Fuentes JD,
Rocha HR, Marengo J, Plana-Fattori A, Sa LDA, Alvala RCS,
Andreae MO, Artaxo P, Gielow R, Gatti L (2002) Clouds and
rain processes in a biosphere–atmosphere interaction context in
the Amazon Region. J Geophys Res 107(D20):39.1–39.20
Sotiropoulou R-EP, Medina J, Nenes A (2006) CCN predictions: is
theory sufficient for assessments of the indirect effect? Geophys
Res Lett 33:L05816. doi:10.1029/2005GL025148
Twomey S (1959) The nuclei of natural cloud formation—part II: the
supersaturation in natural clouds and the variation of cloud
droplet concentration. Geofis Pura e Appl 43:243–249
Twomey SA (1977) The influence of pollution on the shortwave
albedo of clouds. J Atmos Sci 34:1149–1152
Twomey S, Wojciechowski TA (1969) Observations of the geo-
graphical variation of cloud nuclei. J Atmos Sci 26:684–688
VanReken TM, Rissman TA, Roberts GC, Varutbangkul V, Jonsson
HH, Flagan RC, Seinfeld JH (2003) Toward aerosol/cloud
condensation nuclei (CCN) closure during CRYSTAL-FACE.
J Geophys Res 108(D20):4633. doi:10.1029/2003JD003582
Yum SS, Hudson JG (2002) Maritime/continental microphysical
contrasts in stratus. Tellus B 54:61–73
Cloud condensation nuclei from biomass burning 93
123