Sensitivity of M-PACE Mixed-Phase Stratocumulus to Cloud Condensation and Ice Nuclei in a Mesoscale...
60
1 Sensitivity of M-PACE mixed-phase stratocumulus to cloud condensation and ice nuclei in a mesoscale model with two-moment bulk cloud microphysics Hugh Morrison 1 , James O. Pinto 1 , Judith A. Curry 2 , and Greg M. McFarquhar 3 1 National Center for Atmospheric Research, Boulder, CO 2 School of Earth and Atmospheric Science, Georgia Institute of Technology, Atlanta, GA 3 University of Illinois, Urbana, IL Submitted to the Journal of Geophysical Research – Atmospheres, March 24, 2007 Corresponding author address: Dr. Hugh Morrison National Center for Atmospheric Research P. O. Box 3000, Boulder, CO 80309 Email: [email protected]
-
Upload
independent -
Category
Documents
-
view
2 -
download
0
Transcript of Sensitivity of M-PACE Mixed-Phase Stratocumulus to Cloud Condensation and Ice Nuclei in a Mesoscale...

1
Sensitivity of M-PACE mixed-phase stratocumulus to cloud condensation and ice
nuclei in a mesoscale model with two-moment bulk cloud microphysics
Hugh Morrison1, James O. Pinto1, Judith A. Curry2, and Greg M. McFarquhar3
1National Center for Atmospheric Research, Boulder, CO
2School of Earth and Atmospheric Science, Georgia Institute of Technology, Atlanta, GA
3University of Illinois, Urbana, IL
Submitted to the Journal of Geophysical Research – Atmospheres, March 24, 2007
Corresponding author address:
Dr. Hugh Morrison
National Center for Atmospheric Research
P. O. Box 3000, Boulder, CO 80309
Email: [email protected]

2
Abstract.
A two-moment microphysics scheme implemented in the polar version of the mesoscale
model MM5 is used to simulate a mixed-phase stratocumulus deck observed during the
Fall 2004 Mixed-Phase Arctic Cloud Experiment (MPACE). In situ aircraft
instrumentation and remote sensors gathered extensive microphysical and radiative data
that serve as a testbed for the model. Model results are reasonably similar to observations
in terms of the cloud microphysics, especially for the cloud liquid water. Sensitivity tests
examine the impact of increased cloud condensation and ice nuclei concentrations.
Increasing the concentration of cloud condensation nuclei to values typical for polluted
‘Arctic haze’ conditions substantially reduces the mean droplet size, but has little impact
on the downwelling longwave flux because the cloud already emits as a blackbody
(except near the Arctic Ocean pack ice edge). However, the smaller droplet size does lead
to a slight increase in liquid water path and more significant decrease (~ 60%) in the ice
water path and snowfall rate due to reduced collision-coalescence and riming of droplets
by snow. Increasing the ice nuclei concentration by 1 – 2 orders of magnitude produces a
substantial reduction in liquid water path and downwelling longwave flux at the surface
over interior northern Alaska, but has less impact over open ocean regions. These results
suggest that the sensitivity of Arctic mixed-phase clouds (and their radiative properties)
to changes in cloud condensation and ice nuclei concentrations depends in part on the
underlying surface conditions.

3
1. Introduction
Clouds and their impact on the transfer of longwave and solar radiation are among
the most challenging aspect of simulating present-day climate and, more importantly,
climate change [e.g., Stephens, 2005 and references therein]. One of the most uncertain
aspects of climate-cloud interactions is the indirect effect atmospheric aerosols have on
the radiation budget by influencing the microphysical and macrophysical properties of
clouds. The first aerosol indirect effect concerns the influence of aerosols on droplet size
and hence cloud optical depth [e.g., Twomey, 1977] and emissitivity [e.g., Lubin and
Vogelmann 2006] for a given liquid water path. It has also been hypothesized that
smaller droplets could reduce precipitation efficiency, increasing the longevity and water
content of the cloud, i.e. the second indirect effect [e.g., Albrecht, 1989]. Despite the
recent emphasis of observational and modeling studies on indirect aerosol effects, few
studies have focused specifically on indirect aerosol effects in the Arctic.
Indirect aerosol effects may differ significantly in the Arctic compared with other
regions due to uniqueness of the surface and thermodynamic properties of the
atmosphere. Low-level mixed-phase clouds tend to occur frequently throughout the year
[e.g., Intrieri et al. 2002; Pinto et al. 2001; Morrison et al. 2005c]. These clouds may be
especially sensitive to aerosol since they are colloidally unstable and tend to occur under
weak synoptic forcing [Curry et al., 2000; Zuidema et al., 2005]. Indirect aerosol effects
may be particularly important over the Arctic Ocean, since fairly small changes in the
surface radiative fluxes may significantly impact the thickness and concentration of sea
ice over climatic timescales [Curry and Ebert, 1990; Curry et al., 1993]. These surface
changes may, in turn, impact the aerosol and cloud microphysics, representing a

4
potentially important feedback pathway. Understanding these interactions and feedbacks
is critical since climate modeling results have highlighted the Arctic as a region of
particular vulnerability to global climate change [Houghton et al., 2001].
Arctic aerosols have a distinct annual cycle with pristine conditions in late
summer and polluted conditions common during winter and spring [e.g., Barrie, 1986;
Curry, 1995; Sirois and Barrie, 1999]. Arctic pollution aerosols (‘arctic haze’) are
associated with long-range transport from the mid-latitudes of the North American and
Eurasian continents. It has been suggested that arctic pollution aerosol may modify the
characteristics of cloud condensation nuclei (CCN) and thus droplet number
concentration and size [e.g., Shaw, 1986; Curry, 1995; Curry et al., 1996; Garret et al.
2002; Lubin and Vogelmann 2006].
Recent studies by Garret et al. [2002] and Lubin and Vogelmann [2006] suggest
the particular importance of indirect aerosol effects on the longwave radiative fluxes in
the Arctic, while most global and lower latitude studies have focused on shortwave
indirect effects. At higher latitudes, longwave cloud radiative forcing dominates the net
cloud radiative forcing throughout much of the year [Shupe and Intrieri, 2004]. Arctic
clouds often have relatively low liquid water paths and hence tend to emit as graybodies,
meaning that they are potentially susceptible to aerosol-induced changes in emissivity.
Arctic pollution aerosol may also impact ice nucleation by modifying the
characteristics of ice-forming nuclei (IN). However, aerosol-ice microphysical
interactions, and their potential impact on the regional cloud cover, thermodynamics, and
mesoscale dynamics in the Arctic, remain highly uncertain. The impact of pollution on
IN is hypothesized to be largely dependent upon the chemical composition. Borys [1989]

5
suggested that a large sulfate component may deactivate existing IN. Modeling studies
suggest that the microphysical and macrophysical properties of Arctic mixed-phase
clouds are highly sensitive to the assumed concentration of IN [Pinto, 1998; Harrington et
al., 1999; Jiang et al., 2000; Morrison et al., 2005b]. Specifically, increasing the IN
concentration tends to produce rapid glaciation of the simulated mixed-phase clouds.
Observations in mid-latitudes have suggested that pollution decreases the
snowfall rate due to increasing droplet number concentration and hence decreased droplet
size and riming rate [Borys et al., 2000; 2003]. The impact of pollution aerosols on arctic
clouds is less clear due to lack of observations. Lohmann et al. [2003] suggest from
modeling results that the riming rate in arctic clouds is sensitive to pollution aerosol, but
they found that the impact on snowfall rate depended strongly on the assumed crystal
shape.
Two-moment bulk cloud microphysics schemes predicting both number
concentration and mixing ratio of cloud water have been increasingly used in recent years
to simulate indirect aerosol effects in cloud and climate models [e.g., Ghan et al., 1997;
Lohmann et al., 1999; Saleeby and Cotton, 2004; Morrison and Grabowski, 2006]. The
prediction of cloud particle number concentration provides a more physical treatment of
aerosol indirect effects than using simpler one-moment schemes (i.e., schemes that
predict cloud water mixing ratio only). Relevant parameters (e.g., effective radius) can be
diagnosed from the predicted moments assuming some functional form for the particle
size distributions (e.g., gamma, lognormal). While size-resolving (bin) microphysics
models that explicitly calculate particle size distributions provide a more rigorous
solution; they are much more computationally expensive and still rely on a number of
6
uncertain parameters, especially for the ice phase (e.g., sticking efficiency for ice-ice
collisions). It follows that bulk schemes are currently the only viable approach for many
applications, especially for climate and weather prediction models.
In our previous work [Morrison and Pinto, 2005; 2006; hereafter MP05; MP06], a
new two-moment bulk scheme was developed and incorporated into the polar version of
the fifth Generation Pennsylvania State University/NCAR Mesoscale Model MM5
[Bromwich et al., 2001]. Model results were compared with observations of mixed-phase
clouds obtained in May 1998 over the Arctic pack ice during the Surface Heat Budget of
the Arctic Ocean (SHEBA) and First ISCCP Regional Experiment – Arctic Clouds
Experiment (FIRE-ACE). The new scheme was able to simulate reasonably the
persistence and microphysical characteristics of these clouds, but the lifetime and liquid
water content were quite sensitive to several microphysical and thermodynamic
parameters, especially the assumed IN concentration.
In this study, we extend the work of MP05 and MP06 by applying the polar MM5
coupled with the MP05 two-moment microphysics scheme to simulate a mixed-phase
cloud field observed during the Fall 2004 Mixed-Phase Arctic Clouds Experiment
[MPACE; Verlinde et al., 2007]. Conditions during MPACE differed substantially from
SHEBA/FIRE-ACE, most notably by the surface conditions (i.e., open ocean rather than
ice-covered). During MPACE, ground-based remote sensors and research aircraft were
used to investigate mixed-phase cloud properties and processes along the Alaska North
Slope and adjacent Arctic Ocean. The goals of this study are to evaluate the model’s
performance for the MPACE conditions, and quantify the sensitivity of the modeled
cloud layer to ice nuclei and cloud condensation nuclei concentrations. The indirect

7
impacts of aerosol are examined in terms of the cloud microphysical and macrophysical
properties, boundary layer structure, surface radiative fluxes, and mesoscale and large-
scale dynamics.
The paper is organized as follows. In Section 2 the instrumentation and
observations are described and the case study is outlined. Section 3 gives an overview of
the model description and details new upgrades to the two-moment microphysics scheme.
Baseline model results are compared to observations in Section 4, while Section 5
describes sensitivity to aerosol properties. Summary and conclusions are given in Section
6.
2. Observations
During MPACE, which was conducted from late September through October
2004, ground-based and airborne sensors were used to characterize mixed-phase cloud
microphysics, dynamics, and thermodynamics along the North Slope of Alaska and
adjacent Arctic Ocean [Verlinde et al., 2007]. MPACE was designed so that the ensuing
dataset could be used as a testbed to evaluate and improve the representation of Arctic
mixed-phase clouds in climate and weather models.
2.1 Instrumentation
The MPACE experimental domain consisted of four surface sites in northern
Alaska: Barrow, Atqasuk, Oliktok Point, and Toolik Lake (Figure 1). The Department of
Energy Atmospheric Radiation Measurment North Slope of Alaska site (ARM NSA) near
Barrow (http://www.arm.gov/sites/nsa.stm) has hosted a suite of instruments since 1998,

8
which was augmented by additional instrumentation during MPACE. Two instrumented
aircraft participated in the experiment: the University of North Dakota Citation and the
Scaled Composites Proteus, sponsored by the DOE-ARM Unmanned Aerospace Vehicle
(UAV) program (although Proteus data is not used in the present study). The Citation
performed ascent and descent spirals near Barrow and Oliktok Point as well as porpoising
and constant altitude legs between the two sites. In addition, the Aerosonde UAV
[Holland et al., 2001; Curry et al., 2004] operated out of Barrow and provided in-situ
cloud, thermodynamic, and aerosol data. Near-surface aerosol data is provided by the
NOAA Climate Monitoring and Diagnostic Laboratory (now Global Monitoring
Division) located near the ARM NSA site at Barrow
(http://www.cmdl.noaa.gov/obop/BRW/).
This study utilizes data collected at the Barrow and Oliktok surface sites and in-
situ measurements from the Citation and Aerosonde UAV for model evaluation. Note
that the following description is not a comprehensive listing of all the measurements
available during MPACE, but rather gives an overview of the measurements of relevance
to this study. Millimeter-Wavelength Cloud Radar, Micropulse Lidar, and laser
ceilometers provide information on cloud boundaries and phase. Cloud liquid water path
is derived from microwave radiometer measurements. The longwave and shortwave
radiative fluxes at the surface are derived from pyrgeometeor and pyranometer
measurements that have been quality tested with the QCRad code [Long and Shi, 2006].
Broadband surface albedo is obtained from the upwelling and downwelling shortwave
flux measurements. Accumulated precipitation at the surface was measured both at the
National Weather Service (NWS) station as well as near the ARM NSA site in Barrow.

9
Note that the observed precipitation is highly uncertain due to factors of the high-latitude
environment (e.g., blowing snow, sublimation) [e.g., Yang, 1999], especially given the
small precipitation amounts recorded during MPACE. This is reflected by the large
difference in accumulated precipitation (about an order of magnitude) recorded at the
NWS and ARM sites during the period.
McFarquhar et al. [2007] describe the cloud physics instrumentation installed on
the Citation and the processing techniques used to determine the bulk microphysical
parameters needed to evaluate the model. Following McFarquhar and Cober [2004], they
used information on the spectral shape of the forward scattering probe size (FSSP)
distribution, voltage changes induced by water freezing on a Rosemount icing detector
and visual inspection of particles imaged by the two-dimensional cloud probe (2DC), the
high volume precipitation spectrometer (HVPS) and the cloud particle imager to classify
the phase of each 30 s penetration in cloud as mixed, ice or liquid phase. The size
distributions of the supercooled water droplets were determined from the FSSP (range of
3 to 53 µm) adjusted to match the bulk water content measured by the King probe and the
one-dimensional cloud probe (1DC) when drizzle was present (see McFarquhar et al.
[2007] for details). The ice crystal size distributions for particles larger than 53 µm were
determined from the 1DC (53 to 125 µm), 2DC (125 to 1000 µm), and HVPS (1 to 40
mm) probes, or from the 2DC data extended by fits to larger sizes when the HVPS data
were not available. Ice particles < 53 µm were not included in the analysis shown here.
There is some ambiguity in the interpretation of data from the 1DC and FSSP in mixed-
and ice-phase conditions, but since McFarquhar et al. [2007] determined that the majority
of ice mass was contained in crystals larger than 1 mm, this uncertainty does not affect

10
the derived IWC used to compare against model simulations in this study, although it
could impact estimates of concentration. Uncertainty associated with these estimates is
detailed by McFarquhar et al. [2007].
Data from the Met One Handheld Particle Counter (HHPC-6) measured the
aerosol size distribution. The HHPC-6 is a 6 size-channel (0.3 to 5 µm diameter with
flow rate of 2.83 L/min) optical particle counter that was flown on the Aerosonde UAV.
Total aerosol concentration was measured with a condensation nuclei (CN) counter
located at the NOAA CMDL near Barrow (see section 2.3). It assumed that the CMDL
measurements are characteristic of aerosols throughout the domain.
2.2 Case Study Description
During MPACE three distinct weather regimes were noted [Verlinde et al., 2007].
This study focuses on the second regime, occurring between about October 4 and 15.
This period was characterized by strengthening high pressure over the pack ice region
north of Alaska, bringing air from the pack ice, across the open Beaufort Sea, and onto
the Alaskan coast with winds from the east to northeast. Figure 2 illustrates the synoptic
situation that characterized the flow pattern over the Beaufort Sea and North Slope of
Alaska on October 9-10. The pack ice edge was located along the sharp temperature
gradient seen across the northeastern part of the domain shown in Figure 2. During this
period, surface temperatures over the pack ice had dropped to ~ -25o C according to
National Center for Environmental Prediction (NCEP) Eta analyses. As this air traveled
over the relatively warm open ocean, extensive boundary layer roll stratocumulus clouds
developed (Figure 3). Note that the large-scale flow pattern and cloud field varied little

11
during this period. The cloud top height at Barrow varied between 1 - 1.5 km with
periodic oscillations. Similar features were observed at Oliktok Point, although early on
October 9 a second cloud layer was present above the boundary layer at ~ 2 km. The
boundary layer near the coast was well-mixed from the surface to cloud top, with the
cloud top temperature as cold as 257 K (Figure 4). An inversion of ~ 3 K was present just
above the boundary layer. This cloud was mixed-phase, with liquid water dominant near
cloud top and shafts of ice precipitation (and possibly some supercooled drizzle) present
below the main cloud layer. Total water content and particle number concentration were
dominated by the liquid hydrometeors through most of the cloud layer (see aircraft
observations described in section 4).
2.3 Aerosol and Ice Nuclei Observations
The (dry) aerosol size distribution is characterized by HHPC-6 measurements
from the October 10 flight of the Aerosonde UAV, along with mean CN observations
from the NOAA CMDL. Note that the in-situ HHPC-6 data were taken below the cloud
layer, with the 5 smallest size channels used here. A bimodal lognormal aerosol size
distribution is fit to the HHPC-6 data and constrained so that the total concentration
matches the CN measurements from the NOAA CMDL (Figure 5). The CN
measurements are temporally averaged from October 5 – 14; during this period the low-
level flow field did not vary significantly (although locally-varying aerosol properties are
inferred from droplet concentration measurements, see section 4). The size distribution
N(r) for each mode of the lognormal aerosol distribution is given by
⎥⎦
⎤⎢⎣
⎡−=
σσπ 2
2
ln2)/(ln
expln2ln
mt rrNrd
dN
(1)
12
where σ, rm, and Nt are the standard deviation, geometric mean, and total number
concentration, respectively. For mode 1 (smaller), these values are 2.04, 0.052 µm, and
72.2 cm-3, respectively. For mode 2 (larger), these values are 2.5, 1.3 µm, and 1.8 cm-3,
respectively. The soluble portion of the aerosol is assumed to be ammonium bisulfate,
based on evidence for the lack of full neutralization under remote Arctic conditions after
transport over ocean [Fridlind et al., 2000], with a soluble fraction of 0.9. This is higher
than the soluble fraction of 0.7 specified for the MPACE model intercomparison project
[Klein et al., 2007]; using the value of 0.7 here produces a somewhat lower overall
droplet concentration. In the sensitivity tests designed to simulate polluted conditions
(section 5), the Nt of the smaller mode is increased to 400 cm-3 (see Figure 5) which is
typical of ‘Arctic haze’ conditions [e.g., Yum and Hudson, 2001]. Note that the
geometric mean, standard deviation, and solubility of the aerosol may also impact the
model, but for brevity we focus on the sensitivity to aerosol concentration.
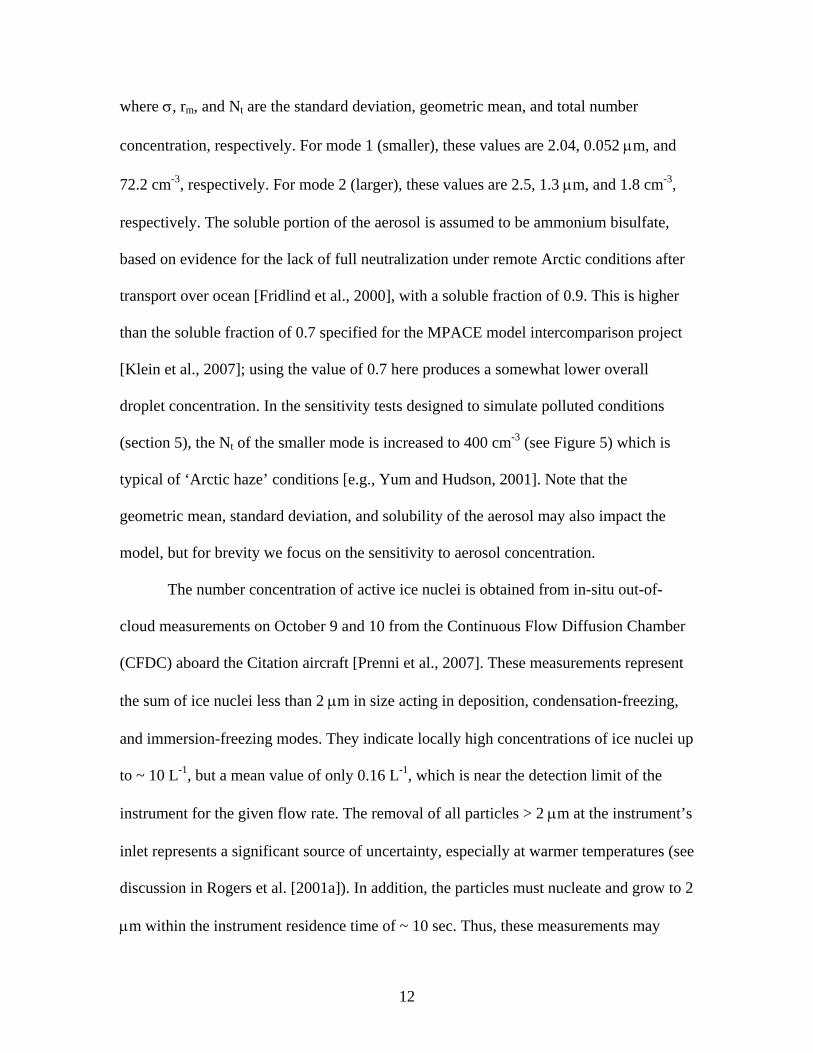
The number concentration of active ice nuclei is obtained from in-situ out-of-
cloud measurements on October 9 and 10 from the Continuous Flow Diffusion Chamber
(CFDC) aboard the Citation aircraft [Prenni et al., 2007]. These measurements represent
the sum of ice nuclei less than 2 µm in size acting in deposition, condensation-freezing,
and immersion-freezing modes. They indicate locally high concentrations of ice nuclei up
to ~ 10 L-1, but a mean value of only 0.16 L-1, which is near the detection limit of the
instrument for the given flow rate. The removal of all particles > 2 µm at the instrument’s
inlet represents a significant source of uncertainty, especially at warmer temperatures (see
discussion in Rogers et al. [2001a]). In addition, the particles must nucleate and grow to 2
µm within the instrument residence time of ~ 10 sec. Thus, these measurements may

13
underestimate the number of IN if the nucleation mechanism is more probabilistic (and
hence slower). A number of the samples were below the detection threshold of the sensor
and were counted as 0 L-1. Data are plotted as a function of processing temperature and
ice supersaturation in Figure 6. These measured IN concentrations are very low relative
to previous observations in the Arctic during springtime (SHEBA/FIRE-ACE) [Rogers et
al., 2001b], and in mid-latitudes [e.g., Meyers et al., 1992]. The average IN concentration
for a given flight during SHEBA [Rogers et al., 2001b] was one to two orders of
magnitude larger than observed during MPACE. Thus, sensitivity tests with increased IN
concentration (section 5) assume 10 times and 100 times the mean value observed during
M-PACE of 0.16 L-1. No direct measurements are available for the number of ice nuclei
acting in contact-freezing mode although it is likely that their concentrations were also
relatively low given the overall pristine conditions encountered during MPACE.
3. Model description
The polar MM5 is a nonhydrostatic model that includes parameterizations for: 1)
shortwave and longwave radiative transfer, 2) boundary layer (BL) and turbulence
processes, 3) surface processes and exchange with the overlying atmosphere, 4) cumulus
convection, and 5) cloud microphysics. The nonhydrostatic momentum equations are
solved using the time splitting method for sound wave stability described by Grell et al.
[1994].
3.1 Model configuration

14
The shortwave and longwave radiative transfer follows Briegleb [1992a; 1992b].
Turbulent fluxes in the atmosphere and between the atmosphere and surface are
parameterized following the 1.5-order prognostic turbulent kinetic energy (TKE) scheme
described by Janjic [1994]. Heat transfer through the land or sea ice-covered surface is
predicted using a multilayer soil or sea ice and snow model depending upon the surface
type [Bromwich et al., 2001]. Turbulent transport is calculated for cloud droplets and ice,
but neglected for precipitation species (rain and snow). The parameterization of deep
convection is turned off since it did not occur during this period. The cloud fraction
within a grid cell is unity if the water content predicted by the microphysics scheme is
greater than 10-5 g m-3 at any level, and zero otherwise.
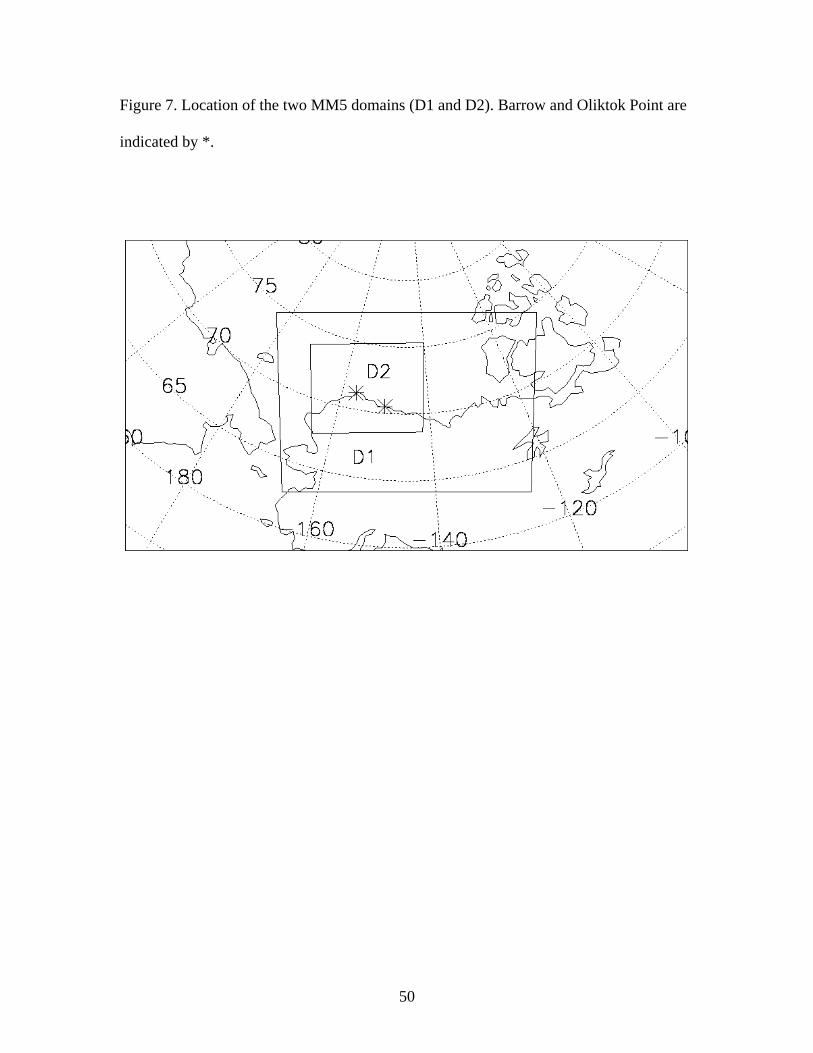
MM5 offers the flexibility of grid nesting. We utilize two domains centered on
North Slope of Alaska (Figure 7). The outer and inner domains have grid spacings of 30
and 10 km, respectively. Results from the inner domain are presented here. Simulations
are performed with 34 vertical levels and 15 levels in the lowest 1 km. These horizontal
and vertical grid spacings are chosen since they are typical for high-resolution numerical
weather prediction and regional climate models. The initial and lateral boundary
conditions are specified using NCEP Eta analyses, except for the lateral boundary
conditions at 0600 UTC which are given by the Eta forecast from the run starting 0000
UTC. The period simulated is from 0000 UTC October 9 to 1200 UTC October 10. A
potential weakness in comparing model results with observations is that the model
represents a grid-average value over 10 km, while the observations are single-point
measurements. For the aircraft data, measurements are limited in both space and time. To
minimize these concerns, the quantitative comparison focuses mainly on time-averaged

15
data. Time-averaged data over the period 1200 UTC October 9 to 1200 UTC October 10
are analyzed, which allows for 12 hours of model spin-up time.
3.2 Description of the cloud microphysics
The two-moment microphysics scheme is described in detail in Morrison et al.
[2005a] and MP05. Prognostic variables include the mixing ratios and number
concentrations of cloud (small) ice, cloud droplets, snow, and rain. The hydrometeor size
distributions are modeled using generalized gamma functions, with several parameterized
microphysical processes acting to transfer mass and number between the various species.
A detailed treatment of droplet activation and ice nucleation from a distribution of CCN
and IN is included, allowing us to simulate the impact of aerosols on both liquid and ice
microphysics in mixed-phase clouds. These parameterizations are described in more
detail below.
Two different modes of heterogeneous ice nucleation are considered by the
model. Since the CFDC is not able to distinguish between deposition, condensation-
freezing, and immersion-freezing, these three mechanisms are considered as a single
mode (hereafter referred to as ‘DCI’) in the model, with the number concentration of ice
nuclei acting in this mode given by the mean CFDC concentration of 0.16 L-1. No
variation of IN concentration with ice supersaturation or temperature is considered. The
other heterogeneous mode included in the model is contact freezing. The CFDC did not
directly measure ice nuclei active in contact mode. Given the lack of observations, we
assume that the number concentration of contact nuclei is a function of temperature
following Meyers et al. [1992]. This parameterization is an empirical fit to mid-latitude

16
measurements. Depletion of ice nuclei is not considered here due to the difficulty of
specifying sources over different surfaces including the open ocean, which may
potentially serve as an important source for biogenic ice nuclei [e.g., Schnell, 1977].
The CCN spectrum as a function of the aerosol chemical and physical properties
is given by the parameterization of Abdul-Razzak and Ghan [2000]. Relevant parameters
are Nt, rm, σ, soluble fraction, and chemical composition of the soluble part of the
aerosol. The number of droplets activated is also a function of environmental conditions
(temperature, pressure) and vertical velocity [see Abdul-Razzak and Ghan, 2000]. Since
local rather than grid-scale vertical velocity is needed for droplet activation, a
parameterization for the sub-grid vertical velocity was developed by MP05. The sub-grid
vertical velocity w’ is related to the predicted TKE assuming that w’ = u’ = v’ (where u’
and v’ are the turbulent horizontal velocity components):
21
32' ⎟
⎠⎞
⎜⎝⎛= TKEw (2)
In this study, aerosol properties (along with ice nuclei) are specified as described in
section 2.3, and assumed to be constant in height and time throughout the model domain.
Additional upgrades have been made to the microphysics scheme relative to
MP05 and MP06. A new parameterization has been implemented that captures changes in
the riming rate as a function of droplet size since a goal of this study is to investigate the
impact of droplet size on ice microphysics and snowfall. The collection efficiency for
riming of cloud droplets by cloud ice/snow is a function of the Stokes number following
Thompson et al. [2004], rather than unity as assumed by MP05 and MP06 (note that here
the riming collection efficiency is still unity for rain-snow collisions). The collection of
17
droplets by cloud ice (neglected by MP05 and MP06) is allowed when the mean cloud ice
diameter exceeds 100 µm. This assumed size threshold is based on observed and
theoretical values [see Pruppacher and Klett 1997, and references therein] that vary
between about 100-300 µm for planar and plate-like crystals, and about 35-50 µm in
terms of width for columnar crystals. Note that in the present scheme, the crystal shape is
not explicitly specified; instead, spherical crystals are assumed with bulk density
following Morrison et al. [2005a] for microphysical process calculations. For
sedimentation, the terminal fallspeed-size relationship for snow is from Locatelli and
Hobbs [1974] assuming ‘aggregates of unrimed assemblages of plates, side planes,
bullets, and columns’, and for cloud ice from Ikawa and Saito [1990].
In MP05 and MP06, the shortwave cloud radiative properties were given by
Slingo [1989] for droplets and Ebert and Curry [1992] for ice as a function of effective
radius and liquid or ice water content, as implemented in the NCAR Community Climate
Model Version 2 (CCM2). Aerosols have no direct impact on the radiative transfer in the
model, allowing us to focus on indirect rather than direct aerosol radiative effects. In
order to simulate the impact of droplet size on cloud emissitivity, additional changes have
been made to the longwave cloud-radiative properties relative to the CCM2 radiation
package. Here, the broadband mass absorption coefficient kc (m2 g-1) is a function of
droplet effective radius, re, following Savijarvi and Raisanen [1998]:
)08.0exp(31.0 ec rk −= . (3)
4. Baseline Results

18
The baseline simulation with configuration as described above produces a
widespread low-level cloud layer over the open ocean and extending into the North Slope
of Alaska consistent with the observations. The cloud layer is mixed-phase with ice
precipitation reaching the surface. Most of the layer is dominated by the liquid phase
except near cloud base (Figure 8). To the northeast of Oliktok Point over the Beaufort
Sea is a region of fairly large IWP (> 25 g m-2) associated with upper-level ice clouds in
the simulation. The distinct bands of higher LWP located along the coast and inland over
the North Slope are associated with diabatically-driven mesoscale circulations (with
maximum vertical velocity ~ 5 cm/s and horizontal scale of about 30-100 km). These
circulations are distinct from the smaller-scale cloud rolls and streaks seen in Figure 3
that the model cannot resolve. The simulated precipitation rate lies within the large
spread between the NWS and ARM observations at Barrow. The sea-level pressure,
surface air temperature and near-surface winds produced by MM5 at 1200 UTC October
10 (Figure 9) are generally similar to the corresponding Eta analysis (see Figure 2).
However, the simulated near surface air temperatures along the Brooks Range are
warmer by 5 – 10 K.
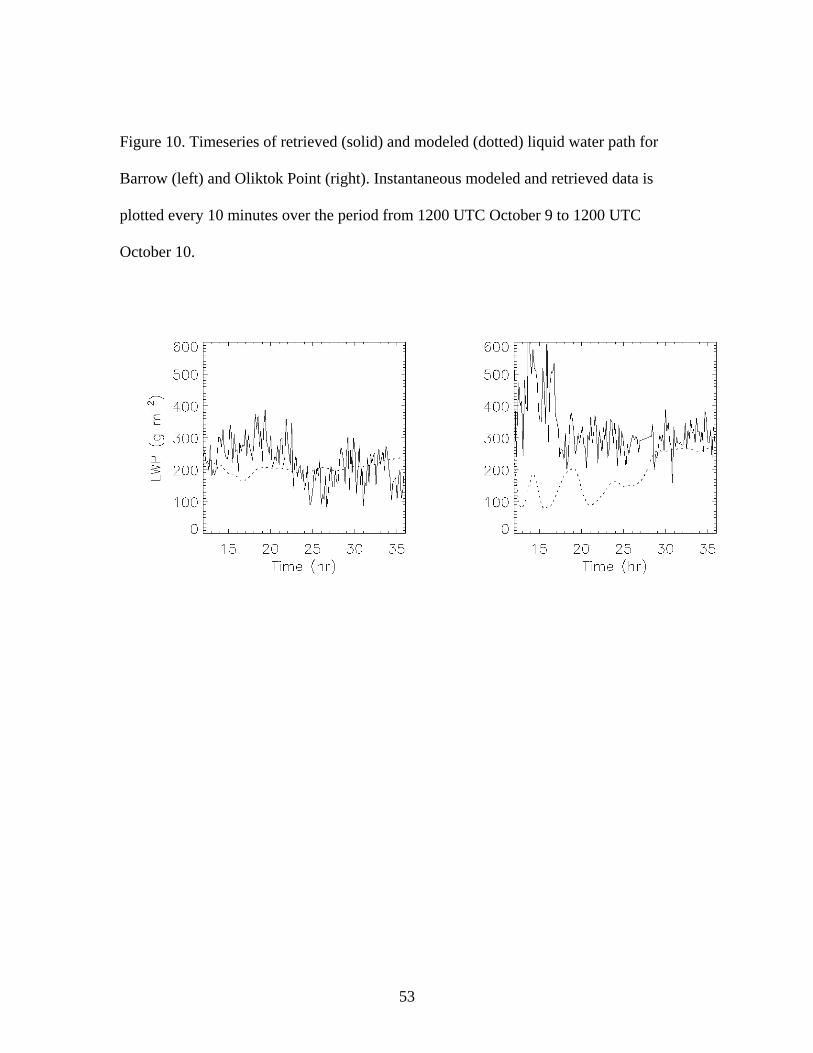
The modeled LWP is quite similar to retrievals at Barrow, but somewhat smaller
than that retrieved at Oliktok Point, especially between 1200 and 2400 UTC October 9
(Figure 10). An obvious difference between the modeled and retrieved timeseries of LWP
is the much larger variability in the retrievals. The higher frequency variability over
timescales less than 1 hr reflects retrieval noise and cloud-scale structures that cannot be
resolved by the model.

19
The model captures general features of the aircraft microphysical observations,
especially for the liquid hydrometeors (Figure 11). For ice, the modeled values of crystal
concentration and IWC are calculated by neglecting particles smaller than 53 µm for
consistency with the observations (see Section 2.1). The neglect of these particles has
little impact on IWC but results in a reduction of the crystal concentration of up to about
30%. The modeled microphysical quantities are averaged over the period 1200 UTC
October 9 to 1200 UTC October 10 at Barrow and Oliktok Point and compared with
average measurements from the two flights between 2000 UTC October 9 and 0300 UTC
October 10. Both the modeled and observed profiles of liquid water content and effective
radius increase with height, although the modeled values tend to be somewhat larger for
both quantities. Variability in the observed liquid water content is largest near the cloud
top, which probably reflects the impact of entrainment. The modeled and observed
droplet number concentrations are fairly constant with height for a given profile.
However, there is some variability in the observed droplet concentrations between the
profiles (ranging from about 30 to over 100 cm-3), suggesting local variability of the
aerosol. The model is not able to capture the ice microphysics as well as the liquid
quantities. However, the observed ice water content and number concentration vary
substantially over space and time and are associated with a larger degree of uncertainty
than the liquid microphysical quantities [McFarquhar et al., 2007]. The modeled crystal
concentration is smaller than observed by about one order of magnitude, possibly due to
uncertainty in the ice nucleation processes or specification of IN. The impact of
increasing the IN number concentration in the model is described in the next section.

20
Despite the large difference in magnitude between the modeled and observed crystal
concentrations, the vertical variability is similar.
Despite similarity between the simulated and observed cloud microphysics, the
simulated downwelling solar and longwave fluxes at the surface show notable differences
relative to the observations (Figure 12, see also Table 2). The downwelling solar flux at
the surface during this period is much smaller than the longwave flux due to extended
periods of darkness and large solar zenith angles; the daily-mean downwelling solar flux
is about an order of magnitude smaller than the downwelling longwave flux (Table 2).
The modeled downwelling longwave flux is persistently too large by 5 – 20 W m-2. This
bias is attributed primarily to a bias in cloud height (modeled cloud boundaries are 200 -
500 m lower than observed) and hence emission temperature (2 – 3 K warmer than
observed); at Barrow and Oliktok Point the modeled and observed clouds have large
enough water paths that they both emit nearly as blackbodies. Differences between the
modeled and observed downwelling solar fluxes are mostly attributed to uncertainty in
the surface albedo that was specified from the Eta anlyses (surface albedo impacts the
downwelling flux due to multiple reflections between the cloud and surface), as well as
difficulty in treating the radiative transfer at large solar zenith angles.
5. Sensitivity tests and discussion
A number of sensitivity experiments examine the impact of CCN and IN number
concentrations on the simulated cloud microphysics, surface radiative fluxes, and
dynamics. The various experiments are listed in Table 1. The first group of sensitivity
tests (POLL, BASE-CEFF, POLL-CEFF) examine the impact of increased CCN

21
concentration associated with polluted aerosol conditions, including the impact on droplet
riming collection efficiency. The second group of sensitivity runs (INx10 and INx100)
examines the impact of increased IN concentration. Time-averaged results from 1200
UTC October 9 to 1200 UTC October 10 for the Barrow grid are shown in Table 2;
similar results are produced for the Oliktok Point grid (not shown).
To test the impact of increased CCN number concentration, the aerosol
concentration of the smaller mode is increased to 400 cm-3 for the polluted aerosol runs,
mimicking typical ‘Arctic haze’ conditions (see Figure 5). As expected, the polluted
aerosol run (POLL) exhibits a much larger mean value of Nc and smaller mean value of re
(by about 4 µm) compared to the baseline run (BASE). The increased aerosol loading
also results in greater LWP and reduced IWP and precipitation rate at the surface at
Barrow (note that 85 - 90% of the total precipitation consists of snow in all of the runs).
A more significant increase in LWP (> 75 g m-2) in POLL relative to BASE occurs to the
west and south of Barrow (Figure 13). Cloud fraction does not differ significantly
between these runs.
Additional sensitivity experiments (BASE-CEFF and POLL-CEFF in Table 1)
help to discern the impact of changes in riming collection efficiency as the aerosol
loading is increased. In these tests, riming collection efficiency for cloud droplets is unity
for both baseline (BASE-CEFF) and polluted (POLL-CEFF) aerosol conditions, in
contrast to the size-dependent riming collection efficiency used in BASE and POLL. The
modeled cloud parameters are more sensitive to changes in CCN concentration when
riming collection efficiency is allowed to vary (as in BASE and POLL). Calculating the
relative differences in LWP, IWP, and precipitation rate between BASE-CEFF and

22
POLL-CEFF for the Barrow grid cell (+15.3, -40.6, -25.0%, respectively), and comparing
with the corresponding differences in LWP, IWP, and precipitation rate between BASE
and POLL (+18.8, -58.4, -63.3%, respectively), suggests that the change in droplet
collection efficiency due to polluted conditions accounts for about one-third to one-half
of the difference in IWP and precipitation rate and about one-fifth of the difference in
LWP between BASE and POLL. The remaining differences in IWP, precipitation rate,
and LWP are mostly attributed to decreased droplet collision-coalescence and
supercooled drizzle formation as the aerosol loading is increased.
The impact of increased CCN under polluted conditions is also examined in terms
of the indirect impact on the surface radiative fluxes through modification of the clouds.
The increase in LWP and decrease in re with increased aerosol loading in POLL produces
a small decrease (3.0 W m-2) in the mean downwelling solar flux compared to BASE (see
Table 2). The impact at solar noon is more significant (decrease of 13.5 W m-2).
However, there is almost no impact on the downwelling longwave flux since the clouds
in the Barrow grid cell emit nearly as blackbodies in both BASE and POLL. In the
northeast section of the domain near the pack ice edge where the clouds contain less
water and cloud emissivity is susceptible to changes in re. The longwave indirect effect in
this region increases the downwelling longwave flux at the surface by up to ~ 10 W m-2
in POLL relative to BASE (Figure 14). Similarly, thinner clouds in the southwest and
southeast corners of the domain are also susceptible to changes in emissivity and are
therefore associated with an increase in the downwelling longwave flux that exceeds 10
W m-2.

23
The sensitivity to increased ice nuclei concentration (deposition, condensation-
freezing, and immersion modes only) is examined in runs INx10 and INx100, with the
baseline concentration of 0.16 L-1 increased by factors of 10 and 100, respectively, giving
concentrations of 1.6 and 16 L-1. These higher ice nuclei concentrations are similar to
mean IN measurements during springtime SHEBA of about one to a few tens per liter
[Rogers et al., 2001b]. In general, the simulated stratocumulus layer is more sensitive to
IN concentration than CCN concentration, for the range of values tested here. Increasing
the IN concentration reduces the LWP and increases IWP and precipitation in the Barrow
grid cell (see Table 2) consistent with previous studies [e.g., Harrington et al., 1999;
Jiang et al., 2000]. This occurs mostly because of the increased strength of the Bergeron-
Findeisen process (i.e., transfer of water from droplets to ice due to the lower saturation
vapor pressure with respect to ice). The decrease in LWP occurs throughout the mixed-
phase stratocumulus region (Figure 15), but is most pronounced over the North Slope
where the surface turbulent water vapor fluxes are small. The mesoscale circulations over
the North Slope evident in BASE are much weaker with the substantial reduction of LWP
in INx100. Note that the average ice crystal concentration of about 2 L-1 from INx10 is
closer to the aircraft observations than BASE (see Figure 11), while INx10 is still able to
reproduce reasonably the liquid microphysical characteristics (although the mean LWP is
somewhat smaller than observed at Barrow, see Table 2).
The impact of increased IN concentration on the surface radiative fluxes is also
examined. The downwelling longwave flux at the surface is decreased throughout the
mixed-phase region in INx10 and especially INx100 (although the longwave flux is
increased for the upper-level ice cloud region northeast of Oliktok Point). However, this
24
decrease is most pronounced in two regions (Figure 16): 1) near the pack ice edge where
LWP is fairly small, and hence where the cloud emissivity is susceptible to a reduction in
LWP, and 2) over the North Slope of Alaska where LWP is reduced substantially
compared to BASE, leading to lower cloud emissivity. Over the open ocean between
these two regions, the clouds still act as near blackbodies even with the reduction in
LWP, so that there is much less impact on the surface downwelling longwave fluxes. In
this region (and in the Barrow grid cell; see Table 2), the increase in mean downwelling
solar flux at the surface is larger in magnitude than the decrease in the mean downwelling
longwave flux. However, farther inland over the North Slope the decrease in
downwelling longwave flux dominates and strongly impacts the surface energy budget.
By the end of the simulation (1200 UTC October 10), surface temperatures in this region
are 3 – 6 K colder in INx100 compared to BASE.
Despite fairly significant differences in the LWP and cloud radiative forcing
between INx100 and BASE, the large-scale dynamics are quite similar (this similarity is
noted among all of the sensitivity runs). In contrast, the large-scale dynamics were more
sensitive to the microphysics for the SHEBA case simulated by MP06; namely, there was
a decrease in the anticyclogenesis and surface pressure across the domain with reduction
of LWP. This difference between our results and MP06 may be due to differences in the
horizontal scale of the cloud-induced changes of surface and lower-tropospheric
temperatures. Here, changes in temperature due to reduction of LWP in INx100 occur
over a fairly limited area of the domain (over interior North Slope of Alaska), in contrast
to the widespread changes in MP06.

25
6. Summary and conclusions
In this study we used a modified version of the MP05 two-moment bulk
microphysics scheme implemented into the Polar-MM5 to simulate low-level mixed-
phase clouds observed during MPACE. Modifications to the microphysics scheme
included the addition of a droplet size-dependent riming collection efficiency and droplet
size-dependent longwave mass absorption coefficient. These changes allowed us to
examine the impact of droplet size on ice microphysics and precipitation as well as cloud
emissivity. Results were compared with in-situ microphysical and radiative
measurements and remotely-based retrievals of LWP. Several sensitivity simulations
were also performed to assess the sensitivity of the modeled cloud properties and surface
radiative fluxes to changes in the CCN and IN number concentrations.
The following is a summary of the main findings:
1) The model was able to reproduce generally the observed microphysical cloud
characteristics. However, the model produced less ice than was observed (especially in
terms of the number concentration), which may have reflected uncertainty in the ice
initiation mechanisms. Despite the reasonably accurate simulation of the microphysics
(especially for the liquid phase which dominates total condensed water mass), the
downwelling shortwave and longwave radiative fluxes at the surface were biased. The
modeled downwelling longwave flux was persistently too large due to a bias in the cloud
height and hence emission temperature.
2) Increasing the CCN concentration produced smaller droplets, increased LWP, and
decreased IWP and snowfall rate in the model. Two processes contributed to these

26
changes: 1) decreased riming efficiency of cloud droplets by cloud ice and snow and 2)
decreased droplet collision-coalescence and hence production of supercooled drizzle.
3) Increasing the CCN concentration had little impact on the longwave fluxes at the
surface despite a significant decrease in droplet effective radius. This was because both
the polluted and pristine clouds emitted nearly as blackbodies; an exception was the
marginal zone near the sea ice edge where the LWP was low and hence cloud emissivity
responded to changes in droplet size. The overall insensitivity of the longwave fluxes to
droplet size, in contrast to the studies of Garrett et al. [2002] and Lubin and Vogelmann
[2006], reflects the fairly unique nature of the MPACE stratocumulus, with much higher
amounts of condensed water than most low-level arctic stratiform clouds. Increased
aerosol loading also led to a decrease in the downwelling solar flux at the surface of a
few W m-2, which had little impact on the total radiative flux at the surface due to the
dominance of the longwave flux (owing to the large solar zenith angle during this
period).
4) Increasing the IN concentration to values more typical of measurements from the
springtime Arctic reduced the LWP and increased the IWP and precipitation rate. The
impact on LWP and cloud emissivity was most significant inland over the North Slope of
Alaska, leading to reduced surface temperatures. The impact on LWP, cloud emissivity,
and lower-tropospheric temperature over the open ocean was much smaller due to the
large forcing provided by the surface turbulent heat and moisture fluxes. Here, contact
nucleation has less impact than in our previous SHEBA studies [e.g., Morrison et al.,
2005c], which appears to reflect our neglect of IN scavenging and the warmer cloud
temperatures for MPACE. Inclusion of IN scavenging here most likely would have

27
resulted in even smaller crystal concentrations compared with observations. There is also
uncertainty in some of the other ice microphysical parameters. It is possible that an
increase in the particle fallspeed or reduction of crystal capacitance from that of spheres
to that suggested by Field et al. [2007] would partially offset the increase in IWC and
reduction in LWC due to increased IN concentration.
5) Reduction of LWP due to increased IN concentration reduced the strength of
mesoscale circulations over the North Slope of Alaska, but there was almost no impact on
the large-scale dynamics. This likely reflected the limited and discontinuous horizontal
extent of changes in lower-tropospheric air temperature as the LWP was reduced, in
contrast to the widespread changes in the SHEBA modeling study of MP06.
Overall, these results suggest that the sensitivity of arctic mixed-phase clouds to
CCN and especially IN concentrations depends on the underlying surface conditions.
During this period, most of the domain was covered with open water which provided a
significant source of heat and moisture. Thus, over the open ocean the condensed water
mass remained large despite changes in the concentrations of CCN and IN, and the
clouds continued to emit as blackbodies except near the pack ice edge. In contrast, the
LWP and hence cloud emissivity was quite sensitive to the IN concentration over snow-
covered land. This sensitivity over land is consistent with previous studies of mixed-
phase stratus over sea ice [e.g., Pinto 1998; Harrington et al. 1999; Jiang et al. 2000],
where surface turbulent fluxes also tend to be much smaller than over open ocean. Our
results suggest that as the surface in the Arctic responds to environmental change (i.e.,
increasing open water fraction), the sensitivity of mixed-phase clouds, and their impact
28
on the radiative fluxes, surface energy balance, and mesoscale dynamics, may be
correspondingly altered.
Since the model was not able to resolve finer-scale features of the stratocumulus
layer using a horizontal grid spacing of 10 km, we could not address the impact of
accompanying changes in the cloud-scale dynamics and entrainment rate as the CCN and
IN concentrations were modified. The large-eddy modeling study of Ackerman et al.
(2004) suggested that under certain conditions, an increase in the CCN concentration can
lead to a decrease in the LWP in subtropical stratocumulus (in contrast to our results
here) due to increased entrainment of dry air into the BL. Of course, arctic mixed-phase
stratocumulus differ from subtropical stratocumulus, most notably by the presence of ice
and the frequent presence of water vapor mixing ratio inversions at the top of the BL
[Curry et al., 1996]. High-resolution cloud models applied to MPACE stratocumulus with
appropriate microphysical packages should help to address interactions between the
microphysics and cloud-scale dynamics.
Acknowledgments. This work was funded by DOE ARM DE-FG02-03ER63539 and
NASA MAP NNG06GBB1G. Contributions of H. Morrison were also funded by the
National Center for Atmospheric Research Advanced Study Program. The National
Center for Atmospheric Research is sponsored by the National Science Foundation.
Contributions of G. McFarquhar were funded by DOE ARM Contract DE-FG03-
02ER63337 and by the ARM Uninhabited Aerospace Vehicle (UAV) Program. Data
were obtained from the ARM program archive, sponsored by DOE, Office of Science,
Office of Biological and Environmental Research, Environmental Sciences Division. We

29
thank C. Long for providing the ARM surface radiative fluxes, A. Prenni for providing
the CFDC ice nuclei measurements, J. Verlinde for providing the map of the MPACE
domain, and J. Y. Harrington for helpful discussion. Comments on the manuscript by P.
Field and G. Thompson are appreciated.

30
References.
Abdul-Razzak, H., and S. J. Ghan (2000), A parameterization of aerosol activation 2.
Multiple aerosol types, J. Geophys. Res., 120, 6837-6844.
Albrecht, B. A. (1989), Aerosols, cloud microphysics, and fractional cloudiness, Science,
245, 1227-1230.
Ackermann, A. S., M. P. Kirkpatrick, D. E. Stevens, and O. B. Toon (2004), The impact
of humidity above stratiform clouds on indirect climate forcing, Nature, 432, 1014-
1017.
Barrie, L. A. (1986), Arctic air pollution: an overview of current knowledge, Atmos.
Environ., 19, 1995-2010.
Borys, R. D. (1989), Studies of ice nucleation by arctic aerosol on AGASP-II, J. Atmos.
Chem., 9, 169-185.
Borys, R. D., D. H. Lowenthal, and D. L. Mitchell (2000), The relationships among cloud
microphysics, chemistry, and precipitation rate in cold mountain clouds, Atmos.
Environ., 34, 2593-2602.
Borys, R. D., D. H. Lowenthal, S. A. Cohn, and W. O. J. Brown (2003), Mountaintop and
radar measurements of anthropogenic aerosol effects on snow growth and snowfall
rate, Geophys. Res. Lett., 30, doi:10.1029/2002GL016855.
Briegleb, B. (1992a), Delta-Eddington approximation for solar radiation in the NCAR
Community Climate Model, J. Geophys. Res., 97, 7603-7612.
Briegleb, B (1992b), Longwave band model for thermal radiation in climate studies, J.
Geophys. Res., 97, 11 475-11 485.

31
Bromwich, D. H., J. J. Cassano, T. Klein, T. G. Heinemann, K. M. Hines, K. Steffen, and
J. E. Box (2001), Mesoscale modeling of katabatic winds over Greenland with the
Polar MM5, Mon. Wea. Rev., 129, 2290-2309.
Curry, J. A., and E. E. Ebert (1990), Sensitivity of the thickness of Arctic sea ice to the
optical properties of clouds, Ann. Glaciol., 14, 43-46.
Curry, J. A., J. L. Schramm, and E. E. Ebert (1993), Impact of clouds on the surface
radiation balance of the Arctic Ocean, Meteor. Atmos. Phys., 51, 197-217.
Curry, J. A., and Coauthors (2000), FIRE Arctic Clouds Experiment, Bull. Amer. Meteor.
Soc., 81, 5-29.
Curry, J. A. (1995), Interactions among aerosols, clouds, and climate of the Arctic Ocean,
Sci. Total Environ., 160, 777-791.
Curry, J. A., W. B. Rossow, and J. L. Schramm (1996), Overview of arctic cloud and
radiation properties, J. Climate, 9, 1731-1764.
Curry, J. A., J. Maslanik, G. Holland, and J. O. Pinto (2004), Application of Aerosondes
in the Arctic, Bull. Amer. Meteorol. Soc., 85, 1855-1861.
Ebert, E. E., and J. A. Curry, (1992), A parameterization of ice-cloud optical properties
for climate models, J. Geophys. Res., 97, 3831-3836.
Field, P. R., A. J. Heymsfield, A. Bansemer, and C. H. Twohy (2007), Capacitance of
snowflakes, J. Atmos. Sci. (submitted)
Fridlind, A. M., M. Jacobson, V.-M. Kerminen, R. E. Hillamo, V. Ricrad, and J.-L.
Jaffrezo (2000), Analysis of gas-aerosol partitioning in the Arctic: Composition of
size-resolved equilibrium model results with field data, J. Geophys. Res., 105, 19
891-19 904.

32
Garrett, T. J., L. F. Radke, and P. V. Hobbs (2002), Aerosol effects on cloud emissivity
and surface longwave heating in the Arctic, J. Atmos. Sci., 59, 769-778.
Ghan, S. J., L. R. Leung, and R. C. Easter (1997), Predictgion of cloud droplet number in
a general circulation model, J. Geophys. Res., 102, 21 777-21 794.
Grell, G. A., J. Dudhia, and D. R. Stauffer (1994), A description of the Fifth-Generation
Penn State/NCAR Mesoscale Model (MM5). NCAR Tech. Note NCAR/TN-398 +
STR, 138 pp.
Harrington, J. Y., T. Reisen , W. R. Cotton, and S. M. Kreidenweis (1999), Cloud
resolving simulations of Arctic stratus. Part II: Transition-season clouds, Atmos.
Res., 51, 45-75.
Holland, G. J., P. J. Webster, J. A. Curry, G. Tyrell, D. Auntlett, G. Brett, J. Becker, R.
Hoag, and W. Vaglienti (2001), The Aerosonde robotic aircraft: A new paradigm
for environmental observations, Bull. Amer. Meteor. Soc., 82, 889-901.
Houghton, J. T., Y. Ding, D. J. Griggs, M. Noguer, P. J. van der Linden, and D. Xiasu,
Eds. (2001), Climate Change 2001: The Scientific Basis, Cambridge Univ. Press,
944 pp.
Ikawa, M., and K. Saito (1990), Description of the nonhydrostatic model developed at the
Forecast Research Department of the MRI, Meteorological Institute Tech. Rep., 28,
238 pp.
Intrieri, J. M., M. D. Shupe, T. Uttal, and B. J. McCarty (2002), An annual cycle of
Arctic cloud characteristics observed by radar and lidar at SHEBA, J. Geophys.
Res., 107, 8030, doi:10.1029/2000JC000423.

33
Janjic, Z. I. (1994), The step-mountain Eta coordinate model: Further developments of
the convection, viscous layer, and turbulence closure schemes, Mon. Wea. Rev.,
122, 927-945.
Jiang, H., W. R. Cotton, J. O. Pinto, J. A. Curry, and M. J. Weissbluth (2000), Cloud
resolving simulations of mixed-phase arctic stratus observed during BASE:
Sensitivity to concentration of ice crystals and large-scale heat and moisture
advection, J. Atmos. Sci., 57, 2105-2117.
Klein, S., A. Fridlind, R. McCoy, G. Mcfarquhar, S. Menon, H. Morrison, D. Veron, S.
Xie, J. J. Yio, and M. Zhang, 2007: ARM Cloud Parameterization and Modeling
Working Group – GCSS Polar Working Group SCM/CRM/LES Intercomparison
Case f2004: ARM Mixed-Phase Arctic Cloud Experiment (MPACE): October 5-22,
2004, available from http://science.arm.gov/wg/cpm/scm/scmic5.
Locatelli, J. D., and P. V. Hobbs (1974), Fallspeeds and masses of solid precipitation
particles, J. Geophys. Res., 79, 2185-2197.
Lohmann, U., J. Feichter, C. C. Chuang, and J. E. Penner (1999), Prediction of the
number of cloud droplets in the ECHAM GCM, J. Geophys. Res., 104, 9169-9198.
Long, C. N., and Y. Shi (2006), The QCRad Value Added Product: Surface radiation
measurement quality control testing, including climatologically configurable limits,
Atmospheric Radiation Measurement Program Technical Report, ARM TR-074, 69
pp.
Lubin, D., and A. M. Vogelmann (2006), A climatologically significant aerosol longwave
indirect effect in the Arctic, Nature, 439, 453-456.

34
McFarquhar, G. M., and S. G. Cober (2004), Single-scattering properties of mixed-phase
Arctic clouds at solar wavelengths: Impacts on radiative transfer, J. Climate, 17,
3799-3813.
McFarquhar, G. M., G. Zhang, M. Poellot, J. Verlinde, G. Kok, R. McCoy, T. Tooman,
A. Fridlind and A. J. Heymsfield (2007), Ice properties of single layer boundary
clouds during the Mixed-Phase Arctic Cloud Experiment (MPACE): Part I
Observations. J. Atmos. Sci. (submitted)
Meyers, M. P., P. J. DeMott, and W. R. Cotton (1992), New primary ice nucleation
parameterization in an explicit model, J. Appl. Meteor., 31, 708-721.
Morrison, H., J. A. Curry, and V. I. Khvorostyanov (2005a), A new double-moment
microphysics scheme for application in cloud and climate models. Part I:
Description, J. Atmos. Sci., 62, 1665-1677.
Morrison, H., J. A. Curry, M. D. Shupe, and P. Zuidema (2005b), A new double-moment
microphysics scheme for application in cloud and climate models. Part II: Single-
column modeling of Arctic clouds, J. Atmos. Sci., 62, 1678-1693.
Morrison, H., M. D. Shupe, J. O. Pinto, and J. A. Curry (2005c), Possible roles of ice
nucleation mode and ice nuclei depletion in the extended lifetime of arctic mixed-
phase clouds, Geophys. Res. Lett., 32, L18801, doi:10.1029/2005GL023614.
Morrison, H., and J. O. Pinto (2005), Mesoscale modeling of springtime arctic mixed-
phase stratiform clouds using a new two-moment bulk microphysics scheme, J.
Atmos. Sci., 62, 3683-3704.

35
Morrison, H., and J. O. Pinto (2006), Intercomparison of bulk cloud microphysics
schemes in mesoscale simulations of springtime arctic mixed-phase stratiform
clouds, Mon. Wea. Rev., 134, 1880-1900.
Morrison, H., and W. W. Grabowski (2006), Comparison of bulk and bin warm rain
microphysics models using a kinematic framework, J. Atmos. Sci. (in press)
Pinto, J. O. (1998), Autumnal mixed-phase cloudy boundary layers in the Arctic, J.
Atmos. Sci., 55, 2016-2038.
Pinto, J. O., J. A. Curry, and J. M. Intrieri (2001), Cloud-aerosol interactions during
autumn over the Beaufort Sea, J. Geophys. Res., 106, 15 077-15 097.
Prenni, A. J., J. Y. Harrington, M. Tjernstrom, P. J. DeMott, A. Avramov, C. N. Long, S.
M. Kreidenweis, P. Q. Olsson, and J. Verlinde (2007), Can ice-nucleating
aerosols affect Arctic seasonal climate?, Bull. Amer. Met. Soc. (in press).
Pruppacher, H. R., and J. D. Klett (1997), Microphysics of Clouds and Precipitation,
Kluwer Academic, 954 pp.
Rangno, A. L., and P. V. Hobbs (2001), Ice particles in stratiform clouds in the Arctic
and possible mechanisms for the production of high ice particle concentration, J.
Geophys. Res., 106, 15 065-15 075.
Rogers, D. C., P. J. DeMott, S. M. Kreidenweis, and Y. Chen (2001a) A continuous-flow
diffusion chamber for airborne measurements of ice nuclei, J. Atmos. Ocean.
Tech., 18, 725-741.
Rogers, D. C., P. J. DeMott, and S. M. Kreidenweis (2001b), Airborne measurements of
tropospheric ice nucleating aerosol particles in the Arctic spring, J. Geophys. Res.,
106, 15 053-15063.
36
Saleeby, S. M., and W. R. Cotton (2004), A large-droplet mode and prognostic number
concentration of clouds droplets in the Colorado State University Regional
Atmospheric Modeling System (RAMS). Part I: Module descriptions and
supercell test simulations, J. Appl. Meteor., 43, 182-195.
Savijarvi, H., and P. Raisanen (1998), Long-wave optical properties of water clouds and
rain, Tellus(A), 50, 1-11.
Schnell, R. C. (1977), Ice nuclei in seawater, fog water and marine air off the coast of
Nova Scotia: Summer 1975, J. Atmos. Sci., 34, 1299-1305.
Shaw, G. E. (1986), Aerosols in Alaskan air masses, J. Atmos. Chem., 4, 157-171.
Shupe, M. D., and J. M. Intrieri (2004), Cloud radiative forcing of the Arctic surface: The
influence of cloud properties, surface albedo, and solar zenith angle, J. Climate,
17, 616-628.
Sirois, A., and L. A. Barrie (1999), Arctic lower tropospheric aerosol trends and
composition at Alert, Canada: 1980-1995, J. Geophys. Res., 104, 11 599-11 618.
Slingo, A. (1989), A GCM parameterization for the shortwave optical properties of water
clouds, J. Atmos. Sci., 46, 1419-1427.
Stevens, G. L. (2005), Cloud feedbacks in the climate system: A critical review, J.
Climate, 18, 237-273.
Thomspon, G., R. M. Rasmussen, and K. Manning (2004), Explicit forecasts of winter
precipitation using an improved bulk microphysics scheme. Part I: Description
and sensitivity analysis, Mon. Wea. Rev., 132, 519-542.
Twomey, S. (1977), The influence of pollution on the shortwave albedo of clouds, J.
Atmos. Sci., 34, 1149-1152.

37
Verlinde, J., and Coauthors (2007), Overview of the Mixed-Phase Arctic Cloud
Experiment (MPACE), Bull. Amer. Meteorol. Soc. (in press).
Yang, D. (1999), An improved precipitation climatology for the Arctic Ocean, Geophys.
Res. Lett., 26(11), 1625-1628.
Yum, S. S., and J. G. Hudson (2001), Vertical distribution of cloud condensation nuclei
spectra over the springtime Arctic Ocean, J. Geophys. Res., 106, 15 045-10 052.
Zuidema, P., and Coauthors (2005), An arctic springtime mixed-phase cloudy boundary
layer observed during SHEBA, J. Atmos. Sci., 62, 160-176.

38
List of Table captions.
Table 1. List of the MM5 runs.
Table 2. Modeled and observed time-averaged liquid water path (LWP), ice water path
(IWP), droplet number concentration (Nc), droplet effective radius (re), downwelling
surface longwave radiative flux (LW), downwelling surface solar flux (SW), and liquid-
equivalent precipitation rate (PREC) for the Barrow grid cell. The various model runs are
defined in Table 1. Time averaging is between 1200 UTC October 9 and 1200 UTC
October 10.

39
List of Figure captions.
Figure 1. Map of the MPACE domain and location of the four surface sites.
Figure 2. Eta analysis (interpolated to the 10 km MM5 Domain 2 grid) of surface air
temperature (color contours), sea level pressure (black contours, interval of 2 mb), and
near-surface winds (barbed vectors, full barb = 5 m s-1), at 1200 UTC October 10, 2004.
Barrow and Oliktok Point are indicated by black dots.
Figure 3. Composite visible image from the NASA Terra satellite for October 9, 2004.
Figure 4. Observed dry-bulb (solid) and dew point (dotted) temperature profiles from the
sounding launched at about 2300 UTC Oct. 9 at the ARM facility near Barrow.
Figure 5. Observed (+) and fitted bimodal aerosol size distributions for baseline (solid)
and polluted (dotted) regimes.
Figure 6. Out-of-cloud CFDC ice nuclei measurements from October 9 and 10 as a
function of processing ice supersaturation and temperature. The formulation from Meyers
et al. [1992], based on a collection of mid-latitude measurements of condensation-
freezing and deposition nuclei, is shown by the solid line.

40
Figure 7. Location of the two MM5 domains (D1 and D2). Barrow and Oliktok point are
indicated by *.
Figure 8. Baseline modeled liquid water path (g m-2) (top) and ice water path (g m-2)
(bottom) at 1200 UTC October 10. Barrow and Oliktok Point are indicated by *.
Figure 9. Surface air temperature (color contours), sea level pressure (black contours,
interval of 2 mb), and near surface winds (barbed vectors, full barb = 5 m s-1) simulated
by MM5 for 1200 UTC October 10. Barrow and Oliktok Point are indicated with black
dots.
Figure 10. Timeseries of retrieved (solid) and modeled (dotted) liquid water path for
Barrow (left) and Oliktok Point (right). Instantaneous modeled and retrieved data is
plotted every 10 minutes over the period from 1200 UTC October 9 to 1200 UTC
October 10.
Figure 11. Comparison of modeled (dash red) and aircraft observed (solid red) liquid
water content (LWC), ice water content (IWC), droplet effective radius (re), droplet
number concentration (Nc) and ice crystal concentration (Ni) as a function of normalized
height (Z) with respect to the cloud layer (0 = cloud bottom, 1 = cloud top). The modeled
profiles are averages over the period 1200 UTC October 9 – 1200 UTC October 10 for
the Barrow and Oliktok Point grid cells. The aircraft profiles are averaged over the two
flights between 2000 UTC October 9 and 0300 UTC October 10. The blue dash and solid

41
lines indicate the mean +/- one standard deviation for the model and aircraft data,
respectively.
Figure 12. Timeseries of observed (solid) and modeled (dotted) downwelling shortwave
(SW) and longwave (LW) radiative fluxes at the surface for Barrow (top) and Oliktok
Point (bottom). Instantaneous modeled and retrieved data is plotted every 10 minutes
over the period from 1200 UTC October 9 to 1200 UTC October 10.
Figure 13. Difference in time-averaged liquid water path between POLL and BASE (g m-
2). Time averaging is between 1200 UTC October 9 and 1200 UTC October 10.
Figure 14. Difference in time-averaged downwelling longwave radiative flux at the
surface (W m-2) between POLL and BASE. Time averaging is between 1200 UTC
October 9 and 1200 UTC October 10.
Figure 15. Difference in time-averaged liquid water path between INx100 and BASE (g
m-2). Time averaging is between 1200 UTC October 9 and 1200 UTC October 10.
Figure 16. Difference in time-averaged downwelling longwave radiative flux at the
surface (W m-2) between INx100 and BASE. Time averaging is between 1200 UTC
October 9 and 1200 UTC October 10.

42
Table 1. List of the MM5 runs.
Run Description
BASE Baseline
POLL Small mode aerosol concentration increased to 400 cm-3
(polluted)
BASE-CEFF Collection efficiency for riming of cloud droplets and rain
by cloud ice and snow set to 1
POLL-CEFF Collection efficiency for riming of cloud droplets and rain
by cloud ice and snow set to 1; small mode aerosol
concentration increased to 400 cm-3 (polluted)
INx10 Number concentration of DCI ice nuclei increased by a
factor of 10
INx100 Number concentration of DCI ice nuclei increased by a
factor of 100

43
Table 2. Modeled and observed time-averaged liquid water path (LWP), ice water path
(IWP), droplet number concentration (Nc), droplet effective radius (re), downwelling
surface longwave radiative flux (LW), downwelling surface solar flux (SW), and liquid-
equivalent precipitation rate (PREC) for the Barrow grid cell. The various model runs are
defined in Table 1. Time averaging is between 1200 UTC October 9 and 1200 UTC
October 10.
Run LWP IWP Nc re LW SW PREC
G m-2 g m-2 cm-3 µm W m-2 W m-2 mm/hr
Observed 223.3 - - - 279.1 13.3 ~ 0.01 – 0.1
BASE 204.8 5.3 51.8 11.2 293.3 7.9 0.044
POLL 241.2 2.2 242.0 7.2 293.5 4.9 0.016
BASE-CEFF 196.1 6.9 51.5 11.2 293.1 7.9 0.060
POLL-CEFF 226.1 4.1 240.0 7.2 293.2 5.0 0.045
INx10 156.7 11.7 50.5 11.1 292.6 9.6 0.074
INx100 30.2 40.2 44.5 9.0 290.8 24.7 0.102

44
Figure 1. Map of the MPACE domain and location of the four surface sites.

45
Figure 2. Eta analysis (interpolated to the 10 km MM5 Domain 2 grid) of surface air
temperature (color contours), sea level pressure (black contours, interval of 2 mb), and
near-surface winds (barbed vectors, full barb = 5 m s-1), at 1200 UTC October 10, 2004.
Barrow and Oliktok Point are indicated by black dots.

46
Figure 3. Composite visible image from the NASA Terra satellite for October 9, 2004.

47
Figure 4. Observed dry-bulb (solid) and dew point (dotted) temperature profiles from the
sounding launched at about 2300 UTC Oct. 9 at the ARM facility near Barrow.

48
Figure 5. Observed (+) and fitted bimodal aerosol size distributions for baseline (solid)
and polluted (dotted) regimes.

49
Figure 6. Out-of-cloud CFDC ice nuclei measurements from October 9 and 10 as a
function of processing ice supersaturation and temperature. The formulation from Meyers
et al. [1992], based on a collection of mid-latitude measurements of condensation-
freezing and deposition nuclei, is shown by the solid line.
50
Figure 7. Location of the two MM5 domains (D1 and D2). Barrow and Oliktok Point are
indicated by *.

51
Figure 8. Baseline modeled liquid water path (g m-2) (top) and ice water path (g m-2)
(bottom) at 1200 UTC October 10. Barrow and Oliktok Point are indicated by *.

52
Figure 9. Surface air temperature (color contours), sea level pressure (black contours,
interval of 2 mb), and near surface winds (barbed vectors, full barb = 5 m s-1) simulated
by MM5 for 1200 UTC October 10. Barrow and Oliktok Point are indicated with black
dots.
53
Figure 10. Timeseries of retrieved (solid) and modeled (dotted) liquid water path for
Barrow (left) and Oliktok Point (right). Instantaneous modeled and retrieved data is
plotted every 10 minutes over the period from 1200 UTC October 9 to 1200 UTC
October 10.

54
Figure 11. Comparison of modeled (dash red) and aircraft observed (solid red) liquid
water content (LWC), ice water content (IWC), droplet effective radius (re), droplet
number concentration (Nc) and ice crystal concentration (Ni) as a function of normalized
height (Z) with respect to the cloud layer (0 = cloud bottom, 1 = cloud top). The modeled
profiles are averages over the period 1200 UTC October 9 – 1200 UTC October 10 for
the Barrow and Oliktok Point grid cells. The aircraft profiles are averaged over the two
flights between 2000 UTC October 9 and 0300 UTC October 10. The blue dash and solid
lines indicate the mean +/- one standard deviation for the model and aircraft data,
respectively.

55
Figure 12. Timeseries of observed (solid) and modeled (dotted) downwelling shortwave
(SW) and longwave (LW) radiative fluxes at the surface for Barrow (top) and Oliktok
Point (bottom). Instantaneous modeled and retrieved data is plotted every 10 minutes
over the period from 1200 UTC October 9 to 1200 UTC October 10.

56
Figure 13. Difference in time-averaged liquid water path between POLL and BASE (g
m-2). Time averaging is between 1200 UTC October 9 and 1200 UTC October 10.

57
Figure 14. Difference in time-averaged downwelling longwave radiative flux at the
surface (W m-2) between POLL and BASE. Time averaging is between 1200 UTC
October 9 and 1200 UTC October 10.

58
Figure 15. Difference in time-averaged liquid water path between INx100 and BASE (g
m-2). Time averaging is between 1200 UTC October 9 and 1200 UTC October 10.

59
Figure 16. Difference in time-averaged downwelling longwave radiative flux at the
surface (W m-2) between INx100 and BASE. Time averaging is between 1200 UTC
October 9 and 1200 UTC October 10.

60