FORM 20-F Annual Report 2010 (PDF) - Nomura
241
SECURITIES AND EXCHANGE COMMISSION Washington, D.C. 20549 FORM 20-F ‘ REGISTRATION STATEMENT PURSUANT TO SECTION 12(b) OR 12(g) OF THE SECURITIES EXCHANGE ACT OF 1934 OR È ANNUAL REPORT PURSUANT TO SECTION 13 OR 15(d) OF THE SECURITIES EXCHANGE ACT OF 1934 For the fiscal year ended March 31, 2010 OR ‘ TRANSITION REPORT PURSUANT TO SECTION 13 OR 15(d) OF THE SECURITIES EXCHANGE ACT OF 1934 For the transition period from to OR ‘ SHELL COMPANY REPORT PURSUANT TO SECTION 13 OR 15(d) OF THE SECURITIES EXCHANGE ACT OF 1934 Date of event requiring this shell company report Commission file number: 1-15270 Nomura Horudingusu Kabushiki Kaisha (Exact name of registrant as specified in its charter) Nomura Holdings, Inc. (Translation of registrant’s name into English) Japan 9-1, Nihonbashi 1-chome Chuo-ku, Tokyo 103-8645 Japan (Jurisdiction of incorporation or organization) (Address of principal executive offices) Takumi Kitamura, 81-3-5255-1000, 81-3-3274-4496 (Name, Telephone, E-mail and/or Facsimile number and Address of Company Contact Person) Securities registered or to be registered pursuant to Section 12(b) of the Act: Title of Each Class Name of Each Exchange On Which Registered Common Stock* New York Stock Exchange * Not for trading, but only in connection with the registration of the American Depositary Shares, each representing one share of Common Stock. Securities registered or to be registered pursuant to Section 12(g) of the Act: None (Title of Class) Securities for which there is a reporting obligation pursuant to Section 15(d) of the Act: None (Title of Class) Indicate the number of outstanding shares of each of the issuer’s classes of capital or common stock as of the close of the period covered by the annual report. As of March 31, 2010, 3,669,044,614 shares of Common Stock were outstanding, including 66,855,920 shares represented by 66,855,920 American Depositary Shares. Indicate by check mark if the registrant is a well-known seasoned issuer, as defined in Rule 405 of the Securities Act. È Yes ‘ No If this report is an annual or transition report, indicate by check mark if the registrant is not required to file reports pursuant to Section 13 or 15(d) of the Securities Exchange Act of 1934. ‘ Yes È No Indicate by check mark whether the registrant: (1) has filed all reports required to be filed by Section 13 or 15(d) of the Securities Exchange Act of 1934 during the preceding 12 months (or for such shorter period that the registrant was required to file such reports), and (2) has been subject to such filing requirements for the past 90 days. Yes È No ‘ Indicate by check mark whether the registrant has submitted electronically and posted on its corporate Web site, if any, every Interactive Data File required to be submitted and posted pursuant to Rule 405 of Regulation S-T (§232.405 of this chapter) during the preceding 12 months (or for such shorter period that the registrant was required to submit and post such files). Yes ‘ No ‘ Indicate by check mark whether the registrant is a large accelerated filer, an accelerated filer, or a non-accelerated filer. See definition of “accelerated filer and large accelerated filer” in Rule 12b-2 of the Exchange Act. (Check one): Large accelerated filer È Accelerated filer ‘ Non-accelerated filer ‘ Indicate by check mark which basis of accounting the registrant has used to prepare the financial statements included in this filing: U.S. GAAP È International Financial Reporting Standards as issued by the International Accounting Standards Board ‘ Other ‘ If “Other” has been checked in response to the previous question, indicate by check mark which financial statement item the registrant has elected to follow. ‘ Item 17 ‘ Item 18 If this is an annual report, indicate by check mark whether the registrant is a shell company (as defined in Rule 12b-2 of the Exchange Act). ‘ Yes È No
-
Upload
khangminh22 -
Category
Documents
-
view
0 -
download
0
Transcript of FORM 20-F Annual Report 2010 (PDF) - Nomura
SECURITIES AND EXCHANGE COMMISSIONWashington, D.C. 20549
FORM 20-F‘ REGISTRATION STATEMENT PURSUANT TO SECTION 12(b) OR 12(g) OF THE SECURITIES EXCHANGE ACT OF
1934OR
È ANNUAL REPORT PURSUANT TO SECTION 13 OR 15(d) OF THE SECURITIES EXCHANGE ACT OF 1934For the fiscal year ended March 31, 2010
OR‘ TRANSITION REPORT PURSUANT TO SECTION 13 OR 15(d) OF THE SECURITIES EXCHANGE ACT OF 1934
For the transition period from toOR
‘ SHELL COMPANY REPORT PURSUANT TO SECTION 13 OR 15(d) OF THE SECURITIES EXCHANGE ACT OF 1934Date of event requiring this shell company report
Commission file number: 1-15270
Nomura Horudingusu Kabushiki Kaisha(Exact name of registrant as specified in its charter)
Nomura Holdings, Inc.(Translation of registrant’s name into English)
Japan
9-1, Nihonbashi 1-chomeChuo-ku, Tokyo 103-8645
Japan(Jurisdiction of incorporation or organization) (Address of principal executive offices)
Takumi Kitamura, 81-3-5255-1000, 81-3-3274-4496(Name, Telephone, E-mail and/or Facsimile number and Address of Company Contact Person)
Securities registered or to be registered pursuant to Section 12(b) of the Act:Title of Each Class Name of Each Exchange On Which Registered
Common Stock* New York Stock Exchange
* Not for trading, but only in connection with the registration of the American Depositary Shares, each representing one share of CommonStock.
Securities registered or to be registered pursuant to Section 12(g) of the Act:None
(Title of Class)Securities for which there is a reporting obligation pursuant to Section 15(d) of the Act:
None(Title of Class)
Indicate the number of outstanding shares of each of the issuer’s classes of capital or common stock as of the close of theperiod covered by the annual report.
As of March 31, 2010, 3,669,044,614 shares of Common Stock were outstanding, including 66,855,920 shares represented by66,855,920 American Depositary Shares.
Indicate by check mark if the registrant is a well-known seasoned issuer, as defined in Rule 405 of the SecuritiesAct. È Yes ‘ No
If this report is an annual or transition report, indicate by check mark if the registrant is not required to file reports pursuant toSection 13 or 15(d) of the Securities Exchange Act of 1934. ‘ Yes È No
Indicate by check mark whether the registrant: (1) has filed all reports required to be filed by Section 13 or 15(d) of theSecurities Exchange Act of 1934 during the preceding 12 months (or for such shorter period that the registrant was required to filesuch reports), and (2) has been subject to such filing requirements for the past 90 days. Yes È No ‘
Indicate by check mark whether the registrant has submitted electronically and posted on its corporate Web site, if any, everyInteractive Data File required to be submitted and posted pursuant to Rule 405 of Regulation S-T (§232.405 of this chapter) duringthe preceding 12 months (or for such shorter period that the registrant was required to submit and post such files). Yes ‘ No ‘
Indicate by check mark whether the registrant is a large accelerated filer, an accelerated filer, or a non-accelerated filer. Seedefinition of “accelerated filer and large accelerated filer” in Rule 12b-2 of the Exchange Act. (Check one):
Large accelerated filer È Accelerated filer ‘ Non-accelerated filer ‘
Indicate by check mark which basis of accounting the registrant has used to prepare the financial statements included in this filing:U.S. GAAP È International Financial Reporting Standards as issued
by the International Accounting Standards Board ‘Other ‘
If “Other” has been checked in response to the previous question, indicate by check mark which financial statement item theregistrant has elected to follow. ‘ Item 17 ‘ Item 18
If this is an annual report, indicate by check mark whether the registrant is a shell company (as defined in Rule 12b-2 of theExchange Act). ‘ Yes È No
TABLE OF CONTENTS
Page
PART I
Item 1. Identity of Directors, Senior Management and Advisers . . . . . . . . . . . . . . . . . . . . . . . . . . . . . . . 2
Item 2. Offer Statistics and Expected Timetable . . . . . . . . . . . . . . . . . . . . . . . . . . . . . . . . . . . . . . . . . . . 2
Item 3. Key Information . . . . . . . . . . . . . . . . . . . . . . . . . . . . . . . . . . . . . . . . . . . . . . . . . . . . . . . . . . . . . . 2
Item 4. Information on the Company . . . . . . . . . . . . . . . . . . . . . . . . . . . . . . . . . . . . . . . . . . . . . . . . . . . . 16
Item 4A. Unresolved Staff Comments . . . . . . . . . . . . . . . . . . . . . . . . . . . . . . . . . . . . . . . . . . . . . . . . . . . . 28
Item 5. Operating and Financial Review and Prospects . . . . . . . . . . . . . . . . . . . . . . . . . . . . . . . . . . . . . . 28
Item 6. Directors, Senior Management and Employees . . . . . . . . . . . . . . . . . . . . . . . . . . . . . . . . . . . . . . 66
Item 7. Major Shareholders and Related Party Transactions . . . . . . . . . . . . . . . . . . . . . . . . . . . . . . . . . . 82
Item 8. Financial Information . . . . . . . . . . . . . . . . . . . . . . . . . . . . . . . . . . . . . . . . . . . . . . . . . . . . . . . . . . 83
Item 9. The Offer and Listing . . . . . . . . . . . . . . . . . . . . . . . . . . . . . . . . . . . . . . . . . . . . . . . . . . . . . . . . . . 84
Item 10. Additional Information . . . . . . . . . . . . . . . . . . . . . . . . . . . . . . . . . . . . . . . . . . . . . . . . . . . . . . . . . 85
Item 11. Quantitative and Qualitative Disclosures about Market Risk . . . . . . . . . . . . . . . . . . . . . . . . . . . 102
Item 12. Description of Securities Other Than Equity Securities . . . . . . . . . . . . . . . . . . . . . . . . . . . . . . . 108
PART II
Item 13. Defaults, Dividend Arrearages and Delinquencies . . . . . . . . . . . . . . . . . . . . . . . . . . . . . . . . . . . 110
Item 14. Material Modifications to the Rights of Security Holders and Use of Proceeds . . . . . . . . . . . . . 110
Item 15. Controls and Procedures . . . . . . . . . . . . . . . . . . . . . . . . . . . . . . . . . . . . . . . . . . . . . . . . . . . . . . . . 110
Item 16A. Audit Committee Financial Expert . . . . . . . . . . . . . . . . . . . . . . . . . . . . . . . . . . . . . . . . . . . . . . . . 111
Item 16B. Code of Ethics . . . . . . . . . . . . . . . . . . . . . . . . . . . . . . . . . . . . . . . . . . . . . . . . . . . . . . . . . . . . . . . 111
Item 16C. Principal Accountant Fees and Services . . . . . . . . . . . . . . . . . . . . . . . . . . . . . . . . . . . . . . . . . . . 111
Item 16D. Exemptions from the Listing Standards for Audit Committees . . . . . . . . . . . . . . . . . . . . . . . . . . 112
Item 16E. Purchases of Equity Securities by the Issuer and Affiliated Purchasers . . . . . . . . . . . . . . . . . . . 112
Item 16F. Change in Registrant’s Certifying Accountant . . . . . . . . . . . . . . . . . . . . . . . . . . . . . . . . . . . . . . 114
Item 16G. Corporate Governance . . . . . . . . . . . . . . . . . . . . . . . . . . . . . . . . . . . . . . . . . . . . . . . . . . . . . . . . . 114
PART III
Item 17. Financial Statements . . . . . . . . . . . . . . . . . . . . . . . . . . . . . . . . . . . . . . . . . . . . . . . . . . . . . . . . . . . 116
Item 18. Financial Statements . . . . . . . . . . . . . . . . . . . . . . . . . . . . . . . . . . . . . . . . . . . . . . . . . . . . . . . . . . . 116
Item 19. Exhibits . . . . . . . . . . . . . . . . . . . . . . . . . . . . . . . . . . . . . . . . . . . . . . . . . . . . . . . . . . . . . . . . . . . . . 117
Index to the Consolidated Financial Statements . . . . . . . . . . . . . . . . . . . . . . . . . . . . . . . . . . . . . . . . . . . . . . . F-1
1
As used in this annual report, references to “Nomura” are to The Nomura Securities Co., Ltd. when thereferences relate to the period prior to, and including, September 30, 2001 and to Nomura Holdings, Inc. whenthe references relate to the period after, and including, October 1, 2001. See “History and Development of theCompany” under Item 4.A of this annual report. Also, as used in this annual report, references to “we”, “our”and “us” are to Nomura and, except as the context otherwise requires, its subsidiaries.
As used in this annual report, “yen” or “¥” means the lawful currency of Japan, and “dollar” or “$”means the lawful currency of the United States of America.
As used in this annual report, “ADS” means an American Depositary Share, currently representing oneshare of Nomura’s common stock, and “ADR” means an American Depositary Receipt evidencing one or moreADSs. See “Rights of Holders of ADSs” under Item 10.B of this annual report.
Amounts shown in this annual report have been rounded to the nearest indicated digit unless otherwisespecified. In tables and graphs with rounded figures, sums may not add up due to rounding.
PART I
Item 1. Identity of Directors, Senior Management and Advisers
Not applicable.
Item 2. Offer Statistics and Expected Timetable
Not applicable.
Item 3. Key Information
A. Selected Financial Data.
The following table shows selected financial information as of and for the years ended March 31, 2006,2007, 2008, 2009 and 2010 which is derived from our consolidated financial statements included in this annualreport. These financial statements are prepared in accordance with accounting principles generally accepted inthe United States (“U.S. GAAP”). Certain reclassifications of previously reported amounts have been made toconform to the current period presentation.
2
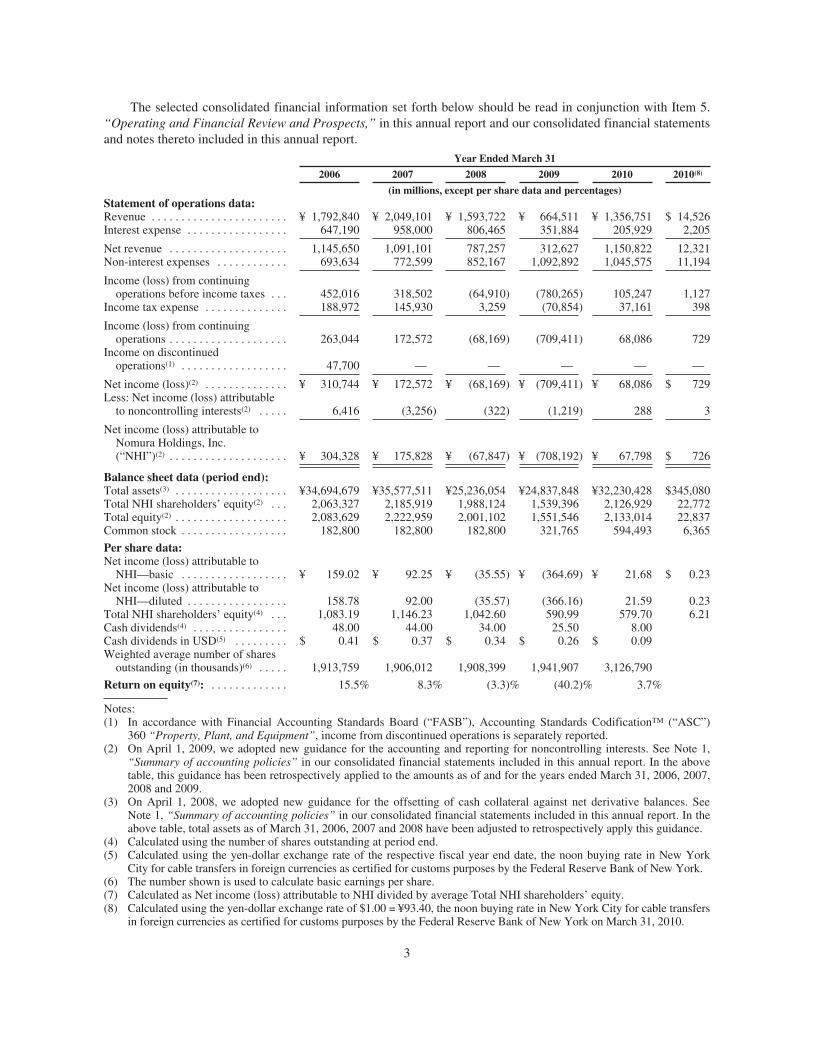
The selected consolidated financial information set forth below should be read in conjunction with Item 5.“Operating and Financial Review and Prospects,” in this annual report and our consolidated financial statementsand notes thereto included in this annual report.
Year Ended March 31
2006 2007 2008 2009 2010 2010(8)
(in millions, except per share data and percentages)Statement of operations data:Revenue . . . . . . . . . . . . . . . . . . . . . . . ¥ 1,792,840 ¥ 2,049,101 ¥ 1,593,722 ¥ 664,511 ¥ 1,356,751 $ 14,526Interest expense . . . . . . . . . . . . . . . . . 647,190 958,000 806,465 351,884 205,929 2,205
Net revenue . . . . . . . . . . . . . . . . . . . . 1,145,650 1,091,101 787,257 312,627 1,150,822 12,321Non-interest expenses . . . . . . . . . . . . 693,634 772,599 852,167 1,092,892 1,045,575 11,194
Income (loss) from continuingoperations before income taxes . . . 452,016 318,502 (64,910) (780,265) 105,247 1,127
Income tax expense . . . . . . . . . . . . . . 188,972 145,930 3,259 (70,854) 37,161 398
Income (loss) from continuingoperations . . . . . . . . . . . . . . . . . . . . 263,044 172,572 (68,169) (709,411) 68,086 729
Income on discontinuedoperations(1) . . . . . . . . . . . . . . . . . . 47,700 — — — — —
Net income (loss)(2) . . . . . . . . . . . . . . ¥ 310,744 ¥ 172,572 ¥ (68,169) ¥ (709,411) ¥ 68,086 $ 729Less: Net income (loss) attributable
to noncontrolling interests(2) . . . . . 6,416 (3,256) (322) (1,219) 288 3
Net income (loss) attributable toNomura Holdings, Inc.(“NHI”)(2) . . . . . . . . . . . . . . . . . . . . ¥ 304,328 ¥ 175,828 ¥ (67,847) ¥ (708,192) ¥ 67,798 $ 726
Balance sheet data (period end):Total assets(3) . . . . . . . . . . . . . . . . . . . ¥34,694,679 ¥35,577,511 ¥25,236,054 ¥24,837,848 ¥32,230,428 $345,080Total NHI shareholders’ equity(2) . . . 2,063,327 2,185,919 1,988,124 1,539,396 2,126,929 22,772Total equity(2) . . . . . . . . . . . . . . . . . . . 2,083,629 2,222,959 2,001,102 1,551,546 2,133,014 22,837Common stock . . . . . . . . . . . . . . . . . . 182,800 182,800 182,800 321,765 594,493 6,365
Per share data:Net income (loss) attributable to
NHI—basic . . . . . . . . . . . . . . . . . . ¥ 159.02 ¥ 92.25 ¥ (35.55) ¥ (364.69) ¥ 21.68 $ 0.23Net income (loss) attributable to
NHI—diluted . . . . . . . . . . . . . . . . . 158.78 92.00 (35.57) (366.16) 21.59 0.23Total NHI shareholders’ equity(4) . . . 1,083.19 1,146.23 1,042.60 590.99 579.70 6.21Cash dividends(4) . . . . . . . . . . . . . . . . 48.00 44.00 34.00 25.50 8.00Cash dividends in USD(5) . . . . . . . . . $ 0.41 $ 0.37 $ 0.34 $ 0.26 $ 0.09Weighted average number of shares
outstanding (in thousands)(6) . . . . . 1,913,759 1,906,012 1,908,399 1,941,907 3,126,790
Return on equity(7): . . . . . . . . . . . . . 15.5% 8.3% (3.3)% (40.2)% 3.7%
Notes:(1) In accordance with Financial Accounting Standards Board (“FASB”), Accounting Standards Codification™ (“ASC”)
360 “Property, Plant, and Equipment”, income from discontinued operations is separately reported.(2) On April 1, 2009, we adopted new guidance for the accounting and reporting for noncontrolling interests. See Note 1,
“Summary of accounting policies” in our consolidated financial statements included in this annual report. In the abovetable, this guidance has been retrospectively applied to the amounts as of and for the years ended March 31, 2006, 2007,2008 and 2009.
(3) On April 1, 2008, we adopted new guidance for the offsetting of cash collateral against net derivative balances. SeeNote 1, “Summary of accounting policies” in our consolidated financial statements included in this annual report. In theabove table, total assets as of March 31, 2006, 2007 and 2008 have been adjusted to retrospectively apply this guidance.
(4) Calculated using the number of shares outstanding at period end.(5) Calculated using the yen-dollar exchange rate of the respective fiscal year end date, the noon buying rate in New York
City for cable transfers in foreign currencies as certified for customs purposes by the Federal Reserve Bank of New York.(6) The number shown is used to calculate basic earnings per share.(7) Calculated as Net income (loss) attributable to NHI divided by average Total NHI shareholders’ equity.(8) Calculated using the yen-dollar exchange rate of $1.00 = ¥93.40, the noon buying rate in New York City for cable transfers
in foreign currencies as certified for customs purposes by the Federal Reserve Bank of New York on March 31, 2010.
3
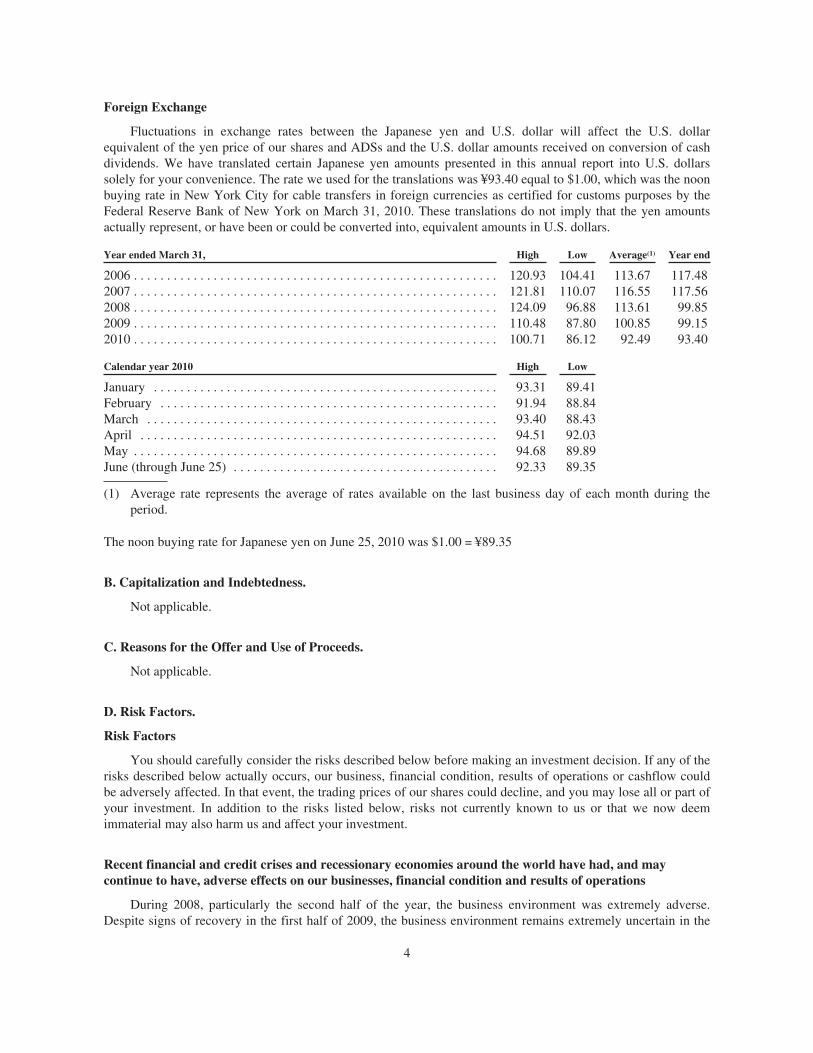
Foreign Exchange
Fluctuations in exchange rates between the Japanese yen and U.S. dollar will affect the U.S. dollarequivalent of the yen price of our shares and ADSs and the U.S. dollar amounts received on conversion of cashdividends. We have translated certain Japanese yen amounts presented in this annual report into U.S. dollarssolely for your convenience. The rate we used for the translations was ¥93.40 equal to $1.00, which was the noonbuying rate in New York City for cable transfers in foreign currencies as certified for customs purposes by theFederal Reserve Bank of New York on March 31, 2010. These translations do not imply that the yen amountsactually represent, or have been or could be converted into, equivalent amounts in U.S. dollars.
Year ended March 31, High Low Average(1) Year end
2006 . . . . . . . . . . . . . . . . . . . . . . . . . . . . . . . . . . . . . . . . . . . . . . . . . . . . . . . 120.93 104.41 113.67 117.482007 . . . . . . . . . . . . . . . . . . . . . . . . . . . . . . . . . . . . . . . . . . . . . . . . . . . . . . . 121.81 110.07 116.55 117.562008 . . . . . . . . . . . . . . . . . . . . . . . . . . . . . . . . . . . . . . . . . . . . . . . . . . . . . . . 124.09 96.88 113.61 99.852009 . . . . . . . . . . . . . . . . . . . . . . . . . . . . . . . . . . . . . . . . . . . . . . . . . . . . . . . 110.48 87.80 100.85 99.152010 . . . . . . . . . . . . . . . . . . . . . . . . . . . . . . . . . . . . . . . . . . . . . . . . . . . . . . . 100.71 86.12 92.49 93.40
Calendar year 2010 High Low
January . . . . . . . . . . . . . . . . . . . . . . . . . . . . . . . . . . . . . . . . . . . . . . . . . . . . 93.31 89.41February . . . . . . . . . . . . . . . . . . . . . . . . . . . . . . . . . . . . . . . . . . . . . . . . . . . 91.94 88.84March . . . . . . . . . . . . . . . . . . . . . . . . . . . . . . . . . . . . . . . . . . . . . . . . . . . . . 93.40 88.43April . . . . . . . . . . . . . . . . . . . . . . . . . . . . . . . . . . . . . . . . . . . . . . . . . . . . . . 94.51 92.03May . . . . . . . . . . . . . . . . . . . . . . . . . . . . . . . . . . . . . . . . . . . . . . . . . . . . . . . 94.68 89.89June (through June 25) . . . . . . . . . . . . . . . . . . . . . . . . . . . . . . . . . . . . . . . . 92.33 89.35
(1) Average rate represents the average of rates available on the last business day of each month during theperiod.
The noon buying rate for Japanese yen on June 25, 2010 was $1.00 = ¥89.35
B. Capitalization and Indebtedness.
Not applicable.
C. Reasons for the Offer and Use of Proceeds.
Not applicable.
D. Risk Factors.
Risk Factors
You should carefully consider the risks described below before making an investment decision. If any of therisks described below actually occurs, our business, financial condition, results of operations or cashflow couldbe adversely affected. In that event, the trading prices of our shares could decline, and you may lose all or part ofyour investment. In addition to the risks listed below, risks not currently known to us or that we now deemimmaterial may also harm us and affect your investment.
Recent financial and credit crises and recessionary economies around the world have had, and maycontinue to have, adverse effects on our businesses, financial condition and results of operations
During 2008, particularly the second half of the year, the business environment was extremely adverse.Despite signs of recovery in the first half of 2009, the business environment remains extremely uncertain in the
4
medium to long term. Starting in mid-2007 in the United States and Europe, and particularly during the secondhalf of 2008, the financial services industry and global securities markets were materially and adversely affectedby significant declines in the values of nearly all asset classes and by a serious lack of liquidity. This was initiallytriggered by declines in the values of subprime mortgages in the U.S. market, but spread to all mortgage and realestate asset classes, to leveraged loans and to nearly all asset classes, including equities. While the markets havegenerally stabilized and improved over the course of 2009, the values of many asset classes have not returned toprevious levels. Further, the markets have been facing new challenges arising out of concerns over certainsovereign risks and our business environment remains extremely uncertain in the medium to long term.
Market conditions have also led to the failure or merger of a number of prominent financial institutions,primarily in the United States. Financial institution failures or problems have resulted in further losses as aconsequence of defaults on securities issued by them and defaults on derivatives and other contracts entered intowith such entities. The geographic reach of such consequences has extended globally. In addition, the UnitedStates, large parts of Europe and Japan have experienced a significant downturn in their economies as a whole.Business activity across a wide range of industries and regions continues to be significantly reduced and manycompanies continue to be in serious difficulty due to the lack of demand for their products or services, primarilydue to significantly reduced consumer spending, lack of liquidity in the credit markets and high unemploymentrates. Any failure to achieve desired results from the recent government aid or stimulus programs around theworld, or any phase-out or termination of such programs, could further adversely affect our businessenvironment.
In response to these challenges in the business environment, we have been implementing several strategicinitiatives. We are seeking to expand our client base, focusing on growing market share in client-driven flowbusinesses and continuing to review and reduce asset size through targeted disposition of assets not suited to ourbusiness focus. We are implementing cost reduction through selective downsizing with a concentration on corebusinesses in the short-term, as well as reengineering our business processes in the longer-term. There can be noassurance, however, that we will be able to carry out any of these strategic initiatives or that, even if they arecarried out, they will have the intended effect or will be effective in addressing the difficulties we have or wemay have under the current business environment. Also, there can be no assurance that the economicenvironment will not worsen in the future (as exemplified by the Greek debt crisis that manifested in the first halfof calendar year 2010, adversely affecting the credibility of the euro currency and fostering financial doubts withregards to other countries), in which case our financial condition and results of operations may be materially andadversely affected.
Market fluctuations could harm our businesses
Our businesses are materially affected by conditions in the financial markets and economic conditions inJapan and elsewhere around the world. Market downturns can occur not only as a result of purely economicfactors, but also as a result of war, acts of terrorism, international tensions, natural disasters or other similarevents. A sustained market downturn can adversely affect our business and can result in substantial losses. Evenin the absence of a prolonged market downturn, we may incur substantial losses due to market volatility orgovernmental fiscal and monetary policy changes in Japan and other jurisdictions where we conduct business.
Our brokerage and asset management revenues may decline
A market downturn could result in a decline in the revenues concerning our intermediary business becauseof a decline in the volume and value of securities that we broker for our clients. Also, with regard to our assetmanagement business, in most cases, we charge fees for managing our clients’ portfolios that are based on thevalue of their portfolios. A market downturn that reduces the value of our clients’ portfolios, increases theamount of withdrawals or reduces the amount of new investments in these portfolios would reduce the revenuewe receive from our asset management businesses.
5
Our investment banking revenues may decline
Unfavorable financial or economic conditions would likely reduce the number and size of transactions forwhich we provide securities underwriting, financial advisory and other investment banking services. Ourinvestment banking revenues, which include fees from these services, are directly related to the number and sizeof the transactions in which we participate and would therefore decrease if there is a sustained market downturn.
We may incur significant losses from our trading and investment activities
We maintain large trading and investment positions in fixed income, equity and other markets, both for ourown account and for the purpose of facilitating our clients’ trades. Our positions consist of various types ofassets, including financial derivatives transactions in equity, interest rate, currency, credit, commodity and othermarkets, as well as in loans and real estate. Fluctuations in the markets where these assets are traded canadversely affect the value of these assets. To the extent that we own assets, or have long positions, a marketdownturn could result in losses if the value of these long positions decreases. Furthermore, to the extent that wehave sold assets we do not own, or have short positions, an upturn in the prices of the assets could expose us topotentially significant losses. Although we have worked to mitigate these position risks with a variety of hedgingtechniques, these market movements could result in losses. We can incur losses if the markets move in a way wehave not anticipated, as a result of specific events such as the Russian economic crisis in 1998, and the globalfinancial and credit crisis in the autumn of 2008. Also, we may face losses if the level of volatility of the marketswhere the foregoing assets are traded differs from our expectation, which may occur particularly in the emergingmarkets.
Our businesses have been and may continue to be affected by changes in market volatility levels. Certain ofour trading businesses depend on market volatility to provide trading and arbitrage opportunities, and decreasesin volatility may reduce these opportunities and adversely affect the results of these businesses. On the otherhand, increased volatility, while it can increase trading volumes and spreads, also increases risk as measured byvalue at risk, or VaR, and may expose us to increased risks in connection with our market-making andproprietary businesses or cause us to reduce the size of these businesses in order to avoid increasing our VaR.
Furthermore, we commit capital to take relatively large positions for underwriting or warehousing assets tofacilitate certain capital market transactions. Also, we structure and possess pilot funds for developing financialinvestment products and invest seed money to set up and support financial investment products. We may incursignificant losses from these positions in the event of significant market fluctuations.
In addition, if we are the party providing collateral in a transaction, significant declines in the value of thecollateral can increase our costs and reduce our profitability; and if we are the party receiving collateral, suchdeclines can reduce our profitability by reducing the level of business done with our clients and counterparties.
Holding large and concentrated positions of securities and other assets may expose us to large losses
Holding a large amount of securities concentrated in specific assets can increase our risks and expose us tolarge losses in our businesses such as market-making, block trading, underwriting, asset securitization andacquiring newly-issued convertible bonds through third-party allotment. We have committed substantial amountsof capital to these businesses. This often requires us to take large positions in the securities of a particular issueror issuers in a particular industry, country or region. In addition, we may incur substantial losses due to marketfluctuations on asset-backed securities such as commercial mortgage-backed securities.
Extended market declines can reduce liquidity and lead to material losses
Extended market declines can reduce the level of market activity and the liquidity of the assets traded in themarket. If we cannot properly close out our associated positions, particularly with respect to over-the-counterderivatives, we may incur substantial losses due to the difficulty of monitoring prices in a less liquid market.
6
Our hedging strategies may not prevent losses
We use a variety of instruments and strategies to hedge our exposure to various types of risk. If our hedgingstrategies are not effective, we may incur losses. We base many of our hedging strategies on historical tradingpatterns and correlations. For example, if we hold an asset, we may hedge this position by taking another assetwhich has, historically, moved in a direction that would offset a change in value of the former asset. However,historical trading patterns and correlations may not continue, as seen in the case of the global financial and creditcrisis in the autumn of 2008, and these hedging strategies may not be fully effective in mitigating our riskexposure because we are exposed to all types of risk in a variety of market environments.
Our risk management policies and procedures may not be fully effective in managing market risk
Our policies and procedures to identify, monitor and manage risks may not be fully effective. Some of ourmethods of managing risk are based upon observed historical market behavior. This historical market behaviormay not continue in future periods. As a result, we may suffer large losses by being unable to predict future riskexposures that could be significantly greater than the historical measures indicate. Other risk managementmethods that we use also rely on our evaluation of information regarding markets, clients or other matters, whichis publicly available or otherwise accessible by us. This information may not be accurate, complete, up-to-date orproperly evaluated, in which case we may be unable to properly assess our risks, and thereby suffer large losses.Furthermore, certain factors, such as market volatility, may render our risk evaluation model unsuitable for thenew market environment. In such event, we may become unable to evaluate or otherwise manage our risksadequately.
Market risk may increase other risks that we face
In addition to the potentially adverse effects on our businesses described above, market risk couldexacerbate other risks that we face. For example, the risks associated with new products developed throughfinancial engineering/innovation may be increased by market risk.
Also, if we incur substantial trading losses caused by our exposure to market risk, our need for liquiditycould rise sharply while our access to cash may be impaired as a result of market perception of our credit risk.Furthermore, in a market downturn, our clients and counterparties could incur substantial losses of their own,thereby weakening their financial condition and, as a result, increasing our credit risk exposure to them.
We may have to recognize impairment charges with regard to the amount of goodwill and intangible assetsrecorded on our consolidated balance sheets
We have purchased all or a part of the equity interests in, or certain operations from, certain othercompanies in order to pursue our business expansion, and expect to continue to do so when and as we deemappropriate. We account for each of those and similar purchases and acquisitions in conformity with U.S. GAAP,as a business combination, and allocate their acquisition costs to the assets acquired and liabilities assumed, andrecord the remaining amount as goodwill.
We may have to record impairment charges with regard to the amount of goodwill and intangible assets.Any impairment charges for goodwill or intangible assets we recognize, if recorded, may adversely affect ourresults of operations and financial condition.
Liquidity risk could impair our ability to fund operations and jeopardize our financial condition
Liquidity, or having ready access to cash, is essential to our businesses. In addition to maintaining a readilyavailable cash position, we seek to enhance our liquidity through repurchase and securities lending transactions,
7
access to long-term debt, issuance of long-term bonds, diversification of our short-term funding sources such ascommercial paper, and by holding a portfolio of highly liquid assets. We bear the risk that we may lose liquidityunder certain circumstances, including the following:
We may be unable to access the debt capital markets
We depend on continuous access to the short-term credit markets and the debt capital markets to finance ourday-to-day operations. An inability to raise money in the long-term or short-term debt markets, or to engage inrepurchase agreements and securities lending, could have a substantial negative effect on our liquidity. Forexample, lenders could refuse to extend the credit necessary for us to conduct our business based on theirassessment of our long-term or short-term financial prospects if:
• we incur large trading losses,
• the level of our business activity decreases due to a market downturn, or
• regulatory authorities take significant action against us.
In addition to the above, our ability to borrow in the debt markets could also be impaired by factors that arenot specific to us, such as increases in banks’ nonperforming loans which reduce their lending capacity, a severedisruption of the financial and credit markets which, among others, can lead to widening credit spreads andthereby increase our borrowing costs, or negative views about the general prospects for the investment banking,brokerage or financial services industries generally.
We may be unable to access the short-term debt markets
We depend primarily on the issuance of commercial paper and short-term bank loans as a principal sourceof unsecured short-term funding of our operations. Our liquidity depends largely on our ability to refinance theseborrowings on a continuous basis. Investors who hold our outstanding commercial paper and other short-termdebt instruments have no obligation to provide refinancing when the outstanding instruments mature. We may beunable to obtain short-term financing from banks to make up any shortfall.
We may be unable to sell assets
If we are unable to borrow in the debt capital markets or if our cash balances decline significantly, we willneed to liquidate our assets or take other actions in order to meet our maturing liabilities. In volatile or uncertainmarket environments, overall market liquidity may decline. In a time of reduced market liquidity, we may beunable to sell some of our assets, which may adversely affect our liquidity or we may have to sell assets atdepressed prices, which could adversely affect our results of operations and financial condition. Our ability tosell our assets may be impaired by other market participants seeking to sell similar assets into the market at thesame time.
Lowering of our credit ratings could increase our borrowing costs
Our borrowing costs and our access to the debt capital markets depend significantly on our credit ratings.Rating agencies may reduce or withdraw their ratings or place us on “credit watch” with negative implications.This could increase our borrowing costs and limit our access to the capital markets. This, in turn, could reduceour earnings and adversely affect our liquidity.
Further, other factors which are not specific to us may increase our funding cost, such as negative marketperception of Japanese fiscal soundness.
Event risk may cause losses in our trading and investment assets as well as market and liquidity risk
Event risk refers to potential losses in value we may suffer through unpredictable events that cause largeunexpected market price movements. These include not only events such as the Russian economic crisis in 1998,
8
the terrorist attacks in the United States on September 11, 2001, U.S. subprime issues since 2007, and the globalfinancial and credit crisis in the autumn of 2008, in each case adversely affecting our business, but also moregenerally the following types of events that could cause losses on our trading and investment assets:
• sudden and significant reductions in credit ratings with regard to our trading and investment assets byrating agencies that have significant presence and influence on the market,
• sudden changes in trading, tax, accounting, laws and other related rules which may make our tradingstrategy obsolete, less competitive or not workable, or
• an unexpected failure in a corporate transaction in which we participate resulting in our not receivingthe consideration we should have received, as well as bankruptcy, deliberate acts of fraud, and criminalprosecution with respect to the issuers of our trading and investment assets.
Losses caused by financial or other problems of third parties may expose us to credit risk
Our counterparties are from time to time indebted to us as a result of transactions or contracts, includingloans, commitments to lend, other contingent liabilities, and derivatives transactions such as swaps and options.
We may incur material losses when our counterparties default on their obligations to us due to bankruptcy,deterioration in their creditworthiness, lack of liquidity, operational failure, an economic or political event, orother reasons. This risk may arise from:
• the decline of prices of securities issued by third parties, or
• the execution of securities, futures, currency or derivative trades that fail to settle at the required timedue to default by the counterparty, such as monoline insurers (financial guarantors) which arecounterparties in credit default swap contracts, or systems failure by clearing agents, exchanges,clearing houses or other financial intermediaries.
Problems related to third party credit risk may include the following:
Defaults by a large financial institution could adversely affect the financial markets generally and usspecifically
The commercial soundness of many financial institutions is closely interrelated as a result of credit, trading,clearing or other relationships among the institutions. As a result, concern about the credit standing of, or adefault by, one institution could lead to significant liquidity problems or losses in, or defaults by, otherinstitutions. This may adversely affect financial intermediaries, such as clearing agencies, clearing houses, banks,securities firms and exchanges, with which we interact on a daily basis. Actual defaults, increases in perceiveddefault risk and other similar events could arise in the future and could have an adverse effect on the financialmarkets and on us. Our finance operations may be damaged if major financial institutions, Japanese or otherwise,fail or experience severe liquidity or solvency problems.
There can be no assurance as to the accuracy of the information about, or the sufficiency of the collateral weuse in managing, our credit risk
We regularly review our credit exposure to specific clients or counterparties and to specific countries andregions that we believe may present credit concerns. Default risk, however, may arise from events orcircumstances that are difficult to detect, such as fraud. We may also fail to receive full information with respectto the risks of a counterparty. In addition, in cases where we have extended credit against collateral, we may fallinto a deficiency in value in the collateral. For example, if sudden declines in market values reduce the value ofour collateral, we may become undersecured.
9
Our clients and counterparties may be unable to perform their obligations to us as a result of political oreconomic conditions
Country, regional and political risks are components of credit risk, as well as market risk. Political oreconomic pressures in a country or region, including those arising from local market disruptions or currencycrises, may adversely affect the ability of clients or counterparties located in that country or region to obtaincredit or foreign exchange, and therefore to perform their obligations owed to us.
The financial services industry is intensely competitive and rapidly consolidating
Our businesses are intensely competitive, and we expect them to remain so. We compete on the basis of anumber of factors, including transaction execution, our products and services, innovation, reputation and price. Inrecent years, we have experienced intense price competition, particularly in brokerage, investment banking andother businesses.
Competition with commercial banks, commercial bank-owned securities subsidiaries and non-Japanese firmsin the Japanese market is increasing
Since the late 1990s, the financial services sector in Japan has been undergoing deregulation. Banks andother types of financial services firms can compete with us to a greater degree than they could beforederegulation in the areas of financing and investment trusts. Among others, securities subsidiaries of commercialbanks and non-Japanese firms have been affecting our market shares in the underwriting business, corporateadvisory services in connection with M&A, and retail business.
Increased domestic and global consolidation in the financial services industry means increased competitionfor us
In recent years, there has been substantial consolidation and convergence among companies in the financialservices industry. In particular, a number of large commercial banks, insurance companies and other broad-basedfinancial services firms have established or acquired broker-dealers or have merged with other financialinstitutions in Japan and overseas. Particularly in Japan, a number of securities companies have allied with orbeen acquired by commercial banks, and non-Japanese commercial banks are enhancing their securitiessubsidiaries in Japan. Most of our major Japanese competitors are now owned by, or allied with, bank holdinggroups. Through such business alliances and consolidations, these other securities companies and commercialbanks have the ability to offer a wide range of products, including loans, deposit-taking, insurance, brokerage,asset management and investment banking services within their group. This diversity of services offered mayenhance their competitive position compared with us. They also have the ability to supplement their investmentbanking and brokerage businesses with commercial banking, insurance and other financial services revenues inan effort to gain market share. Our policy to remain independent from commercial banks may result in the loss ofmarket share as these large, consolidated firms expand their business.
Our ability to expand internationally will depend on our ability to compete successfully with financial servicesfirms in international markets
We believe that significant opportunities and challenges will arise for us outside of Japan. In order to takeadvantage of these opportunities, we will have to compete successfully with financial services firms based inimportant non-Japanese markets, including the United States, Europe and Asia. Some of these financial servicesfirms are larger, better capitalized and have a stronger local presence and a longer operating history in thesemarkets. As a means to bolster our international operations, we acquired certain Lehman operations, includingsome of the Lehman employees in Europe and the Middle East and a majority of the Lehman employees in Asia,as well as certain specialized service companies in India in 2008. There can be no assurance, however, that we
10
will successfully achieve the targeted synergies or other intended benefits from the acquisition of former Lehmanoperations as contemplated. In addition, we are currently rebuilding our operations in the United States. Inparticular, we are increasing headcount to service client-related businesses, including cross-border transactionssuch as sales in Europe or Asia of products originated in the United States and vice versa. We believe that U.S.build-out will be important to our global success due to continued global demand for U.S. products, and failure toexpand and strengthen our operations in the United States may materially and adversely affect our globalstrategy.
Operational risk may disrupt our businesses, result in regulatory action against us or limit our growth
We face, for example, the following types of operational risk which could result in financial losses,disruption in our business, litigation from relevant parties, intervention in our business by the regulatoryauthorities, or damage to our reputation:
• failure to settle securities transactions,
• failure by officers or employees to perform proper administrative activities prescribed in regularprocedures, such as orders to securities exchanges,
• suspension or malfunction of systems,
• the destruction of our facilities or systems due to large-scale disasters or acts of terrorism, which arebeyond anticipation and could not be covered by our contingency plan or
• the disruption of our business due to pandemic diseases or illnesses, such as avian influenza and swineflu.
Our business is subject to substantial legal, regulatory and reputational risks
Substantial legal liability or a significant regulatory action against us could have a material financial effector cause reputational harm to us, which in turn could seriously damage our business prospects. Also, materialchanges in regulations applicable to us or to our market could adversely affect our business.
Our exposure to legal liability is significant
We face significant legal risks in our businesses. These risks include liability under securities or other lawsin connection with securities underwriting and offering transactions, liability arising from the purchase or sale ofany securities or other products, disputes over the terms and conditions of complex trading arrangements or thevalidity of contracts for our transactions and legal claims concerning our financial advisory and merchantbanking business.
During a prolonged market downturn, we would expect claims against us to increase. We may also facesignificant litigation. The cost of defending such litigation may be substantial and our involvement in litigationmay damage our reputation. In addition, even legal transactions might be subject to social criticism according tothe particulars or situations of such transactions. These risks may be difficult to assess or quantify and theirexistence and magnitude may remain unknown for substantial periods of time.
Extensive regulation of our businesses limits our activities and may subject us to significant penalties andlosses
The financial services industry is subject to extensive regulation. We are subject to regulation bygovernmental and self-regulatory organizations in Japan and in virtually all other jurisdictions in which weoperate, and such governmental and regulatory scrutiny may increase as our operations expand. Theseregulations are designed to ensure the integrity of the financial markets and to protect clients and other third
11
parties who deal with us. These regulations are not necessarily designed to protect our shareholders and oftenlimit our activities, through net capital, client protection and market conduct requirements. We face the risk thatregulatory authorities may intervene in our businesses through extended investigation and surveillance activity,adoption of costly or restrictive new regulations or judicial or administrative proceedings that may result insubstantial penalties. We could be fined, prohibited from engaging in some of our business activities, ordered toimprove our internal governance procedures, or be subject to the temporary or long-term suspension orrevocation of our legal authorization to conduct business. Our reputation could also suffer from the adversepublicity that any administrative or judicial sanction against us may create. As a result of any such sanction, wemay lose business opportunities for a period of time, even after the sanction is lifted, if and to the extent that ourclients, especially public institutions, decide not to engage us for their financial transactions.
Material changes in regulations applicable to us or to our market could adversely affect our business
If regulations that apply to our businesses are introduced, modified or removed, we could be adversely affecteddirectly or through resulting changes in market conditions. For example, in accordance with the amendments to theFinancial Instruments and Exchange Act (the “FIEA”), effective from December 1, 2004, banks and certain otherfinancial institutions became able to act as agents of securities companies in the securities brokerage business. Inaddition, in accordance with the amendments to the FIEA effective from June 1, 2009, firewalls betweencommercial banks and securities firms were partially deregulated. Therefore, we may face increased competition asour competitors will be able to cooperate more closely with their affiliated commercial banks.
We currently calculate and disclose our consolidated capital adequacy ratio by applying the FinancialServices Agency (“FSA”) capital adequacy rules applicable to bank holding companies with internationaloperations, as allowed under the guideline published by the FSA. In July 2009, the Basel Committee approved abasic package of measures designed to strengthen its rules for capital adequacy measures, commonly referred toas Basel II, upon which the above-mentioned FSA’s capital adequacy rules are based. Also, in December 2009,the Basel Committee announced consultative proposals to strengthen the resilience of the banking sector, layingout a new framework of capital and liquidity regulations in response to the global financial crisis. For moreinformation about such measures, see “Consolidated Regulatory Requirements” under Item 5.B. of this annualreport. Although specific rules implementing such measures designed to strengthen Basel II as well as the FSA’srules implementing such measures in Japan are yet to be finalized, as a result of the implementation of those newmeasures, our capital adequacy ratio may decrease or we may be required to liquidate assets, raise additionalcapital or otherwise restrict our business activities in a manner that could adversely increase our funding costs orcould otherwise adversely affect our operating or financing activities or the interests of our shareholders.
The FSA amended the “Comprehensive Guidelines for Supervision of the Financial Instruments BusinessOperators, etc.” which became effective on March 4, 2010. Such amendment includes, among others, restrictionson the compensation systems of corporate groups of financial instruments firms engaging in internationaloperations, including Nomura, which are designed to reduce excessive risk taking by their executives andemployees. In addition, to improve the stability and transparency of Japan’s financial system and to ensure theprotection of investors, another bill to amend the FIEA was passed by the Diet on May 12, 2010. The amendmentis scheduled to become effective within one year, and is intended to strengthen group-wide regulation andsupervision by introducing consolidated supervision of securities companies the size of which exceeds specifiedparameters. For more information about such amendments, see “Regulation—Japan” under Item 4.B. of thisannual report.
In addition, in response to the financial markets crisis, governments and regulatory authorities in variousjurisdictions, such as the U.S. and the U.K., have made and continue to make numerous proposals to reform theregulatory framework for, or impose a tax or levy upon, the financial services industry to enhance its resilienceagainst future crises, contribute to the relevant economy generally or for other purposes. For example, onJune 25, 2010, a bi-partisan committee of the U.S. Congress agreed on a financial regulatory reform bill which,
12
among others, would: (i) restrict banks’ proprietary trading as well as investments in hedge funds and privateequity funds; (ii) authorize a special assessment on financial institutions with more than $50 billion in assets, andhedge funds with more than $10 billion in assets; (iii) empower regulators to liquidate failing financialcompanies; (iv) provide for a broader regulatory oversight of hedge funds and credit rating agencies; (v) andcreate a tight new regulatory framework for derivatives. The committee bill is expected to be approved by boththe House of Representatives and the Senate, allowing President Barack Obama to sign it into law before July 4,2010. In the UK Emergency Budget Statement delivered on June 22, 2010, the Chancellor of the Exchequerproposed a levy on the total liabilities of UK banks, which would include the UK entities of non-UK banks andbanking groups. This is in line with initiatives on national bank levies recently taken by the Council of EuropeanUnion and relates more broadly to a proposal regarding new taxes on financial institutions submitted to thegovernments of the Group of Twenty (G-20) by the International Monetary Fund. The impact of the regulationsand legislation on us and our industry is still unknown and various countries where we operate (including Japan)could introduce similar measures. Tightening of regulations or introduction of new tax or levy applicable to usand our industry in many countries could adversely affect our business, financial condition and operating results.
Misconduct or fraud by an employee, director or officer, or any third party, could occur, and ourreputation in the market and our relationships with clients could be harmed
We face the risk that misconduct by an employee, director or officer, or any third party, could occur whichmay adversely affect our business. Misconduct by an employee, director or officer can include, for example,entering into transactions in excess of authorized limits, acceptance of risks that exceed our limits, orconcealment of unauthorized or unsuccessful activities. The misconduct could also involve, for example, theimproper use or disclosure of our or our clients’ confidential information, such as insider trading, which couldresult in regulatory sanctions, legal liability and serious reputational or financial damage to us. We may notalways be able to detect or deter misconduct by an employee, director or officer and the precautions we take todetect and prevent misconduct may not be effective in all cases. If any administrative or judicial sanction isissued against us as a result of such misconduct, we may lose business opportunities for a period of time, evenafter the sanction is lifted, if and to the extent that our clients, especially public institutions, decide not to engageus for their financial transactions.
Third parties may also engage in fraudulent activities, including devising a fraudulent scheme to induce ourinvestment, loans, guarantee or any other form of our financial commitment, both direct and indirect. Because ofthe broad range of businesses that we engage in and the large number of third parties with whom we deal in ourday-to-day business operations, such fraud or any other misconduct may be difficult to prevent or detect. Wemay not be able to recover the financial losses caused by such activities and our reputation may also be damagedby such activities.
Unauthorized disclosure of personal information held by us may adversely affect our business
We keep and manage personal information obtained from clients in connection with our business. In recentyears, there have been many reported cases of personal information and records in the possession of corporationsand institutions being improperly accessed or disclosed. We may have to provide compensation for economicloss and emotional distress arising out of a failure to protect such information in accordance with the Act on theProtection of Personal Information and rules, regulations and guidelines relating thereto.
Although we exercise care in protecting the confidentiality of personal information and take steps tosafeguard such information, if any material unauthorized disclosure of personal information does occur, ourbusiness could be adversely affected in a number of ways. For example, we could be subject to complaints andlawsuits for damages from clients if they are adversely affected as a result of the release of their personalinformation. In addition, we could incur additional expenses associated with changing our security systems,either voluntarily or in response to administrative guidance or other regulatory initiatives, or in connection with
13

public relations campaigns designed to prevent or mitigate damage to our corporate or brand image or reputation.Any damage to our reputation caused by such unauthorized disclosure could lead to a decline in new clients and/or a loss of existing clients, as well as to increased costs and expenses in dealing with any such problems.
We are a holding company and depend on payments from our subsidiaries
We depend on dividends, distributions and other payments from our subsidiaries to fund dividend paymentsand to fund all payments on our obligations, including debt obligations. Regulatory and other legal restrictionsmay limit our ability to transfer funds freely, either to or from our subsidiaries. In particular, many of oursubsidiaries, including our broker-dealer subsidiaries, are subject to laws and regulations that authorizeregulatory bodies to block or reduce the flow of funds to the parent holding company, or that prohibit suchtransfers altogether in certain circumstances. These laws and regulations may hinder our ability to access fundsthat we may need to make payments on our obligations.
We may not be able to realize gains we expect, and may even suffer losses, on our private equityinvestments
We engage in private equity business in Japan and outside of Japan through fully owned subsidiaries andother consolidated entities which have third party pooling of funds. Decline of fair values of our investmentpositions, which could arise from deteriorating business performance of investee companies or any deteriorationin the market conditions of these sectors, may cause material losses to us. Further, our inability to dispose of ourprivate equity investments at the level and time we may wish could have a material impact on our operatingresults and financial condition.
We may not be able to dispose of our operating investments at the time or with the speed we would like
We hold substantial operating investments, which refer to investments in equity securities of companies notaffiliated with us which we hold on a long-term basis in order to promote existing and potential businessrelationships. A substantial portion of these investments consists of equity securities of public companies inJapan. Under U.S. GAAP, depending on market conditions, we may record significant unrealized gains or losseson our operating investments, which would have a substantial impact on our consolidated statements ofoperations. Depending on the conditions of the Japanese equity markets, we may not be able to dispose of theseequity securities when we would like to do so, as quickly as we may wish or at the desired values.
Equity investments in affiliates and other investees accounted for under the equity method in ourconsolidated financial statements may decline significantly over a period of time and result in us incurringan impairment loss
We have affiliates and investees, accounted for under the equity method in our consolidated financialstatements, whose shares are publicly traded. Under U.S. GAAP, if there is a decline in the fair value, i.e., themarket price, of the shares we hold in such affiliates over a period of time, and we determine that the decline isother-than-temporary, then we record an impairment loss for the applicable fiscal period.
We may face an outflow of clients’ assets due to losses of cash reserve funds or bonds we offered
We offer many types of products to meet various needs of our clients with different risk profiles. Cashreserve funds, such as money management funds and money reserve funds are categorized as low-risk products.Such cash reserve funds may fall below par value as a result of losses caused by the rise of interest rates or thewithdrawals or defaults on bonds contained in the portfolio. In addition, bonds that we offer may default orexperience delays in their obligation to pay interest and/or principal. Such losses in the products we offer mayresult in the loss of client confidence and lead to an outflow of client assets from our custody.
14
Because of daily price range limitations under Japanese stock exchange rules, you may not be able to sellyour shares of Nomura’s common stock at a particular price on any particular trading day, or at all
Stock prices on Japanese stock exchanges are determined on a real-time basis by the equilibrium betweenbids and offers. These exchanges are order-driven markets without specialists or market makers to guide priceformation. For the purpose of protecting investors from excessive volatility, these exchanges set daily upwardand downward price fluctuation limits for each stock, based on the previous day’s closing price. Althoughtransactions may continue at the upward or downward limit price if the limit price is reached on a particulartrading day, no transactions may take place outside these limits. Consequently, an investor wishing to sell at aprice above or below the relevant daily limit may not be able to sell his or her shares at such price on a particulartrading day, or at all.
Under Japan’s unit share system, holders of our shares constituting less than one unit are subject totransfer, voting and other restrictions
Pursuant to the Companies Act of Japan, or the Companies Act, relating to joint stock corporations andcertain related legislation, our Articles of Incorporation provide that 100 shares of our stock constitute one “unit.”The Companies Act imposes significant restrictions and limitations on holdings of shares that constitute less thana whole unit. Holders of shares constituting less than one unit do not have the right to vote or any other rightrelating to voting. Under the unit share system, any holders of shares constituting less than a unit has the right torequire us to purchase their shares. Also, any holders of shares constituting less than a unit may require us to sellthem such number of shares as may be necessary to raise such holder’s share ownership to a whole unit. Sharesconstituting less than a unit are transferable under the Companies Act, but may not be traded on any Japanesestock exchange.
As a holder of ADSs, you will have fewer rights than a shareholder has and you will have to act throughthe depositary to exercise these rights
The rights of the shareholders under Japanese law to take actions including voting their shares, receivingdividends and distributions, bringing derivative actions, examining the company’s accounting books and recordsand exercising appraisal rights are available only to holders of record. Because the depositary, through itscustodian agent, is the record holder of the shares underlying the ADSs, only the depositary can exercise thoserights in connection with the deposited shares. The depositary will make efforts to vote the shares underlyingyour ADSs as instructed by you and will pay you the dividends and distributions collected from us. However, inyour capacity as an ADS holder, you will not be able to bring a derivative action, examine our accounting booksand records or exercise appraisal rights except through the depositary.
Rights of shareholders under Japanese law may be more limited than under the laws of other jurisdictions
Our Articles of Incorporation, our Regulations of the Board of Directors and the Companies Act govern ourcorporate affairs. Legal principles relating to such matters as the validity of corporate procedures, directors’ andexecutive officers’ fiduciary duties and shareholders’ rights may be different from those that would apply if wewere a non-Japanese company. Shareholders’ rights under Japanese law may not be as extensive as shareholders’rights under the laws of other jurisdictions, including jurisdictions within the United States. You may have moredifficulty in asserting your rights as a shareholder than you would as a shareholder of a corporation organized inanother jurisdiction.
Our shareholders of record on a record date may not receive the dividend they anticipate
The customary dividend payout practice of publicly listed companies in Japan may significantly differ fromthat widely followed or otherwise deemed necessary or fair in foreign markets. Our dividend payout practice isno exception. We ultimately determine the actual dividend payment amount to our shareholders of record as of a
15
record date, including whether we will make any dividend payment to such shareholders at all, only after suchrecord date. For the foregoing reasons, our shareholders of record on a record date may not receive the dividendsthey anticipate. Furthermore, we do not announce any dividend forecast.
It may not be possible for investors to effect service of process within the United States upon us or ourdirectors or executive officers, or to enforce against us or those persons judgments obtained in UnitedStates courts predicated upon the civil liability provisions of the federal securities laws of the United States
We are a limited liability, joint-stock corporation incorporated under the laws of Japan. Most of ourdirectors and executive officers reside in Japan. Many of our assets and the assets of these persons are located inJapan and elsewhere outside the United States. It may not be possible, therefore, for U.S. investors to effectservice of process within the United States upon us or these persons or to enforce against us or these personsjudgments obtained in the United States courts predicated upon the civil liability provisions of the federalsecurities laws of the United States. We believe that there is doubt as to the enforceability in Japan, in originalactions or in actions for enforcement of judgment of U.S. courts, of liabilities predicated solely upon the federalsecurities laws of the United States.
Special Note Regarding Forward-looking Statements
This annual report contains forward-looking statements that are based on our current expectations,assumptions, estimates and projections about our business, our industry and capital markets around the world.These forward-looking statements are subject to various risks and uncertainties. Generally, these forward-lookingstatements can be identified by the use of forward-looking terminology such as “may”, “will”, “expect”,“anticipate”, “estimate”, “plan” or similar words. These statements discuss future expectations, identifystrategies, contain projections of our results of operations or financial condition, or state other forward-lookinginformation.
Known and unknown risks, uncertainties and other factors may cause our actual results, performance,achievements or financial position to differ materially from any future results, performance, achievements orfinancial position expressed or implied by any forward-looking statement contained in this annual report. Suchrisks, uncertainties and other factors are set forth in this Item 3.D and elsewhere in this annual report.
Item 4. Information on the Company
A. History and Development of the Company.
Nomura was incorporated in Japan on December 25, 1925 under the Commercial Code of Japan when thesecurities division of The Osaka Nomura Bank, Ltd. became a separate entity specializing in the trading anddistribution of debt securities in Japan. Nomura was the first Japanese securities company to develop its businessinternationally with the opening in 1927 of a representative office in New York. In Japan, we broadened thescope of our business when we began trading in equity securities in 1938 and when we organized the firstinvestment trust in Japan in 1941.
Since the end of World War II, we have played a leading role in most major developments in the Japanesesecurities market. These developments include the resumption of the investment trust business in the 1950s, theintroduction of public stock offerings by Japanese companies in the 1960s, the development of theover-the-counter bond market in the 1970s, the introduction of new types of investment trusts such as themedium-term Japanese government bond investment trust in the 1980s, and the growth of the corporate bond andinitial public offering markets in the 1990s.
Our expansion overseas accelerated in 1967, when Nomura acquired a controlling interest in NomuraInternational (Hong Kong) Limited for the purpose of conducting broker-dealer activities in the Hong Kongcapital markets. Subsequently, we established a number of other overseas subsidiaries, including Nomura
16
Securities International, Inc. in the United States in 1969 as a broker dealer and Nomura International Limited,now Nomura International plc, in the United Kingdom in 1981, which acts as an underwriter and a broker, aswell as other overseas affiliates, branches and representative offices.
On October 1, 2001, we adopted a holding company structure. In connection with this reorganization,Nomura changed its name from “The Nomura Securities Co., Ltd.” to “Nomura Holdings, Inc.” Nomuracontinues to be listed on the Tokyo Stock Exchange and other stock exchanges on which it was previously listed.A wholly-owned subsidiary of Nomura assumed Nomura’s securities businesses and was named “NomuraSecurities Co., Ltd.”
In December 2001, we listed our shares (in the form of American Depositary Shares evidenced by AmericanDepositary Receipts) on the New York Stock Exchange.
We have also enhanced our asset management business through the acquisition of a majority interest inNomura Asset Management Co., Ltd. in March 2000. Nomura Asset Management became a wholly-ownedsubsidiary of Nomura in December 2001.
In June 2003, we adopted a committee-based corporate governance system under which we established aNomination Committee, an Audit Committee and a Compensation Committee. See Item 6.C of this annual report.
In February 2007, we acquired Instinet Incorporated, a global agency broker and major provider ofelectronic trading services for institutional investors, to develop an electronic platform in global equities.
In a series of steps beginning in September 2008, we acquired certain operations, including personnel, offormer Lehman Brothers in Asia, Europe and the Middle East.
The address of Nomura’s registered office is 9-1, Nihonbashi 1-chome, Chuo-ku, Tokyo 103-8645, Japan,telephone number: 81-3-5255-1000.
B. Business Overview.
Overview
We are one of the leading financial services groups in Japan and have worldwide operations. As ofMarch 31, 2010, we operated offices in over 30 countries and regions including Japan, the United States, theUnited Kingdom, Singapore and Hong Kong Special Administrative Region (“Hong Kong SAR”) through oursubsidiaries.
Our clients include individuals, corporations, financial institutions, governments and governmentalagencies.
Our business consists of the following three divisions:
• Retail—principally investment consultation services to retail clients
• Wholesale—principally serving corporations and institutional investors with a broad range of productsand services
• Global Markets—principally fixed income and equity trading and asset finance businesses
• Investment Banking—principally M&A advisory, corporate finance, solutions and merchantbanking businesses
• Asset Management—principally development and management of investment trusts, and investmentadvisory services
17
In April 2010, we established the Wholesale Division, encompassing the operations previously conductedby our Global Markets Division, the Investment Banking Division and the Merchant Banking Division. Adiscussion of our historical operating results through March 31, 2010 by category of activity and geographicmarket is provided in accordance with the Divisions in existence as of that date. See Item 5.A of this annualreport.
Our Business Strategy
Our Corporate Goals and Principles
Our management vision is to establish ourselves as a globally competitive financial services group. We havealso set a management target of maintaining an average consolidated return on equity (ROE) of 10% to 15% overthe medium to long term, subject to change depending on capital regulation developments.
In pursuing this vision, we put our clients first and contribute to the creation of an affluent society based oninvestment by listening closely to the needs of our clients and delivering world class products and services andhigh value-added solutions via financial and capital markets. We aim to go beyond the boundaries of thetraditional securities business and take the lead in expanding into new business areas, thereby constructing newgrowth models. In addition, we will promote compliance with applicable laws and regulations as well as engagein ethical corporate behavior.
Management Challenges and Strategies
The global economic downturn, triggered by the turmoil in financial markets, subsided in the Spring of 2009through inventory adjustment and the execution of economic stimulus plans in many countries. Emergingmarkets are helping the global economy move gradually toward normality, but significant economic uncertaintyand market volatility remain.
In this environment, we plan to address the needs of our global client base by taking advantage of ourstrengthened business platform and to strategically allocate management resources to grow our client base andimprove our market share. In addition, we will continue to proceed with our plans to reduce costs byreengineering our business to fit the market environment and by increasing operational efficiency.
To achieve our strategic goals, we will implement the following initiatives:
• Retail
We will continue to enhance our products and service offerings, which are provided through directcontacts, online or via call centers to accommodate increasingly sophisticated and diverse client needs.Other measures include development of new revenue streams through enhanced online businesses,continuous investment in our brand recognition designed to further our market penetration, and creationof new markets via new client segments. Through these efforts, we aim to continue being a trustedpartner to our clients by providing world-class quality products and services that meet their individualneeds.
• Wholesale
Global Markets will continue to be the product supply hub for the Nomura group which will furtherenhance our product development expertise. In addition, we will leverage our global tradinginfrastructure and business franchise to deliver high value-added products and solutions to our clients.In Fixed Income, we will strengthen our global marketing structure and cater to increasing clientneeds by focusing on flow business in foreign exchange, interest rates, credit and commodities as acore, and structured business to attract solutions-oriented clients. We will continue to leverage ourincreased human capital pool in Asia, Europe and the Americas. In Equities, we aim to establishourselves as a world-class liquidity provider.
18
In Investment Banking, we will expand our revenues by fully leveraging our significantlyexpanded client coverage and product platform in Europe, the Middle East and Africa, as well as in theAsia-Pacific and by strengthening collaboration with our Retail and Global Markets distributioncapabilities, and aim to become a vital earnings driver for the entire Nomura group. In addition torevenue from traditional businesses such as M&A advisory and underwriting, we will pursue solutionsbusinesses in order to diversify and expand our revenue sources. We will also continue to strengthen ourcoverage platform in the U.S. for selected industries to support clients’ global activities and increase ourbusiness opportunities. In our merchant banking business, we remain focused on increasing theenterprise value of the companies in which we invest, and on achieving optimal or immediate returns oninvestments by continually weighing exit strategy options. With the continued instability in the globalinvestment environment, we are taking a more cautious approach to new investments and arecontinually reevaluating our investment and exit strategies.
• Asset Management
We aim to increase our world-class competitive advantage in Japan and the rest of Asia by expandingour investment management and product delivery capabilities globally. We intend to increase assetsunder management from both individual and institutional investors and expand our client base byproviding clients in Japan with a diverse range of global investment opportunities and by meetinginternational investor demand for investment opportunities in Japan and Asia.
In implementing the initiatives outlined above, we will enhance collaboration between divisions. We aim tobring together the collective strengths of our domestic and international operations to realize our managementobjectives and to maximize shareholder value by enhancing profitability across our businesses, while helping tostrengthen the global financial and capital markets.
In addition, we are working to further enhance our management system to support continued growth.
In the wake of the financial crisis, the market and regulatory environments surrounding global financialinstitutions have changed significantly. We strengthened our capital base through a public offering in October2009 to allow for these environmental changes as well as to achieve sustainable growth. Going forward, we willcontinue to maintain our strong financial base and leverage it to grow our client-focused business platform.
We understand that it is necessary to further strengthen our global risk management system. By adopting aproactive risk management approach, senior management has directly engaged in risk management-relateddecision making. We will continue to strengthen this system.
As our business becomes increasingly international, we recognize the growing importance of compliance. Inaddition to complying with laws and regulations, we view compliance in a wider context. We will furtherenhance Nomura group’s overall compliance system.
We view talented personnel as key assets. In line with our basic client-oriented business approach, we haveestablished globally-uniform personnel policies firmly rooted in the belief that employees should be rewarded fortheir overall performance. We will continue to build a professional organization capable of delivering acomprehensive range of services that satisfy our clients.
Retail
In Retail, we conduct business activities mainly for individuals and corporations in Japan through a networkof nationwide branches. The number of branches was 172 as of the end of March 2010. We offer investmentconsultation services to meet the medium to long term needs of our customers. The aggregate market value ofour retail client assets increased to ¥73.5 trillion as of the end of March 2010 from ¥59.3 trillion a year ago. Wediscuss retail client assets in “Retail Client Assets” under Item 5.A of this annual report.
19
In order to execute our business strategy described above in “Our Business Strategy”, we employ variousmethods to deliver our services to clients. These include face-to-face meetings with our staff, either in our branchoffices through client visits, communications through Nomura Home Trade, an internet-based trading service, orthrough our call centers.
We capitalize on the linkages between the Retail, Wholesale and Asset Management Divisions to offervarious financial instruments such as stocks, debt securities, investment trusts and variable annuity insuranceproducts, for the short, medium, and long term, with different risk levels. We seek to provide proprietary Nomuraexpertise to clients through various media such as our investor reports and Nomura Home Trade.
Wholesale
Our Wholesale Division consists of Global Markets, Investment Banking and certain other non-Retailoperations. We formed this new division in April 2010 to promote seamless coordination between the underlyingbusinesses and to provide our clients with timely, high value-added services tailored to their needs.
Global Markets
Global Markets consists of three businesses: Fixed Income, Equities and Asset Finance.
• Fixed Income handles mainly debt securities, foreign currencies and commodities as well as relatedderivatives.
• Equities focuses on equities and equity-linked derivatives.
• Asset Finance helps clients raise capital through real estate and asset securitization, financing and othersolutions.
We have full-service offerings in Fixed Income and Equities, with a proven track record of selling andtrading debt securities, stocks, and foreign exchange, as well as derivatives based on these financial instruments,mainly to institutional investors. In response to the increasingly diverse and complex needs of our clients, GlobalMarkets is enhancing its trading and product origination capabilities to be the product supply hub for the Nomuragroup, offering superior products not only to institutional investors but also to Retail and Asset Managementclients. In addition, we offer execution services based on cutting-edge technologies such as algorithmic tradingand transaction cost analysis. We seek to maximize the synergies and cross-selling opportunities across ourrecently expanded global operations.
In Asset Finance, we leverage our broad client base to maximum advantage and offer high value-addedservices including financial advisory, the structuring of privately placed funds and commercial mortgage-backedsecurities, equity and mezzanine financing and other services through a one-stop approach. We are alsobranching out into real estate management operations, as well as enhancing our expertise to supply financialproducts that meet investors’ real estate-related needs.
We have established extensive ties with institutional investors in Japan and international markets; wealthyand affluent investors, public-sector agencies, and regional financial institutions in Japan; and governmentagencies, financial institutions, and corporations around the world. These strong relationships enable us tounderstand specific client requirements and to develop and deliver solutions that meet those needs across a broadproduct lineup.
Investment Banking
We offer a broad range of investment banking services to a diverse range of corporations, financialinstitutions, sovereigns, investment funds and others. We aim to develop and fortify solid relationships with theseclients on a long term basis by providing them with our extensive resources for each bespoke solution.
20
Underwriting. We underwrite offerings of a wide range of securities and other financial instruments, whichinclude various types of stocks, convertible and exchangeable securities, investment grade debt, sovereign andemerging market debt, high yield debt, structured securities and other securities in Asia, Europe and other majorfinancial markets. We also arrange private placements and engage in other capital raising activities. We are oneof the leading equity and fixed income securities underwriters in Japan.
Financial Advisory & Solutions Services. We provide financial advisory services on business transactionsincluding mergers and acquisitions, divestitures, spin-offs, capital structuring, corporate defense activities,leveraged buyouts and risk solutions. Our involvement in initial public offerings (“IPOs”), reorganizations andother corporate restructurings related to industry consolidation enhance our opportunities to offer clients otheradvisory and investment banking services. We are one of the leading financial advisors in Asia.
Merchant Banking. In Japan, we operate through wholly owned subsidiaries, including Nomura PrincipalFinance Co., Ltd. and Nomura Financial Partners Co., Ltd. Our main focus has been targeting investmentopportunities that will offer attractive returns to us and which will also help contribute to the structural reform ofthe Japanese economy. In Europe, our private equity investments are mainly managed by Terra Firma, which isoperated by former Nomura employees. We also make alternative investments in Europe and investments inventure companies in Japan, Europe and the United States. In Asia, we set up Asia Merchant Banking in 2007 toseek investment opportunities brought about by the expansion of the regional economy. For a further descriptionof our private equity business, see Item 5.A “Private Equity Business.”
Asset Management
We conduct our asset management business, which consists of the development and management ofinvestment trusts and investment advisory services, primarily through Nomura Asset Management Co., Ltd.(NAMCO). NAMCO is the largest asset management company in Japan in terms of assets under management ininvestment trusts as of March 31, 2010. In Japan, our challenge is to shift individual financial assets from savingproducts into investment products to create business opportunities. In order to make these opportunities available,NAMCO manages various investment trusts, ranging from low risk/low return products to high risk/high returnproducts, and develops new products to respond to various investor needs. Investment trusts are distributed toinvestors through Nomura Securities Co., Ltd. as well as through financial institutions such as securitiescompanies (including those outside our group), banks and Japan Post Bank. Investment trusts are also offered indefined contribution pension plans. We also provide investment advisory services to public pensions, privatepensions, governments and their agencies, central banks and institutional investors.
Our Research Activities
We have been successfully building a leading global research platform. Research coverage worldwide inMarch of this year reached 1,760 companies and the total number of researchers globally is 640. In this year’sNikkei analyst ranking survey, our Japan team was ranked first. Our European team achieved their best resultsever in the recent Institutional Investor survey, ranking second out of 23 teams which improved from ourprevious ranking of eighth place in 2009. We recently announced key hires to our US equity research team tofurther strengthen our global research capabilities.
Our Information Technology
We believe that information technology is one of the key success factors for our overall business and intendto develop and maintain a solid technology platform to ensure that the firm is able to fulfill the various needs ofour clients. Accordingly, we will continue to build a technology platform suitable for each business segment.
For example, for our retail clients, we have introduced Nomura Home Trade, at www.nomura.co.jp/hometrade, which provides on-line trading capabilities and current status reports on asset portfolios, investments
21
and transactions and investment information, including our research reports through the internet or mobilephones. Our subsidiaries, Nomura Securities merged with JOINVEST Securities Co., Ltd. in 2009 to provideexpanded internet-based services to its clients.
On the wholesale side, we enhanced our technology platform for higher trading capabilities such as DirectMarket Access and Algorithmic Trade, and for better risk management capability. We are planning to furtherleverage our service entities in India to facilitate the operations of the wholesale business.
Competition
As a leading financial services industry player, we are active in markets which remain intensely competitiveand we expect them to remain so. We compete globally with other securities firms, banks and integrated financialinstitutions. We also face competition on regional, product and niche bases from local and specialist firms. Anumber of factors determine our competitive position against other firms, including:
• the quality, range and prices of our products and services,
• our ability to originate and develop innovative client solutions,
• our ability to maintain and develop client relationships,
• our ability to access and commit capital resources,
• our ability to retain and attract qualified employees, and
• our general reputation.
Our competitive position is also affected by the overall condition of the global financial markets, which areinfluenced by factors such as:
• the monetary and fiscal policies of national governments and international economic organizations, and
• economic developments both within and between Japan, the United States, Europe and other majorindustrialized and developing countries and regions.
In Japan, we compete with other Japanese and non-Japanese securities companies and other financialinstitutions. Competition has become more intense due to deregulation in the Japanese financial industry sincethe late 1990s and the increased presence of global securities companies and other financial institutions. Inparticular, major global firms have increased their presence in securities underwriting, corporate advisoryservices (particularly M&A advisory) and secondary securities sales and trading.
There has also been substantial consolidation and convergence among financial institutions in recent years,both within Japan and globally. This trend accelerated further over the course of the past years as several leadingmarket players consolidated, were forced to merge, received governmental assistance, or received regulatoryapproval to transition to bank holding companies in the credit crisis. The growing presence and scale of financialgroups which encompass commercial banking, securities brokerage, investment banking and other financialservices has led to increased competition. Through their broadened offerings, these firms are able to create goodclient relationships and leverage their existing client base in the brokerage and investment banking business aswell.
In addition to the breadth of their products and services, these firms have the ability to pursue greater marketshare in investment banking and securities products by reducing margins and relying on their commercialbanking, asset management, insurance and other financial services activities. This has resulted in pricing pressurein our investment banking and trading businesses and could result in pricing pressure in other areas of ourbusinesses. Moreover, the trend toward consolidation and convergence has significantly increased the capitalbase and geographic reach of some of our competitors, hastening the globalization of the securities and financial
22
services markets. To accommodate this trend, we will have to compete successfully with financial institutionsthat are large and well-capitalized, and that may have a stronger local presence and longer operating historyoutside Japan.
We have also competed, and expect to compete, with other financial institutions which commit capital tobusinesses or transactions for market share in investment banking activities. In particular, corporate clients mayseek such commitments (such as agreements to participate in their commercial paper backstop or other loanfacilities) in connection with investment banking mandates and other assignments.
Regulation
Japan
The FIEA, which came into effect on September 30, 2007 to amend and replace the former Securities andExchange Law, widely regulates financial products and services in Japan under the defined terms “financialinstruments” and “financial instruments trading business”. The FIEA combines previously existing financial andsecurities related laws to comprehensively regulate financial products. It expands the scope of securities subjectto regulation, extending, among others, to a previously unregulated category of products identified under thedefined term “collective investment schemes”. The FIEA also widely regulates “financial instruments tradingbusiness”, which includes not only the securities business but also the investment advisory business, theinvestment trust management business and the financial futures trading business.
In addition, to enhance fairness and transparency in the financial markets and to protect investors, the FIEAprovides for, among other things, stiffer penalties for misrepresentations in disclosure documents and unfairtrading, stricter regulation of tender offer bids, stricter reporting obligations for large shareholders and improvedcorporate information disclosure systems, including quarterly report systems, submission of confirmationcertificates concerning the descriptions in securities reports and internal controls over financial reporting.
Regulation of the Securities Industry. The FIEA regulates most aspects of securities transactions and thesecurities industry in Japan, including public offerings, private placements and secondary trading of securities,on-going disclosure by securities issuers, tender offers for securities, organization and operation of securitiesexchanges and self-regulatory associations, and registration of securities companies. The Prime Minister has theauthority to regulate the securities industry and securities companies. This authority is delegated to theCommissioner of the FSA under the FIEA. The Securities and Exchange Surveillance Commission, an externalagency of the FSA which is independent from the Agency’s other bureaus, is vested with authority to conductday-to-day monitoring of the securities markets and to investigate irregular activities that hinder the fair trading ofsecurities, including inspection of securities companies. Furthermore, the Commissioner of the FSA delegatescertain authority to the Director General of Local Finance Bureau to inspect local securities companies andbranches. A violation of applicable laws and regulations may result in various administrative sanctions, includingthe revocation of registration or authorization, the suspension of business or an order to discharge any director orexecutive officer who has failed to comply with applicable laws and regulations. Securities companies are alsosubject to the rules and regulations of the Japanese stock exchanges and the Japan Securities Dealers Association, aself-regulatory association of the securities industry.
To enhance investor protection, each Japanese securities company is required to segregate client assets andto hold membership in an Investor Protection Fund approved by the government under the FIEA. The InvestorProtection Fund is funded through assessments on its securities company members. In the event of failure of asecurities company that is a member of the fund, the Investor Protection Fund provides protection of up to¥10 million per client. The Investor Protection Fund covers claims related to securities deposited by clients withthe failed securities company and certain other client claims.
Regulation of Financial Instruments Firms. On December 25, 2009, the FSA issued for public comment aproposed amendment to the “Comprehensive Guidelines for Supervision of the Financial Instruments BusinessOperators, etc.”, which became effective on March 4, 2010. This amendment requires corporate groups of
23
financial instruments firms (i.e., firms engaging in the securities business, investment advisory business orcertain other financial services) that engage in international operations, including Nomura, to strengthen theirmanagement and compliance systems in view of the increasingly significant growth, complication anddevelopment of their international operations. These new requirements include strengthening the groups’business management system, compliance system and risk management system, as well as public disclosure ofdetailed information regarding their capital adequacy ratios, in accordance with the Basel II framework.
In addition, the amendment includes restrictions on their compensation system, which are designed toreduce excessive risk taking by their executives and employees.
Regulation of Other Financial Services. Securities companies are not permitted to conduct banking or otherfinancial services directly, except for those which are registered as money lenders and engaged in money lendingbusiness under the Money Lending Business Act or which hold permission to act as bank agents and conductbanking agency activities under the Banking Law. Securities companies are allowed, however, to hold majorityownership in banks and other financial services institutions. Securities company subsidiaries conducting bankingand financial services are also regulated by relevant laws and regulations. The Nomura Trust & Banking Co.,Ltd. is such a subsidiary and engages in banking and certain financial services.
Regulatory Amendments. A bill to amend the FIEA was passed by the Diet on June 6, 2008 and came intofull effect on June 1, 2009, to strengthen the competitiveness of Japan’s financial and capital markets.
A part of the amendment, which became effective on December 12, 2008, requires a review by the Japanesegovernment of the existing system of administrative monetary penalties, in order to create fair, transparent andreliable markets. This amendment has increased the administrative monetary penalties that may be imposed in theevent of certain types of misconduct, such as insider trading, market manipulation and filing of false disclosuredocuments, and has expanded the scope of misconduct to which administrative monetary penalties may apply toinclude additional items, such as illegal market stabilization and failure to file disclosure documents.
Another part of the amendment, which became effective on June 1, 2009, revamped the firewall regulationsamong securities companies, banks and insurance companies and abolished the ban on concurrent holding bycertain employees, including executives, of posts in such companies. To manage conflicts of interest between oramong securities companies, banks and insurance companies, these financial institutions are required toimplement proper information management and to develop appropriate internal control frameworks to preventclient interests from being unfairly harmed due to trading by the financial institution itself or by other financialinstitutions within its group.
To improve the stability and transparency of Japan’s financial system and to ensure the protection ofinvestors, another bill to amend the FIEA was passed by the Diet on May 12, 2010. A part of the amendment,which is scheduled to become effective within one year, is intended to strengthen group-wide regulation andsupervision through the introduction of consolidated regulations on and the supervision of securities companiesthe size of which exceeds specified parameters. The amendment introduces, among others, obligations on parentcompanies of large securities companies to submit business reports and to meet capital adequacy requirements ona consolidated basis related to the whole group.
Another part of the amendment, which is scheduled to become effective within two and a half years, isintended to improve the stability and transparency of the settlement of over-the-counter (“OTC”) derivativestransactions by requiring the use of central counterparties for clearing certain OTC derivative transactions and byestablishing a system for data storage and reporting of trade information for financial instruments businessoperators and clearing organizations.
24
Overseas
Our overseas offices and subsidiaries are also subject to various laws and governmental rules andregulations applicable in the countries where they carry on their operations, including those promulgated andenforced by the Securities and Exchange Commission, the New York Stock Exchange and the Financial IndustryRegulatory Authority (a non-governmental regulator for all securities companies which was established in July2007 through the consolidation of the National Association of Securities Dealers, Inc. and the memberregulation, enforcement and arbitration functions of the New York Stock Exchange) in the United States, and bythe Financial Services Authority and the London Stock Exchange plc in the United Kingdom. Failure to complywith such laws, rules or regulations could result in fines, suspension or expulsion, which could have a materialadverse effect upon us.
Regulatory Capital Rules
Japan
The FIEA requires that all Financial Instruments Firms (Category I) (“Financial Instruments Firms I”),a category that includes Nomura Securities, ensure that their capital adequacy ratios do not fall below 120% on anon-consolidated basis. The FIEA also requires Financial Instruments Firms I to file month-end reports regardingtheir capital adequacy ratios with the Commissioner of the FSA or the Director-General of the appropriate LocalFinance Bureau, and also to disclose their capital adequacy ratios to the public on a quarterly basis. In addition, ifthe capital adequacy ratio of a Financial Instruments Firm I falls below 140%, it must file a daily report with theauthorities. The FIEA provides for actions which the Prime Minister, through the Commissioner of the FSA orthe Director-General of the appropriate Local Finance Bureau, may take if any Financial Instruments Firm I failsto meet the capital adequacy requirement. More specifically, if the capital adequacy ratio of any FinancialInstruments Firms I falls below 120%, the Commissioner of the FSA or the Director-General of the appropriateLocal Finance Bureau may order the Financial Instruments Firm I to change its business conduct, to deposit itsproperty in trust, or may issue any other supervisory order that such authorities deem necessary and appropriateto protect the interests of the general public or investors. If the capital adequacy ratio of a Financial InstrumentsFirm I falls below 100%, the authorities may take further action, including the issuance of orders to temporarilysuspend its business and the revocation of its registration as a Financial Instruments Firm I under the FIEA.
Under the FIEA and regulations thereunder, the “capital adequacy ratio” means the ratio of adjusted capitalto a quantified total of business risks. Adjusted capital is defined as net worth less illiquid assets. Net worthmainly consists of stated capital, additional paid-in capital, retained earnings, reserves for securities transactions,certain allowances for doubtful current accounts, net unrealized gains/losses in the market value of investmentsecurities, and subordinated debt. Illiquid assets generally include non-current assets, certain deposits andadvances and prepaid expenses. The business risks are divided into three categories: (i) market risks (i.e., risks ofasset value changes due to decline in market values and other reasons), (ii) counterparty risks (i.e., risks ofdelinquency of counterparties and other reasons) and (iii) basic risks (i.e., risks in carrying out daily businessactivities, such as administrative problems with securities transactions and clerical mistakes), each quantified inthe manner specified in a rule promulgated under the FIEA.
We closely monitor the capital adequacy ratio of Nomura Securities on a continuous basis. Since theintroduction of the capital adequacy requirement in Japan in 1989, we have at all times been in compliance withthese requirements. We believe that we will continue to be in compliance with all applicable capital adequacyrequirements in the foreseeable future.
Under the “Guideline for Financial Conglomerates Supervision”, established by the FSA in June 2005, a“financial conglomerate” is defined as a corporate group, including two or more different types of financialinstitutions, such as a securities company and a bank. Nomura is classified as a financial conglomerate. Similar toFinancial Instruments Firms I, financial conglomerates are required to maintain a certain capital adequacy ratio,which is 100% on a consolidated basis. The “Comprehensive Guidelines for Supervision of Financial Instruments
25
Business Operators, etc”, established by the FSA in July 2007, requires corporate groups of financial instrumentsfirms engaging in international operations to report their consolidated capital adequacy ratios to theCommissioner of the FSA semi-annually and additionally if the ratio falls below 120%. Nomura is also classifiedas such a corporate group of financial instruments firms engaging in international operations and was thereforesubject to such reporting requirements prior to March 31, 2009. Beginning from March 31, 2009, however,Nomura became subject to a different capital adequacy and reporting requirements as described below.
The “Comprehensive Guidelines for Supervision of Financial Instruments Business Operators, etc” allowscorporate groups of financial instruments firms engaging in international operations to elect to calculate theircapital adequacy ratios in accordance with the “Criteria for bank holding companies to judge whether theircapital adequacy status is appropriate in light of their own and their subsidiaries’ asset holdings, etc. underArticle 52-25 of the Banking Act” (the “Bank Holding Companies Notice”), instead of calculating these ratios inaccordance with the guideline applicable to financial conglomerates. The Bank Holding Companies Notice oncapital adequacy for Japanese bank holding companies closely follows the risk-weighted approach introduced bythe Basel Committee, commonly referred to as Basel II. The capital adequacy ratio required to be maintained bybank holding companies with international operations under the Bank Holding Companies Notice is 8.0% on aconsolidated basis. Corporate groups of financial instruments firms engaging in international operations whoelect to calculate their capital adequacy ratios in accordance with the Bank Holding Companies Notice mustreport their consolidated capital adequacy ratios to the Commissioner of the FSA semi-annually. We elected tocalculate our capital adequacy ratio in accordance with the Bank Holding Companies Notice beginning onMarch 31, 2009, whereupon we became subject to the capital adequacy and reporting requirements describedabove.
We have been monitoring and acting in compliance with the consolidated capital adequacy requirementsapplicable to Nomura, and believe that we will continue to be in compliance with all applicable capital adequacyrequirements in the foreseeable future.
The Basel Committee has issued a series of announcements regarding a broader program to strengthen theregulatory capital framework in light of weaknesses revealed by the financial crises, as described in“Consolidated Regulatory Requirements” under Item 5.B of this annual report. The Bank Holding CompaniesNotice may be amended to follow the new regulatory capital framework after it is officially adopted by the BaselCommittee.
Overseas
In the United States, Nomura Securities International, Inc. (NSI) is a registered broker-dealer and registeredfutures commission merchant. As such, NSI is subject to the minimum net capital requirements of the UnitedStates Securities and Exchange Commission and the Commodity Futures Trading Commission. NSI is regulatedby the Financial Industry Regulatory Authority and the Chicago Board of Trade as its designated self-regulatoryorganization. These requirements specify minimum levels of capital that U.S. broker-dealers are required tomaintain and limit the amount of leverage that such broker-dealers may use in their businesses. As a primarydealer of U.S. government securities, NSI is also subject to the capital adequacy requirements under theGovernment Securities Act of 1986.
In Europe, the Nomura Europe Holdings plc (NEHS) group is regulated under consolidated supervision bythe Financial Services Authority in the United Kingdom. Various banking and broker/dealer subsidiaries of thegroup are regulated on a stand alone basis by their appropriate local regulator.
In addition, certain of our other subsidiaries are subject to various securities and banking regulations, andthe capital adequacy requirements established by the regulatory and exchange authorities of the countries inwhich those subsidiaries operate. We believe that each such subsidiary is, and will in the foreseeable future be, incompliance with these requirements in all material respects.
26
C. Organizational Structure.
The following table lists Nomura and its significant subsidiaries and their respective countries ofincorporation. Indentation indicates the principal parent of each subsidiary. Proportions of ownership interestinclude indirect ownership.
Name CountryOwnership
Interest
(%)Nomura Holdings, Inc. . . . . . . . . . . . . . . . . . . . . . . . . . . . . . . . . . . . . . . . . . . . . . Japan —
Nomura Securities Co., Ltd. . . . . . . . . . . . . . . . . . . . . . . . . . . . . . . . . . . . . . Japan 100Nomura Asset Management Co., Ltd. . . . . . . . . . . . . . . . . . . . . . . . . . . . . . Japan 100The Nomura Trust & Banking Co., Ltd. . . . . . . . . . . . . . . . . . . . . . . . . . . . . Japan 100Nomura Babcock & Brown Co., Ltd. . . . . . . . . . . . . . . . . . . . . . . . . . . . . . . Japan 100Nomura Capital Investment Co., Ltd. . . . . . . . . . . . . . . . . . . . . . . . . . . . . . . Japan 100Nomura Investor Relations Co., Ltd. . . . . . . . . . . . . . . . . . . . . . . . . . . . . . . Japan 100Nomura Principal Finance Co., Ltd. . . . . . . . . . . . . . . . . . . . . . . . . . . . . . . . Japan 100Nomura Funds Research and Technologies Co., Ltd. . . . . . . . . . . . . . . . . . Japan 100Nomura Pension Support & Service Co., Ltd. . . . . . . . . . . . . . . . . . . . . . . . Japan 100Nomura Research & Advisory Co., Ltd. . . . . . . . . . . . . . . . . . . . . . . . . . . . Japan 100Nomura Business Services Co., Ltd. . . . . . . . . . . . . . . . . . . . . . . . . . . . . . . Japan 100Nomura Facilities, Inc. . . . . . . . . . . . . . . . . . . . . . . . . . . . . . . . . . . . . . . . . . Japan 100Nomura Institute of Capital Markets Research . . . . . . . . . . . . . . . . . . . . . . Japan 100Nomura Healthcare Co., Ltd. . . . . . . . . . . . . . . . . . . . . . . . . . . . . . . . . . . . . Japan 100Private Equity Funds Research and Investments Co., Ltd. . . . . . . . . . . . . . Japan 65Nomura Holding America Inc. . . . . . . . . . . . . . . . . . . . . . . . . . . . . . . . . . . . United States 100
Nomura Securities International, Inc. . . . . . . . . . . . . . . . . . . . . . . . . . . United States 100Nomura Corporate Research and Asset Management Inc. . . . . . . . . . . United States 100Nomura Derivative Products Inc. . . . . . . . . . . . . . . . . . . . . . . . . . . . . . United States 100Nomura America Mortgage Finance, LLC . . . . . . . . . . . . . . . . . . . . . . United States 100
Nomura Financial Holding America, LLC . . . . . . . . . . . . . . . . . . . . . . . . . . United States 100Nomura Global Financial Products Inc. . . . . . . . . . . . . . . . . . . . . . . . . United States 100
NHI Acquisition Holding Inc. . . . . . . . . . . . . . . . . . . . . . . . . . . . . . . . . . . . United States 100Instinet Incorporated . . . . . . . . . . . . . . . . . . . . . . . . . . . . . . . . . . . . . . . United States 100
Nomura Europe Holdings plc . . . . . . . . . . . . . . . . . . . . . . . . . . . . . . . . . . . . United Kingdom 100Nomura International plc . . . . . . . . . . . . . . . . . . . . . . . . . . . . . . . . . . . United Kingdom 100Nomura Bank International plc . . . . . . . . . . . . . . . . . . . . . . . . . . . . . . United Kingdom 100Banque Nomura France . . . . . . . . . . . . . . . . . . . . . . . . . . . . . . . . . . . . France 100Nomura Bank (Luxembourg) S.A. . . . . . . . . . . . . . . . . . . . . . . . . . . . . Luxemburg 100Nomura Bank (Deutschland) GmbH . . . . . . . . . . . . . . . . . . . . . . . . . . Germany 100Nomura Bank (Switzerland) Ltd. . . . . . . . . . . . . . . . . . . . . . . . . . . . . . Switzerland 100Nomura Italia S.I.M. p.A. . . . . . . . . . . . . . . . . . . . . . . . . . . . . . . . . . . . Italy 100Nomura Investment Banking (Middle East) B.S.C. (Closed) . . . . . . . Bahrain 100
Nomura Funding Facility Corporation Limited . . . . . . . . . . . . . . . . . . . . . . Ireland 100Nomura Global Funding plc . . . . . . . . . . . . . . . . . . . . . . . . . . . . . . . . . . . . . United Kingdom 100
Nomura Europe Finance N.V. . . . . . . . . . . . . . . . . . . . . . . . . . . . . . . . The Netherlands 100Nomura Principal Investment plc . . . . . . . . . . . . . . . . . . . . . . . . . . . . . . . . . United Kingdom 100Nomura Capital Markets plc . . . . . . . . . . . . . . . . . . . . . . . . . . . . . . . . . . . . . United Kingdom 100Nomura European Investment Limited . . . . . . . . . . . . . . . . . . . . . . . . . . . . United Kingdom 100Nomura Asia Holding N.V. . . . . . . . . . . . . . . . . . . . . . . . . . . . . . . . . . . . . . The Netherlands 100
Nomura International (Hong Kong) Limited . . . . . . . . . . . . . . . . . . . . Hong Kong SAR 100Nomura Singapore Limited . . . . . . . . . . . . . . . . . . . . . . . . . . . . . . . . . Singapore 100Nomura Malaysia Sdn. Bhd. . . . . . . . . . . . . . . . . . . . . . . . . . . . . . . . . . Malaysia 100Nomura Australia Limited . . . . . . . . . . . . . . . . . . . . . . . . . . . . . . . . . . Australia 100P.T. Nomura Indonesia . . . . . . . . . . . . . . . . . . . . . . . . . . . . . . . . . . . . . Indonesia 94
Nomura Financial Advisory and Securities (India) Private Limited . . . . . . India 100Nomura Asia Investment (Fixed Income) Pte. Ltd. . . . . . . . . . . . . . . . . . . . Singapore 100Nomura Asia Investment (India Powai) Pte. Ltd. . . . . . . . . . . . . . . . . . . . . Singapore 100
Nomura Services India Private Limited . . . . . . . . . . . . . . . . . . . . . . . . India 100
27
D. Property, Plants and Equipment.
Our Properties
As of March 31, 2010, our principal head office is located in Tokyo, Japan and occupies 1,031,022 squarefeet of office space. Our other major offices in Japan are our Osaka branch office, which occupies 122,208 squarefeet, our Nagoya branch office, which occupies 82,918 square feet, and the head office of Nomura AssetManagement Co., Ltd. in Tokyo, which occupies 166,765 square feet. We lease certain other office space inJapan. Nomura Land and Building Co., Ltd., which is accounted for under the equity method of accounting in ourconsolidated financial statements, is the lessor of certain office space in Japan, including part of our Tokyoheadquarters.
As of March 31, 2010, our major offices outside Japan are the offices of Nomura International plc (“NIP”)located in London, which occupy 736,746 square feet, the New York head office of Nomura SecuritiesInternational, Inc., which occupies 150,574 square feet, and offices of Nomura International (Hong Kong)Limited located in the Hong Kong Special Administrative Region, which occupy 212,695 square feet. We ownthe land and building for the London head office of NIP. We lease most of our other overseas office space.
As of March 31, 2010, the major office of Nomura Services India Private Limited, our specialized servicecompany in India, occupies 436,082 square feet.
As of March 31, 2010, the aggregate book value of the land and buildings we owned was, including capitallease, ¥144 billion, and the aggregate book value of equipment we owned, including communications and dataprocessing facilities, was ¥40 billion.
In August 2009, a Nomura consolidated subsidiary, Nomura Properties plc entered into a 20 year lease astenant of Watermark Place, a 525,000 square foot development at 1 Angel Lane in London. The building will bepredominantly used for the European headquarters of Nomura International plc. The office fit out commenced inAugust 2009 and the expected completion date is December 2010.
Item 4A. Unresolved Staff Comments
We are a large accelerated filer as defined in Rule 12b-2 under the Securities Exchange Act of 1934. Thereare no written comments which have been provided by the staff of the Securities and Exchange Commissionregarding our periodic reports under that Act not less than 180 days before the end of the fiscal year endedMarch 31, 2010 and which remain unresolved as of the date of the filing of this annual report with theCommission.
Item 5. Operating and Financial Review and Prospects
A. Operating Results.
You should read the following discussion of our operating and financial review and prospects together withItem 3.A “Selected Financial Data” of this annual report and our consolidated financial statements includedelsewhere in this annual report.
This discussion and analysis contains forward-looking statements that involve risks, uncertainties andassumptions. Our actual results may differ materially from those anticipated in these forward-looking statementsas a result of factors, including, but not limited to, those under Item 3.D “Risk Factors” and elsewhere in thisannual report.
28
Business Environment
Japan
The Japanese economy contracted severely in the fiscal year ended March 2009 as it was seriously affectedby rapid deterioration in the global economy amid a credit squeeze triggered by the September 2008 collapse of aU.S. investment bank. Fallout lingered into the year ended March 2010, when real GDP contracted a substantial1.9%, after having fallen 3.7% in the year ended March 2009. Quarter-on-quarter growth during the year,however, showed an improving trend that reflected export recovery supported by economic stimulus measures invarious countries, as well as improved domestic demand being underpinned by measures taken by the Japanesegovernment. This economic recovery has also started to translate into improvements in the employmentenvironment.
Corporate earnings fell sharply in the year ended March 2009 in reaction to economic downturns in Japanand overseas as well as financial market turmoil. In the year ended March 2010, sales remained on a downtrend,but profits turned up, supported by widespread cost-cutting efforts and a second-half upswing in manufacturingindustry sales. We estimate that recurring profits rose in the year ended March 2010 at around 90% of majorcompanies (NOMURA 400 companies), with large contributions to overall earnings improvement fromcompanies in the financial sector and in such processing industries as automobile electrical machinery andprecision equipment.
The stock market had been on a downtrend until March 2009, but it turned up with stock prices rising overthe year ended March 2010. Global stock markets turned up from March 2009 as concerns of economiccontraction sparked by the global credit squeeze were gradually alleviated by monetary easing and economicstimulus measures taken by policymakers around the world. The TOPIX reached a post-bubble low in March2009, rallied through to August, then temporarily slipped back through to November before rising again to reacha high for the fiscal year in March 2010. The TOPIX fell from 1,212.96 as of March 2008 to 773.66 at the end ofMarch 2009, a decline of 36.2%, the steepest decline over a fiscal year since the index’s inception, but it thenrecovered to 978.81 at the end of March 2010, a rise of 26.5%. The Nikkei Stock Average also rallied sharply by36.8%, rising from 8,109.53 at the end of March 2009 to 11,089.94 at the end of March 2010.
Yields on newly issued 10-year Japanese government bonds were at 1.3% at the end of March 2009 asglobal financial market turmoil showed signs of easing, but rose to over 1.5% in June in tandem with the stockmarket rally. Thereafter, long-term rates declined as the view gained ground that an end to monetary easingpolicies in the US would be postponed, and then rose amid concerns of growth in Japan’s fiscal deficit. As aresult, rates held broadly between 1.2% and 1.5% during 2009, finishing little changed at the 1.3% level at theend of March 2010.
On the foreign exchange markets, the yen was influenced by an easing in global financial market turbulence.At the end of March 2009, the yen was trading at the ¥99 level against the U.S. dollar and the ¥130 level againstthe euro. As a result of continued monetary easing in the U.S. to tackle the financial crisis, the U.S. dollarweakened against major currencies through to November 2009, with the yen appreciating to a peak of ¥84against the dollar. Thereafter, the yen depreciated against the dollar in response to additional monetary easing bythe Bank of Japan and other developments, reaching ¥93 at the end of March 2010. Against the euro, the yenmoved between ¥124 and ¥139 from April through December 2009, but from the start of 2010 the eurodepreciated as Greek government debt problems deepened and concerns surfaced over the euro monetary systemand European economies. The yen appreciated to a peak of ¥119 against the euro at one point in February 2010,before correcting to ¥125 at the end of March 2010.
Overseas
The economies of the leading industrialized nations have been recovering as a result of economic stimulusmeasures taken in response to the global financial crisis from September 2008. International commodity pricesfell sharply heading toward the end of 2008 due to the global credit crunch and concerns about the recession, but
29
then rallied. Aggressive interest rate cuts in the U.S. and Europe, the recapitalization of banks using public funds,and fiscal measures helped the global economy emerge from recession, but not sufficiently to allow thewithdrawal of stimulatory policies and a return to normality. Furthermore, in China, the curbing rises in realestate prices has become an issue in the wake of aggressive fiscal policy measures.
U.S. real GDP growth slow down to 0.4% year-on-year in 2008, followed by a 2.4% contraction in 2009. Ona quarterly basis, however, three consecutive quarters of growth starting from July-September 2009 showed theeconomy entering a recovery phase. Benefits from monetary easing in response to the financial crisis, and fromefforts to boost domestic demand through tax cuts and public works spending, helped revive business sentimentand stimulate corporate activity as corporate earnings improved. With the corporate and household sectorscontinuing to reduce debt, the pick-up has been modest, but recovery has spread to capital investment andemployment.
The Federal Reserve Board (FRB), sought to shift gradually to a neutral policy stance while continuing topromote financial market stability and supporting the economy. The FRB held the federal funds rate target at 0–0.25%, effectively maintaining a zero interest rate policy, and indicated its awareness of the markets inacknowledging that it would take time before policy interest rates were raised. However, it phased outquantitative easing measures designed to supply funds to the financial markets through such means as purchasingmortgage backed securities.
The U.S. stock market turned up as the global credit squeeze eased and benefits from monetary easingspread, with the Dow Jones Industrial Average rallying to 10,856.63 at the end of March 2010, from 7,608.92 atthe end of March 2009. The yield on 10-year U.S. Treasuries was at the 2.6% level in March 2009 but then heldat the 3% level from April 2009 onward as upward pressure from rising share prices and concerns about growthin the fiscal deficit was counteracted by downward pressure from the FRB continuing monetary easing.
European economies also entered a period of recovery in 2009. The Eurozone saw real GDP contract 4.2%year-on-year in 2009, after growth of 0.6% in 2008. On a quarterly basis, however, growth was positive for threestraight quarters, starting in the July-September 2009 quarter. The European Central Bank, in order to stabilizefinancial markets and support the economy, lowered its policy rate and supplied ample liquidity to the financialmarkets, in addition to which fiscal stimulus measures taken in different countries contributed to gradualeconomic recovery.
Subsequently, concerns have started to grow about the size of government debt as a side effect of fiscalstimulus measures. European share prices rallied in tandem with stabilization in markets around the world, withthe benchmark German stock index (DAX) rising approximately 50% during the year ended March 2010.
Asia ex-Japan economies also made a strong recovery. Real GDP growth in China in 2009 was 8.7%, versus9.0% in 2008, with the much stronger recovery compared with the leading industrial nations supported by theChinese government’s large-scale stimulus package, worth some 13% of nominal GDP. This recovery droveeconomic recovery across Asia as a whole, though also spawning the need to curb rising real estate prices as apolicy issue.
Executive Summary
The global economy reeled from the intensified financial market turmoil in the second half of the fiscal yearended March 2009, but in the spring of 2009 inventory adjustments and economic stimulus measuresimplemented throughout the world reversed the economic downturn. Emerging countries and resource-richcountries experienced fast-paced economic recoveries. In Japan, fiscal policies brought an end to the economicdownturn in the first half of the fiscal year ended March 2010, followed by the start of a recovery in the secondhalf of the fiscal year ended March 2010, led by an increase of exports, particularly to emerging countries.Although the employment situation has been slow to improve and household sector spending has yet to recover,
30
the situation in the corporate sector has improved. After a significant decline in the year ended March 2009,recurring profits of major listed companies were once again positive in the year ended March 2010 due to cost-cutting measures in response to a steep drop in sales. On the other hand, trading value on the Tokyo StockExchange totaled approximately ¥379 trillion in the fiscal year ended March 31, 2010, the lowest level in fiveyears. In the bond market, the yield on newly issued 10-year Japanese government bonds rose to the 1.5% rangein June 2009 in conjunction with the stock market rebound, but then fell to the 1.1% range at the end of 2009 asinvestors prepared for a prolonged period of low interest rates in industrialized countries. The yield subsequentlyrose to the 1.3% range in March 2010. In the capital markets, reduced risk aversion on a global basis broughtabout a more favorable environment for companies to raise capital through the equity and debt capital marketsboth in Japan and overseas. The amount of equity and equity-related financing was much larger than the previousfiscal year, particularly in Asia. In Japan, equity and equity-related financing increased to ¥7.7 trillion,approximately 5.5 times greater than the previous fiscal year, marking the highest level in a decade. Amid thisenvironment, we focused our efforts on client businesses in equity and fixed income. In Japan, we leveraged ourstrong base to earn stable profits, while overseas we generated profits from our new business platform. We wereprofitable on a pre-tax basis in all previous five business segments. As a result, net revenue increased 268%year-on-year to ¥1,150.8 billion, non-interest expenses decreased 4% year-on-year to ¥1,045.6 billion, incomebefore income taxes was ¥105.2 billion, and net income attributable to Nomura Holdings, Inc. was ¥67.8 billion.Consequently, ROE for the full year was 3.7%.
In Retail, net revenue for the year ended March 31, 2010 was ¥388.3 billion, up 33% from the previousyear, and income before income taxes was ¥113.4 billion, up 522% from the previous year. During the fiscalyear, we focused on businesses that meet client needs, with a particular emphasis on consulting services. We sawan increase in sales of investment trusts, particularly for multi-currency investment trusts, as well as an increasein equity offerings associated with capital raising by companies. We also steadily expanded our Retail client baseduring the period. Retail client assets increased to ¥73.5 trillion as of March 31, 2010, compared to ¥59.3 trillionas of March 31, 2009.
In Global Markets, net revenue for the year ended March 31, 2010 was ¥658.4 billion and income beforeincome taxes was ¥172.0 billion. Over the past year we have seen positive results from our expanded businessplatform following the acquisition of certain Lehman Brothers operations in October 2008. In addition to growthin client equity and fixed income trading in Japan, we also saw an increase in such businesses in both Europe andAsia. In the equity business, we expanded our client franchise by enhancing services related to European andAsian equities in addition to our existing Japanese equity-related business and by serving clients with ouradvanced technologies. In the fixed income business, we became a Primary Dealer in the United States as wecontinued our platform build out aimed at delivering world-class products and services. In Global Markets, weare working to build a regionally-balanced earnings structure with a focus on client trades.
In Investment Banking, net revenue for the year ended March 31, 2010 was ¥118.9 billion, up 87% from theprevious year, and income before income taxes was ¥1.7 billion, due primarily to increased transaction volume inequity finance by major Japanese financial institutions and corporations. In Japan, we maintained our dominantposition in equity underwriting, bond underwriting and M&A advisory. We also won mandates on many largedeals overseas, including cross-border M&A deals and the underwriting of debt issued by foreign governments.In addition to such traditional investment banking activity, the solutions business, which helps clients managetheir balance sheet and portfolios, began contributing to earnings during the fiscal year.
In Merchant Banking, net revenue for the year ended March 31, 2010 was ¥12.2 billion due primarily torealized and unrealized gains on equity securities of certain investee companies. As a result, income beforeincome taxes was ¥1.4 billion. We succeeded in posting a profit as we strengthened our efforts to increase theenterprise value of existing investments and sought optimal exit strategies.
In Asset Management, net revenue for the year ended March 31, 2010 was ¥70.4 billion, up 18% from theprevious year, and income before income taxes was ¥18.6 billion, up 152% from the previous year. Assets under
31
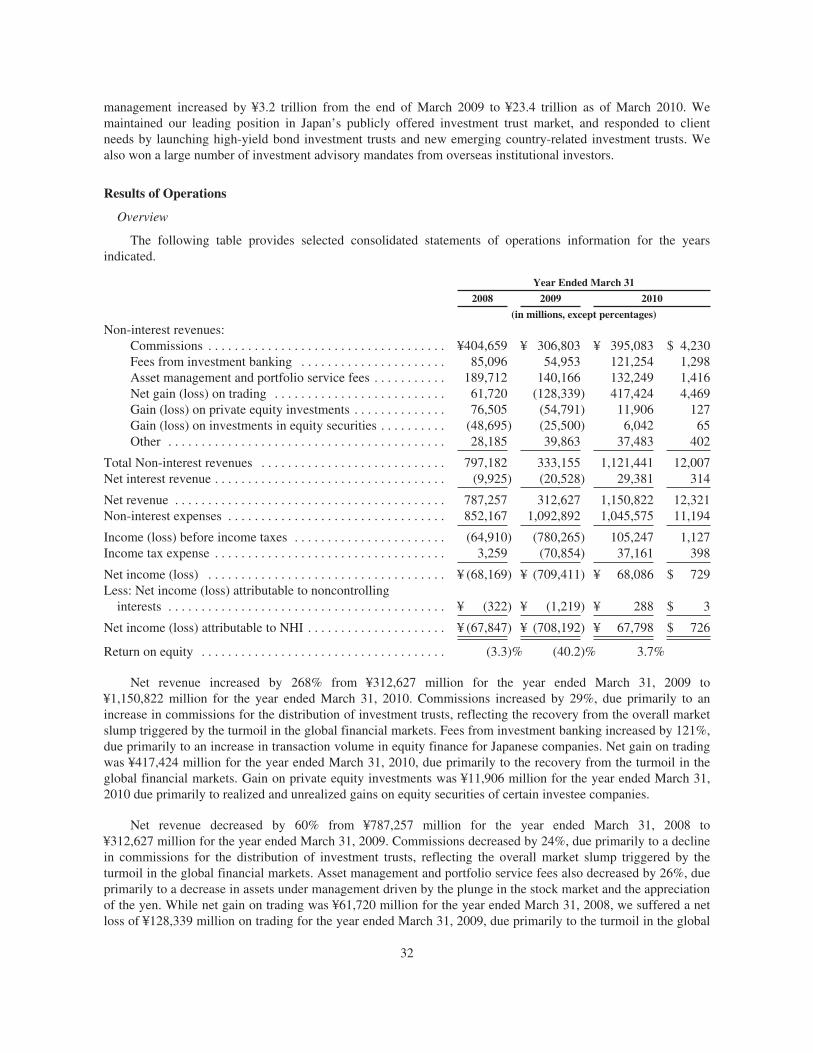
management increased by ¥3.2 trillion from the end of March 2009 to ¥23.4 trillion as of March 2010. Wemaintained our leading position in Japan’s publicly offered investment trust market, and responded to clientneeds by launching high-yield bond investment trusts and new emerging country-related investment trusts. Wealso won a large number of investment advisory mandates from overseas institutional investors.
Results of Operations
Overview
The following table provides selected consolidated statements of operations information for the yearsindicated.
Year Ended March 31
2008 2009 2010
(in millions, except percentages)
Non-interest revenues:Commissions . . . . . . . . . . . . . . . . . . . . . . . . . . . . . . . . . . . . ¥404,659 ¥ 306,803 ¥ 395,083 $ 4,230Fees from investment banking . . . . . . . . . . . . . . . . . . . . . . 85,096 54,953 121,254 1,298Asset management and portfolio service fees . . . . . . . . . . . 189,712 140,166 132,249 1,416Net gain (loss) on trading . . . . . . . . . . . . . . . . . . . . . . . . . . 61,720 (128,339) 417,424 4,469Gain (loss) on private equity investments . . . . . . . . . . . . . . 76,505 (54,791) 11,906 127Gain (loss) on investments in equity securities . . . . . . . . . . (48,695) (25,500) 6,042 65Other . . . . . . . . . . . . . . . . . . . . . . . . . . . . . . . . . . . . . . . . . . 28,185 39,863 37,483 402
Total Non-interest revenues . . . . . . . . . . . . . . . . . . . . . . . . . . . . 797,182 333,155 1,121,441 12,007Net interest revenue . . . . . . . . . . . . . . . . . . . . . . . . . . . . . . . . . . . (9,925) (20,528) 29,381 314
Net revenue . . . . . . . . . . . . . . . . . . . . . . . . . . . . . . . . . . . . . . . . . 787,257 312,627 1,150,822 12,321Non-interest expenses . . . . . . . . . . . . . . . . . . . . . . . . . . . . . . . . . 852,167 1,092,892 1,045,575 11,194
Income (loss) before income taxes . . . . . . . . . . . . . . . . . . . . . . . (64,910) (780,265) 105,247 1,127Income tax expense . . . . . . . . . . . . . . . . . . . . . . . . . . . . . . . . . . . 3,259 (70,854) 37,161 398
Net income (loss) . . . . . . . . . . . . . . . . . . . . . . . . . . . . . . . . . . . . ¥ (68,169) ¥ (709,411) ¥ 68,086 $ 729Less: Net income (loss) attributable to noncontrolling
interests . . . . . . . . . . . . . . . . . . . . . . . . . . . . . . . . . . . . . . . . . . ¥ (322) ¥ (1,219) ¥ 288 $ 3
Net income (loss) attributable to NHI . . . . . . . . . . . . . . . . . . . . . ¥ (67,847) ¥ (708,192) ¥ 67,798 $ 726
Return on equity . . . . . . . . . . . . . . . . . . . . . . . . . . . . . . . . . . . . . (3.3)% (40.2)% 3.7%
Net revenue increased by 268% from ¥312,627 million for the year ended March 31, 2009 to¥1,150,822 million for the year ended March 31, 2010. Commissions increased by 29%, due primarily to anincrease in commissions for the distribution of investment trusts, reflecting the recovery from the overall marketslump triggered by the turmoil in the global financial markets. Fees from investment banking increased by 121%,due primarily to an increase in transaction volume in equity finance for Japanese companies. Net gain on tradingwas ¥417,424 million for the year ended March 31, 2010, due primarily to the recovery from the turmoil in theglobal financial markets. Gain on private equity investments was ¥11,906 million for the year ended March 31,2010 due primarily to realized and unrealized gains on equity securities of certain investee companies.
Net revenue decreased by 60% from ¥787,257 million for the year ended March 31, 2008 to¥312,627 million for the year ended March 31, 2009. Commissions decreased by 24%, due primarily to a declinein commissions for the distribution of investment trusts, reflecting the overall market slump triggered by theturmoil in the global financial markets. Asset management and portfolio service fees also decreased by 26%, dueprimarily to a decrease in assets under management driven by the plunge in the stock market and the appreciationof the yen. While net gain on trading was ¥61,720 million for the year ended March 31, 2008, we suffered a netloss of ¥128,339 million on trading for the year ended March 31, 2009, due primarily to the turmoil in the global
32
financial markets. While we gained ¥76,505 million on private equity investments for the year ended March 31,2008, we lost ¥54,791 million on such investments for the year ended March 31, 2009 due primarily tounrealized losses of certain investee companies.
Net interest revenue was negative ¥9,925 million for the year ended March 31, 2008, negative¥20,528 million for the year ended March 31, 2009 and ¥29,381 million for the year ended March 31, 2010. Netinterest revenue is a function of the level and mix of total assets and liabilities, which includes trading assets andfinancing and lending transactions, and the level, term structure and volatility of interest rates. Net interestrevenue is an integral component of trading activity. In assessing the profitability of our overall business and ofour Global Markets business in particular, we view net interest revenue and non-interest revenues in aggregate.For the year ended March 31, 2010, interest revenue and interest expense decreased 29% and 41%, respectively,due primarily to decline of short-term interest rates of repurchase and reverse repurchase transactions. As aresult, net interest revenue for the year ended March 31, 2010 increased by ¥49,909 million from the year endedMarch 31, 2009. Net interest revenue for the year ended March 31, 2009 declined by ¥10,603 million from theyear ended March 31, 2008. Short-term interest rates declined during the year in major currencies including U.S.dollar and Japanese yen by March 2009, but until the third quarter short-term interest rates in Japanese yenstayed at a relatively high level in comparison to the U.S. dollar, which decreased significantly. Together withthe continuous decline in demand for structured notes from investors, this has pushed up our financial costs,failing to offset the decline in the gross interest revenue which is due to the general decline in the interest ratelevel across the globe. However, the rate at which net interest revenue deteriorated in the last three quarters hasbeen moderated, in response to decreased turmoil in the short-term interest rate market.
In our consolidated statements of operations, we include gains and losses on investments in equity securitieswithin revenue. We recorded gains and losses on such investments in the amount of negative ¥48,695 million forthe year ended March 31, 2008, negative ¥25,500 million for the year ended March 31, 2009 and ¥6,042 millionfor the year ended March 31, 2010. This line item includes both realized and unrealized gains and losses oninvestments in equity securities held for operating purposes. These investments refer to our investments inunaffiliated companies, which we hold on a long-term basis in order to promote existing and potential businessrelationships. In our consolidated financial statements, these investments are recorded at fair value, withunrealized gains and losses on these investments recognized in the consolidated statements of operations.
Non-interest expenses decreased by 4% from ¥1,092,892 million for the year ended March 31, 2009 to¥1,045,575 million for the year ended March 31, 2010. The decrease in non-interest expenses was caused by thedecrease in other expenses by 46% from ¥262,558 million for the year ended March 31, 2009 to¥142,494 million for the year ended March 31, 2010, primarily because impairment losses against affiliatedcompanies were lower for the year ended March 31, 2010. The decrease in non-interest expenses was offset bythe full-year recognition of compensation and benefits, information processing and communications, andoccupancy and depreciation related to the acquisition of Lehman on a half year in October 2008 for the yearended March 31, 2010, while such expenses were recognized in principle for a half year in the year ended March31, 2009.
Non-interest expenses increased by 28% from ¥852,167 million for the year ended March 31, 2008 to¥1,092,892 million for the year ended March 31, 2009. The increase in non-interest expenses consisted mainly ofother expenses and compensation and benefits. Other expenses increased by 67% from ¥157,190 million for theyear ended March 31, 2008 to ¥262,558 million for the year ended March 31, 2009, mainly due to significantimpairment losses being recognized against affiliated companies. Compensation and benefits increased by 34%from ¥366,805 million for the year ended March 31, 2008 to ¥491,555 million for the year ended March 31,2009, due primarily to an increase in the number of employees as a result of the Lehman acquisition.
Income (loss) before income taxes was negative ¥64,910 million for the year ended March 31, 2008, andnegative ¥780,265 million for the year ended March 31, 2009 and ¥105,247 million for the year ended March 31,2010.
33
We are subject to a number of different taxes in Japan and have adopted the consolidation tax systempermitted under Japanese tax law. The consolidation tax system only imposes a national tax. Since April 1, 2004,our domestic statutory tax rate has been approximately 41%. Our foreign subsidiaries are subject to the incometax rates of the countries in which they operate, which are generally lower than those in Japan. Our effective taxrate in any one year is therefore dependent on our geographic mix of profits and losses and also on the specifictax treatment applicable in each location.
Income tax expense for the year ended March 31, 2010 was ¥37,161 million, representing an effective taxrate of 35.3%. The significant factor causing the difference between the effective tax rate of 35.3% and thestatutory tax rate of 41% was due to different tax rates applicable for foreign subsidiaries which decreased theeffective tax rate by 26.9%. Other significant factors causing the difference were taxable items to be added onfinancial profit and non-deductible expenses which increased the effective tax rate by 10.8% and 10.5%,respectively for the year ended March 31, 2010.
Income tax expense for the year ended March 31, 2009 was negative ¥70,854 million, representing aneffective tax rate of 9.1% which was significantly below the statutory tax rate of 41%. The most significant factorcausing the difference was an increase in the valuation allowance, mainly relating to non-recoverability of lossesin certain U.S. and U.K. subsidiaries and also future realizable losses in Japan as a result of the review of thefuture realizable value of the deferred tax assets. Although the increase in the valuation allowance generally hasthe effect of increasing the effective tax rate, this had the effect of decreasing the rate by approximately 27.6%due to losses from continuing operations. Other significant factors included tax benefits recognized on thedevaluation of investments in foreign subsidiaries which increased the effective tax rate by approximately 7.5%and also the different tax rates applicable for foreign subsidiaries which decreased the effective tax rate by 9.9%for the year ended March 31, 2009.
Income tax expense for the year ended March 31, 2008 was ¥3,259 million, representing an effective taxrate of negative 5.0%. The effective tax rate was significantly below the statutory tax rate of 41%. The mostsignificant factor causing the difference was an increase in the valuation allowance, mainly relating to thenon-recoverability of losses in certain U.S. subsidiaries and future realizable losses in Japan as a result of thereview of the future realizable value of deferred tax assets. Although the increase in the valuation allowancegenerally has the effect of increasing the effective tax rate, it resulted in a decreasing effective tax rate for theyear ended March 31, 2008 by approximately 165.5% due to losses from continuing operations. Anothersignificant factor causing the difference was tax benefits recognized on the devaluation of investments in foreignsubsidiaries. This had the effect of increasing the effective tax rate for the year ended March 31, 2008 byapproximately 120.9%.
Net income (loss) attributable to NHI was negative ¥67,847 million for the year ended March 31, 2008, andnegative ¥708,192 million for the year ended March 31, 2009 and ¥67,798 million for the year ended March 31,2010. Our return on equity was negative 3.3% for the year ended March 31, 2008, negative 40.2% for the yearended March 31, 2009, and 3.7% for the year ended March 31, 2010.
Results by Business Segment
As discussed in “Overview” under Item 4.B of this annual report, we provide operation results for the yearended March 31, 2010 in accordance with previous five business segments: Retail, Global Markets, InvestmentBanking, Merchant Banking and Asset Management. Gain (loss) on investments in equity securities, our share ofequity in the earnings (losses) of affiliates, impairment losses on long-lived assets, corporate items and otherfinancial adjustments are included as “Other” operating results outside of business segments in our segmentinformation. Unrealized gain (loss) on investments in equity securities held for operating purposes is classified asreconciling items outside of our segment information. The following segment information should be read inconjunction with Item 4.B “Business Overview” of this annual report and Note 21 “Segment and geographic
34
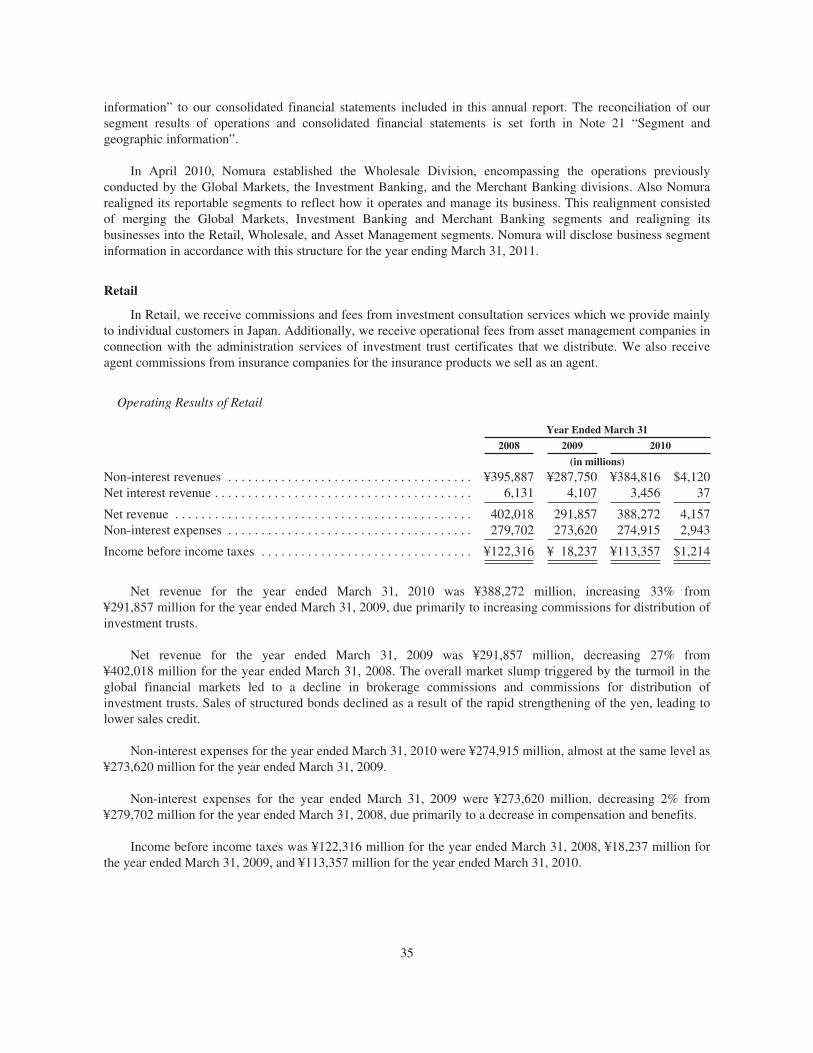
information” to our consolidated financial statements included in this annual report. The reconciliation of oursegment results of operations and consolidated financial statements is set forth in Note 21 “Segment andgeographic information”.
In April 2010, Nomura established the Wholesale Division, encompassing the operations previouslyconducted by the Global Markets, the Investment Banking, and the Merchant Banking divisions. Also Nomurarealigned its reportable segments to reflect how it operates and manage its business. This realignment consistedof merging the Global Markets, Investment Banking and Merchant Banking segments and realigning itsbusinesses into the Retail, Wholesale, and Asset Management segments. Nomura will disclose business segmentinformation in accordance with this structure for the year ending March 31, 2011.
Retail
In Retail, we receive commissions and fees from investment consultation services which we provide mainlyto individual customers in Japan. Additionally, we receive operational fees from asset management companies inconnection with the administration services of investment trust certificates that we distribute. We also receiveagent commissions from insurance companies for the insurance products we sell as an agent.
Operating Results of Retail
Year Ended March 31
2008 2009 2010
(in millions)
Non-interest revenues . . . . . . . . . . . . . . . . . . . . . . . . . . . . . . . . . . . . . ¥395,887 ¥287,750 ¥384,816 $4,120Net interest revenue . . . . . . . . . . . . . . . . . . . . . . . . . . . . . . . . . . . . . . . 6,131 4,107 3,456 37
Net revenue . . . . . . . . . . . . . . . . . . . . . . . . . . . . . . . . . . . . . . . . . . . . . 402,018 291,857 388,272 4,157Non-interest expenses . . . . . . . . . . . . . . . . . . . . . . . . . . . . . . . . . . . . . 279,702 273,620 274,915 2,943
Income before income taxes . . . . . . . . . . . . . . . . . . . . . . . . . . . . . . . . ¥122,316 ¥ 18,237 ¥113,357 $1,214
Net revenue for the year ended March 31, 2010 was ¥388,272 million, increasing 33% from¥291,857 million for the year ended March 31, 2009, due primarily to increasing commissions for distribution ofinvestment trusts.
Net revenue for the year ended March 31, 2009 was ¥291,857 million, decreasing 27% from¥402,018 million for the year ended March 31, 2008. The overall market slump triggered by the turmoil in theglobal financial markets led to a decline in brokerage commissions and commissions for distribution ofinvestment trusts. Sales of structured bonds declined as a result of the rapid strengthening of the yen, leading tolower sales credit.
Non-interest expenses for the year ended March 31, 2010 were ¥274,915 million, almost at the same level as¥273,620 million for the year ended March 31, 2009.
Non-interest expenses for the year ended March 31, 2009 were ¥273,620 million, decreasing 2% from¥279,702 million for the year ended March 31, 2008, due primarily to a decrease in compensation and benefits.
Income before income taxes was ¥122,316 million for the year ended March 31, 2008, ¥18,237 million forthe year ended March 31, 2009, and ¥113,357 million for the year ended March 31, 2010.
35
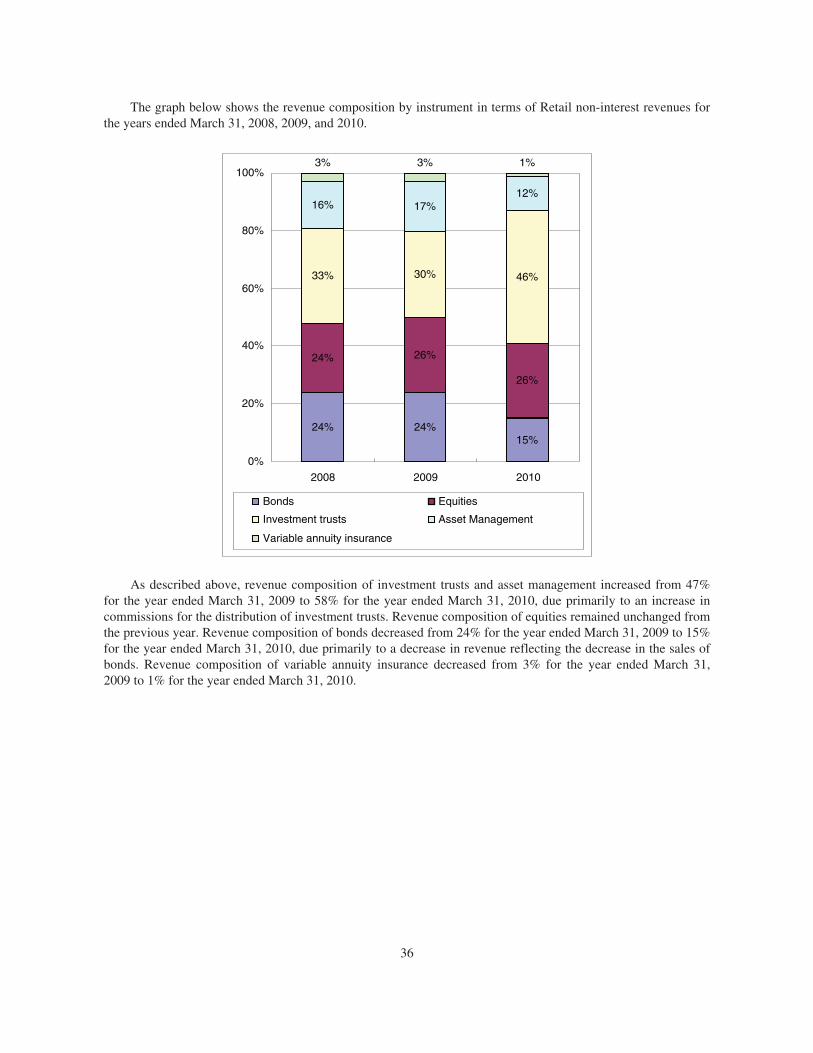
The graph below shows the revenue composition by instrument in terms of Retail non-interest revenues forthe years ended March 31, 2008, 2009, and 2010.
26%
30%
17%
24%
3%
24%
24%
33%
16%
3%
0%
20%
40%
60%
80%
100%
2008 2009 2010
Bonds Equities
Investment trusts Asset Management
Variable annuity insurance
26%
46%
12%
15%
1%
As described above, revenue composition of investment trusts and asset management increased from 47%for the year ended March 31, 2009 to 58% for the year ended March 31, 2010, due primarily to an increase incommissions for the distribution of investment trusts. Revenue composition of equities remained unchanged fromthe previous year. Revenue composition of bonds decreased from 24% for the year ended March 31, 2009 to 15%for the year ended March 31, 2010, due primarily to a decrease in revenue reflecting the decrease in the sales ofbonds. Revenue composition of variable annuity insurance decreased from 3% for the year ended March 31,2009 to 1% for the year ended March 31, 2010.
36
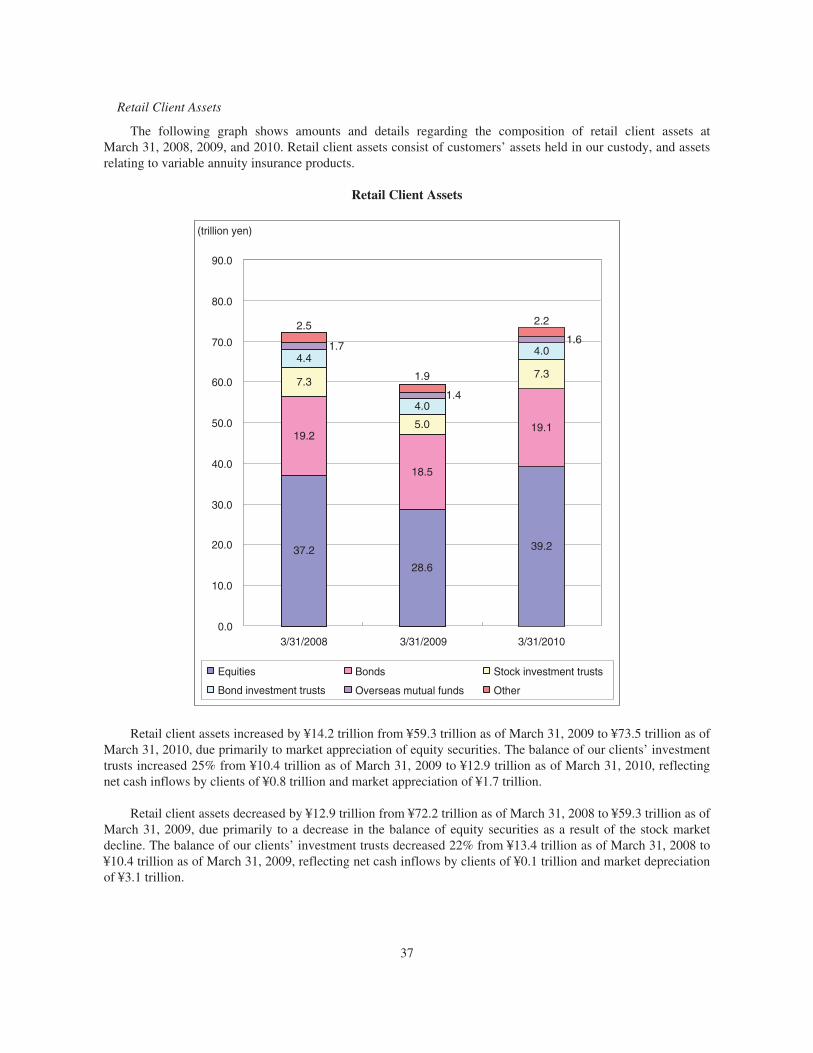
Retail Client Assets
The following graph shows amounts and details regarding the composition of retail client assets atMarch 31, 2008, 2009, and 2010. Retail client assets consist of customers’ assets held in our custody, and assetsrelating to variable annuity insurance products.
Retail Client Assets
0.0
10.0
20.0
30.0
40.0
50.0
60.0
70.0
80.0
90.0
(trillion yen)
Bonds Stock investment trusts
Overseas mutual funds Other
Equities
Bond investment trusts
28.6
18.5
5.0
4.01.4
1.9
37.2
19.2
7.3
4.41.7
2.5
3/31/2008 3/31/2009 3/31/2010
39.2
19.1
7.3
4.01.6
2.2
Retail client assets increased by ¥14.2 trillion from ¥59.3 trillion as of March 31, 2009 to ¥73.5 trillion as ofMarch 31, 2010, due primarily to market appreciation of equity securities. The balance of our clients’ investmenttrusts increased 25% from ¥10.4 trillion as of March 31, 2009 to ¥12.9 trillion as of March 31, 2010, reflectingnet cash inflows by clients of ¥0.8 trillion and market appreciation of ¥1.7 trillion.
Retail client assets decreased by ¥12.9 trillion from ¥72.2 trillion as of March 31, 2008 to ¥59.3 trillion as ofMarch 31, 2009, due primarily to a decrease in the balance of equity securities as a result of the stock marketdecline. The balance of our clients’ investment trusts decreased 22% from ¥13.4 trillion as of March 31, 2008 to¥10.4 trillion as of March 31, 2009, reflecting net cash inflows by clients of ¥0.1 trillion and market depreciationof ¥3.1 trillion.
37
Global Markets
We have a proven track record in sales and trading of bonds, stocks, and foreign exchange, as well asderivatives based on these financial instruments, mainly to institutional investors. In response to the increasinglydiverse and complex needs of our customers, we are building up our trading and product origination capabilitiesto offer superior products not only to institutional investors but also to Retail and Asset Management. This cross-divisional approach also extends to Investment Banking, where close collaboration leads to high value-addedsolutions for our customers. In Asset Finance, we use our broad customer base to maximum advantage and offersophisticated financial solutions for raising capital through real estate and other asset securitization schemes.
We have forged extensive ties with institutional investors in Japan and international markets; wealthy andaffluent investors, public-sector agencies, and regional financial institutions in Japan; and government agencies,financial institutions, and corporations around the world. These ties enable us to identify the types of products ofinterest to investors and then to develop and deliver products that meet their needs.
Operating Results of Global Markets
Year Ended March 31
2008 2009 2010
(in millions)
Non-interest revenues . . . . . . . . . . . . . . . . . . . . . . . . . . . . . . . . . . . . ¥ 145,192 ¥(146,335) ¥625,059 $6,692Net interest revenue . . . . . . . . . . . . . . . . . . . . . . . . . . . . . . . . . . . . . (49,595) (10,919) 33,382 357
Net revenue . . . . . . . . . . . . . . . . . . . . . . . . . . . . . . . . . . . . . . . . . . . . 95,597 (157,254) 658,441 7,049Non-interest expenses . . . . . . . . . . . . . . . . . . . . . . . . . . . . . . . . . . . . 321,794 417,387 486,433 5,207
Income (loss) before income taxes . . . . . . . . . . . . . . . . . . . . . . . . . . ¥(226,197) ¥(574,641) ¥172,008 $1,842
Net revenue increased from negative ¥157,254 million for the year ended March 31, 2009 to¥658,441 million for the year ended March 31, 2010. In Fixed Income, net revenue increased from negative¥217.2 billion for the year ended March 31, 2009 to ¥308.0 billion for the year ended March 31, 2010. InEquities, net revenue increased from ¥98.9 billion for the year ended March 31, 2009 to ¥352.8 billion for theyear ended March 31, 2010. Over the past year we have seen positive results from our expanded businessplatform following the acquisition of certain Lehman Brothers operations in October 2008. In addition to growthin client equity and fixed income trading in Japan, we also saw an increase in such businesses in both Europe andAsia. In Equities, we expanded our client franchise by enhancing services related to European and Asian equitiesin addition to our existing Japanese equity-related business and by serving clients with our advancedtechnologies. In Fixed Income, we became a Primary Dealer in the United States as we continued our platformbuild out aimed at delivering world-class products and services. In Global Markets, we are working to build aregionally-balanced earnings structure with a focus on client trades.
Net revenue decreased from ¥95,597 million for the year ended March 31, 2008 to negative¥157,254 million for the year ended March 31, 2009. In Fixed Income, net revenue was negative ¥217.2 billiondue to trading losses in conjunction with the market drop-off as well as the one-off losses in association with theturmoil in global financial markets. In Equities, the deterioration in the trading environment due to the marketturmoil resulted in a 52% year-on-year decline in net revenue to ¥98.9 billion. We also wrote down the value ofreal estate and other illiquid assets and reduced our exposure to illiquid assets. Following the acquisition ofcertain operations of Lehman Brothers in October 2008, we restructured our organization and business lines, andgenerally completed system and other infrastructure integration projects by the end of fiscal year 2009.
Non-interest expenses increased by 17% from ¥417,387 million for the year ended March 31, 2009 to¥486,433 million for the year ended March 31, 2010, due primarily to increases in commissions, floor brokerageand compensation and benefits.
38
Non-interest expenses increased by 30% from ¥321,794 million for the year ended March 31, 2008 to¥417,387 million for the year ended March 31, 2009, due primarily to the acquisition of certain operations ofLehman Brothers.
Loss before income taxes was ¥226,197 million for the year ended March 31, 2008, ¥574,641 million for theyear ended March 31, 2009 and income before income taxes was ¥172,008 million for the year ended March 31,2010.
The table below shows our market share of Japanese Government bond auctions and secondary bondtrading, in terms of the principal amounts of bonds purchased, for the years indicated. Secondary bond tradingrefers to the trading of bonds originally issued in Japan in the over-the-counter market and on exchanges inJapan, but excludes gensaki and inter-dealer transactions.
Year Ended March 31
2008 2009 2010
Nomura’s Share in Japanese Government bond auctions . . . . . . . . . . . . . . . . . . . 11% 11% 9%Nomura’s Share in secondary bond trading . . . . . . . . . . . . . . . . . . . . . . . . . . . . . . 12% 13% 11%
The following table sets forth the closing level of the TOPIX and the Nikkei 225, which are both stockmarket indices in Japan, as of the dates indicated, and the percentage changes from the closing level at the dateone year before:
March 31
Stock Market Index 2008 2009 2010
TOPIX . . . . . . . . . . . . . . . . . . . . . . . . . . . . . . . . . . . . . . . . . . . . . . . . . . . . 1,212.96 773.66 978.81(29.2)% (36.2)% 26.5%
Nikkei 225 (“Nikkei Stock Average”) . . . . . . . . . . . . . . . . . . . . . . . . . . . 12,525.54 8,109.53 11,089.94(27.5)% (35.3)% 36.8%
The TOPIX reached a post-bubble low in March 2009, rallied through to August, then temporarily slippedback through to November before rising again to reach a high for the fiscal year in March 2010. The TOPIX fellfrom 1,212.96 at the end of March 2008 to 773.66 at the end of March 2009, a decline of 36.2%, the steepestdecline over a fiscal year since the index’s inception, but it then recovered to 978.81 at the end of March 2010, arise of 26.5%. The Nikkei Stock Average also rallied sharply, by 36.8%, rising from 8,109.53 at the end ofMarch 2009 to 11,089.94 at the end of March 2010. The following table shows our market share of Japaneseequity trading for the years indicated.
Year Ended March 31
Nomura’s Share in 2008 2009 2010
Total equity trading market in Japan . . . . . . . . . . . . . . . . . . . . . . . . . . . . . . . . . . . 7% 7% 9%Off-floor/off-exchange equity trading market in Japan . . . . . . . . . . . . . . . . . . . . . 21% 17% 17%
Investment Banking
We provide a broad range of investment banking services, such as underwriting and advisory activities to adiverse range of corporations, financial institutions, sovereigns, investment funds and others. We underwriteofferings of debt, equity and other financial instruments in Asia, Europe and other major financial markets. Wehave been enhancing our M&A and financial advisory expertise to secure more high profile deals both across andwithin regions. We develop and forge solid relationships with these clients on a long-term basis by providingextensive resources in a seamless fashion to facilitate bespoke solutions.
39
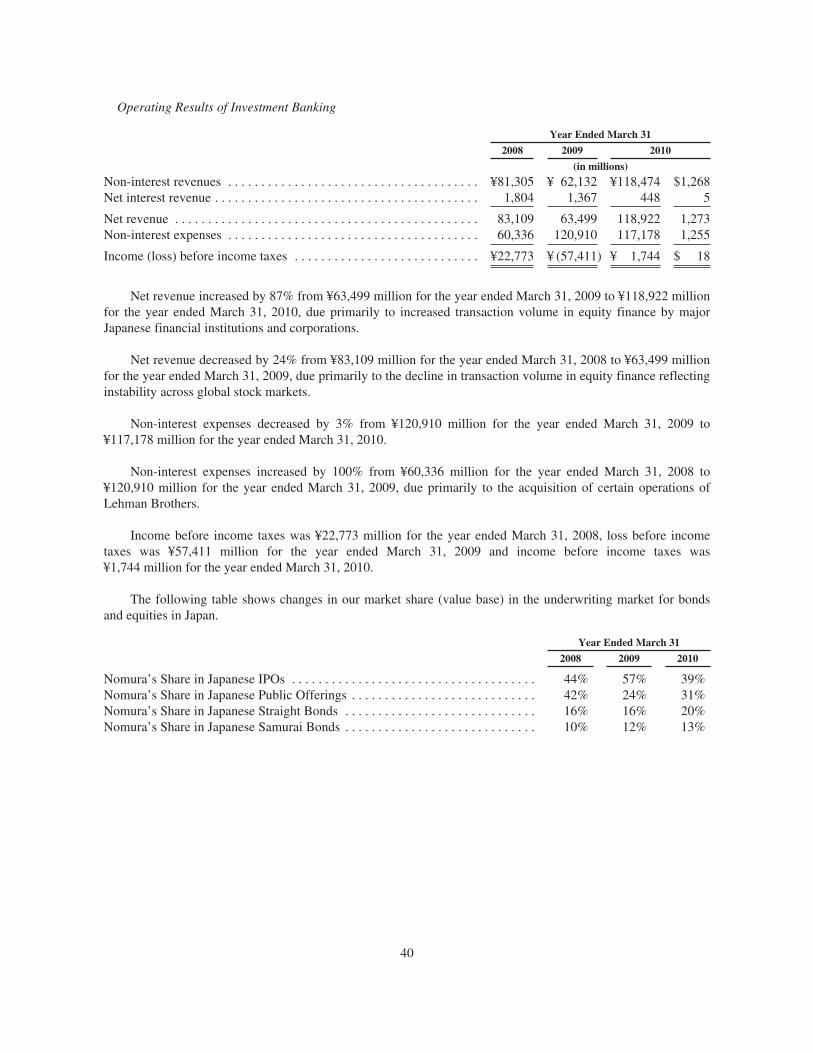
Operating Results of Investment Banking
Year Ended March 31
2008 2009 2010
(in millions)
Non-interest revenues . . . . . . . . . . . . . . . . . . . . . . . . . . . . . . . . . . . . . . ¥81,305 ¥ 62,132 ¥118,474 $1,268Net interest revenue . . . . . . . . . . . . . . . . . . . . . . . . . . . . . . . . . . . . . . . . 1,804 1,367 448 5
Net revenue . . . . . . . . . . . . . . . . . . . . . . . . . . . . . . . . . . . . . . . . . . . . . . 83,109 63,499 118,922 1,273Non-interest expenses . . . . . . . . . . . . . . . . . . . . . . . . . . . . . . . . . . . . . . 60,336 120,910 117,178 1,255
Income (loss) before income taxes . . . . . . . . . . . . . . . . . . . . . . . . . . . . ¥22,773 ¥ (57,411) ¥ 1,744 $ 18
Net revenue increased by 87% from ¥63,499 million for the year ended March 31, 2009 to ¥118,922 millionfor the year ended March 31, 2010, due primarily to increased transaction volume in equity finance by majorJapanese financial institutions and corporations.
Net revenue decreased by 24% from ¥83,109 million for the year ended March 31, 2008 to ¥63,499 millionfor the year ended March 31, 2009, due primarily to the decline in transaction volume in equity finance reflectinginstability across global stock markets.
Non-interest expenses decreased by 3% from ¥120,910 million for the year ended March 31, 2009 to¥117,178 million for the year ended March 31, 2010.
Non-interest expenses increased by 100% from ¥60,336 million for the year ended March 31, 2008 to¥120,910 million for the year ended March 31, 2009, due primarily to the acquisition of certain operations ofLehman Brothers.
Income before income taxes was ¥22,773 million for the year ended March 31, 2008, loss before incometaxes was ¥57,411 million for the year ended March 31, 2009 and income before income taxes was¥1,744 million for the year ended March 31, 2010.
The following table shows changes in our market share (value base) in the underwriting market for bondsand equities in Japan.
Year Ended March 31
2008 2009 2010
Nomura’s Share in Japanese IPOs . . . . . . . . . . . . . . . . . . . . . . . . . . . . . . . . . . . . . 44% 57% 39%Nomura’s Share in Japanese Public Offerings . . . . . . . . . . . . . . . . . . . . . . . . . . . . 42% 24% 31%Nomura’s Share in Japanese Straight Bonds . . . . . . . . . . . . . . . . . . . . . . . . . . . . . 16% 16% 20%Nomura’s Share in Japanese Samurai Bonds . . . . . . . . . . . . . . . . . . . . . . . . . . . . . 10% 12% 13%
40
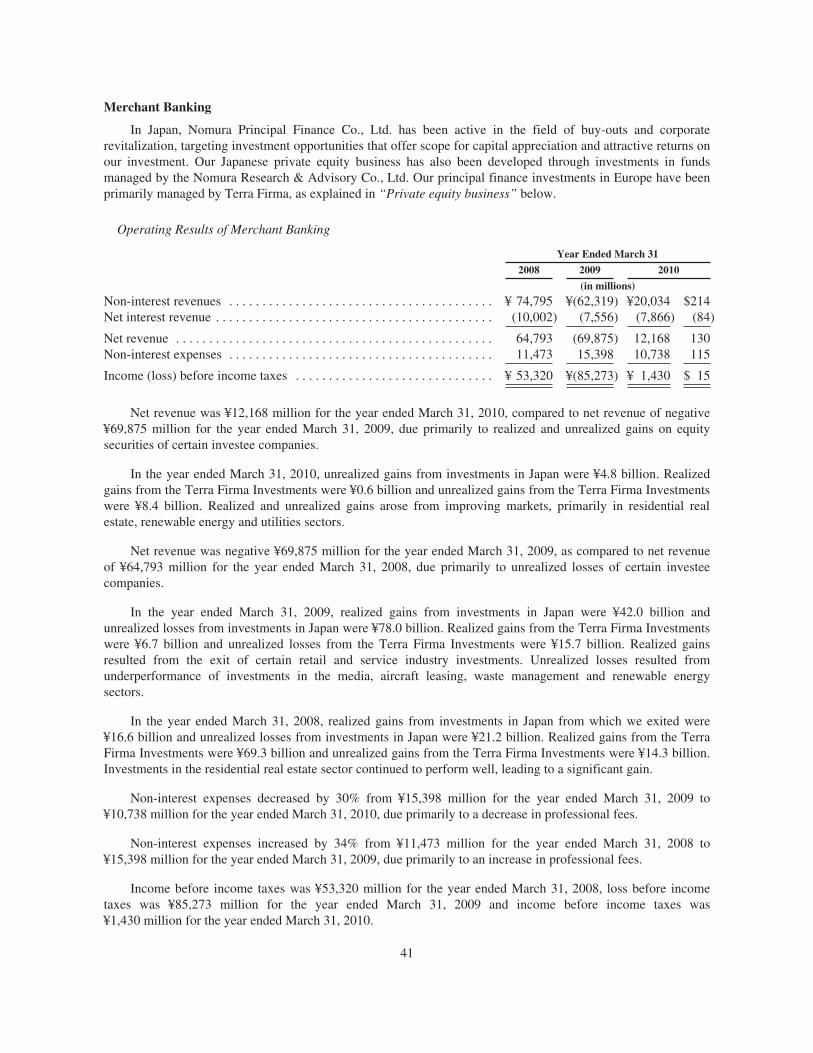
Merchant Banking
In Japan, Nomura Principal Finance Co., Ltd. has been active in the field of buy-outs and corporaterevitalization, targeting investment opportunities that offer scope for capital appreciation and attractive returns onour investment. Our Japanese private equity business has also been developed through investments in fundsmanaged by the Nomura Research & Advisory Co., Ltd. Our principal finance investments in Europe have beenprimarily managed by Terra Firma, as explained in “Private equity business” below.
Operating Results of Merchant Banking
Year Ended March 31
2008 2009 2010
(in millions)
Non-interest revenues . . . . . . . . . . . . . . . . . . . . . . . . . . . . . . . . . . . . . . . . ¥ 74,795 ¥(62,319) ¥20,034 $214Net interest revenue . . . . . . . . . . . . . . . . . . . . . . . . . . . . . . . . . . . . . . . . . . (10,002) (7,556) (7,866) (84)
Net revenue . . . . . . . . . . . . . . . . . . . . . . . . . . . . . . . . . . . . . . . . . . . . . . . . 64,793 (69,875) 12,168 130Non-interest expenses . . . . . . . . . . . . . . . . . . . . . . . . . . . . . . . . . . . . . . . . 11,473 15,398 10,738 115
Income (loss) before income taxes . . . . . . . . . . . . . . . . . . . . . . . . . . . . . . ¥ 53,320 ¥(85,273) ¥ 1,430 $ 15
Net revenue was ¥12,168 million for the year ended March 31, 2010, compared to net revenue of negative¥69,875 million for the year ended March 31, 2009, due primarily to realized and unrealized gains on equitysecurities of certain investee companies.
In the year ended March 31, 2010, unrealized gains from investments in Japan were ¥4.8 billion. Realizedgains from the Terra Firma Investments were ¥0.6 billion and unrealized gains from the Terra Firma Investmentswere ¥8.4 billion. Realized and unrealized gains arose from improving markets, primarily in residential realestate, renewable energy and utilities sectors.
Net revenue was negative ¥69,875 million for the year ended March 31, 2009, as compared to net revenueof ¥64,793 million for the year ended March 31, 2008, due primarily to unrealized losses of certain investeecompanies.
In the year ended March 31, 2009, realized gains from investments in Japan were ¥42.0 billion andunrealized losses from investments in Japan were ¥78.0 billion. Realized gains from the Terra Firma Investmentswere ¥6.7 billion and unrealized losses from the Terra Firma Investments were ¥15.7 billion. Realized gainsresulted from the exit of certain retail and service industry investments. Unrealized losses resulted fromunderperformance of investments in the media, aircraft leasing, waste management and renewable energysectors.
In the year ended March 31, 2008, realized gains from investments in Japan from which we exited were¥16.6 billion and unrealized losses from investments in Japan were ¥21.2 billion. Realized gains from the TerraFirma Investments were ¥69.3 billion and unrealized gains from the Terra Firma Investments were ¥14.3 billion.Investments in the residential real estate sector continued to perform well, leading to a significant gain.
Non-interest expenses decreased by 30% from ¥15,398 million for the year ended March 31, 2009 to¥10,738 million for the year ended March 31, 2010, due primarily to a decrease in professional fees.
Non-interest expenses increased by 34% from ¥11,473 million for the year ended March 31, 2008 to¥15,398 million for the year ended March 31, 2009, due primarily to an increase in professional fees.
Income before income taxes was ¥53,320 million for the year ended March 31, 2008, loss before incometaxes was ¥85,273 million for the year ended March 31, 2009 and income before income taxes was¥1,430 million for the year ended March 31, 2010.
41
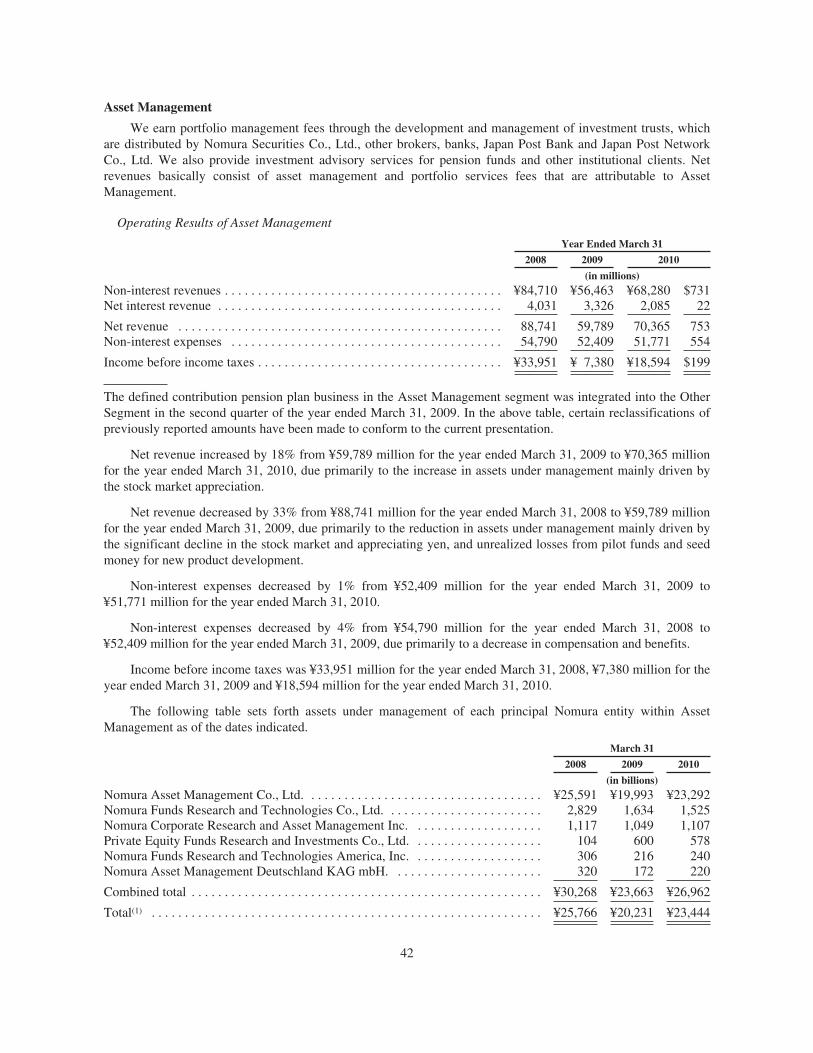
Asset Management
We earn portfolio management fees through the development and management of investment trusts, whichare distributed by Nomura Securities Co., Ltd., other brokers, banks, Japan Post Bank and Japan Post NetworkCo., Ltd. We also provide investment advisory services for pension funds and other institutional clients. Netrevenues basically consist of asset management and portfolio services fees that are attributable to AssetManagement.
Operating Results of Asset Management
Year Ended March 31
2008 2009 2010
(in millions)Non-interest revenues . . . . . . . . . . . . . . . . . . . . . . . . . . . . . . . . . . . . . . . . . . ¥84,710 ¥56,463 ¥68,280 $731Net interest revenue . . . . . . . . . . . . . . . . . . . . . . . . . . . . . . . . . . . . . . . . . . . 4,031 3,326 2,085 22
Net revenue . . . . . . . . . . . . . . . . . . . . . . . . . . . . . . . . . . . . . . . . . . . . . . . . . 88,741 59,789 70,365 753Non-interest expenses . . . . . . . . . . . . . . . . . . . . . . . . . . . . . . . . . . . . . . . . . 54,790 52,409 51,771 554
Income before income taxes . . . . . . . . . . . . . . . . . . . . . . . . . . . . . . . . . . . . . ¥33,951 ¥ 7,380 ¥18,594 $199
The defined contribution pension plan business in the Asset Management segment was integrated into the OtherSegment in the second quarter of the year ended March 31, 2009. In the above table, certain reclassifications ofpreviously reported amounts have been made to conform to the current presentation.
Net revenue increased by 18% from ¥59,789 million for the year ended March 31, 2009 to ¥70,365 millionfor the year ended March 31, 2010, due primarily to the increase in assets under management mainly driven bythe stock market appreciation.
Net revenue decreased by 33% from ¥88,741 million for the year ended March 31, 2008 to ¥59,789 millionfor the year ended March 31, 2009, due primarily to the reduction in assets under management mainly driven bythe significant decline in the stock market and appreciating yen, and unrealized losses from pilot funds and seedmoney for new product development.
Non-interest expenses decreased by 1% from ¥52,409 million for the year ended March 31, 2009 to¥51,771 million for the year ended March 31, 2010.
Non-interest expenses decreased by 4% from ¥54,790 million for the year ended March 31, 2008 to¥52,409 million for the year ended March 31, 2009, due primarily to a decrease in compensation and benefits.
Income before income taxes was ¥33,951 million for the year ended March 31, 2008, ¥7,380 million for theyear ended March 31, 2009 and ¥18,594 million for the year ended March 31, 2010.
The following table sets forth assets under management of each principal Nomura entity within AssetManagement as of the dates indicated.
March 31
2008 2009 2010
(in billions)Nomura Asset Management Co., Ltd. . . . . . . . . . . . . . . . . . . . . . . . . . . . . . . . . . . . ¥25,591 ¥19,993 ¥23,292Nomura Funds Research and Technologies Co., Ltd. . . . . . . . . . . . . . . . . . . . . . . . 2,829 1,634 1,525Nomura Corporate Research and Asset Management Inc. . . . . . . . . . . . . . . . . . . . 1,117 1,049 1,107Private Equity Funds Research and Investments Co., Ltd. . . . . . . . . . . . . . . . . . . . 104 600 578Nomura Funds Research and Technologies America, Inc. . . . . . . . . . . . . . . . . . . . 306 216 240Nomura Asset Management Deutschland KAG mbH. . . . . . . . . . . . . . . . . . . . . . . 320 172 220
Combined total . . . . . . . . . . . . . . . . . . . . . . . . . . . . . . . . . . . . . . . . . . . . . . . . . . . . . ¥30,268 ¥23,663 ¥26,962
Total(1) . . . . . . . . . . . . . . . . . . . . . . . . . . . . . . . . . . . . . . . . . . . . . . . . . . . . . . . . . . . ¥25,766 ¥20,231 ¥23,444
42

(1) Adjusted for overlapping asset amounts among group companies.
Assets under management were ¥23.4 trillion as of March 31, 2010, a ¥2.3 trillion decrease from March 31,2008, and a ¥3.2 trillion increase from March 31, 2009. The greatest proportion of these assets was managed byNomura Asset Management with assets under management of ¥23.3 trillion as of March 31, 2010.
The net assets of stock investment trusts increased as of March 31, 2010 compared to the previous year dueto improving market conditions. However, the net assets of bond investment trusts declined. Assets frominstitutional clients increased as of March 31, 2010 compared to the previous year, reflecting new mandates fromoverseas pension funds.
Investment trust assets included in assets under management by Nomura Asset Management were¥14.7 trillion as of March 31, 2010, up ¥1.7 trillion, or 13%, from the previous year, reflecting net cash outflowsby clients of ¥0.4 trillion and market appreciation of ¥2.1 trillion. The sales of high-yield bond investment trustsand new emerging country-related investment trusts remain robust. For the year ended March 31, 2009, thebalance of investment trusts managed by Nomura Asset Management was ¥13.0 trillion as of March 31, 2009,down ¥4.2 trillion, or 25%, from the previous year, reflecting net cash outflows by clients of ¥0.3 trillion andmarket depreciation of ¥3.9 trillion.
The following table shows Nomura Asset Management’s share, in terms of net asset value, in the Japaneseasset management market as of the dates indicated.
Nomura Asset Management’s share of the fund market in Japan
As of March 31
2008 2009 2010
Total of publicly offered investment trusts . . . . . . . . . . . . . . . . . . . . . . . . . . . . . . . . . . . 22% 22% 20%Stock investment trusts . . . . . . . . . . . . . . . . . . . . . . . . . . . . . . . . . . . . . . . . . . . . . . 17% 16% 15%Bond investment trusts . . . . . . . . . . . . . . . . . . . . . . . . . . . . . . . . . . . . . . . . . . . . . . . 44% 44% 43%
Other Operating Results
Other operating results include gain (loss) on investments in equity securities, our share of equity in theearnings (losses) of affiliates, impairment losses on long-lived assets, corporate items and other financialadjustments. Please refer to Note 21 “Segment and geographic information” to our consolidated financialstatements included in this annual report.
Loss before income taxes in other operating results was ¥20,904 million for the year ended March 31, 2008,¥65,420 million for the year ended March 31, 2009 and ¥211,293 million for the year ended March 31, 2010.
Other operating results for the year ended March 31, 2010 include the losses from changes in the fair valueof the financial liabilities, for which the fair value option was elected, attributable to the change in ourcreditworthiness, of ¥64.4 billion ($0.69 billion), the negative impact of our own creditworthiness on derivativeliabilities, which resulted in loss of ¥27.9 billion ($0.30 billion) and the gains from changes in counterparty creditspreads of ¥18.3 billion ($0.20 billion).
Summary of Regional Contribution
For a summary of our net revenue, income (loss) before income taxes and long-lived assets by geographicregion, see Note 21 “Segment and geographic information” to our consolidated financial statements included inthis annual report.
43
Regulatory Capital Requirements
Many of our business activities are subject to statutory capital requirements, including those of Japan, theUnited States, the United Kingdom and certain other countries in which we operate.
Translation Exposure
A significant portion of our business is conducted in currencies other than yen—most significantly, U.S.dollars, British pounds and Euros. We prepare financial statements of each of our consolidated entities in itsfunctional currency, which is the currency of the primary economic environment in which the entity operates.Translation exposure is the risk arising from the effect of fluctuations in exchange rates on the net assets of ourforeign subsidiaries. Translation exposure is not recognized in our consolidated statements of operations unlessand until we dispose of, or liquidate, the relevant foreign subsidiary, which historically has not occurred, andwhich we do not expect to occur frequently.
Critical Accounting Policies and Estimates
Use of estimates
In presenting the consolidated financial statements, management makes estimates regarding certain financialinstrument and investment valuations, the outcome of litigation and tax examinations, the recovery of thecarrying value of goodwill, the allowance for doubtful accounts, the realization of deferred tax assets and othermatters that affect the reported amounts of assets and liabilities as well as the disclosures in these consolidatedfinancial statements. Estimates, by their nature, are based on judgment and available information. Therefore,actual results may differ from estimates, which could have a material impact on the consolidated financialstatements, and it is possible that such adjustments could occur in the near term.
Fair value for financial instruments
A significant amount of our financial assets and financial liabilities are carried at fair value, with changes infair value recognized through the consolidated statements of operations on a recurring basis. Use of fair value iseither specifically required under U.S. GAAP or we make an election to use fair value for certain eligible itemsunder the fair value option.
Other financial assets and financial liabilities are carried at fair value on a nonrecurring basis, where theprimary measurement basis is not fair value. Fair value is only used in specific circumstances such as to measureimpairment.
In accordance with ASC 820 “Fair Value Measurements and Disclosures”, all financial instrumentsmeasured at fair value have been categorized into a three-level hierarchy based on the transparency of inputsused to establish fair value.
Level 1:
Unadjusted quoted prices in active markets for identical assets or liabilities accessible by us at themeasurement date.
Level 2:
Quoted prices in inactive markets or containing other inputs which are observable, either directly orindirectly. Valuation techniques using observable inputs reflect assumptions used by market participants inpricing financial instruments and are based on data obtained from independent market sources at themeasurement date.
44
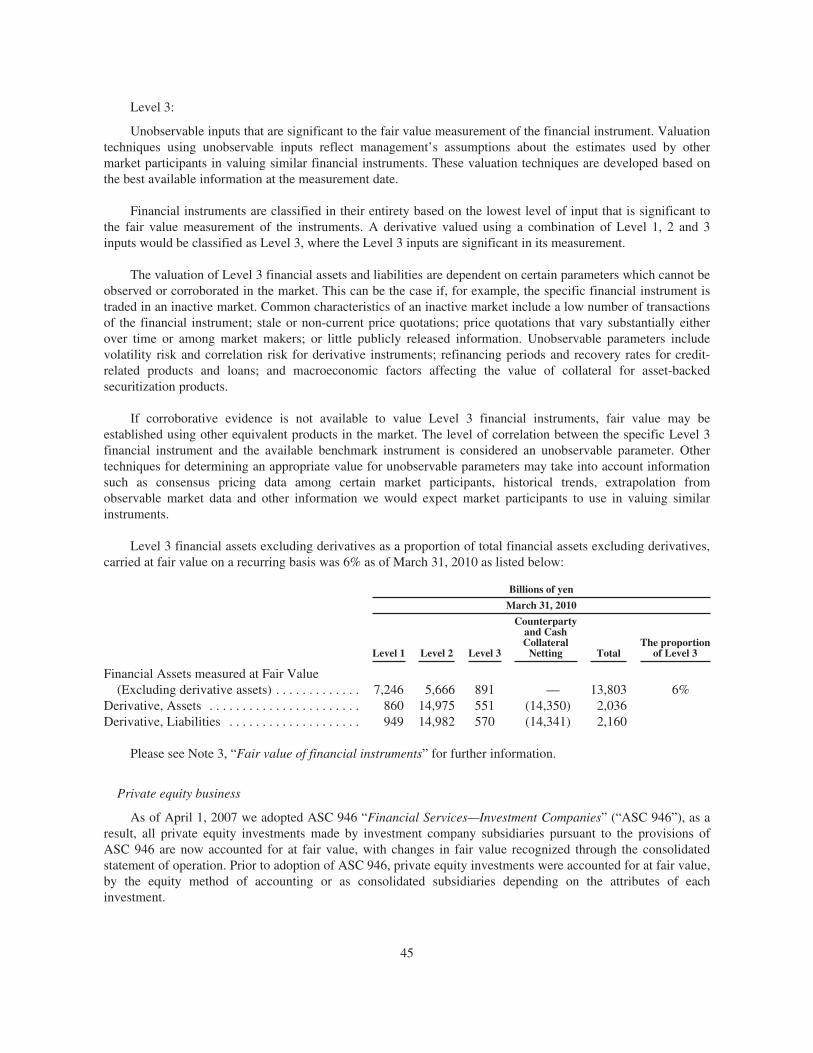
Level 3:
Unobservable inputs that are significant to the fair value measurement of the financial instrument. Valuationtechniques using unobservable inputs reflect management’s assumptions about the estimates used by othermarket participants in valuing similar financial instruments. These valuation techniques are developed based onthe best available information at the measurement date.
Financial instruments are classified in their entirety based on the lowest level of input that is significant tothe fair value measurement of the instruments. A derivative valued using a combination of Level 1, 2 and 3inputs would be classified as Level 3, where the Level 3 inputs are significant in its measurement.
The valuation of Level 3 financial assets and liabilities are dependent on certain parameters which cannot beobserved or corroborated in the market. This can be the case if, for example, the specific financial instrument istraded in an inactive market. Common characteristics of an inactive market include a low number of transactionsof the financial instrument; stale or non-current price quotations; price quotations that vary substantially eitherover time or among market makers; or little publicly released information. Unobservable parameters includevolatility risk and correlation risk for derivative instruments; refinancing periods and recovery rates for credit-related products and loans; and macroeconomic factors affecting the value of collateral for asset-backedsecuritization products.
If corroborative evidence is not available to value Level 3 financial instruments, fair value may beestablished using other equivalent products in the market. The level of correlation between the specific Level 3financial instrument and the available benchmark instrument is considered an unobservable parameter. Othertechniques for determining an appropriate value for unobservable parameters may take into account informationsuch as consensus pricing data among certain market participants, historical trends, extrapolation fromobservable market data and other information we would expect market participants to use in valuing similarinstruments.
Level 3 financial assets excluding derivatives as a proportion of total financial assets excluding derivatives,carried at fair value on a recurring basis was 6% as of March 31, 2010 as listed below:
Billions of yen
March 31, 2010
Level 1 Level 2 Level 3
Counterpartyand CashCollateral
Netting TotalThe proportion
of Level 3
Financial Assets measured at Fair Value(Excluding derivative assets) . . . . . . . . . . . . . 7,246 5,666 891 — 13,803 6%
Derivative, Assets . . . . . . . . . . . . . . . . . . . . . . . 860 14,975 551 (14,350) 2,036Derivative, Liabilities . . . . . . . . . . . . . . . . . . . . 949 14,982 570 (14,341) 2,160
Please see Note 3, “Fair value of financial instruments” for further information.
Private equity business
As of April 1, 2007 we adopted ASC 946 “Financial Services—Investment Companies” (“ASC 946”), as aresult, all private equity investments made by investment company subsidiaries pursuant to the provisions ofASC 946 are now accounted for at fair value, with changes in fair value recognized through the consolidatedstatement of operation. Prior to adoption of ASC 946, private equity investments were accounted for at fair value,by the equity method of accounting or as consolidated subsidiaries depending on the attributes of eachinvestment.
45
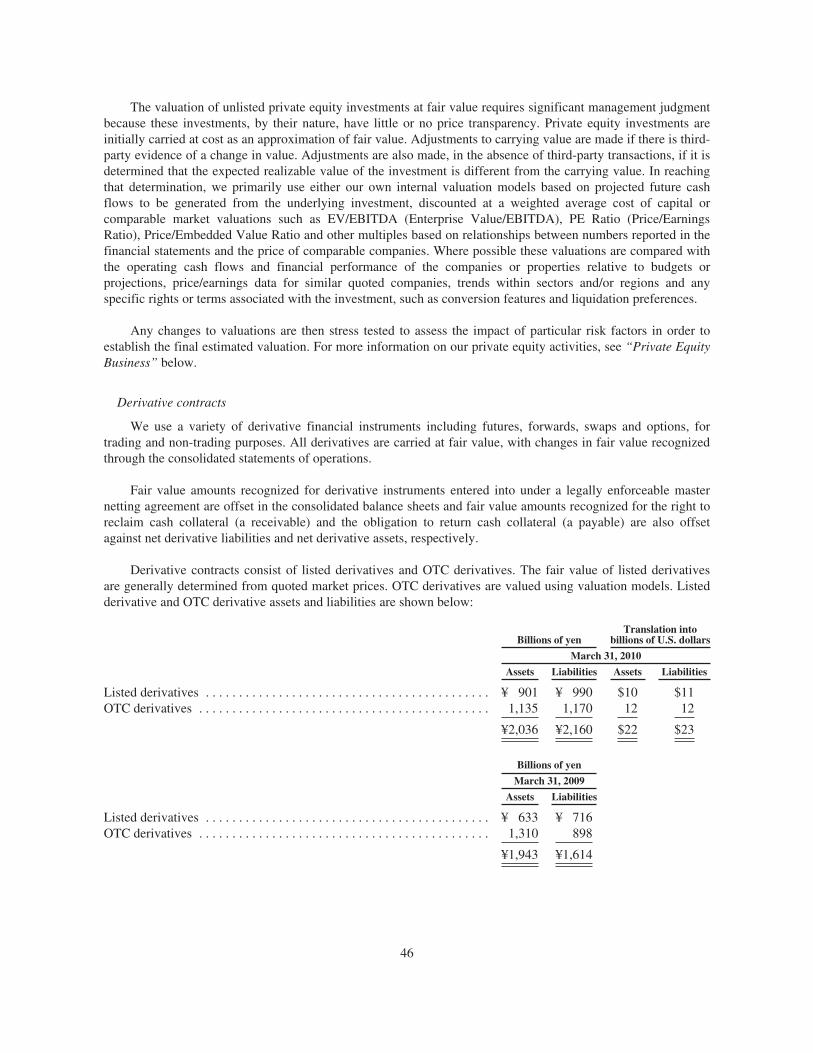
The valuation of unlisted private equity investments at fair value requires significant management judgmentbecause these investments, by their nature, have little or no price transparency. Private equity investments areinitially carried at cost as an approximation of fair value. Adjustments to carrying value are made if there is third-party evidence of a change in value. Adjustments are also made, in the absence of third-party transactions, if it isdetermined that the expected realizable value of the investment is different from the carrying value. In reachingthat determination, we primarily use either our own internal valuation models based on projected future cashflows to be generated from the underlying investment, discounted at a weighted average cost of capital orcomparable market valuations such as EV/EBITDA (Enterprise Value/EBITDA), PE Ratio (Price/EarningsRatio), Price/Embedded Value Ratio and other multiples based on relationships between numbers reported in thefinancial statements and the price of comparable companies. Where possible these valuations are compared withthe operating cash flows and financial performance of the companies or properties relative to budgets orprojections, price/earnings data for similar quoted companies, trends within sectors and/or regions and anyspecific rights or terms associated with the investment, such as conversion features and liquidation preferences.
Any changes to valuations are then stress tested to assess the impact of particular risk factors in order toestablish the final estimated valuation. For more information on our private equity activities, see “Private EquityBusiness” below.
Derivative contracts
We use a variety of derivative financial instruments including futures, forwards, swaps and options, fortrading and non-trading purposes. All derivatives are carried at fair value, with changes in fair value recognizedthrough the consolidated statements of operations.
Fair value amounts recognized for derivative instruments entered into under a legally enforceable masternetting agreement are offset in the consolidated balance sheets and fair value amounts recognized for the right toreclaim cash collateral (a receivable) and the obligation to return cash collateral (a payable) are also offsetagainst net derivative liabilities and net derivative assets, respectively.
Derivative contracts consist of listed derivatives and OTC derivatives. The fair value of listed derivativesare generally determined from quoted market prices. OTC derivatives are valued using valuation models. Listedderivative and OTC derivative assets and liabilities are shown below:
Billions of yenTranslation into
billions of U.S. dollars
March 31, 2010
Assets Liabilities Assets Liabilities
Listed derivatives . . . . . . . . . . . . . . . . . . . . . . . . . . . . . . . . . . . . . . . . . . . ¥ 901 ¥ 990 $10 $11OTC derivatives . . . . . . . . . . . . . . . . . . . . . . . . . . . . . . . . . . . . . . . . . . . . 1,135 1,170 12 12
¥2,036 ¥2,160 $22 $23
Billions of yen
March 31, 2009
Assets Liabilities
Listed derivatives . . . . . . . . . . . . . . . . . . . . . . . . . . . . . . . . . . . . . . . . . . . ¥ 633 ¥ 716OTC derivatives . . . . . . . . . . . . . . . . . . . . . . . . . . . . . . . . . . . . . . . . . . . . 1,310 898
¥1,943 ¥1,614
46

The fair value of OTC derivative assets and liabilities as of March 31, 2009 and 2010 by remainingcontractual maturity are shown below:
Billions of yen
March 31, 2010
Years to Maturity
Less than1 year
1 to 3years
3 to 5years
5 to 7years
More than7 years
Cross-maturitynetting(1)
Totalfair value
OTC derivative assets . . . . . . . . . . . . . . . . ¥ 720 ¥621 ¥727 ¥428 ¥1,426 ¥(2,787) ¥1,135OTC derivative liabilities . . . . . . . . . . . . . 1,157 689 733 505 1,250 (3,164) 1,170
Billions of yen
March 31, 2009
Years to Maturity
Less than1 year
1 to 3years
3 to 5years
5 to 7years
More than7 years
Cross-maturitynetting(1)
Totalfair value
OTC derivative assets . . . . . . . . . . . . . . . . ¥829 ¥746 ¥846 ¥499 ¥1,370 ¥(2,980) ¥1,310OTC derivative liabilities . . . . . . . . . . . . . 728 643 767 447 1,249 (2,936) 898
(1) This column shows the impact of netting derivative assets with derivative liabilities for the samecounterparty across maturity band categories. Derivative assets and derivative liabilities with the samecounterparty in the same maturity category are netted within the maturity category. This column alsoincludes cash collateral netting with the same counterparty.
The fair value of derivative contracts includes adjustments for credit risk, both with regards to counterpartycredit risk on positions held and our own creditworthiness on positions issued.
We realize gains or losses relating to changes in credit risk on our derivative contracts together with themovements of trading positions, which include derivatives, that are expected to mitigate the above mentionedimpact of changes in credit risk. We have various derivative contracts with exposure to credit risk including thosewith monoline insurers (financial guarantors). See “Monoline insurers (financial guarantors)” below for furtherinformation.
The impact of changes in our own creditworthiness on derivative liabilities was a loss of ¥28 billion ($0.30billion) for the year ended March 31, 2010.
Assets and Liabilities Associated with Investment and Financial Services Business
Exposure to Certain Financial Instruments and Counterparties
Challenging market conditions continue to impact numerous products including securitization and leveragedfinance products to which we have certain exposure. We also have exposures to monoline insurers (financialguarantors) in the normal course of business.
47
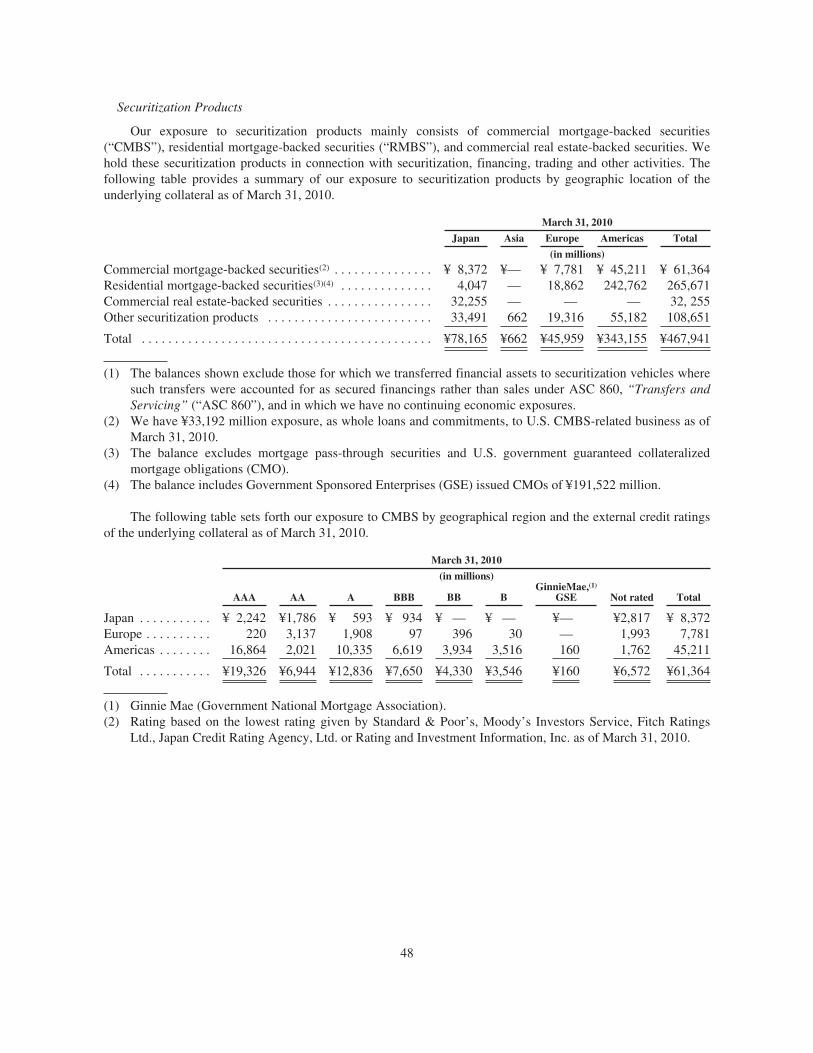
Securitization Products
Our exposure to securitization products mainly consists of commercial mortgage-backed securities(“CMBS”), residential mortgage-backed securities (“RMBS”), and commercial real estate-backed securities. Wehold these securitization products in connection with securitization, financing, trading and other activities. Thefollowing table provides a summary of our exposure to securitization products by geographic location of theunderlying collateral as of March 31, 2010.
March 31, 2010
Japan Asia Europe Americas Total
(in millions)
Commercial mortgage-backed securities(2) . . . . . . . . . . . . . . . ¥ 8,372 ¥— ¥ 7,781 ¥ 45,211 ¥ 61,364Residential mortgage-backed securities(3)(4) . . . . . . . . . . . . . . 4,047 — 18,862 242,762 265,671Commercial real estate-backed securities . . . . . . . . . . . . . . . . 32,255 — — — 32, 255Other securitization products . . . . . . . . . . . . . . . . . . . . . . . . . 33,491 662 19,316 55,182 108,651
Total . . . . . . . . . . . . . . . . . . . . . . . . . . . . . . . . . . . . . . . . . . . . ¥78,165 ¥662 ¥45,959 ¥343,155 ¥467,941
(1) The balances shown exclude those for which we transferred financial assets to securitization vehicles wheresuch transfers were accounted for as secured financings rather than sales under ASC 860, “Transfers andServicing” (“ASC 860”), and in which we have no continuing economic exposures.
(2) We have ¥33,192 million exposure, as whole loans and commitments, to U.S. CMBS-related business as ofMarch 31, 2010.
(3) The balance excludes mortgage pass-through securities and U.S. government guaranteed collateralizedmortgage obligations (CMO).
(4) The balance includes Government Sponsored Enterprises (GSE) issued CMOs of ¥191,522 million.
The following table sets forth our exposure to CMBS by geographical region and the external credit ratingsof the underlying collateral as of March 31, 2010.
March 31, 2010
(in millions)
AAA AA A BBB BB BGinnieMae,(1)
GSE Not rated Total
Japan . . . . . . . . . . . ¥ 2,242 ¥1,786 ¥ 593 ¥ 934 ¥ — ¥ — ¥— ¥2,817 ¥ 8,372Europe . . . . . . . . . . 220 3,137 1,908 97 396 30 — 1,993 7,781Americas . . . . . . . . 16,864 2,021 10,335 6,619 3,934 3,516 160 1,762 45,211
Total . . . . . . . . . . . ¥19,326 ¥6,944 ¥12,836 ¥7,650 ¥4,330 ¥3,546 ¥160 ¥6,572 ¥61,364
(1) Ginnie Mae (Government National Mortgage Association).(2) Rating based on the lowest rating given by Standard & Poor’s, Moody’s Investors Service, Fitch Ratings
Ltd., Japan Credit Rating Agency, Ltd. or Rating and Investment Information, Inc. as of March 31, 2010.
48
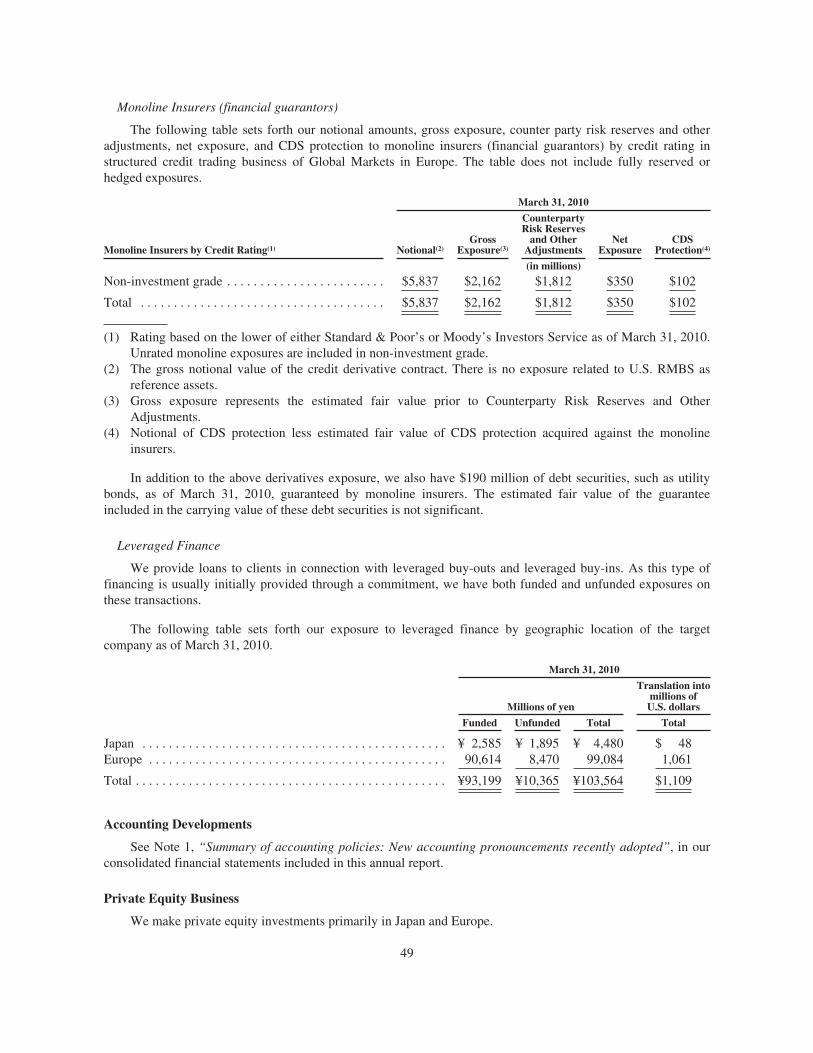
Monoline Insurers (financial guarantors)
The following table sets forth our notional amounts, gross exposure, counter party risk reserves and otheradjustments, net exposure, and CDS protection to monoline insurers (financial guarantors) by credit rating instructured credit trading business of Global Markets in Europe. The table does not include fully reserved orhedged exposures.
March 31, 2010
Monoline Insurers by Credit Rating(1) Notional(2)Gross
Exposure(3)
CounterpartyRisk Reserves
and OtherAdjustments
NetExposure
CDSProtection(4)
(in millions)
Non-investment grade . . . . . . . . . . . . . . . . . . . . . . . . $5,837 $2,162 $1,812 $350 $102
Total . . . . . . . . . . . . . . . . . . . . . . . . . . . . . . . . . . . . . $5,837 $2,162 $1,812 $350 $102
(1) Rating based on the lower of either Standard & Poor’s or Moody’s Investors Service as of March 31, 2010.Unrated monoline exposures are included in non-investment grade.
(2) The gross notional value of the credit derivative contract. There is no exposure related to U.S. RMBS asreference assets.
(3) Gross exposure represents the estimated fair value prior to Counterparty Risk Reserves and OtherAdjustments.
(4) Notional of CDS protection less estimated fair value of CDS protection acquired against the monolineinsurers.
In addition to the above derivatives exposure, we also have $190 million of debt securities, such as utilitybonds, as of March 31, 2010, guaranteed by monoline insurers. The estimated fair value of the guaranteeincluded in the carrying value of these debt securities is not significant.
Leveraged Finance
We provide loans to clients in connection with leveraged buy-outs and leveraged buy-ins. As this type offinancing is usually initially provided through a commitment, we have both funded and unfunded exposures onthese transactions.
The following table sets forth our exposure to leveraged finance by geographic location of the targetcompany as of March 31, 2010.
March 31, 2010
Millions of yen
Translation intomillions of
U.S. dollars
Funded Unfunded Total Total
Japan . . . . . . . . . . . . . . . . . . . . . . . . . . . . . . . . . . . . . . . . . . . . . . ¥ 2,585 ¥ 1,895 ¥ 4,480 $ 48Europe . . . . . . . . . . . . . . . . . . . . . . . . . . . . . . . . . . . . . . . . . . . . . 90,614 8,470 99,084 1,061
Total . . . . . . . . . . . . . . . . . . . . . . . . . . . . . . . . . . . . . . . . . . . . . . . ¥93,199 ¥10,365 ¥103,564 $1,109
Accounting Developments
See Note 1, “Summary of accounting policies: New accounting pronouncements recently adopted”, in ourconsolidated financial statements included in this annual report.
Private Equity Business
We make private equity investments primarily in Japan and Europe.
49
As of April 1, 2007 we adopted ASC 946. As a result, private equity investments made by certain entitieswhich we consolidate under either a voting interest or variable interest model which are investment companiespursuant to the provisions of ASC 946 (“investment company subsidiaries”) are now accounted for at fair value,with changes in fair value recognized through the consolidated statements of operations. Investment companyaccounting applied by each of these investment company subsidiaries is retained in these consolidated financialstatements.
These entities make private equity investments solely for capital appreciation, current income or both ratherthan to generate strategic operating benefits to us. In accordance with our investment policies, non-investmentcompanies within the group may not make investments in entities engaged in non-core businesses if suchinvestments would result in consolidation or application of the equity method of accounting. Such investmentsmay generally only be made by investment company subsidiaries. Non-core businesses are defined as thoseengaged in activities other than our business segments.
We also have a subsidiary which is not an investment company but which makes investments in entitiesengaged in our core businesses. These investments are made for capital appreciation or current income purposesor both and are also carried at fair value, either because fair value is carried by election of the fair value option orother U.S. GAAP requirements.
Private equity business in Japan
We have an established private equity business in Japan, which is operated primarily through a wholly-owned subsidiary, Nomura Principal Finance Co., Ltd (“NPF”).
Since its inception in 2000, NPF has made investments in 21 entities and exited from 16 of theseinvestments (including partial sales). The fair value of its investment portfolio is ¥98,998 million and ¥104,962million ($1,124 million) as of March 31, 2009 and 2010, respectively.
NPF is an investment company subsidiary pursuant to the provisions of ASC 946 and therefore carries all ofits investments at fair value, with changes in fair value recognized through the consolidated statements ofoperations from the adoption date of ASC 946 on April 1, 2007.
We also make private equity investments through another wholly-owned subsidiary, Nomura FinancialPartners Co., Ltd. (“NFP”). NFP is not an investment company subsidiary as it invests in the entities engaged inour core business. We elected the fair value option to account for its 45.5% investment in the common stock ofAshikaga Holdings.
Private equity business in Europe
In Europe, our private equity investments primarily comprise legacy investments made by its formerPrincipal Finance Group (“PFG”) now managed by Terra Firma (collectively referred to as the “Terra FirmaInvestments”), investments in other funds managed by Terra Firma (“Other Terra Firma Funds”) and throughother investment company subsidiaries (“Other Investments”).
Terra Firma Investments
Following a review to determine the optimum structure for our European private equity business, onMarch 27, 2002, we restructured our PFG and, as a result, contributed our investments in certain of ourremaining investee companies to Terra Firma Capital Partners I (“TFCP I”), a limited partnership which isengaged in the private equity business, in exchange for a limited partnership interest. Terra Firma Investments(GP) Limited, the general partner of TFCP I, which is independent of us, assumed the management and control ofthese investments, together with one other PFG investment, Annington Holdings plc, which due to contractualrestrictions was not transferred to the partnership.
50
With effect from March 27, 2002, we ceased consolidating the Terra Firma Investments and accounted forthose investments at fair value in accordance with ASC 946.
The Terra Firma Investments are held by entities which are investment company subsidiaries and thereforewe continue to account for these investments at fair value, with changes in fair value recognized through theconsolidated statements of operations.
The fair value of the Terra Firma Investments was ¥89,762 million and ¥98,683 million ($1,057 million) asof March 31, 2009 and 2010, respectively.
Other Terra Firma Funds
In addition to the Terra Firma Investments, we are in a 10% investor in a ¥242 billion ($2.59 billion) privateequity fund (“TFCP II”) and a 2% investor in a ¥646 billion ($6.91 billion) private equity fund (“TFCP III”), alsoraised and managed by Terra Firma Capital Partners Limited.
Our total commitment for TFCP II was originally ¥24,227 million ($259 million) and reduced to ¥5,033million ($54 million) as a result of adjustments for recyclable distributions. As of March 31, 2010, ¥4,505million ($48 million) had been drawn down for investments.
For TFCP III, our total commitment is ¥12,492 million ($134 million) and ¥7,413 million ($79 million) hadbeen drawn down for investments as of March 31, 2010.
The investments in TFCP II and TFCP III are carried at fair value, with changes in fair value recognizedthrough the consolidated statements of operations.
Other Investments
We also make private equity investments in Europe through wholly-owned subsidiaries and otherconsolidated entities which have third party pooling of funds. Certain of these entities are investment companysubsidiaries and therefore all of their investments are carried at fair value, with changes in fair value recognizedthrough the consolidated statements of operations.
B. Liquidity and Capital Resources.
Liquidity
Overview
We define liquidity risk as the potential inability to meet financial obligations as they become due. This riskcould arise from an inability to access the secured or unsecured debt markets, a deterioration in our credit ratings,a failure to manage unplanned changes in funding requirements, a failure to liquidate assets quickly and withminimal loss in value, or changes in regulatory capital restrictions which may prevent the free flow of fundsbetween different group entities. Liquidity risk could be due both to Nomura-specific and market wide events.Our primary liquidity objective is to ensure continuous liquidity across market cycles and periods of stress, andto ensure that all funding requirements and unsecured debt obligations that fall due within one year can be metwithout additional unsecured funding or forced liquidation of trading assets.
We have in place a number of liquidity policies to achieve our primary liquidity objective. These include(1) ensuring sufficient long term debt to meet our cash capital needs; (2) maintenance of liquidity portfolioscomprising cash and highly liquid unencumbered securities that can be converted into cash to meet our
51
immediate liquidity requirements; (3) diversification of funding sources by currency, products, investor base andmaturity in order to minimize reliance on any one source; (4) contingency funding plans and committed,unsecured credit facilities.
The Executive Management Board has the authority to make decisions concerning the group liquiditymanagement. The Chief Financial Officer (CFO) has the operational authority and responsibility over ourliquidity management based on decisions made by the Executive Management Board. CFO and Global Treasuryare responsible for monitoring and managing our liquidity in accordance with policies determined by theExecutive Management Board or other decision making bodies.
1. Ensure appropriate funding mix. We seek to maintain a surplus of long term debt and equity above thecash capital requirements of our assets. This allows us to be able to fund our operations for at least one year in astress event, without needing to raise additional unsecured funding or forcing the liquidation of trading assets.The amount of liquidity required is based on an internal model which incorporates the following requirements.
(i) Our ability to finance assets using secured funding, including repurchase agreements and securitieslending transactions. The cash capital requirements are calculated using conservative estimates of theassets secured borrowing power in stressed scenarios.
(ii) Goodwill and identifiable intangible assets, property, equipment and other illiquid assets.
(iii) Collateral requirements on derivative contracts arising as a result of a two-notch downgrade in ourcredit rating. In addition, other unencumbered assets held at exchanges for chaining requirements arealso funded with long-term liquidity.
(iv) Commitments to lend to external counterparties based on the probability of drawdown.
(v) Capital or other forms of financing in our regulated subsidiaries that is in excess of their long-term cashcapital requirements.
Our internal model is calculated at the subsidiary level in order to take into account legal, regulatory and taxrestrictions that may impact the transfer of liquidity among us.
We routinely issue long term debt in various maturities and currencies to maintain a long term fundingsurplus, and to also achieve both cost effective funding and a maturity profile where the average duration of ourdebt is sufficient to meet our long-term cash capital requirements. We therefore seek to maintain an averagematurity for plain vanilla instruments greater than three years. The average maturity (for debt securities andborrowings with maturities longer than one year) was 3.88 years as of March 31, 2010. Approximately 80% ofour medium-term notes are structured and linked to interest or equity, indices, currencies or commodities.Conditions for calls by indices are individually set. These maturities are evaluated based on our internal modeland monitored by Global Treasury. Maturities for plain vanilla debt securities and borrowings are based oncontractual maturities. Where there is a possibility that notes may be called prior to their scheduled maturity date,maturities are based on our internal stress option adjusted model. This model values the embedded optionalityunder stress market conditions in order to determine when the note is likely to be called.
52
On this basis, the average maturity of structured notes (notes with maturities longer than one year) was11.63 years as of March 31, 2010. The average maturity of our entire long term debt portfolio including plainvanilla debt securities and borrowings was 6.67 years as of March 31, 2010. The graph below shows thedistribution of maturities of our outstanding long-term debt securities and borrowings.
Long-Term debt maturities ProfileAs of March 31, 2010
0
500
1,000
1,500
2,000
2,500
3,000
Apr
- J
un 2
010
Jul -
Sep
201
0
Oct
- D
ec 2
010
Jan
- M
ar 2
011
Apr
- J
un 2
011
Jul -
Sep
201
1
Oct
- D
ec 2
011
Jan
- M
ar 2
012
Apr
- J
un 2
012
Jul -
Sep
201
2
Oct
- D
ec 2
012
Jan
- M
ar 2
013
Apr
- J
un 2
013
Jul -
Sep
201
3
Oct
- D
ec 2
013
Jan
- M
ar 2
014
Apr
- J
un 2
014
Jul -
Sep
201
4
Oct
- D
ec 2
014
Jan
- M
ar 2
015
Lat
er th
an A
pr 2
015
JPY in Billion
(1) Redemption schedule is individually estimated by considering of probability of redemption. Due to structure bias, we use probabilityadjusted by a certain stress factor.
2. Diversify unsecured funding sources. We seek to reduce refinancing risk through diversification of ourfunding sources. We diversify funding by product, investor and market in order to reduce our reliance on any onefunding source. We benefit by distributing a significant portion of our debt through our retail and institutionalsales force to a diversified global investor base. We believe that maintaining relationships with our investors iscritical to our liquidity strategy.
We also seek to diversify funding by currency. The proportion of our non-yen denominated long-term debtis 22% of total term debt outstanding as of March 31, 2010.
53
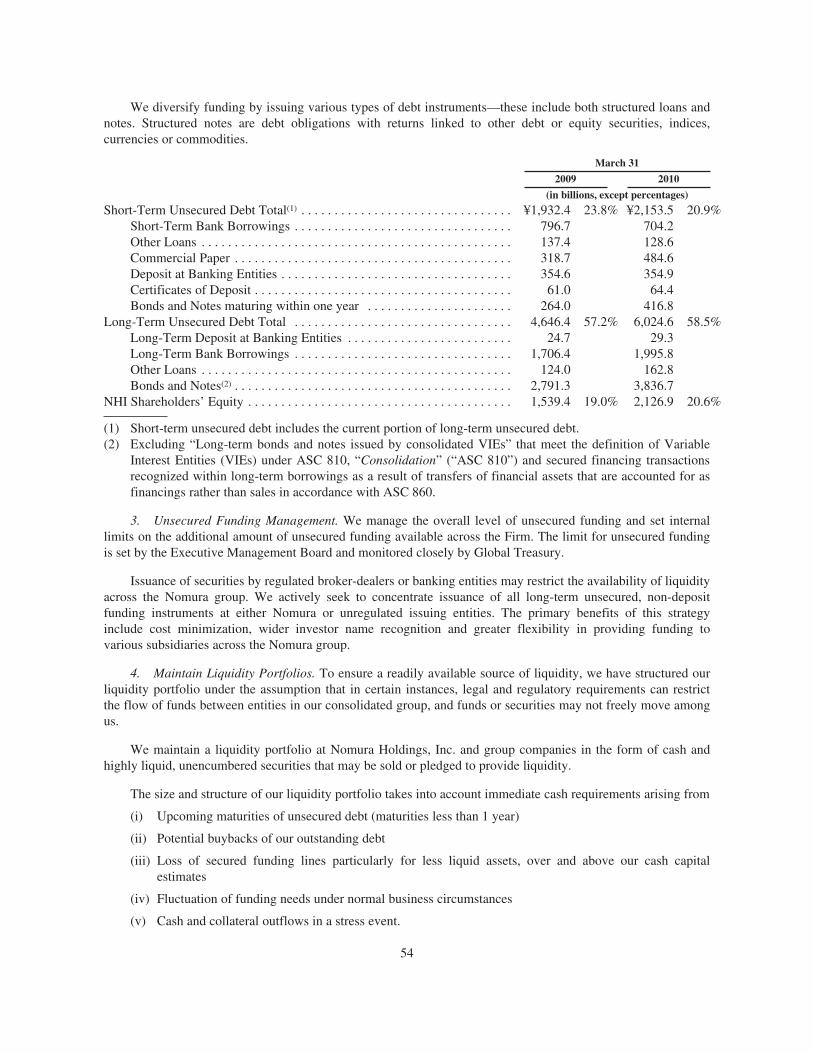
We diversify funding by issuing various types of debt instruments—these include both structured loans andnotes. Structured notes are debt obligations with returns linked to other debt or equity securities, indices,currencies or commodities.
March 31
2009 2010
(in billions, except percentages)
Short-Term Unsecured Debt Total(1) . . . . . . . . . . . . . . . . . . . . . . . . . . . . . . . . ¥1,932.4 23.8% ¥2,153.5 20.9%Short-Term Bank Borrowings . . . . . . . . . . . . . . . . . . . . . . . . . . . . . . . . . 796.7 704.2Other Loans . . . . . . . . . . . . . . . . . . . . . . . . . . . . . . . . . . . . . . . . . . . . . . . 137.4 128.6Commercial Paper . . . . . . . . . . . . . . . . . . . . . . . . . . . . . . . . . . . . . . . . . . 318.7 484.6Deposit at Banking Entities . . . . . . . . . . . . . . . . . . . . . . . . . . . . . . . . . . . 354.6 354.9Certificates of Deposit . . . . . . . . . . . . . . . . . . . . . . . . . . . . . . . . . . . . . . . 61.0 64.4Bonds and Notes maturing within one year . . . . . . . . . . . . . . . . . . . . . . 264.0 416.8
Long-Term Unsecured Debt Total . . . . . . . . . . . . . . . . . . . . . . . . . . . . . . . . . 4,646.4 57.2% 6,024.6 58.5%Long-Term Deposit at Banking Entities . . . . . . . . . . . . . . . . . . . . . . . . . 24.7 29.3Long-Term Bank Borrowings . . . . . . . . . . . . . . . . . . . . . . . . . . . . . . . . . 1,706.4 1,995.8Other Loans . . . . . . . . . . . . . . . . . . . . . . . . . . . . . . . . . . . . . . . . . . . . . . . 124.0 162.8Bonds and Notes(2) . . . . . . . . . . . . . . . . . . . . . . . . . . . . . . . . . . . . . . . . . . 2,791.3 3,836.7
NHI Shareholders’ Equity . . . . . . . . . . . . . . . . . . . . . . . . . . . . . . . . . . . . . . . . 1,539.4 19.0% 2,126.9 20.6%
(1) Short-term unsecured debt includes the current portion of long-term unsecured debt.(2) Excluding “Long-term bonds and notes issued by consolidated VIEs” that meet the definition of Variable
Interest Entities (VIEs) under ASC 810, “Consolidation” (“ASC 810”) and secured financing transactionsrecognized within long-term borrowings as a result of transfers of financial assets that are accounted for asfinancings rather than sales in accordance with ASC 860.
3. Unsecured Funding Management. We manage the overall level of unsecured funding and set internallimits on the additional amount of unsecured funding available across the Firm. The limit for unsecured fundingis set by the Executive Management Board and monitored closely by Global Treasury.
Issuance of securities by regulated broker-dealers or banking entities may restrict the availability of liquidityacross the Nomura group. We actively seek to concentrate issuance of all long-term unsecured, non-depositfunding instruments at either Nomura or unregulated issuing entities. The primary benefits of this strategyinclude cost minimization, wider investor name recognition and greater flexibility in providing funding tovarious subsidiaries across the Nomura group.
4. Maintain Liquidity Portfolios. To ensure a readily available source of liquidity, we have structured ourliquidity portfolio under the assumption that in certain instances, legal and regulatory requirements can restrictthe flow of funds between entities in our consolidated group, and funds or securities may not freely move amongus.
We maintain a liquidity portfolio at Nomura Holdings, Inc. and group companies in the form of cash andhighly liquid, unencumbered securities that may be sold or pledged to provide liquidity.
The size and structure of our liquidity portfolio takes into account immediate cash requirements arising from
(i) Upcoming maturities of unsecured debt (maturities less than 1 year)
(ii) Potential buybacks of our outstanding debt
(iii) Loss of secured funding lines particularly for less liquid assets, over and above our cash capitalestimates
(iv) Fluctuation of funding needs under normal business circumstances
(v) Cash and collateral outflows in a stress event.
54
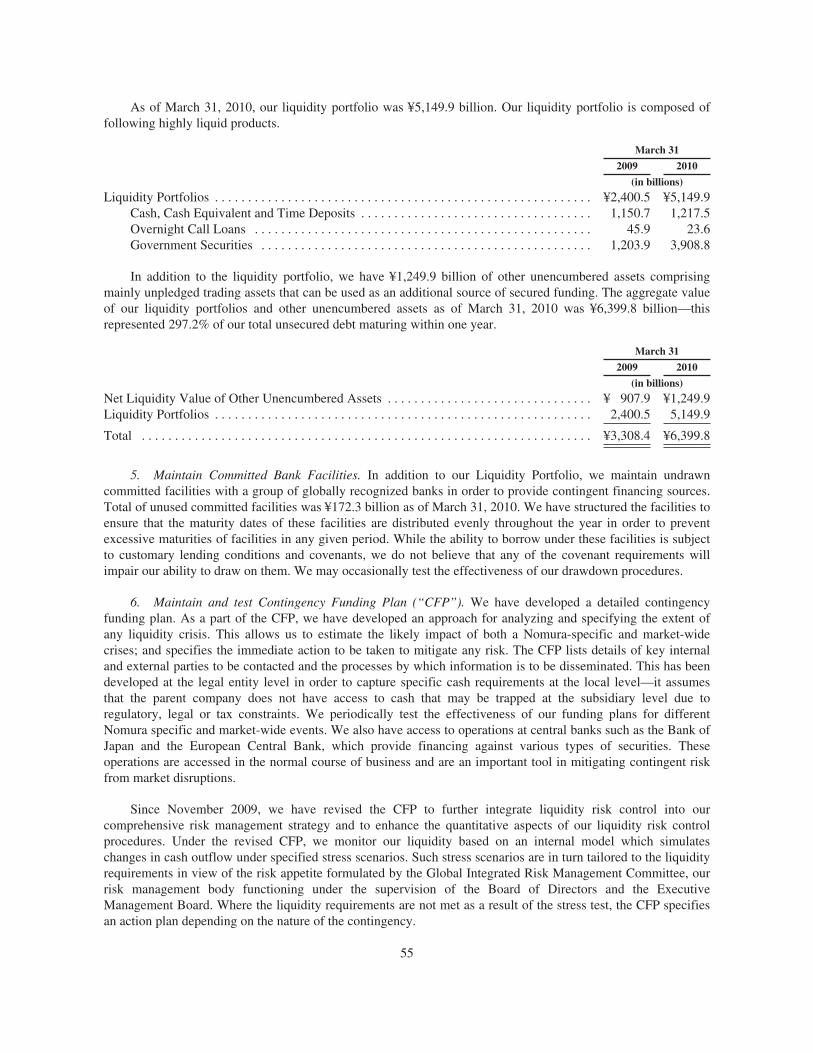
As of March 31, 2010, our liquidity portfolio was ¥5,149.9 billion. Our liquidity portfolio is composed offollowing highly liquid products.
March 31
2009 2010
(in billions)
Liquidity Portfolios . . . . . . . . . . . . . . . . . . . . . . . . . . . . . . . . . . . . . . . . . . . . . . . . . . . . . . . . . ¥2,400.5 ¥5,149.9Cash, Cash Equivalent and Time Deposits . . . . . . . . . . . . . . . . . . . . . . . . . . . . . . . . . . . 1,150.7 1,217.5Overnight Call Loans . . . . . . . . . . . . . . . . . . . . . . . . . . . . . . . . . . . . . . . . . . . . . . . . . . . 45.9 23.6Government Securities . . . . . . . . . . . . . . . . . . . . . . . . . . . . . . . . . . . . . . . . . . . . . . . . . . 1,203.9 3,908.8
In addition to the liquidity portfolio, we have ¥1,249.9 billion of other unencumbered assets comprisingmainly unpledged trading assets that can be used as an additional source of secured funding. The aggregate valueof our liquidity portfolios and other unencumbered assets as of March 31, 2010 was ¥6,399.8 billion—thisrepresented 297.2% of our total unsecured debt maturing within one year.
March 31
2009 2010
(in billions)
Net Liquidity Value of Other Unencumbered Assets . . . . . . . . . . . . . . . . . . . . . . . . . . . . . . . ¥ 907.9 ¥1,249.9Liquidity Portfolios . . . . . . . . . . . . . . . . . . . . . . . . . . . . . . . . . . . . . . . . . . . . . . . . . . . . . . . . . 2,400.5 5,149.9
Total . . . . . . . . . . . . . . . . . . . . . . . . . . . . . . . . . . . . . . . . . . . . . . . . . . . . . . . . . . . . . . . . . . . . ¥3,308.4 ¥6,399.8
5. Maintain Committed Bank Facilities. In addition to our Liquidity Portfolio, we maintain undrawncommitted facilities with a group of globally recognized banks in order to provide contingent financing sources.Total of unused committed facilities was ¥172.3 billion as of March 31, 2010. We have structured the facilities toensure that the maturity dates of these facilities are distributed evenly throughout the year in order to preventexcessive maturities of facilities in any given period. While the ability to borrow under these facilities is subjectto customary lending conditions and covenants, we do not believe that any of the covenant requirements willimpair our ability to draw on them. We may occasionally test the effectiveness of our drawdown procedures.
6. Maintain and test Contingency Funding Plan (“CFP”). We have developed a detailed contingencyfunding plan. As a part of the CFP, we have developed an approach for analyzing and specifying the extent ofany liquidity crisis. This allows us to estimate the likely impact of both a Nomura-specific and market-widecrises; and specifies the immediate action to be taken to mitigate any risk. The CFP lists details of key internaland external parties to be contacted and the processes by which information is to be disseminated. This has beendeveloped at the legal entity level in order to capture specific cash requirements at the local level—it assumesthat the parent company does not have access to cash that may be trapped at the subsidiary level due toregulatory, legal or tax constraints. We periodically test the effectiveness of our funding plans for differentNomura specific and market-wide events. We also have access to operations at central banks such as the Bank ofJapan and the European Central Bank, which provide financing against various types of securities. Theseoperations are accessed in the normal course of business and are an important tool in mitigating contingent riskfrom market disruptions.
Since November 2009, we have revised the CFP to further integrate liquidity risk control into ourcomprehensive risk management strategy and to enhance the quantitative aspects of our liquidity risk controlprocedures. Under the revised CFP, we monitor our liquidity based on an internal model which simulateschanges in cash outflow under specified stress scenarios. Such stress scenarios are in turn tailored to the liquidityrequirements in view of the risk appetite formulated by the Global Integrated Risk Management Committee, ourrisk management body functioning under the supervision of the Board of Directors and the ExecutiveManagement Board. Where the liquidity requirements are not met as a result of the stress test, the CFP specifiesan action plan depending on the nature of the contingency.
55
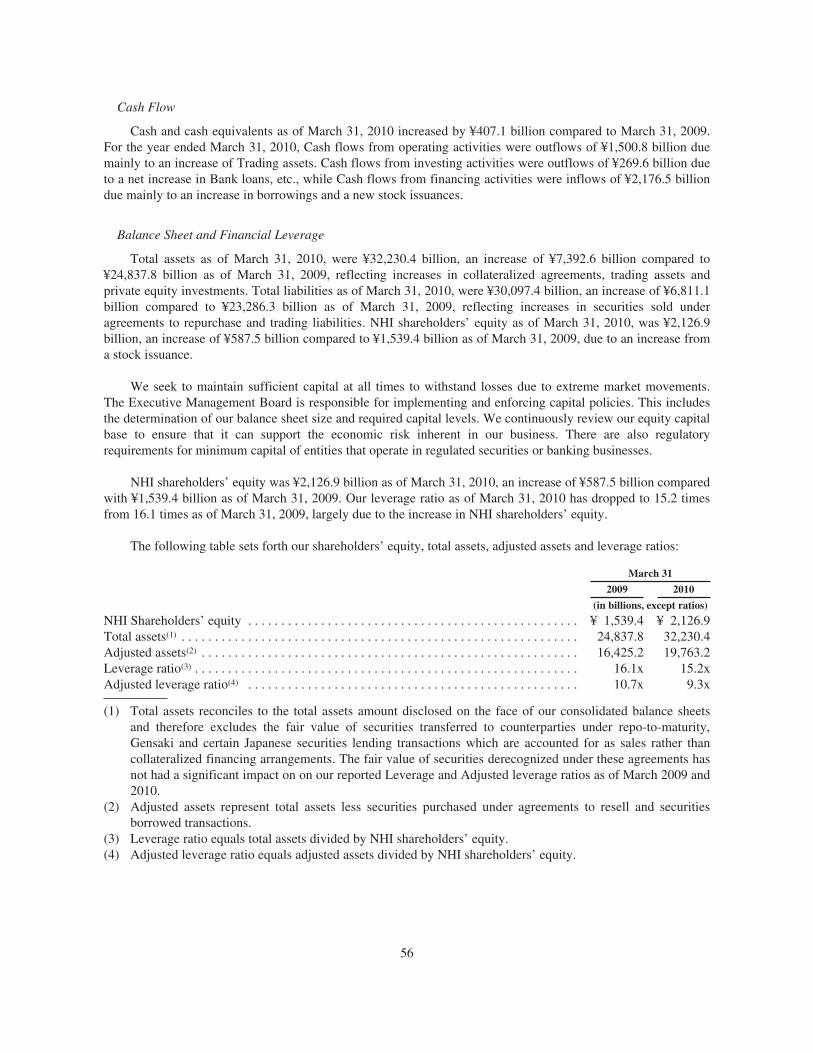
Cash Flow
Cash and cash equivalents as of March 31, 2010 increased by ¥407.1 billion compared to March 31, 2009.For the year ended March 31, 2010, Cash flows from operating activities were outflows of ¥1,500.8 billion duemainly to an increase of Trading assets. Cash flows from investing activities were outflows of ¥269.6 billion dueto a net increase in Bank loans, etc., while Cash flows from financing activities were inflows of ¥2,176.5 billiondue mainly to an increase in borrowings and a new stock issuances.
Balance Sheet and Financial Leverage
Total assets as of March 31, 2010, were ¥32,230.4 billion, an increase of ¥7,392.6 billion compared to¥24,837.8 billion as of March 31, 2009, reflecting increases in collateralized agreements, trading assets andprivate equity investments. Total liabilities as of March 31, 2010, were ¥30,097.4 billion, an increase of ¥6,811.1billion compared to ¥23,286.3 billion as of March 31, 2009, reflecting increases in securities sold underagreements to repurchase and trading liabilities. NHI shareholders’ equity as of March 31, 2010, was ¥2,126.9billion, an increase of ¥587.5 billion compared to ¥1,539.4 billion as of March 31, 2009, due to an increase froma stock issuance.
We seek to maintain sufficient capital at all times to withstand losses due to extreme market movements.The Executive Management Board is responsible for implementing and enforcing capital policies. This includesthe determination of our balance sheet size and required capital levels. We continuously review our equity capitalbase to ensure that it can support the economic risk inherent in our business. There are also regulatoryrequirements for minimum capital of entities that operate in regulated securities or banking businesses.
NHI shareholders’ equity was ¥2,126.9 billion as of March 31, 2010, an increase of ¥587.5 billion comparedwith ¥1,539.4 billion as of March 31, 2009. Our leverage ratio as of March 31, 2010 has dropped to 15.2 timesfrom 16.1 times as of March 31, 2009, largely due to the increase in NHI shareholders’ equity.
The following table sets forth our shareholders’ equity, total assets, adjusted assets and leverage ratios:
March 31
2009 2010
(in billions, except ratios)
NHI Shareholders’ equity . . . . . . . . . . . . . . . . . . . . . . . . . . . . . . . . . . . . . . . . . . . . . . . . . . ¥ 1,539.4 ¥ 2,126.9Total assets(1) . . . . . . . . . . . . . . . . . . . . . . . . . . . . . . . . . . . . . . . . . . . . . . . . . . . . . . . . . . . . 24,837.8 32,230.4Adjusted assets(2) . . . . . . . . . . . . . . . . . . . . . . . . . . . . . . . . . . . . . . . . . . . . . . . . . . . . . . . . . 16,425.2 19,763.2Leverage ratio(3) . . . . . . . . . . . . . . . . . . . . . . . . . . . . . . . . . . . . . . . . . . . . . . . . . . . . . . . . . . 16.1x 15.2xAdjusted leverage ratio(4) . . . . . . . . . . . . . . . . . . . . . . . . . . . . . . . . . . . . . . . . . . . . . . . . . . 10.7x 9.3x
(1) Total assets reconciles to the total assets amount disclosed on the face of our consolidated balance sheetsand therefore excludes the fair value of securities transferred to counterparties under repo-to-maturity,Gensaki and certain Japanese securities lending transactions which are accounted for as sales rather thancollateralized financing arrangements. The fair value of securities derecognized under these agreements hasnot had a significant impact on on our reported Leverage and Adjusted leverage ratios as of March 2009 and2010.
(2) Adjusted assets represent total assets less securities purchased under agreements to resell and securitiesborrowed transactions.
(3) Leverage ratio equals total assets divided by NHI shareholders’ equity.(4) Adjusted leverage ratio equals adjusted assets divided by NHI shareholders’ equity.
56
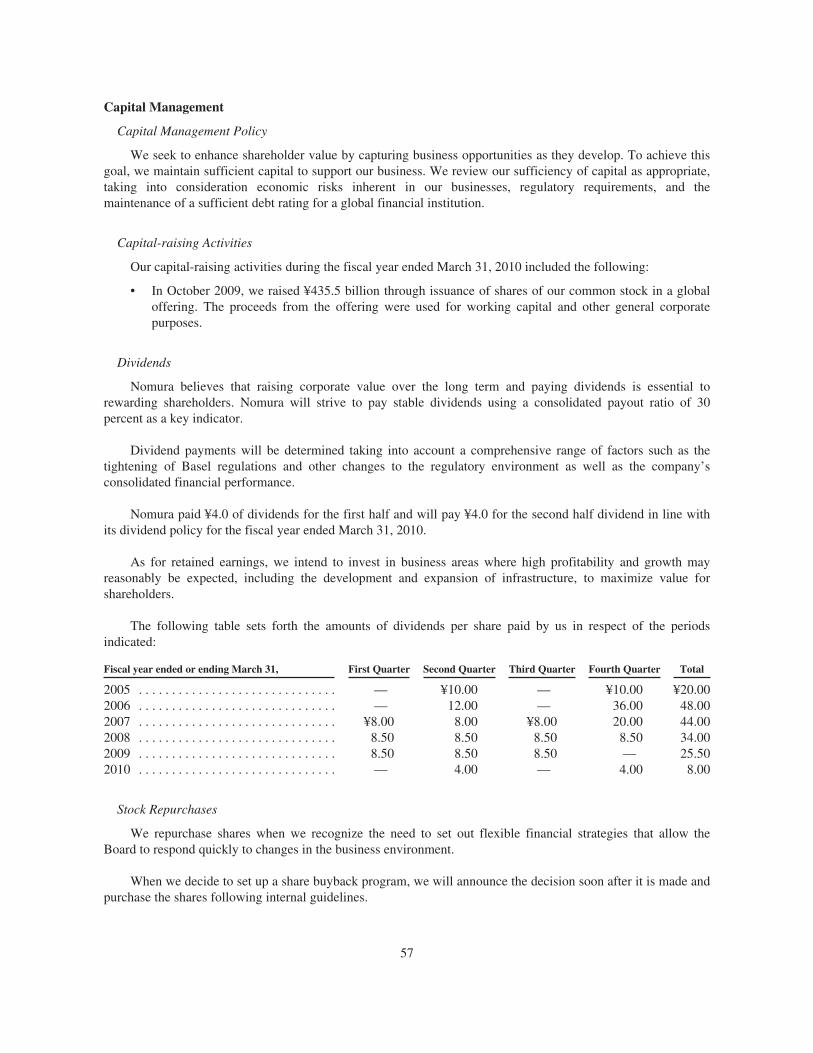
Capital Management
Capital Management Policy
We seek to enhance shareholder value by capturing business opportunities as they develop. To achieve thisgoal, we maintain sufficient capital to support our business. We review our sufficiency of capital as appropriate,taking into consideration economic risks inherent in our businesses, regulatory requirements, and themaintenance of a sufficient debt rating for a global financial institution.
Capital-raising Activities
Our capital-raising activities during the fiscal year ended March 31, 2010 included the following:
• In October 2009, we raised ¥435.5 billion through issuance of shares of our common stock in a globaloffering. The proceeds from the offering were used for working capital and other general corporatepurposes.
Dividends
Nomura believes that raising corporate value over the long term and paying dividends is essential torewarding shareholders. Nomura will strive to pay stable dividends using a consolidated payout ratio of 30percent as a key indicator.
Dividend payments will be determined taking into account a comprehensive range of factors such as thetightening of Basel regulations and other changes to the regulatory environment as well as the company’sconsolidated financial performance.
Nomura paid ¥4.0 of dividends for the first half and will pay ¥4.0 for the second half dividend in line withits dividend policy for the fiscal year ended March 31, 2010.
As for retained earnings, we intend to invest in business areas where high profitability and growth mayreasonably be expected, including the development and expansion of infrastructure, to maximize value forshareholders.
The following table sets forth the amounts of dividends per share paid by us in respect of the periodsindicated:
Fiscal year ended or ending March 31, First Quarter Second Quarter Third Quarter Fourth Quarter Total
2005 . . . . . . . . . . . . . . . . . . . . . . . . . . . . . . — ¥10.00 — ¥10.00 ¥20.002006 . . . . . . . . . . . . . . . . . . . . . . . . . . . . . . — 12.00 — 36.00 48.002007 . . . . . . . . . . . . . . . . . . . . . . . . . . . . . . ¥8.00 8.00 ¥8.00 20.00 44.002008 . . . . . . . . . . . . . . . . . . . . . . . . . . . . . . 8.50 8.50 8.50 8.50 34.002009 . . . . . . . . . . . . . . . . . . . . . . . . . . . . . . 8.50 8.50 8.50 — 25.502010 . . . . . . . . . . . . . . . . . . . . . . . . . . . . . . — 4.00 — 4.00 8.00
Stock Repurchases
We repurchase shares when we recognize the need to set out flexible financial strategies that allow theBoard to respond quickly to changes in the business environment.
When we decide to set up a share buyback program, we will announce the decision soon after it is made andpurchase the shares following internal guidelines.
57
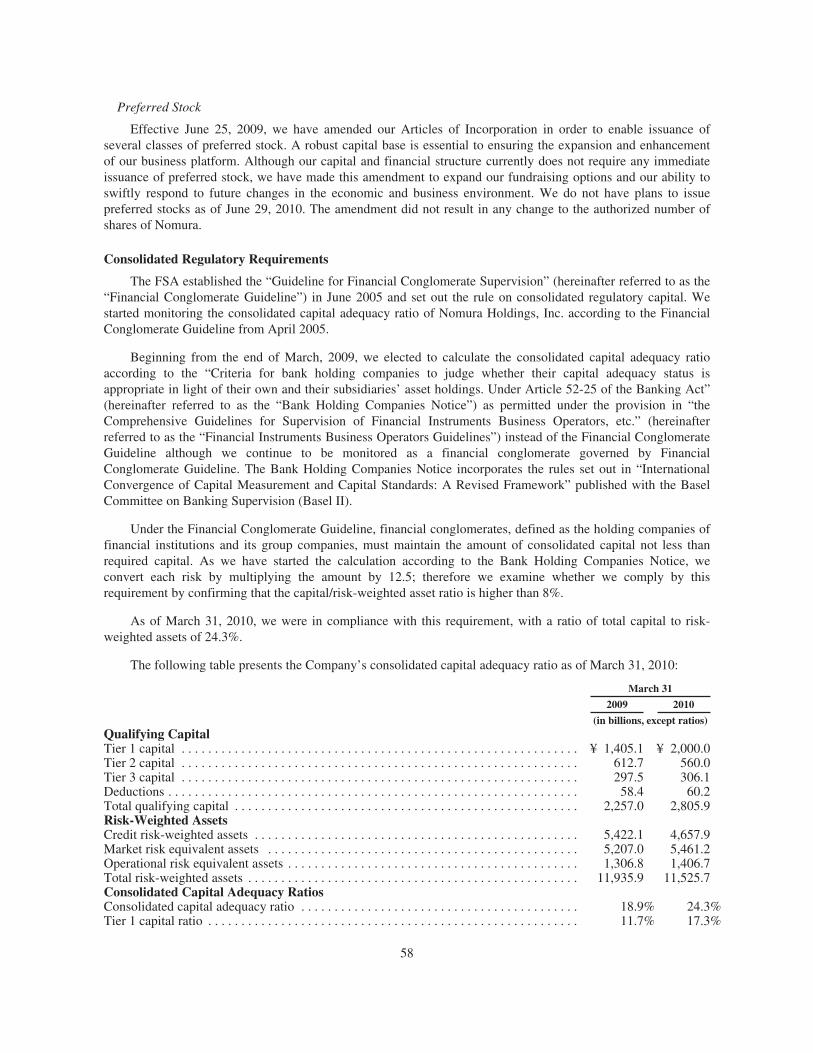
Preferred Stock
Effective June 25, 2009, we have amended our Articles of Incorporation in order to enable issuance ofseveral classes of preferred stock. A robust capital base is essential to ensuring the expansion and enhancementof our business platform. Although our capital and financial structure currently does not require any immediateissuance of preferred stock, we have made this amendment to expand our fundraising options and our ability toswiftly respond to future changes in the economic and business environment. We do not have plans to issuepreferred stocks as of June 29, 2010. The amendment did not result in any change to the authorized number ofshares of Nomura.
Consolidated Regulatory Requirements
The FSA established the “Guideline for Financial Conglomerate Supervision” (hereinafter referred to as the“Financial Conglomerate Guideline”) in June 2005 and set out the rule on consolidated regulatory capital. Westarted monitoring the consolidated capital adequacy ratio of Nomura Holdings, Inc. according to the FinancialConglomerate Guideline from April 2005.
Beginning from the end of March, 2009, we elected to calculate the consolidated capital adequacy ratioaccording to the “Criteria for bank holding companies to judge whether their capital adequacy status isappropriate in light of their own and their subsidiaries’ asset holdings. Under Article 52-25 of the Banking Act”(hereinafter referred to as the “Bank Holding Companies Notice”) as permitted under the provision in “theComprehensive Guidelines for Supervision of Financial Instruments Business Operators, etc.” (hereinafterreferred to as the “Financial Instruments Business Operators Guidelines”) instead of the Financial ConglomerateGuideline although we continue to be monitored as a financial conglomerate governed by FinancialConglomerate Guideline. The Bank Holding Companies Notice incorporates the rules set out in “InternationalConvergence of Capital Measurement and Capital Standards: A Revised Framework” published with the BaselCommittee on Banking Supervision (Basel II).
Under the Financial Conglomerate Guideline, financial conglomerates, defined as the holding companies offinancial institutions and its group companies, must maintain the amount of consolidated capital not less thanrequired capital. As we have started the calculation according to the Bank Holding Companies Notice, weconvert each risk by multiplying the amount by 12.5; therefore we examine whether we comply by thisrequirement by confirming that the capital/risk-weighted asset ratio is higher than 8%.
As of March 31, 2010, we were in compliance with this requirement, with a ratio of total capital to risk-weighted assets of 24.3%.
The following table presents the Company’s consolidated capital adequacy ratio as of March 31, 2010:
March 31
2009 2010
(in billions, except ratios)Qualifying CapitalTier 1 capital . . . . . . . . . . . . . . . . . . . . . . . . . . . . . . . . . . . . . . . . . . . . . . . . . . . . . . . . . . . . ¥ 1,405.1 ¥ 2,000.0Tier 2 capital . . . . . . . . . . . . . . . . . . . . . . . . . . . . . . . . . . . . . . . . . . . . . . . . . . . . . . . . . . . . 612.7 560.0Tier 3 capital . . . . . . . . . . . . . . . . . . . . . . . . . . . . . . . . . . . . . . . . . . . . . . . . . . . . . . . . . . . . 297.5 306.1Deductions . . . . . . . . . . . . . . . . . . . . . . . . . . . . . . . . . . . . . . . . . . . . . . . . . . . . . . . . . . . . . . 58.4 60.2Total qualifying capital . . . . . . . . . . . . . . . . . . . . . . . . . . . . . . . . . . . . . . . . . . . . . . . . . . . . 2,257.0 2,805.9Risk-Weighted AssetsCredit risk-weighted assets . . . . . . . . . . . . . . . . . . . . . . . . . . . . . . . . . . . . . . . . . . . . . . . . . 5,422.1 4,657.9Market risk equivalent assets . . . . . . . . . . . . . . . . . . . . . . . . . . . . . . . . . . . . . . . . . . . . . . . 5,207.0 5,461.2Operational risk equivalent assets . . . . . . . . . . . . . . . . . . . . . . . . . . . . . . . . . . . . . . . . . . . . 1,306.8 1,406.7Total risk-weighted assets . . . . . . . . . . . . . . . . . . . . . . . . . . . . . . . . . . . . . . . . . . . . . . . . . . 11,935.9 11,525.7Consolidated Capital Adequacy RatiosConsolidated capital adequacy ratio . . . . . . . . . . . . . . . . . . . . . . . . . . . . . . . . . . . . . . . . . . 18.9% 24.3%Tier 1 capital ratio . . . . . . . . . . . . . . . . . . . . . . . . . . . . . . . . . . . . . . . . . . . . . . . . . . . . . . . . 11.7% 17.3%
58
Total qualifying capital is comprised of Tier 1, Tier 2 and Tier 3 capital. Our Tier 1 capital mainly consistsof NHI shareholders’ equity and noncontrolling interests less goodwill, certain intangible fixed assets, and netdeferred tax assets in excess of 20% of Tier 1 before deferred tax asset adjustment.
Tier 2 and Tier 3 capital consist of subordinated debt classified to Tier 2 and Tier 3 by original maturity andother conditions set out by the Bank Holding Companies Notice.
Market risk is calculated using the Company’s Value-at-Risk model as permitted under the FinancialInstruments Business Operators Guidelines. Credit risk assets are calculated using the Standardized Approachwhich applies a fixed percentage to the fair value of the assets. Operational risk is calculated under the BasicIndicator Approach, where the average net revenues over the previous three years are multiplied by a fixedpercentage.
The Basel Committee has issued a series of announcements regarding a broader program designed tostrengthen the regulatory capital framework in light of weaknesses revealed by the financial crises. The followingis a summary of the proposals which are most relevant to us.
On March 12, 2009, the Basel Committee, recognizing the need to strengthen the level of capital in thebanking system, announced that the regulatory minimum level of capital would be reviewed in 2010. On July 13,2009, the Basel Committee announced its approval of a package of measures designed to strengthen its rulesgoverning trading book capital and to enhance the three pillars of the Basel II framework. This announcementstates that the Basel Committee’s trading book rules, effective at the end of 2011, will introduce higher capitalrequirements to capture the credit risk of complex trading activities. Such trading rules also include a stressedvalue-at-risk (VaR) requirement, which the Basel Committee believes will help dampen the cyclicality of theminimum regulatory capital framework. On September 7, 2009, the Group of Central Bank Governors and Headsof Supervision, the oversight body of the Basel Committee, reached agreement on certain key measures designedto strengthen regulation of the banking sector, including an increase in the quality, consistency and transparencyof the Tier 1 capital base. In particular, it was agreed that the predominant form of Tier 1 capital should becommon stock and retained earnings. Calibration of these new requirements is expected to be completed by theend of 2010.
In December 2009, in an effort to promote a more resilient banking sector, the Basel Committee approvedfor consultation a package of proposals to strengthen global capital and liquidity regulations. The proposalsinclude raising the quality, consistency and transparency of the capital base (including, in particular, deductionsof goodwill and other intangibles and net deferred tax assets from the predominant form of Tier 1 capital, andexpanding the limitation on the double counting of capital to cover the wider financial system); strengthening therisk coverage of the capital framework (in addition to the higher capital requirements for trading book exposuresannounced in July 2009); introducing a leverage ratio requirement as a supplemental measure to the risk-basedframework; and introducing a series of measures to address concerns over the “procyclicality” of the currentframework. The proposals also introduce a minimum liquidity standard including a 30-day liquidity coverageratio as well as a longer-term structural liquidity ratio. Additional capital, liquidity or other supervisory measuresto reduce the externalities created by systemically important institutions are also under review. After acomprehensive impact assessment, the Committee will develop the fully calibrated set of standards by the end of2010 to be phased in as financial conditions improve and the economic recovery is assured, with plans forimplementation to commence by the end of 2012.
The Bank Holding Companies Notice may be amended to follow the new measures described above afterthey are officially adopted by the Basel Committee.
On December 25, 2009, the FSA issued for public comment a proposed amendment to the “ComprehensiveGuidelines for Supervision of the Financial Instruments Business Operators, etc.”, which became effectiveon March 4, 2010. This amendment requires corporate groups of financial instruments firms engaging in
59
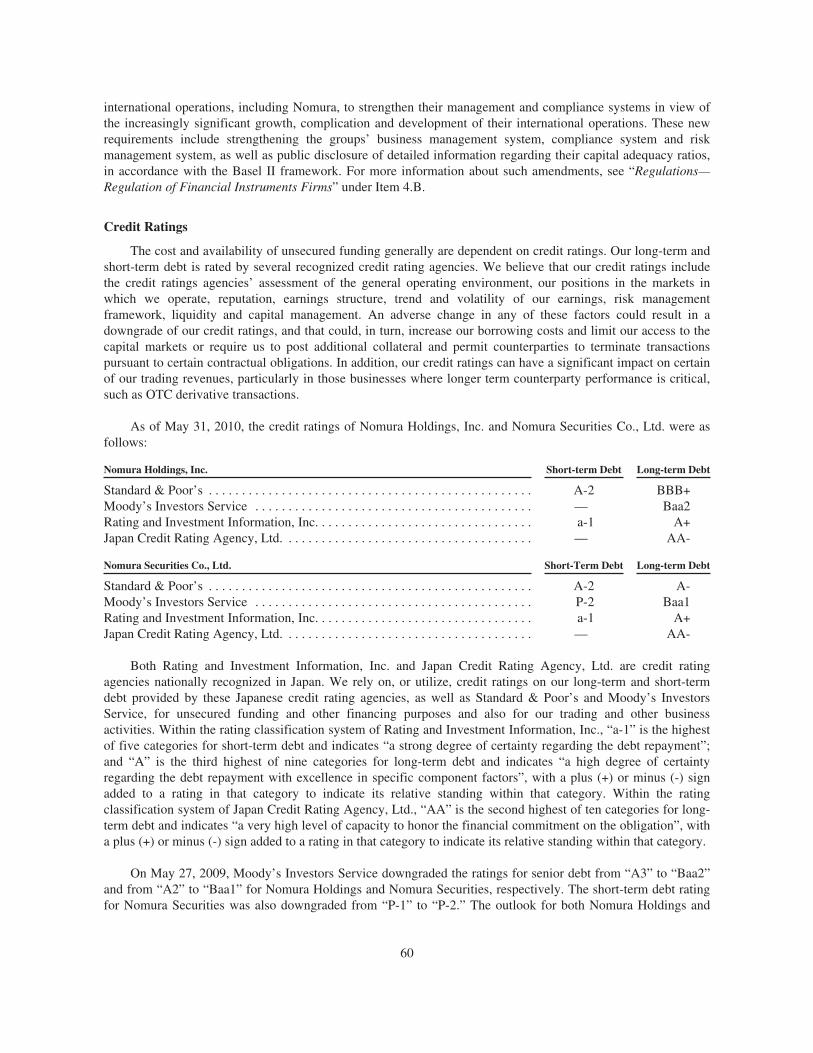
international operations, including Nomura, to strengthen their management and compliance systems in view ofthe increasingly significant growth, complication and development of their international operations. These newrequirements include strengthening the groups’ business management system, compliance system and riskmanagement system, as well as public disclosure of detailed information regarding their capital adequacy ratios,in accordance with the Basel II framework. For more information about such amendments, see “Regulations—Regulation of Financial Instruments Firms” under Item 4.B.
Credit Ratings
The cost and availability of unsecured funding generally are dependent on credit ratings. Our long-term andshort-term debt is rated by several recognized credit rating agencies. We believe that our credit ratings includethe credit ratings agencies’ assessment of the general operating environment, our positions in the markets inwhich we operate, reputation, earnings structure, trend and volatility of our earnings, risk managementframework, liquidity and capital management. An adverse change in any of these factors could result in adowngrade of our credit ratings, and that could, in turn, increase our borrowing costs and limit our access to thecapital markets or require us to post additional collateral and permit counterparties to terminate transactionspursuant to certain contractual obligations. In addition, our credit ratings can have a significant impact on certainof our trading revenues, particularly in those businesses where longer term counterparty performance is critical,such as OTC derivative transactions.
As of May 31, 2010, the credit ratings of Nomura Holdings, Inc. and Nomura Securities Co., Ltd. were asfollows:
Nomura Holdings, Inc. Short-term Debt Long-term Debt
Standard & Poor’s . . . . . . . . . . . . . . . . . . . . . . . . . . . . . . . . . . . . . . . . . . . . . . . . . A-2 BBB+Moody’s Investors Service . . . . . . . . . . . . . . . . . . . . . . . . . . . . . . . . . . . . . . . . . . — Baa2Rating and Investment Information, Inc. . . . . . . . . . . . . . . . . . . . . . . . . . . . . . . . . a-1 A+Japan Credit Rating Agency, Ltd. . . . . . . . . . . . . . . . . . . . . . . . . . . . . . . . . . . . . . — AA-
Nomura Securities Co., Ltd. Short-Term Debt Long-term Debt
Standard & Poor’s . . . . . . . . . . . . . . . . . . . . . . . . . . . . . . . . . . . . . . . . . . . . . . . . . A-2 A-Moody’s Investors Service . . . . . . . . . . . . . . . . . . . . . . . . . . . . . . . . . . . . . . . . . . P-2 Baa1Rating and Investment Information, Inc. . . . . . . . . . . . . . . . . . . . . . . . . . . . . . . . . a-1 A+Japan Credit Rating Agency, Ltd. . . . . . . . . . . . . . . . . . . . . . . . . . . . . . . . . . . . . . — AA-
Both Rating and Investment Information, Inc. and Japan Credit Rating Agency, Ltd. are credit ratingagencies nationally recognized in Japan. We rely on, or utilize, credit ratings on our long-term and short-termdebt provided by these Japanese credit rating agencies, as well as Standard & Poor’s and Moody’s InvestorsService, for unsecured funding and other financing purposes and also for our trading and other businessactivities. Within the rating classification system of Rating and Investment Information, Inc., “a-1” is the highestof five categories for short-term debt and indicates “a strong degree of certainty regarding the debt repayment”;and “A” is the third highest of nine categories for long-term debt and indicates “a high degree of certaintyregarding the debt repayment with excellence in specific component factors”, with a plus (+) or minus (-) signadded to a rating in that category to indicate its relative standing within that category. Within the ratingclassification system of Japan Credit Rating Agency, Ltd., “AA” is the second highest of ten categories for long-term debt and indicates “a very high level of capacity to honor the financial commitment on the obligation”, witha plus (+) or minus (-) sign added to a rating in that category to indicate its relative standing within that category.
On May 27, 2009, Moody’s Investors Service downgraded the ratings for senior debt from “A3” to “Baa2”and from “A2” to “Baa1” for Nomura Holdings and Nomura Securities, respectively. The short-term debt ratingfor Nomura Securities was also downgraded from “P-1” to “P-2.” The outlook for both Nomura Holdings and
60
Nomura Securities was changed from “Negative” to “Stable.” These downgrades were attributed to Moody’sexpectation that stabilizing earnings will continue to be a challenge for Nomura, given a persistently difficultoperating environment. The downgrade also reflects the agency’s lingering uncertainty regarding Nomura’sability to expand its wholesale platform within a reasonable timeframe by integrating Lehman Brothers’operations.
C. Research and Development, Patents and Licenses, etc.
Not applicable.
D. Trend Information.
The information required by this item is set forth in Item 5.A of this annual report.
E. Off-Balance Sheet Arrangements.
Off-balance sheet entities
In the normal course of business, we engage in a variety of off-balance sheet arrangements with off-balancesheet entities which may have an impact on Nomura’s future financial position and performance.
Off-balance sheet arrangements with off-balance sheet entities include the following where Nomura has:
• an obligation under a guarantee contract;
• a retained or contingent interest in assets transferred to an off-balance sheet entity or similararrangement that serves as credit, liquidity or market risk support;
• any obligation, including a contingent obligation, under a contract that would be accounted for as aderivative instrument; or
• any obligation, including contingent obligation, arising out of a variable interest in an off-balance sheetentity that is held by, and material to, us, where such entity provides financing, liquidity, market risk orcredit risk support to, or engages in leasing, hedging or research and development services with, us.
Off-balance sheet entities may take the form of a corporation, partnership, fund, trust or other legal vehiclewhich is designed to fulfill a limited, specific purpose by its sponsor. We both create or sponsor these entities andalso enter into arrangements with entities created or sponsored by others. Such entities generally meet thedefinition of a Variable Interest Entity (“VIE”) under ASC 810 or meet the definition of a Qualifying SpecialPurpose Entity (“QSPE”) under ASC 860.
A VIE, as defined by ASC 810, is an entity with insufficient equity at risk to support its operations withoutadditional subordinated financial support or whose equity investors lack the features of a controlling interest inthe entity. In other words, equity investors in these entities lack either the ability to make significant decisionsthrough their voting rights, an obligation to absorb the expected losses of the entity or a right to receive theexpected residual returns of the entity. A QSPE is generally a passive vehicle whose activities are restricted andpredetermined at inception in accordance with criteria under ASC 860. Such vehicles are generally used tosecuritize financial assets such as loans and debt instruments.
Our only significant arrangements with entities which meet the definition of off-balance sheet entities arethrough program vehicles which we use primarily for the securitization of commercial and residential mortgages,government and corporate bonds and other financial assets. Significant involvement is assessed based on all ofour arrangements with these entities, even if the probability of loss, as assessed at the balance sheet date, isremote.
Our involvement with these entities includes structuring, underwriting, distributing and selling debtinstruments and beneficial interests issued by these entities, subject to prevailing market conditions. In thenormal course of business, we also act as transferor of financial assets to these entities, as well as, and
61
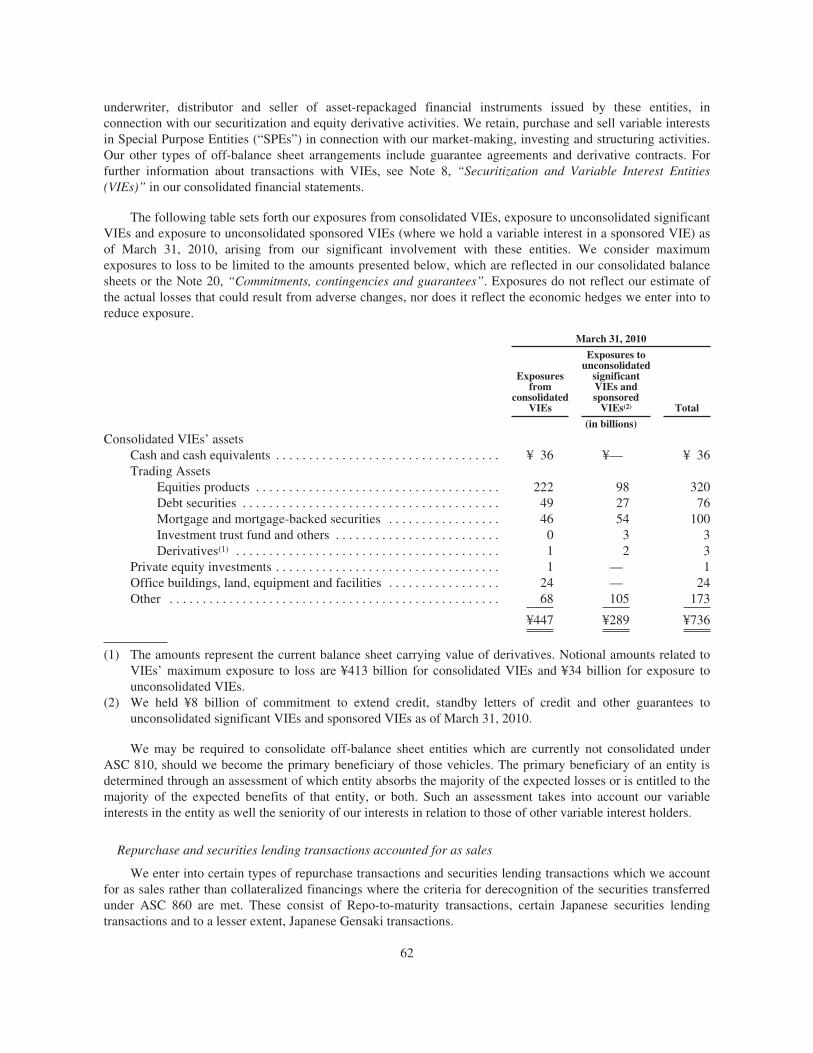
underwriter, distributor and seller of asset-repackaged financial instruments issued by these entities, inconnection with our securitization and equity derivative activities. We retain, purchase and sell variable interestsin Special Purpose Entities (“SPEs”) in connection with our market-making, investing and structuring activities.Our other types of off-balance sheet arrangements include guarantee agreements and derivative contracts. Forfurther information about transactions with VIEs, see Note 8, “Securitization and Variable Interest Entities(VIEs)” in our consolidated financial statements.
The following table sets forth our exposures from consolidated VIEs, exposure to unconsolidated significantVIEs and exposure to unconsolidated sponsored VIEs (where we hold a variable interest in a sponsored VIE) asof March 31, 2010, arising from our significant involvement with these entities. We consider maximumexposures to loss to be limited to the amounts presented below, which are reflected in our consolidated balancesheets or the Note 20, “Commitments, contingencies and guarantees”. Exposures do not reflect our estimate ofthe actual losses that could result from adverse changes, nor does it reflect the economic hedges we enter into toreduce exposure.
March 31, 2010
Exposuresfrom
consolidatedVIEs
Exposures tounconsolidated
significantVIEs andsponsored
VIEs(2) Total
(in billions)
Consolidated VIEs’ assetsCash and cash equivalents . . . . . . . . . . . . . . . . . . . . . . . . . . . . . . . . . . ¥ 36 ¥— ¥ 36Trading Assets
Equities products . . . . . . . . . . . . . . . . . . . . . . . . . . . . . . . . . . . . . 222 98 320Debt securities . . . . . . . . . . . . . . . . . . . . . . . . . . . . . . . . . . . . . . . 49 27 76Mortgage and mortgage-backed securities . . . . . . . . . . . . . . . . . 46 54 100Investment trust fund and others . . . . . . . . . . . . . . . . . . . . . . . . . 0 3 3Derivatives(1) . . . . . . . . . . . . . . . . . . . . . . . . . . . . . . . . . . . . . . . . 1 2 3
Private equity investments . . . . . . . . . . . . . . . . . . . . . . . . . . . . . . . . . . 1 — 1Office buildings, land, equipment and facilities . . . . . . . . . . . . . . . . . 24 — 24Other . . . . . . . . . . . . . . . . . . . . . . . . . . . . . . . . . . . . . . . . . . . . . . . . . . 68 105 173
¥447 ¥289 ¥736
(1) The amounts represent the current balance sheet carrying value of derivatives. Notional amounts related toVIEs’ maximum exposure to loss are ¥413 billion for consolidated VIEs and ¥34 billion for exposure tounconsolidated VIEs.
(2) We held ¥8 billion of commitment to extend credit, standby letters of credit and other guarantees tounconsolidated significant VIEs and sponsored VIEs as of March 31, 2010.
We may be required to consolidate off-balance sheet entities which are currently not consolidated underASC 810, should we become the primary beneficiary of those vehicles. The primary beneficiary of an entity isdetermined through an assessment of which entity absorbs the majority of the expected losses or is entitled to themajority of the expected benefits of that entity, or both. Such an assessment takes into account our variableinterests in the entity as well the seniority of our interests in relation to those of other variable interest holders.
Repurchase and securities lending transactions accounted for as sales
We enter into certain types of repurchase transactions and securities lending transactions which we accountfor as sales rather than collateralized financings where the criteria for derecognition of the securities transferredunder ASC 860 are met. These consist of Repo-to-maturity transactions, certain Japanese securities lendingtransactions and to a lesser extent, Japanese Gensaki transactions.
62
We enter into repo-to-maturity transactions to take advantage of arbitrage opportunities between the cashsecurity and repo markets. These transactions involve the sourcing of specific securities in the market andcontemporaneously entering into repurchase agreements with different counterparties where the maturity of theagreement matches the maturity of the security transferred as collateral. We account for these transactions assales rather than collateralized financings where the criteria for derecognition of the securities transferred underASC 860 are met. The amounts of securities derecognized from our consolidated balance sheets under openrepo-to-maturity transactions as of March 31, 2010 and 2009 were ¥185,047 million and ¥nil, respectively.
We engage in certain Japanese securities lending transactions for funding purposes under which we transferlong securities (such as Japanese listed equities). The agreements supporting these transactions include varyingmargining requirements, but the amount of cash we borrow from our counterparties is typically significantly lessthan the fair value of securities we lend. We account for these transactions as sales in our consolidated financialstatements where the criteria for derecognition of the transferred financial assets under ASC 860 are met. Inparticular, we do not maintain effective control over the transferred financial assets as we are not able to bereturned the transferred financial assets on substantially agreed terms, even in the event of default by thetransferee. The amounts of securities derecognized from our consolidated balance sheets under open securitieslending transactions as of March 31, 2010 and 2009 were ¥153,808 million and ¥174,567 million respectively.
We also have historically engaged in traditional Japanese repurchase agreements called “Gensaki”transactions We account for Gensaki transactions as sales in our consolidated financial statements where thecriteria for derecognition of the transferred financial assets under ASC 860 have been met. The transactions arenow less commonplace in Japan and have largely been replaced with Gensaki Repo transactions which wereintroduced in Japan in 2001 and which are similar to other international repurchase agreements used in theUnited States, United Kingdom and other jurisdictions. These transactions contain margin requirements, rights ofsecurity substitution, or certain restrictions on the customer’s right to sell or repledge the transferred securities.We therefore account for Gensaki repo agreements as collateralized financings in our balance sheet. The amountsof securities derecognized from our consolidated balance sheets under Gensaki Transactions as of March 31,2010 and 2009 were not significant.
F. Tabular Disclosure of Contractual Obligations.
As part of our business, we enter into a variety of contractual obligations and contingent commitments,which may require future payments. These arrangements include:
Standby letters of credit and other guarantees:
• In the normal course of our banking / financing activities, we enter into various guarantee arrangementswith counterparties in the form of standby letters of credit and other guarantees, which generally have afixed expiration date.
Long-term borrowings:
• In connection with our operating activities, we issue Japanese yen and non-Japanese yen denominatedlong-term borrowings with variable and fixed interest in accordance with our funding policy.
Operating lease commitments:
• We lease our office space and certain employees’ residential facilities in Japan primarily undercancellable lease agreements which are customarily renewed upon expiration;
• We lease certain equipment and facilities under non-cancellable operating lease agreements.
63
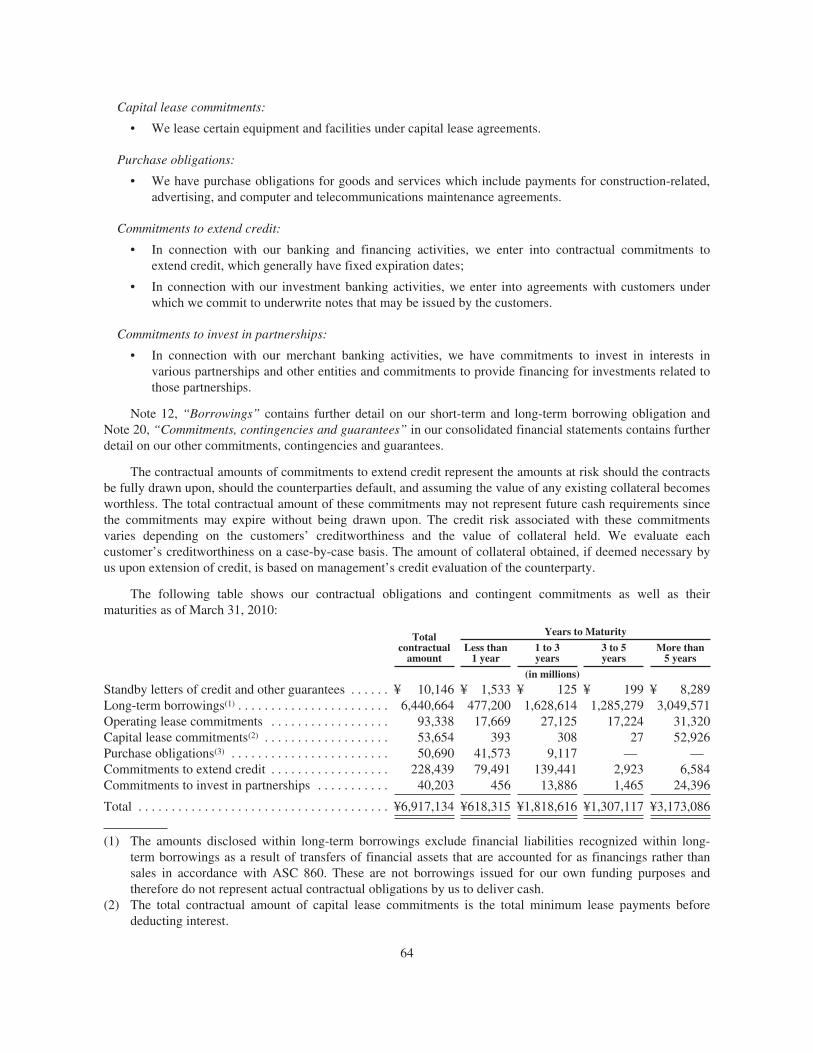
Capital lease commitments:
• We lease certain equipment and facilities under capital lease agreements.
Purchase obligations:
• We have purchase obligations for goods and services which include payments for construction-related,advertising, and computer and telecommunications maintenance agreements.
Commitments to extend credit:
• In connection with our banking and financing activities, we enter into contractual commitments toextend credit, which generally have fixed expiration dates;
• In connection with our investment banking activities, we enter into agreements with customers underwhich we commit to underwrite notes that may be issued by the customers.
Commitments to invest in partnerships:
• In connection with our merchant banking activities, we have commitments to invest in interests invarious partnerships and other entities and commitments to provide financing for investments related tothose partnerships.
Note 12, “Borrowings” contains further detail on our short-term and long-term borrowing obligation andNote 20, “Commitments, contingencies and guarantees” in our consolidated financial statements contains furtherdetail on our other commitments, contingencies and guarantees.
The contractual amounts of commitments to extend credit represent the amounts at risk should the contractsbe fully drawn upon, should the counterparties default, and assuming the value of any existing collateral becomesworthless. The total contractual amount of these commitments may not represent future cash requirements sincethe commitments may expire without being drawn upon. The credit risk associated with these commitmentsvaries depending on the customers’ creditworthiness and the value of collateral held. We evaluate eachcustomer’s creditworthiness on a case-by-case basis. The amount of collateral obtained, if deemed necessary byus upon extension of credit, is based on management’s credit evaluation of the counterparty.
The following table shows our contractual obligations and contingent commitments as well as theirmaturities as of March 31, 2010:
Totalcontractual
amount
Years to Maturity
Less than1 year
1 to 3years
3 to 5years
More than5 years
(in millions)
Standby letters of credit and other guarantees . . . . . . ¥ 10,146 ¥ 1,533 ¥ 125 ¥ 199 ¥ 8,289Long-term borrowings(1) . . . . . . . . . . . . . . . . . . . . . . . 6,440,664 477,200 1,628,614 1,285,279 3,049,571Operating lease commitments . . . . . . . . . . . . . . . . . . 93,338 17,669 27,125 17,224 31,320Capital lease commitments(2) . . . . . . . . . . . . . . . . . . . 53,654 393 308 27 52,926Purchase obligations(3) . . . . . . . . . . . . . . . . . . . . . . . . 50,690 41,573 9,117 — —Commitments to extend credit . . . . . . . . . . . . . . . . . . 228,439 79,491 139,441 2,923 6,584Commitments to invest in partnerships . . . . . . . . . . . 40,203 456 13,886 1,465 24,396
Total . . . . . . . . . . . . . . . . . . . . . . . . . . . . . . . . . . . . . . ¥6,917,134 ¥618,315 ¥1,818,616 ¥1,307,117 ¥3,173,086
(1) The amounts disclosed within long-term borrowings exclude financial liabilities recognized within long-term borrowings as a result of transfers of financial assets that are accounted for as financings rather thansales in accordance with ASC 860. These are not borrowings issued for our own funding purposes andtherefore do not represent actual contractual obligations by us to deliver cash.
(2) The total contractual amount of capital lease commitments is the total minimum lease payments beforededucting interest.
64
(3) The amounts reflect the minimum contractual obligations under enforceable and legally binding contractsthat specify all significant terms. The amounts exclude obligations that are already reflected on ourconsolidated balance sheets as liabilities or payables.
Excluded from the above table are obligations that are generally short-term in nature, including short-termborrowings, deposits received at banks and other payables, collateralized agreements and financing transactions(such as resale and repurchase agreements), and trading liabilities.
In addition to amounts presented above, we have commitments under resale and repurchase agreementsincluding amounts in connection with collateralized agreements, collateralized financing and Gensakitransactions. These commitments amount to ¥2,306 billion for resale agreements and ¥1,072 billion forrepurchase agreements as of March 31, 2010. These amounts include certain types of repurchase transactions andsecurities lending transactions which we account for as sales rather than collateralized financings in accordancewith ASC 860.
65
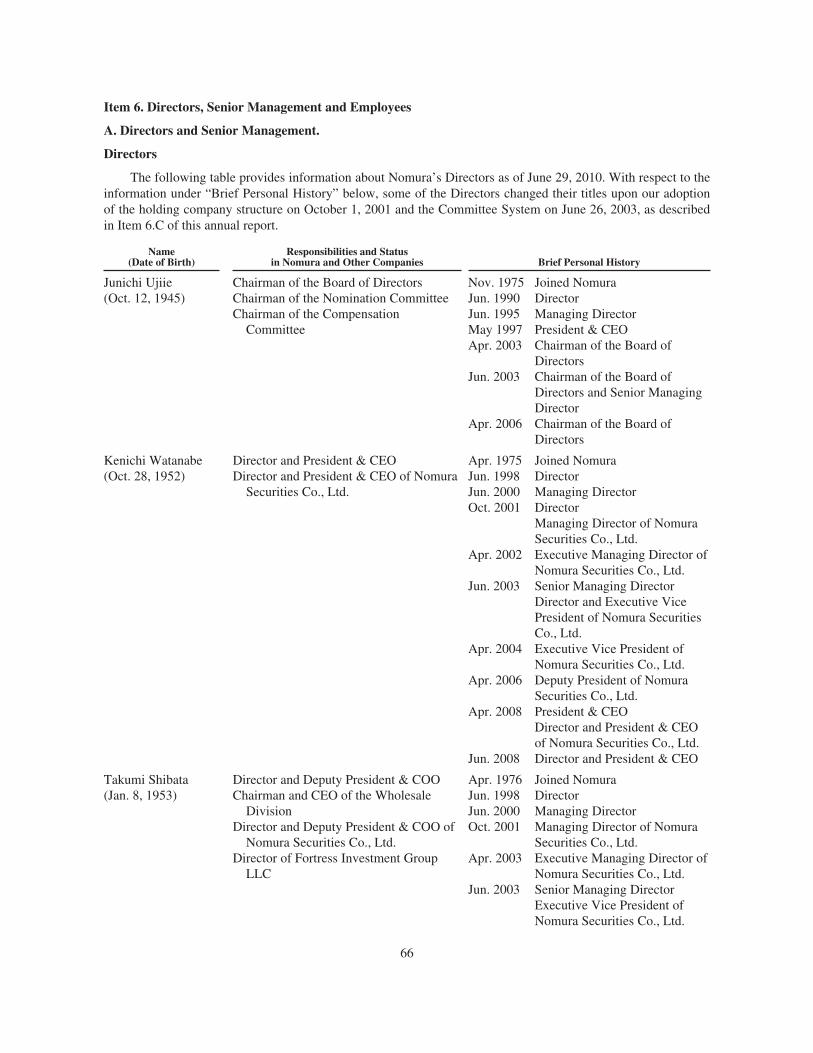
Item 6. Directors, Senior Management and Employees
A. Directors and Senior Management.
Directors
The following table provides information about Nomura’s Directors as of June 29, 2010. With respect to theinformation under “Brief Personal History” below, some of the Directors changed their titles upon our adoptionof the holding company structure on October 1, 2001 and the Committee System on June 26, 2003, as describedin Item 6.C of this annual report.
Name(Date of Birth)
Responsibilities and Statusin Nomura and Other Companies Brief Personal History
Junichi Ujiie Chairman of the Board of Directors Nov. 1975 Joined Nomura(Oct. 12, 1945) Chairman of the Nomination Committee Jun. 1990 Director
Chairman of the CompensationCommittee
Jun. 1995 Managing DirectorMay 1997 President & CEOApr. 2003 Chairman of the Board of
DirectorsJun. 2003 Chairman of the Board of
Directors and Senior ManagingDirector
Apr. 2006 Chairman of the Board ofDirectors
Kenichi Watanabe(Oct. 28, 1952)
Director and President & CEODirector and President & CEO of Nomura
Securities Co., Ltd.
Apr. 1975 Joined NomuraJun. 1998 DirectorJun. 2000 Managing DirectorOct. 2001 Director
Managing Director of NomuraSecurities Co., Ltd.
Apr. 2002 Executive Managing Director ofNomura Securities Co., Ltd.
Jun. 2003 Senior Managing DirectorDirector and Executive VicePresident of Nomura SecuritiesCo., Ltd.
Apr. 2004 Executive Vice President ofNomura Securities Co., Ltd.
Apr. 2006 Deputy President of NomuraSecurities Co., Ltd.
Apr. 2008 President & CEODirector and President & CEOof Nomura Securities Co., Ltd.
Jun. 2008 Director and President & CEO
Takumi Shibata(Jan. 8, 1953)
Director and Deputy President & COOChairman and CEO of the Wholesale
DivisionDirector and Deputy President & COO of
Nomura Securities Co., Ltd.Director of Fortress Investment Group
LLC
Apr. 1976Jun. 1998Jun. 2000Oct. 2001
Joined NomuraDirectorManaging DirectorManaging Director of NomuraSecurities Co., Ltd.
Apr. 2003 Executive Managing Director ofNomura Securities Co., Ltd.
Jun. 2003 Senior Managing DirectorExecutive Vice President ofNomura Securities Co., Ltd.
66
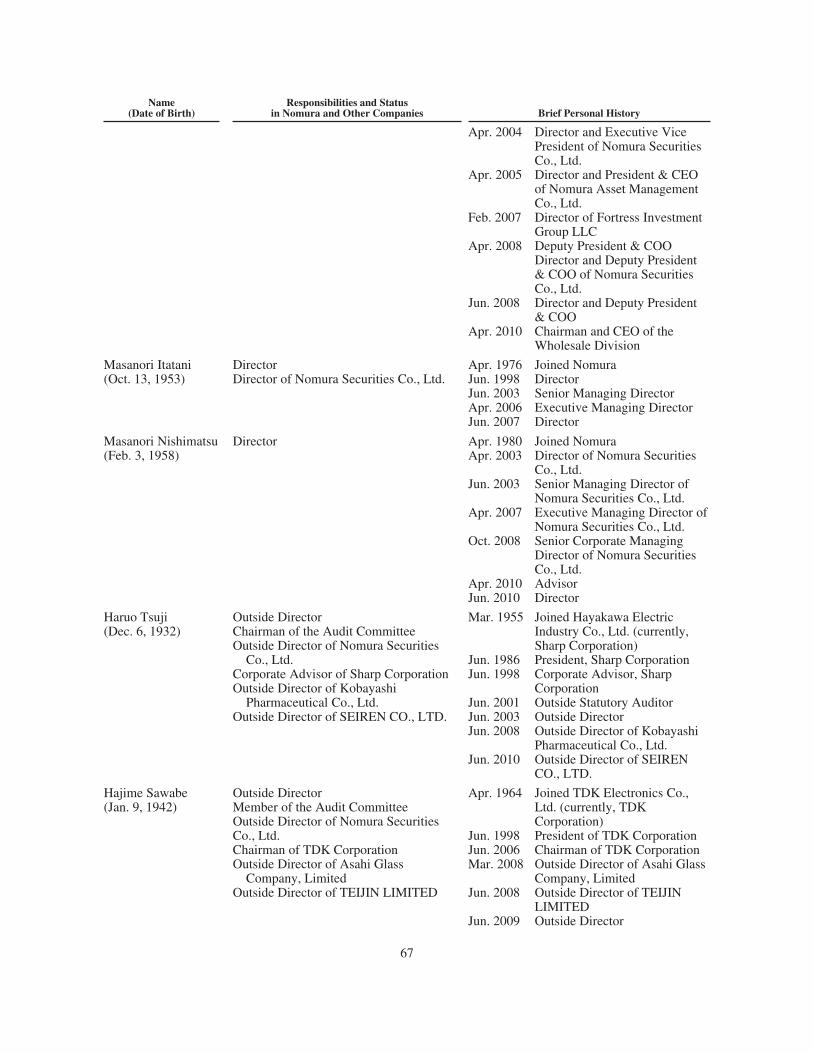
Name(Date of Birth)
Responsibilities and Statusin Nomura and Other Companies Brief Personal History
Apr. 2004 Director and Executive VicePresident of Nomura SecuritiesCo., Ltd.
Apr. 2005 Director and President & CEOof Nomura Asset ManagementCo., Ltd.
Feb. 2007 Director of Fortress InvestmentGroup LLC
Apr. 2008 Deputy President & COODirector and Deputy President& COO of Nomura SecuritiesCo., Ltd.
Jun. 2008 Director and Deputy President& COO
Apr. 2010 Chairman and CEO of theWholesale Division
Masanori Itatani Director Apr. 1976 Joined Nomura(Oct. 13, 1953) Director of Nomura Securities Co., Ltd. Jun. 1998 Director
Jun. 2003 Senior Managing DirectorApr. 2006 Executive Managing DirectorJun. 2007 Director
Masanori Nishimatsu(Feb. 3, 1958)
Director Apr. 1980 Joined NomuraApr. 2003 Director of Nomura Securities
Co., Ltd.Jun. 2003 Senior Managing Director of
Nomura Securities Co., Ltd.Apr. 2007 Executive Managing Director of
Nomura Securities Co., Ltd.Oct. 2008 Senior Corporate Managing
Director of Nomura SecuritiesCo., Ltd.
Apr. 2010 AdvisorJun. 2010 Director
Haruo Tsuji(Dec. 6, 1932)
Outside DirectorChairman of the Audit CommitteeOutside Director of Nomura Securities
Co., Ltd.Corporate Advisor of Sharp CorporationOutside Director of Kobayashi
Pharmaceutical Co., Ltd.Outside Director of SEIREN CO., LTD.
Mar. 1955 Joined Hayakawa ElectricIndustry Co., Ltd. (currently,Sharp Corporation)
Jun. 1986 President, Sharp CorporationJun. 1998 Corporate Advisor, Sharp
CorporationJun. 2001 Outside Statutory AuditorJun. 2003 Outside DirectorJun. 2008 Outside Director of Kobayashi
Pharmaceutical Co., Ltd.Jun. 2010 Outside Director of SEIREN
CO., LTD.
Hajime Sawabe(Jan. 9, 1942)
Outside DirectorMember of the Audit CommitteeOutside Director of Nomura SecuritiesCo., Ltd.Chairman of TDK CorporationOutside Director of Asahi Glass
Company, LimitedOutside Director of TEIJIN LIMITED
Apr. 1964 Joined TDK Electronics Co.,Ltd. (currently, TDKCorporation)
Jun. 1998 President of TDK CorporationJun. 2006 Chairman of TDK CorporationMar. 2008 Outside Director of Asahi Glass
Company, LimitedJun. 2008 Outside Director of TEIJIN
LIMITEDJun. 2009 Outside Director
67
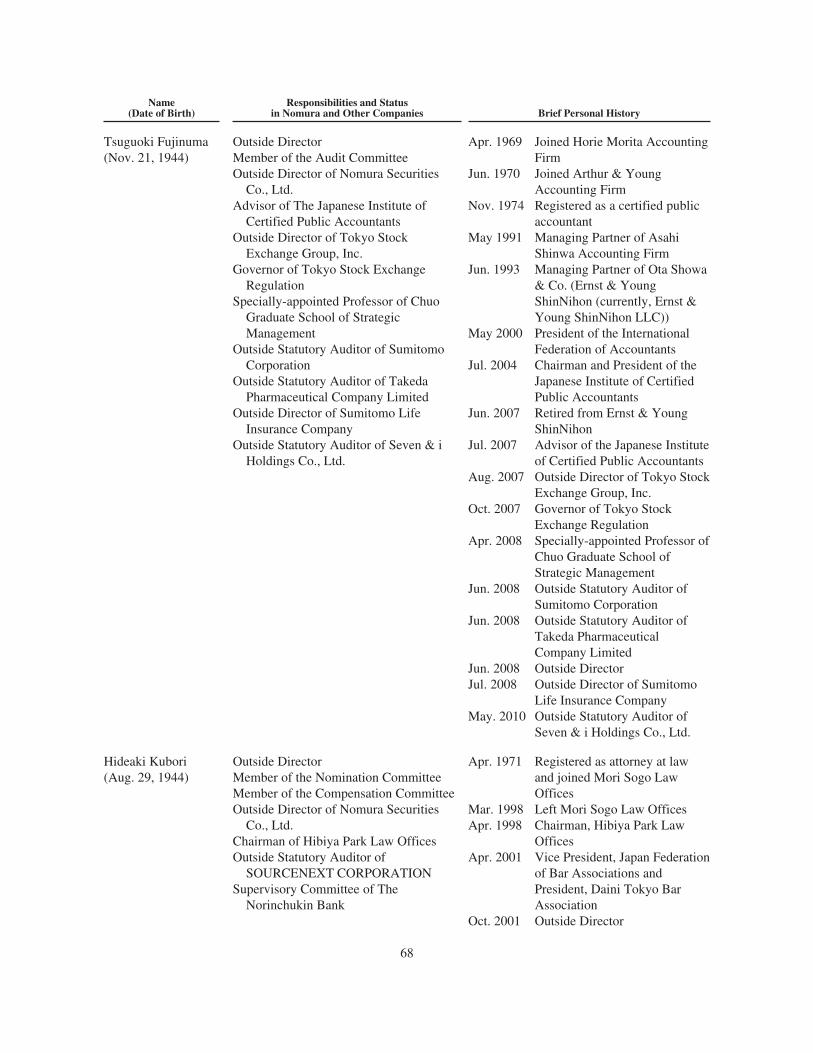
Name(Date of Birth)
Responsibilities and Statusin Nomura and Other Companies Brief Personal History
Tsuguoki Fujinuma(Nov. 21, 1944)
Outside DirectorMember of the Audit CommitteeOutside Director of Nomura Securities
Co., Ltd.Advisor of The Japanese Institute of
Certified Public AccountantsOutside Director of Tokyo Stock
Exchange Group, Inc.Governor of Tokyo Stock Exchange
RegulationSpecially-appointed Professor of Chuo
Graduate School of StrategicManagement
Outside Statutory Auditor of SumitomoCorporation
Outside Statutory Auditor of TakedaPharmaceutical Company Limited
Outside Director of Sumitomo LifeInsurance Company
Outside Statutory Auditor of Seven & iHoldings Co., Ltd.
Apr. 1969 Joined Horie Morita AccountingFirm
Jun. 1970 Joined Arthur & YoungAccounting Firm
Nov. 1974 Registered as a certified publicaccountant
May 1991 Managing Partner of AsahiShinwa Accounting Firm
Jun. 1993 Managing Partner of Ota Showa& Co. (Ernst & YoungShinNihon (currently, Ernst &Young ShinNihon LLC))
May 2000 President of the InternationalFederation of Accountants
Jul. 2004 Chairman and President of theJapanese Institute of CertifiedPublic Accountants
Jun. 2007 Retired from Ernst & YoungShinNihon
Jul. 2007 Advisor of the Japanese Instituteof Certified Public Accountants
Aug. 2007 Outside Director of Tokyo StockExchange Group, Inc.
Oct. 2007 Governor of Tokyo StockExchange Regulation
Apr. 2008 Specially-appointed Professor ofChuo Graduate School ofStrategic Management
Jun. 2008 Outside Statutory Auditor ofSumitomo Corporation
Jun. 2008 Outside Statutory Auditor ofTakeda PharmaceuticalCompany Limited
Jun. 2008 Outside DirectorJul. 2008 Outside Director of Sumitomo
Life Insurance CompanyMay. 2010 Outside Statutory Auditor of
Seven & i Holdings Co., Ltd.
Hideaki Kubori(Aug. 29, 1944)
Outside DirectorMember of the Nomination CommitteeMember of the Compensation CommitteeOutside Director of Nomura Securities
Co., Ltd.Chairman of Hibiya Park Law OfficesOutside Statutory Auditor of
SOURCENEXT CORPORATIONSupervisory Committee of The
Norinchukin Bank
Apr. 1971 Registered as attorney at lawand joined Mori Sogo LawOffices
Mar. 1998 Left Mori Sogo Law OfficesApr. 1998 Chairman, Hibiya Park Law
OfficesApr. 2001 Vice President, Japan Federation
of Bar Associations andPresident, Daini Tokyo BarAssociation
Oct. 2001 Outside Director
68

Name(Date of Birth)
Responsibilities and Statusin Nomura and Other Companies Brief Personal History
Feb. 2003 Outside Statutory Auditor,SOURCENEXTCORPORATION
Jun. 2008 Supervisory Committee, TheNorinchukin Bank
Masahiro Sakane(Jan 7, 1941)
Outside DirectorMember of the Nomination CommitteeMember of the Compensation CommitteeOutside Director of Nomura Securities Co.,
Ltd.Chairman of Komatsu Ltd.Outside Director of Tokyo Electron
Limited
Apr. 1963 Joined Komatsu Ltd.Jun. 2001 President of Komatsu Ltd.Jun. 2003 President & CEO of Komatsu
Ltd.Jun. 2007 Chairman of Komatsu Ltd.Jun. 2008 Outside Director of Tokyo
Electron LimitedJun. 2008 Outside Director
Lord Colin Marshall(Nov. 16, 1933)
Outside DirectorChairman of Pirelli UK plcChairman of Nomura International plcChairman of Nomura Europe Holdings plc
Feb. 1983 Chief Executive of BritishAirways plc
Jan. 1993 Non-Executive Director ofHSBC Holdings plc
Feb. 1993 Chairman of British Airways plcNov. 1995 Chairman of Inchcape plcMay 1996 President of CBI (Confederation
of British Industry)Jan. 1998 Chairman of Invensys plcSep. 2003 Chairman of Pirelli UK plcOct. 2004 Chairman of Nomura
International plcMay 2009 Chairman of Nomura Europe
Holdings plcJun. 2010 Outside Director
Dame Clara Furse(Sept. 16, 1957)
Outside DirectorNon-Executive Director of Legal &
General Group plcNon-Executive Director of Nomura
International plcNon-Executive Director of Nomura Europe
Holdings plcNon-Executive Director of Amadeus IT
Holding SA
Feb. 1983 Joined Philips & Dew(currently, UBS)
Jun. 1991 Non-Executive Director ofLIFFE (London InternationalFinancial Futures Exchange)
Jun. 1997 Deputy Chairman of LIFFEMay 1998 Group Chief Executive of Credit
Lyonnais RouseJan. 2001 Chief Executive of London
Stock Exchange GroupJun. 2009 Non-Executive Director of
Legal & General Group plcDec. 2009 Non-Executive Director of
Nomura International plcNon-Executive Director ofNomura Europe Holdings plc
Apr. 2010 Non-Executive Director ofAmadeus IT Holding SA
Jun. 2010 Outside Director
Among the above listed Directors, Haruo Tsuji, Hajime Sawabe, Tsuguoki Fujinuma, Hideaki Kubori,Masahiro Sakane, Lord Colin Marshall and Dame Clara Furse satisfy the requirements for an “outside director”
69
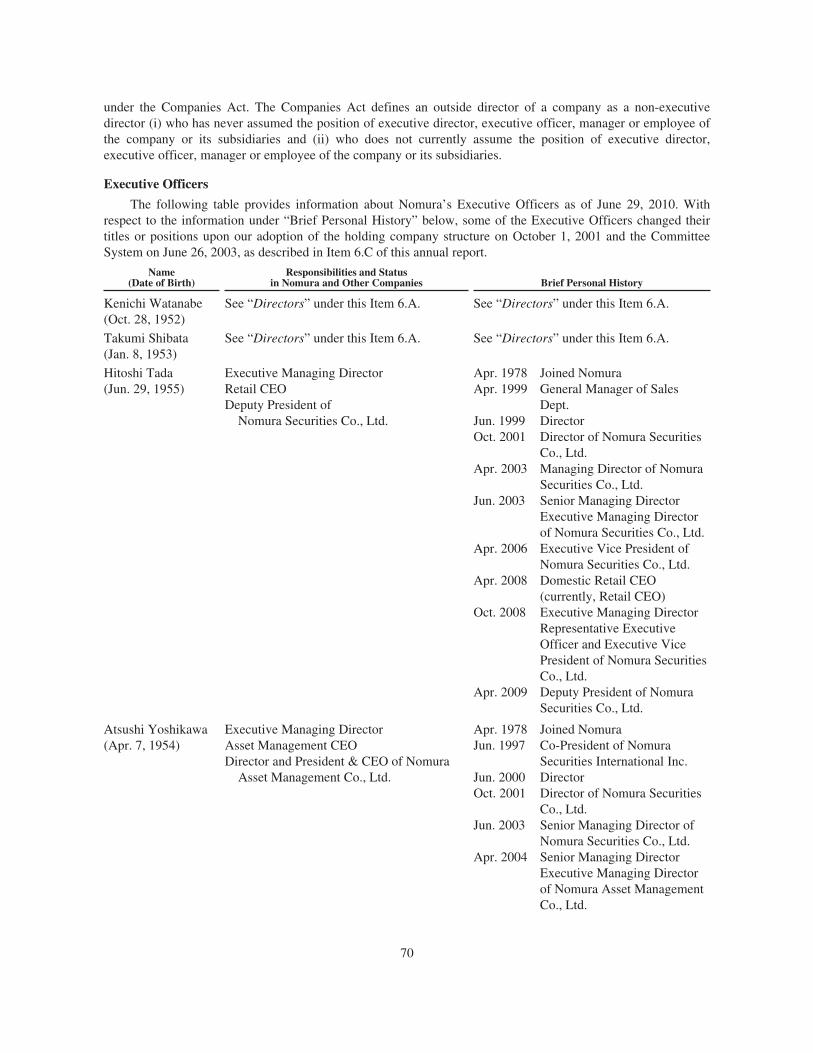
under the Companies Act. The Companies Act defines an outside director of a company as a non-executivedirector (i) who has never assumed the position of executive director, executive officer, manager or employee ofthe company or its subsidiaries and (ii) who does not currently assume the position of executive director,executive officer, manager or employee of the company or its subsidiaries.
Executive Officers
The following table provides information about Nomura’s Executive Officers as of June 29, 2010. Withrespect to the information under “Brief Personal History” below, some of the Executive Officers changed theirtitles or positions upon our adoption of the holding company structure on October 1, 2001 and the CommitteeSystem on June 26, 2003, as described in Item 6.C of this annual report.
Name(Date of Birth)
Responsibilities and Statusin Nomura and Other Companies Brief Personal History
Kenichi Watanabe(Oct. 28, 1952)
See “Directors” under this Item 6.A. See “Directors” under this Item 6.A.
Takumi Shibata(Jan. 8, 1953)
See “Directors” under this Item 6.A. See “Directors” under this Item 6.A.
Hitoshi Tada Executive Managing DirectorRetail CEODeputy President of
Nomura Securities Co., Ltd.
Apr. 1978 Joined Nomura(Jun. 29, 1955) Apr. 1999 General Manager of Sales
Dept.Jun. 1999 DirectorOct. 2001 Director of Nomura Securities
Co., Ltd.Apr. 2003 Managing Director of Nomura
Securities Co., Ltd.Jun. 2003 Senior Managing Director
Executive Managing Directorof Nomura Securities Co., Ltd.
Apr. 2006 Executive Vice President ofNomura Securities Co., Ltd.
Apr. 2008 Domestic Retail CEO(currently, Retail CEO)
Oct. 2008 Executive Managing DirectorRepresentative ExecutiveOfficer and Executive VicePresident of Nomura SecuritiesCo., Ltd.
Apr. 2009 Deputy President of NomuraSecurities Co., Ltd.
Atsushi Yoshikawa(Apr. 7, 1954)
Executive Managing DirectorAsset Management CEODirector and President & CEO of Nomura
Asset Management Co., Ltd.
Apr. 1978 Joined NomuraJun. 1997 Co-President of Nomura
Securities International Inc.Jun. 2000 DirectorOct. 2001 Director of Nomura Securities
Co., Ltd.Jun. 2003 Senior Managing Director of
Nomura Securities Co., Ltd.Apr. 2004 Senior Managing Director
Executive Managing Directorof Nomura Asset ManagementCo., Ltd.
70
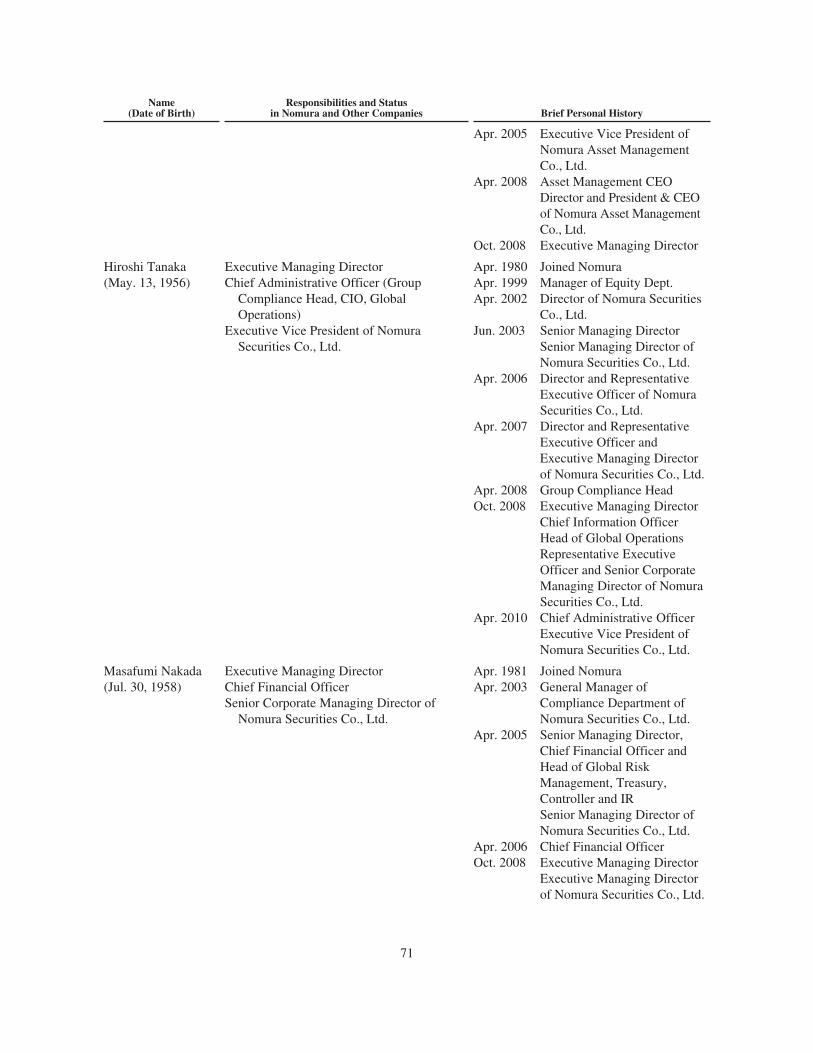
Name(Date of Birth)
Responsibilities and Statusin Nomura and Other Companies Brief Personal History
Apr. 2005 Executive Vice President ofNomura Asset ManagementCo., Ltd.
Apr. 2008 Asset Management CEODirector and President & CEOof Nomura Asset ManagementCo., Ltd.
Oct. 2008 Executive Managing Director
Hiroshi Tanaka(May. 13, 1956)
Executive Managing DirectorChief Administrative Officer (Group
Compliance Head, CIO, GlobalOperations)
Executive Vice President of NomuraSecurities Co., Ltd.
Apr. 1980 Joined NomuraApr. 1999 Manager of Equity Dept.Apr. 2002 Director of Nomura Securities
Co., Ltd.Jun. 2003 Senior Managing Director
Senior Managing Director ofNomura Securities Co., Ltd.
Apr. 2006 Director and RepresentativeExecutive Officer of NomuraSecurities Co., Ltd.
Apr. 2007 Director and RepresentativeExecutive Officer andExecutive Managing Directorof Nomura Securities Co., Ltd.
Apr. 2008 Group Compliance HeadOct. 2008 Executive Managing Director
Chief Information OfficerHead of Global OperationsRepresentative ExecutiveOfficer and Senior CorporateManaging Director of NomuraSecurities Co., Ltd.
Apr. 2010 Chief Administrative OfficerExecutive Vice President ofNomura Securities Co., Ltd.
Masafumi Nakada(Jul. 30, 1958)
Executive Managing DirectorChief Financial OfficerSenior Corporate Managing Director of
Nomura Securities Co., Ltd.
Apr. 1981 Joined NomuraApr. 2003 General Manager of
Compliance Department ofNomura Securities Co., Ltd.
Apr. 2005 Senior Managing Director,Chief Financial Officer andHead of Global RiskManagement, Treasury,Controller and IRSenior Managing Director ofNomura Securities Co., Ltd.
Apr. 2006 Chief Financial OfficerOct. 2008 Executive Managing Director
Executive Managing Directorof Nomura Securities Co., Ltd.
71
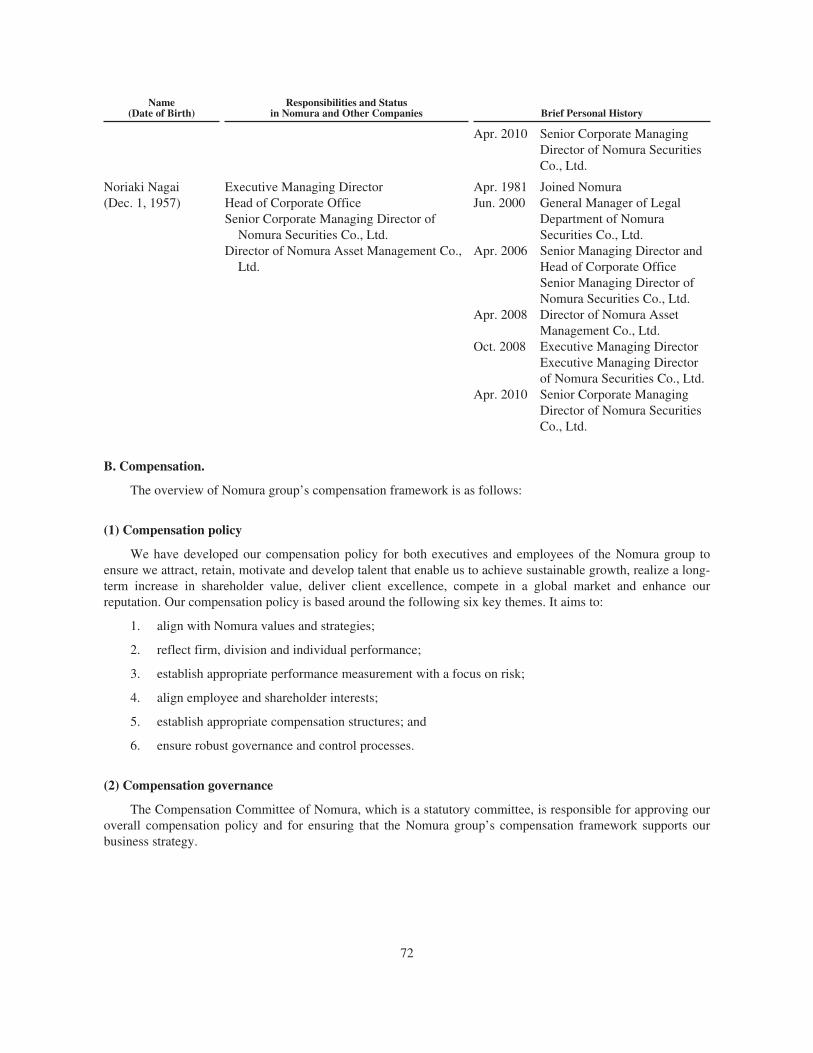
Name(Date of Birth)
Responsibilities and Statusin Nomura and Other Companies Brief Personal History
Apr. 2010 Senior Corporate ManagingDirector of Nomura SecuritiesCo., Ltd.
Noriaki Nagai(Dec. 1, 1957)
Executive Managing DirectorHead of Corporate OfficeSenior Corporate Managing Director of
Nomura Securities Co., Ltd.Director of Nomura Asset Management Co.,
Ltd.
Apr. 1981 Joined NomuraJun. 2000 General Manager of Legal
Department of NomuraSecurities Co., Ltd.
Apr. 2006 Senior Managing Director andHead of Corporate OfficeSenior Managing Director ofNomura Securities Co., Ltd.
Apr. 2008 Director of Nomura AssetManagement Co., Ltd.
Oct. 2008 Executive Managing DirectorExecutive Managing Directorof Nomura Securities Co., Ltd.
Apr. 2010 Senior Corporate ManagingDirector of Nomura SecuritiesCo., Ltd.
B. Compensation.
The overview of Nomura group’s compensation framework is as follows:
(1) Compensation policy
We have developed our compensation policy for both executives and employees of the Nomura group toensure we attract, retain, motivate and develop talent that enable us to achieve sustainable growth, realize a long-term increase in shareholder value, deliver client excellence, compete in a global market and enhance ourreputation. Our compensation policy is based around the following six key themes. It aims to:
1. align with Nomura values and strategies;
2. reflect firm, division and individual performance;
3. establish appropriate performance measurement with a focus on risk;
4. align employee and shareholder interests;
5. establish appropriate compensation structures; and
6. ensure robust governance and control processes.
(2) Compensation governance
The Compensation Committee of Nomura, which is a statutory committee, is responsible for approving ouroverall compensation policy and for ensuring that the Nomura group’s compensation framework supports ourbusiness strategy.
72
The Company has delegated authority to the Human Resources Committee (“HRC”) to develop and toimplement Nomura group’s compensation policy. The HRC’s responsibilities include:
• approving the compensation framework, assuring that it is in line with global compensation strategy,while taking into account necessary factors to ensure that all staff, including members of executivemanagement, are provided with appropriate incentives to enhance their performance and are rewardedfor their individual contributions to the success of our business globally,
• approving the total bonus pool and its allocation to each business,
• reviewing the performance measures of senior executives to ensure that benefits, including rights toperformance-related compensation, reflect the performance of both individuals and our businessglobally,
• continually reviewing the appropriateness and relevance of the compensation policy and
• approving any major changes in employee benefits structures globally.
The term of the office of each HRC member is unlimited, and changes to its members must be approved bythe Chairman. Current members include the CEO (as Chairman of the Committee), COO, President and COO ofthe Wholesale Division, CFO, Chief Risk Officer, head of Corporate Office and heads of Human Resources.
(3) Regulatory developments and review of our compensation plans
The recent global financial crisis has resulted in enhanced regulatory requirements and oversight in many ofour key operating regions. During the fiscal year ended March 31, 2010, we completed a comprehensive reviewof our compensation programs and practices in light of changes to our business, the regulatory environment andthe broader competitive landscape.
We conducted this review with assistance from an independent compensation consulting firm, whichcontributed in the following areas:
• provided an overview of best compensation practice in the industry,
• conducted interviews with over 70 senior members of our management to understand the businesscontext, their views on existing compensation arrangements and potential areas for improvement,
• based on the outcome of the executive interviews, assisted in developing an overall approach for theNomura group and specific practices for the Wholesale business and
• provided market compensation data for the purpose of setting competitive benchmarks.
Based on above mentioned reviews, the new compensation programs have been developed to support ourbusiness strategy and growth, to better respond to the expectations of key stakeholders in the business includingemployees. These programs are aligned with the frameworks created by the Financial Stability Board as well asby regulators in key jurisdictions in which we operate.
We will continue to review our program and will adapt to changes as appropriate based on regulatory inputand guidance and our ever-changing competitive environment.
73
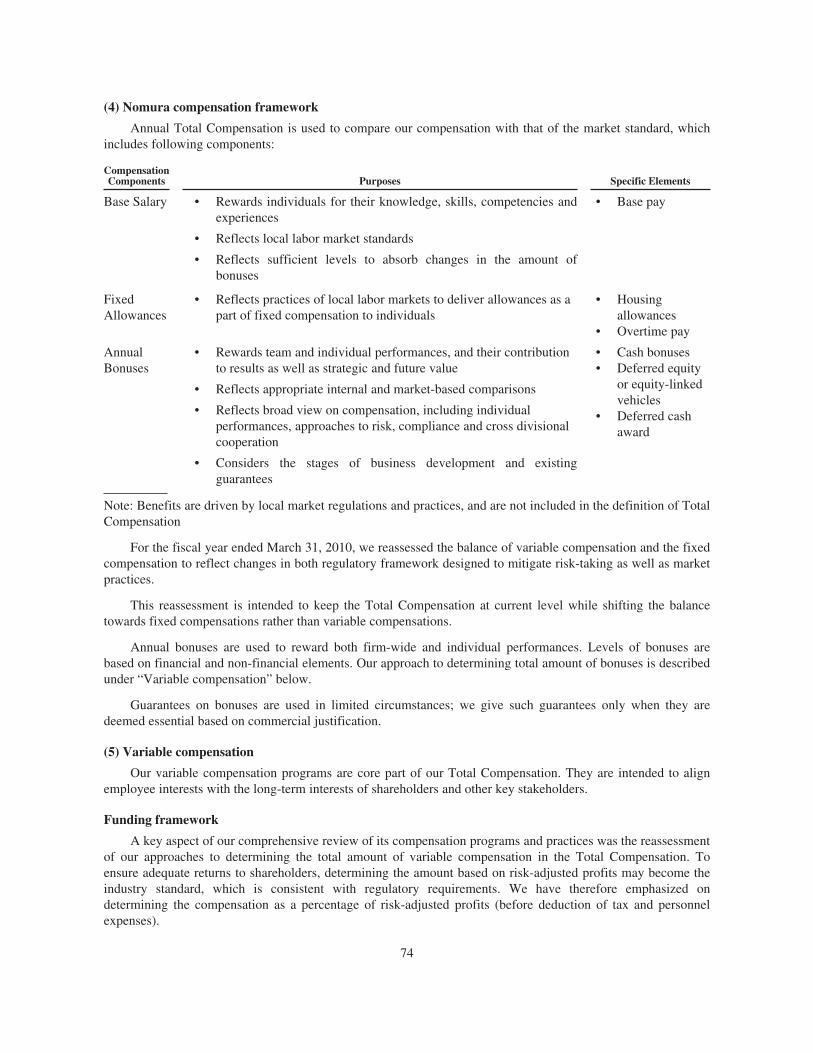
(4) Nomura compensation framework
Annual Total Compensation is used to compare our compensation with that of the market standard, whichincludes following components:
CompensationComponents Purposes Specific Elements
Base Salary • Rewards individuals for their knowledge, skills, competencies andexperiences
• Reflects local labor market standards
• Reflects sufficient levels to absorb changes in the amount ofbonuses
• Base pay
FixedAllowances
• Reflects practices of local labor markets to deliver allowances as apart of fixed compensation to individuals
• Housingallowances
• Overtime pay
AnnualBonuses
• Rewards team and individual performances, and their contributionto results as well as strategic and future value
• Reflects appropriate internal and market-based comparisons
• Reflects broad view on compensation, including individualperformances, approaches to risk, compliance and cross divisionalcooperation
• Considers the stages of business development and existingguarantees
• Cash bonuses• Deferred equity
or equity-linkedvehicles
• Deferred cashaward
Note: Benefits are driven by local market regulations and practices, and are not included in the definition of TotalCompensation
For the fiscal year ended March 31, 2010, we reassessed the balance of variable compensation and the fixedcompensation to reflect changes in both regulatory framework designed to mitigate risk-taking as well as marketpractices.
This reassessment is intended to keep the Total Compensation at current level while shifting the balancetowards fixed compensations rather than variable compensations.
Annual bonuses are used to reward both firm-wide and individual performances. Levels of bonuses arebased on financial and non-financial elements. Our approach to determining total amount of bonuses is describedunder “Variable compensation” below.
Guarantees on bonuses are used in limited circumstances; we give such guarantees only when they aredeemed essential based on commercial justification.
(5) Variable compensation
Our variable compensation programs are core part of our Total Compensation. They are intended to alignemployee interests with the long-term interests of shareholders and other key stakeholders.
Funding framework
A key aspect of our comprehensive review of its compensation programs and practices was the reassessmentof our approaches to determining the total amount of variable compensation in the Total Compensation. Toensure adequate returns to shareholders, determining the amount based on risk-adjusted profits may become theindustry standard, which is consistent with regulatory requirements. We have therefore emphasized ondetermining the compensation as a percentage of risk-adjusted profits (before deduction of tax and personnelexpenses).
74
Decisions are made with reference to payout ratios applicable to companies selected for the purpose ofcomparing. Such ratios differ among each business division. The companies for the comparison are determinedon the basis of similarity in terms of its businesses, size and scope, as well as geographical distribution. Wecompete against these companies to attract and retain the best talent for the development and growth of ourbusiness. On the other hand, determination of bonuses for control functions is made independently of bonuses forbusiness divisions.
During the investment phase of any business which we seek to develop, the actual bonus funding level willbe affected by budget targets, franchise building, capital usage, incentive guarantees and market conditions. It islikely to decrease over time as the business matures and will trend to a sustainable longer-term level.
Types of variable compensation plans
The core elements of variable compensation in the Nomura group are delivered in the following ways:
1. Cash bonus plan
A proportion of the annual bonus is delivered in the form of a cash payment made to the individualsfollowing the end of the fiscal year. The proportion of the annual bonuses that is delivered in cash decreases fromall cash at the lowest level of bonuses so that individuals with higher levels of bonuses receive a lower proportionin cash. This is in line with regulatory guidance, and while the policy is global in application, specific localregulatory requirements will be adhered to when deciding on proportions of the bonuses to be delivered in cash.
2. Equity-linked compensation plan
Certain senior management and employees whose annual bonus is above certain amount receive a part oftheir awards in the form of equity-linked plans. By linking the economic value to Nomura’s stock price withcertain vesting periods in place, such plans will:
• align employee interest with that of shareholders;
• increase employee retention through providing individual wealth creation potential over certain periodfrom the grant to vesting; and
• encourage cross-divisional and cross-regional collaboration by focusing individuals on a common goalof the mid- to long-term increase in corporate value.
With these benefits, equity-linked plans are also recommended by regulators of key jurisdictions in whichwe operate. Our equity-linked plans have the following variations.
(a) Notional Stock Unit (“NSU”) Plan
We introduced this plan globally for the fiscal year ended March 31, 2010. It is a cash-settled plan that hasbeen designed to replicate the key features of the Stock Option B Plan described below. The plan has beenintroduced primarily to deliver a proportion of the annual bonuses where the final value is linked to Nomura’sstock price. This allows equity-linked awards to be made in countries where stock options are less favourablytreated from tax or other perspectives.
(b) Stock Acquisition Rights
Nomura has issued the following two types of stock acquisition rights to certain employees as well as seniormanagement.
• Stock Option A Plan
Options are awarded with an exercise price higher than the Nomura stock price at the date of grant. There iscertain period set between the date of grant and the date of vesting. They are qualified as stock acquisitionrights under Japanese taxation laws and therefore have been issued mainly to employees in Japan.
75
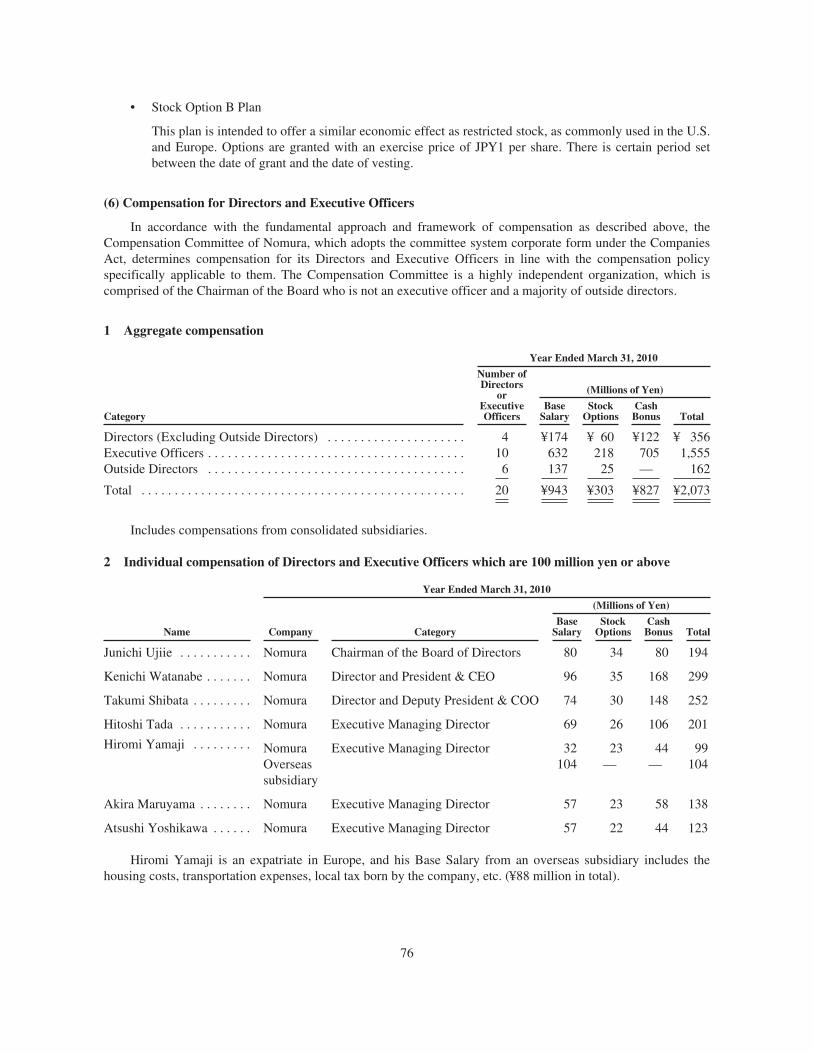
• Stock Option B Plan
This plan is intended to offer a similar economic effect as restricted stock, as commonly used in the U.S.and Europe. Options are granted with an exercise price of JPY1 per share. There is certain period setbetween the date of grant and the date of vesting.
(6) Compensation for Directors and Executive Officers
In accordance with the fundamental approach and framework of compensation as described above, theCompensation Committee of Nomura, which adopts the committee system corporate form under the CompaniesAct, determines compensation for its Directors and Executive Officers in line with the compensation policyspecifically applicable to them. The Compensation Committee is a highly independent organization, which iscomprised of the Chairman of the Board who is not an executive officer and a majority of outside directors.
1 Aggregate compensation
Year Ended March 31, 2010
Number ofDirectors
orExecutiveOfficers
(Millions of Yen)
CategoryBase
SalaryStock
OptionsCashBonus Total
Directors (Excluding Outside Directors) . . . . . . . . . . . . . . . . . . . . . 4 ¥174 ¥ 60 ¥122 ¥ 356Executive Officers . . . . . . . . . . . . . . . . . . . . . . . . . . . . . . . . . . . . . . . 10 632 218 705 1,555Outside Directors . . . . . . . . . . . . . . . . . . . . . . . . . . . . . . . . . . . . . . . 6 137 25 — 162
Total . . . . . . . . . . . . . . . . . . . . . . . . . . . . . . . . . . . . . . . . . . . . . . . . . 20 ¥943 ¥303 ¥827 ¥2,073
Includes compensations from consolidated subsidiaries.
2 Individual compensation of Directors and Executive Officers which are 100 million yen or above
Year Ended March 31, 2010
(Millions of Yen)
Name Company CategoryBase
SalaryStock
OptionsCashBonus Total
Junichi Ujiie . . . . . . . . . . . Nomura Chairman of the Board of Directors 80 34 80 194
Kenichi Watanabe . . . . . . . Nomura Director and President & CEO 96 35 168 299
Takumi Shibata . . . . . . . . . Nomura Director and Deputy President & COO 74 30 148 252
Hitoshi Tada . . . . . . . . . . . Nomura Executive Managing Director 69 26 106 201
Hiromi Yamaji . . . . . . . . . Nomura Executive Managing Director 32 23 44 99Overseassubsidiary
104 — — 104
Akira Maruyama . . . . . . . . Nomura Executive Managing Director 57 23 58 138
Atsushi Yoshikawa . . . . . . Nomura Executive Managing Director 57 22 44 123
Hiromi Yamaji is an expatriate in Europe, and his Base Salary from an overseas subsidiary includes thehousing costs, transportation expenses, local tax born by the company, etc. (¥88 million in total).
76
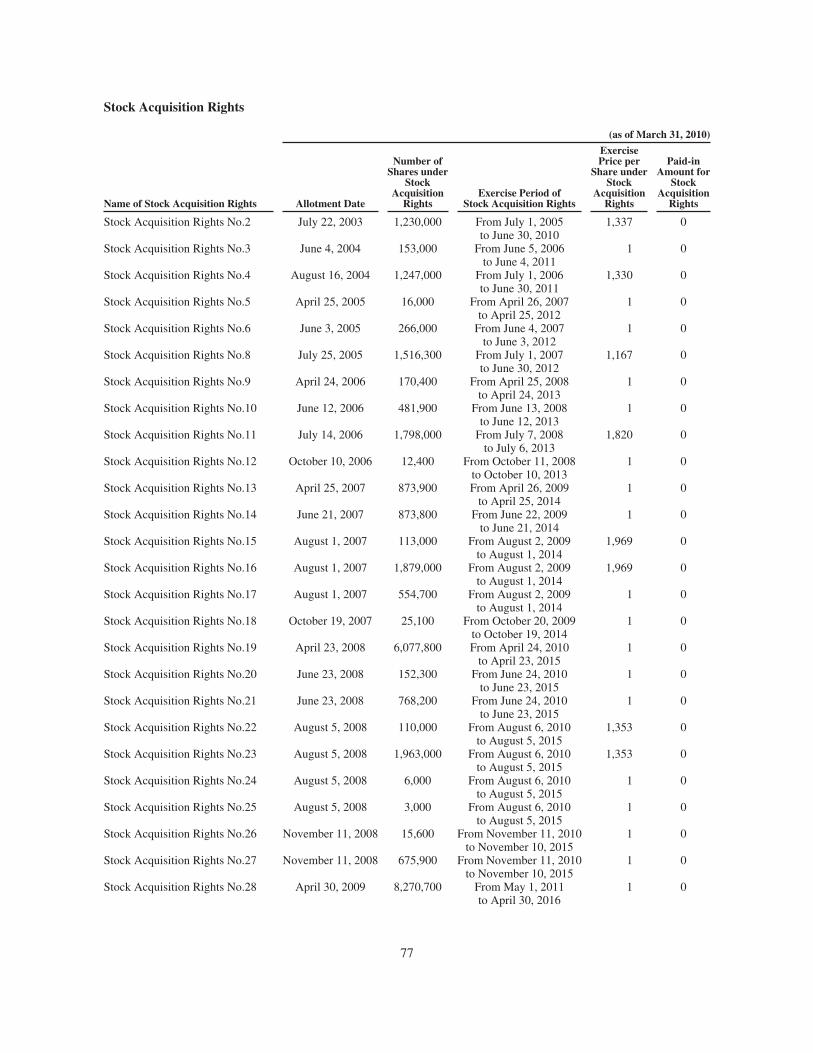
Stock Acquisition Rights
(as of March 31, 2010)
Name of Stock Acquisition Rights Allotment Date
Number ofShares under
StockAcquisition
RightsExercise Period of
Stock Acquisition Rights
ExercisePrice per
Share underStock
AcquisitionRights
Paid-inAmount for
StockAcquisition
Rights
Stock Acquisition Rights No.2 July 22, 2003 1,230,000 From July 1, 2005to June 30, 2010
1,337 0
Stock Acquisition Rights No.3 June 4, 2004 153,000 From June 5, 2006to June 4, 2011
1 0
Stock Acquisition Rights No.4 August 16, 2004 1,247,000 From July 1, 2006to June 30, 2011
1,330 0
Stock Acquisition Rights No.5 April 25, 2005 16,000 From April 26, 2007to April 25, 2012
1 0
Stock Acquisition Rights No.6 June 3, 2005 266,000 From June 4, 2007to June 3, 2012
1 0
Stock Acquisition Rights No.8 July 25, 2005 1,516,300 From July 1, 2007to June 30, 2012
1,167 0
Stock Acquisition Rights No.9 April 24, 2006 170,400 From April 25, 2008to April 24, 2013
1 0
Stock Acquisition Rights No.10 June 12, 2006 481,900 From June 13, 2008to June 12, 2013
1 0
Stock Acquisition Rights No.11 July 14, 2006 1,798,000 From July 7, 2008to July 6, 2013
1,820 0
Stock Acquisition Rights No.12 October 10, 2006 12,400 From October 11, 2008to October 10, 2013
1 0
Stock Acquisition Rights No.13 April 25, 2007 873,900 From April 26, 2009to April 25, 2014
1 0
Stock Acquisition Rights No.14 June 21, 2007 873,800 From June 22, 2009to June 21, 2014
1 0
Stock Acquisition Rights No.15 August 1, 2007 113,000 From August 2, 2009to August 1, 2014
1,969 0
Stock Acquisition Rights No.16 August 1, 2007 1,879,000 From August 2, 2009to August 1, 2014
1,969 0
Stock Acquisition Rights No.17 August 1, 2007 554,700 From August 2, 2009to August 1, 2014
1 0
Stock Acquisition Rights No.18 October 19, 2007 25,100 From October 20, 2009to October 19, 2014
1 0
Stock Acquisition Rights No.19 April 23, 2008 6,077,800 From April 24, 2010to April 23, 2015
1 0
Stock Acquisition Rights No.20 June 23, 2008 152,300 From June 24, 2010to June 23, 2015
1 0
Stock Acquisition Rights No.21 June 23, 2008 768,200 From June 24, 2010to June 23, 2015
1 0
Stock Acquisition Rights No.22 August 5, 2008 110,000 From August 6, 2010to August 5, 2015
1,353 0
Stock Acquisition Rights No.23 August 5, 2008 1,963,000 From August 6, 2010to August 5, 2015
1,353 0
Stock Acquisition Rights No.24 August 5, 2008 6,000 From August 6, 2010to August 5, 2015
1 0
Stock Acquisition Rights No.25 August 5, 2008 3,000 From August 6, 2010to August 5, 2015
1 0
Stock Acquisition Rights No.26 November 11, 2008 15,600 From November 11, 2010to November 10, 2015
1 0
Stock Acquisition Rights No.27 November 11, 2008 675,900 From November 11, 2010to November 10, 2015
1 0
Stock Acquisition Rights No.28 April 30, 2009 8,270,700 From May 1, 2011to April 30, 2016
1 0
77
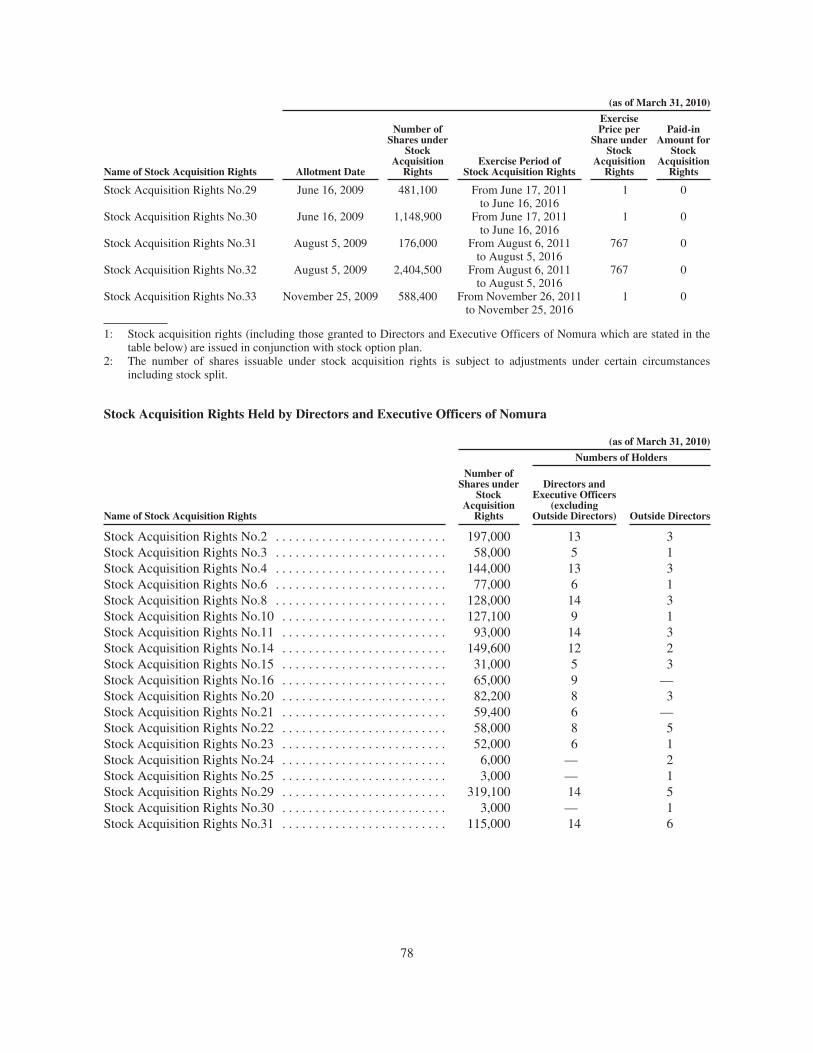
(as of March 31, 2010)
Name of Stock Acquisition Rights Allotment Date
Number ofShares under
StockAcquisition
RightsExercise Period of
Stock Acquisition Rights
ExercisePrice per
Share underStock
AcquisitionRights
Paid-inAmount for
StockAcquisition
Rights
Stock Acquisition Rights No.29 June 16, 2009 481,100 From June 17, 2011to June 16, 2016
1 0
Stock Acquisition Rights No.30 June 16, 2009 1,148,900 From June 17, 2011to June 16, 2016
1 0
Stock Acquisition Rights No.31 August 5, 2009 176,000 From August 6, 2011to August 5, 2016
767 0
Stock Acquisition Rights No.32 August 5, 2009 2,404,500 From August 6, 2011to August 5, 2016
767 0
Stock Acquisition Rights No.33 November 25, 2009 588,400 From November 26, 2011to November 25, 2016
1 0
1: Stock acquisition rights (including those granted to Directors and Executive Officers of Nomura which are stated in thetable below) are issued in conjunction with stock option plan.
2: The number of shares issuable under stock acquisition rights is subject to adjustments under certain circumstancesincluding stock split.
Stock Acquisition Rights Held by Directors and Executive Officers of Nomura
(as of March 31, 2010)
Numbers of Holders
Name of Stock Acquisition Rights
Number ofShares under
StockAcquisition
Rights
Directors andExecutive Officers
(excludingOutside Directors) Outside Directors
Stock Acquisition Rights No.2 . . . . . . . . . . . . . . . . . . . . . . . . . . 197,000 13 3Stock Acquisition Rights No.3 . . . . . . . . . . . . . . . . . . . . . . . . . . 58,000 5 1Stock Acquisition Rights No.4 . . . . . . . . . . . . . . . . . . . . . . . . . . 144,000 13 3Stock Acquisition Rights No.6 . . . . . . . . . . . . . . . . . . . . . . . . . . 77,000 6 1Stock Acquisition Rights No.8 . . . . . . . . . . . . . . . . . . . . . . . . . . 128,000 14 3Stock Acquisition Rights No.10 . . . . . . . . . . . . . . . . . . . . . . . . . 127,100 9 1Stock Acquisition Rights No.11 . . . . . . . . . . . . . . . . . . . . . . . . . 93,000 14 3Stock Acquisition Rights No.14 . . . . . . . . . . . . . . . . . . . . . . . . . 149,600 12 2Stock Acquisition Rights No.15 . . . . . . . . . . . . . . . . . . . . . . . . . 31,000 5 3Stock Acquisition Rights No.16 . . . . . . . . . . . . . . . . . . . . . . . . . 65,000 9 —Stock Acquisition Rights No.20 . . . . . . . . . . . . . . . . . . . . . . . . . 82,200 8 3Stock Acquisition Rights No.21 . . . . . . . . . . . . . . . . . . . . . . . . . 59,400 6 —Stock Acquisition Rights No.22 . . . . . . . . . . . . . . . . . . . . . . . . . 58,000 8 5Stock Acquisition Rights No.23 . . . . . . . . . . . . . . . . . . . . . . . . . 52,000 6 1Stock Acquisition Rights No.24 . . . . . . . . . . . . . . . . . . . . . . . . . 6,000 — 2Stock Acquisition Rights No.25 . . . . . . . . . . . . . . . . . . . . . . . . . 3,000 — 1Stock Acquisition Rights No.29 . . . . . . . . . . . . . . . . . . . . . . . . . 319,100 14 5Stock Acquisition Rights No.30 . . . . . . . . . . . . . . . . . . . . . . . . . 3,000 — 1Stock Acquisition Rights No.31 . . . . . . . . . . . . . . . . . . . . . . . . . 115,000 14 6
78
Pension, Retirement Or Similar Benefits
See Note 14 “Employee benefit plans”.
C. Board Practices.
Information Concerning Our Directors
Under the Companies Act, joint stock companies in Japan have the option of choosing committee-basedcorporate governance system (“Committee System”) that consists of board of directors and committees or atraditional corporate governance system that consists of board of directors and board of statutory auditors. Acompany which chooses the Committee System must establish three committees: a nomination committee, anaudit committee and a compensation committee. The members of each committee are chosen from thecompany’s directors. A majority of each committee must be outside directors who are not executive officers ofthe company. The company must then appoint executive officers and representative executive officers by aresolution of the board of directors. Under the Committee System, the executive officers manage the businessaffairs of a company. While the board of directors is entitled to establish the basic management policy for thecompany and has decision-making authority over certain prescribed matters, all other decisions related tobusiness affairs may be made by executive officers.
We adopted the Committee System by amending our Articles of Incorporation by way of a specialresolution adopted at our annual meeting of shareholders held on June 26, 2003. Our Board of Directorsestablished three committees, a Nomination Committee, an Audit Committee and a Compensation Committee, asdescribed below. Through the adoption of the Committee System, we aim to strengthen management oversight,increase transparency in our management and have more flexible group operations. Our Board of Directors hasthe authority to determine our basic management policy and supervise the execution by the Directors andExecutive Officers of their duties. Our Board of Directors has, by resolution, delegated to our Executive Officersmost of its authority to make decisions with regard to our company’s business.
Our Articles of Incorporation provide for the number of Directors to be not more than 20. Directors areelected at a meeting of shareholders. The term of office of Directors is one year, although they may serve anynumber of consecutive terms. From among its members, our Board of Directors elects the Chairman of meetings.Our Board of Directors met 10 times during the fiscal year ended March 31, 2010. As a group, our Directorsattended approximately 87% of the total number of meetings of our Board of Directors during the year.
Compensation Committee
Our Compensation Committee is authorized to determine the policy with respect to the determination of theparticulars of the compensation for each Director and Executive Officer, and the particulars of the compensationfor each Director and Executive Officer. This committee’s current members are Junichi Ujiie, Hideaki Kuboriand Masahiro Sakane. Junichi Ujiie is the Chairman of this committee. Our Compensation Committee met fivetimes during the fiscal year ended March 31, 2010. As a group, the member Directors attended approximately90% of the total number of meetings of our Compensation Committee during the year.
Nomination Committee
Our Nomination Committee is authorized to determine the particulars of proposals concerning the electionand dismissal of Directors to be submitted to a general meeting of shareholders by our Board of Directors. Thiscommittee’s current members are Junichi Ujiie, Hideaki Kubori and Masahiro Sakane. Junichi Ujiie is theChairman of this committee. Our Nomination Committee met three times during the fiscal year ended March 31,2010. As a group, the member Directors attended approximately 90% of the total number of meetings of ourNomination Committee during the year.
79
Audit Committee
We have an Audit Committee that, according to our Articles of Incorporation, is authorized to (i) audit theexecution by the Directors and the Executive Officers of their duties and formulation of audit reports and(ii) determine the particulars of proposals concerning the election and dismissal of the independent auditors andthe non-retention of such independent auditors to be submitted to a general meeting of shareholders by our Boardof Directors. With respect to financial reporting, our Audit Committee has the statutory duty to examine ourfinancial statements and business reports to be prepared by Executive Officers designated by our Board ofDirectors and is authorized to report its opinion to the annual meeting of shareholders. In addition, pursuant toour Regulations of the Audit Committee or resolutions of the Board of Directors concerning matters to benecessary for the performance of functions of the Audit Committee, our Audit Committee has the authority to(i) pre-approve audit or non-audit services provided by the independent auditors for SEC reporting purposes andtheir fees, (ii) fees for independent auditors, (iii) establish the procedures for (a) the receipt, retention, andtreatment of complaints received by us regarding accounting, internal controls, or auditing matters and (b) theconfidential, anonymous submission by our employees regarding questionable accounting or auditing matters,(iv) approve the annual audit plan of the independent auditors.
This committee is currently composed of Haruo Tsuji, Tsuguoki Fujinuma and Hajime Sawabe. Haruo Tsujiis the Chairman of this committee. Our Audit Committee met 22 times during the fiscal year ended March 31,2010. As a group, the member Directors attended approximately 95% of the total number of meetings of ourAudit Committee during the year.
Limitation of Liabilities of Outside Directors
We have entered into agreements with our Outside Directors, Hideaki Kubori, Haruo Tsuji, MasahiroSakane, Tsuguoki Fujinuma, Hajime Sawabe, Lord Colin Marshall and Dame Clara Furse that limit theirliabilities to us for damages suffered by us due to their acts taken in good faith and without gross negligence, upto the higher of (a) ¥20 million or (b) the amount prescribed by laws and ordinances.
Information Concerning Our Executive Officers
Our Articles of Incorporation provide for the number of the Executive Officers to be not more than 45.Executive Officers are elected at a meeting of our Board of Directors. The term of office of Executive Officers isone year, although they may serve any number of consecutive terms. Our Executive Officers have the authorityto determine the matters delegated by the resolutions of our Board of Directors and to execute our businessactivities.
Rights of ADR Holders
The rights of ADR holders, including their rights to corporate governance practices, are governed by theDeposit Agreement which is an exhibit to this annual report. See also “Rights of Holders of ADSs” underItem 10.B of our Registration Statement on Form 20-F (File No. 1-15270), which we filed with the Securities andExchange Commission on December 13, 2001. The information contained in that part of the RegistrationStatement is incorporated in Item 10.B of this annual report by reference. For fees and charges that a holder ofNomura’s ADSs may have to pay, see “Description of Securities Other Than Equity Securities” under Item 12 ofthis annual report.
80
D. Employees
The following table shows the number of our employees as of the dates indicated:
As of March 31,
2008 2009 2010
Japan . . . . . . . . . . . . . . . . . . . . . . . . . . . . . . . . . . . . . . . . . . . . . . . . . . . . . . . . . . . . . . . . 13,938 15,320 15,053Europe . . . . . . . . . . . . . . . . . . . . . . . . . . . . . . . . . . . . . . . . . . . . . . . . . . . . . . . . . . . . . . 1,955 4,294 4,369Americas . . . . . . . . . . . . . . . . . . . . . . . . . . . . . . . . . . . . . . . . . . . . . . . . . . . . . . . . . . . . . 1,063 1,079 1,781Asia Pacific (excluding Japan), India and Oceania . . . . . . . . . . . . . . . . . . . . . . . . . . . . 1,070 4,933 5,171
Total . . . . . . . . . . . . . . . . . . . . . . . . . . . . . . . . . . . . . . . . . . . . . . . . . . . . . . . . . . . . 18,026 25,626 26,374
As of March 31, 2010, we had 15,053 employees in Japan, including 9,695 of Retail Division, 922 of GlobalMarkets Division, 982 of Investment Banking Division, 45 of Merchant Banking Division and 991 of AssetManagement Division. (Note: As of the submission date, Nomura Group has three Divisions of Retail, Wholesaleand Asset Management, in lieu of the above five Divisions.)
As of March 31, 2010, 8,332 of Nomura Securities’ employees in Japan were members of Nomuraemployees’ union, with which we have a labor contract. Between the company and the labor union, we had beenholding constant discussions to make solutions on labor related matters.
Overseas, we had 11,321 employees, of which 4,369 were located in Europe, 1,781 in the Americas, and5,171 in Asia Pacific (excluding Japan), India and Oceania.
We have not experienced any strikes or other labor disputes in Japan as well as overseas and consider ouremployee relations to be excellent.
E. Share Ownership.
The following table shows the number of shares owned by our Directors and Executive Officers as ofJune 29, 2010. As of that date, none of them owned 1% or more of our issued and outstanding shares. None ofthe shares referred to below have different voting rights.
Directors
NameNumber of
Shareholdings
Junichi Ujiie . . . . . . . . . . . . . . . . . . . . . . . . . . . . . . . . . . . . . . . . . . . . . . . . . . . . . . . . . . . . . . . . . . . . . 198,902Kenichi Watanabe . . . . . . . . . . . . . . . . . . . . . . . . . . . . . . . . . . . . . . . . . . . . . . . . . . . . . . . . . . . . . . . . 20,197Takumi Shibata . . . . . . . . . . . . . . . . . . . . . . . . . . . . . . . . . . . . . . . . . . . . . . . . . . . . . . . . . . . . . . . . . . 78,125Masanori Itatani . . . . . . . . . . . . . . . . . . . . . . . . . . . . . . . . . . . . . . . . . . . . . . . . . . . . . . . . . . . . . . . . . . 80,416Masanori Nishimatsu . . . . . . . . . . . . . . . . . . . . . . . . . . . . . . . . . . . . . . . . . . . . . . . . . . . . . . . . . . . . . . 49,000Haruo Tsuji . . . . . . . . . . . . . . . . . . . . . . . . . . . . . . . . . . . . . . . . . . . . . . . . . . . . . . . . . . . . . . . . . . . . . 14,000Hajime Sawabe . . . . . . . . . . . . . . . . . . . . . . . . . . . . . . . . . . . . . . . . . . . . . . . . . . . . . . . . . . . . . . . . . . 1,000Hideaki Kubori . . . . . . . . . . . . . . . . . . . . . . . . . . . . . . . . . . . . . . . . . . . . . . . . . . . . . . . . . . . . . . . . . . 6,000Tsuguoki Fujinuma . . . . . . . . . . . . . . . . . . . . . . . . . . . . . . . . . . . . . . . . . . . . . . . . . . . . . . . . . . . . . . . 6,456Masahiro Sakane . . . . . . . . . . . . . . . . . . . . . . . . . . . . . . . . . . . . . . . . . . . . . . . . . . . . . . . . . . . . . . . . . 3,400Lord Colin Marshall . . . . . . . . . . . . . . . . . . . . . . . . . . . . . . . . . . . . . . . . . . . . . . . . . . . . . . . . . . . . . . 0Dame Clara Furse . . . . . . . . . . . . . . . . . . . . . . . . . . . . . . . . . . . . . . . . . . . . . . . . . . . . . . . . . . . . . . . . 0
Total . . . . . . . . . . . . . . . . . . . . . . . . . . . . . . . . . . . . . . . . . . . . . . . . . . . . . . . . . . . . . . . . . . . . . . . . . . . 457,496
81
Executive Officers
NameNumber of
Shareholdings
Kenichi Watanabe . . . . . . . . . . . . . . . . . . . . . . . . . . . . . . . . . . . . . . . . . . . . . . . . . . . . . . . . . . . . . . . . See aboveTakumi Shibata . . . . . . . . . . . . . . . . . . . . . . . . . . . . . . . . . . . . . . . . . . . . . . . . . . . . . . . . . . . . . . . . . . See aboveHitoshi Tada . . . . . . . . . . . . . . . . . . . . . . . . . . . . . . . . . . . . . . . . . . . . . . . . . . . . . . . . . . . . . . . . . . . . 73,815Atsushi Yoshikawa . . . . . . . . . . . . . . . . . . . . . . . . . . . . . . . . . . . . . . . . . . . . . . . . . . . . . . . . . . . . . . . 34,897Hiroshi Tanaka . . . . . . . . . . . . . . . . . . . . . . . . . . . . . . . . . . . . . . . . . . . . . . . . . . . . . . . . . . . . . . . . . . 32,284Masafumi Nakada . . . . . . . . . . . . . . . . . . . . . . . . . . . . . . . . . . . . . . . . . . . . . . . . . . . . . . . . . . . . . . . . 3,203Noriaki Nagai . . . . . . . . . . . . . . . . . . . . . . . . . . . . . . . . . . . . . . . . . . . . . . . . . . . . . . . . . . . . . . . . . . . . 10,800
Total . . . . . . . . . . . . . . . . . . . . . . . . . . . . . . . . . . . . . . . . . . . . . . . . . . . . . . . . . . . . . . . . . . . . . . . . . . . 253,321
For information regarding stock options granted to our Directors and Executive Officers, see “Equity-linkedcompensation plan” under Item 6.B of this annual report.
Item 7. Major Shareholders and Related Party Transactions
A. Major Shareholders.
The following table shows our major shareholder who is the beneficial owner holding more than 5% of ouroutstanding common stock as of March 31, 2010.
Names of ShareholdersNumber of Shares Owned and
Percentage of Voting Right
(in thousand shares) (%)
Japan Trustee Services Bank, Ltd. (Trust Account) . . . . . . . . . . . . . . . . . . . . . . . . . . . . 204,709 5.50
To our knowledge, we are not directly or indirectly owned or controlled by another corporation, by anygovernment or by any other natural or legal person severally or jointly. We know of no arrangements theoperation of which may at a later time result in a change of control of Nomura. Also as of March 31, 2010, therewere 267 record shareholders of Nomura with addresses in the United States, and those U.S. holders held677,273,470 shares of Nomura’s common stock, representing 18.2% of Nomura’s then outstanding commonstock. As of March 31, 2010, there were 66,855,920 ADSs outstanding, representing 66,855,920 shares ofNomura’s common stock or 1.8% of Nomura’s then outstanding common stock. Our major shareholders abovedo not have different voting rights.
B. Related Party Transactions.
Nomura Land and Building Co., Ltd.
Nomura Land and Building Co., Ltd. (“NLB”) currently owns some of our leased office space in Japan. Weheld 38.5% of NLB’s outstanding share capital as of March 31, 2010.
Other major shareholders of NLB were Nomura Research Institute, Ltd. (“NRI”), holding 19.2%, andJAFCO Co., Ltd., holding 19.2%.
For the year ended March 31, 2010, we paid ¥4,531 million in rent to NLB. As of March 31, 2010, we had¥6,541 million in lease deposits with NLB.
Nomura Research Institute, Ltd.
NRI develops and manages computer systems and provides research services and management consultingservices. We are one of the major customers of NRI.
We held 38.5% of NRI’s outstanding share capital as of March 31, 2010.
82
For the year ended March 31, 2010, we purchased ¥25,954 million worth of software and computerequipment, and paid NRI ¥56,889 million for other services.
Directors
Fumihide Nomura, who resigned his post as our director on June 25, 2010, serves as President of NomuraShokusan Co., Ltd. (“Shokusan”) incorporated in Japan, which is principally engaged in real-estate leasing.Shokusan leases commercial properties to our subsidiary, Nomura Facilities, Inc. During the year endedMarch 31, 2010, Nomura Facilities, Inc. had paid ¥420 million for the rent to Shokusan. This transaction was inthe ordinary course of business and on substantially the same terms as those prevailing at the time for comparabletransactions with unrelated third parties. We hold approximately 0.9% of Shokusan’s outstanding stocks.
C. Interests of Experts and Counsel.
Not applicable.
Item 8. Financial Information
A. Consolidated Statements and Other Financial Information.
Financial Statements
The information required by this item is set forth in our consolidated financial statements includedelsewhere in this annual report.
Legal Proceedings
We are involved in a number of actions and proceedings in Japan and overseas, which are either ordinaryroutine actions and proceedings incidental to our business or not material to us. Based upon the informationcurrently available to us and our domestic and overseas legal counsel, we believe that the ultimate resolution ofsuch actions and proceedings will not, in the aggregate, have a material adverse effect on our financial conditionor results of our operations.
In April 2009, WestLB AG (“WestLB”) served proceedings on NIP and Nomura Bank International Plc(“NBI”), claiming that under the terms of a note issued by NBI and maturing in October 2008, WestLB wereentitled to receive approximately $22 million, which it claims to be the value of a fund of shares referable to theNBI note. NIP, in its role as calculation agent, and NBI reject this claim and are vigorously defending the action.
In January 2008, NIP was served with a tax notice issued by the tax authorities in Pescara, Italy allegingbreaches by NIP of the U.K.-Italy Double Taxation Treaty of 1998. The alleged breaches relate to payments toNIP of tax credits on dividends on Italian shares. The tax notice not only denies certain payments to which NIPclaims to be entitled but is also seeking reimbursement of EUR33.8 million, including interest, already refunded.In March 2008, NIP lodged an appeal against the Tax Notice rejecting the Italian tax authorities’ demands forreimbursement and in November 2009 a decision was issued by the Pescara Tax Court in favour of the ItalianTax Authorities. NIP intends vigorously to challenge this decision.
NIP is currently being challenged by the U.K. tax authorities with regard to the tax treatment of an offshorepension plan established for the employees of Nomura Employment Services (Isle of Man) Limited. The U.K. taxauthorities are seeking to recover approximately £22 million from NIP on the basis that NIP was the trueemployer of individuals participating in the offshore pension plan. We believe that the position taken by the U.K.tax authorities is erroneous. NIP has lodged the necessary appeals.
83
After the collapse of Lehman Brothers in September 2008, Nomura Securities Co., Ltd. (“NSC”), NIP andNomura Global Financial Products Inc. filed proofs of claim against the bankruptcy estates of Lehman BrothersHoldings Inc. and Lehman Brothers Special Financing Inc. (collectively, “Lehman Inc.”), in respect of swaps andother derivative transactions in the total amount of approximately U.S.$ 1 billion (“the Claims”). In April 2010,Lehman Inc. commenced proceedings in the U.S. Bankruptcy Court in New York objecting to the Claims and, inthe case of NSC and NIP, seeking to recover damages. The subsidiaries intend vigorously to contest theseproceedings.
Nomura supports the position of its subsidiaries in each of these claims.
Dividend Policy
For our dividend policy, see “Capital Management—Dividends” under Item 5.B of this annual report.
B. Significant Changes.
Except as disclosed in this annual report, there have been no significant changes since March 31, 2010.
Item 9. The Offer and Listing
A. Offer and Listing Details.
Price History
The following table sets forth, for the periods indicated, the reported high and low sale prices of ourcommon stock on the Tokyo Stock Exchange and the reported high and low share prices of our ADS on NewYork Stock Exchange.
Tokyo Stock ExchangePrice Per Share of
Common StockNew York Stock Exchange
Price Per Share of ADS
Year ended March 31, High Low High Low
Annual highs and lows2006 . . . . . . . . . . . . . . . . . . . . . . . . . . . . . . . . . . . . . . . . . . . . . 2,630 1,295 22.43 11.652007 . . . . . . . . . . . . . . . . . . . . . . . . . . . . . . . . . . . . . . . . . . . . . 2,870 1,843 24.30 15.632008 . . . . . . . . . . . . . . . . . . . . . . . . . . . . . . . . . . . . . . . . . . . . . 2,580 1,395 21.05 13.082009 . . . . . . . . . . . . . . . . . . . . . . . . . . . . . . . . . . . . . . . . . . . . . 1,918 403 17.89 3.962010 . . . . . . . . . . . . . . . . . . . . . . . . . . . . . . . . . . . . . . . . . . . . . 934 498 9.50 5.35
Quarterly highs and lows2009
First Quarter . . . . . . . . . . . . . . . . . . . . . . . . . . . . . . . . . . 1,918 1,475 17.89 14.29Second Quarter . . . . . . . . . . . . . . . . . . . . . . . . . . . . . . . . 1,695 1,176 16.55 10.94Third Quarter . . . . . . . . . . . . . . . . . . . . . . . . . . . . . . . . . . 1,430 586 14.35 6.18Fourth Quarter . . . . . . . . . . . . . . . . . . . . . . . . . . . . . . . . . 776 403 8.50 3.96
2010First Quarter . . . . . . . . . . . . . . . . . . . . . . . . . . . . . . . . . . 934 498 9.50 5.03Second Quarter . . . . . . . . . . . . . . . . . . . . . . . . . . . . . . . . 850 522 9.01 5.79Third Quarter . . . . . . . . . . . . . . . . . . . . . . . . . . . . . . . . . . 717 515 8.02 5.80Fourth Quarter . . . . . . . . . . . . . . . . . . . . . . . . . . . . . . . . . 783 631 8.58 6.97
Monthly highs and lows2010 (calendar year)
January . . . . . . . . . . . . . . . . . . . . . . . . . . . . . . . . . . . . . . . 783 681 8.58 7.35February . . . . . . . . . . . . . . . . . . . . . . . . . . . . . . . . . . . . . . 715 631 7.90 6.97March . . . . . . . . . . . . . . . . . . . . . . . . . . . . . . . . . . . . . . . . 708 631 7.69 7.13April . . . . . . . . . . . . . . . . . . . . . . . . . . . . . . . . . . . . . . . . . 717 647 7.67 6.77May . . . . . . . . . . . . . . . . . . . . . . . . . . . . . . . . . . . . . . . . . 641 544 7.11 5.99June (through June 28) . . . . . . . . . . . . . . . . . . . . . . . . . . 572 504 6.22 5.59
84
B. Plan of Distribution.
Not applicable.
C. Markets.
The principal trading market for our Common Stock is the Tokyo Stock Exchange, Inc. Our Common Stockhas been listed on the Tokyo Stock Exchange, Inc., the Osaka Securities Exchange Co., Ltd. and the NagoyaStock Exchange, Inc. since 1961.
In December 2001, we listed our Common Stock on New York Stock Exchange in the form of ADSsevidenced by ADRs. Each ADS represents one share of Common Stock. Our Common Stock has been listed onthe Singapore Stock Exchange since 1994.
D. Selling Shareholders.
Not applicable.
E. Dilution.
Not applicable.
F. Expenses of the Issue.
Not applicable.
Item 10. Additional Information
A. Share Capital.
Not applicable.
B. Memorandum and Articles of Association.
Objects and Purposes in Nomura’s Articles of Incorporation
Article 2 of our Articles of Incorporation, which is an exhibit to this annual report, states our objects andpurposes.
Provisions Regarding Our Directors
There is no provision in our Articles of Incorporation as to a Director’s power to vote on a proposal orarrangement in which the Director is materially interested, but, under the Companies Act and our Regulations ofthe Board of Directors, a Director must abstain from voting on such matters at meetings of the Board ofDirectors.
The Companies Act provides that, under the Committee System, the compensation committee determinesthe compensation for directors and executive officers. The compensation committee must first establish a policywith respect to the determination of the individual compensation of each director and executive officer and thenfor each individual case determine the amount of compensation, the calculation method as to variablecompensation and/or define components of non-monetary compensation for each director and executive officerin accordance with the established policy.
85
Pursuant to the Companies Act, under the Committee System, the board of directors may delegate toexecutive officers powers regarding the incurrence by a company of a significant loan from a third party. OurExecutive Officers are delegated such powers by our Board of Directors.
There is no mandatory retirement age for our Directors under the Companies Act or our Articles ofIncorporation.
There is no requirement concerning the number of shares an individual must hold in order to qualify him orher as a Director of Nomura under the Companies Act or our Articles of Incorporation.
Pursuant to the Companies Act and our Articles of Incorporation, we may, by resolution of our Board ofDirectors, release the liabilities of any Directors or Executive Officers to us for damages suffered by us due totheir acts taken in good faith and without gross negligence, to the extent permitted by the Companies Act and ourArticles of Incorporation. In addition, we may execute with outside Directors agreements that limit theirliabilities to us for damages suffered by us due to their acts in good faith and without gross negligence, to theextent permitted by the Companies Act and our Articles of Incorporation. See “Limitation of Liabilities ofOutside Directors” under Item 6.C above.
Holding of Our Shares by Foreign Investors
Other than the Japanese unit share system that is described in “Common Stock—Japanese Unit ShareSystem” below, there are no limitations on the rights of non-residents or foreign shareholders to hold or exercisevoting rights on our shares imposed by the laws or our Articles of Incorporation or our other constituentdocuments.
Common Stock
The following is a description of material features of our shares of common stock, including briefsummaries of the material provisions of our Articles of Incorporation and Share Handling Regulations, ascurrently in effect, and of the Companies Act and related legislation. In this “Common Stock” section, unless thecontext otherwise requires, “shares” means shares of our common stock and “shareholders” means holders ofshares of our common stock.
General
Under our Articles of Incorporation, the authorized share capital is 6,000,000,000 shares, of which3,719,133,241 shares were issued as of March 31, 2010. All issued shares are fully-paid and non-assessable, andare in registered form.
On January 5, 2009, a new central clearing system for shares of Japanese listed companies was establishedpursuant to the Law Concerning Book-Entry Transfer of Corporate Bonds, Stocks, etc. (including regulationspromulgated thereunder; the “Book-Entry Law”), and the shares of all Japanese companies listed on anyJapanese stock exchange, including our shares, became subject to this new system. On the same day, all existingshare certificates for such shares became null and void. At present, Japan Securities Depository Center, Inc.(“JASDEC”) is the only institution that is designated by the relevant authorities as a clearing house which ispermitted to engage in the clearing operations of shares of Japanese listed companies under the Book-Entry Law.Under the new clearing system, in order for any person to hold, sell or otherwise dispose of shares of Japaneselisted companies, they must have an account at an account managing institution unless such person has anaccount at JASDEC. “Account managing institutions” are financial instruments traders (i.e., securitiescompanies), banks, trust companies and certain other financial institutions which meet the requirementsprescribed by the Book-Entry Law, and only those financial institutions that meet further stringent requirementsof the Book-Entry Law can open accounts directly at JASDEC. For purposes of the description under this“Common Stock” section, we assume that the relevant person has no account at JASDEC.
86
Under the Book-Entry Law, any transfer of shares is effected through book-entry, and title to the sharespasses to the transferee at the time when the transferred number of the shares is recorded in the transferee’saccount by an account managing institution. The holder of an account at an account managing institution ispresumed to be the legal owner of the shares held in such account.
Under the Companies Act and the Book-Entry Law, in order to assert shareholders’ rights against us, ashareholder must have its name and address registered in our register of shareholders, except in limitedcircumstances. Under the new clearing system, such registration is generally made upon our receipt of necessaryinformation from JASDEC. See “Share Registrar” and “Record Date” below.
Non-resident shareholders are required to appoint a standing proxy in Japan or provide a mailing address inJapan. Each such shareholder must give notice of such standing proxy or mailing address to the relevant accountmanaging institution. Such notice will be forwarded to us through JASDEC. Japanese securities companies andcommercial banks customarily act as standing proxies and provide related services for standard fees. Noticesfrom us to non-resident shareholders are delivered to such standing proxies or mailing addresses.
The registered beneficial holder of deposited shares underlying the ADSs is the depositary for the ADSs.Accordingly, holders of ADSs will not be able to directly assert shareholders’ rights.
Dividends
Under the Companies Act, distributions of cash or other assets by joint stock corporations to theirshareholders, so called “dividends,” are referred to as “distribution of Surplus” (“Surplus” is defined in“Restriction on Distributions of Surplus” below). We may make distributions of Surplus to the shareholders anynumber of times per fiscal year, subject to certain limitations described in “Restriction on Distributions ofSurplus.” Under the Companies Act, distributions of Surplus are required in principle to be authorized by aresolution of a meeting of shareholders. However, our Articles of Incorporation, in accordance with theCompanies Act, provide that our Board of Directors has the authority to make decisions regarding distributionsof Surplus except for limited exceptions as provided by the Companies Act, since we have satisfied the followingrequirements:
(a) the normal term of office of our Directors terminates on or prior to the date of conclusion of the annualmeeting of shareholders relating to the last fiscal year ending within the period of one year from theelection of the Directors; and
(b) our non-consolidated annual financial statements and certain documents for the last fiscal year presentfairly our assets and profit or loss, as required by the ordinances of the Ministry of Justice.
Under our Articles of Incorporation, dividends, if any, may be distributed to shareholders (or pledgees)appearing in the register of shareholders as of June 30, September 30, December 31 or March 31 of each yearpursuant to a resolution of our Board of Directors. In addition, under the Companies Act and our Articles ofIncorporation, we may (but are not obligated to) make further distributions of Surplus by resolution of our Boardof Directors. However, we may decide not to pay dividends to shareholders of our stocks of any record dateregardless of the amount of Surplus we have.
Under our Articles of Incorporation, we are not obliged to pay any dividends that are left unclaimed for aperiod of three years after the date on which they first became payable.
Distributions of Surplus may be distributed in cash or in kind in proportion to the number of shares held byeach shareholder. A resolution of our Board of Directors authorizing a distribution of Surplus must specify thekind and aggregate book value of the assets to be distributed, the manner of allocation of such assets toshareholders, and the effective date of the distribution. If a distribution of Surplus is to be made in kind, we may,pursuant to a resolution of our Board of Directors, grant a right to our shareholders to require us to make such
87
distribution in cash instead of in kind. If no such right is granted to shareholders, the relevant distribution ofSurplus must be approved by a special resolution of a meeting of shareholders.
For information as to Japanese taxes on dividends, see “Japanese Taxation” under Item 10.E of this annualreport.
Restriction on Distributions of Surplus
When we make a distribution of Surplus, we must, until the aggregate amount of our additional paid-incapital and legal reserve reaches one-quarter of our stated capital, set aside in our additional paid-in capital and/or legal reserve an amount equal to one-tenth of the amount of Surplus so distributed in accordance with anordinance of the Ministry of Justice.
The amount of Surplus at any given time must be calculated in accordance with the following formula:
A + B + C + D - (E + F + G)
In the above formula:
“A” = the total amount of ‘other capital surplus’ and ‘other retained earnings’ each such amount beingthat appearing on our non-consolidated balance sheets as of the end of the last fiscal year;
“B” = (if we have disposed of our treasury stock after the end of the last fiscal year) the amount of theconsideration for such treasury stock received by us less the book value thereof;
“C” = (if we have reduced our stated capital after the end of the last fiscal year) the amount of suchreduction less the portion thereof that has been transferred to additional paid-in capital or legalreserve (if any);
“D” = (if we have reduced our additional paid-in capital or legal reserve after the end of the last fiscalyear) the amount of such reduction less the portion thereof that has been transferred to statedcapital (if any);
“E” = (if we have cancelled our treasury stock after the end of the last fiscal year) the book value of suchtreasury stock;
“F” = (if we have distributed Surplus to our shareholders after the end of the last fiscal year) the totalbook value of Surplus so distributed;
“G” = certain other amounts set forth in ordinances of the Ministry of Justice, including (if we havereduced Surplus and increased our stated capital, additional paid-in capital or legal reserve afterthe end of the last fiscal year) the amount of such reduction and (if we have distributed Surplus toour shareholders after the end of the last fiscal year) the amount set aside in our additional paid-incapital or legal reserve (if any) as required by the ordinances of the Ministry of Justice.
The aggregate book value of Surplus distributed by us may not exceed a prescribed distributable amount(the “Distributable Amount”), as calculated on the effective date of such distribution. The Distributable Amountat any given time shall be equal to the amount of Surplus less the aggregate of the followings:
(a) the book value of our treasury stock;
(b) the amount of consideration for our treasury stock disposed of by us after the end of the last fiscal year;and
(c) certain other amounts set forth in the ordinances of the Ministry of Justice, including (if the sum ofone-half of goodwill and the deferred assets exceeds the total of stated capital, additional paid-incapital and legal reserve, each such amount being that appearing on our non-consolidated balancesheets as of the end of the last fiscal year) all or certain part of such excess amount as calculated inaccordance with the ordinances of the Ministry of Justice.
88

If we have become at our option a company with respect to which consolidated balance sheets should alsobe taken into consideration in the calculation of the Distributable Amount (renketsu haito kisei tekiyo kaisha), itwill be required to further deduct from the amount of Surplus the excess amount, if any, of (x) the total amountof shareholders’ equity appearing on our non-consolidated balance sheets as of the end of the last fiscal year andcertain other amounts set forth in the ordinances of the Ministry of Justice over (y) the total amount ofshareholders’ equity and certain other amounts set forth in the ordinances of the Ministry of Justice appearing onour consolidated balance sheets as of the end of the last fiscal year.
If we have prepared non-consolidated interim financial statements as described below, and if such interimfinancial statements have been approved by the Board of Directors or (if so required by the Companies Act) by ameeting of shareholders, the Distributable Amount must be adjusted to take into account the amount of profit orloss, and the amount of consideration for our treasury stock disposed of by us, during the period in respect ofwhich such interim financial statements have been prepared. We may prepare non-consolidated interim financialstatements consisting of a balance sheet as of any date subsequent to the end of the last fiscal year and an incomestatement for the period from the first day of the current fiscal year to the date of such balance sheet. Interimfinancial statements so prepared by us must be approved by the Board of Directors and audited by our AuditCommittee and independent auditors, as required by the ordinances of the Ministry of Justice.
Stock Splits
We may at any time split the issued shares into a greater number of shares by resolution of our Board ofDirectors, and in accordance with the Companies Act, our Board of Directors has by resolution delegated to ourExecutive Management Board, powers to make such stock splits.
In accordance with the Companies Act, our Board of Directors has by resolution delegated to our ExecutiveManagement Board powers to increase the authorized shares up to the number reflecting the rate of stock splitsand amend our Articles of Incorporation to this effect without the approval of a meeting of shareholders. Forexample, if each share became three shares by way of a stock split, we may increase the authorized shares fromthe current 6,000,000,000 shares to 18,000,000,000 shares.
Japanese Unit Share System
Our Articles of Incorporation provide that 100 shares constitute one “unit”. The Companies Act permits us,by resolution of our Board of Directors, to reduce the number of shares which constitutes one unit or abolish theunit share system, and amend our Articles of Incorporation to this effect without the approval of a meeting ofshareholders.
Transferability of Shares Constituting Less Than One Unit. Under the new clearing system, sharesconstituting less than one unit are transferable. Under the rules of the Japanese stock exchanges, however, sharesconstituting less than one unit do not comprise a trading unit, except in limited circumstances, and accordinglymay not be sold on the Japanese stock exchanges.
Right of a Holder of Shares Constituting Less Than One Unit to Require Us to Purchase Its Shares.A holder of shares constituting less than one unit may at any time request us to purchase its shares. Under thenew clearing system, such request must be made through the relevant account managing institution. Theseshares will be purchased at (a) the closing price of our shares reported by the Tokyo Stock Exchange, Inc.(hereinafter referred to as the “Tokyo Stock Exchange”) on the day when the request to purchase is receivedby our share registrar or (b) if no sale takes place on the Tokyo Stock Exchange on that day, then the price atwhich sale of shares is effected on such stock exchange immediately thereafter. An amount equal to theapplicable handling fee will be deducted from the price so determined pursuant to our Share HandlingRegulations.
89
Right of a Holder of Shares Constituting Less than One Unit to Purchase from Us Its Shares up to a WholeUnit. Our Articles of Incorporation provide that a holder of shares constituting less than one unit may request usto sell any shares we may have to such holder so that the holder can raise its fractional ownership up to a wholeunit. Under the new clearing system, such request must be made through the relevant account managinginstitution. These shares will be sold at (a) the closing price of our shares reported by the Tokyo Stock Exchangeon the day when the request to sell is received by our share registrar or (b) if no sale has taken place on theTokyo Stock Exchange on that day, then the price at which sale of shares is effected on such stock exchangeimmediately thereafter. An amount equal to the applicable handling fee will be added to the price so determinedpursuant to our Share Handling Regulations.
Voting Rights of a Holder of Shares Constituting Less Than One Unit. A holder of shares constituting lessthan one unit cannot exercise any voting rights pertaining to those shares. In calculating the quorum for variousvoting purposes, the aggregate number of shares constituting less than one unit will be excluded from the numberof outstanding shares. A holder of shares representing one or more whole units will have one vote for each wholeunit represented.
A holder of shares constituting less than one unit does not have any rights related to voting, such as the rightto participate in a demand for the resignation of a Director, the right to participate in a demand for theconvocation of a meeting of shareholders and the right to join with other shareholders to propose an agenda itemto be addressed at a meeting of shareholders. In addition, a holder of shares constituting less than one unit doesnot have the right to institute a representative action by shareholders.
In accordance with the Companies Act, our Articles of Incorporation provide that a holder of sharesconstituting less than one unit does not have any other rights of a shareholder in respect of those shares, otherthan those provided by our Articles of Incorporation which includes the following rights:
• to receive dividends,
• to receive cash or other assets in case of consolidation or split of shares, exchange or transfer of shares,corporate split or merger,
• to be allotted rights to subscribe for free for new shares and stock acquisition rights when such rights aregranted to shareholders, and
• to participate in any distribution of surplus assets upon liquidation.
Annual Meeting of Shareholders
We normally hold our annual meeting of shareholders in June of each year. In addition, we may hold anextraordinary meeting of shareholders whenever necessary by giving at least two weeks’ advance notice. Underthe Companies Act, notice of any meeting of shareholders must be given to each shareholder having voting rightsor, in the case of a non-resident shareholder, to his resident proxy or mailing address in Japan in accordance withour Share Handling Regulations, at least two weeks prior to the date of the meeting.
Voting Rights
A shareholder is generally entitled to one vote per one unit of shares as described in this paragraph andunder “Japanese Unit Share System” above. In general, under the Companies Act, a resolution can be adopted ata meeting of shareholders by the holders of a majority of the total number of voting rights represented at themeeting. The Companies Act and our Articles of Incorporation require a quorum for the election of Directors ofnot less than one-third of the total number of voting rights. Our shareholders are not entitled to cumulative votingin the election of Directors. A corporate shareholder having one-quarter or more of the total voting rights ofwhich are directly or indirectly held by us does not have voting rights. Shareholders may exercise their votingrights through proxies, provided that those proxies are also shareholders who have voting rights.
90
The Companies Act provides that certain important matters shall be approved by a “special resolution” ofmeeting of shareholders. Our Articles of Incorporation provide that the quorum for a special resolution isone-third of the total number of voting rights and the approval of at least two-thirds of the voting rights presentedat the meeting is required for adopting a special resolution. Such important matters include:
• a reduction of stated capital,
• amendment to the Articles of Incorporation (except amendments which the Board of Directors (or underthe Committee System, Executive Officers) are authorized to make under the Companies Act),
• establishment of a 100% parent-subsidiary relationship by way of share exchange or share transferrequiring shareholders’ approval,
• a dissolution, merger or consolidation requiring shareholders’ approval,
• a corporate split requiring shareholders’ approval,
• the transfer of the whole or an important part of our business,
• the taking over of the whole of the business of any other corporation requiring shareholders’ approval,
• any issuance of new shares or transfer of existing shares as treasury stock to persons other than theshareholders at a “specially favorable” price,
• any issuance of stock acquisition rights (including those incorporated in bonds with stock acquisitionrights) to persons other than the shareholders under “specially favorable” conditions,
• purchase of shares by us from a specific shareholder other than our subsidiary,
• consolidation of shares, and
• release of part of directors’, independent auditor’s or executive officers’ liabilities to their corporation.
The voting rights of holders of ADSs are exercised by the depositary based on instructions from those holders.
Subscription Rights
Holders of shares have no preemptive rights under our Articles of Incorporation when we issue new shares.Under the Companies Act, our Executive Management Board, which has been delegated by our Board ofDirectors with the authority to issue new shares, may, however, determine that shareholders be givensubscription rights in connection with a particular issue of new shares. In this case, such rights must be given onuniform terms to all shareholders as of a specified record date with at least two weeks’ prior notice toshareholders of the record date.
Stock Acquisition Rights
We may issue stock acquisition rights (shinkabu yoyakuken). Holders of stock acquisition rights are entitledto acquire shares from us, upon payment of the applicable exercise price, and subject to other terms andconditions thereof. The issuance of stock acquisition rights and bonds with stock acquisition rights may beauthorized by our Executive Management Board, which has been delegated by our Board of Directors with theauthority to issue stock acquisition rights, unless it is made under “specially favorable” conditions in which casespecial resolution of meeting of shareholders is required. In issuing stock acquisition rights, notice must be givenat least two weeks prior to the date for allotment in the form of individual notice or public notice. Under theCompanies Act we will not be required to give such notice if we make relevant securities filing or reportingunder the FIEA at least two weeks prior to the date for allotment, subject to the requirements provided by theordinance of the Ministry of Justice.
91
Liquidation Rights
In the event of liquidation, the assets remaining after payment of all debt securities and borrowings,liquidation expenses and taxes will be distributed among the shareholders in proportion to the number of sharesthey own.
Liability to Further Calls or Assessments
All of our currently outstanding shares, including shares represented by the ADSs, are fully paid andnonassessable.
Share Registrar
Mitsubishi UFJ Trust and Banking Corporation (“Mitsubishi UFJ Trust”) is the share registrar for ourshares. Mitsubishi UFJ Trust’s office is located at 4-5, Marunouchi 1-chome, Chiyoda-ku, Tokyo, 100-8212Japan. Mitsubishi UFJ Trust maintains our register of shareholders and registers the names and addresses of ourshareholders and other relevant information in our register of shareholders upon notice thereof from JASDEC, asdescribed in “Record Date” below.
Record Date
The close of business of June 30, September 30, December 31 and March 31 are the record dates for ourdistributions of Surplus (dividends), if any. A holder of shares constituting one or more whole units, who isregistered as a holder on our register of shareholders at the close of business as of March 31, is also entitled toexercise shareholders’ voting rights at the annual meeting of shareholders with respect to the year ended onMarch 31. In addition, we may set a record date for determining the shareholders entitled to other rights and forother purposes by giving at least two weeks’ public notice.
Under the Book-Entry Law, we are required to give notice of each record date to JASDEC at least twoweeks prior to such record date. JASDEC is required to promptly give us notice of the names and addresses ofour shareholders, the numbers of shares held by them and other relevant information as of such record date.
The shares are generally traded ex-dividend or ex-rights in the Japanese stock exchanges on the secondbusiness day prior to the record date (or if the record date is not a business day, the third business day priorthereto), for the purpose of dividends or rights offerings.
Acquisition by Us of Shares
We may acquire our shares (i) by soliciting all our shareholders to offer to sell our shares held by them(pursuant to a resolution of the Board of Directors), (ii) from a specific shareholder other than any oursubsidiaries (pursuant to a special resolution of a meeting of shareholders), (iii) from any of our subsidiaries(pursuant to a resolution of the Board of Directors), or (iv) by way of purchase on any Japanese stock exchangeon which our shares are listed or by way of tender offer (in either case pursuant to a resolution of the Board ofDirectors). In the case of (ii) above, any other shareholder may make a request to us that such other shareholderbe included as a seller in the proposed purchase, provided that no such right will be available if the purchaseprice or any other consideration to be received by the relevant specific shareholder will not exceed the higher of(x) the last trading price of the shares on the relevant stock exchange on the day immediately preceding the dateon which the resolution mentioned in (ii) was adopted (or, if there is no trading in the shares on the stockexchange or if the stock exchange is not open on such day, the price at which the shares are first traded on suchstock exchange thereafter) and (y) if the shares are subject to a tender offer on the day immediately preceding thedate on which the resolution mentioned in (ii) above was adopted, the price of the shares under the agreementwith respect to such tender offer on such day. This acquisition is subject to the condition that the aggregateamount of the purchase price must not exceed the Distributable Amount as described in “Dividends” above.
92

We may hold our shares acquired in compliance with the provisions of the Companies Act, and maygenerally dispose of or cancel such shares by resolutions of the Board of Directors.
In addition, we may acquire our shares by means of repurchase of any number of shares constituting less than oneunit upon the request of the holder of those shares, as described under “Japanese Unit Share System” above.
Preferred Stock
The following is a description of material features of our preferred stocks. The outlines of our preferredstocks are set forth in our Articles of Incorporation, and detailed terms and conditions of our preferred stocks willbe determined prior to the respective issuance thereof by a resolution of our Board of Directors or by ExecutiveOfficer(s) under authorities delegated by a resolution of our Board of Directors.
General
It has become possible for us to issue preferred stocks as a result of the amendment to our Articles ofIncorporation approved at our annual meeting of shareholders on June 25, 2009. We have, however, not yetissued, and currently have no specific plan to issue, any preferred stock.
Under our Articles of Incorporation, we are authorized to issue 200,000,000 shares of Class 1 preferredstock, 200,000,000 shares of Class 2 preferred stock, 200,000,000 shares of Class 3 preferred stock and200,000,000 shares of Class 4 preferred stock. Of these preferred stocks, Class 3 and Class 4 preferred stockswill be convertible into common stock, while Class 1 and Class 2 preferred stocks will not be convertible intocommon stock. See “Right of Shareholders of Preferred Stocks to Demand Acquisition thereof (Conversion)”below.
Preferred Dividends
Under our Articles of Incorporation, preferred dividends will be paid to the shareholders of preferred stockson record as of March 31 every year. In addition, interim preferred dividends may be paid to shareholders of ourpreferred stocks on record as of June 30, September 30 or December 31 of any year. Dividends on preferredstocks will be paid always in priority to dividends on common stock. The detailed terms and conditions of eachclass of preferred stock, including the amount of preferred dividends or preferred interim dividends, will bedetermined by a resolution of our Board of Directors or by Executive Officer(s) under authorities delegated by aresolution of our Board of Directors prior to the time of issuance thereof, provided that the annual dividend rateapplicable to Class 1 and Class 2 preferred stocks will not exceed 15%, and the annual dividend rate applicable toClass 3 and Class 4 preferred stocks will not exceed 10%.
Notwithstanding the provisions of our Articles of Incorporation, no payment of any dividend on preferredstocks may be made unless we have sufficient Surplus to pay such dividend, and each payment of a dividend on apreferred stock must be approved by our Board of Directors.
Dividends on our preferred stocks are non-cumulative. In case the amount of preferred dividends actuallypaid by us in respect of any fiscal year is less than the amount thereof payable in respect of such fiscal year,preferred shareholders will have no right to seek payment of the deficient amount as a cumulative preferreddividend in any subsequent fiscal year.
Shareholders of our preferred stocks will not be entitled to any further dividends or other participation in ordistribution of Surplus.
93
Voting Rights
No shareholder of our preferred stocks has a right to vote at a meeting of shareholders, except as otherwisespecifically provided in the Companies Act, any other applicable law or our Articles of Incorporation. Subject tothe conditions stated therein, our Articles of Incorporation provided that the shareholders of our preferred stockwill be entitled to vote at meetings of shareholders as follows:
• If no resolution to pay a preferred dividend has been passed by our Board of Directors prior to thedispatch of the convocation notice of the annual meeting of shareholders in respect of any fiscal year,and if no proposal to pay such preferred dividend was submitted to the relevant annual meeting ofshareholders, then the shareholders of the relevant preferred stock will be entitled to vote at suchmeeting and all subsequent meetings of shareholders up to the time when our Board of Directors ormeeting of shareholders passes a resolution to pay such preferred dividend; and
• If a resolution to pay a preferred dividend has not been adopted at any annual meeting of shareholders,the shareholders of the relevant preferred stock will be entitled to vote at all subsequent meetings ofshareholders up to the time when our Board of Directors or meeting of shareholders passes a resolutionto pay such preferred dividend.
Liquidation Rights
In the event of our voluntary or involuntary liquidation, shareholders of our preferred stocks will be entitled,in preference over shareholders of common stock, to receive such amounts of our residual assets as may bedetermined by a resolution of our Board of Directors or by Executive Officer(s) under authorities delegated by aresolution of the Board of Directors taking into consideration the amounts of subscription moneys paid for therespective preferred stocks.
Except as described above, shareholders of our preferred stocks will not be entitled to receive distribution ofresidual assets upon our liquidation.
Right of Shareholders of Preferred Stocks to Demand Acquisition thereof (Conversion)
Shareholders of Class 3 preferred stock and shareholders of Class 4 preferred stock will have the right todemand that we shall acquire their shares of preferred stock during a certain period. Upon exercise of such right,we shall deliver to the relevant shareholder a certain number of shares of our common stock in exchange for theshares of the preferred stock acquired by us from such shareholder. Specific terms of such right, including theperiod during which the preferred stock will be acquired (so-called “conversion period”) and the initialacquisition price (so-called “conversion price”), will be determined by a resolution of our Board of Directors orby Executive Officer(s) under authorities delegated by a resolution of the Board of Directors.
Our Right and Obligation to Acquire Preferred Stocks
We shall have the right to acquire all or any part of the shares of Class 1 preferred stock, Class 2 preferredstock and/or Class 4 preferred stock upon the occurrence of such event or on such date as may be determined bya resolution of our Board of Directors or by Executive Officer(s) under authorities delegated by a resolution ofthe Board of Directors prior to the time of issuance of the relevant preferred stock. Upon exercise of such right,we shall deliver to the relevant shareholder a certain amount of cash in exchange for the shares of the preferredstock acquired by us from such shareholder. The initial acquisition price at which the relevant preferred stockwill be acquired by us will be determined prior to the time of issuance thereof by a resolution of our Board ofDirectors or by Executive Officer(s) under authorities delegated by a resolution of the Board of Directors takinginto consideration the amount of subscription moneys paid for the relevant preferred stock.
We shall have the obligation to acquire all the shares of Class 3 preferred stock and Class 4 preferred stockoutstanding on the day immediately following the last day of the relevant conversion period. We shall deliver to
94
the relevant shareholders certain numbers of shares of our common stock in exchange for the shares of thepreferred stock acquired by us from them. The number of shares of our common stock so to be delivered to ashareholder of the relevant preferred stock will be calculated by multiplying the number of the preferred stocksheld by such shareholder by the amount of the subscription moneys per share paid for such preferred stock anddividing the resultant amount by the market price of a share of our common stock at the time.
Order of Priority
Class 1 through Class 4 preferred stocks will be in the same order of priority in respect of the payment ofpreferred dividends and preferred interim dividends and the distribution of residual assets. All classes ofpreferred stocks will be in priority to our common stock in respect of the payments of dividends and interimdividends and the distribution of residual assets.
Report of Substantial Shareholdings
The FIEA requires any person who has become, beneficially and solely or jointly, a holder of more than 5%of the total issued shares of a company listed on any Japanese stock exchange to file with the relevant LocalFinance Bureau, within five business days, a report concerning those shareholdings. With certain exceptions, asimilar report must also be filed to reflect any change of 1% or more in the above shareholding or any change inmaterial matters set out in any previous filed reports. Copies of any reports must also be furnished to thecompany. For this purpose, shares issuable to a person upon exercise of stock acquisition rights are taken intoaccount in determining both the number of shares held by that holder and the company’s total issued sharecapital.
Daily Price Fluctuation Limits under Japanese Stock Exchange Rules
Stock prices on Japanese stock exchanges are determined on a real-time basis by the equilibrium betweenbids and offers. These exchanges are order-driven markets without specialists or market makers to guide priceformation. To prevent excessive volatility, these exchange set daily upward and downward price fluctuationlimits for each stock, based on the previous day’s closing price. Although transactions may continue at theupward or downward limit price if the limit price is reached on a particular trading day, no transactions may takeplace outside these limits. Consequently, an investor wishing to sell at a price above or below the relevant dailylimit may not be able to sell the shares at such price on a particular trading day, or at all.
On June 28, 2010, the closing price of our shares on the Tokyo Stock Exchange was ¥507 per share. Thefollowing table shows the daily price limit for a stock on the Tokyo Stock Exchange with a closing price ofbetween ¥500 and ¥669 per share, as well as the daily price limit if our per share price were to rise to between¥700 and ¥999, and between ¥1,000 and ¥1,499, or fall to between ¥200 and ¥499. Other daily price limits wouldapply if our per share price moved to other ranges.
Selected Daily Price Limits
Previous Day’s Closing Price or Special Quote Maximum Daily Price Movement
Equal to or greater than ¥ 200 Less than ¥ 500 ¥ 80Equal to or greater than 500 Less than 700 100Equal to or greater than 700 Less than 1,000 150Equal to or greater than 1,000 Less than 1,500 300
For a history of the trading price of our shares on the Tokyo Stock Exchange, see Item 9.A of this annualreport.
95
Rights of Holders of ADSs
For a description of rights of holders of ADSs, see “Rights of Holders of ADSs” under Item 10.B of ourRegistration Statement on Form 20-F (File No. 1-15270), which we filed with the Securities and ExchangeCommission on December 13, 2001. The information contained in that part of the Registration Statement isincorporated in this Item 10.B by reference.
C. Material Contracts.
For the two years immediately preceding the date of this annual report, we have not been a party to anymaterial agreement other than in the ordinary course of business, except as disclosed in Item 6.C of this annualreport.
D. Exchange Controls.
Acquisition of Shares
The Foreign Exchange and Foreign Trade Law of Japan governs certain aspects relating to the acquisitionand holding of securities by “non-residents of Japan” and “foreign investors”, as defined below.
In general, acquisition of shares of stock of a Japanese company listed on any Japanese stock exchange by anon-resident of Japan from a resident of Japan is not subject to any prior notification requirement, but subject to apost reporting requirement by the resident.
If a foreign investor acquires shares of a Japanese company listed on a Japanese stock exchange and as aresult of this acquisition directly or indirectly holds, aggregated with its existing holdings and those of otherparties who have a special relationship with that foreign investor, 10% or more of the issued shares of thecompany, the foreign investor is, in general, required to report the acquisition to the Minister of Finance and anyother competent ministers via the Bank of Japan on or prior to the 15th day of the immediately following monthin which the date of acquisition falls. In exceptional cases, a prior notification is required in respect of theacquisition.
“Non-residents of Japan” are generally defined as individuals who are not resident in Japan and corporationswhose principal offices are located outside Japan. Branches and other offices of Japanese corporations locatedoutside Japan are considered as non-residents of Japan, and branches and other offices located within Japan ofnon-resident corporations are considered as residents of Japan. “Foreign investors” are generally defined to be(i) individuals not resident in Japan, (ii) corporations which are organized under the laws of foreign countries orwhose principal offices are located outside Japan, and (iii) corporations of which (a) 50% or more of the votingrights of which are held directly or indirectly by (i) and/or (ii) above, (b) a majority of officers consists ofnon-residents of Japan or (c) a majority of officers having the power of representation consists of non-residentsof Japan.
Dividends and Proceeds of Sale
Under the Foreign Exchange and Foreign Trade Law, dividends paid on, and the proceeds of sales in Japanof, shares held by non-residents of Japan may in general be converted into any foreign currency and repatriatedabroad. Under the terms of the deposit agreement pursuant to which our ADSs will be issued, the depositary isrequired, to the extent that in its judgment it can convert yen on a reasonable basis into dollars and transfer theresulting dollars to the United States, to convert all cash dividends that it receives in respect of deposited sharesinto dollars and to distribute the amount received (after deduction of applicable withholding taxes) to the holdersof ADSs.
96
E. Taxation.
U.S. Federal Income Taxation
This section describes the material U.S. federal income tax consequences of owning shares or ADSs. Itapplies to you only if you are a U.S. holder (as defined below), you acquire your shares or ADSs in an offeringand you hold your shares or ADSs as capital assets for tax purposes. This section does not apply to you if you area member of a special class of holders subject to special rules, including:
• a dealer in securities,
• a trader in securities that elects to use a mark-to-market method of accounting for your securitiesholdings,
• a tax-exempt organization,
• a life insurance company,
• a person liable for alternative minimum tax,
• a person that actually or constructively owns 10% or more of our voting stock,
• a person that holds shares or ADSs as part of a straddle or a hedging, conversion, integrated orconstructive sale transaction, or
• a person below whose functional currency is not the U.S. dollar.
This section is based on the Internal Revenue Code of 1986, as amended, its legislative history, existing andproposed regulations, published rulings and court decisions, all as currently in effect, as well as on the IncomeTax Convention Between the United States of America and Japan (the “Treaty”). These laws are subject tochange, possibly on a retroactive basis. In addition, this section is based in part upon the representations of TheBank of New York and the assumption that each obligation in the deposit agreement and any related agreementwill be performed in accordance with its terms.
You are a U.S. holder if you are a beneficial owner of shares or ADSs and you are:
• a citizen or resident of the United States,
• a domestic corporation,
• an estate whose income is subject to U.S. federal income tax regardless of its source, or
• a trust if a U.S. court can exercise primary supervision over the trust’s administration and one or moreU.S. persons are authorized to control all substantial decisions of the trust.
You should consult your own tax advisor regarding the U.S. federal, state and local and the Japanese and othertax consequences of owning and disposing of shares and ADSs in your particular circumstances.
This discussion addresses only U.S. federal income taxation.
In general, and taking into account the earlier assumptions, for U.S. federal income tax purposes, if you holdADRs evidencing ADSs, you will be treated as the owner of the shares represented by those ADSs. Exchanges ofshares for ADRs, and ADRs for shares, generally will not be subject to U.S. federal income tax.
Taxation of Dividends
Under the U.S. federal income tax laws, and subject to the passive foreign investment company, or PFIC,rules discussed below, the gross amount of any dividend we pay out of our current or accumulated earnings andprofits (as determined for U.S. federal income tax purposes) is subject to U.S. federal income taxation. If you are
97
a noncorporate U.S. holder, dividends paid to you in taxable years beginning before January 1, 2011 thatconstitute qualified dividend income will be taxable to you at a maximum tax rate of 15% provided that you holdthe shares or ADSs for more than 60 days during the 121-day period beginning 60 days before the ex-dividenddate and meet certain other requirements. Dividends we pay with respect to the shares or ADSs generally will bequalified dividend income. You must include any Japanese tax withheld from the dividend payment in this grossamount even though you do not in fact receive it.
The dividend is taxable when you, in the case of shares, or the Depositary, in the case of ADSs, receive thedividend, actually or constructively. The dividend will not be eligible for the dividends-received deductiongenerally allowed to U.S. corporations in respect of dividends received from other U.S. corporations. The amountof the dividend distribution that you must include in your income as a U.S. holder will be the U.S. dollar value ofthe Japanese yen payments made, determined at the spot Japanese yen/U.S. dollar rate on the date the dividenddistribution is includible in your income, regardless of whether the payment is in fact converted into U.S. dollars.Generally, any gain or loss resulting from currency exchange fluctuations during the period from the date youinclude the dividend payment in income to the date you convert the payment into U.S. dollars will be treated asordinary income or loss and will not be eligible for the special tax rate applicable to qualified dividend income.The gain or loss generally will be income or loss from sources within the U.S. for foreign tax credit limitationpurposes. Distributions in excess of current and accumulated earnings and profits, as determined for U.S. federalincome tax purposes, will be treated as a non-taxable return of capital to the extent of your basis in the shares orADSs and thereafter as capital gain.
Subject to certain limitations, the Japanese tax withheld in accordance with the Treaty and paid over toJapan will be creditable against your United States federal income tax liability. Special rules apply indetermining the foreign tax credit limitation with respect to dividends that are subject to the maximum 15% rate.To the extent a refund of the tax withheld is available under Japanese law or the Treaty, the amount of taxwithheld that is refundable will not be eligible for credit against your U.S. federal income tax liability.
Dividends will generally be income from sources outside the United States, and, depending on yourcircumstances, will generally be “passive income” or “general income” for purposes of computing the foreign taxcredit allowable to you.
As discussed in “Japanese taxation” below, if we purchase our shares, selling shareholders will be deemedto have received a dividend payment for Japanese tax purposes, in general. If we purchase the shares pursuant toa tender offer, selling shareholders might be subject to the deemed dividend taxation regime and part ofconsideration for the tender offer would be treated as dividends subject to withholding tax for Japanese taxpurposes (please see the exceptional treatment discussed in “Japanese taxation” below). Such dividend is notgenerally a taxable event for U.S. federal income tax purposes (though a selling U.S. shareholder would besubject to U.S. federal income tax on capital gains realized on a sale of shares to us, as described below) andtherefore would not give rise to foreign source income, and you would not be able to use the foreign tax creditarising from any Japanese withholding tax imposed on such distribution unless you can apply the credit (subjectto limitations) against U.S. tax due or other foreign source income in the appropriate category for foreign taxcredit purposes.
Taxation of Capital Gains
Subject to the PFIC rules discussed below, if you are a U.S. holder and you sell or otherwise dispose of yourshares or ADSs, you will recognize capital gain or loss for United States federal income tax purposes equal to thedifference between the U.S. dollar value of the amount that you realize and your tax basis, determined in U.S.dollars, in your shares or ADSs. Capital gain of a noncorporate U.S. holder is generally taxed at preferential rateswhere the property is held for more than one year. The gain or loss will generally be income or loss from sourceswithin the United States for foreign tax credit limitation purposes.
98
PFIC Rules
We do not expect our shares and ADSs to be treated as stock of a PFIC for United States federal income taxpurposes, but this conclusion is a factual determination that is made annually and thus may be subject to change.Moreover, the application of the PFIC rules to a corporation, such as Nomura, that is primarily engaged in anactive business as a securities dealer is not entirely clear.
In general, if you are a U.S. holder, we will be a PFIC with respect to you if for any taxable year in whichyou held our ADSs or shares:
• at least 75% of our gross income for the taxable year is passive income or,
• at least 50% of the value, determined on the basis of a quarterly average, of our assets is attributable toassets that produce or are held for the production of passive income.
Passive income generally includes dividends, interest, royalties, rents (other than certain rents and royaltiesderived in the active conduct of a trade or business), annuities and gains from assets that produce passive income.If a foreign corporation owns at least 25% by value of the stock of another corporation, the foreign corporation istreated for purposes of the PFIC tests as owning its proportionate share of the assets of the other corporation, andas receiving directly its proportionate share of the other corporation’s income.
If we are treated as a PFIC, and you are a U.S. holder that did not make a mark-to-market election, asdescribed below, you will be subject to special rules with respect to:
• any gain you realize on the sale or other disposition of your shares or ADSs, and
• any excess distribution that we make to you (generally, any distributions to you during a single taxableyear that are greater than 125% of the average annual distributions received by you in respect of theshares or ADSs during the three preceding taxable years or, if shorter, your holding period for the sharesor ADSs).
Under these rules:
• the gain or excess distribution will be allocated ratably over your holding period for the shares or ADSs,
• the amount allocated to the taxable year in which you realized the gain or excess distribution and anytaxable year prior to the first year in which we were a PFIC will be taxed as ordinary income,
• the amount allocated to each other year, with certain exceptions, will be taxed at the highest tax rate ineffect for that year, and
• the interest charge generally applicable to underpayments of tax will be imposed in respect of the taxattributable to each such year.
Special rules apply for calculating the amount of the foreign tax credit with respect to excess distributionsby a PFIC.
If you own shares or ADSs in a PFIC that are regularly traded on a qualified exchange, they will be treatedas marketable stock, and you may elect to mark your shares or ADSs to market. If you make this election, youwill not be subject to the PFIC rules described above. Instead, in general, you will include as ordinary incomeeach year the excess, if any, of the fair market value of your shares or ADSs at the end of the taxable year overyour adjusted basis in your shares or ADSs. These amounts of ordinary income will not be eligible for thefavorable tax rates applicable to qualified dividend income or long-term capital gains. You will also be allowedto take an ordinary loss in respect of the excess, if any, of the adjusted basis of your shares or ADSs over theirfair market value at the end of the taxable year (but only to the extent of the net amount of previously includedincome as a result of the mark-to-market election). Your basis in the shares or ADSs will be adjusted to reflectany such income or loss amounts. We urge you to speak to your tax advisor regarding the availability andadvisability of this election.
99
In addition, notwithstanding any election you make with regard to the shares or ADSs, dividends that youreceive from us will not constitute qualified dividend income to you if we are a PFIC either in the taxable year ofthe distribution or the preceding taxable year. Moreover, your shares or ADSs will be treated as stock in a PFICif we were a PFIC at any time during your holding period in your shares or ADSs, even if we are not currently aPFIC. For purposes of this rule, if you make a mark-to-market election with respect to your shares or ADSs, youwill be treated as having a new holding period in your shares or ADSs beginning on the first day of the firsttaxable year beginning after the last taxable year for which the mark-to-market election applies. Dividends thatyou receive that do not constitute qualified dividend income are not eligible for taxation at the 15% maximumrate applicable to qualified dividend income. Instead, you must include the gross amount of any such dividendpaid by us out of our accumulated earnings and profits (as determined for United States federal income taxpurposes) in your gross income, and it will be subject to tax at rates applicable to ordinary income.
If you own shares or ADSs during any year that we are a PFIC, you must file Internal Revenue ServiceForm 8621.
Japanese Taxation
The following is a summary of the principal Japanese tax consequences to owners of our shares who arenon-resident individuals or non-Japanese corporations without a permanent establishment in Japan to which therelevant income is attributable. As tax laws are frequently revised, the tax treatments described in this summaryare also subject to changes in the applicable Japanese laws and/or double taxation conventions occurring in thefuture, if any. This summary is not exhaustive of all possible tax considerations which may apply to specificinvestors under particular circumstances. Potential investors should satisfy themselves as to
• the overall tax consequences of the acquisition, ownership and disposition of shares or ADSs, includingspecifically the tax consequences under Japanese law,
• the laws of the jurisdiction of which they are resident, and
• any tax treaty between Japan and their country of residence, by consulting with their own tax advisers.
Generally, a non-resident shareholder is subject to Japanese withholding tax on dividends on the shares paidby us. A stock split is not subject to Japanese income or corporation tax, as it is characterized merely as anincrease of number of shares (as opposed to an increase of value of shares) from Japanese tax perspectives.Conversion of retained earnings or legal reserve (but other than additional paid-in capital, in general) into statedcapital on a non-consolidated basis is not characterized as a deemed dividend for Japanese tax purposes, andtherefore such a conversion does not trigger Japanese withholding taxation (Article 2(16) of the JapaneseCorporation Tax Law and Article 8(1)(xiv) of the Japanese Corporation Tax Law Enforcement Order).
Unless an applicable tax treaty, convention or agreement reducing the maximum rate of withholding taxapplies, the rate of Japanese withholding tax applicable to dividends on listed shares such as those paid by us tonon-resident shareholders is currently 7%. This rate is applicable for dividends due and payable on or beforeDecember 31, 2011 and thereafter a 15% rate will apply, except for dividends paid to any individual shareholderwho holds 5% or more of the issued shares for which the applicable rate is 20% (under Article 9-3(1) of theJapanese Special Tax Measures Law including its relevant temporary provision for these withholding rates).Japan has income tax treaties, conventions or agreements whereby the above-mentioned withholding tax rate isreduced, generally to 15% for portfolio investors, with, among others, Belgium, Canada, Denmark, Finland,Germany, Ireland, Italy, Luxembourg, The Netherlands, New Zealand, Norway, Singapore, Spain, Sweden andSwitzerland. Under the Treaty (the tax treaty between the United States and Japan), the withholding tax rate ondividends is 10% for portfolio investors, if they do not have a permanent establishment in Japan or the shareswith respect to which such dividends are paid are not effectively connected with such permanent establishment,and if they are qualified U.S. residents eligible to enjoy treaty benefits. It shall be noted that, under the Treaty,withholding tax on dividends to be paid on or after July 1, 2004 is exempt from Japanese taxation by way ofwithholding or otherwise for pension funds which are qualified U.S. residents eligible to enjoy treaty benefits
100
unless such dividends are derived from the carrying on of a business, directly or indirectly, by such pensionfunds. A similar withholding tax treatment applies under the tax treaty between the United Kingdom and Japan todividends to be paid on or after January 1, 2007. Under the tax treaty between France and Japan which wasrenewed effective from January 1, 2008, the standard treaty withholding rate for portfolio investors on dividendswas reduced from 15% to 10%. In addition, the tax treaty between Australia and Japan was renewed and 10%standard treaty withholding tax rate for portfolio investors on dividends is applicable to dividends to be paid onor after January 1, 2009. Furthermore, renewal of two tax treaties (the one between the Netherlands and Japanand the one between Switzerland and Japan) is currently scheduled under which the standard treaty withholdingrate for portfolio investors on dividends will be reduced from 15% to 10%. Non-resident shareholders who areentitled to a reduced treaty rate of Japanese withholding tax on payment of dividends on the shares by us arerequired to submit an Application Form for Income Tax Convention regarding Relief from Japanese Income Taxon Dividends in advance through us, which is the case for ADS holders, or (in cases where the relevantwithholding taxpayer for the dividend payment is not us but a financial institution in Japan) through the financialinstitution, to the relevant tax authority before payment of dividends. Non-resident shareholders who do notsubmit an application in advance will be entitled to claim the refund of withholding taxes withheld in excess ofthe rate of an applicable tax treaty from the relevant Japanese tax authority. For Japanese tax purpose, the treatyrate normally applies superseding the tax rate under the domestic law. However, due to the so-called“preservation doctrine” under Article 3-2 of the Special Measures Law for the Income Tax Law, Corporation TaxLaw and Local Taxes Law with respect to the Implementation of Tax Treaties, if the tax rate under the domestictax law is lower than that promulgated under the applicable income tax treaty, then the domestic tax rate is stillapplicable. If the domestic tax rate still applies, no treaty application is required to be filed, consequently.
Gains derived from the sale of shares outside Japan by a non-resident shareholder without a permanentestablishment in Japan as a portfolio investor, are, in general, not subject to Japanese income or corporationtaxes.
Japanese inheritance and gift taxes at progressive rates may be payable by an individual who has acquiredshares as a legatee, heir or donee, even if the individual is not a Japanese resident.
F. Dividends and Paying Agents.
Not applicable.
G. Statement by Experts.
Not applicable.
H. Documents on Display.
We are subject to the informational requirements of the Securities Exchange Act of 1934 and, in accordancetherewith, we will file annual reports on Form 20-F within six months of our fiscal year-end and other reportsand information on Form 6-K with the Securities and Exchange Commission. These reports and otherinformation can be inspected at the public reference room at the Securities and Exchange Commission at100 F Street, NE., Washington, D.C. 20549. You can also obtain copies of such material by mail from the publicreference room of the Securities and Exchange Commission at prescribed fees. You may obtain information onthe operation of the Securities and Exchange Commission public reference room by calling the Securities andExchange Commission in the United States at 1-800-SEC-0330. You can also access to the documents filed viathe Electronic Data Gathering, Analysis, and Retrieval system on the SEC’s website (http://www.sec.gov).
I. Subsidiary Information.
Not applicable.
101
Item 11. Quantitative and Qualitative Disclosures about Market Risk
Risk Management
Our business activities are inherently subject to various risks. Managing those risks is an integral part ofmanagement’s responsibilities to secure fiscal health as well as to contribute to the maintenance and expansion ofcorporate value. Our risk management framework and governance structure is intended to providecomprehensive controls, monitoring and reporting.
We established “Structure for Ensuring Appropriate Business” which is a principle from the Board ofDirectors. Within this principle the “Structure for Regulations and others regarding Management of Risk Loss”was established and in accordance with these structures, we are constantly seeking to upgrade the riskmanagement expertise and strengthen and enhance risk management capability.
Global Risk Management Structure
Governance
We have independent units responsible for appropriate financial resources allocation and risk management(i.e. Group Controllers’ Department, Group Finance Department, Group Treasury Department and Group RiskManagement Department).
Within these units, the Group Risk Management Department assists the Chief Risk Officer (CRO) withimplementing the risk management framework and supervising risks. A key component of the framework is theRisk Appetite statement which defines our risk boundaries in the context of corporate strategic objectives. TheCRO is responsible for managing the risk profile of Nomura Group globally; working closely with the businessheads and regional management to ensure that our risk model is complementary to the business strategy, whilesafeguarding the company’s strong balance sheet.
The mission statement of the Risk Management Division, a collective term for the Group Risk ManagementDepartment and risk management departments in each region, is to support and influence senior management inthe execution of its business strategy of increasing shareholder returns and optimising the firm’s return on capitalwhilst ensuring capital adequacy, to:
• Provide a firm wide capital management framework which takes into account the availability and cost ofcapital, its effective utilisation within and across the business lines and the overall capital adequacy ofthe firm.
• Ensure transparency of and effectively manage market, credit, liquidity, concentration and tail riskwithin the risk appetite of the firm.
• Monitor the effectiveness of capital utilisation through the use of limit structures with an emphasis onstress testing and risk adjusted return on capital as efficiency measures.
• Effectively engage with all stakeholders who are key to the risk management process.
Risks are supervised through establishing an enterprise-wide risk management framework, ensuring itsadoption by the entire group, monitoring the appropriateness of the risk management framework, and measuringand analyzing the risks of the entire group. In particular, the Group Risk Management Department establishesand enhances all risk management policies and rules, gathers necessary information for risk management andimplements risk management policies for global operations. The Group Risk Management Department reportsongoing risk status and the results of their analysis to senior management. These processes are audited regularlyby the Group Internal Audit Department.
102
Risk Management Committees
There are two key Risk Management Committees at the group level as follows:
• Group Integrated Risk Management Committee (“GIRMC”); and
• Global Risk Management Committee (“GRMC”)
The GIRMC reports to the Board of Directors and Executive Management Board (“EMB”). The GIRMC isa sub-committee of the EMB and determines Nomura Group’s risk appetite and global risk managementframework. This translates risk appetite into economic capital and other financial and operational limits andassesses global portfolio and concentration risk against portfolio limits to take corrective actions. Additionally,the GIRMC oversees regional capital commitment, credit and risk committees and sets regional delegated limits/scope of authority.
The GRMC reports to the GIRMC. It has the delegated authority from the GIRMC to approve transactionalcapital commitment, credit and risk approvals exceeding regional delegated limits and transactions withsignificant high risk profiles. Additionally, a sub-committee of the GRMC have been established to focus onspecific one-off transactions.
Risk Control
Our regional front office businesses play significant roles on day-to-day risk control. These units are bestplaced to rapidly respond to changing market conditions and the needs of business in each region. However, riskis managed within limits and guidelines set by the Risk Management Division. The Risk Management Division isa collective term for the Group Risk Management and risk management departments in each region and has beenestablished as an independent function from the Business Divisions within the Nomura Group entities.Specifically, the Risk Management Division is in charge of the following tasks concerning risk management:
• To define and embed risk management policies and procedures.
• To establish a framework for economic capital allocation, including setting higher level economiccapital guidelines.
• To define and monitor limits and ensure alignment with the firm’s risk appetite.
• To develop and maintain risk measurement models.
• To independently validate financial models for both inventory positions and regulatory capital.
• To communicate key risks to senior management and the GIRMC on a regular basis.
• To report to and establish frequent dialogue with the regulatory bodies, and/or apply for their approvalon risk management methods.
Market Risk
Market risk refers to the potential loss in the value of an asset resulting from changes in market prices, rates,indices, volatilities, correlations or other market factors. This type of risk primarily impacts our trading activities.Effective management of this risk requires the ability to analyze a complex and constantly changing globalmarket environment, identify problematic trends and ensure that appropriate action is taken in a timely manner.We use a number of tools to help assess and manage market risk on an ongoing basis including Value-at-Risk;stress testing and sensitivity analysis. Market risk is monitored against a set of approved limits, with daily reportsdelivered to the front office and senior management.
VaR
The statistical technique known as Value-at-Risk, or VaR, is the potential loss in the value of our tradingpositions due to adverse movements in markets over a defined time horizon with a specified confidence level.
103
We estimate VaR using a 99% confidence level and a one-day time horizon for our trading portfolio. Marketrisks that are incorporated in the VaR model include equity prices, interest rates, foreign exchange rates, andassociated volatilities and correlations. The historical data to calculate volatilities and correlations are weightedto give greater importance to more recent observations.
VaR Methodology, Assumptions and Limitations. We make a number of assumptions and approximations inrelation to the modeling of the risk characteristics of our trading positions. Different assumptions,approximations or a combination of them could result in a materially different VaR. We believe that theassumptions and approximations we use are reasonable.
Trading Portfolio Risk
The following tables show our VaR as of each of the dates indicated for substantially all of our tradingpositions:
As of
Mar. 31,2009
Apr. 30,2009
May 30,2009
Jun. 30,2009
Jul. 31,2009
Aug. 31,2009
Sep. 30,2009
Oct. 30,2009
Nov. 30,2009
Dec. 31,2009
Jan. 29,2010
Feb. 26,2010
Mar. 31,2010
(in 100 millions of Yen)Equity . . . . . . . . . . . . . . . . . . . . . ¥ 37.9 ¥ 29.0 ¥ 23.1 ¥ 44.3 ¥ 26.1 ¥ 39.0 ¥ 26.4 ¥ 22.0 ¥ 25.6 ¥ 28.5 ¥ 25.8 ¥ 20.6 ¥ 26.2Interest Rate . . . . . . . . . . . . . . . . 67.0 36.7 52.2 39.9 47.7 40.1 34.2 54.5 40.1 62.6 41.6 41.1 43.6Foreign Exchange . . . . . . . . . . . . 86.6 95.2 116.8 120.9 117.6 111.5 109.2 126.8 112.2 112.3 109.3 106.8 105.4
Sub-total . . . . . . . . . . . . . . . . . . . 191.5 160.8 192.1 205.1 191.4 190.6 169.9 203.3 177.9 203.5 176.7 168.5 175.3Less:
Diversification Benefit . . . . (74.8) (54.9) (66.3) (71.4) (61.0) (70.7) (51.7) (57.4) (53.7) (66.3) (49.1) (45.1) (49.7)
Value at Risk . . . . . . . . . . . ¥116.6 ¥106.0 ¥125.8 ¥133.7 ¥130.4 ¥119.9 ¥118.2 ¥145.9 ¥124.2 ¥137.2 ¥127.7 ¥123.4 ¥125.5
Value at Risk(maximum) ¥151.6 : October 16, 2009(average) 127.1 : Average for the period from April 1, 2009 to March 31, 2010(minimum) 98.8 : April 28, 2009
As of
Mar. 31,2008
Apr. 30,2008
May 31,2008
Jun. 29,2008
Jul. 31,2008
Aug. 31,2008
Sep. 28,2008
Oct. 31,2008
Nov. 30,2008
Dec. 31,2008
Jan. 31,2009
Feb. 29,2009
Mar. 31,2009
(in 100 millions of Yen)Equity . . . . . . . . . . . . . . . . . . . . . ¥ 41.6 ¥ 41.0 ¥ 44.5 ¥ 32.6 ¥ 38.3 ¥ 32.4 ¥ 26.8 ¥ 29.7 ¥ 23.8 ¥ 24.6 ¥ 21.6 ¥ 36.4 ¥ 37.9Interest Rate . . . . . . . . . . . . . . . . 47.0 80.2 54.8 37.4 34.3 31.5 33.8 49.2 40.9 42.2 39.7 72.4 67.0Foreign Exchange . . . . . . . . . . . . 80.0 65.4 70.6 47.6 38.4 43.0 63.0 124.3 127.7 118.0 102.0 92.1 86.6
Sub-total . . . . . . . . . . . . . . . . . . . 168.7 186.6 169.8 117.5 111.1 106.9 123.7 203.2 192.3 184.8 163.4 200.9 191.5Less:
Diversification Benefit . . . . (67.6) (92.7) (88.2) (54.6) (49.1) (45.4) (50.8) (72.0) (61.2) (61.7) (54.0) (77.4) (74.8)
Value at Risk . . . . . . . . . . . ¥101.0 ¥ 94.0 ¥ 81.6 ¥ 63.0 ¥ 62.0 ¥ 61.6 ¥ 72.9 ¥131.1 ¥131.1 ¥123.1 ¥109.4 ¥123.5 ¥116.6
Value at Risk(maximum) ¥139.3 : November 25, 2008(average) 96.1 : Average for the period from April 1, 2008 to March 31, 2009(minimum) 58.7 : August 22, 2008
VaR relating to equity risk decreased from ¥3.79 billion at the end of March 2009 to ¥2.62 billion at the endof March 2010 mainly due to a reduction of equity related volatility. VaR relating to interest rate risk decreasedfrom ¥6.70 billion at the end of March 2009 to ¥4.36 billion at the end of March 2010 mainly due to a reductionof interest rate related positions. VaR relating to foreign exchange risk increased from ¥8.66 billion at the end ofMarch 2009 to ¥10.54 billion at the end of March 2010 mainly due to a rise in FX volatility.
104
In the preceding year, VaR relating to equity risk decreased from ¥4.16 billion at the end of March 2008 to¥3.79 billion at the end of March 2009 mainly due to a reduction of equity related positions. VaR relating tointerest rate risk increased from ¥4.70 billion at the end of March 2008 to ¥6.70 billion at the end of March 2009mainly due to a rise of interest rate related volatility. VaR relating to foreign exchange risk increased from ¥8.00billion at the end of March 2008 to ¥8.66 billion at the end of March 2009 mainly due to a rise in FX volatility.
Back-Testing
We compare VaR values with the actual profits and losses in trading portfolio and verify model’s accuracyused in risk measurement. We count the number of actual times that VaR is exceeded and verify whether thenumber of times is within a predetermined range. If the number of exceptions is greater than the numberpredicted by the confidence level used for VaR then we implement any necessary adjustments to the VaRmethodology.
Other Measures
In some business lines or portfolios we use additional measures to control or limit risk taking activity. Thesemeasures include sensitivity analysis which show the potential changes to a portfolio due to standard moves inmarket risk factors. Metrics and limits of this type are typically specific to asset types, businesses or strategiesand are used to complement VaR and economic capital measures.
Stress Testing
Stress testing represents the potential loss on a portfolio due to the impact of applying a severe yet plausiblescenario. We have a comprehensive program of stress testing in place ranging from global cross risk classscenarios, such as the ‘Severe Market and Economic Downturn’ and ‘U.S. bond crash’ used to limit risks againstrisk appetite at the overall group level, to desk level scenarios/grids designed to limit risks within individualbusiness lines. Stress results are compared and used in conjunction with our economic capital measures. Wecontinue to invest in the development of analysis tools, systems and people and although there is a significantglobal team of Risk and Risk IT professionals dedicated to stress testing.
Model Review
Pricing models are used to generate trade valuations and the risk measurement metrics for the managementof the positions. The Global Model Validation Group validates the appropriateness and consistency of thesemodels, independent of those who design and build the models. As part of this process, the Global ModelValidation Group analyzes a number of factors to assess the model’s suitability for the valuation and riskmanagement of a particular product.
Non-Trading Risk
A major market risk in our non-trading portfolio relates to equity investments held for operating purposeswhich we hold on a long-term basis. Our non-trading portfolio is exposed mainly to volatility in the Japanesestock market. One method that can estimate the market risk in the portfolio is to analyze market sensitivity basedon changes in the Tokyo Stock Price Index, or TOPIX, which is a leading index of prices of stocks on the FirstSection of the Tokyo Stock Exchange.
We use regression analysis covering the previous 90 days which tracks and compares fluctuations in theTOPIX and the market value of our equity investments held for operating purposes. Our simulation indicatesthat, for each 10% change in the TOPIX, the market value of our operating equity investments held for operatingpurposes can be expected to change by ¥11,983 million as of March 31, 2009 and ¥13,196 million as ofMarch 31, 2010. On March 31, 2009, the TOPIX closed at 773.66 points and on March 31, 2010, the TOPIX
105
closed at 978.81 points. This simulation analyzes data for our entire portfolio of equity investments held foroperating purposes. Therefore, it is very important to note that the actual results differ from our expectationsbecause of price fluctuations of individual equities.
Credit Risk
The framework for the management of our credit risk and investment risk is outlined in the Credit RiskManagement Policy which was initially approved by the Group Executive Management Committee (which isnow our EMB).
Credit Risk is defined as the risk of losses arising from decrease or disappearance of asset values, on and offbalance sheet, due to deterioration in creditworthiness or default of credit granted entity. Credit Risk includesIssuer Risk and Counterparty Risk.
Investment Risk is defined as the risk of losses arising from decrease or disappearance of position values ofinvestment securities, private equity investment and fund investments.
Scope of Credit Risk Management
The scope of Credit Risk Management includes counterparty trading and various debt or equity instrumentsincluding loans, private equity investments, fund investments, investment securities and any other as deemednecessary from a credit risk management perspective.
Integrated Management
We evaluate credit risk not only by obligor, but also by obligor group where it is appropriate that their creditrisk should be evaluated collectively.
Credit Risk Reporting
The global risk management unit is responsible for monitoring, evaluating and analyzing credit risk and forreporting the status of credit risk to CRO, Senior Managing Directors in charge of risk management and theGIRMC with appropriate frequency.
Credit Risk Measurement
Credit Risk is quantitatively-measured by a globally unified methodology. Credit Risk is properly measuredto reflect the effect of collateral or a guarantee.
Credit Risk to counterparties to derivatives transaction
We measure our credit risk to counterparties to derivatives transactions as the sum of actual currentexposure evaluated daily at its fair value, plus potential exposure until maturity of such transactions. Allderivative credit lines are controlled through the risk management units.
We enter into International Swaps and Derivatives Association, Inc. (“ISDA”) master agreements orequivalent agreements (called master netting agreements) with many of our derivative counterparties. Masternetting agreements provide protection to reduce our risks of counterparty default and, in some cases, offset ourconsolidated balance sheets exposure with the same counterparty. This provides a more meaningful presentationof our balance sheet credit exposure.
In addition, to reduce default risk, we require collateral, principally cash or highly liquid bonds, includingU.S. and Japanese government securities when necessary.
106
The credit exposures in our trading-related derivatives as of March 31, 2010 are summarized in the tablebelow, showing as the fair value by counterparty credit rating and by tenor. The credit ratings are internallydetermined by our credit unit.
Counterparty Credit Ratings for Replacement Cost (Net of Collateral) of Trading Derivatives Assets
Years to Maturity
Credit RatingLess than
1 Year1 to 3Years
3 to 5Years
5 to 7Years
More than7 Years
Cross-MaturityNetting(1)
TotalFair Value
CollateralObtained
ReplacementCost
(a) (b) (a)-(b)(in billions of Yen)
AAA . . . . . . . . . ¥ 9 ¥ 9 ¥ 16 ¥ 16 ¥ 76 ¥ (60) ¥ 66 ¥ 1 ¥ 65AA . . . . . . . . . . 131 213 233 152 340 (762) 307 23 284A . . . . . . . . . . . . 327 316 352 214 803 (1,634) 378 28 350BBB . . . . . . . . . 47 46 38 23 123 (90) 187 36 151BB . . . . . . . . . . . 12 10 13 3 7 (22) 23 15 8Other(2) . . . . . . . 194 27 75 20 77 (219) 174 77 97
Sub-total . . . . . . 720 621 727 428 1,426 (2,787) 1,135 180 955Listed . . . . . . . . 524 296 67 10 4 — 901 — 901
Total . . . . . . . . . ¥1,244 ¥917 ¥794 ¥438 ¥1,430 ¥(2,787) ¥2,036 ¥180 ¥1,856
Notes:(1) This item represents netting of payable balances with receivable balances for the same counterparty across maturity band
categories. Receivable and payable balances with the same counterparty in the same maturity category, however, are netwithin the maturity category. Cash collateral netting against net derivatives in accordance with ASC 210-20 are included.
(2) “Other” does not necessarily indicate that the counterparties’ credit is below investment grade.
Operational Risk
We define operational risk as the risk of loss resulting from inadequate or failed internal processes, peopleand systems or from external events. This definition includes legal risk, but excludes strategic risk. The loss ofevent types which fall under this definition are as follows: (1) Internal Fraud (2) External Fraud (3) EmploymentPractices and Workplace Safety (4) Clients, Products & Business Practices (5) Damage to Physical Assets(6) Business Disruption and System Failures (7) Transaction Processing.
Governance
Primary responsibility for the management of operational risk is within the business units and controlfunctions. Operational risk is managed on a day-to-day basis by the business areas through the maintenance ofappropriate control environments.
In addition, we have a Global Operational Risk function, which is part of Global Risk Management, and isindependent of the business units. The Operational Risk function works with the business units and controlfunctions to ensure a consistent and comprehensive framework for managing operational risk is implementedglobally. The GIRMC promotes and oversees the implementation of the operational risk management framework.
Framework
The framework for the operational risk management is outlined in the Operational Risk Management Policy,which is approved by the GIRMC. The operational risk management framework establishes global standardsrelated to risk measurement, monitoring and management and continually responds to changing regulatory andbusiness environment landscape.
107
The Nomura Group is in the process of improving its operational risk management framework globally tomeet the expected standards for a sophisticated global financial institution. The framework is designed to provideconfidence and transparency in our management of operational risk for our shareholders and investors.
The operational risk management framework consists of four elements: Identification, Assessment, Controland Monitoring of the risk. We identify the risk by capturing and analyzing internal and external loss data. Weassess and control risk appropriately through the analysis of losses and through the implementation of selfassessments. We monitor and report operational risk to senior management and regional and global oversightcommittees. We continually inform and train Nomura Group employees in awareness of operational risk and thepotential impact to the organization.
The overarching objectives of the operational risk management are to respond to and mitigate operationalrisk, improve our processes and systems, and so contribute to our corporate value.
Nomura Group will continue to develop policies and procedures, effective tools and systems in order toimplement this framework globally.
Item 12. Description of Securities Other Than Equity Securities
A. Debt Securities
Not applicable.
B. Warrants and Rights
Not applicable.
C. Other Securities
Not applicable.
108
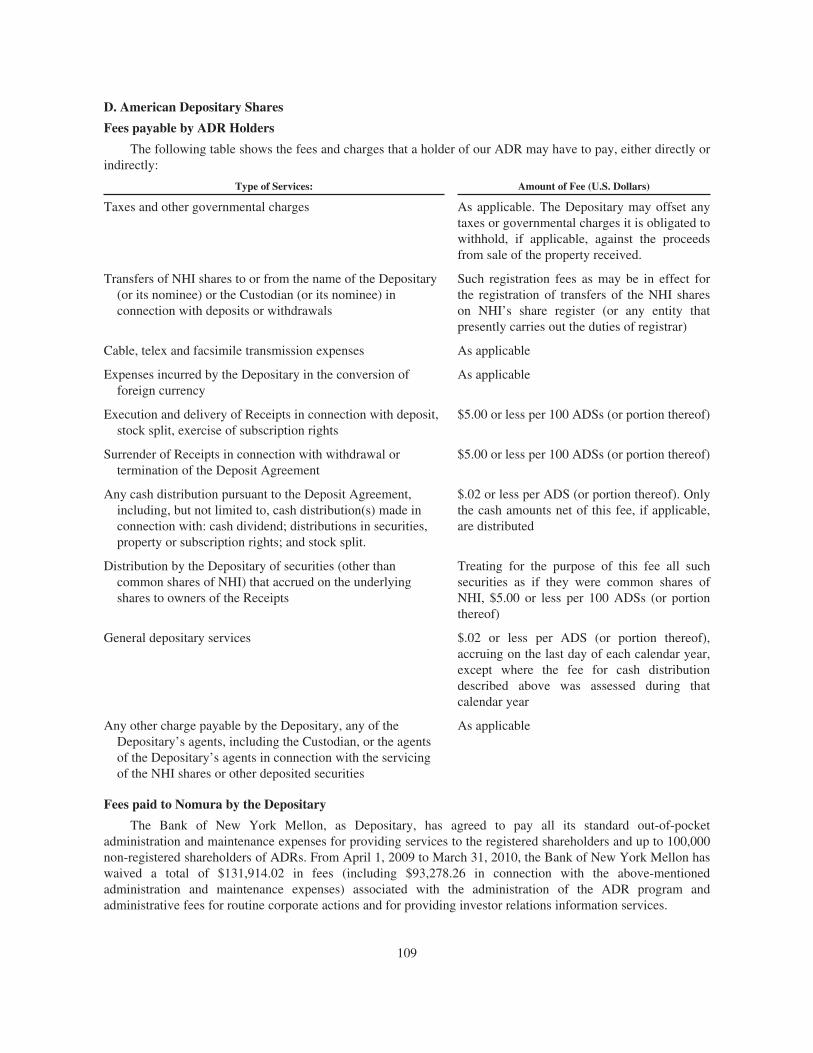
D. American Depositary Shares
Fees payable by ADR Holders
The following table shows the fees and charges that a holder of our ADR may have to pay, either directly orindirectly:
Type of Services: Amount of Fee (U.S. Dollars)
Taxes and other governmental charges As applicable. The Depositary may offset anytaxes or governmental charges it is obligated towithhold, if applicable, against the proceedsfrom sale of the property received.
Transfers of NHI shares to or from the name of the Depositary(or its nominee) or the Custodian (or its nominee) inconnection with deposits or withdrawals
Such registration fees as may be in effect forthe registration of transfers of the NHI shareson NHI’s share register (or any entity thatpresently carries out the duties of registrar)
Cable, telex and facsimile transmission expenses As applicable
Expenses incurred by the Depositary in the conversion offoreign currency
As applicable
Execution and delivery of Receipts in connection with deposit,stock split, exercise of subscription rights
$5.00 or less per 100 ADSs (or portion thereof)
Surrender of Receipts in connection with withdrawal ortermination of the Deposit Agreement
$5.00 or less per 100 ADSs (or portion thereof)
Any cash distribution pursuant to the Deposit Agreement,including, but not limited to, cash distribution(s) made inconnection with: cash dividend; distributions in securities,property or subscription rights; and stock split.
$.02 or less per ADS (or portion thereof). Onlythe cash amounts net of this fee, if applicable,are distributed
Distribution by the Depositary of securities (other thancommon shares of NHI) that accrued on the underlyingshares to owners of the Receipts
Treating for the purpose of this fee all suchsecurities as if they were common shares ofNHI, $5.00 or less per 100 ADSs (or portionthereof)
General depositary services $.02 or less per ADS (or portion thereof),accruing on the last day of each calendar year,except where the fee for cash distributiondescribed above was assessed during thatcalendar year
Any other charge payable by the Depositary, any of theDepositary’s agents, including the Custodian, or the agentsof the Depositary’s agents in connection with the servicingof the NHI shares or other deposited securities
As applicable
Fees paid to Nomura by the Depositary
The Bank of New York Mellon, as Depositary, has agreed to pay all its standard out-of-pocketadministration and maintenance expenses for providing services to the registered shareholders and up to 100,000non-registered shareholders of ADRs. From April 1, 2009 to March 31, 2010, the Bank of New York Mellon haswaived a total of $131,914.02 in fees (including $93,278.26 in connection with the above-mentionedadministration and maintenance expenses) associated with the administration of the ADR program andadministrative fees for routine corporate actions and for providing investor relations information services.
109
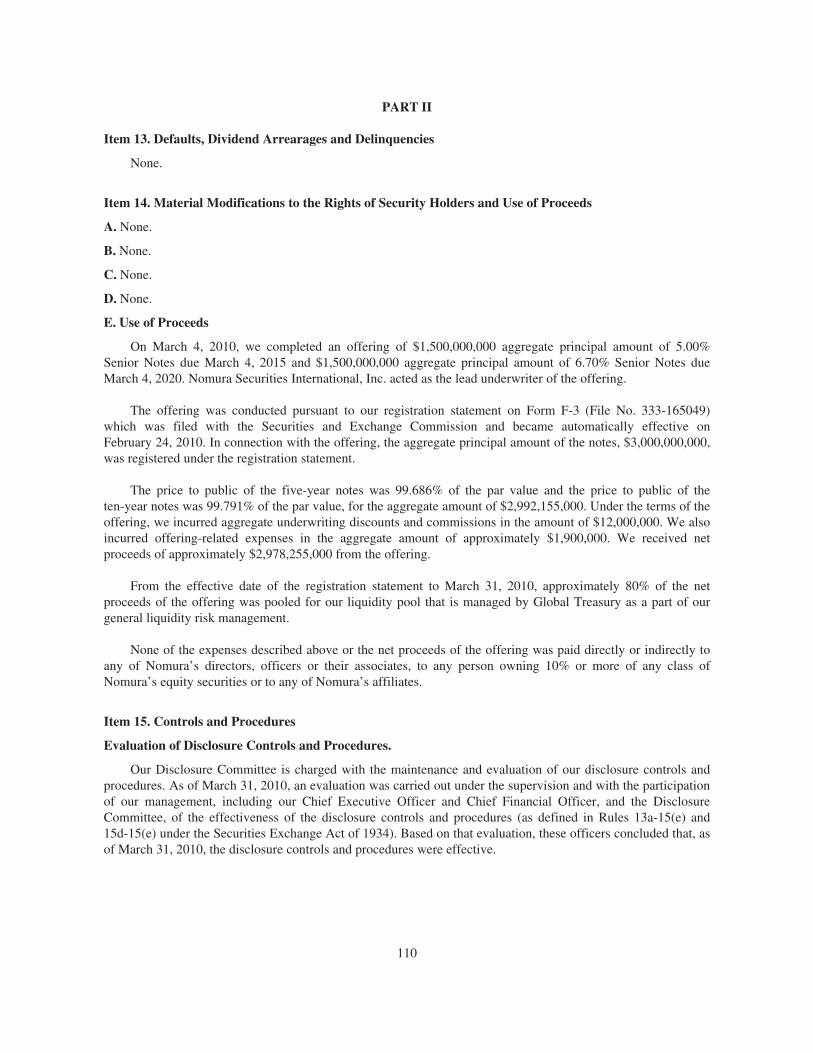
PART II
Item 13. Defaults, Dividend Arrearages and Delinquencies
None.
Item 14. Material Modifications to the Rights of Security Holders and Use of Proceeds
A. None.
B. None.
C. None.
D. None.
E. Use of Proceeds
On March 4, 2010, we completed an offering of $1,500,000,000 aggregate principal amount of 5.00%Senior Notes due March 4, 2015 and $1,500,000,000 aggregate principal amount of 6.70% Senior Notes dueMarch 4, 2020. Nomura Securities International, Inc. acted as the lead underwriter of the offering.
The offering was conducted pursuant to our registration statement on Form F-3 (File No. 333-165049)which was filed with the Securities and Exchange Commission and became automatically effective onFebruary 24, 2010. In connection with the offering, the aggregate principal amount of the notes, $3,000,000,000,was registered under the registration statement.
The price to public of the five-year notes was 99.686% of the par value and the price to public of theten-year notes was 99.791% of the par value, for the aggregate amount of $2,992,155,000. Under the terms of theoffering, we incurred aggregate underwriting discounts and commissions in the amount of $12,000,000. We alsoincurred offering-related expenses in the aggregate amount of approximately $1,900,000. We received netproceeds of approximately $2,978,255,000 from the offering.
From the effective date of the registration statement to March 31, 2010, approximately 80% of the netproceeds of the offering was pooled for our liquidity pool that is managed by Global Treasury as a part of ourgeneral liquidity risk management.
None of the expenses described above or the net proceeds of the offering was paid directly or indirectly toany of Nomura’s directors, officers or their associates, to any person owning 10% or more of any class ofNomura’s equity securities or to any of Nomura’s affiliates.
Item 15. Controls and Procedures
Evaluation of Disclosure Controls and Procedures.
Our Disclosure Committee is charged with the maintenance and evaluation of our disclosure controls andprocedures. As of March 31, 2010, an evaluation was carried out under the supervision and with the participationof our management, including our Chief Executive Officer and Chief Financial Officer, and the DisclosureCommittee, of the effectiveness of the disclosure controls and procedures (as defined in Rules 13a-15(e) and15d-15(e) under the Securities Exchange Act of 1934). Based on that evaluation, these officers concluded that, asof March 31, 2010, the disclosure controls and procedures were effective.
110
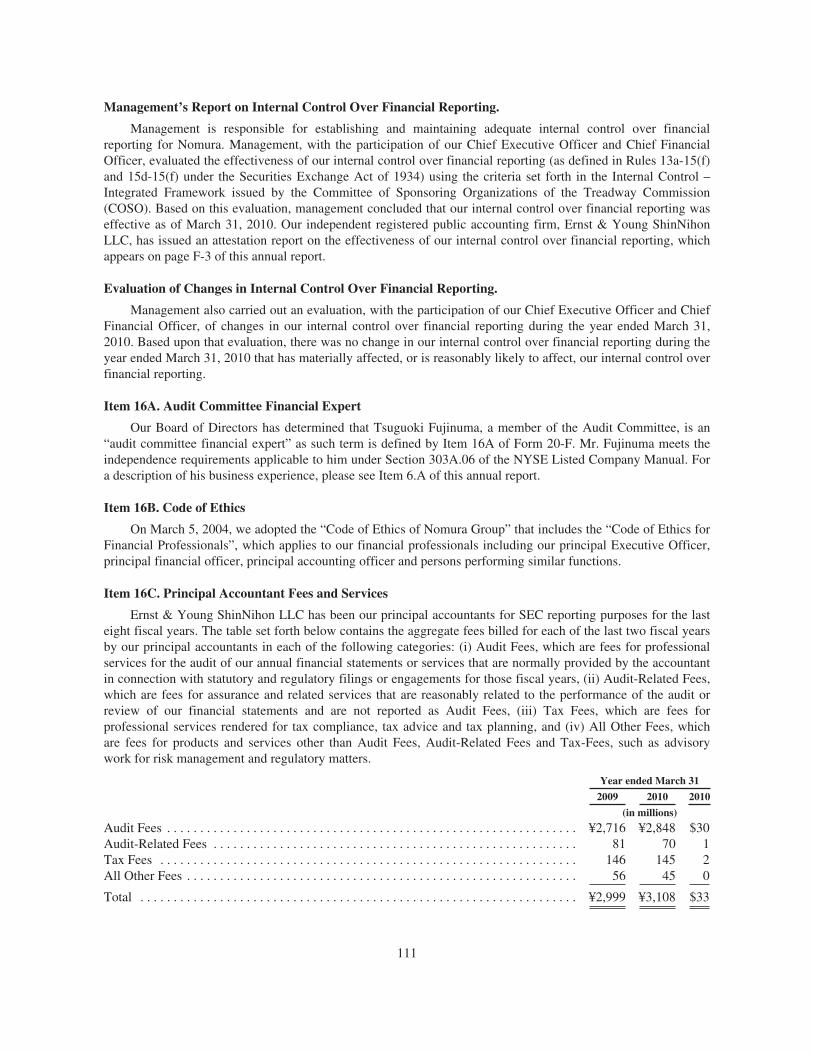
Management’s Report on Internal Control Over Financial Reporting.
Management is responsible for establishing and maintaining adequate internal control over financialreporting for Nomura. Management, with the participation of our Chief Executive Officer and Chief FinancialOfficer, evaluated the effectiveness of our internal control over financial reporting (as defined in Rules 13a-15(f)and 15d-15(f) under the Securities Exchange Act of 1934) using the criteria set forth in the Internal Control –Integrated Framework issued by the Committee of Sponsoring Organizations of the Treadway Commission(COSO). Based on this evaluation, management concluded that our internal control over financial reporting waseffective as of March 31, 2010. Our independent registered public accounting firm, Ernst & Young ShinNihonLLC, has issued an attestation report on the effectiveness of our internal control over financial reporting, whichappears on page F-3 of this annual report.
Evaluation of Changes in Internal Control Over Financial Reporting.
Management also carried out an evaluation, with the participation of our Chief Executive Officer and ChiefFinancial Officer, of changes in our internal control over financial reporting during the year ended March 31,2010. Based upon that evaluation, there was no change in our internal control over financial reporting during theyear ended March 31, 2010 that has materially affected, or is reasonably likely to affect, our internal control overfinancial reporting.
Item 16A. Audit Committee Financial Expert
Our Board of Directors has determined that Tsuguoki Fujinuma, a member of the Audit Committee, is an“audit committee financial expert” as such term is defined by Item 16A of Form 20-F. Mr. Fujinuma meets theindependence requirements applicable to him under Section 303A.06 of the NYSE Listed Company Manual. Fora description of his business experience, please see Item 6.A of this annual report.
Item 16B. Code of Ethics
On March 5, 2004, we adopted the “Code of Ethics of Nomura Group” that includes the “Code of Ethics forFinancial Professionals”, which applies to our financial professionals including our principal Executive Officer,principal financial officer, principal accounting officer and persons performing similar functions.
Item 16C. Principal Accountant Fees and Services
Ernst & Young ShinNihon LLC has been our principal accountants for SEC reporting purposes for the lasteight fiscal years. The table set forth below contains the aggregate fees billed for each of the last two fiscal yearsby our principal accountants in each of the following categories: (i) Audit Fees, which are fees for professionalservices for the audit of our annual financial statements or services that are normally provided by the accountantin connection with statutory and regulatory filings or engagements for those fiscal years, (ii) Audit-Related Fees,which are fees for assurance and related services that are reasonably related to the performance of the audit orreview of our financial statements and are not reported as Audit Fees, (iii) Tax Fees, which are fees forprofessional services rendered for tax compliance, tax advice and tax planning, and (iv) All Other Fees, whichare fees for products and services other than Audit Fees, Audit-Related Fees and Tax-Fees, such as advisorywork for risk management and regulatory matters.
Year ended March 31
2009 2010 2010
(in millions)
Audit Fees . . . . . . . . . . . . . . . . . . . . . . . . . . . . . . . . . . . . . . . . . . . . . . . . . . . . . . . . . . . . . . ¥2,716 ¥2,848 $30Audit-Related Fees . . . . . . . . . . . . . . . . . . . . . . . . . . . . . . . . . . . . . . . . . . . . . . . . . . . . . . . 81 70 1Tax Fees . . . . . . . . . . . . . . . . . . . . . . . . . . . . . . . . . . . . . . . . . . . . . . . . . . . . . . . . . . . . . . . 146 145 2All Other Fees . . . . . . . . . . . . . . . . . . . . . . . . . . . . . . . . . . . . . . . . . . . . . . . . . . . . . . . . . . . 56 45 0
Total . . . . . . . . . . . . . . . . . . . . . . . . . . . . . . . . . . . . . . . . . . . . . . . . . . . . . . . . . . . . . . . . . . ¥2,999 ¥3,108 $33
111

Audit-Related Fees included fees for services relating to consultations on accounting issues relating to ourbusiness such as securitization. Tax Fees included fees for services relating to tax planning and compliance. AllOther Fees included fees for services relating to advice with respect to regulations and disclosures under theFinancial Instruments and Exchange Act in connection with our underwriting business.
In accordance with the regulations of the Securities and Exchange Commission issued pursuant to Sections202 and 208 of the Sarbanes-Oxley Act of 2002, our Audit Committee has adopted a pre-approval policyregarding the engagements of our principal accountants. Under the pre-approval policy, there are two types ofpre-approval procedures, “General Pre-Approval” and “Specific Pre-Approval.”
Under the pre-approval procedure for “General Pre-Approval,” our Chief Financial Officer in conjunctionwith our principal accountants must make a proposal to our Audit Committee for the types of services andestimated fee levels of each category of services to be generally pre-approved. Such proposal must be made noless frequently than annually. The Audit Committee will discuss the proposal and if necessary consult withoutside professionals as to whether the proposed services would impair the independence of our principalaccountants. If such proposal is accepted, our Audit Committee will inform our CFO and principal accountants ofthe services that have generally been pre-approved and included in a “General Pre-Approved List.” Our AuditCommittee is informed of each such service that is provided.
Under the pre-approval procedure for “Specific Pre-Approval,” if any proposed services are not on theGeneral Pre-Approved List, our CFO must submit an application to our Audit Committee for such services. Afterreviewing the details and estimated fee levels for each engagement and if necessary consulting with outsideprofessionals as to whether the proposed services would impair the independence of our principal accountants,our Audit Committee may make a specific pre-approval decision on these services. Also, if any approvedservices in the General Pre-Approved List exceed the fee levels prescribed on the List, our CFO must submit anapplication to our Audit Committee for new fee levels for such services. Our Audit Committee may make apre-approval decision after reviewing the details of the services and the estimated fee levels for eachengagement.
None of the services described in the first paragraph under this Item 16C were waived from the pre-approvalrequirement pursuant to Rule 2-01(c)(7)(i)(C) of Regulation S-X.
Item 16D. Exemptions from the Listing Standards for Audit Committees
We do not avail ourselves of any exemption from the independence requirements of Rule 10A-3 under theSecurities Exchange Act of 1934.
Item 16E. Purchases of Equity Securities by the Issuer and Affiliated Purchasers
In the year ended March 31, 2010, we acquired 26,857 shares of our common stock by means of repurchaseof shares constituting less than one unit upon the request of the holders of those shares. For an explanation of theright of our shareholders to demand such repurchases by us, see “Common Stock” under Item 10.B of this annualreport. As of March 31, 2010, we had 3,669,044,614 outstanding shares excluding 50,088,627 shares as treasurystock. During the year ended March 31, 2010, no affiliated purchaser of Nomura purchased shares of ourcommon stock.
We had not established share buyback programs nor purchased our common stock utilizing the programsduring the year ended March 31, 2010.
112
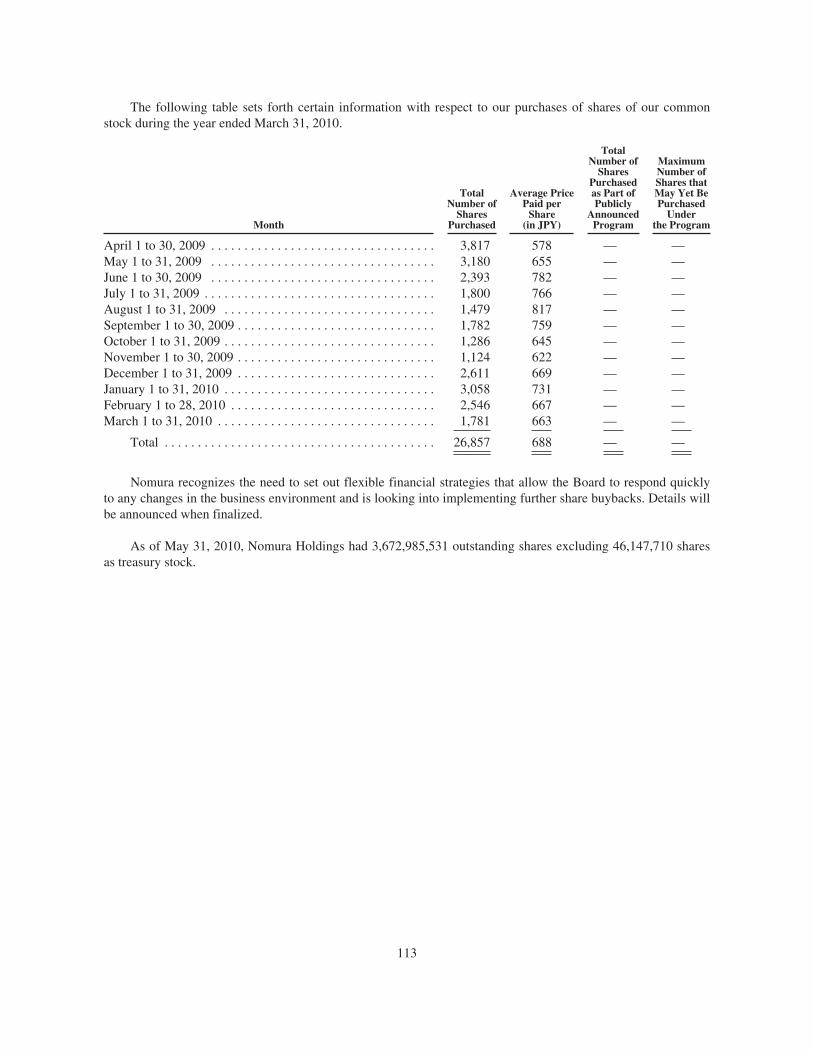
The following table sets forth certain information with respect to our purchases of shares of our commonstock during the year ended March 31, 2010.
Month
TotalNumber of
SharesPurchased
Average PricePaid per
Share(in JPY)
TotalNumber of
SharesPurchasedas Part ofPublicly
AnnouncedProgram
MaximumNumber ofShares thatMay Yet BePurchased
Underthe Program
April 1 to 30, 2009 . . . . . . . . . . . . . . . . . . . . . . . . . . . . . . . . . . 3,817 578 — —May 1 to 31, 2009 . . . . . . . . . . . . . . . . . . . . . . . . . . . . . . . . . . 3,180 655 — —June 1 to 30, 2009 . . . . . . . . . . . . . . . . . . . . . . . . . . . . . . . . . . 2,393 782 — —July 1 to 31, 2009 . . . . . . . . . . . . . . . . . . . . . . . . . . . . . . . . . . . 1,800 766 — —August 1 to 31, 2009 . . . . . . . . . . . . . . . . . . . . . . . . . . . . . . . . 1,479 817 — —September 1 to 30, 2009 . . . . . . . . . . . . . . . . . . . . . . . . . . . . . . 1,782 759 — —October 1 to 31, 2009 . . . . . . . . . . . . . . . . . . . . . . . . . . . . . . . . 1,286 645 — —November 1 to 30, 2009 . . . . . . . . . . . . . . . . . . . . . . . . . . . . . . 1,124 622 — —December 1 to 31, 2009 . . . . . . . . . . . . . . . . . . . . . . . . . . . . . . 2,611 669 — —January 1 to 31, 2010 . . . . . . . . . . . . . . . . . . . . . . . . . . . . . . . . 3,058 731 — —February 1 to 28, 2010 . . . . . . . . . . . . . . . . . . . . . . . . . . . . . . . 2,546 667 — —March 1 to 31, 2010 . . . . . . . . . . . . . . . . . . . . . . . . . . . . . . . . . 1,781 663 — —
Total . . . . . . . . . . . . . . . . . . . . . . . . . . . . . . . . . . . . . . . . . 26,857 688 — —
Nomura recognizes the need to set out flexible financial strategies that allow the Board to respond quicklyto any changes in the business environment and is looking into implementing further share buybacks. Details willbe announced when finalized.
As of May 31, 2010, Nomura Holdings had 3,672,985,531 outstanding shares excluding 46,147,710 sharesas treasury stock.
113
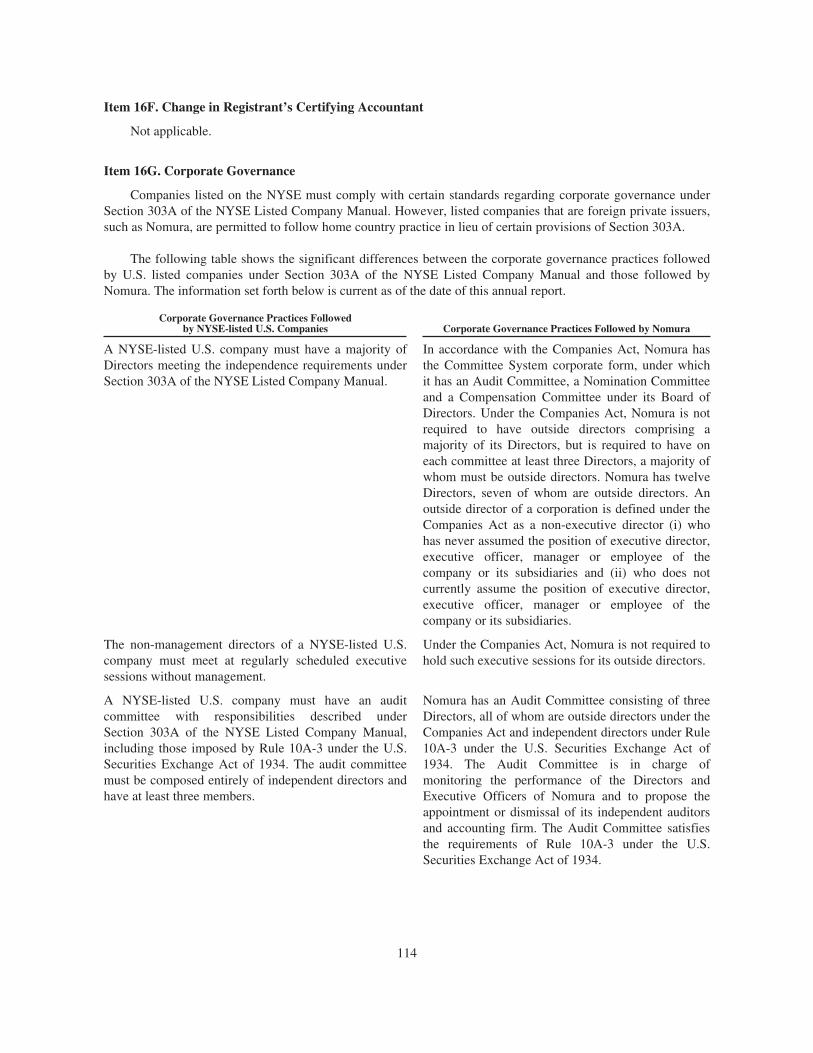
Item 16F. Change in Registrant’s Certifying Accountant
Not applicable.
Item 16G. Corporate Governance
Companies listed on the NYSE must comply with certain standards regarding corporate governance underSection 303A of the NYSE Listed Company Manual. However, listed companies that are foreign private issuers,such as Nomura, are permitted to follow home country practice in lieu of certain provisions of Section 303A.
The following table shows the significant differences between the corporate governance practices followedby U.S. listed companies under Section 303A of the NYSE Listed Company Manual and those followed byNomura. The information set forth below is current as of the date of this annual report.
Corporate Governance Practices Followedby NYSE-listed U.S. Companies Corporate Governance Practices Followed by Nomura
A NYSE-listed U.S. company must have a majority ofDirectors meeting the independence requirements underSection 303A of the NYSE Listed Company Manual.
In accordance with the Companies Act, Nomura hasthe Committee System corporate form, under whichit has an Audit Committee, a Nomination Committeeand a Compensation Committee under its Board ofDirectors. Under the Companies Act, Nomura is notrequired to have outside directors comprising amajority of its Directors, but is required to have oneach committee at least three Directors, a majority ofwhom must be outside directors. Nomura has twelveDirectors, seven of whom are outside directors. Anoutside director of a corporation is defined under theCompanies Act as a non-executive director (i) whohas never assumed the position of executive director,executive officer, manager or employee of thecompany or its subsidiaries and (ii) who does notcurrently assume the position of executive director,executive officer, manager or employee of thecompany or its subsidiaries.
The non-management directors of a NYSE-listed U.S.company must meet at regularly scheduled executivesessions without management.
Under the Companies Act, Nomura is not required tohold such executive sessions for its outside directors.
A NYSE-listed U.S. company must have an auditcommittee with responsibilities described underSection 303A of the NYSE Listed Company Manual,including those imposed by Rule 10A-3 under the U.S.Securities Exchange Act of 1934. The audit committeemust be composed entirely of independent directors andhave at least three members.
Nomura has an Audit Committee consisting of threeDirectors, all of whom are outside directors under theCompanies Act and independent directors under Rule10A-3 under the U.S. Securities Exchange Act of1934. The Audit Committee is in charge ofmonitoring the performance of the Directors andExecutive Officers of Nomura and to propose theappointment or dismissal of its independent auditorsand accounting firm. The Audit Committee satisfiesthe requirements of Rule 10A-3 under the U.S.Securities Exchange Act of 1934.
114
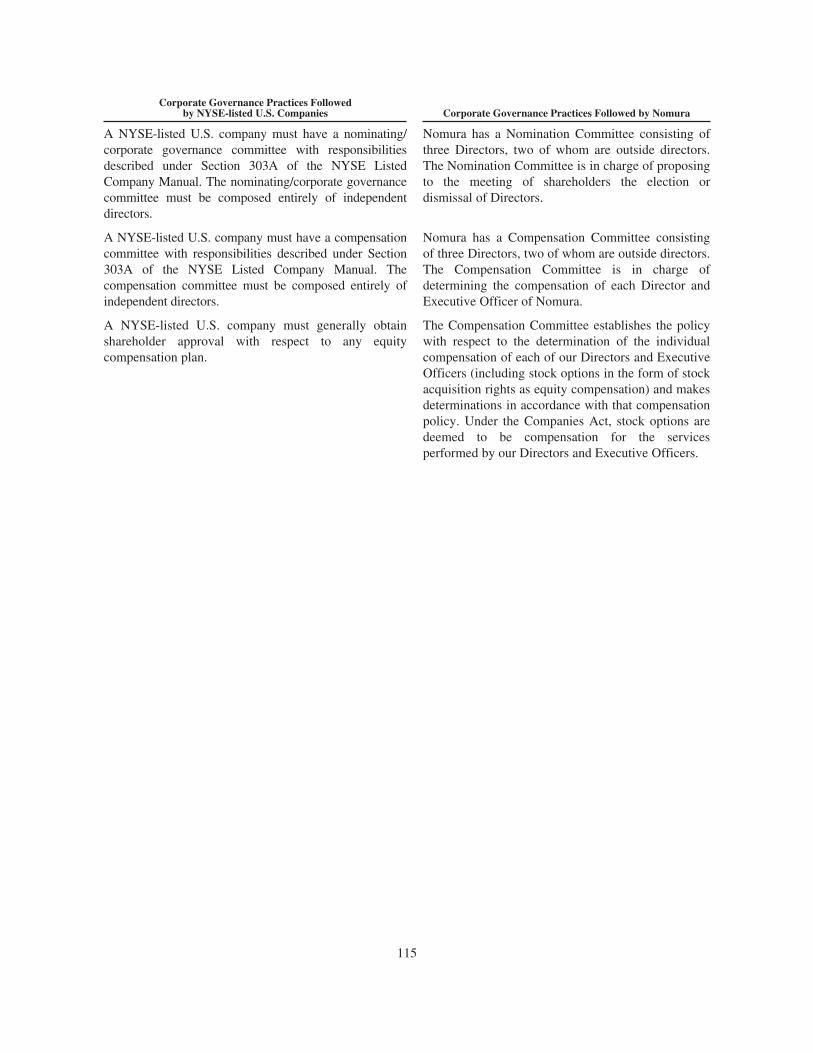
Corporate Governance Practices Followedby NYSE-listed U.S. Companies Corporate Governance Practices Followed by Nomura
A NYSE-listed U.S. company must have a nominating/corporate governance committee with responsibilitiesdescribed under Section 303A of the NYSE ListedCompany Manual. The nominating/corporate governancecommittee must be composed entirely of independentdirectors.
Nomura has a Nomination Committee consisting ofthree Directors, two of whom are outside directors.The Nomination Committee is in charge of proposingto the meeting of shareholders the election ordismissal of Directors.
A NYSE-listed U.S. company must have a compensationcommittee with responsibilities described under Section303A of the NYSE Listed Company Manual. Thecompensation committee must be composed entirely ofindependent directors.
Nomura has a Compensation Committee consistingof three Directors, two of whom are outside directors.The Compensation Committee is in charge ofdetermining the compensation of each Director andExecutive Officer of Nomura.
A NYSE-listed U.S. company must generally obtainshareholder approval with respect to any equitycompensation plan.
The Compensation Committee establishes the policywith respect to the determination of the individualcompensation of each of our Directors and ExecutiveOfficers (including stock options in the form of stockacquisition rights as equity compensation) and makesdeterminations in accordance with that compensationpolicy. Under the Companies Act, stock options aredeemed to be compensation for the servicesperformed by our Directors and Executive Officers.
115

PART III
Item 17. Financial Statements
In lieu of responding to this item, we have responded to Item 18 of this annual report.
Item 18. Financial Statements
The information required by this item is set forth in our consolidated financial statements included in thisannual report.
116
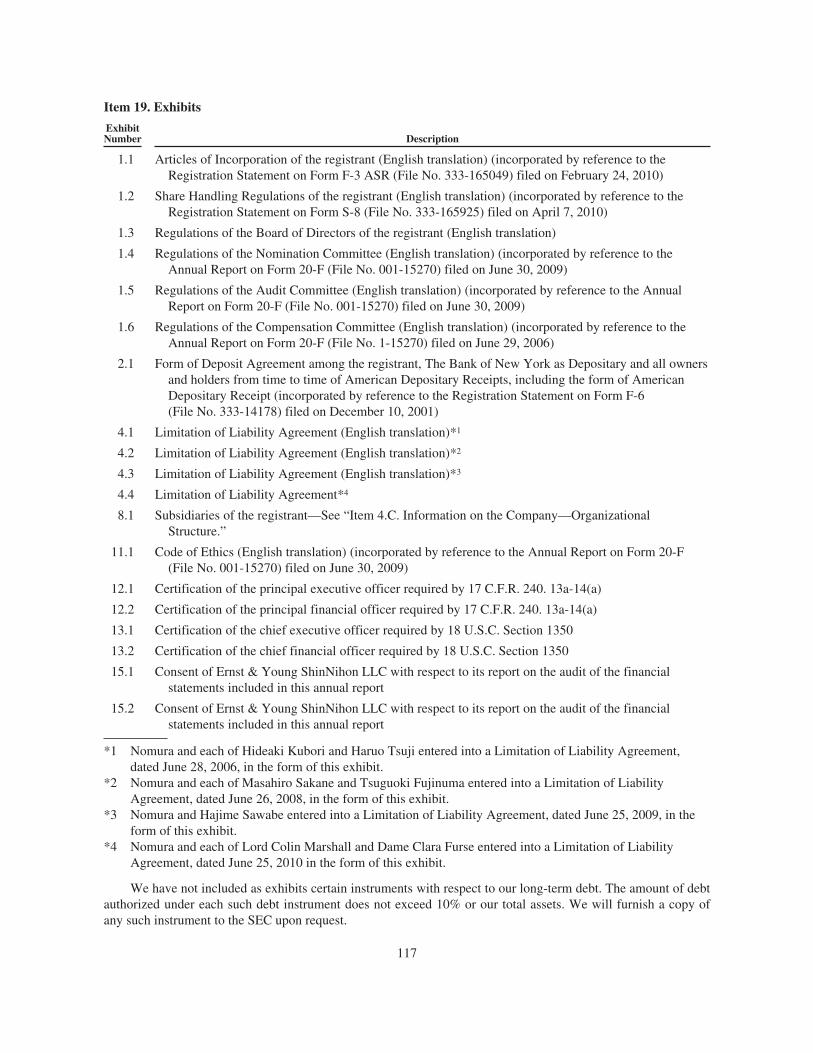
Item 19. Exhibits
ExhibitNumber Description
1.1 Articles of Incorporation of the registrant (English translation) (incorporated by reference to theRegistration Statement on Form F-3 ASR (File No. 333-165049) filed on February 24, 2010)
1.2 Share Handling Regulations of the registrant (English translation) (incorporated by reference to theRegistration Statement on Form S-8 (File No. 333-165925) filed on April 7, 2010)
1.3 Regulations of the Board of Directors of the registrant (English translation)
1.4 Regulations of the Nomination Committee (English translation) (incorporated by reference to theAnnual Report on Form 20-F (File No. 001-15270) filed on June 30, 2009)
1.5 Regulations of the Audit Committee (English translation) (incorporated by reference to the AnnualReport on Form 20-F (File No. 001-15270) filed on June 30, 2009)
1.6 Regulations of the Compensation Committee (English translation) (incorporated by reference to theAnnual Report on Form 20-F (File No. 1-15270) filed on June 29, 2006)
2.1 Form of Deposit Agreement among the registrant, The Bank of New York as Depositary and all ownersand holders from time to time of American Depositary Receipts, including the form of AmericanDepositary Receipt (incorporated by reference to the Registration Statement on Form F-6(File No. 333-14178) filed on December 10, 2001)
4.1 Limitation of Liability Agreement (English translation)*1
4.2 Limitation of Liability Agreement (English translation)*2
4.3 Limitation of Liability Agreement (English translation)*3
4.4 Limitation of Liability Agreement*4
8.1 Subsidiaries of the registrant—See “Item 4.C. Information on the Company—OrganizationalStructure.”
11.1 Code of Ethics (English translation) (incorporated by reference to the Annual Report on Form 20-F(File No. 001-15270) filed on June 30, 2009)
12.1 Certification of the principal executive officer required by 17 C.F.R. 240. 13a-14(a)
12.2 Certification of the principal financial officer required by 17 C.F.R. 240. 13a-14(a)
13.1 Certification of the chief executive officer required by 18 U.S.C. Section 1350
13.2 Certification of the chief financial officer required by 18 U.S.C. Section 1350
15.1 Consent of Ernst & Young ShinNihon LLC with respect to its report on the audit of the financialstatements included in this annual report
15.2 Consent of Ernst & Young ShinNihon LLC with respect to its report on the audit of the financialstatements included in this annual report
*1 Nomura and each of Hideaki Kubori and Haruo Tsuji entered into a Limitation of Liability Agreement,dated June 28, 2006, in the form of this exhibit.
*2 Nomura and each of Masahiro Sakane and Tsuguoki Fujinuma entered into a Limitation of LiabilityAgreement, dated June 26, 2008, in the form of this exhibit.
*3 Nomura and Hajime Sawabe entered into a Limitation of Liability Agreement, dated June 25, 2009, in theform of this exhibit.
*4 Nomura and each of Lord Colin Marshall and Dame Clara Furse entered into a Limitation of LiabilityAgreement, dated June 25, 2010 in the form of this exhibit.
We have not included as exhibits certain instruments with respect to our long-term debt. The amount of debtauthorized under each such debt instrument does not exceed 10% or our total assets. We will furnish a copy ofany such instrument to the SEC upon request.
117
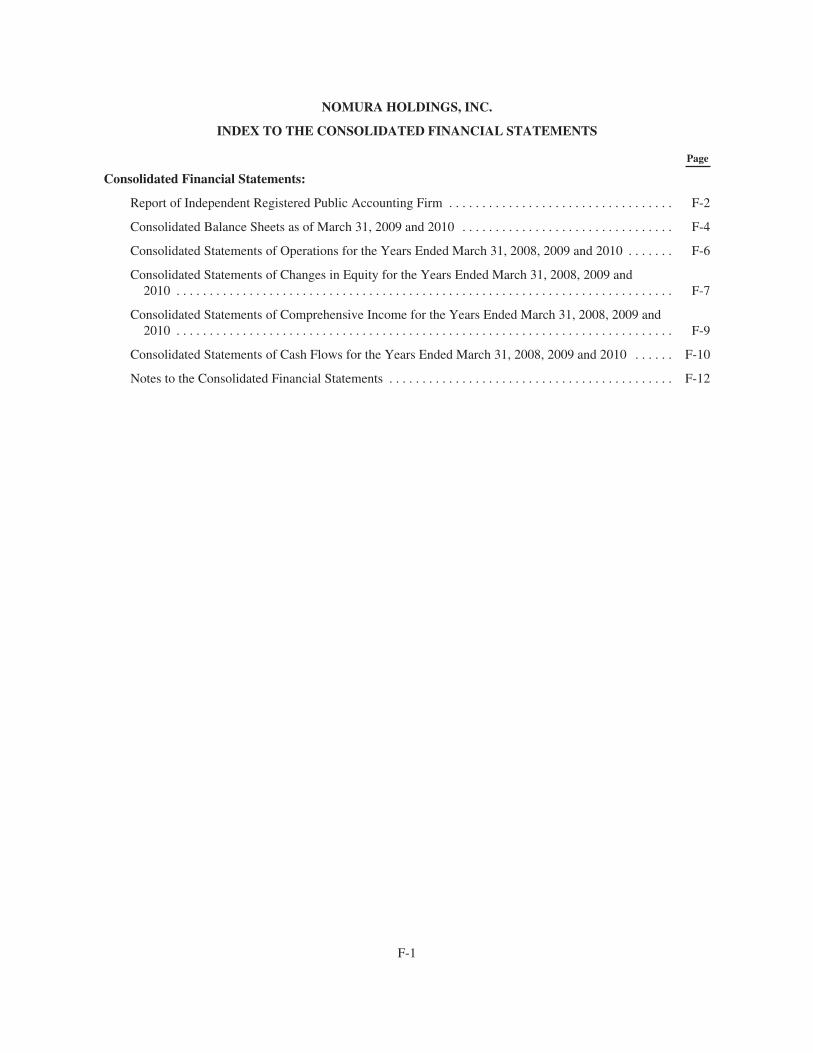
NOMURA HOLDINGS, INC.
INDEX TO THE CONSOLIDATED FINANCIAL STATEMENTS
Page
Consolidated Financial Statements:
Report of Independent Registered Public Accounting Firm . . . . . . . . . . . . . . . . . . . . . . . . . . . . . . . . . . F-2
Consolidated Balance Sheets as of March 31, 2009 and 2010 . . . . . . . . . . . . . . . . . . . . . . . . . . . . . . . . F-4
Consolidated Statements of Operations for the Years Ended March 31, 2008, 2009 and 2010 . . . . . . . F-6
Consolidated Statements of Changes in Equity for the Years Ended March 31, 2008, 2009 and2010 . . . . . . . . . . . . . . . . . . . . . . . . . . . . . . . . . . . . . . . . . . . . . . . . . . . . . . . . . . . . . . . . . . . . . . . . . . . F-7
Consolidated Statements of Comprehensive Income for the Years Ended March 31, 2008, 2009 and2010 . . . . . . . . . . . . . . . . . . . . . . . . . . . . . . . . . . . . . . . . . . . . . . . . . . . . . . . . . . . . . . . . . . . . . . . . . . . F-9
Consolidated Statements of Cash Flows for the Years Ended March 31, 2008, 2009 and 2010 . . . . . . F-10
Notes to the Consolidated Financial Statements . . . . . . . . . . . . . . . . . . . . . . . . . . . . . . . . . . . . . . . . . . . F-12
F-1
REPORT OF INDEPENDENT REGISTERED PUBLIC ACCOUNTING FIRM
The Board of Directors and Shareholders ofNomura Holdings, Inc.
We have audited the accompanying consolidated balance sheets of Nomura Holdings, Inc. (the “Company”)as of March 31, 2009 and 2010, and the related consolidated statements of operations, changes in equity,comprehensive income, and cash flows for each of the three years in the period ended March 31, 2010. Thesefinancial statements are the responsibility of the Company’s management. Our responsibility is to express anopinion on these financial statements based on our audits.
We conducted our audits in accordance with the standards of the Public Company Accounting OversightBoard (United States). Those standards require that we plan and perform the audit to obtain reasonable assuranceabout whether the financial statements are free of material misstatement. An audit includes examining, on a testbasis, evidence supporting the amounts and disclosures in the financial statements. An audit also includesassessing the accounting principles used and significant estimates made by management, as well as evaluatingthe overall financial statement presentation. We believe that our audits provide a reasonable basis for ouropinion.
In our opinion, the financial statements referred to above present fairly, in all material respects, theconsolidated financial position of Nomura Holdings, Inc. at March 31, 2009 and 2010, and the consolidatedresults of its operations and its cash flows for each of the three years in the period ended March 31, 2010, inconformity with U.S. generally accepted accounting principles.
We also have audited, in accordance with the standards of the Public Company Accounting Oversight Board(United States), Nomura Holdings, Inc.’s internal control over financial reporting as of March 31, 2010, based oncriteria established in Internal Control—Integrated Framework issued by the Committee of SponsoringOrganizations of the Treadway Commission and our report dated June 29, 2010 expressed an unqualified opinionthereon.
/s/ Ernst & Young ShinNihon LLC
Tokyo, JapanJune 29, 2010
F-2
REPORT OF INDEPENDENT REGISTERED PUBLIC ACCOUNTING FIRM
The Board of Directors and Shareholders ofNomura Holdings, Inc.
We have audited Nomura Holdings, Inc.’s internal control over financial reporting as of March 31, 2010,based on criteria established in Internal Control—Integrated Framework issued by the Committee of SponsoringOrganizations of the Treadway Commission (the COSO criteria). Nomura Holdings, Inc.’s management isresponsible for maintaining effective internal control over financial reporting, and for its assessment of theeffectiveness of internal control over financial reporting included in the accompanying Management’s Report onInternal Control Over Financial Reporting. Our responsibility is to express an opinion on the Company’s internalcontrol over financial reporting based on our audit.
We conducted our audit in accordance with the standards of the Public Company Accounting OversightBoard (United States). Those standards require that we plan and perform the audit to obtain reasonable assuranceabout whether effective internal control over financial reporting was maintained in all material respects. Ouraudit included obtaining an understanding of internal control over financial reporting, assessing the risk that amaterial weakness exists, testing and evaluating the design and operating effectiveness of internal control basedon the assessed risk, and performing such other procedures as we considered necessary in the circumstances. Webelieve that our audit provides a reasonable basis for our opinion.
A company’s internal control over financial reporting is a process designed to provide reasonable assuranceregarding the reliability of financial reporting and the preparation of financial statements for external purposes inaccordance with generally accepted accounting principles. A company’s internal control over financial reportingincludes those policies and procedures that (1) pertain to the maintenance of records that, in reasonable detail,accurately and fairly reflect the transactions and dispositions of the assets of the company; (2) provide reasonableassurance that transactions are recorded as necessary to permit preparation of financial statements in accordancewith generally accepted accounting principles, and that receipts and expenditures of the company are being madeonly in accordance with authorizations of management and directors of the company; and (3) provide reasonableassurance regarding prevention or timely detection of unauthorized acquisition, use or disposition of thecompany’s assets that could have a material effect on the financial statements.
Because of its inherent limitations, internal control over financial reporting may not prevent or detectmisstatements. Also, projections of any evaluation of effectiveness to future periods are subject to the risk thatcontrols may become inadequate because of changes in conditions, or that the degree of compliance with thepolicies or procedures may deteriorate.
In our opinion, Nomura Holdings, Inc. maintained, in all material respects, effective internal control overfinancial reporting as of March 31, 2010, based on the COSO criteria.
We also have audited, in accordance with the standards of the Public Company Accounting Oversight Board(United States), the consolidated balance sheets of Nomura Holdings, Inc. as of March 31, 2009 and 2010, andthe related consolidated statements of operations, changes in equity, comprehensive income, and cash flows foreach of the three years in the period ended March 31, 2010 and our report dated June 29, 2010 expressed anunqualified opinion thereon.
/s/ Ernst & Young ShinNihon LLC
Tokyo, JapanJune 29, 2010
F-3
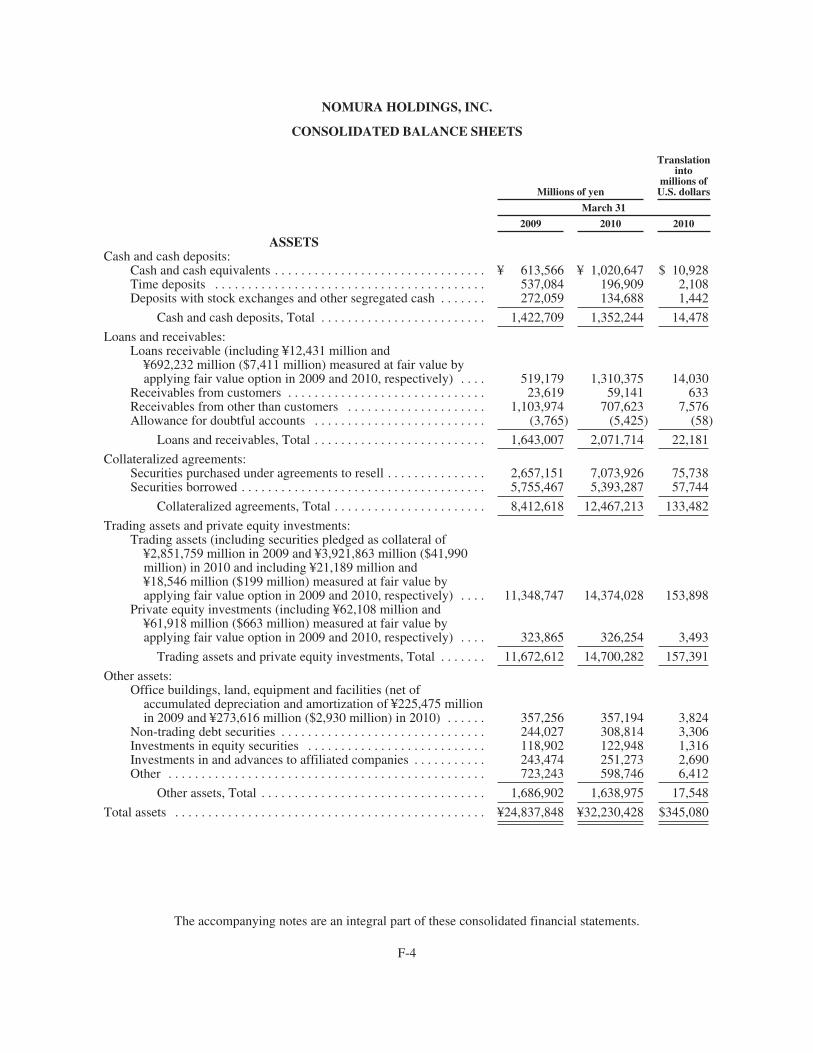
NOMURA HOLDINGS, INC.
CONSOLIDATED BALANCE SHEETS
Millions of yen
Translationinto
millions ofU.S. dollars
March 31
2009 2010 2010
ASSETSCash and cash deposits:
Cash and cash equivalents . . . . . . . . . . . . . . . . . . . . . . . . . . . . . . . . ¥ 613,566 ¥ 1,020,647 $ 10,928Time deposits . . . . . . . . . . . . . . . . . . . . . . . . . . . . . . . . . . . . . . . . . 537,084 196,909 2,108Deposits with stock exchanges and other segregated cash . . . . . . . 272,059 134,688 1,442
Cash and cash deposits, Total . . . . . . . . . . . . . . . . . . . . . . . . . 1,422,709 1,352,244 14,478
Loans and receivables:Loans receivable (including ¥12,431 million and
¥692,232 million ($7,411 million) measured at fair value byapplying fair value option in 2009 and 2010, respectively) . . . . 519,179 1,310,375 14,030
Receivables from customers . . . . . . . . . . . . . . . . . . . . . . . . . . . . . . 23,619 59,141 633Receivables from other than customers . . . . . . . . . . . . . . . . . . . . . 1,103,974 707,623 7,576Allowance for doubtful accounts . . . . . . . . . . . . . . . . . . . . . . . . . . (3,765) (5,425) (58)
Loans and receivables, Total . . . . . . . . . . . . . . . . . . . . . . . . . . 1,643,007 2,071,714 22,181
Collateralized agreements:Securities purchased under agreements to resell . . . . . . . . . . . . . . . 2,657,151 7,073,926 75,738Securities borrowed . . . . . . . . . . . . . . . . . . . . . . . . . . . . . . . . . . . . . 5,755,467 5,393,287 57,744
Collateralized agreements, Total . . . . . . . . . . . . . . . . . . . . . . . 8,412,618 12,467,213 133,482
Trading assets and private equity investments:Trading assets (including securities pledged as collateral of
¥2,851,759 million in 2009 and ¥3,921,863 million ($41,990million) in 2010 and including ¥21,189 million and¥18,546 million ($199 million) measured at fair value byapplying fair value option in 2009 and 2010, respectively) . . . . 11,348,747 14,374,028 153,898
Private equity investments (including ¥62,108 million and¥61,918 million ($663 million) measured at fair value byapplying fair value option in 2009 and 2010, respectively) . . . . 323,865 326,254 3,493
Trading assets and private equity investments, Total . . . . . . . 11,672,612 14,700,282 157,391
Other assets:Office buildings, land, equipment and facilities (net of
accumulated depreciation and amortization of ¥225,475 millionin 2009 and ¥273,616 million ($2,930 million) in 2010) . . . . . . 357,256 357,194 3,824
Non-trading debt securities . . . . . . . . . . . . . . . . . . . . . . . . . . . . . . . 244,027 308,814 3,306Investments in equity securities . . . . . . . . . . . . . . . . . . . . . . . . . . . 118,902 122,948 1,316Investments in and advances to affiliated companies . . . . . . . . . . . 243,474 251,273 2,690Other . . . . . . . . . . . . . . . . . . . . . . . . . . . . . . . . . . . . . . . . . . . . . . . . 723,243 598,746 6,412
Other assets, Total . . . . . . . . . . . . . . . . . . . . . . . . . . . . . . . . . . 1,686,902 1,638,975 17,548
Total assets . . . . . . . . . . . . . . . . . . . . . . . . . . . . . . . . . . . . . . . . . . . . . . . ¥24,837,848 ¥32,230,428 $345,080
The accompanying notes are an integral part of these consolidated financial statements.
F-4
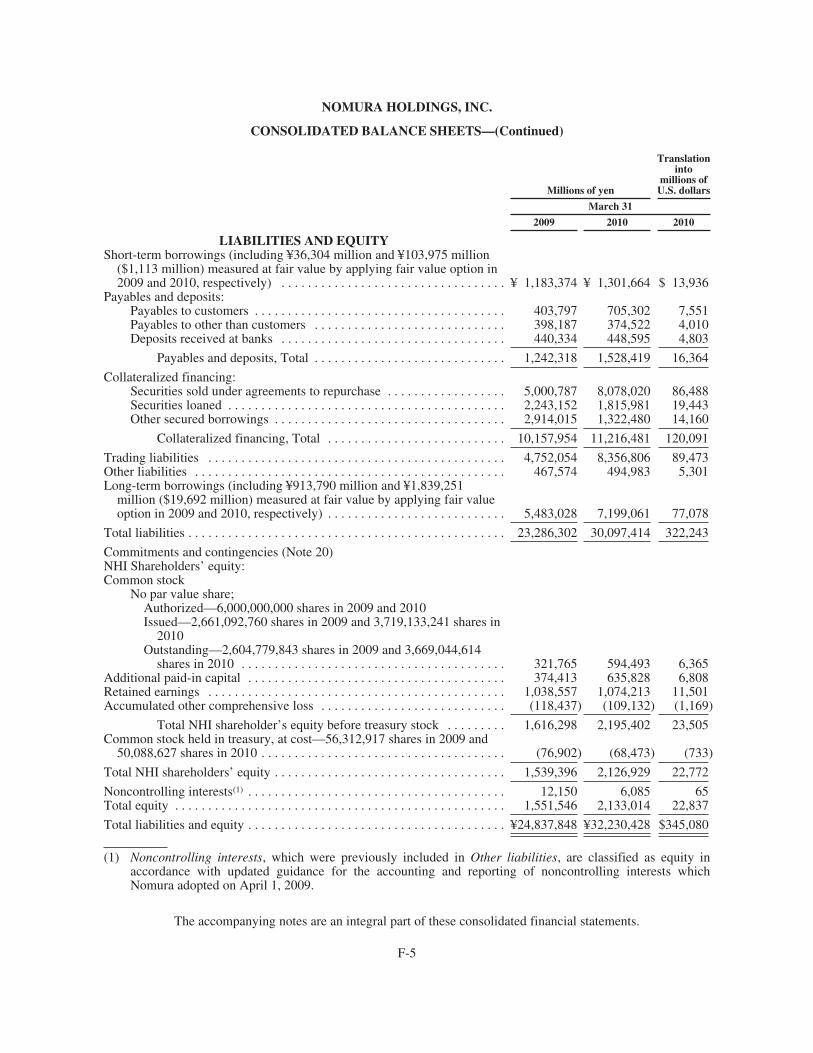
NOMURA HOLDINGS, INC.
CONSOLIDATED BALANCE SHEETS—(Continued)
Millions of yen
Translationinto
millions ofU.S. dollars
March 31
2009 2010 2010
LIABILITIES AND EQUITYShort-term borrowings (including ¥36,304 million and ¥103,975 million
($1,113 million) measured at fair value by applying fair value option in2009 and 2010, respectively) . . . . . . . . . . . . . . . . . . . . . . . . . . . . . . . . . . ¥ 1,183,374 ¥ 1,301,664 $ 13,936
Payables and deposits:Payables to customers . . . . . . . . . . . . . . . . . . . . . . . . . . . . . . . . . . . . . . 403,797 705,302 7,551Payables to other than customers . . . . . . . . . . . . . . . . . . . . . . . . . . . . . 398,187 374,522 4,010Deposits received at banks . . . . . . . . . . . . . . . . . . . . . . . . . . . . . . . . . . 440,334 448,595 4,803
Payables and deposits, Total . . . . . . . . . . . . . . . . . . . . . . . . . . . . . 1,242,318 1,528,419 16,364
Collateralized financing:Securities sold under agreements to repurchase . . . . . . . . . . . . . . . . . . 5,000,787 8,078,020 86,488Securities loaned . . . . . . . . . . . . . . . . . . . . . . . . . . . . . . . . . . . . . . . . . . 2,243,152 1,815,981 19,443Other secured borrowings . . . . . . . . . . . . . . . . . . . . . . . . . . . . . . . . . . . 2,914,015 1,322,480 14,160
Collateralized financing, Total . . . . . . . . . . . . . . . . . . . . . . . . . . . 10,157,954 11,216,481 120,091
Trading liabilities . . . . . . . . . . . . . . . . . . . . . . . . . . . . . . . . . . . . . . . . . . . . . 4,752,054 8,356,806 89,473Other liabilities . . . . . . . . . . . . . . . . . . . . . . . . . . . . . . . . . . . . . . . . . . . . . . . 467,574 494,983 5,301Long-term borrowings (including ¥913,790 million and ¥1,839,251
million ($19,692 million) measured at fair value by applying fair valueoption in 2009 and 2010, respectively) . . . . . . . . . . . . . . . . . . . . . . . . . . . 5,483,028 7,199,061 77,078
Total liabilities . . . . . . . . . . . . . . . . . . . . . . . . . . . . . . . . . . . . . . . . . . . . . . . . 23,286,302 30,097,414 322,243
Commitments and contingencies (Note 20)NHI Shareholders’ equity:Common stock
No par value share;Authorized—6,000,000,000 shares in 2009 and 2010Issued—2,661,092,760 shares in 2009 and 3,719,133,241 shares in
2010Outstanding—2,604,779,843 shares in 2009 and 3,669,044,614
shares in 2010 . . . . . . . . . . . . . . . . . . . . . . . . . . . . . . . . . . . . . . . . 321,765 594,493 6,365Additional paid-in capital . . . . . . . . . . . . . . . . . . . . . . . . . . . . . . . . . . . . . . . 374,413 635,828 6,808Retained earnings . . . . . . . . . . . . . . . . . . . . . . . . . . . . . . . . . . . . . . . . . . . . . 1,038,557 1,074,213 11,501Accumulated other comprehensive loss . . . . . . . . . . . . . . . . . . . . . . . . . . . . (118,437) (109,132) (1,169)
Total NHI shareholder’s equity before treasury stock . . . . . . . . . 1,616,298 2,195,402 23,505Common stock held in treasury, at cost—56,312,917 shares in 2009 and
50,088,627 shares in 2010 . . . . . . . . . . . . . . . . . . . . . . . . . . . . . . . . . . . . . (76,902) (68,473) (733)
Total NHI shareholders’ equity . . . . . . . . . . . . . . . . . . . . . . . . . . . . . . . . . . . 1,539,396 2,126,929 22,772
Noncontrolling interests(1) . . . . . . . . . . . . . . . . . . . . . . . . . . . . . . . . . . . . . . . 12,150 6,085 65Total equity . . . . . . . . . . . . . . . . . . . . . . . . . . . . . . . . . . . . . . . . . . . . . . . . . . 1,551,546 2,133,014 22,837
Total liabilities and equity . . . . . . . . . . . . . . . . . . . . . . . . . . . . . . . . . . . . . . . ¥24,837,848 ¥32,230,428 $345,080
(1) Noncontrolling interests, which were previously included in Other liabilities, are classified as equity inaccordance with updated guidance for the accounting and reporting of noncontrolling interests whichNomura adopted on April 1, 2009.
The accompanying notes are an integral part of these consolidated financial statements.
F-5
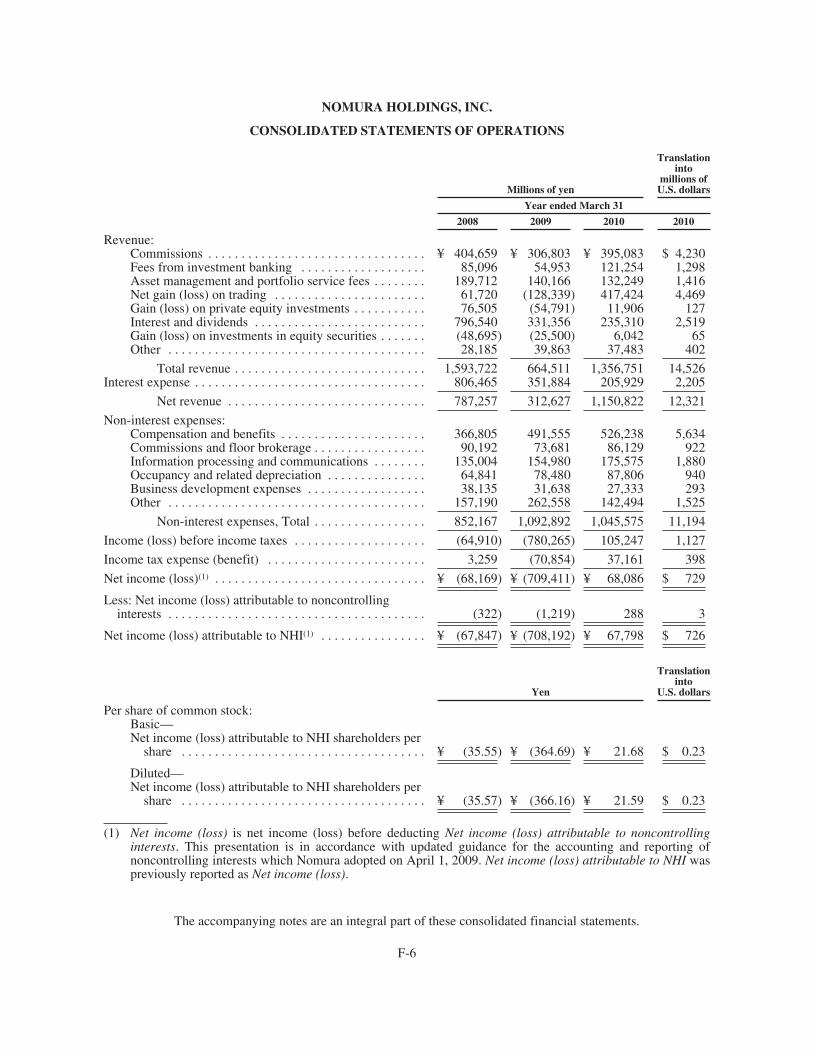
NOMURA HOLDINGS, INC.
CONSOLIDATED STATEMENTS OF OPERATIONS
Millions of yen
Translationinto
millions ofU.S. dollars
Year ended March 31
2008 2009 2010 2010
Revenue:Commissions . . . . . . . . . . . . . . . . . . . . . . . . . . . . . . . . . ¥ 404,659 ¥ 306,803 ¥ 395,083 $ 4,230Fees from investment banking . . . . . . . . . . . . . . . . . . . 85,096 54,953 121,254 1,298Asset management and portfolio service fees . . . . . . . . 189,712 140,166 132,249 1,416Net gain (loss) on trading . . . . . . . . . . . . . . . . . . . . . . . 61,720 (128,339) 417,424 4,469Gain (loss) on private equity investments . . . . . . . . . . . 76,505 (54,791) 11,906 127Interest and dividends . . . . . . . . . . . . . . . . . . . . . . . . . . 796,540 331,356 235,310 2,519Gain (loss) on investments in equity securities . . . . . . . (48,695) (25,500) 6,042 65Other . . . . . . . . . . . . . . . . . . . . . . . . . . . . . . . . . . . . . . . 28,185 39,863 37,483 402
Total revenue . . . . . . . . . . . . . . . . . . . . . . . . . . . . . 1,593,722 664,511 1,356,751 14,526Interest expense . . . . . . . . . . . . . . . . . . . . . . . . . . . . . . . . . . . 806,465 351,884 205,929 2,205
Net revenue . . . . . . . . . . . . . . . . . . . . . . . . . . . . . . 787,257 312,627 1,150,822 12,321
Non-interest expenses:Compensation and benefits . . . . . . . . . . . . . . . . . . . . . . 366,805 491,555 526,238 5,634Commissions and floor brokerage . . . . . . . . . . . . . . . . . 90,192 73,681 86,129 922Information processing and communications . . . . . . . . 135,004 154,980 175,575 1,880Occupancy and related depreciation . . . . . . . . . . . . . . . 64,841 78,480 87,806 940Business development expenses . . . . . . . . . . . . . . . . . . 38,135 31,638 27,333 293Other . . . . . . . . . . . . . . . . . . . . . . . . . . . . . . . . . . . . . . . 157,190 262,558 142,494 1,525
Non-interest expenses, Total . . . . . . . . . . . . . . . . . 852,167 1,092,892 1,045,575 11,194
Income (loss) before income taxes . . . . . . . . . . . . . . . . . . . . (64,910) (780,265) 105,247 1,127
Income tax expense (benefit) . . . . . . . . . . . . . . . . . . . . . . . . 3,259 (70,854) 37,161 398
Net income (loss)(1) . . . . . . . . . . . . . . . . . . . . . . . . . . . . . . . . ¥ (68,169) ¥ (709,411) ¥ 68,086 $ 729
Less: Net income (loss) attributable to noncontrollinginterests . . . . . . . . . . . . . . . . . . . . . . . . . . . . . . . . . . . . . . . (322) (1,219) 288 3
Net income (loss) attributable to NHI(1) . . . . . . . . . . . . . . . . ¥ (67,847) ¥ (708,192) ¥ 67,798 $ 726
Yen
Translationinto
U.S. dollars
Per share of common stock:Basic—Net income (loss) attributable to NHI shareholders per
share . . . . . . . . . . . . . . . . . . . . . . . . . . . . . . . . . . . . . ¥ (35.55) ¥ (364.69) ¥ 21.68 $ 0.23
Diluted—Net income (loss) attributable to NHI shareholders per
share . . . . . . . . . . . . . . . . . . . . . . . . . . . . . . . . . . . . . ¥ (35.57) ¥ (366.16) ¥ 21.59 $ 0.23
(1) Net income (loss) is net income (loss) before deducting Net income (loss) attributable to noncontrollinginterests. This presentation is in accordance with updated guidance for the accounting and reporting ofnoncontrolling interests which Nomura adopted on April 1, 2009. Net income (loss) attributable to NHI waspreviously reported as Net income (loss).
The accompanying notes are an integral part of these consolidated financial statements.
F-6
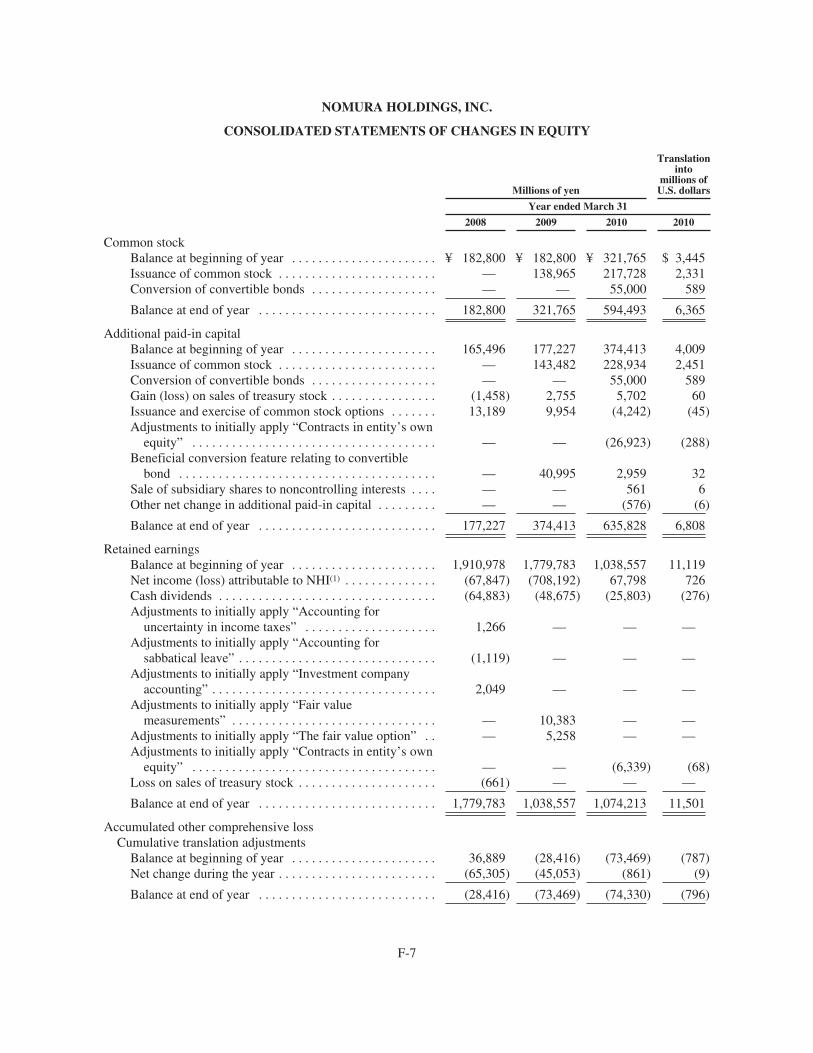
NOMURA HOLDINGS, INC.
CONSOLIDATED STATEMENTS OF CHANGES IN EQUITY
Millions of yen
Translationinto
millions ofU.S. dollars
Year ended March 31
2008 2009 2010 2010
Common stockBalance at beginning of year . . . . . . . . . . . . . . . . . . . . . . ¥ 182,800 ¥ 182,800 ¥ 321,765 $ 3,445Issuance of common stock . . . . . . . . . . . . . . . . . . . . . . . . — 138,965 217,728 2,331Conversion of convertible bonds . . . . . . . . . . . . . . . . . . . — — 55,000 589
Balance at end of year . . . . . . . . . . . . . . . . . . . . . . . . . . . 182,800 321,765 594,493 6,365
Additional paid-in capitalBalance at beginning of year . . . . . . . . . . . . . . . . . . . . . . 165,496 177,227 374,413 4,009Issuance of common stock . . . . . . . . . . . . . . . . . . . . . . . . — 143,482 228,934 2,451Conversion of convertible bonds . . . . . . . . . . . . . . . . . . . — — 55,000 589Gain (loss) on sales of treasury stock . . . . . . . . . . . . . . . . (1,458) 2,755 5,702 60Issuance and exercise of common stock options . . . . . . . 13,189 9,954 (4,242) (45)Adjustments to initially apply “Contracts in entity’s own
equity” . . . . . . . . . . . . . . . . . . . . . . . . . . . . . . . . . . . . . — — (26,923) (288)Beneficial conversion feature relating to convertible
bond . . . . . . . . . . . . . . . . . . . . . . . . . . . . . . . . . . . . . . . — 40,995 2,959 32Sale of subsidiary shares to noncontrolling interests . . . . — — 561 6Other net change in additional paid-in capital . . . . . . . . . — — (576) (6)
Balance at end of year . . . . . . . . . . . . . . . . . . . . . . . . . . . 177,227 374,413 635,828 6,808
Retained earningsBalance at beginning of year . . . . . . . . . . . . . . . . . . . . . . 1,910,978 1,779,783 1,038,557 11,119Net income (loss) attributable to NHI(1) . . . . . . . . . . . . . . (67,847) (708,192) 67,798 726Cash dividends . . . . . . . . . . . . . . . . . . . . . . . . . . . . . . . . . (64,883) (48,675) (25,803) (276)Adjustments to initially apply “Accounting for
uncertainty in income taxes” . . . . . . . . . . . . . . . . . . . . 1,266 — — —Adjustments to initially apply “Accounting for
sabbatical leave” . . . . . . . . . . . . . . . . . . . . . . . . . . . . . . (1,119) — — —Adjustments to initially apply “Investment company
accounting” . . . . . . . . . . . . . . . . . . . . . . . . . . . . . . . . . . 2,049 — — —Adjustments to initially apply “Fair value
measurements” . . . . . . . . . . . . . . . . . . . . . . . . . . . . . . . — 10,383 — —Adjustments to initially apply “The fair value option” . . — 5,258 — —Adjustments to initially apply “Contracts in entity’s own
equity” . . . . . . . . . . . . . . . . . . . . . . . . . . . . . . . . . . . . . — — (6,339) (68)Loss on sales of treasury stock . . . . . . . . . . . . . . . . . . . . . (661) — — —
Balance at end of year . . . . . . . . . . . . . . . . . . . . . . . . . . . 1,779,783 1,038,557 1,074,213 11,501
Accumulated other comprehensive lossCumulative translation adjustments
Balance at beginning of year . . . . . . . . . . . . . . . . . . . . . . 36,889 (28,416) (73,469) (787)Net change during the year . . . . . . . . . . . . . . . . . . . . . . . . (65,305) (45,053) (861) (9)
Balance at end of year . . . . . . . . . . . . . . . . . . . . . . . . . . . (28,416) (73,469) (74,330) (796)
F-7
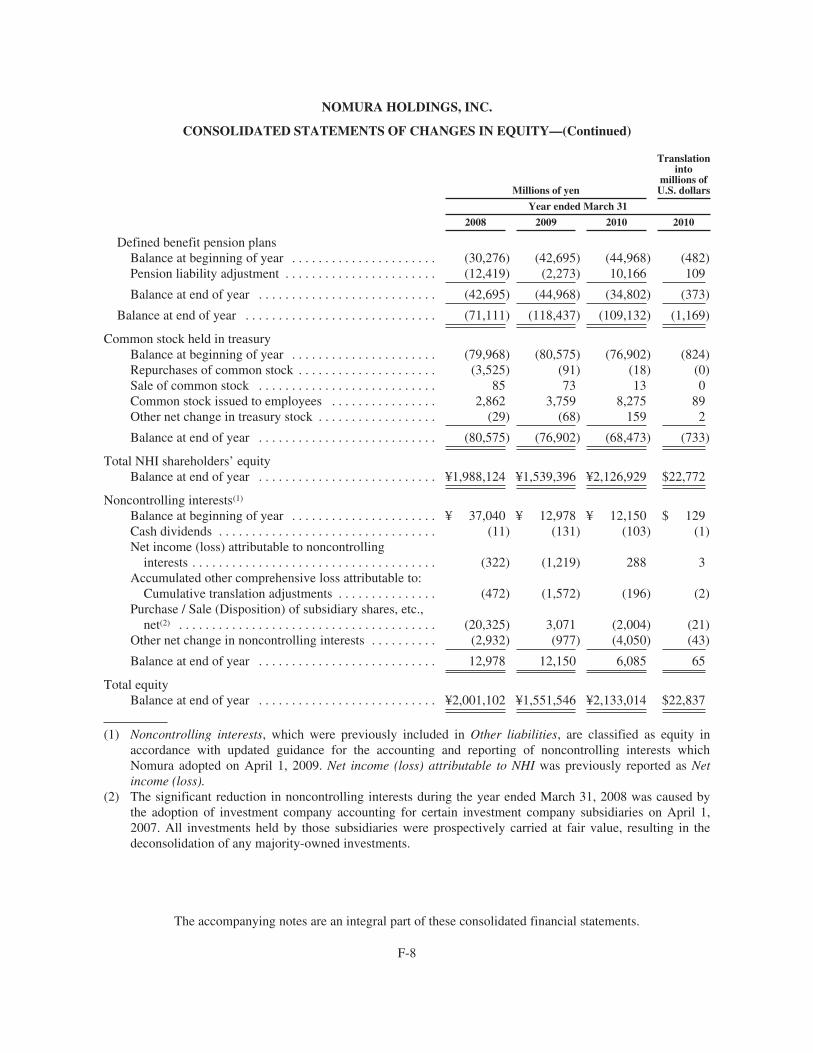
NOMURA HOLDINGS, INC.
CONSOLIDATED STATEMENTS OF CHANGES IN EQUITY—(Continued)
Millions of yen
Translationinto
millions ofU.S. dollars
Year ended March 31
2008 2009 2010 2010
Defined benefit pension plansBalance at beginning of year . . . . . . . . . . . . . . . . . . . . . . (30,276) (42,695) (44,968) (482)Pension liability adjustment . . . . . . . . . . . . . . . . . . . . . . . (12,419) (2,273) 10,166 109
Balance at end of year . . . . . . . . . . . . . . . . . . . . . . . . . . . (42,695) (44,968) (34,802) (373)
Balance at end of year . . . . . . . . . . . . . . . . . . . . . . . . . . . . . (71,111) (118,437) (109,132) (1,169)
Common stock held in treasuryBalance at beginning of year . . . . . . . . . . . . . . . . . . . . . . (79,968) (80,575) (76,902) (824)Repurchases of common stock . . . . . . . . . . . . . . . . . . . . . (3,525) (91) (18) (0)Sale of common stock . . . . . . . . . . . . . . . . . . . . . . . . . . . 85 73 13 0Common stock issued to employees . . . . . . . . . . . . . . . . 2,862 3,759 8,275 89Other net change in treasury stock . . . . . . . . . . . . . . . . . . (29) (68) 159 2
Balance at end of year . . . . . . . . . . . . . . . . . . . . . . . . . . . (80,575) (76,902) (68,473) (733)
Total NHI shareholders’ equityBalance at end of year . . . . . . . . . . . . . . . . . . . . . . . . . . . ¥1,988,124 ¥1,539,396 ¥2,126,929 $22,772
Noncontrolling interests(1)
Balance at beginning of year . . . . . . . . . . . . . . . . . . . . . . ¥ 37,040 ¥ 12,978 ¥ 12,150 $ 129Cash dividends . . . . . . . . . . . . . . . . . . . . . . . . . . . . . . . . . (11) (131) (103) (1)Net income (loss) attributable to noncontrolling
interests . . . . . . . . . . . . . . . . . . . . . . . . . . . . . . . . . . . . . (322) (1,219) 288 3Accumulated other comprehensive loss attributable to:
Cumulative translation adjustments . . . . . . . . . . . . . . . (472) (1,572) (196) (2)Purchase / Sale (Disposition) of subsidiary shares, etc.,
net(2) . . . . . . . . . . . . . . . . . . . . . . . . . . . . . . . . . . . . . . . (20,325) 3,071 (2,004) (21)Other net change in noncontrolling interests . . . . . . . . . . (2,932) (977) (4,050) (43)
Balance at end of year . . . . . . . . . . . . . . . . . . . . . . . . . . . 12,978 12,150 6,085 65
Total equityBalance at end of year . . . . . . . . . . . . . . . . . . . . . . . . . . . ¥2,001,102 ¥1,551,546 ¥2,133,014 $22,837
(1) Noncontrolling interests, which were previously included in Other liabilities, are classified as equity inaccordance with updated guidance for the accounting and reporting of noncontrolling interests whichNomura adopted on April 1, 2009. Net income (loss) attributable to NHI was previously reported as Netincome (loss).
(2) The significant reduction in noncontrolling interests during the year ended March 31, 2008 was caused bythe adoption of investment company accounting for certain investment company subsidiaries on April 1,2007. All investments held by those subsidiaries were prospectively carried at fair value, resulting in thedeconsolidation of any majority-owned investments.
The accompanying notes are an integral part of these consolidated financial statements.
F-8
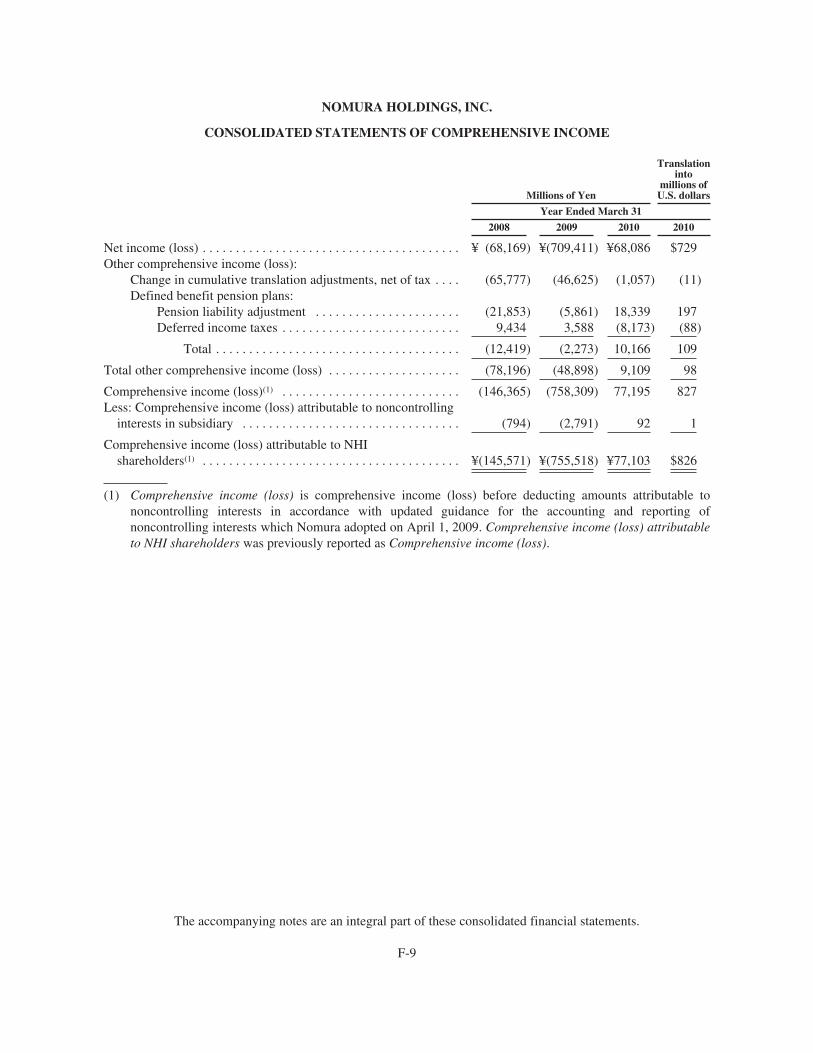
NOMURA HOLDINGS, INC.
CONSOLIDATED STATEMENTS OF COMPREHENSIVE INCOME
Millions of Yen
Translationinto
millions ofU.S. dollars
Year Ended March 31
2008 2009 2010 2010
Net income (loss) . . . . . . . . . . . . . . . . . . . . . . . . . . . . . . . . . . . . . . . ¥ (68,169) ¥(709,411) ¥68,086 $729Other comprehensive income (loss):
Change in cumulative translation adjustments, net of tax . . . . (65,777) (46,625) (1,057) (11)Defined benefit pension plans:
Pension liability adjustment . . . . . . . . . . . . . . . . . . . . . . (21,853) (5,861) 18,339 197Deferred income taxes . . . . . . . . . . . . . . . . . . . . . . . . . . . 9,434 3,588 (8,173) (88)
Total . . . . . . . . . . . . . . . . . . . . . . . . . . . . . . . . . . . . . (12,419) (2,273) 10,166 109
Total other comprehensive income (loss) . . . . . . . . . . . . . . . . . . . . (78,196) (48,898) 9,109 98
Comprehensive income (loss)(1) . . . . . . . . . . . . . . . . . . . . . . . . . . . (146,365) (758,309) 77,195 827Less: Comprehensive income (loss) attributable to noncontrolling
interests in subsidiary . . . . . . . . . . . . . . . . . . . . . . . . . . . . . . . . . (794) (2,791) 92 1
Comprehensive income (loss) attributable to NHIshareholders(1) . . . . . . . . . . . . . . . . . . . . . . . . . . . . . . . . . . . . . . . ¥(145,571) ¥(755,518) ¥77,103 $826
(1) Comprehensive income (loss) is comprehensive income (loss) before deducting amounts attributable tononcontrolling interests in accordance with updated guidance for the accounting and reporting ofnoncontrolling interests which Nomura adopted on April 1, 2009. Comprehensive income (loss) attributableto NHI shareholders was previously reported as Comprehensive income (loss).
The accompanying notes are an integral part of these consolidated financial statements.
F-9
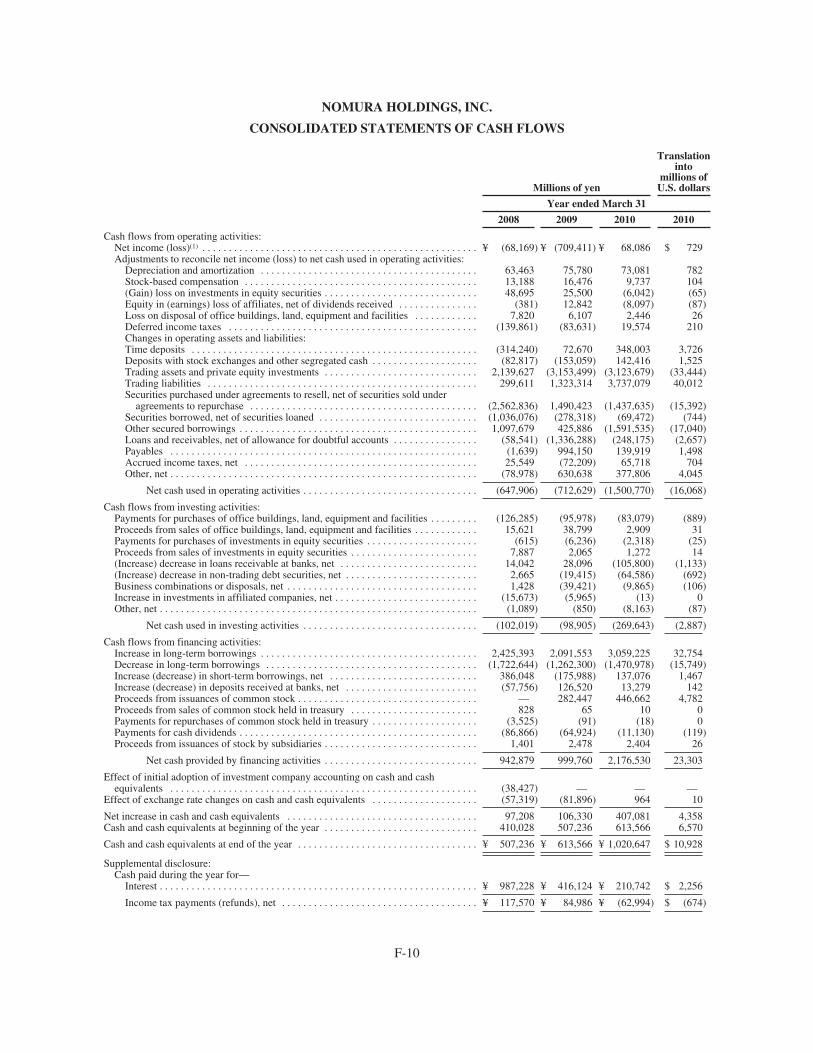
NOMURA HOLDINGS, INC.
CONSOLIDATED STATEMENTS OF CASH FLOWS
Millions of yen
Translationinto
millions ofU.S. dollars
Year ended March 31
2008 2009 2010 2010
Cash flows from operating activities:Net income (loss)(1) . . . . . . . . . . . . . . . . . . . . . . . . . . . . . . . . . . . . . . . . . . . . . . . . . . . . ¥ (68,169) ¥ (709,411) ¥ 68,086 $ 729Adjustments to reconcile net income (loss) to net cash used in operating activities:
Depreciation and amortization . . . . . . . . . . . . . . . . . . . . . . . . . . . . . . . . . . . . . . . . . 63,463 75,780 73,081 782Stock-based compensation . . . . . . . . . . . . . . . . . . . . . . . . . . . . . . . . . . . . . . . . . . . . 13,188 16,476 9,737 104(Gain) loss on investments in equity securities . . . . . . . . . . . . . . . . . . . . . . . . . . . . . 48,695 25,500 (6,042) (65)Equity in (earnings) loss of affiliates, net of dividends received . . . . . . . . . . . . . . . (381) 12,842 (8,097) (87)Loss on disposal of office buildings, land, equipment and facilities . . . . . . . . . . . . 7,820 6,107 2,446 26Deferred income taxes . . . . . . . . . . . . . . . . . . . . . . . . . . . . . . . . . . . . . . . . . . . . . . . (139,861) (83,631) 19,574 210Changes in operating assets and liabilities:Time deposits . . . . . . . . . . . . . . . . . . . . . . . . . . . . . . . . . . . . . . . . . . . . . . . . . . . . . . (314,240) 72,670 348,003 3,726Deposits with stock exchanges and other segregated cash . . . . . . . . . . . . . . . . . . . . (82,817) (153,059) 142,416 1,525Trading assets and private equity investments . . . . . . . . . . . . . . . . . . . . . . . . . . . . . 2,139,627 (3,153,499) (3,123,679) (33,444)Trading liabilities . . . . . . . . . . . . . . . . . . . . . . . . . . . . . . . . . . . . . . . . . . . . . . . . . . . 299,611 1,323,314 3,737,079 40,012Securities purchased under agreements to resell, net of securities sold under
agreements to repurchase . . . . . . . . . . . . . . . . . . . . . . . . . . . . . . . . . . . . . . . . . . . (2,562,836) 1,490,423 (1,437,635) (15,392)Securities borrowed, net of securities loaned . . . . . . . . . . . . . . . . . . . . . . . . . . . . . . (1,036,076) (278,318) (69,472) (744)Other secured borrowings . . . . . . . . . . . . . . . . . . . . . . . . . . . . . . . . . . . . . . . . . . . . . 1,097,679 425,886 (1,591,535) (17,040)Loans and receivables, net of allowance for doubtful accounts . . . . . . . . . . . . . . . . (58,541) (1,336,288) (248,175) (2,657)Payables . . . . . . . . . . . . . . . . . . . . . . . . . . . . . . . . . . . . . . . . . . . . . . . . . . . . . . . . . . (1,639) 994,150 139,919 1,498Accrued income taxes, net . . . . . . . . . . . . . . . . . . . . . . . . . . . . . . . . . . . . . . . . . . . . 25,549 (72,209) 65,718 704Other, net . . . . . . . . . . . . . . . . . . . . . . . . . . . . . . . . . . . . . . . . . . . . . . . . . . . . . . . . . . (78,978) 630,638 377,806 4,045
Net cash used in operating activities . . . . . . . . . . . . . . . . . . . . . . . . . . . . . . . . . (647,906) (712,629) (1,500,770) (16,068)
Cash flows from investing activities:Payments for purchases of office buildings, land, equipment and facilities . . . . . . . . . (126,285) (95,978) (83,079) (889)Proceeds from sales of office buildings, land, equipment and facilities . . . . . . . . . . . . 15,621 38,799 2,909 31Payments for purchases of investments in equity securities . . . . . . . . . . . . . . . . . . . . . (615) (6,236) (2,318) (25)Proceeds from sales of investments in equity securities . . . . . . . . . . . . . . . . . . . . . . . . 7,887 2,065 1,272 14(Increase) decrease in loans receivable at banks, net . . . . . . . . . . . . . . . . . . . . . . . . . . 14,042 28,096 (105,800) (1,133)(Increase) decrease in non-trading debt securities, net . . . . . . . . . . . . . . . . . . . . . . . . . 2,665 (19,415) (64,586) (692)Business combinations or disposals, net . . . . . . . . . . . . . . . . . . . . . . . . . . . . . . . . . . . . 1,428 (39,421) (9,865) (106)Increase in investments in affiliated companies, net . . . . . . . . . . . . . . . . . . . . . . . . . . . (15,673) (5,965) (13) 0Other, net . . . . . . . . . . . . . . . . . . . . . . . . . . . . . . . . . . . . . . . . . . . . . . . . . . . . . . . . . . . . (1,089) (850) (8,163) (87)
Net cash used in investing activities . . . . . . . . . . . . . . . . . . . . . . . . . . . . . . . . . (102,019) (98,905) (269,643) (2,887)
Cash flows from financing activities:Increase in long-term borrowings . . . . . . . . . . . . . . . . . . . . . . . . . . . . . . . . . . . . . . . . . 2,425,393 2,091,553 3,059,225 32,754Decrease in long-term borrowings . . . . . . . . . . . . . . . . . . . . . . . . . . . . . . . . . . . . . . . . (1,722,644) (1,262,300) (1,470,978) (15,749)Increase (decrease) in short-term borrowings, net . . . . . . . . . . . . . . . . . . . . . . . . . . . . 386,048 (175,988) 137,076 1,467Increase (decrease) in deposits received at banks, net . . . . . . . . . . . . . . . . . . . . . . . . . (57,756) 126,520 13,279 142Proceeds from issuances of common stock . . . . . . . . . . . . . . . . . . . . . . . . . . . . . . . . . . — 282,447 446,662 4,782Proceeds from sales of common stock held in treasury . . . . . . . . . . . . . . . . . . . . . . . . 828 65 10 0Payments for repurchases of common stock held in treasury . . . . . . . . . . . . . . . . . . . . (3,525) (91) (18) 0Payments for cash dividends . . . . . . . . . . . . . . . . . . . . . . . . . . . . . . . . . . . . . . . . . . . . . (86,866) (64,924) (11,130) (119)Proceeds from issuances of stock by subsidiaries . . . . . . . . . . . . . . . . . . . . . . . . . . . . . 1,401 2,478 2,404 26
Net cash provided by financing activities . . . . . . . . . . . . . . . . . . . . . . . . . . . . . 942,879 999,760 2,176,530 23,303
Effect of initial adoption of investment company accounting on cash and cashequivalents . . . . . . . . . . . . . . . . . . . . . . . . . . . . . . . . . . . . . . . . . . . . . . . . . . . . . . . . . . (38,427) — — —
Effect of exchange rate changes on cash and cash equivalents . . . . . . . . . . . . . . . . . . . . (57,319) (81,896) 964 10
Net increase in cash and cash equivalents . . . . . . . . . . . . . . . . . . . . . . . . . . . . . . . . . . . . 97,208 106,330 407,081 4,358Cash and cash equivalents at beginning of the year . . . . . . . . . . . . . . . . . . . . . . . . . . . . . 410,028 507,236 613,566 6,570
Cash and cash equivalents at end of the year . . . . . . . . . . . . . . . . . . . . . . . . . . . . . . . . . . ¥ 507,236 ¥ 613,566 ¥ 1,020,647 $ 10,928
Supplemental disclosure:Cash paid during the year for—
Interest . . . . . . . . . . . . . . . . . . . . . . . . . . . . . . . . . . . . . . . . . . . . . . . . . . . . . . . . . . . . ¥ 987,228 ¥ 416,124 ¥ 210,742 $ 2,256
Income tax payments (refunds), net . . . . . . . . . . . . . . . . . . . . . . . . . . . . . . . . . . . . . ¥ 117,570 ¥ 84,986 ¥ (62,994) $ (674)
F-10
NOMURA HOLDINGS, INC.
CONSOLIDATED STATEMENTS OF CASH FLOWS—(Continued)
Non cash activities—Business combinations:There were no business acquisitions during the year ended March 31, 2008. Assets acquired, excluding cash and cash equivalents, anddebt assumed were ¥56,168 million, and ¥28,849 million, respectively, for the year ended March 31, 2009. Assets acquired, excludingcash and cash equivalents, and debt assumed were ¥45,981 million ($492 million) and ¥27,663 million ($296 million), respectively, forthe year ended March 31, 2010.
Capital lease assets:The increase in Office buildings, land, equipment and facilities in the consolidated balance sheets includes newly recognized capital leasein the amount of ¥26,572 million ($284 million) during the year ended March 31, 2010.
Reclassification of convertible bonds:In March 2009, Nomura reclassified the intrinsic value associated with the beneficial conversion feature relating to the SubordinatedUnsecured Convertible Bonds No. 1 issued on December 16, 2008 from Long-term borrowings to Additional paid-in capital. As ofMarch 31, 2009, the balance in Additional paid-in capital associated with the beneficial conversion feature was ¥40,995 million, after theeffect of deferred taxes.
Conversion of convertible bonds:During the year ended March 31, 2010, convertible bonds were exercised at the amount of ¥110,000 million ($1,178 million).Accordingly, Common Stock increased by ¥55,000 million ($589 million) and Additional paid-in capital increased by ¥55,000 million($589 million).
Reclassifications—In conjunction with the retroactive application of certain requirements of ASC 210-20, net derivative assets and liabilities have beenoffset by cash collateral payables and receivables, respectively, and accordingly, certain reclassifications have been made for the yearended March 31, 2008. See Note 1, “Summary of accounting policies”.
Notes:(1) Net income (loss) is net income (loss) before subtracting Net income (loss) attributable to noncontrolling interests in accordance with the
updated noncontrolling interests guidance.(2) Certain reclassifications of previously reported amounts have been made to conform to the current year presentation.
The accompanying notes are an integral part of these consolidated financial statements.
F-11
NOMURA HOLDINGS, INC.
NOTES TO THE CONSOLIDATED FINANCIAL STATEMENTS
1. Summary of accounting policies:
Description of business—
Nomura Holdings, Inc. (the “Company”) and its broker-dealer, banking and other financial servicessubsidiaries provide investment, financing and related services to individual, institutional and governmentcustomers on a global basis. The Company and other entities in which it has a controlling financial interest arecollectively referred to as “Nomura.”
Nomura structures its business segments based upon the nature of specific products and services, its maincustomer base and its management structure. Nomura reports operating results in five business segments: Retail,Global Markets, Investment Banking, Merchant Banking and Asset Management.
In its Retail business, Nomura provides investment consultation services mainly to individual customers inJapan. In its Global Markets business, Nomura is engaged in the sales and trading of debt and equity securitiesand currencies on a global basis to institutions domestically and abroad. In the Investment Banking business,Nomura provides investment banking services such as the underwriting of bonds and equities as well as mergersand acquisition and financial advice. In its Merchant Banking business, Nomura invests in private equitybusinesses and seeks to maximize returns on the investments by increasing the corporate value of investeecompanies. In its Asset Management business, Nomura develops and manages investment trusts, and providesinvestment advisory services.
Subsequent events
In April 2010, Nomura established the Wholesale Division, encompassing the Global Markets Division, theInvestment Banking Division, and the Merchant Banking Division. Therefore, Nomura currently has threedivisions: Retail Division, Wholesale Division, and Asset Management Division.
Basis of presentation—
The accounting and financial reporting policies of the Company conform to accounting principles generallyaccepted in the United States (“U.S. GAAP”) as applicable to broker-dealers. Effective July 1, 2009, Nomuraadopted the Financial Accounting Standards Board (“FASB”) Accounting Standard Codification™(“Codification”) as required by Accounting Standard Codification Topic (“ASC”) 105 “Generally AcceptedAccounting Principles” and Accounting Standards Update (“ASU”) No. 2009-01 “Topic 105—GenerallyAccepted Accounting Principles”. The primary objective of the Codification is to simplify access to allauthoritative literature related to a particular topic in one place by replacing former authoritative guidanceprovided from different sources in various pronouncements such as Statement of Financial AccountingStandards, Emerging Issue Task Force Abstracts, FASB Interpretations, FASB Staff Positions, AICPAStatements of Position and Industry Guides. Further, effective July 1, 2009, any changes to the Codification arecommunicated by the FASB through an ASU.
As the Codification is not intended to change U.S. GAAP but rather consolidates it into a single set of rules,adoption of the Codification by the Company has not had a material financial impact on these consolidatedfinancial statements. All technical references to U.S. GAAP pronouncements within these consolidated financialstatements have been replaced with the relevant Codification topic or sub-topic references.
These consolidated financial statements include the accounts of the Company and other entities in which ithas a controlling financial interest. The Company initially determines whether it has a controlling financialinterest in an entity by evaluating whether the entity is a variable interest entity (“VIE”) under ASC 810,“Consolidation” (“ASC 810”). VIEs are entities in which equity investors do not have the characteristics of a
F-12
NOMURA HOLDINGS, INC.
NOTES TO THE CONSOLIDATED FINANCIAL STATEMENTS—(Continued)
controlling financial interest or which do not have sufficient equity at risk for the entity to finance its activitieswithout additional subordinated financial support. The Company consolidates VIEs where Nomura is the primarybeneficiary, generally defined as the enterprise that will absorb a majority of the expected losses or receive amajority of the expected residual returns of the entity, or both. For entities other than VIEs, Nomura is generallydetermined to have a controlling financial interest in an entity when it owns a majority of the voting interest.Additionally, the Company does not consolidate certain special purpose entities utilized for securitizationtransactions if they meet the definition of a qualifying special purpose entity (“QSPE”).
Equity investments in entities in which Nomura has significant influence over operating and financialdecisions (generally defined as 20 to 50 percent of the voting stock of a corporate entity, or at least 3 percent of alimited partnership) are accounted for under the equity method of accounting and reported in Other assets—Investments in and advances to affiliated companies or at fair value by electing the fair value option permitted byASC 825 “Financial Instruments” (“ASC 825”) and reported in Trading assets or Private equity investments.Investments undertaken by Nomura’s Merchant Banking business are reported in Private Equity Investments.Other investments are reported in Trading assets. Equity investments in which Nomura has neither control norsignificant influence are carried at fair value, with changes in fair value recognized currently through theconsolidated statements of operations.
Certain entities in which the Company has a financial interest are investment companies under ASC 946“Financial Services—Investment Companies” (“ASC 946”). These entities, including subsidiaries such asNomura Principal Finance Co., Ltd. (“NPF”), carry all of their investments at fair value, with changes in fairvalue recognized through the consolidated statements of operations.
The Company’s principal subsidiaries include Nomura Securities Co., Ltd., Nomura Securities International,Inc. and Nomura International plc.
All material intercompany transactions and balances have been eliminated on consolidation. Certainreclassifications of previously reported amounts have been made to conform to the current year presentation.
Use of estimates—
In presenting these consolidated financial statements, management makes estimates regarding the valuationof certain financial instruments and investments, the outcome of litigation and tax examinations, the recovery ofthe carrying value of goodwill, the allowance for doubtful accounts, the realization of deferred tax assets andother matters that affect the reported amounts of assets and liabilities as well as the disclosures in theseconsolidated financial statements. Estimates, by their nature, are based on judgment and available information.Therefore, actual results may differ from estimates which could have a material impact on these consolidatedfinancial statements, and it is possible that such adjustments could occur in the near term.
Fair value of financial instruments—
A significant amount of Nomura’s financial assets and financial liabilities are carried at fair value, withchanges in fair value recognized through the consolidated statements of operations on a recurring basis. Use offair value is either specifically required under U.S. GAAP or Nomura makes an election to use fair value forcertain eligible items under the fair value option.
Other financial assets and financial liabilities are carried at fair value on a nonrecurring basis, where theprimary measurement basis is not fair value. Fair value is only used in specific circumstances such as to measureimpairment.
F-13
NOMURA HOLDINGS, INC.
NOTES TO THE CONSOLIDATED FINANCIAL STATEMENTS—(Continued)
In all cases, fair value is determined in accordance with ASC 820, “Fair Value Measurements andDisclosures” (“ASC 820”) which defines fair value as the amount that would be exchanged to sell a financialasset or transfer a financial liability in an orderly transaction between market participants at the measurementdate. It assumes that the transaction occurs in Nomura’s principal market, or in the absence of a principal market,the most advantageous market for the relevant financial asset or financial liability. See Note 3, “Fair value offinancial instruments” below for more information regarding how Nomura estimates fair value for specific typesof financial instruments used in the ordinary course of business.
Private equity business—
Private equity investments are generally carried at fair value, with changes in fair value recognized throughthe consolidated statements of operations. See Note 5, “Private equity business” for further discussion.
Transfers of financial assets—
Nomura accounts for the transfer of a financial asset as a sale when Nomura relinquishes control over theasset by meeting the following conditions: (a) the asset has been isolated from the transferor (even in bankruptcyor other receivership), (b) the transferee has the right to pledge or exchange the asset received, or if the transfereeis a QSPE, the holders of its beneficial interests have the right to pledge or exchange the beneficial interests heldand (c) the transferor has not maintained effective control over the transferred asset.
In connection with its securitization activities, Nomura utilizes special purpose entities (“SPEs”) tosecuritize commercial and residential mortgage loans, government and corporate securities and other types offinancial assets. Nomura’s involvement with SPEs includes structuring and underwriting, distributing and sellingdebt instruments and beneficial interests issued by SPEs to investors. Nomura derecognizes financial assetstransferred in securitizations provided that Nomura has relinquished control over such assets and does notconsolidate the SPE. Nomura may obtain or retain an interest in the financial assets, including residual interestsin the SPEs dependent upon prevailing market conditions. Any such interests are accounted for at fair value andincluded in Trading assets within the consolidated balance sheets with the change in fair value included inRevenue—Net gain (loss) on trading in the consolidated statements of operations.
Foreign currency translation—
The financial statements of the Company’s subsidiaries are measured using their functional currency whichis the currency of the primary economic environment in which the entity operates. All assets and liabilities ofsubsidiaries which have a functional currency other than Japanese yen are translated into Japanese yen atexchange rates in effect at the balance sheet date; all revenue and expenses are translated at the average exchangerates for the respective years and the resulting translation adjustments are accumulated and reported asAccumulated other comprehensive loss in NHI shareholders’ equity.
Foreign currency assets and liabilities are translated at exchange rates in effect at the balance sheet date andthe resulting translation gains or losses are credited or charged to the consolidated statements of operations.
Fee revenue—
Revenue—Commissions includes amounts charged for executing brokerage transactions accrued on a tradedate basis and are included in current period earnings. Revenue—Fees from investment banking includessecurities underwriting fees and other corporate financing services fees. Underwriting fees are recorded whenservices for underwriting are completed. All other fees are recognized when related services are performed.
F-14
NOMURA HOLDINGS, INC.
NOTES TO THE CONSOLIDATED FINANCIAL STATEMENTS—(Continued)
Revenue—Asset management and portfolio service fees are accrued over the period that the related services areprovided or when specified performance requirements are met.
Trading assets and trading liabilities—
Trading assets and Trading liabilities primarily comprise debt and equity securities, derivatives, and loans.
Trading assets and Trading liabilities, including contractual commitments arising pursuant to derivativetransactions, are recognized on the consolidated balance sheets on a trade date basis and carried at fair value withchanges in fair value recognized within Revenue—Net gain (loss) on trading in the consolidated statements ofoperations.
Collateralized agreements and collateralized financing—
Collateralized agreements consist of resale agreements and securities borrowed. Collateralized financingconsists of repurchase agreements, securities loaned and other secured borrowings.
Resale and repurchase agreements (“repo transactions”) principally involve the buying or selling ofgovernment and government agency securities under agreements with customers to resell or repurchase thesesecurities to or from those customers. Nomura monitors the value of the underlying securities on a daily basisrelative to the related receivables and payables, including accrued interest, and requests or returns additionalcollateral when appropriate. Repo transactions are generally accounted for as collateralized agreements orcollateralized financing transactions and are recorded on the consolidated balance sheets at the amount at whichthe securities were originally acquired or sold with applicable accrued interest, as appropriate.
Repo transactions where the maturity of the security transferred as collateral matches the maturity of therepo transaction (“repo-to-maturity transactions”) are accounted for as sales rather than collateralized financingswhere the criteria for derecognition of the securities transferred under ASC 860 “Transfers and Servicing”(“ASC 860”) are met. The amounts of securities derecognized from the consolidated balance sheets underrepo-to-maturity transactions as of March 31, 2009 and 2010 was ¥nil and ¥185,047 million ($1,981 million),respectively.
Japanese “Gensaki” transactions which have no margin requirements nor substitution rights have also beenhistorically accounted for as sales where the criteria for derecognition of the transferred financial assets underASC 860 are met. The amounts of securities derecognized from the consolidated balance sheets under Gensakitransactions as of March 31, 2009 and 2010 was not significant. These transactions have largely been replacedwith “Gensaki Repo transactions” which have been more common in Japanese financial markets since 2001.Unlike Gensaki transactions, Gensaki Repo transactions contain margin requirements, rights of securitysubstitution, and certain restrictions on the customer’s right to sell or repledge the transferred securities.Accordingly, Gensaki Repo transactions are accounted for as collateralized agreements or collateralizedfinancing transactions and are recorded on the consolidated balance sheets at the amount that the securities wereoriginally acquired or sold with applicable accrued interest, as appropriate.
Repo transactions (including Gensaki Repo transactions) are presented in the consolidated balance sheetsnet-by-counterparty, where offsetting is consistent with ASC 210-20 “Balance Sheet—Offsetting” (“ASC210-20”).
Securities borrowed and securities loaned are generally accounted for as collateralized agreements andcollateralized financing transactions, respectively. Securities borrowed and securities loaned are generally cash
F-15
NOMURA HOLDINGS, INC.
NOTES TO THE CONSOLIDATED FINANCIAL STATEMENTS—(Continued)
collateralized and are recorded on the consolidated balance sheets at the amount of cash collateral advanced orreceived. Securities borrowed transactions generally require Nomura to provide the counterparty with collateralin the form of cash or other securities. For securities loaned transactions, Nomura generally receives collateral inthe form of cash or other securities. Nomura monitors the market value of the securities borrowed or loaned andrequires additional cash or securities, as necessary, to ensure that such transactions are adequately collateralized.
Certain Japanese securities lending transactions are accounted for as sales where the criteria forderecognition of the transferred financial assets under ASC 860 are met. The amounts of securities derecognizedfrom the consolidated balance sheets under these transactions as of March 31, 2009 and 2010 was¥174,567 million and ¥153,808 million ($1,647 million), respectively.
Other secured borrowings consist primarily of secured borrowings from financial institutions and centralbanks in the inter-bank money market, and are recorded at contractual amounts.
Trading balances of secured borrowings consist of the liabilities related to transfers of financial assets thatare accounted for as secured financing transactions rather than sales and are included in the consolidated balancesheets in Short-term borrowings and Long-term borrowings. The fair value option is generally elected for thesetransactions, which are carried at fair value on a recurring basis. See Note 8, “Securitization and VariableInterest Entities (VIEs)” and Note 12, “Borrowings” for further information regarding these transactions.
On the consolidated balance sheets, all Nomura-owned securities pledged to counterparties where thecounterparty has the right to sell or repledge the securities, including Gensaki Repo transactions, are shownparenthetically in Trading assets as Securities pledged as collateral.
Derivatives—
Nomura uses a variety of derivative financial instruments, including futures, forwards, swaps and options,for trading and non-trading purposes. All derivatives are carried at fair value, with changes in fair valuerecognized through the consolidated statements of operations.
Trading
Derivative financial instruments used for trading purposes are carried at fair value with changes in fair valuerecognized currently within Revenue—Net gain (loss) on trading. Derivative assets and liabilities are presented inthe consolidated balance sheets on a net-by-counterparty basis where offsetting is consistent with ASC 210-20. Inaddition, fair value amounts recognized for the right to reclaim cash collateral (a receivable) and the obligation toreturn cash collateral (a payable) are also offset against net derivative liabilities and net derivative assets,respectively.
Non-trading
In addition to its trading activities, Nomura uses derivative financial instruments to manage interest rate riskor to modify the interest rate characteristics of certain financial liabilities.
These derivative financial instruments are linked to specific financial liabilities and are designated as hedgesas they are effective in reducing the risk associated with the exposure being hedged, and they are highlycorrelated with changes in the fair value of the underlying hedged item, both at inception and throughout the lifeof the hedge contract. Nomura applies fair value hedge accounting to these hedging transactions, and the relatingunrealized profits and losses are recognized together with those of the hedged liabilities as interest revenue orexpense.
F-16
NOMURA HOLDINGS, INC.
NOTES TO THE CONSOLIDATED FINANCIAL STATEMENTS—(Continued)
Certain derivatives embedded in hybrid financial instruments are bifurcated from the host contract, such assecurities and certificates of deposit and are carried at fair value and presented separately but in the sameconsolidated balance sheets line item as the host contract. Changes in the fair value of these embeddedderivatives are recognized within Revenue—Net gain (loss) on trading. Derivatives used to economically hedgethese instruments are also carried at fair value, with changes in fair value recognized within Revenue—Net gain(loss) on trading.
Loans receivable—
Loans receivable are loans which management intends to hold for the foreseeable future and consistprimarily of “loans at banks”, “financing activity loans”, “margin transaction loans” and “inter-bank moneymarket loans”. Loans receivable are either carried at amortized cost or at fair value. Interest earned on Loansreceivable is generally recognized within Revenue—Interest and dividends. Amortized cost represents costadjusted for deferred fees or costs on originated loans, unamortized premiums or discounts on purchased loansand after deducting applicable allowances for loan losses. Loan origination fees, net of direct origination costs,are amortized to Revenue—Interest and dividends as an adjustment to yield over the life of the loan.
Loans at banks are loans receivable in connection with banking activities undertaken by bankingsubsidiaries such as The Nomura Trust & Banking Co., Ltd, Nomura Singapore Limited and Nomura BankInternational plc.
Financing activity loans are loans receivable in connection with financing activities undertaken bynon-banking subsidiaries.
Margin transaction loans are loans receivable from customers in connection with stock brokerage activities.These loans are usually collateralized by customers’ securities and customers’ deposits.
Inter-bank money market loans are loans receivable from financial institutions in the inter-bank moneymarket, where overnight and intra-day financings are traded through money market dealers.
Management establishes an allowance for loan losses against these loans, which is disclosed within theAllowance for doubtful accounts and which reflects management’s best estimate of probable losses incurred. Theallowance for loan losses comprises a specific component for loans which have been specifically identified asimpaired and a general component for loans which, while not specifically identified as impaired, are collectivelyassessed for impairment based on historical loss experience.
The specific component of the allowance for loan losses reflects probable losses incurred within loans whichhave been specifically identified as impaired. A loan is defined as being impaired when, based on currentinformation and events, it is probable that all amounts due according to the contractual terms of the loanagreement will not be collected. Factors considered by management in determining impairment include anassessment of the ability of borrowers to pay by considering various factors such as the nature of the loan, priorloan loss experience, current economic conditions, the current financial situation of the borrower, and the fairvalue of any underlying collateral. Loans that experience insignificant payment delays and payment shortfalls arenot classified as impaired. The allowance is measured on a loan by loan basis by adjusting the carrying value ofthe impaired loan to either the present value of expected future cash flows discounted at the loan’s effectiveinterest rate, the loan’s obtainable market price, or the fair value of the collateral if the loan is collateraldependent.
The general component of the allowance for loan losses is for loans not specifically identified as impairedand includes judgment about collectability based on available information at the balance sheet date, and the
F-17
NOMURA HOLDINGS, INC.
NOTES TO THE CONSOLIDATED FINANCIAL STATEMENTS—(Continued)
uncertainties inherent in those underlying assumptions. The allowance is measured taking into considerationhistorical loss experience adjusted for qualitative factors such as current economic conditions.
While management has based its estimate of the allowance for loan losses on the best information available,future adjustments to the allowance for loan losses may be necessary as a result of changes in the economicenvironment or variances between actual results and the original assumptions.
Certain loans which are risk managed on a fair value basis are elected to be carried at fair value. Nomuraelects the fair value option to mitigate volatility in the consolidated statements of operations caused by thedifference in measurement basis that would otherwise exist between the loans and the derivatives used to riskmanage those loans.
Changes in the fair value of loans receivable elected for the fair value option are reported within Revenue –Net gain (loss) on trading in the consolidated statements of operations.
Other receivables—
Receivables from customers include amounts receivable on customer securities transactions and Receivablesfrom other than customers include amounts receivable for securities not delivered to a purchaser by thesettlement date (“fails to deliver”), margin deposits, commissions, and net receivables arising from unsettledsecurities transactions.
An allowance for doubtful accounts is provided for these receivables and included in Allowance for doubtfulaccounts which reflects management’s best estimate of probable losses incurred within receivables which have beenspecifically identified as impaired.
Payables and deposits—
Payables to customers include amounts payable on customer securities transactions and are generallymeasured at contractual amounts due.
Payables to other than customers include payables to brokers and dealers for securities not received from aseller by the settlement date (“fails to receive”) and net payables arising from unsettled securities transactions.Amounts are measured at contractual amounts due.
Deposits received at banks represent amounts held on deposit within Nomura’s banking subsidiaries and aremeasured at contractual amounts due.
Office buildings, land, equipment and facilities—
Office buildings, land, equipment and facilities, held for use by Nomura are stated at cost, net ofaccumulated depreciation and amortization, except for land, which is stated at cost. Significant renewals andadditions are capitalized at cost. Maintenance, repairs and minor renewals are expensed as incurred in theconsolidated statements of operations.
Depreciation and amortization charges are generally computed using the straight-line method and at ratesbased on estimated useful lives of each asset according to general class, type of construction and use. Theestimated useful lives for significant asset classes are as follows:
Office buildings . . . . . . . . . . . . . . . . . . . . . . . . . . . . . . . . . . . . . . . . . . . . . . . . . . . . . . . 15 to 50 yearsEquipment and installations . . . . . . . . . . . . . . . . . . . . . . . . . . . . . . . . . . . . . . . . . . . . . . 3 to 15 yearsSoftware . . . . . . . . . . . . . . . . . . . . . . . . . . . . . . . . . . . . . . . . . . . . . . . . . . . . . . . . . . . . . Up to 5 years
F-18
NOMURA HOLDINGS, INC.
NOTES TO THE CONSOLIDATED FINANCIAL STATEMENTS—(Continued)
Depreciation and amortization is included in Non-interest expenses—Information processing andcommunications in the amount of ¥47,350 million, ¥56,429 million, ¥51,924 million ($556 million), and inNon-interest expenses—Occupancy and related depreciation in the amount of ¥16,113 million, ¥19,351 million,and ¥21,157 million ($227 million) for the years ended March 31, 2008, 2009 and 2010, respectively.
Long-lived assets, excluding goodwill and indefinite-lived intangible assets, are reviewed for impairmentwhenever events or changes in circumstances indicate that the carrying amount may not be recoverable. If theestimated future undiscounted cash flow generated by the asset is less than the carrying amount of the asset, aloss is recognized to the extent that the carrying value exceeds its fair value.
Nomura recorded non-cash impairment charges of ¥93 million, ¥2,656 million, and ¥194 million($2 million) substantially related to write-downs of software, office buildings, land, equipment, facilities, andother assets for the years ended March 31, 2008, 2009 and 2010, respectively. These losses are included in theconsolidated statements of operations in Non-interest expenses—Other. The revised carrying values of theseassets were based on the estimated fair value of the assets.
Investments in equity securities—
Nomura holds minority stakes in the equity securities of unaffiliated Japanese financial institutions andcorporations in order to promote existing and potential business relationships. These companies will also oftenhave similar investments in Nomura. Such cross-holdings are a customary business practice in Japan and providea way for companies to manage the shareholder relationships.
These investments, which Nomura refers to as being held for operating purposes, are carried at fair valuewithin Other assets—Investments in equity securities in the consolidated balance sheets, with changes in fairvalue recognized within Revenue—Gain (loss) on investments in equity securities in the consolidated statementsof operations. These investments comprise listed and unlisted equity securities in the amounts of ¥81,053 millionand ¥37,849 million, respectively, as of March 31, 2009 and ¥89,045 million ($953 million) and ¥33,903 million($363 million), respectively, as of March 31, 2010.
Non-trading debt securities—
Non-trading debt securities consist of debt securities mainly held by non-trading subsidiaries. Non-tradingdebt securities are carried at fair value, with changes in fair value recognized within Revenue—Other in theconsolidated statements of operations.
Short-term and long-term borrowings—
Short-term and long-term borrowings primarily consist of commercial papers, bank borrowings, structurednotes issued by Nomura and SPEs consolidated by Nomura, and financial liabilities recognized in transactionswhich are accounted for as financings under ASC 860 (“secured financing transactions”). Of these financialliabilities, certain structured notes and secured financing transactions are accounted for at fair value on arecurring basis through election of the fair value option. Others are carried at amortized cost.
Structured notes—
Structured notes are debt securities which contain embedded features (often meeting the accountingdefinition of a derivative) that alter the return to the investor from simply receiving a fixed or floating rate of
F-19
NOMURA HOLDINGS, INC.
NOTES TO THE CONSOLIDATED FINANCIAL STATEMENTS—(Continued)
interest to a return that depends upon some other variable(s) such as an equity or equity index, commodity price,foreign exchange rate, credit rating of a third party or more complex interest rate calculation.
All structured notes issued by Nomura on or after April 1, 2008 are carried at fair value on a recurring basisthrough election of the fair value option. This blanket election for structured notes is made primarily to mitigatethe volatility in the consolidated statements of operations caused by differences in the measurement basis forstructured notes and the derivatives used to risk manage those positions and to generally simplify the accountingNomura applies to these financial instruments.
Certain structured notes outstanding as of March 31, 2008 were already measured at fair value but otherscontinue to be accounted for by Nomura by bifurcating the embedded derivative from the associated debt hostcontract. The embedded derivative is accounted for at fair value and the debt host contract is accounted for atamortized cost.
Changes in the fair value of structured notes elected for the fair value option and bifurcated embeddedderivatives are reported within Revenue—Net gain (loss) on trading in the consolidated statements of operations.
Income taxes—
Deferred tax assets and liabilities are recorded for the expected future tax consequences of tax losscarryforwards and temporary differences between the carrying amounts and the tax bases of assets and liabilitiesbased upon enacted tax laws and tax rates. Nomura recognizes deferred tax assets to the extent it believes that itis more likely than not that a benefit will be realized. A valuation allowance is provided for tax benefits availableto Nomura that are not deemed more likely than not to be realized.
Nomura recognizes and measures unrecognized tax benefits based on Nomura’s estimate of the likelihood,based on the technical merits, that tax positions will be sustained upon examination based on the facts andcircumstances and information available at the end of each period. Nomura adjusts the level of unrecognized taxbenefits when there is more information available, or when an event occurs requiring a change. The reassessmentof unrecognized tax benefits could have a material impact on Nomura’s effective tax rate in the period in which itoccurs.
Stock-based compensation—
Stock-based compensation cost is determined either by using option pricing models intended to estimate thefair value of the awards at the grant date or by calculating the fair value of the award at the grant date based onthe market price at the grant date and the exercise price. Compensation cost is recognized over the requisiteservice period, which generally is equal to the vesting period.
Earnings per share—
The computation of basic earnings per share is based on the average number of shares outstanding duringthe year. Diluted earnings per share reflects the assumed conversion of all dilutive securities based on the mostadvantageous conversion rate or exercise price available to the investors, and assuming conversion of convertibledebt under the if-converted method.
Cash and cash equivalents—
Nomura defines cash and cash equivalents as cash on hand and demand deposits with banks.
F-20
NOMURA HOLDINGS, INC.
NOTES TO THE CONSOLIDATED FINANCIAL STATEMENTS—(Continued)
Goodwill and intangible assets—
Goodwill and intangible assets not subject to amortization are reviewed annually, or more frequently incertain circumstances, for impairment. Goodwill is the cost of acquired companies in excess of the fair value ofidentifiable net assets at acquisition date. Nomura periodically assesses the recoverability of goodwill bycomparing the fair value of each reporting unit to which goodwill relates to the carrying amount of the reportingunit including goodwill. If such assessment indicates that the fair value is less than the related carrying amount, agoodwill impairment determination is made. Identifiable intangible assets with finite lives are amortized overtheir expected useful lives.
Restructuring costs—
Costs associated with an exit activity are recognized at fair value in the period in which the liability isincurred. Such costs include one-time termination benefits provided to employees, costs to terminate certaincontracts and costs to relocate employees. Termination benefits provided to employees as part of ongoing benefitarrangements are recognized as liabilities during the period in which it is probable that Nomura has incurred aloss, and the amount of the loss can be reasonably estimated.
Restructuring costs of a plan to either exit an activity of a company acquired by Nomura or involuntarilyterminate or relocate employees of an acquired company are recognized as liabilities assumed in a businesscombination only if an obligation to incur the costs associated with these activities existed at the acquisition date.
For business combinations consummated prior to April 1, 2009, costs associated with restructurings initiatedby Nomura as acquirer were also recognized as liabilities assumed in a business combination providedmanagement committed to, formulated and communicated its detailed restructuring plan to affected employeeswithin one year of acquisition date.
New accounting pronouncements recently adopted—
The following new accounting pronouncements relevant to Nomura have been adopted during the yearended March 31, 2010:
Expanded disclosures regarding fair value measurements
On January 1, 2010, Nomura adopted amendments to ASC 820 required by ASU No. 2010-06 “ImprovingDisclosures about Fair Value Measurements” (“ASU 2010-06”) which expands the disclosures requirements ofASC 820. ASU 2010-06 requires additional disclosures regarding the amounts of significant transfers in and outof Level 1 and 2 of the fair value hierarchy and the reasons for the transfers between Levels. It also requiresinformation about purchases, sales, issuances and settlements of Level 3 instruments to be provided on a grossbasis. ASU 2010-06 also clarifies existing fair-value measurement disclosure guidance about the level ofdisaggregation required for disclosures made regarding the fair value hierarchy, inputs, and valuation techniques.
The new disclosures and clarifications of existing disclosures were required to be implemented for interimor annual periods beginning after December 15, 2009, which for Nomura was the fourth quarter commenced onJanuary 1, 2010. Gross information on purchases, sales, issuances and settlements are required in fiscal yearsbeginning after December 15, 2010 which for Nomura will be within the fiscal year commencing on April 1,2011 and interim periods within that fiscal year.
F-21
NOMURA HOLDINGS, INC.
NOTES TO THE CONSOLIDATED FINANCIAL STATEMENTS—(Continued)
Because the ASU only introduces new disclosures and does not impact upon how Nomura calculates fairvalue, adoption of the currently effective portions has not had a material impact on these consolidated financialstatements, nor will adoption of the pending portions have a material impact in the upcoming fiscal year. SeeNote 3, “Fair value of financial instruments” within these consolidated financial statements where the new andclarified disclosures have been made.
Valuation methodology for investments in certain entities that calculate net asset value (“NAV”) per share
On October 1, 2009, Nomura adopted amendments to ASC 820 required by ASU No. 2009-12 “Investmentsin Certain Entities That Calculate Net Asset Value per Share (or Its Equivalent)” (“ASU 2009-12”) whichamends ASC 820 by permitting the measurement of fair value of certain investments on the basis of NAV pershare as a practical expedient if certain criteria are met. ASU 2009-12 only applies to investments in investmentcompanies and similar entities which do not have a readily determinable fair value. The ASU also providesadditional guidance regarding how such investments should be classified in the fair value hierarchy and requiresadditional disclosures irrespective of whether the practical expedient is used.
Nomura now uses the practical expedient permitted by the ASU in the valuation of certain fund investmentsand also uses the guidance in the ASU to classify certain investments in the fair value hierarchy. Adoption ofthese amendments has not had a material impact on these consolidated financial statements. See Note 3 “Fairvalue of financial instruments” in these consolidated financial statements where the fair value hierarchy and newdisclosures have been made.
Measuring liabilities at fair value
On October 1, 2009, Nomura adopted amendments to ASC 820 required by ASU No. 2009-05, “MeasuringLiabilities at Fair Value” (“ASU 2009-05”), which provides new guidance for determining the fair value of bothfinancial and non-financial liabilities when a fair value measurement is used. It provides valuation methods and ahierarchy for their use and clarifies that restrictions preventing the transfer of a liability should not be consideredas a separate input or adjustment in the measurement of fair value. Nomura now uses the hierarchy in thevaluation of financial liabilities such as structured notes elected for the fair value option.
Adoption of these amendments has not had a material impact on these consolidated financial statements. SeeNote 3, “Fair value of financial instruments” in these consolidated financial statements where more guidanceregarding the fair value of financial liabilities is provided.
Decrease in ownership interests in subsidiaries
On October 1, 2009, Nomura adopted amendments to ASC 810 required by ASU No. 2010-02, “Accountingand Reporting for Decreases in Ownership of a Subsidiary” (“ASU 2010-02”), which clarifies when certainguidance contained within ASC 810 regarding decreases in ownership interests in subsidiaries that result in achange in control and a resulting gain or loss for various fact patterns. ASU 2010-02 clarifies that certainprovisions of ASC 810 apply only to subsidiaries that are businesses, including situations where a business istransferred to an equity method investee or joint venture. Furthermore, these provisions would not apply toin-substance real estate transactions. ASU 2010-02 also requires new disclosures regarding determination of fairvalue in situations where a change in control occurs resulting in a gain or loss, including where an entity achievesa business combination by acquiring control in stages over time.
Adoption of these amendments has not had a material impact on these consolidated financial statements.
F-22
NOMURA HOLDINGS, INC.
NOTES TO THE CONSOLIDATED FINANCIAL STATEMENTS—(Continued)
Accounting for nonderivative contracts by broker-dealers
In September 2009, Nomura adopted amendments to ASC 940 “Financial Services—Broker and Dealers”(“ASC 940”) required by ASU No. 2009-10 “Broker and Dealers: Investments—Other—Amendment to Subtopic940-325” (“ASU 2009-10”), which clarifies how broker-dealers such as Nomura should account for energytrading contracts that do not meet the accounting definition of a derivative. ASU 2009-10 was issued to ensureconsistent accounting for nonderivative energy trading contracts by broker-dealers and specifically to clarifyrelated provisions of ASC 940.
Adoption of these amendments has not had a material impact on these consolidated financial statements.
Enhanced disclosures about pension plan assets
On April 1, 2009, Nomura adopted new disclosure requirements included in ASC 715-20 “Compensation—Retirement Benefits-Defined Benefit Plans” (“ASC 715-20”). ASC 715-20 increases the information to bedisclosed about plan assets by aligning these disclosures with those made for other financial assets. In particular,plan assets must be separated into the three fair value hierarchy levels and a roll forward of the changes in fairvalue of plan assets classified as Level 3 must be provided.
Adoption of the new requirements in ASC 715-20 has not had a material impact on these consolidatedfinancial statements as these are only new disclosures and the requirements do not impact upon the accountingtreatment of plan assets or benefit obligations. See Note 14, “Employee benefit plans” within these consolidatedfinancial statements where the relevant new disclosures have been made.
Subsequent events
On April 1, 2009, Nomura adopted ASC 855 “Subsequent Events” (“ASC 855”), which provides newguidance regarding the accounting treatment and disclosure of events occurring after the balance sheet date butbefore financial statements are issued or available to be issued.
In February 2010, Nomura adopted amendments to ASC 855 required by ASU No. 2010-09 “Amendmentsto Certain Recognition and Disclosure Requirements” (“ASU 2010-09”) which was issued to address theinteraction of ASC 855 with certain SEC reporting requirements.
Adoption of ASC 855 amended by ASU 2010-09 has not had a material impact on these consolidatedfinancial statements.
Accounting for noncontrolling interests
On April 1, 2009, Nomura adopted new guidance for the accounting and reporting for noncontrollinginterests in financial statements included in ASC 810. The new guidance re-characterizes minority interests inconsolidated subsidiaries as non-controlling interests and requires the classification of non-controlling interestsas a component of equity (rather than as a liability or as mezzanine equity). Under the new guidance, a change incontrol is measured at fair value. The new guidance also provides guidance on the accounting for transactionsbetween an entity and noncontrolling interests. The new guidance is applied prospectively as of the beginning ofthe fiscal year in which it is initially applied, except for the presentation and disclosure requirements which areapplied retrospectively for all periods presented. Nomura reclassified ¥322 million (loss) and ¥1,219 million(loss) between Income (loss) before income taxes and Net income (loss) attributable to NHI for the years endedMarch 31, 2008 and 2009, respectively. In addition, ¥12,150 million has been reclassified from Other liabilitiesto Non-controlling interests as of March 31, 2009.
F-23
NOMURA HOLDINGS, INC.
NOTES TO THE CONSOLIDATED FINANCIAL STATEMENTS—(Continued)
Accounting for business combinations
On April 1, 2009, Nomura adopted new guidance for business combinations included in ASC 805 “BusinessCombinations” (“ASC 805”). For business combinations for which the acquisition date is on or after April 1,2009, the new guidance expands the definition of transactions and events that qualify as business combinations;requires that the full value of acquired assets and liabilities, including contingent consideration, be recorded atfair value determined on the acquisition date and changes thereafter in valuation of contingent consideration to bereflected in earnings rather than goodwill; changes the timing for valuing certain arrangements where stock ispaid as consideration; and requires acquisition related costs to be expensed as incurred.
Adoption of the new guidance has not had a material effect on these consolidated financial statements.
Repurchase financing agreements
On April 1, 2009, Nomura adopted new guidance for transfers of financial assets included in ASC 860 thatrequires a transfer of a financial asset and a reverse of repurchase agreement involving the same transferredfinancial asset entered into contemporaneously or in contemplation of each other to be accounted for as a singlelinked transaction unless specific criteria are met.
Adoption of the new guidance has not had a material impact on these consolidated financial statements.
Revisions to calculation of earnings per share
On April 1, 2009, Nomura adopted updated guidance included in ASC 260 “Earnings per Share” (“ASC260”) which clarifies that unvested share-based payment awards that contain non-forfeitable rights to dividendsor dividend equivalents (whether paid or unpaid) are participating securities and therefore are included in thecomputation of earnings per share using the two-class method.
Adoption of the updated guidance has not had a material impact on either a prospective, historical basic oron diluted earnings per share amounts reported within these consolidated financial statements.
Instruments indexed to an entity’s own stock
On April 1, 2009, Nomura adopted updated guidance included in ASC 815-40, “Derivatives and Hedging—Contracts in Entity’s Own Equity” (“ASC 815-40”) that provides guidance on determining whether certaininstruments (or embedded features in other instruments) are considered indexed to an entity’s own stock. Itamends the existing guidance for determining whether a price adjustment mechanism included in an equity-linked financial instrument (or embedded feature) needs to be bifurcated and classified as an asset or liability andbe subject to profit or loss recognition based on its fair value.
Upon adoption of ASC 815-40, Nomura made certain reclassification adjustments to the opening balancesof Long–term borrowings, Additional paid-in-capital, Retained earnings, and Other assets—Other in order tobifurcate certain contingent conversion price adjustment rights contained in 120% Call Attached UnsecuredSubordinated Convertible Bonds No. 1 (the “Convertible Bonds”) that were determined as not indexed to theCompany’s stock. Following the expiration of such clauses, further reclassification of such derivatives was madeto Retained earnings. The effect of adopting ASC 815-40 on the opening balance of Retained earnings was a lossof ¥6,339 million. If Nomura had not adopted ASC 815-40, the effect would have resulted in a decrease ofIncome (loss) before income taxes and Net income (loss) attributable to NHI by ¥56,375 million and¥33,261 million, respectively, and Basic and Diluted Earnings per Share would have been ¥11.05 and ¥11.00,respectively, for the year ended March 31, 2010.
F-24
NOMURA HOLDINGS, INC.
NOTES TO THE CONSOLIDATED FINANCIAL STATEMENTS—(Continued)
See Note 13, “Earnings per share” within these consolidated financial statements for a further discussion ofdiluted earnings per share.
Measurement of fair value in inactive markets
On April 1, 2009, Nomura adopted new guidance included in ASC 820, which clarifies how to measure fairvalue when the volume and level of activity for an asset or liability have significantly decreased. The updatedguidance also requires increased granularity of disclosures regarding the nature and type of financial assets andliabilities that are measured at fair value.
Adoption of the new guidance on fair value measurement has not had a material impact on theseconsolidated financial statements as Nomura’s valuation methodologies were already consistent with the revisedguidance. See Note 3, “Fair value of financial instruments” in these consolidated financial statements wheremore detail around the valuation methodologies is provided and where the relevant revised disclosures requiredby this guidance have been made.
Equity method accounting considerations
On April 1, 2009, Nomura adopted new guidance included in ASC 323 “Investments—Equity Method andJoint Ventures” which clarifies the accounting for certain transactions and provides impairment guidance relatedto equity method investments.
Adoption of the new guidance has not had a material impact on these consolidated financial statements.
Interim disclosures about fair value of financial instruments
On April 1, 2009, Nomura adopted new guidance included in ASC 820 which requires quarterly disclosureof qualitative and quantitative information about the fair value of all financial instruments including methods andsignificant assumptions used to estimate fair value during the period.
As this requirement does not affect the determination of fair value and only extends fair value disclosures tointerim financial statements, adoption of the new guidance has not had a material impact on these consolidatedfinancial statements.
Future accounting developments—
The following new accounting pronouncements relevant to Nomura will be adopted in future periods:
Transfers of financial assets
In December 2009, the FASB issued ASU No. 2009-16 “Transfers and Servicing (Topic 860): Accountingfor Transfers of Financial Assets” (“ASU 2009-16”) which incorporated new guidance around the accounting fortransfers of financial assets into ASC 860. ASU 2009-16 changes the requirements for derecognizing financialassets, eliminates the concept of QSPE, and requires additional disclosures about transfers of financial assets anda transferor’s continuing involvement with transfers of financial assets accounted for as sales. The requirementsfor derecognizing financial assets include new restrictions regarding when a portion of a financial asset may beaccounted for as a sale, as well as a clarification of the criteria needed to ensure isolation of the transferred assetshas occurred from a legal perspective. The elimination of QSPEs will subject such entities to be evaluated underthe revised consolidation guidance provided by ASC 810 as amended by ASU 2009-17, as described below,provided Nomura still has variable interests in those entities at the adoption date.
F-25
NOMURA HOLDINGS, INC.
NOTES TO THE CONSOLIDATED FINANCIAL STATEMENTS—(Continued)
ASU 2009-16 is effective in the first annual reporting period that begins after November 15, 2009, forinterim periods within that first annual reporting period, and for interim and annual reporting periods thereafter.Application of the revised guidance for transfers of financial assets is prospective after adoption.
Nomura intends to adopt ASU 2009-16 on April 1, 2010 and does not expect adoption to have a materialimpact on the consolidated financial statements.
Consolidation of variable interest entities
In December 2009, the FASB issued ASU No. 2009-17, “Consolidations (Topic 810): Improvements toFinancial Reporting by Enterprises Involved with Variable Interest Entities” (“ASU 2009-17”) whichincorporated new guidance around the consolidation of variable interest entities into ASC 810.
ASU 2009-17 amends rules defining which entities are VIEs and requires a company to perform aqualitative analysis when determining whether it must consolidate a VIE. If a company has variable interests thatprovide it with power over the most significant activities of the VIE and the right to receive benefits or theobligation to absorb losses meeting a significance test, the company would consolidate the entity, provided thatthe company does not meet separate tests confirming that it is acting as a fiduciary for other interest holders.Under the new qualitative approach, a quantitative analysis of exposure to expected benefit and loss is no longerdeterminative in isolation. ASU 2009-17 also requires consolidation or deconsolidation of VIEs to be evaluatedon an ongoing basis, which differs from existing guidance that requires evaluation when Nomura first becameinvolved with a VIE and only upon occurrence of certain triggering events.
ASU 2009-17 is effective in the first annual reporting period that begins after November 15, 2009, forinterim periods within that first annual reporting period, and for interim and annual reporting periods thereafter.Earlier application is prohibited. It contains special transition provisions governing whether the assets, liabilities,and noncontrolling interests resulting from consolidation of entities at the date of adoption should occur at theircarrying amounts (as if such entities had been consolidated under the revised guidance prior to the adoptiondate), fair value, or at unpaid principal balances. In certain cases, differences between the net amount added tothe balance sheet upon consolidation and the amount previously recognized on an unconsolidated basis will berecognized as a cumulative adjustment to retained earnings.
In February 2010, the FASB issued ASU No. 2010-10 “Consolidation (Topic 810): Amendments for CertainInvestment Funds” (“ASU 2010-10”) which indefinitely defers the consolidation requirements for certain entitiesthat qualify as investment companies under ASC 946 or for which it is industry practice to apply guidanceconsistent with the measurement principles in ASC 946. The modifications to ASC 946 do not apply to entitieswhere Nomura has an explicit or implicit obligation to fund losses of the entity that could potentially besignificant to the entity (except for certain qualifying money market funds), or if the entity is involved insecuritizations, asset-backed financing or formerly met the definition of a QSPE. The ASU also does not deferthe revised disclosures requirements of ASU 2009-17 for entities determined to be VIEs under guidance existingprior to ASU 2009-17.
Nomura intends to adopt the revised guidance in ASC 810 introduced by ASU 2009-17 and ASU 2010-10on April 1, 2010 and has analyzed the impact on all QSPEs, SPEs, funds and similar entities with which it isinvolved. Entities qualifying for the deferral under ASU 2010-10 will continue to be assessed for consolidationunder existing guidance.
Based on the results of this analysis, Nomura expect to consolidate certain securitization vehicles, whichwill increase total assets and total liabilities by less than 1% upon adoption as of April 1, 2010. No significant
F-26
NOMURA HOLDINGS, INC.
NOTES TO THE CONSOLIDATED FINANCIAL STATEMENTS—(Continued)
impact is expected on total shareholders’ equity. The increase in total assets is not expected to have a significanteffect on Nomura’s calculation of risk-weighted assets and therefore is not expected to have a significant effecton Nomura’s capital ratios.
2. U.S. dollar amounts:
The U.S. dollar amounts are included solely for the convenience of the reader and have been translated atthe rate of ¥93.40 = U.S. $1.00, the noon buying rate in New York City for cable transfers in foreign currenciesas certified for customs purposes by the Federal Reserve Bank of New York on March 31, 2010. This translationshould not be construed to imply that the yen amounts actually represent, or have been or could be convertedinto, equivalent amounts in U.S. dollars.
3. Fair value of financial instruments:
A significant amount of Nomura’s financial instruments are carried at fair value or at amounts thatapproximate fair value. Financial assets which are carried at fair value on a recurring basis are included in theconsolidated balance sheets within Trading assets and private equity investments, Loans and receivables andOther assets. Financial liabilities which are carried at fair value on a recurring basis are included within Tradingliabilities, Short-term borrowings, Payables and deposits, Long-term borrowings, and Other liabilities.
Other financial assets and financial liabilities are carried at fair value on a nonrecurring basis, where theprimary measurement basis is not fair value but where fair value is only used in specific circumstances, such asto measure impairment.
In all cases, fair value is determined in accordance with ASC 820 which defines fair value as the amountthat would be exchanged to sell a financial asset or transfer a financial liability in an orderly transaction betweenmarket participants at the measurement date. It assumes that the transaction occurs in Nomura’s principal market,or in the absence of the principal market, the most advantageous market for the relevant financial asset orfinancial liability.
Financial assets also include investments in certain funds where as a practical expedient, fair value isdetermined on the basis of NAV per share if the NAV per share is calculated in accordance with certain industrystandard principles.
Increases and decreases in the fair value of assets and liabilities will significantly impact Nomura’s position,performance, liquidity and capital resources. As explained later, valuation techniques applied contain inherentuncertainties and Nomura is unable to predict the impact of future developments in the market. Whereappropriate, Nomura uses economic hedging strategies to mitigate its risk, although these hedges are also subjectto unpredictable movements in the market.
Valuation methodology for financial instruments carried at fair value on a recurring basis—
The fair value of financial instruments is based on quoted market prices, including market indices, broker ordealer quotations or an estimation by management of the expected exit price under current market conditions.Various financial instruments, including cash and OTC contracts, have bid and offer prices that are observable inthe market. These are measured at the point within the bid-offer range which best represents Nomura’s estimateof fair value. Where quoted market prices or broker or dealer quotations are not available, prices for similarinstruments or valuation pricing models are considered in the determination of fair value.
F-27

NOMURA HOLDINGS, INC.
NOTES TO THE CONSOLIDATED FINANCIAL STATEMENTS—(Continued)
Where quoted prices are available in active markets, no valuation adjustments are taken to modify the fairvalue of assets or liabilities marked using such prices. Other instruments may be measured using valuationtechniques, such as valuation pricing models, incorporating observable parameters, unobservable parameters or acombination of both. Valuation pricing models use parameters which would be considered by market participantsin valuing similar financial instruments.
Valuation pricing models and their underlying assumptions impact the amount and timing of unrealizedgains and losses recognized, and the use of different valuation pricing models or underlying assumptions couldproduce different financial results. Valuation uncertainty results from a variety of factors, including: thevaluation technique or model selected; the quantitative assumptions used within the valuation model; the inputsinto the model; as well as other factors. Valuation adjustments are used to reflect the assessment of thisuncertainty. Common valuation adjustments include model reserves, credit adjustments, close out adjustments,and other appropriate instrument-specific adjustments, such as those instruments under trade restrictions.
The level of adjustments is largely judgmental and is based on an assessment of the factors that managementbelieve other market participants would use in determining the fair value of similar financial instruments. Thetype of adjustments taken, the methodology for the calculation of these adjustments, and the inputs for thesecalculations are reassessed periodically to reflect current market practice and the availability of new information.
For example, the fair value of certain financial instruments includes adjustments for credit risk; both withregards to counterparty credit risk on positions held and Nomura’s own creditworthiness on positions issued.Credit risk on financial assets is significantly mitigated by credit enhancements such as collateral and nettingarrangements. Any net credit exposure is measured using available and applicable inputs for the relevantcounterparty. The same approach is used to measure the credit exposure on Nomura’s liabilities as is used formeasuring counterparty credit risk on Nomura’s assets.
Such models are calibrated to the market on a regular basis and inputs used are adjusted for current marketconditions and risks. The global risk management unit reviews pricing models and assesses modelappropriateness and consistency independently of the front office. The model reviews consider a number offactors about the model’s suitability for valuation and sensitivity of a particular product. Valuation models arecalibrated to the market on a periodic basis by comparison to observable market pricing, comparison withalternative models, and analysis of risk profiles.
As explained above, any changes in fixed income, equity, foreign exchange and commodity markets canimpact Nomura’s estimates of fair value in the future, potentially affecting trading gains and losses. As financialcontracts have longer maturity dates, Nomura’s estimates of fair value may involve greater subjectivity due to thelack of transparent market data available upon which include base assumptions underlying valuation pricingmodels.
Concentrations of credit risk—
Concentrations of credit risk may arise from trading, securities financing transactions and underwritingactivities, and may be impacted by changes in political or economic factors. Nomura’s significant singleconcentrations of credit risk were with the Japanese Government, U.S. Government, Governments within the EU,their states and municipalities, and their agencies. These concentrations generally arise from taking tradingsecurities positions and are reported in Trading assets in the consolidated balance sheets. Government, state,municipal, and government agency securities, including Securities pledged as collateral, represented 26% of totalassets as of March 31, 2009 and 21% as of March 31, 2010. The following tables present geographic allocations
F-28
NOMURA HOLDINGS, INC.
NOTES TO THE CONSOLIDATED FINANCIAL STATEMENTS—(Continued)
of Nomura’s trading assets related to government, state, municipal, and government agency securities. Please seeNote 4, “Derivative instruments and hedging activities” about the concentration of credit risk for derivatives.
Billions of yen
March 31, 2009
Japan U.S. EU Other Total(1)
Governments, states, municipalities and their agencies . . . . . . . . . . . ¥ 4,005 ¥ 396 ¥1,803 ¥184 ¥6,388
Billions of yen
March 31, 2010
Japan U.S. EU Other Total(1)
Governments, states, municipalities and their agencies . . . . . . . . . . . ¥ 2,756 ¥1,635 ¥2,270 ¥232 ¥6,893
Translation into billions of U.S. dollars
March 31, 2010
Japan U.S. EU Other Total(1)
Governments, states, municipalities and their agencies . . . . . . . . . . . $ 30 $ 18 $ 24 $ 2 $ 74
(1) Other than above, there were ¥120 billion of government, state, municipal and agency securities in Otherassets—Non-trading debt securities as of March 31, 2009 and ¥187 billion ($2.00 billion) as of March 31,2010. The vast majority of these securities are Japanese government, state, municipal and governmentagency securities.
Fair value hierarchy—
All financial instruments measured at fair value, including those carried at fair value using the fair valueoption, have been categorized into a three-level hierarchy (“the fair value hierarchy”) based on the transparencyof inputs used by Nomura to estimate fair value. A financial instrument is classified in the fair value hierarchybased on the lowest level of input that is significant to the fair value measurement of the instrument. The threelevels of the fair value hierarchy are defined as follows, with Level 1 representing the most transparent inputsand Level 3 representing the least transparent inputs:
Level 1:
Unadjusted quoted prices in active markets for identical assets or liabilities accessible by Nomura at themeasurement date.
Level 2:
Quoted prices in inactive markets or containing other inputs which are observable, either directly orindirectly. Valuation techniques using observable inputs reflect assumptions used by market participants inpricing financial instruments and are based on data obtained from independent market sources at themeasurement date.
Level 3:
Unobservable inputs that are significant to the fair value measurement of the financial instrument. Valuationtechniques using unobservable inputs reflect management’s assumptions about the estimates used by othermarket participants in valuing similar financial instruments. These valuation techniques are developed based onthe best available information at the measurement date.
F-29
NOMURA HOLDINGS, INC.
NOTES TO THE CONSOLIDATED FINANCIAL STATEMENTS—(Continued)
The availability of inputs observable in the market varies by product and can be affected by a variety offactors. Significant factors include, but are not restricted to: the prevalence of similar products in the market,especially if the product is significantly customized; how established the product is in the market, for example,whether it is a new product or is relatively mature; and the reliability of information provided in the marketwhich would depend, for example, on the frequency and volume of current data. A period of significant changein the market may reduce the availability of observable data. Under such circumstances, financial instrumentsmay be reclassified into a lower level in the fair value hierarchy.
Significant judgments used in determining the classification of financial instruments include the nature ofthe market in which the product would be traded, the underlying risks, the type and liquidity of market datainputs and the nature of observed transactions for similar instruments.
Where valuation models include the use of parameters which are less observable or unobservable in themarket, significant management judgment is used in establishing fair value. The valuations for Level 3 financialinstruments, therefore, involve a greater degree of judgment than those valuations for Level 1 or Level 2financial instruments.
Certain criteria management use to determine whether a market is active or inactive include the number oftransactions, the frequency that pricing is updated by other market participants, the variability of price quotationsamongst other market participants, and the amount of publicly available information.
The following tables in this note that relate to the prior fiscal year are prepared in accordance with thedisclosure requirements in effect prior to certain amendments to ASC 820 that Nomura adopted during the yearended March 31, 2010.
The following tables present information about Nomura’s financial assets and financial liabilities measuredat fair value on a recurring basis as of March 31, 2009 and 2010, respectively within the fair value hierarchy.
Billions of yen
March 31, 2009
Level 1 Level 2 Level 3
Counterpartyand
Cash CollateralNetting(1)
Balance as ofMarch 31, 2009
Assets:Trading assets and private equity investments(2)
Equities (including private equity)(3) . . . . . . . . . . . . ¥ 271 ¥ 592 ¥ 606 ¥ — ¥ 1,469Debt securities and loans . . . . . . . . . . . . . . . . . . . . 6,007 1,401 793 — 8,201Investment trust funds and other . . . . . . . . . . . . . . . 19 35 6 — 60Derivatives . . . . . . . . . . . . . . . . . . . . . . . . . . . . . . . 638 15,581 1,691 (15,967) 1,943
Loans and receivables(5) . . . . . . . . . . . . . . . . . . . . . . . . . 0 8 4 — 12Other assets . . . . . . . . . . . . . . . . . . . . . . . . . . . . . . . . . . . 285 54 50 — 389
Total . . . . . . . . . . . . . . . . . . . . . . . . . . . . . . . . . . . . . . . . . . . . ¥7,220 ¥17,671 ¥3,150 ¥(15,967) ¥12,074
Liabilities:Trading liabilities
Equities . . . . . . . . . . . . . . . . . . . . . . . . . . . . . . . . . . ¥ 413 ¥ 117 ¥ 1 ¥ — ¥ 531Debt securities . . . . . . . . . . . . . . . . . . . . . . . . . . . . . 2,355 250 0 — 2,605Investment trust funds and other . . . . . . . . . . . . . . . 1 — — — 1Derivatives . . . . . . . . . . . . . . . . . . . . . . . . . . . . . . . 722 15,192 1,424 (15,724) 1,614
Short-term borrowings(6)(7) . . . . . . . . . . . . . . . . . . . . . . . 9 28 8 — 45Payables and deposits(8) . . . . . . . . . . . . . . . . . . . . . . . . . — 0 (1) — (1)Long-term borrowings(6)(7)(9) . . . . . . . . . . . . . . . . . . . . . . 39 485 (81) — 443Other liabilities . . . . . . . . . . . . . . . . . . . . . . . . . . . . . . . . — 1 — — 1
Total . . . . . . . . . . . . . . . . . . . . . . . . . . . . . . . . . . . . . . . . . . . . ¥3,539 ¥16,073 ¥1,351 ¥(15,724) ¥ 5,239
F-30
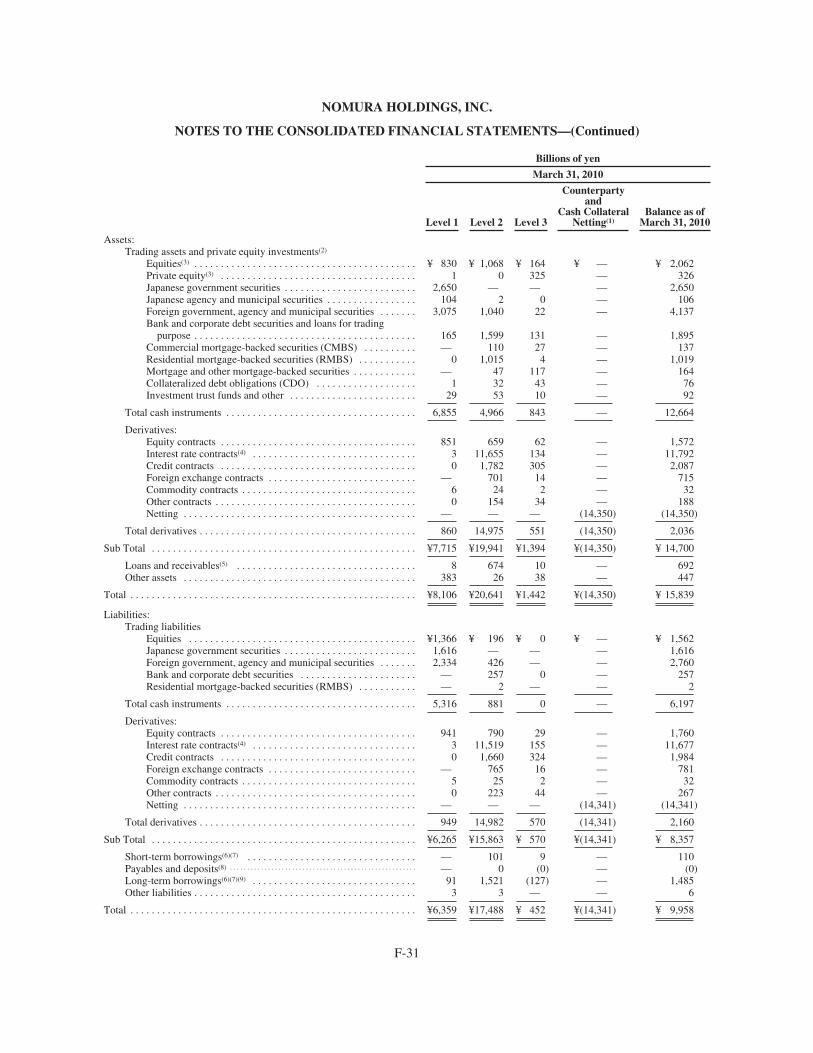
NOMURA HOLDINGS, INC.
NOTES TO THE CONSOLIDATED FINANCIAL STATEMENTS—(Continued)
Billions of yen
March 31, 2010
Level 1 Level 2 Level 3
Counterpartyand
Cash CollateralNetting(1)
Balance as ofMarch 31, 2010
Assets:Trading assets and private equity investments(2)
Equities(3) . . . . . . . . . . . . . . . . . . . . . . . . . . . . . . . . . . . . . . . . . . ¥ 830 ¥ 1,068 ¥ 164 ¥ — ¥ 2,062Private equity(3) . . . . . . . . . . . . . . . . . . . . . . . . . . . . . . . . . . . . . 1 0 325 — 326Japanese government securities . . . . . . . . . . . . . . . . . . . . . . . . . 2,650 — — — 2,650Japanese agency and municipal securities . . . . . . . . . . . . . . . . . 104 2 0 — 106Foreign government, agency and municipal securities . . . . . . . 3,075 1,040 22 — 4,137Bank and corporate debt securities and loans for trading
purpose . . . . . . . . . . . . . . . . . . . . . . . . . . . . . . . . . . . . . . . . . . 165 1,599 131 — 1,895Commercial mortgage-backed securities (CMBS) . . . . . . . . . . — 110 27 — 137Residential mortgage-backed securities (RMBS) . . . . . . . . . . . 0 1,015 4 — 1,019Mortgage and other mortgage-backed securities . . . . . . . . . . . . — 47 117 — 164Collateralized debt obligations (CDO) . . . . . . . . . . . . . . . . . . . 1 32 43 — 76Investment trust funds and other . . . . . . . . . . . . . . . . . . . . . . . . 29 53 10 — 92
Total cash instruments . . . . . . . . . . . . . . . . . . . . . . . . . . . . . . . . . . . . 6,855 4,966 843 — 12,664
Derivatives:Equity contracts . . . . . . . . . . . . . . . . . . . . . . . . . . . . . . . . . . . . . 851 659 62 — 1,572Interest rate contracts(4) . . . . . . . . . . . . . . . . . . . . . . . . . . . . . . . 3 11,655 134 — 11,792Credit contracts . . . . . . . . . . . . . . . . . . . . . . . . . . . . . . . . . . . . . 0 1,782 305 — 2,087Foreign exchange contracts . . . . . . . . . . . . . . . . . . . . . . . . . . . . — 701 14 — 715Commodity contracts . . . . . . . . . . . . . . . . . . . . . . . . . . . . . . . . . 6 24 2 — 32Other contracts . . . . . . . . . . . . . . . . . . . . . . . . . . . . . . . . . . . . . . 0 154 34 — 188Netting . . . . . . . . . . . . . . . . . . . . . . . . . . . . . . . . . . . . . . . . . . . . — — — (14,350) (14,350)
Total derivatives . . . . . . . . . . . . . . . . . . . . . . . . . . . . . . . . . . . . . . . . . 860 14,975 551 (14,350) 2,036
Sub Total . . . . . . . . . . . . . . . . . . . . . . . . . . . . . . . . . . . . . . . . . . . . . . . . . . ¥7,715 ¥19,941 ¥1,394 ¥(14,350) ¥ 14,700
Loans and receivables(5) . . . . . . . . . . . . . . . . . . . . . . . . . . . . . . . . . . 8 674 10 — 692Other assets . . . . . . . . . . . . . . . . . . . . . . . . . . . . . . . . . . . . . . . . . . . . 383 26 38 — 447
Total . . . . . . . . . . . . . . . . . . . . . . . . . . . . . . . . . . . . . . . . . . . . . . . . . . . . . . ¥8,106 ¥20,641 ¥1,442 ¥(14,350) ¥ 15,839
Liabilities:Trading liabilities
Equities . . . . . . . . . . . . . . . . . . . . . . . . . . . . . . . . . . . . . . . . . . . ¥1,366 ¥ 196 ¥ 0 ¥ — ¥ 1,562Japanese government securities . . . . . . . . . . . . . . . . . . . . . . . . . 1,616 — — — 1,616Foreign government, agency and municipal securities . . . . . . . 2,334 426 — — 2,760Bank and corporate debt securities . . . . . . . . . . . . . . . . . . . . . . — 257 0 — 257Residential mortgage-backed securities (RMBS) . . . . . . . . . . . — 2 — — 2
Total cash instruments . . . . . . . . . . . . . . . . . . . . . . . . . . . . . . . . . . . . 5,316 881 0 — 6,197
Derivatives:Equity contracts . . . . . . . . . . . . . . . . . . . . . . . . . . . . . . . . . . . . . 941 790 29 — 1,760Interest rate contracts(4) . . . . . . . . . . . . . . . . . . . . . . . . . . . . . . . 3 11,519 155 — 11,677Credit contracts . . . . . . . . . . . . . . . . . . . . . . . . . . . . . . . . . . . . . 0 1,660 324 — 1,984Foreign exchange contracts . . . . . . . . . . . . . . . . . . . . . . . . . . . . — 765 16 — 781Commodity contracts . . . . . . . . . . . . . . . . . . . . . . . . . . . . . . . . . 5 25 2 — 32Other contracts . . . . . . . . . . . . . . . . . . . . . . . . . . . . . . . . . . . . . . 0 223 44 — 267Netting . . . . . . . . . . . . . . . . . . . . . . . . . . . . . . . . . . . . . . . . . . . . — — — (14,341) (14,341)
Total derivatives . . . . . . . . . . . . . . . . . . . . . . . . . . . . . . . . . . . . . . . . . 949 14,982 570 (14,341) 2,160
Sub Total . . . . . . . . . . . . . . . . . . . . . . . . . . . . . . . . . . . . . . . . . . . . . . . . . . ¥6,265 ¥15,863 ¥ 570 ¥(14,341) ¥ 8,357
Short-term borrowings(6)(7) . . . . . . . . . . . . . . . . . . . . . . . . . . . . . . . . — 101 9 — 110Payables and deposits(8) . . . . . . . . . . . . . . . . . . . . . . . . . . . . . . . . . . . . . . . . . . . . . . . . . . . . . . — 0 (0) — (0)Long-term borrowings(6)(7)(9) . . . . . . . . . . . . . . . . . . . . . . . . . . . . . . . 91 1,521 (127) — 1,485Other liabilities . . . . . . . . . . . . . . . . . . . . . . . . . . . . . . . . . . . . . . . . . . 3 3 — — 6
Total . . . . . . . . . . . . . . . . . . . . . . . . . . . . . . . . . . . . . . . . . . . . . . . . . . . . . . ¥6,359 ¥17,488 ¥ 452 ¥(14,341) ¥ 9,958
F-31
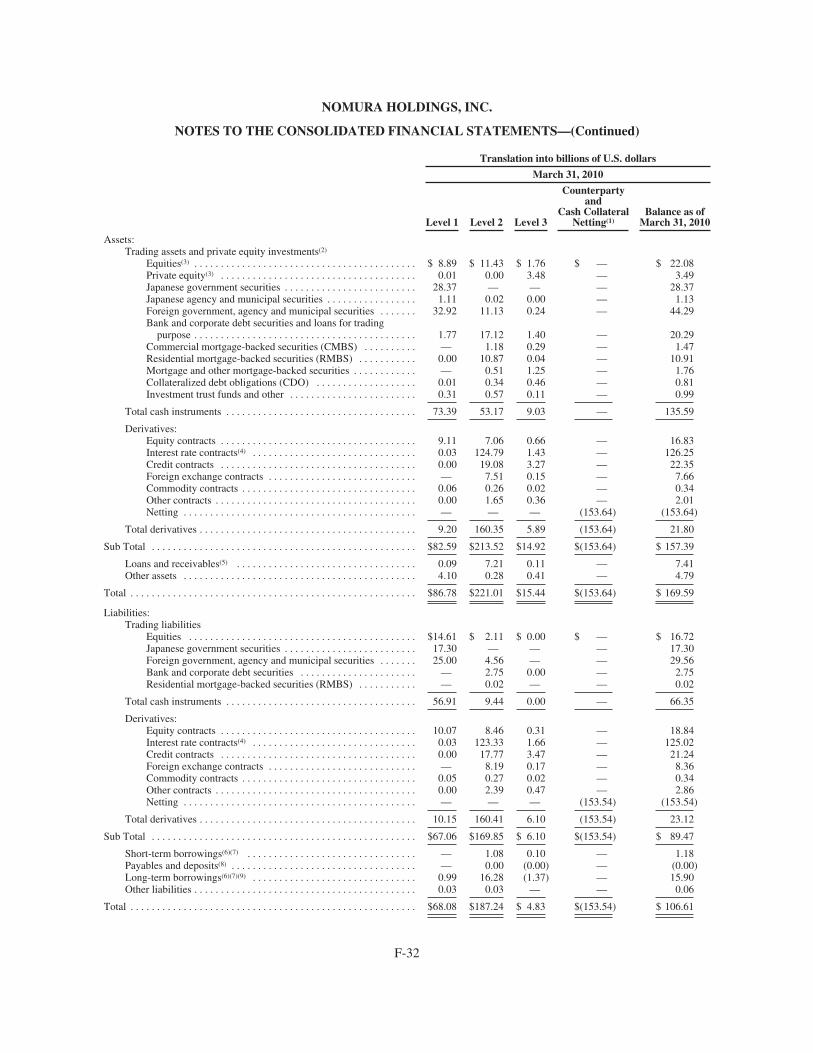
NOMURA HOLDINGS, INC.
NOTES TO THE CONSOLIDATED FINANCIAL STATEMENTS—(Continued)
Translation into billions of U.S. dollars
March 31, 2010
Level 1 Level 2 Level 3
Counterpartyand
Cash CollateralNetting(1)
Balance as ofMarch 31, 2010
Assets:Trading assets and private equity investments(2)
Equities(3) . . . . . . . . . . . . . . . . . . . . . . . . . . . . . . . . . . . . . . . . . . $ 8.89 $ 11.43 $ 1.76 $ — $ 22.08Private equity(3) . . . . . . . . . . . . . . . . . . . . . . . . . . . . . . . . . . . . . 0.01 0.00 3.48 — 3.49Japanese government securities . . . . . . . . . . . . . . . . . . . . . . . . . 28.37 — — — 28.37Japanese agency and municipal securities . . . . . . . . . . . . . . . . . 1.11 0.02 0.00 — 1.13Foreign government, agency and municipal securities . . . . . . . 32.92 11.13 0.24 — 44.29Bank and corporate debt securities and loans for trading
purpose . . . . . . . . . . . . . . . . . . . . . . . . . . . . . . . . . . . . . . . . . . 1.77 17.12 1.40 — 20.29Commercial mortgage-backed securities (CMBS) . . . . . . . . . . — 1.18 0.29 — 1.47Residential mortgage-backed securities (RMBS) . . . . . . . . . . . 0.00 10.87 0.04 — 10.91Mortgage and other mortgage-backed securities . . . . . . . . . . . . — 0.51 1.25 — 1.76Collateralized debt obligations (CDO) . . . . . . . . . . . . . . . . . . . 0.01 0.34 0.46 — 0.81Investment trust funds and other . . . . . . . . . . . . . . . . . . . . . . . . 0.31 0.57 0.11 — 0.99
Total cash instruments . . . . . . . . . . . . . . . . . . . . . . . . . . . . . . . . . . . . 73.39 53.17 9.03 — 135.59
Derivatives:Equity contracts . . . . . . . . . . . . . . . . . . . . . . . . . . . . . . . . . . . . . 9.11 7.06 0.66 — 16.83Interest rate contracts(4) . . . . . . . . . . . . . . . . . . . . . . . . . . . . . . . 0.03 124.79 1.43 — 126.25Credit contracts . . . . . . . . . . . . . . . . . . . . . . . . . . . . . . . . . . . . . 0.00 19.08 3.27 — 22.35Foreign exchange contracts . . . . . . . . . . . . . . . . . . . . . . . . . . . . — 7.51 0.15 — 7.66Commodity contracts . . . . . . . . . . . . . . . . . . . . . . . . . . . . . . . . . 0.06 0.26 0.02 — 0.34Other contracts . . . . . . . . . . . . . . . . . . . . . . . . . . . . . . . . . . . . . . 0.00 1.65 0.36 — 2.01Netting . . . . . . . . . . . . . . . . . . . . . . . . . . . . . . . . . . . . . . . . . . . . — — — (153.64) (153.64)
Total derivatives . . . . . . . . . . . . . . . . . . . . . . . . . . . . . . . . . . . . . . . . . 9.20 160.35 5.89 (153.64) 21.80
Sub Total . . . . . . . . . . . . . . . . . . . . . . . . . . . . . . . . . . . . . . . . . . . . . . . . . . $82.59 $213.52 $14.92 $(153.64) $ 157.39
Loans and receivables(5) . . . . . . . . . . . . . . . . . . . . . . . . . . . . . . . . . . 0.09 7.21 0.11 — 7.41Other assets . . . . . . . . . . . . . . . . . . . . . . . . . . . . . . . . . . . . . . . . . . . . 4.10 0.28 0.41 — 4.79
Total . . . . . . . . . . . . . . . . . . . . . . . . . . . . . . . . . . . . . . . . . . . . . . . . . . . . . . $86.78 $221.01 $15.44 $(153.64) $ 169.59
Liabilities:Trading liabilities
Equities . . . . . . . . . . . . . . . . . . . . . . . . . . . . . . . . . . . . . . . . . . . $14.61 $ 2.11 $ 0.00 $ — $ 16.72Japanese government securities . . . . . . . . . . . . . . . . . . . . . . . . . 17.30 — — — 17.30Foreign government, agency and municipal securities . . . . . . . 25.00 4.56 — — 29.56Bank and corporate debt securities . . . . . . . . . . . . . . . . . . . . . . — 2.75 0.00 — 2.75Residential mortgage-backed securities (RMBS) . . . . . . . . . . . — 0.02 — — 0.02
Total cash instruments . . . . . . . . . . . . . . . . . . . . . . . . . . . . . . . . . . . . 56.91 9.44 0.00 — 66.35
Derivatives:Equity contracts . . . . . . . . . . . . . . . . . . . . . . . . . . . . . . . . . . . . . 10.07 8.46 0.31 — 18.84Interest rate contracts(4) . . . . . . . . . . . . . . . . . . . . . . . . . . . . . . . 0.03 123.33 1.66 — 125.02Credit contracts . . . . . . . . . . . . . . . . . . . . . . . . . . . . . . . . . . . . . 0.00 17.77 3.47 — 21.24Foreign exchange contracts . . . . . . . . . . . . . . . . . . . . . . . . . . . . — 8.19 0.17 — 8.36Commodity contracts . . . . . . . . . . . . . . . . . . . . . . . . . . . . . . . . . 0.05 0.27 0.02 — 0.34Other contracts . . . . . . . . . . . . . . . . . . . . . . . . . . . . . . . . . . . . . . 0.00 2.39 0.47 — 2.86Netting . . . . . . . . . . . . . . . . . . . . . . . . . . . . . . . . . . . . . . . . . . . . — — — (153.54) (153.54)
Total derivatives . . . . . . . . . . . . . . . . . . . . . . . . . . . . . . . . . . . . . . . . . 10.15 160.41 6.10 (153.54) 23.12
Sub Total . . . . . . . . . . . . . . . . . . . . . . . . . . . . . . . . . . . . . . . . . . . . . . . . . . $67.06 $169.85 $ 6.10 $(153.54) $ 89.47
Short-term borrowings(6)(7) . . . . . . . . . . . . . . . . . . . . . . . . . . . . . . . . — 1.08 0.10 — 1.18Payables and deposits(8) . . . . . . . . . . . . . . . . . . . . . . . . . . . . . . . . . . . — 0.00 (0.00) — (0.00)Long-term borrowings(6)(7)(9) . . . . . . . . . . . . . . . . . . . . . . . . . . . . . . . 0.99 16.28 (1.37) — 15.90Other liabilities . . . . . . . . . . . . . . . . . . . . . . . . . . . . . . . . . . . . . . . . . . 0.03 0.03 — — 0.06
Total . . . . . . . . . . . . . . . . . . . . . . . . . . . . . . . . . . . . . . . . . . . . . . . . . . . . . . $68.08 $187.24 $ 4.83 $(153.54) $ 106.61
F-32
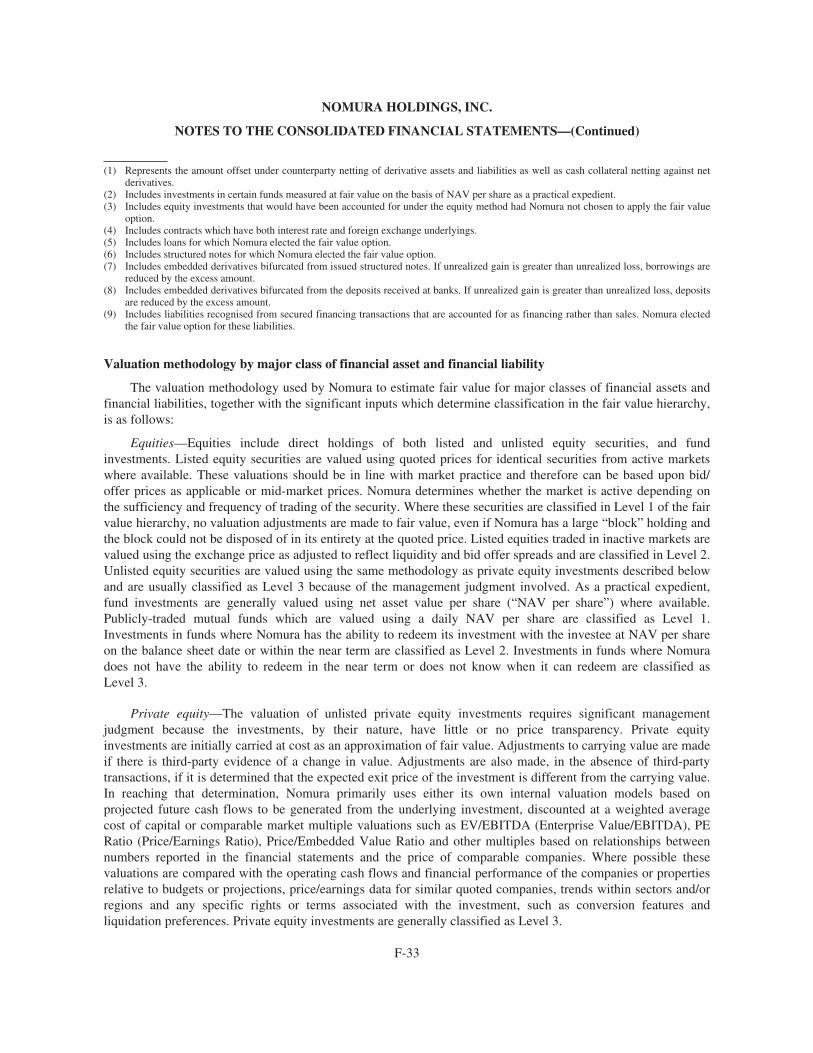
NOMURA HOLDINGS, INC.
NOTES TO THE CONSOLIDATED FINANCIAL STATEMENTS—(Continued)
(1) Represents the amount offset under counterparty netting of derivative assets and liabilities as well as cash collateral netting against netderivatives.
(2) Includes investments in certain funds measured at fair value on the basis of NAV per share as a practical expedient.(3) Includes equity investments that would have been accounted for under the equity method had Nomura not chosen to apply the fair value
option.(4) Includes contracts which have both interest rate and foreign exchange underlyings.(5) Includes loans for which Nomura elected the fair value option.(6) Includes structured notes for which Nomura elected the fair value option.(7) Includes embedded derivatives bifurcated from issued structured notes. If unrealized gain is greater than unrealized loss, borrowings are
reduced by the excess amount.(8) Includes embedded derivatives bifurcated from the deposits received at banks. If unrealized gain is greater than unrealized loss, deposits
are reduced by the excess amount.(9) Includes liabilities recognised from secured financing transactions that are accounted for as financing rather than sales. Nomura elected
the fair value option for these liabilities.
Valuation methodology by major class of financial asset and financial liability
The valuation methodology used by Nomura to estimate fair value for major classes of financial assets andfinancial liabilities, together with the significant inputs which determine classification in the fair value hierarchy,is as follows:
Equities—Equities include direct holdings of both listed and unlisted equity securities, and fundinvestments. Listed equity securities are valued using quoted prices for identical securities from active marketswhere available. These valuations should be in line with market practice and therefore can be based upon bid/offer prices as applicable or mid-market prices. Nomura determines whether the market is active depending onthe sufficiency and frequency of trading of the security. Where these securities are classified in Level 1 of the fairvalue hierarchy, no valuation adjustments are made to fair value, even if Nomura has a large “block” holding andthe block could not be disposed of in its entirety at the quoted price. Listed equities traded in inactive markets arevalued using the exchange price as adjusted to reflect liquidity and bid offer spreads and are classified in Level 2.Unlisted equity securities are valued using the same methodology as private equity investments described belowand are usually classified as Level 3 because of the management judgment involved. As a practical expedient,fund investments are generally valued using net asset value per share (“NAV per share”) where available.Publicly-traded mutual funds which are valued using a daily NAV per share are classified as Level 1.Investments in funds where Nomura has the ability to redeem its investment with the investee at NAV per shareon the balance sheet date or within the near term are classified as Level 2. Investments in funds where Nomuradoes not have the ability to redeem in the near term or does not know when it can redeem are classified asLevel 3.
Private equity—The valuation of unlisted private equity investments requires significant managementjudgment because the investments, by their nature, have little or no price transparency. Private equityinvestments are initially carried at cost as an approximation of fair value. Adjustments to carrying value are madeif there is third-party evidence of a change in value. Adjustments are also made, in the absence of third-partytransactions, if it is determined that the expected exit price of the investment is different from the carrying value.In reaching that determination, Nomura primarily uses either its own internal valuation models based onprojected future cash flows to be generated from the underlying investment, discounted at a weighted averagecost of capital or comparable market multiple valuations such as EV/EBITDA (Enterprise Value/EBITDA), PERatio (Price/Earnings Ratio), Price/Embedded Value Ratio and other multiples based on relationships betweennumbers reported in the financial statements and the price of comparable companies. Where possible thesevaluations are compared with the operating cash flows and financial performance of the companies or propertiesrelative to budgets or projections, price/earnings data for similar quoted companies, trends within sectors and/orregions and any specific rights or terms associated with the investment, such as conversion features andliquidation preferences. Private equity investments are generally classified as Level 3.
F-33
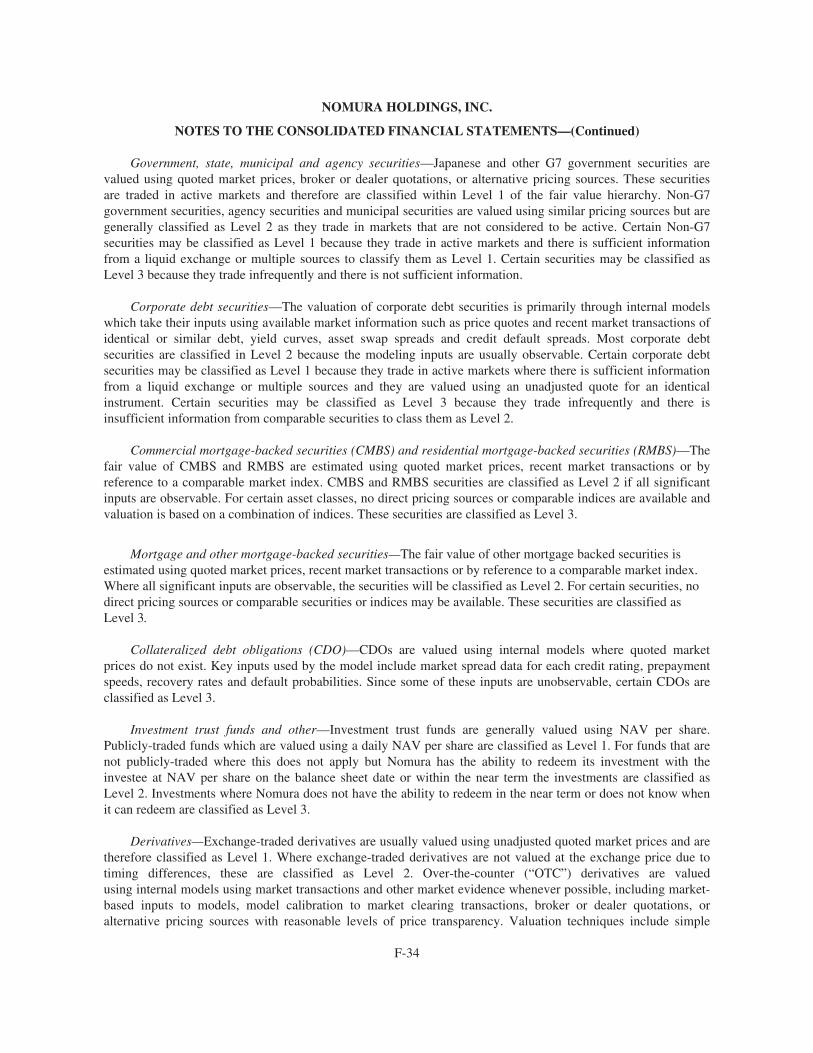
NOMURA HOLDINGS, INC.
NOTES TO THE CONSOLIDATED FINANCIAL STATEMENTS—(Continued)
Government, state, municipal and agency securities—Japanese and other G7 government securities arevalued using quoted market prices, broker or dealer quotations, or alternative pricing sources. These securitiesare traded in active markets and therefore are classified within Level 1 of the fair value hierarchy. Non-G7government securities, agency securities and municipal securities are valued using similar pricing sources but aregenerally classified as Level 2 as they trade in markets that are not considered to be active. Certain Non-G7securities may be classified as Level 1 because they trade in active markets and there is sufficient informationfrom a liquid exchange or multiple sources to classify them as Level 1. Certain securities may be classified asLevel 3 because they trade infrequently and there is not sufficient information.
Corporate debt securities—The valuation of corporate debt securities is primarily through internal modelswhich take their inputs using available market information such as price quotes and recent market transactions ofidentical or similar debt, yield curves, asset swap spreads and credit default spreads. Most corporate debtsecurities are classified in Level 2 because the modeling inputs are usually observable. Certain corporate debtsecurities may be classified as Level 1 because they trade in active markets where there is sufficient informationfrom a liquid exchange or multiple sources and they are valued using an unadjusted quote for an identicalinstrument. Certain securities may be classified as Level 3 because they trade infrequently and there isinsufficient information from comparable securities to class them as Level 2.
Commercial mortgage-backed securities (CMBS) and residential mortgage-backed securities (RMBS)—Thefair value of CMBS and RMBS are estimated using quoted market prices, recent market transactions or byreference to a comparable market index. CMBS and RMBS securities are classified as Level 2 if all significantinputs are observable. For certain asset classes, no direct pricing sources or comparable indices are available andvaluation is based on a combination of indices. These securities are classified as Level 3.
Mortgage and other mortgage-backed securities—The fair value of other mortgage backed securities isestimated using quoted market prices, recent market transactions or by reference to a comparable market index.Where all significant inputs are observable, the securities will be classified as Level 2. For certain securities, nodirect pricing sources or comparable securities or indices may be available. These securities are classified asLevel 3.
Collateralized debt obligations (CDO)—CDOs are valued using internal models where quoted marketprices do not exist. Key inputs used by the model include market spread data for each credit rating, prepaymentspeeds, recovery rates and default probabilities. Since some of these inputs are unobservable, certain CDOs areclassified as Level 3.
Investment trust funds and other—Investment trust funds are generally valued using NAV per share.Publicly-traded funds which are valued using a daily NAV per share are classified as Level 1. For funds that arenot publicly-traded where this does not apply but Nomura has the ability to redeem its investment with theinvestee at NAV per share on the balance sheet date or within the near term the investments are classified asLevel 2. Investments where Nomura does not have the ability to redeem in the near term or does not know whenit can redeem are classified as Level 3.
Derivatives—Exchange-traded derivatives are usually valued using unadjusted quoted market prices and aretherefore classified as Level 1. Where exchange-traded derivatives are not valued at the exchange price due totiming differences, these are classified as Level 2. Over-the-counter (“OTC”) derivatives are valuedusing internal models using market transactions and other market evidence whenever possible, including market-based inputs to models, model calibration to market clearing transactions, broker or dealer quotations, oralternative pricing sources with reasonable levels of price transparency. Valuation techniques include simple
F-34
NOMURA HOLDINGS, INC.
NOTES TO THE CONSOLIDATED FINANCIAL STATEMENTS—(Continued)
discounted expected cash flow techniques, Black-Scholes and Monte Carlo simulations. For OTC derivatives thattrade in liquid markets, such as plain vanilla forwards, swaps and options, model inputs can generally be verifiedand model selection does not involve significant management judgment. OTC derivatives are classified withinLevel 2 of the fair value hierarchy when all of the significant inputs can be corroborated to market evidence.Derivatives that are valued using models with significant unobservable inputs such as correlation, long-datedvolatility, credit curves or other unobservable inputs are classified within Level 3. Examples of derivativesclassified as Level 3 by Nomura include exotic interest rate derivatives, exotic foreign exchange derivatives,exotic equity derivatives, exotic derivatives including a combination of interest rate, foreign exchange and equityrisks and certain other transactions including long-dated or exotic credit derivatives. Valuation adjustments arerecorded to model valuations which do not calibrate to market and consider all factors that would impact fairvalue including bid offer, liquidity and credit risk; both with regards to counterparty credit risk on derivativeassets and Nomura’s own creditworthiness on derivative liabilities.
Loans—The valuation of loans and loan commitments is also performed primarily through internal modelsusing similar inputs to corporate debt securities as quoted prices are usually not available. Where there are nosignificant inputs which are unobservable, loans are classified as Level 2. Certain loans, however, may beclassified as Level 3 because they are traded infrequently and there is not sufficient information from comparablesecurities to classify them as Level 2.
Short-term and long-term borrowings (Structured notes)—Structured notes are debt securities issued byNomura which contain embedded features that alter the return to the investor from simply receiving a fixed orfloating rate of interest to a return that depends upon some other variable such as an equity or equity index,commodity product, foreign exchange rate, credit rating of a third party or more complex interest rate. The fairvalue of structured notes is estimated using a quoted price in an active market for the identical liability ifavailable, and where not available, using mixture of valuation techniques that use the quoted price of theidentical liability when traded as an asset, quoted prices for similar liabilities, similar liabilities when traded asassets, and also the amount at the measurement date that Nomura would pay to transfer the identical liability orwould receive if the identical liability is entered at the measurement date. The fair value of structured notesincludes an adjustment to reflect Nomura’s own creditworthiness. This adjustment can differ depending on themarket in which the structured note is issued and traded. Structured notes are generally classified in Level 2 ofthe fair value hierarchy as unobservable inputs are not significant. Where the unobservable inputs are significant,they will be classified in Level 3.
Secured financing transactions—Liability recognized from secured financing transactions are recognizedwhen a transfer of a financial asset does not meet the criteria for sales accounting and therefore the transaction isaccounted for as a secured borrowing. This liability is valued using the same methodology that is applied to thetransferred financial instruments which remain on the consolidated balance sheets and is therefore classified in thesame level in the fair value hierarchy as the transferred financial asset. These liabilities do not provide generalrecourse to Nomura and therefore no adjustment is made to reflect Nomura’s own creditworthiness.
Level 3 financial assets and financial liabilities
Level 3 financial assets and financial liabilities consist of instruments whose valuations are significantlydependent on inputs which are unobservable in the market. Financial instruments are categorized in accordancewith their lowest level significant input. As a result, a financial instrument valued using a combination of Level1, Level 2 and Level 3 inputs would be classified in Level 3 in its entirety, if its value is significantly affected byat least one significant unobservable input.
These financial instruments are often hedged with instruments within Level 1 or Level 2 of the fair valuehierarchy and the gains or losses below do not reflect the offsetting gains or losses for these hedging instruments.
F-35
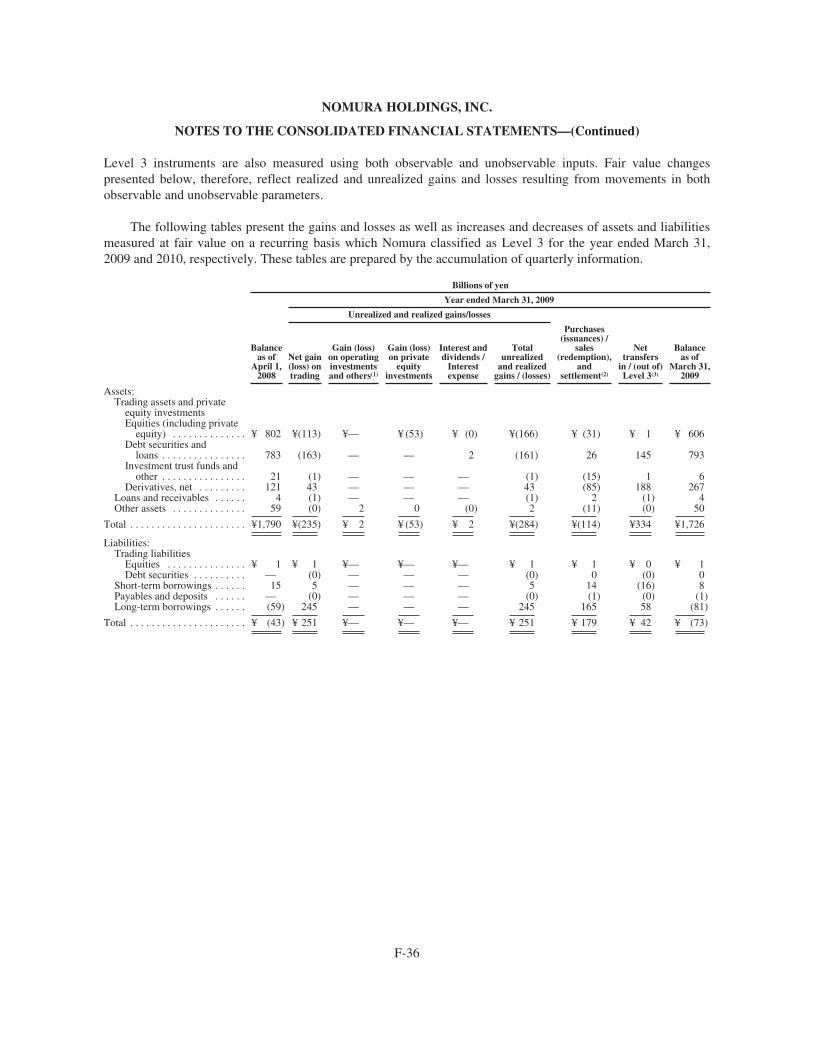
NOMURA HOLDINGS, INC.
NOTES TO THE CONSOLIDATED FINANCIAL STATEMENTS—(Continued)
Level 3 instruments are also measured using both observable and unobservable inputs. Fair value changespresented below, therefore, reflect realized and unrealized gains and losses resulting from movements in bothobservable and unobservable parameters.
The following tables present the gains and losses as well as increases and decreases of assets and liabilitiesmeasured at fair value on a recurring basis which Nomura classified as Level 3 for the year ended March 31,2009 and 2010, respectively. These tables are prepared by the accumulation of quarterly information.
Billions of yen
Year ended March 31, 2009
Unrealized and realized gains/losses
Balanceas of
April 1,2008
Net gain(loss) ontrading
Gain (loss)on operatinginvestmentsand others(1)
Gain (loss)on private
equityinvestments
Interest anddividends /
Interestexpense
Totalunrealized
and realizedgains / (losses)
Purchases(issuances) /
sales(redemption),
andsettlement(2)
Nettransfers
in / (out of)Level 3(3)
Balanceas of
March 31,2009
Assets:Trading assets and private
equity investmentsEquities (including private
equity) . . . . . . . . . . . . . . ¥ 802 ¥(113) ¥— ¥ (53) ¥ (0) ¥(166) ¥ (31) ¥ 1 ¥ 606Debt securities and
loans . . . . . . . . . . . . . . . . 783 (163) — — 2 (161) 26 145 793Investment trust funds and
other . . . . . . . . . . . . . . . . 21 (1) — — — (1) (15) 1 6Derivatives, net . . . . . . . . . 121 43 — — — 43 (85) 188 267
Loans and receivables . . . . . . 4 (1) — — — (1) 2 (1) 4Other assets . . . . . . . . . . . . . . 59 (0) 2 0 (0) 2 (11) (0) 50
Total . . . . . . . . . . . . . . . . . . . . . . ¥1,790 ¥(235) ¥ 2 ¥ (53) ¥ 2 ¥(284) ¥(114) ¥334 ¥1,726
Liabilities:Trading liabilities
Equities . . . . . . . . . . . . . . . ¥ 1 ¥ 1 ¥— ¥— ¥— ¥ 1 ¥ 1 ¥ 0 ¥ 1Debt securities . . . . . . . . . . — (0) — — — (0) 0 (0) 0
Short-term borrowings . . . . . . 15 5 — — — 5 14 (16) 8Payables and deposits . . . . . . — (0) — — — (0) (1) (0) (1)Long-term borrowings . . . . . . (59) 245 — — — 245 165 58 (81)
Total . . . . . . . . . . . . . . . . . . . . . . ¥ (43) ¥ 251 ¥— ¥— ¥— ¥ 251 ¥ 179 ¥ 42 ¥ (73)
F-36
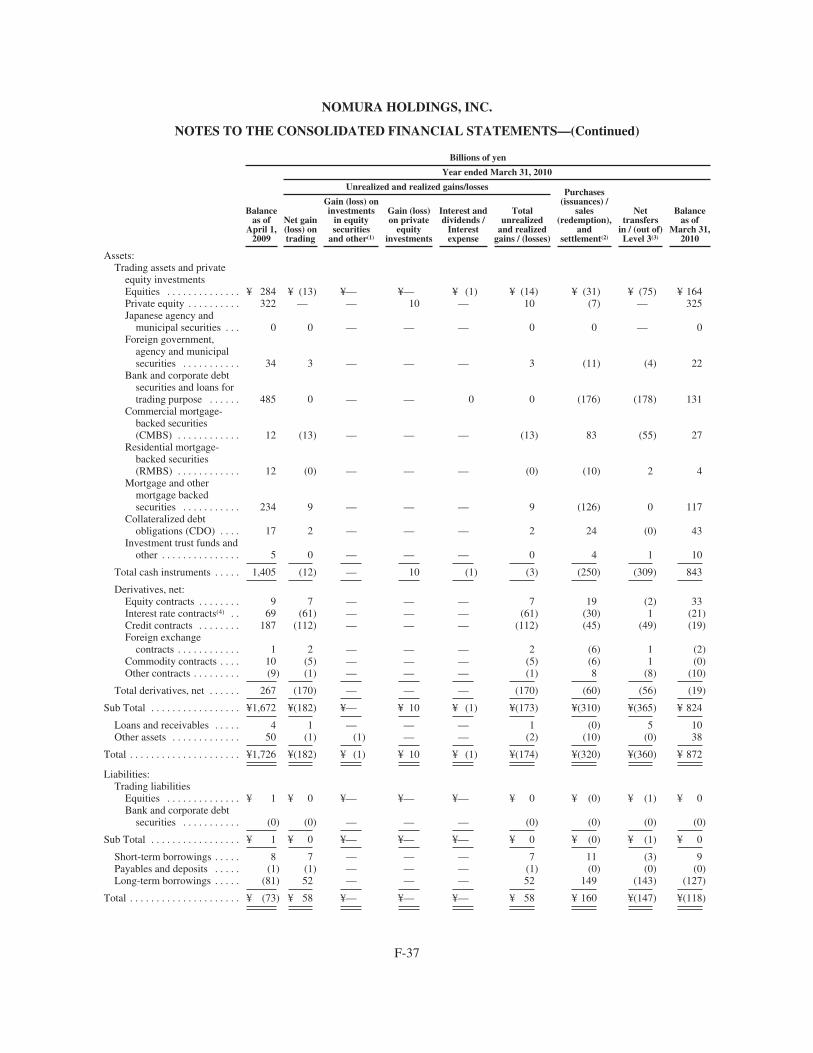
NOMURA HOLDINGS, INC.
NOTES TO THE CONSOLIDATED FINANCIAL STATEMENTS—(Continued)
Billions of yen
Year ended March 31, 2010
Balanceas of
April 1,2009
Unrealized and realized gains/losses Purchases(issuances) /
sales(redemption),
andsettlement(2)
Nettransfers
in / (out of)Level 3(3)
Balanceas of
March 31,2010
Net gain(loss) ontrading
Gain (loss) oninvestments
in equitysecurities
and other(1)
Gain (loss)on private
equityinvestments
Interest anddividends /
Interestexpense
Totalunrealized
and realizedgains / (losses)
Assets:Trading assets and private
equity investmentsEquities . . . . . . . . . . . . . . ¥ 284 ¥ (13) ¥— ¥— ¥ (1) ¥ (14) ¥ (31) ¥ (75) ¥ 164Private equity . . . . . . . . . . 322 — — 10 — 10 (7) — 325Japanese agency and
municipal securities . . . 0 0 — — — 0 0 — 0Foreign government,
agency and municipalsecurities . . . . . . . . . . . 34 3 — — — 3 (11) (4) 22
Bank and corporate debtsecurities and loans fortrading purpose . . . . . . 485 0 — — 0 0 (176) (178) 131
Commercial mortgage-backed securities(CMBS) . . . . . . . . . . . . 12 (13) — — — (13) 83 (55) 27
Residential mortgage-backed securities(RMBS) . . . . . . . . . . . . 12 (0) — — — (0) (10) 2 4
Mortgage and othermortgage backedsecurities . . . . . . . . . . . 234 9 — — — 9 (126) 0 117
Collateralized debtobligations (CDO) . . . . 17 2 — — — 2 24 (0) 43
Investment trust funds andother . . . . . . . . . . . . . . . 5 0 — — — 0 4 1 10
Total cash instruments . . . . . 1,405 (12) — 10 (1) (3) (250) (309) 843
Derivatives, net:Equity contracts . . . . . . . . 9 7 — — — 7 19 (2) 33Interest rate contracts(4) . . 69 (61) — — — (61) (30) 1 (21)Credit contracts . . . . . . . . 187 (112) — — — (112) (45) (49) (19)Foreign exchange
contracts . . . . . . . . . . . . 1 2 — — — 2 (6) 1 (2)Commodity contracts . . . . 10 (5) — — — (5) (6) 1 (0)Other contracts . . . . . . . . . (9) (1) — — — (1) 8 (8) (10)
Total derivatives, net . . . . . . 267 (170) — — — (170) (60) (56) (19)
Sub Total . . . . . . . . . . . . . . . . . ¥1,672 ¥(182) ¥— ¥ 10 ¥ (1) ¥(173) ¥(310) ¥(365) ¥ 824
Loans and receivables . . . . . 4 1 — — — 1 (0) 5 10Other assets . . . . . . . . . . . . . 50 (1) (1) — — (2) (10) (0) 38
Total . . . . . . . . . . . . . . . . . . . . . ¥1,726 ¥(182) ¥ (1) ¥ 10 ¥ (1) ¥(174) ¥(320) ¥(360) ¥ 872
Liabilities:Trading liabilities
Equities . . . . . . . . . . . . . . ¥ 1 ¥ 0 ¥— ¥— ¥— ¥ 0 ¥ (0) ¥ (1) ¥ 0Bank and corporate debt
securities . . . . . . . . . . . (0) (0) — — — (0) (0) (0) (0)
Sub Total . . . . . . . . . . . . . . . . . ¥ 1 ¥ 0 ¥— ¥— ¥— ¥ 0 ¥ (0) ¥ (1) ¥ 0
Short-term borrowings . . . . . 8 7 — — — 7 11 (3) 9Payables and deposits . . . . . (1) (1) — — — (1) (0) (0) (0)Long-term borrowings . . . . . (81) 52 — — — 52 149 (143) (127)
Total . . . . . . . . . . . . . . . . . . . . . ¥ (73) ¥ 58 ¥— ¥— ¥— ¥ 58 ¥ 160 ¥(147) ¥(118)
F-37

NOMURA HOLDINGS, INC.
NOTES TO THE CONSOLIDATED FINANCIAL STATEMENTS—(Continued)
Translation into billions of U.S. dollars
Year ended March 31, 2010
Unrealized and realized gains/losses
Balanceas of
April 1,2009
Net gain(loss) ontrading
Gain (loss) oninvestments
in equitysecurities
and other(1)
Gain (loss)on private
equityinvestments
Interest anddividends /
Interestexpense
Totalunrealized
and realizedgains / (losses)
Purchases(issuances) /
sales(redemption),
andsettlement(2)
Nettransfers
in / (out of)Level 3(3)
Balanceas of
March 31,2010
Assets:Trading assets and private equity
investmentsEquities . . . . . . . . . . . . . . . . . . . . $ 3.04 $(0.14) $ — $ — $(0.01) $(0.15) $(0.33) $(0.80) $ 1.76Private equity . . . . . . . . . . . . . . . 3.45 — — 0.10 — 0.10 (0.07) — 3.48Japanese agency and municipal
securities . . . . . . . . . . . . . . . . . 0.00 0.00 — — — 0.00 0.00 — 0.00Foreign government, agency and
municipal securities . . . . . . . . 0.36 0.03 — — — 0.03 (0.11) (0.04) 0.24Bank and corporate debt
securities and loans fortrading purpose . . . . . . . . . . . . 5.19 0.00 — — 0.00 0.00 (1.88) (1.91) 1.40
Commercial mortgage-backedsecurities (CMBS) . . . . . . . . . . 0.13 (0.14) — — — (0.14) 0.89 (0.59) 0.29
Residential mortgage-backedsecurities (RMBS) . . . . . . . . . . 0.13 (0.00) — — — (0.00) (0.11) 0.02 0.04
Mortgage and other mortgagebacked securities . . . . . . . . . . . 2.51 0.10 — — — 0.10 (1.36) 0.00 1.25
Collateralized debt obligations(CDO) . . . . . . . . . . . . . . . . . . . 0.18 0.02 — — — 0.02 0.26 (0.00) 0.46
Investment trustfunds and other . . . . . . . . . . . . 0.05 0.00 — — — 0.00 0.04 0.02 0.11
Total cash instruments . . . . . . . . . . 15.04 (0.13) — 0.10 (0.01) (0.04) (2.67) (3.30) 9.03
Derivatives, net:Equity contracts . . . . . . . . . . . . . 0.10 0.07 — — — 0.07 0.20 (0.02) 0.35Interest rate contracts(4) . . . . . . . . 0.73 (0.65) — — — (0.65) (0.32) 0.01 (0.23)Credit contracts . . . . . . . . . . . . . . 2.00 (1.20) — — — (1.20) (0.48) (0.52) (0.20)Foreign exchange contracts . . . . 0.02 0.02 — — — 0.02 (0.07) 0.01 (0.02)Commodity contracts . . . . . . . . . 0.11 (0.05) — — — (0.05) (0.07) 0.01 (0.00)Other contracts . . . . . . . . . . . . . . (0.10) (0.01) — — — (0.01) 0.09 (0.09) (0.11)
Total derivatives, net . . . . . . . . . . . . 2.86 (1.82) — — — (1.82) (0.65) (0.60) (0.21)
Sub Total . . . . . . . . . . . . . . . . . . . . . . . $17.90 $(1.95) $ — $0.10 $(0.01) $(1.86) $(3.32) $(3.90) $ 8.82
Loans and receivables . . . . . . . . . . . 0.05 0.01 — — — 0.01 (0.00) 0.05 0.11Other assets . . . . . . . . . . . . . . . . . . . 0.54 (0.01) (0.01) — — (0.02) (0.11) (0.00) 0.41
Total . . . . . . . . . . . . . . . . . . . . . . . . . . $18.49 $(1.95) $(0.01) $0.10 $(0.01) $(1.87) $(3.43) $(3.85) $ 9.34
Liabilities:Trading liabilities
Equities . . . . . . . . . . . . . . . . . . . . $ 0.01 $ 0.00 $ — $ — $ — $ 0.00 $(0.00) $(0.01) $ 0.00Bank and corporate debt
securities . . . . . . . . . . . . . . . . . (0.00) (0.00) — — — (0.00) (0.00) (0.00) (0.00)
Sub Total . . . . . . . . . . . . . . . . . . . . . . . $ 0.01 $ 0.00 $ — $ — $ — $ 0.00 $(0.00) $(0.01) $ 0.00
Short-term borrowings . . . . . . . . . . 0.09 0.07 — — — 0.07 0.11 (0.03) 0.10Payables and deposits . . . . . . . . . . . (0.01) (0.01) — — — (0.01) (0.00) (0.00) (0.00)Long-term borrowings . . . . . . . . . . (0.87) 0.56 — — — 0.56 1.59 (1.53) (1.37)
Total . . . . . . . . . . . . . . . . . . . . . . . . . . $ (0.78) $ 0.62 $ — $ — $ — $ 0.62 $ 1.70 $(1.57) $(1.27)
F-38
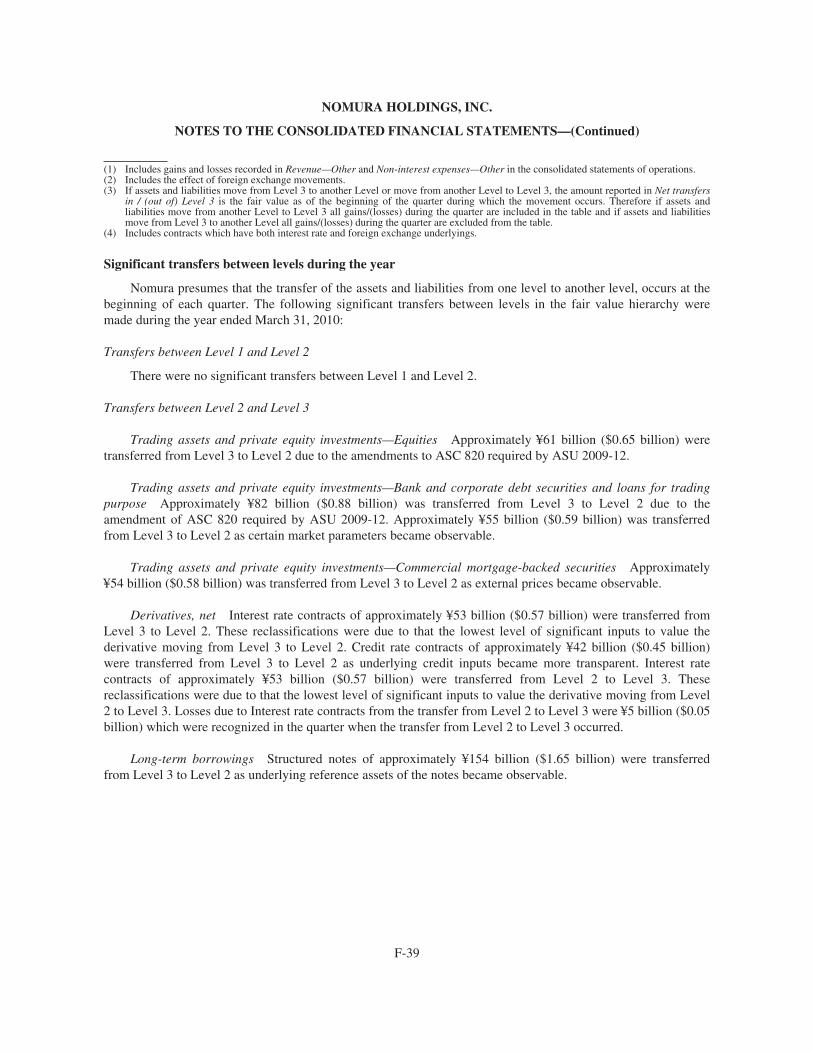
NOMURA HOLDINGS, INC.
NOTES TO THE CONSOLIDATED FINANCIAL STATEMENTS—(Continued)
(1) Includes gains and losses recorded in Revenue—Other and Non-interest expenses—Other in the consolidated statements of operations.(2) Includes the effect of foreign exchange movements.(3) If assets and liabilities move from Level 3 to another Level or move from another Level to Level 3, the amount reported in Net transfers
in / (out of) Level 3 is the fair value as of the beginning of the quarter during which the movement occurs. Therefore if assets andliabilities move from another Level to Level 3 all gains/(losses) during the quarter are included in the table and if assets and liabilitiesmove from Level 3 to another Level all gains/(losses) during the quarter are excluded from the table.
(4) Includes contracts which have both interest rate and foreign exchange underlyings.
Significant transfers between levels during the year
Nomura presumes that the transfer of the assets and liabilities from one level to another level, occurs at thebeginning of each quarter. The following significant transfers between levels in the fair value hierarchy weremade during the year ended March 31, 2010:
Transfers between Level 1 and Level 2
There were no significant transfers between Level 1 and Level 2.
Transfers between Level 2 and Level 3
Trading assets and private equity investments—Equities Approximately ¥61 billion ($0.65 billion) weretransferred from Level 3 to Level 2 due to the amendments to ASC 820 required by ASU 2009-12.
Trading assets and private equity investments—Bank and corporate debt securities and loans for tradingpurpose Approximately ¥82 billion ($0.88 billion) was transferred from Level 3 to Level 2 due to theamendment of ASC 820 required by ASU 2009-12. Approximately ¥55 billion ($0.59 billion) was transferredfrom Level 3 to Level 2 as certain market parameters became observable.
Trading assets and private equity investments—Commercial mortgage-backed securities Approximately¥54 billion ($0.58 billion) was transferred from Level 3 to Level 2 as external prices became observable.
Derivatives, net Interest rate contracts of approximately ¥53 billion ($0.57 billion) were transferred fromLevel 3 to Level 2. These reclassifications were due to that the lowest level of significant inputs to value thederivative moving from Level 3 to Level 2. Credit rate contracts of approximately ¥42 billion ($0.45 billion)were transferred from Level 3 to Level 2 as underlying credit inputs became more transparent. Interest ratecontracts of approximately ¥53 billion ($0.57 billion) were transferred from Level 2 to Level 3. Thesereclassifications were due to that the lowest level of significant inputs to value the derivative moving from Level2 to Level 3. Losses due to Interest rate contracts from the transfer from Level 2 to Level 3 were ¥5 billion ($0.05billion) which were recognized in the quarter when the transfer from Level 2 to Level 3 occurred.
Long-term borrowings Structured notes of approximately ¥154 billion ($1.65 billion) were transferredfrom Level 3 to Level 2 as underlying reference assets of the notes became observable.
F-39
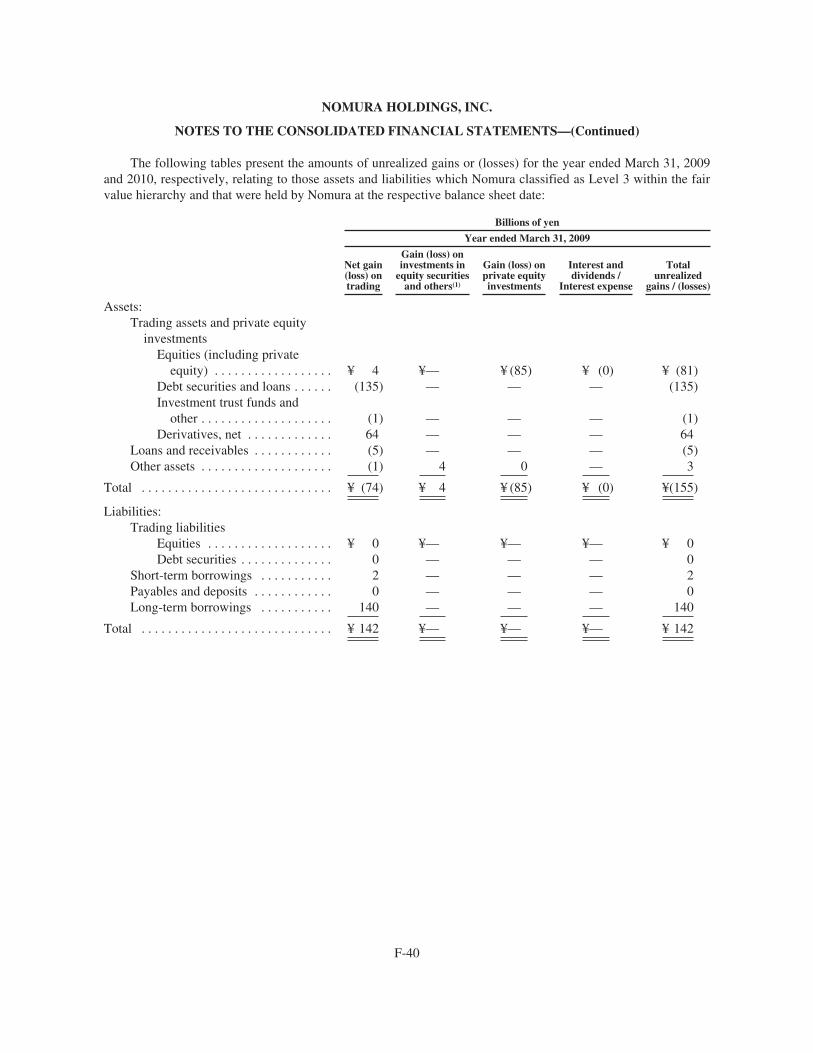
NOMURA HOLDINGS, INC.
NOTES TO THE CONSOLIDATED FINANCIAL STATEMENTS—(Continued)
The following tables present the amounts of unrealized gains or (losses) for the year ended March 31, 2009and 2010, respectively, relating to those assets and liabilities which Nomura classified as Level 3 within the fairvalue hierarchy and that were held by Nomura at the respective balance sheet date:
Billions of yen
Year ended March 31, 2009
Net gain(loss) ontrading
Gain (loss) oninvestments in
equity securitiesand others(1)
Gain (loss) onprivate equityinvestments
Interest anddividends /
Interest expense
Totalunrealized
gains / (losses)
Assets:Trading assets and private equity
investmentsEquities (including private
equity) . . . . . . . . . . . . . . . . . . ¥ 4 ¥— ¥ (85) ¥ (0) ¥ (81)Debt securities and loans . . . . . . (135) — — — (135)Investment trust funds and
other . . . . . . . . . . . . . . . . . . . . (1) — — — (1)Derivatives, net . . . . . . . . . . . . . 64 — — — 64
Loans and receivables . . . . . . . . . . . . (5) — — — (5)Other assets . . . . . . . . . . . . . . . . . . . . (1) 4 0 — 3
Total . . . . . . . . . . . . . . . . . . . . . . . . . . . . . ¥ (74) ¥ 4 ¥ (85) ¥ (0) ¥(155)
Liabilities:Trading liabilities
Equities . . . . . . . . . . . . . . . . . . . ¥ 0 ¥— ¥— ¥— ¥ 0Debt securities . . . . . . . . . . . . . . 0 — — — 0
Short-term borrowings . . . . . . . . . . . 2 — — — 2Payables and deposits . . . . . . . . . . . . 0 — — — 0Long-term borrowings . . . . . . . . . . . 140 — — — 140
Total . . . . . . . . . . . . . . . . . . . . . . . . . . . . . ¥ 142 ¥— ¥— ¥— ¥ 142
F-40
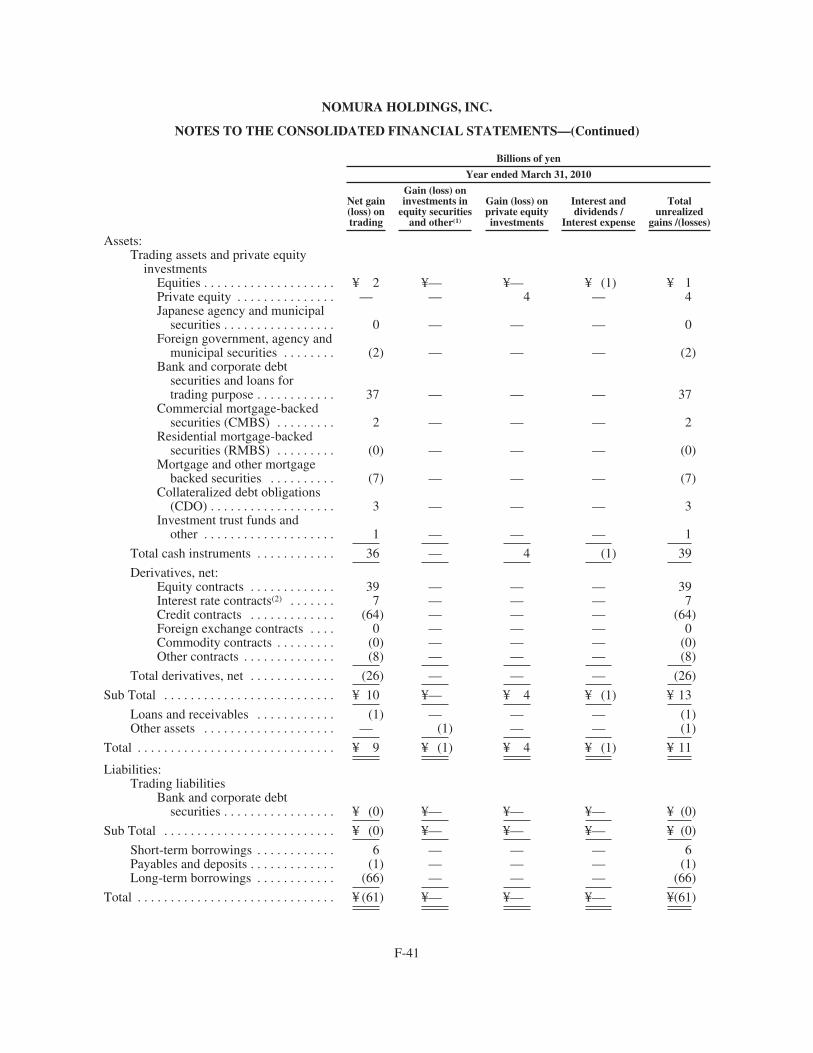
NOMURA HOLDINGS, INC.
NOTES TO THE CONSOLIDATED FINANCIAL STATEMENTS—(Continued)
Billions of yen
Year ended March 31, 2010
Net gain(loss) ontrading
Gain (loss) oninvestments in
equity securitiesand other(1)
Gain (loss) onprivate equityinvestments
Interest anddividends /
Interest expense
Totalunrealized
gains /(losses)
Assets:Trading assets and private equity
investmentsEquities . . . . . . . . . . . . . . . . . . . . ¥ 2 ¥— ¥— ¥ (1) ¥ 1Private equity . . . . . . . . . . . . . . . — — 4 — 4Japanese agency and municipal
securities . . . . . . . . . . . . . . . . . 0 — — — 0Foreign government, agency and
municipal securities . . . . . . . . (2) — — — (2)Bank and corporate debt
securities and loans fortrading purpose . . . . . . . . . . . . 37 — — — 37
Commercial mortgage-backedsecurities (CMBS) . . . . . . . . . 2 — — — 2
Residential mortgage-backedsecurities (RMBS) . . . . . . . . . (0) — — — (0)
Mortgage and other mortgagebacked securities . . . . . . . . . . (7) — — — (7)
Collateralized debt obligations(CDO) . . . . . . . . . . . . . . . . . . . 3 — — — 3
Investment trust funds andother . . . . . . . . . . . . . . . . . . . . 1 — — — 1
Total cash instruments . . . . . . . . . . . . 36 — 4 (1) 39
Derivatives, net:Equity contracts . . . . . . . . . . . . . 39 — — — 39Interest rate contracts(2) . . . . . . . 7 — — — 7Credit contracts . . . . . . . . . . . . . (64) — — — (64)Foreign exchange contracts . . . . 0 — — — 0Commodity contracts . . . . . . . . . (0) — — — (0)Other contracts . . . . . . . . . . . . . . (8) — — — (8)
Total derivatives, net . . . . . . . . . . . . . (26) — — — (26)
Sub Total . . . . . . . . . . . . . . . . . . . . . . . . . . ¥ 10 ¥— ¥ 4 ¥ (1) ¥ 13
Loans and receivables . . . . . . . . . . . . (1) — — — (1)Other assets . . . . . . . . . . . . . . . . . . . . — (1) — — (1)
Total . . . . . . . . . . . . . . . . . . . . . . . . . . . . . . ¥ 9 ¥ (1) ¥ 4 ¥ (1) ¥ 11
Liabilities:Trading liabilities
Bank and corporate debtsecurities . . . . . . . . . . . . . . . . . ¥ (0) ¥— ¥— ¥— ¥ (0)
Sub Total . . . . . . . . . . . . . . . . . . . . . . . . . . ¥ (0) ¥— ¥— ¥— ¥ (0)
Short-term borrowings . . . . . . . . . . . . 6 — — — 6Payables and deposits . . . . . . . . . . . . . (1) — — — (1)Long-term borrowings . . . . . . . . . . . . (66) — — — (66)
Total . . . . . . . . . . . . . . . . . . . . . . . . . . . . . . ¥ (61) ¥— ¥— ¥— ¥(61)
F-41
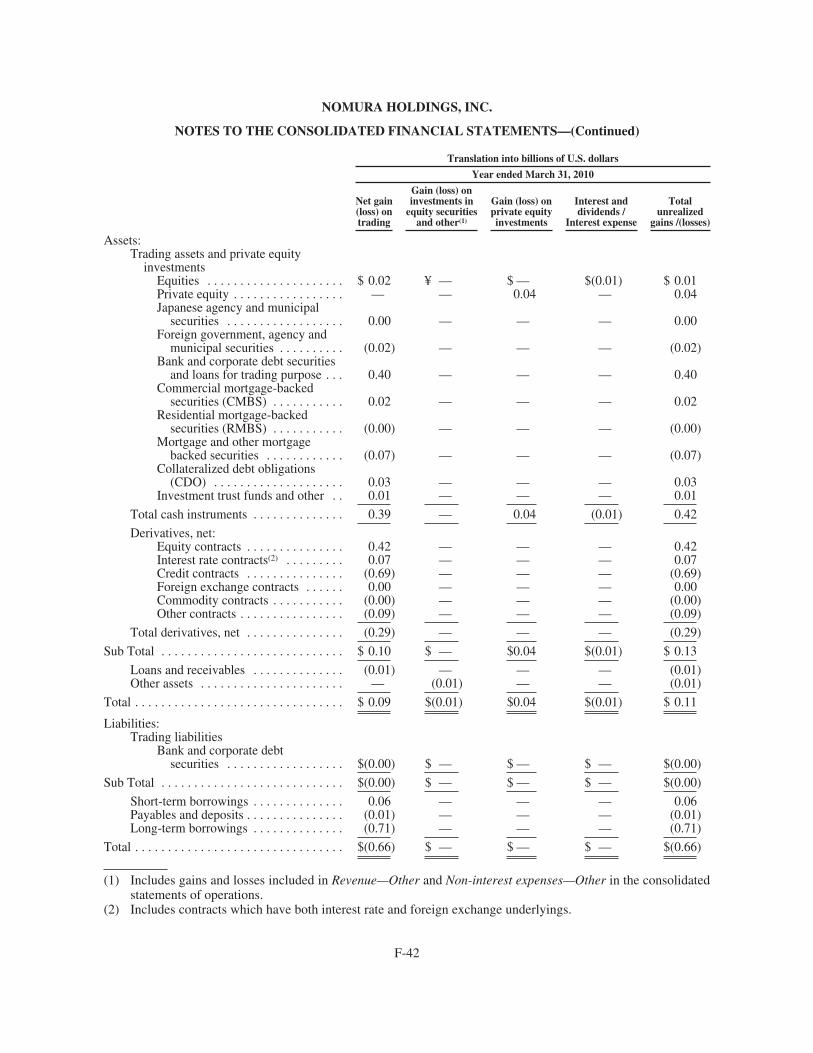
NOMURA HOLDINGS, INC.
NOTES TO THE CONSOLIDATED FINANCIAL STATEMENTS—(Continued)
Translation into billions of U.S. dollars
Year ended March 31, 2010
Net gain(loss) ontrading
Gain (loss) oninvestments in
equity securitiesand other(1)
Gain (loss) onprivate equityinvestments
Interest anddividends /
Interest expense
Totalunrealized
gains /(losses)
Assets:Trading assets and private equity
investmentsEquities . . . . . . . . . . . . . . . . . . . . . $ 0.02 ¥ — $ — $(0.01) $ 0.01Private equity . . . . . . . . . . . . . . . . . — — 0.04 — 0.04Japanese agency and municipal
securities . . . . . . . . . . . . . . . . . . 0.00 — — — 0.00Foreign government, agency and
municipal securities . . . . . . . . . . (0.02) — — — (0.02)Bank and corporate debt securities
and loans for trading purpose . . . 0.40 — — — 0.40Commercial mortgage-backed
securities (CMBS) . . . . . . . . . . . 0.02 — — — 0.02Residential mortgage-backed
securities (RMBS) . . . . . . . . . . . (0.00) — — — (0.00)Mortgage and other mortgage
backed securities . . . . . . . . . . . . (0.07) — — — (0.07)Collateralized debt obligations
(CDO) . . . . . . . . . . . . . . . . . . . . 0.03 — — — 0.03Investment trust funds and other . . 0.01 — — — 0.01
Total cash instruments . . . . . . . . . . . . . . 0.39 — 0.04 (0.01) 0.42
Derivatives, net:Equity contracts . . . . . . . . . . . . . . . 0.42 — — — 0.42Interest rate contracts(2) . . . . . . . . . 0.07 — — — 0.07Credit contracts . . . . . . . . . . . . . . . (0.69) — — — (0.69)Foreign exchange contracts . . . . . . 0.00 — — — 0.00Commodity contracts . . . . . . . . . . . (0.00) — — — (0.00)Other contracts . . . . . . . . . . . . . . . . (0.09) — — — (0.09)
Total derivatives, net . . . . . . . . . . . . . . . (0.29) — — — (0.29)
Sub Total . . . . . . . . . . . . . . . . . . . . . . . . . . . . $ 0.10 $ — $0.04 $(0.01) $ 0.13
Loans and receivables . . . . . . . . . . . . . . (0.01) — — — (0.01)Other assets . . . . . . . . . . . . . . . . . . . . . . — (0.01) — — (0.01)
Total . . . . . . . . . . . . . . . . . . . . . . . . . . . . . . . . $ 0.09 $(0.01) $0.04 $(0.01) $ 0.11
Liabilities:Trading liabilities
Bank and corporate debtsecurities . . . . . . . . . . . . . . . . . . $(0.00) $ — $ — $ — $(0.00)
Sub Total . . . . . . . . . . . . . . . . . . . . . . . . . . . . $(0.00) $ — $ — $ — $(0.00)
Short-term borrowings . . . . . . . . . . . . . . 0.06 — — — 0.06Payables and deposits . . . . . . . . . . . . . . . (0.01) — — — (0.01)Long-term borrowings . . . . . . . . . . . . . . (0.71) — — — (0.71)
Total . . . . . . . . . . . . . . . . . . . . . . . . . . . . . . . . $(0.66) $ — $ — $ — $(0.66)
(1) Includes gains and losses included in Revenue—Other and Non-interest expenses—Other in the consolidatedstatements of operations.
(2) Includes contracts which have both interest rate and foreign exchange underlyings.
F-42
NOMURA HOLDINGS, INC.
NOTES TO THE CONSOLIDATED FINANCIAL STATEMENTS—(Continued)
During the year ended March 31, 2010, market conditions have improved but a lack of liquidity persists in certainasset classes which has impacted the observability of certain inputs which are significant to Nomura’s financialinstrument valuations. These inputs include certain foreign currency exchange volatilities and certain credit spreads.
As described above, the valuation of Level 3 financial assets and liabilities is dependent on certainsignificant inputs which cannot be observed in the market. Common characteristics of an inactive market includea low number of transactions of the financial instrument; stale or non-current price quotations; price quotationsthat vary substantially either over time or among market makers; or little publicly released information.Unobservable inputs include volatility risk and correlation risk for derivative instruments; refinancing periodsand recovery rates for credit-related products and loans; and macroeconomic factors affecting the value ofcollateral for asset-backed securitization products.
If corroborative evidence is not available to value Level 3 financial instruments, fair value may beestablished using other equivalent products in the market. The level of correlation between the specific Level 3financial instrument and the available benchmark instrument is considered an unobservable parameter. Othertechniques for determining an appropriate value for unobservable parameters may consider information such asconsensus pricing data among certain market participants, historical trends, extrapolation from observable marketdata and other information Nomura would expect market participants to use in valuing similar instruments.
There is a range of fair values for Level 3 financial instruments as a result of the uncertainties describedabove. The specific valuation for the instrument is based on management’s judgment of prevailing marketconditions, in accordance with Nomura’s established valuation policies and procedures. Using reasonablypossible alternative assumptions to value Level 3 financial instruments will significantly influence fair values.
As described earlier, Level 3 financial instruments are often hedged by instruments in Level 1 or Level 2 of thefair value hierarchy. For the year ended March 31, 2009, losses of ¥284 billion related to Level 3 assets had amaterial impact on Nomura’s results, however this impact has been mitigated by gains of ¥251 billion related toLevel 3 liabilities and has been further mitigated through Nomura’s management of its liquidity and capitalresources. The impact on the financial performance caused by the loss of ¥174 billion ($1.87 billion) related toLevel 3 assets for the year ended March 31, 2010 was significantly mitigated by gains and losses from hedgingthese financial instruments, and did not have a material impact on Nomura’s liquidity and capital resourcesmanagement.
In view of the fact that the valuation of these instruments fluctuate in response to a variety of factors,including, but not limited to, general market sentiment, credit, interest rate, foreign exchange and correlation risk,the current values may decrease if the market conditions deteriorate. Conversely, should conditions improve, anincrease in value of the Level 3 portfolio would be expected.
Investments in Investment Funds that calculate NAV per share
In the ordinary course of business, Nomura invests in non-consolidated funds which meet the definition ofinvestment companies or are similar in nature and which do not have readily determinable fair values. For certainof these investments, Nomura uses NAV per share as the basis for valuation as a practical expedient. Some ofthese investments are redeemable at different amounts from NAV per share.
F-43
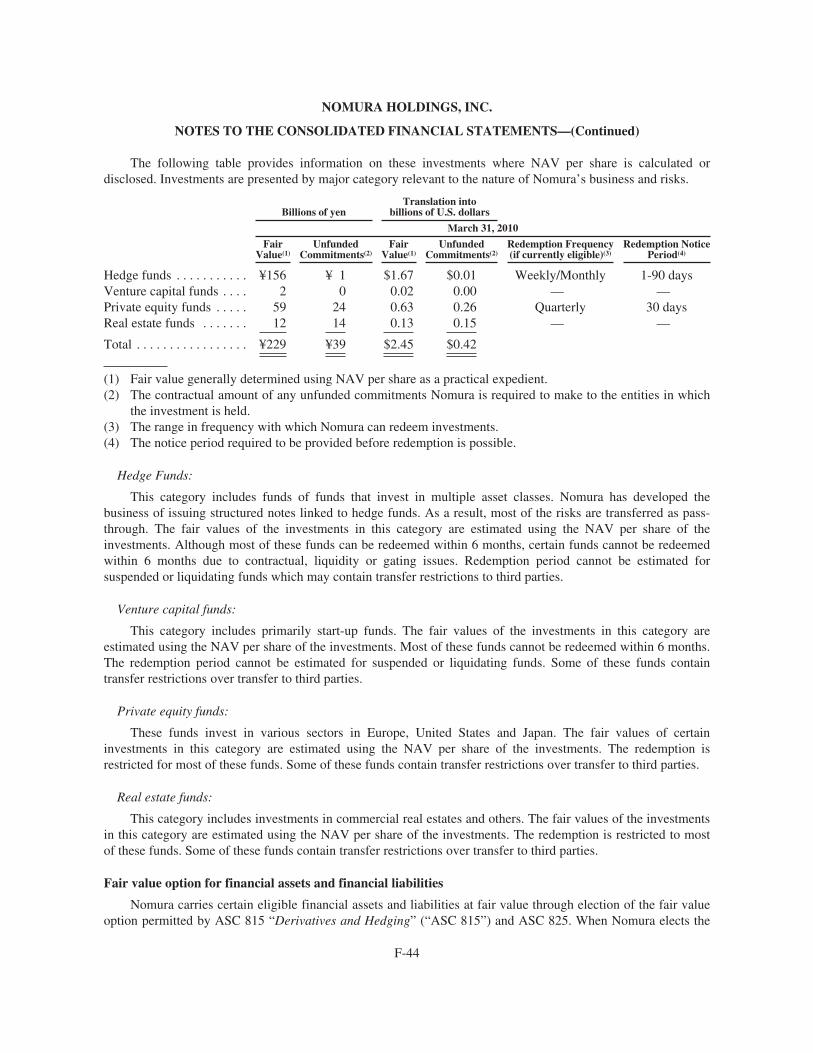
NOMURA HOLDINGS, INC.
NOTES TO THE CONSOLIDATED FINANCIAL STATEMENTS—(Continued)
The following table provides information on these investments where NAV per share is calculated ordisclosed. Investments are presented by major category relevant to the nature of Nomura’s business and risks.
Billions of yenTranslation into
billions of U.S. dollars
March 31, 2010
FairValue(1)
UnfundedCommitments(2)
FairValue(1)
UnfundedCommitments(2)
Redemption Frequency(if currently eligible)(3)
Redemption NoticePeriod(4)
Hedge funds . . . . . . . . . . . ¥156 ¥ 1 $1.67 $0.01 Weekly/Monthly 1-90 daysVenture capital funds . . . . 2 0 0.02 0.00 — —Private equity funds . . . . . 59 24 0.63 0.26 Quarterly 30 daysReal estate funds . . . . . . . 12 14 0.13 0.15 — —
Total . . . . . . . . . . . . . . . . . ¥229 ¥39 $2.45 $0.42
(1) Fair value generally determined using NAV per share as a practical expedient.(2) The contractual amount of any unfunded commitments Nomura is required to make to the entities in which
the investment is held.(3) The range in frequency with which Nomura can redeem investments.(4) The notice period required to be provided before redemption is possible.
Hedge Funds:
This category includes funds of funds that invest in multiple asset classes. Nomura has developed thebusiness of issuing structured notes linked to hedge funds. As a result, most of the risks are transferred as pass-through. The fair values of the investments in this category are estimated using the NAV per share of theinvestments. Although most of these funds can be redeemed within 6 months, certain funds cannot be redeemedwithin 6 months due to contractual, liquidity or gating issues. Redemption period cannot be estimated forsuspended or liquidating funds which may contain transfer restrictions to third parties.
Venture capital funds:
This category includes primarily start-up funds. The fair values of the investments in this category areestimated using the NAV per share of the investments. Most of these funds cannot be redeemed within 6 months.The redemption period cannot be estimated for suspended or liquidating funds. Some of these funds containtransfer restrictions over transfer to third parties.
Private equity funds:
These funds invest in various sectors in Europe, United States and Japan. The fair values of certaininvestments in this category are estimated using the NAV per share of the investments. The redemption isrestricted for most of these funds. Some of these funds contain transfer restrictions over transfer to third parties.
Real estate funds:
This category includes investments in commercial real estates and others. The fair values of the investmentsin this category are estimated using the NAV per share of the investments. The redemption is restricted to mostof these funds. Some of these funds contain transfer restrictions over transfer to third parties.
Fair value option for financial assets and financial liabilities
Nomura carries certain eligible financial assets and liabilities at fair value through election of the fair valueoption permitted by ASC 815 “Derivatives and Hedging” (“ASC 815”) and ASC 825. When Nomura elects the
F-44
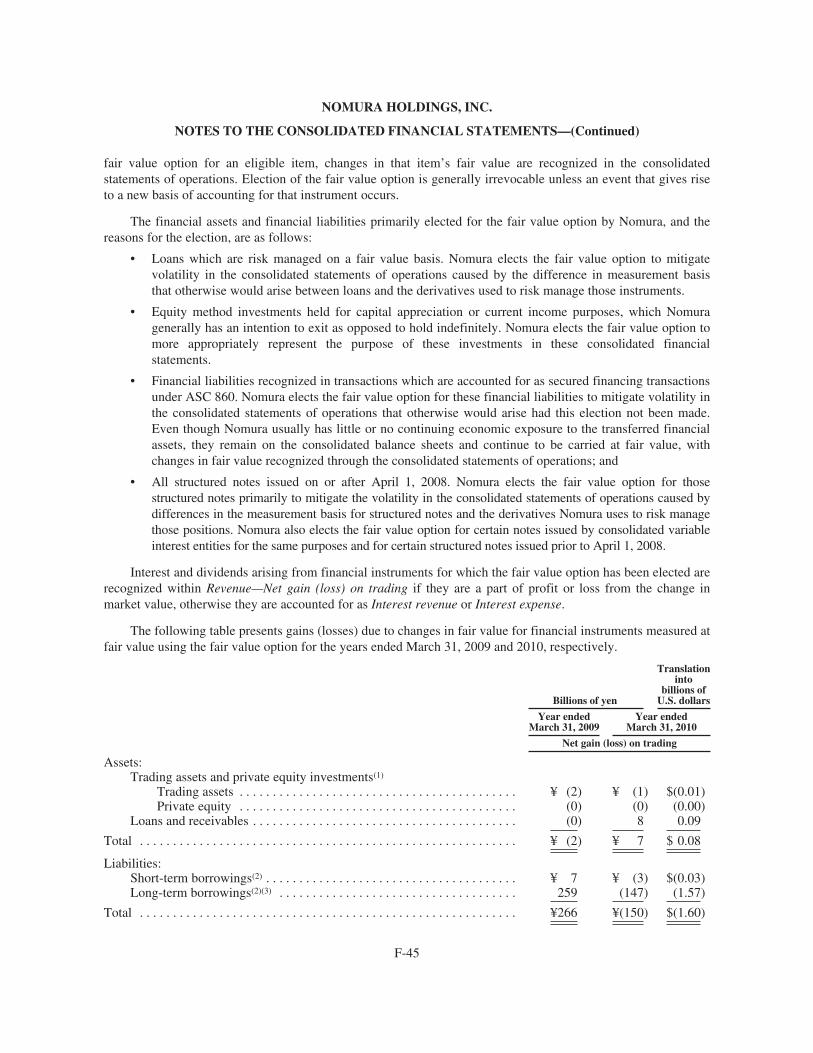
NOMURA HOLDINGS, INC.
NOTES TO THE CONSOLIDATED FINANCIAL STATEMENTS—(Continued)
fair value option for an eligible item, changes in that item’s fair value are recognized in the consolidatedstatements of operations. Election of the fair value option is generally irrevocable unless an event that gives riseto a new basis of accounting for that instrument occurs.
The financial assets and financial liabilities primarily elected for the fair value option by Nomura, and thereasons for the election, are as follows:
• Loans which are risk managed on a fair value basis. Nomura elects the fair value option to mitigatevolatility in the consolidated statements of operations caused by the difference in measurement basisthat otherwise would arise between loans and the derivatives used to risk manage those instruments.
• Equity method investments held for capital appreciation or current income purposes, which Nomuragenerally has an intention to exit as opposed to hold indefinitely. Nomura elects the fair value option tomore appropriately represent the purpose of these investments in these consolidated financialstatements.
• Financial liabilities recognized in transactions which are accounted for as secured financing transactionsunder ASC 860. Nomura elects the fair value option for these financial liabilities to mitigate volatility inthe consolidated statements of operations that otherwise would arise had this election not been made.Even though Nomura usually has little or no continuing economic exposure to the transferred financialassets, they remain on the consolidated balance sheets and continue to be carried at fair value, withchanges in fair value recognized through the consolidated statements of operations; and
• All structured notes issued on or after April 1, 2008. Nomura elects the fair value option for thosestructured notes primarily to mitigate the volatility in the consolidated statements of operations caused bydifferences in the measurement basis for structured notes and the derivatives Nomura uses to risk managethose positions. Nomura also elects the fair value option for certain notes issued by consolidated variableinterest entities for the same purposes and for certain structured notes issued prior to April 1, 2008.
Interest and dividends arising from financial instruments for which the fair value option has been elected arerecognized within Revenue—Net gain (loss) on trading if they are a part of profit or loss from the change inmarket value, otherwise they are accounted for as Interest revenue or Interest expense.
The following table presents gains (losses) due to changes in fair value for financial instruments measured atfair value using the fair value option for the years ended March 31, 2009 and 2010, respectively.
Billions of yen
Translationinto
billions ofU.S. dollars
Year endedMarch 31, 2009
Year endedMarch 31, 2010
Net gain (loss) on trading
Assets:Trading assets and private equity investments(1)
Trading assets . . . . . . . . . . . . . . . . . . . . . . . . . . . . . . . . . . . . . . . . . . ¥ (2) ¥ (1) $(0.01)Private equity . . . . . . . . . . . . . . . . . . . . . . . . . . . . . . . . . . . . . . . . . . (0) (0) (0.00)
Loans and receivables . . . . . . . . . . . . . . . . . . . . . . . . . . . . . . . . . . . . . . . . (0) 8 0.09
Total . . . . . . . . . . . . . . . . . . . . . . . . . . . . . . . . . . . . . . . . . . . . . . . . . . . . . . . . . ¥ (2) ¥ 7 $ 0.08
Liabilities:Short-term borrowings(2) . . . . . . . . . . . . . . . . . . . . . . . . . . . . . . . . . . . . . . ¥ 7 ¥ (3) $(0.03)Long-term borrowings(2)(3) . . . . . . . . . . . . . . . . . . . . . . . . . . . . . . . . . . . . 259 (147) (1.57)
Total . . . . . . . . . . . . . . . . . . . . . . . . . . . . . . . . . . . . . . . . . . . . . . . . . . . . . . . . . ¥266 ¥(150) $(1.60)
F-45
NOMURA HOLDINGS, INC.
NOTES TO THE CONSOLIDATED FINANCIAL STATEMENTS—(Continued)
(1) Includes equity investments that would have been accounted for under the equity method had Nomura notchosen to apply the fair value option.
(2) Includes structured notes and other financial liabilities for which Nomura elected the fair value option.(3) Includes liabilities recognized from secured financing transactions arising from transfers of financial assets
which did not meet the criteria for sales accounting.
Nomura elected to apply the fair value option for its 45.5% investment in the common stock of AshikagaHoldings Co., Ltd. (“Ashikaga Holdings”). This investment is reported within Trading assets and private equityinvestments—Private equity investments in the consolidated balance sheets. Ashikaga Holdings recognized a totalrevenue of ¥83 billion, total expense of ¥110 billion and a net loss of ¥7 billion for the year ended March 31,2009. As of March 31, 2009, its total assets and total liabilities were ¥4,921 billion and ¥4,726 billion,respectively, determined in accordance with accounting principles generally accepted in Japan.
Ashikaga Holdings recognized a total revenue of ¥118 billion ($1.26 billion), total expense of ¥93 billion($1.00 billion) and a net gain of ¥25 billion ($0.27 billion) for the year ended March 31, 2010. As of March 31,2010, its total assets and total liabilities were ¥4,990 billion ($53.43 billion) and ¥4,755 billion ($50.91 billion),respectively, determined in accordance with accounting principles generally accepted in Japan.
Nomura calculates the impact of changes in its own creditworthiness on certain financial liabilities forwhich the fair value option is elected by discounting future cash flows at a rate which incorporates observablechanges in its credit spread. Gains from changes in the fair value of the financial liabilities for which the fairvalue option was elected, attributable to the change in Nomura’s creditworthiness were ¥73 billion for the yearended March 31, 2009, mainly because of the widening of Nomura’s credit spread. Losses from changes in thefair value of the financial liabilities for which the fair value option was elected, attributable to the change in itscreditworthiness, were ¥64 billion ($0.69 billion) for the year ended March 31, 2010, mainly because of thetightening of Nomura’s credit spread.
There was no significant impact on financial assets for which the fair value option was elected attributableto instrument-specific credit risk.
As of March 31, 2009, the fair value of the aggregate unpaid principal balance (which is contractuallyprincipally protected) of loans and receivables for which the fair value option was elected was ¥1 billion morethan the principal balance of such loans and receivables. The fair value of the aggregate unpaid principal balance(which is contractually principally protected) of long-term borrowings for which the fair value option was electedwas ¥14 billion less than the principal balance of such long-term borrowings. There were no loans andreceivables for which the fair value option was elected that were 90 days or more past due. As of March 31,2010, the fair value of the aggregate unpaid principal balance (which is contractually principally protected) ofloans and receivables for which the fair value option was elected was ¥1 billion ($0.01 billion) more than theprincipal balance of such loans and receivables. The fair value of the aggregate unpaid principal balance (whichis contractually principally protected) of long-term borrowings for which the fair value option was elected was ¥6billion ($0.06 billion) less than the principal balance of such long-term borrowings. There were no loans andreceivables for which the fair value option was elected that were 90 days or more past due.
Assets and liabilities carried at fair value on a nonrecurring basis—
In addition to the financial instruments carried at fair value on a recurring basis, which are described above,Nomura also carries other assets and liabilities at fair value on a nonrecurring basis, where the primarymeasurement basis is not fair value. Fair value is only used in specific circumstances such as to measureimpairment.
F-46
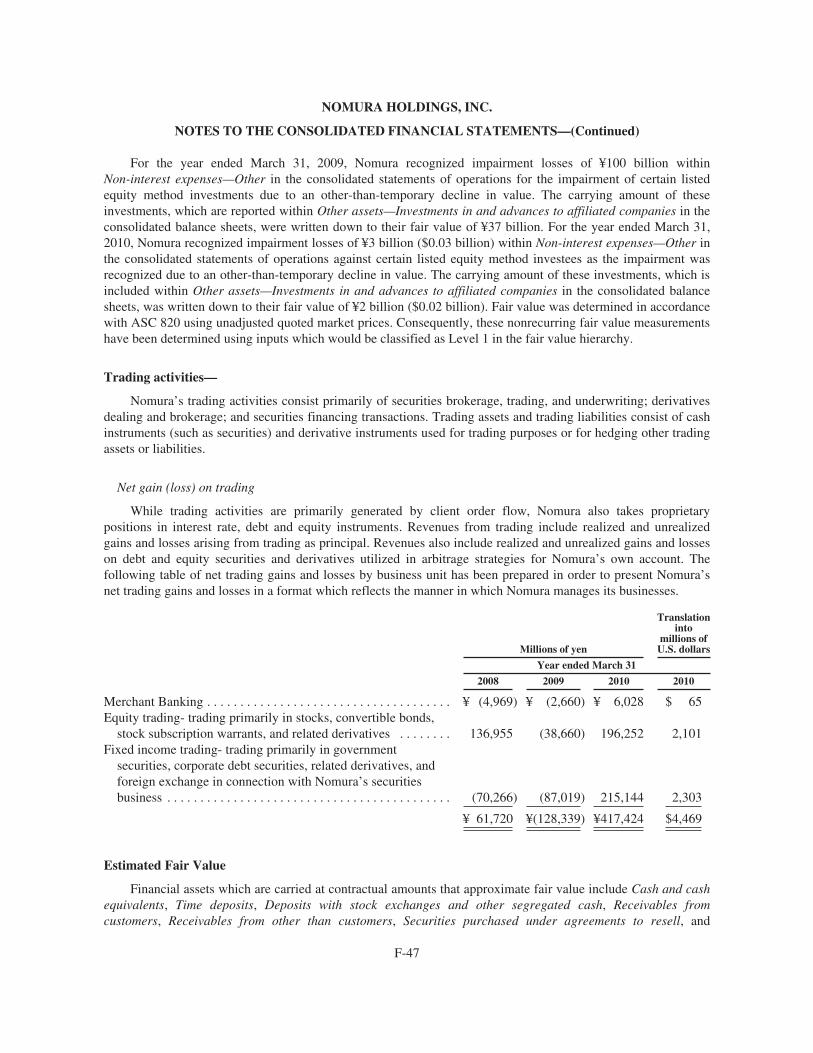
NOMURA HOLDINGS, INC.
NOTES TO THE CONSOLIDATED FINANCIAL STATEMENTS—(Continued)
For the year ended March 31, 2009, Nomura recognized impairment losses of ¥100 billion withinNon-interest expenses—Other in the consolidated statements of operations for the impairment of certain listedequity method investments due to an other-than-temporary decline in value. The carrying amount of theseinvestments, which are reported within Other assets—Investments in and advances to affiliated companies in theconsolidated balance sheets, were written down to their fair value of ¥37 billion. For the year ended March 31,2010, Nomura recognized impairment losses of ¥3 billion ($0.03 billion) within Non-interest expenses—Other inthe consolidated statements of operations against certain listed equity method investees as the impairment wasrecognized due to an other-than-temporary decline in value. The carrying amount of these investments, which isincluded within Other assets—Investments in and advances to affiliated companies in the consolidated balancesheets, was written down to their fair value of ¥2 billion ($0.02 billion). Fair value was determined in accordancewith ASC 820 using unadjusted quoted market prices. Consequently, these nonrecurring fair value measurementshave been determined using inputs which would be classified as Level 1 in the fair value hierarchy.
Trading activities—
Nomura’s trading activities consist primarily of securities brokerage, trading, and underwriting; derivativesdealing and brokerage; and securities financing transactions. Trading assets and trading liabilities consist of cashinstruments (such as securities) and derivative instruments used for trading purposes or for hedging other tradingassets or liabilities.
Net gain (loss) on trading
While trading activities are primarily generated by client order flow, Nomura also takes proprietarypositions in interest rate, debt and equity instruments. Revenues from trading include realized and unrealizedgains and losses arising from trading as principal. Revenues also include realized and unrealized gains and losseson debt and equity securities and derivatives utilized in arbitrage strategies for Nomura’s own account. Thefollowing table of net trading gains and losses by business unit has been prepared in order to present Nomura’snet trading gains and losses in a format which reflects the manner in which Nomura manages its businesses.
Millions of yen
Translationinto
millions ofU.S. dollars
Year ended March 31
2008 2009 2010 2010
Merchant Banking . . . . . . . . . . . . . . . . . . . . . . . . . . . . . . . . . . . . . ¥ (4,969) ¥ (2,660) ¥ 6,028 $ 65Equity trading- trading primarily in stocks, convertible bonds,
stock subscription warrants, and related derivatives . . . . . . . . 136,955 (38,660) 196,252 2,101Fixed income trading- trading primarily in government
securities, corporate debt securities, related derivatives, andforeign exchange in connection with Nomura’s securitiesbusiness . . . . . . . . . . . . . . . . . . . . . . . . . . . . . . . . . . . . . . . . . . . (70,266) (87,019) 215,144 2,303
¥ 61,720 ¥(128,339) ¥417,424 $4,469
Estimated Fair Value
Financial assets which are carried at contractual amounts that approximate fair value include Cash and cashequivalents, Time deposits, Deposits with stock exchanges and other segregated cash, Receivables fromcustomers, Receivables from other than customers, Securities purchased under agreements to resell, and
F-47
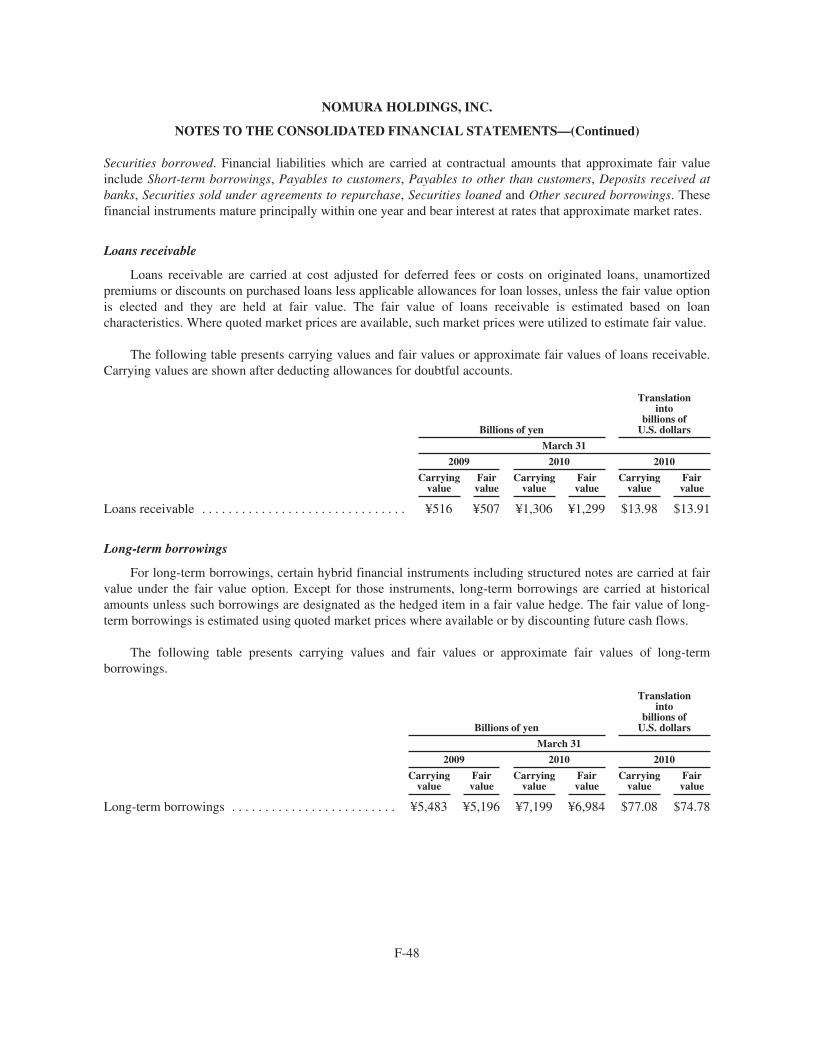
NOMURA HOLDINGS, INC.
NOTES TO THE CONSOLIDATED FINANCIAL STATEMENTS—(Continued)
Securities borrowed. Financial liabilities which are carried at contractual amounts that approximate fair valueinclude Short-term borrowings, Payables to customers, Payables to other than customers, Deposits received atbanks, Securities sold under agreements to repurchase, Securities loaned and Other secured borrowings. Thesefinancial instruments mature principally within one year and bear interest at rates that approximate market rates.
Loans receivable
Loans receivable are carried at cost adjusted for deferred fees or costs on originated loans, unamortizedpremiums or discounts on purchased loans less applicable allowances for loan losses, unless the fair value optionis elected and they are held at fair value. The fair value of loans receivable is estimated based on loancharacteristics. Where quoted market prices are available, such market prices were utilized to estimate fair value.
The following table presents carrying values and fair values or approximate fair values of loans receivable.Carrying values are shown after deducting allowances for doubtful accounts.
Billions of yen
Translationinto
billions ofU.S. dollars
March 31
2009 2010 2010
Carryingvalue
Fairvalue
Carryingvalue
Fairvalue
Carryingvalue
Fairvalue
Loans receivable . . . . . . . . . . . . . . . . . . . . . . . . . . . . . . . ¥516 ¥507 ¥1,306 ¥1,299 $13.98 $13.91
Long-term borrowings
For long-term borrowings, certain hybrid financial instruments including structured notes are carried at fairvalue under the fair value option. Except for those instruments, long-term borrowings are carried at historicalamounts unless such borrowings are designated as the hedged item in a fair value hedge. The fair value of long-term borrowings is estimated using quoted market prices where available or by discounting future cash flows.
The following table presents carrying values and fair values or approximate fair values of long-termborrowings.
Billions of yen
Translationinto
billions ofU.S. dollars
March 31
2009 2010 2010
Carryingvalue
Fairvalue
Carryingvalue
Fairvalue
Carryingvalue
Fairvalue
Long-term borrowings . . . . . . . . . . . . . . . . . . . . . . . . . ¥5,483 ¥5,196 ¥7,199 ¥6,984 $77.08 $74.78
F-48
NOMURA HOLDINGS, INC.
NOTES TO THE CONSOLIDATED FINANCIAL STATEMENTS—(Continued)
4. Derivative instruments and hedging activities:
Derivatives used for trading purposes
In the normal course of business, Nomura enters into transactions involving derivative financial instrumentsto meet customer needs, for its trading activities, and to reduce its own exposure to loss due to adversefluctuations in interest rates, currency exchange rates and market prices of securities. These financial instrumentsinclude contractual agreements such as commitments to swap interest payment streams, exchange currencies orpurchase or sell securities and other financial instruments on specific terms at specific future dates.
Nomura also enters into various derivative financial instrument transactions including forwards, futures,option and swap contracts involving securities, foreign currency, interest rate and other capital marketinstruments as part of its normal trading activities and for market risk management of certain non-trading assetsand liabilities.
Nomura maintains active trading positions in a variety of derivative financial instruments. Most ofNomura’s trading activities are customer oriented. Nomura utilizes a variety of derivative financial instrumentsas a means of bridging customers’ specific financial needs and investors’ demands in the securities markets.Nomura also actively trades securities and various derivatives in order to assist its customers in adjusting theirrisk profiles as markets change. In performing these activities, Nomura carries an inventory of capital marketsinstruments and maintains its access to market liquidity by quoting bid and offer prices to and trading with othermarket makers. These activities are essential to provide customers with securities and other capital marketsproducts at competitive prices.
Forward and futures contracts are commitments to either purchase or sell securities, foreign currency orcapital market instruments at a specific future date for a specified price and may be settled in cash or throughdelivery. Foreign exchange contracts include spot and forward contracts and involve the exchange of twocurrencies at a rate agreed to by the contracting parties. Risks arise from the possible inability of counterpartiesto meet the terms of their contracts and from movements in market prices. Futures contracts are conductedthrough regulated exchanges which clear and guarantee performance of counterparties. Accordingly, credit riskassociated with futures contracts is considered minimal. In contrast, forward contracts are generally negotiatedbetween two counterparties and, therefore, are subject to the performance of the related counterparties.
Options are contracts that grant the purchaser, for a premium payment, the right to either purchase or sell afinancial instrument at a specified price within a specified period of time or on a specified date from or to thewriter of the option. The writer of options receives premiums and bears the risk of unfavorable changes in themarket price of the financial instruments underlying the options.
Swaps are contractual agreements in which two counterparties agree to exchange certain cash flows, atspecified future dates, based on an agreed contract. Certain agreements may result in combined interest rate andforeign currency exposures. Entering into swap agreements may involve the risk of credit loss in the event of thecounterparties’ default.
To the extent these derivative financial instruments are economically hedging financial instruments orsecurities positions of Nomura, the overall risk of loss may be fully or partly mitigated by the hedged position.
Nomura seeks to minimize its exposure to market risk arising from its use of these derivative financialinstruments through various control policies and procedures, including position limits, monitoring proceduresand hedging strategies whereby Nomura enters into offsetting or other positions in a variety of financialinstruments. Credit risk associated with these financial instruments is controlled by Nomura through credit
F-49
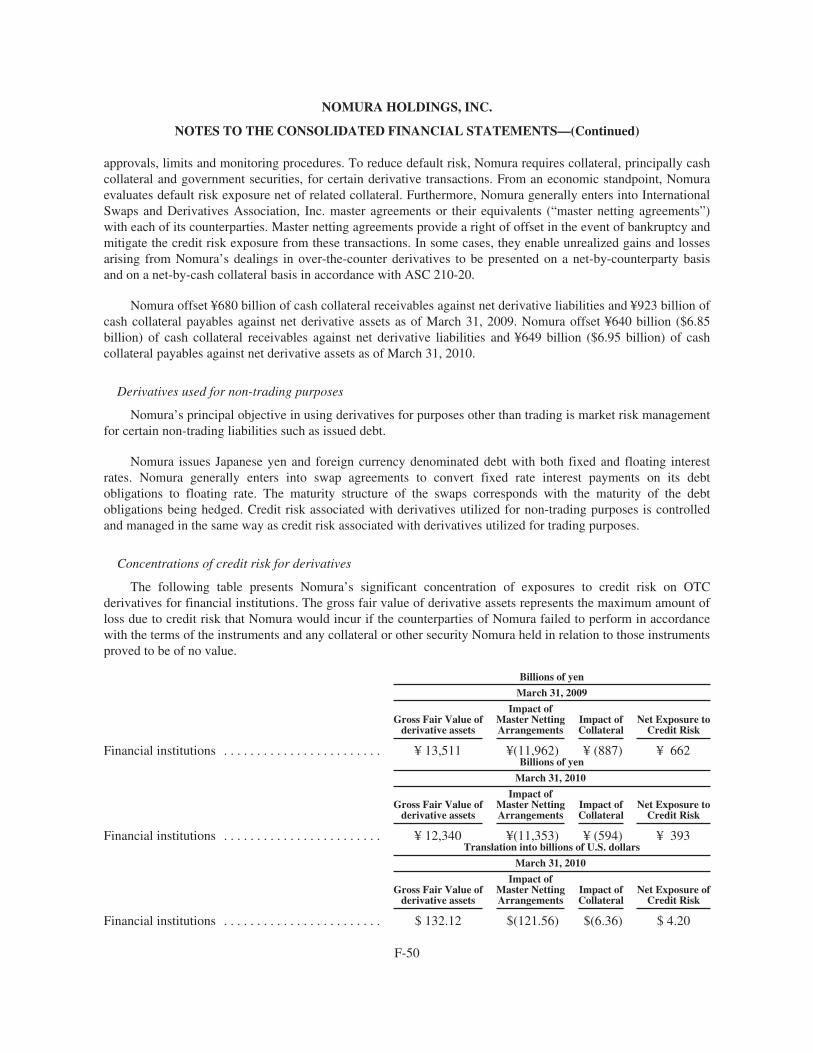
NOMURA HOLDINGS, INC.
NOTES TO THE CONSOLIDATED FINANCIAL STATEMENTS—(Continued)
approvals, limits and monitoring procedures. To reduce default risk, Nomura requires collateral, principally cashcollateral and government securities, for certain derivative transactions. From an economic standpoint, Nomuraevaluates default risk exposure net of related collateral. Furthermore, Nomura generally enters into InternationalSwaps and Derivatives Association, Inc. master agreements or their equivalents (“master netting agreements”)with each of its counterparties. Master netting agreements provide a right of offset in the event of bankruptcy andmitigate the credit risk exposure from these transactions. In some cases, they enable unrealized gains and lossesarising from Nomura’s dealings in over-the-counter derivatives to be presented on a net-by-counterparty basisand on a net-by-cash collateral basis in accordance with ASC 210-20.
Nomura offset ¥680 billion of cash collateral receivables against net derivative liabilities and ¥923 billion ofcash collateral payables against net derivative assets as of March 31, 2009. Nomura offset ¥640 billion ($6.85billion) of cash collateral receivables against net derivative liabilities and ¥649 billion ($6.95 billion) of cashcollateral payables against net derivative assets as of March 31, 2010.
Derivatives used for non-trading purposes
Nomura’s principal objective in using derivatives for purposes other than trading is market risk managementfor certain non-trading liabilities such as issued debt.
Nomura issues Japanese yen and foreign currency denominated debt with both fixed and floating interestrates. Nomura generally enters into swap agreements to convert fixed rate interest payments on its debtobligations to floating rate. The maturity structure of the swaps corresponds with the maturity of the debtobligations being hedged. Credit risk associated with derivatives utilized for non-trading purposes is controlledand managed in the same way as credit risk associated with derivatives utilized for trading purposes.
Concentrations of credit risk for derivatives
The following table presents Nomura’s significant concentration of exposures to credit risk on OTCderivatives for financial institutions. The gross fair value of derivative assets represents the maximum amount ofloss due to credit risk that Nomura would incur if the counterparties of Nomura failed to perform in accordancewith the terms of the instruments and any collateral or other security Nomura held in relation to those instrumentsproved to be of no value.
Billions of yen
March 31, 2009
Gross Fair Value ofderivative assets
Impact ofMaster NettingArrangements
Impact ofCollateral
Net Exposure toCredit Risk
Financial institutions . . . . . . . . . . . . . . . . . . . . . . . . ¥ 13,511 ¥(11,962) ¥ (887) ¥ 662Billions of yen
March 31, 2010
Gross Fair Value ofderivative assets
Impact ofMaster NettingArrangements
Impact ofCollateral
Net Exposure toCredit Risk
Financial institutions . . . . . . . . . . . . . . . . . . . . . . . . ¥ 12,340 ¥(11,353) ¥ (594) ¥ 393Translation into billions of U.S. dollars
March 31, 2010
Gross Fair Value ofderivative assets
Impact ofMaster NettingArrangements
Impact ofCollateral
Net Exposure ofCredit Risk
Financial institutions . . . . . . . . . . . . . . . . . . . . . . . . $ 132.12 $(121.56) $(6.36) $ 4.20
F-50
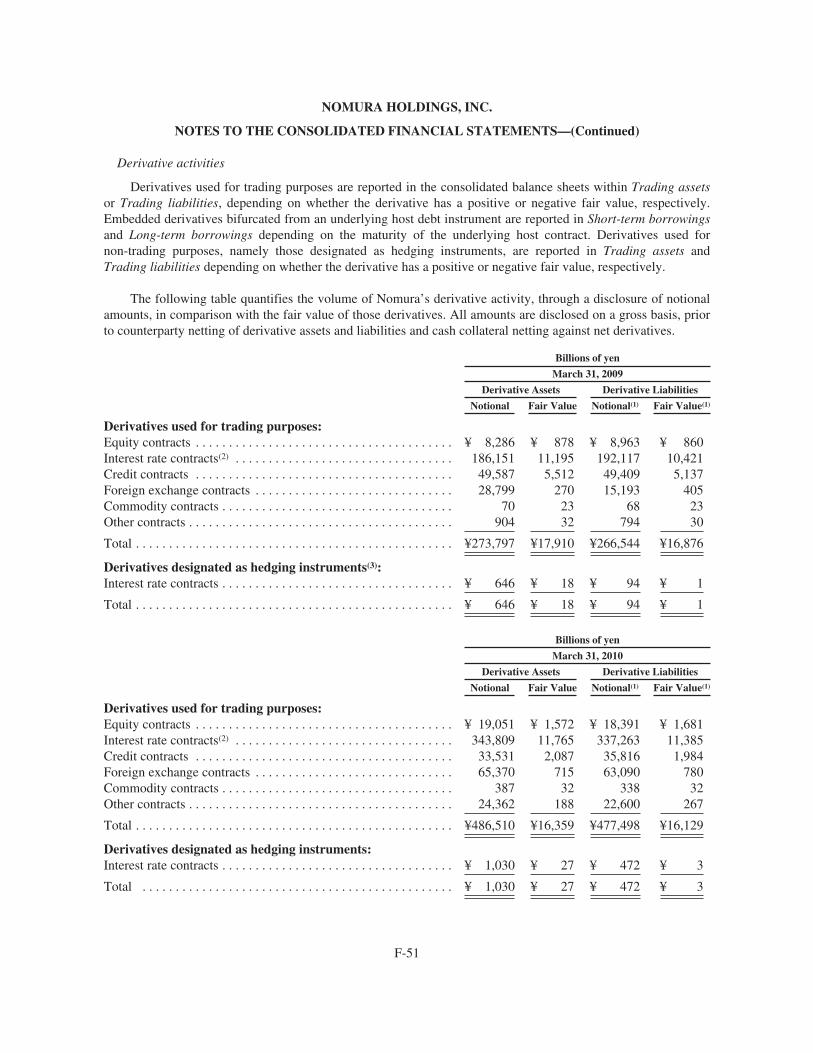
NOMURA HOLDINGS, INC.
NOTES TO THE CONSOLIDATED FINANCIAL STATEMENTS—(Continued)
Derivative activities
Derivatives used for trading purposes are reported in the consolidated balance sheets within Trading assetsor Trading liabilities, depending on whether the derivative has a positive or negative fair value, respectively.Embedded derivatives bifurcated from an underlying host debt instrument are reported in Short-term borrowingsand Long-term borrowings depending on the maturity of the underlying host contract. Derivatives used fornon-trading purposes, namely those designated as hedging instruments, are reported in Trading assets andTrading liabilities depending on whether the derivative has a positive or negative fair value, respectively.
The following table quantifies the volume of Nomura’s derivative activity, through a disclosure of notionalamounts, in comparison with the fair value of those derivatives. All amounts are disclosed on a gross basis, priorto counterparty netting of derivative assets and liabilities and cash collateral netting against net derivatives.
Billions of yen
March 31, 2009
Derivative Assets Derivative Liabilities
Notional Fair Value Notional(1) Fair Value(1)
Derivatives used for trading purposes:Equity contracts . . . . . . . . . . . . . . . . . . . . . . . . . . . . . . . . . . . . . . . ¥ 8,286 ¥ 878 ¥ 8,963 ¥ 860Interest rate contracts(2) . . . . . . . . . . . . . . . . . . . . . . . . . . . . . . . . . 186,151 11,195 192,117 10,421Credit contracts . . . . . . . . . . . . . . . . . . . . . . . . . . . . . . . . . . . . . . . 49,587 5,512 49,409 5,137Foreign exchange contracts . . . . . . . . . . . . . . . . . . . . . . . . . . . . . . 28,799 270 15,193 405Commodity contracts . . . . . . . . . . . . . . . . . . . . . . . . . . . . . . . . . . . 70 23 68 23Other contracts . . . . . . . . . . . . . . . . . . . . . . . . . . . . . . . . . . . . . . . . 904 32 794 30
Total . . . . . . . . . . . . . . . . . . . . . . . . . . . . . . . . . . . . . . . . . . . . . . . . ¥273,797 ¥17,910 ¥266,544 ¥16,876
Derivatives designated as hedging instruments(3):Interest rate contracts . . . . . . . . . . . . . . . . . . . . . . . . . . . . . . . . . . . ¥ 646 ¥ 18 ¥ 94 ¥ 1
Total . . . . . . . . . . . . . . . . . . . . . . . . . . . . . . . . . . . . . . . . . . . . . . . . ¥ 646 ¥ 18 ¥ 94 ¥ 1
Billions of yen
March 31, 2010
Derivative Assets Derivative Liabilities
Notional Fair Value Notional(1) Fair Value(1)
Derivatives used for trading purposes:Equity contracts . . . . . . . . . . . . . . . . . . . . . . . . . . . . . . . . . . . . . . . ¥ 19,051 ¥ 1,572 ¥ 18,391 ¥ 1,681Interest rate contracts(2) . . . . . . . . . . . . . . . . . . . . . . . . . . . . . . . . . 343,809 11,765 337,263 11,385Credit contracts . . . . . . . . . . . . . . . . . . . . . . . . . . . . . . . . . . . . . . . 33,531 2,087 35,816 1,984Foreign exchange contracts . . . . . . . . . . . . . . . . . . . . . . . . . . . . . . 65,370 715 63,090 780Commodity contracts . . . . . . . . . . . . . . . . . . . . . . . . . . . . . . . . . . . 387 32 338 32Other contracts . . . . . . . . . . . . . . . . . . . . . . . . . . . . . . . . . . . . . . . . 24,362 188 22,600 267
Total . . . . . . . . . . . . . . . . . . . . . . . . . . . . . . . . . . . . . . . . . . . . . . . . ¥486,510 ¥16,359 ¥477,498 ¥16,129
Derivatives designated as hedging instruments:Interest rate contracts . . . . . . . . . . . . . . . . . . . . . . . . . . . . . . . . . . . ¥ 1,030 ¥ 27 ¥ 472 ¥ 3
Total . . . . . . . . . . . . . . . . . . . . . . . . . . . . . . . . . . . . . . . . . . . . . . . ¥ 1,030 ¥ 27 ¥ 472 ¥ 3
F-51
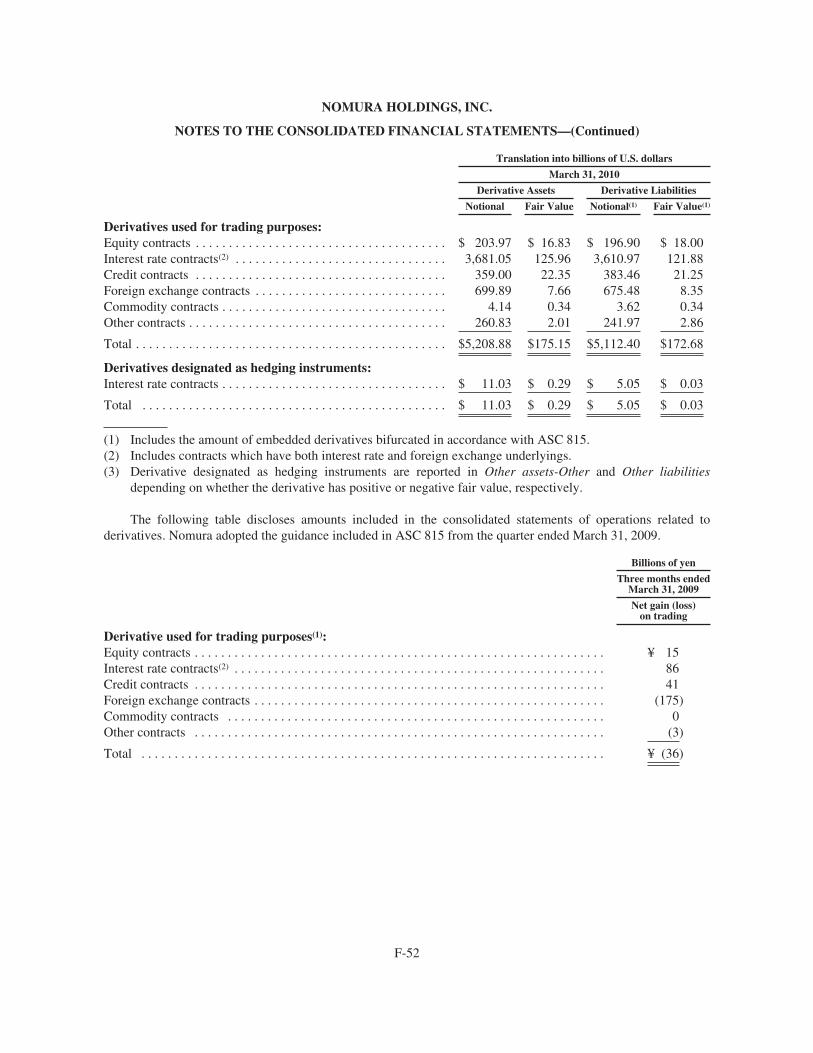
NOMURA HOLDINGS, INC.
NOTES TO THE CONSOLIDATED FINANCIAL STATEMENTS—(Continued)
Translation into billions of U.S. dollars
March 31, 2010
Derivative Assets Derivative Liabilities
Notional Fair Value Notional(1) Fair Value(1)
Derivatives used for trading purposes:Equity contracts . . . . . . . . . . . . . . . . . . . . . . . . . . . . . . . . . . . . . . $ 203.97 $ 16.83 $ 196.90 $ 18.00Interest rate contracts(2) . . . . . . . . . . . . . . . . . . . . . . . . . . . . . . . . 3,681.05 125.96 3,610.97 121.88Credit contracts . . . . . . . . . . . . . . . . . . . . . . . . . . . . . . . . . . . . . . 359.00 22.35 383.46 21.25Foreign exchange contracts . . . . . . . . . . . . . . . . . . . . . . . . . . . . . 699.89 7.66 675.48 8.35Commodity contracts . . . . . . . . . . . . . . . . . . . . . . . . . . . . . . . . . . 4.14 0.34 3.62 0.34Other contracts . . . . . . . . . . . . . . . . . . . . . . . . . . . . . . . . . . . . . . . 260.83 2.01 241.97 2.86
Total . . . . . . . . . . . . . . . . . . . . . . . . . . . . . . . . . . . . . . . . . . . . . . . $5,208.88 $175.15 $5,112.40 $172.68
Derivatives designated as hedging instruments:Interest rate contracts . . . . . . . . . . . . . . . . . . . . . . . . . . . . . . . . . . $ 11.03 $ 0.29 $ 5.05 $ 0.03
Total . . . . . . . . . . . . . . . . . . . . . . . . . . . . . . . . . . . . . . . . . . . . . . $ 11.03 $ 0.29 $ 5.05 $ 0.03
(1) Includes the amount of embedded derivatives bifurcated in accordance with ASC 815.(2) Includes contracts which have both interest rate and foreign exchange underlyings.(3) Derivative designated as hedging instruments are reported in Other assets-Other and Other liabilities
depending on whether the derivative has positive or negative fair value, respectively.
The following table discloses amounts included in the consolidated statements of operations related toderivatives. Nomura adopted the guidance included in ASC 815 from the quarter ended March 31, 2009.
Billions of yen
Three months endedMarch 31, 2009
Net gain (loss)on trading
Derivative used for trading purposes(1):Equity contracts . . . . . . . . . . . . . . . . . . . . . . . . . . . . . . . . . . . . . . . . . . . . . . . . . . . . . . . . . . . . . . ¥ 15Interest rate contracts(2) . . . . . . . . . . . . . . . . . . . . . . . . . . . . . . . . . . . . . . . . . . . . . . . . . . . . . . . . 86Credit contracts . . . . . . . . . . . . . . . . . . . . . . . . . . . . . . . . . . . . . . . . . . . . . . . . . . . . . . . . . . . . . . 41Foreign exchange contracts . . . . . . . . . . . . . . . . . . . . . . . . . . . . . . . . . . . . . . . . . . . . . . . . . . . . . (175)Commodity contracts . . . . . . . . . . . . . . . . . . . . . . . . . . . . . . . . . . . . . . . . . . . . . . . . . . . . . . . . . 0Other contracts . . . . . . . . . . . . . . . . . . . . . . . . . . . . . . . . . . . . . . . . . . . . . . . . . . . . . . . . . . . . . . (3)
Total . . . . . . . . . . . . . . . . . . . . . . . . . . . . . . . . . . . . . . . . . . . . . . . . . . . . . . . . . . . . . . . . . . . . . . ¥ (36)
F-52
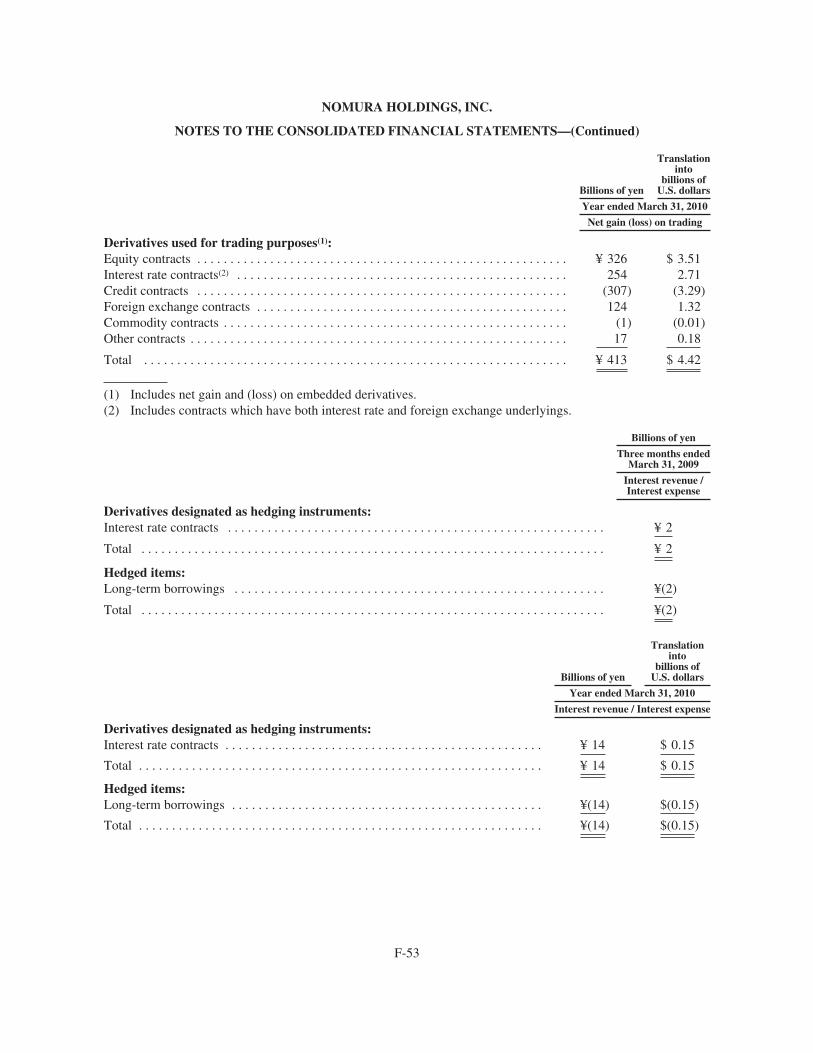
NOMURA HOLDINGS, INC.
NOTES TO THE CONSOLIDATED FINANCIAL STATEMENTS—(Continued)
Billions of yen
Translationinto
billions ofU.S. dollars
Year ended March 31, 2010
Net gain (loss) on trading
Derivatives used for trading purposes(1):Equity contracts . . . . . . . . . . . . . . . . . . . . . . . . . . . . . . . . . . . . . . . . . . . . . . . . . . . . . . . . ¥ 326 $ 3.51Interest rate contracts(2) . . . . . . . . . . . . . . . . . . . . . . . . . . . . . . . . . . . . . . . . . . . . . . . . . . 254 2.71Credit contracts . . . . . . . . . . . . . . . . . . . . . . . . . . . . . . . . . . . . . . . . . . . . . . . . . . . . . . . . (307) (3.29)Foreign exchange contracts . . . . . . . . . . . . . . . . . . . . . . . . . . . . . . . . . . . . . . . . . . . . . . . 124 1.32Commodity contracts . . . . . . . . . . . . . . . . . . . . . . . . . . . . . . . . . . . . . . . . . . . . . . . . . . . . (1) (0.01)Other contracts . . . . . . . . . . . . . . . . . . . . . . . . . . . . . . . . . . . . . . . . . . . . . . . . . . . . . . . . . 17 0.18
Total . . . . . . . . . . . . . . . . . . . . . . . . . . . . . . . . . . . . . . . . . . . . . . . . . . . . . . . . . . . . . . . . ¥ 413 $ 4.42
(1) Includes net gain and (loss) on embedded derivatives.(2) Includes contracts which have both interest rate and foreign exchange underlyings.
Billions of yen
Three months endedMarch 31, 2009
Interest revenue /Interest expense
Derivatives designated as hedging instruments:Interest rate contracts . . . . . . . . . . . . . . . . . . . . . . . . . . . . . . . . . . . . . . . . . . . . . . . . . . . . . . . . . ¥ 2
Total . . . . . . . . . . . . . . . . . . . . . . . . . . . . . . . . . . . . . . . . . . . . . . . . . . . . . . . . . . . . . . . . . . . . . . ¥ 2
Hedged items:Long-term borrowings . . . . . . . . . . . . . . . . . . . . . . . . . . . . . . . . . . . . . . . . . . . . . . . . . . . . . . . . ¥(2)
Total . . . . . . . . . . . . . . . . . . . . . . . . . . . . . . . . . . . . . . . . . . . . . . . . . . . . . . . . . . . . . . . . . . . . . . ¥(2)
Billions of yen
Translationinto
billions ofU.S. dollars
Year ended March 31, 2010
Interest revenue / Interest expense
Derivatives designated as hedging instruments:Interest rate contracts . . . . . . . . . . . . . . . . . . . . . . . . . . . . . . . . . . . . . . . . . . . . . . . . ¥ 14 $ 0.15
Total . . . . . . . . . . . . . . . . . . . . . . . . . . . . . . . . . . . . . . . . . . . . . . . . . . . . . . . . . . . . . ¥ 14 $ 0.15
Hedged items:Long-term borrowings . . . . . . . . . . . . . . . . . . . . . . . . . . . . . . . . . . . . . . . . . . . . . . . ¥(14) $(0.15)
Total . . . . . . . . . . . . . . . . . . . . . . . . . . . . . . . . . . . . . . . . . . . . . . . . . . . . . . . . . . . . . ¥(14) $(0.15)
F-53
NOMURA HOLDINGS, INC.
NOTES TO THE CONSOLIDATED FINANCIAL STATEMENTS—(Continued)
Derivatives containing credit-risk-related contingent features
Nomura enters into certain OTC derivatives and other agreements containing credit-risk-related contingentfeatures. These features would require Nomura to post additional collateral or settle the instrument uponoccurrence of a credit event, the most common of which would be a downgrade in the Company’s long-termcredit rating.
The aggregate fair value of all derivative instruments with credit-risk-related contingent features that are ina liability position on March 31, 2009, was ¥1,578 billion with related collateral pledged at that date of ¥629billion. In the event of a one-notch downgrade to Nomura’s long-term credit rating, the aggregate fair value ofassets that would have been required to be posted as additional collateral or that would have been needed to settlethe instruments immediately was ¥13 billion. The aggregate fair value of all derivative instruments with credit-risk-related contingent features that are in a liability position on March 31, 2010, was ¥1,559 billion ($16.69billion) with related collateral pledged at that date of ¥848 billion ($9.08 billion). In the event of a one-notchdowngrade to Nomura’s long-term credit rating, the aggregate fair value of assets that would have been requiredto be posted as additional collateral or that would have been needed to settle the instruments immediately was¥29 billion ($0.31billion).
Credit derivatives:
Credit derivatives are derivative instruments in which one or more of their underlyings are related to thecredit risk of a specified entity (or group of entities) or an index based on the credit risk of a group of entities andthat expose the seller to potential loss from credit risk related events specified in the contract.
Written credit derivatives are instruments or embedded features where Nomura assumes third party creditrisk, either as guarantor in a guarantee-type contract, or as the party that provides credit protection in an option-type contract, credit default swap, or any other credit derivative contract.
Nomura enters into credit derivatives as part of its normal trading activities as both purchaser and seller forcredit risk mitigation, proprietary trading positions and for client transactions.
The most significant type of credit derivatives used by Nomura are single-name credit default swaps wheresettlement of the derivative is based on the credit risk of a single third party. Nomura also writes creditderivatives linked to the performance of a credit default index and issues other credit-risk related portfolioproducts.
Nomura would have to perform under a credit derivative contract if a credit event as defined in therespective contract occurs. Typical credit events include bankruptcy, failure to pay and restructuring ofobligations of the referenced security.
Credit derivative contracts written by Nomura are either cash or physically settled. In cash-settledinstruments, once payment is made upon an event of a default, the contract usually terminates with no furtherpayments due. Nomura generally has no right to assume the reference assets of the counterparty in exchange forpayment, nor does Nomura usually have any direct recourse to the actual issuers of the reference assets torecover the amount paid. In physically-settled contracts, upon a default event, Nomura takes delivery of thereference asset in return for payment of the full notional of the contract.
Nomura actively monitors and manages its credit derivative exposures. Where protection is sold, risks maybe mitigated through purchasing credit protection from other third parties either on identical underlying reference
F-54
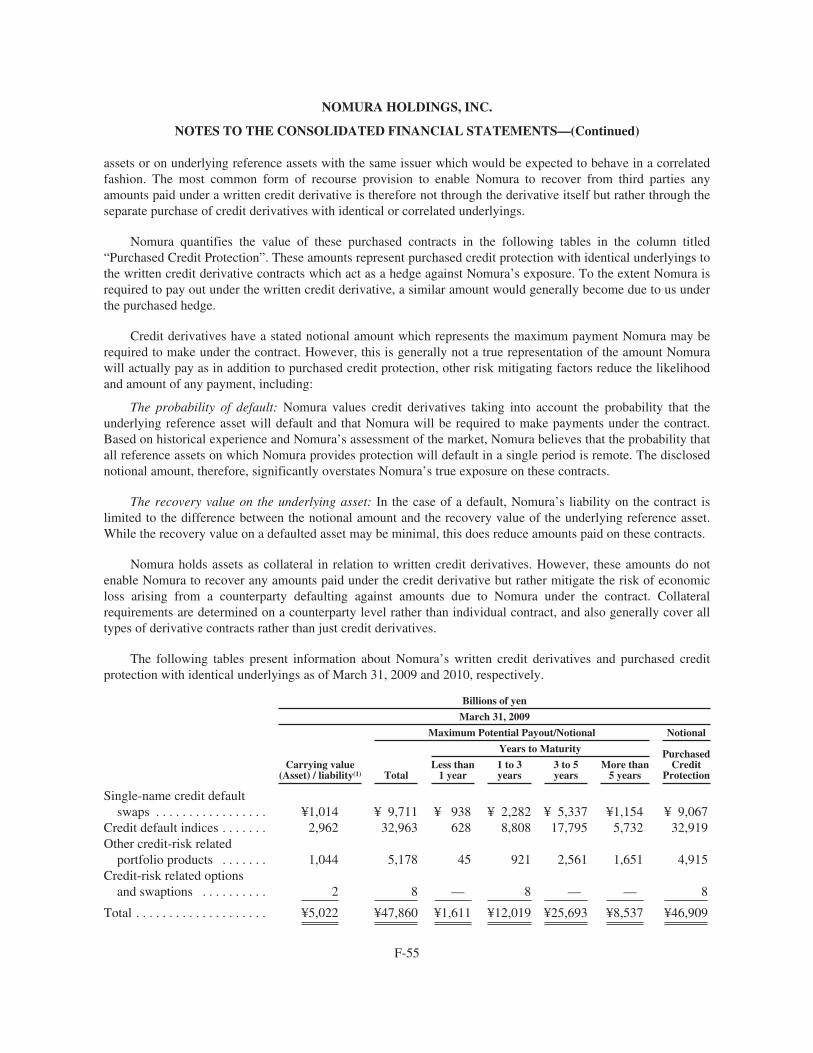
NOMURA HOLDINGS, INC.
NOTES TO THE CONSOLIDATED FINANCIAL STATEMENTS—(Continued)
assets or on underlying reference assets with the same issuer which would be expected to behave in a correlatedfashion. The most common form of recourse provision to enable Nomura to recover from third parties anyamounts paid under a written credit derivative is therefore not through the derivative itself but rather through theseparate purchase of credit derivatives with identical or correlated underlyings.
Nomura quantifies the value of these purchased contracts in the following tables in the column titled“Purchased Credit Protection”. These amounts represent purchased credit protection with identical underlyings tothe written credit derivative contracts which act as a hedge against Nomura’s exposure. To the extent Nomura isrequired to pay out under the written credit derivative, a similar amount would generally become due to us underthe purchased hedge.
Credit derivatives have a stated notional amount which represents the maximum payment Nomura may berequired to make under the contract. However, this is generally not a true representation of the amount Nomurawill actually pay as in addition to purchased credit protection, other risk mitigating factors reduce the likelihoodand amount of any payment, including:
The probability of default: Nomura values credit derivatives taking into account the probability that theunderlying reference asset will default and that Nomura will be required to make payments under the contract.Based on historical experience and Nomura’s assessment of the market, Nomura believes that the probability thatall reference assets on which Nomura provides protection will default in a single period is remote. The disclosednotional amount, therefore, significantly overstates Nomura’s true exposure on these contracts.
The recovery value on the underlying asset: In the case of a default, Nomura’s liability on the contract islimited to the difference between the notional amount and the recovery value of the underlying reference asset.While the recovery value on a defaulted asset may be minimal, this does reduce amounts paid on these contracts.
Nomura holds assets as collateral in relation to written credit derivatives. However, these amounts do notenable Nomura to recover any amounts paid under the credit derivative but rather mitigate the risk of economicloss arising from a counterparty defaulting against amounts due to Nomura under the contract. Collateralrequirements are determined on a counterparty level rather than individual contract, and also generally cover alltypes of derivative contracts rather than just credit derivatives.
The following tables present information about Nomura’s written credit derivatives and purchased creditprotection with identical underlyings as of March 31, 2009 and 2010, respectively.
Billions of yen
March 31, 2009
Maximum Potential Payout/Notional Notional
Years to Maturity PurchasedCredit
ProtectionCarrying value
(Asset) / liability(1) TotalLess than
1 year1 to 3years
3 to 5years
More than5 years
Single-name credit defaultswaps . . . . . . . . . . . . . . . . . ¥1,014 ¥ 9,711 ¥ 938 ¥ 2,282 ¥ 5,337 ¥1,154 ¥ 9,067
Credit default indices . . . . . . . 2,962 32,963 628 8,808 17,795 5,732 32,919Other credit-risk related
portfolio products . . . . . . . 1,044 5,178 45 921 2,561 1,651 4,915Credit-risk related options
and swaptions . . . . . . . . . . 2 8 — 8 — — 8
Total . . . . . . . . . . . . . . . . . . . . ¥5,022 ¥47,860 ¥1,611 ¥12,019 ¥25,693 ¥8,537 ¥46,909
F-55
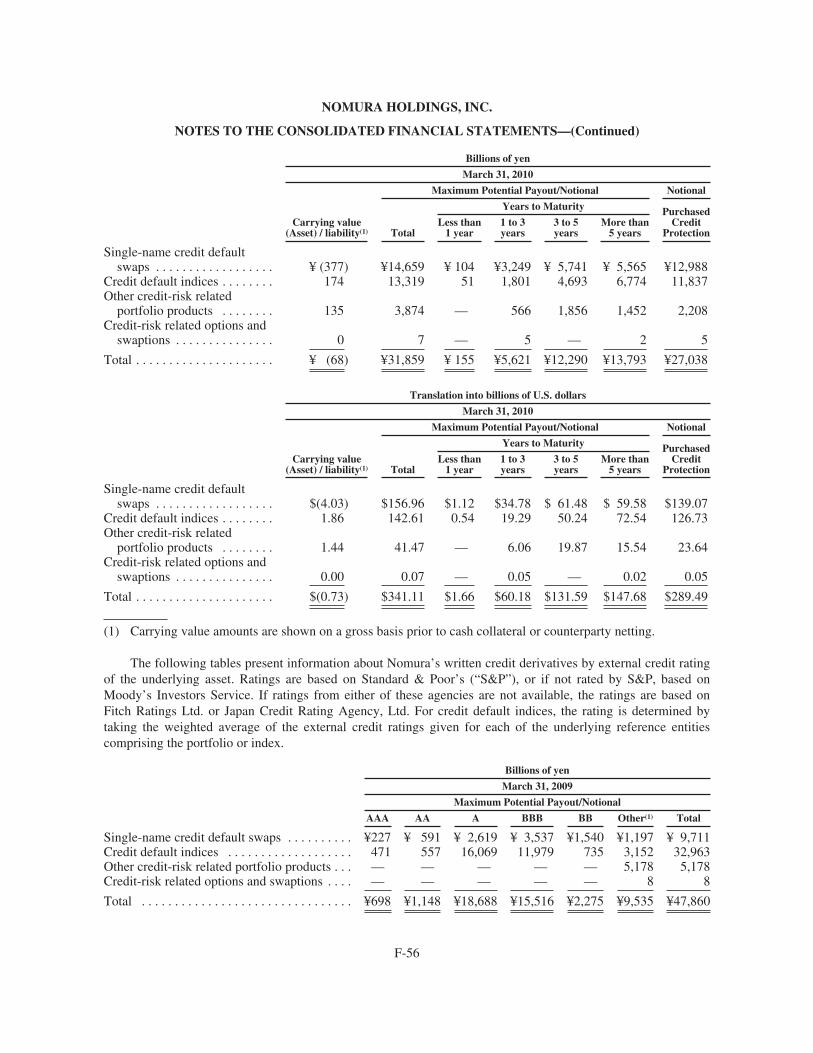
NOMURA HOLDINGS, INC.
NOTES TO THE CONSOLIDATED FINANCIAL STATEMENTS—(Continued)
Billions of yen
March 31, 2010
Maximum Potential Payout/Notional Notional
Years to Maturity PurchasedCredit
ProtectionCarrying value
(Asset) / liability(1) TotalLess than
1 year1 to 3years
3 to 5years
More than5 years
Single-name credit defaultswaps . . . . . . . . . . . . . . . . . . ¥ (377) ¥14,659 ¥ 104 ¥3,249 ¥ 5,741 ¥ 5,565 ¥12,988
Credit default indices . . . . . . . . 174 13,319 51 1,801 4,693 6,774 11,837Other credit-risk related
portfolio products . . . . . . . . 135 3,874 — 566 1,856 1,452 2,208Credit-risk related options and
swaptions . . . . . . . . . . . . . . . 0 7 — 5 — 2 5
Total . . . . . . . . . . . . . . . . . . . . . ¥ (68) ¥31,859 ¥ 155 ¥5,621 ¥12,290 ¥13,793 ¥27,038
Translation into billions of U.S. dollars
March 31, 2010
Maximum Potential Payout/Notional Notional
Years to Maturity PurchasedCredit
ProtectionCarrying value
(Asset) / liability(1) TotalLess than
1 year1 to 3years
3 to 5years
More than5 years
Single-name credit defaultswaps . . . . . . . . . . . . . . . . . . $(4.03) $156.96 $1.12 $34.78 $ 61.48 $ 59.58 $139.07
Credit default indices . . . . . . . . 1.86 142.61 0.54 19.29 50.24 72.54 126.73Other credit-risk related
portfolio products . . . . . . . . 1.44 41.47 — 6.06 19.87 15.54 23.64Credit-risk related options and
swaptions . . . . . . . . . . . . . . . 0.00 0.07 — 0.05 — 0.02 0.05
Total . . . . . . . . . . . . . . . . . . . . . $(0.73) $341.11 $1.66 $60.18 $131.59 $147.68 $289.49
(1) Carrying value amounts are shown on a gross basis prior to cash collateral or counterparty netting.
The following tables present information about Nomura’s written credit derivatives by external credit ratingof the underlying asset. Ratings are based on Standard & Poor’s (“S&P”), or if not rated by S&P, based onMoody’s Investors Service. If ratings from either of these agencies are not available, the ratings are based onFitch Ratings Ltd. or Japan Credit Rating Agency, Ltd. For credit default indices, the rating is determined bytaking the weighted average of the external credit ratings given for each of the underlying reference entitiescomprising the portfolio or index.
Billions of yen
March 31, 2009
Maximum Potential Payout/Notional
AAA AA A BBB BB Other(1) Total
Single-name credit default swaps . . . . . . . . . . ¥227 ¥ 591 ¥ 2,619 ¥ 3,537 ¥1,540 ¥1,197 ¥ 9,711Credit default indices . . . . . . . . . . . . . . . . . . . 471 557 16,069 11,979 735 3,152 32,963Other credit-risk related portfolio products . . . — — — — — 5,178 5,178Credit-risk related options and swaptions . . . . — — — — — 8 8
Total . . . . . . . . . . . . . . . . . . . . . . . . . . . . . . . . ¥698 ¥1,148 ¥18,688 ¥15,516 ¥2,275 ¥9,535 ¥47,860
F-56

NOMURA HOLDINGS, INC.
NOTES TO THE CONSOLIDATED FINANCIAL STATEMENTS—(Continued)
Billions of yen
March 31, 2010
Maximum Potential Payout/Notional
AAA AA A BBB BB Other(1) Total
Single-name credit default swaps . . . . . . . . . . ¥ 668 ¥ 922 ¥ 4,469 ¥4,912 ¥2,201 ¥1,487 ¥14,659Credit default indices . . . . . . . . . . . . . . . . . . . 967 351 5,998 3,987 350 1,666 13,319Other credit-risk related portfolio products . . 23 — — — — 3,851 3,874Credit-risk related options and swaptions . . . — — — 2 — 5 7
Total . . . . . . . . . . . . . . . . . . . . . . . . . . . . . . . . ¥1,658 ¥1,273 ¥10,467 ¥8,901 ¥2,551 ¥7,009 ¥31,859
Translation into billions of U.S. dollars
March 31, 2010
Maximum Potential Payout/Notional
AAA AA A BBB BB Other(1) Total
Single-name credit default swaps . . . . . . . . . . $ 7.15 $ 9.87 $ 47.85 $52.59 $23.56 $15.94 $156.96Credit default indices . . . . . . . . . . . . . . . . . . . 10.36 3.76 64.21 42.69 3.75 17.84 142.61Other credit-risk related portfolio products . . 0.25 — — — — 41.22 41.47Credit-risk related options and swaptions . . . — — — 0.02 — 0.05 0.07
Total . . . . . . . . . . . . . . . . . . . . . . . . . . . . . . . . $17.76 $13.63 $112.06 $95.30 $27.31 $75.05 $341.11
(1) “Other” includes credit derivatives where the credit rating of the underlying reference asset is belowinvestment grade or where a rating is unavailable.
5. Private equity business:
Nomura makes private equity investments primarily in Japan and Europe.
As of April 1, 2007 Nomura adopted ASC 946 and as a result, private equity investments made by certainentities which Nomura consolidates under either a voting interest or variable interest model which are investmentcompanies pursuant to the provisions of ASC 946 (“investment company subsidiaries”) are now accounted for atfair value, with changes in fair value recognized through the consolidated statements of operations. Investmentcompany accounting applied by each of these investment company subsidiaries is retained in these consolidatedfinancial statements.
These entities make private equity investments solely for capital appreciation, current income or both ratherthan to generate strategic operating benefits to Nomura. In accordance with Nomura investment policies,non-investment companies within the group may not make investments in entities engaged in non-corebusinesses if such investments would result in consolidation or application of the equity method of accounting.Such investments may generally only be made by investment company subsidiaries. Non-core businesses aredefined as those engaged in activities other than Nomura’s business segments.
Nomura also has a subsidiary which is not an investment company but which makes investments in entitiesengaged in Nomura’s core businesses. These investments are made for capital appreciation or current incomepurposes or both and are also carried at fair value, either because fair value is carried by election of the fair valueoption or other U.S. GAAP requirements.
F-57
NOMURA HOLDINGS, INC.
NOTES TO THE CONSOLIDATED FINANCIAL STATEMENTS—(Continued)
Private equity business in Japan
Nomura has an established private equity business in Japan, which is operated primarily through a wholly-owned subsidiary, NPF.
Since its inception in 2000, NPF has made investments in 21 entities and exited from 16 of theseinvestments (including partial sales). The fair value of its investment portfolio is ¥98,998 million and¥104,962 million ($1,124 million) as of March 31, 2009 and 2010, respectively.
NPF is an investment company subsidiary pursuant to the provisions of ASC 946 and therefore carries all ofits investments at fair value, with changes in fair value recognized through the consolidated statements ofoperations from the adoption date of ASC 946 on April 1, 2007.
Nomura also makes private equity investments through another wholly-owned subsidiary, Nomura FinancialPartners Co., Ltd. (“NFP”). NFP is not an investment company subsidiary as it invests in the entities engaged inNomura’s core business. Nomura elected the fair value option to account for its 45.5% investment in thecommon stock of Ashikaga Holdings.
Private equity business in Europe
In Europe, Nomura’s private equity investments primarily comprise legacy investments made by its formerPrincipal Finance Group (“PFG”) now managed by Terra Firma (collectively referred to as the “Terra FirmaInvestments”), investments in other funds managed by Terra Firma (“Other Terra Firma Funds”) and throughother investment company subsidiaries (“Other Investments”).
Terra Firma Investments
Following a review to determine the optimum structure for Nomura’s European private equity business, onMarch 27, 2002, Nomura restructured its PFG and, as a result, contributed its investments in certain of itsremaining investee companies to Terra Firma Capital Partners I (“TFCP I”), a limited partnership which isengaged in the private equity business, in exchange for a limited partnership interest. Terra Firma Investments(GP) Limited, the general partner of TFCP I, which is independent of Nomura, assumed the management andcontrol of these investments, together with one other PFG investment, Annington Holdings plc, which due tocontractual restrictions was not transferred to the partnership.
With effect from March 27, 2002, Nomura ceased consolidating the Terra Firma Investments and accountedfor those investments at fair value in accordance with ASC 946.
The Terra Firma Investments are held by entities which are investment company subsidiaries and thereforeNomura continues to account for these investments at fair value, with changes in fair value recognized throughthe consolidated statements of operations.
The fair value of the Terra Firma Investments was ¥89,762 million and ¥98,683 million ($1,057 million) asof March 31, 2009 and 2010, respectively.
Other Terra Firma Funds
In addition to the Terra Firma Investments, Nomura is a 10% investor in a ¥242 billion ($2.59 billion)private equity fund (“TFCP II”) and a 2% investor in a ¥646 billion ($6.91 billion) private equity fund (“TFCPIII”), also raised and managed by Terra Firma Capital Partners Limited.
F-58
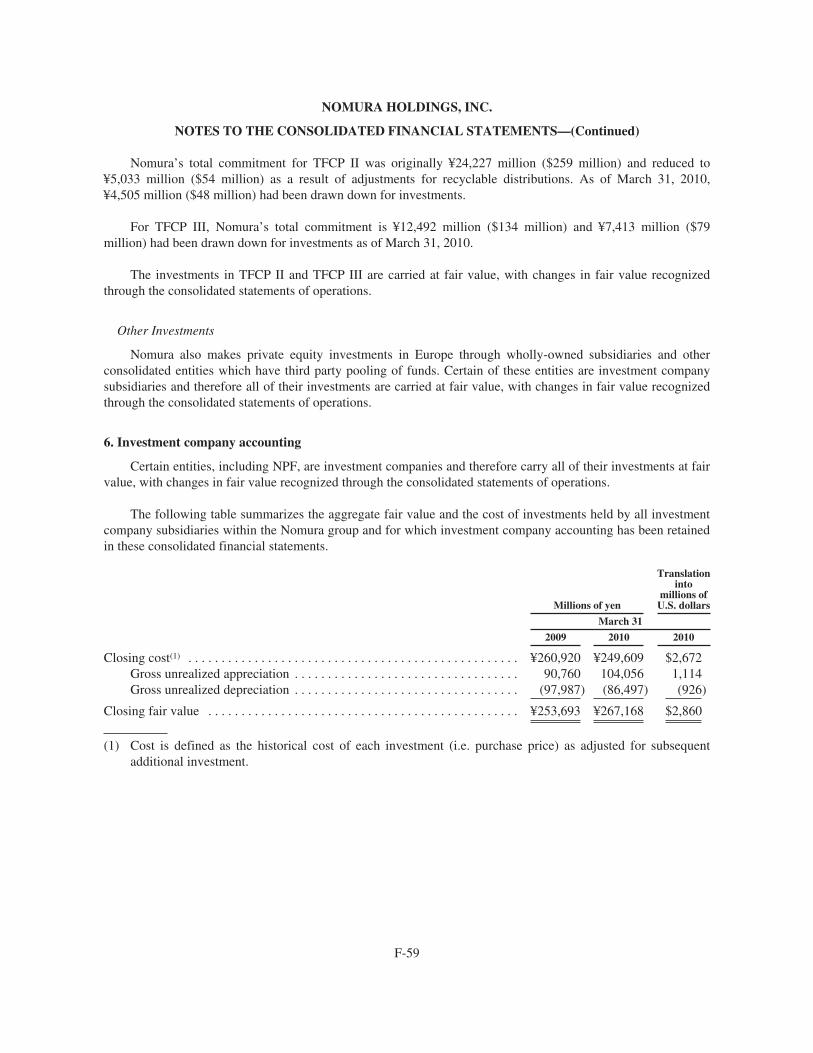
NOMURA HOLDINGS, INC.
NOTES TO THE CONSOLIDATED FINANCIAL STATEMENTS—(Continued)
Nomura’s total commitment for TFCP II was originally ¥24,227 million ($259 million) and reduced to¥5,033 million ($54 million) as a result of adjustments for recyclable distributions. As of March 31, 2010,¥4,505 million ($48 million) had been drawn down for investments.
For TFCP III, Nomura’s total commitment is ¥12,492 million ($134 million) and ¥7,413 million ($79million) had been drawn down for investments as of March 31, 2010.
The investments in TFCP II and TFCP III are carried at fair value, with changes in fair value recognizedthrough the consolidated statements of operations.
Other Investments
Nomura also makes private equity investments in Europe through wholly-owned subsidiaries and otherconsolidated entities which have third party pooling of funds. Certain of these entities are investment companysubsidiaries and therefore all of their investments are carried at fair value, with changes in fair value recognizedthrough the consolidated statements of operations.
6. Investment company accounting
Certain entities, including NPF, are investment companies and therefore carry all of their investments at fairvalue, with changes in fair value recognized through the consolidated statements of operations.
The following table summarizes the aggregate fair value and the cost of investments held by all investmentcompany subsidiaries within the Nomura group and for which investment company accounting has been retainedin these consolidated financial statements.
Millions of yen
Translationinto
millions ofU.S. dollars
March 31
2009 2010 2010
Closing cost(1) . . . . . . . . . . . . . . . . . . . . . . . . . . . . . . . . . . . . . . . . . . . . . . . . . . ¥260,920 ¥249,609 $2,672Gross unrealized appreciation . . . . . . . . . . . . . . . . . . . . . . . . . . . . . . . . . . 90,760 104,056 1,114Gross unrealized depreciation . . . . . . . . . . . . . . . . . . . . . . . . . . . . . . . . . . (97,987) (86,497) (926)
Closing fair value . . . . . . . . . . . . . . . . . . . . . . . . . . . . . . . . . . . . . . . . . . . . . . . ¥253,693 ¥267,168 $2,860
(1) Cost is defined as the historical cost of each investment (i.e. purchase price) as adjusted for subsequentadditional investment.
F-59
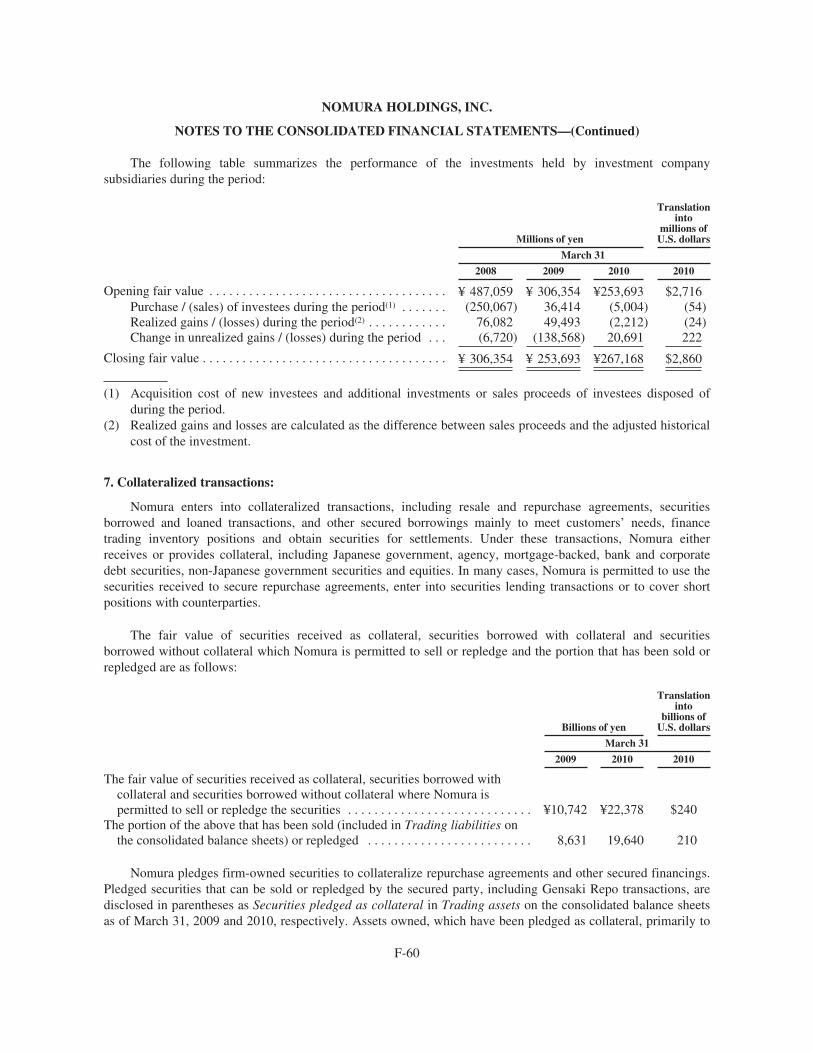
NOMURA HOLDINGS, INC.
NOTES TO THE CONSOLIDATED FINANCIAL STATEMENTS—(Continued)
The following table summarizes the performance of the investments held by investment companysubsidiaries during the period:
Millions of yen
Translationinto
millions ofU.S. dollars
March 31
2008 2009 2010 2010
Opening fair value . . . . . . . . . . . . . . . . . . . . . . . . . . . . . . . . . . . . ¥ 487,059 ¥ 306,354 ¥253,693 $2,716Purchase / (sales) of investees during the period(1) . . . . . . . (250,067) 36,414 (5,004) (54)Realized gains / (losses) during the period(2) . . . . . . . . . . . . 76,082 49,493 (2,212) (24)Change in unrealized gains / (losses) during the period . . . (6,720) (138,568) 20,691 222
Closing fair value . . . . . . . . . . . . . . . . . . . . . . . . . . . . . . . . . . . . . ¥ 306,354 ¥ 253,693 ¥267,168 $2,860
(1) Acquisition cost of new investees and additional investments or sales proceeds of investees disposed ofduring the period.
(2) Realized gains and losses are calculated as the difference between sales proceeds and the adjusted historicalcost of the investment.
7. Collateralized transactions:
Nomura enters into collateralized transactions, including resale and repurchase agreements, securitiesborrowed and loaned transactions, and other secured borrowings mainly to meet customers’ needs, financetrading inventory positions and obtain securities for settlements. Under these transactions, Nomura eitherreceives or provides collateral, including Japanese government, agency, mortgage-backed, bank and corporatedebt securities, non-Japanese government securities and equities. In many cases, Nomura is permitted to use thesecurities received to secure repurchase agreements, enter into securities lending transactions or to cover shortpositions with counterparties.
The fair value of securities received as collateral, securities borrowed with collateral and securitiesborrowed without collateral which Nomura is permitted to sell or repledge and the portion that has been sold orrepledged are as follows:
Billions of yen
Translationinto
billions ofU.S. dollars
March 31
2009 2010 2010
The fair value of securities received as collateral, securities borrowed withcollateral and securities borrowed without collateral where Nomura ispermitted to sell or repledge the securities . . . . . . . . . . . . . . . . . . . . . . . . . . . . ¥10,742 ¥22,378 $240
The portion of the above that has been sold (included in Trading liabilities onthe consolidated balance sheets) or repledged . . . . . . . . . . . . . . . . . . . . . . . . . 8,631 19,640 210
Nomura pledges firm-owned securities to collateralize repurchase agreements and other secured financings.Pledged securities that can be sold or repledged by the secured party, including Gensaki Repo transactions, aredisclosed in parentheses as Securities pledged as collateral in Trading assets on the consolidated balance sheetsas of March 31, 2009 and 2010, respectively. Assets owned, which have been pledged as collateral, primarily to
F-60
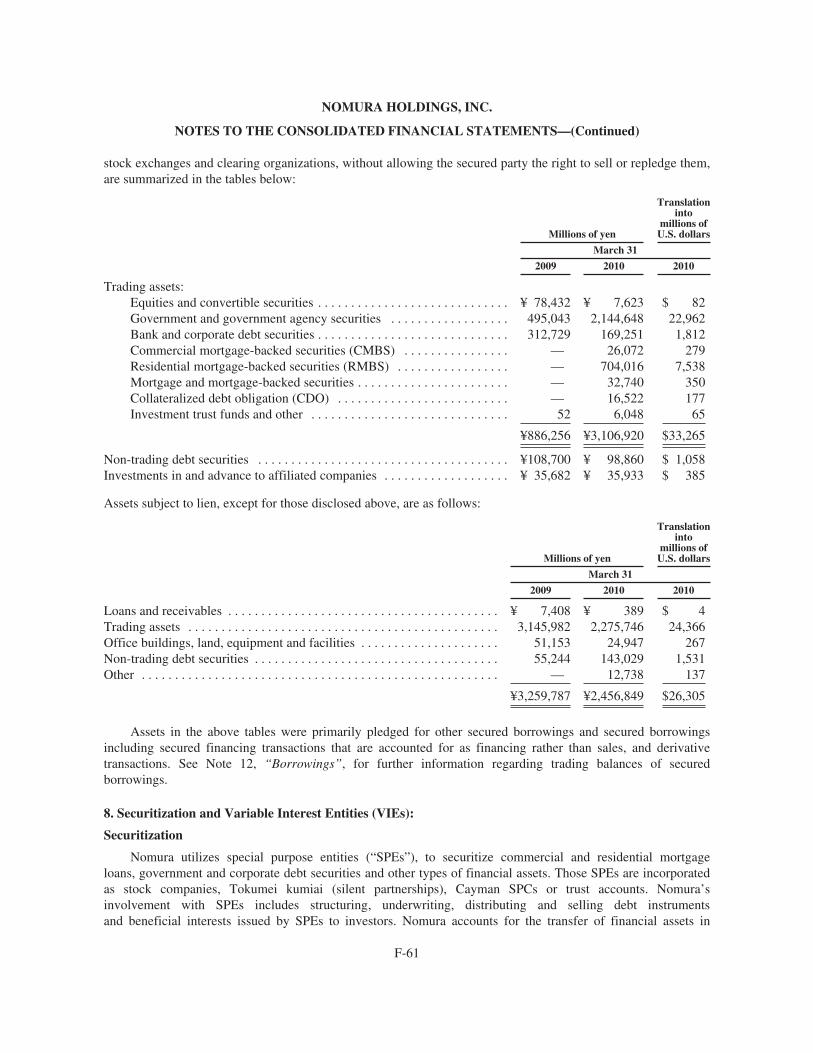
NOMURA HOLDINGS, INC.
NOTES TO THE CONSOLIDATED FINANCIAL STATEMENTS—(Continued)
stock exchanges and clearing organizations, without allowing the secured party the right to sell or repledge them,are summarized in the tables below:
Millions of yen
Translationinto
millions ofU.S. dollars
March 31
2009 2010 2010
Trading assets:Equities and convertible securities . . . . . . . . . . . . . . . . . . . . . . . . . . . . . ¥ 78,432 ¥ 7,623 $ 82Government and government agency securities . . . . . . . . . . . . . . . . . . 495,043 2,144,648 22,962Bank and corporate debt securities . . . . . . . . . . . . . . . . . . . . . . . . . . . . . 312,729 169,251 1,812Commercial mortgage-backed securities (CMBS) . . . . . . . . . . . . . . . . — 26,072 279Residential mortgage-backed securities (RMBS) . . . . . . . . . . . . . . . . . — 704,016 7,538Mortgage and mortgage-backed securities . . . . . . . . . . . . . . . . . . . . . . . — 32,740 350Collateralized debt obligation (CDO) . . . . . . . . . . . . . . . . . . . . . . . . . . — 16,522 177Investment trust funds and other . . . . . . . . . . . . . . . . . . . . . . . . . . . . . . 52 6,048 65
¥886,256 ¥3,106,920 $33,265
Non-trading debt securities . . . . . . . . . . . . . . . . . . . . . . . . . . . . . . . . . . . . . . ¥108,700 ¥ 98,860 $ 1,058Investments in and advance to affiliated companies . . . . . . . . . . . . . . . . . . . ¥ 35,682 ¥ 35,933 $ 385
Assets subject to lien, except for those disclosed above, are as follows:
Millions of yen
Translationinto
millions ofU.S. dollars
March 31
2009 2010 2010
Loans and receivables . . . . . . . . . . . . . . . . . . . . . . . . . . . . . . . . . . . . . . . . . ¥ 7,408 ¥ 389 $ 4Trading assets . . . . . . . . . . . . . . . . . . . . . . . . . . . . . . . . . . . . . . . . . . . . . . . 3,145,982 2,275,746 24,366Office buildings, land, equipment and facilities . . . . . . . . . . . . . . . . . . . . . 51,153 24,947 267Non-trading debt securities . . . . . . . . . . . . . . . . . . . . . . . . . . . . . . . . . . . . . 55,244 143,029 1,531Other . . . . . . . . . . . . . . . . . . . . . . . . . . . . . . . . . . . . . . . . . . . . . . . . . . . . . . — 12,738 137
¥3,259,787 ¥2,456,849 $26,305
Assets in the above tables were primarily pledged for other secured borrowings and secured borrowingsincluding secured financing transactions that are accounted for as financing rather than sales, and derivativetransactions. See Note 12, “Borrowings”, for further information regarding trading balances of securedborrowings.
8. Securitization and Variable Interest Entities (VIEs):
Securitization
Nomura utilizes special purpose entities (“SPEs”), to securitize commercial and residential mortgageloans, government and corporate debt securities and other types of financial assets. Those SPEs are incorporatedas stock companies, Tokumei kumiai (silent partnerships), Cayman SPCs or trust accounts. Nomura’sinvolvement with SPEs includes structuring, underwriting, distributing and selling debt instrumentsand beneficial interests issued by SPEs to investors. Nomura accounts for the transfer of financial assets in
F-61
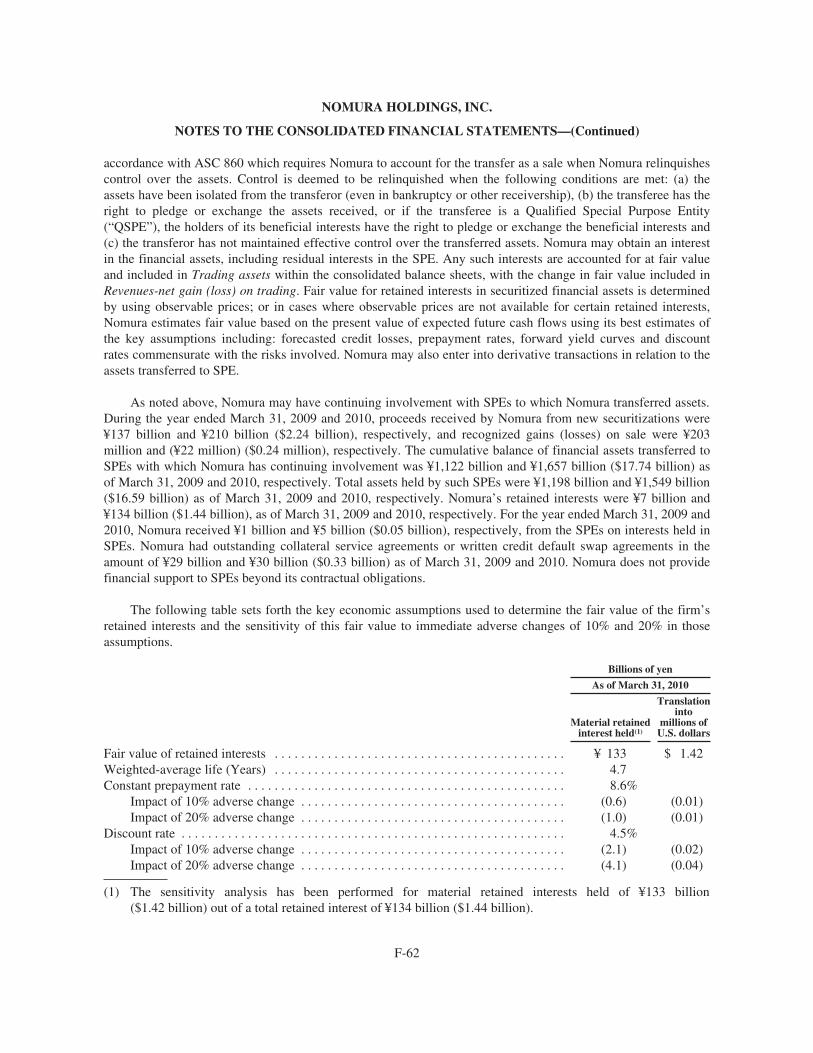
NOMURA HOLDINGS, INC.
NOTES TO THE CONSOLIDATED FINANCIAL STATEMENTS—(Continued)
accordance with ASC 860 which requires Nomura to account for the transfer as a sale when Nomura relinquishescontrol over the assets. Control is deemed to be relinquished when the following conditions are met: (a) theassets have been isolated from the transferor (even in bankruptcy or other receivership), (b) the transferee has theright to pledge or exchange the assets received, or if the transferee is a Qualified Special Purpose Entity(“QSPE”), the holders of its beneficial interests have the right to pledge or exchange the beneficial interests and(c) the transferor has not maintained effective control over the transferred assets. Nomura may obtain an interestin the financial assets, including residual interests in the SPE. Any such interests are accounted for at fair valueand included in Trading assets within the consolidated balance sheets, with the change in fair value included inRevenues-net gain (loss) on trading. Fair value for retained interests in securitized financial assets is determinedby using observable prices; or in cases where observable prices are not available for certain retained interests,Nomura estimates fair value based on the present value of expected future cash flows using its best estimates ofthe key assumptions including: forecasted credit losses, prepayment rates, forward yield curves and discountrates commensurate with the risks involved. Nomura may also enter into derivative transactions in relation to theassets transferred to SPE.
As noted above, Nomura may have continuing involvement with SPEs to which Nomura transferred assets.During the year ended March 31, 2009 and 2010, proceeds received by Nomura from new securitizations were¥137 billion and ¥210 billion ($2.24 billion), respectively, and recognized gains (losses) on sale were ¥203million and (¥22 million) ($0.24 million), respectively. The cumulative balance of financial assets transferred toSPEs with which Nomura has continuing involvement was ¥1,122 billion and ¥1,657 billion ($17.74 billion) asof March 31, 2009 and 2010, respectively. Total assets held by such SPEs were ¥1,198 billion and ¥1,549 billion($16.59 billion) as of March 31, 2009 and 2010, respectively. Nomura’s retained interests were ¥7 billion and¥134 billion ($1.44 billion), as of March 31, 2009 and 2010, respectively. For the year ended March 31, 2009 and2010, Nomura received ¥1 billion and ¥5 billion ($0.05 billion), respectively, from the SPEs on interests held inSPEs. Nomura had outstanding collateral service agreements or written credit default swap agreements in theamount of ¥29 billion and ¥30 billion ($0.33 billion) as of March 31, 2009 and 2010. Nomura does not providefinancial support to SPEs beyond its contractual obligations.
The following table sets forth the key economic assumptions used to determine the fair value of the firm’sretained interests and the sensitivity of this fair value to immediate adverse changes of 10% and 20% in thoseassumptions.
Billions of yen
As of March 31, 2010
Material retainedinterest held(1)
Translationinto
millions ofU.S. dollars
Fair value of retained interests . . . . . . . . . . . . . . . . . . . . . . . . . . . . . . . . . . . . . . . . . . . . ¥ 133 $ 1.42Weighted-average life (Years) . . . . . . . . . . . . . . . . . . . . . . . . . . . . . . . . . . . . . . . . . . . . 4.7Constant prepayment rate . . . . . . . . . . . . . . . . . . . . . . . . . . . . . . . . . . . . . . . . . . . . . . . . 8.6%
Impact of 10% adverse change . . . . . . . . . . . . . . . . . . . . . . . . . . . . . . . . . . . . . . . . (0.6) (0.01)Impact of 20% adverse change . . . . . . . . . . . . . . . . . . . . . . . . . . . . . . . . . . . . . . . . (1.0) (0.01)
Discount rate . . . . . . . . . . . . . . . . . . . . . . . . . . . . . . . . . . . . . . . . . . . . . . . . . . . . . . . . . . 4.5%Impact of 10% adverse change . . . . . . . . . . . . . . . . . . . . . . . . . . . . . . . . . . . . . . . . (2.1) (0.02)Impact of 20% adverse change . . . . . . . . . . . . . . . . . . . . . . . . . . . . . . . . . . . . . . . . (4.1) (0.04)
(1) The sensitivity analysis has been performed for material retained interests held of ¥133 billion($1.42 billion) out of a total retained interest of ¥134 billion ($1.44 billion).
F-62
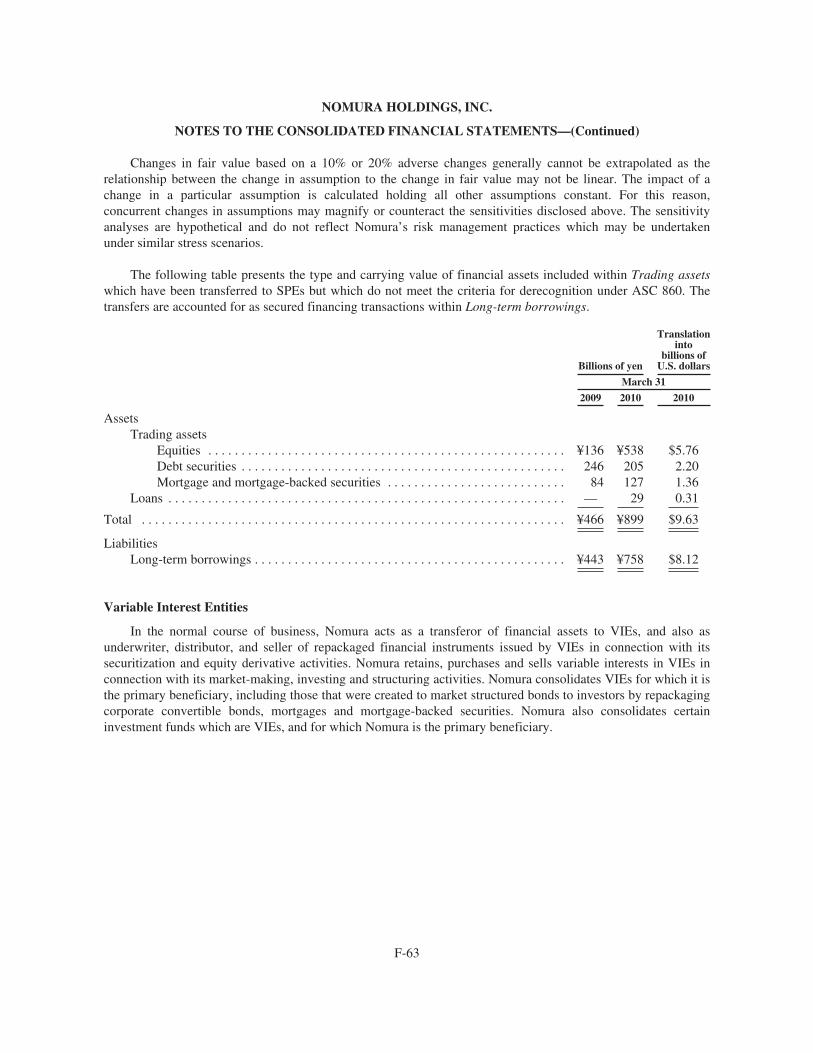
NOMURA HOLDINGS, INC.
NOTES TO THE CONSOLIDATED FINANCIAL STATEMENTS—(Continued)
Changes in fair value based on a 10% or 20% adverse changes generally cannot be extrapolated as therelationship between the change in assumption to the change in fair value may not be linear. The impact of achange in a particular assumption is calculated holding all other assumptions constant. For this reason,concurrent changes in assumptions may magnify or counteract the sensitivities disclosed above. The sensitivityanalyses are hypothetical and do not reflect Nomura’s risk management practices which may be undertakenunder similar stress scenarios.
The following table presents the type and carrying value of financial assets included within Trading assetswhich have been transferred to SPEs but which do not meet the criteria for derecognition under ASC 860. Thetransfers are accounted for as secured financing transactions within Long-term borrowings.
Billions of yen
Translationinto
billions ofU.S. dollars
March 31
2009 2010 2010
AssetsTrading assets
Equities . . . . . . . . . . . . . . . . . . . . . . . . . . . . . . . . . . . . . . . . . . . . . . . . . . . . . . ¥136 ¥538 $5.76Debt securities . . . . . . . . . . . . . . . . . . . . . . . . . . . . . . . . . . . . . . . . . . . . . . . . . 246 205 2.20Mortgage and mortgage-backed securities . . . . . . . . . . . . . . . . . . . . . . . . . . . 84 127 1.36
Loans . . . . . . . . . . . . . . . . . . . . . . . . . . . . . . . . . . . . . . . . . . . . . . . . . . . . . . . . . . . . — 29 0.31
Total . . . . . . . . . . . . . . . . . . . . . . . . . . . . . . . . . . . . . . . . . . . . . . . . . . . . . . . . . . . . . . . . ¥466 ¥899 $9.63
LiabilitiesLong-term borrowings . . . . . . . . . . . . . . . . . . . . . . . . . . . . . . . . . . . . . . . . . . . . . . . ¥443 ¥758 $8.12
Variable Interest Entities
In the normal course of business, Nomura acts as a transferor of financial assets to VIEs, and also asunderwriter, distributor, and seller of repackaged financial instruments issued by VIEs in connection with itssecuritization and equity derivative activities. Nomura retains, purchases and sells variable interests in VIEs inconnection with its market-making, investing and structuring activities. Nomura consolidates VIEs for which it isthe primary beneficiary, including those that were created to market structured bonds to investors by repackagingcorporate convertible bonds, mortgages and mortgage-backed securities. Nomura also consolidates certaininvestment funds which are VIEs, and for which Nomura is the primary beneficiary.
F-63
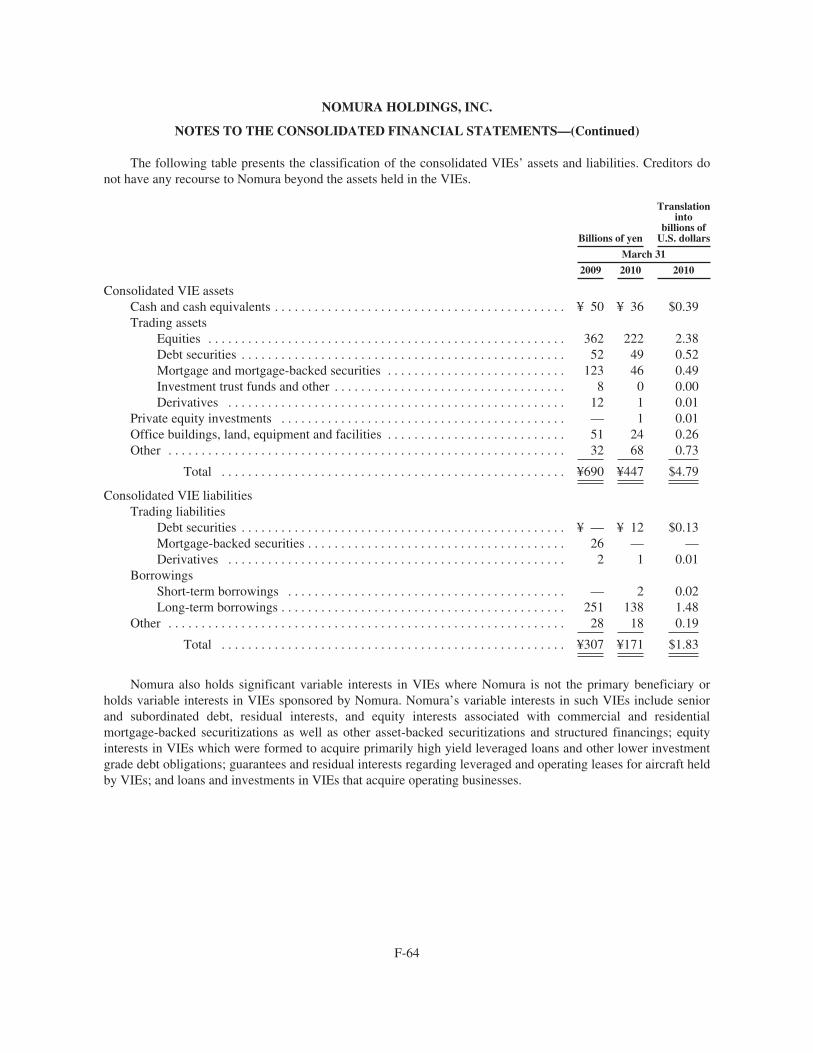
NOMURA HOLDINGS, INC.
NOTES TO THE CONSOLIDATED FINANCIAL STATEMENTS—(Continued)
The following table presents the classification of the consolidated VIEs’ assets and liabilities. Creditors donot have any recourse to Nomura beyond the assets held in the VIEs.
Billions of yen
Translationinto
billions ofU.S. dollars
March 31
2009 2010 2010
Consolidated VIE assetsCash and cash equivalents . . . . . . . . . . . . . . . . . . . . . . . . . . . . . . . . . . . . . . . . . . . . ¥ 50 ¥ 36 $0.39Trading assets
Equities . . . . . . . . . . . . . . . . . . . . . . . . . . . . . . . . . . . . . . . . . . . . . . . . . . . . . . 362 222 2.38Debt securities . . . . . . . . . . . . . . . . . . . . . . . . . . . . . . . . . . . . . . . . . . . . . . . . . 52 49 0.52Mortgage and mortgage-backed securities . . . . . . . . . . . . . . . . . . . . . . . . . . . 123 46 0.49Investment trust funds and other . . . . . . . . . . . . . . . . . . . . . . . . . . . . . . . . . . . 8 0 0.00Derivatives . . . . . . . . . . . . . . . . . . . . . . . . . . . . . . . . . . . . . . . . . . . . . . . . . . . 12 1 0.01
Private equity investments . . . . . . . . . . . . . . . . . . . . . . . . . . . . . . . . . . . . . . . . . . . — 1 0.01Office buildings, land, equipment and facilities . . . . . . . . . . . . . . . . . . . . . . . . . . . 51 24 0.26Other . . . . . . . . . . . . . . . . . . . . . . . . . . . . . . . . . . . . . . . . . . . . . . . . . . . . . . . . . . . . 32 68 0.73
Total . . . . . . . . . . . . . . . . . . . . . . . . . . . . . . . . . . . . . . . . . . . . . . . . . . . . ¥690 ¥447 $4.79
Consolidated VIE liabilitiesTrading liabilities
Debt securities . . . . . . . . . . . . . . . . . . . . . . . . . . . . . . . . . . . . . . . . . . . . . . . . . ¥ — ¥ 12 $0.13Mortgage-backed securities . . . . . . . . . . . . . . . . . . . . . . . . . . . . . . . . . . . . . . . 26 — —Derivatives . . . . . . . . . . . . . . . . . . . . . . . . . . . . . . . . . . . . . . . . . . . . . . . . . . . 2 1 0.01
BorrowingsShort-term borrowings . . . . . . . . . . . . . . . . . . . . . . . . . . . . . . . . . . . . . . . . . . — 2 0.02Long-term borrowings . . . . . . . . . . . . . . . . . . . . . . . . . . . . . . . . . . . . . . . . . . . 251 138 1.48
Other . . . . . . . . . . . . . . . . . . . . . . . . . . . . . . . . . . . . . . . . . . . . . . . . . . . . . . . . . . . . 28 18 0.19
Total . . . . . . . . . . . . . . . . . . . . . . . . . . . . . . . . . . . . . . . . . . . . . . . . . . . . ¥307 ¥171 $1.83
Nomura also holds significant variable interests in VIEs where Nomura is not the primary beneficiary orholds variable interests in VIEs sponsored by Nomura. Nomura’s variable interests in such VIEs include seniorand subordinated debt, residual interests, and equity interests associated with commercial and residentialmortgage-backed securitizations as well as other asset-backed securitizations and structured financings; equityinterests in VIEs which were formed to acquire primarily high yield leveraged loans and other lower investmentgrade debt obligations; guarantees and residual interests regarding leveraged and operating leases for aircraft heldby VIEs; and loans and investments in VIEs that acquire operating businesses.
F-64
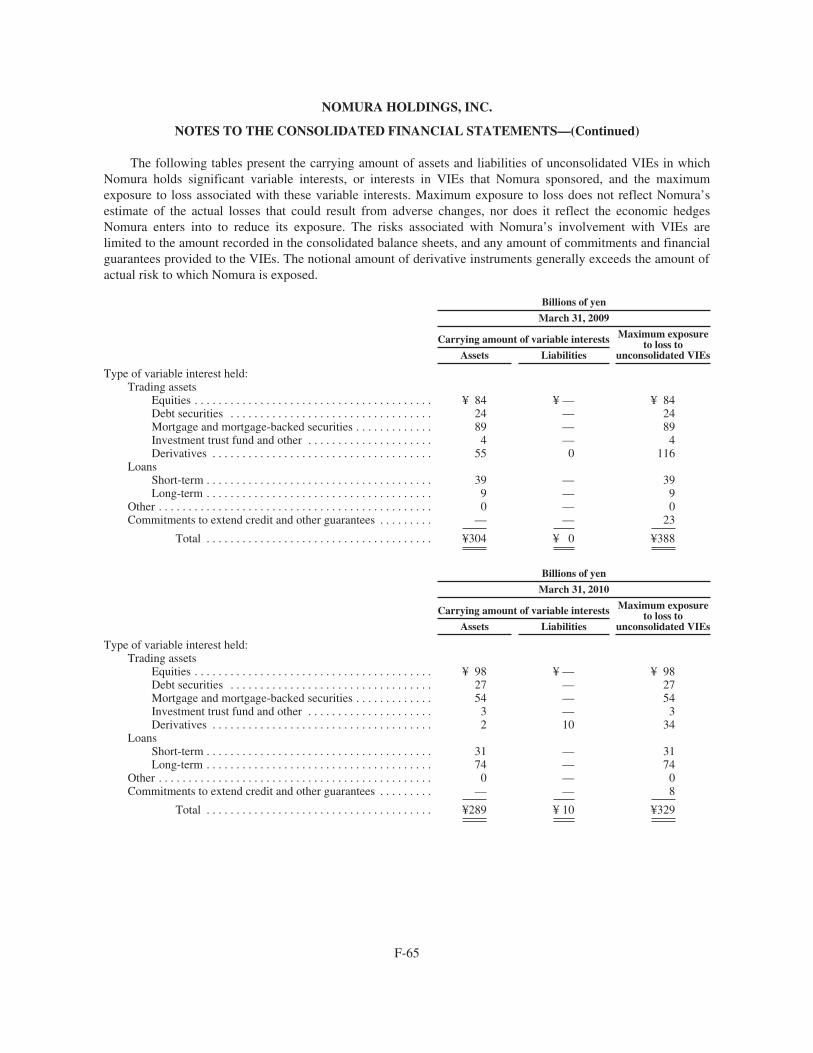
NOMURA HOLDINGS, INC.
NOTES TO THE CONSOLIDATED FINANCIAL STATEMENTS—(Continued)
The following tables present the carrying amount of assets and liabilities of unconsolidated VIEs in whichNomura holds significant variable interests, or interests in VIEs that Nomura sponsored, and the maximumexposure to loss associated with these variable interests. Maximum exposure to loss does not reflect Nomura’sestimate of the actual losses that could result from adverse changes, nor does it reflect the economic hedgesNomura enters into to reduce its exposure. The risks associated with Nomura’s involvement with VIEs arelimited to the amount recorded in the consolidated balance sheets, and any amount of commitments and financialguarantees provided to the VIEs. The notional amount of derivative instruments generally exceeds the amount ofactual risk to which Nomura is exposed.
Billions of yen
March 31, 2009
Carrying amount of variable interests Maximum exposureto loss to
unconsolidated VIEsAssets Liabilities
Type of variable interest held:Trading assets
Equities . . . . . . . . . . . . . . . . . . . . . . . . . . . . . . . . . . . . . . . . ¥ 84 ¥ — ¥ 84Debt securities . . . . . . . . . . . . . . . . . . . . . . . . . . . . . . . . . . 24 — 24Mortgage and mortgage-backed securities . . . . . . . . . . . . . 89 — 89Investment trust fund and other . . . . . . . . . . . . . . . . . . . . . 4 — 4Derivatives . . . . . . . . . . . . . . . . . . . . . . . . . . . . . . . . . . . . . 55 0 116
LoansShort-term . . . . . . . . . . . . . . . . . . . . . . . . . . . . . . . . . . . . . . 39 — 39Long-term . . . . . . . . . . . . . . . . . . . . . . . . . . . . . . . . . . . . . . 9 — 9
Other . . . . . . . . . . . . . . . . . . . . . . . . . . . . . . . . . . . . . . . . . . . . . . 0 — 0Commitments to extend credit and other guarantees . . . . . . . . . — — 23
Total . . . . . . . . . . . . . . . . . . . . . . . . . . . . . . . . . . . . . . ¥304 ¥ 0 ¥388
Billions of yen
March 31, 2010
Carrying amount of variable interests Maximum exposureto loss to
unconsolidated VIEsAssets Liabilities
Type of variable interest held:Trading assets
Equities . . . . . . . . . . . . . . . . . . . . . . . . . . . . . . . . . . . . . . . . ¥ 98 ¥ — ¥ 98Debt securities . . . . . . . . . . . . . . . . . . . . . . . . . . . . . . . . . . 27 — 27Mortgage and mortgage-backed securities . . . . . . . . . . . . . 54 — 54Investment trust fund and other . . . . . . . . . . . . . . . . . . . . . 3 — 3Derivatives . . . . . . . . . . . . . . . . . . . . . . . . . . . . . . . . . . . . . 2 10 34
LoansShort-term . . . . . . . . . . . . . . . . . . . . . . . . . . . . . . . . . . . . . . 31 — 31Long-term . . . . . . . . . . . . . . . . . . . . . . . . . . . . . . . . . . . . . . 74 — 74
Other . . . . . . . . . . . . . . . . . . . . . . . . . . . . . . . . . . . . . . . . . . . . . . 0 — 0Commitments to extend credit and other guarantees . . . . . . . . . — — 8
Total . . . . . . . . . . . . . . . . . . . . . . . . . . . . . . . . . . . . . . ¥289 ¥ 10 ¥329
F-65
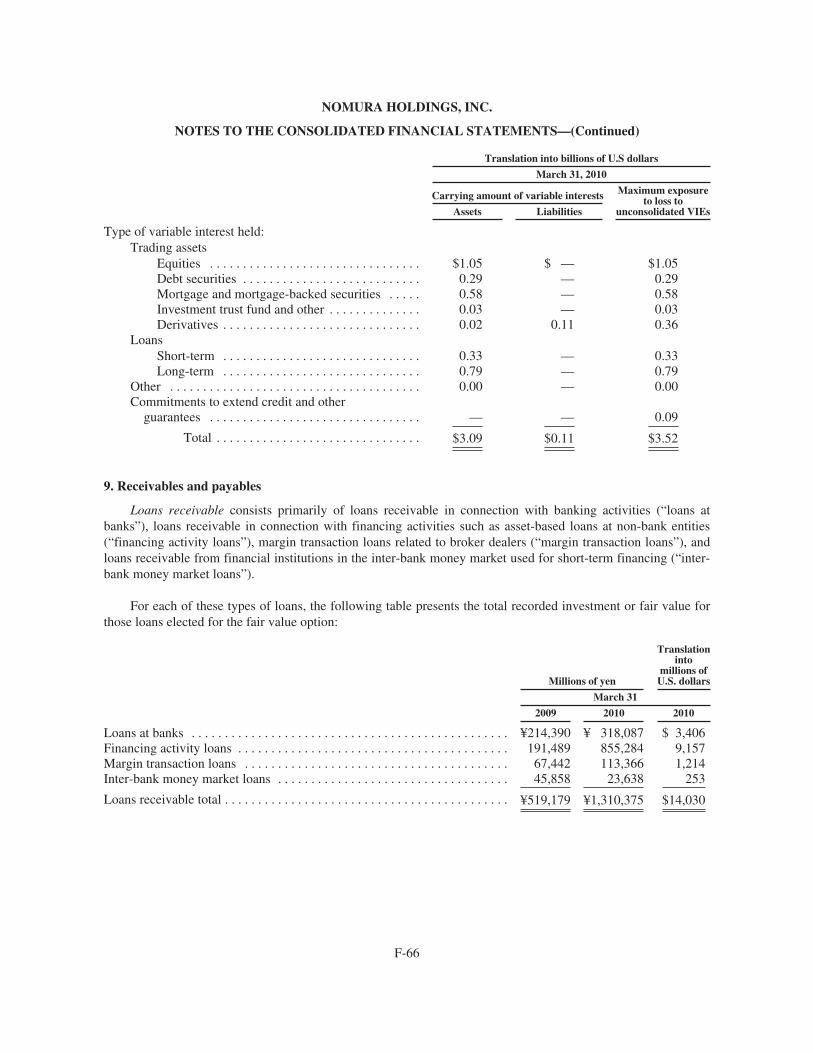
NOMURA HOLDINGS, INC.
NOTES TO THE CONSOLIDATED FINANCIAL STATEMENTS—(Continued)
Translation into billions of U.S dollars
March 31, 2010
Carrying amount of variable interests Maximum exposureto loss to
unconsolidated VIEsAssets Liabilities
Type of variable interest held:Trading assets
Equities . . . . . . . . . . . . . . . . . . . . . . . . . . . . . . . . $1.05 $ — $1.05Debt securities . . . . . . . . . . . . . . . . . . . . . . . . . . . 0.29 — 0.29Mortgage and mortgage-backed securities . . . . . 0.58 — 0.58Investment trust fund and other . . . . . . . . . . . . . . 0.03 — 0.03Derivatives . . . . . . . . . . . . . . . . . . . . . . . . . . . . . . 0.02 0.11 0.36
LoansShort-term . . . . . . . . . . . . . . . . . . . . . . . . . . . . . . 0.33 — 0.33Long-term . . . . . . . . . . . . . . . . . . . . . . . . . . . . . . 0.79 — 0.79
Other . . . . . . . . . . . . . . . . . . . . . . . . . . . . . . . . . . . . . . 0.00 — 0.00Commitments to extend credit and other
guarantees . . . . . . . . . . . . . . . . . . . . . . . . . . . . . . . . — — 0.09
Total . . . . . . . . . . . . . . . . . . . . . . . . . . . . . . . $3.09 $0.11 $3.52
9. Receivables and payables
Loans receivable consists primarily of loans receivable in connection with banking activities (“loans atbanks”), loans receivable in connection with financing activities such as asset-based loans at non-bank entities(“financing activity loans”), margin transaction loans related to broker dealers (“margin transaction loans”), andloans receivable from financial institutions in the inter-bank money market used for short-term financing (“inter-bank money market loans”).
For each of these types of loans, the following table presents the total recorded investment or fair value forthose loans elected for the fair value option:
Millions of yen
Translationinto
millions ofU.S. dollars
March 31
2009 2010 2010
Loans at banks . . . . . . . . . . . . . . . . . . . . . . . . . . . . . . . . . . . . . . . . . . . . . . . . ¥214,390 ¥ 318,087 $ 3,406Financing activity loans . . . . . . . . . . . . . . . . . . . . . . . . . . . . . . . . . . . . . . . . . 191,489 855,284 9,157Margin transaction loans . . . . . . . . . . . . . . . . . . . . . . . . . . . . . . . . . . . . . . . . 67,442 113,366 1,214Inter-bank money market loans . . . . . . . . . . . . . . . . . . . . . . . . . . . . . . . . . . . 45,858 23,638 253
Loans receivable total . . . . . . . . . . . . . . . . . . . . . . . . . . . . . . . . . . . . . . . . . . . ¥519,179 ¥1,310,375 $14,030
F-66
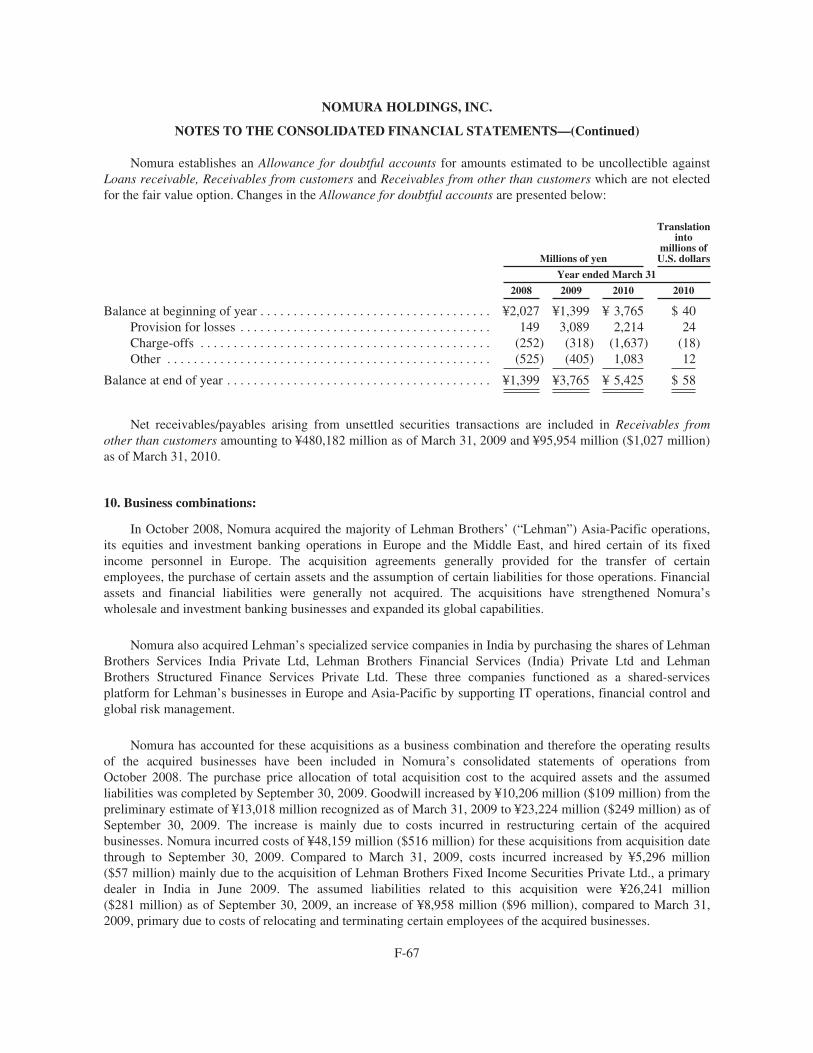
NOMURA HOLDINGS, INC.
NOTES TO THE CONSOLIDATED FINANCIAL STATEMENTS—(Continued)
Nomura establishes an Allowance for doubtful accounts for amounts estimated to be uncollectible againstLoans receivable, Receivables from customers and Receivables from other than customers which are not electedfor the fair value option. Changes in the Allowance for doubtful accounts are presented below:
Millions of yen
Translationinto
millions ofU.S. dollars
Year ended March 31
2008 2009 2010 2010
Balance at beginning of year . . . . . . . . . . . . . . . . . . . . . . . . . . . . . . . . . . . ¥2,027 ¥1,399 ¥ 3,765 $ 40Provision for losses . . . . . . . . . . . . . . . . . . . . . . . . . . . . . . . . . . . . . . 149 3,089 2,214 24Charge-offs . . . . . . . . . . . . . . . . . . . . . . . . . . . . . . . . . . . . . . . . . . . . (252) (318) (1,637) (18)Other . . . . . . . . . . . . . . . . . . . . . . . . . . . . . . . . . . . . . . . . . . . . . . . . . (525) (405) 1,083 12
Balance at end of year . . . . . . . . . . . . . . . . . . . . . . . . . . . . . . . . . . . . . . . . ¥1,399 ¥3,765 ¥ 5,425 $ 58
Net receivables/payables arising from unsettled securities transactions are included in Receivables fromother than customers amounting to ¥480,182 million as of March 31, 2009 and ¥95,954 million ($1,027 million)as of March 31, 2010.
10. Business combinations:
In October 2008, Nomura acquired the majority of Lehman Brothers’ (“Lehman”) Asia-Pacific operations,its equities and investment banking operations in Europe and the Middle East, and hired certain of its fixedincome personnel in Europe. The acquisition agreements generally provided for the transfer of certainemployees, the purchase of certain assets and the assumption of certain liabilities for those operations. Financialassets and financial liabilities were generally not acquired. The acquisitions have strengthened Nomura’swholesale and investment banking businesses and expanded its global capabilities.
Nomura also acquired Lehman’s specialized service companies in India by purchasing the shares of LehmanBrothers Services India Private Ltd, Lehman Brothers Financial Services (India) Private Ltd and LehmanBrothers Structured Finance Services Private Ltd. These three companies functioned as a shared-servicesplatform for Lehman’s businesses in Europe and Asia-Pacific by supporting IT operations, financial control andglobal risk management.
Nomura has accounted for these acquisitions as a business combination and therefore the operating resultsof the acquired businesses have been included in Nomura’s consolidated statements of operations fromOctober 2008. The purchase price allocation of total acquisition cost to the acquired assets and the assumedliabilities was completed by September 30, 2009. Goodwill increased by ¥10,206 million ($109 million) from thepreliminary estimate of ¥13,018 million recognized as of March 31, 2009 to ¥23,224 million ($249 million) as ofSeptember 30, 2009. The increase is mainly due to costs incurred in restructuring certain of the acquiredbusinesses. Nomura incurred costs of ¥48,159 million ($516 million) for these acquisitions from acquisition datethrough to September 30, 2009. Compared to March 31, 2009, costs incurred increased by ¥5,296 million($57 million) mainly due to the acquisition of Lehman Brothers Fixed Income Securities Private Ltd., a primarydealer in India in June 2009. The assumed liabilities related to this acquisition were ¥26,241 million($281 million) as of September 30, 2009, an increase of ¥8,958 million ($96 million), compared to March 31,2009, primary due to costs of relocating and terminating certain employees of the acquired businesses.
F-67
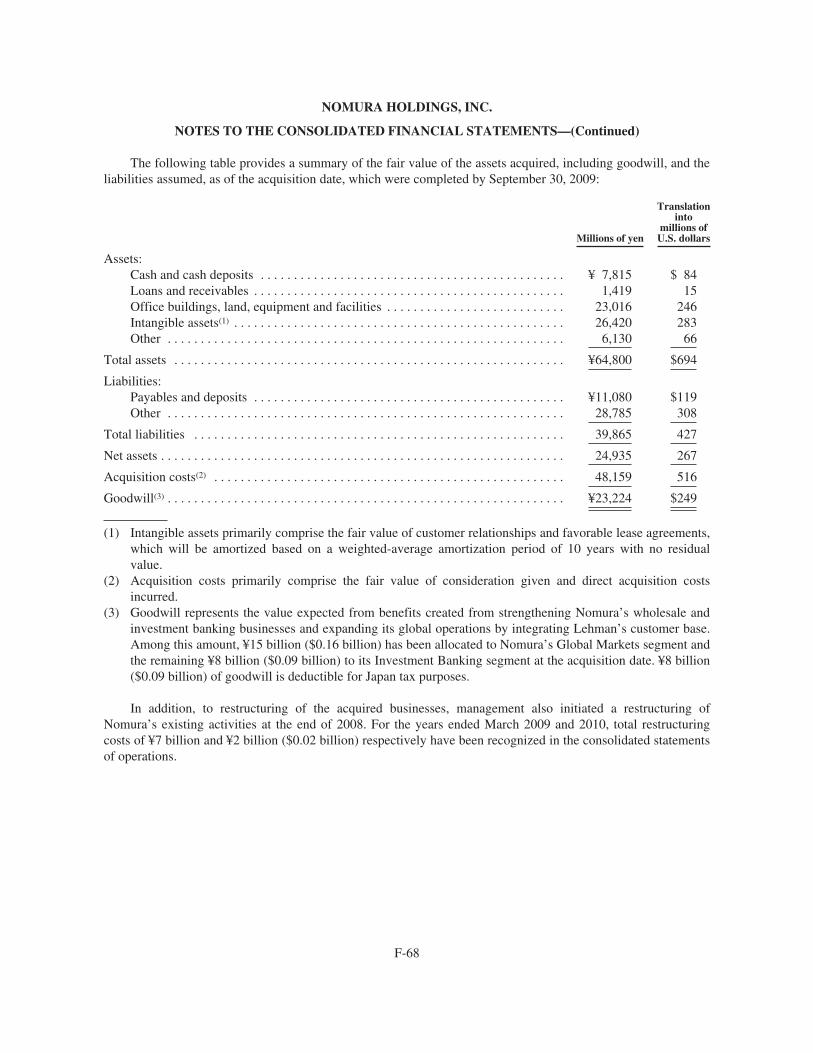
NOMURA HOLDINGS, INC.
NOTES TO THE CONSOLIDATED FINANCIAL STATEMENTS—(Continued)
The following table provides a summary of the fair value of the assets acquired, including goodwill, and theliabilities assumed, as of the acquisition date, which were completed by September 30, 2009:
Millions of yen
Translationinto
millions ofU.S. dollars
Assets:Cash and cash deposits . . . . . . . . . . . . . . . . . . . . . . . . . . . . . . . . . . . . . . . . . . . . . . ¥ 7,815 $ 84Loans and receivables . . . . . . . . . . . . . . . . . . . . . . . . . . . . . . . . . . . . . . . . . . . . . . . 1,419 15Office buildings, land, equipment and facilities . . . . . . . . . . . . . . . . . . . . . . . . . . . 23,016 246Intangible assets(1) . . . . . . . . . . . . . . . . . . . . . . . . . . . . . . . . . . . . . . . . . . . . . . . . . . 26,420 283Other . . . . . . . . . . . . . . . . . . . . . . . . . . . . . . . . . . . . . . . . . . . . . . . . . . . . . . . . . . . . 6,130 66
Total assets . . . . . . . . . . . . . . . . . . . . . . . . . . . . . . . . . . . . . . . . . . . . . . . . . . . . . . . . . . . ¥64,800 $694
Liabilities:Payables and deposits . . . . . . . . . . . . . . . . . . . . . . . . . . . . . . . . . . . . . . . . . . . . . . . ¥11,080 $119Other . . . . . . . . . . . . . . . . . . . . . . . . . . . . . . . . . . . . . . . . . . . . . . . . . . . . . . . . . . . . 28,785 308
Total liabilities . . . . . . . . . . . . . . . . . . . . . . . . . . . . . . . . . . . . . . . . . . . . . . . . . . . . . . . . 39,865 427
Net assets . . . . . . . . . . . . . . . . . . . . . . . . . . . . . . . . . . . . . . . . . . . . . . . . . . . . . . . . . . . . . 24,935 267
Acquisition costs(2) . . . . . . . . . . . . . . . . . . . . . . . . . . . . . . . . . . . . . . . . . . . . . . . . . . . . . 48,159 516
Goodwill(3) . . . . . . . . . . . . . . . . . . . . . . . . . . . . . . . . . . . . . . . . . . . . . . . . . . . . . . . . . . . . ¥23,224 $249
(1) Intangible assets primarily comprise the fair value of customer relationships and favorable lease agreements,which will be amortized based on a weighted-average amortization period of 10 years with no residualvalue.
(2) Acquisition costs primarily comprise the fair value of consideration given and direct acquisition costsincurred.
(3) Goodwill represents the value expected from benefits created from strengthening Nomura’s wholesale andinvestment banking businesses and expanding its global operations by integrating Lehman’s customer base.Among this amount, ¥15 billion ($0.16 billion) has been allocated to Nomura’s Global Markets segment andthe remaining ¥8 billion ($0.09 billion) to its Investment Banking segment at the acquisition date. ¥8 billion($0.09 billion) of goodwill is deductible for Japan tax purposes.
In addition, to restructuring of the acquired businesses, management also initiated a restructuring ofNomura’s existing activities at the end of 2008. For the years ended March 2009 and 2010, total restructuringcosts of ¥7 billion and ¥2 billion ($0.02 billion) respectively have been recognized in the consolidated statementsof operations.
F-68
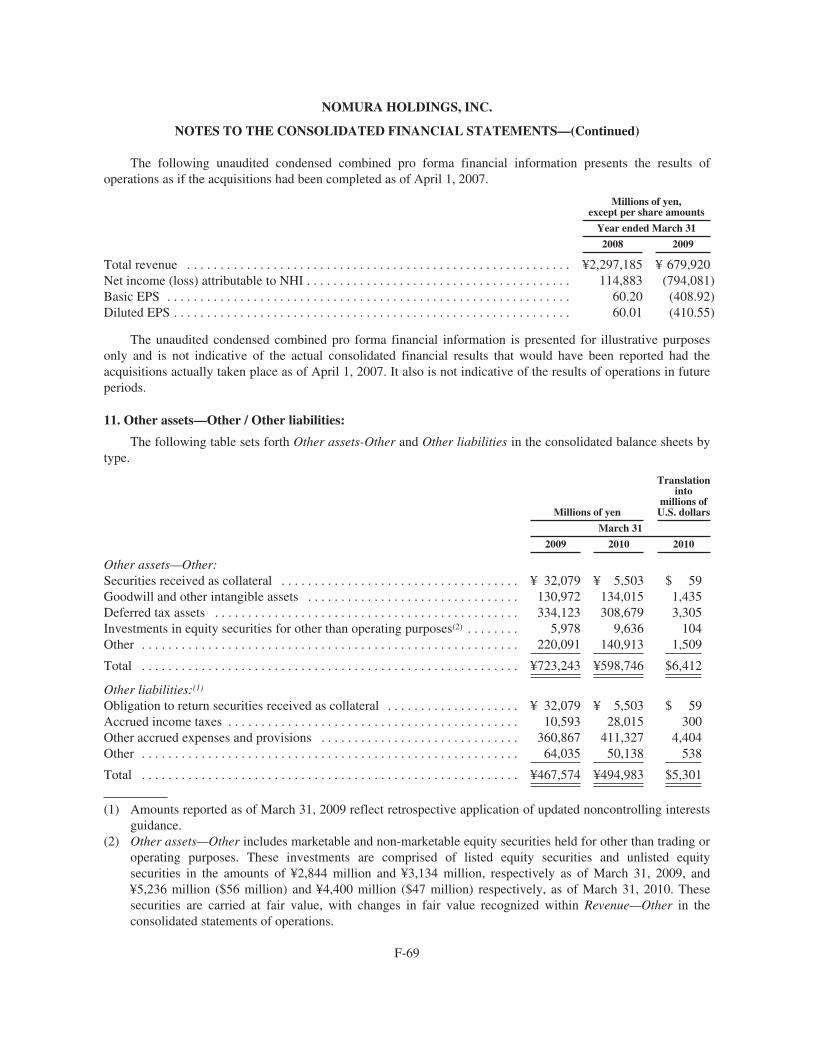
NOMURA HOLDINGS, INC.
NOTES TO THE CONSOLIDATED FINANCIAL STATEMENTS—(Continued)
The following unaudited condensed combined pro forma financial information presents the results ofoperations as if the acquisitions had been completed as of April 1, 2007.
Millions of yen,except per share amounts
Year ended March 31
2008 2009
Total revenue . . . . . . . . . . . . . . . . . . . . . . . . . . . . . . . . . . . . . . . . . . . . . . . . . . . . . . . . . . ¥2,297,185 ¥ 679,920Net income (loss) attributable to NHI . . . . . . . . . . . . . . . . . . . . . . . . . . . . . . . . . . . . . . . . 114,883 (794,081)Basic EPS . . . . . . . . . . . . . . . . . . . . . . . . . . . . . . . . . . . . . . . . . . . . . . . . . . . . . . . . . . . . . 60.20 (408.92)Diluted EPS . . . . . . . . . . . . . . . . . . . . . . . . . . . . . . . . . . . . . . . . . . . . . . . . . . . . . . . . . . . . 60.01 (410.55)
The unaudited condensed combined pro forma financial information is presented for illustrative purposesonly and is not indicative of the actual consolidated financial results that would have been reported had theacquisitions actually taken place as of April 1, 2007. It also is not indicative of the results of operations in futureperiods.
11. Other assets—Other / Other liabilities:
The following table sets forth Other assets-Other and Other liabilities in the consolidated balance sheets bytype.
Millions of yen
Translationinto
millions ofU.S. dollars
March 31
2009 2010 2010
Other assets—Other:Securities received as collateral . . . . . . . . . . . . . . . . . . . . . . . . . . . . . . . . . . . . ¥ 32,079 ¥ 5,503 $ 59Goodwill and other intangible assets . . . . . . . . . . . . . . . . . . . . . . . . . . . . . . . . 130,972 134,015 1,435Deferred tax assets . . . . . . . . . . . . . . . . . . . . . . . . . . . . . . . . . . . . . . . . . . . . . . 334,123 308,679 3,305Investments in equity securities for other than operating purposes(2) . . . . . . . . 5,978 9,636 104Other . . . . . . . . . . . . . . . . . . . . . . . . . . . . . . . . . . . . . . . . . . . . . . . . . . . . . . . . . 220,091 140,913 1,509
Total . . . . . . . . . . . . . . . . . . . . . . . . . . . . . . . . . . . . . . . . . . . . . . . . . . . . . . . . . ¥723,243 ¥598,746 $6,412
Other liabilities:(1)
Obligation to return securities received as collateral . . . . . . . . . . . . . . . . . . . . ¥ 32,079 ¥ 5,503 $ 59Accrued income taxes . . . . . . . . . . . . . . . . . . . . . . . . . . . . . . . . . . . . . . . . . . . . 10,593 28,015 300Other accrued expenses and provisions . . . . . . . . . . . . . . . . . . . . . . . . . . . . . . 360,867 411,327 4,404Other . . . . . . . . . . . . . . . . . . . . . . . . . . . . . . . . . . . . . . . . . . . . . . . . . . . . . . . . . 64,035 50,138 538
Total . . . . . . . . . . . . . . . . . . . . . . . . . . . . . . . . . . . . . . . . . . . . . . . . . . . . . . . . . ¥467,574 ¥494,983 $5,301
(1) Amounts reported as of March 31, 2009 reflect retrospective application of updated noncontrolling interestsguidance.
(2) Other assets—Other includes marketable and non-marketable equity securities held for other than trading oroperating purposes. These investments are comprised of listed equity securities and unlisted equitysecurities in the amounts of ¥2,844 million and ¥3,134 million, respectively as of March 31, 2009, and¥5,236 million ($56 million) and ¥4,400 million ($47 million) respectively, as of March 31, 2010. Thesesecurities are carried at fair value, with changes in fair value recognized within Revenue—Other in theconsolidated statements of operations.
F-69
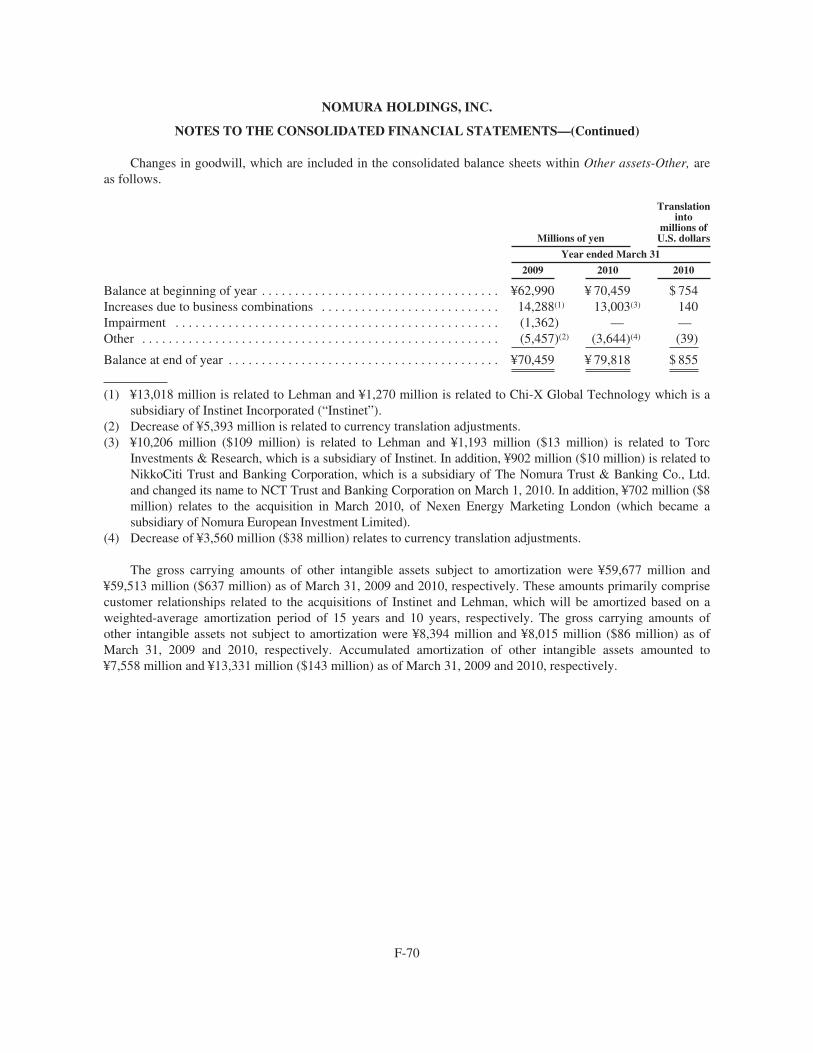
NOMURA HOLDINGS, INC.
NOTES TO THE CONSOLIDATED FINANCIAL STATEMENTS—(Continued)
Changes in goodwill, which are included in the consolidated balance sheets within Other assets-Other, areas follows.
Millions of yen
Translationinto
millions ofU.S. dollars
Year ended March 31
2009 2010 2010
Balance at beginning of year . . . . . . . . . . . . . . . . . . . . . . . . . . . . . . . . . . . . ¥62,990 ¥ 70,459 $ 754Increases due to business combinations . . . . . . . . . . . . . . . . . . . . . . . . . . . 14,288(1) 13,003(3) 140Impairment . . . . . . . . . . . . . . . . . . . . . . . . . . . . . . . . . . . . . . . . . . . . . . . . . (1,362) — —Other . . . . . . . . . . . . . . . . . . . . . . . . . . . . . . . . . . . . . . . . . . . . . . . . . . . . . . (5,457)(2) (3,644)(4) (39)
Balance at end of year . . . . . . . . . . . . . . . . . . . . . . . . . . . . . . . . . . . . . . . . . ¥70,459 ¥ 79,818 $ 855
(1) ¥13,018 million is related to Lehman and ¥1,270 million is related to Chi-X Global Technology which is asubsidiary of Instinet Incorporated (“Instinet”).
(2) Decrease of ¥5,393 million is related to currency translation adjustments.(3) ¥10,206 million ($109 million) is related to Lehman and ¥1,193 million ($13 million) is related to Torc
Investments & Research, which is a subsidiary of Instinet. In addition, ¥902 million ($10 million) is related toNikkoCiti Trust and Banking Corporation, which is a subsidiary of The Nomura Trust & Banking Co., Ltd.and changed its name to NCT Trust and Banking Corporation on March 1, 2010. In addition, ¥702 million ($8million) relates to the acquisition in March 2010, of Nexen Energy Marketing London (which became asubsidiary of Nomura European Investment Limited).
(4) Decrease of ¥3,560 million ($38 million) relates to currency translation adjustments.
The gross carrying amounts of other intangible assets subject to amortization were ¥59,677 million and¥59,513 million ($637 million) as of March 31, 2009 and 2010, respectively. These amounts primarily comprisecustomer relationships related to the acquisitions of Instinet and Lehman, which will be amortized based on aweighted-average amortization period of 15 years and 10 years, respectively. The gross carrying amounts ofother intangible assets not subject to amortization were ¥8,394 million and ¥8,015 million ($86 million) as ofMarch 31, 2009 and 2010, respectively. Accumulated amortization of other intangible assets amounted to¥7,558 million and ¥13,331 million ($143 million) as of March 31, 2009 and 2010, respectively.
F-70
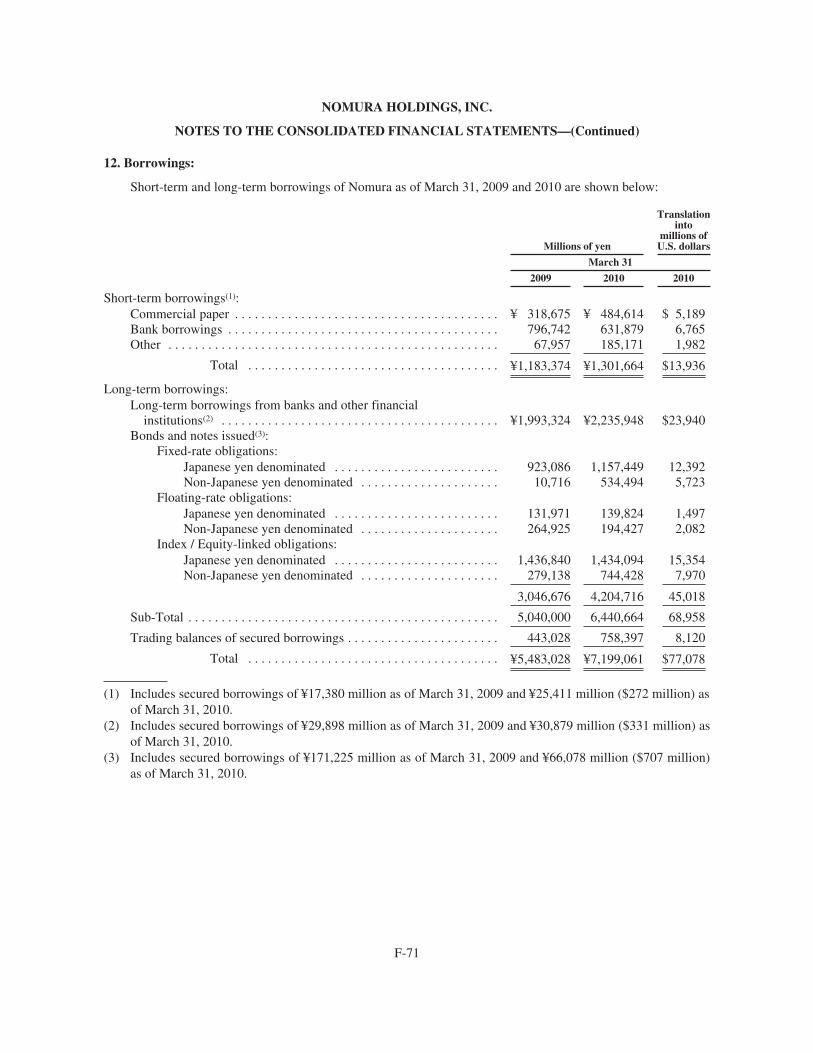
NOMURA HOLDINGS, INC.
NOTES TO THE CONSOLIDATED FINANCIAL STATEMENTS—(Continued)
12. Borrowings:
Short-term and long-term borrowings of Nomura as of March 31, 2009 and 2010 are shown below:
Millions of yen
Translationinto
millions ofU.S. dollars
March 31
2009 2010 2010
Short-term borrowings(1):Commercial paper . . . . . . . . . . . . . . . . . . . . . . . . . . . . . . . . . . . . . . . . ¥ 318,675 ¥ 484,614 $ 5,189Bank borrowings . . . . . . . . . . . . . . . . . . . . . . . . . . . . . . . . . . . . . . . . . 796,742 631,879 6,765Other . . . . . . . . . . . . . . . . . . . . . . . . . . . . . . . . . . . . . . . . . . . . . . . . . . 67,957 185,171 1,982
Total . . . . . . . . . . . . . . . . . . . . . . . . . . . . . . . . . . . . . . ¥1,183,374 ¥1,301,664 $13,936
Long-term borrowings:Long-term borrowings from banks and other financial
institutions(2) . . . . . . . . . . . . . . . . . . . . . . . . . . . . . . . . . . . . . . . . . . ¥1,993,324 ¥2,235,948 $23,940Bonds and notes issued(3):
Fixed-rate obligations:Japanese yen denominated . . . . . . . . . . . . . . . . . . . . . . . . . 923,086 1,157,449 12,392Non-Japanese yen denominated . . . . . . . . . . . . . . . . . . . . . 10,716 534,494 5,723
Floating-rate obligations:Japanese yen denominated . . . . . . . . . . . . . . . . . . . . . . . . . 131,971 139,824 1,497Non-Japanese yen denominated . . . . . . . . . . . . . . . . . . . . . 264,925 194,427 2,082
Index / Equity-linked obligations:Japanese yen denominated . . . . . . . . . . . . . . . . . . . . . . . . . 1,436,840 1,434,094 15,354Non-Japanese yen denominated . . . . . . . . . . . . . . . . . . . . . 279,138 744,428 7,970
3,046,676 4,204,716 45,018
Sub-Total . . . . . . . . . . . . . . . . . . . . . . . . . . . . . . . . . . . . . . . . . . . . . . . 5,040,000 6,440,664 68,958
Trading balances of secured borrowings . . . . . . . . . . . . . . . . . . . . . . . 443,028 758,397 8,120
Total . . . . . . . . . . . . . . . . . . . . . . . . . . . . . . . . . . . . . . ¥5,483,028 ¥7,199,061 $77,078
(1) Includes secured borrowings of ¥17,380 million as of March 31, 2009 and ¥25,411 million ($272 million) asof March 31, 2010.
(2) Includes secured borrowings of ¥29,898 million as of March 31, 2009 and ¥30,879 million ($331 million) asof March 31, 2010.
(3) Includes secured borrowings of ¥171,225 million as of March 31, 2009 and ¥66,078 million ($707 million)as of March 31, 2010.
F-71
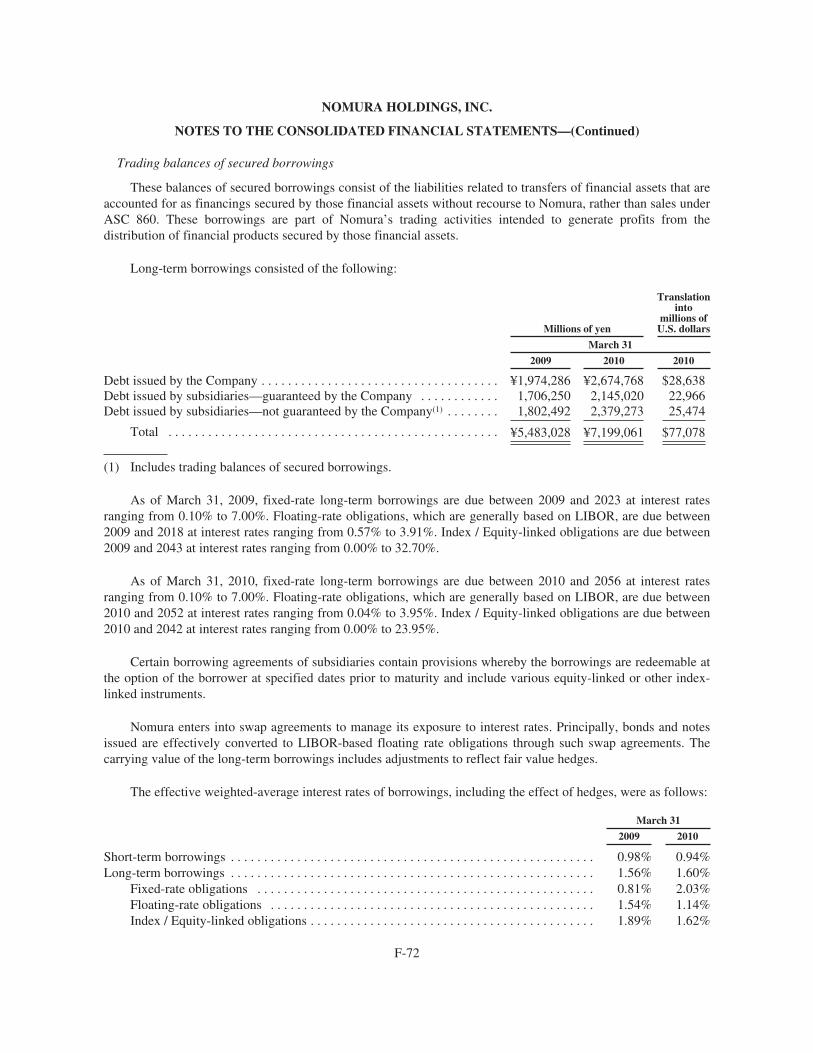
NOMURA HOLDINGS, INC.
NOTES TO THE CONSOLIDATED FINANCIAL STATEMENTS—(Continued)
Trading balances of secured borrowings
These balances of secured borrowings consist of the liabilities related to transfers of financial assets that areaccounted for as financings secured by those financial assets without recourse to Nomura, rather than sales underASC 860. These borrowings are part of Nomura’s trading activities intended to generate profits from thedistribution of financial products secured by those financial assets.
Long-term borrowings consisted of the following:
Millions of yen
Translationinto
millions ofU.S. dollars
March 31
2009 2010 2010
Debt issued by the Company . . . . . . . . . . . . . . . . . . . . . . . . . . . . . . . . . . . . ¥1,974,286 ¥2,674,768 $28,638Debt issued by subsidiaries—guaranteed by the Company . . . . . . . . . . . . 1,706,250 2,145,020 22,966Debt issued by subsidiaries—not guaranteed by the Company(1) . . . . . . . . 1,802,492 2,379,273 25,474
Total . . . . . . . . . . . . . . . . . . . . . . . . . . . . . . . . . . . . . . . . . . . . . . . . . . ¥5,483,028 ¥7,199,061 $77,078
(1) Includes trading balances of secured borrowings.
As of March 31, 2009, fixed-rate long-term borrowings are due between 2009 and 2023 at interest ratesranging from 0.10% to 7.00%. Floating-rate obligations, which are generally based on LIBOR, are due between2009 and 2018 at interest rates ranging from 0.57% to 3.91%. Index / Equity-linked obligations are due between2009 and 2043 at interest rates ranging from 0.00% to 32.70%.
As of March 31, 2010, fixed-rate long-term borrowings are due between 2010 and 2056 at interest ratesranging from 0.10% to 7.00%. Floating-rate obligations, which are generally based on LIBOR, are due between2010 and 2052 at interest rates ranging from 0.04% to 3.95%. Index / Equity-linked obligations are due between2010 and 2042 at interest rates ranging from 0.00% to 23.95%.
Certain borrowing agreements of subsidiaries contain provisions whereby the borrowings are redeemable atthe option of the borrower at specified dates prior to maturity and include various equity-linked or other index-linked instruments.
Nomura enters into swap agreements to manage its exposure to interest rates. Principally, bonds and notesissued are effectively converted to LIBOR-based floating rate obligations through such swap agreements. Thecarrying value of the long-term borrowings includes adjustments to reflect fair value hedges.
The effective weighted-average interest rates of borrowings, including the effect of hedges, were as follows:
March 31
2009 2010
Short-term borrowings . . . . . . . . . . . . . . . . . . . . . . . . . . . . . . . . . . . . . . . . . . . . . . . . . . . . . . . 0.98% 0.94%Long-term borrowings . . . . . . . . . . . . . . . . . . . . . . . . . . . . . . . . . . . . . . . . . . . . . . . . . . . . . . . 1.56% 1.60%
Fixed-rate obligations . . . . . . . . . . . . . . . . . . . . . . . . . . . . . . . . . . . . . . . . . . . . . . . . . . . 0.81% 2.03%Floating-rate obligations . . . . . . . . . . . . . . . . . . . . . . . . . . . . . . . . . . . . . . . . . . . . . . . . . 1.54% 1.14%Index / Equity-linked obligations . . . . . . . . . . . . . . . . . . . . . . . . . . . . . . . . . . . . . . . . . . . 1.89% 1.62%
F-72
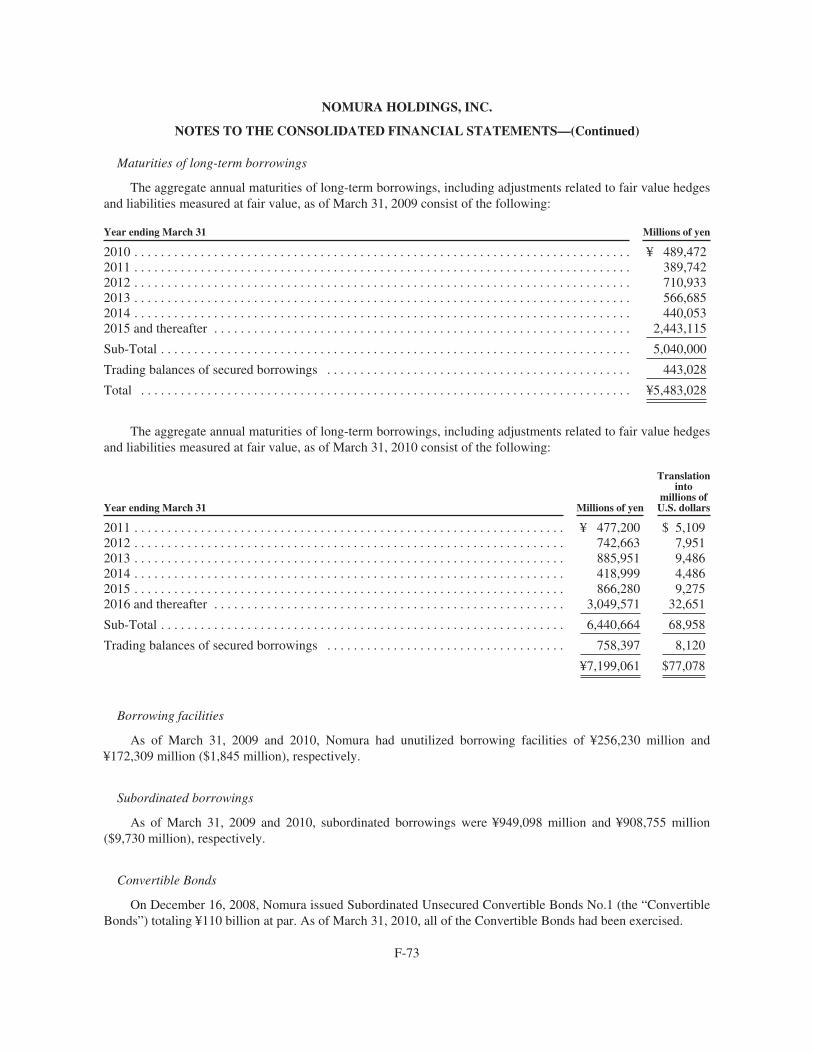
NOMURA HOLDINGS, INC.
NOTES TO THE CONSOLIDATED FINANCIAL STATEMENTS—(Continued)
Maturities of long-term borrowings
The aggregate annual maturities of long-term borrowings, including adjustments related to fair value hedgesand liabilities measured at fair value, as of March 31, 2009 consist of the following:
Year ending March 31 Millions of yen
2010 . . . . . . . . . . . . . . . . . . . . . . . . . . . . . . . . . . . . . . . . . . . . . . . . . . . . . . . . . . . . . . . . . . . . . . . . . . . ¥ 489,4722011 . . . . . . . . . . . . . . . . . . . . . . . . . . . . . . . . . . . . . . . . . . . . . . . . . . . . . . . . . . . . . . . . . . . . . . . . . . . 389,7422012 . . . . . . . . . . . . . . . . . . . . . . . . . . . . . . . . . . . . . . . . . . . . . . . . . . . . . . . . . . . . . . . . . . . . . . . . . . . 710,9332013 . . . . . . . . . . . . . . . . . . . . . . . . . . . . . . . . . . . . . . . . . . . . . . . . . . . . . . . . . . . . . . . . . . . . . . . . . . . 566,6852014 . . . . . . . . . . . . . . . . . . . . . . . . . . . . . . . . . . . . . . . . . . . . . . . . . . . . . . . . . . . . . . . . . . . . . . . . . . . 440,0532015 and thereafter . . . . . . . . . . . . . . . . . . . . . . . . . . . . . . . . . . . . . . . . . . . . . . . . . . . . . . . . . . . . . . . 2,443,115
Sub-Total . . . . . . . . . . . . . . . . . . . . . . . . . . . . . . . . . . . . . . . . . . . . . . . . . . . . . . . . . . . . . . . . . . . . . . . 5,040,000
Trading balances of secured borrowings . . . . . . . . . . . . . . . . . . . . . . . . . . . . . . . . . . . . . . . . . . . . . . 443,028
Total . . . . . . . . . . . . . . . . . . . . . . . . . . . . . . . . . . . . . . . . . . . . . . . . . . . . . . . . . . . . . . . . . . . . . . . . . . ¥5,483,028
The aggregate annual maturities of long-term borrowings, including adjustments related to fair value hedgesand liabilities measured at fair value, as of March 31, 2010 consist of the following:
Year ending March 31 Millions of yen
Translationinto
millions ofU.S. dollars
2011 . . . . . . . . . . . . . . . . . . . . . . . . . . . . . . . . . . . . . . . . . . . . . . . . . . . . . . . . . . . . . . . . . ¥ 477,200 $ 5,1092012 . . . . . . . . . . . . . . . . . . . . . . . . . . . . . . . . . . . . . . . . . . . . . . . . . . . . . . . . . . . . . . . . . 742,663 7,9512013 . . . . . . . . . . . . . . . . . . . . . . . . . . . . . . . . . . . . . . . . . . . . . . . . . . . . . . . . . . . . . . . . . 885,951 9,4862014 . . . . . . . . . . . . . . . . . . . . . . . . . . . . . . . . . . . . . . . . . . . . . . . . . . . . . . . . . . . . . . . . . 418,999 4,4862015 . . . . . . . . . . . . . . . . . . . . . . . . . . . . . . . . . . . . . . . . . . . . . . . . . . . . . . . . . . . . . . . . . 866,280 9,2752016 and thereafter . . . . . . . . . . . . . . . . . . . . . . . . . . . . . . . . . . . . . . . . . . . . . . . . . . . . . 3,049,571 32,651
Sub-Total . . . . . . . . . . . . . . . . . . . . . . . . . . . . . . . . . . . . . . . . . . . . . . . . . . . . . . . . . . . . . 6,440,664 68,958
Trading balances of secured borrowings . . . . . . . . . . . . . . . . . . . . . . . . . . . . . . . . . . . . 758,397 8,120
¥7,199,061 $77,078
Borrowing facilities
As of March 31, 2009 and 2010, Nomura had unutilized borrowing facilities of ¥256,230 million and¥172,309 million ($1,845 million), respectively.
Subordinated borrowings
As of March 31, 2009 and 2010, subordinated borrowings were ¥949,098 million and ¥908,755 million($9,730 million), respectively.
Convertible Bonds
On December 16, 2008, Nomura issued Subordinated Unsecured Convertible Bonds No.1 (the “ConvertibleBonds”) totaling ¥110 billion at par. As of March 31, 2010, all of the Convertible Bonds had been exercised.
F-73
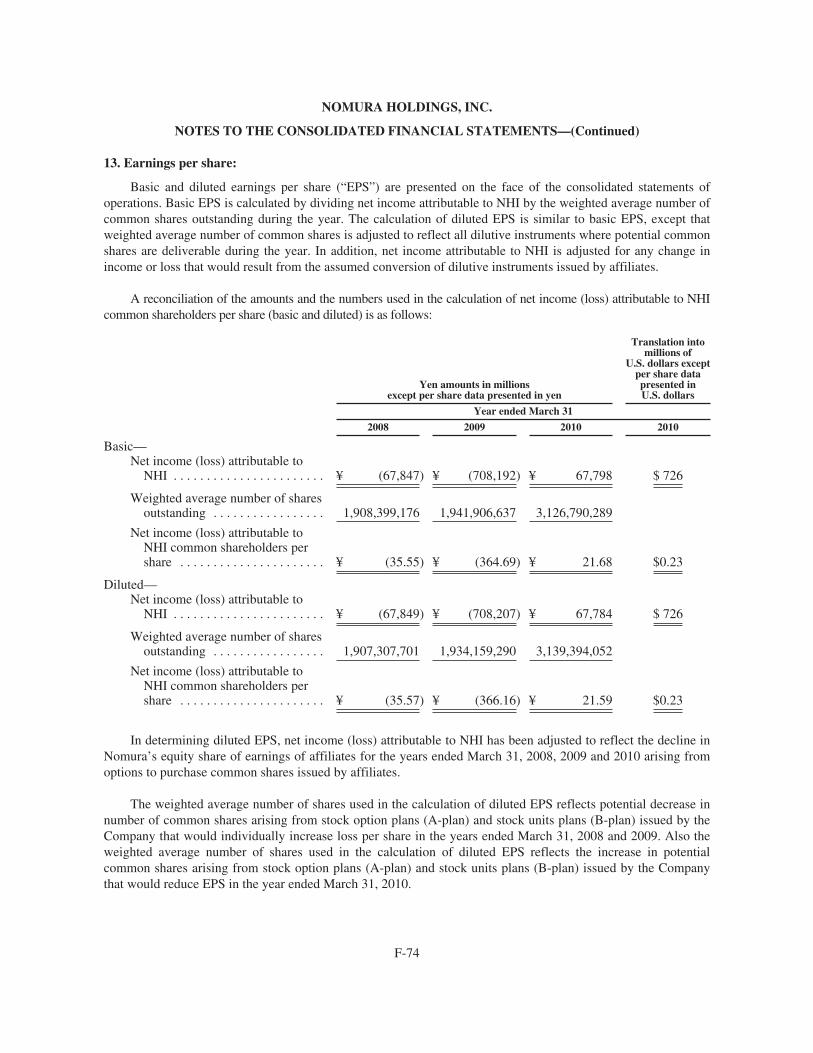
NOMURA HOLDINGS, INC.
NOTES TO THE CONSOLIDATED FINANCIAL STATEMENTS—(Continued)
13. Earnings per share:
Basic and diluted earnings per share (“EPS”) are presented on the face of the consolidated statements ofoperations. Basic EPS is calculated by dividing net income attributable to NHI by the weighted average number ofcommon shares outstanding during the year. The calculation of diluted EPS is similar to basic EPS, except thatweighted average number of common shares is adjusted to reflect all dilutive instruments where potential commonshares are deliverable during the year. In addition, net income attributable to NHI is adjusted for any change inincome or loss that would result from the assumed conversion of dilutive instruments issued by affiliates.
A reconciliation of the amounts and the numbers used in the calculation of net income (loss) attributable to NHIcommon shareholders per share (basic and diluted) is as follows:
Yen amounts in millionsexcept per share data presented in yen
Translation intomillions of
U.S. dollars exceptper share datapresented inU.S. dollars
Year ended March 31
2008 2009 2010 2010
Basic—Net income (loss) attributable to
NHI . . . . . . . . . . . . . . . . . . . . . . . ¥ (67,847) ¥ (708,192) ¥ 67,798 $ 726
Weighted average number of sharesoutstanding . . . . . . . . . . . . . . . . . 1,908,399,176 1,941,906,637 3,126,790,289
Net income (loss) attributable toNHI common shareholders pershare . . . . . . . . . . . . . . . . . . . . . . ¥ (35.55) ¥ (364.69) ¥ 21.68 $0.23
Diluted—Net income (loss) attributable to
NHI . . . . . . . . . . . . . . . . . . . . . . . ¥ (67,849) ¥ (708,207) ¥ 67,784 $ 726
Weighted average number of sharesoutstanding . . . . . . . . . . . . . . . . . 1,907,307,701 1,934,159,290 3,139,394,052
Net income (loss) attributable toNHI common shareholders pershare . . . . . . . . . . . . . . . . . . . . . . ¥ (35.57) ¥ (366.16) ¥ 21.59 $0.23
In determining diluted EPS, net income (loss) attributable to NHI has been adjusted to reflect the decline inNomura’s equity share of earnings of affiliates for the years ended March 31, 2008, 2009 and 2010 arising fromoptions to purchase common shares issued by affiliates.
The weighted average number of shares used in the calculation of diluted EPS reflects potential decrease innumber of common shares arising from stock option plans (A-plan) and stock units plans (B-plan) issued by theCompany that would individually increase loss per share in the years ended March 31, 2008 and 2009. Also theweighted average number of shares used in the calculation of diluted EPS reflects the increase in potentialcommon shares arising from stock option plans (A-plan) and stock units plans (B-plan) issued by the Companythat would reduce EPS in the year ended March 31, 2010.
F-74

NOMURA HOLDINGS, INC.
NOTES TO THE CONSOLIDATED FINANCIAL STATEMENTS—(Continued)
Antidilutive stock options to purchase 14,058,600 and 12,436,800 common shares as of March 31, 2008,and 2010, respectively, were not included in the computation of diluted EPS. Also antidilutive stock options andconvertible bonds to purchase or convert to 266,942,428 common shares as of March 31, 2009, were not includedin the computation of diluted EPS.
14. Employee benefit plans:
Nomura provides various pension plans and other post-employment benefits which cover certain employeesworldwide. In addition, Nomura provides health care benefits to certain active and retired employees through itsNomura Securities Health Insurance Society (“NSHIS”).
Defined benefit pension plans—
The Company and certain subsidiaries in Japan (the “Japanese entities”) have contributory funded benefitpension plans for eligible employees. The benefits are paid as annuity payments subsequent to retirement or aslump-sum payments at the time of retirement based on the combination of years of service, age at retirement andemployee’s choice. The benefits under the plans are calculated based upon position, years of service and reasonfor retirement. In addition to the plans described above, certain Japanese entities also have unfunded lump-sumpayment plans. Under these plans, employees with at least two years of service are generally entitled tolump-sum payments upon termination of employment. The benefits under the plans are calculated based uponposition, years of service and the reason for retirement. Nomura’s funding policy is to contribute annually theamount necessary to satisfy local funding standards. In December 2008, certain contributory funded benefitpension plans and unfunded lump-sum payment plans were amended and “cash balance pension plans” wereintroduced. Participants receive an annual benefit in their cash balance pension plan account, which is computedbased on compensation of the participants, adjusted for changes in Japanese government bond rates. This planamendment contributed to a reduction in the benefit obligations of the subsidiaries.
Substantially all overseas subsidiaries have various local defined benefit plans covering certain employees.Nomura recognized an asset for pension benefits for these plans amounting to ¥7,628 million and ¥4,862 million($52 million) as of March 31, 2009, and 2010, respectively.
Net Periodic Benefit Cost
The net periodic benefit cost of the defined benefit plans includes the following components. Nomura’smeasurement date is March 31 for its defined benefit plans for Japanese entities.
Japanese entities’ plans—
Millions of yen
Translationinto
millions ofU.S. dollars
Year ended March 31
2008 2009 2010 2010
Service cost . . . . . . . . . . . . . . . . . . . . . . . . . . . . . . . . . . . . . . . . . . . . . ¥ 9,395 ¥ 9,706 ¥ 8,719 $ 93Interest cost . . . . . . . . . . . . . . . . . . . . . . . . . . . . . . . . . . . . . . . . . . . . . 4,928 5,058 4,307 46Expected return on plan assets . . . . . . . . . . . . . . . . . . . . . . . . . . . . . . . (4,118) (3,543) (3,023) (32)Amortization of net actuarial losses . . . . . . . . . . . . . . . . . . . . . . . . . . . 1,452 3,260 4,735 51Amortization of prior service cost . . . . . . . . . . . . . . . . . . . . . . . . . . . . 86 (202) (1,148) (12)
Net periodic benefit cost . . . . . . . . . . . . . . . . . . . . . . . . . . . . . . . ¥11,743 ¥14,279 ¥13,590 $146
F-75
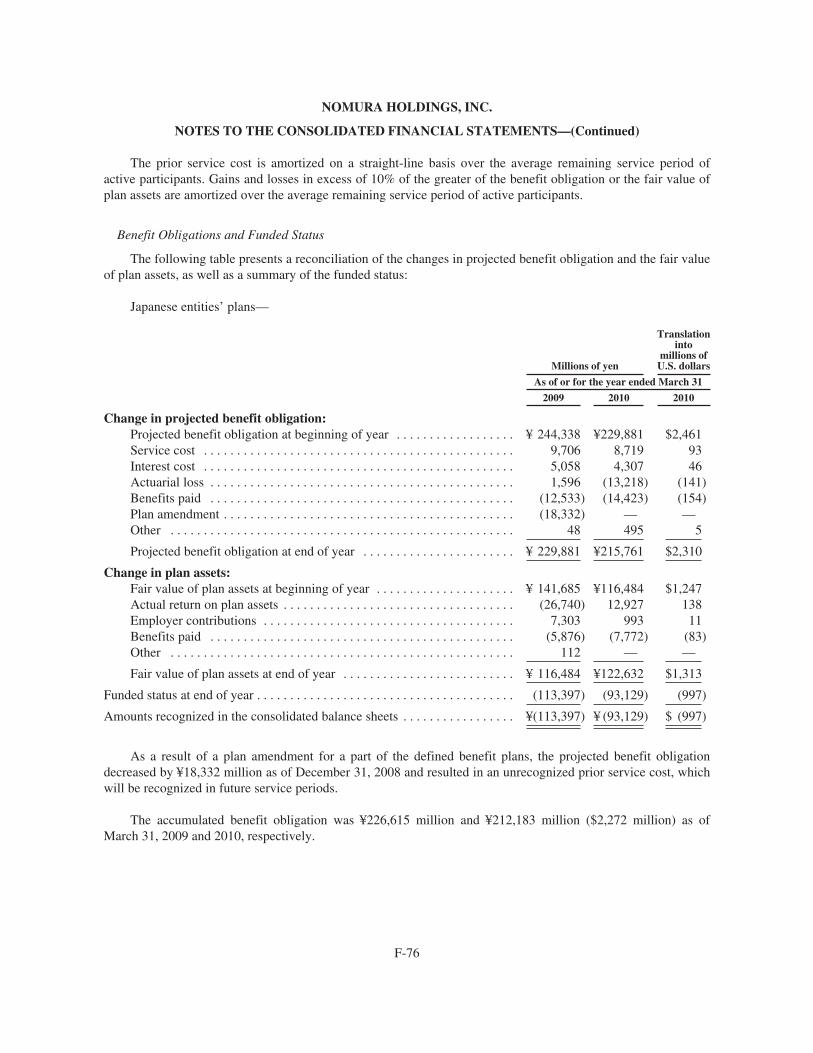
NOMURA HOLDINGS, INC.
NOTES TO THE CONSOLIDATED FINANCIAL STATEMENTS—(Continued)
The prior service cost is amortized on a straight-line basis over the average remaining service period ofactive participants. Gains and losses in excess of 10% of the greater of the benefit obligation or the fair value ofplan assets are amortized over the average remaining service period of active participants.
Benefit Obligations and Funded Status
The following table presents a reconciliation of the changes in projected benefit obligation and the fair valueof plan assets, as well as a summary of the funded status:
Japanese entities’ plans—
Millions of yen
Translationinto
millions ofU.S. dollars
As of or for the year ended March 31
2009 2010 2010
Change in projected benefit obligation:Projected benefit obligation at beginning of year . . . . . . . . . . . . . . . . . . ¥ 244,338 ¥229,881 $2,461Service cost . . . . . . . . . . . . . . . . . . . . . . . . . . . . . . . . . . . . . . . . . . . . . . . 9,706 8,719 93Interest cost . . . . . . . . . . . . . . . . . . . . . . . . . . . . . . . . . . . . . . . . . . . . . . . 5,058 4,307 46Actuarial loss . . . . . . . . . . . . . . . . . . . . . . . . . . . . . . . . . . . . . . . . . . . . . . 1,596 (13,218) (141)Benefits paid . . . . . . . . . . . . . . . . . . . . . . . . . . . . . . . . . . . . . . . . . . . . . . (12,533) (14,423) (154)Plan amendment . . . . . . . . . . . . . . . . . . . . . . . . . . . . . . . . . . . . . . . . . . . . (18,332) — —Other . . . . . . . . . . . . . . . . . . . . . . . . . . . . . . . . . . . . . . . . . . . . . . . . . . . . 48 495 5
Projected benefit obligation at end of year . . . . . . . . . . . . . . . . . . . . . . . ¥ 229,881 ¥215,761 $2,310
Change in plan assets:Fair value of plan assets at beginning of year . . . . . . . . . . . . . . . . . . . . . ¥ 141,685 ¥116,484 $1,247Actual return on plan assets . . . . . . . . . . . . . . . . . . . . . . . . . . . . . . . . . . . (26,740) 12,927 138Employer contributions . . . . . . . . . . . . . . . . . . . . . . . . . . . . . . . . . . . . . . 7,303 993 11Benefits paid . . . . . . . . . . . . . . . . . . . . . . . . . . . . . . . . . . . . . . . . . . . . . . (5,876) (7,772) (83)Other . . . . . . . . . . . . . . . . . . . . . . . . . . . . . . . . . . . . . . . . . . . . . . . . . . . . 112 — —
Fair value of plan assets at end of year . . . . . . . . . . . . . . . . . . . . . . . . . . ¥ 116,484 ¥122,632 $1,313
Funded status at end of year . . . . . . . . . . . . . . . . . . . . . . . . . . . . . . . . . . . . . . . (113,397) (93,129) (997)
Amounts recognized in the consolidated balance sheets . . . . . . . . . . . . . . . . . ¥(113,397) ¥ (93,129) $ (997)
As a result of a plan amendment for a part of the defined benefit plans, the projected benefit obligationdecreased by ¥18,332 million as of December 31, 2008 and resulted in an unrecognized prior service cost, whichwill be recognized in future service periods.
The accumulated benefit obligation was ¥226,615 million and ¥212,183 million ($2,272 million) as ofMarch 31, 2009 and 2010, respectively.
F-76
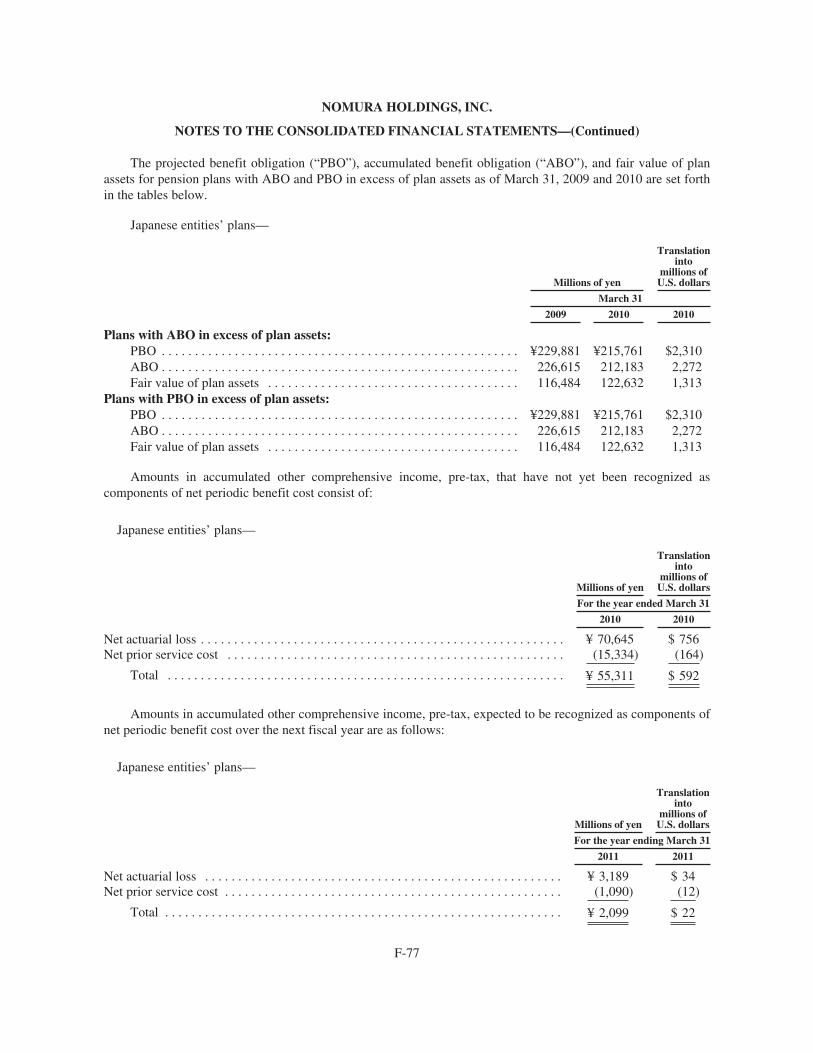
NOMURA HOLDINGS, INC.
NOTES TO THE CONSOLIDATED FINANCIAL STATEMENTS—(Continued)
The projected benefit obligation (“PBO”), accumulated benefit obligation (“ABO”), and fair value of planassets for pension plans with ABO and PBO in excess of plan assets as of March 31, 2009 and 2010 are set forthin the tables below.
Japanese entities’ plans—
Millions of yen
Translationinto
millions ofU.S. dollars
March 31
2009 2010 2010
Plans with ABO in excess of plan assets:PBO . . . . . . . . . . . . . . . . . . . . . . . . . . . . . . . . . . . . . . . . . . . . . . . . . . . . . . ¥229,881 ¥215,761 $2,310ABO . . . . . . . . . . . . . . . . . . . . . . . . . . . . . . . . . . . . . . . . . . . . . . . . . . . . . . 226,615 212,183 2,272Fair value of plan assets . . . . . . . . . . . . . . . . . . . . . . . . . . . . . . . . . . . . . . 116,484 122,632 1,313
Plans with PBO in excess of plan assets:PBO . . . . . . . . . . . . . . . . . . . . . . . . . . . . . . . . . . . . . . . . . . . . . . . . . . . . . . ¥229,881 ¥215,761 $2,310ABO . . . . . . . . . . . . . . . . . . . . . . . . . . . . . . . . . . . . . . . . . . . . . . . . . . . . . . 226,615 212,183 2,272Fair value of plan assets . . . . . . . . . . . . . . . . . . . . . . . . . . . . . . . . . . . . . . 116,484 122,632 1,313
Amounts in accumulated other comprehensive income, pre-tax, that have not yet been recognized ascomponents of net periodic benefit cost consist of:
Japanese entities’ plans—
Millions of yen
Translationinto
millions ofU.S. dollars
For the year ended March 31
2010 2010
Net actuarial loss . . . . . . . . . . . . . . . . . . . . . . . . . . . . . . . . . . . . . . . . . . . . . . . . . . . . . . . ¥ 70,645 $ 756Net prior service cost . . . . . . . . . . . . . . . . . . . . . . . . . . . . . . . . . . . . . . . . . . . . . . . . . . . (15,334) (164)
Total . . . . . . . . . . . . . . . . . . . . . . . . . . . . . . . . . . . . . . . . . . . . . . . . . . . . . . . . . . . . ¥ 55,311 $ 592
Amounts in accumulated other comprehensive income, pre-tax, expected to be recognized as components ofnet periodic benefit cost over the next fiscal year are as follows:
Japanese entities’ plans—
Millions of yen
Translationinto
millions ofU.S. dollars
For the year ending March 31
2011 2011
Net actuarial loss . . . . . . . . . . . . . . . . . . . . . . . . . . . . . . . . . . . . . . . . . . . . . . . . . . . . . . ¥ 3,189 $ 34Net prior service cost . . . . . . . . . . . . . . . . . . . . . . . . . . . . . . . . . . . . . . . . . . . . . . . . . . . (1,090) (12)
Total . . . . . . . . . . . . . . . . . . . . . . . . . . . . . . . . . . . . . . . . . . . . . . . . . . . . . . . . . . . . ¥ 2,099 $ 22
F-77
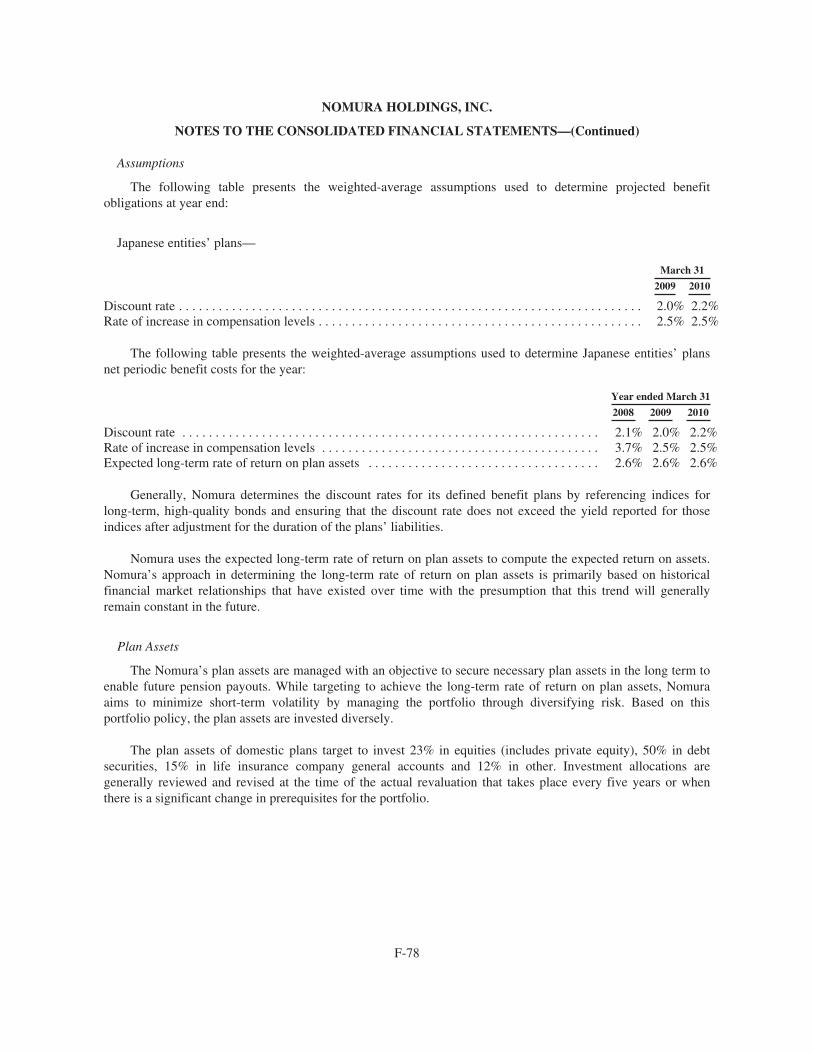
NOMURA HOLDINGS, INC.
NOTES TO THE CONSOLIDATED FINANCIAL STATEMENTS—(Continued)
Assumptions
The following table presents the weighted-average assumptions used to determine projected benefitobligations at year end:
Japanese entities’ plans—
March 31
2009 2010
Discount rate . . . . . . . . . . . . . . . . . . . . . . . . . . . . . . . . . . . . . . . . . . . . . . . . . . . . . . . . . . . . . . . . . . . . . . 2.0% 2.2%Rate of increase in compensation levels . . . . . . . . . . . . . . . . . . . . . . . . . . . . . . . . . . . . . . . . . . . . . . . . . 2.5% 2.5%
The following table presents the weighted-average assumptions used to determine Japanese entities’ plansnet periodic benefit costs for the year:
Year ended March 31
2008 2009 2010
Discount rate . . . . . . . . . . . . . . . . . . . . . . . . . . . . . . . . . . . . . . . . . . . . . . . . . . . . . . . . . . . . . . . 2.1% 2.0% 2.2%Rate of increase in compensation levels . . . . . . . . . . . . . . . . . . . . . . . . . . . . . . . . . . . . . . . . . . 3.7% 2.5% 2.5%Expected long-term rate of return on plan assets . . . . . . . . . . . . . . . . . . . . . . . . . . . . . . . . . . . 2.6% 2.6% 2.6%
Generally, Nomura determines the discount rates for its defined benefit plans by referencing indices forlong-term, high-quality bonds and ensuring that the discount rate does not exceed the yield reported for thoseindices after adjustment for the duration of the plans’ liabilities.
Nomura uses the expected long-term rate of return on plan assets to compute the expected return on assets.Nomura’s approach in determining the long-term rate of return on plan assets is primarily based on historicalfinancial market relationships that have existed over time with the presumption that this trend will generallyremain constant in the future.
Plan Assets
The Nomura’s plan assets are managed with an objective to secure necessary plan assets in the long term toenable future pension payouts. While targeting to achieve the long-term rate of return on plan assets, Nomuraaims to minimize short-term volatility by managing the portfolio through diversifying risk. Based on thisportfolio policy, the plan assets are invested diversely.
The plan assets of domestic plans target to invest 23% in equities (includes private equity), 50% in debtsecurities, 15% in life insurance company general accounts and 12% in other. Investment allocations aregenerally reviewed and revised at the time of the actual revaluation that takes place every five years or whenthere is a significant change in prerequisites for the portfolio.
F-78
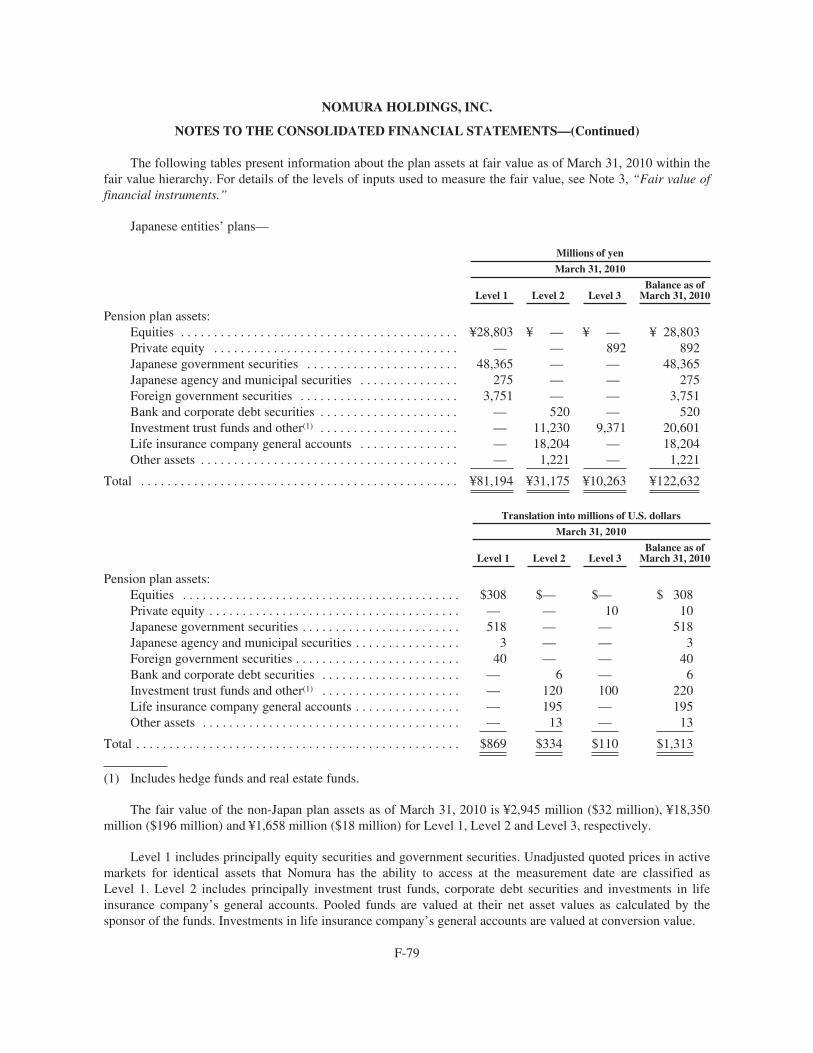
NOMURA HOLDINGS, INC.
NOTES TO THE CONSOLIDATED FINANCIAL STATEMENTS—(Continued)
The following tables present information about the plan assets at fair value as of March 31, 2010 within thefair value hierarchy. For details of the levels of inputs used to measure the fair value, see Note 3, “Fair value offinancial instruments.”
Japanese entities’ plans—
Millions of yen
March 31, 2010
Level 1 Level 2 Level 3Balance as of
March 31, 2010
Pension plan assets:Equities . . . . . . . . . . . . . . . . . . . . . . . . . . . . . . . . . . . . . . . . . . ¥28,803 ¥ — ¥ — ¥ 28,803Private equity . . . . . . . . . . . . . . . . . . . . . . . . . . . . . . . . . . . . . — — 892 892Japanese government securities . . . . . . . . . . . . . . . . . . . . . . . 48,365 — — 48,365Japanese agency and municipal securities . . . . . . . . . . . . . . . 275 — — 275Foreign government securities . . . . . . . . . . . . . . . . . . . . . . . . 3,751 — — 3,751Bank and corporate debt securities . . . . . . . . . . . . . . . . . . . . . — 520 — 520Investment trust funds and other(1) . . . . . . . . . . . . . . . . . . . . . — 11,230 9,371 20,601Life insurance company general accounts . . . . . . . . . . . . . . . — 18,204 — 18,204Other assets . . . . . . . . . . . . . . . . . . . . . . . . . . . . . . . . . . . . . . . — 1,221 — 1,221
Total . . . . . . . . . . . . . . . . . . . . . . . . . . . . . . . . . . . . . . . . . . . . . . . . ¥81,194 ¥31,175 ¥10,263 ¥122,632
Translation into millions of U.S. dollars
March 31, 2010
Level 1 Level 2 Level 3Balance as of
March 31, 2010
Pension plan assets:Equities . . . . . . . . . . . . . . . . . . . . . . . . . . . . . . . . . . . . . . . . . . $308 $— $— $ 308Private equity . . . . . . . . . . . . . . . . . . . . . . . . . . . . . . . . . . . . . . — — 10 10Japanese government securities . . . . . . . . . . . . . . . . . . . . . . . . 518 — — 518Japanese agency and municipal securities . . . . . . . . . . . . . . . . 3 — — 3Foreign government securities . . . . . . . . . . . . . . . . . . . . . . . . . 40 — — 40Bank and corporate debt securities . . . . . . . . . . . . . . . . . . . . . — 6 — 6Investment trust funds and other(1) . . . . . . . . . . . . . . . . . . . . . — 120 100 220Life insurance company general accounts . . . . . . . . . . . . . . . . — 195 — 195Other assets . . . . . . . . . . . . . . . . . . . . . . . . . . . . . . . . . . . . . . . — 13 — 13
Total . . . . . . . . . . . . . . . . . . . . . . . . . . . . . . . . . . . . . . . . . . . . . . . . . $869 $334 $110 $1,313
(1) Includes hedge funds and real estate funds.
The fair value of the non-Japan plan assets as of March 31, 2010 is ¥2,945 million ($32 million), ¥18,350million ($196 million) and ¥1,658 million ($18 million) for Level 1, Level 2 and Level 3, respectively.
Level 1 includes principally equity securities and government securities. Unadjusted quoted prices in activemarkets for identical assets that Nomura has the ability to access at the measurement date are classified asLevel 1. Level 2 includes principally investment trust funds, corporate debt securities and investments in lifeinsurance company’s general accounts. Pooled funds are valued at their net asset values as calculated by thesponsor of the funds. Investments in life insurance company’s general accounts are valued at conversion value.
F-79
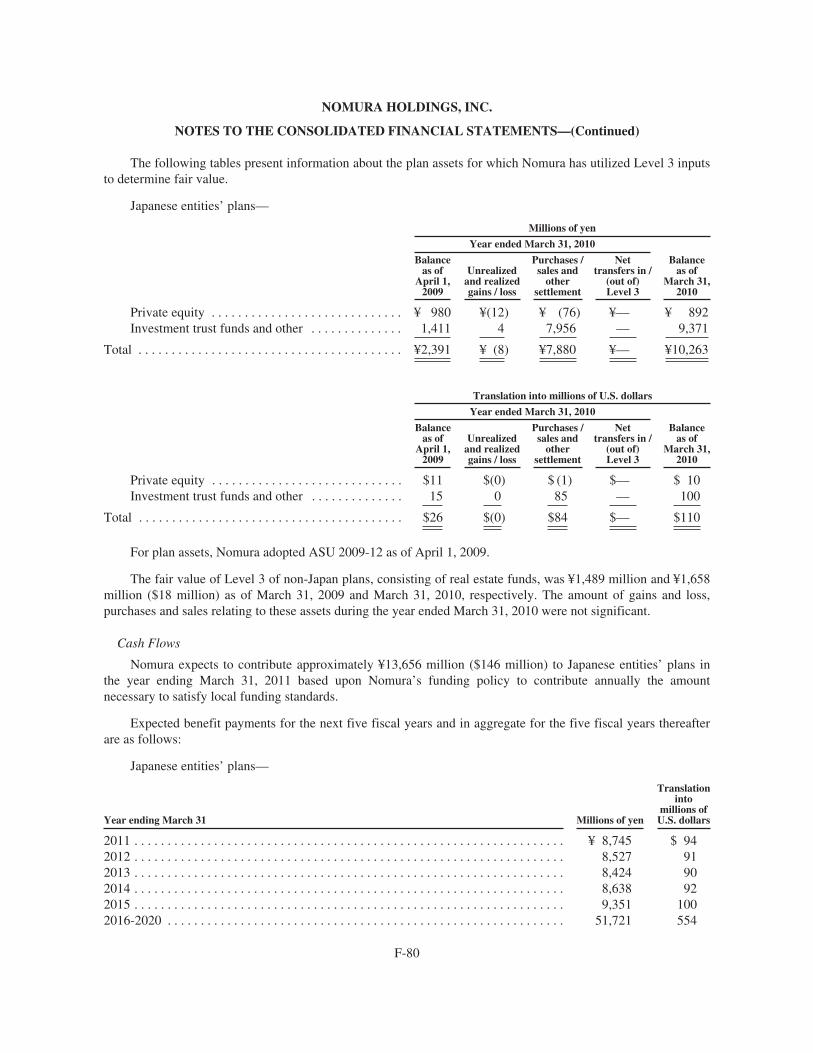
NOMURA HOLDINGS, INC.
NOTES TO THE CONSOLIDATED FINANCIAL STATEMENTS—(Continued)
The following tables present information about the plan assets for which Nomura has utilized Level 3 inputsto determine fair value.
Japanese entities’ plans—
Millions of yen
Year ended March 31, 2010
Balanceas of
April 1,2009
Unrealizedand realizedgains / loss
Purchases /sales and
othersettlement
Nettransfers in /
(out of)Level 3
Balanceas of
March 31,2010
Private equity . . . . . . . . . . . . . . . . . . . . . . . . . . . . . ¥ 980 ¥(12) ¥ (76) ¥— ¥ 892Investment trust funds and other . . . . . . . . . . . . . . 1,411 4 7,956 — 9,371
Total . . . . . . . . . . . . . . . . . . . . . . . . . . . . . . . . . . . . . . . . ¥2,391 ¥ (8) ¥7,880 ¥— ¥10,263
Translation into millions of U.S. dollars
Year ended March 31, 2010
Balanceas of
April 1,2009
Unrealizedand realizedgains / loss
Purchases /sales and
othersettlement
Nettransfers in /
(out of)Level 3
Balanceas of
March 31,2010
Private equity . . . . . . . . . . . . . . . . . . . . . . . . . . . . . $11 $(0) $ (1) $— $ 10Investment trust funds and other . . . . . . . . . . . . . . 15 0 85 — 100
Total . . . . . . . . . . . . . . . . . . . . . . . . . . . . . . . . . . . . . . . . $26 $(0) $84 $— $110
For plan assets, Nomura adopted ASU 2009-12 as of April 1, 2009.
The fair value of Level 3 of non-Japan plans, consisting of real estate funds, was ¥1,489 million and ¥1,658million ($18 million) as of March 31, 2009 and March 31, 2010, respectively. The amount of gains and loss,purchases and sales relating to these assets during the year ended March 31, 2010 were not significant.
Cash Flows
Nomura expects to contribute approximately ¥13,656 million ($146 million) to Japanese entities’ plans inthe year ending March 31, 2011 based upon Nomura’s funding policy to contribute annually the amountnecessary to satisfy local funding standards.
Expected benefit payments for the next five fiscal years and in aggregate for the five fiscal years thereafterare as follows:
Japanese entities’ plans—
Year ending March 31 Millions of yen
Translationinto
millions ofU.S. dollars
2011 . . . . . . . . . . . . . . . . . . . . . . . . . . . . . . . . . . . . . . . . . . . . . . . . . . . . . . . . . . . . . . . . . ¥ 8,745 $ 942012 . . . . . . . . . . . . . . . . . . . . . . . . . . . . . . . . . . . . . . . . . . . . . . . . . . . . . . . . . . . . . . . . . 8,527 912013 . . . . . . . . . . . . . . . . . . . . . . . . . . . . . . . . . . . . . . . . . . . . . . . . . . . . . . . . . . . . . . . . . 8,424 902014 . . . . . . . . . . . . . . . . . . . . . . . . . . . . . . . . . . . . . . . . . . . . . . . . . . . . . . . . . . . . . . . . . 8,638 922015 . . . . . . . . . . . . . . . . . . . . . . . . . . . . . . . . . . . . . . . . . . . . . . . . . . . . . . . . . . . . . . . . . 9,351 1002016-2020 . . . . . . . . . . . . . . . . . . . . . . . . . . . . . . . . . . . . . . . . . . . . . . . . . . . . . . . . . . . . 51,721 554
F-80
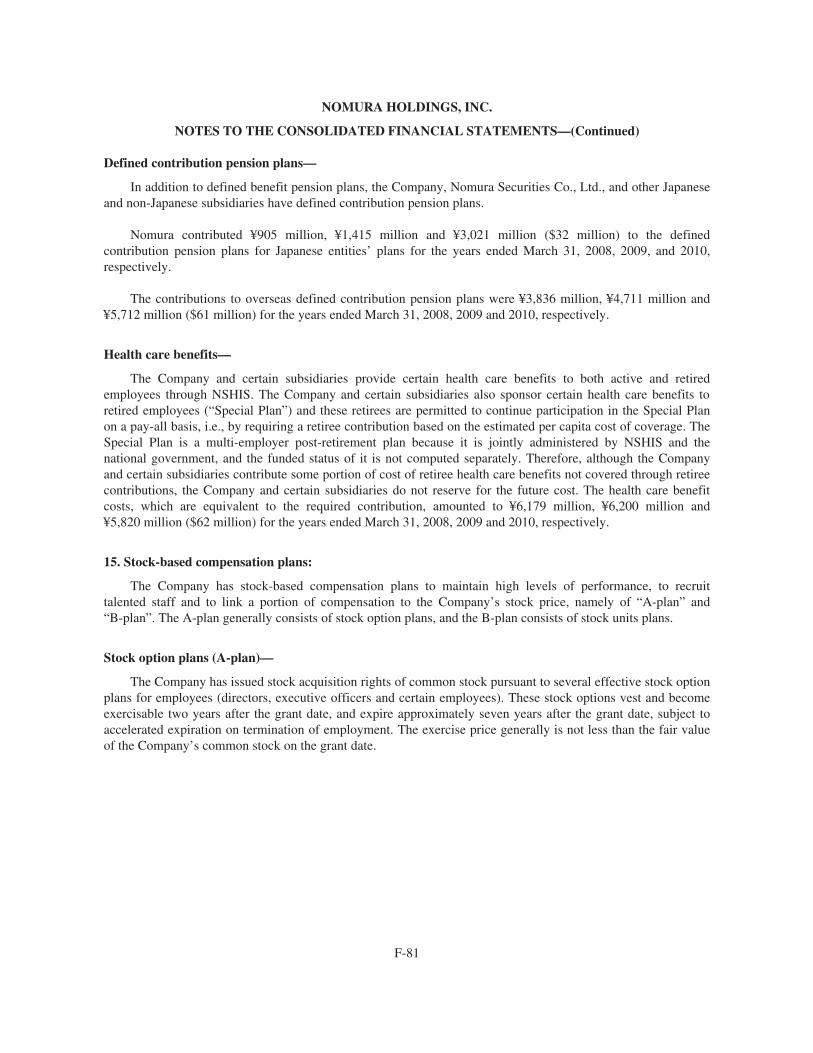
NOMURA HOLDINGS, INC.
NOTES TO THE CONSOLIDATED FINANCIAL STATEMENTS—(Continued)
Defined contribution pension plans—
In addition to defined benefit pension plans, the Company, Nomura Securities Co., Ltd., and other Japaneseand non-Japanese subsidiaries have defined contribution pension plans.
Nomura contributed ¥905 million, ¥1,415 million and ¥3,021 million ($32 million) to the definedcontribution pension plans for Japanese entities’ plans for the years ended March 31, 2008, 2009, and 2010,respectively.
The contributions to overseas defined contribution pension plans were ¥3,836 million, ¥4,711 million and¥5,712 million ($61 million) for the years ended March 31, 2008, 2009 and 2010, respectively.
Health care benefits—
The Company and certain subsidiaries provide certain health care benefits to both active and retiredemployees through NSHIS. The Company and certain subsidiaries also sponsor certain health care benefits toretired employees (“Special Plan”) and these retirees are permitted to continue participation in the Special Planon a pay-all basis, i.e., by requiring a retiree contribution based on the estimated per capita cost of coverage. TheSpecial Plan is a multi-employer post-retirement plan because it is jointly administered by NSHIS and thenational government, and the funded status of it is not computed separately. Therefore, although the Companyand certain subsidiaries contribute some portion of cost of retiree health care benefits not covered through retireecontributions, the Company and certain subsidiaries do not reserve for the future cost. The health care benefitcosts, which are equivalent to the required contribution, amounted to ¥6,179 million, ¥6,200 million and¥5,820 million ($62 million) for the years ended March 31, 2008, 2009 and 2010, respectively.
15. Stock-based compensation plans:
The Company has stock-based compensation plans to maintain high levels of performance, to recruittalented staff and to link a portion of compensation to the Company’s stock price, namely of “A-plan” and“B-plan”. The A-plan generally consists of stock option plans, and the B-plan consists of stock units plans.
Stock option plans (A-plan)—
The Company has issued stock acquisition rights of common stock pursuant to several effective stock optionplans for employees (directors, executive officers and certain employees). These stock options vest and becomeexercisable two years after the grant date, and expire approximately seven years after the grant date, subject toaccelerated expiration on termination of employment. The exercise price generally is not less than the fair valueof the Company’s common stock on the grant date.
F-81
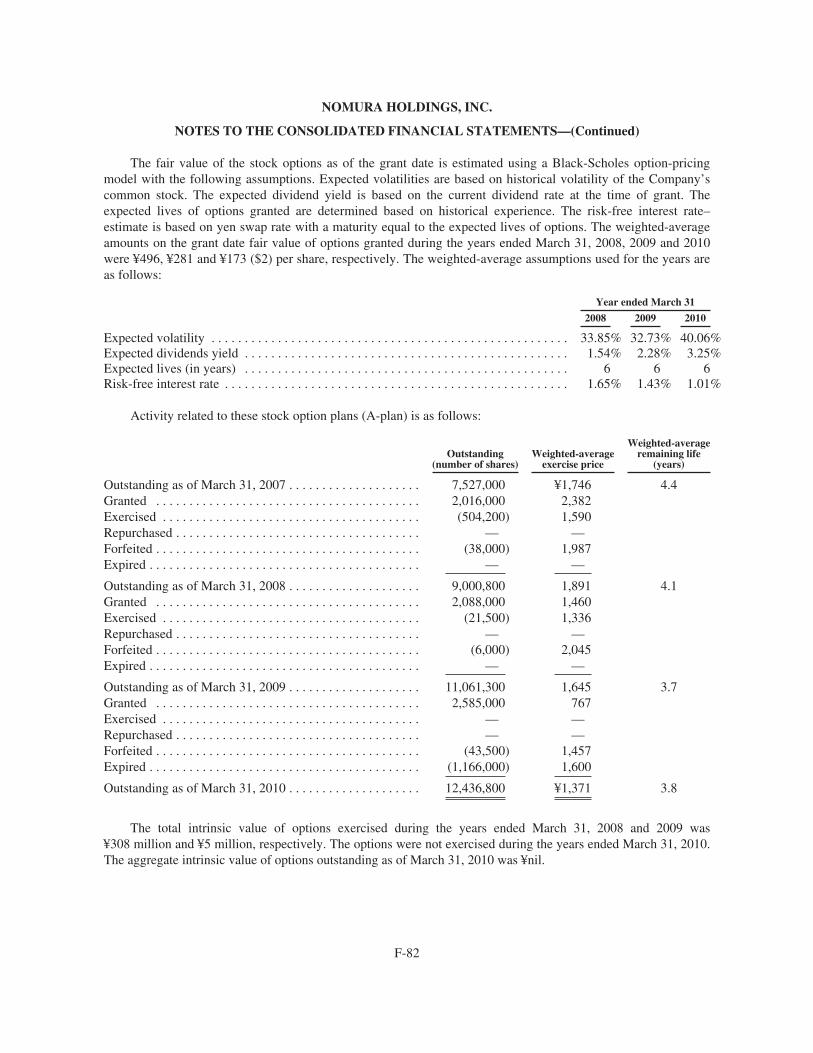
NOMURA HOLDINGS, INC.
NOTES TO THE CONSOLIDATED FINANCIAL STATEMENTS—(Continued)
The fair value of the stock options as of the grant date is estimated using a Black-Scholes option-pricingmodel with the following assumptions. Expected volatilities are based on historical volatility of the Company’scommon stock. The expected dividend yield is based on the current dividend rate at the time of grant. Theexpected lives of options granted are determined based on historical experience. The risk-free interest rate–estimate is based on yen swap rate with a maturity equal to the expected lives of options. The weighted-averageamounts on the grant date fair value of options granted during the years ended March 31, 2008, 2009 and 2010were ¥496, ¥281 and ¥173 ($2) per share, respectively. The weighted-average assumptions used for the years areas follows:
Year ended March 31
2008 2009 2010
Expected volatility . . . . . . . . . . . . . . . . . . . . . . . . . . . . . . . . . . . . . . . . . . . . . . . . . . . . . . 33.85% 32.73% 40.06%Expected dividends yield . . . . . . . . . . . . . . . . . . . . . . . . . . . . . . . . . . . . . . . . . . . . . . . . . 1.54% 2.28% 3.25%Expected lives (in years) . . . . . . . . . . . . . . . . . . . . . . . . . . . . . . . . . . . . . . . . . . . . . . . . . 6 6 6Risk-free interest rate . . . . . . . . . . . . . . . . . . . . . . . . . . . . . . . . . . . . . . . . . . . . . . . . . . . . 1.65% 1.43% 1.01%
Activity related to these stock option plans (A-plan) is as follows:
Outstanding(number of shares)
Weighted-averageexercise price
Weighted-averageremaining life
(years)
Outstanding as of March 31, 2007 . . . . . . . . . . . . . . . . . . . . 7,527,000 ¥1,746 4.4Granted . . . . . . . . . . . . . . . . . . . . . . . . . . . . . . . . . . . . . . . . 2,016,000 2,382Exercised . . . . . . . . . . . . . . . . . . . . . . . . . . . . . . . . . . . . . . . (504,200) 1,590Repurchased . . . . . . . . . . . . . . . . . . . . . . . . . . . . . . . . . . . . . — —Forfeited . . . . . . . . . . . . . . . . . . . . . . . . . . . . . . . . . . . . . . . . (38,000) 1,987Expired . . . . . . . . . . . . . . . . . . . . . . . . . . . . . . . . . . . . . . . . . — —
Outstanding as of March 31, 2008 . . . . . . . . . . . . . . . . . . . . 9,000,800 1,891 4.1Granted . . . . . . . . . . . . . . . . . . . . . . . . . . . . . . . . . . . . . . . . 2,088,000 1,460Exercised . . . . . . . . . . . . . . . . . . . . . . . . . . . . . . . . . . . . . . . (21,500) 1,336Repurchased . . . . . . . . . . . . . . . . . . . . . . . . . . . . . . . . . . . . . — —Forfeited . . . . . . . . . . . . . . . . . . . . . . . . . . . . . . . . . . . . . . . . (6,000) 2,045Expired . . . . . . . . . . . . . . . . . . . . . . . . . . . . . . . . . . . . . . . . . — —
Outstanding as of March 31, 2009 . . . . . . . . . . . . . . . . . . . . 11,061,300 1,645 3.7Granted . . . . . . . . . . . . . . . . . . . . . . . . . . . . . . . . . . . . . . . . 2,585,000 767Exercised . . . . . . . . . . . . . . . . . . . . . . . . . . . . . . . . . . . . . . . — —Repurchased . . . . . . . . . . . . . . . . . . . . . . . . . . . . . . . . . . . . . — —Forfeited . . . . . . . . . . . . . . . . . . . . . . . . . . . . . . . . . . . . . . . . (43,500) 1,457Expired . . . . . . . . . . . . . . . . . . . . . . . . . . . . . . . . . . . . . . . . . (1,166,000) 1,600
Outstanding as of March 31, 2010 . . . . . . . . . . . . . . . . . . . . 12,436,800 ¥1,371 3.8
The total intrinsic value of options exercised during the years ended March 31, 2008 and 2009 was¥308 million and ¥5 million, respectively. The options were not exercised during the years ended March 31, 2010.The aggregate intrinsic value of options outstanding as of March 31, 2010 was ¥nil.
F-82
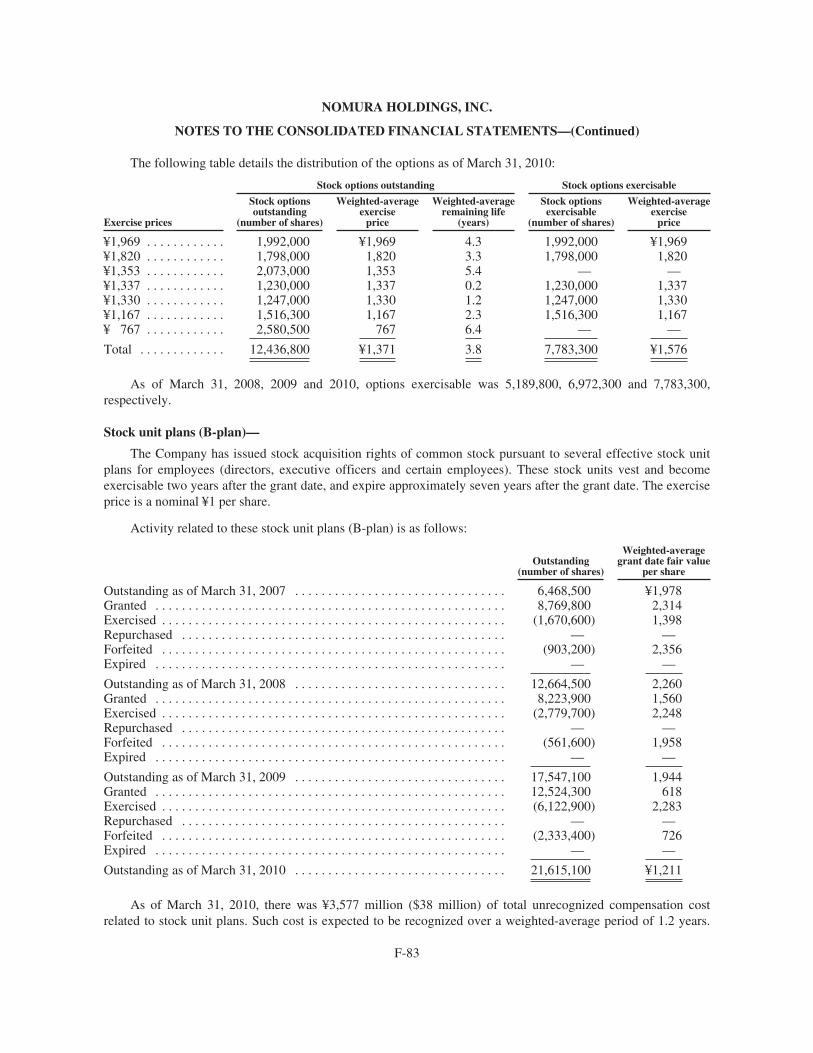
NOMURA HOLDINGS, INC.
NOTES TO THE CONSOLIDATED FINANCIAL STATEMENTS—(Continued)
The following table details the distribution of the options as of March 31, 2010:
Stock options outstanding Stock options exercisable
Exercise prices
Stock optionsoutstanding
(number of shares)
Weighted-averageexercise
price
Weighted-averageremaining life
(years)
Stock optionsexercisable
(number of shares)
Weighted-averageexercise
price
¥1,969 . . . . . . . . . . . . 1,992,000 ¥1,969 4.3 1,992,000 ¥1,969¥1,820 . . . . . . . . . . . . 1,798,000 1,820 3.3 1,798,000 1,820¥1,353 . . . . . . . . . . . . 2,073,000 1,353 5.4 — —¥1,337 . . . . . . . . . . . . 1,230,000 1,337 0.2 1,230,000 1,337¥1,330 . . . . . . . . . . . . 1,247,000 1,330 1.2 1,247,000 1,330¥1,167 . . . . . . . . . . . . 1,516,300 1,167 2.3 1,516,300 1,167¥ 767 . . . . . . . . . . . . 2,580,500 767 6.4 — —
Total . . . . . . . . . . . . . 12,436,800 ¥1,371 3.8 7,783,300 ¥1,576
As of March 31, 2008, 2009 and 2010, options exercisable was 5,189,800, 6,972,300 and 7,783,300,respectively.
Stock unit plans (B-plan)—
The Company has issued stock acquisition rights of common stock pursuant to several effective stock unitplans for employees (directors, executive officers and certain employees). These stock units vest and becomeexercisable two years after the grant date, and expire approximately seven years after the grant date. The exerciseprice is a nominal ¥1 per share.
Activity related to these stock unit plans (B-plan) is as follows:
Outstanding(number of shares)
Weighted-averagegrant date fair value
per share
Outstanding as of March 31, 2007 . . . . . . . . . . . . . . . . . . . . . . . . . . . . . . . . 6,468,500 ¥1,978Granted . . . . . . . . . . . . . . . . . . . . . . . . . . . . . . . . . . . . . . . . . . . . . . . . . . . . . 8,769,800 2,314Exercised . . . . . . . . . . . . . . . . . . . . . . . . . . . . . . . . . . . . . . . . . . . . . . . . . . . . (1,670,600) 1,398Repurchased . . . . . . . . . . . . . . . . . . . . . . . . . . . . . . . . . . . . . . . . . . . . . . . . . — —Forfeited . . . . . . . . . . . . . . . . . . . . . . . . . . . . . . . . . . . . . . . . . . . . . . . . . . . . (903,200) 2,356Expired . . . . . . . . . . . . . . . . . . . . . . . . . . . . . . . . . . . . . . . . . . . . . . . . . . . . . — —
Outstanding as of March 31, 2008 . . . . . . . . . . . . . . . . . . . . . . . . . . . . . . . . 12,664,500 2,260Granted . . . . . . . . . . . . . . . . . . . . . . . . . . . . . . . . . . . . . . . . . . . . . . . . . . . . . 8,223,900 1,560Exercised . . . . . . . . . . . . . . . . . . . . . . . . . . . . . . . . . . . . . . . . . . . . . . . . . . . . (2,779,700) 2,248Repurchased . . . . . . . . . . . . . . . . . . . . . . . . . . . . . . . . . . . . . . . . . . . . . . . . . — —Forfeited . . . . . . . . . . . . . . . . . . . . . . . . . . . . . . . . . . . . . . . . . . . . . . . . . . . . (561,600) 1,958Expired . . . . . . . . . . . . . . . . . . . . . . . . . . . . . . . . . . . . . . . . . . . . . . . . . . . . . — —
Outstanding as of March 31, 2009 . . . . . . . . . . . . . . . . . . . . . . . . . . . . . . . . 17,547,100 1,944Granted . . . . . . . . . . . . . . . . . . . . . . . . . . . . . . . . . . . . . . . . . . . . . . . . . . . . . 12,524,300 618Exercised . . . . . . . . . . . . . . . . . . . . . . . . . . . . . . . . . . . . . . . . . . . . . . . . . . . . (6,122,900) 2,283Repurchased . . . . . . . . . . . . . . . . . . . . . . . . . . . . . . . . . . . . . . . . . . . . . . . . . — —Forfeited . . . . . . . . . . . . . . . . . . . . . . . . . . . . . . . . . . . . . . . . . . . . . . . . . . . . (2,333,400) 726Expired . . . . . . . . . . . . . . . . . . . . . . . . . . . . . . . . . . . . . . . . . . . . . . . . . . . . . — —
Outstanding as of March 31, 2010 . . . . . . . . . . . . . . . . . . . . . . . . . . . . . . . . 21,615,100 ¥1,211
As of March 31, 2010, there was ¥3,577 million ($38 million) of total unrecognized compensation costrelated to stock unit plans. Such cost is expected to be recognized over a weighted-average period of 1.2 years.
F-83
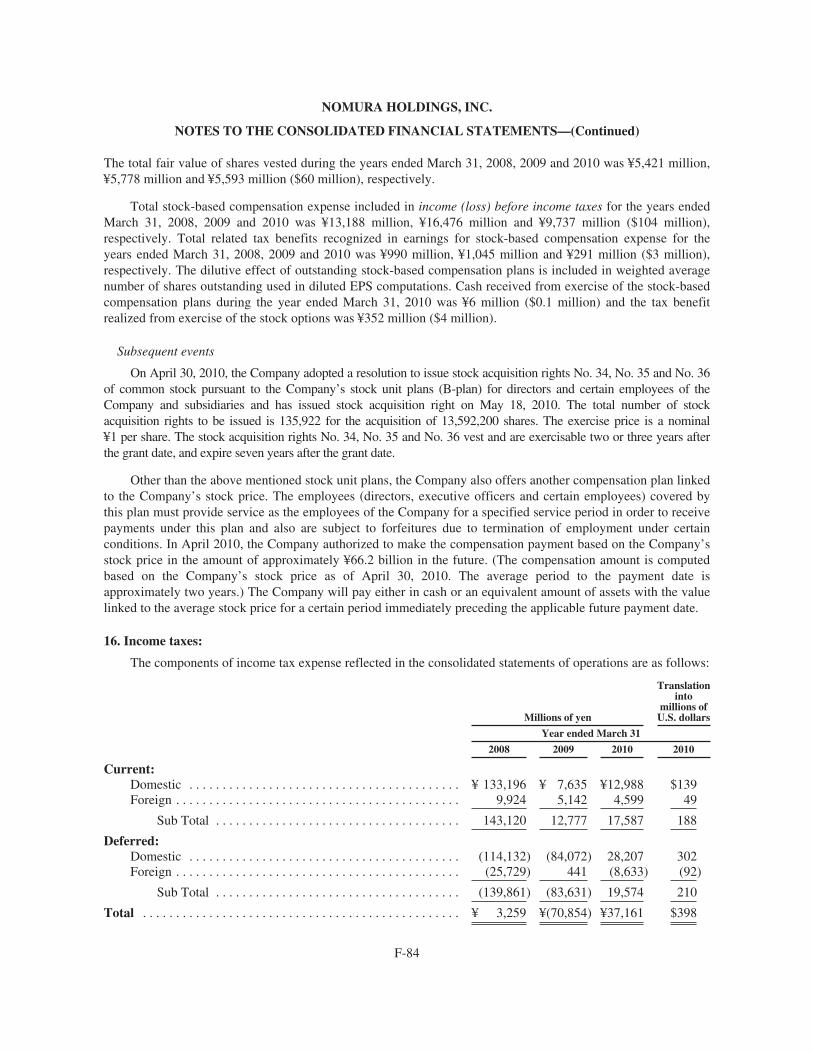
NOMURA HOLDINGS, INC.
NOTES TO THE CONSOLIDATED FINANCIAL STATEMENTS—(Continued)
The total fair value of shares vested during the years ended March 31, 2008, 2009 and 2010 was ¥5,421 million,¥5,778 million and ¥5,593 million ($60 million), respectively.
Total stock-based compensation expense included in income (loss) before income taxes for the years endedMarch 31, 2008, 2009 and 2010 was ¥13,188 million, ¥16,476 million and ¥9,737 million ($104 million),respectively. Total related tax benefits recognized in earnings for stock-based compensation expense for theyears ended March 31, 2008, 2009 and 2010 was ¥990 million, ¥1,045 million and ¥291 million ($3 million),respectively. The dilutive effect of outstanding stock-based compensation plans is included in weighted averagenumber of shares outstanding used in diluted EPS computations. Cash received from exercise of the stock-basedcompensation plans during the year ended March 31, 2010 was ¥6 million ($0.1 million) and the tax benefitrealized from exercise of the stock options was ¥352 million ($4 million).
Subsequent events
On April 30, 2010, the Company adopted a resolution to issue stock acquisition rights No. 34, No. 35 and No. 36of common stock pursuant to the Company’s stock unit plans (B-plan) for directors and certain employees of theCompany and subsidiaries and has issued stock acquisition right on May 18, 2010. The total number of stockacquisition rights to be issued is 135,922 for the acquisition of 13,592,200 shares. The exercise price is a nominal¥1 per share. The stock acquisition rights No. 34, No. 35 and No. 36 vest and are exercisable two or three years afterthe grant date, and expire seven years after the grant date.
Other than the above mentioned stock unit plans, the Company also offers another compensation plan linkedto the Company’s stock price. The employees (directors, executive officers and certain employees) covered bythis plan must provide service as the employees of the Company for a specified service period in order to receivepayments under this plan and also are subject to forfeitures due to termination of employment under certainconditions. In April 2010, the Company authorized to make the compensation payment based on the Company’sstock price in the amount of approximately ¥66.2 billion in the future. (The compensation amount is computedbased on the Company’s stock price as of April 30, 2010. The average period to the payment date isapproximately two years.) The Company will pay either in cash or an equivalent amount of assets with the valuelinked to the average stock price for a certain period immediately preceding the applicable future payment date.
16. Income taxes:
The components of income tax expense reflected in the consolidated statements of operations are as follows:
Millions of yen
Translationinto
millions ofU.S. dollars
Year ended March 31
2008 2009 2010 2010
Current:Domestic . . . . . . . . . . . . . . . . . . . . . . . . . . . . . . . . . . . . . . . . . ¥ 133,196 ¥ 7,635 ¥12,988 $139Foreign . . . . . . . . . . . . . . . . . . . . . . . . . . . . . . . . . . . . . . . . . . . 9,924 5,142 4,599 49
Sub Total . . . . . . . . . . . . . . . . . . . . . . . . . . . . . . . . . . . . . 143,120 12,777 17,587 188
Deferred:Domestic . . . . . . . . . . . . . . . . . . . . . . . . . . . . . . . . . . . . . . . . . (114,132) (84,072) 28,207 302Foreign . . . . . . . . . . . . . . . . . . . . . . . . . . . . . . . . . . . . . . . . . . . (25,729) 441 (8,633) (92)
Sub Total . . . . . . . . . . . . . . . . . . . . . . . . . . . . . . . . . . . . . (139,861) (83,631) 19,574 210
Total . . . . . . . . . . . . . . . . . . . . . . . . . . . . . . . . . . . . . . . . . . . . . . . . ¥ 3,259 ¥(70,854) ¥37,161 $398
F-84
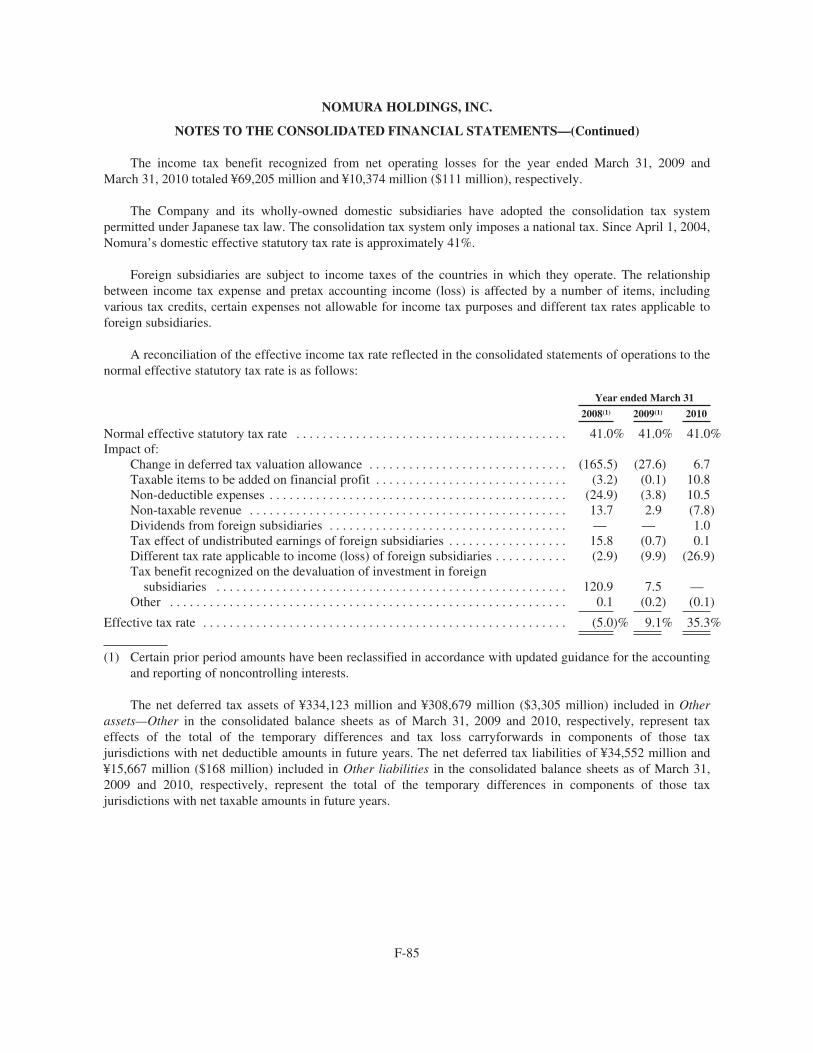
NOMURA HOLDINGS, INC.
NOTES TO THE CONSOLIDATED FINANCIAL STATEMENTS—(Continued)
The income tax benefit recognized from net operating losses for the year ended March 31, 2009 andMarch 31, 2010 totaled ¥69,205 million and ¥10,374 million ($111 million), respectively.
The Company and its wholly-owned domestic subsidiaries have adopted the consolidation tax systempermitted under Japanese tax law. The consolidation tax system only imposes a national tax. Since April 1, 2004,Nomura’s domestic effective statutory tax rate is approximately 41%.
Foreign subsidiaries are subject to income taxes of the countries in which they operate. The relationshipbetween income tax expense and pretax accounting income (loss) is affected by a number of items, includingvarious tax credits, certain expenses not allowable for income tax purposes and different tax rates applicable toforeign subsidiaries.
A reconciliation of the effective income tax rate reflected in the consolidated statements of operations to thenormal effective statutory tax rate is as follows:
Year ended March 31
2008(1) 2009(1) 2010
Normal effective statutory tax rate . . . . . . . . . . . . . . . . . . . . . . . . . . . . . . . . . . . . . . . . . 41.0% 41.0% 41.0%Impact of:
Change in deferred tax valuation allowance . . . . . . . . . . . . . . . . . . . . . . . . . . . . . . (165.5) (27.6) 6.7Taxable items to be added on financial profit . . . . . . . . . . . . . . . . . . . . . . . . . . . . . (3.2) (0.1) 10.8Non-deductible expenses . . . . . . . . . . . . . . . . . . . . . . . . . . . . . . . . . . . . . . . . . . . . . (24.9) (3.8) 10.5Non-taxable revenue . . . . . . . . . . . . . . . . . . . . . . . . . . . . . . . . . . . . . . . . . . . . . . . . 13.7 2.9 (7.8)Dividends from foreign subsidiaries . . . . . . . . . . . . . . . . . . . . . . . . . . . . . . . . . . . . — — 1.0Tax effect of undistributed earnings of foreign subsidiaries . . . . . . . . . . . . . . . . . . 15.8 (0.7) 0.1Different tax rate applicable to income (loss) of foreign subsidiaries . . . . . . . . . . . (2.9) (9.9) (26.9)Tax benefit recognized on the devaluation of investment in foreign
subsidiaries . . . . . . . . . . . . . . . . . . . . . . . . . . . . . . . . . . . . . . . . . . . . . . . . . . . . . 120.9 7.5 —Other . . . . . . . . . . . . . . . . . . . . . . . . . . . . . . . . . . . . . . . . . . . . . . . . . . . . . . . . . . . . 0.1 (0.2) (0.1)
Effective tax rate . . . . . . . . . . . . . . . . . . . . . . . . . . . . . . . . . . . . . . . . . . . . . . . . . . . . . . . (5.0)% 9.1% 35.3%
(1) Certain prior period amounts have been reclassified in accordance with updated guidance for the accountingand reporting of noncontrolling interests.
The net deferred tax assets of ¥334,123 million and ¥308,679 million ($3,305 million) included in Otherassets—Other in the consolidated balance sheets as of March 31, 2009 and 2010, respectively, represent taxeffects of the total of the temporary differences and tax loss carryforwards in components of those taxjurisdictions with net deductible amounts in future years. The net deferred tax liabilities of ¥34,552 million and¥15,667 million ($168 million) included in Other liabilities in the consolidated balance sheets as of March 31,2009 and 2010, respectively, represent the total of the temporary differences in components of those taxjurisdictions with net taxable amounts in future years.
F-85
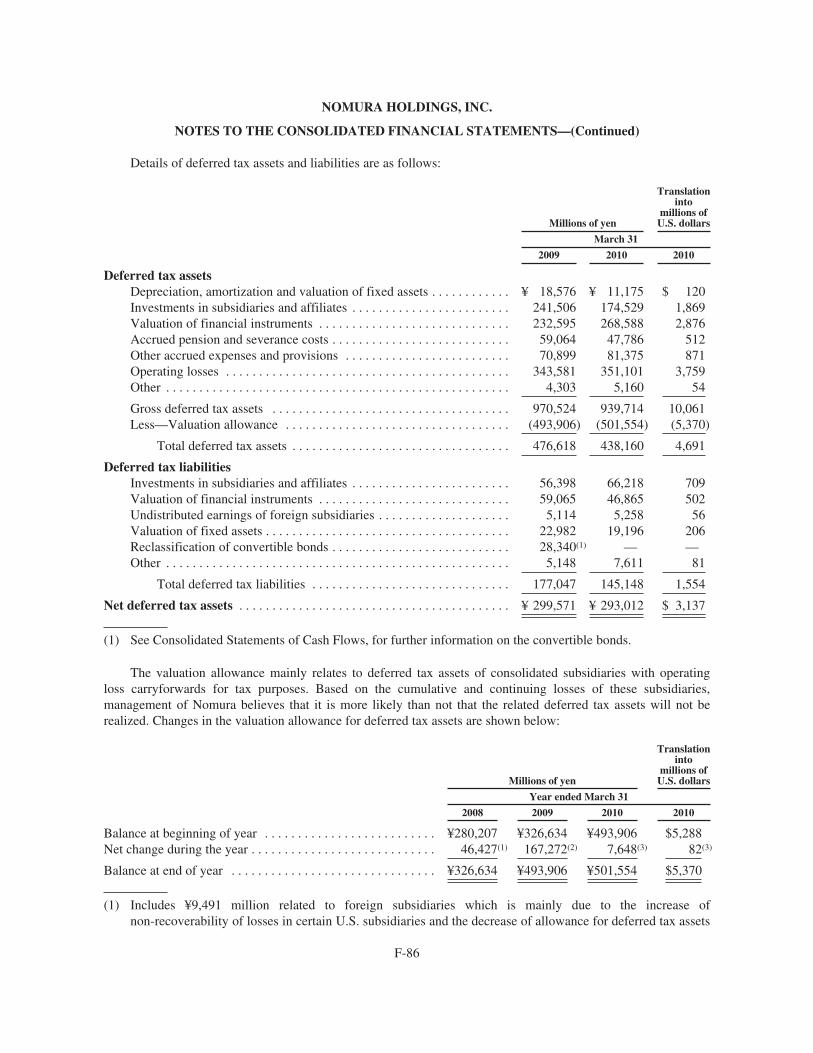
NOMURA HOLDINGS, INC.
NOTES TO THE CONSOLIDATED FINANCIAL STATEMENTS—(Continued)
Details of deferred tax assets and liabilities are as follows:
Millions of yen
Translationinto
millions ofU.S. dollars
March 31
2009 2010 2010
Deferred tax assetsDepreciation, amortization and valuation of fixed assets . . . . . . . . . . . . ¥ 18,576 ¥ 11,175 $ 120Investments in subsidiaries and affiliates . . . . . . . . . . . . . . . . . . . . . . . . 241,506 174,529 1,869Valuation of financial instruments . . . . . . . . . . . . . . . . . . . . . . . . . . . . . 232,595 268,588 2,876Accrued pension and severance costs . . . . . . . . . . . . . . . . . . . . . . . . . . . 59,064 47,786 512Other accrued expenses and provisions . . . . . . . . . . . . . . . . . . . . . . . . . 70,899 81,375 871Operating losses . . . . . . . . . . . . . . . . . . . . . . . . . . . . . . . . . . . . . . . . . . . 343,581 351,101 3,759Other . . . . . . . . . . . . . . . . . . . . . . . . . . . . . . . . . . . . . . . . . . . . . . . . . . . . 4,303 5,160 54
Gross deferred tax assets . . . . . . . . . . . . . . . . . . . . . . . . . . . . . . . . . . . . 970,524 939,714 10,061Less—Valuation allowance . . . . . . . . . . . . . . . . . . . . . . . . . . . . . . . . . . (493,906) (501,554) (5,370)
Total deferred tax assets . . . . . . . . . . . . . . . . . . . . . . . . . . . . . . . . . 476,618 438,160 4,691
Deferred tax liabilitiesInvestments in subsidiaries and affiliates . . . . . . . . . . . . . . . . . . . . . . . . 56,398 66,218 709Valuation of financial instruments . . . . . . . . . . . . . . . . . . . . . . . . . . . . . 59,065 46,865 502Undistributed earnings of foreign subsidiaries . . . . . . . . . . . . . . . . . . . . 5,114 5,258 56Valuation of fixed assets . . . . . . . . . . . . . . . . . . . . . . . . . . . . . . . . . . . . . 22,982 19,196 206Reclassification of convertible bonds . . . . . . . . . . . . . . . . . . . . . . . . . . . 28,340(1) — —Other . . . . . . . . . . . . . . . . . . . . . . . . . . . . . . . . . . . . . . . . . . . . . . . . . . . . 5,148 7,611 81
Total deferred tax liabilities . . . . . . . . . . . . . . . . . . . . . . . . . . . . . . 177,047 145,148 1,554
Net deferred tax assets . . . . . . . . . . . . . . . . . . . . . . . . . . . . . . . . . . . . . . . . . ¥ 299,571 ¥ 293,012 $ 3,137
(1) See Consolidated Statements of Cash Flows, for further information on the convertible bonds.
The valuation allowance mainly relates to deferred tax assets of consolidated subsidiaries with operatingloss carryforwards for tax purposes. Based on the cumulative and continuing losses of these subsidiaries,management of Nomura believes that it is more likely than not that the related deferred tax assets will not berealized. Changes in the valuation allowance for deferred tax assets are shown below:
Millions of yen
Translationinto
millions ofU.S. dollars
Year ended March 31
2008 2009 2010 2010
Balance at beginning of year . . . . . . . . . . . . . . . . . . . . . . . . . . ¥280,207 ¥326,634 ¥493,906 $5,288Net change during the year . . . . . . . . . . . . . . . . . . . . . . . . . . . . 46,427(1) 167,272(2) 7,648(3) 82(3)
Balance at end of year . . . . . . . . . . . . . . . . . . . . . . . . . . . . . . . ¥326,634 ¥493,906 ¥501,554 $5,370
(1) Includes ¥9,491 million related to foreign subsidiaries which is mainly due to the increase ofnon-recoverability of losses in certain U.S. subsidiaries and the decrease of allowance for deferred tax assets
F-86
NOMURA HOLDINGS, INC.
NOTES TO THE CONSOLIDATED FINANCIAL STATEMENTS—(Continued)
previously recorded on certain European subsidiaries, and ¥36,550 million related to the Company, which isdue to the allowance for the non-recoverability of future realizable losses on local taxes. These allowancesagainst deferred tax assets are determined based on a review of future realizable value.
(2) Includes ¥121,273 million related to foreign subsidiaries which is mainly due to an increase innon-recoverability of losses in certain U.S. subsidiaries and in certain European subsidiaries,¥25,817 million related to subsidiaries in Japan and ¥20,182 million related to the Company, which is due tothe allowance for the non-recoverability of future realizable losses on local taxes. These allowances againstdeferred tax assets are determined based on a review of future realizable value.
(3) Includes ¥8,313 million ($89 million) and ¥2,667 million ($29 million) related to subsidiaries which ismainly due to an increase in non-recoverability of losses in certain foreign subsidiaries and in certainsubsidiaries in Japan, negative ¥3,332 million ($36 million) related the Company which is due to thedecrease of allowance for the deferred tax assets previously recorded. In total, ¥7,648 million ($82 million)of allowances increased for the year ended March 31, 2010. These allowances against deferred tax assets aredetermined based on a review of future realizable value.
As of March 31, 2010, no deferred income taxes have been provided on undistributed earnings of foreignsubsidiaries not expected to be remitted in the foreseeable future totaling ¥1,498 million ($16 million). It is notpracticable to determine the amount of income taxes payable in the event all such foreign earnings arerepatriated.
As of March 31, 2010, Nomura has net operating loss carryforwards, for income tax purposes, of¥1,186,873 million ($12,707 million) resulting from certain U.S. and European subsidiaries. These losses, exceptfor ¥474,252 million ($5,078 million), which can be carried forward indefinitely, expire as follows: 2010 through2017—¥387,757 million ($4,152 million), 2018 and thereafter—¥324,864 million ($3,477 million). Nomurabelieves that it is more likely than not that these loss carryforwards, less valuation allowance, will be realized.
The total amount of unrecognised tax benefits as of the date of adoption of ASC 740 and that as ofMarch 31, 2010 were ¥nil. Also there were no movements of the gross amounts in unrealized tax benefits and theamounts of interest and penalties recognised due to the unrealized tax benefits during the year ended March2010. Nomura recognises the accrual of interest related to unrecognised tax benefits and penalties related tounrecognised tax benefits, if there are any, in Income tax expense in the consolidated statements of operations.
Nomura is under continuous examination by the Japanese National Tax Agency and other tax authorities inmajor operating jurisdictions such as the United Kingdom and United States. Nomura regularly assesses thelikelihood of additional assessments in each tax jurisdiction and the impact on the consolidated financialstatements. A liability for unrecognized tax benefits would be established if necessary, which Nomura believes tobe adequate with regards to the potential for additional exposure. It is reasonably possible that there may be asignificant increase in unrecognised tax benefits within 12 months of March 31, 2010. Quantification of anestimated range cannot be made at this time due to the uncertainty of the potential outcomes. However, Nomuradoes not expect that any change in the gross balance of unrecognised tax benefits would have a material effect onits financial condition.
F-87
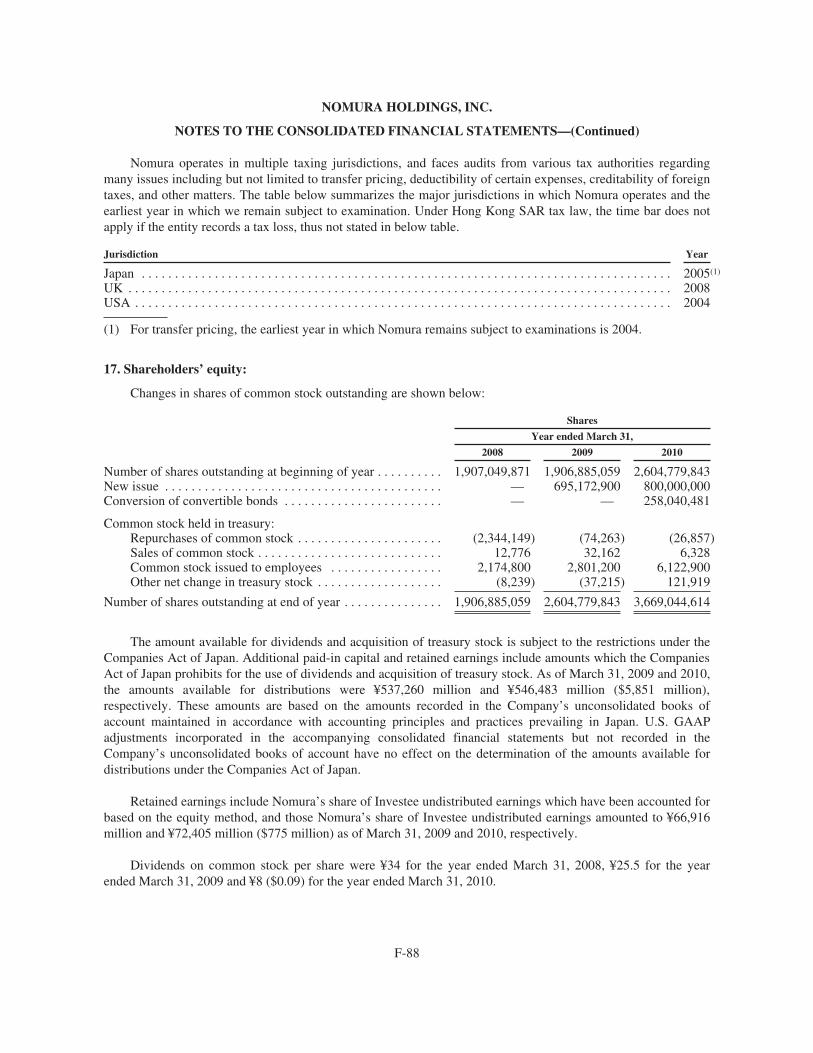
NOMURA HOLDINGS, INC.
NOTES TO THE CONSOLIDATED FINANCIAL STATEMENTS—(Continued)
Nomura operates in multiple taxing jurisdictions, and faces audits from various tax authorities regardingmany issues including but not limited to transfer pricing, deductibility of certain expenses, creditability of foreigntaxes, and other matters. The table below summarizes the major jurisdictions in which Nomura operates and theearliest year in which we remain subject to examination. Under Hong Kong SAR tax law, the time bar does notapply if the entity records a tax loss, thus not stated in below table.
Jurisdiction Year
Japan . . . . . . . . . . . . . . . . . . . . . . . . . . . . . . . . . . . . . . . . . . . . . . . . . . . . . . . . . . . . . . . . . . . . . . . . . . . . . . . . 2005(1)
UK . . . . . . . . . . . . . . . . . . . . . . . . . . . . . . . . . . . . . . . . . . . . . . . . . . . . . . . . . . . . . . . . . . . . . . . . . . . . . . . . . . 2008USA . . . . . . . . . . . . . . . . . . . . . . . . . . . . . . . . . . . . . . . . . . . . . . . . . . . . . . . . . . . . . . . . . . . . . . . . . . . . . . . . . 2004
(1) For transfer pricing, the earliest year in which Nomura remains subject to examinations is 2004.
17. Shareholders’ equity:
Changes in shares of common stock outstanding are shown below:
Shares
Year ended March 31,
2008 2009 2010
Number of shares outstanding at beginning of year . . . . . . . . . . 1,907,049,871 1,906,885,059 2,604,779,843New issue . . . . . . . . . . . . . . . . . . . . . . . . . . . . . . . . . . . . . . . . . . — 695,172,900 800,000,000Conversion of convertible bonds . . . . . . . . . . . . . . . . . . . . . . . . — — 258,040,481
Common stock held in treasury:Repurchases of common stock . . . . . . . . . . . . . . . . . . . . . . (2,344,149) (74,263) (26,857)Sales of common stock . . . . . . . . . . . . . . . . . . . . . . . . . . . . 12,776 32,162 6,328Common stock issued to employees . . . . . . . . . . . . . . . . . 2,174,800 2,801,200 6,122,900Other net change in treasury stock . . . . . . . . . . . . . . . . . . . (8,239) (37,215) 121,919
Number of shares outstanding at end of year . . . . . . . . . . . . . . . 1,906,885,059 2,604,779,843 3,669,044,614
The amount available for dividends and acquisition of treasury stock is subject to the restrictions under theCompanies Act of Japan. Additional paid-in capital and retained earnings include amounts which the CompaniesAct of Japan prohibits for the use of dividends and acquisition of treasury stock. As of March 31, 2009 and 2010,the amounts available for distributions were ¥537,260 million and ¥546,483 million ($5,851 million),respectively. These amounts are based on the amounts recorded in the Company’s unconsolidated books ofaccount maintained in accordance with accounting principles and practices prevailing in Japan. U.S. GAAPadjustments incorporated in the accompanying consolidated financial statements but not recorded in theCompany’s unconsolidated books of account have no effect on the determination of the amounts available fordistributions under the Companies Act of Japan.
Retained earnings include Nomura’s share of Investee undistributed earnings which have been accounted forbased on the equity method, and those Nomura’s share of Investee undistributed earnings amounted to ¥66,916million and ¥72,405 million ($775 million) as of March 31, 2009 and 2010, respectively.
Dividends on common stock per share were ¥34 for the year ended March 31, 2008, ¥25.5 for the yearended March 31, 2009 and ¥8 ($0.09) for the year ended March 31, 2010.
F-88
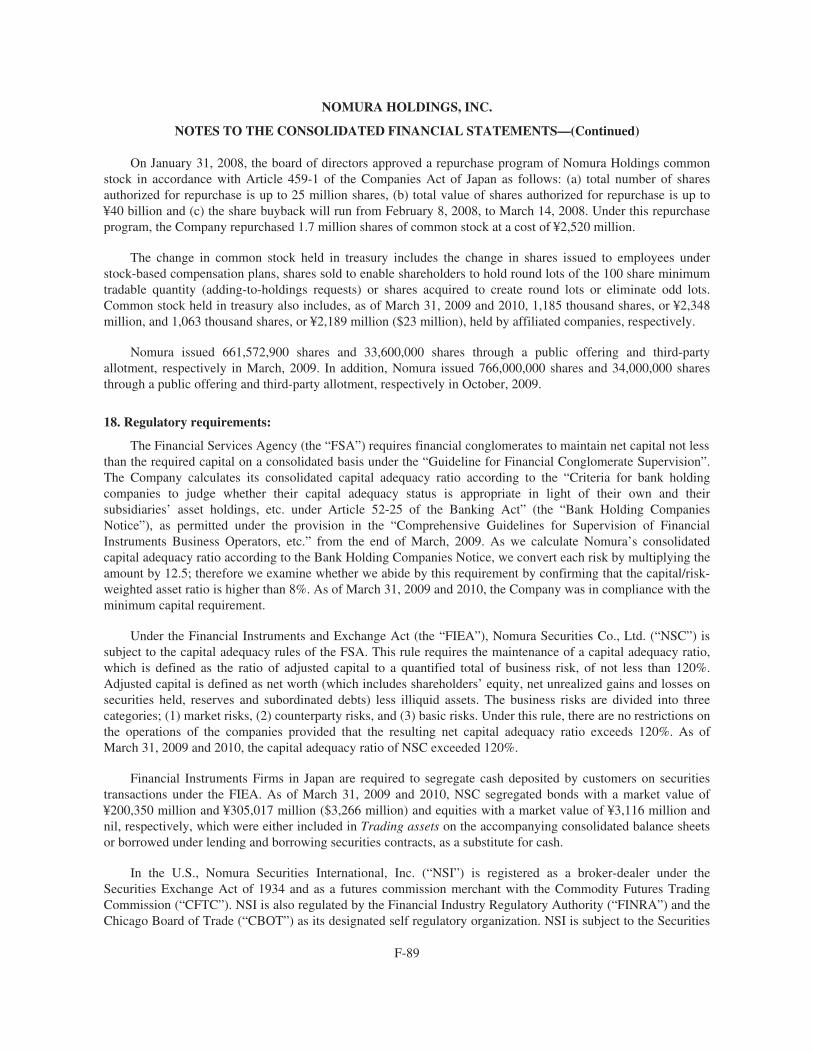
NOMURA HOLDINGS, INC.
NOTES TO THE CONSOLIDATED FINANCIAL STATEMENTS—(Continued)
On January 31, 2008, the board of directors approved a repurchase program of Nomura Holdings commonstock in accordance with Article 459-1 of the Companies Act of Japan as follows: (a) total number of sharesauthorized for repurchase is up to 25 million shares, (b) total value of shares authorized for repurchase is up to¥40 billion and (c) the share buyback will run from February 8, 2008, to March 14, 2008. Under this repurchaseprogram, the Company repurchased 1.7 million shares of common stock at a cost of ¥2,520 million.
The change in common stock held in treasury includes the change in shares issued to employees understock-based compensation plans, shares sold to enable shareholders to hold round lots of the 100 share minimumtradable quantity (adding-to-holdings requests) or shares acquired to create round lots or eliminate odd lots.Common stock held in treasury also includes, as of March 31, 2009 and 2010, 1,185 thousand shares, or ¥2,348million, and 1,063 thousand shares, or ¥2,189 million ($23 million), held by affiliated companies, respectively.
Nomura issued 661,572,900 shares and 33,600,000 shares through a public offering and third-partyallotment, respectively in March, 2009. In addition, Nomura issued 766,000,000 shares and 34,000,000 sharesthrough a public offering and third-party allotment, respectively in October, 2009.
18. Regulatory requirements:
The Financial Services Agency (the “FSA”) requires financial conglomerates to maintain net capital not lessthan the required capital on a consolidated basis under the “Guideline for Financial Conglomerate Supervision”.The Company calculates its consolidated capital adequacy ratio according to the “Criteria for bank holdingcompanies to judge whether their capital adequacy status is appropriate in light of their own and theirsubsidiaries’ asset holdings, etc. under Article 52-25 of the Banking Act” (the “Bank Holding CompaniesNotice”), as permitted under the provision in the “Comprehensive Guidelines for Supervision of FinancialInstruments Business Operators, etc.” from the end of March, 2009. As we calculate Nomura’s consolidatedcapital adequacy ratio according to the Bank Holding Companies Notice, we convert each risk by multiplying theamount by 12.5; therefore we examine whether we abide by this requirement by confirming that the capital/risk-weighted asset ratio is higher than 8%. As of March 31, 2009 and 2010, the Company was in compliance with theminimum capital requirement.
Under the Financial Instruments and Exchange Act (the “FIEA”), Nomura Securities Co., Ltd. (“NSC”) issubject to the capital adequacy rules of the FSA. This rule requires the maintenance of a capital adequacy ratio,which is defined as the ratio of adjusted capital to a quantified total of business risk, of not less than 120%.Adjusted capital is defined as net worth (which includes shareholders’ equity, net unrealized gains and losses onsecurities held, reserves and subordinated debts) less illiquid assets. The business risks are divided into threecategories; (1) market risks, (2) counterparty risks, and (3) basic risks. Under this rule, there are no restrictions onthe operations of the companies provided that the resulting net capital adequacy ratio exceeds 120%. As ofMarch 31, 2009 and 2010, the capital adequacy ratio of NSC exceeded 120%.
Financial Instruments Firms in Japan are required to segregate cash deposited by customers on securitiestransactions under the FIEA. As of March 31, 2009 and 2010, NSC segregated bonds with a market value of¥200,350 million and ¥305,017 million ($3,266 million) and equities with a market value of ¥3,116 million andnil, respectively, which were either included in Trading assets on the accompanying consolidated balance sheetsor borrowed under lending and borrowing securities contracts, as a substitute for cash.
In the U.S., Nomura Securities International, Inc. (“NSI”) is registered as a broker-dealer under theSecurities Exchange Act of 1934 and as a futures commission merchant with the Commodity Futures TradingCommission (“CFTC”). NSI is also regulated by the Financial Industry Regulatory Authority (“FINRA”) and theChicago Board of Trade (“CBOT”) as its designated self regulatory organization. NSI is subject to the Securities
F-89
NOMURA HOLDINGS, INC.
NOTES TO THE CONSOLIDATED FINANCIAL STATEMENTS—(Continued)
and Exchange Commission’s Uniform Net Capital Rule (“Rule 15c3-1”) and other related rules, which requirenet capital, as defined under the alternative method, of not less than the greater of $1,000,000 or 2% of aggregatedebit items arising from customer transactions. The subsidiary is also subject to CFTC Regulation 1.17 whichrequires the maintenance of net capital of 8% of the total risk margin requirement, as defined, for all positionscarried in customer accounts and noncustomer accounts or $1,000,000, whichever is greater. The subsidiary isrequired to maintain net capital in accordance with the SEC, CFTC, or various other exchange requirements,whichever is greater. As of March 31, 2009 and 2010, the subsidiary was in compliance with all applicableregulatory capital adequacy requirements.
In Europe, the Nomura Europe Holdings plc (“NEHS”) group is regulated on a consolidated basis by theFinancial Services Authority in the United Kingdom, which imposes minimum capital adequacy requirements toNEHS group. In addition, Nomura International plc (“NIP”) is a subsidiary of NEHS and provides securitiesbrokerage and dealing business. Therefore, NIP is also regulated and imposed minimum capital adequacyrequirements on a stand alone basis by the Financial Services Authority. As of March 31, 2009 and 2010, theNEHS group and NIP were in compliance with all relevant regulatory capital related requirements.
In Asia, Nomura International (Hong Kong) Limited (“NIHK”) and Nomura Singapore Ltd (“NSL”) areregulated by the respective authorities. NIHK is licensed by the Securities and Futures Commission, Hong Kongto carry out regulated activities including the provision of securities brokerage and dealing, underwriting,investment advisory and securities margin financing services for its clients. NIHK has two branches located inTaiwan and Korea which are also regulated by their local regulators under their respective jurisdictions.Activities of NIHK including its branches are subject to the Securities and Futures (Financial Resources) Ruleswhich requires it, at all times, to maintain its liquid capital at a level not less than its required liquid capital.Liquid capital means an amount by which its liquid assets exceed its ranking liabilities. Required liquid capital iscalculated in accordance with the provisions laid down in the Securities and Futures (Financial Resources) Rules.NSL provides securities brokerage and dealing business. It is regulated by the Monetary Authority of Singapore(“MAS”). The regulations required NSL to maintain a minimum capital of S$3 million. Currently, NSL isobserving Capital Adequacy Ratio which fulfills the requirement from MAS. As of March 31, 2009 and 2010,NIHK and NSL were in compliance with all relevant regulatory capital related requirements.
19. Affiliated companies and other equity-method investees:
Nomura’s significant affiliated companies and other equity-method investees include JAFCO Co., Ltd.,Nomura Research Institute, Ltd., Nomura Land and Building Co., Ltd., Fortress Investment Group LLC andChi-X Europe Limited.
JAFCO Co., Ltd. (“JAFCO”)—
JAFCO, which is a listed company in Japan, manages various venture capital funds and provides privateequity-related investment services to portfolio companies. Nomura held 21.1% of the outstanding share capital asof March 31, 2001 and has applied the equity method of accounting for the investment in JAFCO in theconsolidated financial statements. During the year ended March 31, 2002, Nomura acquired an additional 0.6%equity interest in JAFCO. During the year ended March 31, 2003, Nomura acquired an additional 3.6% equityinterest in JAFCO from Nomura Land and Building Co., Ltd. During the year ended March 31, 2010, Nomurasold a 3.4% equity interest in JAFCO.
Nomura recognized impairment losses of ¥17,551 million and ¥13,618 million against its investment inJAFCO for the years ended March 31, 2008 and 2009, respectively. The share price of JAFCO declined
F-90
NOMURA HOLDINGS, INC.
NOTES TO THE CONSOLIDATED FINANCIAL STATEMENTS—(Continued)
significantly during 2008 and 2009 as the Japanese stock market slowed down and this decline was determined tobe other-than-temporary in nature. The loss was classified within Non-interest expenses—Other in theconsolidated statements of operations.
As of March 31, 2010, Nomura’s ownership of JAFCO was 24.1% and there was no remaining equitymethod goodwill included in the carrying amount of the investment in JAFCO.
Nomura Research Institute, Ltd. (“NRI”)—
NRI develops and manages computer systems and provides research services and management consultingservices. One of the major customers of NRI is Nomura. Nomura has held 25.2% of the outstanding share capitalsince March 31, 2000 and applies the equity method of accounting for the investment in NRI in the consolidatedfinancial statements.
NRI was listed on the First Section of the Tokyo Stock Exchange on December 17, 2001 and completed aninitial public offering and issued 2 million shares of common stock to third parties. As a result of this issuance,Nomura’s equity interest in NRI declined from 25.2% to 24.1%.
Subsequently, during the year ended March 31, 2003 and 2005, Nomura acquired an additional 1.0% and17.2% equity interest in NRI from Nomura Land and Building Co., Ltd, respectively.
In October 2005, Nomura applied for a share repurchase offered by NRI and NRI re-acquired 4 million ofits shares from Nomura in November 2005.
For the year ended March 31, 2009, Nomura sold ¥38,419 million worth of software and computerequipment to NRI.
As of March 31, 2010, Nomura’s ownership of NRI was 38.5% and the remaining balance of equity methodgoodwill included in the carrying value of the investment in NRI was ¥56,934 million ($610 million).
Nomura Land and Building Co., Ltd. (“NLB”)—
Prior to August 1, 2004, NLB owned a substantial portion of Nomura’s leased office space in Japan andfrom August 1, 2004, NLB has owned certain of Nomura’s leased office space in Japan. The lease transactionswith Nomura are disclosed in Note 20 “Commitments, contingencies and guarantees”, Nomura has held 24.9% ofNLB’s outstanding share capital since March 31, 2000 and applies the equity method of accounting for theinvestment in NLB in the consolidated financial statements. During the year ended March 31, 2003, Nomuraacquired an additional 4.4% equity interest in NLB from a financial institution.
Effective August 1, 2004, Nomura acquired NLB’s facility management business, which included theownership, lease, maintenance and administration of certain real estate properties previously leased to Nomura.
In March 2005, Nomura acquired an additional 8.4% equity interest in NLB from a third party.
In October 2006, Nomura Real Estate Holdings, Inc. which is a subsidiary of NLB, completed an initialpublic offering and issued 36 million shares of common stock to third parties at an underwriting price of ¥3,332per share and listed the shares on the First Section of the Tokyo Stock Exchange.
F-91
NOMURA HOLDINGS, INC.
NOTES TO THE CONSOLIDATED FINANCIAL STATEMENTS—(Continued)
As of March 31, 2010, Nomura’s ownership of NLB was 38.5% and the remaining balance of equity methodgoodwill included in the carrying amount of the investment in NLB was ¥1,485 million ($16 million).
Fortress Investment Group LLC (“Fortress”)—
Fortress is a global investment management firm. Fortress raises, invests and manages private equity funds,hedge funds and publicly traded alternative investment vehicles.
In January 2007, Nomura acquired Class A shares of Fortress for approximately $888 million, representing15% of voting interests. On February 8, 2007, Fortress announced its initial public offering of 34,286,000Class A shares priced at $18.50 per share. Fortress also granted the underwriters an option to purchase up to anadditional 5,142,900 Class A shares. The investment in Fortress is treated as an investment in a limitedpartnership and is accounted for by the equity method of accounting. Fortress’s shares began trading onFebruary 9, 2007, on the New York Stock Exchange.
For the year ended March 31, 2009, Nomura recognized an impairment loss of ¥81,248 million against itsinvestment in Fortress. The share price of Fortress had declined significantly during 2008 as the U.S. stockmarket slowed down and this decline was determined to be other-than-temporary in nature. The loss wasclassified within Non-interest expenses—Other in the consolidated statements of operations.
In May 2009, Fortress sold 46,000,000 Class A shares in a public offering and Nomura purchased 5,400,000of these shares, at the public offering price.
As of March 31, 2010, Nomura’s ownership of Fortress was 11.7% and there was no remaining equitymethod goodwill included in the carrying value of the investment in Fortress.
Summary Financial Information—
A summary of financial information for JAFCO, NRI and NLB is as follows:
Millions of yen
Translationinto
millions ofU.S. dollars
March 31
2009 2010 2010
Total assets . . . . . . . . . . . . . . . . . . . . . . . . . . . . . . . . . . . . . . . . . . . . . . . . . ¥2,012,853 ¥2,020,517 $21,633Total liabilities . . . . . . . . . . . . . . . . . . . . . . . . . . . . . . . . . . . . . . . . . . . . . . . 1,507,486 1,474,284 15,785
Millions of yen
Translationinto
millions ofU.S. dollars
Year ended March 31
2008 2009 2010 2010
Net Revenues . . . . . . . . . . . . . . . . . . . . . . . . . . . . . . . . . . . . . . . . . ¥493,058 ¥530,181 ¥526,350 $5,635Non-interest expenses . . . . . . . . . . . . . . . . . . . . . . . . . . . . . . . . . . 430,766 498,104 482,573 5,167Net income attributable to the companies . . . . . . . . . . . . . . . . . . . 30,340 2,598 22,779 244
F-92
NOMURA HOLDINGS, INC.
NOTES TO THE CONSOLIDATED FINANCIAL STATEMENTS—(Continued)
A summary of financial information for Fortress is as follows:
Millions of yen
Translationinto
millions ofU.S. dollars
March 31
2009(1) 2010(1) 2010
Total assets . . . . . . . . . . . . . . . . . . . . . . . . . . . . . . . . . . . . . . . . . . . . . . . . . . . . ¥154,981 ¥154,471 $1,654Total liabilities . . . . . . . . . . . . . . . . . . . . . . . . . . . . . . . . . . . . . . . . . . . . . . . . . . 146,871 98,711 $1,057
Millions of yen
Translationinto
millions ofU.S. dollars
Year ended March 31
2008(1) 2009(1) 2010(1) 2010
Net Revenues . . . . . . . . . . . . . . . . . . . . . . . . . . . . . . . . . . . . . . . . . ¥ 63,835 ¥ 38,702 ¥ 57,602 $ 617Non-interest expenses . . . . . . . . . . . . . . . . . . . . . . . . . . . . . . . . . . 185,405 150,079 144,868 1,551Net income (loss) attributable to the company . . . . . . . . . . . . . . . (6,844) (32,458) (23,651) (253)
(1) Financial information for Fortress is as of its fiscal years ended December 31, 2007, 2008 and 2009,respectively. Nomura records its share of Fortress’s earnings on a three month lag.
A summary of balances and transactions with affiliated companies and other equity-method investees,except for lease transactions with NLB, which are disclosed in Note 20, “Commitments, contingencies andguarantees”, is presented below:
Millions of yen
Translationinto
millions ofU.S. dollars
March 31
2009 2010 2010
Investments in affiliated companies . . . . . . . . . . . . . . . . . . . . . . . . . . . . . . . . . ¥240,055 ¥247,641 $2,651Advances to affiliated companies . . . . . . . . . . . . . . . . . . . . . . . . . . . . . . . . . . . 3,419 3,632 39
Millions of yen
Translationinto
millions ofU.S. dollars
Year ended March 31
2008 2009 2010 2010
Revenues . . . . . . . . . . . . . . . . . . . . . . . . . . . . . . . . . . . . . . . . . . . . . . . ¥ 1,738 ¥ 865 ¥ 362 $ 4Non-interest expenses . . . . . . . . . . . . . . . . . . . . . . . . . . . . . . . . . . . . . 40,526 43,750 58,219 623Purchase of software and tangible assets . . . . . . . . . . . . . . . . . . . . . . . 52,890 44,602 25,954 278
In addition to the above, the sale of tangible fixed assets to affiliates companies for the year endedMarch 31, 2009 was ¥38,420 million.
F-93
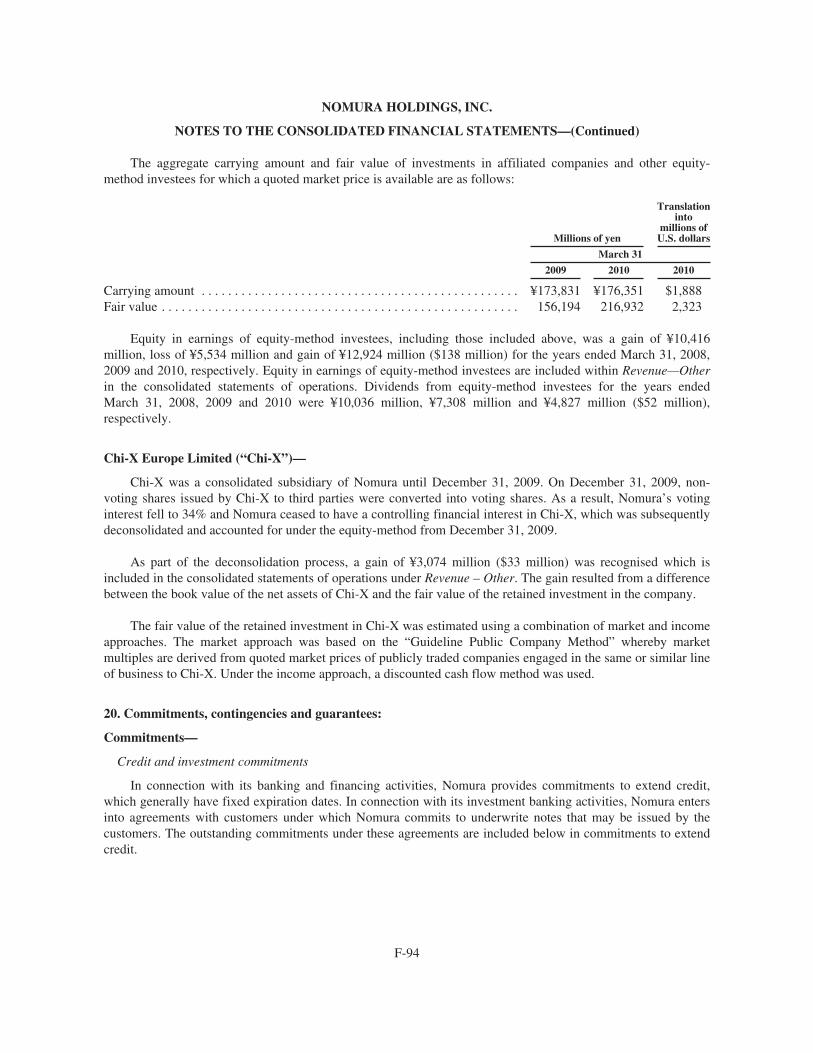
NOMURA HOLDINGS, INC.
NOTES TO THE CONSOLIDATED FINANCIAL STATEMENTS—(Continued)
The aggregate carrying amount and fair value of investments in affiliated companies and other equity-method investees for which a quoted market price is available are as follows:
Millions of yen
Translationinto
millions ofU.S. dollars
March 31
2009 2010 2010
Carrying amount . . . . . . . . . . . . . . . . . . . . . . . . . . . . . . . . . . . . . . . . . . . . . . . . ¥173,831 ¥176,351 $1,888Fair value . . . . . . . . . . . . . . . . . . . . . . . . . . . . . . . . . . . . . . . . . . . . . . . . . . . . . . 156,194 216,932 2,323
Equity in earnings of equity-method investees, including those included above, was a gain of ¥10,416million, loss of ¥5,534 million and gain of ¥12,924 million ($138 million) for the years ended March 31, 2008,2009 and 2010, respectively. Equity in earnings of equity-method investees are included within Revenue—Otherin the consolidated statements of operations. Dividends from equity-method investees for the years endedMarch 31, 2008, 2009 and 2010 were ¥10,036 million, ¥7,308 million and ¥4,827 million ($52 million),respectively.
Chi-X Europe Limited (“Chi-X”)—
Chi-X was a consolidated subsidiary of Nomura until December 31, 2009. On December 31, 2009, non-voting shares issued by Chi-X to third parties were converted into voting shares. As a result, Nomura’s votinginterest fell to 34% and Nomura ceased to have a controlling financial interest in Chi-X, which was subsequentlydeconsolidated and accounted for under the equity-method from December 31, 2009.
As part of the deconsolidation process, a gain of ¥3,074 million ($33 million) was recognised which isincluded in the consolidated statements of operations under Revenue – Other. The gain resulted from a differencebetween the book value of the net assets of Chi-X and the fair value of the retained investment in the company.
The fair value of the retained investment in Chi-X was estimated using a combination of market and incomeapproaches. The market approach was based on the “Guideline Public Company Method” whereby marketmultiples are derived from quoted market prices of publicly traded companies engaged in the same or similar lineof business to Chi-X. Under the income approach, a discounted cash flow method was used.
20. Commitments, contingencies and guarantees:
Commitments—
Credit and investment commitments
In connection with its banking and financing activities, Nomura provides commitments to extend credit,which generally have fixed expiration dates. In connection with its investment banking activities, Nomura entersinto agreements with customers under which Nomura commits to underwrite notes that may be issued by thecustomers. The outstanding commitments under these agreements are included below in commitments to extendcredit.
F-94
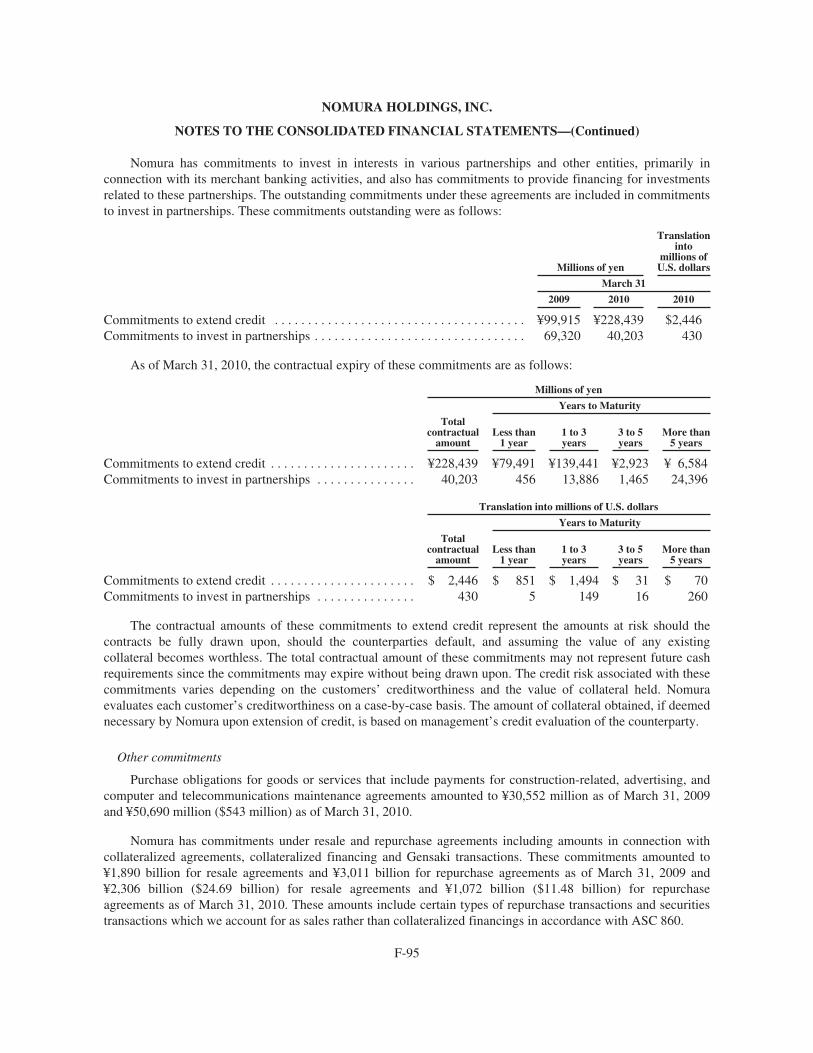
NOMURA HOLDINGS, INC.
NOTES TO THE CONSOLIDATED FINANCIAL STATEMENTS—(Continued)
Nomura has commitments to invest in interests in various partnerships and other entities, primarily inconnection with its merchant banking activities, and also has commitments to provide financing for investmentsrelated to these partnerships. The outstanding commitments under these agreements are included in commitmentsto invest in partnerships. These commitments outstanding were as follows:
Millions of yen
Translationinto
millions ofU.S. dollars
March 31
2009 2010 2010
Commitments to extend credit . . . . . . . . . . . . . . . . . . . . . . . . . . . . . . . . . . . . . . ¥99,915 ¥228,439 $2,446Commitments to invest in partnerships . . . . . . . . . . . . . . . . . . . . . . . . . . . . . . . . 69,320 40,203 430
As of March 31, 2010, the contractual expiry of these commitments are as follows:
Millions of yen
Years to Maturity
Totalcontractual
amountLess than
1 year1 to 3years
3 to 5years
More than5 years
Commitments to extend credit . . . . . . . . . . . . . . . . . . . . . . ¥228,439 ¥79,491 ¥139,441 ¥2,923 ¥ 6,584Commitments to invest in partnerships . . . . . . . . . . . . . . . 40,203 456 13,886 1,465 24,396
Translation into millions of U.S. dollars
Years to Maturity
Totalcontractual
amountLess than
1 year1 to 3years
3 to 5years
More than5 years
Commitments to extend credit . . . . . . . . . . . . . . . . . . . . . . $ 2,446 $ 851 $ 1,494 $ 31 $ 70Commitments to invest in partnerships . . . . . . . . . . . . . . . 430 5 149 16 260
The contractual amounts of these commitments to extend credit represent the amounts at risk should thecontracts be fully drawn upon, should the counterparties default, and assuming the value of any existingcollateral becomes worthless. The total contractual amount of these commitments may not represent future cashrequirements since the commitments may expire without being drawn upon. The credit risk associated with thesecommitments varies depending on the customers’ creditworthiness and the value of collateral held. Nomuraevaluates each customer’s creditworthiness on a case-by-case basis. The amount of collateral obtained, if deemednecessary by Nomura upon extension of credit, is based on management’s credit evaluation of the counterparty.
Other commitments
Purchase obligations for goods or services that include payments for construction-related, advertising, andcomputer and telecommunications maintenance agreements amounted to ¥30,552 million as of March 31, 2009and ¥50,690 million ($543 million) as of March 31, 2010.
Nomura has commitments under resale and repurchase agreements including amounts in connection withcollateralized agreements, collateralized financing and Gensaki transactions. These commitments amounted to¥1,890 billion for resale agreements and ¥3,011 billion for repurchase agreements as of March 31, 2009 and¥2,306 billion ($24.69 billion) for resale agreements and ¥1,072 billion ($11.48 billion) for repurchaseagreements as of March 31, 2010. These amounts include certain types of repurchase transactions and securitiestransactions which we account for as sales rather than collateralized financings in accordance with ASC 860.
F-95
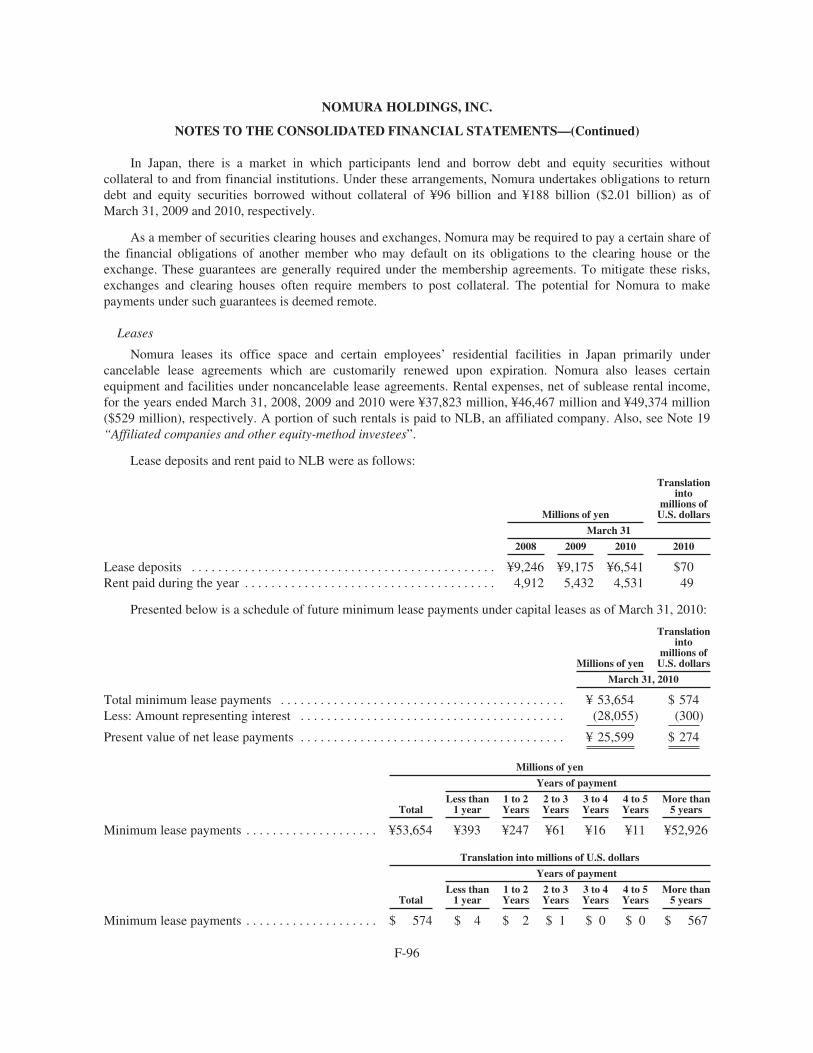
NOMURA HOLDINGS, INC.
NOTES TO THE CONSOLIDATED FINANCIAL STATEMENTS—(Continued)
In Japan, there is a market in which participants lend and borrow debt and equity securities withoutcollateral to and from financial institutions. Under these arrangements, Nomura undertakes obligations to returndebt and equity securities borrowed without collateral of ¥96 billion and ¥188 billion ($2.01 billion) as ofMarch 31, 2009 and 2010, respectively.
As a member of securities clearing houses and exchanges, Nomura may be required to pay a certain share ofthe financial obligations of another member who may default on its obligations to the clearing house or theexchange. These guarantees are generally required under the membership agreements. To mitigate these risks,exchanges and clearing houses often require members to post collateral. The potential for Nomura to makepayments under such guarantees is deemed remote.
Leases
Nomura leases its office space and certain employees’ residential facilities in Japan primarily undercancelable lease agreements which are customarily renewed upon expiration. Nomura also leases certainequipment and facilities under noncancelable lease agreements. Rental expenses, net of sublease rental income,for the years ended March 31, 2008, 2009 and 2010 were ¥37,823 million, ¥46,467 million and ¥49,374 million($529 million), respectively. A portion of such rentals is paid to NLB, an affiliated company. Also, see Note 19“Affiliated companies and other equity-method investees”.
Lease deposits and rent paid to NLB were as follows:
Millions of yen
Translationinto
millions ofU.S. dollars
March 31
2008 2009 2010 2010
Lease deposits . . . . . . . . . . . . . . . . . . . . . . . . . . . . . . . . . . . . . . . . . . . . . . ¥9,246 ¥9,175 ¥6,541 $70Rent paid during the year . . . . . . . . . . . . . . . . . . . . . . . . . . . . . . . . . . . . . . 4,912 5,432 4,531 49
Presented below is a schedule of future minimum lease payments under capital leases as of March 31, 2010:
Millions of yen
Translationinto
millions ofU.S. dollars
March 31, 2010
Total minimum lease payments . . . . . . . . . . . . . . . . . . . . . . . . . . . . . . . . . . . . . . . . . . . ¥ 53,654 $ 574Less: Amount representing interest . . . . . . . . . . . . . . . . . . . . . . . . . . . . . . . . . . . . . . . . (28,055) (300)
Present value of net lease payments . . . . . . . . . . . . . . . . . . . . . . . . . . . . . . . . . . . . . . . . ¥ 25,599 $ 274
Millions of yen
Years of payment
TotalLess than
1 year1 to 2Years
2 to 3Years
3 to 4Years
4 to 5Years
More than5 years
Minimum lease payments . . . . . . . . . . . . . . . . . . . . ¥53,654 ¥393 ¥247 ¥61 ¥16 ¥11 ¥52,926
Translation into millions of U.S. dollars
Years of payment
TotalLess than
1 year1 to 2Years
2 to 3Years
3 to 4Years
4 to 5Years
More than5 years
Minimum lease payments . . . . . . . . . . . . . . . . . . . . $ 574 $ 4 $ 2 $ 1 $ 0 $ 0 $ 567
F-96
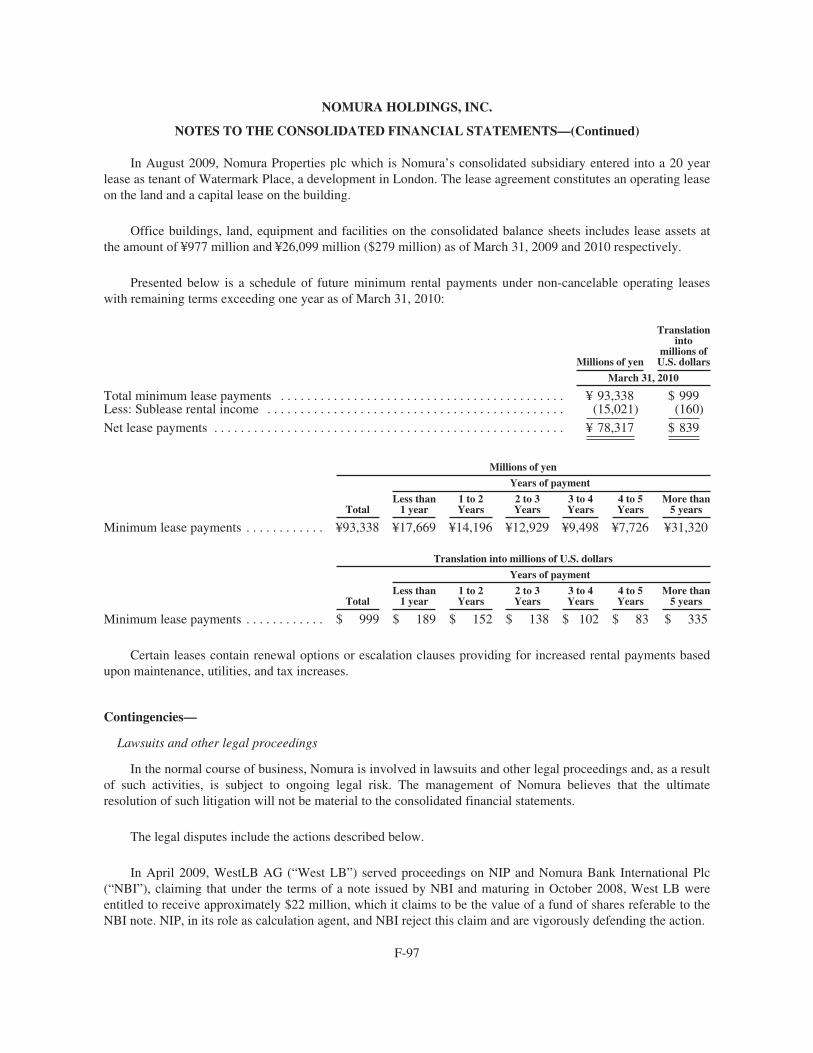
NOMURA HOLDINGS, INC.
NOTES TO THE CONSOLIDATED FINANCIAL STATEMENTS—(Continued)
In August 2009, Nomura Properties plc which is Nomura’s consolidated subsidiary entered into a 20 yearlease as tenant of Watermark Place, a development in London. The lease agreement constitutes an operating leaseon the land and a capital lease on the building.
Office buildings, land, equipment and facilities on the consolidated balance sheets includes lease assets atthe amount of ¥977 million and ¥26,099 million ($279 million) as of March 31, 2009 and 2010 respectively.
Presented below is a schedule of future minimum rental payments under non-cancelable operating leaseswith remaining terms exceeding one year as of March 31, 2010:
Millions of yen
Translationinto
millions ofU.S. dollars
March 31, 2010
Total minimum lease payments . . . . . . . . . . . . . . . . . . . . . . . . . . . . . . . . . . . . . . . . . . . ¥ 93,338 $ 999Less: Sublease rental income . . . . . . . . . . . . . . . . . . . . . . . . . . . . . . . . . . . . . . . . . . . . . (15,021) (160)
Net lease payments . . . . . . . . . . . . . . . . . . . . . . . . . . . . . . . . . . . . . . . . . . . . . . . . . . . . . ¥ 78,317 $ 839
Millions of yen
Years of payment
TotalLess than
1 year1 to 2Years
2 to 3Years
3 to 4Years
4 to 5Years
More than5 years
Minimum lease payments . . . . . . . . . . . . ¥93,338 ¥17,669 ¥14,196 ¥12,929 ¥9,498 ¥7,726 ¥31,320
Translation into millions of U.S. dollars
Years of payment
TotalLess than
1 year1 to 2Years
2 to 3Years
3 to 4Years
4 to 5Years
More than5 years
Minimum lease payments . . . . . . . . . . . . $ 999 $ 189 $ 152 $ 138 $ 102 $ 83 $ 335
Certain leases contain renewal options or escalation clauses providing for increased rental payments basedupon maintenance, utilities, and tax increases.
Contingencies—
Lawsuits and other legal proceedings
In the normal course of business, Nomura is involved in lawsuits and other legal proceedings and, as a resultof such activities, is subject to ongoing legal risk. The management of Nomura believes that the ultimateresolution of such litigation will not be material to the consolidated financial statements.
The legal disputes include the actions described below.
In April 2009, WestLB AG (“West LB”) served proceedings on NIP and Nomura Bank International Plc(“NBI”), claiming that under the terms of a note issued by NBI and maturing in October 2008, West LB wereentitled to receive approximately $22 million, which it claims to be the value of a fund of shares referable to theNBI note. NIP, in its role as calculation agent, and NBI reject this claim and are vigorously defending the action.
F-97
NOMURA HOLDINGS, INC.
NOTES TO THE CONSOLIDATED FINANCIAL STATEMENTS—(Continued)
In January 2008 NIP was served with a tax notice issued by the tax authorities in Pescara, Italy allegingbreaches by NIP of the U.K.-Italy Double Taxation Treaty of 1998. The alleged breaches relate to payments toNIP of tax credits on dividends on Italian shares. The tax notice not only denies certain payments to which NIPclaims to be entitled but is also seeking reimbursement of EUR 33.8 million, including interest, already refunded.In March 2008, NIP lodged an appeal against the Tax Notice rejecting the Italian tax authorities’ demands forreimbursement and in November 2009 a decision was issued by the Pescara Tax Court in favour of the ItalianTax Authorities. NIP intends vigorously to challenge this decision.
NIP is currently being challenged by the U.K. tax authorities with regard to the tax treatment of an offshorepension plan established for the employees of Nomura Employment Services (Isle of Man) Limited. The U.K. taxauthorities are seeking to recover approximately £22 million from NIP on the basis that NIP was the trueemployer of individuals participating in the offshore pension plan. We believe that the position taken by the U.K.tax authorities is erroneous. NIP has lodged the necessary appeals.
The Company supports the position of its subsidiaries in each of these claim.
Subsequent events
After the collapse of Lehman Brothers in September 2008, Nomura Securities Co., Ltd. (“NSC”), NIP andNomura Global Financial Products Inc. filed proofs of claim against the bankruptcy estates of Lehman BrothersHoldings Inc. and Lehman Brothers Special Financing Inc. (collectively, “Lehman Inc.”), in respect of swaps andother derivative transactions in the total amount of approximately U.S.$1 billion (“the Claims”). In April 2010,Lehman Inc. commenced proceedings in the U.S. Bankruptcy Court in New York objecting to the Claims and, inthe case of NSC and NIP, seeking to recover damages. The subsidiaries intend vigorously to contest theseproceedings.
Guarantees—
ASC 460 “Guarantees” specifies the disclosures to be made in regards to obligations under certain issuedguarantees and requires a liability to be recognized for the fair value of a guarantee obligation.
In the normal course of business, Nomura enters into various guarantee arrangements with counterparties inthe form of standby letters of credit and other guarantees, which generally have a fixed expiration date.
In addition, Nomura enters into certain derivative contracts that meet the accounting definition ofguarantees, namely derivative contracts that contingently require a guarantor to make payment to a guaranteedparty based on changes in an underlying that relate to an asset, liability or equity security held by a guaranteedparty. Since Nomura does not track whether its clients enter into these derivative contracts for speculative orhedging purposes, Nomura has disclosed below information about derivative contracts that could meet theaccounting definition of guarantees.
For information about the maximum potential amount of future payments that Nomura could be required tomake under certain derivatives, the notional amount of contracts has been disclosed. However, the maximumpotential payout for certain derivative contracts, such as written interest rate caps and written currency options,cannot be estimated, as increases in interest or foreign exchange rates in the future could be theoreticallyunlimited.
Nomura records all derivative contracts at fair value on its consolidated balance sheets. Nomura believes thenotional amounts generally overstate its risk exposure. Since the derivative contracts are accounted for at fairvalue, carrying value is considered the best indication of payment/performance risk for individual contracts.
F-98
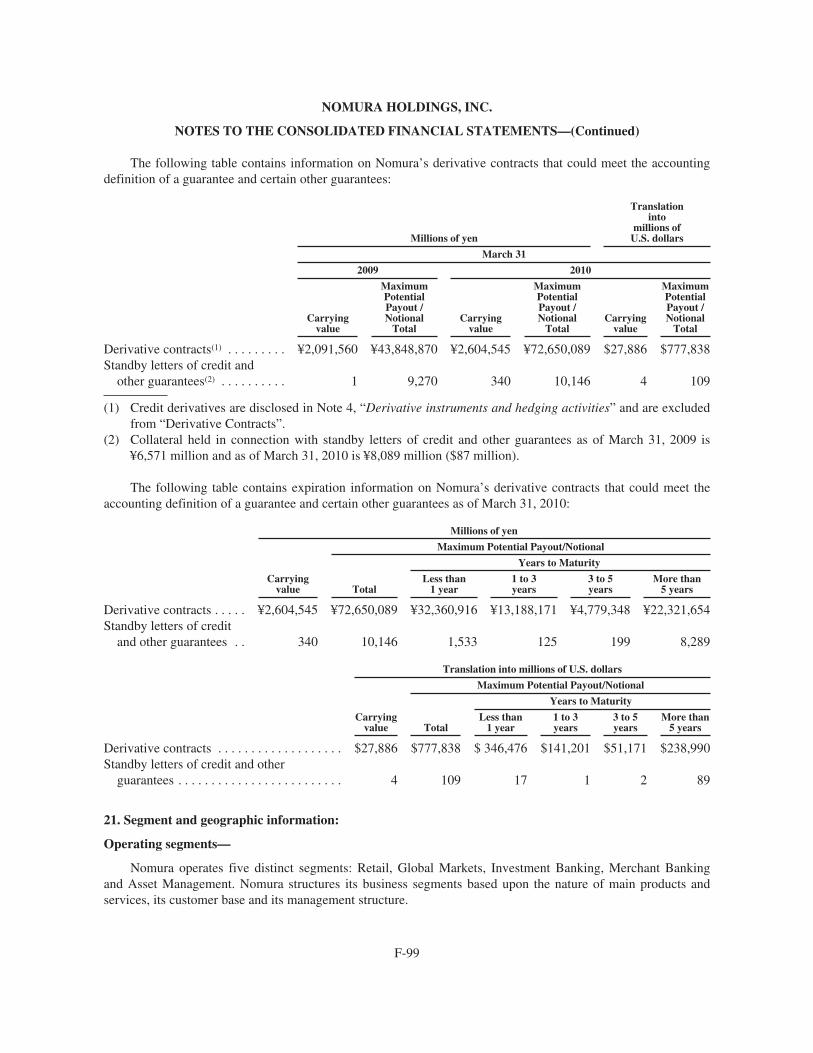
NOMURA HOLDINGS, INC.
NOTES TO THE CONSOLIDATED FINANCIAL STATEMENTS—(Continued)
The following table contains information on Nomura’s derivative contracts that could meet the accountingdefinition of a guarantee and certain other guarantees:
Millions of yen
Translationinto
millions ofU.S. dollars
March 31
2009 2010
Carryingvalue
MaximumPotentialPayout /Notional
TotalCarrying
value
MaximumPotentialPayout /Notional
TotalCarrying
value
MaximumPotentialPayout /Notional
Total
Derivative contracts(1) . . . . . . . . . ¥2,091,560 ¥43,848,870 ¥2,604,545 ¥72,650,089 $27,886 $777,838Standby letters of credit and
other guarantees(2) . . . . . . . . . . 1 9,270 340 10,146 4 109
(1) Credit derivatives are disclosed in Note 4, “Derivative instruments and hedging activities” and are excludedfrom “Derivative Contracts”.
(2) Collateral held in connection with standby letters of credit and other guarantees as of March 31, 2009 is¥6,571 million and as of March 31, 2010 is ¥8,089 million ($87 million).
The following table contains expiration information on Nomura’s derivative contracts that could meet theaccounting definition of a guarantee and certain other guarantees as of March 31, 2010:
Millions of yen
Maximum Potential Payout/Notional
Years to Maturity
Carryingvalue Total
Less than1 year
1 to 3years
3 to 5years
More than5 years
Derivative contracts . . . . . ¥2,604,545 ¥72,650,089 ¥32,360,916 ¥13,188,171 ¥4,779,348 ¥22,321,654Standby letters of credit
and other guarantees . . 340 10,146 1,533 125 199 8,289
Translation into millions of U.S. dollars
Maximum Potential Payout/Notional
Years to Maturity
Carryingvalue Total
Less than1 year
1 to 3years
3 to 5years
More than5 years
Derivative contracts . . . . . . . . . . . . . . . . . . . $27,886 $777,838 $ 346,476 $141,201 $51,171 $238,990Standby letters of credit and other
guarantees . . . . . . . . . . . . . . . . . . . . . . . . . 4 109 17 1 2 89
21. Segment and geographic information:
Operating segments—
Nomura operates five distinct segments: Retail, Global Markets, Investment Banking, Merchant Bankingand Asset Management. Nomura structures its business segments based upon the nature of main products andservices, its customer base and its management structure.
F-99
NOMURA HOLDINGS, INC.
NOTES TO THE CONSOLIDATED FINANCIAL STATEMENTS—(Continued)
The accounting policies for segment information materially follow U.S. GAAP, except as described below:
• The impact of unrealized gains/losses on long-term investments in equity securities held for operatingpurposes, which under U.S. GAAP is included in Income (loss) before income taxes, is excluded fromsegment information.
Revenues and expenses directly associated with each business segment are included in the operating resultsof each respective segment. Revenues and expenses that are not directly attributable to a particular segment areallocated to each respective business segment or included in “Other”, based upon Nomura’s allocationmethodologies as used by management to assess each segment’s performance.
F-100
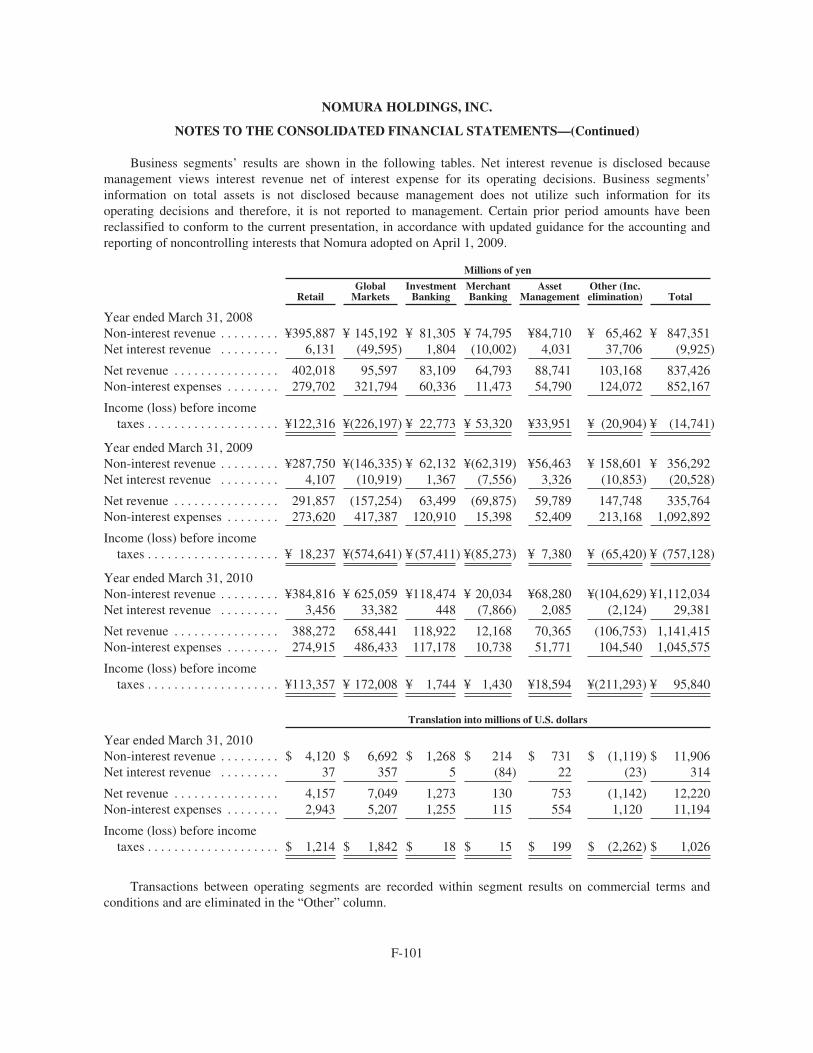
NOMURA HOLDINGS, INC.
NOTES TO THE CONSOLIDATED FINANCIAL STATEMENTS—(Continued)
Business segments’ results are shown in the following tables. Net interest revenue is disclosed becausemanagement views interest revenue net of interest expense for its operating decisions. Business segments’information on total assets is not disclosed because management does not utilize such information for itsoperating decisions and therefore, it is not reported to management. Certain prior period amounts have beenreclassified to conform to the current presentation, in accordance with updated guidance for the accounting andreporting of noncontrolling interests that Nomura adopted on April 1, 2009.
Millions of yen
RetailGlobal
MarketsInvestment
BankingMerchantBanking
AssetManagement
Other (Inc.elimination) Total
Year ended March 31, 2008Non-interest revenue . . . . . . . . . ¥395,887 ¥ 145,192 ¥ 81,305 ¥ 74,795 ¥84,710 ¥ 65,462 ¥ 847,351Net interest revenue . . . . . . . . . 6,131 (49,595) 1,804 (10,002) 4,031 37,706 (9,925)
Net revenue . . . . . . . . . . . . . . . . 402,018 95,597 83,109 64,793 88,741 103,168 837,426Non-interest expenses . . . . . . . . 279,702 321,794 60,336 11,473 54,790 124,072 852,167
Income (loss) before incometaxes . . . . . . . . . . . . . . . . . . . . ¥122,316 ¥(226,197) ¥ 22,773 ¥ 53,320 ¥33,951 ¥ (20,904) ¥ (14,741)
Year ended March 31, 2009Non-interest revenue . . . . . . . . . ¥287,750 ¥(146,335) ¥ 62,132 ¥(62,319) ¥56,463 ¥ 158,601 ¥ 356,292Net interest revenue . . . . . . . . . 4,107 (10,919) 1,367 (7,556) 3,326 (10,853) (20,528)
Net revenue . . . . . . . . . . . . . . . . 291,857 (157,254) 63,499 (69,875) 59,789 147,748 335,764Non-interest expenses . . . . . . . . 273,620 417,387 120,910 15,398 52,409 213,168 1,092,892
Income (loss) before incometaxes . . . . . . . . . . . . . . . . . . . . ¥ 18,237 ¥(574,641) ¥ (57,411) ¥(85,273) ¥ 7,380 ¥ (65,420) ¥ (757,128)
Year ended March 31, 2010Non-interest revenue . . . . . . . . . ¥384,816 ¥ 625,059 ¥118,474 ¥ 20,034 ¥68,280 ¥(104,629) ¥1,112,034Net interest revenue . . . . . . . . . 3,456 33,382 448 (7,866) 2,085 (2,124) 29,381
Net revenue . . . . . . . . . . . . . . . . 388,272 658,441 118,922 12,168 70,365 (106,753) 1,141,415Non-interest expenses . . . . . . . . 274,915 486,433 117,178 10,738 51,771 104,540 1,045,575
Income (loss) before incometaxes . . . . . . . . . . . . . . . . . . . . ¥113,357 ¥ 172,008 ¥ 1,744 ¥ 1,430 ¥18,594 ¥(211,293) ¥ 95,840
Translation into millions of U.S. dollars
Year ended March 31, 2010Non-interest revenue . . . . . . . . . $ 4,120 $ 6,692 $ 1,268 $ 214 $ 731 $ (1,119) $ 11,906Net interest revenue . . . . . . . . . 37 357 5 (84) 22 (23) 314
Net revenue . . . . . . . . . . . . . . . . 4,157 7,049 1,273 130 753 (1,142) 12,220Non-interest expenses . . . . . . . . 2,943 5,207 1,255 115 554 1,120 11,194
Income (loss) before incometaxes . . . . . . . . . . . . . . . . . . . . $ 1,214 $ 1,842 $ 18 $ 15 $ 199 $ (2,262) $ 1,026
Transactions between operating segments are recorded within segment results on commercial terms andconditions and are eliminated in the “Other” column.
F-101
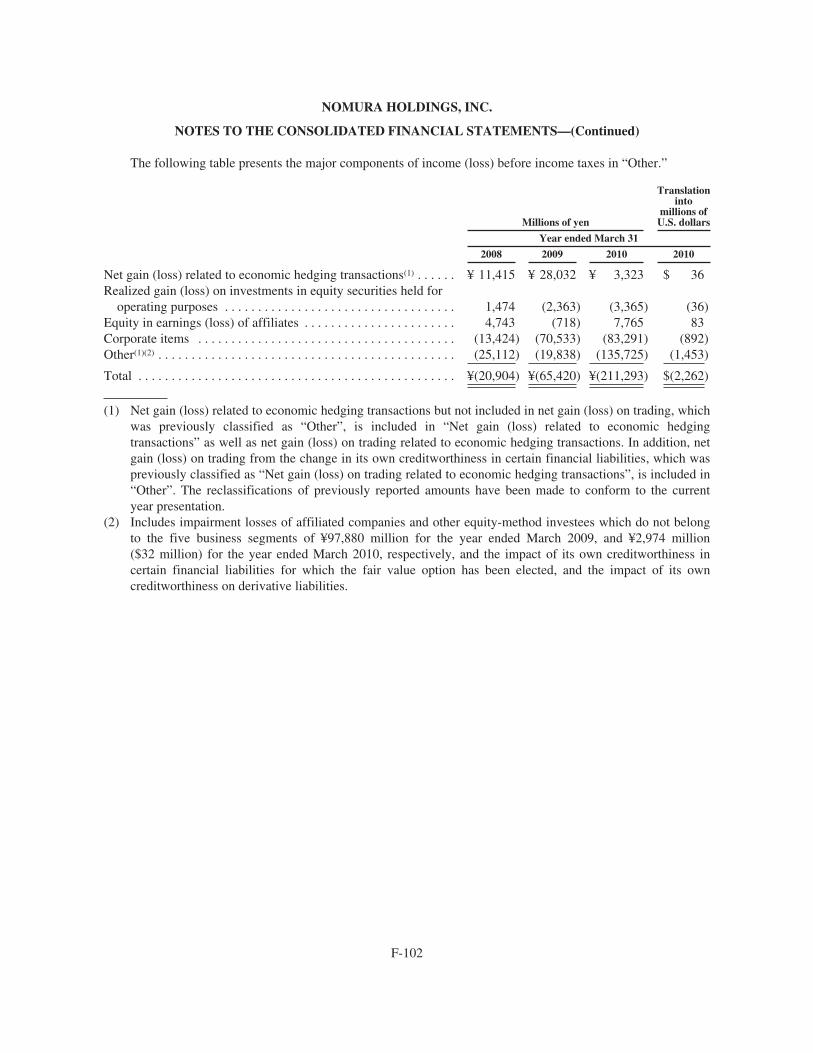
NOMURA HOLDINGS, INC.
NOTES TO THE CONSOLIDATED FINANCIAL STATEMENTS—(Continued)
The following table presents the major components of income (loss) before income taxes in “Other.”
Millions of yen
Translationinto
millions ofU.S. dollars
Year ended March 31
2008 2009 2010 2010
Net gain (loss) related to economic hedging transactions(1) . . . . . . ¥ 11,415 ¥ 28,032 ¥ 3,323 $ 36Realized gain (loss) on investments in equity securities held for
operating purposes . . . . . . . . . . . . . . . . . . . . . . . . . . . . . . . . . . . 1,474 (2,363) (3,365) (36)Equity in earnings (loss) of affiliates . . . . . . . . . . . . . . . . . . . . . . . 4,743 (718) 7,765 83Corporate items . . . . . . . . . . . . . . . . . . . . . . . . . . . . . . . . . . . . . . . (13,424) (70,533) (83,291) (892)Other(1)(2) . . . . . . . . . . . . . . . . . . . . . . . . . . . . . . . . . . . . . . . . . . . . . (25,112) (19,838) (135,725) (1,453)
Total . . . . . . . . . . . . . . . . . . . . . . . . . . . . . . . . . . . . . . . . . . . . . . . . ¥(20,904) ¥(65,420) ¥(211,293) $(2,262)
(1) Net gain (loss) related to economic hedging transactions but not included in net gain (loss) on trading, whichwas previously classified as “Other”, is included in “Net gain (loss) related to economic hedgingtransactions” as well as net gain (loss) on trading related to economic hedging transactions. In addition, netgain (loss) on trading from the change in its own creditworthiness in certain financial liabilities, which waspreviously classified as “Net gain (loss) on trading related to economic hedging transactions”, is included in“Other”. The reclassifications of previously reported amounts have been made to conform to the currentyear presentation.
(2) Includes impairment losses of affiliated companies and other equity-method investees which do not belongto the five business segments of ¥97,880 million for the year ended March 2009, and ¥2,974 million($32 million) for the year ended March 2010, respectively, and the impact of its own creditworthiness incertain financial liabilities for which the fair value option has been elected, and the impact of its owncreditworthiness on derivative liabilities.
F-102
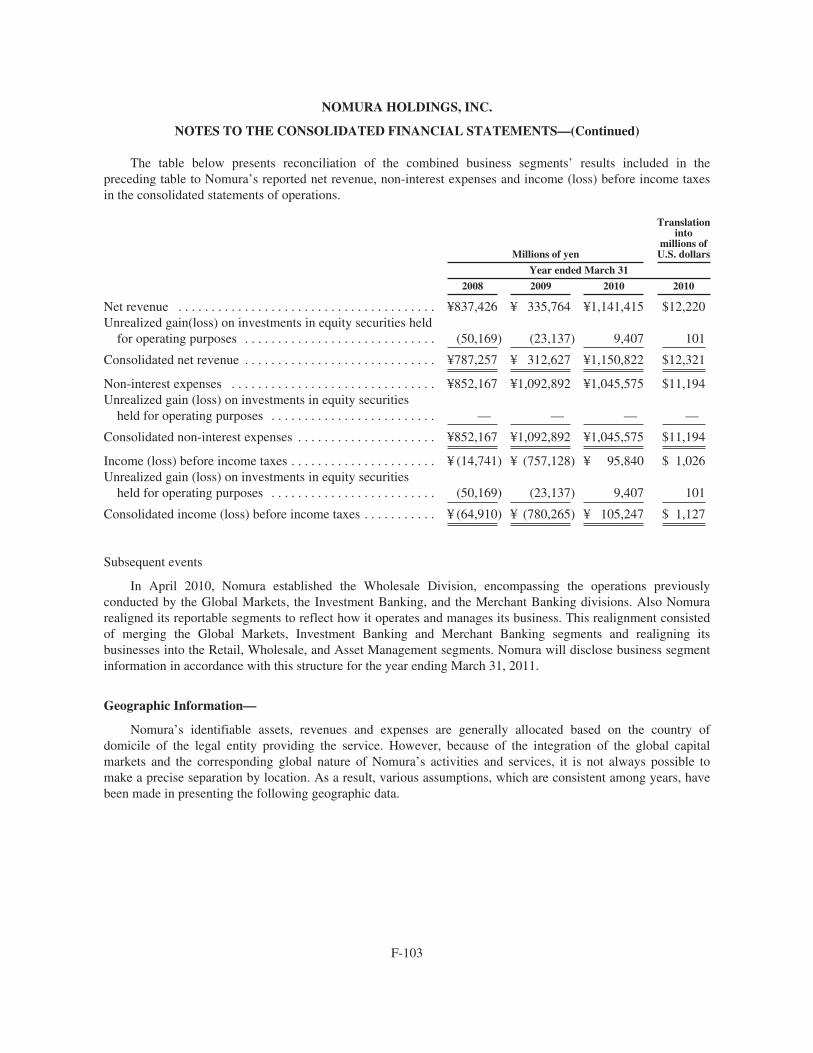
NOMURA HOLDINGS, INC.
NOTES TO THE CONSOLIDATED FINANCIAL STATEMENTS—(Continued)
The table below presents reconciliation of the combined business segments’ results included in thepreceding table to Nomura’s reported net revenue, non-interest expenses and income (loss) before income taxesin the consolidated statements of operations.
Millions of yen
Translationinto
millions ofU.S. dollars
Year ended March 31
2008 2009 2010 2010
Net revenue . . . . . . . . . . . . . . . . . . . . . . . . . . . . . . . . . . . . . . . ¥837,426 ¥ 335,764 ¥1,141,415 $12,220Unrealized gain(loss) on investments in equity securities held
for operating purposes . . . . . . . . . . . . . . . . . . . . . . . . . . . . . (50,169) (23,137) 9,407 101
Consolidated net revenue . . . . . . . . . . . . . . . . . . . . . . . . . . . . . ¥787,257 ¥ 312,627 ¥1,150,822 $12,321
Non-interest expenses . . . . . . . . . . . . . . . . . . . . . . . . . . . . . . . ¥852,167 ¥1,092,892 ¥1,045,575 $11,194Unrealized gain (loss) on investments in equity securities
held for operating purposes . . . . . . . . . . . . . . . . . . . . . . . . . — — — —
Consolidated non-interest expenses . . . . . . . . . . . . . . . . . . . . . ¥852,167 ¥1,092,892 ¥1,045,575 $11,194
Income (loss) before income taxes . . . . . . . . . . . . . . . . . . . . . . ¥ (14,741) ¥ (757,128) ¥ 95,840 $ 1,026Unrealized gain (loss) on investments in equity securities
held for operating purposes . . . . . . . . . . . . . . . . . . . . . . . . . (50,169) (23,137) 9,407 101
Consolidated income (loss) before income taxes . . . . . . . . . . . ¥ (64,910) ¥ (780,265) ¥ 105,247 $ 1,127
Subsequent events
In April 2010, Nomura established the Wholesale Division, encompassing the operations previouslyconducted by the Global Markets, the Investment Banking, and the Merchant Banking divisions. Also Nomurarealigned its reportable segments to reflect how it operates and manages its business. This realignment consistedof merging the Global Markets, Investment Banking and Merchant Banking segments and realigning itsbusinesses into the Retail, Wholesale, and Asset Management segments. Nomura will disclose business segmentinformation in accordance with this structure for the year ending March 31, 2011.
Geographic Information—
Nomura’s identifiable assets, revenues and expenses are generally allocated based on the country ofdomicile of the legal entity providing the service. However, because of the integration of the global capitalmarkets and the corresponding global nature of Nomura’s activities and services, it is not always possible tomake a precise separation by location. As a result, various assumptions, which are consistent among years, havebeen made in presenting the following geographic data.
F-103
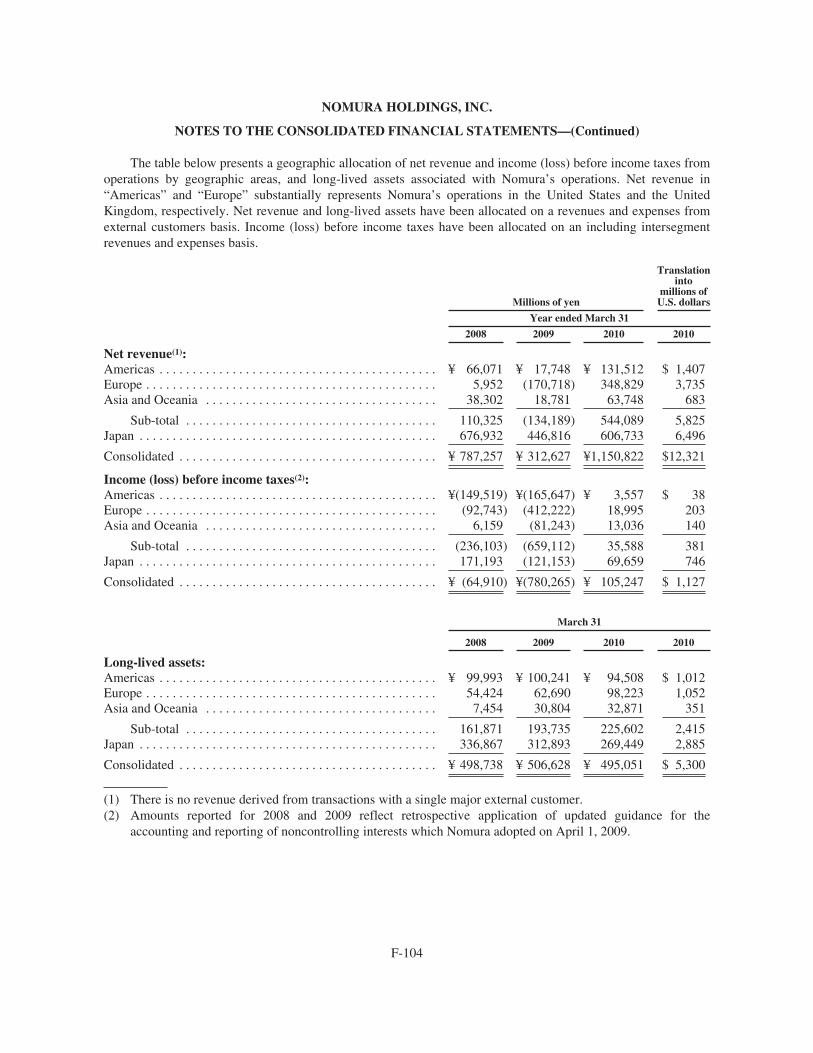
NOMURA HOLDINGS, INC.
NOTES TO THE CONSOLIDATED FINANCIAL STATEMENTS—(Continued)
The table below presents a geographic allocation of net revenue and income (loss) before income taxes fromoperations by geographic areas, and long-lived assets associated with Nomura’s operations. Net revenue in“Americas” and “Europe” substantially represents Nomura’s operations in the United States and the UnitedKingdom, respectively. Net revenue and long-lived assets have been allocated on a revenues and expenses fromexternal customers basis. Income (loss) before income taxes have been allocated on an including intersegmentrevenues and expenses basis.
Millions of yen
Translationinto
millions ofU.S. dollars
Year ended March 31
2008 2009 2010 2010
Net revenue(1):Americas . . . . . . . . . . . . . . . . . . . . . . . . . . . . . . . . . . . . . . . . . . ¥ 66,071 ¥ 17,748 ¥ 131,512 $ 1,407Europe . . . . . . . . . . . . . . . . . . . . . . . . . . . . . . . . . . . . . . . . . . . . 5,952 (170,718) 348,829 3,735Asia and Oceania . . . . . . . . . . . . . . . . . . . . . . . . . . . . . . . . . . . 38,302 18,781 63,748 683
Sub-total . . . . . . . . . . . . . . . . . . . . . . . . . . . . . . . . . . . . . . 110,325 (134,189) 544,089 5,825Japan . . . . . . . . . . . . . . . . . . . . . . . . . . . . . . . . . . . . . . . . . . . . . 676,932 446,816 606,733 6,496
Consolidated . . . . . . . . . . . . . . . . . . . . . . . . . . . . . . . . . . . . . . . ¥ 787,257 ¥ 312,627 ¥1,150,822 $12,321
Income (loss) before income taxes(2):Americas . . . . . . . . . . . . . . . . . . . . . . . . . . . . . . . . . . . . . . . . . . ¥(149,519) ¥(165,647) ¥ 3,557 $ 38Europe . . . . . . . . . . . . . . . . . . . . . . . . . . . . . . . . . . . . . . . . . . . . (92,743) (412,222) 18,995 203Asia and Oceania . . . . . . . . . . . . . . . . . . . . . . . . . . . . . . . . . . . 6,159 (81,243) 13,036 140
Sub-total . . . . . . . . . . . . . . . . . . . . . . . . . . . . . . . . . . . . . . (236,103) (659,112) 35,588 381Japan . . . . . . . . . . . . . . . . . . . . . . . . . . . . . . . . . . . . . . . . . . . . . 171,193 (121,153) 69,659 746
Consolidated . . . . . . . . . . . . . . . . . . . . . . . . . . . . . . . . . . . . . . . ¥ (64,910) ¥(780,265) ¥ 105,247 $ 1,127
March 31
2008 2009 2010 2010
Long-lived assets:Americas . . . . . . . . . . . . . . . . . . . . . . . . . . . . . . . . . . . . . . . . . . ¥ 99,993 ¥ 100,241 ¥ 94,508 $ 1,012Europe . . . . . . . . . . . . . . . . . . . . . . . . . . . . . . . . . . . . . . . . . . . . 54,424 62,690 98,223 1,052Asia and Oceania . . . . . . . . . . . . . . . . . . . . . . . . . . . . . . . . . . . 7,454 30,804 32,871 351
Sub-total . . . . . . . . . . . . . . . . . . . . . . . . . . . . . . . . . . . . . . 161,871 193,735 225,602 2,415Japan . . . . . . . . . . . . . . . . . . . . . . . . . . . . . . . . . . . . . . . . . . . . . 336,867 312,893 269,449 2,885
Consolidated . . . . . . . . . . . . . . . . . . . . . . . . . . . . . . . . . . . . . . . ¥ 498,738 ¥ 506,628 ¥ 495,051 $ 5,300
(1) There is no revenue derived from transactions with a single major external customer.(2) Amounts reported for 2008 and 2009 reflect retrospective application of updated guidance for the
accounting and reporting of noncontrolling interests which Nomura adopted on April 1, 2009.
F-104
SIGNATURES
The registrant hereby certifies that it meets all of the requirements for filing on Form 20-F and that it hasduly caused and authorized the undersigned to sign this annual report on its behalf.
NOMURA HOLDINGS, INC.
By: /s/ KENICHI WATANABE
Name: Kenichi WatanabeTitle: President and Chief Executive Officer
Date: June 29, 2010
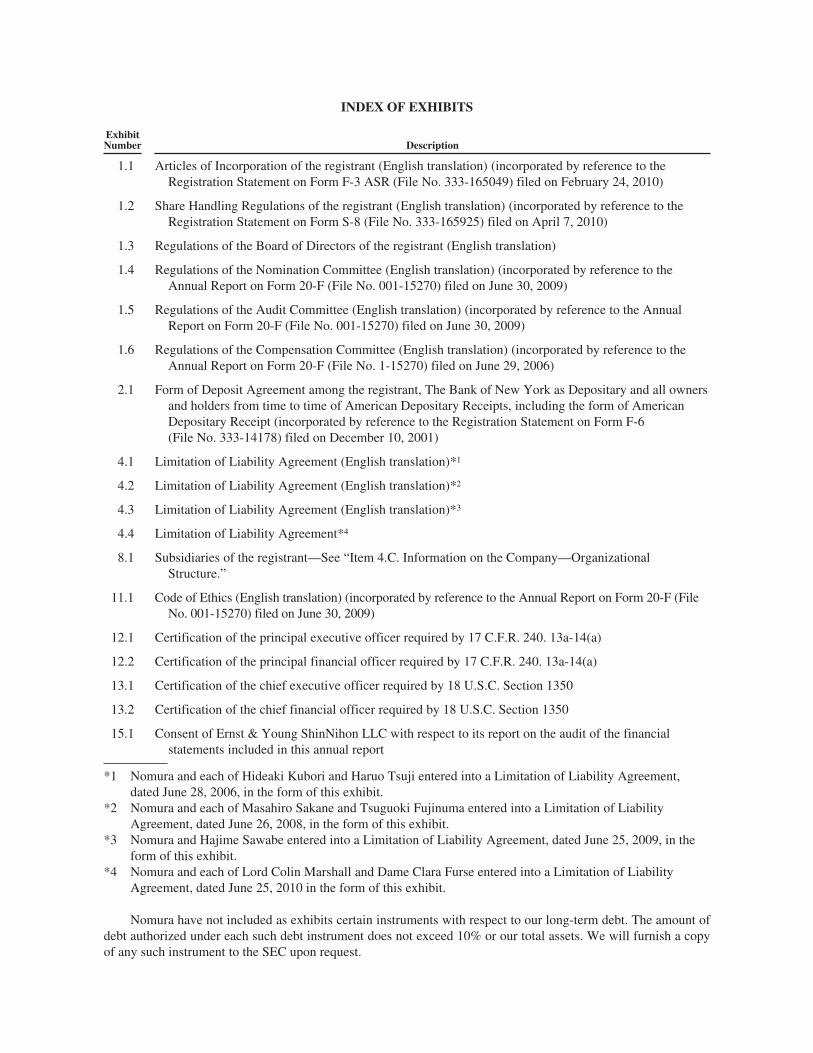
INDEX OF EXHIBITS
ExhibitNumber Description
1.1 Articles of Incorporation of the registrant (English translation) (incorporated by reference to theRegistration Statement on Form F-3 ASR (File No. 333-165049) filed on February 24, 2010)
1.2 Share Handling Regulations of the registrant (English translation) (incorporated by reference to theRegistration Statement on Form S-8 (File No. 333-165925) filed on April 7, 2010)
1.3 Regulations of the Board of Directors of the registrant (English translation)
1.4 Regulations of the Nomination Committee (English translation) (incorporated by reference to theAnnual Report on Form 20-F (File No. 001-15270) filed on June 30, 2009)
1.5 Regulations of the Audit Committee (English translation) (incorporated by reference to the AnnualReport on Form 20-F (File No. 001-15270) filed on June 30, 2009)
1.6 Regulations of the Compensation Committee (English translation) (incorporated by reference to theAnnual Report on Form 20-F (File No. 1-15270) filed on June 29, 2006)
2.1 Form of Deposit Agreement among the registrant, The Bank of New York as Depositary and all ownersand holders from time to time of American Depositary Receipts, including the form of AmericanDepositary Receipt (incorporated by reference to the Registration Statement on Form F-6(File No. 333-14178) filed on December 10, 2001)
4.1 Limitation of Liability Agreement (English translation)*1
4.2 Limitation of Liability Agreement (English translation)*2
4.3 Limitation of Liability Agreement (English translation)*3
4.4 Limitation of Liability Agreement*4
8.1 Subsidiaries of the registrant—See “Item 4.C. Information on the Company—OrganizationalStructure.”
11.1 Code of Ethics (English translation) (incorporated by reference to the Annual Report on Form 20-F (FileNo. 001-15270) filed on June 30, 2009)
12.1 Certification of the principal executive officer required by 17 C.F.R. 240. 13a-14(a)
12.2 Certification of the principal financial officer required by 17 C.F.R. 240. 13a-14(a)
13.1 Certification of the chief executive officer required by 18 U.S.C. Section 1350
13.2 Certification of the chief financial officer required by 18 U.S.C. Section 1350
15.1 Consent of Ernst & Young ShinNihon LLC with respect to its report on the audit of the financialstatements included in this annual report
*1 Nomura and each of Hideaki Kubori and Haruo Tsuji entered into a Limitation of Liability Agreement,dated June 28, 2006, in the form of this exhibit.
*2 Nomura and each of Masahiro Sakane and Tsuguoki Fujinuma entered into a Limitation of LiabilityAgreement, dated June 26, 2008, in the form of this exhibit.
*3 Nomura and Hajime Sawabe entered into a Limitation of Liability Agreement, dated June 25, 2009, in theform of this exhibit.
*4 Nomura and each of Lord Colin Marshall and Dame Clara Furse entered into a Limitation of LiabilityAgreement, dated June 25, 2010 in the form of this exhibit.
Nomura have not included as exhibits certain instruments with respect to our long-term debt. The amount ofdebt authorized under each such debt instrument does not exceed 10% or our total assets. We will furnish a copyof any such instrument to the SEC upon request.
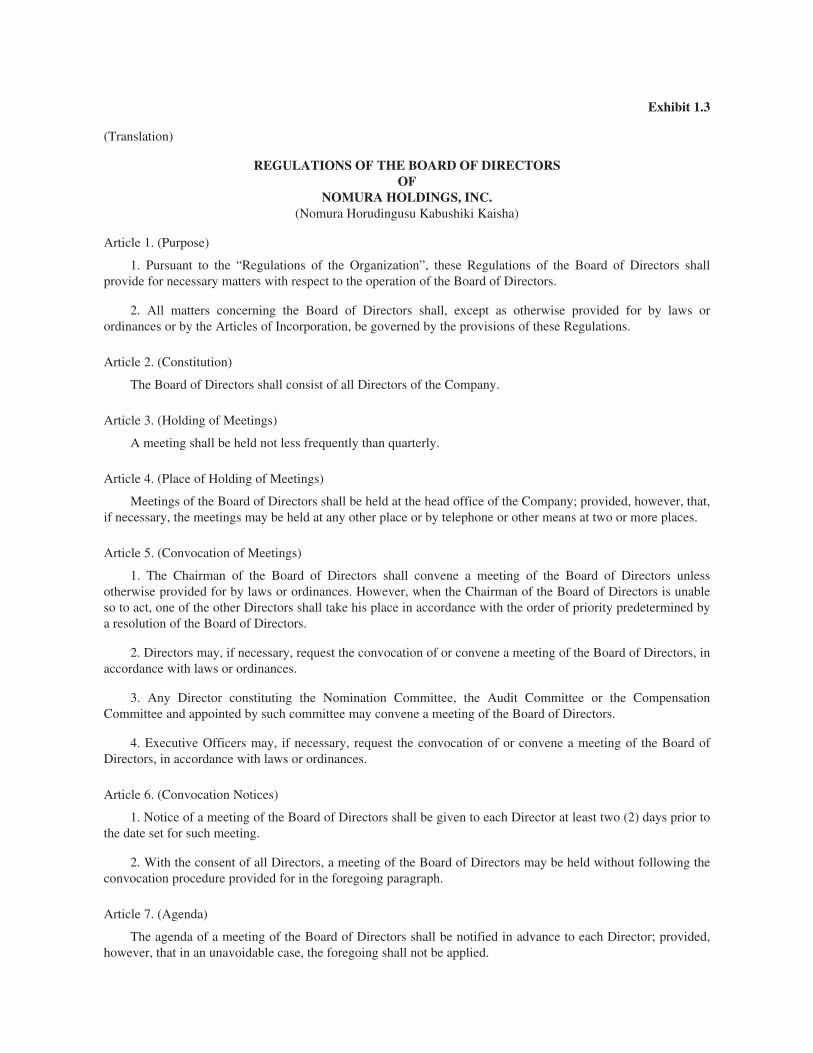
Exhibit 1.3
(Translation)
REGULATIONS OF THE BOARD OF DIRECTORSOF
NOMURA HOLDINGS, INC.(Nomura Horudingusu Kabushiki Kaisha)
Article 1. (Purpose)
1. Pursuant to the “Regulations of the Organization”, these Regulations of the Board of Directors shallprovide for necessary matters with respect to the operation of the Board of Directors.
2. All matters concerning the Board of Directors shall, except as otherwise provided for by laws orordinances or by the Articles of Incorporation, be governed by the provisions of these Regulations.
Article 2. (Constitution)
The Board of Directors shall consist of all Directors of the Company.
Article 3. (Holding of Meetings)
A meeting shall be held not less frequently than quarterly.
Article 4. (Place of Holding of Meetings)
Meetings of the Board of Directors shall be held at the head office of the Company; provided, however, that,if necessary, the meetings may be held at any other place or by telephone or other means at two or more places.
Article 5. (Convocation of Meetings)
1. The Chairman of the Board of Directors shall convene a meeting of the Board of Directors unlessotherwise provided for by laws or ordinances. However, when the Chairman of the Board of Directors is unableso to act, one of the other Directors shall take his place in accordance with the order of priority predetermined bya resolution of the Board of Directors.
2. Directors may, if necessary, request the convocation of or convene a meeting of the Board of Directors, inaccordance with laws or ordinances.
3. Any Director constituting the Nomination Committee, the Audit Committee or the CompensationCommittee and appointed by such committee may convene a meeting of the Board of Directors.
4. Executive Officers may, if necessary, request the convocation of or convene a meeting of the Board ofDirectors, in accordance with laws or ordinances.
Article 6. (Convocation Notices)
1. Notice of a meeting of the Board of Directors shall be given to each Director at least two (2) days prior tothe date set for such meeting.
2. With the consent of all Directors, a meeting of the Board of Directors may be held without following theconvocation procedure provided for in the foregoing paragraph.
Article 7. (Agenda)
The agenda of a meeting of the Board of Directors shall be notified in advance to each Director; provided,however, that in an unavoidable case, the foregoing shall not be applied.
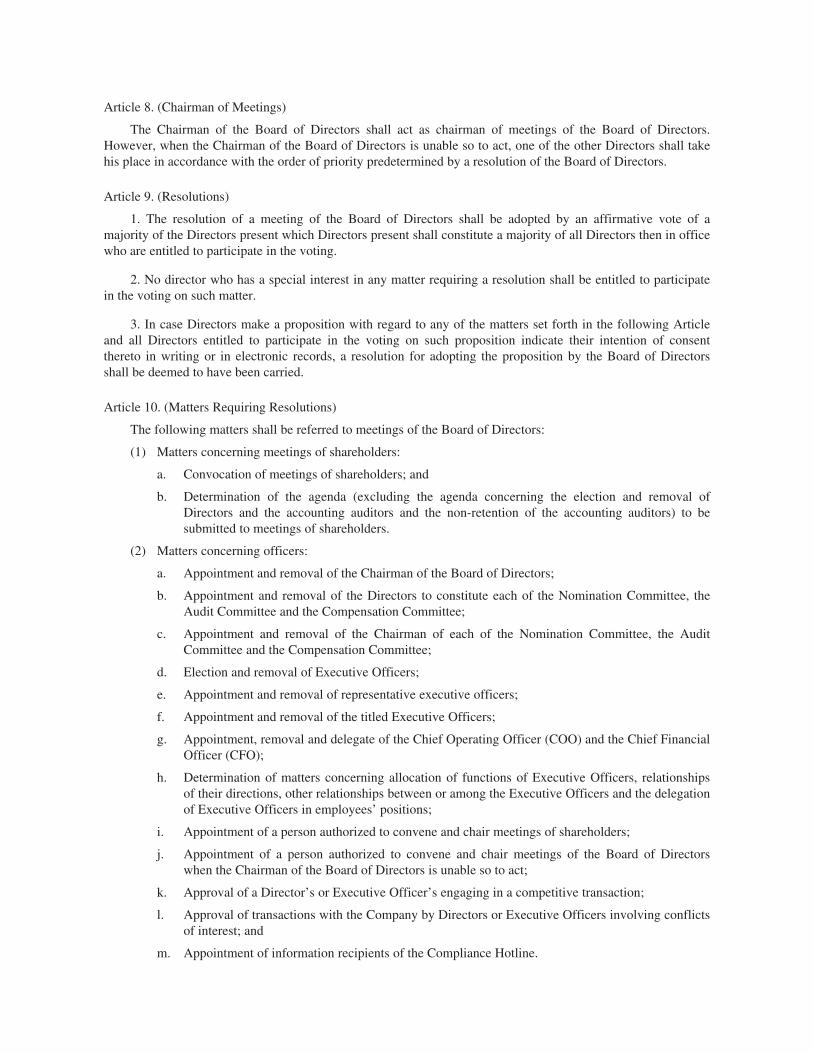
Article 8. (Chairman of Meetings)
The Chairman of the Board of Directors shall act as chairman of meetings of the Board of Directors.However, when the Chairman of the Board of Directors is unable so to act, one of the other Directors shall takehis place in accordance with the order of priority predetermined by a resolution of the Board of Directors.
Article 9. (Resolutions)
1. The resolution of a meeting of the Board of Directors shall be adopted by an affirmative vote of amajority of the Directors present which Directors present shall constitute a majority of all Directors then in officewho are entitled to participate in the voting.
2. No director who has a special interest in any matter requiring a resolution shall be entitled to participatein the voting on such matter.
3. In case Directors make a proposition with regard to any of the matters set forth in the following Articleand all Directors entitled to participate in the voting on such proposition indicate their intention of consentthereto in writing or in electronic records, a resolution for adopting the proposition by the Board of Directorsshall be deemed to have been carried.
Article 10. (Matters Requiring Resolutions)
The following matters shall be referred to meetings of the Board of Directors:
(1) Matters concerning meetings of shareholders:
a. Convocation of meetings of shareholders; and
b. Determination of the agenda (excluding the agenda concerning the election and removal ofDirectors and the accounting auditors and the non-retention of the accounting auditors) to besubmitted to meetings of shareholders.
(2) Matters concerning officers:
a. Appointment and removal of the Chairman of the Board of Directors;
b. Appointment and removal of the Directors to constitute each of the Nomination Committee, theAudit Committee and the Compensation Committee;
c. Appointment and removal of the Chairman of each of the Nomination Committee, the AuditCommittee and the Compensation Committee;
d. Election and removal of Executive Officers;
e. Appointment and removal of representative executive officers;
f. Appointment and removal of the titled Executive Officers;
g. Appointment, removal and delegate of the Chief Operating Officer (COO) and the Chief FinancialOfficer (CFO);
h. Determination of matters concerning allocation of functions of Executive Officers, relationshipsof their directions, other relationships between or among the Executive Officers and the delegationof Executive Officers in employees’ positions;
i. Appointment of a person authorized to convene and chair meetings of shareholders;
j. Appointment of a person authorized to convene and chair meetings of the Board of Directorswhen the Chairman of the Board of Directors is unable so to act;
k. Approval of a Director’s or Executive Officer’s engaging in a competitive transaction;
l. Approval of transactions with the Company by Directors or Executive Officers involving conflictsof interest; and
m. Appointment of information recipients of the Compliance Hotline.
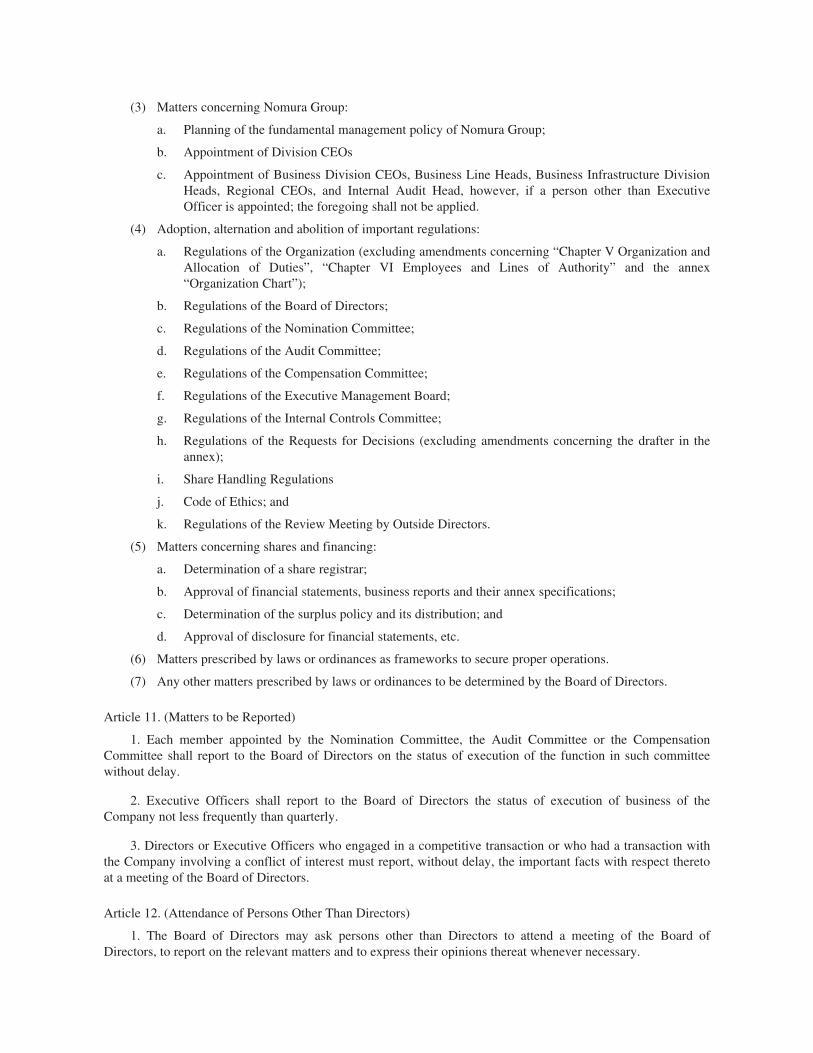
(3) Matters concerning Nomura Group:
a. Planning of the fundamental management policy of Nomura Group;
b. Appointment of Division CEOs
c. Appointment of Business Division CEOs, Business Line Heads, Business Infrastructure DivisionHeads, Regional CEOs, and Internal Audit Head, however, if a person other than ExecutiveOfficer is appointed; the foregoing shall not be applied.
(4) Adoption, alternation and abolition of important regulations:
a. Regulations of the Organization (excluding amendments concerning “Chapter V Organization andAllocation of Duties”, “Chapter VI Employees and Lines of Authority” and the annex“Organization Chart”);
b. Regulations of the Board of Directors;
c. Regulations of the Nomination Committee;
d. Regulations of the Audit Committee;
e. Regulations of the Compensation Committee;
f. Regulations of the Executive Management Board;
g. Regulations of the Internal Controls Committee;
h. Regulations of the Requests for Decisions (excluding amendments concerning the drafter in theannex);
i. Share Handling Regulations
j. Code of Ethics; and
k. Regulations of the Review Meeting by Outside Directors.
(5) Matters concerning shares and financing:
a. Determination of a share registrar;
b. Approval of financial statements, business reports and their annex specifications;
c. Determination of the surplus policy and its distribution; and
d. Approval of disclosure for financial statements, etc.
(6) Matters prescribed by laws or ordinances as frameworks to secure proper operations.
(7) Any other matters prescribed by laws or ordinances to be determined by the Board of Directors.
Article 11. (Matters to be Reported)
1. Each member appointed by the Nomination Committee, the Audit Committee or the CompensationCommittee shall report to the Board of Directors on the status of execution of the function in such committeewithout delay.
2. Executive Officers shall report to the Board of Directors the status of execution of business of theCompany not less frequently than quarterly.
3. Directors or Executive Officers who engaged in a competitive transaction or who had a transaction withthe Company involving a conflict of interest must report, without delay, the important facts with respect theretoat a meeting of the Board of Directors.
Article 12. (Attendance of Persons Other Than Directors)
1. The Board of Directors may ask persons other than Directors to attend a meeting of the Board ofDirectors, to report on the relevant matters and to express their opinions thereat whenever necessary.
2. The Executive Officers, Senior Managing Directors or employees attending a meeting of the Board ofDirectors pursuant to the foregoing paragraph shall explain to the Board of Directors matters demanded by theBoard of Directors.
Article 13. (Minutes of Meetings)
1. The substance of proceedings at a meeting of the Board of Directors, the results thereof and other mattersprescribed by laws or ordinances shall be recorded in minutes (including electronic records; the same applieshereinafter) of the meeting, and the Directors present shall affix their signatures or their names and seals(including electronic signatures; the same applies hereinafter) thereto.
2. In case a resolution by the Board of Directors shall be deemed to have been carried pursuant to theprovision of Article 9, Paragraph 3, the particulars of the proposition and other matters prescribed by laws orordinances shall be recorded in minutes, and all the Directors shall affix their signatures or their names and sealsthereto.
3. The minutes of the meeting of the Board of Directors shall be kept at the head office of the Company forten (10) years from the day on which the meeting was held.
4. The minutes of meetings of the Board of Directors shall not be offered to perusal or permitted to bereproduced, except to the shareholders or creditors who have complied with formalities prescribed by laws orordinances.
Article 14. (Notices to Absent Directors)
Resolutions made at a meeting of the Board of Directors shall be notified to Directors who were absent fromsuch meeting.
Article 15. (Omission of Reports to the Board of Directors)
1. Notwithstanding the provisions of these Regulations, if any matter prescribed by laws or ordinances orthese Regulations to be reported to the Board of Directors (excluding any report on the status of execution ofbusiness of the Company that shall be given by Executive Officers to the Board of Directors not less frequentlythan quarterly) is notified to all the Directors, such matter shall not be required to be reported at a meeting of theBoard of Directors.
2. In the case of the foregoing paragraph, the substance of the matter not required to be reported at a meetingof the Board of Directors and other matters prescribed by laws or ordinances shall be recorded in minutes, and allthe Directors shall affix their signatures or their names and seals thereto.
Supplementary Provision
These Regulations shall come into force as from October 1, 2001.
Dates of Amendments
May 1, 2002 April 1, 2003 June 26, 2003August 1, 2003 April 1, 2004 April 28, 2004April 1, 2005 October 1, 2005 April 1, 2006May 1, 2006 June 28, 2006 April 1, 2007May 15, 2007 April 1, 2008 October 1, 2008October 28, 2008 June 25, 2009 April 1, 2010

Exhibit 4.1
LIMITATION OF LIABILITY AGREEMENT
NOMURA HOLDINGS, INC. (hereinafter, the “Company”) and (hereinafter, the “Outside Director”)hereby agree to enter into this agreement as provided for under Article 33 Paragraph 2 of the Articles ofIncorporation of the Company (hereinafter, the “Agreement”) in accordance with that Article.
Article 1
On or after the execution of this Agreement, in the event that the Outside Director, in good faith and withoutgross negligence in performing his or her duties, incurs liability to compensate the Company under Article 423Paragraph 1 of the Companies Act (hereinafter, the “Relevant Liability”), the Company shall limit the OutsideDirector’s Relevant Liability to the higher of 20 million yen or the sum of the following items:
(1) the total amount of remuneration, bonus or other consideration received, or economic benefit accrued by,the Outside Director while in office as an outside director of the Company (hereinafter, “Shagai-torishimariyaku”) for the performance of his or her duties as a Shagai-torishimariyaku, in the fiscal year inwhich the facts causing the Relevant Liability arose; or in any prior fiscal year, whichever is the highestamount, multiplied by two (2); and
(2) the total amount of retirement bonus or other economic benefit of a similar nature received by the OutsideDirector from the Company divided by: the number of years served by the Outside Director as a Shagai-torishimariyaku (hereinafter, “Years of Service”), or two (2) where the Years of Service is less than two(2) years.
(3) the amount determined according to the following categories as set forth in items (a) and (b) below:
(a) In the event that, following his or her appointment to office, the Outside Director exercises Companystock acquisition rights (excluding those which may have been received by the Outside Director fromthe Company as compensation for the execution of duty) if any (hereinafter, the “Relevant StockAcquisition Rights”): the amount calculated by the multiplying the current price of the Relevant StockAcquisition Rights per relevant share at the time of exercise thereof, less the total of the amount asprovided for in Article 236 Paragraph 1, Item 2 of the Companies Act and the paid-in price as providedfor in Article 238, Paragraph 1, Item 3 of the Companies Act, per share, which shall be issued uponexercise of the Relevant Stock Acquisition Rights (if the amount so calculated is zero or less, thenzero), multiplied by the number of shares of the Company delivered to the Outside Director on exercisethereof; or
(b) In the event that, following his or her appointment to office, the Outside Director transfers RelevantStock Acquisition Rights: the amount calculated by multiplying the transfer price of Relevant StockAcquisition Rights less the paid-in price as provided for in Article 238, Paragraph 1, Item 3 of theCompanies Act, by the number of the Relevant Stock Acquisition Rights.
Article 2
The Company may request the Outside Director to provide any information necessary for determining whether ornot a Relevant Liability exists and the amount up to which any such Relevant Liability may be limited.
Article 3
1. In the event that a limitation of the Outside Director’s Relevant Liability is applied pursuant to Article 1 ofthis Agreement, the Outside Director shall not receive any amount of retirement bonus or other economic benefitof a similar nature from the Company, or exercise or transfer Company stock acquisition rights without approvalat a meeting of the shareholders of the Company.

2. In the event that an Outside Director possesses a certificate of stock acquisition rights representing Companystock acquisition rights where a limitation of the Outside Director’s Relevant Liability has been applied pursuantto Article 1 of this Agreement, the Outside Director shall be required to deposit such certificate of stockacquisition rights with the Company without delay and shall not be permitted to demand the return of the suchcertificate without approval at a meeting of the shareholders for such transfer.
Article 4
In the event that the Outside Director becomes an executive director, executive officer or manager or any otheremployee of the Company or any subsidiary of the Company, this Agreement shall be of no effect from suchtime onwards.
Article 5
Any matters not covered under this Agreement shall be resolved through mutual consultation between theCompany and the Outside Director.
IN WITNESS WHEREOF, this Agreement shall be executed as of the date below by the parties hereto induplicate, with each party retaining a counterpart hereof.
June 28, 2006
NOMURA HOLDINGS, INC.
Nobuyuki Koga,President & CEO9-1, Nihonbashi 1-chome, Chuo-ku, Tokyo
OUTSIDE DIRECTOR
Exhibit 4.2
LIMITATION OF LIABILITY AGREEMENT
NOMURA HOLDINGS, INC. (hereinafter, the “Company”) and (hereinafter, the “Outside Director”)hereby agree to enter into this agreement as provided for under Article 33 Paragraph 2 of the Articles ofIncorporation of the Company (hereinafter, the “Agreement”) in accordance with that Article.
Article 1
On or after the execution of this Agreement, in the event that the Outside Director, in good faith and withoutgross negligence in performing his or her duties, incurs liability to compensate the Company under Article 423Paragraph 1 of the Companies Act (hereinafter, the “Relevant Liability”), the Company shall limit the OutsideDirector’s Relevant Liability to the higher of 20 million yen or the sum of the following items:
(1) the total amount of remuneration, bonus or other consideration received, or economic benefit accrued by,the Outside Director while in office as an outside director of the Company (hereinafter, “Shagai-torishimariyaku”) for the performance of his or her duties as a Shagai-torishimariyaku, in the fiscal year inwhich the facts causing the Relevant Liability arose; or in any prior fiscal year, whichever is the highestamount, multiplied by two (2); and
(2) the total amount of retirement bonus or other economic benefit of a similar nature received by the OutsideDirector from the Company divided by: the number of years served by the Outside Director as a Shagai-torishimariyaku (hereinafter, “Years of Service”), or two (2) where the Years of Service is less than two(2) years.
(3) the amount determined according to the following categories as set forth in items (a) and (b) below:
(a) In the event that, following his or her appointment to office, the Outside Director exercises Companystock acquisition rights (excluding those which may have been received by the Outside Director fromthe Company as compensation for the execution of duty) if any (hereinafter, the “Relevant StockAcquisition Rights”): the amount calculated by the multiplying the current price of the Relevant StockAcquisition Rights per relevant share at the time of exercise thereof, less the total of the amount asprovided for in Article 236 Paragraph 1, Item 2 of the Companies Act and the paid-in price as providedfor in Article 238, Paragraph 1, Item 3 of the Companies Act, per share, which shall be issued uponexercise of the Relevant Stock Acquisition Rights (if the amount so calculated is zero or less, thenzero), multiplied by the number of shares of the Company delivered to the Outside Director on exercisethereof; or
(b) In the event that, following his or her appointment to office, the Outside Director transfers RelevantStock Acquisition Rights: the amount calculated by multiplying the transfer price of Relevant StockAcquisition Rights less the paid-in price as provided for in Article 238, Paragraph 1, Item 3 of theCompanies Act, by the number of the Relevant Stock Acquisition Rights.
Article 2
The Company may request the Outside Director to provide any information necessary for determining whether ornot a Relevant Liability exists and the amount up to which any such Relevant Liability may be limited.
Article 3
1. In the event that a limitation of the Outside Director’s Relevant Liability is applied pursuant to Article 1 ofthis Agreement, the Outside Director shall not receive any amount of retirement bonus or other economic benefitof a similar nature from the Company, or exercise or transfer Company stock acquisition rights without approvalat a meeting of the shareholders of the Company.

2. In the event that an Outside Director possesses a certificate of stock acquisition rights representing Companystock acquisition rights where a limitation of the Outside Director’s Relevant Liability has been applied pursuantto Article 1 of this Agreement, the Outside Director shall be required to deposit such certificate of stockacquisition rights with the Company without delay and shall not be permitted to demand the return of the suchcertificate without approval at a meeting of the shareholders for such transfer.
Article 4
In the event that the Outside Director becomes an executive director, executive officer or manager or any otheremployee of the Company or any subsidiary of the Company, this Agreement shall be of no effect from suchtime onwards.
Article 5
Any matters not covered under this Agreement shall be resolved through mutual consultation between theCompany and the Outside Director.
IN WITNESS WHEREOF, this Agreement shall be executed as of the date below by the parties hereto induplicate, with each party retaining a counterpart hereof.
June 26, 2008
NOMURA HOLDINGS, INC.
Kenichi Watanabe,President & CEO9-1, Nihonbashi 1-chome, Chuo-ku, Tokyo
OUTSIDE DIRECTOR

Exhibit 4.3
LIMITATION OF LIABILITY AGREEMENT
NOMURA HOLDINGS, INC. (hereinafter, the “Company”) and (hereinafter, the “Outside Director”)hereby agree to enter into this agreement as provided for under Article 33 Paragraph 2 of the Articles ofIncorporation of the Company (hereinafter, the “Agreement”) in accordance with that Article.
Article 1
On or after the execution of this Agreement, in the event that the Outside Director, in good faith and withoutgross negligence in performing his or her duties, incurs liability to compensate the Company under Article 423Paragraph 1 of the Companies Act (hereinafter, the “Relevant Liability”), the Company shall limit the OutsideDirector’s Relevant Liability to the higher of 20 million yen or the sum of the following items:
(1) the total amount of remuneration, bonus or other consideration received, or economic benefit accrued by,the Outside Director while in office as an outside director of the Company (hereinafter, “Shagai-torishimariyaku”) for the performance of his or her duties as a Shagai-torishimariyaku, in the fiscal year inwhich the facts causing the Relevant Liability arose; or in any prior fiscal year, whichever is the highestamount, multiplied by two (2); and
(2) the total amount of retirement bonus or other economic benefit of a similar nature received by the OutsideDirector from the Company divided by: the number of years served by the Outside Director as a Shagai-torishimariyaku (hereinafter, “Years of Service”), or two (2) where the Years of Service is less than two(2) years.
(3) the amount determined according to the following categories as set forth in items (a) and (b) below:
(a) In the event that, following his or her appointment to office, the Outside Director exercises Companystock acquisition rights (excluding those which may have been received by the Outside Director fromthe Company as compensation for the execution of duty) if any (hereinafter, the “Relevant StockAcquisition Rights”): the amount calculated by the multiplying the current price of the Relevant StockAcquisition Rights per relevant share at the time of exercise thereof, less the total of the amount asprovided for in Article 236 Paragraph 1, Item 2 of the Companies Act and the paid-in price as providedfor in Article 238, Paragraph 1, Item 3 of the Companies Act, per share, which shall be issued uponexercise of the Relevant Stock Acquisition Rights (if the amount so calculated is zero or less, thenzero), multiplied by the number of shares of the Company delivered to the Outside Director on exercisethereof; or
(b) In the event that, following his or her appointment to office, the Outside Director transfers RelevantStock Acquisition Rights: the amount calculated by multiplying the transfer price of Relevant StockAcquisition Rights less the paid-in price as provided for in Article 238, Paragraph 1, Item 3 of theCompanies Act, by the number of the Relevant Stock Acquisition Rights.
Article 2
The Company may request the Outside Director to provide any information necessary for determining whether ornot a Relevant Liability exists and the amount up to which any such Relevant Liability may be limited.
Article 3
1. In the event that a limitation of the Outside Director’s Relevant Liability is applied pursuant to Article 1 ofthis Agreement, the Outside Director shall not receive any amount of retirement bonus or other economic benefitof a similar nature from the Company, or exercise or transfer Company stock acquisition rights without approvalat a meeting of the shareholders of the Company.

2. In the event that an Outside Director possesses a certificate of stock acquisition rights representing Companystock acquisition rights where a limitation of the Outside Director’s Relevant Liability has been applied pursuantto Article 1 of this Agreement, the Outside Director shall be required to deposit such certificate of stockacquisition rights with the Company without delay and shall not be permitted to demand the return of the suchcertificate without approval at a meeting of the shareholders for such transfer.
Article 4
In the event that the Outside Director becomes an executive director, executive officer or manager or any otheremployee of the Company or any subsidiary of the Company, this Agreement shall be of no effect from suchtime onwards.
Article 5
Any matters not covered under this Agreement shall be resolved through mutual consultation between theCompany and the Outside Director.
IN WITNESS WHEREOF, this Agreement shall be executed as of the date below by the parties hereto induplicate, with each party retaining a counterpart hereof.
June 25, 2009
NOMURA HOLDINGS, INC.
Kenichi Watanabe,President & CEO9-1, Nihonbashi 1-chome, Chuo-ku, Tokyo
OUTSIDE DIRECTOR

Exhibit 4.4
LIMITATION OF LIABILITY AGREEMENT
NOMURA HOLDINGS, INC. (hereinafter, the “Company”) and (hereinafter, the “Outside Director”)hereby agree to enter into this agreement as provided for under Article 33 Paragraph 2 of the Articles ofIncorporation of the Company (hereinafter, the “Agreement”) in accordance with that Article.
Article 1
On or after the execution of this Agreement, in the event that the Outside Director, in good faith and withoutgross negligence in performing his or her duties, incurs liability to compensate the Company under Article 423Paragraph 1 of the Companies Act (hereinafter, the “Relevant Liability”), the Company shall limit the OutsideDirector’s Relevant Liability to the higher of 20 million yen or the sum of the following items:
(1) the total amount of remuneration, bonus or other consideration received, or economic benefit accrued by,the Outside Director while in office as an outside director of the Company (hereinafter, “Shagai-torishimariyaku”) for the performance of his or her duties as a Shagai-torishimariyaku, in the fiscal year inwhich the facts causing the Relevant Liability arose; or in any prior fiscal year, whichever is the highestamount, multiplied by two (2); and
(2) the total amount of retirement bonus or other economic benefit of a similar nature received by the OutsideDirector from the Company divided by: the number of years served by the Outside Director as a Shagai-torishimariyaku (hereinafter, “Years of Service”), or two (2) where the Years of Service is less than two(2) years.
(3) the amount determined according to the following categories as set forth in items (a) and (b) below:
(a) In the event that, following his or her appointment to office, the Outside Director exercises Companystock acquisition rights (excluding those which may have been received by the Outside Director fromthe Company as compensation for the execution of duty) if any (hereinafter, the “Relevant StockAcquisition Rights”): the amount calculated by the multiplying the current price of the Relevant StockAcquisition Rights per relevant share at the time of exercise thereof, less the total of the amount asprovided for in Article 236 Paragraph 1, Item 2 of the Companies Act and the paid-in price as providedfor in Article 238, Paragraph 1, Item 3 of the Companies Act, per share, which shall be issued uponexercise of the Relevant Stock Acquisition Rights (if the amount so calculated is zero or less, thenzero), multiplied by the number of shares of the Company delivered to the Outside Director on exercisethereof; or
(b) In the event that, following his or her appointment to office, the Outside Director transfers RelevantStock Acquisition Rights: the amount calculated by multiplying the transfer price of Relevant StockAcquisition Rights less the paid-in price as provided for in Article 238, Paragraph 1, Item 3 of theCompanies Act, by the number of the Relevant Stock Acquisition Rights.
Article 2
The Company may request the Outside Director to provide any information necessary for determining whether ornot a Relevant Liability exists and the amount up to which any such Relevant Liability may be limited.
Article 3
1. In the event that a limitation of the Outside Director’s Relevant Liability is applied pursuant to Article 1 ofthis Agreement, the Outside Director shall not receive any amount of retirement bonus or other economic benefitof a similar nature from the Company, or exercise or transfer Company stock acquisition rights without approvalat a meeting of the shareholders of the Company.
2. In the event that an Outside Director possesses a certificate of stock acquisition rights representing Companystock acquisition rights where a limitation of the Outside Director’s Relevant Liability has been applied pursuantto Article 1 of this Agreement, the Outside Director shall be required to deposit such certificate of stockacquisition rights with the Company without delay and shall not be permitted to demand the return of the suchcertificate without approval at a meeting of the shareholders for such transfer.
Article 4
In the event that the Outside Director becomes an executive director, executive officer or manager or any otheremployee of the Company or any subsidiary of the Company, this Agreement shall be of no effect from suchtime onwards.
Article 5
Any matters not covered under this Agreement shall be resolved through mutual consultation between theCompany and the Outside Director.
IN WITNESS WHEREOF, this Agreement shall be executed as of the date below by the parties hereto induplicate, with each party retaining a counterpart hereof.
June 25, 2010
NOMURA HOLDINGS, INC.
Kenichi Watanabe,President & CEO9-1, Nihonbashi 1-chome, Chuo-ku, Tokyo
OUTSIDE DIRECTOR
Exhibit 12.1
Certification
I, Kenichi Watanabe, certify that:
1. I have reviewed this annual report on Form 20-F of Nomura Holdings, Inc.;
2. Based on my knowledge, this report does not contain any untrue statement of a material fact or omitto state a material fact necessary to make the statements made, in light of the circumstances under whichsuch statements were made, not misleading with respect to the period covered by this report;
3. Based on my knowledge, the financial statements, and other financial information included in thisreport, fairly present in all material respects the financial condition, results of operations and cash flows ofthe company as of, and for, the periods presented in this report;
4. The company’s other certifying officer and I are responsible for establishing and maintainingdisclosure controls and procedures (as defined in Exchange Act Rules 13a-15(e) and 15d-15(e)) and internalcontrol over financial reporting (as defined in Exchange Act Rules 13a-15(f) and 15d-15(f)) for thecompany and have:
a) Designed such disclosure controls and procedures, or caused such disclosure controls andprocedures to be designed under our supervision, to ensure that material information relating to thecompany, including its consolidated subsidiaries, is made known to us by others within those entities,particularly during the period in which this report is being prepared;
b) Designed such internal control over financial reporting, or caused such internal control overfinancial reporting to be designed under our supervision, to provide reasonable assurance regarding thereliability of financial reporting and the preparation of financial statements for external purposes inaccordance with generally accepted accounting principles;
c) Evaluated the effectiveness of the company’s disclosure controls and procedures and presentedin this report our conclusions about the effectiveness of the disclosure controls and procedures, as ofthe end of the period covered by this report based on such evaluation; and
d) Disclosed in this report any change in the company’s internal control over financial reportingthat occurred during the period covered by the annual report that has materially affected, or isreasonably likely to materially affect, the company’s internal control over financial reporting; and
5. The company’s other certifying officer and I have disclosed, based on our most recent evaluation ofinternal control over financial reporting, to the company’s auditors and the audit committee of thecompany’s board of directors (or persons performing the equivalent functions):
a) All significant deficiencies and material weaknesses in the design or operation of internalcontrol over financial reporting which are reasonably likely to adversely affect the company’s ability torecord, process, summarize and report financial information; and
b) Any fraud, whether or not material, that involves management or other employees who have asignificant role in the company’s internal control over financial reporting.
Date: June 29, 2010
/s/ KENICHI WATANABE
Kenichi WatanabePresident and Chief Executive Officer
Exhibit 12.2
Certification
I, Masafumi Nakada, certify that:
1. I have reviewed this annual report on Form 20-F of Nomura Holdings, Inc.;
2. Based on my knowledge, this report does not contain any untrue statement of a material fact or omitto state a material fact necessary to make the statements made, in light of the circumstances under whichsuch statements were made, not misleading with respect to the period covered by this report;
3. Based on my knowledge, the financial statements, and other financial information included in thisreport, fairly present in all material respects the financial condition, results of operations and cash flows ofthe company as of, and for, the periods presented in this report;
4. The company’s other certifying officer and I are responsible for establishing and maintainingdisclosure controls and procedures (as defined in Exchange Act Rules 13a-15(e) and 15d-15(e)) and internalcontrol over financial reporting (as defined in Exchange Act Rules 13a-15(f) and 15d-15(f)) for thecompany and have:
a) Designed such disclosure controls and procedures, or caused such disclosure controls andprocedures to be designed under our supervision, to ensure that material information relating to thecompany, including its consolidated subsidiaries, is made known to us by others within those entities,particularly during the period in which this report is being prepared;
b) Designed such internal control over financial reporting, or caused such internal control overfinancial reporting to be designed under our supervision, to provide reasonable assurance regarding thereliability of financial reporting and the preparation of financial statements for external purposes inaccordance with generally accepted accounting principles;
c) Evaluated the effectiveness of the company’s disclosure controls and procedures and presentedin this report our conclusions about the effectiveness of the disclosure controls and procedures, as ofthe end of the period covered by this report based on such evaluation; and
d) Disclosed in this report any change in the company’s internal control over financial reportingthat occurred during the period covered by the annual report that has materially affected, or isreasonably likely to materially affect, the company’s internal control over financial reporting; and
5. The company’s other certifying officer and I have disclosed, based on our most recent evaluation ofinternal control over financial reporting, to the company’s auditors and the audit committee of thecompany’s board of directors (or persons performing the equivalent functions):
a) All significant deficiencies and material weaknesses in the design or operation of internalcontrol over financial reporting which are reasonably likely to adversely affect the company’s ability torecord, process, summarize and report financial information; and
b) Any fraud, whether or not material, that involves management or other employees who have asignificant role in the company’s internal control over financial reporting.
Date: June 29, 2010
/s/ MASAFUMI NAKADA
Masafumi NakadaExecutive Managing Director and Chief Financial Officer
Exhibit 13.1
Certification
Pursuant to 18 U.S.C. §1350, the undersigned officer of Nomura Holdings, Inc. (the “Company”) herebycertifies, to such officer’s knowledge, that the Company’s annual report on Form 20-F for the year endedMarch 31, 2010 (the “Report”) fully complies with the requirements of Section 13(a) or 15(d), as applicable, ofthe Securities Exchange Act of 1934 and that the information contained in the Report fairly presents, in allmaterial respects, the financial condition and results of operations of the Company.
Date: June 29, 2010
/s/ KENICHI WATANABE
Kenichi WatanabePresident and Chief Executive Officer
Exhibit 13.2
Certification
Pursuant to 18 U.S.C. §1350, the undersigned officer of Nomura Holdings, Inc. (the “Company”) herebycertifies, to such officer’s knowledge, that the Company’s annual report on Form 20-F for the year endedMarch 31, 2010 (the “Report”) fully complies with the requirements of Section 13(a) or 15(d), as applicable, ofthe Securities Exchange Act of 1934 and that the information contained in the Report fairly presents, in allmaterial respects, the financial condition and results of operations of the Company.
Date: June 29, 2010
/s/ MASAFUMI NAKADA
Masafumi NakadaExecutive Managing Director and Chief Financial Officer
Exhibit 15.1
CONSENT OF INDEPENDENT REGISTERED PUBLIC ACCOUNTING FIRM
We consent to the incorporation by reference in the Registration Statements (Form F-3 No. 333-165049 andForm S-8 No. 333-116985, No. 333-126203, No. 333-134590, No. 333-135430, No. 333-141988, No. 333-144112, No. 333-150267, No. 333-158344 and No. 333-165925) and related Prospectus of Nomura Holdings,Inc. of our reports dated June 29, 2010, with respect to the consolidated financial statements of NomuraHoldings, Inc., and the effectiveness of internal control over financial reporting of Nomura Holdings, Inc.,included in this Annual Report (Form 20-F) for the year ended March 31, 2010.
/s/ Ernst & Young ShinNihon LLC
Tokyo, JapanJune 29, 2010