U.S. Foreign Agricultural Trade Statistical Report, Fiscal Year ...
Upload
khangminh22Category
view
2download
0
United States International Trade Commission
Foreign Censorship, Part 2: Trade and Economic Effects on U.S. Businesses
July 2022 Publication Number: 5334 Investigation Number: 332-586

Commissioners David S. Johanson, Chairman
Rhonda K. Schmidtlein
Jason E. Kearns Randolph J. Stayin
Amy A. Karpel
Catherine B. DeFilippo Director, Office of Operations
William M. Powers Director, Office of Economics
Address all communications to Office of External Relations ([email protected])
United States International Trade Commission Washington, DC 20436

United States International Trade Commission
Foreign Censorship, Part 2: Trade and Economic Effects on U.S. Businesses
July 2022 Publication Number: 5334 Investigation Number: 332-586

Foreign Censorship Part 2: Trade and Economic Effects on U.S. Businesses
4 | www.usitc.gov
This report was prepared principally by:
Project Leader Ravinder Ubee
Deputy Project Leaders
Shova KC and George Serletis
Office of Analysis and Research Services Ann Marie Carton, Maureen Letostak, Laura Thayn, and Aaron Woodward
Office of Economics
Tamara Gurevich, Peter Herman, Ross Jestrab, and Tricia Mueller
Office of Industries Simon Adhanom, David Coffin, Brian Daigle, Dixie Downing, Eric Forden, Tamar Khachaturian,
Sarah Oliver, Christopher Robinson, Mitch Semanik, and Heather Wickramarachi
Content Reviewers Saad Ahmad, Office of Economics
Katherine Linton, Office of Industries
Statistical Reviewers Russell Duncan and Maureen Letostak
Editorial Reviewer Judy Edelhoff
Production Support Justin Holbein
Under the direction of David Riker
Chief, Research Division Office of Economics
Table of Contents
United States International Trade Commission | 5
Table of Contents Abbreviations and Acronyms............................................................................15 Executive Summary ..........................................................................................17 Chapter 1 Introduction ................................................................................27
Censorship-Related Policies and Practices Identified in Foreign Censorship 1 .........................27 Extraterritorial Censorship and Self-Censorship....................................................................29
Focus of the Report and Methodology ......................................................................................30
Information Sources...............................................................................................................32 Challenges to Identifying and Quantifying the Effects of Foreign Censorship ......................32
Organization of the Report ........................................................................................................35 Bibliography ...............................................................................................................................36
Chapter 2 Prevalence and Effects of Censorship on U.S Businesses Providing Media and Digital Services in China ..................................................................39
Summary of Key Findings from the Survey ................................................................................39 Survey Background ....................................................................................................................40 Focus on U.S. Media and Digital Service Providers....................................................................41
Challenges in Quantifying the Impacts of Censorship-Related Measures.............................42 Landscape of U.S. Businesses Active in China............................................................................44 Experience with Censorship-Related Measures ........................................................................44
Experiences with Direct Censorship Measures......................................................................46 Experiences with Censorship-Enabling Measures .................................................................48
Effects of Censorship-Related Measures ...................................................................................50
Self-Censorship ......................................................................................................................52 Extraterritorial Effects ............................................................................................................53
Perceived Impacts on Products and Services and Business Operations ...................................54
Perceived Change in Censorship ............................................................................................56 Comparison to Chinese-Owned Businesses...........................................................................57 Impact on Brand Perception in the United States .................................................................58
Economic Impacts of Chinese Censorship .................................................................................58
Prevalence of Economic Impacts ...........................................................................................58 Impact on U.S. Businesses’ Costs and Revenues ...................................................................60
Censorship-Related Measures in Key Markets Outside of China ..............................................61 Bibliography ...............................................................................................................................63
Chapter 3 Effects of Foreign Censorship on Social Media, Over-the-Top Communications Services, and Internet Search ................................................65
Summary of Key Findings ...........................................................................................................66 Social Media and User-Generated Video...................................................................................67

Foreign Censorship Part 2: Trade and Economic Effects on U.S. Businesses
6 | www.usitc.gov
Over-the-Top Communications Services ...................................................................................82 Internet Search...........................................................................................................................87 Bibliography ...............................................................................................................................94
Chapter 4 Effects of Foreign Censorship on Audiovisual Content and Examples of Extraterritorial Censorship .........................................................................105
Summary of Key Findings .........................................................................................................106 Box Office Movies ....................................................................................................................106
Premarket Review and Self-Censorship ...............................................................................108 Market Access Restrictions ..................................................................................................110
Subscription Video Streaming Services....................................................................................114 Video Games ............................................................................................................................118
Premarket Review and Self-censorship ...............................................................................118 Long-term Market Access Blocks .........................................................................................120 Estimations of Foregone Revenues Resulting from Censorship ..........................................121
Examples of Extraterritorial Censorship ..................................................................................127
The NBA and Extraterritorial Censorship .............................................................................128 Nike, Intel, and the Blurry Line of Boycotts .........................................................................130 Bans on Musicians................................................................................................................131 Extraterritorial Censorship in the Travel Services Industry .................................................132 The Risk of Censorship in U.S. Higher Education .................................................................132
Bibliography .............................................................................................................................136
Appendix A Request Letters ......................................................................151 Appendix B Federal Register Notices .........................................................157 Appendix C Calendar of Hearing Witnesses ...............................................165 Appendix D Summary of Views of Interested Parties .................................169 Appendix E Foreign Censorship Questionnaire ..........................................177 Appendix F Description of the Commission’s Survey Methodology ...........211 Appendix G Additional Survey Results for Media and
Digital Service Providers in China............................................221 Appendix H Survey Results for U.S. Businesses Other than
Media and Digital Service Providers .......................................233 Appendix I Modeling Technical Appendix.................................................249 Appendix J Data Tables for Figures ...........................................................257 Boxes Box 1.1 Censorship During Russia’s Invasion of Ukraine ...................................................................... 34 Box 2.1 Statistical Measures Used for Analysis ................................................................................... 42 Box 3.1 Fines and Other Legal Actions for Failure to Remove Objectionable Content ............................ 81 Box 3.2 Effects of Low Encryption Standards ...................................................................................... 85

Table of Contents
United States International Trade Commission | 7
Box 3.3 Challenges with Censorship in China for Other Information Providers...................................... 92 Box 4.1 Effects of Censorship on Journalism and Publishing .............................................................. 125
Figures Figure 2.1 Shares of U.S. media and digital service providers in China that experienced censorship-related measures, by business size .................................................................................................... 46 Figure 2.2 Shares of U.S. media and digital service providers in China that experienced direct censorship measures in China, by business size ................................................................................................... 47 Figure 2.3 Shares of U.S. media and digital service providers in China, affected by type of direct censorship measures and business size .............................................................................................. 48 Figure 2.4 Shares of U.S. media and digital service providers that experienced any censorship-enabling measures in China since January 1, 2019, by business size .................................................................. 49 Figure 2.5 Shares of U.S. media and digital service providers in China that experienced specific censorship-enabling measures, by business size ................................................................................. 50 Figure 2.6 Shares of censored U.S. media and digital service providers that experienced limitations that impacted business operations in China, by type of limitation .............................................................. 52 Figure 2.7 Shares of U.S. media and digital service providers experiencing censorship-related measures in China that have self-censored in order to provide products and services in China, by business size.... 53 Figure 2.8 Shares of censored U.S. media and digital service providers that are concerned Chinese censorship will have a negative impact on their ability to provide products and services in China, by business size .................................................................................................................................... 55 Figure 2.9 Shares of censored U.S. media and digital service providers in China that are concerned Chinese censorship will have a negative impact on their operations in China, by business size .............. 56 Figure 2.10 Shares of censored U.S. media and digital service providers for which Chinese censorship has become more challenging, by business size ........................................................................................ 57 Figure 2.11 Distribution of U.S. media and digital service providers in China that experienced and were economically impacted by Chinese censorship-related measures ........................................................ 59 Figure 2.12 Net effects of Chinese censorship on costs of doing business in China of U.S. media and digital service providers, by subsets of the population ........................................................................ 60 Figure 2.13 Net effects of Chinese censorship on revenue or sales in China of U.S. media and digital service providers, by subsets of the population .................................................................................. 61 Figure 2.14 Shares of U.S. media and digital service providers in China that operated in and experienced censorship-related measures in key markets, by key market ............................................................... 62 Figure 3.1 Global active users of social media platforms and the country where the company is headquartered, 2021 ........................................................................................................................ 69 Figure 3.2 Global active users of user-generated video platforms and the country where the company is headquartered, 2021 ........................................................................................................................ 70 Figure 3.3 Growth rates of social media advertising spending in Vietnam vs. all Asia, 2018–2021. ......... 76 Figure 3.4 Google’s estimated potential total global search revenue if it had access to the Chinese market in 2017–2021 ........................................................................................................................ 92 Figure 4.1 Estimates of U.S. SVOD providers’ potential revenues in the Chinese market in 2021, under various competitive scenario assumptions ....................................................................................... 117

Foreign Censorship Part 2: Trade and Economic Effects on U.S. Businesses
8 | www.usitc.gov
Tables Table ES.1 Commission estimates of economic losses or foregone revenue from selected services disruptions in key markets ................................................................................................................ 22 Table ES.2 Commission estimates of foregone revenue from censorship-related market access restrictions in China .......................................................................................................................... 24 Table 1.1 Products and services covered, and censorship-related measures analyzed in case studies .... 35 Table 2.1 Shares of U.S. media and digital service providers in China, by product or service category provided in China, since January 1, 2019 ............................................................................................ 44 Table 2.2 Shares of censored U.S. media and digital service providers in China experiencing specific effects of censorship-related measures.............................................................................................. 51 Table 3.1 Share of country-wide economic losses of hypothetical internet shutdowns for U.S. social media and UGV services, by key market, 2020.................................................................................... 74 Table 3.2 Estimated economic loss of actual internet shutdowns for U.S. social media and UGV services, by key market, 2019–2021 ................................................................................................................ 75 Table 3.3 Estimated potential range of annual revenue loss from market access denials to China, Facebook, 2021 ................................................................................................................................ 80 Table 3.4 Potential range of annual ad revenue loss, YouTube, 2021 ................................................... 81 Table 3.5 Estimated economic losses of internet shutdowns for WhatsApp, 2019–21........................... 85 Table 3.6 Estimated range of foregone users from OTT communications app bans and blocks in China (2020) .............................................................................................................................................. 87 Table 3.7 Market share and total search engine advertising (SEA) spending, by country ....................... 88 Table 3.8 Estimated loss of advertising revenue from services disruptions to internet search in India and Indonesia ......................................................................................................................................... 90 Table 4.1 Select U.S. Films: Estimates of film studios’ foregone revenue from being blocked in China, 2021 .............................................................................................................................................. 113 Table 4.2 Revenues for digital and physical video games and country characteristics for censoring countries and top video game markets in 2019 ................................................................................ 122 Table 4.3 Estimated total increases in digital and physical video game revenues, if censorship were reduced to low levels, 2019............................................................................................................. 124 Table F.1 Size cutoff criteria for size-based stratum by industry group, by number of employees and revenue in billions of dollars............................................................................................................ 214 Table F.2 Sample selection rates per population stratum, by business size, types of activity, and industry ................................................................................ 215 Table F.3 Response rates per population stratum, by business size, types of activity, and industry ...... 216 Table F.4 Average final weights per population stratum, by business size and industry ....................... 217 Table F.5 Grouping of questionnaire product and service categories, by product and service grouping used for analysis. ............................................................................................................................ 218 Table F.6 Grouping of direct censorship categories by acts, policies, and practices ............................. 218 Table F.7 Grouping of censorship-enabling categories by acts, policies, and practices......................... 219 Table G.1 Shares of censored U.S. media and digital service providers in China negatively impacted by Chinese censorship-related measures with specific effects from those measures ............................... 223 Table G.2 Shares of all U.S. media and digital service providers in China with specific effects of Chinese censorship-related measures .......................................................................................................... 223

Table of Contents
United States International Trade Commission | 9
Table G.3 Shares of censored U.S. media and digital service providers in China that experienced any effects of Chinese censorship-related measures, by business size ...................................................... 223 Table G.4 Shares of censored U.S. media and digital service providers in China that have undertaken various steps due to Chinese censorship-related measures ............................................................... 224 Table G.5 Shares of U.S. media and digital service providers that experienced censorship-related measures in China that self-censored to provide products and services in China, by business size ....... 224 Table G.6 Shares of U.S. media and digital service providers that experienced censorship-related measures in China that self-censored, by location ............................................................................ 225 Table G.7 Shares of U.S. media and digital service providers that experienced censorship-related measures in China for whom self-censorship impacted the design or functionality of any products or services their business provided outside of China ............................................................................. 225 Table G.8 Shares of censored U.S. media and digital service providers in China that moderated activity on social media .............................................................................................................................. 225 Table G.9 Shares of censored U.S. media and digital service providers in China that experienced negative or mixed impact on their products and services provided outside of China ........................................ 225 Table G.10 Shares of censored U.S. media and digital service providers in China for whom Chinese censorship-related measures has directly impacted products or services provided outside of China, by location.......................................................................................................................................... 225 Table G.11 Shares of censored U.S. media and digital service providers in China that are concerned Chinese censorship-related measures will have a negative impact on their ability to provide products and services in China, by business size ............................................................................................. 226 Table G.12 Shares of censored U.S. media and digital service providers in China that are concerned Chinese censorship-related measures will have a negative impact on their operations in China, by business size .................................................................................................................................. 226 Table G.13 Shares of censored U.S. media and digital service providers for which Chinese censorship-related measures has become more challenging, by business size ..................................................... 226 Table G.14 Shares of censored U.S. media and digital service providers active in China and perceived concern that Chinese censorship-related measures would have a negative impact on their ability to provide products and services, by market ........................................................................................ 226 Table G.15 Shares of censored U.S. media and digital service providers active in China and perceived concern that Chinese censorship-related measures would have a negative impact on their ability to provide products and services in China, by business size ................................................................... 227 Table G.16 Shares of censored U.S. media and digital service providers active in China and perceived concern that Chinese censorship-related measures would have a negative impact on their operations, by market ........................................................................................................................................... 227 Table G.17 Shares of censored U.S. media and digital service providers active in China and perceived concern that Chinese censorship-related measures would have a have a negative impact on their operations, by business size ............................................................................................................ 227 Table G.18 Shares of censored U.S. media and digital service providers in China and perceived challenge of censorship-related measures in China in the past few years, by business size................................. 228 Table G.19 Shares of censored U.S. media and digital service providers in China’s perceived differences in levels of requirements and enforcement of policies related to censoring content by the government of China compared to Chinese-owned companies, by business size ....................................................... 228
Foreign Censorship Part 2: Trade and Economic Effects on U.S. Businesses
10 | www.usitc.gov
Table G.20 Shares of censored U.S. media and digital service providers in China that complied with censorship-related measures’ impact of policies on its brand perceived by customers, by business size ................................................................................................................................................ 228 Table G.21 Shares of censored U.S. media and digital service providers in China that were economically impacted by Chinese censorship-related measures........................................................................... 228 Table G.22 Shares of all U.S. media and digital service providers in China that operate in other key markets, and those that operate in that key market which experience censorship, by key market and business size .................................................................................................................................. 229 Table G.23 Shares of censored U.S. media and digital service providers in China that operate in other key markets, and those that operate in that key market which experience censorship, by key market and business size .................................................................................................................................. 230 Table G.24 Shares of all U.S. media and digital service providers in China that operate in other markets, and those that operate in other markets which experience censorship in that market, by market ....... 231 Table H.1 Products and services offered by U.S. businesses other than media and digital service providers in China........................................................................................................................... 235 Table H.2 Frequency of products and services offered by U.S. businesses other than media and digital service providers in China ............................................................................................................... 235 Table H.3 Shares of U.S. businesses other than media and digital service providers in China, by business size ................................................................................................................................................ 235 Table H.4 Shares of U.S. businesses other than media and digital service providers in China that experienced any direct censorship or censorship-enabling measures, by business size ....................... 236 Table H.5 Shares of U.S. businesses other than media and digital service providers in China that experienced direct censorship measures, by business size ................................................................ 236 Table H.6 Shares of U.S. businesses other than media and digital service providers in China that experienced censorship-enabling measures, by business size ............................................................ 236 Table H.7 Shares of censored U.S. businesses other than media and digital service providers in China that were negatively impacted as a result of Chinese censorship-related measures, by business size .............................................................................................................. 237 Table H.8 Shares of U.S. businesses other than media and digital service providers in China that were negatively impacted as a result of Chinese censorship-related measures ........................................... 237 Table H.9 Shares of censored U.S. businesses other than media and digital service providers in China negatively impacted by Chinese censorship-related measures with specific effects from those measures ....................................................................................................................................... 237 Table H.10 Shares of censored U.S. businesses other than media and digital service providers in China that have undertaken specific steps due to Chinese censorship-related measures.............................. 238 Table H.11 Shares of censored U.S. businesses other than media and digital service providers that experienced limitations from Chinese censorship-related measures impacting business operations .... 239 Table H.12 Shares of censored U.S. businesses other than media and digital service providers that have self-censored in order to provide products and services in China, by business size ............................. 239 Table H.13 Shares of U.S. businesses other than media and digital service providers that have self-censored in order to provide products and services in China, by business size.................................... 239 Table H.14 Shares of censored U.S. businesses other than media and digital service providers in China that self-censored, by location ........................................................................................................ 239

Table of Contents
United States International Trade Commission | 11
Table H.15 Shares of censored U.S. businesses other than media and digital service providers for whom self-censorship impacted the design or functionality of any products or services their business provided outside of China ............................................................................................................................. 240 Table H.16 Shares of censored U.S. businesses other than media and digital service providers in China that moderate or limit activity on social media due to Chinese censorship-related measures .............. 240 Table H.17 Shares of censored U.S. businesses other than media and digital service in China that experienced negative or mixed impact to their products and services provided outside of China ........ 240 Table H.18 Shares of censored U.S. businesses other than media and digital service providers for whom Chinese censorship-related measures have directly impacted products or services provided outside of China, by location ........................................................................................................................... 240 Table H.19 Shares of censored U.S. businesses other than media and digital service providers that are concerned censorship will have a negative impact on their ability to provide products and services in China, by business size .................................................................................................................... 241 Table H.20 Shares of censored U.S. businesses other than media and digital service providers in China that are concerned Chinese censorship will have a negative impact on their operations in China, by business size .................................................................................................................................. 241 Table H.21 Shares of censored U.S. businesses other than media and digital service providers for which Chinese censorship has become more challenging, by business size .................................................. 241 Table H.22 Shares of censored U.S. businesses other than media and digital service providers active in China and perceived concern that Chinese censorship would have a negative impact on their ability to provide product and services, by market.......................................................................................... 242 Table H.23 Shares of censored U.S. businesses other than media and digital service providers active in China and perceived concern that Chinese censorship would have a negative impact on their ability to provide product and services in China, by business size .................................................................... 242 Table H.24 Shares of censored U.S. businesses other than media and digital service providers active in China and perceived concern that Chinese censorship would have a negative impact on their operations, by market....................................................................................................................................... 242 Table H.25 Shares of censored U.S. businesses other than media and digital service providers active in China and perceived concern that Chinese censorship would have a have a negative impact on their operations, by business size ............................................................................................................ 243 Table H.26 Shares of censored U.S. businesses other than media and digital service providers in China and perceived challenge of censorship-related measures in China in the past few years, by business size ................................................................................................................................................ 243 Table H.27 Shares of censored U.S. businesses other than media and digital service providers in China’s perceived differences in levels of requirements and enforcement of policies related to censoring content by the government of China compared to Chinese-owned companies, by business size ...................... 243 Table H.28 Shares of censored U.S. businesses other than media and digital service providers in China that complied with censorship-related measures’ impact of policies on its brand perceived by customers, by business size .............................................................................................................................. 244 Table H.29 Distribution of U.S. businesses other than media and digital service providers in China that experienced Chinese censorship and that were economically impacted by Chinese censorship ........... 244 Table H.30 Shares of U.S. businesses other than media and digital service providers in China that were economically impacted by Chinese censorship ................................................................................. 244
Foreign Censorship Part 2: Trade and Economic Effects on U.S. Businesses
12 | www.usitc.gov
Table H.31 Net effects of Chinese censorship on revenue or sales in China for U.S. businesses other than media and digital service providers, by population group.................................................................. 245 Table H.32 Net effects of Chinese censorship on costs of doing business in China for U.S. businesses other than media and digital service providers, by population group ................................................. 245 Table H.33 Shares of U.S. businesses other than media and digital service providers in China that operate in other key markets, and for those that operate in other markets the share that experience censorship in those markets, by key market and size ........................................................................ 246 Table H.34 Shares of censored U.S. businesses other than media and digital service providers in China that operate in other key markets, and for those that operate in other markets the share that experience censorship in those markets, by key market and size ....................................................... 247 Table H.35 Shares of U.S. businesses other than media and digital service providers in China that operate in other markets, and for those that operate in other markets the share that experience censorship those markets, by market............................................................................................... 248 Table I.1 Regression results for digital and physical video game revenues per user............................. 254 Table J.1 Shares of U.S. media and digital service providers in China that experienced censorship-related measures, by business size .............................................................................................................. 259 Table J.2 Shares of U.S. media and digital service providers in China that experienced direct censorship measures in China, by business size ................................................................................................. 259 Table J.3 Shares of U.S. media and digital service providers in China, affected by type of direct censorship measures and business size ............................................................................................ 259 Table J.4 Shares of U.S. media and digital service providers that experienced any censorship-enabling measures in China since January 1, 2019, by business size ................................................................ 259 Table J.5 Shares of U.S. media and digital service providers in China that experienced specific censorship-enabling measures, by business size ............................................................................... 260 Table J.6 Shares of censored U.S. media and digital service providers that experienced limitations that impacted business operations in China, by type of limitation ............................................................ 260 Table J.7 Shares of U.S. media and digital service providers experiencing censorship-related measures in China that have self-censored in order to provide products and services in China, by business size ..... 260 Table J.8 Shares of censored U.S. media and digital service providers that are concerned Chinese censorship will have a negative impact on their ability to provide products and services in China, by business size .................................................................................................................................. 260 Table J.9 Shares of censored U.S. media and digital service providers in China that are concerned Chinese censorship will have a negative impact on their operations in China, by business size ............ 261 Table J.10 Shares of censored U.S. media and digital service providers for which Chinese censorship has become more challenging, by business size ...................................................................................... 261 Table J.11 Distribution of U.S. media and digital service providers in China that experienced and were economically impacted by Chinese censorship-related measures ...................................................... 261 Table J.12 Net effects of Chinese censorship on costs of doing business in China of U.S. media and digital service providers, by subsets of the population ................................................................................ 261 Table J.13 Net effects of Chinese censorship on revenue or sales in China of U.S. media and digital service providers, by subsets of the population ................................................................................ 262 Table J.14 Shares of U.S. media and digital service providers in China that operated in and experienced censorship-related measures in key markets, by key market ............................................................. 262

Table of Contents
United States International Trade Commission | 13
Table J.15 Global active users of social media platforms and the country where the company is headquartered, 2021 ...................................................................................................................... 262 Table J.16 Global active users of user-generated video platforms and the country where the company is headquartered, 2021 ...................................................................................................................... 263 Table J.17 Growth rates of social media advertising spending in Vietnam vs. all Asia, 2018–2021........ 263 Table J.18 Google’s estimated potential total search revenue if it had access to the Chinese market in 2017–2021 ..................................................................................................................................... 263 Table J.19 Estimates of U.S. SVOD providers’ potential revenues in the Chinese market in 2021, under various competitive scenario assumptions ....................................................................................... 263

Foreign Censorship Part 2: Trade and Economic Effects on U.S. Businesses
14 | www.usitc.gov
Abbreviations and Acronyms
United States International Trade Commission | 15
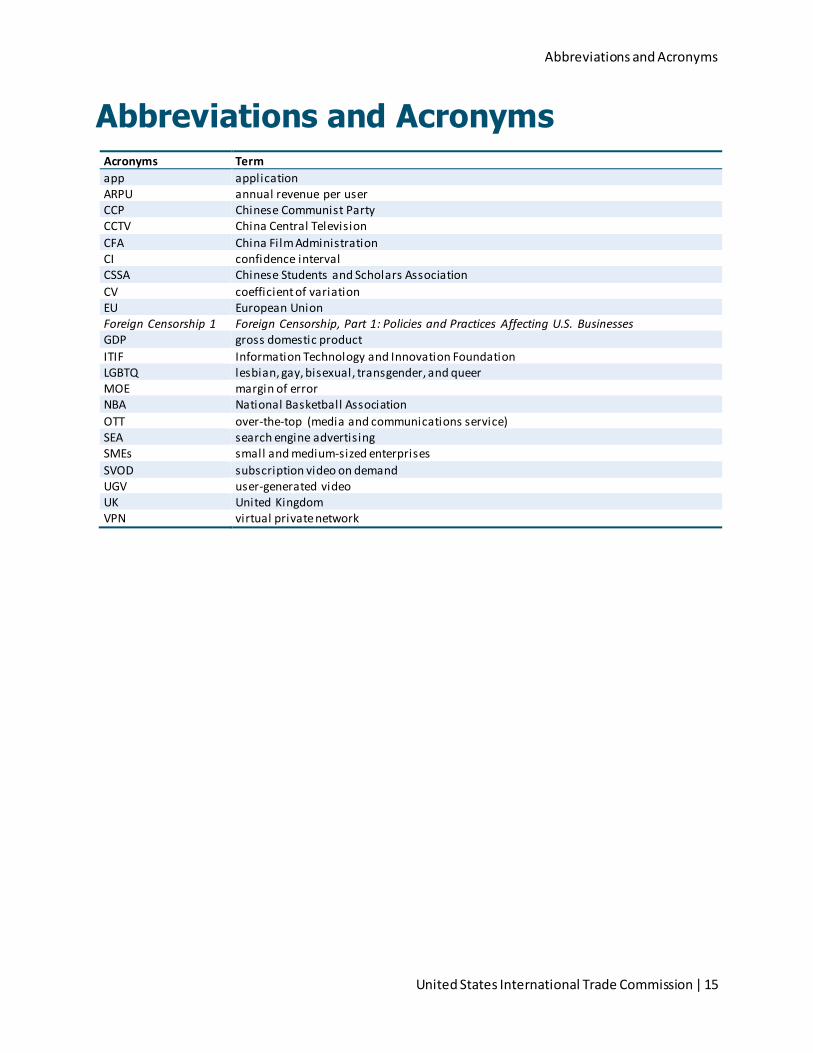
Abbreviations and Acronyms Acronyms Term app application ARPU annual revenue per user CCP Chinese Communist Party CCTV China Central Television CFA China Film Administration CI confidence interval CSSA Chinese Students and Scholars Association CV coefficient of variation EU European Union Foreign Censorship 1 Foreign Censorship, Part 1: Policies and Practices Affecting U.S. Businesses GDP gross domestic product ITIF Information Technology and Innovation Foundation LGBTQ lesbian, gay, bisexual, transgender, and queer MOE margin of error NBA National Basketball Association OTT over-the-top (media and communications service) SEA search engine advertising SMEs small and medium-sized enterprises SVOD subscription video on demand UGV user-generated video UK United Kingdom VPN virtual private network

Foreign Censorship Part 2: Trade and Economic Effects on U.S. Businesses
16 | www.usitc.gov

Executive Summary
United States International Trade Commission | 17
Executive Summary This report provides analysis of the trade and economic effects of foreign censorship on U.S. businesses. The report uses two approaches to present this analysis. First, it includes results from a survey of U.S. businesses active in China regarding this issue. The second approach presents case studies addressing particular products and services and how censorship-related measures in China and other key markets have impacted U.S. businesses. These case studies include original estimates of those impacts calculated by the U.S. International Trade Commission (Commission), when possible. The analysis in both approaches focuses on U.S. businesses that are the most affected by censorship-related measures—those providing audiovisual media products, such as movies and video games, and those providing digital services, such as social media platforms, communications services reliant on the internet, and internet search services.
The Request In its letter dated April 7, 2021, modifying its letter dated January 4, 2021, the U.S. Senate Committee on Finance (Committee) asked the Commission to prepare two reports as part of an investigation under section 332(g) of the Tariff Act of 1930 (19 U.S.C. § 1332 (g)) into the issue of foreign censorship. This report is the second of the two reports requested by the Committee. The Commission delivered the first report to the Committee, Foreign Censorship, Part 1: Policies and Practices Affecting U.S. Businesses (Foreign Censorship 1), on December 29, 2021. At the Committee’s request, the Commission’s first report includes detailed information on the following:
Identification and descriptions of various foreign censorship practices, in particular any examples that U.S. businesses consider to impede trade or investment in key foreign markets. The description included, to the extent practicable:
a. the evolution of censorship policies and practices over the past five years in key foreign markets;
b. any elements that entail extraterritorial censorship; and c. the roles of governmental and nongovernmental actors in implementation and enforcement
of the practices.
In Foreign Censorship 1 the Commission noted that the industries “commonly subject to censorship include digital and non-digital media (such as newspapers, journals, and magazines); producers and distributors of audiovisual content (such as movies and online video, television, books, and music); and social media and internet search providers, as well as computer services more generally.” The report defined the key foreign markets over the last five years as China, Russia, Turkey, Vietnam, India, and Indonesia.
This report responds to the second part of the request letter, which asks for a second report that provides:
To the extent practicable, including through the use of survey data, an analysis of the trade and economic effects of such policies and practices on affected businesses in the United States and their

Foreign Censorship Part 2: Trade and Economic Effects on U.S. Businesses
18 | www.usitc.gov
global operations. The analysis should include to the extent practicable, quantitative and qualitative impacts of the identified policies, including by reference, where identifiable, to:
a. impact on employment; b. direct costs (e.g., compliance and entry costs); c. foregone revenue and sales; d. self-censorship; and e. other effects the Commission consider relevant for the Committee to know.
Approach to the Request The survey and case studies used to respond to this part of the Committee’s request are two complementary analytical approaches. Both approaches seek to estimate the impacts of direct censorship measures and censorship-enabling measures.1 These categories, and the measures that fall into them, are explained further below. But collectively, throughout the report, these measures are referred to as censorship-related measures.
The survey-based analysis primarily provides estimates of the share of media and digital service providers that experience censorship-related measures in China. The survey’s results are statistically representative of U.S. businesses that were commercially active in China anytime between January 1, 2019 and July 25, 2021.2 The set of case studies gives information on how particular products and services are affected by specific types of censorship-related measures. While the survey results provide a high-level overview of U.S. media and digital services providers’ experiences with censorship-related measures, the case studies take a more detailed and nuanced look at the impact of censorship-related measures on particular products and services. These case studies highlight examples where censorship-related measures create additional costs or lead to foregone revenue for U.S. businesses. When possible, the Commission uses available data for a product or service in a key market to estimate foregone revenue and sales due, at least in part, to censorship-related measures. Some of these estimates necessitate the use of broad assumptions and different time periods, that at times lead to large ranges of estimated effects. In addition, in certain cases of services disruptions, estimating the economic losses to U.S. companies was not possible and instead the report presents the estimated losses to a local economy due to the shutdown of a specific service or group of services provided by U.S. firms (i.e., the economic impact to the users of these services in the local market). When data are not available, we describe costs associated with censorship-related measures qualitatively.
Because the analysis in this report focuses on survey results with respect to China and case studies of the impact of censorship-related measures on particular products and services in key markets, it does not provide an overall summary value of the impact of censorship globally on U.S. firms.
1 For the purposes of this investigation, censorship is defined as the prohibition or suppression of speech or other forms of communication. This report estimates the economic impact of foreign government censorship policies and practices including laws, regulations, and other measures that either directly target the suppression of speech or enable or facil itate its suppression. 2 July 25, 2021 was the date that the sample of businesses to survey was selected. Businesses entering China after this date were not surveyed.

Executive Summary
United States International Trade Commission | 19
Major Effects of Censorship-Related Measures on U.S. Businesses Responses to the Commission’s survey of U.S. businesses showed that businesses providing audiovisual and digital services are those most likely to be affected by censorship-related measures. Across all the case studies in this report (see chapters 3 and 4), the Commission estimates that the largest costs associated with censorship-related measures are the foregone revenues from market access denial of these types of businesses. The next largest cost is associated with lost revenue attributable to services disruptions, such as internet shutdowns. Underlying the monetary costs is the lost opportunity for U.S. businesses to serve hundreds of millions of new users. Throughout the report, we show instances where censorship-related measures increase uncertainty for U.S. businesses and present a risk of losing market access in situations where firms have not already been prevented from entering a market. Additionally, the risks of not gaining, or losing, market access from failing to meet the requirements of censors may drive self-censorship among businesses. Instances of self-censorship may be difficult to identify, as practices related to self-censorship may become normalized and decisions to modify content for a market may reflect preferences and sensitivities of that market’s population. Furthermore, the line between tailoring content for a specific market and self-censoring becomes more blurred when U.S. businesses are reliant on foreign partnerships, as a result of policy restrictions, to operate in a market.
Based on the information obtained in this investigation, the potential foregone revenue is significantly larger than the costs to U.S. companies of complying with censorship-related measures, which can vary significantly. Changes to relatively static public-facing materials, like a webpage, generally present a nominal cost. However, it may be cost-prohibitive or technically prohibitive to make changes to products and services, especially when those modifications reduce the value of a product or service to its users. Compliance with censorship-related measures may also entail a reputational cost, so companies must balance the impacts to their brands against the requirements to comply with such laws in other markets.
Survey Results from U.S. Businesses Providing Media and Digital Services in China Pursuant to the request, the Commission conducted a survey of U.S. businesses to collect information on the impacts of foreign censorship. To ensure the Commission’s ability to collect responses that are representative and statistically meaningful, and to make the scope of the survey manageable, the Commission focused the survey on policies and practices in China, a market regularly ranked as the most censorious across a variety of indicators (see Foreign Censorship 1). The Commission’s survey results are statistically representative for U.S. businesses that have done business in China between January 1, 2019, and July 25, 2021. The survey had an overall response rate of 73.1 percent, with 2,767 companies responding.
The Commission’s survey results indicate that U.S. businesses’ experiences with censorship were concentrated in certain industry sectors. The Commission’s survey focused on having businesses identify experiences with censorship-related measures in China since January 1, 2019 and found that U.S. media and digital services providers were the most likely to have faced such restrictions. These companies

Foreign Censorship Part 2: Trade and Economic Effects on U.S. Businesses
20 | www.usitc.gov
include those that provide audiovisual content, such as movies and video games; and digital services and content, such as online platforms and computing services; as well as those that provide a combination of these products and services. Based on the survey results, almost a quarter of U.S. media and digital service providers that were able to enter the Chinese market, representing more than half of the 2020 global revenue of all U.S. media and digital service providers active in China, experienced censorship-related measures. This estimate may undercount U.S. businesses’ actual experiences with censorship, however, as instances of censorship can be difficult for businesses to identify, especially when policies may not be transparent or may have multiple objectives. The survey results indicate that a significantly higher share of large businesses experienced censorship-related measures in China than similar small and medium-sized businesses.
In addition to experiences with censorship-related measures, the questionnaire collected information from U.S. businesses about their perceptions of doing business in China under the risk of censorship. Almost three-quarters of U.S. media and digital service providers that experienced censorship were concerned about negative impacts on their operations in China, including their ability to provide products and services in China. Most also noted that censorship-related measures in China have become more challenging to deal with in the past few years.
Almost 40 percent of U.S. media and digital services providers that experienced censorship indicated that they had to self-censor to provide their products or services in China. As with censorship in general, this share was significantly higher for large U.S. media and digital services providers than SMEs in the category. Also, 12.7 percent of U.S. media and digital services providers that experienced censorship also experienced extraterritorial impacts from censorship-related measures and faced negative or mixed impacts to their products or services outside of China.
The Commission’s survey results also provided some limited information on the economic impacts of censorship in China. Over 40 percent of U.S. media and digital services providers that experienced censorship also experienced increased costs of doing business in China and/or lost revenue in China as a result of censorship-related measures. Some of these product-specific and market-specific costs and lost revenues are detailed further in our case studies.
Censorship-Related Measures Analyzed in Case Studies The case studies in this report focus on the trade and economic effects of foreign censorship-related measures, including those that are direct censorship and those that enable censorship, on particular U.S. media and digital services in China, as well as other markets. Foreign Censorship 1 documented the policies that fall into each category and this report focuses on the economic effects of these policies. In these case studies we analyze, both quantitatively and qualitatively, the economic impact of specific instances of intentional services disruptions, premarket review, market access restrictions, extraterritorial censorship, and self-censorship.
Intentional services disruptions primarily include internet shutdowns, internet blocking and filtering, and internet throttling. Each is defined as follows:

Executive Summary
United States International Trade Commission | 21
• Internet shutdowns: When governments intentionally disrupt internet-based communications for a specific population, location, or mode of access.
• Internet blocking and filtering: Internet blocking includes the use of blacklisting to prevent access to a website, domain, Internet Protocol address, or internet services (blocking). On the other hand, internet filtering includes the use of technology to restrict access to webpages or certain online content based on characteristics, such as keywords or traffic patterns.
• Internet throttling: The intentional slowdown of visitors’ and users’ access to websites and internet-services.
With premarket review, countries limit market entry and censor creative content, such as in films, television shows, books, and video games; these reviews may further encourage self-censorship due to vagueness and uncertainty in how they are implemented. Because of this vagueness, uncertainty, and variance, businesses may be incentivized to self-censor in order to receive approvals quickly and avoid lengthy cycles of submitting, editing, and resubmitting content.
Censorship-enabling measures work in concert with other policies, or each other, to create a censorious environment for businesses by making them more vulnerable to government intimidation and harassment and increasing pressures for self-censorship. Failure to comply with these types of policies may lead to market access restrictions, fines, or other negative consequences from foreign governments. Market access restrictions analyzed in these case studies are censorship-related (i.e., include both direct and censorship-enabling measures), however in some instances they may serve other purposes as well, such as promoting domestic industries. The motivations behind companies’ decisions to self-censor are often opaque and may serve multiple purposes as well. Because of overlapping motivations in some of these censorship-related policies and practices it can be difficult to isolate the effects of censorship.
Effects of Intentional Services Disruptions on Digital Services Providers Digital services providers that offer services such as social media, over-the-top (OTT) communications services, and internet search are negatively impacted by direct censorship measures. These include internet shutdowns, where governments intentionally disrupt internet-based communications for a specific population, location, or mode of access. For example, internet shutdowns in several key markets have temporarily blocked U.S.-based OTT communications services—including Facebook Messenger and WhatsApp—to suppress communications between individuals deemed likely to engage in protests. As detailed below, these disruptions can have a significant effect on digital services providers since user access to one or more services is reduced or eliminated, resulting in decreased revenue when ads are not delivered or clicked on by users during the course of a shutdown. These disruptions can also reduce the income of businesses and individual users that rely on those services to disseminate content. The Commission’s estimates of the impact of services disruptions for social media, user generated video (UGV) and OTT communications services cover the economic losses to a local economy while the Commission’s estimates for internet search focus on firm-specific impacts. The report focuses on examples of services disruptions in key markets other than China because Chinese authorities generally use the “Great Firewall” to control the flow of internet services and information, as opposed to broad shutdowns.

Foreign Censorship Part 2: Trade and Economic Effects on U.S. Businesses
22 | www.usitc.gov
Table ES.1 Commission estimates of economic losses or foregone revenue from selected services disruptions in key markets
Products/Services Companies and services analyzed Estimated economic losses or foregone revenue
Social media and UGV Facebook, Instagram, YouTube, Twitter
Estimated economic losses vary across markets—with impacts in larger key markets ranging from $68.4 mill ion in India in 2021 to $82.2 mill ion in Indonesia in 2019 (see table 3.2 for more detail).
OTT communications services
WhatsApp The estimated economic losses attributable to a shutdown of WhatsApp varies by country and year: $20.5 mill ion in Indonesia and $37.7 mill ion in India in 2019; $3.6 mill ion in Turkey and $81.2 mill ion in India in 2020; and $16.9 mill ion in India in 2021 (table 3.5).
Internet search Google search Estimated foregone revenues for Google in India (the largest user of internet shutdowns) are estimated at $3.5 mill ion in 2019, $7.3 mill ion in 2020, and $1.2 mill ion in 2021 (table 3.8).
Source: USITC calculations. Note: Conceptually, economic losses are broader than foregone revenue. They are based on the effect services disruptions have on a market’s GDP, and thus include the value that the services provide to that market’s economy. Separately, because Chinese authorities generally use the “Great Firewall” to control the flow of internet services and information, broad internet shutdowns are not common. Hence, the examples above focus on other key markets.
Effects of Premarket Review on Content Producers This report focuses on the effects of premarket review for box office movies and video games that have resulted in censorship.
• For U.S. film studios, the effects of premarket review are reflected in material cut or changed at the insistence of censors, as well as instances of self-censorship. Although many markets review movie content prior to box office release, because of the importance of the Chinese market to the movie industry, U.S. filmmakers often go out of their way to edit content and self-censor to ensure that they avoid topics and depictions of China that may raise objections by censors. Such objections may lead to delayed or unfavorable release dates or denial of market access for box office movies; in 2021, this led to the blocking of four major U.S. films, including Spiderman: No Way Home. Costs related to self-censorship by U.S. film studios include those associated with: additional content editing to avoid perceived sensitivities; adding content that could be perceived positively by censors; hiring cultural consultants to avoid sensitive content; uncertainty of what is acceptable to censors; foregone revenues from movies not approved by censors; and lost revenues from global audiences rejecting censored content. The uncertainty around what and how much content to censor likely leads to over-censoring to avoid multiple rounds of review. Because of difficulties with identification and lack of data, the costs associated with self-censorship and the related uncertainty were not quantifiable.
• U.S. video games are also subject to a premarket content review in China where they must meet several vague and therefore restrictive content requirements that ultimately provide the Chinese government with the flexibility to block a wide range of video games from entering the market. During recent years, there have been several periods of complete blockage, and the number of foreign games has been reduced to only 15 percent of games approved for

Executive Summary
United States International Trade Commission | 23
distribution. Video game companies incur costs from modifying and vetting content to satisfy censors, including the cost of vetting script translations for accuracy.
Effects of Market Access Restrictions on Digital and Audiovisual Services Providers Digital services providers, as well as producers and distributors of audiovisual content, experience censorship-related market access restrictions. For digital products and services, such as social media, OTT communications services, internet search, and streaming video-on-demand, these restrictions take the form of outright market blocks, especially in China. For these products and services, these restrictions block users’ ability to access the services and therefore cause companies to forego revenue. For others, such as box office movies and video games, there are quotas and/or blocks on specific content, which can lead to uncertainty and foregone revenue. However, as covered in chapters 3 and 4, the Commission’s estimates of the costs of censorship-related measures are subject to the caveat that in some instances it is not clear whether these measures are instances of censorship or whether there are other or mixed motivations for the policies. The Commission developed these estimates by applying assumptions on potential market share that U.S. services would be able to capture, were they unblocked. These assumptions can create large ranges for potential losses, particularly when we assume that U.S. firms could potentially have been as competitive as the current market leader, such as with UGV platforms.
Foreign Censorship Part 2: Trade and Economic Effects on U.S. Businesses
24 | www.usitc.gov
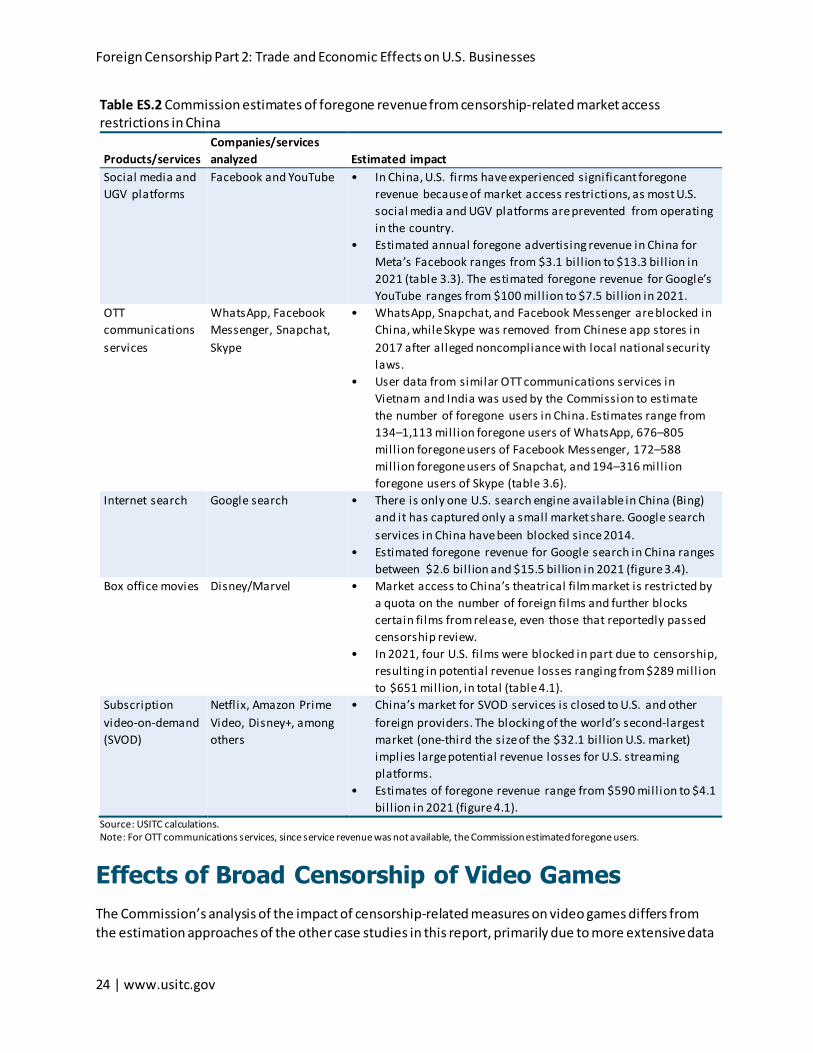
Table ES.2 Commission estimates of foregone revenue from censorship-related market access restrictions in China
Products/services Companies/services analyzed Estimated impact
Social media and UGV platforms
Facebook and YouTube • In China, U.S. firms have experienced significant foregone revenue because of market access restrictions, as most U.S. social media and UGV platforms are prevented from operating in the country.
• Estimated annual foregone advertising revenue in China for Meta’s Facebook ranges from $3.1 bil l ion to $13.3 bil l ion in 2021 (table 3.3). The estimated foregone revenue for Google’s YouTube ranges from $100 mill ion to $7.5 bil l ion in 2021.
OTT communications services
WhatsApp, Facebook Messenger, Snapchat, Skype
• WhatsApp, Snapchat, and Facebook Messenger are blocked in China, while Skype was removed from Chinese app stores in 2017 after alleged noncompliance with local national security laws.
• User data from similar OTT communications services in Vietnam and India was used by the Commission to estimate the number of foregone users in China. Estimates range from 134–1,113 mill ion foregone users of WhatsApp, 676–805 mill ion foregone users of Facebook Messenger, 172–588 mill ion foregone users of Snapchat, and 194–316 mill ion foregone users of Skype (table 3.6).
Internet search Google search • There is only one U.S. search engine available in China (Bing) and it has captured only a small market share. Google search services in China have been blocked since 2014.
• Estimated foregone revenue for Google search in China ranges between $2.6 bil l ion and $15.5 bil lion in 2021 (figure 3.4).
Box office movies Disney/Marvel • Market access to China’s theatrical fi lm market is restricted by a quota on the number of foreign fi lms and further blocks certain fi lms from release, even those that reportedly passed censorship review.
• In 2021, four U.S. fi lms were blocked in part due to censorship, resulting in potential revenue losses ranging from $289 mill ion to $651 mill ion, in total (table 4.1).
Subscription video-on-demand (SVOD)
Netfl ix, Amazon Prime Video, Disney+, among others
• China’s market for SVOD services is closed to U.S. and other foreign providers. The blocking of the world’s second-largest market (one-third the size of the $32.1 bil l ion U.S. market) implies large potential revenue losses for U.S. streaming platforms.
• Estimates of foregone revenue range from $590 mill ion to $4.1 bil l ion in 2021 (figure 4.1).
Source: USITC calculations. Note: For OTT communications services, since service revenue was not available, the Commission estimated foregone users.
Effects of Broad Censorship of Video Games The Commission’s analysis of the impact of censorship-related measures on video games differs from the estimation approaches of the other case studies in this report, primarily due to more extensive data
Executive Summary
United States International Trade Commission | 25
availability video games in the aggregate, but less data available on individual firms in China and globally. This analysis is a holistic approach to estimating the impacts of censorship, as it does not focus on any one type of censorship-related measure. The Commission used statistical regression analysis to estimate the average impact that high levels of media censorship have had on video game revenues per user at the country level between 2017 and 2019. The Commission estimates that high levels of media censorship have been associated with lower per-user revenues for both digital and physical video games between 2017 and 2019. For digital video games, high censorship was associated with per-user revenues that were, on average, about $3.88 lower per video game user per year. In 2019, the average revenue across key markets, per user, ranged from $14.90 to $52.01 for digital games. For physical video game sales, high censorship was associated with per-user revenues that were about $3.02 lower per year. In 2019, the average revenue across key markets, per user, ranged from $0.72 to $6.23 for physical games. These estimates imply revenues for U.S. video game companies in 2019 could have increased by about $1.1 billion in China and $18 million in Vietnam.
Effects of Extraterritorial Censorship Extraterritorial censorship occurs in at least two ways. First, a government may seek to suppress speech outside its market’s borders by enforcing laws that criminalize such speech (e.g., the Hong Kong National Security Law, which asserts that it applies to non-permanent residents of Hong Kong outside the region). Second, censorship-related measures within a jurisdiction may be used to shape and retaliate against speech made outside the borders of that jurisdiction. Chapter 4 highlights examples of the latter method in China, where the government uses website blockages, market access denial, encouraging boycotts, and other forms of economic coercion in retaliation for speech outside of China by U.S. companies operating globally. When extraterritorial censorship is a government response to public statements made by the company or its executives anywhere in the world, it can affect U.S. firms in many sectors, not just media and digital services.
A recent high-profile example involves the National Basketball Association (NBA). In 2019, in response to a tweet from then Houston Rockets general manager Daryl Morey supporting protesters in Hong Kong, the NBA’s Chinese partners suspended broadcasting and streaming games. Other firms partnering with the NBA in merchandising and sponsorships also suspended work with the league. The NBA estimated that its losses due to the response to the tweet in the 2019–20 season were $200 million, with losses continuing in the 2021–22 season.
Extraterritorial censorship presents a risk to the revenues of U.S. businesses, and they are likely to self-censor to avoid repercussions. In the case of U.S. universities, the government of China has attempted to censor classroom discussion and academic research of sensitive topics (mainly relating to Taiwan, Tibet, and Tiananmen) in the United States, for example by having Chinese diplomatic staff in the United States call on universities and complain about academic research or on-campus events covering these topics. Both U.S. academics and Chinese students have faced retaliatory action, including the cancellation of student visas. In a situation where the Chinese government were to block Chinese students from studying at a U.S. university, the hypothetical tuition loss for one college of such an action is estimated to be $6.0 million for a theoretical private, nonprofit, four-year college with a 10,000-student enrollment. As explained in chapter 4, the economy-wide impact of a total embargo of all Chinese students studying at U.S. universities is estimated to be $9.9 billion.

Foreign Censorship Part 2: Trade and Economic Effects on U.S. Businesses
26 | www.usitc.gov

Chapter 1: Introduction
United States International Trade Commission | 27
Chapter 1 Introduction This is the second of two reports on foreign censorship that the U.S. Senate Committee on Finance (Committee) requested the U.S. International Trade Commission (Commission) to prepare. The report provides an analysis of the effects of foreign censorship on U.S. businesses based on results from the Commission’s survey of U.S. businesses and case studies. It builds on the foundation provided by the Commission’s first report, Foreign Censorship, Part 1: Policies and Practices Affecting U.S. Businesses (Foreign Censorship 1), which described and identified censorship-related practices that impede trade and investment. The first report identified China, Russia, Turkey, Vietnam, India, and Indonesia as key markets where U.S. businesses are affected by censorship practices. In this chapter, we first present the findings from Foreign Censorship 1 to provide context and then describe the approach and organization of this report.
Censorship-Related Policies and Practices Identified in Foreign Censorship 1 In its letter dated April 7, 2021, which modified an earlier Committee request dated January 4, 2021, the Committee requested two reports regarding foreign censorship pursuant to section 332(g) of the Tariff Act of 1930 (19 U.S.C. § 1332 (g)).3 The Commission delivered its first report on December 29, 2021. The Committee requested that this first report include:
Identification and descriptions of various foreign censorship practices, in particular any examples that U.S. businesses consider to impede trade or investment in key foreign markets. The description should include to the extent practicable:
a. the evolution of censorship policies and practices over the past 5 years in key foreign markets;
b. any elements that entail extraterritorial censorship; and c. the roles of governmental and non-governmental actors in implementation and
enforcement of the practices.
In its January 4, 2021, request letter, the Committee defined censorship as “the prohibition or suppression of speech or other forms of communication.” The Commission’s survey built upon this definition and explained that censorship may be in the form of an act, policy, or practice (hereafter, measures or policies and practices), and may be de jure (that is, based on laws or other official measures) or it may be de facto (that is, based on official or unofficial activities that as a practical matter have a censorship effect). Censorship acts, policies, and practices may be direct or indirect. Some 3 On January 4, 2021, Committee Chairman Charles Grassley requested that the Commission prepare a single report focusing on foreign censorship. On April 7, 2021, Committee Chairman Ronald Wyden revised the request to include two reports. The first volume was to be delivered by December 30, 2021, and the second volume, with results of the Commission’s survey and any additional information, by July 5, 2022. See appendix A for copies of the request letters.

Foreign Censorship Part 2: Trade and Economic Effects on U.S. Businesses
28 | www.usitc.gov
measures may enable censorship, for example by limiting the pursuit of business activities related to speech or facilitating a government’s ability to carry out censorship. Censorship may be conducted or enabled by governments and state-controlled entities. It may also be conducted or enabled by private sector businesses, acting either at the direction of a government or to gain a market advantage or avoid a disadvantage from a government.4
Foreign Censorship 1 explains that censorship-related measures include those that directly target speech for suppression, as well as those that may enable or facilitate censorship (collectively referred to as “censorship-related measures”). In the latter case, whether the measures may be considered censorship depends on the specific context and ends to which the policies and practices are used.5
According to Foreign Censorship 1 and the Commission’s questionnaire censorship measures that directly suppress speech include:6
• Laws that suppress certain categories of speech: in addition to directly censoring speech, these laws potentially have a wider censoring effect when they restrict broad or undefined categories of speech in the online and offline environments.
• Premarket review to censor creative content, such as films, television shows, books, and video games, by subjecting it to review as a condition of market entry.
• Internet shutdowns: the intentional disruption of internet-based communications by a government for a specific population, location, or mode of access.
• Internet blocking and filtering: internet blocking includes the use of blacklisting to prevent access to a website, domain, Internet Protocol address, or internet-services. Internet filtering includes the use of technology to restrict access to webpages or certain online content based on characteristics, such as keywords or traffic patterns.
• Internet throttling: the intentional slowdown of visitors’ and users’ access to websites and internet services.
• Harm or threats of harm toward an organization or its brands, employees, or products based on speech-related activities.7
Foreign Censorship 1 and the Commission’s questionnaire also address measures that may enable or facilitate censorship, dependent on context and how they are used. In the key markets, censorship-enabling measures may work in concert with other measures, or each other, to create a censorious
4 See appendix E for a copy of the Commission’s questionnaire, which for purposes of this investigation includes further explanation of censorship. 5 USITC, hearing transcript, July 1, 2021, 98 (testimony of Maria Repnikova, Georgia State University); see also Center for Democracy and Technology, written submission to the USITC, July 22, 2021, 1; USITC, Foreign Censorship, Part 1, 2022, 42. For an in-depth description of these acts, policies, and practices see USITC, Foreign Censorship, Part 1, 2022, chapter 2. As a part of its survey, in order to help respondents describe which types of censorship, if any, they have experienced, the Commission identified specific policies and practices that may directly suppress speech or enable suppression of speech. See appendix E, questions 2.1a and 2.2a. 6 USITC, Foreign Censorship, Part 1, 2022, 41–47. 7 See appendix E, question 2.1a.
Chapter 1: Introduction
United States International Trade Commission | 29
environment for businesses by making them more vulnerable to government intimidation and harassment and increasing pressures for self-censorship.8 Censorship-enabling measures may include:
• Broad, opaque, or unreasonable intermediary liability rules and regulations related to the monitoring and takedown of content on a company’s services.9
• Certain policies and regulations when they affect the pursuit of business activities related to speech including:10 • Requirements to turn over personal information of customers or users. • Data localization measures requiring in-country storage of data. • Local presence requirements, which may include a physical location of local employees. • Foreign ownership restrictions.11
For example, India’s Intermediary Guidelines and Digital Media Ethics Code requires companies to identify a chief compliance officer who is personally liable for implementing takedown requirements, including by responding to government orders to remove prohibited content within 72 hours.12 Requirements of this type work in concert with content restrictions to suppress speech and may incentivize companies to pre-emptively restrict online content to avoid legal exposure.
Extraterritorial Censorship and Self-Censorship The censorship-related measures above may also be applied extraterritorially to control and shape speech in markets outside the jurisdiction to which they apply. In turn, such actions can create pressure on companies to self-censor to avoid negative repercussions from potentially offensive speech-related activities. A notable example is the Chinese government’s Hong Kong National Security Law, which may potentially lead to charges in Hong Kong for speech made outside the market.13 Economic coercion may also be used, where a government limits market access as a retaliatory act against companies for statements made outside the country by the company or its employees. Extraterritorial censorship may also occur when businesses’ products are affected on a global scale by decisions to limit or remove content to maintain favorable relationships with certain governments. For example, movies may be
8 USITC, Foreign Censorship, Part 1, 2022, 42–43; USITC, hearing transcript, July 1, 2021, 196–201 (testimony of Nigel Cory, Information Technology and Innovation Foundation; Rachael Stelly, Computer & Communications Industry Association; Daphne Keller, Stanford University; and Timothy Brightbil l , Wiley Rein LLP). 9 USITC, Foreign Censorship, Part 1, 2022, 49–50. 10 Business activities related to speech are activities that involve a business’s public speech and expression, as well as speech and expression that may take place on or in a business’s products and services. For example, statements made in marketing materials, publications or other media, public statements by employees, or user-generated videos posted to a business’s video distribution platform are all speech-related activities. See definitions section of appendix E. 11 USITC, Foreign Censorship, Part 1, 2021, 50–53; See also appendix E, question 2.2a. 12 Government of India, Ministry of Electronics and Information Technology, “Notification Dated, the 25th February, 2021,” February 25, 2021. 13 HKSAR, “Promulgation of National Law 2020,” June 30, 2020, arts. 20–29, and 38. In a travel advisory, the U.S. Department of State notes that “the National Security Law also covers offenses committed by non-Hong Kong residents or organizations outside of Hong Kong, which could subject U.S. citizens who have been publicly critical of the PRC to a heightened risk of arrest, detention, expulsion, or prosecution.” U.S. Department of State, “Hong Kong Travel Advisory,” April 25, 2022.

Foreign Censorship Part 2: Trade and Economic Effects on U.S. Businesses
30 | www.usitc.gov
modified for global release to comply with censorship in a specific market. One such case was Dr. Strange (2016) in which the modifications affected the version of the movie shown outside China, not only the version made for the Chinese market.14
Self-censorship occurs when individuals or businesses suppress their own speech to avoid offending government censors and facilitate market access. Generally, self-censorship is a by-product of the application of censorship and surveillance measures. However, it can be difficult to distinguish between changes in content and products that are driven by self-censorship rather than market-based business decisions.15
Focus of the Report and Methodology The consequences of censorship-related policies and practices can be significant for U.S. firms, especially U.S.-based audiovisual content producers and digital services firms, as they may restrict trade, impede market access, increase operational costs and reputational risks, or discourage foreign direct investment. The Committee requested that this second report include the following:
To the extent practicable, including through the use of survey data, an analysis of the trade and economic effects of such policies and practices on affected businesses in the United States and their global operations. The analysis should include to the extent practicable, quantitative and qualitative impacts of the identified policies, including by reference, where identifiable, to:
a. Impact on employment; b. Direct costs (e.g., compliance and entry costs); c. Foregone revenue and sales; d. Self-censorship; and e. Other effects the Commission consider relevant for the Committee to know.
This report uses information gathered from a survey of U.S. businesses and case studies to present quantitative and qualitative analyses of the impacts of foreign censorship. The survey, which provides primary source information gathered from U.S. businesses, and the case studies are explained further below.
The current report focuses largely on China for two reasons. First, China is ranked by international organizations as the most restrictive market across a number of indicators of free speech and expression, and this is supported by our research in Foreign Censorship 1.16 Second, focusing on a particular market facilitated the collection of useful survey data, including by mitigating the challenges of identifying businesses with useful information and having them collect data across multiple business units. A benefit of limiting the survey to businesses operating in China is that it allowed the Commission to ask detailed questions about experiences in that market. While focusing on China, the report also includes analysis of censorship in other key markets when information is available.
14 Wong, “‘Doctor Strange’ Writer,” April 26, 2016. 15 USITC, Foreign Censorship, Part 1, 2022, 57–58. 16 USITC, Foreign Censorship, Part 1, 2022, 30.

Chapter 1: Introduction
United States International Trade Commission | 31
This report also focuses on U.S. businesses in industries commonly subject to censorship, including “digital and non-digital media (such as newspapers, journals, and magazines); producers and distributors of audiovisual content (such as movies and online video, television, books, music, and video games); and social media and internet search engines, as well as computer services more generally.”17 The focus on these types of businesses is driven by our research in Foreign Censorship 1 and survey results identifying these industries as being most commonly subject to censorship, and is consistent with the Committee’s request. As shown by the Commission’s survey results, censorship-related measures affect these industries’ provision of particular products and services. The case study estimates on the economic impacts of censorship-related measures on U.S. media and digital services providers show that the largest impacts are a result of market access denials. The denial of market access in China to U.S. providers of these services allows Chinese competitors to capture market share, unencumbered by U.S. competition. The support from market access denials can also allow Chinese competitors to compete better with U.S. firms in third markets, particularly for services that facilitate the interaction of users with each other, such as social media and communications services. While market access denials for particular products and services may have objectives other than censorship, because of these products’ and services’ role in conveying speech, as well as other evidence concerning the specific market access denials addressed in this report, this report addresses these measures as censorship-related.
The survey and case studies used to estimate the economic effects of censorship-related practices in this report are two complementary analytical approaches. The analysis of the Commission’s survey of U.S. businesses active in China primarily provides estimates of the share of media and digital service providers that experience censorship-related measures in China. The survey’s results are statistically representative of U.S. businesses that are commercially active in China since January 1, 2019. The second approach uses a set of case studies that estimate the impact of specific types of censorship-related measures on particular products and services. While the survey results provide a high-level overview of U.S. media and digital services providers’ experiences with censorship-related measures, the case studies take a more detailed and nuanced look at the impact of censorship-related measures on specific products and services.18 These case studies highlight examples where censorship-related measures create additional costs or lead to foregone revenue for U.S. businesses. When possible, the Commission uses available data for a product or service in a key market to estimate foregone revenue and sales for U.S. businesses which appear to be due, at least in part, to censorship-related measures. Some of these estimates necessitate the use of broad assumptions and different time periods, that at times lead to large ranges of estimated effects. In addition, in certain cases of services disruptions, data limitations required estimating economic losses to a local economy due to the shutdown of a specific service or group of services provided by U.S. firms. This is a broader metric than foregone revenue, as it encompasses the value those services provide to a market’s economy, beyond the impact to just the U.S. businesses.19 When data are not available, we describe costs associated with censorship-related measures qualitatively.
17 USITC, Foreign Censorship, Part 1, 2022, 22. 18 For the purposes of survey results, “U.S. media and digital services providers” refers to companies that offer products and services that are audiovisual or digital in nature (see table F.5). The companies could offer other products and services in addition to media and digital services. 19 See case study on social media and user-generated video in chapter 3 for a more in-depth explanation of economic losses.
Foreign Censorship Part 2: Trade and Economic Effects on U.S. Businesses
32 | www.usitc.gov
Information Sources For this report, beyond the survey, the Commission relied on information from publicly available data sources, such as the World Bank’s World Development Indicators, as well as fee-based data services, such as Statista, to develop quantitative estimates of the impacts of foreign censorship-related measures on U.S. businesses. To receive information from the public on the matter, the Commission held a public hearing on July 1, 2021, and participants included representatives of industry and trade associations, academic institutions, and nongovernmental organizations. Written submissions were received from interested parties.20 The Commission also interviewed representatives from affected industries, trade associations, and agencies of the U.S. government.
Challenges to Identifying and Quantifying the Effects of Foreign Censorship The effects of censorship are difficult to quantify, and the analysis in this report should be read with a number of considerations in mind. The survey results indicate that censorship is also a challenge for businesses to identify and quantify. Notably, there were insufficient responses to survey questions asking for firms to estimate their costs and lost revenue due to censorship-related measures for the Commission to produce estimates of these costs. It is also unknown the extent to which firms may have been reluctant to be forthcoming about their perceptions of censorship due to concerns that their responses to the survey may be subject to unauthorized disclosure. Furthermore, identifying instances of censorship is difficult, even for companies that experience them. Censorship is often context sensitive and the policies that are applied leave “room for arbitrary interpretation and enforcement.”21 Censorship may occur through informal channels, such as recommendations from market consultants, which adds to the challenge of identification. Also, as a survey respondent noted, it is difficult for businesses to discern whether a government’s motivations for a policy or measure are censorship or otherwise.22 Censorship-enabling measures may often serve a mix of policy objectives and their effects are unlikely to be fully attributable to censorship goals.23 For example, companies may be denied licenses to operate for a variety of reasons, including preventing the distribution of certain content. Companies also may disagree on what constitutes censorship.24 And, as already noted, instances of self-censorship may be difficult to distinguish from market-driven business decisions.
20 The public hearing was held jointly with the investigation for Foreign Censorship, Part 1 (Inv. No. 332-585). Written submissions were also received jointly. A l ist of hearing participants and the summaries of views of interested parties can be found in appendixes C and D, respectively. 21 USITC, hearing transcript, July 1, 2021, 205–7 (testimonies of Nigel Cory, Information Technology and Innovation Foundation; Rachael Stelly, Computer & Communications Industry Association; Daphne Keller, Stanford University; and Timothy Brightbil l , Wiley Rein LLP). 22 USITC, Foreign Censorship Survey, 2021, questionnaire narrative response. 23 When this occurs, the report provides such caveats for related analyses. Industry representative, interview by USITC staff, January 20, 2022. 24 For example, some survey respondents do not consider restrictions on lesbian, gay, bisexual, transgender, and queer (LGBTQ) content or depictions of Taiwan as censorship; rather, they view them as respecting local sensitivities. USITC, Foreign Censorship Survey, 2021, questionnaire narrative responses.

Chapter 1: Introduction
United States International Trade Commission | 33
Even when censorship is identified, U.S. businesses have often noted that they are unable to identify the direct effects or quantify them.25 Moreover, the costs of complying with censorship-related measures can vary significantly. For example, modifying a website so it does not characterize Taiwan as a country presents a negligible monetary cost.26 However, reshooting and editing parts of a feature film would be far more expensive.27 Both would entail censorship but a business experiencing the former would not associate significant costs with the act of censorship. Further, companies must weigh the costs of complying with censorship-related measures against those of not complying. Noncompliance may lead to a loss of market access or the slowing of access to digital services, which would likely result in significant lost revenue, while the monetary cost of compliance could be far less.28 However, when U.S. businesses comply with censorship-related measures, they also bear the reputational risk of potential backlash from U.S. customers, yet the impact and persistence of reputational damage is very difficult to measure.29
The difficulty is compounded by government’s use of tools in addition to censorship to control the flow of information and to reinforce the government’s messaging, such as surveillance and the flooding of social media and other information outlets with misinformation, disinformation, and propaganda. Censorship may occur indirectly and informally, for example, following investment by foreign companies in U.S. businesses.
The types of products and services that are primarily affected by censorship also present challenges to analysis and limit the applicability of standard economic modeling tools. For example, digital products and services are significantly impacted by censorship-related measures. However, these products and services tend to generate revenue through indirect means, such as sales to advertisers and potentially other ways of leveraging user/consumer data. This detailed level of information is generally not available which limits our ability to quantify how much censorship-related measures harm U.S. businesses. As a result, the report mainly provides estimates of foregone revenue and sales resulting from services disruptions or market access denial.30 In some instances we provide a range of estimates, if data are not available to narrow the scope of an estimation and when impacts of censorship-related measures vary by year and market.
Because of the challenges posed by identification and attributional issues regarding the effects of censorship-related policies and practices, as well as the data limitations, there are many potential effects on U.S. businesses that the Commission is not able to quantify. For example, the risk of censorship creates uncertainty for U.S. businesses in foreign markets, particularly for those that provide digital products and services. Heightened risk and uncertainty eventually increase costs, including when the nature of what may be considered politically sensitive or objectionable may change.31 The cost of
25 Industry representative, interview by USITC staff, February 3, 2022; USITC, Foreign Censorship Survey, 2021, questionnaire narrative responses. 26 USITC, Foreign Censorship Survey, 2021, questionnaire narrative responses. 27 See case study on box office movies in chapter 4. 28 USITC, Foreign Censorship Survey, 2021, questionnaire narrative responses. 29 Industry representative, interview by USITC staff, January 20, 2022. 30 In the case of over-the-top communications services, we provide estimates of foregone users because of further data l imitations. 31 USITC, hearing transcript, July 1, 2021, 36, 57 (testimony of Maria Repnikova, Georgia State University).

Foreign Censorship Part 2: Trade and Economic Effects on U.S. Businesses
34 | www.usitc.gov
this uncertainty is not covered in the estimates covered in this report. This report also does not cover downstream effects, which exporting companies did not directly experience.32 Similarly, there are foreign multinationals with substantial U.S. operations and censorship-related measures may affect the foreign parent, U.S. operations, or both. There can also be spillover effects that foreign censorship-related measures create. For example, businesses have noted that they have faced disruptions to their way of doing business and increased costs from not being able to access tools and platforms that they use, such as Google Workspaces and Microsoft Office 365, which has impacted their global operations.33 Also, restrictions on cloud computing, which may be related to censorship, may impact cloud-dependent services that facilitate communications between users or deliver audiovisual content; however, the Commission was unable to estimate what that impact might be. The threat of censorship and the uncertainty it creates for businesses likely prevents businesses from even attempting to enter key markets.34 The Commission did not conduct an economy-wide survey, which would be required to estimate the share of all U.S. companies that did not enter a market because of censorship concerns. Furthermore, the Commission is unable to analyze the extent to which businesses internalize topics for self-censorship or quantify the economic effects of self-censorship.
Box 1.1 Censorship During Russia’s Invasion of Ukraine
On February 24, 2022, Russia launched an attack on Ukraine and the war is ongoing as of the writing of this report.a Among the issues that are arising due to this conflict is the enforcement of censorship measures. Some of these measures have been applied to U.S. companies operating in Russia by the Russian government’s Federal Service for Supervision in the Sphere of Telecom, Information Technologies, and Mass Communications (Roskomnadzor). Facebook, Instagram, and Twitter have been banned in Russia, by order of Roskomnadzor—access to Twitter was initially throttled (i.e., slowed to the point of being unusable). The ban of Facebook and Instagram has been upheld by a Russian court, finding Meta (the platforms’ owner) guilty of carrying out extremist activities.b Based on statements made by Meta, the Commission estimates Meta’s loss of advertising revenue, as a result of Russia’s ban of Facebook and Instagram, is $144 million per month.c Since the ultimate length of the ban is uncertain, the total impact on Meta cannot be calculated.
There have also been increased pressures placed on journalists and news providers in Russia. Roskomnadzor blocked access to a number of news websites including those of Voice of America, Radio Liberty, and the BBC.d Furthermore, the Russian Parliament passed a law that allows for 15-year prison terms for the intentional spreading of “fake” news, which includes using the words “war” or “invasion” to describe Russia’s actions in Ukraine.e The threat of potential prison sentences has reportedly led CNN, the New York Times, and Bloomberg News to pull operations from Russia.f a Zinets and Vasovic, “Missiles Rain Down around Ukraine,” February 24, 2022. b Bond, “Russia Reinstates Twitter Slowdown,” March 1, 2022; Bond, “Russia Plans to Limit Instagram,” March 11, 2022; Wall, “Russia Formally Bans Instagram,” March 14, 2022; Meaker, “Why WhatsApp Survived,” March 21, 2022; Tverskoy District Court in Moscow, Decision on the Case N02-2473/2022, March 21, 2022.
32 For example, a number of manufacturers noted that their business model to operate in China is based on sell ing their products through third parties in the market. These distributors may be impacted by censorship-related measures. USITC, Foreign Censorship Survey, 2021, questionnaire narrative responses. 33 USITC, Foreign Censorship Survey, 2021, questionnaire narrative responses. See chapter 2 for results to question 2.9 from the Commission’s questionnaire. 34 Engine Advocacy, written submission to the USITC, July 22, 2021, 1; USITC, hearing transcript, July 1, 2021, 209 (testimony of Nigel Corey, Information Technology and Innovation Foundation).
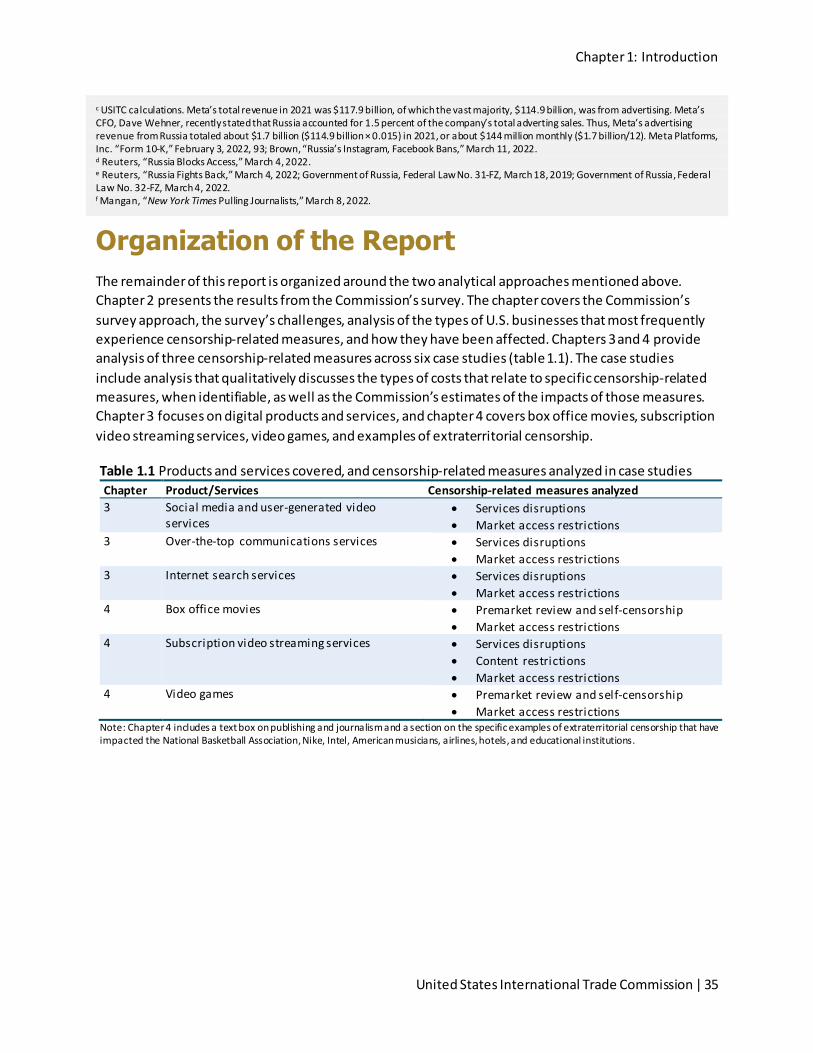
Chapter 1: Introduction
United States International Trade Commission | 35
c USITC calculations. Meta’s total revenue in 2021 was $117.9 billion, of which the vast majority, $114.9 billion, was from advertising. Meta’s CFO, Dave Wehner, recently stated that Russia accounted for 1.5 percent of the company’s total adverting sales. Thus, Meta’s advertising revenue from Russia totaled about $1.7 billion ($114.9 billion × 0.015) in 2021, or about $144 million monthly ($1.7 billion/12). Meta Platforms, Inc. “Form 10-K,” February 3, 2022, 93; Brown, “Russia’s Instagram, Facebook Bans,” March 11, 2022. d Reuters, “Russia Blocks Access,” March 4, 2022. e Reuters, “Russia Fights Back,” March 4, 2022; Government of Russia, Federal Law No. 31-FZ, March 18, 2019; Government of Russia, Federal Law No. 32-FZ, March 4, 2022. f Mangan, “New York Times Pulling Journalists,” March 8, 2022.
Organization of the Report The remainder of this report is organized around the two analytical approaches mentioned above. Chapter 2 presents the results from the Commission’s survey. The chapter covers the Commission’s survey approach, the survey’s challenges, analysis of the types of U.S. businesses that most frequently experience censorship-related measures, and how they have been affected. Chapters 3 and 4 provide analysis of three censorship-related measures across six case studies (table 1.1). The case studies include analysis that qualitatively discusses the types of costs that relate to specific censorship-related measures, when identifiable, as well as the Commission’s estimates of the impacts of those measures. Chapter 3 focuses on digital products and services, and chapter 4 covers box office movies, subscription video streaming services, video games, and examples of extraterritorial censorship.
Table 1.1 Products and services covered, and censorship-related measures analyzed in case studies Chapter Product/Services Censorship-related measures analyzed 3 Social media and user-generated video
services • Services disruptions • Market access restrictions
3 Over-the-top communications services • Services disruptions • Market access restrictions
3 Internet search services • Services disruptions • Market access restrictions
4 Box office movies • Premarket review and self-censorship • Market access restrictions
4 Subscription video streaming services • Services disruptions • Content restrictions • Market access restrictions
4 Video games • Premarket review and self-censorship • Market access restrictions
Note: Chapter 4 includes a text box on publishing and journalism and a section on the specific examples of extraterritorial censorship that have impacted the National Basketball Association, Nike, Intel, American musicians, airlines, hotels, and educational institutions.

Foreign Censorship Part 2: Trade and Economic Effects on U.S. Businesses
36 | www.usitc.gov
Bibliography Bibliography entries denoted with an asterisk (*) include laws, regulations, cases, treaties, legal conventions, international agreements, or other official government documents cited throughout the report. In instances where no official English translation is provided by the government, an unofficial English translation is provided in a website URL in the same bibliography entry. Where only “unofficial translation” is cited with no website URL, an unofficial translation was obtained by Commission staff. Unofficial translations are used only for informational purposes.
Bond, Shannon. “Russia Plans to Limit Instagram and Could Label Meta an Extremist Group.” NPR, March
11, 2022. https://www.npr.org/2022/03/11/1086005218/russia-instagram-meta-extremist-group.
Bond, Shannon. “Russia Reinstates Twitter Slowdown, Says Meta, Google Are ‘Instigators of War.’” Reuters, March 1, 2022. https://www.reuters.com/world/russia-reinstates-twitter-traffic-slowdown-computers-over-fake-ukraine-posts-2022-03-01.
Brown, Abram. “Russia’s Instagram, Facebook Bans Will Cost Meta Nearly $2 Billion in Revenue,” Forbes, March 11, 2022. https://www.forbes.com/sites/abrambrown/2022/03/11/instagram-facebook-bans-will-cost-meta-nearly-2-billion-in-revenue/?sh=68bd6d98262f.
Center for Democracy and Technology. Written submission to the U.S. International Trade Commission in connection with Inv. No. 332-585, Foreign Censorship, Part 1: Policies and Practices Affecting U.S. Businesses, July 22, 2021.
Engine Advocacy. Written submission to the U.S. International Trade Commission in connection with Inv. No. 332-585, Foreign Censorship, Part 1: Policies and Practices Affecting U.S. Businesses, July 22, 2021.
*Government of India. Ministry of Electronics and Information Technology. “Notification Dated, the 25th February, 2021 G.S.R. 139(E): The Information Technology (Intermediary Guidelines and Digital Media Ethics Code) Rules, 2021.” February 25, 2021. https://mib.gov.in/sites/default/files/IT%28Intermediary%20Guidelines%20and%20Digital%20Media%20Ethics%20Code%29%20Rules%2C%202021%20English.pdf.
*Government of Russia. Federal Law No. 31-FZ of March 18, 2019 on Amendments to Article 15-3 of the Federal Law on Information, Information Technologies, and Information Protection. (In Russian). March 18, 2019. http://publication.pravo.gov.ru/Document/View/0001201903180031. Unofficial translation on file.
*Government of Russia. Federal Law No. 32-FZ of March 4, 2022 on Amendments to the Criminal Code of the Russian Federation and Articles 31 and 151 of the Code of Criminal Procedure of the Russian Federation. (In Russian). March 4, 2022. http://publication.pravo.gov.ru/Document/View/0001202203040007. Unofficial translation on file.

Chapter 1: Introduction
United States International Trade Commission | 37
*Hong Kong Special Administrative Region (HKSAR). Promulgation of National Law 2020. HKSAR Gazette Vol. 24, No. 44. June 30, 2020. (In Chinese). https://web.archive.org/web/20200701015733/https://www.gld.gov.hk/egazette/pdf/20202444e/es220202444136.pdf. Unofficial translation in HKSAR Gazette. “The Law of the People’s Republic of China on Safeguarding National Security in the Hong Kong Special Administrative Region.” Vol. 24, No. 48. July 3, 2020. https://www.gld.gov.hk/egazette/english/gazette/volume.php?year=2020&vol=24&no=48&extra=1&type=0.
Mangan, Dan. “New York Times Pulling Journalists from Russia over Censorship Law Passed after Ukraine Invasion.” CNBC, March 8, 2022. https://www.cnbc.com/2022/03/08/new-york-times-staff-leaving-russia-over-ukraine-invasion-censorship.html.
Meaker, Morgan. “Why WhatsApp Survived Russia’s Social Media Purge.” Wired, March 21, 2022. https://www.wired.com/story/whatsapp-russia-meta-ban.
Meta Platforms, Inc. “Form 10-K.” U.S. Securities and Exchange Commission (SEC), February 3, 2022. https://d18rn0p25nwr6d.cloudfront.net/CIK-0001326801/14039b47-2e2f-4054-9dc5-71bcc7cf01ce.pdf.
Reuters. “Russia Blocks Access to BBC and Voice of America Websites,” March 4, 2022. https://www.reuters.com/business/media-telecom/russia-restricts-access-bbc-russian-service-radio-liberty-ria-2022-03-04.
Reuters. “Russia Fights Back in Information War with Jail Warning,” March 4, 2022. https://www.reuters.com/world/europe/russia-introduce-jail-terms-spreading-fake-information-about-army-2022-03-04.
Tverskoy District Court in Moscow. Decision on the Case N02-2473/2022. (In Russian). March 21, 2022. https://mos-gorsud.ru/rs/tverskoj/services/cases/civil/details/de7ea6a0-a3ab-11ec-8a7e-51b31fb55b35. Unofficial translation on file. An unofficial copy of the ruling in Russian is also available in Nadmitov, Ivanov & Partners. “Decision on the Case N02-2473/2022.” March 21, 2022. https://nplaw.ru/upload/iblock/b5a/b5a06b9430d04a8bacbd3d3b30b6da4d.pdf.
U.S. Department of State. “Hong Kong Travel Advisory,” April 25, 2022. https://travel.state.gov/content/travel/en/traveladvisories/traveladvisories/hong-kong-travel-advisory.html.
U.S. International Trade Commission (USITC). Foreign Censorship, Part 1: Policies and Practices Affecting U.S. Businesses. USITC Publication 5244. Washington, DC: USITC, February 2022. https://www.usitc.gov/sites/default/files/publications/332/pub5244.pdf.
U.S. International Trade Commission (USITC). Hearing Transcript in connection with Inv. No. 332-585, Foreign Censorship, Part 1: Policies and Practices Affecting U.S. Businesses and Inv. No. 332-586, Foreign Censorship, Part 2: Trade and Economic Effects on U.S. Businesses, July 1, 2021.
Wall, Robert. “Russia Formally Bans Instagram.” Wall Street Journal, March 14, 2022. https://www.wsj.com/livecoverage/russia-ukraine-latest-news-2022-03-14/card/russia-formally-bans-instagram-khcULGuizf5xmLXlkm4S.
Foreign Censorship Part 2: Trade and Economic Effects on U.S. Businesses
38 | www.usitc.gov
Wong, Edward. “‘Doctor Strange’ Writer Explains Casting of Tilda Swinton as Tibetan.” The New York Times, April 26, 2016. https://www.nytimes.com/2016/04/27/world/asia/china-doctor-strange-tibet.html.
Zinets, Natalia, and Aleksandar Vasovic. “Missiles Rain Down around Ukraine.” Reuters, February 24, 2022. https://www.reuters.com/world/europe/putin-orders-military-operations-ukraine-demands-kyiv-forces-surrender-2022-02-24.

Chapter 2: Prevalence and Effects of Censorship on U.S. Businesses Providing Media and Digital Services in China
U.S. International Trade Commission | 39
Chapter 2 Prevalence and Effects of Censorship on U.S Businesses Providing Media and Digital Services in China Summary of Key Findings from the Survey In late 2021, the Commission conducted a survey of U.S. businesses operating in China. The survey sought information about products and services provided by U.S. businesses operating in China and their experiences with Chinese censorship-related measures since the beginning of 2019. The survey also asked firms to quantify such impacts, as well as to describe them qualitatively, including perceived impacts.
• The Commission’s survey found that U.S. businesses providing media and digital services in China (i.e., “U.S. media and digital service providers in China”) were more likely to experience censorship-related measures than all other U.S. businesses in China. Although almost a quarter of U.S. media and digital service providers that were able to enter the Chinese market, representing more than half of the 2020 global revenue of all U.S. media and digital service providers active in China, experienced these measures, this estimate may undercount U.S. businesses’ actual experiences with censorship as instances of censorship can be difficult for businesses to identify, particularly when censorship-enabling measures that impact business activities related to speech are involved.35 Large U.S. media and digital service providers in China experienced censorship-related measures at a significantly higher rate than similar small and medium-sized enterprises (SMEs).
• Almost three-quarters of U.S. media and digital service providers that experienced Chinese censorship-related measures are concerned about negative impacts on their operations in China, including their ability to provide products and services in China.
• Almost half of large U.S. media and digital service providers that experienced censorship-related measures had to self-censor in order to provide products or services in China.
• About three-quarters of U.S. media and digital service providers that experienced censorship-related measures in China perceived censorship to be increasingly challenging to deal with in the past few years.
• Of U.S. media and digital service providers that experienced censorship-related measures in China, over 40 percent experienced increased costs of doing business in China and/or lost revenue in China due to Chinese censorship. However, the Commission did not receive enough information on the magnitude of these losses to produce generalizable estimates that extrapolate to the broader population.
35 See chapter 1 for further information regarding the difficulty of identifying instances of censorship. Furthermore, U.S. businesses whose services were blocked prior to January 1, 2019 and did not receive revenues otherwise from China may not be included in the survey.

Foreign Censorship Part 2: Trade and Economic Effects on U.S. Businesses
40 | www.usitc.gov
• Over 80 percent of U.S. media and digital service providers in China were also operating in other key markets where censorship-related measures are prevalent (Russia, Turkey, Vietnam, India, and Indonesia); however, only about 6 percent of those businesses experienced censorship in the other key markets.
All data presented in this chapter are weighted results from this survey, referred to as the Commission’s Foreign Censorship Survey, 2021.
Survey Background36 The Commission’s survey focuses on U.S. businesses currently or recently active in China, whether through a Chinese shareholder, local subsidiary, joint venture, non-revenue generating operations in China, or some other connection. However, since there is no publicly available database of such businesses, the Commission compiled a list of 5,570 U.S.-based businesses that met at least one of the following criteria that may indicate companies are more likely to operate in China: (1) if privately held, had foreign shareholders located in China; (2) had subsidiaries located in China; (3) was involved in foreign direct investment projects in China; (4) was involved in mergers or acquisition in China; or (5) had filed a patent in China.37 The Commission randomly selected 3,787 individual companies from the compiled list to survey and sent them questionnaires. During the data collection phase, the Commission conducted extensive email outreach to the sampled companies to ensure adequate response rates. The survey had an overall response rate of 73.1 percent with 2,767 companies responding.
Based on the questionnaire responses, 57 percent of the companies identified in the list were commercially active in China since January 1, 2019. A majority of the U.S. companies that were not active in China had filed only for patent protection there. Some of these companies that had only filed for patent protection were still in the product development phase and had not yet begun generating revenue. Generally, companies that were not commercially active in China were excluded from further analyses.38
The results from individual responses were combined to produce statistically representative estimates of the U.S. companies’ experiences with censorship-related measures in China and their effects on U.S. businesses. Results were grouped into two broad product/service categories: (1) media and digital services, and (2) all other businesses. This chapter primarily presents results of U.S. businesses providing media and digital services in China. Media and digital services include film and television (TV), music, video games, information content including education services, communications services, search engines, social media, e-commerce, online stores, and cloud storage.39
36 For detailed information about the methodology for the survey, please see appendix F. 37 The l ist was generated using information from multiple databases available through Bureau van Dijk. BvD solutions, multiple databases, received on May 20, 2021. 38 The Commission questionnaire asked U.S. companies if they had previously done, or attempted to do, business in China since January 1, 2019. A few companies only had these activities with respect to China and they are included in the analysis. 39 For a detailed l ist of services included in media and digital services, please see appendix F.
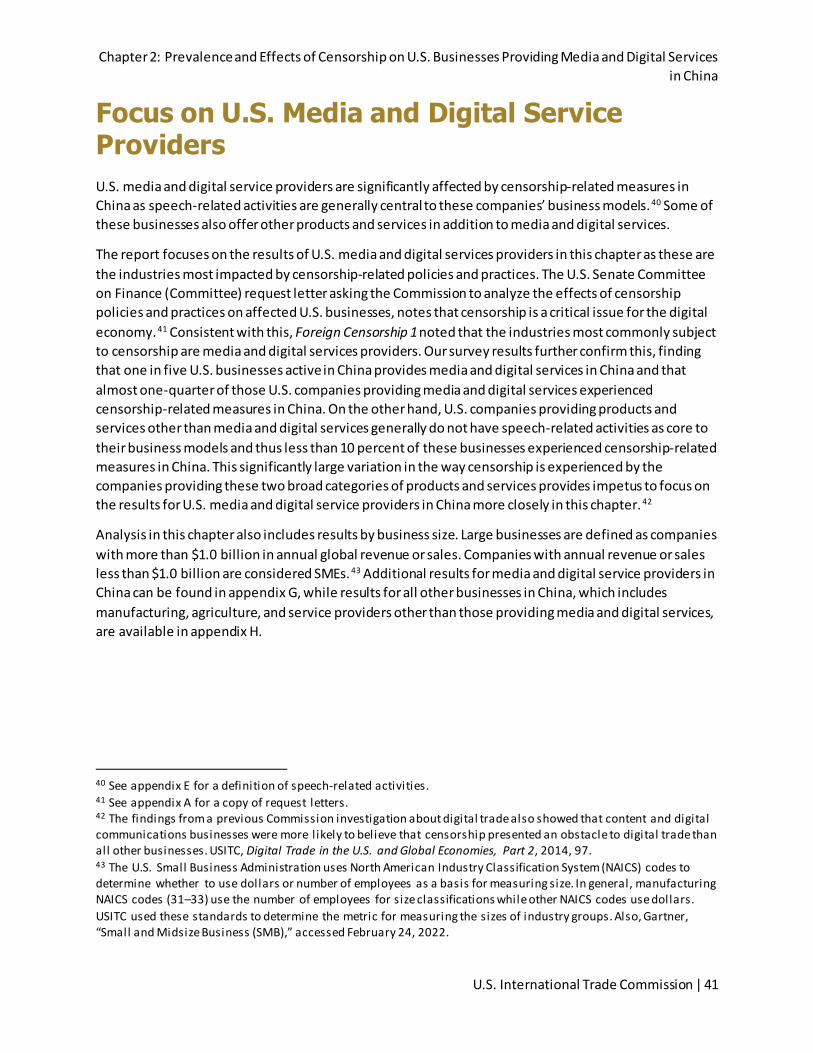
Chapter 2: Prevalence and Effects of Censorship on U.S. Businesses Providing Media and Digital Services in China
U.S. International Trade Commission | 41
Focus on U.S. Media and Digital Service Providers U.S. media and digital service providers are significantly affected by censorship-related measures in China as speech-related activities are generally central to these companies’ business models.40 Some of these businesses also offer other products and services in addition to media and digital services.
The report focuses on the results of U.S. media and digital services providers in this chapter as these are the industries most impacted by censorship-related policies and practices. The U.S. Senate Committee on Finance (Committee) request letter asking the Commission to analyze the effects of censorship policies and practices on affected U.S. businesses, notes that censorship is a critical issue for the digital economy.41 Consistent with this, Foreign Censorship 1 noted that the industries most commonly subject to censorship are media and digital services providers. Our survey results further confirm this, finding that one in five U.S. businesses active in China provides media and digital services in China and that almost one-quarter of those U.S. companies providing media and digital services experienced censorship-related measures in China. On the other hand, U.S. companies providing products and services other than media and digital services generally do not have speech-related activities as core to their business models and thus less than 10 percent of these businesses experienced censorship-related measures in China. This significantly large variation in the way censorship is experienced by the companies providing these two broad categories of products and services provides impetus to focus on the results for U.S. media and digital service providers in China more closely in this chapter. 42
Analysis in this chapter also includes results by business size. Large businesses are defined as companies with more than $1.0 billion in annual global revenue or sales. Companies with annual revenue or sales less than $1.0 billion are considered SMEs.43 Additional results for media and digital service providers in China can be found in appendix G, while results for all other businesses in China, which includes manufacturing, agriculture, and service providers other than those providing media and digital services, are available in appendix H.
40 See appendix E for a definition of speech-related activities. 41 See appendix A for a copy of request letters. 42 The findings from a previous Commission investigation about digital trade also showed that content and digital communications businesses were more l ikely to believe that censorship presented an obstacle to digital trade than all other businesses. USITC, Digital Trade in the U.S. and Global Economies, Part 2, 2014, 97. 43 The U.S. Small Business Administration uses North American Industry Classification System (NAICS) codes to determine whether to use dollars or number of employees as a basis for measuring size. In general, manufacturing NAICS codes (31–33) use the number of employees for size classifications while other NAICS codes use dollars. USITC used these standards to determine the metric for measuring the sizes of industry groups. Also, Gartner, “Small and Midsize Business (SMB),” accessed February 24, 2022.

Foreign Censorship Part 2: Trade and Economic Effects on U.S. Businesses
42 | www.usitc.gov
Challenges in Quantifying the Impacts of Censorship-Related Measures The questionnaire employed complex skip logic that allowed only businesses that had responded affirmatively to questions about experiencing censorship-related measures in China to respond to related questions on the impacts of censorship.44 Statistics compiled from responses to these sections of the questionnaire therefore might not fully capture responses for businesses that had changed their products and services, speech, or overall business in China to avoid experiencing censorship. In addition, the survey did not reach U.S. businesses that were not active between March 2020 and March 2021 because the sampling frame data was compiled in March 2021 and was limited to companies with financial activity during that period. For inclusion in the survey, these active U.S. companies had to meet at least one of the five criteria described above that indicate a commercial connection to China. Accordingly, the survey did not reach businesses that may have considered operations in China but decided against such operations due to censorship or other concerns.45
The economic impact section of the questionnaire asked businesses to quantify the impacts of censorship-related measures in China on both revenue and costs of doing business in China. While many businesses were able to determine they experienced a decrease in revenue or an increased cost of doing business in China, a large portion of these businesses were unable to calculate an estimate of these changes due to censorship-related measures. The Commission did not receive enough responses to these questions to produce generalizable estimates that can be extrapolated to the broader population. Therefore, the limited quantifications of costs or revenue forgone that were received were excluded from the analysis. Moreover, some businesses consider the costs of complying with censorship as part of the cost of doing business in China and may not have considered themselves to be economically impacted by Chinese censorship, while other firms may not consider complying with Chinese censorship to be costly, as the benefits of gaining access to the Chinese market outweigh the costs associated with Chinese censorship. Finally, the costs of compliance with Chinese censorship-related measures may be considered insignificant by some firms when compared to their global revenues.46
The Commission used various statistical measures to analyze the survey results. Box 2.1 provides more information about these measures and their interpretation.
Box 2.1 Statistical Measures Used for Analysis
The following are commonly used statistical measures the Commission employed in the analysis of the survey data.
Coefficient of Variation
44 Skip logic is a questionnaire design feature that automatically skips certain questions or groups of questions that do not pertain to a respondent based on how they have answered previous questions. For example, respondents who indicated their business had not experienced censorship-related measures would not be asked how censorship-related measures had impacted their business. 45 As mentioned in chapter 1, such an analysis would have required an economy-wide survey. 46 USITC, Foreign Censorship Survey, 2021, questionnaire narrative responses.

Chapter 2: Prevalence and Effects of Censorship on U.S. Businesses Providing Media and Digital Services in China
U.S. International Trade Commission | 43
The coefficient of variation (CV) is the ratio of the standard deviation to the mean and shows the extent of variability in relation to the mean of the population. It is generally expressed as a percentage. The higher the CV, the greater the level of dispersion around the mean. The lower the value of the CV, the more precise the estimate.a In this chapter, all estimates have a CV of less than 50 percent. If an estimate is presented in an appendix with a CV greater than 50 percent, it will be noted as a low precision estimate. A low precision estimate’s underlying data displays high levels of variance relative to the estimate.
Margin of Error
The margin of error (MOE) is a measure of random variation underlying a survey’s results. For example, a margin of error of plus or minus (±) 3 percentage points at the 95 percent confidence level means that if we fielded the same survey 100 times, we would expect the result to be within 3 percentage points of the true population value 95 of those times. The margin of error is driven by the sample size, variability in the population, and confidence level. A higher sample size results in a smaller margin of error while a higher confidence level increases the margin of error.b If variability in the population increases, the margin of error increases. In this report, the margin of error is at the 95 percent confidence level and is presented with survey estimates as percentage points (ppts) in the text, tables, and figures.
Confidence Interval
The confidence interval (CI) is a range of values that is likely to include the population value with a certain degree of confidence. Confidence intervals are computed by adding the margin of error to the mean to calculate the upper limit of the interval and similarly subtracting the margin of error from the mean to calculate the lower limit.c In this report, and unless otherwise noted, the CI at a 95 percent confidence level for a point estimate is visually represented in figures using a range bar. Overlapping bars do not indicate lack of statistical significance (for example, see figure 2.3).
Probability value (p-value)
A probability value, commonly known as p-value, is a statistical measurement used to validate a hypothesis against observed data. As p-values are generally used in this report to compare two groups (e.g., large vs small businesses), the hypothesis is that there is no difference between the two groups. The smaller the p-value, the stronger the evidence that there is a difference between the means of two groups being compared.d In this chapter, a p-value less than 0.05 is considered statistically significant. P-values below the threshold of 0.05 are indicated in footnotes throughout the chapter. Use of the term “significantly” in the text also indicates statistical significance between the compared groups.
Interpreting Survey Results
Here is an example of how to interpret the results presented in this chapter. The share of U.S. businesses active in China that were media and digital service providers was 21.4 percent ± 2.0 ppts. Here 21.4 percent is the survey estimate while ± 2.0 ppts is the margin of error in percentage points at the 95 percent confidence level. This means that if we conducted the survey 100 times, the survey estimates for the share of U.S. businesses active in China that were media and digital service providers would be expected to fall between 19.4 percent and 23.4 percent 95 out of 100 times.
a Abdi, “Coefficient of Variation,” 2010. b Ramachandran and Tsokos, Mathematical Statistics with Applications in R, 2020, 223. c Burruss and Bray, Encyclopedia of Social Measurement, 2005, 455. d Beers, “P-value,” March 5, 2022.

Foreign Censorship Part 2: Trade and Economic Effects on U.S. Businesses
44 | www.usitc.gov
Landscape of U.S. Businesses Active in China About a fifth (21.4 percent ± 2.0 ppts) of businesses in the United States that were commercially active in China provided media and digital services in China and these firms accounted for 43.8 percent ± 12.6 ppts of global revenue for U.S. businesses active in China in 2020. This chapter refers to these companies as “U.S. media and digital service providers in China.” Of the U.S. media and digital service providers active in China, slightly over one-half (52.4 percent ± 4.4 ppts) were large. Large U.S. media and digital service providers accounted for nearly all 2020 global revenue of these U.S. businesses active in China.
The types of media and digital services provided by U.S. businesses active in China are listed below in table 2.1 along with the share of U.S. businesses active in China that provide those services. For example, more than a third of U.S. media and digital service providers in China provided cloud storage, computing services, and software and more than a third provided information content development and distribution, including educational services.
Table 2.1 Shares of U.S. media and digital service providers in China, by product or service category provided in China, since January 1, 2019 Shares in percentages. Margin of error (MOE) for 95 percent confidence level in percentage points (ppts); d.s. = data are suppressed to protect confidentiality. Product or Service Category Share ± MOE Cloud storage, computing services, and software 36.5 ± 5.2 Information content development/distribution and educational services 35.2 ± 4.6 Individual company’s online store or web app 31.3 ± 4.6 E-commerce shopping platforms 13.3 ± 3.4 Communications services 9.7 ± 3.2 Social media 6.9 ± 2.7 Film and television (TV) 5.3 ± 2.4 Music development/distribution/licensing/radio broadcasting 2.8 ± 1.8 Video game development/distribution 2.7 ± 1.6 Search engines d.s.
Source: USITC, Foreign Censorship Survey, 2021, weighted responses to question 1.3. Note: The products or service categories were not mutually exclusive, meaning a single business could choose multiple products and services categories, so shares will not add to 100 percent. More detailed definitions for these products and services can be found in appendix E.
Experience with Censorship-Related Measures Censorship policies and practices can be broadly grouped into two categories: measures that directly target speech for suppression, and those that can operate, in some circumstances, to enable or facilitate censorship.47 Together, these two categories are referred to as censorship-related measures.
The first category, referred to hereafter as direct censorship measures, consists of short- or long-term internet shutdowns,48 blocking or filtering of digital products based on the content, and targeted denial
47 USITC, Foreign Censorship, Part 1, 2022, 9. 48 According to the survey, a short-term internet shutdown is one that lasts 48 hours or less, while a long-term internet shutdown lasts longer than 48 hours. See appendix E, question 2.1a.
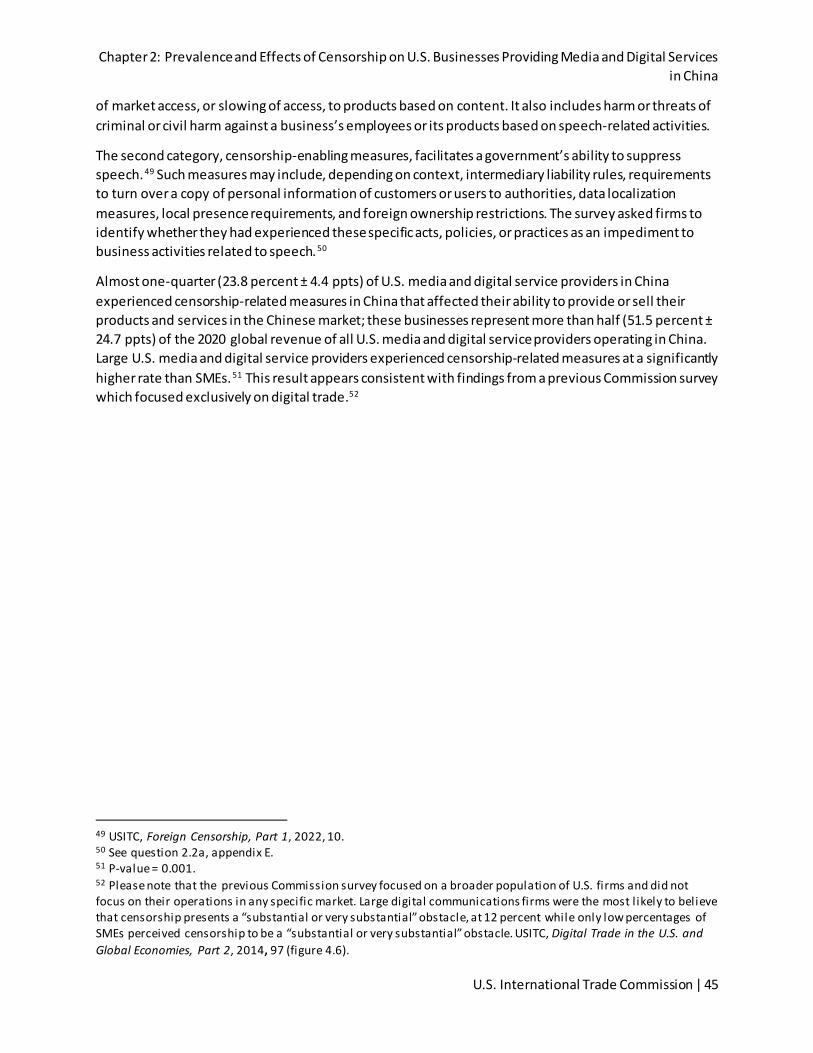
Chapter 2: Prevalence and Effects of Censorship on U.S. Businesses Providing Media and Digital Services in China
U.S. International Trade Commission | 45
of market access, or slowing of access, to products based on content. It also includes harm or threats of criminal or civil harm against a business’s employees or its products based on speech-related activities.
The second category, censorship-enabling measures, facilitates a government’s ability to suppress speech.49 Such measures may include, depending on context, intermediary liability rules, requirements to turn over a copy of personal information of customers or users to authorities, data localization measures, local presence requirements, and foreign ownership restrictions. The survey asked firms to identify whether they had experienced these specific acts, policies, or practices as an impediment to business activities related to speech.50
Almost one-quarter (23.8 percent ± 4.4 ppts) of U.S. media and digital service providers in China experienced censorship-related measures in China that affected their ability to provide or sell their products and services in the Chinese market; these businesses represent more than half (51.5 percent ± 24.7 ppts) of the 2020 global revenue of all U.S. media and digital service providers operating in China. Large U.S. media and digital service providers experienced censorship-related measures at a significantly higher rate than SMEs.51 This result appears consistent with findings from a previous Commission survey which focused exclusively on digital trade.52
49 USITC, Foreign Censorship, Part 1, 2022, 10. 50 See question 2.2a, appendix E. 51 P-value = 0.001. 52 Please note that the previous Commission survey focused on a broader population of U.S. firms and did not focus on their operations in any specific market. Large digital communications firms were the most l ikely to believe that censorship presents a “substantial or very substantial” obstacle, at 12 percent while only low percentages of SMEs perceived censorship to be a “substantial or very substantial” obstacle. USITC, Digital Trade in the U.S. and Global Economies, Part 2, 2014, 97 (figure 4.6).
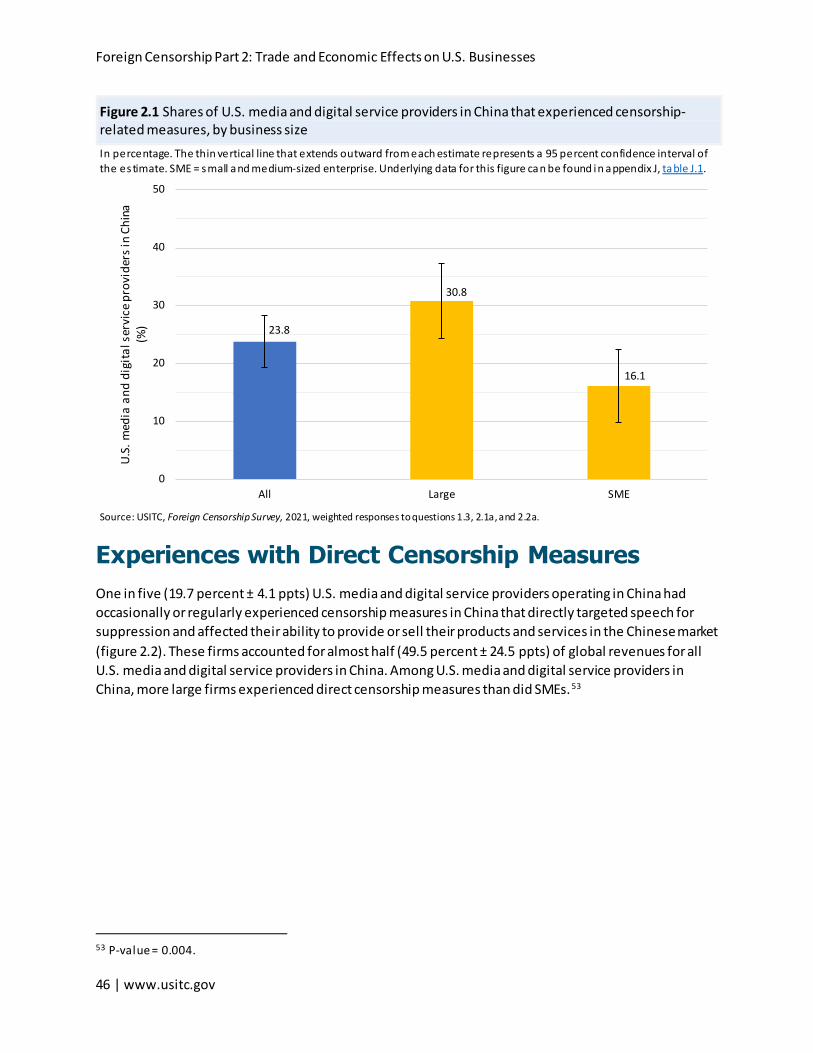
Foreign Censorship Part 2: Trade and Economic Effects on U.S. Businesses
46 | www.usitc.gov
Figure 2.1 Shares of U.S. media and digital service providers in China that experienced censorship-related measures, by business size In percentage. The thin vertical line that extends outward from each estimate represents a 95 percent confidence interval of the estimate. SME = small and medium-sized enterprise. Underlying data for this figure can be found in appendix J, table J.1.
23.8
30.8
16.1
0
10
20
30
40
50
All Large SME
U.S.
med
ia a
nd d
igita
l ser
vice
pro
vide
rs in
Chi
na
(%)
Source: USITC, Foreign Censorship Survey, 2021, weighted responses to questions 1.3, 2.1a, and 2.2a.
Experiences with Direct Censorship Measures One in five (19.7 percent ± 4.1 ppts) U.S. media and digital service providers operating in China had occasionally or regularly experienced censorship measures in China that directly targeted speech for suppression and affected their ability to provide or sell their products and services in the Chinese market (figure 2.2). These firms accounted for almost half (49.5 percent ± 24.5 ppts) of global revenues for all U.S. media and digital service providers in China. Among U.S. media and digital service providers in China, more large firms experienced direct censorship measures than did SMEs.53
53 P-value = 0.004.
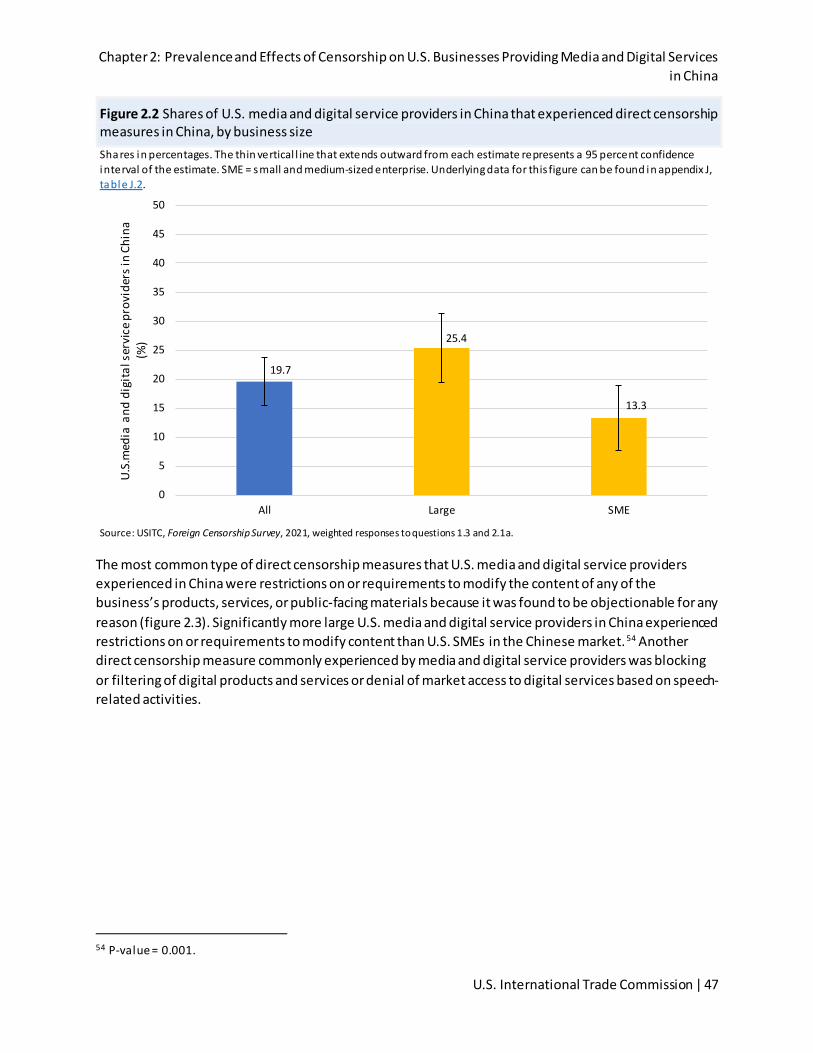
Chapter 2: Prevalence and Effects of Censorship on U.S. Businesses Providing Media and Digital Services in China
U.S. International Trade Commission | 47
Figure 2.2 Shares of U.S. media and digital service providers in China that experienced direct censorship measures in China, by business size Shares in percentages. The thin vertical l ine that extends outward from each estimate represents a 95 percent confidence interval of the estimate. SME = small and medium-sized enterprise. Underlying data for this figure can be found in appendix J, table J.2.
19.7
25.4
13.3
0
5
10
15
20
25
30
35
40
45
50
All Large SME
U.S.
med
ia a
nd d
igita
l ser
vice
pro
vide
rs in
Chi
na
(%)
Source: USITC, Foreign Censorship Survey, 2021, weighted responses to questions 1.3 and 2.1a.
The most common type of direct censorship measures that U.S. media and digital service providers experienced in China were restrictions on or requirements to modify the content of any of the business’s products, services, or public-facing materials because it was found to be objectionable for any reason (figure 2.3). Significantly more large U.S. media and digital service providers in China experienced restrictions on or requirements to modify content than U.S. SMEs in the Chinese market.54 Another direct censorship measure commonly experienced by media and digital service providers was blocking or filtering of digital products and services or denial of market access to digital services based on speech-related activities.
54 P-value = 0.001.

Foreign Censorship Part 2: Trade and Economic Effects on U.S. Businesses
48 | www.usitc.gov
Figure 2.3 Shares of U.S. media and digital service providers in China, affected by type of direct censorship measures and business size In percentages. The thin vertical line that extends outward from each estimate represents a 95 percent confidence interval of the estimate. SME = small and medium-sized enterprise; d.s. = data suppressed to protect confidentiality. Underlying data for this figure can be found in appendix J, table J.3.
10.5
15.9
4.6
10.3
12.8
7.5
5.77.2
4.03.2
5.1
d.s .0.0
5.0
10.0
15.0
20.0
25.0
All Large SME All Large SME All Large SME All Large SME
Restrictions on orrequirements to modify
content
Blocking or filtering andtargeted denial
Internet shutdowns Harm or threats
U.S.
med
ia a
nd d
igita
l ser
vice
pro
vide
rs in
Chi
na
(%)
Source: USITC, Foreign Censorship Survey, 2021, weighted responses to questions 1.3 and 2.1a. Notes: Restrictions on or requirements to modify content refer to modifications to the content of an organization’s products, services, or public-facing materials on the grounds that it is objectionable for any reason. Blocking or filtering and targeted denial refer to blocking or filtering of digital products or services and targeted denial of market access of the digital products or services based on speech related activities. Internet shutdowns include both short-term and long-term internet shutdowns. A short-term internet shutdown lasts for 48 hours or less while a long-term internet shutdown lasts for more than 48 hours. Harm or threats refer to harm and threats of criminal or civil harm, exit bans, or other forms of reprisal against an organization’s employees, brand, or products based on speech-related activities or government-initiated boycotts. The results in this graph are related to the following question: “Since January 1, 2019, how often the following acts, policies, and practices in China impacted your business’s ability to provide or sell your products and services?” The results in this graph combines responses that selected “occasionally” or “regularly” to question 2.1a.
Experiences with Censorship-Enabling Measures Fewer U.S. media and digital service providers in China experienced censorship-enabling measures that impact business activities related to speech compared to those that experienced direct censorship measures. About 14 percent of U.S. media and digital service providers experienced censorship-enabling measures in China that affected their ability to provide or sell products and services in the Chinese market (figure 2.4). These businesses represented almost 39.5 percent ± 23.0 ppts of 2020 global revenues for all U.S. media and digital service providers active in China. More large U.S. media and digital service providers experienced censorship-enabling measures than SMEs.55
55 P-value = 0.001.

Chapter 2: Prevalence and Effects of Censorship on U.S. Businesses Providing Media and Digital Services in China
U.S. International Trade Commission | 49
Figure 2.4 Shares of U.S. media and digital service providers that experienced any censorship-enabling measures in China since January 1, 2019, by business size In percentages. The thin vertical line that extends outward from each estimate represents a 95 percent confidence interval of the estimate. SME = small and medium-sized enterprise. Underlying data for this figure can be found in appendix J, table J.4.
14.2
19.9
7.8
0
5
10
15
20
25
30
35
40
45
50
All Large SME
U.S.
med
ia a
nd d
igita
l ser
vice
pro
vide
rs i
n Ch
ina
(%)
Source: USITC, Foreign Censorship Survey, 2021, weighted responses to questions 1.3 and 2.2a. Note: The results in this graph are related to the following question: “Since January 1, 2019, has your business experienced the following acts, policies, and practices in China that may have enabled censorship and affected your ability to provide or sell your products and services in the Chinese market?” For each of the acts, polices, and practices, we asked that businesses only report experiences that affected the pursuit of business activities related to speech.
The two most experienced censorship-enabling measures by U.S. media and digital service providers in China were data localization measures and local presence requirements. Almost 10 percent of U.S. media and digital service providers in China experienced data localization measures and local presence requirements that affected their pursuit of business activities related to speech in the Chinese market (figure 2.5). Requirements to only use state-approved virtual private networks (VPN) is also a censorship-enabling measure that was experienced by about 5 percent (4.9 percent ± 2.4 ppts) of U.S. media and digital service providers in China. Large U.S. media and digital service providers in China experienced foreign ownership restrictions and local presence requirements at a significantly higher rate than experienced by SMEs.56 Large businesses experienced data localization measures and local presence requirements at twice the rate of SMEs.57
56 P-value = 0.004. 57 P-value = 0.048.

Foreign Censorship Part 2: Trade and Economic Effects on U.S. Businesses
50 | www.usitc.gov
Figure 2.5 Shares of U.S. media and digital service providers in China that experienced specific censorship-enabling measures, by business size In percentages. The thin vertical line that extends outward from each estimate represents a 95 percent confidence interval of the estimate. SMEs = small and medium-sized enterprises. Underlying data for this figure can be found in appendix J, table J.5.
9.0
11.9
5.97.0
10.6
3.04.9 5.3 4.4 3.9
6.3
d.s .0.0
5.0
10.0
15.0
20.0
25.0
All Large SME All Large SME All Large SME All Large SME
Data localization measuresand local presence
requirements
Foreign ownershiprestrictions and licensing
restrictions
Requirement to only usestate-approved virtual
private networks
All other
U.S.
med
ia a
nd d
igita
l ser
vice
pro
vide
rs in
Chi
na
(%)
Source: USITC, Foreign Censorship Survey, 2021, weighted responses to questions 1.3 and 2.2a. Notes: “All other” category includes intermediary liability rules, requirements to turn over personal information of customers or user, and requirements to publicly apologize for statements made by the business or by employees. The results in this graph are related to the following question: “Since January 1, 2019, has your business experienced the following acts, policies, and practices in China that may have enabled censorship and affected your ability to provide or sell your products and services in the Chinese market?” For each of the acts, polices, and practices, we asked that businesses only report experiences that affected the pursuit of business activities related to speech.
Effects of Censorship-Related Measures U.S. media and digital service providers in China that experienced censorship-related measures (also referred to as “censored U.S. media and digital service providers in China”) were impacted by censorship in various ways. More than half (50.8 percent ± 11.3 ppts) of censored U.S. media and digital service providers in China were negatively impacted by censorship-related measures.58 Common negative impacts due to censorship-related measures that businesses face include additional costs of compliance due to data localization and licensing requirements, bans or limits on delivery of educational/training content, and limits on which products and services businesses offered in China, which may be only a subset of their portfolio. However, for some U.S. companies, the impacts of censorship-related measures may have been overshadowed by impacts from other business challenges in China not related to censorship, such as protection of intellectual property.59
58 The share of censored U.S. media and digital service providers that were negatively impacted by censorship-related measures does not differ significantly by size. 59 USITC, Foreign Censorship Survey, 2021, questionnaire narrative responses.

Chapter 2: Prevalence and Effects of Censorship on U.S. Businesses Providing Media and Digital Services in China
U.S. International Trade Commission | 51
More than half of those businesses (54.9 percent ± 14.7 ppts) that were negatively impacted reduced provision of products or services due to Chinese censorship-related measures. About a third (29.2 percent ± 13.5 ppts) were unsuccessful in providing products and services, or stopped providing media and digital services, in response to those policies.60
Some U.S. media and digital service providers in China have had to make changes to their products and services in China as a result of censorship-related measures. Two-thirds (66.5 percent ± 10.1 ppts) of censored U.S. media and digital service providers had their services impacted and experienced at least one effect listed in table 2.2. About 40 percent (40.4 percent ± 10.2 ppts) of censored U.S. media and digital service providers modified their intended services and content offered in China while more than a third had increased costs of doing business due to the costs associated with complying with censorship-related requirements or provided only a subset of their full suite of products or services in China as a result of censorship-related measures.61
Table 2.2 Shares of censored U.S. media and digital service providers in China experiencing specific effects of censorship-related measures Shares in percentages. Margin of error (MOE) for 95 percent confidence level in percentage points (ppts). Effects on U.S. businesses resulting from Chinese censorship-related measures Share ± MOE Modify its intended services or content offered in China 40.4 ± 10.2 Reduced uniformity of products and services across international markets 35.9 ± 10.8 Costs of doing business in China have increased because of the costs associated with complying with measures
35.4 ± 9.3
Only provides/sells a subset of its full suite of products and services in China 34.8 ± 10.0 Modified its products and services, or changed its behavior, after learning about actions by the Chinese Government towards another company because of their speech-related activities
22.6 ± 9.3
Reduced its efforts to do business in China because of the costs associated with complying with measures
20.4 ± 8.8
Reduced its efforts to do business in China because of the uncertainty in the business environment
16.7 ± 8.2
Required to l imit or deny access to its products and services for certain users 15.9 ± 7.5 Ceased doing business in China, at least partly because of the government’s censorship-related measures
7.7 ± 6.1
Changes to products applied to other markets to maintain uniformity or because it is impractical to adapt products for different markets
6.2 ± 4.5
Source: USITC, Foreign Censorship Survey, 2021, weighted responses to questions 1.3 and 2.8. Note: U.S. media and digital service providers that ceased doing business in China may have only done so for certain lines of business.
China has implemented legislation and technologies to regulate the domestic internet.62 These regulations facilitate internet censorship in China by blocking access to selected foreign websites and internet tools such as Facebook, Twitter, Google search, and non-sanctioned VPNs and by slowing down cross-border internet traffic. These limitations may impact business operations in China or globally.
60 When considering all U.S. media and digital service providers in China, 6.6 percent ± 2.5 ppts reduced their provision of products or services and 3.5 percent ± 2.1 ppts were unsuccessful in providing products and services or stopped providing services. 61 These shares do not vary significantly between large businesses and SMEs. 62 See USITC, Foreign Censorship, Part1, 2022, 13–15.

Foreign Censorship Part 2: Trade and Economic Effects on U.S. Businesses
52 | www.usitc.gov
Almost half (44.7 percent ± 11.0 ppts) of censored U.S. media and digital service providers in China were unable to access online tools, such as cloud-based software, which impacted their operations in China.63 These types of restrictions mostly impacted censored U.S. media and digital services providers operations specific to China rather than globally (figure 2.6).
Figure 2.6 Shares of censored U.S. media and digital service providers that experienced limitations that impacted business operations in China, by type of limitation Shares in percentages. The thin vertical l ine that extends outward from each estimate represents a 95 percent confidence interval of the estimate. Underlying data for this figure can be found in appendix J, table J.6.
44.0 44.753.1 49.6
15.5 14.37.5 9.5
0
20
40
60
80
100
Slow cross-borderinternet access
Inability to accessonline tools
Inability to accessblocked websites and
content
VPN restrictions thatlead to slow internet
access
Cens
ored
U.S
. med
ia a
nd d
igita
l ser
vice
pr
ovid
ers i
n Ch
ina
(%)
Impact on operations only in China Impact on global operations
Source: USITC, Foreign Censorship Survey, 2021, weighted responses to questions 1.3 and 2.9. Note: “Inability to access online tools” includes cloud-based software. “Inability to access blocked websites and content” includes websites such as Facebook, YouTube, and Twitter. “Impact on global operations” includes impact in both China and other countries.
Self-Censorship Self-censorship involves censoring or suppressing one’s own speech to avoid offending government censors or to facilitate market access.64 It includes preemptively editing content to obtain approval from the government of China to do business. Common self-censorship practices largely include modifying specific references to places like Hong Kong, Taiwan, and Macau in a business’ public-facing materials, and in some cases, removing functionality in some products to avoid the possibility of censorship. 65 Almost 40 percent (39.9 percent ± 10.7 ppts) of U.S. media and digital service providers that experienced censorship-related measures had to self-censor in order to provide products or services in 63 These l imitations were also faced by businesses other than those providing media and digital services at a similar rate. This indicates that the impact of these l imitations is equally felt by all businesses, regardless of the type products and services they provide (table H.11). 64 USITC, Foreign Censorship, Part 1, 2022, 13. 65 USITC, Foreign Censorship Survey, 2021, questionnaire narrative responses to question 2.10.

Chapter 2: Prevalence and Effects of Censorship on U.S. Businesses Providing Media and Digital Services in China
U.S. International Trade Commission | 53
China (figure 2.7).66 This percentage is significantly higher for large U.S. media and digital service providers in China than that for SMEs.67
Figure 2.7 Shares of U.S. media and digital service providers experiencing censorship-related measures in China that have self-censored in order to provide products and services in China, by business size Shares in percentages. The thin vertical l ine that extends outward from each estimate represents a 95 percent confidence interval of the estimate. SME = small and medium-sized enterprise. Underlying data for this figure can be found in appendix J, table J.7.
39.9
48.3
22.2
0
10
20
30
40
50
60
70
80
90
100
All Large SME
U.S.
med
ia a
nd d
igita
l ser
vice
pro
vide
rs in
Chi
na
that
exp
erie
nced
cen
sors
hip
(%)
Source: USITC, Foreign Censorship Survey, 2021, weighted responses to questions 1.3 and 2.10.
Because of concerns with Chinese censorship-related measures, about 1 in 10 (11.2 percent ± 6.4 ppts) censored U.S. media and digital service providers in China moderated or limited activity on social media posts by official company accounts while a smaller share (6.1 percent ± 5.1 ppts) of U.S. businesses moderated or limited activity on social media by company employees.
Extraterritorial Effects Extraterritorial censorship occurs when a government manages to suppress speech outside of its borders. China has a history of using economic coercion to advance censorship goals when the targeted speech is legal in the jurisdiction where it occurred.68 Some (15.0 percent ± 7.6 ppts) U.S. media and digital service providers self-censored with respect to speech-related activities outside of China due to Chinese censorship-related measures. This shows that there is a substantial extraterritorial aspect to
66 When considering all U.S. media and digital service providers in China, 9.5 percent ± 3.0 ppts self-censored. 67 P-value = 0.015. 68 USITC, Foreign Censorship, Part 1, 2022, 12. See chapter 4 in this report for notable examples of extraterritorial censorship.
Foreign Censorship Part 2: Trade and Economic Effects on U.S. Businesses
54 | www.usitc.gov
self-censorship. More than 10 percent (12.7 percent ± 7.8 ppts) of U.S. media and digital service providers in China that experienced Chinese censorship-related measures experienced a negative or mixed impacts including impacts on the design and functionality of their products or services provided outside of China.69 There was some impact on products and services provided in the U.S. (7.4 percent ± 6.4 ppts) but a slightly higher impact on products and services provided in other markets (9.2 percent ± 6.7 ppts).70 Other markets include, but are not limited to, Taiwan, Hong Kong, and adjacent Southeast Asian markets.71
Perceived Impacts on Products and Services and Business Operations The questionnaire asked about businesses’ perceptions of how censorship might impact them in the future and about doing business in China while dealing with censorship-related measures. Nearly three-fourths (72.3 percent ± 10.0 ppts) of U.S. media and digital service providers in China that experienced Chinese censorship-related measures were concerned about impacts on their ability to provide products and services in China (figure 2.8); by comparison, 17.0 percent ± 6.6 ppts were concerned about impacts on their ability to provide products and services outside of China.
69 The share of censored U.S. media and digital service providers in China that also operate in other markets around the world is 93.4 percent ± 2.9 ppts. 70 U.S. businesses experiencing Chinese censorship-related measures may experience extraterritorial censorship both within and outside the United States, so shares will not add to 100 percent. 71 USITC, Foreign Censorship Survey, 2021, questionnaire narrative responses to question 2.11.

Chapter 2: Prevalence and Effects of Censorship on U.S. Businesses Providing Media and Digital Services in China
U.S. International Trade Commission | 55
Figure 2.8 Shares of censored U.S. media and digital service providers that are concerned Chinese censorship will have a negative impact on their ability to provide products and services in China, by business size Shares in percentages. The thin vertical l ine that extends outward from each estimate represents a 95 percent confidence interval of the estimate. SME = small and medium-sized enterprise. Underlying data for this figure can be found in appendix J, table J.8.
72.368.2
81.1
0
10
20
30
40
50
60
70
80
90
100
All Large SME
Shar
e of
cen
sore
d U.
S. m
edia
and
dig
ital s
ervi
ce
prov
ider
s (%
)
Source: USITC, Foreign Censorship Survey, 2021, weighted responses to questions 1.3 and 3.1. Note: When considering all U.S. media and digital service providers, fewer than 20 percent (16.4 percent ± 3.8 ppts) were concerned about Chinese censorship’s impacts on their ability to provide products and services in China.
Of the censored media and digital service providers, slightly more SMEs (81.1 percent ± 17.3 ppts) were concerned about negative impacts on their ability to provide products and services in China compared to concerns of large businesses (68.2 percent ± 11.5 ppts), though this difference is not statistically significant.
Similarly, most censored U.S. media and digital service providers (75.8 percent ± 9.7 ppts) were concerned Chinese censorship-related measures would negatively impact their operations in China, and this concern does not differ significantly by business size (figure 2.9).72 The degree of concern, though, varied considerably among businesses where a majority (61.0 percent ± 10.5 ppts) of U.S. media and digital service providers were moderately concerned while a small share was very concerned.
72 When considering all U.S. media and digital services providers in China, 16.8 percent ± 3.8 ppts were concerned that Chinese censorship-related measures would negatively impact their operations outside of China.

Foreign Censorship Part 2: Trade and Economic Effects on U.S. Businesses
56 | www.usitc.gov
Figure 2.9 Shares of censored U.S. media and digital service providers in China that are concerned Chinese censorship will have a negative impact on their operations in China, by business size Shares in percentages. SME = small and medium-sized enterprise. Underlying data for this figure can be found in appendix J, table J.9.
75.8 75.3 76.8
0
10
20
30
40
50
60
70
80
90
100
All Large SME
Shar
e of
cen
sore
d U.
S. m
edia
and
dig
ital
serv
ice p
rovi
ders
(%)
Source: USITC, Foreign Censorship Survey, 2021, weighted responses to questions 1.3 and 3.2.
Perceived Change in Censorship Chinese censorship has become more challenging in the past few years for most censored U.S. media and digital service providers in China (72.0 percent ± 10.5 ppts) (figure 2.10).73 This does not differ significantly by business size.
73 When considering all U.S. media and digital service providers in China, Chinese censorship has become more challenging in the past few years for 13.2 percent ± 3.3 ppts of these providers.

Chapter 2: Prevalence and Effects of Censorship on U.S. Businesses Providing Media and Digital Services in China
U.S. International Trade Commission | 57
Figure 2.10 Shares of censored U.S. media and digital service providers for which Chinese censorship has become more challenging, by business size Shares in percentages. The thin vertical l ine that extends outward from each estimate represents a 95 percent confidence interval of the estimate. SME = small and medium-sized enterprise. Underlying data for this figure can be found in appendix J, table J.10.
72.074.3
66.2
0
10
20
30
40
50
60
70
80
90
100
All Large SME
Shar
e of
cen
sore
d U.
S. m
edia
and
dig
ital s
ervi
ce
prov
ider
s (%
)
Source: USITC, Foreign Censorship Survey, 2021, weighted responses to questions 1.3 and 3.3.
Some U.S. businesses perceived that China has been increasing its requirements and restrictions, enforcement, and scrutiny of content, as well as being more proactive in finding violators of Chinese policies within the past few years.74 They stated that policy changes have not been clearly communicated, which makes compliance and the approval process more difficult. Political sensitivity has increased as well.75
Comparison to Chinese-Owned Businesses More than half of censored U.S. media and digital service providers in China (52.3 percent ± 14.2 ppts) perceived that they experienced higher levels of requirements and enforcement of policies related to censoring content by the Chinese government compared to their perceptions of the experiences of Chinese-owned businesses. Only 13.5 percent ± 7.3 ppts of censored U.S. media and digital service providers in China perceived that they experienced lower requirements than did Chinese-owned businesses. The difference between the perceived experiences of large businesses and SMEs is not statistically significant.
74 USITC, Foreign Censorship Survey, 2021, questionnaire narrative responses. 75 USITC, Foreign Censorship Survey, 2021, questionnaire narrative responses.

Foreign Censorship Part 2: Trade and Economic Effects on U.S. Businesses
58 | www.usitc.gov
Impact on Brand Perception in the United States Most censored U.S. media and digital service providers complied with requirements from the Chinese government to modify online content, products, or services (95.6 percent ± 8.6 ppts). As a result of this compliance, about one in five (20.3 percent ± 12.9 ppts) censored U.S. media and digital service providers in China consider their brand perception by U.S. customers to have been negatively impacted, while nearly two-thirds (64.5 percent ± 15.3 ppts) do not consider their brand perception to be impacted.76
Economic Impacts of Chinese Censorship Economic impacts in the context of this section include impacts of Chinese censorship-related measures on a business’s revenue and costs of doing business in China. Businesses noted that quantifying these impacts is difficult for a variety of reasons. One reason is that they are unable to directly relate increased costs or revenue losses to Chinese censorship rather than some other barrier to trade (e.g., domestic supports). Also, some companies do not have the resources to analyze the impact of censorship on their business. The Commission did not receive enough responses to these questions to produce generalizable estimates and extrapolate results to the broader population. Therefore, quantifications of the impact of Chinese censorship on a business’s revenue and costs are not presented.
Additionally, businesses may not have been able to quantify all negative impacts in terms of higher costs or lower revenues. For example, as discussed above, more than half of censored U.S. media and digital service providers were negatively impacted by censorship-related measures.77 However, the discussion below points out that only slightly more than 40 percent were economically impacted (i.e., experienced impacts on revenue or costs).
The questionnaire also sought information on the impacts of censorship-related measures on U.S. employment. However, over 90 percent (90.7 percent ± 11.5 ppts) of censored U.S. media and digital services providers that were economically impacted did not experience an impact to their U.S. employment as a result of censorship-related measures in China.78
Prevalence of Economic Impacts Over 40 percent (41.8 percent ± 9.6 ppts) of censored U.S. media and digital service providers also experienced impacts on revenues and costs of doing business in China due to Chinese censorship-
76 The remaining businesses (15.2 percent ± 10.2 ppts) consider the impact on their brand perception to be mixed. 77 The questionnaire provides examples of negative impacts, which include denial of market entry for certain products and services and reduction in their quality because of perceived or explicit l imitations on speech and content. Economic impacts for the purpose of this report are impacts to a company’s costs (in or outside China), revenue, and/or U.S. employment. 78 The top end of the confidence interval’s range is l imited to 100 percent, despite the estimate’s MOE. As noted earlier, the survey collected l imited information from businesses that were unable to enter the Chinese market.
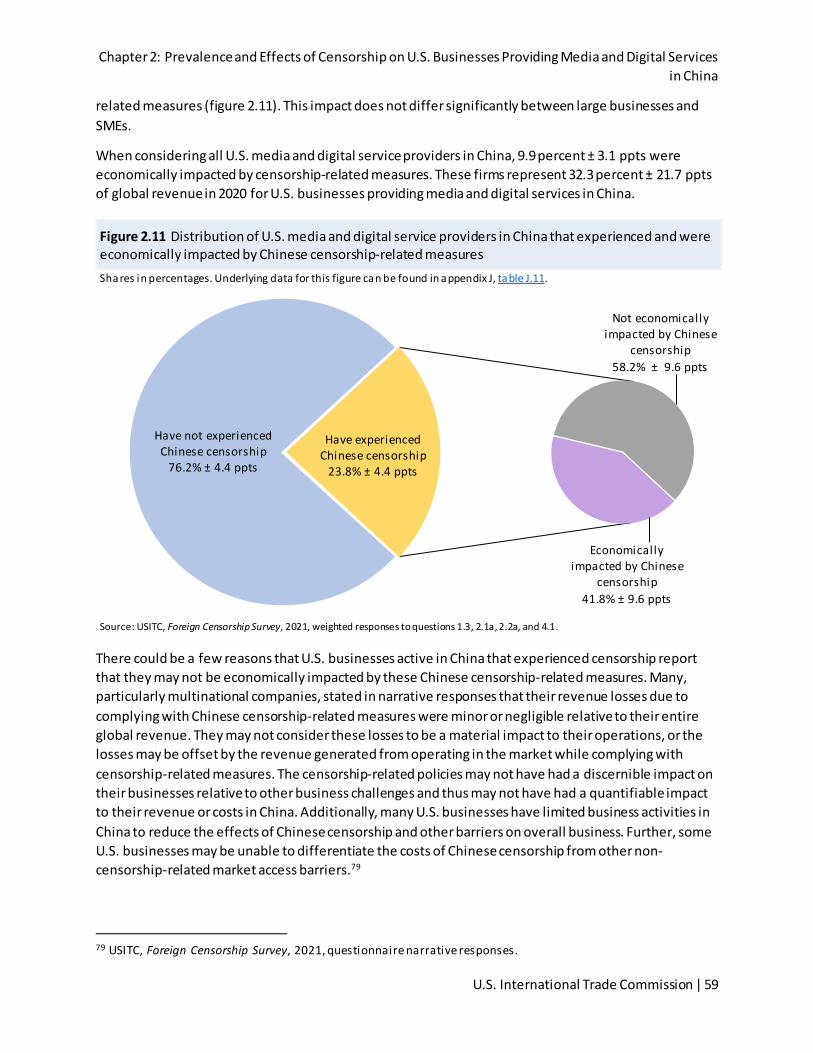
Chapter 2: Prevalence and Effects of Censorship on U.S. Businesses Providing Media and Digital Services in China
U.S. International Trade Commission | 59
related measures (figure 2.11). This impact does not differ significantly between large businesses and SMEs.
When considering all U.S. media and digital service providers in China, 9.9 percent ± 3.1 ppts were economically impacted by censorship-related measures. These firms represent 32.3 percent ± 21.7 ppts of global revenue in 2020 for U.S. businesses providing media and digital services in China.
Figure 2.11 Distribution of U.S. media and digital service providers in China that experienced and were economically impacted by Chinese censorship-related measures Shares in percentages. Underlying data for this figure can be found in appendix J, table J.11.
Have not experienced Chinese censorship
76.2% ± 4.4 ppts
Economically impacted by Chinese
censorship41.8% ± 9.6 ppts
Not economically impacted by Chinese
censorship58.2% ± 9.6 ppts
Have experienced Chinese censorship
23.8% ± 4.4 ppts
Source: USITC, Foreign Censorship Survey, 2021, weighted responses to questions 1.3, 2.1a, 2.2a, and 4.1.
There could be a few reasons that U.S. businesses active in China that experienced censorship report that they may not be economically impacted by these Chinese censorship-related measures. Many, particularly multinational companies, stated in narrative responses that their revenue losses due to complying with Chinese censorship-related measures were minor or negligible relative to their entire global revenue. They may not consider these losses to be a material impact to their operations, or the losses may be offset by the revenue generated from operating in the market while complying with censorship-related measures. The censorship-related policies may not have had a discernible impact on their businesses relative to other business challenges and thus may not have had a quantifiable impact to their revenue or costs in China. Additionally, many U.S. businesses have limited business activities in China to reduce the effects of Chinese censorship and other barriers on overall business. Further, some U.S. businesses may be unable to differentiate the costs of Chinese censorship from other non-censorship-related market access barriers.79
79 USITC, Foreign Censorship Survey, 2021, questionnaire narrative responses.

Foreign Censorship Part 2: Trade and Economic Effects on U.S. Businesses
60 | www.usitc.gov
Impact on U.S. Businesses’ Costs and Revenues
86.5% ± 9.3 ppts
Increased costs of doing business in China
Censored U.S. media & digital service providers economically impacted by
Chinese censorship
35.4% ± 6.4 ppts
No impact on costs of doing business in China
Censored U.S. media & digital service providers in
China
Most (86.5 percent ± 12.5 ppts) censored U.S. media and digital service providers in China that were economically impacted by Chinese censorship-related measures have faced increased costs of doing business in China because of these measures (figure 2.12).
Figure 2.12 Net effects of Chinese censorship on costs of doing business in China of U.S. media and digital service providers, by subsets of the population Shares in percentages. Underlying data for this figure can be found in appendix J, table J.12.
Source: USITC, Foreign Censorship Survey, 2021, weighted responses to questions 1.3, 2.1a, 2.2a, 4.1, and 4.5.
When considering censored U.S. media and digital service providers in China, slightly more than one-third of them had an increase in costs of doing business in China because of these measures. This is consistent with earlier findings in the chapter stating that costs of doing business in China have increased because of the costs associated with complying with censorship-related measures for about one-third of censored U.S. media and digital service providers in China.
Impacts of censorship-related measures in China on a business’s revenue or sales in China were similar to impacts on costs of doing business in China. Over 80 percent of censored U.S. media and digital service providers in China that were economically impacted by Chinese censorship-related measures had lost or foregone revenue or sales in China (figure 2.13).

Chapter 2: Prevalence and Effects of Censorship on U.S. Businesses Providing Media and Digital Services in China
U.S. International Trade Commission | 61
Figure 2.13 Net effects of Chinese censorship on revenue or sales in China of U.S. media and digital service providers, by subsets of the population Shares in percentages. Underlying data for this figure can be found in appendix J, table J.13.
81.6% ± 19.8 ppts
Lost or foregone revenue or sales in China
Censored U.S. media & digital service providers economically
impacted by Chinese censorship
34.1% ± 9.3 ppts
No impact on business's revenue or sales in China
Censored U.S. media & digital service providers in China
Source: USITC, Foreign Censorship Survey, 2021, weighted responses to questions 1.3, 2.1a, 2.2a, 4.1, and 4.2.
Censorship-Related Measures in Key Markets Outside of China80 Businesses with active operations in China were asked about whether they experienced censorship outside of China. The majority (81.8 percent ± 4.5 ppts) of all U.S. media and digital service providers in China also operate in other key markets where censorship-related policies and practices are prevalent, discussed in Foreign Censorship Part 1.81 Of these operating in other key markets, 6.3 percent ± 2.4 ppts had experienced censorship-related measures in key markets other than China since 2019. Large U.S. media and digital service providers in China experienced censorship-related measures in other key markets at a significantly higher rate of 10.0 percent ± 4.2 ppts compared to SMEs, at a rate of 2.1 percent ± 2.0 ppts.82
Additionally, most censored U.S. media and digital service providers in China are also operating in other key markets (90.0 percent ± 6.7 ppts). However, only 22.4 percent ± 8.3 ppts of these companies had
80 The Commission questionnaire asked about business operations in markets across the world. Analysis in this section is l imited to the key markets identified in the Commission’s Foreign Censorship 1 report. Data for all other markets are shown in table G.24. 81 Outside of China, the other key markets are Russia, Turkey, Vietnam, India, and Indonesia. USITC, Foreign Censorship, Part 1, 2022, 15. 82 P-value = 0.043.
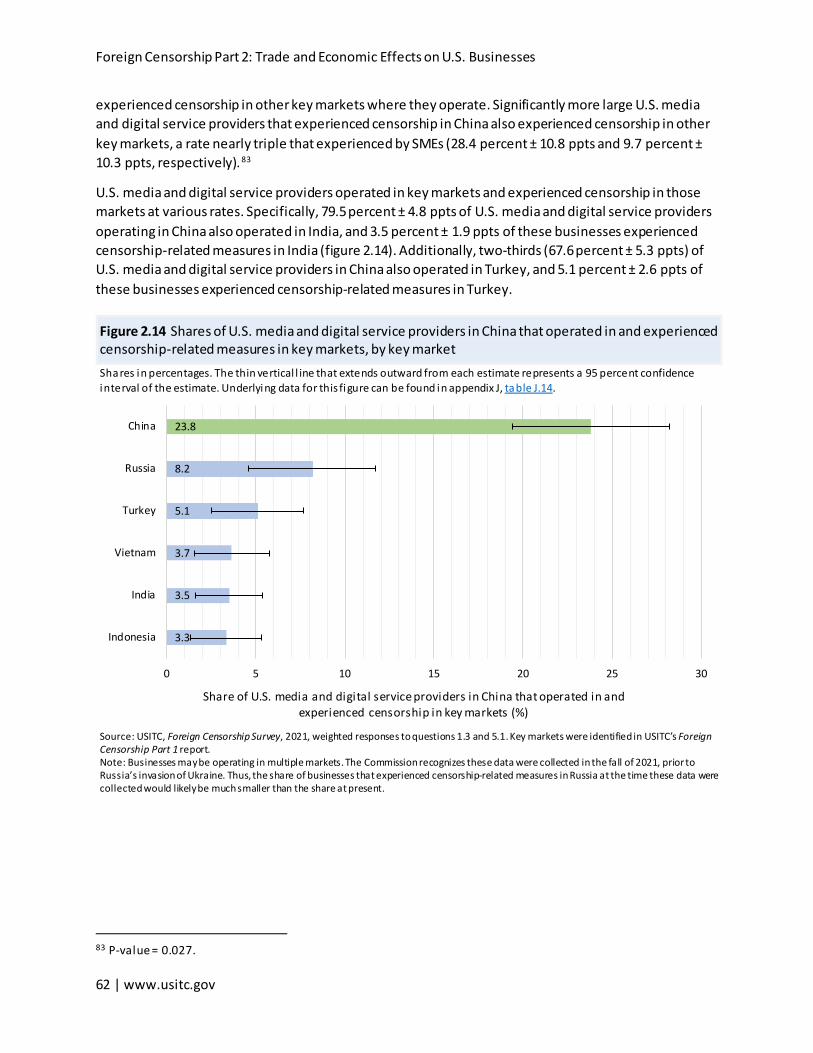
Foreign Censorship Part 2: Trade and Economic Effects on U.S. Businesses
62 | www.usitc.gov
experienced censorship in other key markets where they operate. Significantly more large U.S. media and digital service providers that experienced censorship in China also experienced censorship in other key markets, a rate nearly triple that experienced by SMEs (28.4 percent ± 10.8 ppts and 9.7 percent ± 10.3 ppts, respectively).83
U.S. media and digital service providers operated in key markets and experienced censorship in those markets at various rates. Specifically, 79.5 percent ± 4.8 ppts of U.S. media and digital service providers operating in China also operated in India, and 3.5 percent ± 1.9 ppts of these businesses experienced censorship-related measures in India (figure 2.14). Additionally, two-thirds (67.6 percent ± 5.3 ppts) of U.S. media and digital service providers in China also operated in Turkey, and 5.1 percent ± 2.6 ppts of these businesses experienced censorship-related measures in Turkey.
Figure 2.14 Shares of U.S. media and digital service providers in China that operated in and experienced censorship-related measures in key markets, by key market Shares in percentages. The thin vertical l ine that extends outward from each estimate represents a 95 percent confidence interval of the estimate. Underlying data for this figure can be found in appendix J, table J.14.
23.8
8.2
5.1
3.7
3.5
3.3
0 5 10 15 20 25 30
China
Russia
Turkey
Vietnam
India
Indonesia
Share of U.S. media and digital service providers in China that operated in and experienced censorship in key markets (%)
Source: USITC, Foreign Censorship Survey, 2021, weighted responses to questions 1.3 and 5.1. Key markets were identified in USITC’s Foreign Censorship Part 1 report. Note: Businesses may be operating in multiple markets. The Commission recognizes these data were collected in the fall of 2021, prior to Russia’s invasion of Ukraine. Thus, the share of businesses that experienced censorship-related measures in Russia at the time these data were collected would likely be much smaller than the share at present.
83 P-value = 0.027.

Chapter 2: Prevalence and Effects of Censorship on U.S. Businesses Providing Media and Digital Services in China
U.S. International Trade Commission | 63
Bibliography Abdi, Herve. “Coefficient of Variation.” In Encyclopedia of Research Design. Thousand Oaks, CA: Sage,
2010. https://personal.utdallas.edu/~herve/abdi-cv2010-pretty.pdf.
Beers, Brian. “P-Value.” Investopedia, March 5, 2022. https://www.investopedia.com/terms/p/p-value.asp.
Burruss, George, and Timothy Bray. Encyclopedia of Social Measurement. Vol. 1, 2005. https://www.sciencedirect.com/topics/mathematics/margin-of-error.
Gartner. “Small and Midsize Business (SMB).” Information Technology Glossary. Accessed February 15, 2022. https://www.gartner.com/en/information-technology/glossary/smbs-small-and-midsize-businesses.
Ramachandran, Kandethody, and Chris Tsokos. Mathematical Statistics with Applications in R, 2020. https://www.sciencedirect.com/topics/mathematics/margin-of-error.
U.S. International Trade Commission (USITC). Digital Trade in the U.S. and Global Economies, Part 2. USITC Publication 4485. Washington, DC: USITC, August 2014. https://www.usitc.gov/publications/332/pub4485.pdf.
U.S. International Trade Commission (USITC). Foreign Censorship, Part 1: Policies and Practices Affecting U.S. Businesses. USITC Publication 5244. Washington, DC: USITC, February 2022. https://www.usitc.gov/sites/default/files/publications/332/pub5244.pdf.

Foreign Censorship Part 2: Trade and Economic Effects on U.S. Businesses
64 | www.usitc.gov

Chapter 3: Effects of Foreign Censorship on Social Media, Over-the-Top Communications Services, and Internet Search
United States International Trade Commission | 65
Chapter 3 Effects of Foreign Censorship on Social Media, Over-the-Top Communications Services, and Internet Search This chapter describes and estimates the economic effects of censorship-related measures experienced by U.S. services providers, specifically social media and user-generated video platforms; over-the-top (OTT) communications services, such as WhatsApp; and internet search providers.84
The digital product and services providers highlighted in the following case studies are impacted by a similar set of direct censorship measures, including internet shutdowns, throttling, and short-term market blocks. Temporary services disruptions, such as shutdowns and short-term blocking, intentionally restrict access to internet-based communications and information services in order to control information and mostly occur in key markets other than China given its reliance on the “Great Firewall” and other means to engage in censorship.85 These providers also face censorship-enabling measures, which include laws or government actions that may enable or facilitate government suppression of speech, such as long-term market access blocks for particular products or services.86
Digital product and services providers generate revenue through a variety of means, many indirect, so there are several ways the losses attributable to services disruptions or market access blocks can be incurred by firms. However, losses incurred by these firms are primarily from foregone revenue due to a pause in consumer purchases and/or delivery of advertisements during the shutdown period or, in the case of long-term market access blocks, due to the inability to provide their services. Indeed, the largest estimated economic impact on U.S. digital product and services firms comes from long-term market access restrictions, predominantly in China. As highlighted in each of the case studies below, because of China’s market size, any restriction on the market participation of U.S. firms could result in substantial economic costs. However, as discussed in Foreign Censorship 1, because there can be overlapping motivations for the imposition of market access restrictions on foreign firms, whether such measures may be considered censorship-enabling depends on the context and the ends to which such measures are used.
While the purpose of this chapter is to describe and quantify impacts of foreign censorship-related measures on U.S. digital services providers, different direct censorship measures affect their services in
84 OTT communications applications provide instant messaging and other communications services over the internet rather than through cellular voice networks operated by traditional telecommunications services. 85 For more information on each of these direct censorship measures, see USITC, Foreign Censorship, Part 1, 2022, 41–49. 86 The Commission’s estimates of the costs of censorship-enabling measures are subject to the caveat that these measures may have multiple policy objectives, so the estimated effects associated with such measures are broader than only the effects of censorship. For more information on each of these censorship-enabling measures, see USITC, Foreign Censorship, Part 1, 2022, 49–53.
Foreign Censorship Part 2: Trade and Economic Effects on U.S. Businesses
66 | www.usitc.gov
a nearly identical way (i.e., preventing users from accessing one or more of their services), which creates a challenge for analysis. Relatedly, there is no information on how internet-user activity changes across these services after an internet shutdown ends. Such activity may remain depressed, which would exacerbate the effects of a shutdown, or activity may increase beyond levels prior to the shutdown, which would ameliorate the shutdown’s effect. A challenge, with respect to market access restrictions in China, is the lack of baseline information for comparison. These digital services have either been blocked or have faced repetitive access restrictions in China for nearly 10 years, in the case of Facebook, YouTube, and Google, or information on market share is not available prior to blocking, in the case of WhatsApp.87 Analyzing these situations necessitates assumptions, and these assumptions may lead to large ranges of estimated effects. Further, as discussed in chapter 1, these services generate revenue through disparate means, such as advertising, subscriptions, sales of content downloads, and/or leveraging user data. However, data at this level of detail are not available for all services analyzed here, nor are the available data, such as total revenue, consistently available across services, thus limiting the comparability of results. For example, revenue data for OTT communications services are not available, which leads to estimations of foregone users for those services.
Summary of Key Findings • Temporary internet shutdowns and throttling can have a significant effect on digital product and
services providers since user access to one or more of their services is reduced or eliminated. This can result in foregone revenue when consumer purchases are paused and/or advertisements are not viewed by users during the course of a shutdown. These disruptions can also reduce the income of businesses and individual users that rely on those sites to disseminate content. • For social media and user-generated video (UGV) services providers, the impact of service
disruptions is calculated for Meta Platforms, Inc.’s (Meta) Facebook and Instagram, Google’s YouTube, and Twitter. The estimated loss to revenue varies across markets—from $68.4 million in India in 2021 to $82.2 million in Indonesia in 2019.88
• For OTT communications applications, the estimated annual loss in revenues of service disruptions to WhatsApp varies by country and year—from a low of $50,000 in Russia in 2021 to a high of $81.2 million in India in 2020.89
87 Although the Commission analyzes costs and foregone revenue resulting from censorship-related measures in this chapter for specific services, those effects will be reflected in the performance of the parent companies of those services. For example, YouTube and Google search services are owned by Google LLC, which is held by Alphabet Inc. (Alphabet). 88 The years analyzed correspond to instances of service disruptions by governments in key markets during that year. For the estimation methodology, see “Effects of Short-Term Services Disruptions in India, Indonesia, Russia, and Turkey” under Social Media and User-Generated Video. 89 For the estimation methodology, see “Services Disruptions” under Over-the-Top Communications Services.

Chapter 3: Effects of Foreign Censorship on Social Media, Over-the-Top Communications Services, and Internet Search
United States International Trade Commission | 67
• For internet search, advertising revenue losses due to internet shutdowns in India (the largest user of shutdowns) are estimated at $3.5 million in 2019, $7.3 million in 2020, and $1.2 million in 2021.90
• Censorship-related market access restrictions impact digital product and services providers by blocking users’ ability to access their services and thus contribute to foregone revenue, which can be substantial depending on the market. • Due to market access restrictions faced by social media and UGV services providers, the
Commission estimates that Facebook’s annual advertising revenue losses in China ranged from $3.1 billion to $13.3 billion in 2021, while YouTube’s loss of revenue would range from $100 million to $7.5 billion in 2021, depending on the assumed market share scenario.91
• For OTT communications services, the Commission estimated the number of foregone users in China in 2020 due to market access blocks, or application bans, would be 134–1,113 million for WhatsApp, 676–805 million for Facebook Messenger, 172–588 million for Snapchat, and 194–316 million for Skype.92
• For internet search, the Commission estimates that, because Google search is blocked from the Chinese market, the business misses out on a substantial amount of annual revenue—for example, in 2021, it would have earned between $2.6 billion and $15.5 billion.93
Social Media and User-Generated Video Social media may refer to a broad range of online platforms, including social networks, video-sharing platforms, and “blogs, forums, business networks, photo-sharing platforms, social gaming, microblogs, [and] chat apps.”94 For the purposes of this report, and to the extent possible, we have separated out social media and UGV platforms from chat apps.95 Social media includes social and business networks like Meta’s Facebook96 and LinkedIn (owned by Microsoft), while UGV includes platforms like YouTube (owned by Google) 97, where users can upload videos they have created, or like Twitch (owned by Amazon), where users live-stream content, predominantly of themselves playing video games.
One of the challenges of analyzing the social media and UGV market is the differences in company organization and range of products offered. These differences limit the Commission’s ability to directly compare certain metrics across platforms or to break out services like chat apps from other social media
90 For the estimation methodology, see “Estimated Internet Search Advertising Revenue Lost Due to Services Disruptions” under Internet Search. 91 For the estimation methodologies, see “Estimated Foregone Revenue for Facebook in China” and “Estimated Foregone Revenue for YouTube in China” under Social Media and User-Generated Video. 92 For the estimation methodology, see “Market Access Restrictions” under Over-the-Top Communications Services. 93 For the estimation methodology, see “Market Access Restrictions” under Internet Search. 94 Statista database, “Social Media Statistics & Facts,” February 25, 2021. 95 See the OTT Communications Services section below for a discussion of chat apps and other messaging services. 96 Meta is the parent company of Facebook. Facebook, along with Meta’s other products including Instagram, are typically referred to separately, when applicable, in this section. 97 Alphabet Inc. is the parent company of Google LLC, which also owns YouTube. YouTube is typically referred to separately, when applicable, in this section.

Foreign Censorship Part 2: Trade and Economic Effects on U.S. Businesses
68 | www.usitc.gov
applications, in order to classify and analyze similar types of product offerings. In the case of U.S. platform providers such as Meta, services provided are not as horizontally-integrated as those from Chinese providers, and available metrics, such as user and revenue data, are limited across the different services. For example, Facebook and Instagram are separate social networks that include chat/messaging capabilities, while Chinese platforms such as WeChat are integrated platforms that combine services and associated metrics such as messaging, social media, ride-booking, review sites, electronic payments, and games.98 In cases where UGV content appears as part of a larger social media platform, such as Instagram which includes both photo and video sharing, the platform is considered social media, rather than UGV. UGV does not include subscription-based video services such as those supplied by Netflix or Chinese firm iQIYI.99 In addition to social media and UGV, other types of user-generated content include blogs; podcasts; and reviews on platforms such as Amazon, Yelp, and Tripadvisor.100
In the social media market, the top global platforms are headquartered either in the United States or China. As shown in figure 3.1, in terms of global users, Meta’s Facebook and Instagram are the largest social media platforms, followed by WeChat and Tencent QQ (QQ). From 2018 through 2021, the global number of Facebook users grew by about 30 percent while WeChat users grew about 18 percent over the same period.101
98 Brightbil l , written submission to the USITC, July 15, 2021, 4; Kharpal, “Everything You Need to Know about WeChat,” February 4, 2019; Meta, “Form 10-K”, February 2, 2022, 4, 56; Tencent, Tencent 2021 Annual Report, 2022, 4. 99 Subscription video on demand services are considered separately in chapter 4. 100 However, these types of user-generated content are not considered in this report due to lack of comparable data across platforms/countries on metrics such as users or revenue. 101 Statista, “Facebook: Number of Monthly Active Users Worldwide 2008–2021,” February 14, 2022; Statista, “Number of Active WeChat Messenger Accounts Q2 2011-Q3 2021,” February 8, 2022. Facebook and WeChat data are based on the number of monthly active users worldwide as of Q2 2018 and Q2 2021.

Chapter 3: Effects of Foreign Censorship on Social Media, Over-the-Top Communications Services, and Internet Search
United States International Trade Commission | 69
Figure 3.1 Global active users of social media platforms and the country where the company is headquartered, 2021 In bi llions of active users. Underlying data for this figure can be found in appendix J, table J.15.
Uni ted States
United States
China
China
China
United States
United States
0.0 0.5 1.0 1.5 2.0 2.5 3.0 3.5
Weixin / WeChat
Sina Weibo
Bil l ions of active users
Com
pany
and
com
pany
hea
dqua
rter
loca
tion
Source: Kemp, “Digital 2021 October Global Statshot Report,” October 21, 2021, 62. Note: Figure based on broader list of top social networking platforms and excluding, when applicable, user-generated video platforms, messaging platforms, and others.
Similarly, in the UGV market, the major global platforms are either headquartered in the United States or China. As shown in figure 3.2, in terms of global users, YouTube is the largest platform for user-generated video, followed by the Chinese platform TikTok/Douyin (owned by ByteDance).102 From 2018 through 2021, the number of global TikTok users grew by approximately 269 percent while YouTube users grew by about 28 percent over a similar period.103
102 TikTok is the global version of the video platform, while Douyin is the Chinese market-specific version of the platform. 103 Statista, “YouTube Users in the World 2017–2025,” July 20, 2021; Statista, “TikTok Global Monthly Active Users 2018–2021,” January 28, 2022. TikTok growth rate calculated based on global monthly active users from December 2018 to September 2021. YouTube growth rate calculated based on estimated average monthly users for each year from 2018 to 2021.

Foreign Censorship Part 2: Trade and Economic Effects on U.S. Businesses
70 | www.usitc.gov
Figure 3.2 Global active users of user-generated video platforms and the country where the company is headquartered, 2021 In bi llions of active users. Underlying data for this figure can be found in appendix J, table J.16.
Uni ted States
China
China
United States
China
United States
0.0 0.5 1.0 1.5 2.0 2.5
YouTube
TikTok/Douyin
Kuaishou
Vimeo
Youku Tudou
Twitch
Bil l ions of active users
Com
pany
and
com
pany
hea
dqua
rter
loca
tion
Source: Kemp, “Digital 2021 October Global Statshot Report,” October 21, 2021, 62; Statista, “Leading Online Video Platforms in China,” February 3, 2022; Twitch, “Audience,” accessed January 4, 2022; Vimeo, “Vimeo,” accessed January 4, 2022. Note: Data represent monthly active users for YouTube, TikTok, and Kuaishou for October 2021, and January 2021 for Youku Tudou (Youku). Data represent daily active users for Twitch and Douyin in 2021 and thus may underestimate total monthly active users. Data for Vimeo represent total users. Figure does not include platforms that primarily host subscription-based content, such as Netflix or iQIYI.
Services Disruptions U.S. social media and UGV platforms are negatively affected by short-term services disruptions in foreign markets. Access to social media services can be disrupted via three types of actions: internet shutdowns, where access to the internet is completely cut off for an entire country or region; targeted access blocks of specific sites or services; or throttling, which decreases the speed of accessing the internet or a specific site/services so severely that sites/services are rendered unusable.104 There are two separate estimation exercises in this section. The first estimates the total economic losses to users (e.g., the loss to local GDP) of U.S. social media and UGV platforms in India, Indonesia, Russia, and Turkey due to short term services disruptions of these platforms. The second estimates the foregone revenue of Meta’s platforms being throttled for seven weeks in Vietnam in 2020.
There are several recent examples of internet shutdowns and other short-term blocks in key markets, not including China, that impacted services described in this chapter:105
104 Woodhams and Migliano, “The Global Cost of Internet Shutdowns 2021,” January 3, 2022. 105 For a more comprehensive l ist of recent internet shutdowns, see USITC, Foreign Censorship, Part 1, 2022, 46–47, 107–108, 128. Recent reports on internet shutdowns show zero incidents in China, as Chinese authorities have instead used the various controls known as the “Great Firewall” to control the flow of internet services and
Chapter 3: Effects of Foreign Censorship on Social Media, Over-the-Top Communications Services, and Internet Search
United States International Trade Commission | 71
• Indonesia: Indonesia’s Communications Ministry shut down internet access in the Papua and West Papua provinces to curb protests.106 This affected social media providers, OTT communications services, and internet search providers. The shutdown lasted through September 2019 and was later ruled illegal by a panel of judges of the Jakarta State Administrative Court.107 Internet services were again shut down in West Papua’s capital Jayapura in May 2021 amid a military operation.108
• India: India imposed internet shutdowns more than any other key market. InternetShutdowns, a resource maintained by the Software Freedom Law Center India, reported 558 national and local internet shutdowns in India in 2012–22. During that 10-year period, more than half occurred in 2018–20 and primarily affected India’s union territory of Jammu and Kashmir.109 The “preventative” shutdown and subsequent throttling of internet in Jammu and Kashmir began on August 4, 2019, and lasted 552 days.110 During this shutdown, no internet was available to users until January 2020, after which some verified users were able to access white-listed websites at low speed (2G).111 Internet shutdowns in India have been so pervasive that even the country’s Parliamentary Standing Committee on Information Technology reported that frequent shutdowns cause substantial harm to the economy of the country.112
• Russia: In March 2021, Roskomnadzor, the Russian media and telecommunications regulator, throttled traffic to Twitter. While the official reason for the throttling was the company’s inaction on removal of inappropriate content, this action may also have been linked to the organization of protests related to opposition politician Alexei Navalny.113
• Turkey: In February 2020, the Turkish government blocked access to several social media platforms and other services, including Facebook, YouTube, Instagram, WhatsApp, and Twitter, due to content containing alleged disinformation on Turkish troop activity in Syria.114
information. Woodhams and Migliano, “The Global Cost of Internet Shutdowns 2021,” January 3, 2022; Woodhams and Migliano, “The Cost of Internet Shutdowns 2020,” accessed January 14, 2022. 106 Government of Indonesia, Data Service Blocking in Papua and West Papua, August 21, 2019; Beo Da Costa, “Internet Shut Down in Papua to Stem Unrest,” August 22, 2019. 107 Government of Indonesia, Decision on Case 230/G/TF/2019/PTUN.JKT, June 3, 2020; Access Now, “Court Rules the Internet Shutdowns,” June 3, 2020. 108 RNZ, “Internet Cut in Papua,” May 3, 2021. 109 Software Freedom Law Center India, “Internet Shutdowns,” accessed March 22, 2022; USITC, Foreign Censorship, Part 1, 2022, 46. 110 A preventative shutdown is one that is imposed in anticipation of or in preparation for an event. A reactive shutdown is one that is imposed to control or restore law and order after an event that threatens public safety has already begun. The majority of shutdowns in India are preventative shutdowns. Software Freedom Law Center India, “Internet Shutdowns,” accessed March 22, 2022. The shutdown in Jammu and Kashmir was scaled back over time, after the Supreme Court of India affirmed the freedom to practice any profession, trade, business, or occupation over the internet as a constitutionally protected fundamental right. Supreme Court of India, Anuradha Bhasin v. Union of India, January 10, 2020, 127–128. 111 Software Freedom Law Center India, “Internet Shutdowns,” accessed March 22, 2022; Government of Jammu and Kashmir (India). Government Order No: Home-07 (TSTS) of 2021, February 5, 2021; Woodhams and Migliano, “The Global Cost of Internet Shutdowns 2021,” January 3, 2022; Associated Press, “India Restores 4G Mobile,” February 6, 2021. 112 Government of India, Ministry of Communications, Suspension of Telecom Services, December 2021. 113 Stokel-Walker, “Russia’s Internet Censorship Machine,” December 18, 2021. 114 Woodhams and Migliano, “The Global Cost of Internet Shutdowns 2020,” January 3, 2021.
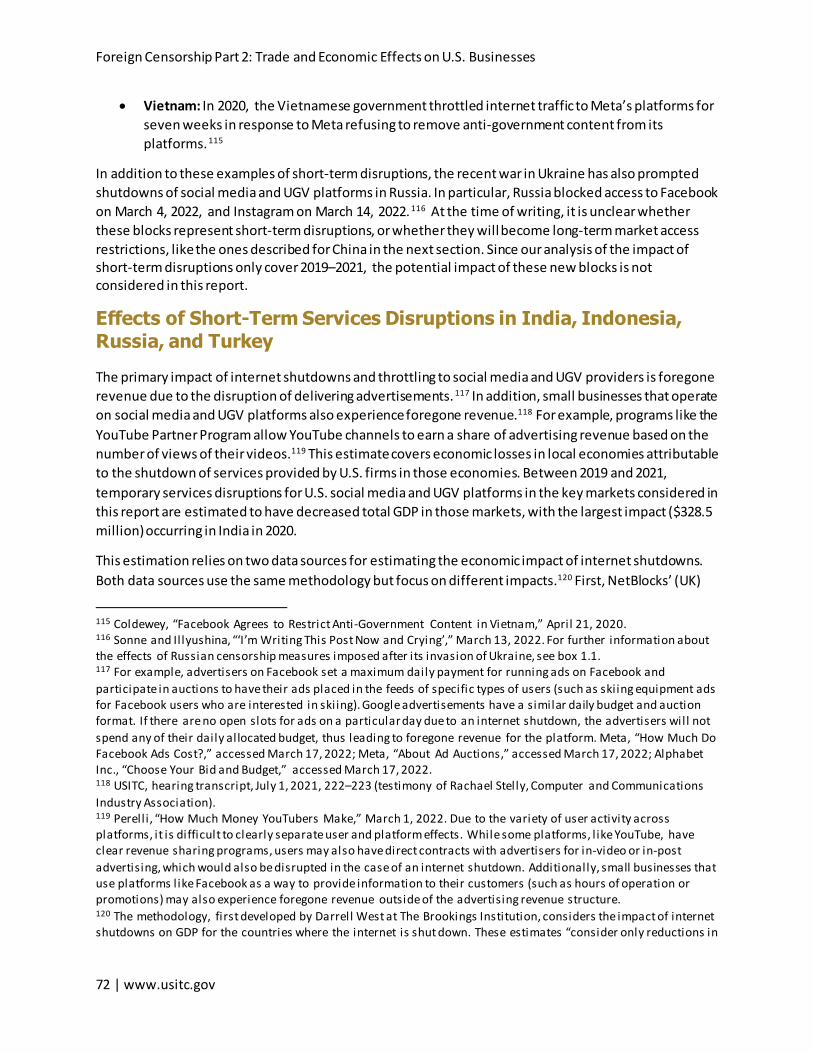
Foreign Censorship Part 2: Trade and Economic Effects on U.S. Businesses
72 | www.usitc.gov
• Vietnam: In 2020, the Vietnamese government throttled internet traffic to Meta’s platforms for seven weeks in response to Meta refusing to remove anti-government content from its platforms.115
In addition to these examples of short-term disruptions, the recent war in Ukraine has also prompted shutdowns of social media and UGV platforms in Russia. In particular, Russia blocked access to Facebook on March 4, 2022, and Instagram on March 14, 2022.116 At the time of writing, it is unclear whether these blocks represent short-term disruptions, or whether they will become long-term market access restrictions, like the ones described for China in the next section. Since our analysis of the impact of short-term disruptions only cover 2019–2021, the potential impact of these new blocks is not considered in this report.
Effects of Short-Term Services Disruptions in India, Indonesia, Russia, and Turkey The primary impact of internet shutdowns and throttling to social media and UGV providers is foregone revenue due to the disruption of delivering advertisements.117 In addition, small businesses that operate on social media and UGV platforms also experience foregone revenue.118 For example, programs like the YouTube Partner Program allow YouTube channels to earn a share of advertising revenue based on the number of views of their videos.119 This estimate covers economic losses in local economies attributable to the shutdown of services provided by U.S. firms in those economies. Between 2019 and 2021, temporary services disruptions for U.S. social media and UGV platforms in the key markets considered in this report are estimated to have decreased total GDP in those markets, with the largest impact ($328.5 million) occurring in India in 2020.
This estimation relies on two data sources for estimating the economic impact of internet shutdowns. Both data sources use the same methodology but focus on different impacts.120 First, NetBlocks’ (UK)
115 Coldewey, “Facebook Agrees to Restrict Anti-Government Content in Vietnam,” April 21, 2020. 116 Sonne and Il lyushina, “‘I’m Writing This Post Now and Crying’,” March 13, 2022. For further information about the effects of Russian censorship measures imposed after its invasion of Ukraine, see box 1.1. 117 For example, advertisers on Facebook set a maximum daily payment for running ads on Facebook and participate in auctions to have their ads placed in the feeds of specific types of users (such as skiing equipment ads for Facebook users who are interested in skiing). Google advertisements have a similar daily budget and auction format. If there are no open slots for ads on a particular day due to an internet shutdown, the advertisers will not spend any of their daily allocated budget, thus leading to foregone revenue for the platform. Meta, “How Much Do Facebook Ads Cost?,” accessed March 17, 2022; Meta, “About Ad Auctions,” accessed March 17, 2022; Alphabet Inc., “Choose Your Bid and Budget,” accessed March 17, 2022. 118 USITC, hearing transcript, July 1, 2021, 222–223 (testimony of Rachael Stelly, Computer and Communications Industry Association). 119 Perell i , “How Much Money YouTubers Make,” March 1, 2022. Due to the variety of user activity across platforms, it is difficult to clearly separate user and platform effects. While some platforms, l ike YouTube, have clear revenue sharing programs, users may also have direct contracts with advertisers for in-video or in-post advertising, which would also be disrupted in the case of an internet shutdown. Additionally, small businesses that use platforms l ike Facebook as a way to provide information to their customers (such as hours of operation or promotions) may also experience foregone revenue outside of the advertising revenue structure. 120 The methodology, first developed by Darrell West at The Brookings Institution, considers the impact of internet shutdowns on GDP for the countries where the internet is shut down. These estimates “consider only reductions in

Chapter 3: Effects of Foreign Censorship on Social Media, Over-the-Top Communications Services, and Internet Search
United States International Trade Commission | 73
“Cost of Shutdown” tool estimates the hypothetical economic impact as gross domestic product (GDP) losses, by country, of an internet shutdown, including both total losses to the economy and social media and UGV-specific losses.121 For example, in India, NetBlocks estimates that a hypothetical country-wide internet shutdown would result in $1,431.0 million per day in economic losses in India. In the same hypothetical country-wide shutdown, NetBlocks estimates that U.S. social media and UGV platforms and users (including Facebook, Instagram, Twitter, and YouTube) experience economic losses of $167.9 million per day.122 This suggests that in India, if the internet is shut down, U.S. social media and UGV platform losses would represent 11.7 percent of the total economic losses. Similarly, in the other key markets considered, NetBlocks’ estimates imply that U.S. social media and UGV platform losses would represent between 23.5 percent and 43.8 percent of total losses due to an internet shutdown (table 3.1). Variations in these loss shares likely reflect differences in the overall composition of each economy.123 For example, in India, the domestic information and communications sector comprised 17.7 percent of Indian GDP in 2021, compared to only 4.4 percent of GDP in Indonesia.124 Thus, even if the disruptions to social media affect a similar number of users across markets, since overall technology services activity is higher in India, disruptions to social media have a relatively smaller effect on a GDP-basis.
The NetBlocks’ tool is useful for understanding the contribution of U.S. social media platforms to total economic activity in these markets in the case of a shutdown. However, using this data source alone, because the calculations are based on hypothetical disruptions of the entire population, the calculations
economic activity and do not account for tax losses or drops in investor, business, and consumer confidence.” In particular, the underlying methodology makes two adjustments to the calculation of free app shutdown losses to capture effects beyond the losses to firms. First, it accounts for the nonmonetary benefits to users for free services by assuming that use of free services contributes 0.23 of 1 percent of national GDP. Second, it uses a multiplier of 1.54 in West’s estimates to reflect the spil lover role of internet-based transactions for supporting other economic activity. West, Internet Shutdowns Cost, October 2016. West, Internet Shutdowns Cost, October 2016. 121 While NetBlocks cites the 2016 West paper as the source of their methodology, there is l imited documentation on how the organization has updated the work for more recent years. As such, additional clarification to the methodology has been added where possible in this analysis but is l ikely incomplete. NetBlocks, “Cost of Shutdown Tool,” accessed January 3, 2022. NetBlocks has been cited by international organizations, such as the United Nations, that document digital technology use. Esberg and Mikulaschek, “Digital Technologies, Peace, and Security,” August 25, 2021. 122 These values are calculated using economic indicators from 2020. The contribution of free platforms to total GDP applied in the NetBlocks is stated to follow the approach of West, and thus may also assume that free services contribute 0.23 of 1 percent of GDP. While the Commission was unable to confirm that the 0.23 percent value was used, using GDP data for 2020, the Commission was able to confirm that the losses associated with social media and UGV platforms comprised the same share of total GDP in each market considered, indicating a consistent parameter was used to estimate social media/UGV losses across markets. NetBlocks, “Cost of Shutdown Tool,” accessed January 3, 2022. 123 The 2016 West paper uses estimates of the percentage of each country’s GDP that is derived from the internet economy based on Boston Consulting Group projections. For the markets considered in this report, India has the highest internet economy share of GDP (5.6 percent), followed by Russia (2.8 percent), Turkey (2.3 percent), and Indonesia (1.5 percent). The most recent updates from NetBlocks (November 9, 2021) indicate these figures have been increased by 10 percent annually for the 2020 edition of the tracker. NetBlocks, “Cost of Shutdown Tool,” accessed January 3, 2022. West, Internet Shutdowns Cost, October 2016. 124 NSO, Ministry of Statistics & Programme Implementation (India), “Provisional estimates of Annual National Income,” May 31, 2021; Badan Pusat Statistik (Indonesia), “Quarterly GDP Distribution,” February 7, 2022.

Foreign Censorship Part 2: Trade and Economic Effects on U.S. Businesses
74 | www.usitc.gov
cannot be used to estimate actual losses because shutdowns are often regional. For example, this tool estimates losses for all internet users in India; but in 2021, the longest internet disruption affected internet users only in India’s union territory of Jammu and Kashmir.125
Table 3.1 Share of country-wide economic losses of hypothetical internet shutdowns for U.S. social media and UGV services, by key market, 2020 Shares in percentages. UGV = User-Generated Videos. Market Share of total losses (%) India 11.7 Indonesia 43.8 Russia 23.5 Turkey 28.6
Source: USITC calculations using data from NetBlocks, “Cost of Shutdown Tool,” accessed January 3, 2022. Note: No data on shutdowns were reported for Vietnam over this period. U.S. social media and UGV services include Facebook, Instagram, YouTube and Twitter. Cost of Shutdown Tool uses data from 2020.
The second source, Top10VPN (launched by PrivacyCo, a UK company), uses the NetBlocks’ tool to consider the total economic losses associated with actual instances of short-term services disruptions by country and year, and is available for India, Indonesia, Russia, and Turkey. For region specific shutdowns like the throttling in Jammu and Kashmir described above, Top10VPN scales the total losses reported by NetBlocks to a specific region based on that region’s output as a share of total GDP.126 Thus, to estimate actual economic losses specifically for U.S. social media and UGV users, the Commission applied the estimated share of economic losses attributed to a hypothetical one-day shutdown of these platforms (table 3.1) to the actual regional economic losses reported by Top10VPN. The total economic losses due to shutdowns, blocks of specific services, and throttling vary considerably across the four markets due in large part to the length of the disruption and the number of users affected (table 3.2).127 Columns 1, 3, and 5 show the Top10VPN’s estimates for total economic losses for 2019, 2020, and 2021.128 Finally, columns 2, 4, and 6 apply equation 1 to the total losses in columns 1, 3, and 5 to estimate the social media- and UGV-related losses.
Overall, estimated losses to a local economy due to the shutdown of a specific service or group of services provided by U.S. firms were the highest in India due to short-term services disruptions from 2019 to 2021, with estimated total economic losses ranging from $68.4 to $328.5 million. In Indonesia, losses were similar in magnitude, at $82.2 million in 2019. In smaller markets (in terms of population), Russia and Turkey, losses ranged from $200,000 in Russia in 2021 to $14.6 million in Turkey in 2020.
125 Woodhams and Migliano, “The Global Cost of Internet Shutdowns 2021,” January 3, 2022. 126 Woodhams and Migliano, “The Global Cost of Internet Shutdowns 2021,” January 3, 2022. 127 Loss estimates were reported for only the top 21 internet shutdowns per year, and thus may exclude smaller scale shutdowns in key markets. Woodhams and Migliano, “The Global Cost of Internet Shutdowns 2021,” January 3, 2022. 128 Data on internet shutdowns from Top10VPN are not available for Vietnam.

Chapter 3: Effects of Foreign Censorship on Social Media, Over-the-Top Communications Services, and Internet Search
United States International Trade Commission | 75
Table 3.2 Estimated economic loss of actual internet shutdowns for U.S. social media and UGV services, by key market, 2019–2021 Estimates in millions of dollars. UGV = User-Generated Videos. Zeros indicate no internet shutdowns in that year.
Market
(1) Total 2019,
Top10VPN estimate
(2) Social media & UGV 2019,
USITC estimated economic losses
(3) Total 2020,
Top10VPN estimate
(4) Social media & UGV 2020,
USITC estimated economic losses
(5) Total 2021,
Top10VPN estimate
(6) Social media & UGV 2021,
USITC estimated economic losses
India 1,300.0 152.5 2,800.0 328.5 582.8 68.4 Indonesia 187.7 82.2 0.0 0.0 0.0 0.0 Russia 0.0 0.0 0.0 0.0 0.9 0.2 Turkey 0.0 0.0 51.1 14.6 0.0 0.0
Source: USITC calculations; NetBlocks, “Cost of Shutdown Tool,” accessed January 3, 2022; Woodhams and Migliano, “The Global Cost of Internet Shutdowns 2019,” January 7, 2020; Woodhams and Migliano, “The Global Cost of Internet Shutdowns 2020,” January 3, 2021; Woodhams and Migliano, “The Global Cost of Internet Shutdowns 2021,” January 3, 2022. Note: No data on shutdowns were reported for Vietnam over this period. U.S. social media and UGV services include Facebook, Instagram, YouTube and Twitter.
Effect of Short-Term Throttling of Meta Platforms in Vietnam In 2020, the Vietnamese government throttled internet traffic to Meta’s platforms (Facebook, Instagram, WhatsApp, and Facebook Messenger) for seven weeks in response to Meta refusing to remove anti-government content from its platforms (the block ended when Meta removed the content).129 The Commission estimates that this throttling, which rendered Meta platforms unusable due to slow loading speeds, cost Meta up to $8.5 million in foregone advertising sales in Vietnam.130
Before the throttling period, advertising spending on social media grew more slowly in Vietnam than in Asia as a whole, but generally, growth trends were parallel (figure 3.3).131 However, while both Vietnam and Asia as a whole continued to experience growth from 2019 to 2020, the gap between overall growth in Asia and advertising spending growth in Vietnam widened from 18.2 percentage points to 23.0 percentage points.132 Meta’s platforms represent 70 percent of all social media use in Vietnam in 2021, resulting in a 4.7 percentage point increase in the gap between ad spending growth in Vietnam and overall growth in Asia.133 We assume that the increase in this gap was driven by the throttling of Meta’s platforms in 2020 and estimate the advertising sales loss to Meta using several steps.134
129 Coldewey, “Facebook Agrees to Restrict Anti-Government Content in Vietnam,” April 21, 2020. 130 USITC calculations. 131 The choice to compare growth in social media ad spending in Vietnam to an all-Asia aggregate reflects the lower spending on advertising per user reported by Meta in Asia relative to the rest of the world, as detailed in the next section. 132 Statista database, “Social Media Advertising—Worldwide,” Vietnam-Ad Spending, accessed December 22, 2021; Statista database, “Social Media Advertising—Worldwide,” Global-Ad Spending, accessed December 22, 2021. 133 Statista database, “Social Media Advertising—Worldwide,” Vietnam-Key Players, accessed December 22, 2021. 134 An alternative to this approach would be to assume that the entire social media market in Vietnam was negatively affected by the throttling of Meta in Vietnam, and thus the total ad sales in 2020 represent only 45 weeks of sales (52 weeks per year minus 7 weeks throttled). Under this assumption, advertising sales per week for Meta totaled $4.04 mill ion, and therefore foregone sales would total $28.3 mill ion ($4.04 mill ion/week × 7 weeks).
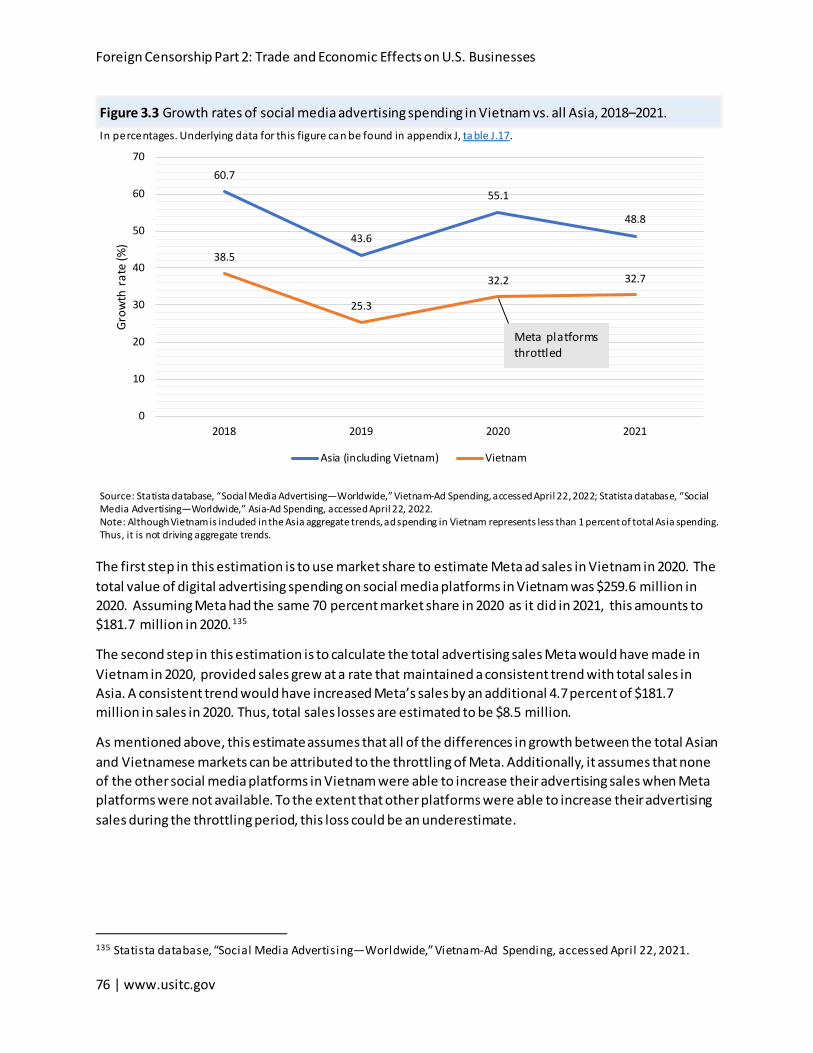
Foreign Censorship Part 2: Trade and Economic Effects on U.S. Businesses
76 | www.usitc.gov
Figure 3.3 Growth rates of social media advertising spending in Vietnam vs. all Asia, 2018–2021. In percentages. Underlying data for this figure can be found in appendix J, table J.17.
60.7
43.6
55.1
48.8
38.5
25.3
32.2 32.7
0
10
20
30
40
50
60
70
2018 2019 2020 2021
Grow
th r
ate
(%)
Asia (including Vietnam) Vietnam
Meta platforms throttled
Source: Statista database, “Social Media Advertising—Worldwide,” Vietnam-Ad Spending, accessed April 22, 2022; Statista database, “Social Media Advertising—Worldwide,” Asia-Ad Spending, accessed April 22, 2022. Note: Although Vietnam is included in the Asia aggregate trends, ad spending in Vietnam represents less than 1 percent of total Asia spending. Thus, it is not driving aggregate trends.
The first step in this estimation is to use market share to estimate Meta ad sales in Vietnam in 2020. The total value of digital advertising spending on social media platforms in Vietnam was $259.6 million in 2020. Assuming Meta had the same 70 percent market share in 2020 as it did in 2021, this amounts to $181.7 million in 2020.135
The second step in this estimation is to calculate the total advertising sales Meta would have made in Vietnam in 2020, provided sales grew at a rate that maintained a consistent trend with total sales in Asia. A consistent trend would have increased Meta’s sales by an additional 4.7 percent of $181.7 million in sales in 2020. Thus, total sales losses are estimated to be $8.5 million.
As mentioned above, this estimate assumes that all of the differences in growth between the total Asian and Vietnamese markets can be attributed to the throttling of Meta. Additionally, it assumes that none of the other social media platforms in Vietnam were able to increase their advertising sales when Meta platforms were not available. To the extent that other platforms were able to increase their advertising sales during the throttling period, this loss could be an underestimate.
135 Statista database, “Social Media Advertising—Worldwide,” Vietnam-Ad Spending, accessed April 22, 2021.

Chapter 3: Effects of Foreign Censorship on Social Media, Over-the-Top Communications Services, and Internet Search
United States International Trade Commission | 77
Market Access Restrictions Of the key markets covered in this report, China has been the main country with long-term market access blocks of U.S. platforms to date. Examples of long-term blocks of U.S. platforms in other key markets include Russia’s ban on LinkedIn (banned in 2016).136 More recently, in March 2022, Russia began limiting access to both Facebook and Instagram, among other platforms (see box 1.1).137
Although most U.S. social media and user-generated video platforms are prevented from operating in China, they reportedly want to operate there as China is an important market for potential advertising revenue.138 It is difficult to measure losses from lack of market access, as effects extend to other U.S. business that use such platforms.139 Losing access to the Chinese market likely has a disproportionately negative effect on small firms with limited resources; such firms may operate in only a few markets and be forced to shut down completely without revenue from China’s users.140
The list of platforms blocked in China includes two Meta platforms—Facebook (banned in 2009) and Instagram (banned in 2014)—Twitter (banned in 2009), and YouTube (banned in 2009), among others.141 LinkedIn had been a notable exception of a U.S. based social media platform that was able to operate in China. However, in October 2021, LinkedIn’s current Chinese iteration announced it was exiting the market to “remain in compliance with local law.”142 Going forward, LinkedIn in China will rebrand as a job-search portal rather than a social media platform.
Considerations in Estimating Revenue Losses Associated with Market Access Restrictions in China The analysis below estimates the revenue loss for YouTube and Facebook due to long-term market blocks in China. There are several important assumptions required to estimate the potential revenue streams for U.S. platforms absent a market access block. One is the estimate of market share U.S. firms would have in China absent the block. Since Chinese social media sites like WeChat include a broader suite of services than most U.S. social media sites, U.S. platforms’ success in the market may be limited due to differences in demand by Chinese consumers relative to consumers in the rest of the world. Similarly, services offered by current UGV platforms operating in China such as TikTok/Douyin differ from U.S. platform YouTube. As such, a range of estimates of foregone revenue is presented for both
136 BBC, “LinkedIn Blocked by Russian Authorities,” November 17, 2016; O’Driscoll, “List of Websites and Apps Blocked in Russia,” November 7, 2020. 137 GlobalCheck, “Instagram.com,” accessed March 21, 2022; GlobalCheck, “Facebook.com,” accessed March 21, 2022. 138 USITC, hearing transcript, July 1, 2021, 15 (testimony of Suzanne Nossel, PEN America); Yuan, “A Generation Grows Up in China Without Google, Facebook or Twitter,” August 6, 2018. 139 USITC, hearing transcript, July 1, 2021, 222–223 (testimony of Rachael Stelly, Computer and Communications Industry Association). 140 Industry representative, interview with USITC staff, August 3, 2021. 141 Leskin, “Here Are All the Major US Tech Companies Blocked,” October 10, 2019; GreatFire Analyzer, “Censorship of Alexa Top 1000 Domains in China,” accessed July 27, 2021. 142 Iyengar, “LinkedIn China Is Shutting Down,” October 15, 2021.
Foreign Censorship Part 2: Trade and Economic Effects on U.S. Businesses
78 | www.usitc.gov
YouTube and Facebook, based on whether the U.S. platforms capture a small, medium, or large share of the Chinese market. A large market share assumes that Facebook or YouTube catch up to the current leaders in the Chinese market and results in the largest estimate of foregone revenue. Medium and small shares assume progressively smaller market shares.
An additional important assumption is the source of revenue these U.S. firms would potentially earn in China. Social media and UGV services typically earn revenues through a combination of subscriptions, advertising, and sales of content downloads, but different firms have different revenue models. In particular, the share of advertising revenue to total revenue may vary across platforms. For example, WeChat’s revenue appears to be primarily driven by sales of digital content while Facebook’s revenue is primarily driven by advertising.143 Using WeChat’s reported revenue to estimate foregone advertising revenue for U.S. firms in China may underestimate such revenue potential. As such, the social media estimate below is based on revenue data specific to Facebook and assumes that the platform‘s advertising-driven business model would be successful in China.144 Although this distinction is not apparent for UGV platforms (as advertising revenue appears to be the main source of revenue for both YouTube and TikTok/Douyin) the UGV estimation is based on revenue data specific to YouTube.145
The estimates that appear below in tables 3.3 and 3.4 focus on foregone revenue for U.S. platforms denied market access in China, consistent with how this report uses the term “economic impact”. These estimates do not focus on other financial impacts such as profits and compliance costs.146 Costs associated with operating a platform in the Chinese market, including censorship compliance costs, are not necessarily additive and are a challenge to quantify. Such costs include complying with China’s strict internet intermediary liability regime to moderate and promote certain content.147 For example, higher spending in the form of technology and human resources would likely be necessary to comply with government regulations and monitor social media content.148 Some industry observers also suggest that the costs incurred to build local data centers required by China could be considered at least in part an indirect censorship cost as these observers contend that local data storage enables surveillance and therefore may chill speech.149 In addition, there may be indirect reputational costs of compliance with
143 Statista, “China—Revenue Distribution of WeChat by Channel 2016,” September 15, 2016; Meta, “Form 10-K,” February 2, 2022, 58. Also see Tencent, Tencent 2021 Annual Report, 2022, 10. 144 The social media estimation focuses on foregone advertising revenue based on Asia-Pacific revenue and user data. Due to more l imited data on YouTube revenue, the UGV estimation focuses on global rather than Asia-Pacific revenue. 145 Statista, “Top Internet Companies Digital Advertising Revenues 2021,” January 24, 2022; Kharpal, “TikTok Owner ByteDance’s Revenue Surged,” June 17, 2021; Alphabet Inc. Alphabet: Year in Review 2020, 2021. 146 The Commission attempted to collect information in its survey that may have helped quantify these impacts but did not receive enough responses to produce generalizable estimates that extrapolate to the broader population of companies doing business in China. 147 USITC, Foreign Censorship, Part 1, 2022, 49–50. 148 USITC, hearing transcript, July 1, 2021, 37 (testimony of Maria Repnikova, Georgia State University); USITC, hearing transcript, July 1, 2021, 22 (testimony of Nathalie Maréchal, Ranking Digital Rights); for potentially rising compliance costs, see Qu, “China’s Top Propaganda Agencies Want to Limit,” August 3, 2021. 149 USITC, hearing transcript, July 1, 2021, 38–39, 98–99 (testimony of Maria Repnikova, Georgia State University); USITC, hearing transcript, July 1, 2021, 140 (testimony of Aynne Kokas). See e.g., Government of China, State Council, Cybersecurity Law, November 7, 2016, art. 37.

Chapter 3: Effects of Foreign Censorship on Social Media, Over-the-Top Communications Services, and Internet Search
United States International Trade Commission | 79
China’s regulations.150 When foreign companies self-censor in China, as has reportedly been done by LinkedIn, they risk “a backlash from users and politicians in the West who see companies taking part in the suppression of free speech.”151
Estimated Foregone Revenue for Facebook in China This section quantifies Facebook’s potential revenue loss from market access denial to the Chinese market in 2021.152 Three hypothetical market shares (small, medium, and large) for the platform are presented, assuming the absence of a market access block. Market share scenarios are based on the position of currently active domestic platforms in China. The number of monthly active users implied in each scenario is multiplied by Facebook’s annual revenue per user (ARPU), specific to the Asia-Pacific region, to estimate a range of potential advertising revenue from China in 2021.
More specifically, as reported in Meta’s earnings filing, ARPU is measured as total revenue in a region for each quarter divided by average number of monthly active users in the region. ARPU annually for the year 2020 was $213.95 in the United States and Canada, and $17.29 in the Asia-Pacific region.153 These data reflect that although the United States and Canada account for the lowest regional share of Facebook users, those two countries generate the highest share of revenue. On the other hand, the Asia-Pacific region accounts for the highest share of monthly active users but generates among the lowest shares of revenue.154
Measured by social media advertising revenue in China during 2020, four Chinese platforms accounted for 85 percent of the market. Based on their share of revenue, Chinese platforms WeChat, QQ, and Qzone each accounted for 25 percent of the market, Sina Weibo accounted for 10 percent, while Microsoft’s LinkedIn comprised 5 percent, and other companies collectively represented 10 percent of the market.155 This information is used to inform the large (25 percent), medium (10 percent), and small (5 percent) market share scenarios as approximated by the number of users in the estimation below. Specifically, an average of WeChat and QQ’s active users (951.25 million and 584.69 million, respectively) are used in the large market share scenario; Sina Weibo’s active users (360.25 million) are used in the medium market share scenario; and half of Sina Weibo’s active (180.13 million) users are
150 USITC, hearing transcript, July 1, 2021, 37–39 (testimony of Maria Repnikova, Georgia State University). 151 Lin, “Scholars on LinkedIn Are Being Blocked in China,” June 25, 2021. 152 Statista, “China: Number of Facebook Users in China from 2017 to 2023,” August 16, 2021. Potentially through the use of virtual private networks, some users in China may have access to Facebook; in 2021, there were an estimated 3.2 mill ion Facebook users in China. 153 Meta, “Form 10-K,” February 2, 2022, 4, 58, 59. The annual ARPU figures for the United States, Canada, and the Asia-Pacific region were calculated by adding the quarterly ARPUs. Facebook’s “annual worldwide ARPU in 2021, which represents the sum of quarterly ARPU during such period, was $40.96.” 154 Meta, “Form 10-K,” February 2, 2022, 56–58. 155 Statista, Digital Advertising Report 2021—Social Media Advertising, July 2021, 12. Note this concept of market share is based on revenue data. More recent reports of market share appear to include video sharing applications and are not used in this analysis (see Statista, Digital Advertising Report 2021—Social Media Advertising, December 2021, 12). Other concepts, for example the shares of internet users of leading social networking platforms, may provide differing perspectives, see Statista, Social Media in China, accessed July 2, 2021, 11.

Foreign Censorship Part 2: Trade and Economic Effects on U.S. Businesses
80 | www.usitc.gov
used in the small market share scenario.156 Multiplying each by the annual sum of quarterly Facebook’s ARPU for the Asia-Pacific region for 2021 ($17.29) produces a range from $3.1 billion to $13.3 billion in estimated lost advertising revenue for Facebook in 2021 (table 3.3).
Table 3.3 Estimated potential range of annual revenue loss from market access denials to China, Facebook, 2021 Monthly active users in millions; estimated annual ad revenue losses in billions of dollars.
Market share scenario for Facebook
Estimated monthly active users in 2021
(million users)
Estimated annual ad revenue losses
(billion $) Large market share (25%) 768.0 13.3 Medium market share (10%) 360.3 6.2 Small market share (5%) 180.1 3.1
Source: USITC calculations; Statista, “China: Most Popular Apps 2021,” January 14, 2022; Meta, “Form 10-K,” February 2, 2022, 58. Note: Calculations of annual revenue are derived by multiplying monthly active users in November 2021 by the sum of quarterly Facebook’s ARPU (based on total revenue) for the Asia-Pacific region for 2021 ($17.29).
The estimated revenue losses presented above are well within industry estimates of total social media advertising revenue in China. Estimated social media advertising revenue was $28.8 billion in China in 2021, according to one source.157 Using this estimate along with market share data for the largest Chinese platforms, a platform with a larger share such as WeChat and QQ has an estimated $7.2 billion in annual revenue in China, while a smaller platform like Sina Weibo has an estimated $2.9 billion in annual revenue in the Chinese market.158
Estimated Foregone Revenue for YouTube in China Estimated revenue losses for YouTube are calculated using the same methodology as above. As in the case of social media, the current UGV platforms operating in China and YouTube may not be exactly comparable. For example, it is not clear whether TikTok/Douyin’s short-form videos directly compete with YouTube’s longer videos, or whether global users consider the two services different products and consume both.159
156 Statista, “China: Most Popular Apps 2021,” January 14, 2022. Data on monthly active users are based on leading apps in China for the November 2021 survey period. This statistic was chosen as it collectively presented users for the leading platforms in China. Other sources may report a higher number of users, for example see Q1 2021 data for Sina Weibo reports 530 mill ion monthly active users, see Statista, Social Media in China, accessed July 2, 2021, 22. 157 Statista, Digital Advertising Report 2021—Social Media Advertising, July 2021, 4. Estimates of social media advertising revenue in China range widely, potentially because of the scope of platforms included in the statistics. The estimated revenue has more recently been reported to be $45.1 bil l ion in 2021, but, as noted above, this estimate l ikely includes revenue for UGV, see Statista, Digital Advertising Report 2021—Social Media Advertising, December 2021, 4. Revenue has also been estimated at $16.1 bil l ion in 2021 (reported in yuan and converted to dollars at the rate one yuan = 0.15 U.S. dollars), see Statista, Social Media in China, accessed July 2, 2021, 10. 158 In 2021, Facebook’s total revenue was about $117.9 bil l ion and Asia-Pacific revenue was $21.7 bil l ion, see Meta, “Form 10-K,” February 2, 2022, 58. 159 YouTube’s 2020 launch of the “shorts” feature on its app, which is explicitly designed to compete with TikTok, suggests that its main platform may not directly compete with the TikTok. Bellan, “Is YouTube Trying to Compete with TikTok?” April 3, 2020.
Chapter 3: Effects of Foreign Censorship on Social Media, Over-the-Top Communications Services, and Internet Search
United States International Trade Commission | 81
Due to more limited data on YouTube revenue, this section uses YouTube ad revenue per user globally for 2021, rather than specific Asia-Pacific numbers on ad revenue per user. As a result, this estimate does not account for differences in the amount of ad revenue earned across different regions. In 2021, YouTube’s ad revenue per user was $12.88.160 In the UGV market for China, the large market share scenario is approximated using active users from Douyin (the China-specific version of TikTok); the medium market share is approximated using active users from Youku, which has drawn the closest comparison to YouTube in China; and active users from Haokan (a Baidu service) are used to approximate a low market share.161 These services were chosen based on the availability of information on the UGV market in China. Overall, these three comparisons suggest that YouTube’s foregone revenue from not operating in the Chinese market ranged from $147.2 million to $7.5 billion in 2021 (table 3.4). Given the difference in product offerings between TikTok/Douyin and YouTube, and the strong global growth of TikTok/Douyin noted above, the large market share scenario likely overestimates the potential market share YouTube could capture in the Chinese market. Additionally, apart from companies that offer platforms for short-form videos (Douyin), the Chinese UGV market has historically experienced churn in the top companies, rather than having a single firm capture the majority of the market share as YouTube does globally.162 Thus, the scenario where YouTube captures a medium share of the Chinese UGV market may be the most plausible estimate of revenue foregone, representing $1.9 billion in ad revenue in 2021. This also represents about 10 percent of overall revenue of the online video market in China in 2021 ($19.6 billion in 2021).163
Table 3.4 Potential range of annual ad revenue loss, YouTube, 2021 Monthly active users in millions; estimated annual ad revenue losses in billions of dollars.
Potential range of market share for YouTube
Monthly active users in 2021
(million users)
Estimated annual ad revenue losses
(billion $) Large market share 578.9 7.5 Medium market share 144.2 1.9 Small market share 11.4 0.1
Source: USITC calculations; Statista, “China: MAU of Leading Short Video Apps 2021,” December 2021; Statista, “Leading Online Video Platforms,” February 3, 2022; Alphabet Inc., “Form 10-K,” February 1, 2022, 33; Statista, “YouTube Users in the World 2017–2025,” July 20, 2021. Note: Calculations of annual ad revenue are derived by multiplying 2021 forecast YouTube users by YouTube revenue per user in 2021 ($12.88).
Box 3.1 Fines and Other Legal Actions for Failure to Remove Objectionable Content
In the markets covered in this report, U.S. platforms may face fines or other government action for failure to remove content that does not violate their terms of service but is objectionable to the
160 Revenue per user calculated by dividing total ad revenue from YouTube, $28.9 bil l ion, by number of users (2,240 mill ion) in 2021. Alphabet Inc., “Form 10-K,” February 1, 2022, 33; Statista, “YouTube Users in the World 2017–2025,” July 20, 2021. 161 As mentioned above, Douyin and TikTok are the same product, with Douyin available in the Chinese market, and TikTok available globally. Statista, “Online Videos in China,” March 9, 2021. 162 Statista, “Online Videos in China,” March 9, 2021. 163 Statista, “Online Videos in China,” March 9, 2021, 4. (Revenue reported in yuan and converted to dollars at the rate one yuan = 0.15 U.S. dollars).

Foreign Censorship Part 2: Trade and Economic Effects on U.S. Businesses
82 | www.usitc.gov
government. This box gives a brief overview of recent fines and legal actions that U.S. digital platforms, including Google and Meta, have faced in key markets.
Turkey: In 2020, Turkey introduced a law requiring local representatives of social media firms to ensure government content removal requests were enforced. Twitter was prohibited from advertising in Turkey and Twitter, Facebook, Instagram, and YouTube were each fined $5.1 million for failure to comply with the requirement to appoint a local representative to ensure enforcement of government content removal requests.a
Vietnam: In 2020, Meta platforms were throttled for seven weeks for failure to remove content critical of the Vietnamese government, leading to foregone revenue for the firm (discussed above).b
Russia: Both Meta and Google have faced fines for failure to remove content in Russia. In December 2018, Google was fined approximately $7,500 for failing to remove certain blacklisted entries from search results.c In 2020, Google was again fined about $41,000.d Most recently, on December 24, 2021, a Russian court issued a fine of $98 million to Google and $27 million to Meta for failure to remove banned content.e Both of these fines were tied to yearly revenue of the firms in Russia.f
a Government of Turkey, Parliament, Law No. 7253, July 29, 2020; Cato Institute, written submission to the USITC, July 22, 2021, 2; PEN America, Splintered Speech, June 15, 2021; Lyons, “Twitter Will Set Up,” March 20, 2021. b Coldewey, “Facebook Agrees to Restrict Anti-Government Content in Vietnam,” April 21, 2020. c “Blacklisted” entries defined by Russia’s 2012 Federal Law No. 139-FZ. Government of Russia, Federal Law No. 139-FZ, July 28, 2012; Axelrod, “Google Fined in Russia,” December 11, 2018. d Roache, “How Russia Is Stepping Up,” April 1, 2021. e Government of Russia, Judicial Precinct of Justice of the Peace No 422, Resolution on the Imposition of an Administrative Penalty, Case 05-3221/422/2021, December 24, 2021 (Meta); Government of Russia, Judicial Precinct of Justice of the Peace No 422, Resolution on the Imposition of an Administrative Penalty, Case 05-3220/422/2021, December 24, 2021 (Google). f Khurshudyan, “Russia Fines Google,” December 24, 2021.
Over-the-Top Communications Services Over-the-top (OTT) communications services provide instant messaging services over the internet rather than through mobile networks operated by traditional telecommunications services. These messaging services transmit text, images, voice, video, or any combination thereof between users. Users access these services via service-specific applications (hereafter “OTT communications apps”). Examples of U.S.-based OTT communications apps include Facebook Messenger, iMessage, Slack, Snapchat, Skype, WhatsApp, and Zoom. There are also foreign OTT communications apps that compete against U.S. services globally, including WeChat (China), QQ (China), and Telegram (UK). Generally, these applications are free to download and generate revenue through other means than pay-to-use. Facebook Messenger and WhatsApp, both owned by Meta, generate revenue by collecting user data and ultimately using these data to tailor advertisements for those users.164 Meta’s Facebook Messenger does not have default end-to-end encryption, allowing Meta to collect messaging data, whereas Meta’s WhatsApp does have end-to-end encryption and therefore Meta can only collect metadata (which can still be monetized).165 Some OTT communications apps, like WeChat, generate a portion of their revenue
164 Wagner, “This Is How Facebook Uses Your Data for Ad Targeting,” April 11, 2018. 165 Doffman, “If You Use Facebook Messenger,” February 2, 2021. End-to-end encryption applies encryption on a message from the device sending the message so that only the device receiving the message can decrypt the message.

Chapter 3: Effects of Foreign Censorship on Social Media, Over-the-Top Communications Services, and Internet Search
United States International Trade Commission | 83
through add-on services, such as WeChat Pay, which allows WeChat users to order food, buy movie tickets, book cabs, and pay for various other business services all within the WeChat app.166
Censorship-related measures that significantly impact OTT communications apps are internet shutdowns that temporarily deny access to all internet services, including the messaging services provided by OTT communications apps, and market access blocks that prevent OTT communications apps from entering certain markets. Each of these censorship-related measures restricts the use of OTT communications apps by limiting user access or participation. Because revenue from OTT communications apps is driven by user activity, these censorship-related measures have reduced revenues for U.S. firms providing OTT communications apps in key markets.
Because of the diverse ways in which OTT communications apps generate revenue, it is difficult to estimate global revenues for the sector. Globally, there are approximately 3 billion monthly users of these services on mobile phones.167 The popularity of OTT communications apps differs by country, however. For example, the percentage of mobile phone users that use OTT communications apps in the United States was 60.4 percent in 2021. By comparison, the key markets had a higher percentage of OTT communications app users, led by China (95.2 percent), Russia (92.7 percent), India (87.6 percent), and Indonesia (79.3 percent).168 One reason for the relatively low percentage in the United States is the availability of free unlimited use of short message services, also known as text messaging, included with mobile phone plans.169
The top global OTT communications apps, by monthly active users, include WhatsApp, WeChat, Facebook Messenger, QQ, and Snapchat.170 As discussed below, however, U.S.-based OTT communications apps are blocked from providing these services in China, where WeChat, QQ, Momo, and Tantan are market leaders.171
Services Disruptions Internet shutdowns in Russia and India have temporarily blocked access to U.S.-based OTT communications apps in those countries on multiple occasions, resulting in foregone revenue. Governments in these countries use internet shutdowns to disrupt political protests by limiting the ability of participants in the locality or region to communicate. For example, in 2018, Russia blocked 3G and 4G mobile internet access (including access to OTT communications apps) in the Ingushetia region for nearly two weeks to stifle communications among protesters.172 Similarly, mobile internet access and services were shut down in Russia on two days in July and August 2019 to prevent potential
166 QPS Software, “WeChat: The App for Everything,” May 16, 2020. 167 Statista, “Number of Mobile Phone Messaging App Users,” November 15, 2021. Based on July 2021 estimates for 2021. 168 Statista, “Mobile Messaging App Penetration Rate,” September 16, 2021. 169 Statista, “Mobile Messaging App Penetration Rate,” September 16, 2021. 170 Statista, “Most Popular Global Mobile Messenger Apps,” October 2021. 171 Statista, “China: MAU of Leading Messaging Apps 2021,” December 6, 2021. 172 Kolomychenko, “Russia Stifled Mobile Network during Protests,” November 16, 2018.

Foreign Censorship Part 2: Trade and Economic Effects on U.S. Businesses
84 | www.usitc.gov
protesters from being able to communicate using OTT communications apps and better organize (although traditional voice calls still worked).173
Because OTT communications apps require users and user activity to create revenue, any interruptions in service impact revenue for services providers. Any blocking of access to OTT communications apps would result in lost revenue from in-app, business-related, or other purchases; a lack of advertising views; and a lack of data-creation to monetize. The impact of internet shutdowns on WhatsApp and its users is estimated using the same methodology as employed above for internet shutdowns affecting social media services providers.174
We use NetBlocks’ Cost of Shutdown tool, first, to estimate the hypothetical economic impact (i.e. total GDP losses), by country, of a one-day internet shutdown, and, second, to estimate the share of these losses that would hypothetically be attributable to a shutdown of WhatsApp.175 The WhatsApp-specific loss shares are then applied to data from Top10VPN, which considers the total economic losses associated with actual instances of short-term services disruptions by country and year, for India, Indonesia, Russia, and Turkey. For example, in 2021, Top10VPN estimated that internet shutdowns in India resulted in a total loss of $582.8 million. Since the estimated losses of a hypothetical one-day internet shutdown for WhatsApp represented 2.9 percent of total losses, the estimated losses for WhatsApp and its users totaled $16.9 million in 2021 (table 3.5).
173 As of June 16, 2022, Russia had not blocked access to Meta’s WhatsApp and Microsoft’s Skype due to the Ukraine conflict. Snapchat has disabled its “heat map” which shows where large populations of Snapchat users are located in Ukraine. Russia blocked access to Facebook Messenger in February 2022. Reuters, “Russia Finds Meta Guilty of ‘Extremist Activity’, Says WhatsApp Can Stay,” March 21, 2022; Jackson, “Snapchat Has Temporarily Disabled,” March 5, 2022; Gilbert, “Russia Is Now Blocking Twitter,” February 26, 2022; Doffman, “Russian Authorities ‘Secretly’ Shut Down Moscow’s Mobile Internet,” August 8, 2019. 174 For detailed explanation of this methodology, see the Social Media and User-Generated Video section earlier in this chapter on the “Effects of Short-Term Service Disruptions in India, Indonesia, Russia, and Turkey.” 175 NetBlocks, “Cost of Shutdown Tool,” accessed January 3, 2022. For OTT communications apps, this data source only reports hypothetical losses from internet shutdowns attributable to the shutdown of WhatsApp. Data were therefore unavailable to estimate economic impacts for other OTT communications apps, such as Facebook Messenger.

Chapter 3: Effects of Foreign Censorship on Social Media, Over-the-Top Communications Services, and Internet Search
United States International Trade Commission | 85
Table 3.5 Estimated economic losses of internet shutdowns for WhatsApp, 2019–21 Estimates in millions of dollars. Share of total costs in percentages; zeros indicate no internet shutdowns in that year.
Market
Estimated WhatsApp
share of total
economic losses, 2020
Total 2019 Top 10VPN
estimate
WhatsApp 2019, USITC
estimate
Total 2020 Top 10VPN
estimate
WhatsApp 2020, USITC
estimate
Total 2021 Top 10VPN
estimate
WhatsApp 2021, USITC
estimate India 2.9 1,300.0 37.7 2,800.0 81.2 582.8 16.9 Indonesia 10.9 187.7 20.5 0.0 0.0 0.0 0.0 Russia 5.9 0.0 0.0 0.0 0.0 0.9 0.1 Turkey 7.1 0.0 0.0 51.1 3.6 0.0 0.0
Source: USITC calculations; NetBlocks, “Cost of Shutdown Tool,” accessed January 3, 2022; Woodhams and Migliano, “The Global Cost of Internet Shutdowns 2019: Update,” January 7, 2020; Woodhams and Migliano, “The Global Cost of Internet Shutdowns 2020,” January 3, 2021; Woodhams and Migliano, “The Global Cost of Internet Shutdowns 2021,” January 3, 2022. Note: No data on shutdowns reported for Vietnam over this period.
Market Access Restrictions There are several U.S.-based OTT communications apps that have been blocked entirely from operating in China in recent years, resulting in potential lost revenue. WhatsApp was first banned in China by being removed from the app stores in 2017.176 WhatsApp may have been blocked due to the app’s strong encryption standards (box 3.2). Similarly, Snapchat, whose parent company Snap Inc. first set up operations in China in 2016, was later blocked in China on the grounds that the company could store personal information about Chinese citizens on servers outside of China.177 In November 2017, Skype was removed from the Chinese app stores after the company was accused of not complying with local national security laws.178
Box 3.2 Effects of Low Encryption Standards
OTT communications apps—including WhatsApp—use end-to-end encryption, which applies encryption on a message from the device sending the message so that only the intended recipient can decrypt the message.a End-to-end encryption makes intercepting messages more difficult for governments and other entities. As a result, some governments have opposed secure messaging by setting requirements for low levels of encryption. Low encryption standards in China, India, and Russia, among other markets, have likely encouraged self-censorship by users of OTT communications apps. If users believe that governments can easily access the communications data or metadata created from using OTT communications apps, they might censor their own speech to avoid potential consequences.b
Many of the key markets have low encryption standards for OTT communications apps or the apps are required to share encryption keys with government entities. For example, China’s WeChat lacks end-to-end encryption leading to cybersecurity concerns as messages can be easily intercepted.c India instituted
176 Bradsher, “China Blocks WhatsApp, Broadening Online Censorship,” September 25, 2017. 177 WorldAtlas, “10 Things That Are Banned in China,” accessed April 12, 2022. In 2016, Snapchat’s parent company Snap Inc. set up an office in Shenzhen to focus on their video-recording sunglasses, Spectacles, establishing a presence in China. However, it is unclear in which subsequent year the Chinese authorities first banned Snapchat. Shead, “Snapchat Has Opened an Office in China,” December 22, 2016. 178 Mozur, “Skype Vanishes from App Stores in China, including Apple’s,” November 21, 2017.

Foreign Censorship Part 2: Trade and Economic Effects on U.S. Businesses
86 | www.usitc.gov
a policy in 2021 requiring firms to identify the “first originator” of a message.d In May 2021, WhatsApp sued the Indian government over the policy as it would require the service to weaken their end-to-end encryption, impacting the security of users in India and the suit remains pending.e In Russia, the Federal Security Service requires firms to share encryption keys with the authority, or the service may be blocked.f
Low encryption standards may also lead to extraterritorial censorship effects. For example, if a user outside China wants to communicate with a WeChat user in China, the user would need to download and use WeChat. That user, even though outside China, may self-censor due to the lack of encryption offered by WeChat, knowing the communications data are more easily accessible.g
a Lutkevich and Bacon, “End-to-End Encryption (E2EE),” accessed February 14, 2022. b Metadata are data used to describe data. Metadata can be descriptive, structural, statistical, and administrative. They are used to enrich data with information to make it easier to discover and manage for future users. Examples of basic metadata include the author’s name, date of publication, and file size of an article. University of North Carolina, “Metadata for Data Management: A Tutorial: Definition,” February 7, 2022; Association for Progressive Communications, “The Right to Freedom of Expression and the Use of Encryption and Anonymity in Digital Communications,” February 2015, 12–13. c Chen, Clayberg, and Li, “Security in the Face of Censorship,” 2019, 1–3. d Raghavan, “India’s New Intermediary and Digital Media Rules,” June 10, 2021. Government of India, Writ petition (civil) no. 2021, July 2, 2021. e Facebook, Writ Petition, High Court of Delhi, May 25, 2021; HRW, written submission to the USITC on censorship in India, Indonesia, and Vietnam, July 23, 2021, 6; Government of India, Ministry of Electronics and Information Technology, “Notification Dated, the 25th February, 2021,” February 25, 2021. f HRW, “Russia: Growing Internet Isolation, Control, Censorship,” June 18, 2020; Government of Russia, “Federal Law No. 374-FZ,” July 6, 2016. g Wang, “WeChat Is a Trap for China’s Diaspora,” August 14, 2020.
China’s restrictions on access to foreign OTT communications apps may also have aimed to protect domestic competitors in the Chinese market from foreign competition. For instance, WhatsApp’s ban in China eliminated competition for WeChat, while the ban on Snapchat cleared the path for the local equivalent, QQ, to lead the market. Additionally, users outside of China must use Chinese OTT communications apps to communicate with users in China creating an extraterritorial effect.179
As revenue data is not available for most OTT communications apps, the Commission estimates the users foregone for WhatsApp, Facebook Messenger, Snapchat, and Skype (table 3.6) instead of revenue foregone. The Commission estimates for each U.S.-based OTT communications app use their specific shares of total internet users in Vietnam and India as proxies for the shares that each app would have in the Chinese market. For each specific OTT communications app, the proportion of OTT communications app users among total internet users in Vietnam represents the low end of the range for the Chinese market estimate, and the same ratio for India represents the high end of the range.180 Because the U.S. firms provide a much narrower set of services than their Chinese competitors, however, we seek to estimate the likely hypothetical performance of U.S. OTT services in China by examining how they compare to other major domestic apps with broad service offerings. For example, Facebook as a whole could be reasonably compared to companies like WeChat, while such a comparison would be inappropriate for individual services like WhatsApp or Facebook Messenger. Vietnam, where the
179 Human Rights Watch, written submission to the USITC on censorship in China, July 23, 2021, 6. 180 The estimated number of foregone user ranges in China for WhatsApp, Facebook Messenger, Snapchat, and Skype were found by identifying the number of internet users in Vietnam and India, and then multiplying that number of internet users by DataReportal’s published percentages of internet users for WhatsApp, Facebook Messenger, Snapchat, and Skype users in each country to calculate the number of OTT communications app users for each service. Then, by service, the number of OTT communications app users were multiplied by the ratio of Chinese internet users to Vietnamese and Indian users to reach the estimated number of foregone users in China.
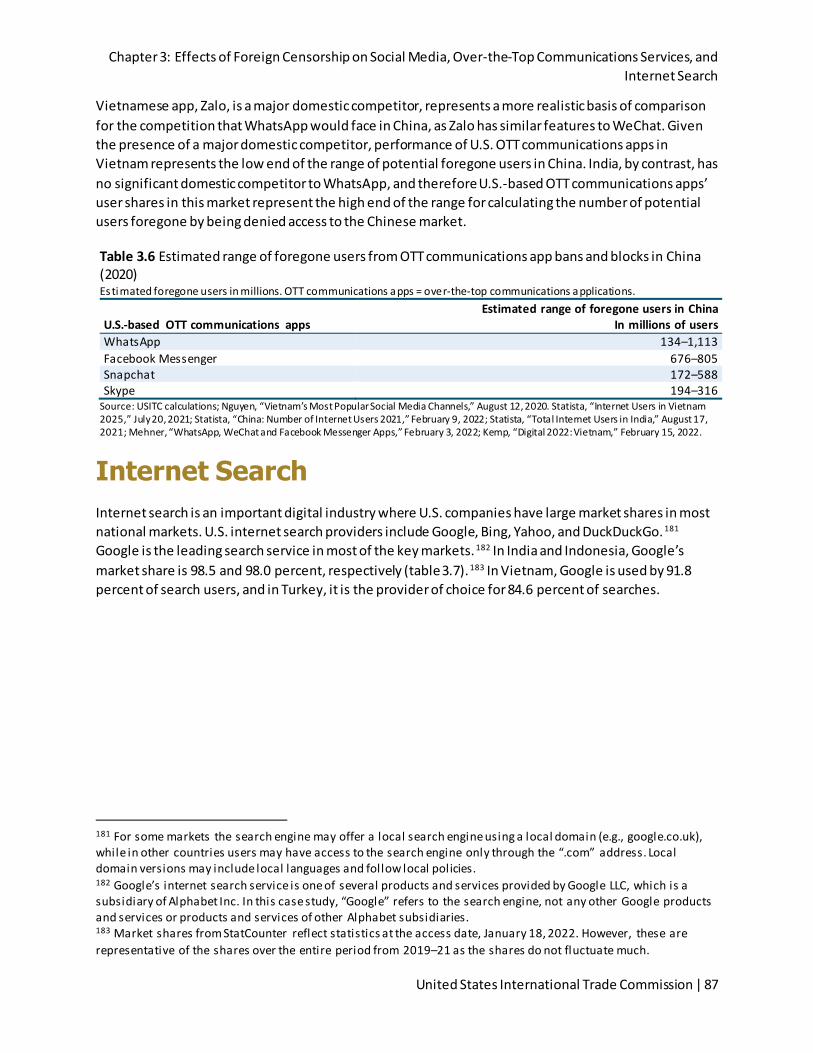
Chapter 3: Effects of Foreign Censorship on Social Media, Over-the-Top Communications Services, and Internet Search
United States International Trade Commission | 87
Vietnamese app, Zalo, is a major domestic competitor, represents a more realistic basis of comparison for the competition that WhatsApp would face in China, as Zalo has similar features to WeChat. Given the presence of a major domestic competitor, performance of U.S. OTT communications apps in Vietnam represents the low end of the range of potential foregone users in China. India, by contrast, has no significant domestic competitor to WhatsApp, and therefore U.S.-based OTT communications apps’ user shares in this market represent the high end of the range for calculating the number of potential users foregone by being denied access to the Chinese market.
Table 3.6 Estimated range of foregone users from OTT communications app bans and blocks in China (2020) Estimated foregone users in millions. OTT communications apps = over-the-top communications applications.
U.S.-based OTT communications apps Estimated range of foregone users in China
In millions of users WhatsApp 134–1,113 Facebook Messenger 676–805 Snapchat 172–588 Skype 194–316
Source: USITC calculations; Nguyen, “Vietnam’s Most Popular Social Media Channels,” August 12, 2020. Statista, “Internet Users in Vietnam 2025,” July 20, 2021; Statista, “China: Number of Internet Users 2021,” February 9, 2022; Statista, “Total Internet Users in India,” August 17, 2021; Mehner, “WhatsApp, WeChat and Facebook Messenger Apps,” February 3, 2022; Kemp, “Digital 2022: Vietnam,” February 15, 2022.
Internet Search Internet search is an important digital industry where U.S. companies have large market shares in most national markets. U.S. internet search providers include Google, Bing, Yahoo, and DuckDuckGo.181 Google is the leading search service in most of the key markets.182 In India and Indonesia, Google’s market share is 98.5 and 98.0 percent, respectively (table 3.7).183 In Vietnam, Google is used by 91.8 percent of search users, and in Turkey, it is the provider of choice for 84.6 percent of searches.
181 For some markets the search engine may offer a local search engine using a local domain (e.g., google.co.uk), while in other countries users may have access to the search engine only through the “.com” address. Local domain versions may include local languages and follow local policies. 182 Google’s internet search service is one of several products and services provided by Google LLC, which is a subsidiary of Alphabet Inc. In this case study, “Google” refers to the search engine, not any other Google products and services or products and services of other Alphabet subsidiaries. 183 Market shares from StatCounter reflect statistics at the access date, January 18, 2022. However, these are representative of the shares over the entire period from 2019–21 as the shares do not fluctuate much.
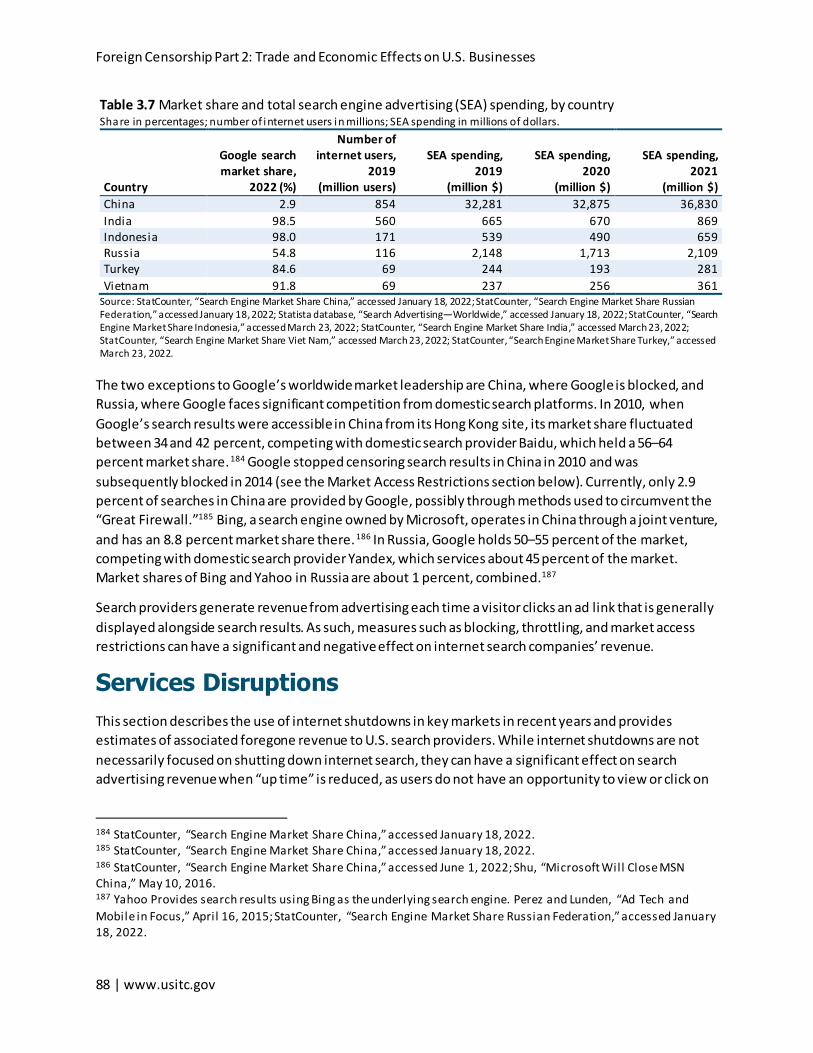
Foreign Censorship Part 2: Trade and Economic Effects on U.S. Businesses
88 | www.usitc.gov
Table 3.7 Market share and total search engine advertising (SEA) spending, by country Share in percentages; number of internet users in millions; SEA spending in millions of dollars.
Country
Google search market share,
2022 (%)
Number of internet users,
2019 (million users)
SEA spending, 2019
(million $)
SEA spending, 2020
(million $)
SEA spending, 2021
(million $) China 2.9 854 32,281 32,875 36,830 India 98.5 560 665 670 869 Indonesia 98.0 171 539 490 659 Russia 54.8 116 2,148 1,713 2,109 Turkey 84.6 69 244 193 281 Vietnam 91.8 69 237 256 361
Source: StatCounter, “Search Engine Market Share China,” accessed January 18, 2022; StatCounter, “Search Engine Market Share Russian Federation,” accessed January 18, 2022; Statista database, “Search Advertising—Worldwide,” accessed January 18, 2022; StatCounter, “Search Engine Market Share Indonesia,” accessed March 23, 2022; StatCounter, “Search Engine Market Share India,” accessed March 23, 2022; StatCounter, “Search Engine Market Share Viet Nam,” accessed March 23, 2022; StatCounter, “Search Engine Market Share Turkey,” accessed March 23, 2022.
The two exceptions to Google’s worldwide market leadership are China, where Google is blocked, and Russia, where Google faces significant competition from domestic search platforms. In 2010, when Google’s search results were accessible in China from its Hong Kong site, its market share fluctuated between 34 and 42 percent, competing with domestic search provider Baidu, which held a 56–64 percent market share.184 Google stopped censoring search results in China in 2010 and was subsequently blocked in 2014 (see the Market Access Restrictions section below). Currently, only 2.9 percent of searches in China are provided by Google, possibly through methods used to circumvent the “Great Firewall.”185 Bing, a search engine owned by Microsoft, operates in China through a joint venture, and has an 8.8 percent market share there.186 In Russia, Google holds 50–55 percent of the market, competing with domestic search provider Yandex, which services about 45 percent of the market. Market shares of Bing and Yahoo in Russia are about 1 percent, combined.187
Search providers generate revenue from advertising each time a visitor clicks an ad link that is generally displayed alongside search results. As such, measures such as blocking, throttling, and market access restrictions can have a significant and negative effect on internet search companies’ revenue.
Services Disruptions This section describes the use of internet shutdowns in key markets in recent years and provides estimates of associated foregone revenue to U.S. search providers. While internet shutdowns are not necessarily focused on shutting down internet search, they can have a significant effect on search advertising revenue when “up time” is reduced, as users do not have an opportunity to view or click on
184 StatCounter, “Search Engine Market Share China,” accessed January 18, 2022. 185 StatCounter, “Search Engine Market Share China,” accessed January 18, 2022. 186 StatCounter, “Search Engine Market Share China,” accessed June 1, 2022; Shu, “Microsoft Will Close MSN China,” May 10, 2016. 187 Yahoo Provides search results using Bing as the underlying search engine. Perez and Lunden, “Ad Tech and Mobile in Focus,” April 16, 2015; StatCounter, “Search Engine Market Share Russian Federation,” accessed January 18, 2022.
Chapter 3: Effects of Foreign Censorship on Social Media, Over-the-Top Communications Services, and Internet Search
United States International Trade Commission | 89
links to advertisements.188 As noted earlier in this chapter, service disruptions have occurred in several key markets, including India and Indonesia.
Throttling and short-term blocking are also tools for restricting access to information. In some countries a short-term block may be due to a legal action, such as a court order. Throttling and blocking can have significant negative effects on search companies because advertisers pay the search company when a user selects the option to view their ads (pay per click), so loss of access to a market deprives the company of revenue.
Estimated Internet Search Advertising Revenue Lost Due to Services Disruptions To develop an estimate of how much services disruptions, including internet shutdowns and throttling, have affected internet search revenue, the Commission calculated a value of each internet user, expressed as the average amount of search revenue per internet user per day in the given market. The estimated revenue lost for each disruption was then determined by the amount of down time and the number of users affected. For example, since January 2020, Google has had 97 percent or more of the search engine market in Indonesia.189 Indonesia search advertising revenue was calculated by using data from Statista and internet population data from the World Bank, for an average annual revenue per internet user of $3.22.190 In 2019, when Indonesia shut down the internet in Papua from August 21 to September 4, leaving an estimated 1.46 million Papuan internet users without access, Google lost an estimated $13,000 per day in advertising revenues.191 Table 3.8 below shows the number of users affected and estimated advertising revenue losses from shutdowns and throttling that occurred in India and Indonesia from 2019 to 2021. The larger revenue losses in India are driven by the fact that it had a higher frequency of internet shutdowns, which were longer than those in Indonesia, and affected a larger population of internet users.192
188 This assumes that advertisers will not compensate by advertising more when the internet is not shut down. 189 StatCounter, “Search Engine Market Share Indonesia,” accessed March 23, 2022. 190 Average revenue per user is calculated by taking the SEA value for a given country in a specific year, and then dividing that value by the number of internet users in that country. This approach differs from social media and OTT communications app approaches to estimating the economic impact of service disruptions. Because NetBlocks, the primary source for estimated losses in the aforementioned approaches, does not break out losses attributable to internet search, it was not possible to calculate the share attributable to U.S. search providers and apply the same approach. USITC calculation based on Statista database, “Search Advertising—Worldwide,” accessed January 18, 2022; World Bank, “Individuals Using the Internet,” accessed February 7, 2022. 191 Estimate is a USITC calculation. 192 Average annual internet revenue per user in India was $1.21 in 2019 and 2020, and $1.58 in 2021. USITC calculation based on Statista database, “Search Advertising—Worldwide,” accessed January 18, 2022; World Bank, “Individuals Using the Internet,” accessed February 7, 2022.

Foreign Censorship Part 2: Trade and Economic Effects on U.S. Businesses
90 | www.usitc.gov
Table 3.8 Estimated loss of advertising revenue from services disruptions to internet search in India and Indonesia Number of users in thousands; revenue loss in thousands of dollars; zero means no internet shutdowns. Estimated number of users affected and loss of advertising revenue Market 2019 2020 2021 Number of users affected by shutdowns (thousands) India 92,214 10,978 68,387 Estimated revenue loss (thousand $) India 3,501 7,281 1,203 Number of users affected by shutdowns (thousands) Indonesia 1,463 0 0 Estimated revenue loss (thousand $) Indonesia 182 0 0
Source: USITC calculations; Woodhams and Migliano, “The Cost of Internet Shutdowns,” accessed January 14, 2022. Note: Zeros in the table indicate no shutdowns in that year. The data cover 30 unique services disruptions in India and 2 in Indonesia. Services disruptions can occur multiple times per year, and hence users may be affected more than once. For example, in 2020, there were four service disruption events in Jammu and Kashmir totaling 8,799 hours of lost or throttled service. The estimated revenue losses reflect the fact that many services disruptions last for a day or less.
The Indian authorities also engaged in internet throttling and short-term blocking in recent years, which affected internet search users and providers. For example, the Indian government throttled the internet in Jammu and Kashmir from March 4, 2020, to February 5, 2021, which affected approximately 6 million internet users.193 Similar to internet shutdowns, throttling the internet affects the users’ ability to use the internet, and only allows them to (at best) slowly access information. This may cause many users to stop using the internet during this time period, or limit their internet use, thus reducing their usage of all websites, including search.194 Google has shown that delays of less than half a second lead to decreased usage of its search services.195 Since search services derive revenue from advertising that is based on views and clicks, reducing those views and clicks directly affects the revenue of search providers. During the time period when India throttled the internet in Jammu and Kashmir, the expected revenue from search advertising in that region would have been nearly $6 million, roughly 83 percent of the estimated $7.3 million in revenue losses in India in 2020 (table 3.8). While table 3.8 is specific to advertising revenue losses for internet search, Top10VPN calculates the losses associated with throttling and internet shutdowns to regional users of all digital products and services (a much broader calculation than in table 3.8) and estimated $2.2 billion to be the total losses of throttling Jammu and Kashmir’s internet for 303 days.196
Market Access Restrictions The government action that has had the greatest impact on U.S. businesses’ internet search revenues is China’s denial of market access to Google. Google’s search engine was available in China starting in 2006. But in 2010, a cyberattack on Google services, that originated in China, and increased content restrictions in China led Google to stop filtering content for the Chinese market by redirecting users in
193 Woodhams and Migliano, “The Cost of Internet Shutdowns 2020,” accessed January 14, 2022. Data on the number of affected internet users may be downloaded from the “Internet Shutdown Research Methodology” section of this reference. 194 Teevan et al., “Slow Search,” October 2013, 1. 195 Brutlag, “Speed Matters,” June 23, 2009. 196 Top10VPN calculates shutdowns using a methodology spearheaded by Darrell West, which multiplies national GDP by percent of nation’s economy derived from the digital economy times duration of the shutdown (number of days divided by 365), then adds a multiplier effect of the disrupted digital economy. Woodhams and Migliano, “The Cost of Internet Shutdowns 2020,” accessed January 14, 2022; West, Internet Shutdowns Cost, October 2016.

Chapter 3: Effects of Foreign Censorship on Social Media, Over-the-Top Communications Services, and Internet Search
United States International Trade Commission | 91
China to the uncensored Hong Kong version of its search services.197 The Chinese government responded by irregularly blocking Google services for several years before completely blocking them in 2014.198 Since then, search engine advertising revenues foregone have been significant for Alphabet, as users of its search platform turned instead to other platforms in China such as Baidu (a Chinese search engine) and Bing. This block appears to have been in large part censorship-related, as Google’s refusal to follow content restrictions was one of the precursors to its services being blocked.199
The Commission used historical market share information and current global revenue data to estimate revenue Google’s search engine would have made in the Chinese market in recent years. Google’s market share in China fluctuated between 7 and 42 percent during 2010 to 2014, when Google was redirecting visitors in China to the Hong Kong version of it search services, but before it was blocked.200 Assuming that Google would have maintained a similar share of the search advertising market as the market expanded, it is possible to develop a range of estimates of foregone revenues. Figure 3.4 shows Google’s global revenue from search by year since 2017 with the current market block in place and Google’s estimated potential revenue from search under two hypothetical scenarios for its market share in China based on its performance in 2010–2014: the “low-end” scenario (7 percent market share) and the “high-end” scenario (42 percent market share). The Commission estimates that in 2021, Google would have earned $2.6 billion in additional revenue under the “low” scenario, and $15.5 billion under the “high” scenario (figure 3.4).
197 Google, “A New Approach to China,” January 12, 2010; Google, “A New Approach to China: An Update,” March 22, 2010. 198 Sheehan, “How Google Took on China—and Lost,” December 19, 2018. 199 See USITC, Foreign Censorship, Part 1, 2022 for discussion on how and why Google became blocked in China. 200 StatCounter, “Search Engine Market Share China,” accessed January 18, 2022.

Foreign Censorship Part 2: Trade and Economic Effects on U.S. Businesses
92 | www.usitc.gov
Figure 3.4 Google’s estimated potential total global search revenue if it had access to the Chinese market in 2017–2021 In bi llions of dollars. Underlying data for this figure can be found in appendix J, table J.18.
70
8598
104
149
71
87100
106
152
79
98
112118
164
0
20
40
60
80
100
120
140
160
180
2017 2018 2019 2020 2021
Glob
al R
even
ue (b
illio
n $)
Current search revenue Estimated revenue (low) Estimated revenue (high)
Source: USITC calculations; Statista database, “Search Advertising—Worldwide,” accessed January 18, 2022; StatCounter, “Search Engine Market Share China,” accessed January 18, 2022; Alphabet Inc., “Form 10-K” February 3, 2020, 29; Alphabet Inc., “Form 10-K” February 1, 2022, 33. Note: Low-end share (low) is 7 percent of estimated total China search revenue, and high-end share (high) is 42 percent of estimated total China search revenue. Both estimates are added to current search revenue.
Box 3.3 Challenges with Censorship in China for Other Information Providers
The information provider industry earns billions of dollars in revenues, and features a number of prominent firms (e.g., Bloomberg, S&P Global, etc.). However, it is unclear the extent to which censorship in China is a challenge for them. Information providers primarily provide a business-to-business service, aggregating and collecting datasets and information that is often for a specific field (e.g., legal translations and analysis, financial market prices, or international trade data). At least four companies in this field had revenues higher than $5 billion in 2020 (Bloomberg, IHS Markit, Thomson Reuters, and S&P Global).a
The suppression of targeted speech may affect information providers both when they collect information, and when they distribute the information they have collected. On the collection end, if the sources of data are censored or no longer exist, then one challenge is to produce a reliable dataset. Also, recent regulatory requirements in China concerning data localization led multiple information providers to express concern in their annual reports about how to maintain compliance while acquiring information and combining it into datasets.b
On the distribution end, due to reported unreliability of some of the data, many information providers attempt to use alternative methods to estimate economic data such as growth, inflation, or employment in China. The most recent U.S.-China Economic and Security Review Commission Annual Report to Congress states that the Chinese government has attempted to censor such estimates.c One

Chapter 3: Effects of Foreign Censorship on Social Media, Over-the-Top Communications Services, and Internet Search
United States International Trade Commission | 93
example described in the report was from April 2020 when a Chinese brokerage firm reported that the actual unemployment rate was likely much higher than the official rate, 20.5 percent compared to 6.2 percent, respectively. After the estimate gained attention online, the firm retracted this estimate (likely due to government pressure) and the research head for that firm was later fired.d Such estimates may run counter to the Chinese authorities’ information control goals, which, according to observers, are to amplify information that supports desirable narratives, and censor information that does not.e Furthermore, datasets produced for Chinese customers need to be modified to match Chinese policy (e.g., change Taiwan to Chinese Taipei, any maps of the South China Sea show Chinese territory claims, etc.).f
It is likely that Chinese censorship negatively affects both information providers and their customers. These censorship challenges can increase costs, as providers may have to put in more work collecting, cleaning, and modifying datasets and information to comply with local requirements.g Further, it can also reduce the value that customers place on the data if they are concerned that it might not be accurate. Adulterated datasets can also have an effect on information providers’ customers, as they may not have as accurate of information regarding the Chinese economy and laws, which they may be using to make business decisions.h
Chinese retaliation for the release of unauthorized information can also affect information providers. Reportedly there was a soft ban on purchases of Bloomberg Terminals in China due to Bloomberg News’ reporting of the wealth of Chinese officials, but the restriction ended when Bloomberg stopped pursuing a follow-up story.i
a Forbes, “Bloomberg,” accessed March 7, 2022; IHS Markit completed its merger with S&P Global on February 28, 2022; S&P Global, “S&P Global and IHS Markit,” February 28, 2022; Thomson Reuters, Annual Report 2020, March 10, 2021, 4; S&P Global. “Form 10-K,” February 9, 2021, 32. b S&P Global, “Form 10-K,” February 9, 2021, 17; IHS Markit, Annual Report 2020, January 22, 2021, 29; Government of China, Personal Information Protection Law, August 20, 2021. c U.S.-China Economic and Security Review Commission, 2021 Annual Report to Congress, November 2021, 126–27. d U.S.-China Economic and Security Review Commission, 2021 Annual Report to Congress, November 2021, 126–27. e U.S.-China Economic and Security Review Commission, hearing transcript, September 8, 2021, 113–15 (testimony of Rebecca Fair, Thresher); Fair, written testimony to the U.S.-China Economic and Security Review Commission, August 24, 2021, 4–7. f Industry representative, interview by USITC Staff, June 2021. g S&P Global, “Form 10-K,” February 9, 2021, 17; IHS Markit, Annual Report 2020, January 22, 2021, 29. h IHS Markit, Annual Report 2020, January 22, 2021, 29. i USITC, Foreign Censorship, Part 1, 2022, 81–82.

Foreign Censorship Part 2: Trade and Economic Effects on U.S. Businesses
94 | www.usitc.gov
Bibliography Bibliography entries denoted with an asterisk (*) include laws, regulations, cases, treaties, legal conventions, international agreements, or other official government documents cited throughout the report. In instances where no official English translation is provided by the government, an unofficial English translation is provided in a website URL in the same bibliography entry. Where only “unofficial translation” is cited with no website URL, an unofficial translation was obtained by Commission staff. Unofficial translations are used only for informational purposes.
Access Now. “Court Rules the Internet Shutdowns in Papua and West Papua Were Illegal.” Access Now
(blog), June 3, 2020. https://www.accessnow.org/court-rules-the-internet-shutdowns-in-papua-and-west-papua-are-illegal.
Alphabet Inc. “Choose Your Bid and Budget.” Google Ads Help. Accessed March 17, 2022. https://support.google.com/google-ads/answer/2375454?_ga=2.41668321.2109946818.1647526633-530651302.1647526633.
Alphabet Inc. “Form 10-K.” U.S. Securities and Exchange Commission (SEC), February 4, 2019. https://www.sec.gov/Archives/edgar/data/1652044/000165204419000004/goog10-kq42018.htm.
Alphabet Inc. “Form 10-K.” U.S. Securities and Exchange Commission (SEC), February 3, 2020. https://www.sec.gov/Archives/edgar/data/1652044/000165204420000008/goog10-k2019.htm.
Alphabet Inc. “Form 10-K.” U.S. Securities and Exchange Commission (SEC), February 2, 2021. https://abc.xyz/investor/static/pdf/20210203_alphabet_10K.pdf?cache=b44182d.
Alphabet Inc. “Form 10-K.” U.S. Securities and Exchange Commission (SEC), February 1, 2022. https://abc.xyz/investor/static/pdf/20220202_alphabet_10K.pdf?cache=fc81690.
Alphabet Inc. Alphabet: Year in Review 2020, 2021. https://abc.xyz/investor/static/pdf/2020_alphabet_annual_report.pdf.
Associated Press (AP). “India Restores 4G Mobile Internet in Kashmir after 18-Month Ban.” NBC News, February 6, 2021. https://www.nbcnews.com/news/world/india-restores-4g-mobile-internet-kashmir-after-18-month-ban-n1256930.
Association for Progressive Communications. “The Right to Freedom of Expression and the Use of Encryption and Anonymity in Digital Communications,” February 2015. https://www.ohchr.org/Documents/Issues/Opinion/Communications/AssociationForProgressiveCommunication.pdf.
Axelrod, Tal. “Google Fined in Russia over Search Results: Report.” The Hill, December 11, 2018. https://thehill.com/policy/technology/technology/420734-google-fined-in-russia-over-search-results-report.

Chapter 3: Effects of Foreign Censorship on Social Media, Over-the-Top Communications Services, and Internet Search
United States International Trade Commission | 95
Badan Pusat Statistik (Indonesia). “Quarterly GDP Distribution Based on Current Prices (percent), 2021.” Gross Domestic Product (Business) Statistics, February 7, 2022. https://www.bps.go.id/indicator/11/106/1/-seri-2010-distribusi-pdb-triwulanan-seri-2010-atas-dasar-harga-berlaku.html.
BBC. “LinkedIn Blocked by Russian Authorities,” November 17, 2016. https://www.bbc.com/news/technology-38014501.
Bellan, Rebecca. “Is YouTube Trying to Compete with TikTok?” Forbes, April 3, 2020. https://www.forbes.com/sites/rebeccabellan/2020/04/03/is-youtube-trying-to-compete-with-tiktok.
Beo Da Costa, Agustinus. “Internet Shut Down in Papua to Stem Unrest.” The Canberra Times, August 22, 2019. https://www.canberratimes.com.au/story/6344279/internet-shut-down-in-papua-to-stem-unrest.
Bradsher, Keith. “China Blocks WhatsApp, Broadening Online Censorship.” New York Times, September 25, 2017. https://www.nytimes.com/2017/09/25/business/china-whatsapp-blocked.html.
Brightbill, Timothy. Written submission to the U.S. International Trade Commission in connection with Inv. No. 332-585, Foreign Censorship, Part 1: Policies and Practices Affecting U.S. Businesses and Inv. No. 332-586, Foreign Censorship, Part 2: Trade and Economic Effects on U.S. Businesses, July 15, 2021.
Brutlag, Jake. “Speed Matters.” Google AI Blog (blog), June 23, 2009. http://ai.googleblog.com/2009/06/speed-matters.html.
Cato Institute. Written submission to the U.S. International Trade Commission in connection with Inv. No. 332-585, Foreign Censorship, Part 1: Policies and Practices Affecting U.S. Businesses, July 22, 2021.
Chen, Melanie, Lauren Clayberg, and Helen Li. “Security in the Face of Censorship,” 2019. https://courses.csail.mit.edu/6.857/2019/project/3-Chen-Clayberg-Li.pdf.
Coldewey, Devin. “Facebook Agrees to Restrict Anti-Government Content in Vietnam after Months of Throttling.” TechCrunch (blog), April 21, 2020. https://social.techcrunch.com/2020/04/21/facebook-agrees-to-restrict-anti-government-content-in-vietnam-after-months-of-throttling.
Doffman, Zak. “If You Use Facebook Messenger, “This is Why You Should Switch.” Forbes, February 2, 2021. https://www.forbes.com/sites/zakdoffman/2021/02/02/whatsapp-just-gave-you-a-reason-to-stop-using-facebook-messenger-after-imessage-privacy-backlash.
Doffman, Zak. “Russian Authorities ‘Secretly’ Shut Down Moscow’s Mobile Internet: Report.” Forbes, August 8, 2019. https://www.forbes.com/sites/zakdoffman/2019/08/08/russian-security-agencies-secretly-shut-moscows-mobile-internet-to-control-protestors-report.

Foreign Censorship Part 2: Trade and Economic Effects on U.S. Businesses
96 | www.usitc.gov
Esberg, Jane, and Christoph Mikulaschek. “Digital Technologies, Peace, and Security: Challenges and Opportunities for United Nations Peace Operations,” August 25, 2021. https://peacekeeping.un.org/sites/default/files/esberg_and_mikulaschek_-_conflict_peace_and_digital_technologies_-_v3_210825.pdf.
Facebook. Writ Petition, High Court of Delhi, May 25, 2021. https://www.forbesindia.com/media/supplement_pdf/Facebook_Petition.pdf.
Fair, Rebecca. Written submission to the U.S.-China Economic and Security Review Commission in connection with the Hearing on U.S.-China Relations in 2021: Emerging Risks, August 24, 2021. https://www.uscc.gov/sites/default/files/2021-08/Rebecca_Fair_Testimony.pdf.
Forbes. “Bloomberg.” Accessed March 7, 2022. https://www.forbes.com/companies/bloomberg.
Gilbert, David. “Russia Is Now Blocking Twitter,” February 26, 2022. https://www.vice.com/en/article/jgmavx/russia-blocking-twitter.
GlobalCheck. “Facebook.com.” Accessed March 21, 2022. https://globalcheck.net/en/monitoring/ru/facebook.com?period=1m.
GlobalCheck. “Instagram.com.” Accessed March 21, 2022. https://globalcheck.net/en/monitoring/ru/instagram.com?period=1m.
Google. “A New Approach to China.” Official Google Blog (blog), January 12, 2010. https://googleblog.blogspot.com/2010/01/new-approach-to-china.html.
Google. “A New Approach to China: An Update.” Official Google Blog (blog), March 22, 2010. https://googleblog.blogspot.com/2010/03/new-approach-to-china-update.html.
*Government of China. State Council. Cybersecurity Law of the People’s Republic of China-Office of the CPC Central Committee Cybersecurity and Information Technology. (In Chinese). November 7, 2016. http://www.cac.gov.cn/2016-11/07/c_1119867116.htm. Unofficial translation in Creemers, Rogier, Paul Triolo, and Graham Webster. “Translation: Cybersecurity Law of the People’s Republic of China (Effective June 1, 2017).” New America. June 29, 2018. https://www.newamerica.org/cybersecurity-initiative/digichina/blog/translation-cybersecurity-law-peoples-republic-china.
*Government of China. Personal Information Protection Law of the People’s Republic of China (Chairman’s Order No. 91). (In Chinese). August 20, 2021. http://www.npc.gov.cn/npc/c30834/202108/a8c4e3672c74491a80b53a172bb753fe.shtml. Unofficial translation in China Briefing from Dezan Shira & Associates. “The PRC Personal Information Protection Law (Final): A Full Translation.” August 24, 2021. https://www.china-briefing.com/news/the-prc-personal-information-protection-law-final-a-full-translation.
*Government of India. High Court of Delhi at New Delhi. Extra ordinary civil writ jurisdiction. Writ petition (civil) no. 2021. Press Trust of India v. Union of India. July 2, 2021. https://www.medianama.com/wp-content/uploads/2021/07/pti-vs-uoi.pdf.

Chapter 3: Effects of Foreign Censorship on Social Media, Over-the-Top Communications Services, and Internet Search
United States International Trade Commission | 97
*Government of India. Ministry of Communications. Department of Telecommunications. Standing Committee on Communications and Information Technology. Suspension of Telecom Services/Internet and Its Impact, Twenty-Sixth Report. December 2021. http://164.100.47.193/lsscommittee/Communications%20and%20Information%20Technology/17_Communications_and_Information_Technology_26.pdf.
*Government of India. Ministry of Electronics and Information Technology. “Notification Dated, the 25th February, 2021 G.S.R. 139(E): The Information Technology (Intermediary Guidelines and Digital Media Ethics Code) Rules, 2021.” February 25, 2021. https://mib.gov.in/sites/default/files/IT%28Intermediary%20Guidelines%20and%20Digital%20Media%20Ethics%20Code%29%20Rules%2C%202021%20English.pdf.
*Government of Indonesia. “Data Service Blocking in Papua and West Papua. Press Release No. 155/HM/KOMINFO/08/2019.” Ministry of Communications and Information. August 21, 2019. (In Indonesian). https://www.kominfo.go.id/content/detail/20821/siaran-pers-no-155hmkominfo082019-tentang-pemblokiran-layanan-data-di-papua-dan-papua-barat/0/siaran_pers. Unofficial translation on file.
*Government of Indonesia. Jakarta State Administrative Court. Decision on Case 230/G/TF/2019/PTUN.JKT. (In Indonesian). June 3, 2020. https://ptun-jakarta.go.id/wp-content/uploads/2020/06/2019_TF_G_230_putusan_akhir.pdf. Limited unofficial translation on file.
*Government of Jammu and Kashmir (India). Government Order No: Home-07 (TSTS) of 2021. February 5, 2021. http://jkhome.nic.in/pdf/07(TSTS)%20of%202021%20dated%2005.02.2021.pdf.
*Government of Russia. Federal Law No. 139-FZ of July 28, 2012, on Amendments to the Federal Law on the Protection of Children from Information Harmful to Their Health and Development and Certain Legislative Acts of the Russian Federation. (In Russian). July 28, 2012. http://publication.pravo.gov.ru/Document/View/0001201207300017. Unofficial translation on file.
*Government of Russia. Federal Law No. 374-FZ of July 6, 2016, on Amendments to the Federal Law on Countering Terrorism and Certain Legislative Acts of the Russian Federation in Terms of Establishing Additional Measures to Counter Terrorism and Ensure Public Safety. (In Russian). July 6, 2016. http://publication.pravo.gov.ru/Document/View/0001201607070016. Unofficial translation on file.
*Government of Russia. Judicial Precinct of Justice of the Peace No. 422. Resolution on the Imposition of an Administrative Penalty, 05-3200/422/2021. (In Russian). December 24, 2021. https://mos-sud.ru/422/cases/docs/content/1b6bebe4-4c2a-4a73-b8b0-d65fa664e175. Unofficial translation on file.
*Government of Russia. Judicial Precinct of Justice of the Peace No. 422. Resolution on the Imposition of an Administrative Penalty, 05-3221/422/2021. (In Russian). December 24, 2021. https://mos-sud.ru/422/cases/admin/details/77de4aa0-dfa8-4586-9e44-34a3d1b98456. Unofficial translation on file.

Foreign Censorship Part 2: Trade and Economic Effects on U.S. Businesses
98 | www.usitc.gov
*Government of Turkey, Parliament, Law No. 7253. (In Turkish). July 29, 2020. https://www.resmigazete.gov.tr/eskiler/2020/07/20200731-1.htm. Unofficial translation on file.
GreatFire Analyzer. “Censorship of Alexa Top 1000 Domains in China.” GreatFire (China). Accessed July 27, 2021. https://en.greatfire.org/SEARCH/ALEXA-TOP-1000-DOMAINS.
Human Rights Watch (HRW). “Russia: Growing Internet Isolation, Control, Censorship,” June 18, 2020. https://www.hrw.org/news/2020/06/18/russia-growing-internet-isolation-control-censorship.
Human Rights Watch (HRW). Written submission to the U.S. International Trade Commission, on censorship in China in connection with Inv. No. 332-585, Foreign Censorship, Part 1: Policies and Practices Affecting U.S. Businesses, July 23, 2021.
Human Rights Watch (HRW). Written submission to the U.S. International Trade Commission, on censorship in India, Indonesia, and Vietnam in connection with Inv. No. 332-585, Foreign Censorship, Part 1: Policies and Practices Affecting U.S. Businesses, July 23, 2021.
IHS Markit. Annual Report 2020, January 22, 2021. https://www.annualreports.com/HostedData/AnnualReports/PDF/NYSE_INFO_2020.pdf.
Iyengar, Rishi. “LinkedIn China Is Shutting Down Because of a ‘Challenging Operating Environment.’” CNN, October 15, 2021. https://www.cnn.com/2021/10/14/tech/linkedin-china-exit-microsoft/index.html.
Jackson, Sarah. “Snapchat Has Temporarily Disabled its Heat Map of Snaps in Ukraine. Russia Could Have Used the Information to Identify Areas Where Ukrainians Are Concentrated,” March 5, 2022. https://www.businessinsider.com/snapchat-temporarily-disables-ukraine-heat-map-safety-precaution-russia-invasion-2022-3.
Kemp, Simon. “Digital 2021 October Global Statshot Report.” DataReportal, October 21, 2021. https://datareportal.com/reports/digital-2021-october-global-statshot.
Kemp, Simon. “Digital 2022: Vietnam.” DataReportal, February 15, 2022. https://datareportal.com/reports/digital-2022-vietnam.
Kharpal, Arjun. “Everything You Need to Know about WeChat—China’s Billion-User Messaging App.” CNBC, February 4, 2019. https://www.cnbc.com/2019/02/04/what-is-wechat-china-biggest-messaging-app.html.
Kharpal, Arjun. “TikTok Owner ByteDance’s Revenue Surged 111% in 2020, Records 1.9 Billion Users.” CNBC, June 17, 2021. https://www.cnbc.com/2021/06/17/chinas-bytedance-tiktok-owner-saw-revenue-surge-111percent-in-2020.html.
Khurshudyan, Isabelle. “Russia Fines Google $100 Million, and Meta $27 Million, over ‘Failure to Remove Banned Content.’” Washington Post, December 24, 2021. https://www.washingtonpost.com/world/2021/12/24/google-russia-fine-banned-content.
Kolomychenko, Maria. “Russia Stifled Mobile Network during Protests: Document.” Reuters, November 16, 2018. https://www.reuters.com/article/us-russia-protests-internet-idUSKCN1NL1I6.

Chapter 3: Effects of Foreign Censorship on Social Media, Over-the-Top Communications Services, and Internet Search
United States International Trade Commission | 99
Leskin, Paige. “Here Are All the Major US Tech Companies Blocked behind China’s ‘Great Firewall.’” Business Insider, October 10, 2019. https://www.businessinsider.com/major-us-tech-companies-blocked-from-operating-in-china-2019-5.
Lin, Liza. “Scholars on LinkedIn Are Being Blocked in China ‘Without Telling Them Why.’” Wall Street Journal, June 25, 2021. https://www.wsj.com/articles/academics-bristle-over-linkedin-blocking-their-profiles-in-china-11624366667.
Lutkevich, Ben, and Madelyn Bacon. “End-to-End Encryption (E2EE).” TechTarget. Accessed February 14, 2022. https://www.techtarget.com/searchsecurity/definition/end-to-end-encryption-E2EE#:~:text=End%2Dto%2Dend%20encryption%20(E2EE)%20is%20a%20method,intended%20recipient%20can%20decrypt%20it.
Lyons, Kim. “Twitter Will Set Up a Legal Entity in Turkey to Comply with Controversial Social Media Law.” The Verge, March 20, 2021. https://www.theverge.com/2021/3/20/22341798/twitter-legal-entity-turkey-comply-social-media-law-privacy.
Meaker, Morgan. “Why WhatsApp Survived Russia’s Social Media Purge.” Wired, March 21, 2022. https://www.wired.com/story/whatsapp-russia-meta-ban.
Mehner, Matthias. “WhatsApp, WeChat and Facebook Messenger Apps—Global Usage of Messaging Apps, Penetration and Statistics.” MessengerPeople by Sinch (blog), February 3, 2022. https://www.messengerpeople.com/global-messenger-usage-statistics.
Meta Platforms, Inc (Meta). “About Ad Auctions.” Facebook Business Help Center. Accessed March 17, 2022. https://www.facebook.com/business/help/430291176997542.
Meta Platforms, Inc (Meta). “Form 10-K.” U.S. Securities and Exchange Commission (SEC), February 2, 2022. https://d18rn0p25nwr6d.cloudfront.net/CIK-0001326801/14039b47-2e2f-4054-9dc5-71bcc7cf01ce.pdf.
Meta Platforms, Inc (Meta). “How Much Do Facebook Ads Cost?” Meta for Business. Accessed March 17, 2022. https://www.facebook.com/business/ads/pricing.Mozur, Paul. “Skype Vanishes from App Stores in China, Including Apple’s.” New York Times, November 21, 2017. https://www.nytimes.com/2017/11/21/business/skype-app-china.html.
National Statistical Office (NSO), Ministry of Statistics and Programme Implementation (India). “Provisional estimates of Annual National Income, 2020–21 and Quarterly estimates (Q4) of Gross Domestic Product 2020-21.” Press Release, May 31, 2021. https://pib.gov.in/PressReleasePage.aspx?PRID=1723153.
NetBlocks. “Cost of Shutdown Tool.” Accessed January 3, 2022. https://netblocks.org/cost.
Nguyen, Thu. “Vietnam’s Most Popular Social Media Channels (and How to Master Them).” We Create Content, August 12, 2020. https://wecreatecontent.asia/content-marketing-blog-asia/2020/3/2/which-are-the-popular-social-media-sites-in-vietnam.
O’Driscoll, Aimee. “List of Websites and Apps Blocked in Russia.” Comparitech (blog), November 7, 2020. https://www.comparitech.com/blog/vpn-privacy/websites-blocked-russia.

Foreign Censorship Part 2: Trade and Economic Effects on U.S. Businesses
100 | www.usitc.gov
PEN America. Splintered Speech: Digital Sovereignty and the Future of the Internet, June 15, 2021. https://pen.org/report/splintered-speech-digital-sovereignty-and-the-future-of-the-internet.
Perelli, Amanda. “How Much Money YouTubers Make, According to Dozens of Creators.” Business Insider, March 1, 2022. https://www.businessinsider.com/how-much-money-youtube-creators-influencers-earn-real-examples-2021-6.
Perez, Sarah, and Ingrid Lunden. “Ad Tech and Mobile in Focus in Microsoft and Yahoo’s Renewed Search Deal.” TechCrunch (blog), April 16, 2015. https://social.techcrunch.com/2015/04/16/microsoft-and-yahoo-renew-search-allian.
QPS Software. “WeChat: The App for Everything.” QPS Software (blog), May 16, 2020. https://qpsoftware.net/blog/all-wechat-features-2020.
Qu, Tracy. “China’s Top Propaganda Agencies Want to Limit the Role of Algorithms in Distributing Online Content.” South China Morning Post, August 3, 2021. https://www.scmp.com/tech/policy/article/3143664/chinas-top-propaganda-agencies-want-limit-role-algorithms-distributing.
Raghavan, Malavika. “India’s New Intermediary and Digital Media Rules: Expanding the Boundaries of Executive Power in Digital Regulation.” Future of Privacy Forum (blog), June 10, 2021. https://fpf.org/blog/indias-new-intermediary-digital-media-rules-expanding-the-boundaries-of-executive-power-in-digital-regulation.
Reuters. “Russia Finds Meta Guilty of ‘Extremist Activity’, Says WhatsApp Can Stay,” March 21, 2022. https://www.reuters.com/technology/meta-asks-russian-court-dismiss-proceedings-extremism-case-reports-2022-03-21.
RNZ. “Internet Cut in Papua as Military Operations Intensify,” May 3, 2021. https://www.rnz.co.nz/international/pacific-news/441684/internet-cut-in-papua-as-military-operations-intensify.
Roache, Madeline. “How Russia Is Stepping Up Its Campaign to Control the Internet.” Time, April 1, 2021. https://time.com/5951834/russia-control-internet.
S&P Global. “Form 10-K.” U.S. Securities and Exchange Commission (SEC), February 9, 2021. https://d18rn0p25nwr6d.cloudfront.net/CIK-0000064040/0c6ddaa1-915c-4d21-9cbc-37ea53a41e2c.pdf.
S&P Global. “S&P Global and IHS Markit Complete Merger,” February 28, 2022. https://press.spglobal.com/2022-02-28-S-P-Global-and-IHS-Markit-Complete-Merger.
Shead, Sam. “Snapchat Has Opened an Office in China—One of the Few Countries Where it’s Banned.” Business Insider, December 22, 2016. https://www.businessinsider.com/snapchat-china-office-spectacles-2016-12.
Sheehan, Matt. “How Google Took on China—and Lost.” MIT Technology Review, December 19, 2018. https://www.technologyreview.com/2018/12/19/138307/how-google-took-on-china-and-lost.

Chapter 3: Effects of Foreign Censorship on Social Media, Over-the-Top Communications Services, and Internet Search
United States International Trade Commission | 101
Shu, Catherine. “Microsoft Will Close MSN China to Focus on Selling Other Services.” TechCrunch, May 10, 2016. https://techcrunch.com/2016/05/10/microsoft-will-close-msn-china-to-focus-on-selling-other-services.
Software Freedom Law Center India. “Internet Shutdowns.” Accessed March 22, 2022. https://internetshutdowns.in.
Sonne, Paul, and Mary Illyushina. “‘I’m Writing This Post Now and Crying’: Russians Bid Farewell to Instagram before Midnight Ban.” Washington Post, March 13, 2022. https://www.washingtonpost.com/world/2022/03/13/russia-instagram-ukraine-war.
StatCounter. “Search Engine Market Share China.” StatCounter Global Stats. Accessed January 18, 2022. https://gs.statcounter.com/search-engine-market-share/all/china.
StatCounter. “Search Engine Market Share India.” StatCounter Global Stats. Accessed March 23, 2022. https://gs.statcounter.com/search-engine-market-share/all/india.
StatCounter. “Search Engine Market Share Indonesia.” StatCounter Global Stats. Accessed March 23, 2022. https://gs.statcounter.com/search-engine-market-share/all/indonesia.
StatCounter. “Search Engine Market Share Russian Federation.” StatCounter Global Stats. Accessed January 18, 2022. https://gs.statcounter.com/search-engine-market-share/all/russian-federation.
StatCounter. “Search Engine Market Share Turkey.” StatCounter Global Stats. Accessed March 23, 2022. https://gs.statcounter.com/search-engine-market-share/all/turkey.
StatCounter. “Search Engine Market Share Viet Nam.” StatCounter Global Stats. Accessed March 23, 2022. https://gs.statcounter.com/search-engine-market-share/all/viet-nam.
Statista database. “Search Advertising—Worldwide.” Accessed January 18, 2022. https://www.statista.com/outlook/amo/advertising/search-advertising/worldwide.
Statista database. “Social Media Advertising—Worldwide.” Accessed various dates. https://www.statista.com/outlook/dmo/digital-advertising/social-media-advertising/worldwide.
Statista database. “Social Media Statistics & Facts.” Published by Statista Research Department, February 25, 2021. https://www.statista.com/topics/1164/social-networks.
Statista. “China: MAU of Leading Messaging Apps 2021.” Published by Lai Lin Thomala, December 6, 2021. https://www.statista.com/statistics/1062449/china-leading-messaging-apps-monthly-active-users.
Statista. “China: MAU of Leading Short Video Apps 2021.” Published by Lai Lin Thomala, December 2021. https://www.statista.com/statistics/910633/china-monthly-active-users-across-leading-short-video-apps.
Statista. “China: Most Popular Apps 2021.” Published by Lai Lin Thomala, January 14, 2022. https://www.statista.com/statistics/1032630/china-leading-apps-by-monthly-active-users.

Foreign Censorship Part 2: Trade and Economic Effects on U.S. Businesses
102 | www.usitc.gov
Statista. “China: Number of Facebook Users in China from 2017 to 2023.” Published by Lai Lin Thomala, August 16, 2021. https://www.statista.com/statistics/558221/number-of-facebook-users-in-china.
Statista. “China: Number of Internet Users 2021.” Published by Lai Lin Thomala, February 9, 2022. https://www.statista.com/statistics/265140/number-of-internet-users-in-china.
Statista. “China—Revenue Distribution of WeChat by Channel 2016.” Published by Statista Research Department, September 15, 2016. https://www.statista.com/statistics/746004/china-revenue-distribution-of-wechat-by-channel.
Statista. “Facebook: Number of Monthly Active Users Worldwide 2008–2021.” Published by Statista Research Department, February 14, 2022. https://www.statista.com/statistics/264810/number-of-monthly-active-facebook-users-worldwide.
Statista. “Internet Users in Vietnam 2025.” Published by J. Degenhard, July 20, 2021. https://www.statista.com/forecasts/1147008/internet-users-in-vietnam.
Statista. “Leading Online Video Platforms in China as of January 2021.” Published by Lai Lin Thomala, February 3, 2022. https://www.statista.com/statistics/276038/china-leading-online-video-platforms.
Statista. “Mobile Messaging App Penetration Rate in 2021, by Country.” Published by L. Ceci, September 16, 2021. https://www.statista.com/statistics/1263720/mobile-messaging-apps-usage-by-country.
Statista. “Most Popular Global Mobile Messenger Apps as of October 2021, Based on Number of Monthly Active Users.” Published by Statista Research Department, October 2021. https://www.statista.com/statistics/258749/most-popular-global-mobile-messenger-apps.
Statista. “Number of Active WeChat Messenger Accounts Q2 2011-Q3 2021.” Published by Lai Lin Thomala, February 8, 2022. https://www.statista.com/statistics/255778/number-of-active-wechat-messenger-accounts.
Statista. “Number of Mobile Phone Messaging App Users Worldwide from 2018 to 2025.” Published by L. Ceci, November 15, 2021. https://www.statista.com/statistics/483255/number-of-mobile-messaging-users-worldwide.
Statista. “Online Videos in China—Statistics & Facts.” Published by Lai Lin Thomala, March 9, 2021. https://www.statista.com/topics/1376/online-videos-in-china.
Statista. “TikTok Global Monthly Active Users 2018–2021.” Published by L. Ceci, January 28, 2022. https://www.statista.com/statistics/1267892/tiktok-global-mau.
Statista. “Top Internet Companies Digital Advertising Revenues 2021.” Published by Statista Research Department, January 24, 2022. https://www.statista.com/statistics/1285405/revenues-digital-ad-major-internet-companies.

Chapter 3: Effects of Foreign Censorship on Social Media, Over-the-Top Communications Services, and Internet Search
United States International Trade Commission | 103
Statista. “Total Internet Users in India.” Published by Sandhya Keelery, August 17, 2021. https://www.statista.com/statistics/255146/number-of-internet-users-in-india.
Statista. “YouTube Users in the World 2017–2025.” Published by J. Degenhard, July 20, 2021. https://www.statista.com/forecasts/1144088/youtube-users-in-the-world.
Statista. Digital Advertising Report 2021—Social Media Advertising, December 2021. https://www.statista.com/study/36294/digital-advertising-report-social-media-advertising.
Statista. Digital Advertising Report 2021—Social Media Advertising, July 2021.
Statista. Social Media in China. Accessed July 2, 2021. https://www.statista.com/study/12459/social-networks-in-china-statista-dossier.
Stokel-Walker, Chris. “Russia’s Internet Censorship Machine is Going After Tor.” Wired, December 18, 2021. https://www.wired.com/story/russia-block-tor-censorship.
Supreme Court of India. Anuradha Bhasin v. Union of India. January 10, 2020. https://main.sci.gov.in/supremecourt/2019/28817/28817_2019_2_1501_19350_Judgement_10-Jan-2020.pdf.
Teevan, Jaime, Kevyn Collins-Thompson, Ryen W. White, Susan T. Dumais, and Yubin Kim. “Slow Search: Information Retrieval without Time Constraints.” Proceedings of the Symposium on Human-Computer Interaction and Information Retrieval - HCIR ’13, October 2013. Vancouver BC, Canada: ACM Press. https://doi.org/10.1145/2528394.2528395.
Tencent. Tencent 2021 Annual Report, 2022. https://static.www.tencent.com/uploads/2022/04/07/7c31a327fb1c068906b70ba7ebede899.pdf.
Thomson Reuters. Annual Report 2020, March 10, 2021. https://ir.thomsonreuters.com/static-files/97aa3f7b-64d6-4a15-84a4-fad545746ab4.
Twitch. “Audience.” Accessed January 4, 2022. https://twitchadvertising.tv/audience.
U.S. International Trade Commission (USITC). Foreign Censorship, Part 1: Policies and Practices Affecting U.S. Businesses, 2021. USITC Publication 5244. Washington, DC: USITC, February 2022. https://www.usitc.gov/sites/default/files/publications/332/pub5244.pdf.
U.S. International Trade Commission (USITC). Hearing Transcript in connection with Inv. No. 332-585, Foreign Censorship, Part 1: Policies and Practices Affecting U.S. Businesses and Inv. No. 332-586, Foreign Censorship, Part 2: Trade and Economic Effects on U.S. Businesses, July 1, 2021.
U.S.-China Economic and Security Review Commission. 2021 Annual Report to Congress, November 2021. https://www.uscc.gov/sites/default/files/2021-11/2021_Annual_Report_to_Congress.pdf.
Foreign Censorship Part 2: Trade and Economic Effects on U.S. Businesses
104 | www.usitc.gov
U.S.-China Economic and Security Review Commission. Hearing Transcript. Hearing before the U.S.-China Economic and Security Review Commission on U.S.-China Relations in 2021: Emerging Risks, September 8, 2021. https://www.uscc.gov/sites/default/files/2021-09/September_8_2021_Hearing_Transcript.pdf.
University of North Carolina. “Metadata for Data Management: A Tutorial: Definition,” February 7, 2022. https://guides.lib.unc.edu/metadata/definition.
Vimeo. “Vimeo.” Accessed January 4, 2022. https://vimeo.com.
Wagner, Kurt. “This Is How Facebook Uses Your Data for Ad Targeting.” Vox, April 11, 2018. https://www.vox.com/2018/4/11/17177842/facebook-advertising-ads-explained-mark-zuckerberg.
Wang, Yaqiu. “WeChat Is a Trap for China’s Diaspora.” Human Rights Watch, August 14, 2020. https://www.hrw.org/news/2020/08/14/wechat-trap-chinas-diaspora.
West, Darrell M. Internet Shutdowns Cost Countries $2.4 Billion Last Year. Center for Technology Innovation at Brookings, October 2016. https://www.brookings.edu/wp-content/uploads/2016/10/intenet-shutdowns-v-3.pdf.
Woodhams, Samuel, and Simon Migliano. “The Cost of Internet Shutdowns 2020.” Top10VPN. Accessed January 14, 2022. https://www.top10vpn.com/research/cost-of-internet-shutdowns.
Woodhams, Samuel, and Simon Migliano. “The Global Cost of Internet Shutdowns 2019 Report,” January 7, 2020. https://www.top10vpn.com/research/cost-of-internet-shutdowns/2019.
Woodhams, Samuel, and Simon Migliano. “The Global Cost of Internet Shutdowns 2020 Report,” January 3, 2021. https://www.top10vpn.com/research/cost-of-internet-shutdowns/2020.
Woodhams, Samuel, and Simon Migliano. “The Global Cost of Internet Shutdowns 2021.” Top10VPN, January 3, 2022. https://www.top10vpn.com/research/cost-of-internet-shutdowns/2021.
Woodhams, Samuel, and Simon Migliano. “The Global Cost of Internet Shutdowns: Update.” Top10VPN, November 2021. https://www.top10vpn.com/research/cost-of-internet-shutdowns/2021.
World Bank. “Individuals Using the Internet (% of Population)—United States,” Accessed February 7, 2022. https://data.worldbank.org/indicator/IT.NET.USER.ZS?locations=US.
WorldAtlas. “10 Things That Are Banned in China.” Accessed April 12, 2022. https://www.worldatlas.com/articles/10-things-that-are-banned-in-china.html.
Yuan, Li. “A Generation Grows Up in China Without Google, Facebook or Twitter.” New York Times, August 6, 2018. https://www.nytimes.com/2018/08/06/technology/china-generation-blocked-internet.html.

Chapter 4: Effects of Foreign Censorship on Audiovisual Content and Examples of Extraterritorial Censorship
United States International Trade Commission | 105
Chapter 4 Effects of Foreign Censorship on Audiovisual Content and Examples of Extraterritorial Censorship This chapter describes and estimates the economic effects of censorship-related measures experienced by producers and distributors of audiovisual content, including box office movies, subscription video streaming video services, and video games. In addition, it also includes examples of extraterritorial censorship faced by U.S. firms across a range of industries.
Producers and distributors of audiovisual content are impacted by premarket content review and self-censorship. As discussed in Foreign Censorship 1, creative content can be subject to censorship review as a condition for market entry and is employed in all of the key markets, particularly in China. The editing and creation of new content to address specific or potential objections from Chinese authorities requires U.S. film studios and video game producers to incur additional costs if they wish to distribute in China. The censorship review process can also encourage these firms to self-censor and preemptively tailor their content to appease government censors.
Like digital services providers discussed in chapter 3, producers and distributors of audiovisual content also experience censorship-enabling measures, specifically market access restrictions.201 For example, movie studios are affected by quotas in China on the number of foreign films allowed to be screened each year. Films that are granted distribution are limited by government-controlled screening dates and times, and the number of theaters for screening. As discussed in the box office movies case study below, these censorship-enabling restrictions boost domestic film production, while simultaneously controlling what Chinese citizens watch, and have significant revenue impacts on U.S. firms.
While the purpose of this chapter is to quantify the impact of foreign censorship-related measures on producers and distributors of audiovisual content, data limitations preclude the Commission from quantifying the impact of certain types of censorship. Specifically, due to the lack of data on editing and other production-specific costs, it is not possible to quantify the cost of complying with premarket content review and self-censorship on box office movies or video games. The analysis below therefore focuses on revenue foregone due to market access blocks for box office movies and subscription video-on-demand (SVOD) services, and due to high levels of media censorship for video games. In addition, where possible a detailed explanation of the possible costs incurred from premarket content review and self-censorship is included.
201 The Commission’s estimates of the costs of censorship-enabling measures are subject to the caveat that these measures may have multiple policy objectives, so the estimated effects associated with such measures are broader than only the effects of censorship. For a complete discussion of direct censorship measures, see USITC, Foreign Censorship, Part 1, 2022, 41–49.

Foreign Censorship Part 2: Trade and Economic Effects on U.S. Businesses
106 | www.usitc.gov
Summary of Key Findings • Premarket content reviews impact U.S. producers and distributors of audiovisual content, who
will often go out of their way to edit content to ensure it avoids sensitive topics that could preclude it from entering a specific market. They also are incentivized to self-censor to increase the probability of obtaining market access. • Costs related to premarket review and self-censorship by U.S. film studios may include
additional content editing to mitigate the risk of offending perceived sensitivities; adding content that could be received positively by censors; hiring cultural consultants to avoid content censors may deem objectionable; foregone revenue on film projects that are not undertaken because of potential sensitivities; and potential lost revenues from global audiences rejecting censored content.
• U.S. video game companies are also subject to premarket content review and self-censorship in China and incur similar costs from modifying and vetting content, as well as foregone revenues, to satisfy censors.
• Market access restrictions impact box office movies, streaming video, and video games by blocking access to the distribution and purchase of content. These blocks are costly in terms of foregone revenue and can be substantial depending on the market. • In 2021, four U.S. films—which were among the 12 largest-earning films in terms of global
box office revenue in 2021—were blocked by China resulting in potential lost revenue ranging from $289 million to $651 million based on historical U.S. film shares of China’s box office revenue.
• China’s market access blocks imply large losses in potential revenues for U.S. streaming video platforms. Estimates of foregone revenue for the block of U.S. SVOD platforms in China range from $590 million to $4.1 billion in 2021.
• For video games, high levels of media censorship have been associated with lower per-user video game revenues for both digital and physical video games. Commission estimates suggest that revenues for U.S. video game companies in 2019 could have increased by about $1.1 billion in China and $584 million in India.
• Through the threat of website access blocks and market access denial, China has been able to extend its censorship aims beyond its borders to affect U.S. firms’ global operations, contributing to increased regulatory compliance costs, reduced revenue, and increased self-censorship.
Box Office Movies Although countries routinely conduct premarket review of films, because of the size of the Chinese box office, which has been important for the profitability of U.S. films, censorship-related measures in China are the most impactful for U.S. film studios. In 2020, China overtook the United States to become the world’s largest global box office, after building new theater screens at a fast pace during the last decade. China now has nearly double the number of movie screens compared with United States, with many

Chapter 4: Effects of Foreign Censorship on Audiovisual Content and Examples of Extraterritorial Censorship
United States International Trade Commission | 107
more expected to be built in the coming years.202 China’s increasingly strict censorship of the film industry is costly for U.S. film studios operating in what is now the world’s largest film market, accounting for more than one-third of the global box office revenue in 2021.203 Increased censorship of films is occurring in the context of an expanding Chinese domestic film industry, which the government views as a key economic sector and a critical vehicle for promoting Chinese Communist Party (CCP) propaganda objectives.204 The market has been vital for the profitability of certain U.S. “tentpoles” (large-budget films that are expected to be highly profitable and able to subsidize studios’ smaller, less profitable films).205
The Chinese government has tightened censorship review and increasingly restricted release of U.S. films in China, while simultaneously encouraging domestic filmmakers to produce nationalistic and patriotic-themed films.206 Chinese film authorities plan to promote 10 domestic tentpoles each year, which include nationalistic films, according to the government’s latest Five-Year Plan.207 With such strong support from the government and improved content quality produced by domestic suppliers, Chinese domestic films now dominate the country’s box office. In 2016, U.S. films accounted for 5 of the top 10 films by number of admissions in China. But U.S. films’ share has declined, particularly since 2018 when regulatory and censorship control were centralized under the China Film Administration (CFA), which is part of the publicity department of the CCP.208 By 2019 (prior to the COVID-19 pandemic), only 2 U.S. films, Avengers: Endgame and Fast and Furious, were in the top 10 in China. In both 2020 and 2021, no U.S. films were among the top 10, despite U.S. productions being among the leading box office films globally.209 The total number of U.S. films shown in the Chinese market also declined. In 2021, 25 U.S. films reportedly were released theatrically in China, compared with an estimated 45 U.S. films in 2019.210 U.S. films accounted for less than 12 percent of China’s total box office receipts in 2021.211 The decline in U.S. films screened in China suggests that censorship-related policies also serve to protect the domestic Chinese film industry from foreign competition.212
202 Li, “How Hollywood Sold Out,” September 10, 2021. By 2025, the government aims to have 100,000 total screens, compared to 45,000 in the United States. Tartaglione, “China Outlines 14th Five-Year Plan,” November 16, 2021. 203 Frater, “China Is Poised to Retain Worldwide Box Office Crown,” December 23, 2021. 204 Liu, “Is Spider-Man: No Way Home Banned?” November 12, 2021. 205 Liu, “Spider-Man,” January 3, 2022. 206 Liu, “Is Spider-Man: No Way Home Banned?” November 12, 2021. 207 Tartaglione, “China Outlines 14th Five-Year Plan,” November 16, 2021. An example of the nationalistic genre is The Battle of Lake Changjin, an historical drama about the Chinese Army in the Korean War, which was the biggest global box office fi lm in 2021 ($896 mill ion) before it was overtaken by Spiderman: No Way Home ($1.3 bil l ion) at the end of the year. Almost all of the revenues for the fi lm were earned in China. Box Office Mojo, “The Battle at Lake Changjin,” Global market revenues 2021, accessed January 2, 2022. 208 Pen America, Made in Hollywood, August 5, 2020. 209 European Audiovisual Observatory, Focus 2017, May 18, 2017, 51; European Audiovisual Observatory, Focus 2020, June 14, 2020, 51; European Audiovisual Observatory, Focus 2021, July 9, 2021. 210 Brzeski, “Who’s In,” December 9, 2021. 211 Davis, “Hollywood’s Abil ity to Influence,” January 4, 2022. 212 Corey, “Censorship and U.S. Content Exports to China,” June 29, 2020.
Foreign Censorship Part 2: Trade and Economic Effects on U.S. Businesses
108 | www.usitc.gov
Premarket Review and Self-Censorship China maintains an increasingly strict and often lengthy premarket censorship review process for U.S. films.213 Reportedly, censorship comments often are communicated verbally by censoring authorities, not in writing and not according to written guidelines, which creates ambiguity and encourages U.S. film studios to self-censor.214
Because of the Chinese government’s control over film imports and their distribution in the Chinese market, U.S. film studios reportedly go out of their way to self-censor to ensure that their content avoids topics and depictions of China that may raise objections and be blocked by censors. 215 In addition to self-censorship, in some cases, studios reportedly create special content for the Chinese market that they think may please censors, in order to receive favorable treatment for their films, such as better release dates, and increased promotion.216 The editing and creation of content to meet specific or potential objections from Chinese authorities impose additional costs on U.S. film studios who do not want to offend Chinese sensitivities. This occurs even for films targeted to the U.S. and third-country markets.
Self-censorship by U.S. film studios of content for the Chinese market could raise costs in several ways:
• Additional editing of content to avoid perceived sensitivities of Chinese authorities. • Creating and adding additional content that could be perceived positively by censors. • Costs associated with hiring cultural consultants to avoid sensitive content. • Costs related to the uncertainty of what is acceptable to the Chinese government and censors,
which result from additional editing and review. • Opportunity costs associated with lost revenue foregone on film projects that were not
undertaken because of potential retribution from Chinese authorities. • Lost revenue from U.S. and other global audiences rejecting censored content.
There is little public information about the extent of self-censorship or the costs related to the practice as U.S. film studios are reluctant to publicly comment on the issue.217 The information that is available is anecdotal, with references in the trade press, or noticeable changes between films released in China compared to the original versions of those films released in other global markets. For example, in China, the trailer for Top Gun: Maverick, revealed self-censorship of Tom Cruise’s flight jacket with flags of Taiwan and Japan removed.218 This may have been a relatively low-cost edit, but other self-censored content changes are more costly. For example, Paramount executives spared the Great Wall of China from destruction in World War Z (2013) because they were anxious to get the movie approved for release in China. This was one of a series of changes aimed at removing content that studio executives feared would be construed negatively by Chinese authorities.219 Despite the extensive and costly
213 See generally Government of China, Film Industry Promotion Law, November 7, 2016. 214 Pen America, Made in Hollywood, August 5, 2020. 215 Allen-Ebrahimian, “China Is Censoring,” September 1, 2020. 216 BBC, “Hollywood Censors Films,” August 6, 2020. 217 Pen America, Made in Hollywood, August 5, 2020, 5. 218 Pen America, Made in Hollywood, August 5, 2020, 24–25. The fi lm was ultimately released in the United States with the flags reinserted. Toh and Chang, “‘Top Gun: Maverick’ Brings Back the Taiwan Flag,” June 2, 2022. 219 Daniel, “Iron Man 3 Execs,” May 14, 2013; Pen America, Made in Hollywood, August 5, 2020, 24, 28.

Chapter 4: Effects of Foreign Censorship on Audiovisual Content and Examples of Extraterritorial Censorship
United States International Trade Commission | 109
changes, the film was still not released in China.220 Another example of a studio making major costly edits was MGM reportedly spending $1 million on the 2012 film, Red Dawn, to digitally transform its Chinese villains into North Koreans.221 At the same time, changes or additional content to please censors in China can incur costs outside China, however. For example, the 2019 film Abominable featured a nine-dash line map, which reflected China’s disputed claims on islands in the South China Sea, a highly sensitive subject to China’s neighbors.222 In this case, the edit also led to lost potential revenue in other markets—Vietnam, Malaysia, and the Philippines banned the movie in response to the characterization of the territory on the map.223
One important source of information on how studios approach self-censorship was revealed in 2014, when information about Sony’s internal business strategy was made public, showing the extent to which studio executives deliberate on altering content in order to anticipate how Chinese authorities might react to their films.224 For example, in Sony’s movie, Pixels, there were reportedly extensive discussions by Sony executives on eliminating content, including deleting a scene of the Great Wall being destroyed and references to the film antagonist’s connection to the Chinese Communist government.225 The edits were made prior to Chinese censors’ review to forestall any objections from authorities.226 Reportedly, there were also internal discussions on how the studio could make other films more agreeable to Chinese censors, including content changes to the 2014 remake of RoboCop.227
Another potential cost could arise if studios alter their content to appease Chinese censors to the extent that U.S. and global viewers “stop watching their movies.”228 If there is some backlash, it could lead to revenue losses from international audiences. For example, credits for the Disney film Mulan thanked the government of Xinjiang where scenes were filmed (home to the repressed ethnic minority Uyghurs), which created a backlash against the film and call for boycotts in the U.S. and other markets.229 In addition, the film’s star Liu Yifei expressed support for police crackdowns in Hong Kong, which added to the foreign backlash against the film.230
There is some debate about whether U.S. film studios are altering films to tailor to Chinese audiences or adding content and adjusting storylines to please Chinese censors.231 For example, one source suggested that additional footage for the version of Iron Man 3 released in the Chinese market was more about
220 Pen America, Made in Hollywood, August 5, 2020, 28. 221 Walker, “9 Things the Sony Hack Has Taught Us,” December 20, 2014. 222 Brenner, “Rated C for Censored,” October 29, 2021. 223 Palatino, “DreamWorks’ ‘Abominable’ Film Banned,” October 28, 2019. 224 Baldwin and Cooke, “How Sony Sanitized,” July 25, 2014. 225 Pen America, Made in Hollywood, August 5, 2020, 24–25. 226 O’Connor and Armstrong, Directed by Hollywood, October 28, 2015. 227 Siegel, “Hollywood Is ‘Increasingly Normalizing,’” August 5, 2020; Baldwin and Cooke, “How Sony Sanitized,” July 25, 2014. 228 Siegel, “Hollywood Is ‘Increasingly Normalizing,’” August 5, 2020; Goh, “Disney’s ‘Mulan’ Sparks Backlash,” September 8, 2020; Brenner, “Rated C for Censored,” October 29. 229 Brenner, “Rated C for Censored,” October 29, 2021; Goh, “Disney’s ‘Mulan’ Sparks Backlash,” September 8, 2020. 230 Goh, “Disney’s ‘Mulan’ Sparks Backlash,” September 8, 2020; Brenner, “Rated C for Censored,” October 29, 2021. 231 Pen America, Made in Hollywood, August 5, 2020.

Foreign Censorship Part 2: Trade and Economic Effects on U.S. Businesses
110 | www.usitc.gov
pleasing Chinese censors than a market strategy to appeal to Chinese theatergoers.232 Substantive edits to create a different version of tentpole films can be costly. Edits for Iron Man 3 included the addition of four minutes of scenes that were produced with a Chinese production company. These changes incurred production costs and likely would not have been made in the absence of the censorious environment.233
U.S. studios also face potential costs related to the uncertainty about whether content might be judged acceptable or not acceptable. U.S. film studios are unsure about the priorities of Chinese censors, beyond avoiding sensitive topics such as Taiwan, ethnic minorities, or China’s claims on the South China Sea. A major problem for studios is that Chinese censors’ sensitivities are reportedly constantly shifting, and are loosened or tightened frequently.234 Although there are official published policies on banned content, the rules are reportedly overly general, vague, and open to interpretation, which makes it difficult for studios to know what content is acceptable.235 As a consequence, studios self-censor even the most “mildly unfavorable” content, which incurs additional time and costs for studios. 236
Market Access Restrictions All U.S. and foreign films in China are subject to a release quota, and all films must be submitted to the CFA for review, clearance, and release. In addition to review, the CFA controls release dates, number of theaters where films can be shown, screening times, and film promotion budgets.237 In some cases, Chinese authorities block films from the market by not providing release dates, even for films that reportedly passed censorship review; while in other cases, film releases are delayed, which can result in lost potential revenues. Chinese release quotas likely have a mix of motives, including promoting the domestic film industry, but they may also facilitate censorship, for example, by limiting the films that may be released in China.238
Quotas on Foreign Films China’s quota on the number of foreign films allowed to be screened under profit-sharing arrangements with Chinese distributors was set at 10 in 1994 and expanded to 34 films in 2012 under the U.S-China Film Agreement.239 Under the agreement, China and the United States were to “engage in consultations” in 2017 to discuss further access to the Chinese market for U.S. films, but the 34-film import quota, which has been allocated mostly to films from large Hollywood studios (Disney,
232 Li, “How Hollywood Sold Out,” September 10, 2021. 233 Daniel, “Iron Man 3 Execs,” May 14, 2013. 234 Pen America, Made in Hollywood, August 5, 2020, 11. 235 Pen America, Made in Hollywood, August 5, 2020, 14; USITC, Foreign Censorship, Part 1, 2022, 75; Government of China, Film Industry Promotion Law, November 7, 2016. 236 Faughnder, “Hollywood ‘Kowtowing’ to China,” July 27, 2020. 237 Pen America, Made in Hollywood, August 5, 2020, 15. 238 See also USITC, Foreign Censorship, Part 1, 2022, 74–76. 239 O’Connor and Armstrong, Directed by Hollywood, October 28, 2015; According to the Office of the U.S. Trade Representative, as of March 2021, China had not fully implemented its commitments under the 2012 fi lm agreement. USTR, 2021 National Trade Estimate Report, 2021, 127; U.S. Department of State, “Films for Theatrical Release: Memorandum of Understanding Between the United States and China,” April 25, 2012. Follows, “The Rise and Rise of the Film Business in China,” January 26, 2015.

Chapter 4: Effects of Foreign Censorship on Audiovisual Content and Examples of Extraterritorial Censorship
United States International Trade Commission | 111
Paramount, Sony, Universal, and Warner Brothers), is reportedly still in effect.240 However, in certain years, the number of foreign films screened may be fewer or more than 34. For example, in 2017 over 40 films were screened, while in 2021, only 25 U.S. films were screened.241 For such profit-sharing films, U.S. film studios primarily submit large-budget tentpoles and earn 25 percent of the box office revenues (compared with roughly 60 percent in the United States and as much as 40 percent in other global markets).242 This leaves 75 percent of box office revenues accruing to the Chinese film industry and government including revenues provided to film distributors and theaters.243 In addition to the titles allowed under the 34-film profit-sharing quota, which are generally larger-budget U.S. movies, foreign films also enter China through separate less lucrative buyout arrangements, where filmmakers sell broadcast rights to Chinese distributors for a flat fee.244 These films, which are not subject to a quota, are generally smaller-budget productions and often, though not exclusively, include films from other country suppliers, such as South Korea, Japan, and India.245 In 2019, 87 foreign flat-fee films were screened in China, which accounted for less than 7 percent of the annual box office that year. 246
China’s film quota is costly for U.S. films studios in terms of lost potential revenue. This can be expressed as the revenue they would have earned in the absence of the quota, with market forces determining the number of U.S. films that could be screened profitably in China, as well as their run time in theaters. An integral part of the profit-sharing quota regime is that Chinese authorities control marketing, screening dates, the number of theaters, and where U.S. films can be shown, which also contributes to lost potential revenues for U.S. film studios. In addition, the cost of the quota is also borne by the Chinese theater industry. One recent study estimates that the quota leads to lower revenues for Chinese film distributors and cinemas, as well as reduced Chinese consumer welfare.247
240 The fi lm quota applies to foreign fi lms that receive a share of profits from the Chinese market. The 34 fi lms consist of 20 2-dimensional and 14 3-D and IMAX fi lms. Zheng, “China Quietly Opens Door,” October 23, 2018; Brzeski, “China’s Quota on Hollywood,” February 9, 2017; Papish, “Foreign Films in China,” March 2, 2017; Harris Bricken, “China Film,” June 19, 2018; USTR, 2021 National Trade Estimate Report, 2021, 127; U.S. Department of State, “Films for Theatrical Release: Memorandum of Understanding Between the United States and China,” April 25, 2012. 241 Brzeski, “Who’s In,” December 9, 2021. Other sources also indicate a decreasing number of U.S. fi lms in the Chinese market in recent years. Zheng, “China Quietly Opens Door,” October 23, 2018; Brzeski, “China’s Quota on Hollywood,” February 9, 2017; Papish, “Foreign Films in China,” March 2, 2017; Harris Bricken, “China Film,” June 19, 2018; Davis, “By the Numbers,” January 13, 2022. 242 O’Connor and Armstrong, Directed by Hollywood, October 28, 2015, 4; Zipin, “How Exactly Do Movies Make Money?” October 18, 2021. 243 Davis, “Hollywood’s Abil ity to Influence,” January 4, 2022; Dezan Shira & Associates, “Navigating Restrictions,” December 17, 2015. 244 Buyout fi lms are not subject to a quota but imported fi lm numbers vary by year. Papish, “Foreign Films in China,” March 2, 2017; Davis, “By the Numbers,” January 13, 2022. 245 Papish, “Foreign Films in China,” March 2, 2017; Davis, “By the Numbers,” January 13, 2022. 246 In 2021, 42 such fi lms were screened in China. Davis, “By the Numbers,” January 13, 2022. 247 Ho, Rysman, and Wang, Demand for Performance Goods, August 3, 2021; Pen America, Made in Hollywood, August 5, 2020, 15.

Foreign Censorship Part 2: Trade and Economic Effects on U.S. Businesses
112 | www.usitc.gov
Estimated Lost Revenue Related to Blocks Chinese censorship authorities may block specific U.S. films by not providing release dates for screening in Chinese theaters, even though in some cases they reportedly pass censorship review. As estimated below, this de facto censorship in the world’s largest film market results in substantial potential revenue losses for U.S. film studios on some of their blockbuster tentpole films which lowers global box office revenue for these films. Also described below, Chinese authorities allow some U.S. films to be released after substantial delays caused by the censorship review process, which reduces the revenues received by U.S. movie studios. When film releases are delayed, widespread piracy in China can severely depress theatrical revenues as potential movie-goers view pirated copies.248
The following section provides estimates of lost revenue of four U.S. films that were blocked or never received a release date by China in 2021. The four films discussed below are U.S. tentpole films released by Disney’s Marvel Studios, as a part of the Marvel Cinematic Universe (MCU), that generated large global box office revenues in 2021 but were blocked by China. MCU films have been popular and traditionally generated large revenues in China, for example, Avengers: Endgame (2019) had box office receipts of $629 million in China.249 The Chinese box office accounted for between 10 to 20 percent of the studio’s global revenues in recent years.250
Two prominent examples of MCU tentpole films that were blocked from release, reportedly because of sensitivity in China, although not officially banned, are Eternals, directed by Chinese-born, Academy Award best director recipient Chloe Zhao, and Shang-Chi and The Legend of the Ten Rings (Shang-Chi), Marvel’s first Asian superhero movie. Both films were expected to have a large market in China based on previous demand for the Marvel franchise’s films in the market. In addition, two other MCU films Spider-Man: No Way Home, which had the largest global box office revenue ($1.4 billion) in 2021, and Black Widow, the 12th largest film by global revenues ($380 million) in 2021, were also blocked. Spider-Man: No Way Home was co-produced by Columbia Pictures and Marvel Studios and distributed by Sony Pictures. The film was reportedly not released in China because Sony ultimately rejected changes requested by authorities to delete and minimize the appearance of the Statue of Liberty in the end scenes.251 Spider-Man films in particular have generated large revenues in China. Spider-Man: Far From Home (2019), earned $199 million, and Spider-Man: Homecoming (2017) generated $116 million.252 The block of the latest Spider-Man film resulted in substantial estimated potential revenue losses for the U.S. film studio. Black Widow reportedly passed censorship review but ultimately did not receive a release date from Chinese authorities, reportedly due to continued anger and controversy surrounding Shang-Chi, discussed further below.253
248 Revenues for box office fi lms may also be foregone from ancil lary revenue streams such as toys and merchandise, as well as l icensing deals. In some cases, movies may make more from merchandise sales than box office ticket sales. Shelton, “Movies that Made More Money,” September 23, 2021. 249 Clark, “Marvel Studios Has Been Shut Out,” November 11, 2021. 250 Whitten, “‘Shang-Chi’ Doesn’t Have a Release Date,” September 2, 2021; Mendelson, “Disney Can’t Depend on China,” April 20, 2021. 251 Belloni, “The Chinese Had One Note,” May 1, 2022. 252 Clark, “Marvel Studios Has Been Shut Out,” November 11, 2021. 253 Davis, “‘Black Widow’s’ China Delay,” July 9, 2021; Liu, “Disney Exec Sidesteps Questions,” October 16, 2021.

Chapter 4: Effects of Foreign Censorship on Audiovisual Content and Examples of Extraterritorial Censorship
United States International Trade Commission | 113
The film Eternals was not provided a release date by Chinese authorities reportedly because of the surfacing of negative comments in an interview by Zhao eight years previously that were critical of the Chinese government. Once the interview was discovered, Chinese censors deleted all online references to the director on social media and in the press, and Eternals was subsequently not released in China.254 Similarly, Shang-Chi was not provided a release date by Chinese authorities, even though it drew large international audiences, including in other Asian markets such as South Korea and Japan in 2021.255 The film reportedly sparked anger because some Chinese social media users stated that the film’s lead character, Simu Liu, had insulted China, and that the film’s backstory, based on the original 1973 comic, was racist.256 In the case of Shang-Chi, the U.S. studio had reportedly targeted Chinese audiences and did not expect the negative backlash. The Asian-themed film included many references to Chinese culture, starred Chinese-American and Hong Kong stars, and used Mandarin language at times, all of which were aimed to appeal to Chinese audiences. According to one industry publication, the studio “actively courted China” for this film with favorable treatment of Chinese culture, and many Chinese viewers who saw the film abroad commented online that it was “the most respectful treatment of Chinese culture coming from a Western production.”257
Commission estimates of foregone revenue resulting from the blocking of the four movies mentioned above in China are generated by multiplying the estimated global box office revenue, adjusted upward to include China, by Chinese market’s historical share of revenue for Marvel films; since 2013, the share has ranged between 10 and 20 percent of the global market.258 In total, revenue losses for these four films are estimated to have ranged from $289 million to $651 million in 2021 (table 4.1).
Table 4.1 Select U.S. Films: Estimates of film studios’ foregone revenue from being blocked in China, 2021 In mi llions of dollars and global rank. n.a. = not applicable.
Film
United States
(million $)
Global (excluding China)
(million $)
Foregone Chinese revenues
(10%) (million $)
Foregone Chinese revenues
(20%) (million $)
Global rank in
2021 Spider-Man: No Way Home 631.8 1,390.8 154.5 347.7 1 Shang-Chi 224.5 432.2 48.0 108.1 9 Eternals 164.8 401.6 44.6 100.4 10 Black Widow 183.7 379.6 42.2 94.9 12 Total 1,204.8 2,604.2 289.4 651.1 n.a.
Source: USITC calculations; IMDb, Box Office Mojo database, accessed January 2, 2022; Whitten, “‘Shang-Chi’ Doesn’t Have a Release Date,” September 2, 2021. Note: Foregone revenue estimates are based on adjustment of global box office revenues upward to reflect global box office revenue that would have included China. We adjust global revenues upward by dividing by 0.9 and 0.8 to create a new base for the 10 percent and 20 percent columns, respectively. For example, for Spider-Man: No Way Home, the calculation for the 20 percent estimate is (1,390.8/0.8) × 0.20=347.7.
254 Brzeski, “Chloe Zhao’s Oscars Glory,” April 26, 2021. 255 Young, Chien, and Paybarah, “‘Shang-Chi’ Wins a Warm Asia Greeting,” September 17, 2021; Xi, “Black Widow’ Release Delayed,” July 2021. 256 Davis, “‘Shang-Chi’ May Be Banned,” September 16, 2021; Young, Chien, and Paybarah, “‘Shang-Chi’ Wins a Warm Asia Greeting,” September 17, 2021; King, Pan, and Roberts, “How the Chinese Government Fabricates Social Media Posts,” August 29, 2017. 257 Davis, “‘Shang-Chi’ May Be Banned,” September 16, 2021. 258 Whitten, “‘Shang-Chi’ Doesn’t Have a Release Date,” September 2, 2021.
Foreign Censorship Part 2: Trade and Economic Effects on U.S. Businesses
114 | www.usitc.gov
Delayed Film Releases Chinese censoring authorities strictly control release dates for films, in some cases they delay the release date of U.S. films beyond commercially optimal release times, which can dramatically decrease film profitability.259 Generally, U.S. studios aim to release films simultaneously across the globe to foster consumer interest and minimize the impact of piracy.260 The release of U.S. films in China, sometimes weeks after the film premiers in other markets, dampens consumer buzz and results in many potential theatergoers viewing the films through pirated means.261 For example, the film Jungle Cruise, starring Dwayne Johnson, reportedly a popular actor with Chinese audiences, was released in China three months after its global theatrical and streaming release date.262 This delay reportedly depressed the box office performance in China because the film was widely viewed on pirated media according to industry sources, and may have resulted in millions of dollars in lost revenue.263 Similar links between delayed release dates, depressed box office revenues, and piracy have been noted for Mulan. 264
Subscription Video Streaming Services SVOD services are fee-based subscription services that provide consumers with unlimited access to a library of video content (e.g., movies, TV shows, documentaries, and other content).265 Netflix and Amazon (Amazon Prime Video) were the largest global providers of such services in 2021. The global SVOD market is expanding rapidly with many new entrants in recent years, including U.S. companies such as Disney (Disney+), Warner Media (HBO Max), Apple (Apple TV+), and CBS Viacom (Paramount+).266 U.S. platforms led the international market for SVOD in 2021. Netflix held the largest global share with 214 million subscribers worldwide; Amazon Prime Video (175 million) and recent entrant Disney+ (118 million) also have large and growing international subscriber bases.267 Although U.S. SVOD platforms are market leaders in most countries, they are banned in China and face various censorship-related measures in many other markets, including Russia, India, and Indonesia, examples of which are elaborated below.268
Indonesia: Shortly after Netflix simultaneously launched in 130 foreign markets in 2016, the platform was blocked in Indonesia by the state-owned Telkom Group, which owns the leading at-home and mobile telecommunications services providers in the country.269 In 2016, Netflix was blocked from
259 Pen America, Made in Hollywood, August 5, 2020, 15. 260 Pen America, Made in Hollywood, August 5, 2020, 15. 261 Pen America, Made in Hollywood, August 5, 2020, 15. 262 Brzeski, “China Box Office: Disney’s ‘Jungle Cruise,’” November 15, 2021. 263 Tartaglione, “China Outlines 14th Five-Year Plan,” November 16, 2021; Tartaglione, “‘The Matrix Resurrections’ Cleared,” November 23, 2021. 264 Xu Elegant, “Disney Tailored ‘Mulan,’” September 20, 2020. 265 Ell is, “What Are SVOD, AVOD, and TVOD?,” accessed January 11, 2022. 266 U.S. companies that have entered the global market in recent years also include Comcast, Discovery, and others. Yahoo News, “Netflix (NFLX) Rides on International Content,” May 27, 2021. 267 Subin and Sherman, “Disney Makes the Trend Clear,” November 10, 2021. 268 USITC, Foreign Censorship, Part 1, 2022. 269 Kelion, “Netfl ix Blocked by Indonesia,” January 28, 2016; industry representative, interview by USITC staff, July 23, 2021.
Chapter 4: Effects of Foreign Censorship on Audiovisual Content and Examples of Extraterritorial Censorship
United States International Trade Commission | 115
operating until July 2020.270 This followed the Telkom Group, which accounts for about 50 percent of the Indonesian SVOD market, reportedly censoring the platform based on content it considered sexually suggestive and violent.271 Before the 2016 block, one industry observer forecast that Netflix’s revenue in Indonesia would reach $76.6 million by 2020, with total revenue between 2017 and 2020 forecast to be $138.3 million.272 Assuming Netflix would have had about half of the Indonesian market, the firm’s estimated foregone revenues would total $69.2 million during the period.273
India: In recent years, original Indian content, created and produced in collaborations between U.S.-based SVOD providers and Indian content suppliers, has faced increased censorship in India, particularly with respect to religion, sexual content, and politically sensitive content. Backlash from certain government officials and segments of the public has resulted in content removal, self-censorship, and increased costs for U.S. platforms in script review and vetting of existing and proposed Indian original content.274 For example, Amazon’s original content production, Tandav, a political drama series released in 2021, garnered complaints to the police and legal complaints about depictions of Hindu deities. As a result, Amazon Prime Video’s head of original content in India was questioned by police. 275 Legal complaints in a number of Indian States regarding the series reached the Indian Supreme Court, which ruled that the show’s Indian producers could not be detained, but opined that there should be some government screening of “these types of content.”276 Amazon relented and cut the “objectionable scenes” and apologized for the content.277
Backlash against SVOD programs by some viewers in India has resulted in tighter government scrutiny of SVOD content. In 2020, oversight of the industry shifted from the technology ministry to the information ministry, which reportedly has a history of strictly regulating over-the-air TV broadcasts.278 In addition, the government set up a three-tier “grievance process” that establishes a grievance redressal mechanism for the public, which requires SVOD executives to coordinate with law enforcement authorities on content complaints.279 Indian censoring practices impose costs on U.S.-based SVOD platforms, which have large subscriber bases in India. The costs include additional spending on
270 Ong, “Netfl ix Indonesia Called Out,” March 3, 2021. 271 Kelion, “Netfl ix Blocked by Indonesia,” January 28, 2016; industry representative, interview by USITC staff, July 23, 2021. 272 Statista, “Netfl ix: Streaming Revenues in Indonesia,” July 8, 2016; Eloksari, “How Netflix Went from Foe to Friend,” August 9, 2020. 273 USITC calculations; Statista, “Netfl ix: Streaming Revenues in Indonesia,” July 8, 2016. More recently, U.S. SVOD providers are facing increased scrutiny from Indonesian authorities including the Indonesian Broadcasting Commission, which asserted that there should be more regulations on “negative content” including “pornography, LGBT, and violence.” Ong, “Netfl ix Indonesia Called Out,” March 3, 2021. 274 Jamkhandikar, Kalra, and Rocha, “Bollywood, Streaming Giants,” March 5, 2021. 275 Jamkhandikar, Kalra, and Rocha, “Bollywood, Streaming Giants,” March 5, 2021. 276 Easton, “Amazon and Netfl ix in Crosshairs,” March 8, 2021; Supreme Court of India, “Record of Proceedings,” February 25, 2021. 277 Jamkhandikar, Kalra, and Rocha, “Bollywood, Streaming Giants,” March 5, 2021. While this is an example of content being restricted, the changes may be due to market preferences instead of censorship. It is a case where the distinction is unclear. 278 Thomson, “India Rejigs Streamer Regulations,” November 16, 2020. 279 Phartiyal, “India Says Video Streaming Platforms,” March 25, 2021; Government of India, Ministry of Electronics and Information Technology, “Notification Dated, the 25th February,” February 25, 2021, Part II., Sec. 3(2).

Foreign Censorship Part 2: Trade and Economic Effects on U.S. Businesses
116 | www.usitc.gov
reviewing and vetting scripts and hiring additional staff and consultants to avoid potentially objectionable content. SVOD providers are also subject to legal and other costs in responding to grievance cases.280 In addition, self-censored and deleted content can reduce the number and variety of programming that the services provide in India, which could lower subscriber interest resulting in foregone revenue. Going forward, foreign and domestic SVOD platforms in India are expected to face continued scrutiny of their content, which may lead to increased uncertainty and self-censorship.281
Russia: In Russia (before Netflix suspended operations in March 2022 due to Russia’s invasion of Ukraine), Netflix was reportedly under investigation in 2021 by Russian authorities over lesbian, gay, bisexual, transgender, and queer (LGBTQ) content under a 2013 “gay propaganda law,” which sets fines for the distribution of information on non-traditional sexual relationships.282 Netflix could have faced fines and a costly temporary suspension.283 This reflects broader censorship of LGBTQ content including self-censorship by film distributors not wanting to displease government officials.284 This form of censorship by authorities has been decried by human rights groups and is a violation of Article 10 of the Convention for the Protection of Human Rights and Fundamental Freedoms, according to a 2017 ruling by the European Court of Human Rights.285 Such reported censorship would force Netflix to restrict a number of programs in its library.286 The outlook for U.S. SVOD providers in Russia is that their services will be suspended indefinitely given Russian measures imposed during the ongoing war in Ukraine.287
China: U.S. SVOD providers are denied access to the Chinese SVOD market, which represents one of the significant impacts of China’s censorship-enabling policies. With estimated revenues of $11.8 billion in 2021, China is the world’s second-largest subscription video streaming market (approximately one-third the size of the $32.1 billion U.S. market), and the blocking of U.S. SVOD providers from entering implies large losses in potential revenues.288 Because foreign SVOD platforms are not allowed to legally operate in China, the market is dominated by domestic suppliers, including iQIYI and Tencent Video, whose combined revenue represents three-quarters of China’s SVOD market.289
Estimates of revenues foregone by the U.S. SVOD platforms being blocked in China range from $590 million to $4.1 billion (figure 4.1). The range is based on three competitiveness scenarios, which
280 Easton, “Amazon and Netfl ix in Crosshairs,” March 8, 2021. 281 Fingus, “Netfl ix, Amazon and Disney+ Will Self-Regulate,” September 5, 2020. 282 Reuters, “Russia Investigates Complaint,” November 26, 2021; Government of Russia, “Federal Law No. 135-FZ,” June 29, 2013. 283 Thubron, “Russian Officials Investigate Netfl ix,” November 26, 2021; Government of Russia, “Federal Law No. 135-FZ,” June 29, 2013. 284 Stewart, “Russia’s Film Distributor Censors,” June 3, 2019. 285 European Court of Human Rights, Case of Bayev and Others v. Russia, November 13, 2017, paras. 42, 83–84; European Convention on Human Rights (ECHR), November 4, 1950, art. 10. Russia is no longer a member of the Council of Europe. Council of Europe, “The Russian Federation Is Excluded,” March 16, 2022. 286 Reuters, “Russia Investigates Complaint,” November 26, 2021. 287 Brown, “Netfl ix Joins Other Media Companies Suspending Services,” March 6, 2022. 288 Statista database, “Video Streaming (SVoD)—China,” accessed January 18, 2022; Statista database, “Video Streaming (SVoD)—United States,” accessed January 18, 2022. 289 Statista database, “Video Streaming (SVoD)—China,” accessed January 18, 2022; Greenberg, “Breaking into the World’s Biggest Country,” January 12, 2016; Government of China, Special Administrative Measures, No. XII.26., December 27, 2021.

Chapter 4: Effects of Foreign Censorship on Audiovisual Content and Examples of Extraterritorial Censorship
United States International Trade Commission | 117
correspond to shares of Chinese domestic SVOD platforms. The highly competitive scenario assumes U.S. SVOD providers would have a 35 percent share of market revenues, which is equivalent to market shares of leading Chinese SVOD providers, iQIYI and Tencent Video. The moderately competitive scenario assumes U.S. SVOD providers would achieve a 15 percent market share, roughly equivalent to shares of second-tier Chinese SVOD providers like Mango TV. The low end of the range assumes low competitiveness for U.S. SVOD providers in the Chinese market (5 percent market share), which is equivalent to all other SVOD providers in China.290
The highly competitive scenario for U.S. firms assumes that domestic Chinese firms would still likely hold a majority share because of strict censorship content restrictions, substantial government participation and promotion of domestic companies in the industry, and the need for the majority of content to be in Mandarin and other domestic dialects/languages in the market. However, if U.S. SVOD providers were able to access the Chinese market, they would likely increase production of Chinese-language content, similar to their strategy elsewhere. U.S. SVOD providers are investing heavily in foreign-language content globally, including Asian-language content, in countries where they have significant market shares.291
Figure 4.1 Estimates of U.S. SVOD providers’ potential revenues in the Chinese market in 2021, under various competitive scenario assumptions In bi llions of dollars. SVOD = subscription video-on-demand. Underlying data for this figure can be found in appendix J, table J.19.
11.8
0.6
1.8
4.1
0
2
4
6
8
10
12
14
Total Market Low competitive (5%market share)
Moderately competitive(15% market share)
Highly competitive (35%market share)
Billi
on $
Source: USITC calculations; Statista database, “Video Streaming (SVoD)—China,” accessed January 18, 2022.
290 Statista database, “Video Streaming—China,” accessed January 18, 2022. 291 Walborn, “International TV Booms,” April 14, 2021.

Foreign Censorship Part 2: Trade and Economic Effects on U.S. Businesses
118 | www.usitc.gov
Video Games The video game industry is complex. It includes developers, publishers, distribution platform owners, and hardware manufacturers, with some companies active in more than one category. Video games can be played on different types of hardware and delivered to customers physically, via discs and memory cards, and digitally, via download and streaming services.
In 2021, global video game revenue was approximately $155.5 billion and was generated from 2.6 billion gaming accounts.292 There are multiple ways and platforms by which video games can generate revenue, including sales of physical games, mobile games (both for smartphones and tablets), online games (either in a web browser or via a downloaded client), download games (both for gaming consoles and personal computers), and gaming networks (subscription-based services that provide access to video games).293 Video games may also allow for in-game transaction and advertisement delivery as means to further collect revenues. The United States and China are the world’s biggest markets for video games, accounting for 19.5 percent and 31.4 percent of global revenue, respectively. Different types of video games range in popularity between countries. For example, mobile games generate 84.1 percent of video game revenues in China compared with 67.4 percent in the United States, where online games and download games have a higher percent share of revenues.294
Censorship-related measures that impact video games include premarket reviews with vague content restrictions involving prohibited content. Failure to satisfy premarket review censors can result in the denial of video game licenses that block market access. Vague premarket reviews and restrictions on foreign investment can also lead to uncertainty and self-censoring. The application of these measures may lead to foregone revenue for video game companies, particularly when market access is lost or denied.
Premarket Review and Self-censorship Both foreign and domestic video games are subject to a premarket review in China. This review has requirements to remove material containing copyright infringement or state secrets, but also vague and unpredictable content prohibitions that ultimately provide the Chinese government with the flexibility to block a wide range of video games from entering the market and create uncertainty for video game companies.295 Some of these vague prohibitions involve content in video games that “endanger social morality or national cultural traditions.”296 Video game companies must submit videos, images, and scripts of games seeking distribution licensing in China to be reviewed for prohibited content—three failures of this review can result in a game being permanently banned.297 Between 2017 and 2020, the
292 Users can have multiple accounts in a given video game category or across categories. Statista database, “Video Games—Worldwide,” accessed December 28, 2021. 293 Statista database, “Video Games—Worldwide,” accessed December 28, 2021. 294 Statista database, “Video Games—Worldwide,” accessed December 28, 2021. 295 USITC, Foreign Censorship, Part 1, 2022, 77. 296 Government of China, NPPA and MIIT, “Provisions on the Administration of Online Publishing Services,” February 4, 2016; Holmes, “No Cults, No Politics, No Ghouls,” July 15, 2021. 297 Holmes, “No Cults, No Politics, No Ghouls,” July 15, 2021.

Chapter 4: Effects of Foreign Censorship on Audiovisual Content and Examples of Extraterritorial Censorship
United States International Trade Commission | 119
number of video games that passed the premarket review and received a license to be sold in China dropped by 85 percent, from nearly 9,400 games to just over 1,400 games.298 Video games that received licenses were mostly made by Chinese companies, despite most major video game companies being located in the United States and Japan.299 For example, in 2019, of the 1,570 video games that received licenses in China, 88.2 percent were domestic titles.300 Even if a game receives a license, it may still be banned at a later time. U.S.-based game developer Roblox Corporation partnered with Tencent to successfully obtain a gaming license for its Roblox game, before it was banned in 2022, reportedly due in part with the way it processed Chinese users’ data.301 Roblox Corporation’s share price lost 39 percent of its value following the ban, and the company will have to go through a new licensing process for the updated Roblox game.302
Some video games that have not gone through the review process and received a license can be played in China via individuals importing physical copies of video games from other countries. Another popular way for Chinese users to access video games in China is though the distribution platform Steam, owned by the U.S. company Valve Corporation (Valve).303 While Valve, in partnership with a Chinese video game publisher, released a Chinese version of Steam in February 2021, it has far fewer options than the global version. The global version offers over 110,000 games compared to the 103 offered on the Chinese version.304 Certain features of the global version of Steam were restricted in China, including forums (where users would presumably be able to discuss prohibited content) and the ability to access adult games.305 These community features are not included in the Chinese version either. Chinese users had the ability to access the global version of Steam online, but this access has been unreliable at times and there are concerns of it being blocked due to censorship.306 Both the developers of games and owners of platforms that distribute games (e.g., Valve, Apple, Alphabet) face foregone revenues when the Chinese government limits catalogs and market access.307
When it comes to China and other censoring markets with strict and vague content restrictions, video game companies are often left with a choice: whether to be blocked from the market or to self-censor to facilitate market access. For example, one U.S. video game company describes vague restrictions involving social morality and national tradition as reasons it is unable to receive a video game license and access the Chinese market.308 Some individual video games—such as Battlefield 4, published by
298 Statista, “China: License Approvals,” March 19, 2021. 299 Eight of the nine top video game companies by global revenues in 2021 were headquartered in the United States or Japan. Statista database, “Video Games—Worldwide,” accessed December 28, 2021. 300 Information Technology and Innovation Foundation (ITIF), written submission to the USITC, August 18, 2021, 40–41. 301 Liao, “Roblox Pauses Service in China,” January 7, 2022. 302 Olcott, “Roblox to Rebuild China App,” January 7, 2022. 303 Holmes, “No Cults, No Politics, No Ghouls,” July 15, 2021. 304 Roth, “The Global Version of Steam,” December 25, 2021; ITIF, written submission to the USITC, August 18, 2021, 45; Valentine, “Steam Finally Launches in China,” February 2, 2021. 305 ITIF, written submission to the USITC, August 18, 2021, 45; Valentine, “Steam Finally Launches in China,” February 2, 2021. 306 Roth, “The Global Version of Steam,” December 25, 2021; Gordon, “Steam Can’t Be Easily Accessed in China,” December 28, 2021. 307 The platform owners, generally, keep a portion of the sales that are made on their platforms. 308 USITC, Foreign Censorship Survey, 2021, questionnaire narrative response.

Foreign Censorship Part 2: Trade and Economic Effects on U.S. Businesses
120 | www.usitc.gov
U.S.-based Electronic Arts, depicting a fictional coup in China—are created knowing no version would make it past Chinese content restrictions.309 Battlefield 4 is banned in China, along with any mentions of the game in press articles and the Chinese name itself, “ZhanDi4,” is censored on social media.310 Japan-based Nintendo’s Animal Crossing: New Horizons, which could be imported via unlicensed online storefronts before those were banned in 2020, was banned in China—not due to developer content but because it offers the ability for users to create unique designs and meetup with other users, a feature that allowed users to create Hong Kong independence and other pro-freedom messages that led to its ban.311
When companies attempt to comply with content revision requirements resulting from premarket content review, they incur additional costs to modify and vet content. For example, compliance may require editing a video game’s graphics and gameplay, which can lead to rebranding and rerelease in extreme cases. In one instance, South Korea-based PUBG Studios’ “PUBG: Battlegrounds,” a multiplayer game where users battle each other to the death, was never released in China because of its violence and gore, including blood. Instead, Tencent, which purchased distribution rights for the game in China, had to create an entirely new game, Peacekeepers Elite, where users still battle each other but there is no longer blood or death.312 In summary, China’s opaque and vague content restrictions add additional barriers for video game companies seeking licenses in China.
Long-term Market Access Blocks Denial of market access for long periods can result in potential revenue losses for U.S. gaming companies operating in China by delaying the introduction of new video games and therefore depressing revenue from purchases or advertisements. China has a history of long-term bans of video games, which have been described as “digital opium,” with the government likening the medium to drug use.313 Beginning in 2000 and lasting until 2012, China banned all video game consoles (and associated video games) and arcade cabinets from entering the market. This ban spanned the release of Microsoft’s Xbox and Xbox 360 consoles and associated video games. More recently, in 2018, there was an unofficial nine-month ban on any foreign or domestic video game publications in China. There were no official explanations for the ban, and it resulted in significant foregone revenue for gaming companies operating in the Chinese market. During the ban, additional content restrictions for video games were put into place (e.g., the ban on red blood became a ban on any depiction of blood). The ban renewed incentives for Chinese-based gaming partners, such as Tencent, to increase self-censorship to prevent future long-term bans.314 There was another unofficial ban of new video games from July 2021 to April 2022.315 Other video game restrictions took effect in 2021 that reduce access to video games for children under
309 Holmes, “No Cults, No Politics, No Ghouls,” July 15, 2021. 310 Jiayi, “Battlefield 4 Banned in China,” December 26, 2013. 311 Travis, “This Is Why ‘Animal Crossing’,” July 23, 2020. 312 Holmes, “No Cults, No Politics, No Ghouls,” July 15, 2021. 313 Holmes, “No Cults, No Politics, No Ghouls,” July 15, 2021. 314 Holmes, “No Cults, No Politics, No Ghouls,” July 15, 2021. 315 Zhou, “China approves first batch of video games in 9 months,” April 12, 2022.

Chapter 4: Effects of Foreign Censorship on Audiovisual Content and Examples of Extraterritorial Censorship
United States International Trade Commission | 121
18 to three hours per week; however, these restrictions are nondiscriminatory and are not necessarily censorship-enabling.316
Restrictions on foreign direct investment and an opaque licensing regime can impact U.S. firm revenue and, when combined with premarket content review, can create an avenue for censorship. As discussed in Foreign Censorship 1, video games in China are considered publications and therefore direct foreign involvement in the video game industry is prohibited. Further, for market access, foreign companies rely on partnering with Chinese-based companies to license their games to enter and be sold in the Chinese market.317 Partnering with Chinese companies may include additional pressure to self-censor products for the Chinese market and U.S. firms may incur reputational costs.318
Vietnam uses similar censorship-related measures as those in China, such as content restrictions enforced by premarket reviews. Before a video game can be made available in Vietnam, it must receive a license from Vietnam’s Ministry of Information and Communications. Requirements to obtain a license include either partnering with a Vietnamese company or establishing a local presence. 319 The video game must also comply with content requirements involving violence, gambling, gore, and distortions of Vietnamese history, among others.320 However, Vietnam has a relatively small video game market, with revenues equal to only 0.6 percent of Chinese video game market revenues in 2021, making these restrictions less costly for video game companies.321 In 2018, only 175 online games received a license, 95 percent of which were from China.322
Estimations of Foregone Revenues Resulting from Censorship The Commission’s analysis of the impact of censorship-related measures on video games differs from the estimation approaches of the other case studies in this report, primarily due to more extensive aggregate data on video games, but less data available on individual firms in China and globally. The effects of censorship on U.S. video game companies can be complex, opaque, and range from minor issues to prohibitions on video game products. Furthermore, video game revenues in different markets are affected by many factors other than censorship, such as income, population, or technology adoption and internet use, making it difficult to isolate the effects of censorship. The information that is available on video games suggests that censorship may be having large effects on video games sales, including the number of video game users and the revenues generated from each user. Table 4.2 shows that revenues
316 Government of China, NPPA, Notice on Further Strict Management and Effectively Preventing Minors from Indulging in Online Games, August 30, 2021; Haldane, “Why Does the Chinese Government,” November 19, 2021. The 2021 restrictions on playtime expand on l imitations initially put into place in 2019. Government of China. Government Information Disclosure-Notice of the NPPA on Preventing Minors from Indulging in Online Games, November 19, 2019. 317 USITC, Foreign Censorship, Part 1, 2022, 76. 318 Industry representative, interview by USITC staff, January 19, 2022. 319 Government of Vietnam, Decree No. 27/2018/ND-CP, March 1, 2018. 320 Government of Vietnam, Law on Cybersecurity, June 12, 2018; An, “142 Il legal Games Removed,” July 16, 2019; Huong Le, “Vietnam Cracks Down,” July 19, 2019. 321 Statista database, “Video Games—Worldwide,” accessed December 28, 2021. 322 Huong Le, “Vietnam Cracks Down,” July 19, 2019.

Foreign Censorship Part 2: Trade and Economic Effects on U.S. Businesses
122 | www.usitc.gov
for digital games are larger than those for physical games in each of the key markets, even in cases where internet usage is lower.
Table 4.2 Revenues for digital and physical video games and country characteristics for censoring countries and top video game markets in 2019 Income per capita in dollars; population in millions; internet use in percentages; revenue in millions of dollars; revenue per user in dollars.
Country Censorship level
Income per
capita ($)
Population (million)
Internet use (% of
population)
Digital game
revenues (million
$)
Digital game
revenues per user
($)
Physical game
revenues (million
$)
Physical game
revenues per user
($) China High 8,334 1,408 65 32,945 52.01 378 2.49 India High 1,822 1,366 41 2,505 14.90 253 0.87 Indonesia Low 3,280 271 48 1,212 15.44 10 0.72 Russia High 8,940 144 83 1,803 36.83 179 6.23 Turkey High 7,585 83 74 386 28.74 41 2.78 Vietnam High 2,163 96 69 165 21.38 16 2.91
Source: Freedom House, Freedom in the World, 2022; World Bank, World Development Indicators, accessed March 10, 2022; Statista database, “Digital Video Games—Worldwide,” accessed March 10, 2022; Statista database, “Physically Sold Video Games—Worldwide,” accessed March 15, 2022. Note: Revenues per user are based on USITC calculations.
To disentangle the effects of censorship from other determinants of video game revenues, the Commission performed a statistical regression analysis based on 141 countries. Because of data limitations and the complex ways that censorship-related measures affect video games, this analysis differs from the estimation methods in the previous case studies in this report. This analysis estimated the average impact that high levels of censorship have had on video game revenues per user at the country level. Importantly, the analysis also controlled for other determinants of video game revenues such as per-capita income, population, the share of the population using the internet, and general trends in video game revenues over time. The results of the analysis indicate that high levels of censorship are associated with video game revenues that were about $3.88 lower per user for digital games and $3.02 lower per user for physical games in recent years. These estimates imply a larger absolute effect of censorship on per-user revenues from digital games, which is further amplified by the fact that there are more users of digital games than physical games in most markets. Meanwhile, $3.02 generally represents a much larger share of per user physical game revenues, implying a larger relative effect on physical games on average.323 At least part of this difference may be due to the unique characteristics of the digital and physical games markets. For example, there are generally far fewer physical games released than digital games, implying that there are fewer substitutes for physical games. This could likely result in a higher relative impact of censorship on physical game revenues.
To conduct the analysis, information about censorship and other economic factors around the world were collected from several sources. Data on censorship were derived from Freedom House’s Freedom in the World report, which rates countries on multiple aspects of political rights and civil liberties annually.324 In particular, the database includes a rating for “free and independent media” that reflects
323 On average, physical games generated less than half the revenues per user of digital games between 2017 and 2019. 324 Freedom House, Freedom in the World, 2022.

Chapter 4: Effects of Foreign Censorship on Audiovisual Content and Examples of Extraterritorial Censorship
United States International Trade Commission | 123
many prominent aspects of censorship discussed in this report. Although not specific to video games, this rating does encompass many of the censorship issues that video game providers face. However, it may also encompass aspects of media freedom that are not necessarily considered censorship in this report. Based on these data, countries were categorized as exhibiting either low or high levels of censorship.325 Most of the key countries discussed throughout this report—including China, India, Russia, Turkey, and Vietnam—exhibited high levels of media censorship in recent years according to the Freedom House ratings (table 4.2). The censorship data were combined with country-level factors such as per-capita incomes, internet penetration rates, and population, which are also expected to influence video game revenues.326 In total, these data were available for 141 countries and the years 2017 to 2019, which formed the basis of the analysis. The dependent variable of interest was revenues per user of digital or physical games, which was derived from total revenue and user data from Statista.327 Finally, the analysis was conducted separately for both the digital and physical video game markets.328
Across the 141 countries included in the analysis, the regression estimates that high media censorship has been associated with lower per-user video game revenues for both digital and physical games between 2017 and 2019. For digital games, high censorship was associated with revenues that were, on average, about $3.88 per user lower per year.329 For physical video game sales, high censorship was associated with per-user revenues that were about $3.02 per user lower per year.330 In both cases, these impacts are relatively large given that average revenues in high censorship countries were about $20.24 and $3.92 per user for digital and physical games, respectively.331
Using these estimates, it is possible to further estimate total revenue losses faced by all video game providers—U.S., foreign, and domestic—associated with censorship in some of the key markets (table 4.3).332 In China, for example, there were approximately 633 million digital video game users in 2019. If revenues were increased by $3.88 dollars per user, total digital video game revenues in China would have increased by nearly $2.5 billion.333 In Vietnam, there were about 8 million digital game users,
325 The report rates countries from 0 to 4, where 0 reflects the lowest level of media freedom/independence and 4 reflects the highest level of freedom/independence. For the regression analysis, ratings of 0, 1, or 2 were considered “high” levels of censorship, and ratings of 3 or 4 were considered “low” levels of censorship. Additional information on the Freedom in the World report, its database, and its “free and independent media” ratings can be found in appendix I. Freedom House, Freedom in the World, 2022. 326 Data on per-capita income, population, and internet penetration were sourced from the World Bank’s World Development Indicators database. World Bank, World Development Indicators, accessed March 10, 2022. 327 Statista database, “Physically Sold Video Games—Worldwide,” accessed March 15, 2022; Statista database, “Digital Video Games—Worldwide,” accessed March 10, 2022. 328 Additional details about the data and analysis can be found in appendix I. 329 A standard error of $1.98 and a 95 percent confidence interval of $0.01 to $7.76. Here and elsewhere in this chapter, standard errors provide a statistical measure of the precision of the estimate. Smaller standard errors relative to the estimate value imply greater precision. 330 A standard error of $1.26 and a 95% confidence interval of $0.55 to $5.50. 331 Of the 141 countries included in the analysis, 87 were classified as having high censorship during at least one year between 2017 and 2019. 332 Estimated total costs were calculated by multiplying the number of users in 2019 with the estimated per-user increase in revenues. 333 A standard error of about $1.3 bil l ion.
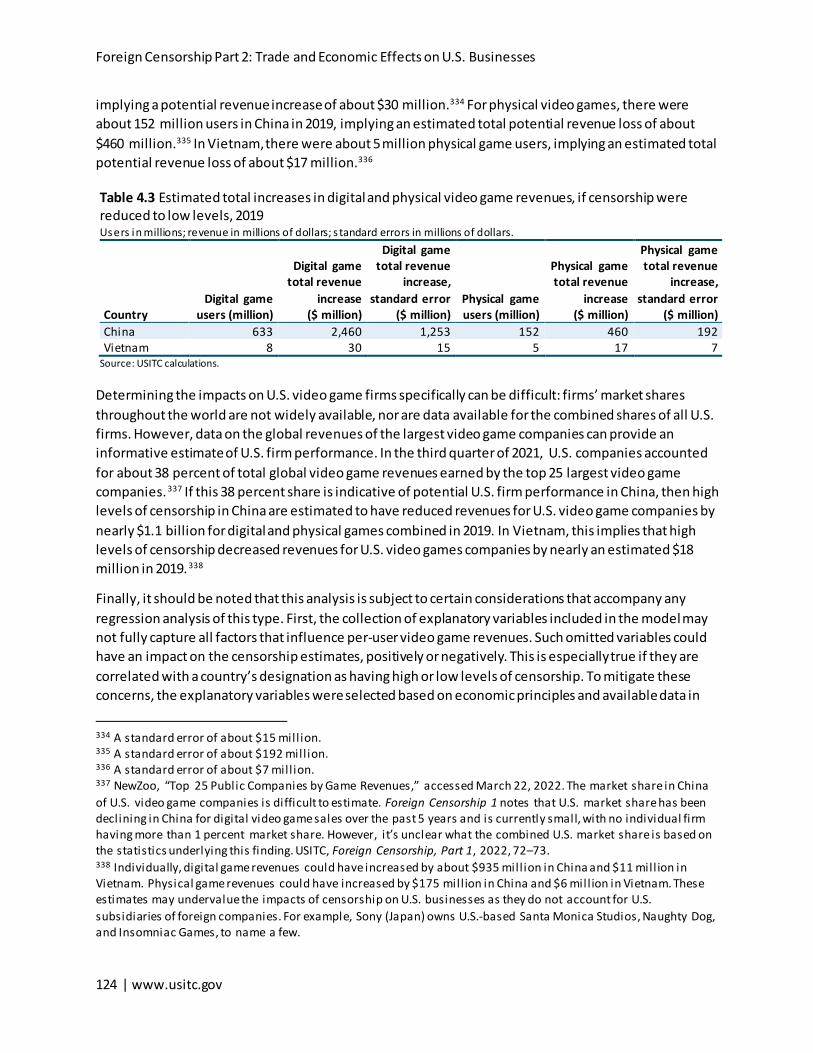
Foreign Censorship Part 2: Trade and Economic Effects on U.S. Businesses
124 | www.usitc.gov
implying a potential revenue increase of about $30 million.334 For physical video games, there were about 152 million users in China in 2019, implying an estimated total potential revenue loss of about $460 million.335 In Vietnam, there were about 5 million physical game users, implying an estimated total potential revenue loss of about $17 million.336
Table 4.3 Estimated total increases in digital and physical video game revenues, if censorship were reduced to low levels, 2019 Users in millions; revenue in millions of dollars; s tandard errors in millions of dollars.
Country Digital game
users (million)
Digital game total revenue
increase ($ million)
Digital game total revenue
increase, standard error
($ million) Physical game users (million)
Physical game total revenue
increase ($ million)
Physical game total revenue
increase, standard error
($ million) China 633 2,460 1,253 152 460 192 Vietnam 8 30 15 5 17 7
Source: USITC calculations.
Determining the impacts on U.S. video game firms specifically can be difficult: firms’ market shares throughout the world are not widely available, nor are data available for the combined shares of all U.S. firms. However, data on the global revenues of the largest video game companies can provide an informative estimate of U.S. firm performance. In the third quarter of 2021, U.S. companies accounted for about 38 percent of total global video game revenues earned by the top 25 largest video game companies.337 If this 38 percent share is indicative of potential U.S. firm performance in China, then high levels of censorship in China are estimated to have reduced revenues for U.S. video game companies by nearly $1.1 billion for digital and physical games combined in 2019. In Vietnam, this implies that high levels of censorship decreased revenues for U.S. video games companies by nearly an estimated $18 million in 2019.338
Finally, it should be noted that this analysis is subject to certain considerations that accompany any regression analysis of this type. First, the collection of explanatory variables included in the model may not fully capture all factors that influence per-user video game revenues. Such omitted variables could have an impact on the censorship estimates, positively or negatively. This is especially true if they are correlated with a country’s designation as having high or low levels of censorship. To mitigate these concerns, the explanatory variables were selected based on economic principles and available data in
334 A standard error of about $15 mill ion. 335 A standard error of about $192 mill ion. 336 A standard error of about $7 mill ion. 337 NewZoo, “Top 25 Public Companies by Game Revenues,” accessed March 22, 2022. The market share in China of U.S. video game companies is difficult to estimate. Foreign Censorship 1 notes that U.S. market share has been declining in China for digital video game sales over the past 5 years and is currently small, with no individual firm having more than 1 percent market share. However, it’s unclear what the combined U.S. market share is based on the statistics underlying this finding. USITC, Foreign Censorship, Part 1, 2022, 72–73. 338 Individually, digital game revenues could have increased by about $935 mill ion in China and $11 mill ion in Vietnam. Physical game revenues could have increased by $175 mill ion in China and $6 mill ion in Vietnam. These estimates may undervalue the impacts of censorship on U.S. businesses as they do not account for U.S. subsidiaries of foreign companies. For example, Sony (Japan) owns U.S.-based Santa Monica Studios, Naughty Dog, and Insomniac Games, to name a few.

Chapter 4: Effects of Foreign Censorship on Audiovisual Content and Examples of Extraterritorial Censorship
United States International Trade Commission | 125
order to comprehensively explain the determinants of video game revenues and minimize the likelihood and magnitude of these influences. Second, the estimates reflect average impacts across countries between 2017 and 2019. Because of this, the estimates may overestimate or underestimate the impacts of individual instances of censorship in certain markets or time periods. Similarly, because the data used to identify censorship are based on a general rating of media freedom, which may imperfectly reflect the forms of video game censorship highlighted throughout this section, the estimated effects may be larger or smaller than those of censorship issues specific to video games. Third, the regression analysis presented here assumed a relatively simple linear relationship between per-user revenues and the explanatory variables. Such an approach may fail to fully capture more complex, nonlinear relationships between revenues and each of the other variables, should they exist. However, despite these general considerations, the regression estimates presented here fit the data well, explain a substantial portion of the data’s variance, and provide a reasonable estimate of the impacts of censorship on video game revenues.339
Box 4.1 Effects of Censorship on Journalism and Publishing
Censorship remains an important issue for written content, which can be distributed in both physical and digital formats. However, data on the extent to which U.S. journalism and publishing businesses are affected by censorship is limited. Despite this limitation, the issues that censorship pose to journalists and publishers cannot be ignored. This box highlights some of the ways that speech and expression from these media sources are being suppressed in the key markets, which have seen some of the sharpest declines in freedom of expression over the past decade.a
Strong-arm tactics that governments use against journalists ultimately affect the content that news organizations are able to distribute. Frequently, journalists are victims of intimidation and harassment, including arbitrary detention by government organizations, criminal charges, restrictions on movement, frozen bank accounts, enforced disappearance, kidnapping, threats of physical violence, and retaliation against family members. Around the world, members of the media are often detained and imprisoned on charges of terrorism, espionage, or conspiracy, as well as for libel and defamation. More recently, governments have begun using charges of “fake news” to arrest journalists.b
The intimidation of journalists often results in self-censorship.c The intimidation of journalists makes it difficult for international news media organizations to report from countries that restrict freedom of the press. Journalists could also be detained by the authorities in an effort to intimidate the outlets.d According to The Committee to Protect Journalists (CPJ), the majority of the journalists imprisoned in 2017–21 for their work were held on anti-state or terrorism charges, censorship violations, defamation, insult, or false news charges. A significant number were held without charge or with no charge disclosed.e
In 2021, China and Vietnam were among the world’s five-largest jailers of journalists and press freedom defenders, with China holding the top spot for the fifth consecutive year with 127 journalists detained.f Of those, at least 11 were detained for reporting on the COVID-19 pandemic, accused of “provoking trouble;” many others were arrested on terrorism charges in connection with reporting on the crisis in the majority-Uyghur region of Xinjiang.g
339 The regression models explain about 68 and 78 percent of the variation in the data for digital and physical game revenues, respectively.

Foreign Censorship Part 2: Trade and Economic Effects on U.S. Businesses
126 | www.usitc.gov
In 2021, Vietnam was third on the list compiled by Reporters Sans Frontiers (RSF), of detained journalists with 43 journalists jailed.h One of the journalists, Nguyen Tuong Thuy, sentenced to 11 years in jail for spreading anti-state propaganda, was a contributor to Radio Free Asia, a U.S. government-funded private nonprofit news service.i
In 2016, in response to anti-government protests, Turkey imprisoned 42 journalists and held some of them without charges in pretrial detention for months.j Hundreds of journalists lost their press accreditation and some had passports revoked, barring them from leaving the country.k Turkey continued using detention against journalists in 2018, holding at least 33—but possibly as many as 100—journalists on various charges, such as “terrorist propaganda” and “denigrating Turkish identity.”l Many others were on bail pending trial or appeal.m Turkey continued to jail journalists in 2019, holding 25, while 10 reportedly chose to leave the country to avoid a trial on charges such as “insulting the president” and “collaborating with an illegal organization.”n
India increased actions against journalists in recent years. Of 154 journalists interrogated, detained, or arrested between 2010–20, 40 percent were in 2020.o There were reports of increased assaults of journalists in Indonesia, with 84 violent attacks registered in 2020.p
Foreign journalists are also subject to various market access restrictions, including credential loss and visa revocation. In 2020, China revoked the press credentials of three journalists for the Wall Street Journal after the newspaper published a column criticizing the Chinese government for its handling of the COVID-19 pandemic. The journalists—two U.S. citizens and one Australian—were ordered to leave the country.q Reporters from the New York Times and the Washington Post also lost their accreditation and were ordered to leave China in retaliation for the United States limiting the number of Chinese citizens allowed to work as journalists in the United States.r
Foreign journalists face similar restrictions in other key markets, too. In Russia, American journalists from media outlets labelled as foreign agents—media outlets that receive part or all of their financing from a foreign source—are barred from entering the Russian Parliament.s Russia has also denied entry to foreign journalists critical of the government and expelled others for being “security threats.”t
Foreign journalists face visa denials, travel restrictions, and arrests in India.u An American journalist was detained in Indonesia in 2020 for working as a journalist while on a business visa, without obtaining a special journalist visa; he was later released and deported.v In Vietnam, foreign reporters are required to obtain government permission to travel outside of the capital and must inform the government about the contents of their reporting. Journalists have also reported self-censoring for fear of government reprisal.w
When looking at publishing, one of the clear ways that publishers are experiencing censorship in China is through the translation process, sometimes occurring without the author’s knowledge. According to Pen America, a non-profit that advocates for free expression, if a writer or publisher sets up a contract with their Chinese publisher for the translation of their work and does not vet the text, they may end up with a very different version of their book in Mandarin, even if their contract says no changes are to be made without the author’s approval. Hence, publishers incur additional costs to vet the Chinese translation. The cost of vetting a Chinese translation is around $0.07 per word, which seems relatively modest but is reportedly a high cost for a low-margin industry.x
a Economist, “Press Freedom is Under Attack,” May 3, 2022. b Ayyub, “Rana Ayyub says,” May 2, 2022; UNESCO, “Threats that Silence: Trends in the Safety of Journalists,” 2021, 16. c Clark and Grech, Journalists under pressure, 2017. d Graham-Harrison, “Chinese Authorities Detain,” December 11, 2020.
Chapter 4: Effects of Foreign Censorship on Audiovisual Content and Examples of Extraterritorial Censorship
United States International Trade Commission | 127
e CPJ, “Explore All CPJ Data,” accessed January 10, 2022. f Reporters Without Borders, (RSF), 2021 Round-Up, accessed January 10, 2021, 8; BBC, “China Is Biggest Captor of Journalists,” December 8, 2021. g RSF, The Great Leap Backwards, January 31, 2022, 31. h RSF, 2021 Round-Up, accessed January 10, 2021, 8. i Reuters, “Vietnam Jails Journalists,” January 5, 2021. j Human Rights Watch (HRW), Silencing Turkey’s Media, December 2016, 51. k RSF, Worldwide Round-Up of Journalists Killed, Detained, Held Hostage, or Missing in 2017, 2017. l RSF, Worldwide Round-Up of Journalists Killed, Detained, Held Hostage, or Missing in 2018, 2018, 16. m RSF, Worldwide Round-Up of Journalists Killed, Detained, Held Hostage, or Missing in 2018, 2018, 15. n RSF, Worldwide Round-Up of Journalists Killed, Detained, Held Hostage, or Missing in 2019, 2019, 13, 16. o Seshu, Behind Bars, December 24, 2020, 2. p Sandoval, “Attacks on Journalists,” May 4, 2021. q Wall Street Journal, “China Revokes,” February 19, 2020. r Tracy, Wong, and Jakes, “China Announces,” March 17, 2020. s NDTV, “Russian Lawmakers Ban US Media from Parliament,” December 6, 2017. t Meyer and Arkhipov, “Russia Will Expel BBC Reporter,” August 13, 2021; Heritage and Baczynska, “Russia Denies Visa,” January 14, 2014; Moscow Times, “Russia Expels Second Foreign Reporter,” November 4, 2021. u Seshu, Behind Bars, December 24, 2020, 6. v Paddoc, “Indonesia Deports U.S. Journalist,” February 1, 2020. w Ghani, “‘Fear and Paranoia’,” May 20, 2019. x PEN America, Censorship and Conscience, May 20, 2015, 14.
Examples of Extraterritorial Censorship U.S. firms are increasingly subject to extraterritorial censorship. This is most prevalent with China where the government uses economic coercion, or threats thereof, to censor speech and propagate self-censorship outside its borders.340 The examples included in this section cover firms across a variety of industries, from sports entertainment to apparel manufacturers, recording artists, and the travel and hospitality industry. By using the threat or actuality of website shutdowns and market access denial, China has been able to extend its censorship aims beyond its borders to U.S. firms operating globally, contributing to regulatory compliance costs, reduced revenue, and increased self-censorship.
Businesses outside the United States, as well as nongovernmental organizations have also been subject to extraterritorial censorship pressures by China. Essex Court Chambers, a group of commercial barristers in the United Kingdom (UK), was sanctioned by China after four members provided a legal opinion on the “crimes against humanity” occurring against the Uyghur population in Xinjiang, China.341 The Japanese-owned convenience store chain, 7-Eleven, was fined $23,500 for referring to Taiwan as an independent country, among other characterizations.342 The Chinese government has also attempted to coerce companies in Germany to cease sourcing products from Lithuania after Lithuania allowed Taiwan to open a representative office in Vilnius.343 Representatives from the Chinese government voiced concerns to the World Bank’s leadership about the ranking of China in the institution’s 2018 Doing Business report. As a result, the World Bank ultimately published a higher ranking for China in its report
340 For more information on extraterritorial censorship, see USITC, Foreign Censorship, Part 1, 2022, 57–59. 341 Riordan and Croft, “UK Chambers Removes Xinjiang,” March 28, 2021; Essex Court Chambers, “International Criminal Responsibility,” January 26, 2021. 342 Tabeta, “Beijing Slams 7-Eleven,” January 7, 2022. 343 Sytas and O’Donnell, “China Pressures Germany’s Continental,” December 17, 2021.
Foreign Censorship Part 2: Trade and Economic Effects on U.S. Businesses
128 | www.usitc.gov
than China otherwise would have been given.344 There are also documented examples of censorship pressures on students and faculty at universities in Australia, Canada, and the UK. 345
The NBA and Extraterritorial Censorship As mentioned in Foreign Censorship 1, the response in China to a tweet from the general manager of the Houston Rockets of the National Basketball Association (NBA) supporting anti-government protesters in Hong Kong is a notable example of the application of extraterritorial censorship.346 There was a major impact on multiple commercial relationships that had developed between the NBA and China over more than 40 years—the total losses and effect on future revenues for the NBA and its franchise teams have not been fully quantified.
The NBA’s relationship with China has been steadily expanding since exploratory exhibition games were held in China in 1979. Starting in 1986, the government-run China Central Television (CCTV) began broadcasting videotaped games provided at no charge by the NBA. In 1998, as the league’s popularity increased and China’s economy grew, broadcast coverage expanded to include live broadcasts and a larger number of games, and CCTV began paying the NBA for broadcast rights.347 The NBA’s popularity in China continued to increase with visits to China by stars like Kobe Bryant (2001), the success of Chinese star Yao Ming in the NBA (starting in 2002), and the introduction of NBA preseason games in China (2004).348 To help manage its China operations, the NBA created a local entity, NBA China. At its inception, NBA China was supported by a $253 million investment from five partner companies—ESPN, a sports broadcasting division of The Walt Disney Company; the Bank of China Group Investment; Legend Holding Ltd.; Li Ka Shing Foundation; and China Merchants Investments. This joint investment accounted for an 11 percent stake, implying a value of $2.3 billion for NBA China at the time.349
NBA China continued to add business partners, including through two 2019 agreements with Chinese companies that indicate the breadth and value of the NBA’s operations in China. One was with the e-commerce firm Alibaba, which included sales of licensed NBA merchandise and a dedicated NBA section featuring NBA highlights and other content on Alibaba sites such as Tmall, Taobao, and Youku Tudou that reach an estimated 700 million Chinese consumers.350 A second agreement was with Tencent, the NBA’s largest partner outside the United States, to provide coverage of games and other programming in addition to joint management of mobile games and social media accounts through the 2024–25
344 Machen et al., “Investigation of Data Irregularities,” September 15, 2021, 2. 345 HRW, “Australia,” June 29, 2021; Blackwell, “Tibetan-Canadian Student Politician,” February 15, 2019; Government of the UK, A Cautious Embrace, November 4, 2019, 5–8. 346 USITC, Foreign Censorship, Part 1, 2022, 97. 347 Catterall, “The NBA’s Operations in China Explained,” October 9, 2019; Zhou et al., “The Development of NBA in China,” February 2017, 84. 348 Zhou et al., “The Development of NBA in China,” February 2017, 81–94. 349 ESPN, “4 Chinese Groups Invest,” January 14, 2008. 350 The financial terms of the NBA-Alibaba agreement were not publicly reported. The NBA also announced a 2019 agreement with ByteDance, the parent of video app TikTok. Roberts, “Why the NBA Really Needs China,” November 1, 2019.

Chapter 4: Effects of Foreign Censorship on Audiovisual Content and Examples of Extraterritorial Censorship
United States International Trade Commission | 129
season.351 In the 2018–19 season, an estimated 490 million Chinese fans watched NBA programming on various Tencent platforms (including QQ, WeChat, and Weishi), “nearly three times the number” of Tencent viewers during the 2014–15 season.352 Game 6 of the 2019 NBA Finals illustrates the scale of the Chinese streaming market; an estimated 21 million viewers streamed the game in China, exceeding the 18.34 million fans who watched it in the United States.353 Building on these agreements, the 2019 valuation of NBA China had increased to an estimated $5 billion, underlying China’s status as one of the most important growth markets for the league.354
On October 4, 2019, responding to political protests in Hong Kong, the Houston Rockets’ general manager, Daryl Morey, tweeted an image that stated, “fight for freedom, stand with Hong Kong.”355 In response, CCTV, which had been showing three to six games per week, stopped airing NBA games, while Tencent, which had been showing all games to paid subscribers, reduced the number of games it streamed.356 These retaliatory actions are unlikely to have taken place without involvement from the Chinese Government (see the following section on boycotts). Reactions to the Morey tweet extended beyond game broadcasting and streaming and resulted in 11 Chinese business partners suspending or terminating their relationship with the NBA China website. Alibaba removed Houston Rockets’ merchandise from its NBA store and sports product firm ANTA Sports suspended talks to renew a sneaker contract with the NBA.357
In an apparent attempt at reconciliation, the NBA issued a statement that the Morey tweet “deeply offended many of our friends and fans in China, which is regrettable,” but also said that the NBA “will not put itself in a position of regulating what players, employees and team owners say or will not say on these issues.”358 CCTV broadcast an NBA game for the first time in 17 months on March 30, 2022, while Tencent has resumed streaming most NBA games.359 One journalist cited “industry insiders” that the broadcast indicates a full return of NBA games to CCTV, but as of June 14, 2022 this cannot be confirmed.360
351 A 2015 deal gave Tencent rights to stream NBA games for $700 mill ion over five years (CCTV separately signed a multi-year broadcast deal in 2012, financial terms were not disclosed). NBA.com, “NBA, Tencent Announce Five-Year Partnership Expansion,” July 28, 2019; Long, “NBA and CCTV Agree,” November 20, 2012; Roberts, “Why the NBA Really Needs China,” November 1, 2019. 352 Total NBA viewership in China that season, including streaming, was estimated to be 800 mill ion viewers. Roberts, “Why the NBA Really Needs China,” November 1, 2019; NBA.com, “NBA, Tencent Announce Five-Year Partnership Expansion,” July 28, 2019. 353 McCollough and Yang, “China Continues to Limit,” February 10, 2020. 354 Roberts, “Why the NBA Really Needs China,” November 1, 2019. 355 Arnovitz, “Inside the NBA’s Silent Tension Surrounding Daryl Morey,” November 12, 2019. 356 McCollough and Yang, “China Continues to Limit,” February 10, 2020; Lucas and Wu, “Nearly All of NBA’s Chinese Partners Cut Ties,” October 11, 2019. 357 Lucas and Wu, “Nearly All of NBA’s Chinese Partners Cut Ties,” October 11, 2019. 358 NBA.com, “NBA statement,” October 6, 2019. 359 Tencent did not stream Houston Rockets games until after Morey left the team in November 2020. That same month, Morey joined the Philadelphia 76ers and Tencent stopped streaming his new team’s games. In October 2021, Tencent stopped streaming games with the Boston Celtics after Celtic player Enes Kanter criticized Chinese leader Xi Jinping on Twitter. Pelit, “NBA and Nike choose silence as Enes Kanter takes on China,” October 29, 2021. 360 Fandi, “NBA games return,” March 30, 2022.
Foreign Censorship Part 2: Trade and Economic Effects on U.S. Businesses
130 | www.usitc.gov
The financial impact of this response, while not publicly available, has been “fairly dramatic” according to NBA Commissioner Adam Silver.361 The league estimated it lost $200 million in revenue in the 2019–20 season due to the disruptions in partnerships in China.362 However, it is unclear if that total includes losses incurred by individual teams and the extent of losses in the following years.363 Mark Tatum, NBA’s deputy commissioner and chief operating officer, provided U.S. Senator Marsha Blackburn with the imprecise estimate of “…the total revenue loss across all of our business lines in China to be in the hundreds of millions of dollars.”364
Nike, Intel, and the Blurry Line of Boycotts Consumer-led public boycotts may be linked to censorship when governments become involved. In China, the line between a grass-roots consumer reaction and government-sponsored censorship becomes blurred when online outrage is instigated or amplified by the CCP.365 Since 2021, several foreign-headquartered companies have become targets of public boycotts in China for positions those companies expressed against the use of forced labor in Xinjiang region. U.S.-based Nike and Intel are two notable examples.
In March 2021, the United States, the European Union (EU), the UK, and Canada announced the imposition of economic sanctions on Chinese officials due to labor rights violations in the Xinjiang province concerning the region’s Uyghur population.366 This announcement prompted backlash from Chinese citizens against U.S. and EU firms, especially those that had released statements against forced labor in Xinjiang, including Swedish clothing manufacturer H&M, German sportwear manufacturer Adidas, and U.S. sportswear manufacturer Nike.367 The initial backlash appears to have been instigated by the Communist Youth League, which is a group within the CCP.368 In an undated statement that was widely circulated in China after the announcement of sanctions, Nike had announced that it would not source any of its cotton from China’s Xinjiang province, due to concerns of labor rights violations in the region.369 While the Chinese government did not directly limit content or block market access, Chinese consumers responded with widespread social media posts calling for a boycott of Nike products.370 This may have contributed to lost revenue; immediately after the boycott began, Nike’s stock market 361 Roberts, “Why the NBA Really Needs China,” November 1, 2019. 362 The NBA’s revenues for that season were $8.3 bil l ion; the league projects $10 bil l ion revenues in 2021–22, expected to be the first full season after two shortened seasons. Wojnarowski and Lowe, “NBA Revenue for 2019–20 Dropped,” October 28, 2020; Young, “NBA Projects $10 Bil l ion in Revenue,” October 18, 2021. 363 By one estimate, the Houston Rockets lost approximately $20 mill ion dollars in cancelled team-specific sponsorships. McGregor, “Daryl Morey Ostracized the NBA,” October 16, 2020; Arnovitz, “Inside the NBA’s Silent Tension Surrounding Daryl Morey,” November 12, 2019. 364 Tatum, “NBA Letter,” March 30, 2021. 365 Brant, “Nike, H&M Face China Fury,” March 25, 2021. 366 Emmott and Brunnstrom, “West Sanctions China,” March 22, 2021. 367 Westcott and He, “H&M and Nike Are Facing a Boycott,” March 25, 2021. 368 Brant, “Nike, H&M Face China Fury,” March 25, 2021. 369 Nike, “Statement on Xinjiang,” accessed October 21, 2021. 370 This response follows similar backlash to the Better Cotton Initiative’s (BCI) statement on Xinjiang forced labor in October 2020. The BCI counts numerous apparel manufacturers, including Nike and Levi Strauss, as members. Roscouet, Hipwell, and Pham, “China Is Forcing Fashion to Mute Itself,” October 14, 2021; Teh, “Chinese Social-Media Users Burn Their Nikes,” March 25, 2021.

Chapter 4: Effects of Foreign Censorship on Audiovisual Content and Examples of Extraterritorial Censorship
United States International Trade Commission | 131
valuation fell 5.1 percent, and its annual growth in sales in China was substantially lower than market expectations and U.S. growth.371 Additionally, popular actor, dancer, and singer, Wang Yibo, announced he had discontinued any collaboration with Nike, further snowballing the informal boycott called for by several social media users.372
Similarly, in December 2021, U.S. semiconductor and technology firm Intel announced it would ban the use of components from Xinjiang for similar human rights concerns.373 There was immediate backlash in China on social media following the announcement and several Chinese celebrities cut their ties with the U.S. firm. One singer of a popular Chinese boy band noted that the company should express a “correct stance” on the issue.374 Following the backlash, Intel apologized for the ban on components from Xinjiang, noting that the ban was only due to an interest in complying with U.S. laws and not its own intention or position, and subsequently removed mention of Xinjiang in its annual letter to suppliers. 375
Bans on Musicians Several foreign entertainers have faced bans on performing in China after expressing messages or attending events deemed unacceptable by censors in China. China’s digital music and live concert industries are both large and growing, and lost market access for U.S. performers can contribute to lost revenue from music sales, concert ticket sales, and merchandise, and extend to the record labels (also often U.S.-based) that contract with them.
U.S. singers have been banned from performing in China by the CCP for a variety of reasons. In 2016, pop music performer Lady Gaga was banned from touring China after she met with the Dalai Lama, and Katy Perry was banned from performing in China in 2017 following her appearance at an event in Taiwan wearing a dress viewed as a symbol of anti-China sentiment.376 Additionally, Canadian pop singer Justin Bieber was blocked from entering China in 2014 after posting a picture of himself at the Yasukuni Shrine in Japan.377 The shrine, which commemorates fallen soldiers, is controversial in China and South Korea because it also enshrines convicted war criminals.378
Banned performers can face lost revenue from cancelled performances, as well as opportunity costs of travel and performance disruptions. The digital music industry in China was estimated in 2020 to be $11.2 billion.379 Live concerts represent a large portion of music industry revenue in China; the country rose from the 14th- to 7th-largest recording market globally between 2015 and 2019. One industry report found that the live music market was worth approximately $1.1 billion in 2018, though this 371 With 19 percent of its revenue derived from the greater China market, the gap between expected revenue and its realized revenue was as high as $320 mill ion. Mozee, “Nike Falls Following Boycott Calls,” March 25, 2021. 372 Teh, “Chinese Social-Media Users Burn Their Nikes,” March 25, 2021. 373 Langley and McMorrow, “Intel Apologises for Banning Use of Components,” December 23, 2021. 374 Langley and McMorrow, “Intel Apologises for Banning Use of Components,” December 23, 2021. 375 Langley and McMorrow, “Intel Apologises for Banning Use of Components,” December 23, 2021; Reuters, “Intel Deletes Reference to Xinjiang,” January 11, 2022. 376 Gupta, “Explained: Why Has China Banned,” November 25, 2021; France 24, “China Censors Lady Gaga,” May 29, 2021. 377 France 24, “China Censors Lady Gaga,” May 29, 2021. 378 BBC, “Friends Reunion,” May 28, 2021. 379 Statista, “Digital Music Industry Size in China,” accessed December 2, 2021.

Foreign Censorship Part 2: Trade and Economic Effects on U.S. Businesses
132 | www.usitc.gov
number declined substantially with the COVID-19 pandemic and subsequent stay-at-home orders in many provinces in China and elsewhere.380 The number of live concerts and large music gatherings nearly doubled between 2014 and 2018, rising from approximately 1,400 in 2014 to 2,600 in 2018.381
Extraterritorial Censorship in the Travel Services Industry Several U.S. hotel chains and airlines have faced censorship challenges in China when their public statements, corporate websites, or business practices do not align with China’s foreign policy stance on Tibet and Taiwan. For example, in March 2018, a social media employee for U.S. hotel firm Marriott “liked” a post on Twitter, using the official Marriott social media account, expressing support for Tibet (the tweet was from a Tibetan separatist group that applauded Marriott for listing Tibet as a country in an online survey, rather than as a part of China). In response, China’s government shut down access to Marriott’s Chinese websites and mobile apps for seven days.382
Chinese authorities have also required U.S. airlines to reflect official Chinese policy in the labeling and mapping of countries and borders.383 For example, in April 2018, China’s Civil Aviation Administration sent a letter to 44 airlines that Taiwan must clearly be referred to as a part of China, whereas before it was labeled as a separate country.384 By July, U.S. airlines United, American, and Delta all changed the classification of Taiwan on their websites.385
The Risk of Censorship in U.S. Higher Education U.S. colleges and universities face significant extraterritorial censorship pressures from the Chinese government. Cross-border trade is the primary means of providing education services to foreign markets, with such trade occurring when a student from one country travels to another country for university-level study. The value of such trade consists of expenditures by students for tuition, fees, and living expenses. International students have grown to become a financially important constituency for U.S. universities, both public and private, largely because most international students pay full, undiscounted tuition or, in the case of public universities, out-of-state tuition. During the 2020–21 academic year, there were 914,095 international students studying in the United States, or 4.6 percent of all U.S. students. The largest country sources of students were China (34.7 percent), India (18.3 percent), South Korea (4.3 percent), Canada (2.8 percent), and Saudi Arabia (2.4 percent).386 Overall, international students reportedly contributed an estimated $28.4 billion to the U.S. economy for tuition,
380 Ma, “Reopen or Cancel,” May 7, 2020. 381 Statista, “Number of Large Concerts,” February 10, 2021. 382 Ma, “Marriott Employee Roy Jones,” March 3, 2018. 383 Examples include labeling Taiwan as a part of China; including the ‘nine dash l ine’ that denotes Chinese territorial control of the South China seas; and l inking the disputed Jammu-Kashmir region to China. 384 For a copy of the letter, see Rogin, “Opinion: White House calls China’s threats,” May 5, 2018. 385 Fish, “The Other Political Correctness,” September 4, 2018. Airl ines have diverged in the ways that they refer to Taiwan. See Chan, “China Wants to Dictate,” May 5, 2018. 386 Open Doors, 2021 Fast Facts, November 15, 2021.

Chapter 4: Effects of Foreign Censorship on Audiovisual Content and Examples of Extraterritorial Censorship
United States International Trade Commission | 133
fees, and living expenses during the 2020–21 academic year and supported—directly and indirectly—306,308 jobs.387
The revenues that universities receive for tuition, fees, and on-campus housing of Chinese students have the potential to be a substantial point of economic coercion for U.S. universities. This coercion could take the form of the Chinese government suspending funding for Chinese students at a U.S. university due to a conflict over teaching and research on “sensitive topics” at that university. Such was the case in 2017 when the Chinese government froze funding for Chinese students and scholars studying at the University of California, San Diego (UCSD) following a commencement speech given at UCSD by the Dalai Lama.388 One way to estimate the economic loss to a U.S. university of such action would be to multiply the number of Chinese students studying at that university by the undiscounted, per-student rate for tuition and fees. Because it is unclear if or when the funding freeze on Chinese students at UCSD was lifted, we estimate the impact of a similar freeze on a hypothetical university. Using a theoretical private, nonprofit, four-year college with 10,000 total students, the Commission estimated the tuition loss would be approximately $6.0 million.389 Although an unlikely scenario, if the Chinese government were to block all Chinese students from studying in the United States, the Commission’s estimated negative impact on the U.S. economy would be approximately $9.9 billion, or 34.7 percent of international students’ contribution to the U.S. economy ($28.4 billion).390
In the Commission’s survey, one U.S.-based university reported instances of Chinese government monitoring, influence, or control of activities/speech of Chinese students, with such behavior potentially impacting the university more broadly, largely by reducing the ability of Chinese students (or potential students) to take advantage of the educational resources offered by the university.391 Such monitoring and censorship runs counter to U.S. universities’ commitment to academic freedom.
387 NAFSA, “Economic Value Statistics,” accessed February 10, 2022. 388 Maxwell, “How China Mastered the Art,” August 5, 2019. 389 Open Doors, 2021 Fast Facts, November 15, 2021; NAFSA, “Economic Value Statistics,” accessed February 10, 2022; College Board, Trends in College Pricing 2021, October 2021; USITC calculations. This estimate is calculated by multiplying the average tuition and fees at private, nonprofit, four-year colleges during the 2020–21 academic year ($37,270) by an estimate of the total number of Chinese students. Using a theoretical college with 10,000 total students, and assuming that Chinese students as a share of total students mirrors the national average in 2020–21 (1.6 percent), the estimated number of Chinese students would be 160. Multiplying $37,270 by 160 yields a product of $6.0 mill ion. This estimate assumes a full-year dispute; the impact of a single-semester dispute could be estimated at one-half the yearly estimate. Due to a decline in the number of Chinese students compared to pre-pandemic levels of enrollment, this could be considered a conservative estimate. A scenario incorporating international student levels from the 2019–20 academic year (372,532 Chinese students and 19.7 mill ion total international students) results in an estimated tuition loss of approximately $7.0 mill ion. 390 NAFSA, “Economic Value Statistics,” accessed February 10, 2022; Open Doors, 2021 Fast Facts, November 15, 2021; USITC calculations. This estimate is calculated by multiplying the total number of Chinese students studying in the United States during the 2020–21 academic year (317,299) by an estimate of the contribution of each student to the U.S. economy ($31,069) during that year. Due to a decline in the number of Chinese students (and their contribution to the U.S. economy) compared to pre-pandemic levels, this could be considered a conservative estimate. A scenario incorporating the number of Chinese students (372,532), and an estimate of their contribution to the U.S. economy ($35,983), during the 2019–20 academic year results in an estimated loss to the U.S. economy of $13.4 bil l ion. 391 USITC, Foreign Censorship Survey, 2021, questionnaire narrative response.

Foreign Censorship Part 2: Trade and Economic Effects on U.S. Businesses
134 | www.usitc.gov
Historically, the government of China has attempted to censor classroom discussion and academic research of sensitive topics on an extraterritorial basis at universities in the United States. Generally, the censorship has focused on the “three T’s”—Taiwan, Tibet, and Tiananmen—although the topics have reportedly expanded to include COVID-19 and the Xinjiang province, among others. Over the past 30 years, Chinese diplomats have repeatedly attempted to influence the discussion of sensitive topics at U.S. universities. In 1991, for example, the Chinese consulate in New York City sent letters to Harvard University, Cornell University, and the Massachusetts Institute of Technology, condemning speaking invitations to the Dalai Lama.392 More recently, in 2013, Chinese embassy officials in Washington, DC, called a George Washington University (GWU) faculty member, attempting to dissuade him from hosting a talk by the Taiwanese representative to the United States.393 Chinese embassy officials have also attempted to deter students from attending events covering sensitive topics. In 2016, for example, the Chinese embassy in Washington, DC, sent emails discouraging members of GWU’s Global China Connection chapter from attending an event on infrastructure development in the Xinjiang province; the email messages reportedly stated that the event was inappropriate and recommended that students in the chapter should avoid holding similar events in the future.394
In limited cases, individual Chinese students have also reportedly attempted to interfere with the norms and processes related to academic freedom, although it can be difficult to ascertain the degree to which such behavior is directed by the Chinese government, as opposed to patriotism, personal conviction, or a lack of familiarity with commonly accepted practices on U.S. campuses.395 Such activities typically take the form of demands that faculty alter teaching material and classroom discussions; pressure on universities to cancel academic activities; interference with campus events; and disruptive classroom behavior. In March 2019, for example, Chinese students attempted to shout down a speaker addressing the mistreatment of Uyghurs at an event sponsored by the University of California, Berkeley.396
In some cases, Chinese organizations on U.S. campuses are actively involved in such activities, particularly the Chinese Students and Scholars Association (CSSA), which receives at least some of its funding from the Chinese government. Broadly, the CSSA is an association of Chinese students, faculty, and community members with branches in at least 196 campuses in the United States. Most activities of the CSSA are nonpolitical, with the organization actively involved in arranging social and cultural events and helping new students with the logistics of adapting to life in the United States. The CSSA also frequently acts as a liaison between the campus Chinese community and university administrators. However, the CSSA on some campuses is actively involved in suppressing speech, including through attempts at intimidation. In 2017, for example, the CSSA at UCSD demanded that the administration withdraw its invitation to the Dalai Lama to speak at commencement.397 More recently, in 2022, the CSSA chapter at GWU asked its members to sign a letter condemning posters created by Chinese-Australian artist Badiucao depicting Chinese human rights abuses. The CSSA also reportedly conducted a search to find the student activists who posted the artwork around the GWU campus. 398
392 Lloyd-Damnjanovic, A Preliminary Study of PRC Political Influence, August 2018, 51. 393 Lloyd-Damnjanovic, A Preliminary Study of PRC Political Influence, August 2018, 52. 394 Lloyd-Damnjanovic, A Preliminary Study of PRC Political Influence, August 2018, 54. 395 Lloyd-Damnjanovic, A Preliminary Study of PRC Political Influence, August 2018, 3. 396 Richardson, “China’s Influence on the Global Human Rights System,” September 2020, 6. 397 Rotella, “Even on U.S. Campuses,” November 30, 2021. 398 Bernstein, “Chinese Artist Calls GW University President,” February 7, 2022.

Chapter 4: Effects of Foreign Censorship on Audiovisual Content and Examples of Extraterritorial Censorship
United States International Trade Commission | 135
Individual academics who discuss, research, or teach topics considered sensitive by the Chinese government face a range of retaliatory actions, including the cancelation of study visas and the withdrawal of access to Chinese scholars, analysts, and government officials. In some cases, access to electronic files at Chinese universities and other research-center archives have reportedly been restricted. In response, some academics are engaging in self-censorship. Researchers at Indiana University and Columbia University reported in a 2018 study that they actively avoided researching certain topics associated with Xinjiang and Tibet due to concerns about how such research might be perceived by the Chinese government and lead to retaliation.399 In the Commission’s survey, one U.S.-based university reported limiting discussion in certain courses on contemporary East Asia to avoid putting Chinese students in risky situations.400 At the university level, the most common form of self-censorship involves the cancellation of events due to fears of retaliation by Chinese authorities. In 2009, for example, North Carolina State University cancelled a visit by the Dalai Lama, with the university’s provost stating that North Carolina was a major trading partner of China.401
399 Lloyd-Damnjanovic, A Preliminary Study of PRC Political Influence, August 2018, 66. 400 USITC, Foreign Censorship Survey, 2021, questionnaire narrative response. 401 Fish, “The Other Political Correctness,” September 4, 2018.
Foreign Censorship Part 2: Trade and Economic Effects on U.S. Businesses
136 | www.usitc.gov
Bibliography Bibliography entries denoted with an asterisk (*) include laws, regulations, cases, treaties, legal conventions, international agreements, or other official government documents cited throughout the report. In instances where no official English translation is provided by the government, an unofficial English translation is provided in a website URL in the same bibliography entry. Where only “unofficial translation” is cited with no website URL, an unofficial translation was obtained by Commission staff. Unofficial translations are used only for informational purposes.
Allen-Ebrahimian, Bethany. “China Is Censoring Hollywood’s Imagination.” Axios, September 1, 2020.
https://www.axios.com/china-censor-hollywood-films-14d77229-b853-4e7a-8635-71191393615d.html.
An, Chau. “142 Illegal Games Removed from Apple, Google App Stores in Vietnam.” VnExpress, July 16, 2019. https://e.vnexpress.net/news/news/142-illegal-games-removed-from-apple-google-app-stores-in-vietnam-3953610.html.
Arnovitz, Kevin. “Inside the NBA’s Silent Tension Surrounding Daryl Morey.” ESPN, November 12, 2019. https://www.espn.com/nba/story/_/id/28059499/inside-nba-silent-tension-surrounding-rockets-gm-daryl-morey.
Ayyub, Rana. “Rana Ayyub Says We Should Stop Calling Journalists ‘Brave’.” Economist, May 2, 2022. https://www.economist.com/by-invitation/2022/05/02/rana-ayyub-says-we-should-stop-calling-journalists-brave.
Baldwin, Clare, and Kristina Cooke. “How Sony Sanitized the New Adam Sandler Movie ‘Pixels’ to Please China.” Reuters, July 25, 2014. http://www.reuters.com/investigates/special-report/china-film.
BBC. “Hollywood Censors Films to Appease China, Report Suggests.” BBC News, August 6, 2020. https://www.bbc.com/news/entertainment-arts-53676789.
BBC. “China Is Biggest Captor of Journalists, Says Report,” December 8, 2021. https://www.bbc.com/news/world-asia-china-59544226.
BBC. “Friends Reunion: BTS, Lady Gaga, Justin Bieber Censored in China,” May 28, 2021. https://www.bbc.com/news/world-asia-china-57277952.
Belloni, Matthew. “The Chinese Had One Note on Spider-Man.” Puck, May 1, 2022. https://puck.news/the-chinese-had-one-note-on-spider-man.
Bernstein, Brittany. “Chinese Artist Calls GW University President ‘So Ignorant’ for Censoring Anti-CCP Art: ’Huge Scandal and a Shame.” Yahoo News, February 7, 2022. https://news.yahoo.com/chinese-artist-calls-gwu-president-004209972.html.

Chapter 4: Effects of Foreign Censorship on Audiovisual Content and Examples of Extraterritorial Censorship
United States International Trade Commission | 137
Blackwell, Tom. “Tibetan-Canadian Student Politician, Uyghur Rights Activists Come under Attack by Chinese Students in Canada.” National Post, February 15, 2019. https://nationalpost.com/news/canada/tibetan-canadian-student-politician-uyghur-rights-activist-come-under-attack-by-chinese-students-in-canada.
Box Office Mojo. “The Battle at Lake Changjin.” Accessed January 2, 2022. https://www.boxofficemojo.com/title/tt13462900.
Brant, Robin. “Nike, H&M Face China Fury over Xinjiang Cotton ‘Concerns.’” BBC News, March 25, 2021, sec. China. https://www.bbc.com/news/world-asia-china-56519411.
Brenner, Lexa. “Rated C for Censored: Walt Disney in China’s Pocket.” Harvard International Review, October 29, 2021. https://hir.harvard.edu/rated-c-for-censored-walt-disney-in-chinas-pocket.
Brown, Elain. “Netflix Joins Other Media Companies Suspending Services in Russia.” iTech Post, March 6, 2022. https://www.itechpost.com/articles/109430/20220306/netflix-joins-media-companies-suspending-services-russia.htm.
Brzeski, Patrick. “China Box Office: Disney’s ‘Jungle Cruise’ Flops After Delayed Release.” The Hollywood Reporter, November 15, 2021. https://www.hollywoodreporter.com/movies/movie-news/jungle-cruise-china-box-office-1235047821.
Brzeski, Patrick. “China’s Quota on Hollywood Film Imports Set to Expand, State Media Says.” The Hollywood Reporter, February 9, 2017. https://www.hollywoodreporter.com/news/general-news/chinas-state-media-says-quota-hollywood-film-imports-will-expand-974224.
Brzeski, Patrick. “Chloe Zhao’s Oscars Glory Met with Media Silence in China.” The Hollywood Reporter, April 26, 2021. https://www.hollywoodreporter.com/movies/movie-news/chloe-zhaos-oscars-glory-met-with-media-silence-in-china-4173305.
Brzeski, Patrick. “Who’s In (and Out) at China’s Major Theater Chains.” The Hollywood Reporter, December 9, 2021. https://www.hollywoodreporter.com/business/business-news/spider-man-china-movie-theaters-1235059555.
Catterall, Peter. “The NBA’s Operations in China, Explained.” SupChina, October 9, 2019. https://signal.supchina.com/the-nbas-operations-in-china-explained.
Chan, Tara Francis. “China Wants to Dictate How Foreign Airlines Refer to Taiwan and the US Is Having None of it—This Is How Every Major Airline Is Responding.” Insider, May 5, 2018. https://www.businessinsider.com/what-do-airlines-call-taiwan-china-2018-5.
Clark, Marilyn, and Anna Grech. Journalists under pressure – Unwarranted interference, fear and self-censorship in Europe (2017). Council of Europe, 2017. https://book.coe.int/en/human-rights-and-democracy/7284-journalists-under-pressure-unwarranted-interference-fear-and-self-censorship-in-europe.html
Clark, Travis. “Marvel Studios Has Been Shut Out of China this Year and Box-office Date Shows How Much it’s Hurt the MCU.” Insider, November 11, 2021. https://www.businessinsider.com/how-much-money-marvel-movies-made-at-china-box-office-2021-11.

Foreign Censorship Part 2: Trade and Economic Effects on U.S. Businesses
138 | www.usitc.gov
College Board. Trends in College Pricing 2021. Trends in Higher Education, October 2021. https://research.collegeboard.org/pdf/trends-college-pricing-student-aid-2021.pdf.
Committee to Protect Journalists (CPJ). “Explore All CPJ Data.” Accessed January 10, 2022. https://cpj.org/data/imprisoned/2021/?status=Imprisoned&start_year=2021&end_year=2021&group_by=location.
Corey, Nigel. “Censorship and U.S. Content Exports to China: Why We Need Better Market Access, Not Cultural Decoupling.” Information Technology and Innovation Foundation, June 29, 2020. https://itif.org/publications/2020/06/29/censorship-and-us-content-exports-china-why-we-need-better-market-access-not.
Council of Europe. “The Russian Federation Is Excluded from the Council of Europe.” March 16, 2022. https://www.coe.int/en/web/portal/-/the-russian-federation-is-excluded-from-the-council-of-europe.
Daniel, James. “Iron Man 3 Execs ‘Changed Film for Chinese Audience’ by Adding Four Minutes to the Film with Chinese Actors.” Daily Mail, May 14, 2013. https://www.dailymail.co.uk/news/article-2324077/Iron-Man-3-execs-changed-film-Chinese-audience-adding-4-minutes-Chinese-actors.html.
Davis, Rebecca. “‘Black Widow’s’ China Delay Rings Alarm Bells for Hollywood.” Variety, July 9, 2021. https://variety.com/2021/film/news/black-widow-china-box-office-troubles-1235016323.
Davis, Rebecca. “‘Shang-Chi’ May Be Banned from China for Perceived ‘Insults,’ Even as Some Chinese Viewers Praise It.” Variety, September 16, 2021. https://variety.com/2021/film/news/shang-chi-china-ban-simu-liu-1235066529.
Davis, Rebecca. “By the Numbers: Foreign Titles Squeezed in China Film Market.” Variety, January 13, 2022. https://variety.com/2022/film/news/foreign-titles-squeezed-in-china-film-market-1235151950.
Davis, Rebecca. “Hollywood’s Ability to Influence Its China Box Office Destiny Has Never Been Weaker.” Variety, January 4, 2022. https://variety.com/2022/film/news/hollywood-never-weaker-in-china-1235145588.
Dezan Shira & Associates. “Navigating Restrictions in China’s Film Industry.” China Briefing News, December 17, 2015. https://www.china-briefing.com/news/navigating-restrictions-in-chinas-film-industry.
Easton, Jonathon. “Amazon and Netflix in Crosshairs as India’s Supreme Court Rules on Streaming.” Television Business International, March 8, 2021. https://tbivision.com/2021/03/08/amazon-netflix-in-crosshairs-as-indias-supreme-court-rules-on-streaming.
Economist. “Press Freedom Is Under Attack.” May 3, 2022. https://www.economist.com/interactive/briefing/2022/05/03/press-freedom.
Ellis, Shawn. “What Are SVOD, AVOD, and TVOD?” Accessed January 11, 2022. https://www.lightcast.com/what-are-svod-avod-tvod.
Chapter 4: Effects of Foreign Censorship on Audiovisual Content and Examples of Extraterritorial Censorship
United States International Trade Commission | 139
Eloksari, Eisya A. “How Netflix Went from Foe to Friend in Indonesia.” The Jakarta Post, August 9, 2020. https://www.thejakartapost.com/news/2020/08/07/explainer-how-netflix-went-from-foe-to-friend-in-indonesia.html.
Emmott, Robin, and David Brunnstrom. “West Sanctions China Over Xinjiang Abuses, Beijing Hits Back at EU.” Reuters, March 22, 2021. https://www.reuters.com/article/uk-usa-china-eu-sanctions-idUSKBN2BE2LF.
ESPN. “4 Chinese Groups Invest in 11 Percent of NBA China,” January 14, 2008. https://www.espn.com/nba/news/story?id=3195974.
Essex Court Chambers. “International Criminal Responsibility for Crimes Against Humanity and Genocide Against the Uyghur Population in the Xinjiang Uyghur Autonomous Region,” January 26, 2021. https://14ee1ae3-14ee-4012-91cf-a6a3b7dc3d8b.usrfiles.com/ugd/14ee1a_3f31c56ca64a461592ffc2690c9bb737.pdf.
European Audiovisual Observatory. Focus 2017—World Film Market Trends. European Audiovisual Observatory, May 18, 2017. https://rm.coe.int/focus-2017/168088dcab.
European Audiovisual Observatory. Focus 2020—World Film Market Trends. European Audiovisual Observatory, June 14, 2020. https://rm.coe.int/focus2020/1680a32252.
European Audiovisual Observatory. Focus 2021—World Film Market Trends. European Audiovisual Observatory, July 9, 2021. https://www.obs.coe.int/en/web/observatoire/industry/focus.
*European Convention on Human Rights (ECHR). Opened for signature November 4, 1950. https://www.echr.coe.int/documents/convention_eng.pdf.
*European Court of Human Rights. Case of Bayev and Others v. Russia. November 13, 2017. https://hudoc.echr.coe.int/eng?i=001-174422.
Fandi, Cui. “NBA games return to China’s state broadcaster after 17 months’ absence.” Global Times, March 30, 2022. https://www.globaltimes.cn/page/202203/1257214.shtml.
Faughnder, Ryan. “Hollywood ‘Kowtowing’ to China Takes Heat from Washington. But Why Now?” Los Angeles Times, July 27, 2020. https://www.latimes.com/entertainment-arts/business/story/2020-07-27/hollywoods-self-censorship-for-china-takes-the-spotlight-but-why-now.
Fingus, J. “Netflix, Amazon and Disney+ Will Self-Regulate to Avoid Censorship in India.” Engadget, September 5, 2020. https://www.engadget.com/netflix-amazon-disney-self-regulate-streaming-224642795.html.
Fish, Isaac Stone. “The Other Political Correctness.” The New Republic, September 4, 2018. https://newrepublic.com/article/150476/american-elite-universities-selfcensorship-china.
Follows, Stephen. “The Rise and Rise of the Film Business in China.” Stephen Follows (blog), January 26, 2015. https://stephenfollows.com/film-business-in-china.

Foreign Censorship Part 2: Trade and Economic Effects on U.S. Businesses
140 | www.usitc.gov
France 24. “China Censors Lady Gaga, LGBT References from ‘Friends’ Reunion Episode,” May 29, 2021. https://www.france24.com/en/culture/20210529-china-censors-lady-gaga-lgbt-references-from-friends-reunion-episode.
Frater, Patrick. “China Is Poised to Retain Worldwide Box Office Crown, While Decoupling from Global Film Industry.” Variety, December 23, 2021. https://variety.com/2021/film/asia/china-box-office-champion-1235142005.
Freedom House. Freedom in the World, 2022. https://freedomhouse.org/report/freedom-world.
Ghani, Faras. “‘Fear and Paranoia’: How Vietnam Controls Its Media.” Al Jazeera, May 20, 2019. https://www.aljazeera.com/news/2019/5/20/fear-and-paranoia-how-vietnam-controls-its-media.
Goh, Brenda. “Disney’s ‘Mulan’ Sparks Backlash Over Ties to Xinjiang, Hong Kong.” Reuters, September 8, 2020. https://www.reuters.com/article/us-film-mulan-idUSKBN25Z1PN.
Gordon, Nicholas. “Steam Can’t Be Easily Accessed in China, and No One Knows Why.” Fortune, December 28, 2021. https://fortune.com/2021/12/28/global-pc-game-superstore-steam-has-basically-gone-dark-in-china-and-no-one-knows-why.
*Government of China. Film Industry Promotion Law of the People’s Republic of China. Order of the President, 12th Session, No 54. (In Chinese). November 7, 2016. http://www.npc.gov.cn/npc/xinwen/2016-11/07/content_2001584.htm. Unofficial translation in China Law Translate. “Film Industry Promotion Law 2016.” November 7, 2016. https://www.chinalawtranslate.com/en/film-industry-promotion-law-2016.
*Government of China. Government Information Disclosure-Notice of the National Press and Publication Administration (NPPA) on Preventing Minors from Indulging in Online Games-Normative Documents. (In Chinese). November 19, 2019. https://www.nppa.gov.cn/nppa/contents/772/76550.shtml. Unofficial translation on file.
*Government of China, National Press and Publication Administration (NPPA) and Ministry of Industry and Information Technology (MIIT). “Provisions on the Administration of Online Publishing Services.” (In Chinese). February 4, 2016. http://www.cac.gov.cn/2016-02/15/c_1118048596.htm. Unofficial translation in DigiChina. “Online Publishing Service Management Rules.” February 4, 2016. https://digichina.stanford.edu/work/online-publishing-service-management-rules.
*Government of China. National Press and Publication Administration (NPPA)-Notice Publicity-Notice of the State Press and Publication Administration on Further Strict Management to Prevent Minors from Indulging in Online Games. (In Chinese). August 30, 2021. https://www.nppa.gov.cn/nppa/contents/279/98792.shtml. Unofficial translation on file.
*Government of China. Special Administrative Measures, No. XII.26. (In Chinese). December 27, 2021. https://www.ndrc.gov.cn/xxgk/zcfb/fzggwl/202112/P020211227540591870254.pdf. Unofficial translation on file.

Chapter 4: Effects of Foreign Censorship on Audiovisual Content and Examples of Extraterritorial Censorship
United States International Trade Commission | 141
*Government of India. Ministry of Electronics and Information Technology. “Notification Dated, the 25th February, 2021 G.S.R. 139(E): The Information Technology (Intermediary Guidelines and Digital Media Ethics Code) Rules, 2021.” February 25, 2021. https://mib.gov.in/sites/default/files/IT%28Intermediary%20Guidelines%20and%20Digital%20Media%20Ethics%20Code%29%20Rules%2C%202021%20English.pdf.
*Government of India. Supreme Court of India. “Record of Proceedings,” February 25, 2021. https://main.sci.gov.in/supremecourt/2021/5697/5697_2021_37_38_26706_Order_05-Mar-2021.pdf.
*Government of Russia. Federal Law No. 135-FZ of June 29, 2013, on Amendments to Article 5 of the Federal Law on the Protection of Children from Information Harmful to Their Health and Development and Certain Legislative Acts of the Russian Federation in Order to Protect Children from Information Promoting the Denial of Traditional Family Values. (In Russian). June 29, 2013. https://rg.ru/2013/06/30/deti-site-dok.html. Unofficial translation on file.
*Government of the United Kingdom (UK). House of Commons. UK House of Commons Foreign Affairs Committee. A Cautious Embrace: Defending Democracy in an Age of Autocracies. November 4, 2019. https://publications.parliament.uk/pa/cm201919/cmselect/cmfaff/109/109.pdf.
*Government of Vietnam, National Assembly. Law on Cybersecurity. Law No. 24/2018/QH14. June 12, 2018. https://data.allens.com.au/pubs/pdf/priv/cupriv22jun18.pdf.
*Government of Vietnam. Decree No. 27/2018/ND-CP. March 1, 2018. https://vnnic.vn/sites/default/files/vanban/decree_no._27.2018.nd-cpof1march2018.pdf.
Graham-Harrison, Emma. “Chinese Authorities Detain Citizen Who Works for Bloomberg News.” The Guardian, December 11, 2020. https://www.theguardian.com/world/2020/dec/11/chinese-authorities-detain-citizen-who-works-for-bloomberg-news.
Greenberg, Julia. “Breaking into the World’s Biggest Country Will Be Netflix’s Biggest Challenge.” Wired, January 12, 2016. https://www.wired.com/2016/01/netflix-may-never-break-into-china.
Gupta, Sonal. “Explained: Why Has China Banned a Viral Pop Song?” The Indian Express, November 25, 2021. https://indianexpress.com/article/explained/explained-china-ban-viral-pop-song-fragile-namewee-7639341.
Haldane, Matt. “Why Does the Chinese Government Hate Video Games?” South China Morning Post, November 19, 2021. https://www.scmp.com/tech/big-tech/article/3156540/china-vs-video-games-why-beijing-stopped-short-gaming-ban-keeping.
Harris Bricken. “China Film: Quota? What Quota?” Harris Bricken China Law Blog (blog), June 19, 2018. https://harrisbricken.com/chinalawblog/china-film-quota-what-quota.
Heritage, Timothy, and Gabriela Baczynska. “Russia Denies Visa to U.S. Journalist Critical of Putin.” Reuters, January 14, 2014. https://www.reuters.com/article/us-russia-usa-journalist/russia-denies-visa-to-u-s-journalist-critical-of-putin-idUSBREA0D0AH20140114.

Foreign Censorship Part 2: Trade and Economic Effects on U.S. Businesses
142 | www.usitc.gov
Ho, Chun-Yu, Marc Rysman, and Yanfei Wang. Demand for Performance Goods: Import Quotas in the Chinese Movie Market, August 3, 2021.
Holmes, Oliver. “No Cults, No Politics, No Ghouls: How China Censors the Video Game World.” The Guardian, July 15, 2021. https://www.theguardian.com/news/2021/jul/15/china-video-game-censorship-tencent-netease-blizzard.
Human Rights Watch (HRW). “Australia: Beijing Threatening Academic Freedom,” June 29, 2021. https://www.hrw.org/news/2021/06/30/australia-beijing-threatening-academic-freedom.
Human Rights Watch (HRW). Silencing Turkey’s Media: The Government’s Deepening Assault on Critical Journalism. New York, N.Y.: Human Rights Watch, December 2016. https://www.hrw.org/sites/default/files/report_pdf/turkey1216_web.pdf.
Huong Le, Thu. “Vietnam Cracks down on Illegal ‘Cross-Border’ Online Games.” Nikkei Asia, July 19, 2019. https://asia.nikkei.com/Business/Business-trends/Vietnam-cracks-down-on-illegal-cross-border-online-games.
IMDb. Box Office Mojo database. Accessed January 2, 2022. https://www.boxofficemojo.com.
Information Technology and Innovation Foundation (ITIF). Written submission to the U.S. International Trade Commission in connection with Inv. No. 332-585, Foreign Censorship, Part 1: Policies and Practices Affecting U.S. Businesses, August 18, 2021.
Jamkhandikar, Shilpa, Aditya Kalra, and Euan Rocha. “Bollywood, Streaming Giants on Edge as Amazon Gets Flak for Hurting Religious Beliefs in India.” Reuters, March 5, 2021. https://www.reuters.com/article/us-amazon-com-india-video-controversy-idUSKBN2AX0UV.
Jiayi, Liu. “Battlefield 4 Banned in China Over National Security.” ZDNet, December 26, 2013. https://www.zdnet.com/article/battlefield-4-banned-in-china-over-national-security.
Kelion, Leo. “Netflix Blocked by Indonesia in Censorship Row.” BBC News, January 28, 2016. https://www.bbc.com/news/technology-35429036.
King, Gary, Jennifer Pan, and Margaret E. Roberts. “How the Chinese Government Fabricates Social Media Posts for Strategic Distraction, Not Engaged Argument.” American Political Science Review 111, no. 3. (August 29, 2017): 484–501. https://doi.org/10.1017/S0003055417000144.
Langley, William, and Ryan McMorrow. “Intel Apologises for Banning Use of Components from Xinjiang.” Financial Times, December 23, 2021. https://www.ft.com/content/59a28f36-2a0e-4b0c-86af-4d82daa525a9.
Li, Shirley. “How Hollywood Sold Out to China.” The Atlantic, September 10, 2021. https://www.theatlantic.com/culture/archive/2021/09/how-hollywood-sold-out-to-china/620021.
Liao, Rita. “Roblox Pauses Service in China as it Takes ‘Important Transitory Actions.’” TechCrunch, January 7, 2022. https://social.techcrunch.com/2022/01/06/roblox-transition-china-luobulesi-tencent.
Chapter 4: Effects of Foreign Censorship on Audiovisual Content and Examples of Extraterritorial Censorship
United States International Trade Commission | 143
Liu, Narayan. “Disney Exec Sidesteps Questions about Marvel’s China Movie Release Problems.” Comic Book Resources, October 16, 2021. https://www.cbr.com/disney-asia-marvel-films-china-bans.
Liu, Narayan. “Is Spider-Man: No Way Home Banned in China?” Comic Book Resources, November 12, 2021. https://www.cbr.com/spider-man-no-way-home-banned-china.
Liu, Narayan. “Spider-Man: No Way Home Proves it’s Time for Hollywood to Change.” Comic Book Resources, January 3, 2022. https://www.cbr.com/spider-man-no-way-home-hollywood-change.
Lloyd-Damnjanovic, Anastasya. A Preliminary Study of PRC Political Influence and Interference Activities in American Higher Education. Wilson Center, August 2018. https://www.wilsoncenter.org/publication/preliminary-study-prc-political-influence-and-interference-activities-american-higher.
Long, Michael. “NBA and CCTV Agree on Comprehensive TV Partnership.” Sports Pro Media, November 20, 2012. https://www.sportspromedia.com/news/nba_and_cctv_agree_on_comprehensive_television_partnership.
Lucas, Amelia, and Lilian Wu. “Nearly All of the NBA’s Chinese Partners Have Cut Ties with the League.” CNBC, October 11, 2019. https://www.cnbc.com/2019/10/09/nearly-all-of-the-nbas-chinese-partners-have-cut-ties-with-the-league.html.
Ma, Mingsi. “Reopen or Cancel: What’s Next for China’s Live Music Industry after COVID-19?” Chinosity (blog), May 7, 2020. https://www.chinosity.com/2020/05/07/reopen-or-cancel-whats-next-for-chinas-live-music-industry-after-covid-19.
Ma, Wayne. “Marriott Employee Roy Jones Hit ‘Like.’ Then China Got Mad.” Wall Street Journal, March 3, 2018. https://www.wsj.com/articles/marriott-employee-roy-jones-hit-like-then-china-got-mad-1520094910.
Machen, Ronald, Matthew Jones, George Varghese, and Emily Stark. “Investigation of Data Irregularities in Doing Business 2018 and Doing Business 2020.” World Bank, Report to the Board of Executive Directors, September 15, 2021. https://thedocs.worldbank.org/en/doc/84a922cc9273b7b120d49ad3b9e9d3f9-0090012021/original/DB-Investigation-Findings-and-Report-to-the-Board-of-Executive-Directors-September-15-2021.pdf.
Maxwell, Daniel. “How China Mastered the Art of Academic Censorship.” Study International, August 5, 2019. https://www.studyinternational.com/news/academic-censorship-china-global-issue.
McCollough, J. Brady, and Tommy Yang. “China Continues to Limit NBA’s Exposure to Fans Months after Controversy.” Los Angeles Times, February 10, 2020. https://www.latimes.com/sports/story/2020-02-10/china-limits-nba-exposure-to-fans-hong-kong-controversy.
Foreign Censorship Part 2: Trade and Economic Effects on U.S. Businesses
144 | www.usitc.gov
McGregor, Grady. “Daryl Morey Ostracized the NBA in Mainland China. Now, Some Fans There Are Reveling in His Resignation.” Fortune, October 16, 2020. https://fortune.com/2020/10/16/daryl-morey-resignation-tweet-china-hong-kong.
Mendelson, Scott. “Disney Can’t Depend on China to Make ‘Shang-Chi’ A Hit.” Forbes, April 20, 2021. https://www.forbes.com/sites/scottmendelson/2021/04/20/movies-box-office-shang-chi-china-disney-marvel.
Meyer, Henry, and Ilya Arkhipov. “Russia Will Expel BBC Reporter Amid Simmering Tensions.” Bloomberg, August 13, 2021. https://www.bloomberg.com/news/articles/2021-08-13/russia-to-expel-bbc-journalist-this-month-in-retaliatory-move.
Moscow Times. “Russia Expels Second Foreign Reporter in 2 Months,” November 4, 2021. https://www.themoscowtimes.com/2021/11/04/russia-expels-second-foreign-reporter-in-2-months-a75481.
Mozee, Carla. “Nike Falls Following Boycott Calls in China Over Statement About Forced Labor of Uyghurs.” Business Insider, Markets, March 25, 2021. https://markets.businessinsider.com/news/stocks/nike-stock-price-china-boycott-cotton-xinjiang-uyghurs-weibo-beijing-2021-3.
National Association of Foreign Student Advisers (NAFSA). “Economic Value Statistics.” Accessed February 10, 2022. https://www.nafsa.org/policy-and-advocacy/policy-resources/nafsa-international-student-economic-value-tool-v2.
NBA.com. “NBA statement,” October 6, 2019. https://pr.nba.com/nba-statement.
NBA.com. “NBA, Tencent Announce Five-Year Partnership Expansion,” July 28, 2019. https://www.nba.com/news/nba-tencent-announce-partnership-expansion-release.
New Delhi Television (NDTV). “Russian Lawmakers Ban US Media from Parliament,” December 6, 2017. https://www.ndtv.com/world-news/russian-lawmakers-ban-us-media-from-parliament-1784329.
NewZoo. “Top 25 Public Companies by Game Revenues.” Accessed March 22, 2022. https://newzoo.com/insights/rankings/top-25-companies-game-revenues.
Nike. “Statement on Xinjiang.” Accessed October 21, 2021. https://purpose.nike.com/statement-on-xinjiang.
O’Connor, Sean, and Nicholas Armstrong. Directed by Hollywood, Edited by China: How China’s Censorship and Influence Affect Films Worldwide. U.S.-China Economic and Security Review Commission, October 28, 2015. https://www.uscc.gov/research/directed-hollywood-edited-china-how-chinas-censorship-and-influence-affect-films-worldwide.
Olcott, Eleanor. “Roblox to Rebuild China App After Going Offline.” Financial Times, January 7, 2022. https://www.ft.com/content/cd523a10-d9d6-48a4-9342-1d9dae4d03c4.

Chapter 4: Effects of Foreign Censorship on Audiovisual Content and Examples of Extraterritorial Censorship
United States International Trade Commission | 145
Ong, Grace. “Netflix Indonesia Called Out for ‘Inappropriate Content’ Again Following Ban Lift.” Marketing-Interactive, March 3, 2021. https://www.marketing-interactive.com/netflix-indonesia-called-out-for-inappropriate-content-again-following-ban-lift.
Open Doors. 2021 Fast Facts. Institute of International Education, November 15, 2021. https://opendoorsdata.org/fast_facts/fast-facts-2021.
Paddoc, Richard C. “Indonesia Deports U.S. Journalist Jailed Over Visa Issue.” New York Times, February 1, 2020. https://www.nytimes.com/2020/02/01/world/asia/indonesia-journalist-deported.html.
Palatino, Mong. “DreamWorks’ ‘Abominable’ Film Banned in Vietnam, Malaysia, and the Philippines for Showing China’s Claim over Disputed Seas.” Global Voices (blog), October 28, 2019. https://globalvoices.org/2019/10/28/dreamworks-abominable-film-banned-in-vietnam-malaysia-and-the-philippines-for-showing-chinas-claim-over-disputed-seas.
Papish, Jonathan. “Foreign Films in China: How Does it Work?” China Film Insider, March 2, 2017. https://chinafilminsider.com/foreign-films-in-china-how-does-it-work.
Pelit, Asli. “NBA and Nike Choose Silence as Enes Kanter Takes on China,” Sportico, October 29, 2021. https://www.sportico.com/personalities/athletes/2021/nba-and-nike-choose-silence-as-enes-kanter-takes-on-china-1234645196.
PEN America. Censorship and Conscience: Foreign Authors and the Challenge of Chinese Censorship, May 20, 2015. https://pen.org/sites/default/files/PEN%20Censorship%20and%20Conscience%202%20June.pdf.
Pen America. Made in Hollywood, Censored by Beijing, August 5, 2020. https://pen.org/report/made-in-hollywood-censored-by-beijing.
Phartiyal, Sankalp. “India Says Video Streaming Platforms Should Be Held Responsible for Content.” Reuters, March 25, 2021. https://www.reuters.com/article/us-india-content-regulation-idINKBN2BH2X2.
Reporters Sans Frontiers (Reporters Without Borders) (RSF). 2021 Round-Up: Journalists Detained, Killed, Held Hostage and Missing. Accessed January 10, 2022. https://rsf.org/sites/default/files/rsfroundup_2021.pdf.
Reporters Sans Frontiers (Reporters Without Borders) (RSF). The Great Leap Backwards of Journalism in China, January 31, 2022. https://rsf.org/en/reports/unprecedented-rsf-investigation-great-leap-backwards-journalism-china.
Reporters Sans Frontiers (Reporters Without Borders) (RSF). Worldwide Round-Up of Journalists Killed, Detained, Held Hostage, or Missing in 2017. Accessed January 10, 2022. https://rsf.org/en/worldwide-round-journalists-killed-detained-held-hostage-or-missing-2017.
Reporters Sans Frontiers (RSF). Worldwide Round-Up of Journalists Killed, Detained, Held Hostage, or Missing in 2018. Accessed January 10, 2022. https://rsf.org/sites/default/files/worldwilde_round-up.pdf.

Foreign Censorship Part 2: Trade and Economic Effects on U.S. Businesses
146 | www.usitc.gov
Reporters Sans Frontiers (Reporters Without Borders) (RSF). Worldwide Round-Up of Journalists Killed, Detained, Held Hostage, or Missing in 2019. Accessed January 10, 2022. https://rsf.org/sites/default/files/rsf_2019_en.pdf.
Reuters. “Intel Deletes Reference to Xinjiang After Backlash in China,” January 11, 2022. https://www.reuters.com/world/china/intel-deletes-reference-xinjiang-after-backlash-china-2022-01-11.
Reuters. “Russia Investigates Complaint Against Netflix Over LGBT Content,” November 26, 2021. https://www.reuters.com/world/europe/russia-investigates-netflix-after-complaint-over-lgbt-content-2021-11-25.
Reuters. “Vietnam Jails Journalists for ‘propaganda’ Critical of State,” January 5, 2021. https://www.reuters.com/article/us-vietnam-security-trial/vietnam-jails-journalists-for-propaganda-critical-of-state-idUSKBN29A0VI.
Richardson, Sophie. “China’s Influence on the Global Human Rights System.” Brookings Institution, September 2020. https://www.brookings.edu/wp-content/uploads/2020/09/FP_20200914_china_human_rights_richardson.pdf.
Riordan, Primrose, and Jane Croft. “UK Chambers Removes Xinjiang Genocide Opinion Reference After China Sanctions.” Financial Times, March 28, 2021. https://www.ft.com/content/dc74a008-3cc5-44b8-966f-085773ba0674.
Roberts, Daniel. “Why the NBA Really Needs China.” Yahoo Finance, November 1, 2019. https://finance.yahoo.com/news/nba-needs-china-revenue-growth-leverage-170102327.html.
Rogin, Josh. “Opinion: White House Calls China’s Threats to Airlines ‘Orwellian Nonsense.’” Washington Post, May 5, 2018. https://www.washingtonpost.com/news/josh-rogin/wp/2018/05/05/white-house-calls-chinas-threats-to-airlines-orwellian-nonsense.
Roscouet, Angelina, Deirdre Hipwell, and Lisa Pham. “China Is Forcing Fashion to Mute Itself Over Dirty Cotton.” BloombergQuint, October 14, 2021. https://www.bloombergquint.com/shell.html.
Rotella, Sebastian. “Even on U.S. Campuses, China Cracks Down on Students Who Speak Out.” Pro Publica, November 30, 2021. https://www.propublica.org/article/even-on-us-campuses-china-cracks-down-on-students-who-speak-out.
Roth, Emma. “The Global Version of Steam Appears to Be Banned in China.” The Verge, December 25, 2021. https://www.theverge.com/2021/12/25/22853520/steam-global-china-banned.
Sandoval, Loren. “Attacks on Journalists Rise in Indonesia.” International Press Institute, May 4, 2021. https://ipi.media/attacks-on-journalists-rise-in-indonesia.
Seshu, Geeta. Behind Bars: Arrests and Detention of Journalists in India 2010–20. Free Speech Collective (blog), December 24, 2020. https://freespeechcollectivedotin.files.wordpress.com/2020/12/behind-bars-arrests-of-journalists-in-india-2010-20.pdf.

Chapter 4: Effects of Foreign Censorship on Audiovisual Content and Examples of Extraterritorial Censorship
United States International Trade Commission | 147
Shelton, Jacob. “Movies that Made More Money on Merchandising than at the Box Office,” September 23, 2021. https://www.ranker.com/list/movies-that-made-money-merchandising/jacob-shelton.
Siegel, Tatiana. “Hollywood Is ‘Increasingly Normalizing’ Self-Censorship for China, Report Finds.” The Hollywood Reporter, August 5, 2020. https://www.hollywoodreporter.com/movies/movie-news/hollywood-is-increasingly-normalizing-censorship-china-report-finds-1305935.
Statista database. “Digital Video Games—Worldwide.” Accessed March 10, 2022. https://www.statista.com/outlook/amo/media/games/digital-video-games/worldwide.
Statista database. “Physically Sold Video Games—Worldwide.” Accessed March 15, 2022. https://www.statista.com/outlook/amo/media/games/physically-sold-video-games/worldwide?currency=USD.
Statista database. “Video Games—Worldwide.” Accessed December 28, 2021. https://www.statista.com/outlook/dmo/digital-media/video-games/worldwide.
Statista database. “Video Streaming (SVoD)—China Market Forecast.” Accessed January 18, 2022. https://www.statista.com/outlook/dmo/digital-media/video-on-demand/video-streaming-svod/china.
Statista database. “Video Streaming (SVoD)—United States Market Forecast.” Accessed January 18, 2022. https://www.statista.com/outlook/dmo/digital-media/video-on-demand/video-streaming-svod/united-states.
Statista. “China: License Approvals of Video Games 2020.” Published by Lai Lin Thomala, March 19, 2021. https://www.statista.com/statistics/1198719/china-license-approval-number-of-video-games.
Statista. “Digital Music Industry Size in China from 2013 to 2020 with an Estimate for 2021.” Published by Lai Lin Thomala. Accessed December 2, 2021. https://www.statista.com/statistics/875109/digital-music-industry-size-china.
Statista. “Netflix: Streaming Revenues in Indonesia 2017–2020.” Published by Statista Research Department, July 8, 2016. https://www.statista.com/statistics/612286/netflix-streaming-revenues-indonesia.
Statista. “Number of Large Concerts and Music Festivals in China from 2012 to 2018.” Published by Lai Lin Thomala, February 10, 2021. https://www.statista.com/statistics/1066398/china-large-concert-and-music-festival-number.
Stewart, Philippa H. “Russia’s Film Distributor Censors Gay Scenes Out of Rocketman.” Human Rights Watch (blog), June 3, 2019. https://www.hrw.org/news/2019/06/03/russias-film-distributor-censors-gay-scenes-out-rocketman.
Subin, Samantha and Alex Sherman. “Disney Makes the Trend Clear: Growth is Slowing for Streaming Services.” CNBC, November 10, 2021. https://www.cnbc.com/2021/11/10/disney-netflix-and-other-streaming-services-subs-arpu-q3-2021.html.

Foreign Censorship Part 2: Trade and Economic Effects on U.S. Businesses
148 | www.usitc.gov
Sytas, Andrius, and John O’Donnell. “China Pressures Germany’s Continental to Cut Out Lithuania-Sources.” Reuters, December 17, 2021. https://www.reuters.com/world/china/exclusive-china-asks-germanys-continental-cut-out-lithuania-sources-2021-12-17.
Tabeta, Shunsuke. “Beijing Slams 7-Eleven for Labeling Taiwan a Country on Website.” Nikkei Asia, January 7, 2022. https://asia.nikkei.com/Business/Retail/Beijing-slams-7-Eleven-for-labeling-Taiwan-a-country-on-website.
Tartaglione, Nancy. “‘The Matrix Resurrections’ Cleared for China Release; Date Still to Be Set.” Deadline, November 23, 2021. https://deadline.com/2021/11/the-matrix-resurrections-china-release-1234879391.
Tartaglione, Nancy. “China Outlines 14th Five-Year Plan for Movies.” Deadline, November 16, 2021. https://deadline.com/2021/11/china-outlines-14th-five-year-plan-for-movies-whither-hollywood-does-that-market-still-matter-1234875506.
Tatum, Mark. “NBA Letter to Hon. Marsha Blackburn,” March 30, 2021. https://www.blackburn.senate.gov/services/files/7172647F-3B5B-4141-A982-676F4CDD099C.
Teh, Cheryl. “Chinese Social-Media Users Burn Their Nikes After the Company Says it’s ‘Concerned’ About Forced Labor of Uyghurs in Xinjiang.” Insider, March 25, 2021. https://www.insider.com/chinese-weibo-angry-xinjiang-burning-nike-shoes-2021-3.
Thomson, Stuart. “India Rejigs Streamer Regulations with Ramifications for Netflix and Others.” Television Business International, November 16, 2020. https://tbivision.com/2020/11/16/india-rejigs-streamer-regulations-with-ramifications-for-netflix-and-others.
Thubron, Rob. “Russian Officials Investigate Netflix Following Complaint Over LGBT Content.” TechSpot, November 26, 2021. https://www.techspot.com/news/92390-russian-officials-investigate-netflix-following-complaint-over-lgbt.html.
Toh, Michelle and Wayne Chang. “‘Top Gun: Maverick’ Brings Back the Taiwan Flag After Controversy.” CNN Business, June 2, 2022. https://www.cnn.com/2022/06/02/media/top-gun-maverick-taiwan-flag-reinstated-intl-hnk/index.html.
Tracy, Marc, Edward Wong, and Lara Jakes. “China Announces that it Will Expel American Journalists.” New York Times, March 17, 2020. https://www.nytimes.com/2020/03/17/business/media/china-expels-american-journalists.html.
Travis, Abi. “This Is Why ‘Animal Crossing: New Horizons’ is Banned in China.” Distractify, July 23, 2020. https://www.distractify.com/p/why-is-animal-crossing-banned-in-china.
U.S. Department of State. “Films for Theatrical Release: Memorandum of Understanding Between the United States and China,” April 25, 2012. https://www.state.gov/wp-content/uploads/2019/02/12-425-China-Trade-Films-for-theatrical-release.pdf.
U.S. International Trade Commission (USITC). Foreign Censorship, Part 1: Policies and Practices Affecting U.S. Businesses, 2021. USITC Publication 5244. Washington, DC: USITC, February 2022. https://www.usitc.gov/sites/default/files/publications/332/pub5244.pdf.
Chapter 4: Effects of Foreign Censorship on Audiovisual Content and Examples of Extraterritorial Censorship
United States International Trade Commission | 149
U.S. Trade Representative (USTR). 2021 National Trade Estimate Report on Foreign Trade Barriers, 2021. https://ustr.gov/sites/default/files/files/reports/2021/2021NTE.pdf.
United Nations Educational, Scientific, and Cultural Organization (UNESCO). “Threats That Silence: Trends in the Safety of Journalists.” World Trends in Freedom of Expression and Media Development: Global Report 2021/2022. Paris: UNESCO, 2021.
Valentine, Rebekah. “Steam Finally Launches in China, But Concerns About Lost Games Arise,” February 2, 2021. https://www.ign.com/articles/steam-gets-official-launch-in-china-could-long-time-users-lose-their-games.
Walborn, Derek. “International TV Booms as Streaming Services Invest in Global Market.” The Streamable, April 14, 2021. https://thestreamable.com/news/international-tv-booms-as-streaming-services-invest-in-global-market.
Walker, Tim. “9 Things the Sony Hack Has Taught Us About Hollywood.” The Independent, December 20, 2014. https://www.independent.co.uk/news/world/americas/9-things-the-sony-hack-has-taught-us-about-the-hollywood-9937994.html.
Wall Street Journal. “China Revokes Three Wall Street Journal Reporters’ Credentials,” February 19, 2020. https://www.wsj.com/articles/china-expels-three-wall-street-journal-reporters-11582100355.
Westcott, Ben, and Laura He. “H&M and Nike Are Facing a Boycott in China Over Xinjiang Cotton Statements.” CNN, March 25, 2021. https://www.cnn.com/2021/03/25/business/hm-nike-xinjiang-cotton-boycott-intl-hnk/index.html.
Whitten, Sarah. “‘Shang-Chi’ Doesn’t Have a Release Date in China—This Chart Shows Why That’s a Big Deal.” CNBC, September 2, 2021. https://www.cnbc.com/2021/09/02/shang-chi-doesnt-have-a-release-date-in-china-why-thats-a-big-deal.html.
Wojnarowski, Adrian, and Zach Lowe. “NBA Revenue for 2019–20 Season Dropped 10% to $8.3 Billion, Sources Say.” ESPN, October 28, 2020. https://www.espn.com/nba/story/_/id/30211678/nba-revenue-2019-20-season-dropped-10-83-billion-sources-say.
World Bank. World Development Indicators. Accessed various dates. https://databank.worldbank.org/source/world-development-indicators.
Xi, Chen. “‘Black Widow’ Release Delayed to Avoid Patriotic Film-Watching Month: Observers,” July 2021. https://www.globaltimes.cn/page/202107/1228600.shtml.
Xu Elegant, Naomi. “Disney Tailored ‘Mulan’ for China. It Still ‘Never Had a Chance’ at the Mainland Box Office.” Fortune, September 20, 2020. https://fortune.com/2020/09/20/disney-mulan-2020-china-box-office-flop.
Yahoo News. “Netflix (NFLX) Rides on International Content Growth in 2021,” May 27, 2021. https://www.yahoo.com/now/netflix-nflx-rides-international-content-130501904.html.

Foreign Censorship Part 2: Trade and Economic Effects on U.S. Businesses
150 | www.usitc.gov
Young, Jabari. “NBA Projects $10 Billion in Revenue as Audiences Return after Covid, but TV Viewership is a Big Question.” CNBC, October 18, 2021. https://www.cnbc.com/2021/10/18/nba-2021-2022-season-10-billion-revenue-tv-viewership-rebound.html.
Young, Jin Yu, Amy Chang Chien, and Azi Paybarah. “‘Shang-Chi’ Wins a Warm Asia Greeting. Then There’s China.” New York Times, September 17, 2021. https://www.nytimes.com/2021/09/17/business/shang-chi-china-marvel.html.
Zheng, Sarah. “China Quietly Opens Door to More Foreign Films.” South China Morning Post, October 23, 2018. https://www.scmp.com/news/china/diplomacy/article/2169837/china-quietly-opens-door-more-foreign-films.
Zhou, Cissy. “China Approves First Batch of Video Games in 9 Months.” Nikkei Asia, April 12, 2022. https://asia.nikkei.com/Business/Media-Entertainment/China-approves-first-batch-of-video-games-in-9-months.
Zhou, Liangjun, Jerred Junqi Wang, Xiaoying Chen, Chundong Lei, James J. Zhang, and Xiao Meng. “The Development of NBA in China: A Glocalization Perspective.” International Journal of Sports Marketing and Sponsorship 18, no. 1 (February 2017): 81–94. http://dx.doi.org/10.1108/IJSMS-05-2016-0013.
Zipin, Dina. “How Exactly Do Movies Make Money?” Investopedia, October 18, 2021. https://www.investopedia.com/articles/investing/093015/how-exactly-do-movies-make-money.asp.
Appendix A: Request Letters
U.S. International Trade Commission | 151
Appendix A Request Letters
Foreign Censorship Part 2: Trade and Economic Effects on U.S. Businesses
152 | www.usitc.gov

Appendix A: Request Letters
U.S. International Trade Commission | 153
DOCKET NUMBER 3521
OFFICE OF THE SECRETARY INT'L
TRADE COMMISSION
The Honorable Jason E. Kearns Chairman U.S. International Trade Commission 500 E Street, SW Washington, DC 20436
Dear Chairman Kearns:
January 4, 2021 RECEIVED 4:45 P.M.
JANUARY 4, 2021 OFFICE OF THE
SECRETARY
U.S. INT'L TRADE COMMISSION
Censorship is the prohibition or suppression of speech or other forms of communication. Foreign governments use many tools to carry out censorship, including technological measures that restrict digital trade. These tools, and the policies that enable them, allow authorities in foreign markets to limit speech by controlling the flow of information and services.
On June 30, 2020, the Senate Finance Committee’s Trade Subcommittee held a hearing on “Censorship as a Non-tariff Barrier.” During the course of this hearing, Members of the Finance Committee learned more about how foreign government censorship adversely impacts U.S. businesses and citizens. Of particular concern, it appears foreign governments in some cases try to apply their censorship practices extraterritorially. This effort undermines U.S. businesses – and more importantly, U.S. values.
The Members of this Committee rightly want to know more so they can better act on this important issue. Therefore, I am writing today to request that the Commission conduct an investigation, and prepare a report, informed by a survey of businesses in the
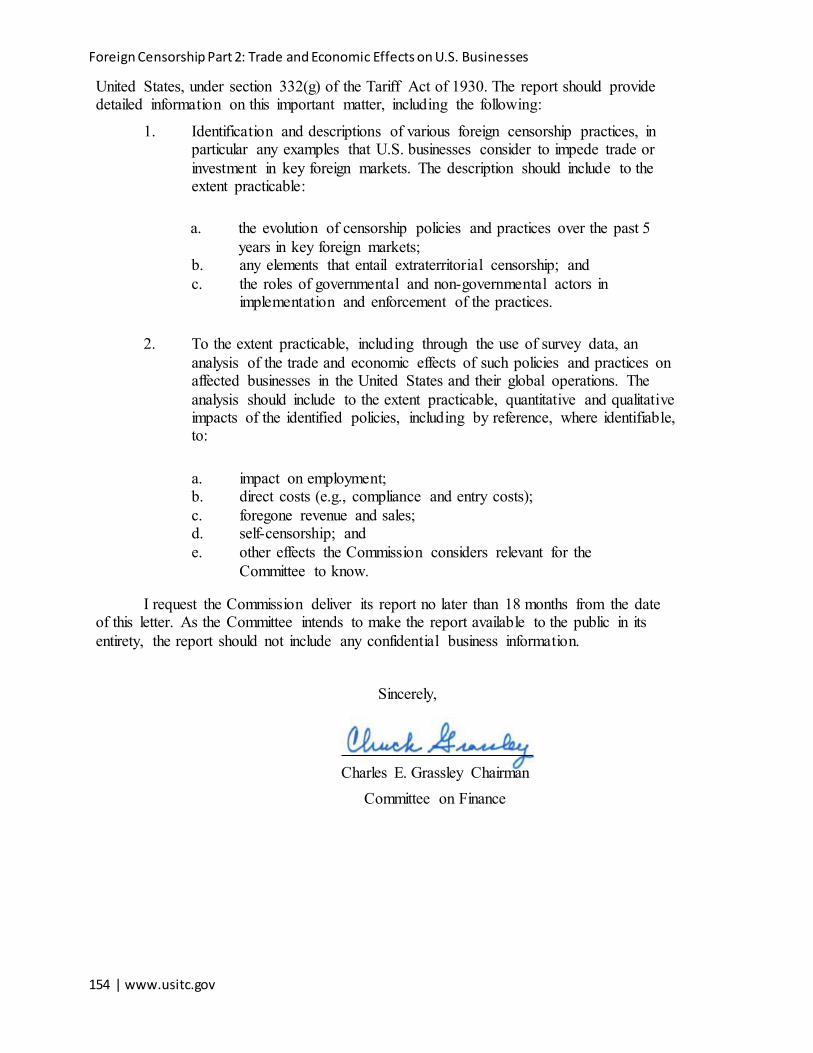
Foreign Censorship Part 2: Trade and Economic Effects on U.S. Businesses
154 | www.usitc.gov
United States, under section 332(g) of the Tariff Act of 1930. The report should provide detailed information on this important matter, including the following:
1. Identification and descriptions of various foreign censorship practices, in particular any examples that U.S. businesses consider to impede trade or investment in key foreign markets. The description should include to the extent practicable:
a. the evolution of censorship policies and practices over the past 5 years in key foreign markets;
b. any elements that entail extraterritorial censorship; and c. the roles of governmental and non-governmental actors in
implementation and enforcement of the practices.
2. To the extent practicable, including through the use of survey data, an analysis of the trade and economic effects of such policies and practices on affected businesses in the United States and their global operations. The analysis should include to the extent practicable, quantitative and qualitative impacts of the identified policies, including by reference, where identifiable, to:
a. impact on employment; b. direct costs (e.g., compliance and entry costs); c. foregone revenue and sales; d. self-censorship; and e. other effects the Commission considers relevant for the
Committee to know.
I request the Commission deliver its report no later than 18 months from the date of this letter. As the Committee intends to make the report available to the public in its entirety, the report should not include any confidential business information.
Sincerely,
Charles E. Grassley Chairman
Committee on Finance

Appendix A: Request Letters
U.S. International Trade Commission | 155
The Honorable Jason E. Kearns Chair U.S. International Trade Commission 500 E Street, SW Washington, DC 20436
Dear Chair Kearns:
April 7, 2021 DOCKET NUMBER 3541
OFFICE OF THE SECRETARY
INT'L TRADE COMMISSION
I am writing today in regard to the investigation requested by former Committee Chairman Grassley regarding "Censorship as a Non-tariff Barrier" on January 4, 2021. I agree with Senator Grassley that censorship and the impact of censorship on the flow of information and services is a critical issue for the digital economy.
For this reason, I support the request for an investigation and survey pursuant to Section 332(g) of the Tariff Act of 1930 regarding foreign censorship and its impact on trade and investment. However, recognizing the pressing concerns regarding this issue, highlighted by the Senate Finance Committee's Trade Subcommittee hearing titled "Censorship as a Non-tariff Barrier," I request that the Commission divide its report into two volumes.
The first volume should include detailed information on the following:
1. Identification and descriptions of various foreign censorship practices, in particular any examples that U.S. businesses consider to impede trade or investment in key foreign markets. The description should include to the extent practicable:
a. the evolution of censorship policies and practices over the past 5 years in key foreign markets;
b. any elements that entail extraterritorial censorship; and c. the roles of governmental and non-governmental actors in
implementation and enforcement of the practices.
And the second volume should provide:
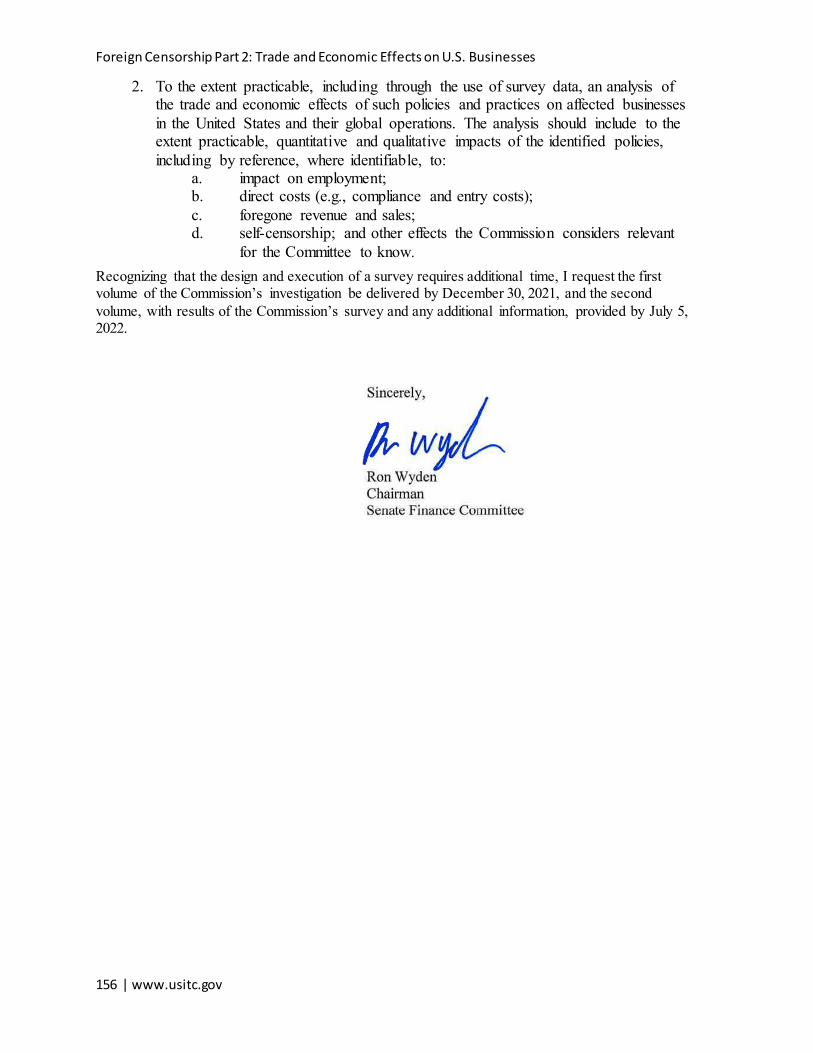
Foreign Censorship Part 2: Trade and Economic Effects on U.S. Businesses
156 | www.usitc.gov
2. To the extent practicable, including through the use of survey data, an analysis of the trade and economic effects of such policies and practices on affected businesses in the United States and their global operations. The analysis should include to the extent practicable, quantitative and qualitative impacts of the identified policies, including by reference, where identifiable, to:
a. impact on employment; b. direct costs (e.g., compliance and entry costs); c. foregone revenue and sales; d. self-censorship; and other effects the Commission considers relevant
for the Committee to know. Recognizing that the design and execution of a survey requires additional time, I request the first volume of the Commission’s investigation be delivered by December 30, 2021, and the second volume, with results of the Commission’s survey and any additional information, provided by July 5, 2022.
Appendix B: Federal Register Notices
U.S. International Trade Commission | 157
Appendix B Federal Register Notices

Foreign Censorship Part 2: Trade and Economic Effects on U.S. Businesses
158 | www.usitc.gov
Appendix B: Federal Register Notices
U.S. International Trade Commission | 159

Foreign Censorship Part 2: Trade and Economic Effects on U.S. Businesses
160 | www.usitc.gov

Appendix B: Federal Register Notices
U.S. International Trade Commission | 161

Foreign Censorship Part 2: Trade and Economic Effects on U.S. Businesses
162 | www.usitc.gov
Appendix B: Federal Register Notices
U.S. International Trade Commission | 163

Foreign Censorship Part 2: Trade and Economic Effects on U.S. Businesses
164 | www.usitc.gov

Appendix C: Calendar of Hearing Witnesses
U.S. International Trade Commission | 165
Appendix C Calendar of Hearing Witnesses

Foreign Censorship Part 2: Trade and Economic Effects on U.S. Businesses
166 | www.usitc.gov

Appendix C: Calendar of Hearing Witnesses
U.S. International Trade Commission | 167
CALENDAR OF PUBLIC HEARING
Those listed below appeared in the United States International Trade Commission’s hearing via videoconference:
Subjects: Foreign Censorship Part 1: Policies and Practices Affecting U.S. Businesses
Foreign Censorship Part 2: Trade and Economic Effects on
U.S. Businesses Inv. Nos.: 332-585 and 332-586, respectively Date and Time: July 1, 2021 - 9:30 a.m.
PANEL 1 ORGANIZATION AND WITNESS: PEN America Washington, DC Suzanne Nossel, CEO Ranking Digital Rights Washington, DC Dr. Nathalie Maréchal, Senior Policy and Partnerships Manager University of Virginia Charlottesville, VA Dr. Aynne Kokas, Associate Professor of Media Studies, University of Virginia, Senior Faculty Fellow, Miller Center Wilson China Fellow Georgia State University Atlanta, Georgia Dr. Maria Repnikova, Assistant Professor of Global Communication, Wilson Fellow 2020-21 George Washington University Digital Trade and Data Governance Hub Washington, DC
Foreign Censorship Part 2: Trade and Economic Effects on U.S. Businesses
168 | www.usitc.gov
Dr. Susan Aaronson, Founder and Director PANEL 2 ORGANIZATION AND WITNESS: The Information Technology and Innovation Foundation Washington, DC Nigel Cory, Associate Director, Trade Policy Computer & Communications Industry Association Washington, DC Rachael Stelly, Policy Counsel Wiley Rein LLP Georgetown University Law Center Washington, DC Timothy C. Brightbill, Partner, Wiley Rein LLP; and Adjunct Professor, Georgetown University Law Center Stanford University Cyber Policy Center Stanford, CA Daphne Keller, Director, Program on Platform Regulation
-END-
Appendix D: Summary of Views of Interested Parties
U.S. International Trade Commission | 169
Appendix D Summary of Views of Interested Parties

Foreign Censorship Part 2: Trade and Economic Effects on U.S. Businesses
170 | www.usitc.gov

Appendix D: Summary of Views of Interested Parties
U.S. International Trade Commission | 171
Summary of Views of Interested Parties Interested parties had the opportunity to file written submissions to the Commission in the course of this investigation and to provide summaries of the positions expressed in the submissions for inclusion in this report. This appendix contains these written summaries, provided that they meet certain requirements set out in the notice of investigation (see appendix B). The Commission has not edited these summaries. This appendix also contains the names of other interested parties who filed written submissions during this investigation but did not provide written summaries. A copy of each written submission is available in the Commission’s Electronic Docket Information System (EDIS), https://www.edis.usitc.gov, by searching for submissions related to Investigation Nos. 332-585 and 332-586. In addition, the Commission also held a public virtual hearing in connection with this investigation on July 1, 2021. The full text of the transcript of the Commission’s hearing is also available on EDIS.
American Chamber of Commerce Vietnam No written summary. Please see EDIS for full submission.
Association of American Publishers No written summary. Please see EDIS for full submission.
Timothy C. Brightbill No written summary. Please see EDIS for full submission.
Cato Institute Submission No written summary. Please see EDIS for full submission.
Center for Democracy and Technology No written summary. Please see EDIS for full submission.

Foreign Censorship Part 2: Trade and Economic Effects on U.S. Businesses
172 | www.usitc.gov
Coalition of Services Industries No written summary. Please see EDIS for full submission.
Computer and Communications Industry Association No written summary. Please see EDIS for full submission.
Engine Advocacy No written summary. Please see EDIS for full submission.
Human Rights Watch No written summary. Please see EDIS for full submission.
Indonesia Chamber of Commerce No written summary. Please see EDIS for full submission.
Internet Association No written summary. Please see EDIS for full submission.
Information Technology and Innovation Foundation No written summary. Please see EDIS for full submission.
Daphne Keller No written summary. Please see EDIS for full submission.
Appendix D: Summary of Views of Interested Parties
U.S. International Trade Commission | 173
Nathalie Maréchal No written summary. Please see EDIS for full submission.
Motion Picture Association No written summary. Please see EDIS for full submission.
PEN America A growing number of governments are adopting novel and expanded means of control over speech and access to information, both within and beyond their borders. In particular, the Chinese Communist Party (CCP) has in recent years strengthened its use of censorship domestically and around the world. While much of the CCP’s censorship on the mainland has strict redlines, the extent and consequences of censorship and censorious influence beyond China’s borders are far more opaque and impact a wide range of American industries.
In Hollywood, U.S. filmmakers face dilemmas as they compete for access to Chinese audiences, where the content and accessibility of foreign movies are sharply limited. Self-censorship or even collaboration with the CCP have become business as usual at some Hollywood Studios. PEN America’s report, Made in Hollywood, Censored in Beijing, explores this topic in more detail.
In publishing, foreign authors face the choice between complying with China’s censorship practices or having some or all of their work excluded from the Chinese market, as PEN America researched in Censorship and Conscience: Foreign Authors and the Challenge of Chinese Censorship. Publishers in Australia, England, and Germany have already come under direct pressure by the CCP; others may engage in self-censorship to avoid similar pressure.
Foreign journalists within China are subject to harassment as well as restricted access to the country. PEN America’s report, Darkened Screen: Constraints on Foreign Journalists in China, details China’s mechanisms for curtailing access for foreign journalists and how U.S. outlets may pull punches to protect Chinese corporate interests.
China’s influence on U.S. higher education has implications for scientific research, technological advancement, and the ability of scholars to help the rest of global society make sense of China. Active monitoring of Chinese students by the CCP may mean that universities reliant on Chinese students for revenue consider what they and their faculty say and publish. However, amid a climate of rising anti-Asian animus, probing the ramifications of these ties can feed suspicions and prejudices against students themselves, which can also impair the free flow of speech and thought.
Most American social media platforms are blocked from operating in China; the few that remain regularly make concessions to the CCP. As economic pressures to engage with China increase, Google and Apple continuously reevaluate their relationships with the CCP. Google has previously discussed plans to provide filtered news and search apps within China, and Apple has made alarming decisions to compromise data privacy and app services. PEN America addressed this topic in Forbidden Feeds: Government Controls on Social Media in China.
One of the greatest challenges that censorship and censoriousness pose is their penchant for invisibility. Particularly when the targets of censorship are heavily incentivized to accede to it, distortions of our

Foreign Censorship Part 2: Trade and Economic Effects on U.S. Businesses
174 | www.usitc.gov
public discourse, suppressed ideas, and the reification of falsehoods can go unspoken. The USITC and United States government should further explore the ways that censorship and censorious influence are shaping American business and the world and make their findings public.
Recording Industry of America No written summary. Please see EDIS for full submission.
Maria Repnikova Political censorship in non-democratic, non-Western markets like China should be understood as any restriction placed on freedom of expression originating from a government entity, including pre-emptive measures, such as legal regulations, directives, and content filtering, as well as post-facto content deletion, criticism, and punishment. In addition to direct censorship measures, we should also account for indirect information practices that can facilitate censorship, including surveillance, propaganda, and cyber nationalism. All these measures work in tandem to restrict and complicate the operations of US companies.
In China, information restrictions (direct and indirect) have expanded in recent years. As for direct censorship, numerous new regulations have been passed to enhance control over the Internet, including VPN crackdowns (2017) and new provisions targeting content producers, platforms, and users (2019). Alongside with legal measures, there has been an intensification in content filtering and censorship directives targeted at digital users, as well as at Chinese and foreign media outlets and platforms. Some of these are pre-emptive, and some are post-facto.
While Chinese censorship is often understood as a rigid and top-down apparatus it is highly adaptive to public opinion trends on social media, and is implemented by many actors, including Internet companies and editors. Topics that are widely discussed on social media are more likely to get censored regardless of their actual sensitivity (Repnikova 2017). This makes censorship especially unpredictable for foreign and Chinese entities alike.
In addition to censorship, surveillance in the form of extensive data collection has significantly expanded. Some of these measures like the recent Data Security Law (2021) that requires approval before exporting sensitive data, directly implicate foreign companies. Online propaganda has also increased, along with more nationalistic expressions online. These expressions can arise spontaneously or as part of a larger propaganda campaign. They can target US companies if they are seen as threatening China’s sovereignty.
Other than presenting direct market entry barriers for those US companies refusing to comply, censorship results in costs associated with self-regulation. These include expenses for monitoring social media activity, costs of state-approved VPN services, local data storage centers, and public relations campaigns to manage nationalistic outbreaks. There are also indirect global reputational costs to obliging a non-democratic regime.
Chinese censorship can also affect US companies’ operations outside of China’s borders, as the Chinese government increasingly promotes cyber sovereignty norms (or the idea of government regulation of the Internet) and as Chinese tech companies compete for contracts in the Global South.
In thinking about censorship in non-Western, non-democratic markets like China, it is pertinent to categorize it into direct and indirect measures, as well as to account for global dimensions of
Appendix D: Summary of Views of Interested Parties
U.S. International Trade Commission | 175
Chinese information governance. While the US government is limited in shaping information environment within China, there is more space to engage globally. This requires rethinking the Internet freedom agenda, as well as encouraging more US tech companies’ competition in emerging markets like Africa.
Tahrir Institute No written summary. Please see EDIS for full submission.

Foreign Censorship Part 2: Trade and Economic Effects on U.S. Businesses
176 | www.usitc.gov

Appendix E: Foreign Censorship Questionnaire
U.S. International Trade Commission | 177
Appendix E Foreign Censorship Questionnaire
Foreign Censorship Part 2: Trade and Economic Effects on U.S. Businesses
U.S. International Trade Commission | 178

Appendix E: Foreign Censorship Questionnaire
U.S. International Trade Commission | 179
FOREIGN CENSORSHIP QUESTIONNAIRE
U. S. INTERNATIONAL TRADE COMMISSION Telephone: 202-780-1638
The U.S. Senate Committee on Finance (Committee) has requested that the U.S. International Trade Commission (USITC or Commission) conduct an investigation and survey pursuant to section 332(g) of the Tariff Act of 1930 regarding foreign censorship and its impact on trade and investment. In response to that request, the Commission has instituted an investigation and has issued this questionnaire to collect information to hear directly from U.S. businesses about how foreign censorship impacts them. This questionnaire mainly focuses on China, although it also includes questions relating to other countries. You are receiving this questionnaire because the Commission has identified you as a U.S. business that may have commercial connections to China. Your response will be treated as confidential and will only be referenced if we can ensure anonymity. If your business does not have such connections, we still require that you answer section 1 of the questionnaire. Answers to this questionnaire will provide information for the Commission’s factfinding investigation on the trade and economic effects of foreign censorship on affected businesses in the United States and their global operations. The Committee requested this investigation in two parts. The first report will provide a qualitative description of censorship policies, and practices, while the second compels the USITC to survey U.S. businesses about how foreign censorship policies, and practices have affected them both in the United States and abroad. You can learn more about this investigation (Inv. No. 332-586) at the following website: http://www.usitc.gov/foreigncensorship.
Your business is required by law to respond to this questionnaire.
Please read all instructions and submit your response to the web-based questionnaire no later than November 3rd, 2021.
The Commission is requesting this information under the authority of section 332(g) of the Tariff Act of 1930 (19 U.S.C. § 1332(g)). Completing the questionnaire is mandatory, and failure to reply as directed can result in a subpoena or other order to compel the submission of records or information in your possession (19 U.S.C. § 1333(a)). For more information on this questionnaire, contact the project team at [email protected]. You may also call the team at 202-780-1638. The project leaders for this investigation are Ricky Ubee, Shova KC, and George Serletis.
OMB no. 3117-0232 No response is required if a currently valid OMB control number is not displayed.

Foreign Censorship Part 2: Trade and Economic Effects on U.S. Businesses
180 | www.usitc.gov
Confidentiality The Commission has designated the information you provide in response to this questionnaire as “confidential business information,” unless such information is otherwise available to the public. Information received in response to this questionnaire will be aggregated with information from other questionnaire responses. The information will not be published in a manner that would identify your firm or reveal the operations of your business. Section 332(g) of the Tariff Act of 1930 (19 U.S.C. 1332(g)) provides that the Commission may not release information which it considers to be confidential business information unless the party submitting such information had notice, at the time of submission, that such information would be released by the Commission, or such party subsequently consents to the release of the information.

Appendix E: Foreign Censorship Questionnaire
U.S. International Trade Commission | 181
Instructions 1. Completing the questionnaire. To provide your business’s responses to this questionnaire, use the secure interactive website version, accessible at this link:
https://www.usitc.gov/foreigncensorship. For the purposes of viewing the full questionnaire, a PDF version is available at this link: https://www.usitc.gov/foreigncensorship/downloads. 2. Accessing the questionnaire. We sent your business a notification letter that includes a personalized website link and the 10-digit questionnaire token. Type in the link provided in the letter in your preferred internet browser and access the questionnaire using your token to complete the questionnaire online. If you have issues with your token or accessing the questionnaire, please email [email protected] or call 202-780-1638 for assistance. 3. Entering information. Please answer each question that applies to your business. Some questions require you to answer by using the provided checkboxes, while others require a detailed response to be typed into entry areas. You will have an opportunity to review your responses, edit them, and download a copy before submitting. 4. Entering numeric data. Enter data for revenue/sales, employees, etc. in actual units, not in thousands, millions, or other multiples of units. For example, for $123.4 million, enter "123400000," not "123400" or "123.4." (Do not add commas between digits; they will appear automatically after you enter the numbers.) 5. Questionnaire structure. This questionnaire is composed of 7 sections. First, read and respond to section 1 questions carefully. Your responses in section 1 will determine whether you must complete every section that follows. 6. Submitting the questionnaire. After you have completed section 7, you may download a copy before submitting. Select the “submit” button to send your final response.

Foreign Censorship Part 2: Trade and Economic Effects on U.S. Businesses
182 | www.usitc.gov
How to report information about your business
1. Coordinating your business's response. Only one questionnaire per business may be submitted. If individuals or departments within your business will share responsibility for completing this questionnaire, please coordinate and combine their responses so that the information your business gives us is consistent. This will minimize our need to contact you for clarification.
2. Relationship to corporate structure. Please provide a single response for your business's activities
and experiences and, to the extent possible, the experiences of its subsidiaries and affiliates. If your business has a parent company, do not send the questionnaire to the parent to complete. If your business is a holding company without operations, please contact the project team at [email protected] or 202-780-1638 for further instruction. U.S. affiliates of foreign companies. Please respond as if the affiliate were an independent business operating in the United States. For example, for an affiliate in the United States, report estimated total domestic and foreign sales for the affiliate and not for the foreign parent company.

Appendix E: Foreign Censorship Questionnaire
U.S. International Trade Commission | 183
Definitions
Censorship: For the purposes of this questionnaire, censorship is defined as the prohibition or suppression of speech or other forms of communication. Censorship may be in the form of an act, policy, or practice, and may be de jure (that is, based on a law or other official measure) or it may be de facto (that is, official or unofficial activities that as a practical matter have a censorship effect). In addition to hearing about acts, policies, and practices that constitute censorship (direct or indirect), we are also interested in hearing about acts, policies, or practices that enable censorship, for example by limiting the pursuit of business activities related to speech or facilitating the ability to carry out censorship. Censorship may be conducted, or enabled, by governments or state-controlled entities. Censorship may also be conducted, or enabled, by private actors at the direction of a government, or to gain a market advantage or avoid a disadvantage from a government. This investigation focuses on censorship as a barrier to trade or investment by U.S. businesses. The questionnaire will ask about your business’s experiences of specific acts, policies, and practices in foreign countries, with a focus on mainland China, that may constitute censorship (direct or indirect), or enable censorship. The Commission has identified some of these acts, policies, and practices in section 2. We ask you to consider whether these (or other acts, policies, and practices) have acted as or enabled censorship, resulting in a barrier to trade or investment of your business’s products or services. Certain government policies, such as licensing restrictions or local presence requirements, may or may not be used to enable censorship, and we leave it to your judgement as to whether they have been used to that end. Indirect censorship may take the form of self-censorship, where a business limits or modifies its communications, products, or services due either to fear of reprisal or deference to the perceived preferences of governmental actors. Censorship may also be extraterritorial in nature; that is, when a foreign government imposes censorship acts, policies, and practices based on speech-related activities outside its own territory or in a way that impacts speech-related activities of businesses or individuals within other jurisdictions. Finally, to the extent practicable, we ask you to focus on impacts and changes to your products and services or their mode of delivery that have resulted or continue to occur due to censorship-related acts, policies, and practices. Please address impacts and changes due to censorship-related acts, policies, and practices rather than impacts and changes to speech-related activity due to other market-specific conditions such as regional consumer preferences or other market characteristics. China: For the purposes of this questionnaire, please consider all references to “China” to mean mainland China (i.e., the geographic area that includes China but does not include Hong Kong, Taiwan, Kinmen, Matsu, the Pescadores, or Macau). Chinese government: For the purposes of this questionnaire, references to the Chinese government are intended to include state authorities in the People’s Republic of China under the leadership of the Chinese Communist Party. It includes the legislative, executive, military, supervisory, and judicial branches of government at the national, provincial, and local levels as well as authorities and officials of the Chinese Communist Party.

Foreign Censorship Part 2: Trade and Economic Effects on U.S. Businesses
184 | www.usitc.gov
Definitions of Products and Services Product/service category Definition Communications services Communications services are telecommunications or
some combination of information and media services provided over fixed or mobile broadband. These services also include online communications services and applications.
Film and television (TV) Film and television include theatrical screening of movies (in theaters) and the streaming of movies, short films, and documentaries; and broadcast TV and streaming of TV shows and events. This category also includes the creation, development, production, distribution, broadcast, and/or licensing of these media through physical or digital means.
Music development and/or distribution, licensing, radio broadcasting
Music development is the process of creating and producing music. This category also covers the delivery of music, which includes the distribution, radio broadcasting, and licensing of music through physical or digital means.
Video game development and/or distribution
Video game development is the process of designing and creating video games. This category also includes their distribution, which may be through physical or digital means.
Information content development and/or distribution, and educational services
Information content development is the process of creating and/or distributing information. Examples of information content developers or distributors include news agencies, and book and journal publishers. Educational services include universities and other teaching institutions.
Search engines Search engines are websites through which users can search for internet content with specified keywords or phrases.

Appendix E: Foreign Censorship Questionnaire
U.S. International Trade Commission | 185
Product/service category Definition Social media, platforms for user-generated content (including reviews), and networking platforms
Social media and platforms for user-generated content are internet applications or websites that allow for the creation, access, and exchange of user-generated content, including reviews of services. Networking platforms are internet applications or websites facilitate user interaction with other users, including employment recruitment-and-networking platforms, dating apps and platforms, and other online forums. If your platform is also used for sales, it may also classify as either “E-commerce shopping platforms for goods and services” or “Individual company’s online store or web application for selling goods or services,” select as appropriate.
E-commerce shopping platforms for goods and services
Platforms that facilitate online trade in goods and services. Examples include e-commerce shopping platforms, classifieds, travel hosting and booking platforms, online auctions, and app stores. The platforms typically allow user-generated reviews of products and services sold on the platform.
Individual company’s online store or web application for selling goods or services, including, for example, provision of electronic payment services
Internet applications or websites that allow users to buy goods and services online. Examples include company websites or virtual storefronts for online sales of their products and services. This category also includes ride-booking services. Electronic payment services are services that allow users to transfer money to stores and other users.
Cloud storage, computing services, and software
Cloud storage and computing services are services such as software as a service (SaaS), platform as a service (PaaS), infrastructure as a service (IaaS), data analytics, and cognitive and artificial intelligence solutions. This category also includes non-cloud software sales or licensing (including downloaded software).
All other services Services not covered by the above categories. Examples include financial (excluding payment services), insurance, express shipping services, and brick & mortar retail.
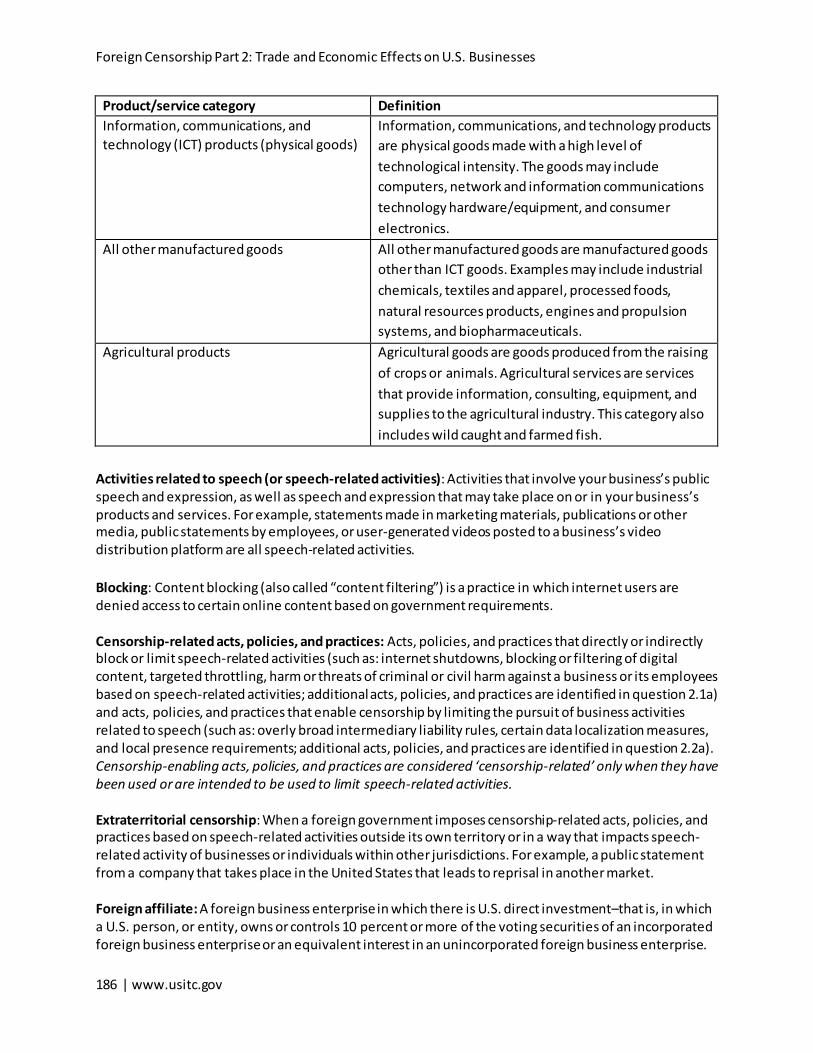
Foreign Censorship Part 2: Trade and Economic Effects on U.S. Businesses
186 | www.usitc.gov
Product/service category Definition Information, communications, and technology (ICT) products (physical goods)
Information, communications, and technology products are physical goods made with a high level of technological intensity. The goods may include computers, network and information communications technology hardware/equipment, and consumer electronics.
All other manufactured goods All other manufactured goods are manufactured goods other than ICT goods. Examples may include industrial chemicals, textiles and apparel, processed foods, natural resources products, engines and propulsion systems, and biopharmaceuticals.
Agricultural products Agricultural goods are goods produced from the raising of crops or animals. Agricultural services are services that provide information, consulting, equipment, and supplies to the agricultural industry. This category also includes wild caught and farmed fish.
Activities related to speech (or speech-related activities): Activities that involve your business’s public speech and expression, as well as speech and expression that may take place on or in your business’s products and services. For example, statements made in marketing materials, publications or other media, public statements by employees, or user-generated videos posted to a business’s video distribution platform are all speech-related activities. Blocking: Content blocking (also called “content filtering”) is a practice in which internet users are denied access to certain online content based on government requirements. Censorship-related acts, policies, and practices: Acts, policies, and practices that directly or indirectly block or limit speech-related activities (such as: internet shutdowns, blocking or filtering of digital content, targeted throttling, harm or threats of criminal or civil harm against a business or its employees based on speech-related activities; additional acts, policies, and practices are identified in question 2.1a) and acts, policies, and practices that enable censorship by limiting the pursuit of business activities related to speech (such as: overly broad intermediary liability rules, certain data localization measures, and local presence requirements; additional acts, policies, and practices are identified in question 2.2a). Censorship-enabling acts, policies, and practices are considered ‘censorship-related’ only when they have been used or are intended to be used to limit speech-related activities. Extraterritorial censorship: When a foreign government imposes censorship-related acts, policies, and practices based on speech-related activities outside its own territory or in a way that impacts speech-related activity of businesses or individuals within other jurisdictions. For example, a public statement from a company that takes place in the United States that leads to reprisal in another market. Foreign affiliate: A foreign business enterprise in which there is U.S. direct investment–that is, in which a U.S. person, or entity, owns or controls 10 percent or more of the voting securities of an incorporated foreign business enterprise or an equivalent interest in an unincorporated foreign business enterprise.

Appendix E: Foreign Censorship Questionnaire
U.S. International Trade Commission | 187
Government-initiated boycott efforts: Actions supported by governments to encourage citizens to stop buying or using goods or services of a certain company or country as a protest. Internet shutdowns: The intentional disruption of internet or electronic communications, rendering them inaccessible or effectively unusable, for a specific population or within a location, often to exert control over the flow of information. Self-censorship: The act of censoring or suppressing one’s own speech, expression, or content in order to avoid offending a government, ensure continued market access, obtain market access, or avoid a disadvantage or gain an advantage from a government. For example, a university may cancel events due to concerns about how such events may be perceived by the Chinese government. Throttling: The intentional slowing down of internet speed in order to decrease, limit, or disrupt specific services or content.

Foreign Censorship Part 2: Trade and Economic Effects on U.S. Businesses
188 | www.usitc.gov
SECTION 1. Business Information
This section asks about the primary characteristics of your business, and your business’s activities in China. Please fill out this section whether or not you believe your business’s operations are relevant to the overall survey.
1.1 Enter the 10-digit questionnaire token that was in the notification letter we sent to your business.
This will allow the project team to track your response. If you do not know this number, contact the project team at [email protected] or 202-780-1638.
Questionnaire token: __________________
1.2 Please list your business’s U.S. headquarters’ address and a contact person.
Business name
Address
City State Zip code Website address
Contact person’s name Contact person’s job title
Contact person’s telephone number Contact person’s email
1.3 Select the products and services that your business provides, as related to each of the following
options since January 1, 2019: to customers in the United States, to customers in China, and products and services your business has previously provided or attempted to provide in China but has been unsuccessful. Check all that apply.
“Provides” includes the provision of goods or services by your business’s domestic and foreign operations (i.e., via cross-border trade and foreign affiliates) and “customers” includes intra-company and external parties, as well as affiliates. Your business has “attempted to provide” its goods and services in China if it has conducted activities beyond market research to enter the market. These activities include seeking approval or licensing to provide goods and services in China or trying to enter into a joint venture to operate in the market.
If none of these product/service categories apply, please contact the project team at [email protected] or 202-780-1638.

Appendix E: Foreign Censorship Questionnaire
U.S. International Trade Commission | 189
Product/service category Provide to customers in the
United States
Provide to customers
in China
Previously provided or
attempted to provide in China
Communications services Film and Television (TV) Music development and/or distribution, licensing, radio broadcasting
Video game development and/or distribution
Information content development and/or distribution, and educational services
Search engines Social media, platforms for user-generated content (including reviews), and networking platforms
E-commerce shopping platforms for goods and services
Individual company’s online store or web application for selling goods or services, including, for example, provision of electronic payment services
Cloud storage, computing services, and software
All other services Information, Communications, and Technology (ICT) products (physical goods)
All other manufactured goods Agricultural products
1.4 Has your business, including subsidiaries (if applicable):
Item Yes No Earned revenue in, or from, China since January 1, 2019? Had any foreign affiliate activity in China or non-revenue generating operations in China at any time since January 1, 2019?
1.5a Please provide estimates of your business’s revenue or sales, whichever is easiest, for the 2019 and
2020 calendar years in each of the areas below. Your best estimate and rounded figures are fine, but please enter your response using whole number (e.g. 15000000 instead of 15.0 million) with no symbols (no commas or dollar signs).
If your company was founded after 2019, please enter zeroes (0) in the 2019 column.

Foreign Censorship Part 2: Trade and Economic Effects on U.S. Businesses
190 | www.usitc.gov
Location 2019 revenue/sales in U.S. Dollars
2020 revenue/sales in U.S. Dollars
United States Global (including United States)
1.5b Please provide estimates of your business’s total employees in the United States for the 2019 and
2020 calendar years in the spaces below. Your best estimate and rounded figures are fine, but please enter your response using whole numbers (e.g., 2000 instead of 2 thousand) with no commas.
If your company was founded after 2019, please enter a zero (0) for 2019.
2019 2020 U.S. employees
1.6 [If 0 to all 2019 in question 1.5] Was your business established after December 31, 2019?
o Yes o No
[If, in question 1.3, your business does not provide any products/services in China, has not previously provided them in China, and has not attempted to provide them in China and you selected “No” to both parts of question 1.4, please skip to section 7.]

Appendix E: Foreign Censorship Questionnaire
U.S. International Trade Commission | 191
SECTION 2. Experiences with Censorship-related Acts, Policies, and Practices
This section asks whether your business (U.S. and affiliates) has experienced censorship in China while providing or attempting to provide goods and services. The section also includes questions about potential self-censorship and extraterritorial censorship.
2.1a Since January 1, 2019, how often have the following censorship acts, policies, and practices in China
impacted your business’s ability to provide or sell your products and services? “Regularly” includes acts, policies, and practices that are experienced as a matter of course when doing business.
Censorship acts, policies, and practices (see page 7
for definitions) Not
experienced Occasionally Regularly
Short-term internet shutdowns (lasting 48 hours or less)
Long-term internet shutdowns (lasting longer than 48 hours)
Blocking or filtering of one or more of your digital products/services based on the content or as reprisal for speech-related activities
Targeted denial of market access of one or more of your digital products/services based on speech related activities
Targeted throttling or slowing of access to your digital products and services
Harm or threats of criminal or civil harm, exit bans, or other forms of reprisal against your organization’s employees based on speech-related activities
Harm or threats of criminal or civil harm, government-initiated boycotts, or other forms of reprisal against your organization, brand, or products based on speech-related activities
Restrictions on or requirements to modify the content of any of your organization’s products, services, or public-facing materials on the grounds that it is objectionable for any reason
Other (please specify) 2.1b Please provide any additional information that could add context for your responses to question
2.1a. As with all answers to this questionnaire, your response will be confidential and will only be referenced if we can ensure anonymity.
2.2a The following acts, policies, and practices have been noted, in some cases, to enable or have the
effect of limiting activities related to speech. For example, requirements to have local employees in a market may lead to concerns about the potential civil or criminal liability of employees that cause
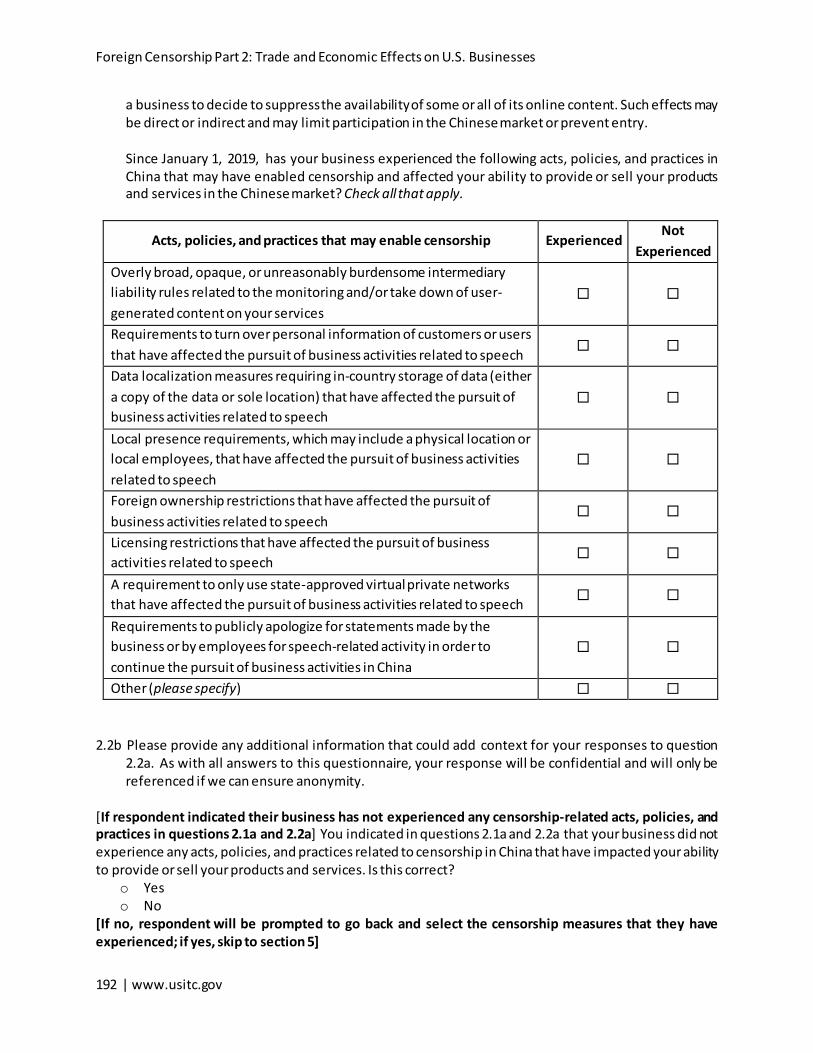
Foreign Censorship Part 2: Trade and Economic Effects on U.S. Businesses
192 | www.usitc.gov
a business to decide to suppress the availability of some or all of its online content. Such effects may be direct or indirect and may limit participation in the Chinese market or prevent entry.
Since January 1, 2019, has your business experienced the following acts, policies, and practices in China that may have enabled censorship and affected your ability to provide or sell your products and services in the Chinese market? Check all that apply.
Acts, policies, and practices that may enable censorship Experienced Not
Experienced Overly broad, opaque, or unreasonably burdensome intermediary liability rules related to the monitoring and/or take down of user-generated content on your services
Requirements to turn over personal information of customers or users that have affected the pursuit of business activities related to speech
Data localization measures requiring in-country storage of data (either a copy of the data or sole location) that have affected the pursuit of business activities related to speech
Local presence requirements, which may include a physical location or local employees, that have affected the pursuit of business activities related to speech
Foreign ownership restrictions that have affected the pursuit of business activities related to speech
Licensing restrictions that have affected the pursuit of business activities related to speech
A requirement to only use state-approved virtual private networks that have affected the pursuit of business activities related to speech
Requirements to publicly apologize for statements made by the business or by employees for speech-related activity in order to continue the pursuit of business activities in China
Other (please specify) 2.2b Please provide any additional information that could add context for your responses to question
2.2a. As with all answers to this questionnaire, your response will be confidential and will only be referenced if we can ensure anonymity.
[If respondent indicated their business has not experienced any censorship-related acts, policies, and practices in questions 2.1a and 2.2a] You indicated in questions 2.1a and 2.2a that your business did not experience any acts, policies, and practices related to censorship in China that have impacted your ability to provide or sell your products and services. Is this correct?
o Yes o No
[If no, respondent will be prompted to go back and select the censorship measures that they have experienced; if yes, skip to section 5]

Appendix E: Foreign Censorship Questionnaire
U.S. International Trade Commission | 193
2.3 Since January 1, 2019, how has your business responded to the Chinese government’s requirements
to modify the content published on your website or platform, or modify your product or services, including the takedown of online content? o Always complied o Complied sometimes o Never complied o Not applicable
2.4a Since January 1, 2019, which of the products/services that your business provides or sells, or has
attempted to sell, to customers in China have been subject to and impacted by the censorship-related acts, policies, and practices in China selected in question 2.1a and 2.2a?
Examples of negative impacts include the denial of market entry for certain products and services and reduction in their quality because of perceived or explicit limitations on speech and content. An example of a positive impact might be limited competition, if others are denied market access.
[Answer only for those product/service categories provided by your business which you identified in question 1.3 as being sold to customers in China, previously provided to customers in China, or attempted to sell in China but have been unsuccessful in doing so.]
Product/service category Not subject to
censorship-related acts, policies, and
practices
Subject to censorship-related acts, policies, and
practices; positively impacted
Subject to censorship-
related acts,
policies, and
practices; no impact
Subject to censorship-related acts, policies, and
practices; negatively impacted
Communications services Film and Television (TV) Music development and/or distribution, licensing, radio broadcasting
Video game development and/or distribution
Information content development and/or distribution, and educational services
Search engines Social media, platforms for user-generated content (including reviews), and networking platforms

Foreign Censorship Part 2: Trade and Economic Effects on U.S. Businesses
194 | www.usitc.gov
Product/service category Not subject to
censorship-related acts, policies, and
practices
Subject to censorship-related acts, policies, and
practices; positively impacted
Subject to censorship-
related acts,
policies, and
practices; no impact
Subject to censorship-related acts, policies, and
practices; negatively impacted
E-commerce shopping platforms for goods and services
Individual company’s online store or web application for selling goods or services, including, for example, provision of electronic payment services
Cloud storage, computing services, and software
All other services Information, Communications, and Technology (ICT) products (physical goods)
All other manufactured goods Agricultural products
2.4b Please provide any additional information that could add context for your responses to question 2.4a. As with all answers to this questionnaire, your response will be confidential and will only be referenced if we can ensure anonymity.
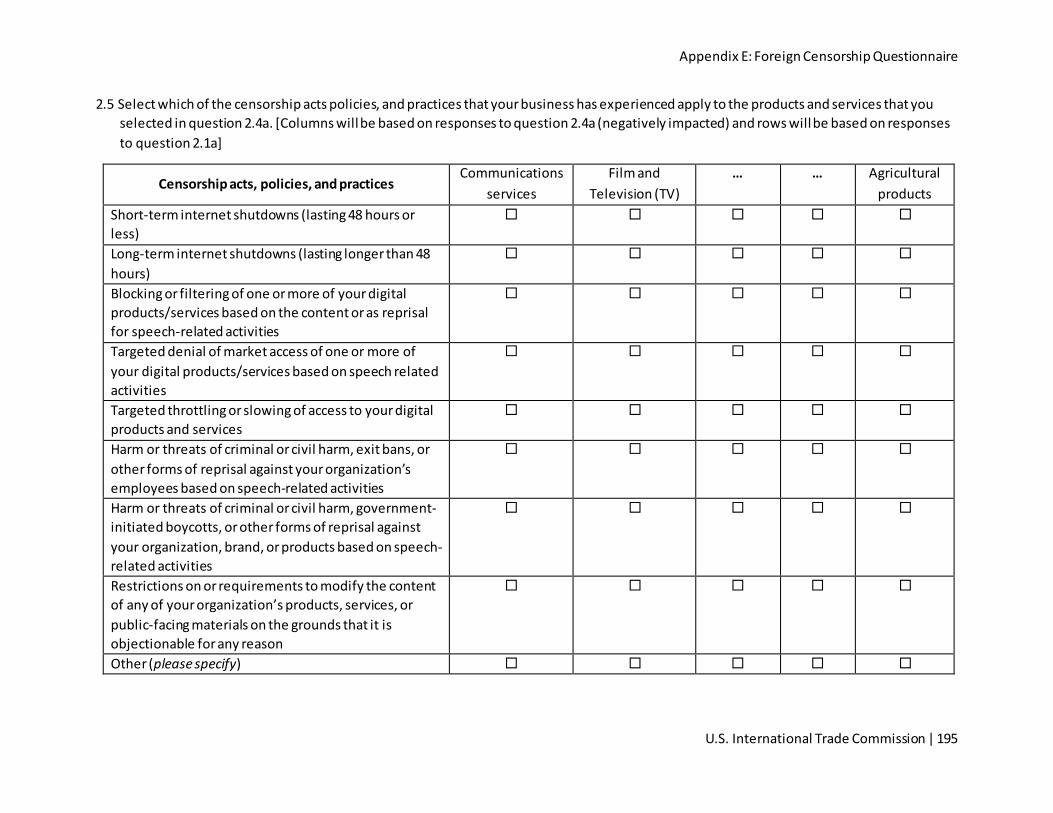
Appendix E: Foreign Censorship Questionnaire
U.S. International Trade Commission | 195
2.5 Select which of the censorship acts policies, and practices that your business has experienced apply to the products and services that you selected in question 2.4a. [Columns will be based on responses to question 2.4a (negatively impacted) and rows will be based on responses to question 2.1a]
Censorship acts, policies, and practices Communications
services Film and
Television (TV) … … Agricultural
products Short-term internet shutdowns (lasting 48 hours or less)
Long-term internet shutdowns (lasting longer than 48 hours)
Blocking or filtering of one or more of your digital products/services based on the content or as reprisal for speech-related activities
Targeted denial of market access of one or more of your digital products/services based on speech related activities
Targeted throttling or slowing of access to your digital products and services
Harm or threats of criminal or civil harm, exit bans, or other forms of reprisal against your organization’s employees based on speech-related activities
Harm or threats of criminal or civil harm, government-initiated boycotts, or other forms of reprisal against your organization, brand, or products based on speech-related activities
Restrictions on or requirements to modify the content of any of your organization’s products, services, or public-facing materials on the grounds that it is objectionable for any reason
Other (please specify)
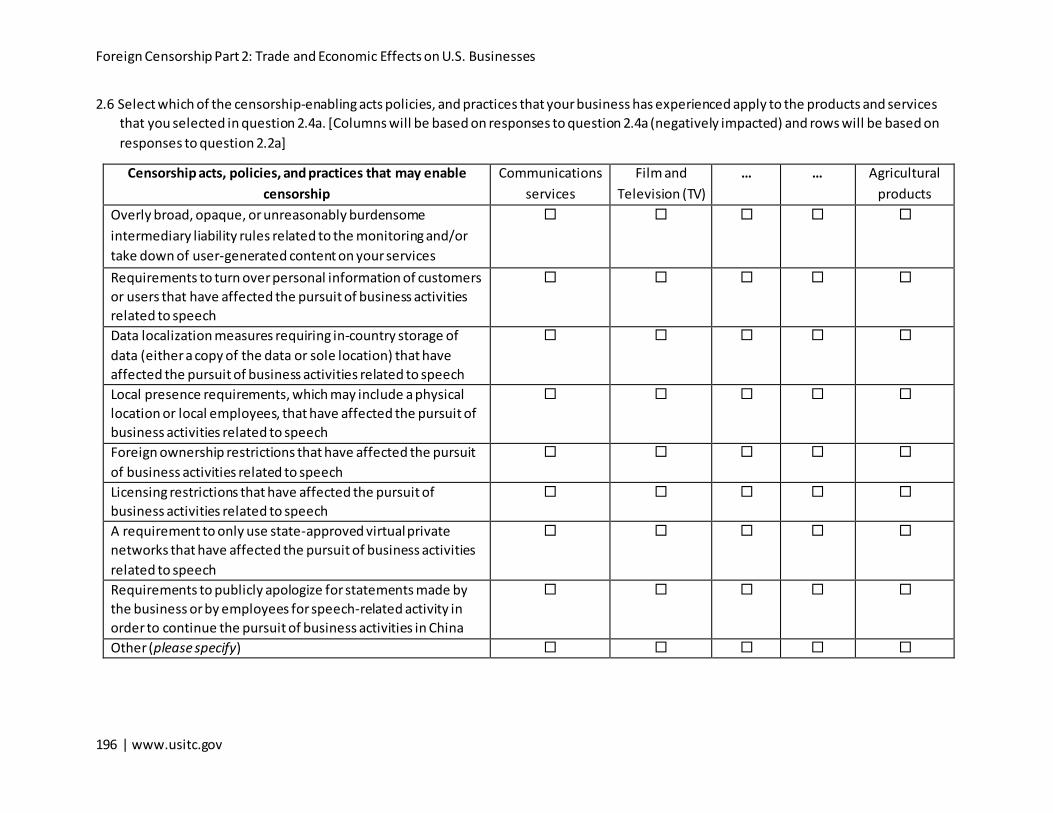
Foreign Censorship Part 2: Trade and Economic Effects on U.S. Businesses
196 | www.usitc.gov
2.6 Select which of the censorship-enabling acts policies, and practices that your business has experienced apply to the products and services that you selected in question 2.4a. [Columns will be based on responses to question 2.4a (negatively impacted) and rows will be based on responses to question 2.2a]
Censorship acts, policies, and practices that may enable censorship
Communications services
Film and Television (TV)
… … Agricultural products
Overly broad, opaque, or unreasonably burdensome intermediary liability rules related to the monitoring and/or take down of user-generated content on your services
Requirements to turn over personal information of customers or users that have affected the pursuit of business activities related to speech
Data localization measures requiring in-country storage of data (either a copy of the data or sole location) that have affected the pursuit of business activities related to speech
Local presence requirements, which may include a physical location or local employees, that have affected the pursuit of business activities related to speech
Foreign ownership restrictions that have affected the pursuit of business activities related to speech
Licensing restrictions that have affected the pursuit of business activities related to speech
A requirement to only use state-approved virtual private networks that have affected the pursuit of business activities related to speech
Requirements to publicly apologize for statements made by the business or by employees for speech-related activity in order to continue the pursuit of business activities in China
Other (please specify)

Appendix E: Foreign Censorship Questionnaire
United States International Trade Commission | 197
2.7 For the following product and service categories your business provides or sells, previously provided, or has attempted to provide in China but has been unsuccessful at doing so, were any censorship-related acts, policies and practices a factor in currently or previously being unable to sell these products/services or reducing their provision? [Only provide answers for product/service categories selected as negatively impacted by censorship in question 2.4a]
Product/service category
Unsuccessful in, or stopped, providing
products/services due to
censorship-related acts, policies, and
practices
Reduced provision of
products/services due to
censorship-related acts, policies, and
practices
Other negative impact(s) due to
censorship-related acts, policies, and
practices Communications services Film and Television (TV) Music development and/or distribution, licensing, radio broadcasting
Video game development and/or distribution
Information content development and/or distribution, and educational services
Search engines Social media, platforms for user-generated content (including reviews), and networking platforms
E-commerce shopping platforms for goods and services
Individual company’s online store or web application for selling goods or services, including, for example, provision of electronic payment services
Cloud storage, computing services, and software
All other services Information, Communications, and Technology (ICT) products (physical goods)
All other manufactured goods Agricultural products

Foreign Censorship Part 2: Trade and Economic Effects on U.S. Businesses
198 | www.usitc.gov
2.8 Please check all the different ways that censorship-related acts, policies, and practices in China that you identified above have impacted your business’s products and services and business operations, as well as any relevant responses your organization has undertaken.
My organization only provides/sells a subset of its full suite of products and services in China My organization has had to modify its intended services or content offered in China My organization is required to limit or deny access to its products and services for certain users Uniformity of our products/services across international markets has been reduced Changes to our products to comply with such policies have been applied to other markets or globally to maintain uniformity or because it is impractical to adapt products or services for different markets
My organization’s costs of doing business in China have increased because of the costs associated with complying with censorship-related acts, policies, and practices
My organization has reduced its efforts to do business in China because of the costs associated with complying with censorship-related acts, policies, and practices
My organization has modified its products and services, or changed its behavior, after learning about actions by the Chinese Government towards another company because of their speech-related activities
My organization has reduced its efforts to do business in China because of the uncertainty in the business environment resulting from censorship-related acts, policies, and practices
My organization has ceased doing business in China, at least partly because of the Government’s censorship-related acts, policies, and practices
Other (specify):
2.9 China has implemented legislation and technologies to regulate the domestic internet (a part of the “Great Firewall”). These regulations facilitate internet censorship in China by blocking access to selected foreign websites and internet tools (such as Facebook, Twitter, Google search, and non-sanctioned VPNs) and by slowing down cross-border internet traffic. These limitations may impact business operations in China, regardless of the industry. Have any of the following limitations related to the Great Firewall impacted your business’s operations in China or global operations?
Limitations
Impact on operations
only in China
Impact on global
operations (including
China)
No impact on
operations Slow cross-border internet access Inability to access online tools, such as cloud-based software
Inability to access blocked websites and content, such as Facebook and Twitter

Appendix E: Foreign Censorship Questionnaire
United States International Trade Commission | 199
VPN restrictions that lead to slow internet access Other (please specify:_____________)
2.10 Has your business self-censored in order to provide products or services in China? This includes pre-emptively editing content to obtain approval to do business by the Government of China.
o Yes o No
[If yes to 2.10] Did this self-censorship occur with respect to speech-related activities in China or speech-related activities outside of China? Check all that apply.
Speech in China
Speech outside of China
[If yes to 2.10] Did this self-censorship impact the design or functionality of any products and/or services your business provides outside of China?
o Yes o No
[If yes, narrative response question:] Please provide any examples of self-censorship in your organization, as well as context, to reduce the chances that its products are denied complete or given only limited access in the Chinese market. As with all answers to this questionnaire, your response will be confidential and will only be referenced if we can ensure anonymity.
2.11 How have your organization’s products and/or services provided outside of China been directly impacted by the Chinese censorship-related acts, policies, and practices selected in questions 2.1a and 2.2a?
Impact Select if applicable Negative impact Mixed impact Positive impact No impact
[If negative impact, mixed impact, or positive impact is chosen in 2.11] Where has the impact on your business taken place?
� United States � Other markets (please specify)
2.12 Does your business moderate/limit activity on social media from the following sources due to Chinese censorship acts, policies, and practices?
Item Yes No Social media posts by official company account(s) Social media posts by company employees
Foreign Censorship Part 2: Trade and Economic Effects on U.S. Businesses
200 | www.usitc.gov
[Narrative response question] Please provide any examples of how public speech by your organization or its employees outside China has affected sales/provision of your organization’s products and services in China. As with all answers to this questionnaire, your response will be confidential and will only be referenced if we can ensure anonymity.

Appendix E: Foreign Censorship Questionnaire
United States International Trade Commission | 201
Section 3. Perceived Impacts of Chinese Censorship
3.1 How concerned is your business that the application of censorship in China will have a negative impact on its ability to provide products and services in the markets below in the next few years?
“Not concerned” may be interpreted as no expectation that censorship-related acts, policies, and practices in China will affect your business’s products and services and “Very concerned” may be interpreted as an expectation that censorship acts, policies, and practices in China will affect your business’s products and services in such a way that causes your business to leave the market.
Ability to provide products and services in:
Not concerned Moderately concerned Very concerned Don’t provide products and
services in this area
China
U.S.
Other countries
3.2 How concerned is your business that the application of censorship-related acts, policies, and practices in China will have a negative impact on its operations in the markets below in the next few years?
“Operations” may include investment, physical operations, and interactions among different business units and suppliers. “Not concerned” may be interpreted as no expectation that censorship acts, policies, and practices in China will affect your business’s operations and “Very concerned” may be interpreted as an expectation that censorship acts, policies, and practices in China will affect your business’s operations in such a way that causes your business to leave the market.
Impact on operations in:
Not concerned Moderately concerned Very concerned Don’t have operations in
this area
China
U.S.
Other countries
3.3a How have the acts, policies, and practices related to censorship in China changed over the past few years?
o They have become more challenging to deal with o They have not changed enough to notice a difference o They have become less challenging to deal with

Foreign Censorship Part 2: Trade and Economic Effects on U.S. Businesses
202 | www.usitc.gov
o I do not know
3.3b Please provide any additional information that could add context for your responses to question 3.3a. As will all answers to this questionnaire, your response will be confidential and will only be referenced if we can ensure anonymity.
3.4 How do policies related to censoring content applied by the government of China compare between your business and Chinese-owned companies?
o My business faces lower levels of requirements and enforcement than Chinese-owned businesses
o My business faces the same levels of requirements and enforcement as Chinese-owned businesses
o My business faces higher levels of requirements and enforcement than Chinese-owned businesses
o Don’t know 3.5 [If always complied or complied sometimes to question 2.3] Does your business believe complying
with Chinese acts, policies, and practices related to censorship impacts how your business’s brand is perceived by U.S. customers?
o Yes, negative impact o Yes, positive impact o Yes, mixed impacts o No impact
3.6 [If always complied or complied sometimes to question 2.3] Does your business believe the size of its customer base in the United States has changed as a result of complying with Chinese acts, policies, and practices related to censorship?
o Yes, it lost customers. o Yes, it gained customers. o No change.

Appendix E: Foreign Censorship Questionnaire
United States International Trade Commission | 203
Section 4 – Economic Effects of Censorship in China 4.1 Have the acts, policies, and practices related to censorship that your business has experienced in
China impacted your business’s costs (in or outside China), revenue, and/or U.S. employment since January 1, 2019? If your business has a non-U.S. parent company and economic impacts are only experienced by the parent company, select “No, no impact.” o Yes o No, no impact (Skip to Section 5) [If “No, no impact” is chosen in 4.1] Check if the economic impact of Chinese censorship-related acts, policies, and practices are only experienced by a foreign parent company.
4.2 Which of the following statements most accurately describes the net effects that acts, policies, and
practices related to censorship in China have had on your business’s revenue or sales in China since January 1, 2019? o My business has lost or foregone revenue or sales in China because of these acts, policies, and
practices. o No impact to my business’s revenue or sales in China. o My business has earned additional revenue or sale in China because of these acts, policies, and
practices. 4.3 Which of the following statements most accurately describes the net effects that acts, policies, and
practices related to censorship in China have had on your business’s revenue or sales outside China since January 1, 2019? o My business has lost or foregone revenue or sales outside China because of these acts, policies,
and practices. o No impact to my business’s revenue or sales outside China. o My business has earned additional revenue or sales outside China because of these acts, policies,
and practices. 4.4 Provide your best estimate of how much the removal of all acts, policies, and practices related to
censorship in China would change your business’s global annual revenue or sales, as a share of 2020 global revenue or sales. If you would like to provide additional information or context for your response to this question, please do so in question 4.14.
4.5 Which of the following statements most accurately describes the net effects that acts, policies, and
practices related to censorship in China have had on your business’s costs in China since January 1, 2019? “Costs” includes compliance and entry costs to do business in China. o My business has faced increased costs in China because of these acts, policies, and practices. o No impact to my business’s costs in China.

Foreign Censorship Part 2: Trade and Economic Effects on U.S. Businesses
204 | www.usitc.gov
o My business has faced reduced costs in China because of these acts, policies, and practices. 4.6 On average, provide your best estimate of how much the acts, policies, and practices related to
censorship in China have impacted your business’s costs of doing business in China (including compliance and entry costs), as a share of total global costs? If you would like to provide additional information or context for your response to this question, please do so in question 4.14.
[If “…increased costs…” chosen in 4.5]
[If “…reduced costs…” chosen in 4.5]
4.7 Which types of costs were affected by acts, policies, and practices related to censorship in China?
Affected Not affected Fixed costs such as the cost of building additional facilities
Variable costs which are the costs of serving an additional customer from existing facilities
4.8 [If both types of costs are affected] Which one is a bigger factor (variable vs fixed) of total costs for
your business? o Fixed costs o Variable costs o Both costs are equally significant factors

Appendix E: Foreign Censorship Questionnaire
United States International Trade Commission | 205
4.9 Which of the following statements most accurately describes the net effects that acts, policies, and practices related to censorship in China have had on your business’s costs outside China since January 1, 2019? o My business has faced increased costs outside China because of these acts, policies, and
practices. o No impact to my business’s costs outside China. o My business has faced reduced costs outside China because of these acts, policies, and practices.
4.10 Which of the following statements most accurately describes the net effects that acts, policies, and
practices related to censorship in China have had on your business’s U.S. employment since January 1, 2019? o My business has reduced U.S. employment or lost U.S. employees because of these acts, policies,
and practices. o No impact to my business’s U.S. employment. o My business has increased U.S. employments or gained U.S. employees because of these acts,
policies, and practices. 4.11 Provide your best estimate of how much the removal of all acts, policies, and practices related to
censorship in China would change your business’s U.S. employment, as a share of 2020 U.S. employment. If you would like to provide additional information or context for your response to this question, please do so in question 4.14.
4.12 [Skip if no products/services provided in China per question 1.3] Provide your best estimate of how
much blocked access to your website and services in China for a single day would cost your business, in terms of lost revenue as a share of your business’s 2020 global revenue.
4.13 How did you reach the costs and revenue estimates above? Check all that apply.
Method Check if yes Internal business estimates
Foreign Censorship Part 2: Trade and Economic Effects on U.S. Businesses
206 | www.usitc.gov
External market research Compared with business’s performance in other foreign markets
External publication (specify): Other (specify):
4.14 Describe any ways that are not captured in the previous questions in this section that acts, policies,
or practices related to censorship in China have affected your company’s global operations outside of China. This can include effects on foreign affiliates, suppliers, and other business-to-business transactions. Additionally, use this box to make any comments about experiences with censorship acts, policies, and practices in Hong Kong. As with all answers to this questionnaire, your response will be confidential and will only be referenced if we can ensure anonymity.

Appendix E: Foreign Censorship Questionnaire
United States International Trade Commission | 207
SECTION 5. Experiences with censorship-related acts, policies, or practices in other markets This section asks about your business’s experiences with censorship-related acts, policies, or practices in markets other than China. As with the rest of the questionnaire, censorship refers to the suppression or prohibition of speech or communication (see the “Definitions” section for more detail). Examples of censorship-related acts include, but are not limited to, internet shutdowns, and requirements to modify audio/visual content of your products/services, as well as acts of retaliation based on speech. 5.1 For each market listed below, select the following. If your business provides products and services
(i.e., operates) in the market, select whether it has experienced acts, policies, and practices related to censorship in that market since January 1, 2019. If your business does not operate in the market, select whether censorship was a factor in that decision. In the case of the European Union, please use “EU27-wide” (which does not include the United Kingdom) to distinguish acts, policies, or practices of the European Union from acts, policies, or practices that are country-specific. Markets are mapped to regions based on the International Telecommunication Union’s economy classifications (https://www.itu.int/en/ITU-D/Statistics/Pages/definitions/regions.aspx).
Markets
Operating in market and
experiencing censorship-related acts, policies, and
practices
Operating in market and not
experiencing censorship-related acts, policies, and
practices
Not operating in market and censorship-related acts, policies, and
practices were a factor
Not operating in market and censorship-related acts, policies, and
practices were not a factor
Africa and the Arab States
Egypt
Nigeria
Saudi Arabia
Other Africa and Arab States
Asia and the Pacific
India
Indonesia
Pakistan
Vietnam
Other Asia and the Pacific
Commonwealth of Independent States (CIS)
Russian Federation
Other CIS
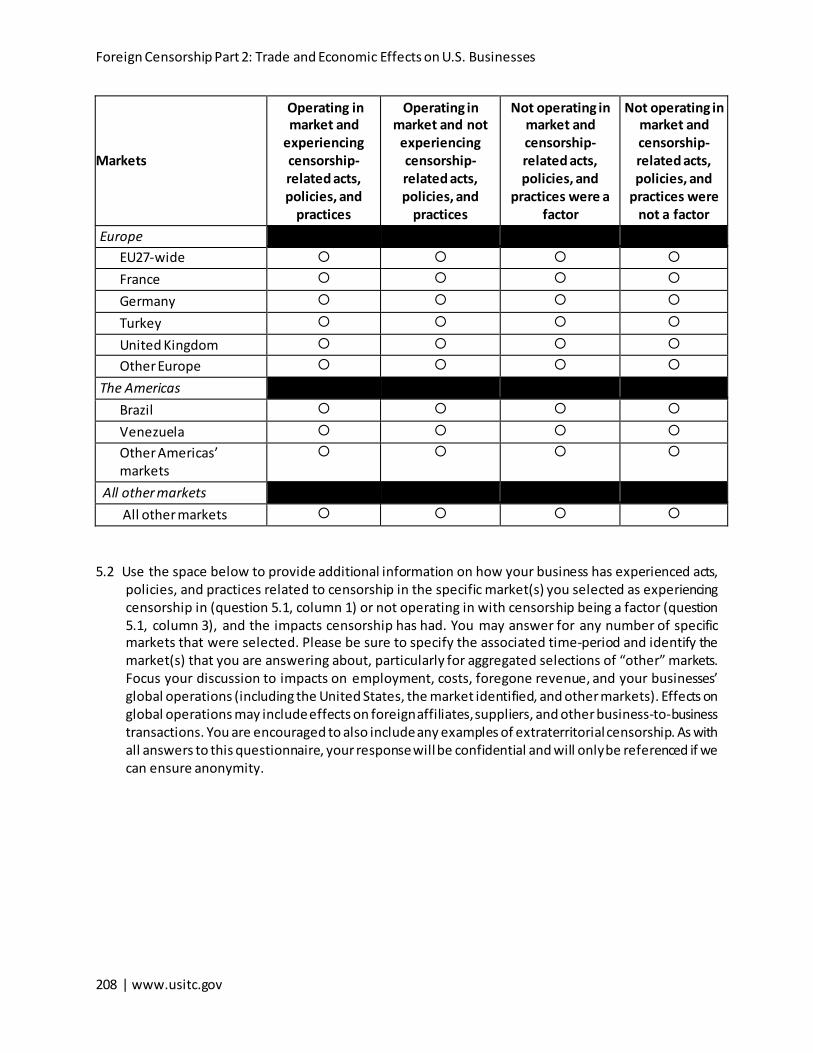
Foreign Censorship Part 2: Trade and Economic Effects on U.S. Businesses
208 | www.usitc.gov
Markets
Operating in market and
experiencing censorship-related acts, policies, and
practices
Operating in market and not
experiencing censorship-related acts, policies, and
practices
Not operating in market and censorship-related acts, policies, and
practices were a factor
Not operating in market and censorship-related acts, policies, and
practices were not a factor
Europe
EU27-wide
France
Germany
Turkey
United Kingdom
Other Europe
The Americas
Brazil
Venezuela
Other Americas’ markets
All other markets
All other markets
5.2 Use the space below to provide additional information on how your business has experienced acts,
policies, and practices related to censorship in the specific market(s) you selected as experiencing censorship in (question 5.1, column 1) or not operating in with censorship being a factor (question 5.1, column 3), and the impacts censorship has had. You may answer for any number of specific markets that were selected. Please be sure to specify the associated time-period and identify the market(s) that you are answering about, particularly for aggregated selections of “other” markets. Focus your discussion to impacts on employment, costs, foregone revenue, and your businesses’ global operations (including the United States, the market identified, and other markets). Effects on global operations may include effects on foreign affiliates, suppliers, and other business-to-business transactions. You are encouraged to also include any examples of extraterritorial censorship. As with all answers to this questionnaire, your response will be confidential and will only be referenced if we can ensure anonymity.

Appendix E: Foreign Censorship Questionnaire
United States International Trade Commission | 209
SECTION 6. Other Information [NARRATIVE RESPONSE PROMPT] 6.1 If your business would like to further explain any of the responses in this questionnaire, use the
space below. Please do not use the return or tab keys when entering your response. As with all answers to this questionnaire, your response will be confidential and will only be referenced if we can ensure anonymity.
Foreign Censorship Part 2: Trade and Economic Effects on U.S. Businesses
210 | www.usitc.gov
SECTION 7. Certification The undersigned certifies that the information supplied herein in response to this questionnaire is complete and accurate to the best of his/her knowledge and belief. Section 332(g) of the Tariff Act of 1930 (19 U.S.C. 1332(g)) provides that the Commission may not release information which it considers to be confidential business information unless the party submitting such information had notice, at the time of submission, that such information would be released by the Commission, or such party subsequently consents to the release of the information. The undersigned acknowledges that all information, including confidential business information, submitted in this questionnaire response and throughout this investigation may be disclosed to and used:
(i) by the Commission, its employees and Offices, and contract personnel (a) for developing or maintaining the records of this or a related proceeding, or (b) in internal investigations, audits, reviews, and evaluations relating to the programs, personnel, and operations of the Commission including under 5 U.S.C. Appendix 3; or
(ii) by U.S. government employees and contract personnel (a) for cybersecurity purposes or (b) in monitoring user activity on U.S. government classified networks.
The undersigned understands that all contract personnel will sign appropriate nondisclosure agreements. The Commission will not disclose any confidential business information, unless such information is otherwise available to the public. The Senate Committee on Finance has asked that the Commission not include any confidential business information in the report it transmits to them. Information received in response to this questionnaire will be aggregated with information from other questionnaire responses. The information will not be published in a manner that would identify your firm or reveal the operations of your business.
Certifier’s name and title Date of certification
Check the box below in place of a written signature to indicate that the authorized official listed above has certified the information provided.
Certified Before submitting your business’s completed questionnaire, report the actual number of hours required and the cost to your business of completing this questionnaire, including all preparatory activities. Number of hours: _____ Cost ($): ____

Appendix F: Description of the Commission’s Survey Methodology
United States International Trade Commission | 211
Appendix F Description of the Commission’s Survey Methodology

Foreign Censorship Part 2: Trade and Economic Effects on U.S. Businesses
212 | www.usitc.gov

Appendix F: Description of the Commission’s Survey Methodology
United States International Trade Commission | 213
Survey Methods In its letter, the Committee on Finance of the U.S. Senate (Committee) requested that the U.S. International Trade Commission (Commission or USITC) provide a report that describes foreign censorship policies and practices and another report that quantifies their trade and economic effects on U.S. businesses. The Commission’s second report was to use, among other information sources, primary data collected from a survey of U.S. companies. To make the scope of the survey manageable and to ensure our ability to collect responses that are representative and statistically meaningful, the survey aimed to collect information on the impact of these policies and practices on U.S. businesses engaged in China. The Commission developed a questionnaire to collect this information, conducted field cognitive testing of its questionnaire with companies in June and July 2021, and submitted its questionnaire to the U.S. Office of Management and Budget for approval in August 2021. After receiving the approval in October 2021, the Commission sent the questionnaire to 3,787 U.S. companies.
Surveying for this investigation consisted of three major steps. First, the Commission combined information from multiple databases available through Bureau van Dijk (BvD) to identify companies of interest and generate a list of U.S. companies more likely to have recent operations in China. Second, the Commission randomly selected individual companies from that list to survey and sent them questionnaires. The Commission also conducted extensive outreach to the surveyed companies to ensure adequate response rates. Third, the Commission combined the responses from individual questionnaires to produce statistically representative estimates of U.S. companies’ experiences with and perceptions of direct censorship or censorship-enabling acts, policies, and practices (i.e., measures) in China and their effects on U.S. businesses.
Sampling Frame The first step in determining which companies would receive the survey was generating the sampling frame, which is a list of companies from which the sample was selected. The list is formed with the goal of identifying—to the extent possible—U.S. companies commercially active in China, which is our target population. The metadata in BvD’s ORBIS databases provided indication of such a connection when U.S. companies active between March 2020 and March 2021 met at least one of the following criteria: (1) had foreign shareholders located in China (at least 10%); (2) had foreign subsidiaries located in China (at least 10% ownership); (3) were involved in foreign direct investment projects in China; (4) were involved in mergers and acquisitions in China; or (5) filed a patent in China.402 The frame does not contain businesses that may have previously provided or attempted to provide products or services in China but are not currently active in China based on the above criteria. Finding these latter businesses would not be possible without an economy-wide survey which would be more resource and time intensive.
Holding companies and government entities (other than universities) were excluded from the sampling frame unless the holding company was found to have operations in the U.S. and China. Subsidiary companies were excluded when its parent company was U.S. owned and already in the population.
402 The Commission used 10 percent as the threshold for criteria 1 and 2 based on the threshold the U.S. Bureau of Economic Analysis (BEA) uses for its surveys of U.S. Direct Investment Abroad. BEA, “A Guide to BEA’s Direct Investment Surveys.” Accessed March 10, 2022.

Foreign Censorship Part 2: Trade and Economic Effects on U.S. Businesses
214 | www.usitc.gov
The Commission used stratified random sampling to select companies from the sampling frame. In the stratified sampling process, the frame is first divided into distinct strata (subpopulations), and then companies are independently selected from each stratum. By constructing strata that contain relatively homogeneous (similar) companies, stratified sampling can produce statistical estimates with lower standard errors than simple random sampling, in which all companies on the list have the same probability of being selected. Companies in this investigation were stratified through a combination of industry, size, and whether the business has operations in China or has only filed a patent in China.
The stratification plan was based on three sets of expectations. First, censorship is likely to impact businesses in service industries more than manufacturing, agriculture, or mining, so the population is stratified by industry group (Services only, Manufacturing only, or Services and manufacturing) using primary and secondary North American Classification System (NAICS) codes obtained through BvD.403 Second, businesses with operations in China are expected to respond differently than businesses that have filed patents only in China. Third, small and medium-sized enterprises (SMEs) are expected to experience censorship-related measures differently than large businesses.
Table F.1 presents the size cut-off criteria used to stratify into SMEs and large businesses by industry group. These same criteria were used for analyses by size in chapter 2.
Table F.4 Size cutoff criteria for size-based stratum by industry group, by number of employees and revenue in billions of dollars Prefatory text: SME = small and medium-sized enterprise. Industry group SME Large Services only <= $1 bil l ion in revenue > $1 bil l ion in revenue Manufacturing only <= 500 employees > 500 employees Services and manufacturing <= $1 bil l ion in revenue > $1 bil l ion in revenue
Source: Gartner, “Small and Midsize Business (SMB),” accessed February 24, 2022. Note: The U.S. Small Business Administration uses North American Industry Classification System (NAICS) codes to determine whether to use dollars or number of employees for size cutoffs. In general, manufacturing NAICS codes (31–33) use number of employees for size classifications while other NAICS codes use dollars. USITC used these standards to determine the metric for cutoffs for industry groups.
A power analysis was conducted to determine the minimum sample size needed per stratum in order to produce statistically valid results with a 90 percent two-sided confidence interval (CI), based on the size cutoff criteria listed in table F.1.404 A sample of 3,787 businesses based on our minimum sample size calculation per stratum was selected as shown in table F.2. Large businesses, regardless of their industry or activity in China, were sampled with certainty. SMEs with only patents in China were sampled at the lowest rate since they are less likely to have operations in China and consequently are more likely to face censorship.
403 Both primary and secondary 6-digit national industry NAICS codes were provided and 2-digit sector NAICS codes derived. Companies with only primary and secondary 2-digit sector manufacturing NAICS codes (31, 32, or 33) were allocated to the “Manufacturing only” industry group. Companies with only primary and secondary 2-digit nonmanufacturing NAICS codes (all codes except 31, 32, and 33) were allocated to the “Services only” industry group. Companies with primary and secondary 2-digit sector NAICS codes that are both designated manufacturing and nonmanufacturing were allocated to the “Services and manufacturing” (i .e., “Both”) industry group. 404 The 90 percent CI in the sample design allows for oversampling in order to mitigate any issues potentially including out-of-scope companies in the frame. In the analysis, a 95 percent two-sided CI was used.

Appendix F: Description of the Commission’s Survey Methodology
United States International Trade Commission | 215
Table F.5 Sample selection rates per population stratum, by business size, types of activity, and industry SME = small and medium-sized enterprise.
Size, Activity, Industry
Population (number of companies)
Sample size (number of companies)
Sampling rate (%)
SME, Operations, Services only 412 389 94.4 SME, Operations, Manufacturing only 148 102 68.9 SME, Operations, Services and manufacturing 265 226 85.3 Large, Operations, Services only 230 230 100.0 Large, Operations, Manufacturing only 240 240 100.0 Large, Operations, Services and manufacturing 211 211 100.0 SME, Patents only, Services only 1,725 942 54.6 SME, Patents only, Manufacturing only 654 377 57.6 SME, Patents only, Services and manufacturing 1,195 580 48.5 Large, Patents only, Services only 137 137 100.0 Large, Patents only, Manufacturing only 260 260 100.0 Large, Patent only, Services and manufacturing 93 93 100.0 Total 5,570 3,787 68.0
Source: USITC calculations.
Response Rates Based on the Commission’s authority under section 332(g) of the Tariff Act of 1930 (19 U.S.C. 1333(a)), all companies that received a questionnaire were legally required to complete it. The companies included in the sample received an initial mailing notifying them of the forthcoming questionnaire, a letter containing instructions for completing it within 30 days, and two follow-up mailings reminding them to complete the questionnaire. The Commission also conducted extensive outreach via email to all sampled companies to accommodate increased teleworking practices during the COVID-19 pandemic. The latter helped boost the response rates to a level not seen previously at the Commission.
The survey had an overall response rate of 73.1 percent. These responses include companies that were not active in China, no longer in business, still in product development phase, or were otherwise exempt from the survey. Table F.3 presents sample sizes and response rates by the sampling frame’s strata. Of the 3,787 questionnaires mailed to companies in the sampling frame, 2,767 responses were received which included 1,183 companies not active in China, no longer in business, or still in the product development phase. After all adjustments, there were 1,584 businesses active or recently active in China that provided complete and timely responses.
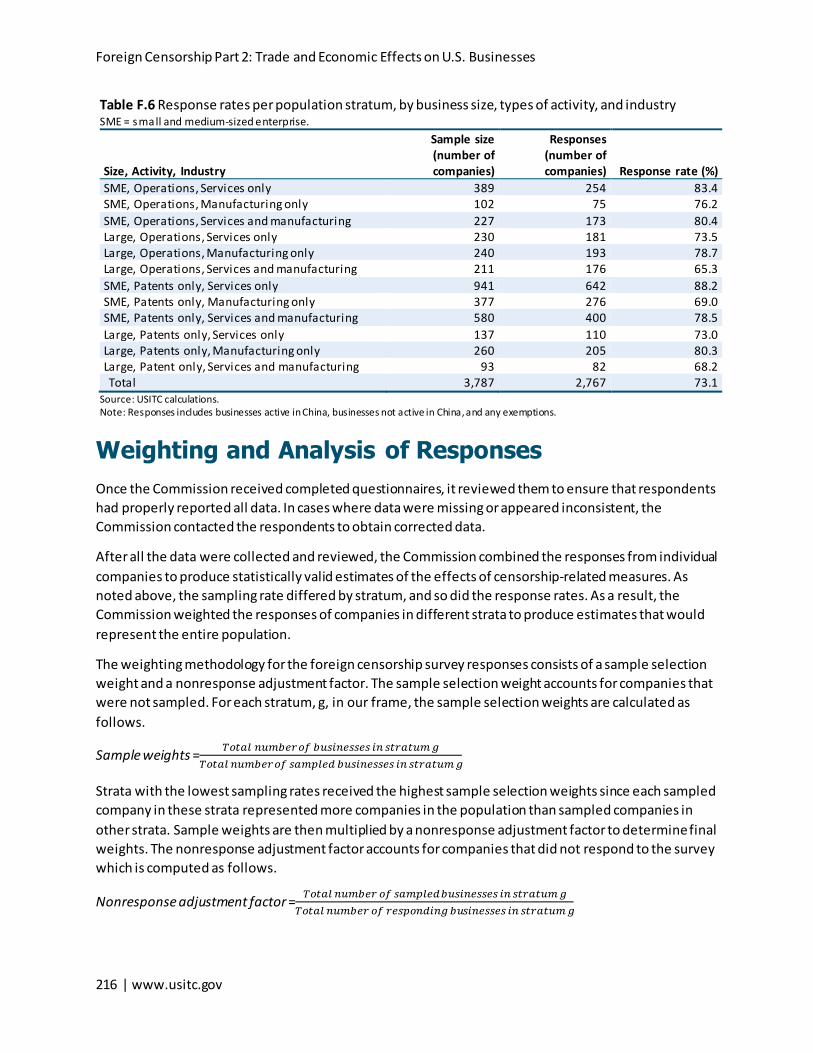
Foreign Censorship Part 2: Trade and Economic Effects on U.S. Businesses
216 | www.usitc.gov
Table F.6 Response rates per population stratum, by business size, types of activity, and industry SME = small and medium-sized enterprise.
Size, Activity, Industry
Sample size (number of companies)
Responses (number of companies) Response rate (%)
SME, Operations, Services only 389 254 83.4 SME, Operations, Manufacturing only 102 75 76.2 SME, Operations, Services and manufacturing 227 173 80.4 Large, Operations, Services only 230 181 73.5 Large, Operations, Manufacturing only 240 193 78.7 Large, Operations, Services and manufacturing 211 176 65.3 SME, Patents only, Services only 941 642 88.2 SME, Patents only, Manufacturing only 377 276 69.0 SME, Patents only, Services and manufacturing 580 400 78.5 Large, Patents only, Services only 137 110 73.0 Large, Patents only, Manufacturing only 260 205 80.3 Large, Patent only, Services and manufacturing 93 82 68.2 Total 3,787 2,767 73.1
Source: USITC calculations. Note: Responses includes businesses active in China, businesses not active in China, and any exemptions.
Weighting and Analysis of Responses Once the Commission received completed questionnaires, it reviewed them to ensure that respondents had properly reported all data. In cases where data were missing or appeared inconsistent, the Commission contacted the respondents to obtain corrected data.
After all the data were collected and reviewed, the Commission combined the responses from individual companies to produce statistically valid estimates of the effects of censorship-related measures. As noted above, the sampling rate differed by stratum, and so did the response rates. As a result, the Commission weighted the responses of companies in different strata to produce estimates that would represent the entire population.
The weighting methodology for the foreign censorship survey responses consists of a sample selection weight and a nonresponse adjustment factor. The sample selection weight accounts for companies that were not sampled. For each stratum, g, in our frame, the sample selection weights are calculated as follows.
Sample weights = 𝑇𝑇𝑇𝑇𝑇𝑇𝑇𝑇𝑇𝑇 𝑛𝑛𝑛𝑛𝑛𝑛𝑛𝑛𝑛𝑛𝑛𝑛 𝑇𝑇𝑜𝑜 𝑛𝑛𝑛𝑛𝑏𝑏𝑏𝑏𝑛𝑛𝑛𝑛𝑏𝑏𝑏𝑏𝑛𝑛𝑏𝑏 𝑏𝑏𝑛𝑛 𝑏𝑏𝑇𝑇𝑛𝑛𝑇𝑇𝑇𝑇𝑛𝑛𝑛𝑛 𝑔𝑔𝑇𝑇𝑇𝑇𝑇𝑇𝑇𝑇𝑇𝑇 𝑛𝑛𝑛𝑛𝑛𝑛𝑛𝑛𝑛𝑛𝑛𝑛 𝑇𝑇𝑜𝑜 𝑏𝑏𝑇𝑇𝑛𝑛𝑠𝑠𝑇𝑇𝑛𝑛𝑠𝑠 𝑛𝑛𝑛𝑛𝑏𝑏𝑏𝑏𝑛𝑛𝑛𝑛𝑏𝑏𝑏𝑏𝑛𝑛𝑏𝑏 𝑏𝑏𝑛𝑛 𝑏𝑏𝑇𝑇𝑛𝑛𝑇𝑇𝑇𝑇𝑛𝑛𝑛𝑛 𝑔𝑔
Strata with the lowest sampling rates received the highest sample selection weights since each sampled company in these strata represented more companies in the population than sampled companies in other strata. Sample weights are then multiplied by a nonresponse adjustment factor to determine final weights. The nonresponse adjustment factor accounts for companies that did not respond to the survey which is computed as follows.
Nonresponse adjustment factor = 𝑇𝑇𝑇𝑇𝑇𝑇𝑇𝑇𝑇𝑇 𝑛𝑛𝑛𝑛𝑛𝑛𝑛𝑛𝑛𝑛𝑛𝑛 𝑇𝑇𝑜𝑜 𝑏𝑏𝑇𝑇𝑛𝑛𝑠𝑠𝑇𝑇𝑛𝑛𝑠𝑠 𝑛𝑛𝑛𝑛𝑏𝑏𝑏𝑏𝑛𝑛𝑛𝑛𝑏𝑏𝑏𝑏𝑛𝑛𝑏𝑏 𝑏𝑏𝑛𝑛 𝑏𝑏𝑇𝑇𝑛𝑛𝑇𝑇𝑇𝑇𝑛𝑛𝑛𝑛 𝑔𝑔𝑇𝑇𝑇𝑇𝑇𝑇𝑇𝑇𝑇𝑇 𝑛𝑛𝑛𝑛𝑛𝑛𝑛𝑛𝑛𝑛𝑛𝑛 𝑇𝑇𝑜𝑜 𝑛𝑛𝑛𝑛𝑏𝑏𝑠𝑠𝑇𝑇𝑛𝑛𝑠𝑠𝑏𝑏𝑛𝑛𝑔𝑔 𝑛𝑛𝑛𝑛𝑏𝑏𝑏𝑏𝑛𝑛𝑛𝑛𝑏𝑏𝑏𝑏𝑛𝑛𝑏𝑏 𝑏𝑏𝑛𝑛 𝑏𝑏𝑇𝑇𝑛𝑛𝑇𝑇𝑇𝑇𝑛𝑛𝑛𝑛 𝑔𝑔

Appendix F: Description of the Commission’s Survey Methodology
United States International Trade Commission | 217
Responding businesses includes businesses that are active in China, businesses that not active in China, and exemptions.
Final weights = Sample weights × Nonresponse adjustment factor
These final weights will be applied to all responses, including those of exempt companies (table F.4).
Table F.7 Average final weights per population stratum, by business size and industry SME = small and medium-sized enterprise.
Size and Industry
Valid responses (number of companies)
Average final weights
SME, Services only 328 2.21 SME, Manufacturing only 198 2.27 SME, Services and manufacturing 300 2.40 Large, Services only 209 1.26 Large, Manufacturing only 334 1.26 Large, Services and manufacturing 215 1.18 Total 1,584 1.79
Source: USITC calculations.
Grouping Product and Services Categories The Commission questionnaire covered products and services that were fairly disaggregated, particularly for media and digital services. Reporting at the level of disaggregation that the data were collected would reduce the amount of information that could be reported because of the obligation to avoid disclosure of confidential business information. Hence, the Commission grouped product and service categories in two broader product groups for analysis. Table F.5 shows the products and services in question 1.3 that were grouped for analysis.405
405 See appendix E for a copy of the Commission’s questionnaire.

Foreign Censorship Part 2: Trade and Economic Effects on U.S. Businesses
218 | www.usitc.gov
Table F.8 Grouping of questionnaire product and service categories, by product and service grouping used for analysis. Analysis product/service grouping Questionnaire product and services Media and digital services Communications services Media and digital services Film and Television (TV) Media and digital services Music development and/or distribution, l icensing, radio broadcasting Media and digital services Video game development and/or distribution Media and digital services Information content development and/or distribution, and educational services Media and digital services Search engines Media and digital services Social media, platforms for user-generated content (including reviews), and
networking platforms Media and digital services E-commerce shopping platforms for goods and services Media and digital services Individual company’s online store or web application for sell ing goods or services,
including, for example, provision of electronic payment services Media and digital services Cloud storage, computing services, and software All others All other services All others Information, Communications, and Technology (ICT) products (physical goods) All others All other manufactured goods All others Agricultural products
Source: USITC, Foreign Censorship Survey, 2021, question 1.3.
Grouping Censorship Acts, Policies, and Practices and Censorship-Enabling Acts, Policies, and Practices The Commission questionnaire covered censorship acts, policies, and practices, and censorship-enabling acts, policies, and practices that were fairly specific. To generalize the issues for simplicity of analysis and avoid confidential data disclosure issues, the Commission grouped each censorship policy or practice into broader groups based on the characteristics of the policies (table F.6 and table F.7).
Table F.9 Grouping of direct censorship categories by acts, policies, and practices Categories for analysis Questionnaire acts, policies, and practices Internet shutdowns Short-term internet shutdowns (lasting 48 hours or less) Internet shutdowns Long-term internet shutdowns (lasting longer than 48 hours) Blocking or fi ltering and targeted denial
Blocking or fi ltering of one or more of your digital products/services based on the content or as reprisal for speech-related activities
Blocking or fi ltering and targeted denial
Targeted denial of market access of one or more of your digital products/services based on speech related activities
Blocking or fi ltering and targeted denial
Targeted throttling or slowing of access to your digital products and services
Harms or threats Harm or threats of criminal or civil harm, exit bans, or other forms of reprisal against your organization’s employees based on speech-related activities
Harms or threats Harm or threats of criminal or civil harm, government-initiated boycotts, or other forms of reprisal against your organization, brand, or products based on speech-related activities
Restrictions on or requirements to modify content
Restrictions on or requirements to modify the content of any of your organization’s products, services, or public-facing materials on the grounds that it is objectionable for any reason
Source: USITC, Foreign Censorship Survey, 2021, question 2.1a.
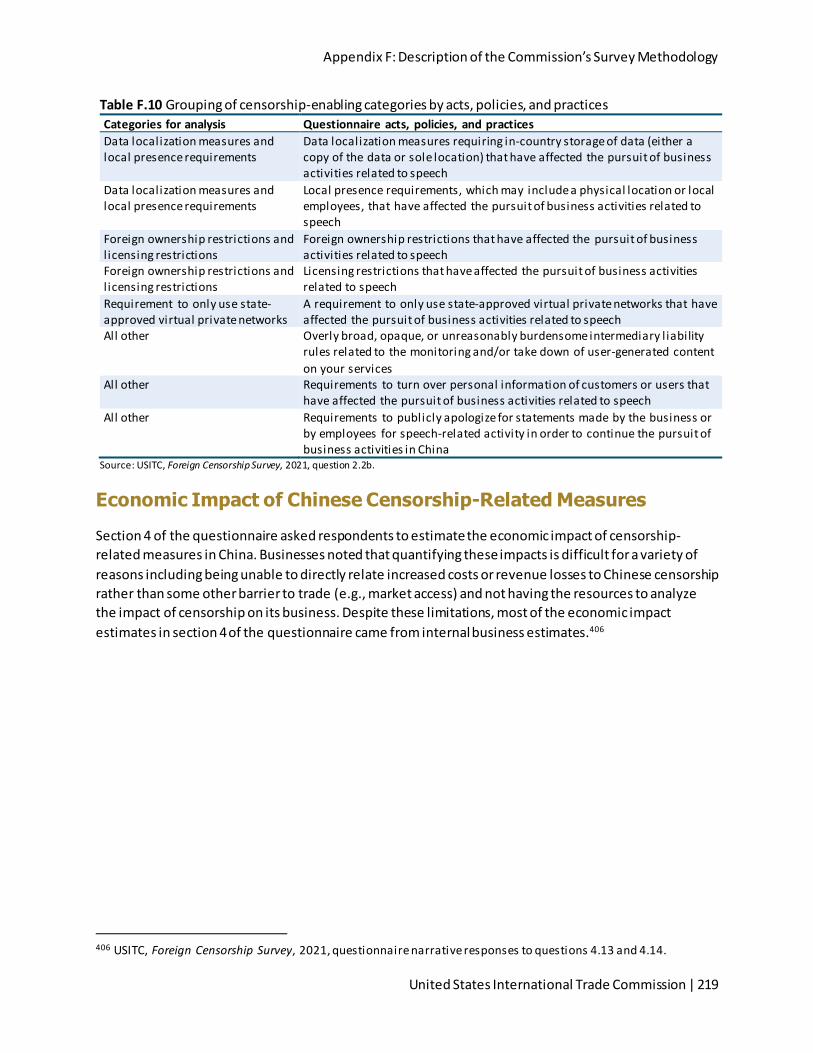
Appendix F: Description of the Commission’s Survey Methodology
United States International Trade Commission | 219
Table F.10 Grouping of censorship-enabling categories by acts, policies, and practices Categories for analysis Questionnaire acts, policies, and practices Data localization measures and local presence requirements
Data localization measures requiring in-country storage of data (either a copy of the data or sole location) that have affected the pursuit of business activities related to speech
Data localization measures and local presence requirements
Local presence requirements, which may include a physical location or local employees, that have affected the pursuit of business activities related to speech
Foreign ownership restrictions and l icensing restrictions
Foreign ownership restrictions that have affected the pursuit of business activities related to speech
Foreign ownership restrictions and l icensing restrictions
Licensing restrictions that have affected the pursuit of business activities related to speech
Requirement to only use state-approved virtual private networks
A requirement to only use state-approved virtual private networks that have affected the pursuit of business activities related to speech
All other Overly broad, opaque, or unreasonably burdensome intermediary l iability rules related to the monitoring and/or take down of user-generated content on your services
All other Requirements to turn over personal information of customers or users that have affected the pursuit of business activities related to speech
All other Requirements to publicly apologize for statements made by the business or by employees for speech-related activity in order to continue the pursuit of business activities in China
Source: USITC, Foreign Censorship Survey, 2021, question 2.2b.
Economic Impact of Chinese Censorship-Related Measures Section 4 of the questionnaire asked respondents to estimate the economic impact of censorship-related measures in China. Businesses noted that quantifying these impacts is difficult for a variety of reasons including being unable to directly relate increased costs or revenue losses to Chinese censorship rather than some other barrier to trade (e.g., market access) and not having the resources to analyze the impact of censorship on its business. Despite these limitations, most of the economic impact estimates in section 4 of the questionnaire came from internal business estimates.406
406 USITC, Foreign Censorship Survey, 2021, questionnaire narrative responses to questions 4.13 and 4.14.

Foreign Censorship Part 2: Trade and Economic Effects on U.S. Businesses
220 | www.usitc.gov
Bibliography Gartner. “Small and Midsize Business (SMB).” Gartner Glossary, accessed February 24, 2022.
https://www.gartner.com/en/information-technology/glossary/smbs-small-and-midsize-businesses.
U.S. Department of Commerce (USDOC). Bureau of Economic Analysis (BEA). “A Guide to BEA’s Direct Investment Surveys.” Accessed March 10, 2022. https://www.bea.gov/sites/default/files/2018-04/a-guide-to-bea-direct-investment-surveys.pdf

Appendix G: Additional Survey Results for Media and Digital Service Providers in China
United States International Trade Commission | 221
Appendix G Additional Survey Results for Media and Digital Service Providers in China
Foreign Censorship Part 2: Trade and Economic Effects on U.S. Businesses
222 | www.usitc.gov

Appendix G: Additional Survey Results for Media and Digital Service Providers in China
United States International Trade Commission | 223
This appendix provides additional results from the Commission’s survey for U.S. media and digital service providers in China to be comprehensive in presenting data collected from the survey without disclosing any confidential business information. These results are intended to provide further information and disaggregation than the estimates provided in chapter 2. Furthermore, these results are still subject to the considerations, challenges, and limitations described at the beginning of chapter 2.
Table G.1 Shares of censored U.S. media and digital service providers in China negatively impacted by Chinese censorship-related measures with specific effects from those measures Shares in percentages; margin of error (MOE) for 95 percent confidence level in percentage points (ppts). Various effects Share ± MOE Unsuccessful in, or stopped, providing products/services due to censorship-related acts, policies, and practices
29.2 ± 13.5
Reduced provision of products/services due to censorship-related acts, policies, and practices
54.9 ± 14.7
Other negative impact(s) due to censorship-related acts, policies, and practices 28.4 ± 13.4 Source: USITC, Foreign Censorship Survey, 2021, weighted responses to questions 1.3, 2.1a, 2.2a, 2.4a, and 2.7. Note: “Censored” includes U.S. media and digital service providers that experienced at least one censorship-related measure in China. These results only apply to censored U.S. media and digital service providers that were negatively impacted by those measures. See section titled “Effects of Censorship-Related Measures” in chapter 2 for additional context.
Table G.2 Shares of all U.S. media and digital service providers in China with specific effects of Chinese censorship-related measures Shares in percentages; margin of error (MOE) for 95 percent confidence level in percentage points (ppts). Various effects Share ± MOE Unsuccessful in, or stopped, providing products/services due to censorship-related acts, policies, and practices
3.5 ± 2.0
Reduced provision of products/services due to censorship-related acts, policies, and practices
6.6 ± 2.5
Other negative impact(s) due to censorship-related acts, policies, and practices 3.4 ± 1.7 Source: USITC, Foreign Censorship Survey, 2021, weighted responses to questions 1.3, 2.1a, 2.2a, and 2.7. Note: These results apply to all U.S. media and digital service providers in China, those that have experienced censorship-related measures and those that have not. See section titled “Effects of Censorship-Related Measures” in chapter 2 for additional context.
Table G.3 Shares of censored U.S. media and digital service providers in China that experienced any effects of Chinese censorship-related measures, by business size Share in percentages; margin of error (MOE) in percentage points (ppts); SME = small and medium-sized enterprise. Business size Share ± MOE Large 66.3 ± 11.8 SME 73.4 ± 17.1 All 66.6 ± 10.1
Source: USITC, Foreign Censorship Survey, 2021, weighted responses to questions 1.3, 1.5, 2.1a, 2.2a, and 2.8. Note: “Censored” includes U.S. media and digital service providers that experienced at least one censorship-related measure in China. See table 2.2 for additional context.

Foreign Censorship Part 2: Trade and Economic Effects on U.S. Businesses
224 | www.usitc.gov
Table G.4 Shares of censored U.S. media and digital service providers in China that have undertaken various steps due to Chinese censorship-related measures Shares in percentages; margin of error (MOE) for 95 percent confidence level in percentage points (ppts); d.s. = data suppressed for confidentiality purposes. Effects on U.S. businesses resulting from Chinese censorship-related measures
Large (share ± MOE)
SME (share ± MOE)
All (share ± MOE)
Modify its intended services or content offered in China 42.0 ± 11.5 36.8 ± 19.5 40.4 ± 10.2 Reduced uniformity of products and services across international markets
34.8 ± 11.9 38.0 ± 21.6 35.9 ± 10.8
Costs of doing business in China have increased because of the costs associated with complying with censorship-related acts, policies, and practices
34.8 ± 11.9 38.0 ± 21.6 35.4 ± 9.3
Only provides/sells a subset of its full suite of products and services in China
32.0 ± 9.7 40.8 ± 22.3 40.4 ± 10.2
Modified its products and services, or changed its behavior, after learning about actions by the Chinese Government towards another company because of their speech-related activities
27.1 ± 11.1 13.2 ± 14.4 22.6 ± 9.3
Reduced its efforts to do business in China because of the costs associated with complying with censorship-related acts, policies, and practices
17.8 ± 8.7 26.0 ± 19.5 20.4 ± 8.8
Reduced its efforts to do business in China because of the uncertainty in the business environment resulting from censorship-related acts, policies, and practices
16.6 ± 9.0 16.7 ± 15.4 16.7 ± 8.2
Required to l imit or deny access to its products and services for certain users
14.1 ± 7.5 19.5 ± 16.3 15.9 ± 7.5
Ceased doing business in China, at least partly because of the Government’s censorship-related acts, policies, and practices
6.8 ± 5.9 d.s. 7.7 ± 6.1
Changes to products applied to other markets to maintain uniformity or because it is impractical to adapt products for different markets
7.6 ± 5.9 d.s. 6.2 ± 4.5
Source: USITC, Foreign Censorship Survey, 2021, weighted responses to questions 1.3, 2.1a, 2.2a, and 2.8. Note: “Censored” includes U.S. media and digital service providers that experienced at least one censorship-related measure in China. See table 2.2 for additional context.
Table G.5 Shares of U.S. media and digital service providers that experienced censorship-related measures in China that self-censored to provide products and services in China, by business size Shares in percentages; margin of error (MOE) for 95 percent confidence level in percentage points (ppts); SME = small and medium-sized enterprise. Business size Share ± MOE Large 14.9 ± 5.0 SME 3.6 ± 3.0 All 9.5 ± 3.0
Source: USITC, Foreign Censorship Survey, 2021, weighted responses to questions 1.3, 1.5, 2.1a, 2.2a, and 2.10. Note: These results apply to U.S. media and digital service providers that experienced at least one censorship-related measure in China. See section titled “Self-Censorship” in chapter 2 for additional context.
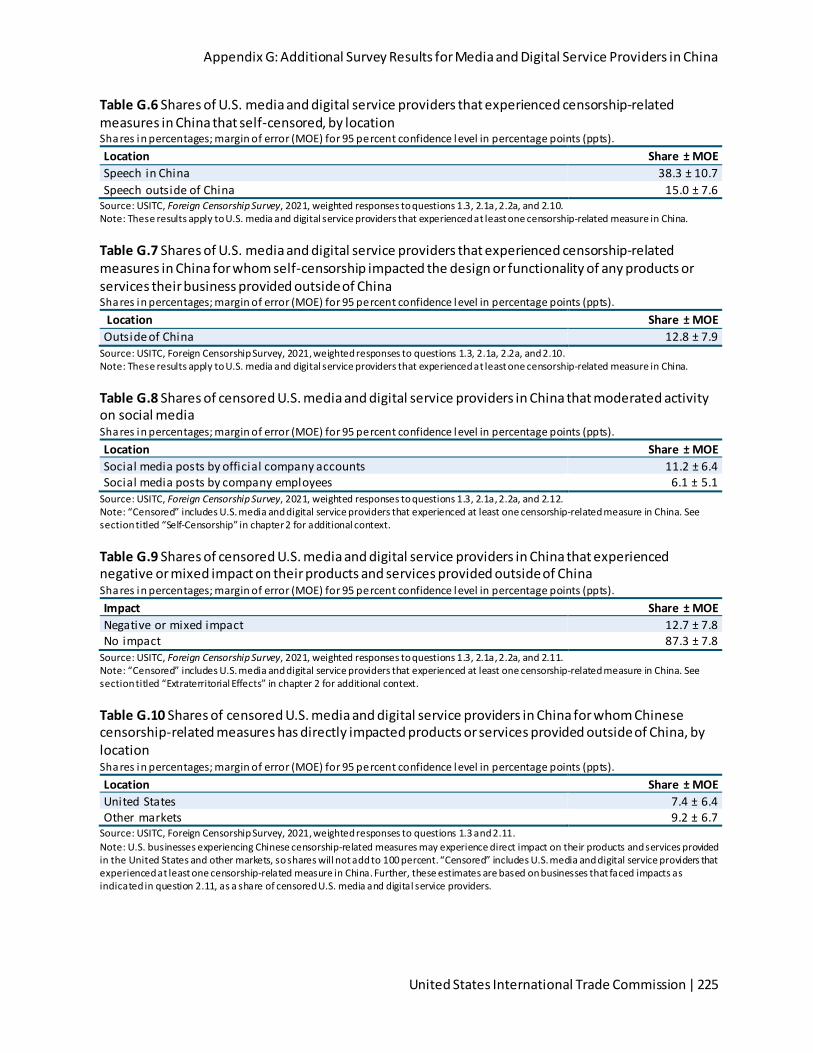
Appendix G: Additional Survey Results for Media and Digital Service Providers in China
United States International Trade Commission | 225
Table G.6 Shares of U.S. media and digital service providers that experienced censorship-related measures in China that self-censored, by location Shares in percentages; margin of error (MOE) for 95 percent confidence level in percentage points (ppts). Location Share ± MOE Speech in China 38.3 ± 10.7 Speech outside of China 15.0 ± 7.6
Source: USITC, Foreign Censorship Survey, 2021, weighted responses to questions 1.3, 2.1a, 2.2a, and 2.10. Note: These results apply to U.S. media and digital service providers that experienced at least one censorship-related measure in China.
Table G.7 Shares of U.S. media and digital service providers that experienced censorship-related measures in China for whom self-censorship impacted the design or functionality of any products or services their business provided outside of China Shares in percentages; margin of error (MOE) for 95 percent confidence level in percentage points (ppts). Location Share ± MOE Outside of China 12.8 ± 7.9
Source: USITC, Foreign Censorship Survey, 2021, weighted responses to questions 1.3, 2.1a, 2.2a, and 2.10. Note: These results apply to U.S. media and digital service providers that experienced at least one censorship-related measure in China.
Table G.8 Shares of censored U.S. media and digital service providers in China that moderated activity on social media Shares in percentages; margin of error (MOE) for 95 percent confidence level in percentage points (ppts). Location Share ± MOE Social media posts by official company accounts 11.2 ± 6.4 Social media posts by company employees 6.1 ± 5.1
Source: USITC, Foreign Censorship Survey, 2021, weighted responses to questions 1.3, 2.1a, 2.2a, and 2.12. Note: “Censored” includes U.S. media and digital service providers that experienced at least one censorship-related measure in China. See section titled “Self-Censorship” in chapter 2 for additional context.
Table G.9 Shares of censored U.S. media and digital service providers in China that experienced negative or mixed impact on their products and services provided outside of China Shares in percentages; margin of error (MOE) for 95 percent confidence level in percentage points (ppts). Impact Share ± MOE Negative or mixed impact 12.7 ± 7.8 No impact 87.3 ± 7.8
Source: USITC, Foreign Censorship Survey, 2021, weighted responses to questions 1.3, 2.1a, 2.2a, and 2.11. Note: “Censored” includes U.S. media and digital service providers that experienced at least one censorship-related measure in China. See section titled “Extraterritorial Effects” in chapter 2 for additional context.
Table G.10 Shares of censored U.S. media and digital service providers in China for whom Chinese censorship-related measures has directly impacted products or services provided outside of China, by location Shares in percentages; margin of error (MOE) for 95 percent confidence level in percentage points (ppts). Location Share ± MOE United States 7.4 ± 6.4 Other markets 9.2 ± 6.7
Source: USITC, Foreign Censorship Survey, 2021, weighted responses to questions 1.3 and 2.11. Note: U.S. businesses experiencing Chinese censorship-related measures may experience direct impact on their products and services provided in the United States and other markets, so shares will not add to 100 percent. “Censored” includes U.S. media and digital service providers that experienced at least one censorship-related measure in China. Further, these estimates are based on businesses that faced impacts as indicated in question 2.11, as a share of censored U.S. media and digital service providers.

Foreign Censorship Part 2: Trade and Economic Effects on U.S. Businesses
226 | www.usitc.gov
Table G.11 Shares of censored U.S. media and digital service providers in China that are concerned Chinese censorship-related measures will have a negative impact on their ability to provide products and services in China, by business size Shares in percentages; margin of error (MOE) in percentage points (ppts); SME = small and medium-sized enterprise.
Business size Concerned (share ±
MOE) Not concerned (share ± MOE)
Large 68.2 ± 11.5 31.8 ± 11.5
SME 81.1 ± 17.3 18.9 ± 17.3
All 72.3 ± 10.0 27.7 ± 10.0 Source: USITC, Foreign Censorship Survey, 2021, weighted responses to questions 1.3, 1.5, 2.1a, 2.2a, and 3.1. Note: “Censored” includes U.S. media and digital service providers that experienced at least one censorship-related measure in China. See section titled “Perceived Impacts on Products and Services and Business Operations” in chapter 2 for additional context.
Table G.12 Shares of censored U.S. media and digital service providers in China that are concerned Chinese censorship-related measures will have a negative impact on their operations in China, by business size Shares in percentages; margin of error (MOE) for 95 percent confidence level in percentage points (ppts); SME = small and medium-sized enterprise.
Business size Concerned (share ±
MOE) Not concerned (share ± MOE)
Large 75.3 ± 11.4 24.7 ± 11.4 SME 76.8 ± 19.4 23.2 ± 19.4 All 75.8 ± 9.7 24.2 ± 9.7
Source: USITC, Foreign Censorship Survey, 2021, weighted responses to questions 1.3, 1.5, 2.1a, 2.2a, and 3.2. Note: “Censored” includes U.S. media and digital service providers that experienced at least one censorship-related measure in China. See section titled “Perceived Impacts on Products and Services and Business Operations” in chapter 2 for additional context.
Table G.13 Shares of censored U.S. media and digital service providers for which Chinese censorship-related measures has become more challenging, by business size Shares in percentages; margin of error (MOE) for 95 percent confidence level in percentage points (ppts); SME = small and medium-sized enterprise. Business size Share ± MOE Large 74.3 ± 12.2 SME 66.2 ± 20.4 All 72.0 ± 10.5
Source: USITC, Foreign Censorship Survey, 2021, weighted responses to questions 1.3, 1.5, 2.1a, 2.2a, and 3.3a. Note: “Censored” includes U.S. media and digital service providers that experienced at least one censorship-related measure in China. See section titled “Perceived Change in Censorship” in chapter 2 for additional context.
Table G.14 Shares of censored U.S. media and digital service providers active in China and perceived concern that Chinese censorship-related measures would have a negative impact on their ability to provide products and services, by market Shares in percentages; margin of error (MOE) for 95 percent confidence level in percentage points (ppts); d.s. = data suppressed for confidentiality.
Market Concerned (share ± MOE) Not concerned (share ± MOE) China 72.3 ± 10.0 27.7 ± 10.0 United States 11.1 ± 7.7 88.9 ± 7.7 Other markets 17.0 ± 6.6 83.0 ± 6.6
Source: USITC, Foreign Censorship Survey, 2021, weighted responses to questions 1.3, 2.1a, 2.2a, and 3.1. Note: “Censored” includes U.S. media and digital service providers that experienced at least one censorship-related measure in China. See section titled “Perceived Impacts on Products and Services and Business Operations” in chapter 2 for additional context.
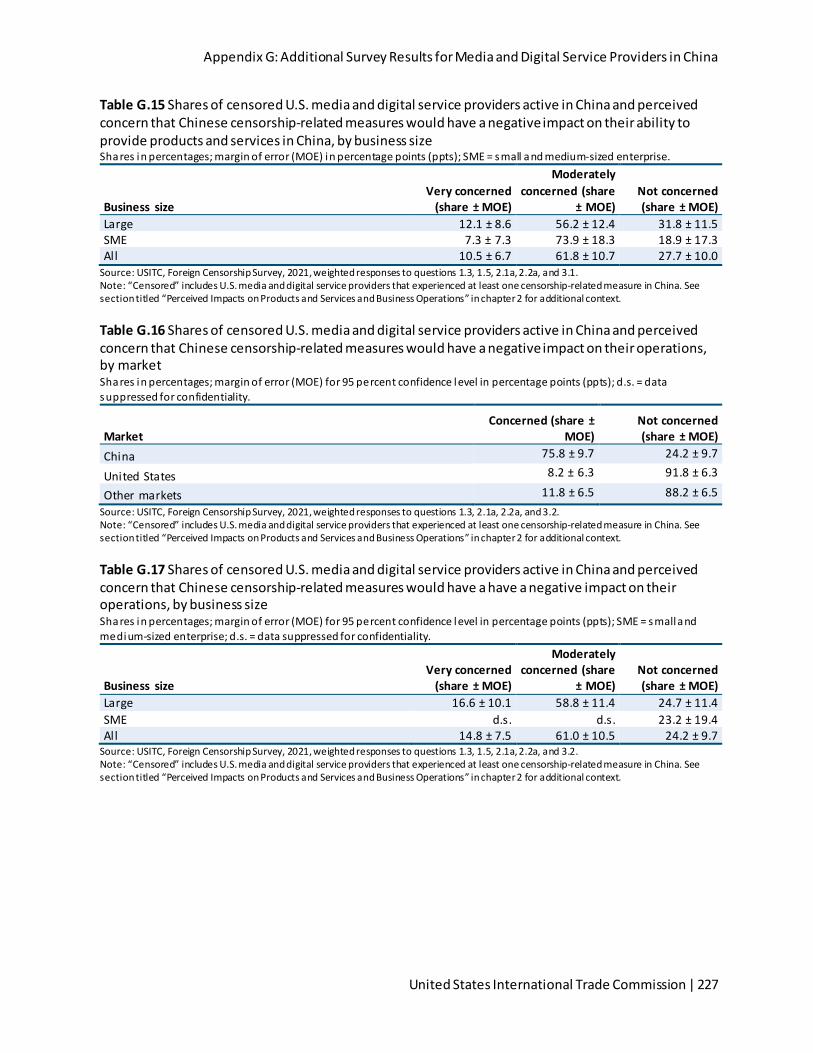
Appendix G: Additional Survey Results for Media and Digital Service Providers in China
United States International Trade Commission | 227
Table G.15 Shares of censored U.S. media and digital service providers active in China and perceived concern that Chinese censorship-related measures would have a negative impact on their ability to provide products and services in China, by business size Shares in percentages; margin of error (MOE) in percentage points (ppts); SME = small and medium-sized enterprise.
Business size Very concerned
(share ± MOE)
Moderately concerned (share
± MOE) Not concerned (share ± MOE)
Large 12.1 ± 8.6 56.2 ± 12.4 31.8 ± 11.5 SME 7.3 ± 7.3 73.9 ± 18.3 18.9 ± 17.3 All 10.5 ± 6.7 61.8 ± 10.7 27.7 ± 10.0
Source: USITC, Foreign Censorship Survey, 2021, weighted responses to questions 1.3, 1.5, 2.1a, 2.2a, and 3.1. Note: “Censored” includes U.S. media and digital service providers that experienced at least one censorship-related measure in China. See section titled “Perceived Impacts on Products and Services and Business Operations” in chapter 2 for additional context.
Table G.16 Shares of censored U.S. media and digital service providers active in China and perceived concern that Chinese censorship-related measures would have a negative impact on their operations, by market Shares in percentages; margin of error (MOE) for 95 percent confidence level in percentage points (ppts); d.s. = data suppressed for confidentiality.
Market Concerned (share ±
MOE) Not concerned (share ± MOE)
China 75.8 ± 9.7 24.2 ± 9.7
United States 8.2 ± 6.3 91.8 ± 6.3
Other markets 11.8 ± 6.5 88.2 ± 6.5 Source: USITC, Foreign Censorship Survey, 2021, weighted responses to questions 1.3, 2.1a, 2.2a, and 3.2. Note: “Censored” includes U.S. media and digital service providers that experienced at least one censorship-related measure in China. See section titled “Perceived Impacts on Products and Services and Business Operations” in chapter 2 for additional context.
Table G.17 Shares of censored U.S. media and digital service providers active in China and perceived concern that Chinese censorship-related measures would have a have a negative impact on their operations, by business size Shares in percentages; margin of error (MOE) for 95 percent confidence level in percentage points (ppts); SME = small and medium-sized enterprise; d.s. = data suppressed for confidentiality.
Business size Very concerned
(share ± MOE)
Moderately concerned (share
± MOE) Not concerned (share ± MOE)
Large 16.6 ± 10.1 58.8 ± 11.4 24.7 ± 11.4 SME d.s. d.s. 23.2 ± 19.4 All 14.8 ± 7.5 61.0 ± 10.5 24.2 ± 9.7
Source: USITC, Foreign Censorship Survey, 2021, weighted responses to questions 1.3, 1.5, 2.1a, 2.2a, and 3.2. Note: “Censored” includes U.S. media and digital service providers that experienced at least one censorship-related measure in China. See section titled “Perceived Impacts on Products and Services and Business Operations” in chapter 2 for additional context.
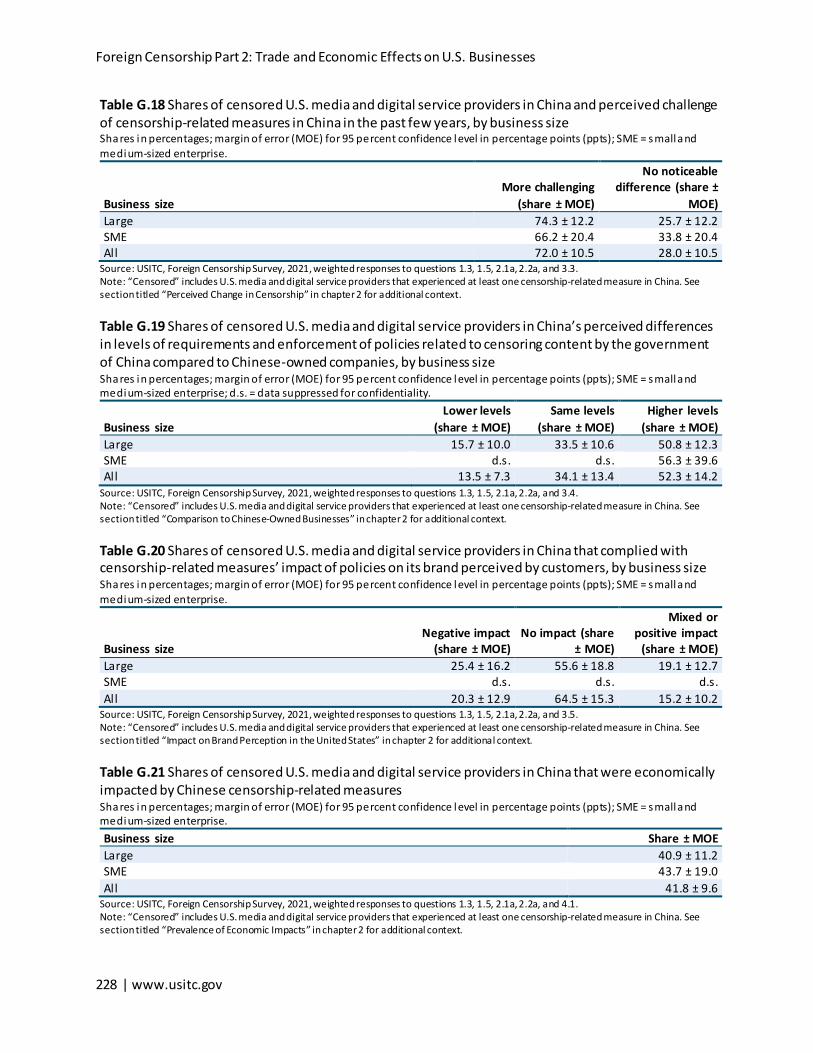
Foreign Censorship Part 2: Trade and Economic Effects on U.S. Businesses
228 | www.usitc.gov
Table G.18 Shares of censored U.S. media and digital service providers in China and perceived challenge of censorship-related measures in China in the past few years, by business size Shares in percentages; margin of error (MOE) for 95 percent confidence level in percentage points (ppts); SME = small and medium-sized enterprise.
Business size More challenging
(share ± MOE)
No noticeable difference (share ±
MOE) Large 74.3 ± 12.2 25.7 ± 12.2 SME 66.2 ± 20.4 33.8 ± 20.4 All 72.0 ± 10.5 28.0 ± 10.5
Source: USITC, Foreign Censorship Survey, 2021, weighted responses to questions 1.3, 1.5, 2.1a, 2.2a, and 3.3. Note: “Censored” includes U.S. media and digital service providers that experienced at least one censorship-related measure in China. See section titled “Perceived Change in Censorship” in chapter 2 for additional context.
Table G.19 Shares of censored U.S. media and digital service providers in China’s perceived differences in levels of requirements and enforcement of policies related to censoring content by the government of China compared to Chinese-owned companies, by business size Shares in percentages; margin of error (MOE) for 95 percent confidence level in percentage points (ppts); SME = small and medium-sized enterprise; d.s. = data suppressed for confidentiality.
Business size Lower levels
(share ± MOE) Same levels
(share ± MOE) Higher levels
(share ± MOE) Large 15.7 ± 10.0 33.5 ± 10.6 50.8 ± 12.3 SME d.s. d.s. 56.3 ± 39.6 All 13.5 ± 7.3 34.1 ± 13.4 52.3 ± 14.2
Source: USITC, Foreign Censorship Survey, 2021, weighted responses to questions 1.3, 1.5, 2.1a, 2.2a, and 3.4. Note: “Censored” includes U.S. media and digital service providers that experienced at least one censorship-related measure in China. See section titled “Comparison to Chinese-Owned Businesses” in chapter 2 for additional context.
Table G.20 Shares of censored U.S. media and digital service providers in China that complied with censorship-related measures’ impact of policies on its brand perceived by customers, by business size Shares in percentages; margin of error (MOE) for 95 percent confidence level in percentage points (ppts); SME = small and medium-sized enterprise.
Business size Negative impact
(share ± MOE) No impact (share
± MOE)
Mixed or positive impact
(share ± MOE) Large 25.4 ± 16.2 55.6 ± 18.8 19.1 ± 12.7 SME d.s. d.s. d.s. All 20.3 ± 12.9 64.5 ± 15.3 15.2 ± 10.2
Source: USITC, Foreign Censorship Survey, 2021, weighted responses to questions 1.3, 1.5, 2.1a, 2.2a, and 3.5. Note: “Censored” includes U.S. media and digital service providers that experienced at least one censorship-related measure in China. See section titled “Impact on Brand Perception in the United States” in chapter 2 for additional context.
Table G.21 Shares of censored U.S. media and digital service providers in China that were economically impacted by Chinese censorship-related measures Shares in percentages; margin of error (MOE) for 95 percent confidence level in percentage points (ppts); SME = small and medium-sized enterprise. Business size Share ± MOE Large 40.9 ± 11.2 SME 43.7 ± 19.0 All 41.8 ± 9.6
Source: USITC, Foreign Censorship Survey, 2021, weighted responses to questions 1.3, 1.5, 2.1a, 2.2a, and 4.1. Note: “Censored” includes U.S. media and digital service providers that experienced at least one censorship-related measure in China. See section titled “Prevalence of Economic Impacts” in chapter 2 for additional context.

Appendix G: Additional Survey Results for Media and Digital Service Providers in China
United States International Trade Commission | 229
Table G.22 Shares of all U.S. media and digital service providers in China that operate in other key markets, and those that operate in that key market which experience censorship, by key market and business size Shares in percentages; margin of error (MOE) for 95 percent confidence level in percentage points (ppts); d.s. = data suppressed for confidentiality; SME = small and medium-sized enterprise; * indicates a low precision estimate.
Business size Market Operate in key market
(share ± MOE) Experience censorship in
key market (share ± MOE) Large Russia 67.5 ± 6.7 11.7 ± 5.4 SME Russia 50.3 ± 8.7 3.1* ± 3.4 All Russia 59.1 ± 5.4 8.2 ± 3.6 Large Turkey 69.8 ± 6.5 9.6 ± 4.8 SME Turkey 65.3 ± 8.4 d.s. All Turkey 67.6 ± 5.3 5.1 ± 2.4 Large Vietnam 70.6 ± 6.6 6.3 ± 3.6 SME Vietnam 55.3 ± 8.9 d.s. All Vietnam 63.2 ± 5.5 3.7 ± 2.1 Large India 86.9 ± 5.0 5.6 ± 3.1 SME India 71.6 ± 8.1 d.s. All India 79.5 ± 4.8 3.5 ± 1.9 Large Indonesia 70.5 ± 6.6 5.8 ± 3.4 SME Indonesia 56.1 ± 8.9 d.s. All Indonesia 63.6 ± 5.5 3.3 ± 2.0 Large Any key market other than China 85.8 ± 5.2 10.0 ± 4.2 SME Any key market other than China 77.5 ± 7.5 2.1 ± 2.0 All Any key market other than China 81.8 ± 4.4 6.2 ± 2.4
Source: USITC, Foreign Censorship Survey, 2021, weighted responses to questions 1.3, 1.5, and 5.1. Note: Businesses may be operating in multiple markets. The Commission recognizes these data were collected in the fall of 2021, prior to Russia’s invasion of Ukraine. Thus, the share of businesses that experienced censorship-related measures in Russia at the time these data were collected would likely be much smaller than the share at present. These results are only applicable to U.S. media and digital service providers that are commercially active in China and cover providers that have and have not experienced censorship-related measures there. The fourth column shows the share of U.S. media and digital service providers that are active in China and also active in the key markets in the second column and have experienced censorship-related measures in that key market. These results should not be applied to any U.S. businesses that are operating in that key market but not operating in China. Furthermore, the results for each country cover different sets of companies and are not representative of U.S. businesses’ experiences with censorship in any one market, therefore shares cannot be compared across countries.

Foreign Censorship Part 2: Trade and Economic Effects on U.S. Businesses
230 | www.usitc.gov
Table G.23 Shares of censored U.S. media and digital service providers in China that operate in other key markets, and those that operate in that key market which experience censorship, by key market and business size Shares in percentages; margin of error (MOE) for 95 percent confidence level in percentage points (ppts); d.s. = data suppressed for confidentiality; SME = small and medium-sized enterprise.
Business size Market Operate in key market
(share ± MOE) Experience censorship in
key market (share ± MOE) Large Russia 74.1 ± 11.3 36.4 ± 14.2 SME Russia 50.9 ± 23.4 d.s. All Russia 66.4 ± 10.8 30.5 ± 12.1 Large Turkey 72.9 ± 11.8 24.7 ± 10.8 SME Turkey 80.9 ± 16.3 d.s. All Turkey 75.5 ± 9.6 16.0 ± 7.3 Large Vietnam 77.0 ± 11.0 19.6 ± 10.6 SME Vietnam 73.1 ± 21.5 d.s. All Vietnam 75.7 ± 9.9 13.4 ± 7.3 Large India 96.0 ± 4.4 17.1 ± 8.8 SME India 89.7 ± 9.4 d.s. All India 93.9 ± 4.7 13.1 ± 6.6 Large Indonesia 74.9 ± 11.2 18.4 ± 9.7 SME Indonesia 65.2 ± 11.2 d.s. All Indonesia 71.8 ± 9.9 13.2 ± 7.2 Large Any key market other than China 89.6 ± 7.9 28.4 ± 10.9 SME Any key market other than China 90.7 ± 13.3 9.7 ± 10.3 All Any key market other than China 90.0 ± 6.7 22.4 ± 8.3
Source: USITC, Foreign Censorship Survey, 2021, weighted responses to questions 1.3, 1.5, and 5.1. Note: Businesses may be operating in multiple markets. The Commission recognizes these data were collected in the fall of 2021, prior to Russia’s invasion of Ukraine. Thus, the share of businesses that experienced censorship-related measures in Russia at the time these data were collected would likely be much smaller than the share at present. “Censored” includes U.S. media and digital service providers that experienced at least one censorship-related measure in China. These results are only applicable to U.S. media and digital service providers that are commercially active in China and have experienced at least one censorship-related measure there. The fourth column shows the share of U.S. media and digital service providers that are active in China and also active in the key markets in the second column and have experienced censorship-related measures in both key markets. These results should not be applied to any U.S. businesses that are operating in that key market but not operating in China. Furthermore, the results for each country cover different sets of companies and are not representative of U.S. businesses’ experiences with censorship in any one market, therefore shares cannot be compared across countries.

Appendix G: Additional Survey Results for Media and Digital Service Providers in China
United States International Trade Commission | 231
Table G.24 Shares of all U.S. media and digital service providers in China that operate in other markets, and those that operate in other markets which experience censorship in that market, by market Shares in percentages; margin of error (MOE) for 95 percent confidence level in percentage points (ppts). CIS = Commonwealth of Independent States.
Market Region Operate in market
(share ± MOE) Experience censorship in
market (share ± MOE) Egypt Africa 50.0 ± 5.5 6.4 ± 3.1 Nigeria Africa 41.9 ± 5.5 5.0 ± 3.0 Saudi Arabia Africa 59.8 ± 5.5 8.5 ± 3.3 Other Africa Africa 71.2 ± 5.2 7.9 ± 3.2 India Asia 79.5 ± 4.8 3.5 ± 1.9 Indonesia Asia 63.6 ± 5.5 3.3 ± 2.0 Pakistan Asia 44.0 ± 5.5 6.4 ± 3.3 Vietnam Asia 63.2 ± 5.4 3.7 ± 2.1 Other Asia Asia 81.4 ± 4.5 6.0 ± 2.7 Russia CIS 59.1 ± 5.4 8.2 ± 3.6 Other CIS CIS 51.7 ± 5.5 4.1 ± 2.5 European Union (27) Europe 83.6 ± 4.2 2.0 ± 1.6 France Europe 82.1 ± 4.4 2.1 ± 1.6 Germany Europe 83.3 ± 4.3 1.8 ± 1.5 Turkey Europe 67.6 ± 5.3 5.1 ± 2.6 United Kingdom Europe 86.7 ± 4.0 1.5 ± 1.4 Other Europe Europe 85.3 ± 4.1 2.3 ± 1.7 Brazil Americas 71.5 ± 5.2 2.1 ± 1.5 Venezuela Americas 38.5 ± 5.4 3.8 ± 2.8 Other Americas Americas 82.4 ± 4.4 1.8 ± 1.3 All other Other 72.9 ± 5.1 1.7 ± 1.4 Source: USITC, Foreign Censorship Survey, 2021, weighted responses to questions 1.3 and 5.1. Note: Businesses may be operating in multiple markets. The Commission recognizes these data were collected in the fall of 2021, prior to Russia’s invasion of Ukraine. Thus, the share of businesses that experienced censorship-related measures in Russia at the time these data were collected would likely be much smaller than the share at present. These results are only applicable to U.S. media and digital service providers that are commercially active in China and cover providers that have and have not experienced censorship-related measures there. The fourth column shows the share of U.S. media and digital service providers that are active in China and also active in the markets in the first column and have experienced censorship-related measures in that market. These results should not be applied to any U.S. businesses that are operating in that market but not operating in China. Furthermore, the results for each country cover different sets of companies and are not representative of U.S. businesses’ experiences with censorship in any one market, therefore shares cannot be compared across countries.

Foreign Censorship Part 2: Trade and Economic Effects on U.S. Businesses
232 | www.usitc.gov

Appendix H: Survey Results for U.S. Businesses Other than Media and Digital Service Providers
United States International Trade Commission | 233
Appendix H Survey Results for U.S. Businesses Other than Media and Digital Service Providers

Foreign Censorship Part 2: Trade and Economic Effects on U.S. Businesses
234 | www.usitc.gov
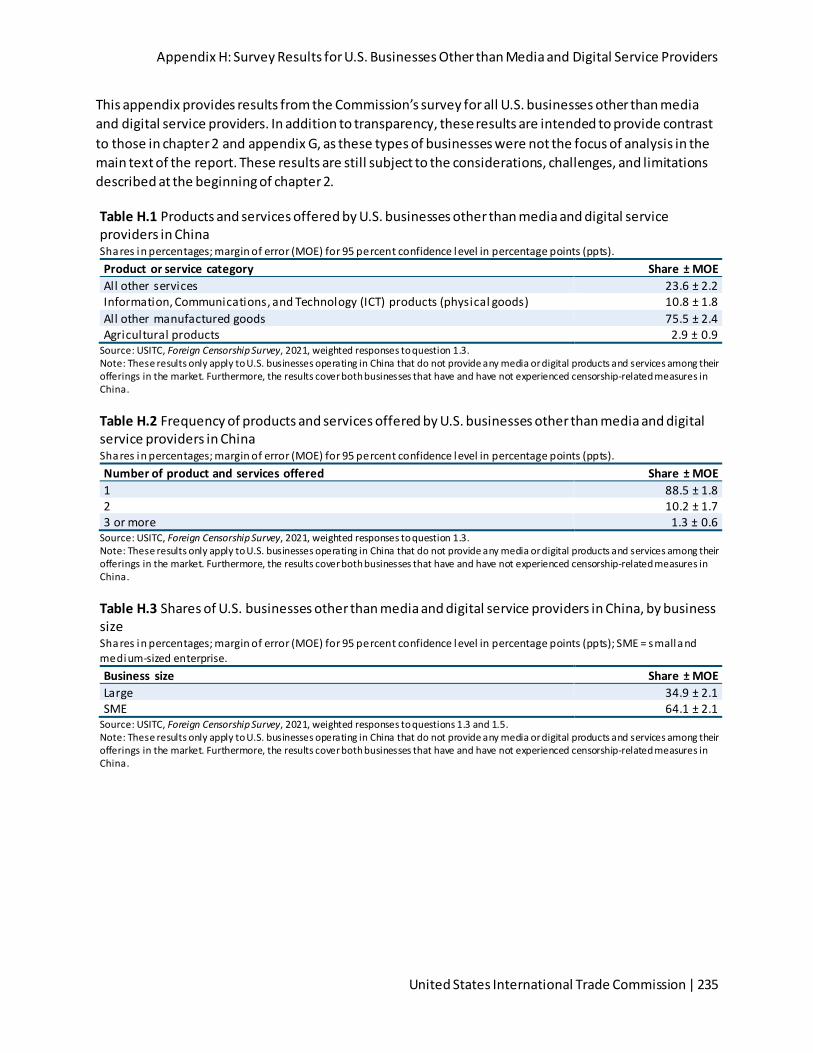
Appendix H: Survey Results for U.S. Businesses Other than Media and Digital Service Providers
United States International Trade Commission | 235
This appendix provides results from the Commission’s survey for all U.S. businesses other than media and digital service providers. In addition to transparency, these results are intended to provide contrast to those in chapter 2 and appendix G, as these types of businesses were not the focus of analysis in the main text of the report. These results are still subject to the considerations, challenges, and limitations described at the beginning of chapter 2.
Table H.1 Products and services offered by U.S. businesses other than media and digital service providers in China Shares in percentages; margin of error (MOE) for 95 percent confidence level in percentage points (ppts). Product or service category Share ± MOE All other services 23.6 ± 2.2 Information, Communications, and Technology (ICT) products (physical goods) 10.8 ± 1.8 All other manufactured goods 75.5 ± 2.4 Agricultural products 2.9 ± 0.9
Source: USITC, Foreign Censorship Survey, 2021, weighted responses to question 1.3. Note: These results only apply to U.S. businesses operating in China that do not provide any media or digital products and services among their offerings in the market. Furthermore, the results cover both businesses that have and have not experienced censorship-related measures in China.
Table H.2 Frequency of products and services offered by U.S. businesses other than media and digital service providers in China Shares in percentages; margin of error (MOE) for 95 percent confidence level in percentage points (ppts). Number of product and services offered Share ± MOE 1 88.5 ± 1.8 2 10.2 ± 1.7 3 or more 1.3 ± 0.6
Source: USITC, Foreign Censorship Survey, 2021, weighted responses to question 1.3. Note: These results only apply to U.S. businesses operating in China that do not provide any media or digital products and services among their offerings in the market. Furthermore, the results cover both businesses that have and have not experienced censorship-related measures in China.
Table H.3 Shares of U.S. businesses other than media and digital service providers in China, by business size Shares in percentages; margin of error (MOE) for 95 percent confidence level in percentage points (ppts); SME = small and medium-sized enterprise. Business size Share ± MOE Large 34.9 ± 2.1 SME 64.1 ± 2.1
Source: USITC, Foreign Censorship Survey, 2021, weighted responses to questions 1.3 and 1.5. Note: These results only apply to U.S. businesses operating in China that do not provide any media or digital products and services among their offerings in the market. Furthermore, the results cover both businesses that have and have not experienced censorship-related measures in China.

Foreign Censorship Part 2: Trade and Economic Effects on U.S. Businesses
236 | www.usitc.gov
Table H.4 Shares of U.S. businesses other than media and digital service providers in China that experienced any direct censorship or censorship-enabling measures, by business size Shares in percentages; margin of error (MOE) for 95 percent confidence level in percentage points (ppts); SME = small and medium-sized enterprise.
Type of censorship-related measures Large (share ±
MOE) SME (share ±
MOE) All (share ±
MOE) Direct censorship 7.6 ± 2.2 7.2 ± 2.1 7.3 ± 1.5 Censorship-enabling 3.6 ± 1.6 2.7 ± 1.2 3.0 ± 1.0 Either direct censorship or censorship-enabling 9.9 ± 2.5 8.9 ± 2.3 9.2 ± 1.7
Source: USITC, Foreign Censorship Survey, 2021, weighted responses to questions 1.3, 2.1a, and 2.2a. Note: These results only apply to U.S. businesses operating in China that do not provide any media or digital products and services among their offerings in the market.
Table H.5 Shares of U.S. businesses other than media and digital service providers in China that experienced direct censorship measures, by business size Shares in percentages; margin of error (MOE) for 95 percent confidence level in percentage points (ppts); SME = small and medium-sized enterprise.
Censorship acts, policies, and practices Large (share ±
MOE) SME (share ±
MOE) All (share ±
MOE) Internet shutdowns 3.5 ± 1.5 4.0 ± 1.5 3.8 ± 1.1 Blocking or fi ltering or targeted denial and throttling 1.8 ± 1.2 1.9 ± 1.1 1.8 ± 0.8 Harm or threats 0.3 ± 0.5 0.4 ± 0.5 0.3 ± 0.4 Restrictions on or requirements to modify content 1.6 ± 1.0 1.2 ± 0.9 1.9 ± 0.8
Source: USITC, Foreign Censorship Survey, 2021, weighted responses to questions 1.3 and 2.1a. Note: Internet shutdowns includes short-term and long-term shutdowns. Short-term internet shutdowns last for 48 hours or less while long-term internet shutdowns last for longer than 48 hours. Blocking or filtering or targeted denial and throttling refers to targeted denial of market access of the digital products/services based on speech related activities and targeted throttling or slowing of digital products and services. Harms and threats refer to harm and threats of criminal or civil harm, exit bans, or other forms of reprisal against the organization’s employees, brand, or products based on speech-related activities or government-initiated boycotts. These results only apply to U.S. businesses operating in China that do not provide any media or digital products and services among their offerings in the market.
Table H.6 Shares of U.S. businesses other than media and digital service providers in China that experienced censorship-enabling measures, by business size Shares in percentages; margin of error (MOE) for 95 percent confidence level in percentage points (ppts); SME = small and medium-sized enterprise.
Censorship acts, policies, and practices Large (share ±
MOE) SME (share ±
MOE) All (share ±
MOE) Data localization measures and local presence requirements
1.4 ± 1.1 1.7 ± 1.0 1.6 ± 0.7
Foreign ownership restrictions and l icensing restrictions 1.2 ± 1.0 0.9 ± 0.6 1.0 ± 0.5 Requirement to only use state-approved virtual private networks
1.6 ± 1.0 1.6 ± 1.0 1.6 ± 2.5
All other 1.1 ± 0.8 0.2 ± 0.2 0.5 ± 0.3 Source: USITC, Foreign Censorship Survey, 2021, weighted responses to questions 1.3 and 2.2a. Notes: All other category includes intermediary liability rules, requirements to turn over personal information of customers or user, and requirements to publicly apologize for statements made by the business or by employees. These results only apply to U.S. businesses operating in China that do not provide any media or digital products and services among their offerings in the market.

Appendix H: Survey Results for U.S. Businesses Other than Media and Digital Service Providers
United States International Trade Commission | 237
Table H.7 Shares of censored U.S. businesses other than media and digital service providers in China that were negatively impacted as a result of Chinese censorship-related measures, by business size Shares in percentages; margin of error (MOE) for 95 percent confidence level in percentage points (ppts); SME = small and medium-sized enterprise. Business size Share ± MOE Large 19.7 ± 11.2 SME 14.3 ± 8.8 All 16.4 ± 7.2
Source: USITC, Foreign Censorship Survey, 2021, weighted responses to questions 1.3, 1.5, and 2.4. Note: “Censored” includes U.S. businesses other than media and digital service providers that experienced at least one censorship-related measure in China. These results only apply to U.S. businesses operating in China that were negatively impacted by censorship-related measures in China and do not provide any media or digital products and services among their offerings in the market.
Table H.8 Shares of U.S. businesses other than media and digital service providers in China that were negatively impacted as a result of Chinese censorship-related measures Shares in percentages; margin of error (MOE) for 95 percent confidence level in percentage points (ppts). Impact Share ± MOE Negatively impacted 1.5 ± 0.7 Not negatively impacted 98.5 ± 0.7
Source: USITC, Foreign Censorship Survey, 2021, weighted responses to questions 1.3 and 2.4. Note: These results only apply to U.S. businesses operating in China that were negatively impacted by censorship-related measures in China and do not provide any media or digital products and services among their offerings in the market. Furthermore, the results cover both businesses that have and have not experienced censorship-related measures in China.
Table H.9 Shares of censored U.S. businesses other than media and digital service providers in China negatively impacted by Chinese censorship-related measures with specific effects from those measures Shares in percentages; margin of error (MOE) for 95 percent confidence level in percentage points (ppts); * indicates a low-precision estimate. Various effects Share ± MOE Unsuccessful in, or stopped, providing products/services due to censorship-related acts, policies, and practices 20.2 ± 21.6 * Reduced provision of products/services due to censorship-related acts, policies, and practices 24.2 ± 27.4 * Other negative impact(s) due to censorship-related acts, policies, and practices 55.6 ± 31.6
Source: USITC, Foreign Censorship Survey, 2021, weighted responses to questions 1.3, 2.4, and 2.7. Note: “Censored” includes U.S. businesses other than media and digital service providers that experienced at least one censorship-related measure in China. These results only apply to U.S. businesses operating in China that were negatively impacted by censorship-related measures in China and do not provide any media or digital products and services among their offerings in the market.

Foreign Censorship Part 2: Trade and Economic Effects on U.S. Businesses
238 | www.usitc.gov
Table H.10 Shares of censored U.S. businesses other than media and digital service providers in China that have undertaken specific steps due to Chinese censorship-related measures Shares in percentages; margin of error for 95 percent confidence level shown in percentage points; SME = small and medium-s ized enterprise. Effects on U.S. businesses resulting from Chinese censorship-related measures
Large (share ± MOE)
SME (share ± MOE)
All (share ± MOE)
Modify its intended services or content offered in China 14.8 ± 10.7 16.4 ± 9.9 15.8 ± 7.4 Reduced uniformity of products and services across international markets
4.8 ± 5.1 10.8 ± 8.1 8.5 ± 5.4
Costs of doing business in China have increased because of the costs associated with complying with censorship-related acts, policies, and practices
19.4 ± 11.7 13.5 ± 8.8 15.8 ± 7.1
Only provides/sells a subset of its full suite of products and services in China
18.2 ± 11.5 21.6 ± 11.5 20.3 ± 8.3
Modified its products and services, or changed its behavior, after learning about actions by the Chinese Government towards another company because of their speech-related activities
8.5 ± 9.1 4.2 ± 5.9 5.9 ± 4.9
Reduced its efforts to do business in China because of the costs associated with complying with censorship-related acts, policies, and practices
10.1 ± 9.5 10.0 ± 7.5 10.1 ± 6.0
Reduced its efforts to do business in China because of the uncertainty in the business environment resulting from censorship-related acts, policies, and practices
13.5 ± 10.7 9.8 ± 8.3 11.2 ± 6.4
Required to l imit or deny access to its products and services for certain users
6.3 ± 6.0 7.7 ± 7.0 7.2 ± 5.0
Ceased doing business in China, at least partly because of the Government’s censorship-related acts, policies, and practices
6.9 ± 8.5 1.9 ± 3.7 3.8 ± 4.0
Changes to products applied to other markets to maintain uniformity or because it is impractical to adapt products for different markets
5.7 ± 4.1 4.0 ± 5.6 4.7 ± 4.2
Any effects 44.7 ± 13.6 41.4 ± 13.2 42.7 ± 10.0 Source: USITC, Foreign Censorship Survey, 2021, weighted responses to questions 1.3 and 2.8. Note: U.S. businesses that ceased doing business only did it for certain lines of business. “Censored” includes U.S. businesses other than media and digital service providers that experienced at least one censorship-related measure in China. These results only apply to U.S. businesses operating in China that do not provide any media or digital products and services among their offerings in the market.

Appendix H: Survey Results for U.S. Businesses Other than Media and Digital Service Providers
United States International Trade Commission | 239
Table H.11 Shares of censored U.S. businesses other than media and digital service providers that experienced limitations from Chinese censorship-related measures impacting business operations Shares in percentages; margin of error (MOE) for 95 percent confidence level in percentage points (ppts).
Limitation
Impact on operations only
in China (share ± MOE)
Impact on global operations
including China (share ± MOE)
No impact on operations (share
± MOE) Slow cross-border internet access 44.9 ± 10.2 11.9 ± 6.4 43.2 ± 10.1 Inabil ity to access online tools, such as cloud-based software
53.3 ± 10.4 11.4 ± 6.6 35.2 ± 10.1
Inabil ity to access blocked websites and content, such as Facebook and Twitter
44.8 ± 10.3 9.5 ± 5.8 45.7 ± 10.2
Other 22.4 ± 19.7 2.4 ± 4.7 75.2 ± 20.2 Source: USITC, Foreign Censorship Survey, 2021, weighted responses to question 2.9. Note: “Censored” includes U.S. businesses other than media and digital service providers that experienced at least one censorship-related measure in China. These results only apply to U.S. businesses operating in China that do not provide any media or digital products and services among their offerings in the market.
Table H.12 Shares of censored U.S. businesses other than media and digital service providers that have self-censored in order to provide products and services in China, by business size Shares in percentages; margin of error (MOE) for 95 percent confidence level in percentage points (ppts); SME = small and medium-sized enterprise. Business size Share ± MOE Large 25.5 ± 9.1 SME 11.0 ± 8.7 All 16.6 ± 6.5
Source: USITC, Foreign Censorship Survey, 2021, weighted responses to questions 1.3, 1.5, and 2.10. Note: “Censored” includes U.S. businesses other than media and digital service providers that experienced at least one censorship-related measure in China. These results only apply to U.S. businesses operating in China that do not provide any media or digital products and services among their offerings in the market.
Table H.13 Shares of U.S. businesses other than media and digital service providers that have self-censored in order to provide products and services in China, by business size Shares in percentages; margin of error (MOE) for 95 percent confidence level in percentage points (ppts); SME = small and medium-sized enterprise. Business size Share ± MOE Large 2.5 ± 1.2 SME 1.0 ± 0.8 All 1.5 ± 6.5
Source: USITC, Foreign Censorship Survey, 2021, weighted responses to questions 1.3, 1.5, and 2.10. Note: These results only apply to U.S. businesses operating in China that do not provide any media or digital products and services among their offerings in the market. Furthermore, the results cover both businesses that have and have not experienced censorship-related measures in China.
Table H.14 Shares of censored U.S. businesses other than media and digital service providers in China that self-censored, by location Shares in percentages; margin of error (MOE) for 95 percent confidence level in percentage points (ppts). Location Share ± MOE Speech in China 12.6 ± 5.9 Speech outside of China 8.5 ± 4.9
Source: USITC, Foreign Censorship Survey, 2021, weighted responses to questions 1.3 and 2.10. Note: “Censored” includes U.S. businesses other than media and digital service providers that experienced at least one censorship-related measure in China. These results only apply to U.S. businesses operating in China that do not provide any media or digital products and services among their offerings in the market.

Foreign Censorship Part 2: Trade and Economic Effects on U.S. Businesses
240 | www.usitc.gov
Table H.15 Shares of censored U.S. businesses other than media and digital service providers for whom self-censorship impacted the design or functionality of any products or services their business provided outside of China Shares in percentages; margin of error (MOE) for 95 percent confidence level in percentage points (ppts). Location Share ± MOE Outside of China 5.2 ± 4.4
Source: USITC, Foreign Censorship Survey, 2021, weighted responses to sections 2.10. Note: “Censored” includes U.S. businesses other than media and digital service providers that experienced at least one censorship-related measure in China. These results only apply to U.S. businesses operating in China that do not provide any media or digital products and services among their offerings in the market.
Table H.16 Shares of censored U.S. businesses other than media and digital service providers in China that moderate or limit activity on social media due to Chinese censorship-related measures Shares in percentages; margin of error (MOE) for 95 percent confidence level in percentage points (ppts). Moderate posts Share ± MOE Social media posts by official company accounts 9.3 ± 5.1 Social media posts by company employees 5.4 ± 4.3
Source: USITC, Foreign Censorship Survey, 2021, weighted responses to questions 1.3 and 2.12. Note: “Censored” includes U.S. businesses other than media and digital service providers that experienced at least one censorship-related measure in China. These results only apply to U.S. businesses operating in China that do not provide any media or digital products and services among their offerings in the market.
Table H.17 Shares of censored U.S. businesses other than media and digital service in China that experienced negative or mixed impact to their products and services provided outside of China Shares in percentages; margin of error (MOE) for 95 percent confidence level in percentage points (ppts). Impact Share ± MOE Negative or mixed impact 11.9 ± 6.4 No impact 88.1 ± 6.4
Source: USITC, Foreign Censorship Survey, 2021, weighted responses to sections 2.11. Note: “Censored” includes U.S. businesses other than media and digital service providers that experienced at least one censorship-related measure in China. These results only apply to U.S. businesses operating in China that do not provide any media or digital products and services among their offerings in the market.
Table H.18 Shares of censored U.S. businesses other than media and digital service providers for whom Chinese censorship-related measures have directly impacted products or services provided outside of China, by location Shares in percentages; margin of error (MOE) for 95 percent confidence level in percentage points (ppts). Location Share ± MOE United States 6.5 ± 4.6 Other markets 8.1 ± 5.9
Source: USITC, Foreign Censorship Survey, 2021, weighted responses to questions 1.3, 2.10, and 2.11. Note: U.S. businesses experiencing Chinese censorship-related measures may experience direct impact on their products and services provided in the United States and other markets, so shares will not add to 100 percent. “Censored” includes U.S. businesses other than media and digital service providers that experienced at least one censorship-related measure in China. These results only apply to U.S. businesses operating in China that do not provide any media or digital products and services among their offerings in the market. Further, these estimates are based on businesses that faced impacts as indicated in question 2.11, as a share of censored U.S. businesses other than media and digital service providers.

Appendix H: Survey Results for U.S. Businesses Other than Media and Digital Service Providers
United States International Trade Commission | 241
Table H.19 Shares of censored U.S. businesses other than media and digital service providers that are concerned censorship will have a negative impact on their ability to provide products and services in China, by business size Shares in percentages; margin of error (MOE) for 95 percent confidence level in percentage points (ppts); SME = small and medium-sized enterprise. Business size Share ± MOE Large 54.5 ± 14.3 SME 68.1 ± 12.8 All 62.9 ± 9.5
Source: USITC, Foreign Censorship Survey, 2021, weighted responses to questions 1.3, 1.5, 2.1a, 2.2a, and 3.1. Note: “Censored” includes U.S. businesses other than media and digital service providers that experienced at least one censorship-related measure in China. These results only apply to U.S. businesses operating in China that do not provide any media or digital products and services among their offerings in the market.
Table H.20 Shares of censored U.S. businesses other than media and digital service providers in China that are concerned Chinese censorship will have a negative impact on their operations in China, by business size Shares in percentages; margin of error (MOE) for 95 percent confidence level in percentage points (ppts); SME = small and medium-sized enterprise. Business size Share ± MOE Large 55.1 ± 13.8 SME 58.5 ± 14.5 All 57.1 ± 10.1
Source: USITC, Foreign Censorship Survey, 2021, weighted responses to questions 1.3, 1.5, 2.1a, 2.2a, and 3.2. Note: “Censored” includes U.S. businesses other than media and digital service providers that experienced at least one censorship-related measure in China. These results only apply to U.S. businesses operating in China that do not provide any media or digital products and services among their offerings in the market.
Table H.21 Shares of censored U.S. businesses other than media and digital service providers for which Chinese censorship has become more challenging, by business size Shares in percentages; margin of error (MOE) for 95 percent confidence level in percentage points (ppts); SME = small and medium-sized enterprise. Business size Share ± MOE Large 46.9 ± 15.7 SME 54.0 ± 18.5 All 50.8 ± 12.4
Source: USITC, Foreign Censorship Survey, 2021, weighted responses to questions 1.3, 1.5, 2.1a, 2.2a, and 3.3. Note: “Censored” includes U.S. businesses other than media and digital service providers that experienced at least one censorship-related measure in China. These results only apply to U.S. businesses operating in China that do not provide any media or digital products and services among their offerings in the market.

Foreign Censorship Part 2: Trade and Economic Effects on U.S. Businesses
242 | www.usitc.gov
Table H.22 Shares of censored U.S. businesses other than media and digital service providers active in China and perceived concern that Chinese censorship would have a negative impact on their ability to provide product and services, by market Shares in percentages; margin of error (MOE) for 95 percent confidence level in percentage points (ppts); * indicates a low precision estimate.
Market
Very concerned
(share ± MOE)
Moderately concerned
(share ± MOE)
Not concerned
(share ± MOE) China 10.4 ± 6.4 52.5 ± 10.1 37.1 ± 9.5 United States 3.0* ± 3.5 10.6 ± 6.1 86.4 ± 6.8 Other markets 3.0* ± 3.5 16.3 ± 7.4 80.7 ± 7.8
Source: USITC, Foreign Censorship Survey, 2021, weighted responses to questions 1.3, 2.1a, 2.2a, and 3.1. Note: “Censored” includes U.S. businesses other than media and digital service providers that experienced at least one censorship-related measure in China. These results only apply to U.S. businesses operating in China that do not provide any media or digital products and services among their offerings in the market.
Table H.23 Shares of censored U.S. businesses other than media and digital service providers active in China and perceived concern that Chinese censorship would have a negative impact on their ability to provide product and services in China, by business size Shares in percentages; margin of error (MOE) for 95 percent confidence level in percentage points (ppts); SME = small and medium-sized enterprise.
Business size Very concerned
(share ± MOE)
Moderately concerned (share
± MOE) Not concerned (share ± MOE)
Large 10.5 ± 10.0 44.0 ± 12.4 45.5 ± 14.3 SME 10.3 ± 8.3 57.9 ± 13.8 31.9 ± 12.8 All 10.4 ± 6.4 52.5 ± 10.1 37.1 ± 9.5
Source: USITC, Foreign Censorship Survey, 2021, weighted responses to questions 1.3, 1.5, 2.1a, 2.2a, and 3.1. Note: “Censored” includes U.S. businesses other than media and digital service providers that experienced at least one censorship-related measure in China. These results only apply to U.S. businesses operating in China that do not provide any media or digital products and services among their offerings in the market.
Table H.24 Shares of censored U.S. businesses other than media and digital service providers active in China and perceived concern that Chinese censorship would have a negative impact on their operations, by market Shares in percentages; margin of error (MOE) for 95 percent confidence level in percentage points (ppts); * indicates a low precision estimate.
Market
Very concerned
(share ± MOE)
Moderately concerned
(share ± MOE)
Not concerned
(share ± MOE) China 14.8 ± 6.9 43.9 ± 10.2 42.9 ± 10.1 United States 4.5 ± 3.9 9.6 ± 7.4 86.0 ± 7.9 Other markets 3.8 ± 4.1 * 15.8 ± 6.2 80.3 ± 7.1
Source: USITC, Foreign Censorship Survey, 2021, weighted responses to questions 3.2. Note: “Censored” includes U.S. businesses other than media and digital service providers that experienced at least one censorship-related measure in China. These results only apply to U.S. businesses operating in China that do not provide any media or digital products and services among their offerings in the market.

Appendix H: Survey Results for U.S. Businesses Other than Media and Digital Service Providers
United States International Trade Commission | 243
Table H.25 Shares of censored U.S. businesses other than media and digital service providers active in China and perceived concern that Chinese censorship would have a have a negative impact on their operations, by business size Shares in percentages; margin of error (MOE) for 95 percent confidence level in percentage points (ppts); SME = small and medium-sized enterprise.
Business size Very concerned
(share ± MOE)
Moderately concerned (share
± MOE) Not concerned (share ± MOE)
Large 15.5 ± 11.0 39.6 ± 11.7 44.9 ± 13.8 SME 11.7 ± 8.9 46.8 ± 14.6 41.5 ± 14.5 All 14.8 ± 6.9 43.9 ± 10.2 42.9 ± 10.1
Source: USITC, Foreign Censorship Survey, 2021, weighted responses to questions 1.3, 1.5, 2.1a, 2.2a, and 3.2. Note: “Censored” includes U.S. businesses other than media and digital service providers that experienced at least one censorship-related measure in China. These results only apply to U.S. businesses operating in China that do not provide any media or digital products and services among their offerings in the market.
Table H.26 Shares of censored U.S. businesses other than media and digital service providers in China and perceived challenge of censorship-related measures in China in the past few years, by business size Shares in percentages; margin of error (MOE) for 95 percent confidence level in percentage points (ppts); SME = small and medium-sized enterprise.
Business size More challenging
(share ± MOE)
No noticeable difference (share ±
MOE) Large 46.9 ± 15.7 53.1 ± 15.7 SME 54.0 ± 18.5 46.0 ± 18.5 All 50.8 ± 12.4 49.2 ± 12.4
Source: USITC, Foreign Censorship Survey, 2021, weighted responses to questions 1.3, 1.5, 2.1a, 2.2a, and 3.3. Note: “Censored” includes U.S. businesses other than media and digital service providers that experienced at least one censorship-related measure in China. These results only apply to U.S. businesses operating in China that do not provide any media or digital products and services among their offerings in the market.
Table H.27 Shares of censored U.S. businesses other than media and digital service providers in China’s perceived differences in levels of requirements and enforcement of policies related to censoring content by the government of China compared to Chinese-owned companies, by business size Shares in percentages; margin of error (MOE) for 95 percent confidence level in percentage points (ppts); SME = small and medium-sized enterprise.
Business size Lower levels
(share ± MOE) Same levels
(share ± MOE) Higher levels
(share ± MOE) Large 10.3 ± 9.5 63.9 ± 13.3 25.8 ± 11.4 SME 38.8 ± 18.8 44.3 ± 22.3 16.9 ± 14.6 All 24.9 ± 13.8 53.9 ± 13.3 21.3 ± 13.0
Source: USITC, Foreign Censorship Survey, 2021, weighted responses to questions 1.3, 1.5, 2.1a, 2.2a, and 3.4. Note: “Censored” includes U.S. businesses other than media and digital service providers that experienced at least one censorship-related measure in China. These results only apply to U.S. businesses operating in China that do not provide any media or digital products and services among their offerings in the market.

Foreign Censorship Part 2: Trade and Economic Effects on U.S. Businesses
244 | www.usitc.gov
Table H.28 Shares of censored U.S. businesses other than media and digital service providers in China that complied with censorship-related measures’ impact of policies on its brand perceived by customers, by business size Shares in percentages; margin of error (MOE) for 95 percent confidence level in percentage points (ppts); SME = small and medium-sized enterprise; d.s. = data suppressed for confidentiality.
Business size Negative impact
(share ± MOE) No impact (share
± MOE)
Mixed or positive impact
(share ± MOE) Large d.s. 79.8 ± 12.7 d.s. SME d.s. 80.7 ± 37.9 d.s. All d.s. 80.2 ± 17.6 d.s.
Source: USITC, Foreign Censorship Survey, 2021, weighted responses to questions 1.3, 1.5, 2.1a, 2.2a, and 3.5. Note: “Censored” includes U.S. businesses other than media and digital service providers that experienced at least one censorship-related measure in China. These results only apply to U.S. businesses operating in China that do not provide any media or digital products and services among their offerings in the market.
Table H.29 Distribution of U.S. businesses other than media and digital service providers in China that experienced Chinese censorship and that were economically impacted by Chinese censorship Shares in percentages; margin of error (MOE) for 95 percent confidence level in percentage points (ppts); — (em dash) = not applicable.
Subset of population
All businesses other than media and digital services
providers in China (Share ± MOE)
Censored businesses other
than media and digital services
providers in China (Share ± MOE)
Economically impacted by Chinese censorship 2.5 ± 0.9 26.8 ± 4.5 Not economically impacted by Chinese censorship 6.8 ± 0.9 73.2 ± 4.5
Experienced Chinese censorship 9.2 ± 1.7 — Had not experienced Chinese censorship 90.8 ± 4.4 —
Source: USITC, Foreign Censorship Survey, 2021, weighted responses to questions 1.3, 2.1a, 2.2a, and 4.1. Note: “Censored” includes U.S. businesses other than media and digital service providers that experienced at least one censorship-related measure in China. These results only apply to U.S. businesses operating in China that do not provide any media or digital products and services among their offerings in the market.
Table H.30 Shares of U.S. businesses other than media and digital service providers in China that were economically impacted by Chinese censorship Shares in percentages; margin of error (MOE) for 95 percent confidence level in percentage points (ppts); SME = small and medium-sized enterprise. Business size Share ± MOE Large 2.1 ± 1.3 SME 2.7 ± 1.3 All 2.5 ± 0.9
Source: USITC, Foreign Censorship Survey, 2021, weighted responses to questions 1.3, 1.5, 2.1a, 2.2a, and 4.1. Note: These results only apply to U.S. businesses operating in China that do not provide any media or digital products and services among their offerings in the market. Furthermore, the results cover businesses that have and have not experienced censorship-related measures in China.

Appendix H: Survey Results for U.S. Businesses Other than Media and Digital Service Providers
United States International Trade Commission | 245
Table H.31 Net effects of Chinese censorship on revenue or sales in China for U.S. businesses other than media and digital service providers, by population group Shares in percentages; margin of error (MOE) for 95 percent confidence level in percentage points (ppts).
Subset/population
Lost or foregone revenue (share ±
MOE)
No lost or foregone revenue
(share ± MOE) Censored U.S. businesses other than media and digital service providers in China that have been economically impacted by Chinese censorship
65.2 ± 14.2 34.8 ± 14.2
Censored U.S. businesses other than media and digital service providers in China
17.5 ± 7.5 82.5 ± 7.5
U.S. businesses other than media and digital service providers in China 1.6 ± 0.8 98.4 ± 0.8 Source: USITC, Foreign Censorship Survey, 2021, weighted responses to questions 1.3, 2.1a, 2.2a, 4.1, and 4.2. Note: “Censored” includes U.S. businesses other than media and digital service providers that experienced at least one censorship-related measure in China. These results only apply to U.S. businesses operating in China that do not provide any media or digital products and services among their offerings in the market. Furthermore, the last row of results covers businesses that have and have not experienced censorship-related measures in China.
Table H.32 Net effects of Chinese censorship on costs of doing business in China for U.S. businesses other than media and digital service providers, by population group Shares in percentages; margin of error (MOE) for 95 percent confidence level in percentage points (ppts).
Subset/population
Increased costs of doing business in
China (share ± MOE)
No increase in costs of doing
business in China (share ± MOE)
Censored U.S. businesses other than media and digital service providers in China that have been economically impacted by Chinese censorship
80.8 ± 15.6 19.2 ± 15.6
Censored U.S. businesses other than media and digital service providers in China
21.6 ± 8.2 78.4 ± 8.2
U.S. businesses other than media and digital service providers in China 2.0 ± 0.9 98.0 ± 0.9 Source: USITC, Foreign Censorship Survey, 2021, weighted responses to questions 1.3, 2.1a, 2.2a, 4.1, and 4.5. Note: “Censored” includes U.S. businesses other than media and digital service providers that experienced at least one censorship-related measure in China. These results only apply to U.S. businesses operating in China that do not provide any media or digital products and services among their offerings in the market. Furthermore, the last row of results covers businesses that have and have not experienced censorship-related measures in China.

Foreign Censorship Part 2: Trade and Economic Effects on U.S. Businesses
246 | www.usitc.gov
Table H.33 Shares of U.S. businesses other than media and digital service providers in China that operate in other key markets, and for those that operate in other markets the share that experience censorship in those markets, by key market and size Shares in percentages; margin of error (MOE) for 95 percent confidence level in percentage points (ppts); SME = small and medium-sized enterprise; d.s. = data suppressed for confidentiality; * indicates a low precision estimate.
Business size Market Operate in key market
(share ± MOE) Experience censorship in key
market (share ± MOE) Large Russia 53.6 ± 4.3 1.9 ± 1.5 SME Russia 25.6 ± 3.5 d.s. All Russia 35.7 ± 2.7 1.3 ± 1.0 Large Turkey 61.3 ± 4.1 1.1 ± 1.0 * SME Turkey 38.2 ± 3.9 d.s. All Turkey 46.5 ± 2.9 0.8 ± 0.8 Large Vietnam 53.6 ± 4.2 d.s. SME Vietnam 31.5 ± 3.7 d.s. All Vietnam 39.4 ± 2.8 1.1 ± 1.0 Large India 72.9 ± 3.9 d.s. SME India 47.4 ± 4.0 d.s. All India 56.6 ± 2.9 0.8 ± 0.8 Large Indonesia 53.7 ± 4.2 1.5 ± 1.3 SME Indonesia 31.9 ± 3.7 d.s. All Indonesia 39.7 ± 2.8 1.3 ± 1.1 Large Any key market other than China 83.4 ± 3.3 1.7 ± 1.0 SME Any key market other than China 58.5 ± 3.9 0.7 ± 0.7 * All Any key market other than China 67.4 ± 2.8 1.1 ± 0.6
Source: USITC, Foreign Censorship Survey, 2021, weighted responses to questions 1.3, 1.5, and 5.1. Note: Businesses may be operating in multiple markets. The Commission recognizes these data were collected in the fall of 2021, prior to Russia’s invasion of Ukraine. Thus, the share of businesses that experienced censorship-related measures in Russia at the time these data were collected would likely be much smaller than the share at present. These results are only applicable to U.S. businesses operating in China that do not provide any media or digital products and services among their offerings in the market and cover providers that have and have not experienced censorship-related measures there. The fourth column shows the share of these providers that are active in China and also active in the key markets in the second column and have experienced censorship-related measures in both key markets. These results should not be applied to any U.S. businesses that are operating in that key market but not operating in China. Furthermore, the results for each country cover different sets of companies and are not representative of U.S. businesses’ experiences with censorship in any one market, therefore shares cannot be compared across countries.

Appendix H: Survey Results for U.S. Businesses Other than Media and Digital Service Providers
United States International Trade Commission | 247
Table H.34 Shares of censored U.S. businesses other than media and digital service providers in China that operate in other key markets, and for those that operate in other markets the share that experience censorship in those markets, by key market and size In percentage and percentage points (ppts); margin of error (MOE) for 95 percent confidence level in percentage points (ppts); SME = small and medium-sized enterprises; d.s. = data suppressed for confidentiality; * indicates a low precision estimate.
Business size Market Operate in key market
(share ± MOE) Experience censorship in key
market (share ± MOE) Large Russia 69.7 ± 13.7 d.s. SME Russia 26.4 ± 12.0 d.s. All Russia 43.0 ± 9.3 7.2 ± 5.4 Large Turkey 66.8 ± 11.2 d.s. SME Turkey 46.2 ± 13.5 d.s. All Turkey 54.0 ± 9.4 d.s. Large Vietnam 59.7 ± 11.8 d.s. SME Vietnam 39.0 ± 13.2 d.s. All Vietnam 46.9 ± 9.5 d.s. Large India 82.7 ± 11.4 d.s. SME India 58.7 ± 13.8 d.s. All India 68.0 ± 9.5 d.s. Large Indonesia 62.9 ± 11.4 10.3 ± 10.1 * SME Indonesia 42.7 ± 13.7 d.s. All Indonesia 50.4 ± 9.7 7.3 ± 6.7 Large Any key market other than China 88.1 ± 10.3 12.9 ± 8.7 SME Any key market other than China 68.2 ± 12.7 5.3 ± 5.8 * All Any key market other than China 75.9 ± 5.8 8.2 ± 4.9
Source: USITC, Foreign Censorship Survey, 2021, weighted responses to questions 1.3, 1.5, and 5.1. Note: Businesses may be operating in multiple markets. The Commission recognizes these data were collected in the fall of 2021, prior to Russia’s invasion of Ukraine. Thus, the share of businesses that experienced censorship-related measures in Russia at the time these data were collected would likely be much smaller than the share at present. “Censored” includes U.S. businesses other than media and digital service providers that experienced at least one censorship-related measure in China. These results only apply to U.S. businesses operating in China that do not provide any media or digital products and services among their offerings in the market and have experienced at least one censorship-related measure there. The fourth column shows the share of these providers that are active in China and also active in the key markets in the second column and have experienced censorship-related measures in both key markets. These results should not be applied to any U.S. businesses that are operating in that key market but not operating in China. Furthermore, the results for each country cover different sets of companies and are not representative of U.S. businesses’ experiences with censorship in any one market, therefore shares cannot be compared across countries.

Foreign Censorship Part 2: Trade and Economic Effects on U.S. Businesses
248 | www.usitc.gov
Table H.35 Shares of U.S. businesses other than media and digital service providers in China that operate in other markets, and for those that operate in other markets the share that experience censorship those markets, by market In percentage and percentage points (ppts); margin of error (MOE) for 95 percent confidence level in percentage points (ppts); d.s . = data suppressed for confidentiality; * indicates a low precision estimate. CIS = Commonwealth of Independent States.
Market Region Operate in key market
(share ± MOE) Experience censorship in key
market (share ± MOE) Egypt Africa 26.8 ± 1.2 1.4 ± 0.8 * Nigeria Africa 16.5 ± 1.0 d.s. Saudi Arabia Africa 35.2 ± 1.4 1.6 ± 0.6 Other Africa Africa 44.0 ± 1.4 1.3 ± 0.5 India Asia 56.6 ± 1.5 0.8 ± 0.4 Indonesia Asia 39.7 ± 1.4 1.3 ± 0.5 Pakistan Asia 23.0 ± 1.2 d.s. Vietnam Asia 39.4 ± 1.4 1.1 ± 0.5 Other Asia Asia 72.7 ± 1.4 0.9 ± 0.3 Russia CIS 35.7 ± 1.4 1.3 ± 0.5 Other CIS CIS 27.8 ± 1.3 0.9 ± 0.5 European Union (27) Europe 73.0 ± 1.4 d.s. France Europe 68.3 ± 1.4 d.s. Germany Europe 72.7 ± 1.4 d.s. Turkey Europe 46.5 ± 1.5 0.8 ± 0.4 United Kingdom Europe 75.6 ± 1.3 d.s. Other Europe Europe 72.2 ± 1.4 d.s. Brazil Americas 53.1 ± 1.5 0.9 ± 0.4 Venezuela Americas 19.3 ± 1.1 1.7 ± 0.9 * Other Americas Americas 66.4 ± 1.4 0.6 ± 0.3 All other Other 58.6 ± 1.5 0.8 ± 0.4 Source: USITC, Foreign Censorship Survey, 2021, weighted responses to questions 1.3 and 5.1. Note: Businesses may be operating in multiple markets. The Commission recognizes these data were collected in the fall of 2021, prior to Russia’s invasion of Ukraine. Thus, the share of businesses that experienced censorship-related measures in Russia at the time these data were collected would likely be much smaller than the share at present. These results are only applicable to U.S. businesses operating in China that do not provide any media or digital products and services among their offerings in the market and cover providers that have and have not experienced censorship-related measures there. The fourth column shows the share of these providers that are active in China and also active in the key markets in the first column and have experienced censorship-related measures in that market. These results should not be applied to any U.S. businesses that are operating in that market but not operating in China. Furthermore, the results for each country cover different sets of companies and are not representative of U.S. businesses’ experiences with censorship in any one market, therefore shares cannot be compared across countries.

Appendix I: Modeling Technical Appendix
U.S. International Trade Commission | 249
Appendix I Modeling Technical Appendix

Foreign Censorship Part 2: Trade and Economic Effects on U.S. Businesses
250 | www.usitc.gov

Appendix I: Modeling Technical Appendix
U.S. International Trade Commission | 251
This appendix details the regression analysis used to examine the effects of censorship on video game revenues that is presented in chapter 4. The following provides a thorough description of the regressions that were estimated, the data that were used, the results that were produced, and some potential limitations of this approach.
The video game analysis used a conventional linear regression of per-user video game revenues on a series of variables reflecting censorship and other determinants of video game revenues. The data used for the analysis, which are detailed later in this appendix, represent a panel consisting of country-level information on video game revenues and country characteristics for the period of 2017 to 2019 for 141 countries. Throughout, the analysis distinguishes between and reports separate estimates for video games that were sold digitally and those that were sold physically.
The video game revenues regression took the following form:
𝑟𝑟𝑟𝑟𝑟𝑟𝑟𝑟𝑟𝑟𝑟𝑟𝑟𝑟𝑠𝑠𝑏𝑏𝑇𝑇 = 𝛽𝛽1𝑖𝑖𝑟𝑟𝑖𝑖𝑖𝑖𝑖𝑖𝑟𝑟𝑏𝑏𝑇𝑇 + 𝛽𝛽2𝑝𝑝𝑖𝑖𝑝𝑝𝑟𝑟𝑝𝑝𝑝𝑝𝑝𝑝𝑖𝑖𝑖𝑖𝑟𝑟𝑏𝑏𝑇𝑇 + 𝛽𝛽3𝑖𝑖𝑟𝑟𝑝𝑝𝑟𝑟𝑟𝑟𝑟𝑟𝑟𝑟𝑝𝑝𝑏𝑏𝑇𝑇 + 𝛽𝛽4𝑖𝑖𝑟𝑟𝑟𝑟𝑠𝑠𝑖𝑖𝑟𝑟𝑠𝑠ℎ𝑖𝑖𝑝𝑝𝑏𝑏𝑇𝑇 + 𝑌𝑌𝑇𝑇 + 𝜖𝜖𝑏𝑏𝑇𝑇
Per-user revenues for country i in year t (revenuesit) are modeled as a function of per capita national income (incomeit), population (populationit), and internet penetration rates (internetit). Censorship is included as an indicator variable (censorshipit) that equals zero if country i had high levels of censorship in year t and 1 if it had low levels. A series of year fixed effects (Yt) are included to capture trends in video game revenues over time. Finally, an error term (εit) is included to capture otherwise unexplained variation in revenues.
The model was estimated via ordinary least squares, which is a standard regression technique. The estimation results include heteroskedasticity robust standard errors, which help to provide more accurate measures of standard errors if heteroskedasticity is a present. Heteroskedasticity refers to cases in which the variance of the error term is not constant over the range of the sample.
The variables included on the right-hand side of the regression explain per-user revenues for video games. Censorship, as highlighted in the report, was expected to reduce per-user revenues by limiting market access and constraining the content of games. Income was included because higher levels of income likely allow for greater spending on video games at higher prices, thereby raising revenues. Population captures possible effects that market size (in terms of potential users) might have on video game revenues. Unlike with censorship and income where there were clear anticipated impacts on revenues, the likely relationships between revenues and population are less obvious, though the inclusion of this term improves goodness of fit in the results below.407 Finally, internet penetration captures the impacts that internet connectivity may have on game revenues. In recent years, video games have increasingly relied on the internet for both distribution and as part of their game play. For
407 On the one hand, larger populations may offer advantages to producers in the form of economies of scale. Similarly, producers may be more inclined to invest in developing and marketing games in countries with large numbers of potential users. It may also be the case that video games have network effects for users in which the appeal of the game increases with a rise in the number of local users, as might be the case in many multiplayer games. On the other hand, country population may be expected to have a negligible impact on revenues given how global many games are. When users are able to play with other people worldwide, the local population may not be very important. Similarly, the solitary nature of many games that are not played with others may further l imit the effect of a country’s population on game revenues.

Foreign Censorship Part 2: Trade and Economic Effects on U.S. Businesses
252 | www.usitc.gov
these reasons, we might expect it to have an increasing effect on revenues—especially for digital games. Additionally, internet penetration is likely a good indicator of technology adoption more broadly, which could similarly impact video game sales.
The data for the analysis were derived from several sources. Information on video game revenues and users was sourced from two Statista data series covering worldwide digitally and physically sold video games.408 Throughout the analysis, digital and physical sales were treated separately in order to avoid potential double-counting with respect to users. Within the data, it is not possible to determine the extent to which the physical and digital users overlap, which precluded them from being combined into a single user-base. The Statista data provided information on both total revenues and user penetration rates for 148 countries beginning in 2017. Information on income, population, and internet penetration was sourced from the World Bank’s World Development Indicators database.409 The three series drawn from this database were “Adjusted net national income per capita (current US$),” “Population, total,” and “Individuals using the Internet (% of population).” Per-user revenues were calculated from these two sources. First, the video game user penetration data were combined with the total population data to calculate the total number of users in each country and year. Second, total revenues were divided by the total number of users to generate per-user revenues.
Information on censorship was derived from Freedom House’s Freedom in the World report and its accompanying database.410 The Freedom House database numerically rates countries on a range of different aspects of political rights and civil liberties. For the analysis, a rating category titled “Are there free and independent media?” was used to identify the presence of video game censorship. Although not specific to video games, the basis of this media rating is reflective of many of the types of censorship activities that affect video games. For example, the rating reflects responses to questions like the following:411
• Are the media directly or indirectly censored? • Are works of literature, art, music, or other forms of cultural expression censored or banned for
political purposes? • Does the government attempt to influence media content and access through means including
politically motivated awarding or suspension of broadcast frequencies and newspaper registrations, unfair control and influence over printing facilities and distribution networks, blackouts of internet or mobile service, selective distribution of advertising, onerous operating requirements, prohibitive tariffs, and bribery?
The Freedom House media freedom rating is categorical and ranges from 0 to 4, where 0 denotes the least freedom and 4 denotes the most freedom. For the regression analysis, censorship ratings were used to define a single indicator for high or low censorship. Ratings of 0, 1, or 2 were considered “high
408 Statista database, “Digital Video Games—Worldwide,” accessed March 10, 2022; Statista database, “Physically Sold Video Games—Worldwide,” accessed March 15, 2022. 409 World Bank, World Development Indicators, accessed March 10, 2022. 410 Freedom House, Freedom in the World, 2022. The database (“All Data, FIW 2013-2022 (Excel Download)”) is available at the l ink to the report, provided in the bibliography. 411 Additional information on the media censorship rating, which is sub-question D1 in the database, can be found in the database’s methodology documentation. Freedom House, “Freedom in the World Research Methodology,” accessed March 15, 2022.

Appendix I: Modeling Technical Appendix
U.S. International Trade Commission | 253
censorship,” while ratings of 3 or 4 were considered “low censorship.” The decision on how to divide the ratings between these two categories was based on the scores for the key markets discussed as having notable censorship throughout this report. In particular, of the six key markets (China, India, Indonesia, Russia, Turkey, and Vietnam), all but Indonesia exhibited ratings of 2 or lower. Based on this, 2 was selected as the cutoff for high censorship. It should be noted that despite the discussions elsewhere in this report that identify Indonesia as a key censoring market, it was rated a 3 by Freedom House in all years, implying that it was considered “low censorship” in this specific analysis. Across all countries and years in the sample, about 58 percent of countries exhibited high levels of censorship and 42 percent exhibited low.
The decision to simplify the media ratings into a high/low censorship indicator was based on the fact that the ratings are categorical and cannot be treated like a continuous measure of censorship. While there is a strict ordering to the ratings, their magnitudes may not accurately capture the differences between each level in terms of their impact on video game revenues. For example, there is no clear reason to believe that the effect of increasing from a 0 to a 1 rating is necessarily equivalent to that of increasing from a 3 to a 4. Similarly, it is not clear if the difference between 1 and 3 should be exactly twice that of 1 and 2. For this reason, defining and using an indicator variable based on the ratings is more appropriate than using the ratings themselves.
The final sample used for estimation covered 141 countries for the years 2017, 2018, and 2019. The earliest year was determined by the Statista video game data. The latest year was determined by the national income data, which was not available past 2019 at the time of writing. The country coverage was primarily based on the Statista video game data although missing data in the other series prevented several of the Statista countries from being included in at least some years.
The regression estimates largely fit the expectations discussed above and are, in most cases, statistically significant at conventional levels (table I.1). For both digital and physical games, low censorship is associated with statistically significantly higher per-user revenues. Net national income per capita is also associated with higher revenues. A $1,000 increase in income per capita is associated with an approximately $1.26 increase in digital video game revenues per person and a $1.46 increase in revenues for physical games. For internet penetration, a 1 percentage point increase in the percent of the population using the internet is associated with an approximately $0.30 increase in digital game revenues but a $0.16 decrease in physical game revenues, suggesting there may be a substitution between the two mediums as people become internet users. The estimates for population show a significant relationship with digital game revenues such that a 1 million person increase in the population is associated with a $0.02 increase in per-user revenues. By comparison, there appears to be a negative relationship between population and physical revenues, but the estimate is not significant at conventional levels. Finally, because there was no constant included in either regression, the estimated values for the year fixed effects can be thought of as the regression intercepts for each year. For digital goods, the values increase in each of the three years, implying that average revenues have grown each year over the sample time period. For physical goods, 2017 exhibits the highest value, implying the largest average per-user revenues occurred at the beginning of the sample. Finally, the R-squared values for the digital and physical games were 0.680 and 0.785, respectively. These values suggest that the models fit the data well and explain a substantial portion of their variation.
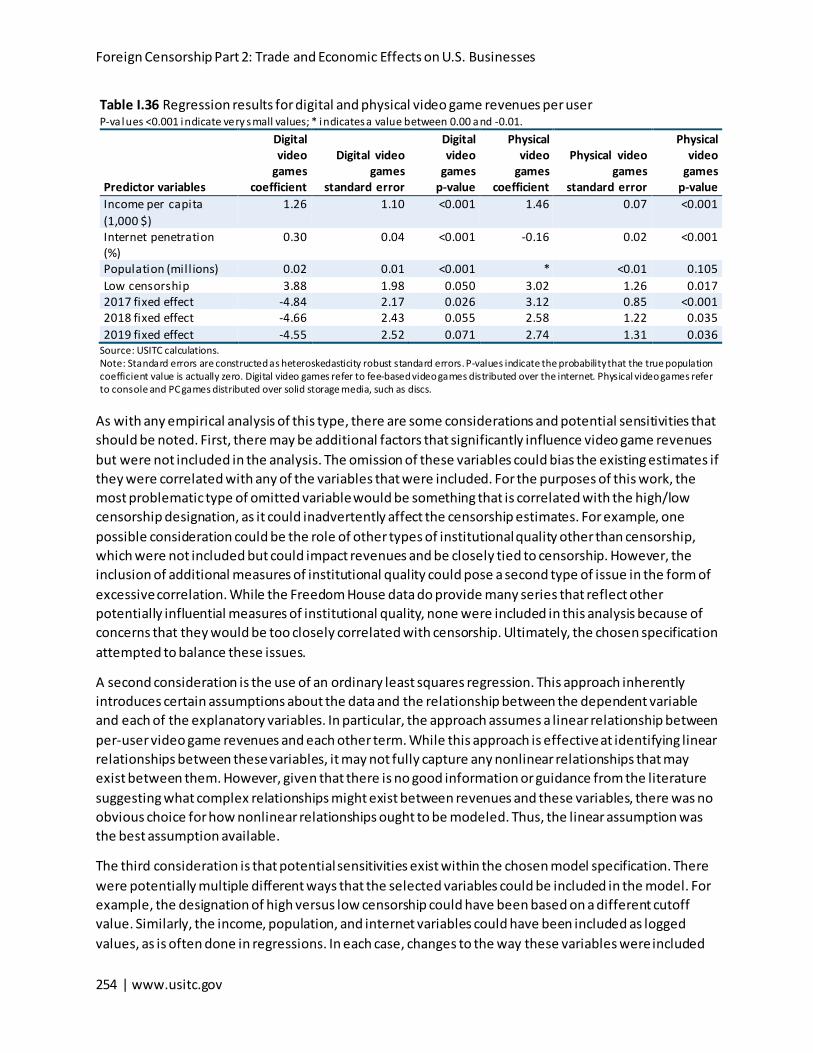
Foreign Censorship Part 2: Trade and Economic Effects on U.S. Businesses
254 | www.usitc.gov
Table I.36 Regression results for digital and physical video game revenues per user P-va lues <0.001 indicate very small values; * indicates a value between 0.00 and -0.01.
Predictor variables
Digital video
games coefficient
Digital video games
standard error
Digital video
games p-value
Physical video
games coefficient
Physical video games
standard error
Physical video
games p-value
Income per capita (1,000 $)
1.26 1.10 <0.001 1.46 0.07 <0.001
Internet penetration (%)
0.30 0.04 <0.001 -0.16 0.02 <0.001
Population (mill ions) 0.02 0.01 <0.001 * <0.01 0.105 Low censorship 3.88 1.98 0.050 3.02 1.26 0.017 2017 fixed effect -4.84 2.17 0.026 3.12 0.85 <0.001 2018 fixed effect -4.66 2.43 0.055 2.58 1.22 0.035 2019 fixed effect -4.55 2.52 0.071 2.74 1.31 0.036
Source: USITC calculations. Note: Standard errors are constructed as heteroskedasticity robust standard errors. P-values indicate the probability that the true population coefficient value is actually zero. Digital video games refer to fee-based video games distributed over the internet. Physical video games refer to console and PC games distributed over solid storage media, such as discs.
As with any empirical analysis of this type, there are some considerations and potential sensitivities that should be noted. First, there may be additional factors that significantly influence video game revenues but were not included in the analysis. The omission of these variables could bias the existing estimates if they were correlated with any of the variables that were included. For the purposes of this work, the most problematic type of omitted variable would be something that is correlated with the high/low censorship designation, as it could inadvertently affect the censorship estimates. For example, one possible consideration could be the role of other types of institutional quality other than censorship, which were not included but could impact revenues and be closely tied to censorship. However, the inclusion of additional measures of institutional quality could pose a second type of issue in the form of excessive correlation. While the Freedom House data do provide many series that reflect other potentially influential measures of institutional quality, none were included in this analysis because of concerns that they would be too closely correlated with censorship. Ultimately, the chosen specification attempted to balance these issues.
A second consideration is the use of an ordinary least squares regression. This approach inherently introduces certain assumptions about the data and the relationship between the dependent variable and each of the explanatory variables. In particular, the approach assumes a linear relationship between per-user video game revenues and each other term. While this approach is effective at identifying linear relationships between these variables, it may not fully capture any nonlinear relationships that may exist between them. However, given that there is no good information or guidance from the literature suggesting what complex relationships might exist between revenues and these variables, there was no obvious choice for how nonlinear relationships ought to be modeled. Thus, the linear assumption was the best assumption available.
The third consideration is that potential sensitivities exist within the chosen model specification. There were potentially multiple different ways that the selected variables could be included in the model. For example, the designation of high versus low censorship could have been based on a different cutoff value. Similarly, the income, population, and internet variables could have been included as logged values, as is often done in regressions. In each case, changes to the way these variables were included

Appendix I: Modeling Technical Appendix
U.S. International Trade Commission | 255
could have impacts on the estimate values. While preparing the analysis, multiple potential specifications were considered. The final specification presented here reflects that which produced the best model fit of the data from among the set of alternatives considered.
Finally, much of the post-estimation analysis conducted using the regression estimates—including the computation of total revenue effects and the impacts on U.S. video game revenues—was conducted based on some assumptions about the key video game markets. Many pieces of information on specific conditions in each of the key markets, in general and for U.S. firms, were largely unavailable. In light of this, these additional analyses were conducted by applying information about global video game sales and average effects of censorship to the specific markets. In the case of the total revenue calculations, the global average censorship effects of $3.88 and $3.02 per user may not perfectly reflect the individual impacts in each of the key markets. Depending on how the censorship occurs in each market, the local effects could be higher or lower than the global average. Further, the local impacts could depend on the types of games being sold in each market. For example, internet shutdowns likely impact online multiplayer games more severely than games without any online components. Similarly, China’s console ban likely had large impacts on many console-based games but more limited impacts on many digital mobile games. In the case of the U.S. revenue impacts, the calculations were based on the third-quarter 2021 U.S. share of the global revenues generated by the top 25 video game companies. This value may not perfectly reflect the shares that all U.S. companies had in each of the individual markets in 2019, thereby potentially over- or under-estimating the impacts of censorship on U.S. video game producers.

Foreign Censorship Part 2: Trade and Economic Effects on U.S. Businesses
256 | www.usitc.gov
Bibliography Freedom House. Freedom in the World, 2022. https://freedomhouse.org/report/freedom-world.
Freedom House. “Freedom in the World Research Methodology.” Accessed March 15, 2022. https://freedomhouse.org/reports/freedom-world/freedom-world-research-methodology.
Statista database. “Digital Video Games—Worldwide.” Accessed March 10, 2022. https://www.statista.com/outlook/amo/media/games/digital-video-games/worldwide.
Statista database. “Physically Sold Video Games—Worldwide.” Accessed March 15, 2022. https://www.statista.com/outlook/amo/media/games/physically-sold-video-games/worldwide?currency=USD.
World Bank. World Development Indicators. Accessed March 10, 2022. https://databank.worldbank.org/source/world-development-indicators.

Appendix J: Data Tables for Figures
United States International Trade Commission | 257
Appendix J Data Tables for Figures

Foreign Censorship Part 2: Trade and Economic Effects on U.S. Businesses
258 | www.usitc.gov

Appendix J: Data Tables for Figures
United States International Trade Commission | 259
Table J.1 Shares of U.S. media and digital service providers in China that experienced censorship-related measures, by business size Shares in percentages; margin of error (MOE) for 95 percent confidence level in percentage points (ppts); SME = small and medium-sized enterprise. This table corresponds to figure 2.1. Size Share ± MOE Large 30.8 ± 6.4 SME 16.1 ± 6.3 All 23.8 ± 4.4
Source: USITC, Foreign Censorship Survey, 2021, weighted responses to questions 1.3, 2.1a, and 2.2a.
Table J.2 Shares of U.S. media and digital service providers in China that experienced direct censorship measures in China, by business size Shares in percentages; margin of error (MOE) for 95 percent confidence level in percentage points (ppts); SME = small and medium-sized enterprise. This table corresponds to figure 2.2. Size Share ± MOE Large 25.4 ± 6.0 SME 13.3 ± 5.6 All 19.7 ± 4.1
Source: USITC, Foreign Censorship Survey, 2021, weighted responses to questions 1.3, and 2.1a.
Table J.3 Shares of U.S. media and digital service providers in China, affected by type of direct censorship measures and business size Shares in percentages; margin of error (MOE) for 95 percent confidence level in percentage points (ppts). d.s. = data suppressed to protect confidentiality. This table corresponds to figure 2.3.
Direct censorship measure Large (Share ±
MOE) SME (Share ±
MOE) All (Share ±
MOE) Restrictions on or requirements to modify content 15.9 ± 4.9 4.6 ± 3.3 10.5 ± 3.0 Blocking or fi ltering and targeted denial 12.8 ± 4.7 7.5 ± 4.7 10.3 ± 3.3 Internet shutdowns 7.2 ± 3.8 4.0 ± 2.7 5.7 ± 2.4 Harm or threats 5.1 ± 3.0 d.s. 3.2 ± 1.7
Source: USITC, Foreign Censorship Survey, 2021, weighted responses to questions 1.3 and 2.1a. Note: Blocking or filtering and targeted denial refer to blocking or filtering of digital products or services and targeted denial of market access of the digital products or services based on speech related activities; throttling refers to targeted throttling or slowing of digital products and services. Internet shutdowns include both short-term and long-term internet shutdowns. A short-term internet shutdown lasts for 48 hours or less while a long-term internet shutdown lasts for more than 48 hours. Harm or threats refer to harm and threats of criminal or civil harm, exit bans, or other forms of reprisal against an organization’s employees, brand, or products based on speech-related activities or government-initiated boycotts. The results in this table are related to the following question: “Since January 1, 2019, how often the following acts, policies, and practices in China impacted your business’s ability to provide or sell your products and services?” The results in this table combines responses that selected “occasionally” or “regularly” to question 2.1a.
Table J.4 Shares of U.S. media and digital service providers that experienced any censorship-enabling measures in China since January 1, 2019, by business size Shares in percentages; margin of error (MOE) for 95 percent confidence level in percentage points (ppts); SME = small and medium-sized enterprise. This table corresponds to figure 2.4. Size Share ± MOE Large 19.9 ± 5.4 SME 7.8 ± 4.5 All 14.2 ± 3.5
Source: USITC, Foreign Censorship Survey, 2021, weighted responses to questions 1.3 and 2.2a.
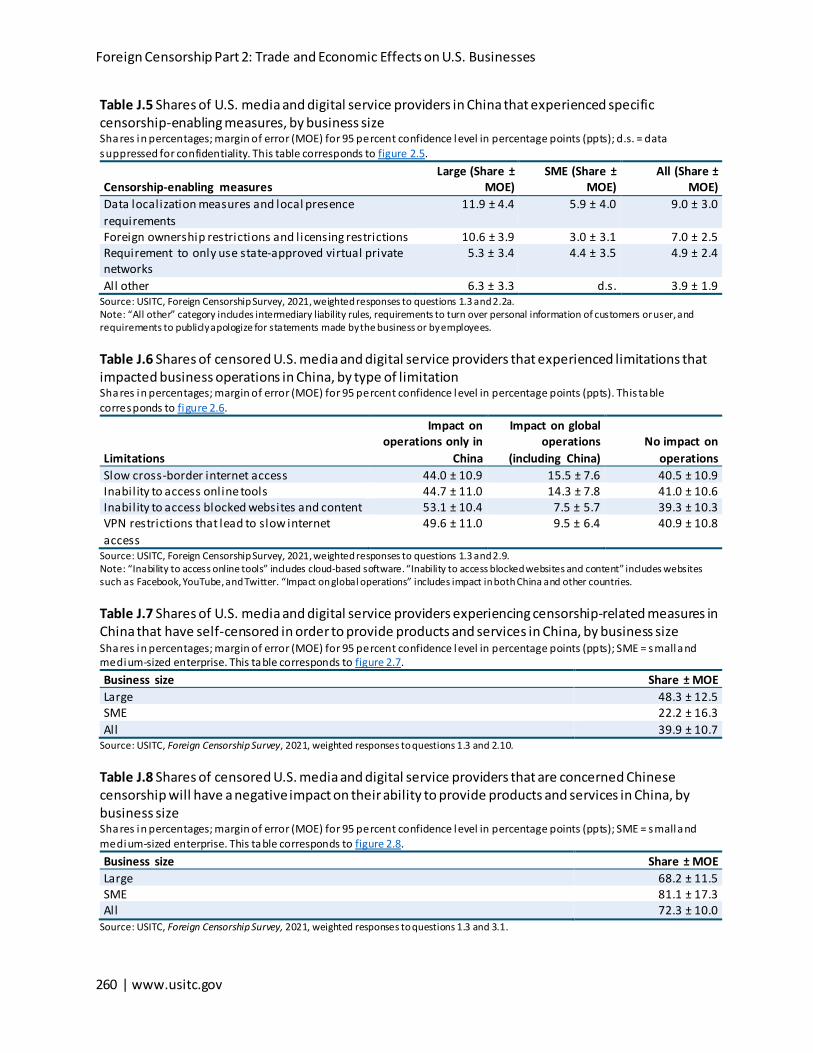
Foreign Censorship Part 2: Trade and Economic Effects on U.S. Businesses
260 | www.usitc.gov
Table J.5 Shares of U.S. media and digital service providers in China that experienced specific censorship-enabling measures, by business size Shares in percentages; margin of error (MOE) for 95 percent confidence level in percentage points (ppts); d.s. = data suppressed for confidentiality. This table corresponds to figure 2.5.
Censorship-enabling measures Large (Share ±
MOE) SME (Share ±
MOE) All (Share ±
MOE) Data localization measures and local presence requirements
11.9 ± 4.4 5.9 ± 4.0 9.0 ± 3.0
Foreign ownership restrictions and l icensing restrictions 10.6 ± 3.9 3.0 ± 3.1 7.0 ± 2.5 Requirement to only use state-approved virtual private networks
5.3 ± 3.4 4.4 ± 3.5 4.9 ± 2.4
All other 6.3 ± 3.3 d.s. 3.9 ± 1.9 Source: USITC, Foreign Censorship Survey, 2021, weighted responses to questions 1.3 and 2.2a. Note: “All other” category includes intermediary liability rules, requirements to turn over personal information of customers or user, and requirements to publicly apologize for statements made by the business or by employees.
Table J.6 Shares of censored U.S. media and digital service providers that experienced limitations that impacted business operations in China, by type of limitation Shares in percentages; margin of error (MOE) for 95 percent confidence level in percentage points (ppts). This table corresponds to figure 2.6.
Limitations
Impact on operations only in
China
Impact on global operations
(including China) No impact on
operations Slow cross-border internet access 44.0 ± 10.9 15.5 ± 7.6 40.5 ± 10.9 Inabil ity to access online tools 44.7 ± 11.0 14.3 ± 7.8 41.0 ± 10.6 Inabil ity to access blocked websites and content 53.1 ± 10.4 7.5 ± 5.7 39.3 ± 10.3 VPN restrictions that lead to slow internet access
49.6 ± 11.0 9.5 ± 6.4 40.9 ± 10.8
Source: USITC, Foreign Censorship Survey, 2021, weighted responses to questions 1.3 and 2.9. Note: “Inability to access online tools” includes cloud-based software. “Inability to access blocked websites and content” includes websites such as Facebook, YouTube, and Twitter. “Impact on global operations” includes impact in both China and other countries.
Table J.7 Shares of U.S. media and digital service providers experiencing censorship-related measures in China that have self-censored in order to provide products and services in China, by business size Shares in percentages; margin of error (MOE) for 95 percent confidence level in percentage points (ppts); SME = small and medium-sized enterprise. This table corresponds to figure 2.7. Business size Share ± MOE Large 48.3 ± 12.5 SME 22.2 ± 16.3 All 39.9 ± 10.7
Source: USITC, Foreign Censorship Survey, 2021, weighted responses to questions 1.3 and 2.10.
Table J.8 Shares of censored U.S. media and digital service providers that are concerned Chinese censorship will have a negative impact on their ability to provide products and services in China, by business size Shares in percentages; margin of error (MOE) for 95 percent confidence level in percentage points (ppts); SME = small and medium-sized enterprise. This table corresponds to figure 2.8. Business size Share ± MOE Large 68.2 ± 11.5 SME 81.1 ± 17.3 All 72.3 ± 10.0
Source: USITC, Foreign Censorship Survey, 2021, weighted responses to questions 1.3 and 3.1.

Appendix J: Data Tables for Figures
United States International Trade Commission | 261
Table J.9 Shares of censored U.S. media and digital service providers in China that are concerned Chinese censorship will have a negative impact on their operations in China, by business size Shares in percentages; margin of error (MOE) for 95 percent confidence level in percentage points (ppts); SME = small and medium-sized enterprise. This table corresponds to figure 2.9. Business size Share ± MOE Large 75.3 ± 11.4 SME 76.8 ± 19.4 All 75.8 ± 9.7
Source: USITC, Foreign Censorship Survey, 2021, weighted responses to questions 1.3 and 3.2.
Table J.10 Shares of censored U.S. media and digital service providers for which Chinese censorship has become more challenging, by business size Shares in percentages; margin of error (MOE) for 95 percent confidence level in percentage points (ppts); SME = small and medium-sized enterprise. This table corresponds to figure 2.10. Business size Share ± MOE Large 74.3 ± 12.2 SME 66.2 ± 20.4 All businesses 72.0 ± 10.5
Source: USITC, Foreign Censorship Survey, 2021, weighted responses to questions 1.3 and 3.3.
Table J.11 Distribution of U.S. media and digital service providers in China that experienced and were economically impacted by Chinese censorship-related measures Shares in percentages; margin of error (MOE) for 95 percent confidence level in percentage points (ppts); — (em dash) = not applicable. This table corresponds to figure 2.11.
Subset of population
All media and digital service
providers in China (Share ± MOE)
Censored media and digital service providers in China
(Share ± MOE) Economically impacted by Chinese censorship 9.9 ± 3.1 41.8 ± 9.6 Not economically impacted by Chinese censorship 13.8 ± 3.1 58.2 ± 9.6 Have experienced Chinese censorship 23.8 ± 4.4 — Have not experienced Chinese censorship 76.2 ± 4.4 —
Source: USITC, Foreign Censorship Survey, 2021, weighted responses to questions 1.3, 2.1a, 2.2a, and 4.1.
Table J.12 Net effects of Chinese censorship on costs of doing business in China of U.S. media and digital service providers, by subsets of the population Shares in percentages; margin of error (MOE) for 95 percent confidence level in percentage points (ppts). This table corresponds to figure 2.12.
Population/subset of population
Increased costs of doing business in
China (share ± MOE)
No impact on costs of doing business in
China (share ± MOE) Censored U.S. media & digital service providers economically impacted by Chinese censorship
86.5 ± 9.3 13.5 ± 9.3
Censored U.S. media & digital service providers in China 35.4 ± 6.4 64.6 ± 6.4 Source: USITC, Foreign Censorship Survey, 2021, weighted responses to questions 1.3, 2.1a, 2.2a, 4.1, and 4.5.
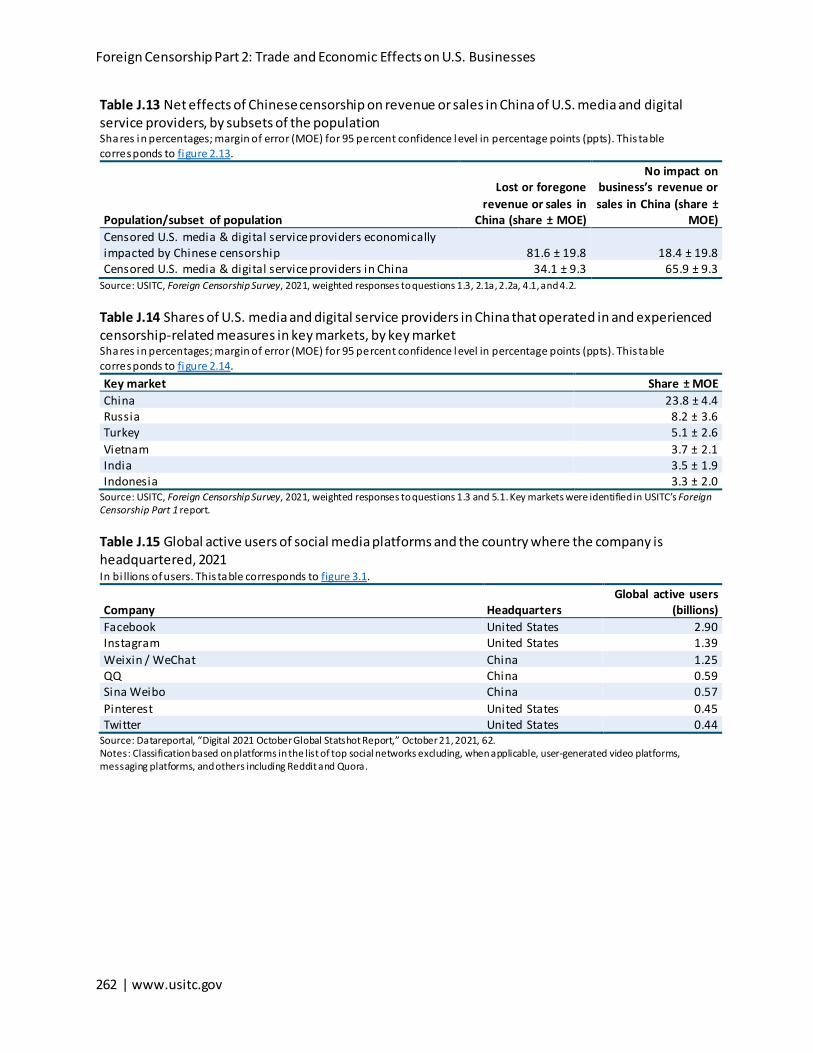
Foreign Censorship Part 2: Trade and Economic Effects on U.S. Businesses
262 | www.usitc.gov
Table J.13 Net effects of Chinese censorship on revenue or sales in China of U.S. media and digital service providers, by subsets of the population Shares in percentages; margin of error (MOE) for 95 percent confidence level in percentage points (ppts). This table corresponds to figure 2.13.
Population/subset of population
Lost or foregone revenue or sales in
China (share ± MOE)
No impact on business’s revenue or sales in China (share ±
MOE) Censored U.S. media & digital service providers economically impacted by Chinese censorship 81.6 ± 19.8 18.4 ± 19.8 Censored U.S. media & digital service providers in China 34.1 ± 9.3 65.9 ± 9.3
Source: USITC, Foreign Censorship Survey, 2021, weighted responses to questions 1.3, 2.1a, 2.2a, 4.1, and 4.2.
Table J.14 Shares of U.S. media and digital service providers in China that operated in and experienced censorship-related measures in key markets, by key market Shares in percentages; margin of error (MOE) for 95 percent confidence level in percentage points (ppts). This table corresponds to figure 2.14. Key market Share ± MOE China 23.8 ± 4.4 Russia 8.2 ± 3.6 Turkey 5.1 ± 2.6 Vietnam 3.7 ± 2.1 India 3.5 ± 1.9 Indonesia 3.3 ± 2.0
Source: USITC, Foreign Censorship Survey, 2021, weighted responses to questions 1.3 and 5.1. Key markets were identified in USITC’s Foreign Censorship Part 1 report.
Table J.15 Global active users of social media platforms and the country where the company is headquartered, 2021 In bi llions of users. This table corresponds to figure 3.1.
Company Headquarters Global active users
(billions) Facebook United States 2.90 Instagram United States 1.39 Weixin / WeChat China 1.25 QQ China 0.59 Sina Weibo China 0.57 Pinterest United States 0.45 Twitter United States 0.44
Source: Datareportal, “Digital 2021 October Global Statshot Report,” October 21, 2021, 62. Notes: Classification based on platforms in the list of top social networks excluding, when applicable, user-generated video platforms, messaging platforms, and others including Reddit and Quora.
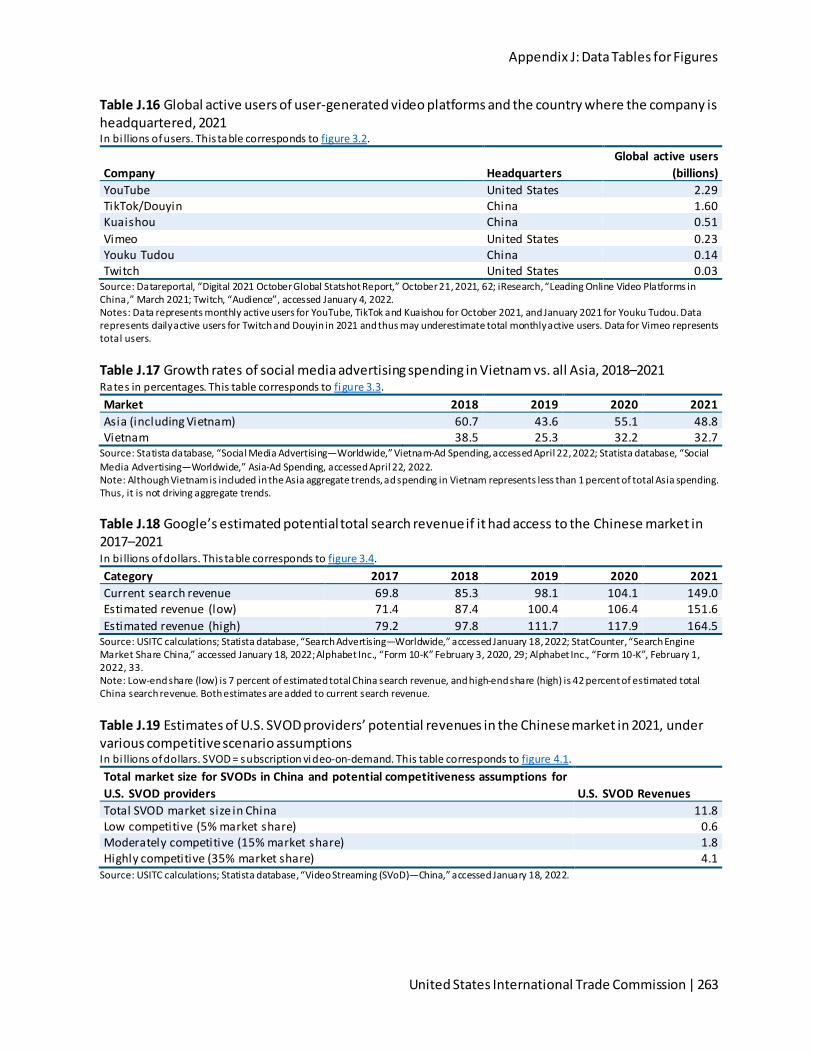
Appendix J: Data Tables for Figures
United States International Trade Commission | 263
Table J.16 Global active users of user-generated video platforms and the country where the company is headquartered, 2021 In bi llions of users. This table corresponds to figure 3.2.
Company Headquarters Global active users
(billions) YouTube United States 2.29 TikTok/Douyin China 1.60 Kuaishou China 0.51 Vimeo United States 0.23 Youku Tudou China 0.14 Twitch United States 0.03
Source: Datareportal, “Digital 2021 October Global Statshot Report,” October 21, 2021, 62; iResearch, “Leading Online Video Platforms in China,” March 2021; Twitch, “Audience”, accessed January 4, 2022. Notes: Data represents monthly active users for YouTube, TikTok and Kuaishou for October 2021, and January 2021 for Youku Tudou. Data represents daily active users for Twitch and Douyin in 2021 and thus may underestimate total monthly active users. Data for Vimeo represents total users.
Table J.17 Growth rates of social media advertising spending in Vietnam vs. all Asia, 2018–2021 Rates in percentages. This table corresponds to figure 3.3. Market 2018 2019 2020 2021 Asia (including Vietnam) 60.7 43.6 55.1 48.8 Vietnam 38.5 25.3 32.2 32.7
Source: Statista database, “Social Media Advertising—Worldwide,” Vietnam-Ad Spending, accessed April 22, 2022; Statista database, “Social Media Advertising—Worldwide,” Asia-Ad Spending, accessed April 22, 2022. Note: Although Vietnam is included in the Asia aggregate trends, ad spending in Vietnam represents less than 1 percent of total Asia spending. Thus, it is not driving aggregate trends.
Table J.18 Google’s estimated potential total search revenue if it had access to the Chinese market in 2017–2021 In bi llions of dollars. This table corresponds to figure 3.4. Category 2017 2018 2019 2020 2021 Current search revenue 69.8 85.3 98.1 104.1 149.0 Estimated revenue (low) 71.4 87.4 100.4 106.4 151.6 Estimated revenue (high) 79.2 97.8 111.7 117.9 164.5
Source: USITC calculations; Statista database, “Search Advertising—Worldwide,” accessed January 18, 2022; StatCounter, “Search Engine Market Share China,” accessed January 18, 2022; Alphabet Inc., “Form 10-K” February 3, 2020, 29; Alphabet Inc., “Form 10-K”, February 1, 2022, 33. Note: Low-end share (low) is 7 percent of estimated total China search revenue, and high-end share (high) is 42 percent of estimated total China search revenue. Both estimates are added to current search revenue.
Table J.19 Estimates of U.S. SVOD providers’ potential revenues in the Chinese market in 2021, under various competitive scenario assumptions In bi llions of dollars. SVOD = subscription video-on-demand. This table corresponds to figure 4.1. Total market size for SVODs in China and potential competitiveness assumptions for U.S. SVOD providers U.S. SVOD Revenues Total SVOD market size in China 11.8 Low competitive (5% market share) 0.6 Moderately competitive (15% market share) 1.8 Highly competitive (35% market share) 4.1
Source: USITC calculations; Statista database, “Video Streaming (SVoD)—China,” accessed January 18, 2022.

Foreign Censorship Part 2: Trade and Economic Effects on U.S. Businesses
264 | www.usitc.gov
Copyright © 2022 FDOKUMEN