Force gradation and motor unit activity during voluntary movements in man
10
Electroencephalography and Clinical Neurophysiology, 1980, 48:573--582 573 © Elsevier/North-Holland Scientific Publishers, Ltd. FORCE GRADATION AND MOTOR UNIT ACTIVITY DURING VOLUNTARY MOVEMENTS IN MAN JEAN MARIANI l, BERNARD MATON and SIMON BOUISSET (J.M.) Ddpartement de Biologie Moldculaire, Instilut Pasteur, Paris, (B.M.) Laboratoire de Physiologie du Travail du CNRS, CHU Pitid-Salp~tri~re, Paris, and (S.B.), Laboratoire de Physiologie du Mouvement, Universitd Paris Sud, Orsay (France) (Accepted for publication: July 27, 1979) The gradation of muscle force during con- traction depends classically on both the recruitment of motor units (MU) and the increase in firing frequency of units already active (Adrian and Bronk 1929}. Both mecha- nisms are involved in isometric contractions either when different levels of force are main- tained (Bigland and Lippold 1954; Dasgupta and Simpson 1962; Maton 1977; Monster and Chan 1977) or when slow ramp contractions are performed (Seyffarth 1941; Gillis 1973; Milner-Brown et al. 1973a, b, c; Tanji and Kato 1973a, b; Freund et al. 1975; Maton 1974, 1977). A peculiar pattern of MU activity has been described during isometric contractions with fast variation of force. The interval between the first two spikes of each MU is the shortest one and increases thereafter (Gilson and Mills 1941; Gurfinkel et al. 1972; Gydikov et al. 1972; Gillis 1973; Tanji and Kato 1973a, b; Maton 1974; Desmedt and Godaux 1977). It can be speculated that this pattern of MU activity occurs for movements executed in open-loop conditions, the contraction being achieved in too short a time to allow control by feedback signals. A somewhat similar pattern of MU activity has been disclosed in a preceding paper (Ma- ton and Bouisset 1975) for movements per- formed against inertia, i.e., in anisotonic anis- 1 Attach~ de Recherche INSERM. ometric conditions: the interval between the first two consecutive potentials of a single MU was always shorter than the following ones while the force was still increasing. Moreover, this minimal value was related both to the inertia and to the peak velocity of the move- ment, suggesting a pre-programming of this movement. Thus for fast anisotonic isometric contractions and for anisotonic anisometric ones the most likely mechanism for gradation of force during a single movement seems to be MU recruitment. The aim of the present paper is mainly to test this hypothesis in voluntary elbow flexions performed against inertia. MU recruitment will be inferred from the density of spikes, or 'spike output' {SO} obtained from a sample of muscle fibres representative of the whole biceps brachii activity. Methods Electromyographic recording The elementary myoelectric activity of the biceps brachii was recorded by means of 3 wire electrodes similar to those described ear- lier (Maton et al. 1969; Maton 1977). After light anaesthesia of the skin by vaporisation of ethyl chloride, selective bifilar electrodes were inserted at 3 separate points of the biceps by means of a hypodermic needle, which was then removed (Inman et al. 1952). The exact location and depth of the 3
-
Upload
independent -
Category
Documents
-
view
1 -
download
0
Transcript of Force gradation and motor unit activity during voluntary movements in man

Electroencephalography and Clinical Neurophysiology, 1980, 48 :573--582 573 © Elsevier/North-Holland Scientific Publishers, Ltd.
FORCE GRADATION AND MOTOR UNIT ACTIVITY DURING VOLUNTARY MOVEMENTS IN MAN
JEAN MARIANI l, BERNARD MATON and SIMON BOUISSET
(J.M.) Ddpartement de Biologie Moldculaire, Inst i lut Pasteur, Paris, (B.M.) Laboratoire de Physiologie du Travail du CNRS, CHU Pitid-Salp~tri~re, Paris, and (S.B.), Laboratoire de Physiologie du Mouvement, Universitd Paris Sud, Orsay (France)
(Accepted for publication: July 27, 1979)
The gradation of muscle force during con- traction depends classically on both the recruitment of motor units (MU) and the increase in firing frequency of units already active (Adrian and Bronk 1929}. Both mecha- nisms are involved in isometric contractions either when different levels of force are main- tained (Bigland and Lippold 1954; Dasgupta and Simpson 1962; Maton 1977; Monster and Chan 1977) or when slow ramp contractions are performed (Seyffarth 1941; Gillis 1973; Milner-Brown et al. 1973a, b, c; Tanji and Kato 1973a, b; Freund et al. 1975; Maton 1974, 1977).
A peculiar pattern of MU activity has been described during isometric contractions with fast variation of force. The interval between the first two spikes of each MU is the shortest one and increases thereafter (Gilson and Mills 1941; Gurfinkel et al. 1972; Gydikov et al. 1972; Gillis 1973; Tanji and Kato 1973a, b; Maton 1974; Desmedt and Godaux 1977). It can be speculated that this pattern of MU activity occurs for movements executed in open-loop conditions, the contraction being achieved in too short a time to allow control by feedback signals.
A somewhat similar pattern of MU activity has been disclosed in a preceding paper (Ma- ton and Bouisset 1975) for movements per- formed against inertia, i.e., in anisotonic anis-
1 Attach~ de Recherche INSERM.
ometric conditions: the interval between the first two consecutive potentials of a single MU was always shorter than the following ones while the force was still increasing. Moreover, this minimal value was related both to the inertia and to the peak velocity of the move- ment, suggesting a pre-programming of this movement. Thus for fast anisotonic isometric contractions and for anisotonic anisometric ones the most likely mechanism for gradation of force during a single movement seems to be MU recruitment. The aim of the present paper is mainly to test this hypothesis in voluntary elbow flexions performed against inertia. MU recruitment will be inferred from the density of spikes, or 'spike output ' {SO} obtained from a sample of muscle fibres representative of the whole biceps brachii activity.
Methods
Electromyographic recording The elementary myoelectric activity of the
biceps brachii was recorded by means of 3 wire electrodes similar to those described ear- lier (Maton et al. 1969; Maton 1977). After light anaesthesia of the skin by vaporisation of ethyl chloride, selective bifilar electrodes were inserted at 3 separate points of the biceps by means of a hypodermic needle, which was then removed (Inman et al. 1952).
The exact location and depth of the 3

574 J. MARIANI ET AL.
intramuscular electrodes varied from one elec- t rode and from one experiment to another in order to sample activities from different parts of the muscle.
The surface myoelectric activity of the biceps was recorded by two silver electrodes stuck to the skin above the belly of the mus- cle. The surface activity of the triceps brachii was similarly recorded. For both muscles the distance between electrodes varied from one test to another but was in all cases greater than 2 cm.
Mechanical recording The movement studied was flexion of the
right forearm. Subjects were seated and a device held the shoulders in a fixed position. Right arm and forearm were in the same hori- zontal plane, with the hand semiprone. The forearm was fixed in a splint that formed part of a mechanical system rotating around a ver- tical axis coincident with that of the elbow. Angular displacement, velocity and tangential acceleration were measured as previously described (Bouisset and Maton 1972). The inertia of the moveable system could be adjusted by the addition of weights {1--10 kg) at 25.5 cm from the rotat ion axis; inertias (Ii--I~0) thus ranged between 0.375 and 0.960 kg/m:. The force exerted by the biceps consi- dered as the ' f lexor equivalent ' was obtained with an analogic calculator, as previously indicated (Bouisset 1973).
Experimental protocol Five normal young subjects (20--25 years
old) were tested at least twice, giving a total of 14 experiments. During each exper iment 3 inertias (addition of 1, 5 and 10 kg weights) and 3 angular velocities (1.1, 2.2 and 4.2 rad/sec) were studied. A visual tracking device was used to allow execut ion of almost identi- cal movements (see Results). This device con- sisted of a series of small lights disposed in a semicircle just in f ront of the right hand and sequentially switched on at the different velo- cities quoted above. Subjects were also asked to perform movements at the highest velocity
they could reach (so called 'maximum move- ments'). The amplitude of the displacement was restricted by guide marks located 15 ~ on either side of the reference position defined by orthogonali ty between arm and forearm. For each group of movements (corresponding to a given velocity and a given inertia) about 15 trials were performed by each subject with sufficient rest to avoid fatigue (Scherrer and Monod 1960). The total duration of an exper- iment never exceeded 2 h.
The data were recorded on magnetic tape and transcribed on a Mingograf ink jet recorder (bandpass limited to 1000 Hz). They were analysed on a PDP 10 computer , using the conversational program reported by Du- fosse et al. (1975).
The myoelectr ic and mechanical records were divided into 30 msec bins; a threshold was set above the noise level of the EMG, and the number of spikes from each of the 3 records were added and counted during each bin. The instantaneous value of the force reached at the end of each bin was simultane- ously measured.
Results
(1) Study o f the total spike output ( S O ) o f motor units (MU) during movement
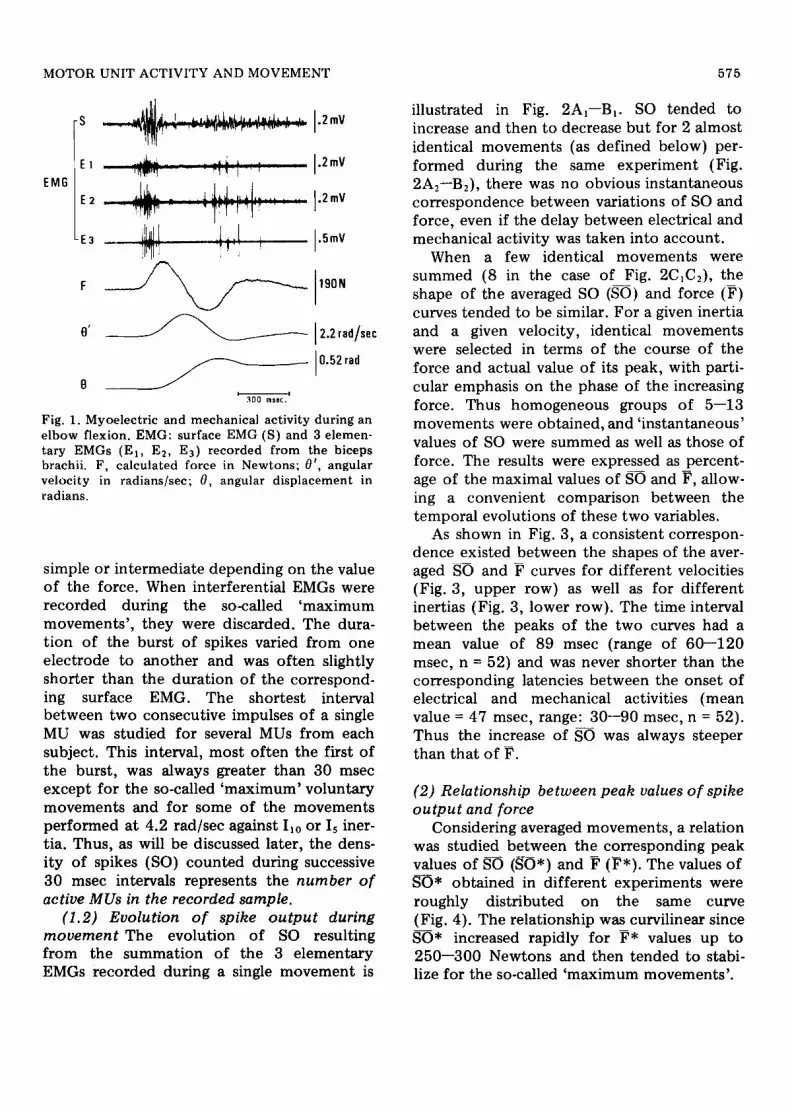
(1.1) Elementary electromyogram (EMG) during movement As shown in Fig. 1 both surface and intramuscular EMGs from the biceps consisted of two bursts of activity separated by a silent period. Only the first one, corresponding to the acceleration phase of the movement , was studied. Electrical activity appeared before the onset of the force and lasted until a few milliseconds prior to the peak velocity, its durat ion depending on the value of this peak. Triceps activity began only after the peak force and reached its maximum at the peak of velocity (not illustrated). Thus the instantaneous relation between MU activity and force was studied only up to the peak force.
Intramuscular EMGs were generally either
MOTOR UNIT ACTIVITY AND MOVEMENT 575
EMG E1 ,
E2
-E3
i L~w.-I +M~P'9 . . . . . : -'11 j' *j -, r ' '
m 3 0 0 r e s e t . I
.2mV
.2 mV
.2 mV
.5mV
190N
12.2 rad/sec
0.52 tad
Fig. 1. Myoelectric and mechanical activity during an elbow flexion. EMG: surface EMG (S) and 3 elemen- tary EMGs (El, E2, E3) recorded from the biceps brachii. F, calculated force in Newtons; 0', angular velocity in radians/sec; a, angular displacement in radians.
simple or intermediate depending on the value of the force. When interferential EMGs were recorded during the so-called 'maximum movements ' , they were discarded. The dura- t ion of the burst of spikes varied from one electrode to another and was often slightly shorter than the duration of the correspond- ing surface EMG. The shortest interval between two consecutive impulses of a single MU was studied for several MUs from each subject. This interval, most often the first of the burst, was always greater than 30 msec except for the so-called 'maximum' voluntary movements and for some of the movements performed at 4.2 rad/sec against I~0 or Is iner- tia. Thus, as will be discussed later, the dens- ity of spikes (SO) counted during successive 30 msec intervals represents the number o f active MUs in the recorded sample.
(1.2) Evolution o f spike output during movement The evolution of SO resulting from the summation of the 3 elementary EMGs recorded during a single movement is
illustrated in Fig. 2A,--Bt. SO tended to increase and then to decrease but for 2 almost identical movements (as defined below} per- formed during the same experiment {Fig. 2A2--B2), there was no obvious instantaneous correspondence between variations of SO and force, even if the delay between electrical and mechanical activity was taken into account.
When a few identical movements were summed (8 in the case of Fig. 2C~C2), the shape of the averaged SO (SO) and force (F) curves tended to be similar. For a given inertia and a given velocity, identical movements were selected in terms of the course of the force and actual value of its peak, with parti- cular emphasis on the phase of the increasing force. Thus homogeneous groups of 5--13 movements were obtained, and ' instantaneous' values of SO were summed as well as those of force. The results were expressed as percent- age of the maximal values of S-O and F, allow- ing a convenient comparison between the temporal evolutions of these two variables.
As shown in Fig. 3, a consistent correspon- dence existed between the shapes of the aver- aged SO and P curves for different velocities (Fig. 3, upper row) as well as for different inertias (Fig. 3, lower row). The time interval between the peaks of the two curves had a mean value of 89 msec (range of 60--120 msec, n = 52} and was never shorter than the corresponding latencies between the onset of electrical and mechanical activities (mean value = 47 msec, range: 30--90 msec, n = 52). Thus the increase of SO was always steeper than that of F.
(2) Relationship between peak values o f spike output and force
Considering averaged movements, a relation was studied between the corresponding peak values of SO {SO*} and F (F*). The values of SO* obtained in different experiments were roughly distributed on the same curve (Fig. 4). The relationship was curvilinear since S--O* increased rapidly for F* values up to 250--300 Newtons and then tended to stabi- lize for the so-called 'maximum movements' .

576 d. MARIANI ET AI,
A~
"5 O.
5. Ch
A2
LL
P.100 100
50
0
P 100 100
50-
O
-50-
o e o o e o o *
e ~ e e o e o e o
e o • o o e e e
~ = = = = = = = = o o • e o ~ q ~ e ~ e
~ e e * , e e ° o e e e e ~ e ~ e e
e u N n
• e ~ e e ~ o
e e e e e e o e o
t : : : : : : : : : = :
B1
B2
• ...
~ e
~ e
~ e ~ e e u ~ *
e e e e •
• e e e e • e e ~ e ~ e ~ e
O e e ~ ~ J e e e e . . . . . . . . : . : . : . • e o e e • e e e e e e o
t ~ * o t l , 0 a o o l o * l
e . o N * o l e t ~ e o * l o * ~ e e o o ~ e
~ t e e ~ e
o N * e ~ o e e H i o ~ * e ° * , Q a o o * , o
~ , N e e ~ R ~ e
e o e ~ * e ~ e * e e e * e * H N ~ ~ e e o e e e ~
• • e o e
•
. e • . e ~ e • e • o o ~ e e . e o . e e * e
• e e e
o e * ~
e o e e e 0 e e o o o e e e
C1
C2
[
J
t
/ \
, \ / /
/ !
/
• 6 sec • 6 sec
Fig. 2. Temporal evolution of spike output and force during elbow flexions. A]--A2: computer representation of spike output (Al) and force (A2) in the course of a single movement. B1--B2: same parameters during another identical movement performed by the same subject. Note the similarity between the force increases contrasting with differences between the corresponding spike outputs. Cz--C2: Spike output (C1) and force (C2) obtained by summation of 8 identical movements including the two represented in A and B. Spike outputs and forces are expressed as percentages of their maximal values. Arrows indicate the spike output value corresponding to the peak force.
(3) Relationship between successive values of spike output and force
As was noted in a p rev ious work (Maton and Bouisset 1 9 7 5 ) as well as in the present e x p e r i m e n t s , the firing frequency of each MU did n o t increase during a given m o v e m e n t . Thus the peak force was expec ted to be a con- sequence of the peak SO (SO*). The re fo re , the relation between successive values o f SO
and F during force increase was established as fol lows: each value o f SO was associated with the value o f F which occurred after a delay equal to the interpeak interval, so that the peak force corresponded to the peak SO. For
each exper iment a family o f curves was obtained (Fig. 5), with each curve correspond- ing to a given value o f inertia and o f angular veloci ty . For a given m o v e m e n t there was a rather abrupt increase o f SO preceded by a s lower one which was more and more notice- able when higher and higher F* values were reached. This t endency appeared to be a gen- eral feature o f the experiments , as illustrated in Fig. 6. Considering a given value o f force it appears that for a given inertia the greater the ve loc i ty , the lower the SO, and similarly for a given ve loc i ty the greater the inertia, the lower the SO. For the fastest movements , and partic-

M O T O R UNIT A C T I V I T Y AND M O V E M E N T 577
p t00
p 1o0
b i
300 ,',~s~.
Fig. 3. Evolu t ions of average spike ou tpu t (SO) and force (F) during summed e lbow flexions. Do t t ed points represent SO and crosses represent F. Each curve results f rom the summat ion of 5--13 move- ments. The m o v e m e n t s of the upper row were per- formed against cons tant inertia (Is) and with increas- ing peak velocit ies; those of the lower row were against d i f ferent inertias ( I i , Is , I10) at the same peak veloci ty . S-O and (F) are expressed as percentages of their maximal values.
40-
30
~o- --'.:-
s~ ,6o ,~o 260 2~o
Fig. 5. Rela t ionship be tween successive corresponding values of the curves of the spike ou tpu t (S-O) and force (F). The relat ion takes into account the inter- peak interval be tween the two curves (see text) . SO is expressed as number o f spikes per bin (30 msec) and (F) in Newtons . The curves correspond to the same exper iment . VI , V2, V3, Max as in Fig. 4. The ha tched area corresponds to the maximal range of peak values p lo t t ed in Fig. 4.
~o ~ .-'o
K- :~ X []
L~'~ °
"/
s" /
,6o 260 360 460 560 g ~
Fig. 4. Rela t ionship be tween peak values o f averaged curves of spike o u t p u t (S--O*) and force (F*). S--O* is expressed as number o f spikes per bin (30 msec) and F* in Newtons . V 1 = 1.1 rad/sec; V 2 = 2.2 rad/sec; V 3 = 4.2 rad/sec; Max = so-called ' m a x i m u m move- ments ' .
5O 407
30-
20-
5'o ,60 go 260 230
Fig. 6. Relationship between successive corresponding values of SO and ? obta ined in d i f ferent exper iments . Three groups of condi t ions have been selected to cover the range of inertias and velocit ies used. In each cond i t ion ext remes and mean individual curves are represented. V1, V2, V 3 as in Fig. 4.

578 J. MARIANI ET AL.
ularly for the maximal ones, these curves seem to present a final inflexion so that for the maximum values, the SO increases more slowly than the force. This inflexion, which is apparent in Fig. 5 for only one of the two maximal movements tested, was found for most of the so-called 'maximum movements ' studied.
Discussion
We have compared in this work successive values of averaged spike output (SO) and force (F) up to the peak of force reached dur- ing elbow flexions performed at various veloc- ities against various inertias. We shall discuss successively: (1) the validity of the SO mea- sured from 3 intramuscular EMGs as an index of MU recruitment, and (2) the characteristics of MU recruitment during the movement.
(1) Validity o f the SO as an index o f MU recruitment
The intramuscular EMG led off by wire electrodes is either simple or of an interme- diate type even at most of the highest values of force. Thus the different spikes do not interfere with each other and each represents the activity of a single MU. The use of a sim- ple threshold system for SO determination has already been discussed and justified (Ma- ton 1976). Thus, once the conditions for counting these spikes are fulfilled, it is neces- sary to be sure that the myoelectric activity sampled with 3 electrodes is representative of the activity of the whole muscle. This last assumption has been well established for iso- metric contractions (Maton et al. 1969) and also for anisotonic anisometric contractions (Bouisset and Maton 1972) when considering overall values of the activity, i.e., integrated EMG from the beginning of the movement to the peak velocity.
In the present study, in which the same sampling method was used, the SO was mea- sured during small successive time intervals, and it has been seen that almost identical
movements correspond to different SOs (see Fig. 2). Thus the activity sampled with 3 elec- trodes during one movement does not seem to reflect the activity of the whole muscle when quasi-instantaneous values are considered. It is in fact possible that the temporal organization of the discharge within the burst would not be completely fixed for a given movement. However, several technical factors could also be involved in the variability of SO. Among these are (i) the duration of the bin and the selectivity of the electrodes, and (ii) the possi- bility of small variations of forces and veloci- ties between the averaged movements in spite of the care taken to select identical move- ments (see above). When the variability of SO is overcome by the summations of a few iden- tical movements, the averaged SO exhibits monotonous evolution and is considered as representative of the activity of the whole muscle for all groups of movements and for all subjects tested.
In order to discuss the validity of the SO as an index of MU recruitment, the interval between two consecutive spikes of a single MU has to be compared to the bin width (30 msec). In most of the movements tested this interval was somewhat greater than 30 msec (see Results) in agreement with previous data (Maton and Bouisset 1975). Thus, in each bin each MU is statistically counted only once, and SO represents the number of MUs firing in the recorded samples.
When the shortest interspike interval is smaller than the bin width {maybe for some of the so-called 'maximum movements') , more than one impulse of a single MU could be counted in each bin. Thus the number of MU recruited would be overestimated. How- ever, an increase of SO can only be due to recruitment of new MUs because the interval between two consecutive potentials of a single MU increases during force increase of these movements (Maton and Bouisset 1975).
The last possibility corresponds to an inter- spike interval strikingly larger than the bin width, in which case no MU potentials couid be counted during some bins. This eventuality
M O T O R UNIT A C T I V I T Y AND M O V E M E N T 579
might have been encountered only for the slowest movements tested.
To summarize, the measured spike ou tpu t (SO) appears to be a valid index of MU recruitment.
(2) Characteristics o f M U recruitment during movemen t
(2.1) Correspondence between recruitment and force curves The correspondence between the shapes of the recruitment and force curves, for different velocities and dif- ferent inertias (Fig. 3) suggests that the varia- tion of force is mostly due to that of the number of active MUs.
When considering the phase of force increase it appears that MU recruitment increases faster than force so that the peak force is not reached until after the number of firing MUs is already decreasing. At least two interpretations can be proposed. First, the biceps brachii could not be considered as the 'flexor equivalent' (as defined by Bouisset 1973} in terms of quasi-instantaneous values, i.e., the peak of force exerted by biceps brachii would occur before that of other elbow flexors. However, the results obtained with force transducers implanted in the differ- ent e lbow flexors of monkeys do not support this idea (Maton et al. in preparation). A sec- ond interpretation appears when considering the time course of recruitment and force curves. The delay between the onsets of these curves represents the latent period whereas the interpeak interval reflects the delay between MU excitation and peak of tension, i.e., a contraction time. This appears to be a plausible explanation for the difference between the slopes of MU recruitment and force curves. Indeed, with the precision of the bin width, the values of the interpeak interval are in the range of the contraction times given by Buchthal and Schmalbruch (1970) for biceps brachii. These values correspond mainly to the contract ion of the slowest MUs, i.e., the ' tonic ' ones. In this respect the peak values of the forces studied (except for the so-called 'maximum' ones) never exceed 25%
of the maximal force and it is known that under these values mainly type I fibres corre- sponding to ' tonic ' MUs are active (Gollnick et al. 1974). Therefore, the differences between the contraction times of the MUs recruited are within the range of indetermina- tion due to the bin width. Thus a single con- traction time (the interpeak interval) can be used to establish the relationship between the increase of active MUs and the resulting increase of force (Fig. 5).
(2.2) Force gradation during one move- ment When considering the curve of one averaged movement, a roughly linear relation- ship appears between recruitment and force for most of the SO range. However, the slope of the relationship is smaller at lower values of S-O, especially for rapid movements. Thus for a given condition of velocity and inertia the mechanical efficiency of the MU recruitment is decreasing while force increases. Among the factors which could contr ibute to this phe- nomenon the following might be considered: (i) a decreasing mechanical efficiency of the successive discharges of each MU due to the increased duration of interspike interval dur- ing the movement (Maton and Bouisset 1975); (ii) the potent iat ion of the excitation-contrac- tion processes that is known to occur only at the beginning of the burst of activity (Des- medt and Hainaut 1968}. However, the effect of tendinous elasticity on the summation of the twitches elicited by asynchronous im- pulses of different MUs cannot be excluded (Lind and Petrofsk.v 1978).
The decreasing mechanical eff iciency of MU recruitment could be counteracted b y the recruitment of more 'phasic' MUs, pro- ducing greater twitches. However, this effect could only be significant when type II fibres are recruited, i.e., for force values greater than 25% of the maximal force (Gollnick et al. 1974). This seems to be the case for a few movements plot ted in Figs. 4 and 5: the recruitment of more 'phasic' MUs could explain the slope decrease occurring in Fig. 4 at force values greater than 200--250 New- tons, and also the inflexion noticed near the

580 J. MARIANI ET AL.
peak force for so called 'maximum move- ments ' (Fig. 5).
(2.3) Force gradation f rom one m o v e m e n t to another For movements performed at dif- ferent velocities and inertias in the same experiment (Fig. 5) the number of MUs recruited at a given level of force is smaller when the inertia or the velocity increases. This rather unexpected but general (Fig. 6) result must be correlated with the finding that the firing frequency of each MU increases from one movement to another with both inertia and velocity of the movement (Maton and Bouisset 1975); however, one must also consider that a given value of force, reached in different movements, occurs at different states of mechanical efficiency, as quoted above.
The comparison between MU recruitment and force relations disclosed for movements performed at different velocities is valid since the force-velocity relation for this type of movement does not follow the classical Hill curve (Hill 1938; Wilkie 1950; Pertuzon and Bouisset 1973).
In conclusion, it appears that for anisome- tric anisotonic contractions the shape of force increase is mostly related to that of MU recruitment, although the absolute value of the force depends on both the firing fre- quency and the number of active MUs.
Summary
The density of spikes, or spike output (SO), recorded by means of 3 selective bifilar electrodes simultaneously implanted in the biceps brachii has been studied during elbow flexions performed against inertia and with a variable velocity (anisometric, anisotonic con- tractions). The total numbers of motor unit (MU) potentials were sequentially measured during intervals of 30 msec, and the force (F) values were calculated during the same inter- vals.
The SO obtained during movements of very similar mechanical characteristics was differ-
ent from one movement to another. However, when a small number of identical movements was summed, an average SO (~O) was obtained that was representative of the ' instantaneous' global activity of the biceps. Taking into account the respective values of the bin duration and of the interval between two successive potentials of a single MU, the increase of SO represents the recruitment of MU during the phase of force increase of the movement. Relations have been established between successive values of SO and F as well as between their peak values. From these rela- tions it is concluded that the shape of force increase in anisometric anisotonic conditions is mostly related to that of MU recruitment, although the absolute value of force depends on both the firing frequency and the number of active MUs.
R6sum6
Gradation de la force et activitd motr ice uni- taire au cours du m o u v e m e n t volontaire de l ' homme
L'activit6 des unit6s motrices (UM) du biceps brachii a 6t6 enregistr6e au moyen de 3 61ectrodes bifilaires s61ectives, lors de mouve- ments de flexion du coude effectu~s contre inertie et fi vitesse instantan6ment variable {contractions anisotoniques, anisom~triques). Le nombre total de potentiels d'UM ainsi que la force ont 6t6 mesur6s durant des intervalles de temps successifs de 30 msec.
La densit~ des potentiels d'UM (SO)mesu- r6e pendant des mouvements aux caract6ris- tiques m6caniques tr~s similaires peut diff~rer net tement d 'un mouvement fi un autre. Cependant la sommation d'un petit nombre de mouvements identiques conduit ~ un d6bit global moyenn~ (SO) repr6sentatif de l'acti- vit6 globale 'instantan6e' du biceps.
Compte tenu des valeurs respectives de la dur6e d'~chantillonage et de l'intervalle qui s6pare deux potentiels successifs d 'une m~me UM, l 'augmentation du SO repr6sente le

MOTOR UNIT ACTIVITY AND MOVEMENT 581
r e c r u t e m e n t d e s U M p e n d a n t la p h a s e d e m o n t 6 e d e f o r c e d u m o u v e m e n t . Des r e l a t i o n s o n t ~t6 6 t a b l i e s e n t r e les v a l e u r s succes s ives d u S O e t d e la f o r c e m o y e n n e ( F ) a ins i q u ' e n t r e les v a l e u r s m a x i m a l e s d e ces d e u x p a r a m ~ t r e s a u c o u r s d e s d i f f ~ r e n t s m o u v e m e n t s . D e l ' 6 t u d e d e ces r e l a t i o n s il p e u t ~ t r e c o n c l u q u ' a u c o u r s d e c o n t r a c t i o n s a n i s o t o n i q u e s a n i s o m ~ t r i q u e s , l ' 6 v o l u t i o n d e la f o r c e e s t e s s e n t i e l l e m e n t d e t e r m i n ~ e p a r la m a n i ~ r e d o n t s ' e f f e c t u e le r e c r u t e m e n t d e s UM. L a v a l e u r a b s o l u e d e la f o r c e d ~ p e n d q u a n t ~i e l le
la fois d u n o m b r e e t d e la f r ~ q u e n c e d e d ~ c h a r g e des UM a c t i v e s .
The authors wish to express their thanks to Miss M.C. Reymond and to J.R. Teilhac for skillful techni- cal assistance.
R e f e r e n c e s
Adrian, E.D. and Bronk, D.W. The discharge of im- pulses in motor nerves fibers. II. The frequency of discharge in reflex and voluntary contraction. J. Physiol. (Lond.), 1929, 67: 119--151.
Bigland, B. and Lippold, O.C.J. Motor unit activity in the voluntary contract ion of human muscles. J. Physiol. (Lond.), 1954, 125: 322--335.
Bouisset, S. EMG and muscle force in normal motor activities. In: J.E. Desmedt (Ed.), New Develop- ments in Electromyography and Clinical Neuro- physiology, Vol. 1. Karger, Basel, 1973: 547--583.
Bouisset, S. and Maton, B. The quantitative relation between surface and intramuscular electromyo- graphic activities for voluntary movement. Amer. J. Phys. Med., 1972, 51: 285--295.
Buchthal, F. and Schmalbruch, H. Contraction times and fibre types in intact human muscle. Acta phys- iol. scand., 1970, 79: 435--452.
Dasgupta, A. and Simpson, J.A. Relation between fir- ing frequency of motor units and muscle tension in the human. Electromyography, 1962, 2: 117--128.
Desmedt, J.E. and Godaux, E. Ballistic contractions in man: characteristic recruitment pat tern of single motor units of the tibialis anterior muscle. J. Phys- iol. (Lond.), 1977, 264: 673--693.
Desmedt, J.E. and Hainaut, K. Kinetics of myofila- ment activation in potent ia ted contract ion: stair- case phenomenon in human skeletal muscle. Na- ture (Lond.), 1968, 217: 529--532.
Dufosse, M., Decante, P. et Hanen, A. Syst~me d'ana- lyse des processus ponctuels simples et multiples.
Applicat ion ~ la neurophysiologie. Biomed. Com- put., 1975, 6: 249--291.
Freund, H.J., Budingen, H.J. and Dietz, V. Activity of single motor units from human forearm muscles during voluntary isometric contractions. J. Neuro- physiol., 1975, 38: 933--946.
Gillis, J.D. Motor unit discharge patterns during iso- metric contractions in man. J. Physiol. {Lond.), 1973, 223: 36--37.
Gilson, A.S. and Mills, W.B. Activities of single motor unit in man during slight voluntary efforts. Amer. J. Physiol., 1941, 133: 658--669.
Gollnick, P.D., Piehl, K. and Saltin, B. Selective gly- cogen depletion pattern in human muscle fibres after exercise of varying intensity and at varying rates. J. Physiol. (Lond.), 1974, 241: 45--57.
Gurfinkel, V.S., Mirsky, M.L., Tarko, A.M. and Surg- uladze, T.D. Functioning of human motor units during the initiation of muscle tension. Biofizika, 1972, 17: 303--310.
Gydikov, A., Kosarov, D. and Tankov, N. Studying the alpha motoneurone activity by investigating motor units of various sizes. Electromyography, 1972, 12: 99--117.
Hill, A.V. The heat of shortening and the dynamic constants of muscle. Proc. roy. soc. B, 1938, 126: 136--195.
Inman, V.T., Ralston, H.J., Saunders, J.B., Feinstein, B. and Wright, E.W. Relation of human electromy- ogram to muscular tension. Electroenceph. clin. Neurophysiol. , 1952, 4: 187--194.
Lind, A.R. and Petrofsky, J.S. Isometric tension from rotary stimulation of fast and slow cat muscles. Muscle and Nerve, 1978, 1: 213--218.
Maton, B. Activit6s des U.M. au cours de la contrac- tion isom6trique anisotonique volontaire. J. Phys- iol. (Paris), 1974, 69: 164--165A.
Maton, B. Motor unit differentiation and integrated surface EMG in voluntary isometric contraction. Europ. J. appl. Physiol., 1976, 35: 149--157.
Maton, B. Fr~quence et recrutement des unit6s mo- trices du muscle biceps brachial au cours du travail statique chez l 'homme normal. J. Physiol. {Paris), 1977, 73: 177--199.
Maton, B. and Bouisset, S. Motor unit activity and preprogramming of movement in man. Electroen- ceph. clin. Neurophysiol. , 1975, 38: 658--660.
Maton, B., Bouisset, S. et Metral, S. Comparaison des activit6s 61ectromyographiques globale et 616men- taire au cours de la contraction statique volontaire. Electromyography, 1969, 9: 311--323.
Milner-Brown, H.S., Stein, R.B. and Yemm, R. The contractile properties of human motor units dur- ing voluntary isometric contractions. J. Physiol. (Lond.), 1973a, 228: 285--306.
Milner-Brown, H.S., Stein, R.B. and Yemm, R. The orderly recruitment of human motor units during

582 J. MARIANI ET AL.
voluntary isometric contractions. J. Physiol. (Lond.), 1973b, 230: 359--370.
Milner-Brown, H.S., Stein, R.B. and Yemm, R. Changes in firing rate of human motor units during linearly changing voluntary contractions. J. Phys- iol. (Lond.), 1973c, 230: 371--390.
Monster, A.W. and Chan, H. The isometric force pro- duction by motor units of extensor digitorum communis muscle in man. J. Neurophysiol., 1977, 40: 1432--1443.
Pertuzon, E. and Bouisset, S. Instantaneous force-ve- locity relation in human muscle. Biomechanics, 1973, 8: 230--234.
Scherrer, J. et Monod, H. Le travail musculaire local et la fatigue chez l 'homme. J. Physiol. (Paris),
1960, 52: 419--501. Seyffarth, H. The behaviour of motor units in healthy
and paretic muscles in man (Part II). Acta psy- chiat, neurol., 1941, 16: 261--277.
Tanji, J. and Kato, M. Recruitment of motor units in voluntary contraction of a finger muscle in man. Exp. Neuro]., 1973a, 40: 759--770.
Tanji, J. and Kato, M. Firing rate of individual motor units in voluntary contraction of abductor digiti minimi muscle in man. Exp. Neurol., 1973b, 40: 771--783.
Wilkie, D.R. The relation between force and velocity in human muscle. J. Physiol. (Lond.), 1950, 110: 249--280.