Beamformer Source Analysis and Connectivity on Concurrent EEG and MEG Data during Voluntary...
10
Beamformer Source Analysis and Connectivity on Concurrent EEG and MEG Data during Voluntary Movements Muthuraman Muthuraman 1 *, Helge Hellriegel 1 , Nienke Hoogenboom 3 , Abdul Rauf Anwar 1,2 , Kidist Gebremariam Mideksa 1,2 , Holger Krause 3 , Alfons Schnitzler 3 , Gu ¨ nther Deuschl 1 , Jan Raethjen 1 1 Department of Neurology, Christian-Albrechts-University, Kiel, Germany, 2 Institute for Circuit and System Theory, Christian-Albrechts-University, Kiel, Germany, 3 Department of Neurology, Heinrich-Heine University, Dusseldorf, Germany Abstract Electroencephalography (EEG) and magnetoencephalography (MEG) are the two modalities for measuring neuronal dynamics at a millisecond temporal resolution. Different source analysis methods, to locate the dipoles in the brain from which these dynamics originate, have been readily applied to both modalities alone. However, direct comparisons and possible advantages of combining both modalities have rarely been assessed during voluntary movements using coherent source analysis. In the present study, the cortical and sub-cortical network of coherent sources at the finger tapping task frequency (2–4 Hz) and the modes of interaction within this network were analysed in 15 healthy subjects using a beamformer approach called the dynamic imaging of coherent sources (DICS) with subsequent source signal reconstruction and renormalized partial directed coherence analysis (RPDC). MEG and EEG data were recorded simultaneously allowing the comparison of each of the modalities separately to that of the combined approach. We found the identified network of coherent sources for the finger tapping task as described in earlier studies when using only the MEG or combined MEG+EEG whereas the EEG data alone failed to detect single sub-cortical sources. The signal-to-noise ratio (SNR) level of the coherent rhythmic activity at the tapping frequency in MEG and combined MEG+EEG data was significantly higher than EEG alone. The functional connectivity analysis revealed that the combined approach had more active connections compared to either of the modalities during the finger tapping (FT) task. These results indicate that MEG is superior in the detection of deep coherent sources and that the SNR seems to be more vital than the sensitivity to theoretical dipole orientation and the volume conduction effect in the case of EEG. Citation: Muthuraman M, Hellriegel H, Hoogenboom N, Anwar AR, Mideksa KG, et al. (2014) Beamformer Source Analysis and Connectivity on Concurrent EEG and MEG Data during Voluntary Movements. PLoS ONE 9(3): e91441. doi:10.1371/journal.pone.0091441 Editor: Francesco Di Russo, University of Rome, Italy Received October 9, 2013; Accepted February 12, 2014; Published March 11, 2014 Copyright: ß 2014 Muthuraman et al. This is an open-access article distributed under the terms of the Creative Commons Attribution License, which permits unrestricted use, distribution, and reproduction in any medium, provided the original author and source are credited. Funding: This work was supported by Sonderforschungsbereich (SFB) 855, Project D2. The funders had no role in study design, data collection and analysis, decision to publish, or preparation of the manuscript. Competing Interests: The authors have declared that no competing interests exist. * E-mail: [email protected] Introduction EEG and MEG are two non-invasive techniques with a high temporal resolution for imaging the neuronal activity in the brain. The integration of both these modalities have been shown to be more advantageous than using them separately in previous studies [1–10]. The differences in SNR and sensitivity for MEG and/or EEG have been examined [11–14] either in pure simulations or simulated data from real recordings. Especially in MEG, the sensitivity is different for systems with only magnetometers or gradiometers (planar or axial) [15,16]. It is well established that MEG recordings yield higher signal-to-noise ratios than EEG recordings whereas its sensitivity to more radially oriented dipoles is minimal which could be a disadvantage especially for detecting deep sub-cortical sources [17,18]. However, in coherent source analysis approaches it has been clearly shown that MEG is able to detect oscillatory network components even in the thalamic region [19,20]. In previous studies direct comparisons between MEG, EEG and the combination of the two are lacking for such coherent source analysis. Thus, it is not clear if the better SNR of MEG data improves the lack of sensitivity to the more radially oriented dipoles in deep brain structures. We chose a voluntary task like the finger tapping task, a well-defined task in which the central networks that are involved are well described [21–24]. This allowed us to assess the quality of the source analyses performed on MEG, EEG and the combination of the two modalities. In order to detect the oscillatory central networks involved in this task, we computed coherence between simultaneously recorded 128-channel EEG with 306 MEG and forearm electromyography (EMG) and performed coherent source analysis using DICS [19]. In the next step, we analysed the direction of information flow between the source signals using the RPDC [25]. Both methods are well established and have been extensively applied on EEG and MEG data [19,20,24–28]. Subjects and Methods 2.1 Subjects Eight male and seven female healthy volunteers participated in this study. All gave written informed consent. The study was PLOS ONE | www.plosone.org 1 March 2014 | Volume 9 | Issue 3 | e91441
-
Upload
independent -
Category
Documents
-
view
1 -
download
0
Transcript of Beamformer Source Analysis and Connectivity on Concurrent EEG and MEG Data during Voluntary...
Beamformer Source Analysis and Connectivity onConcurrent EEG and MEG Data during VoluntaryMovementsMuthuraman Muthuraman1*, Helge Hellriegel1, Nienke Hoogenboom3, Abdul Rauf Anwar1,2, Kidist
Gebremariam Mideksa1,2, Holger Krause3, Alfons Schnitzler3, Gunther Deuschl1, Jan Raethjen1
1 Department of Neurology, Christian-Albrechts-University, Kiel, Germany, 2 Institute for Circuit and System Theory, Christian-Albrechts-University, Kiel, Germany,
3 Department of Neurology, Heinrich-Heine University, Dusseldorf, Germany
Abstract
Electroencephalography (EEG) and magnetoencephalography (MEG) are the two modalities for measuring neuronaldynamics at a millisecond temporal resolution. Different source analysis methods, to locate the dipoles in the brain fromwhich these dynamics originate, have been readily applied to both modalities alone. However, direct comparisons andpossible advantages of combining both modalities have rarely been assessed during voluntary movements using coherentsource analysis. In the present study, the cortical and sub-cortical network of coherent sources at the finger tapping taskfrequency (2–4 Hz) and the modes of interaction within this network were analysed in 15 healthy subjects using abeamformer approach called the dynamic imaging of coherent sources (DICS) with subsequent source signal reconstructionand renormalized partial directed coherence analysis (RPDC). MEG and EEG data were recorded simultaneously allowing thecomparison of each of the modalities separately to that of the combined approach. We found the identified network ofcoherent sources for the finger tapping task as described in earlier studies when using only the MEG or combined MEG+EEGwhereas the EEG data alone failed to detect single sub-cortical sources. The signal-to-noise ratio (SNR) level of the coherentrhythmic activity at the tapping frequency in MEG and combined MEG+EEG data was significantly higher than EEG alone.The functional connectivity analysis revealed that the combined approach had more active connections compared to eitherof the modalities during the finger tapping (FT) task. These results indicate that MEG is superior in the detection of deepcoherent sources and that the SNR seems to be more vital than the sensitivity to theoretical dipole orientation and thevolume conduction effect in the case of EEG.
Citation: Muthuraman M, Hellriegel H, Hoogenboom N, Anwar AR, Mideksa KG, et al. (2014) Beamformer Source Analysis and Connectivity on Concurrent EEGand MEG Data during Voluntary Movements. PLoS ONE 9(3): e91441. doi:10.1371/journal.pone.0091441
Editor: Francesco Di Russo, University of Rome, Italy
Received October 9, 2013; Accepted February 12, 2014; Published March 11, 2014
Copyright: � 2014 Muthuraman et al. This is an open-access article distributed under the terms of the Creative Commons Attribution License, which permitsunrestricted use, distribution, and reproduction in any medium, provided the original author and source are credited.
Funding: This work was supported by Sonderforschungsbereich (SFB) 855, Project D2. The funders had no role in study design, data collection and analysis,decision to publish, or preparation of the manuscript.
Competing Interests: The authors have declared that no competing interests exist.
* E-mail: [email protected]
Introduction
EEG and MEG are two non-invasive techniques with a high
temporal resolution for imaging the neuronal activity in the brain.
The integration of both these modalities have been shown to be
more advantageous than using them separately in previous studies
[1–10]. The differences in SNR and sensitivity for MEG and/or
EEG have been examined [11–14] either in pure simulations or
simulated data from real recordings. Especially in MEG, the
sensitivity is different for systems with only magnetometers or
gradiometers (planar or axial) [15,16]. It is well established that
MEG recordings yield higher signal-to-noise ratios than EEG
recordings whereas its sensitivity to more radially oriented dipoles
is minimal which could be a disadvantage especially for detecting
deep sub-cortical sources [17,18]. However, in coherent source
analysis approaches it has been clearly shown that MEG is able to
detect oscillatory network components even in the thalamic region
[19,20]. In previous studies direct comparisons between MEG,
EEG and the combination of the two are lacking for such coherent
source analysis. Thus, it is not clear if the better SNR of MEG data
improves the lack of sensitivity to the more radially oriented
dipoles in deep brain structures. We chose a voluntary task like the
finger tapping task, a well-defined task in which the central
networks that are involved are well described [21–24]. This
allowed us to assess the quality of the source analyses performed
on MEG, EEG and the combination of the two modalities. In
order to detect the oscillatory central networks involved in this
task, we computed coherence between simultaneously recorded
128-channel EEG with 306 MEG and forearm electromyography
(EMG) and performed coherent source analysis using DICS [19].
In the next step, we analysed the direction of information flow
between the source signals using the RPDC [25]. Both methods
are well established and have been extensively applied on EEG
and MEG data [19,20,24–28].
Subjects and Methods
2.1 SubjectsEight male and seven female healthy volunteers participated in
this study. All gave written informed consent. The study was
PLOS ONE | www.plosone.org 1 March 2014 | Volume 9 | Issue 3 | e91441
approved by the Ethics Committee, Medical Faculty, University of
Kiel. Age ranged from 23 to 39 yr. (mean: 29.8165.25). All were
right handed. Subjects were seated in a comfortable chair in a
slightly reclined position. Both forearms were supported by firm
armrests up to the wrist joints. The hands were held outstretched
against gravity, and the subjects were asked to keep their eyes open
and fixed on a point about 2 m away.
Muscle activity was recorded by surface electromyography from
the right hand forearm flexors and extensors using silver chloride
electrodes. MEG and EEG were recorded simultaneously using an
Elekta Neuromag system. The EEG data was recorded with 128
electrodes, the MEG data from 306 sensors containing a triple
sensor array, which optimally combines the focal sensitivity of 204
planar gradiometers and the widespread sensitivity of 102
magnetometers. Data were stored in a computer and analyzed
off-line. Individual recordings were of 4 to 5 minutes duration.
The subjects were asked to perform a rhythmic right index finger
tapping movement in a self-paced manner. The rhythmic
movements were checked for each subject by looking at the
EMG activity online to have at least 2–4 bursts per second.
2.2 Data Pre-processingThe simultaneous recording of MEG, EEG and EMG were
sampled at 1000 Hz and band-pass filtered (EMG 30–200 Hz;
MEG and EEG 0.05–200 Hz). EMG was full-wave rectified; the
combination of band-pass filtering and rectification is the common
demodulation procedure for tremor EMG [29]. Due to some
recent differences in opinion about the rectification of the EMG
signals as mentioned in [30–32], we estimated the EMG power
spectrum with and without rectification and also cortico-muscular
coherence with a single EEG/MEG channel on the contralateral
motor cortex (e.g., C3/MEG 0231). Each record was segmented
into a number of 1 s - long high-quality epochs (L) discarding all
those data sections with visible artifacts. For each task, depending
on the length (N) of the recording and the quality of the data,
between 250 to 260 1-s segments (M) were used for analysis such
that N = LM.
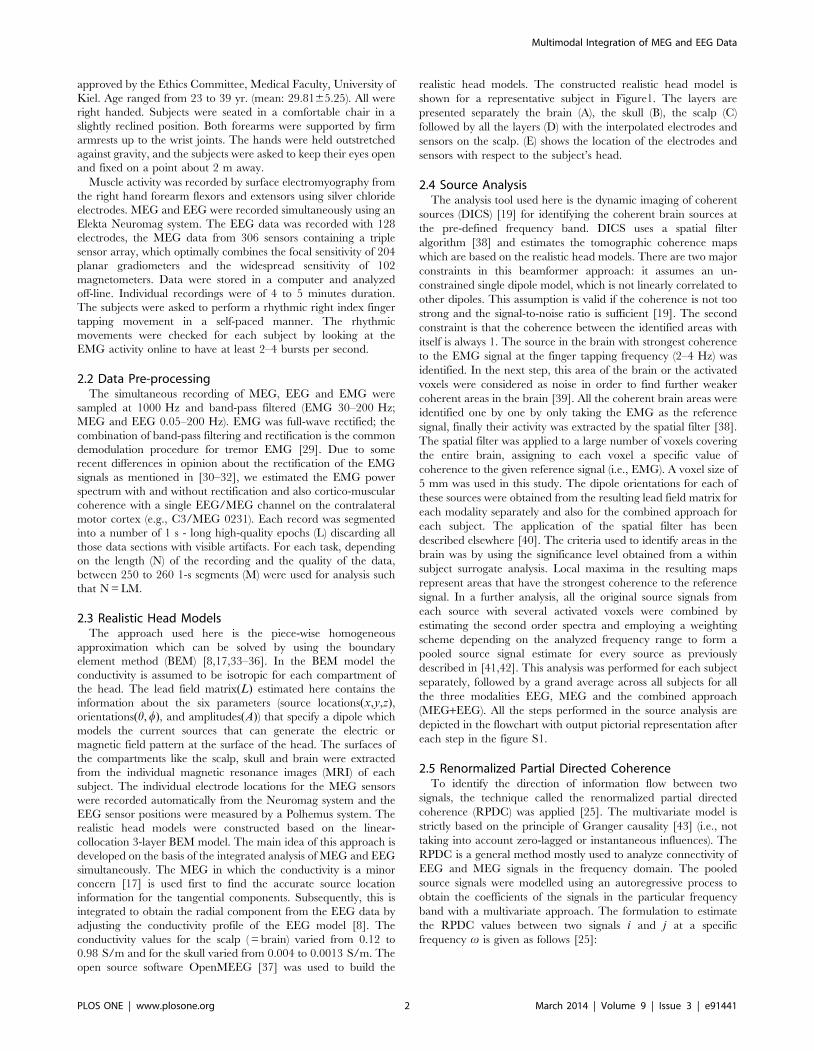
2.3 Realistic Head ModelsThe approach used here is the piece-wise homogeneous
approximation which can be solved by using the boundary
element method (BEM) [8,17,33–36]. In the BEM model the
conductivity is assumed to be isotropic for each compartment of
the head. The lead field matrix(L) estimated here contains the
information about the six parameters (source locations(x,y,z),orientations(h, w), and amplitudes(A)) that specify a dipole which
models the current sources that can generate the electric or
magnetic field pattern at the surface of the head. The surfaces of
the compartments like the scalp, skull and brain were extracted
from the individual magnetic resonance images (MRI) of each
subject. The individual electrode locations for the MEG sensors
were recorded automatically from the Neuromag system and the
EEG sensor positions were measured by a Polhemus system. The
realistic head models were constructed based on the linear-
collocation 3-layer BEM model. The main idea of this approach is
developed on the basis of the integrated analysis of MEG and EEG
simultaneously. The MEG in which the conductivity is a minor
concern [17] is used first to find the accurate source location
information for the tangential components. Subsequently, this is
integrated to obtain the radial component from the EEG data by
adjusting the conductivity profile of the EEG model [8]. The
conductivity values for the scalp ( = brain) varied from 0.12 to
0.98 S/m and for the skull varied from 0.004 to 0.0013 S/m. The
open source software OpenMEEG [37] was used to build the
realistic head models. The constructed realistic head model is
shown for a representative subject in Figure1. The layers are
presented separately the brain (A), the skull (B), the scalp (C)
followed by all the layers (D) with the interpolated electrodes and
sensors on the scalp. (E) shows the location of the electrodes and
sensors with respect to the subject’s head.
2.4 Source AnalysisThe analysis tool used here is the dynamic imaging of coherent
sources (DICS) [19] for identifying the coherent brain sources at
the pre-defined frequency band. DICS uses a spatial filter
algorithm [38] and estimates the tomographic coherence maps
which are based on the realistic head models. There are two major
constraints in this beamformer approach: it assumes an un-
constrained single dipole model, which is not linearly correlated to
other dipoles. This assumption is valid if the coherence is not too
strong and the signal-to-noise ratio is sufficient [19]. The second
constraint is that the coherence between the identified areas with
itself is always 1. The source in the brain with strongest coherence
to the EMG signal at the finger tapping frequency (2–4 Hz) was
identified. In the next step, this area of the brain or the activated
voxels were considered as noise in order to find further weaker
coherent areas in the brain [39]. All the coherent brain areas were
identified one by one by only taking the EMG as the reference
signal, finally their activity was extracted by the spatial filter [38].
The spatial filter was applied to a large number of voxels covering
the entire brain, assigning to each voxel a specific value of
coherence to the given reference signal (i.e., EMG). A voxel size of
5 mm was used in this study. The dipole orientations for each of
these sources were obtained from the resulting lead field matrix for
each modality separately and also for the combined approach for
each subject. The application of the spatial filter has been
described elsewhere [40]. The criteria used to identify areas in the
brain was by using the significance level obtained from a within
subject surrogate analysis. Local maxima in the resulting maps
represent areas that have the strongest coherence to the reference
signal. In a further analysis, all the original source signals from
each source with several activated voxels were combined by
estimating the second order spectra and employing a weighting
scheme depending on the analyzed frequency range to form a
pooled source signal estimate for every source as previously
described in [41,42]. This analysis was performed for each subject
separately, followed by a grand average across all subjects for all
the three modalities EEG, MEG and the combined approach
(MEG+EEG). All the steps performed in the source analysis are
depicted in the flowchart with output pictorial representation after
each step in the figure S1.
2.5 Renormalized Partial Directed CoherenceTo identify the direction of information flow between two
signals, the technique called the renormalized partial directed
coherence (RPDC) was applied [25]. The multivariate model is
strictly based on the principle of Granger causality [43] (i.e., not
taking into account zero-lagged or instantaneous influences). The
RPDC is a general method mostly used to analyze connectivity of
EEG and MEG signals in the frequency domain. The pooled
source signals were modelled using an autoregressive process to
obtain the coefficients of the signals in the particular frequency
band with a multivariate approach. The formulation to estimate
the RPDC values between two signals i and j at a specific
frequency v is given as follows [25]:
Multimodal Integration of MEG and EEG Data
PLOS ONE | www.plosone.org 2 March 2014 | Volume 9 | Issue 3 | e91441
Dpi/j(v)D~Aij(v)ffiffiffiffiffiffiffiffiffiffiffiffiffiffiffiffiffiffiffiffiffiffiffiffiP
k
DAAik(v)D2r ð1Þ
In the above equation the numeratorAij(v) is the estimated
autoregressive coefficient from j to i at a certain frequency band .
The denominator AAik(v) also gives the autoregressive coefficients
at the same frequency band v from i to all other k signals, that is,
RPDC ranks the interaction strength with respect to the given
target signal.
The optimal model order needs to be chosen which was
estimated by minimizing the Akaike Information Criterion (AIC).
This order indicates the ideal number of coefficients that need to
be estimated [44,45]. The AIC is a measure of the relative
goodness of fit which has the minimum loss of information for a
resulting statistical model with an optimal order [45]. The
bootstrapping method [46] was used to calculate the significance
level on the applied data after the estimation of the RPDC values.
In the bootstrapping method [46,47] we divided the original time
series into smaller non-overlapping segments of equal size. The
smaller windows are shuffled randomly and then concatenated.
This process was repeated 100 times and the 99th percentile was
taken as the threshold or significance value. The concatenated
time series has the same power spectrum as that of the original
time series, however all the coherence and directionality is lost. In
addition, the significant connections were tested with a time
reversal technique only for the EEG modality. In order to justify
that the shown connections were due to the strong symmetry
present in the data and not due to any volume conduction effects
[48]. The open source Matlab (The MatWorks Inc., Natick, MA,
USA) package ARFIT [49,50] was used for estimating the
autoregressive coefficients from the spatially filtered source signals.
2.6 Signal-to-noise Ratio AnalysisThe scalp level relative SNR was estimated for both the
modalities separately from the power spectrum of each of the
electrodes/sensors. The signal is defined by the peak finger
tapping frequency (2–4 Hz) in this task. In order to use a session-
specific noise [14] then the noise was estimated from another
recording where the same subjects open their eyes without
performing any task. The noise level is then defined as the power
in the frequency band (2–4 Hz). The same number of sensors was
selected from MEG and corresponding EEG electrodes to have a
direct comparison of the SNR values. In total 15 electrodes/
sensors were selected for the finger tapping task from the
contralateral motor cortex region in the scalp. At the end, the
mean SNR was estimated from the 15 electrodes/sensors for both
the modalities separately. The selection of the electrodes and
sensors was done by estimating the Euclidean distance between the
EEG electrodes and the corresponding MEG sensors (selected by
Figure 1. For a representative single subject, the created realistic head model is shown. The layers are represented separately the brain(A), the skull (B), the scalp (C) followed by all the layers (D) with the interpolated electrodes and sensors on the scalp with transparent sections. (E)shows the location of the electrodes and sensors with respect to the subject’s head.doi:10.1371/journal.pone.0091441.g001
Multimodal Integration of MEG and EEG Data
PLOS ONE | www.plosone.org 3 March 2014 | Volume 9 | Issue 3 | e91441
visualization in the forward model). A sphere with the radius of
40 mm was considered with the center being the EEG-C3
electrode on the scalp. In this analysis, 15 electrodes were selected
surrounding the C3 electrode. The criterion was to meet the
Euclidean distance, = 20 mm between the EEG channels and
corresponding MEG sensors. The source level SNR was estimated
by taking the pooled source signals from the identified sources in
each modality separately, instead of the electrodes/sensors signals.
In case of the combined approach, the SNR was calculated by
normalization of the pooled source/scalp signals to their individual
noise amplitudes, yielding unit-free measures for both EEG and
MEG [10]. The individual noise amplitudes were estimated from
the eyes open recording for each individual subject at the
frequency band (2–4 Hz).
2.7 Time Frequency AnalysisThis analysis was performed to find the time segments with
higher significant coherence between the EEG/MEG electrodes
and the EMG. The dynamics of the cortico-muscular coherence
was estimated by the multitaper method [51]. In this method the
signals are multiplied initially with different windows (i.e., tapers)
(K = 7). The length of the window used in this analysis is 1000 ms.
The time step used was 50 ms with overlapping windows of
950 ms, a coherence value is calculated every 50 ms and the
frequency resolution is approximately 1 Hz. A 95% overlapping
corresponds to a time resolution of approximately 50 ms. The
complete description of this method is explained elsewhere [52]. In
the subsequent analysis, all the coherence estimates of the
significantly coherent EEG/MEG electrodes (selected 15 elec-
trodes/sensors) with the EMG were combined to get a pooled
coherence estimate as described earlier in the source analysis
section. From the pooled estimate, the time segments (FT-mean:
10062.4;) were chosen with coherence values greater than (mean+std) for the whole recorded data length. Source analysis was
repeated on these time segments for the case of EEG modality only
to see whether the analysis identifies sub-cortical sources.
2.8 Statistical AnalysisThe total data length between the subjects was tested with a
non-parametric Friedman test for dependent samples (n = 15,
a= 0.01). The significance of the sources were tested by a within
subject surrogate analysis. The surrogates were estimated by a
Monte Carlo random permutation, i.e., 100 times shuffling of one
second segments within each subject. The p-value was estimated
for each of these 100 random permutations and the 99th percentile
value of each source for all these permutations is taken as the final
threshold.
Next, the voxel co-ordinates of the identified sources with the
maximum coherence were compared to that of the reference voxel
within the same modality. A reference voxel for each of the
identified sources was determined in the MNI co-ordinate system
for the finger tapping task; [primary sensory motor cortex -
PSMC: (256.0, 214.0, 41.0); premotor cortex – PMC: (227.0,
46.0, 32.0); supplementary motor area – SMA: (214.0, 24.0,
44.0); posterior parietal cortex – PPC: (246.0, 271.0, 35.0);
thalamus – TH: (25.0, 216.0, 8.0); cerebellum – CER: (13.0, 2
76.0, 251.0)]. The euclidean distance was estimated between the
reference voxel and the maximum coherent voxel. In the further
analysis, the euclidean distance was estimated between the
different modalities, for each of the sources, to compare the
difference in the source location (e.g. EEG vs. MEG; EEG vs.
EEG+MEG; MEG vs. EEG+MEG). The chi-square variance test
was used by defining the category with the minimum distance as
zero and the maximum depending on the calculated distance in
each combination. Bonferroni correction was done. For three
comparisons the level of significance would drop from 0.05 to
0.017 between all three combinations (EEG vs. MEG; EEG vs.
EEG+MEG and MEG vs. EEG+MEG).
Finally, the source coherence values and the source signal SNR
values (n = 15, a= 0.01) for each of the modalities were tested for
significance using the multifactorial analysis of variance (AN-
OVA), within-subject factors being the sources (n = 4 sources:
EEG), (n = 6 sources: MEG and EEG+MEG) and the between
subject factor being the modalities (n = 3: EEG, MEG, EEG+MEG). The scalp level SNR between the modalities (EEG vs.
MEG) was tested using a non-parametric Friedman test for
dependent samples (n = 15, a= 0.01). The mean SNR values of
the selected 15 electrodes were compared with the SNR values of
the pooled coherence estimate of the time segments with the
highest coherence value. These values were tested with a non-
parametric Friedman test for dependent samples (n = 15, a= 0.01).
The RPDC values (n = 15, a= 0.01) between the pooled source
signals were tested for significance using the multifactorial
ANOVA, within-subject factors being the connections of the
pooled source signals (n = 12 connections: EEG), (n = 30 connec-
tions: MEG and EEG+MEG) and the between subject factor being
the modalities (n = 3: EEG, MEG, EEG+MEG). The Bonferroni
correction was performed for all the post-hoc test which involved
multiple comparisons.
Results
3.1 EEG/MEG-EMG CoherenceThe data length within the subjects was not significantly
different (p = 0.423). Power spectral analysis on the EMG activity
of all the subjects showed a dominant peak at the frequency range
(2–4 Hz; mean: 2.9360.70). The cortico-muscular coherence did
not differ either in the frequency or in amplitude for both EMG
signals with or without rectification. At the above mentioned
frequency, all subjects exhibited significant coherence between
EMG and EEG/MEG electrodes or sensors covering the region of
the contralateral sensorimotor cortex.
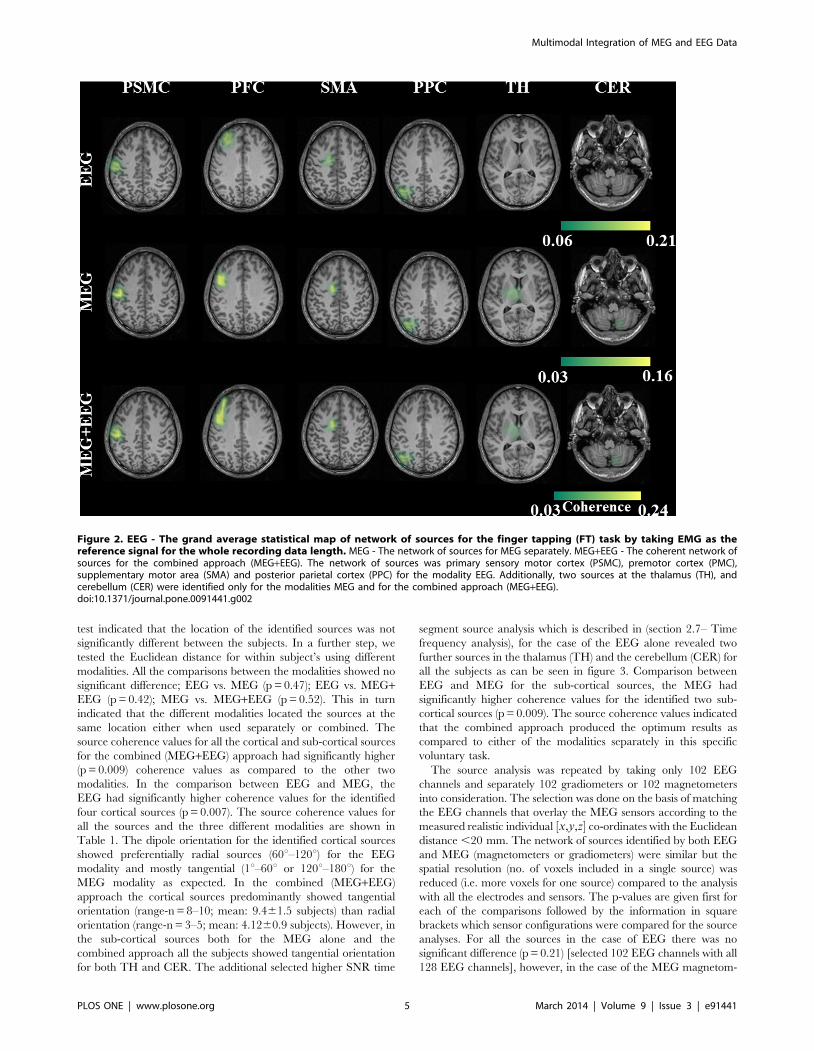
3.2 Network of SourcesIn all the healthy subjects the network of sources were identified
for each of these modalities first separately and then combined.
For the EEG modality, the network for the finger tapping
frequency consisted of the PSMC (primary sensory motor cortex)
Brodmann area (BA) 3, PFC (prefrontal/premotor cortex) BA 6,
proper-SMA (supplementary motor area) BA 6 and the PPC
(posterior parietal cortex) BA 7 as shown in figure 2. The network
for the MEG modality included the first four cortical sources seen
in EEG and additional two sub-cortical sources; the thalamus (TH)
BA 23 and the cerebellum (CER) in the posterior lobe (right lobule
V) (Figure 2). The network for the combined (MEG+EEG)
modality also consisted of similar network as that of the MEG
modality. This is illustrated in figure 2 group statistics maps of the
healthy subjects. All of these identified sources were statistically
significant (p = 0.003) in a Monte Carlo random permutation test
across all subjects within each modality. For the between subjects
same modality test, the euclidean distance of the sources with the
reference source was not statistically different for all the sources in
all the three modalities; PSMC (EEG-p = 0.76; MEG-p = 0.35;
MEG+EEG-p = 0.42); PMC (EEG-p = 0.65; MEG-p = 0.74;
MEG+EEG-p = 0.21); SMA (EEG-p = 0.56; MEG-p = 0.63;
MEG+EEG-p = 0.4); PPC (EEG-p = 0.49; MEG-p = 0.57;
MEG+EEG-p = 0.62); TH (MEG-p = 0.28; MEG+EEG-
p = 0.19); CER (MEG-p = 0.35; MEG+EEG-p = 0.45). Thus, this
Multimodal Integration of MEG and EEG Data
PLOS ONE | www.plosone.org 4 March 2014 | Volume 9 | Issue 3 | e91441
test indicated that the location of the identified sources was not
significantly different between the subjects. In a further step, we
tested the Euclidean distance for within subject’s using different
modalities. All the comparisons between the modalities showed no
significant difference; EEG vs. MEG (p = 0.47); EEG vs. MEG+EEG (p = 0.42); MEG vs. MEG+EEG (p = 0.52). This in turn
indicated that the different modalities located the sources at the
same location either when used separately or combined. The
source coherence values for all the cortical and sub-cortical sources
for the combined (MEG+EEG) approach had significantly higher
(p = 0.009) coherence values as compared to the other two
modalities. In the comparison between EEG and MEG, the
EEG had significantly higher coherence values for the identified
four cortical sources (p = 0.007). The source coherence values for
all the sources and the three different modalities are shown in
Table 1. The dipole orientation for the identified cortical sources
showed preferentially radial sources (60u–120u) for the EEG
modality and mostly tangential (1u–60u or 120u–180u) for the
MEG modality as expected. In the combined (MEG+EEG)
approach the cortical sources predominantly showed tangential
orientation (range-n = 8–10; mean: 9.461.5 subjects) than radial
orientation (range-n = 3–5; mean: 4.1260.9 subjects). However, in
the sub-cortical sources both for the MEG alone and the
combined approach all the subjects showed tangential orientation
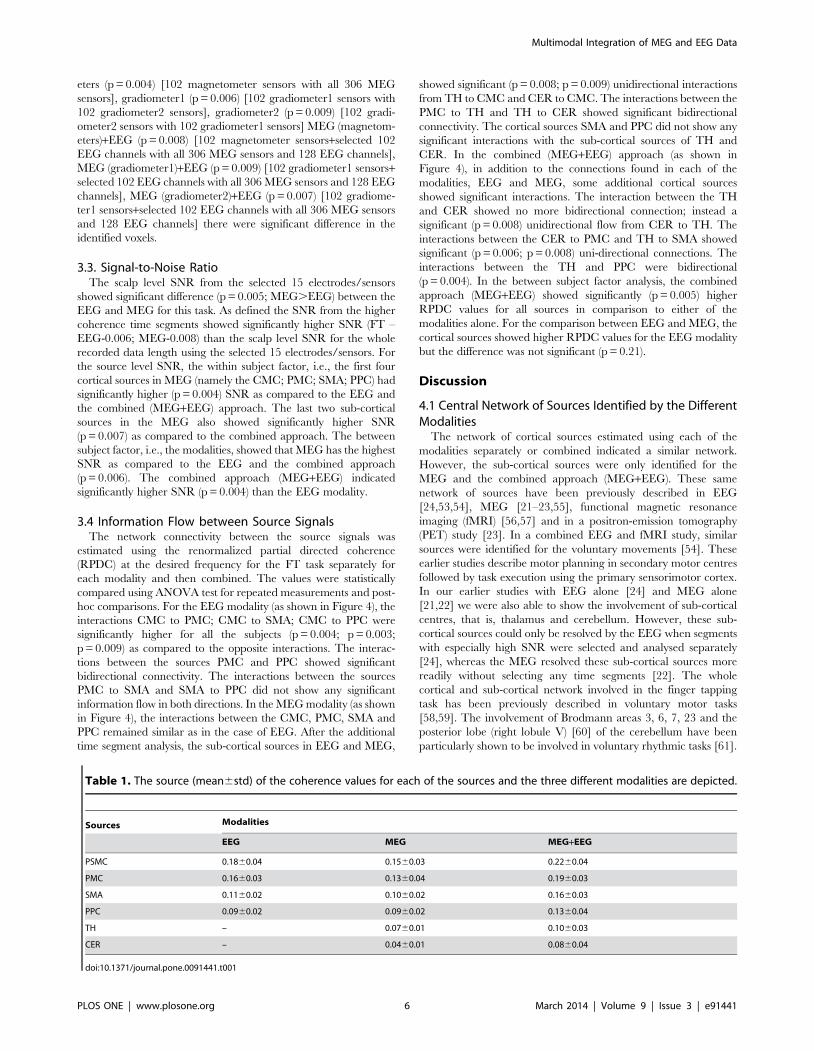
for both TH and CER. The additional selected higher SNR time
segment source analysis which is described in (section 2.7– Time
frequency analysis), for the case of the EEG alone revealed two
further sources in the thalamus (TH) and the cerebellum (CER) for
all the subjects as can be seen in figure 3. Comparison between
EEG and MEG for the sub-cortical sources, the MEG had
significantly higher coherence values for the identified two sub-
cortical sources (p = 0.009). The source coherence values indicated
that the combined approach produced the optimum results as
compared to either of the modalities separately in this specific
voluntary task.
The source analysis was repeated by taking only 102 EEG
channels and separately 102 gradiometers or 102 magnetometers
into consideration. The selection was done on the basis of matching
the EEG channels that overlay the MEG sensors according to the
measured realistic individual ½x,y,z� co-ordinates with the Euclidean
distance ,20 mm. The network of sources identified by both EEG
and MEG (magnetometers or gradiometers) were similar but the
spatial resolution (no. of voxels included in a single source) was
reduced (i.e. more voxels for one source) compared to the analysis
with all the electrodes and sensors. The p-values are given first for
each of the comparisons followed by the information in square
brackets which sensor configurations were compared for the source
analyses. For all the sources in the case of EEG there was no
significant difference (p = 0.21) [selected 102 EEG channels with all
128 EEG channels], however, in the case of the MEG magnetom-
Figure 2. EEG - The grand average statistical map of network of sources for the finger tapping (FT) task by taking EMG as thereference signal for the whole recording data length. MEG - The network of sources for MEG separately. MEG+EEG - The coherent network ofsources for the combined approach (MEG+EEG). The network of sources was primary sensory motor cortex (PSMC), premotor cortex (PMC),supplementary motor area (SMA) and posterior parietal cortex (PPC) for the modality EEG. Additionally, two sources at the thalamus (TH), andcerebellum (CER) were identified only for the modalities MEG and for the combined approach (MEG+EEG).doi:10.1371/journal.pone.0091441.g002
Multimodal Integration of MEG and EEG Data
PLOS ONE | www.plosone.org 5 March 2014 | Volume 9 | Issue 3 | e91441
eters (p = 0.004) [102 magnetometer sensors with all 306 MEG
sensors], gradiometer1 (p = 0.006) [102 gradiometer1 sensors with
102 gradiometer2 sensors], gradiometer2 (p = 0.009) [102 gradi-
ometer2 sensors with 102 gradiometer1 sensors] MEG (magnetom-
eters)+EEG (p = 0.008) [102 magnetometer sensors+selected 102
EEG channels with all 306 MEG sensors and 128 EEG channels],
MEG (gradiometer1)+EEG (p = 0.009) [102 gradiometer1 sensors+selected 102 EEG channels with all 306 MEG sensors and 128 EEG
channels], MEG (gradiometer2)+EEG (p = 0.007) [102 gradiome-
ter1 sensors+selected 102 EEG channels with all 306 MEG sensors
and 128 EEG channels] there were significant difference in the
identified voxels.
3.3. Signal-to-Noise RatioThe scalp level SNR from the selected 15 electrodes/sensors
showed significant difference (p = 0.005; MEG.EEG) between the
EEG and MEG for this task. As defined the SNR from the higher
coherence time segments showed significantly higher SNR (FT –
EEG-0.006; MEG-0.008) than the scalp level SNR for the whole
recorded data length using the selected 15 electrodes/sensors. For
the source level SNR, the within subject factor, i.e., the first four
cortical sources in MEG (namely the CMC; PMC; SMA; PPC) had
significantly higher (p = 0.004) SNR as compared to the EEG and
the combined (MEG+EEG) approach. The last two sub-cortical
sources in the MEG also showed significantly higher SNR
(p = 0.007) as compared to the combined approach. The between
subject factor, i.e., the modalities, showed that MEG has the highest
SNR as compared to the EEG and the combined approach
(p = 0.006). The combined approach (MEG+EEG) indicated
significantly higher SNR (p = 0.004) than the EEG modality.
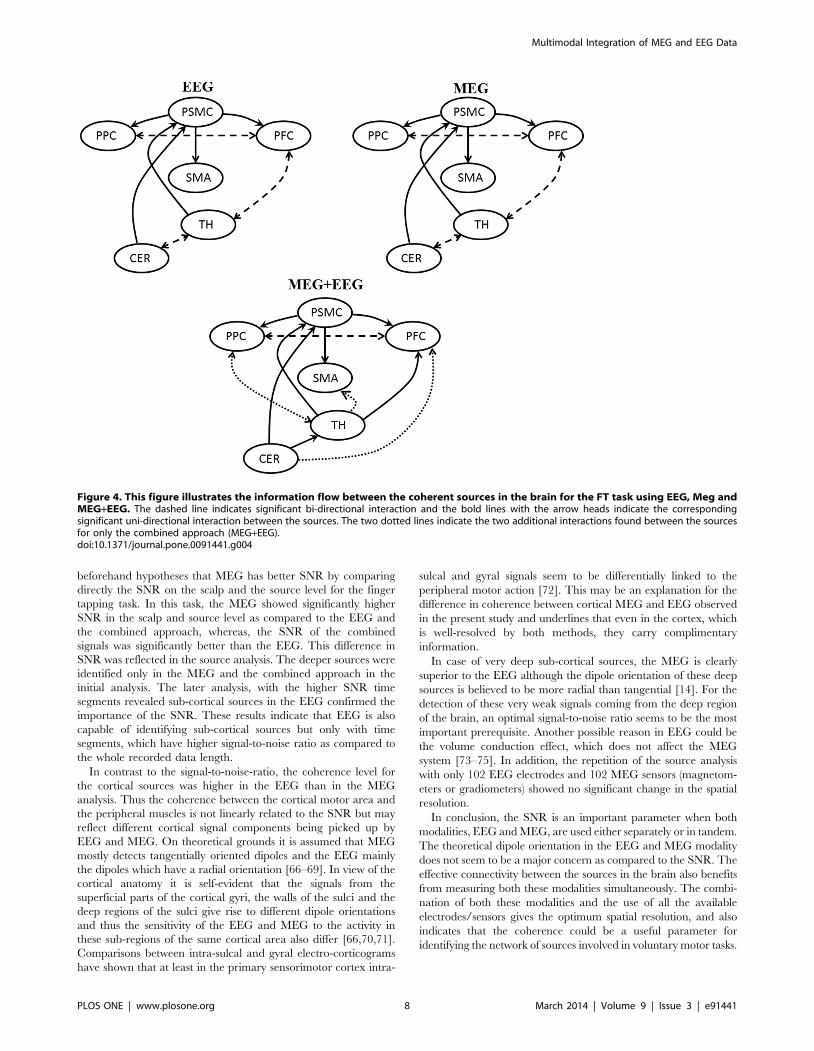
3.4 Information Flow between Source SignalsThe network connectivity between the source signals was
estimated using the renormalized partial directed coherence
(RPDC) at the desired frequency for the FT task separately for
each modality and then combined. The values were statistically
compared using ANOVA test for repeated measurements and post-
hoc comparisons. For the EEG modality (as shown in Figure 4), the
interactions CMC to PMC; CMC to SMA; CMC to PPC were
significantly higher for all the subjects (p = 0.004; p = 0.003;
p = 0.009) as compared to the opposite interactions. The interac-
tions between the sources PMC and PPC showed significant
bidirectional connectivity. The interactions between the sources
PMC to SMA and SMA to PPC did not show any significant
information flow in both directions. In the MEG modality (as shown
in Figure 4), the interactions between the CMC, PMC, SMA and
PPC remained similar as in the case of EEG. After the additional
time segment analysis, the sub-cortical sources in EEG and MEG,
showed significant (p = 0.008; p = 0.009) unidirectional interactions
from TH to CMC and CER to CMC. The interactions between the
PMC to TH and TH to CER showed significant bidirectional
connectivity. The cortical sources SMA and PPC did not show any
significant interactions with the sub-cortical sources of TH and
CER. In the combined (MEG+EEG) approach (as shown in
Figure 4), in addition to the connections found in each of the
modalities, EEG and MEG, some additional cortical sources
showed significant interactions. The interaction between the TH
and CER showed no more bidirectional connection; instead a
significant (p = 0.008) unidirectional flow from CER to TH. The
interactions between the CER to PMC and TH to SMA showed
significant (p = 0.006; p = 0.008) uni-directional connections. The
interactions between the TH and PPC were bidirectional
(p = 0.004). In the between subject factor analysis, the combined
approach (MEG+EEG) showed significantly (p = 0.005) higher
RPDC values for all sources in comparison to either of the
modalities alone. For the comparison between EEG and MEG, the
cortical sources showed higher RPDC values for the EEG modality
but the difference was not significant (p = 0.21).
Discussion
4.1 Central Network of Sources Identified by the DifferentModalities
The network of cortical sources estimated using each of the
modalities separately or combined indicated a similar network.
However, the sub-cortical sources were only identified for the
MEG and the combined approach (MEG+EEG). These same
network of sources have been previously described in EEG
[24,53,54], MEG [21–23,55], functional magnetic resonance
imaging (fMRI) [56,57] and in a positron-emission tomography
(PET) study [23]. In a combined EEG and fMRI study, similar
sources were identified for the voluntary movements [54]. These
earlier studies describe motor planning in secondary motor centres
followed by task execution using the primary sensorimotor cortex.
In our earlier studies with EEG alone [24] and MEG alone
[21,22] we were also able to show the involvement of sub-cortical
centres, that is, thalamus and cerebellum. However, these sub-
cortical sources could only be resolved by the EEG when segments
with especially high SNR were selected and analysed separately
[24], whereas the MEG resolved these sub-cortical sources more
readily without selecting any time segments [22]. The whole
cortical and sub-cortical network involved in the finger tapping
task has been previously described in voluntary motor tasks
[58,59]. The involvement of Brodmann areas 3, 6, 7, 23 and the
posterior lobe (right lobule V) [60] of the cerebellum have been
particularly shown to be involved in voluntary rhythmic tasks [61].
Table 1. The source (mean6std) of the coherence values for each of the sources and the three different modalities are depicted.
Sources Modalities
EEG MEG MEG+EEG
PSMC 0.1860.04 0.1560.03 0.2260.04
PMC 0.1660.03 0.1360.04 0.1960.03
SMA 0.1160.02 0.1060.02 0.1660.03
PPC 0.0960.02 0.0960.02 0.1360.04
TH – 0.0760.01 0.1060.03
CER – 0.0460.01 0.0860.04
doi:10.1371/journal.pone.0091441.t001
Multimodal Integration of MEG and EEG Data
PLOS ONE | www.plosone.org 6 March 2014 | Volume 9 | Issue 3 | e91441
This was confirmed in the present study. The additional
information to the previous literature is the setting of simultaneous
recordings of these two modalities (EEG and MEG) allowing a
direct comparison of the spatial location of the identified sources
and their corresponding coherence values. The source location were
neither significantly different between the subjects nor between the
different modalities. This confirms that both approaches detected
the same physiological motor network. This also indicated that for
identifying the network of cortical sources, the spatial resolution of
EEG is sufficient. However, the coherence values for the combined
approach were significantly higher for all the sources as compared
to either EEG or MEG. In the comparison between EEG and
MEG, cortical sources of EEG showed significantly higher
coherence values than MEG; and in the sub-cortical sources
MEG showed significantly higher coherence values.
4.2 Network of Interactions Indicated by the DifferentModalities
The network of interactions during the finger tapping task in
healthy subjects has been presented in earlier studies using MEG/
EEG [21,22,24]. In some fMRI studies Granger causality analysis
was used to study the effective connectivity during a motor
response task [62] and visuomotor task [63]. In most of these
studies either part of the network is involved or one of these
modalities, EEG/MEG, is used. But, in this work, both these
modalities were analysed separately and directly compared with
the combined approach which appends to our previous knowledge
about the interpretation of the interactions between the network
involved in a finger tapping task. Very similar network interactions
were revealed when analysing EEG and MEG separately as in
these earlier studies [21,22,24]. However, the combined approach
depicted a few more connections from the sub-cortical to cortical
areas. The feedback connection from the TH to SMA and the
CER to PMC has been earlier described as direct connections
which are hypothesized as a basis of normal oscillatory phenom-
ena [64,65]. The oscillations induced in the brain due to a finger
tapping task are controlled oscillations. The first feedback
connection from the main relay nuclei of the thalamus to the
(secondary) motor areas is vital for sustaining the coupling between
the motor areas and hand muscle. The second feedback from the
cerebellum to the pre-motor cortex is vital for the task execution.
The bi-directional connection between TH and PPC has been
discussed as the connection which maintains the repetitive stability
in the brain for motor tasks [22]. This bi-directional connection is
important for constant feedback between these two areas which
passes on information about the performance of the task from the
sub-cortical to cortical centres. These connections were revealed
only due to the combined approach which could indicate that
more complete network connections are visible when both
modalities are used in tandem.
4.3 Effect of Signal-to-noise Ratio and Dipole Orientationon Source Analysis
The role of SNR on source analysis has been examined in MEG
and/or EEG [11–14] with pure simulations or simulated data
from real recordings. In this study, we supplement to the
Figure 3. The grand average sources for the higher SNR time segment analysis for EEG, MEG and for the combined approach(MEG+EEG). In this analysis all the modalities showed a similar network of sources.doi:10.1371/journal.pone.0091441.g003
Multimodal Integration of MEG and EEG Data
PLOS ONE | www.plosone.org 7 March 2014 | Volume 9 | Issue 3 | e91441
beforehand hypotheses that MEG has better SNR by comparing
directly the SNR on the scalp and the source level for the finger
tapping task. In this task, the MEG showed significantly higher
SNR in the scalp and source level as compared to the EEG and
the combined approach, whereas, the SNR of the combined
signals was significantly better than the EEG. This difference in
SNR was reflected in the source analysis. The deeper sources were
identified only in the MEG and the combined approach in the
initial analysis. The later analysis, with the higher SNR time
segments revealed sub-cortical sources in the EEG confirmed the
importance of the SNR. These results indicate that EEG is also
capable of identifying sub-cortical sources but only with time
segments, which have higher signal-to-noise ratio as compared to
the whole recorded data length.
In contrast to the signal-to-noise-ratio, the coherence level for
the cortical sources was higher in the EEG than in the MEG
analysis. Thus the coherence between the cortical motor area and
the peripheral muscles is not linearly related to the SNR but may
reflect different cortical signal components being picked up by
EEG and MEG. On theoretical grounds it is assumed that MEG
mostly detects tangentially oriented dipoles and the EEG mainly
the dipoles which have a radial orientation [66–69]. In view of the
cortical anatomy it is self-evident that the signals from the
superficial parts of the cortical gyri, the walls of the sulci and the
deep regions of the sulci give rise to different dipole orientations
and thus the sensitivity of the EEG and MEG to the activity in
these sub-regions of the same cortical area also differ [66,70,71].
Comparisons between intra-sulcal and gyral electro-corticograms
have shown that at least in the primary sensorimotor cortex intra-
sulcal and gyral signals seem to be differentially linked to the
peripheral motor action [72]. This may be an explanation for the
difference in coherence between cortical MEG and EEG observed
in the present study and underlines that even in the cortex, which
is well-resolved by both methods, they carry complimentary
information.
In case of very deep sub-cortical sources, the MEG is clearly
superior to the EEG although the dipole orientation of these deep
sources is believed to be more radial than tangential [14]. For the
detection of these very weak signals coming from the deep region
of the brain, an optimal signal-to-noise ratio seems to be the most
important prerequisite. Another possible reason in EEG could be
the volume conduction effect, which does not affect the MEG
system [73–75]. In addition, the repetition of the source analysis
with only 102 EEG electrodes and 102 MEG sensors (magnetom-
eters or gradiometers) showed no significant change in the spatial
resolution.
In conclusion, the SNR is an important parameter when both
modalities, EEG and MEG, are used either separately or in tandem.
The theoretical dipole orientation in the EEG and MEG modality
does not seem to be a major concern as compared to the SNR. The
effective connectivity between the sources in the brain also benefits
from measuring both these modalities simultaneously. The combi-
nation of both these modalities and the use of all the available
electrodes/sensors gives the optimum spatial resolution, and also
indicates that the coherence could be a useful parameter for
identifying the network of sources involved in voluntary motor tasks.
Figure 4. This figure illustrates the information flow between the coherent sources in the brain for the FT task using EEG, Meg andMEG+EEG. The dashed line indicates significant bi-directional interaction and the bold lines with the arrow heads indicate the correspondingsignificant uni-directional interaction between the sources. The two dotted lines indicate the two additional interactions found between the sourcesfor only the combined approach (MEG+EEG).doi:10.1371/journal.pone.0091441.g004
Multimodal Integration of MEG and EEG Data
PLOS ONE | www.plosone.org 8 March 2014 | Volume 9 | Issue 3 | e91441
Supporting Information
Figure S1 The figure illustrates the steps involved in thesource analysis with a pictorial representation of theoutput after each step.(TIF)
Author Contributions
Conceived and designed the experiments: JR AS MM GD. Performed the
experiments: MM HK HH NH. Analyzed the data: MM NH ARA KGM.
Contributed reagents/materials/analysis tools: MM NH ARA KGM.
Wrote the paper: MM AS NH HH JR GD.
References
1. Cohen D, Cuffin BN (1987) A method for combining MEG and EEG todetermine the sources. Physics in Medicine and Biology 32: 85–89.
2. Cohen D, Cuffin BN (1983) Demonstration of useful differences between
magnetoencephalogram and electroencephalogram. Electroencephalographyand Clinical Neurophysiology 56: 38–51.
3. Baillet S, Garnero L, Marin G, Hugonin JP (1999) Combined MEG and EEG
source imaging by minimization of mutual information. Biomedical Engineer-
ing, IEEE Transactions on 46: 522–534.
4. Babiloni F, Carducci F, Cincotti F, Del Gratta C, Pizzella V, et al. (2001) Linear
inverse source estimate of combined EEG and MEG data related to voluntary
movements. Human Brain Mapping 14: 197–209.
5. Babiloni F, Babiloni C, Carducci F, Romani GL, Rossini PM, et al. (2004)
Multimodal integration of EEG and MEG data: A simulation study with
variable signal-to-noise ratio and number of sensors. Human Brain Mapping 22:52–62.
6. Sharon D, Hamalainen MS, Tootell RBH, Halgren E, Belliveau JW (2007) The
advantage of combining MEG and EEG: Comparison to fMRI in focallystimulated visual cortex. NeuroImage 36: 1225–1235.
7. Liu AK, Dale AM, Belliveau JW (2002) Monte Carlo simulation studies of EEG
and MEG localization accuracy. Human Brain Mapping 16: 47–62.
8. Huang MX, Song T, Hagler DJ Jr, Podgorny I, Jousmaki V, et al. (2007) Anovel integrated MEG and EEG analysis method for dipolar sources.
NeuroImage 37: 731–748.
9. Molins A, Stufflebeam SM, Brown EN, Hamalainen MS (2008) Quantificationof the benefit from integrating MEG and EEG data in minimum a,,‘‘2-norm
estimation. NeuroImage 42: 1069–1077.
10. Fuchs M, Wagner M, Wischmann HA, Kohler T, Theissen A, et al. (1998)Improving source reconstructions by combining bioelectric and biomagnetic
data. Electroencephalography and Clinical Neurophysiology 107: 93–111.
11. de Jongh A, de Munck JC, Goncalves S, Ossenblok P (2005) Differences inMEG/EEG Epileptic Spike Yields Explained by Regional Differences in Signal-
to-Noise Ratios. J Clin Neurophysiol 22: 153–158.
12. Hillebrand A, Barnes GR (2002) A Quantitative Assessment of the Sensitivity ofWhole-Head MEG to Activity in the Adult Human Cortex. NeuroImage 16:
638–650.
13. Tarkiainen A, Liljestrom M, Seppa M, Salmelin R (2003) The 3D topography ofMEG source localization accuracy: effects of conductor model and noise.
Clinical Neurophysiology 114: 1977–1992.
14. Goldenholz DM, Ahlfors SP, Hamalainen MS, Sharon D, Ishitobi M, et al.
(2009) Mapping the signal-to-noise-ratios of cortical sources in magnetoenceph-alography and electroencephalography. Human Brain Mapping 30: 1077–1086.
15. Lin FH, Vesanen PT, Nieminen JO, Hsu YC, Zevenhoven KCJ, et al. (2013)
Noise amplification in parallel whole-head ultra-low-field magnetic resonanceimaging using 306 detectors. Magnetic Resonance in Medicine 70: 595–600.
16. Henson RN, Mouchlianitis E, Friston KJ (2009) MEG and EEG data fusion:
Simultaneous localisation of face-evoked responses. NeuroImage 47: 581–589.
17. Hamalainen MS, Sarvas J (1989) Realistic conductivity geometry model of thehuman head for interpretation of neuromagnetic data. Biomedical Engineering,
IEEE Transactions on 36: 165–171.
18. Hamalainen M, Hari R, Ilmoniemi RJ, Knuutila J, Lounasmaa OV (1993)Magnetoencephalography–theory, instrumentation, and applications to nonin-
vasive studies of the working human brain. Reviews of modern Physics 65: 413.
19. Gross J, Kujala J, Hamalainen M, Timmermann L, Schnitzler A, et al. (2001)Dynamic imaging of coherent sources: Studying neural interactions in the
human brain. Proc Natl Acad Sci U S A 98: 694–699.
20. Schnitzler A, Gross J, Timmermann L (2000) Synchronised oscillations of thehuman sensorimotor cortex. Acta Neurobiol Exp (Wars) 60: 271–287.
21. Pollok B, Gross J, Dirks M, Timmermann L, Schnitzler A (2004) The cerebral
oscillatory network of voluntary tremor. J Physiol 554: 871–878.
22. Pollok B, Gross J, Schnitzler A (2006) How the brain controls repetitive fingermovements. Journal of Physiology-Paris 99: 8–13.
23. Parker F, Tzourio N, Blond S, Petit H, Mazoyer B (1992) Evidence for a
common network of brain structures involved in Parkinsonian tremor andvoluntary repetitive movement. Brain Research 584: 11–17.
24. Muthuraman M, Heute U, Arning K, Anwar AR, Elble R, et al. (2012)
Oscillating central motor networks in pathological tremors and voluntarymovements. What makes the difference? NeuroImage 60: 1331–1339.
25. Schelter B, Timmer J, Eichler M (2009) Assessing the strength of directed
influences among neural signals using renormalized partial directed coherence.J Neurosci Methods 179: 121–130.
26. Bouet R, Jung J, Delpuech C, Ryvlin P, Isnard J, et al. (2012) Towards source
volume estimation of interictal spikes in focal epilepsy using magnetoenceph-alography. NeuroImage 59: 3955–3966.
27. Schlee W, Leirer V, Kolassa IT, Weisz N, Elbert T (2012) Age-related changes
in neural functional connectivity and its behavioral relevance. BMC Neurosci-
ence 13: 16.
28. Michalareas G, Schoffelen JM, Paterson G, Gross J (2013) Investigating causality
between interacting brain areas with multivariate autoregressive models of MEG
sensor data. Human Brain Mapping 34: 890–913.
29. Journee HL (2007) Demodulation of amplitude modulated noise: a mathemat-
ical evaluation of a demodulator for pathological tremor EMG’s. IEEE
Transactions on Biomedical Engineering: 304–308.
30. Farina D, Merletti R, Enoka RM (2004) The extraction of neural strategies from
the surface EMG. Journal of Applied Physiology 96: 1486–1495.
31. McClelland VM, Cvetkovic Z, Mills KR (2012) Rectification of the EMG is an
unnecessary and inappropriate step in the calculation of Corticomuscular
coherence. Journal of Neuroscience Methods 205: 190–201.
32. Stegeman DF, van de Ven WJM, van Elswijk GA, Oostenveld R, Kleine BU
(2010) The [alpha]-motoneuron pool as transmitter of rhythmicities in cortical
motor drive. Clinical Neurophysiology 121: 1633–1642.
33. Meijs JWH, Bosch FGC, Peters MJ, Lopes da Silva FH (1987) On the magnetic
field distribution generated by a dipolar current source situated in a realistically
shaped compartment model of the head. Electroencephalography and Clinical
Neurophysiology 66: 286–298.
34. Ferguson AS, Xu Z, Stroink G (1994) A complete linear discretization for
calculating the magnetic field using the boundary element method. Biomedical
Engineering, IEEE Transactions on 41: 455–460.
35. Schlitt HA, Heller L, Aaron R, Best E, Ranken DM (1995) Evaluation of
boundary element methods for the EEG forward problem: effect of linear
interpolation. Biomedical Engineering, IEEE Transactions on 42: 52–58.
36. Mosher JC, Leahy RM, Lewis PS (1999) EEG and MEG: forward solutions for
inverse methods. Biomedical Engineering, IEEE Transactions on 46: 245–259.
37. Gramfort A, Papadopoulo T, Olivi E, Clerc M (2010) OpenMEEG: opensource
software for quasistatic bioelectromagnetics. Biomed Eng Online 9: 45.
38. van Veen BD, Van Drongelen W, Yuchtman M, Suzuki A (2002) Localization of
brain electrical activity via linearly constrained minimum variance spatial
filtering. IEEE Trans Biomed Eng 44: 867–880.
39. Schoffelen JM, Oostenveld R, Fries P (2008) Imaging the human motor system’s
beta-band synchronization during isometric contraction. NeuroImage 41: 437–
447.
40. Muthuraman M, Raethjen J, Hellriegel H, Deuschl G, Heute U (2008) Imaging
coherent sources of tremor related EEG activity in patients with Parkinson’s
disease. Conf Proc IEEE Eng Med Biol Soc 2008: 4716–4719.
41. Amjad AM, Halliday DM, Rosenberg JR, Conway BA (1997) An extended
difference of coherence test for comparing and combining several independent
coherence estimates: theory and application to the study of motor units and
physiological tremor. J Neurosci Methods 73: 69–79.
42. Rosenberg JR, Amjad AM, Breeze P, Brillinger DR, Halliday DM (1989) The
Fourier approach to the identification of functional coupling between neuronal
spike trains. Progress in Biophysics and Molecular Biology 53: 1–31.
43. Granger CWJ (1969) Investigating Causal Relations by Econometric Models
and Cross-spectral Methods. Econometrica 37: 424–438.
44. Akaike H (1974) A new look at the statistical model identification. Automatic
Control, IEEE Transactions on 19: 716–723.
45. Ding M, Bressler SL, Yang W, Liang H (2000) Short-window spectral analysis of
cortical event-related potentials by adaptive multivariate autoregressive
modeling: data preprocessing, model validation, and variability assessment. Biol
Cybern 83: 35–45.
46. Kaminski M, Ding M, Truccolo WA, Bressler SL (2001) Evaluating causal
relations in neural systems: granger causality, directed transfer function and
statistical assessment of significance. Biol Cybern 85: 145–157.
47. Theiler J, Eubank S, Longtin A, Galdrikian B, Doyne Farmer J (1992) Testing
for nonlinearity in time series: the method of surrogate data. Physica D:
Nonlinear Phenomena 58: 77–94.
48. Haufe S, Nikulin VV, Muller KR, Nolte G (2013) A critical assessment of
connectivity measures for EEG data: A simulation study. NeuroImage 64: 120–
133.
49. Arnold N, Tapio S (2001) Estimation of parameters and eigenmodes of
multivariate autoregressive models. ACM. 27–57.
50. Tapio S, Arnold N (2001) Algorithm 808: ARfit\—a matlab package for the
estimation of parameters and eigenmodes of multivariate autoregressive models.
ACM. 58–65.
51. Mitra PP, Pesaran B (1999) Analysis of dynamic brain imaging data. Biophysical
Journal 76: 691–708.
Multimodal Integration of MEG and EEG Data
PLOS ONE | www.plosone.org 9 March 2014 | Volume 9 | Issue 3 | e91441
52. Muthuraman M, Galka A, Deuschl G, Heute U, Raethjen J (2010) Dynamical
correlation of non-stationary signals in time domain–A comparative study.Biomedical Signal Processing and Control 5: 205–213.
53. Feige B, Aertsen A, Kristeva-Feige R (2000) Dynamic Synchronization Between
Multiple Cortical Motor Areas and Muscle Activity in Phasic VoluntaryMovements. J Neurophysiol 84: 2622–2629.
54. Ball T, Schreiber A, Feige B, Wagner M, Lucking CH, et al. (1999) The Role ofHigher-Order Motor Areas in Voluntary Movement as Revealed by High-
Resolution EEG and fMRI. NeuroImage 10: 682–694.
55. Salmelin R, Forss N, Knuutila J, Hari R (1995) Bilateral activation of the humansomatomotor cortex by distal hand movements. Electroencephalography and
Clinical Neurophysiology 95: 444–452.56. Nedelko V, Hassa T, Hamzei F, Weiller C, Binkofski F, et al. (2010) Age-
independent activation in areas of the mirror neuron system during actionobservation and action imagery. A fMRI study. Restorative Neurology and
Neuroscience 28: 737–747.
57. Wu T, Hallett M (2005) The influence of normal human ageing on automaticmovements. The journal of Physiology 562: 605–615.
58. Hepp-Reymond MC (1988) Functional Organization of Motor Cortex and ItsParticipation in Voluntary Movements.
59. Rothwell J, Thompson P, Day B, Boyd S, Marsden C (1991) Stimulation of the
human motor cortex through the scalp. Experimental Physiology 76: 159–200.60. Stoodley CJ, Schmahmann JD (2009) Functional topography in the human
cerebellum: A meta-analysis of neuroimaging studies. NeuroImage 44: 489–501.61. Kandel E, Schwartz J, Jessell T (2013) Principles of Neural Science, Fifth
Edition: McGraw-Hill Education.62. Abler B, Roebroeck A, Goebel R, Hose A, Schonfeldt-Lecuona C, et al. (2006)
Investigating directed influences between activated brain areas in a motor-
response task using fMRI. Magnetic Resonance Imaging 24: 181–185.63. Roebroeck A, Formisano E, Goebel R (2005) Mapping directed influence over
the brain using Granger causality and fMRI. NeuroImage 25: 230–242.64. Jones EG (2002) Thalamic circuitry and thalamocortical synchrony. Philos
Trans R Soc Lond B Biol Sci 357: 1659–1673.
65. Llinas R, Urbano FJ, Leznik E, Ramirez RR, van Marle HJ (2005) Rhythmic
and dysrhythmic thalamocortical dynamics: GABA systems and the edge effect.
Trends Neurosci 28: 325–333.
66. Ahlfors S, Han J, Belliveau J, Hamalainen M (2010) Sensitivity of MEG and
EEG to Source Orientation. Brain Topography 23: 227–232.
67. Cohen D (1972) Magnetoencephalography: Detection of the Brain’s Electrical
Activity with a Superconducting Magnetometer. Science 175: 664–666.
68. Neil Cuffin B, Cohen D (1979) Comparison of the magnetoencephalogram and
electroencephalogram. Electroencephalography and Clinical Neurophysiology
47: 132–146.
69. Melcher JR, Cohen D (1988) Dependence of the MEG on dipole orientation in
the rabbit head. Electroencephalography and Clinical Neurophysiology 70: 460–
472.
70. Starr A, Kristeva R, Cheyne D, Lindinger G, Deecke LD (1991) Localization of
brain activity during auditory verbal short-term memory derived from magnetic
recordings. Brain Research 558: 181–190.
71. Cheyne D, Kristeva R, Lang W, Lindinger G, Deecke L (1990) Neuromagnetic
Localisation of Sensorimotor Cortex Sources Associated with Voluntary
Movements in Humans. In: Williamson S, Hoke M, Stroink G, Kotani M,
editors. Advances in Biomagnetism: Springer US. 177–180.
72. Yanagisawa T, Hirata M, Saitoh Y, Kato A, Shibuya D, et al. (2009) Neural
decoding using gyral and intrasulcal electrocorticograms. NeuroImage 45:
1099–1106.
73. Mima T, Hallett M (1999) Electroencephalographic analysis of cortico-muscular
coherence: reference effect, volume conduction and generator mechanism.
Clinical Neurophysiology 110: 1892–1899.
74. van den Broek SP, Reinders F, Donderwinkel M, Peters MJ (1998) Volume
conduction effects in EEG and MEG. Electroencephalography and Clinical
Neurophysiology 106: 522–534.
75. Winter WR, Nunez PL, Ding J, Srinivasan R (2007) Comparison of the effect of
volume conduction on EEG coherence with the effect of field spread on MEG
coherence. Statistics in Medicine 26: 3946–3957.
Multimodal Integration of MEG and EEG Data
PLOS ONE | www.plosone.org 10 March 2014 | Volume 9 | Issue 3 | e91441