Optimizing Gradation Design for Ultra-Thin Wearing Course ...
15
materials Article Optimizing Gradation Design for Ultra-Thin Wearing Course Asphalt Wentian Cui, Kuanghuai Wu, Xu Cai , Haizhu Tang and Wenke Huang * School of Civil Engineering, Guangzhou University, Guangzhou 510006, China; [email protected] (W.C.); [email protected] (K.W.); [email protected] (X.C.); [email protected] (H.T.) * Correspondence: [email protected]; Tel.: +86-135-1275-7010 Received: 2 December 2019; Accepted: 30 December 2019; Published: 2 January 2020 Abstract: In recent years, ultra-thin wearing course asphalt mixture has been widely used in the reconstruction of old road surfaces and the functional layer of new road surfaces due to its good road performance. To improve the rutting resistance of ultra-thin wearing course asphalt mixture, this research presents an Ultra-thin Wearing Course-10 (UTWC-10) asphalt mixture with good high-temperature stability and skid resistance based on the Taylor system standard mesh specifications. The Course Aggregate Void Filling (CAVF) method is used to design the UTWC-10 asphalt mixture, which is compared with two other traditional ultra-thin wearing course asphalt mixtures on the basis of different laboratory performance tests. The high-temperature rutting test data shows that the rutting dynamic stability (DS) index of the UTWC-10 asphalt mixture is much higher than that of traditional wearing course asphalt mixtures, as it has better high-temperature stability. Moreover, anti-sliding performance attenuation tests are conducted by a coarse aggregate polishing machine. The wear test results show that the skid resistance of the UTWC-10 asphalt mixture is promising. The anti-sliding performance attenuation test can effectively reflect the skid resistance attenuation trend of asphalt pavement at the long-term vehicle load. It is verified that the designed UTWC-10 asphalt mixture shows excellent high-temperature rutting resistance and skid resistance, as well as better low temperature crack resistance and water stability than the traditional wearing course asphalt mixtures. Keywords: functional pavement layer; ultra-thin wearing course asphalt mixture; high-temperature stability; pavement performance test 1. Introduction As the economy continues to grow and urbanization deepens, the traffic load is also rising year by year [1,2]. Most of the roads will suffer from defects such as cracking, loosening, and deformation after 3–5 years of service, which will sharply weaken important pavement performance factors like water damage resistance, high-temperature stability, and skid resistance. These defects will not only shorten the service life of roads but will also bring severe threats to comfort and safety [3]. To reduce the occurrence of these pavement defects, researchers have started to study preventive pavement maintenance technologies [4]. The ultra-thin wearing course asphalt mixture can enhance the whole flatness and skid resistance of roads, reduce pavement noise, improve driving comfort and safety, prolong the time until surface cracking, fix local potholes, and other defects on pavement occur, as well as enhance the service life of roads [5–7]. Therefore, it has been widely used in the pavement rehabilitation for the extension of the service life of roads. As an overlay, the ultra-thin wearing course is the uppermost layer in pavement structures. In case of insufficient rutting resistance of ultra-thin wearing course, defects such as waves, displacements, and ruts will occur after a repetitive traffic load, thus affecting the slip resistance and driving comfort Materials 2020, 13, 189; doi:10.3390/ma13010189 www.mdpi.com/journal/materials
-
Upload
khangminh22 -
Category
Documents
-
view
5 -
download
0
Transcript of Optimizing Gradation Design for Ultra-Thin Wearing Course ...

materials
Article
Optimizing Gradation Design for Ultra-Thin WearingCourse Asphalt
Wentian Cui, Kuanghuai Wu, Xu Cai , Haizhu Tang and Wenke Huang *
School of Civil Engineering, Guangzhou University, Guangzhou 510006, China; [email protected] (W.C.);[email protected] (K.W.); [email protected] (X.C.); [email protected] (H.T.)* Correspondence: [email protected]; Tel.: +86-135-1275-7010
Received: 2 December 2019; Accepted: 30 December 2019; Published: 2 January 2020�����������������
Abstract: In recent years, ultra-thin wearing course asphalt mixture has been widely used inthe reconstruction of old road surfaces and the functional layer of new road surfaces due to itsgood road performance. To improve the rutting resistance of ultra-thin wearing course asphaltmixture, this research presents an Ultra-thin Wearing Course-10 (UTWC-10) asphalt mixture withgood high-temperature stability and skid resistance based on the Taylor system standard meshspecifications. The Course Aggregate Void Filling (CAVF) method is used to design the UTWC-10asphalt mixture, which is compared with two other traditional ultra-thin wearing course asphaltmixtures on the basis of different laboratory performance tests. The high-temperature rutting test datashows that the rutting dynamic stability (DS) index of the UTWC-10 asphalt mixture is much higherthan that of traditional wearing course asphalt mixtures, as it has better high-temperature stability.Moreover, anti-sliding performance attenuation tests are conducted by a coarse aggregate polishingmachine. The wear test results show that the skid resistance of the UTWC-10 asphalt mixture ispromising. The anti-sliding performance attenuation test can effectively reflect the skid resistanceattenuation trend of asphalt pavement at the long-term vehicle load. It is verified that the designedUTWC-10 asphalt mixture shows excellent high-temperature rutting resistance and skid resistance,as well as better low temperature crack resistance and water stability than the traditional wearingcourse asphalt mixtures.
Keywords: functional pavement layer; ultra-thin wearing course asphalt mixture; high-temperaturestability; pavement performance test
1. Introduction
As the economy continues to grow and urbanization deepens, the traffic load is also rising year byyear [1,2]. Most of the roads will suffer from defects such as cracking, loosening, and deformationafter 3–5 years of service, which will sharply weaken important pavement performance factors likewater damage resistance, high-temperature stability, and skid resistance. These defects will not onlyshorten the service life of roads but will also bring severe threats to comfort and safety [3]. To reducethe occurrence of these pavement defects, researchers have started to study preventive pavementmaintenance technologies [4]. The ultra-thin wearing course asphalt mixture can enhance the wholeflatness and skid resistance of roads, reduce pavement noise, improve driving comfort and safety,prolong the time until surface cracking, fix local potholes, and other defects on pavement occur, aswell as enhance the service life of roads [5–7]. Therefore, it has been widely used in the pavementrehabilitation for the extension of the service life of roads.
As an overlay, the ultra-thin wearing course is the uppermost layer in pavement structures. In caseof insufficient rutting resistance of ultra-thin wearing course, defects such as waves, displacements,and ruts will occur after a repetitive traffic load, thus affecting the slip resistance and driving comfort
Materials 2020, 13, 189; doi:10.3390/ma13010189 www.mdpi.com/journal/materials
Materials 2020, 13, 189 2 of 15
of pavement and threatening the safety of driving. However, few studies of ultra-thin wearing coursewere focused on the high-temperature resistance to permanent deformation [8–12].
At present, coarse aggregate is mostly concentrated at 4.75–9.5 mm, when the gradation design ofultra-thin wearing course asphalt mixture is designed to be open- or semi-graded. However, becausethe distance between the 4.75 mm mesh hole and 9.5 mm mesh hole is slightly larger, the uniformityof the coarse aggregate cannot be controlled. This will reduce the contact points between coarseaggregates and affect the spatial structure of the overall framework of the asphalt mixture. As a result,the embedded extrusion force between coarse aggregates will be reduced, the dynamic stability (DS) ofthe ultra-thin wearing course will be low, and rutting resistance will be insufficient [13,14]. Therefore,8 mm (two meshes) and 6.7 mm (three meshes) mesh holes are added between 4.75 mm (four meshes)and 9.5 mm according to the Taylor system standard mesh specifications [15].
This research presents a new gradation design method to improve the high-temperatureperformance of the Ultra-thin Wearing Course-10 (UTWC-10) asphalt mixture based on the CourseAggregate Void Filling (CAVF) designed method and the mechanical performances were evaluatedwith two other commonly used open-graded friction courses OGFC-7 and Novachip-B asphalt mixture.
2. Materials and Methods
2.1. Raw Materials
2.1.1. Aggregates
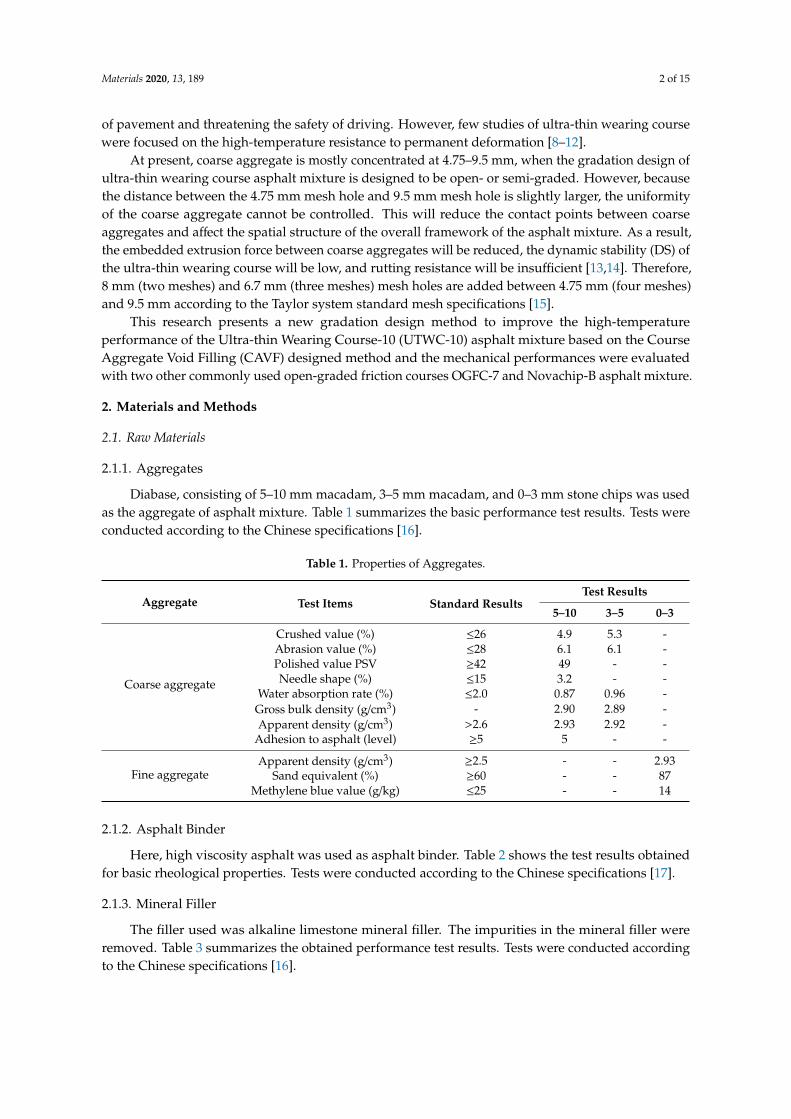
Diabase, consisting of 5–10 mm macadam, 3–5 mm macadam, and 0–3 mm stone chips was usedas the aggregate of asphalt mixture. Table 1 summarizes the basic performance test results. Tests wereconducted according to the Chinese specifications [16].
Table 1. Properties of Aggregates.
Aggregate Test Items Standard ResultsTest Results
5–10 3–5 0–3
Coarse aggregate
Crushed value (%) ≤26 4.9 5.3 -Abrasion value (%) ≤28 6.1 6.1 -Polished value PSV ≥42 49 - -Needle shape (%) ≤15 3.2 - -
Water absorption rate (%) ≤2.0 0.87 0.96 -Gross bulk density (g/cm3) - 2.90 2.89 -Apparent density (g/cm3) >2.6 2.93 2.92 -
Adhesion to asphalt (level) ≥5 5 - -
Fine aggregateApparent density (g/cm3) ≥2.5 - - 2.93
Sand equivalent (%) ≥60 - - 87Methylene blue value (g/kg) ≤25 - - 14
2.1.2. Asphalt Binder
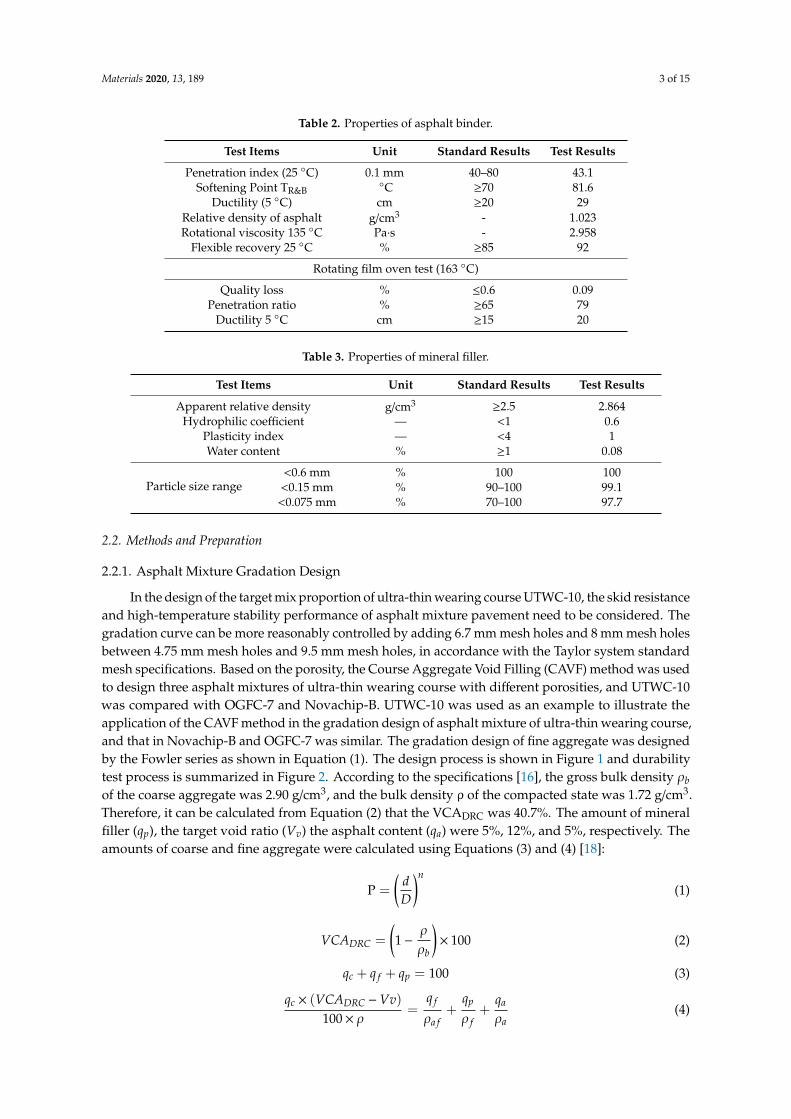
Here, high viscosity asphalt was used as asphalt binder. Table 2 shows the test results obtainedfor basic rheological properties. Tests were conducted according to the Chinese specifications [17].
2.1.3. Mineral Filler
The filler used was alkaline limestone mineral filler. The impurities in the mineral filler wereremoved. Table 3 summarizes the obtained performance test results. Tests were conducted accordingto the Chinese specifications [16].
Materials 2020, 13, 189 3 of 15
Table 2. Properties of asphalt binder.
Test Items Unit Standard Results Test Results
Penetration index (25 ◦C) 0.1 mm 40–80 43.1Softening Point TR&B
◦C ≥70 81.6Ductility (5 ◦C) cm ≥20 29
Relative density of asphalt g/cm3 - 1.023Rotational viscosity 135 ◦C Pa·s - 2.958
Flexible recovery 25 ◦C % ≥85 92
Rotating film oven test (163 ◦C)
Quality loss % ≤0.6 0.09Penetration ratio % ≥65 79
Ductility 5 ◦C cm ≥15 20
Table 3. Properties of mineral filler.
Test Items Unit Standard Results Test Results
Apparent relative density g/cm3 ≥2.5 2.864Hydrophilic coefficient — <1 0.6
Plasticity index — <4 1Water content % ≥1 0.08
Particle size range<0.6 mm % 100 100<0.15 mm % 90–100 99.1<0.075 mm % 70–100 97.7
2.2. Methods and Preparation
2.2.1. Asphalt Mixture Gradation Design
In the design of the target mix proportion of ultra-thin wearing course UTWC-10, the skid resistanceand high-temperature stability performance of asphalt mixture pavement need to be considered. Thegradation curve can be more reasonably controlled by adding 6.7 mm mesh holes and 8 mm mesh holesbetween 4.75 mm mesh holes and 9.5 mm mesh holes, in accordance with the Taylor system standardmesh specifications. Based on the porosity, the Course Aggregate Void Filling (CAVF) method was usedto design three asphalt mixtures of ultra-thin wearing course with different porosities, and UTWC-10was compared with OGFC-7 and Novachip-B. UTWC-10 was used as an example to illustrate theapplication of the CAVF method in the gradation design of asphalt mixture of ultra-thin wearing course,and that in Novachip-B and OGFC-7 was similar. The gradation design of fine aggregate was designedby the Fowler series as shown in Equation (1). The design process is shown in Figure 1 and durabilitytest process is summarized in Figure 2. According to the specifications [16], the gross bulk density ρbof the coarse aggregate was 2.90 g/cm3, and the bulk density ρ of the compacted state was 1.72 g/cm3.Therefore, it can be calculated from Equation (2) that the VCADRC was 40.7%. The amount of mineralfiller (qp), the target void ratio (Vv) the asphalt content (qa) were 5%, 12%, and 5%, respectively. Theamounts of coarse and fine aggregate were calculated using Equations (3) and (4) [18]:
P =
(dD
)n
(1)
VCADRC =
(1−
ρ
ρb
)× 100 (2)
qc + q f + qp = 100 (3)
qc × (VCADRC −Vv)100× ρ
=q f
ρa f+
qp
ρ f+
qa
ρa(4)

Materials 2020, 13, 189 4 of 15
where, P is the percentage of aggregate passing through the mesh size (%); d is the mesh size in mm; Dis the maximum particle size of the aggregate in mm; n is the index, 0.3 ≤ n ≤ 0.5; ρb is the gross bulkdensity of the synthetic coarse aggregate in g/cm3; ρ is the density of accumulation under rammedstate in g/cm3; ρa f is the apparent relative density of fine aggregate in g/cm3; ρa is the relative densityof asphalt in g/cm3; and ρ f is the relative density of mineral filler.
Materials 2019, 12, x FOR PEER REVIEW 4 of 16
𝑞 + 𝑞 + 𝑞 = 100 (3) 𝑞 × (𝑉𝐶𝐴 − 𝑉𝑣)100 × 𝜌 = 𝑞𝜌 + 𝑞𝜌 + 𝑞𝜌 (4)
where, P is the percentage of aggregate passing through the mesh size (%);d is the mesh size in mm; D is the maximum particle size of the aggregate in mm; n is the index, 0.3 ≤ n ≤ 0.5; 𝜌 is the gross bulk density of the synthetic coarse aggregate in g/cm3; 𝜌 is the density of accumulation under rammed state in g/cm3 ; 𝜌 is the apparent relative density of fine aggregate in g/cm3 ; 𝜌 is the relative density of asphalt in g/cm3; and 𝜌 is the relative density of mineral filler.
Figure 1. Design process of three asphalt mixtures. Figure 1. Design process of three asphalt mixtures.
Materials 2019, 12, x FOR PEER REVIEW 5 of 16
Figure 2. Flow chart of the durability test of three asphalt mixtures.
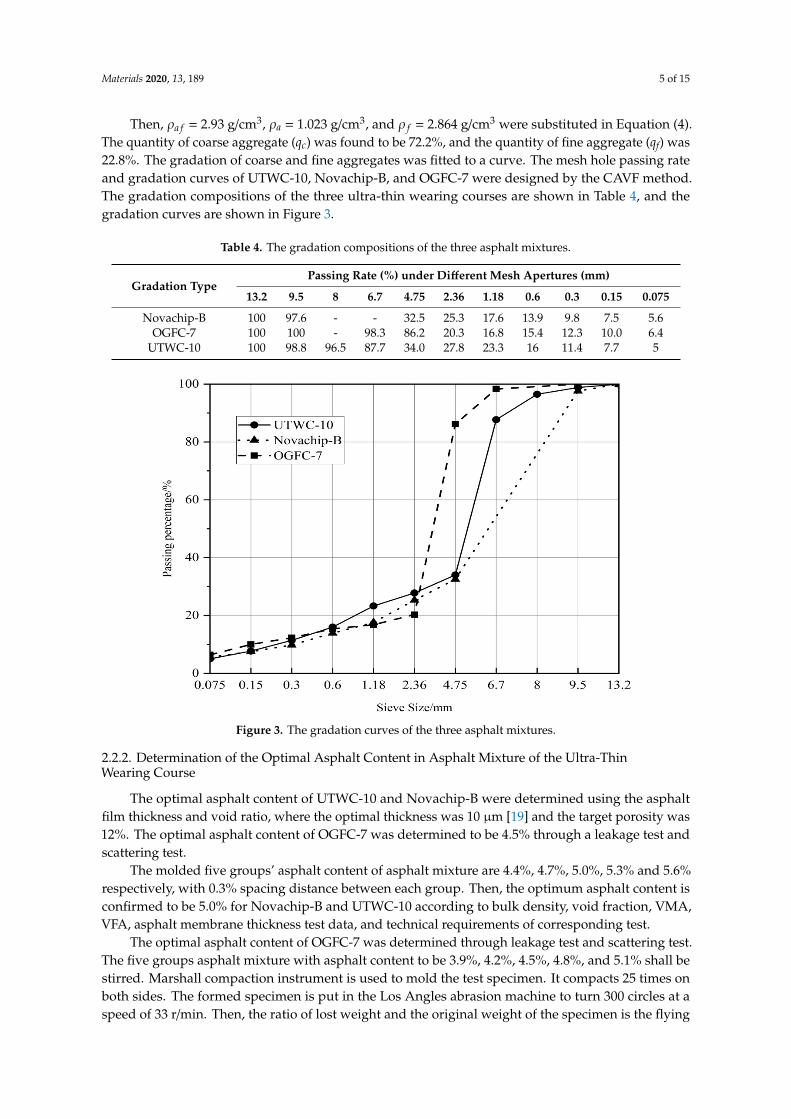
Then, 𝜌 = 2.93 g/cm3, 𝜌 = 1.023 g/cm3, and 𝜌 = 2.864 g/cm3 were substituted in Equation (4). The quantity of coarse aggregate (qc) was found to be 72.2%, and the quantity of fine aggregate (qf) was 22.8%. The gradation of coarse and fine aggregates was fitted to a curve. The mesh hole passing rate and gradation curves of UTWC-10, Novachip-B, and OGFC-7 were designed by the CAVF method. The gradation compositions of the three ultra-thin wearing courses are shown in Table 4, and the gradation curves are shown in Figure 3.
Figure 3. The gradation curves of the three asphalt mixtures.
Figure 2. Flow chart of the durability test of three asphalt mixtures.
Materials 2020, 13, 189 5 of 15
Then, ρa f = 2.93 g/cm3, ρa = 1.023 g/cm3, and ρ f = 2.864 g/cm3 were substituted in Equation (4).The quantity of coarse aggregate (qc) was found to be 72.2%, and the quantity of fine aggregate (qf) was22.8%. The gradation of coarse and fine aggregates was fitted to a curve. The mesh hole passing rateand gradation curves of UTWC-10, Novachip-B, and OGFC-7 were designed by the CAVF method.The gradation compositions of the three ultra-thin wearing courses are shown in Table 4, and thegradation curves are shown in Figure 3.
Table 4. The gradation compositions of the three asphalt mixtures.
Gradation TypePassing Rate (%) under Different Mesh Apertures (mm)
13.2 9.5 8 6.7 4.75 2.36 1.18 0.6 0.3 0.15 0.075
Novachip-B 100 97.6 - - 32.5 25.3 17.6 13.9 9.8 7.5 5.6OGFC-7 100 100 - 98.3 86.2 20.3 16.8 15.4 12.3 10.0 6.4
UTWC-10 100 98.8 96.5 87.7 34.0 27.8 23.3 16 11.4 7.7 5
Materials 2019, 12, x FOR PEER REVIEW 5 of 16
Figure 2. Flow chart of the durability test of three asphalt mixtures.
Then, 𝜌 = 2.93 g/cm3, 𝜌 = 1.023 g/cm3, and 𝜌 = 2.864 g/cm3 were substituted in Equation (4). The quantity of coarse aggregate (qc) was found to be 72.2%, and the quantity of fine aggregate (qf) was 22.8%. The gradation of coarse and fine aggregates was fitted to a curve. The mesh hole passing rate and gradation curves of UTWC-10, Novachip-B, and OGFC-7 were designed by the CAVF method. The gradation compositions of the three ultra-thin wearing courses are shown in Table 4, and the gradation curves are shown in Figure 3.
Figure 3. The gradation curves of the three asphalt mixtures. Figure 3. The gradation curves of the three asphalt mixtures.
2.2.2. Determination of the Optimal Asphalt Content in Asphalt Mixture of the Ultra-ThinWearing Course
The optimal asphalt content of UTWC-10 and Novachip-B were determined using the asphaltfilm thickness and void ratio, where the optimal thickness was 10 µm [19] and the target porosity was12%. The optimal asphalt content of OGFC-7 was determined to be 4.5% through a leakage test andscattering test.
The molded five groups’ asphalt content of asphalt mixture are 4.4%, 4.7%, 5.0%, 5.3% and 5.6%respectively, with 0.3% spacing distance between each group. Then, the optimum asphalt content isconfirmed to be 5.0% for Novachip-B and UTWC-10 according to bulk density, void fraction, VMA,VFA, asphalt membrane thickness test data, and technical requirements of corresponding test.
The optimal asphalt content of OGFC-7 was determined through leakage test and scattering test.The five groups asphalt mixture with asphalt content to be 3.9%, 4.2%, 4.5%, 4.8%, and 5.1% shall bestirred. Marshall compaction instrument is used to mold the test specimen. It compacts 25 times onboth sides. The formed specimen is put in the Los Angles abrasion machine to turn 300 circles at aspeed of 33 r/min. Then, the ratio of lost weight and the original weight of the specimen is the flying

Materials 2020, 13, 189 6 of 15
loss. When the asphalt content of the open graded friction course OGFC-7 is between 4.4% and 4.6%,the change rate in leakage analysis loss and flying loss varies greatly. And since both the two lossesof the asphalt mixture at this time meet the specification requirement, 4.5% is the optimum asphaltcontent of OGFC-7.
The volume parameters of the three asphalt mixtures under the optimum asphalt content areshown in Table 5, and the detailed volume parameters of the three asphalt mixtures can be seen inTables A1–A5 in Appendix A.
Table 5. The volume parameters of thea three asphalt mixtures.
AsphaltMixture Type
Optimal AsphaltContent (%)
Void Ratio(%) VMA (%) VFA (%) Stability
(kN)Flow Value
(mm)
UTWC-10 5.0 12.1 21.9 44.7 8.64 27.4Novachip-B 5.0 12.3 22.4 43.5 8.43 32.1
OGFC-7 4.5 20.3 28.3 28.3 6.80 38.5
2.3. Methods and Tests
2.3.1. High-Temperature Rutting Test
Rutting dynamic stability (DS) index can be used to check the asphalt texture stability at ahigh temperature. The larger the DS value, the better asphalt mixture performance in resistance todeformation and high temperature. Rutting modeling machine of asphalt mixture is used to mold the300 mm × 300 mm × 50 mm rutting plate. The wheel tracking tests instrument is shown in Figure 4.Then, it is put for curing for 48 h. Rut test can be conducted after 5 h at temperature 60 ◦C. Wheelpressure and roundtrip speed of 0.7 MPa and 42 times/min were applied in tests. The wheel drivingdirection is consistent with the rolling direction in specimen molding. The deformation of asphaltmixture is 45 min, and 60 min is recorded separately. Total round trip times divides the gap of specimendeformation in 60 min and 45 min to gain the value of DS. DS can be calculated using Equation (5):
DS =(t2 − t1) × 42
d2 − d1× c1 × c2 (5)
where d1 and d2 are tracking depths at 45 and 60 min, t1 and t2 are 45 and 60 min, respectively; c1 andc2 are correction factors.
Materials 2019, 12, x FOR PEER REVIEW 7 of 16
specimen deformation in 60 min and 45 min to gain the value of DS. DS can be calculated using
Equation (5): 𝐷𝑆 = (𝑡 − 𝑡 ) × 42𝑑 − 𝑑 × 𝑐 × 𝑐 (5)
where d1 and d2 are tracking depths at 45 and 60 min, t1 and t2 are 45 and 60 min, respectively; 𝑐 and 𝑐 are correction factors.
Figure 4. Wheel tracking tests instrument.
2.3.2. Three-point Beam-bending Test
The low temperature crack resistance of asphalt mixture was evaluated by the small beam specimen bend test at low temperature. The formed rutting plate is cut to 250 mm × 30 mm × 35 mm trabecular specimen. Then, all specimens will be put in the incubator for about 6 h to enable the interior of specimen to reach the given temperature. The test temperature is –10 °C, 0 °C, and 15 °C. The specimen reaching the temperature shall be taken out to be put in the two-point support frame. The universal testing machine will load by means of mid-point loading at a speed of 50mm/min. The maximum bending strength and strain at failure were calculated and employed as evaluation indices for asphalt mixture low temperature crack resistance. Calculations were performed using Equations (6)–(8): 𝑅 = 3𝐿𝑃2𝑏ℎ (6) 𝜀 = 6ℎ𝑑𝐿 (7)
𝑆 = 𝑅𝜀 (8)
where ε is maximum bending strain at failure; P is breaking load (N); R is damage strength (MPa); S is stiffness modulus (MPa); h is cross-section sample height (mm); L sample length (mm); d is mid-span deflection at sample breaking point (mm); and b is test specimen width across middle section (mm).
2.3.3. Immersed Marshall Test
The immersed Marshall method is quite simple and highly practical. The standard and formed Marshall test specimens are divided into two groups. One group is cured in 60 °C thermostatic water tank for 30 min, then goes for the Marshall stability test. The other group is cured for 48 h in 60 °C thermostatic water tank, then goes for the stability test. The ratio of the two stability values is residual stability. The closer the residual stability is to 1, the better asphalt mixture water stability. Calculations were performed based on Equation (9):
Figure 4. Wheel tracking tests instrument.
Materials 2020, 13, 189 7 of 15
2.3.2. Three-point Beam-bending Test
The low temperature crack resistance of asphalt mixture was evaluated by the small beamspecimen bend test at low temperature. The formed rutting plate is cut to 250 mm × 30 mm × 35 mmtrabecular specimen. Then, all specimens will be put in the incubator for about 6 h to enable theinterior of specimen to reach the given temperature. The test temperature is –10 ◦C, 0 ◦C, and 15 ◦C.The specimen reaching the temperature shall be taken out to be put in the two-point support frame.The universal testing machine will load by means of mid-point loading at a speed of 50mm/min.The maximum bending strength and strain at failure were calculated and employed as evaluationindices for asphalt mixture low temperature crack resistance. Calculations were performed usingEquations (6)–(8):
R =3LP2bh2 (6)
ε =6hdL2 (7)
S =Rε
(8)
where ε is maximum bending strain at failure; P is breaking load (N); R is damage strength (MPa); S isstiffness modulus (MPa); h is cross-section sample height (mm); L sample length (mm); d is mid-spandeflection at sample breaking point (mm); and b is test specimen width across middle section (mm).
2.3.3. Immersed Marshall Test
The immersed Marshall method is quite simple and highly practical. The standard and formedMarshall test specimens are divided into two groups. One group is cured in 60 ◦C thermostatic watertank for 30 min, then goes for the Marshall stability test. The other group is cured for 48 h in 60 ◦Cthermostatic water tank, then goes for the stability test. The ratio of the two stability values is residualstability. The closer the residual stability is to 1, the better asphalt mixture water stability. Calculationswere performed based on Equation (9):
MS =S2
S1(9)
where MS is test specimen residual stability (%); S1 is stability after immersing test specimen in waterfor 30 min (kN); and S2 is stability after immersing test specimen in water for 48 h (kN).
2.3.4. Freeze-Thaw Splitting Test
The Marshall test method is adopted to mold two test specimen groups. One group is immersedin 25 ◦C water bath for 2 h, then its splitting strength (R1) is tested. The other group is immersed forvacuum treatment and water saturation for 15 min at 98 kPa, then the vacuum valve is switched on tocure for 30 min in water bath in ordinary pressure. 10 mL water shall be poured after the vacuum andwater-saturated test specimen is sealed with a plastic bag. Next, it is tightened, sealed, and put in the−18 ◦C incubator to cure for 16 h. After that, the specimen saved in low temperature is taken out fromthe incubator and put in the 60 ◦C thermostatic water tank to cure for 24 h. At last, the test specimen istaken out from the hot water bath and put in 25 ◦C water. As can be seen from Figure 5, specimenswere then removed to perform splitting tests according to the Chinese specifications [17]. After 2 h ofconstant temperature curing, its splitting strength (R2) is tested. The ratio of R2 and R1 is splittingtensile strength ratio (TSR). Calculations were performed using Equations (10) and (11):
R = 0.006287Ph
(10)
TSR =R2
R1(11)

Materials 2020, 13, 189 8 of 15
where TSR is freeze thaw splitting strength ratio; R is splitting tensile strength (MPa); R1 and R2 areaverage splitting tensile strength without and after freeze-thaw cycle (MPa), respectively; P is singlespecimen test load (N); and h is single specimen height (mm).
Materials 2019, 12, x FOR PEER REVIEW 8 of 16
𝑀𝑆 = 𝑆𝑆 (9)
where MS is test specimen residual stability (%); S1 is stability after immersing test specimen in water for 30 min (kN); and S2 is stability after immersing test specimen in water for 48 h (kN).
2.3.4. Freeze-Thaw Splitting Test
The Marshall test method is adopted to mold two test specimen groups. One group is immersed
in 25 °C water bath for 2 h, then its splitting strength (R1) is tested. The other group is immersed for
vacuum treatment and water saturation for 15 min at 98 kPa, then the vacuum valve is switched on
to cure for 30 min in water bath in ordinary pressure. 10 mL water shall be poured after the vacuum
and water-saturated test specimen is sealed with a plastic bag. Next, it is tightened, sealed, and put
in the –18 °C incubator to cure for 16 h. After that, the specimen saved in low temperature is taken
out from the incubator and put in the 60 °C thermostatic water tank to cure for 24 h. At last, the test
specimen is taken out from the hot water bath and put in 25 °C water. As can be seen from Figure 5,
specimens were then removed to perform splitting tests according to the Chinese specifications [17].
After 2 h of constant temperature curing, its splitting strength (R2) is tested. The ratio of R2 and R1 is
splitting tensile strength ratio (TSR). Calculations were performed using Equation (10) and
Equation (11): 𝑅 = 0.006287 𝑃ℎ (10)
𝑇𝑆𝑅 = 𝑅𝑅 (11)
where TSR is freeze thaw splitting strength ratio; R is splitting tensile strength (MPa); R1 and R2 are average splitting tensile strength without and after freeze-thaw cycle (MPa), respectively; P is single specimen test load (N); and h is single specimen height (mm).
Figure 5. Freeze-thaw splitting test.
2.3.5. Texture Depth Test
The sand patch method is commonly used in texture depth test, which is simple and widely applied. Firstly, 0.15 mm to 3 mm dry and clean sands shall be prepared. Then, they are filled into a 25 mL sand measuring cylinder, knock on the cylinder and bulldoze the cylinder mouth. After the
Figure 5. Freeze-thaw splitting test.
2.3.5. Texture Depth Test
The sand patch method is commonly used in texture depth test, which is simple and widelyapplied. Firstly, 0.15 mm to 3 mm dry and clean sands shall be prepared. Then, they are filled into a 25mL sand measuring cylinder, knock on the cylinder and bulldoze the cylinder mouth. After the surfaceof the rutting plate specimen is cleaned, fine sands are poured into the cylinder slowly. Then, the sandsare spread outward to a circle with a push plate as much as possible and filled in the interspace of thetest specimen. Lastly, the diameter of the circle in the two vertical directions can be measured and itsaverage value shall be gained. The calculation method is shown in Equation (12):
TD =1000VπD2/4
=31831
D2 (12)
where TD is pavement texture depth (mm); V is sand volume (cm3); and D is paved sand averagediameter (mm).
2.3.6. British Pendulum Number (BPN) Test
The BPN test makes use of pendulum type friction coefficient measuring instrument (BPN tester) toget the BPN in bituminous pavement and cement concrete pavement in order to evaluate the anti-slideperformance of the pavement in wet environments. The film in the bottom of the pendulum bob standsfor the wheel. The pendulum bob falls from a certain height and the film in the bottom will rub for acertain distance on the pavement before swinging back. The height of swinging back is the pendulumof this section. In this article, the test specimen of the rut plate standards for tested pavement.
2.3.7. Anti-Sliding Performance Attenuation Test
In order to simulate the actual paving thickness of ultra-thin wearing course, 1.5 cm thick ruttingplate is molded according to the method described in Section 2.3.1. The rutting plate is cut to 30 mm ×1.5 mm × 8 mm slices and put in the steps of standard test film. Then, glue sands are made in the testof polishing value of coarse aggregate and filled in the interspace of the test film (Figure 6). After thetest specimen demolds, it shall be put in the road wheel of the polishing machine. The rubber load andfunction times of the polishing machine shall be adjusted to test the BPN variance before and after

Materials 2020, 13, 189 9 of 15
abrasion. The value of BPN can be obtained by using pendulum type friction coefficient measuringinstrument (BPN tester). The anti-slide performance attenuation acts as the main index to evaluate theanti-slide performance of asphalt mixture.
Materials 2019, 12, x FOR PEER REVIEW 9 of 16
surface of the rutting plate specimen is cleaned, fine sands are poured into the cylinder slowly. Then, the sands are spread outward to a circle with a push plate as much as possible and filled in the interspace of the test specimen. Lastly, the diameter of the circle in the two vertical directions can be measured and its average value shall be gained. The calculation method is shown in Equation (12): 𝑇𝐷 = 1000𝑉𝜋𝐷 /4 = 31831𝐷 (12)
where TD is pavement texture depth (mm); V is sand volume (cm3); and D is paved sand average diameter (mm).
2.3.6. British Pendulum Number (BPN) Test
The BPN test makes use of pendulum type friction coefficient measuring instrument (BPN tester) to get the BPN in bituminous pavement and cement concrete pavement in order to evaluate the anti-slide performance of the pavement in wet environments. The film in the bottom of the pendulum bob stands for the wheel. The pendulum bob falls from a certain height and the film in the bottom will rub for a certain distance on the pavement before swinging back. The height of swinging back is the pendulum of this section. In this article, the test specimen of the rut plate standards for tested pavement.
2.3.7. Anti-Sliding Performance Attenuation Test
In order to simulate the actual paving thickness of ultra-thin wearing course, 1.5 cm thick rutting plate is molded according to the method described in 2.3.1. The rutting plate is cut to 30 mm × 1.5 mm × 8 mm slices and put in the steps of standard test film. Then, glue sands are made in the test of polishing value of coarse aggregate and filled in the interspace of the test film. After the test specimen demolds, it shall be put in the road wheel of the polishing machine. The rubber load and function times of the polishing machine shall be adjusted to test the BPN variance before and after abrasion. The value of BPN can be obtained by using pendulum type friction coefficient measuring instrument (BPN tester). The anti-slide performance attenuation acts as the main index to evaluate the anti-slide performance of asphalt mixture.
(a) (b)
Figure 6. Wear test system: (a) coarse aggregate polishing machine; (b) ultra-thin wearing course specimen.
3. Results and Discussion
3.1. High-Temperature Rutting Resistance
The dynamic stability of the three asphalt mixtures meets the specification of being not less than 3000 times/mm [17]. For the UTWC-10 asphalt mixture shown in Table 6, the high-temperature stability was far more than that of OGFC-7, and the DS was 77.2% more than that of OGFC-7.
Figure 6. Wear test system: (a) coarse aggregate polishing machine; (b) ultra-thin wearingcourse specimen.
3. Results and Discussion
3.1. High-Temperature Rutting Resistance
The dynamic stability of the three asphalt mixtures meets the specification of being not less than3000 times/mm [17]. For the UTWC-10 asphalt mixture shown in Table 6, the high-temperature stabilitywas far more than that of OGFC-7, and the DS was 77.2% more than that of OGFC-7. Compared withNovachip-B, the high-temperature stability of UTWC-10 was strongly improved, and the DS was 36.9%higher than that of Novachip-B. The reason for the improvement in the high-temperature stabilityof the ultra-thin wearing course is that when UTWC-10 was optimized for gradation design, 8 mm(two meshes) and 6.7 mm (three meshes) mesh holes were added between 4.75 mm (four meshes)and 9.5 mm, according to the Taylor system standard mesh specifications. Coarse aggregates witha particle size of 4.75–6.7mm accounted for about 50% of the gradation. This increased the contactpoints between coarse aggregates, which made the spatial structure of the overall framework morereasonable and improved the embedded extrusion forces between coarse aggregates [20,21].
Table 6. The high-temperature rutting test results of the three asphalt mixtures.
Gradation45 min
Deformation(mm)
60 minDeformation
(mm)
DeformationDifference
(mm)DS (times/mm) Mean Value of
DS (times/mm)
UTWC-101.26 1.38 0.12 5250.00
55681.30 1.41 0.11 5727.271.28 1.39 0.11 5727.27
Novachip-B1.47 1.63 0.16 3937.5
40251.51 1.66 0.15 4200.001.49 1.65 0.16 3937.5
OGFC-72.10 2.30 0.20 3150.00
31502.13 2.33 0.21 2985.782.15 2.34 0.19 3314.22

Materials 2020, 13, 189 10 of 15
3.2. Low Temperature Crack Resistance
As can be seen from Figure 7, the stress and strain changes of the UTWC-10, Novachip-B, andOGFC-7 asphalt mixtures were similar. With temperatures from −10 ◦C to 15 ◦C, the bending strain ofUTWC-10 increased by 34.5%, that of Novachip-B increased by 32.8%, and that of OGFC-7 increasedby 12.9%. The bending strain of UTWC-10 increased the most with the increase in temperature. As thetemperature rose, the ductility of the asphalt increased, improving the strain of the asphalt mixture.The bending strength of the three asphalt mixtures tended to be low with an increasing temperature,with a strength drop of 13.5% for UTWC-10, 14.3% for Novachip-B, and 28.5% for OGFC-7. Thebending strength of UTWC-10 was least affected by temperature, because the rising temperaturegradually increased the embedded squeeze forces within the framework of the UTWC-10 asphaltmixture. The bending stiffness modulus is the ratio of the bending strength and bending strain, and itis an important index for the evaluation of the low-temperature crack resistance of the asphalt mixture.The smaller the bending stiffness is, the better the elastoplasticity of the asphalt mixture is at the samedamage strength. As the temperature increased, the bending stiffness modulus of UTWC-10 decreasedby 35.7%, that of Novachip-B decreased by 35.4%, and that of OGFC-7 decreased by 36.7%. BecauseUTWC-10 had the fastest reduction in the bending stiffness modulus and the smallest bending stiffnessmodulus, it was shown to have the best crack resistance at low temperatures.
Materials 2019, 12, x FOR PEER REVIEW 11 of 16
(a) (b)
(c)
Figure 7. The various performance indexes of the three asphalt mixtures: (a) relationship between the bending strain and temperature; (b) relationship between the bending strength and temperature; and (c) relationship between the bending stiffness modulus and temperature.
3.3. Water Stability
3.3.1. Immersed Marshall Test Results
Figure 8 shows that the residual stability of the three asphalt mixtures meets the requirements of the specifications [17]. The residual stability of the three asphalt mixtures is above 90%, and the residual stability of UTWC-10 was 94.3%, that of Novachip-B was 92.9%, and that of OGFC-7 was 90.8%. Due to the high strength of the high viscosity asphalt used, the damage effect of the water immersion on the specimen is greatly reduced, so the residual stability of the OGFC-7 asphalt mixture with large void ratio was also good. The residual stability of utwc-10 is high and has good water stability.
Figure 7. The various performance indexes of the three asphalt mixtures: (a) relationship between thebending strain and temperature; (b) relationship between the bending strength and temperature; and(c) relationship between the bending stiffness modulus and temperature.

Materials 2020, 13, 189 11 of 15
3.3. Water Stability
3.3.1. Immersed Marshall Test Results
Figure 8 shows that the residual stability of the three asphalt mixtures meets the requirementsof the specifications [17]. The residual stability of the three asphalt mixtures is above 90%, and theresidual stability of UTWC-10 was 94.3%, that of Novachip-B was 92.9%, and that of OGFC-7 was 90.8%.Due to the high strength of the high viscosity asphalt used, the damage effect of the water immersionon the specimen is greatly reduced, so the residual stability of the OGFC-7 asphalt mixture with largevoid ratio was also good. The residual stability of utwc-10 is high and has good water stability.Materials 2019, 12, x FOR PEER REVIEW 12 of 16
Figure 8. The average residual stability of the three asphalt mixtures.
3.3.2. Freeze-Thaw Splitting Test Results
It can be seen from Table 7 that the TSR value of UTWC-10 was 92.3%, the TSR value of Novachip-B was 90.4%, and the TSR value of OGFC-7 was 86.4%. Because the TSR value of UTWC-10 was the largest, the water stability performance of the UTWC-10 asphalt mixture was the best. The water porosity of the asphalt mixture will increase at low temperatures and produce tensile stress, causing micro cracks inside materials and thus attenuating the mechanical properties of the asphalt mixture. In the drainage material test of the OGFC-7 asphalt mixture, water was able to fill in most of the voids to reduce the free space of water after heaving. Therefore, the mechanical properties of heaved materials attenuated the fastest. UTWC-10 has a good framework strength and large density, and the heaving force of water has little effect on the mechanical properties of materials, so its freeze–thaw splitting strength ratio was shown to be the highest.
Table 7. Freeze-thaw splitting test results of three asphalt mixtures.
Asphalt Mixture Type
Original Splitting Strength
(R1)/MPa
Freeze-thaw Splitting Strength
(R2)/MPa
Strength Ratio
Standard Results
UTWC-10 0.765 0.706 92.3%
≥80% Novachip-
B 0.757 0.684 90.4%
OGFC-7 0.543 0.469 86.4%
3.4. Asphalt Mixture Surface Roughness
Figure 9 shows that the texture depths of the three asphalt mixtures meet the requirements of the specifications [17] greater than or equal to 0.55 mm. The texture depth of UTWC-10 was shown to be 0.75 mm, that of Novachip-B was 0.73 mm, and that of OGFC-7 was 0.92 mm. OGFC-7 was shown to have the largest texture depth. The research results show that the void ratio is proportional to the texture depth index. The larger the void ratio is, the larger the texture depth is [22,23].
Figure 8. The average residual stability of the three asphalt mixtures.
3.3.2. Freeze-Thaw Splitting Test Results
It can be seen from Table 7 that the TSR value of UTWC-10 was 92.3%, the TSR value of Novachip-Bwas 90.4%, and the TSR value of OGFC-7 was 86.4%. Because the TSR value of UTWC-10 was thelargest, the water stability performance of the UTWC-10 asphalt mixture was the best. The waterporosity of the asphalt mixture will increase at low temperatures and produce tensile stress, causingmicro cracks inside materials and thus attenuating the mechanical properties of the asphalt mixture. Inthe drainage material test of the OGFC-7 asphalt mixture, water was able to fill in most of the voids toreduce the free space of water after heaving. Therefore, the mechanical properties of heaved materialsattenuated the fastest. UTWC-10 has a good framework strength and large density, and the heavingforce of water has little effect on the mechanical properties of materials, so its freeze–thaw splittingstrength ratio was shown to be the highest.
Table 7. Freeze-thaw splitting test results of three asphalt mixtures.
Asphalt MixtureType
Original SplittingStrength (R1)/MPa
Freeze-thaw SplittingStrength (R2)/MPa Strength Ratio Standard Results
UTWC-10 0.765 0.706 92.3%≥80%Novachip-B 0.757 0.684 90.4%
OGFC-7 0.543 0.469 86.4%
3.4. Asphalt Mixture Surface Roughness
Figure 9 shows that the texture depths of the three asphalt mixtures meet the requirements of thespecifications [17] greater than or equal to 0.55 mm. The texture depth of UTWC-10 was shown to be

Materials 2020, 13, 189 12 of 15
0.75 mm, that of Novachip-B was 0.73 mm, and that of OGFC-7 was 0.92 mm. OGFC-7 was shownto have the largest texture depth. The research results show that the void ratio is proportional to thetexture depth index. The larger the void ratio is, the larger the texture depth is [22,23].Materials 2019, 12, x FOR PEER REVIEW 13 of 16
Figure 9. The texture depths of the three asphalt mixtures.
3.5. Anti-sliding Performance Attenuation
The anti-sliding performance attenuation test was completed by using a coarse aggregate polishing machine as shown in Figure 6. It can be seen from Figure 10 that as wear times rose, the pendulum BPN of the three asphalt mixtures showed a significant downward trend. The wearing results show that among the three ultra-thin wearing course, the attenuation rate of the anti-sliding performance of UTWC-10 was 15.80%, that of Novachip-B was 16.05%, and that of OGFC-7 was 18.18%. OGFC-7 was shown to have the highest anti-sliding performance attenuation rate. The attenuation rate of the anti-sliding performance of UTWC-10 and Novachip-B was similar. Besides, the BPN of Novachip-B was smaller than that of UTWC-10 and the skid resistance of UTWC-10 was the best. The anti-sliding performance attenuation test was able to effectively reflect the skid resistance attenuation trend of asphalt pavement at a long-term vehicle load.
Figure 10. The anti-sliding performance attenuation curves of the three asphalt mixtures.
Figure 9. The texture depths of the three asphalt mixtures.
3.5. Anti-sliding Performance Attenuation
The anti-sliding performance attenuation test was completed by using a coarse aggregate polishingmachine as shown in Figure 6. It can be seen from Figure 10 that as wear times rose, the pendulumBPN of the three asphalt mixtures showed a significant downward trend. The wearing results showthat among the three ultra-thin wearing course, the attenuation rate of the anti-sliding performanceof UTWC-10 was 15.80%, that of Novachip-B was 16.05%, and that of OGFC-7 was 18.18%. OGFC-7was shown to have the highest anti-sliding performance attenuation rate. The attenuation rate of theanti-sliding performance of UTWC-10 and Novachip-B was similar. Besides, the BPN of Novachip-Bwas smaller than that of UTWC-10 and the skid resistance of UTWC-10 was the best. The anti-slidingperformance attenuation test was able to effectively reflect the skid resistance attenuation trend ofasphalt pavement at a long-term vehicle load.
Materials 2019, 12, x FOR PEER REVIEW 13 of 16
Figure 9. The texture depths of the three asphalt mixtures.
3.5. Anti-sliding Performance Attenuation
The anti-sliding performance attenuation test was completed by using a coarse aggregate polishing machine as shown in Figure 6. It can be seen from Figure 10 that as wear times rose, the pendulum BPN of the three asphalt mixtures showed a significant downward trend. The wearing results show that among the three ultra-thin wearing course, the attenuation rate of the anti-sliding performance of UTWC-10 was 15.80%, that of Novachip-B was 16.05%, and that of OGFC-7 was 18.18%. OGFC-7 was shown to have the highest anti-sliding performance attenuation rate. The attenuation rate of the anti-sliding performance of UTWC-10 and Novachip-B was similar. Besides, the BPN of Novachip-B was smaller than that of UTWC-10 and the skid resistance of UTWC-10 was the best. The anti-sliding performance attenuation test was able to effectively reflect the skid resistance attenuation trend of asphalt pavement at a long-term vehicle load.
Figure 10. The anti-sliding performance attenuation curves of the three asphalt mixtures. Figure 10. The anti-sliding performance attenuation curves of the three asphalt mixtures.

Materials 2020, 13, 189 13 of 15
4. Conclusions
This study proposed a UTWC-10 (Ultra-thin Wearing Course-10) asphalt mixture with goodhigh-temperature stability and skid resistance. In the gradation design of UTWC-10, 8 mm (twomeshes) and 6.7 mm (three meshes) mesh holes were added between 4.75 mm and 9.5 mm based onthe Taylor system standard mesh specifications. Based on the laboratory tests and results discussion,the following conclusions can be drawn:
(1) The DS of UTWC-10 asphalt mixture is as high as 5568 times/mm, which is much larger thanNovachip-B and OGFC-7 asphalt mixture.
(2) The test results of low temperature bending beam tests, immersed Marshall tests, and freeze–thawsplitting tests proved that UTWC-10 asphalt mixture has satisfied crack resistance at lowtemperatures and the ability to resist water damage.
(3) The results of texture depth test and pendulum test confirmed that UTWC-10 asphalt mixture canprovide good compactness and frictional resistance.
(4) The anti-sliding performance attenuation test system employed in the paper can closely simulatethe skid resistance attenuation of roads at a long-term vehicle load. The test results show that theskid resistance of UTWC-10 is the best.
Author Contributions: Investigation and project administration, K.W.; writing—review and editing, W.H.;writing—original draft, W.C.; formal analysis and validation, W.C. and H.T.; supervision, X.C. All authors haveread and agreed to the published version of the manuscript.
Funding: This publication is supported by National Natural Science Foundation of China (No. 51908154,No.51878193) and Science and Technology Program of Guangzhou (No. 201804010231).
Acknowledgments: The authors thank all those who contributed in the experimental part of this study.
Conflicts of Interest: The authors declare no conflict of interest, financial or otherwise.
Appendix A. Volume Parameters of the Three Asphalt Mixtures
The detailed volume parameters of the three asphalt mixtures and the leakage test results ofUTWC-10 and Novachip-B were in Tables A1–A5.
Table A1. The volume parameters of UTWC-10.
AsphaltContent (%)
Void Ratio(%) VMA (%) VFA (%) Stability
(kN)Flow Value
(mm)Asphalt Film
Thickness (µm)
4.4 14.1 23.6 40.1 6.69 27.0 7.64.7 13.3 23.5 43.4 7.40 32.3 8.75.0 12.1 21.9 44.7 8.64 27.4 10.35.3 11.3 21.5 47.4 7.25 30.7 11.15.6 11.0 21.2 48.1 6.30 34.4 12.3
Table A2. The leakage test results of UTWC-10.
SampleNumber
MixtureQuality (g)
AdhesiveQuality (g)
Leakage Loss(%)
Average LeakageRate (%)
Test Temperature(◦C)
1 1000.8 0.84 0.08
0.08 1852 1000.1 0.77 0.083 1000.3 0.91 0.094 1000.1 0.72 0.07

Materials 2020, 13, 189 14 of 15
Table A3. The volume parameters of Novachip-B.
AsphaltContent (%)
Void Ratio(%) VMA (%) VFA (%) Stability
(kN)Flow Value
(mm)Asphalt Film
Thickness (µm)
4.4 15.2 25.3 40.4 6.72 33.4 8.14.7 13.4 24.6 42.3 7.51 31.5 9.35.0 12.3 22.4 43.5 8.43 32.1 10.55.3 11.6 22.1 45.9 7.38 30.8 11.65.6 11.1 21.7 47.2 6.67 33.6 12.8
Table A4. The leakage test results of Novachip-B.
SampleNumber
MixtureQuality (g)
AdhesiveQuality (g)
Leakage Loss(%)
Average LeakageRate (%)
Test Temperature(◦C)
1 1000.1 0.71 0.07
0.09 1852 1000.4 0.93 0.093 1000.6 1.14 0.114 1000.3 0.82 0.08
Table A5. The volume parameters of OGFC-7.
AsphaltContent (%)
LeakageLoss (%)
ScatteringLoss (%)
VoidRatio (%) VMA (%) VFA (%) Stability
(kN)Flow Value
(mm)
3.9 0.08 24.87 24.8 27.7 25.4 5.82 34.84.2 0.11 19.12 22 28.1 26.7 6.53 36.84.5 0.17 13.88 20.3 28.3 28.3 6.80 38.54.8 0.33 13.29 19 28.6 30.5 5.41 41.25.1 0.47 11.6 18.3 29.1 32.9 5.07 40.3
References
1. Xue, G. Study on design method and road performances of ultra-thin wearing course SMA-5 asphalt mixture.Highw. Transp. Res. Dev. 2009, 26, 18–21.
2. Qian, Z.; Lu, Q. Design and laboratory evaluation of small particle porous epoxy asphalt surface mixture forroadway pavements. Constr. Build. Mater. 2015, 77, 110–116. [CrossRef]
3. Zhao, D.; Kane, M.; Do, M.T. Effect of aggregate and asphalt on pavement skid resistance evolution. Am. Soc.Civ. Eng. 2010, 46, 8–18.
4. Sun, X.L.; Zhang, X.N.; Cai, X. Accelerated test-based study of long-term pavement performance ofmicro-surfacing. J. Tongji Univ. 2012, 40, 691–695.
5. Krummenauer, K.; Andrade, J.O. Incorporation of chromium-tanned leather residue to asphalt micro-surfacelayer. Constr. Build. Mater. 2009, 23, 574–581. [CrossRef]
6. Zhang, H.J.; Li, H.; Zhang, Y. Performance enhancement of porous asphalt pavement using red mud asalternative filler. Constr. Build. Mater. 2018, 160, 707–713. [CrossRef]
7. Wang, X.W.; Gu, X.Y.; Dong, Q. Evaluation of permanent deformation of multilayer porous asphalt coursesusing an advanced multiply-repeated load test. Constr. Build. Mater. 2018, 160, 19–29. [CrossRef]
8. Wu, K.H.; Zhang, X.N. Design of SMA-5 asphalt mixture for thin overlays. J. South China Univ. Technol. 2006,34, 43–46.
9. Liu, C.H.; Sha, Q.L. Comparision testing research on aggregate gradation of ultra-thin layer asphalt concreteSAC-10. China J. Highw. Transp. 2005, 18, 7–13.
10. Audrius, V.; Tadas, A.; Viktoras, V.; Aleksandras, J.; Boris, F.; Ewa, Z. Asphalt wearing course optimizationfor road traffic noise reduction. Constr. Build. Mater. 2017, 152, 345–356.
11. Hu, M.J.; Li, L.H.; Peng, F.X. Laboratory investigation of OGFC-5 porous asphalt ultra-thin wearing course.Constr. Build. Mater. 2019, 219, 101–110. [CrossRef]
12. Wan, J.M.; Wu, S.P.; Xiao, Y.; Fang, M.J.; Song, W.; Pan, P.; Zhang, D. Enhanced ice and snow melting efficiencyof steel slag based ultra-thin friction courses with steel fiber. J. Clean. Prod. 2019, 236, 117613. [CrossRef]

Materials 2020, 13, 189 15 of 15
13. Nekkanti, H.; Putman, B.J.; Danish, B. Influence of aggregate gradation and nominal maximum aggregatesize on the performance properties of OGFC mixtures. Transp. Res. Rec. 2019, 1, 240–245. [CrossRef]
14. David, A.H.; Xiao, F.P.; Serji, A. Investigation of Los Angeles value and alternate aggregate gradations inOGFC mixtures. Constr. Build. Mater. 2016, 110, 278–285.
15. ISO 565-1990. Test Sieves-Metal Wire Cloth, Perforated Metal Plate and Electroformed Sheet-Nominal Sizes ofOpenings; International Organization for Standardization: Geneva, Switzerland, 1990.
16. JTG E42-2005. Testing Procedures of Aggregate for Highway Engineering in China; General Administration ofQuality Supervision, Inspection and Quarantine of the People’s Republic of China: Beijing, China, 2005.
17. JTG E20-2011. Standard Test Method of Bitumen and Bituminous Mixture for Highway Engineering in China;General Administration of Quality Supervision, Inspection and Quarantine of the People’s Republic of China:Beijing, China, 2011.
18. Zhang, X.N.; Wang, S.H.; Wu, K.H. CAVF method of asphalt mixture composition design. Highway 2001, 12,17–20. (In Chinese)
19. Ghazi, G.; Aroon, S. Mixture-property-independent asphalt film thickness model. Mater. Today Commun.2019, 19, 482–486.
20. Reza Pouranian, M.; Haddock, J.E. Determination of voids in the mineral aggregate and aggregate skeletoncharacteristics of asphalt mixtures using a linear-mixture packing model. Constr. Build. Mater. 2018, 188,292–304. [CrossRef]
21. Ding, X.H.; Ma, T. Effects by property homogeneity of aggregate skeleton on creep performance of asphaltconcrete. Constr. Build. Mater. 2018, 171, 205–213. [CrossRef]
22. Praticò, F.G.; Vaiana, R. A study on the relationship between mean texture depth and mean profile depth ofasphalt pavements. Constr. Build. Mater. 2015, 101, 72–79. [CrossRef]
23. Plati, C.; Pomoni, M.; Stergiou, T. Development of a mean profile depth to mean texture depth shift factor forasphalt pavements. Transp. Res. Rec. 2017, 1, 156–163. [CrossRef]
© 2020 by the authors. Licensee MDPI, Basel, Switzerland. This article is an open accessarticle distributed under the terms and conditions of the Creative Commons Attribution(CC BY) license (http://creativecommons.org/licenses/by/4.0/).