For Reference - eScholarship
278
MAR 3 1989 UEr{/>.\lY AND DOCUMENTS SECTION PROCEEDINGS OF THE CHINESE-AMERICAN SYMPOSIUM ON ENERGY MARKETS AND THE FUTURE OF ENERGY DEMAND / N anjing, China June 22-24, 1988 For Reference Not to be taken from this room "- Lawrence Berkeley Laboratory University of California Berkeley, CA 94720 November 1988 LBL-26260 \ Prepared for the U.S. Department of Energy under Contract Number DE-AC03-76SF00098
-
Upload
khangminh22 -
Category
Documents
-
view
0 -
download
0
Transcript of For Reference - eScholarship
MAR 3 1989
UEr{/>.\lY AND DOCUMENTS SECTION
PROCEEDINGS OF THE CHINESE-AMERICAN SYMPOSIUM ON
ENERGY MARKETS AND THE FUTURE OF ENERGY DEMAND
/
N anjing, China June 22-24, 1988
For Reference
Not to be taken from this room
"---------------~------~
Lawrence Berkeley Laboratory University of California
Berkeley, CA 94720
November 1988
u~-qf)d LBL-26260 ~. \
~CONF-8806261
Prepared for the U.S. Department of Energy under Contract Number DE-AC03-76SF00098
DISCLAIMER
This document was prepared as an account of work sponsored by the United States Government. While this document is believed to contain correct information, neither the United States Government nor any agency thereof, nor the Regents of the University of California, nor any of their employees, makes any warranty, express or implied, or assumes any legal responsibility for the accuracy, completeness, or usefulness of any information, apparatus, product, or process disclosed, or represents that its use would not infringe privately owned rights. Reference herein to any specific commercial product, process, or service by its trade name, trademark, manufacturer, or otherwise, does not necessarily constitute or imply its endorsement, recommendation, or favoring by the United States Government or any agency thereof, or the Regents of the University of California. The views and opinions of authors expressed herein do not necessarily state or reflect those of the United States Government or any agency thereof or the Regents of the University of California.
PROCEEDINGS OF THE
CHINESE-AMERICAN SYMPOSIUM ON
ENERGY MARKETS AND
LBL-26260
THE FUTURE OF ENERGY DEMAND
Nanjing, China
June 22-24, 1988
Edited by
Stephen Meyers
Energy Analysis Program
Applied Science Division
Lawrence Berkeley Laboratory
1 Cyclotron Road
Berkeley, CA 94720
November 1988
This work was supported by the Office of Policy, Planning and Analysis of the U.S. Department of Energy under Contract No. DE-AC03-76SF00098. The Symposium was sponsored by the Office of Policy, Planning and Analysis of the U.S. Department of Energy and the Department of Resources Conservation and Integrated Utilization of the Chinese State Planning Commission.
PREFACE
China has experienced remarkable double-digit economic growth over the last eight years. This growth has been accompanied by commensurate increase in energy consumption, albeit at a slower pace. Much of this increase in energy consumption has been supported by the increased development of the country's vast coal resources.
The promising oil finds of the early 1980s have given way to more sober assessment of the country's oil resources. Utilization of natural gas finds offshore has been slow, given the lack of infrastructure near the natural gas fields.
China's GDP is growing at a rapid rate. Energy resources to support this rate of economic development are expected to come from traditional sources. This may require that coal production increase by 60% by 2000. The efficiency of energy use would also have to increase significantly in order to achieve this economic goal. Failure to achieve either could hurt economic development or require that China import energy resources from other countries in the Pacific Basin.
Knowledge abroad about China's energy demand patterns and its likely future growth of demand, is limited. Likewise, Chinese planners are eager to seek additional information and knowledge about energy use and government policy in the United States. In order to exchange information and viewpoints, a Symposium was sponsored jointly by the State Planning Commission of China and the Office of Policy, Planning, and Evaluation of'the U.S. Department of Energy.
The Symposium was organized by the Energy Research Institute of the State Economic Commission of China, and the Lawrence Berkeley Laboratory and Johns Hopkins University from the United States. It was held at the Johns Hopkins University Nanjing Center in late June 1988. It was attended by about 15 Chinese and an equal number of U.S. experts on various topics related to energy demand and supply. Each presenter is one of the best observers of the energy situation in their field. A Chinese and U.S. speaker presented papers on each topic. In all, about 30 papers were presented over a period of two and one half days. Each paper was translated into English and Chinese.
The Chinese papers provide an excellent overview of the emerging energy demand and supply situation in China and the obstacles the Chinese planners face in managing the expected increase in demand for energy. These are matched by papers that discuss the energy situation in the U.S. and worldwide, and the implications of the changes in the world energy situation on both countries.
The paper by Zhu in Part 1 introduces the Chinese energy situation and that by Stagliano presents a similar overview for the U.S. They provide historical background and discuss future directions.
Part 2 focuses on the historical development of energy planning and policy in each country and the methodologies and tools used for projecting energy demand and supply. One of the Chinese papers (Zhou) also provides an excellent overview of the energy pricing situation in China. The emerging Chinese concern with air pollution is highlighted in the paper by Wang and Zhau, while Miller presents an overview of global environmental concerns linked with energy use.
The papers in Part 3 examine the pattern of energy demand, the forces driving demand, and opportunities for energy conservation in each of the major sectors in China and the U.S. The Chinese papers highlight the need for energy conservation in buildings (Lang), the rapid growth in transport oil demand (Yang), and the progress made in industrial energy conservation (Wang). American papers cover similar topics for the U.S. Topics such as petrochemicals are given special treatment. Urban energy use, a phenomena of growing importance, is examined separately, as is the evolving rural energy situation in China.
The papers in Part 4 deal with the outlook for global and Pacific region energy markets and the development of the oil and natural gas sector in China. Finally, the paper by Mao presents a Chinese perspective on the evolution of the U.S. energy economy.
The Symposium papers provide the reader with a rare insight into the Chinese energy demand situation observed from a not-so-monolithic Chinese perspective. We hope that this set of papers will serve to provide a good background on the energy demand situation in China in comparison to that in the U.S.
Zhou Fengqi Energy Research Institute Beijing
Jayant Sathaye Lawrence Berkeley Laboratory Berkeley
T ABLE OF CONTENTS
Part 1: Introduction
PRESENT AND FUTURE STATUS OF CHINA'S ENERGY - Zhu Liangdong ........ . 1-1
THE U.S. ENERGY SITUATION - Vito Stagliano ...................................................... . 2-1
Part 2: Energy Planning and Policy
APPLICATION OF NATIONAL ENERGY DEMAND MODEL
AND SOME POLICY SUGGESTIONS - Qiu Daxiong and Wu Zongxin ................. . 3-1
ENERGY SCENARIOS - G.R. Davis ........................................................................... . 4-1
THE REFORM OF ENERGY PLANNING IN CHINA - Zhu Liangdong ................... . 5-1
U.S. ENERGY POLICY SINCE 1973 - Wilfrid L. Kohl .............................................. . 6-1
ENERGY PRICE MANAGEMENT IN ECONOMIC
SYSTEM REFORM - Zhou Dadi ................................................................................ . 7-1
APPROACHING LONG-TERM ENERGY DEMAND:
ENERGY DEMAND FOR PRODUCTION OR PLEASURE? - Lee Schipper .......... . 8-1
AIR POLLUTION CONTROL AND ENERGY USE IN CHINA-
Wang Hanchen and Zhau Dianwu .................................................................................. . 9-1
ENVIRONMENTAL CONCERNS OF ENERGY USE - Alan S. Miller ..................... . 10-1
DEVELOPMENT AND ENERGY CONSUMPTION OF
THE COAL CHEMICAL INDUSTRY IN CHINA - Li Shilun ...............•................... 11-1
THE ROLE OF COAL IN THE U.S. ENERGY ECONOMY - Manfred Raschke ....... . 12-1
Part 3: Energy Demand and Demand Management
ENERGY USE IN BUILDINGS: THE U.S. EXPERIENCE
AND LESSONS FOR CHINA - Mark D. Levine and Bo Adamson .......................................................... 13-1
ENERGY USE IN CHINESE BUILDINGS - Lang Siwei ................ , .......................................................... 14-1
URBANIZATION AND MODERN LIFESTYLES:
IMPLICATIONS FOR FUEL USE- Jayant A. Sathaye ............................................................................ 15-1
URBAN ENERGY SUPPLY AND UTILIZATION IN CHINA - Zhang Tingwu ...................................... 16-1
REDUCING ENERGY DEMAND WITH COMMUNITY BASED SYSTEMS:
A NATIONAL ENERGY POLICY VIEWPOINT FOR CHINA-Fred S. Dubin ..................................... 17-1
ENERGY AND TRANSPORT IN CHINA - Yang Hongnian ..................................................................... 18-1
THE U.S. TRANSPORTATION SECTOR INPERSPECTIVE- Vito Stagliano ....................................... 19-1
ENERGY USE IN CHINESE INDUSTRY - Wang Jiacheng ...................................................................... 20-1
INDUSTRIAL ENERGY USE AND CONSERVATION
IN THE UNITED STATES - Marc Ross .................................................................................................... 21-1
ELECTRICAL ENERGY SOURCES AND CONSUMPTION IN CHINA - Hu Zhao-yi .......................... 22-1
STRUCTURAL CHANGES IN THE U.S. BUSINESS ENVIRONMENT AND
ELECTRICITY MARKETS: POTENTIAL LESSONS FOR CHINA - Oliver S. Yu .............................. .23-1
PROGRESS OF ENERGY SAVING IN CHINA'S
PETROCHEMICAL INDUSTRY - Wang Bing Shen ................................................................................ 24-1
TRENDS IN DEMAND FOR PETROCHEMICALS - Edward Flom ......................................................... 25-1
ENERGY UTILIZATION IN RURAL CHINA - Qiao Mu .......................................................................... 26-1
THE ENERGY CONSERVATION CENTER OF JIANGSU-NANJING -
Zhang Xiaodan ................................................................................................................................................ 27-1
Part 4: Global and Regional Energy Markets and China
THE WORLD OIL OUTLOOK TO 1995 - John H. Lichtblau .................................................................... 28-1
PACIFIC REGION OIL PRODUCT TRADE - Dennis J. O'Brien .............................................................. 29-1
PACIFIC REGION COAL TRADE - Stuart B. Ehrenreich ......................................................................... 30-1
PROSPECTS FOR CHINA'S PETROLEUM TRADE
AND INVESTMENT - Kim Woodard ........................................................................................................ 31-1
CHINA'S OIL SECTOR-Lu Huaibin ......................................................................................................... 32-1
THE U.S. ENERGY ECONOMY AFTER ENERGY CRISES - Mao Yushi .............................................. 33-1
List of Participants
PRESENT AND FUTURE STATUS OF CmNA'S ENERGY
Zhu Liangdong*
Energy is important for developing the social economy and improving people's living standard. In the course of China's modernization drive, dealing with energy issues has been a constant concern of government staff and intellectuals working in the energy domain. Since the founding of the People's Republic of China, the energy industry has been developed greatly. At present, both China's energy production and consumption rank third in the world. The great increase in energy production has supported the stable development of the national economy and constant improvement of people's life. In order to speed up the modernization, developing the energy industry will be an important task for the future.
Of course, today's energy issue is not only met by an individual country, but is faced by the whole world, so it is very significant for us to hold this Sino-American energy seminar and to approach this world-wide issue commonly. This seminar will be beneficial to further strengthen the information exchange and technical cooperation between our two countries.
China's Energy Resource is Abundant
Coal is the Major Resource of Conventional Energy "-
By the end of 1985, China's proven coal reserves had reached 780 billion tons. According to data from the World Energy Conference, this figure makes up about 35% of total proven reserves of the world, ranking first. There is a complete range of coal varieties with bituminous, anthracite, coking coal, lignite, and so on.
Geographically, there are different quantities of coal reserves spreading from the northeast to the southeast part of China, but they are mainly concentrated in the north and northwest. The coal base with Shanxi province as center accounts for 70% of the total reserves. The reserve in several provinces in south China is relatively less. This uneven distribution results in a coal transportation pattern from west to east and from north to south.
With the decrease of oil reserves in the world, and coal being one of the most realistic conventional energy resources, the significance of China's rich coal reserve is that coal from China will play a role in expanding coal trade in Asia and the Pacific basin as well as the world.
* Deputy Director, Department of Resources Saving and Comprehensive Utilization, State Planning Commission
1-1
Hydropower is Plentiful
Having many rivers and rich rainfall, our country has a very large hydropower resource. The theoretical reserve reaches 680 GW, with exploitable capacity 380 GW. The annual hydro electricity output of 1900 TWh ranks first in the world. The hydropower resource is the treasure-house of our country and is also a clean, renewable energy resource.
China's hydropower resource is mainly in the western area, with about 70% concentrated in the southwest. The resources in Yunnan and Shichuan provinces and Tibet area all exceed 100 GW separately. The famous "three rivers" valley in Henduan mountain area, the upper and middle reaches of the Yanzhi River, the upper reaches of the Yellow River, the Hongshui River valley, and the upper and middle reaches of the Yaluzhangbu River are all areas rich in hydropower resource. With poor hydropower resource in the east part of China, the hydropower reserve in northeast, north, and east China accounts for only 6.6% of the whole country, but it can be used to build many small and mediumsized hydropower stations. The development of hydropower in large scale and transmission of electricity from west to east will be another feature and inevitable trend of China's energy industry.
Oil and Natural Gas Resources Need Further Exploration and Development
Exploration and development of China's oil and natural gas resources has produced great achievements. Especially since adopting the policy of opening to the outside world, China's oil industry has made new advances. By cooperating with foreign countries, importing advanced technologies and raising foreign funds for exploration, China's proven reserve of oil and natural gas has been increased year by year.
The proved oil reserve of our country is mostly concentrated in the north and northeast area, while the gas reserve is concentrated in Shichuan province. Exploration of oil and gas reserves on the seashore has also made some progress.
The increase in China's oil and gas reserves depends on the strengthening of exploration. There are large areas of sedimentary basin, continental shelf in coastal areas, and the western wide districts that have abundant oil and gas resources. The area that has been explored accounts for only a small part; most of the areas remain to be explored and developed.
Theoretically, the future of natural gas is very hopeful, but the proven reserve is relatively less because of lack of geological exploration work. China's coal reserve is rich, so the natural gas resource associated with coal could also be abundant. Therefore, the exploration of natural gas is worth paying more attention to. Experts estimate that in average depths of 3000 m, there are dozens of trillion cubic meters of natural gas waiting for us to exploit.
Evaluation of China's Conventional Energy Resources
In future decades, the energy demand for China's modernization drive will still rely on conventional energy resources, and the proven reserve is basically sufficient. The fact that the main conventional energy resource is coal has shaped the orientation of utilizing energy resources in the future. Increased attention should be paid to solve the problems
1-2
concerning utiliz'ation of coal in large scale.
The potential for development of hydropower is enormous. To build hydropower stations in the river-sections with rich reserve and good conditions can provide multiple benefits of producing electricity, preventing floods, and developing navigation and supplying water for industry and agriculture.
Although the conventional energy resource is rich, energy output per capita is less than the world average because of China's large population. Therefore, China should promote efficient use of energy and persist in getting the best social-economic results instead of comparing energy consumption per capita with developed countries.
With the development of science and technology, the obtainable energy will be increasing constantly. This means that with thorough and wide exploration, proven reserves will increase, and that advanced technology can increase the recovery ratio. For instance, at present, the final recovery ratio in petroleum exploitation is only 1/3. If the secondary and tertiary recovery technique is developed' to its practical level, the obtainable oil resource can be increased.
Features of China's Energy Production and Consumption
The Growth of Energy Production is Fast
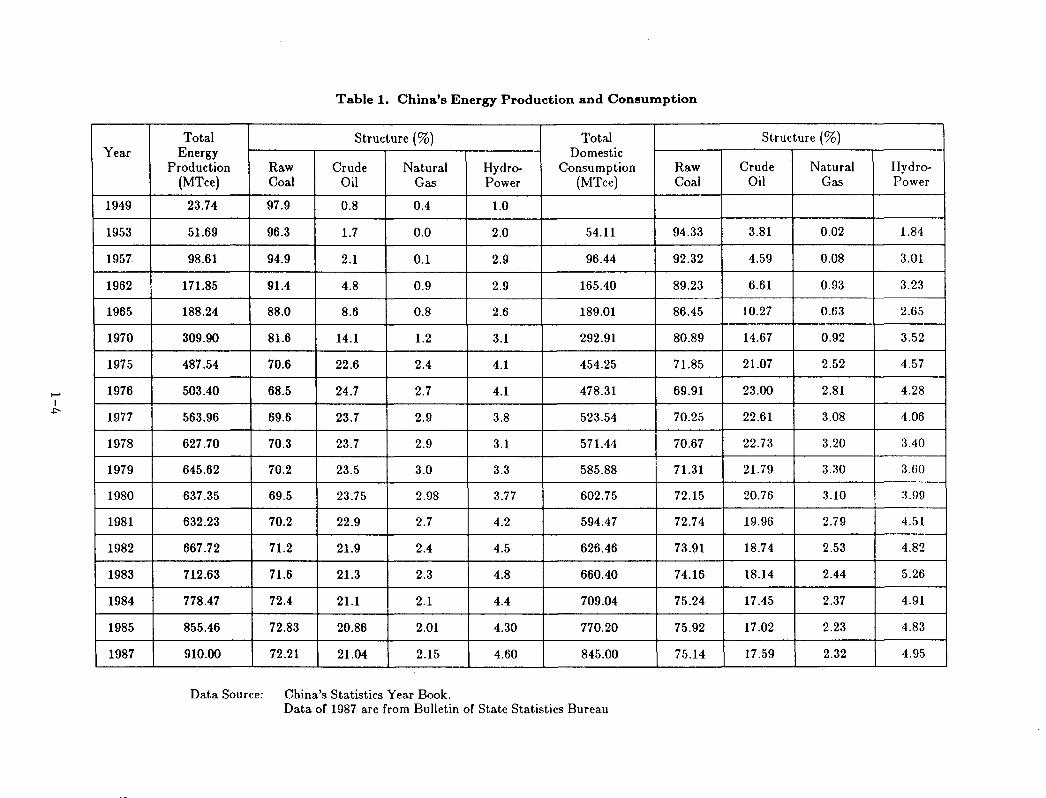
Since the founding of new China, the energy industry has made tremendous progress. In 1987, the total output of primary energy reached 0.91 billion tons, 38 times the 1949 level. Coal output was 0.92 billion tons, crude oil output was 0.134 billion tons, natural gas output was 13.8 billion cubic meters, and hydro electricity produced 99.5 TWh. Table 1 shows China's energy production over the past three decades.
In different periods, the average annual growth rates were as follows:
1949 - 1987: 10% 1949 - 1965: 13.8% 1966 - 1980: 8.5% 1981 - 1987: 5.2%
Generally speaking, the 10% growth rate during the 1949-1987 period is rather fast. The growth rate in the period of 1949-1965 was even faster because the initial basis for comparison was small and the development of heavy industry in the beginning period of industrialization was faster. In the later period, the growth rate slowed down because of adjustments in the national economy and the production structure and efforts to encourage energy conservation.
Changes Taking Place in Primary Energy Production Structure
In the 1950s, coal accounted for more than 95% of total primary energy production. Petroleum production only took 2%. In the 1960s, the large oil fields like Da Quing, Shen Li, and others were developed. Later on, the new oil fields, Dan Gang, North China, Liao He, and Zhong Yuan were put into production. Since then, petroleum occupies more than 20% of total energy output, though coal still occupies the major portion.
1-3
t-' I ~
Year
. 1949
1953
1957
1962
1965
1970
1975
1976
1977
1978
1979
1980
1981
1982
1983
1984
1985
1987
Table 1. China's Energy Production and Consumption
Total Structure (%) Total Energy Domestic
Production Raw Crude Natural Hydro- Consumption Raw (MTce) Coal Oil Gas Power (MTce) Coal
23.74 97.9 0.8 0.4 1.0
51.69 96.3 1.7 0.0 2.0 54.11 94.33
98.61 94.9 2.1 0.1 2.9 96.44 92.32
171.85 91.4 4.8 0.9 2.9 165.40 89.23
188.24 88.0 8.6 0.8 2.6 189.01 86.45
309.90 81.6 14.1 1.2 3.1 292.91 80.89
487.54 70.6 22.6 2.4 4.1 454.25 71.85
503.40 68.5 24.7 2.7 4.1 478.31 69.91
563.96 69.6 23.7 2.9 3.8 523.54 70.25
627.70 70.3 23.7 2.9 3.1 571.44 70.67
645.62 70.2 23.5 3.0 3.3 585.88 71.31
637.35 69.5 23.75 2.98 3.77 602.75 72.15
632.23 70.2 22.9 2.7 4.2 594.47 72.74
667.72 71.2 21.9 2.4 4.5 626.46 73.91
712.63 71.6 21.3 2.3 4.8 660.40 74.16
778.47 72.4 21.1 2.1 4.4 709.04 75.24
855.46 72.83 20.86 2.01 4.30 770.20 75.92
910.00 72.21 21.04 2.15 4.60 845.00 75.14
Data Source: China's Statistics Year Book. Data of 1987 are from Bulletin of State Statistics Bureau
Structure (%)
Crude Natural Hydro-Oil Gas Power
3.81 0.02 1.84
4.59 0.08 3.01 I
6.61 0.93 3.23 I
I
10.27 0.63 2.65
14.67 0.92 3.52
21.07 2.52 4.57
23.00 2.81 4.28
22.61 3.08 1.06
22.73 3.20 3.40
21.79 3.30 3.60
20.76 3.10 3.99
19.96 2.79 4.51
18.74 2.53 4.82
18.14 2.44 5.26
17.45 2.37 4.91
17.02 2.23 4.83
17.59 2.32 4.95
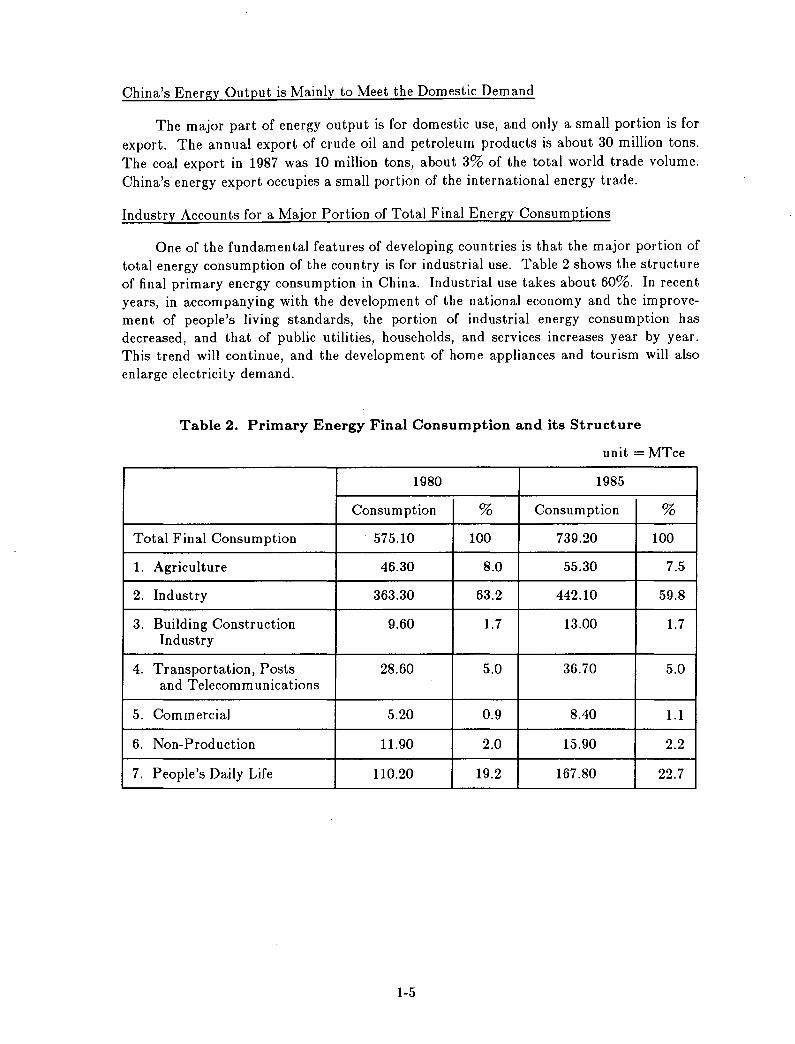
China's Energy Output is Mainly to Meet the Domestic Demand
The major part of energy output is for domestic use, and only a small portion is for export. The annual export of crude oil and petroleum products is about 30 million tons. The coal export in 1987 was 10 million tons, about 3% of the total world trade volume. China's energy export occupies a small portion of the international energy trade.
Industry Accounts for a Major Portion of Total Final Energy Consumptions
One of the fundamental features of developing countries is that the major portion of total energy consumption of the country is for industrial use. Table 2 shows the structure of final primary energy consumption in China. Industrial use takes about 60%. In recent years, in accompanying with the development of the national economy and the improvement of people's living standards, the portion of industrial energy consumption has decreased, and that of public utilities, households, and services increases year by year. This trend will continue, and the development of home appliances and tourism will also enlarge electricity demand.
Table 2. Primary Energy Final Consumption and its Structure
unit = MTce
1980 1985
Consum ption % Consumption %
Total Final Consumption 575.10 100 739.20 100
1. Agriculture 46.30 8.0 55.30 7.5
2. Industry 363.30 63.2 442.10 59.8
3. Building Construction 9.60 1.7 13.00 1.7 Industry
4. Transportation, Posts 28.60 5.0 36.70 5.0 and Telecommunications
5. Commercial 5.20 0.9 8.40 1.1
6. Non-Production 11.90 2.0 15.90 2.2
7. People's Daily Life 110.20 19.2 167.80 22.7
1-5
Most Coal is Directly Burnt by the Consumer
In 1985, 820 Mt of coal were consumed. Only 30% was used to generate electricity and to convert into coke-oven gas for consumer use, and nearly 70% was directly burnt in industrial boilers, kilns, and for people's daily life.
The large amount of coal directly burnt in boilers, family cooking ovens, and household heating boilers and ovens brings a serious problem of environmental pollution. The ways to solve this problem are: to construct more coal fired thermal power stations to supply clean electrical energy, to construct more co-generation power stations and district heating systems to supply steam and hot water for industrial and household use, and to construct plants producing gaseous fuel to replace direct burning of coal at the consumer side. All these plants should be equipped with effective facilities to make a minimum emission for environmental protection. We are also making coal briquettes for residential usage to improve combustion efficiency and reduce pollution simultaneously.
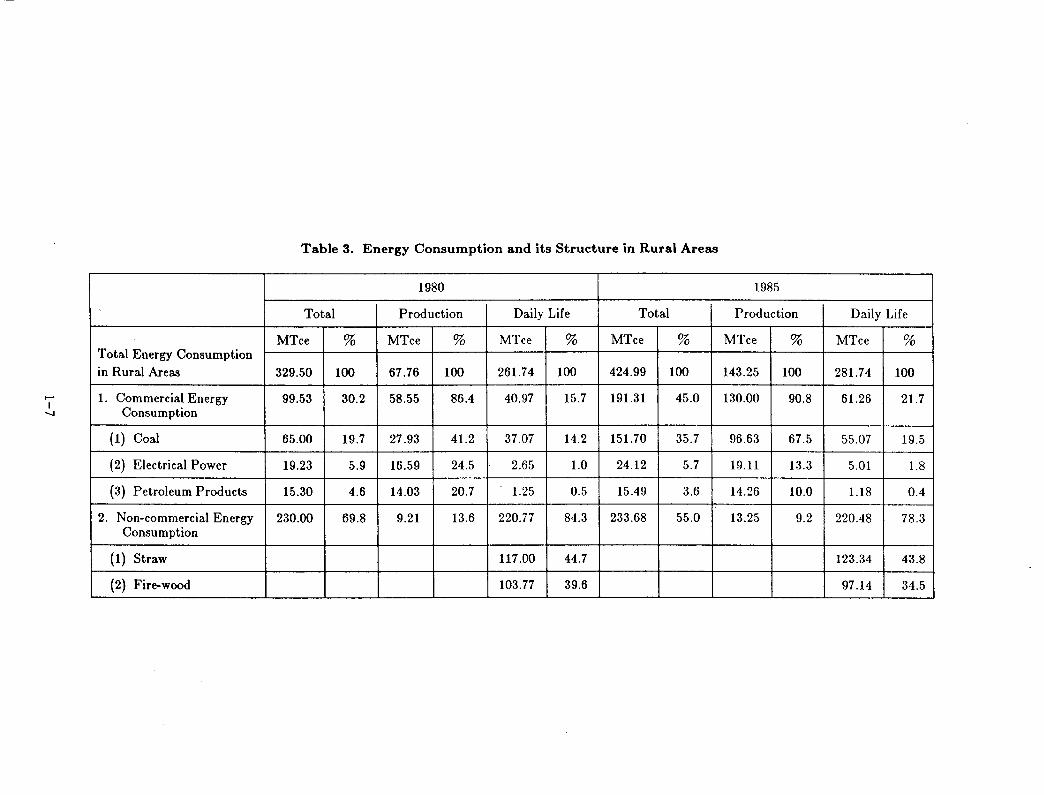
Rural Residents Mainly Rely on Bio-Energy
Specialists estimate that 1/3 of the world's population uses firewood and crop residues for daily life energy; China's 800 million peasants are half of this population. In recent years, because of the implementation of the policies adopted by our government, the energy demand in rural areas has increased rapidly along with the development of the rural economy and the rising living standard in rural areas. Therefore, solving the rural energy problem requires solving a complete systems engineering problem including ·comprehensive rural economic development, selecting appropriate energy resources and balancing energy supply and demand, and ecological and environmental protection. Table 3 shows the fundamental data of rural energy consumption in China.
Based on the recent experience of rural economic development, we can draw several conclusions about our rural energy problems:
(1) The development of the rural economy results in more dependence on commercial energy. During the Sixth Five Year Plan period, the township and village industries have developed rapidly, and commercial energy consumption has almost doubled. This trend will continue in the future.
(2) Rural needs of commercial energy will be solved principally in the rural areas themselves. In recent years, township-owned small coal mines, small hydro and thermal power plants have been developed quickly. They supply energy to meet the needs in the rural area. We should do more work to improve the safety conditions of the mines, and to promote their technology progress so that these mines and plants can work well for a longer time.
(3) Firewood afforestation and comprehensive use of biomass are important ways to solve the energy problem in rural areas. The government encouraged firewood afforestation and development of bio-gas to allow comprehensive use of biomass. This has proved to be very effective.
(,1) Fully using the natural energy resource according to the local conditions will give great resource potential for China's rural areas. Solar energy, wind energy, geothermal energy, tide energy and others may be used as supplementary rural energy resources.
1-6
...... I .....
Total Energy Consumption in Rural Areas
1. Commercial Energy Consumption
(1) Coal
(2) Electrical Power .
(3) Petroleum Products
2. Non-commercial Energy Consumption
(1) Straw
(2) Fire-wood - ----
Table 3. Energy Consumption and its Structure in Rural Areas
1980
Total Production Daily Life Total
MTce % MTce % MTce % MTce %
329.50 100 67.76 100 261.74 100 424.99 100
99.53 30.2 58.55 86.4 40.97 15.7 191.31 45.0
65.00 19.7 27.93 41.2 37.07 14.2 151.70 35.7
19.23 5.9 16.59 24.5 2.65 1.0 24.12 5.7
15.30 4.6 14.03 20.7 . 1.25 0.5 15.49 3.6
230.00 69.8 9.21 13.6 220.77 84.3 233.68 55.0
117.00 44.7
103.77 39.6 -_._----
1985
Production Daily Life
MTce % MTce %
143.25 100 281.74 100
130.00 90.8 61.26 21.7
96.63 67.5 55.07 19.5
19.11 13.3 5.01 1.8
14.26 10.0 1.18 0.4
13.25 9.2 220.48 78.3
123.34 43.8
97.14 34.5
Energy Demand and Energy Policy in the Future
The development of a modern society depends on the continuous increase of energy consumption. The question of how much energy we need and how we should promote the development of the energy industry to meet the energy demand in the modernization of China is a very important issue.
The Strategic Goal of Economic Development
In the report on the 13th National Conference of the Party, General Secretary Zhao Ziyang pointed out: "After the third plenary session of the 11th central committee, the strategic arrangement for economic construction of our country can be principally divided into three steps. The first step was to double the GNP of 1980 and solve the food and clothing problem of the people. This task has been basically fulfilled. The second step is to quadruple the GNP of 1980 and make the living of the people "well-off". The third step is that by the middle of the next century, GNP per capita will reach the level of a middle-developed-country, and the life of the people will get relatively rich."
The key point at present is how to realize the second strategic goal of the development. At present, the economic output in our country is relatively low, energy consumption per unit product is high, the waste of various resources is severe, electricity supply cannot meet the needs of national construction, and there is a lack of construction funds. To solve these problems, we must pay attention to the economic results, improve the quality of goods, reduce material consumption, realize a rational distribution of production factors, and improve the utilization of funds and the efficiency of resources utilization.
We will rationalize the structure of enterprises by adjusting and transforming industrial structure. Using advances in science and technology, we will gradually improve the management and efficiency of energy use so as to reduce the demand for energy.
We believe that with the speeding up and deepening of the reform of the economic system, the strategic goals of economic development can be realized.
Energy Demand and Production by the Year 2000
In the year 2000, China's population will probably surpass 1.2 billion. According to preliminary planning and forecasting, the GNP will be 1250-1300 billion U.S. dollars and the energy demand will be 1.4-1.5 billion Tce, with energy consumption per capita of 1100-1200 kgce.
According to the present primary energy production structure and the growth possibility of energy production, it is planned that the average annual growth rate of primary energy production will be 3.5%. The projected coal output is 1.3-1.4 billion tons, and the projected hydro and nuclear electricity output is 250-300 TWh. According to this plan, the task for the next decade is very heavy, but we believe that we will realize our goals provided that our plan is properly arranged and correct measures are taken.
Policy Will Continue to Emphasize Energy Exploitation and Conservation
China's modernization cannot be built on the basis of low energy consumption. The average energy consumption per capita in our country is only about 800 kgce. In order to
1-8
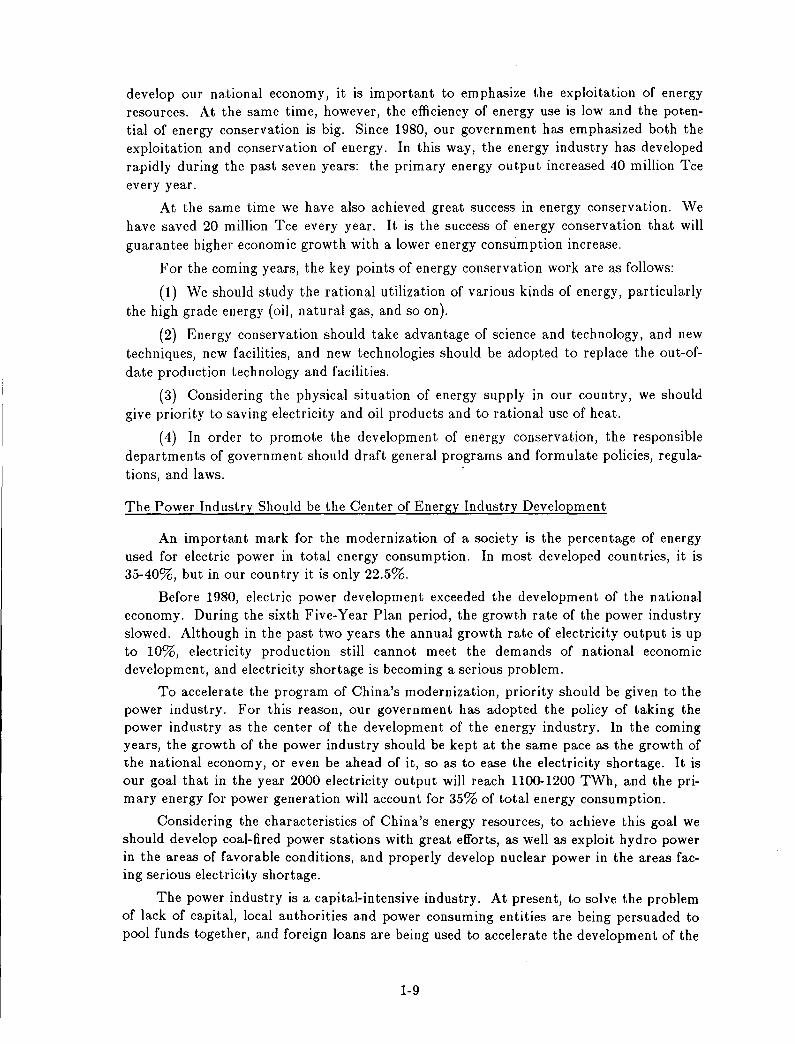
develop our national economy, it is important to emphasize the exploitation of energy resources. At the same time, however, the efficiency of energy use is low and the potential of energy conservation is big. Since 1980, our government has emphasized both the exploitation and conservation of energy. In this way, the energy industry has developed rapidly during the past seven years: the primary energy output increased 40 million Tce every year.
At the same time we have also achieved great success in energy conservation. We have saved 20 million Tce every year. It is the success of energy conservation that will guarantee higher economic growth with a lower energy consumption increase.
For the coming years, the key points of energy conservation work are as follows:
(1) We should study the rational utilization of various kinds of energy, particularly the high grade energy (oil, natural gas, and so on).
(2) Energy conservation should take advantage of science and technology, and new techniques, new facilities, and new technologies should be adopted to replace the out-ofdate production technology and facilities.
(3) Considering the physical situation of energy supply in our country, we should give priority to saving electricity and oil products and to rational use of heat.
(4) In order to promote the development of energy conservation, the responsible departments of government should draft general programs and formulate policies, regula-tions, and laws. .
The Power Industry Should be the Center of Energy Industry Development
An important mark for the modernization of a society is the percentage of energy used for electric power in total energy consumption. In most developed countries, it is 35-40%, but in our country it is only 22.5%.
Before 1980, electric power development exceeded the development of the national economy. During the sixth Five-Year Plan period, the growth rate of the power industry slowed. Although in the past two years the annual growth rate of electricity output is up to 10%, electricity production still cannot meet the demands of national economic development, and electricity shortage is becoming a serious problem.
To accelerate the program of China's modernization, priority should be given to the power industry. For this reason, our government has adopted the policy of taking the power industry as the center of the development of the energy industry. In the coming years, the growth of the power industry should be kept at the same pace as the growth of the national economy, or even be ahead of it, so as to ease the electricity shortage. It is our goal that in the year 2000 electricity output will reach 1100-1200 TWh, and the primary energy for power generation will account for 35% of total energy consumption.
Considering the characteristics of China's energy resources, to achieve this goal we should develop coal-fired power stations with great efforts, as well as exploit hydro power in the areas of favorable conditions, and properly develop nuclear power in the areas facing serious electricity shortage.
The power industry is a capital-intensive industry. At present, to solve the problem of lack of capital, local authorities and power consuming entities are being persuaded to pool funds together, and foreign loans are being used to accelerate the development of the
1-9
power ind ustry.
Promote International Exchange and Cooperation
China has a great potential in promoting international exchange and cooperation in the energy field. Today's meeting is a good beginning, and we believe it will promote further cooperation between governments, enterprises and persons of our two countries. This cooperation can take the following forms:
(1) Utilizing foreign loans to exploit China's energy resources. In the coal industry, utilizing foreign loans together with funds raised in China, we have built twelve coal mines and open-pit mines. In the power industry, with the help of long-term loans from the World Bank and foreign countries, we have constructed a number of thermal and hydro power stations and super-high voltage transmission lines.
(2) Cooperative exploitation and joint venture business. During recent years the exploitation of off-shore oil field mainly took this cooperative form. We have signed 33 contracts with 45 foreign companies from 12 different countries, and total capital investment is more than 2 billion U.S. dollars.
(8) Hiring foreign working teams. For exploiting the oil deposit in Xinjian Autonomous region, we have hired more than 20 foreign working teams from the U.S. and France. In the future, for exploiting the oil and natural gas deposit in southern China, there will be more opportunities for expanding this kind of cooperation.
(.1) In the course of introducing new techniques, new facilities, and new technologies, flexible forms such as combining technology transfer with trade business can be adopted.
In summary, along with the wider opening of China's coastal areas to the outside world, the international exchange and cooperation in the field of energy will progress further and further.
1-10
THE U.S. ENERGY SITUATION
Vito Stagliano*
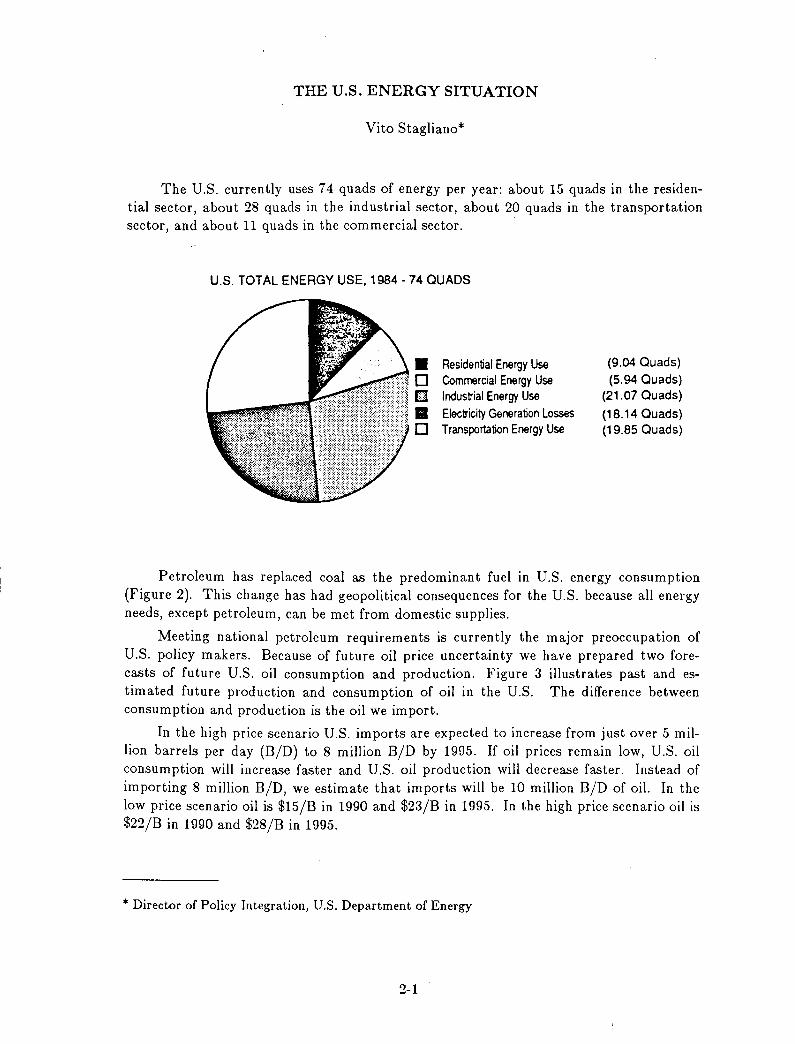
The U.S. currently uses 74 quads of energy per year: about 15 quads in the residential sector, about 28 quads in the industrial sector, about 20 quads in the transportation sector, and about 11 quads in the commercial sector.
u.s. TOTAL ENERGY USE, 1984 - 74 QUADS
• Residential Energy Use o Commercial Energy Use [] Industrial Energy Use • Electricity Generation Losses o Transportation Energy Use
(9.04 Quads)
(5.94 Quads) (21.07 Quads)
(18.14 Quads) (19.85 Quads)
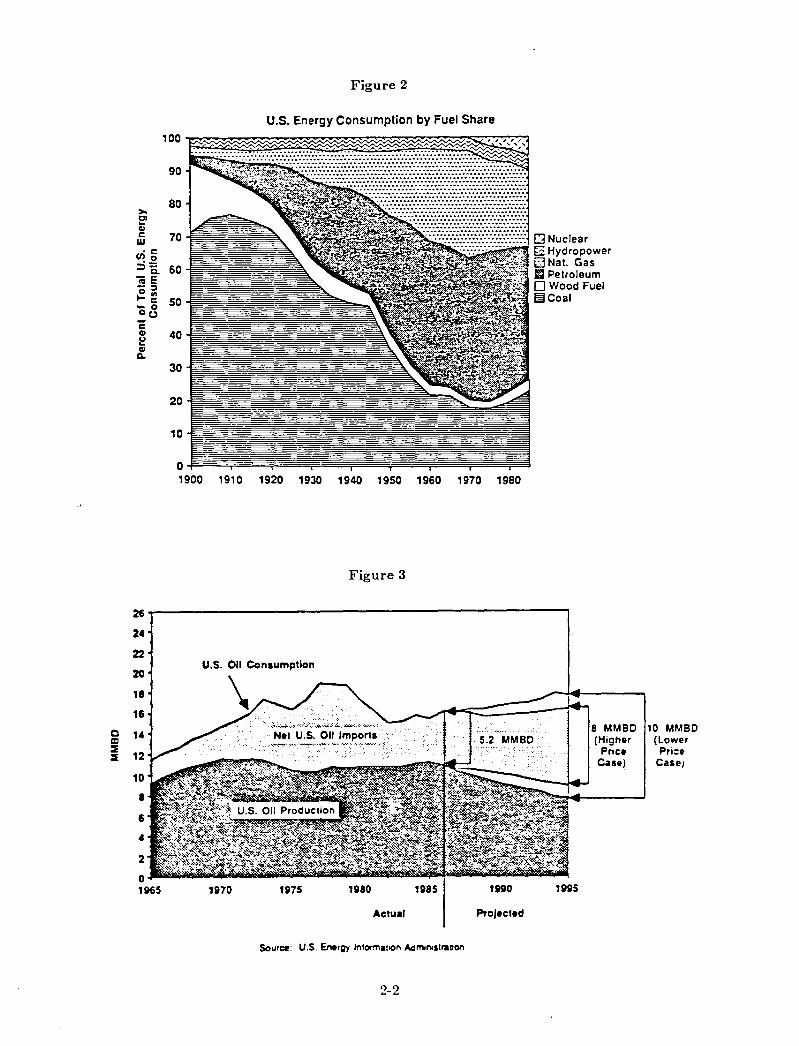
Petroleum has replaced coal as the predominant fuel in U.S. energy consumption (Figure 2). This change has had geopolitical consequences for the U.S. because all energy needs, except petroleum, can be met from domestic supplies.
Meeting national petroleum requirements is currently the major preoccupation of U.S. policy makers. Because of future oil price uncertainty we have prepared two forecasts of future U.S. oil consumption and production. Figure 3 illustrates past and estimated future production and consumption of oil in the U.S. The difference between consumption and production is the oil we import.
In the high price scenario U.S. imports are expected to increase from just over 5 million barrels per day (B/D) to 8 million B/D by 1995. If oil prices remain low, U.S. oil consumption will increase faster and U.S. oil production will decrease faster. Instead of importing 8 million B/D, we estimate that imports will be 10 million B/D of oil. In the low price scenario oil is $15/B in 1990 and $23/B in 1995. In the high price scenario oil is $22/B in 1990 and $28/B in 1995.
* Director of Policy Integration, U.S. Department of Energy
2-1
>-01 "-CII c w ·c
"'0 ::i= Q.
iiiE -::;, 0", I-c -0 °u C CII u "-CII ~
26
24
22
20
11
1fi
0 14 al ~
12 ~
10
1
fi
4
2
0 1~5
Figure 2
u.s. Energy Consumption by Fuel Share
100
90
80
70
60
50
40
30
20
10
o 1900 1910 1920 1930 1940 1950 1960 1970 1980
Figure 3
u.s. 011 Consumption
1870 1egO
Actua' Projected
Source: u.s. Energy informatIOn AdmontstraDon
2-2
o Nuclear G Hydropower DNa!. Gas II Petroleum o Wood Fuel ~Coal
8 MMBD (Higher
Pnce Cue)
10 MMBD (lower Pri:e
Case)
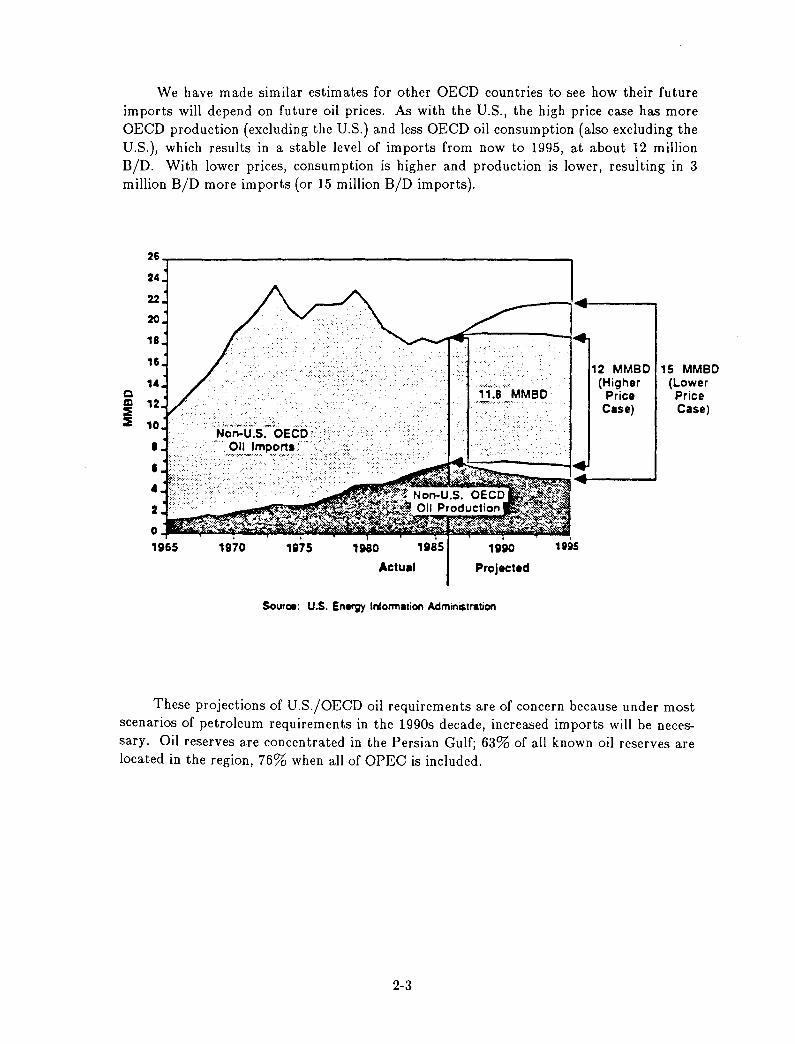
We have made similar estimates for other OECD countries to see how their future imports will depend on future oil prices. As with the U.S., the high price case has more OECD production (excluding the U.S.) and less OEeD oil consumption (also excluding the U.S.), which results in a stable level of imports from now to 1995, at about 12 million B/D. With lower prices, consumption is higher and production is lower, resulting in 3 million B/D more imports (or 15 million B/D imports).
26
24
22
20
18
16
1. C al 12 ~ ~ 10
• I
• 2
0 , 1965 1970 1975 1980
Actual
1985 1990
ProJected
Source: u.s. Energy Information Administration
1 II is
2 MMBD (Higher
Price Case)
'5 MMBD (Lower Price Case)
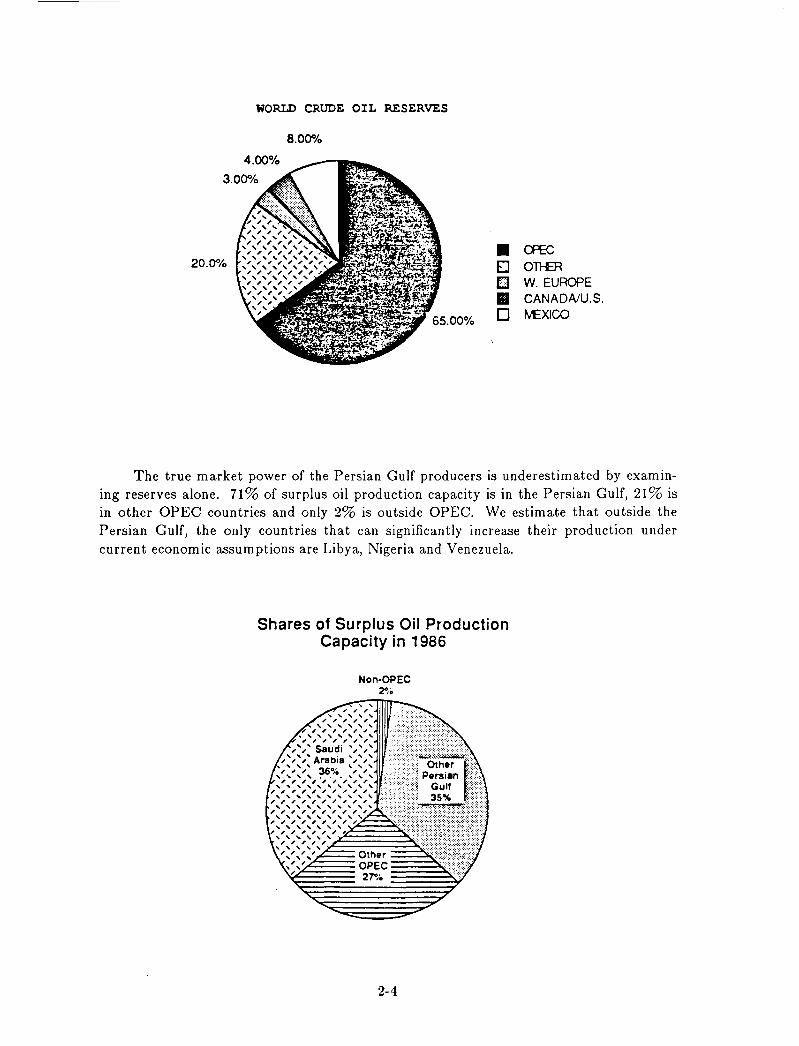
These projections of U.S./OECD oil requirements are of concern because under most scenarios of petroleum requirements in the 1990s decade, increased imports will be necessary. Oil reserves are concentrated in the Persian Gulf; 63% of all known oil reserves are located in the region, 76% when all of OPEC is included.
2-3
WORLD CRUDE OIL RESERVES
8.00"10
• ate 20.0% El OTI-£R
EJ w. EUROPE
II CANADA/U.S.
0 M:XICO
The true market power of the Persian Gulf producers is underestimated by examining reserves alone. 71% of surplus oil production capacity is in the Persian Gulf, 21% is in other OPEC countries and only 2% is outside OPEC. We estimate that outside the Persian Gulf, the only countries that can significantly increase their production under current economic assumptions are Libya, Nigeria and Venezuela.
Shares of Surplus Oil Production Capacity in 1986
Non-OPEC 2%
2-4
After taking these facts into account, we have estimated that the future share of OPEC and Persian Gulf oil production will increase. Under the higher price case, the increase is gradual, under the lower price case, the increase is rapid. Persian Gulf producers will return to roughly the same percentage share of the world oil market that they had around 1975. This is of concern to the U.S. because Persian Gulf producers may regain their ability to control the world price of oil. This might result in sudden and unpredictable increases in price that would be disruptive to the U.S. and other economies.
In order to protect our economy from sudden reductions in world oil supplies, the U.S. has greatly increased its emergency reserves of oil from 100 million barrels in 1980 to over 540 million in 1988. The ability of the U.S. to release this oil into the market quickly will help moderate price shocks that would otherwise result from a disruption of oil supplies.
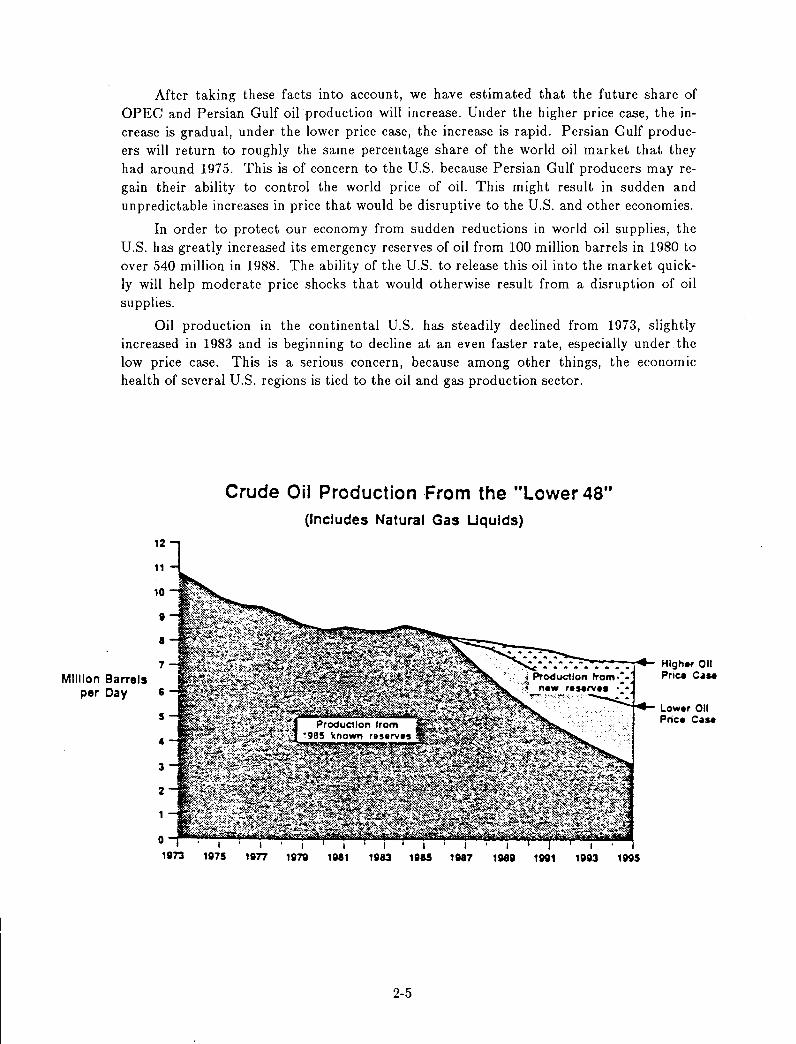
Oil production in the continental U.S. has steadily declined from 1973, slightly increased in 1983 and is beginning to decline at an even faster rate, especially under the low price case. This is a serious concern, because among other things, the economic health of several U.S. regions is tied to the oil and gas production sector.
Million Barrels per Day
12
11
10
, 8
Crude Oil Production From the "Lower 48" (Includes Natural Gas Uqulds)
7 ;;-.::-----~ Highet' 011
6
5
4
3
2
o~~~-I I 1S173 1S175 1S1n 1S1N
I 1N1 1S183 1S185 1N7
2-5
I 1Nt 1101
I
1S1S13 1105
Price Cue
Lower 011 Price Cue
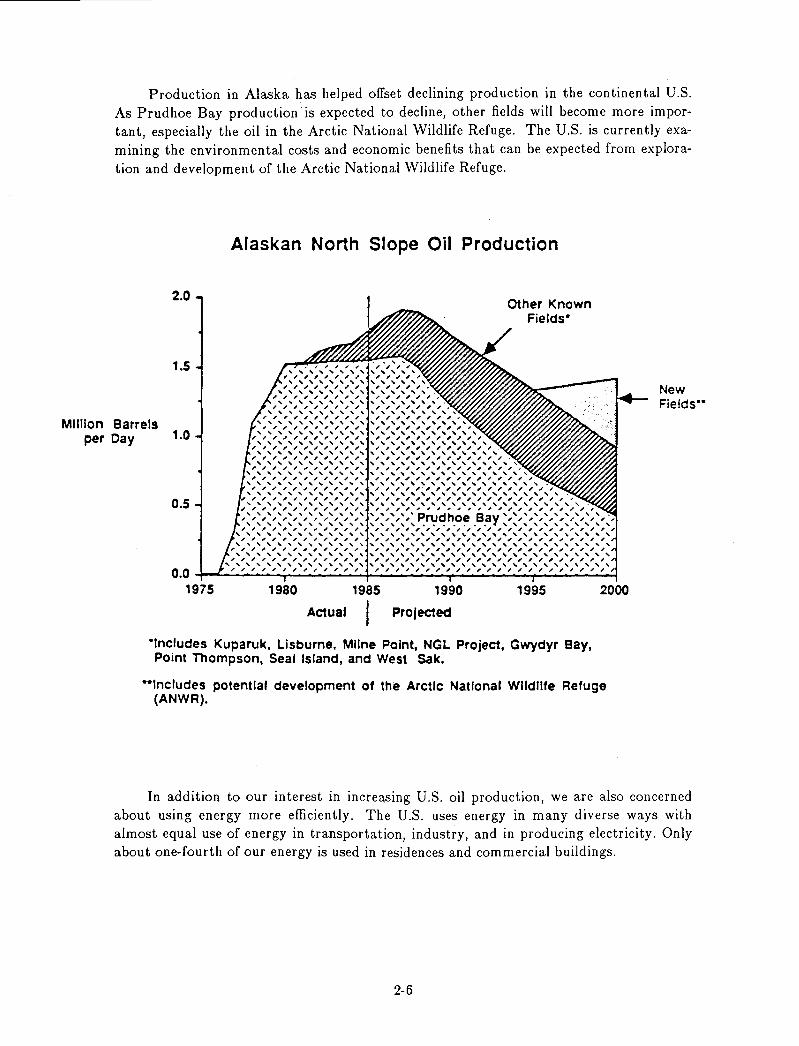
Production in Alaska has helped offset declining production in the continental U.S. As Prudhoe Bay production is expected to decline, other fields will become more important, especially the oil in the Arctic National Wildlife Refuge. The U.S. is currently examining the environmental costs and economic benefits that can be expected from exploration and development of the Arctic National Wildlife Refuge.
MIllion Barrels per Day
2.0
1.5
1.0
0.5
0.0 1975
Alaskan North Slope Oil Production
,. , , , , , " , , , , , , " , , , " " , , , , , , , , , , " " , , , , , , , , , , , , , , , , , , , , , , , , , , , , , , , , , " , , , , , , , , , , , , , , , , " , , , , , , , , , , , , , , , , , " , , , " " , , , , , , , , , , , , , " , , " , , , , , , , , , , , , , , , , , , , " , , , , , , , , , , , , , , , , , , " , , , " , , , , , , , , , , , , , , , , , , , " " , , , , , , , , , , , , , , , , , , , , , , , , , , , , , , , , , , , , , , , , , , , , , , , , , , , , , , , , , , , , , , , , , , , , , , , , , , , , , , , , , , , , , , , , , , , , , , , , , , , , , , , , , , , , " , , , , , , , , , , , , , , , , , , , , , , , , , , , , , , , , , , , , , , , , , , , , " , , , , , , , , , , , , , , , , , , , , , , , , , , , , , , , , " , , , , , , , , , , , , , , , , , , , , , , , , , , , , , , , , , , , , , ,
, , , , , , , , , , , , , , , , , , " " , , , , , , , , , , " , , , """ , , , , , , , , , , , , , , , , , , , , , , """" , , , , , , , , , , , , , , , , , , , , , , , , , , , , , , , , , , , , , , , , , , , , , " , , , , , , , , , , , , ,
Other Known Fields·
, , , , , , , , , , , , , , , , , , , , , , , , , , , , , , , , , , , , , , , , , , , , , , , , , , , , , , , , , , , , , , , , , , , , , , , , , , , , , , , , , , , , , , , , , , , , , '"' , , , , , , , , , , , , , , , , , , , , , , , , , , , , , , , , , , , , , , , , , , , , , , , , , , , , , , , , , , , , , , , , , , , , , , , , , , , , , , , , , , , , , , , , , , ,,:,~,:,: ~~C!h.O!! .B_ay ~,:,~,~,:,:,:,~,~,: , , , , , , , , , , , , , , , , , , , , , , , , , , , , , , , , , , , , , , , , , , , , , , , , , , , , , , , , , , , , , , , , , , , , , , , , , , , , , , , , , , , , , , , , , , , , , , , , , , , , , , , , , , , , , , , , , , , , , , , , , , , , , , , , , , , , , , , , , , , , , , , , , , , , , , , , , , , , , , , , , , , , , , , , , , , , , , , , , , , , , , , , , , , , , , , , ,
1980 1985 1990 1995
Actual I Projected
·'ncludes Kuparuk, Lisburne, Milne Point, NGL Project, Gwydyr Bay, Point Thompson, Seal Island, and West Sak.
2000
··'ncludes potential development of the ArctIc National Wildlife Refuge (ANWR).
New Fields'·
In addition to our interest in increasing U.S. oil production, we are also concerned about using energy more efficiently. The U.S. uses energy in many diverse ways with almost equal use of energy in transportation, industry, and in producing electricity. Only about one-fourth of our energy is used in residences and commercial buildings.
2-6
200
175
150
125
II "tl 100 II
8 75
50
25
0
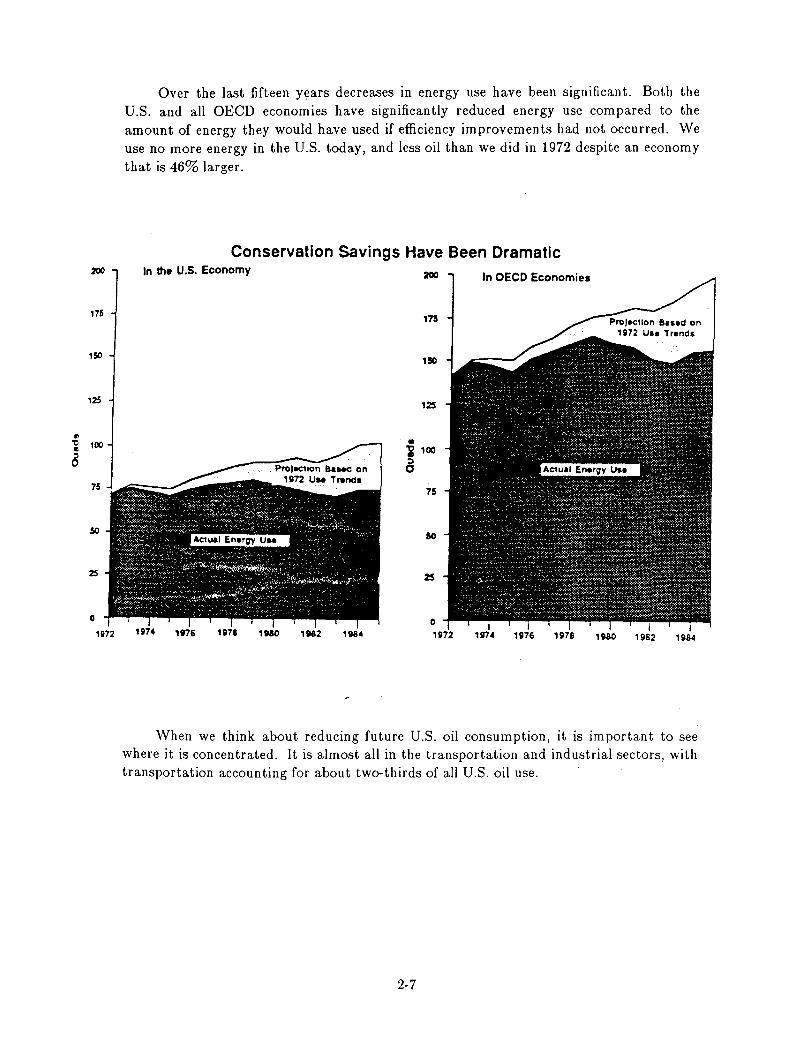
Over the last fifteen years decreases in energy use have been significant. Both the u.s. and all OEeD economies have significantly reduced energy use compared to the amount of energy they would have used if efficiency improvements had not occurred. We use no more energy in the U.S. today, and less oil than we did in 1972 despite an economy that is 46% larger.
Conservation Savings Have Been Dramatic In the u.s. Economy 200 In OECD Economies
175
150
125
• i 'OO
6 75
50
2S
0
When we think about reducing future U.S. oil consumption, it is important to see where it is concentrated. It is almost all in the transportation and industrial sectors, with transportation accounting for about two-thirds of all U.S. oil use.
2-7
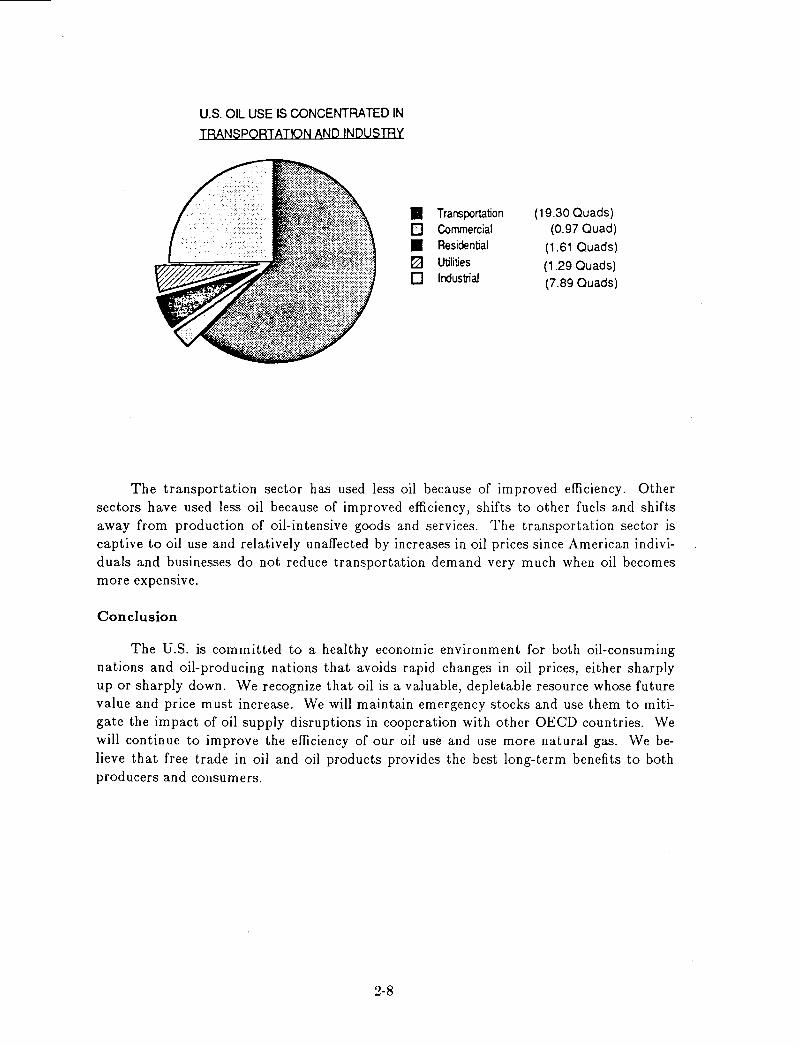
U.S. OIL USE IS CONCENTRATED IN
TRANSPORTATION AND INDUSmy
• 0 • ~ 0
Transportation Commercial Residential Utilities Irdustrial
(19.30 Quads) (0.97 Quad)
(1.61 Quads)
(1.29 Quads) (7.89 Quads)
The transportation sector has used less oil because of improved efficiency. Other sectors have used less oil because of improved efficiency, shifts to other fuels and shifts away from production of oil-intensive goods and services. The transportation sector is captive to oil use and relatively unaffected by increases in oil prices since American individuals and businesses do not reduce transportation demand very much when oil becomes more expenSIve.
Conclusion
The U.S. is committed to a healthy economic environment for both oil-consuming nations and oil-producing nations that avoids rapid changes in oil prices, either sharply up or sharply down. We recognize that oil is a valuable, depletable resource whose future value and price must increase. We will maintain emergency stocks and use them to mitigate the impact of oil supply disruptions in cooperation with other OEeD countries. 'vVe will continue to improve the efficiency of our oil use and use more natural gas. 'vVe believe that free trade in oil and oil products provides the best long-term benefits to both producers and consumers.
2-8
APPLICATION OF NATIONAL ENERGY DEMAND MODEL AND SOME POLICY SUGGESTIONS
Qiu Daxiong and Wu Zongxin*
Current Energy Problems
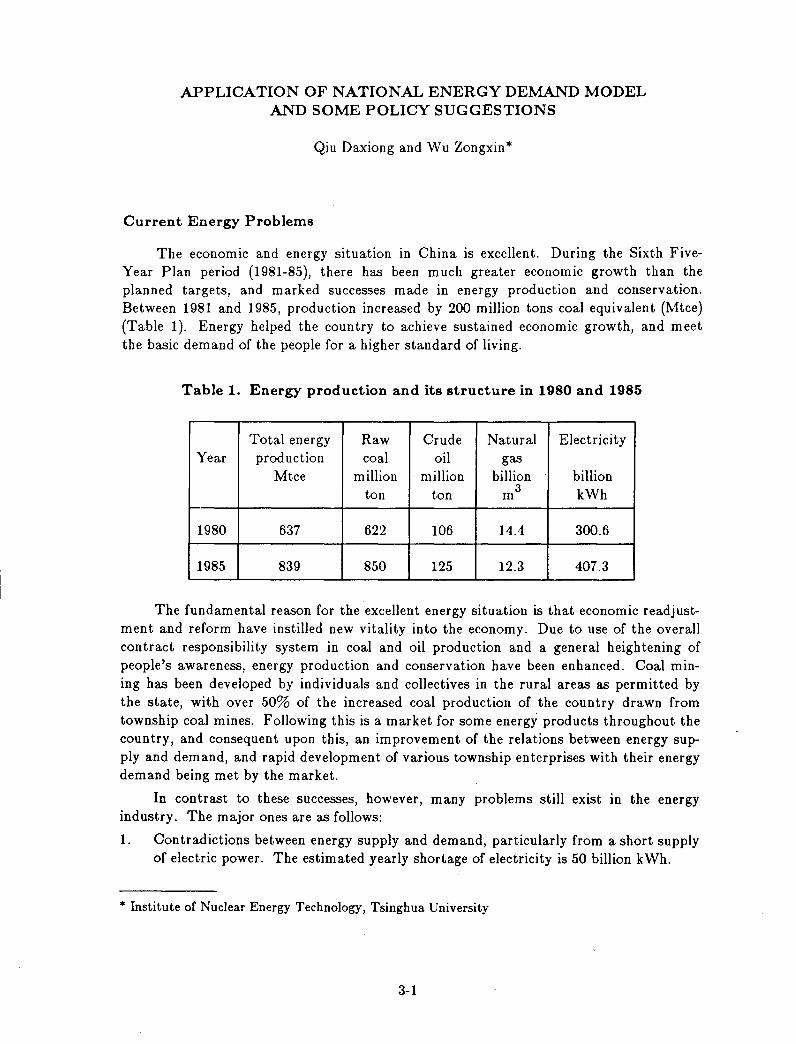
The economic and energy situation in China is excellent. During the Sixth FiveYear Plan period (1981-85), there has been much greater economic growth than the planned targets, and marked successes made in energy production and conservation. Between 1981 and 1985, production increased by 200 million tons coal equivalent (Mtce) (Table 1). Energy helped the country to achieve sustained economic growth, and meet the basic demand of the people for a higher standard of living.
Table 1. Energy production and its structure in 1980 and 1985
Total energy Raw Crude Natural Electricity Year production coal oil gas
Mtce million million billion billion ton ton 3 kWh m
1980 637 622 106 14.4 300.6
1985 839 850 125 12.3 407.3
The fundamental reason for the excellent energy situation is that economic readjustment and reform have instilled new vitality into the economy. Due to use of the overall contract responsibility system in coal and oil production and a general heightening of people's awareness, energy production and conservation have been enhanced. Coal mining has been developed by individuals and collectives in the rural areas as permitted by the state, with over 50% of the increased coal production of the country drawn from township coal mines. Following this is a market for some energy products throughout the country, and consequent upon this, an improvement of the relations between energy supply and demand, and rapid development of various township enterprises with their energy demand being met by the market.
In contrast to these successes, however, many problems still exist in the energy industry. The major ones are as follows:
1. Contradictions between energy supply and demand, particularly from a short supply of electric power. The estimated yearly shortage of electricity is 50 billion kWh.
* Institute of Nuclear Energy Technology, Tsinghua University
3-1
2. Imbalanced energy supply and demand among regions due to a lack of transport for energy resources. It is estimated that there are 50 million tons of coal awaiting transport form the coal-producing areas.
3. Greatly changed composition of energy consumption by township enterprises. With the growth of township enterprises, commercial energy consumption and energy used for production increased rapidly in rural areas.
4. Serious air pollution in Chinese cities and acid rain from the use of coal as a major fuel. This is particularly true of South China, where rainfall with pH lower than 5.6 and recurrent crop damages are reported.
When economic advances are made following the goal set by the Chinese Communist Party Central Committee for this country and the Chinese people to attain a fairly comfortable standard of living by the turn of this century, how much energy will be needed? How is the trend of related problems in the energy field? These are the tasks of our energy demand forecast.
Features of the National Energy Demand Model
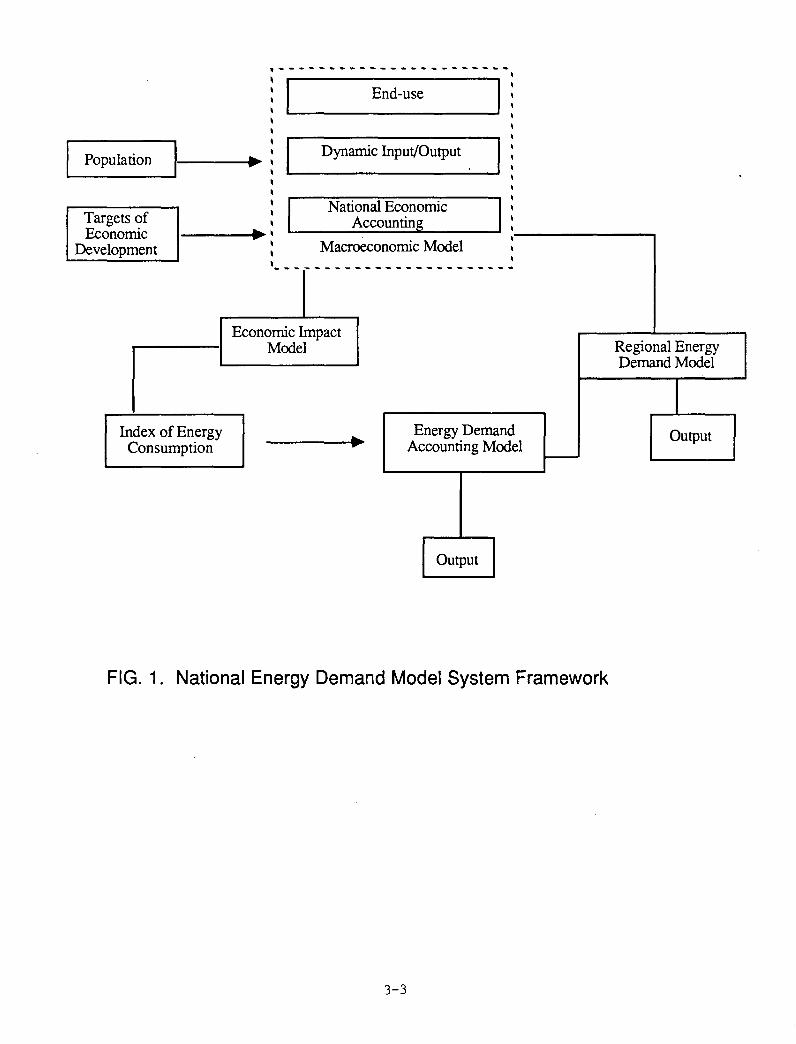
Since 1980, INET of Tsinghua University and many other research units have taken on the task of energy demand forecasting. There has been in-depth study of forecasting methods, e.g., energy consumption elasticity, sector analysis and static input-output analysis. As a result, a model of energy demand with a set of submodels, including dynamic input-output analysis and techno-economic analysis, has been set up (see Figure 1). Following are the characteristics of the model system:
The Macroeconomic Submodel
The macroeconomic submodel concentrates on dynamic input-output analysis. It is a sectoral, balanced model with multiple periodic dynamism. It can produce important information such as annual increases in total output value and investment, and provide the scenarios for coordinated and balanced development of various economic sectors. The operation of the model proceeds from the end-use demand of the society and various households, not from the productive forces.
Energy Demand Accounting Submodel
This is a techno-economic analytical model based on detailed forecasts of the activity level of energy consumption units such as population, the number of households, the output of products, the volume of commodity turnover, and the intensity of energy consumption. Take diesel locomotives, for example. The activity level is the freight volume of goods moved by diesel locomotives, and the future oil consumption intensity is placed at 100 tons/kilometer. The latter includes the impact of the types of locomotives in use in the year 2000, and the impact exerted by improved technology.
The submodel forecasts for each basic energy consumption unit, then sums them to obtain the demand value at a higher level, i.e., by sectors. Finally, the total end-use demand of energy in the whole nation can be obtained. Energy forecasts proceed from end-use-useful energy to the demand of primary energy resources.
.-----------------------i I End-use I : \ \
i-----t.~ ~ I Dynamic Input/Output I ~-------~ \
Population
Targets of Economic
Development
Index of Energy Consumption
\ \ \ \ .\ National Economic I :
Accounting ~----------~~------~
\ \
Macroeco \- -- --- - --- -
Economic Impact Model
nomic Model , , ,
-------------
Energy Demand Accounting Model
Output
-
FIG. 1. National Energy Demand Model System Framework
3-3
Regional Energy Demand Model
I Output
The Economic Impact Submodel
This model is used for evaluating the economic gains from investment in energy conservation technology retooling. It shows that energy conservation technology retooling brings lower productive costs and lowered demand on the energy sector, thus reducing investment requirements. The overall economic results can be assessed from a comparison of reduced energy sector investment with investments in energy conservation technology retooling.
The Regional Energy Demand Submodel
The regional energy demand submodel is used for studying the regional distribution of locally-distributed productive forces, the structure of production, and the output of major local products to obtain the amount of energy resources needed in various regions. It considers the potential of resources and the technical advantages enjoyed locally, as well as the constraints of national economic growth and reform of the national productive structure.
The whole model system shows not only the influence of structural changes from social economic progress on energy demand, but also changes in the structure of production, the influence of changes in the structure of various trades, and the impact of changed product mix on energy demand.
Application of the National Energy Demand Model
The functions of the model system are:
1. To forecast the national energy demand according to planned targets;
2. To forecast the energy demand in various regions;
3. To analyze the influence of related factors such as the structure of production, product mix and technical progress on energy demand; and
4. To assess the economic results of investment in energy conservation technology retooling.
The model uses interactive software and IBM microcomputers, with the help of which the planners can carry out data examination and revision of forecasts. Thus, it makes an effective tool for planning.
The model has been applied to national and regional energy demand forecasting for the year 2000, according to the targets of total output value of industry and agriculture and a fairly comfortable standard of living of the Chinese people. Table 2 lists the composition of output value by 2000, according to the macroeconomic model.
3-4
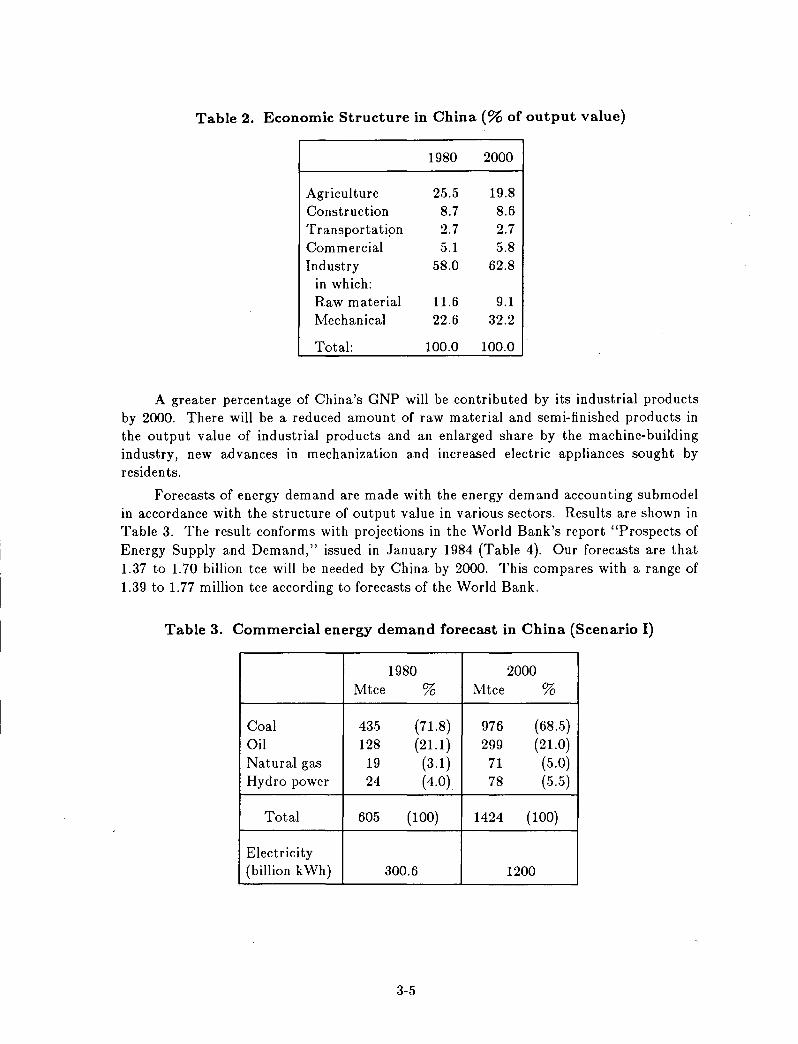
Table 2. Economic Structure in China (% of output value)
1980 2000
Agriculture 25.5 19.8 Construction 8.7 8.6 Transportati?n 2.7 2.7 Commercial 5.1 5.8 Industry 58.0 62.8
in which: Raw material 11.6 9.1 Mechanical 22.6 32.2
Total: 100.0 100.0
A greater percentage of China's GNP will be contributed by its industrial products by 2000. There will be a reduced amount of raw material and semi-finished products in the output value of industrial products and an enlarged share by the machine-building industry, new advances in mechanization and increased electric appliances sought by residents.
Forecasts of energy demand are made with the energy demand accounting submodel in accordance with the structure of output value in various sectors. Results are shown in Table 3. The result conforms with projections in the World Bank's report "Prospects of Energy Supply and Demand," issued in January 1984 (Table 4). Our forecasts are that 1. 37 to 1. 70 billion tce will be needed by China by 2000. This com pares with a range of 1.39 to 1.77 million tce according to forecasts of the World Bank.
Table 3. Commercial energy demand forecast in China (Scenario I)
1980 2000 Mtce % Mtce %
Coal 435 (71.8) 976 (68.5) Oil 128 (21.1) 299 (21.0) Natural gas 19 (3.1) 71 (5.0) Hydro power 24 (4.0) 78 (5.5)
Total 605 (100) 1424 (100)
Electrici ty (billion kWh) 300.6 1200
3-5
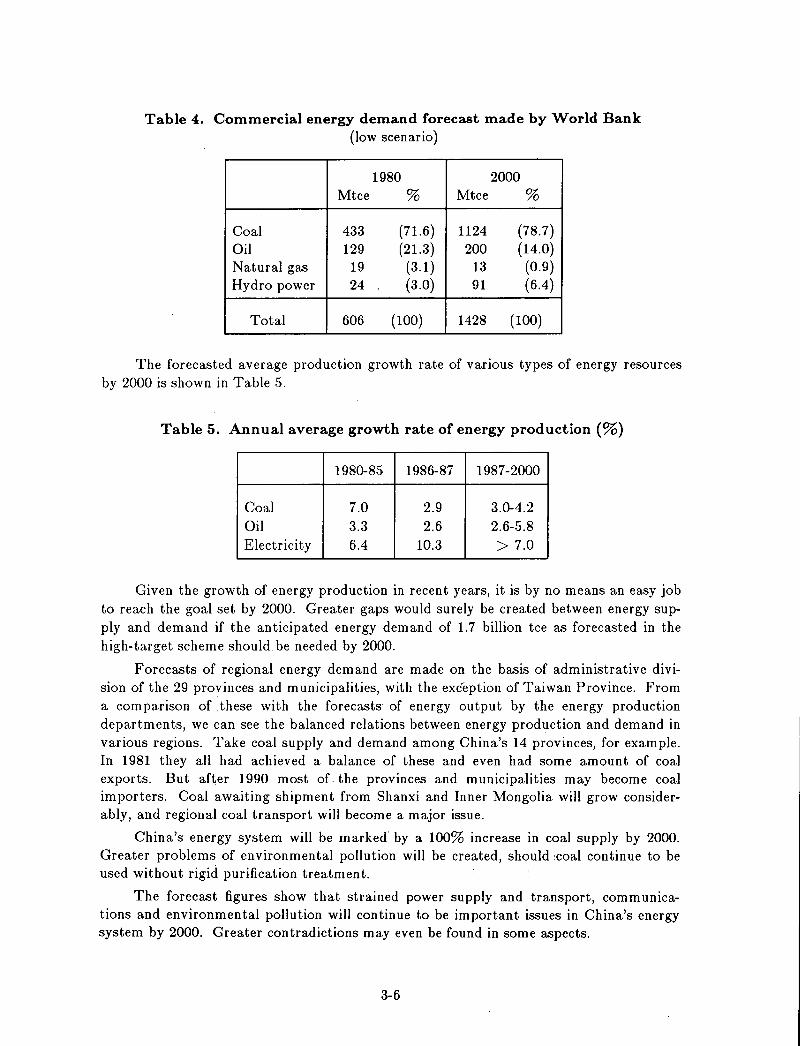
Table 4. Commercial energy demand forecast made by World Bank (low scenario)
1980 2000 Mtce % Mtce %
Coal 433 (71.6) 1124 (78.7) Oil 129 (21.3) 200 (14.0) Natural gas 19 (3.1 ) 13 (0.9) Hydro power 24 (3.0) 91 (6.4)
Total 606 (100) 1428 (100)
The forecasted average production growth rate of various types of energy resources by 2000 is shown in Table 5.
Table 5. Annual average growth rate of energy production (%)
1980-85 1986-87 1987-2000
Coal 7.0 2.9 3.0-4.2 Oil 3.3 2.6 2.6-5.8 Electricity 6.4 10.3 > 7.0
Given the growth of energy production in recent years, it is by no means an easy job to reach the goal set by 2000. Greater gaps would surely be created between energy supply and demand if the anticipated energy demand of 1.7 billion tce as forecasted in the high-target scheme should be needed by 2000.
Forecasts of regional energy demand are made on the basis of administrative division of the 29 provinces and municipalities, with the exception of Taiwan Province. From a comparison of .these with the forecasts of energy output by the energy production departments, we can see the balanced relations between energy production and demand in various regions. Take coal supply and demand among China's 14 provinces, for example. In 1981 they all had achieved a balance of these and even had some amount of coal exports. But after 1990 most of the provinces and municipalities may become coal importers. Coal awaiting shipment from Shanxi and Inner Mongolia will grow considerably, and regional coal transport will become a major issue.
China's energy system will be marked· by a 100% increase in coal supply by 2000. Greater problems of environmental pollution will be created, should ,coal continue to be used without rigid purification treatment.
The forecast figures show that strained power supply and transport, communications and environmental pollution will continue to be important issues in China's energy system by 2000. Greater contradictions may even be found in some aspects.
3-6
Some Policy Suggestions
Contradictions between energy supply and demand will still be acute in the years to come and will call for remedial measures to be taken.
Strengthened Control of Energy Demand Management Over Energy Supply and Demand and Good Planning Work by all Sectors
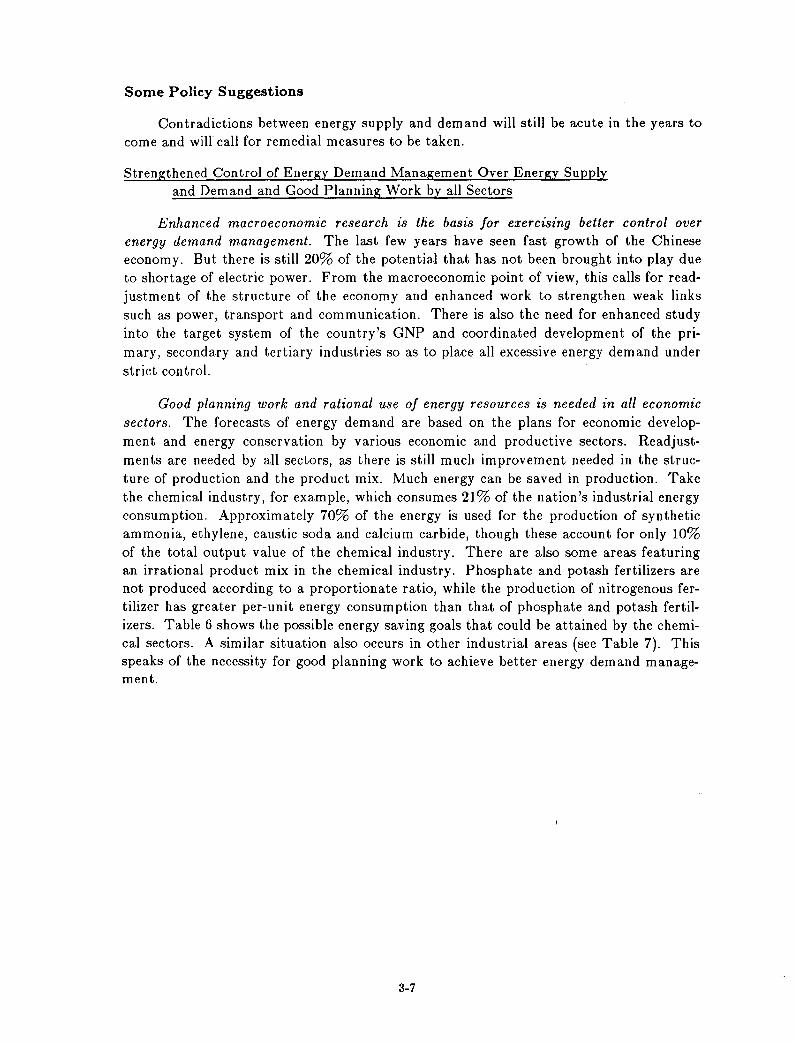
Enhanced macroeconomic research is the basis for exercising better control over energy demand management. The last few years have seen fast growth of the Chinese economy. But there is still 20% of the potential that has not been brought into play due to shortage of electric power. From the macroeconomic point of view, this calls for readjustment of the structure of the economy and enhanced work to strengthen weak links such as power, transport and communication. There is also the need for enhanced study into the target system of the country's GNP and coordinated development of the primary, secondary and tertiary industries so as to place all excessive energy demand under strict control.
Good planning work and rational use of energy resources is needed in all economic sectors. The forecasts of energy demand are based on the plans for economic development and energy conservation by various economic and productive sectors. Readjustments are needed by all sectors, as there is still much improvement needed in the structure of production and the product mix. Much energy can be saved in production. Take the chemical industry, for example, which consumes 21% of the nation's industrial energy consumption. Approximately 70% of the energy is used for the production of synthetic ammonia, ethylene, caustic soda and calcium carbide, though these account for only 10% of the total output value of the chemical industry. There are also some areas featuring an irrational product mix in the chemical industry. Phosphate and potash fertilizers are not produced according to a proportionate ratio, while the production of nitrogenous fertilizer has greater per-unit energy consumption than that of phosphate and potash fertilizers. Table 6 shows the possible energy saving goals that could be attained by the chemical sectors. A similar situation also occurs in other industrial areas (see Table 7). This speaks of the necessity for good planning work to achieve better energy demand management.
3-7
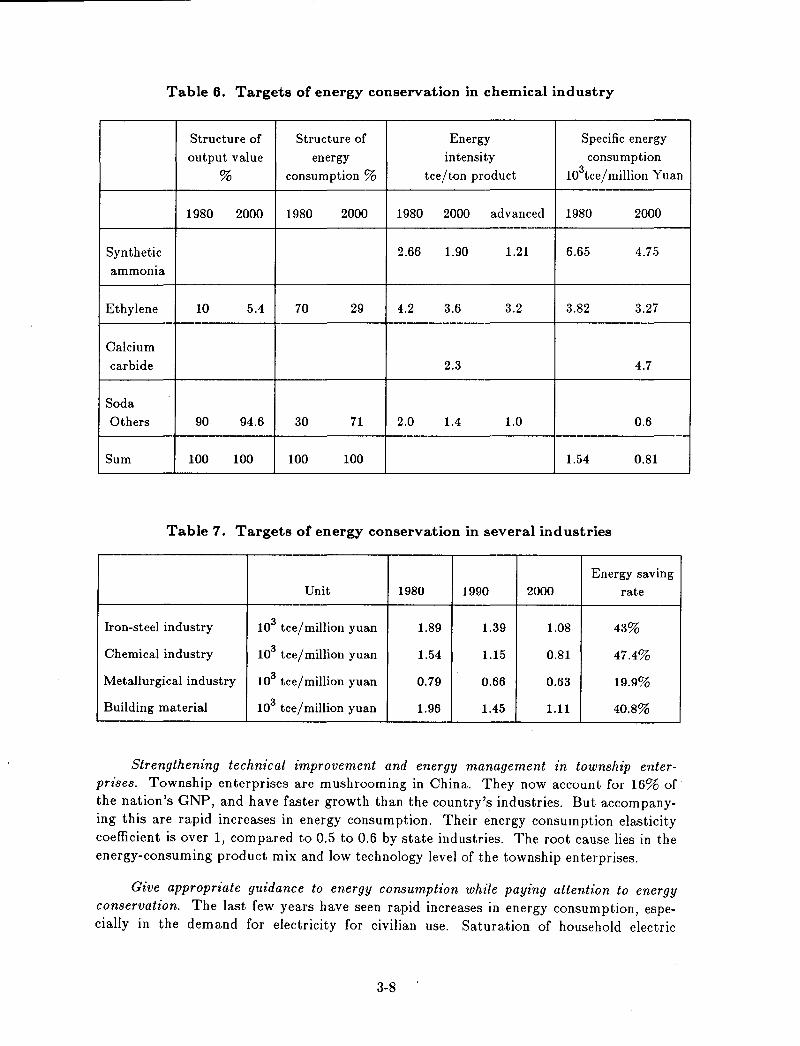
Table 6. Targets of energy conservation in chemical industry
Structure of Structure of Energy Specific energy
output value energy intensity consumption
% consumption % tce/ton product lO\ce/million Yuan
1980 2000 1980 2000 1980 2000 advanced 1980 2000
Synthetic 2.66 1.90 1.21 6.65 4.75
ammoma
Ethylene 10 5.4 70 29 4.2 3.6 3.2 3.82 3.27
Calcium carbide 2.3 4.7
Soda Others 90 94.6 30 71 2.0 1.4 1.0 0.6
Sum 100 100 100 100 1.54 0.81
Table 7. Targets of energy conservation in several industries
Energy saving Unit 1980 1990 2000 rate
Iron-steel industry 103 tce/million yuan 1.89 1.39 1.08 43%
Chemical industry 103 tce/million yuan 1.54 1.15 0.81 47.4%
Metallurgical industry 103 tce/million yuan 0.79 0.66 0.63 19.9%
Building material 103 tce / million yuan 1.96 1.45 1.11 40.8%
Strengthening technical improvement and energy management in township enterprises. Township enterprises are mushrooming in China. They now account for 16% of the nation's GNP, and have faster growth than the country's industries. But accompanying this are rapid increases in energy consumption. Their energy consumption elasticity coefficient is over 1, compared to 0.5 to 0.6 by state industries. The root cause lies in the energy-consuming product mix and low technology level of the township enterprises.
Give appropriate guidance to energy consumption while paying attention to energy conservation. The last few years have seen rapid increases in energy consumption, especially in the demand for electricity for civilian use. Saturation of household electric
3-8
appliances possessed by urban residents has grown rapidly. To some extent, this is a situation of market demand by people "living beyond one's means." This calls for developing new markets to attract social consumption, e.g., commercialized housing.
Developing Effective Policies for Improving Energy Supply
Implement the policy of "developing electricity by pooling the efforts from varzous quarters" instead of "running electricity by one department but sharing it by all." Practically speaking, power construction cannot depend merely on state investment; funds must be raised through various channels so as to arouse the enthusiasm of various quarters to go in for power construction. Power undertakings ~nd especially hydropower projects involve a long construction period. The construction of large and medium-sized hydropower projects should be rationally arranged and priority given to hydropower 'projects with a short construction period, so as to enable them to meet the growing demand for electricity in a fairly short period of time.
Coal will still be the major type of energy used by China by the turn of this century. Coal mines run by township enterprises have made and will continue to make important contributions. It is thus necessary to enhance planning and technical improvement of the rural coal mines to enable them to achieve greater advances. At the same time, attention should be paid to coordinated development of collieries under central planning, coal mines run by local governments, and those by township enterprises.
Continue to Expand the Role of the Energy Market
Opening the coal market countrywide has brought about an improved situation between coal supply and demand in China. Competition has been initiated between various types of coal mines, and this has given rise to increased coal supplies and reduced production costs by all coal mines; price regulation through the market has forced energy saving by various enterprises. This suggests that other types of energy products and the relation between supply and demand can also be regulated through the market by following the law of market price.
Stringent and Comprehensive Planning of Transportation, including Transportation of Energy
At present, the transportation of energy products occupies 50% of the total freight volume of China. But there is still 50 million tons of coal awaiting transport. Transportation will be more strained in the years to come. Thus, it is necessary to strengthen overall planning work by the transport and communication departments for bringing about comprehensive development of railways, highways, water transport and pipeline transport.
The Great Strategic Importance of Long-Term Research, Especially Study of the Energy System in the Next 40 to 50 Years
Energy projects generally have long lifetimes and long construction periods. Technological development from research to introduction and adoption by the markets generally takes about 50 years. Short-term plans can in no way speak of the impact of large
3-9

pivotal projects on the national economy and the results brought on by new technologies. So it is a necessity for forecasts in the next 30 to 50 years to analyze and find the objective laws of development, taking precautions and making timely preparations.
According to our initial forecasts on energy demand, by 2030 China will need a yearly total of 4.5 billion tce. A yearly total of 4.9 billion tce, equivalent to the present world's annual coal output, would be demanded if coal were still made a major national fuel by 2030. In that case, untold difficulties would inevitably be met.
How will the energy system be by 2030? Will this have any influence on the current energy policy and development of related science and technologies? How are the changes to be brought about by a change of the current energy system to one by 2030? It is of great strategic importance to research into these issues.
3-10
ENERGY SCENARIOS
G.R. Davis*
Who knows what the future holds? (Passage 58) See simplicity in the complicated. (Passage 63) Once the whole is divided the parts need names. (Passage 32) The named is the mother of ten thousand things. (Passage 1)
Tao Te Ching, Lao Tsu (Translation by Gia-Fu Feng and Jane English, 1972)
Energy Scenarios
A feature of the work of planning departments in most organisations is to describe the external environment in which the organisation operates and its likely evolution. To this end there is a need for effective tools of analysis and synthesis. The selection of relevant tools will be influenced by:
o The organisation's structure: The Royal Dutch/Shell Group of companies is a transnational, multi-cultural corporation having interests in several hundred operating companies in over 100 countries. In many of the operating companies Shell companies have only a part interest with the remaining share held by government, companies outside the Group or by private investors. The management of each operating company is responsible for the performance and long-term viability of its own operation, but can draw on the experience of the central service companies.
o The place of the planning function in the organisation: each 'Decision centre' within Shell has some form of planning support. Group Planning, one of the functions in the service companies, maintains a global perspective on the business environment.
o The temporal and geographical scope of the business environment: many of the businesses the Group invests in have heavy up-front capital commitments and long lead-times. Their profitability is strongly influenced by international developments; for many businesses this requires consideration of how the environment will look up to 20 years ahead.
Shell's size and needs, given the emphasis on decentralisation, places a premium on contextual tools, i.e. planning methods which provide a context for:
o 'Decision centres' to develop local scenarios.
o Strategy studies.
* Head of Energy Planning, Group Planning, Shell International Petroleum Co., London
4-1
o Investment guidelines.
o Corporate policies.
The main tool used is global scenarios which provide a broad framework for consideration of issues, act as a complexity reducer and provide a common language across 'Decision centres'.
Mental Map8
The underlying concept of scenario methodology is mental maps. We assume that every individual has personal and subjective views of the world, of the 'driving forces' for change, and of cause/effect relationships. Depending on his mental map, an individual will absorb and amplify certain signals, while not noticing or ignoring other signals. Recognition plays a major role; signals that fit into existing knowledge are more likely to be observed and accepted. Of importance to the organisation is that the individual is tempted to consider only options that are compatible with his view of the world. He gives more emphasis to signals and options recognised by his personal model. Any decision he may make therefore, tends to be in line with his mental map.
Scenarios and Mental Maps
A person's perception of the world and his interpretation of history and current affairs are directly linked with his expectations about the future. Scenarios which many define as alternative futures, can also be regarded as alternative interpretations of the present. The main purpose of scenarios is to explore and discuss what is happening now. Clearly scenarios are written in the future tense but one should not confuse scenarios with crystal-ball gazing.
Wherever strategic options are discussed in the organisation, different mental maps will underpin the individual opinions that are expressed. When open-ended strategic issues are being discussed it can be important tO'make the differences visible and to deal with them consciously.
Scenarios can assist in making mental maps explicit, since different scenarios are likely to represent different views held by members of the management team or alternative views from outsiders.
When change is gradual and incremental companies do not find it difficult to plan for the future and even straightforward forecasting provides sufficient guidance. However, occasionally discontinuities occur; these may be viewed as transitions between alternative models of the business environment, i.e. from one type of logic to another. At those moments, just when the business has much at stake and is in need of clear perspectives, forecasts and expert forecasters fail. There are many examples of changes of models and mental maps in the energy industries:
4-2
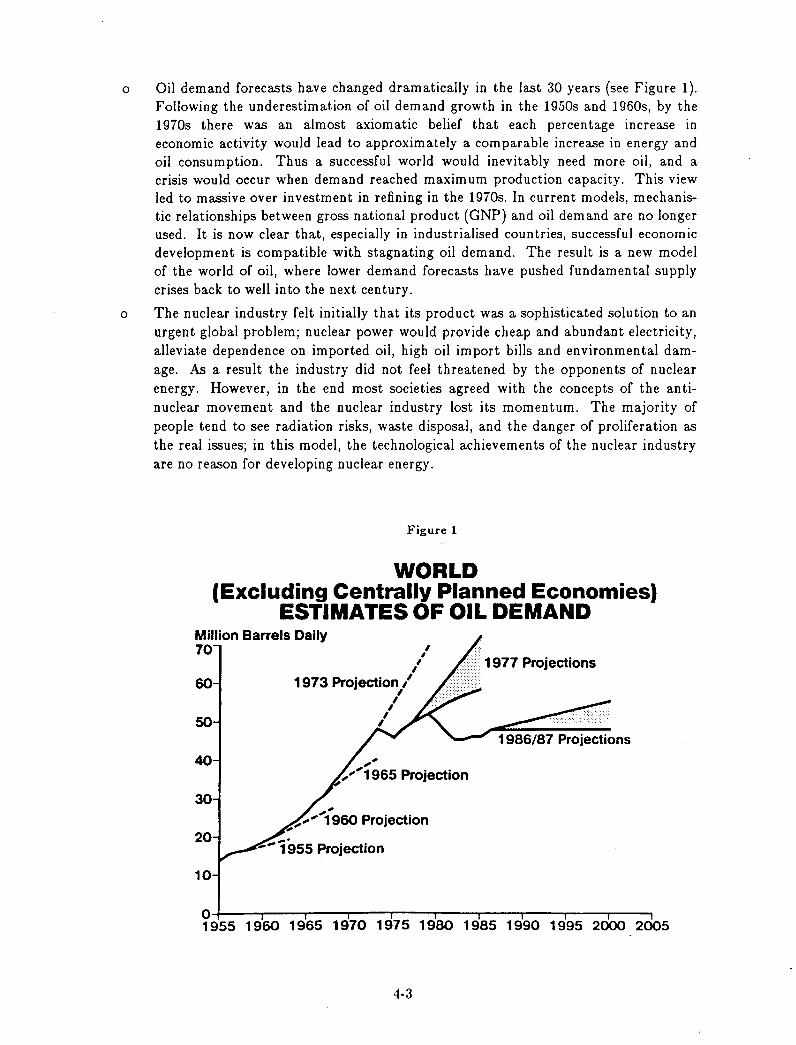
o Oil demand forecasts have changed dramatically in the last 30 years (see Figure 1). Following the underestimation of oil demand growth in the 1950s and 1960s, by the 1970s there was an almost axiomatic belief that each percentage increase in economic activity would lead to approximately a comparable increase in energy and oil consumption. Thus a successful world would inevitably need more oil, and a crisis would occur when demand reached maximum production capacity. This view led to massive over investment in refining in the 1970s. In current models, mechanistic relationships between gross national product (GNP) and oil demand are no longer used. It is DOW clear that, especially in industrialised countries, successful economic development is compatible with stagnating oil demand. The result is a new model of the world of oil, where lower demand forecasts have pushed fundamental supply crises back to well into the next century.
o The nuclear industry felt initially that its product was a sophisticated solution to an urgent global problem; nuclear power would provide cheap and abundant electricity, alleviate dependence on imported oil, high oil import bills and environmental damage. As a result the industry did not feel threatened by the opponents of nuclear energy. However, in the end most societies agreed with the concepts of the an tinuclear movement and the nuclear industry lost its momentum. The majority of people tend to see radiation risks, waste disposal, and the danger of proliferation as the real issues; in this model, the technological achievements of the nuclear industry are no reason for developing nuclear energy.
Figure 1
WORLD (Excluding Centrally Planned Economies)
ESTIMATES OF OIL DEMAND Million Barrels Daily 70 , , , , 60
50
40
30
20
10
""
1973 Projection,' ,
,
, , , ,
,,"1960 Projection
....... 1955 Projection
1977 Projections
o~--~--~~--~--.---~--~~--~---.---.--~ 1955 1960 1965 1970 1975 1980 1985 1990 1995 2000 2005
4-3
o In 1985, the consensus was that oil prices could not and would not fall as 'low' as US$ 20 per barrel (/bbl). One year and a price collapse later, US$ 20/bbl seemed a 'high' price; it was considered unlikely that prices would rise as high as US$ 20 for the foreseeable future.
Scenarios can legitimise the debate around the several business logics in the organisation.
Socio-Economic and Oil Scenarios
The construction of energy scenarios requires explicit assumptions about socioeconomic developments. In 1986 it was felt that the links between economic and energy developments had weakened considerably and were no longer unequivocal. The evidence for weaker links between oil and economic developments emerged in particular in 1985, when the oil market started to collapse under its own weight, without clear macroeconomic triggers. A year later the collapse did not stirn ulate the OEeD economies. It seemed that oil, like other commodities, was being 'decoupled' from the industrial economies. Oil does not play the central role in the world economy that it played in the 1970s, as industrialised countries have become less dependent on and more resilient towards changes in the energy world.
Two socio-economic scenarios were developed; Managed World with a strong emphasis on successful economic performance and World in Turmoil in which politics prevails and, in particular, the developing countries suffer from low growth. Their main features are presented below:
Managed World:
o Assumes that the restructuring of organisations and economies III the early 1980s have laid the basis for the effective use of resources.
o One of the forces at work that will assist in these developments is a new generation which is pragmatic and flexible in outlook and will have increasing influence.
o Governments endorse and implement 'No-Nonsense' policies underpinned by clear models of economic success.
o Markets become more global.
o World economic system has considerable resilience. Most of the present problems, e.g. debt crisis, ultimately get defused, if not resolved.
World in Turmoil:
o Assumes that the pendulum could swing back in the 1990s from market-oriented policies to greater emphasis on social and political priorities.
o The failure of 'No-Nonsense' policies leads to a rationalisation of failure and rejection of successful economic models. Economic under-performance results - world economic growth of 2% per annum compared to 3.5% per annum in Managed
4-4
World.
o In particular the burden of population growth and rapid urbanisation would prove unmanageable in the developing countries.
o This scenario is one of transition to a world in turmoil.
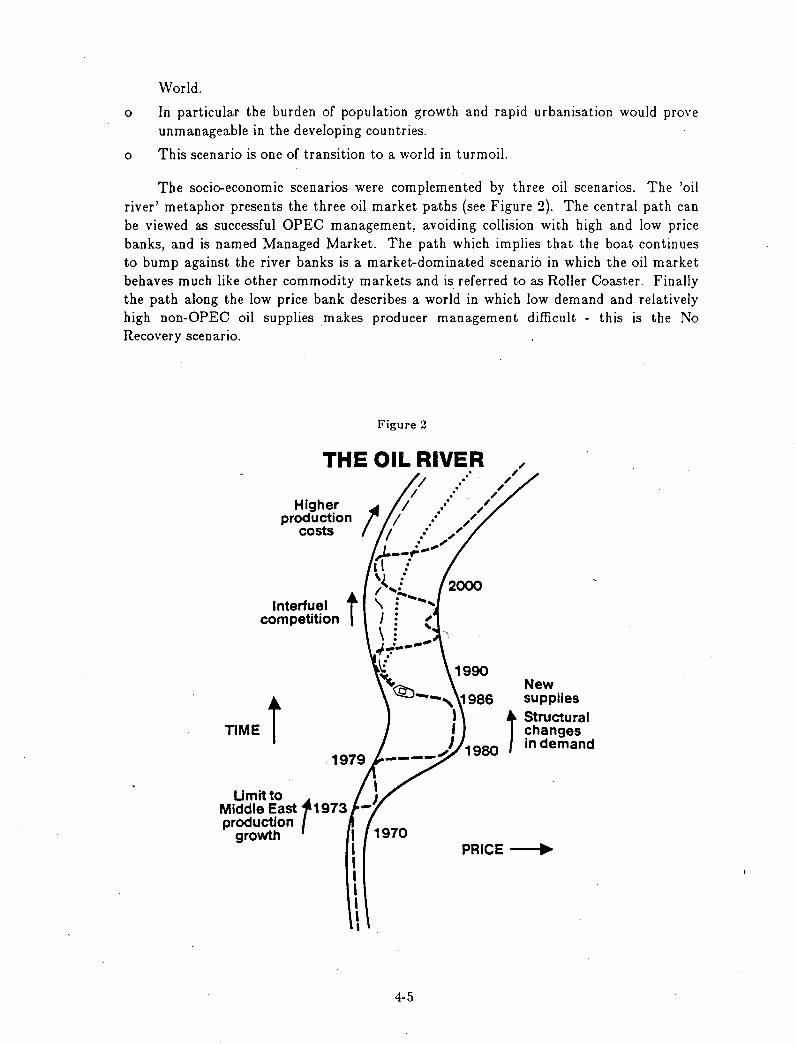
The soci<reconomic scenarios were complemented by three oil scenarios. The 'oil river' metaphor presents the three oil market paths (see Figure 2). The central path can be viewed as successful OPEC management, avoiding collision with high and low price banks, and is named Managed Market. The path which implies that the boat continues to bump against the river banks is a market-dominated scenario in which the oil market behaves much like other commodity markets and is referred to as Roller Coaster. Finally the path along the low price bank describes a world in which low demand and relatively high non-OPEC oil supplies makes producer management difficult - this is the No Recovery scenario.
Figure 2
THE OIL RIVER
Higher production
costs
Interfuel t competition·
TIME t Umitto }
Middle East ,1973 -productJon
growth I 1970 I I I I I I I
4-5
. . . . . . .
. . . . . . .
New supplies
j Structural changes
1980 in demand
PRICE -004 ••
Scenario Links
A set of scenarios is based on a judgement as to which are the key driving forces and uncertainties. The global energy scenarios were designed to explore the following key
uncertain ties:
o Will energy markets become less oversupplied and therefore
o When markets recover and oil is the trend-setter for other energy prices will producers regain lasting control over the oil markets?
Three energy scenarios were developed, based both on the oil scenarios (from which they take their names) and the socio-economic scenarios.
Although the sets of scenarios each describe well-defined sectors of global development, they are interdependent. Economic developments influence the probability of particular oil and energy scenarios, and vice versa. In principle, there are various ways in which oil, energy and socio-economic scenarios can be linked. However, not every combination is equally plausible; the energy scenarios are based on the most probable linkages. Strong economic performance (in a Managed World) stimulates energy consumption and assists producers to embark on a Managed Market strategy; the stability of Managed Market is in turn beneficial for the world' economy. Rapid demand growth can also trigger a Roller Coaster, the volatility of which will have a depressing effect on economic growth. A No Recovery scenario becomes more likely when economic ,Performance IS
poor, as in World in Turmoil.
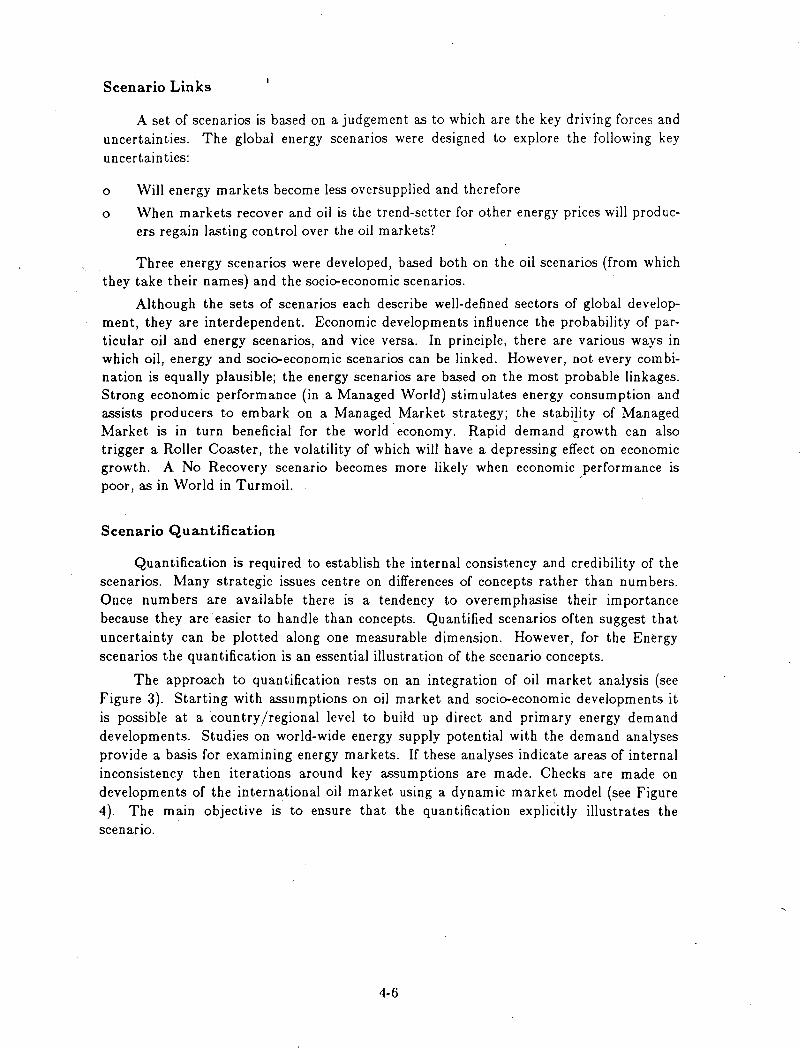
Scenario Quantification
Quantification is required to establish the internal consistency and credibility of the scenarios. Many strategic issues centre on differences of concepts rather than num bers. Once numbers are available there is a tendency to overemphasise their importance because they are' easier to handle than concepts. Quantified scenarios often suggest that uncertainty can be plotted along one measurable dimension. However, for the Energy scenarios the quantification is an essential illustration of the scenario concepts.
The approach to quantification rests on an integration of oil market analysis (see Figure 3). Starting with assumptions on oil market and socio-economic developments it is possible at a country/regional level to build up direct and primary energy demand developments. Studies on world-wide energy supply potential with the demand analyses provide a basis for examining energy markets. If these analyses indicate areas of internal inconsistency then iterations around key assumptions are made. Checks are made on developments of the international oil market using a dynamic market model (see Figure 4). The main objective is to ensure that the quantification explicitly illustrates the scenarIo.
4-6
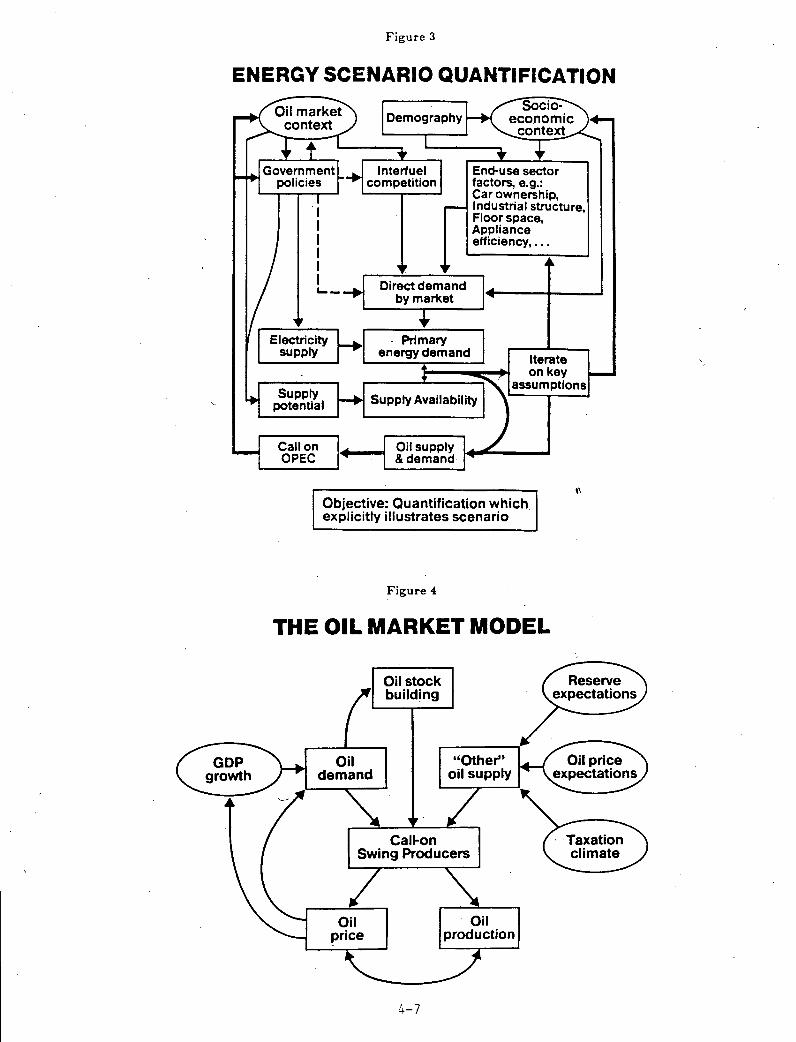
Figure 3
ENERGY SCENARIO QUANTIFICATION
Supply potential
Call on OPEC
End-use sector factors, e.g.: Car ownership, Industrial swcture, Floor space, Appliance efficiency, ...
Objective: Quantification which explicitly illustrates scenario
Figure 4
THE OIL MARKET MODEL
Oil stock building
4-7
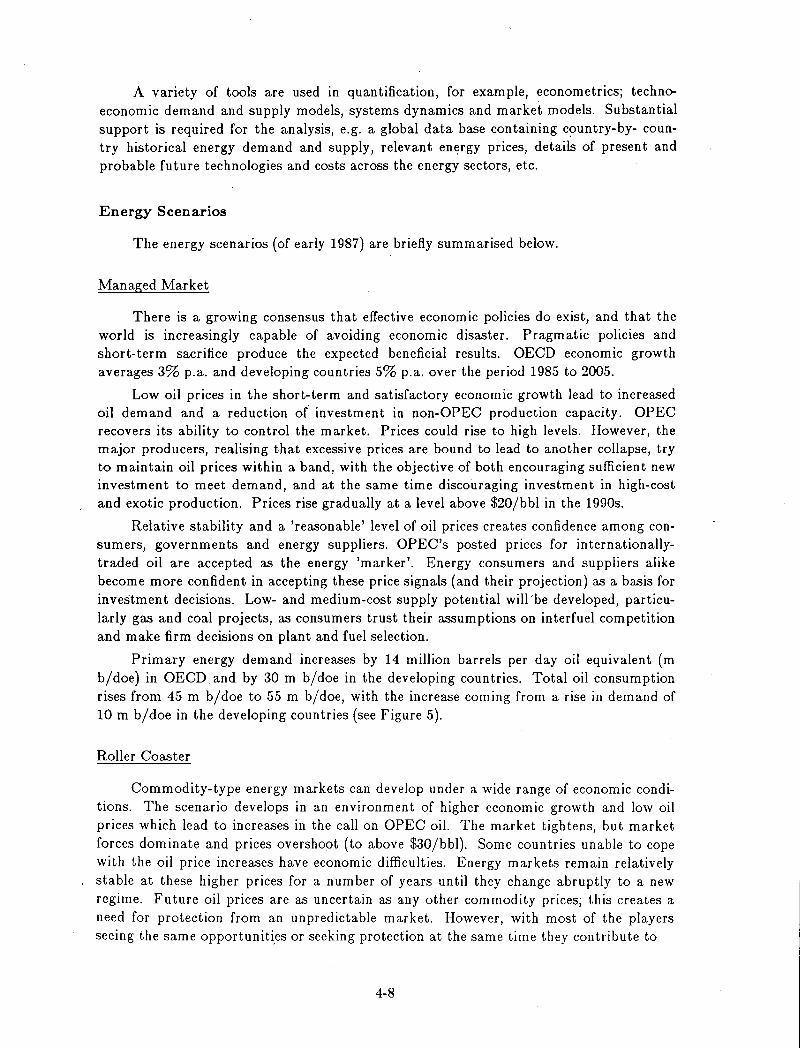
A variety of tools are used in quantification, for example, econometrics; technoeconomic demand and supply models, systems dynamics and market models. Substantial support is required for the analysis, e.g. a global data base containing c~untry-by- country historical energy demand and supply, relevant energy prices, details of present and probable future technologies and costs across the energy sectors, etc.
Energy Scenarios
The energy scenarios (of early 1987) are briefly summarised below.
Managed Market
There is a growing consensus that effective economic policies do exist, and that the world is increasingly capable of avoiding economic disaster. Pragmatic policies and short-term sacrifice produce the expected beneficial results. OECD economic growth averages 3% p.a. and developing countries 5% p.a. over the period 1985 to 2005.
Low oil prices in the short-term and satisfactory economic growth lead to increased oil demand and a reduction of investment in non-OPEC production capacity. OPEC recovers its ability to control the market. Prices could rise to high levels. However, the major producers, realising that excessive prices are bound to lead to another collapse, try to maintain oil prices within a band, with the objective of both encouraging sufficient new investment to meet demand, and at the same time discouraging investment in high-cost and exotic production. Prices rise gradually at a level above $20jbbl in the 1990s.
Relative stability and a 'reasonable' level of oil prices creates confidence among consumers, governments and energy suppliers. OPEC's posted prices for internationallytraded oil are accepted as the energy 'marker'. Energy consumers and suppliers alike become more confident in accepting these price signals (and their projection) as a basis for investment decisions. Low- and medium-cost supply potential will 'be developed, particularly gas and coal projects, as consumers trust their assumptions on interfuel competition and make firm decisions on plant and fuel selection.
Primary energy demand increases by 14 million barrels per day oil equivalent (m bjdoe) in OECD and by 30 m bjdoe in the developing countries. Total oil consumption rises from 45 m b/doe to 55 m bjdoe, with the increase coming from a rise in demand of 10 m bjdoe in the developing countries (see Figure 5).
Roller Coaster
Commodity-type energy markets can develop under a wide range of economic conditions. The scenario develops in an environment of higher economic growth and low oil prices which lead to increases in the call on OPEC oil. The market tightens, but market forces dominate and prices overshoot (to above $30jbbl). Some countries unable to cope with the oil price increases have economic difficulties. Energy markets remain relatively stable at these higher prices for a number of years until they change abruptly to a new regime. Future oil prices are as uncertain as any other commodity prices; this creates a need for protection from an unpredictable market. However, with most of the players seeing the same opportunities or seeking protection at the same time they contribute to
4-8
Figure 5
ENERGY SCENARIOS
Million b/doe 1985 2005 MANAGED NO
PRI MARY EN ERGY MARKET RECOVERY . WOCPE 98 141 111
OECD 76 89 79 Developing Countries 22 52 32
OIL WOCPE 45 55 47 OECD 33 33 31112 Developing Countries 12 22 15112
Note: WOCPE - World Outside Centrally Planned Economies OECD - Organisation for Economic Cooperation and
Development
'herd behaviour' which reinforces the pattern of this scenario.
No Recovery
~ew technologies stimulate the world economy, companies restructure, new markets develop but economic success is elusive. Many countries face high population growth and most leaders are unable to tackle the huge problems of development and their countries experience social unrest and turmoil. In OECD countries there is insufficient support for any kind of short-term sacrifice or long-term strategy. The resulting uncertainty erodes confidence, which has negative effects on investment ,and trade. OECD economies grow at 1.8% p.a. and developing countries 2.6% p.a. over the period 1985 to 2005; the potential for growth is not achieved in this scenario.
.... Current prices do not lead to the demand increases predicted by most econometric
models. In OECD signs of maturity are apparent and technological advances prove to be irreversible. There is no sharp decline in non-OPEC oil supply, as some had expected. Governments take a more active role in energy matters. Some countries aim to reduce hard currency payments for imported energy by any means possible. In others the me~its of projects are judged by 'national' standards, e.g. the effects on employment, balance of payments or on strategic considerations. Producers react to low prices not by reducing supply but by finding ways to reduce costs. Low prices with sluggish demand and continuing potential oversupply imply a prolonged buyer's market with interfuel competition
4-9
as the major factor shaping the industry environment.
Primary energy demand increases by only 3 m b/doe in OECD and 10 m b/doe in developing countries (see Figure 5).
Use of Scenarios
Scenarios can be used in a n,umber of different ways, for example:
o Scenarios contain a great deal of information, and just by passing this on via scenarios they serve a purpose. Part of this information may be factual e.g. when might OPEC control the oil markets, how many cars will there be in developing countries, which technological improvements will reduce energy demand. Other types of information can reflect views external to the company or specific theories. There are also implicit messages in the scenarios e.g. the view that demographic pressures can be contained provided economic growth remains high.
o When global scenarios are widely used as a background for discussion, they create and become a 'common language'. This is of considerable value in a large and decentralised organisation.
o Scenarios can be used as the starting point for 'what if .. .' exercises.
o Finally the set of scenarios can be considered as a framework for discussing strategy.
Analysing the environment and benefiting from the forces at work is an intrinsic part of the managers' job. Scenario planning is one of the tools at their disposal; not for forecasting ,but for analysing the environment.
4-10
THE REFORM OF ENERGY PLANNING IN CHINA
Zhu Liangdong*
The reform of energy planning is linked with reform of the economic system in general. As early as ten years ago, when the Chinese Communist Party decided to convert the emphasis of its work to economic reconstruction, it was realized that socialist modernization required reform of the economic system. This was carried out mainly in the countryside at that time. The Twelth Conference of the Party put forward again the task of carrying out systematic reform of the economic system.
The basic task of economic reform is to set up a new socialist economic system with Chinese characteristics, full of vigor and vitality. This economic system will promote the development of productive forces. The key parts of the reform are to strengthen the vitality and expand the autonomy of enterprises, to set up a planning system that can consciously use the law of value, and to develop the planned socialist commodity economy.
To speed up the socialist modernization, we must develop productive forces with all efforts. It is impossible to realize this task without reform of the old system. Economic construction and reform must promote and restrain each other.
The reform of the planning syst,em is an important aspect of macroeconomic management. The emphasis of reform is to convert the function of the State Planning Department. This includes reducing mandatory planning, increasing guided planning, attaching importance to the form ulation of long- and medium-term industrial policies, and gradually forming new economic operating mechanisms in which the State regulates the market while the latter guides enterprises by using economic means.
The main functions of the new State Planning Commission are to carry out macroeconomic adjustment and control, and to act in a balancing and coordinating manner. Its work includes research regarding the development strategy of the economy, science and technology, and techno-economic policies. It will plan for an integrated balance of the general economy, as well as perform macro-adjustment and control. It will . also provide decisionmaking, services, and necessary coordination.
In accordance with the goal of setting up economic mechanisms in which the state regulates the market while the latter gliicles enterprises, a series of important conversions must be realized. They are: 1) to convert from distributing investment material and approving projects and managing much of enterprises' concrete activities, to studying development strategy, industrial policies and other important economic-technical policies; 2) to convert from mainly managing the economic activities of state-owned enterprises to managing and regulating general economic quantity and structure of the whole society; 3) to convert from managing of direct quota plans to producing indirect policy plans, from mainly year plans to long- and medium-period plans; 4) for the management of the
* Deputy Director, Department of Hesourccs Saving and Comprehensive Utilization, State Planning Commission
5-1
economy, to convert from usmg mainly administrative means to usmg the means of economic regulation, economic law, and so on.
In executing reform of the planning syste"m, (the State Planning Commission is responsible for formulating annual ~.nd long- and medium-period fixed assets plans, gen~ eral balancing of overall supply and demand of the national economy, and overseeing finance, credit, material, foreign currency, and the labor market.
Decisions regarding investment for fixed assets of large and medium size, as well as regarding quota limits, will be made by the Professional Administrative Department, which will put forward a primary scheme, considering the requirements of the national long-medium period plan, rational use of resources, economic efficiency and technical policies. It will also consider external conditions of energy and material transportation, etc., and refer decisions to the State Planning Commission for approval.
With regard to industrial policies, the State Planning Commission will study the rational proportion of various professions in the national economy, the development velocity, and the scale and investment proportions of important professions. The various professional sectors will study proportion relations among their internal units so as to avoid duplication and unrational distribut,ion.
The State is setting up a professional investment company that will contract important construction projects to professional companies according to the principle of linking output with input. The companies will be in charge of inviting bids and the recovery of investment with interest. The practice has proved that competitive bidding is a very efficient method.
With regard to reform of the energy planning system, energy is one of three important strategies for economic construction of our country. Although the energy industry has been greatly developed since liberation, it cannot meet the needs of national economic construction. At present the lack of electricity restricts production and daily life of the people. For this reason the State has given investment priority to the energy industry, taking electric power construction as the center of development for the energy industry. It has adopted the policy of raising money from several departments and channels for electricity administration. Unified dispatch of the national network has been executed and provincial administrative departments have. their own economic accounting. This method will mobilize the initiative of different parties and create conditions for electricity development.
With the deepening of reform, we will adjust investment structure and relevant policies, rely on advance of science and technology, improve management and operation, promote the development of coal, electricity, oil, and gas more rapidly, and also promote energy conservation. In order to do a good job in energy saving, the State should increase investments to projects for energy and materials savings, and further guide use of regional funds for these purposes. Labor productivity, goods quality, and material consumption should be improved greatly so as to suit the requirement of national economic development and improvement of people's daily life.
In summary, the energy indust,ry of our country will take electricity as the center and coai as the basis. It will develop oil and natural gas with great effort, actively tap and use hydropower resources, gradually develop nuclear power, and strive to improve the energy infrastructure. It will develop rural energy according to local conditions and
5-2
carryon energy saving con tin uously, so that energy can serve socialist construction better and meet the needs of national economic development.
At present the economic situation of our country is good because production is increasing month by month, the proportion between light and heavy industry is being harmonized, and people's daily life is being gradually improved. This is the result of reform and opening. We will still carry out the opening policy and accelerate and deepen reform of the economic system. We have started to execute a significant development strategy for coastal regions and reform of the economic system has entered a critical stage. Although we encounter some problems and difficulties in the course of advance, we are confident of overcoming the difficulties. Learning from experiences, we will push forward reform of the economic and political system .
. 5-3
u.s. ENERGY POLICY SINCE 1973
Wilfrid L. Kohl*
Introduction
The 1973 oil embargo and subsequent oil price rise caught the governments of many countries, including the U.S. government, by surprise. The United States had no spare domestic oil production capacity nor adequate oil reserves, and it lacked an energy policy. Unlike many other countrie1?, however, it took the United States longer to adopt effective policies to deal with the energy problem. Early responses were partial at best and many failed, as U.S. oil consumption and imports continued to rise substantially through the seventies. It took the second oil shock of 1979 to stimulate more effective 'actions. Why did America have such difficulty in shaping a national energy policy?
o The United States is a major consumer and a major producer of energy. It. is. also a very large country with more regions dominated by consumers than producers. This greatly complicates the politics of energy policy-making. Domestic oil production in the lower 48 states had quietly peaked in 1971-72. Yet the country was still adjusting to the realities of depletion and rising dependence on oil imports.
o The American economy is basically a free market economy with a large decentralized private oil industry made up of many independent oil companies as well as integrated international majors. These two groups have different objectives, a fact which has impeded the formation of a national oil policy.
o Cooperation and trust between government and industry in the United States is notoriously weak, with few institutionalized channels for effective communication. This is especially true in the oil industry which enjoys a love-hate relationship with the government. A history of anti-trust regulation and suspicion of monopolistic profits at home alternates with government concerns for national security and occasional support for the industry, especially abroad.
o Demand management through sacrifice and inconvenience runs counter to the values of Americans who are accustomed to abundance. But Americans will respond to strong market incentives to save money by using energy more efficiently.
o The structure of the American political system with its separation of exec~tive and legislative powers has made it very difficult to formulate national energy policy, since the American President does not "form a government" in the manner of parliamentary systems. Instead, he and his administration must devote considerable time and effort to. persuade Congress to support his programs and be willing to compromise.
* International Energy Program, Johns Hopkins Foreign Policy Institute, Washington, D.C.
6-1
Energy Planning in the 1970's
The executive-legislative division in the American political system is absolutely crucial to understanding the American experience with energy policies. For example, during the 1970's there were three major efforts at national energy planning. None of the three survived the legislative process intact. 1 The three efforts were:
1) An industry study, u.s. Energy Outlook, issued in December 1972 by the National Petroleum Council, concentrated on the supply side of the energy balance. It warned that 38% of U.S. energy demand would be supplied from foreign sources by 1985 unless government took actions accordingly. Recommendations included accelerated leasing of mineral rights, maintenance of oil import quotas, deregulation of natural gas, more favorable tax incentives to industry, expanded government research and development (R & D) of synthetic fuels. The recommendations of this study were largely incorporated into President Richard Nixon's comprehensive energy message of April 1973. Most of the actions called for required Congressional action, but Congress cooperated on only one item-a larger energy R&D budget.
2) In 1974 following the oil embargo the Federal Energy Administration published the Project Independence Report, a technical study utilizing a flexible econometric model that looked at various supply and demand scenarios and "sought to provide a framewor k for developing a national energy policy." While avoiding specific recommendations, the Report indicated that if oil imports were to be reduced, government would have to playa significant role. Even stronger government actions would be necessary to develop supply, e.g., via synthetic fuels, and/or to reduce demand. The analysis in this Report helped shape President Gerald Ford's proposed Energy Independence Act of 1975, which called for a host of measures, among them a windfall profits tax (to accompany administrative decontrol of crude oil), a strategic petroleum reserve, natural gas decontrol, delayed implementation of the Clean Air Act, coal utilization and conservation. Refusing the core elements of oil and gas price decontrol, the Congress retained only a few pieces of the Ford proposals in its own more limited law, the Energy Policy and Conservation Act of 1975.
3) The National Energy Plan of 1977 put together early in the Carter administration had the objective of reducing oil imports by 5 mbd in 1985 through both conservation and domestic supply measures. Incredibly detailed, it fed into President Jimmy Carter's 1977 energy message and included the proposed establishment of a Department of Energy. After 18 months of wrangling with Congress, about 60% of the President's original program survived.
u.S. Energy Policy in the 1970s: Oil Price and Allocation Controls
The centerpiece of U.S. policy in the seventies was the federal regulation of crude oil prices which lasted from August 1971 until January 1981. For most of that period petroleum product prices were regulated as well. The program started with President Nixon's freeze on all wages and prices on August 15, 1971 as part of the New Economic
1 The following draws on the excellent recent study by Richard H.K. Vietor, Energy Policy In America Since 1945 (Cambridge University Press, 1984), ch. 13.
6-2
Policy designed to reduce inflation, unemployment, and the balance of payments deficit. By 1973 price controls on most goods and services were terminated, but under Phases III and IV of the Nixon program crude oil and product price controls were continued under complex regulations which were targeted especially at the largest oil,companies and established two tier pricing for "old oil" and "new oil" (prices of the latter were allowed slowly to rise).
Price controls were extended under the Emergency Petroleum Allocation Act of 1973, which also gave authority to the federal government to allocate reduced supplies of oil in a crisis. A system of entitlements favored small refiners with lower-priced domestic crude. The price control system was renewed and made more complicated again under the Energy Policy and Conservation Act of 1975, which actually lowered temporarily a composite oil price (to $7.66/barrel), thus stimulating increased demand and imports, before allowing some oil prices slowly to increase. By this time a small staff had been assembled at the Federal Energy Administration and was given the gargantuan task of issuing and enforcing mountains of complex price regulations in a continental-sized market. The task was difficult to carry out effectively.
Following the Iranian revolution and the second oil market disruption the Emergency Energy Conservation Act of 1979 was passed which again gave the President authority to ration gasoline supplies, and also allowed him to set state conservation targets. In the same year President Jimmy Carter issued an executive. order announcing a phased decontrol of oil prices over a period of 30 months, to be accompanied by a Windfall Profits Tax to place limits on excessive profits by the oil companies, a tax which Congress passed in 1980.
Looking back at this U.S. experience of the seventies, the judgment of economists and other analysts is a harsh one. Despite good intentions, the efforts of a hastily assembled and inexperienced bureaucracy to administer allocation controls in 1973-74 made the supply shortage worse. Although the fourfold increase in crude oil prices administered by OPEC in 1973-74 did yield huge, short-term rents for domestic oil companies, which posed a problem for the American liberal democracy, in the words of Richard Vietor "the cure was worse than the disease.
The story of oil price controls ... attests to an institutional failure of relations among Congress, the oil industry, and the bureaucracy .... Three successive administrations proposed some form of price decontrol with a tax on windfall profits. None succeeded until 1980 because congressmen could not agree on the details, major oil companies would not admit their willingness to compromise, and the press could not get the story straight .... For six years, rent controls were allowed to stimulate demand, depress supply, and give OPEC the chance to do it again.,,2
Other analysts agree that price controls distorted markets, encouraged imports, and postponed the inevitable and necessary adjustment of the American economy to higher
. d .1 3 prIce 01.
2 Ibid., pp. 348-49.
3 See, for example, Paul W. MacAvoy, Energy Policy, An Economic Analysis (New York: W.W. Norton and Co., 1983); and Joseph P. Kalt, The Economics And Politics of Oil Price Regulation
6-3
u.s. Energy Policy in the Seventies: Other Actions
The two energy shocks and their effects-shortages, gasoline lines, and startling price increases-gave rise to a feeling arp.ong a majority of Americans that the United, States needed a comprehensive energy policy. However, there ~as no agreement on the substance of policy, especially not on the degree of government intervention necessary in the energy economy. As a result, and following from the decentralized structure of the American economy and the shared powers in its political system, the country was left with a lot of interest groups battling it out. At the end of the decade, the United States had not one but many energy policies, fashioned sometimes under White House leadership, sometimes by Congress, and usually the result of compromises between the branches. While there is not space here for a comprehensive account, a few highlights will be noted. 4
In terms of government organization, President Nixon had proposed a cabinet level energy department in 1973, but the idea met considerable opposition. Instead he settled for the Energy Research and Development Administration (ERDA), established by Congress in 1974, which merged the research functions of the old Atomic Energy Commission, the Office of Coal Research, and the Bureau of Mines. A separate Nuclear Regulatory Commission was also created. Meanwhile, Nixon expanded the Executive Office of the President to include a Federal Energy Office, which later became the Federal Energy Administration. In 1977 President Carter proposed and Congress approved the establishment of the Department of Energy.
With respect to conservation and demand management, a few actions were put in place in the seventies. A mandatory 55 mile-per-hour automobile speed limit and some energy-saving rules for federal office buildings were the only actions of the Nixon administration, which focused mainly on supply and was preoccupied by Watergate. As part of its package of proposals to Congress, the Ford administration sought an excise tax on domestic oil and natural gas along with decontrol of oil and gas prices. Citing the burden on consumers, Congress refused to go along, and enacted instead its own Energy Policy and Conservation Act of 1975 which established mandatory fuel economy standards for automobiles and light trucks (so-called CAFE standards which set an objective of an average car efficiency of 27.5 miles/gallon by 1985 with penalties for failure to comply). The Act also set efficiency standards for household appliances and strengthened FEA authority to order conversions of some power plants to coal.
However, it was the Carter administration, spurred by a philosophical conviction that government should take the lead in energy policy, which attached a high priority to conservation and fuel efficiency. Excise taxes and tax credits were proposed on several fronts, but only a few such measures were accepted by Congress. Modest tax incentives were established for, energy conservation in buildings. Oil and gas use was prohibited in new electric power plants, and conversion of existing facilities was encouraged. A small
(Cambridge: MIT Press, 1981).
4 For a lively account by a participant-observer, see Paul S. Basile, "U.S. Energy Policy," in Wilfrid L. Kohl, After the Second Oil Crisis: Energy Policies in Europe, America, and Japan (Lexington, MASS: Lexington Books, D.C. Heath & Co., 1982). Also Dorothy S. Zinberg, ed., Uncertain Power: The Struggle fora National Energy Policy (New York: Pergamon Press, 1983).
6-4
tax was imposed on cars with very low fuel efficiency. Standby gasoline taxes were . d 5 reJecte .
Turning to other supply side measures, the Energy Security Act of 1980 established the Synthetic Fuels Corporation and made available $20 billion as an initial subsidy to synthetic fuels projects, with further possible subsidies up to $68 billion. Smaller subsidies supported biomass energy research, geothermal energy, renewable resources, and solar energy programs. Meanwhile, following a long struggle with Congress, the 1978 Natural Gas Policy Act established a gradual schedule for gas price decontrol by 1985 within a very complicated framework including some 25 categories of old and new natural gas. In the same year another law (the Fuel Use Act) required the gradual conversion by utilities and some industry users from oil and gas to coal and alternative fuels.
By the late seventies nuclear power was approaching a severe downturn in the United States, driven more by the increasingly long construction times. and high costs of new power plants than by government policy. (The Ford and Carter administrations were more skeptical of nuclear power at home and outrightly opposed the spread of advanced fuel cycle technologies and breeder reactors abroad because of fears of nuclear weapons proliferation.)
Another important aspect of American energy policy in the seventies was oil crisis management. In 1974 President Nixon and Secretary of State Henry Kissinger had taken the lead in organizing the Western effort that culminated in the establishment of the International Energy Agency, which included an emergency oil sharirrg scheme as protection against a future oil embargo. It also provided a high level forum for coordination of energy policies essentially among the OECD countries and for collection and analysis of data on energy markets. A U.S. Strategic Petroleum Reserve was established in EPCA in 1975, although by. the end of the seventies it was only beginning to be filled.
"At the end of the Carter administration the United States was still feeling its way around in energy policies. The recognition of the failure of price controls and other regulations was taking hold. The energy market of the future (was) widely seen to be one of permanently higher prices and vulner'able supplies.,,6 .
The Carter administration was the most interventionist government the United ,States has had in energy policy. In retrospect, it can be said that it tried to do too much. President Carter overloaded Congress with more energy proposals than it could handle in 1977-78. Government subsidies of synthetic fuels and renewable energy technologies went too far and later were sharply curtailed. Yet by 1980 important groundwork had been laid for decontrol of oil and natural gas prices, a strategic petroleum reserve, and limited conservation measures.
5 See Vietor, op. cit., pp. 340-44. Also James Everett Katz, Congress and National Energy Policy (New Brunswick, NJ: Transaction Books, 1984.
6 Paul Basile, op. cit., p. 214
6-5
u.s. Energy Policy in the 1980's: The Reagan Administration
By the time President Ronald Reagan took office in January 1981, he had clearly articulated his intention to reduce the size and role of the federal government. His economic policies emphasized "supply side" measures and reliance on market forces. A tax cut was a centerpiece of his Economic Recovery Program for the nation, which was suffering from double-digit inflation and a major recession. As applied to energy policy, the Reagan approach appeared to represent an ideological revolution. In contrast to the interventionist approach of the Carter administration, President Reagan set out to remove energy policy from the government agenda and return it to the free market. Deregulation was one dominant theme. Yet the early decision, announced in January 1981, to speed up the final decontrol of oil prices manifested a certain degree of continuity with the previous administration, which had begun decontrol in 1979. Another Reagan objective was to abolish the Department of Energy. This turned out to be not so easy when Congress refused to go along. Indeed, the Reagan energy policies, which began rather simplistically, went through a learning process and reflected a certain amount of pragmatism and political compromise. As events and policies unfolded, we can identify three phases.
Reagan Energy Policy: Phase 1
In its first year Reagan energy policy was dominated by the administration's budget director, David Stockman, who presided over a sharp cutback of some 60% in the Department of Energy (DOE) budget. There were dramatic reductions in energy conservation, solar energy research, and even in the fossil fuel program. Henceforth, diminished research and development funds would only support long term, high risk research which industry would not itself be willing to underwrite. Conservation, it was argued, would occur most efficiently via the marketplace, especially after oil prices were fully decontrolled. Support for the Synthetic Fuels Corporation (SF C), just recently approved by Congress, was continued temporarily and reluctantly but at a reduced level. (Buffeted by internal scandal as well as falling oil prices, the SFC was finally abolished by Congress a few years later.)
All of this fit within the Reagan free market philosophy, except the curious tilt toward nuclear power and nuclear fusion, which enjoyed favored treatment in the otherwise austere DOE budget. Since the nuclear industry in the United States had entered a period of decline, this tilt was difficult to explain. The Clinch river breeder reactor project, which the Carter administration had opposed, was kept alive by the Reagan administration until the Senate voted to terminate it in 1983.7
The President's first appointee as Secretary of Energy, James Edwards, a man with little background in the energy field, pledged to work for the abolition of the Department. In late 1981 a plan was announced to split up DOE with 80% of it to be absorbed by the Department of Commerce, and the rest by various other cabinet departments. The proposal was sent to Congress in early 1982 but was abandoned soon thereafter when it met
7 See, for example, William W. Hogan, "Energy Policy and the Reagan Experiment, 1981-82," discussion paper E-84-01, Energy and Environmental Policy Center, Kennedy School of Government, Harvard University, February 1984.
6-6
with little support.
In the early Reagan energy policy considerable emphasis was placed on more rapid . 8
development of energy resources on federal lands and the Outer Continental Shelf. The aggressive manner in which this was shepherded by Interior Secretary James Watt, as well as his prickly rhetoric, offended many environmentalists and eventually led to his departure and replacement by the more soft-spoken William Clark, close associate of the President who previously was National Security advisor.
Another area of controversy was oil crisis management. While proclaiming to be in favor of developing the nation's emergency oil reserve (the Strategic Petroleum Reserve, SPR), the administration insisted on funding it as an off budget item. Any detailed policy planning for an oil market disruption was refused. There was even great skepticism early in the administration regarding American participation in the International Energy Agency's oil sharing plan, viewed by many as contrary to the free market.
Reagan Energy Policy: Phase 2
With the appointment in late 1982 of Donald P. Hodel as Energy Secretary, a man with considerable energy experience, the administration granted energy a more serious place on the national agenda. A new tone was reflected in the second energy report sent to Congress in 1983 which stated a national energy policy goal: "an adequate supply of energy at reasonable costs." Strategies to meet that goal were listed as: "to minimize federal control and involvement in energy markets while maintaining public health and safety and environmental quality; and to promote a balanced and mixed energy resource system" (including renewable and alternative energy technologies). 9 The role of conservation as an energy resource was acknowledged, but no further government actions were called for, and greater attention was paid to energy security.
Two legislative initiatives were proposed by the Administration, but neither were passed by Congress. The Natural Gas Consumer Regulatory Reform Amendments of 1983 were designed to speed up natural gas decontrol. They included a provision to void previous "take-or-pay" contracts for high cost gas. Troubled by this provision, and faced with a less urgent market situation (the average price of natural gas and residual fuel oil were about equal and plenty of gas was available), the Congress held hearings but in the end chose not to act. However, as a result of phased decontrol set in motion by the 1978 Natural Gas Policy Act, 65% of natural gas prices were decontrolled by January 1985. But since the ceiling prices for remaining categories of controlled gas are above market prices, all natural gas prices in the U.S. are currently set by the market. A second proposal to reform and speed up the nuclear licensing and regulatory process also received no action. Meanwhile, the Nuclear Waste Policy Act was passed at the end of 1982, which committed the nation to a process leading to selection of a national repository for high level nuclear waste by the late 1990's.
8 See the first Reagan administration report to Congress, The National Energy Policy Plan, July 1981.
9 The National Energy Policy Plan, October 1983.
6-7
Internationally, a major issue since 1981 was the Soviet-West European Yamal natural gas pipeline. Fearing excessive European dependence on Soviet gas supplies, the Administration initially opposed the pipeline by embargoing the sale of related technology from American companies or their European licensees. This produced a nasty row in the Alliance over extra-territoriality and the definition of European gas security. In a transatlantic compromise reached in 1983, the European countries agreed not to rely on Soviet imports for more than 30% of their gas needs. The International Energy Agency played an important role as a diplomatic forum in the negotiation of the compromise, thus raising its visibility and credibility in the eyes of the President.
In 1984 with the escalation of the tanker war in the Persian Gulf, two actions were taken to bolster energy security. In the spring Secretary Hodel announced that henceforth the Administration's policy was to use part of the Strategic Petroleum Reserve early in an oil market disruption to dampen a price spiral and restore market stability. By then the SPR had been filled to 400 million barrels, representing about 80 days of supply at then current level of imports. About the same time an American-inspired effort in the lEA led to a ministerial decision in July 1984 which provided a framework for future informal coordination in the release of government-controlled emergency oil reserves by those countries possessing such stocks.
Reagan Energy Policy: Phase 3
When William Clark left the government at the end of 1984, Paul Hodel was shifted to the post of Secretary of the Interior where he vigorously pursued federal land and OOS leasing for energy resource development. John Herrington, a former official in the Executive Office of the President, became Secretary of Energy in early 1985. Shortly thereafter, the Chernobyl nuclear power accident in the Soviet Union and the oil price collapse of 1985-86 made energy security the dominant theme of this third phase of Reagan administration energy policy.
By the summer of 1986, oil prices had fallen from $28/barrel to below $lO/barrel, immediately causing a decline in U.S. oil production and a recession in the U.S. oil industry. In response to a request from the President in the fall of 1986, the DOE chaired an interagency high level study of the situation and published a lengthy report, Energy Security-A Report to the President, in March 1987. One of the most comprehensive government studies ever conducted of the U.S. energy scene, the report analyzed every domestic energy sector within the context of international energy markets. It concluded that the United States would be vulnerable in the 1990s to rising dependence on oil imports from the insecure Persian Gulf. Projections showed imports increasing from 5.2 mbd (about one-third of U.S. consumption) in 1986 to between 8 and 10 mbd in the 1990s (about one-half of projected consumption.) While several policy options were outlined as to how to deal with this future vulnerability, none was specifically recommended, but the disadvantages of an oil import fee were emphasized. lO Meanwhile, two industry studies and a study by a Congressional agency reached essentially the same conclusion regarding rising future U.S. dependence on oil imports. l1
10 Energy Security: A Report To The President, U.S. Department of Energy, March 1987.
11 See Domestic Petroleum Production and National Security, American Petroleum Institute (De-
6-8
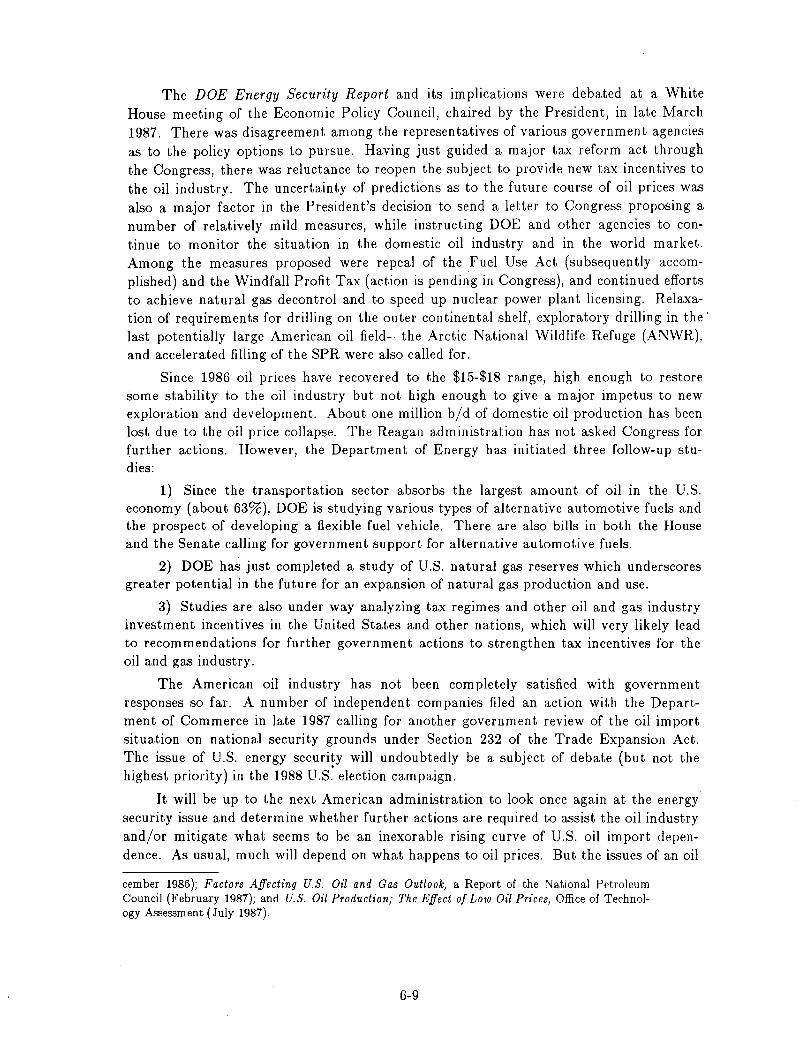
The DOE Energy Securz'ty Report and its implications were debated at a White House meeting of the Economic Policy Council, chaired by the President, in late March 1987. There was disagreement among the representatives of various government agencies as to the policy options to pursue. Having just guided a major tax reform act through the Congress, there was reluctance to reopen the subject to provide new tax incentives to the oil industry. The uncertainty of predictions as to the future course of oil prices was also a major factor in the President's decision to send a letter to Congress proposing a num ber of relatively mild measures, while instructing DOE and other agencies to continue to monitor the situation in the domestic oil industry and in the world market. Among the measures proposed were repeal of the Fuel Use Act (subsequently accomplished) and the Windfall Profit Tax (action is pending in Congress), and continued efforts to achieve natural gas decontrol and to speed up nuclear power plant licensing. Relaxation of requirements for drilling on the outer continental shelf, exploratory drilling in the' last potentially large American oil field-the Arctic National Wildlife Refuge (ANWR), and accelerated filling of the SPR were also called for.
Since 1986 oil prices have recovered to the $15-$18 range, high enough to restore some stability to the oil industry but not high enough to give a major impetus to new exploration and development. About one million bid of domestic oil production has been lost due to the oil price collapse. The Reagan administration has not asked Congress for further actions. However, the Department of Energy has initiated three follow-up studies:
1) Since the transportation sector absorbs the largest amount of oil in the U.S. economy (about 63%), DOE is studying various types of alternative automotive fuels and the prospect of developing a flexible fuel vehicle. There are also bills in both the House and the Senate calling for government support for alternative automotive fuels.
2) DOE has just completed a study of U.S. natural gas reserves which underscores greater potential in the future for an expansion of natural gas production and use.
3) Studies are also under way analyzing tax regimes and other oil and gas industry investment incentives in the United States and other nations, which will very likely lead to recommendations for further government actions to strengthen tax incentives for the oil and gas industry.
The American oil industry has not been completely satisfied with government responses so far. A number of independent companies filed an action with the Departmen t of Commerce in late 1987 calling for another government review of the oil import situation on national security grounds under Section 232 of the Trade Expansion Act. The issue of U.S. energy security will undoubtedly be a subject of debate (but not the highest priority) in the 1988 U .S~ election campaign.
It will be up to the next American administration to look once again at the energy security issue and determine whether further actions are required to assist the oil industry and/or mitigate what seems to be an inexorable rising curve of U.S. oil import dependence. As usual, much will depend on what happens to oil prices. But the issues of an oil
cember 1986); Factors Affecting U.S. Oil and Gas Outlook, a Report of the National Petroleum Council (February 1987); and U.S. Oil Production; The Effect of Low Oil Prices, Office of Technology Assessment (July 1987).
6-9
import fee, tax incentives, an oil price floor, restoration of the depletion allowance, and development of the Arctic National Wildlife Refuge, remain on the American agenda. Other issues relate to the demand side, i.e., should the government take a more aggressive role in furthering energy conservation? in protecting the environment?
While it is too early to judge the effectiveness of the Reagan administration energy policies, clearly the emphasis on dismantling past regulations and returning to a more free market orientation has been on the whole a healthy one for the American energy economy. And the vigorous build-up of a Strategic Petroleum Reserve (now well over 500 mb) has been important as a first line of defense in an energy emergency. However, the challenge for the future will be for government to strike a balance between the free market and further actions to ensure American energy security in a world of lower oil pnces.
As we know, the free market does not plan for the long term future. With oil imports likely to rise substantially in the next decade, can America take steps to offset or at least postpone this development by encouraging more domestic supply? Should more incentives be given to other fuel sectors and conservation? Will enhanced oil dependence pose a future threat to the stability of the American economy in case of a future oil price shock? to America's leadership role in the world? In the United States there is still no firm consensus on these questions which the next administration and the next Congress will face.
6-10
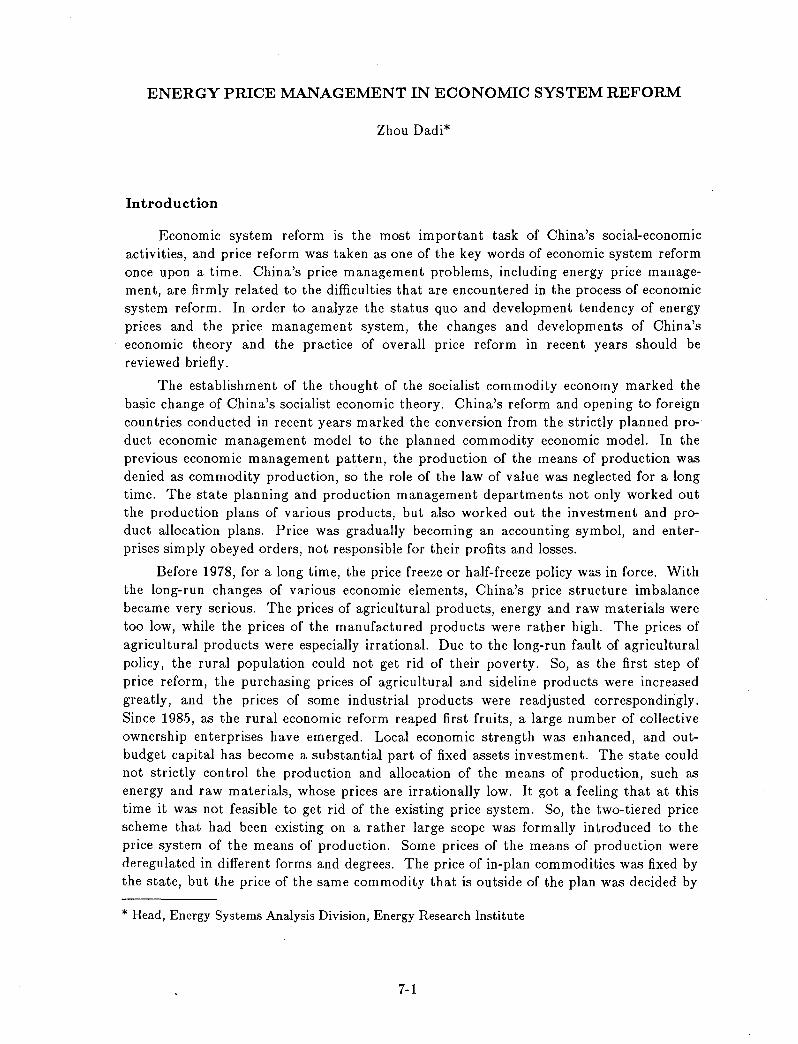
ENERGY PRICE MANAGEMENT IN ECONOMIC SYSTEM REFORM
Zhou Dadi*
Introduction
Economic system reform is the most important task of China's social-economic activities, and price reform was taken as one of the key words of economic system reform once upon a time. China's price management problems, including energy price management, are firmly related to the difficulties that are encountered in the process of economic system reform. In order to analyze the status quo and development tendency of energy prices and the price management system, the changes and developments of China's economic theory and the practice of overall price reform in recent years should be reviewed briefly.
The establishment of the thought of the socialist commodity economy marked the basic change of China's socialist economic theory. China's reform and opening to foreign countries conducted in recent years marked the conversion from the strictly planned product economic management model to the planned commodity economic model. In the previous economic management pattern, the production of the means of production was denied as commodity production, so the role of the law of value was neglected for a long time. The state planning and production management departments not only worked out the production plans of various products, but also worked out the investment and product allocation plans. Price was gradually becoming an accounting symbol, and enterprises simply obeyed orders, not responsible for their profits and losses.
Before 1978, for a long time, the price freeze or half-freeze policy was in force. With the long-run changes of various economic elements, China's price structure imbalance became very serious. The prices of agricultural products, energy and raw materials were too low, while the prices of the manufactured products were rather high. The prices of agricultural products were especially irrational. Due to the long-run fault of agricultural policy, the rural population could not get rid of their poverty. So, as the first step of price reform, the purchasing prices of agricultural and sideline products were increased greatly, and the prices of some industrial products were readjusted correspondingly. Since 1985, as the rural economic reform reaped first fruits, a large number of collective ownership enterprises have emerged. Local economic strength was enhanced, and outbudget capital has become a substantial part of fixed assets investment. The state could not strictly control the production and allocation of the means of production, such as energy and raw materials, whose prices are irrationally low. It got a feeling that at this time it was not feasible to get rid of the existing price system. So, the two-tiered price scheme that had been existing on a rather large scope was formally introduced to the price system of the means of production. Some prices of the means of production were deregulated in different forms and degrees. The price of in-plan commodities was fixed by the state, but the price of the same commodity that is outside of the plan was decided by
* Head, Energy Systems Analysis Division, Energy Research Institute
7-1
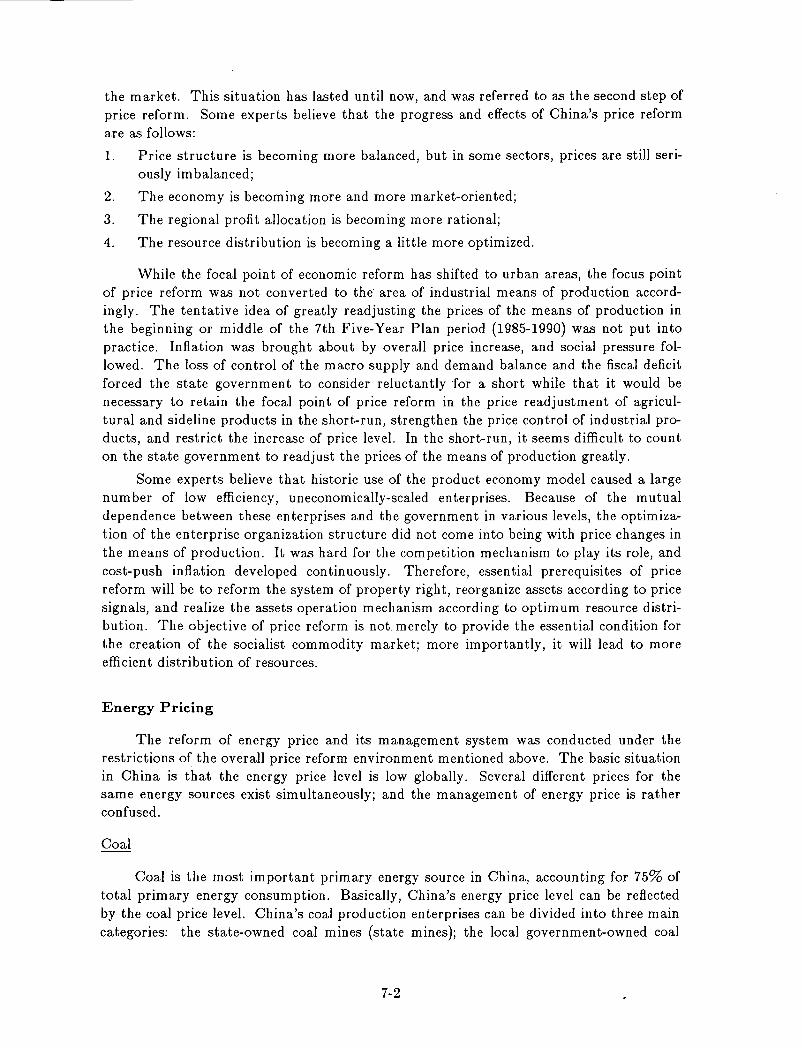
the market. This situation has lasted until now, and was referred to as the second step of price reform. Some experts believe that the progress and effects of China's price reform are as follows:
1. Price structure is becoming more balanced, but in some sectors, prices are still seri-ously imbalanced;
2. The economy is becoming more and more market-oriented;
3. The regional profit allocation is becoming more rational;
4. The resource distribution is becoming a little more optimized.
While the focal point of economic reform has shifted to urban areas, the focus point of price reform was not converted to the area of industrial means of production accordingly. The tentative idea of greatly readjusting the prices of the means of production in the beginning or middle of the 7th Five-Year Plan period (1985-1990) was not put into practice. Inflation was brought about by overall price increase, and social pressure followed. The loss of control of the macro supply and demand balance and the fiscal deficit forced the state government to consider reluctantly for a short while that it would be necessary to retain the focal point of price reform in the price readjustment of agricultural and sideline products in the short-run, strengthen the price control of industrial products, and restrict the increase of price level. In the short-run, it seems difficult to count on the state government to readjust the prices of the means of production greatly.
Some experts believe that historic use of the product economy model caused a large number of low efficiency, uneconomically-scaled enterprises. Because of the mutual dependence between these enterprises and the government in various levels, the optimization of the enterprise organization structure did not come into being with price changes in the means of production. It was hard for the competition mechanism to play its role, and cost-push inflation developed continuously. Therefore, essential prerequisites of price reform will be to reform the system of property right, reorganize assets according to price signals, and realize the assets operation mechanism according to optimum resource distribution. The objective of price reform is not merely to provide the essential condition for the creation of the socialist commodity market; more importantly, it will lead to more efficient distribution of resources.
Energy Pricing
The reform of energy price and its management system was conducted under the restrictions of the overall price reform environment mentioned above. The basic situation in China is that the energy price level is low globally. Several different prices for the same energy sources exist simultaneously; and the management of energy price is rather confused.
Coal
Coal is the most important primary energy source in China, accounting for 75% of total primary energy consumption. Basically, China's energy price level can be reflected by the coal price level. China's coal production enterprises can be divided into three main categories: the state-owned coal mines (state mines); the local government-owned coal
7-2
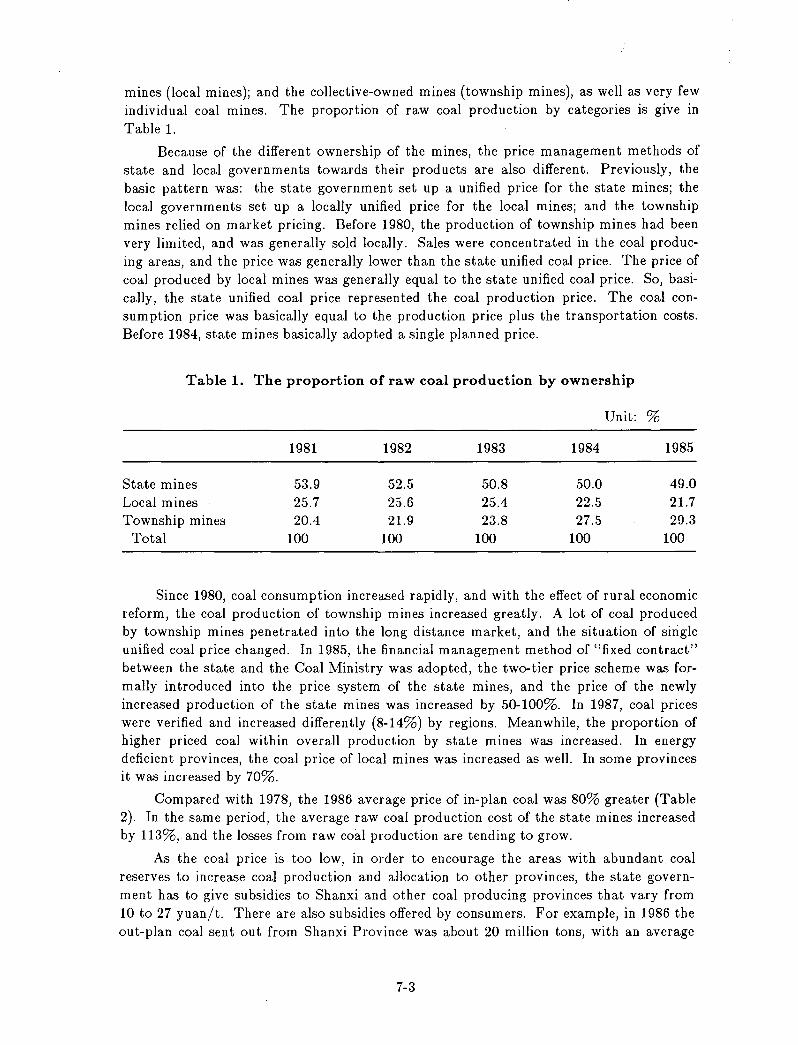
mines (local mines); and the collective-owned mines (township mines), as well as very few individual coal mines. The proportion of raw coal production by categories is give in Table 1.
Because of the different ownership of the mines, the price management methods of state and local governments towards their products are also different. Previously, the basic pattern was: the state government set up a unified price for the state mines; the local governments set up a locally unified price for the local mines; and the township mines relied on market pricing. Before 1980, the production of township mines had been very limited, and was generally sold locally. Sales were concentrated in the coal producing areas, and the price was generally lower than the state unified coal price. The price of coal produced by local mines was generally equal to the state unified coal price. So, basically, the state unified coal price represented the coal production price. The coal consumption price was basically equal to the production price plus the transportation costs. Before 1984, state mines basically adopted a single planned price.
Table 1. The proportion of raw coal production by ownership
Unit: %
1981 1982 1983 1984 1985
State mines 53.9 52.5 50.8 50.0 49.0 Local mines 25.7 25.6 25.4 22.5 21.7 Township mines 20.4 21.9 23.8 27.5 29.3
Total 100 100 100 100 100
Since 1980, coal consumption increased rapidly, and with the effect of rural economic reform, the coal production of township mines increased greatly. A lot of coal produced by township mines penetrated into the long distance market, and the situation of single unified coal price changed. In 1985, the financial management method of "fixed contract" between the state and the Coal Ministry was adopted, the two-tier price scheme was formally introduced into the price system of the state mines, and the price of the newly increased production of the state mines was increased by 50-100%. In 1987, coal prices were verified and increased differently (8-14%) by regions. Meanwhile, the proportion of higher priced coal within overall production by state mines was increased. In energy deficient provinces, the coal price of local mines was increased as well. In some provinces it was increased by 70%.
Compared with 1978, the 1986 average price of in-plan coal was 80% greater (Table 2). In the same period, the average raw coal production cost of the state mines increased by 113%, and the losses from raw coal production are tending to grow.
As the coal price is too low, in order to encourage the areas with abundant coal reserves to increase coal production and allocation to other provinces, the state government has to give subsidies to Shanxi and other coal producing provinces that vary from 10 to 27 yuan/to There are also subsidies offered by consumers. For example, in 1986 the out-plan coal sent out from Shanxi Province was about 20 million tons, with an average
7-3
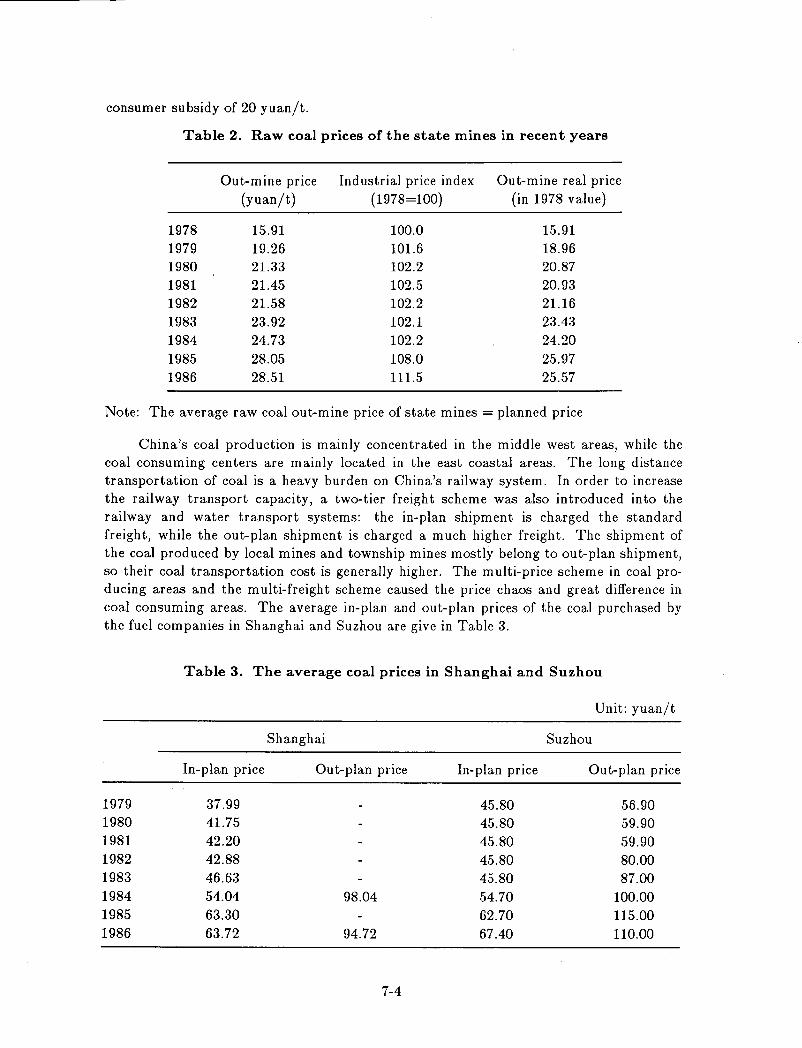
consumer subsidy of 20 yuan/to
Table 2. Raw coal prices of the state mines in recent years
Out-mine price Ind ustrial price index Out-mine real price (yuan/t) (1978=100) (in 1978 value)
1978 15.91 100.0 15.91 1979 19.26 101.6 18.96 1980 21.33 102.2 20.87 1981 21.45 102.5 20.93 1982 21.58 102.2 21.16 1983 23.92 102.1 23.43 1984 24.73 102.2 24.20 1985 28.05 108.0 25.97 1986 28.51 111.5 25.57
Note: The average raw coal out-mine price of state mines = planned price
China's coal production is mainly concentrated in the middle west areas, while the coal consuming centers are mainly located in the east coastal areas. The long distance transportation of coal is a heavy burden on China's railway system. In order to increase the railway transport capacity, a two-tier freight scheme was also introduced into the railway and water transport systems: the in-plan shipment is charged the standard freight, while the out-plan shipment is charged a much higher freight. The shipment of the coal produced by local mines and township mines mostly belong to out-plan shipment, so their coal transportation cost is generally higher. The multi-price scheme in coal producing areas and the multi-freight scheme caused the price chaos and great difference in coal consuming areas. The average in-plan and out-plan prices of the coal purchased by the fuel companies in Shanghai and Suzhou are give in Table 3.
Table 3. The average coal prices in Shanghai and Suzhou
Unit: yuan/t
Shanghai Suzhou
In-plan price Out-plan price In-plan price Out-plan price
1979 37.99 45.80 56.90 1980 41.75 45.80 59.90 1981 42.20 45.80 59.90 1982 42.88 45.80 80.00 1983 46.63 45.80 87.00 1984 54.04 98.04 54.70 100.00 1985 63.30 62.70 115.00 1986 63.72 94.72 67.40 110.00
7-4
Even though in the eastern consuming centers, the prices of out-plan coal are much higher than in-plan coal, the out-mine coal prices of township mines, which are the main producer of out-plan coal, are generally lower than those of the state mines. The extra consumer cost is transferred into the transportation and sales sectors. The subsidies offered by the state government for the out-plan coal produced by local mines are taken by the local governments at various levels; only a small proportion is returned to mines.
Electricity and Oil Pricing
The price management and regulation of electricity and oil are similar to that of coal. The difference is that the electric power and oil industries are highly state monopolistic sectors. There are few intermediate links of transportation and sales between producers and consumer, so production price and consumption price should be basically the same. But with refined oil products, often the consumers bear irrational and illegal additional cost.
Since the 1950s, electricity price has been under nationally unified regulations. Preferential electricity prices were offered to agriculture and some electricity-intensive industries. By 1979, the national average electricity price was 25% lower than that of the end of the 1950s. Only the electricity price in northeast China increased because the electricity price there had been much lower than that of the national average. Since 1980, the financial situation of the power industry has steadily deteriorated. Generation cost increased annually, and electricity price also increased somehow, with some of the preferential prices canceled. Since 1985, because of the introduction of the two-tiered price scheme of the means of production, some of the power plants that consumed higher price coal or oil could no longer bear the increasing fuel cost, and the price of this part of electricity began to fluctuate with fuel prices.
Because the power shortage situation has been very serious in recent years, local enthusiasm for developing power industry with locally gathered funds has been stimulated. In addition to a number of small thermal power plants and small hydropower stations, some large and medium-sized power plants have been constructed with locally gathered funds. The electricity prices of these local power plants are not restricted by the nationally unified electricity price. The in-plan power consumption still takes up about 90% of the national total power consumption, but in the areas where the economic growth rate is rather high and power shortage is very serious, the proportion of out-plan power consumption has become rather large. In some of these areas, the average electricity price is about two times higher than the national average.
For oil, a contract was signed in 1983 between the State and the Ministry of Oil Industry, in which a crude oil production quota was specified. The crude oil production exceeding the quota was to be priced the same as the exported crude oil. Besides a few small oil refiners that belong to oil fields, China's oil refinery industry is monopolized by the Chinese National Petrochemical Company (CNPC). In 1983, a similar contract was signed between the State and the CNPC. The oil products production exceeding a specified quota could be sold at a higher price. Currently, the price of the over-quota oil products is higher than the international price. Since 1983, except for a few special consumers specified by the State, all newly-added domestic crude oil and oil products consumers have been charged the higher prices. Because the demands on highway and water shipments have increased very rapidly in recent years, crude oil and oil products have
7-5
been in serious shortage. Even the high price oil must be put on rations; many consumers who do not have access to sufficient consumption quota are forced to buy oil products with even higher prices. The oil products prices in a few black markets are over two times the state-specified over-quota prices.
The Problems from Low Energy Prices
Although though the introduction of the two-tiered price scheme has increased the overall energy price level, from the producer side China's energy price level is still irrationally low.
The fact that raw coal production price is lower than production cost is a problem. For the past 7 years, the state mines, which take up 50% of the national total coal production, have operated at losses. The amount of losses has increased annually, and now reaches above 1 billion yuan per year. Further, the current cost accounting method does not include every cost item that should be calculated. The simple reproduction of the state mines is maintained by state subsidies. The investment in new mines has to rely completely on the national government. Most local mines, which make up 20% of the total coal production, also operate at losses. Their production is maintained by the subsidies offered by local governments. Most of the township mines are operating in a primitive non-mechanization pattern. Their production cost is rather low, and profit is also very low. A lot of resource is wasted in their production, and their economic strength for expanding production capacity is very weak.
The profit level of the power industry has decreased annually and now is much lower than the national average. As power shortage is very serious, development of the power industry should be speeded up. But because the profit rate is too low, the funds needed for self-development are deficient, and the development speed of the industry is seriously infl uenced.
With the deterioration of oil recovery conditions, the production cost of oil has increased rapidly. The natural progressive decline in production capacity in old oil fields increased, and the exploration and development cost of new oil fields is rather high. The stable and increased production of the oil industry in recent years was supported financially by the revenue generated from the sales of high price oil. With the sharp fall of international oil price, the development funds of the oil industry decreased. The crude oil industry as a whole is becoming another sector operated in losses.
Possible Directions for Energy Price Reform
The harm of low energy price has been mentioned by many experts and from many aspects. The low energy price caused wasteful consumption and restricted the development of energy production. Here, we would like to analyze the tendency of energy price changes from the point of view of economic system reform. In fact, everyone knows that China's energy price is too low; the question is how and when to solve this problem.
Oil, power and coal (state mines) industries are highly monopolistic productive groups directly operated by governments. For a long time, state coal mines have been operating at losses, state subsidies have been received annually, and development funds
7-6
totally rely on state free input. In this way, the production and low level development of state mines has been and could be maintained.
The investment in the power industry is mainly supported by state non-interest or low-interest loans, and supplemented by mandatory funds gathering. The electricity price control has been canceled for those power construction projects that use foreign capital and local funds. In the short run, the construction funds shortage is solved to some extent. Meanwhile, the overall energy price level is increased continuously, pushed by the coal and power production industries using flexible approaches. As long as this pattern and policy are unchanged, the tendency to expand the proportion of out-plan production through flexible approaches and slow increase of the overall price level will be maintained. If there are no tremendous changes in price reform, the pattern of two-tiered energy price will remain for a rather long period. But as long as the two-tiered price scheme exists, the low energy price situation will remain.
Another possibility is that the management system reform of the energy production enterprises may promote the process of energy price reform. In the recent organization reform of the State Council, the Ministries of Coal and Water Resources and Electric Power Industries were canceled, and the Ministry of Energy was founded. It is very clear that the Ministry of Energy cannot exercise the direct production operation function that used to be exercised by the oil, coal, and power ministries. It is very possible that a series of regional coal, oil, and power companies will be founded, and the responsibility of energy production will be borne by enterprises. If this pattern can be realized, the regional energy companies will change their energy prices. As a result, it is possible that instead of national large-scale energy price readjustment, regional step-by-step energy price readjustment may come into being. The feasibility of the regional price increase will be larger, and the impact of the price increase will be dispersed.
Some experts project that if the current energy production management system, especially the coal production management system, and the energy price regulation policy are unchanged, in the near future the overall coal supply shortage will reappear. At that time, the state government would be forced to re-evaluate the current energy price policy. Large-scale coal price and maybe electricity price readjustment would be possible then. It seems not a good prospect, but is possible.
Because most oil consumers do not consume crude oil directly, the price changes of crude oil will only lead to profit reallocation between the oil recovery industry and the oil refinery industry, and influence to some extent the accounting balance of foreign trade. This kind of profit reallocation will be relatively easy to conduct. The opportune moment of oil price readjustment will depend on the fiscal situation of the oil recovery industry.
Conclusion
In recent years, much research has been conducted by various governmental departments and scientific research units to decide the rational energy price level and pricing principles. Many beneficial results were obtained. But the practice of price reform in recent years demonstrated that change of energy price is mainly dependent on changes in the macroeconomic situation and the process of economic system reform. It is also dependent on the evaluation and understanding of the high-level decisionmakers about the significance and effects of price reform. Recently, the central government has reiterated
7-7
the importance of price reform for the overall economy reform, and decided to rationalize the price system in the next 3-5 years in order to establish the new order of socialist commodity economy. The fundamental trend is likely to accelerate the progress of marketorientation of the means of production, and to found the price system based on the market. With regard to the energy price reform, it seems unclear what kind of concrete policies will be pursued. Whether deregulation or some combination of adjustment and deregulation will become the dominant reforming approach has not been decided. Therefore, further analysis of the role and position of energy price reform in the overall economic system reform from the viewpoint of socialist commodity economy, analyzing the current status and changes in the macroeconomic situation more completely, and assessing the opportune moment and concrete pattern and method of price reform will be very beneficial.
References
"China Coal Price Policy Research." Techno-Economic Social Development Research Center of the State Council.
"Price Reform and the Transform of Property Right System." Techno-Economic Social Development Research Center of the State Council.
"Energy Price Reform Discussion." Zhou Dadi, Wan Chunhou, Chen Xiaoqing.
"The Influence of Market Force on Energy Supply and Demand in the Sixth Five-Year Plan Period and the Future Tendency," Wan Chunhou.
"China Energy Price Readjust," Song Wucheng.
"The Discussion of Electricity Price Reform," Wei Bingcai.
7-8
APPROACIDNG LONG-TERM ENERGY DEMAND: ENERGY DEMAND FOR PRODUCTION OR PLEASURE?
Lee Schipper*
Introd uction
The transition from smooth growth in world economic activity and energy demand through 1973 to the irregular patterns of the last 15 years makes determination of future energy-use patterns very uncertain. Analyzing evolution of various sectors of use in developed and developing countries, and understanding how underlying structure of consumption as well as efficiency and fuel choice has changed, shows which long range forces affect energy needs through changes in structure, and which forces affect principally intensity or fuel choice. Additionally, the understanding of the changes during these 15 years, and whether such changes are easily reversible with lower energy prices, is important to understanding where today's consumption patterns will lead. This paper will discuss some of these energy demand issues, emphasizing those which present the greatest uncertainties and challenges to the planner or modeller who is considering the energy options of an individual, a firm, or a nation. We first discuss the most recent changes in energy use in developed countries. Then we examine how the changes in energy prices might affect energy use, particularly through changes in efficiency. Finally we ask whether there are underlying forces that affect the efficiency and structure of energy use in ways relatively independent of energy prices, forces that may have important upward -- or downward -effects on long-term energy demands.
The Short-Term Concern: Reversibility of Conservation and Substitution
The increases in energy prices after 1973 and 1979 caused or accelerated im provements in the efficiency of energy use (1). In 1985, homes, services, automobiles, truck freight, air passenger traffic, other transport, and manufacturing in the OECD used 48 million barrels per day of oil equivalent (mb/doe).** Between 1972 and 1985, however, energy use per unit of activity in each of these sectors in the OECD fell significantly. If these energy intensities had been frozen at their 1972 values, 1985 end-use would have been close to 64 m b / doe at the rates of activity that prevailed in each sector in 1985. t The difference yields a savings of 16 mb/doe. The corresponding oil savings in this period amount to close to 12 mb/doe, including substitution by other fuels.
In the residential sector (2,3), centrally heate.d homes in cold countries (save Great Britain) reduced use by 15-35%, oil heated homes in Denmark reducing use by as much as 50% (3). Through 1985 consumption had not rebounded by more than 10% of this
• International Energy Studies Group, Applied Science Division, Lawrence Berkeley Laboratory
•• Note on Units: 1 million tonnes of oil equivalent (MTOE) - 41.87 P J; 1 mb/doe - 2233 P J.
t Consumption in 1985 for space heating was corrected for the abnormally cold winter. 1972 was closer to a normal winter.
8-1
reduction in energy/household. Roughly 35% of the reduction· in home energy use through 1982 was permanent, increasing to 50% by 1985, as the impact of insulation and better buildings and appliances became apparent. The immediate savings were in oil heated homes, and in gas heated homes in the U.S., Canada, Holland, and France, and to a lesser extent in Italy, Belgium, Germany, and Britain. As gas and electricity assumed a larger share of heating systems in new homes, which were considerably better insulated than older, savings increased. In all OECD countries, too, more efficient appliances began to appear. By 1985 new appliances were about 25% less energy intensive than ones that had appeared 10 years earlier, although increases in their numbers and sizes between 1973 and 1985 offset some of these savings (4).
In the service sector, there is evidence of a drop in fuel use per unit of floor space in all OECD countries, but there was growth in electricity use (5). There has been about a 20% drop in space heating intensity in OECD service sector buildings.
In industry, efficiency increased more rapidly in the period after 1973 than before, and the 1979-1985 period brought rapid energy saving with higher oil prices and, more recently, brighter economic times. Overall, energy use per unit of output in 1985 was more than 30% below its 1972 level (6,7). At least 1/3 of the reduction in industrial energy use/{value added) was caused by permanent restructuring of output towards less energy-intensive materials. Although some substitution back to oil is apparently underway in 1987, it does not appear that more than 10% of the drop in energy per unit of output in OECD industry could return as a result of lower oil or energy prices.
In the transport sector, new car miles-per-gallon improved nearly 100% in N. America (See Fig. 1) and by a smaller amount in Europe and Japan (8), where through the end of the 1970s cars were still getting larger and more powerful. Soaring rates of au to ownership, however, drove motor fuel use upward in Europe and Japan until higher prices, saturation, and more efficient cars in the 1980s checked the increase. More dramatic up to 1986 has been the 40% decrease in energy/pass-km for air travel (relative to 1972/3 intensity). Finally, a small increase in truck freight efficiency added to savings. Since the changes that persisted through 1985 were caused by more efficient vehicles and, for freight and air traffic, better handling and load factors as well, these will remain with lower oil prices because they make economic sense at virtually any oil price. Indeed, the drop in crude oil prices in 1986 was preceded by con tin ual declines in the real prices of gasoline, withou t any significant increase in miles driven or liters/km. This suggests that consumers, particularly in the U.S., have adjusted to more efficient vehicles by simply spending their savings on other things besides fuel. However, if energy prices stay low for long enough, American autos might begin to increase in size rapidly enough for gains in MPG to be erased.
Thus in almost every OECD country in Central or N. Europe, as well as in N. America and Japan, energy intensities fell significantly in all sectors. In Japan and C. Europe some of this drop was obscured or even offset by increase in house area, central heating and car ownership, or, in the case of Italy, by an increase in output from heavy industry. But energy was saved.
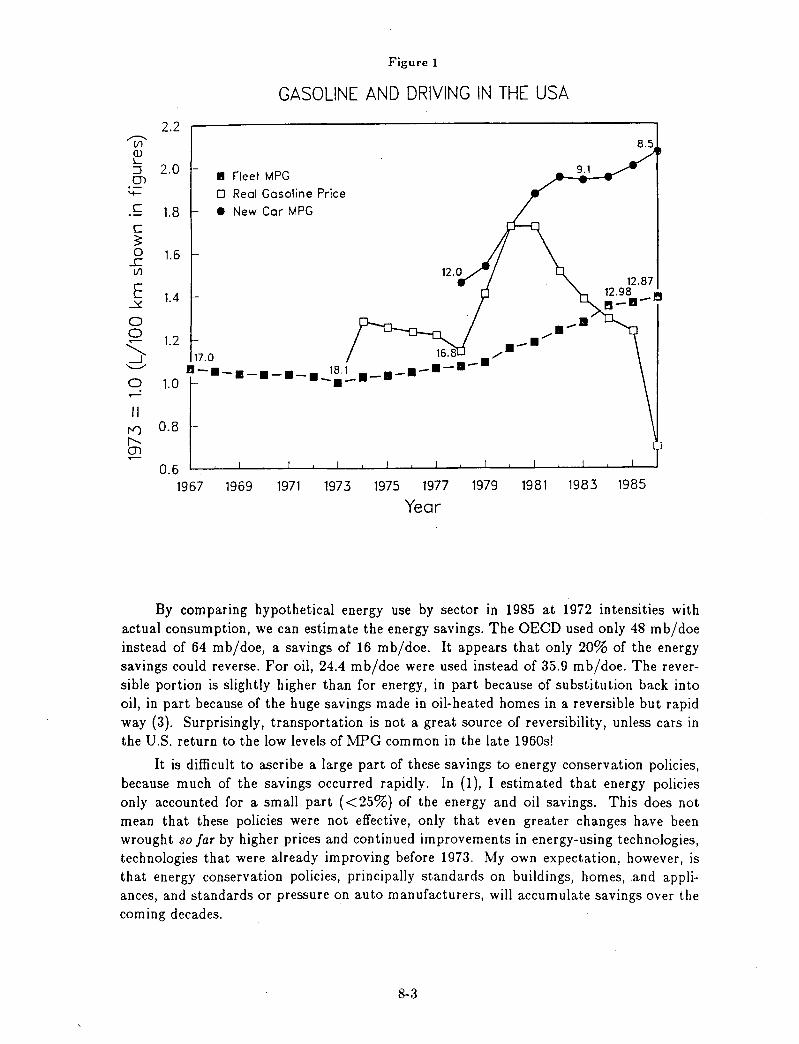
Figure 1
GASOLINE AND DRIVING IN THE USA
~ Q) L
2.2
::J 2.0 0>
'+-
c 1.8 c 3: o
-.C VI
E ..Y-
1.6
1.4
I! Fleel MPG
o Real Gasoline Price
• New Car MPG
O o S
1.2 ._ ........ 17.0 16.8 ",,-
'--"
o 11-._._._._. 18.1 ._._.-.-.-.
1.0 -.-
II I") 0.8 -r--.. m
0.6
9.1
.-.
8.5
1967 1969 1971 1973 1975 1977 1979 1981 1983 1985
Year
By comparing hypothetical energy use by sector in 1985 at 1972 intensities with actual consumption, we can estimate the energy savings. The OECD used only 48 mb/doe instead of 64 mb/doe, a savings of 16 mb/doe. It appears that only 20% of the energy savings could reverse. For oil, 24.4 mb/doe were used instead of 35.9 mb/doe. The reversible portion is slightly higher than for energy, in part because of su bstitu tion back in to oil, in part because of the huge savings made in oil-heated homes in a reversible but rapid way (3). Surprisingly, transportation is not a great source of reversibility, unless cars in the U.S. return to the low levels of MPG common in the late 1960s!
It is difficult to ascribe a large part of these savings to energy conservation policies, because much of the savings occurred rapidly. In (1), I estimated that energy policies only accounted for a small part «25%) of the energy and oil savings. This does not mean that these policies were not effective, only that even greater changes have been wrought so far by higher prices and continued improvements in energy-using technologies, technologies that were already improving before 1973. My own expectation, however, is that energy conservation policies, principally standards on buildings, homes, and appliances, and standards or pressure on auto manufacturers, will accumulate savings over the coming decades.
8-3
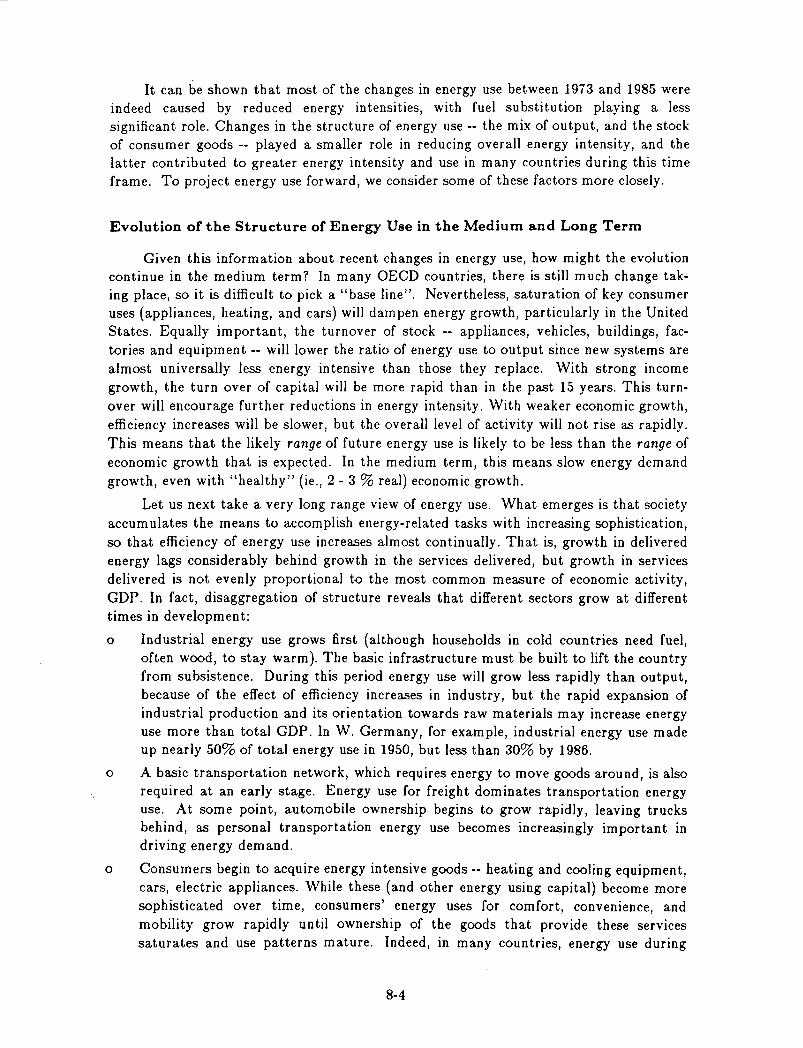
It can be shown that most of the changes in energy use between 1973 and 1985 were indeed caused by reduced energy intensities, with fuel substitution playing a less significant role. Changes in the structure of energy use -- the mix of output, and the stock of consumer goods -- played a smaller role in reducing overall energy intensity, and the latter contributed to greater energy intensity and use in many countries during this time frame. To project energy use forward, we consider some of these factors more closely.
Evolution of the Structure of Energy Use in the Medium and Long Term
Given this information about recent changes in energy use, how might the evolution continue in the medium term? In many OECO countries, there is still much change taking place, so it is difficult to pick a "base line". Nevertheless, saturation of key consumer uses (appliances, heating, and cars) will dampen energy growth, particularly in the United States. Equally important, the turnover of stock -- appliances, vehicles, buildings, factories and equipment -- will lower the ratio of energy use to output since new systems are almost universally less energy intensive than those they replace. With strong income growth, the turn over of capital will be more rapid than in the past 15 years. This turnover will encourage further reductions in energy intensity. With weaker economic growth, efficiency increases will be slower, but the overall level of activity will not rise as rapidly. This means that the likely range of future energy use is likely to be less than the range of economic growth that is expected. In the medium term, this means slow energy demand growth, even with "healthy" (ie., 2 - 3 % real) economic growth.
Let us next take a very long range view of energy use. What emerges is that society accumulates the means to accomplish energy-related tasks with increasing sophistication, so that efficiency of energy use increases almost continually. That is, growth in delivered energy lags considerably behind growth in the services delivered, but growth in services delivered is not evenly proportional to the most common measure of economic activity, GOP. In fact, disaggregation of structure reveals that different sectors grow at different times in development:
o Industrial energy use grows first (although households in cold countries need fuel, often wood, to stay warm). The basic infrastructure must be built to lift the country from subsistence. Ouring this period energy use will grow less rapidly than output, because of the effect of efficiency increases in industry, but the rapid expansion of industrial production and its orientation towards raw materials may increase energy use more than total GOP. In W. Germany, for example, industrial energy use made up nearly 50% of total energy use in 1950, but less than 30% by 1986.
o A basic transportation network, which requires energy to move goods around, is also required at an early stage. Energy use for freight dominates transportation energy use. At some point, automobile ownership begins to grow rapidly, leaving trucks behind, as personal transportation energy use becomes increasingly important in driving energy demand.
o Consumers begin to acquire energy intensive goods -- heating and cooling equipment, cars, electric appliances. While these (and other energy using capital) become more sophisticated over time, consumers' energy uses for comfort, convenience, and mobility grow rapidly until ownership of the goods that provide these services saturates and use patterns mature. Indeed, in many countries, energy use during
8-4
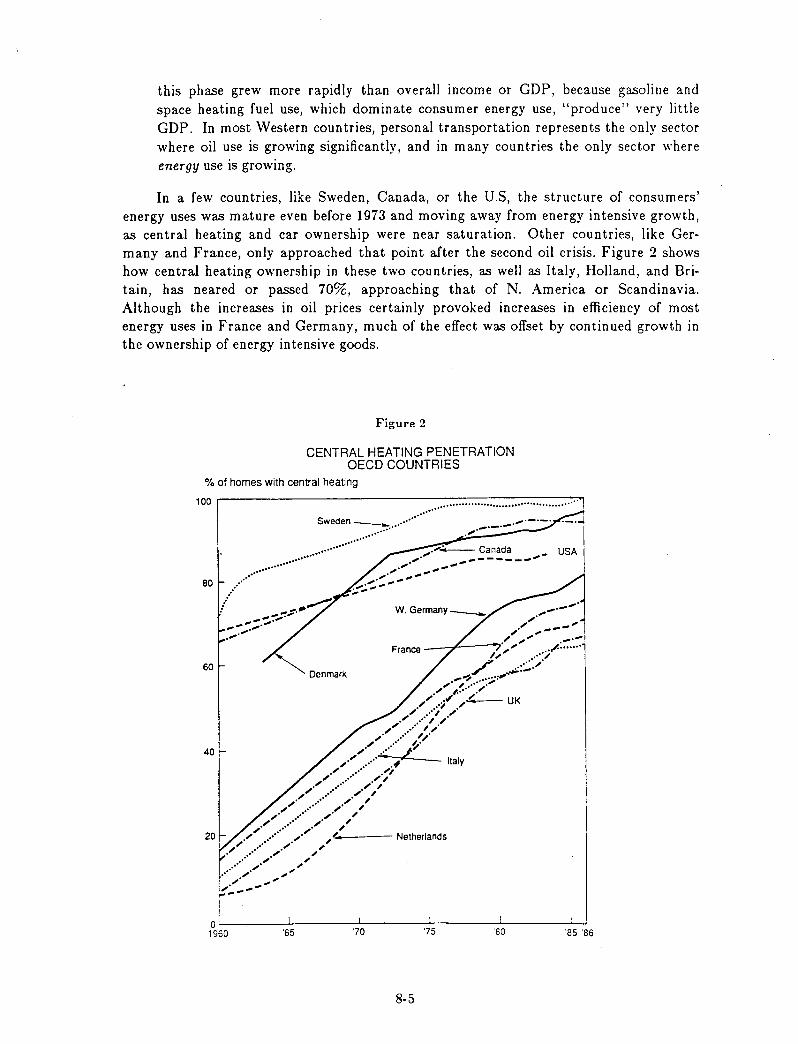
this phase grew more rapidly than overall income or GDP, because gasoline and space heating fuel use, which dominate consumer energy use, "produce" very little GDP. In most Western countries, personal transportation represents the only sector where oil use is growing significantly, and in many countries the only sector where energy use is growing.
In a few countries, like Sweden, Canada, or the U.S, the structure of consumers' energy uses was mature even before 1973 and moving away from energy intensive growth, as central heating and car ownership were near saturation. Other countries, like Germany and France, only approached that point after the second oil crisis. Figure 2 shows how central heating ownership in these two countries, as well as Italy, Holland, and Britain, has neared or passed 70%, approaching that of N. America or Scandinavia. Although the increases in oil prices certainly provoked increases in efficiency of most energy uses in France and Germany, much of the effect was offset by continued growth in the ownership of energy intensive goods.
Figure 2
CENTRAL HEATING PENETRATION OECD COUNTRIES
% of homes with central heating
100 .------------------------------... -.. -... -•• -.. -... -.. -..• -.. -•• -••• ~ .. ~ •. -... -.. -.. -•.. -.. ~ ... ~
Sweden ---:: ..•••••••••••••••
80 •.. / .. / •••..••.••..• " ••.• = ....... ::~:::.::.::" ,5~!d':_ ,,-~-~ ---...... ;.;. ",-'"
60
40
20
... ...... ~....... " ,. -- ". , ... --....... , .".,,' ...... .".
Denmark
France 1.-.... . ... -;,/. ...... . ./ ..-;:.:::.,,-
.... .-,. ...... ,.,., ",' , ..... '" .'" ~ .. , -'"
/"' ••• -;01' /4-- UK '" ... , '" .'" .... ,,,-'" .. ' '''--'" .. ' ,.
",'" .. ' ,,/ ",' ...... j;l'
",.'" ...... -.". -'" .... -""
-",'" ....... ".~' '" .... ,., ~-'" .... ",', , .. ' ",' , ",.'" ..... ,. , '" .. ' . ,
". .... ,.' , ".'" ..... .",' ,'-'-004_--- Netherlands
-'" ....... ,.'" " .. ' ",' , .. ' ",' .-.... ",' .,," .",' ... ;"
11'_-,-
Italy
oL-______ ~ ______ ~ ________ ~-------L------__ ~ '960 '65 "75 '80 '85 '86
8-5
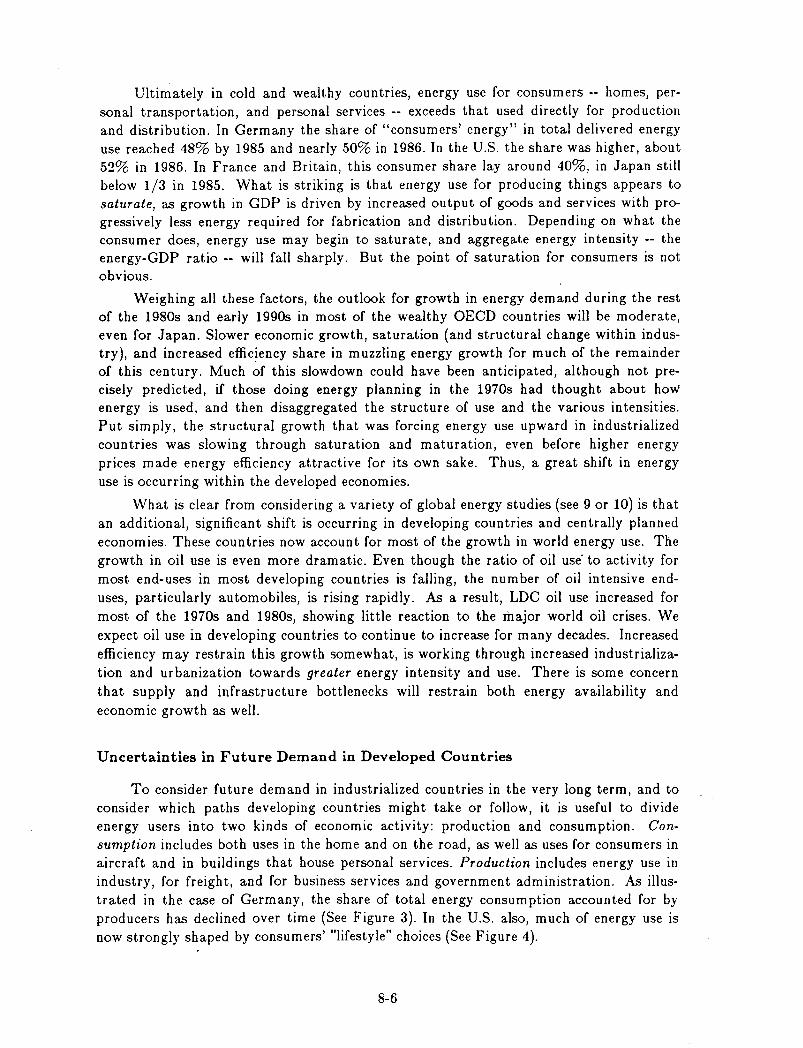
Ultimately in cold and wealthy countries, energy use for consumers -- homes, personal transportation, and personal services -- exceeds that used directly for production and distribution. In Germany the share of "consumers' energy" in total delivered energy use reached 48% by 1985 and nearly 50% in 1986. In the U.s. the share was higher, about 52% in 1986. In France and Britain, this consumer share lay around 40%, in Japan still below 1/3 in 1985. What is striking is that energy use for producing things appears to saturate, as growth in GOP is driven by increased output of goods and services with prC?gressively less energy required for fabrication and distribution. Depending on what the consumer does, energy use may begin to saturate, and aggregate energy intensity -- the energy-GOP ratio -- will fall sharply. But the point of saturation for consumers is not obvious.
Weighing all these factors, the outlook for growth in energy demand during the rest of the 1980s and early 1990s in most of the wealthy OECD countries will be moderate, even for Japan. Slower economic growth, saturation (and structural change within industry), and increased efficiency share in muzzling energy growth for much of the remainder of this century. Much of this slowdown could have been anticipated, although not precisely predicted, if those doing energy planning in the 1970s had thought about how energy is used, and then disaggregated the structure of use and the various intensities. Put simply, the structural growth that was forcing energy use upward in industrialized countries was slowing through saturation and maturation, even before higher energy prices made energy efficiency attractive for its own sake. Thus, a great shift in energy use is occurring within the developed economies.
What is clear from considering a variety of global energy studies (see 9 or 10) is that an additional, significant shift is occurring in developing countries and centrally planned economies. These countries now account for most of the growth in world energy use. The growth in oil use is even more dramatic. Even though the ratio of oil use· to activity for most end-uses in most developing countries is falling, the number of oil intensive enduses, particularly automobiles, is rising rapidly. As a result, LDC oil use increased for most of the 1970s and 1980s, showing little reaction to the major world oil crises. We expect oil use in developing countries to continue to increase for many decades. Increased efficiency may restrain this growth somewhat, is working through increased industrialization and urbanization towards greater energy intensity and use. There is some concern that supply and infrastructure bottlenecks will restrain both energy availability and economic growth as well.
Uncertainties in Future Demand in Developed Countries
To consider future demand in industrialized countries in the very long term, and to consider which paths developing countries might take or follow, it is useful to divide energy users into two kinds of economic activity: production and consumption. Consumption includes both uses in the home and on the road, as well as uses for consumers in aircraft and in buildings that house personal services. Production includes energy use in industry, for freight, and for business services and government administration. As illustrated in the case of Germany, the share of total energy consumption accounted for by producers has declined over time (See Figure 3). In the U.S. also, much of energy use is now strongly shaped by consumers' "lifestyle" choices (See Figure 4).
8-6
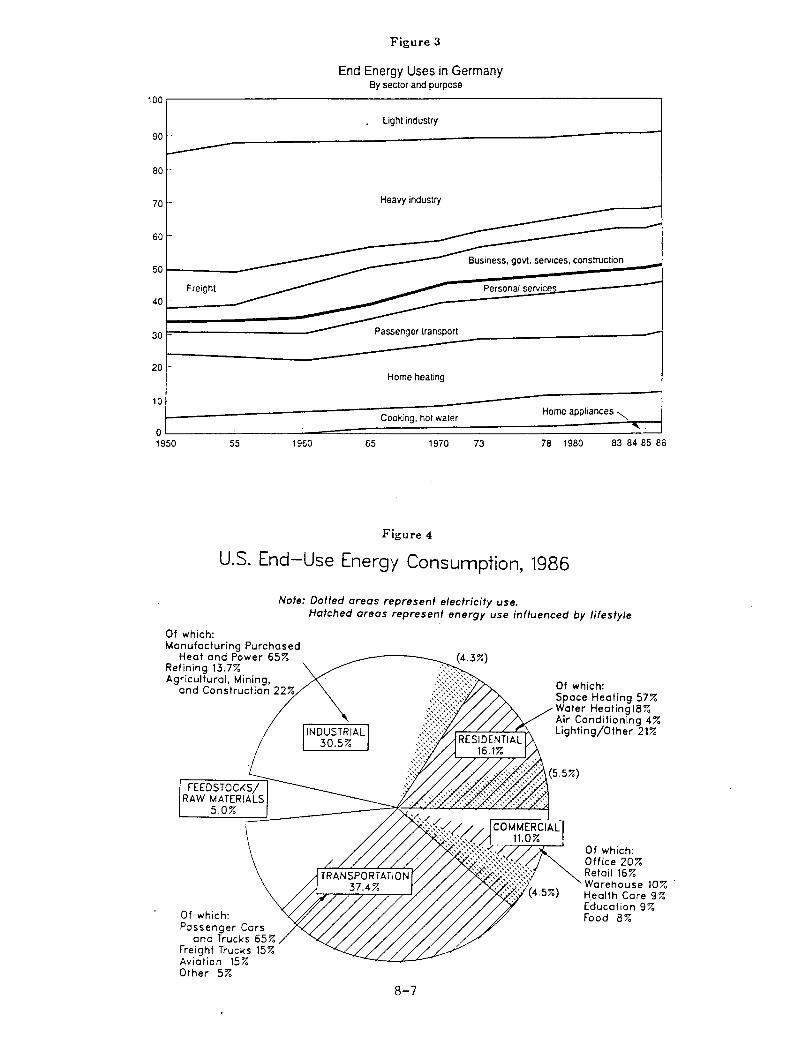
100
90
80 -
70 -
60
50
Freight 40 -
30
20
10
0 1950 55 1960
Figure 3
End Energy Uses in Germany By sector and purpose
Light industry
Heavy industry
Personal service
Home heating
Cooking. hot water Home appliances "-..
65 1970 73 78 1980 83 84 85 86
Figure 4
u.s. End-Use Energy Consumption, 1986
Note: Doffed areas represent electricity use.
Of which: Manufacturing Purchased
Heat and Power 65% Refining 13.7% Agricultural. Mining,
and Construction 22%
\
Of which: Passenger Cars
and Trucks 65% Freight Trucks 15% Aviation 15% Other 5%
Hatched areas represent energy use influenced by lifestyle
(4.3%)
8-7
Of which: Space Heating 57% Water Heating18% Air Conditioning 4% Lighting/Other 21%
Of which: Office 20% Retail 16% Warehouse 10% Health Core 9% Educalion 9% Food 8%
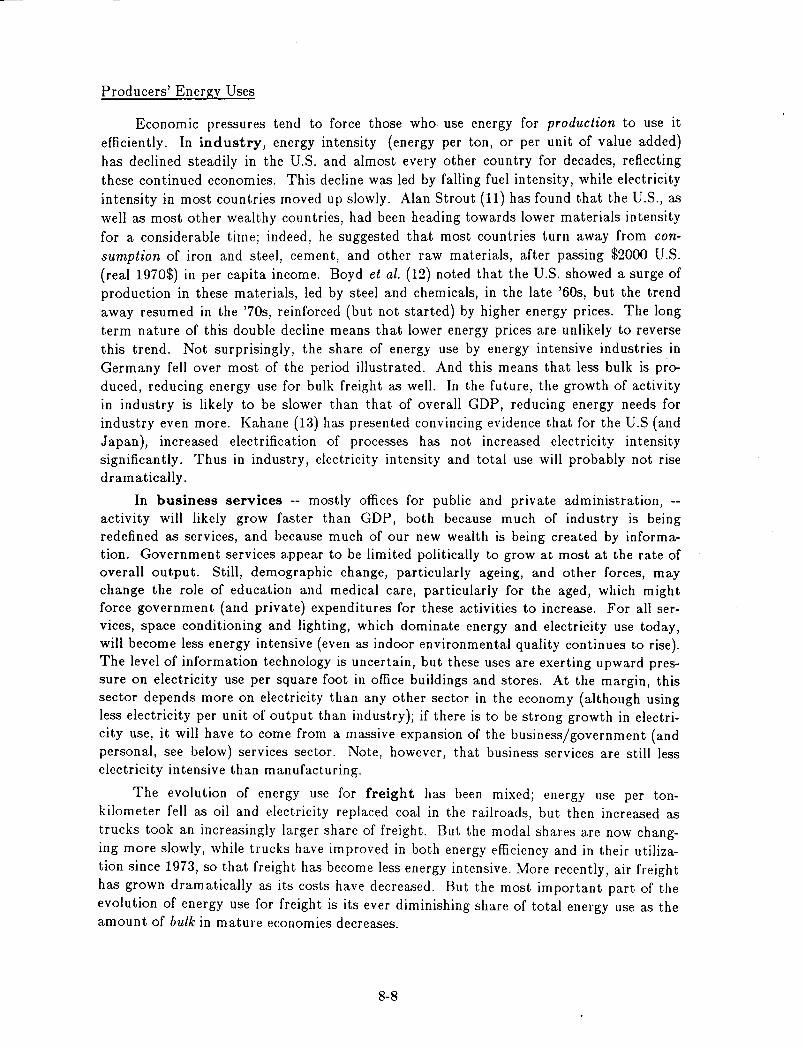
Producers' Energy Uses
Economic pressures tend to force those who use energy for production to use it efficiently. In industry, energy intensity (energy per ton, or per unit of value added) has declined steadily in the U.S. and almost every other country for decades, reflecting these continued economies. This decline was led by falling fuel intensity, while electricity intensity in most countries moved up slowly. Alan Strout (11) has found that the U.S., as well as most other wealthy countries, had been heading towards lower materials intensity for a considerable time; indeed, he suggested that most countries turn away from consumption of iron and steel, cement, and other raw materials, after passing $2000 U.S. (real 1970$) in per capita income. Boyd et al. (12) noted that the U.S. showed a surge of production in these materials, led by steel and chemicals, in the late '60s, but the trend away resumed in the '70s, reinforced (but not started) by higher energy prices. The long term nature of this double decline means that lower energy prices are unlikely to reverse this trend. Not surprisingly, the share of energy use by energy intensive industries in Germany fell over most of the period illustrated. And this means that less bulk is produced, reducing energy use for bulk freight as well. In the future, the growth of activity in industry is likely to be slower than that of overall GDP, reducing energy needs for industry even more. Kahane (13) has presented convincing evidence that for the U.S (and Japan), increased electrification of processes has not increased electricity intensity significantly. Thus in industry, electricity intensity and total use will probably not rise dramatically.
In business services -- mostly offices for public and private administration, -activity will likely grow faster than GDP, both because much of industry is being redefined as services, and because much of our new wealth is being created by information. Government services appear to be limited politically to grow at most at the rate of overall output. Still, demographic change, particularly ageing, and other forces, may change the role of education and medical care, particularly for the aged, which might force government (and private) expenditures for these activities to increase. For all services, space conditioning and lighting, which dominate energy and electricity use today, will become less energy intensive (even as indoor environmental quality continues to rise). The level of information technology is uncertain, but these uses are exerting upward pressure on electricity use per square foot in office buildings and stores. At the margin, this sector depends more on electricity than any other sector in the economy (although using less electricity per unit of ou tpu t than industry); if there is to be strong growth in electricity use, it will have to come from a massive expansion of the business/government (and personal, see below) services sector. Note, however, that business services are still less electricity intensive than manufacturing.
The evolution of energy use for freight has been mixed; energy use per tonkilometer fell as oil and electricity replaced coal in the railroads, but then increased as trucks took an increasingly larger share of freight. But the modal shares are now changing more slowly, while trucks have improved in both energy efficiency and in their utilization since 1973, so that freight has become less energy intensive. More recently, air freight has grown dramatically as its costs have decreased. But the most important part of the evolution of energy use for freight is its ever diminishing share of total energy use as the amount of bulk in mature economies decreases.
8-8
I have only described in broadest of terms the direction of both energy intensity and activity levels for the major energy uses for production in mature economies. Certainly this description does not hold for every OECD economy or region. Nevertheless, the overall evidence is that the "producer" share of energy and electricity in the economy will continue to decline, and that most energy intensities, and some electricity intensities, will also fall as overall factor productivity increases. While there are uncertainties in both levels of activity, overall energy intensity, and the share of electricity, these are small enough to be captured in existing models by assumptions about prices, GDP growth, and
technical change.
Consumer Energy Uses
In the sectors that concern the consumer, energy use is for personal transportation, personal services, * and homes, i.e., sectors directly affected by consumer choices. These choices present the energy planner with different kinds of uncertainties than the technological uncertainties of energy use in factories or for freight. To be sure, energy prices and the level of personal incomes will affect energy use choices. But once a society reaches the level of afH uence enjoyed by most Swedes, Germans, or Americans, the basic "needs" as related to energy are satisfied. Consumers' choices as to how to use their homes, cars, and where to spend their time when away from home, i.e., their lifestyles, will play an increasingly important role in the determination of overall energy use. And as the stock of energy-using capital becomes saturated, changes in the utilization of that stock may become more important than changes in the levels of ownership alone.
In homes, space comfort dominates energy use. By 1985, central heating equipment ownership was saturated in most countries, including the U.S., and air conditioning reached more than 60% of homes in the U.S. and Japan. Buildings now leak 20-40% less heat (or cold) than before 1972, reducing energy needs considerably. Hot water use and the services of appliances are still growing, albeit slowly, while cooking energy use has been declining for decades. In all these applications, the conversion of delivered into useful energy has improved markedly, but there remains an enormous potential for increased efficiency in home energy uses, even after savings made since 1973 are discounted. If this potential is realized over the next three decades, total household energy use will decline in most wealthy countries. However, the choice of appliance efficiency, insulation levels, and equipment, are rarely made by the user and may appear irrational, unless guided by standards (in California, for example) or by financial incentives, as in Sweden. Thus we know the potential for savings but not what will be realized. We do know that if energy prices increase noticeably, people will heat less and reduce hot water usage, at least until the next generation of energy saving technologies allows them to increase these amenities without increasing energy costs.
From the historical relationship between income and home energy use, it could be argued that energy demand will continue to climb with incomes. But now Westerners are spending increasingly for low-energy, high-tech appliances with trivial energy use. Ownership of video recorders, computers, CD-players, and other communication/information
* Personal services include restaurants and hotels, cultural and leisure services, shopping, ie., the services and buildings we use as consumers.
8-9
equipment has also grown rapidly. It appears therefore that the structure of home energy use is also headed towards lower energy intensity. That is, the income elasticity of home energy use is now less than one. Combining these effects with the march of technology towards greater efficiency indicates reduced home energy use in the future.
Demography, however, is exerting a small but offsetting force. The shrinking of household size, which is expected to continue slowly for several decades, increases energy use per capita by spreading uses for heating and many appliances over fewer people. For Holland this unbundling increased per capita residential gas use by 33% between 1960 and 1985; for the U.S. the effect was around 15%. Even if house size remains constant, space per person will increase. In all, household energy use per capita will not fall as rapidly as use per household.
There are two uncertainties that make the long term future of home energy use murky. The first is utilization. Once all households own the main energy-intensive appliances, then utilization will have a profound influence on home energy use. What affects utilization? One way to answer the question is to consider the time people will spend in their homes, and what they will do with that time. Particularly important is the disposition of free time, which has increased in most countries. (See [14] for an international comparison of free-time use.) Interestingly enough, the United States has seen a drop in free time and an increase in time worked, particularly for women, between 1975 and 1985 (see Fig. 5). During the past several decades, out-of-home leisure has increased, while increased work-force participation decreased occupancy of homes further. But hours worked, and time spent in domestic work (cleaning, shopping), have also changed for different strati of the population; only time for bodily necessities (eating, sleeping, etc.) has remained roughly constant.
These measures of activity are one set of parameters that describe "lifestyles". One change in lifestyles, the reduction in time spent at home, reduced home energy use somewhat for reasons virtually unrelated to energy, because energy use for water heating, cooking, and most appliances tends to be proportional to time spent at home, or occupancy. Reduced occupancy also had a downward impact on space heating needs. As a result of the increase in hours worked and workforce participation, as well as the increase in out-of-home leisure, a large share of the population is driving, which has had an important upward impact on oil use in almost every OECD country. Thus lifestyles -- whether future families are home more or less, whether more people choose to live alone -- will have an important impact on energy use, but the magnitude and sign is very uncertain.
The impact of the ageing of the population on activity and energy use is the second major uncertainty in the picture. The increasing numbers of older people in society will have an unquestionable impact on home energy use, but again, the sign of this change is uncertain. Will older people bunch together in retirement comm unities (increasingly the word "retirement" refers only to their formal participation in the work force!), move back to nuclear families, or simply survive longer on their own? And will they stay close to their nests, or will they go out for much of their free time? Will their health tolerate wide swings in indoor comfort, both at home and away, or will they require a narrow range of temperature and humidity? These questions will affect energy use in homes and buildings, as well as for transportation.
Finally, the nature of the home -- its physical shape and location, its utilization as a place for increased paid or unpaid work -- will doubtless change significantly because of
8-10
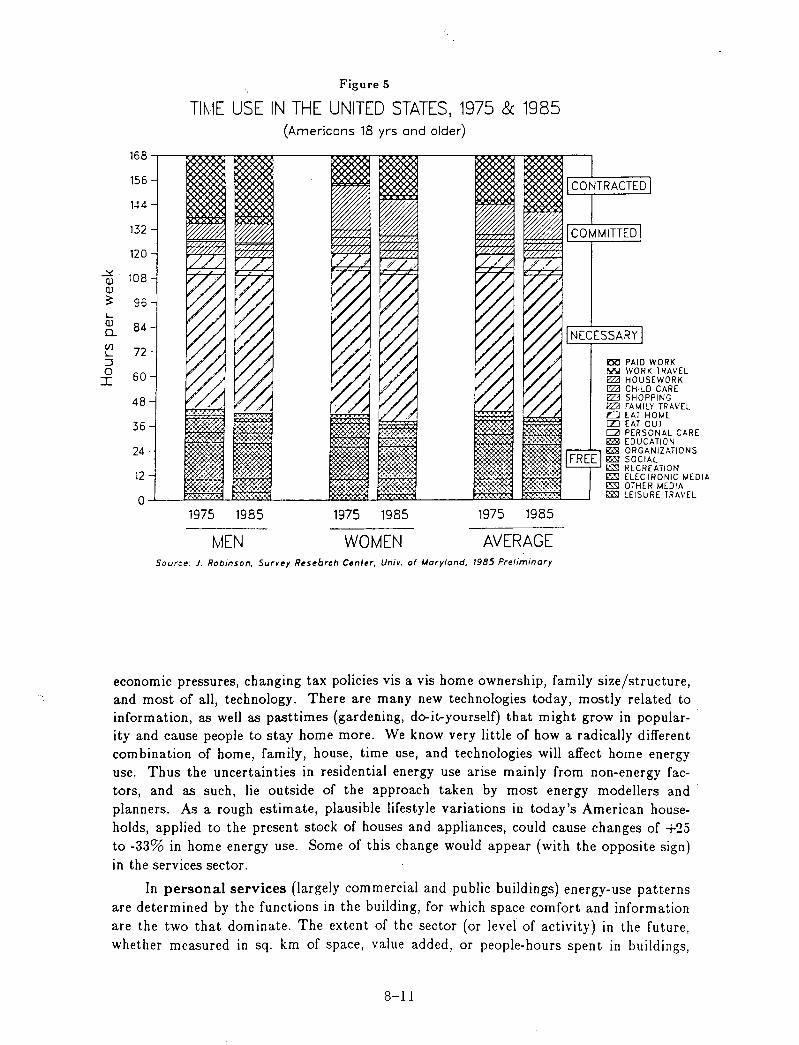
Figure 5
TI~IE USE IN THE UNITED STATES, 1975 & 1985 (Americans 18 yrs and older)
168
156
144
132
120
~ 108 Q) Q)
?; 96 L-Q) 84 0... en 72 L-::J 00 PAID WORK
IS<'Si! WORK TRAVEL E'2Ll HOUSEWORK E'2Ll CHILD CARE
0 I 60
48
36
24
12
0 1975 1985 1975 1985 1975 1985
MEN WOMEN AVERAGE Sour.;e: J. Robinson, Surv~y R~s"brch Center, Univ. of /.lory/and, 1985 Preliminary
o SHOPPING o FAMILY TRAVEL a EAT HOME CZJ EAT OUT Q PERSONAL CARE 00 EDUCATION 00 ORGANIZATIONS 00 SOCIAL ~ RECREATION ~ ELEcrRONIC MEDIA ~ OTHER MEDIA bS1IJ LEISURE TRAVEL
economic pressures, changing tax policies vis a vis home ownership, family size/structure, and most of all, technology. There are many new technologies today, mostly related to information, as well as pasttimes (gardening, do-it-yourself) that might grow in popularity and cause people to stay home more. We know very little of how a radically different combination of home, family, house, time use, and technologies will affect home energy use. Thus the uncertainties in residential energy use arise mainly from non-energy factors, and as such, lie outside of the approach taken by most energy modellers and planners. As a rough estimate, plausible lifestyle variations in today's American households, applied to the present stock of houses and appliances, could cause changes of +25 to -33% in home energy use. Some of this change would appear (with the opposite sign)
in the services sector.
In personal services (largely commercial and public buildings) energy-use patterns are determined by the functions in the building, for which space comfort and information are the two that dominate. The extent of the sector (or level of activity) in the future, whether measured in sq. km of space, value added, or people-hours spent in buildings,
8-11

remains very uncertain. As with homes, there are many opportunities for energy savings in this sector. However, many factors operate to attract consumers into buildings as customers: doors remain open in the warmest or coldest periods, signs glare, rooms are overheated or over chilled, indoor lighting can be largely for display, and energy considerations are usually forgotten. For much of this sector, then, building use depends on where and how people choose to spend their money and free time, and how those competing for this time and money make their business attractive.
Unlike business and government services, the calculus of those operating buildings for personal services may not take all energy saving opportunities into account, unless cost pressures rise. Like business and government services, however, the personal services sector holds potential for structural growth, and this growth would be more electricity dependent than in either the residential or industrial sectors. The lifestyle factors mentioned above are extremely important: will we want to spend more time away from home in the future? If so, where? How much space will each visitor in a building require?
In the personal transport sector lies the most important source of variability in future energy use. Recall that transportation is required to move people to most personal services, as well as to and from work, i.e., between their homes and their chosen places for spending free time (as well as working and conducting family business). Not surprisingly, the pattern of automobile use at present (roughly 1/3 of all passenger-km driven in the U.S. are to/from work, 1/3 for family business, 1/3 for leisure) is a sensitive function both of distances between where we work, sleep, and play, as well as how often we choose to move about. Very little car use is simply for excursions. Similarly, airline travel, already dominated by personal rather than business travel in the U.S., is more and more determined by how and where people want to spend their free time, but here the main reason for travel is "to get away."
In maturing economies, traditional economic factors may explain part of the behavior of consumers vis a vis travel, at least in the short run. Airline travel is very sensitive to costs (including the costs of staying at the destination), as the recent boomlet in U.S. air travel that accompanied airfare wars showed, and is also dependent on the economic health of the nation. Automobile use tends to be relatively insensitive to income changes once people have cars, and car owners will only sacrifice their mobility for short periods when gasoline becomes expensive or hard to get.
Most of the people who will ever fly have now flown (70% according to a 1984 Gallup poll), while most households that will ever have access to cars (over 80%) already do so. Tomorrow's consumers may want to fly or drive more or less -- time use age today does not indicate that they've run out of time, and more leisure time will be available in the future. Thus the pattern of time use, which reflects work, services, and play, will determine how much mobility is required, unless severe congestion, a sudden increase in energy costs, or some other disruption occurs that makes it difficult to travel.
Demographic change will also affect travel. Smaller families, particularly the increasing number of singles, increase per capita vehicle miles, although singles living in-town fit better the services that mass transit offer. Bow older people will choose to travel is still uncertain, although at least one travel services company has indicated that it expects the retirees of the future to be extremely active. Again, with income and price changes less important than in the past as determinants of the total amount of automobile travel, demographic change may dominate future changes in transportation.
8-12
The level of mobility is the most significant uncertainty in future energy use. Both greater mobility, whether for business, services, or pleasure, and less mobility should be considered in planning energy futures. Less mobility means more time spent at or near home, living closer to work, taking advantage of information and the local network of friends and shops. This is already being encouraged by home electronics and catalogue shopping, i.e., changes that make the home useful for more activities. The trade-off between activities in the home and those in public buildings leaves energy use in buildings roughly unchanged, although the share of electricity in final energy use in commercial buildings is significantly higher than that in homes.
However people chose to spend their increasing free time, they will indirectly make big energy choices when they choose whether to stay home (or in the "neighborhood") more, or move around more. It is the growing freedom to choose that makes forecasting uncertain: the purposes for travel -- and the distances involved -- are no longer related to shopping for essentials, getting to work, visiting friends (or the local pub) in the immediate vicinity. As a result, I would not trust a model to predict the level of automobile or air travel in 20 or 30 years, because of the uncertain impact of lifestyle factors discussed above. Nor would I want to predict the tradeoff between time at home and time in service buildings using past behavior.
Conservation
One issue is the extent to which the potential for energy savings will be realized. This depends on the discount rate of the system buyer as well as the energy user. Because the end-user does not always determine the choice of technologies, and because the consumer has a demonstrably high discount rate (15), the penetration of energysaving technologies will remain uncertain in most countries. However, most efficiencies have im proved over the last several decades, accelerating somewhat after 1973. The issue is not whether energy efficiency will improve, only how rapidly.
The Heritage (or Burden?) of Existing Capital Stock
While the stock of autos, home appliances, and aircraft replace themselves within one to two decades, the homes and buildings we occupy as well as the patterns of transportation that connect them take decades, if not centuries to change in many places (as evidenced by the road and rail system in England!). Since the stock of autos and home equipment has grown to very high levels of saturation by 1987, additional growth will not cause changes in energy use as great as in the past. However, the "lifestyle" uncertainties to which I referred above are very much up to the "fickle consumer". This is very much evidenced by the growth in automobile travel in England, in spite of a medieval road system! People learn how to use existing systems in ways, or at intensities never intended! Clearly, the use of the existing stock of equipment, which is reflected in time use, will cause variations in energy use even if ownership and characteristics of that equipmen-t do not change very much. The ability of consumers to liberate themselves from old patterns, as new patterns of transportation, housing, and s~rvice buildings emerge, places an additional uncertainty on future energy demand.
8-13
Urban Design
Urban design may have a fundamental influence on how much people and goods need to move around. This is particularly important in the Third World, where cities are still growing. How do the locations of work, play, and home interact to "cause" transportation demand? Donald Jones (16) has begun to look at various aspects of urbanization and how it affects energy use, particularly through economic structural evolution over very long periods of time. As lifestyles, demographics, and the pattern of formal work change, individuals and entrepreneurs will doubtlessly begin to redefine the kinds of homes and their location to adapt to increasingly smaller households with fewer hours worked formally per household and more older people. How this will change urban energy use is largely unknown.
Institutional Forces
Government policies vis a vis automobiles -- taxation, treatment of imports, encouragement of domestic production -- may have as great an impact on the number of cars and their fuel use as incomes and gasoline prices (17). Governments may set standards related to performance on automobiles, household appliances, or other energy-using equipment. Government housing policy and the taxation of interest on housing plays a key role in where homes get built, how big they are, and who owns them. Finally, government industrial policy may have a major impact on the kinds of industries that develop, and the kinds of technologies adopted for energy use.
Lifestyle and the Ultimate Level of Energy-Intensive Services
transportation energy, services, and incomes? Are highly mobile people also big users of energy in the home and willing to pay for expanded conditioned space in the service sector? That is, are there lifestyle types that have certain energy use patterns, i.e., more or less mobile, more or less at home? Qr is there only a continuum of individual lifestyles that leads to more or less energy use in each "consumer sector" described above? Better understanding of how behavior and lifestyles interact, through study of time, energy, and consumer expenditure budgets, would show how energy use in different sectors covary, how certain lifestyle types are likely to use energy in the future, how demographic changes are likely to affect energy use. Careful thought might allow estimation of long-term saturation levels of mobility and energy services in homes and buildings.
Developing Countries: More of the Same in the Future?
Will the LDCs follow the same path vis a vis the evolution of the structure of energy use as did the OECD? On the one hand we have clear evidence that urban households and buildings in LDCs have the same kinds of equipment, supporting the same energy services, as those in the OECD, although levels of comfort, efficiency, and fuel mix may differ. And most of the key energy-using technologies are far cheaper today to own (air conditioners, cars) or use (aircraft) than they were when they were introduced in the OECD. As a result, these technologies are proliferating rapidly in LDCs. On the other hand, these LDCs are not saddled with a huge infrastructure of buildings built before
8-14
1973. And new building systems are almost always less energy intensive than those based on pre-1973 technologies. Therefore, continued expansion of the service sector (as well as first acquisition of home appliances) should reflect increasing energy efficiency, i.e., energy use should grow less rapidly than sector activity. In this sense the LDCs could leapfrog the OECD countries by establishing and developing their modern buildings with high energy efficiency.
Similar changes may affect transportation. Congestion in the most third world cities might cause government and private authorities to challenge the Western pattern by which private automobiles with four or more cylinders came to dominate land transportation. Thus LDCs may appear to follow the path of development of the OECD, but important differences in the approach to mobility may arise as authorities in LDCs recognize the difficulties that OECD countries (and many LDCs) have faced because of congestion. Additionally, the proliferation of automobiles, home appliances and comfort systems, and aircraft, will likely be based on more energy-efficient technologies than were available when these end-uses first became important in the OECD. This means that the increases in energy use caused by the accelerated saturation of energy intensive activities may be partly or wholly offset by rapid increases in efficiency. Finally, the LDCs have opportunities to produce and use raw materials more efficiently, with important consequences for energy demand.
Conclusions
These multi-sector questions leave me uneasy, because they suggest cause-and-effect relationships that lie outside the energy models in use today. Yet it is these questions that hide the greatest uncertainties from the analyst today.
Energy use patterns evolve with economic development in ways that pit energy intensity and the structure of output or activity' against each other. Ultimately the energy intensities of most economic and personal activities spiral downward, even without the pull of higher prices. The wealthy countries have moved in this direction for much of the past decade or two, and there is much evidence that little energy use growth will occur in these countries unless there is an unforeseen economic boom or a huge surge in personal mobility that raises energy use for air and land travel. While these possibilities cannot be predicted, they can be modelled with existing information and techniques. But the role of behavior and lifestyle, which are increasingly important to determining energy use in the long term, is still fuzzy. So we must conclude that much of the future structure
of energy use needs to be understood. From this understanding will follow a much clearer picture of our energy options.
The choice set out in the title of this paper should be clear. In the development phase of most economies, energy use for producing goods and services dominates the picture, and occupies the interest of energy analysts and planners as well. But according to the picture presented here, it is energy use for pleasure -- consumption of comfort, entertainment, and mobility -- that is now the driving force in energy demand, and the uncertain element in continued progress in energy conservation. But this shift in the structure of energy demand places new challenges on the planner and analyst as well, who may have to look in entirely different directions for signals on the future development of energy demand.
8-15
References
1. Schipper, 1., 1987. "Energy Conservation Policies: Did They Make a Difference?" Energy Policy, December.
2. Schipper, L., Ketoff, A., and Kahane, A., 1985. "Explaining Home Energy Use Through International, Bottom-Up Comparisons." Ann. Rev. of Energy, Vol. 11. See also Schipper, L., 1985. Energy Conservation in OEeD Homes: Permanent or Reversible? Energy Economics, Fall, 1985.
3. Schipper, 1., and Ketoff, A., 1985. "Home Heating Oil Savings in the OECD: Permanent or Reversible?" Science, 6 Dec.
4. Schipper, L., Ketoff, D., Meyers, S., and Hawk, D., 1987. "Residential Electricity Use in the OECD: An International View." Energy, the International Journal (Decem ber).
5. Schipper, L., Meyers, S., and Ketoff, A., 1986. "Energy Use in the Service Sector: An International Perspective." Energy Policy, June.
6. Morovic, T., et al., 1986. Energy Conservation Indicators. Karlsruhe: Fraunhofer Institut fuer System analyse und Innovation. (Prepared for the Commission of the European Communities)
7. International Energy Agency, 1987. Energy Conservation in lEA Member Countries. (Paris: OECD). See also Marlay, R., 1984. "Trends in Industrial Energy Use." Science 226 (14 Dec.).
8. International Energy Agency, ibid. See also Kouris, G., 1985. Energy and Transportation in the OECD in the Year 2000. London: Economist Intelligence Unit. U.S. Data are published regularly by the Dept. of Energy and Dept. of Transportation.
9. Sathaye, J., Ghirardi, A., and Schipper, 1., 1987. "Energy Demand in Developing Countries." Annual Review of Energy, Vol. 12.
10. Goldemberg, J., Johansson, T., Reddy, A., and Williams, R., 1985. "An End-Use Oriented Global Energy Strategy." Ann. Rev. En. 10.
11. Strout, A., 1985. Energy Intensive Materials and the Developing Countries. ERG Review Paper 053. Cambridge: Mass. Inst. of Technology.
12. Boyd, G., McDonald, J.F., Ross, M., and Hanson, D. A., 1986. Effects of the Changing Composition of U.S. Manufacturing Production on Energy Demand. ANL/EESTM-298. Chicago: Argonne Nat'l. Laboratory.
13. Kahane, A., 1986. Industrial Electrification: Case Studies of Four Industries. LBL-22098. Lawrence Berkeley Lab.
14. Robinson, J., 1984. Free Time in Western Countries. College Park: Univ. of Maryland Survey Research Center. See also Gersh uny, J., and Jones, S., 1986. Time Use in Seven Countries 1961-1984. Bath: School of Humanities and Social Sciences, Univ. of Bath (UK).
15. Ruderman, H., Levine, M., and MacMahon, J. 1986. The Behavior of the Market for Energy Energy Efficiency in the Purchase of Appliances. LBL-15304. Lawrence Berkeley Lab. See also their Analysis of Federal Energy Efficiency Standards for Appliances. See also Energy Journal, Jan. 1987.
8-16

16. Jones, D., 1985. Urbanization and Energy Use in Economic Development. Oak Ridge: ORNL.
17. Meyers, S., 1988. Transportation in the LDCs: A Major Area of Growth in World Oil Demand. LBL-24198. Lawrence Berkeley Laboratory .
..
8-17
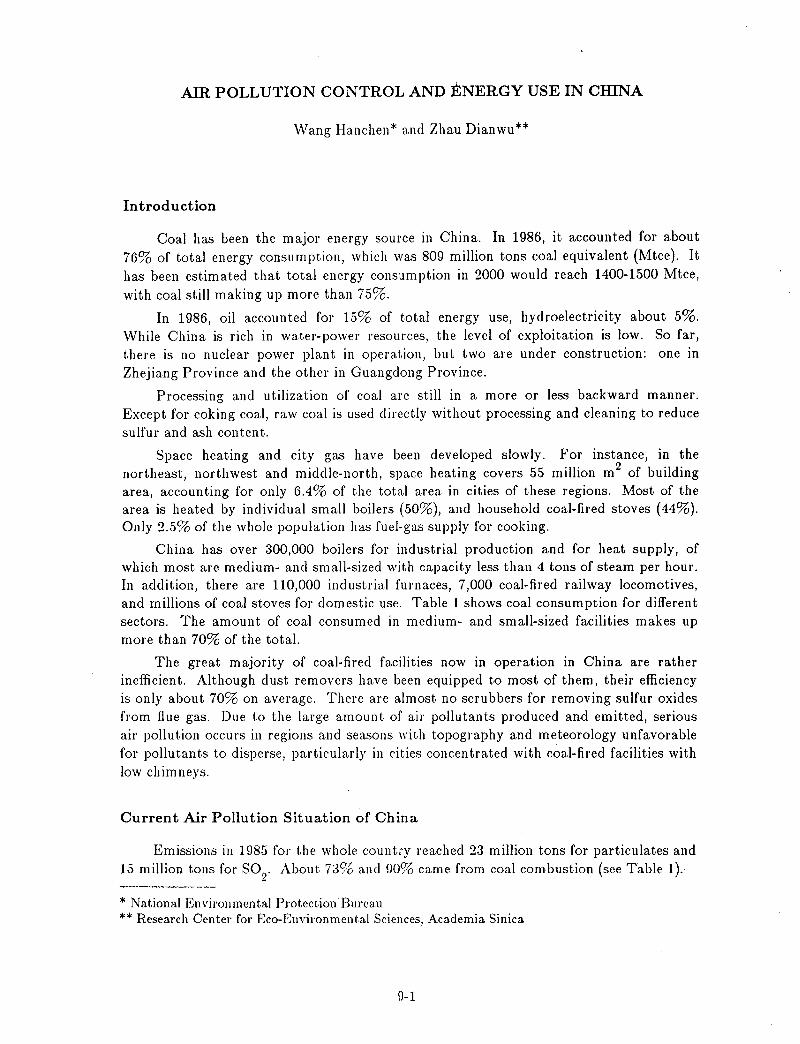
AIR POLLUTION CONTROL AND ENERGY USE IN CHINA
Wang Hanchen* and Zhau Dianwu**
Introduction
Coal has been the major energy source in China. In 1986, it accounted for about 76% of total energy consumption, which was 809 million tons coal equivalent (Mtce). It has been estimated that total energy consumption in 2000 would reach 1400-1500 Mtce, with coal still making up more than 75%.
In 1986, oil accounted for 15% of total energy use, hydroelectricity about 5%. \Vhile China is rich in water-power resources, the level of exploitation is low. So far, there is no nuclear power plant in operation, but two are under construction: one in Zhejiang Province and the other in Guangdong Province.
Processing and utilization of coal are still in a more or less backward manner. Except for coking coal, raw coal is used directly without processing and cleaning to reduce sulfur and ash content.
Space heating and city gas have been developed slowly. For instance, in the northeast, northwest and middle-north, space heating covers 55 million m2 of building area, accounting for only 6.4% of the total area in cities of these regions. Most of the area is heated by individual small boilers (50%), and household coal-fired stoves (44%). Only 2.5% of the whole population has fuel-gas supply for cooking.
China has over 300,000 boilers for industrial production and for heat supply, of which most are medium- and small-sized with capacity less than 4 tons of steam per hour. In addition, there are 110,000 industrial furnaces, 7,000 coal-fired railway locomotives, and millions of coal stoves for domestic use. Table 1 shows coal consumption for different sectors. The amount of coal consumed in medium- and small-sized facilities makes up more than 70% of the total.
The great majority of coal-fired facilities now in operation in China are rather inefficient. Although dust removers have been equipped to most of them, their efficiency is only about 70% on average. There are almost no scrubbers for removing sulfur oxides from flue gas. Due to the large amount of air pollutants produced and emitted, serious air pollution occurs in regions and seasons with topography and meteorology unfavorable for pollutants to disperse, particularly in cities concentrated with coal-fired facilities with low chimneys.
Current Air Pollution Situation of China
Emissions in 1985 for t.he whole country reached 23 million tons for particulates and 15 million tons for S02. About 73% and 90% came from coal combustion (see Table 1).
* National Environmental Protection Bureau ** Research Center for Eco-Environmental Sciences, Academia Sinica
9-1
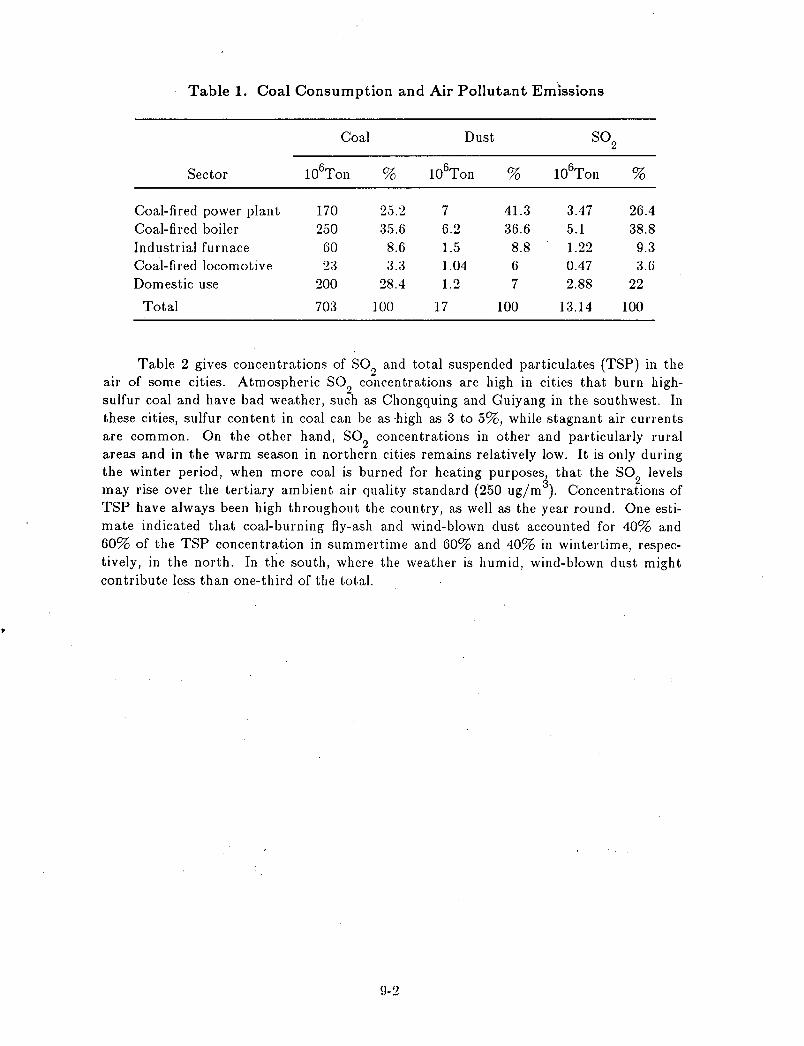
Table 1. Coal Consumption and Air Pollutant Emissions
Coal Dust S02
Sector 106Ton % 106Ton % 6 10 Ton %
Coal-fired power plant 170 25.2 7 41.3 3.47 26.4 Coal-fired boiler 250 35.6 6.2 36.6 5.1 38.8 Industrial furnace 60 8.6 1.5 8.8 1.22 9.3 Coal-fired locomotive 2:3 3.3 1.04 6 0.47 3.6 Domestic use 200 28.4 1.2 7 2.88 22
Total 703 100 17 100 13.14 100
Table 2 gives concentrations of SOl) and total suspended particulates (TSP) in the air of some cities. Atmospheric S02 cO~lcentrations are high in cities that burn highsulfur coal and have bad weather, such as Chongquing and Guiyang in the southwest. In these cities, sulfur content in coal can be as -high as 3 to 5%, while stagnant air currents are common. On the other hand, S02 concentrations in other and particularly rural areas and in the warm season in northern cities remains relatively low. It is only during the winter period, when more coal is burned for heating purposes
3 that the S02 levels
may rise over the tertiary ambient air quality standard (250 ug/m). Concentrations of TSP have always been high throughout the country, as well as the year round. One esti" mate indicated that coal-burning fly-ash and wind-blown dust accounted for 40% and 60% of the TSP concentration in summertime and 60% and 40% in wintertime, respectively, in the north. In the south, where the weather is humid, wind-blown dust might contribute less than one-third of the total.
9-2
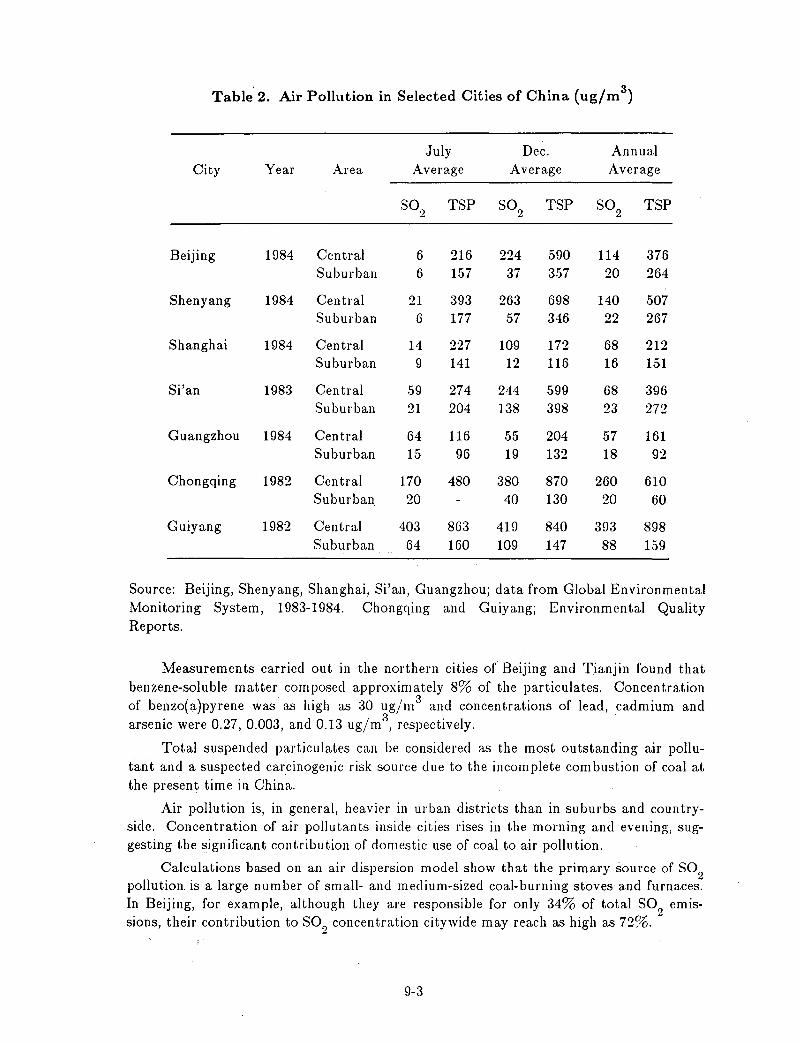
\
Air Pollution in Selected Cities of China (ug/m3) Table 2.
July Dec. Annual City Year Area Average Average Average
S02 TSP S02 TSP SO 2 TSP
Beijing 1984 Central 6 216 224 590 114 376 Suburban 6 157 37 357 20 264
Shenyang 1984 Central 21 393 263 698 140 507 Suburban 6 177 57 346 22 267
Shanghai 1984 Central 14 227 109 172 68 212 Suburban 9 141 12 116 16 151
Si'an 1983 Central .59 274 244 599 68 396 Suburban 21 204 138 398 23 272
Guangzhou 1984 Central 64 116 55 204 57 161 Suburban 15 96 19 132 18 92
Chongqing 1982 Central 170 480 380 870 260 610 Suburban 20 40 130 20 60
Guiyang 1982 Central 403 863 419 840 393 898 Suburban 64 160 109 147 88 159
Source: Beijing, Shenyang, Shanghai, Si'an, Guangzhou; data from Global Environmental Monitoring System, 1983-1984. Chongqing and Guiyang; Environmental Quality Reports.
Measurements carried out in the northern cities of Beijing and Tianjin found that benzene-soluble matter composed approximately 8% of the particulates. Concentration of benzo(a)pyrene was as high as 30 ug/m3 and concentrations of lead, cadmium and arsenic were 0.27,0.003, and 0.13 ug/m3
, respectively.
Total suspended particulates can be considered as the most outstanding air pollutant and a suspected carcinogenic risk source due to the incomplete combustion of coal at the present time in China.
Air pollution is, in general, heavier in urban districts than in suburbs and countryside. Concentration of air pollutants inside cities rises in the morning and evening, suggesting the significant contribution of domestic use of coal to air pollution.
Calculations based on an air dispersion model show that the primary source of S02 pollution. is a large number of small- and medium-sized coal-burning stoves and furnaces. In Beijing, for example, although they are responsible for only 34% of total SO<) emissions, their contribution to S02 concentration citywide may reach as high as 72%. ~
9-3
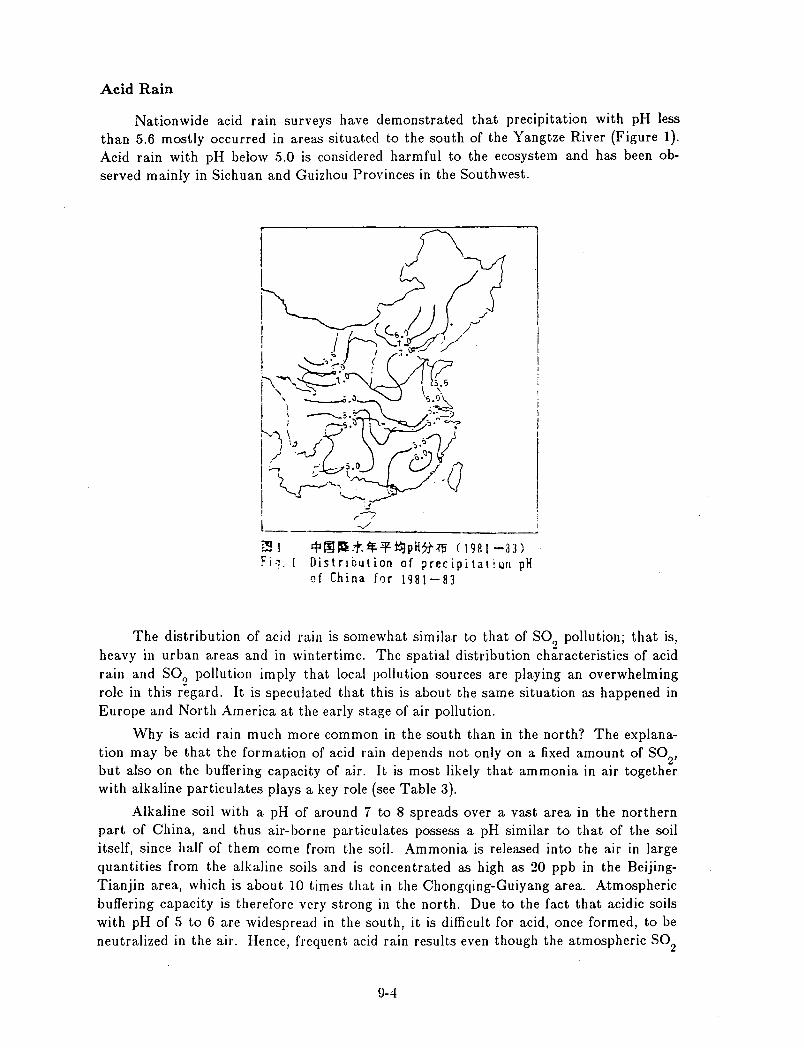
Acid Rain
Nationwide acid rain surveys have demonstrated that precipitation with pH less than 5.6 mostly occurred in areas situated to the south of the Yangtze River (Figure 1). Acid rain with pH below 5.0 is considered harmful to the ecosystem and has been observed mainly in Sichuan and Guizhou Provinces in the Southwest.
The distribution of acid rain is somewhat similar to that of SO" pollution; that is, heavy in urban areas and in wintertime. The spatial distribution characteristics of acid rain and SO" pollution imply that local pollution sources are playing an overwhelming role in this regard. It is speculated that this is about the same situation as happened in Europe and North America at the early stage of air pollution.
Why is acid rain much more common in the south than in the north? The explanation may be that the formation of acid rain depends not only on a fixed amount of S02' but also on the buffering capacity of air. It is most likely that ammonia in air together with alkaline particulates plays a key role (see Table 3).
Alkaline soil with a pH of around 7 to 8 spreads over a vast area in the northern part of China, and thus air-borne particulates possess a pH similar to that of the soil itself, since half of them come from the soil. Ammonia is released into the air in large quantities from the alkaline soils and is concentrated as high as 20 ppb in the BeijingTianjin area, which is about 10 times that in the Chongqing-Guiyang area. Atmospheric buffering capacity is therefore very strong in the north. Due to the fact that acidic soils with pH of 5 to 6 are widespread in the south, it is difficult for acid, once formed, to be neutralized in the air. Hence, frequent acid rain results even though the atmospheric S02
9-4
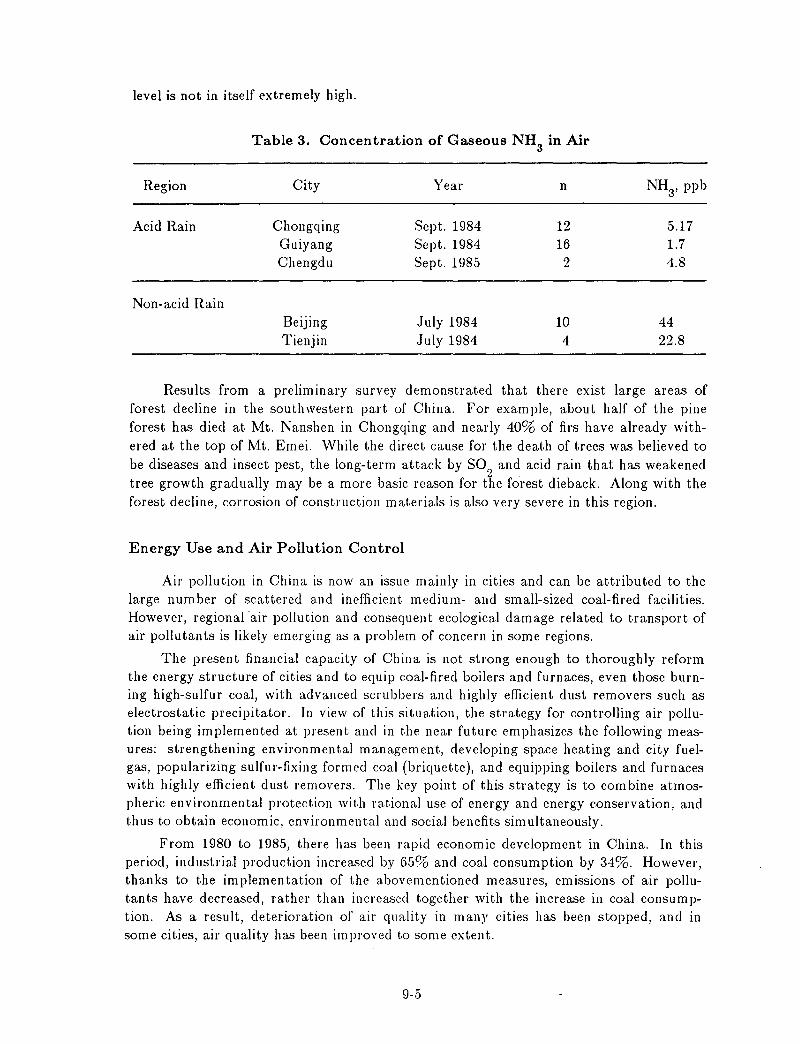
level is not in itself extremely high.
Table 3. Concentration of Gaseous NHa in Air
Region City Year n NH3
, ppb
Acid Rain Chongqing Sept. 1984 12 5.17 Guiyang Sept. 1984 16 1.7 Chengdu Sept. 1985 2 4.8
Non-acid Rain Beijing July 1984 10 44 Tienjin July 1984 4 22.8
Results from a preliminary survey demonstrated that there exist large areas of forest decline in the southwestern part of China. For exam pie, about half of the pine forest has died at Mt. Nanshen in Chongqing and nearly 40% of firs have already withered at the top of Mt. Emei. While the direct cause for the death of trees was believed to be diseases and insect pest, the long-term attack by S02 and acid rain that has weakened tree growth gradually may be a more basic reason for the forest dieback. Along with the forest decline, corrosion of construction materials is also very severe in this region.
Energy Use and Air Pollution Control
Air pollution in China is now an issue mainly in cities and can be attributed to the large number of scattered and inefficient medium- and small-sized coal-fired facilities. However, regional air pollution and consequent ecological damage related to transport of air pollutants is likely emerging as a problem of concern in some regions.
The present financial capacity of China is not strong enough to thoroughly reform the energy structure of cities and to equip coal-fired boilers and furnaces, even those burning high-sulfur coal, with advanced scrubbers and highly efficient dust removers such as electrostatic precipitator. In view of this situation, the strategy for controlling air pollution being implemented at present and in the near future emphasizes the following measures: strengthening environmental management, developing space heating and city fuelgas, popularizing sulfur-fixing formed coal (briquette), and equipping boilers and furnaces with highly efficient dust removers. The key point of this strategy is to combine atmospheric environmental protection with rational use of energy and energy conservation, and thus to obtain economic, environmental and social benefits simultaneously.
From 1980 to 1985, there has been rapid economic development in China. In this period, industrial production increased by 65% and coal consumption by 34%. However, thanks to the implementation of the abovementioned measures, emissions of air pollutants have decreased, rather than increased together with the increase in coal consumption. As a result, deterioration of air quality in many cities has been stopped, and in some cities, air quality has been improved to some extent.
9-5
Space Heating
Space heating area reached .55 million m2 in 1985, about three times that in 1980. Space heating has been expanded mainly on the basis of use of industrial waste heat and com bined production of heat and electricity. It is estimated that this caused coal consumption in 1985 to decrease by 1.3 million tons, resulting in decrease of S02 and smoke emissions by 49 thousand tons and 72 thousand tons respectively.
Space heating area based on the use of industrial waste heat grew to 12 million m2
during 1980-1985 in Shenyang, Taiyuan, Beijing and some other northern cities. This permitted shutting down 1500 small boilers and savings of coal and electricity of about 640,000 tons and 7 million kWh per heating season. As a result, smoke emissions decreased by 20 thousand tons and S02 by 10 thousand tons. Compared with setting up a new boiler, use of waste heat can cut the investment by about 30%.
As an example, two generating units of 25 MW each in Shenyang power plant have been reformed into heat and power generating units at a cost of 14 million yuan (about $3.5 million). The heat supply area of the two new units reached 2.3 million m2 and replaced 205 boilers. In one heating season, it was estimated that savings on coal, electricity and manpower reached 100 thousand tons, 800 thousand kWh and 1670 man-days respectively. This means a benefit of 3.1 million yuan, about 1/4 of the total investment. In the meantime, there has been a significant benefit to the environment: emissions of smoke and SO 2 declined by 8000 and 1000 tons respectively. This resulted in a decline of particulates concentration from 1400 to 490 ug/m3
, below the tertiary standard for TSP, and decrease in S02 concentration from 150 to 45 ug/m3
, below the respective primary standard.
City Gas
Along with building new coal gasification plants, city governments have been making efforts to recover and use coke oven gas and coal mine gas, and to rationalize the allocation and use of natural gas and liquefied petroleum gas. The purpose is to expand the city gas supply and to replace the backward small coal-fired cooking stoves. In 1980, 11 million people had city gas supply for cooking; this figure increased to 27 million in 1985. Compared to 1980,coal saving of 3.2 million tons and S02 emission decrease of 46 thousand were obtained in 1985.
Coal used in Chengdu, the capital of Sichuan Province, has a sulfur content as high as 3-5%. S02 concentration exceeded the air quality standard in about 40% of the city's area. In order to ameliorate this situation, natural gas formerly provided for industrial use has recently been replaced by coal and targeted for domestic purposes. The city inhabitants having gas supply for cooking accounted for 50% of the total population in 1985 compared to only 10% in 1980. SO? emission decreased by about 3600 tons and atmospheric S02 concentration no longer exceeded the standard.
Sulfur-fixing Formed Coal and Efficient Stoves
Measurements have demonstrated that the smoke'Iess combustion of coal briquettes in efficient household stove~(briquette being burnt downwards) can save coal consumption by 30%, decrease CO emission by 70-80%, and decrease smoke and P AH by about
9-6
90%. By adding some sulfur absorbent such as lime, 502 production can be reduced by about 40-50%. Production of coal briquettes for household use was 21 million tons in 1985, two times that in 1980. The estimated coal saving was about 11 million tons, and 502 emission reduction was 160 thousand tons during this five-year period.
Reconstruction and Renewal of Inefficient Boilers and Furnaces
In recent years, more than 100 thousand inefficient and heavily polluting boilers and furnaces, about one-third of the total, have been reconstructed or replaced by efficient advanced ones. This resulted in lowering the smoke and 502 emissions by 80 and 34 thousand tons respectively and saving 2.5 million tons of coal.
Clean Air - A Goal that Needs Continuous and Arduous Effort to Achieve
Along with the abovementioned measures related to energy use, the Chinese government and National Environmental Protection Bureau have made every effort to protect the atmospheric environment. Measures have included promulgating the Air Pollution Control Law; implementing the rule of Environmental Impact Assessment Report prior to construction; stipulating that the design, construction and operation of pollutioncontrolling facilities should be carried out together with that of the principal project; and imposing a pollution tax. They encouraged and sponsored research on environmental capacity, rational siting, acid rain, flue gas desulfurization and many other topics.
It is clear that energy consumption and pollutant emissions will be increasing together with the further development of economic construction. In this circumstance, air pollution control can only be a long-lasting and arduous task. We believe, however, that with the joint efforts of scientists in the field of energy and environmental protection, China can improve her air quality step by step, despite the rapid growth of the national economy and associated energy demand.
9-7
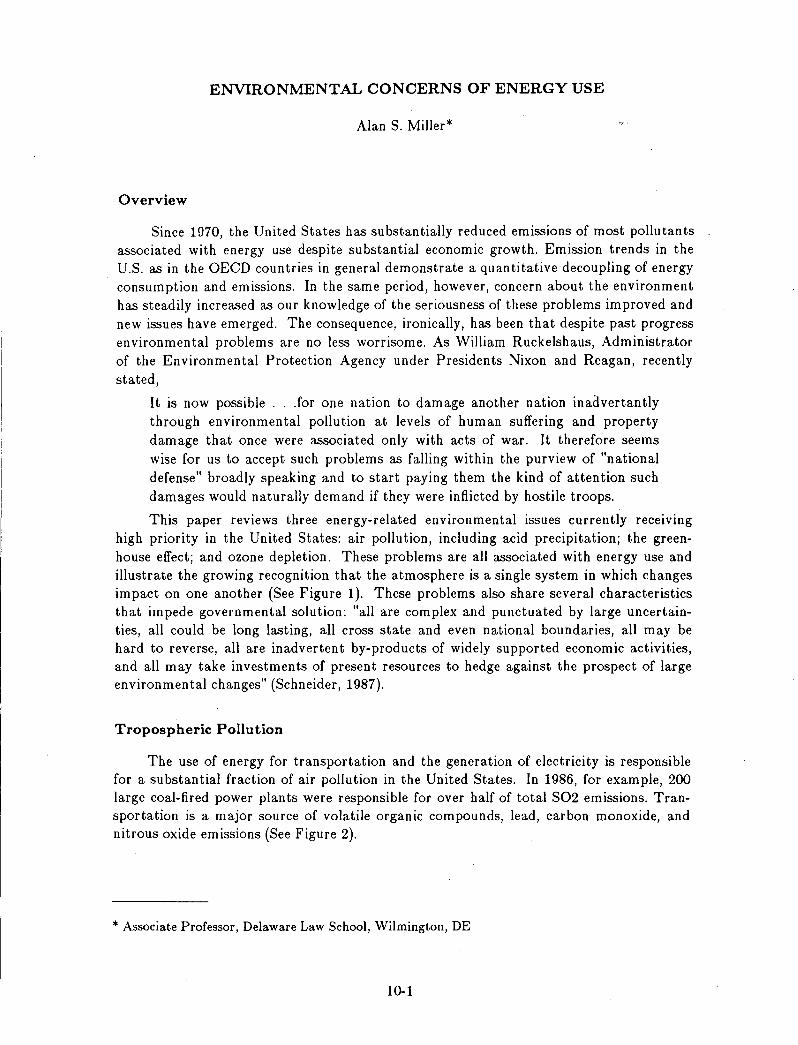
ENVIRONMENTAL CONCERNS OF ENERGY USE
Alan S. Miller*
Overview
Since 1970, the United States has substantially reduced emissions of most pollutants associated with energy use despite substantial economic growth. Emission trends in the U.S. as in the OEeD countries in general demonstrate a quantitative decoupling of energy consumption and emissions. In the same period, however, concern about the environment has steadily increased as our knowledge of the seriousness of these problems improved and new issues have emerged. The consequence, ironically, has been that despite past progress environmental problems are no less worrisome. As William Ruckelshaus, Administrator of the Environmental Protection Agency under Presidents Nixon and Reagan, recently stated,
It is now possible .. .for one nation to damage another nation inadvertantly through environmental pollution at levels of human suffering and property damage that once were associated only with acts of war. It therefore seems wise for us to accept such problems as falling within the purview of "national defense" broadly speaking and to start paying them the kind of attention such damages would naturally demand if they were inflicted by hostile troops.
This paper reviews three energy-related environmental issues currently receiving high priority in the United States: air pollution, including acid precipitation; the greenhouse effect; and ozone depletion. These problems are all associated with energy use and illustrate the growing recognition that the atmosphere is a single system in which changes im pact on one another (See Figure 1). These problems also share several characteristics that impede governmental solution: "all are complex and punctuated by large uncertainties, all could be long lasting, all cross state and even national boundaries, all may be hard to reverse, all are inadvertent by-products of widely supported economic activities, and all may take investments of present resources to hedge against the prospect of large environmental changes" (Schneider, 1987).
Tropospheric Pollution
The use of energy for transportation and the generation of electricity is responsible for a substantial fraction of air pollution in the United States. In 1986, for example, 200 large coal-fired power plants were responsible for over half of total S02 emissions. Transportation is a major source of volatile organic compounds, lead, carbon monoxide, and nitrous oxide emissions (See Figure 2).
* Associate Professor, Delaware Law School, Wilmington, DE
10-1
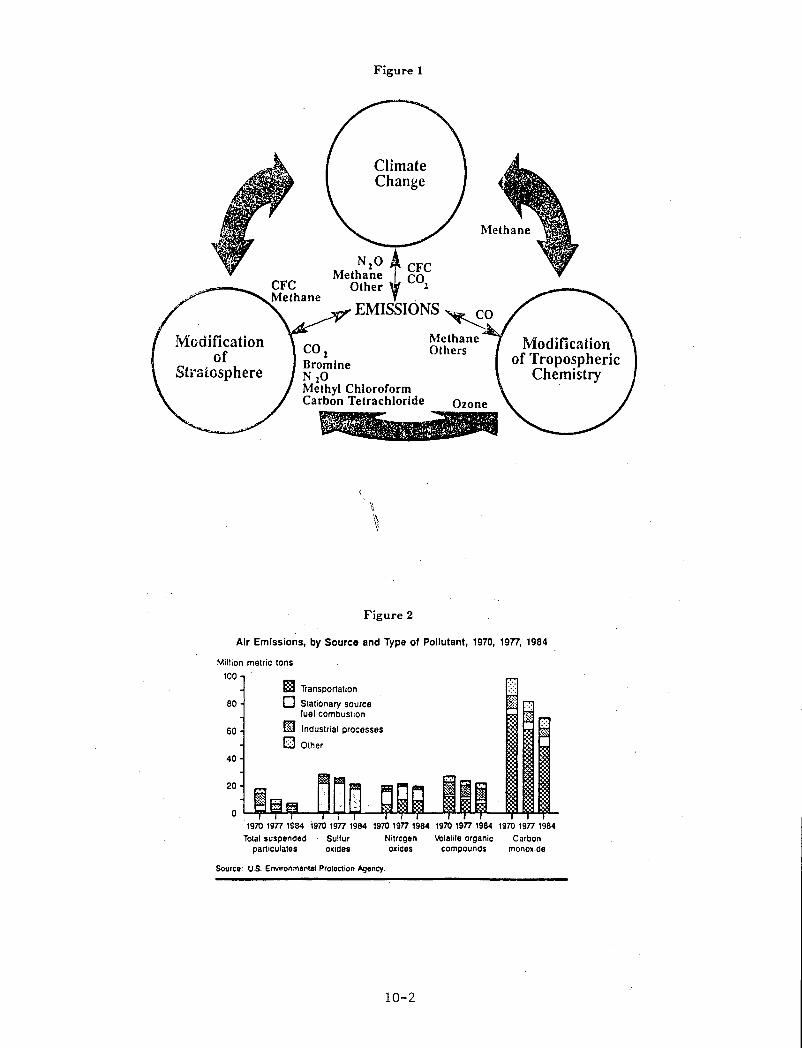
Modification of
Stratosphere
Figure 1
Climate Change
NlO ~ CFC Methane CO Other 1
EMISSIONS ~O
COl Bromine N10 Methyl Chloroform Carbon Tetrachloride
Figure 2
Methane Others
Ozone
Modification of Tropospheric
Chemistry
Air Emissions, by Source and Type of Pollutant, 1970, 19n, 1984
Million metric tons
100
80
60
40
I§I Transportation
o Stationary source fuel combustion
m Industrial processes
[] Other
1970 1977 1S84 1970 1977 1984 1970 1977 1984 1970 1977 1984 1970 1977 1984
Total suspended Sulfur Nitrogen Volatile organic Carbon particulates oxides oxides compounds monoxide
Source: U.S. Environmental Protection Agency.
10-2
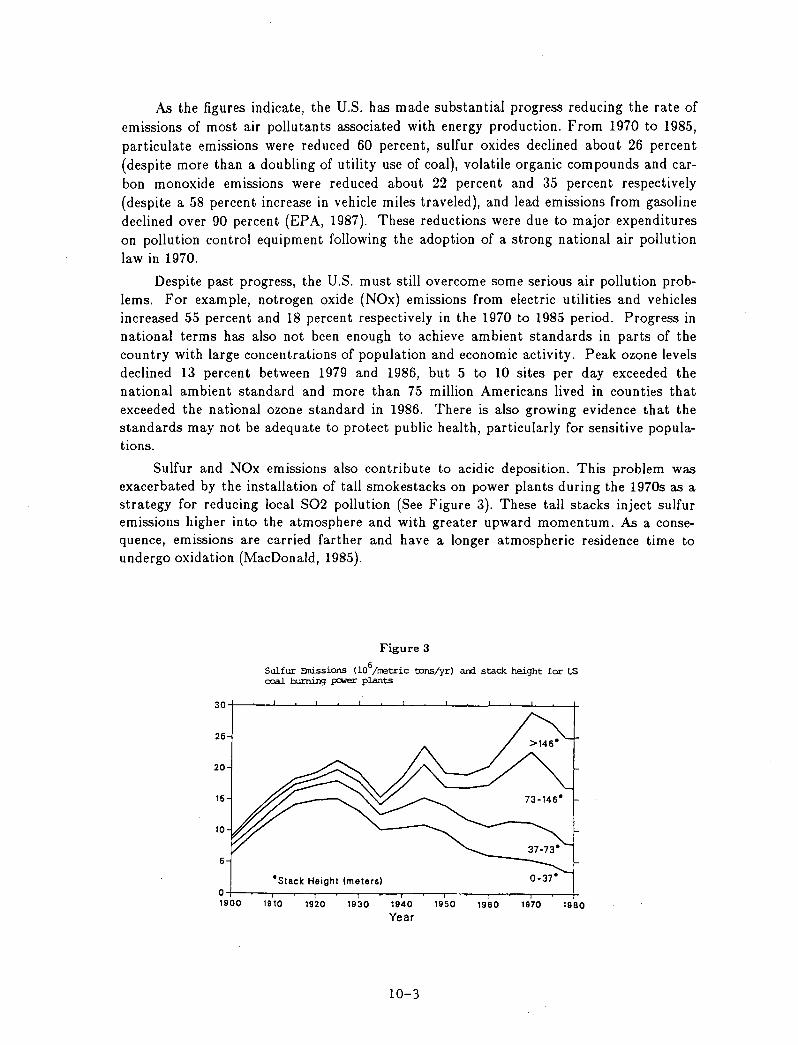
As the figures indicate, the U.S. has made substantial progress reducing the rate of emissions of most air pollutants associated with energy production. From 1970 to 1985, particulate emissions were reduced 60 percent, sulfur oxides declined about 26 percent (despite more than a doubling of utility use of coal), volatile organic compounds and carbon monoxide emissions were reduced about 22 percent and 35 percent respectively (despite a 58 percent increase in vehicle miles traveled), and lead emissions from gasoline declined over 90 percent (EPA, 1987). These reductions were due to major expenditures on pollution control equipment following the adoption of a strong national air pollution law in 1970.
Despite past progress, the U.S. must still overcome some serious air pollution problems. For example, notrogen oxide (NOx) emissions from electric utilities and vehicles increased 55 percent and 18 percent respectively in the 1970 to 1985 period. Progress in national terms has also not been enough to achieve ambient standards in parts of the country with large concentrations of population and economic activity. Peak ozone levels declined 13 percent between 1979 and 1986, but 5 to 10 sites per day exceeded the national ambient standard and more than 75 million Americans lived in counties that exceeded the national ozone standard in 1986. There is also growing evidence that the standards may not be adequate to protect public health, particularly for sensitive populations.
Sulfur and NOx emissions also contribute to acidic deposition. This problem was exacerbated by the installation of tall smokestacks on power plants during the 1970s as a strategy for reducing local S02 pollution (See Figure 3). These tall stacks inject sulfur emissions higher into the atmosphere and with greater upward momentum. As a consequence, emissions are carried farther and have a longer atmospheric residence time to undergo oxidation (MacDonald, 1985).
Figure 3
Sulfur Einissions (106/metric tons/yr) aOO stack height for US coal burning paNer plants
• Stacie Height (meters) O+-~--r-~~--~-r--~~----.-~ __ --~~ __ --+ 1900 1910 1920 1930 1940 1950 1960
Year
10-3
1970 19BO
NOx, S02, and photochemical oxidants (particularly ozone) are all involved in the chemistry of acid precipitation (Mohnen, 1988). Oxides of nitrogen and sulfur dioxide are converted to nitric acid (HN03) and sulfuric acid (H2S04) in a reaction cycle involving oxygen and water molecules, readily available atmospheric chemicals. These acidic gases concense to form microscopic droplets and either drop to the ground as dry deposition or grow into cloud droplets. The result is highly acidic clouds and precipitation; on average, rainfall in the Northeast has a pH of about 4.2 (a pH of 7 is neutral).
The major environmental concern associated with acid precipitation is damage to lakes and forests. The effect on lakes is dependent on acid-neutralizing capacity, a function of bicarbonate and other basic ions which neutralize acid. The combination of older, more polluting coal-fired power plants and thin soils with little acid-buffering capacity is evident in parts of the northeast and midwest, where ten percent or more of lakes have become acidified (Mohnen, 1988).
It has also recently been proposed that airborne emissions of nitrous oxides affect lake ecology through the deposition of significant amounts if nitrates (Oppenheimer et ai, 1988). This in turns leads to growth of algae and removal of oxygen necessary for all other forms of life.
Research on the effects of air pollution indicates that the cost of damage to human health, forests, and agriculture may be substantial. Crops vary in their sensitivity to pollution, but the U.S. government estimates that crop damage due to ozone amounts to as much as $5 billion a year (WRI, 1987). The cost of a 25 percent increase in ozone concentrations is calculated in excess of $2 billion a year.
Forests have shown increasing evidence of air pollution damage in recent years. Forests in the south and northeast have suffered substantial damage in recent years and tree-ring records show sharply reduced growth rates at high elevations where acidity is highest. However, the mechanism by which acid damages trees has not yet been established, and multiple forms of stress, such as ozone pollution, pests, and weather extremes may be involved as well as increased acidity (Mohnen, 1988).
Some reduction in acid precipitation has been reported in the U.S. since detailed monitoring began in 1979. An analysis of 44 monitoring stations in the northeast found that sulfate concentration in precipitation declined at 15 stations while nitrate concentrations declined significantly at 5 stations. The acidity of precipitation declined at 5 of 30 stations (NAP AP, 1987).
Since coal-fired power plants built after 1975 have been subjected to stringent environmental controls, environmental debate has focused on the feasibility of adding sulfer removal technology or other retrofit controls (See Table 1). It was expected that this problem would gradually disappear as these plants were retired. However U.S. utilities have increasingly found it economic to extend the life of old plants and sulfur emissions may therefore not decline as quickly as originally expected. It may be possible to repower these old plants with new combustion equipment, improving perfomance and substantially reducing emissions at the same time for less than the cost of scrubber systems (Mohnen, 1988).
10-4
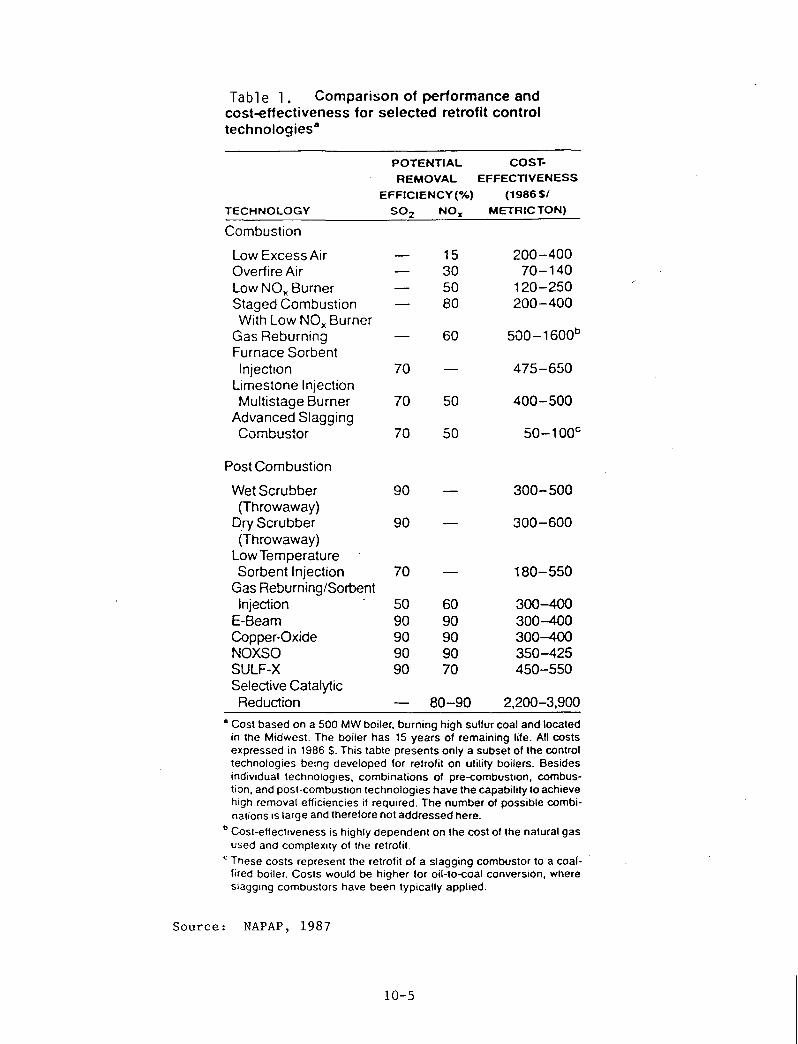
Table 1. Comparison of performance and cost-effectiveness for selected retrofit control technologies·
POTENTIAL COST-
REMOVAL EFFECTIVENESS
EFFICIENCY (%) (1986$1
TECHNOLOGY S02 NOx METRIC TON)
Combustion
Low Excess Air 15 200-400 Overfire Air 30 70-140 Low NO" Burner 50 120-250 Staged Combustion 80 200-400 With Low NO" Burner
500-1600b Gas Reburning 60 Furnace Sorbent Injection 70 475-650
Limestone Injection Multistage Burner 70 50 400-500
Advanced Siagging Combustor 70 50 50-100c
Post Combustion
Wet Scrubber 90 300-500 (Throwaway)
Dry Scrubber 90 300-600 (Throwaway)
Low Temperature Sorbent Injection 70 180-550
Gas Reburning/Sorbent Injection 50 60 300-400
E-Beam 90 90 300-400 Copper-Oxide 90 90 300-400 NOXSO 90 90 350-425 SULF-X 90 70 450-550 Selective Catalytic Reduction 80-90 2,200-3,900
• Cost based on a 500 MW boiler, burning high sulfur coal and located in the Midwest. The boiler has 15 years of remaining life. All costs expressed in 1986 S. This table presents only a subset of the control technologies being developed for retrofit on utility boilers. Besides individual technologies, combinations of pre-combustion, combustion, and post-combustion technologies have the capability to achieve high removal efficiencies if required. The number of possible combinations is large and therefore not addressed here.
b Cost-effectiveness is highly dependent on the cost of the natural gas used and complexity of the retrofit.
C These costs represent the retrofit of a slagging combustor to a coalfired boiler. Costs would be higher lor oil-to-coal conversion, where slagglOg combustors have been typically applied.
Source: NAPAP, 1987
10-5
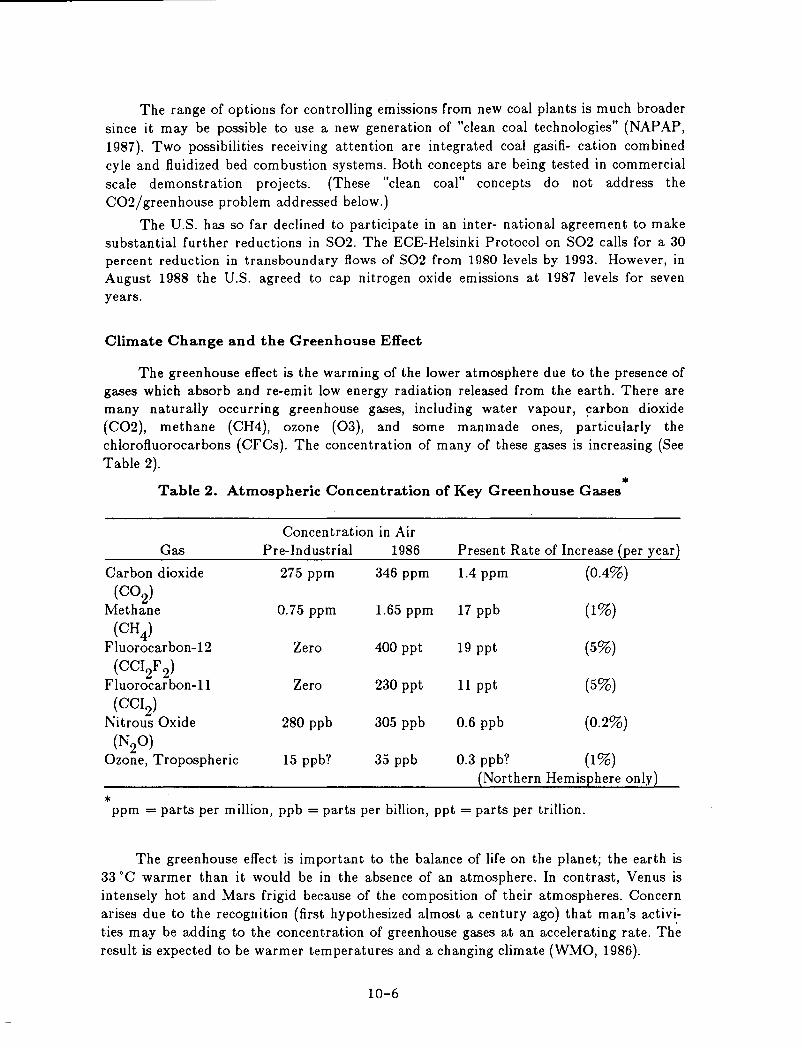
The range of options for controlling emissions from new coal plants is much broader since it may be possible to use a new generation of "clean coal technologies" (NAPAP, 1987). Two possibilities receiving attention are integrated coal gasifi- cation combined cyle and fluidized bed combustion systems. Both concepts are being tested in commercial scale demonstration projects. (These "clean coal" concepts do not address the C02/greenhouse problem addressed below.)
The U.S. has so far declined to participate in an inter- national agreement to make substantial further reductions in S02. The ECE-Helsinki Protocol on S02 calls for a 30 percent reduction in transboundary flows of 502 from 1980 levels by 1993. However, in August 1988 the U.S. agreed to cap nitrogen oxide emissions at 1987 levels for seven years.
Climate Change and the Greenhouse Effect
The greenhouse effect is the warming of the lower atmosphere due to the presence of gases which absorb and re-emit low energy radiation released from the earth. There are many naturally occurring greenhouse gases, including water vapour, ~arbon dioxide (C02), methane (CH4), ozone (03), and some manmade ones, particularly the chlorofluorocarbons (CFCs). The concentration of many of these gases is increasing (See Table 2).
* Table 2. Atmospheric Concentration of Key Greenhouse Gases
Concentration in Air Gas Pre-Industrial 1986 Presen t Rate of Increase (per year}
Carbon dioxide 275 ppm 346 ppm 1.4 ppm (0.4%) (CO2)
Methane 0.75 ppm 1.65 ppm 17 ppb (1%) (CH4)
(5%) Fluorocarbon-12 Zero 400 ppt 19 ppt
(CCI2F 2) Fluorocarbon-ll Zero 230 ppt 11 ppt (5%)
(CCI2) Nitrous Oxide 280 ppb 305 ppb 0.6 ppb (0.2%)
(N2O) Ozone, Tropospheric 15 ppb? 35 ppb 0.3 ppb? (1%)
(Northern Hemisphere only)
* ppm = parts per million, ppb = parts per billion, ppt = parts per trillion.
The greenhouse effect is important to the balance of life on the planet; the earth is 33°C warmer than it would be in the absence of an atmosphere. In contrast, Venus is intensely hot and Mars frigid because of the composition of their atmospheres. Concern arises due to the recognition (first hypothesized almost a century ago) that man's activi.ties may be adding to the concentration of greenhouse gases at an accelerating rate. The result is expected to be warmer temperatures and a changing climate (WMO, 1986).
10-6
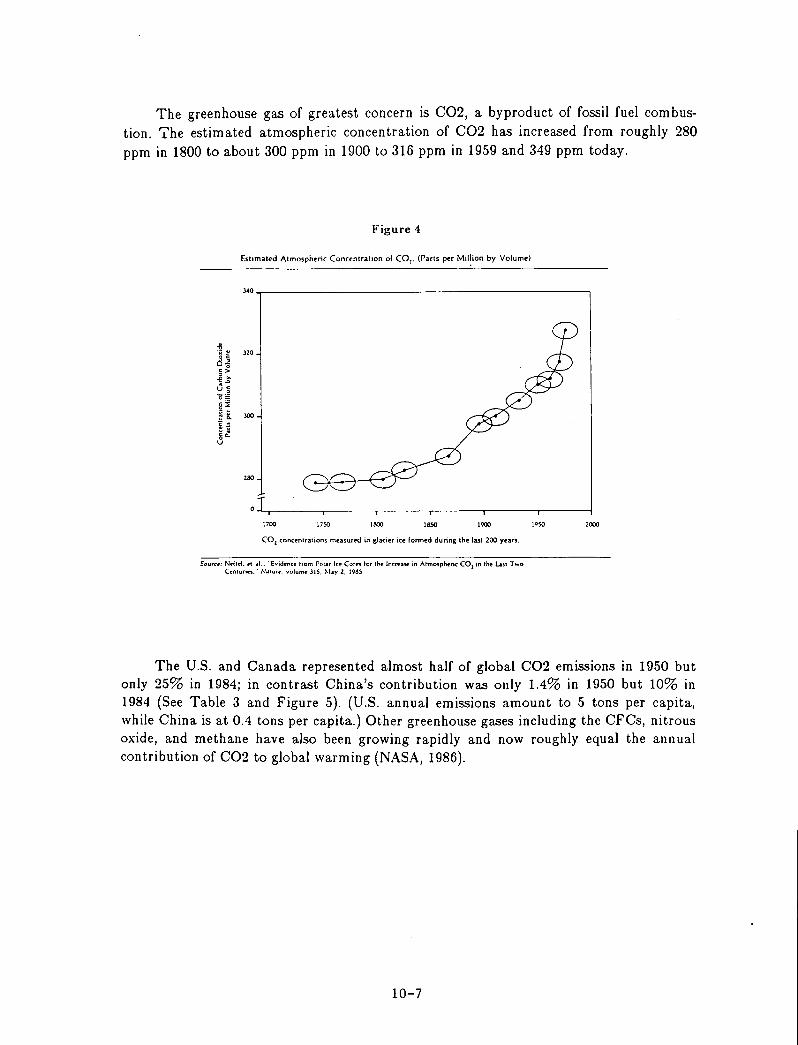
The greenhouse gas of greatest concern is C02, a byproduct of fossil fuel combustion. 7he estimated atmospheric concentration of C02 has increased from roughly 280 ppm in 1800 to about 300 ppm in 1900 to 316 ppm in 1959 and 349 ppm today.
Figure 4
Estimated Atmospheric Concentration of CO,. (Parts per Million by Volume)
HO..,----____________________ --,
~ )20
a > ~ .., c 0
i 0. 300
J:
280
1700 1750 I BOO 11150 1900
CO2 conunlrations mrasurtd in glaci~r ic~ (ormni during the last 200 yurs.
Sou,,,: N"t~1. rt .II.. "Evidence hom Polu Ice Corn for t!-le lncruse in Atmosp~ric COl in the usl Two Cenlurln."· Na'ure, volume 315, :"hy 2. 1985.
2000
The U.S. and Canada represented almost half of global C02 emissions in 1950 but only 25% in 1984; in contrast China's contribution was only 1.4% in 1950 but 10% in 1984 (See Table 3 and Figure 5). (U.S. annual emissions amount to 5 tons per capita, while China is at 0.4 tons per capita.) Other greenhouse gases including the CFCs, nitrous oxide, and methane have also been growing rapidly and now roughly equal the annual contribution of C02 to global warming (NASA, 1986).
10-7
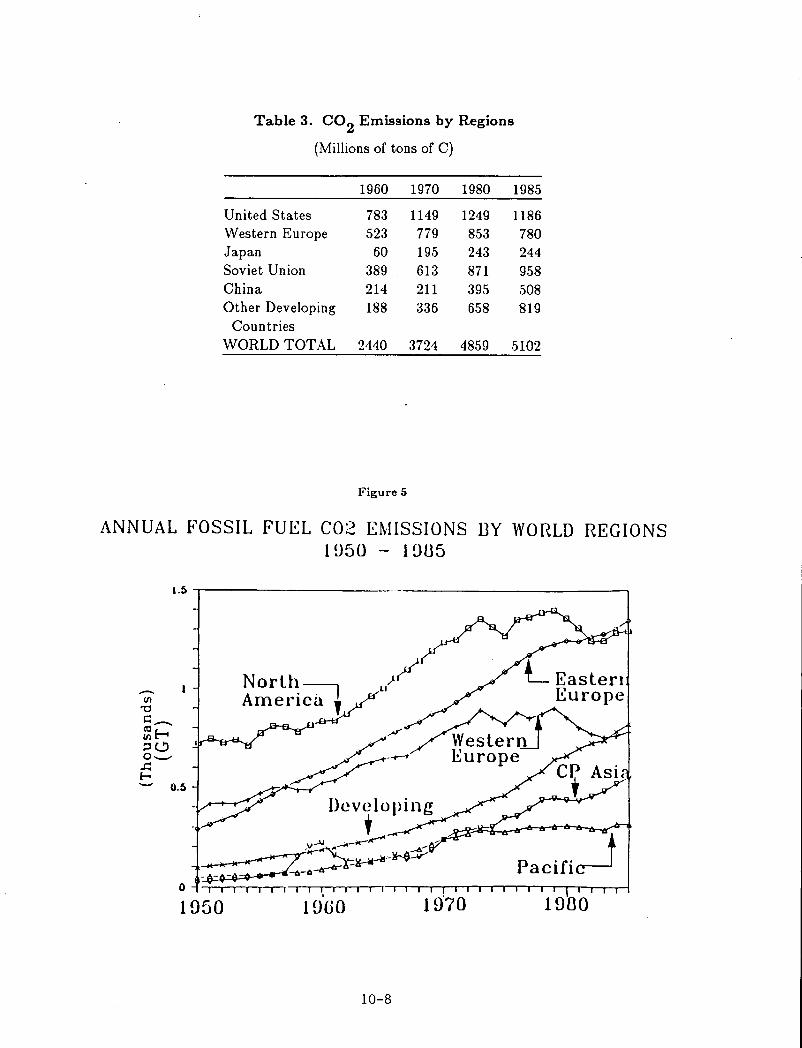
Table 3. CO2 Emissions by Regions
(Millions of tons of C)
1960 1970 1980 1985
United States 783 1149 1249 1186 Western Europe 523 779 853 780 Japan 60 195 243 244 Soviet Union 389 613 871 958 China 214 211 395 508 Other Developing 188 336 658 819
Countries WORLD TOTAL 2440 3724 4859 5102
Figure 5
ANNUAL FOSSIL FUEL C02 EMISSIONS BY WORLD REGIONS lU50 - IDU5
&.5 -r---------- -------------,
0.5
NorLh / L Easter! Americ~lI. Europe
/./~ ~.-..-. Europe
o 'I I ,
1050 lOBO
10-8
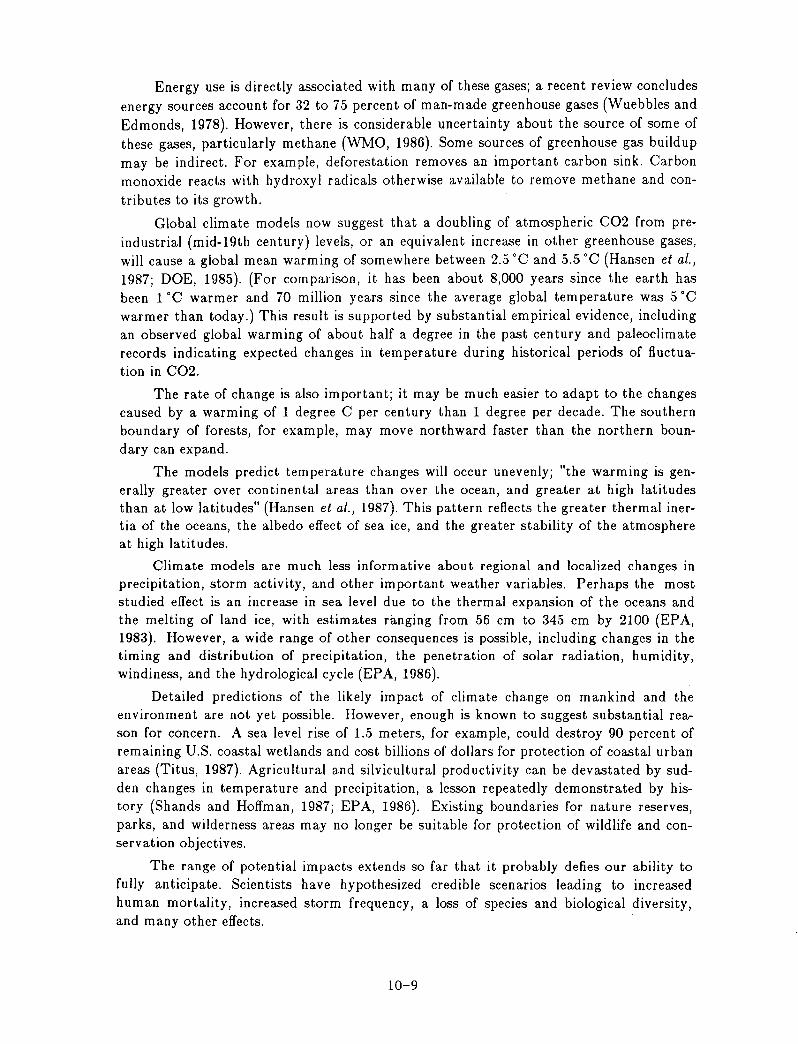
Energy use is directly associated with many of these gases; a recent review concludes energy sources account for 32 to 75 percent of man-made greenhouse gases (Wuebbles and Edmonds, 1978). However, there is considerable uncertainty about the source of some of these gases, particularly methane (WMO, 1986). Some sources of greenhouse gas buildup may be indirect. For example, deforestation removes an important carbon sink. Carbon monoxide reacts with hydroxyl radicals otherwise available to remove methane and contributes to its growth.
Global climate models now suggest that a doubling of atmospheric C02 from preindustrial (mid-19th century) levels, or an equivalent increase in other greenhouse gases, will cause a global mean warming of somewhere between 2.5 °C and 5.5 °C (Hansen et at., 1987; DOE, 1985). (For comparison, it has been about 8,000 years since the earth has been 1 °C warmer and 70 million years since the average global temperature was 5°C warmer than today.) This result is supported by substantial empirical evidence, including an observed global warming of about half a degree in the past century and paleoclimate records indicating expected changes in temperature during historical periods of fluctuation in C02.
The rate of change is also important; it may be much easier to adapt to the changes caused by a warming of 1 degree C per century than 1 degree per decade. The southern boundary of forests, for example, may move northward faster than the northern boundary can expand.
The models predict temperature changes will occur unevenly; "the warming is generally greater over continental areas than over the ocean, and greater at high latitudes than at low latitudes" (Hansen et at., 1987). This pattern reflects the greater thermal inertia of the oceans, the albedo effect of sea ice, and the greater stability of the atmosphere at high latitudes.
Climate models are much less informative about regional and localized changes in precipitation, storm activity, and other important weather variables. Perhaps the most studied effect is an increase in sea level due to the thermal expansion of the oceans and the melting of land ice, with estimates ranging from 56 cm to 345 cm by 2100 (EPA, 1983). However, a wide range of other consequences is possible, including changes in the timing and distribution of precipitation, the penetration of solar radiation, humidity, windiness, and the hydrological cycle (EPA, 1986).
Detailed predictions of the likely impact of climate change on mankind and the environment are not yet possible. However, enough is known to suggest substantial reason for concern. A sea level rise of 1.5 meters, for example, could destroy 90 percent of remaining U.S. coastal wetlands and cost billions of dollars for protection of coastal urban areas (Titus, 1987). Agricultural and silvicultural productivity can be devastated by sudden changes in temperature and precipitation, a lesson repeatedly demonstrated by history (Shands and Hoffman, 1987; EPA, 1986). Existing boundaries for nature reserves, parks, and wilderness areas may no longer be suitable for protection of wildlife and conservation objectives.
The range of potential impacts extends so far that it probably defies our ability to fully anticipate. Scientists have hypothesized credible scenarios leading to increased human mortality, increased storm frequency, a loss of species and biological diversity, and many other effects.
10-9
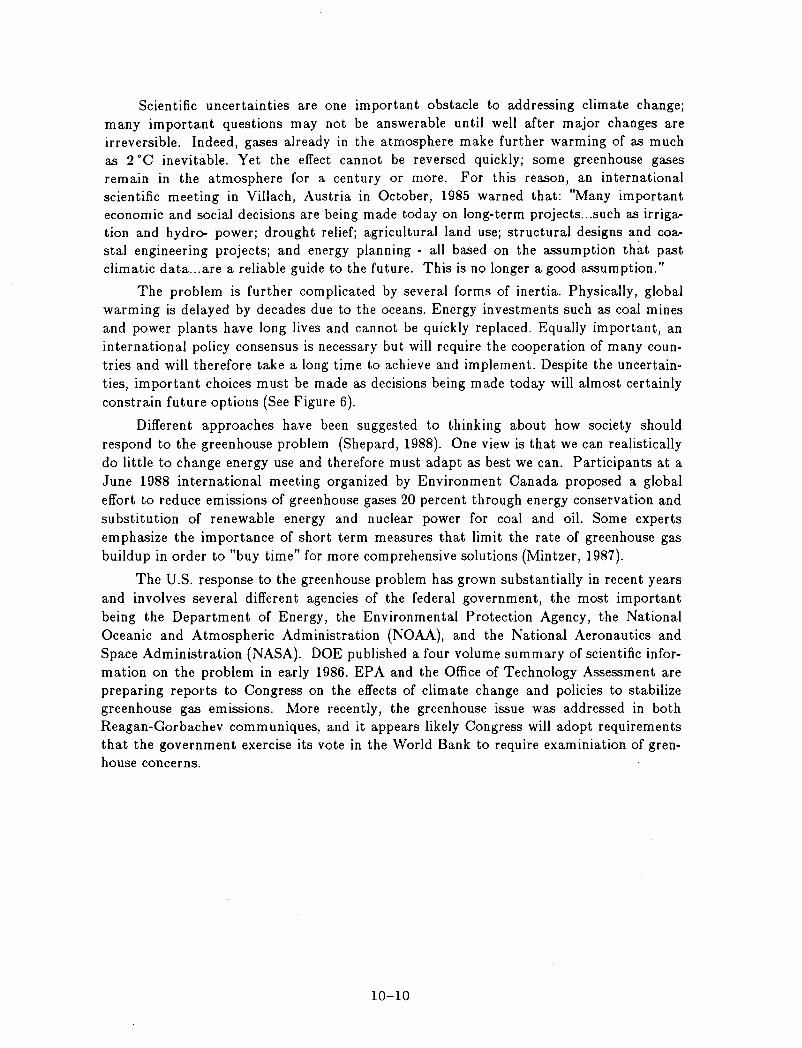
Scientific uncertainties are one important obstacle to addressing climate change; many important questions may not be answerable until well after major changes are irreversible. Indeed, gases already in the atmosphere make further warming of as much as 2·C inevitable. Yet the effect cannot be reversed quickly; some greenhouse gases remain in the atmosphere for a century or more. For this reason, an international scientific meeting in Villach, Austria in October, 1985 warned that: "Many important economic and social decisions are being made today on long-term projects ... such as irrigation and hydro- power; drought relief; agricultural land use; structural designs and coastal engineering projects; and energy planning - all based on the assumption that past climatic data ... are a reliable guide to the future. This is no longer a good assumption."
The problem is further complicated by several forms of inertia. Physically, global warming is delayed by decades due to the oceans. Energy investments such as coal mines and power plants have long lives and cannot be quickly replaced. Equally important, an international policy consensus is necessary but will require the cooperation of many countries and will therefore take a long time to achieve and implement. Despite the uncertainties, important choices must be made as decisions being made today will almost certainly constrain future options (See Figure 6).
Different approaches have been suggested to thinking about how society should respond to the greenhouse problem (Shepard, 1988). One view is that we can realistically do little to change energy use and therefore must adapt as best we can. Participants at a June 1988 international meeting organized by Environment Canada proposed a global effort to reduce emissions of greenhouse gases 20 percent through energy conservation and substitution of renewable energy and nuclear power for coal and oil. Some experts emphasize the importance of short term measures that limit the rate of greenhouse gas buildup in order to "buy time" for more comprehensive solutions (Mintzer, 1987).
The U.S. response to the greenhouse problem has grown substantially in recent years and involves several different agencies of the federal government, the most important being the Department of Energy, the Environmental Protection Agency, the National Oceanic and Atmospheric Administration (NOAA), and the National Aeronautics and Space Administration (NASA). DOE published a four volume summary of scientific information on the problem in early 1986. EPA and the Office of Technology Assessment are preparing reports to Congress on the effects of climate change and policies to stabilize greenhouse gas emissions. More recently, the greenhouse issue was addressed in both Reagan-Gorbachev communiques, and it appears likely Congress will adopt requirements that the government exercise its vote in the World Bank to require examiniation of grenhouse concerns.
10-10
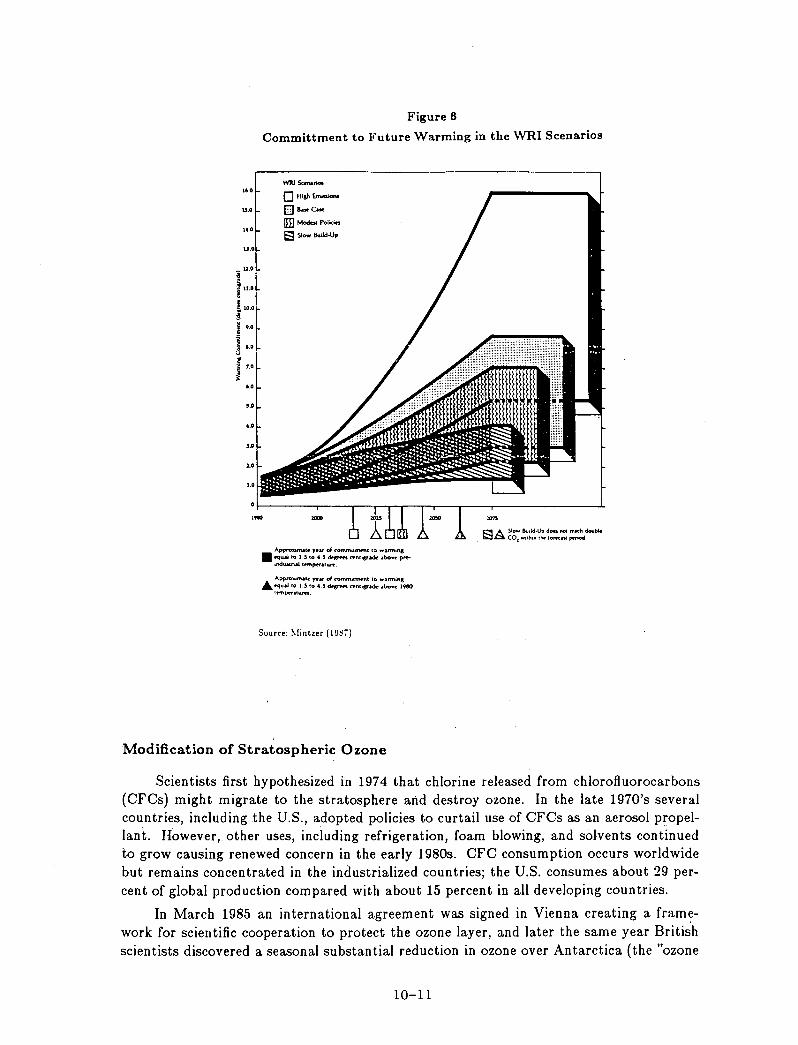
16.0
1>.0
i 11.0
·ino ~ .
£ 100
~ 9.0
i ~ 1.0 U
:/ ~ 1.0
~ '.0
'.0
4.0
Figure 6
Committment to Future Warming in the WRI Scenarios
WRJ SclNrioi
o Hish Enuaiono
Os-c..c 1m Modooi Polan
El Slow 1kWd.u.
Appt"OX.l1ft.l11' YI'&I' 04 commltnwnl 10 w,Jrmll\l .I'qu,.aj to I.S 10 c.s ~ C'l'nllsr_ abov .. p~ U"\dw.trWlfmp"aturY.
Source: Mintzer (1 USn
Modification of Stratospheric Ozone
Scientists first hypothesized in 1974 that chlorine released from chlorofluorocarbons (CFCs) might migrate to the stratosphere and destroy ozone. In the late 1970's several countries, including the U.S., adopted policies to curtail use of CFCs as an aerosol propellant. However, other uses, including refrigeration, foam blowing, and solvents continued to grow causing renewed concern in the early 1980s. CFC consumption occurs worldwide but remains concentrated in the industrialized countries; the U.S. consumes about 29 percent of global production compared with about 15 percent in all developing countries.
In March 1985 an international agreement was signed in Vienna creating a fram~work for scientific cooperation to protect the ozone layer, and later the same year British scientists discovered a seasonal substantial reduction in ozone over Antarctica (the "ozone
10-11
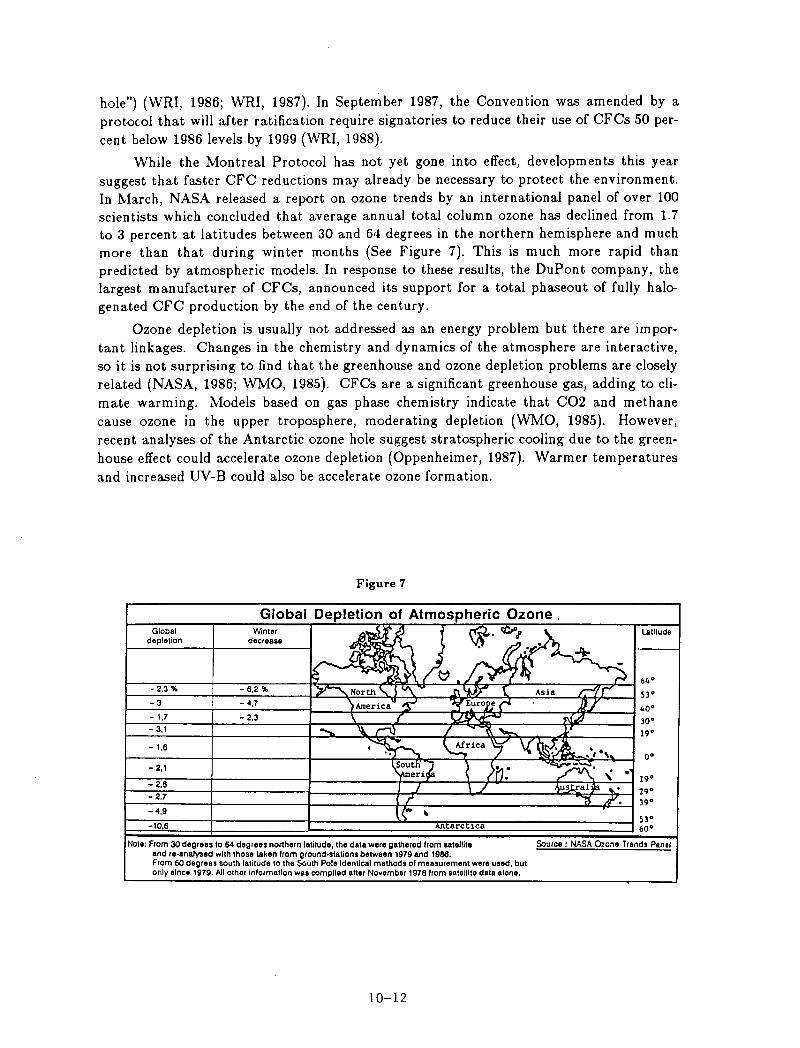
hole") (WRI, 1986; WRI, 1987). In September 1987, the Convention was amended by a protocol that will after ratification require signatories to reduce their use of CFCs 50 percent below 1986 levels by 1999 (WRI, 1988).
While the Montreal Protocol has not yet gone into effect, developments this year suggest that faster CFC reductions may already be necessary to protect the environment. In March, NASA released a report on ozone trends by an international panel of over 100 scientists which concluded that average annual total column ozone has declined from 1.7 to 3 percent at latitudes between 30 and 64 degrees in the northern hemisphere and much more than that during winter months (See Figure 7). This is much more rapid than predicted by atmospheric models. In response to these results, the DuPont company, the largest manufacturer of CFCs, announced its support for a total phaseout of fully halogenated CFC production by the end of the century.
Ozone depletion is usually not addressed as an energy problem but there are important linkages. Changes in the chemistry and dynamics of the atmosphere are interactive, so it is not surprising to find that the greenhouse and ozone depletion problems are closely related (NASA, 1986; WMO, 1985). CFCs are a significant greenhouse gas, adding to climate warming. Models based on gas phase chemistry indicate that C02 and methane cause ozone in the upper troposphere, moderating depletion (WMO, 1985). However, recent analyses of the Antarctic ozone hole suggest stratospheric cooling due to the greenhouse effect could accelerate ozone depletion (Oppenheimer, 1987). Warmer temperatures and increased UV-B could also be accelerate ozone formation.
Global depletion
-2.1
Figure 7
Global Depletion of Atmospheric Ozone. Winter
decrease latitude
0°
• r-~-~2~.6------r------------+----------~~~~--~-4~~----~~~~~~ 19° r-~-~2~.7------r------------~-----------+~~----~~--------~~~~~~ 29° r---~------r------------+-----------+~----------------------~-4~~ 39° - 4.9 r---~~--~r-----------~----------~~--~~~~-------------------J 53° -10.6 arc lca 600
Note: From 30 degrees to 64 deg.ees northern latitude, the date were gathered from satellite Source: NASA Ozone Trends Panel and re·analysed with those teken from ground·stations between 1979 and 1986. From 60 degrees south latitude to the South Pole Identical methods of measurement were used, but only since 1979. All other Information was complied after November 1978 from aateliite data alone.
10-12
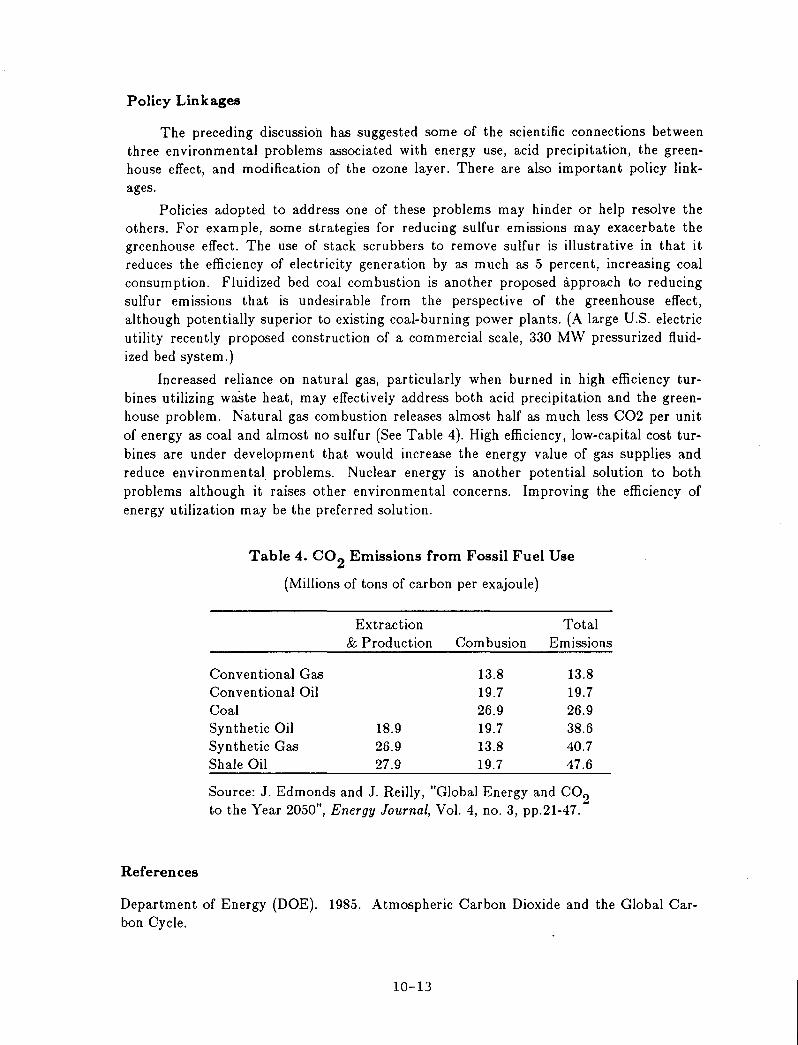
Policy Linkages
The preceding discussion has suggested some of the scientific connections between three environmental problems associated with energy use, acid precipitation, the greenhouse effect, and modification of the ozone layer. There are also important policy linkages.
Policies adopted to address one of these problems may hinder or help resolve the others. For example, some strategies for reducing sulfur emissions may exacerbate the greenhouse effect. The use of stack scrubbers to remove sulfur is illustrative in that it reduces the efficiency of electricity generation by as much as 5 percent, increasing coal consumption. Fluidized bed coal combustion is another proposed approach to reducing sulfur emissions that is undesirable from the perspective of the greenhouse effect, although potentially superior to existing coal-burning power plants. (A large U.S. electric utility recently proposed construction of a commercial scale, 330 MW pressurized fluidized bed system.)
Increased reliance on natural gas, particularly when burned in high efficiency turbines utilizing waSte heat, may effectively address both acid precipitation and the greenhouse problem. Natural gas combustion releases almost half as much less C02 per unit of energy as coal and almost no sulfur (See Table 4). High efficiency, low-capital cost turbines are under development that would increase the energy value of gas supplies and reduce environmental problems. Nuclear energy is another potential solution to both problems although it raises other environmental concerns. Improving the efficiency of energy utilization may be the preferred solution.
References
Table 4. CO2 Emissions from Fossil Fuel Use
(Millions of tons of car bon per exajoule)
Extraction Total & Production Combusion Emissions
Conventional Gas 13.8 13.8 Conventional Oil 19.7 19.7 Coal 26.9 26.9 Synthetic Oil 18.9 19.7 38.6 Synthetic Gas 26.9 13.8 40.7 Shale Oil 27.9 19.7 47.6
Source: J. Edmonds and J. Reilly, "Global Energy and CO2 to the Year 2050", Energy Journal, Vol. 4, no. 3, pp.21-47.
Department of Energy (DOE). 1985. Atmospheric Carbon Dioxide and the Global Carbon Cycle.
10-13
Environmental Protection Agency (EPA). 1983. Projecting Future Sea Level Rise.
------. 1986. Effect of Changes in Stratospheric Ozone and Global Climate: Climate Change (Vol. 3).
------. 1987. National Air Pollutant Emission Estimates, 1940 - 1985.
Hansen, J., Fung, I., Lacis, A., Lebedeff, S., Rind, D., Ruedy, R., Russell, G., and Stone, P. 1987. "Prediction of Near-Term Climate Evolution: What Can We Tell DecisionMakers Now?" in Preparing for Climate Change, Proceedings of the First North Mohnen, Volker. 1988. "The Challenge of Acid Rain," Scientific American, Vol. 259, n. 2, pp. 30-38.
Koomanoff, Frederick. 1987. "Energy C02 Global Change," in Preparing for Climate Change.
MacDonald, Gordon. 1985. Climate Change and Acid Rain.
Minzter, Irving. 1987. A Matter of Degrees: The Potential for Controlling the Greenhouse Effect. World Resources Institute.
Mohnen, Volker. 1988. "The Challenge of Acid Rain," Scientific American, Vol. 259, no. 2.
National Acid Precipitation Assessment Program (NAPAP). 1987. Interim Assessment.
NASA. 1986. Present State of Knowledge of the Upper Atmosphere: An Assessment Report.
Oppenheimer, Michael. 1987. "Climate Change and Environmental Pollution: Physical and Bilogical Interactions."
Oppenheimer, Michael, Fisher, Diane, Ceraso, Jane, and Mathews, Tom. 1988. Polluted Coastal Waters: The Role of Acid Rain. (New York: Environmental Defense Fund).
Schneider, Stephen. 1987. "The Greenhouse Effect: What We Can or Should Do About It," in Preparing for Climate Change.
Shands, William and Hoffman, John (editors). 1987. The Greenhouse Effect, Climage Change, and U.S. Forests.
Shepard, Michael. 1988. "The Politics of Climate," EPRI Journal (June 1988).
Titus, Jim. 1987. "Causes and Effects of Sea Level Rise," in Preparing for Clim ate Change.
World Meterolorical Organization. 1986. Atmospheric Ozone 1985.
World Resources Institute (WRI). 1986, 1987, 1988 (in press). World Resources.
Wuebbles, D., and Edmonds, J. 1988. A Primer on Greenhouse Gases. (Report to the Department of Energy; DOE/NBB-0083).
10-14
I
) \ '\
\ i
DEVELOPMENT AND ENERGY CONSUMPTION OF THE COAL CHEMICAL INDUSTRY IN CHINA
Li Shilun*
China has abundant resources of coal, which accounts for about 75% of total national energy consumption. The development of the Chinese chemical industry originated from the coal chemical industry. Since the 1970s, with the development of the oil industry, the proportion taken up by oil and natural gas in the feedstock of the chemical industry has gradually increased. However, at present the coal chemical industry still plays an important role in the chemical industry. In 1985, the chemical industry consumed more than 50 million tons of coal and about 7 million tons of coke. Two-thirds of total ammonia production used coal and coke as feedstock, and more than 80% of polyvinyl chloride (PVC) used calcium carbide as feedstock.
The Development of the Coal Chemical Industry
Synthetic Gas from Coal
The utilization of coal as feedstock to produce synthetic gas, which is then synthesized to produce chemical products such as ammonia and methanol, is the major approach adopted in the chemical industry.
The main product of the Chinese chemical industry is ammonia. Its annual production in 1986 was over 16 million tons. Most of the medium and small-sized ammonia plants use coal and coke as feedstock and half of the total ammonia production is produced by small ammonia plants. The annual coal consumption of nearly 20 million tons is 30% of the total energy consumption in the Chinese chemical industry.
Methanol is an important organic chemical raw material in China. There are more than 50 methanol plants in China and the total methanol production was 443,000 tons in 1985, over half of which was synthesized from coal and coke.
Coal Gasification
Great progress has been made in coal gasification. There are more than 4500 atmospheric fixed-bed gasifiers in China that produce low-heating-value fuel gas and synthetic gas from coal. Domestic-made fixed-bed water-gas generators have been used in many small and medium ammonia and methanol plants for a long time to produce synthetic gas. China has also grasped the technology for the production of synthetic gas in atmospheric fluidized-bed gasifier. Lurgi gasifiers of 3.8m in diameter imported from Germany have been put into operation in the Shanxi Chemical Fertilizer Plant.
As the resources of brown coal and high-volatile bituminous coal are abundant in China, using them as feed to produce gas through complete gasification is one of the important routes to develop town gas in China. In recent years, China has produced
* Chief Engineer, Beijing Research Institute of Coal Chemistry
11-1
town gas by adopting the pressurized fixed-bed Lurgi gasification and two-stage gasification processes. Lanzhou pressurized gasification plant with a capacity of 540,000m3/day and Yilan pressurized gasification plant with a capacity of 1,600,000 m 3/ day are under construction.
Coking, Including Coke Production and Coal Carbonization to Produce Town Gas
In 1986, more than 70 million tons of coal were used for coking, and the national coke output was over 40 million tons. The chemicals from coking process are important raw materials of the chemical industry. At present, there are more than 50 varieties of coking chemical products in commercial production.
Gas from coal carbonization is one of the important sources of town gas in China. The existing commercial coking plants supply large amounts of coke oven gas to their nearby cities or towns. In addition, China has also set up a number of vertical retorts to supply coal gas to cities. The production of town gas in 1986 by using conventional processes was more than 2.4 billion m 3, mostly from coke ovens and vertical retorts.
Calcium Carbide-Acetylene Chemicals
Acetylene is mainly manufactured from calcium carbide, which occupies an important position in Chinese chemical industry. The total national output of calcium carbide in 1986 was over 2 million tons.
Coal-derived fuel and Coal Water Slurry
China has been engaged in direct liquefaction research, with the emphasis on converting coal into clean liquid fuel by direct hydrogenation. Continuous process units of 0.1 tons/day have been set up and put into operation. As for indirect coal liquefaction, the advanced Fischer-Tropsch synthesis process has been put into tests.
Since 1982, China has conducted studies on the technology of preparation and combustion of coal water slurry (CWS). CWS with a concentration of 70% coal has been prepared and com busted in a 20t/h industrial boiler with fairly good result.
Problems Encountered During the Development of the Coal Chemical Industry and Their Countermeasures
Coal Source for Production of Synthetic Gas
Fixed-bed water-gas generators have long been used in most of the medium and small synthetic ammonia plants in China to produce synthetic feed gas. These need lump feed. In the early period, coke was used as feedstock. In 1956, experim,ents using lump anthracite to replace coke achieved success, so it became the main feedstock. Later, along with the development of the ammonia industry, the supply of lump anthracite was becoming shorter, so China started to develop briquetting of anthracite fines to provide gasification feedstock. Hundreds of ammonia plants in China are using briquettes so that the situation of short supply of lump anthracite can be eased.
11-2
Coal Resources for Coking
In the total reserves of coal for coking, gas coal and weakly caking coal take up a great proportion, while coking coal and fat coal take up a small proportion. In order to save the valuable resources of coking and fat coal, since the 1950s systematic studies have been carried out to expand the types of coal for coking and to develop the technology of blending coking that is suitable to the characteristics of Chinese coal resources. As a result, the blending ratio of weakly caking coal is up to 20-25% and that of gas coal up to 50% to produce coke meeting the quality specifications.
In order to save coal resources for coking, China has also developed and grasped the technique of blowing pulverized anthracite into a blast furnace so as to substitute for premium coke. The consumption of pulverized anthracite for this application reached 2.2 million tons in 1986. Practice shows that blowing one ton of pulverized anthracite can replace 0.8-1.0 ton of coke. The capital expenditure for the equipment of anthracite blowing is equivalent to only 20-25% of the coking plant with the same capacity. Maanshan Iron and Steel Corporation has also developed a pulverized coal blowing technique so as to further expand coal types suitable for this use.
Outlook
Since the founding of New China, the coal chemical industry has developed rapidly. But there is still a long way to go compared with the advanced countries in the aspects such as technology and energy consumption of products. Coal is the principal energy resource of China. Faced with the situation that by the end of this century, the energy output can only be doubled while we envision a quadrupling of the national production value of industry and agriculture, it is even more necessary to accelerate the development of the coal chemical industry and rationally and effectively utilize the coal resources. The following areas call for further development.
Development of the C-1 Chemical Industry on the Basis of Synthetic Gas
China has abundant coal resources suitable for coal gasification. Using them as raw material to produce chemical products and liquid fuel through the route of C-1 chemistry is not only a practical need, but also possesses long term significance. It is necessary to greatly enhance the technology of synthetic gas production, accelerate the development of the chemical fertilizer and C-1 chemical industry, and grasp the technology of methanol production on large scale as soon as possible.
The fixed-bed water-gas generators now being used in medium and small ammonia plants are backward in technology, low in gasification efficiency and could only use lumps or briquettes of anthracite, thus causing short supply of feedstock. Therefore, the development of advanced gasification technology that can utilize coal fines directly should be accelerated. The pressurized gasification of coal water slurry developed by Lintong Chemical Fertilizer Research Institute of China offers many advantages, and has obtained fairly good test results in a 1.5t/h pilot plant. The research work on this basis should be speeded up in order to achieve the technical conditions of commercial utilization and provide a set of advanced gasification techniques for the development of the Chinese chemical industry.
11-3
Development of Coal Gasification Technology for Production of Town Gas
In order to achieve the target of supplying town gas to 70 million urban residents by the end of this century, the development of town gas should be accelerated. China has rich resources of brown coal and high volatile bituminous coal suitable for gasification. It is important to develop coal gasification in the cities close to these resources. However, at present there is little gasification technology available in China for town gas production. Thus, a good job should be done in scientific research and introduction of key techniques so as to speed up the grasping of advanced coal gasification technology and create technical conditions for developing town gas.
Development of the Coking Industry
Although the coking industry in China has made considerable progress, the task we are faced with is still very hard. It is estimated that by the year 2000 the annual demand for coke will reach about 80 million tons. Thus, coking technology should be greatly improved and the types of coal used for coking should be expanded. With the continuous increase of tar output, the processing of coal-tar should be developed in order to produce even more tar-based chemical products.
Calcium Carbide-Acetylene Chemicals
China has a good foundation in the chemical industry of calcium carbide and acetylene. It is estimated that the demands for calcium carbide will be doubled by the year 2000. Therefore, in those areas where there are abundant coal, limestone and electricity, chemical plants for producing calcium carbide and acetylene should be developed.
Development of Coal-Based Liquid Fuel
Although oil output will increase greatly by the end of this century, it still will not be able to meet the increasing demand. Therefore, the development of coal-based liquid fuel should be given priority. China has rich coal resources suitable for liquefaction. Some areas, such as Yunnan and Shanxi, are short of oil resources. Thus, there is a good prospect for developing coal liquefaction. The development of liquefaction technology should be continued and at the same time, the technology for manufacturing methanol fuel and low-carbon mixed alcohols from synthetic gas should be actively studied.
The research on techniques of production and combustion of coal water slurry should be carried out continuously and put into commercial application as soon as possible.
Comprehensive Utilization of Brown Coal
The proven geological reserves of brown coal in China are more than 120 billion tons. At present, the annual production of brown coal is more than 30 million tons, and its proportion in the total coal production will increase year by year. Therefore, China should actively develop comprehensive utilization technology of brown coal.
11-4
THE ROLE OF COAL IN THE U.S. ENERGY ECONOMY: INTERFUEL COMPETITION, ENVIRONMENTAL CONCERNS, AND
THE IMPACT OF UTILITY RESTRUCTURING
Manfred G. Raschke*
It is ironic that one and a half decades after the first oil crisis, which seemed to give the U.S. coal industry the promise of an almost limitless golden future, the industry is embarking upon a period of great uncertainty. What is most chastening to forecasters about this period of risk and uncertainty is that the primary sources of this uncertainty were generally unanticipated until recently. It is not nuclear power which poses the greatest competitive threat to coal in the United States, but rather a series of changes in energy and environmental policies and perceptions. Renewed interfuel competition, particularly from natural gas in both the industrial and utility sectors, combined with environmental legislation which compels coal-burning utilities and coal producers to internalize more of the environmental costs of coal, will slow the relatively rapid progress coal has made in the past two decades.
In this paper, it is.my intention to examine briefly the role coal currently plays in the U.S. energy economy and its competition with nuclear power, then to examine in greater detail the impact of environmental regulation, changes in utility regulation, and interfuel competition on the future of coal. In the course of this paper, it will become apparent that the world's number two coal producer, the United States, shares many of the same problems and concerns as the world's number one coal producer, China.
Retrospect and Prospect
The past quarter century has been a period of rapid growth for the U.S. coal industry. After experiencing two decades of declining production after World War II, coal production began to increase again in the early 1960s, and it has since continued to grow steadily. The primary factor responsible for this change has been the adoption of coal as the fuel for new base-loaded electric generating plants in the 1960s. The use of coal in electric generation has been and will continue to be the only growth sector for the coal industry. For fuels, American industry relies primarily on petroleum and natural gas, with a few exceptions, such as cement and pulp and paper. The steel industry remains in permanent long-term decline; in 1973, about 100 million tons of metallurgical coal were used; in 1987, only 37 million tons were needed. With industrial coal consumption not expected to grow significantly and metallurgical coal demand continuing to decrease, the coal industry has come to its present position of importance in the U.S. energy economy because of its key role in the electric utility sector.
In 1960, total U.S. coal production was about 415 million tons; by 1987, this amount had increased to 916 million tons (all refe'rences are to short tons). In 1970, before the first oil crisis, coal constituted 18 percent of the total U.S. primary energy consumption;
* President, International Strategic Information Services, Newburyport, Mass.
12-1
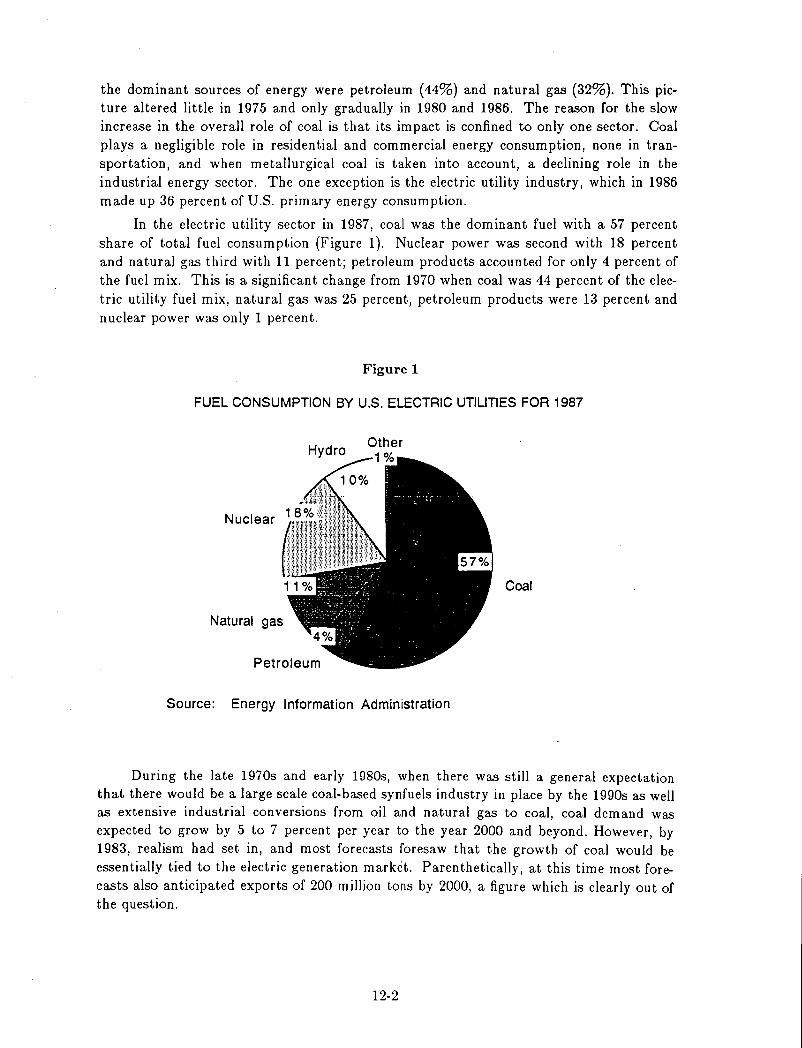
the dominant sources of energy were petroleum (44%) and natural gas (32%). This picture altered little in 1975 and only gradually in 1980 and 1986. The reason for the slow increase in the overall role of coal is that its impact is confined to only one sector. Coal plays a negligible role in residential and commercial energy consumption, none in transportation, and when metallurgical coal is taken into account, a declining role in the industrial energy sector. The one exception is the electric utility industry, which in 1986 made up 36 percent of U.S. primary energy consumption.
In the electric utility sector in 1987, coal was the dominant fuel with a 57 percent share of total fuel consumption (Figure 1). Nuclear power was second with 18 percent and natural gas third with 11 percent; petroleum products accounted for only 4 percent of the fuel mix. This is a significant change from 1970 when coal was 44 percent of the electric utility fuel mix, natural gas was 25 percent, petroleum products were 13 percent and nuclear power was only 1 percent.
Figure 1
FUEL CONSUMPTION BY U.S. ELECTRIC UTILITIES FOR 1987
Hydro Other
Nuclear 1
Coal
Natural gas
Source: Energy Information Administration
During the late 1970s and early 1980s, when there was still a general expectation that there would be a large scale coal-based synfuels industry in place by the 1990s as well as extensive industrial conversions from oil and natural gas to coal, coal demand was expected to grow by 5 to 7 percent per year to the year 2000 and beyond. However, by 1983, realism had set in, and most forecasts foresaw that the growth of coal would be essentially tied to the electric generation market. Parenthetically, at this time most forecasts also anticipated exports of 200 million tons by 2000, a figure which is clearly out of the question.
12-2
The forecasts produced in 1983 by the two major private forecasting organizations, ICF of Washington DC and DRI of Lexington, Massachusetts, were both predicting production of just below 1,700 million tons by 2000. Both of these firms use linear programming models to develop their forecasts and their bullish outlook had a significant impact on both government policy makers and coal industry leaders. 1983 is significant in the history of U.S. coal forecasting because in that year, the National Coal Association converted its forecasting methodology to the use of a panel of industry specialists preparing bottom-up forecasts. As a consequence of this more rigorous methodology, the forecast issued in December, 1983, for the year 2000 was 300 million tons below the March, 1983, forecast.
The development of accurate supply curves assumes a knowledge about the detailed engineering characteristics of coal reserves which we in general do not possess. The recent EPRI-financed studies on Appalachian low-sulfur coal reserves have demonstrated that when it comes to the detailed characteristics of the reserve base, we are woefully ignorant. Moreover, as utilities increasingly stress overall boiler performance in selecting their coals, there are many factors such as ash, chemical characteristics, "grind ability", nitrogen, chlorine, calcium, and ash fusion temperatures that are not captured by the data on sulfur, ash, and heat content used to develop supply curves. As utilities evaluate coals for boiler slagging and fouling, steam temperature control, combustion efficiency, and pulverizer performance, the data captured in conventional supply curves becomes increasingly less significan t.
A preferable methodology is the one employed recently by Resource Data International (ROl) to prepare a long-term coal forecast as an input to the Gas Research Institute's (GRI) 1987 Energy Forecast. The RDI model gave far greater weighting to bottom-up demand analysis and to the impact on the coal market of such subjective factors as utility buying practices and government policy. RDI projected that total consumption in 2000 will be 1,133 million tons of which 879 million tons will be in the utility sector. This is an increase from the 718 million tons consumed by electric utilities in 1987. The Energy Information Administration (EIA) forecasted a somewhat higher number, 1,217 million tons in its projections for the year 2000; of this amount, 962 million tons is expected to be used by electric utilities.
Both of these forecasts are conservative in terms of the numbers used in the mid-1980s; however, there are indications that even in these conservative forecasts, there is more downside risk than upside potential. It takes eight to ten years or even longer to build a large coal-fired power plant. Thus to a very real extent, what you see in 1988 is likely to be what you will have in 1995-1998. If we look at the November, 1987, Electricity Supply & Demand forecast for 1987-1996 prepared by the North American Electric Reliability Council (NERC), we find that coal demand is anticipated to rise by about 100 million tons between 1987 and 1996. Some 22,479 MW of new coal-fired units are to be completed between 1988 and 1996 discounting the 3,513 MW which were completed in 1987. Of this total, only 12,157 MW are currently in any phase of construction. The Utility Data Institute (UDI) in early 1988 reported that a 150 MW lignite unit whose construction began in 1987 is the first new coal-fired power plant to go into construction in five years. UDl's data shows that in 1986, 33 new coal-fired power plants entered service and that an average of 20 new plants were added annually to 1983, when the number dropped to 14. For 1989, UDI predicts four new plants, two in 1990, three in 1991 and
12-3
two in 1 992. Thus, if coal consumption is to rise at the rate projected by either RDI or EIA, it will have to do so in large part through increased consumption at existing units. This is certainly possible since there is currently a large excess of coal-fired capacity whose utilization rate could rise in response to higher electricity demand. Moreover, lifeextension programs are likely to keep the current population of coal- fired units operating 20 to 30 years longer than was originally anticipated. Therefore NERC's latest forecast contains only about 200 MW of deletions of coal-fired capacity.
The upside potential for coal lies in the possibility that electric load growth will be greater than the approximately 2.0-2.5 percent per annum that most utilities currently anticipate, and that the installed base of nuclear plants will perform worse than expected. Neither is an entirely unreasonable assumption. The latest ten-year forecast of the NERO, which aggregates by region forecasts submitted by individual utilities, projects an average annual growth rate of 2.2 percent for the period 1987-1996. The EIA in its Annual Energy Outlook 1987 published in March 1988, projects that in the period 1987-2000, total electricity sales will grow 2.4 percent, with industrial sales leading the way with a growth rate of 3.1 percent. The 1986 baseline GRI electricity demand forecast envisages an average annual growth rate of 1.8 percent for the period 1985-2010.
The NERO forecast is the most disaggregated and shows considerable variations among the various regions of the country. The most rapid growth, 3.3 percent per year, is projected for Texas, 3.2 percent per year for Arizona and New Mexico. The lowest growth of 1.3 percent to 1.6 percent is expected to occur in the Midwest and Middle Atlantic.
Industrialized nations have in general broken the GNP loil relationship but have failed to do so with the GNP I electricity relationship. Although fifteen years ago the electricity growth rate was more than double the GNP growth rate, the ratio is now below 1:1 but electricity demand growth continues to parallel economic growth relatively closely. There is the potential that the demand projections that are now generally accepted could be too low: some economic scenarios for the 1 990s suggest that we may be entering a period of sustained 5 percent real GNP growth. This rate in turn could result in growth of demand for electricity which is higher than was forecasted. On the other hand, mandatory conservation programs could moderate anticipated electric demand growth to below forecast levels.
The uncertainty is thus considerable not only in the annual rate of growth, but also in the growth of total demand versus peak demand and in the regional variations in the rate of growth. These latter factors have an impact on how the aggregate electricity demand forecast is transformed into a demand for coal. A rapid growth in peak demand would tend to be met primarily by natural gas and oil since in most parts of the country, nuclear and coal-fired plants are confined to serving only baseload demand. Similarly, the rapid anticipated growth in demand in Texas and Florida may be met primarily by natural gas rather than coal.
Nuclear Power
Poor performance in the nuclear power sector can be expected to have a favorable impact on coal consumption in the longterm. However, in 1987, five new nuclear plants were brought into service, making a total of 109 operating plants in the United States.
12-4
Nuclear generation rose to 450 billion KWh in 1987, an increase of 10 percent over the previous year. There are still a further sixteen nuclear plants either under construction or complete and awaiting operating licenses. As these plants come on line, they can be expected to depress coal demand below anticipated levels for several years. However, for the long run, coal is now the only option open for utilities.
For both political and economic reasons, the further expansion of the nuclear generating base is unlikely until well after 2000. Accidents such as Three Mile Island and Chernobyl and scandals such as those recently in Germany have turned public opinion against nuclear power. Even more damaging for the long-term future of the present generation of nuclear technology are the operating results which have largely gone unnoticed. UDI, based on a survey of nuclear and coal-fired plant variable costs over the period 1982-1986, found that coal plant costs declined 22 percent, from $27.49/MWh to $21.67/MWh, while nuclear plant costs increased 32 percent from $14.16/MWh to $20.70/MWh.
The most damaging economic analysis of the current generation of nuclear plants comes in a study recently released by the EIA. This analysis considered both operating and maintenance costs as well as post-operational expenditures arising from the need to add or replace systems in the plant. The EIA found that costs in the decade from 1974 had quadrupled to almost $95/KW ($1982) of installed capacity. The EIA concluded that the continued escalation in operating costs could erode any cost advantage that operating nuclear plants currently enjoy. Furthermore, the escalation in operating costs was seen as rendering it economic to shut down some of the older plants. Thus, nuclear plants are not only more expensive to keep in operation than are coal-fired units, but the savings from shutting down the most expensive units would be sufficient to pay the capital and operating costs of replacing them with coal units. The primary factor preventing Public Utility Commissions (PUCs) from compelling some operators to adopt this approach is the unfathomable magnitude of the decommissioning costs.
It can be argued with good cause that nuclear plant construction and operating experience have demonstrated that the costs of nuclear power plants have been subject to unwarranted optimism and rapid escalation. Moreover, radioactive waste disposal costs, a major component of the decommissioning expense, have increased very rapidly in the past and are likely to continue to increase in the future. The Central Electric Generating Board (CEGB) in the United Kingdom is the first utility to announce that it will decommission and disri1antle a commercial scale reactor. The unit is a 276 MW station at Berkeley which has been in operation only 26 years, although its scheduled operating life had been expected to be 35 to 40 years. The CEGB estimates that the decommissioning process will take over 110 years and will cost about $600 million.
Nuclear operating costs to utility shareholders are also rising for several reasons. In an increasing number of states (e.g., New York, Pennsylvania, Michigan, New Jersey), shareholders rather than ratepayers bear the costs for unplanned nuclear plant outages that result from imprudent management decisions and that require the need for expensive replacement power. PUCs are beginning to pass judgement on management's prudence in such unplanned outages and are more willing to disallow replacement power costs.
Despite these enormous problems for the future of nuclear power, it is premature to write its obituary. As coal-fired power plants are compelled by legislation to internalize a greater portion of their environmental costs, their costs will also escalate and nuclear
12-5
energy may again by comparison look more attractive. More important, concern over the impact of the "greenhouse effect" may lead policy makers to reexamine the nuclear option. If nuclear power does make a comeback in the next decade, it is likely to be in the form of "inherently safe" reactors. The technology for such reactors already exists in the United States, Europe and the USSR. "Inherently safe" reactors will be smaller than the current generation of commercial reactors. They will be modular in construction and in large part built off-site and contain a smaller amount of fuel. As concern over carbon dioxide levels in the atmosphere increases, one can anticipate that this new type of reactor will attract the attention of politicians and utility executives.
Clean Air Concerns
The greatest challenge to the growing use of coal in both the electric utility and the industrial sectors of the U.S. economy comes from environmental concer~s. These concerns deal primarily with pollutants created by the combustion of coal as well as considerably less significant pollution problems at the mining end of the coal business. The leading public policy issue in regard to coal combustion in both the United States and Western Europe is Acid Rain. Acid Rain legislation has been expected to pass into law every year for the past seven, but as yet, no bill has been passed.
Acid rain is a tremendously complex issue, politically, economically, and scientifically. There is general agreement that in North America, over 90 percent of sulfur dioxide emissions come from man-made sources (the natural sources of sulfur dioxide can be quite significant in some parts of the world). Such man-made sources include fossil fuel-fired utility generating plants, industrial boilers, industrial processes, transportation, and residential and commercial combustion. However, scientific agreement ceases when we turn to such questions as the atmospheric transformation of sulfur dioxide and nitrogen oxides into sulfuric and nitric acids, the distance over which emissions are transported, and how deposition on the earth's surface occurs. One vital issue that hiLs received a great deal of attention because of its high degree of uncertainty is the relationship between emissions of acid- forming gases and the deposition of potentially harmful pollutants. Some research findings have suggested that the relationship is non- linear and that precursor emission reductions of a particular amount will not result in similar proportional reductions in pollutant depositions. Politically, this is a highly explosive question. If there is no certainty about this question, it becomes difficult to justify both a specific target volume of reductions and to justify the inclusion of power plants in one part of the country but not those in another under the provisions of potential legislation. The National Academy of Sciences reviewed most of the major studies of atmospheric modeling and concluded that there was no strong evidence of non-linearity. However, the report was so riddled with caveats and so Delphic in its phrasing that Congress asked the Department of Energy's (DOE) National Laboratories to re-analyze the report. What one may conclude from reading both of these reports is that the scientific evidence is not conclusive. But it is also fair to say that the opponents of acid rain legislation, both coal and utility executiv'es and the economists who serve them, are holding scientists up to higher standards of proof than they themselves are subject to in their own analyses of the economic impact of acid rain legislation.
12-6
In the past year, the acid rain issue has become part of the broader movement to amend the Clean Air Act. The Clean Air Act had set December 31, 1987, as the deadline for the achievement of compliance with federal ozone standards. Some 60 cities were found to be out of compliance and the EPA moved to implement the punitive measures contained in the Act: moratoria on new construction, cutoffs of federal highway funding, etc. Unable to pass legislation in time, Congress voted to delay the deadline for sanctions until August 31, 1988. Thus, in 1988, there are three bills in the Congress pertaining to clean air issues: H.R. 3054, concerned with ozone non-attainment, and H.R. 2666, concerned with acid rain, both in the House of Representatives, and S. 1894, a comprehensive bill before the Senate dealing with both issues. The bill in the Senate is the more stringent, and it is the one favored by environmentalists. In the midst of the increasingly acrimonious debate over acid rain legislation, Senator Robert Byrd, a long-time foe of acid rain legislation, of West Virginia, a major coal-producing state, announced his decision to step down from his position as Majority Leader. Proponents of acid rain legislation were optimistic that Byrd's resignation and new leadership in the White House would give their cause the boost needed to enact legislation. However, in recent years, the Congress, particularly the Senate, has been plagued by gridlock on many major legislative issues. Debate on proposed acid rain legislation has become increasingly acrimonious, and it is not at all certain that acid rain bills will fare any better in the remainder of 1988 and 1989 than they have in past seven years.
The many policy-oriented studies on all sides of the acid rain issue which have been conducted in the past five years have relied almost exclusively on computer models. To my knowledge, only one analysis, that performed for the Electric Power Research Institute (EPRI), has attempted a bottom-up, site-specific review of the impact of various legislative scenarios on all of the power plants likely to be affected. Not surprisingly, the EPRI study found that many site-specific factors were important in the scrub-versusswitch decision faced by individual utilities. The study performed for EPRI by three consulting firms reached a number of significant conclusions about the impact of acid rain legislation on electric utilities and the coal industry:
o Under any emission scenario, there will be a wide diversity in utility compliance strategies as a consequence of site-specific factors, the timing of the compliance decisions, and other institutional concerns.
o Retrofit scrubbing costs vary substantially by power plant, with some having relatively low costs (generally large, modern units with am pIe space) and some where the costs are extremely high. Under the high tonnage, reduction scenario, the cost effectiveness of FGD retrofits varies between $400 and $2,400 per ton of sulfur dioxide removed.
o The demand for and price of eastern low-sulfur and compliance coal relative to high-sulfur coal could be significantly affected by an emission reduction program.
o The differences in prices between low-sulfur coal (1% sulfur), compliance coal «0.7% sulfur) and high-sulfur coal are the primary factor influencing utility com pliance strategies.
o The higher the emission reduction requirement, the more utilities will prefer to reduce emissions through scrubbing rather than switching.
12-7
o Central Appalachian low-sulfur and compliance-coal producers will supply the majority of the new markets created by coal switching. Western low-sulfur coals only supply about 20 percent of the coal switching markets under the high emission reduction scenarios. However, if the costs of devoting units for the use of low-ranked Powder River Basin coals is less than assumed in the EPRI analysis, then the eastward penetration of this coal may be significantly greater.
The EPRI study also highlighted some previously unanticipated gaps in data. The study team found that relatively little is known about the reserve base and production cost of eastern compliance coal. Moreover, in contradiction of the common view incorporated in most coal models that depleting reserves make new mines the highest-cost mines, new mines often were the lowest-cost producers in many regions.
Although many of the policy proposals and analytic approaches to the acid rain problem discussed here may appear to be mutually exclusive and logically incompatible, the Congressional legislative process deals with compromise, not logic. Hence, the final legislation, when it eventually emerges from a House-Senate Conference committee and is sent to the President for his signature, may contain elements of many of these proposals since only in this way will it be possible to accum ulate sufficient votes for the passage of the final piece of legislation.
Even when an acid rain bill has been passed into law, there will remain many areas of uncertainty. There is considerable likelihood, as has occurred in other major pieces of environmental legislation in the past two decades, that the states will be called upon to playa key role in implementing acid rain legislation. If the final bill either does not mandate a technology for clean-up or only mandates a technology for one phase of the cleanup effort, the governments of high-sulfur coal-producing states are almost certain to restrict fuel switching by the utilities within their boundaries. Furthermore, some states may elect to include large industrial sulfur dioxide emittors in their implementation programs, even though the federal legislation focuses on electric utilities. As in all major environmental legislation, there is also the potential for litigation. While the courts will probably uphold the government in most cases, litigation does have a considerable potential to slow the implementation of acid rain legislation.
The single-most significant factor in creating uncertainty as to the eventual results arising from the passage of acid rain legislation is the dynamism of the energy market itself. Many variables will determine the eventual extent of the impact of acid rain legislation on the U.S. coal industry: the import of power from Canada, the greater use of natural gas in electric generation, a shift from an exclusive reliance on large central generating facilities by utilities to small distributed facilities operated by cogenerators and independent power producers, a greater economic wheeling of electricity from region to region, improvements in new clean coal technologies, and the interaction of acid rain legislation with other clean air initiatives such as ozone non-attainment, "greenhouse" legislation, and tall stacks regulations.
12-8
Clean Coal Technologies
Clean coal technologies are seen by many in the coal industry as the answer to the threat posed by various forms of clean air legislation and regulation. The current government funding for clean coal technologies in the United States originates from a joint report on acid rain prepared in 1985 by Bill Davis of Canada (the former premier of Ontario) and Drew Lewis of the United States. Among other things, the report recommended the expenditure of $5 billion over five years to control sulfur dioxide and nitrogen oxides emissions. President Reagan and Canadian Prime Minister Mulroney signed the report early in 1986. The DOE began the Clean Coal Technology Program in 1986 in partial fulfillment of these commitments. The initial federal share of the budget was $400 million. In 1987, an additional $536 million of federal funds were made available under a second phase of the program. The intention is to provide $2.5 billion over a five-year period with the private sector contributing an equal amount. Politically this would not only fulfill President Reagan's commitment to Prime Minister Mulroney, but also it would put a more positive slant on the Reagan administration's long-standing opposition to acid rain legislation.
The process of obtaining federal funding for a project is, however, arduous. The initial round of proposals has resulted in seven agreed-upon projects and four proposals still in negotiation. The length of the negotiation period has led to complaints from some would-be participants that it is very difficult to keep the original engineering team together through such a lengthy process. The second round of funding by the May 23, 1988, deadline drew 54 proposals competing for $536 million in federal funds. The companies selected will at least need to match any monies received from the government. Among those submitting bids, the major plant builders were the leaders. Babcock & Wilcox and Combustion Engineering both submitted four projects each. Among utilities submitting proposals, Southern Companies is the leader with four projects, and the Tennessee Valley Authority has two.
The rather sparse representation of electric utilities among those presenting proposals is a result of the changing regulatory environment for electric utilities. In recent years public utility commissions have been defining in a much narrower context the term "used and useful" for purposes of rate making. This narrow definition has resulted in the exclusion of large portions of conventional power plants (both nuclear and coal) from rates because they were in excess of immediate load needs. As a consequence, utilities have become reluctant to invest in new conventional power plants and in many cases, have lost interest in contributing to research. This withdrawal of utilities from technological development is unfortunately occurring just as large sums are needed for the commercial demonstration of some clean coal technologies. In order to convince potential users of the soundness of a new technology, a demonstration at a meaningful scale, generally over 100 MW, is needed. This permits cost data, both capital and operating and maintenance, to be obtained along with data on yields, availability or reliability, capacity factor, quantity of air emissions along with liquid and solid wastes disposal, the number and type of operating personnel required, spare parts required, and other factors required for operability. Very few new coal technologies have been adopted by electric utilities without a demonstration of this type. Moreover, the economies of scale for handling coal makes it difficult to obtain meaningful cost numbers from a small-scale installation.
12-9
The predominant technology proposed is some form of fluidized bed combustor (11 proposals). The remaining proposals deal primarily with various combustion technologies, including gasification and to a lesser extent with flue gas clean up and precombustion removal of sulfur through coal cleaning. Some of the technologies are complete responses to a given emission problem, while others, such as physical coal cleaning are a partial response and must be combined with another technology. The selection of technologies is somewhat biased by the fundamental principle embodied in the Clean Air Act amendments of 1977 which set as the primary regulatory mechanism the "best technological system for continuous emission reduction." The New Source Performance Standards (NSPS), which require a percent removal of sulfur dioxide from a flue gas stream, have favored flue gas desulfurization over coal cleaning and the burning of low sulfur coal.
Several commercial-scale plants are currently undergoing tests in the United States. The Tennessee Valley Authority is heading a consortium of engineering companies and electric utilities in the construction of a MW atmospheric FBC unit at the Shawnee plant in Paducah, Kentucky. Although the unit is not scheduled to be operational until later this month, TVA anticipates that projected costs will be comparable to existing units with scrubbers. The Shawnee test unit is expected to burn coal with a sulfur content of 3 percent to 6 percent. TVA has applied for federal assistance in the latest round of the clean coal technology program. A 130 MW atmospheric FBC unit retrofitted into an existing power plant has been in operation at Black Dog Generating Plant owned by Northern States Power Company since July, 1986. To date, the unit has only operated with low sulfur Western subituminous coals. Future tests will involve refuse-derived fuel and petroleum coke, which is high in sulfur.
The somewhat newer technology of the pressurized fluidized-bed com bustion boiler is to be tested on a commercial scale through the repowering of American Electric Power's Tidd plant with a 60 MW unit. The unit is due to start up in mid-1990. Preliminary estimates indicate that the unit has slightly lower capital costs and operating costs than does a comparably-sized pulverized coal unit equipped with scrubbers. Moreover, the removal rates for sulfur dioxide and nitrogen oxide are superior to a conventional plant equipped with a scrubber. The pressurized FBC boiler also is very fuel flexible because the combustion occurs at a relatively low temperature, i.e., below the ash fusion temperature of virtually all coals.
Since the summer of 1987, the Colorado-Ute Electric Association has been operating a 110 MW circulating fluidized-bed combustion unit which had been retrofitted into an existing smaller coal-fired plant. The Nucla station's operating experience to date indicates very significant reductions in sulfur dioxide and nitrogen oxides emissions and a 30 percent reduction in the cost of coal as a consequence of the substitution of lower grade coals.
In May, 1988, American Electric Power submitted a proposal to the DOE in the clean coal technology program for a combined-cycle plant with a pressurized FBC boiler. The intention is to repower the Philip Sporn plant in West Virginia by replacing two of its boilers with one 330 MW PFBC.
These projects have several features in common. They all appear to be economically competitive with the present conventional technology with the added benefits of lower emissions and a very broad range of fuel utilization. Most utilities are considering the technologies described above not so much for new greenfield generating technologies as for
12-10

extending the lives of and upgrading older existing coal units. There are also a considerable number of industrial FBC units in operation in the United States at present. Excluding trash-to-energy facilities, telephone surveys done in the course of building large proprietary industrial energy-use data bases suggest that at least one million tons of industrial coal are now being burned in FBC boilers at industrial facilities.
FBC technology is not necessarily a blessing for the coal industry. On one hand, FBC technology helps to mitigate many of the air quality concerns which currently result in opposition to coal use, but on the other hand, by greatly expanding the fuel flexibility of a unit, FBC technology will depress coal prices. If a unit will burn almost anything from lignite to anthracite without significant cost or operating disadvantages resulting from a high ash or high sulfur content or from variations in ash fusion temperature, why would a utility pay a premium for a better coal? Further, why pay more to use coal at all? FBC technology is the basis of a rapidly-growing number of refuse-derived plants in the United States which rely upon a wide variety of fuels from conventional urban garbage to chemical wastes, automobile tires, agricultural wastes, and anthracite wastes. By significantly enlarging the scope of the materials which can be used as fuel for electricity generation, FBC technology may tend to depress both the demand and the price of coal. It has been argued by some advocates of the technology that it will put new life into the now moribund movement to convert oil-fired power plants to coal. Perhaps, but this trend could only be economically justified if oil prices were again to rise sharply. Overall, FBC technology will favor thos~ coals with the lowest production costs regardless of quality. In time, as these technologies penetrate the electric utility market in the United States, they may have an unfavorable impact on companies which have built their strategies around the production of premium quality coals.
There are also some promising technologies for gasification now available, the results of design work conducted in the 1970s by Texaco, Shell, Allis Chalmers, Dow Chemical, Kellogg, British Gas and Lurgi. Most of the new generation of gasifiers that have been built or are planned are in the United States. These systems are designed for a variety of uses from producing feedstock for chemical operations to providing fuel for electric power generation. The dominant technology at present is the Texaco gasifier, which is already in use in commercial-scale chemical plants by the Tennessee Valley Authority (TVA) at Muscle Shoals, Alabama, and Tennessee Eastman at Kingsport, Tennessee. Shell, based on the successful operation of its large pilot plant at Deer Park, Texas, has declared its proprietary process commercial ready. The company claims that its process is characterized by high thermal efficiency, a high throughput rate, useful by-products, environmental compatibility, and efficient heat recovery through the production of high-pressure super heated steam. The Dow Chemical gasification system is currently undergoing tests in a commercial-scale facility at Plaquemine, Louisiana.
The use of gasification in the production of electricity, primarily in the form of integrated gasification/combined cycle (IGCC) plants, has in recent years begun to attract utility interest in the United States. The world's first demonstration of the technology using commercial-scale components and based on the Texaco gasifier has been operating successfully for more than three years at Barstow, California. The Cool Water Project was initiated by Texaco and Southern California Edison and extensively funded by EPRI and the Japanese. As the project progressed, oil prices dropped. Thus, avoided costs, which was the basis for the purchase price of power produced by the plant,
12-11
consequently was not be as high as was originally anticipated by the project sponsors. They were compelled to seek price support guarantees from the Synthetic Fuels Corp up to a maximum amount of $120 million during the plant's demonstration period, which ends in 1989.
Technically the project has been a success but economically the plant cannot be judged a commercial success. EPRI has progressed in its thinking on the gasification issue and now is proposing the development of "coal refineries" which would recover and market the by-products from coal gasification. For example, EPRI is studying a processing plant for using fly ash to remove valuable metals such as aluminum, iron, silver, titanium, and gallium. The Cool Water plant at present removes 99 percent of the sulfur from the coal and sells it for as much as $100/ton. However, the "coal refinery" is more like a chemical plant than an electric generating plan t and it is not clear that electric u tilities will want to be in the business of marketing coal by-products. EPRI has also proposed the use of the gasifier at Barstow for methanol production. The methanol could be stored and then used for peaking fuel or could be sold for use as a transportation fuel. Storing methanol for use as a peaking fuel in IGCC plants would also reduce the size of the gasifier needed in such units and consequently the capital costs. EPRI has submitted a proposal in the second round of the clean coal technology program to test this concept at the Barstow plant.
Utilities are not expected to adopt IGCC technology very quickly. Although many of the individual components of IGCC have been commercially applied for many years, other components are new and in fact unique to IGCC. The Cool Water plant's experience to date suggests that these components will perform adequately and will not involve excessive cost. Despite the good performance of the Cool Water project, many utility investors may lack sufficient confidence in component cost and performance estimates. There is also justifiable concern over the lack of demonstrated experience with the entire system since the only operating IGCC's are Cool Water and the Dow facility. There could also be major delays in the licensing and permitting process for IGCCs, particularly if the potential environmental impacts are not precisely known by regulators. For example, there is at present very little data available on the long-term leaching characteristics of gasification ash and slag.
Although the coal industry has had some reason to see low-cost natural gas as a significant threat to coal in some markets, the ready availability of such gas and the end of restrictions on its use in utility boilers because of the repeal of the relevant sections of the Fuel Use Act in 1987, have created considerable interest in building plants at which the initial unit is a combustion turbine. A steam turbine and gasifier are added at later stages. This has the benefit of taking advantage of a low-cost clean fuel while it is available and adding gasification technology as gas prices rise and gasification technology improves. Potomac Electric Power is planning a similar natural gas combined-cycle plant. The gasifier is to be added later when the economics become more favorable. The economics of such projects are discussed further below.
Such a phased-in approach is proposed for a project recently approved by Virginia Power. International Energy Corp. is to build two 300 MW units for Virginia Power which are to use a mixture of natural gas and synthetic gas produced from coal. The units, which are to be in operation late in 1990, are to operate initially on natural gas and will add gasifiers as natural gas prices rise. International Energy also has a 100 MW
12-12
coal-gas combined-cycle unit under construction in Hazelton, Pennsylvania which will use natural gas and synthetic gas in a 3:1 or 4:1 ratio. The electricity from the plant is to be purchased by Pennsylvania Power & Light and the steam is to be sold to nearby industries.
A further enhancement in gasification technology is being developed by M.W. Kellogg and Bechtel, who have submitted a proposal to fund a demonstration project in the second round of clean coal technology funding. The advanced gasification/combinedcycle system being developed by the two companies is said to be an improvement on the Cool Water technology. The project will use a KRW air-blown fluidized-bed gasifier and a combustion turbine with a non-reheat steam turbine. The goal is to develop gasification equipment which is compatible with standardized off-the-shelf gas turbines. The demonstration facility will be a 600 MW unit with a modularized gasifier island. The goal is to achieve capital costs below $l,OOOjkW of installed capacity. The planned unit will be built in Somerset County, Pennsylvania, and is expected to be operational by mid-1991. However, avoided costs, which cap the rate at which the electricity produced by the project can be sold to a utility, are too low for the project to be profitable in the first ten years.
There are still further improvements in the experimental phase of gasification technology. The DOE research laboratories are focussing on the technologies for hot gas clean-up. If implemented, these technololgies would remove sulfur and particles without first cooling the hot gas from the gasifier. If successful, this clean-up technology would significantly lower the cost of IGCC technology to below $l,OOOjkW.
Cogeneration
In 1978, the Carter Administration, deeply concerned about the nation's growing dependence on oil and gas, passed the National Energy Act of 1978. One aspect of this strategy was the Public Utility Regulatory Policies Act (PURPA) of 1978, which was to encourage entrepreneurial investment in renewable and alternative forms of energy. Prior to 1978, cogeneration had been in decline for about eighty years. In the 1890s, about two-thirds of U.S. electricity was produced at on-site power plants by industrial plant owners. At the turn of the century, cogenerated electricity was about 60 percent, by 1978, it was down to less than 5 percent.
In part, the basis of this trend was related to the economies of scale from large power plants. Further, it was reinforced by the existence of three key barriers to cogeneration:
o Utilities were not required to purchase excess power from cogenerators; if they did buy power, they paid for it at their average system cost.
o Rates for back-up power were very high.
o Cogenerators were regulated as utilities.
PURPA eliminated these barriers and created incentives for entrepreneurs to become involved in cogeneration and small power production. The major provisions of the act were as follows:
12-13
o Exemption from federal and state regulation as a utility.
o Exemption from oil and gas use prohibitions.
o Exemption from incremental pricing of natural gas.
o Guaranteed sale of excess power to utilities at their avoided cost.
o Permission for the simultaneous purchase and sale of power.
o Provision of tax incentive credits.
o Liberalized depreciation and leasing rules.
o Utilities are required to sell back-up power at reasonable rates.
o Utilities are com pelled to provide interconnection capability.
o Provision of mandatory wheeling authority across utility transmission systems.
o Profits exempt from federal and state rate of return regulations.
PURPA also imposed a minimum operating standard for "qualifying facilities" (QF), that is, thermal output must exceed 5 percent of total energy output, as well as minimum efficiency standards for facilities using oil or gas as fuel. Utility ownership of QFs was restricted to 50 percent or less. QFs were also permitted to easily obtain exemptions from the Power Plant and Industrial Fuel Use Act (PIFUA) for the use of gas in cogeneration facilities.
When PURP A was first proposed and passed into law, it was anticipated that entrepreneurs would build perhaps 5,000 MW of incremental capacity, primarily from renewable resources. Initially, the impact of PURPA was limited. PURPA gave the authority to each state utility commission to define avoided costs as it sees appropriate. This took some time to accomplish since some states attempted to establish benchmarks at 80 percent rather than 100 percent of avoided costs. It took time for the courts to rule in favor of the 100 percent avoided-cost interpretation. As well, the electric utility industry, led by American Electric Power Company, filed a lawsuit challenging PURPA. The suit was finally dismissed by the Supreme Court in 1983.
Uncertainties about the structures of financing of the QFs and about power purchase contracts signed by utilities with QFs resulted in an initial reluctance to invest on the part of the financial community. However, by 1983, several successful financial models had been tried, the litigation had been largely resolved, and investment in PURPA facilities became highly fashionable in the financial community. As of June 1987, cogeneration filings totaled 41,985.5 MW and small power filings totaled 15,347 MW. Small power production facilities tend to use either biomass or waste products as fuel or to be powered from wind, hydro, or geothermal sources. This "alternative energy" industry, which surged ahead faster than cogeneration in the early years after PURP A became law, appears now to be slowing down.
One difficulty in assessing the ultimate magnitude of the cogeneration industry is the lack of data on the historical base of installed capacity. GRI estimates that in 1980, the installed base was approximately 9,000 MW, but other industry sources put the figure for 1980 as high as 14,000 MW. For 1985, GRI estimates an installed capacity of 19,000 MW while other industry estimates suggest 22,900 MW. Both the DOE and the FERC have attempted to collect national data on cogeneration, but both have failed. The
12-14
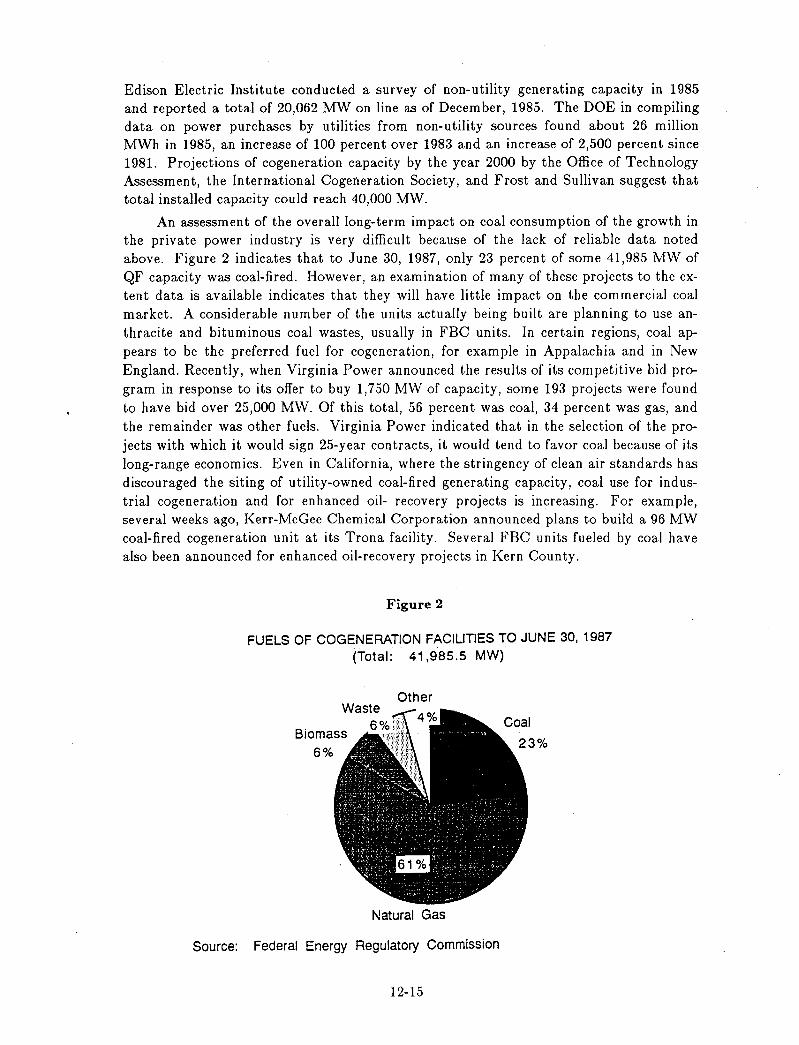
Edison Electric Institute conducted a survey of non-utility generating capacity in 1985 and reported a total of 20,062 MW on line as of December, 1985. The DOE in compiling data on power purchases by utilities from non-utility sources found about 26 million MWh in 1985, an increase of 100 percent over 1983 and an increase of 2,500 percent since 1981. Projections of cogeneration capacity by the year 2000 by the Office of Technology Assessmen t, the International Cogeneration Society, and Frost and Sullivan suggest that total installed capacity could reach 40,000 MW.
An assessment of the overall long-term impact on coal consumption of the growth in the private power industry is very difficult because of the lack of reliable data noted above. Figure 2 indicates that to June 30, 1987, only 23 percent of some 41,985 MW of QF capacity was coal-fired. However, an examination of many of these projects to the extent data is available indicates that they will have little impact on the commercial coal market. A considerable number of the units actually being built are planning to use anthracite and bituminous coal wastes, usually in FBC units. In certain regions, coal appears to be the preferred fuel for cogeneration, for example in Appalachia and in New England. Recently, when Virginia Power announced the results of its competitive bid program in response to its offer to buy 1,750 MW of capacity, some 193 projects were found to have bid over 25,000 MW. Of this total, 56 percent was coal, 34 percent was gas, and the remainder was other fuels. Virginia Power indicated that in the selection of the projects with which it would sign 25-year contracts, it would tend to favor coal because of its long-range economics. Even in California, where the stringency of clean air standards has discouraged the siting of utility-owned coal-fired generating capacity, coal use for industrial cogeneration and for enhanced oil- recovery projects is increasing. For example, several weeks ago, Kerr-McGee Chemical Corporation announced plans to build a 96 MW coal-fired cogeneration unit at its Trona facility. Several FBC units fueled by coal have also been announced for enhanced oil-recovery projects in Kern County.
Figure 2
FUELS OF COGENERATION FACILITIES TO JUNE 3D, 1987 (Toial: - 41,985.5 MW)
Other
Natural Gas
Source: Federal Energy Regulatory Commission
12-15
The Restructuring of the U.S. Electricity Utility Industry
Significant changes in the regulatory environment for electric and gas utilities and technological developments in the generation of electricity are likely in the 1990s to gradually alter the nature of the electric generation industry. Since the economic health of the U.S. coal industry is closely tied to the stability of the electric utility industry, a period of potentially significant change lies ahead. There are many factors to be considered in measuring the likely impact of these changes. However, from the present perspective, it appears that the net impact of these changes could be negative for the U.S. coal industry both in terms of demand growth and profitability.
The electric utility industry of the 1990s is expected to be more competitive, but substantial institutional and regulatory constraints will remain to inhibit effective competition, resulting in a mixed "competitive-regulated" marketplace. Large industrial, commercial, and wholesale customers have an increasing array of alternatives available to them in obtaining electric service. Institutionally, these choices include cogeneration, self-generation, or the purchase of service from entrepreneurs willing to invest in generation facilities to supply a facility's needs. Technologically, the choices now include coal, oil, gas, and alternate fuels (e.g., RDF, biomass). On the wholesale level, Canadian utilities and independent power producers (IPPs) will increasingly compete in the marketplace. The expansion of the number of options available to entities shopping for bulk power will have a number of effects on the electric utility industry:
o Electric utilities will be forced to enter into price competition to retain or obtain bulk power loads.
o A disaggregation of vertically-integrated services will occur in order to tailor service to a specific customer's needs.
o There will be an elimination of historical cross subsidies of certain classes of customers by others.
The many factors involved will have a major cumulative impact on the coal industry. Competition between generating entities using different fuels and different technologies on the one hand and between generating entities using the same technology, but having different fuel costs attributable either to location, contract vintage or transportation costs, on the other hand, will put severe pressure on coal prices.
The impact is already being felt in the cpal industry. Utilities are increasingly resorting to litigation to escape from high-priced contracts. In most instances, the courts have defended the sanctity of contracts entered into between utilities and coal companies, and some rather large damages awards have been made to coal producers. In many other cases, utilities have bought out contracts which,. because of escalation clauses, have risen above current market prices. Recent instances include Georgia Power's buy-out of two Westmoreland Coal contracts and Delmarva Power. & Light's buy-out of a Pittston contract.
Bulk-power-off-system sales have' also significantly increased the uncertainty about fuel needs. This causes utilities to rely more on the spot market and to build frequent price and volume re-openers into new long-term contracts. Far shorter contracts have also replaced the ten-to-twenty year contracts of the 1970s and early 1980s. Resource
12-16

Data International of Denver, which tracks utility coal contracts, found that in 1985, 50 percent of all new contracts signed were for a period of two years or less; in 1986, it was 60 percent and in 1987, it rose to 72 percent. Rising bulk power sales and inter-utility competition in the bulk power market are one mechanism by which lower oil and gas prices exert competitive power over coal prices. Such sales also bring utilities with highpriced coal into competition with utilities with low price of coal. It is not uncommon for utilities to offer to buy incremental coal tonnage for use in generating power for offsystem sales if their coal suppliers will decrease their prices. Thus, the competitive forces in the electricity industry will exert a steady downward pressure on coal prices. The effect of this pressure may, however, not be all bad because as coal prices decline, coal becomes more competitive than oil and natural gas, and the economics of at least some gas-fired projects could become more doubtful.
12-17
ENERGY USE IN BUILDINGS: THE U.S. EXPERIENCE AND LESSONS FOR CHINA
Mark D. Levine* and Bo Adamson**
This paper covers three topics concerning energy use in buildings. Its main focus is that of energy use in buildings in the United States. A second section describes some of the recent results of work by one the authors (BA) on energy performance of residential buildings in China. The third section contains suggestions for ways in which Chinese and U.S. researchers could establish fruitful collaborations on energy use in buildings.
Energy Use in U.S. Buildings
Buildings in the U.S. consume, according to the standard tabulations, more than 36% of total U.S. energy. 1 This means that buildings and industry, also at 36%, are by far the largest consumers of energy in the United States. If the energy required to heat, cool, light, and ventilate industrial buildings were included in the buildings sector, buildings would be the largest U.S. energy consumer.
Building energy consumption in the U.S. amounts to a total of 26.8 quads (one quad = 1015 Btu.) This compares with total commercial energy consumption in China of 21 quads. Thus, U.S. buildings, serving a population less than one-fifth that of China, consume more commercial energy than China uses for running its entire industry, transporting all people, materials, and products, pumping water, planting, harvesting, transporting, and harvesting crops, and all other uses.
The total bill for the 26.8 quads is more than $170 billion per year, at 1985 energy prices. (Today the energy bill for buildings is higher than it was in 1985, in spite of the decline in oil prices, because of the relatively small use of oil and the large use of electricity in buildings.) This $170 billion is about $750 per person in the United States, an amount three times greater than the per capita income of the average Chinese!
Trends in U.S. Building Energy Use
In 1973, residential buildings in the U.S. consumed 14.6 quads. In 1985, residential buildings consumed 15.3 quads, an increase of only 4.2% over a twelve year period (or about 0.34% per year). During the twelve year period before 1973, residential energy use increased 71%. Thus, the growth rate of energy use in the U.S. residential sector prior to the oil embargo was more than 13 times greater than after the embargo!
In 1973, commercial buildings consumed 9.5 quads. In 1985, the consumption was 11.6 quads, an increase of about 22%, or about 1.7% per year over this twelve year period. In the twelve year period prior to 1973, energy use in commercial buildings
* Energy Analysis Program, Lawrence Berkeley Laboratory, University of California
** Head, Dept. of Building Sciences, University of Lund, Sweden
13-1
increased by 97%, or 5.8% per year. Thus, the growth in commercial building energy use also declined substantially after the embargo (annual growth was cut by a factor of 3.4), but the commercial building sector appeared to respond less than the residential sector to higher energy prices.
These reductions in energy growth in the building sector are smaller than for other sectors. As a result, buildings consume a larger fraction of total U.S. energy use today than they did at the time of the oil embargo: 36.3% today versus 32.5% in 1973. Since the embargo, industry has cut its energy use by 4.5 quads (-14%), transportation has increased by 1.5 quads (+8%), and buildings have increased by 2.7 quads (+11%). According to these statistics, it might well appear that buildings have been the laggard in reducing energy use, compared with other end use sectors.
This is, we believe, not a correct conclusion. It is very important to recognize that buildings are very long-lived capital stock. A building will typically survive 75 to 100 years. Once a building is built many worthwhile options for increasing energy efficiency in a cost-effective manner are gone. Thus, considering that the existing building stock turns over very slowly, the gains in energy performance in the U.S. building sector that have occurred during the past decade and one half have been very substantial.
It is useful to look at the data on building energy use in a slightly different way. For the residential sector, the primary unit is the household. In 1973, the average household consumed 205.6 million Btu per year. In 1985, consumption was reduced to 176 million Btu per household per year. This 14% reduction occurred in spite of the fact that (1) electricity consumption increased in residential buildings, and the saturation of electric space heating increased, (2) the saturation of central air conditioners increased significantly (eg., less than half of new homes in 1973 had central air conditioners compared with 70% in each of the last five years), and (3) saturation of other energy using products increased as well.
The improved energy performance of the residential sector on a per household basis is a result of a large number of factors. These factors include two that have little to do with energy conservation or efficiency per se: the decline in the average household size during this period (from 3.1 to about 2.8 persons per household, a significant reduction) and a substantial population shift to the southern and southwestern regions of the United States (resulting in the movement of the average house to milder climates).
However, there have been significant conservation and efficiency measures in the U.S. residential sector: (1) the thermal integrity of new houses in much improved from 1973 houses, (2) a large number of existing houses have had energy audits and have installed energy retrofits, (3) the energy efficiency of many new appliances (especially refrigerators, freezers, furnaces, and central air conditioners) have increased significantly, (4) people are using appliances less than in the past, and (5) people are overheating houses less in winter, overcooling less in summer, and practicing night setback of thermostats. In addition to these factor, it is worth noting that almost all appliances (except central air conditioners) had achieved a large saturation by 1973, so that higher percentage saturations did not contribute to increased energy use. (See Levine, 1985, and Meyers, 1987, for more details and quantitative information about the efficiency improvements and conservation measures that have occurred in residential buildings. 2
,3)
13-2
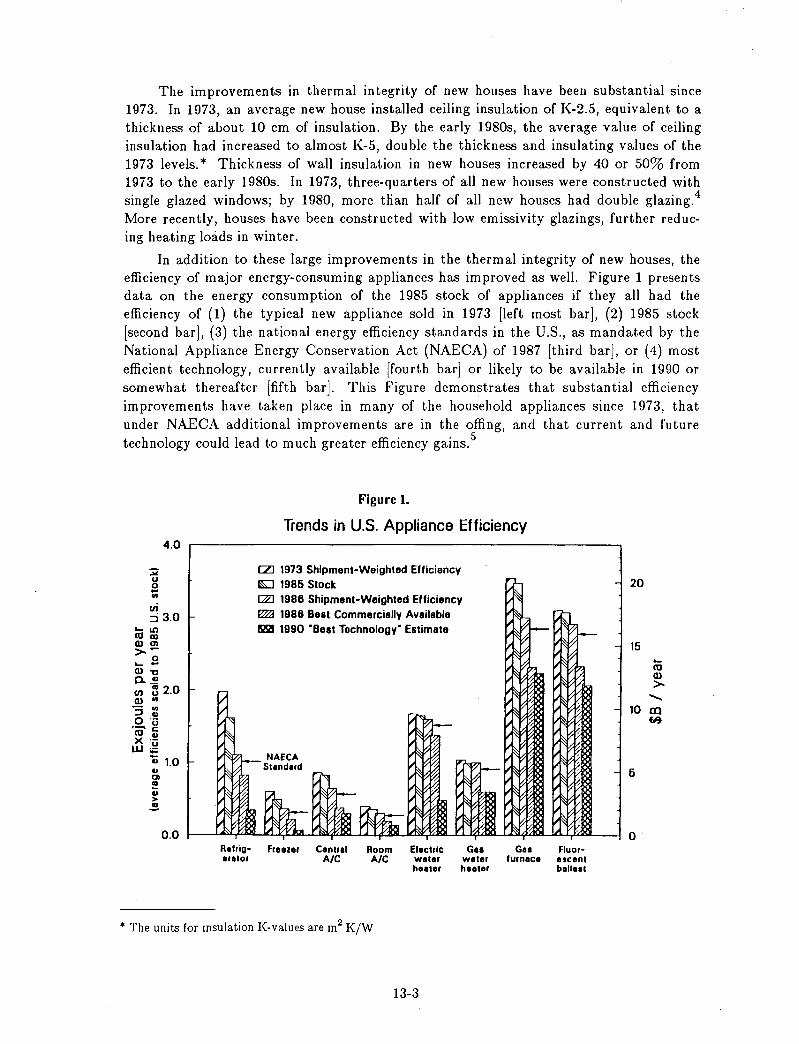
The improvements in thermal integrity of new houses have been substantial since 1973. In 1973, an average new house installed ceiling insulation of K-2.5, equivalent to a thickness of about 10 em of insulation. By the early 1980s, the average value of ceiling insulation had increased to almost K-5, double the thickness and insulating values of the 1973 levels. * Thickness of wall insulation in new houses increased by 40 or 50% from 1973 to the early 1980s. In 1973, three-quarters of all new houses were constructed with single glazed windows; by 1980, more than half of all new houses had double glazing.4
More recently, houses have been constructed with low emissivity glazings, further reducing heating loads in winter.
In addition to these large improvements in the thermal integrity of new houses, the efficiency of major energy-consuming appliances has improved as well. Figure 1 presents data on the energy consumption of the 1985 stock of appliances if they all had the efficiency of (1) the typical new appliance sold in 1973 [left most bar]' (2) 1985 stock [second bar]' (3) the national energy efficiency standards in the U.S., as mandated by the National Appliance Energy Conservation Act (NAECA) of 1987 [third bar], or (4) most efficient technology, currently available [fourth bar] or likely to be available in 1990 or somewhat thereafter [fifth bar]. This Figure demonstrates that substantial efficiency improvements have taken place in many of the household appliances since 1973, that under NAECA additional improvements are in the offing, and that current and future technology could lead to much greater efficiency gains. 5
~ u E ... vi
4.0
:j 3.0 ~1Cl CUeD O)cn >--
o ~ -0)"0 a..!! (I) ~ 2.0 0) ...
:; :: o 'u .(0 ; x .w~
i; to r I> CI ~ I> > ~
Figure 1.
Trends in U.S. Appliance Efficiency
!Zl 1973 Shipment-Weighted Efficiency ~ 1986 Stock ~ 1986 Shipment-Weighted Efficiency ~ 1986 Best Commercially Availabla 8Z5Z! 1990 ·Best Technology· Estimate
NAECA -Standard
Relrig- F"ezer Centrll eretor A/C
Room A/C
Electric Gill water wlter heeler heeter
Gil Fluor-'urnlce esclnt
belll.t
* The units for insulation K-values are m2 K/W
13-3
- 20
- 15 ~
CU 0)
>-......
10 OJ 'fl
6
o
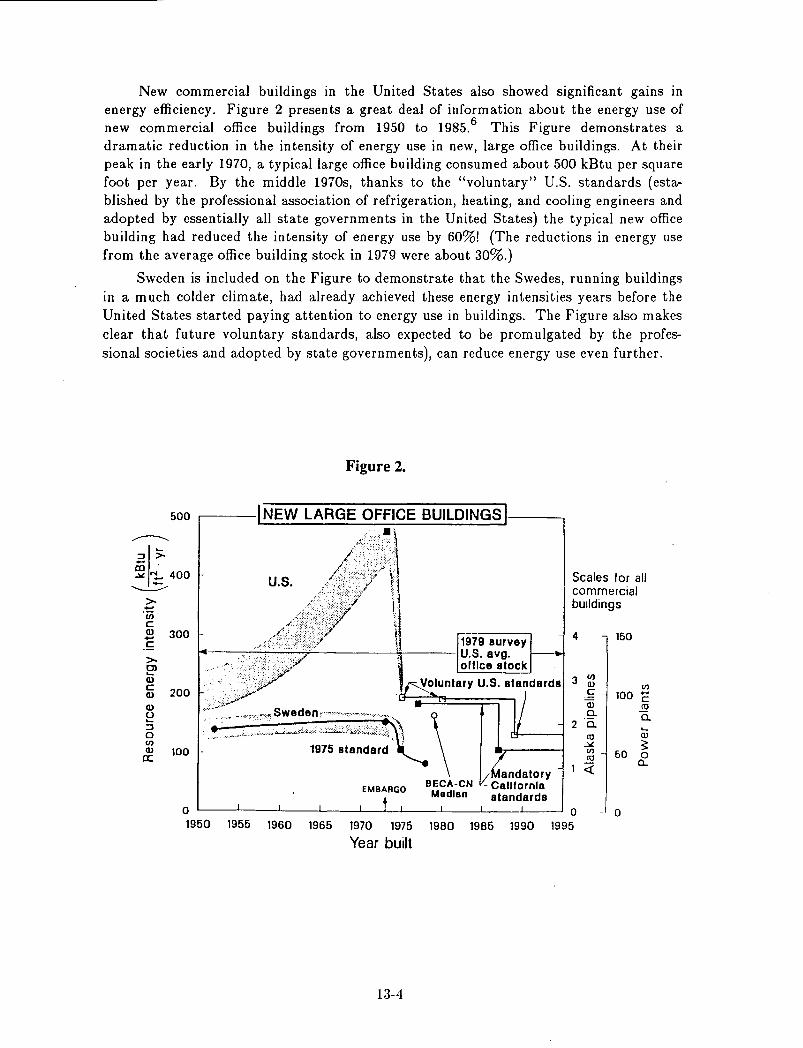
New commercial buildings in the United States also showed significant gains in energy efficiency. Figure 2 presents a great deal of information about the energy use of new commercial office buildings from 1950 to 1985.6 This Figure demonstrates a dramatic reduction in the intensity of energy use in new, large office buildings. At their peak in the early 1970, a typical large office building consumed about 500 kBtu per square foot per year. By the middle 1970s, thanks to the "voluntary" U.S. standards (established by the professional association of refrigeration, heating, and cooling engineers and adopted by essentially all state governments in the United States) the typical new office building had reduced the intensity of energy use by 60%! (The reductions in energy use from the average office building stock in 1979 were about 30%.)
Sweden is included on the Figure to demonstrate that the Swedes, running buildings in a much colder climate, had already achieved these energy intensities years before the United States started paying attention to energy use in buildings. The Figure also makes clear that future voluntary standards, also expected to be promulgated by the professional societies and adopted by state governments), can reduce energy use even further.
500
>--'iii c
Figure 2 .
.----1 NEW LARGE OFFICE BUILDINGS I
u.s.
~,::s
Scales tor all commercial buildings
.e 300 ,!:
.,l ,: .;< .. ;:~: , .. ,,~; . 1979 survey
"-'_-:~-"-?C:-:"":"-~""""":";;W;;"·~";;d7.'-n -:""-""-_'-'~'M-_'-"_-'''-' ~-•. ~, ,,,. -V-o-lu-n-tal~~~~~S~~~:~dard8 4 150
>-Cl '-Q)
c Q)
Q)
~ ::J o U) Q)
a:
200
100 -.... '"'~~,~ ~ \
EMBARGO BECA-CN
Madlan
3 ~ ,!: -ni a.
2 '0. ~-----i !O
andatory California standards
.:¥. U)
!O
1~
U)
100 C !O
0. '-OJ
3: 50 0
a..
o 0 - 0 1950 1955 1960 1965 1970 1975 1980 1985 1990 1995
Year built
13-4
With these dramatic reductions in energy use intensity in new office buildings since the peak in the early 1 970s, it is useful to ask why energy consumption in commercial buildings has continued to increase (albeit at a much slower growth rate than in the past) since 1973. Some factors that have worked to increase energy intensity in new commercial buildings (compared with results for office buildings) include: (1) many non-office commercial buildings have taken fewer steps to increase energy efficiency, (2) various miscellaneous energy uses (eg., computers) have increased substantially in the existing stock of office buildings, (3) building energy retrofit activity has been emphasized much less in commercial than residential buildings (with the exception of federally supported programs for schools and hospitals), (4) commercial buildings are often thought of as being much more complicated than residential buildings, with the result that common sense measures to save energy (including changes in behavior) are often not taken, (5) commercial building space has been growing more rapidly than housing, and (6) commercial appliances have not increased in efficiency as much as residential appliances (with the exception of lighting systems).
Thus, it is likely that commercial energy consumption will continue to increase at a rate somewhat faster than residential energy use in the United States. The opportunities for successful energy retrofit programs (eg., promoted by electric utilities) are substantial.
The Future
Overall, the energy efficiency of new residential and commercial buildings in the United States could increase by 25 to 50% through cost-effective investments at current energy prices. In spite of the large reductions in energy use that have already taken place through efficiency improvements, much more can be done in the future. The view, once widely held, that energy conservation would yield benefits for only a short time appears not to be valid. As time marches on, so does new, energy efficient, and cost-effective technology for buildings.
The critical issues affecting the future energy efficiency of the U.S. building stock and newly constructed buildings are: (1) will the marketplace invest in efficiency at suitable levels, (2) will the research efforts aimed at developing more efficient technologies continue, and (3) will the federal and state governments develop and implement new programs and policies to promote energy efficiency in buildings? The answers to these three questions are crucial determinants of the energy use of the next generation of U.S. buildings. As we have noted, buildings are the largest energy consuming sector in the United States. As such, the answers to these questions will profoundly influence the balance between energy supply and demand in the United States in the years to come.
Energy Use in Residential Buildings in China
One of us (BA) is, with Mr. Lang Siwei of the China Academy for Building Research, co-leader of a project concerning "design of new energy efficient buildings in moderate and cold climatic zones in China, including utilization of passive solar energy.,,7 The purpose of the studies has been to improve the indoor thermal and moisture conditions in unheated houses and to reduce the energy consumption in heated houses, in both cases by an improved building envelope. The approach taken has been to perform parametric
13-5
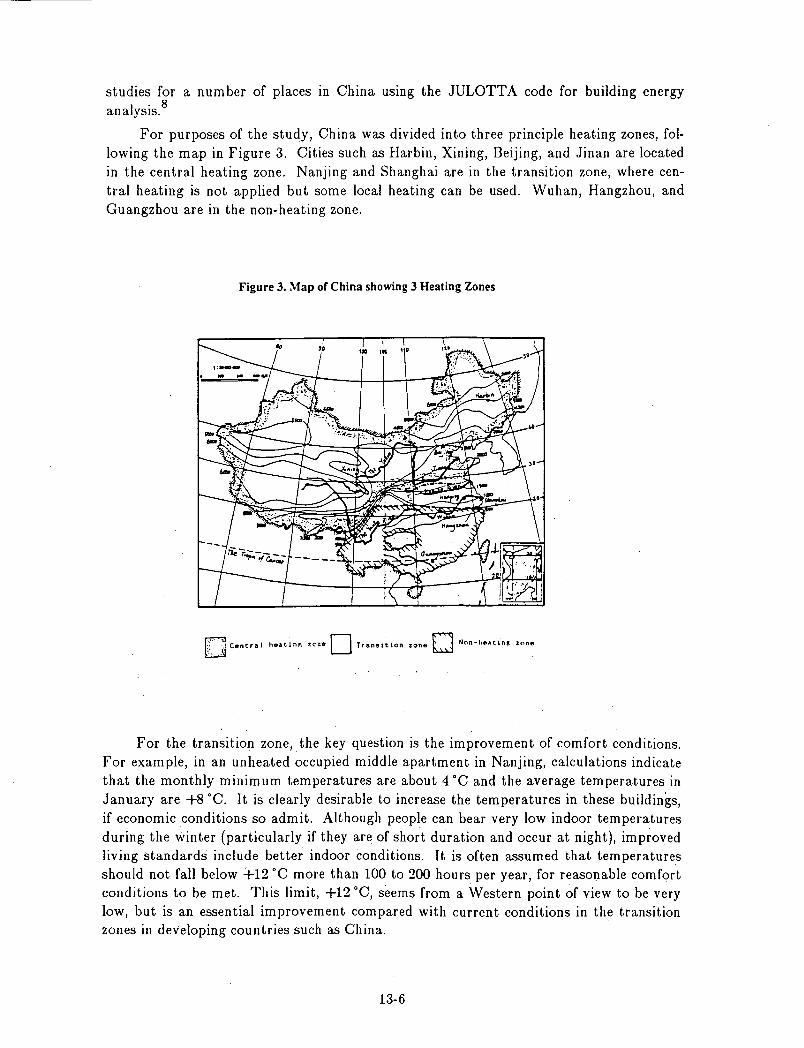
studies for a number of places in China USIng the JULOTTA code for building energy
I . 8 ana YSIS.
For purposes of the study, China was divided into three principle heating zones, following the map in Figure 3. Cities such as Harbin, Xining, Beijing, and Jinan are located in the central heating zone. Nanjing and Shanghai are in the transition zone, where central heating is not applied but some local heating can be used. Wuhan, Hangzhou, and Guangzhou are in the non-heating zone.
Figure 3. Map of China showing 3 Heating Zones
IT' 'I Central heatln, 7.Ne 0 Tr.nOltlon zone 0 Non-h .. .eln. Zt'n .. .. . \ .
For the transition zone, the key question is the improvement of comfort conditions. For example, in an unheated occupied middle apartment in Nanjing, calculations indicate that the monthly minimum temperatures are about 4°C and the average temperatures in January are +8°C. It is clearly desirable to increase the temperatures in these buildings, if economic conditions so admit. Although people can bear very low indoor temperatures
during the winter (particularly if they are of short duration and occur at night), improved living standards include better indoor conditions. It is often assumed that temperatures should not fall below +12 °C more than 100 to 200 hours per year, for reasonable comfort conditions to be met. This limit, +12 °C, seems from a Western point of view to be very low, but is an essential improvement compared with current conditions in the transition zones in developing countries such as China.
13-6
For buildings with central heating, the cost of the heating system is an essential part of the total building cost. If the heating system can be excluded (ie., a passively heated building), the cost of the heating system can be used to improve the building envelope without increasing the total building cost. We investigate this issue for buildings in the central heating zone, with the purpose of moving the border between the transition and the central heating zones northwards.
The possibility of passive climatization was studied for one city in the transition zone (Nanjing) and two cities in the central heating zone (Beijing and Xining). The design variables to achieve passive design included increasing: (1) insulation of exterior walls, (2) areas of south-facing glazing, (3) thermal mass of interior walls, and (4) reduction of air infiltration.
Results of Analysis
For Nanjing, in the transition zone, the simulations show that a middle-story apartment building can be expected to achieve temperatures of greater than +9 °0 in all but 100 hours with no heating system using a passive design. The temperature does not go below +8 °0 at any time during the year. This is accomplished by making the building envelope air tight (infiltration rate of 0.5 air changes per hour), placing moderate levels of insulation in the walls (K-value of 1.15) and roof (K-3), and orienting a large single-glazed window area (10.5 square meters) facing south. Double glazing can raise the indoor temperature 2 to 2.5 °0. Reduction of the south glazing area to 3.3 square meters will lower the indoor temperature 0.5 °0. With relatively simple passive design measures, reduction in infiltration, and envelope insulation, the indoor conditions in Nanjing can be improved by +4 °0.
For Beijing, in the central heating zone, the simulations showed that an apartment building can be expected to achieve temperatures of greater than +14 °0 in all but 100 hours with· no heating system using a passive design. This design includes (1) wellinsulated exterior walls (K-3) and roofs (K-6), (2) inner walls simulated with 100 square meters of 24 cm brick per apartment, a rather high thermal storage capacity, (3) 10.5 square meters glass area facing south, a large glass area, and (4) low infiltration (0.5 air changes per hour). The windows are single-glazed. If the inner walls are of bricks with less than 12 cm thickness, +13 °0 is achieved all but 100 hours of the year. (Upper stories are very slightly colder.) These results should be compared with interior temperatures of +8 °0 achieved all but 100 hours with relatively small south-facing windows (3.3 square meters) and much lower temperatures if the walls and roof are not insulated and infiltration is high (i.e., current practice). The important finding from this analysis is that it is possible to design a passive residential house in the Beijing climate that meets comfort conditions significantly better than present ones.
For a heated building in Beijing, the annual energy consumption can be reduced from 78 kWh/square meter (uninsulated building, single glazing, 1.1 air changes per hour, and 5.2 square meters of south-facing glass) to 33 kWh/square meter (double glazing and moderate wall and roof insulation) to 11 kWh/square meter (as above but with infiltration reduced to 0.5 air changes per hour). Thus, the sim ulations suggest that, at current comfort conditions, the installation of a very few conservation measures can reduce annual energy use to 15% of typical current levels, for heated apartments in
13-7
Beijing.
Moving to a colder climate, Xining, the analyses show that one cannot come close to the comfort region with passive design and no heating system. For the house in Beijing that achieved a minimum temperature of 13 ·C, the minimum temperature in Xining is about 2 ·C. These passive measures and envelope insulation will, however, significantly reduce heating requirements in apartments in Xining.
Opportunities for Cooperation
This paper highlights (1) improvements in the energy efficiency of the building stock that have taken place in the United States during the past fifteen years and (2) the potential for improvements in residential buildings in China.
We suggest that there are a number of areas where collaborative work among Chinese and U.S. (as well as other western) researchers would be highly desirable. These include:
• establishing methods to gather data on energy use in buildings in China
This would be an extremely valuable activity, as it is important to track building energy consumption over time to determine needed policy approaches. A number of different data bases would be valuable: an aggregate data base of energy use in residential and commercial buildings and more detailed regional data bases that provides more information about the causes of the changes in energy consumption. U.S. researchers could provide the benefit of their experience in the design of different data gathering instruments.
• assessing technologies to increase energy efficiency of buildings and energy consuming equipment in buildings
Numerous technologies have been developed in the industrialized West that improve energy efficiency, comfort, and economic performance of buildings. Advances in methods for identifying energy inefficiencies in buildings, improved insulation, more efficient appliances, air infiltration controls, more efficient lighting systems, and passive design are just a few examples of the technological improvements that have been made in the past ten to fifteen years. An effort to evaluate western technology for application to China and, where appropriate, to identify ways to establish the capability to manufacture and employ these technologies could be highly beneficial. A closely related issue concerns the development and transfer of technology to avert potentially injurious environmental impacts of energy production and use. A particularly important case that comes to mind is the need for refrigeration that does not use CFCs. As China's economy expands, the sale of refrigerators is likely to expand enormously. Chinese refrigerators could have a very large impact on global climate, if measures are not taken to develop and employ refrigeration technologies that avoid the use of CFCs.
• development of programs and policies to cost-effectively increase the energy efficiency of Chinese buildings
There have evolved over the past decade a wide variety of programs and policies to effect energy savings in building in the United States and other developed countries. Of particular note in the United States have been (1) federal energy efficiency
13-8
standards (either voluntary or mandatory), (2) state standards, (3) electric utility rebate programs to foster energy efficient appliances, (4) electric utility energy audit programs for residential buildings, and (5) utility low interest loan programs to foster energy conservation investments in residential and commercial buildings. These policies and programs are dependent on a substantial body of analysis, as well as the development and application of analytical tools and data.
Lawrence Berkeley Laboratory is presently leading a major effort to develop policies to promote energy efficient commercial buildings in five countries in Southeast Asia (Indonesia, Malaysia, Philippines, Singapore, and Thailand). One of the authors (MDL) is the principal investigator of this project. The project involves education, collaborative research, cooperation with the private sector, and technical and policy studies, with the purpose of developing and implementing energy standards for commercial buildings (as well as exploring other policy vehicles to improve energy efficiency). The other author (BA), as noted, is already engaged in a collaboration with Chinese researchers. These types of exchanges, significantly amplified, could be extremely valuable.
As China's economy grows, the need to use limited energy resources efficiently will, we believe, become increasingly apparent. The inefficient use of energy will (1) cost China valuable foreign exchange (as oil exports are reduced), (2) cost consumers yuan, as they overspend for energy (directly in houses and indirectly through more costly products), and (3) strain the capital resources of China, as large amounts of capital are needed to fuel the energy sector. As the developed countries have discovered, investments in energy efficiency payoff handsomely. We believe that some of the various approaches to spur such investments in energy efficiency in industrial countries may apply to industrializing countries like China. We also believe that the Chinese will develop indigenous methods of improving the efficiency of energy use. Collaboration, in both technical and policy studies, has the potential to be a very valuable undertaking.
Notes and References
1. U.S. Department of Energy/Energy Information Agency, State Energy Data Book, April, 1987.
2. Levine, Mark, "Patterns of Energy Use in Buildings," draft chapter in a forthcoming book Fundamentals of Building Energy Dynamics, MIT Press, draft prepared 1985.
3. Meyers, Steven, "Energy Consumption and Structure of the U.S. Residential Sector: Changes between 1970 and 1985," Annual Review of Energy, 12:81-97, 1987.
4. National Association of Home Builders, Characteristics of Residential New Construction in the United States, 1983.
5. McMahon, James, Levine, M. D., Ruderman, Stoft, S., and H., Turiel, I, "Analysis of the Impacts of the National Appliance Energy Conservation Act of 1987," LBL Report, 1988.
6. Rosenfeld, A. H., "A Collection of Useful Information about Energy Use in Buildings," Lawrence Berkeley Lab., 1988.
13-9

7. This project is taking place under the aegis of the research cooperation between the Ministry for Urban and Rural Construction and Environmental Protection, China, and the Council for Building Research, Sweden.
8. Kallblad, K., JULOTTA, computer program for calculation of heat balance in rooms and buildings, Report BKL 1986:26.
13-10
ENERGY USE IN CHINESE BUILDINGS
Lang Siwei*
Introduction
In this paper the current situation of energy consumption for space heating in residential buildings and for air conditioning in high-rise commercial buildings is described. We also discuss measures for saving energy, the status of district heating, and ways of promoting its development.
Realizing the modernization of China depends on the adequate supply of energy and its effective use. At present, energy use in buildings accounts for about 20% of total energy consumption in China. In recent years construction of residential buildings has proceeded at a rapid rate. The floor area of existing residential buildings has reached 4,600 million m2
. Half of this is located in the central heating zone. As the living standard improves, the area in which heating occurs will be expanded southward. Since 1979, a large number of high-rise buildings, such as hotels, offices and apartments, have been built to serve the needs of tourism and of exchange between our country and the outside world. By the end of 1986, the floor area of new buildings with air conditioning installation had reached 2.3 million m2
, equivalent to 19% of the total floor area of new high-rise buildings. 1
Energy Use for Heating in Residential Buildings and Measures for Saving Energy
China is divided into three heating zones: the central heating zone, the transition zone, and the non-heating zone. The central heating zone is defined as those areas in which there are more than ninety days having average daily temperature less than or equal to 5 ·C. In the transition zone, the number of such days is between sixty and eighty-nine, or is less than sixty days, but there are more than seventy-five days in which the average daily temperature is less than or equal to 8 ·C. Other areas are called the non-heating zone. The central heating zone occupies about 70% of the total land area, the transition zone about 15%. The floor area of residential buildings in cities and towns in the central heating zone accounts for about 50% of total floor area of residential buildings in cities and towns of China, and the floor area in the transition zone accounts for about 20%. The floor area of residential buildings occupies about 70% of the floor area of all non-industrial heated buildings in cities and towns. Most residential buildings are multi-storied and made of brick and concrete.
* Institute of Air Conditioning, China Academy of Building Research
14-1
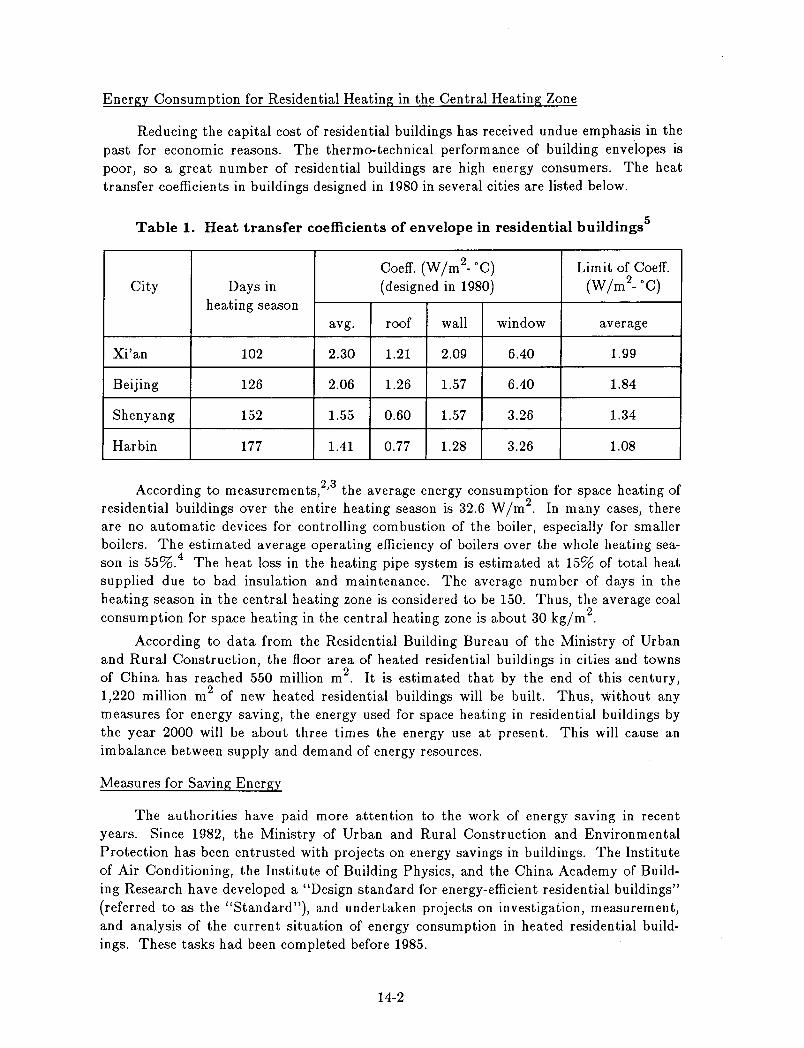
Energy Consumption for Residential Heating in the Central Heating Zone
Reducing the capital cost of residential buildings has received undue emphasis in the past for economic reasons. The thermo-technical performance of building envelopes is poor, so a great number of residential buildings are high energy consumers. The heat transfer coefficients in buildings designed in 1980 in several cities are listed below.
Table 1. Heat transfer coefficients of envelope in residential buildings5
Coefl'. (W Im2- °C) Limit of Coefl'.
City Days in (designed in 1980) (W Im 2- °C)
heating season avg. roof wall window average
Xi'an 102 2.30 1.21 2.09 6.40 1.99
Beijing 126 2.06 1.26 1.57 6.40 1.84
Shenyang 152 1.55 0.60 1.57 3.26 1.34
Harbin 177 1.41 0.77 1.28 3.26 1.08
According to measurements,2,3 the average energy consumption for space heating of residential buildings over the entire heating season is 32.6 W 1m2
. In many cases, there are no automatic devices for controlling combustion of the boiler, especially for smaller boilers. The estimated average operating efficiency of boilers over the whole heating season is 55%. 4 The heat loss in the heating pipe system is estimated at 15% of total heat supplied due to bad insulation and maintenance. The average number of days in the heating season in the central heating zone is considered to be 150. Thus, the average coal consumption for space heating in the central heating zone is about 30 kg/m2.
According to data from the Residential Building Bureau of the Ministry of Urban and Rural Construction, the floor area of heated residential buildings in cities and towns of China has reached 550 million m2. It is estimated that by the end of this century, 1,220 million m2 of new heated residential buildings will be built. Thus, without any measures for energy saving, the energy used for space heating in residential buildings by the year 2000 will be about three times the energy use at present. This will cause an imbalance between supply and demand of energy resources.
Measures for Saving Energy
The authorities have paid more attention to the work of energy saving in recent years. Since 1982, the Ministry of Urban and Rural Construction and Environmental Protection has been entrusted with projects on energy savings in buildings. The Institute of Air Conditioning, the Institute of Building Physics, and the China Academy of Building Research have developed a "Design standard for energy-efficient residential buildings" (referred to as the "Standard"), and undertaken projects on investigation, measurement, and analysis of the current situation of energy consumption in heated residential buildings. These tasks had been completed before 1985.
14-2
Through investigation and measurement over several years, the energy consumption of residential buildings in the central heating zone has become understood. This provides the basic data for formulating policy of energy saving in buildings, and for com piling a design standard for energy-efficient residential buildings.
The Standards was approved in March 1986 by the Ministry of Urban and Rural Construction, and since August 1986, it has been approved for trial use. A circular about putting the Standard into effect was issued in September 1987 by the Ministry, the State Planning Commission, the State Economic Commission, and the State Building Material Bureau. The circular will promote projects on energy savings in residential heated buildings. The target of energy savings put forward in the Standard is as follows: the average energy consumption for space heating in new buildings designed before 1990 will be reduced 30% compared with that of buildings designed in 1980, and the average energy consumption of new buildings in 2000 will be reduced 30% compared with that of new buildings designed in 1990.
The Standard is composed of general principles: the number of heating degree days in the heating season, indoor calculation temperature, the heat consumption index, estimation of energy consumption for space heating, thermo-technical design in building, design of heating engineering, economic evaluation, and eight appendices. According to the stipulation of the Standard, some detailed implementation programs are being compiled, and demonstration buildings have been built by some provinces and cities in the central heating zone. 6
,7 According to the measurements and analysis in the pilot buildings, it is possible to reduce energy consumption by 30% with an incremental capital cost of less than 5%.
Improvement of Thermal Conditions in Residential Buildings in Cities and Towns in the Transition Zone
One of the features of the transition zone is high population and developed industry. According to 1985 data, the total floor area of residential buildings in cities and towns is about 470 million m2 and the population is about 38 million, which is 31% of the urban population in the whole country. Although the temperature is mild in winter, it is humid and cold, and also very hot in summer. Because of the economic situation, there are no central heating installations in residential buildings, no insulation, and poor air-tightness in the envelope, so that the indoor environment conditions are poor.
Feasibility studies and pilot buildings utilizing passive solar design have shown that the average temperature in the heating season can reach 10-12°C in the bedroom facing the south, and residents in the top story do not receive too much heat in summer. The incremental capital cost of such a building is less than 10%.8
Analysis of Energy Consumption and Potential for Energy Savings in High-Rise BuildingsO
In existing high-rise buildings with air conditioning, it is estimated that air conditioning and refrigeration accounts for 50-60% of total electricity consumption in the building. 1 Of the electricity consumption for air conditioning and refrigeration, 40-50% is consumed through heat transfer of the envelope, 30-40% is consumed by treating
14-3
outdoor fresh air, and 25-30% is consumed by transportation and distribution of water and air. On the basis of data from high-rise hotels, the installed capacity of air conditioning, refrigeration and ventilating equipment is about 45-65% of total installed electrical capacity; that of lighting is about 20-30%; that of kitchen, laundry, steam bath; etc., is about 10-15%; and that of elevators, telephone, TVs, etc., is about 5-10%.
According to data from ten hotels in several cities, average electricity use for a standard guest room (double-bed room with floor area of 30 m2) is about 21-30 kWh/day.
Factors rnfl uencing Electricity Oonsum ption
Selection of chiller plant and heating plant. Use of absorption chillers is a good way of reducing electricity consumption and reducing the pressure of supplying electricity in the summer. Electrical resistance heating should be prohibited in winter.
Thermo-technical performance of the envelope in existing and new high-rise buildings is generally poor. In Shanghai and Guangzhou, the heat transfer coefficient of external walls is more than that in residential buildings in Beijing. Single glazing is used in external windows. The ratio between window area and wall area is about 0.3-0.4; sometimes the ratio reaches 0.5. This makes energy consumption increase greatly.
Outdoor fresh air circulation and heat recovery. At present the value of outdoor fresh area circulation for guest rooms is about 40-50 m 3/ hour per person in most hotels. According to this value, energy consumption for treating outdoor air accounts for 30-35% of total energy consumption in the whole year. It is possible to reduce this by 50-60% by using heat recovery.
The rate of hire for guest rooms and the rate of business for restaurants and shops in hotels also influences electricity consumption.
The difference in weather in various regions influences energy consumption in two aspects. One is the difference between indoor and outdoor calculation temperatures and indoor and outdoor enthalpies. The other one is the difference in the number of days in which heat and cool energy should be supplied.
Methods for Saving Energy
By improving the thermo-technical performance of the building envelope, loss of cool energy through heat transfer can b~ reduced 30-50%. At present, the average heat transfer coefficient of the envelope in Shanghai and Guangzhou regions is more than 3.49 W /m2 °0, and the average in Beijing region is about 2.33 W /m2 00. The electricity consumed for cool energy loss through heat transfer in external walls accounts for 10-17% of total electricity use in hotels. If the average heat transfer coefficient of the envelope is reduced to 1.16 W /m2 °0, for example, the heat loss through heat transfer will be reduced 30-50%, resulting in a reduction in total electricity use of 3-8%. This can be accomplished if the external wall of high-rise buildings in the abovementioned regions is insulated, if thermal-reflect hollow glass is used for external windows, and the ratio between window area and wall area is less than 0.4.
By means of recovery of cool energy or heat energy from exhaust air in the air conditioning system, the outdoor fresh air is pre-heated or pre-cooled. This can reduce electricity consumption for treating outdoor air by 3-5%.
14-4
If the following measures are put into effect to save energy used for transporting and distributing water and air, total electricity consumption can be reduced by 10%.
• Operating the circulation pump of the hot water and cold water systems takes about 3.7% of total electricity consumption. If the water system is reasonably divided into different subsystems, and the number of sets and capacity of pu~ps are correctly selected, and the number of sets are also controlled with variable volume of water, or pumps of variable rotation speed are used, electricity use can be reduced by 60%.
• Electricity use for transporting and distributing supply air and exhaust air of guest rooms takes about 6% of the total at present. If half value of outdoor fresh air volume is ventilated when guests go out in the day and in the night, electricity use can be cut in half.
• Electricity use for the ventilating system in the kitchen is about 2.8% of the total at present. If half of the normal ventilating volume is operated in the time for preparation of meal and cleaning, this can reduce electricity use by 60%.
• Electricity use for transporting and distributing air in the restaurant is about 2.4% of the total. If 80% of the lights are turned off and a variable air volume system is used when the restaurant is closed, this can reduce electricity consumption by 75%.
The air leakage in air conditioning and ventilation systems should be stopped. The volume of air leakage reaches to 10-20% of the total volume at present. This loss corresponds to 5% of total electricity use over the whole year. If the air leakage is reduced to 3%, electricity use can be reduced.
It is evident from the above analysis that the potential of energy saving is high. As long as energy saving in buildings is given importance and some measures are adopted in design and construction, electricity consumption can be reduced 20-27%, only considering the energy saving in air conditioning. Research about energy saving in buildings with air conditioning is now being further developed.
District Heating in Cities10
Current Status of District Heating
District heating in cities began with cogeneration of power and heat. It has experienced a development stage, a stagnant stage, and again a development stage in the past thirty years.
The supply of heat from cogeneration is rising steadily at an average rate of 6% per year. Total heat supplied in 1984 was 84.7 trillion kcal. There are district heating installations in forty-one cities, which amounts to one-third of the cities in the entire central heating zone. District heating covered 55.2 million m2 of floor area by the end of 1985. The average coverage of district heating in cities has risen from 2% in 1980 to 6.4% in 1985. In Beijing the coverage is nearly 16%. Supply heat plans for forty-three cities have been compiled on the basis of the city general plan.
District heating improves the quality of heat supply and the heating conditions in public and residential buildings. The average value of energy savings for one year is about 1.3 million tons of coal. The reduction of dust is about 0.72 million tons and that of sulfur dioxide is about 0.49 million tons.
14-5
Generally, the development of district heating in cItIes has not kept up with the demand of city construction. The engineering technology of district heating has lagged behind. The heat loss from supply heat pipelines is rather high and there are not yet advanced adjustment devices.
Development of District Heating
It is important to raise understanding of the necessity, urgency and feasibility of speeding up development of district heating. Analysis about technology and economics is required, as well as a process for selecting the optimum scheme according to the practical situation. Also needed are ways of improving system economy as fully as possible.
Selecting the mode for supply heat and its capacity should consider integration with gasification and electrification. Construction of power cogeneration should be in accordance with the requirement of the supply heat plan. In cities that have a longer heating season, the steam-condensing turbine unit, which is located in the downtown or the suburb of the city, should be retrofitted to use circulating waste hot water for space heating. In the transition heating zone, which has a shorter heating season, research is needed into the special modes of supply heat that are optimal.
It is important to take measures for reducing the engineering cost of supply pipelines. This includes selecting the optimum layout of pipelines, and selecting a reasonable load density of pipelines. It is also important to formulate a code about supply heat as early as possible, and to strengthen technical management and training.
References
1. "The current situation, problem and countermeasures of air conditioning engineering in high-rise buildings," Institute of Air Conditioning, CABR, 1987,7.
2. Research Group on Energy Consumption, "Measurement and analysis of energy use for heating system of residential building," Institute of Air Conditioning, CABR, 1985,6.
3. Heating Research Laboratory, "A field testing of energy energy consumption in a district heating system at the campus of Harbin Teachers University," Harbin Architectural and Civil Engineering Institute, 1984,1l.
4. Lang Siwei, "Discussion of measures for decreasing heating energy consumption in residen tial buildings," Report of Building Research 1 986, No. 5-5, CARB.
5. Ministry Standard, "Design standard for energy efficient residential buildings (heating residential building part), JGJ 26-28," 1 986, Beijing.
6. Zhu Wenpeng, "Research on applied technology for energy efficient residential building," "Test and research on energy efficient residential building in Fu Jiang Xi Li," Beijing Architectural Design Institute, 1987,9.
7. Tu Fengxiang, "An energy-conserving and cost-effective residential building," Building Research Institute, China Construction First Engineering Division, 1987,8.
8. Lang Siwei, "Climate characteristics and feasibility of energy efficient building in transition zone of China," First Colloquium on Building Energy Conservation between CABR of China and CSTB of France, 1986.
14-6

9. Wang Xunchang, "Design and air conditioning engineering in high-rise building and analysis of potentiality for energy saving," Institute of Air Conditioning, CABR, 1987,9.
10. Research Group of District Heating in Cities, "The status quo, prospect and way for promoting the district heating in China," Building Science, 1986, No.3, CABR.
14-7
URBANIZATION AND MODERN LIFESTYLES: IMPLICATIONS FOR FUEL USE
Jayant A. Sathaye*
Introduction
Urbanization is an integral part of the process of economic development. Mexico City, Calcutta, Shanghai and other large urban areas are continuing to grow at a rapid pace. By the end of the century developing country urban centers will dominate the list of the largest cities in the world, overshadowing cities like Tokyo, New York and London.
Energy demand in the developing countries has increased at 4.7% annually since 1973. This is in stark contrast to a 0.2% annual growth rate for the OECD group of countries during the same period. The rapid growth makes it important to better understand the process of urbanization and the likely consequences for energy and oil demand. Urbanization has been an increasingly important factor in the rapidly rising demand for energy in the developing countries. Urban populations have better access to modern fuels and electricity and are more likely to use them because of their modern lifestyles.
This paper examines several issues regarding the changes in lifestyles and fuel use brought about by the increasing urbanization in developing countries. These issues focus on the use of fuels and electricity in urban households, and the increasingly faster acquisition of motor vehicles and the use of government policy to control their growth. In earlier papers we have extensively reviewed the literature on urban energy use [1]. Here we focus on some recent findings and selected issues regarding the use of energy in an urban setting.
The development of urban centers is due to the migration of rural population to economically attractive urban areas and due to the gradual increase in size of smaller towns which eventually become large enough to be denoted as urban areas. Because of these reasons, the number of cities in the low-income economies with populations over 500,000 persons almost tripled between 1960 and 1980 while the total population increased only 60% [2].
Most people in the developing countries still live in rural areas. But the proportion living in urban areas has grown between 1960 and 1985 from 17% to 22% in the lowincome countries and from 24% to 37% in the lower-middle-income countries. The process of urbanization prevails across all continents and income classes although the growth rates differ across regions and coun tries.
Higher levels of urbanization are associated with higher average incomes. Although, the way continents were settled and consequent economic development took place also have a strong influence on urbanization levels. In Latin America, where much of the settlement took place due to migration from abroad, urban centers developed quickly. Development of the hinterland and farms occurred as settlers moved towards less
* Energy Analysis Program, Lawrence Berkeley Laboratory
15-1
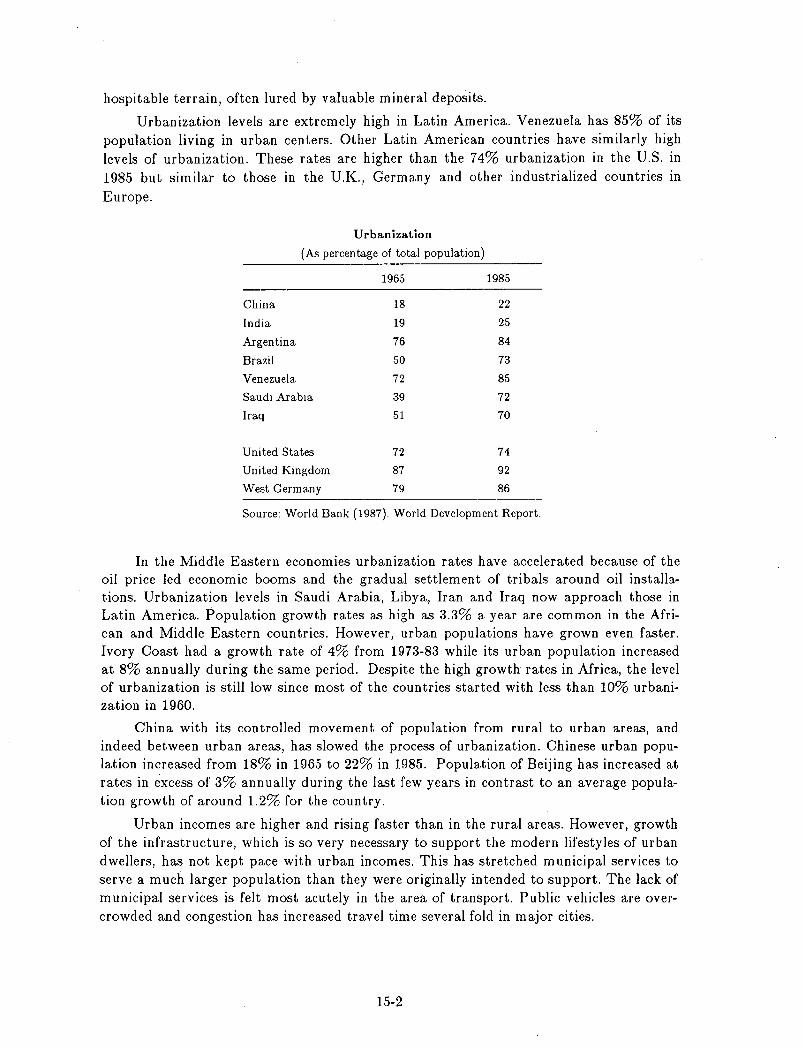
hospitable terrain, often lured by valuable mineral deposits.
Urbanization levels are extremely high in Latin America. Venezuela has 85% of its population living in urban centers. Other Latin American countries have similarly high levels of urbanization. These rates are higher than the 74% urbanization in the U.S. in 1985 but similar to those in the U.K., Germany and other industrialized countries in
Europe.
Urbanization
(As percentage of total population)
1965 1985
China 18 22
India 19 25
Argentina 76 84
Brazil 50 73
Venezuela 72 85
Saudi Arabia 39 72
Iraq 51 70
United States 72 74
United Kingdom 87 92
West Germany 79 86
Source: World Bank (1987). World Development Report.
In the Middle Eastern economies urbanization rates have accelerated because of the oil price led economic booms and the gradual settlement of tribals around oil installations. Urbanization levels in Saudi Arabia, Libya, Iran and Iraq now approach those in Latin America. Population growth rates as high as 3.3% a year are common in the African and Middle Eastern countries. However, urban populations have grown even faster. Ivory Coast had a growth rate of 4% from 1973-83 while its urban population increased at 8% annually during the same period. Despite the high growth· rates in Africa, the level of urbanization is still low since most of the countries started with less than 10% urbanization in 1960.
China with its controlled movement of population from rural to urban areas, and indeed between urban areas, has slowed the process of urbanization. Chinese urban population increased from 18% in 1965 to 22% in 1985. Population of Beijing has increased at rates in excess of 3% annually during the last few years in contrast to an average population growth of around 1.2% for the country.
Urban incomes are higher and rising faster than in the rural areas. However, growth of the infrastructure, which is so very necessary to support the modern lifestyles of urban dwellers, has not kept pace with urban incomes. This has stretched municipal services to serve a much larger population than they were originally intended to support. The lack of municipal services is felt most acutely in the area of transport. Public vehicles are overcrowded and congestion has increased travel time several fold in major cities.
15-2
Modern Lifestyles
An important feature of urbanization is the adoption of modern lifestyles. Rural populations tend to be less mobile, attuned to lower comfort levels and rely largely on traditional fuels. Movement to urban areas and the subsequent adoption of modern lifestyles brings with it a quantum shift in the types and levels of energy use. The adoption of modern lifestyles is facilitated by the availability of reliable supply of electricity, kerosene, LPG and transportation fuels in urban areas.
Modern lifestyles bring about changes in the pattern of living. Generally the move to urban areas leads to higher income levels and a consequent propensity to acquire modern appliances and motorized personal vehicles. Both have important implications for fuel use.
Appliances may be classified into those needed for cooking, water heating, food preservation, personal comfort and entertainment. In cooking, the move to urban areas leads to the use of more efficient stoves that use modern fuels. Refrigerators for food preservation tend to be one of the first appliances that are bought by urban households. Water heating is predominantly electric and consists of the use of in-flow heaters (often referred to as geysers); personal comfort is achieved through the use of ceiling and table fans and room air-conditioners for cooling and a variety of systems for both room and home heating. Entertainment, which was once dominated by radios, now largely consists of TVs and VCRs.
Difference in Urban and Rural Household Energy Consumption
Data from India illustrate the large differences between urban and rural patterns of household energy consumption. Per capita use of modern energy sources in 1978 was six times higher in urban households than in rural ones.
15-3
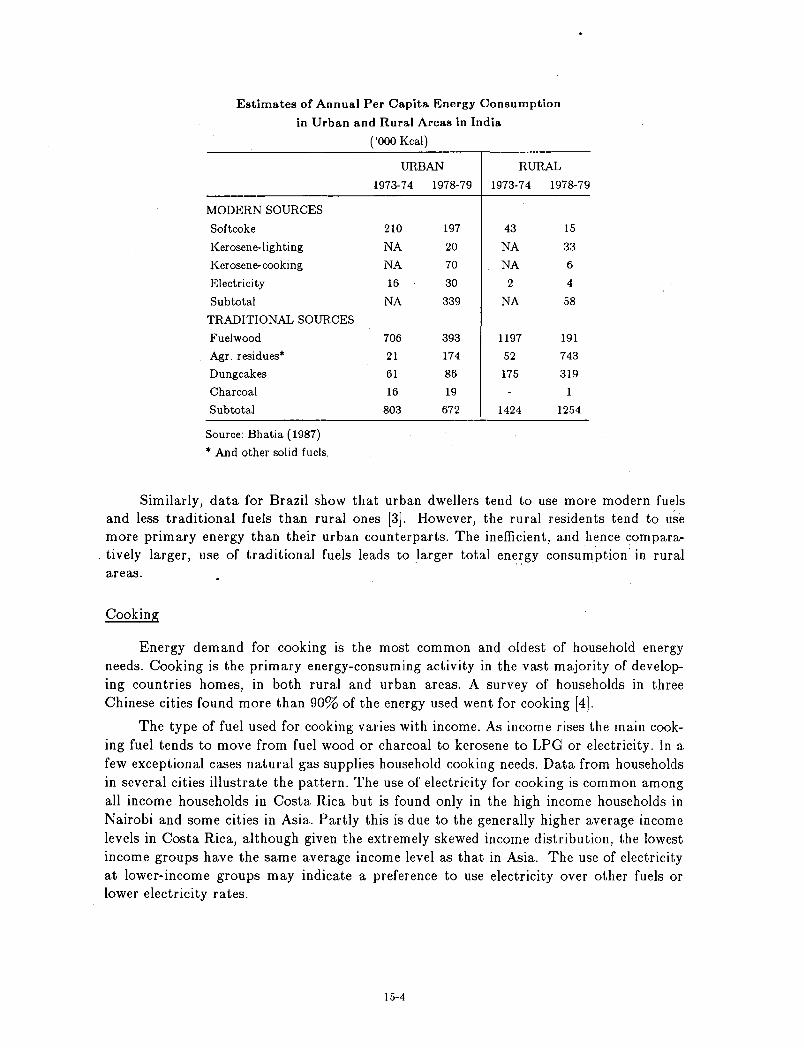
Estimates of Annual Per Capita Energy Consumption
in Urban and Rural Areas in India
('000 Kcal)
URBAN RURAL
1973-74 1978-79 1973-74 1978-79
MODERN SOURCES
Softcoke 210 197 43 15
Kerosene-lighting NA 20 NA 33
Kerosene-cooking NA 70 NA 6
Electricity 16 30 2 4
Subtotal NA 339 NA 58
TRADITIONAL SOURCES
Fuelwood 706 393 1197 191
Agr. residues* 21 174 52 743
Dungcakes 61 86 175 319
Charcoal 16 19 1
Subtotal 803 672 1424 1254
Source: Bhatia (1987)
* And other solid fuels.
Similarly, data for Brazil show that urban dwellers tend to use more modern fuels and less traditional fuels than rural ones [3]. However, the rural residents tend to use more primary energy than their urban counterparts. The inefficient, and hence comparatively larger, use of traditional fuels leads to larger total energy consumption in rural areas.
Cooking
Energy demand for cooking is the most common and oldest of household energy needs. Cooking is the primary energy-consuming activity in the vast majority of developing countries homes, in both rural and urban areas. A survey of households in three Chinese cities found more than 90% of the energy used went for cooking [4].
The type of fuel used for cooking varies with income. As income rises the main cooking fuel tends to move from fuel wood or charcoal to kerosene to LPG or electricity. In a few exceptional cases natural gas supplies household cooking needs. Data from households in several cities illustrate the pattern. The use of electricity for cooking is common among all income households in Costa Rica but is found only in the high income households in Nairobi and some cities in Asia. Partly this is due to the generally higher average income levels in Costa Rica, although given the extremely skewed income distribution, the lowest income groups have the same average income level as that in Asia. The use of electricity at lower-income groups may indicate a preference to use electricity over other fuels or lower electricity rates.
15-4

Hyderabad (1982)
Lower-income
Middle-income
Higher- income
Nairobi (1981)
Lower-income
Middle-income
Higher-income
Costa Rica Urban (1981)
Lower-income
Middle- income
Higher-income
Source: Surveys cited in
Cooking Fuels Used in Urban Householdsa
Firewood Charcoal Kerosene LPG
(percent of households in grouping)
41
24
13
15
9
4
(b) (b) (b)
52
18
9
2
1
70
65
57
35
14
0
2
1
0
19
54
71
14
52
27
16
15
14
Electricity
0
16
70
57
72
82
Sazama, G. (1986). Residential Energy and the Growth Process. Economics Dept., University of Connecticut.
Sathaye, J., Meyers, S. (1985). Energy use in cities of the developing countries.Ann. Rev. of Energy, 10.
Hughe&-Cromwick, E. (1985). Nairobi households and their energy use. Energy Economics, Oct. 1985.
(a) Data for Hyderabad (India) reflect use of more than one fuel by households.
Nairobi (Kenya) data refer to "primary" cooking fuel.
(b) Small amounts of charcoal are used at all income levels.
Availability strongly influences the use of fuel wood, which remains a common fuel among the urban poor in many places. Where it is available for free or at low cost, it tends to be used, for reasons of both cost and habit. However, while the price of modern fuels, such as kerosene and LPG, is often subsidized by the government that of fuel wood and charcoal is not. The consequence of this policy is that the poor are made to pay a disproportionate share of their disposable income for energy [5]. Where traditional fuels have a commercial market in urban areas, they may be trucked from several hundred miles away. The city of Hyderabad in central India receives fuel wood Jrom forested areas 300 to 400 miles north of the city [6]. .
Ownership and use of multiple appliances which use different fuels for cooking is a common feature of developing country households. This occurs with rising incomes as households tend to use kerosene, LPG and finally electricity each with diminishing reliability of supply. Lack of reliable fuel supply forces households to maintain a variety of options. This is also the reason that 57% of households in Italy rely on a mix of natural gas, LPG and electricity for cooking.
Lighting
The degree of indoor lighting is one of the main differences between developing countries urban and rural homes. Most rural households use kerosene lamps that do not provide a great deal of light. Studies in India have shown rural dwellers use kerosene lamps,
15-5
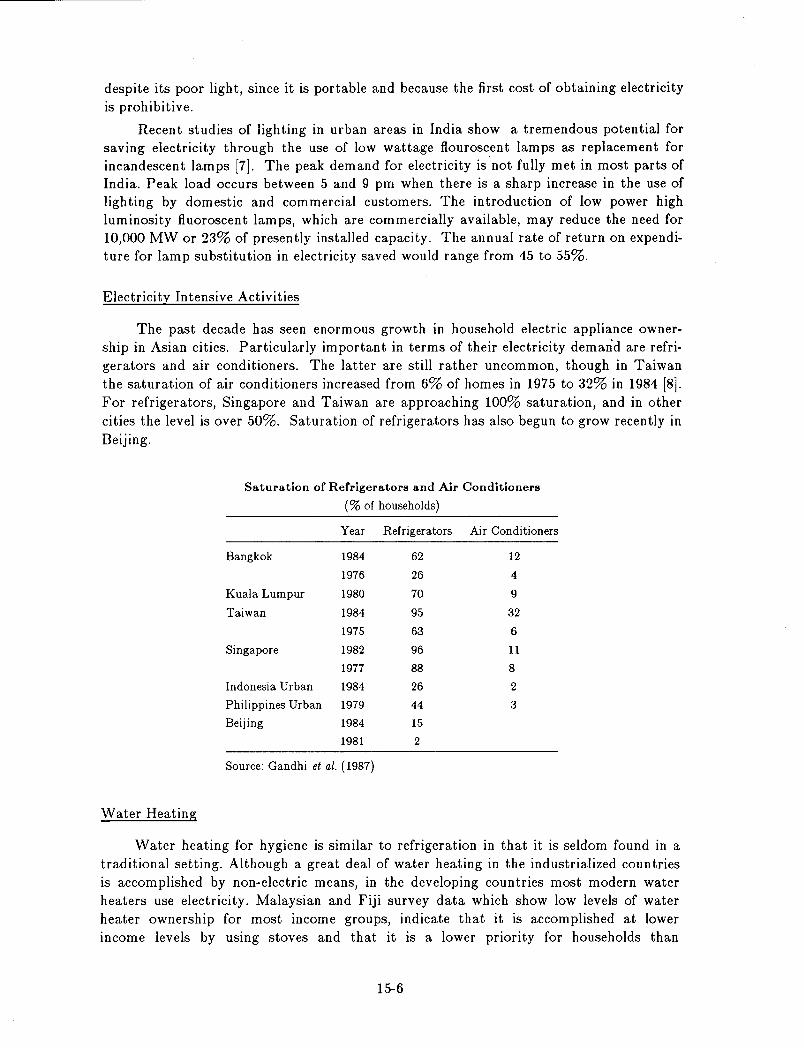
despite its poor light, since it is portable and because the first cost of obtaining electricity is prohibitive.
Recent studies of lighting in urban areas in India show a tremendous potential for saving electricity through the use of low wattage flouroscent lamps as replacement for incandescent lamps [7]. The peak demand for electricity is not fully met in most parts of India. Peak load occurs between 5 and 9 pm when there is a sharp increase in the use of lighting by domestic and commercial customers. The introduction of low power high luminosity fluoroscent lamps, which are commercially available, may reduce the need for 10,000 MW or 23% of presently installed capacity. The annual rate of return on expenditure for lamp substitution in electricity saved would range from 45 to 55%.
Electricity Intensive Activities
The past decade has seen enormous growth in household electric appliance ownership in Asian cities. Particularly important in terms of their electricity demand are refrigerators and air conditioners. The latter are still rather uncommon, though in Taiwan the saturation of air conditioners increased from 6% of homes in 1975 to 32% in 1984 [8]. For refrigerators, Singapore and Taiwan are approaching 100% saturation, and in other cities the level is over 50%. Saturation of refrigerators has also begun to grow recently in Beijing.
Saturation of Refrigerators and Air Conditioners
(% of households)
Year Refrigerators Air Conditioners
Bangkok 1984 62 12
1976 26 4
Kuala Lumpur 1980 70 9
Taiwan 1984 95 32
1975 63 6
Singapore 1982 96 11
1977 88 8
Indonesia Urban 1984 26 2
Philippines Urban 1979 44 3
Beijing 1984 15
1981 2
Source: Gandhi et al. (1987)
Water Heating
Water heating for hygiene is similar to refrigeration in that it is seldom found in a traditional setting. Although a great deal of water heating in the industrialized countries is accomplished by non-electric means, in the developing countries most modern water heaters use electricity. Malaysian and Fiji survey data which show low levels of water heater ownership for most income groups, indicate that it is accomplished at lower income levels by using stoves and that it is a lower priority for households than
15-6
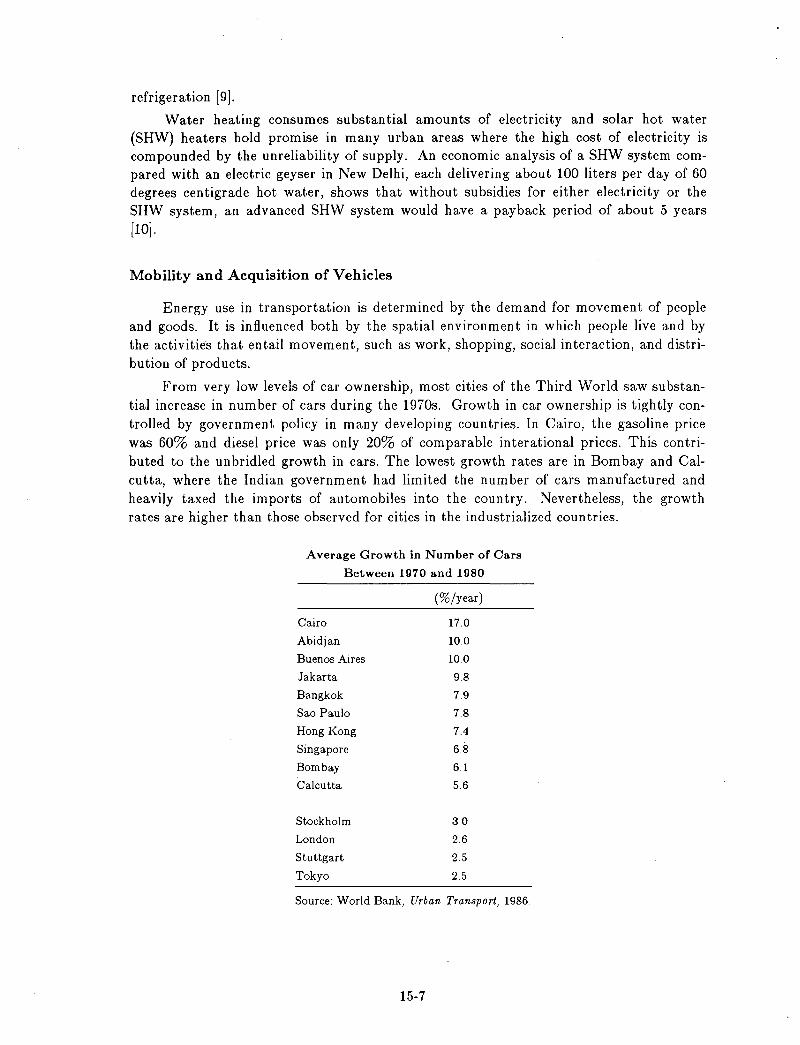
refrigeration [9].
Water heating consumes substantial amounts of electricity and solar hot water (SHW) heaters hold promise in many urban areas where the high cost of electricity is compounded by the unreliability of supply. An economic analysis of a SHW system compared with an electric geyser in New Delhi, each delivering about 100 liters per day of 60 degrees centigrade hot water, shows that without subsidies for either electricity or the SHW system, an advanced SHW system would have a payback period of about 5 years [10].
Mobility and Acquisition of Vehicles
Energy use in transportation is determined by the demand for movement of people and goods. It is influenced both by the spatial environment in which people live and by the activities that entail movement, such as work, shopping, social interaction, and distribution of products.
From very low levels of car ownership, most cities of the Third World saw substantial increase in number of cars during the 1970s. Growth in car ownership is tightly controlled by government policy in many developing countries. In Cairo, the gasoline price was 60% and diesel price was only 20% of comparable interational prices. This contributed to the unbridled growth in cars. The lowest growth rates are in Bombay and Calcutta, where the Indian government had limited the number of cars manufactured and heavily taxed the imports of automobiles into the country. Nevertheless, the growth rates are higher than those observed for cities in the industrialized countries.
Average Growth in Number of Cars
Between 1970 and 19SO
(%/year)
Cairo 17.0
Abidjan 10.0
Buenos Aires 10.0
Jakarta 9S
Bangkok 79
Sao Paulo 7.8
Hong Kong 7.4
Singapore 6.8
Bombay 6.1
Calcutta 5.6
Stockholm 3.0
London 2.6
Stuttgart 2.5
Tokyo 2.5
Source: World Bank, Urban Transport, 1986.
15-7
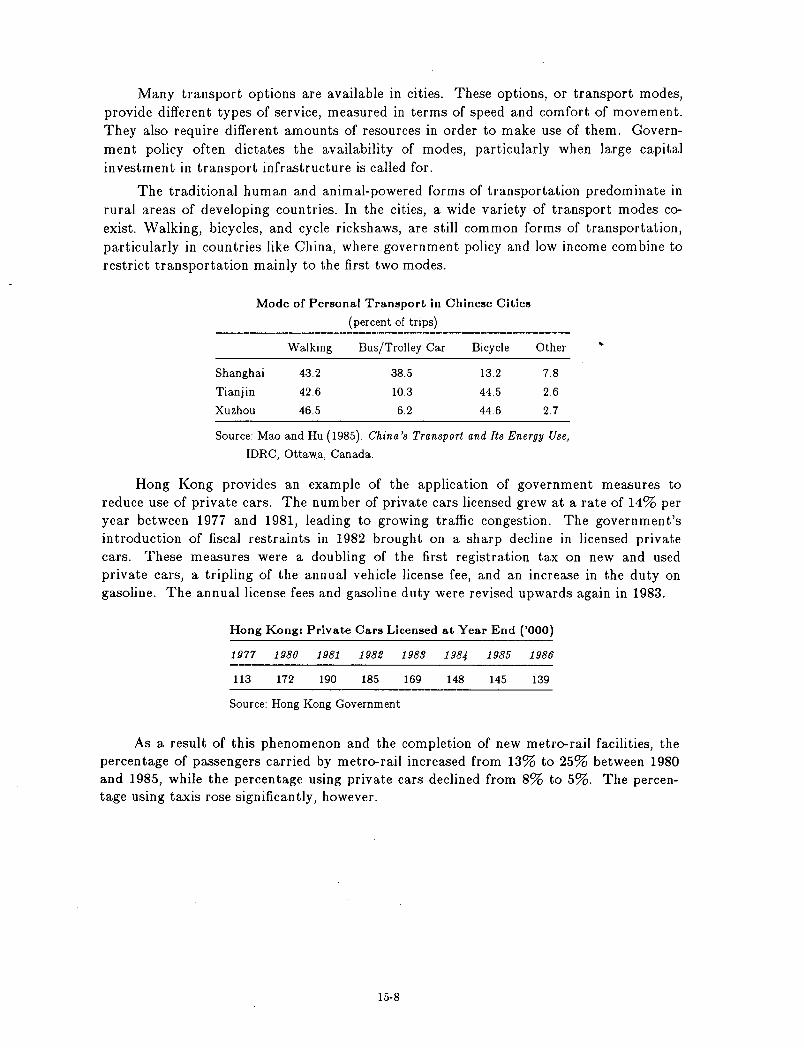
Many transport options are available in cities. These options, or transport modes, provide different types of service, measured in terms of speed and comfort of movement. They also require different amounts of resources in order to make use of them. Government policy often dictates the availability of modes, particularly when large capital investment in transport infrastructure is called for.
The traditional human and animal-powered forms of transportation predominate in rural areas of developing countries. In the cities, a wide variety of transport modes coexist. Walking, bicycles, and cycle rickshaws, are still common forms of transportation, particularly in countries like China, where government policy and low income combine to restrict transportation mainly to the first two modes.
Mode of Personal Transport in Chinese Cities
(percent of trips)
Walking Bus/Trolley Car Bicycle Other
Shanghai 43.2 38.5 13.2 7.8
Tianjin 42.6 10.3 44.5 2.6
Xuzhou 46.5 6.2 44.6 2.7
Source: Mao and Hu (1985). China's Transport and Its Energy Use,
IDRC, Ottawa, Canada.
..
Hong Kong provides an example of the application of government measures to reduce use of private cars. The num ber of private cars licensed grew at a rate of 14% per year between 1977 and 1981, leading to growing traffic congestion. The government's introduction of fiscal restraints in 1982 brought on a sharp decline in licensed private cars. These measures were a doubling of the first registration tax on new and used private cars, a tripling of the annual vehicle license fee, and an increase in the duty on gasoline. The annual license fees and gasoline duty were revised upwards again in 1983.
Hong Kong: Private Cars Licensed at Year End ('000)
1977 1980 1981 1982 1988 1984 1985 1986
113 172 190 185 169 148 145 139
Source: Hong Kong Government
As a result of this phenomenon and the completion of new metro-rail facilities, the percentage of passengers carried by metro-rail increased from 13% to 25% between 1980 and 1985, while the percentage using private cars declined from 8% to 5%. The percentage using taxis rose significantly, however.
15-8
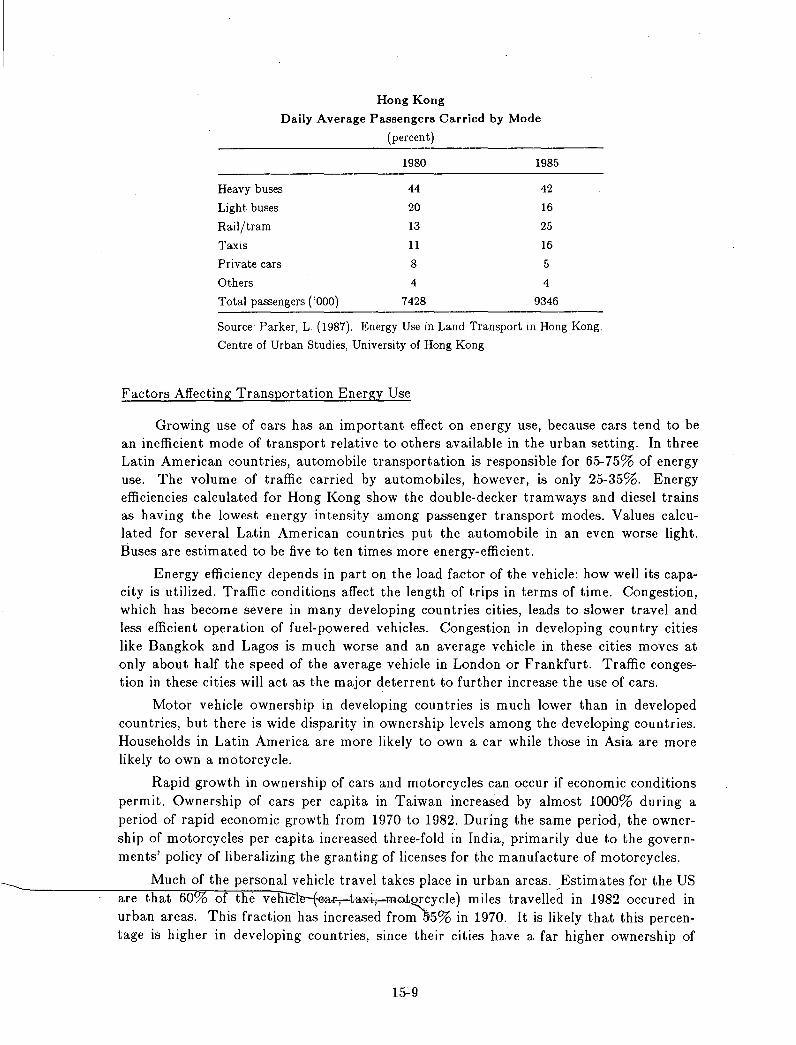
Hong Kong
Daily Average Passengers Carried by Mode
(percent)
1980 1985
Heavy buses 44 42
Light buses 20 16
Rail/tram 13 25
Taxis 11 16
Private cars 8 5
Others 4 4
Total passengers ('000) 7428 9346
Source: Parker, L. (1987). Energy Use in Land Transport in Hong Kong.
Centre of Urban Studies, University of Hong Kong.
Factors Affecting Transportation Energy Use
Growing use of cars has an important effect on energy use, because cars tend to be an inefficient mode of transport relative to others available in the urban setting. In three Latin American countries, automobile transportation is responsible for 65-75% of energy use. The volume of traffic carried by automobiles, however, is only 25-35%. Energy efficiencies calculated for Hong Kong show the double-decker tramways and diesel trains as having the lowest energy intensity among passenger transport modes. Values calculated for several Latin American countries put the automobile in an even worse light. Buses are estimated to be five to ten times more energy-efficient.
Energy efficiency depends in part on the load factor of the vehicle: how well its capacity is utilized. Traffic conditions affect the length of trips in terms of time. Congestion, which has become severe in many developing countries cities, leads to slower travel and less efficient operation of fuel-powered vehicles. Congestion in developing country cities like Bangkok and Lagos is much worse and an average vehicle in these cities moves at only about half the speed of the average vehicle in London or Frankfurt. Traffic congestion in these cities will act as the major deterrent to further increase the use of cars.
Motor vehicle ownership in developing countries is much lower than in developed countries, but there is wide disparity in ownership levels among the developing countries. Households in Latin America are more likely to own a car while those in Asia are more likely to own a motorcycle.
Rapid growth in ownership of cars and motorcycles can occur if economic conditions permit. Ownership of cars per capita in Taiwan increased by almost 1000% during a period of rapid economic growth from 1970 to 1982. During the same period, the ownership of motorcycles per capita increased three-fold in India, primarily due to the governments' policy of liberalizing the granting of licenses for the manufacture of motorcycles.
Much of the personal vehicle travel takes place in urban areas. Estimates for the US are that 60% of the veliiTh-(-c-ar..,.t-a&i,m~cycle) miles travelled in 1982 occured in urban areas. This fraction has increased from 55% in 1970. It is likely that this percentage is higher in developing countries, since their cities have a far higher ownership of
15-9
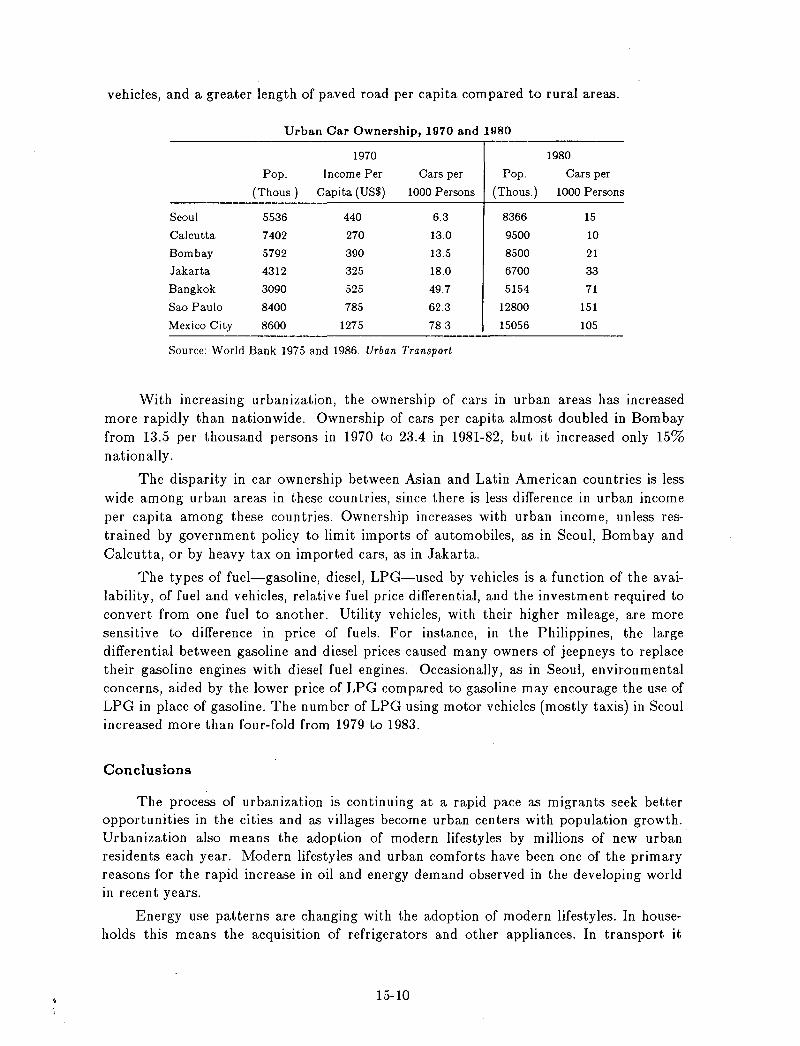
vehicles, and a greater length of paved road per capita compared to rural areas.
Urban Cal' Ownership, 1970 and 19SO
1970 1980
Pop. Income Per Cars per Pop. Cars per
(Thous.) Capita (US$) 1000 Persons (Thous.) 1000 Persons
Seoul 5536 440 6.3 8366 15
Calcutta 7402 270 13.0 9500 10
Bombay 5792 390 13,5 8500 21
Jakarta 4312 325 18.0 6700 33
Bangkok 3090 525 49,7 5154 71
Sao Paulo 8400 785 62,3 12800 151
Mexico City 8600 1275 78.3 15056 105
Source: World Bank 1975 and 1986. Urban Transport.
With increasing urbanization, the ownership of cars in urban areas has increased more rapidly than nationwide. Ownership of cars per capita almost doubled in Bombay from 13.5 per thousand persons in 1970 to 23.4 in 1981-82, but it increased only 15% nationally.
The disparity in car ownership between Asian and Latin American countries is less wide among urban areas in these countries, since there is less difference in urban income per capita among these countries. Ownership increases with urban income, unless restrained by government policy to limit imports of automobiles, as in Seoul, Bombay and Calcutta, or by heavy tax on imported cars, as in Jakarta.
The types of fuel-gasoline, diesel, LPG-used by vehicles is a function of the availability, of fuel and vehicles, relative fuel price differential, and the investment required to convert from one fuel to another. Utility vehicles, with their higher mileage, are more sensitive to difference in price of fuels. For instance, in the Philippines, the large differential between gasoline and diesel prices caused many owners of jeepneys to replace their gasoline engines with diesel fuel engines. Occasionally, as in Seoul, environmental concerns, aided by the lower price of LPG compared to gasoline may encourage the use of LPG in place of gasoline. The number of LPG using motor vehicles (mostly taxis) in Seoul increased more than four-fold from 1979 to 1983.
Conclusions
The process of urbanization is continuing at a rapid pace as migrants seek better opportunities in the cities and as villages become urban centers with population growth. Urbanization also means the adoption of modern lifestyles by millions of new urban residents each year. Modern lifestyles and urban comforts have been one of the primary reasons for the rapid increase in oil and energy demand observed in the developing world in recen t years.
Energy use patterns are changing with the adoption of modern lifestyles. In households this means the acquisition of refrigerators and other appliances. In transport it
15-10
means the acquisition of cars, motorcycles and other personal vehicles. While there is room for growth in the adoption of appliances and modern heating systems, vehicle saturations in many urban areas may have peaked. Strong government policy in Hong Kong has been responsible for dissuading customers from purchasing vehicles in favor of using mass transit systems.
Cities like Shanghai in China are already crowded with very little or no personal ownership of vehicles. Allowing personal ownership of vehicles will exacerbate congestion and increase the consumption of scarce petroleum products. Yet, in order to achieve higher economic standards mobility is important. Can it be achieved without the ownership of personal vehicles or do new types of motor vehicles need to be favored? This is the dilemma faced by many governments today.
Acknowledgements: The author would like to acknowledge the assistance of Steve Meyers in compiling specific information on fuel use and government policy.
References
[1] Sathaye, J. and S. Meyers. (1985). "Energy Use in the Cities of the Developing Countries." Annual Review of Energy, Vol. 10, 109-133; and Sathaye, J. and S. Meyers. (1988). "Transport and Home Energy Use in Cities of the Developing Countries: A Review." The Energy Journal, Vol.8.
[2] World Bank (1987). World Development Report, 1987.
[3] Goldemberg J.,et.al.. (1984). Brazil: A Study on End-Use Energy Strategy. Presented at the Global Workshop on End-Use Oriented Energy Strategy, Sao Paulo.
[4] Zhu, H., Brambley, M. and Morgan, R. (1983). "Household Energy Consumption in the People's Republic of China." Energy 8:763-74.
[5] Bhatia, R. (1987). Energy Pricing and Household Energy Consumption in India: An Analysis of Efficiency and Equity Issues.
[6] Alam, M., Dunkerley, J., Gopi, K., Ramsay, W. (1983). Fuelwood Survey of Hyderabad. Resources for the Future: Washington, DC.
[7] Gadgil A. et. al. (1987). Two Strategies for Electric Load Levelling for India. Phase I, Final Report. Tata Energy Research Institute, Delhi.
[8] Gandhi, S., Ketoff, A., and Sathaye, J. (1987). Trends in Saturation of Refrigerators and Air Conditioners in Developing Countries. LBL-23745, Lawrence Berkeley Laboratory: Berkeley, CA.
[9] Socio Economic Research Unit, 1981. The Use of Energy and Attitudes towards Energy Conservation among Urban Households. Kuala Lumpur: Prime Minister's Dept.; and Siwatibau, S. (1987). Urban Energy in Fiji: A Survey of Suva's Household Industrial and Commercial Sectors. International Development Research Center, Canada.
[10] Mubayi V. and Leigh R. (1987). Issues in Commercialization of Solar Hot Water Technology in India. Presentation to U.S. AID.
15-11
URBAN ENERGY SUPPLY AND UTILIZATION IN CHINA
Zhang Tingwu*
Introduction
With the deepening of economic reform, China's urbanization process has accelerated. Since 1979, non-agricultural production in rural areas has developed rapidly. According to incomplete statistics, now about 20% of rural labor has been shifted into industrial production. This has caused growth of cities. In 1985, the number of cities has passed 300, and the "town" population exceeded 200 million. This is a significant historical shift.
Along with urban population growth, the living standard of urban residents has also improved remarkably. In 1982, the per capital living expenses of town residents was 495 yuan; in 1987, the figure increased to 916 yuan. Deducting the influence of inflation, the real average annual increase rate was 6.3%. Urban modernization also progressed rapidly. All these changes caused the increase of urban energy demand and changes in the consumption structure.
China's urban energy supply and consumption have the following features:
1. Urban energy consumption is based mainly on coal. Except for a few cases, China's large and medium-size cities consume no firewood and non-commercial energy sources. Except for in a few large cities, coal takes up more than 80% of total urban energy consumption.
2. The State offers subsidies for civil used coal, urban gas, and LPG. For historical reasons, the production costs of all urban energy sources, except for electricity, are generally higher than the prices of these energy sourceS. Because there is no perfectly developed energy market, the freedom of most urban residents to choose energy sources is very limited.
3. Urban energy suppl:y and especially electricity supply is insufficient. At present, the civil-used coal and LPG in most cities are still supplied on the basis of rationing. Even though urban gas has been dev~loped, it ~till cannot meet the urgent demand of urban residents. Power shortage is China's long unsolved problem. Even in large cities, such as Beijing, Tianjing, and Shanghai, power cuts happen frequently. With the rapid popularization of domestic appliances such as refrigerators and TV in recent years, residents have become increasingly resentful about power cuts.
4. Low consumption level and low efficiency. According to investigations in Beijing, Wuhan, Hangzhou, and Xinxiang conducted by the Nuclear Energy Institute, Qinghua UnIversity, China's urban energy consumption takes up 17-21% of total energy consumption. Consumption per capita is about 0.4 TCE. Compared with the per capita urban energy consumption of developed countries, this consumption level is rather low. Moreover, because only a little more than 20% of urban residents are supplied with gas, most
* Beijing Engineering Consulting Company
16-1
domestic cooking and space heating is based on direct com bustion of coal, the energy utilization efficiency of which is very low.
5. Air pollution is aggravated by direct combustion of coal, especially in the cities where space heating is required in winter. This is a long unsolved, difficult problem.
To solve or improve these urban energy supply and utilization-related problems, issues related· to energy production, transportation, allocation and usage are involved. While the discussion of these problems is beyond the range of this paper, we discuss some of China's urban energy-related policy issues below.
Realizing High-Grade Urban Energy Supply
Clean gaseous fuels, liquid fuels, and electricity are needed to gradually substitute for solid fuels in modern cities, as is the common tendency of urban energy development in developed countries. In different cities, various energy sources should be utilized to meet the energy demand according to local characteristics. The process of reform will be a long one, and it is impossible to find a fixed pattern.
Many factors influence the realization of a high-grade energy supply for China's cities. The major difficulties are energy shortage and capital shortage. China has abundant oil resources, but the per capita figure is very small. By 2000, China's annual oil production is projected to be about 200 million tons, about 0.167 tons per capita. In addition to meeting the oil demand of domestic transportation, agriculture, chemical industry and other oil users, some oil should be exported to generate foreign exchange. So for most cities, use of kerosene, diesel oil, and heavy oil as fuel, as in some foreign cities, is possible.
Natural gas could be the optimum urban fuel, as it is convenient and clean. But China's natural gas production is very low, only about 13 billion cubic meters annually, and cannot meet the demand of all sectors and enterprises. In addition, China's natural gas allocation policy gives priority to chemical feedstocks. The share of urban natural gas supply is only the "crumbs on the table." For example, in Beijing, the current annual natural gas supply is only 150 million cubic meters, about half of the natural gas consumption in Cangzhou Chemical Fertilizer Factory. So, if the natural gas reserve has no remarkable increase, and the price of civil-used natural gas is not readjusted on a large scale, for most cities (except for those adjacent to oil fields) prospects for acquiring the natural gas needed are rather dim. To import LNG for city use is even more impossible.
China has abundant coal resources. Theoretically, high-grade energy supply can be realized through coal conversion to generate electricity and produce coal gas. But such conversion is very capital-intensive; the cost to produce coal gas is much higher than that of natural gas and LPG. In the near future it is not feasible to meet the energy demand of space heating, cooking, and domestic hot water supply by electricity, as the problem of power shortage cannot be solved in a short period. The newly-added power generation capacity should be used to meet the increasing demand of production development, urban lighting, and small power domestic appliances first. The development and implementation of substituting fuels with electricity cannot be conducted until the problem of power shortage has been basically solved.
16-2
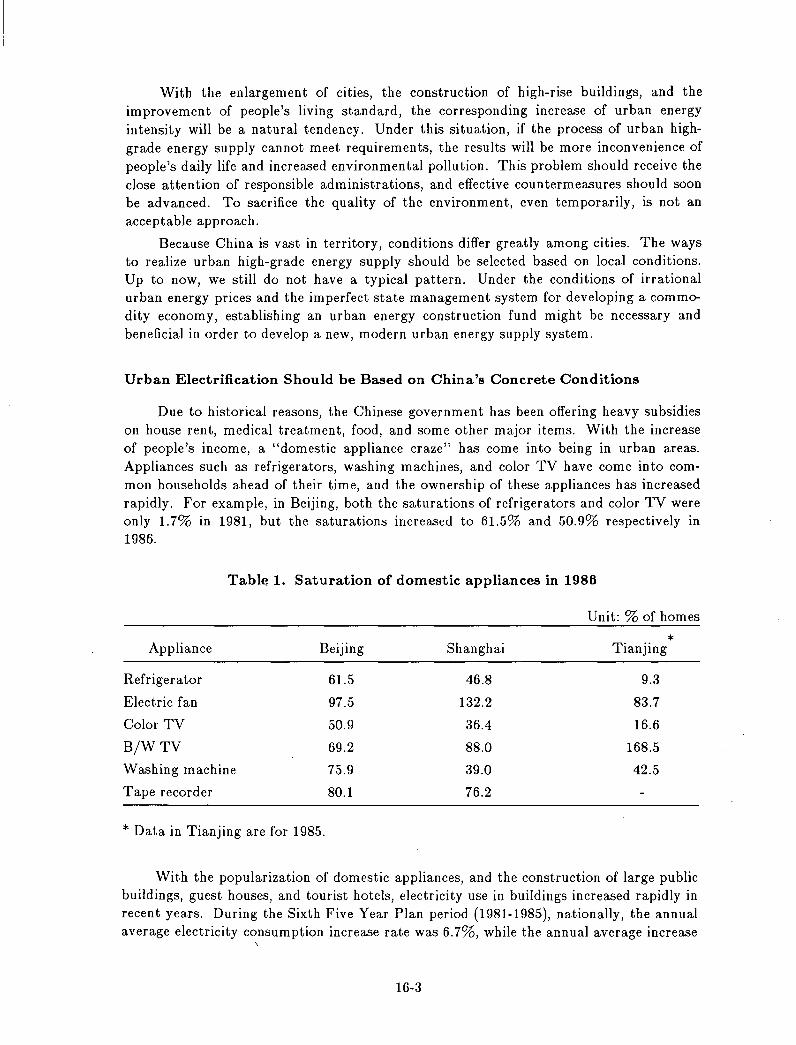
With the enlargement of cities, the construction of high-rise buildings, and the improvement of people's living standard, the corresponding increase of urban energy intensity will be a natural tendency. Under this situation, if the process of urban highgrade energy supply cannot meet requirements, the results will be more inconvenience of people's daily life and increased environmental pollution. This problem should receive the close attention of responsible administrations, and effective countermeasures should soon be advanced. To sacrifice the quality of the environment, even temporarily, is not an acceptable approach.
Because China is vast in territory, conditions differ greatly among cities. The ways to realize urban high-grade energy supply should be selected based on local conditions. Up to now, we still do not have a typical pattern. Under the conditions of irrational urban energy prices and the imperfect state management system for developing a commodity economy, establishing an urban energy construction fund might be necessary and beneficial in order to develop a new, modern urban energy supply system.
Urban Electrification Should be Based on China's Concrete Conditions
Due to historical reasons, the Chinese government has been offering heavy subsidies on house rent, medical treatment, food, and some other major items. With the increase of people's income, a "domestic appliance craze" has come into being in urban areas. Appliances such as refrigerators, washing machines, and color TV have come into common households ahead of their time, and the ownership of these appliances has increased rapidly. For example, in Beijing, both the saturations of refrigerators and color TV were only 1.7% in 1981, but the saturations increased to 61.5% and 50.9% respectively in 1986.
Tabl~ 1. Saturation of domestic appliances in 1986
Unit: % of homes
* Appliance Beijing Shanghai Tianjing
Refrigerator 61.5 46.8 9.3
Electric fan 97.5 132.2 83.7
Color TV 50.9 36.4 16.6
B/WTV 69.2 88.0 168.5
Washing machine 75.9 39.0 42.5
Tape recorder 80.1 76.2
* Data in Tianjing are for 1 985.
With the popularization of domestic appliances, and the construction of large public buildings, guest houses, and tourist hotels, electricity use in buildings increased rapidly in recent years. During the Sixth Five Year Plan period (1981-1985), nationally, the annual average electricity consumption increase rate was 6.7%, while the annual average increase
\
16-3
rate in the "civil daily life" class was 13.2%. We should see that China's "daily life" electricity consumption level is still very low (the national average per capita "daily life" electricity consum ption in 1985 was less than 7 kWh), so the large-scale increase in "daily life" electricity consumption has the nature of "repaying a debt." Now the problem is, under China's concrete conditions, how to guide the development of urban electrification correctly and avoid the unnecessary chaos caused by unreasonable development. Suggested measures are discussed below.
1. The basic daily life electricity demand of residents should be met as much as possible. Now mainly some small power appliances, such as TV, refrigerator, electric fan, washing machine, and vacuum cleaner have come into households. The popularization of these appliances not only enriches people's cultural life, but also reduces household labor intensity. The power demand of these appliances is not large, and their load characteristics result in staggered utilization, with small influence on the winter evening peak. Thus their electricity demand should be met as much as possible.
2. Electric cooking and electric space heating should be restricted. At present, China cannot afford to develop electric heating. Because coal-fired power plants take a very large proportion in China, and the overall efficiency to convert coal into electricity is generally below 30%, from the point of view of rational resource utilization, developing electric heating is wasteful. Besides, in winter, the cooking and space heating load of northern cities basically overlaps with the peak load. Developing electric heating would require substantial increase in generating capacity of electric systems. A typical household can buy an electric stove or electric water heater for only 100-200 yuan, but the electric system must invest over 2500 yuan to add one kW of power supply capacity. So, according to China's concrete conditions, the use of electric heating should be restricted in the short-term. The "Regulations about Further Strengthening Electricity Conservation" recently issued by the State Economic Commission and the State Planning Commission indicated that electric water heating and space heating should not be used in guest houses, hotels, offices, shops, and institutions, and electric cooking appliances used by residents should be charged an equipment capacity fee equal to 5-10 times the basic electric rate. But the results have not been so good, for there are no concrete measures to implement the regulations.
3. The purchase and usage of large power appliances such as air conditioners by public entities should be restricted. In recent years, because the control over social purchasing power is not so strict, the n urn ber of air conditioners increased rapidly. Given the current situation of power shortage in most cities, power allocation should meet the demand of production and residents' basic power needs first. Usage of large power appliances, such as air conditioners, should be restricted, except for foreign-related organizations and tourist hotels.
In brief, the State should strengthen macro control over the development of urban electrification. The unpleasant situation of purchasing expensive appliances as furnishings and decorations should be avoided. Because there are vast differences among China's cities, the control of non-productive electricity consumption should not observe the same rules. For example, the small cities supplied by isolated hydropower stations should develop electric cooking if there is surplus electricity supply; or in the fuel-deficient remote areas, such as Tibet, it is rational to substitute fuel with electricity, if abundant hydropower resources can be developed.
16-4
The Development of Urban Gas Supply
The development of urban gas supply should follow the policy of using multiple gas sources according to local conditions and should promote rational utilization. Increasing urban gas supply is very significant for improving the urban environment, improving people's living standard, and saving energy. In 1985, about 1/4 of the national urban population was supplied with gas. According to the Seventh Five Year Plan of the former Urban and Rural Construction Ministry, by 1990 about 50 million people will be supplied with gas, amounting to more than 40% of the urban population. In order to realize this target successfully, the following should be done:
1. Develop multiple gas supply sources according to local conditions. First, if conditions permit, LPG and natural gas should be developed with great efforts. With the population over 1 billion and the production of natural gas only about 13 billion cubic meters and LPG production only about 1 million tons, the per capita gas consumption is too small. A large part of natural gas and LPG is still consumed in industrial furnaces. If prices can be readjusted rationally, following the law of value, it will be possible to substitute this LPG and natural gas with coal (or coal gas), and supply this LPG and natural gas to urban users. From the overall point of view, it is rational to supply the newlydeveloped natural gas and LPG to urban civil users first.
Coke-oven gas should be recovered and substituted as much as possible to supply urban users. Using part of the self-used coke-oven gas from steel enterprises and coking plants to supply adjacent cities is a rational approach economically, and should be popularized. China has abundant coal resources. In the long-term, to select suitable gasmaking technologies and construct different scale coal-gas plants will be the development direction for most Chinese cities.
2. Adopt a prudent policy about the introduction of large-scale gasification plants. Now, the introduced large-scale gasification ovens include Lurgi and Texaco. Both of them are technically mature, and the quality of gas produced can meet the requirements of urban users, but the gasification process of these ovens is conducted under high pressure, and oxygen is needed, so the equipment is rather complicated and the investment and costs are rather high. It is not economical to produce gas in medium and small cities using these ovens (for example, gasification plants with a daily production below 0.5 million cubic meters). Even for large-scale gasification plants, the economic feasibility and the possibility that the gas price can be borne by the urban residents should be verified according to the concrete conditions of the cities in question. Based on the current situation, comprehensive management of urban gas might be a possible way to improve economic efficiency, if there is sufficient capital and markets.
3. Priority should be given to cooking in urban gas allocation. At present, gas price is still irrational in some cities. This causes the gas supply shortage, as well as the large amount of urban gas consumed in furnaces and space heating boilers by some enterprises and institutions. In order to save energy and capital, a rational allocation system should be established immediately.
The development of urban gas should have a long-term plan, especially in the selection of gas supply sources, to avoid unnecessary losses.
16-5
Developing District Heat Supply System Has Benefits
In China, the range of space heating areas, the period of space heating, and the standard of space heating have been fixed by the government for along time. The expenses of the state workers for space heating are also paid by the state or enterprises. Up to now, the residence houses are still not commodities, so most urban residents cannot choose the ways of space heating according to their needs. Coal is the main fuel used in urban space heating, which is relatively simple. Generally, heating radiators are installed in the newly constructed buildings in space heating areas, and the heat is supplied by various-scaled coal-fired boilers. Coal stoves are still used in many one-story houses and some buildings.
In recent years, urban district heat supply systems have been developed in north and northeast China, though the proportion is still rather small. Beijing is the city with the most district heating area. The heated area, supplied by thermal power plants and district boiler stations, exceeds 10 million square meters, but the proportion has been under 15% for a long time.
Because coal is the main fuel used in urban space heating, and clean fuels are not expected in the short run, it is necessary to substitute the many scattered small boilers with district heating systems in order to save energy, improve the quality of space heating, and especially to control air pollution effectively. It is planned that in the Seventh Five Year Plan period, China's district heating area will increase by 50 million square meters.
Although the social effect of district heating has been good, its economic benefit is not certain. The problem arises from the use of boilers with low efficiencies, and the relatively cheap coal prices. In most cases, the payback period of the investment used in developing district heating is rather long, or cannot be recovered at all. Because the urban thermal network investment is very large, its fixed cost is very high. Generally the cost of a district heating system is higher than the scattered boiler heating system of the same scale. After residence houses become a commodity in the future, in principle, the expenses of heat sources and space heating will be carried by the owners of the house. According to current conditions, it is calculated that the annual per household expenditure on space heating will be 300-400 yuan or more. Common workers may not be able to afford this expenditure. So, it is an urgent task to reduce the capital cost of urban district heating systems and improve their economic benefit. Otherwise, it will be difficult to ask the common people to spend money to buy "clean" after the government subsidies have been canceled, even though it might be rational from the macro point of view.
16-6
REDUCING ENERGY DEMAND WITH COMMUNITY BASED SYSTEMS: A NATIONAL ENERGY POLICY VIEWPOINT FOR CHINA
Fred S. Dubin*
Background
Energy consumption per capita will continue to grow - perhaps leap upward - as China increases its industrial base, expand its transportation network and capacity, and provides more housing and non-residential buildings, individually and in complexes, in existing and new communities.
Similar to the situation in other countries throughout the world, buildings and supporting infrastructure will require an ever increasing share of China's energy production and/or fuel imports.
On the premise that a rational energy policy seeks the following:
o Reduce or limit the gap between energy supply and energy demand.
o Reduce imports and improve China's balance of trade.
o Provide adequate energy supplies to support China's national security, and economic and social interests.
o Export energy to other countries.
o Conserve non-renewable resources.
o Enhance the economic condition of China's citizens and the country as a whole.
o Impact China's foreign and domestic policy.
o Reduce or limit air, soil, and water pollution.
Then reducing energy consumption for individual buildings and entire communities is an important element of national energy policy.
The importance of reducing energy demand - conservation and energy management - is manifest in the recent development of Energy Efficiency Standards and Codes for individual buildings in Thailand, Malaysia, Singapore and Jamaica, as well as in the developed countries of the West.
The potential to reduce energy consumption and peak power demands in communities, entire cities and even regions is very great. Community energy systems first depend upon improving the energy conservation performance of individual buildings in the community. Energy efficiency planning, construction and operation for entire communities adds a new dimension to reducing energy demand for the individual building, and is in fact interactive with individual building energy efficiency. Construction, equipment, systems and operation of individual buildings must be done in context with the design of energy efficient communities. The design of energy efficient communities can and often
* President, Dubin-BIoome Associates, and Professor of Architecture, Carnegie-Mellon University
17-1
does determine the design parameters of the individual buildings comprising the community.
Even if increasing energy supplies could keep up with ever increasing demand, it is only with great costs in capital, increased pollution, and increasing depletion of resources - and let's keep in mind, saving one Btu is equivalent to producing 3 new Btus. Also, we must keep in mind that reducing energy demand with energy conservation and energy management offsets the need for construction of new capital-intensive and energyintensive electricity generating plants.
Community systems may involve each of the following disciplines individually, or in combinations with one or more of the others:
0 Space Heating
0 Heating Hot Water
0 Lighting
0 Power for Motors and Appliance
0 Natural or Mechanical Cooling
0 Potable Water Supply
0 Fire Protection
0 Solid and Liquid Waste Disposal
0 Air Pollution Abatement
0 Industrial Process
Opportunities to Reduce Energy Requirements for Communities
Reducing energy requirements starts with minimizing energy requirements of individual buildings for one or more of the disciplines noted above. Reducing the heating and cooling loads is climate specific, and is a function of building design, orientation, and materials.
Reducing energy demand for the other disciplines is not climate specific (although lighting and heat gain/loss are related), but is system and equipment dependent. The magnitude of each discipline influences energy requirements for the distribution systems. The energy requirements for distribution systems are dependent upon the terminal loads, the thermal characteristics of system (ducts, pipes, and wires), and the power required to move the fluids through the conductors. The power requirements are dependent upon frictional resistance, which in turn, is related to the length of the distribution runs from an energy conversion source inter and intra buildings - a function of the physical plan.
Community Planning Can Reduce the Building Loads
Community planning includes the siting of buildings (I) so that some buildings pro-. vide solar shading and wind shielding for other buildings; (2) the development of land
mass can provide topo profile to accommodate berms for insulation and thermal mess; (3) trees and shrubs can provide wind breaks and solar shading to reduce heating and cooling loads, and wind channeling for passive cooling.
17-2
One can use landscape planning to provide trees to create venture-effects for natural cooling of building complexes. In the UNEP World Headquarters in Nairobi Kenya, Dubin-Bloome Associates designed wind channeling systems to passively cool the buildings and act as solar shading as well.
One can use site development to create berms for insulation and thermal storage to reduce heating and cooling loads. The layout of streets and land development are important considerations for reducing loads on a community-wide basis.
Underground buildings, with exposed south-facing facades, requiring site development to attain the topographical profiles on a community-wide scale, reduce heating and cooling requirements and system capacity.
Energy storage using the acquifer, deep abandoned mines, caves and other natural subterranean features can be used with a number of community energy system options.
In most climatic zones in China, space heating is, and will be, a requirement. Energy-conscious community planning can reduce energy for heating by orienting each building with an east-west axis to maximize passive solar heating through south, southwest, and southeast exposures. The community plan will avoid locating buildings which will shade those facades of adjacent buildings, while providing wind breaks for the north, northwest and northeast exposures of adjacent buildings. Community systems provides this opportunity, which is not fully available in individual stand-alone buildings. Proper orientation can reduce heat loss and heat gain in the summer by 20 to 40%, while contributing passive solar heat gain in the winter to meet the reduced residual load.
One can locate buildings within a community so that south-facing structures can reflect sunlight to the north facade fenestration of neighboring buildings to enhance daylighting.
Developing the site plan so that solar access is assured to all buildings can increase solar passive heating and daylighting to all buildings. This requires control of building heights, set-backs, and careful study of solar angles. Dubin-Bloome Associates planned such a development for three large sites in New York City; will now lead to ordinances to assure compliance.
The juxtaposition of industrial plants, housing, and institutional and commercial buildings provides opportunities to meet the individual loads in combined systems, taking advantage of the diversity. Capital costs and operating costs and fuel consumption are materially reduced.
Community Planning Can Reduce Distribution Loads
For community systems with distribution services between buildings, the energy requirements for distribution must be less than the energy savings resulting from the more efficient community systems equipment and diversified load. It is essential that piping distribution runs be as short as possible, which leads to the requirement for energy efficiency community planning, with the largest loads closely adjacent to the energy plant.
An efficient distribution system starts with the community physical plan. Central facilities distribute to high thermal loads near the central facility, often w'ith a spoke wheel type distribution pattern. Light loads in decentralized systems are more remote from the energy center. A good example of such planning was a project in Minnesota, not
17-3
yet built, which we worked on with Buckminster Fuller, the noted engineer, architect, innovator, philosopher. The Minnesota Experimental City was conceived in 1966 as a new town plan that is "ambitious without being impractical," a completely self-contained entity that will serve as a "living laboratory for the most advanced ideas in urban planning, and technology." The project originated with a scientist, Athelstan Spilhaus, who first proposed the city in the comic strip, "Our New Age," which he writes for Sunday newspapers. Under the guidance of Spilhaus, former dean of the University of Minnesota's Institute of Technology, the full resources of that university were placed at the disposal of the project. The 73,000-acre site is 120 miles north of Minneapolis.
Dubin-Bloome Associates are the consulting engineers responsible for the energy and waste management programs, and for recommendations for future design and planning. The emphasis is on the integration of energy and utility systems with transportation and building structures. Several energy sources will be used. One area of the city will harness wind power, one solar energy, while another will use heat energy from the gas produced in the treatment of sewage. There will be complete recycling of liquid waste.
Buckminster Fuller planned for the whole city to be covered with a dome. Present plans call for smaller domes to cover and protect parts of the city. With its pollution-free, total energy systems, many jobs will be created in research-oriented industries alone.
To reduce the distribution loads for all energy efficient community systems, basic principles apply:
o Reduce power for fans and pumps by reducing end-use loads.
o Reduce thermal system losses with insulation; higher transmission voltages; efficient pumps, fans, and motors; short distribution runs; minimal frictional resistance.
The Energy Plant
Community systems may be decentralized, centralized, or decentralized/centralized com binations. There are benefits and constraints with each type. Decentralized systems provide individual end use control as do centralized/decentralized systems, but decentralized systems alone can not take advantage of load diversity, central maintenance, higher efficiency central equipment, centralized pollution control, and more effective use of recovered waste heat.
Community systems may comprise multi-use buildings, wherein one energy plant designed for the building as a whole is smaller than the sum of the energy plants designed for each discrete building function, i.e., schools and dwelling units, and shops and public spaces, all housed in one building or supplied from one energy plant Diversity (time of use) permits a smaller plant to meet the total load since maximum requirements for each function do not peak at the same time.
Energy management techniques and technology that should be evaluated in a community system include the following:
o Solar ponds for heating domestic hot water, space heating, and air conditioning for some commercial spaces requiring cooling.
o Community greenhouses which can supply thermal energy to adjacent buildings for space and hot water heatings, as well as providing efficient agricultural methods to produce food and plants.
17-4
o Central boiler plants with large efficient units to provide thermal energy to multiple buildings.
o Central chiller plants with large efficient units to provide air conditioning and refrigeration to multiple facilities.
o Large heat recovery units from prime movers to provide lower grade thermal energy for other uses.
o Cogeneration systems to generate electricity for the community, with waste heat recovered and used for thermal purposes.
o Seasonal heat and cooling storage, taking advantage of climatic conditions with hot summers and cold winters.
o Chilled water or ice storage systems for air conditioning and commercial and domestic cold storage facilities in a com bined system for daily or weekly storage.
o Regional evaporative cooling systems to condition the outdoors and produce a desired micro-climate as designed for the AECC community in Iran.
o Central active solar thermal energy systems, and solar photovoltaic cells to generate electricity, combined with wind generators to provide urban energy requirements -again diversity permits smaller plants.
o Energy efficiency standards and codes to assure that all structures will be energy efficient and fit into the energy parameters of community energy system reqUIrements.
o Central biogas energy plants serving multiple and individual buildings.
o Fiber optic power and light transmission.
o Wind generators to generate electricity on a regional scale, with power supplied to the electric grid to eliminate storage.
o Wind-driven heat pumps to provide heating and/or cooling at high Coefficient of Performance (COP).
o Large-scale solar crop drying systems to improve food production and condition the crop in a shorter period of time.
o Large-scale "phytotron" type structures for food production using solar pasSIve heating and power to control nutrients and growth.
o A high technology application for communities near the coast line can eventually employ the Ocean Thermal Energy Concept (OTEC) to generate electricity and thermal energy.
o More efficient lamps and luminaires for street lighting, and other outdoor applications on a community scale can reduce electric power or gas consumption by a factor of 3 or 4 compared to present practice.
Community energy systems listed above, plus others yet to be optimized, can result in reducing energy consumption some 20 to 50% compared to the same number, type, and size individual buildings in the same location, not favored by Total Energy Efficient Community Planning. The potential is very great to reduce energy demand and depletion of natural resources with community systems. To evaluate the cost/benefits of such a system(s) requires a comprehensive study of total community planning in context with
17-5
presen t cultural and social values, political considerations, and technology.
Energy systems are linked to other essential societal needs, i.e., food, water, waste disposal shelter, clean air, national security, sociological patterns, and local economics.
The Modular Integrated Utility Systems (M.LU.S) developed by HUD (USA) at the initial suggestion of Fred Dubin is an energy efficient alternative to conventional utility systems for providing heating, cooling, electric power, solid and liquid waste management and potable water. This system reduces the drain on non-renewable resources and energy. Rejected heat from power generation, liquid sewage from homes and nonresidential buildings and garbage and trash are the principal wastes involved. The benefits of M.LU.S include the following:
o Saves fuel by utilizing waste heat from on-site power generation.
o Saves fuel by recovering heat from solid waste combustion.
o Provides opportunity for drawing upon new energy sources.
o Reduces air pollution emissions and improves air quality.
o Reduces solid wastes volume for disposal.
o Reduces thermal pollution.
o Reduces potable water requirements.
o Reduces fuel requirements.
o Provides savings due to better organization and management of the overall utility system.
o Provides savings due to a better matching between demand and capacity, which avoids "overbuilding."
o Provides savings due to greater usage of installed capacity.
o Offers single management responsibility.
o Improves operation and maintenance because of integrated design.
o Allows land development independent of existing utility infrastructure.
o Allows application to remote, isolated communities.
o Increases the need for enforceable mechanisms for shaping community growth.
o Provides alternatives for military bases, national parks, and other government installations.
o Offers portable system for disaster relief and emergency housing.
o Reduces reliance on foreign oil exports.
o Offers exportable system for sale to other countries.
o Provides opportunity to increase off-site fabrication of utility components.
o Provides opportunity to develop mechanisms for institutional innovation.
Heat-Pump-Centered Integrated Community Energy Systems developed by DubinBloome Associates for Boston, Mass. and Washington D.C. reduce dependence on scarce fuels and other resources. The very efficient system is based on the second law of thermodynamics, when usually only the first law efficiencies are addressed. The operating costs for an integrated system for New York City were calculated to be $787 compared to
17-6

$1,057 per year per dwelling unit for similar performance.
A solar pond is one of the most cost effective solar energy techniques. It is low technology, and can provide energy for space heating, water heating, absorption cooling, or electric power generation. There is no limit, except land area, to the number of such ponds that could supply the energy needs of a community.
A heat pump system, drawing heat from sewage in a relatively dense building development, can be used to upgrade the heat from sewage and deliver thermal energy at a higher level to buildings.
While air conditioning will not be used widely by residential and small nonresidential buildings in the immediate future, air conditioning for industrial processes, large commercial buildings, hospitals, and tourist facilities can grow to become a major energy user and contribute heavily to peak power demand. Therefore, it is important to utilize low energy systems for air conditioning. These may include direct and indirect evaporative cooling, dessicant dehumidification, cooling storage systems, efficient equipment, night sky radiation, and diurnal swing cooling.
New problems will arise over time. A master plan for community energy systems must be adaptable to accommodate change. Changes in transportation for instance, or development of new products, or sociological changes all impact energy, and the energy systems design must be able to meet new challenges.
However, with goals firmly in mind, energy community systems as they develop, and as China's industrial development develops, will be of increasing importance in attaining the goals of national policy.
17-7
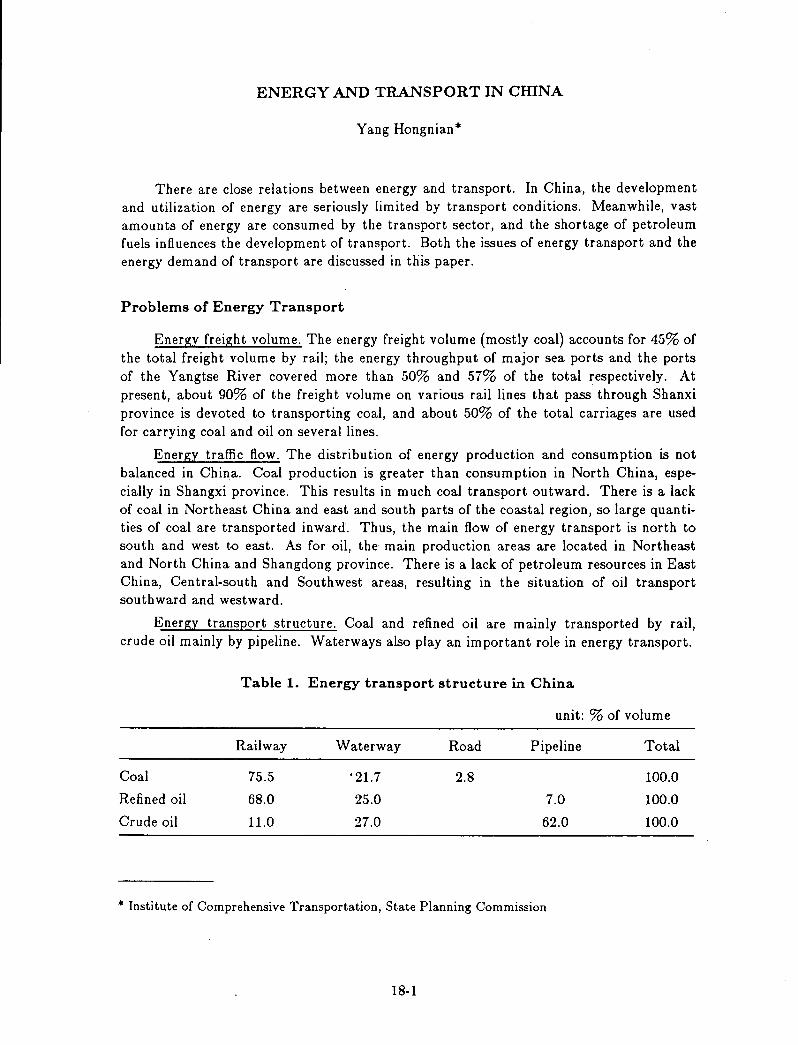
ENERGY AND TRANSPORT IN CIDNA
Yang Hongnian*
There are close relations between energy and transport. In China, the development and utilization of energy are seriously limited by transport conditions. Meanwhile, vast amounts of energy are consumed by the transport sector, and the shortage of petroleum fuels influences the development of transport. Both the issues of energy transport and the energy demand of transport are discussed in this paper.
Problems of Energy Transport
Energy freight volume. The energy freight volume (mostly coal) accounts for 45% of the total freight volume by rail; the energy throughput of major sea ports and the ports of the Yangtse River covered more than 50% and 57% of the total respectively. At present, about 90% of the freight volume on various rail lines that pass through Shanxi province is devoted to transporting coal, and about 50% of the total carriages are used for carrying coal and oil on several lines.
Energy traffic flow. The distribution of energy production and consumption is not balanced in China. Coal production is greater than consumption in North China, especially in Shangxi province. This results in much coal transport outward. There is a lack of coal in Northeast China and east and south parts of the coastal region, so large quantities of coal are transported inward. Thus, the main flow of energy transport is north to south and west to east. As for oil, the main production areas are located in Northeast and North China and Shangdong province. There is a lack of petroleum resources in East China, Central-south and Southwest areas, resulting in the situation of oil transport southward and westward.
Energy transport structure. Coal and re·fined oil are mainly transported by rail, crude oil mainly by pipeline. Waterways also play an important role in energy transport.
Table 1. Energy transport structure in China
unit: % of volume
Railway Waterway Road Pipeline Total
Coal 75.5 . 21.7 2.8 100.0
Refined oil 68.0 25.0 7.0 100.0
Crude oil 11.0 27.0 62.0 100.0
* Institute of Comprehensive Transportation, State Planning Commission
18-1
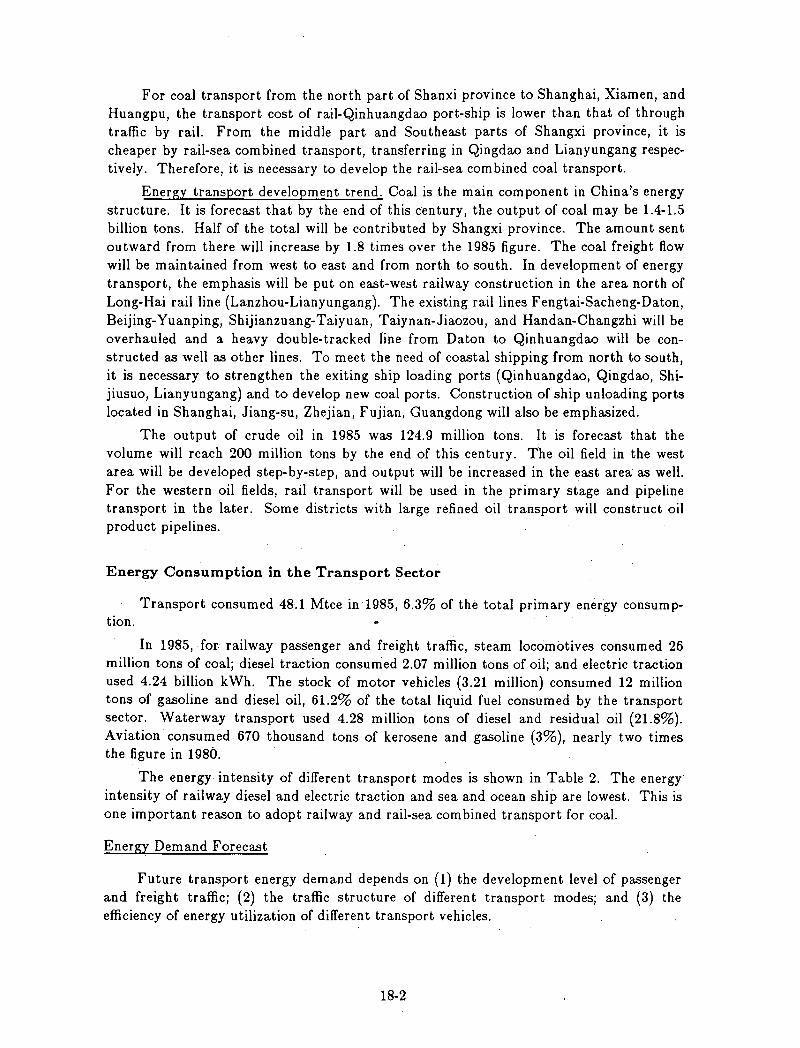
For coal transport from the north part of Shanxi province to Shanghai, Xiamen, and Huangpu, the transport cost of rail-Qinhuangdao port-ship is lower than that of through traffic by rail. From the middle part and Southeast parts of Shangxi province, it is cheaper by rail-sea combined transport, transferring in Qingdao and Lianyungang respectively. Therefore, it is necessary to develop the rail-sea combined coal transport.
Energy transport development trend. Coal is the main component in China's energy structure. It is forecast that by the end of this century, the output of coal may be 1.4-1.5 billion tons. Half of the total will be contributed by Shangxi province. The amount sent outward from there will increase by 1.8 times over the 1985 figure. The coal freight flow will be maintained from west to east and from north to south. In development of energy transport, the emphasis will be put on east-west railway construction in the area north of Long-Hai rail line (Lanzhou-Lianyungang). The existing rail lines Fengtai-Sacheng-Daton, Beijing-Yuanping, Shijianzuang-Taiyuan, Taiynan-Jiaozou, and Handan-Changzhi will be overhauled and a heavy double-tracked fine from Daton to Qinhuangdao will be constructed as well as other lines. To meet the need of coastal shipping from north to south, it is necessary to strengthen the exiting ship loading ports (Qinhuangdao, Qingdao, Shijiusuo, Lianyungang) and to develop new coal ports. Construction of ship unloading ports located in Shanghai, Jiang-su, Zhejian, Fujian, Guangdong will also be emphasized.
The output of crude oil in 1985 was 124.9 million tons. It is forecast that the volume will reach 200 million tons by the end of this century. The oil field in the west area will be developed step-by-step, and output will be increased in the east area as well. For the western oil fields, rail transport will be used in the primary stage and pipeline transport in the later. Some districts with large refined oil transport will construct oil product pipelines.
Energy Consumption in the Transport Sector
Transport consumed 48.1 Mtce in 1985, 6.3% of the total primary energy consumption.
In 1985, for. railway passenger and freight traffic, steam locomotives consumed 26 million tons of coal; diesel traction consumed 2.07 million tons of oil; and electric traction used 4.24 billion kWh. The stock of motor vehicles (3.21 million) consumed 12 million tons of gasoline and diesel oil, 61.2% of the total liquid fuel consumed by the transport sector. Waterway transport used 4.28 million tons of diesel and residual oil (21.8%). Aviation consumed 670 thousand tons of kerosene and gasoline (3%), nearly two times the figure in 1980.
The energy intensity of different transport modes is shown in Table 2. The energy intensity of railway diesel and electric traction and sea and ocean ship are lowest. This is one important reason to adopt railway and rail-sea combined transport for coal.
Energy Demand Forecast
Future transport energy demand depends on (1) the development level of passenger and freight traffic; (2) the traffic structure of different transport modes; and (3) the efficiency of energy utilization of different transport vehicles.
18-2
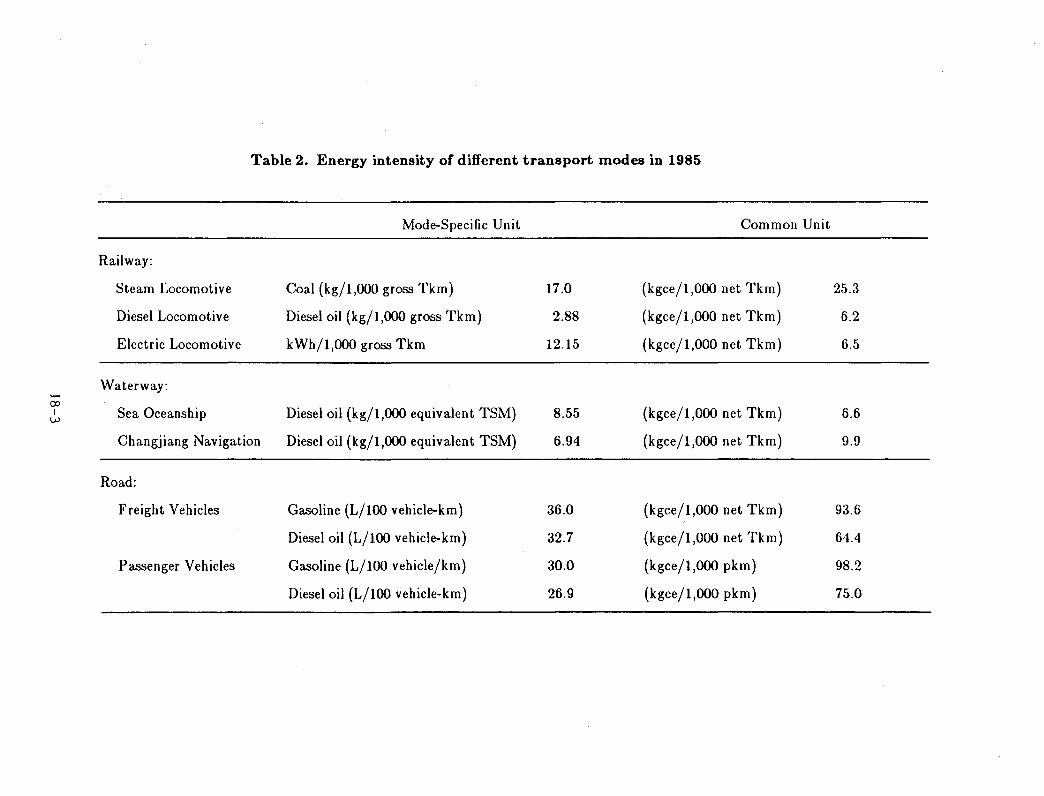
Table 2. Energy intensity of different transport modes in 1985
Mode-Specific Unit Common Unit
Railway:
Steam Locomotive Coal (kg/1,000 gross Tkm) 17.0 (kgce/1,000 net Tkm) 25.3
Diesel Locomotive Diesel oil (kg/1,OOO gross Tkm) 2.88 (kgce/1,000 net Tkm) 6.2
Electric Locomotive kWh/1,OOO gross Tkm 12.15 (kgce/1,000 net Tkm) 6.5
Waterway: -00 Diesel oil (kg/1,OOO equivalent TSM) (kgce/1,OOO net Tkm) I Sea Oceanship 8.55 6.6 w
Changjiang Navigation Diesel oil (kg/1,OOO equivalent TSM) 6.94 (kgce/1,000 net Tkm) 9.9
Road:
Freight Vehicles Gasoline (L/100 vehicle-km) 36.0 (kgce/1,OOO net Tkm) 93.6
Diesel oil (L/lOO vehicle-km) 32.7 (kgce/1,000 net Tkm) 64.4
Passenger Vehicles Gasoline (L/100 vehicle/km) 30.0 (kgce/1,OOO pkm) 98.2
Diesel oil (L/100 vehicle-km) 26.9 (kgce/1,000 pkm) 75.0
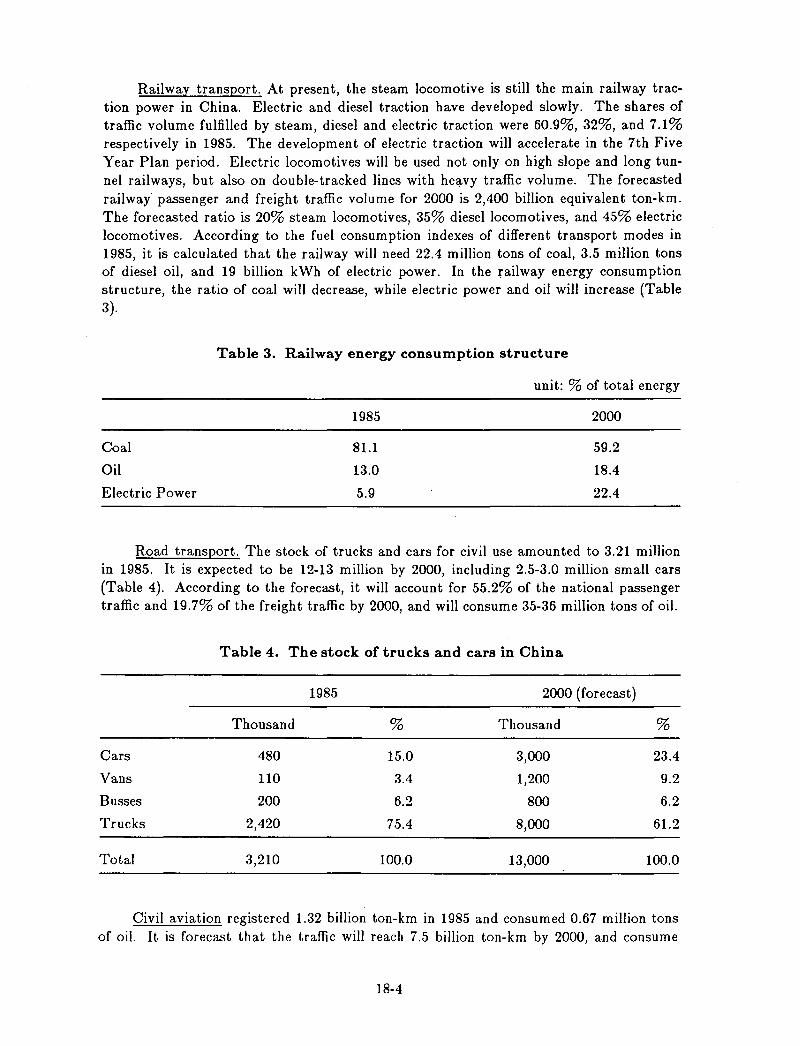
Railway transport. At present, the steam locomotive is still the main railway traction power in China. Electric and diesel traction have developed slowly. The shares of traffic volume fulfilled by steam, diesel and electric traction were 60.9%, 32%, and 7.1% respectively in 1985. The development of electric traction will accelerate in the 7th Five Year Plan period. Electric locomotives will be used not only on high slope and long tunnel railways, but also on double-tracked lines with heavy traffic volume. The forecasted railway passenger and freight traffic volume for 2000 is 2,400 billion equivalent ton-km. The forecasted ratio is 20% steam locomotives, 35% diesel locomotives, and 45% electric locomotives. According to the fuel consumption indexes of different transport modes in 1985, it is calculated that the railway will need 22.4 million tons of coal, 3.5 million tons of diesel oil, and 19 billion kWh of electric power. In the railway energy consumption structure, the ratio of coal will decrease, while electric power and oil will increase (Table 3).
Table 3. Railway energy consumption structure
unit: % of total energy
1985 2000
Coal 81.1 59.2
Oil 13.0 18.4
Electric Power 5.9 22.4
Road transport. The stock of trucks and cars for civil use amounted to 3.21 million in 1985. It is expected to be 12-13 million by 2000, including 2.5-3.0 million small cars (Table 4). According to the forecast, it will account for 55.2% of the national passenger traffic and 19.7% of the freight traffic by 2000, and will consume 35-36 million tons of oil.
Table 4. The stock of trucks and cars in China
1985 2000 (forecast)
Thousand % Thousand %
Cars 480 15.0 3,000 23.4
Vans 110 3.4 1,200 9.2
Busses 200 6.2 800 6.2
Trucks 2,420 75.4 8,000 61.2
Total 3,210 100.0 13,000 100.0
Civil aviation registered 1.32 billion ton-km in 1985 and consumed 0.67 million tons of oil. It is forecast that the traffic will reach 7.5 billion ton-km by 2000, and consume
18-4
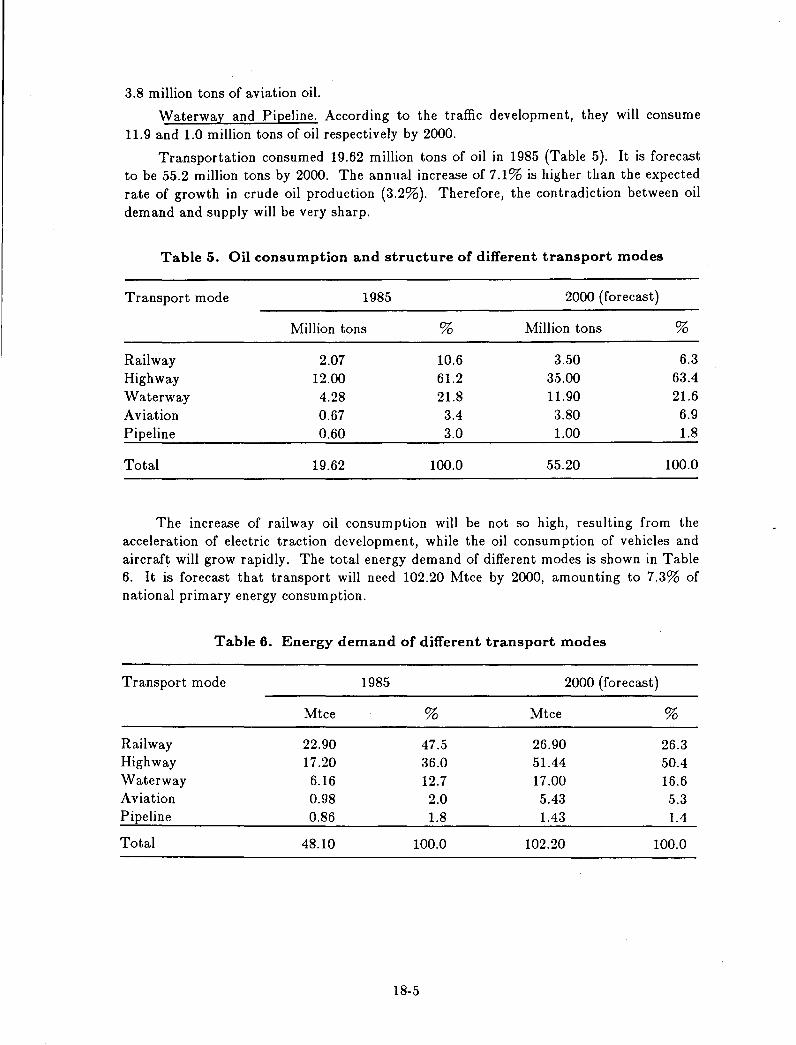
3.8 million tons of aviation oil.
Waterway and Pipeline. According to the traffic development, they will consume 11.9 and 1.0 million tons of oil respectively by 2000.
Transportation consumed 19.62 million tons of oil in 1985 (Table 5). It is forecast to be 55.2 million tons by 2000. The annual increase of 7.1% is higher than the expected rate of growth in crude oil production (3.2%). Therefore, the contradiction between oil demand and supply will be very sharp.
Table 5. Oil consumption and structure of different transport modes
Transport mode 1985 2000 (forecast)
Million tons % Million tons %
Railway 2.07 10.6 3.50 6.3 Highway 12.00 61.2 35.00 63.4 Waterway 4.28 21.8 11.90 21.6 Aviation 0.67 3.4 3.80 6.9 Pipeline 0.60 3.0 1.00 1.8
Total 19.62 100.0 55.20 100.0
The increase of railway oil consumption will be not so high, resulting from the acceleration of electric traction development, while the oil consumption of vehicles and aircraft will grow rapidly. The total energy demand of different modes is shown in Table 6. It is forecast that transport will need 102.20 Mtce by 2000, amounting to 7.3% of national primary energy consumption.
Table 6. Energy demand of different transport modes
Transport mode
Railway Highway Waterway Aviation Pipeline
Total
Mtce
22.90 17.20
6.16 0.98 0.86
48.10
1985
%
47.5 36.0 12.7 2.0 1.8
100.0
18-5
2000 (forecast)
Mtce %
26.90 26.3 51.44 50.4 17.00 16.6 5.43 5.3 1.43 1.4
102.20 100.0
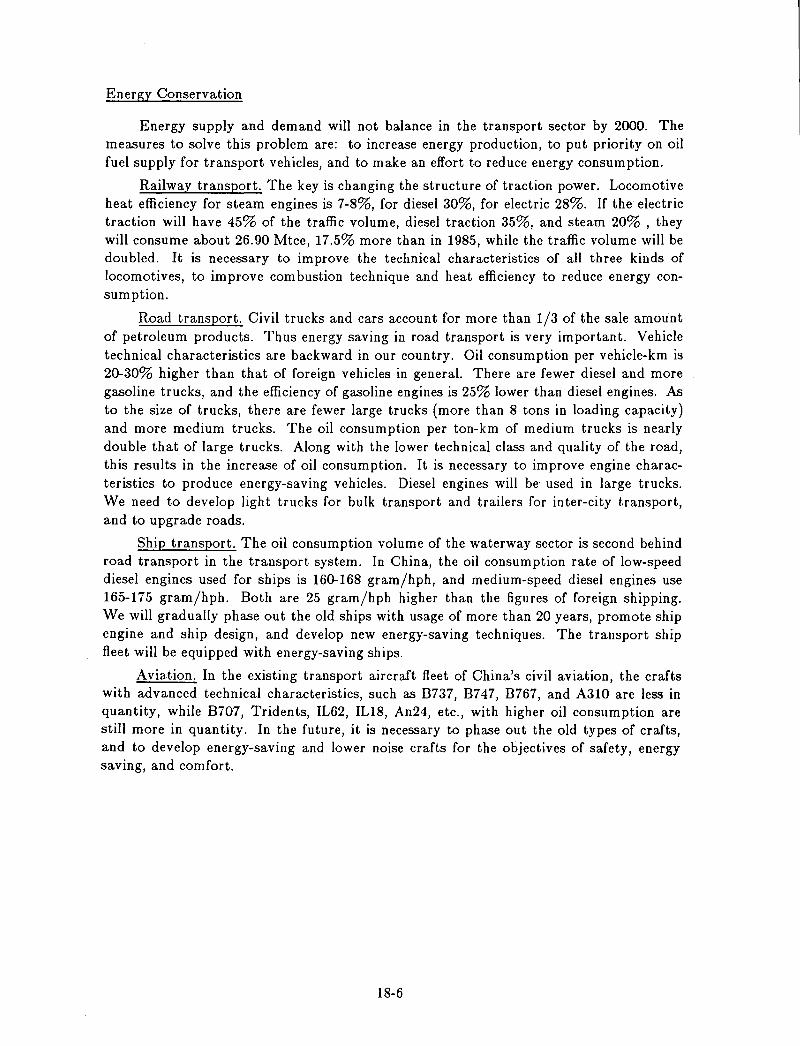
Energy Conservation
Energy supply and demand will not balance in the transport sector by 2000. The measures to solve this problem are: to increase energy production, to put priority on oil fuel supply for transport vehicles, and to make an effort to reduce energy consumption.
Railway transport. The key is changing the structure of traction power. Locomotive heat efficiency for steam engines is 7-8%, for diesel 30%, for electric 28%. If the electric traction will have 45% of the traffic volume, diesel traction 35%, and steam 20% , they will consume about 26.90 Mtce, 17.5% more than in 1985, while the traffic volume will be doubled. It is necessary to improve the technical characteristics of all three kinds of locomotives, to improve combustion technique and heat efficiency to reduce energy consumption.
Road transport. Civil trucks and cars account for more than 1/3 of the sale amount of petroleum products. Thus energy saving in road transport is very important. Vehicle technical characteristics are backward in our country. Oil consumption per vehicle-km is 20-30% higher than that of foreign vehicles in general. There are fewer diesel and more gasoline trucks, and the efficiency of gasoline engines is 25% lower than diesel engines. As to the size of trucks, there are fewer large trucks (more than 8 tons in loading capacity) and more medium trucks. The oil consumption per ton-km of medium trucks is nearly double that of large trucks. Along with the lower technical class and quality of the road, this results in the increase of oil consumption. It is necessary to improve engine characteristics to produce energy-saving vehicles. Diesel engines will be used in large trucks. We need to develop light trucks for bulk transport and trailers for inter-city transport, and to upgrade roads.
Ship transport. The oil consumption volume of the waterway sector is second behind road transport in the transport system. In China, the oil consumption rate of low-speed diesel engines used for ships is 160-168 gram/hph, and medium-speed diesel engines use 165-175 gram/hph. Both are 25 gram/hph higher than the figures of foreign shipping. We will gradually phase out the old ships with usage of more than 20 years, promote ship engine and ship design, and develop new energy-saving techniques. The transport ship fleet will be equipped with energy-saving ships.
Aviation. In the existing transport aircraft fleet of China's civil aviation, the crafts with advanced technical characteristics, such as B737, B747, B767, and A310 are less in quantity, while B707, Tridents, IL62, IL18, An24, etc., with higher oil consumption are still more in quantity. In the future, it is necessary to phase out the old types of crafts, and to develop energy-saving and lower noise crafts for the objectives of safety, energy saving, and comfort.
18-6
THE U.S. TRANSPORTATION SECTOR IN PERSPECTIVE
Vito Stagliano*
Background
Road Transportation
Federal involvement in transportation is based on constitutional powers to assure mobility for national security purposes, for delivery of mail and for interstate commerce. For most of the twentieth century, Federal funds have been distributed to States for road construction purposes according to formulas based on population, area, and mileage requirements.
Full construction of what came to be known as the Interstate Highway System began with Congressional establishment of the Highway Trust Fund. The Trust Fund consists of taxes collected by the Federal Government on gasoline and diesel fuel and other user fees. As of December 1987, 41,859 miles, or 98% of the Interstate Highway System was open to traffic.
Overall, the U.S. road system comprises slightly less than 3.9 million miles of road. Management of these roads is overwhelmingly under the control of County and local governments. State taxes on fuel and on licensing of persons and vehicles produce the bulk of the revenue required to construct and maintain the national road system.
Air Transportation
The Federal Aviation Administration (FAA), an agency of the U.S. Department of Transportation, traces its origin to the Air Commerce Act of 1926. This legislation provided the authority by which the Federal Government has certified pilots and aircraft, developed air navigation facilities and assured flying safety. In 1958 Congress enacted the Federal Aviation Act, reorganizing the national air transportation system.
A principal responsibility of the FAA's 50,000 member staff is the management of the world's largest air traffic control and navigation system. The FAA's second major responsibility is the establishment and enforcement of standards for the training and testing of aircraft operators, and for the design, certification, and airworthiness inspection of aircraft. A third critical FAA responsibility is the expansion and modernization of the nation's airport facilities. The present system contains about 16,000 facilities, comprising 5,200 airports with paved runways, 300 of which are used for regular service by large certified carriers and account for 96% of passenger emplanements.
The Airport and Airways Trust Fund was established by Congress in 1970 for aviation system construction and enhancement. It is financed by taxes on passenger tickets, on air cargo, and on aviation fuel.
* Director of Policy Integration, U.S. Department of Energy, Washington, D.C.
19-1
The Airline Deregulation Act of 1978 established that the air transportation system will rely "on competitive market forces to determine the quality, variety, and price of air services," and not on governmental regulation. The Act provided a public policy framework which resulted in substantial reductions in air travel costs for the average consumer, in increased competition in the airline industry, and in a proliferation of new national and regional carriers providing service to dramatically larger numbers of air travelers. About 560 million passengers are em planed annually in the United States, or more than twice the population.
Rail Transportation
Railroad transportation in the U.S. comprises two distinct systems, freight and passenger, which are regulated and supported by the Federal Government in distinct ways.
The Rail Passenger Service Act of 1970 was enacted by Congress in order to reverse the decline of inter-city rail passenger service. Congress created a quasi-governmental passenger rail corporation known as Amtrak, and charged it with management of a basic route system to connect 495 points around the nation. Amtrak was initially designed as a self-financing corporation but it has required Federal subsidies since inception.
The Federal Interstate Commerce Commission regulates rail freight transportation. Until mid-century, railroads were key arteries in the national transportation system. By 1980 nearly two-thirds of the nation's intercity freight was moved by other means. Heavily regulated and economically uncompetitive, railroads were not generating sufficient earnings to meet basic capital expenditures requirements.
The Staggers Rail Act of 1980 partially deregulated the rail ind ustry and established provisions for federal support to rehabilitate those portions of the industry deemed essential to the national interest.
Current System Size and Use
Road Transportation
The surface transportation system is central to the U.S. economy in terms of manufacturing capacity, freedom of movement, and energy use. The United States remains the world's largest vehicle market. Its vitality is critical to the health of both domestic and international vehicle manufacturers. Car and truck sales amounted to 16.3 million in 1986, with imports capturing 25.7% of the market. The nearly 160 million licensed drivers in the U.S. travelled a record 1.9 trillion miles in 1986, using 126 billion gallons of fuel.
Air Transportation
Air transportation in the U.S. is provided through two systems, certificated air carriers and general aviation, the latter comprising all aircraft not associated with commercial fleets. General aviation aircraft do not provide passenger or freight service and are used principally for personal activity. General aviation aircraft account for 98.8% of the
19-2
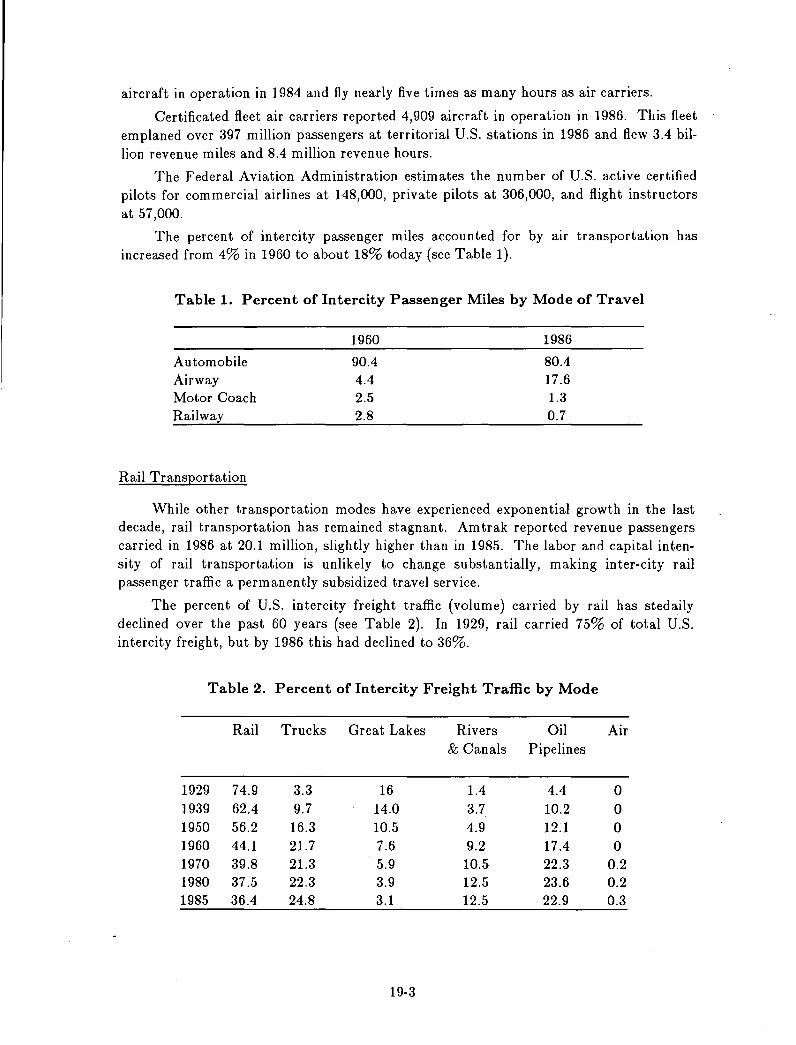
aircraft in operation in 1984 and fly nearly five times as many hours as air carriers.
Certificated fleet air carriers reported 4,909 aircraft in operation in 1986. This fleet emplaned over 397 million passengers at territorial U.S. stations in 1986 and flew 3.4 billion revenue miles and 8.4 million revenue hours.
The Federal Aviation Administration estimates the number of U.S. active certified pilots for commercial airlines at 148,000, private pilots at 306,000, and flight instructors at 57,000.
The percent of intercity passenger miles accounted for by air transportation has increased from 4% in 1960 to about 18% today (see Table 1).
Table 1. Percent of Intercity Passenger Miles by Mode of Travel
1960 1986
Automobile 90.4 80.4 Airway 4.4 17.6 Motor Coach 2.5 1.3 Railway 2.8 0.7
Rail Transportation
While other transportation modes have experienced exponential growth in the last decade, rail transportation has remained stagnant. Amtrak reported revenue passengers carried in 1986 at 20.1 million, slightly higher than in 1985. The labor and capital intensity of rail transportation is unlikely to change substantially, making inter-city rail passenger traffic a permanently subsidized travel service.
The percent of U.S. intercity freight traffic (volume) carried by rail has stedaily declined over the past 60 years (see Table 2). In 1929, rail carried 75% of total U.S. intercity freight, but by 1986 this had declined to 36%.
Table 2. Percent of Intercity Freight Traffic by Mode
Rail Trucks Great Lakes Rivers Oil Air & Canals Pipelines
1929 74.9 3.3 16 1.4 4.4 0 1939 62.4 9.7 14.0 3.7 10.2 0 1950 56.2 16.3 10.5 4.9 12.1 0 1960 44.1 21.7 7.6 9.2 17.4 0 1970 39.8 21.3 5.9 10.5 22.3 0.2 1980 37.5 22.3 3.9 12.5 23.6 0.2 1985 36.4 24.8 3.1 12.5 22.9 0.3
19-3
Freight railroads reported improvements only in their truck trailer-to-rail operations in 1986. Containerized and truck-to-rail freight shipment is viewed as having significant growth potential as a trans-continental transport system. Coal and farm products hauling represents nearly 50% of revenue freight for reporting railroads.
Energy in Transportation
The transportation sector accounts for one-fourth of all energy used in the United States and for 64% of all petroleum consumption. Furthermore, transportation is dependent on petroleum for 97% of its energy requirements, having insignificant fuel-switching capability. In 1987, the U.S. consumed 16.5 million barrels of oil per day, 10.5 million BID of which were used in the transportation sector.
Since 1975, the amount of petroleum used for transportation has exceeded domestic U.S. production and this condition is expected to continue into the 1990s. By 2000, the transportation sector is expected to require close to 11 million BID in order to satisfy increasing demand, while domestic oil production, depending on relative international petroleum prices, is likely to decline to between 6 and 8 million BID.
Since 1970, transportation energy consumption has increased at an annual rate of 1.5% per year in spite of considerable gains in fuel-use efficiency. The fuel efficiency of new automobiles and trucks increased 68% from 1973 to 1986, and aircraft operating efficiency increased 90% in the same period. Transportation oil consumption is projected to increase even as average fuel efficiency for new vehicles approaches 40 miles per gallon by the year 2000. The increase is due to continual expansion of the vehicle fleet, and to a larger population driving more vehicle miles.
The largest petroleum users in transportation are automobiles and motorcycles (45%). Trucks and buses account for 31% of the sector's petroleum use, air transport nearly 8%, and rail 2.5%.
Policy Effects
Policies adopted by the U.S. Congress in the last fifty years have been translated into an efficient and cost-effective transportation system. The exceptional market competitiveness that has been created permits two-thirds of all households in the U.S. to own at least one vehicle, and over 19% of all households to own three or more. Furthermore, passenger cars operating costs have remained extremely low. In 1986, fuel, tires and maintenance costs averaged 6.5 cents per mile for an intermediate vehicle, with service available at over 329,000 repair, maintenance, and fuel stations around the country.
Deregulation of the air transportation industry has also resulted in substantial consumer benefits. Air travel costs have been reduced in most cases. It costs less to fly between New York and Los Angeles than between Paris and London, a fraction of the distance. The least efficient transportation sub-sector in the U.S. is the railroad, which is also the most regulated. Federal transportation subsidies per passenger mile, net of user fees, were estimated by the Congressional Budget Office in 1980 at 23.6 cents for rail, 0.1 cents for autos, and 0.2 cents for commercial aviation.
19-4
Deregulation of the petroleum market in 1981 brought about consumer and economic benefits that significantly affected the transportation sector. After adjustment for inflation, U.S. gasoline prices are the lowest they have been in a generation. Since mid-1985 gasoline prices have remained below $1.00 per gallon. Furthermore, the U.S. taxes gasoline at the lowest percentage of any Western nation, with consequent retail prices that are among the lowest in the world.
Near-Term Transportation Issues
Clean Air
The benefits and freedom inherent in private ownership of vehicles carry environmental costs. Federal standards for exhaust emissions have been in effect for two decades and have resulted in dramatic reductions of pollutants. Between 1973 and 1982, hydrocarbon and CO emissions were reduced by 96%, and NOx emissions by 76%. Nevertheless, air pollutants have remained substantially above the standards set by Congress in 1960. About 80 U.S. metropolitan areas are, and are likely to remain, in violation of the law.
A range of policy initiatives are being contemplated, at national and local levels, to address the air pollution issue. The transportation sector is at the center of these deliberations because greater options are available to reduce pollution from mobile sources than from stationary sources. Options being considered include tighter vehicle emission standards and the use of alternative fuels. Some U.S. states like California are implementing long-term programs to substitute gasoline-powered vehicles with alternative fuel ones. Others are focusing their efforts on replacing diesel-powered buses with cleanerburning fuels and engines.
The U.S. Congress will reassess air pollution issues during the latter half of 1988 when the Clean Air Act, which is close to expiration, comes up for reauthorization. Among the proposals being considered are legislative requirements for the use of alternative fuels in fleet-operated vehicles and for minimum levels of oxygenated blends.
Fuel Economy
Federal standards for automotive fuel efficiency were legislated by Congress in the late 1970's in the aftermath of the OPEC induced oil shocks. Corporate Average Fuel Economy (CAFE) for the U.S. fleet averaged 15 miles per gallon (mpg) in 1970. The U.S. Department of Transportation. administers the CAFE law, and the U.S. Environmental Protection Agency provides estimates of new vehicle fuel economy.
CAFE Standards were to have reached 27.5 mpg by 1984 and to have remained at that level. In 1986, the standards were temporarily lowered to 26 mpg in response to a petition by two domestic auto manufacturers, and based on the determination that, though technologically feasible, the higher standards would have resulted in an unacceptable economic and marketing burden on manufacturers. Nevertheless, new car fuel efficiency in 1988 is projected to meet or surpass the 27.5 CAFE Standard. U.S. Department of Energy projections of year 2000 petroleum demand assume a continual rise in au to fuel efficiency, reaching nearly 40 m pg levels by 2000.
19-5
The unresolved debate as to the future of CAFE standards is whether fllel efficiency can or cannot be achieved through the competitive nature of the auto industry in the absence of governmental regulation. The Reagan Administration has consistently advocated repeal of the CAFE law and Congress has consistently declined to do so. The fuel efficiency debate is expected to continue under the new Administration that will take office in January 1989.
Alternative Fuels
The 1986 collapse of oil prices and subsequent reduction in U.S. domestic oil production induced a re-examination of national dependence on petroleum imports.! Subsequent analyses concluded the U.S. faces oil imports of between 8 and 10 million BID by 1995 and beyond. Because non-transportation oil use in the U.S. is concentrated in specialized sectors, transportation offers one of the few options for substantially decreasing oil imports.
Alternative transportation fuels are being actively examined as possible contributors to energy security as well as possible mitigators of air pollution. DOE's ongoing assessment of fuels such as methanol, compressed natural gas, and electricity indicates that oil producers, especially those controlling large reserves and excess capacity, will have the capability to price oil below the cost of any alternative fuel. 2 Furthermore, alternative fuels such as methanol would be produced from natural gas feedstocks, the most economical of which can be found outside the U.S. Imports of alternative fuels would therefore be as likely as imports of petroleum, with the important caveat that they could be produced in a wide range of world regions that would render the emergence of an oil-like cartel extremely unlikely. Widespread or even limited introduction of alternative fuel vehicles would require a substantial restructuring of the transportation sector. The time frame required to modify a system as complex as that of the United States would limit introduction of alternative fuels, in substantial volumes, before the year 2000.
Summary
The U.S. transportation sector reflects national goals of providing maximum freedom of mobility for people, goods and services. The Federal Government has been a major force in shaping and developing the American air, rail and road transportation systems by financing transportation since 1823 and regulating it since 1887.
The current system was substantially restructured by acts of Congress promulgated between 1950 and 1970. Perhaps the most influential of these were the Highway Trust Fund legislation of 1956, the Federal Aviation Administration Act of 1958 and the related Aviation Trust fund, the Aviation Deregulation Act of 1978. Policies emanating from these laws have shaped where and how Americans live, work, and pursue leisure activities.
In the next decade, public policy considerations will likely focus on managing the environmental effects of auto emissions, reaching levels of auto fuel efficiency standards that will contribute to a reduction of petroleum imports, and determining conditions for the introduction of alternative transportation fuels.
19-6

References
1. U.S. Department of Energy. Energy Securz'ty: A Report to the Presz'dent. March 1987.
2. U.S. Department of Energy. Assessment of Costs and Benefits of Flexz'ble and Alternatz've Fuel Use z'n the u.s. Transportatz'on Sector. January 1988.
19-7
ENERGY USE IN CHINESE INDUSTRY
Wang Jiacheng*
The Present Situation of Industrial Energy Consumption in China
Over 60% of China's total energy consumption of more than 800 million tons of coal equivalent (Mtce) is consumed by the industrial sectors (including energy-processing and energy-converting sectors). This is an important characteristic of China's energy consumption that is different from developed countries. Analysis and research about the present situation and development trend of energy consumption, and the forecast of industrial energy demand in the distant future are major tasks for energy study in China.
Industrial energy consumption in one country (or area) is closely connected with the development and change of industry and its structure. As a result of different industrial trade structures, there are different industrial output value given by the same amount of industrial energy consumption. In other words, there is different industrial energy consumption required by the same amount of industrial output value because of different industrial trade structures.
With the development of industry, China's industrial energy consumption has increased rapidly. According to the State Statistics Bureau, during the period of the Sixth Five-Year Plan the industrial net output value (calculated by current prices) increased from 180.4 billion yuan in 1980 to 315.2 billion yuan in 1985. The average annual growth rate (calculated in constant prices) was 10.1%. Industrial energy consumption (excluding the village-run industries) increased from 389.9 Mtce in 1980 to 471.7 Mtce in 1985, an average annual growth rate of 3.9%. During this period, the proportion of industrial energy consumption in China's total energy consumption decreased from 64.7% to 61.2%. This was a result of structural trends towards energy-saving patterns within industry.
Historically, the development of the industrial trades in China was not sufficiently coordinated. The speed of development of raw material industries such as metallurgical industry, chemical industry, and building material industry greatly exceeded that of processing industries such as food, textiles, etc. During the period from 1953 to 1980 the average annual growth rates in the metallurgical, chemical, and building material industries were over 11%, while that in the food and textile industries were only about 7%. Because the energy consumption per unit of output value in raw material industries is three or four times as much as that in processing industries, the excessive development of high-energy-consuming raw material industries necessarily led to the increase of industrial energy consumption and its proportion of total energy consumption. As a result of carrying out the policy of "readjustment, reformation, reorganization and improvement" since 1979, the economic structure, particularly the industrial structure, has been gradually rationalized and coordinated, and the economic effect of energy utilization has been
* Energy Research Institute, State Planning Commission
20-1
constantly improving.
The energy consumption per unit of industrial output value is a composite index to measure the utilization level of energy in the country's (or area's) industrial development. Between 1980 and 1985, the energy consumption per 100 million yuan of industrial net output value (calculated in constant prices of 1980) declined from 0.216 Mtce to 0.161 Mtce. The steady decline of energy consumption per unit of industrial output value is the result of the readjustment of industrial structure and the energetic development of energy conservation in the industrial trades. Since 1980 the Chinese government has set up and carried out the energy policy of "paying attention to both the development and conservation of energy, and giving priority to energy conservation in recent years," and has put the stress of energy conservation on the industrial sectors.
Energy conservation includes both "direct" and "indirect" energy conservation. Readjustment of the trade structure within the industries, reformation of production composition, saving on raw materials, improvement of product quality, and increase in the variety of products can all playa role in indirect energy conservation. Direct energy conservation includes adopting various technical measures such as reformation of technological processes, renewal of equipment, recovery of waste energy and waste materials, etc., to reduce the expenses of energy. During the period of the Sixth Five-year Plan, the total amount of energy saved was 149 Mtce, equivalent to 4.27% of total energy consumed. Most of this was saved by industrial sectors. Direct energy conservation accounted for 25% of savings.
The proportion of coal in the energy consumption of the industrial sectors is relatively great. In 1985, the composition of industrial energy consumption by sources was: coal 43.2%, coke 9.5%, oil products 8.5%, gaseous fuels such as natural gas 5.5%, electricity 26.9%, heat 2.5%, other 3.9%. The high reliance on coal and the large amount of raw coal used as direct industrial fuel are the main reasons bringing about a low efficiency of energy utilization and serious environmental pollution.
The Trend of Industrial Energy Consumption in China
In the course of China's modernization, the speed of development of industry will exceed that of agriculture, and the speed of development of heavy industry will exceed that of light industry. Therefore, industrial energy demand will continue to increase. Given the relatively tight contradiction between energy supply and the goal of doubling the industrial output value, energy conservation is crucial for resolving the industrial energy problems. China will continue to carry out the policy of direct energy conservation in combination with indirect energy conservation in the industrial sectors to cut the expenses of energy and to reduce the amount of energy consumption.
The energy consumption of industrial sectors in China is great, and so is the potential of energy conservation. At present, the expenses on energy per unit of industrial output value are very high. Given that the expense of energy per unit of output value differs greatly among the industrial sectors, continuing readjustment of the industrial structure on the basis of coordinated development of the trades is beneficial to decrease industrial energy consumption and increase the economic effect of energy utilization. The rationalization of industrial structure will accompany the coordinated development and balancing of the whole national economy. It will focus on readjustment of industrial product
20-2
structure; developing more complete processing, "processing depth" and fineness of products, and improvement of the quality of products. For example, petrochemical and coal-chemical processing industries based on the rational and comprehensive utilization of the coal and oil resources should be developed quickly.
In China, existing production techniques and energy consumption equipment such as boilers, industrial furnaces, electrical machinery, pneumatic machines, water pumps, etc., are mostly equivalent to the 1950s-1960s level of developed countries, while a few reach foreign 1970s level. So there is great potential to reduce industrial expenses on energy through technical progress. For instance, in the iron and steel industry there are various new domestic and foreign energy-saving techniques that are suited to local conditions. These include shaft furnace pellet, top-blown net oxygen steelmaking, continuous casting, and direct rolling. In the chemical industry, particularly in synthetic ammonia production, there is good potential for cogeneration of heat with power. In the machinery industry, the processes of precision boundary, chipless metal working, etc., should be spread. All industries can adopt advanced combustion equipment, high efficiency heat exchangers, high-grade furnace body lagging materials, and so on. The movement from rough processing toward depth processing will also promote adoption of new technologies. In brief, renewing and remaking low efficiency energy-consuming equipment and backward production technologies using advanced technical equipment, and at the same time adopting various effective technical measures aimed at reducing per unit expenses of energy and increasing efficiency of energy utilization in each trade, are the main ways of energy conservation in the future. The goal of energy conservation stipulated in China's Seventh Five-year Plan is 100 Mtce. This will be achieved depending mainly on the industrial sectors. In the period of the Seventh Five-year Plan, the state intends to establish a batch of key projects for energy conservation and introduce widespread projects with advanced techniques and good energy-saving and economic effects.
The energy industry is both an energy producer and an energy consumer. The selfconsumed energy in China's energy industry (including the loss in energy processing and converting) accounts for about 17.6% of industrial energy consumption. In 1985 the selfconsumed energy by the energy industry was 82.76 Mtce, which accounted for 9.7% of total energy production. This was much higher than the proportion in the main industrialized countries (about 6%). Henceforth, the Chinese government will strengthen the management of the energy industry, improve technology, and steadily increase energy production, while doing the best to reduce the proportion of self-consumed energy and energy loss.
Electricity is important for industrial technical progress. The level of electricity consumption is one of the important signs of the modernization of production and life. At present, the proportion of electricity in industrial energy consumption (calculated by equivalent of calorific value, 9.8% in 1985) is far lower than that of the main industrialized countries (in 1982, 15.4% in the U.S., 23.5% in Japan, 19.8% in West Germany, and 16.0% in Britain). In order to suit the requirements of modernization, the Chinese government proposed the policy that "energy industry development should take the power industry as the key" in the Seventh Five-year Plan. The electric power production of the whole country in 1990 was planned to reach about 550 billion kWh, and in 2000 it is forecast to exceed 1,200 billion kWh. Therefore, the proportion of electric power in China's industrial energy consumption will increase in the future.
20-3
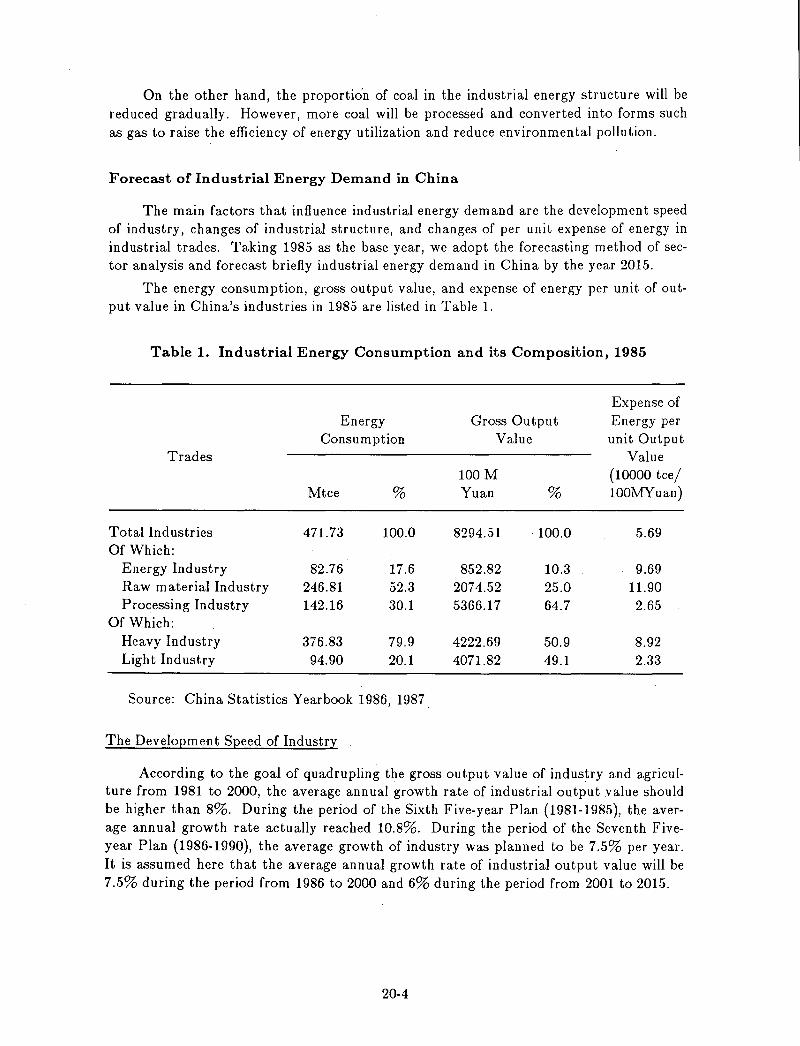
On the other hand, the proportion of coal in the industrial energy structure will be reduced gradually. However, more coal will be processed and converted into forms such as gas to raise the efficiency of energy utilization and reduce environmental pollution.
Forecast of Industrial Energy Demand in China
The main factors that influence industrial energy demand are the development speed of industry, changes of industrial structure, and changes of per unit expense of energy in industrial trades. Taking 1985 as the base year, we adopt the forecasting method of sector analysis and forecast briefly industrial energy demand in China by the year 2015.
The energy consumption, gross output value, and expense of energy per unit of output value in China's industries in 1985 are listed in Table 1.
Table 1. Industrial Energy Consumption and its Composition, 1985
Expense of Energy Gross Output Energy per
Consum ption Value unit Output Trades Value
100M (10000 tce/ Mtce % Yuan % 100MYuan)
Total Industries 471.73 100.0 8294.51 100.0 5.69 Of Which:
Energy Industry 82.76 17.6 852.82 10.3 9.69 Raw material Industry 246.81 52.3 2074.52 25.0 11.90 Processing Industry 142.16 30.1 5366.17 64.7 2.65
Of Which: Heavy Industry 376.83 79.9 4222.69 50.9 8.92 Light Industry 94.90 20.1 4071.82 49.1 2.33
Source: China Statistics Yearbook 1986, 1987.
The Development Speed of Industry
According to the goal of quadrupling the gross output value of industry and agriculture from 1981 to 2000, the average annual growth rate of industrial output value should be higher than 8%. During the period of the Sixth Five-year Plan (1981-1985), the average annual growth rate actually reached 10.8%. During the period of the Seventh Fiveyear Plan (1986-1990), the average growth of industry was planned to be 7.5% per year. It is assumed here that the average annual growth rate of industrial output value will be 7.5% during the period from 1986 to 2000 and 6% during the period from 2001 to 2015.
20-4
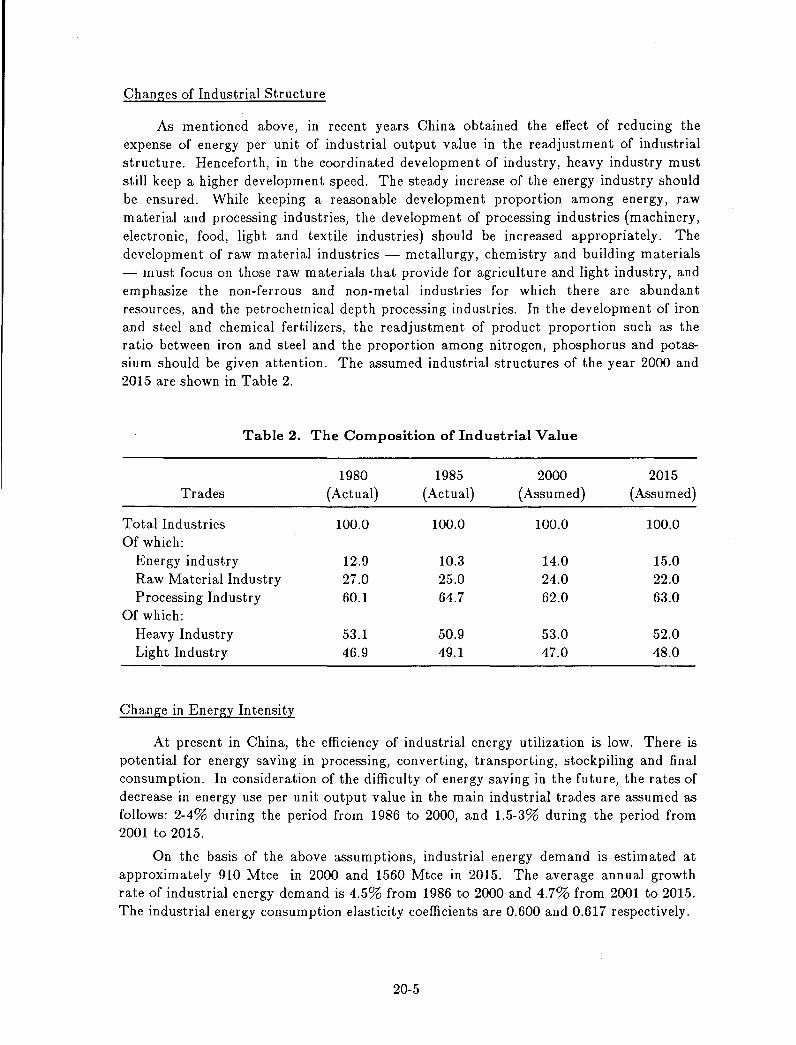
Changes of Industrial Structure
As mentioned above, in recent years China obtained the effect of reducing the expense of energy per unit of industrial output value in the readjustment of industrial structure. Henceforth, in the coordinated developmen t of industry, heavy industry must still keep a higher development speed. The steady increase of the energy industry should be ensured. While keeping a reasonable development proportion among energy, raw material and processing industries, the development of processing industries (machinery, electronic, food, light and textile industries) should be increased appropriately. The development of raw material industries - metallurgy, chemistry and building materials - must focus on those raw materials that provide for agriculture and light industry, and emphasize the non-ferrous and non-metal industries for which there are abundant resources, and the petrochemical depth processing industries. In the development of iron and steel and chemical fertilizers, the readjustment of product proportion such as the ratio between iron and steel and the proportion among nitrogen, phosphorus and potassium should be given attention. The assumed industrial structures of the year 2000 and 2015 are shown in Table 2.
Table 2. The Composition of Industrial Value
1980 1985 2000 2015 Trades (Actual) (Actual) (Assumed) (Assumed)
Total Industries 100.0 100.0 100.0 100.0 Of which:
Energy industry 12.9 10.3 14.0 15.0 Raw Material Industry 27.0 25.0 24.0 22.0 Processing Industry 60.1 64.7 62.0 63.0
Of which: Heavy Industry 53.1 50.9 53.0 52.0 Light Industry 46.9 49.1 47.0 48.0
Change in Energy Intensity
At present in China, the efficiency of industrial energy utilization is low. There is potential for energy saving in processing, converting, transporting, stockpiling and final consumption. In consideration of the difficulty of energy saving in the future, the rates of decrease in energy use per unit output value in the main industrial trades are assumed as follows: 2-4% during the period from 1986 to 2000, and 1.5-3% during the period from 2001 to 2015.
On the basis of the above assumptions, industrial energy demand is estimated at approximately 91O Mtce in 2000 and 1560 Mtce in 2015. The average annual growth rate of industrial energy demand is 4.5% from 1986 to 2000 and 4.7% from 2001 to 2015. The industrial energy consumption elasticity coefficients are 0.600 and 0.617 respectively.
20-5
Conclusion
Industry is the main sector of energy consumption in China. With continuing modernization, China's industrial energy demand will increase greatly. Energy conservation is the key for resolving the contradiction of industrial energy supply and demand. The readjustment of industrial structure should adhere to the principle of national coordinated economic development and overall balance, and lay emphasis on rationalizing the product structure and increasing depth processing. Energy saving depending on technical progress is the basic way of industrial energy conservation. During the coming thirty years, as a result of the coordinated development of energy, raw material and processing industries, and the increasing difficulty in technical energy saving, the proportion of industrial energy demand in the total energy demand will probably increase slightly.
20-6
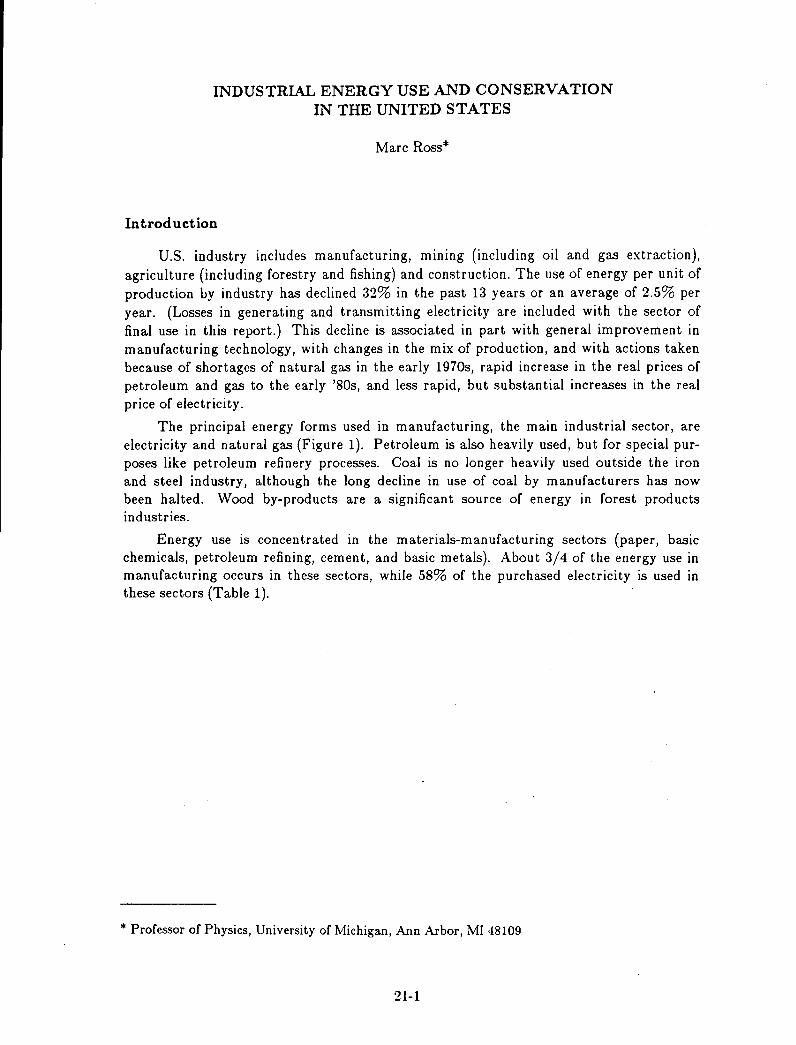
INDUSTRIAL ENERGY USE AND CONSERVATION IN THE UNITED STATES
Marc Ross*
Introduction
U.S. industry includes manufacturing, mlDlDg (including oil and gas extraction), agriculture (including forestry and fishing) and construction. The use of energy per unit of production by industry has declined 32% in the past 13 years or an average of 2.5% per year. (Losses in generating and transmitting electricity are included with the sector of final use in this report.) This decline is associated in part with general improvement in manufacturing technology, with changes in the mix of production, and with actions taken because of shortages of natural gas in the early 1970s, rapid increase in the real prices of petroleum and gas to the early '80s, and less rapid, but substantial increases in the real price of electricity.
The principal energy forms used in manufacturing, the main industrial sector, are electricity and natural gas (Figure 1). Petroleum is also heavily used, but for special purposes like petroleum refinery processes. Coal is no longer heavily used outside the iron and steel industry, although the long decline in use of coal by manufacturers has now been halted. Wood by-products are a significant source of energy in forest products industries.
Energy use is concentrated in the materials-manufacturing sectors (paper, basic chemicals, petroleum refining, cement, and basic metals). About 3/4 of the energy use in manufacturing occurs in these sectors, while 58% of the purchased electricity is used in these sectors (Table 1).
* Professor of Physics, University of Michigan, Ann Arbor, MI 48109
21-1
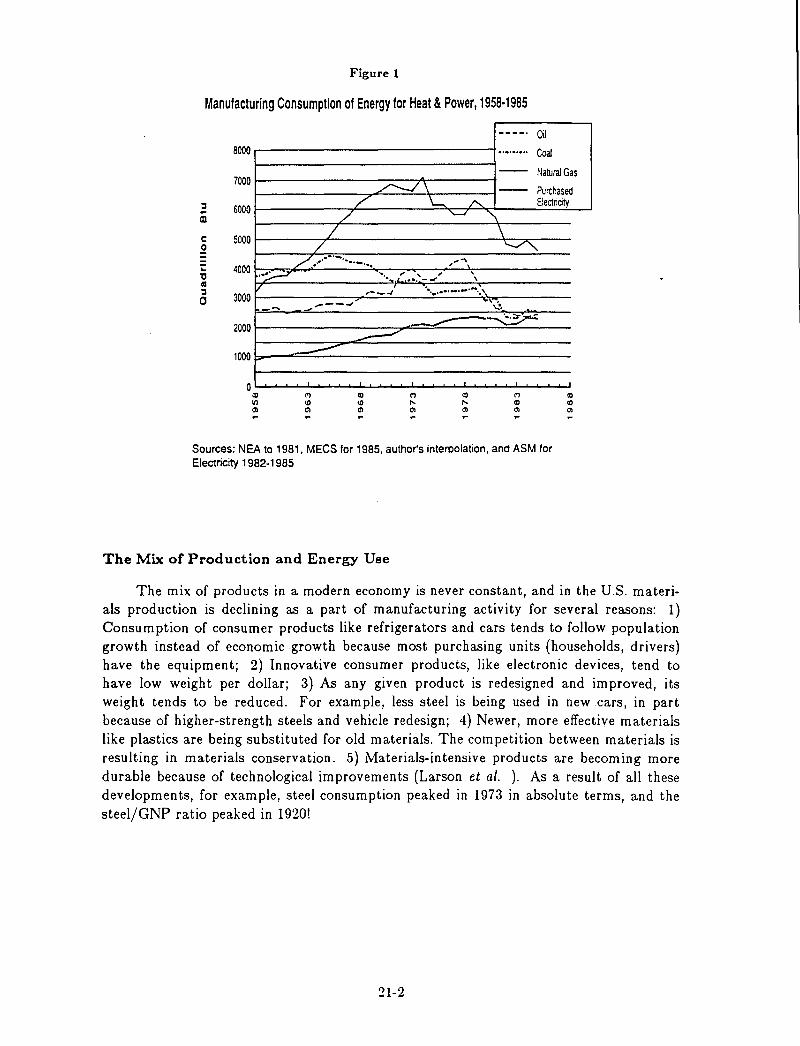
Figure 1
Manufacturing Consumption of Energy for Heat & Power, 1958·1985 ____ ,
Oil 8000 ......... Coal
-- Natural Gas 7000 ./'--/\ '- Purchased
::I 6000 /" \..--. I'... Electricity -ID / "'--" '\ c: 5000 0
/ \ / ~
;: 4000 'C ~ ::I
3000 C
/ .. " .... -..... -.. " , ,",
.. ;:;-:r .. ,. , \ '. }'-I.·.'-J \ ,-_J •.•...... -.-.-.~"
, .,"". -- ..... ~--., .......
-----~ 2000 .----"
1000
o <I) III Ol
--M (I) Ol
<I) (I) Ol
Sources: NEA to 1981. MECS for 1985. author's interpolation. and ASM for Electricity 1982-1985
The Mix of Production and Energy Use
<I) <I)
Ol
The mix of products in a modern economy is never constant, and in the U.S. materials production is declining as a part of manufacturing activity for several reasons: 1) Consumption of consumer products like refrigerators and cars tends to follow population growth instead of economic growth because most purchasing units (households, drivers) have the equipment; 2) Innovative consumer products, like electronic devices, tend to have low weight per dollar; 3) As any given product is redesigned and improved, its weight tends to be reduced. For example, less steel is being used in new cars, in part because of higher-strength steels and vehicle redesign; 4) Newer, more effective materials like plastics are being substituted for old materials. The competition between materials is resulting in materials conservation. 5) Materials-intensive products are becoming more durable because of technological improvements (Larson et al. ). As a result of all these developments, for example, steel consumption peaked in 1973 in absolute terms, and the steel/GNP ratio peaked in 1920!
21-2
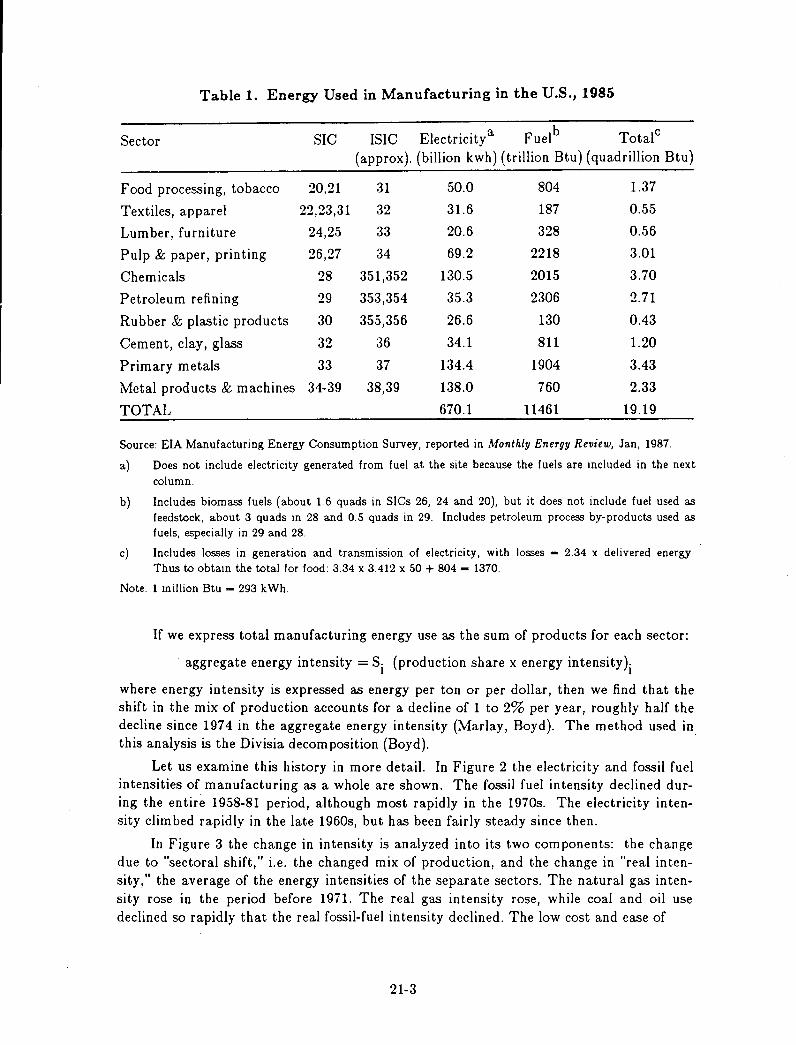
Table 1. Energy Used in Manufacturing in the U.S., 1985
Sector SIC ISIC Electricitya Fuel b TotalC
(approx). (billion kwh) (trillion Btu) (quadrillion Btu)
Food processing, tobacco 20,21 31 50.0 804 1.37
Textiles, apparel 22,23,31 32 31.6 187 0.55
Lumber, furniture 24,25 33 20.6 328 0.56
Pulp & paper, printing 26,27 34 69.2 2218 3.01
Chemicals 28 351,352 130.5 2015 3.70
Petroleum refining 29 353,354 35.3 2306 2.71
Rubber & plastic products 30 355,356 26.6 130 0.43
Cement, clay, glass 32 36 34.1 811 1.20
Primary metals 33 37 134.4 1904 3.43
Metal products & machines 34-39 38,39 138.0 760 2.33
TOTAL 670.1 11461 19.19
Source: EIA Manufacturing Energy Consumption Survey, reported in Monthly Energy Review, Jan, 1987.
a) Does not include electricity generated from fuel at the site because the fuels are included in the next column.
b) Includes biomass fuels (about 1.6 quads in SICs 26, 24 and 20), but it does not include fuel used as feedstock, a.bout 3 quads in 28 a.nd 0.5 quads in 29. Includes petroleum process by-products used as fuels, especially in 29 and 28.
c) Includes losses in generation and transmission of electricity, with losses - 2.34 x delivered energy. Thus to obtain the total for food: 3.34 x 3.412 x 50 + 804 - 1370.
Note: 1 million Btu - 293 kWh.
If we express total manufacturing energy use as the sum of products for each sector:
aggregate energy intensity = S. (production share x energy intensity). 1 1
where energy intensity is expressed as energy per ton or per dollar, then we find that the shift in the mix of production accounts for a decline of 1 to 2% per year, roughly half the decline since 1974 in the aggregate energy intensity (Marlay, Boyd). The method used in this analysis is the Divisia decomposition (Boyd).
Let us examine this history in more detail. In Figure 2 the electricity and fossil fuel intensities of manufacturing as a whole are shown. The fossil fuel intensity declined during the entire 1958-81 period, although most rapidly in the 1970s. The electricity intensity clim bed rapidly in the late 1960s, but has been fairly steady since then.
In Figure 3 the change in intensity is analyzed into its two components: the change due to "sectoral shift," i.e. the changed mix of production, and the change in "real intensity," the average of the energy intensities of the separate sectors. The natural gas in tensity rose in the period before 1971. The real gas intensity rose, while coal and oil use declined so rapidly that the rea] fossil-fuel intensity declined. The low cost and ease of
21-3
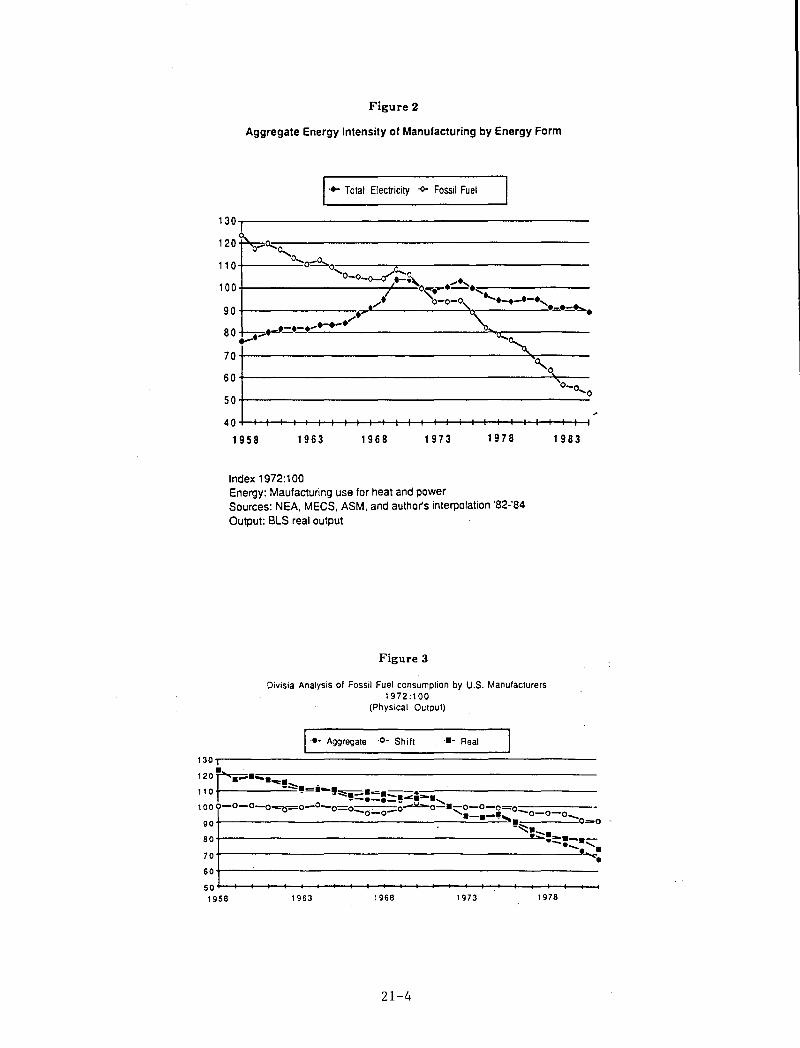
Figure 2
Aggregate Energy Intensity of Manufacturing by Energy Form
... Total Electricity -0- Fossil Fuel
130~1-----------------------------------------
120 o-O;;;::~
110+-------0,~~ --------~--------------------------0'0 o"'~o
1 0 0 -0-0_ .-.~ ....... ,
o ..... --.-.,~--------• "0-0-0 ...... -.-.-., 9 0 ~---------•. "7"./ ' '\ .=.-~. - _./ 80 ~'_"~~-~'~-~'~~-'-'-----------~~~--------....... '0 .... ,
70+---------------------------------~~----0.....0
60+-------------------------------------~~--0_0....
0 SO+---------------------------------------~
40+-~-+-+~+-~~-+~+-~-+-+~+-~-+-+~+-~~
1958 1963 1968 1973 1978
Index 1972:100 Energy: Maufacturing use for heat and power Sources: NEA, MECS, ASM, and author's interpolation '82-'84
Output: BLS real output
Figure 3
Divisia Analysis of Fossil Fuel consumplion by U.S. Manulaclurers 1972:100
(Physical Oulpul)
.• - Aggregale ·0- Shift '.- Real
1983
130~1----------~==========================~----------• 120~_."'.""".""" _
, 1 0 .. ~,~.~!..::::::.-.-=.:::::--.----------------.-.-!-.-........ 100 -0-0-0---0_0_0-0_0 " o~o-.-o-O-o-o --0-0- ........ _.-~, -0-0-0_
90+-------------------~~~~. 0"'0 -~.-.
80+------------------------~·~.~.-..-......... 70t-------------------------------------------------~~. 60+-------------------------------------------------------50~~~-+~--~+-~~~~~+-+-~~~~~+-~~~~--~
1958 1963 1968 1973 1978
21-4
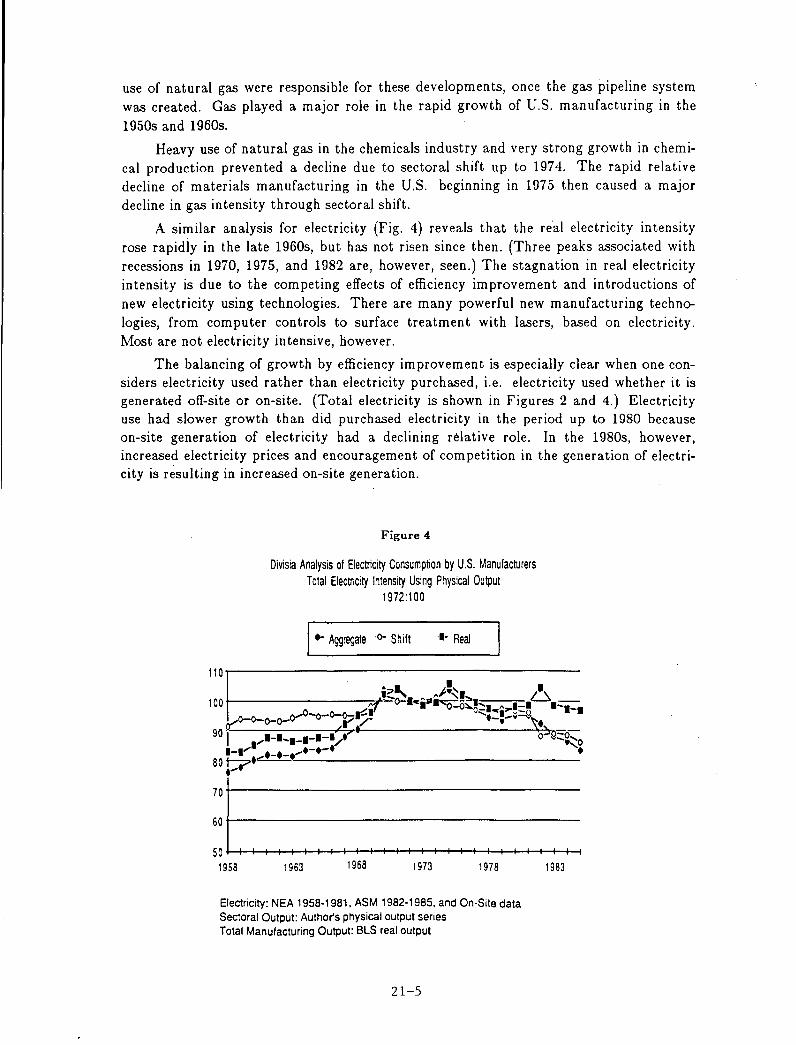
use of natural gas were responsible for these developments, once the gas pipeline system was created. Gas played a major role in the rapid growth of U.S. manufacturing in the
1950s and 1960s.
Heavy use of natural gas in the chemicals industry and very strong growth in chemical production prevented a decline due to sectoral shift up to 1974. The rapid relative decline of materials manufacturing in the U.S. beginning in 1975 then caused a major decline in gas intensity through sectoral shift.
A similar analysis for electricity (Fig. 4) reveals that the re'al electricity intensity rose rapidiy in the late 1960s, but has not risen since then. (Three peaks associated with recessions in 1970, 1975, and 1982 are, however, seen.) The stagnation in real electricity intensity is due to the competing effects of efficiency improvement and introductions of new electricity using technologies. There are many powerful new manufacturing technologies, from computer controls to surface treatment with lasers, based on electricity. Most are not electricity intensive, however.
The balancing of growth by efficiency improvement is especially clear when one considers electricity used rather than electricity purchased, i.e. electricity used whether it is generated off-site or on-site. (Total electricity is shown in Figures 2 and 4.) Electricity use had slower growth than did purchased electricity in the period up to 1980 because on-site generation of electricity had a declining relative role. In the 1980s, however, increased electricity prices and encouragement of competition in the generation of electricity is r~sulting in increased on-site generation.
Figure 4
Divisia Analysis of Electricity Consumption by U.S. Manufacturers Total Electricity Intensity Using Physical Output
1972:100
I'" Aggregate '0- Shift '1- Real
110r------------------------------------------------------------------------------------
:: I , , , , , , , , , , , , , , , , , ' 1958 1963 1968 1973
I I I I I
1978
Electricity: NEA 1956-1961. ASM 1962-1965. and On-Site data Sectoral Output: Author's physical output series Total Manufacturing Output: BLS real output
21-5
I I I I
1983
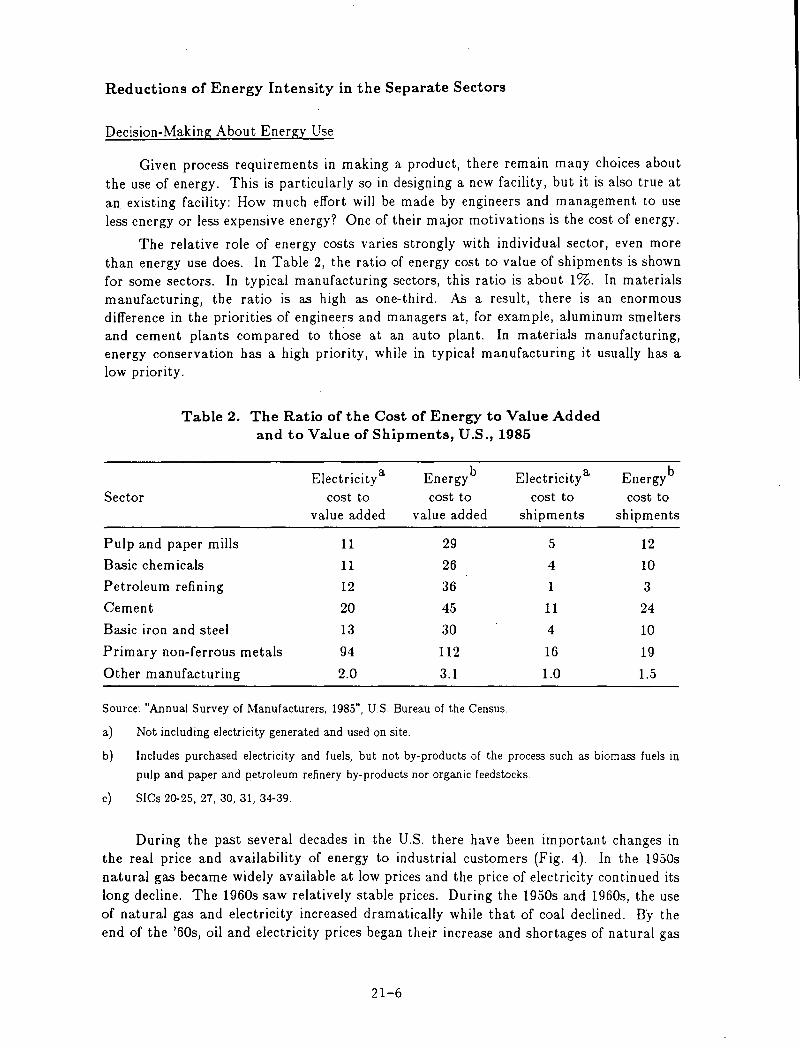
Reductions of Energy Intensity in the Separate Sectors
Decision-Making About Energy Use
Given process requirements in making a product, there remain many choices about the use of energy. This is particularly so in designing a new facility, but it is also true at an existing facility: How much effort will be made by engineers and management to use less energy or less expensive energy? One of their major motivations is the cost of energy.
The relative role of energy costs varies strongly with individual sector, even more than energy use does. In Table 2, the ratio of energy cost to value of shipments is shown for some sectors. In typical manufacturing sectors, this ratio is about 1%. In materials manufacturing, the ratio is as high as one-third. As a result, there is an enormous difference in the priorities of engineers and managers at, for example, aluminum smelters and cement plants compared to those at an auto plant. In materials manufacturing, energy conservation has a high priority, while in typical manufacturing it usually has a low priority.
Table 2. The Ratio of the Cost of Energy to Value Added and to Value of Shipments, U.S., 1985
Electricitya Energy b Electricitya
Sector cost to cost to cost to value added value added shipments
Pulp and paper mills 11 29 5
Basic chemicals 11 26 4
Petroleum refining 12 36 1
Cement 20 45 11
Basic iron and steel 13 30 4
Primary non-ferrous metals 94 112 16
Other manufacturing 2.0 3.1 1.0
Source: "Annual Survey of Manufacturers, 1985", US. Bureau of the Census.
a) Not including electricity generated and used on site.
Energy b
cost to shipments
12
10
3
24
10
19
1.5
b) Includes purchased electricity and fuels, but not by-products of the process such as biomass fuels in pulp and paper and petroleum refinery by-products nor organic feedstocks.
c) SICs 20-25, 27, 30, 31, 34-39.
During the past several decades in the U.S. there have been important changes in the real price and availability of energy to industrial customers (Fig. 4). In the 1950s natural gas became widely available at low prices and the price of electricity continued its long decline. The 1960s saw relatively stable prices. During the 1950s and 1960s, the use of natural gas and electricity increased dramatically while that of coal declined. Hy the end of the '60s, oil and electricity prices began their increase and shortages of natural gas
21-6
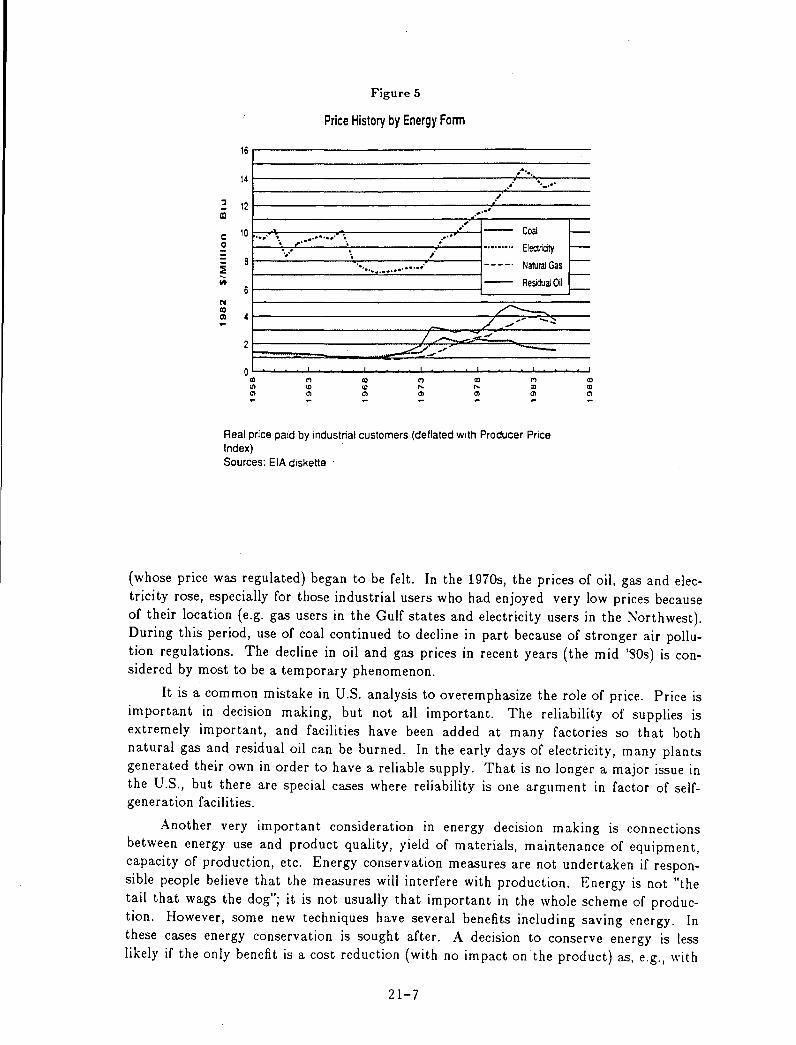
Figure 5
Price History by Energy Form
16.-------------------------------------___ . .". .•.
14~------------------------------~ .• ~~ ... ~ .. ~.----= 12~----------------------------.-~ ... t------------In .. ' c 10r. .• ~ •. ~.----.7. •• ~ .. ~ •. ~.------------.~ •.• ~~ o ... ~.. '. ~~ - ".," ..
....................
6 N
Coal rElectrtoty t
NaMa! Gas t
Residual Oil := ~ 4~----------------------------~~~~~----~
/ ,~ -.;: .. -"'"
.,., /...-. -'
..r:::::./.;/ --CD (') CD (') CD
o~~~~~~~~~~~--~~~~--~~ CD (') <I) cD cD ... ... CD
'" '" '" '" '" '" - - - - -Real price paid by industrial customers (deflated with Producer Price Index) Sources: EIA diskette .
CD
'" -
(whose price was regulated) began to be felt. In the 1970s, the prices of oil, gas and electricity rose, especially for those industrial users who had enjoyed very low prices because of their location (e.g. gas users in the Gulf states and electricity users in the Northwest). During this period, use of coal continued to decline in part because of stronger air pollution regulations. The decline in oil and gas prices in recent years (the mid '80s) is considered by most to be a temporary phenomenon.
It is a common mistake in U.S. analysis to overemphasize the role of price. Price is important in decision making, but not all important. The reliability of supplies is extremely important, and facilities have been added at many factories so that both natural gas and residual oil can be burned. In the early days of electricity, many plants generated their own in order to have a reliable supply. That is no longer a major issue in the U.S., but there are special cases where reliability is one argument in factor of selfgeneration facilities.
Another very important consideration in energy decision making is connections between energy use and product quality, yield of materials, maintenance of equipment, capacity of production, etc. Energy conservation measures are not undertaken if responsible people believe that the measures will interfere with production. Energy is not "the tail that wags the dog"; it is not usually that important in the whole scheme of production. However, some new techniques have several benefits including saving energy. In these cases energy conservation is sought after. A decision to conserve energy is less likely if the only benefit is a cost reduction (with no impact on ·the product) as, e.g., with
21-7
heat recovery.
Of course, if people are aware of opportunities to save energy which provide very large cost savings and will not interfere with production, they will do it. The typical criterion for energy conservation projects in U.S. industries appears to be a simple payback of 2 years or less. Simple payback is the ratio:
(cost of installation}/(net benefits per year).
Of course, this criterion is not universally used. Some firms have too few engineers to consider energy conservation measures, or no money to invest, and so do not look for projects to save energy and renovate their production processes. Other firms have high earnings and large engineering staffs. These firms have carried out many conservation projects, even in cases where energy is a very small fraction of costs. (Examples of the latter are IBM and AT&T).
Energy Intensity Reductions Since 1972
A nation.al program was introduced in the mid-1970s requiring the various industrial sectors to report the change in their energy use per unit of production. Goals were set for 1980 and 1985. For the period 1972 - 1985, the following average rates of reduction in energy per ton of product were achieved: chemicals 3.4%/year, steel 1.8%/year, paper 2.5%/year, petroleum refining 1.1 %/year. (The reduction of energy intensity in petroleum refining would have been much larger in the absence of changes such as a higher fraction of products like gasoline being made.)
Three main categories of change were responsible for reduced energy intensities of this kind: 1) changes in operations and maintenance, 2) relatively small investments in energy-intensive equipment or in energy- conservation technologies (typically costing fifty thousand to ten million dollars), and 3) changes in the major processes of production, often requiring new facilities costing tens or hundreds of million dollars. Consider the second and third categories.
The best targets for energy-saving investments have proven to be: 1) improving secondary energy systems, like steam and compressed air systems, 2} reducing energy use during non-production shifts and at times of low production, using automatic controls, 3) improving the performance of process heaters and boilers, and 4) reducing waste streams, such water discharge at paper mills, and rejection of product at steel mills. The use of sensors (for electrical parameters, pressure, temperature, chemical composition, size, etc.) in combination with micro-processors and actuators has proved especially helpful in achieving many of these goals, because it permits operating much closer to optimum conditions than manual control, often enabling multiple benefits.
New facilities are most likely to be justified when increased production is needed. This is no longer the situation in many of the energy- intensive industries in the U.S. Nevertheless, it is important to consider the choice between bulding plants using established technology or striving to develop and introduce new technology. There are promising new processes which could conserve materials, reduce pollution, save energy, and reduce overall costs. Consider an example.
Steel making processes should be a general focus for research and development in the U.S. because we have the raw materials including abundant coal and we have extensive
21-8
markets. Radical new processes for reducing iron ore using coal, such as reduction by blowing powdered ore and coal into a bath of molten metal, appear to have promise. Radical processes for casting steel near its final shape have great promise as well. Such processes, if developed and applied, would both save energy and enable much better control over the product. They would sharply reduce the time for processing and enable a
continuous flow process (Eketorp).
Thus, while it is important to renovate and improve the performance of existing factories, it is also important to look to the long-term future and plan developmental work so that new facilities may incorporate technology that is better adapted to local resources and needs.
References
1. Boyd, G. et aI., 1987, "Separating the Changing Composition of U.S. Manufacturing Production from Energy Efficiency Improvements: A Divisia Index Approach," Energy Journal, Vol. 8, no. 2.
2 Eketorp, Sven, 1987, "Energy Considerations in Classical and New Iron- and SteelMaking Technology" in Energy Conservation, proceedings of the Soviet-American Symposium, June 1985, R.H. Socolow and M. Ross, editors. Available as Vol. 12, No. 10/11 of Energy.
3 Larson, Eric, Marc Ross and Robert Williams, 1986, "Beyond the Era of Materials," Scientific American, June.
4 Marlay, Robert, 1984, "Trends in Industrial Use of Energy," Science Vol. 226, p. 1277; and "Industrial Electricity Consumption and Changing Economic Conditions," in The Changing Structure of American Industry and Energy Use Patterns, Faruqui and Broehl, editors, Electric Power Research Inst. {1987}.
21-9
ELECTRICAL ENERGY PRODUCTION AND CONSUMPTION IN CHINA
Hu Zhao-yi*
The Electric Power Industry in China
The Chinese government attaches great importance to the electric power industry. As of the end of 1987, the installed generating capacity was 101.92 GW, and the annual electricity generation of 496 TWh ranked in the world.
In 1987 new installed generating capacity was 8.1 GW. The growth rate was the highest since the founding of the PRC. The plants with size over 1000 MW recently built are Douhe power plant in Hebei province; Quinghe in Liaoning; Jianbi in Jiangsu; and Gezhouba, Liujiaxia hydropower station. More power plants and stations of size over 1000 MW are being built.
The manufacturing capability and technology level are improving. China can now make generating units of 200 MW, 300 MW and 600 MW. 200 MW and 300 MW units are the dominant units in current thermal power plants. 600 MW units have been made in 1986 and will be put into operation in 1988.
To match the construction of large thermal power plants and hydropower stations, high voltage transmission technologies are improving and electric power grids are being extended. At present, 11 power grids have exceeded 1000 MW in capacity, of which four inter-regional grids (North China, Northeast China, East China and Central China) are over 10,000 MW.
The dominant transmission voltage grade is 220 kV. The first 500 kV transmission line was put into service at the end of 1981. Since then 500 kV transmission lines have been commissioned among the four large power grids mentioned above, with the total route length of 3269 km as of the end of 1986. The Ge-shang 500 kV HVDC project will be put into operation in 1988. However, Northwest China grids are operating at 330 kV.
Coal consumption for electricity generation, power plant use, and line losses is above the level of some developed countries. Generating units with medium and low pressure turbines still occupy 13.4 GW. Old domestic-made generator efficiency is relatively low. The high utilization of power generating equipment results from the serious electricity shortage.
* Electric Power Research Institute, Beijing
22-1
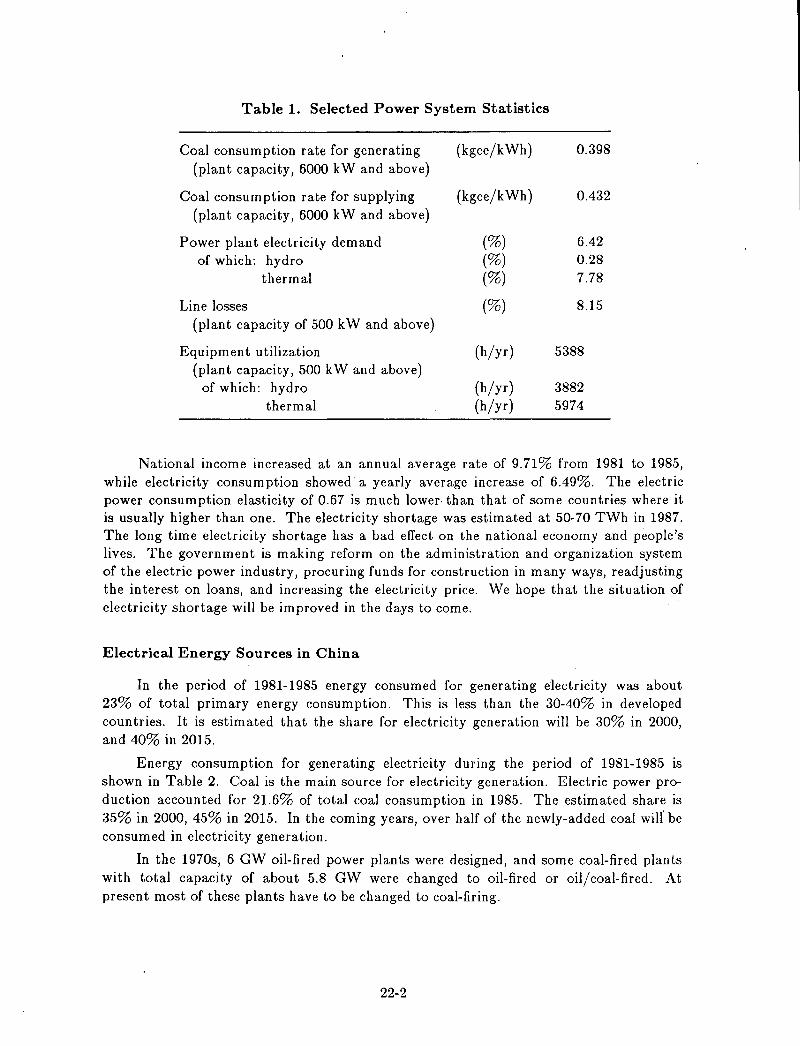
Table 1. Selected Power System Statistics
Coal consumption rate for generating (kgce/kWh) 0.398 (plant capacity, 6000 kW and above)
Coal consumption rate for supplying (kgce/kWh) 0.432 (plant capacity, 6000 kW and above)
Power plant electricity demand (%) 6.42 of which: hydro (%) 0.28
thermal (%) 7.78
Line losses (%) 8.15 (plant capacity of 500 kW and above)
Equipment utilization (h/yr) 5388 (plant capacity, 500 kW and above)
of which: hydro (h/yr) 3882 thermal (h/yr) 5974
National income increased at an annual average rate of 9.71% from 1981 to 1985, while electricity consumption showed a yearly average increase of 6.49%. The electric power consumption elasticity of 0.67 is much lower, than that of some countries where it is usually higher than one. The electricity shortage was estimated at 50-70 TWh in 1987. The long time electricity shortage has a bad effect on the national economy and people's lives. The government is making reform on the administration and organization system of the electric power industry, procuring funds for construction in many ways, readjusting the interest on loans, and increasing the electricity price. We hope that the situation of electricity shortage will be improved in the days to come.
Electrical Energy Sources in China
In the period of 1981-1985 energy consumed for generating electricity was about 23% of total primary energy consumption. This is less than the 30-40% in developed countries. It is estimated that the share for electricity generation will be 30% in 2000, and 40% in 2015.
Energy consumption for generating electricity during the period of 1981-1985 is shown in Table 2. Coal is the main source for electricity generation. Electric power production accounted for 21.6% of total coal consumption in 1985. The estimated share is 35% in 2000, 45% in 2015. In the coming years, over half of the newly-added coal will' be consumed in electricity generation.
In the 1970s, 6 GW oil-fired power plants were designed, and some coal-fired plants with total capacity of about 5.8 GW were changed to oil-fired or oil/coal-fired. At present most of these plants have to be changed to coal-firing.
22-2
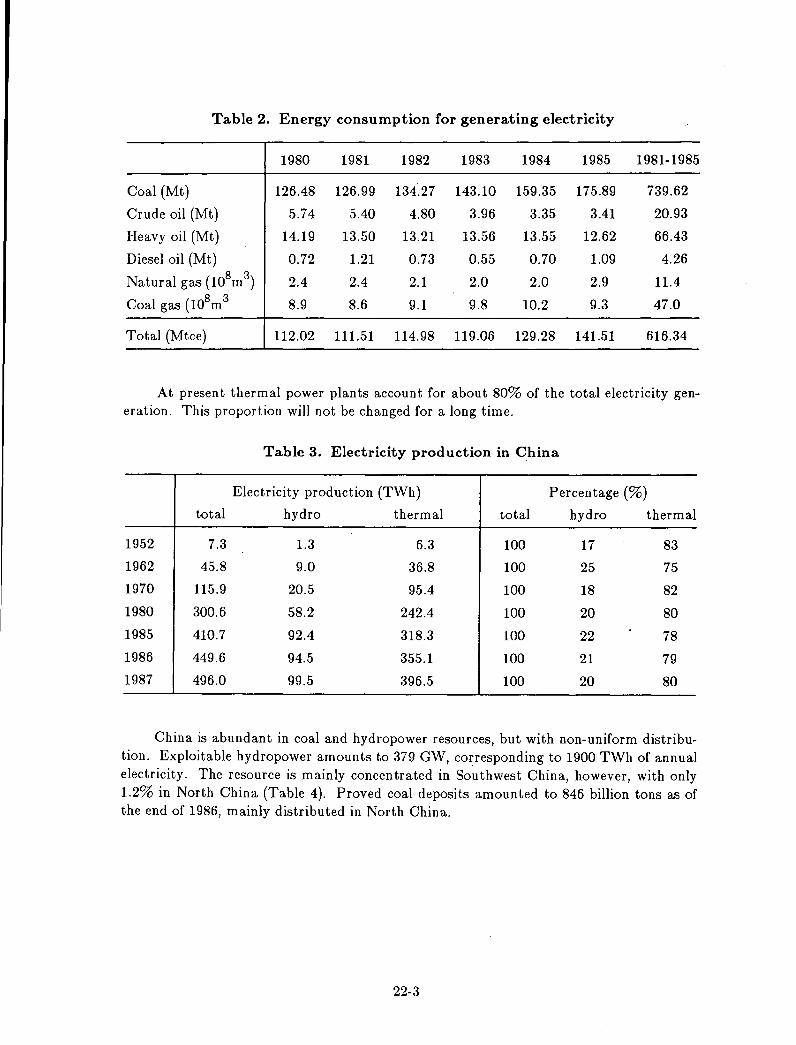
Table 2. Energy consumption for generating electricity
1980 1981 1982 1983 1984 1985 1981-1985
Coal (Mt) 126.48 126.99 134.27 143.10 159.35 175.89 739.62
Crude oil (Mt) 5.74 5.40 4.80 3.96 3.35 3.41 20.93
Heavy oil (Mt) 14.19 13.50 13.21 13.56 13.55 12.62 66.43
Diesel oil (Mt) 0.72 1.21 0.73 0.55 0.70 1.09 4.26 ( 8 3 Natural gas 10 m ) 2.4 2.4 2.1 2.0 2.0 2.9 11.4
Coal gas {108m 3 8.9 8.6 9.1 9.8 10.2 9.3 47.0
Total (Mtce) 112.02 111.51 114.98 119.06 129.28 141.51 616.34
At present thermal power plants account for about 80% of the total electricity generation. This proportion will not be changed for a long time.
Table 3. Electricity prod uction in China
Electricity production (TWh) Percentage (%)
total hydro thermal total hydro thermal
1952 7.3 1.3 6.3 100 17 83
1962 45.8 9.0 36.8 100 25 75
1970 115.9 20.5 95.4 100 18 82
1980 300.6 58.2 242.4 100 20 80
1985 410.7 92.4 318.3 100 22 78
1986 449.6 94.5 355.1 100 21 79
1987 496.0 99.5 396.5 100 20 80
China is abundant in coal and hydropower resources, but with non-uniform distribution. Exploitable hydropower amounts to 379 GW, corresponding to 1900 TWh of annual electricity. The resource is mainly concentrated in Southwest China, however, with only 1.2% in North China (Table 4). Proved coal deposits amounted to 846 billion tons as of the end of 1986, mainly distributed in North China.
22-3
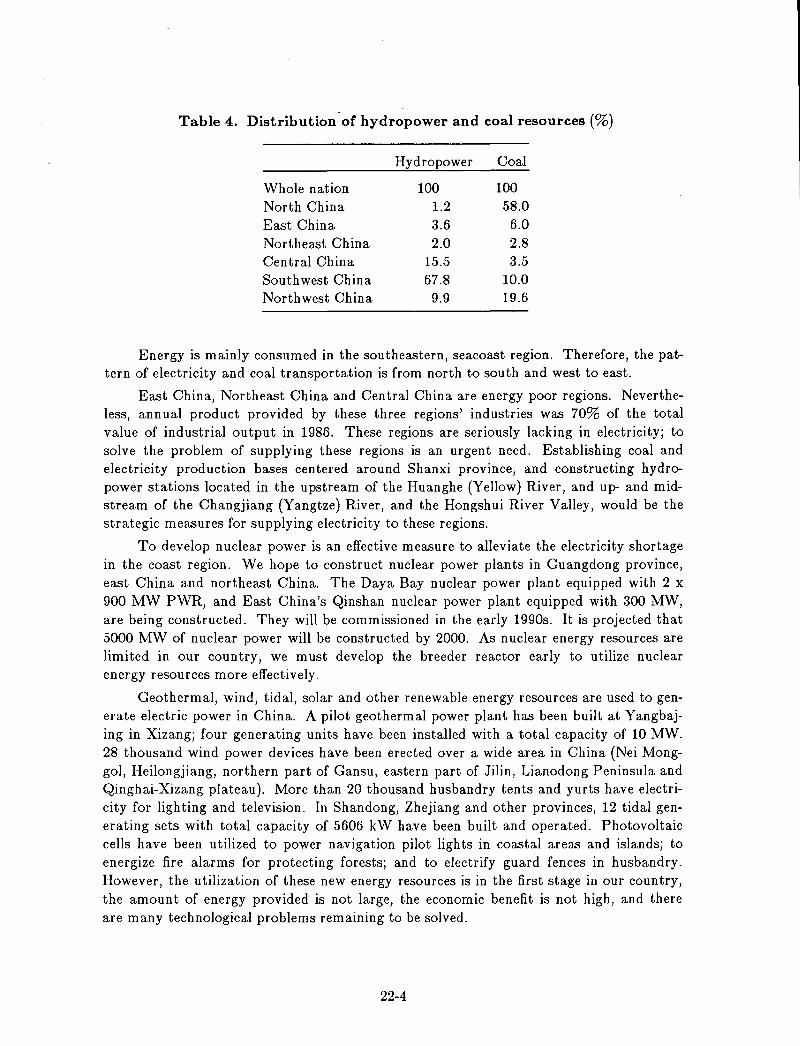
Table 4. Distribution·of hydropower and coal resources (%)
Hydropower Coal
Whole nation 100 100 North China 1.2 58.0 East China 3.6 6.0 Northeast China 2.0 2.8 Central China 15.5 3.5 Southwest China 67.8 10.0 Northwest China 9.9 19.6
Energy is mainly consumed in the southeastern, seacoast region. Therefore, the pattern of electricity and coal transportation is from north to south and west to east.
East China, Northeast China and Central China are energy poor regions. Nevertheless, annual product provided by these three regions' industries was 70% of the total value of industrial output in 1986. These regions are seriously lacking in electricity; to solve the problem of supplying these regions is an urgent need. Establishing coal and electricity production bases centered around Shanxi province, and constructing hydropower stations located in the upstream of the Huanghe (Yellow) River, and up- and midstream of the Changjiang (Yangtze) River, and the Hongshui River Valley, would be the strategic measures for supplying electricity to these regions.
To develop nuclear power is an effective measure to alleviate the electricity shortage in the coast region. We hope to construct nuclear power plants in Guangdong province, east China and northeast China. The Daya Bay nuclear power plant equipped with 2 x 900 MW PWR, and East China's Qinshan nuclear power plant equipped with 300 MW, are being constructed. They will be commissioned in the early 1990s. It is projected that 5000 MW of nuclear power will be constructed by 2000. As nuclear energy resources are limited in our country, we must develop the breeder reactor early to utilize nuclear energy resources more effectively.
Geothermal, wind, tidal, solar and other renewable energy resources are used to generate electric power in China. A pilot geothermal power plant has been built at Yangbajing in Xizang; four generating units have been installed with a total capacity of 10 MW. 28 thousand wind power devices have been erected over a wide area in China (Nei Monggol, Heilongjiang, northern part of Gansu, eastern part of Jilin, Lianodong Peninsula and Qinghai-Xizang plateau). More than 20 thousand husbandry tents and yurts have electricity for lighting and television. In Shandong, Zhejiang and other provinces, 12 tidal generating sets with total capacity of 5606 kW have been built and operated. Photovoltaic cells have been utilized to power navigation pilot lights in coastal areas and islands; to energize fire alarms for protecting forests; and to electrify guard fences in husbandry. However, the utilization of these new energy resources is in the first stage in our country, the amount of energy provided is not large, the economic benefit is not high, and there are many technological problems remaining to be solved.
22-4
Peaking capacity is in short supply almost everywhere. We plan to build some pump-storage hydropower stations. One (800 MW) is located in Ming Tomb, Beijing, another (1200 MW) in Conghua, Guangzhou. East China's Tianhuongping pump-storage hydropower station of 1600 MW is under feasibility investigation. Coal-fired generating sets to meet peak load are under research.
The policy for the electric power industry of China is to devote great efforts to construction of thermal power plants, exploitation of hydropower, and construction of nuclear power plants by steps and in suitable areas. A forecast of the structure of electricity generation in the year 2000 i.s as follows:
Total Electricity Generation (TWh) 1200-1300 100% hydropower 250-260 21-20 % thermal power 920-1000 77% nuclear power 30-40 3%
Total Installed Capacity (GW) 240-266 100% hydropower 55-60 23% thermal power 180-200 75% nuclear power 5-6 2%
The Structure of Electricity Consumption in China
The proportion of material production in total energy and electricity consumption is excessively large (Table 5). This implies that the tertiary industry in China is not developed. During the period 1980-85 the share of productive consumption declined and that of household consumption increased. This implies that people's living standard has gradually improved.
With adjustment in recent years, the share of heavy industry has declined. Part of the reason is that during the period of 1983-85 the import of high-energy-intensity raw materials increased.
22-5
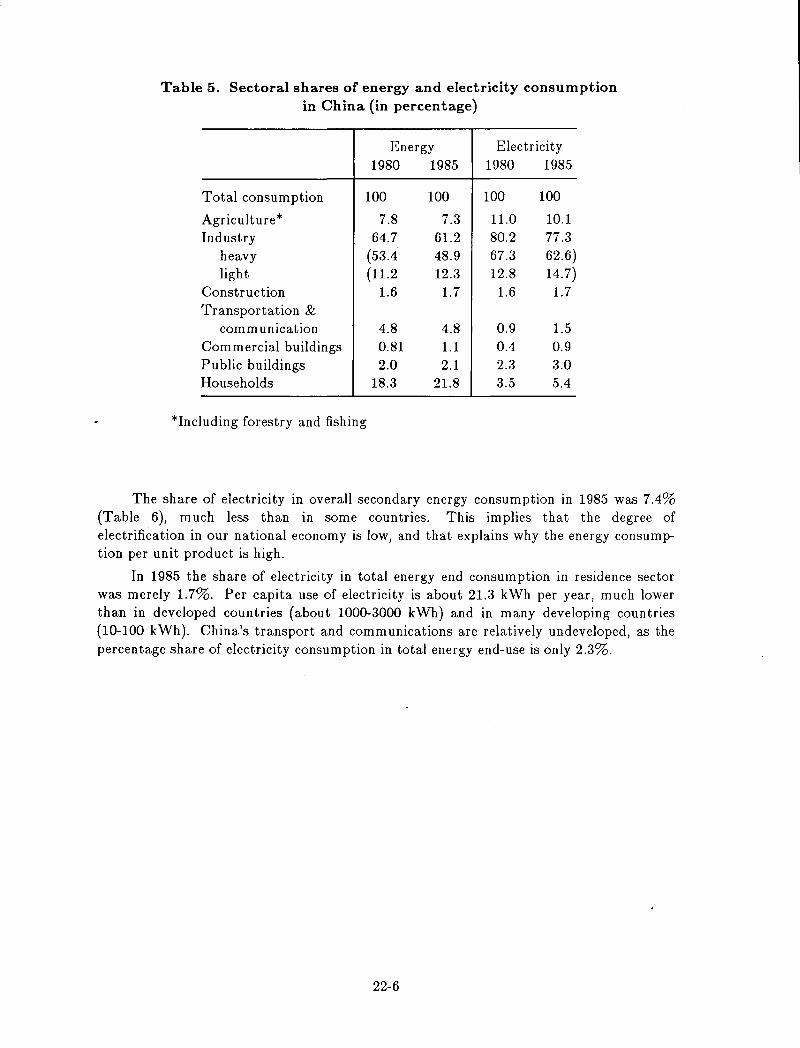
Table 5. Sectoral shares of energy and electricity consumption in China (in percentage)
Energy Electricity 1980 1985 1980 1985
Total consumption 100 100 100 100
Agriculture* 7.8 7.3 11.0 10.1 Industry 64.7 61.2 80.2 77.3
heavy (53.4 48.9 67.3 62.6) light (11.2 12.3 12.8 14.7)
Construction 1.6 1.7 1.6 1.7 Transportation &
comm unication 4.8 4.8 0.9 1.5 Commercial buildings 0.81 1.1 0.4 0.9 Public buildings 2.0 2.1 2.3 3.0 Households 18.3 21.8 3.5 5.4
*Including forestry and fishing
The share of electricity in overall secondary energy consumption in 1985 was 7.4% (Table 6), much less than in some countries. This im plies that the degree of electrification in our national economy is low, and that explains why the energy consumption per unit product is high.
In 1985 the share of electricity in total energy end consumption in residence sector was merely 1.7%. Per capita use of electricity is about 21.3 kWh per year, much lower than in developed countries (about 1000-3000 kWh) and in many developing countries (10-100 kWh). China's transport and communications are relatively undeveloped, as the percentage share of electricity consumption in total energy end-use is only 2.3%.
22-6
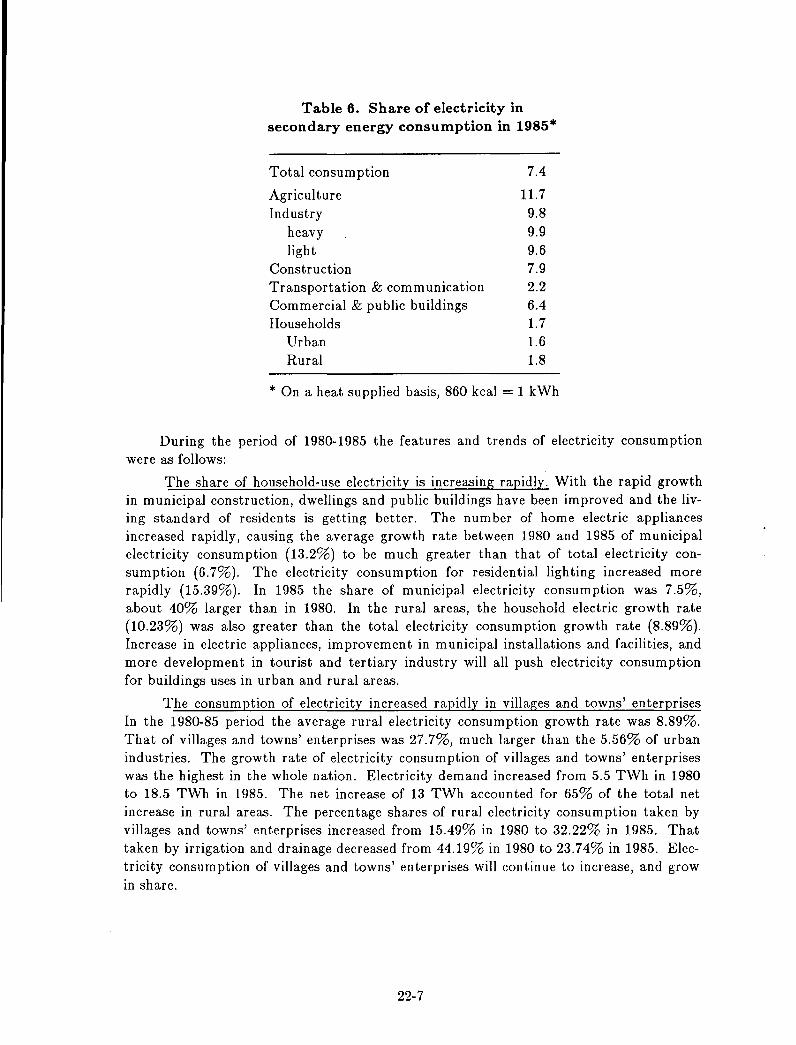
Table 6. Share of electricity in secondary energy consumption in 1985*
Total consumption 7.4
Agriculture 11.7 Industry 9.8
heavy 9.9 light 9.6
Construction 7.9 Transportation & communication 2.2 Commercial & public buildings 6.4 Households 1. 7
Urban 1.6 Rural 1.8
* On a heat supplied basis, 860 kcal = 1 kWh
During the period of 1980-1985 the features and trends of electricity consumption were as follows:
The share of household-use electricity is increasing rapidly. With the rapid growth in municipal construction, dwellings and public buildings have been improved and the living standard of residents is getting better. The number of home electric appliances increased rapidly, causing the average growth rate between 1980 and 1985 of municipal electricity consumption (13.2%) to be much greater than that of total electricity consumption (6.7%). The electricity consumption for residential lighting increased more rapidly (15.39%). In 1985 the share of municipal electricity consumption was 7.5%, about 40% larger than in 1980. In the rural areas, the household electric growth rate (10.23%) was also greater than the total electricity consumption growth rate (8.89%). Increase in electric appliances, improvement in municipal installations and facilities, and more development in tourist and tertiary industry will all push electricity consumption for buildings uses in urban and rural areas.
The consumption of electricity increased rapidly in villages and towns' enterprises In the 1980-85 period the average rural electricity consumption growth rate was 8.89%. That of villages and towns' enterprises was 27.7%, much larger than the 5.56% of urban industries. The growth rate of electricity consumption of villages and towns' enterprises was the highest in the whole nation. Electricity demand increased from 5.5 TWh in 1980 to 18.5 TWh in 1985. The net increase of 13 TWh accounted for 65% of the total net increase in rural areas. The percentage shares of rural electricity consumption taken by villages and towns' enterprises increased from 15.49% in 1980 to 32.22% in 1985. That taken by irrigation and drainage decreased from 44.19% in 1980 to 23.74% in 1985. Electricity consumption of villages and towns' enterprises will continue to increase, and grow in share.
22-7
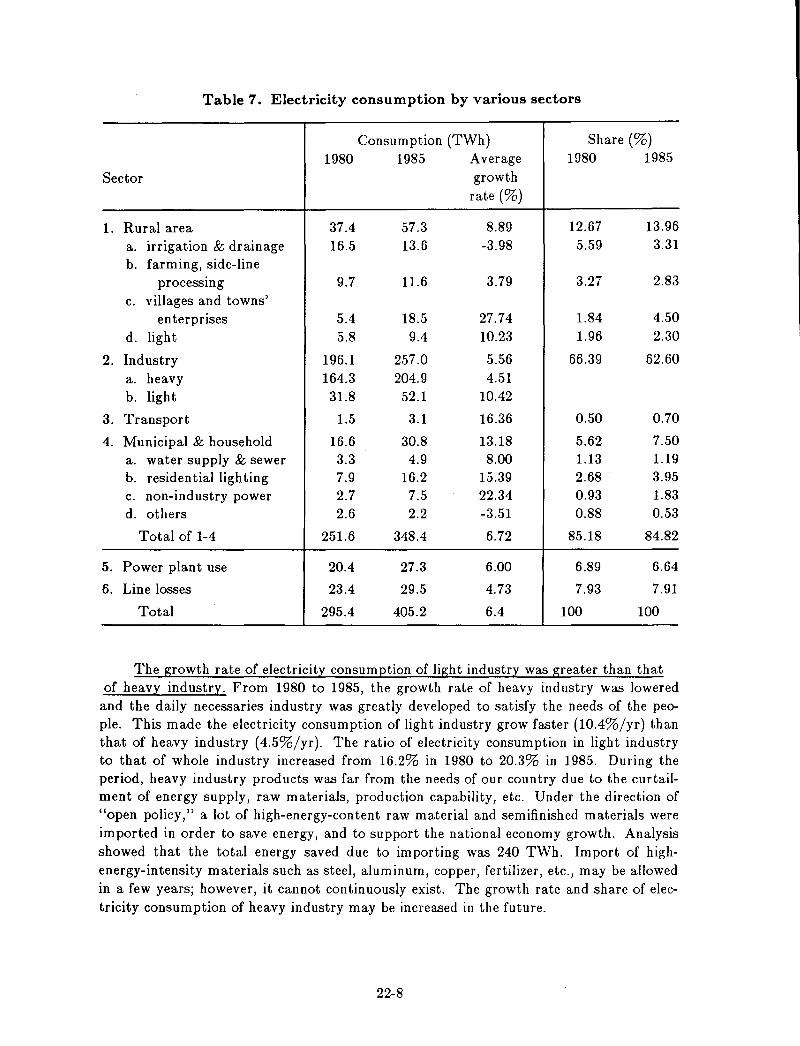
Table 7. Electricity consumption by various sectors
Consumption (TWh) Share (%) 1980 1985 Average 1980 1985
Sector growth rate (%)
1. Rural area 37.4 57.3 8.89 12.67 13.96
a. irrigation & drainage 16.5 13.6 -3.98 5.59 3.31 b. farming, side-line
processmg 9.7 11.6 3.79 3.27 2.83
c. villages and towns' enterprises 5.4 18.5 27.74 1.84 4.50
d. light 5.8 9.4 10.23 1.96 2.30
2. Industry 196.1 257.0 5.56 66.39 62.60 a. heavy 164.3 204.9 4.51 b. light 31.8 52.1 10.42
3. Transport 1.5 3.1 16.36 0.50 0.70
4. Municipal & household 16.6 30.8 13.18 5.62 7.50 a. water supply & sewer 3.3 4.9 8.00 1.13 1.19 b. residential ligh ting 7.9 16.2 15.39 2.68 3.95 c. non-industry power 2.7 7.5 22.34 0.93 1.83 d. others 2.6 2.2 -3.51 0.88 0.53
Total of 1-4 251.6 348.4 6.72 85.18 84.82
5. Power plant use 20.4 27.3 6.00 6.89 6.64
6. Line losses 23.4 29.5 4.73 7.93 7.91
Total 295.4 405.2 6.4 100 100
The growth rate of electricity consumption of light industry was greater than that of heavy industry. From 1980 to 1985, the growth rate of heavy industry was lowered
and the daily necessaries industry was greatly developed to satisfy the needs of the people. This made the electricity consumption of light industry grow faster (lO.4%jyr) than that of heavy industry (4.5%jyr). The ratio of electricity consumption in light industry to that of whole industry increased from 16.2% in 1980 to 20.3% in 1985. During the period, heavy industry products was far from the needs of our country due to the curtailment of energy supply, raw materials, production capability, etc. Under the direction of "open policy," a lot of high-energy-content raw material and semifinished materials were imported in order to save energy, and to support the national economy growth. Analysis showed that the total energy saved due to importing was 240 TWh. Import of highenergy-intensity materials such as steel, aluminum, copper, fertilizer, etc., may be allowed in a few years; however, it cannot continuously exist. The growth rate and share of electricity consumption of heavy industry may be increased in the future.
22-8
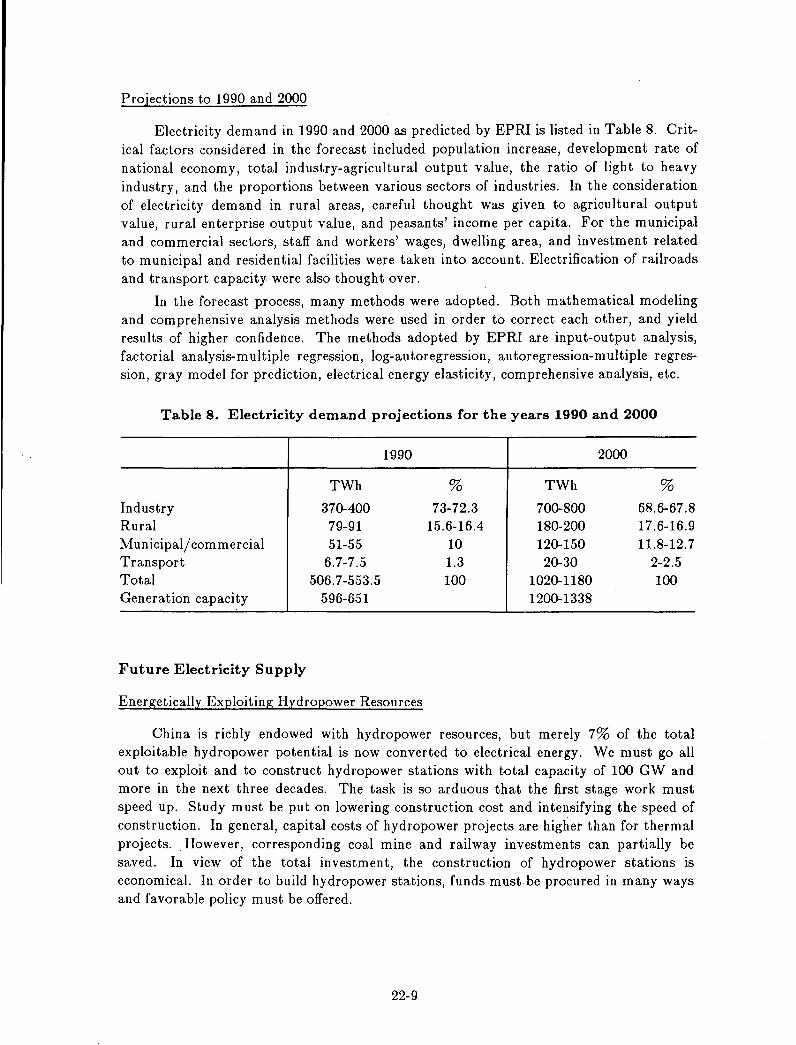
Projections to 1990 and 2000
Electricity demand in 1990 and 2000 as predicted by EPRI is listed in Table 8. Critical factors considered in the forecast included population increase, development rate of national economy, total industry-agricultural output value, the ratio of light to heavy industry, and the proportions between various sectors of industries. In the consideration of electricity demand in rural areas, careful thought was given to agricultural output value, rural enterprise output value, and peasants' income per capita. For the municipal and commercial sectors, staff and workers' wages, dwelling area, and investment related to municipal and residential facilities were taken into account. Electrification of railroads and transport capacity were also thought over.
In the forecast process, many methods were adopted. Both mathematical modeling and comprehensive analysis methods were used in order to correct each other, and yield results of higher confidence. The methods adopted by EPRI are input-output analysis, factorial analysis- multiple regression, log-autoregression, au toregression-multiple regression, gray model for prediction, electrical energy elasticity, comprehensive analysis, etc.
Table 8. Electricity demand projections for the years 1990 and 2000
1990 2000
TWh % TWh % Industry 370-400 73-72.3 700-800 68.6-67.8 Rural 79-91 15.6-16.4 180-200 17.6-16.9 Municipalj commercial 51-55 10 120-150 11.8-12.7 Transport 6.7-7.5 1.3 20-30 2-2.5 Total 506.7-553.5 100 1020-1180 100 Generation capacity 596-651 1200-1338
Future Electricity Supply
Energetically Exploiting Hydropower Resources
China is richly endowed with hydropower resources, but merely 7% of the total exploitable hydropower potential is now converted to electrical energy. We must go all out to exploit and to construct hydropower stations with total capacity of 100 GW and more in the next three decades. The task is so arduous that the first stage work must speed up. Study must be put on lowering construction cost and intensifying the speed of construction. In general, capital costs of hydropower projects are higher than for thermal projects. However, corresponding coal mine and railway investments can partially be saved. In view of the total investment, the construction of hydropower stations is economical. In order to build hydropower stations, funds must be procured in many ways and favorable policy must be offered.
22-9
Unified Planning of Coal Transportation
In North China and Northwest China, coal consumed by electricity generation is provided by local coal mines. Coal consumed by power plants in East China, Northeast China, and South China is supplied from Shanxi, West Nei Monggol, Shaanxi, and West Henan province. The distance is as far as 1000-2000 km, and the freight volume is large. The amount of coal output from Shanxi's coal mines was about 180 million tons (Mt) in 1985 and is estimated to be 400 Mt in 2000 and 900 Mt in 2015. Many ways for transporting coal must be adopted, such as by rail, highway, land and water transportation. It is necessary to study pipeline transportation of coal. It is important to construct an integrated transport network in order to expand the transportation capability.
Raising Coal Quality for Electricity Generation
In our country most power plants burn coals of rather inferior quality. The average heating value of coal burned in power plants is about 19.3 MJ /kg; average ash content is about 30%. This results in increased transport costs for coal and capital costs for plants. Because of the limitation of water supply, mine-mouth power plants cannot be constructed in some regions. About half of coal-fired power plants will hereafter be built at railway junctions, harbors and near the load center of metropolitan areas. This means that half of the coal for electricity generation will be transported a long distance.
To alleviate the burden on railway or shipping systems, to lower the capital cost of plants, and to improve the environmental condition, it is best to transport washed coals in which ash content is less than 20%. Low-grade coals may be burned in power plants located in mine area.
Construction of High-energy-intensity Enterprises in Energy-rich Regions
For example, to produce 1 ton of aluminum the consumption of coal is about 10 tons. If the aluminum plant is built near the mine-mouth power plant, transportation capacity would be saved. So high-energy-intensity plants must be built in the energy-rich regions as much as possible: plants must be built in Southwest China where hydropower potential is rich, and in Shanxi province and others where coal reserves are abundant.
Power Plant Siting and Environmental Conservation
Half of new thermal power plants hereafter will be built in the populous areas. For example, near the mouth of Changjiang River, power plants with total capacity of about 50 GW will be built in the next three decades. Most of these will be located along the river and sea coast, very close together. Study must be put on solving the problems of environmental conservation. Careful planning, careful selection of the site of power plant, and careful design of the plants and their facilities are needed to lower pollution, to preserve the natural surroundings, and to be in harmony with the environment.
22-10
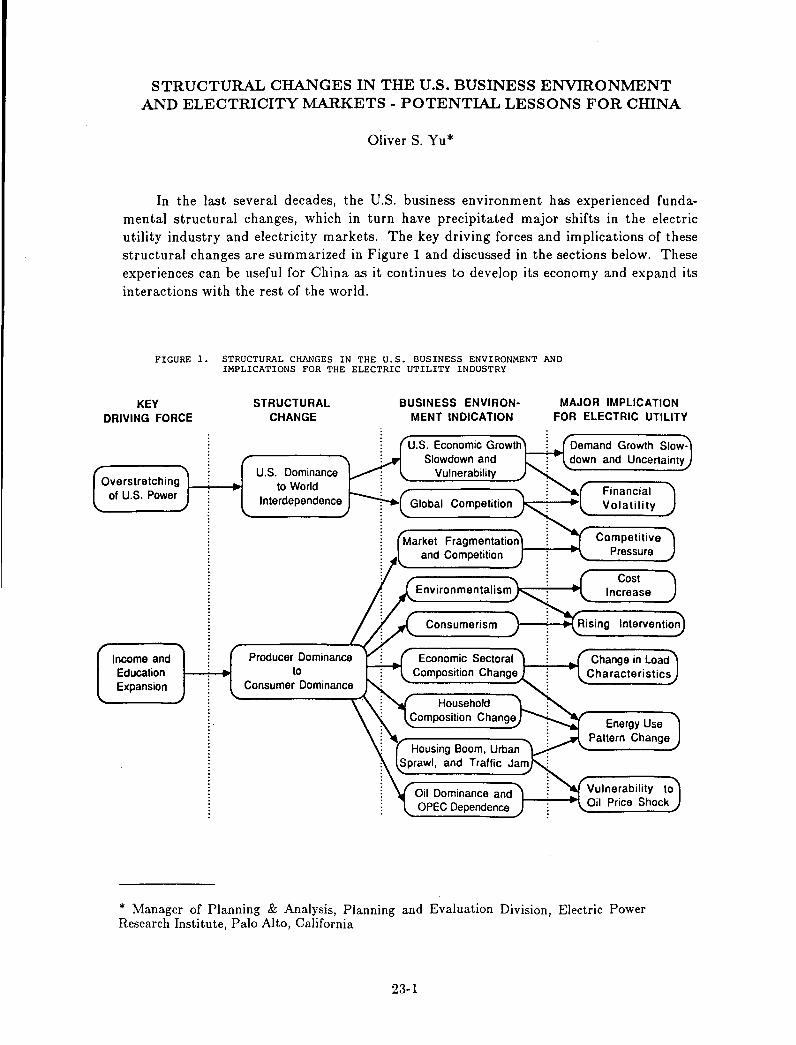
STRUCTURAL CHANGES IN THE U.S. BUSINESS ENVIRONMENT AND ELECTRICITY MARKETS - POTENTIAL LESSONS FOR CmNA
Oliver S. Yu *
In the last several decades, the U.S. business environment has experienced fundamental structural changes, which in turn have precipitated major shifts in the electric utility industry and electricity markets. The key driving forces and implications of these structural changes are summarized in Figure 1 and discussed in the sections below. These experiences can be useful for China as it continues to develop its economy and expand its interactions with the rest of the world.
FIGURE 1. STRUCTURAL CHANGES IN THE U.S. BUSINESS ENVIRONMENT AND IMPLICATIONS FOR THE ELECTRIC UTILITY INDUSTRY
KEY DRIVING FORCE
Overstretching I-_~~ of U.S. Power
Income and Education Expansion
STRUCTURAL CHANGE
U.S. Dominance to World
Interdependence
Producer Dominance to
Consumer Dominance
BUSINESS ENVIRONMENT INDICATION
U.S. Economic Growth Slowdown and
Vulnerability
Global Competition
MAJOR IMPLICATION FOR ELECTRIC UTILITY
Demand Growth Slow· and Uncertainty
Financial Volatility
Market Fragmentation Competitive and Competition I-~--.! __ P_r_e_ss_u_re_,/
Environmentalism k--';---1~ Cost
Increase
Consumerism }--.;..-+I Rising Intervention
Economic Sectoral Composition Change
Household Composition Change
Oil Dominance and OPEC Dependence
Change in load Characteristics
Energy Use Pattern Change
Vulnerability to 1-""";"-+1 Oil Price Shock
* Manager of Planning & Analysis, Planning and Evaluation Division, Electric Power Research Institute, Palo Alto, California
23-1
Structural Change in International Power Politics
The first fundamental structural change is in international power politics and may be characterized as a change from U.S. dominance to world interdependence. The key driving force of this change has been the overstretching of U.S. power, i.e., the inability of the United States to finance the sum of its global and domestic interests and obligations.
Since the end of World War II, the United States has not only taken on the responsibility of reconstructing Japan and most of Western Europe as well as the role of world policemen with far-flung global military deployments, but has also launched ambitious domestic programs such as the Great Society and social security expansions, contributing to the large uncontrollable entitlement portion of the government budget. Moreover, past world market dominance has induced many U.S. manufacturers to be complacent, as typified by the lagging process of modernization in the steel industry and the long neglect of product quality in the automobile industry. As a result, U.S. economic productivity growth has slowed and its world market share has fallen sharply. This overextension of U.S. power, resulting from the inability of productivity growth to meet massive government expenditures, has significantly weakened the U.S. position in the world economy and fostered strong foreign competition. It is a major cause for the erosion of basic industries, the unprecedented budget and trade deficits, the rapid rise in foreign debts, and the precipitous decline of the U.S. dollar. On the other hand, public and business concerns about productivity improvement and future growth have intensified the competitive pressures and efficiency drive in the general business environment.
For the electric utility industry, the relative decline and overall vulnerability of the national economy in a tightly interconnected world economy have contributed not only to the general slowdown and increased uncertainty in electric demand growth, but also to the potential volatility in both inflation and interest rates. Moreover, unlike the 1950s when U.S. Marines could control trouble spots in the Middle East, the loss of U.S. military as well as economic dominance in the world has also made the energy industries highly susceptible to international politics. In addition, the intense competitive atmosphere in the general business environment has increased the political appeal of introducing competition into traditionally regulated industries such as the electric utilities.
Structural Change in the Socia-Economic Development
The other fundamental structural change is in socio-economic development. This change has been broad and extensive with wide-ranging effects on electric utilities. We will highlight one of its key implications by characterizing it as a change from producer dominance to consumer dominance in the general business environment. This change has been driven mainly by the sharp increases in income and education levels in the United States following World War II. As an indication of these increases, by 1970, 50% of the people had income levels equal to the top 15% of the population in 1950, demonstrating that the "Affluent Society" has indeed become a reality for many. The increase in educational levels during this time period was equally dramatic. With rising income and education, people became increasingly individualistic, expressive, and demanding. These collective attitudinal shifts have spawned many social changes in the past decades including consumerism, environmentalism, the "me" generation, as well as changes in the American family with rising single-person and single-parent households.
23-2
Another aspect of this structural change has been on the economic side. While the dominant position of the United States in the world economy has eroded between 1950 and 1985, real per capita expenditures doubled. In 1950, the living standard for the majority of the U.S. population was reasonably comfortable in material terms. Most people could afford the essentials: food, clothing, shelter, and transportation for work. About 10% of personal expenditures was for strictly discretionary items such as recreation. The importance of the doubling of average real income by 1985 is that funds available for expenditures other than essentials, in 1950 terms, have increased not twice but tenfold. Thus, income expansion has given the consumers a tremendous amount of discretionary power. With this power comes the great diversity in consumer choices, the vanishing mass markets, the declining producer dominance, and the increasing competition in the general business environment. Furthermore, in response to the changes in consumption patterns and the increasing discretionary expenditures that are relatively serviceintensive, the service sector in the U.S. economy has grown rapidly.
Still another part of this structural change has been in the geographic distribution of the population. With increased income, personal automobiles became affordable and people began to move to the suburbs in search of a more attractive living environment. The resulting urban sprawl and suburbanization has made American life not only dominated by oil use but also heavily dependent on low-cost oil imports.
This socio-economic structural change has had profound impact on electric utilities. Consumerism and environmentalism have caused special interest groups to increase their intervention into the decision-making processes of business in general and utilities in particular. The exponential rise in environmental laws has added significantly to electricity supply costs. The increased competition in a consumer dominated business environment further adds to the incentive for some groups to call for a change in the regulatory structure of the electric utilities. Changes in household and economic output mixes have caused changes in electricity consumption patterns, with residential and commercial sales growth outstripping that in industrial sales. In turn, the end use shifts have resulted in a gradually declining overall load factor for electric demand. Finally, as an integral part of the energy industry, electric utilities have been and will continue to be vulnerable to the direct fuel price effects as well as the indirect economic impacts and government policy responses resulting from international oil politics.
Potential Lessons for China
As China expands its interactions with the rest of the world, it is no longer a closed economy. Therefore, it will be increasingly affected by global competition and international economic fluctuations, which in turn will introduce added volatility in its own economy. These changes in national policy will cause new uncertainties in the demand and cost of electricity.
Although China has become concerned with environmental issues, its priorities in the next decade will be economic prosperity and infrastructure development. However, as per capita income and educational levels increase, there will be a growing conflict between interest in economic expansion and environmental quality. These changes in social values will pose important challenges to electric power development.
23-3

Currently, electricity markets in China are dominated by industrial use. Again, as income increases, electricity consumption will shift increasingly to residential and commercial sectors. These changes in consumption and production patterns will affect the characteristics of future electricity demand.
With new technologies and past lessons from industrialized nations, however, China should be able to anticipate the many difficulties, bypass the many pitfalls, and leapfrog the many obstacles in traditional economic, energy, and electricity developments.
23-4
PROGRESS OF ENERGY SAVING IN CHINA'S PETROCHEMICAL INDUSTRY
Wang Bing Shen *
Introduction
The petrochemical industry (including petroleum refining) is an important industry in China and it plays a key role in the development of the national economy. By the end of 1987, crude oil refining capacity reached 110 million tons per year and ranked fifth in the world, and ethylene capacity amounted to 1.5 million tons per year.
To make full use of our petrochemical resourcs and to expedite the development of the petrochemical industry, the state council decided in 1983 to set up the China Petrochemical Corporation (SINOPEC) to have overall control, planning and management over the key refining and petrochemical enterprises in China. Since the establishment of SINOPEC, the experience shows that the reform in the economic system has brought vigor and vitality to the development of the petrochemical industry.
At present, SINOPEC has 40 large and medium-sized enterprises with an annual refining capacity of 100 million tons, which accounts for 91% of the total in China. The annual capacity of the other major products are as follows: 1.5 million tons of ethylene, 1.5 million tons of plastics, 220,000 tons of synthetic rubber, 580,000 tons of synthetic fibre monomer, 520,000 tons of snythetic fibre polymer, 360,000 tons of synthetic fibre, 3 million tons of synthetic ammonia, and 4.5 million tons of urea. 97 million tons of crude oil were processed in 1987, an increase of 29.9% over the amount in 1982. From 1986 to 1987, the ethylene production capacity increased by 900,000 tons. In 1987, SINOPEC provided the society with 83 million tons of petroleum products and 7 million tons of synthetic and organic materials. The total output value of SINOPEC in 1987 was 35.4 billion yuan, an increase of 8.5% over that in 1986. The total value of product sold came to 46.1 billion yuan, 11.1% more than in 1986.
With the technical revamp of the production units and enhancement of energy conservation management, outstanding achievements have been made in energy saving. The overall energy consumption per 10 thousand yuan output value was reduced from 5.85 to 4.94 toe from 1983 to 1987. The annual average reduction rate was 4.1%. More than 4 million tons of oil were saved within the five years since the founding of SINOPEC.
Progress in Energy Conservation
The progress made in the five years since the founding of SINOPEC is described below.
* China National Petrochemical Corporation
24-1
Adopting and Spreading Energy Saving Techniques
Energy Conservation Revamping of the Processing Units. New energy savings techniques are being adopted and spread to the processing units, of which the energy consumption is high and technological revamping is being made to decrease energy consumption. The energy consumption of the processing units accounts for 84% of the total refining energy consumption, and the energy consumption of the atmospheric and vacuum distillation units and the FCC units is 55% of that of the processing units, so they are the key areas for energy conservation. We successively conducted a widespread energy conservation revamping of 45 atmospheric and vacuum distillation units and 35 FCC units. We adopted new type trays, dry vacuum distillation process, optimal heat exchange schemes, measures to increase the furnace efficiency and other energy saving techniques for the atmospheric and vacuum distillation units. As a result, average energy consumption in 1987 decreased to 13.35 kg oil equivalent/ton, which was reduced by half as compared to the year of 1978; the best unit reached 10.6 kgoe/ton. We adopted complete regeneration, flue gas turbine, waste heat boiler and other techniques for the FCC units; average energy consumption (including the energy consumption of some heavy oik FCC units) decreased to 700 thousand Kcaljton, and the best unit reached 600 thousand Kcaljton. For other processing units that consume more energy, we also adopted appropriate energy saving measures.
With respect to petrochemical production, our focal point is to revamp the four existing ethylene production units for energy conservation. Although the revamping is still being conducted, we can see the preliminary results from the partial measures of the cracking furnace revamping. The energy consumption of the four units in 1987 decreased by 15.8% as compared to 1984. We have also achieved some results in the energy saving revamping of the petrochemical polymer production units. For example, after revamping of the 80 thousand tons/year polymer unit, its capacity has increased by 44%, but its energy consumption has decreased by 25%, and the payback period is only one year.
For the ammonia units, we recover the hydrogen from the tail gas and have replaced the inner constructional elements of the ammonia reactors, resulting in decreasing the fuel and power consumption per unit charge.
Improving Equipment Efficiency to Save Energy. The process furnaces and steam boilers consume about 75% of the fuel and power consumption in the petrochemical production. Therefore improving the furnace efficiency is a major field of energy conservation. We used heat pipes, rotary preheaters and wind-type air preheaters to recover the waste heat of the flue gas, and adopted new fire-resistant materials such.as ceramic fibres, high efficiency burners, heat radiation paints and other techniques; this increased the heat efficiency of most big and medium-sized furnaces to over 85%. With respect to the mechanical and power equipment, besides adopting the high efficiency equipment, we use hydraulic couplers, oil film clutches, frequency-modulated electromotors, etc. to improve the efficiency.
Adopting New Insulating Materials and New Constructions To Reduce the Heat Loss of the Pipeline System and Equipment. This job requires a tremendous amount of work, but the investment is low and we can see the effect very soon. In recent years we set up optimal procedures for designing heat insulation systems for heat transfer pipeline, and realized control of the overheat extent and the temperature profile of the steam pipeline
24-2
system. We reduced the heat loss to less than 5% after the energy conservation revamping of the pipeline system.
Increased Application of Computers. Since the establishment of SINOPEC, use of computers has been adopted rapidly. Today the enterprises of SINOPEC have 87 medium and small sized computers, and 2280 microcomputers. Through the process control and the optimization of the energy utilization, we have made good progress in the field of energy conservation. We have adopted computer systems in 10 atmospheric and vacuum distillation units, 24 FCC units and 12 fertilizer and fiber units. By the end of 1987, we realized combustion control of 80% of the furnaces by microcomputer, improving the furnace efficiency by 1--2%, resulting in saving 30 thousand tons of fuel oil and gas annually. A certain refinery reduced energy consumption of processing units by 1 kgoe/ton crude oil after adopting the computer system for optimization. Another refinery reduced the energy consumption of the total refinery by 1 kgoe/ton after accepting the linear program optimization.
Other Energy Saving Techniques. The new techniques, new equipment and new materials such as multistep heat utilization, low temperature waste heat utilization for electricity generation, new catalysts, new solvents, multistep utilization of hydrogen, multieffect evaporation, supercritical recovery process, heat pumps heat segregators, new heat exchangers of forced heat transfer, high temperature leak online plugging, anticorrosion paints, etc. also play an important role in energy conservation.
Improving the Management of Energy Conservation
SINOPEC is not only an energy-product-providing organization, but also an organization consuming energy and providing non-energy products. Therefore, energy conservation is an effective way to increase economic results. For that reason, in recent years we have established a comprehensive management system for the headquarters of SINOPEC to subordinate enterprises. The system includes target management system, responsibility system, contract system and assessing system. It leads to the work of energy conservation to being done successfully.
Target management system. The headquarters of SINOPEC worked out a long-term plan and target of energy conservation on the basis of specific features of our petrochemical, fertilizer and other enterprises. It assigns the tasks of energy conservation to subordinate enterprises on the basis of their different situations every year. The subordinate enterprises assign the tasks to grass-roots organizations and launch the activities of target management.
Responsibility system. The enterprises have their organs of energy conservation management. The departments and the grass-roots organizations of the enterprises have their special or part-time energy conservation managers whose responsibilities for energy conservation are definite. A system of combining comprehensive management with division management and, special management with the whole staff management is being carried out. So a network of energy conservation management is formed, the energy consumed everywhere is under control of somebody, and every project of energy conservation is under soneone's responsibility.
Contract system. The contracts in various forms are being carried out in the enterprises on the basis of advanced and reasonable norms and targets. The people who reduce
24-3
the energy consumption to below the norms or reach the targets of energy conservation are rewarded.
Assess£ng system. We have a specific assessing system to supervise and speed-up the fulfillment of energy conservation tasks and targets. The staff and workers who achieve successes in energy conservation are rewarded on the basis of ten-day and monthly assessing. Thus, the energy conservation work is being accelerated.
Decrease in Energy Consum ption
As a result of persisting in optimization of overall energy consumption and effective energy utilization, the energy consumption in refining, petrochemical, synthetic fibre and fertilizer industries is decreasing year by year. For example, refining energy consumption per unit energy factor (kgoe/ton factor) in 1987 decreased by 44.9% as compared to 1979, an annual decrease rate of 6.4%. The energy consumption per 10 thousand yuan product value in petrochemical, synthetic fibre and fertilizer industries in 1987 decreased respectively by 21.8%, 66.0% and 14.1% as compared to 1983, an annual decrease rate of 6.0%, 23.6% and 3.7% respectively. For example, the unit energy consumption in recent three years for polypropylene decreased by 27.7%, for cis-nolybutadiene rubber decreased by 22.6%, for acrylonitrile decreased by 25.9%, for nitrilon decreased by 12.6% and for polyester decreased by 49.4%.
Outlook for Energy Conservation
Though the China petrochemical industry has laid quite a good foundation, greater progress should be made to satisfy the development of the national economy. Energy conservation is a long-term strategic task. Here, I would like to give a brief outlook for the future energy conservation in our petrochemical industry. We will:
• Continue to spread and apply the effective energy saving techniques in the petrochemical industry.
• Strive to develop new energy saving techniques, new schemes and new equipment to improve the equipment efficiency and to reduce the energy consumption of petrochemical units.
• Accelerate the application of modern management and microcomputer techniques within our enterprises. Energy grades should be well disposed so as to make optimum use of energy to reduce devaluation and loss of energy and to improve the overall energy efficiency.
• Study the effective utilization of energy and develop the techniques of heat and electricity cogeneration, etc.
• Actively develop the techniques of recovering low-grade energy.
The promotion of our petrochemical industry is based on self-reliance, but the cooperation with foreign countries has a bright future as well, especially in the fields of rational use of energy and resources of energy conservation. We shall be willing to research and exploit various new methods of cooperation and exchange with those who are in the same trade with us in order to promote our mutual development.
24-4
TRENDS IN DEMAND FOR PETROCHEMICALS
Edward Flom *
From 1960 to 1973, U.S. real GNP and oil demand grew 4% per year while petrochemical feedstocks grew at a lO%/year rate. From 1973 to 1987 both GNP and petrochemical feedstocks grew at a rate of 2 to 3%/year, and we at AMOCO believe this rate of growth will continue until the year 2000. One area of most rapid petrochemical growth was for plastics, including polypropylene and polyethylene, which grew at a rate 1.9 times as fast as real GNP. The use of oil to produce petrochemicals is increasing rapidly and currently about 9% of total oil consumption in the U.S. is used for chemicals.
Synthetic man-made fibers production also grew at a rate faster than that of the economy, including the substitution of man-made fibers for cotton. Cotton's share of total fiber consumption declined from 1970 to 1988, while the use of polyester and nylon increased. Production of olefin fibers, primarily polypropylene fibers, grew from 3% in 1970 to 10% of the total fiber market in 1988. AMOCO is a leading producer of polyester raw material and polypropylene fibers and we are very optimistic about the outlook for these petrochemicals.
The market shares of steel, glass and aluminum declined during the 1970-1988 period while the consumption of five plastics grew from 3% to 8% of a marht that also includes paper and lumber. We at AMOCO believe this trend will continue and that the plastics industry will be a significant user of petroleum in the future.
In terms of real prices, excluding inflation, the price of crude oil is now 2 times what it was in 1970. However, the price of petrochemicals has increased less. Plastics are now 1.3 times their 1970 prices while synthetic fibers are about 1/2 of their 1970 price. The reason for this disparity is that oil is only one component of the total cost of plastics and synthetic fibers and there have been technical improvements in manufacturing them.
The amount of investment capital used in producing petrochemicals in the U.S. increased about l1%/year during the 1970s and early 1980s. Capital investment for production of specialty chemicals has increased to about $8 billion while capital invested for commodity chemicals has increased to about $35 billion. From 1982 to 1987 growth in capital employed to produce commodity chemicals slowed as surplus capacity developed. Capacity utilization of the U.S. chemical industry declined from 80% in 1978 to 67% in 1983 after new plants were built. It is now at 85%, which we consider a tight situation. Utilization rates for the major plastics are even higher, averaging about 95%. Capacity utilization is also high at the present time in other chemical producing countries.
I would like to illustrate the outlook for petrochemicals by showing data on world demand for polypropylene. Polypropylene is the second most used plastic in China and the U.S. and AMOCO is the second largest producer of it in the U.S. Demand for polypropylene is growing rapidly in the Far East and combined demand in Japan and other Far Eastern countries now exceeds that of the U.S. or Europe. China's demand has grown very rapidly at about 30%/year from 1974 to 1986.
* Manager of Industry Analysis and Forecasts, AMOCO Corporation
25-1
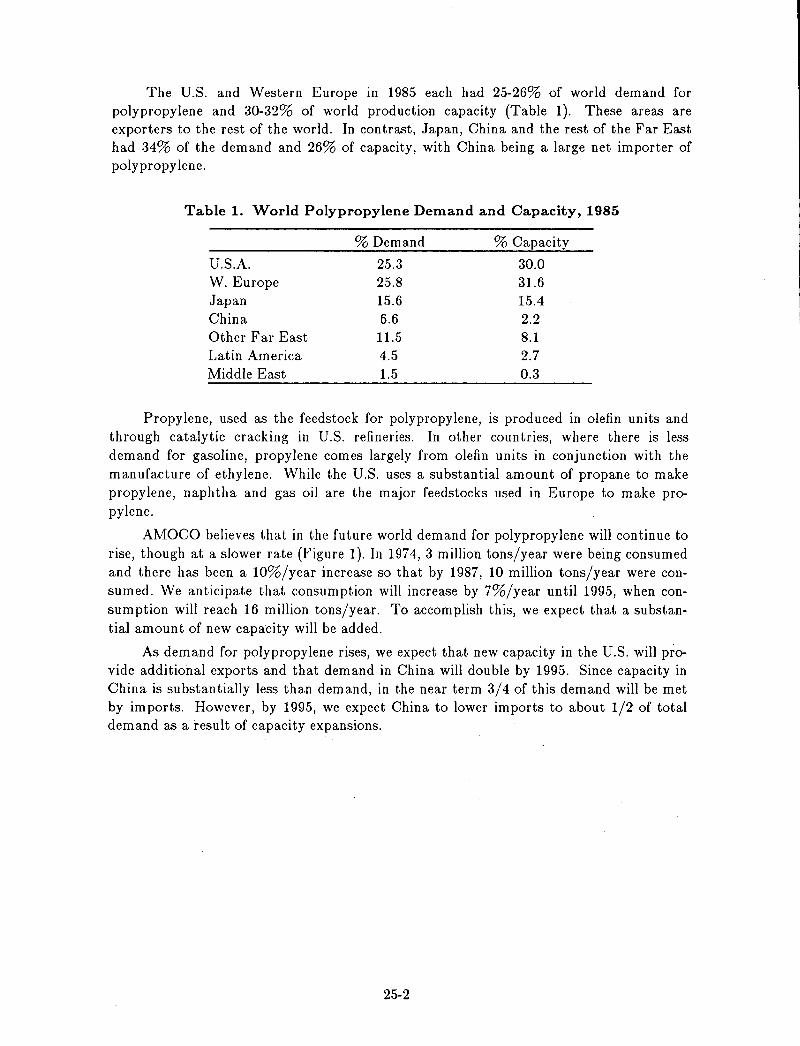
The U.S. and Western Europe in 1985 each had 25-26% of world demand for polypropylene and 30-32% of world production capacity (Table 1). These areas are exporters to the rest of the world. In contrast, Japan, China and the rest of the Far East had 34% of the demand and 26% of capacity, with China being a large net importer of polypropy lene.
Table 1. World Polypropylene Demand and Capacity, 1985
% Demand % Capacity
U.S.A. 25.3 30.0 W. Europe 25.8 31.6 Japan 15.6 15.4 China 6.6 2.2 Other Far East 11.5 8.1 Latin America 4.5 2.7 Middle East 1.5 0.3
Propylene, used as the feedstock for polypropylene, is produced in olefin units and through catalytic cracking in U.S. refineries. In other countries, where there is less demand for gasoline, propylene comes largely from olefin units in conjunction with the manufacture of ethylene. While the U.S. uses a substantial amount of propane to make propylene, naphtha and gas oil are the major feedstocks used in Europe to make propylene.
AMOCO believes that in the future world demand for polypropylene will continue to rise, though at a slower rate (Figure 1). In 1974, 3 million tons/year were being consumed and there has been a lO%/year increase so that by 1987, 10 million tons/year were consumed. We anticipate that consumption will increase by 7%/year until 1995, when consumption will reach 16 million tons/year. To accomplish this, we expect that a substantial amount of new capacity will be added.
As demand for polypropylene rises, we expect that new capacity in the U.S. will provide additional exports and that demand in China will double by 1995. Since capacity in China is substantially less than demand, in the near term 3/4 of this demand will be met by imports. However, by 1995, we expect China to lower imports to about 1/2 of total demand as a result of capacity expansions.
25-2
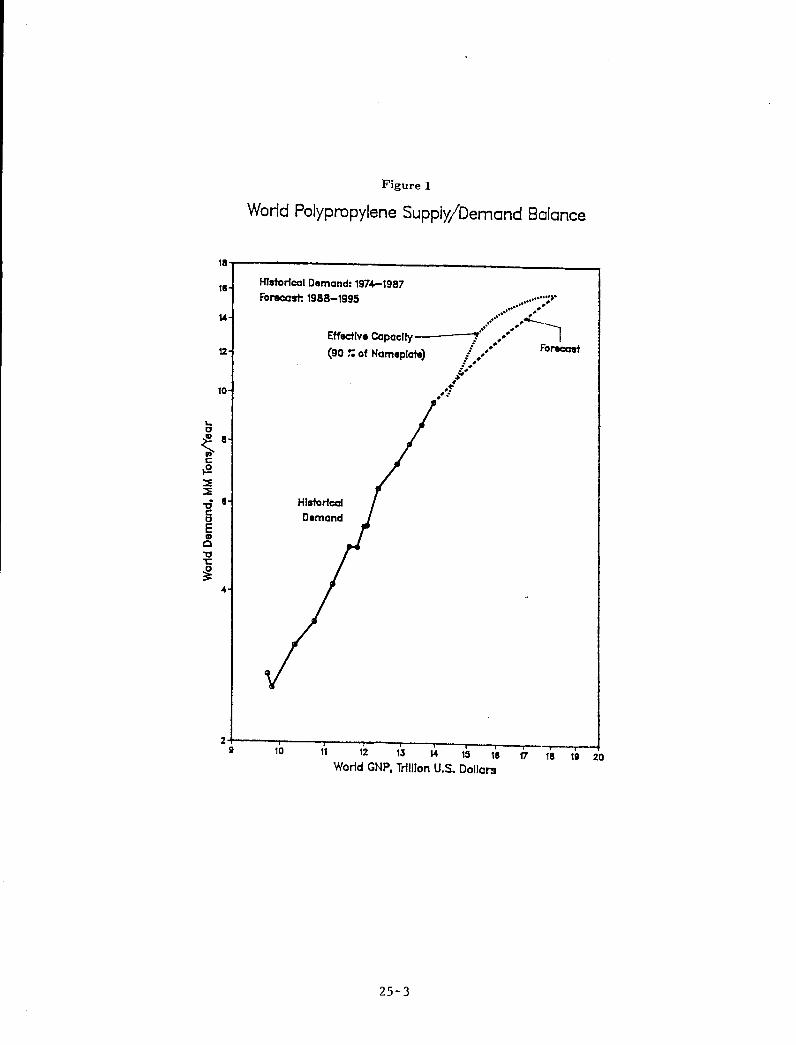
Figure 1
World Polypropylene Supply/Demand Balance
111~----------________________________________ ~
L. o
18
12
10
{II lit c ~ :::e :::e -g 8 o E III o "0 "l:
~
HI.torfcal Oemand: 1974-1987
Forecast: 1988-1995
2T-----~----r---~--~--_.--_.--~--_r--T_~~ 51 10 11 12 13 14 15 15 f7 111 151 20
World GNP, Trillion U.S. Dollars
25-3
ENERGY UTILIZATION IN RURAL CHINA
Qiao Mu*
Introduction
The Bureau of Energy and Environmental Protection under the Ministry of Agriculture is an administrative body responsible for rural energy and protection of the agricultural environment. Similar bodies have been established in various provinces, prefectures and most counties and they take guidance from this Bureau. In China, rural energy includes biomass energy (fuelwood, biomass gasification and biogas), solar energy (solar cells, solar-heated buildings, solar drying systems, solar water heaters and solar cookers), wind energy, geothermal energy, small coal mines, small hydropower plants, tidal energy, and the related equipment and energy-saving technologies.
The Ministry of Agriculture is responsible for the extension and application of biogas technology, fuelwood-saving and coal-saving stove technology, the applied technology of solar energy, wind energy and geothermal energy, as well as reasonable utilization of rural energy and energy-saving technology for the village-town enterprises. In addition, the Ministry is also in charge of research programs devoted to rural energy in the State's 7th Five-Year Plan for national economic development.
Progress of Rural Energy Development in China
At the beginning of the 1980's our government and the concerned departments started to put the issue of rural energy on the working agenda. As a result, a series of programs and plans have been formulated, guidelines for the development of rural energy have been put forward, and various forms of pilot projects have been initiated that have further developed rural energy.
Since 1983, the Ministry of Agriculture has arranged demonstration of fuel wood and coal-saving stoves in 589 counties. At the same time, various provinces have also selected counties for demonstration. The purpose of doing this is to ease the shortage of energy for daily use in rural areas, to rationally utilize the biomass energy, and to reduce damage to forests and vegetation. The measures have proven effective as many provinces developed highly efficient and easy-to-use stoves that have been popularized after evaluation. The thermal efficiency of the old stoves is less than 12% while the thermal efficiency of the fuel-wood and coal-saving stoves is normally over 25%. At present, our Bureau is selecting models from the finalized designs for commercial production in order to reduce the use of manually-built stoves and ensure high thermal efficiency, which was warmly welcomed by many users.
Starting from 1983, our Ministry has selected 100 counties for the development of biogas digesters. These counties are mainly located in the middle and lower reach of the Yangtze River and the southern part of China, where family-based and specialized
* Bureau of Energy & Environmental Protection, Ministry of Agriculture
26-1
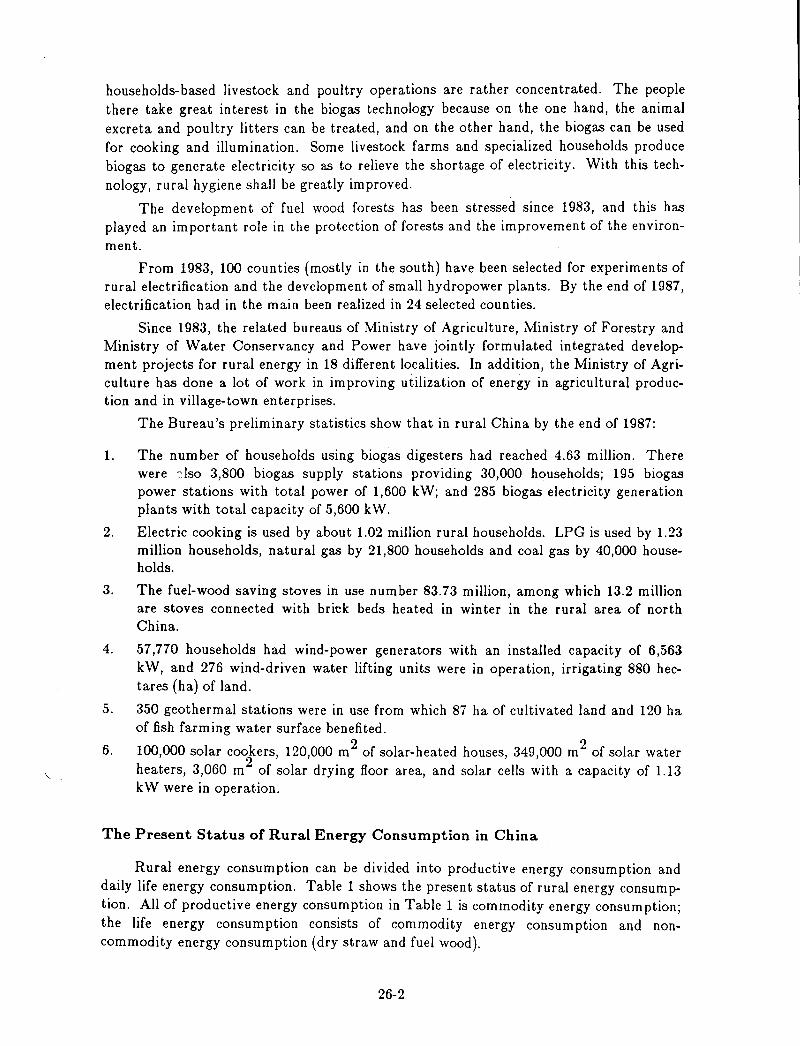
households-based livestock and poultry operations are rather concentrated. The people there take great interest in the biogas technology because on the one hand, the animal excreta and poultry litters can be treated, and on the other hand, the biogas can be used for cooking and illumination. Some livestock farms and specialized households produce biogas to generate electricity so as to relieve the shortage of electricity. With this technology, rural hygiene shall be greatly improved.
The development of fuel wood forests has been stressed since 1983, and this has played an important role in the protection of forests and the improvement of the environment.
From 1983, 100 counties (mostly in the south) have been selected for experiments of rural electrification and the development of small hydropower plants. By the end of 1987, electrification had in the main been realized in 24 selected counties.
Since 1983, the related bureaus of Ministry of Agriculture, Ministry of Forestry and Ministry of Water Conservancy and Power have jointly formulated integrated development projects for rural energy in 18 different localities. In addition, the Ministry of Agriculture has done a lot of work in improving utilization of energy in agricultural production and in village-town enterprises.
The Bureau's preliminary statistics show that in rural China by the end of 1987:
1. The number of households using biogas digesters had reached 4.63 million. There were :,lso 3,800 biogas supply stations providing 30,000 households; 195 biogas power stations with total power of 1,600 kW; and 285 biogas electricity generation plants with total capacity of 5,600 kW.
2. Electric cooking is used by about 1.02 million rural households. LPG is used by 1.23 million households, natural gas by 21,800 households and coal gas by 40,000 households.
3. The fuel-wood saving stoves in use number 83.73 million, among which 13.2 million are stoves connected with brit:k beds heated in winter in the rural area of north China.
4. 57,770 households had wind-power generators with an installed capacity of 6,563 k W, and 276 wind-driven water lifting units were in operation, irrigating 880 hectares (ha) of land.
5. 350 geothermal stations were in use from which 87 ha of cultivated land and 120 ha of fish farming water surface benefited.
6. 100,000 solar cookers, 120,000 m2 of solar-heated houses, 349,000 m2 of solar water heaters, 3,060 m 2 of solar drying floor area, and solar cells with a capacity of 1.13 kW were in operation.
The Present Status of Rural Energy Consumption in China
Rural energy consumption can be divided into productive energy consumption and daily life energy consumption. Table 1 shows the present status of rural energy consumption. All of productive energy consumption in Table 1 is commodity energy consumption; the life energy consumption consists of commodity energy consumption and noncommodity energy consumption (dry straw and fuel wood).
26-2
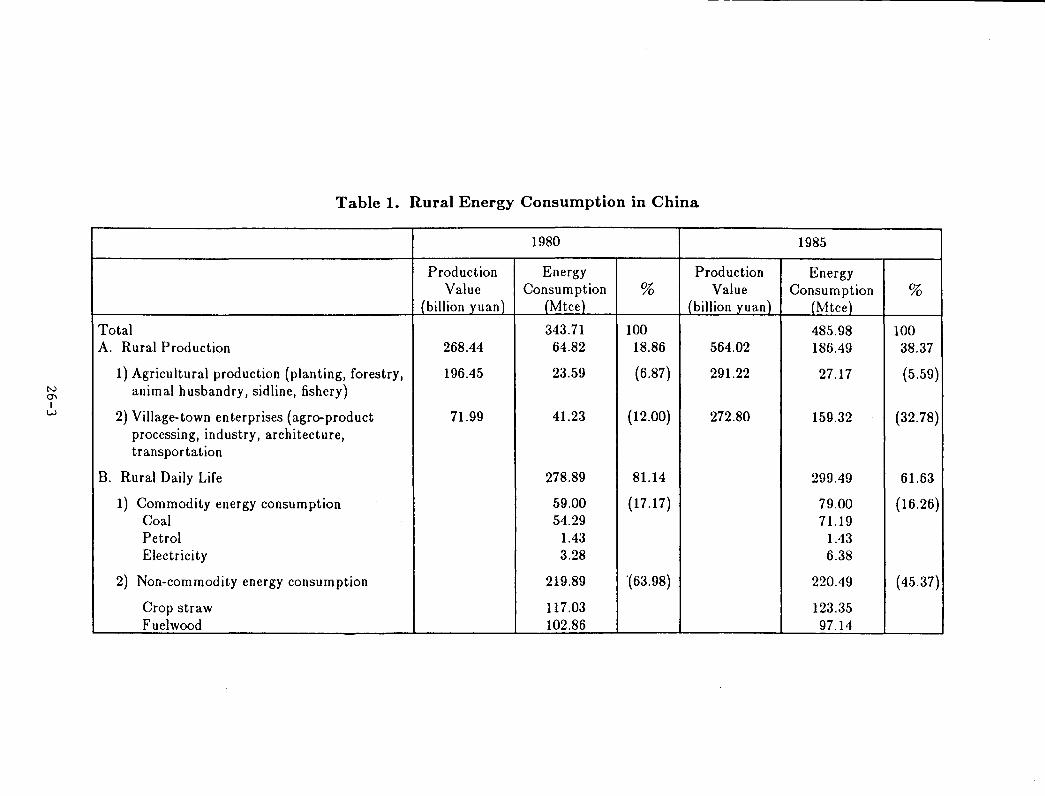
N (J\
I w
Table 1. Rural Energy Consumption in China
1980
Production Energy Production Value Consumption % Value
{billion yuan} (Mtce) (billion yuan)
Total 343.71 100 A. Rural Production 268.44 64.82 18.86 564.02
1) Agricultural production (planting, forestry, 196.45 23.59 (6.87) 291.22 animal husbandry, sidline, fishery)
2) Village-town enterprises (agro-product 71.99 41.23 (12.00) 272.80 processing, industry, architecture, transportation
B. Rural Daily Life 278.89 81.14
1) Commodity energy consumption 59.00 (17.17) Coal 54.29 Petrol 1.43 Electricity 3.28
2) Non-commodity energy consumption 219.89 ·(63.98)
Crop straw 117.03 Fuelwood 102.86
1985
Energy I
Consumption % (Mtce)
485.98 100 186.49 38.37
27.17 (5.59)
159.32 (32.78)
299.49 61.63
79.00 (16.26) 71.19
1.43 6.38
220.49 ( 45.37)
123.35 97.14
The total value of rural production increased from 268 billion yuan in 1980 to 564 billion yuan in 1985, among which agricultural production value increased by 67% from 196 to 291 billion yuan, and the productive value made by village-town enterprises increased from 72 to 272 billion yuan. The growth of village-town enterprises productive value is 4 times faster than that of the agricultural production value. Meanwhile, the total consumption of rural energy increased by 41% from 344 Mtce in 1980 to 486 Mtce in 1985. The commodity energy consumption increased from 125 Mtce to 265 Mtce, while the consumption of non-commodity biomass energy didn't change greatly, maintaining at the range of 220 Mtce.
In the rural area of China, the energy consumption has the following features:
1. Since the mid-1980s, the commodity energy consumed by rural production and daily life is greater than non-commodity energy. The consumption of commodity energy increased from 36% of total energy consumption in 1980 to 55% in 1985. It is forecast that the share of commodity energy will increase in the future continuously. The main reasons for the growth of commodity energy consumption are: a) consumption by the village-town enterprises increased from 41 Mtce in 1980 to 159 Mtce in 1985; b) the commodity energy consumed by rural life increased from 59 Mtce in 1980 up to 79 Mtce in 1985. This growth was faster than in the 1970's.
2. The per capita consumption of commodity energy for rural personal needs is still low. The total energy consumption of rural area in 1985 was 486 Mtce. With the rural population of 840 million at that time, the average energy consumption per person was 570 kgce. The consumption of rural commodity energy (for production and life) was 316 kgce per person, and the consumption of non-commodity energy was only 263 kgce per person.
3. The main energy consumed by rural life in the year 2000 will still be non-commodity energy. The proportion of non-commodity energy in the total energy consumption of rural life was 79% in 1980 and 74% in 1985. It is forecast that it will be about 60% by 2000.
4. The energy efficiency in the rural area is low. Most of the energy-using equipment is out of fashion, and there is a lower technological, operational and management level. Therefore, a great difference in energy consumption per product exists between village-town enterprises and similar state-enterprises, sometimes with the difference as much as 1-3 times. The heat efficiency for the old-fashion stoves consuming biomass energy in rural life was only 12%.
Conclusion
Rural China is now facing a new situation of greater development of the commodity economy and big growth in the peasant's income. This requires that the State provide a great amount of commodity energy. In the aspect of rural life, advanced-quality energy is urgently needed. So the contradictions between the supply and demand of rural energy will become more apparent and be one of the serious problems for the development of the rural economy.
For rural energy development, in one hand the related items of rural energy should be actively developed and utilized. In the other hand we would put the work of energy-
26-4

saving for rural production and life in the first place so as to reduce the pressure of rural energy shortage and serve the requirements of rural economic and cultural development.
26-5
THE ENERGY CONSERVATION TECHNIQUE SERVICE CENTER OF JIANGSU-NANJING
Zhang Xiaodan*
The Energy-Conservation Technique Service Center of Jiangsu Province and Nanjing Municipality (here after the Center), founded in 1985, is an institution under the leadership of the Planning and Economic Commission of Jiangsu Province and the Economic Commission of Nanjing Municipality in organization and under the guidance of the State Economic Commission and the State Scientific and Technological Commission in its vocational work.
The Center is a technical service institution, combining diversified functions, such as scientific researches, designing, monitoring and testing, training, technical information and development, in one single body. It is also in charge of managing energy utilization work assigned by Economic Commissions of the Province and Municipality. The Center occupies an area of around two acres and has 109 staff and workers, of which 75% are engineers and technicians.
The Center consists of seven departments: the Monitoring and Testing Station for Energy Utilization of Nanjing Municipality, the Design Office of Energy Engineering of Jiangsu Province, the Training Section, the Technical Information Section, the Computer Station, the Technical Service Department, and the Editorial Department of the periodical Energy Utilization.
The Center is well equipped by the European Economic Community (EEC) with various kinds of advanced instruments and meters, computer equipment, and an energytesting van for field heat-energy monitoring or remote monitoring. Monitoring and testing services for energy utilization can be provided for all kinds of power-consumption equipment and systems.
The Center has 77 experienced and skilled engineers and technicians, covering 20 specialities, such as thermal engineering, electricity, automatic control, turbine machinery, civil construction machine-building, chemical engineering, applied physics and computer science. The Center has its feet firmly planted in Nanjing, offers services to the whole province and takes care of energy-conservation training and energy-conservation demonstration projects, which are co-operation projects with the EEC assigned by the state, and is also energy information center of China and EEC. The Center offers complete services to enterprises for consultation, designing, construction organization, adjusting and testing, and personnel training of energy engineering.
Monitoring and Testing Section
This section is responsible for monitoring, testing and management of energy utilization in Jiangsu Province and Nanjing Municipality. Its tasks are to supervise the energyutilization units to carry out the relevant energy-utilization standards issued by the state
* Vice-Director, Jiangsu-Nanjing Energy Conservation Center, Nanjing.
27-1
and the municipality and to monitor energy utilization, such as power consumption of the energy-utilization unit, the efficiencies of energy consumption equipment, the level of energy consumption of products, and the quality of energy supply.
This section is equipped with an energy-monitoring van specially designed and manufactured for our country by the EEC with various kinds of advanced instruments and meters. This section is in charge of the examination of entitling "Energy-Saving Products", appraisal of energy-saving effects of new products and new technology, energy equilibrium of enterprises, diagnosis of power consumption equipment, expounding and proving heat equilibrium of capacity increase of boilers, and physical and chemical analysis of fuel and energy-saving chemical products.
The qualification of this Station has been officially approved by the Measuring Bureau of Jiangsu Province. All the testing data provided by this Section have legal authority.
Design Office of Energy Engineering
The business this office can undertake is as follows:
1. Thermal power planning for large and medium cities;
2. Design and reform of medium and small-sized cogeneration systems and urban district heating;
3. Reform of all kinds of boilers and kilns for industrial uses and design and research of waste heat utilization;
4. Design and research of energy engineering, such as drying, vaporization, distillation, heat exchange, heat pump, refrigeration, thermal insulation and low-heat utilization;
5. Design of transformer substation and power station building, energy-conservation technical reform of power-consumption mechanical and electrical equipments;
6. Design and research of automatic control systems and computer control systems of energy engineering;
7. Development and utilization of solar energy, wind energy and biological energy;
8. Design and research of energy technology relevant to other industrial and civil uses.
Training Section
The Training Section is a collaboration channel of the Center with the EEC. In addition to running two training classes annually assigned by the State Scientific and Technological Commission and the State Economic Commission, all kinds of energyconservation lectures and short-term training courses are also held according to the needs of either the Provincial or Municipal governments.
Technical Information Section and Editorial Department
The center is a member of the China Energy-Saving Information network and the China Energy Information network, and also is the Energy Information Center of China and the EEC, invested by the State Scientific and Technological Commission with the task of exchanging information between China and the EEC.
27-2
The Technical Information Section offers the following services:
1. Information on the basic situation, the state-of-the-art, and the development tendency of energy both at home and abroad for helping to lay down the plan, principles and policies for energy development;
2. Information services for continuous development of co-operation projects between China and the EEC;
3. Information services for tackling key energy-conservation projects of the state, and or researching and manufacturing major energy-conservation equipment;
4. Information services for technical reform of power consumption equipment and for better energy utilization;
5. Information services for introducing energy-saving projects into China and for exporting energy-saving products;
6. Information services for opening the energy technology market and for promoting transfer of technology;
7. Information services for summing-up and popularizing new technology, new technique, new products and new materials for energy-conservation;
8. Services to enterprises and institutions by acting for energy-saving information consultation and patent application, and to supply information services for special topics;
9. Services for editing and publishing all kinds of energy information publications, audio and video information and popular science books.
10. Services for holding exhibits, symposia for exchanging experiences and press conferences for various kinds of energy-saving products.
Energy Utilization, a bimonthly periodical, and its supplement News in Brief of Jiangsu are publications of the Center that are distributed throughout the country. Their main purposes are to popularize the national energy principle of "laying equal stress on both energy development and conservation" and to popularize various energy policies; to pass on energy information both at home and abroad; to spread the new technology, new technique, new materials and new products of energy utilization; to improve utilization efficiencies of energy; and to assist energy development and energy conservation in Jinangsu Province.
The periodical has several columns, such as "energy management", "researches and exploration", "forecast and prospect", "abstracts of world energy patents", "special topics", "international survey", and "information and recent developments". The periodical has the approval of the Administration for Industry and Commerce at both the Provincial and Municipal levels. Each issue carries some ads of energy-saving products. The supplement of this periodical gives timely messages, expounded by leading organs at different levels about energy-conservation principles and policies and also gives the recent development of energy conservation at different enterprises.
Technical Service Department
The Technical Service Department is a liasion window of the Provincial and Municipal Service Center for Energy-Conservation Technique in the urban area. It offers:
27-3

1. Complete technical services for energy-conservation reform projects, designing, installation and adjusting of equipment for factories, mines, enterprises and civil daily requirements;
2. To act as an agent to purchase and market energy-saving products and equipment;
3. To develop and popularize energy-saving results of new technology, techniques, products and materials;
4. To supply domestic and foreign energy-conservation information.
27-4
THE WORLD On.. OUTLOOK TO 1995
John H. Lichtblau*
Some major changes have taken place in the world oil market since the price collapse of 1986. World oil demand, which had declined more or less steadily through 1985 from its 1979 peak, reversed its direction in 1986 and 1987 and will apparently rise further in 1988. This year's demand in what oil industry statisticians refer to as the Non-Communist World (NCW) market (excluding the Soviet Bloc and the People's Republic of China) is likely to be more than 3 million barrels per day (BID), or about 7% above the 1985 level, according to estimates by the International Energy Agency (lEA).
While non-OPEC production in the NCW, which had risen steadily since the mid-1970's, has not shown a reversal, the U.S., the world's second largest oil producer, has changed the direction of its production from fiat in the first half of the 1980's to distinctly downward since 1986. U.S. crude production in 1988 will be about 800,000 BID below the 1985 level.
Oil Prices
The 1986 price collapse is of course the major factor in both the world demand increase and the U.S. production decline. Now that we have lived with the new price scenario for 2 1/2 years and have actually seen an increase from the mid-1986 low point, we sometimes forget the magnitude of the total drop -- the price drop itself plus the decline in the exchange value of the dollar since 1985 and the world inflation rate. In real (inflation-adjusted) national currencies the lEA's average price in 1987 was about half the 1985 price (which itself was abou t 20% below the peak price of 1981). The real 1988 price is still lower by 10-15%. The fact that NCW oil demand will have grown by only 3%, 2% and 2%, respectively, in the first 3 years (1986-88) of the price break is a clear sign of the very low short-term price elasticity of world oil demand. The same can be said about the price elasticity of world oil supply, given the fact that, so far, NCW production outside the U.S. has risen almost as much since 1985 as it would have if there had been no price break.
Where do we go from here? Let us limit our forecast to the medium term, i.e. the 8-year period to 1995, since it is less likely to contain market-impacting fundamental geological and technological changes than would a longer period. What price can we expect during this period? In a free market the price would of course be a function of the interaction of supply and demand. In a cartel market it reflects the policy of the cartel and its ability to enforce the policy.
The OPEC cartel has maintained a price that was a multiple of the free-market price. The price collapse of 1986 has reduced that spread but has by no means eliminated it. Given OPEC's excess producing potential of at least 10 million BID, a free-market
* President, Petroleum Industry Research Foundation
28-1
price of $10-11, the low point of 1986, would be sufficient to meet world oil requirements for several years. Thus, the cartel is still maintaining prices 40 to 50% above the hypothetical market level.
Of course, a free market price in oil could only come about if OPEC were to collapse totally and its members were then to engage'in maximum competition with each other and if no reconstitution of the organization in any form became possible. In other words, prices would have to be determined in a fully competitive, totally free, unfettered market. This is unlikely, given the overwhelming economic and political self-interest of all oil exporters to prevent it or, if it should happen, to quickly reverse it.
What we are likely to see in the period to 1995, and probably longer, is a world oil market in which prices will be determined by the interaction of the OPEC cartel and market forces, much as it is right now. Thus, we probably won't see a return to the 1973-81 period when OPEC set and maintained prices without regard for the reality of the market. Nor is there likely to be a return to the 6-month period in 1986 when the market took over almost completely, depressing the average world oil price to $10, with further declines certain if OPEC had not reconstituted itself. However, of these two extreme developments a price collapse has a much higher degree of probability in the near future than a price spike, given the very weak market and the current behavior of several cartel members which clearly undermines the cartel's function of collective revenue maximization.
The forecast I'm presenting here for the period to 1995 is what the industry likes to call a "consensus" forecast. The term means that a relatively large number of companies, academic analysts, business consultants and government agencies agree· at least on the direction of the trend and, within a broad band, on the rate and speed of the trend's movements. This does not necessarily make the consensus forecast more likely than any of the projections which disagree with it. But it reflects the current thinking of the majority of decision makers. As such it is valuable.
The consensus scenario shows a slow, modest upward movement in the world oil price, probably starting next year. The increases should be less than the world inflation rate until 1991-92 and slightly faster thereafter. I won't attempt to predict a specific price for 1995, but directionally the real price in that year will still be significantly below the 1985 price but significantly above the 1988 price. An example of this price trend is contained in the latest edition of U.S. Department of Energy's Annual Energy Outlook. Its Base Case assumes a U.S. oil import price of $22.40 (in 1987$) in 1995. This would be 24% above the comparable 1987 level but 22% below the 1985 level. Several other reputable forecasts show a somewhat lower base case price for 1995.
Prices will rise during this period not because supply and demand forces require it, but primarily because OPEC will regain some of its strength. Probably, the trend I have just described will not follow a smooth path. The cartel and the market will battle it out all along the way, with the result that price volatility will often mask the underlying trend.
What is the rationale for this price path? A principal factor is that for the foreseeable future, OPEC will have to cope with substantial excess producing capacity. From 1973 through 1981 the cartel had virtually no available excess capacity, nor did any other oil exporter. This was the key factor in OPEC's pricing power during that period. I
28-2
believe OPEC will not even attempt to raise prices "excessively" between now and 1995. The reason is the publicly acknowledged recognition by at least 3 of OPEC's Persian Gulf super powers (Saudi Arabia, Kuwait, Abu Dhabi) that the long term interest of their countries, whose current reserves/production ratios are over 100 years, are better served by maintenance and eventual expansion of market shares than by price maximization at the risk of permanently losing market shares. Venezuela, OPEC's largest producer outside the Persian Gulf, has expressed similar views. Having had a dramatic demonstration in the 1981-85 period of how much and how quickly market share can be lost when prices remain excessive, and having seen in the 2 1/2 years since the big price break how difficult it is to regain the losses, OPEC's pricing policy in the first half of the 1990's will not be a repetition of the 1970's, almost regardless of commercial circumstances.
However, even the most committed price doves in OPEC recognize that modest price increases are not only feasible but essential if the cartel is to maintain any effective solidarity, since for some members the ability to raise revenues through expansion of market share is quite limited. Hence, we can expect an irregular but persistent upward trend of modest proportions in prices from next year on, despite the cartel's continuing surplus and continuing ability to meet all demand requirements at substantially lower prIces.
Market Trends
What market trends to 1995 can we expect under this price scenario? In broad terms: (1) A modest increase in world oil demand -- 1% per year or slightly more, which would be about half of the total energy growth rate; (2) Continued growth in non-OPEC supplies for the next few years (but slower than in the 1979-85 period), followed by a leveling off in the early-to-mid 1990's and a decline somewhat later; (3) A steady increase in OPEC's world market share in the 1990's, with the bulk of the increase coming from the Middle East.
Among major markets, Europe will have very little increase in oil demand because of the continuing inroads of other fuels (nuclear power and natural gas) into the stationary oil market. Japan, which had experienced almost steady annual declines from 1979 to 1984, registered growth rates of about 1.3% in both 1986 and 1987 and will probably continue to grow at about this rate. The U.S. market, which is as large as Europe and Japan combined, can be expected to grow at somewhat below 1% annually, which will increase its volume by 1.0-1.2 million B/D between 1987 and 1995. Among major products the fastest growth in the U.S. will be in middle distillates. But U.S. residual fuel oil demand will also rise again from about 1990 on, primarily due to increased demand by electric utilities as the construction phase of nuclear power plants ends in the U.S. The developing countries other than OPEC (which can supply its growth out of its own shut-in excess production), will register the most rapid growth rate, perhaps 2% annually, from their current 9.5 million B/D.
In all major industrial countries other than the U.S., residual fuel oil demand will decline while light products demand will rise. In the developing countries, both light and heavy oil products will register a growth. But fuel substitution will be at work there, too, so that demand will grow much faster for light products than for heavy fuel oil in these countries.
28-3
Oil Supply
On the supply side, non-OPEC NCW production will be about 0.6 million BID higher this year than in 1985, the year before the price break. This is a very modest increase com pared to those registered regularly in the pre-1986 period. It is due almost entirely to the aforementioned decline of 0.8 million BID in U.S. production. For most of the rest of the NCW the production level since 1986 has been almostas high as it would have been if prices had remained at their 1985 level.
The reason for the U.S. decline lies principally in the immediate sharp reduction in drilling activities, following the price drop. In 1986 the number of active drilling rigs declined by 51 %. In 1987 it dropped by another 15%. This year we are seeing a modest increase, perhaps on the order of 12-13%. Since the U.S. has by far the lowest output per well of any major oil producer, its production level is much more sensitive to the number of wells drilled at any given moment than almost any other producer.
Outside North America and OPEC the number of drilling rigs dropped by only 19% between 1985 and 1987 and is now rising again. There are several reasons for the much smaller drop in drilling activities in these areas as well as the continuing increase in production: (1) For most fields coming on stream in the 1986-88 period, the investment decisions and most actual expenditures had been made several years earlier; (2) A number of countries (but not the U.S.) offset part of the 1986 price decline by reducing government taxes andlor royalties; and (3) Finding and production costs in most countries are substantially lower than in the U.S. Hence in those countries exploration and development activities did not have to be curtailed as much as in the U.S. nor did any flowing production have to be shut in at prevailing post-1985 prices.
The general perception that prices will rise slightly for the next several years and somewhat faster thereafter has spurred an increase in drilling activities in most regions of the world. In the first quarter of 1988, the global rig count outside OPEC was 17% higher than in the same period of 1987. This is likely to result in a small but steady increase in total world production outside the U.S. and OPEC, at least into the early 1990's. By 1995 we estimate the increase to amount to 1.5 - 2.0 million BID above last year's level, a 9% -12% growth.
U.S. production on the other hand will continue to decline throughout this period. In fact, after 1990 the decline can be expected to accelerate because Alaskan production, which has continued to grow since 1985 and is now at a peak of 2.1 million BID, will then enter its long term decline phase. By 1995 U.S. production will have dropped by at least 1.5 million BID from its 1987 level. This could offset the entire increase in other nonOPEC production during this period.
Balance of Supply and Demand
In arriving at a future balance of NCW oil supply and demand we must consider one other factor: net imports from the Soviet Bloc and People's Republic of China. In 1985 net Soviet Bloc exports amounted to 1.4 million BID and exports from China to 733,000 BID. This year Soviet Bloc exports will have grown to 1.8 million BID (about the same as in 1987) while Chinese net exports will have dropped to slightly below 600,000 BID.
28-4
By 1995 we expect the Soviet Bloc to register a modest decline, since production will at best remain at its current level while domestic demand is likely to grow. However, the growth will be quite small since Soviet natural gas will continue to displace oil in nontransportation uses of oil. Let us assume a net Soviet oil export level of 1.5 million BjD for 1995.
I am reluctant to make any projections of oil exports by the People's Republic of China in the presence of experts who are far more qualified to make such forecasts. However, we do know that Chinese oil exports peaked in 1985 and have declined since then. Given the slow growth in domestic production and the rapid industrialization of the country, requiring rising levels of oil and other energy sources, I assume that Chinese exports will continue to decline. By 1995 I have somewhat arbitrarily assumed they will be no more than half of this year's level.
We can now put together the NCW supply and demand balance for 1995. Demand, based on our annual growth rate of 1% or slightly more, will be 52-53 million BjD in 1995. Non-OPEC supplies from all sources should be approximately 28-29 million BjD. Thus, depending on how we combine the upper and lower ends of the supply and demand ranges, OPEC, as the world's swing producer, would have to provide 23-25 million BjD of liquids to balance supply and demand. Since the cartel can be expected to produce about 2 million BjD of natural gas liquids by then, its required crude oil production would be on the order of 21-23 million BjD. While this would be a significant improvement from this year's likely 18.5 million BjD, it would still leave the cartel with a substantial excess producing capacity. Thus, our projected price path to 1995 is not required by market fundamentals, but assumes a moderately effective cartel whose power is very gradually strengthened over time by market fundamentals.
28-5
PACIFIC REGION OIL PRODUCT TRADE
Dennis J. O'Brien*
The Pacific Economies
I want to say something about the extraordinary economIC changes ill the AsiaPacific region:
o By 2000 the combined GNP of the Asia-Pacific region will equal the size of Europe or the United States.
o The combination of trade development, domestic economic expansion, dedicated work force, emphasis on quality and technical education, a vigorous "safe" enterprise system, outstanding government-business cooperation and support, will result in Asia leading the world economy into the 21st Century.
o Meanwhile, the European and U.S. economies are very sluggish and suffering from what some analysts call "Eurosclerosis."
This leads to two possible scenarios depending on the strength of economic trends and the wisdom of the people who manage them:
o A RISING TIDE economic and political scenario in which the U.S. gets its economic house in order, the world economic leaders and banks cooperate, finance and trade continue to flow through opening windows, and good luck prevails.
o A DEEP MALAISE in which everything goes wrong and the system breaks down.
Asia will be affected greatly by both scenarios but will perform better than Europe and North America in both cases. China will be less affected by the lower case because the economy is less involved in international trade and finance.
The Energy Environment
The diverse c~untries in the Asia-Pacific region do share a number of common features. Firstly, their rate of economic growth is faster than that of the U.S., Europe and the rest of the world. Secondly, their governments are heavily involved in the energy sector. Thirdly, they are heavily reliant on petroleum.
Together with economic growth, the region is also seeing strong growth in oil consumption. Lower crude oil prices have contributed to this growth, as well as the appreciation of many currencies, making petroleum products more affordable. Government regulation of oil imports have also been relaxed in some countries, increasing demand for oil.
In Asia the dominant transport fuel is diesel, followed by gasoline and jet fuel. Car and truck registrations have seen double-digit growth in several countries as the standard
* Chief Economist, Caltex Petroleum Corporation
29-1
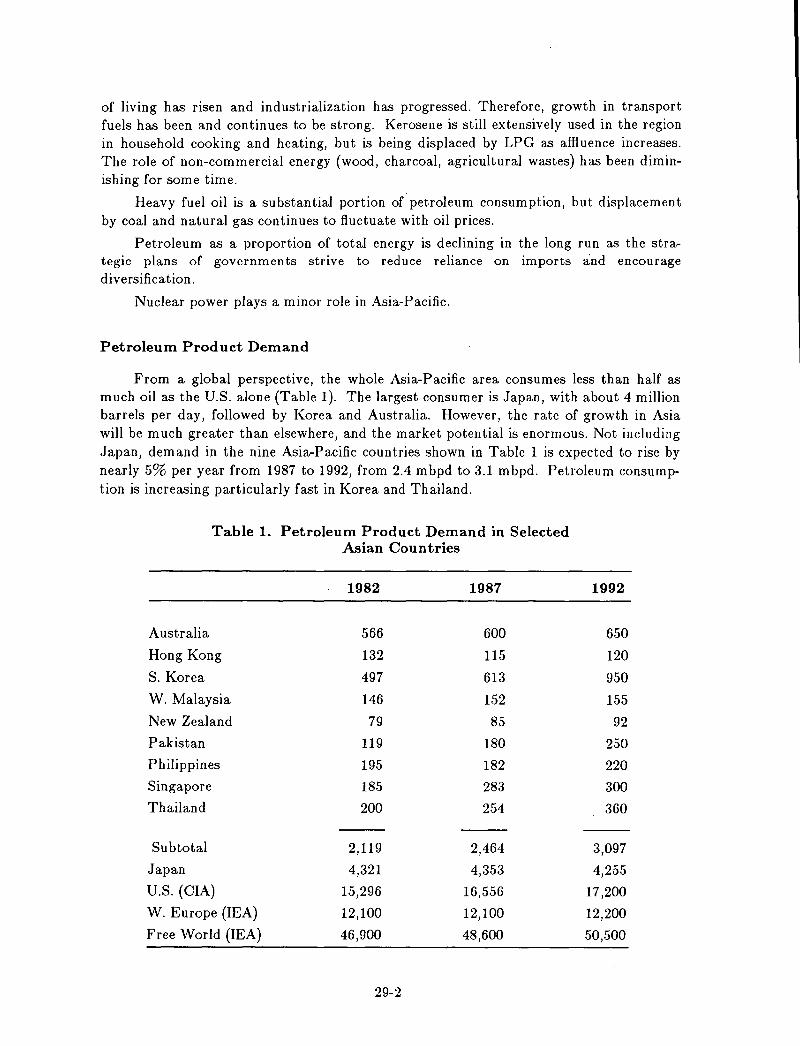
of living has risen and industrialization has progressed. Therefore, growth in transport fuels has been and continues to be strong. Kerosene is still extensively used in the region in household cooking and heating, but is being displaced by LPG as affluence increases. The role of non-commercial energy (wood, charcoal, agricultural wastes) has been diminishing for some time.
Heavy fuel oil is a substantial portion of petroleum consumption, but displacement by coal and natural gas continues to fluctuate with oil prices.
Petroleum as a proportion of total energy is declining in the long run as the strategic plans of governments strive to reduce reliance on imports and encourage diversification.
Nuclear power plays a minor role in Asia-Pacific.
Petroleum Product Demand
From a global perspective, the whole Asia-Pacific area consumes less than half as much oil as the U.S. alone (Table 1). The largest consumer is Japan, with about 4 million barrels per day, followed by Korea and Australia. However, the rate of growth in Asia will be much greater than elsewhere, and the market potential is enormous. Not including Japan, demand in the nine Asia-Pacific countries shown in Table 1 is expected to rise by nearly 5% per year from 1987 to 1992, from 2.4 mbpd to 3.1 mbpd. Petroleum consumption is increasing particularly fast in Korea and Thailand.
Table 1. Petroleum Product Demand in Selected Asian Countries
1982 1987 1992
Australia 566 600 650
Hong Kong 132 115 120
S. Korea 497 613 950
W. Malaysia 146 152 155
New Zealand 79 85 92
Pakistan 119 180 250
Philippines 195 182 220
Singapore 185 283 300
Thailand 200 254 360
Subtotal 2,119 2,464 3,097
Japan 4,321 4,353 4,255
U.S. (CIA) 15,296 16,556 17,200
W. Europe (lEA) 12,100 12,100 12,200
Free World (lEA) 46,900 48,600 50,500
29-2
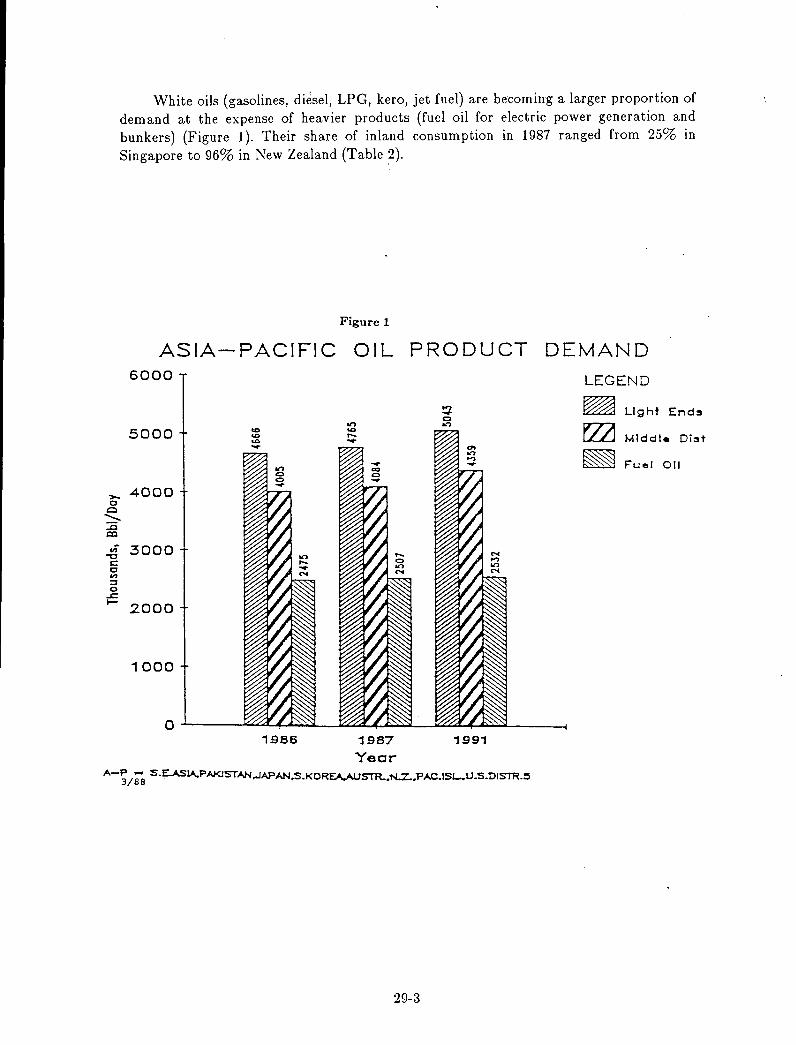
White oils (gasolines, diesel, LPG, kero, jet fuel) are becoming a larger proportion of demand at the expense of heavier products (fuel oil for electric power generation and bunkers) (Figure 1). Their share of inland consumption in 1987 ranged from 25% in Singapore to 96% in New Zealand (Table 2).
Figure 1
ASIA-PACIFIC OIL PRODUCT DEMAND 6000 LEGEND
Llghi End:s
5000 Mlddl. Di:st
Fuel 011
4000
~ 3000 c C ." :::l o
oJ:; I- 2000
1000
1986 '987 Yecr
'99'
A-j/~ S.E..ASlA.PAKlSTAN,.JAPAN,s.KOREA.AUSTR...N.Z..PAC.1SL.U.S.DISTR.5
29·3
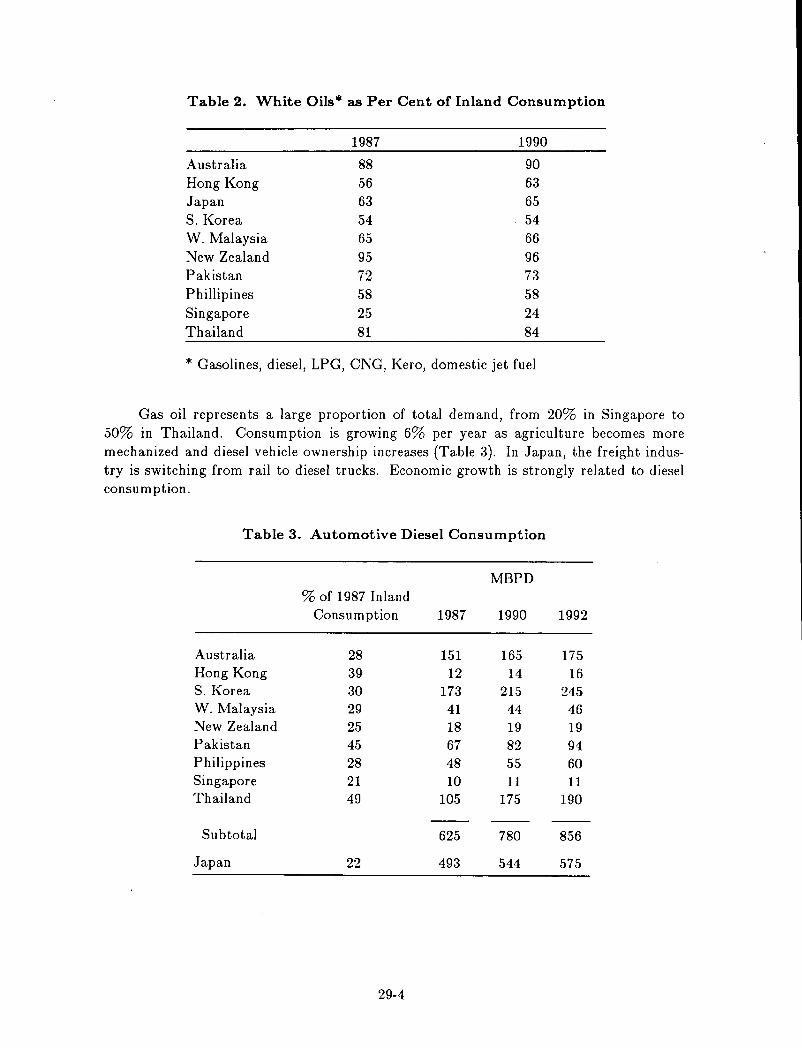
Table 2. White Oils· as Per Cent of Inland Consumption
1987 1990
Australia 88 90 Hong Kong 56 63 Japan 63 65 S. Korea 54 54 W. Malaysia 65 66 New Zealand 95 96 Pakistan 72 73 Phillipines 58 58 Singapore 25 24 Thailand 81 84
* Gasolines, diesel, LPG, CNG, Kero, domestic jet fuel
Gas oil represents a large proportion of total demand, from 20% in Singapore to 50% in Thailand. Consumption is growing 6% per year as agriculture becomes more mechanized and diesel vehicle ownership increases (Table 3). In Japan, the freight industry is switching from rail to diesel trucks. Economic growth is strongly related to diesel consumption.
Table 3. Automotive Diesel Consumption
MBPD % of 1987 Inland
Consumption 1987 1990 1992
Australia 28 151 165 175 Hong Kong 39 12 14 16 S. Korea 30 173 215 245 W. Malaysia 29 41 44 46 New Zealand 25 18 19 19 Pakistan 45 67 82 94 Philippines 28 48 55 60 Singapore 21 10 11 11 Thailand 49 105 175 190
Subtotal 625 780 856
Japan 22 493 544 575
29-4
Selected Countries
AUSTRALIA. Gasoline comprises over 50% of total consumption, but growth is levelling off with increases in engine efficiency. In contrast, LPG demand is increasing by 5% p.a. Diesel demand is being boosted by growth in agriculture and mining. Tourism and expanding air freight are boosting jet fuel consumption.
HONG KONG. Petroleum use is declining as town gas and LPG are displacing kerosene. Also, coal-fired power stations are displacing fuel oil. Jet fuel demand is growing by 7% p.a.
KOREA. The car population has been growing by 20% a year and consequently gasoline consumption. However, nuclear energy and LNG are displacing fuel oil in electric power generation. LPG is growing at 16% p.a. in the household sector and as a vehicle fuel. Also, naphtha use for petrochemical production is increasing sharply.
MALAYSIA. In Malaysia, the vehicle population, mogas and diesel consumption are all increasing. Also, LPG growth of 10% per year is anticipated in household and industrial use. Kerosene use however is declining as more electricity is available. Fuel oil continues to be displaced by coal, natural gas and hydro power.
PAKISTAN. Road expansion and agricultural mechanization are contributing to the rise in diesel demand. Economic growth and increasing vehicle ownership are boosting gasoline consumption. Electricity is still generated by fuel oil to a large extent as natural gas is restricted by an inadequate distribution system. Kerosene will remain a major household fuel.
PHILIPPINES. Strong demand for transport fuels is forecast with increased economic growth. Fuel oil use for electric power generation will increase to 1990; thereafter some substitution is expected. Kerosene is expected to remain a popular household fuel; LPG use is forecast to grow by nearly 15% p.a.
SINGAPORE. Fuel oil demand will remain strong for electricity generation including the public transportation system. Gasoline and diesel are being partially displaced by the new mass rapid transport system; the car population is declining. The Changi Airport expansion will increase demand for jet fuel. Piped gas will displace LPG for cooking in new housing estates. Naphtha use is also increasing for conversion to LPG and pipegas.
THAILAND. Gasoline and diesel demand is expanding with economic growth and new vehicle registrations. LPG use in the household sector is growing. Tourism and jet fuel demand will remain strong. Fuel oil is being displaced by gas and coal in the electric power industry. Kerosene consumption is declining as electrification to rural areas expands.
Conclusions
Demand for transportation fuels will continue to grow into the 21st Century throughout Asia as economic growth improves the lives of the people of Asia. The automobile fleet will continue to expand at a rapid rate and continue to be balanced between diesel and motor gasoline engines, with the split between them depending upon the local taxes on each.
29-5
This will strain Asia's refining capacity and more investments will be made in national refineries designed to meet individual product deficit requirements. Initially, product differentials will not support heavy investment in fuel oil upgrading plants; investments will initially focus on improvements in yields of existing units; for example, modifications to allow the use of new catalytic cracking catalysts will be made. Product quality standards will also increase, putting further upward pressure on differentials. By the mid-1990.s, continued strong growth in transportation fuels, slow fuel oil growth, a heavier crude mix worldwide and the start-up of little new upgrading capacity will all contribute to an increase in the upgrading differential, which will prompt a new waver of major refinery investments.
In the meantime, the surplus capacity in both natural gas and coal will continue to overhang the market. There will be strong efforts to continue substitution for fuel oil in boiler and bunker applications. We have nearly reached the limit in these applications.
There will be increased efforts to substitute coal and gas in transportation applications. In Indonesia, Singapore, Malaysia, and Thailand, eNG and LPG use as transportation fuels will grow, slightly alternating the growth in gasoline and diesel.
Japan has also undertaken a massive effort to develop new technologies to use these fuels and reduce Japan's oil share of the energy mix (from 56% now to 24% in 2030). Japan is also looking at ways to commercialize these transportation fuel technologies and export them as a new wave of exports in the late 1990s. Japan has a large program aimed at development, construction, and export of new technologies in the electric power sector. The timing of these Japanese exports of energy technology could affect either the decision of governments and private companies in investing in refineries or new exploration and production. Once the investments are made, the technologies could affect the pay-out of those investments.
In short, I am suggesting a tightening light petroleum product market in the medium-term which encourages investment. In the longer-term, surplus capacity will again return due to a wider range of transportation fuel options and probably excessive or premature construction of fuel oil upgrading facilities.
29-6
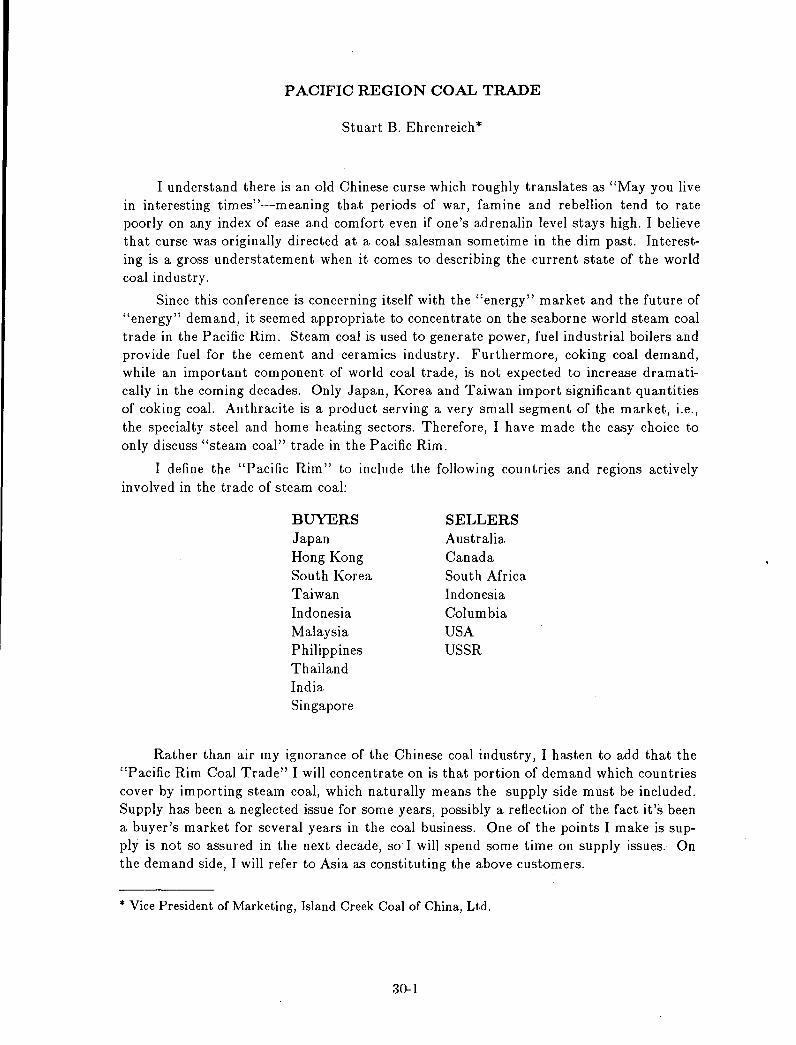
PACIFIC REGION COAL TRADE
Stuart B. Ehrenreich*
I understand there is an old Chinese curse which roughly translates as "May you live in interesting times"-meaning that periods of war, famine and rebellion tend to rate poorly on any index of ease and comfort even if one's adrenalin level stays high. I believe that curse was originally directed at a coal salesman sometime in the dim past. Interesting is a gross understatement when it comes to describing the current state of the world coal industry.
Since this conference is concerning itself with the "energy" market and the future of "energy" demand, it seemed appropriate to concentrate on the seaborne world steam coal trade in the Pacific Rim. Steam coal is used to generate power, fuel industrial boilers and provide fuel for the cement and ceramics industry. Furthermore, coking coal demand, while an important component of world coal trade, is not expected to increase dramatically in the coming decades. Only Japan, Korea and Taiwan import significant quantities of coking coal. Anthracite is a product serving a very small segment of the market, i.e., the specialty steel and home heating sectors. Therefore, I have made the easy choice to only discuss "steam coal" trade in the Pacific Rim.
I define the "Pacific Rim" to include the following countries and regions actively involved in the trade of steam coal:
BUYERS Japan Hong Kong South Korea Taiwan Indonesia Malaysia Philippines Thailand India Singapore
SELLERS Australia Canada South Africa Indonesia Columbia USA USSR
Rather than air my ignorance of the Chinese coal industry, I hasten to add that the "Pacific Rim Coal Trade" I will concentrate on is that portion of demand which countries cover by importing steam coal, which naturally means the supply side must be included. Supply has been a neglected issue for some years, possibly a reflection of the fact it's been a buyer's market for several years in the coal business. One of the points I make is supply is not so assured in the next decade, so I will spend some time on supply issues. On the demand side, I will refer to Asia as constituting the above customers.
* Vice President of Marketing, Island Creek Coal of China, Ltd.
30-1
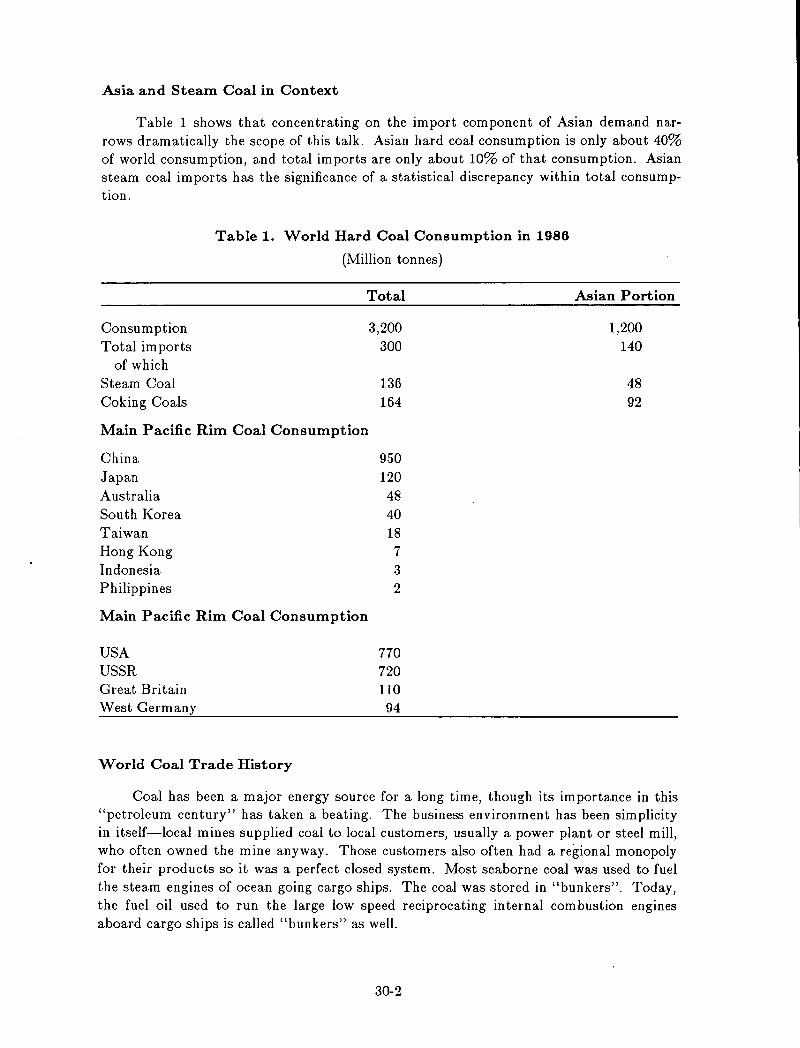
Asia and Steam Coal in Context
Table 1 shows that concentrating on the import component of Asian demand narrows dramatically the scope of this talk. Asian hard coal consumption is only about 40% of world consumption, and total imports are only about 10% of that consumption. Asian steam coal imports has the significance of a statistical discrepancy within total consumption.
Table 1. World Hard Coal Consumption in 1986
(Million tonnes)
Total
Consumption Total imports
of which Steam Coal Coking Coals
Main Pacific Rim Coal Consumption
China Japan Australia South Korea Taiwan Hong Kong Indonesia Philippines
Main Pacific Rim Coal Consumption
USA USSR Great Britain West Germany
World Coal Trade History
3,200 300
136 164
950 120
48 40 18
7
3 2
770 720 110 94
Asian Portion
1,200 140
48 92
Coal has been a major energy source for a long time, though its importance in this "petroleum century" has taken a beating. The business environment has been simplicity in itself-local mines supplied coal to local customers, usually a power plant or steel mill, who often owned the mine anyway. Those customers also often had a regional monopoly for their products so it was a perfect closed system. Most seaborne coal was used to fuel the steam engines of ocean going cargo ships. The coal was stored in "bunkers". Today, the fuel oil used to run the large low speed reciprocating internal combustion engines aboard cargo ships is called "bunkers" as well.
30-2
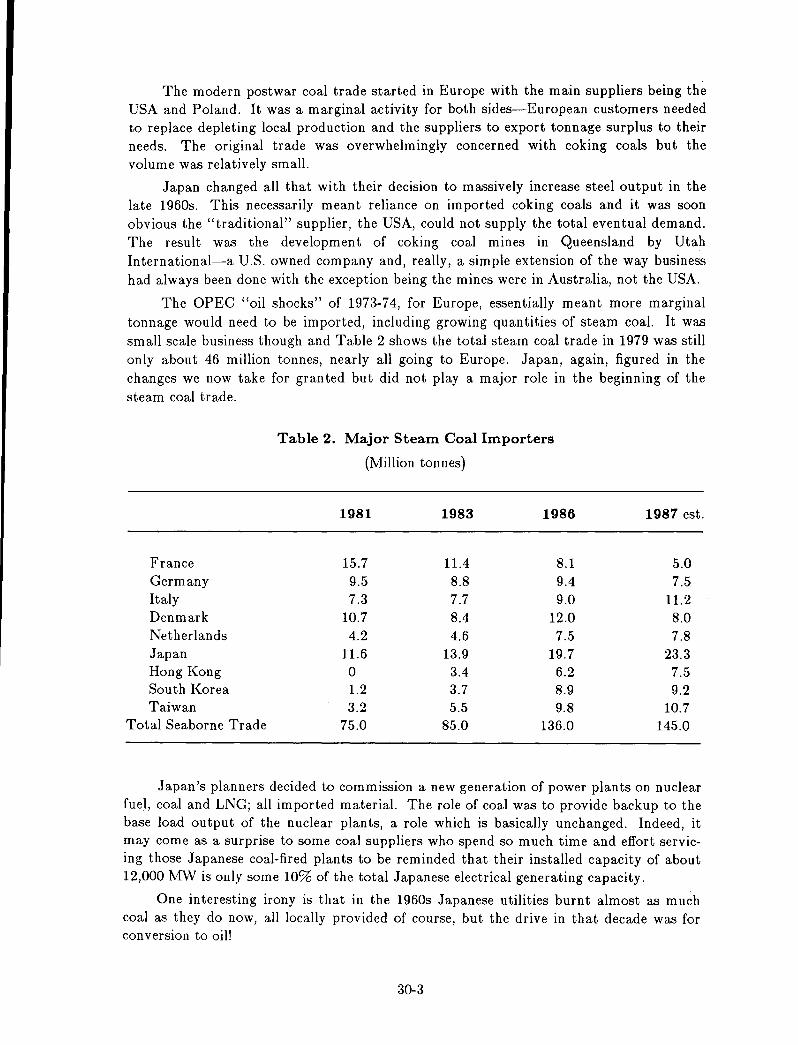
The modern postwar coal trade started in Europe with the main suppliers being the USA and Poland. It was a marginal activity for both sides-European customers needed to replace depleting local production and the suppliers to export tonnage surplus to their ~eeds. The original trade was overwhelmingly concerned with coking coals but the volume was relatively small.
Japan changed all that with their decision to massively increase steel output in the late 1960s. This necessarily meant reliance on imported coking coals and it was soon obvious the "traditional" supplier, the USA, could not supply the total eventual demand. The result was the development of coking coal mines in Queensland by Utah International-a U.S. owned company and, really, a simple extension of the way business had always been done with the exception being the mines were in Australia, not the USA.
The OPEC "oil shocks" of 1973-74, for Europe, essentially meant more marginal tonnage would need to be imported, including growing quantities of steam coal. It was small scale business though and Table 2 shows the total steam coal trade in 1979 was still only about 46 million tonnes, nearly all going to Europe. Japan, again, figured in the changes we now take for granted but did not playa major role in the beginning of the steam coal trade.
Table 2. Major Steam Coal Importers
(Million tonnes)
1981 1983 1986 1987 est.
France 15.7 11.4 8.1 5.0 Germany 9.5 8.8 9.4 7.5 Italy 7.3 7.7 9.0 11.2 Denmark 10.7 8.4 12.0 8.0 Netherlands 4.2 4.6 7.5 7.8 Japan 11.6 13.9 19.7 23.3 Hong Kong 0 3.4 6.2 7.5 South Korea 1.2 3.7 8.9 9.2 Taiwan 3.2 5.5 9.8 10.7
Total Seaborne Trade 75.0 85.0 136.0 145.0
Japan's planners decided to commission a new generation of power plants on nuclear fuel, coal and LNG; all imported material. The role of coal was to provide backup to the base load output of the nuclear plants, a role which is basically unchanged. Indeed, it may come as a surprise to some coal suppliers who spend so much time and effort servicing those Japanese coal-fired plants to be reminded that their installed capacity of about 12,000 MW is only some 10% of the total Japanese electrical generating capacity.
One interesting irony is that in the 1960s Japanese utilities burnt almost as much coal as they do now, all locally provided of course, but the drive in that decade was for conversion to oil!
30-3
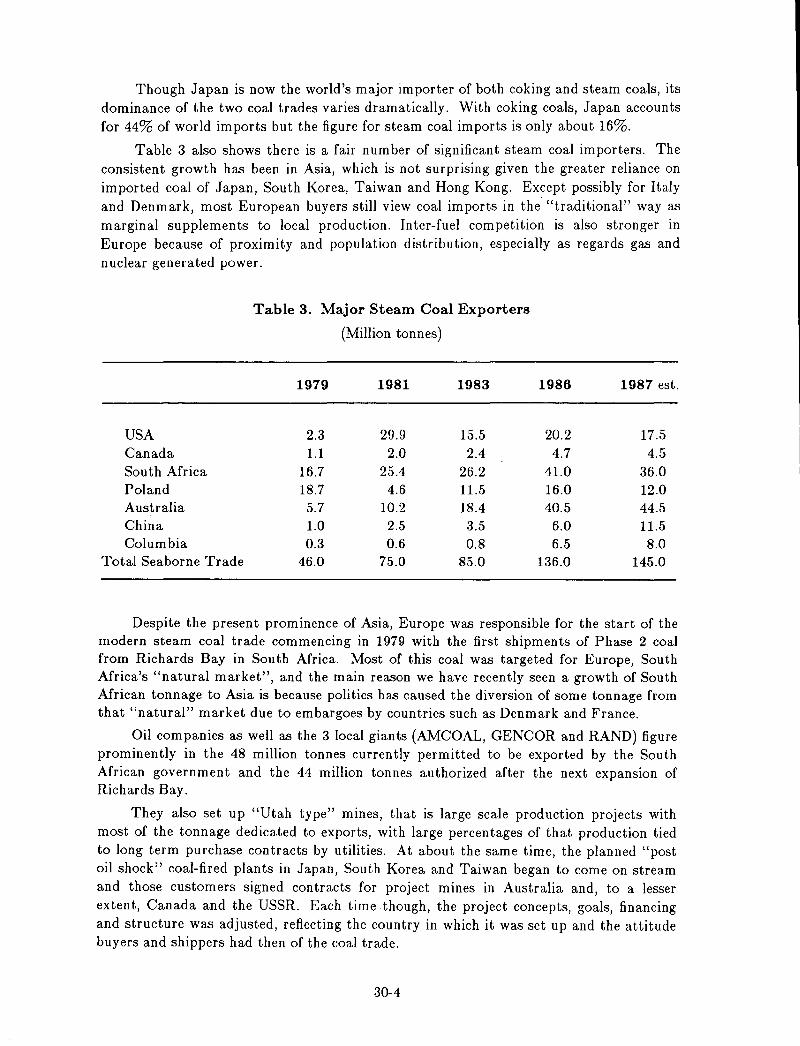
Though Japan is now the world's major importer of both coking and steam coals, its dominance of the two coal trades varies dramatically. With coking coals, Japan accounts for 44% of world imports but the figure for steam coal imports is only about 16%.
Table 3 also shows there is a fair number of significant steam coal importers. The consistent growth has been in Asia, which is not surprising given the greater reliance on imported coal of Japan, South Korea, Taiwan and Hong Kong. Except possibly for Italy and Denmark, most European buyers still view coal imports in the "traditional" way as marginal supplements to local production. Inter-fuel competition is also stronger in Europe because of proximity and population distribution, especially as regards gas and nuclear generated power.
Table 3. Major Steam Coal Exporters
(Million tonnes)
1979 1981 1983 1986 1987 est.
USA 2.3 29.9 15.5 20.2 17.5 Canada 1.1 2.0 2.4 4.7 4.5 South Africa 16.7 25.4 26.2 41.0 36.0 Poland 18.7 4.6 11.5 16.0 12.0 Australia 5.7 10.2 18.4 40.5 44.5 China 1.0 2.5 3.5 6.0 11.5 Columbia 0.3 0.6 0.8 6.5 8.0
Total Seaborne Trade 46.0 75.0 85.0 136.0 145.0
Despite the present prominence of Asia, Europe was responsible for the start of the modern steam coal trade commencing in 1979 with the first shipments of Phase 2 coal from Richards Bay in South Africa. Most of this coal was targeted for Europe, South Africa's "natural market", and the main reason we have recently seen a growth of South African tonnage to Asia is because politics has caused the diversion of some tonnage from that "natural" market due to embargoes by countries such as Denmark and France.
Oil companies as well as the 3 local giants (AMCOAL, GENCOR and RAND) figure prominently in the 48 million tonnes currently permitted to be exported by the South African government and the 44 million tonnes authorized after the next expansion of Richards Bay.
They also set up "Utah type" mines, that is large scale production projects with most of the tonnage dedicated to exports, with large percentages of that production tied to long term purchase contracts by utilities. At about the same time, the planned "post oil shock" coal-fired plants in Japan, South Korea and Taiwan began to come on stream and those customers signed contracts for project mines in Australia and, to a lesser extent, Canada and the USSR. Each time though, the project concepts, goals, financing and structure was adjusted, reflecting the country in which it was set up and the attitude buyers and shippers had then of the coal trade.
30-4
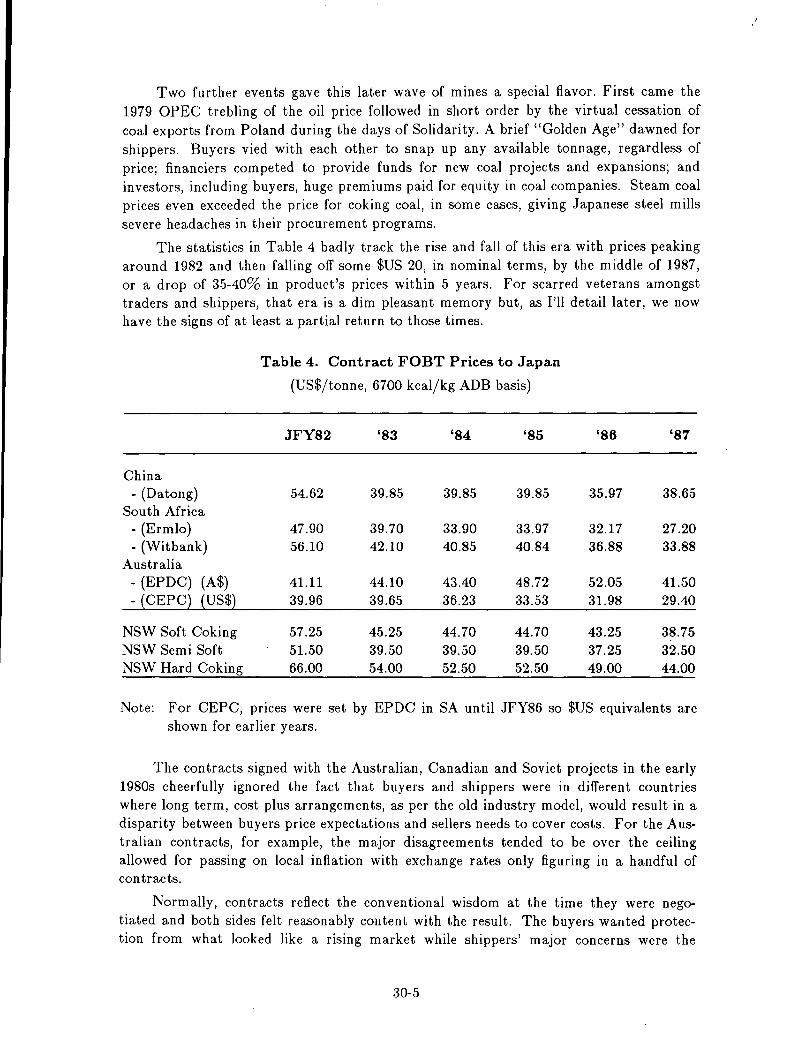
Two further events gave this later wave of mines a special flavor. First came the 1979 OPEC trebling of the oil price followed in short order by the virtual cessation of coal exports from Poland during the days of Solidarity. A brief "Golden Age" dawned for shippers. Buyers vied with each other to snap up any available tonnage, regardless of price; financiers competed to provide funds for new coal projects and expansions; and investors, including buyers, huge premiums paid for equity in coal companies. Steam coal prices even exceeded the price for coking coal, in some cases, giving Japanese steel mills severe headaches in their procurement programs.
The statistics in Table 4 badly track the rise and fall of this era with prices peaking around 1982 and then falling off some $US 20, in nominal terms, by the middle of 1987, or a drop of 35-40% in product's prices within 5 years. For scarred veterans amongst traders and shippers, that era is a dim pleasant memory but, as I'll detail later, we now have the signs of at least a partial return to those times.
Table 4. Contract FOBT Prices to Japan
(US$/tonne, 6700 kcal/kg ADB basis)
JFY82 '83 '84 '85 '86 '87
China - (Datong) 54.62 39;85 39.85 39.85 35.97 38.65
South Africa - (Ermlo) 47.90 39.70 33.90 33.97 32.17 27.20 - (Witbank) 56.10 42.10 40.85 40.84 36.88 33.88
Australia - (EPDC) (A$) 41.11 44.10 43.40 48.72 52.05 41.50 - {CEPC} {US$} 39.96 39.65 36.23 33.53 31.98 29.40
NSW Soft Coking 57.25 45.25 44.70 44.70 43.25 38.75 NSW Semi Soft 51.50 39.50 39.50 39.50 37.25 32.50 NSW Hard Coking 66.00 54.00 52.50 52.50 49.00 44.00
Note: For CEPC, prices were set by EPDC in SA until JFY86 so $US equivalents are shown for earlier years.
The contracts signed with the Australian, Canadian and Soviet projects in the early 1980s cheerfully ignored the fact that buyers and shippers were in different countries where long term, cost plus arrangements, as per the old industry model, would result in a disparity between buyers price expectations and sellers needs to cover costs. For the Australian contracts, for example, the major disagreements tended to be over the ceiling allowed for passing on local inflation with exchange rates only figuring in a handful of contracts.
Normally, contracts reflect the conventional wisdom at the time they were negotiated and both sides felt reasonably content with the result. The buyers wanted protection from what looked like a rising market while shippers' major concerns were the
30-5
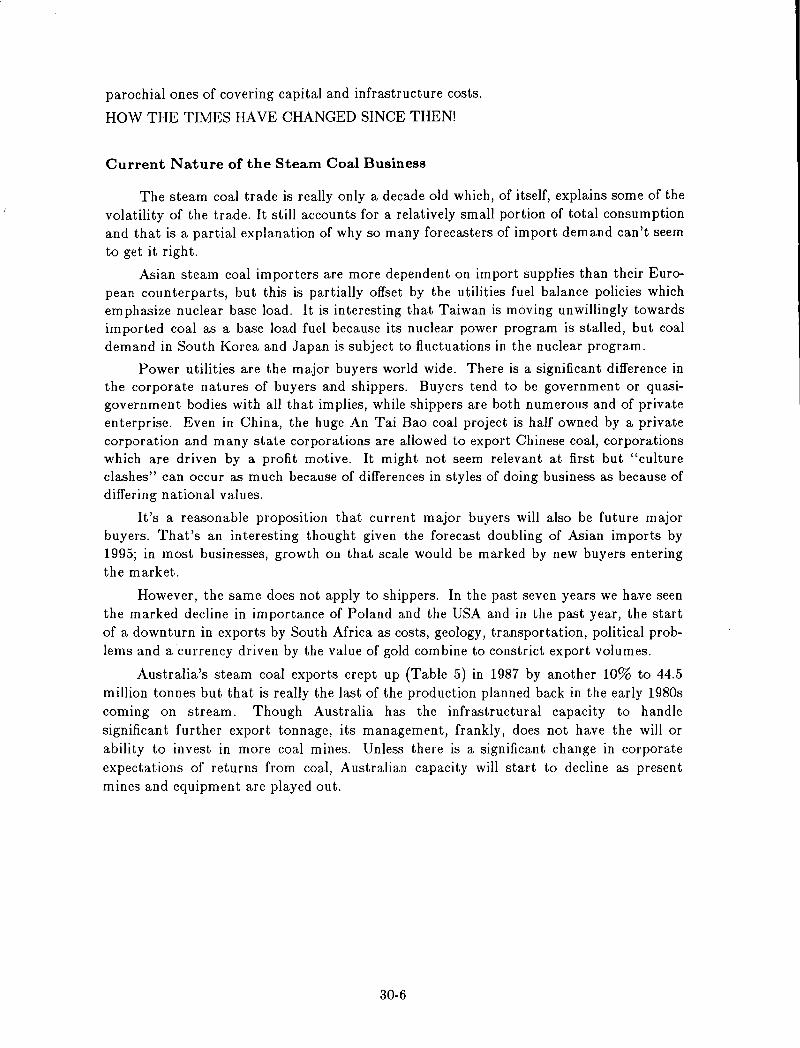
parochial ones of covering capital and infrastructure costs.
HOW THE TIMES HAVE CHANGED SINCE THEN!
Current Nature of the Steam Coal Business
The steam coal trade is really only a decade old which, of itself, explains some of the volatility of the trade. It still accounts for a relatively small portion of total consumption and that is a partial explanation of why so many forecasters of import demand can't seem to get it right.
Asian steam coal importers are more dependent on import supplies than their European counterparts, but this is partially offset by the utilities fuel balance policies which emphasize nuclear base load. It is interesting that Taiwan is moving unwillingly towards imported coal as a base load fuel because its nuclear power program is stalled, but coal demand in South Korea and Japan is subject to fluctuations in the nuclear program.
Power utilities are the major buyers world wide. There is a significant difference in the corporate natures of buyers and shippers. Buyers tend to be government or quasigovernment bodies with all that implies, while shippers are both numerous and of private enterprise. Even in China, the huge An Tai Bao coal project is half owned by a private corporation and many state corporations are allowed to export Chinese coal, corporations which are driven by a profit motive. It might not seem relevant at first but "culture clashes" can occur as much because of differences in styles of doing business as because of differing national values.
It's a reasonable proposition that current major buyers will also be future major buyers. That's an interesting thought given the forecast doubling of Asian imports by 1995; in most businesses, growth on that scale would be marked by new buyers entering the market.
However, the same does not apply to shippers. In the past seven years we have seen the marked decline in importance of Poland and the USA and in the past year, the start of a downturn in exports by South Africa as costs, geology, transportation, political problems and a currency driven by the value of gold com bine to constrict export volumes.
Australia's steam coal exports crept up (Table 5) in 1987 by another 10% to 44.5 million tonnes but that is really the last of the production planned back in the early 1980s coming on stream. Though Australia has the infrastructural capacity to handle significant further export tonnage, its management, frankly, does not have the will or ability to invest in more coal mines. Unless there is a significant change in corporate expectations of returns from coal, Australian capacity will start to decline as present mines and equipment are played out.
30-6
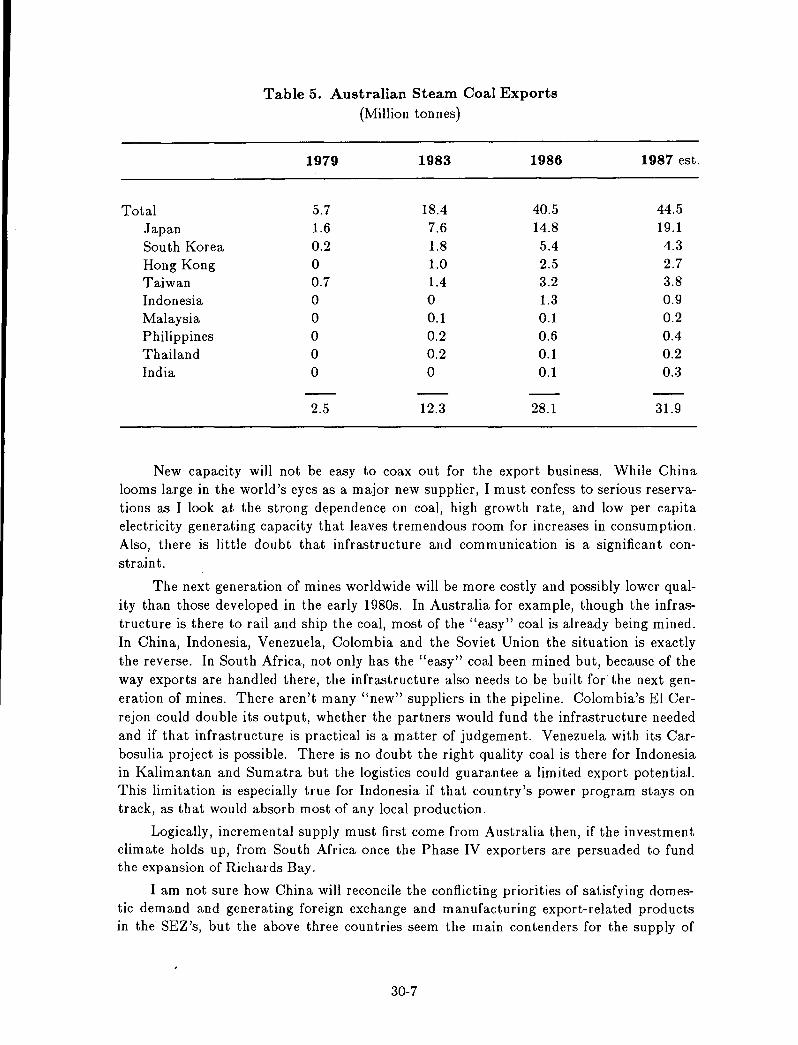
Table 5. Australian Steam Coal Exports
(Million tonnes)
1979 1983 1986 1987 est.
Total 5.7 18.4 40.5 44.5 Japan 1.6 7.6 14.8 19.1 South Korea 0.2 1.8 5.4 4.3 Hong Kong 0 1.0 2.5 2.7 Taiwan 0.7 1.4 3.2 3.8 Indonesia 0 0 1.3 0.9 Malaysia 0 0.1 0.1 0.2 Philippines 0 0.2 0.6 0.4 Thailand 0 0.2 0.1 0.2 India 0 0 0.1 0.3
2.5 12.3 28.1 31.9
New capacity will not be easy to coax out for the export business. While China looms large in the world's eyes as a major new supplier, I must confess to serious reservations as I look at the strong dependence on coal, high growth rate, and low per capita electricity generating capacity that leaves tremendous room for increases in consumption. Also, there is little doubt that infrastructure and communication is a significant constraint.
The next generation of mines worldwide will be more costly and possibly lower quality than those developed in the early 1980s. In Australia for example, though the infrastructure is there to rail and ship the coal, most of the "easy" coal is already being mined. In China, Indonesia, Venezuela, Colombia and the Soviet Union the situation is exactly the reverse. In South Africa, not only has the "easy" coal been mined but, because of the way exports are handled there, the infrastructure also needs to be built for the next generation of mines. There aren't many "new" suppliers in the pipeline. Colombia's EI Cerrejon could double its output, whether the partners would fund the infrastructure needed and if that infrastructure is practical is a matter of judgement. Venezuela with its Carbosulia project is possible. There is no doubt the right quality coal is there for Indonesia in Kalimantan and Sumatra but the logistics could guarantee a limited export potential. This limitation is especially true for Indonesia if that country's power program stays on track, as that would absorb most of any local production.
Logically, incremental supply must first come from Australia then, if the investment climate holds up, from South Africa once the Phase IV exporters are persuaded to fund the expansion of Richards Bay.
I am not sure how China will reconcile the conflicting priorities of satisfying domestic demand and generating foreign exchange and manufacturing export-related products III the SEZ's, but the above three countries seem the main contenders for the supply of
30-7
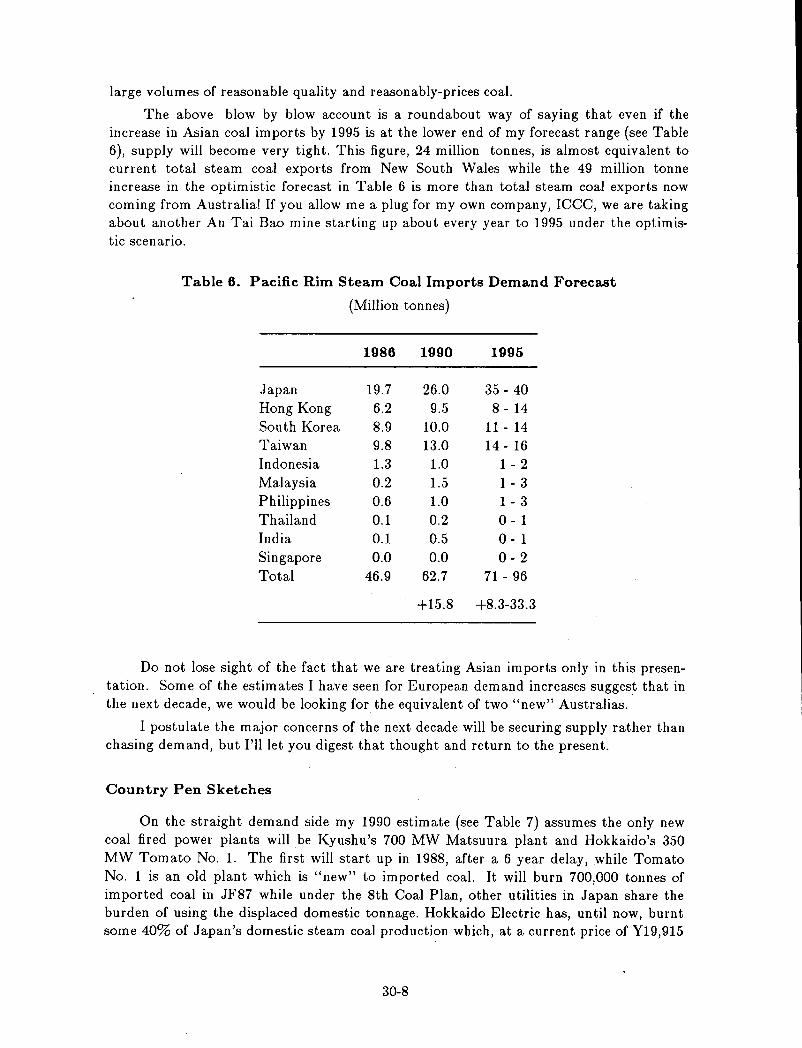
large volumes of reasonable quality and reasonably-prices coal.
The above blow by blow account is a roundabout way of saying that even if the increase in Asian coal imports by 1995 is at the lower end of my forecast range (see Table 6), supply will become very tight. This figure, 24 million tonnes, is almost equivalent to current total steam coal exports from New South Wales while the 49 million tonne increase in the optimistic forecast in Table 6 is more than total steam coal exports now coming from Australia! If you allow me a plug for my own company, ICCC, we are taking about another An Tai Bao mine starting up about every year to 1995 under the optimistic scenario.
Table 6. Pacific Rim Steam Coal Imports Demand Forecast
(Million tonnes)
1986 1990 1995
Japan 19.7 26.0 35 - 40 Hong Kong 6.2 9.5 8 - 14 South Korea 8.9 10.0 11 - 14 Taiwan 9.8 13.0 14 - 16 Indonesia 1.3 1.0 1 - 2 Malaysia 0.2 1.5 1 - 3 Philippines 0.6 1.0 1 - 3 Thailand 0.1 0.2 0- 1 India 0.1 0.5 0- 1 Singapore 0.0 0.0 0-2 Total 46.9 62.7 71 - 96
+15.8 +8.3-33.3
Do not lose sight of the fact that we are treating Asian imports only in this presentation. Some of the estimates I have seen for European demand increases suggest that in the next decade, we would be looking for the equivalent of two "new" Australias.
I postulate the major concerns of the next decade will be securing supply rather than chasing demand, but I'll let you digest that thought and return to the present.
Country Pen Sketches
On the straight demand side my 1990 estimate (see Table 7) assumes the only new coal fired power plants will be Kyushu's 700 MW Matsuura plant and Hokkaido's 350 MW Tomato No. 1. The first will start up in 1988, after a 6 year delay, while Tomato No. 1 is an old plant which is "new" to imported coal. It will burn 700,000 tonnes of imported coal in JF87 while under the 8th Coal Plan, other utilities in Japan share the burden of using the displaced domestic tonnage. Hokkaido Electric has, until now, burnt some 40% of Japan's domestic steam coal production which, at a current price of Y19,915
30-8
a tonne, means Hokkaido Electric bears a disproportionately large fuel cost compared with other utilities.
Table 7. Estimate of Coal Fired Power Plants in Key Pacific Rim Markets
(Megawatts of capacity)
1987 1990 1995
Japan 11,802 12,502 17,362 Taiwan 3,955 3,955 5,055 South Korea 2,680 2,680 3,180 Hong Kong 4,490 5,150 5,810 Philippines 300 600 720 Malaysia 0 300 600 Thailand 0 0 0 Singapore 0 0 300 Indonesia 450 750 1,350 Total 23,677 25,937 34,377
+ 2,260 + 8,440
From 1990, the success of the 8th Coal Policy will have a big impact on demand for imports. The plan is to reduce domestic tonnage by about 10 million tonnes by 1991. About half this tonnage at least would be steam coal but the problem with rationalization programs like this is knowing when to stop. There are only 11 mines now in Japan and the plan is to end up with 4 but, as the last ones are big mines like Mitsui's 4.3 million tonne Miike Mine, closure of one of these will add significantly to import demand.
One rumor suggests that the Japanese government would reserve all the import demand generated by displacement of domestic coals for the USA to placate the anger over Japan's huge trade surplus. Even if the USA could supply all the coal, which is not a given, you can be sure such a move would draw no approving nods from Japan's other traditional suppliers such as Australia and Canada.
Besides this new source of import demand, the other components of increased Japanese demand will be the power utilities, general industry and the steel mills. Between 1990-95, the new coal fired capacity I see being commissioned is: EPDC's Matsuura (1000 MW), Chuba's Hekinan (2100 MW), Horukiku's Tsuruga (500 MW), and Tohoku's Noshiro (600 MW). Of the officially approved new plants in the period to 1995 I have already eliminated Kyush's 700 MW Reihoku project. I must confess to a belief that Noshiro will not start before 1995 and at least 1 of the 3 X 700 MW units for Hekinan will also be delayed. Still, even if these slippages occur, the power sector will be looking for coal to fire 2900 MW of new plant capacity or some 6 million tonnes of annual steam coal demand.
30-9
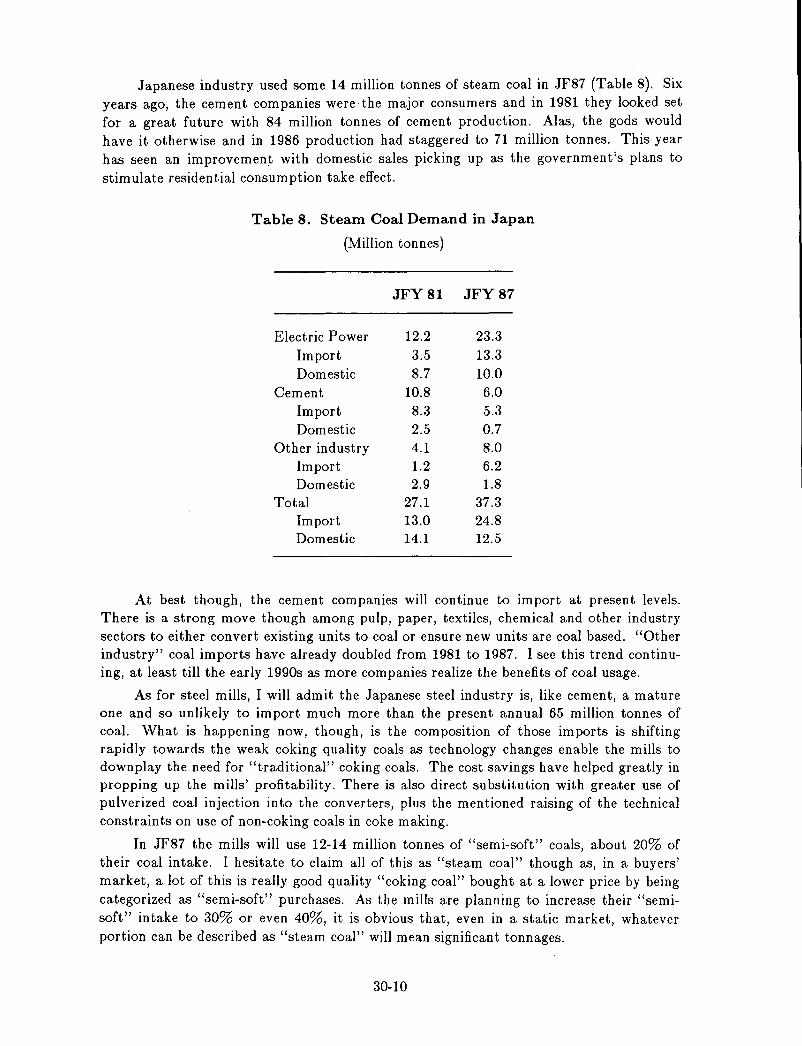
Japanese industry used some 14 million tonnes of steam coal in JF87 (Table 8). Six years ago, the cement companies were the major consumers and in 1981 they looked set for a great future with 84 million tonnes of cement production. Alas, the gods would have it otherwise and in 1986 production had staggered to 71 million tonnes. This year has seen an improvement with domestic sales picking up as the government's plans to stim ulate residential consumption take effect.
Table 8. Steam Coal Demand in Japan
(Million tonnes)
JFY 81 JFY 87
Electric Power 12.2 23.3 Import 3.5 13.3 Domestic 8.7 10.0
Cement 10.8 6.0 Import 8.3 5.3 Domestic 2.5 0.7
Other industry 4.1 8.0 Import 1.2 6.2 Domestic 2.9 1.8
Total 27.1 37.3 Import 13.0 24.8 Domestic 14.1 12.5
At best though, the cement companies will continue to import at present levels. There is a strong move though among pulp, paper, textiles, chemical and other industry sectors to either convert existing units to coal or ensure new units are coal based. "Other industry" coal imports have already doubled from 1981 to 1987. I see this trend continuing, at least till the early 1990s as more companies realize the benefits of coal usage.
As for steel mills, I will admit the Japanese steel industry is, like cement, a mature one and so unlikely to import much more than the present annual 65 million tonnes of coal. What is happening now, though, is the composition of those imports is shifting rapidly towards the weak coking quality coals as technology changes enable the mills to downplay the need for "traditional" coking coals. The cost savings have helped greatly in propping up the mills' profitability. There is also direct substitution with greater use of pulverized coal injection into the converters, plus the mentioned raising of the technical constraints on use of non-coking coals in coke making.
In JF87 the mills will use 12-14 million tonnes of "semi-soft" coals, about 20% of their coal intake. I hesitate to claim all of this as "steam coal" though as, in a buyers' market, a lot of this is really good quality "coking coal" bought at a lower price by being categorized as "semi-soft" purchases. As the mills are planning to increase their "semisoft" intake to 30% or even 40%, it is obvious that, even in a static market, whatever portion can be described as "steam coal" will mean significant tonnages.
30-10
There is more downside in the figures for South Korea than those for Japan. Two major assumptions I've built into my estimates are that Korea Electric (KEPCO) will in the early 1990s revert substantially to an emphasis on coal-fired plants rather than another nuclear plan, and the government inspired push for industry to switch towards coal reliance will continue unabated.
The present stalled situation of the nuclear program in Taiwan has given coal demand a major boost. Taiwan Power is switching its coal-fired plant base load to cope with an annual electricity demand growth of 10-11 % and is sure to speed up commissioning of the 4 X 550 MW coal fired units at Taichung. Industry demand for coal in Taiwan continues to be strong also, so present imports of about 3.7 million tonnes will expand.
Since its emergence as a coal user in 1982, Hong Kong has continued to be the kind of growth market shippers dream about. With another 660 MW due to be commissioned at Castle Peak before 1990 and an annual electricity growth demand of 10-13%, that dream will run for some time yet. However, the mid to late 1990s pose big questions for coal exporters (other than China). Will, for example, coal imports continue at the present rate or will it gradually become a reserved domestic market for Chinese steam coal? If Hong Kong used 100% Chinese steam coal today, China would have to ship all of its export steam coal to Hong Kong and that would just barely be able to keep up with the demand.
When the nuclear plant at Daya Bay is eventually commissioned, will its output be in addition to that from existing Hong Kong coal fired stations? Or could it, as rumored, be commissioned at the expense of existing Hong Kong coal fired capacity, resulting in the loss of up to 3 million tonnes of coal imports to Hong Kong?
In the Philippines, the installation of at least another 300 MW unit at its Calaca coal-fired power station is almost a certainty. Furthermore, by 1995 a third unit should be installed at Calaca and possibly two smaller units in the islands, like Cebu. The Philippines has the advantage of having large quantities of semi-bituminous coal but the disadvantage of it being wet, clayey and difficult to handle. These characteristics have led to difficulties at its major mine, Semirara, and will encourage greater dependence on imports in the future.
The need for incremental power capacity is great, especially in light of the expensive fiasco of an attempt to commission a nuclear plant in Manila. Co-generation is one possibility that is just beginning to be explored in the Philippines. The competing priorities for the trickle of funding available from the government makes the future uncertain for additional coal-fired capacity.
Indonesia has ambitious plans for both coal-fired power plants and domestic coal production. Suralaya should have 1800 MW of capacity by 2000 and there are similar projects planned for Paiton and Central Java. The official plans describe 9-15 million tonnes of coal production from Kalimantan and Sumatra so, officially, no import needs will persist beyond the very short-term. However, I believe imports will continue at least at present levels for some time. If the power plant program continues, the domestic coal production falters (which based on past experience is a very real possibility!), and oil production declines as predicted, Indonesia could be catapulted into the ranks of the major coal importers by the end of the century.
30-11
There is a good chance Singapore could enter the coal fired power stakes in the 1990s with an initial 300 MW unit. Also the massive 2400 MW Ao Phy project in Thailand should see some of the 1990s, but I've allowed only for Singapore in my demand figures. Even with the probable scrubbing of the Nam Choan Hydro Project, Thailand's huge high quality lignite reserves pose a hurdle for coal importers.
That leaves Malaysia, which is much more tangible in that construction of the Port Klang complex is advanced and this month or next should see the first importation of coal for the first 300 MW coal-fired station of the National Electric Board at that complex. The Malaysians are hedging their bets about whether future units will be based on coal, oil or gas. I know I'm biased and think the jury is already in on that one but am reasonably certain at least one more 300 MW unit, and possibly two will be in place by 1995.
Conclusion
I have not tried to formulate fanciful theories on the relationships between fuel demand and economic growth or the crossover points for inter-fuel competition because I'm dealing with the next 7-8 years only and am presumptuous enough to think we'll have more of the same in that period.
More of the same is enough for shippers, and I suspect buyers, to handle! In the last 7-8 years, prices have halved, freight rates doubled and halved again within six months, exchange rates fluctuated within annual bands of 20-40%, and actual tonnage demands fl uctuated wildly.
As mentioned earlier, I think the major concern of the next 7-8 years will be supply as capacity falls away under the pressure of falling nominal prices, unfavorable exchange rates, rising costs and soaring "risk premiums" placed by bankers on loans to coal industry. Shippers and buyers are seeing the start of a correction with prices moving up steadily from the trough we hit in the middle of 1987. Indeed, the upward movement over the past 5-6 months for spot prices has already reversed the 1987 downturn in prices and has yet to show signs of flattening out. Personally, I hope we all manage this rising market better than last time it occurred in the late 70s-early 80s for both our sakes.
With supply availability a growing concern again, I think we shall see more buyers trying to cover their coal needs with "long term" contracts, that is 1-5 years. These contracts though will reflect the experiences and wisdom of the past few years in that they will allow for greater flexibility in the tonnages supplied and, at least, closer consultation on price because of freight and currency fluctuations.
Whatever happens, the coal industry in the Pacific Rim and elsewhere is sure to continue to "live in interesting times" so we'll have to treat that curse as part of our working conditions.
N.B. The views expressed in the above paper are my own and .do not necessarily reflect the views of Island Creek of China ("ICCC"), its shareholders, the An Tai Bao Mine ("ATB") or the various Chinese ministries, corporations and enterprises involved with the ATB/ICCC coal joint venture.
30-12
PROSPECTS FOR CHINA'S PETROLEUM TRADE AND INVESTMENT
Kim Woodard*
The Impact of Price Volatility on China's Petroleum Exports
For the first two decades of its development (1959 to 1979), China's petroleum industry was completely insulated from world energy markets. At the same time, the central planning system, central government allocation of investment capital, and energy price controls in the domestic market created a highly stable environment for the early development of the Chinese oil industry.
With the advent of the "open door" policy in 1980 and the introduction of a mixed "planned-market" economy, artificial stability in the energy system is giving way to the creative dynamic of the energy marketplace. The opening of the door to international markets has introduced advanced petroleum exploration, production, and refining technology along with nearly $3 billion in foreign exploration capital, greatly accelerating the development of the entire petroleum industry within a very short time frame (1980-1988). But the open door has also exposed China's petroleum and energy industries to the full force of the world market at a time of great volatility and uncertainty in energy prices.
The precipitous decline in world oil prices in the first quarter of 1986 from an average of $24 per barrel to $13 per barrel completely restructured the economic and commercial framework within which China's petroleum industry is developing. The effects of oil price volatility on China's domestic petroleum industry are as dramatic as elsewhere in the world oil industry. Consider the following trends:
1. By 1985, China had emerged as the largest petroleum exporter in Asia. Crude oil and refined petroleum products export volume doubled between 1981 and 1985 to 733,000 barrels per day. This trend was reversed in 1986 and 1987, as net petroleum export volume declined by 20% in two years.
2. In 1985, China's oil exports earned $6.7 billion in foreign exchange, fully 25% of total exports in that year. The value of petroleum exports dropped by 50% in 1986 and 1987 to just 10% of China's export earnings. The decline in oil export earnings coincided with a period of rising imports, trade imbalance, and falling foreign exchange reserves.
3. The decline in oil export revenues directly affected the ability of both the upstream and downstream sectors of the petroleum industry to import badly needed foreign technology and equipment for domestic oil fields and refineries. The domestic oil industry was thus hit with a foreign exchange squeeze at a time of surging demand and slowing growth in output.
4. The onset of world oil price volatility also coincided with a critical phase in joint exploration of the Chinese continental shelf. Lower oil prices reduced the
* President, China Energy Ventures, Inc. (CEVCO), Washington, D.C.
31-1
exploration and development budgets of the multinational oil companies, contributing to a 50% decline in foreign investment in China's offshore oil projects. Oil price volatility simultaneously reduced the commercial viability of a number of offshore development prospects, including the giant' natural gas field discovered by Atlantic Richfield and a number of small to medium offshore oil
discoveries.
5. Lower oil prices completely derailed an initiative to open ten southern provinces to joint foreign-Chinese exploration and significantly delayed the open
ing of the vast western basins to joint exploration.
All of these trends are related in one way or another to world oil prices. The sim ultaneous impact of these changes is having indirect, but important repercussions for central governmental organizations that control the energy sector. Just a few years ago, the Ministry of Petroleum Industry ruled the oil fields with an iron hand, determining by fiat their capital investments, technology imports, equipment purchases, and access to foreign exchange. In the wake of the 1986 decline in world oil prices, the inability to sustain foreign exchll:nge earnings from oil exports diminished the stature of the entire petroleum industry within the structure of national planning priorities and may have been a factor in the recent restructuring of the national energy ministries.
Now the Ministry of Petroleum Industry is being combined with the Ministries of Coal, Electric Power, and Nuclear Industry to form a single, comprehensive Energy Ministry. The new Energy Ministry has broad planning and investment approval authority, on the model of the old State Planning Commission, but will no longer interfere with the day-to-day operation of the oil fields and other key energy enterprises.
The Ministry of Petroleum Industry itself is being converted into a corporate form as the China National Petroleum Corporation. The Petroleum Corporation will continue to exercise much of the authority of the old ministry for an interim period. But the Petroleum Corporation itself is now responsible for its own profits and losses and must over time become more sensitive to market considerations and more responsive to the needs of the oil fields and other production-level organizations.
In my own view, key planning agencies and the leadership of major energy enterprises have responded in a remarkably creative and flexible manner to the near-term challenges posed by the exposure of China's domestic energy sector to the force of the world market. Above all, there is no evidence that the government is prepared to retreat on basic reforms, or to retrench to the rigidities of a command economy. The reform program is in fact working quite well in the energy industries as well as throughout the entire economy. Despite near-term shortages and imbalances, the results of reform are readily evident throughout the energy sector -- sustained growth on the supply side, greater efficiency and greater rationality in distribution on the demand side. China is now embarked on the third great wave of Asian economic development, following closely on the heels of Japan and the "Four Small Dragons."
Demand Factors
As reviewed in detail in the papers of our Chinese colleagues, China is movmg through a period of rapid growth in domestic commercial energy demand. Energy
31-2
demand pressure is particularly intense for electric power and refined petroleum products.
The source of surging energy demand is not difficult to discern. Stimulated by a successful economic reform program, in 1980 China entered a sustained period of high economic growth. Real growth in the national product, discounted for inflation, averaged 10% per year between 1981 and 1985, and reached a peak at 12% in 1985. Efforts to restrain economic growth in 1986 and 1987 were only partially successful. The national product expanded by 8% in 1986, 9% in 1987, and is projected to grow by at least 7-8% this
year.
Sectoral economic expansion is also impressive. Growth in industrial output has run 10-15% per year since the early 1980's. Disposable personal income and retail sales are growing faster than the GNP, although this year's inflation, which resulted from price decontrol, may cut into recent gains in disposable income.
Even if energy conservation programs are successful in significantly reducing energy waste and in increasing the average energy efficiency of the industrial, power generation, and transportation sectors, sustained economic growth in the range of 8-10% per year will continue to place enormous demand pressure on available energy commodities for the foreseeable future. As in many other developing countries, growth rates for sectors of the economy that are directly dependent on refined petroleum products are substantially higher than for the economy as a whole. Let me provide a few details on expansion of road transportation as an example.
China's vehicle fleet currently includes roughly 3 million trucks, 1 million passenger cars, and 3 million tractors, the latter being used primarily for transportation rather than agricultural applications. Over 90% of the trucks and cars are gasoline-powered, and most of the tractors are diesel-powered. About 60% of the truck fleet consists of medium and heavy trucks (i.e. over 5 tons payload), resulting in high per-mile gasoline consumption. Although there are no specific data available on average vehicle utilization, roughly 10% of China's existing vehicle fleet is idled at any given point in time by gasoline shortages.
More than half a million trucks and passenger cars are being added to the existing fleet each year from domestic production and imports for an implied growth in the vehicle fleet of 10-15% per year. Furthermore, given the acute shortage of vehicles (one vehicle per 157 people) and surging economic growth, the retirement schedule on old vehicles is extremely slow. Despite government decrees calling for vehicle retirement at ten years, I would guess that the average life expectancy of a Liberation 5-ton truck is in the range of 20-30 years.
Against this background, the central planning authorities and major automotive enterprises such as First and Second Auto Works are launching a major expansion program for domestic vehicle manufacture. Investment authorization for this program under the Seventh Five-Year Plan (1986-1990) is the local currency equivalent of $1 billion and had originally been set at twice this level. Planning targets for vehicle production are 700,000 for 1990, 1.1 million for 1995, and 1.7 million for the year 2000. The 1990 target is likely to be exceeded.
If these targets are met, the domestic vehicle population will continue to grow at 10-15% per year for the balance of this century. There is likely to be a substantial shift within the vehicle population in favor of light trucks and fuel-efficient passenger cars.
31-3
Nonetheless, the bottom line for petroleum products demand is clear. Expansion of the vehicle fleet will increase vehicle gasoline and diesel fuel consumption by at least 8-12%
per year for the next 10-15 years.
A similar picture could be painted for a number of other sectors of the economy that are dependent on light and middle distillates. Expansion in air transportation, petrochemical production, and agricultural mechanization is averaging 10-20% per year. Rapid growth in these sectors is stirn ulating consumption of jet fuel, petrochemical feedstocks, and diesel fuel. Total refined products demand is growing at 6-8% per year, with demand for light and middle distillates rising at closer to 8-12% per year.
The China Petrochemical Corporation has undertaken a refinery expansion program that would add 450,000 barrels per day of primary distillation capacity and 480,000 barrels per day of secondary processing capacity to China's existing refinery capacity of about 2.2 million barrels per day between 1986 and 1990. However, even if this expansion program is completed as scheduled, demand for light and middle distillates will continue to outpace supply, and a much larger refinery construction and renovation program may be needed under the Eighth Five-Year Plan (1991-1996).
Supply Factors
Total crude oil output is currently running at about 2.7 million barrels per day. Following increases in crude oil production of 9% per year in 1984 and 1985, output growth has dropped to 2-3% per year in 1986 and 1987. If sustained over time, a 3-4% per year rate of growth for crude petroleum production would be sufficient to meet state targets set for 1990 (3 million bbl/day), 1995 (3.5 million bbl/day) and the year 2000 (4.0 million bbbljday). However, growth in crude oil output of 3-4% per year may fall considerably short of demand requirements by the mid-1990's, given the projected growth in refined products demand of 6-8% per year and in light and middle distillates demand of 8-12% per year.
Existing crude oil production is concentrated at seven major oil field complexes (Daqing, Shengli, Zhongyuan, Liaohe, Huabei, Dagang, and Karamay). All of these fields were discovered twenty or more years ago and several have been at maturity for a number of years. Over 90% of proven and probable reserves and 95% of existing production is located at these aging fields. The super-giant Daqing complex has been producing at over one million barrels per day for ten years. The Daqing oil field administration believes that they can sustain output at this level for another ten years through development of peripheral structures, the combination of electric submersible pumps with highvolume water injection, and the application of secondary recovery technology.
Shengli oil field, China's "second Daqing" is providing most of the annual increment of production increase. Shengli is currently producing at about 700,000 barrels per day and is targeted to produce 1 million barrels per day by the early 1990's. Shengli consists of nearly 50 separate producing structures, each with its own distinct reservoir conditions and development history.
The other five major land fields have responded well to the introduction of advanced geophysical and development technology. Several (e.g. Huabei and Liaohe) have reversed earlier output declines. But none of these field complexes has the reserves potential of
31-4
either Daqing or Shengli.
Sustained growth in crude oil production beyond the mid-1990's will depend on frontier exploration programs that are currently underway. The major constraint facing new exploration is a persistent capital shortage. Total domestic investment in exploration and development averages the equivalent of about $1 billion per year, which would be comparable to the exploration and development budget of a single mid-sized independent oil company (e.g. Pennzoil or Union Oil). Expenditures for frontier exploration are just a fraction of the total exploration and development budget -- perhaps $100-200 million per year, spread over the entire country.
In an effort to remedy the chronic shortage of exploration capital, foreign multinationals were invited in the late 1970's to participate in joint exploration of the Chinese continental shelf under the terms of production-sharing contracts similar to those used in other developing countries. The first foreign offshore exploration wells were drilled in 1980 and the program was greatly accelerated through a round of open bidding in 1982 and 1983. Total foreign investment in exploration offshore China reached $500 million per year in 1984 and 1985.
The offshore exploration program has been sharply curtailed a:s a result of falling world crude oil prices and mixed drilling results on the first 150 offshore wells. The success ratio on offshore wells was respectable by world standards (30% of total wells drilled with test yields over 1,000 bbljday, 8% with test yields over 5,000 bbljday). But the offshore oil fields discovered to date are all in the small- to mid-sized range (50-200 million bbl recoverable). Two offshore fields have been put onstream (Chengbei and Weizhou 10-3), but have achieved only marginal commercial success. Development programs are underway or likely on seven additional oil fields and the giant ARCO gas discovery. But all of these programs have been slowed down by the decline in world oil prices.
The decline in new offshore exploratory drilling may be even more damaging in the long term. Foreign investment in drilling offshore China dropped from $500 million (30 wells) per year in 1984 and 1985 to $270 million per year in 1986, and perhaps $200 million (10 wells) in 1987. The China National Offshore Oil Corporation is mounting its own offshore exploration programs in the eastern Beibu Gulf and Liaodong Bay areas, and these programs have met with some success. But this obviates the original purpose of the joint exploration program, which is to introduce foreign exploration capital into a key frontier exploration zone.
Joint exploration of China's land basins remains little more than a dream. Only one exploration contract (CSR/BHP in northern Hainan island) was signed and implemented following the opening of 10 southern provinces to foreign exploration in April 1985. It is simply not economic to explore in these areas under the terms of a production-sharing contract at $17 per barrel oil. Prospects for joint exploration of the western basins are still visible in the long term, but difficult to implement in the near term.
The upshot of these trends is that annual investment in frontier exploration in China is once again well under $500 million per year -- too little for a country of China's magnitude and too little to sustain long-term growth in crude petroleum production. The result may well be that the current petroleum supply/demand squeeze will persist for some time to come.
31-.5
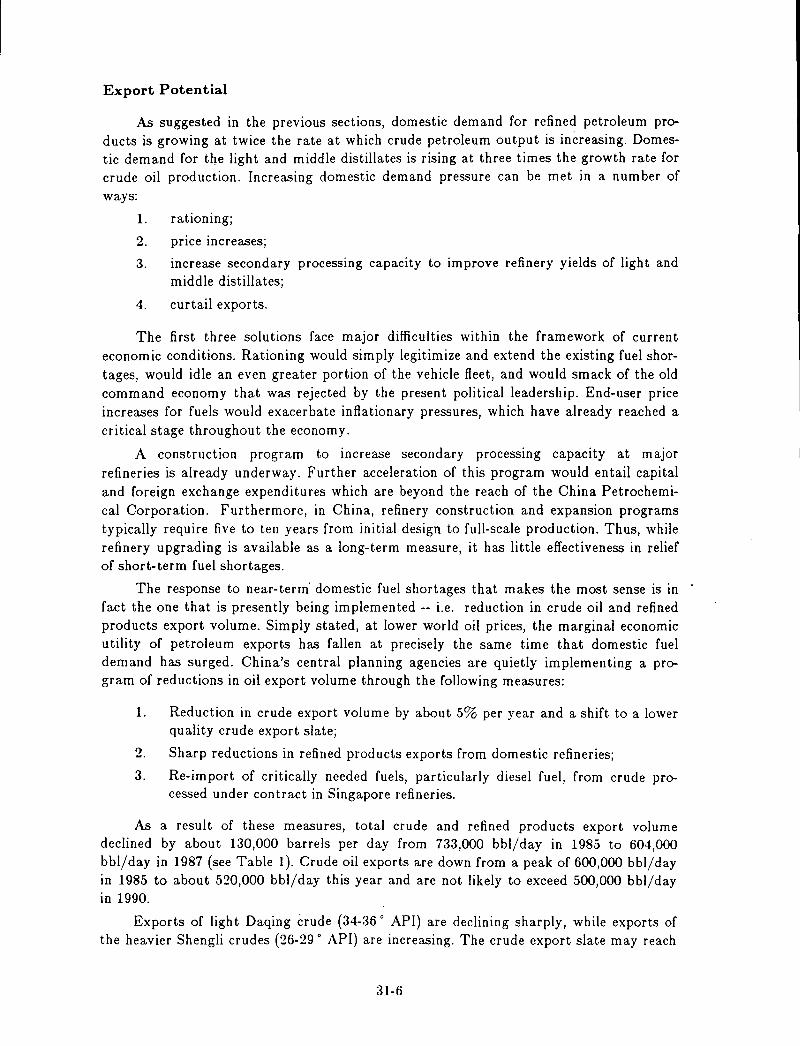
Export Potential
As suggested in the previous sections, domestic demand for refined petroleum products is growing at twice the rate at which crude petroleum output is increasing. Domestic demand for the light and middle distillates is rising at three times the growth rate for crude oil production. Increasing domestic demand pressure can be met in a number of ways:
1. rationing;
2. pnce mcreases;
3. increase secondary processing capacity to improve refinery yields of light and middle distillates;
4. curtail exports.
The first three solutions face major difficulties within the framework of current economic conditions. Rationing would simply legitimize and extend the existing fuel shortages, would idle an even greater portion of the vehicle fleet, and would smack of the old command economy that was rejected by the present political leadership. End-user price increases for fuels would exacerbate inflationary pressures, which have already reached a critical stage throughout the economy.
A construction program to increase secondary processing capacity at major refineries is already underway. Further acceleration of this program would entail capital and foreign exchange expenditures which are beyond the reach of the China Petrochemical Corporation. Furthermore, in China, refinery construction and expansion programs typically require five to ten years from initial design to full-scale production. Thus, while refinery upgrading is available as a long-term measure, it has little effectiveness in relief of short-term fuel shortages.
The response to near-term' domestic fuel shortages that makes the most sense is in fact the one that is presently being implemented -- i.e. reduction in crude oil and refined products export volume. Simply stated, at lower world oil prices, the marginal economic utility of petroleum exports has fallen at precisely the same time that domestic fuel demand has surged. China's central planning agencies are quietly implementing a program of reductions in oil export volume through the following measures:
1. Reduction in crude export volume by about 5% per year and a shift to a lower quality crude export slate;
2. Sharp reductions in refined products exports from domestic refineries;
3. Re-import of critically needed fuels, particularly diesel fuel, from crude processed under contract in Singapore refineries.
As a result of these measures, total crude and refined products export volume declined by about 130,000 barrels per day from 733,000 bbljday in 1985 to 604,000 bbljday in 1987 (see Table 1). Crude oil exports are down from a peak of 600,000 bbl/day in 1985 to about 520,000 bbljday this year and are not likely to exceed 500,000 bbl/day in 1990.
Exports of light Daqing crude (34-36 0 API) are declining sharply, while exports of the heavier Shengli crudes (26-29 0 API) are increasing. The crude export slate may reach
31-6
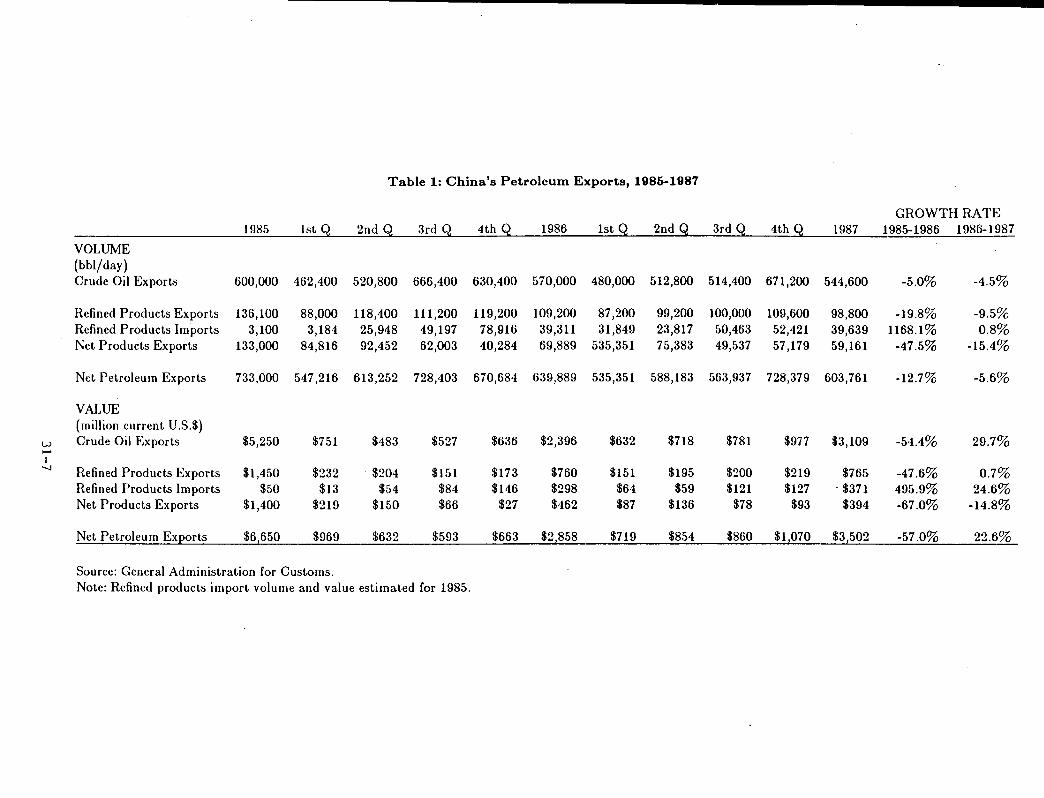
Table 1: China's Petroleum Exports, 1986-1987
GROWTH RATE 1985 1st Q 2nd Q 3rd Q 4th Q 1986 1st Q 2nd Q 3rd Q 4th Q 1987 1985-1986 1986-1987
VOLUME (bbl/day) Crude Oil Exports 600,000 462,400 520,800 666,400 630,400 570,000 480,000 512,800 514,400 671,200 544,600 -5.0% -4.5%
Refined Products Exports 136,100 88,000 118,400 111,200 119,200 109,200 87,200 99,200 100,000 109,600 98,800 -19.8% -9.5% Refined Products Imports 3,100 3,184 25,948 49,197 78,916 39,311 31,849 23,817 50,463 52,421 39,639 1168.1% 0.8% Net Products Exports 133,000 84,816 92,452 62,003 40,284 69,889 535,351 75,383 49,537 57,179 59,161 -47.5% -15.4%
Net Petroleum Exports 733,000 547,216 613,252 728,403 670,684 639,889 535,351 588,183 563,937 728,379 603,761 -12.7% -5.6%
VALUE (million current U.S.$)
w Crude Oil Exports $5,250 $751 $483 $527 $636 $2,396 $632 $718 $781 $977 $3,109 -54.4% 29.7% ~
I -...J Refined Products Exports $1,450 $232 . $204 $151 $173 $760 $151 $195 $200 $219 $765 -47.6% 0.7%
Refined Products Imports $50 $13 $54 $84 $146 $298 $64 $59 $121 $127 - $371 495.9% 24.6% Net Products Exports $1,400 $219 $150 $66 $27 $462 $87 $136 $78 $93 $394 -67.0% -14.8%
Net Petroleum Exports $6,650 $969 $632 $593 $663 $2,858 $719 $854 $860 $1,070 $3,502 -57.0% 22.6%
Source: General Administration for Customs. Note: Refined products import volume and value estimated for 1985.
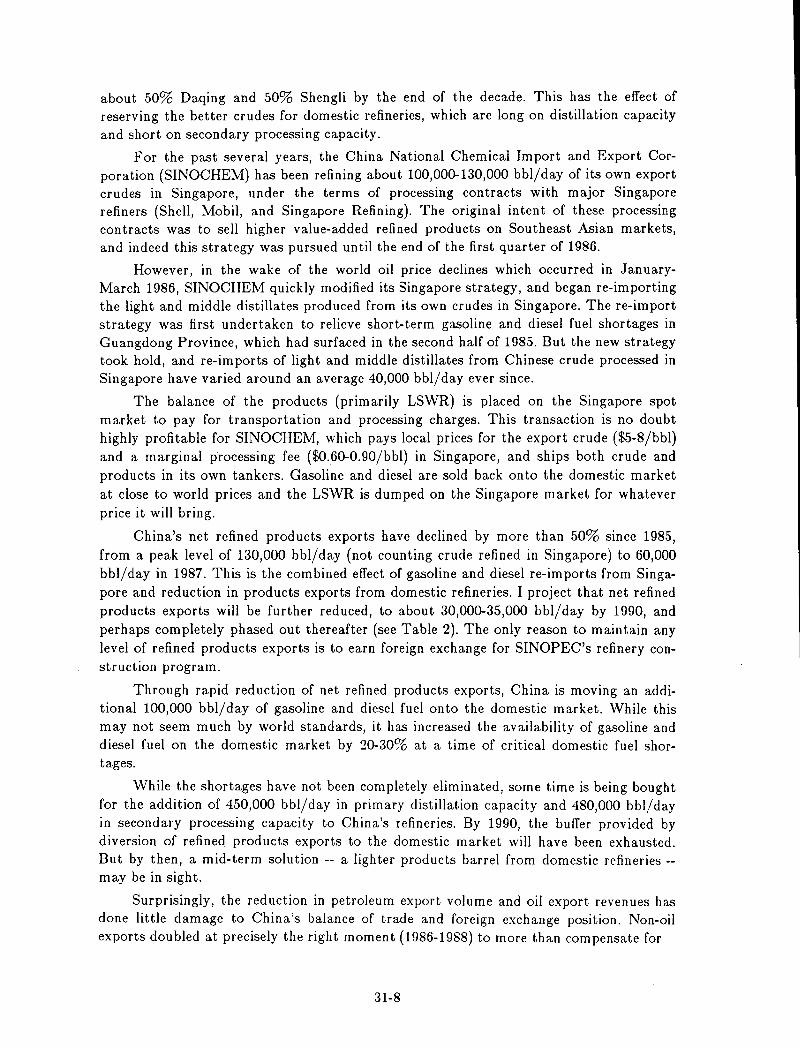
about 50% Daqing and 50% Shengli by the end of the decade. This has the effect of reserving the better crudes for domestic refineries, which are long on distillation capacity and short on secondary processing capacity.
For the past several years, the China National Chemical Import and Export Corporation (SINOCHEM) has been refining about 100,000-130,000 bbl/day of its own export crudes in Singapore, under the terms of processing contracts with major Singapore refiners (Shell, Mobil, and Singapore Refining). The original intent of these processing contracts was to sell higher value-added refined products on Southeast Asian markets, and indeed this strategy was pursued until the end of the first quarter of 1986.
However, in the wake of the world oil price declines which occurred in JanuaryMarch 1986, SINOCHEM quickly modified its Singapore strategy, and began re-importing the light and middle distillates produced from its own crudes in Singapore. The re-import strategy was first undertaken to relieve short-term gasoline and diesel fuel shortages in Guangdong Province, which had surfaced in the second half of 1985. But the new strategy took hold, and re-imports of light and middle distillates from Chinese crude processed in Singapore have varied around an average 40,000 bbljday ever since.
The balance of the products (primarily LSWR) is placed on the Singapore spot market to pay for transportation and processing charges. This transaction is no doubt highly profitable for SINOCHEM, which pays local prices for the export crude ($5-8/bbl) and a marginal processing fee ($O.60-0.90/bbl) in Singapore, and ships both crude and products in its own tankers. Gasoline and diesel are sold back onto the domestic market at close to world prices and the LSWR is dumped on the Singapore market for whatever price it will bring.
China's net refined products exports have declined by more than 50% since 1985, from a peak level of 130,000 bbl/day (not counting crude refined in Singapore) to 60,000 bbl/day in 1987. This is the combined effect of gasoline and diesel re-imports from Singapore and reduction in products exports from domestic refineries. I project that net refined products exports will be further reduced, to about 30,000-35,000 bbl/ day by 1990, and perhaps completely phased out thereafter (see Table 2). The only reason to maintain any level of refined products exports is to earn foreign exchange for SINOPEC's refinery construction program.
Through rapid reduction of net refined products exports, China is moving an additional 100,000 bbl/day of gasoline and diesel fuel onto the domestic market. While this may not seem much by world standards, it has increased the availability of gasoline and diesel fuel on the domestic market by 20-30% at a time of critical domestic fuel shortages.
While the shortages have not been completely eliminated, some time is being bought for the addition of 450,000 bbl/day in primary distillation capacity and 480,000 bbl/day in secondary processing capacity to China's refineries. By 1990, the buffer provided by diversion of refined products exports to the domestic market will have been exhausted. But by then, a mid-term solution -- a lighter products barrel from domestic refineries -may be in sight.
Surprisingly, the reduction in petroleum export volume and oil export revenues has done little damage to China's balance of trade and foreign exchange position. Non-oil exports doubled at precisely the right moment (1986-1988) to more than compensate for
31-8
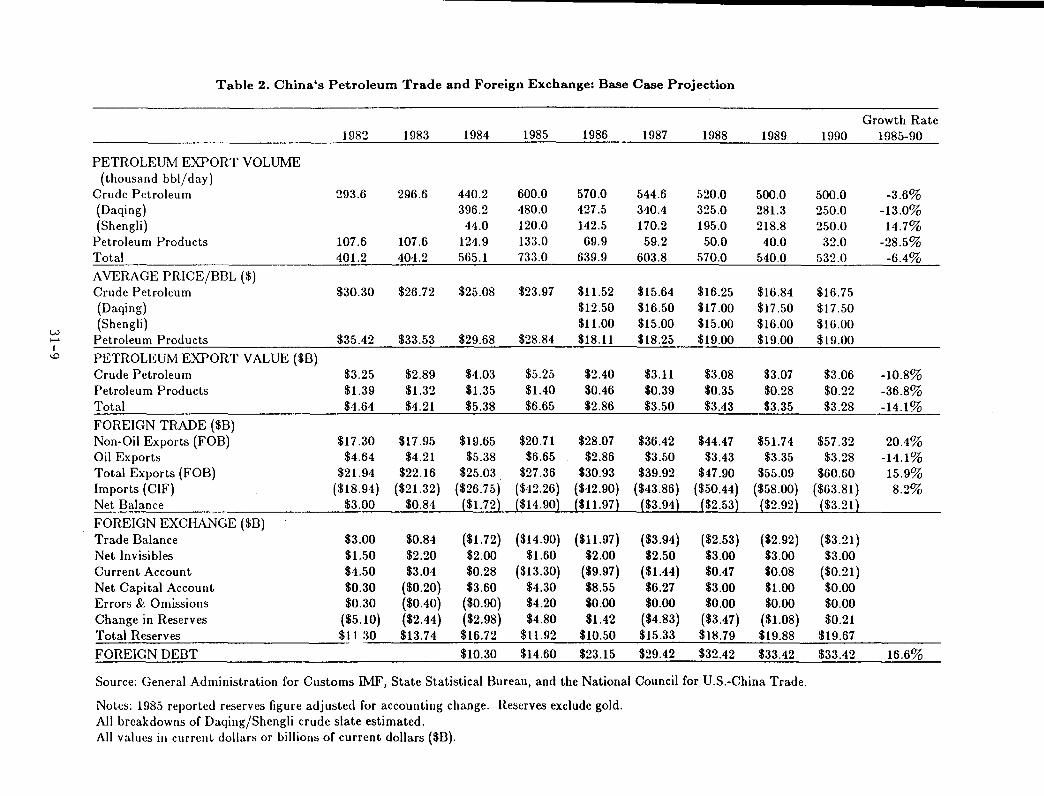
Table 2. China's Petroleum Trade and Foreign Exchange: Base Case Projection
Growth Rate 1982 1983 1984 1985 1986 1987 1988 1989 1990 1985-90
PETROLEUM EXPORT VOLUME (thousand bbl/day)
Crude Petroleum 293.6 296.6 440.2 600.0 570.0 544.6 520.0 500.0 500.0 -3.6% (Daqing) 396.2 480.0 427.5 340.4 325.0 281.3 250.0 -13.0% (Shengli) 44.0 120.0 142.5 170.2 195.0 218.8 250.0 14.7%
Petroleum Products 107.6 107.6 124.9 133.0 69.9 59.2 50.0 40.0 32.0 -28.5% Total 401.2 404.2 565.1 733.0 639.9 603.8 570.0 540.0 532.0 -6.4%
AVERAGE PRICE/BBL ($) Crude Petroleum $30.30 $26.72 $25.08 $23.97 $11.52 $15.64 $16.25 $16.84 $16.75 (Daqing) $12.50 $16.50 $17.00 $17.50 $17.50 (Sheng Ii) $11.00 $15.00 $15.00 $16.00 $16.00
w Petroleum Products $35.42 $33.53 $29.68 $28.84 $18.11 $18.25 $19.00 $19.00 $19.00 ......
I
'" PETROLEUM EXPORT VALUE ($B) Crude Petroleum $3.25 $2.89 $4.03 $5.25 $2.40 $3.11 $3.08 $3.07 $3.06 -10.8% Petroleum Products $1.39 $1.32 $1.35 $1.40 $0.46 $0.39 $0.35 $0.28 $0.22 -36.8% Total $4.64 $4.21 $5.38 $6.65 $2.86 $3.50 $3.43 $3.35 $3.28 -14.1%
FOREIGN TRADE ($B) Non-Oil Exports (FOB) $17.30 $17.95 $19.65 $20.71 $28.07 $36.42 $44.47 $51.74 $57.32 20.4% Oil Exports $4.64 $4.21 $5.38 $6.65 $2.86 $3.50 $3.43 $3.35 $3.28 -14.1% Total Exports (FOB) $21.94 $22.16 $25.03 $27.36 $30.93 $39.92 $47.90 $55.09 $60.60 15.9% Imports (CIF) ($18.94) ($21.32) ($26.75) ($42.26) ($42.90) ($43.86) ($50.44) ($58.00) ($63.81 ) 8.2% Net Balance $3.00 $0.84 ($1.72) ($14.90) ($11.97) ($3.94) ($2.53) ($2.92) ($3.21 )
FOREIGN EXCHANGE ($B) Trade Balance $3.00 $0.84 ($1. 72) ($14.90) ($11.97) ($3.94) ($2.53) ($2.92) ($3.21) Net Invisibles $1.50 $2.20 $2.00 $1.60 $2.00 $2.50 $3.00 $3.00 $3.00 Current Account $4.50 $3.04 $0.28 ($13.30) ($9.97) ($1.44) $0.47 $0.08 ($0.21 ) Net Capital Account $0.30 ($0.20) $3.60 $4.30 $8.55 $6.27 $3.00 $1.00 $0.00 Errors & Omissions $0.30 ($0.40) ($0.90) $4.20 $0.00 $0.00 $0.00 $0.00 $0.00 Change in Reserves ($5.10) ($2.44) ($2.98) $4.80 $1.42 ($4.83) ($3.47) ($1.08) $0.21 Total Reserves $11 :30 $13.74 $16.72 $11.92 $10.50 $15.33 $18.79 $19.88 $19.67
FOREIGN DEBT $10.30 $14.60 $23.15 $29.42 $32.42 $33.42 $33.42 16.6%
Source: General Administration for Customs IMF, State Statistical Bureau, and the National Council for U.S.-China Trade.
Notes: 1985 reported reserves figure adjusted for accounting change. Reserves exclude gold. All breakdowns of Daqing/Shengli crude slate estimated. All values ill current dollars or billions of current dollars ($8).

the loss in oil export revenues. Indeed, China's current trade account is now back in balance. Foreign exchange reserves are over the $17 billion level reached in 1984 and growing. Foreign debt is about $30 billion, easily manageable within the framework of annual two-way trade on the order of $100 billion. Import controls are once again being relaxed to permit acquisition of badly needed foreign equipment and technology. In short, China's foreign trade accounts are in excellent health, despite the loss of oil export revenues.
31-10
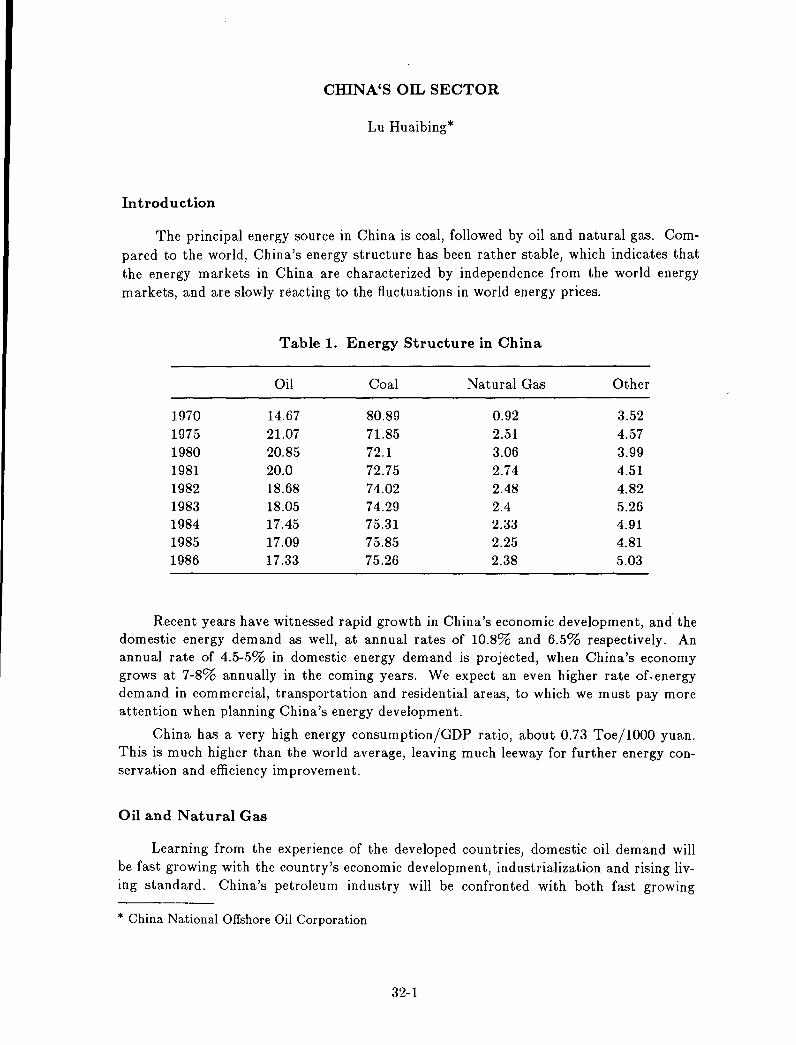
CHINA'S On.. SECTOR
Lu Huaibing*
Introduction
The principal energy source in China is coal, followed by oil and natural gas. Compared to the world, China's energy structure has been rather stable, which indicates that the energy markets in China are characterized by independence from the world energy markets, and are slowly reacting to the fluctuations in world energy prices.
Table 1. Energy Structure in China
Oil Coal Natural Gas Other
1970 14.67 80.89 0.92 3.52 1975 21.07 71.85 2.51 4.57 1980 20.85 72.1 3.06 3.99 1981 20.0 72.75 2.74 4.51 1982 18.68 74.02 2.48 4.82 1983 18.05 74.29 2.4 5.26 1984 17.45 75.31 2.33 4.91 1985 17.09 75.85 2.25 4.81 1986 17.33 75.26 2.38 5.03
Recent years have witnessed rapid growth in China's economic development, and the domestic energy demand as well, at annual rates of 10.8% and 6.5% respectively. An annual rate of 4.5-5% in domestic energy demand is projected, when China's economy grows at 7-8% annually in the coming years. We expect an even higher rate of. energy demand in commercial, transportation and residential areas, to which we must pay more attention when planning China's energy development.
China has a very high energy consumption/GDP ratio, about 0.73 Toe/WOO yuan. This is much higher than the world average, leaving much leeway for further energy conservation and efficiency improvement.
Oil and Natural Gas
Learning from the experience of the developed countries, domestic oil demand will be fast growing with the country's economic development, industrialization and rising living standard. China's petroleum industry will be confronted with both fast growing
* China National Offshore Oil Corporation
32-1
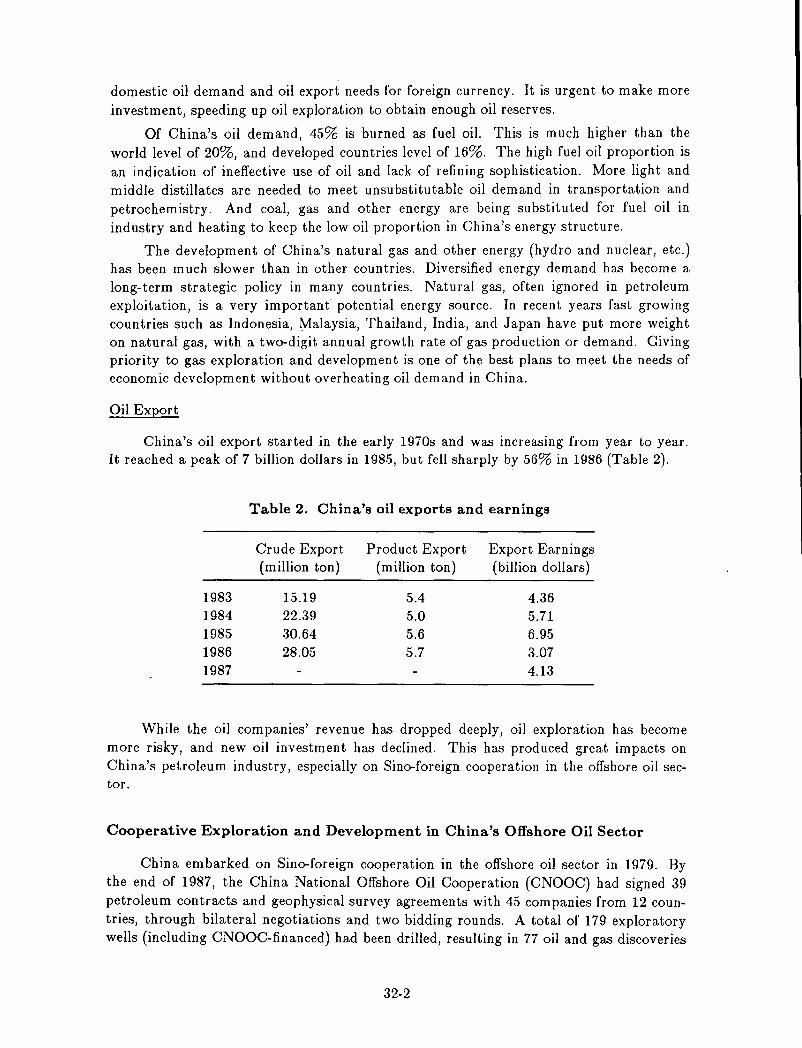
domestic oil demand and oil export needs for foreign currency. It is urgent to make more investment, speeding up oil exploration to obtain enough oil reserves.
Of China's oil demand, 45% is burned as fuel oil. This is much higher than the world level of 20%, and developed countries level of 16%. The high fuel oil proportion is an indication of ineffective use of oil and lack of refining sophistication. More light and middle distillates are needed to meet unsubstitutable oil demand in transportation and petrochemistry. And coal, gas and other energy are being substituted for fuel oil in industry and heating to keep the low oil proportion in China's energy structure.
The development of China's natural gas and other energy (hydro and nuclear, etc.) has been much slower than in other countries. Diversified energy demand has become a long-term strategic policy in many countries. Natural gas, often ignored in petroleum exploitation, is a very important potential energy source. In recent years fast growing countries such as Indonesia, Malaysia, Thailand, India, and Japan have put more weight on natural gas, with a two-digit annual growth rate of gas production or demand. Giving priority to gas exploration and development is one of the best plans to meet the needs of economic development without overheating oil demand in China.
Oil Export
China's oil export started in the early 1970s and was increasing from year to year. It reached a peak of 7 billion dollars in 1985, but fell sharply by 56% in 1986 (Table 2).
Table 2. China's oil exports and earnings
Crude Export Product Export Export Earnings (million ton) (million ton) (billion dollars)
1983 15.19 5.4 4.36 1984 22.39 5.0 5.71 1985 30.64 5.6 6.95 1986 28.05 5.7 3.07 1987 4.13
While the oil companies' revenue has dropped deeply, oil exploration has become more risky, and new oil investment has declined. This has produced great impacts on China's petroleum industry, especially on Sino-foreign cooperation in the offshore oil sector.
Cooperative Exploration and Development in China's Offshore Oil Sector
China embarked on Sino-foreign cooperation in the offshore oil sector in 1979. By the end of 1987, the China National Offshore Oil Cooperation (CNOOC) had signed 39 petroleum contracts and geophysical survey agreements with 45 companies from 12 countries, through bilateral negotiations and two bidding rounds. A total of 179 exploratory wells (including CNOOC-financed) had been drilled, resulting in 77 oil and gas discoveries
32-2
and the definition of 39 hydrocarbon-bearing structures.
With respect to field development, two fields are already on stream: the Chengbei field under Sino-Japanese cooperation in the Bohai Gulf, and Weizhou 10-3 field under Sino-French cooperation in the Beibu Gulf in the South China Sea. Both are producing about 400 thousand tons crude per years. In addition, development of BZ 28-1 and 6 other fields is underway, giving an expectation of annual oil production of three million tons from China offshore in 1990.
Over the past nine years, we have furthered our understanding of the occurrence, accumulation and migration of hydrocarbon resources on China's continental shelf. A success rate of 30% in the offshore exploratory drilling has been made, which should not be regarded as a low figure. We have faith in promising prospects for China's offshore petroleum, as we have extensive continental shelf and less than one-third of the prospective structures have been tested.
This year has witnessed even more encouraging oil and gas discoveries, among which Huizhou 26-1-1 well, located east of the Pearl River Mouth in the South China Sea, is the best. The well was tested at 42 hundred cubic meters per day crude oil, the highest oil production of tested wells on China's offshore, and of a production well in a sandstone layer. It shows the great potential for new breakthroughs in prospecting on the Pearl River Mouth Basin.
The second round bidding met the oil price collapse, which forced petroleum companies to cut back extensively exploratory and development expenditures. We have taken some flexible policies and approaches since the second round bidding:
(1) We regularly make geological data available to facilitate foreign partners to select favorable areas for cooperation. Last January CNOOC made an announcement of the first open sale of geophysical data packages for Dongsha-Shenhu area on the Pearl River Basin in the South China Sea.
(2) With respect to cooperative exploration, we take the approach of phasing in a company's exploration commitment, allowing foreign contractors to sign a geophysical surveyor drilling agreement for areas of interest with limited initial commitment. They will then have the option of entering into a petroleum contract based on the results of exploration. In this way risks of foreign investors can be reduced.
(3) We adopt a more lenient policy for high-risk areas, such as deep water areas, allowing foreign contractors to hold a longer contract area, longer exploration period, flexible relinquishment requirements, reduced or no Chinese participating share, and fast recovery of exploration expenditures.
(4) We try to reduce the financial burdens on foreign contractors as much as possible. For instance, the signature fee can be paid by installments under certain conditions, and the training and technology transfer fee reduced or paid by installments.
(5) Some fiscal terms for new contracts such as the percentage of profit split and arrangements for the investment recovery will be negotiated and determined on the principle of mutual benefit according to the resource assessment made by both parties, so the foreign contractors can have reasonable return under the oil price conditions during the contract life.
32-3
(6) We make an appropriate cost reduction for Chinese personnel, to serve the purpose of reducing investments of both parties and minimize the costs of exploration and development.
(7) Contracting services needed in the exploration and development operations, except those few specified by the government where tenders must be called in China, will be selected by way of international call for tenders and through competition.
In the future we will continue the flexible approaches we have adopted before, such as in developing fields on Pearl River Mouth Basin, so that we ensure the reasonable profit of foreign contractors by reducing royalties according to the size and the economic conditions of fields. If a foreign oil company fails to profit from an operation and revokes the contract, its expenses incurred on the failed operation can be used to directly offset the amount of taxable income earned from other profitable operations contracted in China.
CNOOC will start the third round of bidding in the second half of 1988. We will make adjustments to the exploration clauses and fiscal terms in the model contract based on the principle of reducing the investment risks shouldered by foreign companies, providing foreign operators with more latitude, and ensuring reasonable profits of foreign contractors.
Chinese offshore oil industry will certainly make its proper contributions to China's energy development.
32-4
THE U.S. ENERGY ECONOMY AFTER ENERGY CRISES
Mao Yushi*
First, the energy production and consumption of the United States is reviewed, and the relationship between U.S. energy and the world market is discussed. Then, the interactions between U.S. energy structure and economy is analyzed; discussions include oil, coal, natural gas, and electric power. Following this, the responses of U.S. energy structure to energy prices since 1973 and the successes and failures are commented on. Finally, it is pointed out that if the United States keeps a flexible economic structure, the third global energy crisis may not occur, or will be much easier to cope with.
The U.s. in the International Energy Market
The more a country is dependent on oil, the more it is threatened by oil exhaustion, and the United States is just such a country. Its energy consumption (commercial energy) takes up 22% of the global total; its per capita energy consumption is 5.5 times the average number of the other countries [1]. The U.s. energy production cannot meet its demand, so large amounts of energy must be imported annually.
The U.S. is a resource-abundant country, and energy resources are not exceptions. Its coal reserve is second only to that of the USSR, and can be mined for more than 300 years at current pace. Its oil reserve used to be the largest in the world before the finding of the Middle East oil. Up to 1965, the U.S. had been the largest oil producer in the world. Its oil production used to take up 50-65% of the world's total, and it supplied 20-33% of oil export of the international market.
From the late 1940s to about 1960, U.S. energy consumption transferred from reliance mainly on coal to oil and natural gas. Since the 1960s, cheap Middle East oil surged into the U.S. U.S. natural gas production quadrupled in the 1950s and 1960s. By 1973, coal took up only 18% of total primary energy consumption, domestic oil took up 30%, imported oil took up 17%, and natural gas took up 30%. Even though U.S. oil production was still ranked second in the world then (less only than the USSR), because of the great oil demand of domestic production and daily life, imported oil had become an indispensable element of the U.S. economy. So, the OPEC oil embargo in 1973 caused a serious impact. The Iran and Iraq war in 1979 caused sharp decrease of Middle East oil production, and the oil price soared again.
Diversifying its oil import sources will help the U.S. to improve its oil supply reliability, but it cannot guarantee that the U.S. can avoid the impact of political and economic changes of certain oil producers. The U.S. policy of diversifying oil import sources can only alleviate the impact of market changes. In the process of market readjustment, the U.S. can use its strategic reserve to alleviate the impact.
In recent years, the U.S. ratio of oil reserve to oil production has been decreasing gradually; the annual newly-added reserve is less than the production of the same year.
* Chinese Academy of Social Sciences, Beijing
33-1
The ratio of oil reserve to oil production is under 9 in the U.S., while the ratio is above 30 on the world average. In 1986, US oil production took up 1/4 of the global total, but its remaining recoverable reserve is only 5% of the total. And the degree of U.S. oil exploration is rather high, so the opportunity to find large-scale new oil reserves is less than that of other places in the world. This situation indicates that the exhaustion of the U.S. oil reserve will be earlier than that of the other places in the world, while the oil demand of the U.S. economy shows no tendency to decrease. We can project reasonably that the U.S. dependency on imported oil will increase. Even though the U.S. is making great effort to reduce such dependency, the development tendency of oil reserve and economy indicates that this effort will be hard to succeed.
The decline speed of oil reserves is faster than the progress speed of exploration and recovery technologies, so, from the supply side oil price is bound to increase. Meanwhile, due to the growth of population and the improvement of living standard, oil demand will increas also. So, under the influence of both factors, oil price is bound to increase. For the year 2000, if we take the oil price as $40/barrel (in 1987 dollars), the US oil consumption as 19 million barrels/d (about 1/5 increased), and imported oil as 11 million barrels/d [2], the annual foreign exchange spent will be $160 billion. This would take up 40-50% of the total U.S. export value then (assuming the U.S. annual export increase rate as 3%). The current ratio of oil import expenditure to export revenue is about 1/4. This expenditure will be a heavy burden on the U.S. international trade balance.
U.S. coal exports will help to make up the foreign trade deficit. But compared with the foreign exchange expenditure spent on oil import, the foreign exchange revenue generated from coal export is very small. The coal export revenue was only 1/10 of the oil expenditure several years ago. Since 1983, the U.S. coal export has stabilized at 75 to 80 Mt. The U.S. has become the second largest coal exporter, less than only Australia. But before 1995, the U.s. will find it very difficult to increase in large scale its coal export. Because of soft oil prices, the substitution of oil by coal in power industry will be slowed down, and nuclear power will join the competition. For about 10 years, the world's iron and steel industry has been in a slump, without indications that its coal demand will increase on large-scale. Power and metallurgical industries are two of the largest coal consumers. Besides, the production capacity of other coal-producing countries, such as Colombia and China, is increasing rapidly. Before 1995, China's newly-added coal exporting capacity will reach 30 Mt, sufficient to meet the increased coal demand in the Asia and Pacific region. To increase coal export, the U.S. probably should wait until after 1995.
The U.S. imports natural gas mainly from Canada and Mexico. Since 1985, the U.S. annual gas import has been about 25 billion cubic meters, 5% of the total U.S. gas consumption. The U.S. ratio of proven natural gas reserve to annual production has been decreasing. The gas production was highest in 1973, and 12% decreased by 1978; the proven gas reserve was highest in 1967, and 25% decreased by 1978 [3]. According to an optimistic estimate, by 2000 the newly-added proven gas reserve can only make up the reduction of current reserve. Gas production will not be decreased on a large scale, while the gas import will be increased slightly. In the future, the U.S. will probably import more LNG.
33-2
The U.S. Energy and Economic Development
From 1950 to 1973, the U.S. energy consumption per dollar GNP was between 61.9 and 56.7 Btu. If we compare the U.S. annual growth rate of GNP with its increase rate of energy consumption, the firm relation of the two can be seen. But after 1979, the coincidence disappeared. With the changes of oil price, the production technologies and economic structure also changed, and the previous fixed relationship disappeared. After 1973, the energy consumption per unit GNP began to decrease in the U.S. By 1986, it was decreased by more than 1/4. The U.S. GNP was increased by 40%, and the change in energy consumption was only 1%. U.S. oil consumption was highest in 1978, and 20% decreased by 1985. Oil import was reduced by more than half from the record 2.4 billion barrels in 1977 to 1.17 billion barrels in 1985.
In the past 15 years, great success has been made in the effort to substitute oil by other energy sources or non-energy resources in the U.S. Oil was substituted by coal and nuclear power in electricity generation; the proportion of coal and nuclear power to total power utility energy consumption increased from 55% in 1973 to 70% in 1985, while the proportion of oil decreased from 15% to 4.7%. Automobile oil conservation is an example of substituting energy by non-energy resources. Because of the improvement of engines, body materials, driving force controls, and transmission systems, the average mileage of new automobiles increased from 14.2 mpg in 1973 to 26.6 mpg in 1984. The energy conservation law in 1975 reduced the speed limit on expressways to 55 mph; about 100,000 barrels of gasoline can be saved daily because of this measure. All physical changes and chemical reactions have fixed laws, but people can choose different physical and chemical processes to meet their needs, so the energy intensity of GNP is rather elastic.
The development of science and technology will increase the possibility of energy conservation. And research on energy conservation is promoted by the impact of increased energy price. In 1973, the money spent on industrial energy science and technology research was $1 billion; this increased to $3.9 billion III 1979, when the second energy crisis began [4].
In the two decades after World War II, the U.S. energy consumption structure changed from mainly coal to mainly oil and gas. But oil consumption increase was hindered by the oil price increase in 1973. Consum ption of natural gas is restricted by limited gas reserves and price regulations, and has not increased since 1 973.
The Power Industry
The decade before 1973 was the golden age of the U.S. power industry. Power demand increased steadily, 7% per year, while cost was decreased gradually. The reasons were continuous economic prosperity and cheap oil from the Middle East. The U.S. power industry was overwhelmed with optimistic feelings, the power production investment was kept at a rather high level, and it was believed that power demand would increase as before. But, after the oil crisis, coal price increase was driven by oil price increase, the cost of power production began to increase, and the annual increase rate decreased by three percent points. After the second energy crisis, electricity price increased again, and the growth rate of power demand decreased further. As the result of decreased demand, many power plants could not be put into operation after their
33-3
completion, because there was no power demand. But the interest had to be included in current electricity price. It is hotly debated whether current power consumers should bear the burden of the interest [5]. (In the U.S. electricity price is regulated by the government, because the power industry is a natural monopolistic industry.) No matter what the result of the debate, the consumers are bound to be the loser. If it is decided not to include this interest into electricity price, the power industry will no longer construct new power plants to avoid bearing the interest burden of "surplus investment". Eventually, power supply will fall short, and electricity price will soar. If it is decided that the interest should be included in cost, power industry may spend freely its capital construction funds, and the consumers will pay for the interest anyway.
In 1965, coal took up 65% of the U.S. utility fuel consumption. This eased to 52% in 1973, as fuel oil and natural gas took up half of the remainder. After 1973, the proportion of coal-fired electricity increased. Now the proportion is 65% again, and the oil-fired electricity is reduced by 2/3. But the most-changed utility fuel is nuclear energy. The proportion of nuclear power increased from 7% in 1973 to its current 17%. But the development of nuclear power was hindered by the psychology of nuclear panic of the public. Even though the Three Mile Island nuclear accident in 1978 claimed no injuries, the serious nature of nuclear accident was exaggerated by the press, the development of nuclear power was hindered further, and safety regulations of nuclear power were formulated by the federal government. Faced with the panic of the public, the safety regulations were revised frequently and became more rigid, the designs of the nuclear power plants had to be revised in the process of construction, the construction period was prolonged, and the cost of nuclear electricity was greatly increased. The designers were forced to project the next revision of the safety regulations. In such an environment, the development of nuclear power is bound to be hindered.
Coal Production
At the beginning of the 1960s, U.S. coal production had fallen to its lowest level; in the 1960s, the average annual increase rate was only 1%. In this period, the safety regulations of coal mines became more rigid, the injuries of coal mines reduced remarkably, but labor productivity also reduced. After the oil crisis, coal demand was increased, the price of steam coal increased from $32.8/ton in 1972 to $62.2/ton in 1977 (in 1972 dollars) and to a record $65.1/ton in 1978 [6]. Even though it might be a golden time for the coal industry, in reality, coal production was reduced by the coal mine strike, which was caused by the labor and capital disputes from 1977 to 1978. In 1979, coal production increased greatly, but the increase was very slow after the second energy crisis. Another factor that restricts coal production is the backward railway system. For example, the coal in Wyoming has low sulphur content, and the coal deposit is near the surface, but the coal is far away from the market.
The Responses of the U.S. to the Fluctuation of Energy Prices
The U.S. economy is a market-oriented one, or more precisely a price-oriented one. Its production structure, consumption structure, process selection, and investment direction are all based on the fluctuation of prices. The violent fluctuation of oil price in the past 15 years has had profound influence on the U.S. economy.
33-4
Problems of Oil Price Controls
The 1973 oil embargo brought great panic in the U.S. At that time, the OPEC oil export took up more than 90% of the global oil export and 40% of the U.S. domestic oil consumption relied on imported oil. According to the market principle of the U.S. economy, oil shortage might drive oil prices up, and that might bring windfall profit to domestic oil producers and heavy losses to oil consumers. This issue was debated in the Congress. Because consumers were superior in number to producers, the consumer won the debate. As a result, the Emergency Petroleum Allocation Act of 1973 (EP AA) was passed in November 1973 and was valid until January 1981. Even though the details of the Act were revised many times, its basic principle was not changed: to conduct price controls on domestic oil and make it lower than the international oil price. The burden of high price imported oil was shared by all refiners equally according to a nationally unified ratio; that is, the refiner who used more domestic oil had to use proportionally more imported oil. The prices of oil products were decided according to cost. Because of the government oil price controls, the domestic oil price was about $3-5/barrellower than the international oil price; the price difference was enlarged again after 1979 [7]. The low oil price was harmful to both conservation and production growth. From 1975 to 1979, the U.S. oil consumption increased by 14%, while in the European countries, the increase was only 10%, and the increase was only 5.4% in Japan. In the U.S. not only the total oil consumption increased; the dependence on imported oil also increased, while the oil import was reduced in the European countries at the same period. So, the U.S. was damaged by the second oil crisis most seriously. The U.S. price controls were intended to protect oil consumers, but on the contrary, consumers were damaged, for without right price signals to guide their consuming behavior, and because of the increased dependence on imported oil, the national security was threatened.
Waste in resource utilization was caused by the distorted oil price. This involved not only oil resource. A series of resources that related to oil production and consumption directly or indirectly were influenced. This can be explained in the example of automobile manufacturing.
After the oil price rise, new oil-efficient automobiles were developed in Japan and Europe with great efforts. This was realized through investment on scientific research, and introduction of more sophisticated controls and high quality materials. The higher the oil price, the more willing the automobile consumers are to spend more money on new oil-efficient automobiles, and the more money will be spent to improve the oil efficiency of the automobiles by the manufacturers. Since the oil price was controlled artificially, consumers were not willing to spend more money on oil-efficient automobiles. Because the oil conservation measures that would have been acceptable technically and economically were not fully utilized, more oil was imported. The basic contradiction here is that the oil price faced by the auto consumers was different from the price faced by the country. In order to correct the wrong oil consuming behavior caused by irrational low domestic oil price, the Energy Policy and Conservation Act (EPCA) was passed in Congress in December 1975. In EPCA, the mileage of cars manufactured after 1978 was specified. This index was 18 miles/gallon (mpg) in 1978, and increased year by year to 27.5 mpg in 1985. The auto manufacturers who produce automobiles with lower mileage will be fined. At first glance, it seems that the legislative mileage standards would solve the problem of wrong consuming behavior of auto consumers, but in fact, solving economic problems
33-5
with legislative measures caused a series of problems.
First, oil price start to fall after 1981, but according to EPCA, the automobile mileage should be increased from 22 mpg in 1981 to 27.5 mpg in 1985. The conservation requirement ran in the opposite direction to the oil price changes. In fact, the U.S. oil price controls were canceled in 1981. Consumers could choose between increased oil cost and more expensive oil-efficient automobiles rationally, but EPCA forced the consumers to spend irrationally more money on automobile oil conservation. In 1985, the mileage of the automobiles manufactured by General Motors was only 25.5 mpg, less than the legislatively fixed 27.5 mpg. The new automobiles satisfied the choice of the consumers but General Motors was fined about $400 million.
Second, the Act is only valid for new automobiles; it put no conservation requirements on old automobiles, which take up 80% of the total automobiles. With the fluctuation of international oil price, the owners of the old automobiles might have bought new oil-efficient automobiles, cut unnecessary driving, or spent more money to maintain their old automobiles to save oil. Because the oil price was low, these conservation measures were not adopted.
Third, Americans prefer large automobiles, because the density of the population is less in the U.S. than in Europe and Japan, the road and parking areas are relatively more spacious, and large automobiles are relatively safer in traffic accidents. Due to oil price increase, some Americans were forced to change into small automobiles. After the oil price fall in 1981, Americans started to choose large automobiles again, but most large automobiles cannot meet the mileage requirement. Auto manufacturers were fined, the fines were put into cost, and transferred to consumers. Small automobile manufacturers were not fined, and their market share was enlarged. But manufacturing small automobiles is the specialty of the Japanese. The Japanese auto manufacturers were benefited by the mileage fines. One of the reasons that the U.S. auto industry lost competition power was the restriction of the Energy Conservation Act.
Above is only one example of resource waste caused by distorted price signal. From 1974 to 1981, the annual resource waste caused by oil price controls in the U.S. was between $2 billion and $5 billion [7]. Fortunately, the days of oil price controls have gone; the windfall profit tax, which is the only thing left, also became meaningless due to the sharp fall in oil price in 1986. The U.S. oil industry has returned to the normal situation of market force guiding. The mistake of the years of oil price controls has been admitted by the international energy society. But people are forgetful, so the same mistake may occur elsewhere. If the lesson which was so dear for the Americans will be learned by other countries is hard to tell.
Natural Gas Pricing
In the U.S., price controls were also conducted on natural gas. The problems caused by natural gas price controls were more complicated. It is debated whether the market forces can rationalize the development and utilization of natural gas, because the natural gas market is not the same as the market defined in economics. From the supply side, the natural gas industry is not a monopolistic industry. There are 24 large companies, which take up 1/2 of the total gas production, and about 500 large independent producers and 5400 small independent producers [8]. But natural gas supply is through pipelines.
33-6
Producers and consumers cannot select trade partners freely, so there is not a full competitive market. Another basic question is how much natural gas reserves remain in the U.S. If the remaining gas reserves are very limited, gas supply cannot be increased even under very high price; then the gas price level will not influence gas supply, it can only influence the consumption behavior.
Due to the suspicion against the natural gas market, the theoretical basis of gas price controls was found. The gas price controls of the federal government were only valid to inter-state gas trade; the gas price within a state can change according to market situations. The in-state gas price was promoted by oil price increase, but the inter-state traded gas price was controlled. The ratio of the two prices became 1 :4.1. As a result, the inter-state gas supply was cut sharply, the gas consumers along the inter-state natural gas pipelines were not supplied, some consumers were forced to construct new pipelines, and resources were wasted.
As is commonly known, there are two pricing principles, one based on cost and profits, another on the price of substitutes. In the case of natural gas, the price is based on the oil price. The cost-based price is lower than the substitute-based price. The consumers wanted cost-based pricing, and the producers called for substitute-based pricing. In order to persuade the government, both sides employed many geologists, economists, and energy management experts to conduct research. Their agreement was harder to reach even than the agreement of producers and consumers.
According to the theory of economics, in the long-run equilibrium the two pricing principles will reach the same result. But the condition of long-run equilibrium should take the risk of natural gas exploration into consideration. The degree of the risk can only be decided through estimation, and the estimations of different persons may differ greatly. Now, the pricing principle of international natural gas transactions is based on the use value of the natural gas, and has nothing to do with the recovery and transportation cost. But natural gas is priced based on cost in the U.S., and the problem of price controls followed.
The debate of natural gas pricing is also a question of equity against efficiency. The cost of previously found natural gas is rather low. If gas price is allowed to rise with oil price, gas producers will reap windfall profits. But the remaining gas reserves are quite limited in the U.S., and the future recovery cost will be higher and higher. Gas price controls will deteriorate the development of natural gas; the lower the domestic gas production, the more gas and oil will be imported. So, on the basis of efficiency, gas price should change with international gas price changes. In order to settle the debate of equity and efficiency, since the early 1970s natural gas has been divided in to old gas and new gas. Old gas has a lower price to achieve equity, and new gas has a higher price to achieve efficiency. For example, the average gas price in inter-state market was $0.69/1000 CF, but the newly contracted inter-state gas price in the same year was $1.42/1000 CF. Even though this two-tiered price system was conducted in a different background from the two-tiered price system adopted in China's economic reform, the principles of the two are the same; that is, employ previous price to keep the old share of vested interest, and employ new price or marginal price to lead to effective allocation of resources. The success of the two-tiered price system is based on the strict distinction of old gas and new gas, but the distinction is difficult to make. For example, whether the newly drilled gas well adjacent to an existing gas field belongs to old gas or new gas is hard to tell.
33-7
Fortunately, the U.S. has decided to give up gas price controls. Even though the natural gas market is not a real competitive market and the market clearing pr'ice of natural gas cannot guarantee the rational allocation of resources, compared with other allocation mechanisms, the imperfect competitive market can approach rational resource allocation better.
Is the United States Making the Third Energy Crisis?
After the second energy crisis, the U.S. oil and natural gas price controls were cancelled gradually. Production, allocation, and consumption are under the control of market forces. When the oil price decreased sharply in 1986, the response of the U.S. economy was to cut energy production and increase energy consumption and import. If this tendency continues, is it possible that the U.S. will follow the same disastrous road of 1973? Many Americans are worried about that [9].
Because of the sharp fall of oil price in 1986, U.S. oil production decreased by 0.68 million barrels/day (bbl/day), about 7.5% of the total production in that year. Even though oil price increased on average about $3/bbl in 1987, the oil market was very unstable, so the oil production decreased further by 0.4 million bbl/day. Oil consumption increased by 0.4 million bbi/day in 1986, and then by 0.3 million bbl/day in 1987. The proportion of imported oil to total U.S. oil consumption decreased from 46% in 1979 to 25% in 1985, and then increased to 37% in 1987.
But we should take the changes of the U.S. oil production and consumption as normal and expected. After above 30 years of heavy recovery, the U.S. oil reserve is nearly exhausted. From 1971 to 1978, the increased oil price stimulated oil exploration, but the depleted reserves were about two times the newly found reserves [1]. This critical situation was not alleviated until the finding of the large oil reserve in Alaska in 1979, but oil reserves were still declining. Only the decline speed reduced. Now the U.S. has 0.65 million oil wells, with a total production of 9 million bbl/ day. There are a lot of stripper wells with daily oil production of only several barrels. The U.S. average per barrel oil production cost (not including exploration cost) is $7, with the high about $14. While the daily oil production in the Middle East is also 9 million barrels, there are only 3,000 operating wells there, producing 3,100 bbl/day on average, about 220 times of that in the U.S. The average per barrel production cost in the Middle East is only $1. This com-
. parison indicates that the U.S. oil production has become an arrow at the end of its flight. The decrease caused by the recent oil price fall was in fact the substitution of domestic oil reserves by cheaper imported oil. Of course, no matter how the oil price fluctuates, the world's oil reserves will decline day by day, especially the U.S. oil reserves, so the general tendency of oil price will be an increasing one.
During the process of oil price fall, the U.S. oil production of the wells with highest production cost was cut. The U.S. has 0.45 million stripper wells with a daily production lower than 10 barrels. In the process of continuous oil price fall after 1982, about 90,000 stripper wells were shut down. The production costs of these wells were higher than the price of) the imported oil. Obviously, insisting on domestic production and refusing import is not an intelligent approach.
In 1986, the average oil price (1980 $) in the U.S. was $15/barrel, about 40% decreased from the previous year, and 60% decreased from the record price in 1980. The
33-8
annual revenue of the oil industry decreased by 44% compared with 1985, and the development investment was cut by 1/3. Since the oil price began to decrease gradually in 1981, employment in the oil industry has been reduced; from 1982 to 1987, about 300,000 jobs were lost, and about 40% of oil enterprises were shut down. This situation caused the panic of some people in the U.S. They believed that the problems caused by oil price fall were not better than the problems caused by oil price rise. Tens of billions of dollars circulated in the oil industry, the fluctuations of oil price caused the changes of capital flow, the readjustments of employment structure, and shutdown of some enterprises, and the fluctuations of stocks. These changes greatly surpassed the changes in the oil ind ustry.
But what will be the result if the oil price changed and the U.S. kept everything unchanged in face of the international oil price fluctuations? First, the U.S. oil industry would invest heavily to produce the already depreciated oil, and the oil industry would operate in even larger losses. Second, oil consumers would develop expensive substitutes instead of consuming cheaper oil. On the whole, it would be a stupid approach for the U.S. to insist on developing its high cost domestic oil instead of importing the cheaper foreign oil. Readjusting the economy with price changes will favor producers, consumers, and the whole country. Because the U.S. has established a quick response and wellfunctioning market system, the allocation of production factors, such as capital, labor, and natural resources, and the organization of the industrial structures can be readjusted freely with the changes of price signals, and keep the whole economy operating in a rather efficient manner.
Of course, the economic structure readjustment following the changes of price signals also has a cost. For example, some equipment and installations may be abandoned before their service time is over, personnel should be retrained, and the channels of production, supply, and sale should be re-established. The two sharp rises and one sharp fall of oil price caused readjustments in opposite directions. It seems that most of the readjustments were unnecessary afterwards, and that the economic losses caused by the readjustment were unnecessary waste. If there had been no changes since the first oil price rise until the oil price fall 13 years later, we would have found that we still stand in the right position. If things were really like this, we will find that the losses caused in the 13 years are much larger than the cost of the two readjustments. In fact, some less developed oil-importing countries actually underwent such a process. When oil prices rose in 1973 and 1979, they did not have the strength to conduct readjustments, and they did not have effective price signal conveying mechanisms and stimulating mechanisms in their economic systems to realize these readjustments. For example, they did not change their oil-fired power plants into coal-fired ones with the oil price fall. Now the oil-fired power plants are economically rational, but the total losses during the 13 years are much larger than the possible readjustment costs. Up to now, some countries have still not recovered from the impact of the first oil price soar.
Some complain about the blindness of the market. The oil price up and down not only damaged oil importers, but also brought many difficulties to oil exporters. If there were no such "blind" fluctuations, the world economy would have developed better; large amount of unnecessary readjustment costs would have been saved. But at the moment of oil price changes, no one can accurately forecast the future oil price changes forever. Complaining about the blindness of the market is "wise after the event". Because of the
33-9
uncertainty of future events, at the moment of price changes we can only readjust ourselves to suit the changes of price. Of course, it does not mean that people should not try to make possibly more accurate estimations and readjust themselves according to the estimations; otherwise the impact and influence caused by oil price changes would be even larger. But the forecasting ability of human beings is quite limited; we cannot accurately forecast the oil price in next year or even the next morning. Only the current oil price is real, and the future possible changes are also based on the current oil price. So, the only reasonable principle is to readjust our economic behavior according to the current price level. The best approach to deal with future uncertainty is to keep the economic system flexible, and not rely on the market to get rid of its "blindness" or the human ability to control the market changes. The good wish to master the market has existed for hundreds of years, but we have not found the method to approach success yet.
Many Americans worry that the current low oil price will be unfavorable to oil exploration and development, and the future oil production capacity might be reduced. It is a fact that oil exploration was cut as the result of oil price fall. But the reduced exploratory wells are the wells with highest cost or lowest possibility of success. The current average exploratory well cost has been reduced to half of that in 1981. The oil price in 1980 reached $39.75/barrel, and the number of exploratory wells soared to 3,220. There is no reason to keep this exploration enthusiasm stimulated by high oil price now. But the research achievements of exploration technologies developed at that time will be helpful to reduce current drilling cost and increase the success rate of drilling.
The business efficiencies of the large U.S. oil companies differ greatly. The average exploration cost was only $5/barrel in 1986 for the most effectively operated company, Shell, about half of the U.S. average level. Shell can make a profit even if the oil price falls to $15/barrel, while the largest U.S. oil-producing company, Arco, can keep a balanced account only when oil price reaches $18-20/barrel. So, the result of oil price fall is to eliminate the exploration and development activities with high cost and low efficiency. Since the founding of the U.S., prices have been playing an important role in competition; businesses with low efficiences were eliminated. The fluctuation of oil price accelerated the process of elimination.
What we know about the prospect of oil price changes is that with the continuous decline of the global ratio of reserve to recovery, oil production will reach the highest record in ten or more years and then will begin to decline. Because of the enlargement of oil demand, oil price will increase continuously before oil production reaches its peak. The proper approach to deal with this foreseeable prospect is to increase investment on exploration in advance, not give up the pre-production preparation due to the current soft oil price. In fact, the U.S. oil industry has conducted new exploration in Alaska. Standard Oil planned to invest $350 million to develop Niakuk oil field, Arco also planned to invest $300 million, a 100% increase from 1987 [10]. Six oil companies are involved in the new exploration activities of that area. The current problem in the U.S. oil exploration investment is relatively less overseas investment. 90% of the oil exploration investment in the past decade was concentrated in North America. Based on the opinions of most petroleum geologists, however, 90% of the oil reserves are distributed outside of North America [11]. The investment efficiency was reduced greatly by the divorce of investment and resource distribution.
33-10
Compared with 1973, now the U.S. is better prepared for a sudden oil supply crisis. The U.S. has established a Strategic Petroleum Reserve of about 5 billion barrels, more than the U.S. imported from the Middle East in 1973. It is sufficient to make up the deficiency of import stop for 9 months. During the 9 months, the U.S. can readjust its domestic energy structure and reduce energy consumption, and can seek new international oil supply channels. Except if there is great international support, there are no major oil exporting countries that can bear the production stop of 9 months at present. So, the 9-month Strategic Petroleum Reserve will be a sufficient reserve to guarantee reliable oil supply.
In addition to the Strategic Petroleum Reserve, the U.S. also has a rather large geological oil reserve. All the proven oil reserves in the U.S. are under privately owned land or land rented according to federal leases. The U.S. ownership of land and underground mineral resources is different from other countries, not only differ from socialist countries, but also differ from other capitalist countries. In the U.S., when land is privately owned, the underground mineral resources also belong to the private owners. This is in favor of rational exploration and development of mineral resources, for the land owners are very interested in the economically rational development and utilization of these underground mineral resources. The land owners will make every effort to increase the percentage of recovery until the marginal cost equals the marginal revenue, and this is just the optimal percentage of recovery for the whole society. Under other ownerships, this problem is hard to be solved properly. Because the underground mineral resources and the development and utilization rights do not belong to private owners, the mineral resources under the federally-owned land are basically not developed. In the U.S., about 60% of the total land belongs to private owners, 32% belongs to the federal government, and 7% belongs to state and local governments. It is estimated that about 20% of oil reserves, 30% of natural gas reserves, and about 40% of coal reserves are under federal-owned land [12]. In recent years, the Bureau of Land Management adopted a more active attitude toward leasing for oil and gas development. This will help to increase future U.S. oil production.
Oil reserves will exhaust eventually. This is not an unforeseeable and sudden event, but its arrival might be caused by many unexpected events. People have learned a lot from the past changes of oil supply and demand, and become wiser, but there will be many new problems that we have not experienced before. In face of the uncertainty of the future, what is needed is the flexible ability to deal with political and economical changes.
References
[1] Energy Annual 1986/87, Information Organization of UK Economists. Re-quoted from the Research Dispatches of Energy Policy, 1987, p.4-6.
[2] World Energy Outlook Through 2000, Conoco, September 1986.
[3] William F. Thompson, et al.: Choice Over Chance, 1981, Praeger Publisher, p.203.
[4] Final Report of the Multiprogram Laboratory Panel, Energy Research Advisory Board, Support Studies, Vol.2., Oak Ridge, Tenn, Oak Ridge National Laboratory, September 1982.
33-11
[5] Joseph P. Kalt, et al.: Re-establishing the Regulatory Bargain in Electric Utility Industry, March 1987. John F. Kennedy School of Government, Harvard University.
[6] Statistical Abstract of the U.S., 1986, p.562.
[7] Joseph F. Kalt: The Economics and Politics of Oil Price Regulation, 1981, pp.17,234.
[8] Robert Stobaugh and Daniel Yergin: Energy in the Future (Chinese Translation), p.76.
[9] John Paul Newport, Jr.: Get Ready for the Coming Oil Crisis (Fortune), March 16, 1987, pp.36-45.
[10] "U.S. to search for oil in Alaska," China Daily, January 20, 1988.
[11] H.G. Broadman, "Corporate Strategies of Foreign Investment in Oil Exploration Outside North American," John F. Kennedy School of Government, Harvard University, February 1987.
[12] Malcolm Gillis, et al., Economics of Development, Norton Press, 1983, p.509.
33-12
Chinese - American Energy Symposium ENERGY MARKETS AND THE FUTURE OF ENERGY DEMAND
Nanjing, China
Chinese Participants
Lu Bing
Zhu Li'angdong
Xu Junzhang
Zhou Changyi
Bai Yunxiu
Chen Yinbin
Bai Xianzhang
Zhou Fengqi
Wang Jiacheng
Zhou Dadi
Zhou Dianwu
Zhang Tingwu
Lang Siwei
Yang Hongnian
Hu Zhaoyi
Director, Department of Resources Conservation and Integrated Utilization, State Planning Commission. Co-Sponsor of the Symposium.
Deputy Director, Department of Resources Conservation and Integrated Utilization, SPC.
Professor, Department of Resources Conservation and Integrated Utilization, SPC.
Chief, Integrated Planning Division, Department of Resources and Integrated Utilization, SPC.
Deputy Division Chief, Petro-Chemical Division, Productive Coordination Department, SPC.
Former Director of Energy Bureau, State Economic Commission.
Chief, Integrated Planning Division, Planning Department, Ministry of Energy.
Director, Energy Research Institute, SPC. Co-organizer of the Symposium.
Vice Chief-Engineer, Energy Research Institute, SPC.
Chief of Energy Systems Analysis Division, Energy Research Institute, SPC.
Professor, Biological Environmental Research Center, Chinese Academy of Sciences.
Chief Engineer, Beijing Engineering Consultant Company.
Head of the Second Division, Air Conditioning Institute, Chinese Academy of Architectural Sciences.
Division Chief, Comprehensive Transportation Research Institute, SPC.
Head of the Power Economic Planning Division, Academy of Electric Power Science.
34-1
Wang Jingtao
Li Shilun
Qiao Mu
Lu Huaibing
Zhu Shiqi
Gao Bocheng
Qiu Daxiong
American Participants
Vito Stagliano
Wilfrid L. Kohl
Jayant Sathaye
Ged R. Davis
Fred S. Dubin
Stuart B. Ehrenreich
Edward L. Flom
Mark D. Levine
John H. Lichtblau
Vince Chief-Engineer, Production Department, China National Petro-Chemical Corporation.
Chief Engineer, Beijing Institute of Coal Chemistry, Deputy Director of Energy Conservation Center, Ministry of Coal Industry.
Division Chief, Department of Energy & Environmental Protection, Ministry of Agriculture.
Economist, Supervisor of Program on Economic Evaluation, Plannlllg Department, China National Off-shore Petroleum Corporation.
Division of Chief Commercial Information, China National Chemical Import & Export Corporation.
Vice Chairman, Beijing Energy Society, Former Chief-Engineer of Capital Iron-Steel Complex.
Director, Techno-Economics and Energy Systems Analysis Institute, Institute of Nuclear Energy Technology, Tsinghua University.
Director of the Office of Policy Integration, U.S. Department of Energy. Co-Sponsor of the Symposium.
Research Professor on International Relations, The Johns Hopkins School for Advanced International Studies; Director of the International Energy Program, The Johns Hopkins Foreign Policy Institute. Co-Organizer of the Symposium.
Staff Scientist, Lawrence Berkeley Laboratory; Co-Organizer of the Symposium.
Head of Energy, Group Planning, Shell International Petroleum Company.
President, Dubin-Bloome Associates.
Vice President of Marketing for Island Creek Coal of China, Ltd.
Manager of Industry Analysis and Forecasts, Amoco Corporation.
Program Leader, Energy Analysis Program and Group Leader, Energy Conservation Policy Group, Lawrence Berkeley Laboratory.
President, Petroleum Industry Research Foundation.
34-2
Alan S. Miller
Dennis O'Brien
Manfred G. Raschke
Marc Ross
Lee Schipper
Kim Woodard
Oliver Yu
Industry Observers
David J. Hwa
Gan Seow Kee
Harry Taylor
Rapporteur
Pamela S. Viglielmo
Associate Professor of Law, Delaware Law School, Widener University.
Chief Economist, Caltex Petroleum Corporation.
President, International Strategic Information Services.
Professor of Physics, University of Michigan; Senior Scientists, Energy and Environmental Systems Division, Argonne National Laboratory.
Staff Scientist, Lawrence Berkeley Laboratory.
President, China Energy Ventures; Consultant, SAIS International Energy Program.
Manager, Planning Analysis, Electric Power Research Institute.
Mobil, Hong Kong
Esso, Singapore
Mobil, Beijing
Hopkins-Nanjing Center
34-3

LA WRENCE BERKELEY LABORATORY TECHNICAL INFORMATION DEPARTMENT
1 CYCLOTRON ROAD BERKELEY, CALIFORNIA 94720