Food Insecurity and Obesity in Low-Income Women
198
Food Insecurity and Obesity in Low-Income Women: The Monthly Cycle of Food Abundance and Food Shortage Dissertation Presented in Partial Fulfillment of the Requirements for the Degree Doctor of Philosophy in the Graduate School of The Ohio State University By Qian Ye, M.S. The Ohio State University Nutrition Graduate Program The Ohio State University 2011 Dissertation Committee: Dr. Hugo Melgar-Quiñonez, Advisor Dr. Carla Miller Dr. Chris Taylor Dr. Sarah Anderson
-
Upload
khangminh22 -
Category
Documents
-
view
2 -
download
0
Transcript of Food Insecurity and Obesity in Low-Income Women
Food Insecurity and Obesity in Low-Income Women:
The Monthly Cycle of Food Abundance and Food Shortage
Dissertation
Presented in Partial Fulfillment of the Requirements for the Degree Doctor of Philosophy
in the Graduate School of The Ohio State University
By
Qian Ye, M.S.
The Ohio State University Nutrition Graduate Program
The Ohio State University
2011
Dissertation Committee:
Dr. Hugo Melgar-Quiñonez, Advisor
Dr. Carla Miller
Dr. Chris Taylor
Dr. Sarah Anderson

Copyright by
Qian Ye
2011
ii
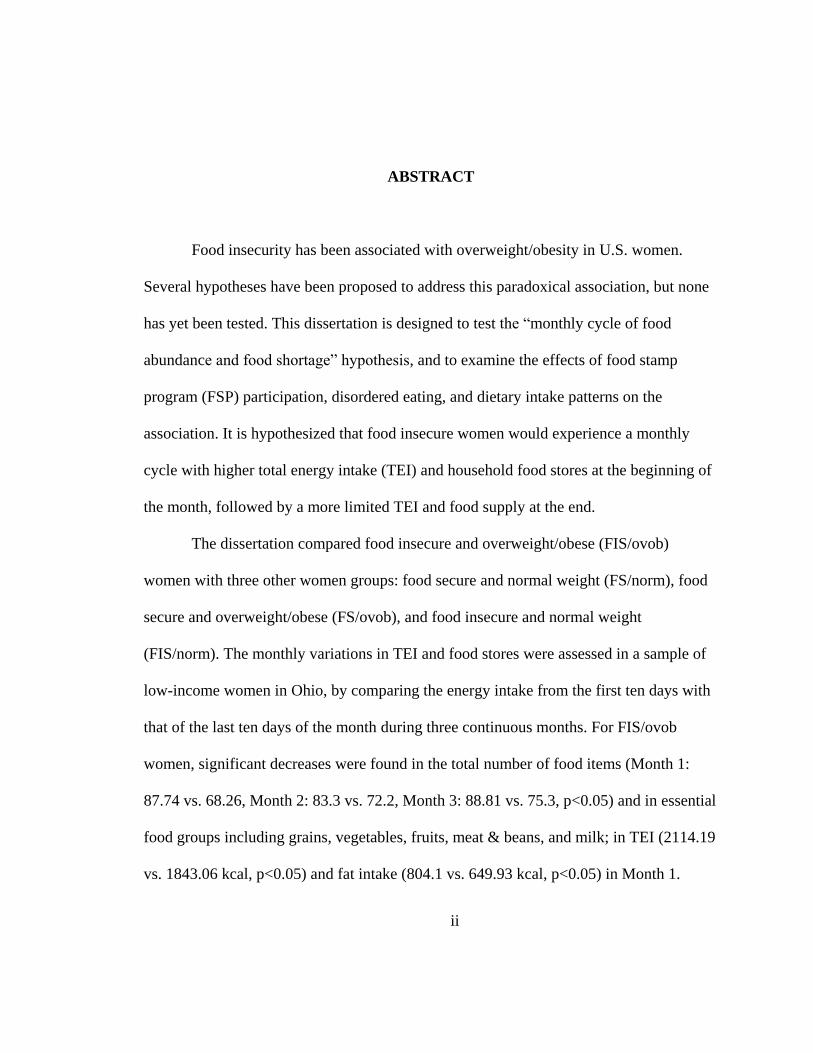
ABSTRACT
Food insecurity has been associated with overweight/obesity in U.S. women.
Several hypotheses have been proposed to address this paradoxical association, but none
has yet been tested. This dissertation is designed to test the ―monthly cycle of food
abundance and food shortage‖ hypothesis, and to examine the effects of food stamp
program (FSP) participation, disordered eating, and dietary intake patterns on the
association. It is hypothesized that food insecure women would experience a monthly
cycle with higher total energy intake (TEI) and household food stores at the beginning of
the month, followed by a more limited TEI and food supply at the end.
The dissertation compared food insecure and overweight/obese (FIS/ovob)
women with three other women groups: food secure and normal weight (FS/norm), food
secure and overweight/obese (FS/ovob), and food insecure and normal weight
(FIS/norm). The monthly variations in TEI and food stores were assessed in a sample of
low-income women in Ohio, by comparing the energy intake from the first ten days with
that of the last ten days of the month during three continuous months. For FIS/ovob
women, significant decreases were found in the total number of food items (Month 1:
87.74 vs. 68.26, Month 2: 83.3 vs. 72.2, Month 3: 88.81 vs. 75.3, p<0.05) and in essential
food groups including grains, vegetables, fruits, meat & beans, and milk; in TEI (2114.19
vs. 1843.06 kcal, p<0.05) and fat intake (804.1 vs. 649.93 kcal, p<0.05) in Month 1.

iii
Among food insecure women, food stamp recipients showed a higher BMI (38.24 vs.
30.94, p<0.01) and more severe decreases in three-month food items (61.58 vs. 8.22,
p<0.01) than non-recipients. In addition, deeper food insecurity was marginally
correlated with more severe Eating Concern in disordered eating (Pearson’s correlation:
0.23, p=0.09). Using the National Health and Nutrition Examination Survey (NHANES)
1999–2008 data, a higher carbohydrates/energy ratio and a lower protein/energy ratio was
found in FIS/ovob women compared to food secure women; no differences of TEI or
fat/energy ratio were observed. Furthermore, FIS/ovob women showed higher prevalence
of a 4.54 kg (10 lbs) 1-yr weight gain (28.81%) than other women groups. The results
suggest the existence of the monthly cycle of food abundance and food shortage in
FIS/ovob women, which may be caused by the interaction in food insecurity with FSP
participation; carbohydrate intake may increase, and daily energy intake and fat intake
may fluctuate in response to the monthly cycle and result in gradual weight gain over
long periods of time. Policy changes may be necessary; nutrition education integrating
with community-based intervention programs and efforts from private sectors like food
providers are needed for FIS/ovob women to have a more even distribution of available
food sources throughout the month, and a reduction of the potentially episodic overeating
behaviors.

iv
Dedicated to my parents
v
ACKNOWLEDGMENTS
I would like to take this opportunity to thank people who have supported me
during my research process and the PhD period. Thanks to my advisor, Dr. Hugo Melgar-
Quiñonez, for his guidance and encouragement. He is the one who opens the door of
public health nutrition for me, and he is also a mentor and a friend to me. I would also
like to thank my doctoral committee members, Dr. Carla Miller, Dr. Chris Taylor and Dr.
Sarah Anderson, for their patience, expertise and help.
I would like to recognize people who contributed to this research project: Daniel
Remley, Deb Angell, Melinda Fischer, Ana Claudia Zubieta, Cindy Long and Dawn
Winkle. Thanks to their work in The Ohio State University (OSU) Extension to help to
set up the research and to recruit and interview the study subjects. I would also like to
thank these students, Guillermo Bervejillo, Jenny Geoge, Ellen Greathouse, Brittney
Keller, Sheryl Mims, and Paola Seguil, for their help in data processing. The study would
not have been completed without the commitment of all these people.
I am thankful for programs, scholarships and awards supporting me during the
PhD period: the OSUN program (The Ohio State University Interdisciplinary Nutrition
Ph.D. Program), the Graduate Dissertation Fellowship from College of Education and
Human Ecology, the Russell Klein Research Award, the Excellent Abstract Award from
vi
Society for Nutrition Education Annual Conference, the Summer Survey Research
Award from Graduate Interdisciplinary Specialization in Survey Research at OSU, and
the summer internship in the North America Nutrition Group in Mead Johnson Nutrition.
Finally, I would like to thank my family and friends. Thanks to my parents, my
parents-in-law for being so patient and supportive during the process, and special thanks
to my husband, Ke Hu, for his continuous support, understanding and love.
vii
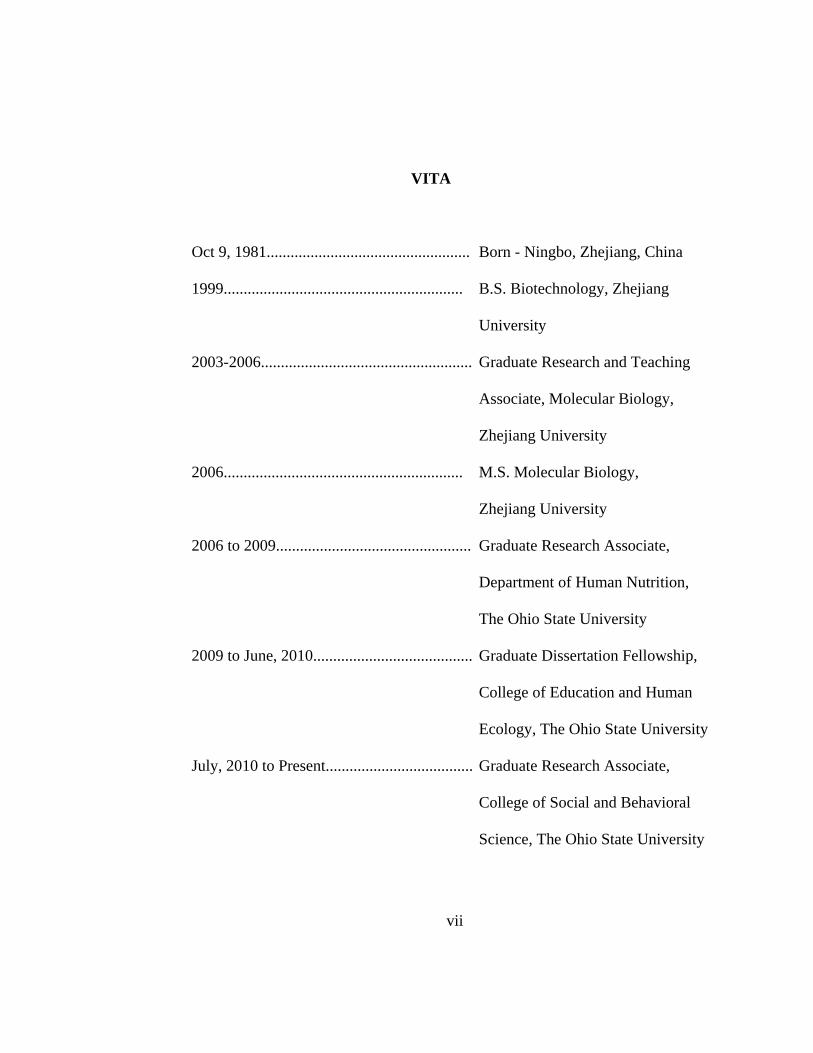
VITA
Oct 9, 1981................................................... Born - Ningbo, Zhejiang, China
1999............................................................ B.S. Biotechnology, Zhejiang
University
2003-2006..................................................... Graduate Research and Teaching
Associate, Molecular Biology,
Zhejiang University
2006............................................................ M.S. Molecular Biology,
Zhejiang University
2006 to 2009................................................. Graduate Research Associate,
Department of Human Nutrition,
The Ohio State University
2009 to June, 2010........................................ Graduate Dissertation Fellowship,
College of Education and Human
Ecology, The Ohio State University
July, 2010 to Present..................................... Graduate Research Associate,
College of Social and Behavioral
Science, The Ohio State University
viii
Publications
- Alvarez-Uribe MC, Melgar-Quiñonez H, Ye Q. 2009. Food insecurity and weight
status in Colombia: inverse association in adults and children. Abstract. International
Congress of Nutrition (2009), Bangkok, Thailand. Ann Nutr Metab. 2009; 55 (suppl
1): 365.
- Chen G, Melgar-Quinonez H, Ye Q. 2009. Differences in the psychometric
characteristics by gender of respondents to a household food security scale in
Yunnan, China. Abstract. International Congress of Nutrition (2009), Bangkok,
Thailand. Ann Nutr Metab. 2009; 55 (suppl 1): 365.
- Ye Q, Zubieta AC, Remley D, Angell D, Mims S, Melgar-Quiñonez H. 2009.
Assessing the Monthly Food Abundance-Shortage Cycle in Food insecure
Overweight/Obese Women in Ohio. Abstract. International Congress of Nutrition
(2009), Bangkok, Thailand. Ann Nutr Metab. 2009; 55 (suppl 1): 602.
- Ye Q, Zubieta AC, Remley D, Angell D, Mims S, Melgar-Quiñonez H. Household
food supply is affected by food abundance-food shortage monthly cycle among food
insecure women in Ohio. Experimental Biology (2009), New Orleans, LA. FASEB J.
2009; 23: Abstract 737.21.
- Ye Q, Zubieta AC, Remley D, Long C, Angell D, Mims S, Melgar-Quiñonez H.
Assessing the monthly food abundance-shortage cycle in food insecure overweight
women. Abstract. Society for Nutrition Education Conference (2009), New Orleans,
LA. J Nutr Educ Behav. 2009; 41(suppl 1): S4.
- Ye Q, Qiu YX, Quo YQ, Chen JX, Yang SZ, Fu CX. Species-specific SCAR markers
for authentication of Sinocalycanthus chinensis. J Zhejiang Univ Sci B. 2006; 7: 868-
872.
- Ye Q, Li ZH, Zheng YP, Qiu YX, Fu CX. Analysis of Machilus thunbergii types using
ISSR-PCR marker assays. J Zhejiang Univ Agric & Life Sci. 2006.
ix
Fields of Study
Major Field: The Ohio State University Nutrition Graduate Program
x
TABLE OF CONTENTS
ABSTRACT ........................................................................................................................ ii
ACKNOWLEDGMENTS .................................................................................................. v
VITA ................................................................................................................................. vii
TABLE OF CONTENTS .................................................................................................... x
LIST OF TABLES ............................................................................................................ xii
LIST OF FIGURES ......................................................................................................... xiii
CHAPTER 1 INTRODUCTION ........................................................................................ 1
1.1 Background ................................................................................................................1
1.2 Study Design, Research Hypotheses and Objectives .................................................5
1.2.1 Study 1 ......................................................................................................... 5
1.2.2 Study 2 ......................................................................................................... 7
1.3 Significance ................................................................................................................8
1.4 Subsequent Chapters ................................................................................................10
CHAPTER 2 REVIEW OF LITERATURE ..................................................................... 11
2.1 Food Insecurity and Obesity ....................................................................................11
2.1.1 Food Insecurity ........................................................................................... 11
2.1.2 Obesity ........................................................................................................ 18
2.1.3 The Paradox in Food Insecurity and Obesity in Women ........................... 21
2.2 Questionnaire-based Measurements and Dietary Intake Assessment ......................33
2.2.1 Household Food Insecurity Measurement .................................................. 33
2.2.2 Self-reported Eating Disorders Examination Questionnaire (EDE-Q) ...... 38
2.2.3 Dietary Assessment Methods ..................................................................... 42
2.3.4 Shelf Food-Inventory.................................................................................. 48
CHAPTER 3 Addressing the Association of Food Insecurity and Overweight/Obesity by
Testing the ―Monthly Cycle of Food Abundance and Food Shortage‖ Hypothesis ......... 51
3.1 Introduction ..............................................................................................................51
3.2 Methods ....................................................................................................................54
3.2.1 Subjects ....................................................................................................... 54
3.2.2 Data Collection ........................................................................................... 58
3.3 Data Analysis ...........................................................................................................62
3.3.1 Data Processing .......................................................................................... 63
3.3.2 Variables of Interest ................................................................................... 65
3.3.3 Statistical Analysis ..................................................................................... 65
3.4 Results ......................................................................................................................67
3.4.1 Subjects ....................................................................................................... 67
3.4.2 Characteristics of Subjects ......................................................................... 68

xi
3.4.3 Monthly Variations in Household Food Supply ......................................... 69
3.4.4 Monthly Variation of Nutrient Intake ......................................................... 73
3.4.5 Disordered Eating ....................................................................................... 75
3.4.6 Food Stamp Program (FSP) Participation .................................................. 77
3.5 Summary and Results of Hypothesis Testing ..........................................................78
CHAPTER 4 Addressing the Association of Food Insecurity and Overweight/Obesity.. 95
Using data from NHANES 1999-2008 ............................................................................. 95
4.1 Introduction ..............................................................................................................95
4.1.1 Hypothesis Testing ..................................................................................... 96
4.2 Methods ....................................................................................................................96
4.2.1 Sample ........................................................................................................ 96
4.2.2 Data Collection ........................................................................................... 97
4.2.3 Data Analysis............................................................................................ 103
4.3 Results ....................................................................................................................105
4.4 Summary and Results of Hypothesis Testing ........................................................111
CHAPTER 5 DISCUSSION AND CONCLUSIONS .................................................... 121
5.1 Discussion ..............................................................................................................122
5.1.1 Study Populations and TEIs Comparison ................................................. 122
5.1.2 Energy Requirements and Over-buying Behaviors .................................. 123
5.1.3 Food Insecurity and Dietary Intake Patterns (TEI and Macronutrient Intake)
................................................................................................................................. 125
5.1.4 Food Insecurity and Disordered Eating ................................................. 128
5.1.5 The Mediating Effects of Food Stamp Program (FSP) Participation ....... 129
5.1.6 Other Issues .............................................................................................. 132
5.2 Limitations and Future Studies ..............................................................................136
5.2.1 Limitations ................................................................................................ 136
5.2.2 Future studies............................................................................................ 138
5.3 Conclusions ............................................................................................................141
REFERENCE .................................................................................................................. 142
APPENDIX A ................................................................................................................. 163
Family Record Questionnaire ......................................................................................... 163
APPENDIX B ................................................................................................................. 166
Modified Household Food Security Survey Module (HFSSM) ..................................... 166
APPENDIX C ................................................................................................................. 172
Shelf Food-Inventory Survey .......................................................................................... 172
APPENDIX D ................................................................................................................. 181
Eating Disorders Examination Questionnaire (EDE-Q) ................................................. 181
xii
LIST OF TABLES
Table 2. 1 US-HFSSM questions used to assess household food security in the Current
Population Survey (CPS) Food Security Survey ............................................ 50
Table 3.1 Sample sizes by food security, weight status and interview dates 80
Table 3.2 Characteristics of women completed the six surveys ....................................... 81
Table 3.3 Total shelf food items (SD) by food security and weight status ....................... 83
Table 3.4 Food groups significantly decreased food groups in the three months ............. 84
Table 3.5 Monthly differences (SD) in household food stores by USDA essential food
groups (including holidays).............................................................................. 85
Table 3.6 Monthly differences (SD) in household food stores by USDA essential food
groups (excluding holidays) ............................................................................. 87
Table 3.7a Monthly differences in total energy intake (TEI) ........................................... 89
Table 3.7b Monthly differences in macronutrient intakes ............................................... 90
Table 3.8 Monthly Differences (SD) in micronutrient intakes in Month 1 ...................... 91
Table 3.9a EDE-Q subscale scores (SD) by food security status and weight status ........ 92
Table 3.9b EDE-Q subscale scores (SD) by food security status and by weight status ... 92
Table 3.10 Correlations of EDE-Q subscale scores with BMI and food security status .. 93
Table 3.11 Featured behaviors of eating disorders by food security status ...................... 93
Table 3.12 Monthly differences of household food stores by food security and food
stamps receiving status ..................................................................................... 94
Table 4.1 Characteristics of women by household food security status ......................... 113
Table 4.2 Characteristics of low-income women by household food security status ..... 115
Table 4.3 Comparison of 1-yr weight change and macronutrient intakes by food security
status ............................................................................................................... 117
Table 4.4 Comparison of 1-yr weight change and macronutrient intakes by weight status
and food insecurity ......................................................................................... 118
Table 4.5 Comparison of 1-yr weight change and macronutrient intakes in food insecure
women by food stamp participation ............................................................... 120
xiii
LIST OF FIGURES
Figure 1 The prevalence of food insecurity in the United States from 1995-2009 .......... 13
Figure 2 Conceptualization in food insecurity and its risk factors ................................... 16
Figure 3 The total energy intake (TEI) in food insecure and overweight/obese (FIS/ovob)
women in the Ohio study and in the NHANES study ...................................... 110
1
CHAPTER 1
INTRODUCTION
This chapter briefly reviews the concepts and prevalence of food insecurity and
overweight/obesity and the paradoxical relationship between the two, the design and
objectives of the study, and the significance of the research.
1.1 Background
What is food insecurity? It is defined as ―the limited or uncertain availability of
nutritionally adequate and safe foods‖ [1]. The prevalence of food insecurity is high
globally and has been increasing recently, particularly after the onset of food crisis and
the economic crisis [2]. In 2009, about 1.02 billion people worldwide suffered from food
insecurity (measured by dietary energy supply1) [2]. In U.S., food insecurity is measured
by a questionnaire-based instrument: the U.S. Household Food Security Survey Module
(US-HFSSM); the module assesses household food insecurity experiences and coping
strategies to subsequent events from worrying about running out of food to reduction of
quality and quantity of foods during the previous 12 months [3]. The most recent national
survey data showed that in 2008, the prevalence of food insecurity in U.S. households has
1 The dietary energy supply method is used by the Food and Agriculture Organization (FAO) to
report undernourishment [100].
2
reached the highest percentage since the first national food security survey was conducted
in 1995: 17 million (14.6%) U.S. households experienced low and very low food security
in 2008 [4].
Risk factors in food insecurity include socioeconomic characteristics such as
household income [5], parental education [6], household size [7] [8] and parental age [9].
Low income is considered as one of the strongest predictors in food insecurity In U.S.
and in some developing countries [5]. In U.S., low-income households, single-parent
households, Black and Hispanic households, and households in large cities and rural
areas have considerably higher prevalence of food insecurity, compared to their
corresponding counterparts [4]. Moreover, more than half (55%) of food insecure
households had participated in some types of food assistance programs in 2008 [4].
Household food insecurity leads to food consumption reduction in both quality
and quantity, and therefore reduces the nutrient intake needed for a healthy life. Indeed,
food insecurity as measured by current food security scales is related with poor nutrition,
such as lower diet diversity [10], less consumption of fruits/vegetables [11], [12] and
animal-source products [12], and lower nutrient intakes [11], [12], [13], [14], and poor
health outcomes including chronic illness [15], [16], [17] and psychological problems
[13], [18]. In addition, increased participation in assistance programs is associated with
household food insecurity [19], [11].
Like food insecurity, overweight and obesity, defined as ―abnormal or excessive
fat accumulation that may impair health‖ [20], are serious public health concerns in many
parts of the world [20], [21], [22], [23]. Industrialized countries hold the highest
3
prevalence of obesity. In U.S., for example, the prevalence of obesity has experienced a
dramatic increase in the past twenty years [24]. According to the most recent data, more
than two thirds of U.S. adults (68%) are overweight or obese [25], and almost one in
three U.S. children and adolescents aged 2 to 19 years (31.7%) has a BMI over the 85th
percentile (i.e. childhood overweight or obesity) [26].
Overweight and obesity are risk factors for a number of chronic diseases and
psychological consequences. These diseases include type 2 diabetes, coronary heart
disease, certain cancers, hypertension, and dyslipidemia [27], and mental stress like
weight control and body image [28]. Accordingly, the high prevalence of overweight and
obesity poses a real burden to the society. A fact to prove this burden is that
cardiovascular disease accounts for 40% of deaths in developed countries [29]. As a
consequence, the economic costs for treating obesity or obesity-related diseases are
amplified, and hence the social burden of overweight and obesity is increased [30].
Conventional belief associated obesity with affluence due to the excessive energy
consumption. However, more and more studies have reported a paradoxical association
of obesity and food insecurity [21], [23], [31], [32], [33], [34], [35]. In U.S., a number of
cross sectional studies have shown a significant trend of increased severity in food
insecurity and greater obesity rates, particularly among women [36], [37], [38], [39],
[40], [41]. Townsend et al. [38] analyzed data from the 1994–1996 Continuing Survey of
Food Intakes by Individuals (CSFII) and concluded that food insecurity was much more
highly correlated with overweight compared to food security. This conclusion was further
confirmed by more recent national survey data (National Health and Nutrition
4
Examination Survey, NHANES) in 1999-2000 and 2001-2002 [41] and regional studies
[36], [39], [40]. For example, a study in California women found that food insecurity was
associated with obesity in all ethnic groups, including non-Hispanic whites, Hispanics,
African Americans, and Asians [36]. This inverse association was weaker or even less
consistent in men [35], [42], [43].
The paradoxical association of food insecurity with obesity has been studied for
about twenty years. Several possibilities have been proposed to explain this association.
The most popular one is that when nutritionally-balanced diets are less available in food
insecure households [44], [45], high-fat-high-calorie food turns out to be the most
affordable energy source to prevent hunger [46], [47], [48]. An extended scenario of this
hypothesis is that food insecure people may indulge in highly palatable and energy-rich
food and hence an increased risk of obesity [46]. Another hypothesis for the paradoxical
association is that obesity could be a result of a periodic cycle of food availability and
food shortage; such a cycle may result in an increase of the efficiency in fat deposition
when food is available again [46], [47], [49]. The third hypothesis focuses on the
psychosocial stress prevalent among food insecure people, resulting in endocrine
abnormalities and promoting visceral obesity [46], [50].
Although a number of hypotheses were proposed for the paradoxical relationship
in food insecurity and obesity, none of them have yet been tested. In addition, most of the
previous studies were from cross-sectional data, which could not provide enough
information needed to explain the dietary and weight change during the food insecure
5
process. For these reasons, there is a need for a prospective study to test any of these
hypotheses in food insecure people.
1.2 Study Design, Research Hypotheses and Objectives
With the aim of understanding the paradoxical association in food insecurity and
overweight/obesity in U.S., this dissertation divided women into four groups: food
insecure and overweight/obese (FIS/ovob), food secure and normal weight (FS/norm),
food secure and overweight/obese (FS/ovob), and food insecure and normal weight
(FIS/norm). The dissertation includes two studies: a prospective study to test ―monthly
cycle of food abundance and food shortage‖ hypothesis in a group of low-income women
in Ohio, and a cross-sectional study using the survey data from the continuous National
Health and Nutrition Examination Survey (NHANES) 1999–2008.
1.2.1 Study 1 – Addressing the Association in Food Insecurity and Overweight/Obesity
among Women by the “Monthly Cycle of Food Abundance and Food Shortage”
Hypothesis
This study examined a group of low-income women in Ohio, which will be called
the Ohio study from now on.
Most of the studies reporting the paradoxical relationship of food insecurity with
obesity were from cross-sectional data [3], [4]. However, it is difficult to answer the
question about how food insecurity relates to the consumption of nutrients and total
6
energy intake because of the simultaneous nature of cross-sectional study designs:
participants’ usual energy intake cannot be accurately assessed. In contrast, a prospective
design allows exploring the changes of dietary intake to answer the research questions.
Moreover, a prospective study can provide repeated measurements to reduce the intra-
individual random errors of dietary intake measurement (see section 3.2.2.3 for more
details). Therefore, it allows testing the existence of the monthly cycle of food shortage
and food abundance in food insecure families, and can provide useful information to
address ―why‖ food insecurity is related to overweight.
This study is one of the few studies using a prospective study design to address
the relationship in food insecurity and obesity among women [51], [52], [53]. According
to the proposed hypothesis, food insecure households have access to abundant food
sources during the first few weeks of the month, while face problems of food shortage at
the end. Thus, higher energy consumption may occur in food insecure people at the
beginning of the month when food supply is plentiful, and restricted energy intake may
happen at the end of the month. Such a monthly cycle of food abundance and food
shortage may repeat month to month when the household keeps food insecure, and may
lead to overweight/obesity in food insecure women.
In this dissertation, the Ohio study is designed to test the existence of the monthly
cycle of food abundance and food shortage among food insecure women, by measuring
the total energy intake (TEI) and household food stores in a group of low-income women
in Ohio at the beginning and the end of three continuous months.
Specifically, the following hypotheses are proposed to be tested in this study:
7
1. FIS/ovob women will have higher TEI at the beginning of the month compared to
the end of the month in three continuous months.
2. FIS/ovob women will have more household food items at the beginning of the
month compared to the end of the month in three continuous months.
3. The monthly decrease of TEI and household food items will be greater in
FIS/ovob women compared to FS/norm, FS/ovob, and FIS/norm women.
4. FIS/ovob women will have more severe disordered eating behaviors than
FS/norm, FS/ovob, and FIS/norm women.
5. Among food insecure women, food stamp recipients will have higher body mass
index (BMI) and greater monthly decrease in TEI and household food items than
food stamp non-recipients.
1.2.2 Study 2 – Addressing the Association in Food Insecurity and Overweight/Obesity
among Women by Macronutrient Intakes and 1-Year Weight Change - NHANES
1999-2008 Data
This study used the national survey data from the continuous National Health and
Nutrition Examination Survey (NHANES) 1999–2008, and will be called the NHANES
study from now on.
The NHANES study is another way to address the paradoxical association in food
insecurity and obesity. The study was designed to test if this paradoxical relationship
exists in NHANES women sample with similar characteristics (i.e. Non-Hispanic white,
reproductive age, non-pregnant, non-lactating) as Ohio study; if the paradox exists, is it
8
mediated by macronutrient intakes (i.e. energy, fat, protein, and fiber) and Food Stamp
Program (FSP) participation? In addition, the average TEI in U.S. FIS/ovob women
calculated from the NHANES study may allow some introspection into the monthly cycle
tested in Ohio study.
Specifically, the following hypotheses are proposed to be tested in this study:
1. Food insecure women will have higher body mass index (BMI) than food secure
women, and low-income food insecure women have higher BMI than low-income
food secure women.
2. Compared to FS/ovob women, FIS/ovob women will have greater 1-yr body
weight increase, higher total energy intake (TEI), and higher percentage of energy
from fat, lower percentage of energy from protein and lower grams of fiber
intake.
3. Among food insecure women, food stamp recipients will have higher BMI,
greater 1-yr body weight increase, higher TEI, higher percentage of energy from
fat, lower percentage of energy from protein and lower grams of fiber intake than
food stamp non-recipients.
4. FIS/ovob women in the NHANES study will have lower TEI than FIS/ovob
women in the Ohio study at the beginning of the month, but higher at the end of
the month.
1.3 Significance

9
The paradoxical relationship of deepening food insufficiency and increasing
obesity rate has been studied for about twenty years. In spite of the many proposed
possibilities, no theory has yet been tested. The Ohio study contributes key information
on how episodic food intake patterns mediate the association in food insecurity and
obesity, illustrating the need to promote consistent eating patterns in food insecure
people. The use of a prospective design in the Ohio study is necessary to explore the
monthly variation of dietary intake, meanwhile providing repeated measurements to
reduce intra-individual random errors on dietary intake assessment [54]. Additionally, the
results of the Ohio study provide information for policy makers to make changes in
federally funded food assistance programs, such as the Supplemental Nutrition
Assistance Program (SNAP2, formerly Food Stamp Program) which assigns its benefits
on a monthly basis.
The Ohio study was supported through a seed grant by the Ohio Agricultural
Research and Development Center (OARDC). The limited resource of a seed grant
restricts the generalization ability of this study. For example, although multiple 24-hour
dietary recalls were applied in the study, the number of interview days could only provide
the estimation for TEI, but not for macronutrient intakes. However, the larger sample size
and more complicated survey design in NHANES make the NHANES data provide more
2 Effective October 1, 2008, the U.S. Department of Agriculture's Food Stamp Program was
renamed Supplemental Nutrition Assistance Program (SNAP). In addition, this program has many
different state-specific names. To keep consistency, the program is called Food Stamp Program (FSP) in
the dissertation.
10
nationally representative data, including regular dietary intake data. Therefore, the
dissertation includes the NHANES study as well to address the paradoxical association in
food insecurity and obesity in U.S. women. With the NHANES data, the study can
further analyze the macronutrient intakes and macronutrient/energy ratios in the
population of interest, for example, in the food insecure and overweight/obese women,
and the effect of FSP participation in the association in food insecurity and
overweight/obesity. In addition, the NHANES study can help to estimate the association
in food insecurity and overweight/obesity on a national level among sub-groups of
interest. Therefore, the findings of this dissertation provide comprehensive information
from both a prospective study and a cross-sectional study, to address the association of
food insecurity and overweight/obesity in U.S. women.
1.4 Subsequent Chapters
Chapter 1 briefly introduces the hypotheses to be tested in the dissertation and the
significance of the research. A review of literature is in Chapter 2, introducing the
prevalence, risk factors and consequences of food insecurity and obesity, and their
association. Questionnaire-based instruments used in this dissertation and the 24-hour
dietary recalls are also introduced in Chapter 2. The analysis methods and results from
the Ohio study and the NHANES study are presented in Chapter 3 and Chapter 4
respectively. Chapter 5 compares the results from the Ohio study and the NHANES study,
and discussed the limitations and direction of future research based on the study findings
and conclusions.

11
CHAPTER 2
REVIEW OF LITERATURE
This chapter contains two parts reviewing relevant studies for the dissertation.
The first part reviews the definition, prevalence and correlated consequences of
overweight/obesity and food insecurity, the association of food insecurity and obesity,
and possible explanations to this association. The second part of the chapter provides
information about the development and validation of tools used for food insecurity
measurement, disordered eating behaviors, dietary intake and household food stores.
2.1 Food Insecurity and Obesity
2.1.1 Food Insecurity
Food insecurity is defined as ―the limited or uncertain availability of nutritionally
adequate and safe foods or the limited or uncertain ability to acquire acceptable foods in
socially acceptable ways‖, while food security is the ―access by all people at all times to
enough food for an active and healthy life‖ [1].
Food insecurity has long been a concern of world leaders [55]. In 1996, the World
Food Summit in Rome reaffirmed the human right to get access to adequate, safe and
nutritious foods [56]. In the same year the United Nations set the goal of cutting the
number of people suffering from hunger by half to ―no more than 420 million‖ by 2015
12
[57]. Unfortunately, the number of people worldwide affected by food insecurity had
been increasing ―slowly but steadily‖ before the onset of food crisis and the economic
crisis in 2009, and increased ―sharply‖ after these crises [2]. In 2009 Food and
Agriculture Organization (FAO) estimated that 1.02 billion people worldwide were
suffering from undernourishment [2].
In the United States, household food insecurity as a public health concern has
been monitored nationally since 1995 (Figure 1) by United States Department of
Agriculture (USDA) Economic Research Service (ERS) using data from the Current
Population Survey (CPS) Food Security Supplement [4]. The 2-yr cycle of the prevalence
of food insecurity in 1995-2000 suggests the seasonal effects resulted from the food
security survey collection patterns: administered in April in odd-numbered years and
August/September in even-numbered years. To avoid such a seasonal effect, from 2001
food security surveys were conducted in early December every year [4]. From 2001 to
2004, the prevalence food insecurity in U.S. increased from 10.69% to 11.95%, and
declined to 11.0% in 2005, and remained around until 2007 (11.10%). In 2008, this
number increased substantially to 14.6% (i.e. 17 million of U.S. households) and
remained basically unchanged in 2009 (14.7%) [4]. In Ohio, the estimated prevalence of
food insecurity during 2006 – 2008 was 13.3% [4].

13
Figure 1 The prevalence of food insecurity in the United States from 1995-2009 [4]
Food insecurity in the U.S. includes two categories: low food security and very
low food security. The two categories constitute food insecure levels with coping
strategies related to decreasing food quality and variety, and reduced food intake as well
as interrupted eating patterns. Food insecure households ―obtained enough food to avoid
substantially disrupting their eating patterns or reducing food intake by using a variety of
coping strategies‖ are considered with low food security; comparatively, food insecure
households with interrupted eating patterns and reduced food intake due to lack of money
or other resources are with very low food security (formerly known as ―food insecure
with hunger‖ prior to 2006). The prevalence of very low food security in U.S. increased
slowly but steadily from 2001 (3.26%) to 2007 (4.1%); in 2008 and 2009, 5.7% (i.e. 6.7
million) of U.S. households experienced very low food security. These two percentages
were the highest since the first food security survey conducted nationally in 1995[4].

14
Risk Factors in Food Insecurity
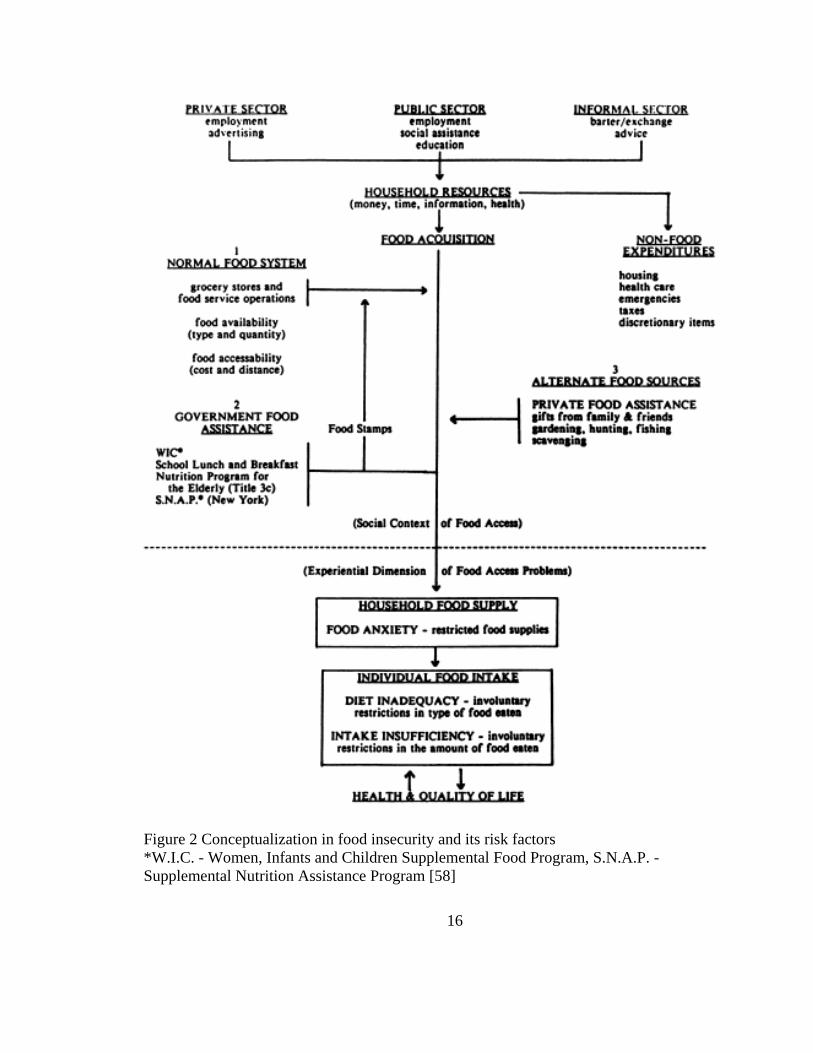
A conceptualization in food insecurity and its risk factors was elaborated by
Campbell in Figure 2 [58]. In this conceptual model, three sources of food acquisition
were identified: normal food system like grocery stores and food service operations,
governmental food assistance programs, and alternate food sources like gardening,
hunting and fishing. The first two are considered as conventional food sources.
Therefore, risk factors in food insecurity are anything that limits the household resources
(e.g. money, time, information, health, etc.), or increases the proportion of non-food
expenditures in household resources, such as employment, income, social assistance,
housing, health care, taxes, emergency expenditure and so on [58].
A number of risk factors has been associated with household food insecurity, such
as low income [4], [53], [59], being headed by a single parent [4], [53], [59], minority
race [4], [53], [59], with children and the number of children [4], [53], [59], education
[6], [53], household size [8], [7], [53], and household location [4], [53]. Income level has
proven to be the strongest predictor for food insecurity [4], [5], [60], [6], [53] [59]. Early
CPS food security surveys have proved declined hunger rates along with increased
income levels [5]. In 2009, 43.0% of U.S. households with incomes below the poverty
line were food insecure [4]. Furthermore, compared to the national level, the prevalence
of food insecurity in U.S. is higher in: households with children (21.3%), with children
and headed by a single parent (36.6% for single women and 27.8% for single man), Black
households (24.9%), Hispanic households (26.9%), and households living in the
15
metropolitan areas of principal cities (17.2%) [4]. Similar results were found in
households participated in the Panel Study of Income Dynamics (PSID) study in 1999
and 2001 [53]; fewer years of education and higher rates of unmarried/divorced/separated
were also found in food insecure women than their food secure counterparts. In addition,
food insecure households have a higher participation rate in food assistance programs
than food secure households [4] [53]. For example, more than half (55%) of U.S. food
insecure households had participated in some food assistance programs in 2008; under
the same income range, food stamp receiving households showed prevalence of very low
food security almost twice as high as non-participating households (25.7% vs. 13.4%)
[4].
16
Figure 2 Conceptualization in food insecurity and its risk factors
*W.I.C. - Women, Infants and Children Supplemental Food Program, S.N.A.P. -
Supplemental Nutrition Assistance Program [58]
17
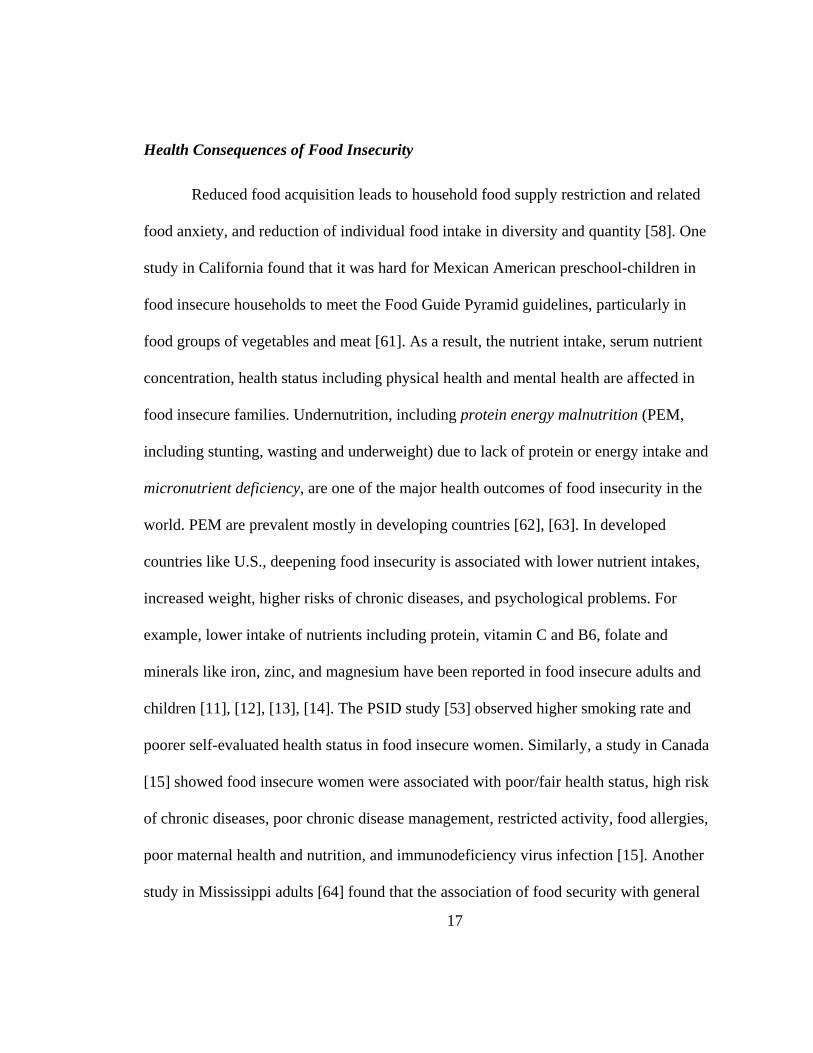
Health Consequences of Food Insecurity
Reduced food acquisition leads to household food supply restriction and related
food anxiety, and reduction of individual food intake in diversity and quantity [58]. One
study in California found that it was hard for Mexican American preschool-children in
food insecure households to meet the Food Guide Pyramid guidelines, particularly in
food groups of vegetables and meat [61]. As a result, the nutrient intake, serum nutrient
concentration, health status including physical health and mental health are affected in
food insecure families. Undernutrition, including protein energy malnutrition (PEM,
including stunting, wasting and underweight) due to lack of protein or energy intake and
micronutrient deficiency, are one of the major health outcomes of food insecurity in the
world. PEM are prevalent mostly in developing countries [62], [63]. In developed
countries like U.S., deepening food insecurity is associated with lower nutrient intakes,
increased weight, higher risks of chronic diseases, and psychological problems. For
example, lower intake of nutrients including protein, vitamin C and B6, folate and
minerals like iron, zinc, and magnesium have been reported in food insecure adults and
children [11], [12], [13], [14]. The PSID study [53] observed higher smoking rate and
poorer self-evaluated health status in food insecure women. Similarly, a study in Canada
[15] showed food insecure women were associated with poor/fair health status, high risk
of chronic diseases, poor chronic disease management, restricted activity, food allergies,
poor maternal health and nutrition, and immunodeficiency virus infection [15]. Another
study in Mississippi adults [64] found that the association of food security with general
18
health (i.e. physical and mental health) were dependent on race: white or black food
secure people were more likely to report good health than black food insecure people,
while white and food insecure people were less likely to report good health than black
food insecure people. Furthermore, the increased risk of overweight/obesity in food
insecure women [52], [36], [37], [46], [38], [39], [40] will be discussed in section 2.1.3.
In addition, hospital data showed patients with high rates of hunger in the emergency
department were more likely to choose to buy food instead of medications [16]; food
insecure children were more likely to be hospitalized since birth [65]. Poor chronic
disease management has also been reported in food insecure women [66], [16], [67].
Except poor physical health, psychological issues like depression and distress due to
preoccupation of access to enough food, disparagement of self-image and unhealthy
eating behaviors have been found in food insecure women. For example, maternal
depression was observed to be associated with poor child health status and household
food insecurity [59], [18], and food insecure women were more likely to report
disordered eating than food secure women [11].
2.1.2 Obesity
In general, overweight and obesity are defined as ―abnormal or excessive fat
accumulation that may impair health‖ [20]. According to the clinical guideline from
National Heart, Lung and Blood Institute (NHLBI) in U.S., adult overweight and obesity
are determined as a Body Mass Index (BMI) of 25 to 29.9 kg/m2 and of 30 kg/m
2 or
higher, respectively [27].

19
The prevalence of obesity has been increasing globally [20], [21], [22], [23],
regions [68], [69], [70], [71], [72]. In 1997, the WHO formally recognized obesity as a
global epidemic in both industrialized and developing countries [20]. Industrialized
countries hold the highest prevalence of obesity. In U.S., the successive nationally
representative surveys make it possible to follow the trends in overweight/obesity. Three
phases have been identified in this trend. In Phase I from the 1960’s to the 1980’s, the
prevalence of obesity increased slightly: 12.8% in the National Health Examination
Survey (NHES I, 1960-1962), and 14.1% and 14.5% in the first and the second National
Health and Nutrition Examination Surveys (NHANES I, 1971-1974; NHANES II, 1976-
1980), respectively [73]. A dramatic increase was detected in Phase II from the 1980’s to
the 1990’s, where obesity prevalence increased to 22.5% in NHANES III (1988-1994)
[73], and continued increasing to 30.5% in NHANES 1999-2000 [74]; the crude
prevalence of overweight/obesity increased from 55.9% in NHANES III to 64.5% in
NHANES 1999-2000 [74]. In Phase III (1999-2008), the prevalence of obesity seemed to
be more stable over the 10-year period compared to the previous phase: no significant
changes were observed in women [25]; a significant linear trend was found in men, but
the prevalence in 2003-2004, 2005-2006, and 2007-2008 was not significantly different
from each other [25]. In 2007-2008, more than one third of U.S. adults were obese
(33.8%), and women had a little higher prevalence than men (35.5% vs. 32.2%). The
prevalence of overweight and obese combined in U.S. adults were 68% [25]. Obesity
prevalence varies by racial/ethnic populations. Data from Behavioral Risk Factor
Surveillance System (BRFSS) surveys in 2006 – 2008 reported higher prevalence of
20
obesity in Non-Hispanic blacks (35.7%) and Hispanics (28.7%), compared to non-
Hispanic whites (23.7%) [75]. In Ohio, the prevalence of overweight and obesity was
36.9% and 29.7% respectively in adults in 2009 [24].
Obesity and overweight are risk factors of the following diseases: type 2 diabetes,
coronary heart disease, certain cancers (endometrial, breast, and colon), hypertension,
dyslipidemia, stroke, liver and gallbladder disease, sleep apnea and respiratory problems,
osteoarthritis, and gynecological problems [27]. For example, the Nurses’ Health Study
reported that compared to women with lower BMI (< 21), the relative risks (RR) for
Coronary Heart Disease were more than twice as high for women with BMI 25 - 28.9,
and greater than three and half times as high for women with BMI > 29 [76]. In addition,
psychological consequences like disparagement of body image and negative emotional
reactions to dieting represent another part of health concerns associated with obesity [28].
Unhealthy weight control behaviors were reported in women from both high and low
socioeconomic status (SES) [77]. In addition to these health and social consequence,
expenditure directly and indirectly owing to overweight and obesity and their associated
health problems is a major expense for the society. For example, medical cost in U.S.
attributed to overweight and obesity in 1998 was estimated to be $78.5 billion dollars
($92.6 billion in 2002 dollars) [30].
The epidemic of overweight/obesity and related health consequences are major
public health concerns in U.S... Possible risk factors for obesity include generic factors,
birth weight, social factors, and behavioral factors like physical activity, dietary intake
patterns, and psychological factors [78]. For example, lower socioeconomic status in
21
early childhood is associated with increased fatness in later life time [78]. And
consumption of food with high energy density but low in micronutrients is considered to
be a reason in the obesity epidemic [79]. The following section will give a literature
review about the association of food insecurity and obesity and its possible explanations.
2.1.3 The Paradox in Food Insecurity and Obesity in Women
It is known that food insecurity has a positive association with socioeconomic
characteristics such as household income [5], [60], parental education [6] and household
size [8], [7]. Conventional wisdom considers food insecurity as correlated with
undernourishment due to insufficient food supply, while overnutrition (overweight and
obesity) is associated with higher food security [46]. This rationale still holds in some
populations in developing or non-western countries where overnutrition is reported to be
associated with higher socioeconomic status (SES) [21], [22].
The inverse association of food insecurity and related social factors with weight
status has been observed in the developed societies [21], [23], [31], [42], [43]. In specific,
this association differs by gender: women of lower SES have a higher prevalence of
obesity, regardless of race or ethnicity [34], [35] while men shows weaker or even less
consistent association in food insecurity and overnutrition [35], [42], [43]. In U.S.,
―disproportionately higher risk‖ of overweight/obesity has been found in food insecure
women [46]. Early in 1965, a study for a sample of residents in Midtown Manhattan,
New York City reported an obesity rate among women of lower SES (30%) six times as
high as that in women of upper SES (5%) [35]. In 1995, Dietz reported a case study of a
22
7-year-old African American girl, discussing the coexistence of hunger and obesity
within one person [47]. Later on, Townsend et al. [38] used national survey data from
1994–1996 Continuing Survey of Food Intakes by Individuals (CSFII) and found that
food insecurity was highly correlated with overweight than food security; food insecurity
was a significant predictor of overweight even when 15 potential confounders, including
factors of demographics (i.e. age and ethnicity), SES (i.e. income, education, and
occupation), assistance programs, environment (e.g. household size, urbanization), and
lifestyle (i.e. physical activity and food choices) were adjusted [38]. Another cross-
sectional study using national data from the 1999-2000 and 2001-2002 found that women
living in households of marginal food security and food insecurity without hunger had a
higher risk of obesity compared to their fully food secure counterparts, after adjusting for
race/ethnicity, household income, education, and current health status; moreover,
marginally food secure women were more likely to gain weight [41]. Significant trends
between worsening food insecurity and increased obesity rates have also been reported
from state-level survey data [36], [40] and community studies in U.S. women [32], [39],
[41]. For example, in the data from the 1998 and 1999 California Women's Health
Survey, the obesity rate in food insecure women were about twice as high as that in food
secure women (31% vs. 16%) [36]. Another study investigated BMI and its association
with SES characteristics in 13,167 participants (45 - 64 yr) in the Atherosclerosis Risk in
Communities Study and reported a negative association in women but not in men [32]. In
one study from a group of 2,580 adults in an Appalachian Ohio county (rural population),
23
it was found that women’s BMI and obesity rate in women were higher in food insecure
households compared to those in food secure households [80].
The possible causes of the paradoxical correlation of household food insecurity
and high rate of obesity have been studied [52], [46], [38], [47], [41], [51]. In the case
study reported by Dietz, the mother of a 7-year old African American girl said they could
hardly afford high-quality food for weight reduction after they paid the rent fee with the
welfare check; from then till they received their second check, they had to supply their
daughter with high-calorie food like pasta and hot dogs [47]. Based on this report two
explanations are proposed for the paradox: 1) the low-quality but high-fat and high-
calorie food that food insecure people eat to prevent hunger, and 2) the periodic food
availability and shortage frequently experienced by these people [47]. Besides, the
association in food insecurity and obesity is hypothesized also be mediated by dietary
behaviors, like disordered eating patterns [11].
Based on these explanations, factors involved from food insecurity to
overweight/obesity in women include dietary intake, periodic food availability and food
shortage, and abnormal dietary behaviors. Based on these, the dietary intake patterns,
food stamp program participation, and binge eating behavior and their potential
mediating effects are reviewed in the following sections.
2.1.3.1 Dietary Intake Patterns
Researchers believe that food insecure people may have access to ―sufficient or
even excessive energy‖ but limited foods of high nutritional quality and diversity, such as
24
fruits and vegetables [48], [52]. Furthermore, food insecure people may indulge in these
highly palatable and energy-rich foods [46]. Lower diet diversity [10], less consumption
of fruits/vegetables [60], [11], [12] and animal-source products [60], [12], and lower
nutrient intakes [11], [12], [13], [14] have been reported in food insecure people
compared to food secure people. In the data from the Third National Health and Nutrition
Examination Survey (NHANES III), adults (20–59 yr) in food insufficient households
had lower calcium intakes, lower frequency of milk/fruits/vegetable consumption, and
lower serum nutrients like total cholesterol, vitamin A and specific carotenoids than those
in food sufficient households [12]. Using the same survey data, Bhattacharya et al. [10]
found household food insecurity would reduce the Healthy Eating Index (HEI, an index
for diet diversity) in whites and increase the risk of low serum nutrients in whites and
blacks for adults 18-64 yr. Significant decrease in the frequency of fruits and vegetable
consumption in food insecure women was also reported in a sample of women (15-40 yr)
in a rural New York State county [11]; lower intakes of potassium and fiber were found
to be associated with more severe food insecurity. Another study in Toronto, Canada
analyzed the nutritional adequacy in a group of women (19-48yr) receiving emergency
food assistance by measuring dietary intake data and household food security status over
the past 30 days; low levels of intakes in micronutrients like Vitamin A, folate, iron, and
magnesium were observed to be associated with severe household food insecurity [13].
Since weight increase is associated with energy intake, it is more helpful to know
the differences in total energy intake (TEI) as well as macronutrient intake patterns (i.e.
protein, carbohydrates, and fat) in food secure women compared with in food insecure
25
women. The results of macronutrient intake patterns are varied by studies. The study in
Toronto for women receiving emergency food assistance [13] found women in
households without hunger consumed more energy and protein than those in households
with hunger, while controlling for other socioeconomic and behavioral confounders;
however no significant difference was found in fat intake or carbohydrate intake. Another
study in Canada [14] used data from the 2004 Canadian Community Health Survey found
similar association of energy intake (marginal difference, p<0.1) and protein intake with
food insecurity among women (19-50 yr), while lower fat intake in food insecure women
who were 31-50 yr. In terms of carbohydrates intake, this study reported marginally
higher intake in food insecure women 31-50 yr after controlling for income adequacy,
respondent education, immigrant status, current daily smoking status, and household size,
but no significant difference in women 19-30 yr [14]. In U.S., using data from the
NHANES III [12], Dixon et al. found no significant difference in TEI or in fat intake
between food insufficient adults and food sufficient adults (20-59 yr), while Zizza et al.
[81] reported no significant difference of TEI or carbohydrates intake in women (18-60
yr) in NHANES 1999-2002 but higher fat intake in women in food insecurity with hunger
compared to fully food secure women (18-60 yr).
2.1.3.2 Food Stamp Participation
Food Stamp Program (FSP) is a food and nutrition assistance program provides
food stamps/benefits to low- income population who live in U.S... The program is
sponsored by the federal government and administered by the U.S. Department of
26
Agriculture; benefits are distributed by the individual states in US. To be eligible for FSP,
households should meet certain criterion like the income tests to receive food stamps.
Since low income is a strong predictor for food insecurity, food insecure people have a
higher possibility to receive food stamps. However, due to the definition of food
insecurity focusing on food availability rather than income level, food stamp recipients
are not meant to be food insecure. National data in 2008 [4] reported that 56% of food
stamp receiving households were food insecure. Under the same income range, food
stamp receiving households showed prevalence of very low food security almost twice as
high as non-participating households (25.7% vs. 13.4%) [4]. Due to the high correlation
between FSP participation and food insecurity, the periodic distribution cycle of FSP
benefits is hypothesized to lead to a periodic cycle of food availability and shortage, and
a higher risk of weight gain in food insecure recipients.
Associations of FSP participation and weight increase have been studied by cross-
sectional studies [38] [82] and longitudinal studies [83] [84] [53] [85]. Townsend et al.
[38] examined 9451 women from the 1994–1996 Continuing Study of Food Intake of
Individuals (CSFII). After controlling for potential confounders (including food
insecurity), they reported women FSP recipients had a 38% increased odds of being
overweight (classified as BMI> 27.3 kg/m2) compared to non-recipients. However,
inconsistent results have been reported in other cross-sectional studies. For example,
using NHANES 1976–1980, 1988–1994, and 1999–2002, positive association of FSP and
obesity in women was observed in early waves but not in most recent waves [82]:
compare to early waves, the most recent data showed similar BMI in food stamp
27
participants and in income-eligible non-participants. In addition, the study also found this
association is varied by age and ethnic groups. Therefore, cross-sectional data may have
its limitation to investigate the effects of FSP participation on weight status. Gibson [83]
analyzed data from the National Longitudinal Survey of Youth (NLSY), a nationally
representative survey interviewed people born between 1957 and 1964; it was estimated
that current FSP participation is associated with an increase of 9% in women’s obesity
risk and a five-year participation in FSP is associated with a 20.5% increase in the obesity
risk, holding all available confounders. Using the same NLSY survey with a sample of
20,922 women, Zagorsky & Smith [85] reported a 1.15 unit rise in BMI with FSP
participation in the overall sample; specifically, BMI increased the most when women
were in FSP (0.40 unit per year), compared to lower increasing rates when women left
FSP (0.20 unit per year) or before women’s food stamp receipt (0.07 unit per year).
Cross-sectional analysis in this study also found a higher BMI in FSP participants than
non-participants (28.2 vs. 26.6) [85]. Another longitudinal study by Meyerhoefer and
Pylypchuk used the Medical Expenditure Panel Survey (MEPS) and estimated a 6 – 7%
increase in women’s risk of obesity when participating FSP [84].
Although many studies show supportive evidence for the long-term association of
FSP and weight increase, very few studies have done to investigate the FSP participation
and its effect on weight status in food insecure women. One longitudinal study [53]
investigated the effects of FSP participation on weight change in a sample of 5303 food
insecure women from 1999 to 2001[53]. Their study found that a full participation in FSP
would result in a weight increase only among ―persistently food insecure‖ women, while
28
in women who were ―became food secure or food insecure‖, or ―persistently food
secure‖; food insecurity was associated with a weight decrease [53].
2.1.3.3 Disordered Eating
Disordered eating is not the same as eating disorders. Eating disorders are very
complex illnesses marked by extreme food intake or food intake reduction, and related
extreme concern about body weight/shape [86]. There are two main types of eating
disorders: anorexia nervosa and bulimia nervosa, and a third type "eating disorders not
otherwise specified (EDNOS)". In contrast, disordered eating is irregular eating
behaviors such as binge eating with loss of control, or extreme weight-control behaviors
like self-induced vomiting, or the use of diet pills, laxatives, and diuretics. People who
are affected by disordered eating may be diagnosed with an EDNOS. For example, binge
eating disorder is one type of EDNOS [86]. Binge eating disorder refers to behaviors of
episodically consuming large quantities of food in a short time period; unlike bulimia
nervosa, binge eating disorder is not accompanied by compensatory behaviors like
excessive exercise, fasting, inducing vomiting or using laxative [87]. People with binge
eating disorder have both the syndromes of episodically large-amount ingestion and the
guilt sense of losing control over eating [88]. Binge eating disorder can lead to serious
chronic diseases like severe obesity, diabetes, hypertension and cardiovascular diseases
[86] [88].
It has been proposed that the association of food insecurity and
overweight/obesity is mediated by disordered eating, particularly binge eating behaviors
29
[11] [38] [52]. Although little is known about how binge eating behaviors start,
psychosocial factors such as low self-esteem and anxiety have been hypothesized to be
important [52]. Since food insecure women have similar psychological characteristics
due to the uncertainty in life, food insecure women may under high psychosocial stress
which then leads to binge eating and subsequent weight gain. To the best of our
knowledge, only one study - the study in a sample of 193 women in a rural county in
New York State [11] [52] - has investigated the association of food insecurity and
disordered eating patterns. More severe disordered eating patterns was observed along
with worsening food insecurity; using multivariate regression models, the study
concluded that severe food insecurity itself was associated with lower BMI and less
likelihood of obesity, but severe food insecurity was also associated with higher risk of
disordered eating and hence the risk of obesity was increased; because the former one had
a larger effect, women of severe food insecurity were less likely to become obese
compared to food insecure women of less severe levels [52]. In this study the disordered
eating behaviors were evaluated using a 4-item scale: the Stanford Eating Disorders
Questionnaire [89]. The four questions in the scales were relevant to binge eating
behaviors: ―(1) has abnormal or unusual eating patterns compared to others in terms of
how much she eats or how fast she eats; (2) ever eats large amounts of food very quickly
in a short period of time; (3) ever has episodes of overeating that she would refer to as
binges, and (4) eats large quantities of food deliberately out of the sight of other people‖
[52].

30
In addition, Townsend et al. [38] reported the association of food insecurity and
overweight in women from the 1994–1996 Continuing Study of Food Intake of
Individuals (CSFII), and proposed that overweight may be related to ―involuntary,
temporary food restriction‖. Furthermore, researchers believe that a periodic pattern of
food deprivation/food restriction tends to promote binge eating behaviors and excessive
weight gain when a plentiful food supply is available. For example, experimental studies
observed significantly stronger requests and attempts in children to restricted palatable
snack foods compared to similar non-restricted foods, or to the same foods during non-
restriction session [90]; such restriction may increase their subsequent selection and
intake of these foods [90]. Furthermore, longitudinal studies exploring the eating in the
absence of hunger (EAH) in girls (5-9y) have found that food restriction level at younger
age was a strong predictor for higher EAH at older age [91].
2.1.4 The “Monthly Cycle of Food Abundance and Food Shortage” Hypothesis
Based on the possible explanations discussed above, the ―monthly cycle of food
abundance and food shortage‖ hypothesis was proposed. In this hypothesis, obesity could
be a result of the periodic food availability and shortage existing among food insecure
people, which may cause the body to change permanently and increase fat deposition
when food is available [46], [47], [49]. In particular, abundant food sources may be
available in food insecure households during the first week(s) of the month, but restricted
at the end; such an abundance-shortage cycle may continue during following months.
31
Additionally, due to the first explanation, it is possible that most of the available foods
for food insecure households during the first week(s) are high-fat and high-calories.
There are two important assumptions in this hypothesis. First, the episodic
abundance and shortage of food intake can lead to obesity. This assumption was first
supported by the ―thrifty genotype‖ hypothesis proposed by Neel early in 1962,
suggesting that a cycle with ―periods of gorging alternated with periods of greatly
reduced food intake‖ would have helped to develop an adaptive method called ―thrifty‖
metabolism [49]. This hypothesis states that individuals experiencing such a fluctuating
cycle would have high efficiency in fat deposition when calories are available, and the
accumulated fat would be used during the next food shortage period [49]. The ―thrifty
genotype‖ hypothesis is supported by some animal studies, showing that multiple cycles
of the starvation-refeeding strategy in rats were followed by the up-regulation of white
adipose tissue (WAT) lipogenesis [92]. In addition, researchers believe that a periodic
pattern of food deprivation/food restriction tends to promote binge eating behaviors and
excessive weight gain when a plentiful food supply is available [93], [94], [92], [90],
[95]. Experimental studies among children suggested causality between child weight gain
and food restriction: children had significantly stronger requests and attempts to restricted
palatable snack foods compared to similar non-restricted foods, or to the same foods
during non-restriction session. Therefore, such restriction may increase their subsequent
selection and intake of these foods [90]. Similar results were reported by other
observational studies, showing the strong association of childhood overweight and
restriction-feeding strategy in children [95]. Furthermore, longitudinal studies exploring

32
the eating in the absence of hunger (EAH) in girls (5-9y) have found that food restriction
level at younger age was a strong predictor for higher EAH at older age [91].
Interestingly, many of the studies on food restriction and weight gain are found in girls
rather than boys [95], [96]. For example, a study showed that maternal restriction of
snack food was a stronger predictor of levels of snack food intake only in girls [96].
The second assumption is that the episodic pattern of food supply and food intake
does exist in food insecure households. Very few studies have been conducted to testify
this assumption. However, several studies have shown an episodic lack of food followed
by increased food servings during times of relative abundance in low-income families or
in food insecure households. For example, one study using the 1989–1991 Continuing
Survey of Food Intakes by Individuals (CSFII) data reported that food expenditure in
food stamps receiving households peaked dramatically in a couple few days right after
the benefits were received but flattened out throughout the rest of the month; in addition,
energy intake significantly dropped from the first week to the last week in households
doing grocery shopping once per month or less [51]. Another study showed low-income
families had decreased number of food servings in the last week of the month [97].
Moreover, a study reported that in food insecure households, meat and energy intake
dropped significantly in children as payday came close [98]. A similar study in Canada
analyzed the dietary intake using 24-hour dietary recalls in low-income women by their
food security status; after the receipt of income, within-month declines of TEI was found
in food sincere women [99].However, all these studies lacked the data of women’s
weight status to be associated with the monthly declines.
33
2.2 Questionnaire-based Measurements and Dietary Intake Assessment
This section introduces tools used in the study for measuring household food
security, disordered eating behaviors, and dietary intake data.
2.2.1 Household Food Insecurity Measurement
In U.S., the development of reliable measures for hunger was promoted by a
Presidential Task Force Report in U.S. in 1984, which reported hunger in U.S. but could
not quantity the extent [1]. This report brought up the uncertainty of the exact number of
people affected by food insecurity and to what extent they were affected, which makes it
necessary to have a food insecurity measurement tool. Therefore, in 1990 the National
Nutrition Monitoring and Related Research Act was enacted to emphasize the importance
of developing a standard and consistent measurement for food insecurity in U.S. and
defining food insecurity [1]. A tool that provides a valid and comparable measurement in
food insecurity can help researchers to estimate the prevalence of food insecurity,
correctly identify the causes and consequences, target high-risk population groups, and
establish, monitor, and evaluate intervention programs.
Several methods have been used to assess household food insecurity [100], such
as national economic indicators like food production and dietary energy supply, and
within-country level methods like household income and expenditure, individual dietary
intake, nutritional status and anthropometric measurement. These indicators are
intensively dependent on time, skills and resources; more importantly, none of them can

34
help to understand the conceptualization in food insecurity [100], [101]. Therefore, a
qualitative food security scale (questionnaire) is necessary to account for the experience
of food insecurity in the household. In addition, a qualitative food security scale costs
less, and can be applied easily in different populations and in multiple levels (e.g.
individual, household, and community level).
In order to quantify, monitor and evaluate food insecurity with an easy-to-use and
valid tool, researchers from various U.S. federal agencies, academics, and the private-
sector have been involved in the development of questionnaire-based measures to
quantify the extent in food insecurity over the last twenty years [102], using approaches
like in-depth interview, focus group, and validation studies to develop tools and measure
the validity of developed tools in different population groups.
One of the first studies in the food security scale development was part of the
Community Childhood Hunger Identification Project (CCHIP), which was based on the
1983 Massachusetts Nutrition Survey. This study developed an 8-item tool specifically
for low-income households with children, asking about coping methods and sequential
events to deal with food insecurity process from mild food insecurity to severe hunger in
the previous 12 months [103]. The study defined hunger as ―food insufficiency due to
lack of resources‖ [104]. At approximately the same time as the CCHIP tool was
developed, Radimer and colleagues at Cornell University constructed the
Radimer/Cornell scale by conducting open-ended personal interviews with low-income
women to assess their perceptions in food insecurity and hunger for themselves as well as
their children. The conceptual definition of hunger and the 12-item tool were developed
35
based on these women’s statements and further factor and psychometric analysis. Half of
the items were about the perceptions in food insecurity and half were about food
insecurity related behaviors [105].
The CCHIP and Radimer/Cornell scale provide basic foundation for the
development of the U.S. Core Food Security Module (CFSM) later on in 1990 [106].
This module uses 18 items as a whole to assess the underlying level of severity of
household food insecurity and hunger, assessing food insecurity experiences and coping
strategies to subsequent events during the previous 12 months.
The CFSM was further modified to generate the U.S. Household Food Security
Survey Module (US-HFSSM) by the U.S. Department of Agriculture (USDA) in the mid-
1990s [3]. This module is composed of 18 questions based on the CFSM, 10 of which are
for adult food insecurity experience, and 8 are for children [3]. It asks about experience
and coping approaches to food insecurity from worrying about running out of food to
reduction of quality and quantity of foods during the previous 12 months. Using this tool,
a food security score can be generated for each household to categorize the households
into four food security status: food secure, food insecure without hunger, food insecure
with moderate hunger and food insecurity with severe hunger. In 2005, the category food
insecure without hunger was changed to low food security, and food insecurity with
hunger was changed to very low food security. The new four categories since 2005 are:
high food security, marginal food security, low food security, and very low food security
[107]. The US-HFSSM (Table 2.1) is the module currently applied in NHANES and has
been widely adapted and applied to different populations (see 2.3.2).
36
In addition, there is a short form of the US-HFSSM developed for application in
screening, monitoring, and evaluating intervention programs when resources are limited.
It contains 6 items from the 10-item adult component in; no child component was
included. The short form was comparable to US-HFSSM when approximating the three
major categories of food secure, food insecure without hunger, and food insecure with
hunger in US-HFSSM, but performed a little better in households without children than
households with children [108], [109].
Validation of Questionnaire-based Household Food Insecurity Measurement
After developing a questionnaire-based tool, it is essential to verify the validity of
this measurement: to ensure the very tool analytically captures the exact underlying
construct of what to be measured. To be a valid tool in a specific population, a household
food insecurity scale should measure the exact experience and coping approaches of
household food security during a period of time in the very population. Two major types
of validity measures have been commonly used in validating household food security
scales: internal validity and criterion-related validity.
Internal validity refers to the capability of the tool to capture each single
underlying construct in food insecurity precisely, meanwhile maintaining consistency
with empirical data and patterns of confirmative responses. One common method to
evaluate the internal validity in food insecurity tools is the Rasch Model. This model
assesses the psychometric characteristics of items in measurement tools by detecting
37
whether there is any problem within the items, about the order of the items within the
questionnaire, and about the score interpretation of the tool [3].
The internal validity of qualitative food security scales have been confirmed
[110], [111], [112], [113], [7], [60]. For example, tools translated from CCHIP and US-
HFSSM have been locally adapted and tested separately by Rasch Model in Antioquia,
Colombia [7] and Campinas, Brazil [60]. Both tools showed reasonable responses
compared to expected values of each item, and consistent patterns of affirmative
responses. These encouraging results made the two countries incorporate these two tools
into their national nutrition surveys. Another study in Trinidad, an English-speaking
Caribbean country showed that the six-item short form of HFSSM is suitable for food
insecurity classification in adults and adolescents in the country [112], [113]. In U.S., the
CFSM has been confirmed to fit well in the Hawaii population as well as with national
data [110]. Similar as the results reported by studies using Rasch Models, another
validation study applied generalized linear model to evaluate the 1995, 1997 and 1999
Food Security Module used by USDA, and confirmed the validation and robustness of
the questionnaire-based tool in measuring food insecurity [111].
Criterion-related validity is defined as the comparability of the results of the
tested tool with those of one or more criterion-related methods which are theorized to be
related to the measured concept [114]. Since there is no gold-standard for measuring food
insecurity, researchers have assessed the criterion-related validity of food security scales
by evaluating their correlation with socioeconomic and demographic indicators like
income, education, dietary intake, nutrition status, and health outcomes [104][115]. These
38
indicators are hypothesized to be related to and vary by household food insecurity status.
As discussed in section 2.1.1, a number of social factors like low income, single parent,
being Black or Hispanic, large household size, and lower education [4], [53], [59], [6],
[53], and health outcomes including lower nutrient intake [11], [12], [13], [14] and poor
health status [15], [64] , [65], [66], [16], [67], [59], [18] have been associated with
household food insecurity, measured by adapted questionnaire-based tools.
In spite of internal and criterion-related validity, external validity is of greater
interest in some situations. External validity is also called ―generalizability‖, indicating
that the tool can be universally used in different population settings. In U.S., HFSSM
shows its suitability in capturing the experience in food insecurity and hunger in different
populations including minority groups like Asian and Pacific Islanders and Latinos [116],
[110], [19], [61]. Adapted HFSSM also demonstrate a similar suitability in countries
inside and outside the America, including Canada, Latin America and Caribbean
countries, UK, Russia, Java, Thailand, Bangladesh, Philippines, Republic of Korea,
Southwest Pacific Islands countries, and countries in Africa and West Africa [104]. This
generalizability may be due to the similarity of experience to food insecurity from
worrying to coping approaches.
2.2.2 Self-reported Eating Disorders Examination Questionnaire (EDE-Q)
EDE-Q is the self-reported version of the Eating Disorder Examination (EDE)
[117], an investigator-based instrument. EDE is considered as the ―gold standard‖ for
assessing the complex psychopathological features in eating disorders [118], [119]; as a
39
self-reported tool, EDE-Q is more welcome because of its privacy, efficiency, and
reduced time and money expenditure. EDE-Q contains 28 items to comprehensively
assess the aspects of ―specific psychopathology‖ in eating disorders in the past 28 days
[117]. There are two types of data collected by EDE-Q: the frequency data on key
behaviors of eating disorders (6 items - times of overeating episodes, days of overeating
episodes, extreme dietary restraint, use of self-induced vomiting, use of laxative, and
excessive exercise) and the subscale scores on the severity of four psychopathological
aspects (i.e. Restraint, Eating Concern, Shape Concern and Weight Concern) [120]. Here
are the items included in each subscale: restraint (restraint over eating, avoidance of
eating, food avoidance, dietary rules, and empty stomach), eating concern (preoccupation
with food/eating/calories, fear of losing control over eating, eating in secret, social eating,
and guilt about eating), shape concern (flat stomach, preoccupation with shape or weight,
importance of shape, fear of weight gain, dissatisfaction with shape, discomfort seeing
body, avoidance of exposure, and feelings of fatness), and weight concern (importance of
weight, reaction to prescribed weighting, preoccupation with shape or weight,
dissatisfaction with weight, and desire to lose weight). The subscale data are obtained
from 22 items using a 7-point rating scheme [117]: a particular subscale score is
calculated by dividing the sum of the ratings of items belonging to this subscale by the
total item numbers. Thus a higher score represents greater severity of the certain
behavior. Finally, a global score is generated by dividing the sum of subscale scores by
the total number of subscales [120]. Besides, EDE-Q also asks about self-reported weight
40
and height, missed menstrual periods in the past three to four months, and use of any diet
pills [117].
There are several self-report instruments developed for binge eating assessment,
including general measures for eating disorders: the Eating Attitudes Test [121] and the
Eating Disorder Inventory [122], and specific measures for binge eating behaviors: Binge
Eating Scale [123], the Bulimia Test [124], and the Questionnaire on Eating and Weight
Patterns [125]. However, these measures have been criticized [118] by the lack of
definition of ―binge eating‖, providing only a complicated index rather than clear
measures of specific binge eating behaviors, and without a specific time frame.
Comparatively, the EDE-Q focuses on the overeating episodes and accompanied feelings
of loss of control on the past 28 days. Specifically, the EDE-Q assesses binge eating
behaviors by yielding both a comprehensive index (the Eating Concern subscale score) as
well as the frequency of number of days/times on which binge eating occurred by the
following two items: (1) ―Over the past 28 days, how many times have you eaten what
other people would regard as an unusually large amount of food?‖, and (2) ―On how
many of these times did you have a sense of having lost control over your eating (at the
time that you were eating)?‖. Here the EDE-Q defines binge eating as ―eating what others
would regard as an unusually large amount of food for the circumstances, accompanied
by a sense of having lost control over eating‖ [120]. Furthermore, EDE-Q is a
comprehensive tool for measuring eating disorders. The use of EDE-Q can help to assess
binge eating behaviors and potentially associated eating disorder psychopathology in
food insecure and overweight/obese women in the dissertation.

41
EDE-Q has been used to identify binge eating in previous studies in women [126].
One study classified binge eaters for reporting at least four times of binge eating in the
past 28 days, and binged in the previous three months [126]. Another study measured
binge eating by assessing how many days was the number of days on which the subjects
―eating an unusually large amount of food for the circumstances, accompanied by a sense
of loss of control‖ [127].
The validity of EDE-Q have been studied in the general community population
[120], [128], college students [129], female substance abusers [130], and people with
binge eating disorder and uncontrolled overeating [127], [131]. The external validity was
tested by comparing EDE-Q and interviewer-based EDE: high correlations are confirmed
between the two on subscales and on key behavioral features [120], [130], [127].
However, some studies have reported that it is more accurate for EDE-Q to identify
unambiguous behaviors rather than more complex features such as binge eating and
shape concerns [120], [130], and vomiting episodes and objective binge eating [131].
Another study reported that EDE-Q detected higher scores in complex behaviors than
EDE [127]. The internal validity of EDE-Q is tested as well: great internal consistency
and test-retest reliability for all four subscales were reported in a sample of 139 female
undergraduate students who were tested and re-tested after two weeks [129]. But this
study also showed that items to measure key behavioral features were a little less stable
than those of subscales [129]. In addition, community norms for EDE-Q have been
developed for young adult women [132] and adolescent girls [133]. The norms for young
adults women were developed from a large sample (n = 5,255) of women in Australia
42
[132]. The study assessed features of EDE-Q for each of five-yr age range in women
aged 18 – 42 yr: 18–22, 23–27, 28–32, 33–37, and 38–42 yr [132]. [132]The Mean scores
(SDs) for the Restraint, Eating Concern, Weight Concern and Shape Concern subscales
were 1.30 (1.40), 0.76 (1.06), 1.79 (1.51) and 2.23 (1.65), respectively, and the mean
global score was 1.52 (1.25) for the total sample; and the frequency for any objective and
subjective overeating episodes was 17.3% and 22.1%, respectively.
2.2.3 Dietary Assessment Methods
There are three dietary assessment methods commonly used in nutrient
epidemiology: food records, food frequency questionnaires (FFQ), and 24-hour dietary
recalls. Each method has its advantages and limitations. In this section a brief review of
the three methods is provided, and he reasons for choosing 24-hour dietary recalls rather
than other dietary assessment methods in this study are presented as well.
In the method of food records, participants are asked to estimate (or weigh) and
record the amounts of all the foods and beverages they consumed from all meals and
snacks for a period of time, sometimes including food description, preparation methods,
brand names, and other details relating to food consumption [134]. Food records are
usually used to obtain exact individual dietary intake of energy or specific macro-/micro-
nutrients, or to give reference values for another dietary assessment method in validity
studies. The limitations of this method include: 1) selection bias – this method requires
the tested population with a relatively high literacy level as well as a high degree of self-
motivation; 2) the estimated food record method tends to put research burden on
43
participants. This may affect study results and yield underestimation, such as incomplete
records and reduced dietary intake, especially when the number of recording days
increases [134]. Consequently, the method itself can change food consumption behaviors;
3) this method could bias the dietary intake estimation by changing individuals’ food
consumption patterns: participants may begin to pay attention to their dietary intake
during food recording process, and try to change their diet purposely.
Food frequency questionnaires (FFQs) are methods used to assess the usual
dietary intake by asking the frequency of consumptions of certain groups of food during a
period of time [134]. Typical FFQs emphasize the frequency rather than exact portion
sizes, but some FFQs also gather information on rough estimation of portion sizes. The
most important advantage of FFQs is that it is a more reliable way to measure
individuals’ usual (long-term) dietary intake compared to food records or 24-hour dietary
recalls. In addition, the questionnaire form of FFQs makes it easy to administer, and
hence less burdensome for participants compared to food records. However, FFQs do not
measure many details of dietary intake, and hence cannot quantify dietary intakes as
accurately as 24-hour recalls or food records, particularly in a short time period. FFQs are
usually used to rank individuals by their dietary intake rather than estimating the exact
dietary intake values during specific time periods. Furthermore, FFQs can lead to report
bias and recall bias since it is usually self-reported and asks for dietary consumption in
previous months or even years.
In 24-hour dietary recalls, interviewers ask individuals to report their food
consumption during the preceding 24 hours or on the previous day [134]. 24-hour recalls
44
are usually used to obtain group dietary intake or individual dietary intake of energy or
specific macro-/micro-nutrients [134]. This requires detailed information about dietary
intake. To obtain such information, interviewers usually use probing questions and
certain procedures during the process: more of the procedures are discussed in the
following ―Multiple-Pass Approach‖ section. 24-hour recall data can be gathered via
either in-person or phone interviews. There have been concerns on the accuracy of 24-
hour recall results gathered by phone interviews [135]. However, it is shown that as long
as interviewees and interviewers have a face-to-face interview at the beginning, the
following intake estimation from in-person interviews and telephone recalls are
―interchangeable‖, since interviewees have experience on portion size estimation and
interviewers have some information on basic food consumption habits of interviewees
[136], [135].
There are several reasons to choose 24-hour dietary recalls in assessing the dietary
intake in this study.1) Compared to other dietary assessment methods like FFQs, 24-hour
dietary recalls can assess the exact varieties and provide quantitative estimation of dietary
intake in a short time period [134], [137]. The quantification of dietary intake is critical in
this study to find the variations of TEI among low-income women. 2) Most subjects in
the study would be of low literacy level and socioeconomic status (SES). Therefore, a 24-
hour dietary recall administered by trained interviewers puts low burden to participants,
reduces selection bias (a type of bias which is commonly reported in self-conducting
methods like food records) [134], [137], and obtain more information on dietary intake
by using probing questions. In addition, this method will not change participants’ dietary
45
behaviors. 3) The short recall period in this method, around 24 hours, can help
respondents to recall most of their preceding food consumption, which in turn reduces the
recall bias [134].
Based on the reasons listed above, 24-hour dietary recalls are an appropriate
method for dietary assessment in this study. However, there are limitations for this
method. One of the limitations is that the accuracy of 24-hour recalls is highly depending
on interviewing skills. And since this is still a self-report method, reporting bias (e.g. TEI
underreport in obese participants) still exists in 24-hour recalls [134]. Such limitations
can be improved by standardized data collection protocols and comprehensive quality
assurance system (see 3.2.2). Another shortcoming of 24-hour dietary recalls is its
uncertainty to measure individuals’ usual dietary intake, since the single-day food
consumption measured by this method may vary day by day. More details and the
solution to this limitation are provided in the following section.
The Variation in Dietary Intake Collected by 24-hour Dietary Recalls
It has been widely concerned by researchers that 24-hour dietary recalls cannot
reflect the usual dietary intake of individuals [134], [137]. That is because the usual
dietary intake of a free-living person is featured as an underlying consistent eating pattern
along with day-to-day variation [137], while a single 24-hour dietary recall can only
catch food consumption on a single day. To fully understand this contradiction, the
sources of variation in 24-hour dietary recalls and their influences to the estimation of
different nutrient intake is explained here.
46
There are two major components in the variation: the inter-individual variance (or
between-person variation) and the intra-individual variance (or within-person variation)
[138]. The inter-individual variance is the difference of interest: the true difference of
dietary intake among different individuals. On the contrast, the intra-individual variance
should be as low as possible in order to catch the usual dietary intake pattern of
individuals. The day-to-day variation within individuals is the most significant
contributor to the intra-person variance when estimating different nutrient intake: TEI,
macronutrients (i.e. carbohydrates, fat, and protein), and micronutrients (i.e. vitamins and
minerals) [139]. Among all the nutrients, the TEI is quite well regulated by physiologic
mechanisms and has the lowest day-to-day variation [54], [137]. It was reported that the
intra-individual variance was equal to the inter-individual variance in TEI [138].
Comparatively, specific nutrients have much higher ratios of inter-individual variance
(i.e. greater than 1), which means these nutrients have higher intra-individual variance.
For this reason, it is necessary to have more days in data collection to obtain more
accurate estimation. Among these specific nutrients, most of the macronutrients, due to
their high contribution to the TEI, have a somewhat lower day-to-day variation compared
to micronutrients [137]. Other nutrients, like polyunsaturated fat, cholesterol, and most
micronutrients (e.g. Vitamin A) have much higher degrees of day-to-day variation [137],
[138]. This high variation is because these nutrients are highly concentrated in certain
foods; the consumption of these foods is depending on the individual’s food choice on the
particular day [137]. Besides the day-to-day variation, days of the week effect has been
found to be another component of the intra-individual variance only in females [138].
47
Data showed that working women consumed more food on Sunday than on weekdays
[138]. Seasonal variation is another reported component of intra-individual variance,
which may not be a significant contributor in the United States [137]. It is shown that the
correlations between 1-week diet records did not vary substantially within three, six, nine
or twelve months [140].
Because of the large intra-individual variation, a single 24-hour dietary recall is a
poor estimate for the usual dietary intake of individuals; multiple-day recalls are needed.
But how many days are necessary for estimation? The optimal number of recalls can vary
depending on the nutrients or food of interest [54]: the larger day-to-day variation of the
nutrient of interest, the more recalls are needed to get an accurate estimation. For certain
nutrients, it is even beyond practical possibilities to get a highly accurate estimate by
repeated recalls [137]. For example, it is estimated that 424 repeated days are needed to
allow for 95% of the observed values being within 10% of the true mean of an
individual’s Vitamin A intake. Comparatively, only 7 days are needed for the true mean
of TEI to achieve the same accuracy [137]. In addition, to reduce the days of week effect,
multiple-day dietary recalls should include both weekdays and weekends proportionally
[134], [138].
Multiple-Pass Approach
As mentioned before, the interview process is critical to obtain accurate data in
24-hour food intake recalls. The multiple-pass approach introduced here has been widely
used in 24-hour dietary recalls in national surveys [141], [142], [143]. The multiple-pass
48
method has been proved as a validated way to estimate group energy intake: no
significant difference between reported energy intake and total energy expenditure
measured by doubly labeled water method (DLW) [144], [145], [53]. In the multiple-pass
approach, 3 to 5 standard steps are applied to assure highly-qualified results. The passes
in this study include ―a quick list, detailed description, and review‖. In the first step,
subjects are asked to list all the foods and beverages consumed on the previous day in any
order they liked. The next step is a detailed description of all the listed food. Interviewers
use probing questions to gather detailed information on the ingredients, portion sizes,
brand names, and preparation methods. Food models can be used to help subjects for
portion size estimation. In the final review step, interviewers go through all listed
information with the subjects, making sure the accuracy and any forgotten foods or
beverages. Finally, interviewers should check all the information again after each step.
2.3.4 Shelf Food-Inventory
Shelf food-inventory is a questionnaire with an extensive list of food items
commonly found in U.S. households. There are in total 19 food groups consisting of 222
items, with an open-ended question at the end inquiring about any other items in the
household.
Household inventory questionnaires have been validated to assess food selection
behaviors. The self-reported shelf inventory was first described by Crockett et al. [146] as
part of a nutrition education project in 1992: the self-report shelf inventory was compared
with a food frequency questionnaire for its overall accuracy, and an interviewer-based
49
shelf inventory administered on the same day for the specificity and sensitivity. Results
confirmed the validity for the tool to measure the presence/absence of food items in
households [146]. As such, it may be a useful tool for measuring the household food
stores in this study. Another validation study in Chicago found the self-report inventory
was effective in assessing food purchase behaviors in low-income black and Hispanic
households, using a food frequency questionnaire and the 24-hour food diary as reference
methods [147]. The shelf-inventory instrument has been successfully used in many
studies [19], [61], [39]. For example, a study measuring food insecurity and household
food supply in Latino households found that the most commonly reported food supply by
Californian Latino families was very similar to that reported in the Chicago validation
study [19].
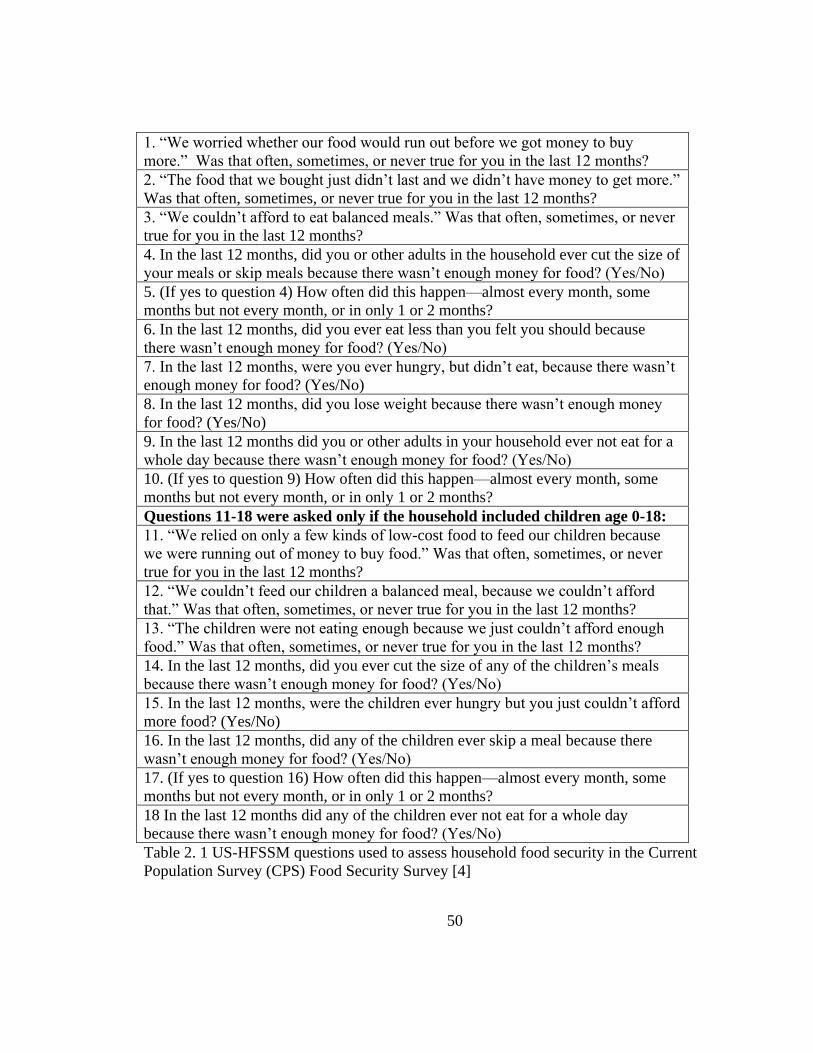
50
1. ―We worried whether our food would run out before we got money to buy
more.‖ Was that often, sometimes, or never true for you in the last 12 months?
2. ―The food that we bought just didn’t last and we didn’t have money to get more.‖
Was that often, sometimes, or never true for you in the last 12 months?
3. ―We couldn’t afford to eat balanced meals.‖ Was that often, sometimes, or never
true for you in the last 12 months?
4. In the last 12 months, did you or other adults in the household ever cut the size of
your meals or skip meals because there wasn’t enough money for food? (Yes/No)
5. (If yes to question 4) How often did this happen—almost every month, some
months but not every month, or in only 1 or 2 months?
6. In the last 12 months, did you ever eat less than you felt you should because
there wasn’t enough money for food? (Yes/No)
7. In the last 12 months, were you ever hungry, but didn’t eat, because there wasn’t
enough money for food? (Yes/No)
8. In the last 12 months, did you lose weight because there wasn’t enough money
for food? (Yes/No)
9. In the last 12 months did you or other adults in your household ever not eat for a
whole day because there wasn’t enough money for food? (Yes/No)
10. (If yes to question 9) How often did this happen—almost every month, some
months but not every month, or in only 1 or 2 months?
Questions 11-18 were asked only if the household included children age 0-18:
11. ―We relied on only a few kinds of low-cost food to feed our children because
we were running out of money to buy food.‖ Was that often, sometimes, or never
true for you in the last 12 months?
12. ―We couldn’t feed our children a balanced meal, because we couldn’t afford
that.‖ Was that often, sometimes, or never true for you in the last 12 months?
13. ―The children were not eating enough because we just couldn’t afford enough
food.‖ Was that often, sometimes, or never true for you in the last 12 months?
14. In the last 12 months, did you ever cut the size of any of the children’s meals
because there wasn’t enough money for food? (Yes/No)
15. In the last 12 months, were the children ever hungry but you just couldn’t afford
more food? (Yes/No)
16. In the last 12 months, did any of the children ever skip a meal because there
wasn’t enough money for food? (Yes/No)
17. (If yes to question 16) How often did this happen—almost every month, some
months but not every month, or in only 1 or 2 months?
18 In the last 12 months did any of the children ever not eat for a whole day
because there wasn’t enough money for food? (Yes/No)
Table 2. 1 US-HFSSM questions used to assess household food security in the Current
Population Survey (CPS) Food Security Survey [4]
51
CHAPTER 3
Addressing the Association of Food Insecurity and Overweight/Obesity by Testing
the “Monthly Cycle of Food Abundance and Food Shortage” Hypothesis
This chapter presents the background, study design, data collection and analysis
methods, and results and conclusions in the Ohio study. The hypothesis tested in the
study is ―the monthly cycle of food abundance and food shortage‖ hypothesis, which
suggests that women in food insecure households experience a monthly cycling pattern of
food intake featured by periods of food deprivation or limited food selection, followed by
periods of binge eating characterized by increased total energy intake (TEI).
3.1 Introduction
The paradoxical association in food insecurity and obesity has been studied for
about twenty years. Several possibilities have been proposed to explain this association.
The most popular one is that when nutritionally-balanced diets are less available in food
insecure households [44], [45], high-fat-high-calorie food is be the most affordable
energy source to prevent hunger [46], [47], [48]. An extended scenario of this hypothesis
is that food insecure people may indulge in highly palatable and energy-rich food and
hence have an increased risk of obesity [46]. Another hypothesis for the paradoxical
association is that obesity could be a result of a periodic cycle of food availability and
52
food shortage; such a cycle may result in body change and increase the efficiency of fat
deposition when food is available again [46], [47], [49]. The third hypothesis focuses on
the psychosocial stress prevalent among food insecure people, resulting in endocrine
abnormalities and promoting visceral obesity [46], [50]. Although a number of
hypotheses were proposed for the paradoxical relationship in food insecurity and obesity,
none of them have yet been tested. In addition, most of the previous studies were from
cross-sectional data, which could only provide correlated information of dietary intake,
food insecurity and weight status at a defined time. For these reasons, there is a need for a
prospective study to test these hypotheses in food insecure people.
To address this paradoxical association, the ―monthly cycle of food abundance
and food shortage‖ hypothesis is proposed in the study. According to this hypothesis,
food insecure households have access to abundant food sources during the first few
weeks of the month, while face problems of food shortage at the end. Thus, higher energy
consumption may occur in food insecure people at the beginning of the month when food
supply is plentiful, and restricted energy intake may happen at the end of the month. Such
a monthly cycle of food abundance and food shortage may repeat month to month when
the household keeps food insecure. This study is one of the few studies using a
prospective study design to address the relationship in food insecurity and obesity among
women [51], [52], [53]; a prospective design allows exploring the changes of dietary
intake and the monthly varying patterns as well.
The ―monthly cycle of food abundance and food shortage‖ hypothesis has not yet
been tested. Nevertheless, several studies have shown support for this hypothesis. One

53
study found that food expenditure in food stamps receiving households peaked
dramatically in the first three days right after the benefits were received but flattened out
throughout the rest of the month; in addition, energy intake significantly dropped from
the first week to the last week in households doing grocery shopping once per month or
less [51]. Another study in public health showed low-income families demonstrated
decreased number of food servings in the last week of the month [97]. Furthermore,
researchers believe that a periodic pattern of food deprivation/food restriction tends to
promote binge eating behaviors and excessive weight gain when a plentiful food supply
is available [93], [94], [92], [90], [95]; there was evidence supporting a causal
relationship between child-feeding restricting strategies and childhood overweight [95].
The purpose of the study is to testify a monthly cycle of food abundance and food
shortage among a group of low-income women in Ohio, and its association with food
security and weight status. Specifically, the following hypotheses are proposed to be
tested in this study:
1. FIS/ovob women will have higher TEI at the beginning of the month compared to
the end of the month in three continuous month.
2. FIS/ovob women will have more household food items at the beginning of the
month compared to the end of the month in three continuous month.
3. The monthly decrease of TEI and household food items will be greater in
FIS/ovob women compared to FS/norm, FS/ovob, and FIS/norm women.
4. FIS/ovob women will have more severe disordered eating behaviors than
FS/norm, FS/ovob, and FIS/norm women.
54
5. Among food insecure women, food stamp recipients will have higher body mass
index (BMI) and greater monthly decrease in TEI and household food items than
food stamp non-recipients.
The study can contribute key information on how episodic food intake patterns
mediate the association in food insecurity and obesity, illustrating the need to promote
consistent eating patterns in food insecure people. Moreover, the study provides
information for policy makers to make changes in federally funded food assistance
programs which assign benefits on a monthly basis: a more even distribution of such
benefits throughout the month, combined with intervention programs emphasizing better
food shopping strategies and more even intra-household food distribution might result in
a reduction of episodic overeating behavior patterns in food insecure households.
3.2 Methods
The study was designed to compare the total energy intake (TEI) and household
food stores at the beginning of the months with those at the end of the months in three
continuous months, among women groups of different food security status and weight
status. Featured characteristics of disordered eating were also compared among women
groups.
3.2.1 Subjects
55
The target population in the study is food insecure and overweight/obese women
in Ohio. The major source of sample recruitment was participants of Ohio Family
Nutrition Program (FNP), a free nutrition education program for low-income adults in
Ohio. The reason to use FNP participants as the major source for subject recruitment was
because these adults are FSP eligible individuals. In a previous study, food stamp
recipients were observed experiencing a monthly pattern of food expenditure [51]. In
Ohio FNP is a program supporting families with nutrition education in over sixty five
counties. Its presence throughout Ohio allows us to assure the local support needed for
this study. Also it helps to count on nutritionists and interviewer staff with rich
experience working in low-income communities, and/or leading the implementation of
FNP in Ohio. In addition, in 2007 77% of FNP participants in Ohio were women
(personal communication with FNP staff).
Subjects were recruited by The Ohio State University (OSU) Extension educators
in three Ohio counties: Butler County (South), Richland County and Huron County
(North). Counties were selected based on the availability of human resources in local
OSU Extension offices, the participation of food assistance program staff, and geographic
locations. Richland County and Huron County are located in the northern area of Ohio.
As of the census of 2000 [148], about 50,000 households were in Richland County and
22,000 households were in Huron County; approximately 30% of the households in these
two counties had children under 18. The percentages of families below the poverty line
were about 8% and 6% in Richland county and Huron county, and the per capita income
was $18,582 for Richland County and $18,133 for Huron County, respectively. Butler
56
County has about 123,000 households and more than 30% of which had children under
18. The per capita income for Butler County was $22,076; nearly 5% of the families in
Butler County were below the poverty line. Since the average per capita income was
$21,003 in Ohio and $21,587 in U.S.in 2000 [148], the income in Richland County and
Huron County were below the average level [148]. In addition, most of the residents in
these three counties were white people [148].
To recruit low-income women, flyers and cards with brief study introduction and
staff contact information were posted and distributed in places where Family Nutrition
Program (FNP) participants are gathered. Registered potential subjects were contacted
and screened for age, race, and pregnancy/lactation status in the local OSU Extension
offices using a short screening form. Before entering the study, participants were read a
script introducing the study and their rights and responsibilities during the research period
after acceptance. A consent form was signed by them after they read it. Each participant
received $15 gift card for each interview. Incentives were given to interviewees after
each interview.
The study was designed to recruit 80 women evenly distributed throughout the
year and followed each of them for three months. For example, group 1=January-March,
group 2=April-June, group 3=July-September, group 4=October-December. This is
because food assistance program participants remain in the program for a short period of
time, and the risk factors of food insecurity such as household income and household
member employment are affected by seasonal factors. Women should be Caucasian,
reproductive age (22-49 years of age), non-pregnant and non-lactating. The sample size

57
of eighty women was determined based on the following assumptions: 1) significant
differences in mean energy intake (kcal and % of RDA) of 10% or greater between food
insecure and food secure women; and 2) probability of 80% to detect differences at a
significance level of 0.05. These calculations are based on data from the CSFII [38]. In
addition, a sample size of 80 allows for a 25% attrition rate. After recruitment,
participants were then classified into four categories by their Body Mass Index
(BMI>=25: overweight/obese; BMI<25: normal weight) and food security status (food
secure and food insecure): food secure and normal weight (FS/norm), food secure and
overweight/obese (FS/ovob), food insecure and normal weight (FIS/norm), and food
insecure and overweight/obese (FIS/ovob). However, it was difficult to recruit enough
sample size of women in each group throughout the year. And some women subjects
dropped in the middle of the study due to the hard economic status at the study time. As a
result of such a difficult situation, the study then expanded its recruitment range to all
low-income women (not only FNP participants). Finally, sixty-six women were present at
the first interview, while only forty women completed all six interviews. The attrition rate
was 40%.
Each woman was interviewed twice every month, during the first and last few
days of the month and six times in total. The first few days are ―beginning of the month‖
which represent the time when food stamps or any other financial resources are available
to the household. This study design allowed us to address the research question and to
identify differences due to seasonal changes. Interviewers who were responsible for
gathering data from the three counties were educators from the OSU Extension.
58
Interviews were face-to-face, conducted in the local OSU Extension offices, and lasted
between 1 and 1.5 hours.
3.2.2 Data Collection
Data collection methods included interviewer-administrated and self-reported
survey questionnaires, anthropometric measurements, and data entry. In this study,
interviewers were experienced OSU Extension educators working with low-income
population for a long time. To maintain high quality of data, interviewers were trained
with standardized data collection guides before subject recruitment and interviews:
details including consent form and script reading, which tool(s) should be administered in
a certain interview, how to ask questions to women subjects during the interview
(particularly questions about dietary intake ), how to measure body weight and height,
and how to review the surveys for completeness. To assure data quality, each county was
assigned a supervisor (OSU Extension officers) to re-review each survey for
completeness and accuracy before sending back to the central office for data entry.
Communications between interviewers and study researchers were kept during the data
collection process. Unexpected situation were discussed and retraining of interviewers
was conducted when data collection methods were modified. Completed surveys were
sent back to the central office (the office of the principle investigator) and were locked
for reasons of confidentiality. The study protocol was approved by the Institutional
Review Board (IRB) at The Ohio State University.

59
Received surveys were first reviewed for obvious errors such as lack of some
surveys, no signature from the supervisor, wrong age, blank survey questions, and so on.
After screening, data entry were conducted in the central office. Data entry personnel
were trained to use standardized coding system and provided sample templates. All
survey data, except for 24-hour recalls, were entered into spreadsheets; data of 24-hour
dietary recalls were recorded in a word document. Entered data were reviewed by another
data entry person, and then rechecked by the project coordinator (myself) for erroneous
items, unreasonable results, or extreme observations before data analysis.
In the following sections, survey tools and data collection methods including
family record questionnaire, household food security survey module (HFSSM), 24-hour
dietary recall, shelf food-inventory questionnaire, eating disorders examination
questionnaire (EDE-Q), and weight and height measurements are introduced.
3.2.2.1 Family Record Questionnaire
Family record questionnaire gathers information on demographics and socio-
economic characteristics about the participant and her household members. Items
assessed included age, household size, family composition, birth and living place,
pregnant or lactating status, income, education, use/access to food assistance, the latest
date for receiving food stamps, housing expenditure, cooking skills and the frequency of
cooking. This tool was administered only during the first interview.
60
3.2.2.2 Household Food Security Survey Module (HFSSM)
The development and validity testing of household food security status
measurement has been addressed in detail in previous sections (section 2.3).The survey
module used in this study was a 16-item questionnaire addressing the experiences on
multiple levels in food insecurity in the household due to financial restraints in the month
previous to the interview. This module was modified from the U.S. Household Food
Security Supplemental Module (US-HFSSM): three items asking about the frequency of
some food insecurity experience were excluded from the US-HFSSM and one item about
whether the household has children under 18 or not was added to the 16-item HFSSM
used in the study. The last seven questions in the module is regarding to children’s food
insecurity status. In addition, an affirmative response to each item led to a frequency of
occurrence question in the modified version, asking about how often the situation
happens: rarely, sometimes, or always. This tool was administered at the beginning of
Month 1 (i.e. survey 1).
3.2.2.3 24-hour Dietary Recalls
The 24- hour dietary recall method was applied to assess the total energy intake
(TEI) of participating individuals at the beginning and the end of the months. In total six
dietary recalls were administered in three months, with each month had one recall at the
beginning and one at the end. The 24-hour dietary recall questionnaire was asked by
trained interviewers in all six interviews (i.e. survey 1 to survey 6). Although multiple
recalls are needed for valid estimation on individual dietary intake, it has been confirmed
61
that a single-day 24-hour recall is a valid way to estimate the unbiased mean of dietary
intake in a group with a greatly-overestimated standard deviation [54], [137]. In this
study, the research purpose is to measure TEI in particular women groups. In addition,
the intra-individual variation of the variable of most interest - TEI is fairly low.
24-hour recall data were collected with the assistance of the multiple-pass
approach [141] [142]. The passes in this study included ―a quick list, detailed description,
and review‖. In the first step, subjects were asked to list all the foods and beverages
consumed on the previous day in any order they liked. The next step was a detailed
description of all the listed food. Interviewers used probing questions to gather detailed
information on the ingredients, portion sizes, brand names, and preparation methods.
Food models were also used to help subjects for portion size estimation. In the final
review step, interviewers went through all listed information with the subjects, making
sure the accuracy and any forgotten foods or beverages. In addition, interviewers were
required to check all the information again after each step.
Collected 24-hour dietary intake data were entered by trained data entry personnel
and were processed by ―The Food Processor‖ Program [149]. To obtain high quality
data, interviewers in the interviews and coders in the data processing period received
training and re-training. Other quality control methods including data review and data
recoding by another coder were applied.
3.2.2.4 Shelf Food-Inventory
62
Shelf food-inventory was used to collect information about household food supply
at the time of the interview. There are in total 19 food groups consisting of 222 items,
with an open-ended question at the end inquiring about any other items in the household.
A self-report version of this instrument was administered at each interview (i.e. survey 1
to survey 6) to assess the monthly variation pattern of household food supply.
3.2.2.5 Eating Disorders Examination Questionnaire (EDE-Q)
To further understand the experience of disordered, particularly binge eating
among food insecure and overweight/obese women, a self-reported Eating Disorders
Examination Questionnaire (EDE-Q) was administrated in the study at the fourth
interview (i.e. survey 4), when interviewers have established a closer relationship with
participants.
3.2.2.6 Anthropometrics
Participants’ height (centimeters) and weight (kilograms) were measured at the
first interview (i.e. survey 1). Trained interviewers were required to measure the weight
and height at least twice at each interview. A third measurement would be taken when
there was a difference of 0.3 kg or more in weight or 0.5 cm or more in height . Body
mass indexes (BMI) were then calculated by dividing weight by height squared (kg/m2)
[150].
3.3 Data Analysis

63
3.3.1 Data Processing
Data collected by certain tools were processed and analyzed based on the research
purposes. The 16-item HFSSM was coded as follows: negative responses to items were
coded as ―0‖, while affirmative responses were coded as ―1‖. A food security score was
assigned to each household as the sum of all affirmative points. Interviewed women were
subsequently categorized food security – including high food security (score 0) and
marginal food security (score 1-2), or food insecurity – including low food security (score
3-7 in households with children; 3-5 in households without children) and very low food
security (score 8 and above in households with children; 6 and above in households
without children) [107].
Data of 24-hour dietary recalls were analyzed by ―The Food Processor‖ program
[149] to calculate daily total energy intake (TEI) and other nutrient intake. Each subject
has six recalls which can yield three dietary intake data at the beginning of the months
and three at the end of the months. Average daily dietary intakes for the beginning and
the end of the month were then calculated by dividing the sum of intake values by three
days.
Food items in the Shelf Food-Inventory were categorized into six essential food
groups (i.e. grains, vegetables, fruits, milk, meat & beans, and oils) according to
Mypyramid Food Guidance System [151]. Each food group was analyzed by the number
of food items: the sum of all confirmed food item types during the interview. Only food
groups/individual food items present at both the beginning and the end of the month were
compared. To assess the monthly variation, number of food items were compared
64
between the beginning and the end of the three months. In addition, particular food items
accounting for the major variations in food groups were identified in the target
population: food insecure and obese women.
EDE data were analyzed using descriptive statistics and their associations with
food security and weight status. Two types of data were generated from EDE-Q: scores
of four subscales3 (i.e. Restraint, Eating Concern, Weight Concern and Shape Concern)
as well as a global score based on the subscales, and the frequency of key behaviors of
eating disorders. The subscale and global scores of EDE-Q were reported as the mean
scores and standard deviations of each subscale by individuals’ food security and weight
status, while each of the featured behaviors were analyzed by computing the proportion
of women reporting the specific behavior (either occasionally or frequently) in different
food security and weight status groups. The reported occurrence of key eating disorder
features (i.e. times of overeating episodes, days of overeating episodes, extreme dietary
restraint, use of self-induced vomiting, use of laxative, and excessive exercise) were
calculated for comparison of women from the food insecure and obese group with those
from other groups.
Anthropometric data (weight and height) were used to calculate BMI (kg/m2),
measured weight (kilograms) divided by measured height squared (meter square). BMI
was used to categorize subjects into two weight status groups: normal weight (BMI <
18.5-24.9 kg/m2), overweight/obesity (BMI >= 25 kg/m
2) [27]. Due to the small sample
3 It is required that more than half of the items need to be rated to calculate subscale scores [120].
65
size of women who were not overweight in this study, all women with BMI less than 25
were considered as normal weight.
3.3.2 Variables of Interest
This section provides a brief introduction for the variables of interest in the study:
1) Total energy intake (TEI), collected by 24-hour dietary recalls at the beginning
and the end of three continuous months.
2) Number of food item types, including total food items, food items in groups (18
food groups in the Food Shelf Inventory Questionnaire, and 6 essential food
groups recommended by USDA), and individual food items (i.e. food items
decreasing in two or three months). Data on Food Shelf Inventory were collected
at the beginning and the end of three continuous months.
3) The Eating Concern subscale score and the frequency of number of days/times on
which binge eating occurred.
4) Household food security status: food secure, and food insecure.
5) Weight status: normal weight, and overweight/obesity.
6) Demographic and household controls: women’s age, education (school in years),
household size, household income, housing expenditure last month, number of
receiving food assistance programs, and receiving food stamps or not.
3.3.3 Statistical Analysis

66
Women in the study were categorized into four groups based on their BMI and
food security status: food secure and normal weight (FS/norm), food secure and
overweight/obese (FS/ovob), food insecure and normal weight (FIS/norm), and food
insecure and overweight/obese (FIS/ovob). Demographic and household controls were
analyzed by descriptive statistics.
Paired t-tests were applied to examine the differences of household food supply
(total food items and food items in particular food groups) and the dietary intake (TEI,
macro/micro nutrients) between the beginning and the end of the months within each
women group.
Oneway analysis of variance (oneway-ANOVA) was used to test for differences
in EDE-Q subscale scores across the four women groups, while Chi-Square tests were for
differences in the occurrence frequency of featured eating disorder behaviors. Since the
sample sizes of four women groups in the study were different, the assumption of equal
variances (homogeneity) in oneway-ANOVA might be violated. To avoid a too liberal or
too conservative estimation, a simulated p-value was also calculated for oneway ANOVA
for more robust results4.
Two multivariate logistic regression models were generated to assess the risk
factors of showing a decreased TEI of 200 kcal or more in each month. Independent
variables were two dummy variables (i.e. food insecure or not, overweight/obese or not)
4 Assuming the means across groups are equal, STATA can perform ANOVA simulation many
times with given sample sizes and standard deviations, and calculate simulated p-values with confidence
intervals (CIs) given the very data pattern.
67
in the first model, and one dummy variable (i.e. women in the FIS/ovob group or not) in
the second model. Control variables included age, education (school years), household
income category, household size, housing expenditure last month, number of receiving
food assistance programs, and interviewed during holiday seasons or not.
All the statistical analyses were performed using the software package STATA
[152]. Statistically significant differences were determined at p < 0.05, and differences at
p < 0.1 was determined as marginally different.
3.4 Results
3.4.1 Subjects
Sample Sizes and Women Groups
The study was originally designed to recruit a sample size of 80 women, allowing
for a 25% attrition rate. The first interview (survey 1 in Month 1) recruited 66 eligible
women. However, women started to drop the study because of different reasons, like
unaffordable gas fee or not enough incentives. And some of the participants were not
available during the first or the last week of the months for dietary intake and household
food store measurements. To keep more participants in the study, the interview days were
extended to the first and last ten days of the months. Table 3.1 shows the sample sizes of
interviewed women in each women group (i.e. FS/norm, FS/ovob, FIS/norm, and
FIS/ovob) during the three months: 59 women in Month 1, 48 in Month 2, and 44 in
Month 3. In total 40 women had completed the six surveys.
68
Holiday Interviews
Most of the interviews were conducted during non-holiday seasons. But some of
the participants were interviewed during holiday seasons (i.e. November or December).
Due to the irregular food consumption in holiday times, participants’ dietary intake may
be affected by the interview time. A list of the numbers of participants interviewed during
holiday seasons were listed in Table 3.1. It was found that Month 2 had the highest
percentage of holiday season interviews (November 22.92%, December 27.08%), and
Month 3 had more participants interviewed in December (27.27%) and less in November
(6.82%) compared to Month 1 (November 23.73%, December 10.17%).
3.4.2 Characteristics of Subjects
In total forty women had completed six surveys. The demographics and featured
characteristics of these women were compared among the four groups of women in Table
3.2. On average households in this study had 4 household members. Most of the women
were in low-income households: 82.50% of the households had a monthly income less
than $2000 and 62.50% of the households were under $1750 per month; only one
household made more than $2,500 per month (data not shown). The median of household
monthly income was between $1251-1500. According to the 2009 Poverty Guideline by
the Department of Health and Human Services (HHS) which is $22,050 per year (i.e.
$1837.5 per month) for a 4-member household [153], the majority of respondents should
be women living in low-income households.
69
No significant differences were found in women’s age, household size, household
income, and school years. Seventy percent of the women were from food insecure
households: fifty percent were low food secure and twenty percent were very low food
secure. The number of received assistance programs was higher in food insecure women
(p<0.05) than food secure women.
The study also tested the cooking skills among women (Table 3.2). Three-fourths
of the women evaluated their cooking skills as ―adequate‖. FIS/norm women tended to
have a lower percentage (50%) of self-rating cooking skills as ―adequate‖. The frequency
of preparing a green salad in last three months was lower in food insecure women than in
food secure women (p < 0.05), particularly in FIS/ovob women. Almost two-thirds of
FIS/ovob women (62.5%) prepared a green salad once a month or never in the last three
months. No difference was found among women groups in the frequency of preparing
beef/chicken/fish/vegetables or an entire dinner in the last three months: the majority of
the women reported ―once a week or daily‖.
3.4.3 Monthly Variations in Household Food Supply
3.4.3.1 Total Food Items
The total shelf food items were composed of all the food items listed in the Shelf
Inventory Questionnaire and other items reported by participants. These items were
counted to obtain the number of total food items in the household during the interview
time (Table 3.3). For FIS/ovob women, the total food items significantly decreased from
the beginning to the end of the months in three continuous months. In addition, FS/ovob
70
women had the highest total food items at both the beginning and the end of the three
month among four women groups, and significant drop of total food items were observed
in Month 1 and Month 3 in FIS/ovob women. Less consistent and less significant
decreasing patterns were observed in women of normal weight (Table 3.3).
3.4.3.2 Food Groups
As mentioned before, there are in total 19 food groups in the Shelf Inventory
Questionnaire. After combining food group ―sauce‖ with food group ―soups‖, food items
in the questionnaire were categorized into eighteen groups: 1) milk, dairy, ice cream and
yogurt, 2) cheese, 3) cereals, 4) bread and cakes, 5) tortillas, pasta and rice, 6) cookies,
crackers and chips, 7) vegetables (fresh, frozen or canned), 8) legumes, 9) fruits (fresh,
frozen or canned), 10) beverages, 11) meat (beef and pork), ham and sausages (fresh or
frozen), 12) poultry (fresh or frozen), 13) sea food (fresh, frozen or canned), 14) oils and
other fats, 15) mayonnaise, sauce and salad dressing, broth and soups, 16) condiments,
17) miscellaneous food items, 18) baby food.
Items by food groups were analyzed to see whether a monthly decrease exists or
not.5 Table 3.4 lists food groups that significantly decreased in the three months by
household food security and weight status. It was observed that FIS/ovob women had a
much less stable food shelf inventory in three continuous months compared to other three
groups of women: almost all food groups dropped in Month 1 (except for baby food), five
5 Three significant increases were observed: oils in FS/ovob women in Month 1, cereals in
FS/norm women in Month 1, and poultry in FS/ovob women in Month 2.
71
and eight food groups dropped in Month 2 and Month 3, respectively. Specifically, food
groups like vegetables, fruits, and meat dropped considerably (vegetables: 11.23 vs. 8.72,
fruits: 5.26 vs. 3.46, meat: 5.69 vs. 3.64, p<0.05) in Month 1; in Month 2, the storage of
legumes, fruits, meat, condiments and other miscellaneous food were significantly higher
at the beginning than the end of the month; in Month 3, eight food groups (i.e. cereals,
bread, pasta, meat, poultry, sauce and soups, condiments, and miscellaneous)
significantly decreased. Comparatively, no significant decrease in fruits was found in the
other three women groups. Meat and legumes decreased happened in FS/ovob women in
Month 1 and Month 3, respectively, and vegetables decrease were found in FS/norm
women in Month 2. Grains (cereals, pasta, and bread) were the only essential food group
(please see the following paragraph for more details) that decreased in two months in
other three groups of women. In addition, normal weight women tended to have a more
stable household food stores than overweight/obese women, but the sample sizes of
FS/norm and FIS/norm women were too small to draw conclusions in these two groups.
Essential Food Groups
To further analyze the effects of the monthly decrease of household food stores,
food groups and food items in the Shelf Inventory Questionnaire were then re-categorized
into six essential food groups: grains, vegetables, fruits, oils, meat & beans, and milk
according to USDA recommendation (http://www.mypyramid.gov/pyramid/index.html).
Among FIS/ovob women, grains decreased significantly in two months, and fruits and
meat & beans decreased in all three months. Comparatively, other groups of women
72
showed much less decreasing food groups (Table 3.5). In Month 1, compared to other
women groups, the largest decrease in groups of meat & beans, and vegetables were
observed in FIS/ovob women. Additionally, FIS/norm women had the lowest numbers at
the beginning and the end of Month 1 in most essential food groups, and FS/ovob women
showed the highest numbers of food items at the beginning and the end, particularly
groups of grains, meat & beans, and milk.
In order to remove the influence of holiday seasons, women who were not
interviewed in November or December were analyzed separately. Table 3.6 shows
monthly differences of essential food groups among women who were not interviewed in
November or December. In FIS/ovob women, five essential food groups (grains,
vegetables, fruits, meat & beans, and milk) significantly dropped from the beginning to
the end in the three continuous months.
3.4.3.3 Individual Food Items in FIS/ovob Women
Since FIS/ovob women showed obvious monthly decreasing patterns on
household food stores, it was interesting to know what individual food items were
decreasing during the interview time in this group of women. It was found that 71 food
items were significantly higher at the beginning than the end of Month 1 in FIS/ovob
women, while in FS/ovob women it was only 12 food items higher in the first ten days of
the month. In Month 2 and Month 3, FIS/ovob women showed 33 food items
significantly higher at the beginning of the months.
73
Here is a list of specific food items which were found as decreasing for two or
three months among FIS/ovob women: regular cottage cheese, regular cream cheese,
white bread, muffins, flour tortillas, fruit snacks, mixed vegetables, celery, asparagus,
beans, apples, any kind of berries, regular soda pop, 100% pure fruit juices, beef or pork
frankfurters, bacon, salami/pepperoni/sausages/liver pate (three months), chicken breast,
breaded chicken, shortening, tartar, chicken or beef broth, mustard, vinegar (three
months), condiment powder, powdered mashed potatoes, frozen entrees, and candy.
Therefore, it was found that items from almost every food group (out of the eighteen
groups) showed significantly decrease in certain months, except items from the group of
baby food.
3.4.4 Monthly Variation of Nutrient Intake
3.4.4.1 TEI and Macronutrients
The monthly decrease of TEI (Table 3.7a) and macronutrient intakes were also
compared among the four women groups (Table 3.7b). Among FIS/ovob women, a
significant decrease of energy intake (271.13 kcal, 12.82%) was observed in Month 1;
about 57% of this decrease was from fat (154.17 kcal, 19.15%). The protein and sugar
intake did not show significant decrease in Month 1, but the mean decreasing amount of
protein and sugar were highest in FIS/ovob women than other women groups. In Month 2
and Month 3, FIS/ovob women showed very similar energy intake and macronutrient
intakes at the begging and the end of the months: no significant differences were
observed. For other groups of women, FS/ovob women showed similar mean caloric
74
intake in the first and last ten days of the three months (monthly differences: -80 kcal in
Month 1, 93 kcal in Month 2, -126 kcal in Month 3). The two women groups of normal
weight showed very unstable increase or decrease variation patterns of macronutrient
intakes in the three months.
3.4.4.2 Other Nutrients
The differences of other nutrients (including vitamins and minerals) were also
compared in FIS/ovob women in the three months. It was found that cholesterol, vitamin
B2, vitamin B12, biotin, vitamin D, iodine, molybdenum, and choline (mg) significantly
decreased from the beginning to the end of Month 1, vitamin K, omega-3, and omega-6
significantly decreased in Month 2, and no nutrient decreased in Month 3. Almost every
nutrient decreased in Month 1 was highly lower than the reference values for an adult
with a caloric intake of 2,000 calories (Table 3.8). No continuous decreasing pattern of
these nutrients was observed. This can be explained by the high day-to-day variation of
micronutrient intakes among free-living persons, and the high percentages of holiday-
season interview in Month 2 and 3.
3.4.4.3 Logistic regression analysis
Two multivariate logistic regression models were generated to assess the risk
factors of showing a decreased TEI of 200 kcal or more in every month. The value 200
kcal was chosen is because the median of the TEI decrease in the overall women sample
was around 200 kcal (213.745 kcal) in Month 1. Independent variables of interest were

75
two dummy variables (i.e. food insecure or not, overweight/obese or not) in the first
model, and one dummy variable (i.e. women in the FIS/ovob group or not) in the second
model. Control variables included age, education (school years), household income,
household size, housing expenditure last month, and number of received food assistance
programs.
In Month 1, 59 women were analyzed using logistic regression models. It was
found that being overweight/obese (odds ratio (OR) = 3.58), being food insecure (OR =
2.10), or within the FIS/ovob group (OR = 2.56) had high odds ratios of showing a
decreased TEI of 200 kcal or more, but the p-values were not significant. In addition,
household size in the control variables showed a significant effect on a decreased TEI in
the two models: OR = 2.20 in the first model, OR = 2.25 in the second model, p<0.05,
which means an increased household size indicates a higher risk of showing a monthly
caloric drop 200 kcalor more. In Month 2, the number of food assistance programs
showed protective effects on TEI decrease in the two models (OR=0.61, p<0.05). No
significant results were found in Month 3.
3.4.5 Disordered Eating
3.4.5.1 Subscales
Subscale scores as well as the global score in EDE-Q across the four women
groups are present in Table 3.9a. No significant differences were found in subscales
Eating Concern and Restraint. Subscales Weight Concern and Shape Concern and the
global score were significantly different among the four groups of women. To further
76
understand 1) the association of disordered eating behaviors and food insecurity and 2)
the association of disordered eating and weight status, subscale scores were compared
between food secure women and food insecure women, and between non-
overweight/obese women and overweight/obese women, respectively (Table 3.9b). The
former comparison showed no significant difference between food secure women and
food insecure women, while the latter comparison found that overweight/obese women
had much higher scores in Weight Concern (2.74 vs. 1.03, p<0.0001), Shape Concern
(3.34 vs. 1.39, p<0.0001), and the global score (2.13 vs. 0.99, p=0.0004) as well.
The correlations of subscale scores with BMI and with food security scores were
then analyzed (Table 3.10). Out of the four subscales, it is shown that three subscales:
Restraint (correlation: 0.27, p=0.05), Weight Concern (correlation: 0.31, p=0.02), Shape
Concern (correlation: 0.35, p=0.01), and the global score (correlation: 0.31, p=0.02) have
significant and positive correlations with BMI. Comparatively, Eating Concern was
marginally correlated with food security scores (correlation: 0.23, p=0.09).
Since Eating Concern was the subscale of interest for investigating binge eating
behaviors in food insecure subjects, items within Eating Concern were then analyzed
separately and compared by women’s food security status (Table 3.11). The following
items are included in Eating Concern: preoccupation with food/eating/calories, fear of
losing control over eating, eating in secret, social eating (i.e. concern of eating with the
presence other people), and guilt about eating [120]. It was shown that food insecure
women had a significantly higher score in the item ―preoccupation with
77
food/eating/calories‖ (1.24 vs. 0.21, p=0.007), and a marginally higher score in ―fear of
losing control over eating, and guilt about eating‖ (1.27 vs. 0.57, p=0.1).
3.4.5.2 Featured Disordered Eating Behaviors
The frequency of occurrence of featured disordered eating behaviors (i.e. the
proportion of individuals reporting the very behavior) across women groups was also
analyzed. Among the 36 FIS/ovob women who completed EDE-Q, 13 women (36.11%)
reported overeating episodes in the past 28 days. In addition, more than 10% of FIS/ovob
women reported extreme dietary restraint (data not shown). No significant differences
were found among the four groups of women.
3.4.6 Food Stamp Program (FSP) Participation
Table 3.2 has showed that sixty percent of the participants in the study were
receiving food stamps during the interview time. In general, food stamp recipients had a
higher BMI than non-recipients (36.81 vs. 31.16, p=0.01); particularly in food insecure
women (n=50), those who were receiving food stamps had a mean BMI much higher than
those not receiving food stamps (38.24 vs. 30.94, p<0.01). Comparatively, no significant
difference of BMI was found between food secure recipients and non-recipients
(recipients: 30.38; non-recipients: 31.54, n=16).
The monthly variations of household food stores as well as TEI were also
compared between food stamp recipients and non-recipients (Table 3.12). No significant
78
differences were observed in food secure women. Comparatively, in food insecure
women the monthly decrease of household food items was more severe in food stamp
recipients than in non-recipients in Month 1 (22.33 vs. 2.67, p=0.01) and Month 3 (21.71
vs. 0.9, p=0.01). No significant difference was observed in the TEI variation.
3.5 Summary and Results of Hypothesis Testing
The study tested the existence of ―monthly cycle of food abundance and food
shortage‖ among a group of food insecure and overweight/obese women in Ohio. Most of
the women in the study had very high BMI (mean BMI=32.90). The majority participants
(70%) were food insecure women, who had a significantly higher mean BMI than food
secure women (36.19 vs. 30.96, p<0.05). Sixty percent of the participants were receiving
food stamps during the interview time.
Five hypotheses were proposed in this study. Hypotheses 1 and 2 were about the
monthly decrease of TEI and household food stores in FIS/ovob women. Results in the
study confirmed Hypothesis 2 by showing consistent decreasing patterns in total
household food items and in essential food groups (i.e. grains, vegetables, fruits, meat &
beans, and milk) in FIS/ovob women in three continuous months. However, Hypothesis 1
is only true in Month 1, since the monthly decrease of TEI was found in Month 1, but no
Month 2 or in Month 3. Hypothesis 3 was proposed to compare the monthly variation
patterns in the four women groups. This one is also accepted since the results showed that
compared to FIS/ovob women, other women groups had less consistent decreasing
patterns of TEI or food stores. The disordered eating data found that worsening food
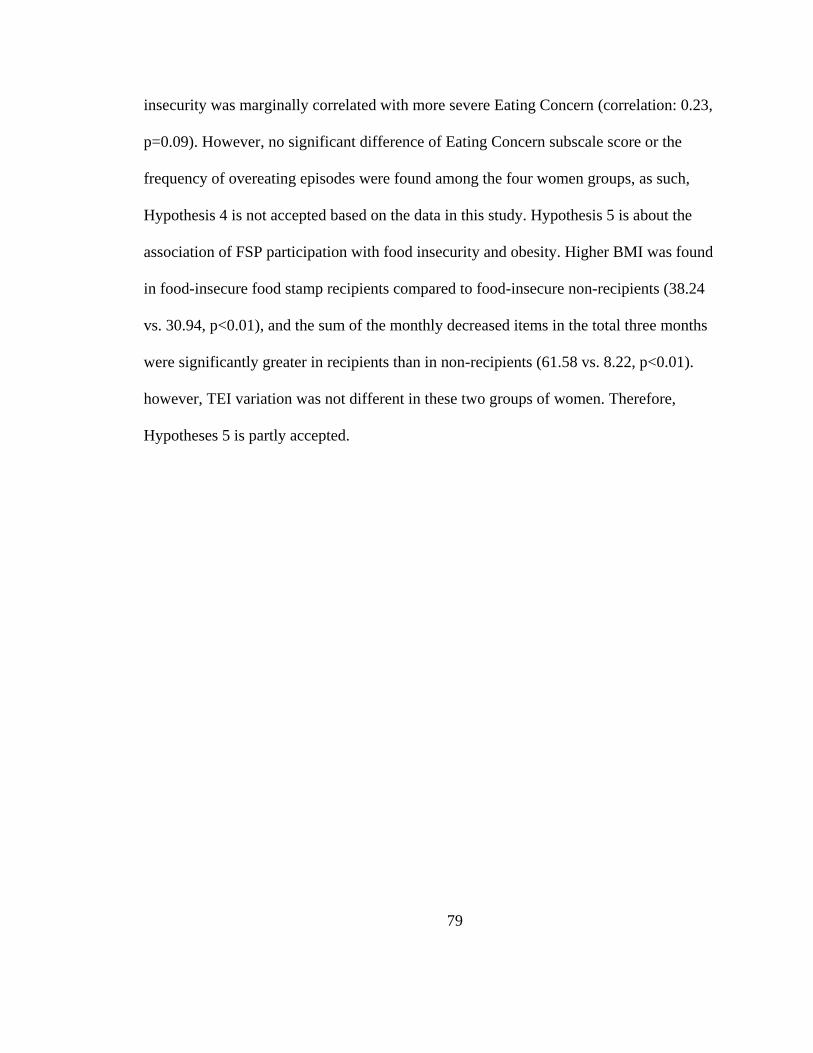
79
insecurity was marginally correlated with more severe Eating Concern (correlation: 0.23,
p=0.09). However, no significant difference of Eating Concern subscale score or the
frequency of overeating episodes were found among the four women groups, as such,
Hypothesis 4 is not accepted based on the data in this study. Hypothesis 5 is about the
association of FSP participation with food insecurity and obesity. Higher BMI was found
in food-insecure food stamp recipients compared to food-insecure non-recipients (38.24
vs. 30.94, p<0.01), and the sum of the monthly decreased items in the total three months
were significantly greater in recipients than in non-recipients (61.58 vs. 8.22, p<0.01).
however, TEI variation was not different in these two groups of women. Therefore,
Hypotheses 5 is partly accepted.
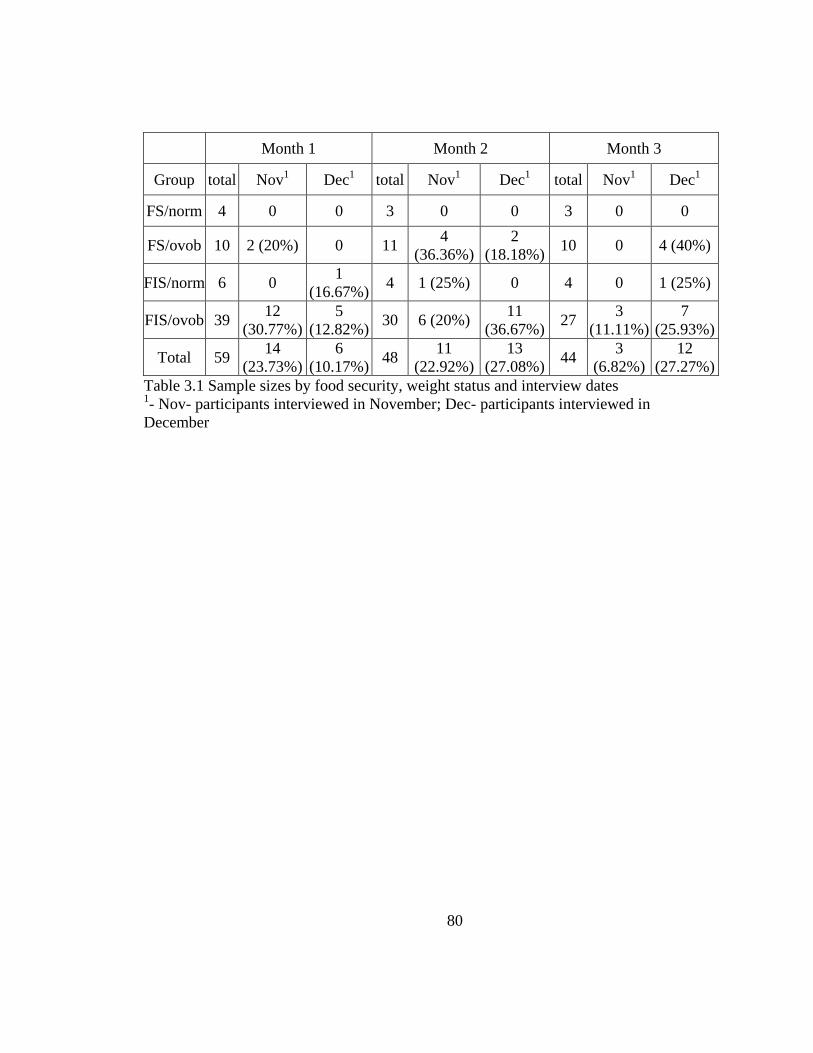
80
Month 1 Month 2 Month 3
Group total Nov1 Dec
1 total Nov
1 Dec
1 total Nov
1 Dec
1
FS/norm 4 0 0 3 0 0 3 0 0
FS/ovob 10 2 (20%) 0 11 4
(36.36%)
2
(18.18%) 10 0 4 (40%)
FIS/norm 6 0 1
(16.67%) 4 1 (25%) 0 4 0 1 (25%)
FIS/ovob 39 12
(30.77%)
5
(12.82%) 30 6 (20%)
11
(36.67%) 27
3
(11.11%)
7
(25.93%)
Total 59 14
(23.73%)
6
(10.17%) 48
11
(22.92%)
13
(27.08%) 44
3
(6.82%)
12
(27.27%)
Table 3.1 Sample sizes by food security, weight status and interview dates 1- Nov- participants interviewed in November; Dec- participants interviewed in
December
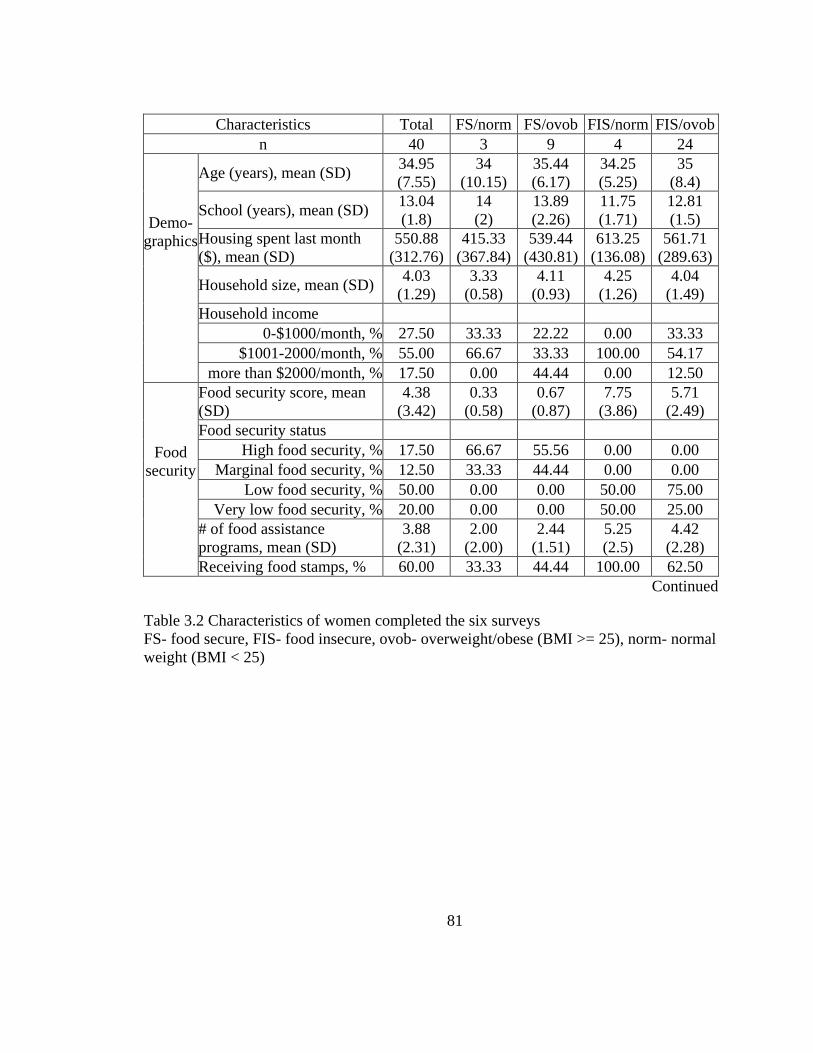
81
Characteristics Total FS/norm FS/ovob FIS/norm FIS/ovob
n 40 3 9 4 24
Demo-
graphics
Age (years), mean (SD) 34.95
(7.55)
34
(10.15)
35.44
(6.17)
34.25
(5.25)
35
(8.4)
School (years), mean (SD) 13.04
(1.8)
14
(2)
13.89
(2.26)
11.75
(1.71)
12.81
(1.5)
Housing spent last month
($), mean (SD)
550.88
(312.76)
415.33
(367.84)
539.44
(430.81)
613.25
(136.08)
561.71
(289.63)
Household size, mean (SD) 4.03
(1.29)
3.33
(0.58)
4.11
(0.93)
4.25
(1.26)
4.04
(1.49)
Household income
0-$1000/month, % 27.50 33.33 22.22 0.00 33.33
$1001-2000/month, % 55.00 66.67 33.33 100.00 54.17
more than $2000/month, % 17.50 0.00 44.44 0.00 12.50
Food
security
Food security score, mean
(SD)
4.38
(3.42)
0.33
(0.58)
0.67
(0.87)
7.75
(3.86)
5.71
(2.49)
Food security status
High food security, % 17.50 66.67 55.56 0.00 0.00
Marginal food security, % 12.50 33.33 44.44 0.00 0.00
Low food security, % 50.00 0.00 0.00 50.00 75.00
Very low food security, % 20.00 0.00 0.00 50.00 25.00
# of food assistance
programs, mean (SD)
3.88
(2.31)
2.00
(2.00)
2.44
(1.51)
5.25
(2.5)
4.42
(2.28)
Receiving food stamps, % 60.00 33.33 44.44 100.00 62.50
Continued
Table 3.2 Characteristics of women completed the six surveys
FS- food secure, FIS- food insecure, ovob- overweight/obese (BMI >= 25), norm- normal
weight (BMI < 25)
82
Table 3.2 continued
Characteristics Total FS/norm FS/ovob FIS/norm FIS/ovob
Sample size 40 3 9 4 24
Weight
status
BMI (kg/m2), mean (SD)
32.91
(9.15)
22.11
(2.85)
33.52
(7.45)
19.67
(1.04)
36.22
(8.03)
Weight status
normal weight, % 17.50 100.00 0.00 100.00 0.00
overweight, % 20.00 0.00 33.33 0.00 20.83
obesity, % 62.50 0.00 66.67 0.00 79.17
Cooking
Self-rated cooking skills
Inadequate, % 25.00 0.00 22.22 50.00 25.00
Adequate, % 75.00 100 77.78 50.00 75.00
Preparing a green salad last
3 months, freq.
Once a month or never, % 47.50 33.33 11.11 50.00 62.50
Once a week or daily, % 52.50 66.67 88.89 50.00 37.50
Preparing beef, chicken,
fish, vegetables last 3
months, freq.
Once a month or never, % 30.00 0.00 0.00 0.00 8.33
Once a week or daily, % 70.00 100.00 100.00 100.00 91.67
Preparing an entire dinner
(>= 2 people) last 3 months,
freq.
Once a month or never, % 5.00 0.00 0.00 0.00 8.33
Once a week or daily, % 95.00 100.00 100.00 100.00 91.67

83
n Mean (SD) p$
Month 1 Beginning End Difference
FS/norm 4 83.00 (14.51) 72.50 (11.70) 10.50 (15.09) 0.13
FS/ovob 10 105.30 (23.78) 95.90 (24.58) 9.40 (7.46)* 0.002
FIS/norm 6 75.83 (32.82) 74.33 (25.85) 1.50 (13.46) 0.4
FIS/ovob 39 87.74 (22.17) 68.26 (24.08) 19.49 (24.68)* <0.0001
Total 59 89.19 (24.10) 73.85 (25.37) 15.34 (21.77)* <0.0001
Month 2 Beginning End Difference
FS/norm 3 91.67 (7.51) 65.67 (9.07) 26.00 (16.52) 0.056
FS/ovob 11 98.64 (23.59) 97.09 (24.68) 1.55 (10.30) 0.31
FIS/norm 4 84.50 (18.70) 72.50 (8.50) 12.00 (21.89) 0.18
FIS/ovob 30 83.30 (25.84) 72.20 (19.55) 11.10 (29.08)* 0.02
Total 48 87.46 (24.43) 77.54 (22.18) 9.92 (24.92)* 0.004
Month 3 Beginning End Difference
FS/norm 3 83.00 (13.00) 80.00 (5.29) 3.00 (9.64) 0.3
FS/ovob 10 103.60 (25.29) 88.30 (22.00) 15.30 (13.87)* 0.003
FIS/norm 4 86.75 (11.00) 61.75 (16.7) 25.00 (17.42)* 0.03
FIS/ovob 27 88.81 (24.89) 75.30 (20.78) 13.52 (26.58)* 0.007
Total 44 91.59 (23.89) 77.34 (20.90) 14.25 (22.65)* 0.0001
Table 3.3 Total shelf food items (SD) by food security and weight status $- p-values of one-tailed t-test for testing food items higher at the beginning than at the
end; *- significantly higher at the beginning of the month compared to the end
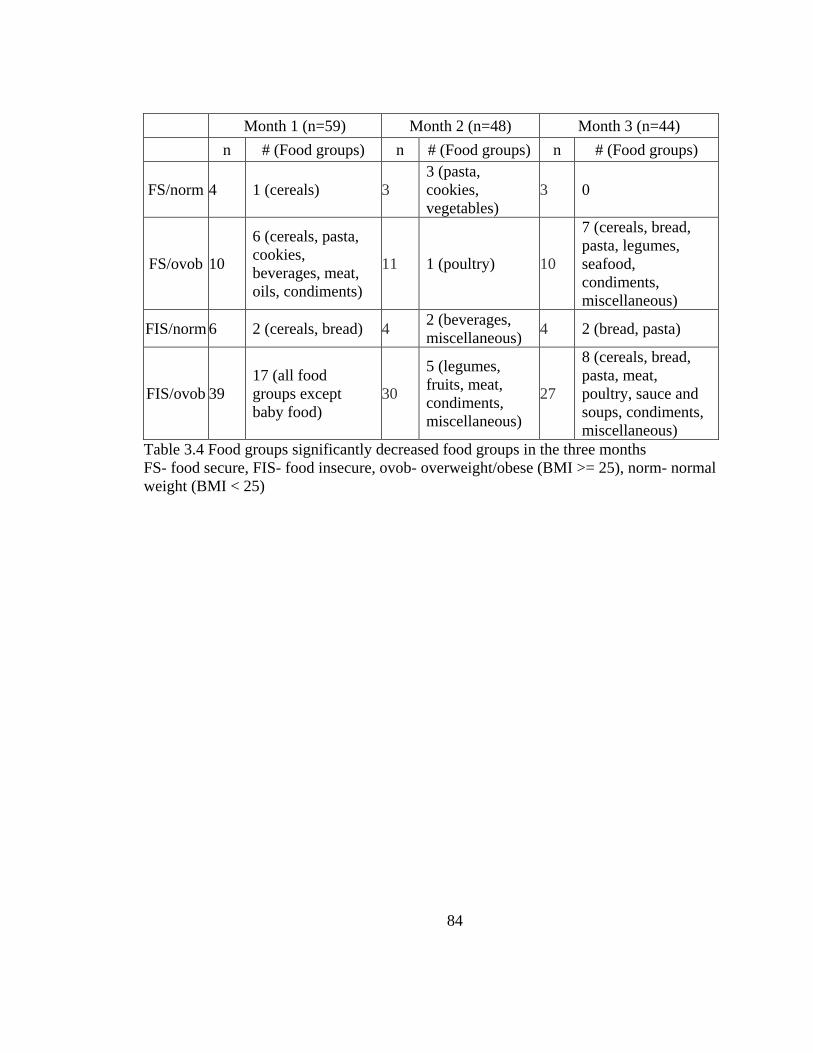
84
Month 1 (n=59) Month 2 (n=48) Month 3 (n=44)
n # (Food groups) n # (Food groups) n # (Food groups)
FS/norm 4 1 (cereals) 3
3 (pasta,
cookies,
vegetables)
3 0
FS/ovob 10
6 (cereals, pasta,
cookies,
beverages, meat,
oils, condiments)
11 1 (poultry) 10
7 (cereals, bread,
pasta, legumes,
seafood,
condiments,
miscellaneous)
FIS/norm 6 2 (cereals, bread) 4 2 (beverages,
miscellaneous) 4 2 (bread, pasta)
FIS/ovob 39
17 (all food
groups except
baby food)
30
5 (legumes,
fruits, meat,
condiments,
miscellaneous)
27
8 (cereals, bread,
pasta, meat,
poultry, sauce and
soups, condiments,
miscellaneous)
Table 3.4 Food groups significantly decreased food groups in the three months
FS- food secure, FIS- food insecure, ovob- overweight/obese (BMI >= 25), norm- normal
weight (BMI < 25)
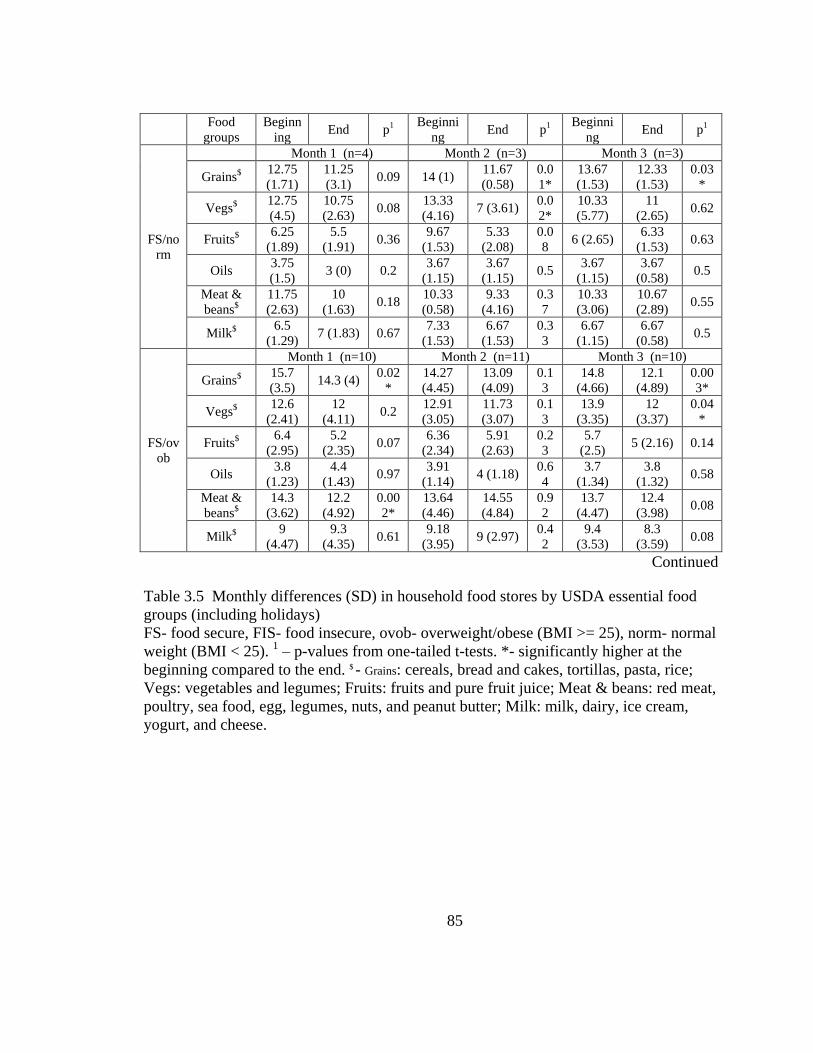
85
Food
groups
Beginn
ing End p1
Beginni
ng End p1
Beginni
ng End p1
FS/no
rm
Month 1 (n=4) Month 2 (n=3) Month 3 (n=3)
Grains$ 12.75
(1.71)
11.25
(3.1) 0.09 14 (1)
11.67
(0.58)
0.0
1*
13.67
(1.53)
12.33
(1.53)
0.03
*
Vegs$ 12.75
(4.5)
10.75
(2.63) 0.08
13.33
(4.16) 7 (3.61)
0.0
2*
10.33
(5.77)
11
(2.65) 0.62
Fruits$ 6.25
(1.89)
5.5
(1.91) 0.36
9.67
(1.53)
5.33
(2.08)
0.0
8 6 (2.65)
6.33
(1.53) 0.63
Oils 3.75
(1.5) 3 (0) 0.2
3.67
(1.15)
3.67
(1.15) 0.5
3.67
(1.15)
3.67
(0.58) 0.5
Meat &
beans$
11.75
(2.63)
10
(1.63) 0.18
10.33
(0.58)
9.33
(4.16)
0.3
7
10.33
(3.06)
10.67
(2.89) 0.55
Milk$ 6.5
(1.29) 7 (1.83) 0.67
7.33
(1.53)
6.67
(1.53)
0.3
3
6.67
(1.15)
6.67
(0.58) 0.5
FS/ov
ob
Month 1 (n=10) Month 2 (n=11) Month 3 (n=10)
Grains$ 15.7
(3.5) 14.3 (4)
0.02
*
14.27
(4.45)
13.09
(4.09)
0.1
3
14.8
(4.66)
12.1
(4.89)
0.00
3*
Vegs$ 12.6
(2.41)
12
(4.11) 0.2
12.91
(3.05)
11.73
(3.07)
0.1
3
13.9
(3.35)
12
(3.37)
0.04
*
Fruits$ 6.4
(2.95)
5.2
(2.35) 0.07
6.36
(2.34)
5.91
(2.63)
0.2
3
5.7
(2.5) 5 (2.16) 0.14
Oils 3.8
(1.23)
4.4
(1.43) 0.97
3.91
(1.14) 4 (1.18)
0.6
4
3.7
(1.34)
3.8
(1.32) 0.58
Meat &
beans$
14.3
(3.62)
12.2
(4.92)
0.00
2*
13.64
(4.46)
14.55
(4.84)
0.9
2
13.7
(4.47)
12.4
(3.98) 0.08
Milk$ 9
(4.47)
9.3
(4.35) 0.61
9.18
(3.95) 9 (2.97)
0.4
2
9.4
(3.53)
8.3
(3.59) 0.08
Continued
Table 3.5 Monthly differences (SD) in household food stores by USDA essential food
groups (including holidays)
FS- food secure, FIS- food insecure, ovob- overweight/obese (BMI >= 25), norm- normal
weight (BMI < 25). 1 – p-values from one-tailed t-tests. *- significantly higher at the
beginning compared to the end. $ - Grains: cereals, bread and cakes, tortillas, pasta, rice;
Vegs: vegetables and legumes; Fruits: fruits and pure fruit juice; Meat & beans: red meat,
poultry, sea food, egg, legumes, nuts, and peanut butter; Milk: milk, dairy, ice cream,
yogurt, and cheese.

86
Table 3.5 continued
Food
groups
Begin
ning End p1
Beginni
ng End p1
Beginni
ng End p1
FIS/n
orm
Month 1 (n=6) Month 2 (n=4) Month 3 (n=4)
Grains$ 12
(5.87)
13
(4.05) 0.78
14.25
(4.03)
14.25
(3.5) 0.5
16.5
(1.73)
10.5
(2.89)
0.03
*
Vegs$ 10.67
(5.57)
9.33
(5.99) 0.23
10.25
(2.63)
8.25
(2.22) 0.2
11.75
(1.26)
7.25
(5.19) 0.06
Fruits$ 4.83
(2.56)
5.5
(1.97) 0.8
6.5
(3.51)
4.25
(0.96) 0.14 7 (1.41)
3.5
(1.73)
0.01
*
Oils 3.33
(1.97)
2.83
(2.04) 0.1
3.75
(0.48) 3 (0) 0.11
2.75
(1.71) 3.5 (1) 0.89
Meat &
beans$
11
(6.2) 10 (5.1) 0.34
11.75
(5.12)
9.75
(3.77)
0.04
6*
11.75
(3.4)
8.75
(4.03) 0.15
Milk$ 5.67
(3.72)
6.17
(3.31) 0.73
7.75
(2.75)
6.75
(2.22) 0.29
7.5
(3.42) 5 (0) 0.12
FIS/o
vob
Month 1 (n=39) Month 2 (n=30) Month 3 (n=27)
Grains$ 14.33
(4.59)
11.08
(4.19)
0.000
1*
13.3
(4.76)
12.07
(4.49) 0.1
14.78
(5.5)
12.15
(4.21)
0.00
3*
Vegs$ 13.05
(4.08)
10.08
(4.2)
0.000
2*
11.6
(4.04)
10.57
(3.87) 0.15
12.19
(4.52)
11.48
(4.6) 0.26
Fruits$ 6.08
(3.13)
4.1
(2.67)
0.000
1*
5.63
(3.15)
4.3
(2.29)
0.01
*
5.63
(2.53)
4.7
(2.63)
0.04
7*
Oils 3.46
(1.02)
3.05
(1.34)
0.007
*
3.4
(1.28) 3 (1.02) 0.06
3.33
(1.04)
3.26
(1.48) 0.39
Meat &
beans$
14.21
(5.24)
9.87
(4.74)
<0.00
01*
12.9
(4.84)
10.2
(4.15)
0.01
*
13.41
(4.9)
11.19
(4.76)
0.01
*
Milk$ 6.1
(2.83)
4.41
(2.48)
0.000
1*
6.13
(3.01)
5.33
(2.63) 0.12
6.96
(3.47)
6.11
(2.78) 0.12
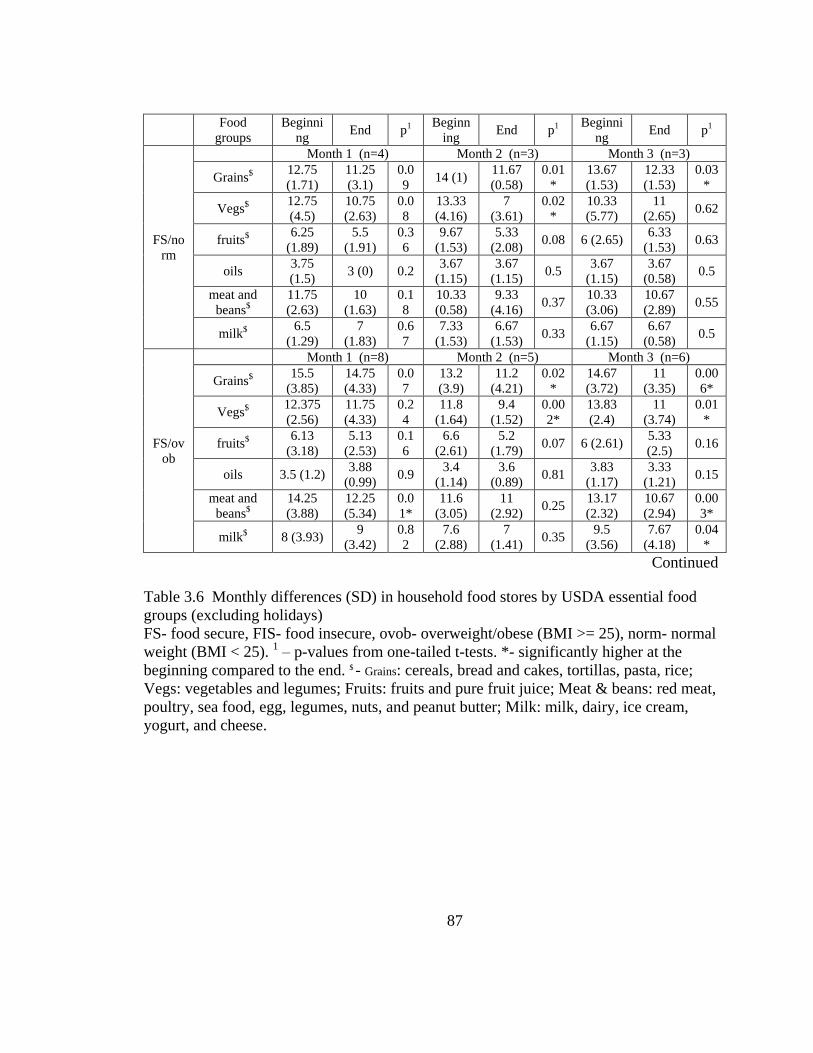
87
Food
groups
Beginni
ng End p1
Beginn
ing End p1
Beginni
ng End p1
FS/no
rm
Month 1 (n=4) Month 2 (n=3) Month 3 (n=3)
Grains$ 12.75
(1.71)
11.25
(3.1)
0.0
9 14 (1)
11.67
(0.58)
0.01
*
13.67
(1.53)
12.33
(1.53)
0.03
*
Vegs$ 12.75
(4.5)
10.75
(2.63)
0.0
8
13.33
(4.16)
7
(3.61)
0.02
*
10.33
(5.77)
11
(2.65) 0.62
fruits$ 6.25
(1.89)
5.5
(1.91)
0.3
6
9.67
(1.53)
5.33
(2.08) 0.08 6 (2.65)
6.33
(1.53) 0.63
oils 3.75
(1.5) 3 (0) 0.2
3.67
(1.15)
3.67
(1.15) 0.5
3.67
(1.15)
3.67
(0.58) 0.5
meat and
beans$
11.75
(2.63)
10
(1.63)
0.1
8
10.33
(0.58)
9.33
(4.16) 0.37
10.33
(3.06)
10.67
(2.89) 0.55
milk$ 6.5
(1.29)
7
(1.83)
0.6
7
7.33
(1.53)
6.67
(1.53) 0.33
6.67
(1.15)
6.67
(0.58) 0.5
FS/ov
ob
Month 1 (n=8) Month 2 (n=5) Month 3 (n=6)
Grains$ 15.5
(3.85)
14.75
(4.33)
0.0
7
13.2
(3.9)
11.2
(4.21)
0.02
*
14.67
(3.72)
11
(3.35)
0.00
6*
Vegs$ 12.375
(2.56)
11.75
(4.33)
0.2
4
11.8
(1.64)
9.4
(1.52)
0.00
2*
13.83
(2.4)
11
(3.74)
0.01
*
fruits$ 6.13
(3.18)
5.13
(2.53)
0.1
6
6.6
(2.61)
5.2
(1.79) 0.07 6 (2.61)
5.33
(2.5) 0.16
oils 3.5 (1.2) 3.88
(0.99) 0.9
3.4
(1.14)
3.6
(0.89) 0.81
3.83
(1.17)
3.33
(1.21) 0.15
meat and
beans$
14.25
(3.88)
12.25
(5.34)
0.0
1*
11.6
(3.05)
11
(2.92) 0.25
13.17
(2.32)
10.67
(2.94)
0.00
3*
milk$ 8 (3.93) 9
(3.42)
0.8
2
7.6
(2.88)
7
(1.41) 0.35
9.5
(3.56)
7.67
(4.18)
0.04
*
Continued
Table 3.6 Monthly differences (SD) in household food stores by USDA essential food
groups (excluding holidays)
FS- food secure, FIS- food insecure, ovob- overweight/obese (BMI >= 25), norm- normal
weight (BMI < 25). 1 – p-values from one-tailed t-tests. *- significantly higher at the
beginning compared to the end. $ - Grains: cereals, bread and cakes, tortillas, pasta, rice;
Vegs: vegetables and legumes; Fruits: fruits and pure fruit juice; Meat & beans: red meat,
poultry, sea food, egg, legumes, nuts, and peanut butter; Milk: milk, dairy, ice cream,
yogurt, and cheese.

88
Table 3.6 continued
Food
groups
Beginni
ng End p1
Beginn
ing End p1
Beginni
ng End p1
FIS/n
orm
Month 1 (n=5) Month 2 (n=3) Month 3 (n=3)
Grains$ 10.6
(5.32)
12.6
(4.39)
0.9
6
15
(4.58)
13.67
(4.04) 0.4
16.33
(2.08)
11.67
(2.08) 0.09
Vegs$ 10.4
(6.19)
10.6
(5.73)
0.5
9
11
(2.65)
7.33
(1.53) 0.09
11.67
(1.53)
5.67
(5.03) 0.05
fruits$ 4.4
(2.61)
5.6
(2.19)
0.9
5
5.67
(3.79) 4 (1) 0.27
7.33
(1.53)
4.33
(0.58)
0.04
8*
oils 3.2
(2.17)
2.6
(2.19) 0.1 4 (1) 3 (0) 0.11
3.33
(1.53)
3.67
(1.15) 0.79
meat and
beans$
10.2
(6.57)
10.6
(5.46)
0.5
7
13.67
(4.16)
11
(3.46)
0.03
*
13.33
(1.53)
8.67
(4.93) 0.09
milk$ 4.8
(3.42)
5.6
(3.36) 0.8
8.33
(3.06)
6.33
(2.52) 0.18 9 (2) 5 (0)
0.04
*
FIS/o
vob
Month 1 (n=22) Month 2 (n=13) Month 3 (n=17)
Grains$ 14.32
(4.52)
12.5
(4.13)
0.0
6*
14.08
(4.72)
11.46
(5.17)
0.02
*
15.65
(5.7)
12.06
(4.22)
0.00
2*
Vegs$ 13.55
(3.62)
11.09
(4.28)
0.0
07*
12.92
(3.57)
10.31
(3.35)
0.02
*
13.59
(5.04)
10.82
(4.35)
0.00
8*
fruits$ 6.5
(2.74)
5
(2.78)
0.0
08*
6.38
(3.71)
4
(2.42)
0.00
6*
6.24
(2.68)
4.53
(2.27)
0.01
*
oils 3.68
(1.13)
3.5
(1.37) 0.2
3.38
(1.26)
3.08
(0.95) 0.13
3.71
(0.92)
3.35
(1.41) 0.17
meat and
beans$
14.27
(5.35)
11.59
(5.14)
0.0
3*
13.38
(5.62)
9.38
(3.04)
0.02
*
13.82
(4.9)
10.47
(3.41)
0.00
4*
milk$ 6.09
(2.64)
5.14
(2.59)
0.0
2*
6.54
(3.28)
4.54
(1.9)
0.02
*
7.47
(3.28)
5.94
(1.92)
0.01
*
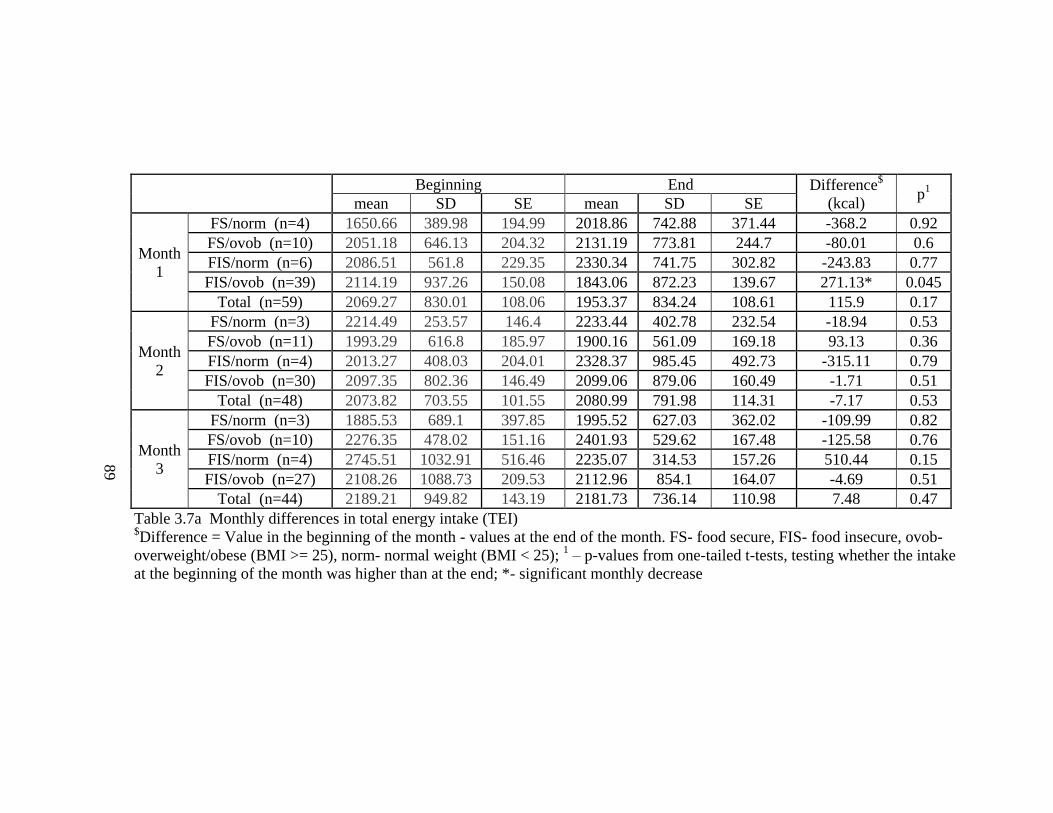
89
Table 3.7a Monthly differences in total energy intake (TEI) $Difference = Value in the beginning of the month - values at the end of the month. FS- food secure, FIS- food insecure, ovob-
overweight/obese (BMI >= 25), norm- normal weight (BMI < 25); 1 – p-values from one-tailed t-tests, testing whether the intake
at the beginning of the month was higher than at the end; *- significant monthly decrease
Beginning End Difference$
(kcal) p
1
mean SD SE mean SD SE
Month
1
FS/norm (n=4) 1650.66 389.98 194.99 2018.86 742.88 371.44 -368.2 0.92
FS/ovob (n=10) 2051.18 646.13 204.32 2131.19 773.81 244.7 -80.01 0.6
FIS/norm (n=6) 2086.51 561.8 229.35 2330.34 741.75 302.82 -243.83 0.77
FIS/ovob (n=39) 2114.19 937.26 150.08 1843.06 872.23 139.67 271.13* 0.045
Total (n=59) 2069.27 830.01 108.06 1953.37 834.24 108.61 115.9 0.17
Month
2
FS/norm (n=3) 2214.49 253.57 146.4 2233.44 402.78 232.54 -18.94 0.53
FS/ovob (n=11) 1993.29 616.8 185.97 1900.16 561.09 169.18 93.13 0.36
FIS/norm (n=4) 2013.27 408.03 204.01 2328.37 985.45 492.73 -315.11 0.79
FIS/ovob (n=30) 2097.35 802.36 146.49 2099.06 879.06 160.49 -1.71 0.51
Total (n=48) 2073.82 703.55 101.55 2080.99 791.98 114.31 -7.17 0.53
Month
3
FS/norm (n=3) 1885.53 689.1 397.85 1995.52 627.03 362.02 -109.99 0.82
FS/ovob (n=10) 2276.35 478.02 151.16 2401.93 529.62 167.48 -125.58 0.76
FIS/norm (n=4) 2745.51 1032.91 516.46 2235.07 314.53 157.26 510.44 0.15
FIS/ovob (n=27) 2108.26 1088.73 209.53 2112.96 854.1 164.07 -4.69 0.51
Total (n=44) 2189.21 949.82 143.19 2181.73 736.14 110.98 7.48 0.47
89
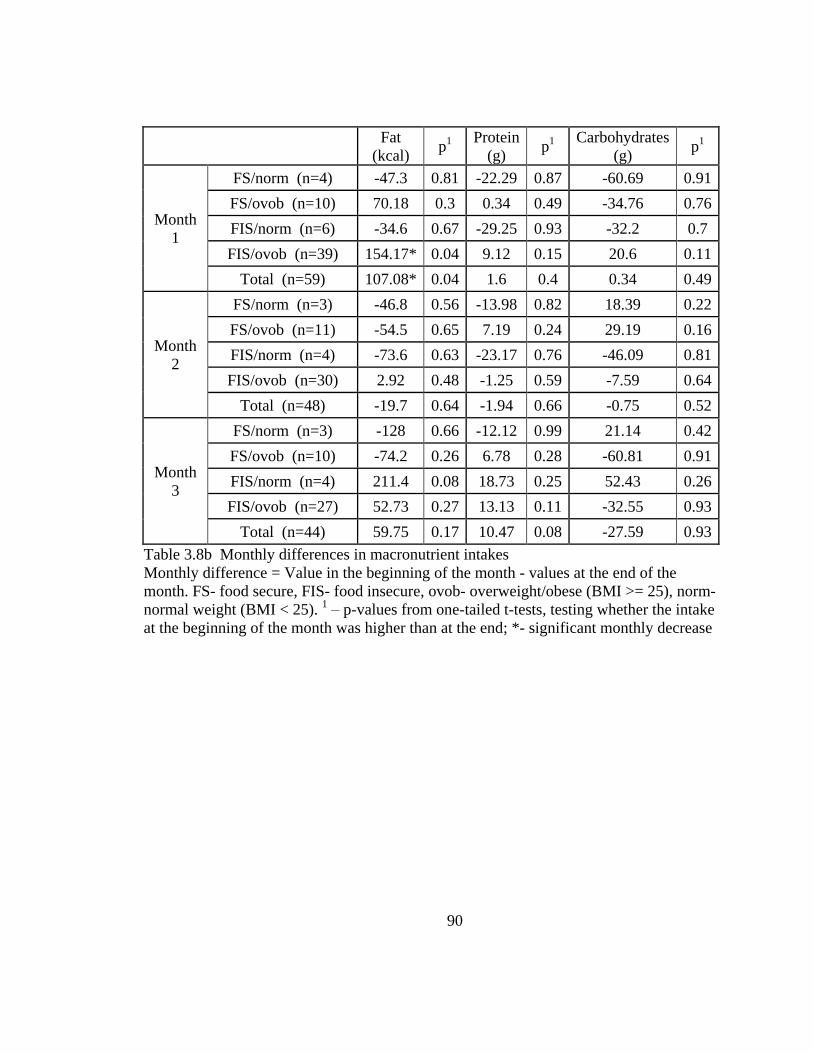
90
Table 3.8b Monthly differences in macronutrient intakes
Monthly difference = Value in the beginning of the month - values at the end of the
month. FS- food secure, FIS- food insecure, ovob- overweight/obese (BMI >= 25), norm-
normal weight (BMI < 25). 1 – p-values from one-tailed t-tests, testing whether the intake
at the beginning of the month was higher than at the end; *- significant monthly decrease
Fat
(kcal) p
1
Protein
(g) p
1
Carbohydrates
(g) p
1
Month
1
FS/norm (n=4) -47.3 0.81 -22.29 0.87 -60.69 0.91
FS/ovob (n=10) 70.18 0.3 0.34 0.49 -34.76 0.76
FIS/norm (n=6) -34.6 0.67 -29.25 0.93 -32.2 0.7
FIS/ovob (n=39) 154.17* 0.04 9.12 0.15 20.6 0.11
Total (n=59) 107.08* 0.04 1.6 0.4 0.34 0.49
Month
2
FS/norm (n=3) -46.8 0.56 -13.98 0.82 18.39 0.22
FS/ovob (n=11) -54.5 0.65 7.19 0.24 29.19 0.16
FIS/norm (n=4) -73.6 0.63 -23.17 0.76 -46.09 0.81
FIS/ovob (n=30) 2.92 0.48 -1.25 0.59 -7.59 0.64
Total (n=48) -19.7 0.64 -1.94 0.66 -0.75 0.52
Month
3
FS/norm (n=3) -128 0.66 -12.12 0.99 21.14 0.42
FS/ovob (n=10) -74.2 0.26 6.78 0.28 -60.81 0.91
FIS/norm (n=4) 211.4 0.08 18.73 0.25 52.43 0.26
FIS/ovob (n=27) 52.73 0.27 13.13 0.11 -32.55 0.93
Total (n=44) 59.75 0.17 10.47 0.08 -27.59 0.93
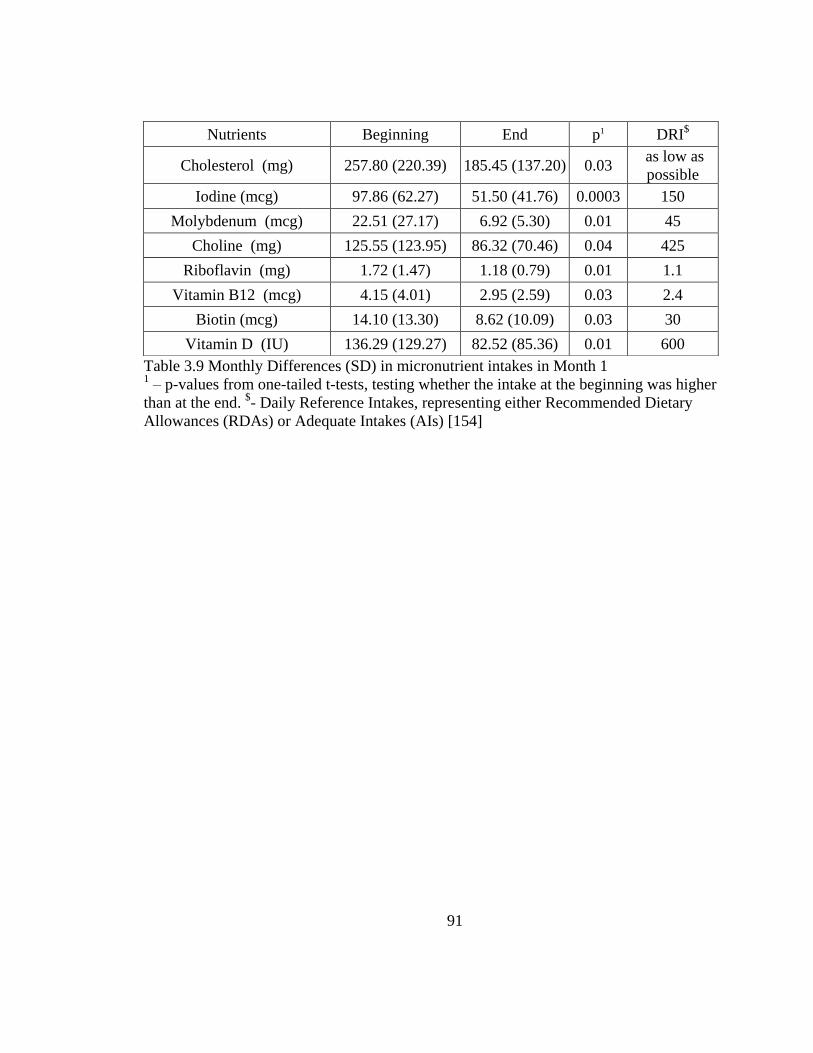
91
Table 3.9 Monthly Differences (SD) in micronutrient intakes in Month 1 1 – p-values from one-tailed t-tests, testing whether the intake at the beginning was higher
than at the end. $- Daily Reference Intakes, representing either Recommended Dietary
Allowances (RDAs) or Adequate Intakes (AIs) [154]
Nutrients Beginning End p1 DRI$
Cholesterol (mg) 257.80 (220.39) 185.45 (137.20) 0.03 as low as
possible
Iodine (mcg) 97.86 (62.27) 51.50 (41.76) 0.0003 150
Molybdenum (mcg) 22.51 (27.17) 6.92 (5.30) 0.01 45
Choline (mg) 125.55 (123.95) 86.32 (70.46) 0.04 425
Riboflavin (mg) 1.72 (1.47) 1.18 (0.79) 0.01 1.1
Vitamin B12 (mcg) 4.15 (4.01) 2.95 (2.59) 0.03 2.4
Biotin (mcg) 14.10 (13.30) 8.62 (10.09) 0.03 30
Vitamin D (IU) 136.29 (129.27) 82.52 (85.36) 0.01 600
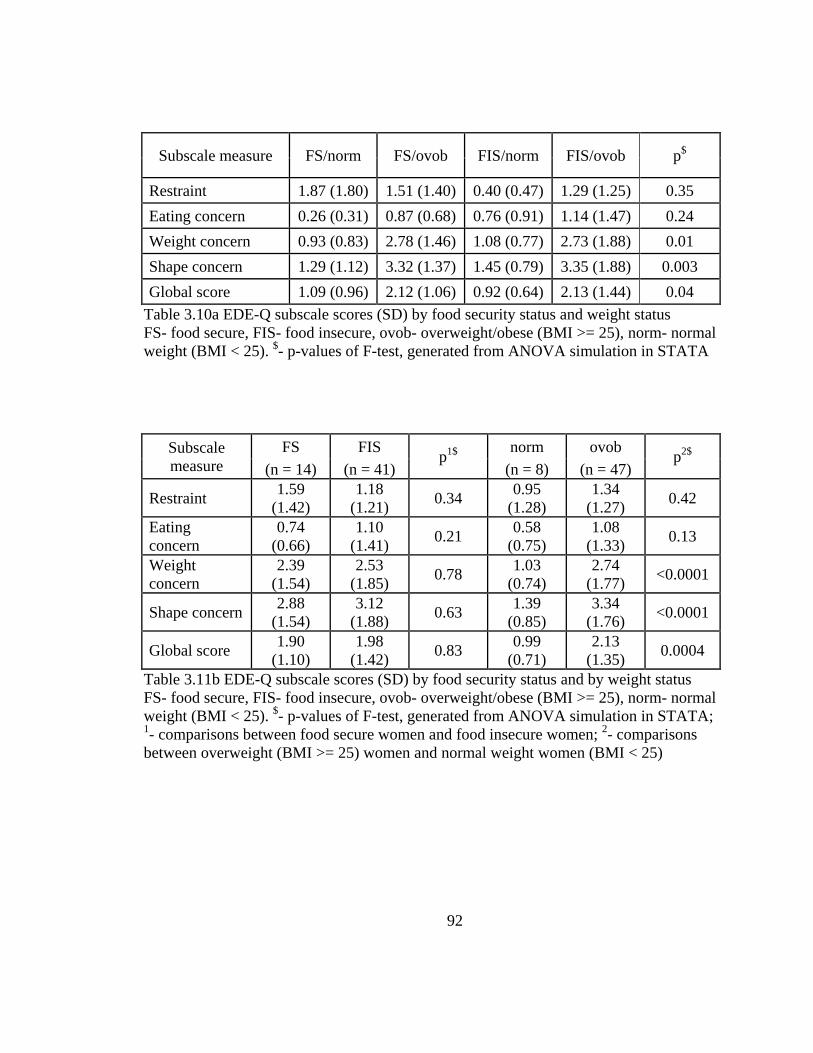
92
Subscale measure FS/norm FS/ovob FIS/norm FIS/ovob p$
Restraint 1.87 (1.80) 1.51 (1.40) 0.40 (0.47) 1.29 (1.25) 0.35
Eating concern 0.26 (0.31) 0.87 (0.68) 0.76 (0.91) 1.14 (1.47) 0.24
Weight concern 0.93 (0.83) 2.78 (1.46) 1.08 (0.77) 2.73 (1.88) 0.01
Shape concern 1.29 (1.12) 3.32 (1.37) 1.45 (0.79) 3.35 (1.88) 0.003
Global score 1.09 (0.96) 2.12 (1.06) 0.92 (0.64) 2.13 (1.44) 0.04
Table 3.10a EDE-Q subscale scores (SD) by food security status and weight status
FS- food secure, FIS- food insecure, ovob- overweight/obese (BMI >= 25), norm- normal
weight (BMI < 25). $- p-values of F-test, generated from ANOVA simulation in STATA
Subscale
measure
FS FIS p
1$
norm ovob p
2$
(n = 14) (n = 41) (n = 8) (n = 47)
Restraint 1.59
(1.42)
1.18
(1.21) 0.34
0.95
(1.28)
1.34
(1.27) 0.42
Eating
concern
0.74
(0.66)
1.10
(1.41) 0.21
0.58
(0.75)
1.08
(1.33) 0.13
Weight
concern
2.39
(1.54)
2.53
(1.85) 0.78
1.03
(0.74)
2.74
(1.77) <0.0001
Shape concern 2.88
(1.54)
3.12
(1.88) 0.63
1.39
(0.85)
3.34
(1.76) <0.0001
Global score 1.90
(1.10)
1.98
(1.42) 0.83
0.99
(0.71)
2.13
(1.35) 0.0004
Table 3.11b EDE-Q subscale scores (SD) by food security status and by weight status
FS- food secure, FIS- food insecure, ovob- overweight/obese (BMI >= 25), norm- normal
weight (BMI < 25). $- p-values of F-test, generated from ANOVA simulation in STATA;
1- comparisons between food secure women and food insecure women;
2- comparisons
between overweight (BMI >= 25) women and normal weight women (BMI < 25)

93
EDE-Q Subscales
BMI Food security score
Correlation
coefficients p
$
Correlation
coefficients p
$
Restraint 0.27 0.05 -0.20 0.15
Eating concern 0.11 0.41 0.23 0.09
Weight concern 0.31 0.02 0.04 0.76
Shape concern 0.35 0.01 0.15 0.28
Global score 0.31 0.02 0.07 0.60
Table 3.12 Correlations of EDE-Q subscale scores with BMI and food security status $- significance levels of the pair-wise correlation coefficients
Behavior Measure FS FIS
p$
(n = 14) (n = 41)
Preoccupation with food, eating or
calories 0.21 (0.43) 1.24 (2.11) 0.007
Fear of losing control over eating 0.57 (0.94) 1.27 (2.06) 0.1
Eating in secret 0.21 (0.43) 0.12 (0.40) 0.48
Social eating 1.14 (1.61) 1 (1.88) 0.78
Guilt about eating 1.57 (1.22) 1.85 (2.12) 0.55
Table 3.13 Featured behaviors of eating disorders by food security status
FS- food secure women; FIS- food insecure women; $- p-values of F-test, generated from
ANOVA simulation in STATA

94
Food Stamps n Beginning End
Differ-
ences p
$
FIS
Month 1
Non-recipients 12 83.25
(17.67)
80.58
(25.78)
2.67
(20.39) 0.01
Recipients 33 87.21
(25.75)
64.88
(22.42)
22.33
(23.55)
Month 2
Non-recipients 10 86.1
(26.67)
82.9
(21.17)
3.2
(25.67) 0.26
Recipients 24 82.38
(24.6)
67.83
(15.69)
14.54
(28.84)
Month 3
Non-recipients 10 81.3
(25.24)
80.4
(18.63)
0.9
(16.54) 0.01
Recipients 21 92
(22.33)
70.29
(21.08)
21.71
(26.78)
FS
Month 1
Non-recipients 8 87.25
(11.74)
79.63
(14.56)
7.63
(8.48) 0.38
Recipients 6 114.5
(26.94)
102
(29.03)
12.5
(10.97)
Month 2
Non-recipients 7 92.29
(14.91)
88.29
(15.8) 4 (15.53)
0.53
Recipients 7 102
(26.23)
92.43
(34.21)
9.57
(15.60)
Month 3
Non-recipients 7 93
(10.83)
83.57
(9.52)
9.43
(14.08) 0.41
Recipients 6 105.67
(34.2)
89.67
(27.95)
16
(13.70)
Table 3.14 Monthly differences of household food stores by food security and food
stamps receiving status
FS- food secure women, FIS- food insecure women; $- p-values of F-test, generated from
ANOVA simulation in STATA, comparing monthly differences between food stamp
recipients and non-recipients
95
CHAPTER 4
Addressing the Association of Food Insecurity and Overweight/Obesity
Using data from NHANES 1999-2008
4.1 Introduction
Based on what had been found in the Ohio study (Chapter 3), the monthly cycle
of food abundance and food shortage, and the participation of Food Stamp Program
(FSP) may contribute to the paradoxical relationship in food insecurity and
overweight/obesity. However, the Ohio study was limited by a small sample size,
especially for women of normal weight status or income level. In order to generate more
nationally representative results, and to address this paradoxical relationship in a larger
sample, the study in this chapter analyzed U.S. women with similar characteristics (22-49
years old, non-Hispanic white, non-pregnant, non-lactating) as those in the Ohio study
using data from the continuous National Health and Nutrition Examination Survey
(NHANES) 1999–2008. The study aimed to test whether dietary intake (total energy
intake – TEI, and macronutrient intakes) and food stamp participation have an impact on
the paradoxical in food insecurity and overweight/obesity. In addition, the study
calculated the daily total energy intake (TEI) in FIS/ovob women in U.S. on average to
provide a reference value for the TEI in FIS/ovob women in the Ohio study.

96
4.1.1 Hypothesis Testing
The following hypotheses were proposed to be tested in this study:
1. Food insecure women have higher body mass index (BMI) than food secure
women, and low-income food insecure women have higher BMI than low-income
food secure women.
2. Compared to FS/ovob women, FIS/ovob women have greater 1-yr body weight
increase, higher total energy intake (TEI), and higher percentage of energy from
fat, lower percentage of energy from protein and lower grams of fiber intake.
3. Among food insecure women, food stamp recipients have higher BM, greater 1-yr
body weight increase, higher TEI, higher percentage of energy from fat, lower
percentage of energy from protein and lower grams of fiber intake than food
stamp non-recipients.
4. FIS/ovob women in the NHANES study have lower TEI than FIS/ovob women in
the Ohio study at the beginning of the month, but higher at the end of the month.
4.2 Methods
4.2.1 Sample
To ensure enough sample size, the data from the NHANES 1999-2008 were
analyzed in this study. In total there were 26,263 women in the NHANES 1999-2008,
among which 10,194 were non-Hispanic White. Women whose age were not within 22-
49 years old (n=7257), pregnant (n=721) or breastfeeding (n=72) were excluded from the
study. In addition, women with zero energy intake (n=1) or with energy intake 4 standard
97
deviations above the mean (n=3) were excluded to eliminate outliers. The final sample
size is 2140 in the NHANES study.
4.2.2 Data Collection
The National Health and Nutrition Examination Surveys (NHANES) are
continuous national nutrition and health monitoring surveys collecting data from non-
institutionalized U.S. citizens. NHANES covered a stratified, probabilistic, multistage,
cluster sampling of households representing the fifty U.S. states as well as Washington
DC. The data oversampled hard-to-reach populations like elders, minorities, low-income
and adolescents. The NHANES survey includes health interviews at respondents’ homes,
and examinations in specially-designed and equipped Mobile Examination Center (MEC),
which can travel to survey locations throughout the country [155].
Public-available NHANES 1999-2008 were downloaded from the Centers for
Disease Control and Prevention (CDC) website. Female interviewees who were at
reproductive age (22-49 years old) and with similar characteristics (non-Hispanic white,
non-pregnant, non-lactating) as those in the Ohio study were chosen to obtain the average
dietary intake in this population.
Demographic data
Demographic variables included in this research were gender, age, race/ethnicity,
education, household size, family poverty income ratio (PIR) and current pregnant and
breastfeeding status. Except pregnant and breastfeeding status, demographic data were
98
collected during household interviews in respondents’ homes, using the Sample Person
and Family Demographics questionnaires containing family-level and individual-level
questions. Participants who were 16 years and older and emancipated minors were
interviewed directly by interviewers. The variable of pregnancy status in the demographic
file was derived from two other variables – the self-reported current pregnancy status
assessed in the MEC, and the urine pregnancy test result from the laboratory results. The
current breastfeeding question was asked face-to-face in the MEC to female participants
who were pregnant before. Quality control included the use of NHANES computer-
assisted personal interview (CAPI) software program for data collection and error
checking, and reviewing and re-contacting a subset of household interviews and
participants.
The family poverty income ratio (PIR) was used to determine whether a
household is low-income or not, subsequently, low-income women were those whose
family PIR was less than or equal to 1.3.
Weight history
Self-reported weight 1-yr ago and currently self-reported weight were used to
calculate women’s weight change over one year. These questions were asked in the
Weight History section in household in-person interviews and were asked to persons 16
years and older. In NHANES 2005-2006, 207-2008, the data collection was assisted with
a computer-assisted personal interviewing (CAPI) system.
99
In the analysis, self-reported body weights were released in pounds in the dataset
and were converted to kilograms using the conversion factor 2.2046 pounds per kilogram.
In addition, current self-reported weight was compared with measured weight to estimate
the report bias of self-reported weight.
Except the mean value of 1-yr weight change, the study used 2.27 kg (5 lbs) and
4.54 kg (10 lbs) as cutoff points to generate two dummy variables indicating 1-yr weight
gain bigger than or equal to the two cutoff values. Studies have shown that weight gain is
associated with vitality and physical functioning declines [156]. For example, a long-term
weight gain of 5 kg or more is a risk factor for diseases like diabetes [157], stroke [158],
and coronary heart disease [76]; and the risks are increased by maintaining a 4.54 kg
weight gain in a single year [41]. The two cutoff points chosen here were for single-year
weight change, which can reach substantial weight gain if maintained for a long term;
additionally, these cutoff points have been proved to be associated with household food
security in a previous study of NHANES [41].
Household food security data
NHANES household food security section (FSQ) consisted of four sub-
components: 1) household food security, 2) individual food security, 3) household and
individual FSP benefits, and 4) household and individual Women, Infants and Children
(WIC) benefits. The sub-components analyzed in this study are the household food
security and household FSP benefits. The household food security status was measured
with the US FSSM questions responded by an adult in the household during the
100
household interview [3]. The US FSSM asked 18 questions to households with children,
and 10 questions to households without children. Household food security status was then
derived from these responses as follows: 1) high food secure (score: 0); 2) marginal food
secure (score: 1-2); 3) low food secure, (score: 3-7 in households with children; 3-5 in
households without children); 4) very low food secure (score: 8 and above in households
with children; 6 and above in households without children) [107]. Quality control system
when acquiring the household food security data included reviewing incoming data and
taped interviews, interviews observation, training and re-training sessions, and reviewing
for outliers and non-response.
In this study, households in both the categories of high food security and marginal
food security were considered as food secure households, and households of low food
security and very low food security were combined as food insecure households. In
addition, data of a subcomponent ―household FSP benefits‖ were used to define food
stamp recipients in the study: women who live in the households with at least one person
received food stamps in the last 12 months.
24-hour dietary recall data
The dietary intake data were collected using two different methods. In NHANES
1999-2000, the data were collected using the NHANES computer-assisted dietary
interview (CADI) system with built-in food probe features [159]. Databases like Quick
List food list, brand name food list, and food amount unit list were linked to this
automated data collection system. A multi-pass method ―quick list, time, occasion and

101
place, food details, and final review‖ was used in CADI to collect details on food and
beverage consumption. In this cycle, in-person interview was the primary interview
mode6.
In NHANES 2001-2002, two different computer-assisted systems were used in
dietary intake data collection. In 2001, data were collected using the same computer-
assisted dietary interview system (CADI) as in NHANES 1999-2000 [159]. In 2002, the
dietary intake survey in NHANES was integrated with another nationwide survey - the
Continuing Survey of Food Intakes by Individuals (CSFII). Due to this integration,
another fully computerized method: Automated Multiple Pass Method (AMPM) with the
assistance of five steps (i.e. quick list, forgotten foods, time and occasion, detail cycle,
and final probe) has been used in dietary intake interviews since 2002 [143]. Compared
to the CADI system, the AMPM is updated yearly and ―features automated routing of
questions based on previous answers‖ [143]. Collected 24-hour dietary intake data were
processed by USDA’s Food and Nutrient Database for Dietary Studies, 3.0 (FNDDS, 3.0)
to generate dietary intakes. Nutrient values in FNDDS 3.0 were derived from the USDA
National Nutrient database for Standard Reference, release 20 [160]. In-person interview
was still the primary interview mode in this cycle7.
6 Participants who were randomly assigned to be interviewed in afternoons or evenings were also
asked for a following telephone interview 4-10 days later; only a small part of these participants completed
the 2nd phone interview.
7 In 2002, dietary intake data also included data from a second-day telephone interview, but the
data were not publicly released due to confidentiality issues.
102
Starting from the cycle of 2003-2004, NHANES has two 24-hour dietary recall
interviews conducted to NHANES examinees. The first recall was an in-person interview
conducted in the Mobile Examination Centers (MECs). Measuring guides like glasses,
rulers, spoons were provided to help for estimation of food consumption amounts. A
second telephone dietary interview was conducted 3 to 10 days after the initial interview
but not on the same day of the week as the one in MEC [161]. To keep data consistent
among different cycles of NHANES, the study here used 24-hour dietary recall data from
the first in-person interview in all the cycles in NHANES.
To obtain high quality data, interviewers in the interviews and coders in the data
processing period received training and re-training. Other quality control methods like
interview monitoring, review of data, re-coding by another coder were applied.
Dietary intake of macronutrients (i.e. protein, fat, and carbohydrates) was released
as grams in NHANES. To generate ratios of protein/energy, fat/energy, and
carbohydrates/energy, macronutrient intakes were first converted to kcals -1 gram of fat
containing 9 kcal, 1 gram of carbohydrates and 1 gram of protein containing 4 kcal – and
were divided by total energy intake (kcal).
Anthropometric measurements
Participants’ weights and heights were measured by trained health technicians in
the NHANES mobile examination centers (MECs). Weight was measured in pounds by a
digital scale and was converted to kilograms. Standing height measurements were taken
to the nearest tenth of a centimeter on a fixed stadiometer. Measurements would be
103
verified before going to the next step. Body Mass Index (BMI, kg/m2) was calculated by
weight (in kilograms) divided by height squared (in meters square), and used to
categorize weight status by NIH recommended cut-off points normal weight (BMI 18.5-
24.9 kg/m2), overweight (BMI 25-29.9 kg/m
2), and obesity (BMI higher or equal to 30
kg/m2) [27].
4.2.3 Data Analysis
Public-available NHANES 1999-2008 from National Center for Health Statistics
(NCHS) website were downloaded and saved as appropriate files. Components from
different survey cycles were recoded, concatenated, and merged into one dataset.
Variables of interest were kept in the final dataset. Here is a list of variables of interest:
Demographics - gender, age, race/ethnicity, education, household size, family
PIR, current pregnant status, current breastfeeding status
Body measures - measured weight (kg), measured height (cm), BMI
Food security - household food security category, anyone in the household
authorized for food stamps in last 12 months
Dietary intake - energy (kcal), protein (gm), protein/energy ratio (%),
carbohydrates (gm), carbohydrates/energy ratio (%), dietary fiber (gm), total fat (gm),
fat/energy ratio (%)
Weight history - currently self-reported weight (kg), self-reported weight 1-yr ago
(kg), 1-yr weight change (kg), 1-yr weight gain >= 2.27 kg (5 lbs), 1-yr weight gain >=
4.54 kg (10 lbs)
104
Statistical analysis
The comparison between food secure and food insecure women, between
overweight or obese women who were food secure and food insecure, and between food
insecure women who were food stamp recipients and non-recipients were assessed by t-
test analysis and chi-square test. All statistical analyses were performed using the
software package STATA [152]. The complex sample design in NHANES was
considered when running statistical analyses by using this statistical software.
Statistically significant differences were determined at p < 0.05, while p < 0.1 was
defined as marginally significant.
Sample weights
In order to gain a nationally representative sample, three types of sample weights
in NHANES were used in the data analysis: the interview weights (for interviewed
sample persons), the MEC weights (for the sample persons with MEC data), and the
dietary intake weights (for the sample persons with dietary intake data). Different sample
weights account for different interview settings. Data of demographics, breastfeeding
status, weight history, and household food security and food stamp participation were
collected at home, and the interview weights were applied to these data. The MEC
weights were applied to weight and height which were measured in the MEC. Although
the dietary intake data on Day 1 (in-person interview) were also collected in the MEC,
105
the MEC sample weights should not be used for dietary intake analysis. That is because
dietary intake interviews occurred more on weekends than on weekdays. Due to the high
day-to-day variation in dietary intake, use of the MEC weights would ―disproportionately
represent‖ intakes during weekends. Therefore, the study used the dietary intake (Day 1)
weights, which were constructed from the MEC weights but further adjusting for the
―additional non-response‖ and the ―differential allocation by day of the week‖ [155].
The original 2-year sample weights in each NHANES cycle were used to
construct 10-year sample weights for combined surveys, except in 1999-2000 and 2001-
2002. In these two cycles, the combined 4-year weights were used rather than the 2-year
weights to account for the two different population bases – the population estimates
before 2000 Census counts in NHANES 1999-2000 and after 2000 Census counts in
NHANES 2001-2002 and later 2-year cycles.
4.3 Results
Basic characteristics of food secure women and food insecure women were
examined in Table 4.1. Compared to food secure women, food insecure women had a
higher mean BMI (29.22 vs. 27.44, p<0.01), and weighed significantly more in measured
weight (78.95 vs. 74.28 kg, p<0.01) and self-reported weight (77.04 vs. 72.73 kg,
p<0.05). The report bias of women’s weight - calculated as measured weight minus self-
reported weight (not shown in Table 4.1) - was significant in both food secure women
106
(1.50 kg, 95% CI8: 1.28 - 1.72 kg) and food insecure women (1.86 kg, 95% CI: 1.23-2.49
kg). The prevalence of obesity (42.47% (95% CI: 34.9 - 50.03%) vs. 29.3% (95% CI:
26.74 - 31.87%)) was higher in food insecure women than food secure women;
comparatively, a lower prevalence of normal weight women (30.82% (95% CI: 24.29 -
37.36%) vs. 44.52% (95% CI: 41.27 - 47.78%)) was found in food insecure women. The
prevalence of overweight in food insecure women was not significantly different from
food insecure women.
No significant differences between the two groups of women were found in age,
household size, and measured height. Food secure women were wealthier: a higher
family poverty income ratio (PIR) was found in this group of women compared to food
insecure women (3.47 vs. 1.32, p<0.001). In addition, half of the food insecure women
(50%) participated in the FSP, compared to a much lower participation rate 7.75% among
food secure women.
The education status in women was categorized into five levels (Table 4.1).
Significant differences were observed in the distribution of education status. More than
half (55%) of food insecure women were in low education levels (i.e. less than 9th
grade,
9-11th
grade, 12th
grade with no diploma, and high school grad/GED or equivalent),
compared to a frequency of 30% in food secure women. On the other hand, more than
one third (35%) of food secure women had college degree or above, while less than 8%
food insecure women were in this level.
8 CI: Confidence Interval
107
Table 4.2 compared the same characteristics as Table 4.1 among low-income food
secure women and low-income food insecure women. No significant differences were
found in household size, family PIR, education level, BMI, prevalence of underweight,
normal weight, overweight, obesity, measured weight and self-reported weight between
the two groups, but food secure low-income women were younger (34.51 vs. 36.82 years,
p=0.022) and shorter (162.67 vs. 164.07 cm, p=0.037) than food insecure counterparts. A
significant difference between the two groups of women was found in the participation of
the FSP: about two thirds (64.22%) of food insecure low-income women were in the
households receiving food stamps in the last 12 months, compared to a participation rate
42.71% in food secure low-income women (p=0.0006).
Table 4.3 shows the comparison of 1-yr weight change and dietary intake (total
energy and macronutrient intakes) between food secure women and food insecure women.
A positive weight change (i.e. weight increase) was found in food insecure women
showed within last 12 months (1.24, 95% CI: 0.20 – 2.28 kg) with no significant
difference from food secure women. However, for food insecure women, the prevalence
of substantial 1-yr weight gain was significantly higher than food secure women (2.27 kg
or 5 lbs - 35.84% vs. 26.21%; 4.54 kg or 10 lbs - 24.45% vs. 15.28%). The total energy
intake (FS: 1915.49 vs. FIS: 1968.03 kcal) and fat intake (FS: 73.48 vs. FIS: 72.1 gm)
were not significantly different in food secure women and food insecure women.
However, food insecure women consumed less protein (63.46 vs. 71.65 gm, p=0.001),
less fiber (12.11 vs. 13.99 gm, p=0.017), but more carbohydrates (257.26 vs. 235.57 gm,
p=0.017) than food insecure women. Macronutrient energy ratios were also calculated

108
and compared in Table 4.3: food insecure women obtained 13.28% of energy from
protein, more than half from carbohydrates (52.7%), and about one third (32.69%) from
fat; comparatively, food secure women showed a higher protein/energy ratio (15.27%,
p<0.001) and a lower carbohydrates/energy ratio (49.77%, p=0.002). No significant
different was found when comparing fat/energy ratio in the two groups of women.
The macronutrient energy ratios were also compared with the Acceptable
Macronutrient Distribution Range (AMDR)9 range (carbohydrates: 45-65%, total fat: 20-
35%, protein and amino acids: 10-35%) [162], and both food secure women and food
insecure women were with within the AMDR range. But the percentages of energy from
fat were around the upper limit in both groups (FS: 33.98, FIS: 32.69 %), and the
protein/energy ratio was around the lower bound (FS: 15.27, FIS: 13.28 %). In addition,
the daily fiber intake was about half of the required fiber intake (Adequate Intake - AI: 25
gm/day) [162].
Both food secure women and food insecure women were then categorized into
two subgroups separately – overweight/obese group and normal weight (including
underweight) group. In Table 4.4 four women groups were analyzed: FS/ovob, FIS/ovob,
FS/norm, FIS/norm. Pair-wise comparisons of 1-yr weight change and dietary intake
between FIS/ovob women and the other three women groups were examined in Table 4.4.
FIS/ovob women were the only group showing a weight increase over one year (1.67,
95% CI: 0.07-3.27 kg). Furthermore, for FIS/ovob women, the prevalence of a 2.27 kg (5
9 AMDR is defined as ―the range of intake for a particular energy source that is associated with
reduced risk of chronic disease while providing intakes of essential nutrients‖ [Trumbo.etal2002].
109
lbs) weight gain over one year (37.41%) was significantly higher than FS/norm women
(18.94%); the prevalence of a 4.54 kg (10 lbs) weight gain over one year (28.81%) was
significantly higher than any other women group (FS/ovob: 21.83%, FS/norm:7.95%,
FIS/norm: 17.10%). No significant difference of total energy intake was found among the
four groups. FIS/ovob women showed a lower protein intake than FS/ovob women (65.26
vs. 71.74 gm, p=0.037) and FS/norm women (65.26 vs. 71.99 gm, p=0.026). And the
protein/energy ratio in FIS/ovob women was lower than in the two food secure groups of
women, but higher than in FIS/norm women. Consumption of carbohydrates in FIS/ovob
women was marginally higher than FS/ovob women (253.48 vs. 232.58 gm, p=0.062),
and the carbohydrates/energy ratio was significantly higher in FIS/ovob women than
FS/ovob women and FS/norm women. No significant differences were found in either fat
intake or fat/energy ratio. Significant differences of fiber intake were not found between
FIS/ovob women and FS/ovob women, but was found between FIS/ovob women and
FS/norm women (12.76 vs. 14.89 gm, p=0.044).
The TEI in FIS/ovob women calculated from the NHANES data (Table 4.4) were
also compared with that of the Ohio sample (Table 3.7a). Compared to the average TEI
(1944.35±77.90 kcal) from NHANES, FIS/ovob women in the Ohio sample had a
monthly decrease in TEI in Month 1, characterized by a higher energy intake at the
beginning of the month (2114.19±150.08 kcal) followed with a lower TEI at the end of
the month (1843.06±139.67 kcal). The TEIs in Month 2 and in Month 3 in the Ohio study
(Month 2: beginning- 2097.35±146.49, end- 2099.06±160.49; Month 3: beginning-
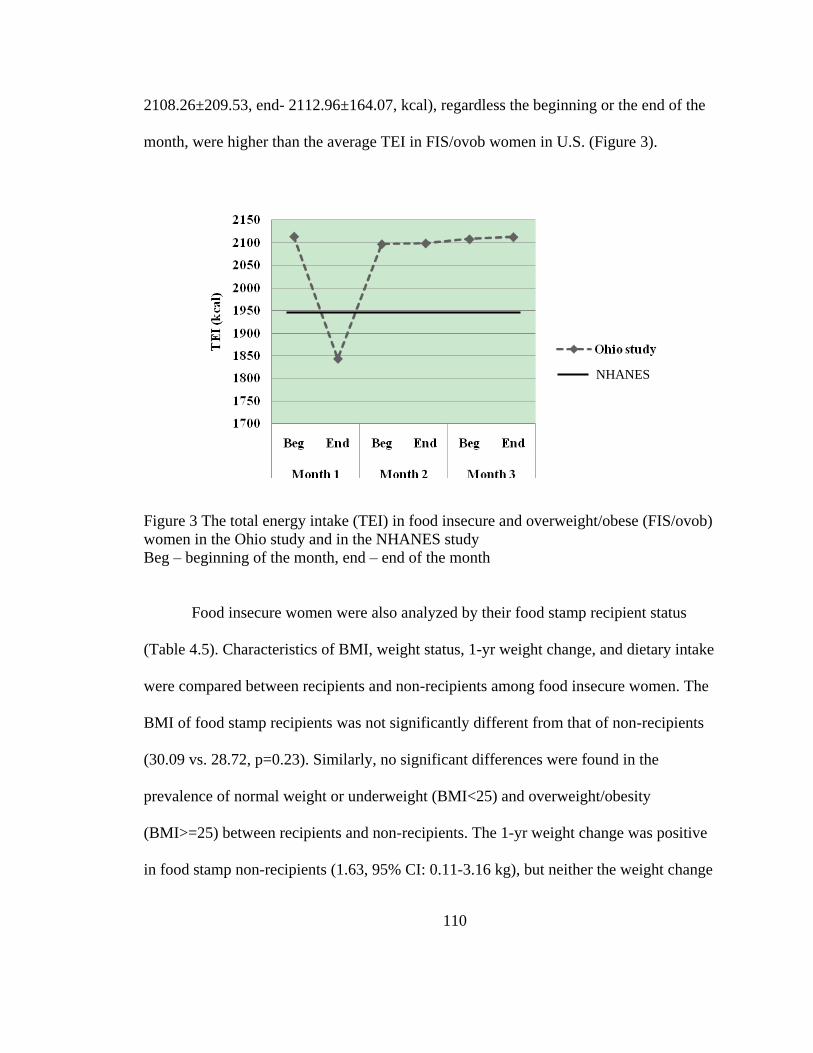
110
2108.26±209.53, end- 2112.96±164.07, kcal), regardless the beginning or the end of the
month, were higher than the average TEI in FIS/ovob women in U.S. (Figure 3).
Figure 3 The total energy intake (TEI) in food insecure and overweight/obese (FIS/ovob)
women in the Ohio study and in the NHANES study
Beg – beginning of the month, end – end of the month
Food insecure women were also analyzed by their food stamp recipient status
(Table 4.5). Characteristics of BMI, weight status, 1-yr weight change, and dietary intake
were compared between recipients and non-recipients among food insecure women. The
BMI of food stamp recipients was not significantly different from that of non-recipients
(30.09 vs. 28.72, p=0.23). Similarly, no significant differences were found in the
prevalence of normal weight or underweight (BMI<25) and overweight/obesity
(BMI>=25) between recipients and non-recipients. The 1-yr weight change was positive
in food stamp non-recipients (1.63, 95% CI: 0.11-3.16 kg), but neither the weight change
NHANES
111
nor the prevalence of a 2.27 kg (5 lbs) or a 4.54 kg (10 lbs) weight gain over one year
was significantly different from food stamps recipients. The comparison of total energy
intake and macronutrient intakes between recipients and non-recipients did not show
significant differences, except for the protein intake. It was found that recipients
consumed marginally less protein (60.49 vs. 68.41 gm, p=0.09) and showed a lower
protein/energy ratio (12.41% vs. 13.89%, p=0.036) compared to non-recipients.
4.4 Summary and Results of Hypothesis Testing
The study analyzed women sample from the NHANES 1999-2008 who were 22-
49 yr, non-Hispanic white, non-pregnant and non-lactating, to address the paradoxical
association in food insecurity and overweight/obesity in this women population on a
national level.
Food insecure women had a higher mean BMI (29.22 vs. 27.44), higher
prevalence of obesity (42.47% vs. 29.3%), a lower family poverty income ratio (PIR)
(1.32 vs. 3.47), a higher FSP participation rate (50% vs. 7.75%), and lower education
level than food secure women. However, no significant differences were found between
low-income food secure women and low-income food insecure women, except for the
higher percentages food stamp participation in food insecure low-income households
(64.22% vs. 42.71%). Therefore, the higher BMI in food insecure women than food
secure women in Hypothesis 1 is accepted, but the higher BMI in low-income food
insecure women than low-income food secure women is rejected.
112
In Hypothesis 2 it was hypothesized that FIS/ovob women have greater 1-yr body
weight increase, higher total energy intake (TEI), and higher percentage of energy from
fat, lower percentage of energy from protein and lower grams of fiber intake than to
FS/ovob women. Although no significant difference was observed in the values of 1-yr
body weight change, FIS/ovob women had a higher prevalence of a 4.54 kg (10 lbs) 1-yr
weight gain (28.81%) than FS/ovob women (21.83%). No significant differences were
found in TEI or in fat/energy ratio between the two groups. The protein/energy ratio was
higher in FS/ovob women (15.44) than in FIS/ovob women (13.79%). And the fiber
consumption in FIS/ovob women (12.76 gm) was not differed from that in FS/ovob
women (13.34 gm). Therefore, Hypothesis 2 is partly accepted.
Unlike Hypothesis 2, Hypothesis 3, the comparisons between food insecure food-
stamps-recipients and non-recipients, was rejected in most parts: except for the lower
protein/energy ratio (12.41% vs. 13.89%) in recipients, no significant differences were
found in BMI, prevalence of overweight/obesity, 1-yr weight change, TEI, and
macronutrient intakes.
The final hypothesis, Hypothesis 4 is only true in Month 1, where FIS/ovob
women in the NHANES study showed lower TEI (1944.35±77.90 kcal) than FIS/ovob
women in the Ohio study at the beginning of Month 1 (2114.19±150.08 kcal) , but higher
at the end of Month 1 (1843.06±139.67 kcal). Comparatively, the TEI in Month 2 and in
Month 3 in the Ohio study was higher than that in the NHANES study, regardless it was
at the beginning or the end of the month.
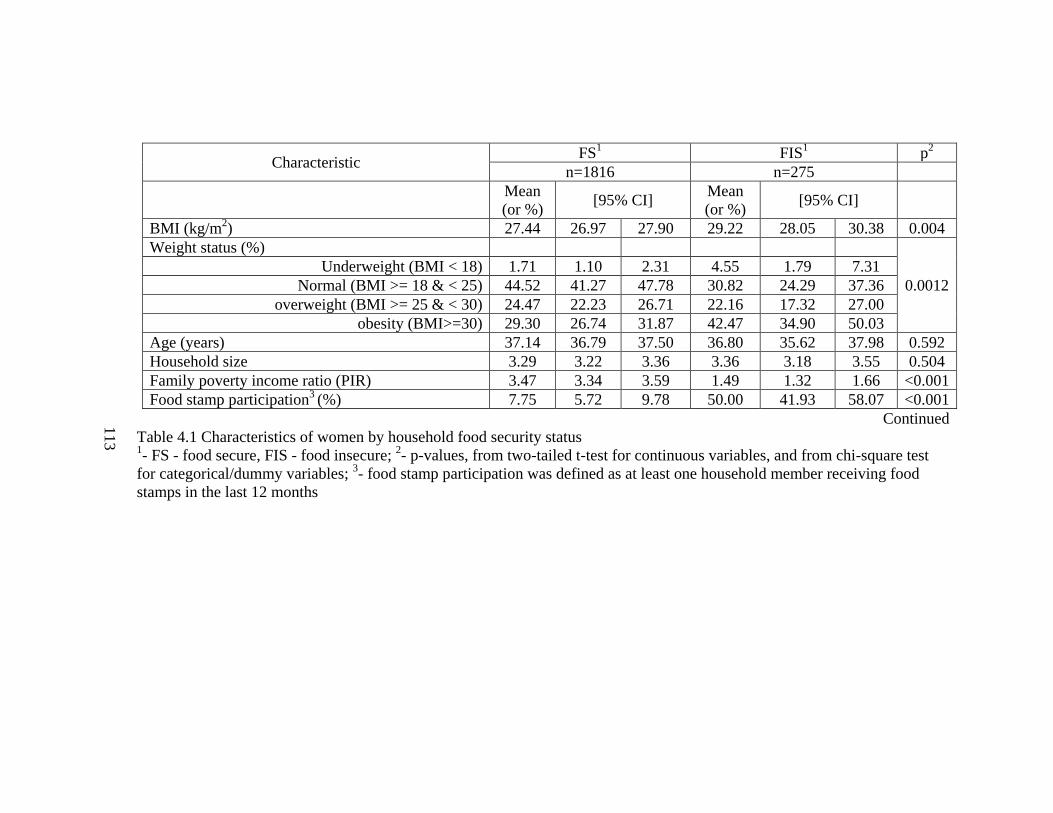
113
Characteristic FS
1 FIS
1 p
2
n=1816 n=275
Mean
(or %) [95% CI]
Mean
(or %) [95% CI]
BMI (kg/m2) 27.44 26.97 27.90 29.22 28.05 30.38 0.004
Weight status (%)
0.0012
Underweight (BMI < 18) 1.71 1.10 2.31 4.55 1.79 7.31
Normal (BMI >= 18 & < 25) 44.52 41.27 47.78 30.82 24.29 37.36
overweight (BMI >= 25 & < 30) 24.47 22.23 26.71 22.16 17.32 27.00
obesity (BMI>=30) 29.30 26.74 31.87 42.47 34.90 50.03
Age (years) 37.14 36.79 37.50 36.80 35.62 37.98 0.592
Household size 3.29 3.22 3.36 3.36 3.18 3.55 0.504
Family poverty income ratio (PIR) 3.47 3.34 3.59 1.49 1.32 1.66 <0.001
Food stamp participation3 (%) 7.75 5.72 9.78 50.00 41.93 58.07 <0.001
Continued
Table 4.1 Characteristics of women by household food security status 1- FS - food secure, FIS - food insecure;
2- p-values, from two-tailed t-test for continuous variables, and from chi-square test
for categorical/dummy variables; 3- food stamp participation was defined as at least one household member receiving food
stamps in the last 12 months
113
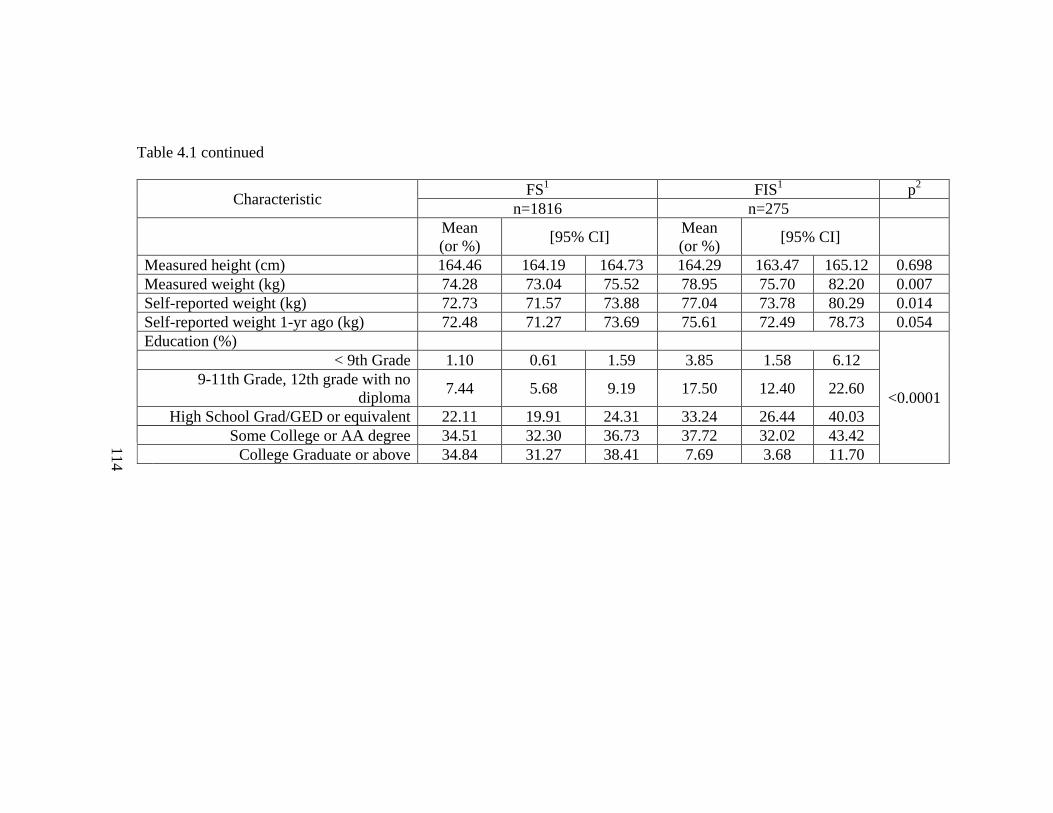
114
Table 4.1 continued
Characteristic FS
1 FIS
1 p
2
n=1816 n=275
Mean
(or %) [95% CI]
Mean
(or %) [95% CI]
Measured height (cm) 164.46 164.19 164.73 164.29 163.47 165.12 0.698
Measured weight (kg) 74.28 73.04 75.52 78.95 75.70 82.20 0.007
Self-reported weight (kg) 72.73 71.57 73.88 77.04 73.78 80.29 0.014
Self-reported weight 1-yr ago (kg) 72.48 71.27 73.69 75.61 72.49 78.73 0.054
Education (%)
<0.0001
< 9th Grade 1.10 0.61 1.59 3.85 1.58 6.12
9-11th Grade, 12th grade with no
diploma 7.44 5.68 9.19 17.50 12.40 22.60
High School Grad/GED or equivalent 22.11 19.91 24.31 33.24 26.44 40.03
Some College or AA degree 34.51 32.30 36.73 37.72 32.02 43.42
College Graduate or above 34.84 31.27 38.41 7.69 3.68 11.70
114

115
Characteristic FS/lowinc
1 FIS/lowinc
1 p
2
n=279 n=176
Mean (or %) [95% CI] Mean (or %) [95% CI]
BMI (kg/m2) 28.84 27.97 29.71 28.83 27.40 30.26 0.992
Weight status (%)
0.5553
Underweight (BMI < 18) 2.50 0.52 4.49 4.66 1.11 8.20
Normal (BMI >= 18 & < 25) 39.90 34.77 45.03 35.31 25.78 44.84
overweight (BMI >= 25 & < 30) 19.53 14.14 24.91 17.21 12.11 22.32
obesity (BMI>=30) 38.07 31.74 44.41 42.82 33.22 52.43
Age (years) 34.51 33.41 35.61 36.82 35.36 38.27 0.022
Household size 3.50 3.27 3.73 3.45 3.18 3.72 0.791
Family poverty income ratio (PIR) 0.79 0.73 0.85 0.82 0.76 0.88 0.492
Food stamp participation3 (%) 42.71 34.38 51.03 64.22 56.08 72.37 <0.001
Continued
Table 4.2 Characteristics of low-income women by household food security status 1: FS - food secure, FIS - food insecure, lowinc - low-income, defined as family poverty income ratio (PIR) <= 130;
2- p-values,
from two-tailed t-test for continuous variables, and from chi-square test for categorical/dummy variables; 3- food stamp
participation was defined as at least one household member receiving food stamps in the last 12 months
115
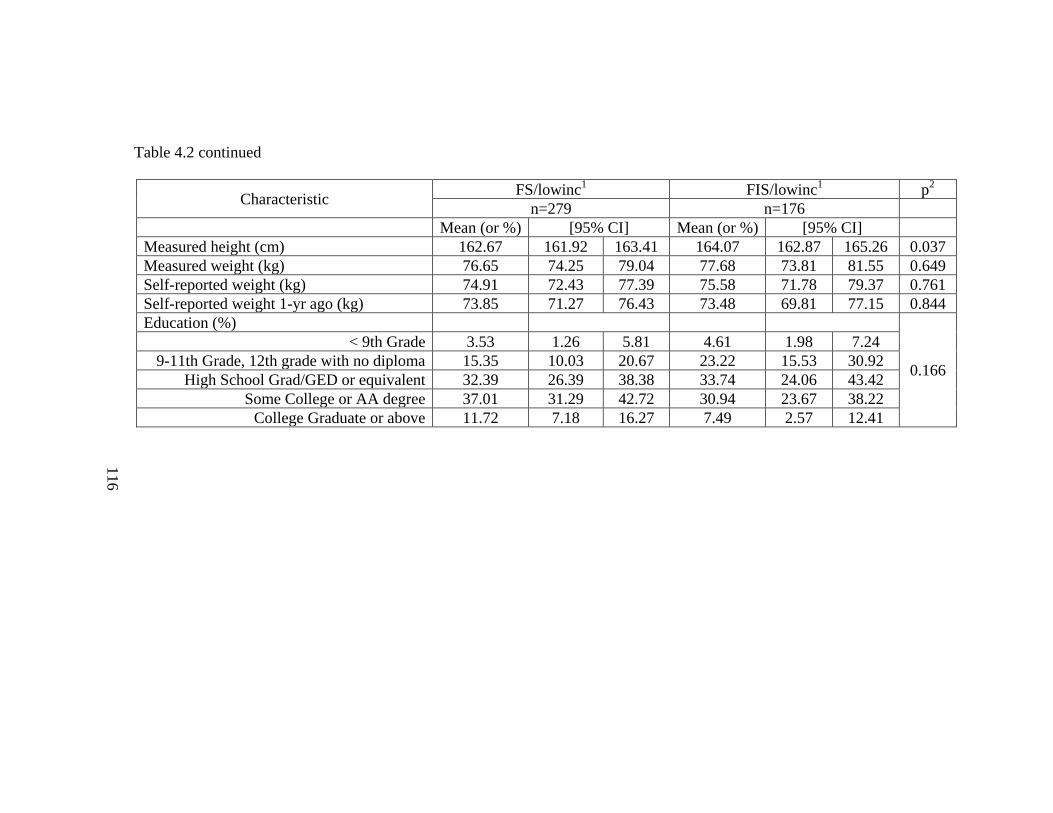
116
Table 4.2 continued
Characteristic FS/lowinc
1 FIS/lowinc
1 p
2
n=279 n=176
Mean (or %) [95% CI] Mean (or %) [95% CI]
Measured height (cm) 162.67 161.92 163.41 164.07 162.87 165.26 0.037
Measured weight (kg) 76.65 74.25 79.04 77.68 73.81 81.55 0.649
Self-reported weight (kg) 74.91 72.43 77.39 75.58 71.78 79.37 0.761
Self-reported weight 1-yr ago (kg) 73.85 71.27 76.43 73.48 69.81 77.15 0.844
Education (%)
0.166
< 9th Grade 3.53 1.26 5.81 4.61 1.98 7.24
9-11th Grade, 12th grade with no diploma 15.35 10.03 20.67 23.22 15.53 30.92
High School Grad/GED or equivalent 32.39 26.39 38.38 33.74 24.06 43.42
Some College or AA degree 37.01 31.29 42.72 30.94 23.67 38.22
College Graduate or above 11.72 7.18 16.27 7.49 2.57 12.41
116

117
FS1 FIS
1 p
2
n=1816 n=275
Mean (or %) [95% CI] Mean (or %) [95% CI]
1-yr weight change (kg)3 0.19 -0.19 0.57 1.24 0.20 2.28 0.073
1-yr weight gain (%)
>= 2.27 kg (5 lbs) 26.21 24.00 28.42 35.84 30.35 41.32 0.002
>= 4.54 kg (10 lbs) 15.28 13.38 17.19 24.45 19.59 29.31 0.001
Energy intake (kcal) 1915.49 1874.75 1956.23 1968.03 1835.77 2100.28 0.443
Protein intake (gm) 71.65 69.96 73.33 63.46 58.97 67.96 0.001
Protein/energy ratio (%) 15.27 14.97 15.57 13.28 12.60 13.96 <0.001
Carbohydrates (gm) 235.57 230.27 240.87 257.26 239.97 274.55 0.017
Carbohydrates/energy ratio (%) 49.77 49.03 50.51 52.70 50.99 54.41 0.002
Fat (gm) 73.48 71.36 75.61 72.10 66.13 78.07 0.658
Fat/energy ratio (%) 33.98 33.44 34.51 32.69 31.26 34.12 0.102
Fiber (gm) 13.99 13.36 14.62 12.11 10.58 13.64 0.017
Table 4.3 Comparison of 1-yr weight change and macronutrient intakes by food security status 1- FS - food secure, FIS - food insecure;
2- p-values from two-tailed t-test;
3- 1-yr weight change was calculated as self-reported
weight minus self-reported weight 1-yr ago
117
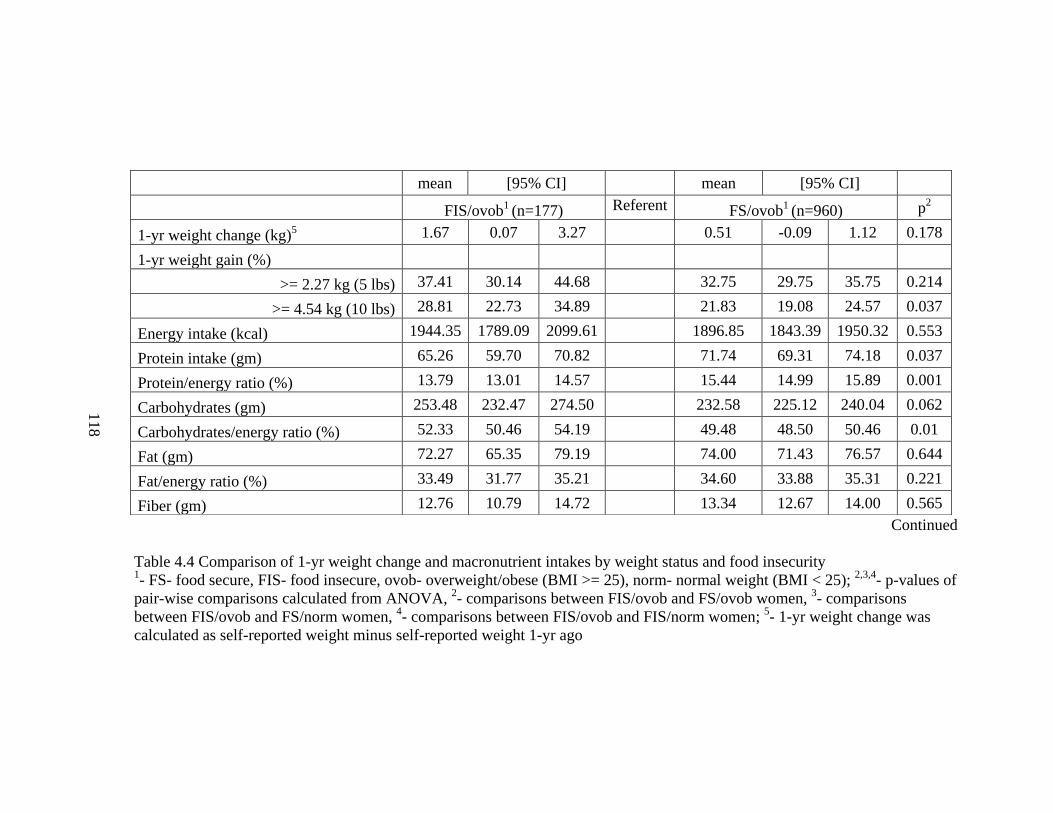
118
Continued
Table 4.4 Comparison of 1-yr weight change and macronutrient intakes by weight status and food insecurity 1- FS- food secure, FIS- food insecure, ovob- overweight/obese (BMI >= 25), norm- normal weight (BMI < 25);
2,3,4- p-values of
pair-wise comparisons calculated from ANOVA, 2- comparisons between FIS/ovob and FS/ovob women,
3- comparisons
between FIS/ovob and FS/norm women, 4- comparisons between FIS/ovob and FIS/norm women;
5- 1-yr weight change was
calculated as self-reported weight minus self-reported weight 1-yr ago
mean [95% CI] mean [95% CI]
FIS/ovob1 (n=177) Referent FS/ovob
1 (n=960) p
2
1-yr weight change (kg)5 1.67 0.07 3.27 0.51 -0.09 1.12 0.178
1-yr weight gain (%)
>= 2.27 kg (5 lbs) 37.41 30.14 44.68 32.75 29.75 35.75 0.214
>= 4.54 kg (10 lbs) 28.81 22.73 34.89 21.83 19.08 24.57 0.037
Energy intake (kcal) 1944.35 1789.09 2099.61 1896.85 1843.39 1950.32 0.553
Protein intake (gm) 65.26 59.70 70.82 71.74 69.31 74.18 0.037
Protein/energy ratio (%) 13.79 13.01 14.57 15.44 14.99 15.89 0.001
Carbohydrates (gm) 253.48 232.47 274.50 232.58 225.12 240.04 0.062
Carbohydrates/energy ratio (%) 52.33 50.46 54.19 49.48 48.50 50.46 0.01
Fat (gm) 72.27 65.35 79.19 74.00 71.43 76.57 0.644
Fat/energy ratio (%) 33.49 31.77 35.21 34.60 33.88 35.31 0.221
Fiber (gm) 12.76 10.79 14.72 13.34 12.67 14.00 0.565
118

119
Table 4.4 continued
mean [95% CI] mean [95% CI]
FS/norm1 (n=836) p
3 FIS/norm
1 (n=95) p
4
1-yr weight change (kg)5 -0.10 -0.42 0.23 0.039 0.44 -0.83 1.71 0.282
1-yr weight gain (%)
>= 2.27 kg (5 lbs) 18.94 16.31 21.57 <0.001 32.36 20.51 44.22 0.519
>= 4.54 kg (10 lbs) 7.95 6.31 9.59 <0.001 17.10 7.89 26.30 0.042
Energy intake (kcal) 1947.33 1879.41 2015.24 0.972 2018.38 1795.22 2241.54 0.576
Protein intake (gm) 71.99 69.43 74.54 0.026 60.48 53.98 66.99 0.242
Protein/energy ratio (%) 15.10 14.66 15.55 0.004 12.36 11.19 13.53 0.043
Carbohydrates (gm) 240.02 230.89 249.14 0.263 264.91 230.97 298.84 0.586
Carbohydrates/energy ratio (%) 49.99 49.01 50.96 0.027 53.31 49.76 56.86 0.631
Fat (gm) 73.37 69.85 76.89 0.764 72.19 63.39 81.00 0.988
Fat/energy ratio (%) 33.35 32.62 34.09 0.887 31.34 29.04 33.63 0.129
Fiber (gm) 14.89 13.99 15.80 0.044 11.08 9.34 12.81 0.158
119
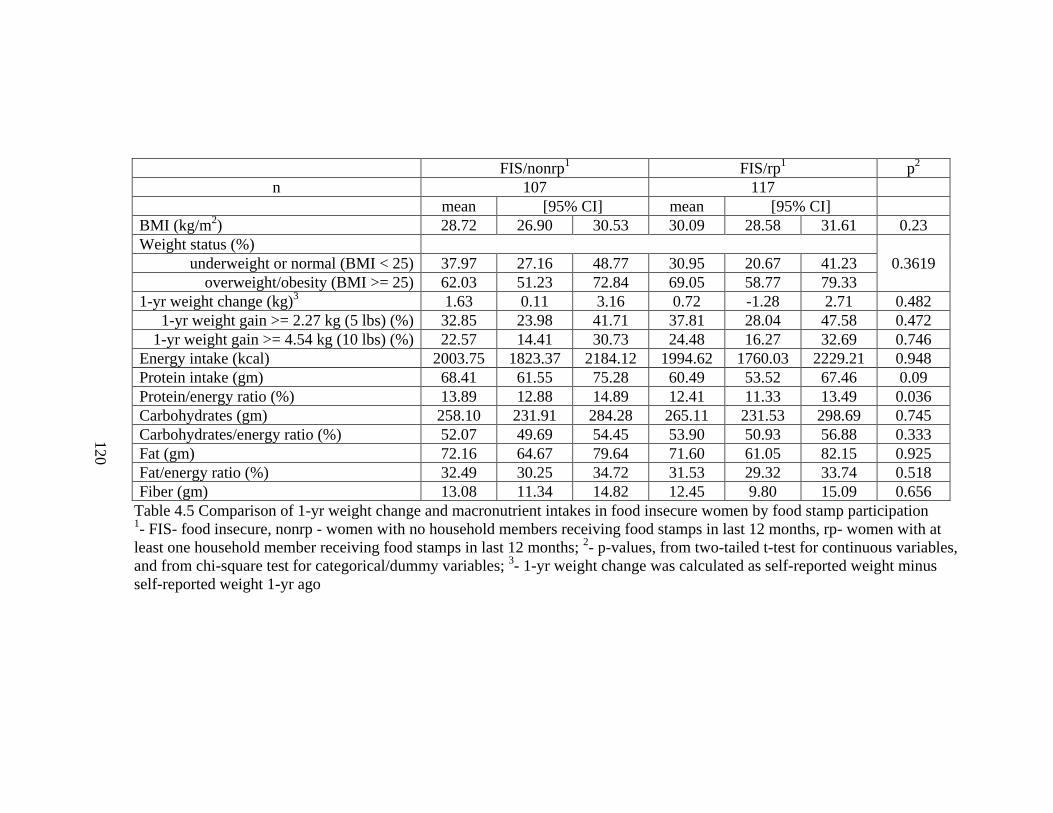
120
FIS/nonrp1 FIS/rp
1 p
2
n 107 117
mean [95% CI] mean [95% CI]
BMI (kg/m2) 28.72 26.90 30.53 30.09 28.58 31.61 0.23
Weight status (%)
0.3619 underweight or normal (BMI < 25) 37.97 27.16 48.77 30.95 20.67 41.23
overweight/obesity (BMI >= 25) 62.03 51.23 72.84 69.05 58.77 79.33
1-yr weight change (kg)3 1.63 0.11 3.16 0.72 -1.28 2.71 0.482
1-yr weight gain >= 2.27 kg (5 lbs) (%) 32.85 23.98 41.71 37.81 28.04 47.58 0.472
1-yr weight gain >= 4.54 kg (10 lbs) (%) 22.57 14.41 30.73 24.48 16.27 32.69 0.746
Energy intake (kcal) 2003.75 1823.37 2184.12 1994.62 1760.03 2229.21 0.948
Protein intake (gm) 68.41 61.55 75.28 60.49 53.52 67.46 0.09
Protein/energy ratio (%) 13.89 12.88 14.89 12.41 11.33 13.49 0.036
Carbohydrates (gm) 258.10 231.91 284.28 265.11 231.53 298.69 0.745
Carbohydrates/energy ratio (%) 52.07 49.69 54.45 53.90 50.93 56.88 0.333
Fat (gm) 72.16 64.67 79.64 71.60 61.05 82.15 0.925
Fat/energy ratio (%) 32.49 30.25 34.72 31.53 29.32 33.74 0.518
Fiber (gm) 13.08 11.34 14.82 12.45 9.80 15.09 0.656
Table 4.5 Comparison of 1-yr weight change and macronutrient intakes in food insecure women by food stamp participation 1- FIS- food insecure, nonrp - women with no household members receiving food stamps in last 12 months, rp- women with at
least one household member receiving food stamps in last 12 months; 2- p-values, from two-tailed t-test for continuous variables,
and from chi-square test for categorical/dummy variables; 3- 1-yr weight change was calculated as self-reported weight minus
self-reported weight 1-yr ago
120
121
CHAPTER 5
DISCUSSION AND CONCLUSIONS
The paradoxical association in food insecurity and obesity has been a public
health concern for about twenty years [44], [45], [46], [47], [48], [49], [50]. However, to
the best of our knowledge, studies in this dissertation, for the first time, addressed the
episodic pattern of food supply and food intake in the population of high vulnerability:
women dealing with both food insecurity and overweight/obesity [51] [97] [98] [99].
Two studies were included in this dissertation. The Ohio study is a prospective and
regional study; it showed a possible monthly cycle of food abundance and food shortage
among a convenience sample of FIS/ovob women in Ohio in three continuous months.
Further analysis in the Ohio study focused on explaining this monthly cycle with Food
Stamp Program (FSP) participation and disordered eating. The second study, the
NHANES study was designed to use the cross-sectional and nationally representative
survey data to explain the association in food insecurity and obesity by examining the
associations of dietary intake and FSP participation with food insecurity and
overweight/obesity in women. Both studies confirmed the association in food insecurity
and overweight/obesity among U.S. women who were aged 22-49 yr, non-Hispanic
white, non-pregnant and non-lactating. The findings from the two studies were integrated
and are discussed as follows.
122
5.1 Discussion
5.1.1 Study Populations and TEIs Comparison
Although both the Ohio study and the NHANES study showed significantly
higher BMI in women living in food insecure households compared to women in food
secure households, the mean BMIs in the Ohio study were higher than those in the
NHANES study (food secure: 30.67 vs.27.44; food insecure: 33.86 vs. 29.22). This may
be explained by the high percentages of low-income women in Ohio study (Table 3.2).
However, when analyzing the BMI in low-income women in the NHANES study, it was
found that the BMI in the Ohio sample was higher than that in the NHANES sample, in
both food secure women (OARDC: 30.67 vs. NHANES: 28.84) and food insecure
women (OARDC: 33.86 vs. NHANES: 28.83). Furthermore, the OARDC respondents
showed a higher prevalence of overweight (62.5%) than the NHANES low-income
women (39.20%). Therefore, the two populations of FIS/ovob women examined in the
Ohio study and in the NHANES study may not be the same. While the NHANES study
was designed to describe nationally representative populations, the Ohio study was to
purposively testify the monthly cycle hypothesis in low-income women by recruiting
such women using a convenience sampling method.
One of the purposes of the NHANES study was to calculate the TEI for FIS/ovob
women in U.S. on average to provide a reference value for the Ohio study. It is true that
the FIS/ovob population from the Ohio study was not a nationally-representative
population as the one from the NHANES study. The reason to compare the TEIs from the
123
two populations was to provide some implications for the potential local impacts in the
sample in Ohio. The comparison results (Figure 3) in Month 1 suggest the group of low-
income FIS/ovob women in Ohio may consume more energy at the beginning of the
month, but less at the end, when compared to the average energy intake in U.S. FIS/ovob
women. Such a TEI pattern may indicate the existence a monthly cycle of food
abundance and food shortage in these women. However, due to the lack of physical
activity measure in Ohio study, women’s energy requirements could not be estimated;
thus one could not conclude that FIS/ovob women in the Ohio sample had energy over-
consumption at the beginning followed by an energy under-consumption at the end in
Month 1. The lack of variation in TEI in Month 2 and Month 3 could be a consequence of
high percentages of holiday interviews in these two months, as later discussed in this
chapter.
5.1.2 Energy Requirements and Over-buying Behaviors
In Ohio study, the list of declined individual food items in FIS/ovob women
included food items from almost every food group. Food items which are more
affordable, like white bread, soda pop, and candy were also included in the list. One
possible explanation to this wide-range monthly decline is that these food insecure
households may have episodic over-buying behaviors at the beginning of the months
when food sources are available after a lack of resources for a period of time. Such kind
of behaviors may lead to subsequent over-eating and weight gain in these women.
124
Based on this theory, FIS/ovob women should have enough food to meet their
energy requirements, even at the end of the months. The energy requirements for these
women have been estimated in Ohio study: FIS/ovob women were 35 years old (mean
age) and 163cm tall (mean height); assuming physical activity level as sedentary, the
Estimated Energy Requirements (EERs) for 35 years old women who are 165cm and
have BMI of 24.99 kg/m2 is 1947 kcal [162]. Compared to the mean TEIs in the three
months (Month 1: beginning- 2114.19±937.26, end- 1843.06±872.23; Month 2:
beginning- 2097.35±802.36, end- 2099.06±879.06; Month 3: beginning-
2108.26±1088.73, end- 2112.96±854.1, kcal), more energy than needed was consumed
by FIS/ovob women in Month 2, Month 3, and the beginning of Month 1.
However, the Ohio study is limited by its high percentage of holiday interviews
and large estimation errors resulted from the small sample size. To find out whether the
energy requirement is met in FIS/ovob women in U.S., women’s TEI was also compared
with their EER in the NHANES study, where women were 37 years old and 164 cm tall
on average. Assuming physical activity level as sedentary, the EER for 37 years old
women who are 165cm and have BMI of 24.99 kg/m2 is 1933 kcal [162]. This EER was
lower than the mean TEI of FIS/ovob women in the NHANES study (1944.35±77.90
kcal), but was still within the 95% CI (1896.85, 95% CI: 1843.39, 1950.32, kcal). In
addition, dietary analysis results showed no significant difference in TEI in FIS/ovob
women compared to FS/norm, FS/ovob, FIS/norm women. Thus, on average, FIS/ovob
women in U.S. may have enough food sources to meet their energy requirements.
Accordingly, the monthly decline of food items in every food group in the women sample
125
in Ohio might be a result from the episodic over-buying behaviors in FIS/ovob women’s
households. Nevertheless, the dissertation has very little power to prove whether
FIS/ovob women met their energy requirements or not throughout the month. the
NHANES study generated TEI from a single-day 24-hour recall for FIS/ovob women,
while the Ohio study only measured TEI in two days of the month in a small group of
convenience sample; none of the studies associated women’s physical activity levels with
EERs. Therefore, multiple-day 24-hour dietary recalls, a more representative sample with
larger sample size than Ohio study, and valid measures of physical activity levels are
required to address this issue in the future.
5.1.3 Food Insecurity and Dietary Intake Patterns (TEI and Macronutrient Intake)
Lower diet diversity [10], less consumption of fruits/vegetables [11], [12] and
animal-source products [12], and lower nutrient intakes [11], [12], [13], [14] have been
reported in food insecure people compared to food secure people. The Ohio study tried to
find a monthly variation in dietary intake patterns (like the yo-yo dieting) to explain the
high prevalence of obesity in food insecure population. The study observed a monthly
decline in TEI and fat intake in FIS/ovob women in Month 1, but no significant
differences were found in other macronutrient intakes.
The NHANES study could not identify such a monthly variation due to lack of
necessary information; instead, the NHANES study presented a picture of the dietary
intake patterns on average in food insecure women, and particularly, in FIS/ovob women
compared to women who were food secure or who were not overweight/obese. In this

126
picture, the TEI in FIS/ovob women constituted a higher portion from carbohydrates, a
lower portion from protein, and a similar portion from fat, compared to FS/norm women
and FS/ovob women; when compared to FIS/norm women, FIS/ovob women took more
energy from protein.
The findings, that food insecure women consumed less protein and fiber than food
secure women, have confirmed results from previous studies [13] [14] as expected. But
the findings of total energy intake (TEI) and fat intake agree only in part with previous
studies. The TEI results in the dissertation are consistent with some of the previous
studies in women using NHANES III [12] and NHANES 1999-2002 [81]. However, in
Canada, a country facing similar paradoxical situation as in U.S., studies have found
lower energy intake in food insecure women receiving emergency food assistance [13],
and in women from the 2004 Canadian Community Health Survey (marginal difference,
p<0.1) [14]. Although the results were inconsistent, none of the studies has reported
higher energy intake in food insecure women compared to food secure women. Thus, the
association in food insecurity and overweight/obesity may not result from a higher daily
energy intake in food insecure women.
If the regular TEI in women does not differ by their food security status, the
macronutrient intakes may have different patterns in food secure women and food
insecure women. As mentioned in Chapter 2, Dietz [47] proposed that food insecure
individuals may over-consume fat and become obese. In addition, Townsend et al. [38]
proposed ―fat, % energy‖ as one of the factors mediating food insecurity and obesity.
However, the overconsumption of fat in food insecure people has not been confirmed.
127
One study reported higher fat intake in women in food insecurity with hunger compared
to fully food secure women aged 18-60 yr [81], while another study found that fat intake
was lower in food insecure women who were 31-50 yr [14]. Our study showed no
significant difference in fat intake between food secure women and food insecure
women, a finding similar to some of the previous studies [12] [13].
While no differences were found in fat intake, the NHANES study demonstrated
higher carbohydrates/energy ratio in FIS/ovob women compared to FS/norm women, and
even FS/ovob women. To the best of our knowledge, only one study has reported
significantly higher carbohydrates intake in food insecure women (31-50 yr) in a
bivariate model; the difference became marginal (p < 0.1) after controlling for variables
including income, education, immigrant status, current daily smoking status, and
household size [14]. In addition, it has been proposed that obesity can be a consequence
of excessive consumption of carbohydrates [163] [164]. Moreover, a cost-benefit study in
371 low-income women enrolled in the Expanded Food and Nutrition Education Program
(EFNEP) reported a higher carbohydrate intake related with a monthly saving in family
food expenditure due to the enrollment of EFNEP [165]. Thus, overconsumption of
carbohydrates could be a reason that results in weight gain in food insecure women.
The inconsistency in dietary findings from different studies should be treated
carefully when the results of dietary intake and food insecurity were interpreted. The
inconsistency can resulted from many reasons. Different target populations can be the
first reason. The studies can sample people from different countries, or from different age
ranges, or from participants of particular food assistance programs, or from men and
128
women, or just from women. Furthermore, studies may use different instruments to
evaluate the food insecurity/insufficiency level. Other possible explanations include
differences in survey and sampling design, analytical methods and statistical models, and
different dietary assessment methods.
5.1.4 Food Insecurity and Disordered Eating
It is believed that the high psychosocial stress related with food insecurity may
alter the dietary behaviors related and change women’s weight status [8] [42], [52] [166]
[11]. Studies have been done about the eating frequency [167], energy per meal in adult
women [81], and disordered eating [52]. It is suggested the indirect effects of food
insecurity on obesity is mediated by disordered eating in women [52]; the study used a 4-
item scale with questions relevant to binge eating behaviors. In the Ohio Study, the
dissertation tested disordered eating behavior by EDE-Q in FIS/ovob women.
Community norms of EDE-Q for young women in the general population have
been developed [132]. FIS/ovob women in the Ohio study showed higher subscale scores
(Table 3.9a) in Eating Concern, Weight Concern and Shape Concern, and a higher global
score than any of the age group in the population (18–22, 23–27, 28–32, 33–37, and 38–
42 yr); comparatively, the subscale Restraint was within the range of norms [132]. In
addition, the frequency of overeating episodes in Ohio FIS/ovob women (36.11%) was
higher than the norms (< 30% in each age group) [132].
The higher subscale scores of Weight Concern and Shape Concern may be a
result of high BMIs in FIS/ovob women, but since FS/ovob women had a Eating Concern
129
score (0.87) within the norms’ range, the higher Eating Concern score in FIS/ovob
women may be caused by the food insecurity. The results of the correlation test (Table
3.10) also proved it. Within subscale Eating Concern, food insecure women in the Ohio
sample showed more severe ―preoccupation with food/eating/calories‖ and ―fear of losing
control over eating‖ than food secure women. However, the former item asked the
frequency in the past 28 days of ―thinking about food, eating or calories made it very
difficult to concentrate on things you are interested in‖, which makes it hard to be
interpreted for food insecure participants, as the preoccupation with food in these women
can be caused by food shortage rather than worrying about eating too much, or can be
caused by both. Therefore, the findings of the subscale Eating Concern in EDE-Q in the
Ohio study could not provide enough evidence to support the mediating effects, but the
high frequency of overeating episodes in FIS/ovob may indicate some potential impacts.
Studies with larger sample size and more non-obese subjects are needed in the future to
address this issue.
5.1.5 The Mediating Effects of Food Stamp Program (FSP) Participation
Another possible explanation for the association in food insecurity and obesity
can be the monthly abundance and shortage cycle related to food stamps benefits. Since
the FSP distributes benefits monthly and is at the beginning of every month, according to
the tested hypothesis, food stamp recipients may at high risk of experiencing such a
monthly cycle of food abundance and food shortage. The Ohio study exhibited that
among food insecure women, food stamp recipients had more food items decreased from
130
the beginning to the end of the months in the three months in total than non-recipients
(61.58 vs. 8.22, p<0.01). The results indicate an uneven distribution of household food
stores in food insecure recipients throughout the month, compared to more stable
monthly food allocation in both the food insecure non-recipients and food secure women.
The associations of FSP participation with food insecurity and overweight/obesity
haven’t been cleared yet. Positive associations have been reported by both cross-sectional
and longitudinal studies. Townsend et al. [38] examined 9451 women from the 1994–
1996 Continuing Study of Food Intake of Individuals (CSFII). After controlling for
potential confounders (including food insecurity), they reported women FSP recipients
had a 38% increased odds of being overweight (classified as BMI> 27.3 kg/m2) compared
to non-recipients. In the study in Ohio, significantly higher BMI was observed among
food insecure FSP recipients compared to food insecure non-recipients (38.24 vs. 30.94,
p<0.01), indicating an increased risk of getting obese when participating FSP. Likewise, a
longitudinal study in low-income women reported that a 5-yr participation in FSP was
associated with increased probability of obesity, holding all available confounders; but
women’s food insecurity level was not analyzed in this study [83]. Another longitudinal
study investigated the effects of FSP participation on weight change in a sample of 5303
food insecure women from 1999 to 2001 [53]. Their study found that a full participation
in FSP would result in a weight increase only among ―persistently food insecure‖ women,
while in women who were ―became food secure or food insecure‖, or ―persistently food
secure‖; food insecurity was associated with a weight decrease [53].
131
However, contradictory results were found in the NHANES study: no differences
in BMI or 1-yr weight change between food insecure recipients and non-recipients were
observed. Several reasons can explain this inconsistency. 1) The definition of FSP
participation was different in these studies. The NHANES study defined FSP
participation as ―at least one member received food stamps in the last 12 months‖; while
in Ohio study, current FSP participation was directly asked to the respondents. One study
used the amounts of food stamps benefits received during the research time to calculate
FSP participation [53] and another study used both the FSP participation and the amounts
of benefits received in the previous calendar year [83]. It is possible that the indicator
used to identify FSP participation in the NHANES study affected the ability to reveal the
effects of FSP participation on women’s weight status. 2) The simultaneous nature of
cross-sectional study design in the NHANES study. Due to the dynamic nature of FSP
participation and food insecurity status, a cross-sectional study design may not be able to
exactly reflect the variation of weight change in response to the dynamic processes.
Although the CSFII study [38] and the Ohio study10
were cross-sectional design as well,
the former one used a much larger sample that was not restricted to only non-Hispanic
White women, while the latter one selected sample from a population with very BMI. 3)
The 1-yr period in the NHAENS study may not be long enough for researchers to observe
any significant change in weight resulted from FSP participation in food insecure women.
4) The socioeconomic characteristics like age, and ethnic group (non-Hispanic White vs.
10 The Ohio study measured food security status, weight status, and FSP participation at the
beginning of the study.
132
multiple ethnic groups) were different in the NHANES study from other studies [53]
[83].
Therefore, it is possible that a full FSP participation can alter the shopping
strategies and dietary behaviors in women suffering long-term food insecurity, and lead
to weight gain over long periods of time. In addition, FSP participation may also lead to a
change in dietary intake patterns [83], such as the lower protein/energy ratio in food
insecure recipients found in the NHANES study.
One argument to the proxy role of FSP participation in obesity-food insecurity
association is the absence of potentially long-term confounders in most of the studies
assessing FSP and obesity, such as poverty history, health history, long-term social
program participation or other long-term resources. These variables can interact with FSP
participation to affect individuals’ weight status [83].
5.1.6 Other Issues
Food Insecurity Levels - The effects of the severity in food insecurity on dietary
intake behaviors and weight status has not been analyzed in this dissertation. The Ohio
study could not separate the effects in food insecurity on overweight/obesity by the
severity levels, because most of the participants had very high BMI: high food secure
(HFS) women – BMI = 27.16, marginal food security (MFS) women – BMI = 34.76, low
food security (LFS) women – BMI = 36.37, very low food security (VLFS) women –
BMI = 35.77. In addition, the comparisons of the monthly variations in TEI and total
133
household food stores (data not shown) showed that there were no significant differences
among women of different household food security status.
However, evidence has been found to support the association of less severe food
insecurity and overweight/obesity, since severe food insecurity may restrict food intake
involuntarily and lead to weight loss rather than weight gain [52] [38] [168]. Some
studies have shown significant association in food insecurity and BMI exist only in
households of less severe food insecurity [8] [38]. Townsend et al. [38] reported lower
prevalence of overweight in severely food insecure women compared to mildly and
moderately counterpart; but the sample size in this group was too small (n=11) to support
a statistically significant comparison. Frongillo et al. [52] proposed that food insecurity
would lead to both weight gain and weight loss; while weight gain was mediated by
disordered eating caused by mild food insecurity, weight loss was predominant in
severely food insecure households. In addition, among ―persistently food insecure‖
women, food insecurity was associated with a weight loss while a full participation in the
FSP would result in weight gain in these women [53]. Therefore, when interpreting the
effects of the monthly cycle of food abundance and food shortage mediated by FSP or the
eating order behaviors, one should keep in mind the possible opposite effects of severe
food insecurity on weight status.
The Monthly Stability of Baby Food - The consistent decreasing patterns in
household food stores among FIS/ovob women in the Ohio study are consistent with
previous studies on low-income households: depletion of food supply happened at the
end of the months in these households [169], [170], [171], [172], [97]. However, the
134
relatively stable stores of baby food were reported the first time. The stability can be
explained by the Women, Infants and Children (WIC) program participation: women in
the study may run out of food from other sources like food stamps at the end of the
month, but still have enough food items from WIC. In addition, children living in food
insecure households may be protected from hunger by their parents or other adults in
these households.
Holiday Season Interviews – The Ohio study showed that FIS/ovob women had
monthly TEI decrease in Month 1, not in Month 2 or Month 3. This could be explained
by the high percentage of holiday interviews in the other two months. For example, the
sample size of FIS/ovob women interviewed in December were five (12.82%) in Month
1, eleven (36.67%) in Month 2 and seven (25.93%) in Month 3. This could affect the
results of dietary intake: the non-significant monthly variation patterns of TEI in
FIS/ovob women in Month 2 and Month 3 could be partly explained by the high
percentages of holiday interviews, particularly interviews conducted in December. Since
the whole month of December is within the holiday season, dietary intake measured in
December may affect the final results. Data from the 1989–1991 Continuing Survey of
Food Intakes by Individuals (CSFII) found that energy intake significantly dropped from
the first week to the last week in ―infrequent shoppers‖ (households doing grocery
shopping once per month or less) [51]. Therefore, these FIS/ovob women might be
―infrequent shoppers‖ in Month 1, but turned to be frequent shoppers in holiday seasons,
particularly in December.
135
Food insecurity and 1-yr Weight Change – It has been suggested that individuals in
food insecurity may be inclined to gain weight [45]. In the NHANES study, though the 1-
yr weight change was positive in food insecure women and in FIS/ovob women as well,
differences of the weight change were not significant until this continuous variable was
categorized by weight gain equal or bigger than specific values (2.27 kg and 4.54 kg
here). Further analysis found that food secure women had a much wider range of weight
change (data not shown) due to the larger sample size in this population compared to
food insecure women in NHANES. In addition, large weight gain and weight loss can be
canceled out when calculating mean values; thus, only comparing the mean values of
weight change may not be able to uncover the more frequent weight gain in vulnerable
populations. The higher percentages of gaining weight equal to or more than 2.27 kg (i.e.
5 lbs) or 4.54 kg (i.e. 10 lbs) in food insecure women confirmed the results from a
previous study using NHANES 1999-2002 [41]. Furthermore, the findings that FIS/ovob
women had a higher percentage of 1-yr weight gain >= 4.54 kg than FS/ovob women,
indicate that FIS/ovob women, may have a different cause to gain weight compared to
FS/ovob women.
The Report Bias of Women’s weight – The NHANES study calculated the 1-yr
weight change by comparing the self-reported current weight with the self-reported
weight 1-yr ago. The quality of the weight change variable should be more accurate when
comparing self-reported weight 1-yr ago with the currently self-reported weight rather
than the measured weight, because respondents have a tendency to underreport their
weight [173]; thus, the reporting bias is systematic errors and can be cancelled out, at

136
least partly, by comparing the two self-reported weight (i.e. current weight vs. weight 1-
yr ago). In this study, a 1.5 kg-report bias was found in food secure women and a bias of
1.86 kg was found in food insecure women. These underreporting bias are similar to
those reported by other studies [173], [174].
5.2 Limitations and Future Studies
5.2.1 Limitations
The Ohio study was supported by a seed grant, to explore the possible existence
of the monthly cycle of food abundance and food shortage in FIS/ovob women. Due to
the limited resources of the seed grant, the study results presented in this dissertation are
more exploratory and do not allow confirmative conclusions of any causality or
mediating process. One of the weaknesses in the study is that women’s sample sizes were
not large enough, particularly for those who were food secure or normal weight. Because
the study was designed to compare food stores and food intake in FIS/ovob women with
those in other groups of women: FS/norm, FS/ovob, and FIS/norm, small sample sizes in
these groups would make the comparison results lack of significance. However, the
sample size of FIS/ovob women - the target population in the study - was enough to
demonstrate the monthly TEI and food variations in this group of women. Likewise, the
examination in the NHANES study is also limited by the small numbers when stratifying
food insecure respondents by their FSP participation, or by severity of their household
food insecurity. It is necessary to oversampling these sub-population groups in future
137
survey studies is necessary to describe the pathways leading food insecure women to
obesity.
The high percentages of overweight/obese women and food insecure women in
the OARDC sample may affect the study’s generalization ability. Participants in the Ohio
study had a very high mean BMI (> 30), and 70% of them were from food insecure
households. Therefore, the results from the Ohio study may not be applicable to the
general population. Researchers put a lot of effort in recruiting normal weight women and
food secure women, but it was very difficult to recruit these women from a low-income
population; the hard economic status during the study time deteriorated the subject
recruitment. In future studies for comparisons among women of different weight status
and food security status, I would suggest recruit women sample from both low-income
and normal income women.
Another limitation of the Ohio study is that some of the interviews were taken
during holiday seasons. As was mentioned before, assessing dietary intake and household
food stores during holiday seasons would bias the results. However, data from the
household food stores found that FIS/ovob women showed significant decreases in food
stores in three continuous months, even when including data gathered during holidays.
The cross-sectional nature in the NHANES study restricts its ability to capture the
dynamics in food insecurity on the change of dietary intakes and weigh status. Although
the Ohio study measured dietary intake in three continuous months, the study assessed
the food insecurity experience and weight status at the first interview, which in some
sense could also be considered as a cross-sectional study when assessing the associations
138
of these two. Another limitation relevant to the cross-sectional study design is that the
dietary intakes measured by the 24-hour recalls may not reflect the exact dietary intake
patterns under food insecurity. In the NHANES study, food security measurements asked
the experience in the past 12 months while the dietary assessment encompassed only one
24-hour recall. Similarly, the Ohio study used a single 24-hour recall at the beginning and
the end of each month to assess dietary intake, and classified food insecurity status based
on the experience in the past month before the initial interview. Therefore, one cannot be
certain the change of dietary intake patterns and dietary behavior occurred when
individuals were really food insecure.
One more consideration is that both the Ohio study and the NHANES study used
dietary intake data from 24-hour dietary recalls. Since it is a self-reported method, under-
reporting of diets has been found and is more common in obese respondents [134].
Consequently, the results may underestimate the true energy intake and fat intake in
FIS/ovob women and hence the effects in food insecurity on weight status.
5.2.2 Future studies
Based on these results and limitations mentioned before, additional research
questions are inspired by this research. In order to capture the monthly variations of
dietary intake more precisely, it would be of great importance for future studies to collect
multiple-day dietary intake data within one time period (i.e. the first or last ten days of
the months in this study), including both weekdays and weekends. If one is interested in
the variations of micronutrient intake, more recall days are needed. In Ohio study,

139
significant declines of several micronutrients in FIS/ovob women were observed only in
Month 1. This could be explained by the high day-to-day variation of micronutrient
intakes among free-living individuals, and the high percentage of holiday-season
interviews in Month 2 and 3 as well. Thus, in future studies holiday seasons should be
avoided for interviews or be analyzed separately with enough sample size, depending on
the research purposes.
One of the major findings in this dissertation is the monthly variations of TEI in
FIS/ovob women in Month 1. It has been hypothesized that such kind of variations are
partly caused by binge eating at the beginning of months and restricted eating at the end.
However, this hypothesis could not be testified in the study since no energy requirements
of these women were assessed. Future studies should be more specific in assessing the
physical activity level to assess the energy requirements and further verify the monthly
cycle of TEI as a cause of obesity in these women.
Two possible mediating factors for the obesity-food insecurity association were
discussed in the dissertation: FSP participation and disordered eating. The FSP
participation was associated with higher BMI and more severe monthly food declines in
food insecure women in Ohio study, but not in the NHANES study. One of the reasons
for this consistency could be that the women sub-populations in the two studies may not
be the same. In addition, the severity of household food insecurity has been discussed to
be related to weight change (weight gain or weight loss). Therefore, as part of future
studies, I would suggest examine the effects of FSP participation on weight status and on
the monthly variations by stratifying food insecure women with their BMI and the
140
severity of their household food insecurity; enough sample size is needed when doing so.
After stratification, further analysis could use food insecure food-stamps recipients as the
target population, and food insecure non-recipients, food secure recipients and food
secure non-recipients as control groups. The exploratory analysis of disordered eating in
the Ohio study has revealed the potential role of Eating Concern subscale in relating food
insecurity with obesity. However, it is hard to determine whether the eating concern is
due to food shortage or worrying about eating too much, or both. Therefore, future
studies are necessary to address the conceptual process of eating concern in women
experiencing both food insecurity and obesity. Multiplevariate models should be
considered when assessing the mediating effects of both FSP participation and eating
disorders, controlling for other confounders.
Another direction for future studies would be a longitudinal study. In this
dissertation, the Ohio study was designed to examine the variations in dietary intakes and
household food stores in three continuous months. This time period may not be long
enough to demonstrate any significant change in weight, and could not account for
changes in weight, household food insecurity, and FSP participation. With a longitudinal
study (for example, a two-year study), the effects of the monthly food abundance and
food shortage cycle on women’s weight change can be assessed, and it allows to testify
the influence of the periodicity in food insecurity status and FSP participation [53]. In
addition, a longitudinal study with a larger sample size is helpful to investigate the
influence of seasonal factors on food insecurity [4] and dietary intake [140] [137]. A two-
141
way ANOVA assessing the effects of beginning/end and specific month(s) and the
interaction between the two can be applied.
5.3 Conclusions
Taken together, this dissertation suggests that long-lasting status in food
insecurity may alter the shopping strategies and dietary behaviors, characterized by a
monthly cycle of food abundance and food shortage in women; carbohydrate intake may
increase, and daily energy intake and fat intake may fluctuate in response to the monthly
cycle and result in gradual weight gain over long periods of time. This process may be
mediated by a full participation in FSP.
From a policy point of view, these findings provide information for policy makers
to make changes in federally funded food assistance programs, such as the Food Stamp
Program, which assigns its benefits on a monthly basis; policy changes to better distribute
food assistance benefits (like food stamps) throughout the month may be helpful to
prevent high prevalence of obesity in food insecure women. In order to avoid the monthly
variation of energy intake and reduce the incidence of potentially episodic overeating
behaviors, nutrition education integrating with community-based intervention programs
and efforts from private sectors like food providers are needed in food insecure
households, emphasizing more even monthly household food source distribution and
more smart grocery shopping strategies.
142
REFERENCE
[1] Anderson SA. Core indicators of nutritional state for difficult-to-sample
populations. J Nutr. 1990;120:1559S–1600S.
[2] Food and Agriculture Organization of the United Nations. The state of food
insecurity in the world 2009: economic crises - impact and lessons learned. Rome; 2009.
[3] Bickel G, Nord M, Price C, Hamilton W, Cook J. Guide to measuring household
food security. Alexandria, VA; 2000.
[4] Nord M, Andrews M, Carlson S. Household Food Security in the United States,
2008. Economic Research Report No (ERR-83) 66 pp, US Department of Agriculture,
November. 2009.
[5] Rose D. Economic determinants and dietary consequences of food insecurity in
the United States. J Nutr. 1999;129:517S–520S.
[6] Hackett M, Zubieta AC, K KH, Melgar-Quinonez H. Food insecurity and
household food supplies in rural Ecuador. Arch Latinoam Nutr. 2007;57(1):10–7.
[7] Alvarez MC, Estrada A, Montoya EC, Melgar-Quinonez H. Validation of a
household food security scale in Antioquia, Colombia. S Pub Mex. 2006;48(6):474–481.
[8] Olson CM. Nutrition and health outcomes associated with food insecurity and
hunger. J Nutr. 1999;129(2S):517S–520S.

143
[9] McIntyre L, Glanville NT, Officer S, Anderson B, Raine KD, Dayle JB. Food
insecurity of low-income lone mothers and their children in Atlantic Canada. Can J
Public Health. 2002;93(6):411–415.
[10] Bhattacharya J, Currie J, Haider S. Poverty, food insecurity, and nutritional
outcomes in children and adults. J Health Econ. 2004;23:839–862.
[11] Kendall A, Olson CM, Frongillo EA. Relationship of hunger and food security to
food availability and consumption. J Am Diet Assoc. 1996;96:1019–1024.
[12] Dixon LB, Winkleby M, Radimer K. Dietary intakes and serum nutrients differ
between adults from food-insufficient and food-sufficient families: Third National Health
and Nutrition Examination Survey 1988-1994. J Nutr. 2001;131:1232–1246.
[13] Tarasuk VS, Beaton GH. Women’s Dietary Intakes in the Context of Household
Food Insecurity. J Nutr. 1999;129(3):672–679.
[14] Kirkpatrick SI, Tarasuk V. Food insecurity is associated with nutrient
inadequacies among Canadian adults and adolescents. J Nutr. 2008;138:604–612.
[15] Vozoris NT, Tarasuk VS. Household food insufficiency is associated with poorer
health. J Nutr. 2003;133:120–126.
[16] Biros MH, Hoffman PL, Resch K. The prevalence and perceived health
consequences of hunger in emergency department patient populations. Acad Emerg Med.
2005;12:310–317.
[17] Centers for Disease Control and Prevention, Department of Health and Human
Services. Overweight and Obesity: Health Consequences; 2005.
144
[18] Casey P, Goolsby S, Berkowitz C, Frank D, Cook J, Cutts D, et al. Maternal
depression, changing public assistance, food security, and child health status. Pediatrics.
2004;113:298–304.
[19] Kaiser LL, Melgar-Quinonez H, Townsend MS, Nicholson Y, Lavender MF,
Martin A, et al. Food insecurity and food supplies in Latino households with young
children. J Nutr Educ Behav. 2003;35:148–153.
[20] Organization WH. Obesity: preventing and managing the global epidemic. In:
Report of a WHO Consultation. WHO technical report series 894. Geneva, Switzerland:
World Health Organization; 2000. .
[21] Martorell R, Khan LK, Hughes ML, Grummer-Strawn LM. Overweight and
obesity in preschool children from developing countries. Int J Obes Relat Metab Disord.
2000;24(8):959–967.
[22] Martorell R, Khan LK, Hughes ML, Grummer-Strawn LM. Obesity in Latin
American women and children. J Nutr. 1998;128(9):1464–1473.
[23] Martorell R, Khan LK, Hughes ML, Grummer-Strawn LM. Obesity in women
from developing countries. Eur J Clin Nutr. 2000;54(3):247–252.
[24] Behavioral Risk Factor Surveillance System Survey Data. Centers for Disease
Control and Prevention; 2009.
[25] Flegal KM, Carroll MD, Ogden CL, Curtin LR. Prevalence and trends in obesity
among US adults,1999-2008. JAMA. 2010;303(3):235–241.
145
[26] Ogden CL, Carroll MD, Curtin LR, Lamb MM, Flegal KM. Prevalence of high
body mass index in US children and adolescents, 2007-2008. JAMA. 2010;303(3):242–
249.
[27] Clinical Guidelines on the Identification, Evaluation, and Treatment of
Overweight and Obesity in Adults: The Evidence Report. National Institutes of Health;
1998.
[28] Wadden TA, Stunkard AJ. Social and psichological consequences of obesity. Ann
Intern Med. 1985;103(6):1062–1067.
[29] Urek R, Crncevic-Urek M, Cubrilo-Turek M. Obesity - a global public health
problem. Acta Med Croatica. 2007;61(2):161–164.
[30] Finkelstein EA, Fiebelkorn IC, Wang G. National medical spending attributable
to overweight and obesity: how much, and who’s paying? Health Aff (Millwood).
2003;W3:219–226.
[31] Rennie KL, Jebb SA. Prevalence of obesity in Great Britain. Obes Rev.
2005;6(1):11–12.
[32] Mujahid MS, Diez-Roux AV, Borrell LN, Nieto FJ. Cross-sectional and
longitudinal associations of BMI with socioeconomic characteristics. Obes res.
2005;13:1412–1421.
[33] Rand CS, Kuldau JM. The epidemiology of obesity and self-defined weight
problem in the general population: gender, race, age, and social class. Int J Eating Disord.
1990;9:329:343.

146
[34] Jeffery RW, French SA. Socioeconomic status and weight control practices
among 20- to 45-year-old women. Am J of Public Health. 1996;86:1005–1010.
[35] Goldblatt PB, Moore ME, Stunkard AJ. Social factors in obesity. J Am Med
Assoc. 1965;192:197–102.
[36] Adams EJ, Grummer-Strawn L, Chavez G. Food insecurity is associated with
increased risk of obesity in California women. J Nutr. 2003;133:1070–1074.
[37] Basiotis PP, Lino M. Food insufficiency and prevalence of overweight among
adult women. Nutr Insights. 2002;26:1–2.
[38] Townsend MS, Peerson J, Love B, Achterberg C, Murphy SP. Food insecurity is
positively related to overweight in women. J Nutr. 2001;131:1738–1745.
[39] Kaiser LL, Townsend MS, Melgar-Quinonez H, Fujii ML, Crawford PB. Choice
of instrument influences relations between food insecurity and obesity in Latino women.
Am J Clin Nutr. 2004;80:1372–1378.
[40] VanEenwyk J. Self-reported concern about food security associated with obesity
– Washington 1995-1999. Morbidity and Mortality Weekly Report. 2003;52:840–842.
[41] Wilde PE, Peterman JN. Individual weight change is associated with household
food security status. J Nutr. 2006;136:1395–1400.
[42] Sobal J, Stunkard AJ. Socioeconomic status and obesity: a review of the literature.
Psycho Bull. 1989;105:260–275.
[43] Ball K, Crawford D. Socioeconomic status and weight change in adults: a review.
Soc Sci Med. 2005;60:1987–2010.

147
[44] Drewnowski A, Darmon N. The economics of obesity: Dietary energy density and
energy cost. Am J Clin Nutr. 2005;82:265S–273S.
[45] Drewnowski A, Specter SE. Poverty and obesity: The role of energy density and
energy costs. Am J Clin Nutr. 2004;79:6–16.
[46] Crawford PB, Townsend MS, Metz DL, Smith D, Espinosa-Hall G, Donohue SS,
et al. How can Californians be overweight and hungry? California Agriculture.
2004;58:12–17.
[47] Dietz WH. Does hunger cause obesity? Pediatrics. 1995;95:766–767.
[48] Tanumihardjo SA, Anderson C, Kaufer-Horwitz M, Bode L, Emenaker NJ, Haqq
AM, et al. Poverty, obesity, and malnutrition: an international perspective recognizing the
paradox. J Am Diet Assoc. 2007;107(11):1966–1972.
[49] Neel JV. The thrifty genotype. Am J Human Genet. 1962;14:353–362.
[50] Bjorntorp P. Endocrine abnormalities of obesity. Metabolism. 1995;44(9):21–23.
Suppl 3.
[51] Wilde PE, Ranney CK. The monthly food stamp cycle: shopping frequency and
food intake decisions in an endogenous switching regression framework. Am J Agr Econ.
2000;82:200–213.
[52] Frongillo EA, Olson CM, Raschenbach BS, Kendall A. Nutritional consequences
of food insecurity in a rural New York State county (discussion paper no. 1120-97).
Madison (WI): Institute for Research on Poverty, University of Wisconsin-Madison;
1997.

148
[53] Jones SJ, Frongillo EA. The modifying effects of Food Stamp Program
participation on the relation between food insecurity and weight change in women. J Nutr.
2006;136(4):1091–1094.
[54] Hu FB. Obesity Epidemiology. New York: Oxford University Press; 2008.
[55] United Nations. Fiftieth anniversary of the universal declaration of human tights,
1948-1998. General assembly resolution 217 A (III) of 10 December 1948.
[56] Food and Agriculture Organization. Food: A fundamental human right. Rome;
1996.
[57] United Nations Department of Economic and Social Affairs. The Millennium
Development Goals Report. New York, NY; 2006.
[58] Campbell CC. Food insecurity: a nutritional outcome or a predictor variable? J
Nutr. 1991;121(3):408–415.
[59] Cook JT, Frank DA. Food security, poverty, and human development in the
United States. Ann N Y Acad Sci. 2008;1136:193–209.
[60] Perez-Escamilla R, Segall-Correa AM, Maranha LK, Sampaio MMF, Marin-Leon
L, Panigassi G. An adapted version of the U.S. Department of Agriculture Food
Insecurity Module is a valid tool for assessing household food insecurity in Campinas,
Brazil. J Nutr. 2004;134(8):1923–1928.
[61] Kaiser LL, Melgar-Quinonez HR, Lamp CL, Johns MC, Sutherlin JM, Harwood
JO. Food security and nutritional outcomes of preschool-age Mexican-American children.
J Am Diet Assoc. 2002;102:924–929.
149
[62] United Nation for Children’s Fund. The state of world’s children 1998 (focus on
nutrition). UNICEF, New York, 1998.
[63] World Health Organization. Turning the tide of malnutrition, responding to the
challenge of the 21st Century. Department of Nutrition for Health and Development,
WHO, Geneva; 2000. WHO/NHD/00.7.
[64] Stuff JE, Casey PH, Szeto KL, Gossett JM, Robbins JM, Simpson PM, et al.
Household food insecurity is associated with adult health status. J Nutr. 2004;134:2330–
2335.
[65] Cook JT, Frank DA, Berkowitz C, Black MM, Casey PH, Cutts DB, et al. Food
insecurity is associated with adverse health outcomes among human infants and toddlers.
J Nutr. 2004;134(6):1432–1438.
[66] Nelson K, Cunningham W, Andersen R, G GH, Gelberg L. Is food insufficiency
associated with health status and health care utilization among adults with diabetes? J
Gen Intern Med. 2001;16:404–411.
[67] Nelson K, Brown ME, Lurie N. Hunger in an adult patient population. J Am Med
Assoc. 1998;279:1211–1214.
[68] Huang JY, Wang GQ, Guo JP, Yang YJ, Yu XH, Wang Y, et al. Study on over-
weight, obesity and the exposure to stroke risk factors among 40 year olds and over in a
community-based population. Zhonghua Liu Xing Bing Xue Za Zhi. 2008;29(11):1057–
1060.
150
[69] Xie WX, Cao WH, J LinNawaz H AMLDKD Chan W. Study on the relationship
between obesity and clustering of major risk factors on cardiovascular diseases in the
elderly. Zhonghua Liu Xing Bing Xue Za Zhi. 2008;29:975–978.
[70] Wang HJ, Wang ZH, Yu WT, Zhang B, Zhai FY. Changes of waist circumference
distribution and the prevalence of abdominal adiposity among Chinese adults from 1993
to 2006. Zhonghua Liu Xing Bing Xue Za Zhi. 2008;29(10):953–958.
[71] Bhardwaj S, Misra A, Khurana L, Gulati S, Shah P, Vikram NK. Childhood
obesity in Asian Indians: a burgeoning cause of insulin resistance, diabetes and sub-
clinical inflammation. Asia Pac J Clin Nutr. 2008;17:172S–175S.
[72] Amuna P, Zotor FB. Epidemiological and nutrition transition in developing
countries: impact on human health and development. Proc Nutr Soc. 2008;67(1):82–90.
[73] Flegal KM, Carroll MD, Kuczmarski RJ, Johnson CL. Overweight and obesity in
the United States: prevalence and trends, 1960-1994. Int J Obes Relat Metab Disord.
1998;22:39–47.
[74] Flegal KM, Carroll MD, Ogden CL, Johnson CL. Prevalence and trends in obesity
among US adults, 1999-2000. JAMA. 2002;288:1723–1727.
[75] Centers for Disease Control and Prevention (CDC). Differences in prevalence of
obesity among black, white, and Hispanic adults - United States, 2006-2008. Morb
Mortal Wkly Rep. 2009;58:740–744.
[76] Willett WC, Manson JE, Stampfer MJ, Colditz GA, Rosner B, Speizer FE, et al.
Weight, weight change, and coronary heart disease in women. Risk within the 憓 normal
拀 weight range. JAMA. 1995;273:461–465.
151
[77] Story M, French SA, Resnick MD, Blum RW. Ethnic/racial and socioeconomic
diffrences in dieting behaviors and body image perceptions in adolescents. Int J Eat
Disorder. 1995;18(2):173–179.
[78] Parsons TJ, Power C, Logan S, Summerbell CD. Childhood predictors of adult
obesity: a systematic review. Int J Obes Relat Metab Disord. 1999;28:S1–107.
[79] Mendoza JA, Drewnowski A, Cheadle A, Christakis DA. Dietary energy density
is associated with selected predictors of obesity in U.S. Children. J Nutr. 2006;136:1318–
1322.
[80] Holben D, Pheley A. Diabetes risk and obesity in food-insecure households in
rural Appalachian Ohio. Prev Chronic Dis. 2006;3:A82.
[81] Zizza CA, Duffy PA, Gerrior SA. Food insecurity is not associated with lower
energy intakes. Obesity. 2008;16:1908–1913.
[82] Ver Ploeg M, Mancino L, Lin B, C Wang C. The vanishing weight gap: trends in
obesity among adult food stamp participants (US) (1976-2002). Economics and Human
Biology. 2007;5:20–36.
[83] Gibson D. Food stamp program participation is positively related to obesity in
low income women. J Nutr. 2003;133:2225–2231.
[84] Meyerhoefer C, Pylypchuk Y. Does participation in the Food Stamp Program
increase the prevalence of obesity and health care spending? American Journal of
Agricultural Economics. 2008;90:287 – 305.
[85] Zagorsky J, Smith P. Does the U.S. Food Stamp Program contribute to adult
weight gain? Econ Hum Biol. 2009;7:246 – 258.
152
[86] National institute of mental health. Eating disorders.
[87] Diagnostic and statistical manual of mental disorders. Washington. DC; 1994.
[88] Marcus MD, Moulton MM, Greeno CG. Binge eating onset in obese patients with
binge eating disorder. Addict Behav. 1995;20(6):747–755.
[89] Agras WS. Eating Disorders: Management of Obesity, Bulemia, and Anorexia
Nervosa. New York: Pergamon Press; 1987.
[90] Fisher JO, Birch LL. Restricting access to palatable foods affects children’s
behavioral response, food selection, and intake. Am J Clin Nutr. 1999;69:1264–1272.
[91] Birch LL, Fisher JO, Davison KK. Learning to overeat: maternal use of restrictive
feeding practices promotes girls’ eating in the absence of hunger. Am J Clin Nutr.
2003;78(2):215–220.
[92] Kochan Z, Karbowska J, Swierczynski J. Unusual increase of lipogenesis in rat
white adipose tissue after multiple cycles of starvation-refeeding. Metab: Clin Exper.
1997;46(1):7–10.
[93] Polivy J. Psychological consequences of food restriction. J Am Diet Assoc.
1996;96:589–592.
[94] Lavery MA, Loewy JW. Identifying predictive variables for long-term weight
change after participation in a weight loss program. J Am Diet Assoc. 1993;93:1017–
1024.
[95] Clark HR, Goyder E, Bissell P, Blank L, Peters J. How do parents’ child-feeding
behaviours influence child weight? Implications for childhood obesity policy. J Public
Health. 2007;29(2):132–141.
153
[96] Fisher JO, Birch LL. Restricting access to foods and children’s eating. Appetite.
1999;32(3):405–419.
[97] Taren DL, Clark W, Chernesky M, Quirk E. Weekly food servings and
participation in social programs among low-income families. American J Public Health.
1990;80:1376–1378.
[98] Matheson DM, Varady J, Varady A, Killen JD. Household food security and
nutritional status of Hispanic children in the fifth grade. Am J Clin Nutr. 2002;76(1):210–
217.
[99] Tarasuk V, McIntyre L, Li J. Low-income women’s dietary intakes are sensitive
to the depletion of household resources in one month. J Nutr. 2007;137:1980–1987.
[100] Smith L. The use of household expenditure surveys for the assessment of food
insecurity. Washington, DC: International Food Policy Research Institute (IFPRI).
[101] Food and Agriculture Organization. The state of food insecurity in the world 2006:
eradicating world hunger - taking stock ten years after the World Food Summit. Rome;
2006.
[102] Keenan DP, Olson C, Hersey JC, Parmer SM. Measures of food
insecurity/security. J Nutr Educ. 2001;33(Suppl 1):49S–58S.
[103] Wehler C, Scott R, Anderson J. The community childhood identification project:
a model of domestic hunger-demonstration project in Seattle, Washington. J Nutr Educ
Behav. 1992;24:29S–35S.
[104] Melgar-Quinonez H, Hackett M. Measuring household food security: the global
experience. Rev Nutr. 2008;21:27–37.
154
[105] Radimer KL, Olson CM, Campbell CC. Development of indices to assess hunger.
J Nutr. 1990;120:1544–1548.
[106] Hamilton WL, Cook JT, Thompson WW, Buron LF, E A Frongillo J, Olson CM,
et al. Household food security in the United States in 1995: Technical Report of The
Food Security Measurement Project. USDA, food consumer service, Alexandria, VA;
1997.
[107] National Research Council. In: Committee on National Statistics, Panel to Review
the U S Department of Agriculture’s Measurement of Food Insecurity and Hunger, G S
Wunderlich and J L Norwood, editor. Food Insecurity and Hunger in the United States:
An Assessment of the Measure. Washington, DC: The National Academies Press; 2006. .
[108] Blumberg S, Bialostosky K, Hamilton WL, Briefel RR. Six-item short form of the
Household Food Security Scale, 1999; 1999.
[109] Blumberg S, Bialostosky K, Hamilton WL, Briefel RR. The effectiveness of a
short form of the Household Food Security Scale. Am J Public Health. 1999;89(8):1231–
1234.
[110] Derrickson JP, Fisher AG, Anderson JE. The core food security module scale
measure is valid and reliable when used with Asians and Pacific Islanders. J Nutr.
2000;130:2666–2674.
[111] Opsomer JD, Jensen HH, Pan S. An evaluation of the U.S. Department of
Agriculture food security measure with generalized linear mixed models. J Nutr.
2003;133(2):421–427.
155
[112] Gulliford MC, Mahabir D, Nunes C, Rocke B. Self-administration of a food
security scale by adolescents: item functioning, socio-economic position and food intakes.
Public Health Nutr. 2005;8(7):853–860.
[113] Gulliford MC, Mahabir D, Rocke B. Reliability and validity of a short form
household food security scale in a Caribbean community. BMC Public Health. 2004;4:22.
[114] Carmines EG, Zeller RA. Reliability and Validity Assessment. Newbury Park,
CA: Sage Publications; 1979.
[115] Kendall A, Olson CM, Frongillo EA. Validation of the Radimer/Cornell measures
of hunger and food insecurity. J Nutr. 1995;125:2793–2801.
[116] Frongillo EA. Validation of measures of food insecurity and hunger. J Nutr.
1999;129:506S–509S.
[117] Fairburn CG, Cooper Z. The Eating Disorder Examination. In: Fairburn CG,
Wilson GT, editors. Binge eating: Nature, assessment and treatment. 12th ed. New York:
Guilford Press; 1993. p. 317–360.
[118] Wilson GT. Assessment of binge eating. In: Fairburn CG, Wilson GT, editors.
Binge eating: Nature, assessment and treatment. New York: Guilford Press; 1993. p.
227–249.
[119] Garner DM. Assessment of eating disorder psychopathology. In: K D Brownell
CGF, editor. Eating disorders and obesity. New York: Guilford Press; 1995. p. 117–121.
[120] Fairburn CG, Beglin SJ. Assessment of eating disorders: interview or self-report
questionnaire? Int J Eat Disord. 1994;16(4):363–370.
156
[121] Garner DM, Garfinkel PE. The Eating Attitudes Test: An index of the symptoms
of anorexia nervosa. Psychological Medicine. 1979;9:273–279.
[122] Garner DM, Olmsted MP, Polivy J. Development and validation of a
multidimensional eating disorder inventory for anorexia nervosa and bulimia. Int J Eat
Disord. 1983;2:15–34.
[123] Gormally J, Black S, Dalston S, Rardin D. The assessment of binge-eating
severity among obese persons. Addictive Behaviors. 1982;7:47–55.
[124] Smith M, Thelen M. Development and validation of a test for bulimia. Journal of
Consulting and Clinical Psychology. 1984;52:863–872.
[125] Spitzer RL, Devlin M, Walsh BT, Hasin D, Wing R, Marcus M, et al. Binge
eating disorder: A multisite field trial of the diagnostic criteria. Int J Eat Disorder.
1992;11:191–203.
[126] Wilson GT, Nonas CA, Rosenblum GD. Assessment of binge eating in obese
patients. Int J Eat Disord. 1993;13:25–33.
[127] Wilfley DE, Schwartz MB, Spurrel EB, Fairburnd CG. Assessing the specific
psychopathology of binge eating disorder: Interview or self-report? Behav Res Ther.
1997;35:1151–1159.
[128] Mond JM, Hay PJ, Rodgers B, Owen C, Beumont PJV. Validity of the Eating
Disorder Examination Questionnaire (EDE-Q) in screening for eating disorders in
community samples. Behav Res Ther. 2004;42:551–567.
[129] Luce KH, Crowther JH. The reliability of the Eating Disorder Examination - self-
report questionnaire version (EDE-Q). Int J Eating Disord. 1999;25:349–351.
157
[130] Black CMD, Wilson GT. Assessment of eating disorders: Interview vs
questionnaire. Int J Eating Disord. 1996;20:43–50.
[131] Carter JC, Aime AA, Mills JS. Assessment of bulimia nervosa: a comparison of
interview and self-report questionnaire methods. Int J Eat Disord. 2001;30(2):187–192.
[132] Mond JM, Hay PJ, Rodgers B, Owen C. Eating Disorder Examination
Questionnaire (EDE-Q): norms for young adult women. Behav Res Ther. 2006;44(1):53–
62.
[133] Carter JC, Stewart DA, Fairburn CG. Eating disorder examination questionnaire:
norms for young adolescent girls. Behav Res Ther. 2001;39(5):625–632.
[134] Thompson FE, Byers T. Dietary assessment resource manual. J Nutr.
1994;124(11):2245S–2317S.
[135] Tran KM, Johnson RK, Soultanakis RP, Matthews DE. In-person vs telephone-
administered multiple-pass 24-hour recalls in women: validation with doubly labeled
water. J Am Diet Assoc. 2000;100(7):777–783.
[136] McKenzie DC, Johnson RK, Harvey-Berino J, Gold BC. Impact of interviewer’s
body mass index on underreporting energy intake in overweight and obese women. Obes
Res. 2002;10(6):471–477.
[137] Willett W. Nutritional Epidemiology. New York: Oxford University Press; 1998.
[138] Beaton GH, Milner J, Corey P, McGuire V, Cousins M, Stewart E, et al. Sources
of variance in 24-hour dietary recall data: implications for nutrition study design and
interpretation. Am J Clin Nutr. 1979;32(12):2546–2559.
158
[139] Beaton GH, Milner J, McGuire V, Feather TE, Little JA. Source of variance in
24-hour dietary recall data: implications for nutrition study design and interpretation.
Carbohydrate sources, vitamins, and minerals. Am J Clin Nutr. 1983;37(6):986–995.
[140] Willett WC, Sampson L, Stampfer MJ, Rosner B, Bain C, Witschi J, et al.
Reproducibility and validity of a semiquantitative food frequency questionnaire. Am J
Epidemiol. 1985;122(1):51–65.
[141] Guenther PM, DeMaio TJ, Ingwersen LA, Berlin M. The Multiple-pass approach
for the 24-hour recall in the Continuing Survey of Food Intakes by Individuals (CSFII)
1994-1996. In: 2nd International Conference of Dietary Assessment Methods. Boston,
MA; 1995. .
[142] Guenther PM, DeMaio TJ, Ingwersen LA, Berlin M. The multiple-pass approach
for the 24-h recall in the Continuing Survey of Food Intakes by Individuals. FASEB
Journal. 1996;10:A198.
[143] Agricultural Research Service FSRGHM Beltsville Human Nutrition
Research Center. Agricultural Research Service, Beltsville Human Nutrition Research
Center, Food Surveys Research Group, Hyattsville, MD. USDA Automated Multiple-
Pass Method for Dietary Recalls.
[144] Johnson RK, Driscoll P, Goran MI. Comparison of multiple-pass 24-hour recall
estimates of energy intake with total energy expenditure determined by the doubly
labeled water method in young children. J Am Diet Assoc. 1996;(11):1140–1144.
159
[145] Moshfegh AJ, Rhodes DG, Baer DJ, Murayi T, Clemens JC, Rumpler WV, et al.
The US Department of Agriculture Automated Multiple-Pass Method reduces bias in the
collection of energy intakes. Am J Clin Nutr. 2008;88(2):324–332.
[146] Crockett SJ, Potter JD, Wright MS, Bacheller A. Validation of a self-reported
shelf inventory to measure food purchase behavior. J Am Diet Assoc. 1992;92(6):694–
697.
[147] Beto JA, Sheth G, Rewers P. Assessing food purchase behavior among low-
income black and Hispanic clients using a self-reported shelf inventory. J Am Diet Assoc.
1997;97(1):69–70.
[148] Current Population Survey, Educational Attainment in the United States. U.S.
Census Bureau; 2005.
[149] ESHA; version 10.2.0, 2008, ESHA Research, Salem, OR .
[150] Frisancho AR. Anthropometric Standards for the Assessment of Growth and
Nutritional Status. Ann Arbor, MI: University of Michigan Press; 1990.
[151] Marcoe K, Juan W, Yamini S, Carlson A, Britten P. Development of food group
composites and nutrient profiles for the MyPyramid Food Guidance System. J Nutr Educ
Behav. 2006;38(6):93S–107S.
[152] Stata Corporation: College Station: Statistical Software: release 9. Texas 2005.
[153] Federal Register. 2009;74:4199–4201.
[154] Dietary Reference Intakes (DRIs): Recommended Dietary Allowances and
Adequate Intakes, Food and Nutrition Board, Institute of Medicine, National Academies,
2011.
160
[155] The National Health and Nutrition Examination Survey (NHANES) Analytic and
Reporting Guidelines. Hyattsville, MD: U.S. Department of Health and Human Services,
Centers for Disease Control and Prevention; 2006.
[156] Fine JT, Colditz GA, Coakley EH, Moseley G, Manson JE, Willett WC, et al. A
prospective study of weight change and health-related quality of life in women. JAMA.
1999;282:2136–2142.
[157] Colditz GA, Willett WC, Rotnitzky A, Manson JE. Weight gain as a risk factor
for clinical diabetes mellitus in women. Ann Intern Med. 1995;122:481–486.
[158] Rexrode KM, Hennekens CH, Willett WC, Colditz GA, Stampfer MJ, Rich-
Edwards JW, et al. A prospective study of body mass index, weight change, and risk of
stroke in women. JAMA. 1997;277:1539–1545.
[159] National Health and Nutrition Examination Survey MEC In-Person Dietary
Interviewers Procedure Manual. Hyattsville, MD: U.S. Department of Health and Human
Services, Centers for Disease Control and Prevention; 2000.
[160] USDA National Nutrient Database for Standard Reference, Release 20. Beltsville,
MD.
[161] National Health and Nutrition Examination Survey Phone Follow-Up Dietary
Interviewer Procedure Manual. Hyattsville, MD: U.S. Department of Health and Human
Services, Centers for Disease Control and Prevention; 2003.
[162] Trumbo P, Schlicker S, Yates AA, Poos M, Food and Nutrition Board of the
Institute of Medicine, The National Academies. Dietary reference intakes for energy,
161
carbohydrate, fiber, fat, fatty acids, cholesterol, protein, and amino acids. J Am Diet
Assoc. 2002;102:1621–1630.
[163] Willett WC. Is dietary fat a major determinant of body fat? Am J Clin Nutr.
1998;67:556S–562S.
[164] Willett WC, Leibel RL. Dietary fat is not a major determinant of body fat. Am J
Med. 2002;13:47S–59S.
[165] Burney J, Haughton B. EFNEP: a nutrition education program that demonstrates
cost-benefit. J Am Diet Assoc. 2002;105:39–45.
[166] Wardle J, Robb KA, Johnson F, Griffith J, Brunner E, Power C, et al.
Socioeconomic variation in attitudes to eating and weight in female adolescents. Health
Psychol. 2004;23(3):275–282.
[167] Metzner HL, Lamphiear DE, Wheeler NC, Larkin FA. The relationship between
frequency of eating and adiposity in adult men and women in the Tecumseh Community
Health Study. Am J Clin Nutr. 1977;30(5):712–715.
[168] Cristofar S, Basiotis P. Dietary intakes and selected characteristics of women ages
19-50 years and their children ages 1-5 years by reported perception of food sufficiency.
J Nutr Educ. 1992;24:53–58.
[169] Abelow B. Home grown hunger: A study of people who use emergency food
shelves in Minnesota. Minneapolis, MN: Minnesota Food Education and Resource Center;
1985.
[170] Hunger Watch, New York State: Part I. Profile of "At-Risk" Populations and
Service Agencies. Albany, NY: NY State, February 1984.
162
[171] A Report on Nine Case Studies of Emergency Food Assistance Programs: Social
and Scientific Systems. Social and Scientific Systems, Inc; 1983.
[172] Thompson FE, Taren DL, E EA, Casella G, Lambert JK, Campbell CC, et al.
Within month variability in use of soup kitchens in New York State. Am J Public Health.
1988;78:1298–1301.
[173] Nawaz H, Chan W, Abdulrahman M, D DL, Katz DL. Self-reported weight and
height: implications for obesity research. Am J Prev Med. 2001;20:294–298.
[174] Danubio ME, Miranda G, Vinciguerra MG, Vecchi E, Rufo F. Comparison of
self-reported and measured height and weight: implications for obesity research among
young adults. Econ Hum Biol. 2008;6:181–190.
163
APPENDIX A
Family Record Questionnaire
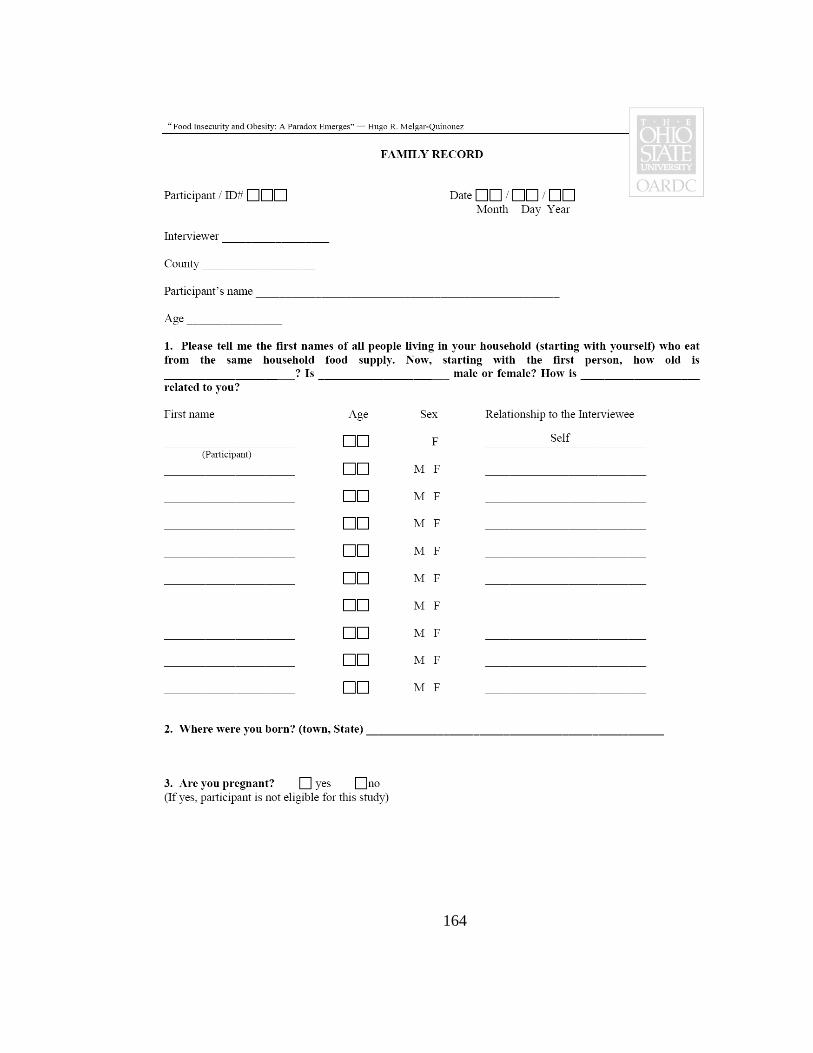
164
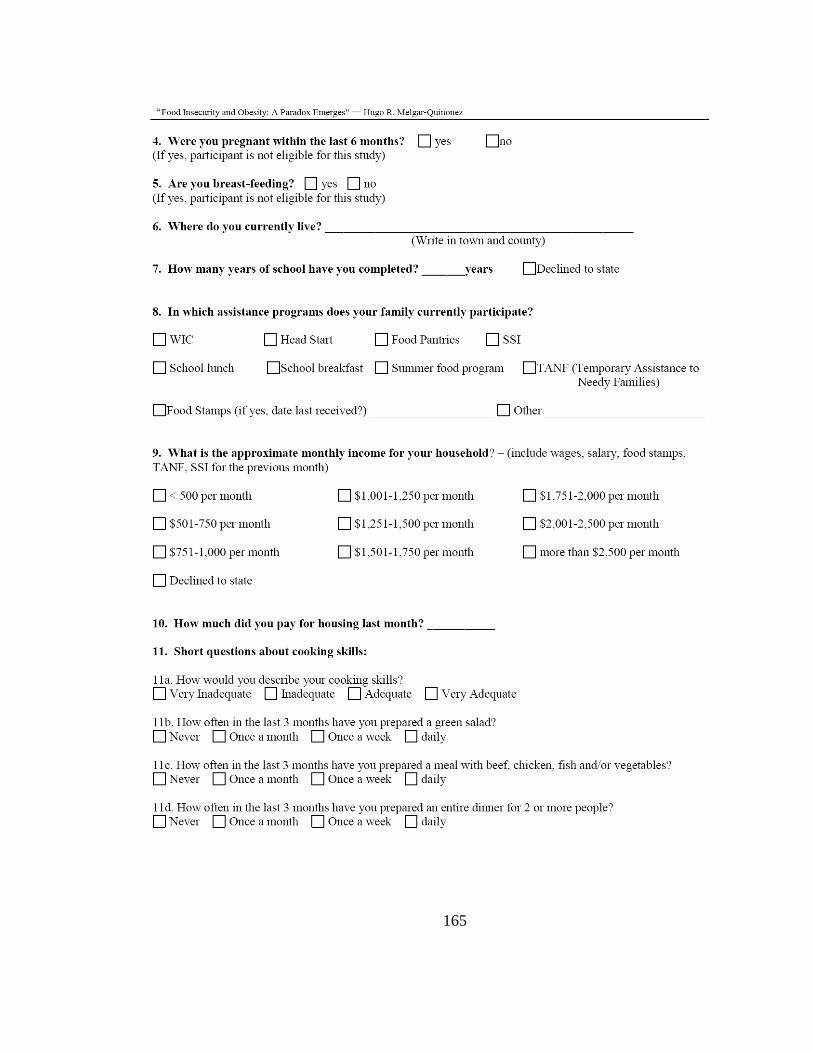
165
166
APPENDIX B
Modified Household Food Security Survey Module (HFSSM)
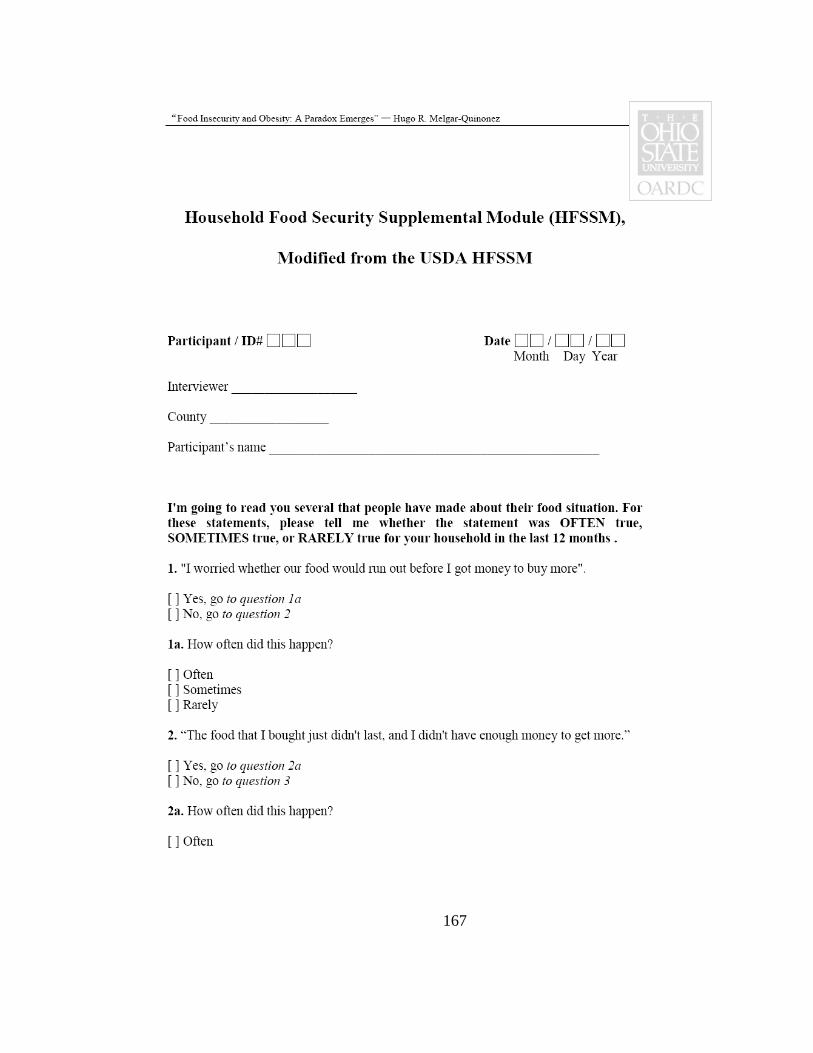
167
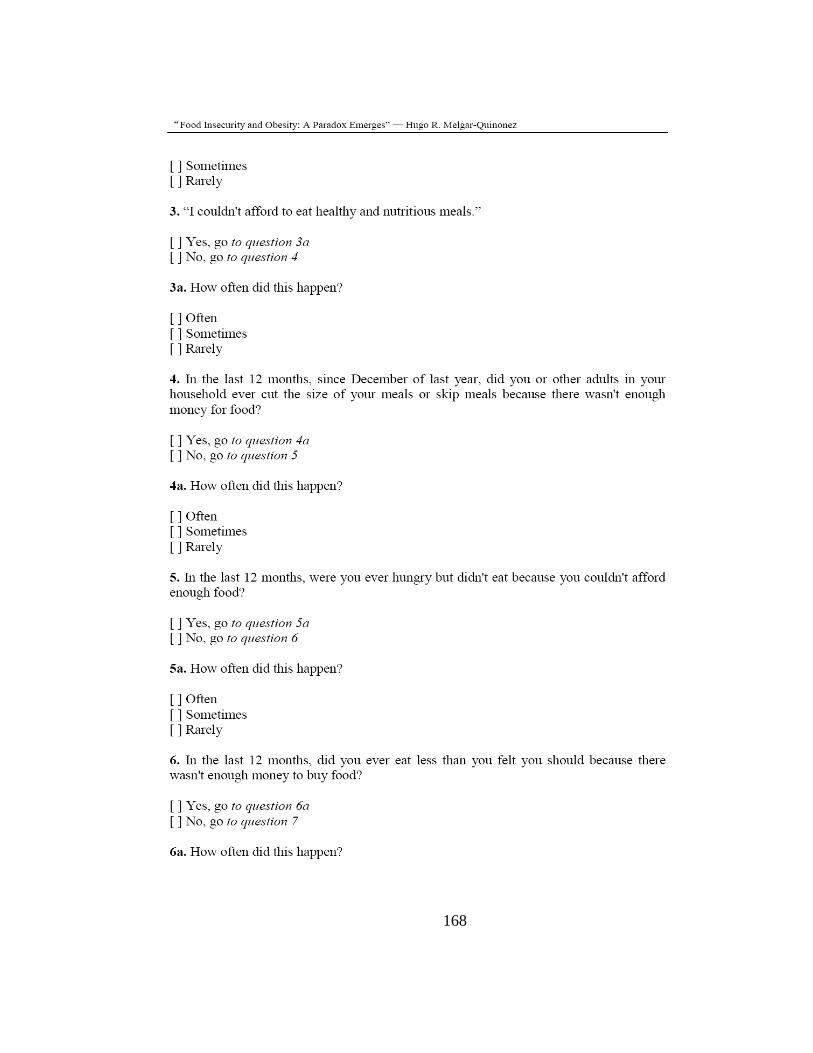
168
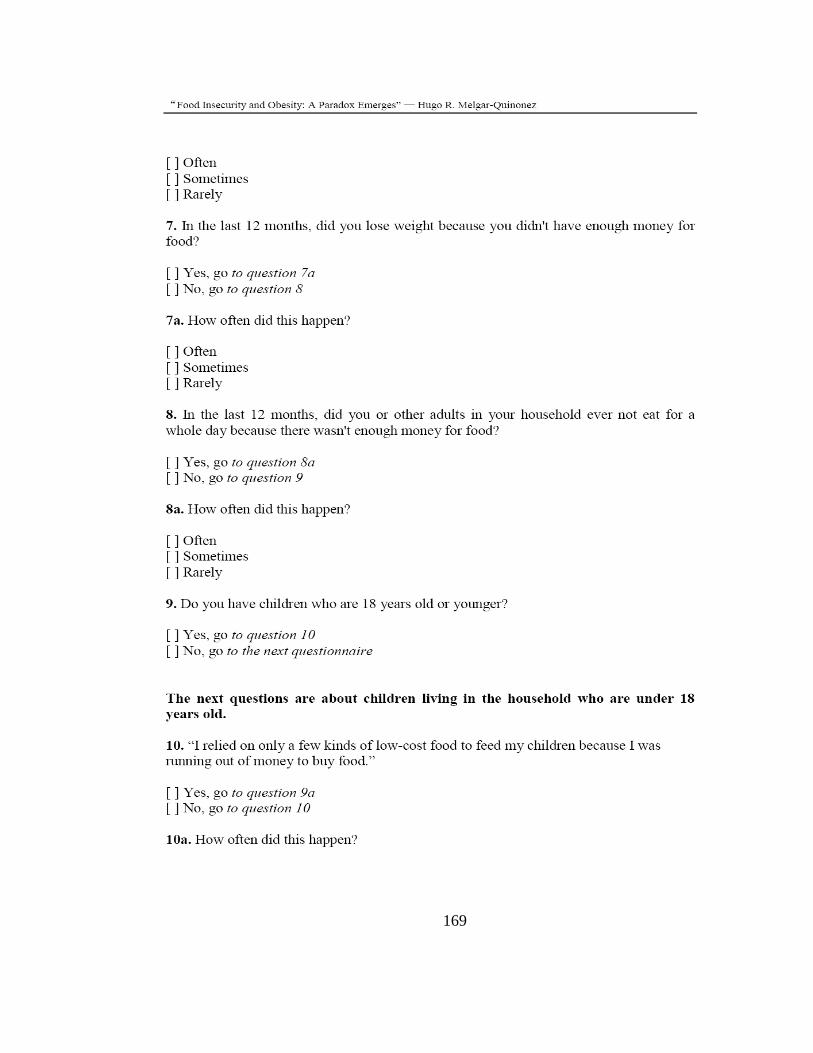
169
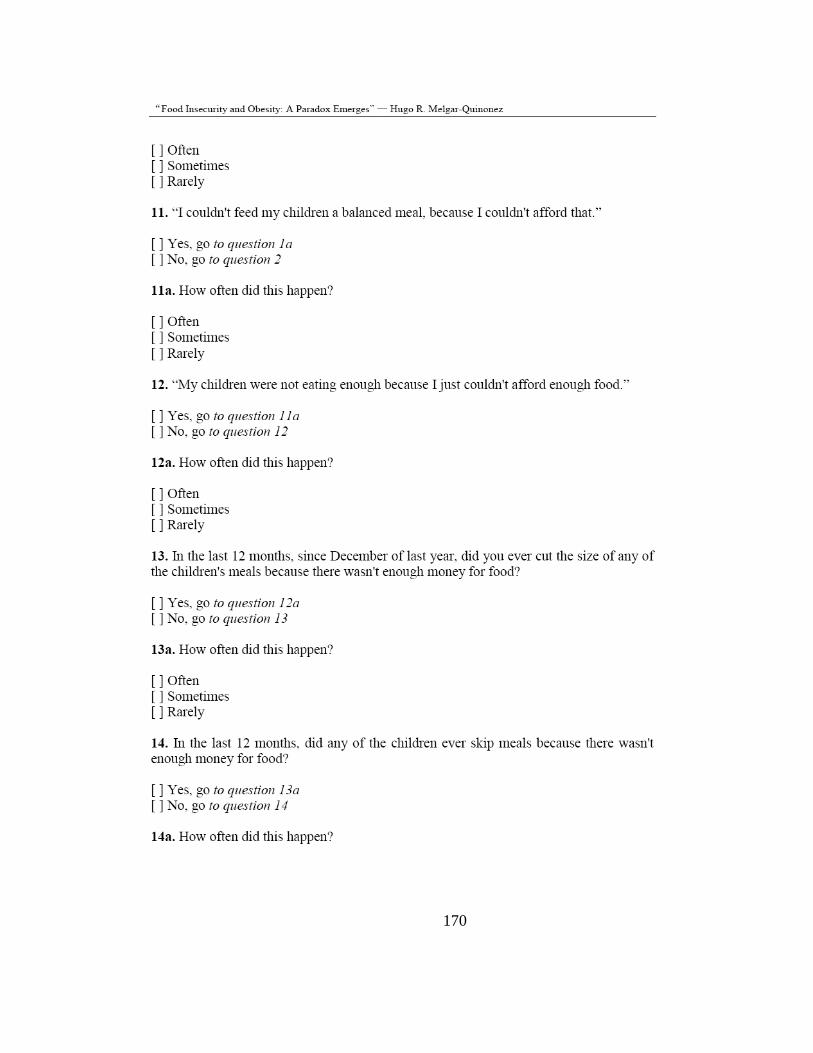
170
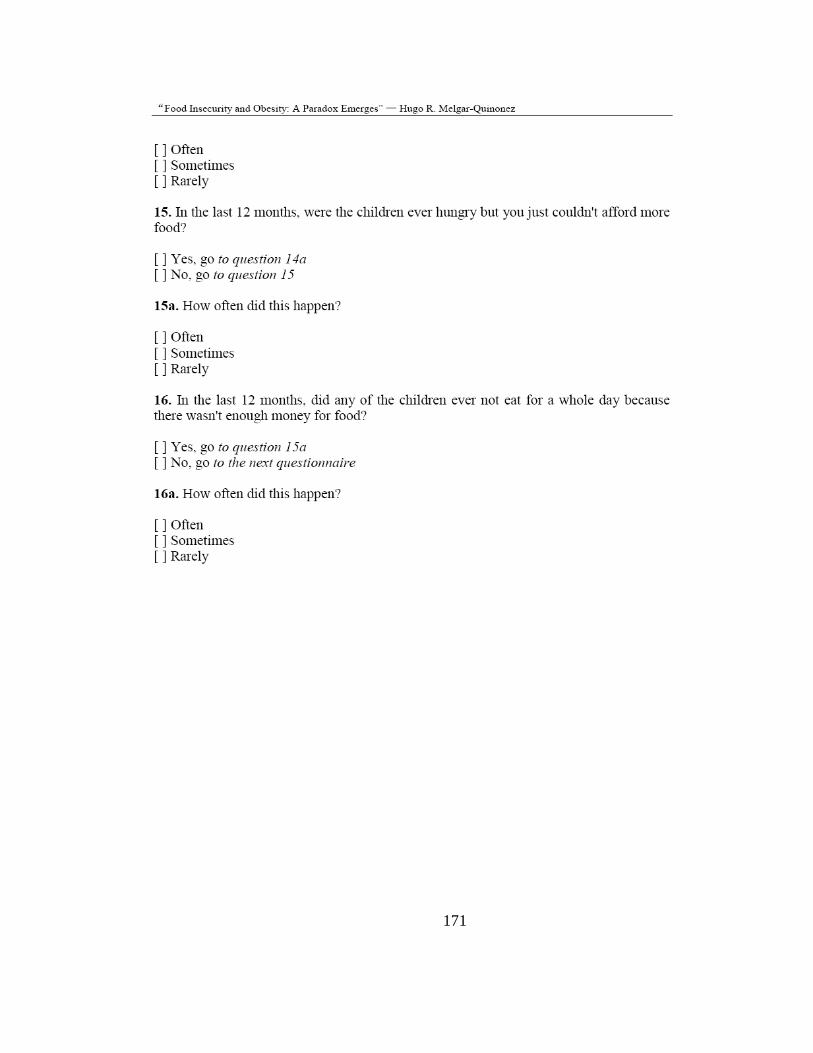
171

172
APPENDIX C
Shelf Food-Inventory Survey
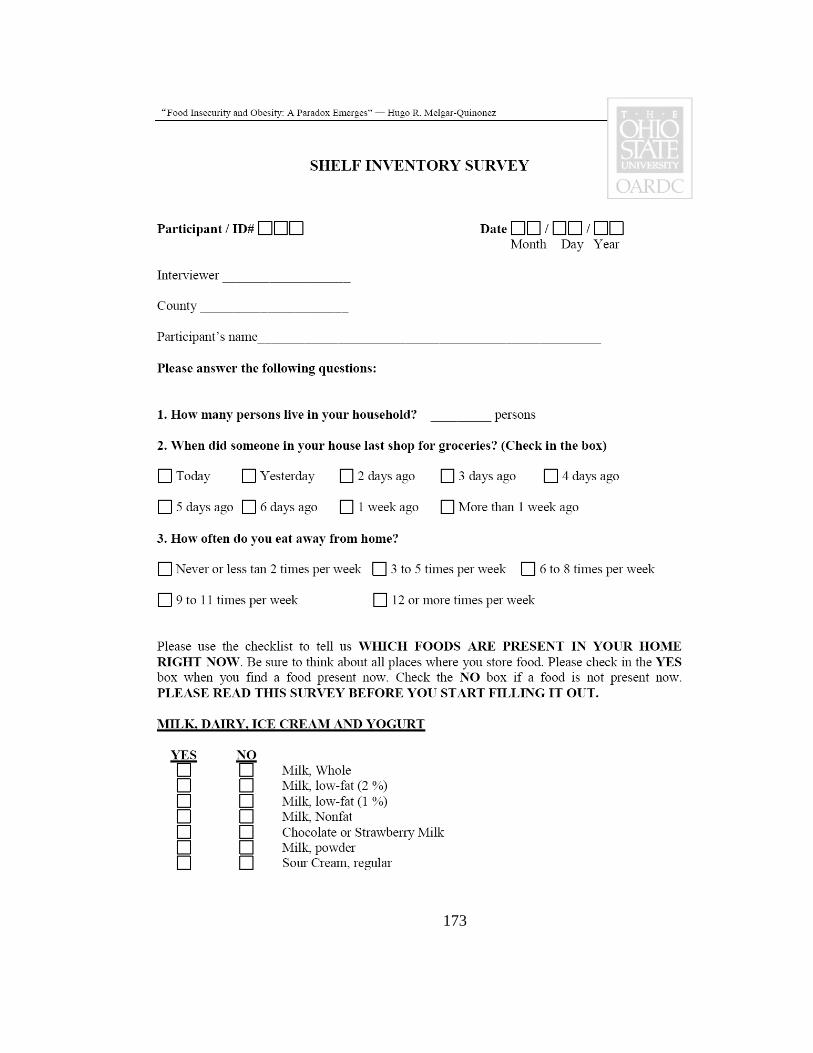
173
174
175

176
177
178
179
180
181
APPENDIX D
Eating Disorders Examination Questionnaire (EDE-Q)

182
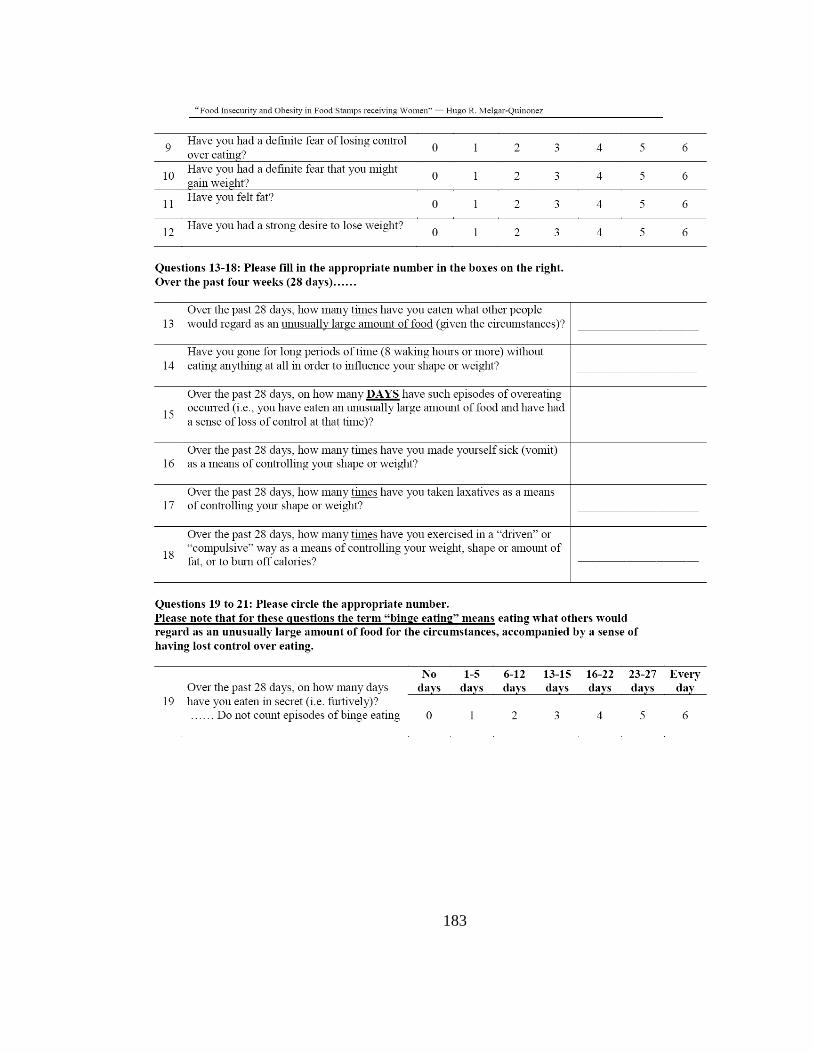
183
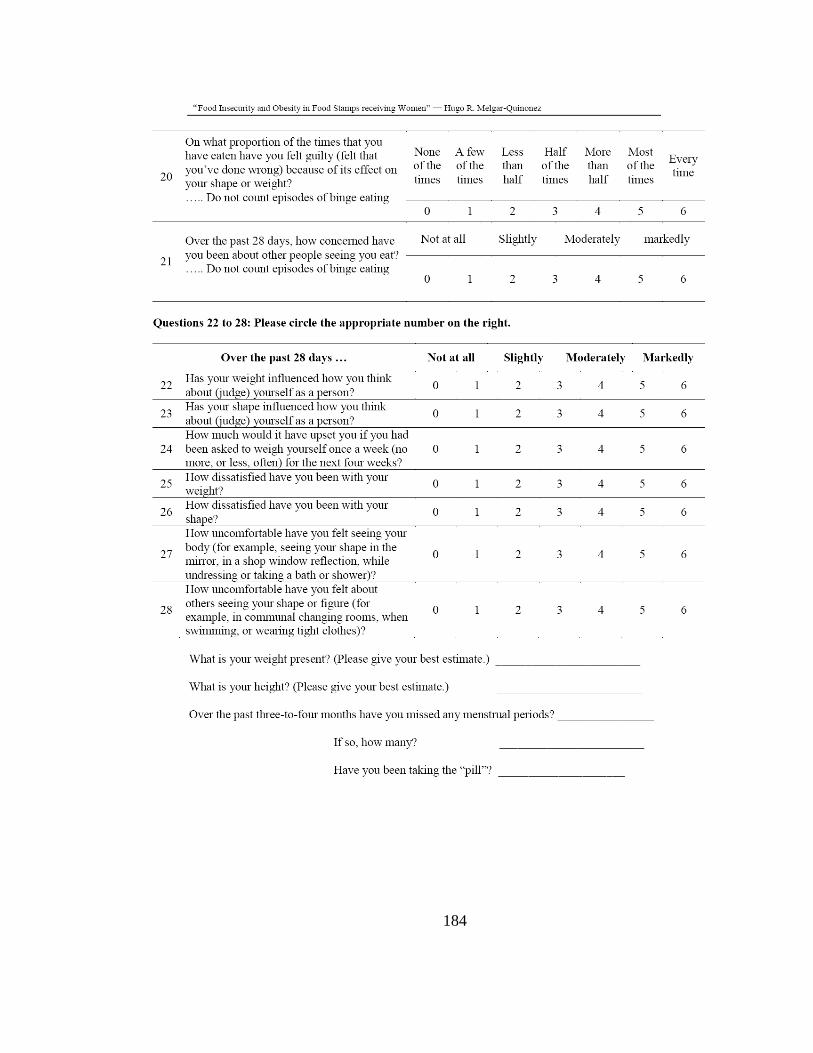
184