Follow-up Assessment of Under-nourished Children Under Integrated Child Development Services Scheme...
9
Original Article www.ijpm.ir International Journal of Preventive Medicine, Vol 5, No 6, June, 2014 758 Follow‑up Assessment of Under‑nourished Children Under Integrated Child Development Services Scheme in Tapi District, India Kanan T. Desai, Sunil N. Nayak 1 , Prakash B. Patel, Bhautik P. Modi 2 , Vaibhav V. Gharat 3 , Rajkumar Bansal ABSTRACT Background: India shares the largest burden of under‑nutrition in world. The aim of this study was to conduct follow‑up assessment of under‑nourished children attending anganwadi center (AWC). Methods: This was a retrospective cohort study conducted in 50 AWC of Tapi district. Total 529 children aged 1‑6 years diagnosed as under‑nourished before 1 year were included. Pre‑structured questionnaire was used for present day assessment of these children followed by Epi‑info mediated analysis. Results: Children of literate mothers had higher weight gain. Ninety percent of children attended anganwadi regularly, however 25% of children dropped out for more than 1 month. In 1 year, growth had faltered in 20% children and was stagnant in 63% of them. Children who were treated for under‑nutrition; that completed course at Child Development and Nutrition Center; and whose parents were counseled about the under‑nourished status of child had higher weight gain than their counterparts. Conclusions: Parents of under‑nourished children must be counseled about the nutritional status of their child. In cases of under‑nourished child, referral to higher center must be ensured by health worker. Supplementary feeding as a long‑term solution to country’s under‑nutrition problem should be studied in detail with the alternative solutions. Keywords: Anganwadi, follow‑up, nutritional assessment, under‑nourished children INTRODUCTION Forty percent of the world’s severely under‑nourished under‑five children live in India. [1‑3] Major underlying causes for this under‑nutrition are inadequate access to food, insufficient health services and unhealthful environment. [4] Integrated Child Development Services (ICDS) scheme was launched in India in 1975 with a prime objective of improving the nutrition status of underprivileged children, by providing Department of Community Medicine, Surat Municipal Institute of Medical Education and Research, Umarwada, Surat, Gujarat, India, 1 Department of Community Medicine, Gujarat Medical Education and Research Society (GMERS), Dharpur, Patan, Gujarat, India, 2 Department of Community Medicine, Gujarat Medical Education and Research Society (GMERS), Gandhinagar, Gujarat, India, 3 Department of Community Medicine, Gujarat Medical Education and Research Society (GMERS), Valsad, Gujarat, India Correspondence to: Dr. Kanan T. Desai, Department of Community Medicine, ‘C’‑Block, Surat Municipal Institute of Medical Education and Research, Umarwada, Surat ‑ 395 010, Gujarat, India. E‑mail: [email protected] Date of Submission: Oct 09, 2012 Date of Acceptance: Mar 23, 2013 How to cite this article: Desai KT, Nayak SN, Pate PB, Modi BP, Gharat VV, Bansal R. Follow-up Assessment of Under‑nourished Children Under Integrated Child Development Services Scheme in Tapi District, India. Int J Prev Med 2014;5:758-66.
-
Upload
independent -
Category
Documents
-
view
6 -
download
0
Transcript of Follow-up Assessment of Under-nourished Children Under Integrated Child Development Services Scheme...

Original A
rticle
www.ijpm.inwww.ijpm.ir
International Journal of Preventive Medicine, Vol 5, No 6, June, 2014758
Follow‑up Assessment of Under‑nourished Children Under Integrated Child Development Services Scheme in Tapi District, India
Kanan T. Desai, Sunil N. Nayak1, Prakash B. Patel, Bhautik P. Modi2, Vaibhav V. Gharat3, Rajkumar Bansal
ABSTRACT
Background: India shares the largest burden of under‑nutrition in world. The aim of this study was to conduct follow‑up assessment of under‑nourished children attending anganwadi center (AWC).Methods: This was a retrospective cohort study conducted in 50 AWC of Tapi district. Total 529 children aged 1‑6 years diagnosed as under‑nourished before 1 year were included. Pre‑structured questionnaire was used for present day assessment of these children followed by Epi‑info mediated analysis.Results: Children of literate mothers had higher weight gain. Ninety percent of children attended anganwadi regularly, however 25% of children dropped out for more than 1 month. In 1 year, growth had faltered in 20% children and was stagnant in 63% of them. Children who were treated for under‑nutrition; that completed course at Child Development and Nutrition Center; and whose parents were counseled about the under‑nourished status of child had higher weight gain than their counterparts.Conclusions: Parents of under‑nourished children must be counseled about the nutritional status of their child. In cases of under‑nourished child, referral to higher center must be ensured by health worker. Supplementary feeding as a long‑term solution to country’s under‑nutrition problem should be studied in detail with the alternative solutions.Keywords: Anganwadi, follow‑up, nutritional assessment, under‑nourished children
INTRODUCTIONForty percent of the world’s severely under‑nourished
under‑five children live in India.[1‑3] Major underlying causes for this under‑nutrition are inadequate access to food, insufficient health services and unhealthful environment.[4]
Integrated Child Development Services (ICDS) scheme was launched in India in 1975 with a prime objective of improving the nutrition status of underprivileged children, by providing
Department of Community Medicine, Surat Municipal Institute of Medical Education and Research, Umarwada, Surat, Gujarat, India, 1Department of Community Medicine, Gujarat Medical Education and Research Society (GMERS), Dharpur, Patan, Gujarat, India, 2Department of Community Medicine, Gujarat Medical Education and Research Society (GMERS), Gandhinagar, Gujarat, India, 3Department of Community Medicine, Gujarat Medical Education and Research Society (GMERS), Valsad, Gujarat, India
Correspondence to:Dr. Kanan T. Desai, Department of Community Medicine, ‘C’‑Block, Surat Municipal Institute of Medical Education and Research, Umarwada, Surat ‑ 395 010, Gujarat, India. E‑mail: [email protected]
Date of Submission: Oct 09, 2012
Date of Acceptance: Mar 23, 2013
How to cite this article: Desai KT, Nayak SN, Pate PB, Modi BP, Gharat VV, Bansal R. Follow-up Assessment of Under‑nourished Children Under Integrated Child Development Services Scheme in Tapi District, India. Int J Prev Med 2014;5:758-66.

Desai, et al.: Follow‑up assessment of under‑nourished children
759International Journal of Preventive Medicine, Vol 5, No 6, June, 2014
supplementary nutrition, through the network of anganwadi centers (AWCs) and anganwadiworkers (AWW).[5‑7] The AWC is plainly acourtyard play center and the heart of ICDS.[8] It is the central point for the deliverance of ICDS services to children below 6 years of age, expecting women, lactating mothers and adolescent girls at community levels.[8] The existing population normforAWCis:OneAWCper1000populationinruralandurbanprojectandoneAWCper700persons in the tribal project.[9] EachAWC is runby anAWWsupported by a helper in integratedservicedelivery.TogetherAWWandAWCworksfor better linkages of the community with the health system; as well as escalating the capability of community and women, particularly mothers for childcare, survival, and development.[8]
As per the revised guidelines of the ICDS, supplementary nutrition worth 500 Kcal and 12‑15 g of protein is distributed to all children of 6‑72 months age.[7] Severely under‑nourished children aged 6‑72 months of age are provided additional 300 Kcal and 8‑10 g of protein.[7] Moreover, growth monitoring and nutrition surveillance of these children is also carried out with the help of growth chart.[7] Growth chart is a vital appraisal tool for the evaluation of growth and development of child, which could be further used to detect early growth faltering and take preventive interventions accordingly.[10] Referral service for severely under‑nourished children is also provided under the scheme.[7]
A new initiative in Gujarat for under‑nourished children is setting up of child development and nutrition centers (CDNC).[11] Severely under‑nourished (red category) child are referred to such centers for rehabilitation.[11] At such centers, mother and child stays together; the child is treated for infection if any and is provided nutritious dietary supplementation with active participation of mother.[11] Child is discharged from the center once he/she starts gaining weight.[11]
Despite being most widely studied program there are many controversies regarding benefits of ICDS. The present study was therefore undertaken with the objective of assessing the progress in growth of under‑nourished children under ICDS and the factors associated with it in the Tapi district of Gujarat.
Tapi is a predominantly tribal district. Tribal population constitutes around 8% of
the population of India.[12] Tribal population has higher rates of under‑nutrition because of dependence on agricultural practices for food supply, discrimination in terms of socio economic status as well as neglect in the national programs.[12] Assessment of nutritional status of children under ICDS is considered as a measure of effectiveness of the program and it is necessary for planners to understand the program and nutrition situation among the vulnerable tribal population of Tapi region. Hence, far adequate literature is not available from the region on the subject matter.
METHODS
EthicsInformed oral consent was taken from the
mothers of children who were examined. The study was conducted with priori permission from the Health and Family Welfare Department,Government of Gujarat.
Study typeThis was a retrospective cohort study where
cohort of study participants was identified retrospectivelyfromtheAWCdataandfollow‑upassessment of them was carried out up to the day of the survey.
Study settingTapi is predominantly a tribal district of
Southern Gujarat with agriculture being its principal economy. The study was conducted in 50 AWCunder 25 primary health centers (PHC) of Tapi giving equal representation to each of its five blocks.
Study periodFebruary to March, 2012.
Sampling designThere are a total of 30 PHCs in the Tapi District.
Initially all the PHCs were decided to be included in the study. However, due to time constraint and certain national health program activities like Intensive Pulse Polio Immunization round and Mass Drug Administration for Filariasis, we were finally able to cover only 25 PHCs. Equal representations was given to all the five blocks of the district, selecting five PHCs from each block. In the

Desai, et al.: Follow‑up assessment of under‑nourished children
International Journal of Preventive Medicine, Vol 5, No 6, June, 2014760
firstphaseof sampling, listof AWCwasusedassamplingframeforeachPHCandtwoAWCfromeach PHC were selected using the simple random sampling(SRS),thus,total50AWCwereselected.Under the ICDS scheme, growth chart registers are maintained for the growth monitoring of children attendingtheAWC.ThesegrowthchartsarebasedonWorldHealthOrganization growth standardsfor weight for age for boys and girls. Three color coded categories are given in it: Green for normal, yellow for under‑weight (−2 SD to −3 SD) and red for severely under‑weight (< −3 SD) child. For the second phase of sampling, list of all children aged one to five years, who were in red or yellow category of growth chart of AWCbefore 1 year,was prepared. The month of February 2011 was considered for selecting children before 1 year. For each selected AWC, on an average, tenunder‑nourished children of 1 to 5 years of age were selected randomly from the above list by SRS. In case the selected child was not available, next child in the list was taken. Thus total 529 children were covered in the study.
Data collection toolA structured questionnaire was prepared after
literature review and departmental discussion. The questionnaire was designed to assess the growth status of the children. Pretesting and piloting was carried out for checking practicability of the questionnaire and necessary corrections were made accordingly. Proper training of all interviewers was conducted before starting the data collection.
General information like age, sex, education status of parents as well as service utilization of AWC was assessed by personal interviewof mothers. In case mother was not available, information was collected from any other available family member.
Current growth status of child including current weight (kg) and mid upper arm circumference (MUAC) (cm) was measured using standard technique. From the past records of growth chart plotting, other information like weight and category before 1 year was also collected.
Statistical studyData entry was carried out in Microsoft
Excel. Analysis was carried out to understand the advancement of growth status and factors
associated with it, using independent sample t‑test using Epi info 2007.
RESULTSIn current study, from the growth chart registers
of AWC, total of 529 under‑nourished childrenfalling into red 162 (30.6%) and yellow 367 (69.4%) category before 1 year (February 2011) were included. Follow‑up weighing and categorizing of the same children after 1 year showed that 39 (7.4%) were in green category, 273 (51.6%) were in yellow category and 217 (41%) were in red category. It was observed that 89 (16.9%) of the 529 children had shown improvement in their growth in 1 year, while 334 (63.1%) and 106 (20%) of the children had shown stagnancy and faltering in their growth respectively. Number of children migrating from yellow/red category to green, yellow, and red category in 1 year was as seen in Figure 1. Mean weight gain in 1 year for all under‑nourished children was 1.7 (±1.4 SD) kg. There was no statistically significant difference between past and current weight in both yellow and red category children (P=0.44) [Table 1].
Moreover, looking at the growth chart it was evident that out of total 529 under‑nourished children, only 114 (21.6%) children had fallen in to green category at any point of time during past 1 year. Only 19 (16.7%) out of 114 were able to maintain the green category up until the end of the year.
According to the current MUAC, 73 (13.9%) of the children were severely under‑nourished (MUAC<12.5 cm), 242 (45.7%) were mild and moderately under‑nourished
Figure 1: Categories of under nourished children: Present and before one year (n = 529)

Desai, et al.: Follow‑up assessment of under‑nourished children
761International Journal of Preventive Medicine, Vol 5, No 6, June, 2014
(MUAC=12.5‑13.5 cm) and 214 (40.4%) were in normal grade (MUAC>13.5 cm) (Kappa agreement for categorization of under‑nutrition in to three categories between use of growth chart method and MUAC measurement was 0.029, [P=0.20]).
Out of total 529 under‑nourished children, 257 (48.6%) were male and 272 (51.4%) were female. Gender‑wise no difference in terms of mean weight gain in 1 year was seen between the two (P = 0.42). Furthermore, in the study, 151 (28.5%) children were in one to 3 years and 378 (71.5%) in 3 to 6 years age group with mean weight gain in younger children higher than older children [P =0.004, Table 1]. Around 140 (26.4%) fathers and 176 (33.3%) mothers of under‑nourished children were illiterate with mean weight gain of children of illiterate mother being lower than literate mothers (P=0.02), though no such difference was seen with education level of fathers (P=0.14) [Table 1].
Majority 480 (90.7%) of 529 under‑nourished childrenhadregularattendanceinAWCandonly49 (9.3%) children had irregular visits (absence in last 2 weeks). The major reasons for irregular visits given by mothers can be seen from Figure 2.
On checking for drop outs (weighing not carried out for 1 month or more in last year as seen from growth chart registers), one quarter
that is 132 (25%) of children had drop‑outs. Major reasons for drop‑out were family being out of station as stated by 78.2% mothers, irregular runningof AWCas statedby7.3%mothers, faraway location of AWC from home as given by5.5% mothers, consistently ill child as given by 3.6% mothers, no one to accompany child to AWC,nofaithinAWCservicesandnofeltneedof AWC service as said by 1.8%mothers each.In 77 mothers there was no response regarding reason for dropout.
Most of the 516 (97.5%) children were eating supplementary meals given from AWC. Majorreasons for not eating supplementary feed in rest 13 (2.5%) children were: Bad taste of food for 46.2%,notawareabouttheAWCservicesfor7.7%,family being out of station for 7.7%, and child’s unwillingnesstoattendAWCfor7.7%mothers.Inthree children there was no response. As seen from Table 2, mean weight gain was not found to be associatedwithregularityinAWCvisit(P=0.99), drop‑outs (P = 0.99) or eating supplementary feedinggivenfromAWC(P=0.61).On observing growth chart registers atAWC,
519 (98.1%) children’s weight was plotted regularly, i.e., monthly. One important finding is that almost 120 (22.7%) parents were not explained about their child’s under‑nourished
Table 1: Association of demographic profile of under‑nourished children with weight gain (n=529)
Variables (n) Mean weight gain in one year (kg)
±SD (kg)
Mean difference
CI lower
CI upper
P value‡
Growth category of child before one year§
Yellow (367) 1.7 1.5 0.1 −0.16 0.36 0.44Red (162) 1.8 1.1
GenderMale (257) 1.7 1.1 0.1 −0.15 0.35 0.42Female (272) 1.8 1.7
Age12‑36 months (151) 2.0 1.2 0.4 0.13 0.67 0.00437‑60 months (378) 1.6 1.5
Education of motherIlliterate (176) 1.5 1.0 0.3 0.04 0.55 0.02Literate (353) 1.8 1.6
Education of fatherIlliterate (140) 1.6 0.9 0.2 −0.06 0.46 0.14Literate (389) 1.8 1.5
SD=Standard deviation, CI=Confidence interval, ‡Independent sample t-test applied, §Three color coded categories are given in the growth charts (based on World Health Organization growth standards for weight for age for boys and girls) maintained at the anganwadis: Green for normal, yellow for under‑weight (−2 SD to −3 SD) and red for severely under‑weight (< −3 SD) child

Desai, et al.: Follow‑up assessment of under‑nourished children
International Journal of Preventive Medicine, Vol 5, No 6, June, 2014762
status and category by AWW. Children whoseparents were explained about their child’s nutrition status had gained higher mean weight than their counterparts (P=0.01).
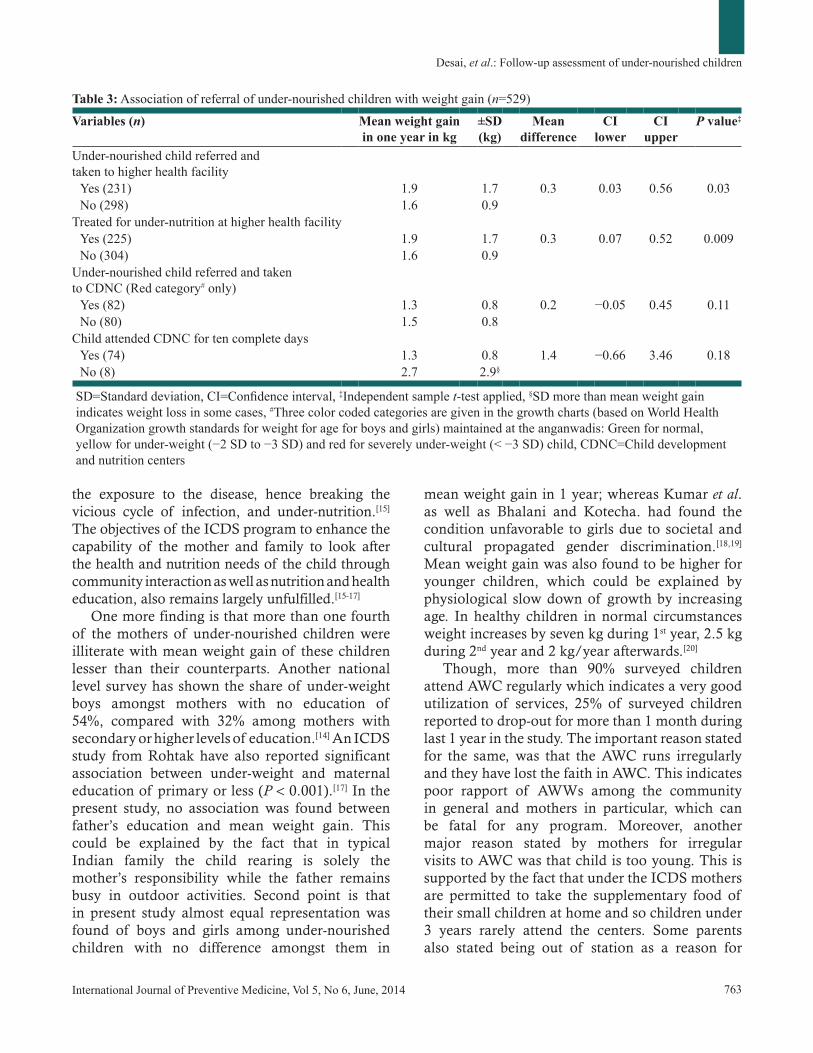
As seen from Figure 3, only half of the children 285 (53.9%) were referred to higher health facility for treatment of under‑nourishment by AWW,from which 231 (81%) were actually taken to higher health facility by the parents. As seen from Table 3 mean weight gain of children who were taken to higher centers (P=0.03) and treated for under‑nutrition (P=0.009) was higher than others. Out of total 162 red category children before 1 year, 150 (92.6%) children were advised to visit CDNCbyAWW[Figure3].Averageweightgainduring CDNC visit was 0.7 (SD=±0.5) kg. There was no difference in weight gain between CDNC attendees and non‑attendees (P=0.11) [Table 3].
DISCUSSIONOut of all the under‑nourished children, more
than three‑fourth of the children in yellow/red category had not come into the green category even a single time during the 1 year. Besides, in 1 year, growth faltered in one‑fifth children and remained stagnant in three‑fifth children despite being covered under the ICDS. A number of previous studies have also questioned the actual impact of ICDS on nutrition of children due to major implementation problems such as inadequately trained, supervised and supported AWW; erratic provision of food supplies, and leakage in food procurement; poor quality bad taste food; and poorly targeted food supplementation not confined to under‑nourished children.[13,14] Furthermore, the highly focused approach of the program on the supplementary nutrition leads to neglection of other important interventions for reducing childhood under‑nutrition like environment hygiene which directly curtails
Figure 3: Referral, compliance and outcome of under nourished children to health facilities (n = 529)
Table 2: Association of ICDS services utilization indicators by under‑nourished children with weight gain (n=529)
Variables (n) Mean weight gain in one year (kg)
±SD (kg)
Mean difference
CI lower
CI upper
P value‡
AWC visit by childRegular (480) 1.7 1.4 0.0 −0.40 0.40 0.99Irregular (49) 1.7 0.9
Dropout of one month or more from AWCYes (132) 1.7 1.1 0.0 −0.28 0.28 0.99No (397) 1.7 1.5
Child eating Supplementary feedingYes (516) 1.7 1.4 0.2 −0.57 0.97 0.61No (13) 1.9 0.8
Parents explained category of their under-nourished child
Yes (409) 2.1 2.1 0.5 0.11 0.89 0.01No (120) 1.6 1.1
ICDS=Integrated child development services, AWC=Anganwadi centers, SD=Standard deviation, CI=Confidence interval, ‡Independent sample t-test applied
Figure 2: Self‑reported reasons given by mothers for irregular visit of their under nourished children to AWC (n = 49)
Desai, et al.: Follow‑up assessment of under‑nourished children
763International Journal of Preventive Medicine, Vol 5, No 6, June, 2014
the exposure to the disease, hence breaking the vicious cycle of infection, and under‑nutrition.[15] The objectives of the ICDS program to enhance the capability of the mother and family to look after the health and nutrition needs of the child through community interaction as well as nutrition and health education, also remains largely unfulfilled.[15‑17]
One more finding is that more than one fourth of the mothers of under‑nourished children were illiterate with mean weight gain of these children lesser than their counterparts. Another national level survey has shown the share of under‑weight boys amongst mothers with no education of 54%, compared with 32% among mothers with secondary or higher levels of education.[14] An ICDS study from Rohtak have also reported significant association between under‑weight and maternal education of primary or less (P<0.001).[17] In the present study, no association was found between father’s education and mean weight gain. This could be explained by the fact that in typical Indian family the child rearing is solely the mother’s responsibility while the father remains busy in outdoor activities. Second point is that in present study almost equal representation was found of boys and girls among under‑nourished children with no difference amongst them in
mean weight gain in 1 year; whereas Kumar et al. as well as Bhalani and Kotecha. had found the condition unfavorable to girls due to societal and cultural propagated gender discrimination.[18,19] Mean weight gain was also found to be higher for younger children, which could be explained by physiological slow down of growth by increasing age. In healthy children in normal circumstances weight increases by seven kg during 1st year, 2.5 kg during 2nd year and 2 kg/year afterwards.[20]
Though, more than 90% surveyed children attendAWCregularlywhichindicatesaverygoodutilization of services, 25% of surveyed children reported to drop‑out for more than 1 month during last 1 year in the study. The important reason stated for the same,was that theAWC runs irregularlyandtheyhavelostthefaithinAWC.Thisindicatespoor rapport of AWWs among the communityin general and mothers in particular, which can be fatal for any program. Moreover, another major reason stated by mothers for irregular visitstoAWCwasthatchildistooyoung.Thisissupported by the fact that under the ICDS mothers are permitted to take the supplementary food of their small children at home and so children under 3 years rarely attend the centers. Some parents also stated being out of station as a reason for
Table 3: Association of referral of under‑nourished children with weight gain (n=529)
Variables (n) Mean weight gain in one year in kg
±SD (kg)
Mean difference
CI lower
CI upper
P value‡
Under‑nourished child referred and taken to higher health facility
Yes (231) 1.9 1.7 0.3 0.03 0.56 0.03No (298) 1.6 0.9
Treated for under‑nutrition at higher health facilityYes (225) 1.9 1.7 0.3 0.07 0.52 0.009No (304) 1.6 0.9
Under‑nourished child referred and taken to CDNC (Red category# only)
Yes (82) 1.3 0.8 0.2 −0.05 0.45 0.11No (80) 1.5 0.8
Child attended CDNC for ten complete daysYes (74) 1.3 0.8 1.4 −0.66 3.46 0.18No (8) 2.7 2.9§
SD=Standard deviation, CI=Confidence interval, ‡Independent sample t-test applied, §SD more than mean weight gain indicates weight loss in some cases, #Three color coded categories are given in the growth charts (based on World Health Organization growth standards for weight for age for boys and girls) maintained at the anganwadis: Green for normal, yellow for under‑weight (−2 SD to −3 SD) and red for severely under‑weight (< −3 SD) child, CDNC=Child development and nutrition centers

Desai, et al.: Follow‑up assessment of under‑nourished children
International Journal of Preventive Medicine, Vol 5, No 6, June, 2014764
non attendance. This is supported by the fact that Tapi is a rural district where many parents migrate in sugarcane farm seasonally for harvesting and young children of theirs usually accompany them. Another valuable reason given by some mothers was,farawaylocationof AWCfromhome,whichshould not be overlooked.
Important point is that similar to present study one another study also did not found any association between nutritional status of children and duration of stay at AWC (P = 0.56). The same study also showed overall percentage of deterioration (14‑21%) in nutritional status among the children under ICDS twice that of improvement (5‑12%). However, one finding of that Karnataka based study of greater improvement for children with baseline higher grade of under‑nutrition was in contrast to present study.[18]
In current study, around three quarter mothers were explained about the under‑nutrition status of their child and hence they were aware about the same. In another study for evaluating ICDS, awareness about current status of child was found in 70% mothers, which is similar to present study.[15] Overall in the study, children whose parents were aware about their child’s under‑nutrition status had higher average weight gain, which is similar to Abbi et al.’s findings.[21] This highlights the fact that, in addition to mere weighing of child, information of parents about their child’s progress in terms of weight gain and proper counseling on how to improve and maintain their child’s nutrition is more helpful in overall weight gain.
In current study, more than 90% of the children referredbyAWWtoCDNChadattendedCDNCfor the complete 10 days and most of these children gained weight during their CDNC stay. This finding supports the beneficial effect of CDNC. However, more than two‑third of them lost weight again in their follow‑up visits post CDNC stay. This exposed the actuality that proper attention was not given to nutrition of the child in follow‑up, which reversed the benefit gained from CDNC. This is also the reason why at the end of 1 year no difference in mean weight gain was found between CDNC attendees and non attendees.
The higher mean weight gain was found in children who were refereed and treated for under‑nutrition in current study; which emphasis the importance of referral of all under‑nourished children to community health center or other
higher facilities. Follow‑up on whether the child parents actually take the child to referral center is alsoneededtobekeptbyAWW.
MUAC in place of weight for age is widely used in population surveys to check nutritional status of under‑five children because of its feasibility. Attempt to check kappa agreement between MUAC and weight for age based classification of under‑nutrition was made in current study. However, no agreement was found between two. There is also lack of clarity regarding the appropriate cut‑off for MUAC to detect under‑nutrition. One Zimbabwe based study using 15.5 cm as cut‑off found to perform it poorly in comparison to other standard indices for detecting under‑nutrition.[22] Further research to check for validity and reliability of MUAC, as well as standardizing appropriate cut off to achieve maximum sensitivity and specificity for detecting under‑nutrition, needs to be carried out in large sample.
Limitations of present study and further researchOverall the current study shows important
finding from the under studied tribal region in the area of under‑nutrition, though it fails to take into consideration important confounders such as immunization, peri natal conditions, breast feeding, and other co‑morbid conditions like diarrhea. This is the limitation of present study. In the background of knowledge gained from the current study regarding growth flattering of children despite attendingAWC,furtheroperationalresearchfromthe region is needed in areas of strengthening ICDS services; exact caloric content of food given to the childrenwithrespecttotheirrequirementatAWC;role of parental awareness; role of under‑nutrition treatment; CDNC visit; and interventions to maintain the weight gained in CDNC.
CONCLUSIONSMore than three quarter under‑nourished
children have shown either growth stagnation or faltering at the end of 1 year despite attending AWC.Thisindicatestheneedof earlyidentificationand special nutritional care of yellow/red category childrenasearlyaspossiblebytheAWWalongwithstrengthening of ICDS services. Literate mothers as well as parents who were counseled about the nutritional status of their child are better off in
Desai, et al.: Follow‑up assessment of under‑nourished children
765International Journal of Preventive Medicine, Vol 5, No 6, June, 2014
taking appropriate care of their under‑nourished child. Hence, regular weighing and plotting in growth chart for each child must be done and this informationmust be shared by theAWW to theparents. Improvement in taste of supplementary foods may be helpful to increase its consumption by children. Referral to the higher center in case of under‑nourished children must be ensured by AWW.Follow‑upmustbetakenregardingwhetherthe child was actually taken to the referred health facility, since it was found to be an important contributing factor in improving growth status of these children. Additionally, AWW should alsofollow‑up children attending CDNC and should ensurethattheyavailservicesof AWConcetheyreturn back to their home. This is an important step to prevent re‑slipping of child towards red category. Supplementary feeding as a long run solution to country’s under‑nutrition problem and its actual benefits should be studied in detail with alternative innovative solutions.
ACKNOWLEDGMENTSThestudywasfundedbyHealthandFamilyWelfare
Department; Government of Gujarat. There is no other support to be acknowledged.
REFERENCES1. The United Nations Children’s Fund (UNICEF).The state
of the world’s children 2003. New York: UNICEF; 2002. p. 123.
2. Gragnolati M, Shekar M, Das Gupta M, Bredenkamp C, Lee Y. India’s undernourished children: A call for reform and action. Washington DC: The World Bank; 2005.p. 93.
3. International Institute for Population Sciences (IIPS) and Macro International. National Family Health Survey (NFHS‑3), 2005‑06: India: Vol 1. Mumbai: IIPS; 2007. p. 48.
4. Central Statistical Organization. Millennium Development Goals: India Country Report 2011. New Delhi: Ministry of Statistics and Programme Implementation, Government of India; 2011. p. 57.
5. Kapil U. Integrated Child Development Services (ICDS) scheme: A program for holistic development of children in India. Indian J Pediatr 2002;69:597-601.
6. Kapil U, Tandon M, Pathak P, Nayar D. Nutrient intake and consumption of supplementary nutrition by severely malnourished children in two ICDS projects in Rajasthan state. Indian Pediatr 1999;36:799-802.
7. Wcd.nic.in. New Delhi: Ministry of Women and Child Development, Government of India; [Cited 2013 April 1]. Available from: http://www.wcd.nic.in/icds.htm
8. Vaijayanti K.Analyzing the ICDS Anganwadi Centres in Bengaluru. Bengaluru: R and E Akshara Foundation; 2010. p. 12.
9. Park K. Park’s Textbook of Preventive and Social Medicine. 20th ed. Jabalpur: M/s Banarasidas Bhanot Publishers; 2009. p. 509.
10. Abtahi M, Doustmohammadian A, Abbdollahi M. Construction of national standards of weight and height and growth charts of Iranian children: A review article. Int J Prev Med 2011;2:122-6.
11. National Rural Health Mission, Department of Health & Family Welfare, Govt. of. Gujarat. Guidelines for Management of Severe Acute Malnutrition children at Nutrition Rehabilitation Center. Gandhinagar: Department of Health & Family Welfare, Govt. of Gujarat; 2012. p. 68.
12. Maiti S, Ghosh D, Paul S. Determinants of Nutritional Status among Tribal Adolescent in Girls Paschim Medinipur District of West Bengal. Int J Prev Med 2012;3:298‑9.
13. Ghosh S. Integrated Child Development Services Programme – Need for reappraisal. Indian Pediatr 1997;34:911-8.
14. Improving child nutrition outcomes in India: Can the ICDS programme be more effective? World Bank Policy Research Working Paper 3647. Washington DC: Development research group, The World Bank; c2005. Available from: http://www.papers.ssrn.com/sol3/papers.cfm?abstract_id=757406. [Cited 2012 Nov 3].
15. Bhasin SK, Bhatia V, Kumar P, Aggarwal OP. Long‑term nutritional effects of ICDS. Indian J Pediatr 2001;68:211-6.
16. Trivedi S, Chhaparwal BC, Thora S. Utilization of ICDS scheme in children one to six years of age in a rural block of central India. Indian Pediatr 1995;32:47-50.
17. Prinja S, Verma R, Lal S. Role of ICDS program in delivery of nutritional services and functional integration between anganwadi and health worker in north India. Internet J Nutr Wellness [Internet]. 2008;5(2):[about 5 p.]. Available from: http://archive.ispub.com/journal/the-internet-journal-of-nutrition-and-wellness/volume-5-number-2/role‑of‑icds‑program‑in‑delivery‑of‑nutritional‑services‑and‑functional‑integration‑between‑anganwadi‑and‑health-worker-in-north-india.html#sthash.Kk6zChvY.dpbs. [Last cited on 2013 Apr 01].
18. Kumar A, Kamath V, Kamath A, Rao C, Pattanshetty S, Sagir A. Nutritional status assessment of under‑five beneficiaries of Integrated Child Development Services program in rural Karnataka. Australas Med J 2010;3:495-8.
Desai, et al.: Follow‑up assessment of under‑nourished children
International Journal of Preventive Medicine, Vol 5, No 6, June, 2014766
19. Bhalani KD, Kotecha PV. Nutritional status and gender differences in the children of less than 5 years of age attending ICDS Anganwadis in Vadodra city. Indian J Community Med 2002;27:124-9.
20. Park K. Park’s Textbook of Preventive & Social Medicine. 20th ed. Jabalpur: M/s Banarasidas Bhanot Publishers; 2009. p. 467.
21. Abbi R, Christian P, Gujral S, Gopladas T. Mother’s nutrition knowledge and child nutritional status in India. Food Nutr Bull 1988;10:51-4. Available from: http://www.greenstone.org/greenstone3/nzdl?a=d&book=off
&c=ccgi&d=HASH84818ab68703c2c7d5e85d.2.9&dt=hierarchy&sib=1&p.a=q&p.sa=&p.s=TextQuery. [Cited 2012 Nov 3].
22. Siziya S, Matchaba-Hove RB. Comparison of arm circumference against standard anthropometric indices using data from a high density town near Harare, Zimbabwe. Cent Afr J Med 1994;40:250-4.
Source of Support: The Health and Family Welfare Department, Govt. of Gujarat for support, Conflict of Interest: None declared.
New features on the journal’s website
Optimized content for mobile and hand-held devices
HTML pages have been optimized of mobile and other hand-held devices (such as iPad, Kindle, iPod) for faster browsing speed.Click on [Mobile Full text] from Table of Contents page.This is simple HTML version for faster download on mobiles (if viewed on desktop, it will be automatically redirected to full HTML version)
E-Pub for hand-held devices
EPUB is an open e-book standard recommended by The International Digital Publishing Forum which is designed for reflowable content i.e. the text display can be optimized for a particular display device.Click on [EPub] from Table of Contents page.There are various e-Pub readers such as for Windows: Digital Editions, OS X: Calibre/Bookworm, iPhone/iPod Touch/iPad: Stanza, and Linux: Calibre/Bookworm.
E-Book for desktop
One can also see the entire issue as printed here in a ‘flip book’ version on desktops.Links are available from Current Issue as well as Archives pages. Click on View as eBook