FoCuS BAlAnCe SCAle - CapitaLand Limited ...
256
ANNUAL REPORT 2012 FOCUS BALANCE SCALE POSITIONED FOR GROWTH
-
Upload
khangminh22 -
Category
Documents
-
view
3 -
download
0
Transcript of FoCuS BAlAnCe SCAle - CapitaLand Limited ...
AnnuAl RepoRt
2012
FoCuS BAlAnCe
SCAlePOSITIONED FOR GROWTH

ContentsCorporate Profile 2Financial Highlights FY2012 35-Year Financial Summary 4
Share Price Performance 5
Management Reports
Letter to Shareholders 10Year In Brief 21Awards & Accolades 28Corporate Directory 32Financial Calendar 33Board of Directors 34Executive Management Council 42Corporate Office 50
Corporate Governance
Corporate Governance Report 52Risk Assessment and Management 75Stakeholder Communication 78
portfolio Details
Residential 116Commercial 120Shopping Malls 122Serviced Residences 128
Mixed Developments 134
Appendix
Statutory Accounts 136Economic Value Added Statements 242Value Added Statements 243Supplemental Information 244Shareholding Statistics 246Notice of Annual General Meeting 247Proxy Form 251
Sustainability
Environment, Health and Safety 82People 84Community 86
Business Review
Global Presence 88Performance Overview 90Group Businesses 102CapitaLand Singapore 104CapitaLand China 106CapitaMalls Asia 108Ascott 110Financial Products & Services and Regional Investments 112
ContentsCorporate Profile 2Financial Highlights FY2012 35-Year Financial Summary 4
Share Price Performance 5
Management Reports
Letter to Shareholders 10Year In Brief 21Awards & Accolades 28Corporate Directory 32Financial Calendar 33Board of Directors 34Executive Management Council 42Corporate Office 50
Corporate Governance
Corporate Governance Report 52Risk Assessment and Management 75Stakeholder Communication 78
Portfolio Details
Residential 116Commercial 120Shopping Malls 122Serviced Residences 128
Mixed Developments 134
Appendix
Statutory Accounts 136Economic Value Added Statements 242Value Added Statements 243Supplemental Information 244Shareholding Statistics 246Notice of Annual General Meeting 247Proxy Form 251
Sustainability
Environment, Health and Safety 82People 84Community 86
Business Review
Global Presence 88Performance Overview 90Group Businesses 102CapitaLand Singapore 104CapitaLand China 106CapitaMalls Asia 108Ascott 110Financial Products & Services and Regional Investments 112

2
Corporate profile
Capitaland is one of asia’s largest real estate companies. Headquartered and listed in Singapore, the company’s businesses in real estate and real estate fund management are focused on its core markets of Singapore and China.
the company’s diversified real estate portfolio primarily includes homes, offices, shopping malls, serviced residences and mixed developments. the company also has one of the largest real estate fund management businesses with assets located in asia. Capitaland leverages its significant asset base, real estate domain knowledge, product design and development capabilities, active capital management strategies and extensive market network to develop real estate products and services in its markets.
the listed entities of the Capitaland Group include australand, CapitaMalls asia, ascott residence trust, CapitaCommercial trust, CapitaMall trust, CapitaMalls Malaysia trust, Capitaretail China trust and Quill Capita trust.
To build a world-class company, with an international presence and a strong global network, that is managed by people whose core values are respected by the business and social community to:• Createsustainableshareholdervalue• Deliverqualityproductsandservices• Attractanddevelopqualityhumancapital
MiSSion & ViSion
• Ourpeopleareourstrength.Webuildpeopletobuildforpeople.• Wearecommittedtothehigheststandardsofintegrity.• Wehavethecouragetodowhatisrightandthewilltosucceed.• Weaddvaluetowhatwedothroughinnovationandcontinuousimprovement.• Wearefairandreasonableinallouractionsanddealingswithbusinesspartners,customersandcolleagues.
• Wecontributetothewell-beingofthecommunity.
CoRe VAlueS
3
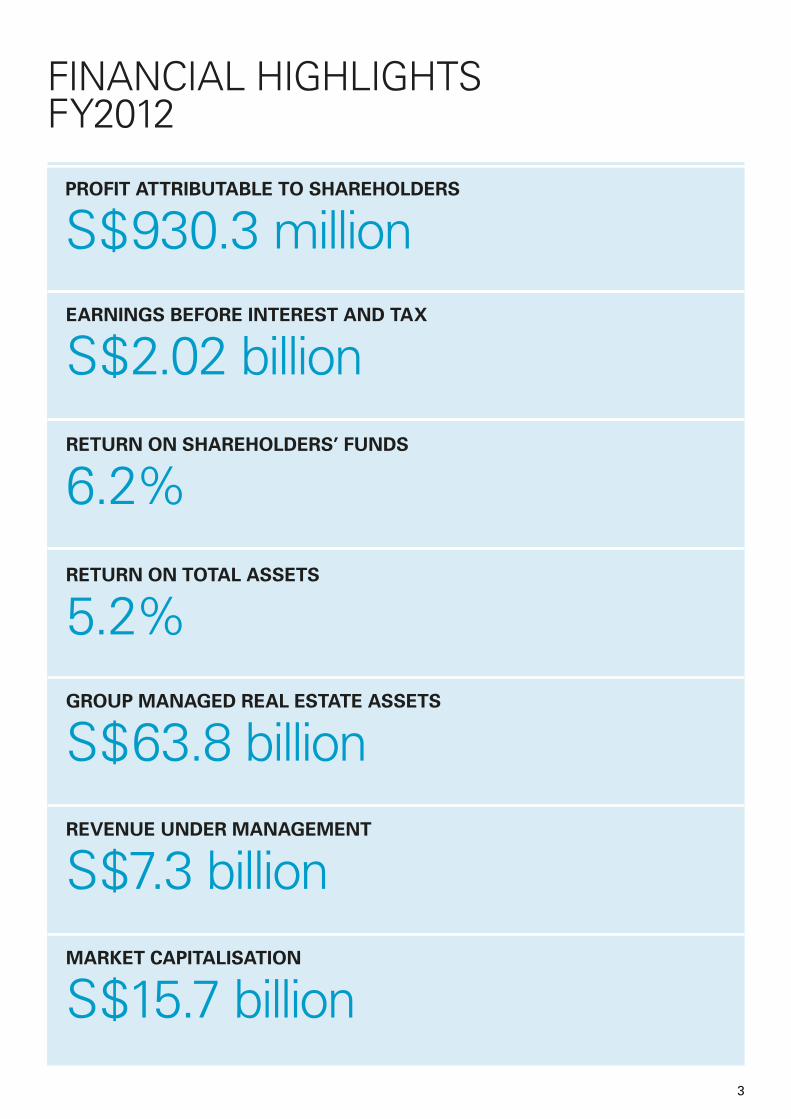
finanCial HiGHliGHtSfY2012
PRofiT ATTRiBuTABle To ShAReholDeRS
S$930.3 millioneARninGS BefoRe inTeReST AnD TAx
S$2.02 billionReTuRn on ShAReholDeRS’ funDS
6.2%
GRouP MAnAGeD ReAl eSTATe ASSeTS
S$63.8 billion
ReTuRn on ToTAl ASSeTS
5.2%
ReVenue unDeR MAnAGeMenT
S$7.3 billionMARkeT CAPiTAliSATion
S$15.7 billion

4
5-Year finanCial SuMMarY 2008 2009 2010 2011 2012 (Restated)
(A) inCoMe STATeMenT (S$ million) Revenue by SBUs Capitaland residential Singapore 400.2 673.8 1,284.9 774.1 854.3 Capitaland China Holdings 330.3 647.0 327.2 526.6 404.1 Capitaland Commercial (1) 227.9 144.9 142.9 96.7 86.5 the ascott limited 441.8 393.7 407.4 377.5 381.7 CapitaValue Homes (1) – – 0.1 80.3 3.9 Capitaland financial 182.2 162.2 116.2 103.3 114.1 CapitaMalls asia 206.7 228.9 245.4 246.2 353.7 australand 984.3 732.5 879.8 836.4 1,131.7 others (21.1) (25.6) (20.5) (21.5) (28.6) Total 2,752.3 2,957.4 3,383.4 3,019.6 3,301.4 Earnings Before Interest and Tax (EBIT) by SBUs Capitaland residential Singapore 175.0 371.7 514.0 327.4 328.2 Capitaland China Holdings 883.4 551.2 648.9 423.7 322.8 Capitaland Commercial (1) 395.6 (497.4) 250.2 189.6 174.2 the ascott limited 132.2 31.4 173.0 148.4 163.2 CapitaValue Homes (1) – – (20.5) (12.9) (80.9) Capitaland financial 90.4 98.0 103.0 80.0 67.8 CapitaMalls asia 298.6 449.1 603.4 597.0 676.2 australand 169.6 (240.8) 311.9 324.2 357.3 others 68.7 785.8 0.6 9.2 8.6 Total 2,213.5 1,549.0 2,584.5 2,086.6 2,017.4 Net Profit attributable to Shareholders 1,260.1 1,053.0 1,425.7 1,057.3 930.3 (B) BAlAnCe SheeT (S$ million) investment properties 4,848.9 5,058.5 4,732.9 7,074.6 7,969.4 Development properties for Sale and Stock 3,347.2 3,590.2 5,667.1 6,905.1 7,510.1 associates and Joint Ventures 7,864.6 8,684.2 10,048.8 10,685.0 12,511.3 Cash and Cash equivalents 4,228.4 8,729.7 7,190.1 6,264.5 5,497.7 other assets 4,794.5 4,103.4 4,248.2 4,390.3 4,299.1 Total Assets 25,083.6 30,166.0 31,887.1 35,319.5 37,787.6 equity attributable to owners of the Company 10,681.7 13,408.3 14,031.9 14,901.6 15,080.4 total Borrowings 9,829.3 10,312.6 10,358.0 12,190.6 14,179.8 non-controlling interests and other liabilities 4,572.6 6,445.1 7,497.2 8,227.3 8,527.4 Total Equities & Liabilities 25,083.6 30,166.0 31,887.1 35,319.5 37,787.6 (C) finAnCiAl RATioS Earnings per share (cents) 37.0 26.2 33.5 24.8 21.9
Net Tangible Assets per share (S$) 3.57 3.03 3.18 3.40 3.44
Return on Shareholders’ Funds (%) 12.2 8.7 10.5 7.3 6.2
Return on Total Assets (%) 7.9 5.5 7.7 5.9 5.2 Dividend ordinary dividend per share (cents) 5.5 5.5 6.0 6.0 7.0 Special dividend per share (cents) 1.5 5.0 – 2.0 – total dividend per share (cents) 7.0 10.5 6.0 8.0 7.0 Dividend cover (times) 4.2 2.4 5.6 3.1 3.1 Debt Equity Ratio (net of cash) (times) 0.47 0.09 0.18 0.31 0.45 Interest Cover (times) 5.50 4.54 7.63 5.72 5.50 Note: For changes in accounting policies, adoption of new and/or revised accounting standards, as well as changes in the presentation of
financial statements for the respective financial year under review, only the comparative figures for the previous year were restated to conform with the requirements arising from the said changes or adoption.
(1) With effect from 1 January 2011, the residential business in Vietnam is reported under CapitaValue Homes and no longer under CapitaLand Commercial.
5
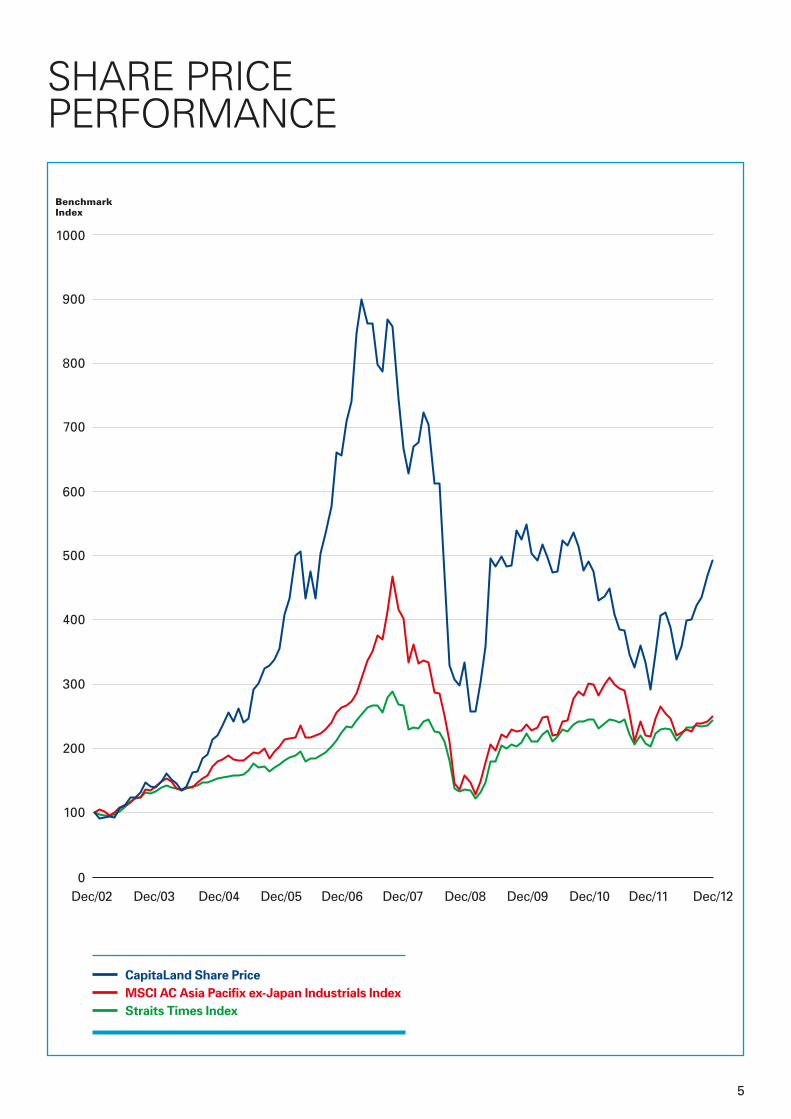
Capitaland Share PriceMSCi AC Asia Pacifix ex-Japan industrials indexStraits Times index
SHare priCe perforManCe
1000
900
800
700
600
500
400
300
200
100
0
BenchmarkIndex
Dec/02 Dec/04 Dec/08Dec/06 Dec/10Dec/03 Dec/05 Dec/09Dec/07 Dec/11 Dec/12

1 SkY hABiTAT
2 ASCoTT RAffleS PlACe SinGAPoRe
3 The STAR ViSTA
4 BeDok MAll & BeDok ReSiDenCeS
5 CAPiTAGReen
2 31
4
5
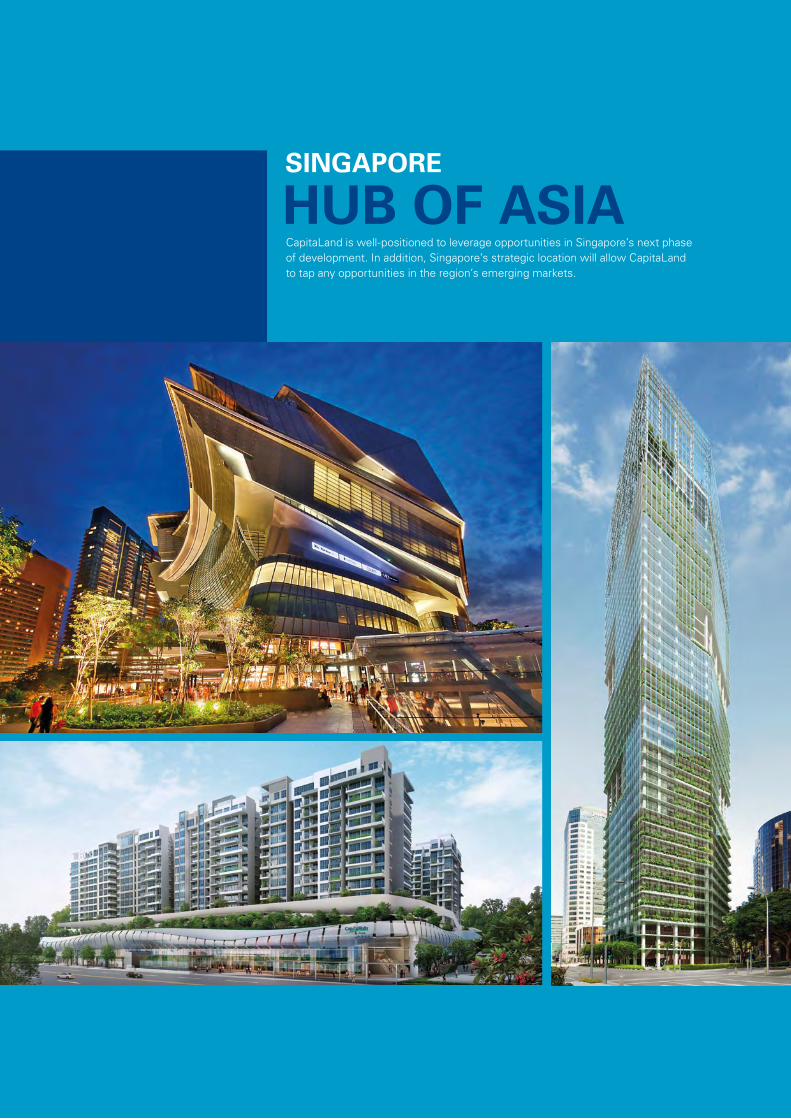
SinGAPoRe
huB of ASiACapitaland is well-positioned to leverage opportunities in Singapore’s next phase of development. in addition, Singapore’s strategic location will allow Capitaland to tap any opportunities in the region’s emerging markets.

8
ChinA
enGine of GROWTHthe fundamentals of urbanisation, economic growth, aspirations of the growingmiddle-class and improving infrastructure will underpin the housing industry in China. We want to continue to be a part of China’s urbanisation and growth story.
9
1 32
4 5
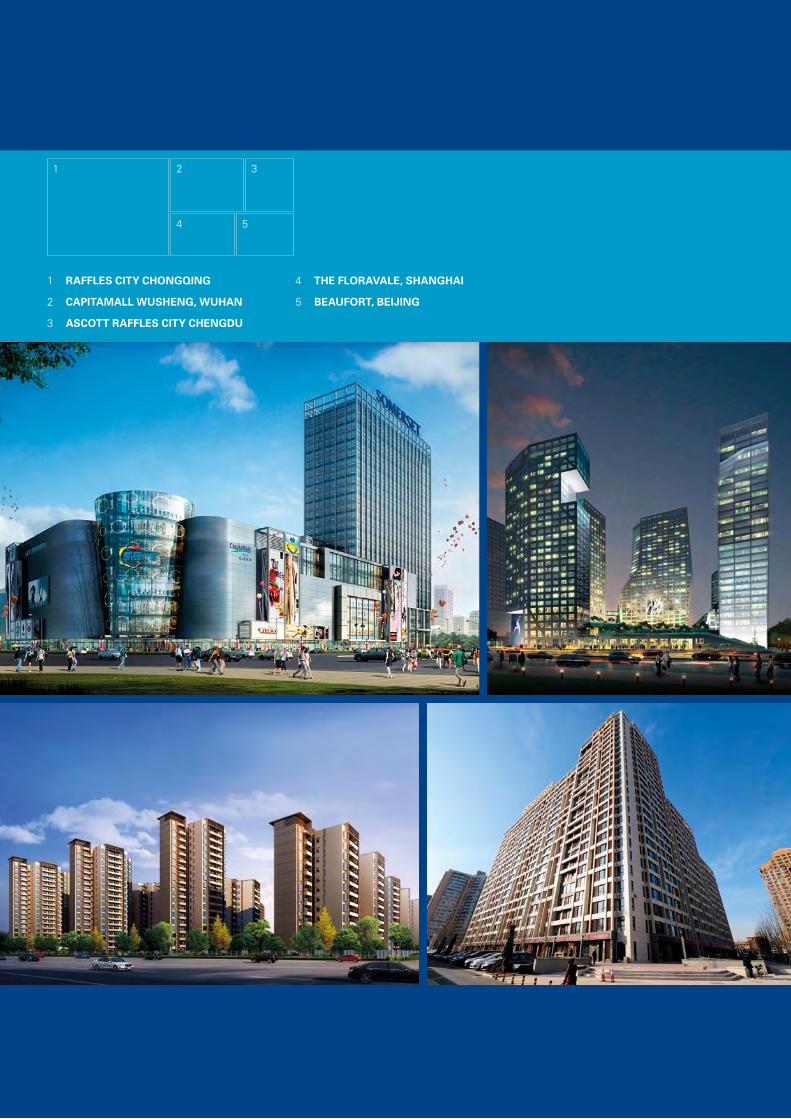
1 RAffleS CiTY ChonGqinG
2 CApiTAmAllWusHenG,WuHAn
3 ASCoTT RAffleS CiTY ChenGDu
4 The floRAVAle, ShAnGhAi
5 BeAufoRT, BeiJinG

10
Management Reportsletter to SHareHolDerS
letter to SHareHolDerS
liM MinG YAnPReSiDenT & GRouP Ceo
nG kee ChoeChAiRMAn

11
Between 2010 and 2012, it committed approximately s$21.0billionofnewinvestments, positioning the Group well to ride the growth in Asia
As at end 2012, Capitaland’s businesses in Singapore accountedfors$11.3billionor33%oftheGroup’s total assets (excluding treasury cash)
S$21.0b new investments
S$11.3b assets in Singapore
DeAR ShAReholDeRS,
Capitaland registered a commendable set of financial results for the year ended 31 December 2012, posting net profit after tax and minority interests of S$930.3 million and revenue of S$3.3 billion, amidst global economic uncertainties.
in 2012, the Group delivered better than expected residential sales in Singapore and China, and opened two new shopping malls in Singapore and seven in China. During the year, Capitaland continued to invest in new projects amounting to S$4.06 billion. Between 2010 and 2012, it committed approximately S$21.0 billion of new investments, positioning the Group well to ride the growth in asia. about 90% of these investments are focused in Singapore and China. Despite a high level of investment activities, the Group maintains a robust balance sheet through its capital recycling model and prudent capital management.
to position for the future, Capitaland simplified its organisational structure in 2013 into four main businesses – Capitaland Singapore, Capitaland China, CapitaMalls asia limited (CMa) and the ascott limited (ascott). By consolidating its key residential, office and mixed development businesses into two integrated country-centric structures – Capitaland Singapore and Capitaland China, the Group will be better able to drive its growth in these two core markets. Shopping mall and serviced residence businesses in all markets including Singapore and China continue to be spearheaded by CMa and ascott respectively. this will allow CMa and ascott to deepen their product expertise and maximise the international network effect inherent in both businesses. the Group has also streamlined its Chinese name to “凯德集团” (Kai Dé Jí tuán) since the beginning of 2013. this allows the Group to better leverage its brand recognition in both China and Singapore.
STRATeGiC foCuS on SinGAPoRe AnD ChinACapitaland is confident of the long-term prospects of the real estate markets in Singapore and China, two markets that are underpinned by strong economic fundamentals, growing population, rising disposable income and improving consumption patterns. in both markets, Capitaland has built up strong capabilities spanning the full real estate value chain from land acquisition, development, operation to capital management. the Group has a strong track record and enjoys a high level of brand recognition.
as at end 2012, Capitaland’s businesses in Singapore accounted for S$11.3 billion or 33% of the Group’s total assets (excluding treasury cash). this diversified portfolio spans across homes (31%), offices and mixed developments (19%), shopping malls (40%), serviced residences (5%), financial services (2%) and others (3%). Singapore was Capitaland’s most profitable market in 2012, with eBit contribution of S$893.8 million, or 44% of total Group eBit.
as at end 2012, China accounted for S$13.4 billion or about 39% of the Group’s overall balance sheet in terms of assets. Capitaland’s China portfolio is diversified across the following sectors: homes (33%), shopping malls (35%), mixed developments (23%), serviced residences (6%) and others (3%). China is also Capitaland’s second most profitable geography after Singapore, with eBit contribution of S$658.4 million, or 33% of total Group eBit in 2012.
12
Management Reports
letter to SHareHolDerS
letter to SHareHolDerS
Capitaland Singapore is Capitaland’s main business unit for residential, office and mixed development businesses in Singapore
Capitaland has made its maiden direct large scale mixed development investment in Danga Bay A2 island in iskandar, Malaysia
CAPiTAlAnD SinGAPoReCapitaland Singapore is Capitaland’s main business unit for residential, office and mixed development businesses in Singapore.
in the residential sector in Singapore, market sentiments were affected by additional rounds of cooling measures introduced in october 2012 and January 2013. these measures were principally aimed to curb speculative demand. amidst these challenges, the Group launched Sky Habitat in Bishan and new phases of d’leedon and achieved total sales value of S$1.3 billion in 2012, comparable to a year ago. the number of units sold was 19% lower at 681 homes.
in 2012, Capitaland acquired two pieces of land, increasing its residential pipeline to approximately 2,800 units. the first acquisition from ascott reit is a prime mixed development site in Cairnhill, where Capitaland plans to build about 270 residential units for sale. the second site acquired from the Government is an adjoining plot to Sky Habitat in Bishan where a 700-unit condominium is planned.
for 2013, the Group plans to progressively release new phases at d’leedon and the interlace, and launch a freehold 150-unit seafront condominium project in east Coast, and its second Bishan site, subject to market conditions. the Group intends to expand its residential pipeline via selective government land tenders as the long-term prospects of the Singapore housing market remain attractive.
in the commercial sector, office outlook is cautious over the short-term due to slower economic growth prospects. the situation is, however, mitigated by limited new supply, estimated to be less than one million square feet per annum, within the Central Business District (CBD) between 2013 and 2015. the rate of market rental decline within the office sector in the CBD has eased since mid 2012 and is poised for recovery over the next 12 months. Capitaland’s income generating commercial and mixed development portfolio is held under our associate, CapitaCommercial trust (CCt). the newly acquired twenty anson contributed to CCt’s earnings from March 2012. CCt will focus on active portfolio management, capital recycling and yield accretive acquisitions in 2013. the Group is positive about CapitaGreen at Market Street and Westgate tower in Jurong east, as both projects are slated for completion in 2014 when new office supply is expected to be low.
as an extension of our Singapore business, Capitaland has made its maiden direct large scale mixed development investment in Danga Bay a2 island in iskandar, Malaysia. the Group will hold a 51% stake in the project and lead in master planning and project management of the approximately 3.1 million square feet of freehold net land. the total gross development value of the project is estimated at MYr8.1 billion (S$3.2 billion) for 11 million square feet of total gross floor area. We envisage a premier waterfront residential development comprising high rise and landed homes on the island, complemented with marina, shopping mall, f&B outlets, offices and serviced residences. Development duration is projected at between 10 to 12 years.
CAPiTAlAnD ChinACapitaland China is Capitaland’s main business unit for residential, office and mixed development businesses in China.
13
in the residential market in China, the Chinese government had implemented policies to moderate real estate prices. Homebuyers who initially adopted a ‘wait and see’ attitude returned to the market from april 2012, following two rounds of interest rates easing by the people’s Bank of China and price discounts from developers. in 2012, Capitaland sold over 3,000 units and achieved a total sales value of rMB7.0 billion (S$1.4 billion). these figures compared favourably to the 1,466 units sold with a sales value of rMB2.9 billion (S$0.6 billion) in 2011. the loft in Chengdu, Dolce Vita in Guangzhou and ipark phase 1, the residential component of raffles City Shenzhen, contributed much to the success.
revenue and earnings recognition for 2012 decreased compared to the previous year due to lower divestment gains and fewer completions handed to homebuyers. Capitaland handed over 1,995 units to homebuyers in 2012, a 40% year-on-year decline compared to 2011.
During the year, Capitaland secured a residential site in Shanghai. the Group’s development pipeline now stands at approximately 28,000 homes with a gross floor area in excess of three million square metres.
three new residential projects, namely Vermont Hills in Beijing, Summit residences in ningbo and the lakeside in Wuhan, will be launch-ready in 2013. in addition, the boutique apartments at raffles City Chengdu, together with subsequent phases from existing projects such as the loft, Dolce Vita and imperial Bay will also be planned for release. Collectively, about 4,000 housing units are scheduled for launch with an estimated value of rMB6.0 billion. Separately, Capitaland is on schedule to hand over some 3,000 residential units from Beaufort in Beijing, imperial Bay, Dolce Vita and the loft to homebuyers in 2013.
in 2012, Capitaland sold over3,000unitsandachieved a total sales valueofRmB7.0billion
rMB7.0b total Sales Value
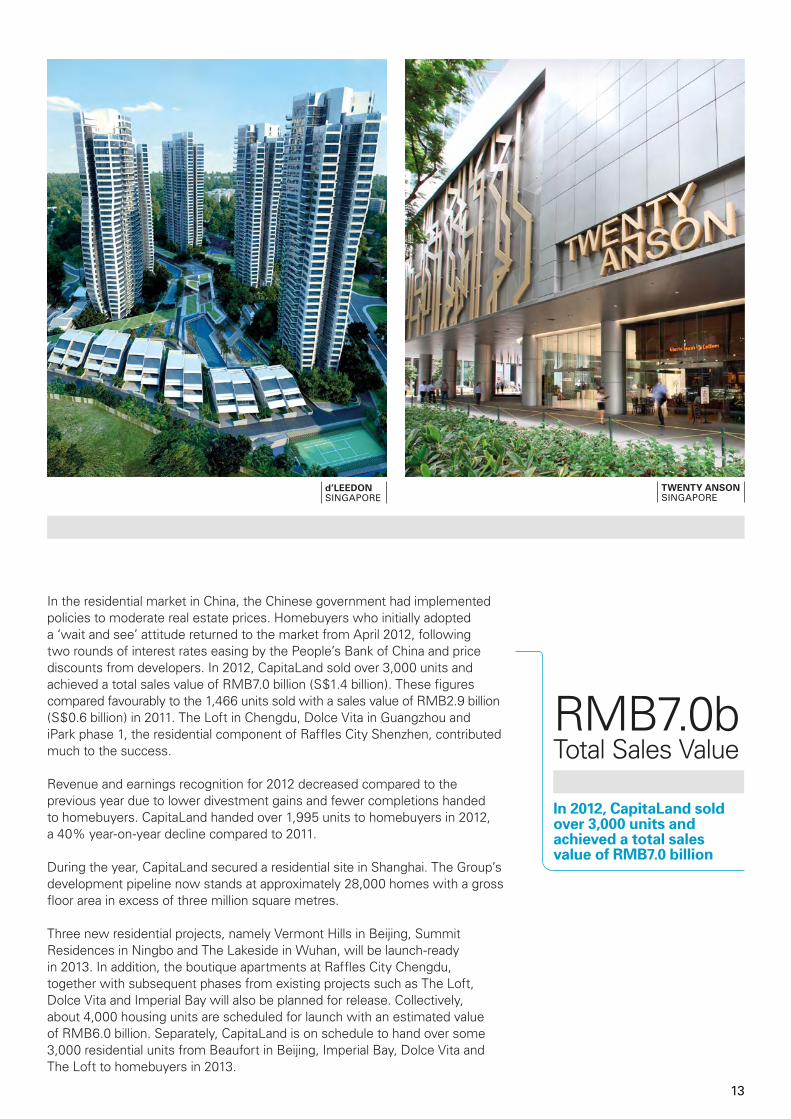
d’leeDon SINGAPORE
TWenTYAnsOnSINGAPORE
14
Management Reports
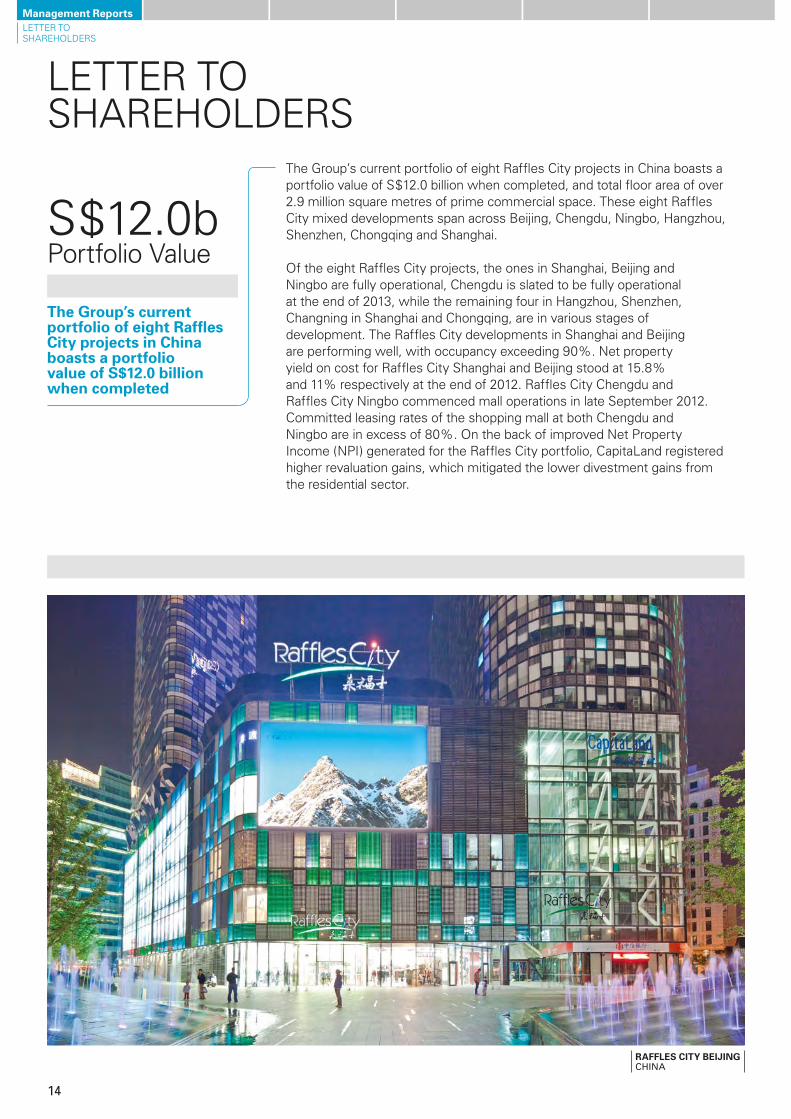
the Group’s current portfolio of eight raffles City projects in China boasts a portfolio value of S$12.0 billion when completed, and total floor area of over 2.9 million square metres of prime commercial space. these eight raffles City mixed developments span across Beijing, Chengdu, ningbo, Hangzhou, Shenzhen, Chongqing and Shanghai.
of the eight raffles City projects, the ones in Shanghai, Beijing and ningbo are fully operational, Chengdu is slated to be fully operational at the end of 2013, while the remaining four in Hangzhou, Shenzhen, Changning in Shanghai and Chongqing, are in various stages of development. the raffles City developments in Shanghai and Beijing are performing well, with occupancy exceeding 90%. net property yield on cost for raffles City Shanghai and Beijing stood at 15.8% and 11% respectively at the end of 2012. raffles City Chengdu and raffles City ningbo commenced mall operations in late September 2012. Committed leasing rates of the shopping mall at both Chengdu and ningbo are in excess of 80%. on the back of improved net property income (npi) generated for the raffles City portfolio, Capitaland registered higher revaluation gains, which mitigated the lower divestment gains from the residential sector.
letter to SHareHolDerS
letter to SHareHolDerS
S$12.0b portfolio Value
The Group’s current portfolio of eight Raffles City projects in China boasts a portfolio valueofs$12.0billion when completed
RAffleS CiTY BeiJinG CHINA
15
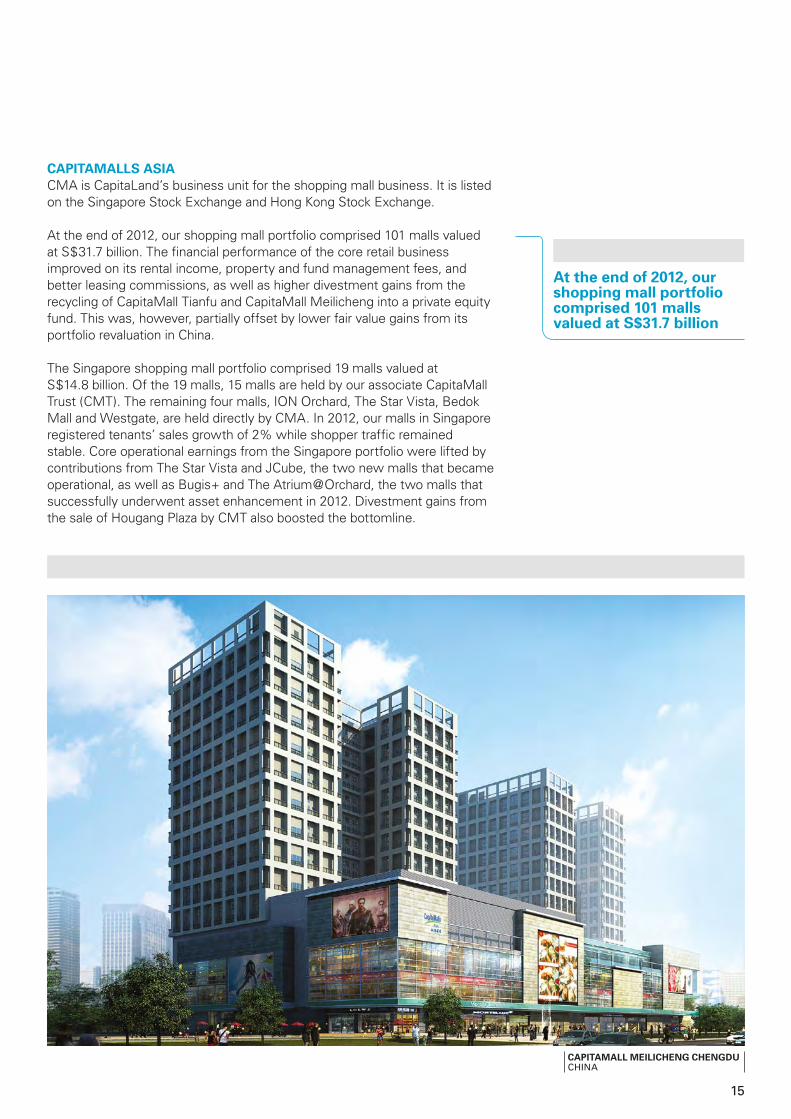
CAPiTAMAllS ASiACMa is Capitaland’s business unit for the shopping mall business. it is listed on the Singapore Stock exchange and Hong Kong Stock exchange.
at the end of 2012, our shopping mall portfolio comprised 101 malls valued at S$31.7 billion. the financial performance of the core retail business improved on its rental income, property and fund management fees, and better leasing commissions, as well as higher divestment gains from the recycling of CapitaMall tianfu and CapitaMall Meilicheng into a private equity fund. this was, however, partially offset by lower fair value gains from its portfolio revaluation in China.
the Singapore shopping mall portfolio comprised 19 malls valued at S$14.8 billion. of the 19 malls, 15 malls are held by our associate CapitaMall trust (CMt). the remaining four malls, ion orchard, the Star Vista, Bedok Mall and Westgate, are held directly by CMa. in 2012, our malls in Singapore registered tenants’ sales growth of 2% while shopper traffic remained stable. Core operational earnings from the Singapore portfolio were lifted by contributions from the Star Vista and JCube, the two new malls that became operational, as well as Bugis+ and the atrium@orchard, the two malls that successfully underwent asset enhancement in 2012. Divestment gains from the sale of Hougang plaza by CMt also boosted the bottomline.
At the end of 2012, our shopping mall portfolio comprised 101 malls valuedats$31.7billion
CAPiTAMAll MeiliChenG ChenGDu CHINA
16
Management Reports
in China, CMa opened seven new malls in 2012, lifting its total number of operational malls to 49 out of its total portfolio of 60. this China shopping mall portfolio is valued at S$14.0 billion. in terms of net asset value, 70% of CMa’s retail portfolio has turned operational and is generating rental cash flow. the Group’s shopping malls in China performed well in 2012, with tenants’ sales and shopper traffic at CMa’s shopping malls experiencing growth of 9.8% and 7% respectively, compared to 13.2% and 7.5% recorded for 2011. npi grew 16.9% and the average occupancy rate of the shopping malls with at least two years’ operating history was 96.7%. in 2012, CMa’s malls generated gross yield on cost and npi yield on cost of 12.6% and 7.3% respectively, up from 11.8% and 6.8% in 2011.
in Malaysia, CMa’s portfolio comprised five operational malls and one under development, valued at S$1.5 billion. of the operational malls, four are held via our listed associate, CapitaMalls Malaysia trust (CMMt), while Queensbay Mall in penang is held by CMa. CMa also participated in its first retail joint development project in Klang Valley, Malaysia with Sime Darby. the S$204.5 million (MYr500.0 million) project is expected to offer some 635,000 square feet of retail space when completed in 2016. the Group’s Malaysian shopping malls business was lifted by full year contribution from east Coast Mall, Kuantan and an overall 7.8% improvement in npi on a same mall basis. the Malaysian mall portfolio experienced shopper traffic growth of 1.5% and a high average occupancy rate of 96.6%.
in Japan, earnings were boosted by maiden contribution from olinas Mall in tokyo and contributions from our increased stakes in three Japanese shopping malls.
in 2013, CMa’s portfolio will benefit from the full year contributions from malls opened in 2012 including the Star Vista, JCube, Bugis+ and the atrium@orchard. the Group plans to open six malls in 2013: Westgate and Bedok Mall in Singapore; CapitaMall tianfu, CapitaMall Meilicheng and CapitaMall Jinniu phase two in China; and CapitaMall Mangalore in india.
ASCoTTascott is the largest international owner and manager of serviced residences with more than 31,000 apartment units in asia and europe.
in 2012, for its investment portfolio, ascott acquired (together with Capitaland Singapore) Somerset Grand Cairnhill for redevelopment into a new serviced residence cum residential development. it also acquired the 230-unit the Cavendish london with a view to transform it into a premier ascott branded serviced residence. at the same time, ascott sold two premier assets, ascott raffles place Singapore and ascott Guangzhou, to its associate ascott reit. ascott also invested about S$20.0 million to refurbish four properties in 2012. Separately, ascott reit acquired 60% interest in Citadines Kyoto and the 166-unit Madison Hamburg from third parties.
operationally, revenue per available unit (revpau) per day improved 3% from S$115 to S$119 across all serviced residences owned, leased and managed by ascott. the Group’s serviced residence portfolio in China, in particular, had a robust year with revpau growth of 15% year-on-year. the Group’s european serviced residence portfolio performed well, lifted by maiden contribution from
letter to SHareHolDerS
letter to SHareHolDerS
Ascott is the largest international owner and manager of serviced residences with more than31,000apartmentunits in Asia and europe
31,000 apartment units
The Group’s shopping malls in China performed well in 2012, with tenants’ sales and shopper traffic at CMA’s shopping malls experiencing growth of 9.8%and7%respectively,comparedto13.2%and7.5%recordedfor2011
17
the Cavendish Hotel, which was acquired in 2012, and a fairly resilient uK and french market. the Group’s serviced residence portfolio in Japan also showed marked improvement with revpau increase of 17% year-on-year to S$133 per available unit per day.
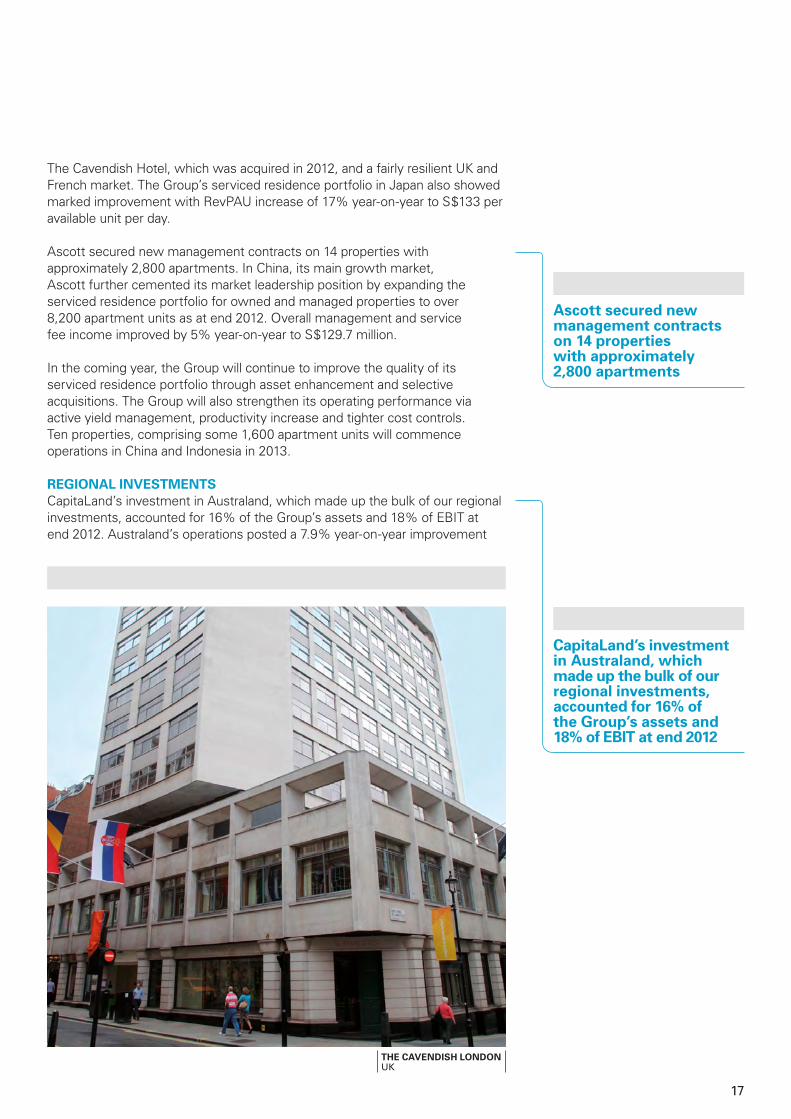
ascott secured new management contracts on 14 properties with approximately 2,800 apartments. in China, its main growth market, ascott further cemented its market leadership position by expanding the serviced residence portfolio for owned and managed properties to over 8,200 apartment units as at end 2012. overall management and service fee income improved by 5% year-on-year to S$129.7 million.
in the coming year, the Group will continue to improve the quality of its serviced residence portfolio through asset enhancement and selective acquisitions. the Group will also strengthen its operating performance via active yield management, productivity increase and tighter cost controls. ten properties, comprising some 1,600 apartment units will commence operations in China and indonesia in 2013.
ReGionAl inVeSTMenTSCapitaland’s investment in australand, which made up the bulk of our regional investments, accounted for 16% of the Group’s assets and 18% of eBit at end 2012. australand’s operations posted a 7.9% year-on-year improvement
Ascott secured new management contracts on 14 properties with approximately 2,800 apartments
The CAVenDiSh lonDon UK
Capitaland’s investment in Australand, which made up the bulk of our regional investments, accountedfor16%of the Group’s assets and 18%ofeBiTatend2012

18
Management Reports
in operating eBit, lifted by stronger results from the investment property and residential divisions. the Group is currently undertaking a strategic review of its 59.3% stake in australand with a view to optimise shareholder value.
the Group has reviewed its current direct investments in Japan and Vietnam, and will maintain its presence in both markets as this is believed to be the optimal approach to maximise value for the investments there. Capitaland will continue to review its other regional investments in uK, india, and the Gulf Cooperation Council countries outside the retail and serviced residence space, with the aim to rationalise and optimise its capital productivity in the coming year.
STRATeGiC CAPiTAl MAnAGeMenT Capitaland maintains a healthy balance sheet with a net debt equity ratio of 0.45 and a cash position of S$5.5 billion through prudent capital management and active capital recycling. less than 8.4% of the Group’s total debt is due within one year and its average debt maturity profile remains stable at 3.7 years.
the Group taps diversified funding sources including banks, capital markets and private equity capital. in September 2012, Capitaland successfully raised its first uSD bond issue with strong support from about 200 accounts.
letter to SHareHolDerS
letter to SHareHolDerS
The inAuGuRATion of CliMB CHINA
Capitaland maintains a healthy balance sheet withanetdebtequityratioof0.45andacashpositionofs$5.5billionthrough prudent capital management and active capital recycling
S$5.5b Cash position
19
the Group also successfully set up two private equity funds – the uS$1.0 billion CapitaMalls China Development fund iii, and the uS$215.0 million Capitaland China Value Housing fund in 2012.
the Group’s capital recycling model and prudent capital management will continue to provide a high level of financial flexibility for the Group to seek out accretive investments and to manage an uncertain business environment.
DeVeloPinG huMAn CAPiTAlthe Group has an integrated human capital strategy to recruit, develop, promote and motivate employees. Based on our philosophy of “Building people”, Capitaland actively identifies talents internally and externally to build its pipeline for succession planning and bench strength. Capitaland continues to provide training and development opportunities through programmes conducted by Capitaland institute of Management and Business (CliMB) and ascott Centre for excellence. for senior management who show potential to take up higher office, Capitaland offers opportunities for management courses to be pursued at Harvard, Stanford, tsinghua and Beijing university. a strong pool of management talents, well-trained, tested and equipped, has been groomed and developed to steer the Group to greater heights.
CoRPoRATe SoCiAl ReSPonSiBiliTY Capitaland has always been committed to being responsible in the communities it operates within. our corporate social responsibility efforts are in the areas of corporate philanthropy, volunteerism, community and the environment. every year, Capitaland allocates up to 0.5% of its net profit to Capitaland Hope foundation, the philanthropic arm of Capitaland, to support programmes for shelter, education and healthcare needs of underprivileged children in the communities where Capitaland operates.
We strive to be an environmentally-sustainable real estate developer and aim to be at the forefront of the industry in terms of green buildings and stakeholder engagement. in 2012, we obtained 20 green building ratings with five projects clinching the prestigious Green Mark platinum award given by Singapore’s Building and Construction authority. We also engage our tenants, shoppers, residents, service-providers and the wider community through our Building a Greener future programme.
BoARD We welcomed tan Sri amirsham Bin a aziz and Mr Stephen lee who bring with them extensive corporate and business expertise to the Board. We look forward to their counsel and contributions in the years ahead.
our corporate social responsibility efforts are in the areas of corporate philanthropy, volunteerism, community and the environment
Capitaland actively identifies talents internally and externally to build its pipeline for succession planning and bench strength
The Group also successfully setuptwoprivateequityfunds–theus$1.0billionCapitaMalls China Development fund iii, andtheus$215.0millionCapitaland China Value housing fund in 2012
20
Management Reports
Mr liew Mun leong who stepped down as president and Chief executive officer of Capitaland limited on 1 January 2013 and was succeeded by Mr lim Ming Yan, will not be seeking re-election as Director at the forthcoming annual General Meeting. Mr liew has led the Group with distinction in the last 12 years, growing it from strength to strength and steering it to chart new frontiers in the real estate industry. on behalf of the Board and staff, we extend to Mr liew our deep appreciation for all his contributions to the Group and wish him well in his future endeavours.
GOinGFORWARDlooking into 2013, we expect asia to lead world economic growth, with Singapore and China playing key roles in the region. Singapore is forecasted to post GDp growth of between 1% and 3%, while China’s growth is projected to be about 7.5%.
Capitaland will continue to build on its leadership position in the multi-sector real estate businesses to drive its growth strategy. With our strong balance sheet and financial capacity, we remain confident to weather market volatility and are ready for selective acquisitions.
Despite possible economic headwinds, we are confident that the Group, led by strong management and armed with a robust balance sheet, will be able to continue growing its businesses into the future.
on behalf of the Board and management, we wish to thank all staff, shareholders, business partners and associates for their continued commitment and support for the Group.
nG kee Choe liM MinG YAnChAiRMAn PReSiDenT & GRouP Ceo
28February2013
letter to SHareHolDerS
letter to SHareHolDerS / Year in Brief
Capitaland will continue to build on its leadership position in the multi-sector real estate businesses to drive its growth strategy
21
Year in Brief
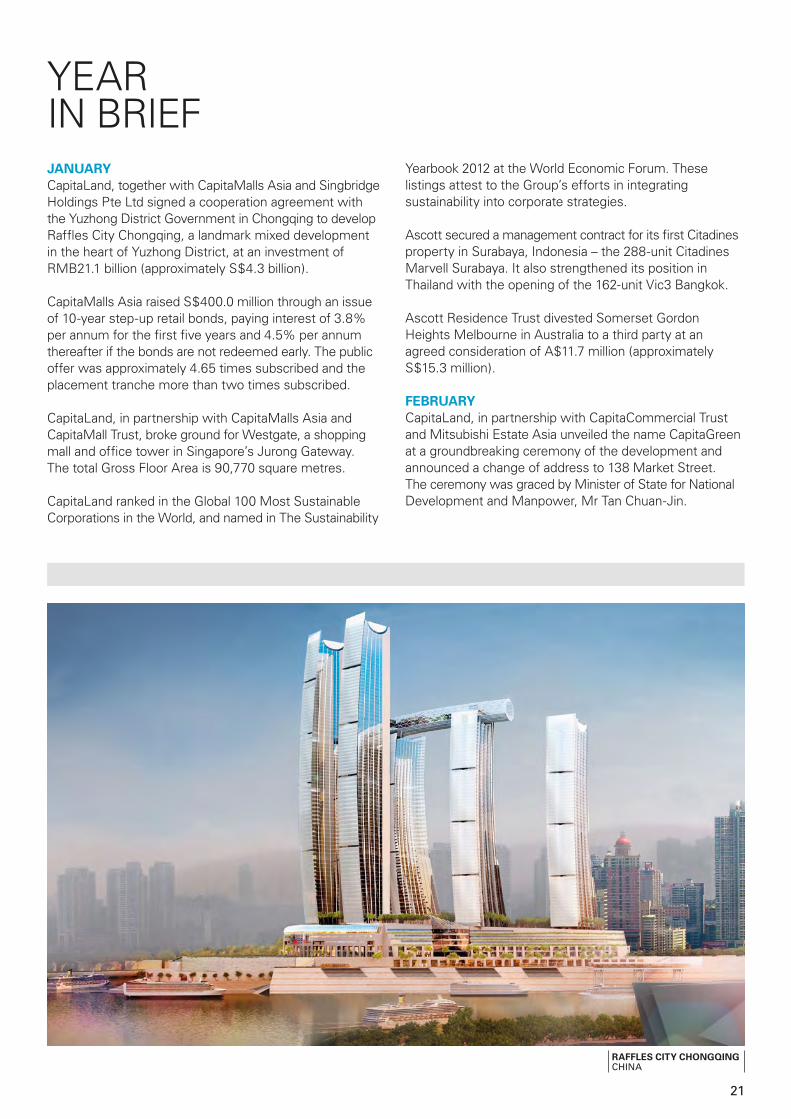
RAffleS CiTY ChonGqinGCHINA
JAnuARYCapitaland, together with CapitaMalls asia and Singbridge Holdings pte ltd signed a cooperation agreement with the Yuzhong District Government in Chongqing to develop raffles City Chongqing, a landmark mixed development in the heart of Yuzhong District, at an investment of rMB21.1 billion (approximately S$4.3 billion).
CapitaMalls asia raised S$400.0 million through an issue of 10-year step-up retail bonds, paying interest of 3.8% per annum for the first five years and 4.5% per annum thereafter if the bonds are not redeemed early. the public offer was approximately 4.65 times subscribed and the placement tranche more than two times subscribed.
Capitaland, in partnership with CapitaMalls asia and CapitaMall trust, broke ground for Westgate, a shopping mall and office tower in Singapore’s Jurong Gateway. the total Gross floor area is 90,770 square metres.
Capitaland ranked in the Global 100 Most Sustainable Corporations in the World, and named in the Sustainability
Yearbook 2012 at the World economic forum. these listings attest to the Group’s efforts in integrating sustainability into corporate strategies.
ascott secured a management contract for its first Citadines property in Surabaya, indonesia – the 288-unit Citadines Marvell Surabaya. it also strengthened its position in thailand with the opening of the 162-unit Vic3 Bangkok.
ascott residence trust divested Somerset Gordon Heights Melbourne in australia to a third party at an agreed consideration of a$11.7 million (approximately S$15.3 million).
feBRuARYCapitaland, in partnership with CapitaCommercial trust and Mitsubishi estate asia unveiled the name CapitaGreen at a groundbreaking ceremony of the development and announced a change of address to 138 Market Street. the ceremony was graced by Minister of State for national Development and Manpower, Mr tan Chuan-Jin.
22
Management Reports
Year in BriefCapitaland launched the year-long Because iCare campaign. the campaign reinforced Capitaland’s ‘Building people’ credo and rallied Group-wide effort to engage and care for its stakeholders including homebuyers, shoppers, retail and office tenants, serviced residence guests, investors, partners, employees and the community-at-large.
CapitaMalls asia acquired the remaining 73.71% stakes each in three malls in Japan – la park Mizue in tokyo, izumiya Hirakata in osaka and Coop Kobe nishinomiya-Higashi in Hyogo for about JpY13.2 billion (on a 100% basis).
MARChCapitaCommercial trust acquired twenty anson, a two-year old prime office tower for a property price of S$430.0 million.
Capitaland organised Capitaland Debt investor Day 2012 as part of the Group’s overall initiative to reach out to debt investors in Singapore. it was attended by over 100 targeted participants.
Capitaland’s 235 properties across asia and europe participated in WWf’s earth Hour initiative. this is the fifth year that the Group is participating in the annual global sustainability movement to show commitment
Year in Brief
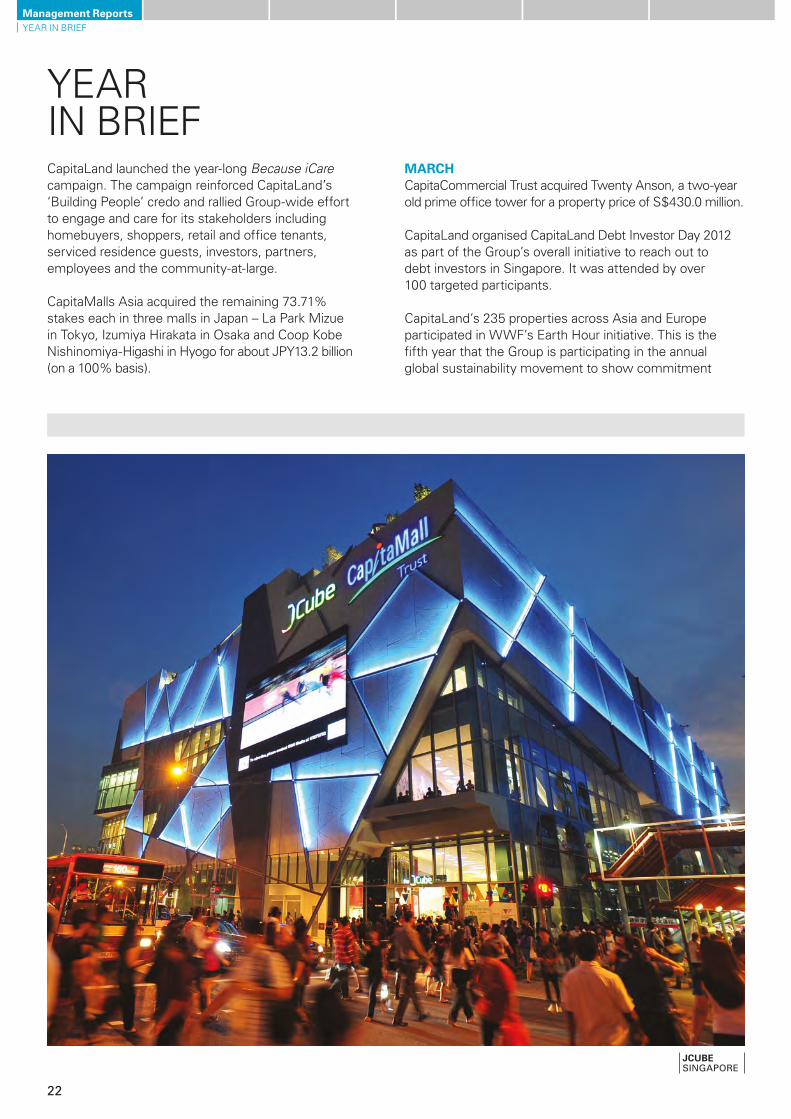
JCuBe SINGAPORE
23
towards protecting the environment since many other cities globally adopted the event in 2008.
CapitaMalls asia was included as a constituent stock of the Hang Seng Global Composite index and Hang Seng foreign Companies Composite index. the indices serve as benchmarks for global investors for the performances of all Hong Kong-listed companies and Hong Kong-listed foreign companies respectively.
ascott extended its leadership position in China as the largest international serviced residence owner-operator in the country by securing a contract to manage the 169-unit Citadines Jinshang road Xiamen, its first serviced residence in Xiamen.
ascott residence trust expanded its footprint into a new city in Japan by acquiring 60% interest in the 124-unit Citadines Karasuma-Gojo Kyoto from a third party for a total sum of JpY1.2 billion (approximately S$18.3 million).
APRilCapitaland set up the art Management unit to formalise, direct and manage art as a development strategy by integrating art into our buildings.
Capitaland successfully launched Sky Habitat, the iconic residential development located at Bishan Central and designed by internationally-renowned architect, Moshe Safdie.
CapitaMalls asia opened JCube, an ultra-hip mall with Singapore’s only olympic-size ice rink and first iMaX cinema in the suburbs.
CapitaMalls asia acquired a site for CapitaMall tiangongyuan, its ninth mall in Beijing, China. the total development cost for the mall is expected to be about rMB2,343.0 million (approximately S$469.2 million).
ascott secured a contract to manage the 290-unit Beverly park residences in Mumbai, india.
CapitaMalls asia broke ground for luwan integrated development, which comprises an eight-storey shopping mall and 29-storey office tower in Shanghai, China.
MAYMr S r nathan was appointed as Chairman of Capitaland Hope foundation Capitaland’s philanthropic arm.
CapitaMalls asia and Sime Darby property announced their plan to jointly develop a shopping mall on a freehold site in taman Melawati in the Klang Valley, Malaysia, for about rM500.0 million (approximately S$204.5 million). it is CapitaMalls asia’s first greenfield development and sixth mall in the country.
CapitaMalls asia, together with Suzhou industrial park Jinji lake urban Development Co., ltd broke ground for the largest shopping mall in east China. this integrated development in Suzhou, China will comprise a seven-storey shopping mall and two Grade a office towers on a prime site in Suzhou Centre in the heart of the western CBD of Suzhou industrial park. it will be developed at a total cost of about rMB6,740.0 million (approximately S$1,331 million).
JuneCapitaland announced Mr liew Mun leong’s retirement as president & Chief executive officer of Capitaland Group in a year’s time.
ascott divested Citadines ashley Hongkong to a third party for HK$311.0 million (approximately S$50.0 million). following the divestment, the property continued to be leased to and managed by ascott under the Citadines brand.
CapitaMalls asia established CapitaMalls China Development fund iii (CMCDf iii) with a fund size of uS$1.0 billion, its largest private equity fund to date and fourth one in China. the fund will invest in the development of shopping malls and properties predominantly used for retail purposes in China.
JulYCapitaMalls asia opened CapitaMall taiyanggong in Beijing, China.
CapitaMalls asia acquired olinas Mall in tokyo, Japan for JpY22.8 billion (approximately S$367.3 million). the mall is part of a large integrated development which is connected to a residential tower and an office tower. it has a total gross floor area of about 583,000 square feet.

24
Management Reports
CapitaMalls asia acquired site for CapitaMall Xinduxin, its first shopping mall in Qingdao, China. the total development cost is expected to be about rMB1,457.0 million (approximately S$294.9 million).
Capitaland, together with ascott, acquired Somerset Grand Cairnhill Singapore at S$359.0 million from ascott residence trust for redevelopment into a new serviced residence and a residential development. it also divested the 146-unit ascott raffles place Singapore at S$220.0 million and the 208-unit ascott Guangzhou at S$63.5 million to ascott residence trust. ascott clinched a contract to manage its third property in Chengdu, China – the 296-unit ascott raffles City Chengdu.
AuGuSTCapitaland signed a joint venture agreement with Mitsubishi Jisho residence Co., ltd. and SeCoM Home life Co., ltd for the joint development of the parkhouse nishi-azabu residence. the 190-unit residential project is located in Minato Ward, tokyo, Japan.
Capitaland announced that the Capitaland Group will relocate to Westgate tower progressively from end 2014. the Group will occupy 11 floors, a total of about 160,000 square feet of the new 20-storey prime office tower.
raffles City Shenzhen held the groundbreaking ceremony. located at the commercial hub and residential centre of
Year in Brief
RAffleS CiTY ChenGDuCHINA
Year in Brief
25
the nanshan area, and seamlessly linked to the urban park, the 308,235 square metre mixed development will upgrade the commercial status and boost local growth of the nanshan area.
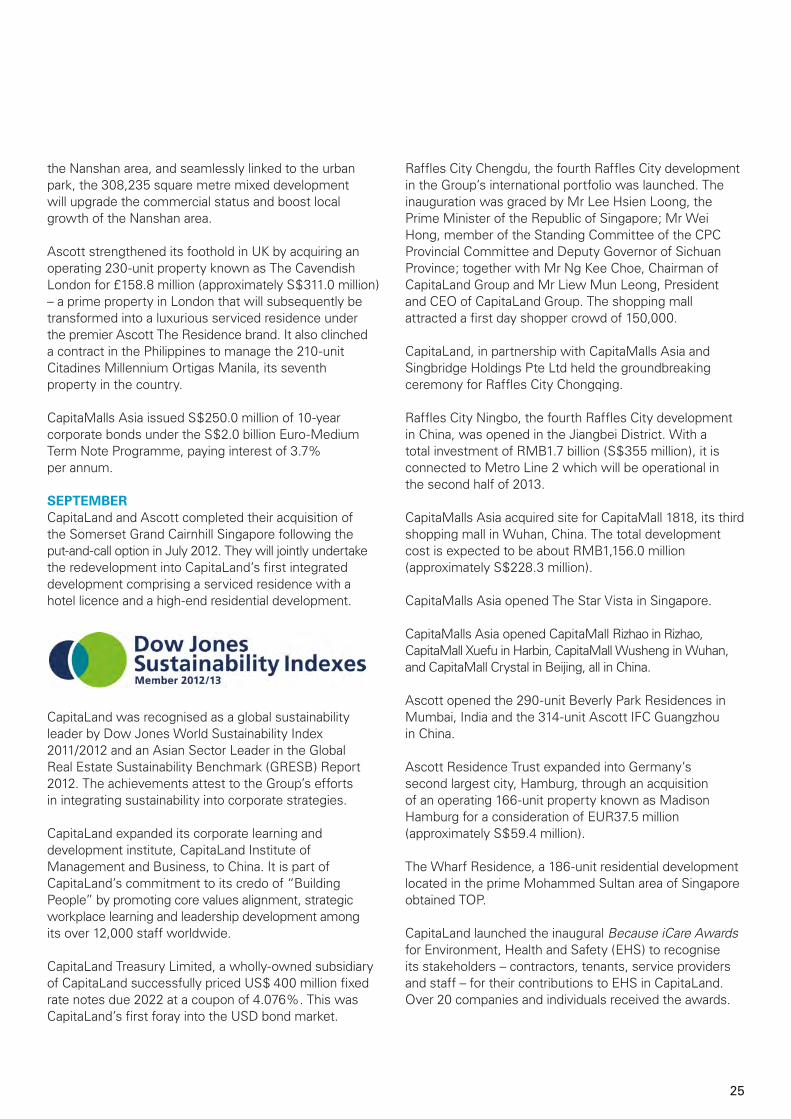
ascott strengthened its foothold in uK by acquiring an operating 230-unit property known as the Cavendish london for £158.8 million (approximately S$311.0 million) – a prime property in london that will subsequently be transformed into a luxurious serviced residence under the premier ascott the residence brand. it also clinched a contract in the philippines to manage the 210-unit Citadines Millennium ortigas Manila, its seventh property in the country.
CapitaMalls asia issued S$250.0 million of 10-year corporate bonds under the S$2.0 billion euro-Medium term note programme, paying interest of 3.7% per annum.
SePTeMBeRCapitaland and ascott completed their acquisition of the Somerset Grand Cairnhill Singapore following the put-and-call option in July 2012. they will jointly undertake the redevelopment into Capitaland’s first integrated development comprising a serviced residence with a hotel licence and a high-end residential development.
Capitaland was recognised as a global sustainability leader by Dow Jones World Sustainability index 2011/2012 and an asian Sector leader in the Global real estate Sustainability Benchmark (GreSB) report 2012. the achievements attest to the Group’s efforts in integrating sustainability into corporate strategies.
Capitaland expanded its corporate learning and development institute, Capitaland institute of Management and Business, to China. it is part of Capitaland’s commitment to its credo of “Building people” by promoting core values alignment, strategic workplace learning and leadership development among its over 12,000 staff worldwide.
Capitaland treasury limited, a wholly-owned subsidiary of Capitaland successfully priced uS$ 400 million fixed rate notes due 2022 at a coupon of 4.076%. this was Capitaland’s first foray into the uSD bond market.
raffles City Chengdu, the fourth raffles City development in the Group’s international portfolio was launched. the inauguration was graced by Mr lee Hsien loong, the prime Minister of the republic of Singapore; Mr Wei Hong, member of the Standing Committee of the CpC provincial Committee and Deputy Governor of Sichuan province; together with Mr ng Kee Choe, Chairman of Capitaland Group and Mr liew Mun leong, president and Ceo of Capitaland Group. the shopping mall attracted a first day shopper crowd of 150,000.
Capitaland, in partnership with CapitaMalls asia and Singbridge Holdings pte ltd held the groundbreaking ceremony for raffles City Chongqing.
raffles City ningbo, the fourth raffles City development in China, was opened in the Jiangbei District. With a total investment of rMB1.7 billion (S$355 million), it is connected to Metro line 2 which will be operational in the second half of 2013.
CapitaMalls asia acquired site for CapitaMall 1818, its third shopping mall in Wuhan, China. the total development cost is expected to be about rMB1,156.0 million (approximately S$228.3 million).
CapitaMalls asia opened the Star Vista in Singapore.
CapitaMalls asia opened CapitaMall rizhao in rizhao, CapitaMall Xuefu in Harbin, CapitaMall Wusheng in Wuhan, and CapitaMall Crystal in Beijing, all in China.
ascott opened the 290-unit Beverly park residences in Mumbai, india and the 314-unit ascott ifC Guangzhou in China.
ascott residence trust expanded into Germany’s second largest city, Hamburg, through an acquisition of an operating 166-unit property known as Madison Hamburg for a consideration of eur37.5 million (approximately S$59.4 million).
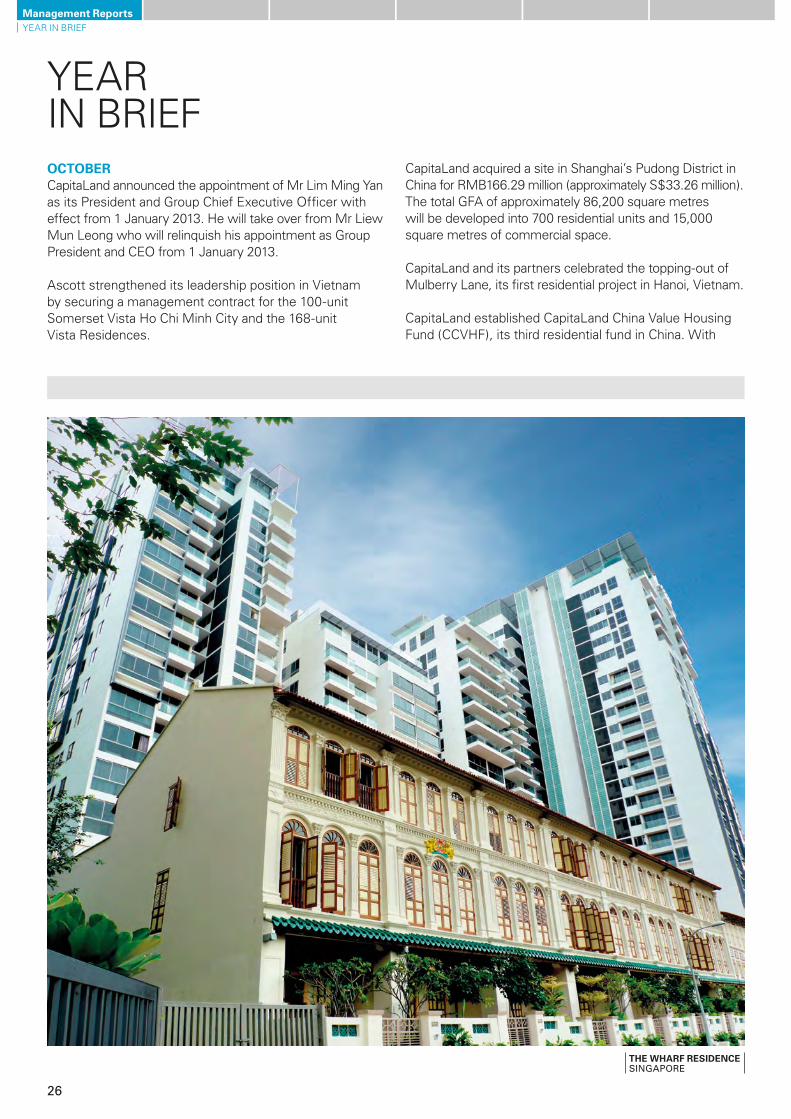
the Wharf residence, a 186-unit residential development located in the prime Mohammed Sultan area of Singapore obtained top.
Capitaland launched the inaugural Because iCare Awards for environment, Health and Safety (eHS) to recognise its stakeholders – contractors, tenants, service providers and staff – for their contributions to eHS in Capitaland. over 20 companies and individuals received the awards.
26
Management Reports
Year in BriefoCToBeRCapitaland announced the appointment of Mr lim Ming Yan as its president and Group Chief executive officer with effect from 1 January 2013. He will take over from Mr liew Mun leong who will relinquish his appointment as Group president and Ceo from 1 January 2013.
ascott strengthened its leadership position in Vietnam by securing a management contract for the 100-unit Somerset Vista Ho Chi Minh City and the 168-unit Vista residences.
Capitaland acquired a site in Shanghai’s pudong District in China for rMB166.29 million (approximately S$33.26 million). the total Gfa of approximately 86,200 square metres will be developed into 700 residential units and 15,000 square metres of commercial space.
Capitaland and its partners celebrated the topping-out of Mulberry lane, its first residential project in Hanoi, Vietnam.
Capitaland established Capitaland China Value Housing fund (CCVHf), its third residential fund in China. With
Year in Brief
THeWHARFResiDenCeSINGAPORE
27
a fund size of uS$215.0 million, the fund will focus on building more affordable home in China.
Capitaretail China trust successfully raised S$86.1 million in a private placement which was increased from the original offer of S$75.0 million, due to strong demand from over 30 existing and new investors from asia, the united States and europe.
the S$150 million asset enhancement programme for the revamped plaza Singapura in Singapore was completed. it aims to foster a seamless and more vibrant shopping experience for shoppers.
noVeMBeRa Capitaland and Mitsubishi estate asia joint venture successfully bidded for a residential site at Bishan Street 14 for S$505.1 million in a government land sales tender. the site will be developed into a condominium with approximately 700 units, and is expected to be launched in the second half of 2013.
CapitaMalls asia organised the second edition of retail Global Connexion in Singapore, bringing together over 1,000 retailers and tertiary students to network and be inspired by the tales of successful retailers.
CapitaStar, CapitaMalls asia’s cardless rewards programme for shoppers, was launched in China, starting with four malls in West China.
over 20,000 underprivileged children in Singapore, China, Malaysia, Japan and india benefited from a donation of more than S$500,000 under “My Schoolbag”, the signature annual corporate social responsibility programme. the donation from Capitaland Hope foundation was used to purchase school and daily necessities.
CapitaMall trust raised S$250.0 million equity at an issue price of S$2.00 per unit through a private placement.
ascott secured a contract in China to manage the 177-unit Citadines South Chengdu, its 10th Citadines-branded serviced residence in the country. it also opened the 229-unit ascott Doha in Qatar and the 168-unit Vista residences in Vietnam.
DeCeMBeRJCube, the newest mall in Singapore’s West was officially opened by Dr amy Khor, Minister of State, Ministry of Health and Ministry of Manpower, and Mayor of South West District in Singapore.
CapitaMall Xindicheng, the first shopping mall developed by CapitaMalls asia in Xi’an, commenced operations. it targets middle to high-end retailers and has attracted more than 150 famous brands from China and abroad.
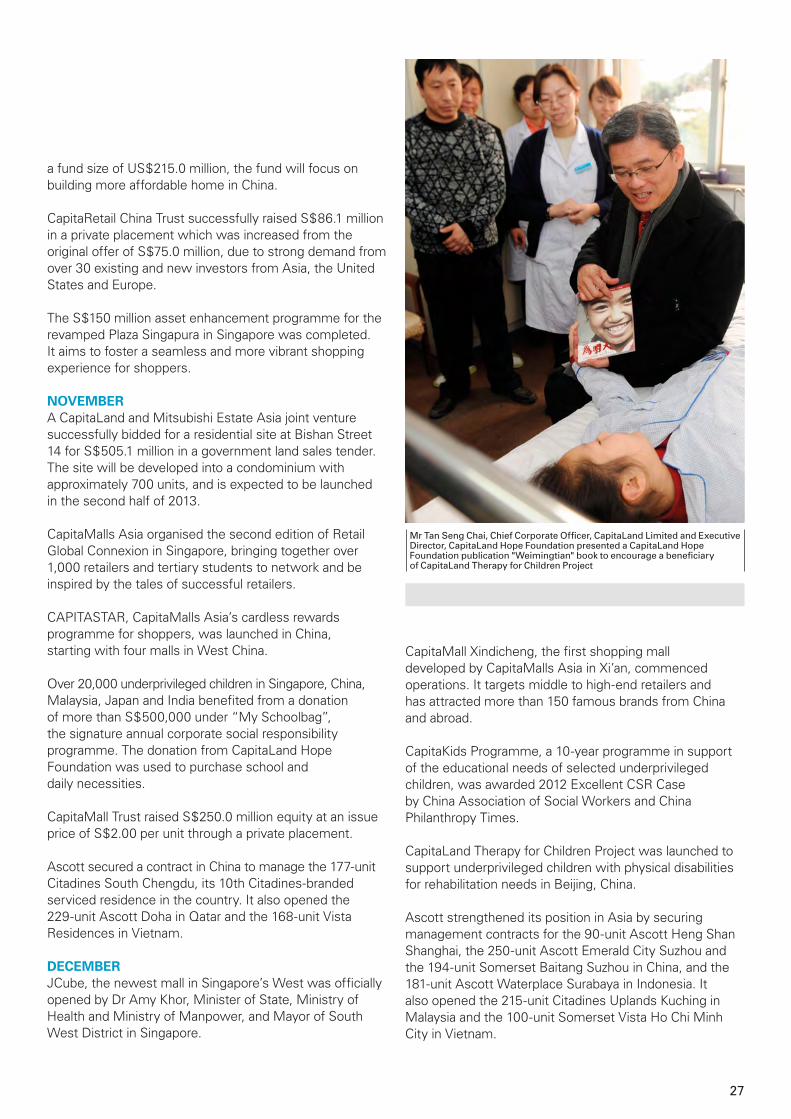
CapitaKids programme, a 10-year programme in support of the educational needs of selected underprivileged children, was awarded 2012 excellent CSr Case by China association of Social Workers and China philanthropy times.
Capitaland therapy for Children project was launched to support underprivileged children with physical disabilities for rehabilitation needs in Beijing, China.
ascott strengthened its position in asia by securing management contracts for the 90-unit ascott Heng Shan Shanghai, the 250-unit ascott emerald City Suzhou and the 194-unit Somerset Baitang Suzhou in China, and the 181-unit ascott Waterplace Surabaya in indonesia. it also opened the 215-unit Citadines uplands Kuching in Malaysia and the 100-unit Somerset Vista Ho Chi Minh City in Vietnam.
Mr Tan Seng Chai, Chief Corporate Officer, CapitaLand Limited and Executive Director, CapitaLand Hope Foundation presented a CapitaLand Hope Foundation publication "Weimingtian" book to encourage a beneficiary of CapitaLand Therapy for Children Project

28
Management ReportsaWarDS & aCColaDeS
aWarDS & aCColaDeS
CAPiTAlAnD liMiTeDBuSineSS exCellenCe• BestDeveloperinsingapore euromoney real estate awards 2012
• Bestmixed-useDeveloper in Singapore
euromoney real estate awards 2012
• BestResidentialDeveloper in Singapore
euromoney real estate awards 2012
• BestinvestorRelations (Real estate)
ir Magazine South east asia awards 2012
• BestinvestmentCommunityMeetings
ir Magazine South east asia awards 2012
• Arthurlang,GroupCFO Best investor Relations by
a Cfo ir Magazine South east asia
awards 2012
• iRmagazinesoutheastAsiaTop25
Capitaland limited (3rd place) ir Magazine South east asia
awards 2012
• BestinvestorRelations Gold Award (Market Cap of
$1 billion & above) Singapore Corporate awards 2012
• GoldenCircleAward(OverallMost Transparent Company)
Securities investors association (Singapore) investors’ Choice award 2012
• mostTransparentCompanyAward (Real estate)
Securities investors association (Singapore) investors’ Choice award 2012
• mostOrganised investor Relations
alpha Southeast asia Magazine
• AssetAsiaAward2012 (Real estate) – Platinum
the asset
• includedinWorldFinance100
• mrliewmunleong outstanding PR Champion priSM awards 2012
SuSTAinABiliTY• Global100mostsustainableCorporationsintheWorld(Global 100)
Corporate Knights
• DowJonessustainabilityWorldindex2012
Dow Jones Sustainability indexes in collaboration with robecoSaM
• DowJonessustainabilityAsiaPacific index 2012
Dow Jones Sustainability indexes in collaboration with robecoSaM
• Thesustainability Yearbook 2012
robecoSaM and KpMG international
• strongestAdherencetoCorporate Governance
alpha Southeast asia Magazine
• BeststrategicCorporate Social Responsibility
alpha Southeast asia Magazine
• mostAdmiredAseAnenterprise for CSR (large Company)
aSean Business awards 2012
• BCAGreenmark Champion Award
Building and Construction authority, Singapore
• BestCommunityDeveloper in Singapore
Singapore Compact CSr awards 2012
• WorkplacesafetyandHealthDeveloper Award
Workplace Safety and Health Council, Singapore
CAPiTACoMMeRCiAl TRuST• FTse4GoodGlobalindex
• Financingdealoftheyear (Debt Capital Markets)
CMBS for raffles City (Silver oak's uS$ 645 million CMBS)
• upgradedfromsmall-captomid-cap stock by MSCi
• AddedtothemsCiGlobalStandard indices
CAPiTAlAnD ChinA• 2011mostinfluential
foreign enterprise House Weekly
• ChinaWell-knownTrademark State administration for industry &
Commerce of the people's republic of China
• RankedasmostValuableCommercial estate in China
the economic observer
• CommercialpropertywithBestinvestment Value in China
the economic observer
• OutstandingCorporateCitizenof China 2012
China association of Social Work
CAPiTAMAllS ASiA liMiTeD • BestRetailDeveloperinAsia euromoney real estate awards 2012
• BestRetailDeveloperinChina euromoney real estate awards 2012
• BestRetailDeveloper in Singapore
euromoney real estate awards 2012
Corporate Awards
29
• mostinfluentialDeveloper in China
China Commercial real estate association
• mostTrustworthy enterprise
China influence Summit 2012
• Certificateofexcellence ir Magazine South east asia
awards 2012
CAPiTAMAll TRuST • FTse4GoodGlobalindex
• BestAnnualReport(ReiTs&Business Trusts) – Gold Award
Singapore Corporate awards 2012
• BestinvestorRelations (ReiTS & Business Trusts) – Gold Award
Singapore Corporate awards 2012
• singaporeCorporateGovernance Award (ReiTs)–Winner
Securities investors association (Singapore) investors’ Choice award 2012
• mostTransparentCompany(ReiTs & Business Trusts) – Runner up
Securities investors association (Singapore) investors’ Choice award 2012
• Certificateofexcellenceininvestor Relations
ir Magazine South east asia awards 2012
• mrWilsonTan,CeOCapitamallTrust Management limited
BrendanWoodinternational–siAsTopGun Ceo Designation Award
Securities investors association (Singapore) investors’ Choice award 2012
The ASCoTT liMiTeD• Bestserviced
Apartment Company Business traveller uK awards 2012
• BestservicedResidence Brand in Asia-Pacific
Business traveller asia-pacific awards 2012
• BestservicedResidence Brand in China
Business traveller China awards 2012
• BestservicedApartment Destinasian readers' Choice
awards 2012
• Bestserviced Residence operator
ttG travel awards 2012
• BestservicedResidenceoperator in China
ttG China travel awards 2012
• Greenmodel,innovationModel and Most Popular Brand amongst Business elites
China economy Summit 2012
• BestservicedResidenceoperator in China
China Hotel Starlight awards 2012
• 2012China'smost Popular Serviced Residence hotel Brand
9th Golden-pillow award of China’s Hotels
• China’sOutstanding Serviced Apartment Brand
Hotel industry Development Summit 2012
• BestservicedResidenceGroup travel Weekly China travel & Meetings
industry awards 2012
• BestHospitalityindustryBrand top travel Hospitality industry leaders
awards 2012
• BestRecommended Serviced Apartment
travel + leisure China travel awards 2012
• preferredserviced Apartment (1st)
Human resources’ Hr Vendors of the Year 2012
• GreenAchievement (highly Commended)
re:locate awards 2011/2012
• Certificateofexcellence Vietnam economic times’ the Guide
awards 2011-2012
ASCoTT ReSiDenCe TRuST MAnAGeMenT liMiTeD• BestAnnualReport
(ReiTS & Business Trusts) –BronzeAward
Singapore Corporate awards 2012
• includedinWorldFinance100
finAnCiAl PRoDuCTS & SeRViCeS AnD ReGionAl inVeSTMenTSCapitaland Vietnam
• BCiAsiaTop10DevelopersAward – Vietnam
BCi asia top 10 awards 2012
• GoldenDragonAward2012 Vietnam economic times
Corporate Awards
30
Management Reports
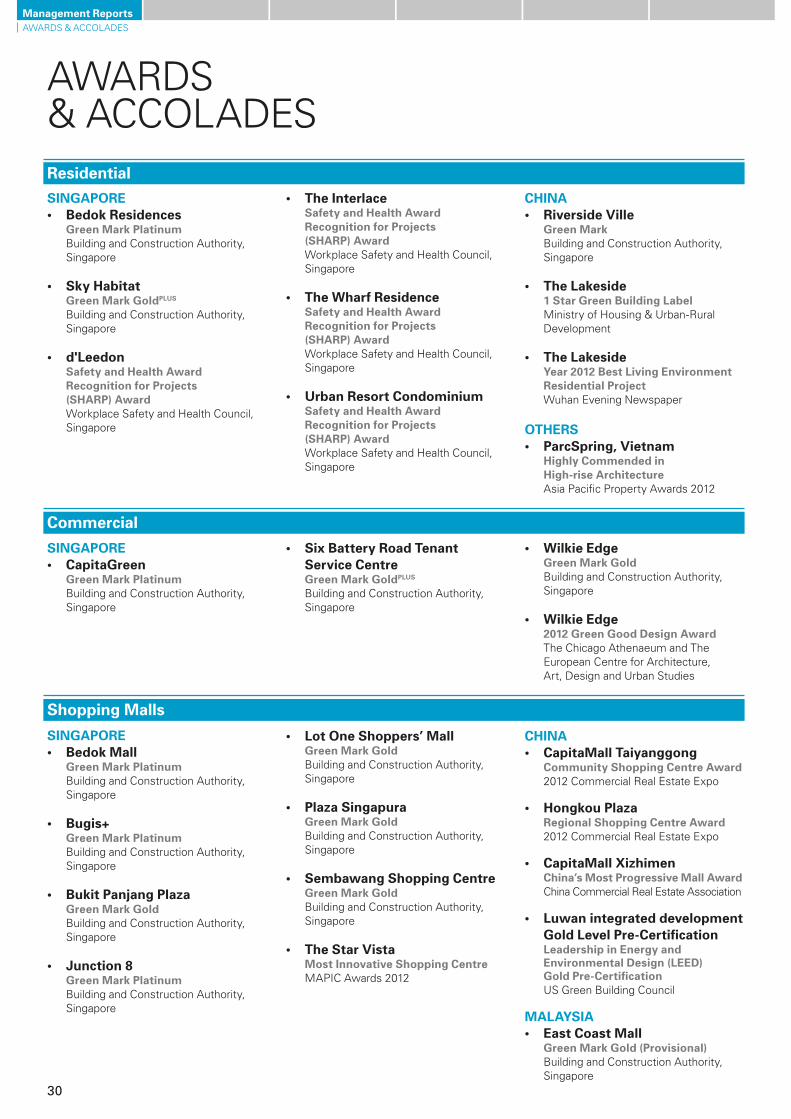
SinGAPoRe • BedokResidences Green Mark Platinum Building and Construction authority,
Singapore
• skyHabitat Green Mark GoldPluS
Building and Construction authority, Singapore
• d'leedon Safety and health Award
Recognition for Projects (ShARP) Award
Workplace Safety and Health Council, Singapore
• Theinterlace Safety and health Award
Recognition for Projects (ShARP) Award
Workplace Safety and Health Council, Singapore
• TheWharfResidence Safety and health Award
Recognition for Projects (ShARP) Award
Workplace Safety and Health Council, Singapore
• urbanResortCondominium Safety and health Award
Recognition for Projects (ShARP) Award
Workplace Safety and Health Council, Singapore
ChinA• RiversideVille Green Mark Building and Construction authority,
Singapore
• Thelakeside 1 Star Green Building label Ministry of Housing & urban-rural
Development
• Thelakeside Year 2012 Best living environment
Residential Project Wuhan evening newspaper
oTheRS• parcspring,Vietnam highly Commended in
high-rise Architecture asia pacific property awards 2012
Shopping Malls
Commercial
Residential
SinGAPoRe • CapitaGreen Green Mark Platinum Building and Construction authority,
Singapore
• sixBatteryRoadTenantService Centre
Green Mark GoldPluS Building and Construction authority,
Singapore
SinGAPoRe• Bedokmall Green Mark Platinum Building and Construction authority,
Singapore
• Bugis+ Green Mark Platinum Building and Construction authority,
Singapore
• Bukitpanjangplaza Green Mark Gold Building and Construction authority,
Singapore
• Junction8 Green Mark Platinum Building and Construction authority,
Singapore
• lotOneshoppers’mall Green Mark Gold Building and Construction authority,
Singapore
• plazasingapura Green Mark Gold Building and Construction authority,
Singapore
• sembawangshoppingCentre Green Mark Gold Building and Construction authority,
Singapore
• ThestarVista Most innovative Shopping Centre MapiC awards 2012
ChinA• CapitamallTaiyanggong Community Shopping Centre Award 2012 Commercial real estate expo
• Hongkouplaza Regional Shopping Centre Award 2012 Commercial real estate expo
• CapitamallXizhimen China’s Most Progressive Mall Award China Commercial real estate association
• luwanintegrateddevelopmentGold level Pre-Certification
leadership in energy and environmental Design (leeD) Gold Pre-Certification
uS Green Building Council
MAlAYSiA• eastCoastmall Green Mark Gold (Provisional) Building and Construction authority,
Singapore
• Wilkieedge Green Mark Gold Building and Construction authority,
Singapore
• Wilkieedge 2012 Green Good Design Award the Chicago athenaeum and the
european Centre for architecture, art, Design and urban Studies
aWarDS & aCColaDeS
aWarDS & aCColaDeS
31
Serviced Residences
Mixed Development
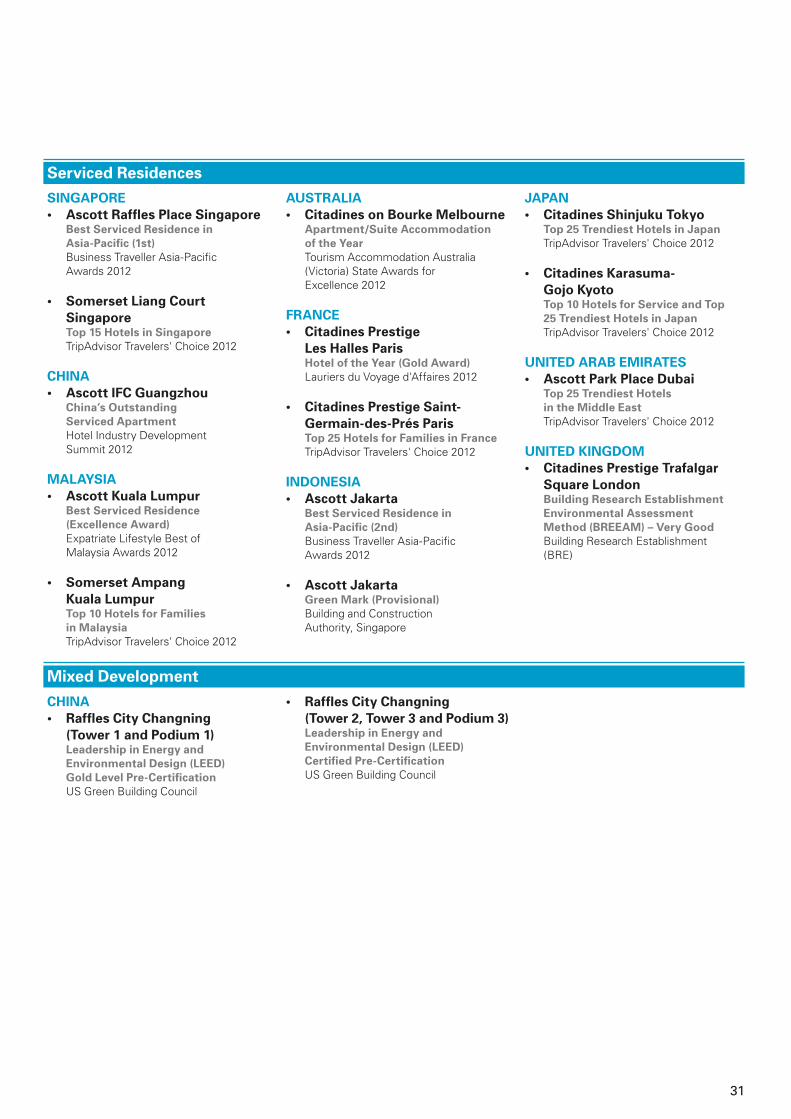
SinGAPoRe• AscottRafflesplacesingapore Best Serviced Residence in
Asia-Pacific (1st) Business traveller asia-pacific
awards 2012
• somersetliangCourtSingapore
Top15Hotelsinsingapore tripadvisor travelers' Choice 2012
ChinA• AscottiFCGuangzhou China’s outstanding
Serviced Apartment Hotel industry Development
Summit 2012
MAlAYSiA• AscottKualalumpur Best Serviced Residence
(excellence Award) expatriate lifestyle Best of
Malaysia awards 2012
• somersetAmpang kuala lumpur
Top 10 hotels for families in Malaysia
tripadvisor travelers' Choice 2012
AuSTRAliA• CitadinesonBourkemelbourne Apartment/Suite Accommodation
of the Year tourism accommodation australia
(Victoria) State awards for excellence 2012
fRAnCe• Citadinesprestige
les halles Paris hotel of the Year (Gold Award) lauriers du Voyage d'affaires 2012
• Citadinesprestigesaint-Germain-des-Prés Paris
Top25HotelsforFamiliesinFrance tripadvisor travelers' Choice 2012
inDoneSiA• AscottJakarta Best Serviced Residence in
Asia-Pacific (2nd) Business traveller asia-pacific
awards 2012
• AscottJakarta Green Mark (Provisional) Building and Construction
authority, Singapore
JAPAn• CitadinesshinjukuTokyo Top25TrendiestHotelsinJapan tripadvisor travelers' Choice 2012
• CitadinesKarasuma- Gojo kyoto
Top 10 hotels for Service and Top 25TrendiestHotelsinJapan
tripadvisor travelers' Choice 2012
uniTeD ARAB eMiRATeS• AscottparkplaceDubai Top25TrendiestHotels
in the Middle east tripadvisor travelers' Choice 2012
uniTeD kinGDoM• CitadinesprestigeTrafalgarsquarelondon
Building Research establishment environmental Assessment Method (BReeAM) – Very Good
Building research establishment (Bre)
ChinA• RafflesCityChangning
(Tower 1 and Podium 1) leadership in energy and
environmental Design (leeD) Gold level Pre-Certification
uS Green Building Council
• RafflesCityChangning (Tower2,Tower3andpodium3)
leadership in energy and environmental Design (leeD) Certified Pre-Certification
uS Green Building Council

32
Management ReportsCorporate DireCtorY /finanCial CalenDar
Corporate DireCtorYAsat28February2013
BoARD of DiReCToRS
ng Kee ChoeChairman
peter Seah lim HuatDeputy Chairman
lim Ming YanPresident & Group Ceo
liew Mun leongJames Koh Cher Siangarfat pannir Selvamprof Kenneth Stuart CourtisJohn powell MorschelSimon Claude israeleuleen Goh Yiu Kiangtan Sri amirsham Bin a azizStephen lee Ching Yen
CoMPAnY SeCReTARY
low Sai Choy
ASSiSTAnT CoMPAnY SeCReTARY
ng Chooi peng
BoARD CoMMiTTeeS
Audit Committeeeuleen Goh Yiu Kiang (Chairman)James Koh Cher Siangarfat pannir Selvamtan Sri amirsham Bin a aziz
investment Committeeng Kee Choe (Chairman)lim Ming Yanprof Kenneth Stuart CourtisJohn powell MorschelSimon Claude israel
executive Resource and Compensation Committeepeter Seah lim Huat (Chairman)ng Kee ChoeSimon Claude israelStephen lee Ching Yen
nominating Committeepeter Seah lim Huat (Chairman)ng Kee Choe arfat pannir SelvamJohn powell MorschelSimon Claude israel
finance and Budget Committeepeter Seah lim Huat (Chairman)ng Kee Choelim Ming Yanprof Kenneth Stuart Courtis
Corporate Disclosure CommitteeJames Koh Cher Siang (Chairman)lim Ming Yanarfat pannir Selvam
Risk CommitteeJames Koh Cher Siang (Chairman)euleen Goh Yiu Kiangtan Sri amirsham Bin a azizStephen lee Ching Yen
ReGiSTeReD ADDReSS
168 robinson road#30-01 Capital towerSingapore 068912telephone: +65 6823 3200facsimile: +65 6820 2202
ShARe ReGiSTRAR
M & C Services private limited112 robinson road #05-01 Singapore 068902telephone: +65 6227 6660 facsimile: +65 6225 1452
AuDiToRS
KpMG llp16 raffles Quay#22-00 Hong leong BuildingSingapore 048581telephone: +65 6213 3388facsimile: +65 6225 4142(Engagement Partner since financial year ended 31 December 2010: Leong Kok Keong)
PRinCiPAl BAnkeRS
• AgriculturalBankofChinaLimited• AustraliaandNewZealand
Banking Group limited• BankofChina• CIMBBankBerhad• CommonwealthBankofAustralia• CreditAgricoleCorporateand
investment Bank• DBSBankLtd• DeutscheBankAG• IndustrialandCommercialBank
of China limited• MizuhoCorporateBank,Ltd.• NationalAustraliaBankLimited• Oversea-ChineseBanking
Corporation limited• StandardCharteredBank• SumitomoMitsuiBanking
Corporation• TheBankofTokyo-Mitsubishi
ufJ, ltd.• TheHongkongandShanghai
Banking Corporation limited• UnitedOverseasBankLimited• WestpacBankingCorporation
33
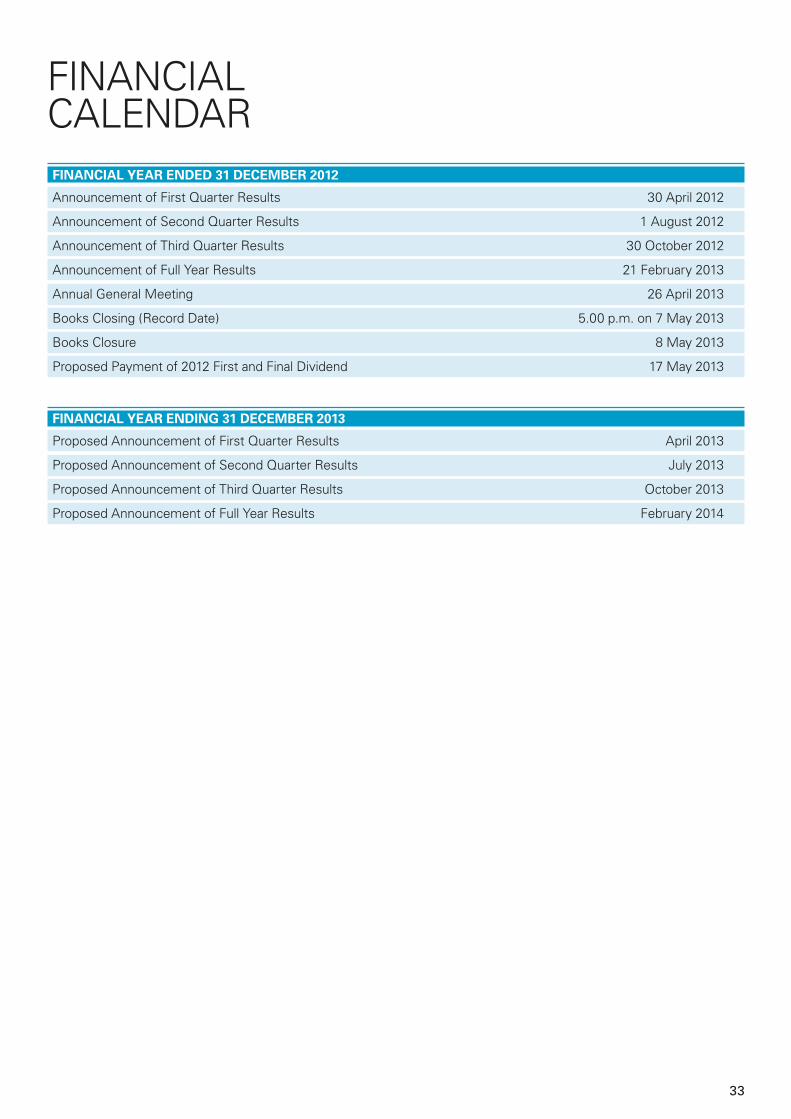
finanCial CalenDarFinAnCiAlYeARenDeD31DeCemBeR2012
announcement of first Quarter results 30 april 2012
announcement of Second Quarter results 1 august 2012
announcement of third Quarter results 30 october 2012
announcement of full Year results 21 february 2013
annual General Meeting 26 april 2013
Books Closing (record Date) 5.00 p.m. on 7 May 2013
Books Closure 8 May 2013
proposed payment of 2012 first and final Dividend 17 May 2013
FinAnCiAlYeARenDinG31DeCemBeR2013
proposed announcement of first Quarter results april 2013
proposed announcement of Second Quarter results July 2013
proposed announcement of third Quarter results october 2013
proposed announcement of full Year results february 2014
34
Management Reports
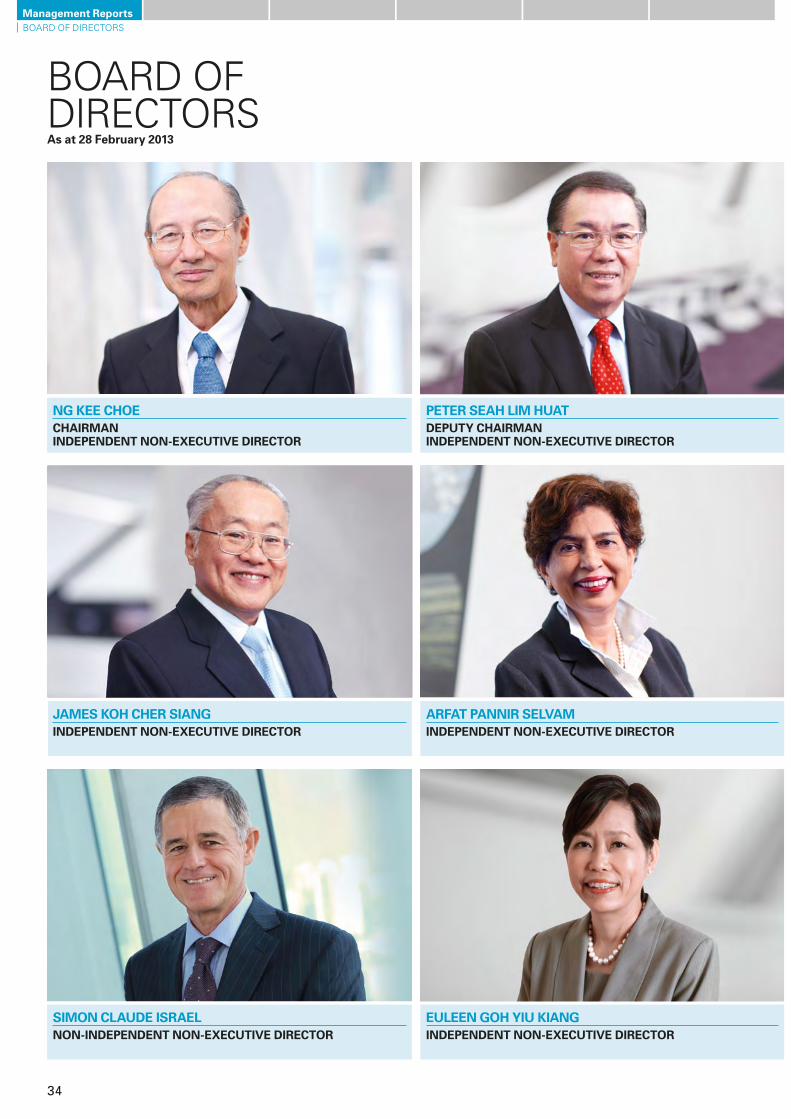
BoarD of DireCtorSAsat28February2013
BoarD of DireCtorS
nG kee ChoeChAiRMAninDePenDenT non-exeCuTiVe DiReCToR
PeTeR SeAh liM huATDePuTY ChAiRMAninDePenDenT non-exeCuTiVe DiReCToR
ARfAT PAnniR SelVAMinDePenDenT non-exeCuTiVe DiReCToR
JAMeS koh CheR SiAnGinDePenDenT non-exeCuTiVe DiReCToR
SiMon ClAuDe iSRAelnon-inDePenDenT non-exeCuTiVe DiReCToR
euleen Goh Yiu kiAnGinDePenDenT non-exeCuTiVe DiReCToR
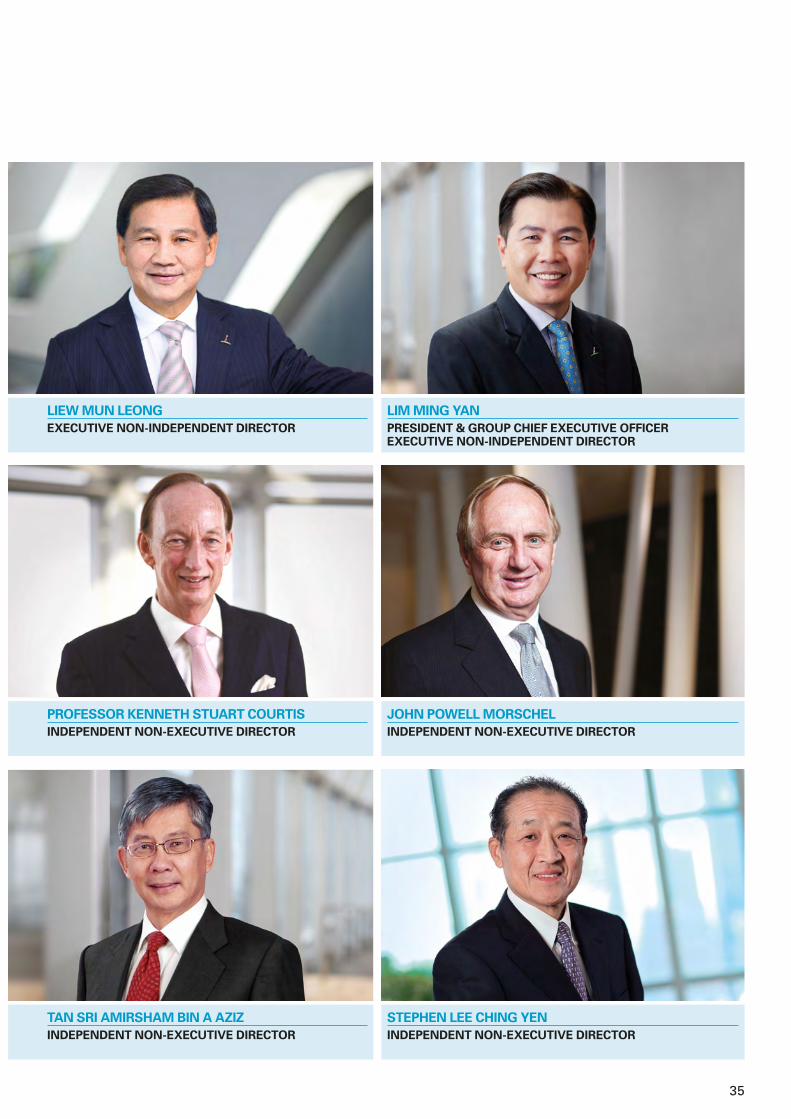
35
liM MinG YAnPReSiDenT & GRouP Chief exeCuTiVe offiCeRexeCuTiVe non-inDePenDenT DiReCToR
lieWmunleOnGexeCuTiVe non-inDePenDenT DiReCToR
PRofeSSoR kenneTh STuART CouRTiSinDePenDenT non-exeCuTiVe DiReCToR
JOHnpOWellmORsCHelinDePenDenT non-exeCuTiVe DiReCToR
STePhen lee ChinG YeninDePenDenT non-exeCuTiVe DiReCToR
TAn SRi AMiRShAM Bin A AzizinDePenDenT non-exeCuTiVe DiReCToR
36
BoarD of DireCtorS
BoarD of DireCtorS
nG kee Choe, 68ChAiRMAninDePenDenT non-exeCuTiVe DiReCToRBachelor of Science (Honours), University of Singapore
Date of first appointment as a director: 16 april 2010Date of appointment as Chairman: 1 May 2012lengthofserviceasadirector(asat31December2012): 2 years 8 months
Board committees served on• executive resource and Compensation Committee (Member)• finance and Budget Committee (Member)• investment Committee (Chairman)• nominating Committee (Member)
Present Directorships in other listed companies• CapitaMalls asia limited (Chairman) (from 25 april 2013)
• pt Bank Danamon indonesia, tbk (President-Commissioner)• Singapore exchange limited• Sp ausnet (Chairman)
Present Principal Commitments (other than Directorships in other listed companies) • fullerton financial Holdings pte ltd (Director)• ntuC income insurance Co-operative limited (Chairman)• tanah Merah Country Club (Chairman)
Directorships in other listed companies held over the preceding three years• Singapore power limited (Chairman)• Singapore airport terminal Services limited
BackgroundandWorkingexperience• Vice-Chairman of DBS Group Holdings ltd (“DBS”)• retired from his executive position in DBS in July 2003
after 33 years of service
Awards• the Meritorious Service Medal at the Singapore
national Day awards 2012• the public Service Star at the Singapore national Day
awards 2001
PeTeR SeAh liM huAT, 66DePuTY ChAiRMAninDePenDenT non-exeCuTiVe DiReCToRBachelor of Business Administration (Honours), University of Singapore
Date of first appointment as a director: 18 December 2001Date of appointment as Deputy Chairman: 1 January 2009Date of last re-election as a director: 16 april 2010lengthofserviceasadirector(asat31December2012): 11 years
Board committees served on• executive resource and Compensation Committee (Chairman)• finance and Budget Committee (Chairman)• nominating Committee (Chairman)
Present Directorships in other listed companies• DBS Group Holdings ltd (Chairman)• level 3 Communications inc• Singapore technologies engineering limited (Chairman)
(until 24 april 2013)
• StatS ChippaC ltd• StarHub ltd
Present Principal Commitments (other than Directorships in other listed companies)• asia Mobile Holdings pte ltd (Director)• DBS Bank ltd (Chairman)• DBS Bank (Hong Kong) limited (Chairman)• Defence Science technology agency (Board Member)• fullerton financial Holdings pte ltd (Director)• Government of Singapore investment Corporation
pte ltd (Director)• laSalle College of the arts limited (Chairman)• Singapore Health Services pte ltd (Chairman)• Stt Communications ltd (Deputy Chairman)
Directorships in other listed companies held over the preceding three years• alliance Bank Malaysia Berhad• Bank of China limited• Global Crossing limited (Deputy Chairman)• SembCorp industries ltd (Chairman)
BackgroundandWorkingexperience• president & Ceo of Singapore technologies pte ltd
(from 2001 to 2004)
• Joined overseas union Bank (ouB) in 1997 and became president & Ceo of ouB (from 1991 to 2001)
Awards• the Distinguished Service order at the Singapore
national Day awards 2012
Management Reports

37
lieWmunleOnG,66exeCuTiVe non-inDePenDenT DiReCToR (1)
PReSiDenT & Chief exeCuTiVe offiCeR (until 31 December 2012)Bachelor of Engineering (Civil), University of SingaporeRegistered Professional Civil Engineer
Date of first appointment as a director: 1 January 1997Date of last re-election as a director: 16 april 2010lengthofserviceasadirector(asat31December2012): 16 years
Boardcommitteesserveduntil31December2012• Corporate Disclosure Committee (Member)• finance and Budget Committee (Member)• investment Committee (Member)• nominating Committee (Member)
Present Directorships in other listed companies• CapitaMalls asia limited (Chairman) (until 24 april 2013)• Singapore exchange limited
Present Principal Commitments (other than Directorships in other listed companies)• Capitaland Hope foundation (Director)• Centre for liveable Cities (Advisory Board Member)• Changi airport Group (Singapore) pte ltd (Chairman)• China Club investment pte ltd (Chairman)• Chinese Development assistance Council (Trustee)• Human Capital leadership institute (Director)• nuS Business School (Advisory Board Member)• Singapore-China foundation ltd (Director)• Surbana Corporation pte ltd (Director)
Directorships in other listed companies held over the preceding three years• ascott residence trust Management limited
(manager of ascott residence trust) (Deputy Chairman)• CapitaCommercial trust Management limited
(manager of CapitaCommercial trust) (Deputy Chairman)• CapitaMall trust Management limited
(manager of CapitaMall trust) (Deputy Chairman)• Capitaretail China trust Management limited
(manager of Capitaretail China trust) (Deputy Chairman)
BackgroundandWorkingexperience• president & Ceo of Capitaland Group
(november 2000 to 31 December 2012)• Various leadership positions in the public sector and
in the private sector
Awards• the Meritorious Service Medal at the Singapore
national Day awards 2011• the outstanding pr Champion award by the institute
of public relations of Singapore 2012• one of the top 25 most powerful businesspeople in
asia by fortune Magazine 2011• Best Ceo in Singapore by financeasia 2011• asia’s Best executive (Singapore) by asiamoney 2008• Best Ceo in asia (property) by institutional investor 2008• Ceo of the Year award (for firms with market value
of S$500 million or more) in the Business times’ Singapore Corporate awards 2007
• outstanding Ceo of the Year in the Singapore Business awards 2006
• the public administration Medal by the Singapore Government in 1979
limminGYAn,50exeCuTiVe non-inDePenDenT DiReCToRPReSiDenT & GRouP Chief exeCuTiVe offiCeR(from 1 January 2013)Bachelor of Engineering (Mechanical) and Economics (First Class Honours), University of Birmingham, UK
Date of first appointment as a director: 1 January 2013
Boardcommitteesservedfrom1January2013• Corporate Disclosure Committee (Member)• finance and Budget Committee (Member)• investment Committee (Member)
Present Directorships in other listed companies• CapitaMalls asia limited• ascott residence trust Management limited
(manager of ascott residence trust) (Deputy Chairman)• CapitaCommercial trust Management limited
(manager of CapitaCommercial trust) (Deputy Chairman)• CapitaMall trust Management limited
(manager of CapitaMall trust) (Deputy Chairman)• Capitaretail China trust Management limited
(manager of Capitaretail China trust) (Deputy Chairman)• Central China real estate limited
Present Principal Commitments (other than Directorships in other listed companies)• Business China (Director)• Capitaland China Holdings pte ltd (Chairman)• Capitaland Singapore limited
(known as Capitaland Commercial limited prior to 15 March 2013) (Chairman)
• Capitaland Hope foundation (Director)• Capitaland Malaysia pte. ltd. (Chairman)• CtM property trust, Steering Committee (Chairman)• lfie Holding limited (Co-Chairman)• Shanghai YiDian Holding (Group) Company (Director)• the ascott limited (Chairman)
Directorships in other listed companies held over the preceding three years• lai fung Holdings limited
BackgroundandWorkingexperience• Chief operating officer of Capitaland limited
(from May 2011 to December 2012)
• Ceo of the ascott limited (from July 2009 to february 2012)
• Ceo of Capitaland China Holdings pte ltd (from July 2000 to June 2009)
Awards• outstanding Ceo (overseas) in the Singapore Business
awards 2006• Magnolia award by the Shanghai Municipal Government
in 2003 and 2005
(1) Due to retire by rotation at the next Annual General Meeting and will not be seeking re-election.
38
Management Reports
BoarD of DireCtorS
BoarD of DireCtorS
JAMeS koh CheR SiAnG, 67inDePenDenT non-exeCuTiVe DiReCToRBachelor of Arts (Honours), Oxford University, UKMaster of Arts in Philosophy, Political Science and Economics, Oxford University, UKMaster in Public Administration, Harvard University, USA
Date of first appointment as a director: 1 July 2005Date of last re-election as a director: 25 april 2011lengthofserviceasadirector(asat31December2012): 7 years 6 months
Board committees served on• audit Committee (Member)• Corporate Disclosure Committee (Chairman)• risk Committee (Chairman)
Present Directorships in other listed companies• CapitaMall trust Management limited
(manager of CapitaMall trust) (Chairman) • pan pacific Hotels Group limited• united overseas Bank limited
Present Principal Commitments (other than Directorships in other listed companies)• Capitaland Hope foundation (Director)• Housing & Development Board (Chairman)• MechanoBiology institute (Chairman)• presidential Council for religious Harmony (Member)• Singapore island Country Club (Chairman)• thye Hua Kwan Moral Charities limited (Director)
Directorships in other listed companies held over the preceding three years• Singapore airlines limited• uol Group limited
BackgroundandWorkingexperience• Ceo of the inland revenue authority of Singapore,
Commissioner of inland revenue and Commissioner of Charities (1997 to 2005)
• permanent Secretary in the Ministries of national Development, Community Development and education
• Served in the Ministries of finance, national Development, Community Development, education and the prime Minister’s office
Awards• the Meritorious Service Medal at the Singapore
national Day awards 2002• the public administration Medal (Gold) by the
Singapore Government in 1983
ARfAT PAnniR SelVAM, 67inDePenDenT non-exeCuTiVe DiReCToRBachelor of Laws, University of Singapore Advocate & Solicitor
Date of first appointment as a director: 2 January 2006Date of last re-election as a director: 25 april 2011lengthofserviceasadirector(asat31December2012): 7 years
Board committees served on• audit Committee (Member)• Corporate Disclosure Committee (Member)• nominating Committee (Member)• risk Committee (Member) (2)
Present Directorships in other listed companies• CapitaMalls asia limited
Present Principal Commitments (other than Directorships in other listed companies)• Duane Morris & Selvam llp (Managing Director)• Selvam llC (Managing Director)• aSa investment Holdings pte ltd (Director)• Hope Villages fund pte ltd (Director)• iGlobe partners pte ltd (Director)• iGlobe partners (ii) pte ltd (Director)• naSDaQ oMX (South east asia & pacific) pte ltd (Director)• priya roshni pte ltd (Director)• Selvam Corporate Services pte ltd (Director)• Singapore institute of Directors (fellow)• Muslim financial planning association (President)• Breast Cancer foundation (Vice President)• rahmatan lil’alamin foundation ltd (Board of
Trustees Member)• law Society of Singapore pro Bono, Management
Committee (Chairman)
BackgroundandWorkingexperience• over 40 years experience in legal practice as a corporate
finance lawyer• involved in many landmark Singapore M&a transactions
(2) Ceased on 1 February 2013.

39
PRofeSSoR kenneTh STuART CouRTiS, 67inDePenDenT non-exeCuTiVe DiReCToRBachelor Degree, Glendon College, Toronto, CanadaMaster in International Relations, Sussex University, UKMaster of Business Administration, INSEAD (the European Institute of Business Administration)Doctorate with Honours & High Distinction, l’Institut D’Etudes Politiques, Paris
Date of first appointment as a director: 14 february 2007Date of last re-election as a director: 30 april 2012lengthofserviceasadirector(asat31December2012): 5 years 10 months
Board committees served on• finance and Budget Committee (Member)• investment Committee (Member)
Present Principal Commitments (other than Directorships in other listed companies)• emerson electric Company (Advisory Board Member) • CnooC limited (Advisory Board Member)• the economic Strategy institute (Advisory Board Member)• international MBa program, York university
(Advisory Board Member)• asia pacific foundation of Canada (Director)• Global advisory Council (Member)
(formerly known as McKinsey advisory Council)
Directorships in other listed companies held over the preceding three years• CnooC limited • noble Group limited
BackgroundandWorkingexperience• ex Managing Director and Vice Chairman of Goldman
Sachs asia • ex Managing Director, Chief economist and Strategist
of Deutsche Bank Group asia• led a number of large, international corporate
transactions centered on asia and pioneered a number of investment banking specialities across the region
JOHnpOWellmORsCHel,69inDePenDenT non-exeCuTiVe DiReCToRDiploma in Quantity Surveying, The University of New South Wales
Date of first appointment as a director: 1 february 2010Date of last re-election as a director: 30 april 2012lengthofserviceasadirector(asat31December2012): 2 years 11 months
Board committees served on• investment Committee (Member)• nominating Committee (Member)
Present Directorships in other listed companies• AustraliaandNewZealandBankingGroupLimited
(Director from 2004 and Chairman from 2010)
Present Principal Commitments (other than Directorships in other listed companies)• australian institute of Company Directors (fellow)• australian institute of Management (fellow)• Gifford Communications pty ltd (Director)• tenix Group pty limited (Director)
Directorships in other listed companies held over the preceding three years • rinker Group limited (Chairman and Director) (2003 – 2007)
• rio tinto limited (Director) (1998 – 2005)
• Singapore telecommunications limited (Director) (2001 – 2010)
• Westpac Banking Corporation (Director) (1993 – 2001)
BackgroundandWorkingexperience• executive Director and Managing Director and Ceo
of lend lease Corporation limited • executive Director of Westpac Banking Corporation
limited responsible for the australian Consumer and Small Business sectors, information technology and property
40
Management ReportsBoarD of DireCtorS
BoarD of DireCtorSsimOnClAuDeisRAel,59non-inDePenDenT non-exeCuTiVe DiReCToRDiploma in Business Studies, The University of the South Pacific, Fiji
Date of first appointment as a director: 1 July 2010Date of last re-election as a director: 25 april 2011lengthofserviceasadirector(asat31December2012): 2 years 6 months
Board committees served on• executive resource and Compensation Committee (Member)• investment Committee (Member)• nominating Committee (Member)
Present Directorships in other listed companies• Singapore telecommunications limited (Chairman)
Present Principal Commitments (other than Directorships in other listed companies)• lee Kuan Yew School of public policy (Governing
Board Member)
Directorships in other listed companies held over the preceding three years• asia pacific Breweries limited (Chairman)• neptune orient lines limited
BackgroundandWorkingexperience• executive Director of temasek Holdings (private) limited
(from 1 July 2006 to 1 July 2011)
• Chairman, asia pacific of the Danone Group (from 1 July 2005 to 30 June 2006)
• president (Household & personal Care), asia pacific of Sara lee Corporation
Awards• the Knight in the legion of Honour by the french
Government 2007 • the public Service Medal at the Singapore national
Day awards 2011
euleenGOHYiuKiAnG,58inDePenDenT non-exeCuTiVe DiReCToRFellow of Institute of Chartered Accountants in England and WalesFellow of The Chartered Institute of Taxation, UKFellow of Institute of Certified Accountants of SingaporeFellow of Ifs School of Finance
Date of first appointment as a director: 1 october 2011Date of last re-election as a director: 30 april 2012lengthofserviceasadirector(asat31December2012): 1 year 3 months
Board committees served on• audit Committee (Chairman)(3)
• risk Committee (Member) (4)
Present Directorships in other listed companies• DBS Group Holdings ltd• Singapore airlines limited
Present Principal Commitments (other than Directorships in other listed companies)• northlight School (Chairman, Board of Governors)• nuS Business School (Management Advisory Board Member)• Singapore international foundation (Chairman,
Board of Governors)• DBS Bank ltd (Director)• Singapore Chinese Girls’ School (Chairman)
Directorships in other listed companies held over the preceding three years• aviva plc• Singapore exchange limited
BackgroundandWorkingexperience• Ceo of Standard Chartered Bank, Singapore
(from 2001 until March 2006)
• Various senior management positions in Standard Chartered Bank, retiring in March 2006 after some 21 years with the Bank
Awards• the public Service Star at the Singapore national Day
awards 2012• Her World Woman of the Year 2005• the public Service Medal at the Singapore national Day
awards 2005
(3) Appointed as Chairman on 30 April 2012.(4) Appointed on 30 April 2012.
41
STePhen lee ChinG Yen, 66inDePenDenT non-exeCuTiVe DiReCToRMaster of Business Administration, Northwestern University, Illinois, USA
Date of first appointment as a director: 1 January 2013
Boardcommitteesservedfrom1February2013• executive resource and Compensation Committee (Member)• risk Committee (Member)
Present Directorships in other listed companies• Singapore airlines limited (Chairman)• Sia engineering Company (Chairman)
Present Principal Commitments (other than Directorships in other listed companies)• Council of presidential advisers (Alternate Member)• Dr Goh Keng Swee Scholarship fund (Director)• national Wages Council (Member)• Kidney Dialysis foundation (Director)• Singapore national employers federation (President)• Singapore labour foundation (Director)• CofCo Corporation, China (Director)• G2000 apparel (S) pte ltd (Director)• Great Malaysia textile investments pte ltd (Managing Director)• Shanghai Commercial and Savings Bank ltd,
taiwan (Managing Director)• Shanghai Commercial & Savings Bank ltd,
Hong Kong (Director)• Slf Strategic advisers private limited (Director)
Directorships in other listed companies held over the preceding three years• Baosteel Group Corporation, Shanghai• fraser and neave limited
BackgroundandWorkingexperience• Chairman of international enterprise Singapore
(formerly known as tDB) • Chairman/advisor of pSa international pte ltd• Chairman of Singapore Business federation
Awards• the Distinguished Service order at the Singapore
national Day awards 2006• the public Service Star at the Singapore national Day
awards 1998
TAn SRi AMiRShAM Bin A Aziz, 62inDePenDenT non-exeCuTiVe DiReCToRBachelor of Economics (Honours), The University of MalayaCertified Public Accountant
Date of first appointment as a director: 30 July 2012lengthofserviceasadirector(asat31December2012): 5 months
Board committees served on• audit Committee (Member)(5)
• risk Committee (Member)(5)
Present Directorships in other listed companies• CapitaMalls asia limited• lingui Developments Berhad
Present Principal Commitments (other than Directorships in other listed companies)• Destination resorts & Hotels Sdn Bhd• Malaysian investment Development authority• petroliam nasional Berhad• pulau indah Ventures Sdn Bhd• Samling Global limited• StarChase Motorsports limited• themed attractions & resorts Sdn Bhd
BackgroundandWorkingexperience• executive Director of Malayan Banking Berhad
(from 1994 to 2008)
• Minister in the Malaysian prime Minister’s Department heading the economic planning unit and Department of Statistics (from March 2008 to april 2009)
• Chairman of the Malaysian national economic advisory Council (from 1 June 2009 to 31 May 2011)
Awards• Global Hall of fame by the international association of
outsourcing professionals 2009• the asian Bankers lifetime achievement award 2008
(5) Appointed on 15 August 2012.

42
Management Reports
eXeCutiVe ManaGeMent CounCilAsat28February2013
eXeCutiVe ManaGeMent CounCil
liM MinG YAnPReSiDenT & GRouP Ceo CapitalanD liMiteD
oliVieR liMGRouP DePuTY Ceo CapitalanD liMiteD
JAsOnleOWCeoCapitalanD CHina
WenKHAimenGCeo CapitalanD SinGapore
Chen liAn PAnG CeoCapitalanD VietnaM
ChonG liT CheonG Ceo reGional inVeStMentS, CapitalanD liMiteD

43
ARThuR lAnG GRouP Chief finAnCiAl offiCeRCapitalanD liMiteD
TAn SenG ChAiGRouP Chief CoRPoRATe offiCeRCapitalanD liMiteD
liM BenG Chee CeoCapitaMallS aSia liMiteD
ChonG kee hionG CeotHe aSCott liMiteD
WOnGHeAnGFineCeoreSiDential, CapitalanD SinGapore
MARGAReT Goh Ceo SpeCial proJeCtS, CapitalanD SinGapore
44
Management ReportseXeCutiVe ManaGeMent CounCil
eXeCutiVe ManaGeMent CounCilliM MinG YAnPReSiDenT & GRouP Ceo, CAPiTAlAnD liMiTeD(from 1 January 2013)
Chief oPeRATinG offiCeR(until 31 December 2012)
Mr lim Ming Yan is president and Group Chief executive officer of Capitaland limited. prior to this, he was the Chief operating officer of Capitaland limited. He joined the Capitaland Board as Director on 1 January 2013.
Mr lim is Chairman of Capitaland residential Singapore pte ltd, Capitaland China Holdings pte ltd, the ascott limited, Capitaland Singapore limited (known as Capitaland Commercial limited prior to 15 March 2013), Capitaland Malaysia pte ltd and Capitaland financial limited. He is also Deputy Chairman of CapitaMall trust Management limited, CapitaCommercial trust Management limited, Capitaretail China trust Management limited and ascott residence trust Management limited.
Mr lim is Chairman of Capitaland China executive Committee and Capitaland Vietnam executive Committee. the committees co-ordinate and align Capitaland’s investments, operations, branding and resources in China and Vietnam. He is also a Director of Capitaland Hope foundation, the Group’s philanthropic arm.
Mr lim was the Chief executive officer of the ascott limited from July 2009 to february 2012. prior to joining ascott, Mr lim was the Chief executive officer of Capitaland China Holdings pte ltd from november 2000 to June 2009, responsible for growing Capitaland into a leading foreign real estate developer in China.
Mr lim was named outstanding Chief executive (overseas) at the Singapore Business awards 2006. He was also conferred the prestigious Magnolia award by the Shanghai Municipal Government in 2003 and 2005 for his significant contributions to Shanghai.
Mr lim obtained first class honours in Mechanical engineering and economics from the university of Birmingham, united Kingdom in 1985. He attended the advanced Management program at Harvard Business School in 2002.
oliVieR liMGRouP DePuTY Ceo, CAPiTAlAnD liMiTeD(from 3 January 2013)
GRouP Chief inVeSTMenT offiCeR, CAPiTAlAnD liMiTeD(until 2 January 2013)
heAD of STRATeGiC CoRPoRATe DeVeloPMenT, CAPiTAlAnD liMiTeD(until 5 february 2012)
Mr olivier lim is the Group Deputy Chief executive officer of Capitaland limited. He is concurrently the non-executive Chairman of australand Holdings limited, and a non-executive director of CapitaMalls asia limited, raffles Medical Group ltd and neptune orient lines limited. Mr lim also serves as a board member of Sentosa Development Corporation, and as the non-executive Chairman of its subsidiary, Mount faber leisure Group pte ltd.
Mr lim’s prior positions in Capitaland were as Group Chief investment officer until 2 January 2013, Head of Strategic Corporate Development until 5 february 2012, and Group Chief financial officer for six years until 2011. prior to joining Capitaland limited in 2003, he was Director and Head of the real estate unit, Corporate Banking in Citibank Singapore.
Mr lim was awarded Best investor relations by a Cfo by ir Magazine for South east asia for 2009, 2010 and 2011, and pan-asia for 2011. He was named Cfo of the Year by the asset magazine in its 2010 asian awards. He was also named Cfo of the Year in 2007 (for firms with market value of S$500 million or more) in the Business times’ Singapore Corporate awards.
Mr lim holds a first Class Honours degree in Civil engineering from imperial College, london.
45
ARThuR lAnGGRouP Chief finAnCiAl offiCeR, CAPiTAlAnD liMiTeD
Mr arthur lang is the Group Chief financial officer of Capitaland limited. in his current role, he has direct oversight of the functions of the treasury, financial reporting and controls, risk management, corporate finance, tax and investor relations departments of Capitaland. He also looks after the administrative matters of the internal audit department.
prior to joining Capitaland, he was co-head of the Southeast asia investment banking division for Morgan Stanley where he spearheaded the client coverage and transaction execution efforts across Southeast asia.
prior roles Mr lang held at Morgan Stanley also included the Chief operating officer for the asia pacific investment banking division where he was based in Hong Kong.
Mr lang is also a board member of the land transport authority of Singapore and tiger airways Holdings limited.
Mr lang was awarded the Best investor relations by a Cfo at the ir Magazine South east asia awards 2012.
Mr lang has an MBa from the Harvard Business School and a Ba in economics (magna cum laude) from Harvard university.
TAn SenG ChAiGRouP Chief CoRPoRATe offiCeR, CAPiTAlAnD liMiTeD(from 3 January 2013)
DePuTY Chief CoPoRATe offiCeR, CAPiTAlAnD liMiTeD(until 2 January 2013)
Mr tan Seng Chai is Group Chief Corporate officer of Capitaland limited. prior to this, he was Deputy Chief Corporate officer and Chief Human resource officer of Capitaland limited.
Mr tan oversees the Group’s corporate functions including Human resource, organisational Development, information technology, Corporate Communications, Corporate Marketing, legal & Company Secretariat, operations Compliance unit, office administration and Corporate Security & investigation. Mr tan is also the executive Director of Capitaland Hope foundation, the philanthropic arm of Capitaland.
prior to joining the Group, Mr tan was with Chartered Semiconductor Manufacturing ltd, Singapore for 12 years. He held key positions in the company including heading its worldwide human resource organisation as well as overseeing key project implementation and strategic investment activities.
an engineer by training, Mr tan started his career with national Semiconductor Manufacturer Singapore pte ltd as a process engineer and subsequently became the company’s Human resource Manager. He continued his career progression to head the human resource function at Creative technology ltd, Singapore before joining Chartered Semiconductor Manufacturing ltd.
Mr tan holds an honours degree in Civil & Structural engineering and a Master of Science degree in industrial & System engineering from the national university of Singapore.

46
Management Reports
eXeCutiVe ManaGeMent CounCil
eXeCutiVe ManaGeMent CounCil
WenKHAimenGCeo, CAPiTAlAnD SinGAPoRe(from 3 January 2013)
Ceo, CAPiTAlAnD finAnCiAl liMiTeD(until 2 January 2013)
Chief inVeSTMenT offiCeR, CAPiTAlAnD liMiTeD(until 5 february 2012)
Mr Wen Khai Meng is the Chief executive officer of Capitaland Singapore. He is also a non-executive Director of CapitaCommercial trust Management limited and Quill Capita Management Sdn. Bhd.
prior to this, Mr Wen has held several senior appointments within the Group including Chief investment officer of Capitaland limited, Chief executive officer of Capitaland Commercial limited and Chief executive officer of Capitaland financial limited. He was also a non-executive Director of ascott residence trust Management limited. Before joining the Group, Mr Wen was with the Ministry of national Development, Singapore.
Mr Wen holds a Master of Business administration and a Master of Science in Construction engineering as well as a Bachelor of engineering (first Class Honours).
JAsOnleOWCeo, CAPiTAlAnD ChinA(from 3 January 2013)
Ceo, CAPiTAlAnD ChinA holDinGS PTe lTD (until 2 January 2013)
Mr Jason leow is the Chief executive officer of Capitaland China. Mr leow has been Chief executive officer of Capitaland China Holdings pte ltd since 2009.
Mr leow has been with Capitaland from 1994 and has over 19 years of experience in China. He has held several appointments within the Group, including General Manager of Business Development, General Manager of Corporate Services and Deputy Chief executive officer of Capitaland China Holdings.
prior to joining Capitaland, he was a senior financial analyst at St aerospace ltd and also spent three years at DBS finance ltd.
Mr leow is a Certified public accountant and a member of the institute of Certified public accountants of Singapore. He obtained an executive Master in Business administration degree from fudan university and also attended the advanced Management program at Harvard Business School in 2007.
47
liM BenG CheeCeo, CAPiTAMAllS ASiA liMiTeD
Mr lim Beng Chee is the Chief executive officer and executive Director of CapitaMalls asia limited. He has more than 10 years of real estate investment and asset management experience.
Mr lim previously held various positions within Capitaland, including Chief executive officer of CapitaMall trust Management limited and Capitaretail China trust Management limited. Mr lim has played an instrumental role in the creation of CapitaMalls asia’s retail real estate funds and retail real estate investment trusts (reits).
Mr lim holds a Master of Business administration (accountancy) from the nanyang technological university of Singapore and a Bachelor of arts in physics (Honours) from the university of oxford, united Kingdom.
ChonG kee hionGCeo, The ASCoTT liMiTeD (from 6 february 2012)
Ceo, ASCoTT ReSiDenCe TRuST MAnAGeMenT liMiTeD (until 5 february 2012)
Mr Chong Kee Hiong is the Chief executive officer of the ascott limited. He was the Chief executive officer of ascott residence trust Management limited from March 2006 to february 2012. Before joining ascott, Mr Chong was the Chief financial officer of raffles Holdings limited.
Mr Chong is the president of the General Committee of orchid Country Club and is a Director of Slf leisure enterprises (pte) ltd and pasir ris resort pte ltd. He also sits on the audit Committee of Sentosa Development Corporation.
Mr Chong holds a Bachelor of accountancy degree from the national university of Singapore and is a member of the institute of Certified public accountants of Singapore. He completed Harvard Business School’s advanced Management program in 2008.
48
Management Reports
eXeCutiVe ManaGeMent CounCil
eXeCutiVe ManaGeMent CounCil
Chen liAn PAnGCeo, CAPiTAlAnD VieTnAM(from 3 January 2013)
Ceo, CAPiTAVAlue hoMeS liMiTeD(until 2 January 2013)
Mr Chen lian pang is the Chief executive officer of Capitaland Vietnam. Mr Chen was the Chief executive officer of CapitaValue Homes limited until 2 January 2013.
in his 16 years of service with Capitaland, Mr Chen has held various positions within the Group where he was responsible for the company’s operations in Southeast asia. He was instrumental in the setting up t.C.C. Capital land ltd in thailand in 2003 and Capitaland Vietnam Holdings in Vietnam in 2007.
Mr Chen has 30 years of construction and real estate experience both in Singapore and overseas. He started his career with the Housing and Development Board of Singapore. He had overseen the development of both commercial and residential projects, including Capital tower in Singapore, raffles City Shanghai in China, Westlake international Hotel in Hanoi, Vietnam (now the Sofitel plaza Hanoi) and a luxury condominium, Suasana Sentral in Kuala lumpur, Malaysia.
Mr Chen holds a Master of Science in Civil engineering from the national university of Singapore and a Bachelor of Science in Civil engineering (first Class Honours) from the university of Cardiff, united Kingdom. He completed the General Management program at Harvard Business School and an international Business fellowship executive programme with tsinghua university in 2000 and 2011 respectively. He is also a registered professional engineer.
ChonG liT CheonGCeo, ReGionAl inVeSTMenTS, CAPiTAlAnD liMiTeD(from 3 January 2013)
Ceo, CAPiTAlAnD CoMMeRCiAl liMiTeD(until 2 January 2013)
Mr Chong lit Cheong is the Chief executive officer, regional investments of Capitaland limited. He was appointed as Director of Surbana Corporation pte ltd (Surbana), a 40%-owned associate company of Capitaland, in 2012. Mr Chong was the Chief executive officer of Capitaland Commercial limited until 2 January 2013.
prior to joining the Group, Mr Chong was the Chief executive officer of international enterprise Singapore, an agency under Singapore’s Ministry of trade and industry which promotes the overseas growth of Singapore-based enterprises and international trade. prior to that, he was the Chief executive officer of JtC Corporation and Managing Director of national Science and technology Board (now called a*Star). He had previously served in Singapore’s economic Development Board where he was posted to Suzhou, China, to lead the development of the China-Singapore Suzhou industrial park project.
Mr Chong is a Mombusho (Colombo plan) Scholar and holds a Bachelor of engineering (electronic) from the university of tokyo. He also completed an advanced Management programme at inSeaD in france in 1994 and the tsinghua executive program in Shanghai, China, in 2004.

49
WOnGHeAnGFineCeo, ReSiDenTiAl, CAPiTAlAnD SinGAPoRe (from 3 January 2013)
Ceo, CAPiTAlAnD ReSiDenTiAl SinGAPoRe PTe lTD(until 2 January 2013)
Mr Wong Heang fine is the Chief executive officer of residential, Capitaland Singapore.
Mr Wong was the Chief executive officer of Capitaland ileC pte. ltd. He was also in charge of Capitaland’s business in the Gulf Cooperation Council (GCC) region. Mr Wong was the president of the real estate Developers’ association of Singapore (reDaS) until end Jan 2013.
prior to joining Capitaland, Mr Wong was president and Ceo of Sembcorp engineers and Constructors, the largest engineering and construction company in Southeast asia. He also has varied experience in the leisure and entertainment industries.
Mr Wong holds a Master of Science in engineering production & Management from the university of Birmingham, uK and a Bachelor of Science in Mechanical engineering (first Class Honours) from the university of leeds, united Kingdom.
MARGAReT GohCeo, SPeCiAl PRoJeCTS, CAPiTAlAnD SinGAPoRe (from 3 January 2013)
Ceo, SPeCiAl PRoJeCTS, CAPiTAlAnD liMiTeD(until 2 January 2013)
Ms Margaret Goh is the Chief executive officer, Special projects of Capitaland Singapore. She is in charge of Capitaland’s development business in Malaysia as well as support cross-SBu projects. this includes overseeing joint venture projects between temasek and Khazanah where Capitaland has been appointed as the project manager.
Ms Goh joined Capitaland in april 2012. prior to joining Capitaland, she was the Chief executive officer of ntuC Choice Homes Co-operative limited since 2007. earlier, she was the General Manager of Sentosa Cove pte ltd. Ms Goh has also served in City Developments ltd, pontiac Marina pte ltd and Hong leong Holdings ltd.
Ms Goh holds a Bachelor of land economics (first Class) from the university of technology, Sydney.

50
Management Reports
Corporate offiCe
Corporate offiCe
lieWmunleOnGPReSiDenT & Ceo(until 31 December 2012)
liM MinG YAnChief oPeRATinG offiCeR (until 31 December 2012)
PReSiDenT & GRouP Ceo(from 1 January 2013)
WenKHAimenGChief exeCuTiVe offiCeRCapitalanD finanCial liMiteD (until 2 January 2013)
TAn SenG ChAiDePuTY Chief CoRPoRATe offiCeR (until 2 January 2013)
GRouP Chief CoRPoRATe offiCeR(from 3 January 2013)
Chief exeCuTiVe offiCeRCapitalanD SinGapore(from 3 January 2013)
oliVieR liMChief inVeSTMenT offiCeR (until 2 January 2013)
ARThuR lAnGGRouP Chief finAnCiAl offiCeRGRouP DePuTY Ceo
(from 3 January 2013)
51
noT PhoToGRAPheD
AnDRe liM ViCe PReSiDenTMarKet & StrateGY inSiGHt anD Corporate planninG
AnGeline oh SenioR ViCe PReSiDenTHuMan reSourCe
AnnA Choo SenioR ViCe PReSiDenTtreaSurY
AnThonY SeAh Chief of TeChniCAl SeRViCeS
BelinDA GAn GRouP finAnCiAl ConTRolleR
BoAz Boon SenioR ViCe PReSiDenTMarKet & StrateGY inSiGHt (CHina) unit
ChYe Moi June heADGroup taX
FRAnCisWOnGHOOeWAiChief of ART MAnAGeMenT
HAROlDWOOSenioR ViCe PReSiDenTinVeStor relationS
huBeRT lADSTATTeR SenioR ViCe PReSiDenTriSK ManaGeMent
lee TionG PenGSenioR ViCe PReSiDenT CapitalanD inStitute of ManaGeMent & BuSineSS
leonG Soon PenG Chief TeChnoloGY offiCeR
leOWsieWBenGSenioR ViCe PReSiDenTHuMan reSourCe (orGaniSational DeVelopMent)
liM Soo GeeheAD Corporate SeCuritY & inVeStiGation
loRnA TAn SenioR ViCe PReSiDenTCorporate CoMMuniCationS
lOWsAiCHOYSenioR ViCe PReSiDenTleGal/CoMpanY SeCretarY
MoniCA ChiA SenioR ViCe PReSiDenTGroup internal auDit
Poon hin konG CHieFOFDesiGnReVieWuniT
ShARon SnG SenioR ViCe PReSiDenTCorporate finanCe
TAn Bee lenGViCe PReSiDenT Corporate MarKetinG & Corporate SoCial reSponSiBilitY
TinG TonG koiSenioR ViCe PReSiDenT operationS CoMplianCe unit
52
Corporate GovernanceCorporate GoVernanCe report
Corporate GoVernanCe reportCapitaland limited (the “Company”) observes high standards of corporate conduct in line with the principles of the Code of Corporate Governance (“Code”). the Code was revised by the Monetary authority of Singapore in May 2012 and although it takes effect only for companies in respect of annual reports relating to financial years commencing from 1 July 2012, the Company has revised its policies and practices (including its Board Charter and terms of reference of its Board Committees) to adhere to the revised Code. Where there is any material deviation, an explanation has been provided within this report.
the Company believes in developing and maintaining sound and transparent policies and practices to meet its business needs as a trusted and respected business enterprise. it remains focused on the substance and spirit of the principles of the revised Code while achieving operational excellence and delivering the Group’s long term strategic objectives.
this report on the Company’s corporate governance practices for financial year 2012 describes its application of good governance principles in building a company committed to integrity, excellence and its people. the application is underpinned by sound and robust systems of internal controls and accountability to promote and drive long-term sustainable growth and shareholder value.
the following sections covering each of the principles of the revised Code outlines the Company’s policies and practices.
(A) BoARD MATTeRSPrinciple 1: The Board’s Conduct of Affairs
the Company is led by an effective Board comprising a majority of independent non-executive Directors. each Director brings to the Board his skills, experience, insights and sound judgement, which together with strategic networking relationships, serves to further the interests of the Company. at all times, the Directors are collectively and individually obliged to act in good faith and consider the best interests of the Company.
the Board oversees the affairs of the Company and is collectively responsible for the long-term success of the Company. the Board works with Management to achieve this objective and Management remains accountable to the Board.
the Board has adopted a Board Charter setting forth the duties and responsibilities of the Board. these include:
(a) approving the broad policies, strategies and objectives of the Group;
(b) approving annual budgets, major funding, including capital management proposals, investment and divestment proposals;
(c) reviewing at least annually the adequacy and effectiveness of the Group’s risk management and internal control systems including establishing risk appetite and parameters, and internal control systems including financial, operational, compliance and information technology controls;
(d) reviewing succession plans for Directors and recommending their appointment for shareholders’ approval;
(e) reviewing the appointment of and succession plans for the Chief executive officer (“Ceo”);
(f) recommending Board compensation for shareholders’ approval;
(g) approving compensation framework and specific remuneration packages of Ceo and key management personnel; and
(h) appointing and removing the Company Secretary. Specific matters which are reserved for the Board’s approval include:
(a) material acquisitions, investments, disposals and divestments;
(b) corporate and financial restructuring;(c) share issuances, dividends and other returns to
shareholders;(d) the targets for and assessing the performance of the
Ceo and determining the compensation package for the Ceo; and
(e) matters which involve a conflict of interest for a substantial shareholder or a Director.
the Board has adopted a set of internal controls which sets out approval limits for capital expenditure, investments and divestments, bank borrowings and signatories of cheques at Board level. approval sublimits are also provided at Management levels to facilitate operational efficiency.
the Board meets regularly to review the key activities and business strategies of the Group, at least once every quarter, and as required by business imperatives. prior to the start of each Board Meeting, the non-executive Directors would meet without the presence of Management.
53
a total of seven Board meetings was held in 2012.
to assist the Board in the discharge of its oversight functions, various Board Committees, namely audit Committee (“aC”), Corporate Disclosure Committee (“CDC”), executive resource and Compensation Committee (“erCC”), finance and Budget Committee (“fBC”), investment Committee (“iC”), nominating Committee (“nC”) and risk Committee (“rC”) have been constituted with clear written terms of reference. other Board Committees may be formed as dictated by business imperatives. Membership of the various Board Committees is carefully managed to ensure an equitable distribution of responsibility among Board members, to maximise the effectiveness of the Board and to foster active participation and contribution from Board members. Diversity of experience and appropriate skills are considered. the Company has also taken steps to ensure that there are appropriate checks and balances in the compositions of the various Board Committees.
the membership of the Board Committees is set out on page 68 of this report.
a table showing the attendance record of Directors at Board and Board Committee meetings during the year is set out on page 69 of this report. We believe in the manifest contribution of our Directors beyond attendance at formal Board and Board Committee meetings.
the Company is responsible for arranging the training of Directors.
newly appointed Directors are given briefings by Management to orientate them on the strategic objectives and business activities of the Group. arrangements are also made for the newly appointed Directors to visit the Company’s properties and development sites both in Singapore and overseas.
upon appointment, each Director is briefed and provided with a formal letter setting out the Director’s duties and obligations. Directors are expected to exercise independent judgement in the best interests of the Company. Directors are also briefed and provided with relevant information on the Company’s policies and procedures relating to corporate conduct and governance
including disclosure of interests in securities, prohibitions on dealings in the Company’s securities, restrictions on disclosure of price sensitive information and the disclosure of interests relating to certain property transactions.
the Directors are provided with opportunities for continuing education in areas such as Directors’ duties and responsibilities, corporate governance, changes in financial reporting standards, insider trading, changes in the Companies act, the listing rules of the listing Manual of the Singapore exchange Securities trading limited (“SGX-St”) and the Code, and industry-related matters, so as to update them on matters that affect or may enhance their performance as Board or Board Committee members.
training provided to new and existing Directors in 2012 included:
(a) update on new property measures by the authorities;(b) recent changes to the listing rules of the listing Manual
of the SGX-St;(c) Code of Corporate Governance 2012;(d) new notification regime for Substantial Shareholders/
unitholders and Directors and Ceos under the Securities and futures act (“Sfa”); and
(e) a case study on non-disclosure offences under the Sfa.
Principle 2: Board Composition and Guidance
the Board comprises 12 Directors with 10 non-executive Directors as at 28 february 2013. profiles of the Directors are provided on pages 34 to 41 of the annual report.
in financial year 2012, Dr Hu tsu tau, Mr richard edward Hale and Dr fu Yuning stepped down from the Board on 30 april 2012. tan Sri amirshim bin aziz joined the Board on 30 July 2012
Mr lim Ming Yan and Mr Stephen lee joined the Board on 1 January 2013.
Mr ng Kee Choe was appointed non-executive Chairman on 1 May 2012. He brings with him a wealth of experience in finance and banking and listed company experience in Singapore and australia.
Mr lim Ming Yan, the president & Group Ceo, is the executive Director. He succeeded Mr liew Mun leong who was president and Ceo, from 1 January 2013.

54
Corporate GovernanceCorporate GoVernanCe report
Corporate GoVernanCe reportthe Directors are business leaders and professionals with financial, banking, real estate, tax, legal, economics, investment, accounting and manufacturing backgrounds. Management has benefitted from their diverse experience and perspectives on issues brought before the Board. the Board and Management interacts formally and informally. this, together with the separation of the role of the Chairman and the Ceo, provides a healthy professional relationship between the Board and Management with clarity of roles.
the Board has established the nC which recommends to the Board, the appointments to the Board and Board Committees and the independence of the Directors. the nC has recommended and the Board has determined that nine of the 10 non-executive Directors were independent in the financial year 2012. for the purposes of the determination, the non-executive Directors have provided declarations of their independence which were deliberated upon by the nC and the Board.
the Board has determined that Mr ng Kee Choe be considered independent as he has demonstrated independence in character and judgement in the discharge of his responsibilities as a Director of the Company and there are no relationships or circumstances that are likely to affect, or could appear to affect, his judgement based on his declaration received.
the Board has determined that Mr peter Seah lim Huat be considered independent notwithstanding that he has served on the Board beyond nine years as he has continued to demonstrate strong independence in character and judgement in the discharge of his responsibilities as a Director of the Company. He has continued to express his individual viewpoints, debated issues and objectively scrutinised and challenged Management. He has sought clarification and amplification as he deemed required, including through direct access to the Group’s employees and external advisors. Based on his declaration received, Mr Seah has no association with Management that could compromise his independence.
the Board has determined that Mr Seah be considered independent notwithstanding that he is Chairman of DBS Bank as (i) the threshold of S$200,000 recommended in Guideline 2.3(d) of the Code for payments made by the Group to DBS Bank was not significant compared with the overall payments made by the Group in the financial year 2012, (ii) the services received by the Group from DBS Bank was not material in the context of all the
financial advisory and related services that the Group had received from its other banks and (iii) Mr Seah is required under the Company’s policy to recuse himself from any transaction with DBS Bank or any matter that might give rise to a conflict of interest with DBS Bank and would abstain from voting on such proposals at the Board meetings. Based on his declaration received, there are no other relationships or circumstances that are likely to affect, or could appear to affect Mr Seah’s judgement.
the Board has determined that Mr James Koh Cher Siang be considered independent notwithstanding that he is a Director of united overseas Bank (“uoB”) as (i) the threshold of S$200,000 recommended in Guideline 2.3(d) of the Code for payments made by the Group to uoB was not significant compared with the overall payments made by the Group in the financial year 2012, (ii) the services received by the Group from uoB was not material in the context of all the financial advisory and related services that the Group had received from its other banks and (iii) Mr Koh is required under the Company’s policy to recuse himself from any transaction with uoB or any matter that might give rise to a conflict of interest with uoB and would abstain from voting on such proposals at Board meetings. Mr Koh has also demonstrated independence in character and judgement in the discharge of his responsibilities as a Director of the Company and there are no other relationships or circumstances that are likely to affect, or could appear to affect, his judgement based on his declaration received.
the Board has determined that Mrs arfat pannir Selvam be considered independent notwithstanding that she is a Director of the Company’s listed subsidiary, CapitaMalls asia limited (“CMa”) as (i) the threshold of S$200,000 recommended in Guideline 2.3(d) of the Code for payments made by CMa to the Company was not significant compared with the revenues received by the Group in the financial year 2012, (ii) the payments received by the Group from CMa for the corporate support services supplied were interested person transactions (“ipts”) from CMa’s perspective and would be on normal commercial terms since ipts were regulated by Chapter 9 of the listing Manual of SGX-St, (iii) the corporate support services supplied were not material to the Group’s business and (iv) Mrs Selvam is required under the Company’s policy to recuse herself from any transaction with CMa or any matter that might give rise to a conflict of interest with CMa and would abstain from voting on such proposals at Board meetings. Mrs Selvam
55
has also demonstrated independence in character and judgement in the discharge of her responsibilities as a Director of the Company and there are no other relationships or circumstances that are likely to affect, or could appear to affect, her judgement based on her declaration received.
the Board has determined that prof Kenneth Stuart Courtis be considered independent as he has demonstrated independence in character and judgement in the discharge of his responsibilities as a Director of the Company and there are no relationships or circumstances that are likely to affect, or could appear to affect, his judgement based on his declaration received.
the Board has determined that Mr John powell Morschel be considered independent notwithstanding that he isChairmanofAustraliaandNewZealandBankingGroup(“ANZBank”)as(i)thethresholdofS$200,000recommended in Guideline 2.3(d) of the Code for paymentsmadebytheGrouptoANZBankwasnotsignificant compared with the overall payments made by the Group in the financial year 2012, (ii) the services receivedbytheGroupfromANZBankwasnotmaterialin the context of all the financial advisory and related services that the Group had received from its other banks and (iii) Mr Morschel is required under the Company’s policytorecusehimselffromanytransactionwithANZBank or any matter that might give rise to a conflict of interestwithANZBankandwouldabstainfromvoting on such proposals at Board meetings. Mr Morschel has also demonstrated independence in character and judgement in the discharge of his responsibilities as a Director of the Company and there are no other relationships or circumstances that are likely to affect, or could appear to affect, his judgement based on his declaration received.
Mr Simon Claude israel retired as executive Director of temasek Holdings (private) limited (“temasek”) on 1 July 2011. as temasek is not a related company of the Company, he could technically be considered an independent Director under the Code. However as temasek is the Company’s major shareholder, the Board has determined that Mr israel be considered non-independent until the next annual review of the Directors’ independence.
the Board has determined that Ms euleen Goh Yiu Kiang be considered independent notwithstanding that she is Director of DBS Bank as (i) the threshold of S$200,000
recommended in Guideline 2.3(d) of the Code for payments made by the Group to DBS Bank was not significant compared with the overall payments made by the Group in the financial year 2012, (ii) the services received by the Group from DBS Bank was not material in the context of all the financial advisory and related services that the Group had received from its other banks and (iii) Ms Goh is required under the Company’s policy to recuse herself from any transaction with DBS Bank or any matter that might give rise to a conflict of interest with DBS Bank and would abstain from voting on such proposals at Board meetings. Ms Goh has also demonstrated independence in character and judgement in the discharge of her responsibilities as a Director of the Company and there are no other relationships or circumstances that are likely to affect, or could appear to affect, her judgement based on her declaration received.
the Board has determined that tan Sri amirsham Bin a aziz be considered independent notwithstanding that he is a Director of CMa as (i) the threshold of S$200,000 recommended in Guideline 2.3(d) of the Code for payments made by CMa to the Company was not significant compared with the revenues received by the Group in the financial year 2012, (ii) the payments received by the Group from CMa for the corporate support services supplied were ipts from CMa’s perspective and would be on normal commercial terms since ipts were regulated by Chapter 9 of the listing Manual of SGX-St, (iii) the corporate support services supplied were not material to the Group’s business and (iv) tan Sri amirsham is required under the Company’s policy to recuse himself from any transaction with CMa or any matter that might give rise to a conflict of interest with CMa and would abstain from voting on such proposals at Board meetings. tan Sri amirsham has also demonstrated independence in character and judgement in the discharge of his responsibilities as a Director of the Company and there are no other relationships or circumstances that are likely to affect, or could appear to affect, his judgement based on his declaration received.
Mr Stephen lee Ching Yen was appointed on 1 January 2013 as independent non-executive Director as the Board has determined that there are no relationships or circumstances that are likely to affect, or could appear to affect, Mr lee’s judgement based on his declaration received.
Mr liew Mun leong and Mr lim Ming Yan are both executives of the Company and they are therefore deemed to be non-independent Directors.

56
Corporate GovernanceCorporate GoVernanCe report
Corporate GoVernanCe reportprinciple3: Chairman and Chief executive officer
to maintain effective supervision and accountability at each of the Board and Management levels, the positions of Chairman and Ceo are held by separate individuals.
the non-executive Chairman leads the Board and acts independently in the best interests of the Company and its shareholders, while the Ceo is responsible for the running of the Group’s businesses.
the Chairman ensures that the members of the Board and Management work together with integrity, competency and moral authority, and that the Board constructively engages Management on strategy, business operations, enterprise risk and other plans.
the Ceo is a Board member and has full executive responsibilities over the business directions and operational decisions of the Group. the Ceo, in consultation with the Chairman, schedules Board meetings and finalises the preparation of the Board meeting agenda. He ensures the quality and timeliness of the flow of information between Management and the Board. He is also responsible for ensuring that the Company complies with corporate governance guidelines.
the Chairman and Mr lim Ming Yan, the president & Group Ceo, are not related family members. the Chairman and Mr liew Mun leong, the president and Ceo in financial year 2012, are also not related family members.
Principle 4: Board Membership
Board renewal is a continual process, for good governance and to maintain relevance to the changing needs of the Group’s businesses. election of Board members is the prerogative and right of shareholders.
the nC is chaired by Mr peter Seah lim Huat and comprises Mr ng Kee Choe, Mrs arfat pannir Selvam, Mr John powell Morschel and Mr Simon Claude israel. Mr liew Mun leong stepped down from the nC on 1 January 2013.
the majority of the nC members, including the Chairman, are independent non-executive Directors.
the nC ensures that the Board and Board Committees in the Group comprise individuals who are best able to discharge their responsibilities as Directors having regard to the law and the highest standards of corporate governance. in performing its role, the nC is guided by its terms of reference. in particular, the nC will recommend to the Board:
(a) candidates for appointments to the Company’s Board and Board Committees;
(b) candidates to be the Company’s nominees on the Boards of listed subsidiaries and/or associates within the Group; and
(c) candidates to the Board and Board Committees of holding companies of the unlisted business units.
in addition, the nC shall:
(a) make recommendations to the Board on the succession plans for Directors and the appointment of and succession plan for the Ceo;
(b) review and recommend the development of a process for evaluation of the performance of the Board, Board Committees and Directors;
(c) review and recommend the training and professional development programmes for the Board;
(d) consider annually, and as and when circumstances require, if a Director is independent, and shall provide its views to the Board for consideration;
(e) review and decide if a Director is able to and has been adequately carrying out his duties as a Director, taking into consideration the Director’s number of listed company board representation and other principal commitments; and
(f) review at least once a year the Company’s corporate governance practices, having regard to relevant local and international developments in the area of corporate governance (including changes in applicable law, regulations and listing rules), and recommend changes to the Board.

57
the Board has delegated specific duties to the nC with regard to the selection, appointment and re-election of non-executive Directors. the Board has formalised the process for selecting, appointing and re-electing non-executive Directors to the Board as follows:
(a) the nC will at least annually carry out proactive review of the Board composition as well as on each occasion that an existing non-executive Director gives notice of his or her intention to retire or resign. this is to assess the collective skills of non-executive Directors represented on the Board to determine whether the Board, as a whole, has the skills required to achieve the Group’s strategic and operational objectives. the outcome of that assessment will be reported to the Board;
(b) in carrying out this review, the nC will take into account that the Board composition should reflect balance in matters such as skill representation, tenure, experience, age spread and diversity (including gender diversity);
(c) the nC will identify suitable candidates for appointment to the Board having regard to the skills required and the skills represented on the Board;
(d) external consultants may be used from time to time to access a wide base of potential non-executive Directors. those considered will be assessed against a range of criteria including background, experience, professional skills and personal qualities. the nC and the Board will also consider whether a candidate’s skills and experience will complement the existing Board and whether the candidate has sufficient time available to commit to his responsibilities as a Director;
(e) the nC will make recommendations to the Board on candidates it considers appropriate for appointment;
(f) a new Director will receive a formal letter of appointment and during the appointment process will also be given a copy of the new Directors’ Manual (which includes information on a broad range of matters relating to the role of a Director);
(g) all Directors on appointment will be required to undertake an induction programme to familiarise them with matters relating to the Company’s business, strategy and any matters before the Board. the induction programme includes meetings with the Chairman of the Board, the Chairmen of the Board Committees, the Ceo, the Company Secretary, the Group Chief financial officer (“Cfo”) and other key executive members;
(h) following appointment and induction, the Board will encourage Directors to continue their education by participating in formal workshops and attending relevant site visits. Directors are also encouraged to undertake relevant external training by attending briefings, market updates, etc;
(i) Subject to the provisions of the articles of association of the Company (“articles”) and the Companies act, the Board may appoint a person as a Director of the Company at any time but that person must retire, and may seek election by shareholders, at the next annual General Meeting (“aGM”);
(j) in regard to the re-election of existing Directors each year, the nC will advise the Board of those Directors who are retiring in accordance with the provisions of the articles of the Company;
(k) the nC will make recommendations to the Board as to whether the Board should support the re-election of a Director retiring in accordance with the provisions of the articles;
(l) in making recommendations, the nC will undertake a process of review of the retiring non-executive Director’s performance during the period in which the non-executive Director has been a member of the Board; and
(m) a non-executive Director will serve a maximum of two three-year terms and thereafter by exception on the recommendation of the nC.
the above process shall be reviewed periodically at the discretion of the Board.
the Company’s articles require one-third of its Directors to retire and subject themselves to re-election (“one-third rotation rule”) by shareholders at every aGM. in other words, no Director stays in office for more than three years without being re-elected by shareholders.
the Ceo, as a Board member, is also subject to the one-third rotation rule. this separates his role as Ceo from his position as a Board member, and enables shareholders to exercise their right to select all Board members.
in addition, a new Director appointed by the Board will submit himself for retirement and re-election at the aGM immediately following his appointment. thereafter, he is subject to the one-third rotation rule.
58
Corporate GovernanceCorporate GoVernanCe report
Corporate GoVernanCe reportDirectors who are above the age of 70 are also statutorily required to seek re-appointment at each aGM.
the nC has assessed that each Director in the Company is able to and has been adequately carrying out his duties as a Director of the Company, taking into consideration the Director’s number of listed company board representations and other principal commitments.
the Board is of the view that setting a maximum number of listed company board representations would not be meaningful as the contributions of the Directors would depend on many other factors such as whether they were in full time employment and their other responsibilities. all Directors had confirmed that notwithstanding the number of listed company board representations and other principal commitments, which the Directors held, they were able to devote sufficient time and attention to the affairs of the Company.
Directors who are seeking re-election at the next aGM on 26 april 2013 are stated in the notice of aGM on pages 247 to 250 of the annual report.
principle5: Board Performance
We believe that Board performance is ultimately reflected in the long term performance of the Group.
the Board, through the nC, has ensured from the outset the requisite blend of background, experience and knowledge in technology, business, finance and management skills critical to the Group’s businesses. it has from the outset ensured that each Director with his special contribution brings to the Board an independent and objective perspective to enable balanced and well-considered decisions to be made.
renewal or replacement of Board members do not necessarily reflect their contributions to date, but may be driven by the need to position and shape the Board in line with the needs of the Company and its business.
the Board has adopted a process whereby an external consultant will be appointed to assess the effectiveness of the Board and Board Committees annually. the consultant appointed is independent of and is not related to the Company or any of its Directors.
in financial year 2012, questionnaires were sent by the consultant to the Directors and the Senior Management and the findings were evaluated by the consultant and reported, together with the recommendations of the consultant, to the Chairman of the nC. the findings and the recommendations were reviewed by the Board.
Principle 6: Access to information
We believe that the Board should be provided with timely, adequate and complete information prior to Board meetings, and as and when the need arises. as a general rule, Board papers are sent to Board members at least five working days before the Board meeting so that the members may better understand the matters prior to the Board meeting and discussion may be focused on questions that the members may have. However, sensitive matters may be tabled at the meeting itself or discussed without any papers being distributed. new Board members are fully briefed on the businesses of the Group.
Management provides timely, adequate and complete information to the Board on Board affairs and issues requiring the Board’s decision. it also provides ongoing reports relating to operational and financial performance of the Company, such as monthly management financial reports. the articles of the Company provide for Directors to convene meetings by teleconferencing or videoconferencing. Where a physical Board meeting is not possible, timely communication with members of the Board is effected through electronic means which include electronic mail, teleconferencing and videoconferencing. alternatively, Management will brief Directors in advance before seeking the Board’s approval.
the Board has access to Senior Management and the Company Secretary at all times. the Company Secretary attends to corporate secretarial administration matters and is the corporate governance advisor on corporate matters to the Board and Senior Management. the Company Secretary attends Board meetings. the Board also has access to independent professional advice where appropriate.
Board meetings for each year are scheduled in advance in the preceding year to facilitate Directors’ individual administrative arrangements in respect of competing commitments.

59
(B) ReMuneRATion MATTeRS Principle 7: Procedures for Developing
Remuneration Policies Principle 8: level and Mix of RemunerationPrinciple 9: Disclosure on Remuneration
We believe that a framework of remuneration for the Board and key executives should not be taken in isolation. it should be linked to the building of management bench strength and the development of key executives. this is to ensure continual development of talent and renewal of strong and sound leadership for a sustainable business and a lasting company. the Company’s erCC plays a crucial role in helping to ensure that the Company is able to attract, recruit and retain the best talents to drive the Group’s businesses forward.
the erCC is chaired by Mr peter Seah lim Huat and comprises Mr ng Kee Choe, Mr Simon Claude israel and Mr Stephen lee Ching Yen who was appointed on 1 february 2013. Mr ng Kee Choe will be replacing Mr peter Seah as Chairman of erCC on 27 april 2013.
all the erCC members, including the Chairman, are independent non-executive Directors.
the erCC oversees executive compensation and development in the Group. it sets appropriate remuneration policies and designs competitive compensation packages with focus on long term sustainability of business and long term shareholders’ return.
the erCC is guided by its terms of reference. Specifically, the erCC will in relation to each of the following areas:
executive remuneration policy(a) review and recommend to the Board a general
framework of remuneration for key management personnel of the Group; and
(b) review the on-going appropriateness and relevance of the executive remuneration policy and other benefit programmes;
Key Management personnel(a) consider, review, vary (if necessary) and recommend
to the Board the entire specific remuneration package and service contract terms for each key management personnel in the Group excluding its listed subsidiaries (including salaries, allowances, bonuses, payments, options, benefits in kind, retirement rights, severance packages and service contracts) having regard to the general framework of remuneration for key management personnel in the Group excluding its listed subsidiaries;
(b) consider and approve termination payments, retirement payments, gratuities, ex-gratia payments, severance payments and other similar payments to key management personnel in the Group excluding its listed subsidiaries; and
(c) ensure that their contracts of service contain fair and reasonable termination clauses which are not overly generous;
equity Based plans (a) review and approve the design of all option plans, stock
plans and/or other equity based plans in the Company;(b) for each equity based plan, determine each year
whether awards will be made under that plan;(c) review and approve each award as well as the total
proposed awards under each plan in accordance to the rules governing each plan, including awards to Directors and each key management personnel; and
(d) review, approve and keep under review performance hurdles and/or fulfillment of performance hurdles for each equity based plan in the Company;
non-executive Director remuneration framework(a) review and recommend to the Board a general
framework of remuneration (including Directors’ fees) for non-executive Directors in the Group excluding its listed subsidiaries; and
(b) review and recommend to the Board specific remuneration packages for each Director in the Company;
executive and leadership Development(a) oversee the development plans of Management
with the aim of a continual build up of talent and renewal of strong and sound leadership to ensure the continued success of the Group and its businesses. it shall approve appointment of key management positions and review succession plans for key management positions in the Group (excluding the Ceo) and oversee the development of key executives and talented executives in the Group.
the aim of the erCC is to build capable and committed management teams, through competitive compensation, focused management, and progressive policies which can attract, motivate and retain a pool of talented executives to meet the current and future growth of the Company. the erCC conducts, on an annual basis, a succession planning review of the Ceo and selected key management positions in the Company. potential internal and external candidates for succession are reviewed in the light of immediate, medium term and longer term needs and readiness.

60
Corporate GovernanceCorporate GoVernanCe report
Corporate GoVernanCe report
the Board sets the remuneration policies in line with the Company’s business strategy and approves the executive compensation framework based on the key principle of tying pay to performance at the beginning of the financial year. the Board approves the guaranteed cash component based on position size and relevant market competitive levels of compensation, sets performance conditions for all incentive plans and reviews the potential compensation payouts for various levels of group, business unit and individual performance at the end of the financial year. the Board reviews the performance and the resulting incentives taking into account the relevant market competitive levels of compensation. the Board has access to the advice of independent remuneration consultant to assist with the above procedure.
in financial year 2012, the erCC appointed an external counsultant Carrots Consulting pte ltd (“Carrots”) to provide professional advice on board and executive remuneration. Carrots and its principal consultant Mr Johan Grundlingh, is independent and is not related to the Company or any of its Directors. in its deliberations, the erCC took into consideration industry practices and norms in compensation. Mr liew Mun leong, the president and Ceo, was not present during the discussions relating to his own compensation and terms and conditions of service, and the review of his performance. He was in attendance when the erCC discussed policies and compensation of his senior team and key staff which included contingent share awards, bonus, staff salary review and other incentive schemes.
the principles governing the Company’s key management personnel remuneration policy are as follows:
BuSineSS AliGnMenT
MoTiVATe RiGhT BehAViouRS
fAiR & APPRoPRiATe
effeCTiVe iMPleMenTATion
• Buildsustainable value creation and drive wealth-added to align with longer term shareholder interests
• Providesound, structured funding to ensure affordability and cost-effectiveness in line with performance goals
• Enhanceretentionofkeytalentstobuild strong organisational capabilities
• Pay for performance –align, differentiate and balance rewards according to multiple dimensions of performance
• Strengthen line-of-sight linking rewards and performance goals
• FosterGroup-Wideinterests to recognise the interdependence of the various business units and drive superior outcomes
• Ensureremunerationiscompetitive relative to the appropriate external talent markets
• Manageinternalequity so that remuneration systems are viewed as fair across the Group
• Significantandappropriateportionofpay-at-risk, taking into account risk policies of the Group, symmetrical with risk outcomes and sensitive to risk time horizon
• Maintainrigorous corporate governance requirements
• exercise appropriate flexibility to meet strategic business needs and practical implementation considerations
• facilitate employee understanding to maximise the value of the remuneration programs
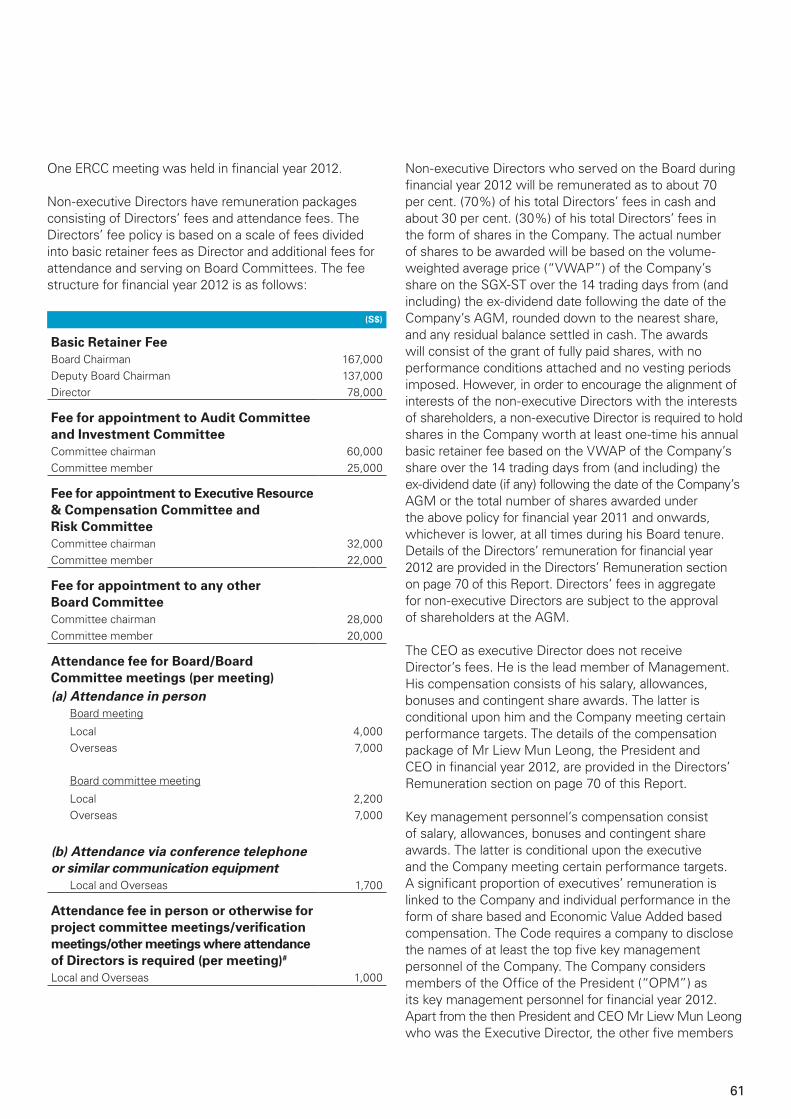
61
one erCC meeting was held in financial year 2012.
non-executive Directors have remuneration packages consisting of Directors’ fees and attendance fees. the Directors’ fee policy is based on a scale of fees divided into basic retainer fees as Director and additional fees for attendance and serving on Board Committees. the fee structure for financial year 2012 is as follows:
(S$)
Basic Retainer feeBoard Chairman 167,000Deputy Board Chairman 137,000Director 78,000
fee for appointment to Audit Committee and investment CommitteeCommittee chairman 60,000Committee member 25,000
fee for appointment to executive Resource & Compensation Committee and Risk CommitteeCommittee chairman 32,000Committee member 22,000
fee for appointment to any other Board CommitteeCommittee chairman 28,000Committee member 20,000
Attendance fee for Board/Board Committee meetings (per meeting)(a) Attendance in person Board meeting
local 4,000 overseas 7,000
Board committee meeting
local 2,200 overseas 7,000
(b) Attendance via conference telephone or similar communication equipment local and overseas 1,700
Attendance fee in person or otherwise for project committee meetings/verification meetings/other meetings where attendance ofDirectorsisrequired(permeeting)#
local and overseas 1,000
non-executive Directors who served on the Board during financial year 2012 will be remunerated as to about 70 per cent. (70%) of his total Directors’ fees in cash and about 30 per cent. (30%) of his total Directors’ fees in the form of shares in the Company. the actual number of shares to be awarded will be based on the volume-weighted average price (“VWap”) of the Company’s share on the SGX-St over the 14 trading days from (and including) the ex-dividend date following the date of the Company’s aGM, rounded down to the nearest share, and any residual balance settled in cash. the awards will consist of the grant of fully paid shares, with no performance conditions attached and no vesting periods imposed. However, in order to encourage the alignment of interests of the non-executive Directors with the interests of shareholders, a non-executive Director is required to hold shares in the Company worth at least one-time his annual basic retainer fee based on the VWap of the Company’s share over the 14 trading days from (and including) the ex-dividend date (if any) following the date of the Company’s aGM or the total number of shares awarded under the above policy for financial year 2011 and onwards, whichever is lower, at all times during his Board tenure. Details of the Directors’ remuneration for financial year 2012 are provided in the Directors’ remuneration section on page 70 of this report. Directors’ fees in aggregate for non-executive Directors are subject to the approval of shareholders at the aGM.
the Ceo as executive Director does not receive Director’s fees. He is the lead member of Management. His compensation consists of his salary, allowances, bonuses and contingent share awards. the latter is conditional upon him and the Company meeting certain performance targets. the details of the compensation package of Mr liew Mun leong, the president and Ceo in financial year 2012, are provided in the Directors’ remuneration section on page 70 of this report.
Key management personnel’s compensation consist of salary, allowances, bonuses and contingent share awards. the latter is conditional upon the executive and the Company meeting certain performance targets. a significant proportion of executives’ remuneration is linked to the Company and individual performance in the form of share based and economic Value added based compensation. the Code requires a company to disclose the names of at least the top five key management personnel of the Company. the Company considers members of the office of the president (“opM”) as its key management personnel for financial year 2012. apart from the then president and Ceo Mr liew Mun leong who was the executive Director, the other five members

62
Corporate GovernanceCorporate GoVernanCe report
Corporate GoVernanCe reportof the opM for financial year 2012 were the then Chief operating officer Mr lim Ming Yan, the then Chief Corporate officer Ms Jennie Chua Kheng Yeng, the then Chief executive officer of Capitaland financial limited Mr Wen Khai Meng, the then Chief investment officer Mr olivier lim tse Ghow and the Group Cfo Mr arthur lang tao Yih. the details of their compensation package in bands of S$250,000 and in percentage terms are provided in the Key executives’ remuneration section on page 74 of this report.
in performing the duties as required under its terms of reference, the erCC ensures that remuneration paid to the Ceo and key management personnel is strongly linked to the achievement of business and individual performance targets. the performance targets as determined by the erCC are set at realistic yet stretched levels each year to motivate a high degree of business performance with emphasis on both short- and long-term quantifiable objectives. a pay-for-performance alignment study was conducted by the external consultant and reviewed by erCC and it was found that there was sufficient evidence indicating pay-for-performance alignment for the Company in both absolute and relative terms for the 3-year period from financial year 2009 to financial year 2011.
for financial year 2012, there were no termination, retirement and post-employment benefits granted to Directors, the Ceo and the top five key management personnel other than the payment in lieu of notice in the event of termination in the employment contracts of the Ceo and the top five key management personnel.
no employee of the Company and its subsidiaries was an immediate family member of a Director or the president and Ceo and whose remuneration exceeded S$150,000 during the financial year 2012. “immediate family member” means the spouse, child, adopted child, step-child, sibling and parent.
Share awards which were made in 2012 were based on the Capitaland performance Share plan 2010 and the Capitaland restricted Share plan 2010 (the “new Share plans”) approved and adopted by the shareholders of the Company at the extraordinary General Meeting held on 16 april 2010.
upon the adoption of the new Share plans, the existing Capitaland performance Share plan and the Capitaland restricted Stock plan (the “existing Share plans”) were terminated without prejudice to the rights of holders of outstanding options and awards. the new Share plans carry the same terms as the existing Share plans except
that the maximum size of the shares to be issued has been reduced to 8% over the 10-year life of the new Share plans (compared to 15% of the existing Share plans).
Details of the existing Share plans and new Share plans as well as awards granted under the existing Share plans and new Share plans are given in the Share plans section of the Directors’ report from pages 140 to 145.
(C) ACCounTABiliTY AnD AuDiTPrinciple 10: Accountability
the Board provides shareholders with quarterly and annual financial reports. results for the first three quarters are released to shareholders within 45 days from the end of the quarter. annual results are released within 60 days from the financial year-end. the Company’s results for first three quarters and full year for financial year 2012 were all released on a timely basis, within 31 days of the end of the relevant quarter and within 51 days of the end of the full year. in presenting the annual and quarterly financial statements to shareholders, the Board aims to provide shareholders with a balanced and clear assessment of the Company’s position and prospects.
for financial year 2012, the president and Ceo and Group Cfo have provided assurance to the Board on the integrity of the financial statements for the Group. for the interim financial statements, the Board has provided a negative assurance confirmation to shareholders, in line with the listing Manual of the SGX-St. for the full year financial statements, the Board has received an assurance from the president & Group Ceo and the Group Cfo set out in page 63 of this report. Principle 11: Risk Management and internal Controls
the Company believes that it has in place a robust and effective system of internal controls addressing material financial, operational, compliance and information technology risks to safeguard shareholders’ interests and the Group’s assets, and also to manage risks.
the aC is responsible for making the necessary recommendation to the Board such that an opinion or comment regarding the adequacy and effectiveness of the risk management and internal control systems of the Group can be made by the Board in the annual report of the Company according to the listing Manual of the SGX-St and the Code. in this regard, the aC is assisted by the rC which was formed in 2002 as part of the Company’s efforts to strengthen its risk management processes and framework.
63
the rC is chaired by Mr James Koh Cher Siang and comprises Ms euleen Goh Yiu Kiang who was appointed on 30 april 2012, tan Sri amirsham Bin a aziz who was appointed on 15 august 2012 and Mr Stephen lee Ching Yen who was appointed on 1 february 2013. Mr richard edward Hale stepped down from the rC on 30 april 2012. Mrs arfat pannir Selvam stepped down from the rC on 1 february 2013. a total of four rC meetings was held in 2012.
the rC is guided by its terms of reference. Specifically, the rC assists the Board to:
(a) determine the Group’s levels of risk tolerance and risk policies;
(b) oversee Management in the formulation, updating and maintenance of an adequate and effective risk management framework in addressing material risks including material financial, operational, compliance and information technology risks;
(c) make the necessary recommendation to aC and the Board such that an opinion or comment regarding the adequacy and effectiveness of the risk management and internal control systems can be made by the Board of Directors in the annual report in accordance to the listing Manual of the SGX-St and the Code;
(d) review the Group’s risk profile regularly and the adequacy of any proposed action if necessary; and
(e) review any material breaches of risk limits and the adequacy of any proposed action if necessary.
the Company has an established risk identification and management framework developed with the assistance of an external consultant. in the Company, risks are proactively identified and addressed. the ownership of these risks lies with the respective business and corporate executive heads with stewardship residing with the Board. the rC assists the Board to oversee Management in the formulation, updating and maintenance of an adequate and effective risk management framework while the aC reviews the adequacy and effectiveness of the risk management and internal control systems. at the Management level, an enterprise risk Management Committee (erMC) comprising key management personnel, is responsible for directing and monitoring the development, implementation and practice of enterprise risk Management (“erM”) across the Group. erMC reports through president & Group Ceo to the rC.
the Company maintains a risk register which identifies the material risks facing the Group and the internal controls in place to manage or mitigate those risks.
Business and corporate executive heads in the Group review and update the risk register regularly. the risk register is reviewed annually by the rC, the aC and the Board. the rC also reviews the approach of identifying and assessing risks and internal controls in the risk register.
internal and external auditors conduct audits that involve testing the effectiveness of the material internal controls in the Group including testing, where practical, material internal controls in areas managed by external service providers. any material non-compliance or lapses in internal controls together with corrective measures recommended by internal and external auditors are reported to the aC. the effectiveness of the measures taken by Management in response to the recommendations made by the internal and external auditors is also reviewed by the aC. the system of risk management and internal controls is continually being refined by Management, the rC, the aC and the Board.
the Board has received assurance from the president & Group Ceo and the Group Cfo at the Board meeting on 20 february 2013 that:
(a) the financial records of the Group have been properly maintained and the financial statements for the year ended 31 December 2012 give a true and fair view of the Group’s operations and finances; and
(b) the system of risk management and internal controls in place within the Group is adequate and effective in addressing the material risks in the Group in its current business environment including material financial, operational, compliance and information technology risks. the president & Group Ceo and the Group Cfo have obtained similar assurance from the business and corporate executive heads in the Group.
Based on the framework established and the reviews conducted by Management and both the internal and external auditors throughout the financial year, as well as the assurance from the president & Group Ceo and the Group Cfo, the Board opines pursuant to rule 1207(10) of the listing Manual of the SGX-St, with the concurrence of the aC, that the Group’s internal controls were adequate as at 31 December 2012 to address financial, operational and compliance risks which the Group considers relevant and material to its operations.
64
Corporate GovernanceCorporate GoVernanCe report
Corporate GoVernanCe reportthe Board notes that the system of risk management and internal controls established by the Company provides reasonable, but not absolute, assurance that the Group will not be significantly affected by any event that can be reasonably foreseen as it strives to achieve its business objectives. However, the Board also notes that no system of risk management and internal controls can provide absolute assurance in this regard, or absolute assurance against poor judgment in decision making, human error, losses, fraud or other irregularities.
Principle 12: Audit Committee
the aC comprises Ms euleen Goh Yiu Kiang who was appointed Chairman on 30 april 2012, Mr James Koh Cher Siang, Mrs arfat pannir Selvam and tan Sri amirsham Bin a aziz who was appointed on 15 august 2012. Mr richard edward Hale stepped down from the aC on 30 april 2012. all the members of the aC, including the Chairman, are independent non-executive Directors. the members bring with them invaluable managerial and professional expertise in the financial, tax, legal and accounting domains.
the aC functions independently of the officers and other Directors of the Company who are not aC members. Such officers and other Directors of the Company who are not aC members may attend any particular aC meeting only at the aC’s invitation, specific to the relevant meeting. Management is required to provide the fullest co-operation in providing information and resources, and in implementing or carrying out all requests made by the aC.
the aC is responsible for overseeing the internal audit function. the aC ensures that the internal audit Department (“Cl ia”) is provided with adequate resources and that it has the appropriate standing within the Company to enable it to carry out its function effectively.
Where the aC becomes aware of any suspected fraud or irregularity, or suspected infringement of any law, rules or regulations, which has or is likely to have a material impact on the operating results or financial position of the Company, the aC shall discuss such matter with the external auditors and, at an appropriate time, report the matter to the Board.
the aC is guided by terms of reference which defines its scope of authority. Specifcally, the aC shall:
(a) review the Company’s and the Group’s financial statements and any public financial reporting with Management and external auditors for submission to the Board;
(b) review with the external auditors their audit plan, audit report, management letter and the response from the Management or difficulties with Management encountered during the course of the audit;
(c) review with the external and internal auditors the adequacy and effectiveness of the Group’s internal control systems, including financial, operational, compliance and information technology controls;
(d) make the necessary recommendation to the Board such that an opinion or comment regarding the adequacy and effectiveness of the risk management and internal control systems of the Group can be made by the Board in the annual report according to the listing Manual of the SGX-St and the Code;
(e) review with the internal auditors, the programme, scope and results of the internal audit and Management’s response to their findings to ensure that appropriate follow-up measures are taken;
(f) review at least annually the adequacy and effectiveness of the internal audit function;
(g) review with the external auditors the impact of any new or proposed changes in accounting principles or regulatory requirements on the financial statements of the Company and the Group;
(h) review ipts for potential conflicts of interest; (i) review on a periodic basis the framework and
processes established for the implementation of the terms of the collaboration agreement with CMa in order to ensure that such framework and processes remain appropriate;
(j) review and assess from time to time whether additional processes are required to be put in place to manage any material conflicts of interest within the Group and propose, where appropriate, the relevant measures for the measurement of such conflicts;
(k) review and resolve all conflicts of interest matters referred to it;
65
(l) assess the suitability of the accounting firm as external auditors and recommend to the Board their appointment or re-appointment as external auditors for the coming year, to approve their compensation as negotiated by Management and to review and approve their discharge. the aC shall review the scope and results of the external audit and also assess the cost effectiveness, the independence and objectivity of the external auditors. Where the auditors also supply a substantial volume of non-audit services to the Company, the aC shall keep the nature and extent of such services under review, seeking to balance the maintenance of objectivity and value for money;
(m) review filings with SGX-St or other regulatory bodies which contain the Company’s and the Group’s financial statements and ensure proper disclosure;
(n) commission and review the findings of internal investigations into matters where there is any suspected fraud or irregularity or failure of internal controls or infringement of any law, rule and regulation which has or is likely to have a material impact on the Group’s operating results and/or financial position. the aC shall be empowered to retain independent counsel, accountants or others to assist in the conduct of any investigation;
(o) report to the Board the work performed by the aC in carrying out its functions; and
(p) consider any other matters, as defined by the Board.
the aC also reviews arrangements by which employees of the Company may, in confidence, raise concerns about possible improprieties in matters of financial reporting or other matters. pursuant to this, the aC has introduced a Whistle Blowing policy where staff may raise improprieties to the aC Chairman, with the confidence that, in good faith, the staff making such reports will be treated fairly and be protected from reprisal. the aC confirms that no reports have been received under the Whistle Blowing policy thus far.
a total of four aC meetings was held in 2012. the aC also held one meeting with the external auditors and internal auditors, without Management’s presence, to discuss the reasonableness of the financial reporting process, the system of internal control, and the significant comments and recommendations by the auditors.
During financial year 2012, the Group Cfo briefed the aC on the impact of the new accounting standards on the Group’s consolidated financial statements. the external auditors also made a presentation on the new accounting standards at an aC Meeting.
principle13: internal Audit
Cl ia reports directly to the Chairman of the aC and administratively to the Group Cfo. Cl ia plans its internal audit schedules in consultation with, but independently of, Management and its plan is submitted to the aC for approval prior to the beginning of each year. the aC also meets with Cl ia at least once a year without the presence of Management.
Cl ia is a corporate member of the Singapore branch of the institute of internal auditors inc. (“iia”), which has its headquarters in the uSa. Cl ia subscribes to, and is guided by, the Standards for the professional practice of internal auditing (“Standards”) developed by the iia and has incorporated these Standards into its audit practices.
the Standards set by the iia cover requirements on:
(a) independence;(b) professional proficiency;(c) Scope of Work;(d) performance of audit Work; and(e) Management of the internal auditing Department.
Cl ia staff involved in information technology (“it”) audits are Certified information System auditors and members of the information System audit and Control association (“iSaCa”) in the uSa. the iSaCa information System auditing Standards provide guidance on the standards and procedures to be applied in it audits.
to ensure that the internal audits are performed by competent professionals, Cl ia recruits and employs suitably qualified staff. in order that their technical knowledge remains current and relevant, Cl ia identifies and provides training and development opportunities to these staff.
66
Corporate GovernanceCorporate GoVernanCe report
Corporate GoVernanCe report(D) ShAReholDeR RiGhTS AnD ReSPonSiBiliTieSPrinciple 14: Shareholder Rights
the Company treats all its shareholders fairly and equitably and keeps all its shareholders and other stakeholders and analysts in Singapore and around the world informed of its corporate activities, including changes in the Company or its business which would be likely to materially affect the price or value of its shares, on a timely and consistent basis.
the Company ensures that shareholders have the opportunity to participate effectively and vote at general meetings of shareholders and informs shareholders of the rules, including voting procedures, governing such meetings.
principle15: Communication with Shareholders
the Company actively engages with its shareholders and has put in place its investor relations policy to promote regular, effective and fair communication with its shareholders. the policy is uploaded on the Company’s website at www.capitaland.com and is reproduced on page 80 of the annual report.
the Company makes disclosures on an immediate basis as required under the listing Manual of the SGX-St, or as soon as possible where immediate disclosure is not practicable. regular briefings and meetings for analysts and the media are held, generally coinciding with the release of the Group’s second quarter and full-year results. During these briefings, Senior Management reviews the Group’s most recent performance and discusses the Company’s outlook. in the interest of transparency and broad dissemination, these briefings are webcast live and accessible to the public on the Company’s website at www.capitaland.com, materials used in the briefings are disseminated via SGXnet and recordings of the briefings are also archived on the Company’s website.
the Board has formed the CDC which is chaired by Mr James Koh Cher Siang and comprises Mrs arfat pannir Selvam and Mr lim Ming Yan who was appointed on 1 January 2013. Mr liew Mun leong stepped down from the CDC on 1 January 2013. the CDC reviews the promptness and comprehensiveness of corporate disclosures and announcements made to the SGX-St, and ensures the adoption of good corporate governance and best practices in terms of transparency to shareholders
and the investing community. the views and approvals of the CDC were sought throughout the year on various announcements and news releases issued by the Company.
in addition, the Company’s investor relations and Corporate Communications departments facilitate effective communications with the Company’s shareholders, analysts, fund managers and the media. in addition, the Company pursues opportunities to keep its retail shareholders informed through the business media, website postings and other publicity channels. Materials used in the briefings to institutional shareholders are also disseminated via SGXnet for easy access by retail shareholders.
in 2012, Senior Management conducted more than 500 meetings with institutional investors. Management also participated in investor conferences in Kuala lumpur, new York, frankfurt, Hong Kong, london, amsterdam and Boston besides Singapore.
the Company has a policy on the payment of dividends. Barring unforeseen circumstances, the Company’s policy is to declare a dividend of at least 30% of the annual profit after tax and non-controlling interests excluding unrealised revaluation gains or losses as well as impairment charges or write backs.
Principle 16: Conduct of Shareholder Meetings
the Company supports the Code’s principle to encourage shareholder participation. Shareholders receive the summary financial report and notice of the aGM. notice of the aGM is also advertised in the press and issued via SGXnet.
to ensure transparency in the voting process and better reflect shareholders’ interest, the Company conducts electronic poll voting for shareholders/proxies present at the meeting for all the resolutions proposed at the aGM. Votes cast, for or against and the respective percentages, on each resolution will be tallied and displayed ‘live-on-screen’ to shareholders immediately at the aGM. the total number of votes cast for or against the resolutions and the respective percentages are also announced after the aGM via SGXnet. Voting in absentia and by email may only be possible following careful study to ensure that the integrity of the information and authentication of the identity of shareholders through the web are not compromised and legislative changes are effected to recognise electronic voting.
67
there are separate resolutions on each substantially separate issue.
Comprehensive minutes of the meetings are taken and are available to shareholders for their inspection upon their request.
Shareholders also have the opportunity to communicate their views and discuss with the Board and Management matters affecting the Company after the meetings. the Group’s communication efforts have been recognised by the investment community. in 2012, it was conferred a number of awards which are listed on page 28 of the annual report.
ADDiTionAl CoMMiiTTeeS
apart from the Board Committees recommended by the Code and the CDC, the Company has also set up the iC and fBC. the iC has been delegated the authority by the Board to approve the Group’s investments and divestments, project budget variances, asset write-offs and disposals, reported losses of money, bad debt write-offs, granting of rebates and credits, rescheduling of recoverable debts, budget variances and procurement of goods and services within certain limits. the iC also approves the acceptance of credit facilities from financial institutions and capital markets. the iC is chaired by Mr ng Kee Choe with effect from 1 May 2012 and comprises prof Kenneth Stuart Courtis, Mr John powell Morschel, Mr Simon Claude israel and Mr lim Ming Yan who was appointed on 1 January 2013. Dr Hu tsu tau stepped down from the iC on 30 april 2012. Mr liew Mun leong stepped down from the iC on 1 January 2013 and Mr arthur lang tao Yih on 26 february 2013.
Six iC meetings were held in financial year 2012.
the fBC reviews the annual budget and financial policies of the Group. the fBC is chaired by Mr peter Seah lim Huat and comprises Mr ng Kee Choe, prof Kenneth Stuart Courtis and Mr lim Ming Yan who was appointed on 1 January 2013. Mr liew Mun leong stepped down from the fBC on 1January 2013 and Mr arthur lang tao Yih on 26 february 2013.
the fBC is guided by its terms of reference. Specifically, the fBC:
(a) reviews the annual budget or financial policies of the Group. the annual budget, after being endorsed by the fBC, shall be approved by the Board;
(b) reviews the full year forecast and three-year outlook (if any) of the Group; and
(c) reviews the Group finance Manual which contains policies, procedures, financial authority limits and guidelines in areas such as accounting, treasury, investment appraisal, management and statutory reporting, and corporate governance. the finance Manual and any updates, after being endorsed by the fBC, shall be approved by the Board.
two fBC meetings were held in financial year 2012.
in financial year 2012, the Board also set up an ad-hoc Board Succession Committee comprising Mr ng Kee Choe, Mr peter Seah and Mr Simon israel to manage the process for the succession of Mr liew Mun leong. the Committee met on a number of occasions. external and internal candidates were reviewed before the Board appointment Mr lim Ming Yan as president & Group Ceo with effect from 1 January 2013.
DeAlinGS in SeCuRiTieS
taking into consideration the SGX-St Best practices Guide, the Company has issued guidelines to Directors and employees in the Group, prohibiting dealings in the Company’s securities (i) while in possession of material unpublished price-sensitive information, (ii) during two weeks before the release of the Company’s results for the first three quarters and, (iii) one month before the release of the Company’s full-year results. they are also discouraged from dealing in the Company’s securities on short term considerations.
Directors and employees are also prohibited from dealing in securities of other listed companies in the Group while in possession of unpublished price-sensitive information by virtue of their status as Directors and/or employees. they are also made aware of the applicability of the insider trading laws at all times.
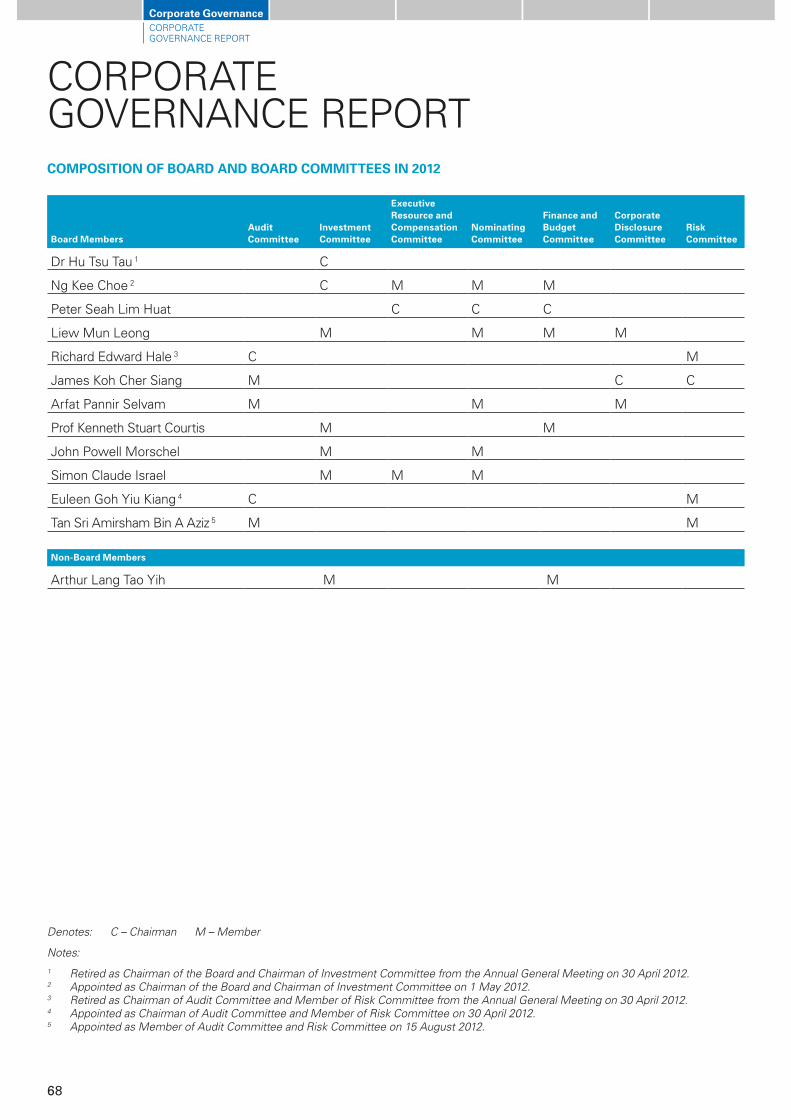
68
Corporate GovernanceCorporate GoVernanCe report
Corporate GoVernanCe reportCoMPoSiTion of BoARD AnD BoARD CoMMiTTeeS in 2012
Board MembersAudit Committee
investment Committee
executive Resource and Compensation Committee
nominating Committee
finance and Budget Committee
Corporate Disclosure Committee
Risk Committee
Dr Hu tsu tau 1 C
ng Kee Choe 2 C M M M
peter Seah lim Huat C C C
liew Mun leong M M M M
richard edward Hale 3 C M
James Koh Cher Siang M C C
arfat pannir Selvam M M M
prof Kenneth Stuart Courtis M M
John powell Morschel M M
Simon Claude israel M M M
euleen Goh Yiu Kiang 4 C M
tan Sri amirsham Bin a aziz 5 M M
non-Board Members
arthur lang tao Yih M M
Denotes: C – Chairman M – Member
Notes:
1 Retired as Chairman of the Board and Chairman of Investment Committee from the Annual General Meeting on 30 April 2012.2 Appointed as Chairman of the Board and Chairman of Investment Committee on 1 May 2012.3 Retired as Chairman of Audit Committee and Member of Risk Committee from the Annual General Meeting on 30 April 2012.4 Appointed as Chairman of Audit Committee and Member of Risk Committee on 30 April 2012.5 Appointed as Member of Audit Committee and Risk Committee on 15 August 2012.
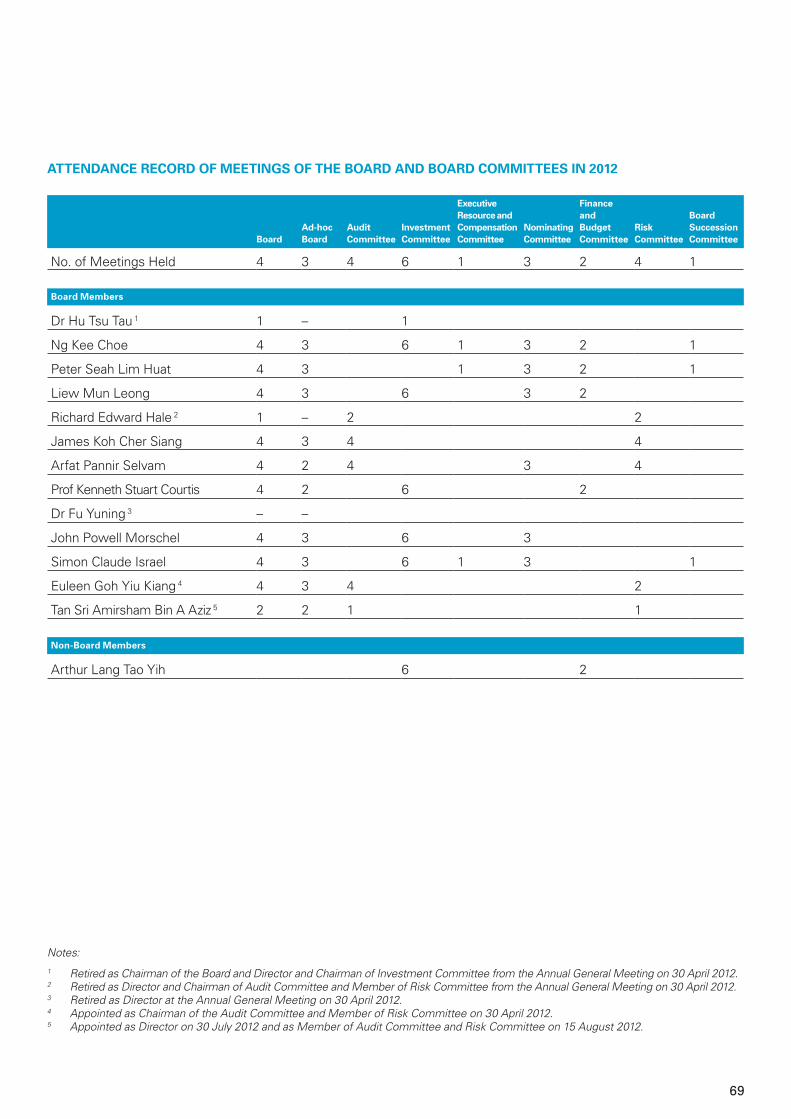
69
ATTenDAnCe ReCoRD of MeeTinGS of The BoARD AnD BoARD CoMMiTTeeS in 2012
BoardAd-hoc Board
Audit Committee
investment Committee
executive Resource and Compensation Committee
nominatingCommittee
finance and Budget Committee
Risk Committee
Board Succession Committee
no. of Meetings Held 4 3 4 6 1 3 2 4 1
Board Members
Dr Hu tsu tau 1 1 – 1
ng Kee Choe 4 3 6 1 3 2 1
peter Seah lim Huat 4 3 1 3 2 1
liew Mun leong 4 3 6 3 2
richard edward Hale 2 1 – 2 2
James Koh Cher Siang 4 3 4 4
arfat pannir Selvam 4 2 4 3 4
prof Kenneth Stuart Courtis 4 2 6 2
Dr fu Yuning 3 – –
John powell Morschel 4 3 6 3
Simon Claude israel 4 3 6 1 3 1
euleen Goh Yiu Kiang 4 4 3 4 2
tan Sri amirsham Bin a aziz 5 2 2 1 1
non-Board Members
arthur lang tao Yih 6 2
Notes:
1 Retired as Chairman of the Board and Director and Chairman of Investment Committee from the Annual General Meeting on 30 April 2012.2 Retired as Director and Chairman of Audit Committee and Member of Risk Committee from the Annual General Meeting on 30 April 2012.3 Retired as Director at the Annual General Meeting on 30 April 2012.4 Appointed as Chairman of the Audit Committee and Member of Risk Committee on 30 April 2012.5 Appointed as Director on 30 July 2012 and as Member of Audit Committee and Risk Committee on 15 August 2012.
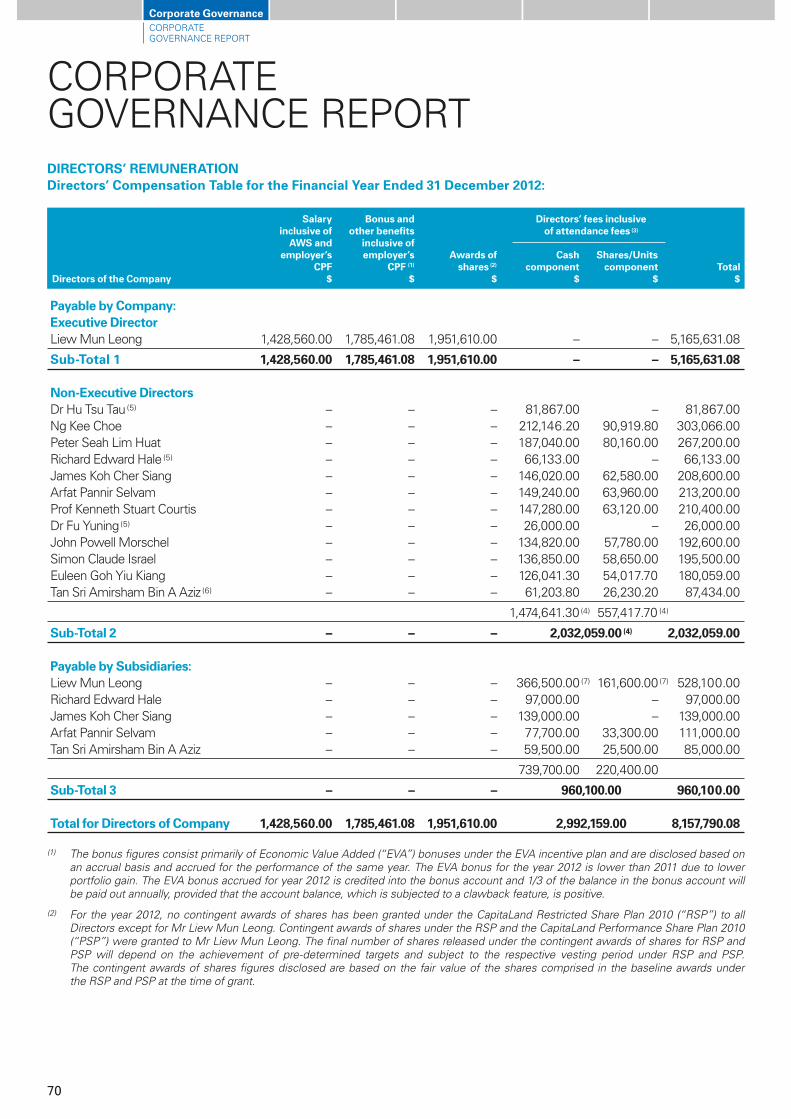
70
Corporate Governance
DiReCToRS’ ReMuneRATionDirectors’CompensationTablefortheFinancialYearended31December2012:
Salary Bonus and Directors’ fees inclusive inclusive of other benefits of attendance fees(3) AWsand inclusiveof employer’s employer’s Awards of Cash Shares/units CPf CPf (1) shares (2) component component Total Directors of the Company $ $ $ $ $ $
Payable by Company: executive Director liew Mun leong 1,428,560.00 1,785,461.08 1,951,610.00 – – 5,165,631.08
Sub-Total 1 1,428,560.00 1,785,461.08 1,951,610.00 – – 5,165,631.08 non-executive Directors Dr Hu tsu tau (5) – – – 81,867.00 – 81,867.00 ng Kee Choe – – – 212,146.20 90,919.80 303,066.00 peter Seah lim Huat – – – 187,040.00 80,160.00 267,200.00 richard edward Hale (5) – – – 66,133.00 – 66,133.00 James Koh Cher Siang – – – 146,020.00 62,580.00 208,600.00 arfat pannir Selvam – – – 149,240.00 63,960.00 213,200.00 prof Kenneth Stuart Courtis – – – 147,280.00 63,120.00 210,400.00 Dr fu Yuning (5) – – – 26,000.00 – 26,000.00 John powell Morschel – – – 134,820.00 57,780.00 192,600.00 Simon Claude israel – – – 136,850.00 58,650.00 195,500.00 euleen Goh Yiu Kiang – – – 126,041.30 54,017.70 180,059.00 tan Sri amirsham Bin a aziz (6) – – – 61,203.80 26,230.20 87,434.00
1,474,641.30 (4) 557,417.70 (4)
Sub-Total 2 – – – 2,032,059.00 (4) 2,032,059.00 Payable by Subsidiaries: liew Mun leong – – – 366,500.00 (7) 161,600.00 (7) 528,100.00 richard edward Hale – – – 97,000.00 – 97,000.00 James Koh Cher Siang – – – 139,000.00 – 139,000.00 arfat pannir Selvam – – – 77,700.00 33,300.00 111,000.00 tan Sri amirsham Bin a aziz – – – 59,500.00 25,500.00 85,000.00
739,700.00 220,400.00
sub-Total3 – – – 960,100.00 960,100.00 Total for Directors of Company 1,428,560.00 1,785,461.08 1,951,610.00 2,992,159.00 8,157,790.08 (1) The bonus figures consist primarily of Economic Value Added (“EVA”) bonuses under the EVA incentive plan and are disclosed based on
an accrual basis and accrued for the performance of the same year. The EVA bonus for the year 2012 is lower than 2011 due to lower portfolio gain. The EVA bonus accrued for year 2012 is credited into the bonus account and 1/3 of the balance in the bonus account will be paid out annually, provided that the account balance, which is subjected to a clawback feature, is positive.
(2) For the year 2012, no contingent awards of shares has been granted under the CapitaLand Restricted Share Plan 2010 (“RSP”) to all Directors except for Mr Liew Mun Leong. Contingent awards of shares under the RSP and the CapitaLand Performance Share Plan 2010 (“PSP”) were granted to Mr Liew Mun Leong. The final number of shares released under the contingent awards of shares for RSP and PSP will depend on the achievement of pre-determined targets and subject to the respective vesting period under RSP and PSP. The contingent awards of shares figures disclosed are based on the fair value of the shares comprised in the baseline awards under the RSP and PSP at the time of grant.
Corporate GoVernanCe report
Corporate GoVernanCe report
71
Directors’CompensationTablefortheFinancialYearended31December2012:(cont’d)
(3) The directors’ fees will only be paid upon approval by the shareholders at the forthcoming Annual General Meeting of the Company and its subsidiaries.
(4) The total compensation of the non-executive Directors for 2012 of an aggregate amount of S$2,032,059, if approved, will be paid as to S$1,474,641.30 in cash, and S$557,417.70 in the form of share awards under the RSP. Consequently, and in accordance with the “Directors’ Fee Policy”, a non-executive Director who served on the Board during 2012 (with the exception of Dr Hu Tsu Tau, Mr Richard Edward Hale and Dr Fu Yuning, who retired from the Board during 2012) will be remunerated as to about 70 per cent. (70%) of his total Directors’ fees in cash and about 30 per cent. (30%) of his total Directors’ fees in the form of shares in the Company. The actual number of shares to be awarded will be based on the volume-weighted average price of a share on the SGX-ST over the 14 trading days from (and including) the ex-dividend date following the Company’s Annual General Meeting, rounded down to the nearest share, and any residual balance settled in cash. The awards will consist of the grant of fully paid shares, with no performance conditions attached and no vesting periods imposed. Each of Dr Hu Tsu Tau, Mr Richard Edward Hale and Dr Fu Yuning will receive all of their Directors’ fees in cash.
(5) Dr Hu Tsu Tau and Mr Richard Edward Hale retired from the Board of the Company from the Annual General Meeting on 30 April 2012. Dr Fu Yuning retired from the Board of the Company at the Annual General Meeting on 30 April 2012.
(6) Tan Sri Amirsham Bin A Aziz was appointed as Director of the Company on 30 July 2012.
(7) Mr Liew Mun Leong is an employee of CapitaLand Limited. The cash component of his directors’ fees will be paid to CapitaLand Limited, but he will be entitled to retain the shares component of the subsidiaries and/or units component of the real estate investment trusts managed by the subsidiaries.
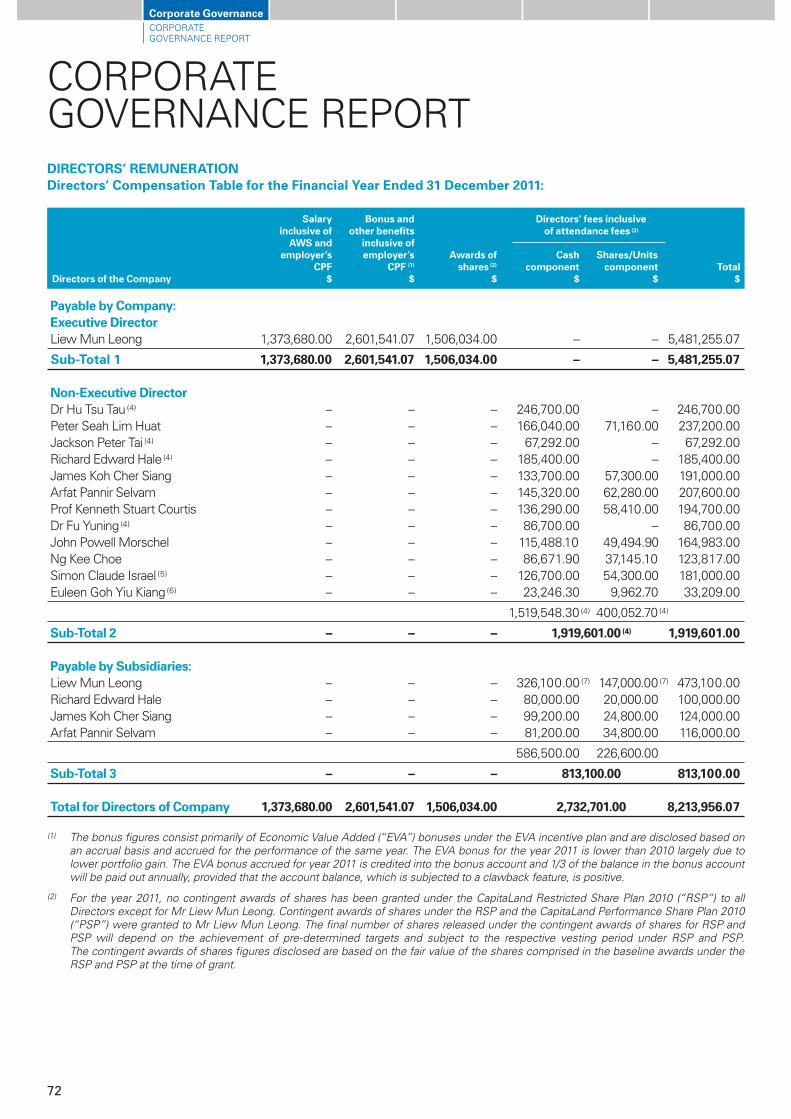
72
Corporate Governance
DiReCToRS’ ReMuneRATionDirectors’CompensationTablefortheFinancialYearended31December2011:
Salary Bonus and Directors’ fees inclusive inclusive of other benefits of attendance fees(3) AWsand inclusiveof employer’s employer’s Awards of Cash Shares/units CPf CPf (1) shares (2) component component Total Directors of the Company $ $ $ $ $ $
Payable by Company: executive Director liew Mun leong 1,373,680.00 2,601,541.07 1,506,034.00 – – 5,481,255.07
Sub-Total 1 1,373,680.00 2,601,541.07 1,506,034.00 – – 5,481,255.07 non-executive Director Dr Hu tsu tau (4) – – – 246,700.00 – 246,700.00 peter Seah lim Huat – – – 166,040.00 71,160.00 237,200.00 Jackson peter tai (4) – – – 67,292.00 – 67,292.00 richard edward Hale (4) – – – 185,400.00 – 185,400.00 James Koh Cher Siang – – – 133,700.00 57,300.00 191,000.00 arfat pannir Selvam – – – 145,320.00 62,280.00 207,600.00 prof Kenneth Stuart Courtis – – – 136,290.00 58,410.00 194,700.00 Dr fu Yuning (4) – – – 86,700.00 – 86,700.00 John powell Morschel – – – 115,488.10 49,494.90 164,983.00 ng Kee Choe – – – 86,671.90 37,145.10 123,817.00 Simon Claude israel (5) – – – 126,700.00 54,300.00 181,000.00 euleen Goh Yiu Kiang (6) – – – 23,246.30 9,962.70 33,209.00
1,519,548.30 (4) 400,052.70 (4)
Sub-Total 2 – – – 1,919,601.00 (4) 1,919,601.00 Payable by Subsidiaries: liew Mun leong – – – 326,100.00 (7) 147,000.00 (7) 473,100.00 richard edward Hale – – – 80,000.00 20,000.00 100,000.00 James Koh Cher Siang – – – 99,200.00 24,800.00 124,000.00 arfat pannir Selvam – – – 81,200.00 34,800.00 116,000.00
586,500.00 226,600.00
sub-Total3 – – – 813,100.00 813,100.00
Total for Directors of Company 1,373,680.00 2,601,541.07 1,506,034.00 2,732,701.00 8,213,956.07
(1) The bonus figures consist primarily of Economic Value Added (“EVA”) bonuses under the EVA incentive plan and are disclosed based on an accrual basis and accrued for the performance of the same year. The EVA bonus for the year 2011 is lower than 2010 largely due to lower portfolio gain. The EVA bonus accrued for year 2011 is credited into the bonus account and 1/3 of the balance in the bonus account will be paid out annually, provided that the account balance, which is subjected to a clawback feature, is positive.
(2) For the year 2011, no contingent awards of shares has been granted under the CapitaLand Restricted Share Plan 2010 (“RSP”) to all Directors except for Mr Liew Mun Leong. Contingent awards of shares under the RSP and the CapitaLand Performance Share Plan 2010 (“PSP”) were granted to Mr Liew Mun Leong. The final number of shares released under the contingent awards of shares for RSP and PSP will depend on the achievement of pre-determined targets and subject to the respective vesting period under RSP and PSP. The contingent awards of shares figures disclosed are based on the fair value of the shares comprised in the baseline awards under the RSP and PSP at the time of grant.
Corporate GoVernanCe report
Corporate GoVernanCe report
73
Directors’CompensationTablefortheFinancialYearended31December2011:(cont’d)
(3) The Directors’ fees will only be paid upon approval by the shareholders at the forthcoming Annual General Meeting of the Company and its subsidiaries.
(4) The total compensation of the non-executive Directors for 2011 of an aggregate amount of S$1,919,601, if approved, will be paid out as to S$1,519,548.30 in cash, and S$400,052.70 in the form of share awards under the RSP. Consequently, and in accordance with the “Directors’ Fee Policy”, a non-executive Director who served on the Board during 2011 (with the exception of Dr Hu Tsu Tau, Mr Richard Edward Hale and Dr Fu Yuning, who are retiring from the Board and Mr Jackson Peter Tai who retired from the Board during 2011) will be remunerated as to about 70 per cent. (70%) of his total Directors’ fees in cash and about 30 per cent. (30%) of his total Directors’ fees in the form of shares in the Company. The number of shares to be awarded will be determined by reference to the volume-weighted average price of a share on the SGX-ST over the 14 trading days immediately following the date of the Annual General Meeting, rounded down to the nearest share, and any residual balance settled in cash. The awards will consist of the grant of fully paid shares, with no performance conditions attached and no vesting periods imposed. Each of Dr Hu Tsu Tau, Mr Richard Edward Hale, Dr Fu Yuning and Mr Jackson Peter Tai will receive all of their Directors’ fees in cash.
(5) Mr Simon Claude Israel was an employee of Temasek Holdings (Private) Limited (“Temasek”) until 30 June 2011. His fee for the period from 1 January 2011 to 30 June 2011 is S$92,700 and will be paid entirely in cash to Temasek. His fee for the period from 1 July 2011 to 31 December 2011 is S$88,300 and will be paid to him in the portion of S$34,000 in cash and S$54,300 in the form of share awards under the RSP. His total directors’ fees of S$181,000 for 2011 will be paid in accordance with the Directors’ Fee Policy (see note (4) above).
(6) Ms Euleen Goh Yiu Kiang was appointed as Director of the Company on 1 October 2011.
(7) Mr Liew Mun Leong is an employee of CapitaLand Limited. The cash component of his directors’ fees will be paid to CapitaLand Limited, but he will be entitled to retain the shares component of the subsidiaries and/or units component of the real estate investment trusts managed by the subsidiaries.

74
Corporate Governance
keY exeCuTiVeS’ ReMuneRATionKey executives’ Compensation table for the financial Year ended 31 December 2012:
Total Compensation Bands
Salary inclusive ofAWsand
employer’s CPf
Bonus and other benefits
inclusive of employer’s CPf(1)
Award of Shares(2) Total
Betweens$2,750,000tos$3,000,000lim Ming Yan 31% 38% 31% 100%arthur lang tao Yih 20% 37% 43% 100% Betweens$2,000,000tos$2,250,000olivier lim tse Ghow 33% 29% 38% 100%Wen Khai Meng 33% 31% 36% 100% Betweens$250,000tos$500,000Jennie Chua Kheng Yeng(3) 89% 11% 0% 100%
Total s$10,616,052
(1) The bonus figures consist primarily of Economic Value Added (“EVA”) bonuses under the EVA incentive plan and are disclosed based on an accrual basis and accrued for the performance of the same year.
(2) The share awards are based on the fair value of the shares comprised in the contingent awards under the CapitaLand Restricted Share Plan 2010 (“RSP”) and the CapitaLand Performance Share Plan 2010 (“PSP”) at the time of grant. The final number of shares released under the contingent awards of shares for RSP and PSP will depend on the achievement of pre-determined targets and subject to the respective vesting period under RSP and PSP.
(3) Jennie Chua Kheng Yeng retired from CapitaLand Limited on 31 July 2012.
Corporate GoVernanCe report / riSK aSSeSSMent anD ManaGeMent
Corporate GoVernanCe report
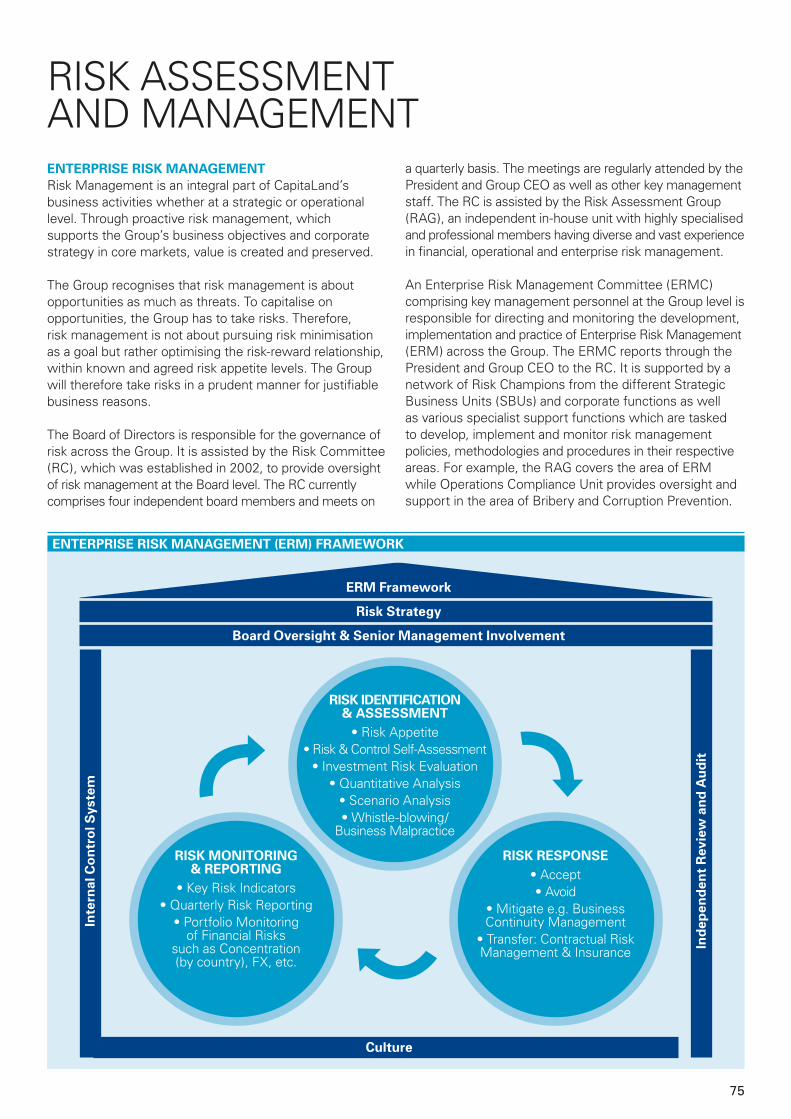
75
riSK aSSeSSMent anD ManaGeMentenTeRPRiSe RiSk MAnAGeMenTrisk Management is an integral part of Capitaland’s business activities whether at a strategic or operational level. through proactive risk management, which supports the Group’s business objectives and corporate strategy in core markets, value is created and preserved.
the Group recognises that risk management is about opportunities as much as threats. to capitalise on opportunities, the Group has to take risks. therefore, risk management is not about pursuing risk minimisation as a goal but rather optimising the risk-reward relationship, within known and agreed risk appetite levels. the Group will therefore take risks in a prudent manner for justifiable business reasons.
the Board of Directors is responsible for the governance of risk across the Group. it is assisted by the risk Committee (rC), which was established in 2002, to provide oversight of risk management at the Board level. the rC currently comprises four independent board members and meets on
a quarterly basis. the meetings are regularly attended by the president and Group Ceo as well as other key management staff. the rC is assisted by the risk assessment Group (raG), an independent in-house unit with highly specialised and professional members having diverse and vast experience in financial, operational and enterprise risk management.
an enterprise risk Management Committee (erMC) comprising key management personnel at the Group level is responsible for directing and monitoring the development, implementation and practice of enterprise risk Management (erM) across the Group. the erMC reports through the president and Group Ceo to the rC. it is supported by a network of risk Champions from the different Strategic Business units (SBus) and corporate functions as well as various specialist support functions which are tasked to develop, implement and monitor risk management policies, methodologies and procedures in their respective areas. for example, the raG covers the area of erM while operations Compliance unit provides oversight and support in the area of Bribery and Corruption prevention.
enTeRpRiseRisKmAnAGemenT(eRm)FRAmeWORK
RiSk iDenTifiCATion & ASSeSSMenT
•RiskAppetite•Risk&ControlSelf-Assessment
•InvestmentRiskEvaluation•QuantitativeAnalysis
•ScenarioAnalysis•Whistle-blowing/
Business Malpractice
RiSk ReSPonSe•Accept•Avoid
•Mitigatee.g.BusinessContinuity Management
•Transfer:ContractualRiskManagement & insurance
RiSk MoniToRinG & RePoRTinG
•KeyRiskIndicators•QuarterlyRiskReporting
•PortfolioMonitoring of financial risks
such as Concentration (by country), fX, etc.
eRM framework
Risk Strategy
Board oversight & Senior Management involvement
Culture
inte
rnal
Co
ntr
ol S
yste
m
ind
epen
den
t R
evie
w a
nd
Au
dit
76
Corporate GovernanceriSK aSSeSSMent anD ManaGeMent
the Group has adopted an erM framework that enables it to manage risks in an integrated, systematic and consistent manner. as a foundation to this framework, the Group aims to create a risk-aware culture which embeds prudent risk-taking in decision-making and business processes. to this end, the Group draws upon:
1. its core values such as integrity and Courage to do the right thing;
2. its operating principles such as Corruption-free, financial Discipline and entrepreneurship, Management, technical Strengths (eMt);
3. programmes and policies such as Code of Conduct, open Door policy and the Because iCare programme to foster open discussion among management and staff; and learning and Development activities to inculcate corporate values and cultures, etc.
a robust internal Control system and an effective and independent review and audit process are the twin pillars that underpin the erM framework. While the line management is responsible for the design and implementation of effective internal controls using a risk-based approach, the internal audit function reviews such design and implementation to provide reasonable assurance to the audit Committee on the adequacy and effectiveness of the internal control system.
Capitaland maintains a prudent risk profile by counterchecking business initiatives and potential investments with raG and by investing in a mix of stable assets and development properties. on a quarterly basis, raG generates and presents to the rC a comprehensive group-wide portfolio risk report that measures a spectrum of risks and keeps the Board and management apprised of the risk profiles of activities and investments in different countries. raG employs an innovative, state-of-the-art Value-at-risk (Var) model that is adapted from the banking industry and is especially tailored for the real estate industry. this is a comprehensive risk measurement tool that measures the potential value deterioration of all key risk exposures of the Group using a historical simulation method.
keY RiSkSat least once a year, the SBus and various corporate functions will conduct an assessment of their risk and control environment. Key risks and their associated controls are consolidated and reviewed at the Group level before they are presented to the rC. the potential key risks include but are not limited to:
economic Riskthe Group is exposed to major economies and key financial and property markets. this could reduce revenue, increase costs and result in revaluation losses. Market illiquidity during a financial crisis could make asset divestment challenging for the Group, hence it could affect the Group’s investment or strategic objectives.
among other things, the Group manages this by adopting a disciplined approach towards financial management. a team of in-house experts is also on hand to monitor the macro-economic environment and to advise the senior management and the SBus on the macro-economic trends and their implications on the property market.
Property Market Riskreal estate markets are cyclical in nature and are significantly affected by global and local conditions, such as government regulations, competition, consumer confidence, as well as demand and supply situations. existing and new property exposures are subjected to stress testing and scenario analyses are evaluated with the Var model to measure potential economic loss. additionally, financial assumptions of project cash flows pertaining to new investments are benchmarked to ensure forecasts and projections are objective.
over the past year, several rounds of property cooling measures and changes to policies related to the real estate market were implemented by the government, both in Singapore and China. adopting a dynamic, proactive and prudent risk management approach, raG conducted a comprehensive study to evaluate and analyse the impact of these measures and regulations on the Group’s property exposure. Detailed findings were presented to the rC as a special focus item. furthermore, to enhance the quarterly risk report, multiple scenario analyses and stress testing were performed and results were incorporated in the risk report.
riSK aSSeSSMent anD ManaGeMent
77
foreign Currency Riskthe Group operates internationally and is exposed to various currencies. although the Group tries to naturally hedge its foreign currency exposure whenever possible by borrowing in the currency of the country in which the property investment is located or by borrowing in currencies that match future revenue streams generated by investments, it is exposed to substantial un-hedged currency positions from our equity investments in foreign currencies, especially in rMB and auD, due to liquidity constraints and significant cost factors in hedging these open positions. nevertheless, these and all other open currency positions are closely monitored, foreign currency risk evaluated and stress tested by raG and extensive foreign exchange risk management reports are regularly submitted to the rC as part of the quarterly risk report. in 2012, raG also partnered and worked closely with Group treasury and finance to study in detail the foreign currency risk arising from the Group’s substantial investment into global markets. Comprehensive findings were presented to the rC.
interest rate riskthe Group’s interest rate risk exposure relates mainly to funding of its property investments. this is managed with a prudent mix of fixed and floating rate borrowing. this allows the Group to capitalise on lower cost of funding in a low interest rate environment and protect against potential rate hikes. an interest cost at risk stress simulation method was developed by raG and it measures the potential rise in interest cost for a given debt portfolio in view of the prevailing low interest rate environment.
Development risknew investments typically take several years to complete, depending on the size and complexity of the project. the risks of potential delays and cost overruns of ongoing development projects are regularly monitored and quantified with the Var model, and reported to the rC.
liquidityriskto mitigate liquidity risk of not meeting financial obligations as they fall due, Capitaland actively manages its debt maturity profile, operating cash flows and the availability of funding through multiple sources to ensure that all refinancing, repayment and funding needs are fulfilled.
Political & Policy Riskthe Group operates in numerous locations, some of which may experience political risks such as political leadership uncertainty, inconsistency in public policies, social unrest, etc. Such risks could result in the deterioration of the economic or social conditions and affect the financial viability of the Group’s investments or even its control of assets in these countries. to mitigate this, local operations are run by experienced management team supported by local team who are both familiar with the local conditions and culture. Concentration risk in a single country is also avoided through a risk-based country asset allocation system. this uses a multi-faceted and risk-adjusted methodology based on Capitaland’s investment strategy, sovereign risk ratings by international rating agencies and macroeconomic views from the Group’s in-house economic unit.
investment Riskat the individual project level, to ensure that all significant risks are identified and quantified, raG continues to perform an independent risk evaluation for all individual investment proposals above a stipulated investment value threshold. risks of each proposal are highlighted and all parameters are benchmarked against objective market comparables and historical projects undertaken by the Group. Where possible, mitigation strategies are then proposed.
the prolonged financial crisis has reinforced the importance and value of comprehensive and effective risk management. to ensure that the potential returns of new investments are commensurate with the risks undertaken, risk-adjusted weighted average cost of capital and hurdle rates of individual countries and business units are calculated by raG according to their respective risk profiles and adopted as investment benchmarks. they are reviewed annually and when necessary, adjustments are made to reflect higher business risk and costs of investments. this ensures that every investment undertaken will create value for stakeholders on a risk-adjusted basis.
raG continues to promote a culture of risk awareness by developing business development teams and equipping them with optimal risk management skills. in 2012, raG conducted two workshops at Capitaland institute of Management and Business. the workshop sessions included but were not limited to investment risk analysis and best practices, and lessons learnt from past investment proposals were interactively shared with staff.
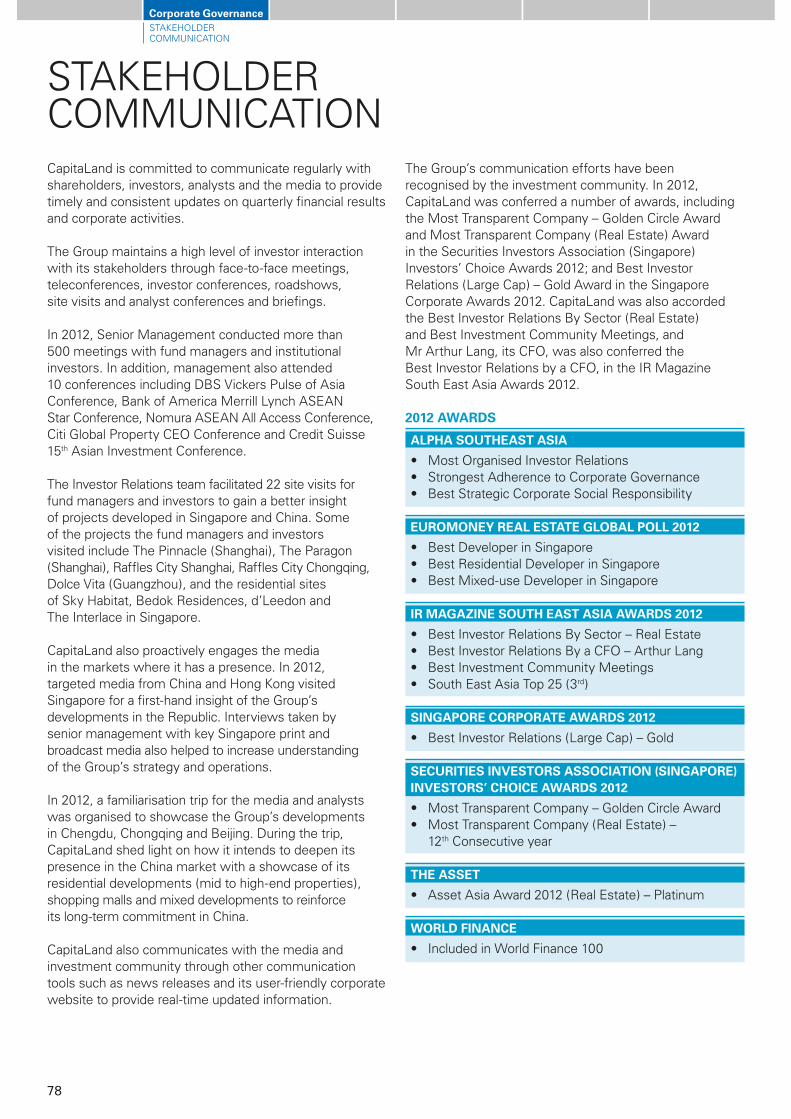
78
the Group’s communication efforts have been recognised by the investment community. in 2012, Capitaland was conferred a number of awards, including the Most transparent Company – Golden Circle award and Most transparent Company (real estate) award in the Securities investors association (Singapore) investors’ Choice awards 2012; and Best investor relations (large Cap) – Gold award in the Singapore Corporate awards 2012. Capitaland was also accorded the Best investor relations By Sector (real estate) and Best investment Community Meetings, and Mr arthur lang, its Cfo, was also conferred the Best investor relations by a Cfo, in the ir Magazine South east asia awards 2012.
2012AWARDs
AlPhA SouTheAST ASiA
• MostOrganisedInvestorRelations• StrongestAdherencetoCorporateGovernance• BestStrategicCorporateSocialResponsibility
euRoMoneY ReAl eSTATe GloBAl Poll 2012
• BestDeveloperinSingapore• BestResidentialDeveloperinSingapore• BestMixed-useDeveloperinSingapore
iRmAGAzinesOuTHeAsTAsiAAWARDs2012
• BestInvestorRelationsBySector–RealEstate• BestInvestorRelationsByaCFO–ArthurLang• BestInvestmentCommunityMeetings• SouthEastAsiaTop25(3rd)
sinGApOReCORpORATeAWARDs2012
• BestInvestorRelations(LargeCap)–Gold
SeCuRiTieS inVeSToRS ASSoCiATion (SinGAPoRe) inVesTORs’CHOiCeAWARDs2012
• MostTransparentCompany–GoldenCircleAward• MostTransparentCompany(RealEstate)–
12th Consecutive year
The ASSeT
• AssetAsiaAward2012(RealEstate)–Platinum
WORlDFinAnCe
• IncludedinWorldFinance100
StaKeHolDer CoMMuniCationCapitaland is committed to communicate regularly with shareholders, investors, analysts and the media to provide timely and consistent updates on quarterly financial results and corporate activities.
the Group maintains a high level of investor interaction with its stakeholders through face-to-face meetings, teleconferences, investor conferences, roadshows, site visits and analyst conferences and briefings.
in 2012, Senior Management conducted more than 500 meetings with fund managers and institutional investors. in addition, management also attended 10 conferences including DBS Vickers pulse of asia Conference, Bank of america Merrill lynch aSean Star Conference, nomura aSean all access Conference, Citi Global property Ceo Conference and Credit Suisse 15th asian investment Conference.
the investor relations team facilitated 22 site visits for fund managers and investors to gain a better insight of projects developed in Singapore and China. Some of the projects the fund managers and investors visited include the pinnacle (Shanghai), the paragon (Shanghai), raffles City Shanghai, raffles City Chongqing, Dolce Vita (Guangzhou), and the residential sites of Sky Habitat, Bedok residences, d’leedon and the interlace in Singapore.
Capitaland also proactively engages the media in the markets where it has a presence. in 2012, targeted media from China and Hong Kong visited Singapore for a first-hand insight of the Group’s developments in the republic. interviews taken by senior management with key Singapore print and broadcast media also helped to increase understanding of the Group’s strategy and operations.
in 2012, a familiarisation trip for the media and analysts was organised to showcase the Group’s developments in Chengdu, Chongqing and Beijing. During the trip, Capitaland shed light on how it intends to deepen its presence in the China market with a showcase of its residential developments (mid to high-end properties), shopping malls and mixed developments to reinforce its long-term commitment in China.
Capitaland also communicates with the media and investment community through other communication tools such as news releases and its user-friendly corporate website to provide real-time updated information.
StaKeHolDer CoMMuniCation
Corporate Governance
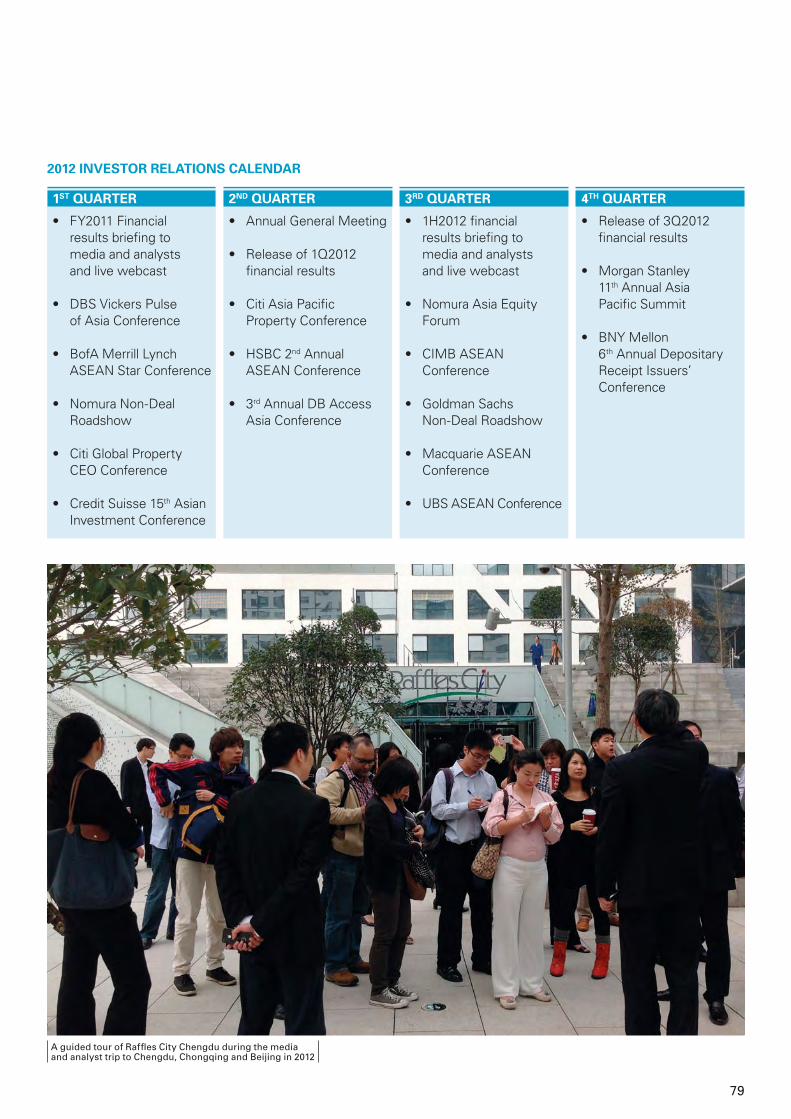
79
1ST quARTeR
• FY2011Financial results briefing to media and analysts and live webcast
• DBSVickersPulse of asia Conference
• BofAMerrillLynchaSean Star Conference
• NomuraNon-Dealroadshow
• CitiGlobalProperty Ceo Conference
• CreditSuisse15th asian investment Conference
2nD quARTeR
• AnnualGeneralMeeting
• Releaseof1Q2012financial results
• CitiAsiaPacific property Conference
• HSBC2nd annual aSean Conference
• 3rd annual DB access asia Conference
3RD quARTeR
• 1H2012financial results briefing to media and analysts and live webcast
• NomuraAsiaEquityforum
• CIMBASEANConference
• GoldmanSachs non-Deal roadshow
• MacquarieASEANConference
• UBSASEANConference
4Th quARTeR
• Releaseof3Q2012financial results
• MorganStanley 11th annual asia pacific Summit
• BNYMellon 6th annual Depositary receipt issuers’ Conference
2012 inVeSToR RelATionS CAlenDAR
A guided tour of Raffles City Chengdu during the media and analyst trip to Chengdu, Chongqing and Beijing in 2012

80
Corporate Governance
ShAReholDeRS’ CoMMuniCATion AnD inVeSToR RelATionS PoliCY
1. GeneRAlpOliCYat all times, Capitaland is committed to making timely, full and accurate disclosure and distributing other corporate communications materials* in accordance with the Singapore Code of Corporate Governance 2012.
1.1 all disclosures submitted to the Singapore exchange Securities trading limited (“SGX-St”) through SGXnet shall be made available on Capitaland’s well maintained and updated corporate website.
1.2 this policy is subject to regular review by the senior management and board of directors of Capitaland (the “Board”) to ensure its effectiveness. updates and amendments (as appropriate) will be made to reflect current best practices in our communication with Shareholders and the investment community.
* Other corporate communication materials refer to any document issued or to be issued by CapitaLand for the information or action of its Shareholders, including, but not limited to, the annual report, a notice of meeting, a circular and a proxy form.
2. sHAReHOlDeRRiGHTsCapitaland is also committed to treating all Shareholders fairly and equitably, and would recognise, protect and facilitate the exercise of Shareholders’ rights, and continually review and update such governance arrangements by adhering by the following guidelines: 2.1 Capitaland would facilitate the opportunity for
Shareholders to participate effectively in and vote at general meetings of Shareholders. the Shareholders would also be informed of the rules, including voting procedures that govern general meetings of Shareholders.
2.2 Capitaland would allow corporations which provide nominee or custodial services to appoint more than two proxies so that Shareholders who hold shares through such corporations can attend and participate in general meetings as proxies.
3.COmmuniCATiOnpRinCiples3.1 Capitaland strives to provide pertinent and accurate
information to its Shareholders and the investment community in an effective and timely manner.
3.2 Capitaland will use clear and plain language in its communication with its Shareholders.
3.3 Capitaland endeavours to provide a consistent level of disclosure on both positive and negative developments of the organisation.
3.4 Capitaland will communicate only through its designated spokespersons.
3.5 Capitaland and its designated senior spokespersons will establish and maintain regular dialogue with Shareholders, analysts and the media community through press cum analysts’ briefings, investor roadshows or investors’ Day briefings in order to solicit and understand the views of Shareholders, analysts and media.
3.6 Capitaland does not respond to rumours. However, if rumours indicate that material information has been leaked or they are in fact false or inaccurate, the rumours will be promptly denied or clarified via announcements made through SGXnet to SGX-St.
3.7 Capitaland observes a “blackout period” of two weeks prior to the announcement of its quarterly results and one month prior to the announcement of its full-year results. During this period, Capitaland does not comment on industry outlook, the Group’s business performance and financial results.
StaKeHolDer CoMMuniCation
StaKeHolDer CoMMuniCation
81
4. COmmuniCATiOnsTRATeGies4.1 Capitaland actively engages its Shareholders and the
investment community via:
(i) annual General Meeting (“aGM”) and extraordinary General Meeting (“eGM”) if necessary;
(ii) quarterly results presentation slides and financial results announced via SGXnet to SGX-St and posted on Capitaland’s corporate website;
(iii) half yearly media and analysts’ briefings for half-year and full-year financial results, with “live” webcasts available for viewing on Capitaland’s corporate website;
(iv) one-on-one/group meetings or conference calls, investor luncheons, local/overseas roadshows and conferences;
(v) site, property and mall visits; (vi) annual reports; (vii) news releases and statements; (viii) notices of, and explanatory memoranda for
aGMs and eGMs; and (ix) corporate website (www.capitaland.com)
investors’ Communication4.2 Capitaland meets with investors, the media and
analysts at appropriate times and participates in investor roadshows, and sector conferences throughout the year.
4.3 upon the release of half-year and full-year financial results, Capitaland will hold media and analysts’ briefings. “live” webcasts of the briefings are recorded and archived on the corporate website within a reasonable time after the relevant briefing.
Shareholders’ Meetings4.4 Capitaland’s aGMs are the principal communication
channels with its Shareholders and for Shareholders’ participation.
4.5 all Shareholders are sent a copy of Capitaland’s summary report with notice of aGM prior to the aGM. as and when an eGM of the Shareholders is to be held, each Shareholder will be sent a copy of a circular with notice of eGM which contains details of the matters to be proposed for Shareholders’ consideration and approval.
4.6 notices for the general meetings setting out all items of business to be transacted at the general meeting, are also announced via SGXnet to SGX-St.
4.7 Members of the Board, Capitaland’s senior management and the external auditors of the organisation are in attendance at all general meetings to address Shareholders’ queries. Shareholders are given the opportunity to communicate their views on various matters affecting Capitaland. a Shareholder is allowed to appoint up to two proxies to attend and vote at the general meetings in his/her stead.
4.8 Capitaland supports voting by poll at all general meetings and the poll results are announced via SGXnet to SGX-St on the same day of each Shareholders’ meeting.
CorporateWebsite4.9 Capitaland maintains a corporate website
(www.capitaland.com). Capitaland’s business developments and operations, financial reports, announcements, news releases and other information are posted on its corporate website. Both current information and archives of previously released information including presentation slides and announcements can be found under the “investor relations” section of the corporate website.
5. COmpAnYCOnTACTs5.1 Shareholders can contact our Singapore Share
registrar at the following address:
M&C Services private limited 112 robinson road #05-01 Singapore 068902 telephone: +65 6227 6660 fax: +65 6225 1452
5.2 Shareholders and the investment community can contact Capitaland’s investor relations team by telephone at +65 6823 3200, or by fax at +65 6820 2202 or by email at [email protected].
6. sHAReHOlDeRpRiVACYCapitaland recognises the importance of Shareholders’ privacy and will not disclose Shareholders’ information without their consent unless required by law.

82
SustainabilityenVironMent, HealtH anD SafetY
enVironMent, HealtH anD SafetY
environmental, health and safety (eHS) is of utmost importance to Capitaland. the Group’s eHS objectives are guided by its belief that reducing the environmental footprint of its buildings and having an emphasis on occupational health and safety creates value for its stakeholders and is beneficial to the community at large. its stakeholders include employees, tenants, contractors, suppliers and users of its properties.
as an international corporate social citizen, Capitaland is committed to protecting the environment and upholding the occupational health and safety of everyone in the workplace, and will:• CarryoutexemplaryEnvironmental,HealthandSafetypractices
to minimise pollution and health and safety risks• SeekcontinualimprovementonitsEnvironmental,Healthand
Safety performance• Complywithpertinentlegislationsandotherrequirements• ImplementtheCapitaLandGreenBuildingsGuidelinesandOccupational
Health and Safety programmes.
this policy is published on www.capitaland.com and is readily available to all employees, suppliers, service providers and partners.
in 2012, Capitaland become the first and largest real estate company in asia to receive iSo 14001 and oHSaS 18001 certification covering 15 countries. these international standards are externally audited annually.
Capitaland was listed in the Global 100 Most Sustainable Corporations in the World, Sustainability Yearbook, Dow Jones Sustainability World index, one of the asian leaders in the Global real estate Sustainability Benchmark (GreSB), aSean Business awards 2012 for CSr (large Company). Capitaland was accorded the Building and Construction authority (BCa) Green Mark Champion. its residential business in Singapore won the Workplace Safety and Health (WSH) Developer award.
Capitaland incorporated eHS Key performance indicators (Kpis) linked to the remuneration of all staff, as well as top management. these include green rating for its development projects, energy and water reduction for its operating properties, certified main contractors and zero fatality/permanent disability of its employees, as follows:
Green Ratings: in 2012, Capitaland achieved 20 green ratings. in Singapore, these include BCa’s top rating Green Mark platinum for Bedok residence, Bedok Mall, Bugis+, CapitaGreen and Junction 8. in China, luwan integrated development achieved the leeD pre-certification Gold rating, while the lakeside, Wuhan was awarded 1 Star Green Building label by the Ministry of Housing and urban-rural Development – the first mass market residence to achieve green rating. in uK, Citadines prestige trafalgar Square london obtained Capitaland’s first BreeaM certification achieving a “Very Good” rating.
energyandWaterusageReduction: for the first ten months of 2012, the reduction in energy usage in KWh/m2 was 10.8% and the reduction in water usage in m3/m2 was 16% from the 2008 baseline. Capitaland will continue to implement energy and water conservation measures to ensure efficient operations and minimise resource wastage.
The first and largest real estate company in Asia to receive iSo 14001 and ohSAS 18001 certification covering15countries for its environmental, health and Safety Management System
achieved Certification in 15 Countries
Capitaland wins BCA Green markChampionAward.A total of 68 Green Mark Awards have been accorded to the Group’s properties in Singapore, China, Malaysia and Vietnam
Green Mark Champion award

83
Certified Contractors: in 2012, nine main contractors appointed were both iSo 14001 and oHSaS 18001 certified. they implemented eHS measures at Capitaland construction sites as part of their certified eHS Management System.
zero fatality/Permanent Disability: in 2012, none of Capitaland’s staff met with work-related fatality or permanent injury.
Beyond developing and operating environmentally sustainable properties in line with eHS best practices, Capitaland actively engages its stakeholders. in 2012, it held its inaugural Because iCare awards for environment, Health and Safety to recognise its contractors, tenants, service providers and staff for their contribution to eHS in Capitaland. over 20 companies and individuals received the awards.
Capitaland participates in national efforts towards environmental protection, climate change, and occupational health and safety. in Singapore, Capitaland is represented in the Singapore Green Building Council, WSH Council on Construction and real estate, and BCa Green Mark advisory Committee.
australand, one of Capitaland’s regional investments in australia, was represented in eHS Committees and workgroups in various cities and states. it was also the Gold Sponsor of the Green-Star-Communities rating tool by the Green Building Council of australia. the objective of this rating is to establish a framework for sustainable large scale community development projects across australia. australand staff participated in developing this rating.
Recognising more than 20 stakeholders with the Because iCare Awards for environment, health and Safety
Awards recipients of the inaugural CapitaLand Because iCare Awards for Environment, Health and Safety
84
Sustainabilitypeople
people
in Capitaland, developing and growing human capital is integral to its business strategy. Capitaland has an integrated human capital strategy to recruit, develop and motivate employees. in line with its credo of “Building people”, employees are provided with appropriate development opportunities to perform well in their jobs as they align their individual goals with the company’s business objectives. through deploying progressive workplace policies and practices while inculcating the company’s core values, a positive work environment is created for employees to contribute and pursue their career growth.
huMAn CAPiTAlCapitaland identifies talents internally and externally to build bench strength as well as talent pipeline for leadership succession planning. Capitaland recruits talents through its network of local and overseas universities, and also attracts young talents early through scholarship programmes such as the Capitaland–BCa Scholarship, Capitaland-nuS-uSp Scholarship, Capitaland international Scholarship and Capitaland-MoM national Human resources Scholarship. aside from fresh graduates, Capitaland also employs experienced and mid-career professionals as well as industry veterans.
in 2012, Capitaland expanded its corporate learning and development capability to establish its first Capitaland institute of Management and Business (CliMB) overseas in Shanghai, China. it targets to serve the training needs of about 7,000 employees in China. CliMB China signed a Memorandum of understanding (Mou) with tongji university’s School of economics and Management in Shanghai to expand its network of training partners. through the partnership, Capitaland employees can benefit from the teaching faculty and training resources in real estate and business management programmes in this prestigious university. CliMB has provided over 10,850 training places since inception.
the ascott Centre for excellence (aCe), ascott’s global hospitality training centre in Singapore, has provided more than 4,000 training places since 2008, including employees from the hotel and accommodation services sector.
Capitaland employees are encouraged to be creative and innovative in generating new ideas, solving problems and continuous improvement. employees can do so by participating in programmes such as in iCe (innovation, Creativity, and entrepreneurship) activities. to date, more than 2,000 employees have shared ideas at 40 iCe camps and related activities held in various countries.
CoMPeTiTiVe CoMPenSATion/ BenefiTSCapitaland motivates and rewards employees with comprehensive and competitive compensation and benefits programmes. incentives include short-term cash bonuses and long-term equity-based reward plans. the performance-based restricted Share plan (rSp) is an attractive long-term incentive offered to employees of managerial grades to provide them with a personal stake in the company, contingent on achieving performance targets. this better aligns employee and shareholder interests to deliver business results. for non-managerial grade employees, an equivalent restricted Cash plan (rCp) was implemented with effect from fY2012 to give out cash award when targets are met. the incentive pool is funded by the Group’s profitability and economic value-added (eVa) performance to award employees based on their job responsibilities and individual work performance.
Capitaland has an integrated human capital strategy to recruit, develop and motivate employees
recruit, Develop and Motivate
Capitaland institute of Management and Business (CliMB) has provided over 10,850trainingplacessince inception
10,850 training places
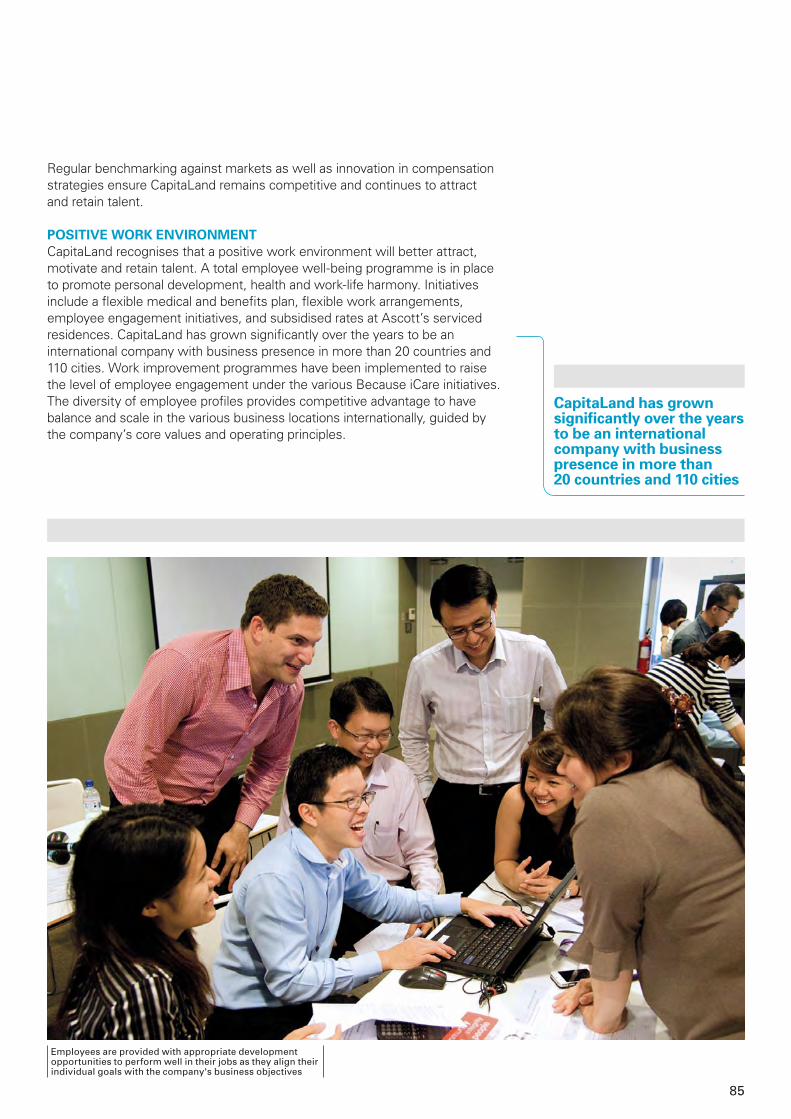
85
regular benchmarking against markets as well as innovation in compensation strategies ensure Capitaland remains competitive and continues to attract and retain talent.
pOsiTiVeWORKenViROnmenTCapitaland recognises that a positive work environment will better attract, motivate and retain talent. a total employee well-being programme is in place to promote personal development, health and work-life harmony. initiatives include a flexible medical and benefits plan, flexible work arrangements, employee engagement initiatives, and subsidised rates at ascott’s serviced residences. Capitaland has grown significantly over the years to be an international company with business presence in more than 20 countries and 110 cities. Work improvement programmes have been implemented to raise the level of employee engagement under the various Because iCare initiatives. the diversity of employee profiles provides competitive advantage to have balance and scale in the various business locations internationally, guided by the company’s core values and operating principles.
Employees are provided with appropriate development opportunities to perform well in their jobs as they align their individual goals with the company's business objectives
Capitaland has grown significantly over the years to be an international company with business presence in more than 20 countries and 110 cities
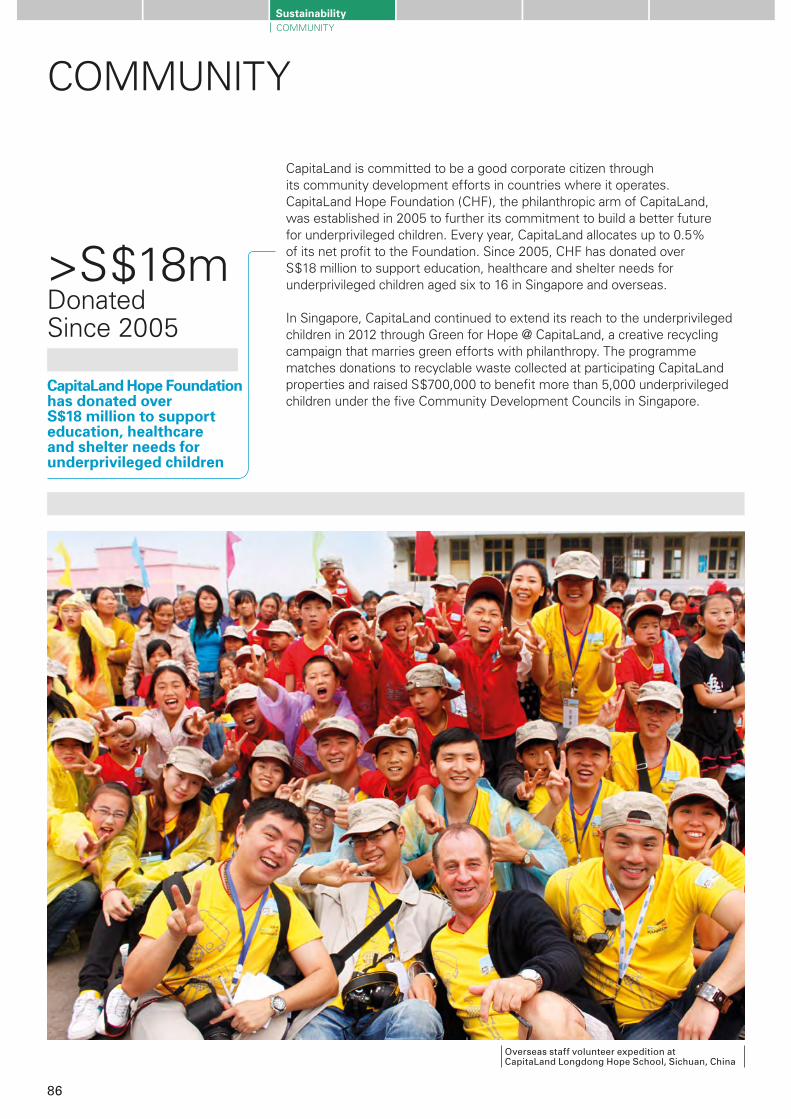
86
SustainabilityCoMMunitY
CoMMunitY
Capitaland is committed to be a good corporate citizen through its community development efforts in countries where it operates. Capitaland Hope foundation (CHf), the philanthropic arm of Capitaland, was established in 2005 to further its commitment to build a better future for underprivileged children. every year, Capitaland allocates up to 0.5% of its net profit to the foundation. Since 2005, CHf has donated over S$18 million to support education, healthcare and shelter needs for underprivileged children aged six to 16 in Singapore and overseas.
in Singapore, Capitaland continued to extend its reach to the underprivileged children in 2012 through Green for Hope @ Capitaland, a creative recycling campaign that marries green efforts with philanthropy. the programme matches donations to recyclable waste collected at participating Capitaland properties and raised S$700,000 to benefit more than 5,000 underprivileged children under the five Community Development Councils in Singapore.
Capitaland hope foundation has donated over S$18 million to support education, healthcare and shelter needs for underprivileged children
>S$18m Donated Since 2005
Overseas staff volunteer expedition at CapitaLand Longdong Hope School, Sichuan, China
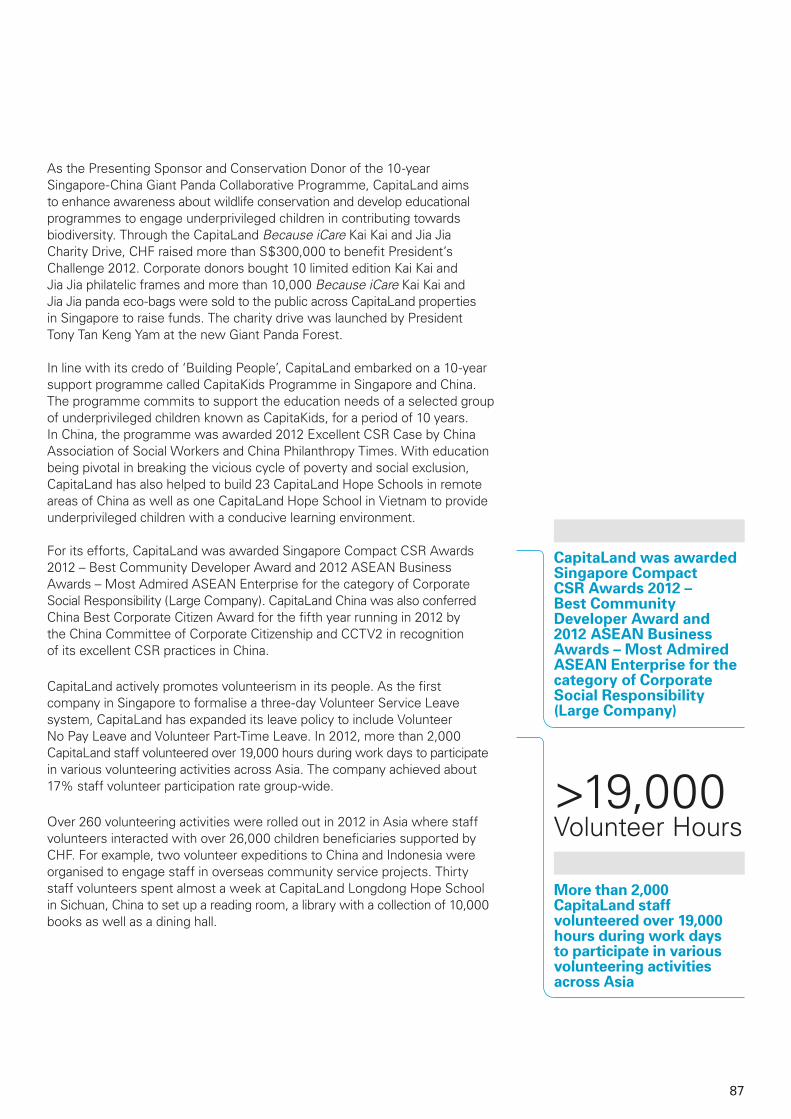
87
as the presenting Sponsor and Conservation Donor of the 10-year Singapore-China Giant panda Collaborative programme, Capitaland aims to enhance awareness about wildlife conservation and develop educational programmes to engage underprivileged children in contributing towards biodiversity. through the Capitaland Because iCare Kai Kai and Jia Jia Charity Drive, CHf raised more than S$300,000 to benefit president’s Challenge 2012. Corporate donors bought 10 limited edition Kai Kai and Jia Jia philatelic frames and more than 10,000 Because iCare Kai Kai and Jia Jia panda eco-bags were sold to the public across Capitaland properties in Singapore to raise funds. the charity drive was launched by president tony tan Keng Yam at the new Giant panda forest.
in line with its credo of ‘Building people’, Capitaland embarked on a 10-year support programme called CapitaKids programme in Singapore and China. the programme commits to support the education needs of a selected group of underprivileged children known as CapitaKids, for a period of 10 years. in China, the programme was awarded 2012 excellent CSr Case by China association of Social Workers and China philanthropy times. With education being pivotal in breaking the vicious cycle of poverty and social exclusion, Capitaland has also helped to build 23 Capitaland Hope Schools in remote areas of China as well as one Capitaland Hope School in Vietnam to provide underprivileged children with a conducive learning environment.
for its efforts, Capitaland was awarded Singapore Compact CSr awards 2012 – Best Community Developer award and 2012 aSean Business awards – Most admired aSean enterprise for the category of Corporate Social responsibility (large Company). Capitaland China was also conferred China Best Corporate Citizen award for the fifth year running in 2012 by the China Committee of Corporate Citizenship and CCtV2 in recognition of its excellent CSr practices in China.
Capitaland actively promotes volunteerism in its people. as the first company in Singapore to formalise a three-day Volunteer Service leave system, Capitaland has expanded its leave policy to include Volunteer no pay leave and Volunteer part-time leave. in 2012, more than 2,000 Capitaland staff volunteered over 19,000 hours during work days to participate in various volunteering activities across asia. the company achieved about 17% staff volunteer participation rate group-wide.
over 260 volunteering activities were rolled out in 2012 in asia where staff volunteers interacted with over 26,000 children beneficiaries supported by CHf. for example, two volunteer expeditions to China and indonesia were organised to engage staff in overseas community service projects. thirty staff volunteers spent almost a week at Capitaland longdong Hope School in Sichuan, China to set up a reading room, a library with a collection of 10,000 books as well as a dining hall.
Overseas staff volunteer expedition at CapitaLand Longdong Hope School, Sichuan, China
More than 2,000 Capitaland staff volunteered over 19,000 hours during work days to participate in various volunteering activities across Asia
>19,000 Volunteer Hours
Capitaland was awarded Singapore Compact CSR Awards 2012 – Best Community Developer Award and 2012 ASeAn Business Awards – Most Admired ASeAn enterprise for the category of Corporate Social Responsibility (large Company)

UNITEDKINGDOM
BELGIUM
FRANCE
SPAIN
GERMANY
GEORGIA
BAHRAINQATAR
UAEOMAN
INDIA
CHINASOUTH
JAPAN
THAILANDPHILIPPINES
SINGAPORE
INDONESIA
AUSTRALIA
KOREA
VIETNAM
MALAYSIA
88
Business ReviewGloBal preSenCe
GloBal preSenCeAsat21February2013
Serviced residences
Mixed Developments
financial Services
Homes
offices
Shopping Malls
Asia Pacific
AuSTRAliAadelaideBrisbaneHobartMelbourne perthSydney
ChinAanyangBeijingChangshaChengduChongqingDalianDeyangDongguanfoshanGuangzhouHarbinHangzhouHong KongHuhhotKunshanMacauMaomingMianyangnanchang
ningboQingdaoQuanzhourizhaoShanghaiShenyangShenzhenSuzhoutianjinWeifangWuhanWuhu Xi’anXiamenXinxiang YangzhouYibinYiyangZhangzhouZhanjiangZhaoqingZhengzhouZibo
inDiAahmedabadBangaloreChennai
Cochin Hyderabad Jalandhar MangaloreMumbaiMysorenagpurudaipur
inDoneSiAJakartaSurabaya
JAPAnChitoseeniwafukuokaHiroshimaKobeKyotonagoyaosakaSagaSapporoSendaitokyo
MAlAYSiACyberjayaKuala lumpurKuantanKuchingnusajayapenangpetaling JayaShah alam
PhiliPPineSManila
SinGAPoRe
SouTh koReASeoul
ThAilAnDBangkok
VieTnAMDanangHai phong CityHanoi Ho Chi Minh City
BelGiuMBrussels
fRAnCeBordeauxCannesferney-VoltaireGrenoble
lillelyonMarseilleMontpellierniceparisStrasbourgtoulouse
europe
GeoRGiAtbilisi
GeRMAnYBerlinfrankfurt HamburgMunich
SPAinBarcelona
uniTeD kinGDoM london
BAhRAinManama
oMAnMuscat
Gulf Cooperation Council Countries
qATARDoha
uniTeD ARAB eMiRATeSabu DhabiDubai

UNITEDKINGDOM
BELGIUM
FRANCE
SPAIN
GERMANY
GEORGIA
BAHRAINQATAR
UAEOMAN
INDIA
CHINASOUTH
JAPAN
THAILANDPHILIPPINES
SINGAPORE
INDONESIA
AUSTRALIA
KOREA
VIETNAM
MALAYSIA
89
raffles City Developments
Multi-sector
Schools/facilities
Serviced residences
Mixed Developments
financial Services

90
Business ReviewperforManCe oVerVieW
revenue from Capitaland residential Singapore saw a 10% increase to S$854.3 million as compared to fY2011. this was due to commencement of revenue recognition for units sold in Sky Habitat and continued progressive revenue recognition from units sold from the interlace and urban resort Condominium.
revenue from Capitaland China Holdings fell by 23% to S$404.1 million as fewer units were handed over to homebuyers in the current year. in 2012, revenue was recognised for units sold and delivered from the Metropolis and the pinnacle in Shanghai, as well as riverside Ville and Beau residences in foshan.
Capitaland Commercial recorded a decrease in revenue by 11% to S$86.5 million due to the absence of revenue from the adelphi and Corporation place following its divestment in January and December 2011 respectively, partially mitigated by higher fee income from project management.
peRFORmAnCeOVeRVieWCapitaland Group achieved a profit after tax and non-controlling interests (patMi) of S$930.3 million for the full year ended 2012, despite challenges posed by the uncertain global economy, european debt crisis and policy restrictions imposed by both the Singapore and Chinese government to cool the property market.
ReVenuerevenue for fY2012 was S$3.30 billion which was 9% higher than fY2011. the increase was fuelled by higher contribution from development projects in Singapore and australia, shopping mall business and fee-based income. Geographically, Singapore and China operations contributed about 53% or S$1.76 billion of the Group’s revenue.
perforManCe oVerVieW
Capitaland residential Singapore
Capitaland China Holdings
Capitaland Commercial
the ascott limited
CapitaValue Homes
Capitaland financial
CapitaMalls asia
australand
2012 ReVenue BY STRATeGiC BuSineSS uniTTotal:s$3.30billion
10.6%3.4%
25.7%
12.1%
2.6%11.5%
34.0%
0.1%
2011 ReVenue BY STRATeGiC BuSineSS uniTTotal:s$3.02billion
25.5%
17.3%
3.2%
27.5%
8.1%
3.4%2.6%
12.4%
2012 2011

91
revenue from ascott improved marginally to S$381.7 million as the contributions from newly acquired serviced residences and higher property management fees were partially offset by the absence of contribution from divested properties.
CapitaValue Homes recorded lower revenue at S$3.9 million due to fewer units sold and handed over to buyers for the Vista in Vietnam which was completed in fY2011.
revenue for Capitaland financial increased by 11% to S$114.1 million due to one-off acquisition and divestment fees earned from our reits as well as higher interest income. in fY2012, acquisition fees earned were in respect of the acquisition of twenty anson, ascott raffles place and ascott Guangzhou, while the divestment fee was related to Somerset Grand Cairnhill.
CapitaMalls asia’s revenue grew 44% to S$353.7 million mainly due to contribution from the four malls in Japan acquired during the year, the Star Vista which began operations in September 2012, improved management fee, leasing commission from new mall openings and new projects undertaken.
australand’s revenue rose by 33% as it recorded higher sales from development projects and higher rental income from investment properties.
Singapore
China (including Hong Kong and Macau)
australia
europe
other asia (excluding Singapore and China)
others
2012 ReVenue BY GeoGRAPhiCAl loCATionTotal:s$3.30billion
35.4%
0.8%
17.8%
6.0%
4.2%
35.8%
2011 ReVenue BY GeoGRAPhiCAl loCATionTotal:s$3.02billion
35.6%
1.1%
22.0%
6.6%
5.2%
29.5%2012 2011
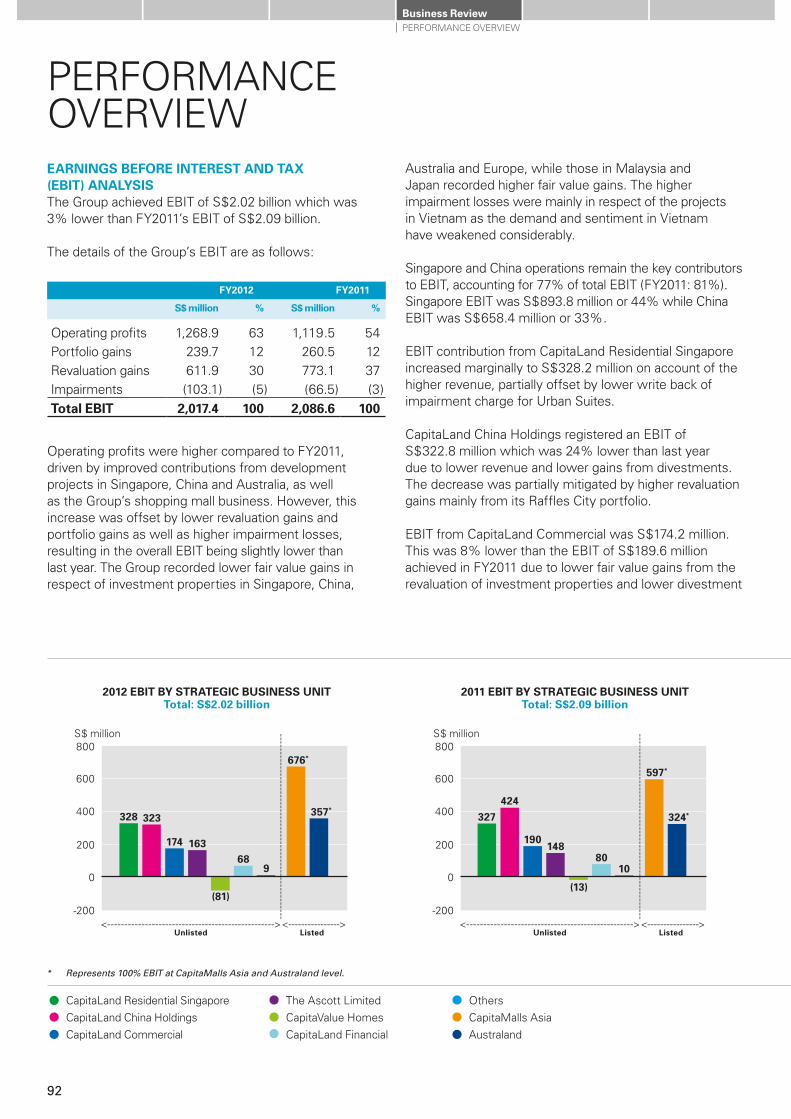
92
Business Review
<-------------------------------------------------->unlisted
<---------------->listed
-200
0
200
400
600
800S$ million ----------------------------------------------------
<-------------------------------------------------->unlisted
<---------------->listed
-200
0
200
400
600
800S$ million ----------------------------------------------------
australia and europe, while those in Malaysia and Japan recorded higher fair value gains. the higher impairment losses were mainly in respect of the projects in Vietnam as the demand and sentiment in Vietnam have weakened considerably.
Singapore and China operations remain the key contributors to eBit, accounting for 77% of total eBit (fY2011: 81%). Singapore eBit was S$893.8 million or 44% while China eBit was S$658.4 million or 33%.
eBit contribution from Capitaland residential Singapore increased marginally to S$328.2 million on account of the higher revenue, partially offset by lower write back of impairment charge for urban Suites.
Capitaland China Holdings registered an eBit of S$322.8 million which was 24% lower than last year due to lower revenue and lower gains from divestments. the decrease was partially mitigated by higher revaluation gains mainly from its raffles City portfolio.
eBit from Capitaland Commercial was S$174.2 million. this was 8% lower than the eBit of S$189.6 million achieved in fY2011 due to lower fair value gains from the revaluation of investment properties and lower divestment
eARninGS BefoRe inTeReST AnD TAx (eBiT) AnAlYSiSthe Group achieved eBit of S$2.02 billion which was 3% lower than fY2011’s eBit of S$2.09 billion.
the details of the Group’s eBit are as follows:
fY2012 fY2011
S$ million % S$ million %
operating profits 1,268.9 63 1,119.5 54portfolio gains 239.7 12 260.5 12revaluation gains 611.9 30 773.1 37impairments (103.1) (5) (66.5) (3)Total eBiT 2,017.4 100 2,086.6 100
operating profits were higher compared to fY2011, driven by improved contributions from development projects in Singapore, China and australia, as well as the Group’s shopping mall business. However, this increase was offset by lower revaluation gains and portfolio gains as well as higher impairment losses, resulting in the overall eBit being slightly lower than last year. the Group recorded lower fair value gains in respect of investment properties in Singapore, China,
perforManCe oVerVieW
perforManCe oVerVieW
Capitaland residential Singapore
Capitaland China Holdings
Capitaland Commercial
the ascott limited
CapitaValue Homes
Capitaland financial
others
CapitaMalls asia
australand
2012 eBiT BY STRATeGiC BuSineSS uniTTotal:s$2.02billion
328 323
174 163
(81)
68
357*
676*
9
2011 eBiT BY STRATeGiC BuSineSS uniTTotal:s$2.09billion
327424
190148
(13)
80
324*
597*
10
* Represents 100% EBIT at CapitaMalls Asia and Australand level.

93
gains, partially mitigated by a write back of provision for income support for one George Street.
ascott recorded a higher eBit of S$163.2 million in fY2012 as compared to S$148.4 million in fY2011. this was mainly attributable to higher portfolio gains from the divestment of ascott raffles place, ascott Guangzhou and Citadines ashley Hongkong and contributions from newly acquired properties. this increase was partially offset by lower share of net fair value gains from ascott residence trust and ascott Serviced residence (China) fund.
CapitaValue Homes posted a higher loss of S$80.9 million in fY2012 compared to a loss of S$12.9 million in fY2011. the higher loss was mainly due to lower revenue for the Vista, operating costs for business expansion in China, as well as provision for foreseeable losses primarily for its projects in Vietnam as the demand and sentiment in Vietnam have weakened considerably.
eBit for Capitaland financial saw a decrease of 15% to S$67.8 million primarily due to an allowance for doubtful receivables and the absence of portfolio gains, partially mitigated by lower operating costs and the absence of foreign exchange losses.
CapitaMalls asia recorded an eBit of S$676.2 million which was higher than fY2011’s eBit of S$597.0 million. the improvement was largely contributed by the portfolio gain in relation to the injection of CapitaMall tianfu and CapitaMall Meilicheng into CapitaMalls China Development fund iii and the disposal of Hougang plaza by CapitaMall trust, contribution from the four Japan malls and improved results from the management fee business. the increase was partially offset by lower fair value gains and impairment losses taken up for its investments in india.
australand achieved an eBit of S$357.3 million in fY2012 as compared to S$324.2 million in fY2011. the increase was mainly attributable to higher development profits from its residential division, higher rental income from the investment property division and the absence of write down of development projects, partially offset by lower fair value gains from the revaluation of investment properties.
others comprised the corporate office, Surbana and businesses in Gulf Cooperation Council countries. eBit in fY2012 amounted to S$8.7 million, mainly attributable to the fair value gains from the revaluation of investment properties, partially offset by the impairment of projects in Bahrain and Kazakhstan.
Singapore
China (including Hong Kong and Macau)
australia
europe and others
other asia (excluding Singapore and China)
2012 eBiT BY GeoGRAPhiCAl loCATionTotal:s$2.02billion
0
200
400
600
800
1,000S$ million
894
658
365
8020
2011 eBiT BY GeoGRAPhiCAl loCATionTotal:s$2.09billion
0
200
400
600
800
1,000S$ million
877813
337
4713
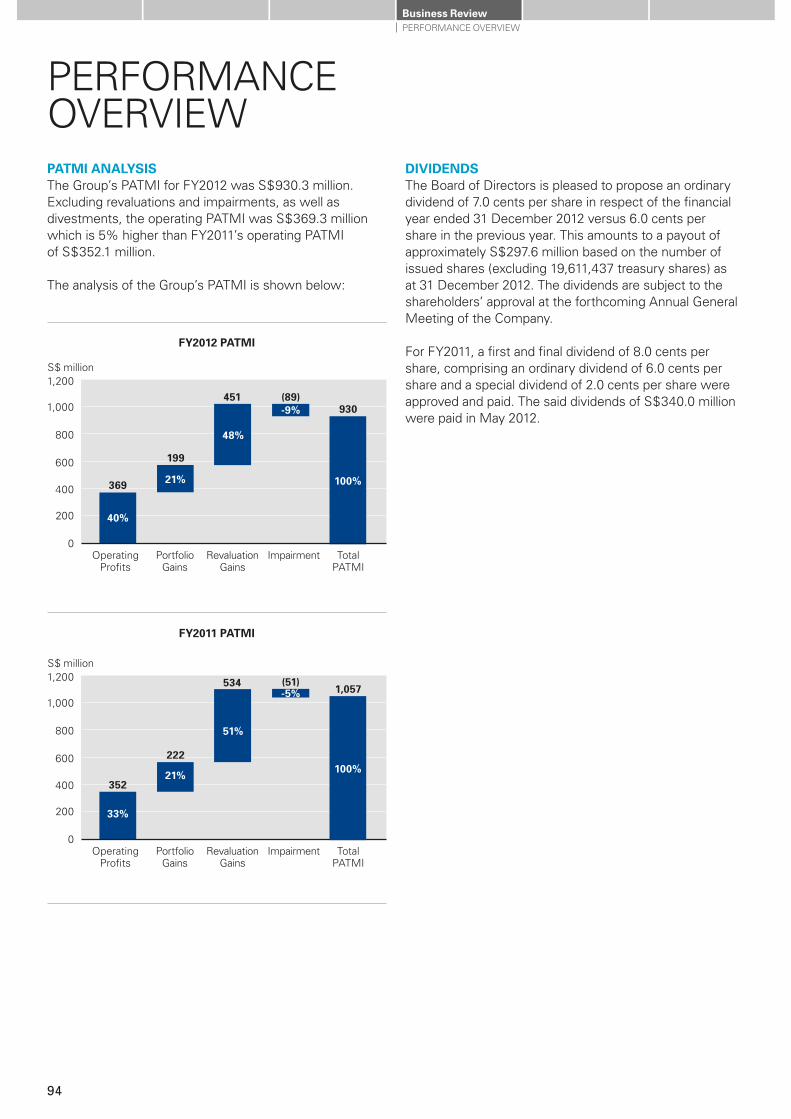
94
Business Review
PATMi AnAlYSiSthe Group’s patMi for fY2012 was S$930.3 million. excluding revaluations and impairments, as well as divestments, the operating patMi was S$369.3 million which is 5% higher than fY2011’s operating patMi of S$352.1 million.
the analysis of the Group’s patMi is shown below:
perforManCe oVerVieW
perforManCe oVerVieW
DiViDenDSthe Board of Directors is pleased to propose an ordinary dividend of 7.0 cents per share in respect of the financial year ended 31 December 2012 versus 6.0 cents per share in the previous year. this amounts to a payout of approximately S$297.6 million based on the number of issued shares (excluding 19,611,437 treasury shares) as at 31 December 2012. the dividends are subject to the shareholders’ approval at the forthcoming annual General Meeting of the Company.
for fY2011, a first and final dividend of 8.0 cents per share, comprising an ordinary dividend of 6.0 cents per share and a special dividend of 2.0 cents per share were approved and paid. the said dividends of S$340.0 million were paid in May 2012.
0
400
600
800
200
operating profits
portfolioGains
revaluationGains
impairment total patMi
1,000
1,200S$ million
40%
100%369 21%
199
48%
451-9%(89)
930
fY2012 PATMi
0
400
600
800
200
operating profits
portfolioGains
revaluationGains
impairment total patMi
1,000
1,200S$ million
33%
21%
51%
352
222
534-5%(51)
100%
1,057
fY2011 PATMi
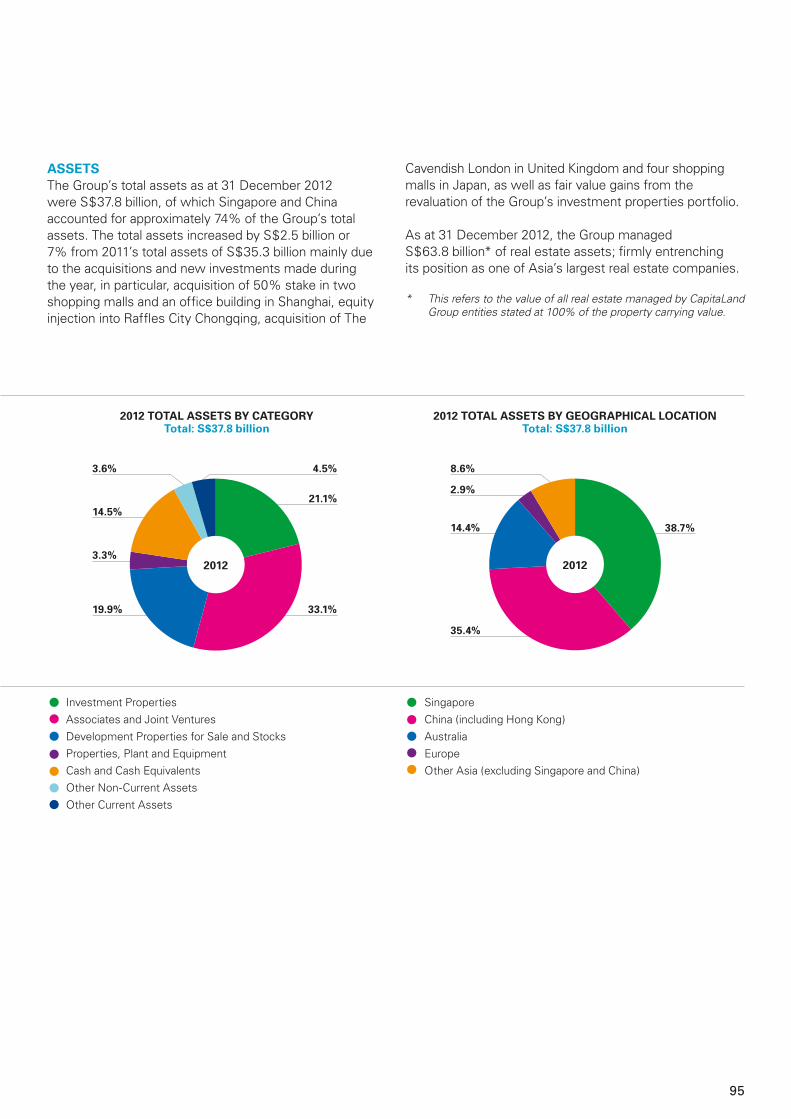
95
14.4%
2.9%
35.4%
8.6%
38.7%
21.1%
4.5%
33.1%
3.3%
14.5%
3.6%
19.9%
Singapore
China (including Hong Kong)
australia
europe
other asia (excluding Singapore and China)
2012 ToTAl ASSeTS BY CATeGoRYTotal:s$37.8billion
2012 ToTAl ASSeTS BY GeoGRAPhiCAl loCATionTotal:s$37.8billion
investment properties
associates and Joint Ventures
Development properties for Sale and Stocks
properties, plant and equipment
Cash and Cash equivalents
other non-Current assets
other Current assets
ASSeTSthe Group’s total assets as at 31 December 2012 were S$37.8 billion, of which Singapore and China accounted for approximately 74% of the Group’s total assets. the total assets increased by S$2.5 billion or 7% from 2011’s total assets of S$35.3 billion mainly due to the acquisitions and new investments made during the year, in particular, acquisition of 50% stake in two shopping malls and an office building in Shanghai, equity injection into raffles City Chongqing, acquisition of the
Cavendish london in united Kingdom and four shopping malls in Japan, as well as fair value gains from the revaluation of the Group’s investment properties portfolio.
as at 31 December 2012, the Group managed S$63.8 billion* of real estate assets; firmly entrenching its position as one of asia’s largest real estate companies.
* This refers to the value of all real estate managed by CapitaLand Group entities stated at 100% of the property carrying value.
2012 2012
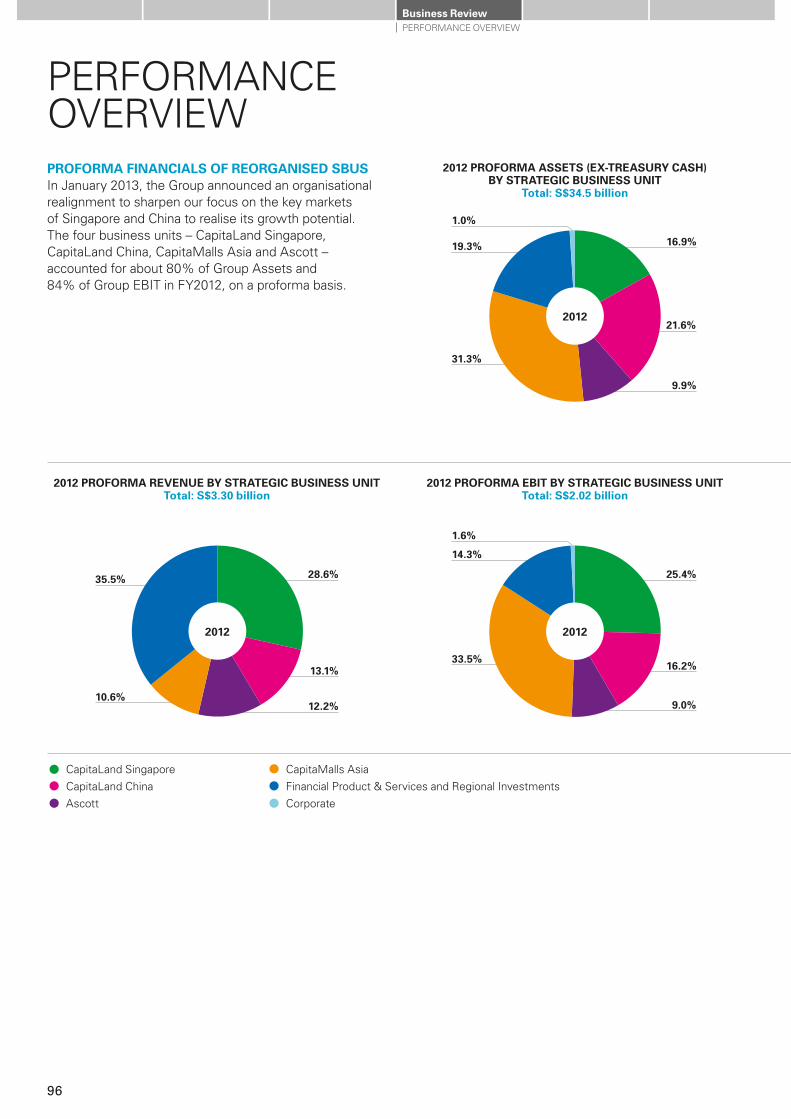
96
Business Review
25.4%
16.2%
9.0%
14.3%
33.5%
10.6%
28.6%
13.1%
12.2%
35.5%
Capitaland Singapore
Capitaland China
ascott
CapitaMalls asia
financial product & Services and regional investments
Corporate
2012 PRofoRMA ReVenue BY STRATeGiC BuSineSS uniTTotal:s$3.30billion
2012 PRofoRMA eBiT BY STRATeGiC BuSineSS uniTTotal:s$2.02billion
1.6%
PRofoRMA finAnCiAlS of ReoRGAniSeD SBuSin January 2013, the Group announced an organisational realignment to sharpen our focus on the key markets of Singapore and China to realise its growth potential. the four business units – Capitaland Singapore, Capitaland China, CapitaMalls asia and ascott – accounted for about 80% of Group assets and 84% of Group eBit in fY2012, on a proforma basis.
perforManCe oVerVieW
perforManCe oVerVieW
2012 2012
16.9%
21.6%
9.9%
19.3%
31.3%
1.0%
2012 PRofoRMA ASSeTS (ex-TReASuRY CASh) BY STRATeGiC BuSineSS uniT
Total:s$34.5billion
2012

97
BORROWinGsas at 31 December 2012, the Group’s gross debt stood at S$14.2 billion, an increase of S$2.0 billion over 31 December 2011’s gross debt. With a cash balance of S$5.5 billion, the net debt as at 31 December 2012 was S$8.7 billion as compared to S$5.9 billion as at end 2011. the net debt position as at 31 December 2012 was higher as the Group had utilised its cash as well as drawn on new borrowings to fund its ongoing capital commitments as well as acquisitions and investments made during the year.
the Group’s net debt equity ratio remained healthy at 0.45 as at 31 December 2012 (2011: 0.31).
ShAReholDeRS’ equiTYas at 31 December 2012, issued and paid-up ordinary share capital (excluding treasury shares) of the Company comprised 4.25 billion shares at S$6.3 billion. the Group’s total reserves increased from S$8.6 billion in December 2011 to S$8.8 billion in December 2012. this increase was mainly contributed by the S$930.3 million net profit for the year, partially offset by exchange losses arising from the translation of foreign operations and payment of the 2011 dividends during the year. the shareholders’ funds rose to S$15.1 billion as at end 2012 compared to S$14.9 billion in 2011. accordingly, the Group’s net tangible assets per share increased to S$3.44 as at 31 December 2012.

98
Business ReviewperforManCe oVerVieW
perforManCe oVerVieW
Treasury highlights 2012 2011
Bank facilities And Available funds Bank facilities available (S$m) 10,439 9,961 amount utilised for loans (S$m) 7,383 6,532 available and unutilised (S$m) 3,056 3,429 Cash and fixed deposit balances (S$m) 5,498 6,264 unutilised facilities and funds available for use (S$m) 8,554 9,693 Debt Securities Capacity Debt securities capacity (S$m) 15,604 10,209 Debt securities issue (net of debt securities purchased) (S$m) 6,797 5,659 unutilised debt securities capacity (S$m) 8,807 4,550 interest Cover Ratio earnings before net interest, tax, depreciation and amortisation (S$m) 2,229 2,242 net interest expense (S$m) 405 392 interest cover ratio (times) 5.50 5.72 interest Service Ratio operating cashflow before interest and tax (S$m) 1,658 1,209 net interest paid (S$m) 506 444 interest service ratio (times) 3.28 2.72 Secured Debt Ratio Secured debt (S$m) 2,864 2,482 percentage of secured debt 20% 20% DebtequityRatio Gross debt (S$m) 14,180 12,191 Cash and fixed deposit balances (S$m) 5,498 6,264 net debt (S$m) 8,682 5,927 equity (S$m) 19,444 19,239 net debt equity ratio (times) 0.45 0.31
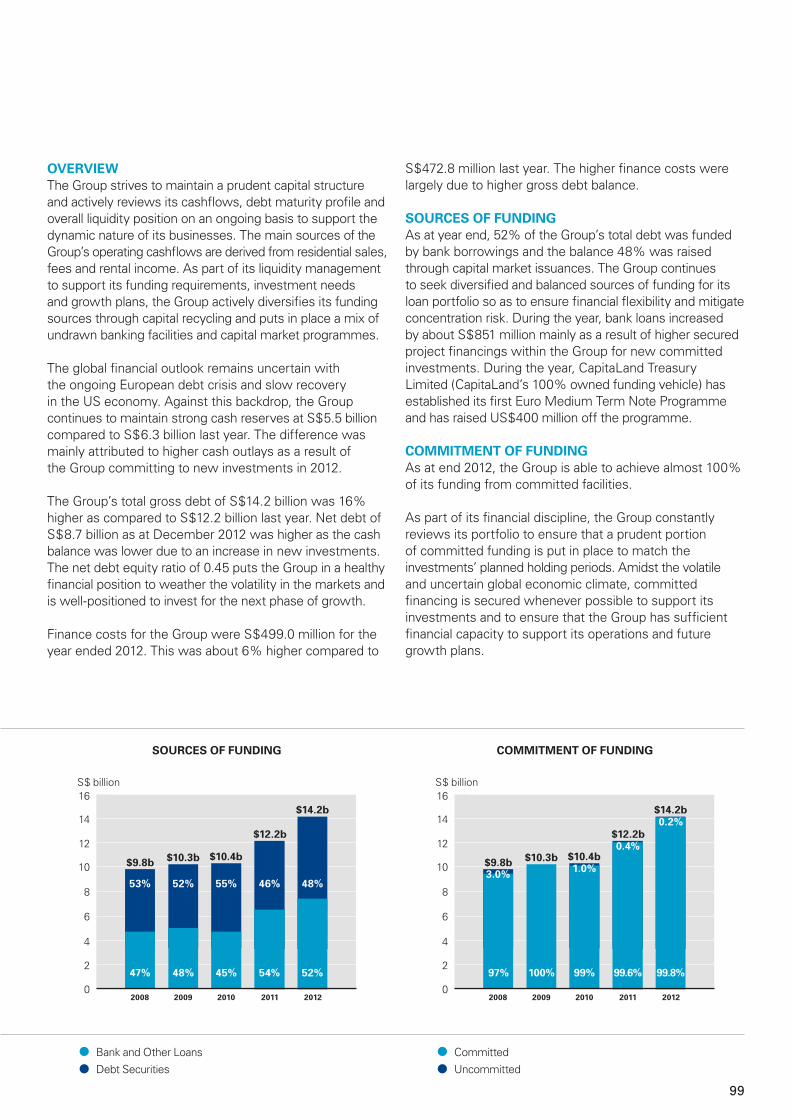
99
OVeRVieWthe Group strives to maintain a prudent capital structure and actively reviews its cashflows, debt maturity profile and overall liquidity position on an ongoing basis to support the dynamic nature of its businesses. the main sources of the Group’s operating cashflows are derived from residential sales, fees and rental income. as part of its liquidity management to support its funding requirements, investment needs and growth plans, the Group actively diversifies its funding sources through capital recycling and puts in place a mix of undrawn banking facilities and capital market programmes. the global financial outlook remains uncertain with the ongoing european debt crisis and slow recovery in the uS economy. against this backdrop, the Group continues to maintain strong cash reserves at S$5.5 billion compared to S$6.3 billion last year. the difference was mainly attributed to higher cash outlays as a result of the Group committing to new investments in 2012. the Group’s total gross debt of S$14.2 billion was 16% higher as compared to S$12.2 billion last year. net debt of S$8.7 billion as at December 2012 was higher as the cash balance was lower due to an increase in new investments. the net debt equity ratio of 0.45 puts the Group in a healthy financial position to weather the volatility in the markets and is well-positioned to invest for the next phase of growth.
finance costs for the Group were S$499.0 million for the year ended 2012. this was about 6% higher compared to
S$472.8 million last year. the higher finance costs were largely due to higher gross debt balance.
SouRCeS of funDinGas at year end, 52% of the Group’s total debt was funded by bank borrowings and the balance 48% was raised through capital market issuances. the Group continues to seek diversified and balanced sources of funding for its loan portfolio so as to ensure financial flexibility and mitigate concentration risk. During the year, bank loans increased by about S$851 million mainly as a result of higher secured project financings within the Group for new committed investments. During the year, Capitaland treasury limited (Capitaland’s 100% owned funding vehicle) has established its first euro Medium term note programme and has raised uS$400 million off the programme.
CoMMiTMenT of funDinGas at end 2012, the Group is able to achieve almost 100% of its funding from committed facilities.
as part of its financial discipline, the Group constantly reviews its portfolio to ensure that a prudent portion of committed funding is put in place to match the investments’ planned holding periods. amidst the volatile and uncertain global economic climate, committed financing is secured whenever possible to support its investments and to ensure that the Group has sufficient financial capacity to support its operations and future growth plans.
Bank and other loans
Debt Securities
Committed
uncommitted
SouRCeS of funDinG
0
2
4
6
8
10
12
14
16S$ billion
47%
53%
$9.8b $10.3b $10.4b
$12.2b
$14.2b
48%
52%
45%
55%
54%
46%
52%
48%
2008 2009 2010 2011 2012
CoMMiTMenT of funDinG
0
2
4
6
8
10
12
14
16S$ billion
97%
3.0%$9.8b $10.3b $10.4b
$12.2b
$14.2b
100% 99%
1.0%
99.6%
0.4%
99.8%
0.2%
2008 2009 2010 2011 2012

100
Business Review
MATuRiTY PRofilethe Group has proactively built up sufficient cash reserves and credit lines to enable it to meet its short term debt obligations, support its refinancing needs and pursue opportunistic investments. the Group maintains a strong cash position of S$5.5 billion and unutilised bank lines of about S$3.1 billion. to ensure financial discipline, the Group constantly reviews its loan profile so as to diversify the refinancing risks, avoid concentration and extend its maturity profile where possible. in reviewing the maturity profile of its loan portfolio, the Group also took into account any divestment or investment plans, interest rate outlook and the prevailing credit market conditions.
AVAilABle lineS BY nATionAliTY of BAnkS the Group has built up an extensive and active relationship with a network of more than 30 banks of various nationalities. Diversity has allowed the Group to tap on the strengths and support from the financial institutions in pursuing its strategic growth and presence globally, thus enhancing its competitiveness in core markets and enabling the Group to develop other markets where appropriate.
perforManCe oVerVieW
perforManCe oVerVieW
DeBT MATuRiTY PRofile
0
1
2
3
4
5S$ billion
6%
$0.8b
$1.6b
$2.4b
$3.9b
$0.8b
$4.7b
11% 17% 27% 6% 33%
Within1 year
2 years 3years 4 years 5years More Than 5Years
AVAilABle lineS BY nATionAliTY of BAnkS
Note: Convertible Bonds are reflected as held till final maturity.
Singapore
Japan
australia
europe
others
34%
31%
11%
13%
11%
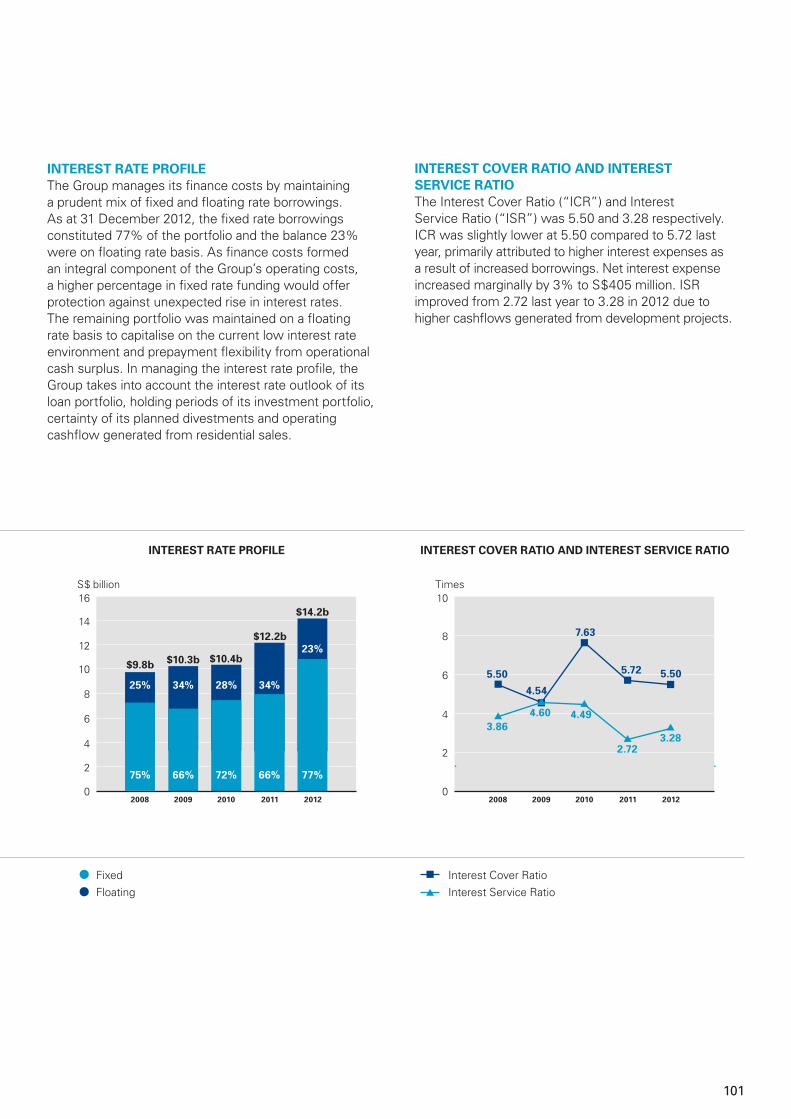
101
inTeReST RATe PRofile the Group manages its finance costs by maintaining a prudent mix of fixed and floating rate borrowings. as at 31 December 2012, the fixed rate borrowings constituted 77% of the portfolio and the balance 23% were on floating rate basis. as finance costs formed an integral component of the Group’s operating costs, a higher percentage in fixed rate funding would offer protection against unexpected rise in interest rates. the remaining portfolio was maintained on a floating rate basis to capitalise on the current low interest rate environment and prepayment flexibility from operational cash surplus. in managing the interest rate profile, the Group takes into account the interest rate outlook of its loan portfolio, holding periods of its investment portfolio, certainty of its planned divestments and operating cashflow generated from residential sales.
inTeReST CoVeR RATio AnD inTeReST SeRViCe RATio the interest Cover ratio (“iCr”) and interest Service ratio (“iSr”) was 5.50 and 3.28 respectively. iCr was slightly lower at 5.50 compared to 5.72 last year, primarily attributed to higher interest expenses as a result of increased borrowings. net interest expense increased marginally by 3% to S$405 million. iSr improved from 2.72 last year to 3.28 in 2012 due to higher cashflows generated from development projects.
fixed
floating
inTeReST RATe PRofile inTeReST CoVeR RATio AnD inTeReST SeRViCe RATio
0
2
4
6
8
10
12
14
16S$ billion
75%
25%
$9.8b $10.3b $10.4b
$12.2b
$14.2b
66%
34%
72%
28%
66%
34%
77%
23%
2008 2009 2010 2011 20120
2
4
6
8
10times
3.86
5.50
4.60
2.723.28
2008 2009 2010 2011 2012
4.49
4.54
7.63
5.72 5.50
interest Cover ratio
interest Service ratio

102
Business ReviewGroup BuSineSSeS
Group BuSineSSeSoRGAniSATionAl ReAliGnMenT AnD SiMPlifiCATionon 3 January 2013, Capitaland realigned and simplified its organisational structure into four main businesses to sharpen its focus on key markets and to realise its growth potential. the four main businesses are Capitaland Singapore, Capitaland China, CapitaMalls asia (CMa) and the ascott limited (ascott).
the following is a broad overview of the four businesses:
1. CApiTAlAnDsinGApORe Capitaland Singapore, a wholly-owned subsidiary
of Capitaland limited, is one of Singapore’s leading developers and owners of homes, office and mixed development projects. it comprises the businesses of Capitaland residential Singapore, the Singapore businesses under Capitaland Commercial, and Capitaland’s residential, office and mixed development businesses in Malaysia.
Capitaland Singapore is the sponsor and manager of two commercial real estate investment trusts, CapitaCommercial trust and Quill Capita trust, separately listed in Singapore and Malaysia.
Capitaland Singapore invests, develops and manages homes, offices and mixed developments in Singapore and Malaysia.
2. CApiTAlAnDCHinA Capitaland China, the leading foreign real estate
developer in China, is a wholly-owned subsidiary of Capitaland limited. it comprises the businesses of Capitaland China Holdings and the residential businesses under CapitaValue Homes limited in China.
its core business ranges from homes, commercial properties to mixed developments and financial services. With a portfolio of about 48,000 units of residences, 16 commercial projects and 8 raffles City mixed developments in China, it also manages six real estate funds in China.
Certified as a China Well-Known trademark, Capitaland China is dedicated to provide quality products and services to customers.
3. CApiTAmAllsAsiA CMa is one of the largest listed shopping mall
developers, owners and managers in asia by total property value of assets and geographic reach. CMa has an integrated shopping mall business model encompassing retail real estate investment, development, mall operations, asset management and fund management capabilities. it has interests in and manages a pan-asian portfolio of 101 shopping malls across 52 cities in the five countries of Singapore, China, Malaysia, Japan and india, with a total property value of approximately S$31.7 billion and a total Gfa of approximately 92.5 million square feet as at 31 December 2012.
4. AsCOTT ascott is the world’s largest international serviced
residence owner-operator with more than 22,000 operating serviced residence units in key cities of asia pacific, europe and the Gulf region, as well as over 9,000 units which are under development, making a total of more than 31,000 units in over 200 properties.
in addition, there are two areas which fall under Capitaland Group Headquarters, namely financial products & Services and regional investments.
Capitaland’s financial products & Services unit oversees the Group’s real estate financial products and services. it has an established track record in originating, structuring, distributing and managing real estate financial products. its areas of focus include originating, structuring and managing private real estate funds, listed real estate investment trusts (reits) and structuring credit enhancements for financing arrangements in relation to real estate assets.
the regional investments unit manages regional real estate investments that fall outside the four main business units. these include Capitaland Vietnam, australand, Surbana, and StorHub, as well as investments in Japan, india, united Kingdom and Gulf Cooperation Council.
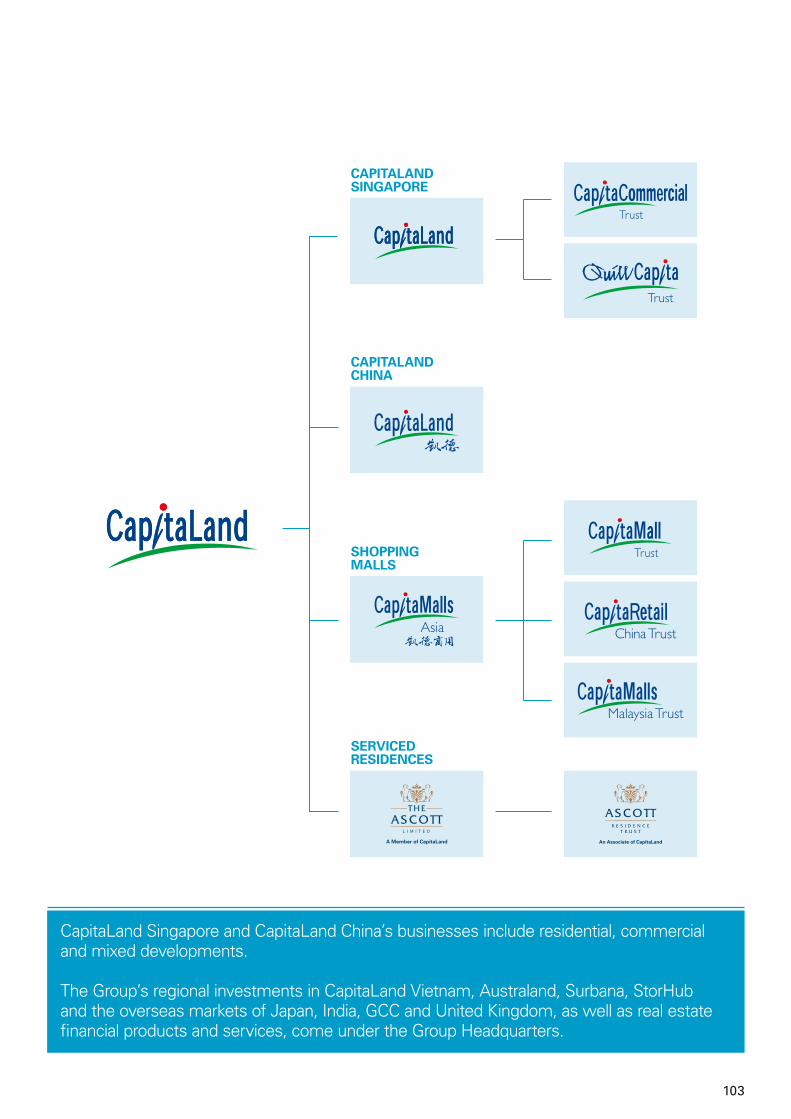
103
Capitaland Singapore and Capitaland China’s businesses include residential, commercial and mixed developments.
the Group’s regional investments in Capitaland Vietnam, australand, Surbana, StorHub and the overseas markets of Japan, india, GCC and united Kingdom, as well as real estate financial products and services, come under the Group Headquarters.
CAPiTAlAnD SinGAPoRe
ShoPPinG MAllS
SeRViCeD ReSiDenCeS
CAPiTAlAnD ChinA
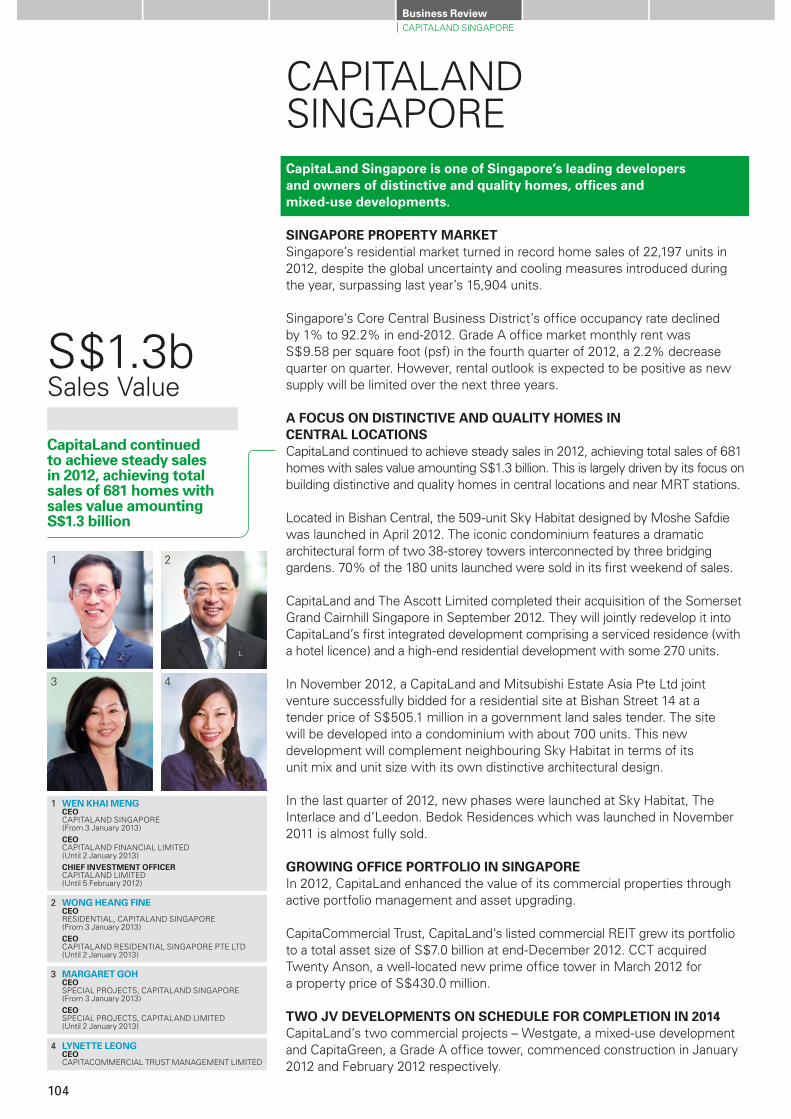
104
Business ReviewCapitalanD SinGapore
CapitalanD SinGaporeCapitaland Singapore is one of Singapore’s leading developers andownersofdistinctiveandqualityhomes,officesand mixed-usedevelopments.
SinGAPoRe PRoPeRTY MARkeTSingapore’s residential market turned in record home sales of 22,197 units in 2012, despite the global uncertainty and cooling measures introduced during the year, surpassing last year’s 15,904 units.
Singapore’s Core Central Business District’s office occupancy rate declined by 1% to 92.2% in end-2012. Grade a office market monthly rent was S$9.58 per square foot (psf) in the fourth quarter of 2012, a 2.2% decrease quarter on quarter. However, rental outlook is expected to be positive as new supply will be limited over the next three years.
A foCuS on DiSTinCTiVe AnD quAliTY hoMeS in CenTRAl loCATionSCapitaland continued to achieve steady sales in 2012, achieving total sales of 681 homes with sales value amounting S$1.3 billion. this is largely driven by its focus on building distinctive and quality homes in central locations and near Mrt stations.
located in Bishan Central, the 509-unit Sky Habitat designed by Moshe Safdie was launched in april 2012. the iconic condominium features a dramatic architectural form of two 38-storey towers interconnected by three bridging gardens. 70% of the 180 units launched were sold in its first weekend of sales.
Capitaland and the ascott limited completed their acquisition of the Somerset Grand Cairnhill Singapore in September 2012. they will jointly redevelop it into Capitaland’s first integrated development comprising a serviced residence (with a hotel licence) and a high-end residential development with some 270 units.
in november 2012, a Capitaland and Mitsubishi estate asia pte ltd joint venture successfully bidded for a residential site at Bishan Street 14 at a tender price of S$505.1 million in a government land sales tender. the site will be developed into a condominium with about 700 units. this new development will complement neighbouring Sky Habitat in terms of its unit mix and unit size with its own distinctive architectural design.
in the last quarter of 2012, new phases were launched at Sky Habitat, the interlace and d’leedon. Bedok residences which was launched in november 2011 is almost fully sold.
GROWinGOFFiCepORTFOliOinsinGApORein 2012, Capitaland enhanced the value of its commercial properties through active portfolio management and asset upgrading.
CapitaCommercial trust, Capitaland’s listed commercial reit grew its portfolio to a total asset size of S$7.0 billion at end-December 2012. CCt acquired twenty anson, a well-located new prime office tower in March 2012 for a property price of S$430.0 million.
TWOJVDeVelOpmenTsOnsCHeDuleFORCOmpleTiOnin2014Capitaland’s two commercial projects – Westgate, a mixed-use development and CapitaGreen, a Grade a office tower, commenced construction in January 2012 and february 2012 respectively.
Capitaland continued to achieve steady sales in 2012, achieving total sales of 681 homes with sales value amounting s$1.3billion
S$1.3b Sales Value
1 WenKHAimenG Ceo CapitalanD SinGapore (from 3 January 2013) Ceo CapitalanD finanCial liMiteD (until 2 January 2013) Chief inVeSTMenT offiCeR CapitalanD liMiteD (until 5 february 2012)
2 WOnGHeAnGFine Ceo reSiDential, CapitalanD SinGapore (from 3 January 2013) Ceo CapitalanD reSiDential SinGapore pte ltD (until 2 January 2013)
3 MARGAReT Goh Ceo SpeCial proJeCtS, CapitalanD SinGapore (from 3 January 2013) Ceo SpeCial proJeCtS, CapitalanD liMiteD (until 2 January 2013)
4 lYneTTe leonG Ceo CapitaCoMMerCial truSt ManaGeMent liMiteD
3 4
1 2
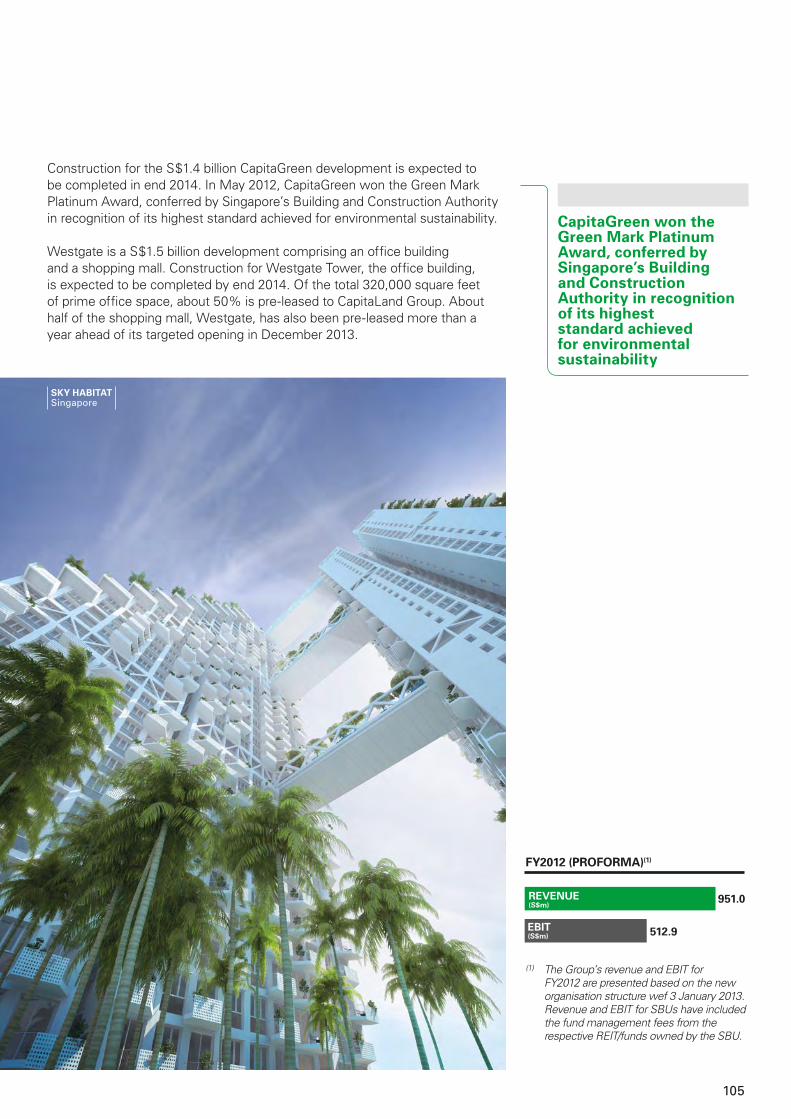
105
Construction for the S$1.4 billion CapitaGreen development is expected to be completed in end 2014. in May 2012, CapitaGreen won the Green Mark platinum award, conferred by Singapore’s Building and Construction authority in recognition of its highest standard achieved for environmental sustainability.
Westgate is a S$1.5 billion development comprising an office building and a shopping mall. Construction for Westgate tower, the office building, is expected to be completed by end 2014. of the total 320,000 square feet of prime office space, about 50% is pre-leased to Capitaland Group. about half of the shopping mall, Westgate, has also been pre-leased more than a year ahead of its targeted opening in December 2013.
CapitaGreen won the Green Mark Platinum Award, conferred by Singapore’s Building and Construction Authority in recognition of its highest standard achieved for environmental sustainability
SkY hABiTAT Singapore
ReVenue(S$m)
951.0
512.9
fY2012 (PRofoRMA)(1)
(1) The Group’s revenue and EBIT for FY2012 are presented based on the new organisation structure wef 3 January 2013. Revenue and EBIT for SBUs have included the fund management fees from the respective REIT/funds owned by the SBU.
eBiT (S$m)
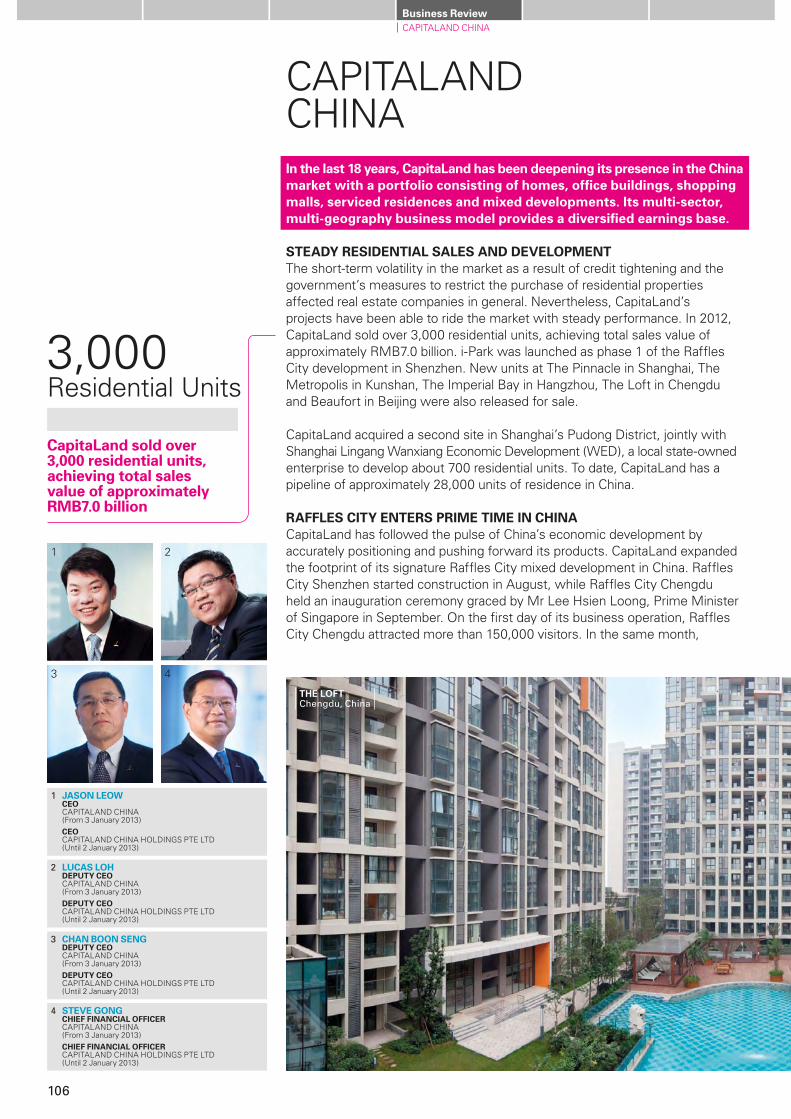
106
CapitalanD CHina
CapitalanD CHina
Capitaland sold over 3,000residentialunits,achieving total sales value of approximately RmB7.0billion
in the last 18 years, Capitaland has been deepening its presence in the China market with a portfolio consisting of homes, office buildings, shopping malls,servicedresidencesandmixeddevelopments.itsmulti-sector,multi-geographybusinessmodelprovidesadiversifiedearningsbase.
STeADY ReSiDenTiAl SAleS AnD DeVeloPMenTthe short-term volatility in the market as a result of credit tightening and the government’s measures to restrict the purchase of residential properties affected real estate companies in general. nevertheless, Capitaland’s projects have been able to ride the market with steady performance. in 2012, Capitaland sold over 3,000 residential units, achieving total sales value of approximately rMB7.0 billion. i-park was launched as phase 1 of the raffles City development in Shenzhen. new units at the pinnacle in Shanghai, the Metropolis in Kunshan, the imperial Bay in Hangzhou, the loft in Chengdu and Beaufort in Beijing were also released for sale.
Capitaland acquired a second site in Shanghai’s pudong District, jointly with Shanghai lingang Wanxiang economic Development (WeD), a local state-owned enterprise to develop about 700 residential units. to date, Capitaland has a pipeline of approximately 28,000 units of residence in China.
RAffleS CiTY enTeRS PRiMe TiMe in ChinACapitaland has followed the pulse of China’s economic development by accurately positioning and pushing forward its products. Capitaland expanded the footprint of its signature raffles City mixed development in China. raffles City Shenzhen started construction in august, while raffles City Chengdu held an inauguration ceremony graced by Mr lee Hsien loong, prime Minister of Singapore in September. on the first day of its business operation, raffles City Chengdu attracted more than 150,000 visitors. in the same month,
3,000 residential units
1 JAsOnleOW Ceo CapitalanD CHina (from 3 January 2013) Ceo CapitalanD CHina HolDinGS pte ltD (until 2 January 2013)
2 luCAS loh DePuTY Ceo CapitalanD CHina (from 3 January 2013) DePuTY Ceo CapitalanD CHina HolDinGS pte ltD (until 2 January 2013)
3 ChAn Boon SenG DePuTY Ceo CapitalanD CHina (from 3 January 2013) DePuTY Ceo CapitalanD CHina HolDinGS pte ltD (until 2 January 2013)
4 STeVe GonG Chief finAnCiAl offiCeR CapitalanD CHina (from 3 January 2013) Chief finAnCiAl offiCeR CapitalanD CHina HolDinGS pte ltD (until 2 January 2013)
3 4
1 2
The lofTChengdu, China
Business Review
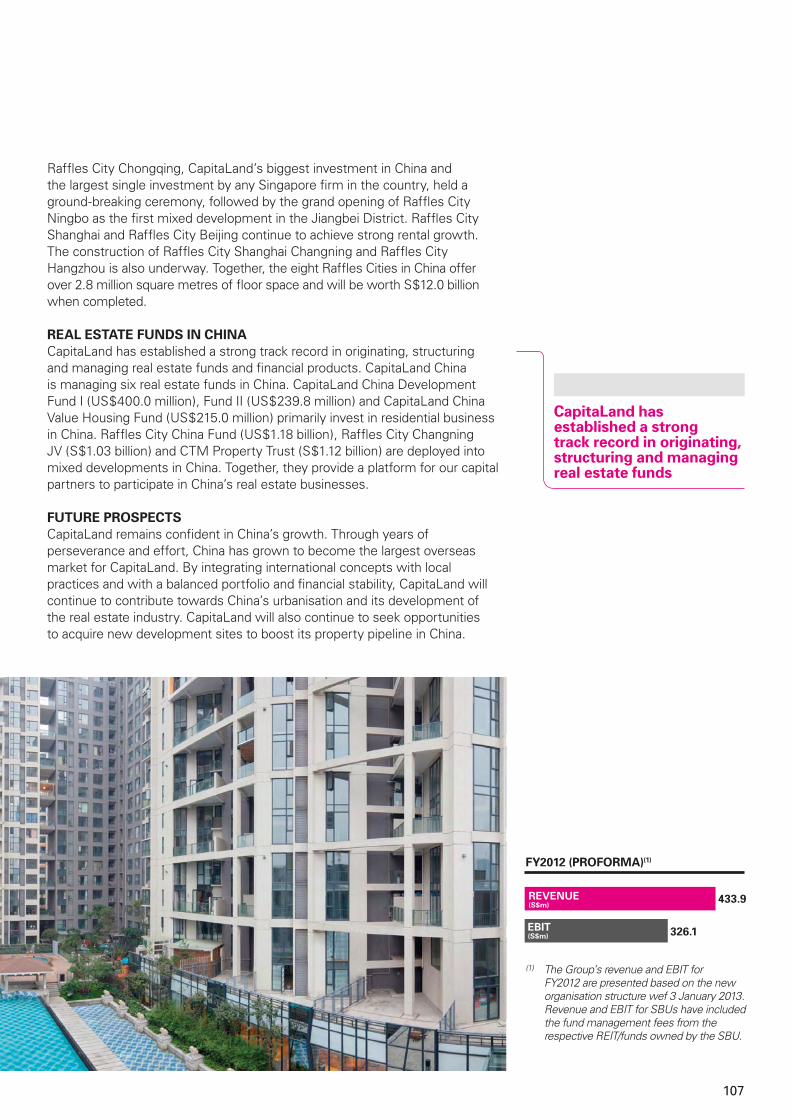
107
raffles City Chongqing, Capitaland’s biggest investment in China and the largest single investment by any Singapore firm in the country, held a ground-breaking ceremony, followed by the grand opening of raffles City ningbo as the first mixed development in the Jiangbei District. raffles City Shanghai and raffles City Beijing continue to achieve strong rental growth. the construction of raffles City Shanghai Changning and raffles City Hangzhou is also underway. together, the eight raffles Cities in China offer over 2.8 million square metres of floor space and will be worth S$12.0 billion when completed.
ReAl eSTATe funDS in ChinACapitaland has established a strong track record in originating, structuring and managing real estate funds and financial products. Capitaland China is managing six real estate funds in China. Capitaland China Development fund i (uS$400.0 million), fund ii (uS$239.8 million) and Capitaland China Value Housing fund (uS$215.0 million) primarily invest in residential business in China. raffles City China fund (uS$1.18 billion), raffles City Changning JV (S$1.03 billion) and CtM property trust (S$1.12 billion) are deployed into mixed developments in China. together, they provide a platform for our capital partners to participate in China’s real estate businesses.
fuTuRe PRoSPeCTSCapitaland remains confident in China’s growth. through years of perseverance and effort, China has grown to become the largest overseas market for Capitaland. By integrating international concepts with local practices and with a balanced portfolio and financial stability, Capitaland will continue to contribute towards China’s urbanisation and its development of the real estate industry. Capitaland will also continue to seek opportunities to acquire new development sites to boost its property pipeline in China.
Capitaland has established a strong track record in originating, structuring and managing real estate funds
ReVenue(S$m)
433.9
326.1
fY2012 (PRofoRMA)(1)
(1) The Group’s revenue and EBIT for FY2012 are presented based on the new organisation structure wef 3 January 2013. Revenue and EBIT for SBUs have included the fund management fees from the respective REIT/funds owned by the SBU.
eBiT (S$m)
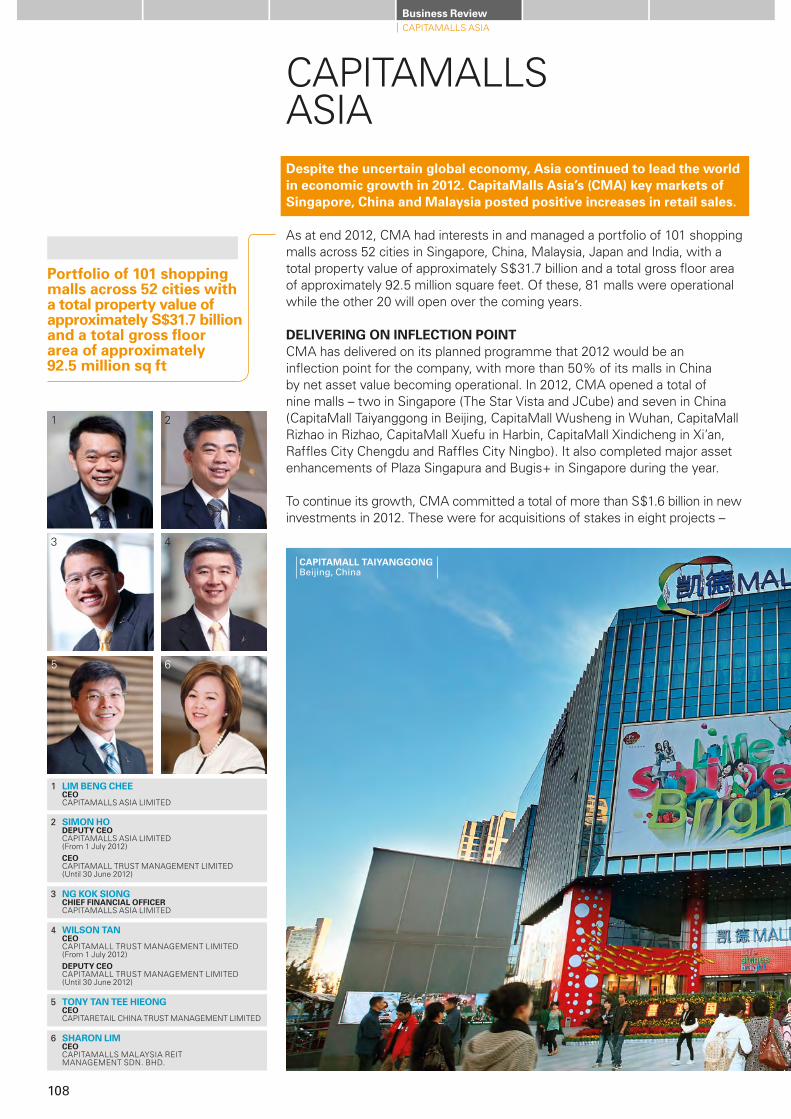
108
Business ReviewCapitaMallS aSia
CapitaMallS aSiaDespite the uncertain global economy, Asia continued to lead the world ineconomicgrowthin2012.CapitamallsAsia’s(CmA)keymarketsofsingapore,Chinaandmalaysiapostedpositiveincreasesinretailsales.
as at end 2012, CMa had interests in and managed a portfolio of 101 shopping malls across 52 cities in Singapore, China, Malaysia, Japan and india, with a total property value of approximately S$31.7 billion and a total gross floor area of approximately 92.5 million square feet. of these, 81 malls were operational while the other 20 will open over the coming years.
DeliVeRinG on infleCTion PoinTCMa has delivered on its planned programme that 2012 would be an inflection point for the company, with more than 50% of its malls in China by net asset value becoming operational. in 2012, CMa opened a total of nine malls – two in Singapore (the Star Vista and JCube) and seven in China (CapitaMall taiyanggong in Beijing, CapitaMall Wusheng in Wuhan, CapitaMall rizhao in rizhao, CapitaMall Xuefu in Harbin, CapitaMall Xindicheng in Xi’an, raffles City Chengdu and raffles City ningbo). it also completed major asset enhancements of plaza Singapura and Bugis+ in Singapore during the year.
to continue its growth, CMa committed a total of more than S$1.6 billion in new investments in 2012. these were for acquisitions of stakes in eight projects –
Portfolio of 101 shopping mallsacross52citieswitha total property value of approximatelys$31.7billionand a total gross floor area of approximately 92.5millionsqft
5 TonY TAn Tee hieonG Ceo Capitaretail CHina truSt ManaGeMent liMiteD
6 ShARon liM Ceo CapitaMallS MalaYSia reit ManaGeMent SDn. BHD.
1 liM BenG Chee Ceo CapitaMallS aSia liMiteD
2 SiMon ho DePuTY Ceo CapitaMallS aSia liMiteD (from 1 July 2012) Ceo CapitaMall truSt ManaGeMent liMiteD (until 30 June 2012)
3 nG kok SionG Chief finAnCiAl offiCeR CapitaMallS aSia liMiteD
4 WilsOnTAn Ceo CapitaMall truSt ManaGeMent liMiteD (from 1 July 2012) DePuTY Ceo CapitaMall truSt ManaGeMent liMiteD (until 30 June 2012)
3
5
4
6
1 2
CAPiTAMAll TAiYAnGGonG Beijing, China
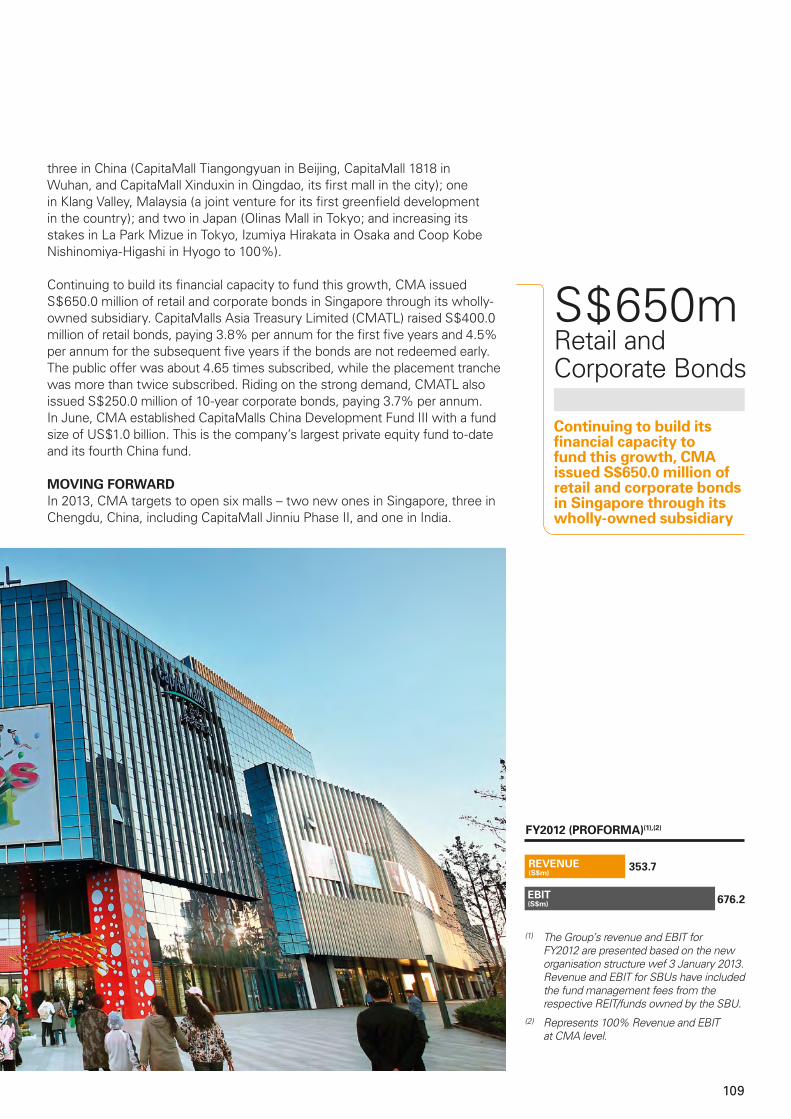
109
three in China (CapitaMall tiangongyuan in Beijing, CapitaMall 1818 in Wuhan, and CapitaMall Xinduxin in Qingdao, its first mall in the city); one in Klang Valley, Malaysia (a joint venture for its first greenfield development in the country); and two in Japan (olinas Mall in tokyo; and increasing its stakes in la park Mizue in tokyo, izumiya Hirakata in osaka and Coop Kobe nishinomiya-Higashi in Hyogo to 100%).
Continuing to build its financial capacity to fund this growth, CMa issued S$650.0 million of retail and corporate bonds in Singapore through its wholly-owned subsidiary. CapitaMalls asia treasury limited (CMatl) raised S$400.0 million of retail bonds, paying 3.8% per annum for the first five years and 4.5% per annum for the subsequent five years if the bonds are not redeemed early. the public offer was about 4.65 times subscribed, while the placement tranche was more than twice subscribed. riding on the strong demand, CMatl also issued S$250.0 million of 10-year corporate bonds, paying 3.7% per annum. in June, CMa established CapitaMalls China Development fund iii with a fund size of uS$1.0 billion. this is the company’s largest private equity fund to-date and its fourth China fund.
mOVinGFORWARDin 2013, CMa targets to open six malls – two new ones in Singapore, three in Chengdu, China, including CapitaMall Jinniu phase ii, and one in india.
Continuing to build its financial capacity to fund this growth, CMA issueds$650.0millionofretail and corporate bonds in Singapore through its wholly-owned subsidiary
S$650m retail and Corporate Bonds
ReVenue(S$m)
353.7
676.2
fY2012 (PRofoRMA)(1),(2)
(1) The Group’s revenue and EBIT for FY2012 are presented based on the new organisation structure wef 3 January 2013. Revenue and EBIT for SBUs have included the fund management fees from the respective REIT/funds owned by the SBU.
(2) Represents 100% Revenue and EBIT at CMA level.
eBiT (S$m)
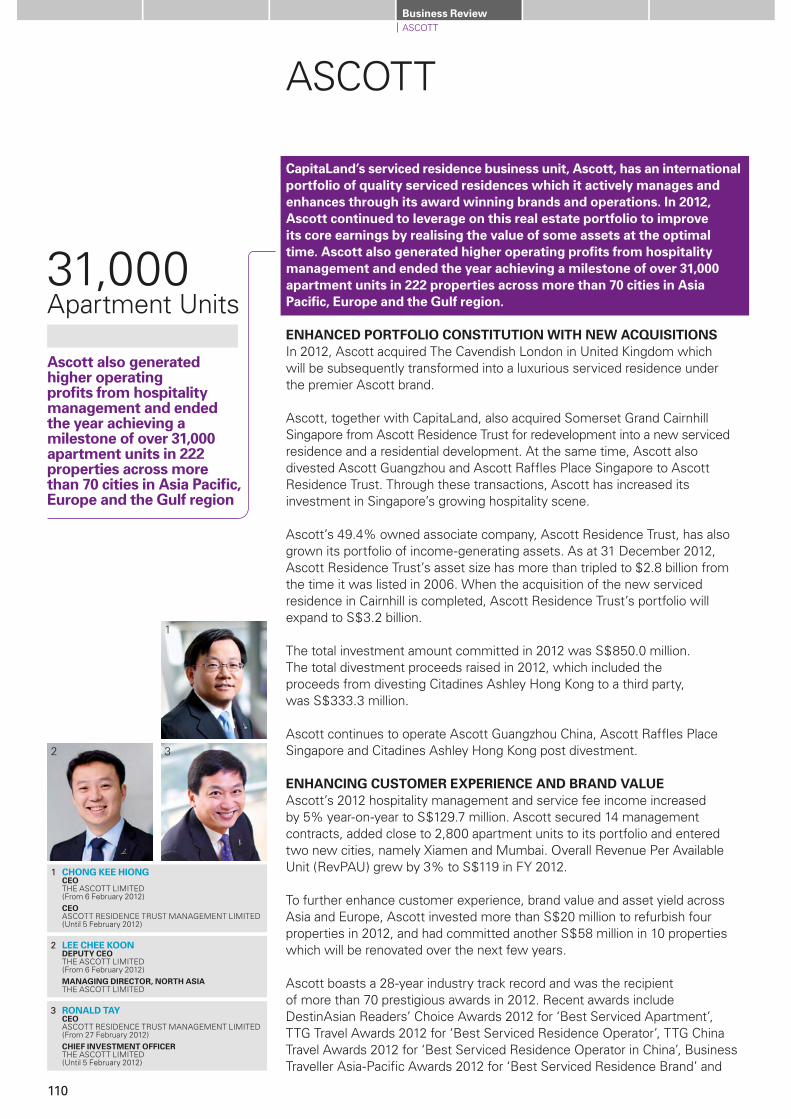
110
Business ReviewaSCott
aSCott
Ascott also generated higher operating profits from hospitality management and ended the year achieving a milestoneofover31,000apartment units in 222 properties across more than 70 cities in Asia Pacific, europe and the Gulf region
Capitaland’s serviced residence business unit, Ascott, has an international portfolioofqualityservicedresidenceswhichitactivelymanagesandenhancesthroughitsawardwinningbrandsandoperations.in2012,Ascott continued to leverage on this real estate portfolio to improve its core earnings by realising the value of some assets at the optimal time.Ascottalsogeneratedhigheroperatingprofitsfromhospitalitymanagementandendedtheyearachievingamilestoneofover31,000apartment units in 222 properties across more than 70 cities in Asia pacific,europeandtheGulfregion.
enHAnCeDpORTFOliOCOnsTiTuTiOnWiTHneWACquisiTiOnsin 2012, ascott acquired the Cavendish london in united Kingdom which will be subsequently transformed into a luxurious serviced residence under the premier ascott brand.
ascott, together with Capitaland, also acquired Somerset Grand Cairnhill Singapore from ascott residence trust for redevelopment into a new serviced residence and a residential development. at the same time, ascott also divested ascott Guangzhou and ascott raffles place Singapore to ascott residence trust. through these transactions, ascott has increased its investment in Singapore’s growing hospitality scene.
ascott’s 49.4% owned associate company, ascott residence trust, has also grown its portfolio of income-generating assets. as at 31 December 2012, ascott residence trust’s asset size has more than tripled to $2.8 billion from the time it was listed in 2006. When the acquisition of the new serviced residence in Cairnhill is completed, ascott residence trust’s portfolio will expand to S$3.2 billion.
the total investment amount committed in 2012 was S$850.0 million. the total divestment proceeds raised in 2012, which included the proceeds from divesting Citadines ashley Hong Kong to a third party, was S$333.3 million.
ascott continues to operate ascott Guangzhou China, ascott raffles place Singapore and Citadines ashley Hong Kong post divestment.
enhAnCinG CuSToMeR exPeRienCe AnD BRAnD VAlue ascott’s 2012 hospitality management and service fee income increased by 5% year-on-year to S$129.7 million. ascott secured 14 management contracts, added close to 2,800 apartment units to its portfolio and entered two new cities, namely Xiamen and Mumbai. overall revenue per available unit (revpau) grew by 3% to S$119 in fY 2012.
to further enhance customer experience, brand value and asset yield across asia and europe, ascott invested more than S$20 million to refurbish four properties in 2012, and had committed another S$58 million in 10 properties which will be renovated over the next few years.
ascott boasts a 28-year industry track record and was the recipient of more than 70 prestigious awards in 2012. recent awards include Destinasian readers’ Choice awards 2012 for ‘Best Serviced apartment’, ttG travel awards 2012 for ‘Best Serviced residence operator’, ttG China travel awards 2012 for ‘Best Serviced residence operator in China’, Business traveller asia-pacific awards 2012 for ‘Best Serviced residence Brand’ and
31,000 apartment units
1 ChonG kee hionG Ceo tHe aSCott liMiteD (from 6 february 2012) Ceo aSCott reSiDenCe truSt ManaGeMent liMiteD (until 5 february 2012)
3 RonAlD TAY Ceo aSCott reSiDenCe truSt ManaGeMent liMiteD (from 27 february 2012) Chief inVeSTMenT offiCeR tHe aSCott liMiteD (until 5 february 2012)
2 lee Chee koon DePuTY Ceo tHe aSCott liMiteD (from 6 february 2012) MAnAGinG DiReCToR, noRTh ASiA tHe aSCott liMiteD
1
2 3
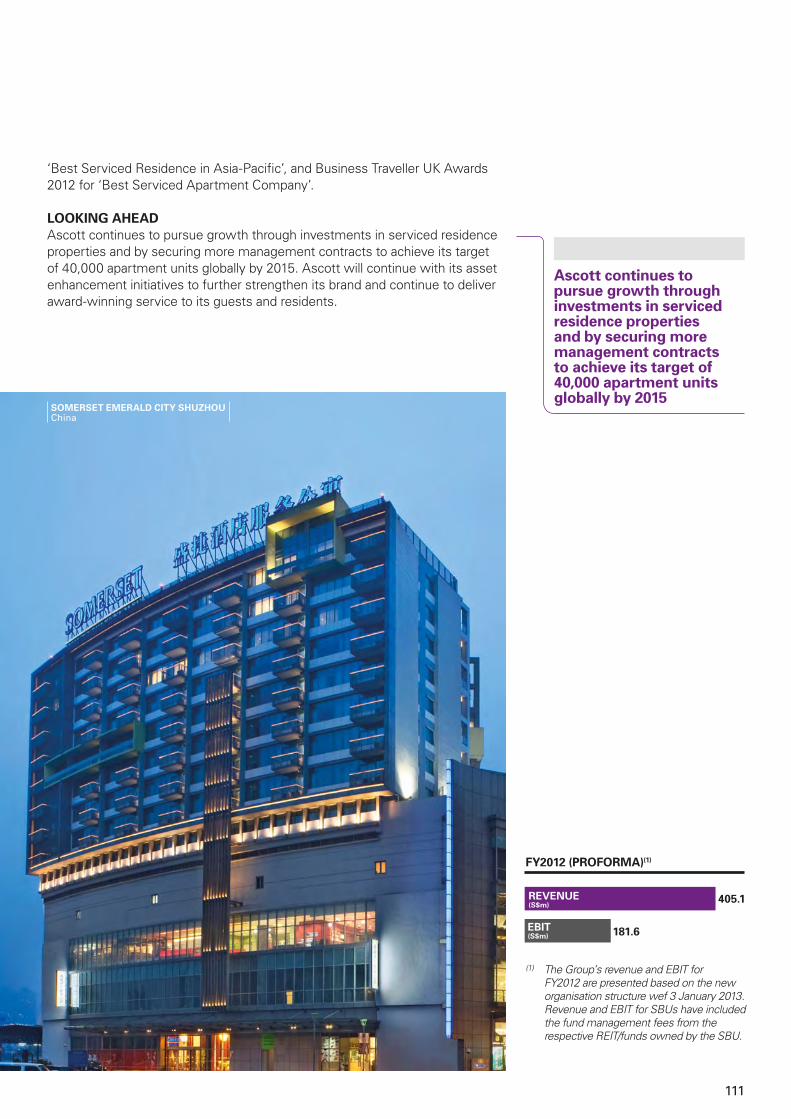
111
‘Best Serviced residence in asia-pacific’, and Business traveller uK awards 2012 for ‘Best Serviced apartment Company’.
lookinG AheADascott continues to pursue growth through investments in serviced residence properties and by securing more management contracts to achieve its target of 40,000 apartment units globally by 2015. ascott will continue with its asset enhancement initiatives to further strengthen its brand and continue to deliver award-winning service to its guests and residents.
Ascott continues to pursue growth through investments in serviced residence properties and by securing more management contracts to achieve its target of 40,000 apartment units globallyby2015
SoMeRSeT eMeRAlD CiTY Shuzhou China
ReVenue(S$m)
405.1
181.6
fY2012 (PRofoRMA)(1)
(1) The Group’s revenue and EBIT for FY2012 are presented based on the new organisation structure wef 3 January 2013. Revenue and EBIT for SBUs have included the fund management fees from the respective REIT/funds owned by the SBU.
eBiT (S$m)
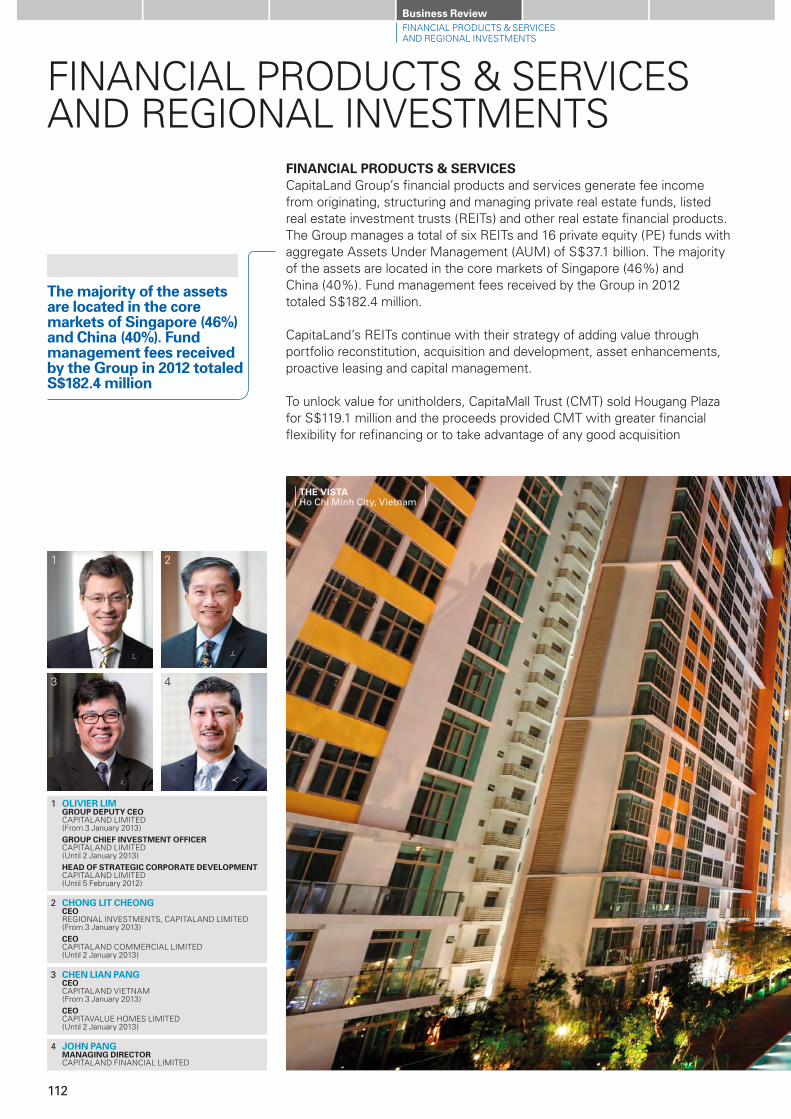
112
Business ReviewfinanCial proDuCtS & SerViCeS anD reGional inVeStMentS
finanCial proDuCtS & SerViCeS anD reGional inVeStMentS
1 oliVieR liM GRouP DePuTY Ceo CapitalanD liMiteD (from 3 January 2013) GRouP Chief inVeSTMenT offiCeR CapitalanD liMiteD (until 2 January 2013) heAD of STRATeGiC CoRPoRATe DeVeloPMenT CapitalanD liMiteD (until 5 february 2012)
2 ChonG liT CheonG Ceo reGional inVeStMentS, CapitalanD liMiteD (from 3 January 2013) Ceo CapitalanD CoMMerCial liMiteD (until 2 January 2013)
3 Chen liAn PAnG Ceo CapitalanD VietnaM (from 3 January 2013) Ceo CapitaValue HoMeS liMiteD (until 2 January 2013)
4 John PAnG MAnAGinG DiReCToR CapitalanD finanCial liMiteD
3 4
1 2
finAnCiAl PRoDuCTS & SeRViCeSCapitaland Group’s financial products and services generate fee income from originating, structuring and managing private real estate funds, listed real estate investment trusts (reits) and other real estate financial products. the Group manages a total of six reits and 16 private equity (pe) funds with aggregate assets under Management (auM) of S$37.1 billion. the majority of the assets are located in the core markets of Singapore (46%) and China (40%). fund management fees received by the Group in 2012 totaled S$182.4 million.
Capitaland’s reits continue with their strategy of adding value through portfolio reconstitution, acquisition and development, asset enhancements, proactive leasing and capital management.
to unlock value for unitholders, CapitaMall trust (CMt) sold Hougang plaza for S$119.1 million and the proceeds provided CMt with greater financial flexibility for refinancing or to take advantage of any good acquisition
The ViSTA Ho Chi Minh City, Vietnam
The majority of the assets are located in the core marketsofsingapore(46%)andChina(40%).Fundmanagement fees received by the Group in 2012 totaled s$182.4million
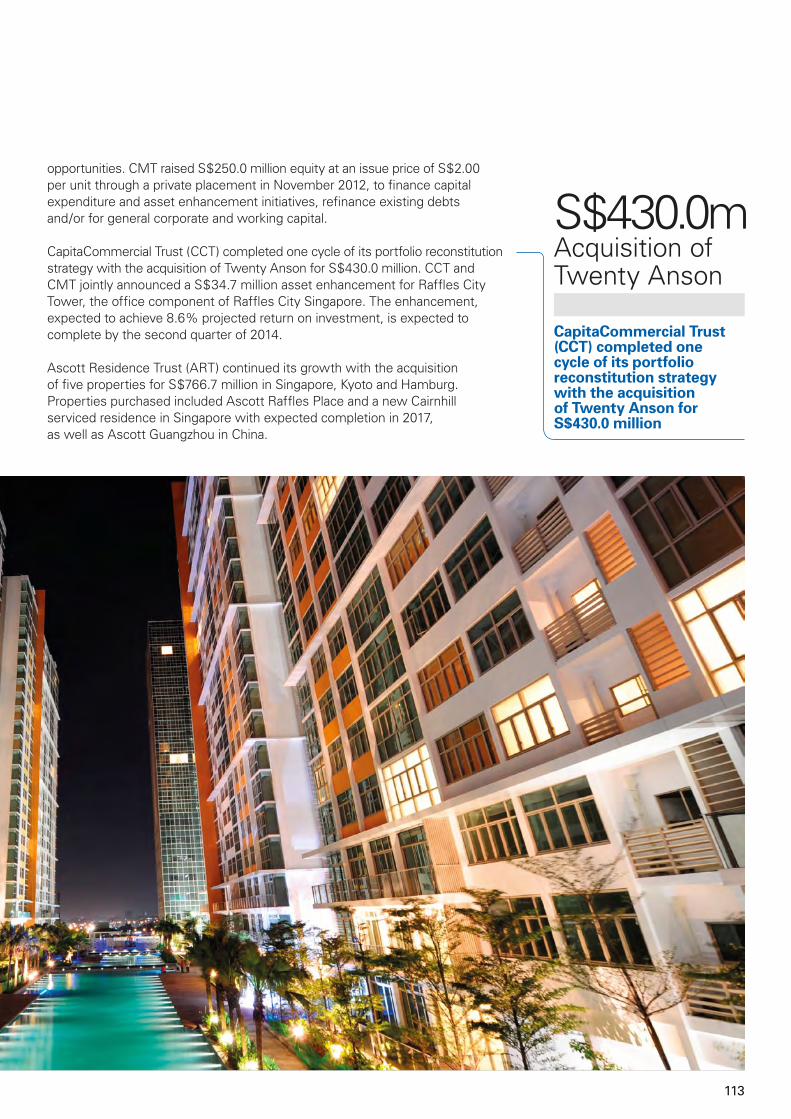
113
opportunities. CMt raised S$250.0 million equity at an issue price of S$2.00 per unit through a private placement in november 2012, to finance capital expenditure and asset enhancement initiatives, refinance existing debts and/or for general corporate and working capital.
CapitaCommercial trust (CCt) completed one cycle of its portfolio reconstitution strategy with the acquisition of twenty anson for S$430.0 million. CCt and CMt jointly announced a S$34.7 million asset enhancement for raffles City tower, the office component of raffles City Singapore. the enhancement, expected to achieve 8.6% projected return on investment, is expected to complete by the second quarter of 2014.
ascott residence trust (art) continued its growth with the acquisition of five properties for S$766.7 million in Singapore, Kyoto and Hamburg. properties purchased included ascott raffles place and a new Cairnhill serviced residence in Singapore with expected completion in 2017, as well as ascott Guangzhou in China.
CapitaCommercial Trust (CCT) completed one cycle of its portfolio reconstitution strategy withtheacquisition of Twenty Anson for s$430.0million
S$430.0m acquisition of twenty anson
114
Business Review
finanCial proDuCtS & SerViCeS anD reGional inVeStMentS
Capitaretail China trust successfully raised S$86.1 million in a private placement which was increased from the original offer of S$75.0 million, due to strong demand from over 30 existing and new investors from asia, the united States and europe.
reits and fund management remain cornerstones of Capitaland’s business model. Capitaland will continue to grow auM through accretive acquisitions, developments and asset enhancements. it will also seek opportunities to originate new real estate private equity funds and real estate financial products in Singapore and China.
ReGionAl inVeSTMenTSthe regional investments unit manages regional real estate investments that fall outside the four main business units. these include Capitaland Vietnam, australand,Surbana, and StorHub, as well as investments in Japan, india, united Kingdom and Gulf Cooperation Council.
Australand Property Groupaustraland property Group delivered net profit after tax of a$180.0 million (S$229.8 million) for the 2012 financial year, a 28% increase over 2011. each of australand’s three divisions made a solid contribution to the full year result with the a$2.3 billion (S$2.9 billion) investment portfolio underpinning the overall result. the portfolio continues to retain high quality tenants and has a long dated lease expiry profile. the development of 357 Collins Street, an office and retail building in Melbourne, was completed in 2012 and is a high quality addition to the portfolio.
the Commercial & industrial development division also successfully completed a number of new industrial/logistics facilities during the year and secured commitments for new facilities that will either be retained or developed for external sale.
australand’s residential division delivered growth of 16%, a creditable result given the challenging conditions experienced in the residential sector for most of the year. australand remains well positioned in the residential sector, with over 20,000 lots under management in its development pipeline at an estimated end value of a$8.0 billion (S$10.2 billion), underpinning future earnings.
Capitaland Vietnamnotwithstanding the challenging market conditions, Capitaland remains committed to the Vietnam market. Mulberry lane, its project in Hanoi, achieved structural completion in october 2012 and is on track to complete by early 2014.
in Ho Chi Minh City, management of the Somerset Vista Ho Chi Minh, the 100-unit serviced residence within the Vista development in the prime residential precinct District 2, was awarded to ascott in the fourth quarter of 2012 and opened in December 2012. ascott also managed Vista residences, the 168-unit residential property within the Vista, which was available for lease from november 2012.
finanCial proDuCtS & SerViCeS anD reGional inVeStMentS
Capitaland will continue to grow AuM through accretiveacquisitions,developments and asset enhancements
Australand’s Residential division delivered growth of16%,acreditableresultgiven the challenging conditions experienced in the residential sector for most of the year
16% residential Division Delivered Growth
115
phase 1 of parCSpring, another project located in Ho Chi Minh’s District 2 is expected to achieve structural completion in the first quarter of 2013, and be completed by end 2013.
Surbana CorporationSurbana’s two businesses of township development and building consultancy continued to enjoy good growth in 2012. for financial Year 2011 ended 31 March 2012, Surbana achieved revenue of S$227.8 million and an eBit of S$54.7 million. net profit after tax was S$56.2 million, a 14.9% year-on-year increase.
Surbana land (Slpl) has continued on a steady path of growth in 2012. in 2012, Slpl sold over 3,400 residential and commercial units and over 800 car park lots in its four township projects in China. to date, Slpl has sold over 17,700 homes in the projects in Chengdu, Wuxi, Xi’an and Shenyang. Slpl also moved its headquarters to Chengdu, China, so that it will operate more efficiently and respond faster to the opportunities and operations in the China market.
in Singapore, Surbana international Consultants (SiC) continues to be a dominant player in the public housing sector. it has also made significant inroads into the non-public housing market. Key projects secured in 2012 included condominiums such as Heron Bay, one Canberra, Skies Miltonia, Watercolours, forestville and Citylife. SiC has also completed a major project, Cleantech one, in Singapore’s first eco-business park. the project clinched the BCa Green Mark platinum, the highest award for sustainable design. SiC clinched a major contract for a 11,800-unit public housing project in penang, Malaysia. it is the third public housing project SiC has secured overseas, after Brunei and tianjin, China, both of which are under construction.
SiC won various industry awards in 2012, including a clean sweep of six HDB Design awards and five fiaBCi Singapore property awards.
StorhubCapitaland owns 62% interest in StorHub, a joint venture with Hersing Corporation limited. StorHub has grown to a total of nine facilities – seven in Singapore and two in China. StorHub opened its seventh facility in Woodlands, Singapore in august 2012. in China, the first two StorHub facilties began operating in Guangzhou and Shanghai in 2012.
Surbana achieved revenue ofs$227.8millionandan eBiTofs$54.7million. net profit after tax was s$56.2million,a14.9%year-on-year increase
S$56.2m net profit
SiC won various industry awards in 2012, including a clean sweep of six hDB Design Awards and five fiABCi Singapore Property Awards
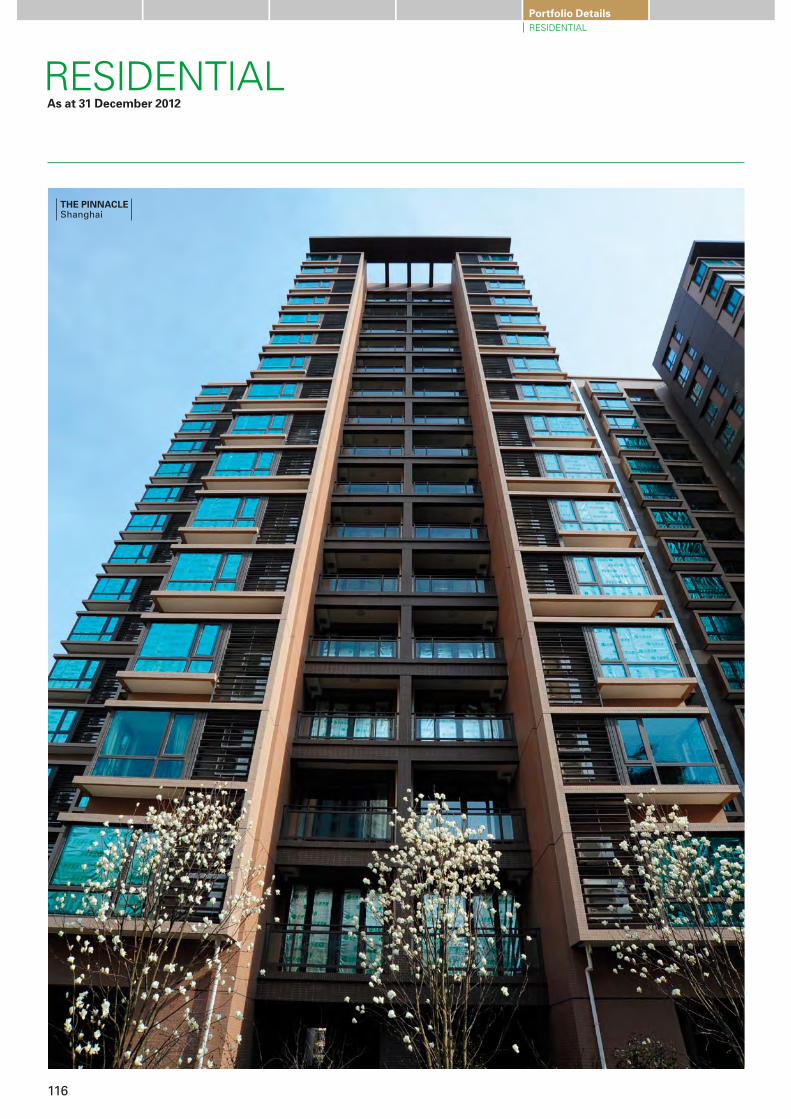
116
Portfolio DetailsreSiDential
reSiDential Asat31December2012
The PinnACle Shanghai
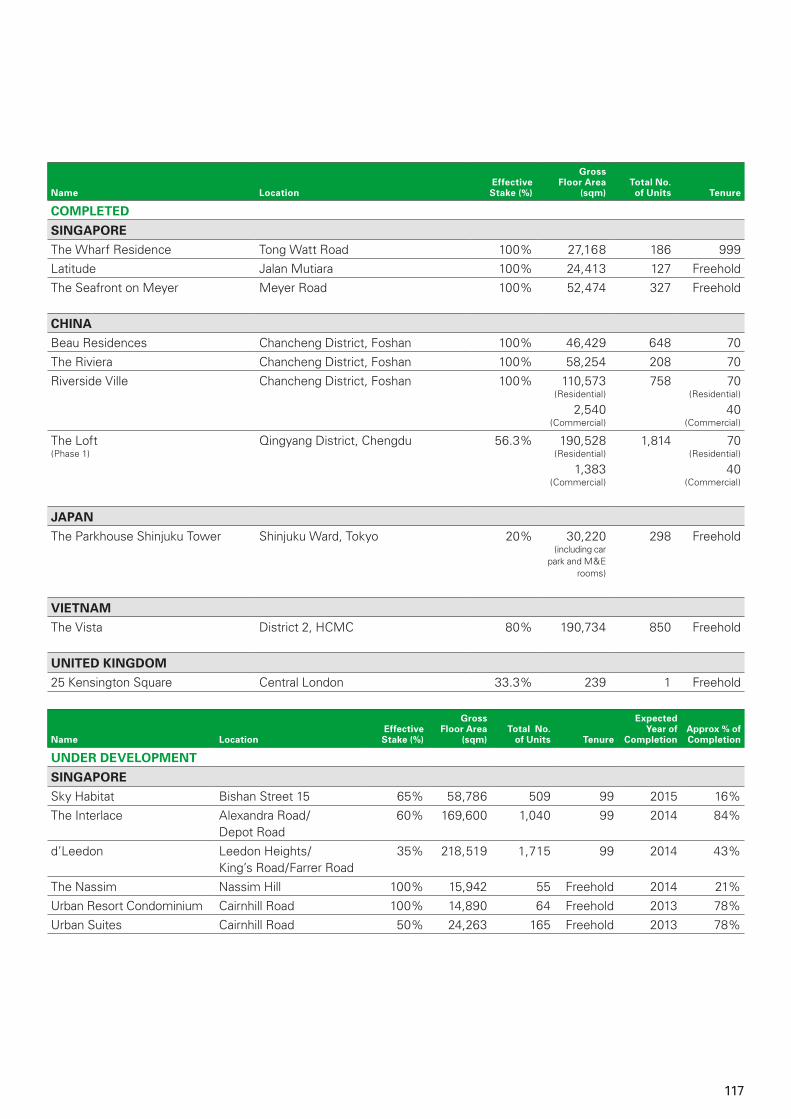
117
name locationeffective stake(%)
Grossfloor Area
(sqm)Totalno.of units Tenure
CoMPleTeD
SinGAPoRethe Wharf residence tong Watt road 100% 27,168 186 999
latitude Jalan Mutiara 100% 24,413 127 freehold
the Seafront on Meyer Meyer road 100% 52,474 327 freehold
ChinABeau residences Chancheng District, foshan 100% 46,429 648 70
the riviera Chancheng District, foshan 100% 58,254 208 70
riverside Ville Chancheng District, foshan 100% 110,573(residential)
2,540 (Commercial)
758 70(residential)
40 (Commercial)
the loft (phase 1)
Qingyang District, Chengdu 56.3% 190,528 (residential)
1,383 (Commercial)
1,814 70(residential)
40 (Commercial)
JAPAnthe parkhouse Shinjuku tower Shinjuku Ward, tokyo 20% 30,220
(including car park and M&e
rooms)
298 freehold
VieTnAMthe Vista District 2, HCMC 80% 190,734 850
freehold
uniTeD kinGDoM25 Kensington Square Central london 33.3% 239 1 freehold
name locationeffective stake(%)
Grossfloor Area
(sqm)Totalno.
of units Tenure
expected Year of
Completion
Approx%ofCompletion
unDeR DeVeloPMenT
SinGAPoReSky Habitat Bishan Street 15 65% 58,786 509 99 2015 16%
the interlace alexandra road/ Depot road
60% 169,600 1,040 99 2014 84%
d’leedon leedon Heights/ King’s road/farrer road
35% 218,519 1,715 99 2014 43%
the nassim nassim Hill 100% 15,942 55 freehold 2014 21%
urban resort Condominium Cairnhill road 100% 14,890 64 freehold 2013 78%
urban Suites Cairnhill road 50% 24,263 165 freehold 2013 78%
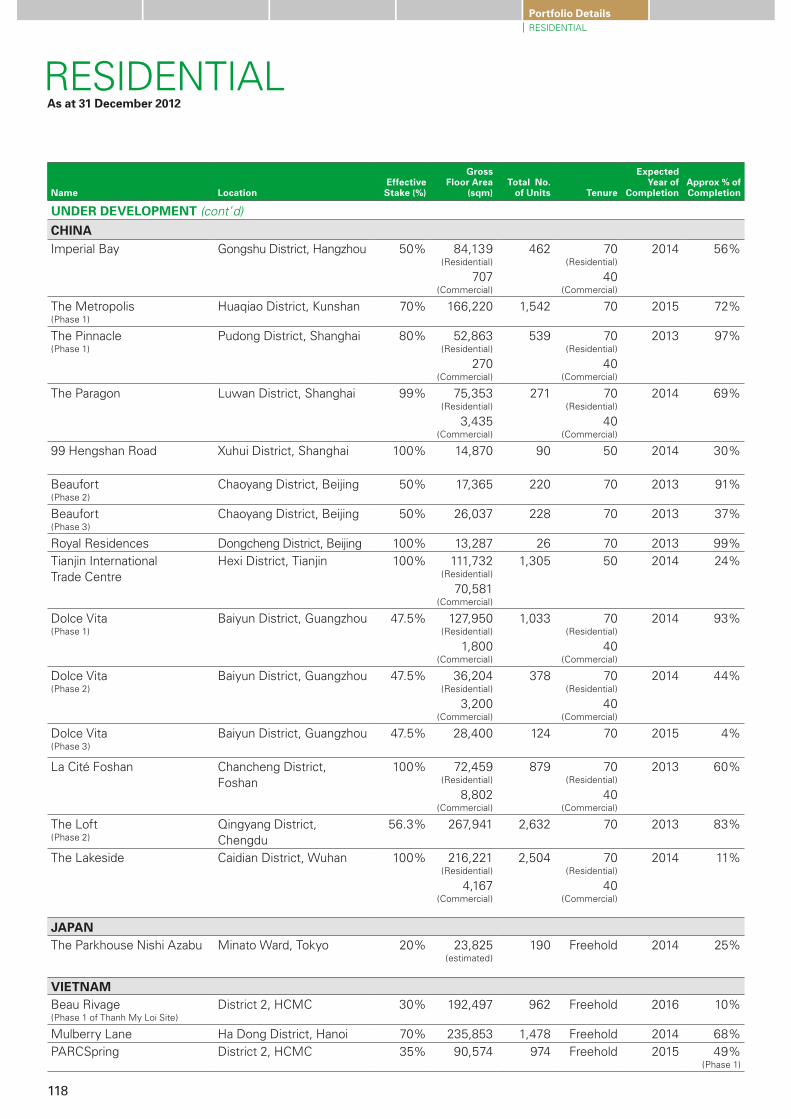
118
Portfolio DetailsreSiDential
name locationeffective stake(%)
Grossfloor Area
(sqm)Totalno.
of units Tenure
expected Year of
Completion
Approx%ofCompletion
unDeR DeVeloPMenT (cont’d)
ChinAimperial Bay Gongshu District, Hangzhou 50% 84,139
(residential)
707 (Commercial)
462 70 (residential)
40 (Commercial)
2014 56%
the Metropolis (phase 1)
Huaqiao District, Kunshan 70% 166,220 1,542 70 2015 72%
the pinnacle (phase 1)
pudong District, Shanghai 80% 52,863 (residential)
270 (Commercial)
539 70 (residential)
40 (Commercial)
2013 97%
the paragon luwan District, Shanghai 99% 75,353 (residential)
3,435 (Commercial)
271 70 (residential)
40 (Commercial)
2014 69%
99 Hengshan road Xuhui District, Shanghai 100% 14,870 90 50 2014 30%
Beaufort (phase 2)
Chaoyang District, Beijing 50% 17,365 220 70 2013 91%
Beaufort (phase 3)
Chaoyang District, Beijing 50% 26,037 228 70 2013 37%
royal residences Dongcheng District, Beijing 100% 13,287 26 70 2013 99%tianjin international trade Centre
Hexi District, tianjin 100% 111,732 (residential)
70,581(Commercial)
1,305 50 2014 24%
Dolce Vita (phase 1)
Baiyun District, Guangzhou 47.5% 127,950(residential)
1,800(Commercial)
1,033 70 (residential)
40 (Commercial)
2014 93%
Dolce Vita (phase 2)
Baiyun District, Guangzhou 47.5% 36,204 (residential)
3,200 (Commercial)
378 70(residential)
40 (Commercial)
2014 44%
Dolce Vita (phase 3)
Baiyun District, Guangzhou 47.5% 28,400 124 70 2015 4%
la Cité foshan Chancheng District, foshan
100% 72,459 (residential)
8,802 (Commercial)
879 70 (residential)
40 (Commercial)
2013 60%
the loft (phase 2)
Qingyang District, Chengdu
56.3% 267,941 2,632 70 2013 83%
the lakeside Caidian District, Wuhan 100% 216,221 (residential)
4,167 (Commercial)
2,504 70 (residential)
40 (Commercial)
2014 11%
JAPAnthe parkhouse nishi azabu Minato Ward, tokyo 20% 23,825
(estimated)190 freehold 2014 25%
VieTnAMBeau rivage (phase 1 of thanh My loi Site)
District 2, HCMC 30% 192,497 962 freehold 2016 10%
Mulberry lane Ha Dong District, Hanoi 70% 235,853 1,478 freehold 2014 68%parCSpring District 2, HCMC 35% 90,574 974 freehold 2015 49%
(phase 1)
reSiDential Asat31December2012
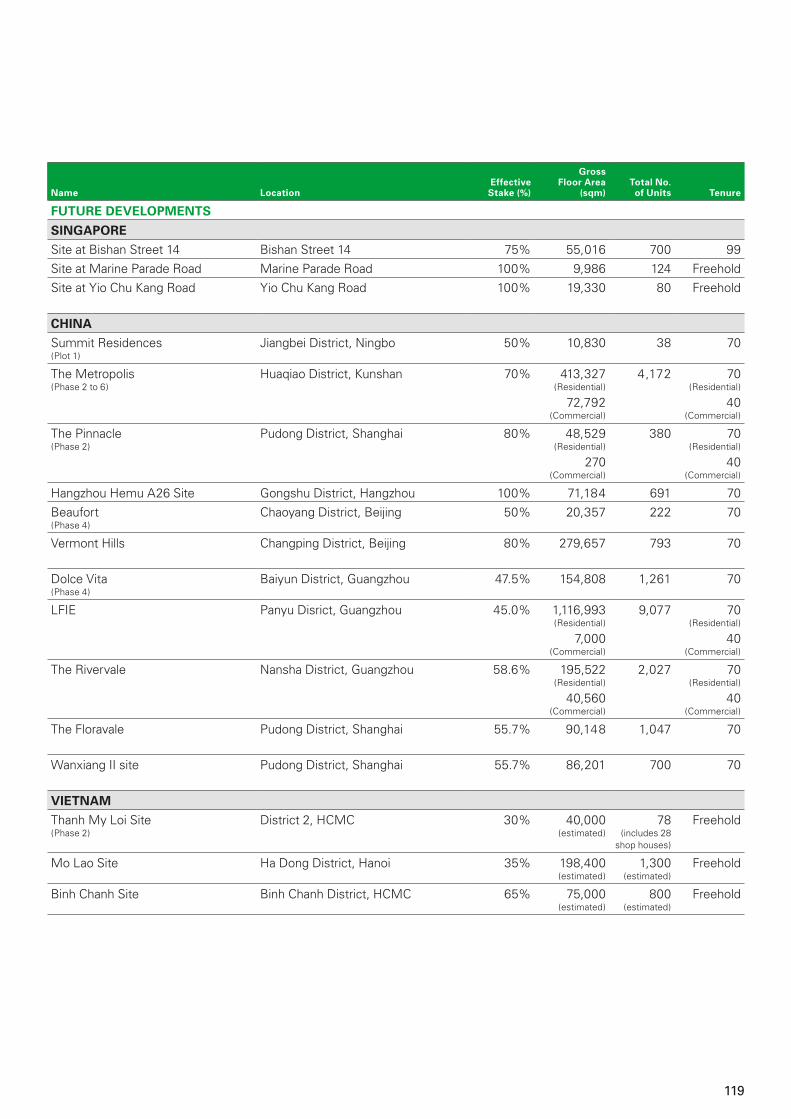
119
name locationeffective stake(%)
Grossfloor Area
(sqm)Totalno.of units Tenure
fuTuRe DeVeloPMenTS
SinGAPoReSite at Bishan Street 14 Bishan Street 14 75% 55,016 700 99
Site at Marine parade road Marine parade road 100% 9,986 124 freehold
Site at Yio Chu Kang road Yio Chu Kang road 100% 19,330 80 freehold
ChinASummit residences (plot 1)
Jiangbei District, ningbo 50% 10,830 38 70
the Metropolis (phase 2 to 6)
Huaqiao District, Kunshan 70% 413,327 (residential)
72,792 (Commercial)
4,172 70 (residential)
40(Commercial)
the pinnacle (phase 2)
pudong District, Shanghai 80% 48,529 (residential)
270 (Commercial)
380 70 (residential)
40 (Commercial)
Hangzhou Hemu a26 Site Gongshu District, Hangzhou 100% 71,184 691 70
Beaufort (phase 4)
Chaoyang District, Beijing 50% 20,357 222 70
Vermont Hills Changping District, Beijing 80% 279,657 793 70
Dolce Vita (phase 4)
Baiyun District, Guangzhou 47.5% 154,808 1,261 70
lfie panyu Disrict, Guangzhou 45.0% 1,116,993 (residential)
7,000 (Commercial)
9,077 70 (residential)
40(Commercial)
the rivervale nansha District, Guangzhou 58.6% 195,522 (residential)
40,560 (Commercial)
2,027 70 (residential)
40(Commercial)
the floravale pudong District, Shanghai 55.7% 90,148 1,047 70
Wanxiang ii site pudong District, Shanghai 55.7% 86,201 700 70
VieTnAMthanh My loi Site (phase 2)
District 2, HCMC 30% 40,000 (estimated)
78 (includes 28
shop houses)
freehold
Mo lao Site Ha Dong District, Hanoi 35% 198,400 (estimated)
1,300 (estimated)
freehold
Binh Chanh Site Binh Chanh District, HCMC 65% 75,000 (estimated)
800(estimated)
freehold
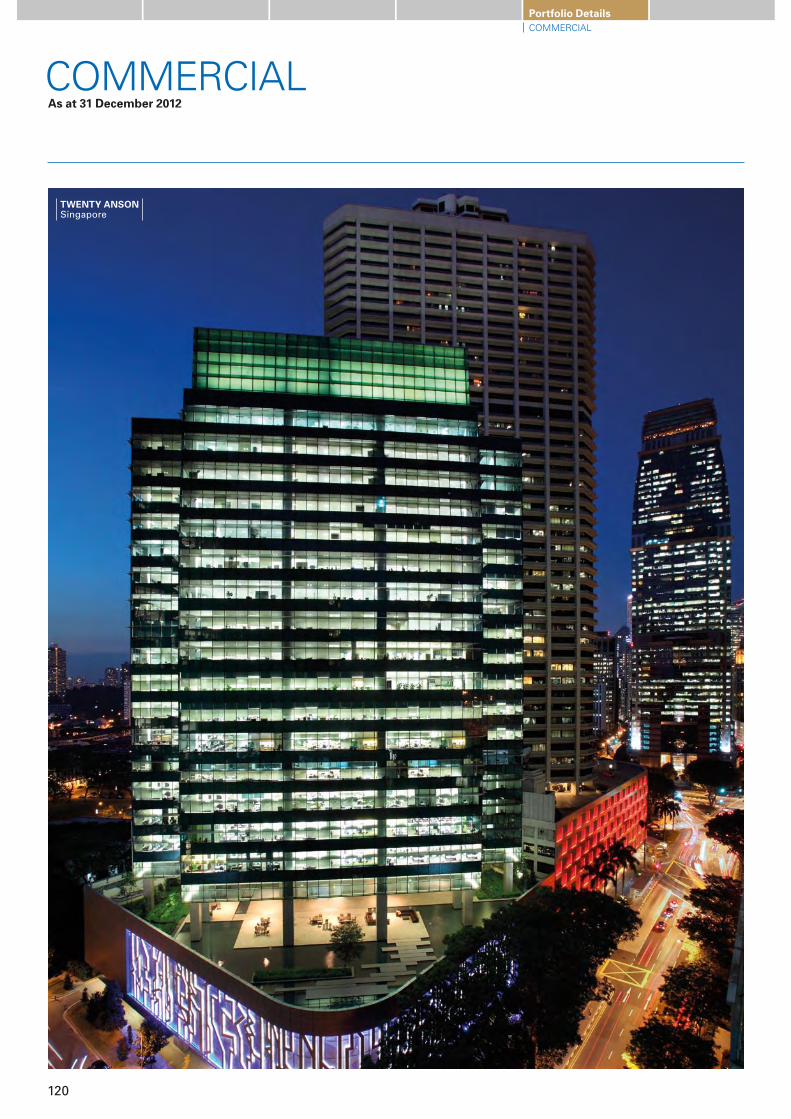
120
Portfolio DetailsCoMMerCial
CoMMerCial Asat31December2012
TWenTYAnsOnSingapore
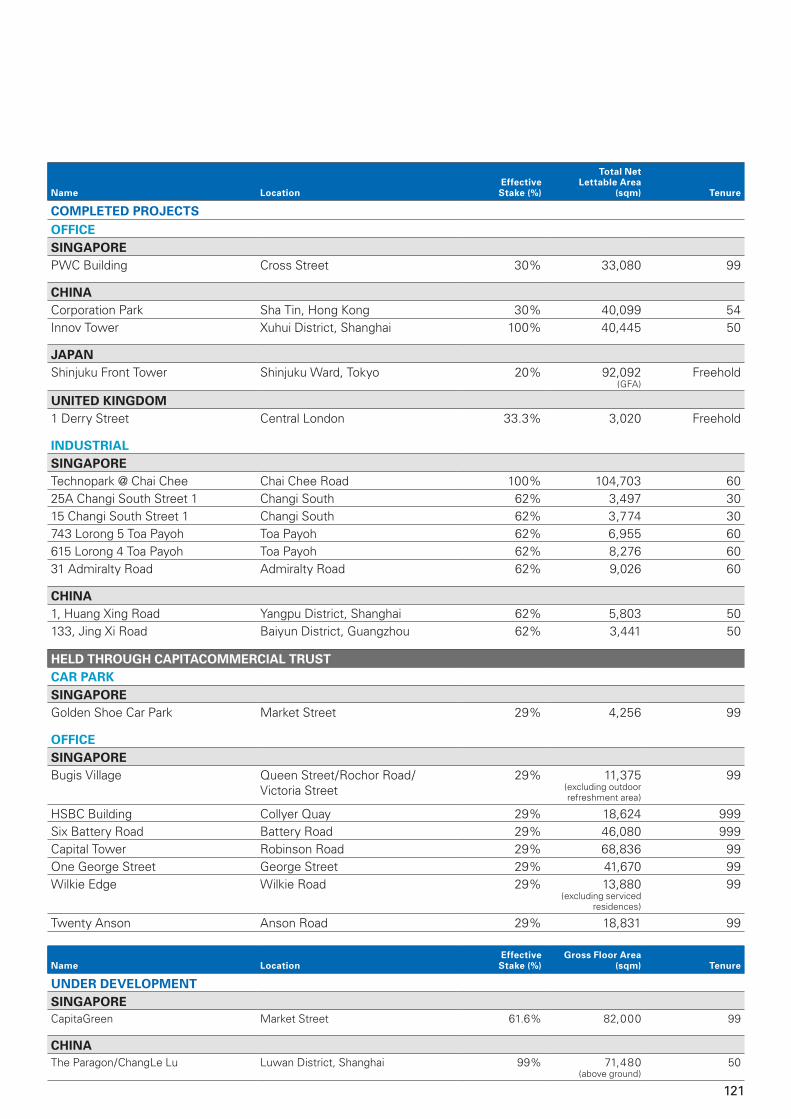
121
name locationeffective stake(%)
Total net lettable Area
(sqm) Tenure
CoMPleTeD PRoJeCTSoffiCeSinGAPoRepWC Building Cross Street 30% 33,080 99
ChinACorporation park Sha tin, Hong Kong 30% 40,099 54innov tower Xuhui District, Shanghai 100% 40,445 50
JAPAnShinjuku front tower Shinjuku Ward, tokyo 20% 92,092
(Gfa) freehold
uniTeD kinGDoM1 Derry Street Central london 33.3% 3,020 freehold
inDuSTRiAlSinGAPoRetechnopark @ Chai Chee Chai Chee road 100% 104,703 6025a Changi South Street 1 Changi South 62% 3,497 3015 Changi South Street 1 Changi South 62% 3,774 30743 lorong 5 toa payoh toa payoh 62% 6,955 60615 lorong 4 toa payoh toa payoh 62% 8,276 6031 admiralty road admiralty road 62% 9,026 60
ChinA1, Huang Xing road Yangpu District, Shanghai 62% 5,803 50133, Jing Xi road Baiyun District, Guangzhou 62% 3,441 50
helD ThRouGh CAPiTACoMMeRCiAl TRuSTCAR PARkSinGAPoReGolden Shoe Car park Market Street 29% 4,256 99
offiCeSinGAPoReBugis Village Queen Street/rochor road/
Victoria Street29% 11,375
(excluding outdoor refreshment area)
99
HSBC Building Collyer Quay 29% 18,624 999Six Battery road Battery road 29% 46,080 999 Capital tower robinson road 29% 68,836 99 one George Street George Street 29% 41,670 99Wilkie edge Wilkie road 29% 13,880
(excluding serviced residences)
99
twenty anson anson road 29% 18,831 99
name locationeffective stake(%)
Gross floor Area(sqm) Tenure
unDeR DeVeloPMenTSinGAPoReCapitaGreen Market Street 61.6% 82,000 99
ChinAthe paragon/Changle lu luwan District, Shanghai 99% 71,480
(above ground)50
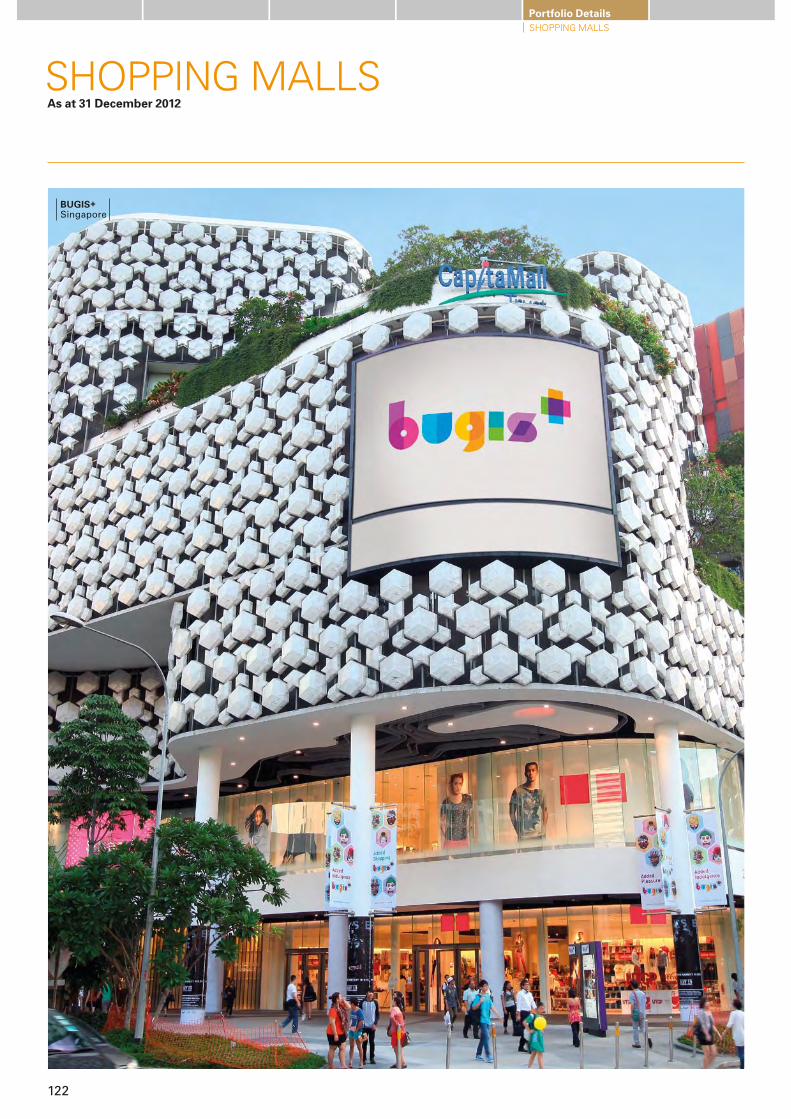
122
Portfolio Details
BuGiS+ Singapore
SHoppinG MallS
SHoppinG MallS Asat31December2012

123
name locationeffective stake(%)
operational net
lettable Area(sqm) Tenure
CoMPleTeD PRoJeCTS
ChinACapitaMall aidemengdun, Harbin Daoli District, Harbin 29.4% 27,847 expiring in
September 2042
CapitaMall Beiguan, anyang Beiguan District, anyang 29.4% 25,929 expiring in March 2046
CapitaMall Chengnanyuan, nanchang Qingyunpu District, nanchang 29.4% 37,261 expiring in february 2045
CapitaMall Crystal, Beijing Haidian District, Beijing 29.4% 37,887 Commercial: expiring in
January 2043 underground carpark:
expiring in January 2053
CapitaMall Cuiwei, Beijing Haidian District, Beijing 29.4% 35,367 Commercial: expiring in May 2046 underground carpark: expiring in May 2056
CapitaMall Deyang Jingyang District, Deyang 29.4% 30,413 expiring in november 2045
CapitaMall Dongguan nancheng District, Dongguan 29.4% 32,980 expiring in January 2055
CapitaMall fucheng, Mianyang fucheng District, Mianyang 29.4% 34,642 expiring in September 2044
CapitaMall Guicheng, foshan nanhai District, foshan 47.8% 36,141 expiring in august 2044
CapitaMall Hongqi, Xinxiang Hongqi District, Xinxiang 29.4% 25,615 expiring in november 2045
CapitaMall Jinniu, Chengdu Jinniu District, Chengdu 29.4% 48,517 expiring in october 2044
CapitaMallJinshui,Zhengzhou JinshuiDistrict,Zhengzhou 19.6% 36,180 expiring in July 2045
CapitaMall Jiulongpo, Chongqing Jiulongpo District, Chongqing 47.8% 38,915 expiring in october 2042
CapitaMall Kunshan Yushan town, Kunshan 29.4% 27,517 expiring in May 2045
CapitaMall Maoming Maonan District, Maoming 47.8% 28,352 expiring in november 2044
CapitaMall nan’an, Yibin Cuiping District, Yibin 29.4% 28,037 expiring in May 2045
CapitaMall peace plaza, Dalian Shahekou District, Dalian 19.6% 106,226 expiring in november 2035
CapitaMall Quanzhou licheng District, Quanzhou 29.4% 30,128 expiring in february 2045
CapitaMall rizhao Donggang District, rizhao 19.6% 42,325 expiring in november 2043
CapitaMall Shapingba, Chongqing Shapingba District, Chongqing 19.6% 26,912 Master lease expiring in
December 2023
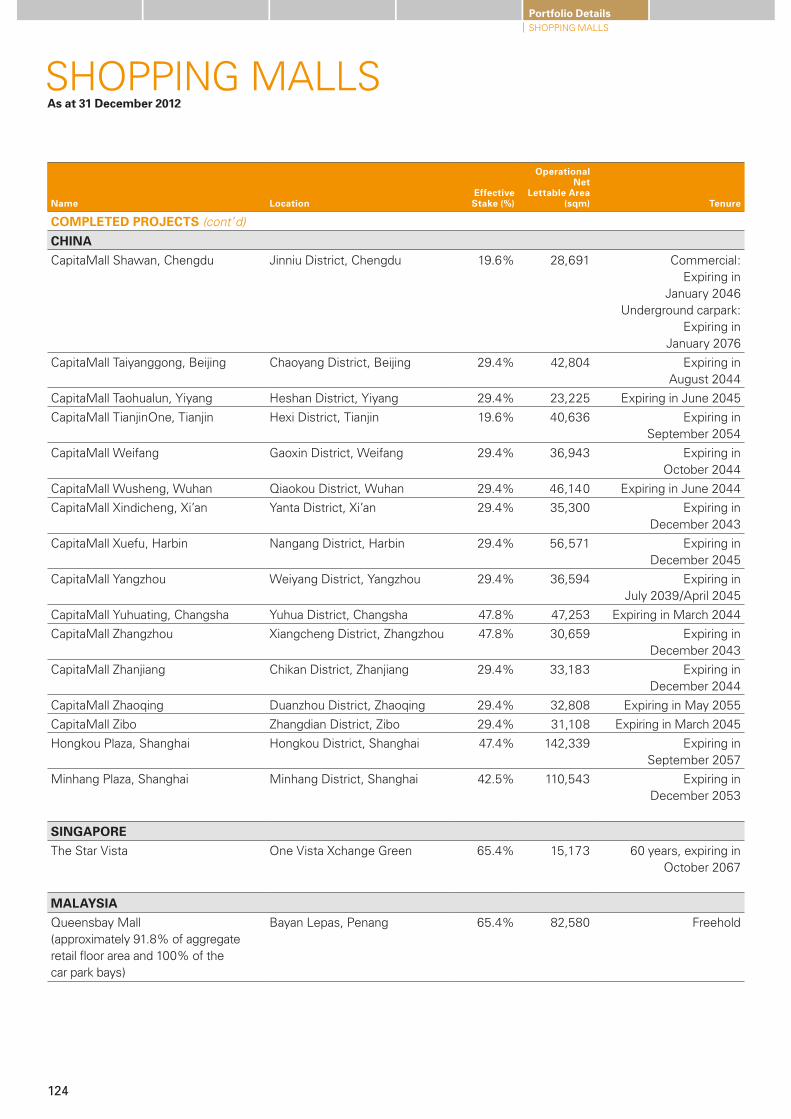
124
Portfolio Details
name locationeffective stake(%)
operational net
lettable Area(sqm) Tenure
CoMPleTeD PRoJeCTS (cont’d)
ChinACapitaMall Shawan, Chengdu Jinniu District, Chengdu 19.6% 28,691 Commercial:
expiring in January 2046
underground carpark: expiring in
January 2076
CapitaMall taiyanggong, Beijing Chaoyang District, Beijing 29.4% 42,804 expiring in august 2044
CapitaMall taohualun, Yiyang Heshan District, Yiyang 29.4% 23,225 expiring in June 2045
CapitaMall tianjinone, tianjin Hexi District, tianjin 19.6% 40,636 expiring in September 2054
CapitaMall Weifang Gaoxin District, Weifang 29.4% 36,943 expiring in october 2044
CapitaMall Wusheng, Wuhan Qiaokou District, Wuhan 29.4% 46,140 expiring in June 2044
CapitaMall Xindicheng, Xi’an Yanta District, Xi’an 29.4% 35,300 expiring in December 2043
CapitaMall Xuefu, Harbin nangang District, Harbin 29.4% 56,571 expiring in December 2045
CapitaMall Yangzhou Weiyang District, Yangzhou 29.4% 36,594 expiring in July 2039/april 2045
CapitaMall Yuhuating, Changsha Yuhua District, Changsha 47.8% 47,253 expiring in March 2044
CapitaMallZhangzhou XiangchengDistrict,Zhangzhou 47.8% 30,659 expiring in December 2043
CapitaMallZhanjiang ChikanDistrict,Zhanjiang 29.4% 33,183 expiring in December 2044
CapitaMallZhaoqing DuanzhouDistrict,Zhaoqing 29.4% 32,808 expiring in May 2055
CapitaMallZibo ZhangdianDistrict,Zibo 29.4% 31,108 expiring in March 2045
Hongkou plaza, Shanghai Hongkou District, Shanghai 47.4% 142,339 expiring in September 2057
Minhang plaza, Shanghai Minhang District, Shanghai 42.5% 110,543 expiring in December 2053
SinGAPoRethe Star Vista one Vista Xchange Green 65.4% 15,173 60 years, expiring in
october 2067
MAlAYSiAQueensbay Mall(approximately 91.8% of aggregate retail floor area and 100% of the car park bays)
Bayan lepas, penang 65.4% 82,580 freehold
SHoppinG MallS
SHoppinG MallS Asat31December2012
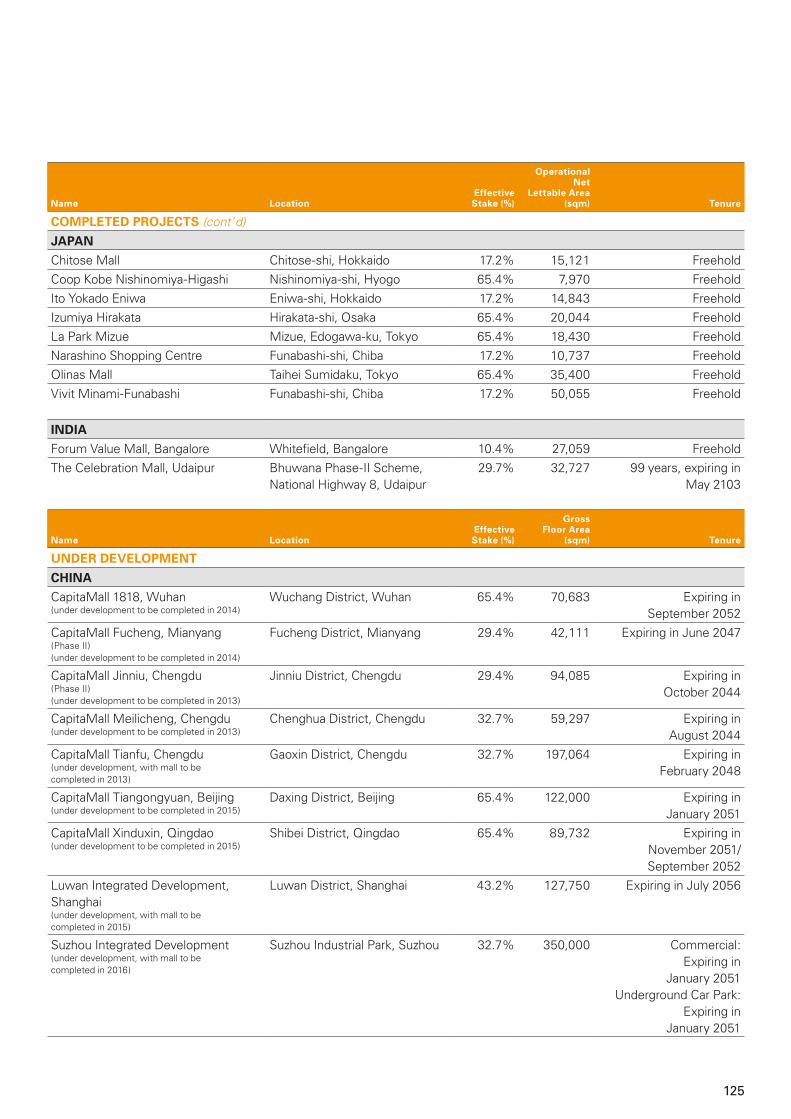
125
name locationeffective stake(%)
operational net
lettable Area(sqm) Tenure
CoMPleTeD PRoJeCTS (cont’d)
JAPAnChitose Mall Chitose-shi, Hokkaido 17.2% 15,121 freehold
Coop Kobe nishinomiya-Higashi nishinomiya-shi, Hyogo 65.4% 7,970 freehold
ito Yokado eniwa eniwa-shi, Hokkaido 17.2% 14,843 freehold
izumiya Hirakata Hirakata-shi, osaka 65.4% 20,044 freehold
la park Mizue Mizue, edogawa-ku, tokyo 65.4% 18,430 freehold
narashino Shopping Centre funabashi-shi, Chiba 17.2% 10,737 freehold
olinas Mall taihei Sumidaku, tokyo 65.4% 35,400 freehold
Vivit Minami-funabashi funabashi-shi, Chiba 17.2% 50,055 freehold
inDiAforum Value Mall, Bangalore Whitefield, Bangalore 10.4% 27,059 freehold
the Celebration Mall, udaipur Bhuwana phase-ii Scheme, national Highway 8, udaipur
29.7% 32,727 99 years, expiring in May 2103
name locationeffective stake(%)
Grossfloor Area
(sqm) Tenure
unDeR DeVeloPMenT
ChinACapitaMall 1818, Wuhan (under development to be completed in 2014)
Wuchang District, Wuhan 65.4% 70,683 expiring in September 2052
CapitaMall fucheng, Mianyang (phase ii) (under development to be completed in 2014)
fucheng District, Mianyang 29.4% 42,111 expiring in June 2047
CapitaMall Jinniu, Chengdu (phase ii) (under development to be completed in 2013)
Jinniu District, Chengdu 29.4% 94,085 expiring in october 2044
CapitaMall Meilicheng, Chengdu (under development to be completed in 2013)
Chenghua District, Chengdu 32.7% 59,297 expiring in august 2044
CapitaMall tianfu, Chengdu (under development, with mall to be completed in 2013)
Gaoxin District, Chengdu 32.7% 197,064 expiring in february 2048
CapitaMall tiangongyuan, Beijing (under development to be completed in 2015)
Daxing District, Beijing 65.4% 122,000 expiring in January 2051
CapitaMall Xinduxin, Qingdao (under development to be completed in 2015)
Shibei District, Qingdao 65.4% 89,732 expiring in november 2051/September 2052
luwan integrated Development, Shanghai (under development, with mall to be completed in 2015)
luwan District, Shanghai 43.2% 127,750 expiring in July 2056
Suzhou integrated Development (under development, with mall to be completed in 2016)
Suzhou industrial park, Suzhou 32.7% 350,000 Commercial: expiring in
January 2051 underground Car park:
expiring in January 2051
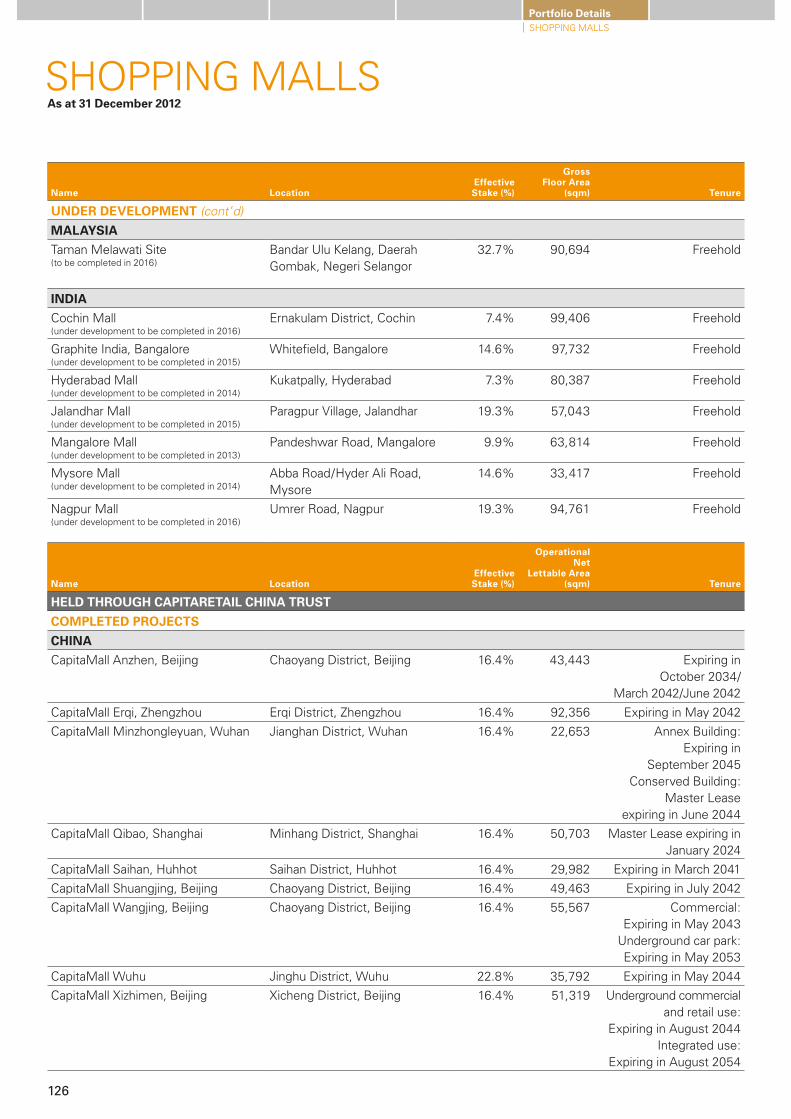
126
Portfolio Details
SHoppinG MallS Asat31December2012
name locationeffective stake(%)
Grossfloor Area
(sqm) Tenure
unDeR DeVeloPMenT (cont’d)
MAlAYSiAtaman Melawati Site (to be completed in 2016)
Bandar ulu Kelang, Daerah Gombak, negeri Selangor
32.7% 90,694 freehold
inDiACochin Mall (under development to be completed in 2016)
ernakulam District, Cochin 7.4% 99,406 freehold
Graphite india, Bangalore (under development to be completed in 2015)
Whitefield, Bangalore 14.6% 97,732 freehold
Hyderabad Mall (under development to be completed in 2014)
Kukatpally, Hyderabad 7.3% 80,387 freehold
Jalandhar Mall (under development to be completed in 2015)
paragpur Village, Jalandhar 19.3% 57,043 freehold
Mangalore Mall (under development to be completed in 2013)
pandeshwar road, Mangalore 9.9% 63,814 freehold
Mysore Mall (under development to be completed in 2014)
abba road/Hyder ali road, Mysore
14.6% 33,417 freehold
nagpur Mall (under development to be completed in 2016)
umrer road, nagpur 19.3% 94,761 freehold
name locationeffective stake(%)
operational net
lettable Area(sqm) Tenure
helD ThRouGh CAPiTAReTAil ChinA TRuST
CoMPleTeD PRoJeCTS
ChinACapitaMall anzhen, Beijing Chaoyang District, Beijing 16.4% 43,443 expiring in
october 2034/ March 2042/June 2042
CapitaMallErqi,Zhengzhou ErqiDistrict,Zhengzhou 16.4% 92,356 expiring in May 2042
CapitaMall Minzhongleyuan, Wuhan Jianghan District, Wuhan 16.4% 22,653 annex Building: expiring in
September 2045 Conserved Building:
Master lease expiring in June 2044
CapitaMall Qibao, Shanghai Minhang District, Shanghai 16.4% 50,703 Master lease expiring in January 2024
CapitaMall Saihan, Huhhot Saihan District, Huhhot 16.4% 29,982 expiring in March 2041
CapitaMall Shuangjing, Beijing Chaoyang District, Beijing 16.4% 49,463 expiring in July 2042
CapitaMall Wangjing, Beijing Chaoyang District, Beijing 16.4% 55,567 Commercial: expiring in May 2043
underground car park: expiring in May 2053
CapitaMall Wuhu Jinghu District, Wuhu 22.8% 35,792 expiring in May 2044
CapitaMall Xizhimen, Beijing Xicheng District, Beijing 16.4% 51,319 underground commercial and retail use:
expiring in august 2044 integrated use:
expiring in august 2054
SHoppinG MallS
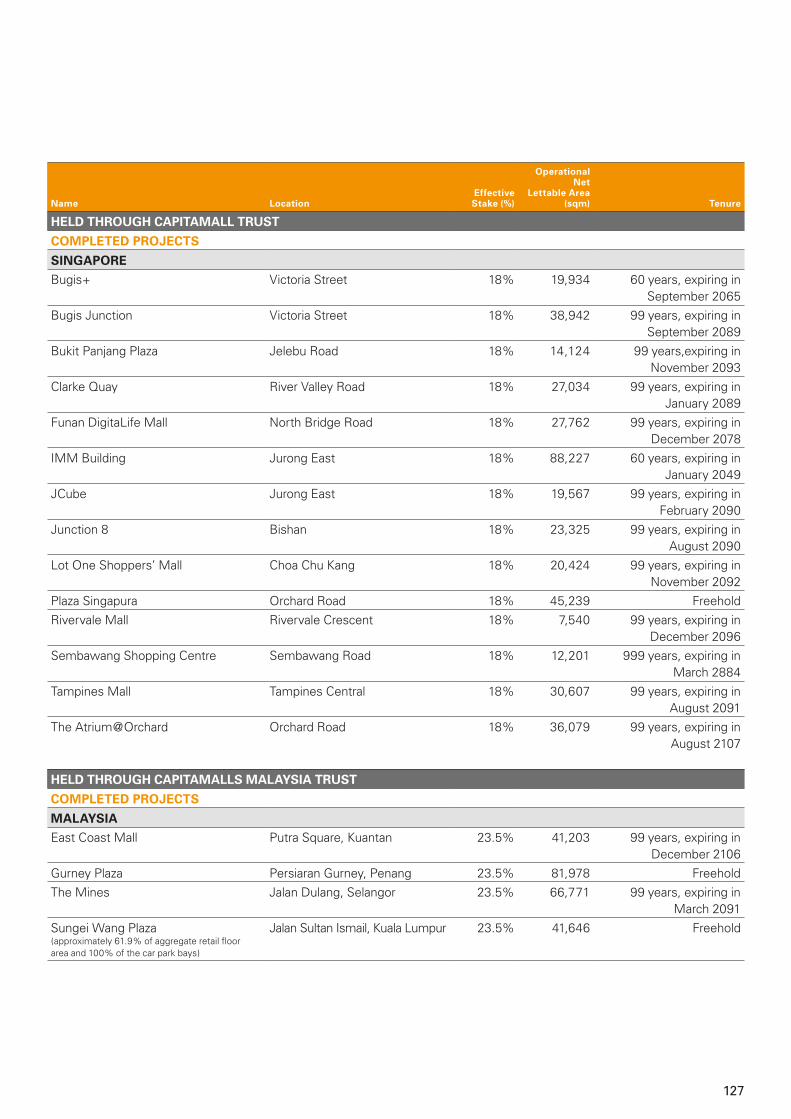
127
name locationeffective stake(%)
operational net
lettable Area(sqm) Tenure
helD ThRouGh CAPiTAMAll TRuST
CoMPleTeD PRoJeCTS
SinGAPoReBugis+ Victoria Street 18% 19,934 60 years, expiring in
September 2065
Bugis Junction Victoria Street 18% 38,942 99 years, expiring in September 2089
Bukit panjang plaza Jelebu road 18% 14,124 99 years,expiring in november 2093
Clarke Quay river Valley road 18% 27,034 99 years, expiring in January 2089
funan Digitalife Mall north Bridge road 18% 27,762 99 years, expiring in December 2078
iMM Building Jurong east 18% 88,227 60 years, expiring in January 2049
JCube Jurong east 18% 19,567 99 years, expiring in february 2090
Junction 8 Bishan 18% 23,325 99 years, expiring in august 2090
lot one Shoppers’ Mall Choa Chu Kang 18% 20,424 99 years, expiring in november 2092
plaza Singapura orchard road 18% 45,239 freehold
rivervale Mall rivervale Crescent 18% 7,540 99 years, expiring in December 2096
Sembawang Shopping Centre Sembawang road 18% 12,201 999 years, expiring in March 2884
tampines Mall tampines Central 18% 30,607 99 years, expiring in august 2091
the atrium@orchard orchard road 18% 36,079 99 years, expiring in august 2107
helD ThRouGh CAPiTAMAllS MAlAYSiA TRuST
CoMPleTeD PRoJeCTS
MAlAYSiAeast Coast Mall putra Square, Kuantan 23.5% 41,203 99 years, expiring in
December 2106
Gurney plaza persiaran Gurney, penang 23.5% 81,978 freehold
the Mines Jalan Dulang, Selangor 23.5% 66,771 99 years, expiring in March 2091
Sungei Wang plaza (approximately 61.9% of aggregate retail floor area and 100% of the car park bays)
Jalan Sultan ismail, Kuala lumpur 23.5% 41,646 freehold

128
Portfolio Details
CiTADineS SouThChengdu
SerViCeD reSiDenCeS
SerViCeD reSiDenCeS Asat31December2012
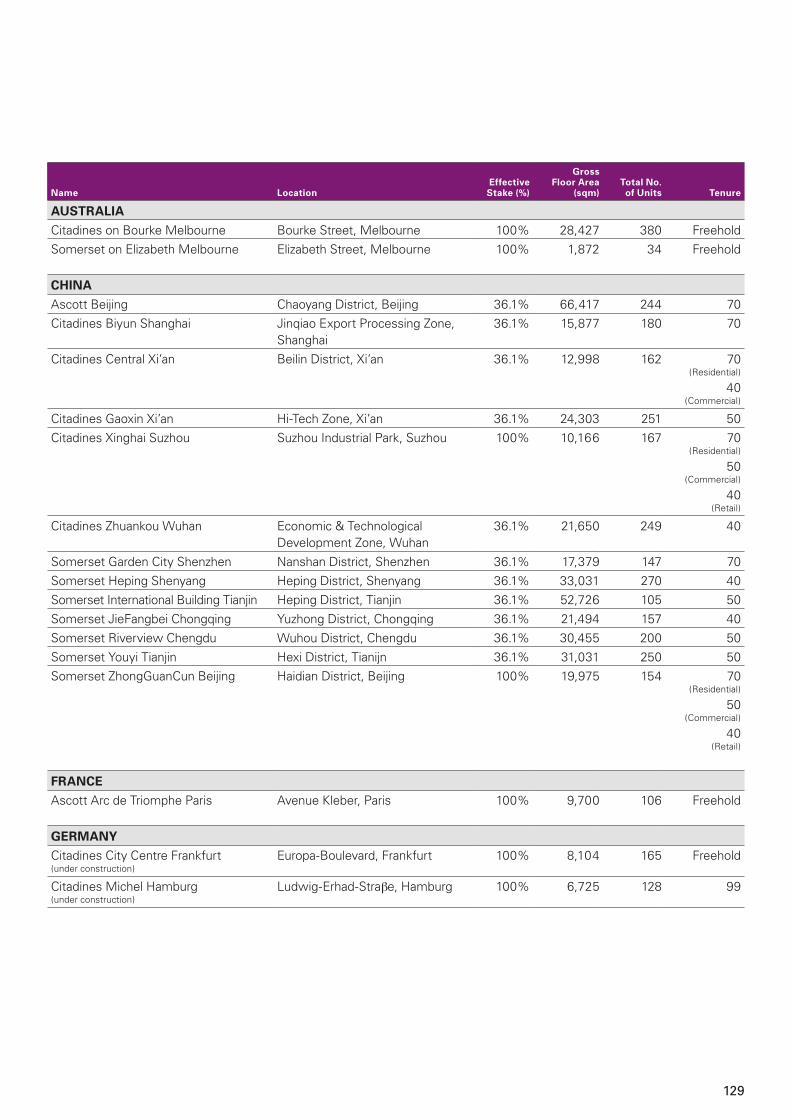
129
name locationeffective stake(%)
Grossfloor Area
(sqm)Totalno.of units Tenure
AuSTRAliACitadines on Bourke Melbourne Bourke Street, Melbourne 100% 28,427 380 freehold
Somerset on elizabeth Melbourne elizabeth Street, Melbourne 100% 1,872 34 freehold
ChinAascott Beijing Chaoyang District, Beijing 36.1% 66,417 244 70
Citadines Biyun Shanghai JinqiaoExportProcessingZone,Shanghai
36.1% 15,877 180 70
Citadines Central Xi’an Beilin District, Xi’an 36.1% 12,998 162 70 (residential)
40(Commercial)
Citadines Gaoxin Xi’an Hi-TechZone,Xi’an 36.1% 24,303 251 50
Citadines Xinghai Suzhou Suzhou industrial park, Suzhou 100% 10,166 167 70 (residential)
50(Commercial)
40 (retail)
CitadinesZhuankouWuhan economic & technological DevelopmentZone,Wuhan
36.1% 21,650 249 40
Somerset Garden City Shenzhen nanshan District, Shenzhen 36.1% 17,379 147 70
Somerset Heping Shenyang Heping District, Shenyang 36.1% 33,031 270 40
Somerset international Building tianjin Heping District, tianjin 36.1% 52,726 105 50
Somerset Jiefangbei Chongqing Yuzhong District, Chongqing 36.1% 21,494 157 40
Somerset riverview Chengdu Wuhou District, Chengdu 36.1% 30,455 200 50
Somerset Youyi tianjin Hexi District, tianijn 36.1% 31,031 250 50
SomersetZhongGuanCunBeijing Haidian District, Beijing 100% 19,975 154 70 (residential)
50 (Commercial)
40 (retail)
fRAnCeascott arc de triomphe paris avenue Kleber, paris 100% 9,700 106 freehold
GeRMAnYCitadines City Centre frankfurt (under construction)
europa-Boulevard, frankfurt 100% 8,104 165 freehold
Citadines Michel Hamburg (under construction)
ludwig-erhad-Strabe, Hamburg 100% 6,725 128 99

130
Portfolio Details
name locationeffective stake(%)
Grossfloor Area
(sqm)Totalno.of units Tenure
inDiACitadines Galleria Bangalore (under construction)
Yelanhanka, Bangalore 50% 13,935 203 freehold
Citadines Hitec City Hyderabad (under construction)
Hitec City, Hyderabad 100% 10,388 218 freehold
Citadines oMr Gateway Chennai (under construction)
old Mahabalipuram road, Chennai 100% 18,649 268 freehold
Citadines parimal Garden ahmedabad (under construction)
Central Business District, ahmedabad 100% 9,118 220 freehold
Somerset Greenways Chennai Sathyadev avenue, Chennai 64.4% 21,933 187 freehold
Somerset Whitefield Bangalore (under construction)
Whitefield, Bangalore 100% 19,021 280 freehold
JAPAn CoRPoRATe leASinGactus Hakata V-tower Hakata-ward, fukuoka 88.9% 9,248 297 freehold
Big palace Kita 14 Jo Kita-ward, Sapporo 88.9% 5,896 140 freehold
Colonnade Kamiikedai ota-ward, tokyo 18.9% 5,903 43 freehold
fujimi Duplex riz Chiyoda-ward, tokyo 18.9% 1,824 22 freehold
fukuoka College Court Hakata-ward, fukuoka 18.9% 2,706 112 freehold
Grand e’terna Chioninmae Higashiyama-ward, Kyoto 88.9% 1,049 18 freehold
Grand e’terna Sagaidaidori nabeshima, Saga 88.9% 1,507 46 freehold
Grand e’terna nijojomae nakagyo-ward, Kyoto 88.9% 1,736 47 freehold
Grand e’terna Saga Honjocho, Saga 88.9% 4,973 128 freehold
Grand Mire Miyamachi aoba-ward, Sendai 88.9% 2,306 91 freehold
Grand Mire Shintera Wakabayashi-ward, Sendai 88.9% 1,711 59 freehold
Gravis Court Kakomachi naka-ward, Hiroshima 88.9% 2,270 63 freehold
Gravis Court Kokutaiji naka-ward, Hiroshima 88.9% 1,659 48 freehold
Gravis Court nishiharaekimae asaminami-ward, Hiroshima 88.9% 1,151 30 freehold
infini Garden Hamao District, fukuoka 30% 36,770 395 freehold
Kasahokomachi Shimogyo-ward, Kyoto 88.9% 5,699 191 freehold
Marunouchi Central Heights naka-ward, nagoya 88.9% 1,937 31 freehold
SaMtY namba-Minami naniwa-ward, osaka 18.9% 4,660 123 freehold
S-residence fukushima luxe fukushima-ward, osaka 18.9% 6,568 179 freehold
S-residence Gakuenzaka naniwa-ward, osaka 88.9% 2,822 58 freehold
S-residence Hommachi Marks Chuo-ward, osaka 18.9% 3,680 110 freehold
S-residence Midoribashi Serio Higashinari-ward, osaka 18.9% 2,904 100 freehold
S-residence namba Viale naniwa-ward, osaka 88.9% 3,522 116 freehold
S-residence Shukugawa Hyogo, Kobe 88.9% 3,189 33 freehold
S-residence tanimachi 9 chome tennoji-ward, osaka 18.9% 3,171 104 freehold
the Grandview osaka Yodogawa-ward, osaka 18.9% 10,156 60 freehold
MAlAYSiAascott Kuala lumpur Jalan pinang, Kuala lumpur 50% 36,206 221 freehold
Somerset ampang Kuala lumpur Jalan ampang, Kuala lumpur 100% 18,847 207 freehold
Somerset Seri Bukit Ceylon Kuala lumpur
lorong Ceylon, Kuala lumpur 100% 3,604 48 freehold
SerViCeD reSiDenCeS Asat31December2012
SerViCeD reSiDenCeS
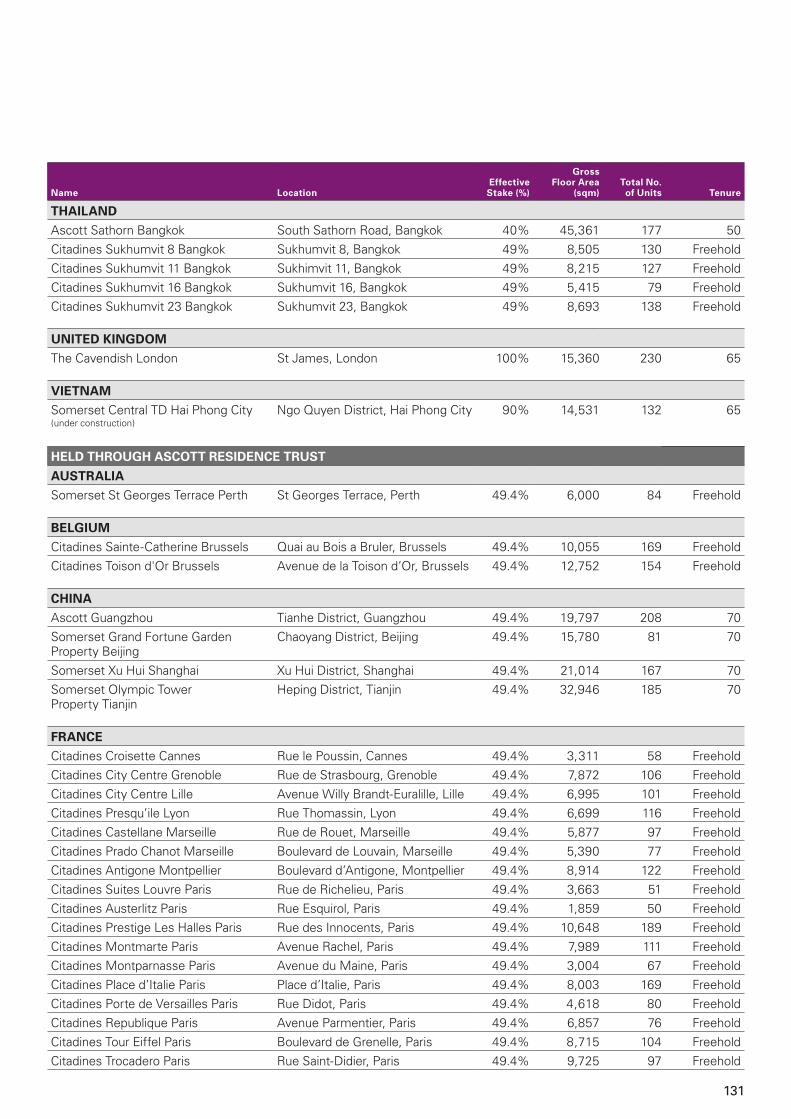
131
name locationeffective stake(%)
Grossfloor Area
(sqm)Totalno.of units Tenure
ThAilAnDascott Sathorn Bangkok South Sathorn road, Bangkok 40% 45,361 177 50
Citadines Sukhumvit 8 Bangkok Sukhumvit 8, Bangkok 49% 8,505 130 freehold
Citadines Sukhumvit 11 Bangkok Sukhimvit 11, Bangkok 49% 8,215 127 freehold
Citadines Sukhumvit 16 Bangkok Sukhumvit 16, Bangkok 49% 5,415 79 freehold
Citadines Sukhumvit 23 Bangkok Sukhumvit 23, Bangkok 49% 8,693 138 freehold
uniTeD kinGDoMthe Cavendish london St James, london 100% 15,360 230 65
VieTnAMSomerset Central tD Hai phong City (under construction)
ngo Quyen District, Hai phong City
90% 14,531 132 65
helD ThRouGh ASCoTT ReSiDenCe TRuST
AuSTRAliASomerset St Georges terrace perth St Georges terrace, perth 49.4% 6,000 84 freehold
BelGiuMCitadines Sainte-Catherine Brussels Quai au Bois a Bruler, Brussels 49.4% 10,055 169 freehold
Citadines toison d'or Brussels avenue de la toison d’or, Brussels 49.4% 12,752 154 freehold
ChinAascott Guangzhou tianhe District, Guangzhou 49.4% 19,797 208 70
Somerset Grand fortune Garden property Beijing
Chaoyang District, Beijing 49.4% 15,780 81 70
Somerset Xu Hui Shanghai Xu Hui District, Shanghai 49.4% 21,014 167 70
Somerset olympic tower property tianjin
Heping District, tianjin
49.4% 32,946 185 70
fRAnCeCitadines Croisette Cannes rue le poussin, Cannes 49.4% 3,311 58 freehold
Citadines City Centre Grenoble rue de Strasbourg, Grenoble 49.4% 7,872 106 freehold
Citadines City Centre lille avenue Willy Brandt-euralille, lille 49.4% 6,995 101 freehold
Citadines presqu’ile lyon rue thomassin, lyon 49.4% 6,699 116 freehold
Citadines Castellane Marseille rue de rouet, Marseille 49.4% 5,877 97 freehold
Citadines prado Chanot Marseille Boulevard de louvain, Marseille 49.4% 5,390 77 freehold
Citadines antigone Montpellier Boulevard d’antigone, Montpellier 49.4% 8,914 122 freehold
Citadines Suites louvre paris rue de richelieu, paris 49.4% 3,663 51 freehold
Citadines austerlitz paris rue esquirol, paris 49.4% 1,859 50 freehold
Citadines prestige les Halles paris rue des innocents, paris 49.4% 10,648 189 freehold
Citadines Montmarte paris avenue rachel, paris 49.4% 7,989 111 freehold
Citadines Montparnasse paris avenue du Maine, paris 49.4% 3,004 67 freehold
Citadines place d’italie paris place d’italie, paris 49.4% 8,003 169 freehold
Citadines porte de Versailles paris rue Didot, paris 49.4% 4,618 80 freehold
Citadines republique paris avenue parmentier, paris 49.4% 6,857 76 freehold
Citadines tour eiffel paris Boulevard de Grenelle, paris 49.4% 8,715 104 freehold
Citadines trocadero paris rue Saint-Didier, paris 49.4% 9,725 97 freehold
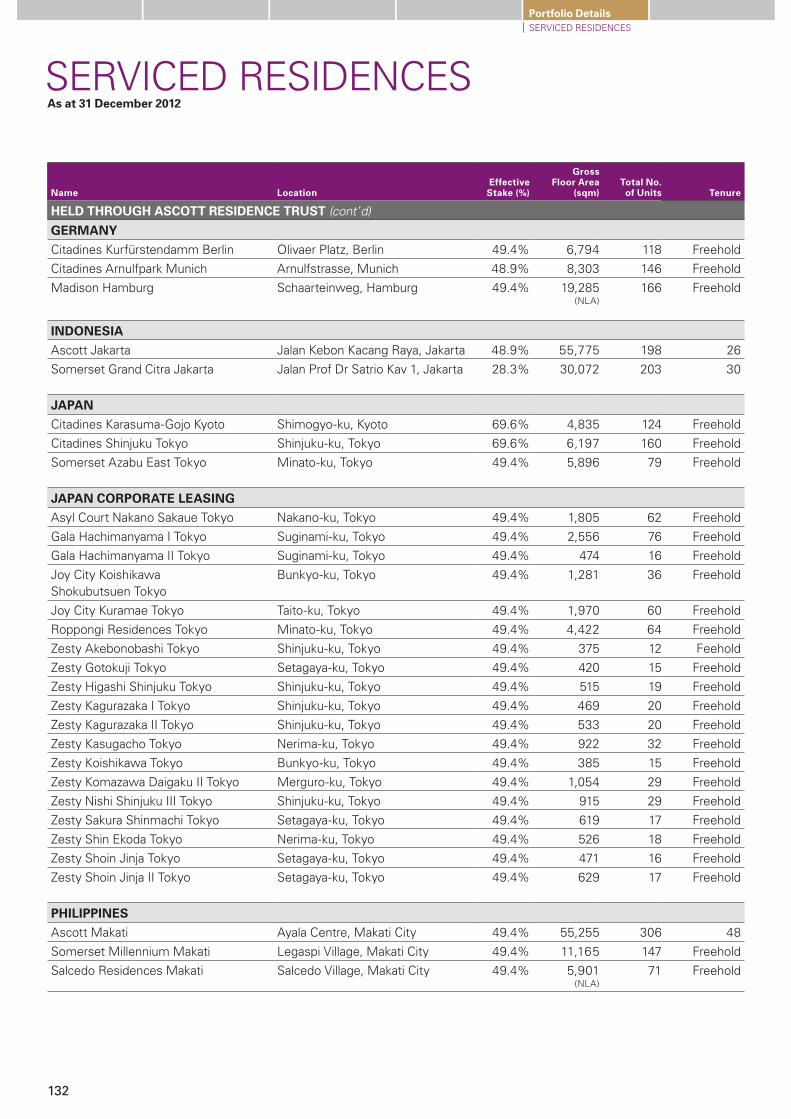
132
Portfolio DetailsSerViCeD reSiDenCeS
SerViCeD reSiDenCeS Asat31December2012
name locationeffective stake(%)
Grossfloor Area
(sqm)Totalno.of units Tenure
helD ThRouGh ASCoTT ReSiDenCe TRuST (cont’d)
GeRMAnYCitadines Kurfürstendamm Berlin olivaer platz, Berlin 49.4% 6,794 118 freehold
Citadines arnulfpark Munich arnulfstrasse, Munich 48.9% 8,303 146 freehold
Madison Hamburg Schaarteinweg, Hamburg 49.4% 19,285 (nla)
166 freehold
inDoneSiAascott Jakarta Jalan Kebon Kacang raya, Jakarta 48.9% 55,775 198 26
Somerset Grand Citra Jakarta Jalan prof Dr Satrio Kav 1, Jakarta 28.3% 30,072 203 30
JAPAnCitadines Karasuma-Gojo Kyoto Shimogyo-ku, Kyoto 69.6% 4,835 124 freehold
Citadines Shinjuku tokyo Shinjuku-ku, tokyo 69.6% 6,197 160 freehold
Somerset azabu east tokyo Minato-ku, tokyo 49.4% 5,896 79 freehold
JAPAn CoRPoRATe leASinGasyl Court nakano Sakaue tokyo nakano-ku, tokyo 49.4% 1,805 62 freehold
Gala Hachimanyama i tokyo Suginami-ku, tokyo 49.4% 2,556 76 freehold
Gala Hachimanyama ii tokyo Suginami-ku, tokyo 49.4% 474 16 freehold
Joy City Koishikawa Shokubutsuen tokyo
Bunkyo-ku, tokyo 49.4% 1,281 36 freehold
Joy City Kuramae tokyo taito-ku, tokyo 49.4% 1,970 60 freehold
roppongi residences tokyo Minato-ku, tokyo 49.4% 4,422 64 freehold
ZestyAkebonobashiTokyo Shinjuku-ku, tokyo 49.4% 375 12 feehold
ZestyGotokujiTokyo Setagaya-ku, tokyo 49.4% 420 15 freehold
ZestyHigashiShinjukuTokyo Shinjuku-ku, tokyo 49.4% 515 19 freehold
ZestyKagurazakaITokyo Shinjuku-ku, tokyo 49.4% 469 20 freehold
ZestyKagurazakaIITokyo Shinjuku-ku, tokyo 49.4% 533 20 freehold
ZestyKasugachoTokyo nerima-ku, tokyo 49.4% 922 32 freehold
ZestyKoishikawaTokyo Bunkyo-ku, tokyo 49.4% 385 15 freehold
ZestyKomazawaDaigakuIITokyo Merguro-ku, tokyo 49.4% 1,054 29 freehold
ZestyNishiShinjukuIIITokyo Shinjuku-ku, tokyo 49.4% 915 29 freehold
ZestySakuraShinmachiTokyo Setagaya-ku, tokyo 49.4% 619 17 freehold
ZestyShinEkodaTokyo nerima-ku, tokyo 49.4% 526 18 freehold
ZestyShoinJinjaTokyo Setagaya-ku, tokyo 49.4% 471 16 freehold
ZestyShoinJinjaIITokyo Setagaya-ku, tokyo 49.4% 629 17 freehold
PhiliPPineSascott Makati ayala Centre, Makati City 49.4% 55,255 306 48
Somerset Millennium Makati legaspi Village, Makati City 49.4% 11,165 147 freehold
Salcedo residences Makati Salcedo Village, Makati City 49.4% 5,901 (nla)
71 freehold
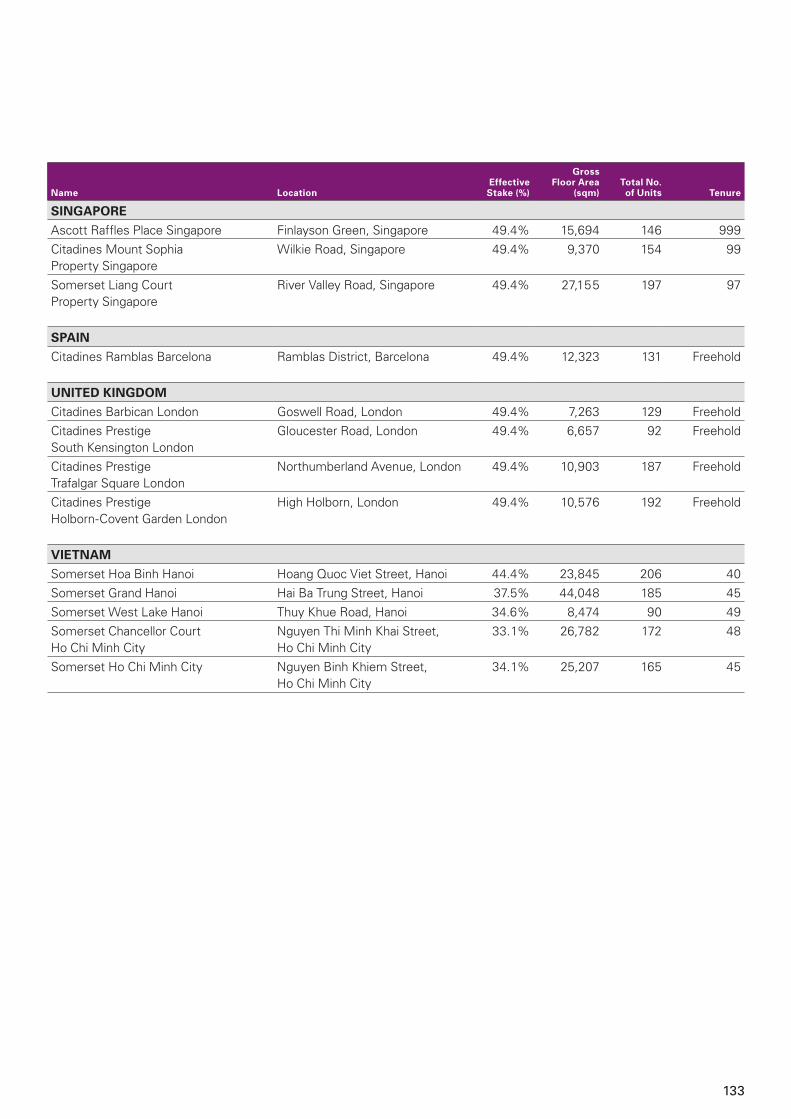
133
name locationeffective stake(%)
Grossfloor Area
(sqm)Totalno.of units Tenure
SinGAPoReascott raffles place Singapore finlayson Green, Singapore 49.4% 15,694 146 999
Citadines Mount Sophia property Singapore
Wilkie road, Singapore 49.4% 9,370 154 99
Somerset liang Court property Singapore
river Valley road, Singapore 49.4% 27,155 197 97
SPAinCitadines ramblas Barcelona ramblas District, Barcelona 49.4% 12,323 131 freehold
uniTeD kinGDoMCitadines Barbican london Goswell road, london 49.4% 7,263 129 freehold
Citadines prestige South Kensington london
Gloucester road, london 49.4% 6,657 92 freehold
Citadines prestige trafalgar Square london
northumberland avenue, london 49.4% 10,903 187 freehold
Citadines prestige Holborn-Covent Garden london
High Holborn, london 49.4% 10,576 192 freehold
VieTnAMSomerset Hoa Binh Hanoi Hoang Quoc Viet Street, Hanoi 44.4% 23,845 206 40
Somerset Grand Hanoi Hai Ba trung Street, Hanoi 37.5% 44,048 185 45
Somerset West lake Hanoi thuy Khue road, Hanoi 34.6% 8,474 90 49
Somerset Chancellor Court Ho Chi Minh City
nguyen thi Minh Khai Street, Ho Chi Minh City
33.1% 26,782 172 48
Somerset Ho Chi Minh City nguyen Binh Khiem Street, Ho Chi Minh City
34.1% 25,207 165 45
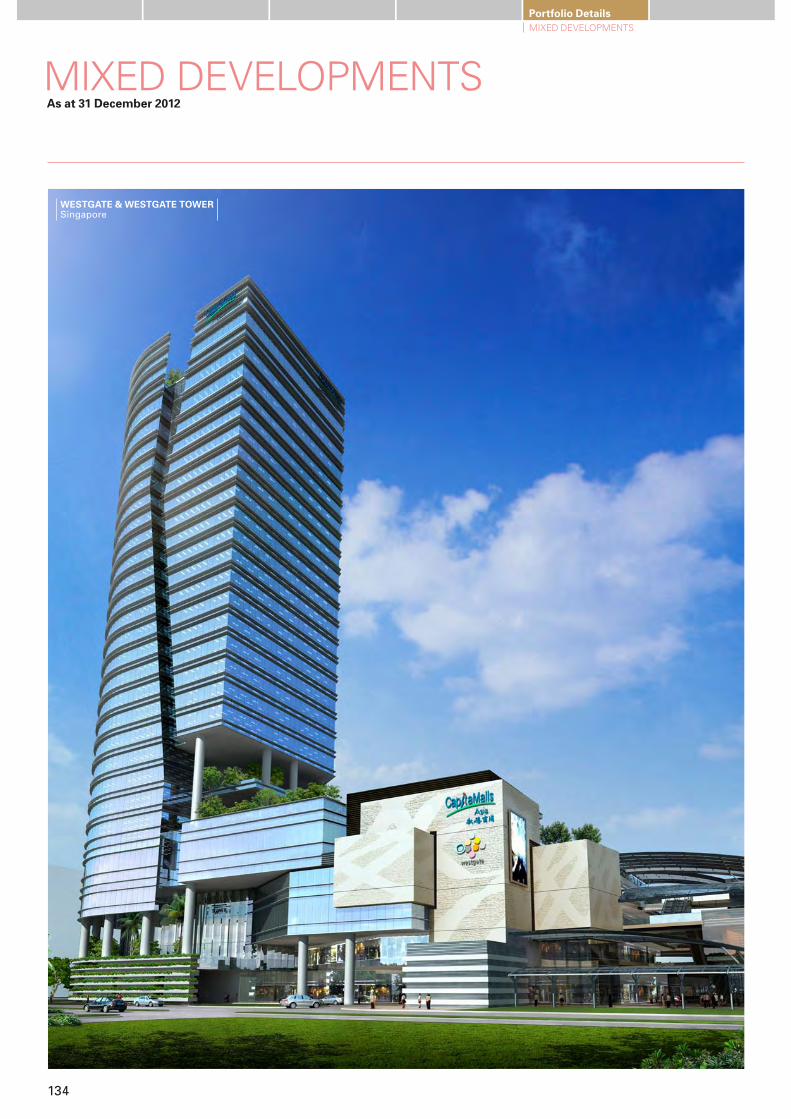
134
Portfolio Details
MiXeD DeVelopMentS Asat31December2012
MiXeD DeVelopMentS
WesTGATe&WesTGATeTOWeRSingapore
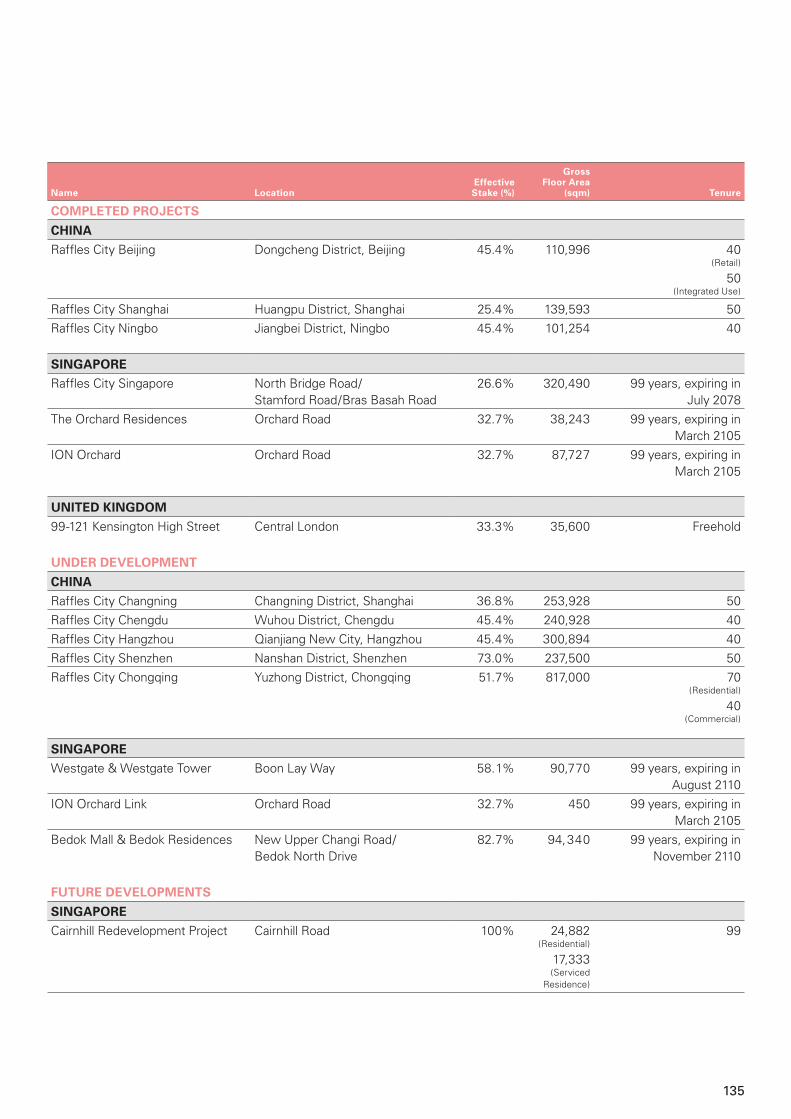
135
name locationeffective stake(%)
Grossfloor Area
(sqm) Tenure
CoMPleTeD PRoJeCTS
ChinAraffles City Beijing Dongcheng District, Beijing 45.4% 110,996 40
(retail)
50 (integrated use)
raffles City Shanghai Huangpu District, Shanghai 25.4% 139,593 50
raffles City ningbo Jiangbei District, ningbo 45.4% 101,254 40
SinGAPoReraffles City Singapore north Bridge road/
Stamford road/Bras Basah road26.6% 320,490 99 years, expiring in
July 2078
the orchard residences orchard road 32.7% 38,243 99 years, expiring in March 2105
ion orchard orchard road 32.7% 87,727 99 years, expiring in March 2105
uniTeD kinGDoM99-121 Kensington High Street Central london 33.3% 35,600 freehold
unDeR DeVeloPMenT
ChinAraffles City Changning Changning District, Shanghai 36.8% 253,928 50
raffles City Chengdu Wuhou District, Chengdu 45.4% 240,928 40
raffles City Hangzhou Qianjiang new City, Hangzhou 45.4% 300,894 40
raffles City Shenzhen nanshan District, Shenzhen 73.0% 237,500 50
raffles City Chongqing Yuzhong District, Chongqing 51.7% 817,000 70 (residential)
40 (Commercial)
SinGAPoReWestgate & Westgate tower Boon lay Way 58.1% 90,770 99 years, expiring in
august 2110
ion orchard link orchard road 32.7% 450 99 years, expiring in March 2105
Bedok Mall & Bedok residences new upper Changi road/ Bedok north Drive
82.7% 94,340 99 years, expiring in november 2110
fuTuRe DeVeloPMenTS
SinGAPoReCairnhill redevelopment project Cairnhill road 100% 24,882
(residential)
17,333 (Serviced
residence)
99
STATUTORY ACCOUNTS
Directors’ Report 137
Statement by Directors 148Independent Auditors’ Report to the Members of CapitaLand Limited 149
Balance Sheets 150Income Statements 151Statements of Comprehensive Income 152Statements of Changes in Equity 153
Consolidated Statement of Cash Flows 156Notes to the Financial Statements 158
Contents
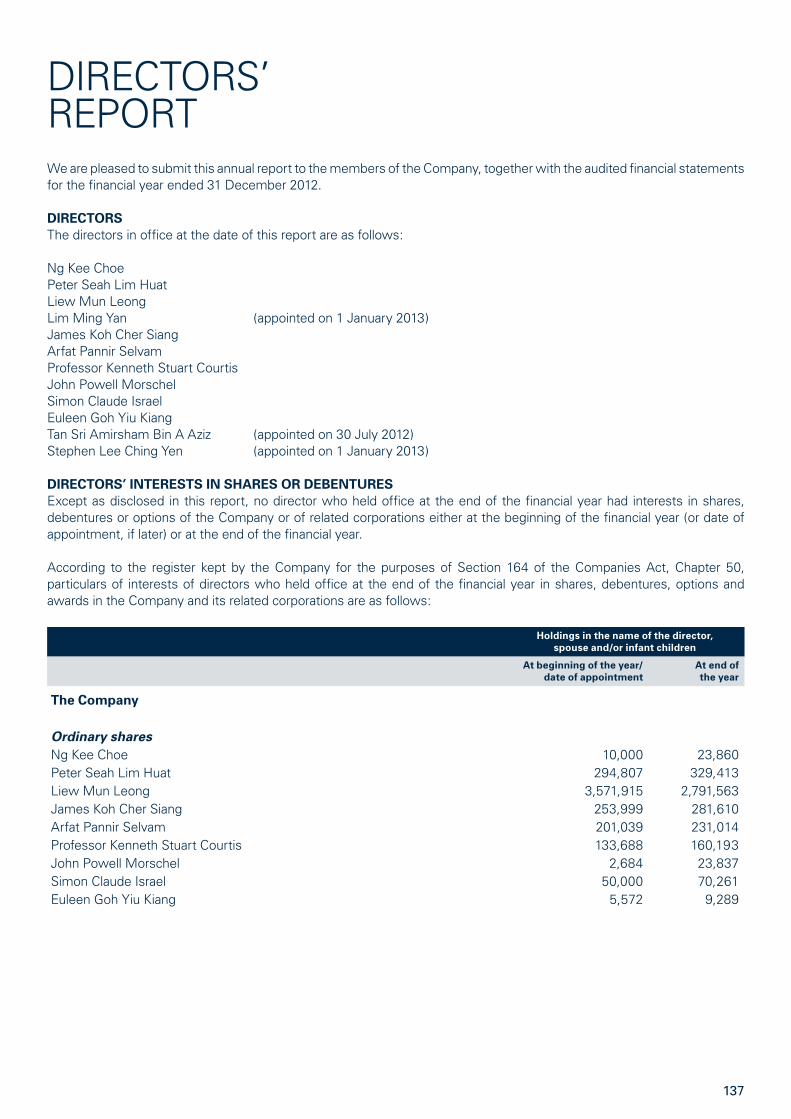
137
diReCTORS’ RepORTWe are pleased to submit this annual report to the members of the Company, together with the audited financial statements for the financial year ended 31 december 2012.
DireCtorsThe directors in office at the date of this report are as follows:
Ng Kee Choepeter Seah Lim HuatLiew Mun LeongLim Ming Yan (appointed on 1 January 2013)James Koh Cher SiangArfat pannir Selvamprofessor Kenneth Stuart CourtisJohn powell MorschelSimon Claude israeleuleen Goh Yiu KiangTan Sri Amirsham Bin A Aziz (appointed on 30 July 2012)Stephen Lee Ching Yen (appointed on 1 January 2013)
DireCtors’ interests in shares or Debenturesexcept as disclosed in this report, no director who held office at the end of the financial year had interests in shares, debentures or options of the Company or of related corporations either at the beginning of the financial year (or date of appointment, if later) or at the end of the financial year.
According to the register kept by the Company for the purposes of Section 164 of the Companies Act, Chapter 50, particulars of interests of directors who held office at the end of the financial year in shares, debentures, options and awards in the Company and its related corporations are as follows:
holdings in the name of the director, spouse and/or infant children
at beginning of the year/ date of appointment
at end of the year
the Company
Ordinary sharesNg Kee Choe 10,000 23,860peter Seah Lim Huat 294,807 329,413Liew Mun Leong 3,571,915 2,791,563James Koh Cher Siang 253,999 281,610Arfat pannir Selvam 201,039 231,014professor Kenneth Stuart Courtis 133,688 160,193John powell Morschel 2,684 23,837Simon Claude israel 50,000 70,261euleen Goh Yiu Kiang 5,572 9,289
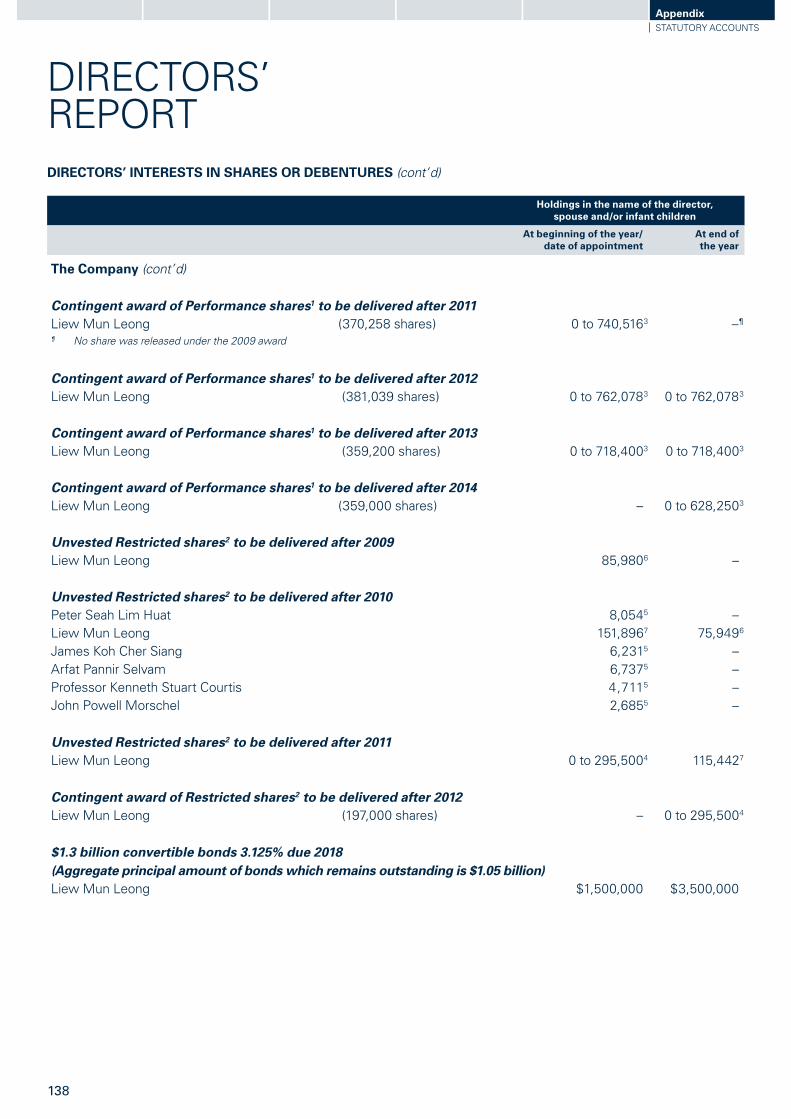
138
appendixSTATUTORY ACCOUNTS
DireCtors’ interests in shares or Debentures (cont’d)
holdings in the name of the director, spouse and/or infant children
at beginning of the year/ date of appointment
at end of the year
the Company (cont’d)
Contingent award of Performance shares1 to be delivered after 2011Liew Mun Leong (370,258 shares) 0 to 740,5163 –
¶ No share was released under the 2009 award
Contingent award of Performance shares1 to be delivered after 2012Liew Mun Leong (381,039 shares) 0 to 762,0783 0 to 762,0783
Contingent award of Performance shares1 to be delivered after 2013Liew Mun Leong (359,200 shares) 0 to 718,4003 0 to 718,4003
Contingent award of Performance shares1 to be delivered after 2014Liew Mun Leong (359,000 shares) – 0 to 628,2503
Unvested Restricted shares2 to be delivered after 2009Liew Mun Leong 85,9806 –
Unvested Restricted shares2 to be delivered after 2010peter Seah Lim Huat 8,0545 –Liew Mun Leong 151,8967 75,9496
James Koh Cher Siang 6,2315 –Arfat pannir Selvam 6,7375 –professor Kenneth Stuart Courtis 4,7115 –John powell Morschel 2,6855 –
Unvested Restricted shares2 to be delivered after 2011Liew Mun Leong 0 to 295,5004 115,4427
Contingent award of Restricted shares2 to be delivered after 2012Liew Mun Leong (197,000 shares) – 0 to 295,5004
$1.3 billion convertible bonds 3.125% due 2018 (Aggregate principal amount of bonds which remains outstanding is $1.05 billion)Liew Mun Leong $1,500,000 $3,500,000
diReCTORS’ RepORT
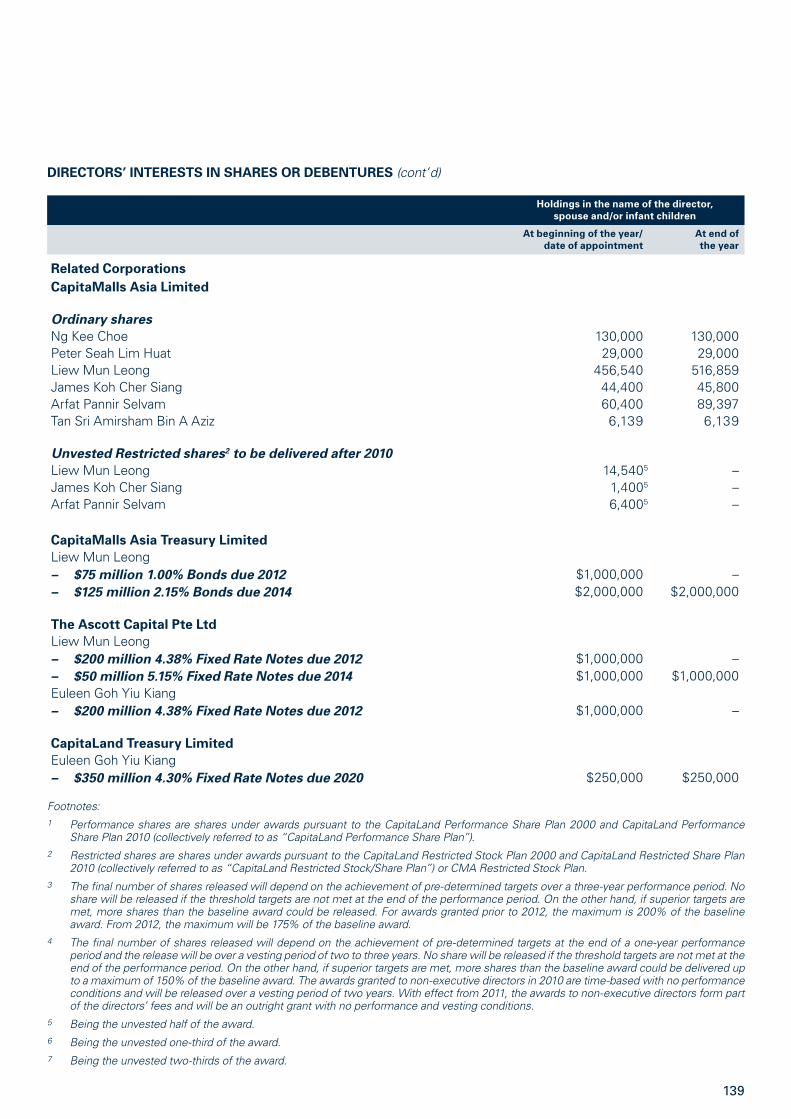
139
DireCtors’ interests in shares or Debentures (cont’d)
holdings in the name of the director, spouse and/or infant children
at beginning of the year/ date of appointment
at end of the year
related CorporationsCapitaMalls asia Limited
Ordinary sharesNg Kee Choe 130,000 130,000peter Seah Lim Huat 29,000 29,000Liew Mun Leong 456,540 516,859James Koh Cher Siang 44,400 45,800Arfat pannir Selvam 60,400 89,397Tan Sri Amirsham Bin A Aziz 6,139 6,139
Unvested Restricted shares2 to be delivered after 2010Liew Mun Leong 14,5405 –James Koh Cher Siang 1,4005 –Arfat pannir Selvam 6,4005 –
CapitaMalls asia treasury LimitedLiew Mun Leong– $75 million 1.00% Bonds due 2012 $1,000,000 –– $125 million 2.15% Bonds due 2014 $2,000,000 $2,000,000
the ascott Capital Pte LtdLiew Mun Leong– $200 million 4.38% Fixed Rate Notes due 2012 $1,000,000 –– $50 million 5.15% Fixed Rate Notes due 2014 $1,000,000 $1,000,000euleen Goh Yiu Kiang– $200 million 4.38% Fixed Rate Notes due 2012 $1,000,000 –
CapitaLand treasury Limitedeuleen Goh Yiu Kiang– $350 million 4.30% Fixed Rate Notes due 2020 $250,000 $250,000
Footnotes:1 Performance shares are shares under awards pursuant to the CapitaLand Performance Share Plan 2000 and CapitaLand Performance
Share Plan 2010 (collectively referred to as “CapitaLand Performance Share Plan”).2 Restricted shares are shares under awards pursuant to the CapitaLand Restricted Stock Plan 2000 and CapitaLand Restricted Share Plan
2010 (collectively referred to as “CapitaLand Restricted Stock/Share Plan”) or CMA Restricted Stock Plan.3 The final number of shares released will depend on the achievement of pre-determined targets over a three-year performance period. No
share will be released if the threshold targets are not met at the end of the performance period. On the other hand, if superior targets are met, more shares than the baseline award could be released. For awards granted prior to 2012, the maximum is 200% of the baseline award. From 2012, the maximum will be 175% of the baseline award.
4 The final number of shares released will depend on the achievement of pre-determined targets at the end of a one-year performance period and the release will be over a vesting period of two to three years. No share will be released if the threshold targets are not met at the end of the performance period. On the other hand, if superior targets are met, more shares than the baseline award could be delivered up to a maximum of 150% of the baseline award. The awards granted to non-executive directors in 2010 are time-based with no performance conditions and will be released over a vesting period of two years. With effect from 2011, the awards to non-executive directors form part of the directors’ fees and will be an outright grant with no performance and vesting conditions.
5 Being the unvested half of the award.6 Being the unvested one-third of the award.7 Being the unvested two-thirds of the award.
140
appendixSTATUTORY ACCOUNTS
DireCtors’ interests in shares or Debentures (cont’d)Mr Liew Mun Leong’s shareholding in the Company had been reduced from 2,791,563 shares as at 31 december 2012 to 1,791,563 shares as at 21 January 2013.
Save as disclosed above, there was no change in any of the above-mentioned directors’ interests in the Company between the end of the financial year and 21 January 2013.
DireCtors’ interests in ContraCtsSince the end of the last financial year, no director has received or become entitled to receive a benefit by reason of a contract made by the Company or a related corporation with the director, or with a firm of which he is a member or with a company in which he has a substantial financial interest.
directors’ emoluments are disclosed in “directors’ Remuneration”.
arrangeMents to enabLe DireCtors to aCquire shares anD Debenturesexcept as disclosed under the “directors’ interests in Shares or debentures” and “Share plans” sections of this report, neither at the end of nor at any time during the financial year was the Company a party to any arrangement whose objects are, or one of whose objects is, to enable the directors of the Company to acquire benefits by means of the acquisition of shares in or debentures of the Company or any other body corporate.
share PLansThe executive Resource and Compensation Committee (“eRCC”) of the Company has been designated as the Committee responsible for the administration of the Share plans. The eRCC members at the date of this report are Mr peter Seah Lim Huat (Chairman), Mr Ng Kee Choe, Mr Simon Claude israel and Mr Stephen Lee Ching Yen.
(a) CapitaLand share option Plan, Performance share Plan and restricted stock/share Plan At the extraordinary General Meeting held on 16 April 2010, shareholders approved a new CapitaLand performance
Share plan 2010 (“pSp 2010”) and CapitaLand Restricted Share plan 2010 (“RSp 2010”). These plans replaced the CapitaLand performance Share plan 2000 and CapitaLand Restricted Stock plan 2000 which were terminated. The Company did not extend the duration of, or replace, the existing CapitaLand Share Option plan. All awards granted under the previous share plans prior to its termination will continue to be valid and be subject to the terms and conditions of the plans. The first grant of award under the new share plans was made in March 2011. The duration of each share plan is 10 years commencing on 16 April 2010.
Under the pSp 2010, the awards granted are conditional on performance targets set based on medium-term corporate objectives. Awards represent the right of a participant to receive fully paid shares, their equivalent cash value or combinations thereof, free of charge, upon the Company achieving prescribed performance target(s). Awards are released once the eRCC is satisfied that the prescribed target(s) have been achieved. There are no vesting periods beyond the performance achievement periods.
Under the RSp 2010, awards granted to eligible participants vest only after the satisfactory completion of time-based service conditions or where the award is performance-related, after a further period of service beyond the performance target completion date (performance-based restricted awards).
Awards granted under the RSp 2010 differ from awards granted under the pSp 2010 in that an extended vesting period is normally imposed beyond the performance target completion date, that is, they also incorporate a time-based service condition as well, to encourage participants to continue serving the Group beyond the achievement date of the pre-determined performance target(s). in addition, the RSp 2010 also enable grants of fully paid shares to be made to non-executive directors as part of their remuneration in respect of their office as such in lieu of cash.
The aggregate number of new shares which may be allotted, issued and/or delivered pursuant to awards granted under the Share plans on any date, when aggregated with existing shares (including shares held in treasury and cash equivalents) delivered and/or to be delivered, pursuant to the Share plans, and all shares, options or awards granted under any other share schemes of the Company then in force, shall not exceed 8% of the total number of issued shares (excluding treasury shares) from time to time.
diReCTORS’ RepORT
141
share PLans (cont’d)(b) options exercised The Company ceased to grant options under the CapitaLand Share Option plan since 2007. during the financial year,
there were new ordinary shares issued for cash in the capital of the Company pursuant to the exercise of options granted:
name of Companyexercise Price
(per share)number of
shares issued
CapitaLand Limited $0.30 to $3.18 836,913
Save as disclosed above, there were no shares issued during the financial year by virtue of the exercise of options to take up unissued shares of the Company and its subsidiary.
(c) unissued shares under options At the end of the financial year, there were the following unissued ordinary shares of the Company under options:
number of holders expiry Date
exercise Price(per share)
$
number of unissued shares
under options
the CompanyGroup executives 9 28/02/2013 0.30 64,383
4 29/08/2013 0.30 7,84645 27/02/2014 0.50 367,232
5 27/08/2014 0.85 15,120133 25/02/2015 1.72 1,237,820
18 26/08/2015 2.15 72,290353 24/02/2016 3.18 5,632,884
1 19/06/2016 3.65 87,35047 01/09/2016 4.09 621,650
total 8,106,575
The aggregate number of options granted since the commencement of the CapitaLand Share Option plan to the end of the financial year is as follows:
Participants
aggregate options granted since the commencement
of the CapitaLand share option Plan
aggregate options
exercised
aggregate options lapsed/
cancelled
aggregate options
outstanding
directors of the Company:peter Seah Lim Huat 494,460 (494,460) – –Liew Mun Leong 6,257,200 (6,257,200) – –James Koh Cher Siang 134,800 (134,800) – –Arfat pannir Selvam 100,880 (100,880) – –
6,987,340 (6,987,340) – –
Non-executive directors of subsidiaries (including former directors of the Company) 11,636,530 (10,880,120) (756,410) –Group executives (excluding Liew Mun Leong) 138,155,955 (95,514,418) (34,534,962) 8,106,575parent Group executives and others 2,662,482 (2,232,834) (429,648) –total 159,442,307 (115,614,712) (35,721,020) 8,106,575
Save as disclosed above, there were no unissued shares of the Company or its subsidiary under options as at the end of the financial year.

142
appendixSTATUTORY ACCOUNTS
share PLans (cont’d)(d) awards under the CapitaLand Performance share Plan during the financial year, the eRCC of the Company has granted awards which are conditional on targets set for a
performance period, currently prescribed to be a three-year performance period. A specified number of shares will only be released by the eRCC to the recipient at the end of the qualifying performance period, provided the threshold targets are achieved. An initial number of shares (“baseline award”) is allocated equally according to the following performance conditions:
• Group’sAbsoluteTotalShareholderReturnmeasuredasamultipleofCostofEquity;and • Group’sRelativeTotalShareholderReturnmeasuredas theoutperformanceagainst theMSCIAsiaPacific
ex-Japan Real estate index.
The above performance measures are selected as key measurements of wealth creation for shareholders. The final number of shares to be released will depend on the achievement of pre-determined targets over a three-year performance period. No share will be released if the threshold targets are not met at the end of the performance period. Conversely, if superior targets are met, more shares than the baseline award could be released. For awards granted prior to 2012, the maximum is 200% of the baseline award. From 2012, the maximum will be 175% of the baseline award.
details of the movement in the awards of the Company during the year were as follows:
<-- Movements during the year -->
balance as at 1 January 2012 granted
Lapsed/ Cancelled
balance as at 31 December 2012
Year of award no. of holders no. of shares no. of shares no. of shares no. of holders no. of shares
2009 69 3,281,727 – (3,281,727) – –2010 51 2,847,827 – (69,811) 49 2,778,0162011 62 3,139,500 – (116,574) 59 3,022,9262012 – – 3,488,000 (90,000) 63 3,398,000
9,269,054 3,488,000 (3,558,112) 9,198,942
(e) awards under the CapitaLand restricted stock/share Plan during the financial year, the eRCC of the Company has granted awards which are conditional on targets set for a
performance period, currently prescribed to be a one-year performance period. A specified number of shares will only be released by the eRCC to the recipients at the end of the qualifying performance period, provided the threshold targets are achieved. An initial number of shares (“baseline award”) is allocated equally according to the following performance conditions:
• Group’sEarningsBeforeInterestandTax;and • Group’sReturnonTotalAssets.
The above performance measures are selected as they are the key drivers of shareholder value and are aligned to the Company’s business objectives. The final number of shares to be released will depend on the achievement of pre-determined targets at the end of a one-year performance period. No share will be released if the threshold targets are not met at the end of the performance period. On the other hand, if superior targets are met, more shares than the baseline award could be delivered up to a maximum of 150% of the baseline award. Once the final number of shares has been determined, it will be released over a vesting period of three years. Recipients can receive fully paid shares, their equivalent cash value or combinations thereof, at no cost. From 2012, cash-settled award plan for non-managerial grade employees in Singapore, Malaysia and Japan has been replaced by a Restricted Cash plan (“RCp”). Under RCp, a cash bonus is distributed to eligible employee at the end of each financial year based on the Group’s financial performance and achievement of performance targets, as well as individual performance.
diReCTORS’ RepORT

143
share PLans (cont’d)(e) awards under the CapitaLand restricted stock/share Plan (cont’d) The eRCC of the Company has instituted a set of share ownership guidelines for senior management who receives
shares under the CapitaLand Restricted Stock/Share plan. Under these guidelines, members of the senior management team are required to retain a portion of the total number of CapitaLand shares acquired through the CapitaLand Restricted Stock/Share plan which will vary according to their job grades and base salaries.
The awards granted to non-executive directors prior to 2010 have a vesting period of two years. in 2010, the awards granted are time-based with no performance conditions and will be released over a vesting period of two years. With effect from 2011, the awards to non-executive directors form part of the directors’ fees and will be an outright grant with no performance and vesting conditions.
details of the movement in the awards by the Company during the year were as follows:
<----------- Movements during the year ----------->
balance as at 1 January 2012 granted released*
Lapsed/ Cancelled
balance as at 31 December 2012
Year of award no. of holders no. of shares no. of shares no. of shares no. of shares no. of holders no. of shares
2009 1,313 2,773,682 – (2,708,531) (65,151) – –2010 815 4,038,491 – (2,014,638) (173,731) 718 1,850,1222011 952 6,250,405 – (1,783,947) (1,082,124) 857 3,384,3342012 – – 7,635,290 (151,620) (404,506) 682 7,079,164
13,062,578 7,635,290 (6,658,736) (1,725,512) 12,313,620 * The number of shares released during the year was 6,658,736, of which 846,520 were cash-settled.
As at 31 december 2012, the number of shares comprised in awards granted under the CapitaLand Restricted Stock/Share plan is as follows:
equity-settled Cash-settled total
Final number of shares has not been determined (baseline award)# 6,820,334 258,830 7,079,164Final number of shares determined but not released 4,647,933 586,523 5,234,456
11,468,267 845,353 12,313,620
# The final number of shares released could range from 0% to 150% of the baseline award.
(f) awards under the CapitaMalls asia Limited (“CMa”) share Plans The CMA performance Share plan and the CMA Restricted Stock plan (collectively referred to as the “CMA Share
plans”) were approved and adopted by the shareholders’ of CMA at an extraordinary General Meeting held on 30 October 2009.
Under the CMA Share plans, awards are granted to eligible participants who will have the right to receive fully paid shares, their equivalent cash value or combinations thereof, free of charge, upon the company achieving prescribed performance target(s).
144
appendixSTATUTORY ACCOUNTS
share PLans (cont’d)(f) awards under the CapitaMalls asia Limited (“CMa”) share Plans (cont’d) (i) awards under the CMa Performance share Plan The CMA performance Share plan has no vesting periods beyond the performance achievement periods and
applies only to key executives.
details of the movement in the awards by CMA during the year were as follows:
<-- Movements during the year -->
balance as at 1 January 2012 granted
Lapsed/ Cancelled
balance as at 31 December 2012
Year of award no. of holders no. of shares no. of shares no. of shares no. of holders no. of shares
2010 20 871,700 – (95,000) 18 776,7002011 29 1,286,700 – (136,000) 26 1,150,7002012 – – 1,769,000 (49,000) 29 1,720,000
2,158,400 1,769,000 (280,000) 3,647,400
(ii) awards under the CMa restricted stock Plan Under the CMA Restricted Stock plan, awards granted to eligible participants vest only after the satisfactory
completion of time-based service conditions or where the award is performance-related, after a further period of service beyond the performance target completion date (performance-related awards). performance-related awards differ from awards granted under the CMA performance Share plan in that an extended vesting period is imposed beyond the performance target completion date.
CMA has instituted a set of share ownership guidelines for senior management who receive shares under the CMA Restricted Stock plan. Under these guidelines, members of the senior management team are required to retain a portion of the total number of CMA shares acquired through the CMA Restricted Stock plan which will vary according to their job grades and base salaries. The 2010 award to non-executive directors was time-based with no performance conditions and will be released over a vesting period of two years. With effect from 2011, no share awards were granted under the CMA Restricted Stock plan to non-executive directors.
details of the movement in the awards by CMA during the year were as follows:
<----------- Movements during the year ----------->
balance as at 1 January 2012 granted released*
Lapsed/ Cancelled
balance as at 31 December 2012
Year of award no. of holders no. of shares no. of shares no. of shares no. of shares no. of holders no. of shares
2010 716 2,778,529 – (1,390,644) (155,546) 667 1,232,3392011 934 5,208,345 1,056,139 (2,028,091) (459,085) 847 3,777,3082012 – – 6,328,400 – (403,610) 701 5,924,790
7,986,874 7,384,539 (3,418,735) (1,018,241) 10,934,437
* The number of shares released during the year was 3,418,735, of which 995,898 were cash-settled.
As at 31 december 2012, the number of shares comprised in awards granted under the CMA Restricted Stock plan is as follows:
equity-settled Cash-settled total
Final number of shares has not been determined (baseline award)# 4,931,990 992,800 5,924,790Final number of shares determined but not released 3,527,305 1,482,342 5,009,647
8,459,295 2,475,142 10,934,437
# The final number of shares released could range from 0% to 150% of the baseline award.
diReCTORS’ RepORT
145
share PLans (cont’d)(g) awards under the australand share Plans (i) australand Performance rights Plan The establishment of the Australand performance Rights plan was approved by Australand’s shareholders at the
2007 Annual General Meeting (“AGM”).
The number of securities outstanding under the Australand performance Rights plan as at the end of the year is summarised below:
<--------------- Movements during the year --------------->
Year of awardbalance as at
1 January 2012 granted exercisedLapsed/
Forfeited balance as at
31 December 2012
2007 111,620 – (23,866) – 87,7542008 35,673 – (5,420) – 30,2532009 1,564,492 – (228,611) – 1,335,8812010 1,442,256 – – (394,211) 1,048,0452011 1,839,937 – – (39,900) 1,800,0372012 – 2,061,039 – (39,100) 2,021,939
4,993,978 2,061,039 (257,897) (473,211) 6,323,909
(ii) australand tax exempt employee security Plan The Australand Tax exempt employee Security plan in which tax exempt stapled securities may be issued by the
company to employees for no cash consideration was approved by Australand’s shareholders at the 2007 AGM. All Australian resident permanent (full-time and part-time) employees (excluding directors and participants in the Australand performance Rights plan) who have been continuously employed by Australand for a period of at least nine months as at the invitation date and are still employees as at the acquisition date (the date Australand acquires the securities) are eligible to participate in the plan. employees may elect not to participate in the plan.
The plan provides up to A$1,000 of Australand stapled securities (tax-free) to eligible employees annually for no cash consideration.
A three-year restriction period on selling, transferring or otherwise dealing with the securities applies, unless the employee leaves Australand. Under the plan, employees will receive the same benefits as all other security holders.
The number of securities issued to participants in the plan is the offer amount divided by the weighted average price at which Australand’s stapled securities are traded on the Australian Stock exchange during the week up to and including the acquisition date (rounded down to the nearest whole number of stapled securities).
No securities were issued under the Australand Tax exempt employee Security plan during the year. in 2011, 108,016 securities were issued at the weighted average market price of A$2.90 per security.
146
appendixSTATUTORY ACCOUNTS
auDit CoMMitteeThe Audit Committee members at the date of this report are Ms euleen Goh Yiu Kiang (Chairman), Mr James Koh Cher Siang, Mrs Arfat pannir Selvam and Tan Sri Amirsham Bin A Aziz.
The Audit Committee performs the functions specified by Section 201B of the Companies Act, Chapter 50 (the “Act”), the Listing Manual of the SGX-ST, and the Code of Corporate Governance.
The principal responsibility of the Audit Committee is to assist the Board of directors in fulfilling its oversight responsibilities. Areas of review by the Audit Committee include:
• thereliabilityandintegrityofthefinancialstatements;
• theimpactofnew,revisedorproposedchangesinaccountingpoliciesorregulatoryrequirementsonthefinancialstatements;
• thecompliancewithlawsandregulations,particularlythoseoftheActandtheListingManualoftheSGX-ST;
• theappropriatenessofquarterlyandfullyearannouncementsandreports;
• theadequacyofinternalcontrolsandevaluationofadherencetosuchcontrols; • theeffectivenessandefficiencyofinternalandexternalaudits;
• theappointmentandre-appointmentofexternalauditorsandthelevelofauditors’remuneration;
• thenatureandextentofnon-auditservicesandtheirimpactonindependenceandobjectivityoftheexternalauditors;
• interestedpersontransactions;
• thefindingsofinternalinvestigation,ifany;
• theframeworkandprocessesestablishedfortheimplementationofthetermsofthecollaborationagreementwithCMAinordertoensurethatsuchframeworkandprocessesremainappropriate;
• theprocessesputinplacetomanageanymaterialconflictsofinterestwithintheGroup;and
• allconflictsofinterestmattersreferredtoit.
The Audit Committee also reviews arrangements by which employees of the Company may, in confidence, raise concerns about possible improprieties in matters of financial reporting or other matters. pursuant to this, the Audit Committee has introduced a Whistle Blowing policy where employees may raise improprieties to the Audit Committee Chairman in good faith, with the confidence that employees making such reports will be treated fairly and be protected from reprisal.
The Audit Committee met four times in 2012. Specific functions performed during the year included reviewing the scope of work and strategies of both the internal and external auditors, and the results arising therefrom, including their evaluation of the system of internal controls. The Audit Committee also reviewed the assistance given by the Company’s officers to the auditors. The financial statements of the Group and the Company were reviewed by the Audit Committee prior to the submission to the Board of directors of the Company for adoption. The Audit Committee also met with the internal and external auditors, without the presence of management, to discuss issues of concern to them.
diReCTORS’ RepORT

147
auDit CoMMittee (cont’d)The Audit Committee has, in accordance with Chapter 9 of the Listing Manual of the SGX-ST, reviewed the requirements for approval and disclosure of interested person transactions, reviewed the procedures set by the Group and the Company to identify and report and where necessary, seek approval for interested person transactions and, with the assistance of the internal auditors, reviewed interested person transactions.
The Audit Committee also undertook quarterly reviews of all non-audit services provided by KpMG LLp and its member firms and was satisfied that they did not affect their independence as external auditors of the Company.
The Audit Committee has recommended to the Board of directors that the auditors, KpMG LLp, be nominated for re-appointment as auditors at the forthcoming Annual General Meeting of the Company. auDitorsThe auditors, KpMG LLp, have indicated their willingness to accept re-appointment.
On behalf of the Board of directors
ng Kee ChoeDireCtor
LiM Ming YanDireCtor
singapore28 February 2013
148
appendixSTATUTORY ACCOUNTS
STATeMeNT BY diReCTORSin our opinion:
(a) the financial statements set out on pages 150 to 241 are drawn up so as to give a true and fair view of the state of affairs of the Group and of the Company as at 31 december 2012, and of the results and changes in equity of the Group and of the Company, and of the cash flows of the Group for the year ended on that date in accordance with the provisionsoftheSingaporeCompaniesAct,Chapter50andSingaporeFinancialReportingStandards;and
(b) at the date of this statement, there are reasonable grounds to believe that the Company will be able to pay its debts as and when they fall due.
The Board of directors has, on the date of this statement, authorised these financial statements for issue.
On behalf of the Board of directors
ng Kee ChoeDireCtor
LiM Ming YanDireCtor
singapore28 February 2013
149
We have audited the accompanying financial statements of CapitaLand Limited (the “Company”) and its subsidiaries (the “Group”), which comprise the balance sheets of the Group and the Company as at 31 december 2012, the income statements, statements of comprehensive income and statements of changes in equity of the Group and the Company and the statement of cash flows of the Group for the year then ended, and a summary of significant accounting policies and other explanatory information, as set out on pages 150 to 241.
Management’s responsibility for the financial statementsManagement is responsible for the preparation of financial statements that give a true and fair view in accordance with the provisions of the Singapore Companies Act, Chapter 50 (the “Act”) and Singapore Financial Reporting Standards, and for devising and maintaining a system of internal accounting controls sufficient to provide a reasonable assurance that assets aresafeguardedagainstlossfromunauthoriseduseordisposition;andtransactionsareproperlyauthorisedandthattheyare recorded as necessary to permit the preparation of true and fair profit and loss accounts and balance sheets and to maintain accountability of assets.
Auditors’ responsibilityOur responsibility is to express an opinion on these financial statements based on our audit. We conducted our audit in accordance with Singapore Standards on Auditing. Those standards require that we comply with ethical requirements and plan and perform the audit to obtain reasonable assurance about whether the financial statements are free from material misstatement.
An audit involves performing procedures to obtain audit evidence about the amounts and disclosures in the financial statements. The procedures selected depend on the auditor’s judgement, including the assessment of the risks of material misstatement of the financial statements, whether due to fraud or error. in making those risk assessments, the auditor considers internal control relevant to the entity’s preparation of the financial statements that give a true and fair view in order to design audit procedures that are appropriate in the circumstances, but not for the purpose of expressing an opinion on the effectiveness of the entity’s internal control. An audit also includes evaluating the appropriateness of accounting policies used and the reasonableness of accounting estimates made by management, as well as evaluating the overall presentation of the financial statements. We believe that the audit evidence we have obtained is sufficient and appropriate to provide a basis for our audit opinion.
Opinionin our opinion, the consolidated financial statements of the Group and the balance sheet, income statement, statement of comprehensive income and statement of changes in equity of the Company are properly drawn up in accordance with the provisions of the Act and Singapore Financial Reporting Standards to give a true and fair view of the state of affairs of the Group and of the Company as at 31 december 2012 and the results and changes in equity of the Group and the Company and cash flows of the Group for the year ended on that date.
Report on other legal and regulatory requirementsin our opinion, the accounting and other records required by the Act to be kept by the Company and by those subsidiaries incorporated in Singapore of which we are the auditors have been properly kept in accordance with the provisions of the Act.
KPMg LLPPubLiC aCCountants anDCertiFieD PubLiC aCCountants
singapore28 February 2013
iNdepeNdeNT AUdiTORS’ RepORTto the members of CapitaLand Limited

150
appendixSTATUTORY ACCOUNTS
the group the Company
note2012
$’0002011
$’0002012
$’0002011
$’000
non-current assetsproperty, plant and equipment 3 1,263,615 1,075,505 14,400 12,830intangible assets 4 462,093 458,722 147 147investment properties 5 7,969,402 7,074,617 – –Subsidiaries 6 – – 10,546,914 10,605,809Associates 7(a) 9,692,297 9,290,737 – –Joint ventures 8(a) 2,818,985 1,394,263 – –deferred tax assets 9 91,595 95,671 2,589 2,884Other non-current assets 10(a) 795,713 795,955 – –
23,093,700 20,185,470 10,564,050 10,621,670Current assetsdevelopment properties for sale and stocks 11 7,510,093 6,905,124 – –Trade and other receivables 12 1,484,753 1,769,374 2,447,221 2,590,302Other current assets 10(b) 201,370 195,000 – –Cash and cash equivalents 15 5,497,693 6,264,473 442,650 326,539
14,693,909 15,133,971 2,889,871 2,916,841Less: current liabilitiesTrade and other payables 16 2,359,598 2,270,488 76,694 70,834Short term bank borrowings 18 765,826 426,011 – –Current portion of debt securities 19 16,346 434,228 – –Current tax payable 432,489 441,075 7,560 7,560
3,574,259 3,571,802 84,254 78,394net current assets 11,119,650 11,562,169 2,805,617 2,838,447
Less: non-current liabilitiesLong term bank borrowings 18 6,617,114 6,105,790 – –debt securities 19 6,780,492 5,224,610 3,512,287 3,432,956deferred tax liabilities 9 658,989 627,638 33,558 44,367Other non-current liabilities 20 712,971 550,130 17,628 27,815
14,769,566 12,508,168 3,563,473 3,505,138net assets 19,443,784 19,239,471 9,806,194 9,954,979
Representing:Share capital 22 6,300,011 6,298,355 6,300,011 6,298,355Revenue reserves 8,910,445 8,328,115 3,125,358 3,296,610Other reserves 23 (130,048) 275,067 380,825 360,014equity attributable to owners of the Company 15,080,408 14,901,537 9,806,194 9,954,979non-controlling interests 4,363,376 4,337,934 – –total equity 19,443,784 19,239,471 9,806,194 9,954,979
BALANCe SHeeTSas at 31 December 2012
The accompanying notes form an integral part of these financial statements.
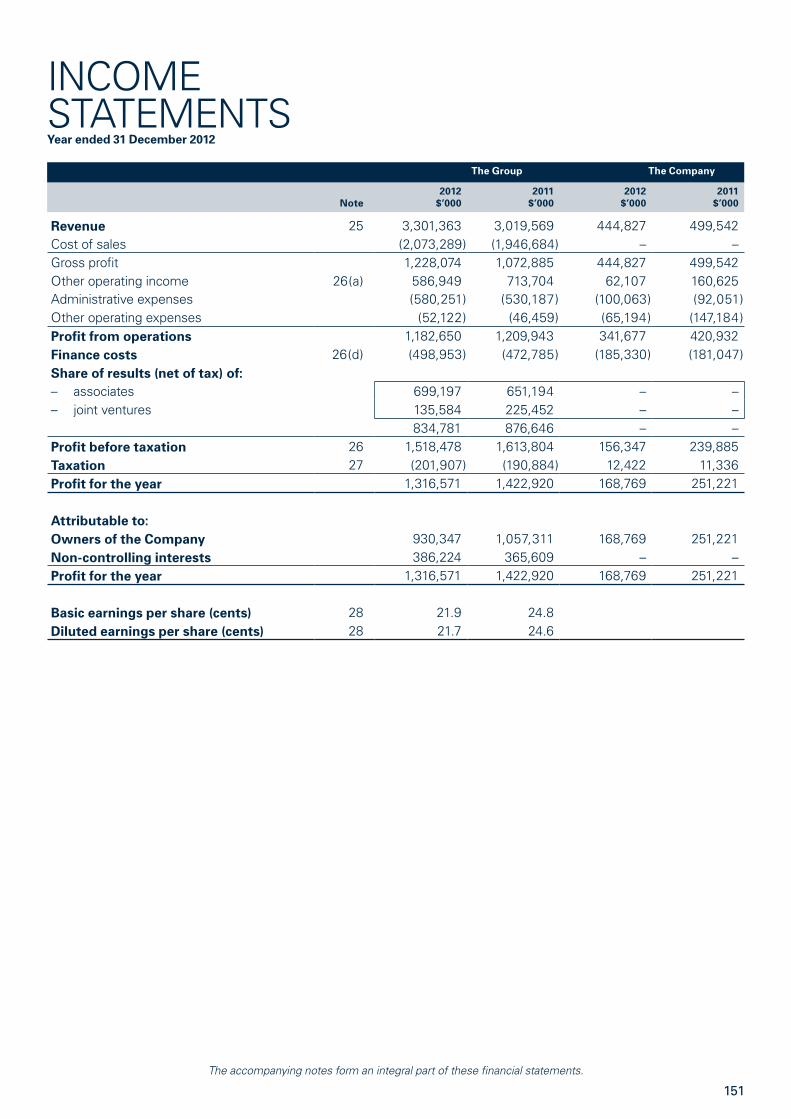
151
the group the Company
note2012
$’0002011
$’0002012
$’0002011
$’000
revenue 25 3,301,363 3,019,569 444,827 499,542Cost of sales (2,073,289) (1,946,684) – –Gross profit 1,228,074 1,072,885 444,827 499,542Other operating income 26(a) 586,949 713,704 62,107 160,625Administrative expenses (580,251) (530,187) (100,063) (92,051)Other operating expenses (52,122) (46,459) (65,194) (147,184)Profit from operations 1,182,650 1,209,943 341,677 420,932Finance costs 26(d) (498,953) (472,785) (185,330) (181,047)share of results (net of tax) of:– associates 699,197 651,194 – –– joint ventures 135,584 225,452 – –
834,781 876,646 – –Profit before taxation 26 1,518,478 1,613,804 156,347 239,885taxation 27 (201,907) (190,884) 12,422 11,336Profit for the year 1,316,571 1,422,920 168,769 251,221
attributable to:owners of the Company 930,347 1,057,311 168,769 251,221non-controlling interests 386,224 365,609 – –Profit for the year 1,316,571 1,422,920 168,769 251,221
basic earnings per share (cents) 28 21.9 24.8Diluted earnings per share (cents) 28 21.7 24.6
iNCOMe STATeMeNTSYear ended 31 December 2012
The accompanying notes form an integral part of these financial statements.

152
appendixSTATUTORY ACCOUNTS
the group the Company
note2012
$’0002011
$’0002012
$’0002011
$’000
profit for the year 1,316,571 1,422,920 168,769 251,221
other comprehensive income:exchange differences arising from translation of foreign operations and foreign currency loans forming part of net investment in foreign operations (443,366) 145,889 – –Change in fair value of available-for-sale investments (254) (43,848) – –effective portion of change in fair value of cash flow hedges (63,600) (75,048) – –Share of other comprehensive income of associates and joint ventures (84,312) 101,812 – –total other comprehensive income for the year, net of income tax 24 (591,532) 128,805 – –total comprehensive income for the year 725,039 1,551,725 168,769 251,221
attributable to:owners of the Company 487,993 1,153,805 168,769 251,221non-controlling interests 237,046 397,920 – –total comprehensive income for the year 725,039 1,551,725 168,769 251,221
STATeMeNTS OF COMpReHeNSive iNCOMeYear ended 31 December 2012
The accompanying notes form an integral part of these financial statements.
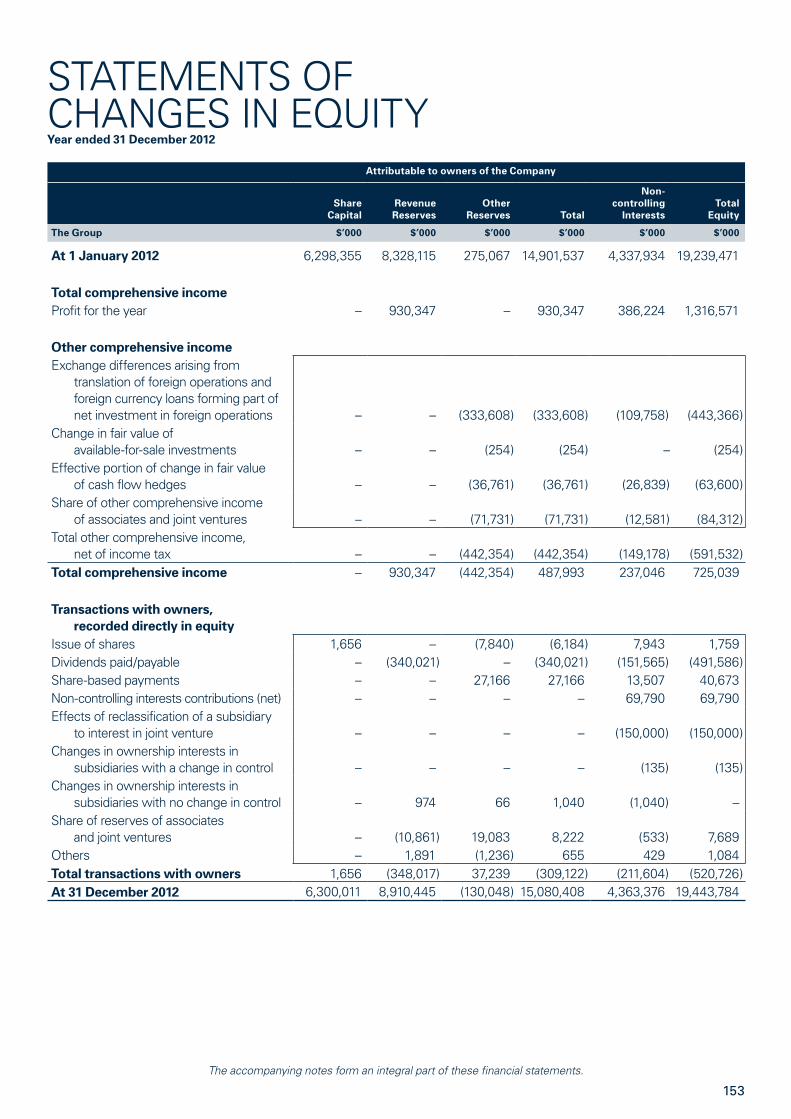
153
STATeMeNTS OF CHANGeS iN eqUiTYYear ended 31 December 2012
attributable to owners of the Company
share Capital
revenue reserves
other reserves total
non-controlling
intereststotal
equity
the group $’000 $’000 $’000 $’000 $’000 $’000
at 1 January 2012 6,298,355 8,328,115 275,067 14,901,537 4,337,934 19,239,471
total comprehensive incomeprofit for the year – 930,347 – 930,347 386,224 1,316,571
other comprehensive incomeexchange differences arising from translation of foreign operations and foreign currency loans forming part of net investment in foreign operations – – (333,608) (333,608) (109,758) (443,366)Change in fair value of available-for-sale investments – – (254) (254) – (254)effective portion of change in fair value of cash flow hedges – – (36,761) (36,761) (26,839) (63,600)Share of other comprehensive income of associates and joint ventures – – (71,731) (71,731) (12,581) (84,312)Total other comprehensive income, net of income tax – – (442,354) (442,354) (149,178) (591,532)total comprehensive income – 930,347 (442,354) 487,993 237,046 725,039
transactions with owners, recorded directly in equityissue of shares 1,656 – (7,840) (6,184) 7,943 1,759dividends paid/payable – (340,021) – (340,021) (151,565) (491,586)Share-based payments – – 27,166 27,166 13,507 40,673Non-controlling interests contributions (net) – – – – 69,790 69,790effects of reclassification of a subsidiary to interest in joint venture – – – – (150,000) (150,000)Changes in ownership interests in subsidiaries with a change in control – – – – (135) (135)Changes in ownership interests in subsidiaries with no change in control – 974 66 1,040 (1,040) –Share of reserves of associates and joint ventures – (10,861) 19,083 8,222 (533) 7,689Others – 1,891 (1,236) 655 429 1,084total transactions with owners 1,656 (348,017) 37,239 (309,122) (211,604) (520,726)at 31 December 2012 6,300,011 8,910,445 (130,048) 15,080,408 4,363,376 19,443,784
The accompanying notes form an integral part of these financial statements.
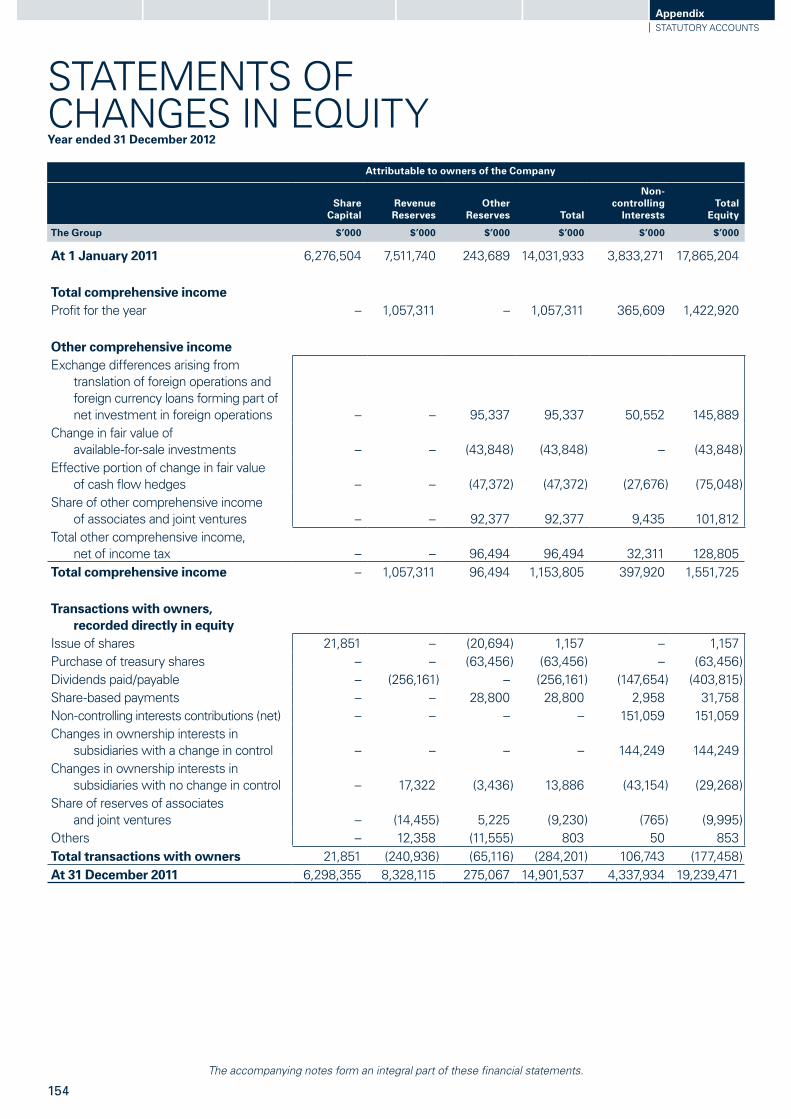
154
appendixSTATUTORY ACCOUNTS
attributable to owners of the Company
share Capital
revenue reserves
other reserves total
non-controlling
intereststotal
equity
the group $’000 $’000 $’000 $’000 $’000 $’000
at 1 January 2011 6,276,504 7,511,740 243,689 14,031,933 3,833,271 17,865,204
total comprehensive incomeprofit for the year – 1,057,311 – 1,057,311 365,609 1,422,920
other comprehensive incomeexchange differences arising from translation of foreign operations and foreign currency loans forming part of net investment in foreign operations – – 95,337 95,337 50,552 145,889Change in fair value of available-for-sale investments – – (43,848) (43,848) – (43,848)effective portion of change in fair value of cash flow hedges – – (47,372) (47,372) (27,676) (75,048)Share of other comprehensive income of associates and joint ventures – – 92,377 92,377 9,435 101,812Total other comprehensive income, net of income tax – – 96,494 96,494 32,311 128,805total comprehensive income – 1,057,311 96,494 1,153,805 397,920 1,551,725
transactions with owners, recorded directly in equityissue of shares 21,851 – (20,694) 1,157 – 1,157purchase of treasury shares – – (63,456) (63,456) – (63,456)dividends paid/payable – (256,161) – (256,161) (147,654) (403,815)Share-based payments – – 28,800 28,800 2,958 31,758Non-controlling interests contributions (net) – – – – 151,059 151,059Changes in ownership interests in subsidiaries with a change in control – – – – 144,249 144,249Changes in ownership interests in subsidiaries with no change in control – 17,322 (3,436) 13,886 (43,154) (29,268)Share of reserves of associates and joint ventures – (14,455) 5,225 (9,230) (765) (9,995)Others – 12,358 (11,555) 803 50 853total transactions with owners 21,851 (240,936) (65,116) (284,201) 106,743 (177,458)at 31 December 2011 6,298,355 8,328,115 275,067 14,901,537 4,337,934 19,239,471
The accompanying notes form an integral part of these financial statements.
STATeMeNTS OF CHANGeS iN eqUiTYYear ended 31 December 2012

155
attributable to owners of the Company
share Capital
revenue reserves
reserves For own
sharesCapital
reserves
equity Compensation
reservetotal
equity
the Company $’000 $’000 $’000 $’000 $’000 $’000
at 1 January 2012 6,298,355 3,296,610 (63,456) 383,490 39,980 9,954,979
total comprehensive incomeprofit for the year – 168,769 – – – 168,769
transactions with owners, recorded directly in equitydividends paid – (340,021) – – – (340,021)issue of shares 1,656 – – – (204) 1,452issue of treasury shares – – 14,090 – (2,560) 11,530Share-based payments – – – – 9,485 9,485total transactions with owners 1,656 (340,021) 14,090 – 6,721 (317,554)at 31 December 2012 6,300,011 3,125,358 (49,366) 383,490 46,701 9,806,194
at 1 January 2011 6,276,504 3,301,550 – 383,490 37,862 9,999,406
total comprehensive incomeprofit for the year – 251,221 – – – 251,221
transactions with owners, recorded directly in equitydividends paid – (256,161) – – – (256,161)issue of shares 21,851 – – – (4,813) 17,038purchase of treasury shares – – (63,456) – – (63,456)Share-based payments – – – – 6,931 6,931total transactions with owners 21,851 (256,161) (63,456) – 2,118 (295,648)at 31 December 2011 6,298,355 3,296,610 (63,456) 383,490 39,980 9,954,979
The accompanying notes form an integral part of these financial statements.
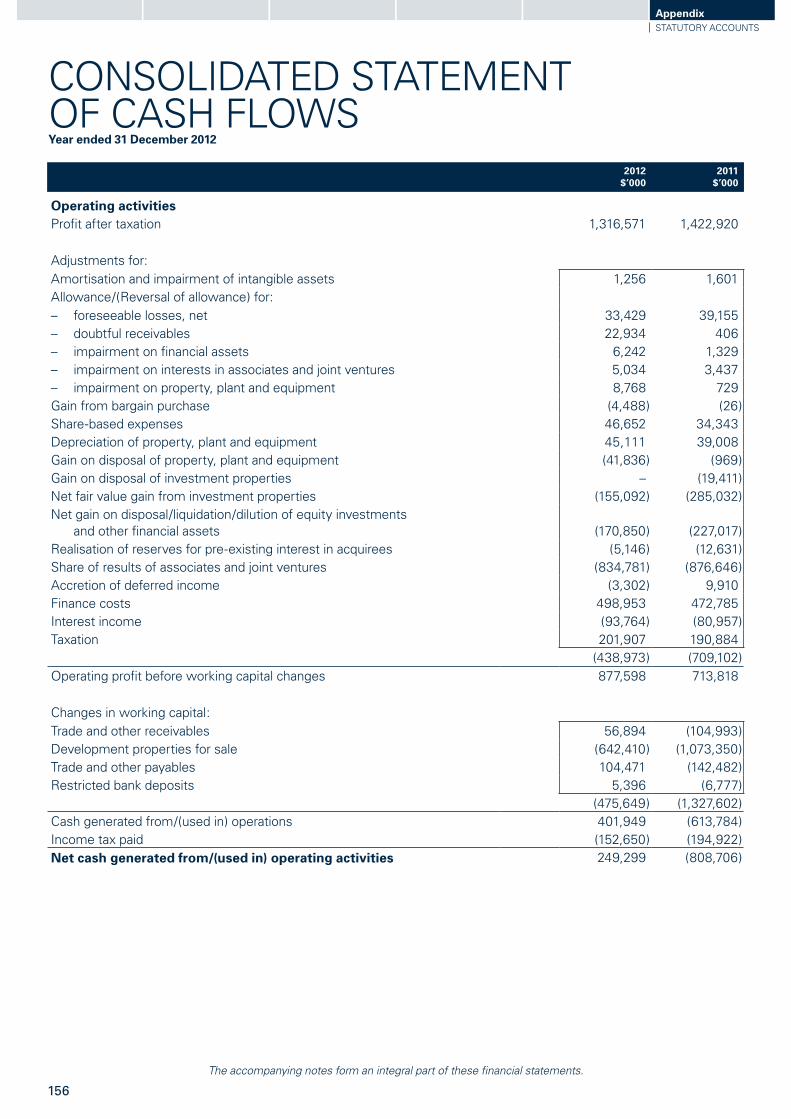
156
appendixSTATUTORY ACCOUNTS
CONSOLidATed STATeMeNT OF CASH FLOWSYear ended 31 December 2012
The accompanying notes form an integral part of these financial statements.
2012$’000
2011$’000
operating activitiesprofit after taxation 1,316,571 1,422,920
Adjustments for:Amortisation and impairment of intangible assets 1,256 1,601Allowance/(Reversal of allowance) for:– foreseeable losses, net 33,429 39,155– doubtful receivables 22,934 406– impairment on financial assets 6,242 1,329– impairment on interests in associates and joint ventures 5,034 3,437– impairment on property, plant and equipment 8,768 729Gain from bargain purchase (4,488) (26)Share-based expenses 46,652 34,343depreciation of property, plant and equipment 45,111 39,008Gain on disposal of property, plant and equipment (41,836) (969)Gain on disposal of investment properties – (19,411)Net fair value gain from investment properties (155,092) (285,032)Net gain on disposal/liquidation/dilution of equity investments and other financial assets (170,850) (227,017)Realisation of reserves for pre-existing interest in acquirees (5,146) (12,631)Share of results of associates and joint ventures (834,781) (876,646)Accretion of deferred income (3,302) 9,910Finance costs 498,953 472,785interest income (93,764) (80,957)Taxation 201,907 190,884
(438,973) (709,102)Operating profit before working capital changes 877,598 713,818
Changes in working capital:Trade and other receivables 56,894 (104,993)development properties for sale (642,410) (1,073,350)Trade and other payables 104,471 (142,482)Restricted bank deposits 5,396 (6,777)
(475,649) (1,327,602)Cash generated from/(used in) operations 401,949 (613,784)income tax paid (152,650) (194,922)net cash generated from/(used in) operating activities 249,299 (808,706)
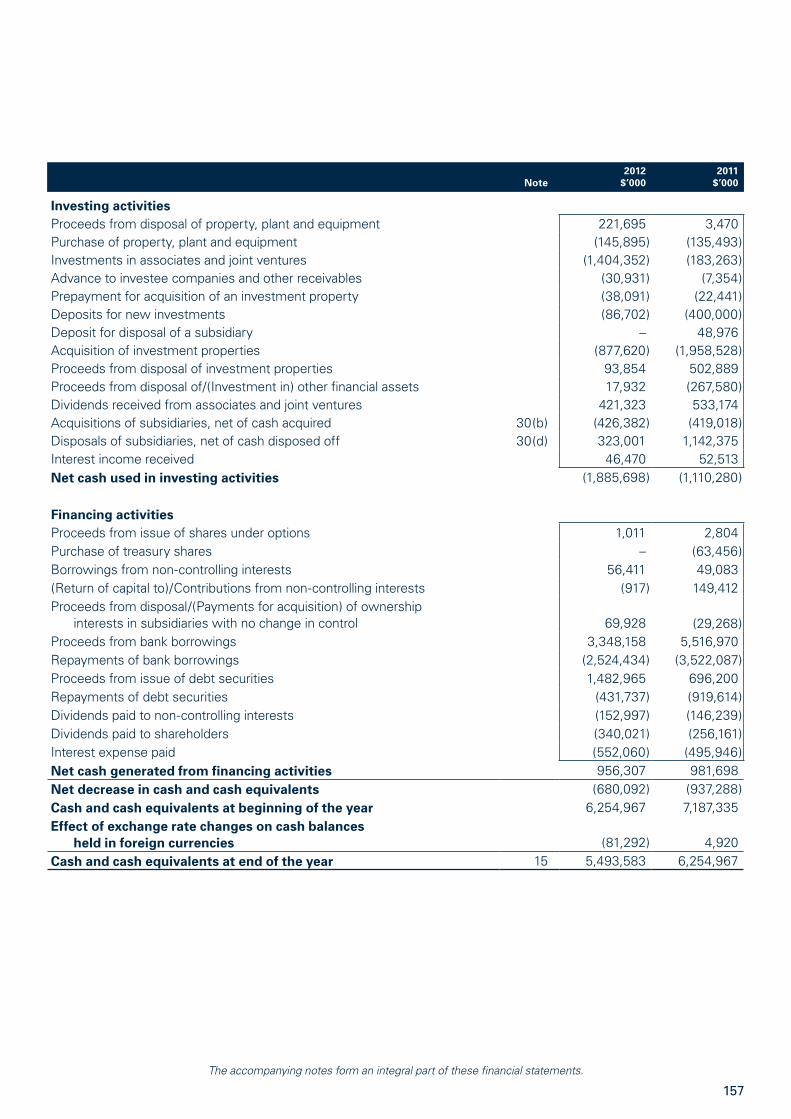
157
note2012
$’0002011
$’000
investing activitiesproceeds from disposal of property, plant and equipment 221,695 3,470purchase of property, plant and equipment (145,895) (135,493)investments in associates and joint ventures (1,404,352) (183,263)Advance to investee companies and other receivables (30,931) (7,354)prepayment for acquisition of an investment property (38,091) (22,441)deposits for new investments (86,702) (400,000)deposit for disposal of a subsidiary – 48,976Acquisition of investment properties (877,620) (1,958,528)proceeds from disposal of investment properties 93,854 502,889proceeds from disposal of/(investment in) other financial assets 17,932 (267,580)dividends received from associates and joint ventures 421,323 533,174Acquisitions of subsidiaries, net of cash acquired 30(b) (426,382) (419,018)disposals of subsidiaries, net of cash disposed off 30(d) 323,001 1,142,375interest income received 46,470 52,513net cash used in investing activities (1,885,698) (1,110,280)
Financing activitiesproceeds from issue of shares under options 1,011 2,804purchase of treasury shares – (63,456)Borrowings from non-controlling interests 56,411 49,083(Return of capital to)/Contributions from non-controlling interests (917) 149,412proceeds from disposal/(payments for acquisition) of ownership interests in subsidiaries with no change in control 69,928 (29,268)proceeds from bank borrowings 3,348,158 5,516,970Repayments of bank borrowings (2,524,434) (3,522,087)proceeds from issue of debt securities 1,482,965 696,200Repayments of debt securities (431,737) (919,614)dividends paid to non-controlling interests (152,997) (146,239)dividends paid to shareholders (340,021) (256,161)interest expense paid (552,060) (495,946)net cash generated from financing activities 956,307 981,698net decrease in cash and cash equivalents (680,092) (937,288)Cash and cash equivalents at beginning of the year 6,254,967 7,187,335effect of exchange rate changes on cash balances held in foreign currencies (81,292) 4,920Cash and cash equivalents at end of the year 15 5,493,583 6,254,967
The accompanying notes form an integral part of these financial statements.
158
appendixSTATUTORY ACCOUNTS
NOTeS TO THe FiNANCiAL STATeMeNTSThese notes form an integral part of the financial statements.
The financial statements were authorised for issue by the Board of directors on 28 February 2013.
1 DoMiCiLe anD aCtivities CapitaLand Limited (the “Company”) is incorporated in the Republic of Singapore and has its registered office at
168 Robinson Road, #30-01, Capital Tower, Singapore 068912.
The principal activities of the Company during the financial year are those relating to investment holding and consultancy services as well as the corporate headquarters which gives direction, provides management support services and integrates the activities of its subsidiaries.
The principal activities of the significant subsidiaries are those relating to investment holding, real estate development, investment in real estate financial products and real estate assets, investment advisory and management services as well as management of serviced residences.
The consolidated financial statements relate to the Company and its subsidiaries (the “Group”) and the Group’s interests in associates and joint ventures.
2 suMMarY oF signiFiCant aCCounting PoLiCies (a) basis of preparation The financial statements have been prepared in accordance with the Singapore Financial Reporting Standards (“FRS”).
The financial statements have been prepared on the historical cost basis except as disclosed in the accounting policies below.
These financial statements are presented in Singapore dollars, which is the Company’s functional currency. All financial information presented in Singapore dollars have been rounded to the nearest thousand, unless otherwise stated.
The preparation of the financial statements in conformity with FRSs requires management to make judgements, estimates and assumptions that affect the application of accounting policies and the reported amounts of assets, liabilities, income and expenses. Actual results may differ from these estimates.
estimates and underlying assumptions are reviewed on an ongoing basis. Revisions to accounting estimates are recognised in the period in which the estimates are revised and in any future periods affected.
information about critical judgements in applying accounting policies that have the most significant effect on the amount recognised in the financial statements are described in the following notes:
Note 9 – recognition of deferred tax assets
information about assumptions and estimation uncertainties that have a significant risk of resulting in a material adjustment within the next financial year are included in the following notes:
Note 2(d), Note 3 – determination of useful lives of property, plant and equipment and estimation of residual value of serviced residence properties
Note 4 – measurement of recoverable amounts of goodwill Note 5 – fair value determination of investment properties Note 11 – estimation of the percentage of completion of the projects’ attributable profits for development
properties for sale and allowance for foreseeable losses
159
2 suMMarY oF signiFiCant aCCounting PoLiCies (cont’d) (a) basis of preparation (cont’d) Note 20 – measurement of provisions Note 21 – measurement of share-based payments Note 31 – fair value determination of assets, liabilities and contingent liabilities acquired in business combinations Note 32 – fair value determination of financial instruments
The Group applies the amendments to FRS 12 Income Tax – Deferred Tax: Recovery of Underlying Assets, which became effective as of 1 January 2012. The amendments apply to the measurement of deferred tax liabilities and assets arising from investment properties measured using the fair value model under FRS 40 Investment Property. For the purposes of measuring deferred tax, the amendments introduce a rebuttable presumption that the carrying amount of such investment property will be recovered entirely through sale. The adoption of amendments to FRS 12 do not have any significant impact on the financial position or performance of the Group.
except for the above changes, the accounting policies set out below have been applied consistently by the Group to all periods presented in these financial statements and have been applied consistently by the entities in the Group.
(b) basis of consolidation (i) Business combinations Business combinations are accounted for using the acquisition method as at the acquisition date, which is the
date on which control is transferred to the Group. Control is the power to govern the financial and operating policies of an entity so as to obtain benefits from its activities. in assessing control, the Group takes into consideration potential voting rights that are currently exercisable.
The consideration transferred does not include amounts related to the settlement of pre-existing relationships. Such amounts are generally recognised in the profit or loss.
Any contingent consideration payable is recognised at fair value at the acquisition date and included in the consideration transferred. if the contingent consideration is classified as equity, it is not re-measured and settlement is accounted for within equity. Otherwise, subsequent changes to the fair value of the contingent consideration are recognised in the profit or loss.
Costs related to the acquisition, other than those associated with the issue of debt or equity securities, that
the Group incurs in connection with a business combination are expensed as incurred. Non-controlling interests that are present ownership interests and entitle their holders to a proportionate
share of the acquiree’s net assets in the events of liquidation are measured either at fair value or at the non-controlling interests’ proportionate share of the recognised amounts of the acquiree’s identifiable net assets, at the acquisition date. The measurement basis taken is elected on a transaction-by-transaction basis. All other non-controlling interests are measured at acquisition-date fair value. if the business combination is achieved in stages, the Group’s previously held equity interest in the acquiree is re-measured to fair value at each acquisition date and any changes are taken to the profit or loss.

160
appendixSTATUTORY ACCOUNTS
NOTeS TO THe FiNANCiAL STATeMeNTS2 suMMarY oF signiFiCant aCCounting PoLiCies (cont’d) (b) basis of consolidation (cont’d) (ii) Subsidiaries Subsidiaries are entities controlled by the Group. The financial statements of subsidiaries are included in the
consolidated financial statements from the date that control commences until the date that control ceases. Losses applicable to the non-controlling interests in a subsidiary are allocated to the non-controlling interests even if this results in the non-controlling interests having a deficit balance.
Changes in the Group’s interests in subsidiaries that do not result in a loss of control are accounted for as equity transactions. Upon the loss of control of a subsidiary, the Group derecognises the assets and liabilities of the subsidiary, any non-controlling interests and the other components of equity related to the subsidiary. Any surplus or deficit arising from the loss of control is recognised in the profit or loss. if the Group retains any interest in the previous subsidiary, then such interest is measured at fair value at the date that control is lost. Subsequently, it is accounted for as an equity-accounted investee or as an available-for-sale financial asset depending on the level of influence retained.
(iii) Associates and joint ventures Associates are those entities in which the Group has significant influence, but not control, over their financial
and operating policies. Significant influence is presumed to exist when the Group holds between 20% and 50% of the voting power of another entity. Joint ventures are entities (including unincorporated or incorporated companies, partnerships and trusts) over whose activities the Group has joint control, established by contractual agreement and requiring unanimous consent for strategic financial and operating decisions.
Associates and joint ventures (collectively referred to as “equity-accounted investees”) are accounted for using the equity method and are recognised initially at cost. The cost of the investments includes transaction costs. The Group’s investments in equity-accounted investees include goodwill identified on acquisition, net of any accumulated impairment losses. The consolidated financial statements include the Group’s share of the profit or loss and other comprehensive income of the equity-accounted investees, after adjustments to align the accounting policies of the equity-accounted investees with those of the Group, from the date that significant influence or joint control commences until the date that significant influence or joint control ceases.
When the Group’s share of losses exceeds its interest in an equity-accounted investee, the carrying amount of that interest is stated at zero and the recognition of further losses is discontinued except to the extent that the Group has an obligation to fund the investee’s operation or has made payments on behalf of the investee.
(iv) Transactions eliminated on consolidation intra-group balances and transactions, and any unrealised income and expenses arising from intra-group
transactions, are eliminated in preparing the consolidated financial statements. Unrealised gains arising from transactions with associates and joint ventures are eliminated against the investment to the extent of the Group’s interest in the investee. Unrealised losses are eliminated in the same way as unrealised gains, but only to the extent that there is no evidence of impairment.
(v) Accounting for subsidiaries, associates and joint ventures by the Company investments in subsidiaries, associates and joint ventures are stated in the Company’s balance sheet at cost
less accumulated impairment losses.
161
2 suMMarY oF signiFiCant aCCounting PoLiCies (cont’d) (c) Foreign currencies Foreign currency transactions items included in the financial statements of each entity in the Group are measured using the currency that
best reflects the economic substance of the underlying events and circumstances relevant to that entity (the “functional currency”).
Transactions in foreign currencies are translated to the respective functional currencies of the Group’s entities at the exchange rates at the dates of the transactions. Monetary assets and liabilities denominated in foreign currencies at the end of the reporting period are retranslated to the functional currency at the exchange rate prevailing at that reporting date. Non-monetary assets and liabilities denominated in foreign currencies that are measured at fair value are retranslated to the functional currency at the exchange rate at the date on which the fair value was determined.
Foreign currency differences arising from retranslation are recognised in the profit or loss, except for differences arising from the retranslation of monetary items that in substance form part of the Group’s net investment in a foreign operation, available-for-sale equity instruments and financial liabilities designated as hedges of net investment in a foreign operation (see note 2(g)) or qualifying cash flow hedges to the extent such hedges are effective, which are recognised in other comprehensive income.
Foreign operations The assets and liabilities of foreign operations are translated to Singapore dollars at exchange rates prevailing at
the end of the reporting period. The income and expenses of foreign operations are translated to Singapore dollars at exchange rates prevailing at the dates of the transactions. Goodwill and fair value adjustments arising from the acquisition of a foreign operation are treated as assets and liabilities of the foreign operation and translated at the exchange rates at the end of the reporting period.
Foreign currency differences are recognised in other comprehensive income, and presented in the foreign currency translation reserve (translation reserve) in equity. However, if the foreign operation is not a wholly-owned subsidiary, then the relevant proportionate share of the translation difference is allocated to the non-controlling interests. When a foreign operation is disposed off such that control, significant influence or joint control is lost, the cumulative amount in the translation reserve related to that foreign operation is transferred to the profit or loss as part of the gain or loss on disposal. When the Group disposes off only part of its interest in a subsidiary that includes a foreign operation while retaining control, the relevant proportion of the cumulative amount is reattributed to non-controlling interests. When the Group disposes off only part of its investment in an associate or joint venture that includes a foreign operation while retaining significant influence or joint control, the relevant proportion of the cumulative amount is transferred to the profit or loss.
Net investment in a foreign operation When the settlement of a monetary item receivable from or payable to a foreign operation is neither planned nor
likely to occur in the foreseeable future, foreign exchange gains and losses arising from such a monetary item are considered to form part of a net investment in a foreign operation. These are recognised in other comprehensive income and are presented in the translation reserve in equity.
(d) Property, plant and equipment property, plant and equipment are measured at cost less accumulated depreciation and accumulated impairment
losses. Cost includes expenditure that is directly attributable to the acquisition of the asset. Certain of the Group’s property, plant and equipment acquired through interests in subsidiaries, are accounted for as acquisition of assets.
Subsequent expenditure relating to property, plant and equipment that has already been recognised is added to the carrying amount of the asset if it is probable that future economic benefits, in excess of the originally assessed standard of performance of the existing asset, will flow to the Group and its cost can be measured reliably. All other subsequent expenditure is recognised as an expense in the period in which it is incurred.

162
appendixSTATUTORY ACCOUNTS
NOTeS TO THe FiNANCiAL STATeMeNTS2 suMMarY oF signiFiCant aCCounting PoLiCies (cont’d) (d) Property, plant and equipment (cont’d) depreciation is recognised from the date that the property, plant and equipment are installed and are ready for use.
depreciation on property, plant and equipment is recognised in the profit or loss on a straight-line basis over the estimated useful lives of each component of an item of property, plant and equipment as follows:
Leasehold land and buildings (excluding Lease period ranging from serviced residence properties) 30 years to 50 years Hospitality plant, machinery and improvements, furniture, fittings and equipment 1 to 10 years plant, machinery and improvements 3 to 10 years Motor vehicles 5 years Furniture, fittings and equipment 2 to 5 years
For serviced residence properties where the residual value at the end of the intended holding period is lower than the carrying amount, the difference in value is depreciated over the Group’s intended holding period. No depreciation is recognised where the residual value is higher than the carrying amount. The intended holding period (the period from the date of commencement of serviced residence operations to the date of expected strategic divestment of the properties) ranges from three to five years.
Assets under construction are stated at cost and are not depreciated. expenditure relating to assets under construction (including borrowing costs) are capitalised when incurred. depreciation will commence when the development is completed.
The assets’ residual values, useful lives and depreciation methods are reviewed at each reporting date, and adjusted if appropriate.
(e) intangible assets (i) Goodwill Acquisition on or after 1 January 2010 For business combinations on or after 1 January 2010, the Group measures goodwill as at acquisition date
based on the fair value of the consideration transferred (including the fair value of any pre-existing equity interest in the acquiree) and the recognised amount of any non-controlling interests in the acquiree, less the net recognised amount (generally fair value) of the identifiable assets acquired and liabilities assumed. When the amount is negative, a bargain purchase gain is recognised in the profit or loss. Goodwill is subsequently measured at cost less accumulated impairment losses.
Goodwill arising from the acquisition of subsidiaries is included in intangible assets. Goodwill arising from the acquisition of associates and joint ventures is presented together with interests in associates and joint ventures.
Acquisition up to 31 December 2009 prior to 1 January 2010, goodwill is measured at cost less accumulated impairment losses. Goodwill is tested
for impairment as described in note 2(j). Negative goodwill is credited to the profit or loss in the period of the acquisition.
Acquisition of non-controlling interests From 1 January 2010, acquisitions of non-controlling interests are accounted for as transactions with owners in their
capacity as owners and therefore no goodwill is recognised. previously, goodwill arising on the acquisition of non-controlling interests in a subsidiary has been recognised, and represented the excess of the cost of the additional investment over the carrying amount of the interest in the net assets acquired at the date of the transaction.
163
2 suMMarY oF signiFiCant aCCounting PoLiCies (cont’d) (e) intangible assets (cont’d) (ii) Other intangible assets Other intangible assets with finite useful lives are measured at cost less accumulated amortisation and
impairment losses. They are amortised in the profit or loss on a straight-line basis over their estimated useful lives of one to 10 years, from the date on which they are available for use.
Other intangible assets with indefinite useful lives are not amortised and are measured at cost less impairment losses.
(f) investment properties and investment properties under development investment properties are properties held either to earn rental or for capital appreciation or both. investment
properties under development are properties being constructed or developed for future use as investment properties. Certain of the Group’s investment properties acquired through interests in subsidiaries, are accounted for as acquisition of assets. investment properties and investment properties under development are initially recognised at cost, including transaction costs, and subsequently at fair value with any change therein recognised in the profit or loss. The fair value is determined based on internal valuation or independent professional valuation. independent professional valuation is obtained at least once every three years.
When an investment property or investment property under development is disposed off, the resulting gain or loss recognised in the profit or loss is the difference between the net disposal proceed and the carrying amount of the property.
(g) Financial instruments (i) Non-derivative financial assets Non-derivative financial assets comprise investments in equity and debt securities, trade and other receivables
and cash and cash equivalents.
Non-derivative financial assets are recognised initially at fair value plus, including financial assets not held at fair value through profit or loss, any directly attributable transaction costs. Subsequent to initial recognition, non-derivative financial assets are measured as described below.
A financial asset is recognised if the Group becomes a party to the contractual provisions of the financial asset. Financial assets are derecognised if the Group’s contractual rights to the cash flows from the financial assets expire or if the Group transfers the financial assets to another party without retaining control or transfers substantially all the risks and rewards of the assets. Regular way purchases and sales of financial assets are accounted for at trade date, i.e., the date that the Group commits itself to purchase or sell the asset.
Financial assets at fair value through profit or loss A financial asset is classified as fair value through profit or loss if it is held for trading or is designated as such
upon initial recognition. Financial assets are designated as fair value through profit or loss if the Group manages such investments and makes purchase and sale decisions based on their fair value. Upon initial recognition, attributable transaction costs are recognised in the profit or loss when incurred. Financial assets at fair value through profit or loss are measured at fair value, and changes therein, which takes into account any dividend income, are recognised in the profit or loss.
Available-for-sale financial assets The Group’s investments in equity securities and certain debt securities are classified as available-for-sale
financial assets. Subsequent to initial recognition, they are measured at fair value and changes therein, other than for impairment losses (see note 2(g)(v)) and foreign exchange gains and losses on available-for-sale monetary items (see note 2(c)), are recognised directly in other comprehensive income and presented in the available-for-sale reserve in equity. When an investment is derecognised, the cumulative gain or loss in other comprehensive income is reclassified to the profit or loss.
investments in equity securities whose fair value cannot be reliably measured are measured at cost less impairment loss.
164
appendixSTATUTORY ACCOUNTS
NOTeS TO THe FiNANCiAL STATeMeNTS2 suMMarY oF signiFiCant aCCounting PoLiCies (cont’d) (g) Financial instruments (cont’d) (i) Non-derivative financial assets (cont’d) Loans and receivables Loans and receivables are financial assets with fixed or determinable payments that are not quoted in an active
market. Such assets are recognised initially at fair value plus any directly attributable transaction costs. Subsequent to initial recognition, loans and receivables are measured at amortised cost using the effective interest method, less any impairment losses. Loans and receivables comprise cash and cash equivalents, and trade and other receivables.
Cash and cash equivalents Cash and cash equivalents comprise cash balances and bank deposits. For the purpose of statement of
cash flows, pledged deposits are excluded whilst bank overdrafts that are repayable on demand and form an integral part of the Group’s cash management are included as a component of cash and cash equivalents.
Non-derivative financial liabilities The Group initially recognises debt securities issued and subordinated liabilities on the date that they are
originated. Financial liabilities for contingent consideration payable in a business combination are recognised at the acquisition date. All other financial liabilities (including liabilities designated at fair value through profit or loss) are recognised initially on the trade date, which is the date that the Group becomes a party to the contractual provisions of the instrument.
The Group derecognises a financial liability when its contractual obligations are discharged, cancelled or expired.
Financial liabilities for contingent consideration payable in a business combination are initially measured at fair value. Subsequent changes in the fair value of the contingent consideration are recognised in profit or loss.
Financial assets and liabilities are offset and the net amount presented in the statement of financial position when, and only when, the Group has a legal right to offset the amounts and intends either to settle on a net basis or to realise the asset and settle the liability simultaneously.
The Group classifies non-derivative financial liabilities under the other financial liabilities category. Such financial liabilities are recognised initially at fair value plus any directly attributable transaction costs. Subsequent to initial recognition, these financial liabilities are measured at amortised cost using the effective interest rate method.
Other financial liabilities comprise loans and borrowings and trade and other payables.
(ii) Derivative financial instruments and hedging activities The Group holds derivative financial instruments to hedge its foreign currency and interest rate risk exposures.
embedded derivatives are separated from the host contract and accounted for separately if the economic characteristics and risks of the host contract and the embedded derivative are not closely related, a separate instrument with the same terms as the embedded derivative would meet the definition of a derivative, and the combined instrument is not measured at fair value through profit or loss.
On initial designation of the derivative as the hedging instrument, the Group formally documents the relationship between the hedging instrument and hedged item, including the risk management objectives and strategy in undertaking the hedge transaction and the hedged risk, together with the methods that will be used to assess the effectiveness of the hedging relationship. The Group makes an assessment, both at the inception of the hedge relationship as well as on an ongoing basis, of whether the hedging instruments are expected to be “highly effective” in offsetting the changes in the fair value or cash flows of the respective hedged items attributable to the hedged risk, and whether the actual results of each hedge are within a range of 80%-125%. For a cash flow hedge of a forecast transaction, the transaction should be highly probable to occur and should present an exposure to variations in cash flows that could ultimately affect reported profit or loss.
Derivativesarerecognisedinitiallyatfairvalue;attributabletransactioncostsarerecognisedintheprofitor loss when incurred. Subsequent to initial recognition, derivatives are measured at fair value, and changes therein are accounted for as described below.

165
2 suMMarY oF signiFiCant aCCounting PoLiCies (cont’d) (g) Financial instruments (cont’d) (ii) Derivative financial instruments and hedging activities (cont’d) Cash flow hedges Changes in the fair value of the derivative hedging instrument designated as a cash flow hedge are recognised
directly in other comprehensive income and presented in the hedging reserve in equity to the extent that the hedge is effective. Any ineffective portion of changes in the fair value of the derivative is recognised immediately in the profit or loss. if the hedging instrument no longer meets the criteria for hedge accounting, expires or is sold, terminated or exercised, hedge accounting is discontinued prospectively. if the forecast transaction is no longer expected to occur, then the balance is reclassified to profit or loss.
When the hedged item is a non-financial asset, the amount accumulated in equity is included in the carrying amount of the asset when the asset is recognised. in other cases, the amount accumulated in equity is reclassified to the profit or loss in the same period that the hedged item affects profit or loss.
Fair value hedges Changes in the fair value of a derivative hedging instrument designated as a fair value hedge are recognised
in the profit or loss. The hedged item is adjusted to reflect change in its fair value in respect of the risk being hedged, with any gain or loss being recognised in the profit or loss.
Hedge of net investment in a foreign operation in the Company’s financial statements, foreign currency differences arising from the retranslation of a financial
liability designated as a hedge of a net investment in a foreign operation are recognised in the profit or loss. On consolidation, such differences are recognised directly in other comprehensive income and presented in the foreign currency translation reserve in equity, to the extent that the hedge is effective. To the extent that the hedge is ineffective, such differences are recognised in the profit or loss. When the hedged net investment is disposed off, the cumulative amount in other comprehensive income is transferred to the profit or loss.
Separable embedded derivatives Changes in the fair value of separated embedded derivatives are recognised immediately in the profit or loss.
Other non-trading derivatives When a derivative financial instrument is not designated in a hedge relationship that qualifies for hedge accounting,
all changes in its fair value are recognised immediately in the profit or loss.
(iii) Convertible bonds Convertible bonds that can be converted into share capital where the number of shares issued does not vary
with changes in the fair value of the bonds are accounted for as compound financial instruments. The gross proceeds are allocated to the equity and liability components, with the equity component being assigned the residual amount after deducting the fair value of the liability component from the fair value of the compound financial instrument.
Subsequent to initial recognition, the liability component of convertible bonds is measured at amortised cost using the effective interest method. The equity component of convertible bonds is not re-measured. When the conversion option is exercised, its carrying amount will be transferred to the share capital. When the conversion option lapses, its carrying amount will be transferred to revenue reserve.
When a convertible bond is being repurchased before its maturity date, the purchase consideration (including directly attributable costs, net of tax effects) is allocated to the liability and equity components of the instrument at the date of transaction. Any resulting gain or loss relating to the liability component is recognised in the profit or loss.
166
appendixSTATUTORY ACCOUNTS
NOTeS TO THe FiNANCiAL STATeMeNTS2 suMMarY oF signiFiCant aCCounting PoLiCies (cont’d) (g) Financial instruments (cont’d) (iv) Financial guarantees Financial guarantee contracts are classified as financial liabilities unless the Group or the Company has previously
asserted explicitly that it regards such contracts as insurance contracts and accounted for them as such. Financial guarantees classified as financial liabilities Such financial guarantees are recognised initially at fair value and are classified as financial liabilities. Subsequent
to initial measurement, the financial guarantees are stated at the higher of the initial fair value less cumulative amortisation and the amount that would be recognised if they were accounted for as contingent liabilities. When financial guarantees are terminated before their original expiry date, the carrying amount of the financial guarantees is transferred to the profit or loss.
Financial guarantees classified as insurance contracts These financial guarantees are accounted for as insurance contracts. provision is recognised based on the
Group’s or the Company’s estimate of the ultimate cost of settling all claims incurred but unpaid at the end of the reporting period.
The provision is assessed by reviewing individual claims and tested for adequacy by comparing the amount recognised and the amount that would be required to settle the guarantee contract.
(v) Impairment of financial assets A financial asset not carried at fair value through profit or loss is assessed at each reporting period to determine
whether there is any objective evidence that it is impaired. A financial asset is impaired if objective evidence indicates that a loss event has been occurred after the initial recognition of the asset, and that the loss event had a negative effect on the estimated future cash flows of that asset that can be estimated reliably. Objective evidence that financial assets (including equity securities) are impaired can include default or delinquency by a debtor, restructuring of an amount due to the Group on terms that the Group would not consider otherwise, indications that a debtor or issuer in the Group, economic conditions that correlate with defaults or the disappearance of an active market for a security.
All individually significant financial assets are assessed for specific impairment on an individual basis. All individually significant financial assets found not to be specifically impaired are then collectively assessed for any impairment that has incurred but not yet identified. The remaining financial assets that are not individually significant are collectively assessed for impairment by grouping together such instruments with similar risk characteristics.
in assessing collective impairment, the Group uses historical trends of the probability of default, timing of recoveries and the amount of loss incurred, adjusted for management’s judgement as to whether current economic and credit conditions are such that the actual losses are likely to be greater or lesser than that suggested by historical trends.
An impairment loss in respect of a financial asset measured at amortised cost is calculated as the difference between its carrying amount, and the present value of the estimated future cash flows discounted at the original effective interest rate. Losses are recognised in the profit or loss and reflected as an allowance account against receivables. When a subsequent event causes the amount of impairment loss to decrease, the decrease in impairment loss is reversed through profit or loss.
impairment losses on available-for-sale financial assets are recognised by reclassifying the losses accumulated
in the available-for-sale reserve in equity to profit or loss. The cumulative loss that is reclassified from equity to profit or loss is the difference between the acquisition cost, net of any principal repayment and amortisation, and the current fair value, less any impairment loss recognised previously in the profit or loss. Changes in impairment provision attributable to application of the effective interest method are reflected as a component of interest income.
167
2 suMMarY oF signiFiCant aCCounting PoLiCies (cont’d) (g) Financial instruments (cont’d) (v) Impairment of financial assets (cont’d) if, in a subsequent period, the fair value of an impaired available-for-sale debt security increases and the increase
can be related objectively to an event occurring after the impairment loss was recognised in the profit or loss, then the impairment loss is reversed, with the amount of the reversal recognised in the profit or loss. However, any subsequent recovery in the fair value of an impaired available-for-sale equity security is recognised in other comprehensive income.
(h) share capital Ordinary shares are classified as equity. incremental costs directly attributable to the issue of ordinary shares and options are recognised as a deduction
from equity.
Where share capital recognised as equity is repurchased (“treasury shares”), the amount of the consideration paid, including directly attributable costs, is recognised as a deduction from equity. Repurchased shares are classified as treasury shares and are presented in reserve for own share account. Where treasury shares are subsequently reissued, sold or cancelled, the consideration received is recognised as an increase in equity, and the resulting surplus or deficit on the transaction is presented in non-distributable capital reserve.
(i) Development properties for sale development properties for sale are stated at the lower of cost plus, where appropriate (see note 2(n)), a portion
of the attributable profit, and estimated net realisable value, net of progress billings. Net realisable value represents the estimated selling price less costs to be incurred in selling the property.
The cost of properties under development comprises specifically identified costs, including acquisition costs, development expenditure, borrowing costs and other related expenditure. Borrowing costs payable on loans funding a development property are also capitalised, on a specific identification basis, as part of the cost of the development property until the completion of development.
(j) impairment of non-financial assets The carrying amounts of the Group’s non-financial assets, other than investment properties, inventories and
deferred tax assets, are reviewed at each reporting date to determine whether there is any indication of impairment. if any such indication exists, the assets’ recoverable amounts are estimated. For goodwill, the recoverable amount is estimated at each reporting date, and as and when indicators of impairment are identified, an impairment loss is recognised if the carrying amount of an asset or its related cash-generating unit (“CGU”) exceeds its estimated recoverable amount.
The recoverable amount of an asset or CGU is the greater of its value in use and its fair value less costs to sell. in assessing value in use, the estimated future cash flows are discounted to their present value using a pre-tax discount rate that reflects current market assessments of the time value of money and the risks specific to the asset or CGU. For the purpose of impairment testing, assets that cannot be tested individually are grouped together into the smallest group of assets that generate cash inflows from continuing use that are largely independent of the cash inflows of other assets or CGU. Subject to an operating segment ceiling test, for the purposes of goodwill impairment testing, CGUs to which goodwill has been allocated are aggregated so that the level at which impairment is tested reflects the lowest level at which goodwill is monitored for internal reporting purposes. Goodwill acquired in a business combination is allocated to groups of CGU that are expected to benefit from the synergies of the combination.
168
appendixSTATUTORY ACCOUNTS
NOTeS TO THe FiNANCiAL STATeMeNTS 2 suMMarY oF signiFiCant aCCounting PoLiCies (cont’d) (j) impairment of non-financial assets (cont’d) An impairment loss is recognised if the carrying amount of an asset or its CGU exceeds its estimated recoverable
amount. impairment losses are recognised in the profit or loss. impairment losses recognised in respect of CGUs are allocated first to reduce the carrying amount of any goodwill allocated to the units and then to reduce the carrying amounts of the other assets in the unit (group of units) on a pro-rata basis.
An impairment loss in respect of goodwill is not reversed. in respect of other assets, impairment losses recognised in prior periods are assessed at each reporting date for any indication that the loss has decreased or no longer exists. An impairment loss is reversed if there has been a change in the estimates used to determine the recoverable amount. An impairment loss is reversed only to the extent that the asset’s carrying amount does not exceed the carrying amount that would have been determined, net of depreciation or amortisation, if no impairment loss had been recognised.
Goodwill that forms part of the carrying amount of an investment in an associate or a joint venture is not recognised separately, and therefore is not tested for impairment separately. instead, the entire amount of the investment in an associate or a joint venture is tested for impairment as a single asset when there is objective evidence that the investment in an associate or a joint venture may be impaired.
(k) employee benefits Short term employee benefits All short term employee benefits, including accumulated compensated absences, are recognised in the period
in which the employees render their services.
A provision is recognised for the amount expected to be paid under short-term cash bonus or profit-sharing plans if the Group has a present legal or constructive obligation to pay this amount as a result of past service provided by the employee and the obligation can be estimated reliably.
Defined contribution plans Contributions to post-employment benefits under defined contribution plans are recognised as an expense in
profit or loss in the period during which the related services are rendered by employees.
Long service leave entitlement Liabilities for other employee entitlements which are not expected to be paid or settled within twelve months of
the reporting date are accrued in respect of all employees at the present value of the future amounts expected to be paid based on a projected weighted average increase in wage and salary rates. expected future payments are discounted using interest rates on relevant government securities with terms to maturity that match, as closely as possible, the estimated future cash outflows.
Share-based payments For equity-settled share-based payment transactions, the fair value of the services received is recognised as an
expense with a corresponding increase in equity over the vesting period during which the employees become unconditionally entitled to the equity instrument. The fair value of the services received is determined by reference to the fair value of the equity instrument granted at the grant date. At each reporting date, the number of equity instruments that are expected to be vested are estimated. The impact on the revision of original estimates is recognised as an expense and as a corresponding adjustment to equity over the remaining vesting period, unless the revision to original estimates is due to market conditions. No adjustment is made if the revision or actual outcome differs from the original estimate due to market conditions.

169
2 suMMarY oF signiFiCant aCCounting PoLiCies (cont’d) (k) employee benefits (cont’d) Share-based payments (cont’d) For cash-settled share-based payment transactions, the fair value of the goods or services received is recognised
as an expense with a corresponding increase in liability. The fair value of the services received is determined by reference to the fair value of the liability. Until the liability is settled, the fair value of the liability is re-measured at each reporting date and at the date of settlement, with any changes in fair value recognised for the period.
The proceeds received from the exercise of the equity instruments, net of any directly attributable transaction costs, are credited to share capital when the equity instruments are exercised.
(l) Provision A provision is recognised if, as a result of a past event, the Group has a present legal or constructive obligation
that can be estimated reliably, and it is probable that an outflow of economic benefits will be required to settle the obligation.
A provision for onerous contract is recognised when the expected benefits to be derived by the Group from a contract are lower than the unavoidable cost of meeting its obligations under the contract. The provision is measured at the present value of the lower of the expected cost of terminating the contract and the expected net cost of continuing with the contract. Before a provision is established, the Group recognises any impairment loss on the assets associated with the contract.
(m) Leases When entities within the Group are lessees of a finance lease Leased assets in which the Group assumes substantially all the risks and rewards of ownership are classified
as finance leases. Upon initial recognition, property, plant and equipment acquired through finance leases are capitalised at the lower of their fair value and the present value of the minimum lease payments. Subsequent to initial recognition, the asset is accounted for in accordance with the accounting policy applicable to that asset. Leased assets are depreciated over the shorter of the lease term and their useful lives. Lease payments are apportioned between finance expense and reduction of the lease liability. The finance expense is allocated to each period during the lease term so as to produce a constant periodic rate of interest over the remaining balance of the liability. Contingent lease payments are accounted for by revising the minimum lease payments over the remaining term of the lease when the lease adjustment is confirmed.
At inception, an arrangement that contains a lease is accounted for as such based on the terms and conditions even though the arrangement is not in the legal form of a lease.
When entities within the Group are lessees of an operating lease Where the Group has the use of assets under operating leases, payments made under the leases are recognised
in profit or loss on a straight-line basis over the term of the lease. Lease incentives received are recognised as an integral part of the total lease payments made. Contingent rentals are charged to the profit or loss in the accounting period in which they are incurred.
When entities within the Group are lessors of an operating lease Assets subject to operating leases are included in either property, plant and equipment (see note 2(d)) or
investment properties (see note 2(f)).
170
appendixSTATUTORY ACCOUNTS
NOTeS TO THe FiNANCiAL STATeMeNTS2 suMMarY oF signiFiCant aCCounting PoLiCies (cont’d) (n) revenue recognition Rental income Rental income receivable under operating leases is recognised on a straight-line basis over the term of the lease,
except where an alternative basis is more representative of the pattern of benefits to be derived from the leased asset. Lease incentives granted are recognised as an integral part of the total rental income to be received. Contingent rentals are recognised as income in the accounting period in which they are earned.
Development properties for sale The Group recognises income on property development projects when the significant risks and rewards of
ownership have been transferred to the purchasers. For development projects under progressive payment scheme in Singapore, whereby the legal terms in the sale contracts result in continuous transfer of work-in-progress to the purchasers, revenue is recognised based on the percentage of completion method. Under the percentage of completion method, profit is brought into profit or loss only in respect of sales procured and to the extent that such profit relates to the progress of construction work. The progress of construction work is measured by the proportion of the construction costs incurred to date to the estimated total construction costs for each project. For development projects under deferred payment scheme in Singapore and overseas development projects, the revenue will be recognised upon the transfer of significant risks and rewards of ownership, which generally coincides with the time the development units are delivered to the purchasers.
Revenue excludes goods and services or other sale taxes and is after deduction of any trade discounts. No revenue is recognised if there are significant uncertainties regarding recovery of the consideration due, associated costs or the possible return of unit sold.
Financial advisory and management fee Financial advisory and management fee is recognised as and when services are rendered.
Dividends dividend income is recognised on the date that the Group’s right to receive payment is established.
Interest income interest income is recognised as it accrues, using the effective interest method.
(o) Finance costs Borrowing costs are recognised using the effective interest method, except to the extent that they are capitalised
as being directly attributable to the acquisition, construction or production of an asset which necessarily takes a substantial period of time to be prepared for its intended use or sale.
(p) tax income tax expense comprises current and deferred tax. income tax expense is recognised in the profit or loss
except to the extent that it relates to a business combination, or items recognised directly in equity or in other comprehensive income.
Current tax is the expected tax payable or receivable on the taxable income or loss for the year, using tax rates enacted or substantively enacted at the reporting date, and any adjustment to tax payable in respect of previous years.
171
2 suMMarY oF signiFiCant aCCounting PoLiCies (cont’d) (p) tax (cont’d) deferred tax is recognised in respect of temporary differences between the carrying amounts of assets and liabilities
for financial reporting purposes and the amounts used for taxation purposes. deferred tax is not recognised for: • temporarydifferencesontheinitialrecognitionofassetsorliabilitiesinatransactionthatisnotabusiness
combinationandthataffectsneitheraccountingnortaxableprofitorloss; • temporarydifferencesrelatedtoinvestmentsinsubsidiaries,associatesandjointventurestotheextentthat
the Group is able to control the timing of the reversal of the temporary difference and it is probable that they willnotreverseintheforeseeablefuture;and
• taxabletemporarydifferencesarisingontheinitialrecognitionofgoodwill.
The measurement of deferred taxes reflects the tax consequences that would follow the manner in which the Group expects, at the end of the reporting period, to recover or settle the carrying amount of its assets and liabilities. deferred tax is measured at the tax rates that are expected to be applied to temporary differences when they reverse, based on the laws that have been enacted or substantively enacted by the reporting date.
deferred tax assets and liabilities are offset if there is a legally enforceable right to offset current tax liabilities and assets, and they relate to income taxes levied by the same tax authority on the same taxable entity, or on different tax entities, but they intend to settle current tax liabilities and assets on a net basis or their tax assets and liabilities will be realised simultaneously.
A deferred tax asset is recognised to the extent that it is probable that future taxable profits will be available against which temporary differences can be utilised. deferred tax assets are reviewed at each reporting date and are reduced to the extent that it is no longer probable that the related tax benefit will be realised.
in determining the amount of current and deferred tax, the Group takes into account the impact of uncertain tax positions and whether additional taxes and interest may be due. The Group believes that its accruals for tax liabilities are adequate for all open tax years based on its assessment of many factors, including interpretations of tax law and prior experience. This assessment relies on estimates and assumptions and may involve a series of judgements about future events. New information may become available that causes the Group to change its judgement regarding the adequacy of existing tax liabilities; such changes to tax liabilities will impact taxexpense in the period that such a determination is made.
(q) earnings per share The Group presents basic and diluted earnings per share (“epS”) data for its ordinary shares. Basic epS is
calculated by dividing the profit or loss attributable to owners of the Company by the weighted average number of ordinary shares outstanding during the period, adjusted for own shares held. diluted epS is determined by adjusting the profit or loss attributable to owners of the Company and the weighted average number of ordinary shares outstanding, adjusted for own shares held, for the effects of all dilutive potential ordinary shares, which comprise issued convertible bonds and share plans granted to employees.
(r) operating segments An operating segment is a component of the Group that engages in business activities from which it may
earn revenues and incur expenses, including revenues and expenses that relate to transactions with any of the Group’s other components. Operating segments are reported in a manner consistent with the internal reporting provided to the chief operating decision-maker. The chief operating decision-maker has been identified as the Council of Chief executive Officers (“CeOs”) that makes strategic resources allocation decisions. Following the re-organisation on 3 January 2013, the Council of CeOs has been renamed to executive Management Council. The Council comprises the president & Group CeO, all CeOs of business units and key management officers of the Corporate Office.
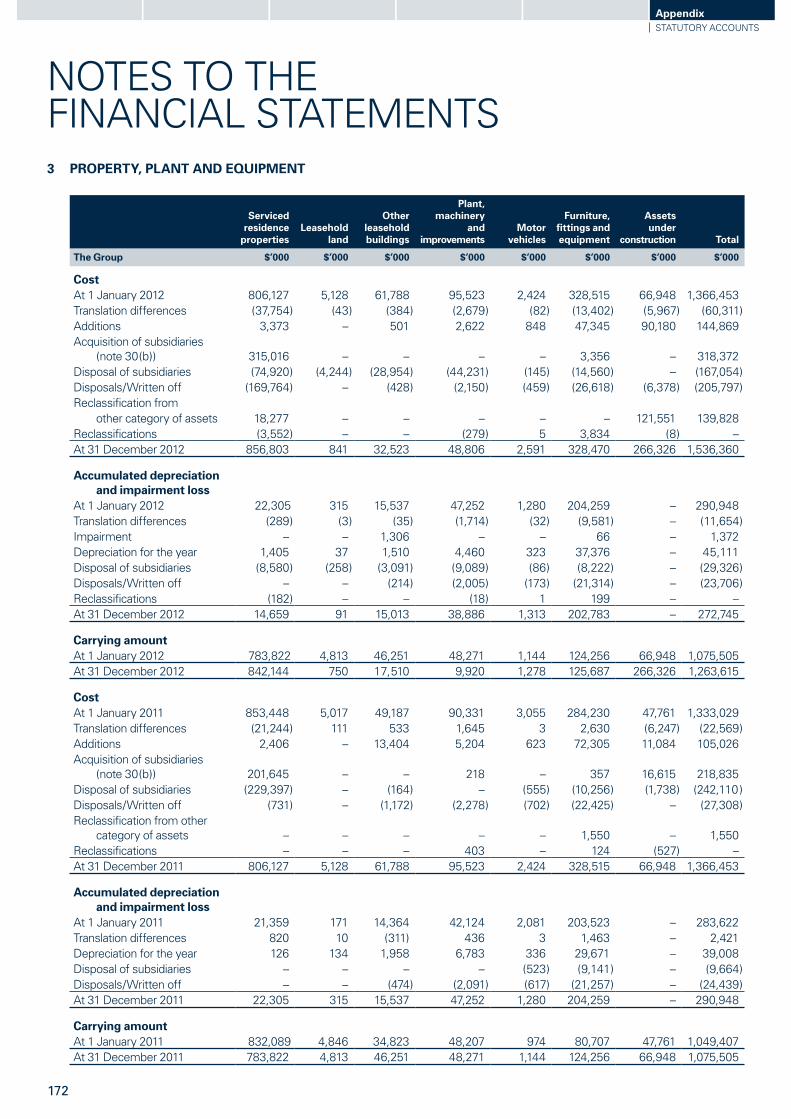
172
appendixSTATUTORY ACCOUNTS
NOTeS TO THe FiNANCiAL STATeMeNTS3 ProPertY, PLant anD equiPMent
serviced residence
propertiesLeasehold
land
other leasehold buildings
Plant, machinery
andimprovements
Motor vehicles
Furniture, fittings and equipment
assets under
construction total
the group $’000 $’000 $’000 $’000 $’000 $’000 $’000 $’000
CostAt 1 January 2012 806,127 5,128 61,788 95,523 2,424 328,515 66,948 1,366,453Translation differences (37,754) (43) (384) (2,679) (82) (13,402) (5,967) (60,311)Additions 3,373 – 501 2,622 848 47,345 90,180 144,869Acquisition of subsidiaries (note 30(b)) 315,016 – – – – 3,356 – 318,372disposal of subsidiaries (74,920) (4,244) (28,954) (44,231) (145) (14,560) – (167,054)disposals/Written off (169,764) – (428) (2,150) (459) (26,618) (6,378) (205,797)Reclassification from other category of assets 18,277 – – – – – 121,551 139,828Reclassifications (3,552) – – (279) 5 3,834 (8) –At 31 december 2012 856,803 841 32,523 48,806 2,591 328,470 266,326 1,536,360
accumulated depreciation and impairment lossAt 1 January 2012 22,305 315 15,537 47,252 1,280 204,259 – 290,948Translation differences (289) (3) (35) (1,714) (32) (9,581) – (11,654)impairment – – 1,306 – – 66 – 1,372depreciation for the year 1,405 37 1,510 4,460 323 37,376 – 45,111disposal of subsidiaries (8,580) (258) (3,091) (9,089) (86) (8,222) – (29,326)disposals/Written off – – (214) (2,005) (173) (21,314) – (23,706)Reclassifications (182) – – (18) 1 199 – –At 31 december 2012 14,659 91 15,013 38,886 1,313 202,783 – 272,745
Carrying amountAt 1 January 2012 783,822 4,813 46,251 48,271 1,144 124,256 66,948 1,075,505At 31 december 2012 842,144 750 17,510 9,920 1,278 125,687 266,326 1,263,615
CostAt 1 January 2011 853,448 5,017 49,187 90,331 3,055 284,230 47,761 1,333,029Translation differences (21,244) 111 533 1,645 3 2,630 (6,247) (22,569)Additions 2,406 – 13,404 5,204 623 72,305 11,084 105,026Acquisition of subsidiaries (note 30(b)) 201,645 – – 218 – 357 16,615 218,835disposal of subsidiaries (229,397) – (164) – (555) (10,256) (1,738) (242,110)disposals/Written off (731) – (1,172) (2,278) (702) (22,425) – (27,308)Reclassification from other category of assets – – – – – 1,550 – 1,550Reclassifications – – – 403 – 124 (527) –At 31 december 2011 806,127 5,128 61,788 95,523 2,424 328,515 66,948 1,366,453
accumulated depreciation and impairment lossAt 1 January 2011 21,359 171 14,364 42,124 2,081 203,523 – 283,622Translation differences 820 10 (311) 436 3 1,463 – 2,421depreciation for the year 126 134 1,958 6,783 336 29,671 – 39,008disposal of subsidiaries – – – – (523) (9,141) – (9,664)disposals/Written off – – (474) (2,091) (617) (21,257) – (24,439)At 31 december 2011 22,305 315 15,537 47,252 1,280 204,259 – 290,948
Carrying amountAt 1 January 2011 832,089 4,846 34,823 48,207 974 80,707 47,761 1,049,407At 31 december 2011 783,822 4,813 46,251 48,271 1,144 124,256 66,948 1,075,505
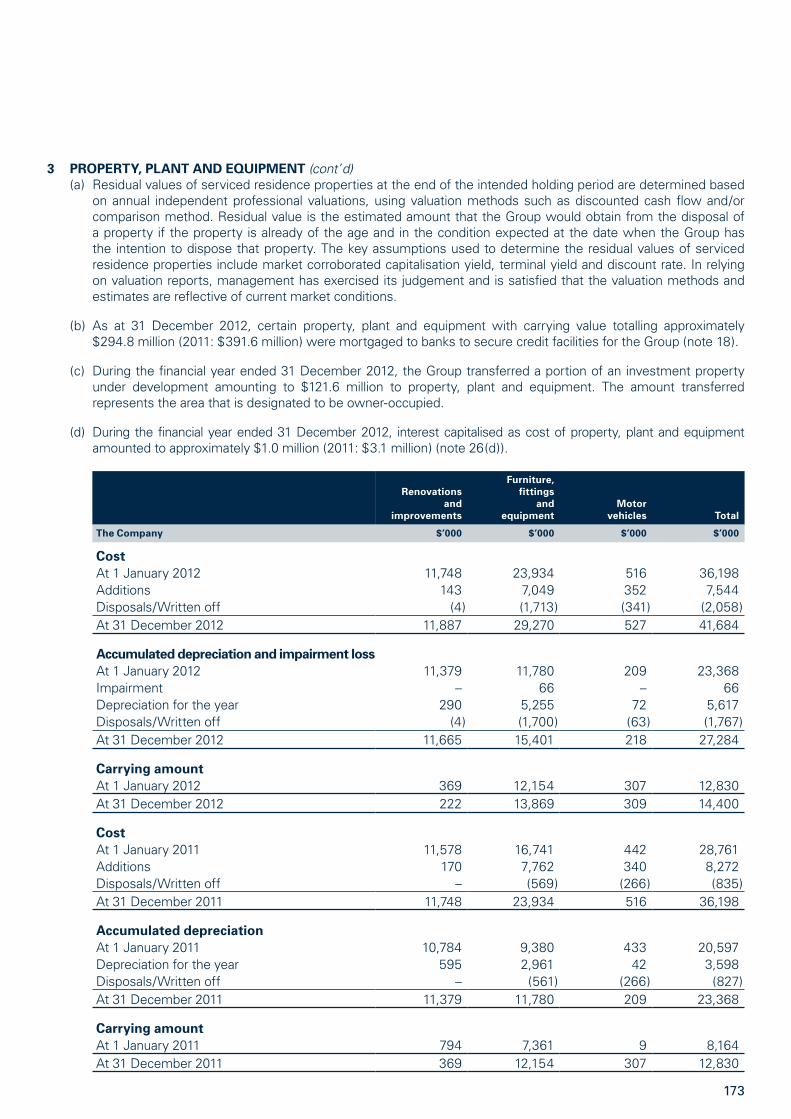
173
3 ProPertY, PLant anD equiPMent (cont’d) (a) Residual values of serviced residence properties at the end of the intended holding period are determined based
on annual independent professional valuations, using valuation methods such as discounted cash flow and/or comparison method. Residual value is the estimated amount that the Group would obtain from the disposal of a property if the property is already of the age and in the condition expected at the date when the Group has the intention to dispose that property. The key assumptions used to determine the residual values of serviced residence properties include market corroborated capitalisation yield, terminal yield and discount rate. in relying on valuation reports, management has exercised its judgement and is satisfied that the valuation methods and estimates are reflective of current market conditions.
(b) As at 31 december 2012, certain property, plant and equipment with carrying value totalling approximately
$294.8 million (2011: $391.6 million) were mortgaged to banks to secure credit facilities for the Group (note 18). (c) during the financial year ended 31 december 2012, the Group transferred a portion of an investment property
under development amounting to $121.6 million to property, plant and equipment. The amount transferred represents the area that is designated to be owner-occupied.
(d) during the financial year ended 31 december 2012, interest capitalised as cost of property, plant and equipment
amounted to approximately $1.0 million (2011: $3.1 million) (note 26(d)).
renovations
andimprovements
Furniture,fittings
andequipment
Motorvehicles total
the Company $’000 $’000 $’000 $’000
CostAt 1 January 2012 11,748 23,934 516 36,198Additions 143 7,049 352 7,544disposals/Written off (4) (1,713) (341) (2,058)At 31 december 2012 11,887 29,270 527 41,684
accumulated depreciation and impairment lossAt 1 January 2012 11,379 11,780 209 23,368impairment – 66 – 66depreciation for the year 290 5,255 72 5,617disposals/Written off (4) (1,700) (63) (1,767)At 31 december 2012 11,665 15,401 218 27,284
Carrying amountAt 1 January 2012 369 12,154 307 12,830At 31 december 2012 222 13,869 309 14,400
CostAt 1 January 2011 11,578 16,741 442 28,761Additions 170 7,762 340 8,272disposals/Written off – (569) (266) (835)At 31 december 2011 11,748 23,934 516 36,198
accumulated depreciationAt 1 January 2011 10,784 9,380 433 20,597depreciation for the year 595 2,961 42 3,598disposals/Written off – (561) (266) (827)At 31 december 2011 11,379 11,780 209 23,368
Carrying amountAt 1 January 2011 794 7,361 9 8,164At 31 december 2011 369 12,154 307 12,830

174
appendixSTATUTORY ACCOUNTS
NOTeS TO THe FiNANCiAL STATeMeNTS4 intangibLe assets
goodwill others^ total
the group note $’000 $’000 $’000
CostAt 1 January 2012 511,086 26,969 538,055Acquisition of a subsidiary 30(b) 16,919 – 16,919Additions – 1,202 1,202disposals (12,350) – (12,350)Reclassification to other category of assets – (726) (726)Translation differences (478) (468) (946)At 31 december 2012 515,177 26,977 542,154
accumulated amortisation and impairment lossAt 1 January 2012 66,161 13,172 79,333Amortisation for the year – 1,329 1,329Reversal of impairment – (73) (73)Translation differences (182) (346) (528)At 31 december 2012 65,979 14,082 80,061
Carrying amountAt 1 January 2012 444,925 13,797 458,722At 31 december 2012 449,198 12,895 462,093
CostAt 1 January 2011 511,341 26,048 537,389Acquisition of a subsidiary – 835 835Additions – 410 410disposals/Written off (492) (21) (513)Translation differences 237 (303) (66)At 31 december 2011 511,086 26,969 538,055
accumulated amortisation and impairment lossAt 1 January 2011 65,924 11,860 77,784Amortisation for the year – 1,601 1,601Translation differences 237 (289) (52)At 31 december 2011 66,161 13,172 79,333
Carrying amountAt 1 January 2011 445,417 14,188 459,605At 31 december 2011 444,925 13,797 458,722
goodwill others^ total
the Company $’000 $’000 $’000
Cost and carrying amountAt 1 January 2011, 31 december 2011 and 31 december 2012 – 147 147
^ Others comprise trademarks, franchises, patents, licences and club memberships.
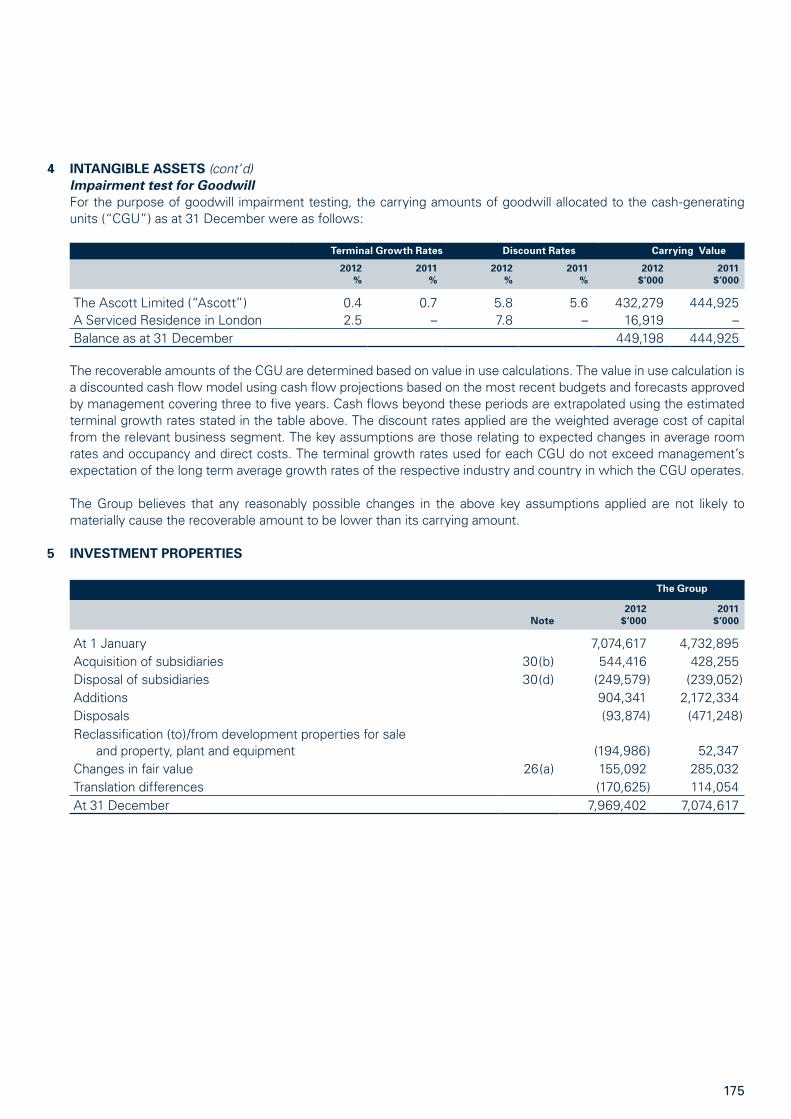
175
4 intangibLe assets (cont’d) Impairment test for Goodwill For the purpose of goodwill impairment testing, the carrying amounts of goodwill allocated to the cash-generating
units (“CGU”) as at 31 december were as follows:
terminal growth rates Discount rates Carrying value
2012 %
2011 %
2012 %
2011 %
2012 $’000
2011 $’000
The Ascott Limited (“Ascott”) 0.4 0.7 5.8 5.6 432,279 444,925A Serviced Residence in London 2.5 – 7.8 – 16,919 –Balance as at 31 december 449,198 444,925
The recoverable amounts of the CGU are determined based on value in use calculations. The value in use calculation is
a discounted cash flow model using cash flow projections based on the most recent budgets and forecasts approved by management covering three to five years. Cash flows beyond these periods are extrapolated using the estimated terminal growth rates stated in the table above. The discount rates applied are the weighted average cost of capital from the relevant business segment. The key assumptions are those relating to expected changes in average room rates and occupancy and direct costs. The terminal growth rates used for each CGU do not exceed management’s expectation of the long term average growth rates of the respective industry and country in which the CGU operates.
The Group believes that any reasonably possible changes in the above key assumptions applied are not likely to materially cause the recoverable amount to be lower than its carrying amount.
5 investMent ProPerties
the group
note2012
$‘0002011
$‘000
At 1 January 7,074,617 4,732,895Acquisition of subsidiaries 30(b) 544,416 428,255disposal of subsidiaries 30(d) (249,579) (239,052)Additions 904,341 2,172,334disposals (93,874) (471,248)Reclassification (to)/from development properties for sale and property, plant and equipment (194,986) 52,347Changes in fair value 26(a) 155,092 285,032Translation differences (170,625) 114,054At 31 december 7,969,402 7,074,617

176
appendixSTATUTORY ACCOUNTS
NOTeS TO THe FiNANCiAL STATeMeNTS5 investMent ProPerties (cont’d) (a) investment properties, which include investment properties in the course of development are stated at fair value
based on independent professional valuations or internal valuations. The fair values are based on open market values, being the estimated amount for which a property could be exchanged on the date of the valuation between a willing buyer and a willing seller in an arm’s length transaction wherein the parties had each acted knowledgeably and without compulsion. in determining the fair value, the valuers have used valuation techniques which involve certain estimates. The key assumptions used to determine the fair value of investment properties include market-corroborated capitalisation yield, terminal yield and discount rate. in relying on the valuation reports, management has exercised its judgement and is satisfied that the valuation methods and estimates are reflective of current market conditions.
The valuers have considered valuation techniques including the direct comparison method, capitalisation approach, discounted cash flows and residual method in arriving at the open market value as at the balance sheet date. The direct comparison method involves the analysis of comparable sales of similar properties and adjusting the sale prices to that reflective of the investment properties. The capitalisation approach capitalises an income stream into a present value using revenue multipliers or single-year capitalisation rates. The discounted cash flow method involves the estimation and projection of an income stream over a period and discounting the income stream with an internal rate of return to arrive at the market value. in the residual method of valuation, the total gross development costs and developer’s profit are deducted from the gross development value to arrive at the residual value of land. The gross development value is the estimated value of the property assuming satisfactory completion of the development as at the date of valuation.
(b) As at 31 december 2012, investment properties valued at $2,956.1 million (2011: $3,376.5 million) were under development.
(c) As at 31 december 2012, certain investment properties with carrying value of approximately $3,319.2 million (2011: $2,289.0 million) were mortgaged to banks to secure credit facilities for the Group (notes 18 and 19).
(d) during the financial year ended 31 december 2012, interest capitalised as cost of investment properties amounted to approximately $52.6 million (2011: $23.5 million) (note 26(d)).
(e) investment properties of the Group are held mainly for use by tenants under operating leases. Minimum lease payments receivable under non-cancellable operating leases of investment properties and not recognised in the financial statements are as follows:
the group the Company
2012$’000
2011$’000
2012$’000
2011$’000
Lease rentals receivable: Not later than 1 year 346,878 300,985 – – Between 1 and 5 years 1,096,018 1,030,601 – – After 5 years 638,301 491,466 – –
2,081,197 1,823,052 – – (f) Contingent rents, representing income based on sales turnover achieved by tenants, amounted to $5.7 million for
the year (2011: $3.5 million).
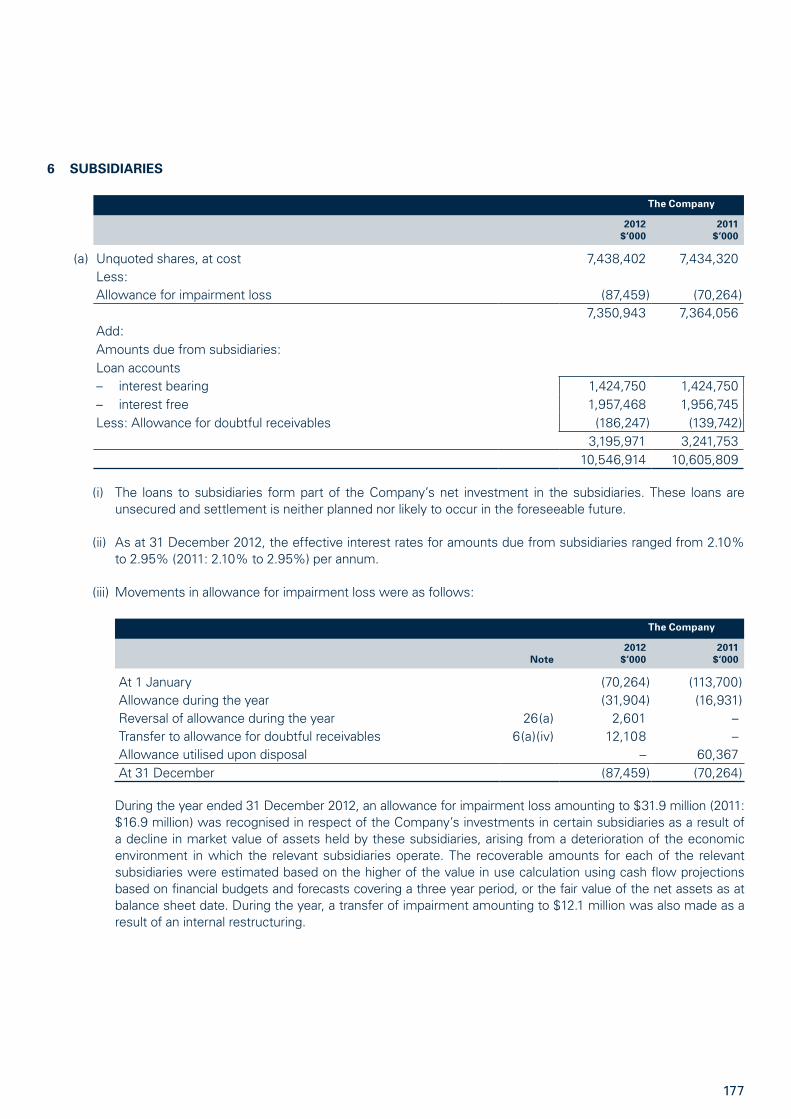
177
6 subsiDiaries
the Company
2012$‘000
2011$‘000
(a) Unquoted shares, at cost 7,438,402 7,434,320 Less: Allowance for impairment loss (87,459) (70,264)
7,350,943 7,364,056 Add: Amounts due from subsidiaries: Loan accounts – interest bearing 1,424,750 1,424,750 – interest free 1,957,468 1,956,745 Less: Allowance for doubtful receivables (186,247) (139,742)
3,195,971 3,241,75310,546,914 10,605,809
(i) The loans to subsidiaries form part of the Company’s net investment in the subsidiaries. These loans are unsecured and settlement is neither planned nor likely to occur in the foreseeable future.
(ii) As at 31 december 2012, the effective interest rates for amounts due from subsidiaries ranged from 2.10% to 2.95% (2011: 2.10% to 2.95%) per annum.
(iii) Movements in allowance for impairment loss were as follows:
the Company
note2012
$‘0002011
$‘000
At 1 January (70,264) (113,700)Allowance during the year (31,904) (16,931)Reversal of allowance during the year 26(a) 2,601 –Transfer to allowance for doubtful receivables 6(a)(iv) 12,108 –Allowance utilised upon disposal – 60,367At 31 december (87,459) (70,264)
during the year ended 31 december 2012, an allowance for impairment loss amounting to $31.9 million (2011:
$16.9 million) was recognised in respect of the Company’s investments in certain subsidiaries as a result of a decline in market value of assets held by these subsidiaries, arising from a deterioration of the economic environment in which the relevant subsidiaries operate. The recoverable amounts for each of the relevant subsidiaries were estimated based on the higher of the value in use calculation using cash flow projections based on financial budgets and forecasts covering a three year period, or the fair value of the net assets as at balance sheet date. during the year, a transfer of impairment amounting to $12.1 million was also made as a result of an internal restructuring.
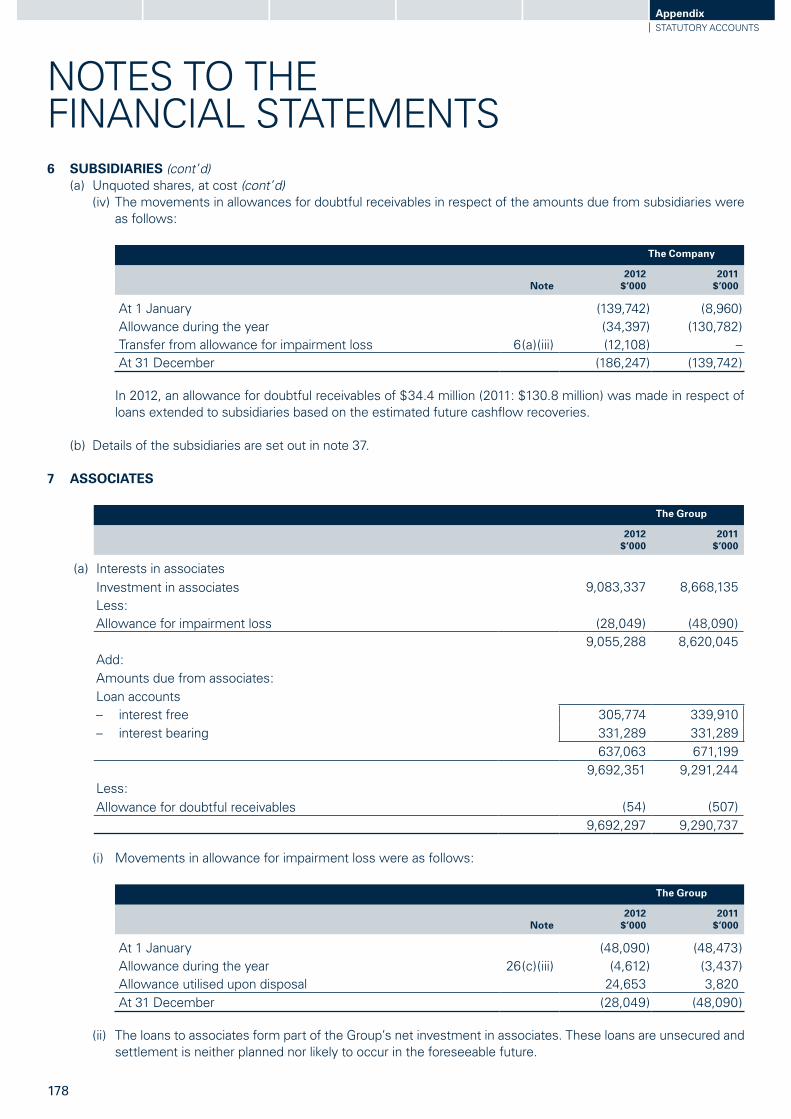
178
appendixSTATUTORY ACCOUNTS
NOTeS TO THe FiNANCiAL STATeMeNTS6 subsiDiaries (cont’d) (a) Unquoted shares, at cost (cont’d) (iv) The movements in allowances for doubtful receivables in respect of the amounts due from subsidiaries were
as follows:
the Company
note2012
$‘0002011
$‘000
At 1 January (139,742) (8,960)Allowance during the year (34,397) (130,782)Transfer from allowance for impairment loss 6(a)(iii) (12,108) –At 31 december (186,247) (139,742)
in 2012, an allowance for doubtful receivables of $34.4 million (2011: $130.8 million) was made in respect of loans extended to subsidiaries based on the estimated future cashflow recoveries.
(b) details of the subsidiaries are set out in note 37.
7 assoCiates
the group
2012$‘000
2011$‘000
(a) interests in associates investment in associates 9,083,337 8,668,135 Less: Allowance for impairment loss (28,049) (48,090)
9,055,288 8,620,045 Add: Amounts due from associates: Loan accounts – interest free 305,774 339,910 – interest bearing 331,289 331,289
637,063 671,1999,692,351 9,291,244
Less: Allowance for doubtful receivables (54) (507)
9,692,297 9,290,737
(i) Movements in allowance for impairment loss were as follows:
the group
note2012
$‘0002011
$‘000
At 1 January (48,090) (48,473)Allowance during the year 26(c)(iii) (4,612) (3,437)Allowance utilised upon disposal 24,653 3,820At 31 december (28,049) (48,090)
(ii) The loans to associates form part of the Group’s net investment in associates. These loans are unsecured and
settlement is neither planned nor likely to occur in the foreseeable future.
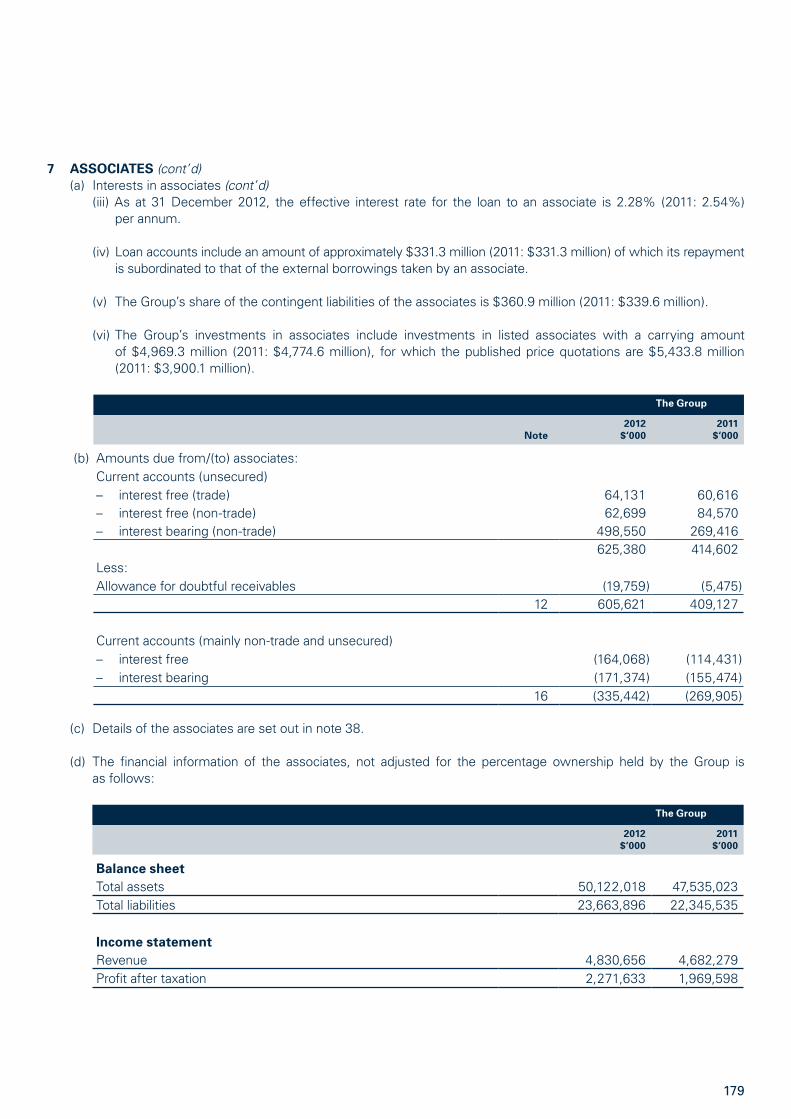
179
7 assoCiates (cont’d) (a) interests in associates (cont’d) (iii) As at 31 december 2012, the effective interest rate for the loan to an associate is 2.28% (2011: 2.54%)
per annum.
(iv) Loan accounts include an amount of approximately $331.3 million (2011: $331.3 million) of which its repayment is subordinated to that of the external borrowings taken by an associate.
(v) The Group’s share of the contingent liabilities of the associates is $360.9 million (2011: $339.6 million).
(vi) The Group’s investments in associates include investments in listed associates with a carrying amount of $4,969.3 million (2011: $4,774.6 million), for which the published price quotations are $5,433.8 million (2011: $3,900.1 million).
the group
note2012
$‘0002011
$‘000
(b) Amounts due from/(to) associates: Current accounts (unsecured) – interest free (trade) 64,131 60,616 – interest free (non-trade) 62,699 84,570 – interest bearing (non-trade) 498,550 269,416
625,380 414,602 Less: Allowance for doubtful receivables (19,759) (5,475)
12 605,621 409,127
Current accounts (mainly non-trade and unsecured) – interest free (164,068) (114,431) – interest bearing (171,374) (155,474)
16 (335,442) (269,905) (c) details of the associates are set out in note 38.
(d) The financial information of the associates, not adjusted for the percentage ownership held by the Group is as follows:
the group
2012$‘000
2011$‘000
balance sheetTotal assets 50,122,018 47,535,023Total liabilities 23,663,896 22,345,535
income statementRevenue 4,830,656 4,682,279profit after taxation 2,271,633 1,969,598
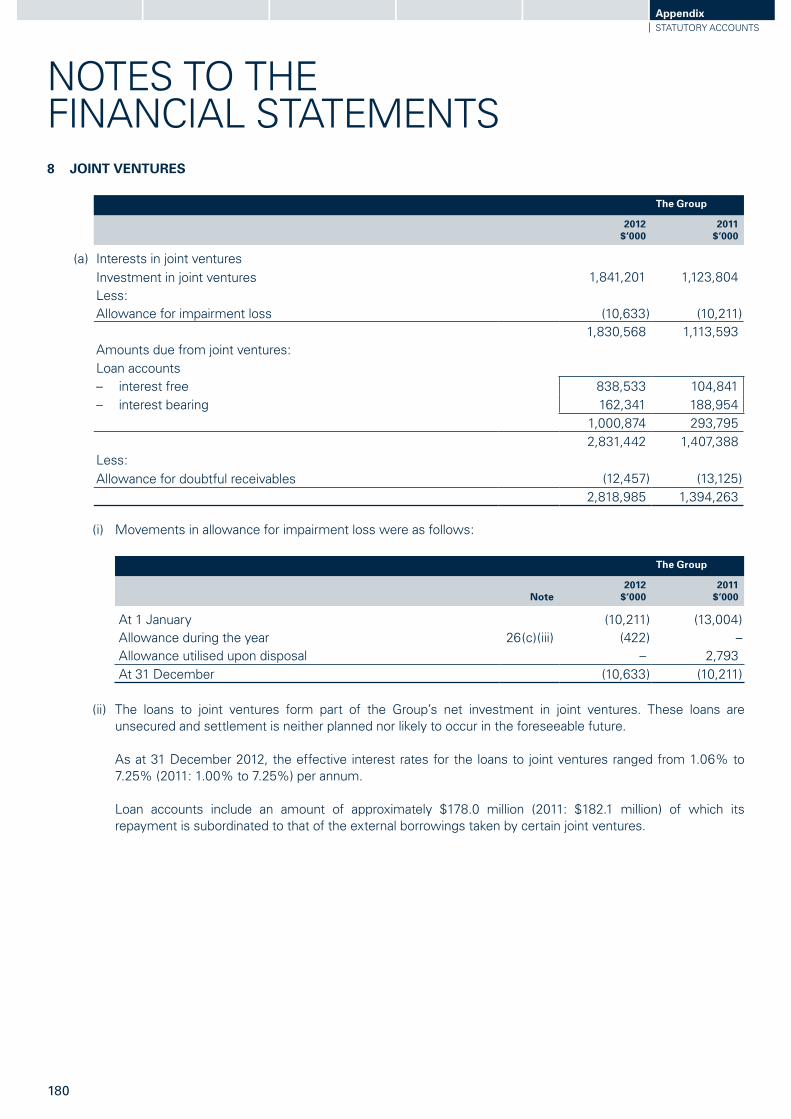
180
appendixSTATUTORY ACCOUNTS
NOTeS TO THe FiNANCiAL STATeMeNTS8 Joint ventures
the group
2012$‘000
2011$‘000
(a) interests in joint ventures investment in joint ventures 1,841,201 1,123,804 Less: Allowance for impairment loss (10,633) (10,211)
1,830,568 1,113,593 Amounts due from joint ventures: Loan accounts – interest free 838,533 104,841 – interest bearing 162,341 188,954
1,000,874 293,7952,831,442 1,407,388
Less: Allowance for doubtful receivables (12,457) (13,125)
2,818,985 1,394,263
(i) Movements in allowance for impairment loss were as follows:
the group
note2012
$‘0002011
$‘000
At 1 January (10,211) (13,004)Allowance during the year 26(c)(iii) (422) –Allowance utilised upon disposal – 2,793At 31 december (10,633) (10,211)
(ii) The loans to joint ventures form part of the Group’s net investment in joint ventures. These loans are unsecured and settlement is neither planned nor likely to occur in the foreseeable future.
As at 31 december 2012, the effective interest rates for the loans to joint ventures ranged from 1.06% to 7.25% (2011: 1.00% to 7.25%) per annum.
Loan accounts include an amount of approximately $178.0 million (2011: $182.1 million) of which its
repayment is subordinated to that of the external borrowings taken by certain joint ventures.
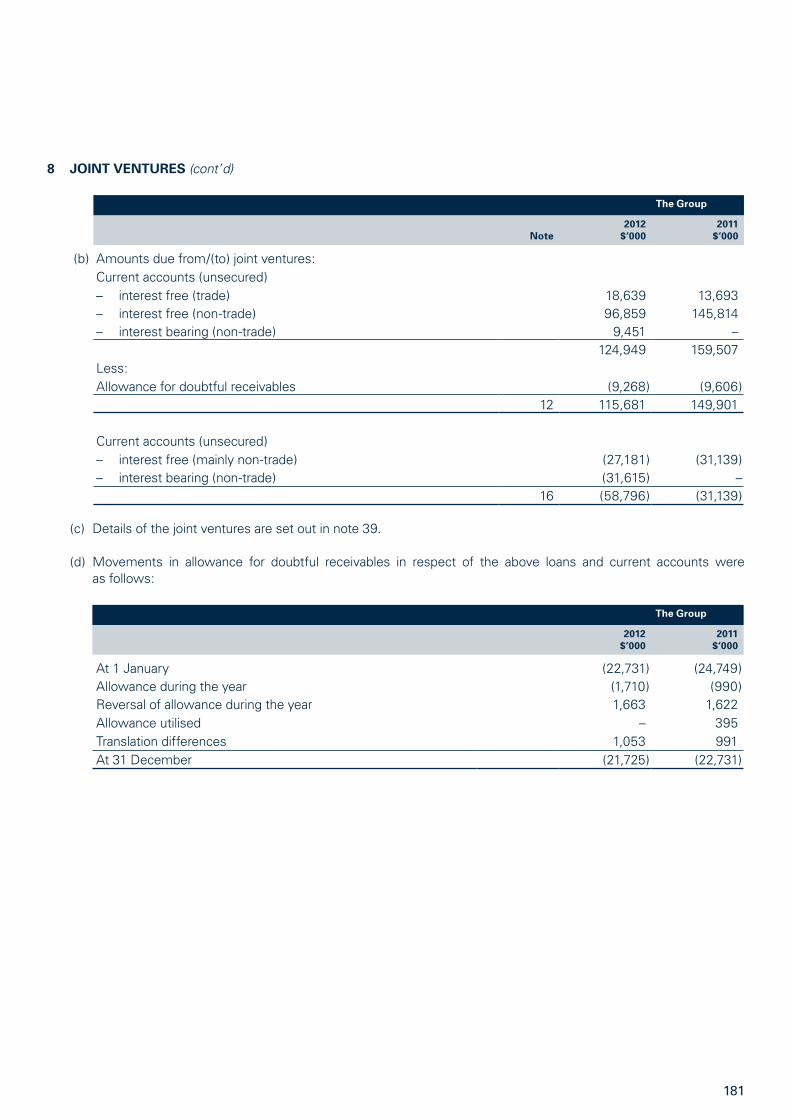
181
8 Joint ventures (cont’d)
the group
note2012
$‘0002011
$‘000
(b) Amounts due from/(to) joint ventures: Current accounts (unsecured) – interest free (trade) 18,639 13,693 – interest free (non-trade) 96,859 145,814 – interest bearing (non-trade) 9,451 –
124,949 159,507 Less: Allowance for doubtful receivables (9,268) (9,606)
12 115,681 149,901
Current accounts (unsecured) – interest free (mainly non-trade) (27,181) (31,139) – interest bearing (non-trade) (31,615) –
16 (58,796) (31,139)
(c) details of the joint ventures are set out in note 39.
(d) Movements in allowance for doubtful receivables in respect of the above loans and current accounts were as follows:
the group
2012$‘000
2011$‘000
At 1 January (22,731) (24,749)Allowance during the year (1,710) (990)Reversal of allowance during the year 1,663 1,622Allowance utilised – 395Translation differences 1,053 991At 31 december (21,725) (22,731)
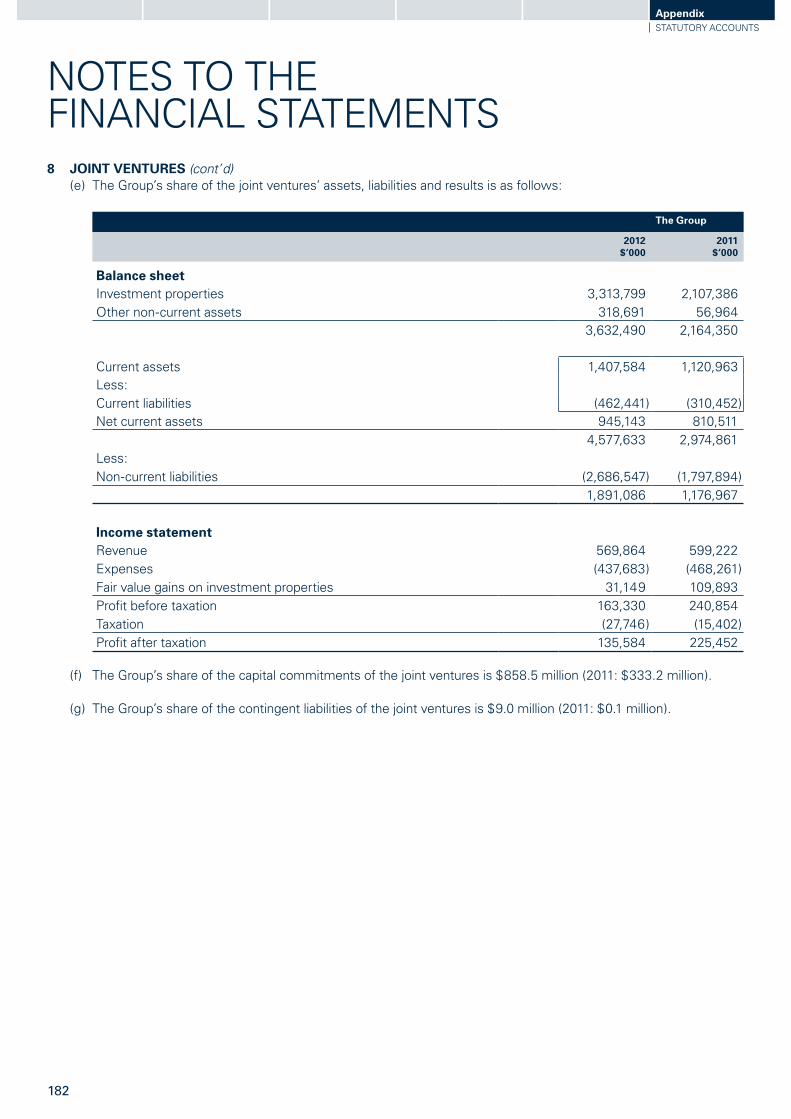
182
appendixSTATUTORY ACCOUNTS
NOTeS TO THe FiNANCiAL STATeMeNTS8 Joint ventures (cont’d) (e) The Group’s share of the joint ventures’ assets, liabilities and results is as follows:
the group
2012$‘000
2011$‘000
balance sheetinvestment properties 3,313,799 2,107,386Other non-current assets 318,691 56,964
3,632,490 2,164,350
Current assets 1,407,584 1,120,963Less:Current liabilities (462,441) (310,452)Net current assets 945,143 810,511
4,577,633 2,974,861Less:Non-current liabilities (2,686,547) (1,797,894)
1,891,086 1,176,967
income statementRevenue 569,864 599,222expenses (437,683) (468,261)Fair value gains on investment properties 31,149 109,893profit before taxation 163,330 240,854Taxation (27,746) (15,402)profit after taxation 135,584 225,452
(f) The Group’s share of the capital commitments of the joint ventures is $858.5 million (2011: $333.2 million).
(g) The Group’s share of the contingent liabilities of the joint ventures is $9.0 million (2011: $0.1 million).
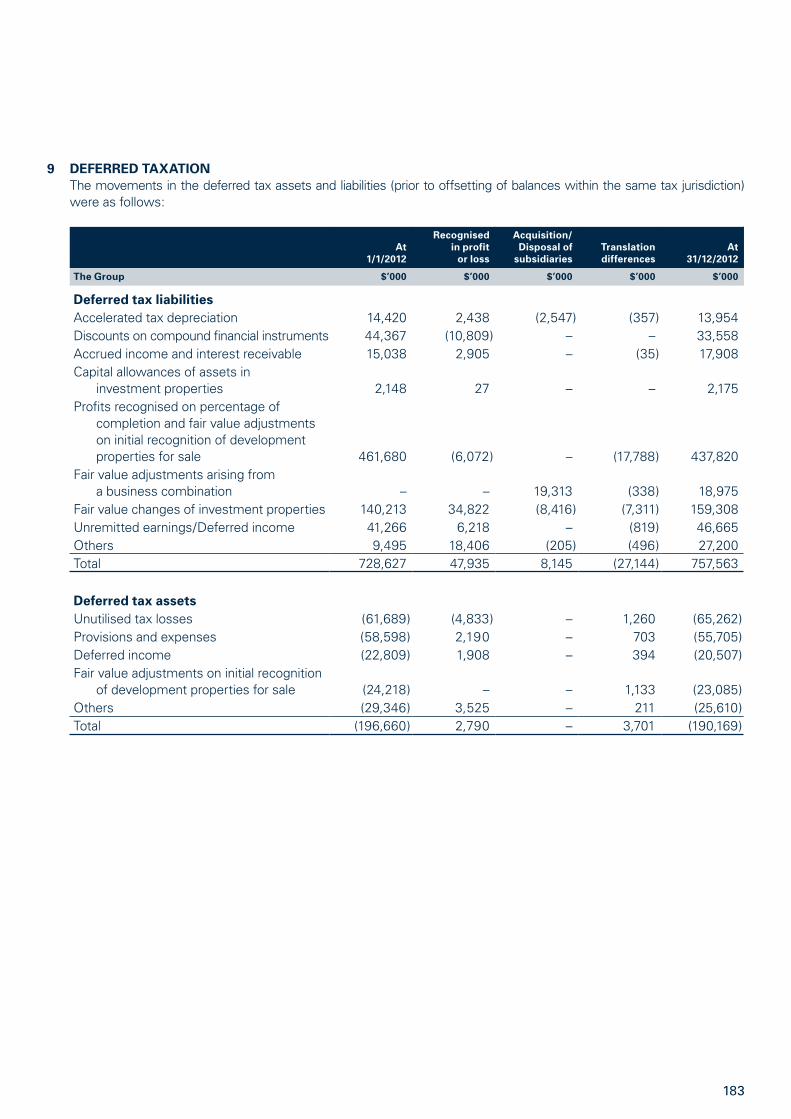
183
9 DeFerreD taxation The movements in the deferred tax assets and liabilities (prior to offsetting of balances within the same tax jurisdiction)
were as follows:
at1/1/2012
recognised in profit
or loss
acquisition/Disposal of
subsidiariestranslation differences
at 31/12/2012
the group $’000 $’000 $’000 $’000 $’000
Deferred tax liabilitiesAccelerated tax depreciation 14,420 2,438 (2,547) (357) 13,954discounts on compound financial instruments 44,367 (10,809) – – 33,558Accrued income and interest receivable 15,038 2,905 – (35) 17,908Capital allowances of assets in investment properties 2,148 27 – – 2,175profits recognised on percentage of completion and fair value adjustments on initial recognition of development properties for sale 461,680 (6,072) – (17,788) 437,820Fair value adjustments arising from a business combination – – 19,313 (338) 18,975Fair value changes of investment properties 140,213 34,822 (8,416) (7,311) 159,308Unremitted earnings/deferred income 41,266 6,218 – (819) 46,665Others 9,495 18,406 (205) (496) 27,200Total 728,627 47,935 8,145 (27,144) 757,563
Deferred tax assetsUnutilised tax losses (61,689) (4,833) – 1,260 (65,262)provisions and expenses (58,598) 2,190 – 703 (55,705)deferred income (22,809) 1,908 – 394 (20,507)Fair value adjustments on initial recognition of development properties for sale (24,218) – – 1,133 (23,085)Others (29,346) 3,525 – 211 (25,610)Total (196,660) 2,790 – 3,701 (190,169)
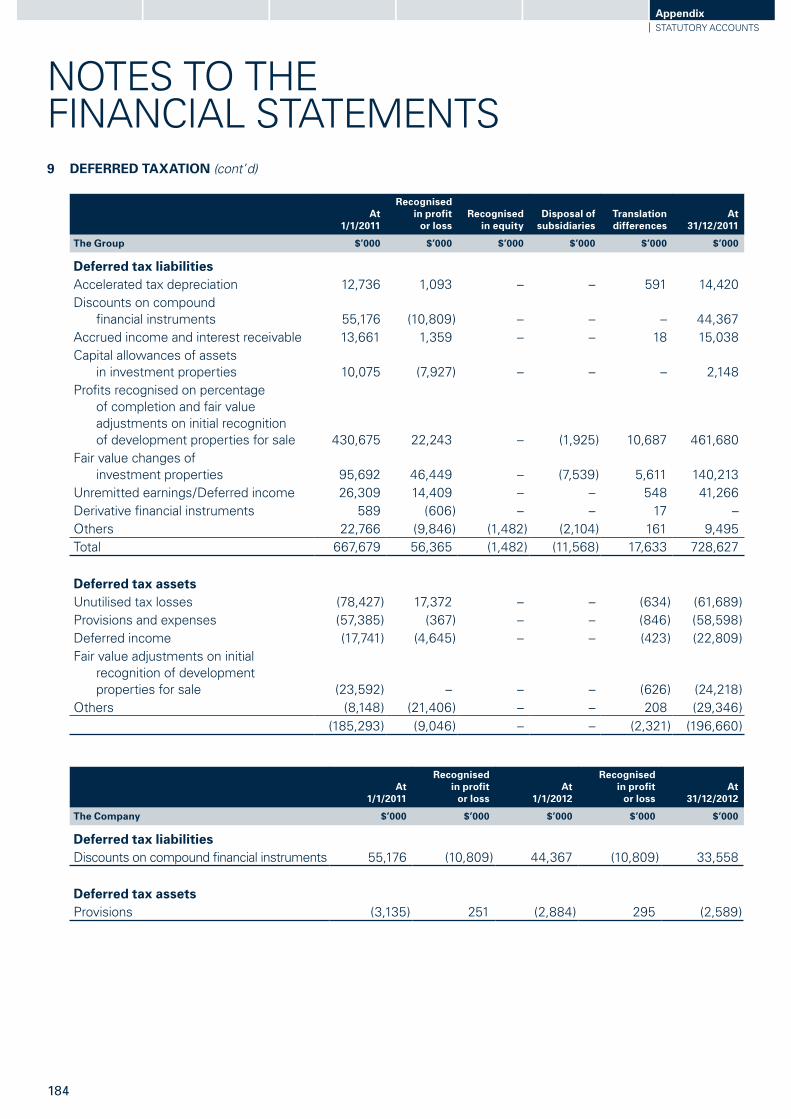
184
appendixSTATUTORY ACCOUNTS
NOTeS TO THe FiNANCiAL STATeMeNTS9 DeFerreD taxation (cont’d)
at1/1/2011
recognised in profit
or lossrecognised
in equityDisposal of
subsidiariestranslation differences
at 31/12/2011
the group $’000 $’000 $’000 $’000 $’000 $’000
Deferred tax liabilitiesAccelerated tax depreciation 12,736 1,093 – – 591 14,420discounts on compound financial instruments 55,176 (10,809) – – – 44,367Accrued income and interest receivable 13,661 1,359 – – 18 15,038Capital allowances of assets in investment properties 10,075 (7,927) – – – 2,148profits recognised on percentage of completion and fair value adjustments on initial recognition of development properties for sale 430,675 22,243 – (1,925) 10,687 461,680Fair value changes of investment properties 95,692 46,449 – (7,539) 5,611 140,213Unremitted earnings/deferred income 26,309 14,409 – – 548 41,266derivative financial instruments 589 (606) – – 17 –Others 22,766 (9,846) (1,482) (2,104) 161 9,495Total 667,679 56,365 (1,482) (11,568) 17,633 728,627
Deferred tax assetsUnutilised tax losses (78,427) 17,372 – – (634) (61,689)provisions and expenses (57,385) (367) – – (846) (58,598)deferred income (17,741) (4,645) – – (423) (22,809)Fair value adjustments on initial recognition of development properties for sale (23,592) – – – (626) (24,218)Others (8,148) (21,406) – – 208 (29,346)
(185,293) (9,046) – – (2,321) (196,660)
at1/1/2011
recognised in profit
or lossat
1/1/2012
recognised in profit
or lossat
31/12/2012
the Company $’000 $’000 $’000 $’000 $’000
Deferred tax liabilitiesdiscounts on compound financial instruments 55,176 (10,809) 44,367 (10,809) 33,558
Deferred tax assetsprovisions (3,135) 251 (2,884) 295 (2,589)
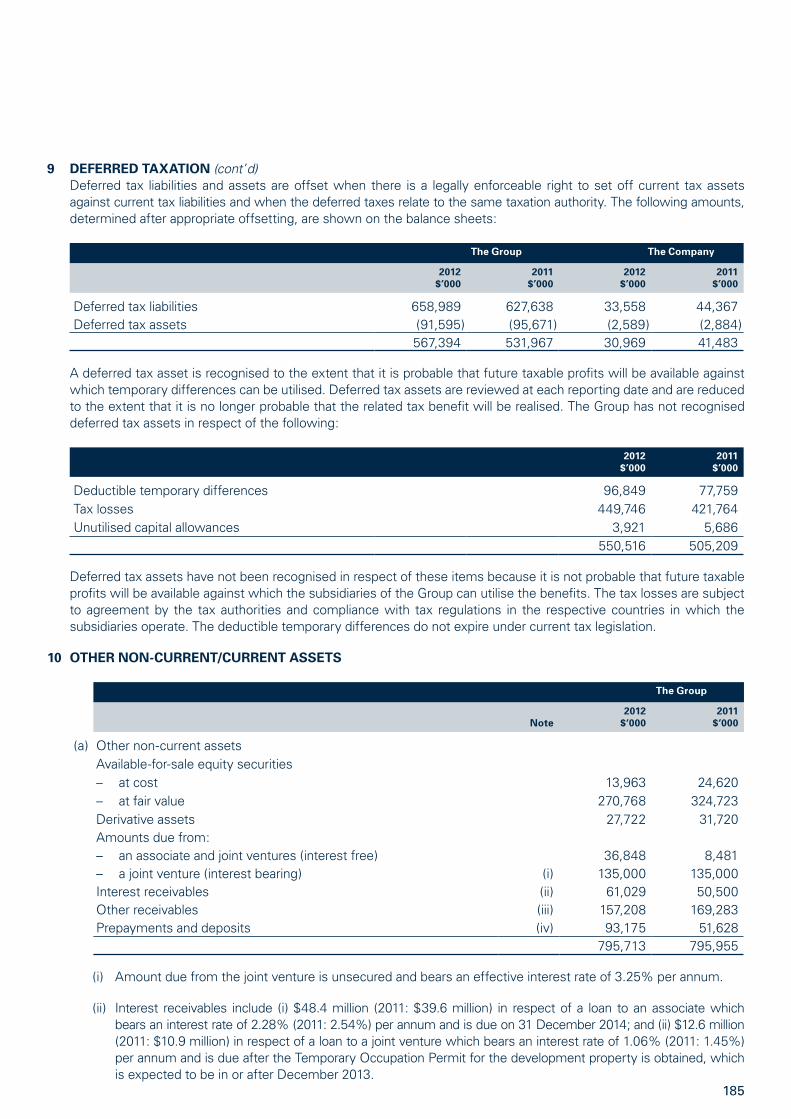
185
9 DeFerreD taxation (cont’d) deferred tax liabilities and assets are offset when there is a legally enforceable right to set off current tax assets
against current tax liabilities and when the deferred taxes relate to the same taxation authority. The following amounts, determined after appropriate offsetting, are shown on the balance sheets:
the group the Company
2012$’000
2011$’000
2012$’000
2011$’000
deferred tax liabilities 658,989 627,638 33,558 44,367deferred tax assets (91,595) (95,671) (2,589) (2,884)
567,394 531,967 30,969 41,483
A deferred tax asset is recognised to the extent that it is probable that future taxable profits will be available against which temporary differences can be utilised. deferred tax assets are reviewed at each reporting date and are reduced to the extent that it is no longer probable that the related tax benefit will be realised. The Group has not recognised deferred tax assets in respect of the following:
2012$’000
2011$’000
deductible temporary differences 96,849 77,759Tax losses 449,746 421,764Unutilised capital allowances 3,921 5,686
550,516 505,209
deferred tax assets have not been recognised in respect of these items because it is not probable that future taxable profits will be available against which the subsidiaries of the Group can utilise the benefits. The tax losses are subject to agreement by the tax authorities and compliance with tax regulations in the respective countries in which the subsidiaries operate. The deductible temporary differences do not expire under current tax legislation.
10 other non-Current/Current assets
the group
note2012
$‘0002011
$‘000
(a) Other non-current assets Available-for-sale equity securities – at cost 13,963 24,620 – at fair value 270,768 324,723 derivative assets 27,722 31,720 Amounts due from: – an associate and joint ventures (interest free) 36,848 8,481 – a joint venture (interest bearing) (i) 135,000 135,000 interest receivables (ii) 61,029 50,500 Other receivables (iii) 157,208 169,283 prepayments and deposits (iv) 93,175 51,628
795,713 795,955
(i) Amount due from the joint venture is unsecured and bears an effective interest rate of 3.25% per annum.
(ii) interest receivables include (i) $48.4 million (2011: $39.6 million) in respect of a loan to an associate which bearsaninterestrateof2.28%(2011:2.54%)perannumandisdueon31December2014;and(ii)$12.6million (2011: $10.9 million) in respect of a loan to a joint venture which bears an interest rate of 1.06% (2011: 1.45%) per annum and is due after the Temporary Occupation permit for the development property is obtained, which is expected to be in or after december 2013.
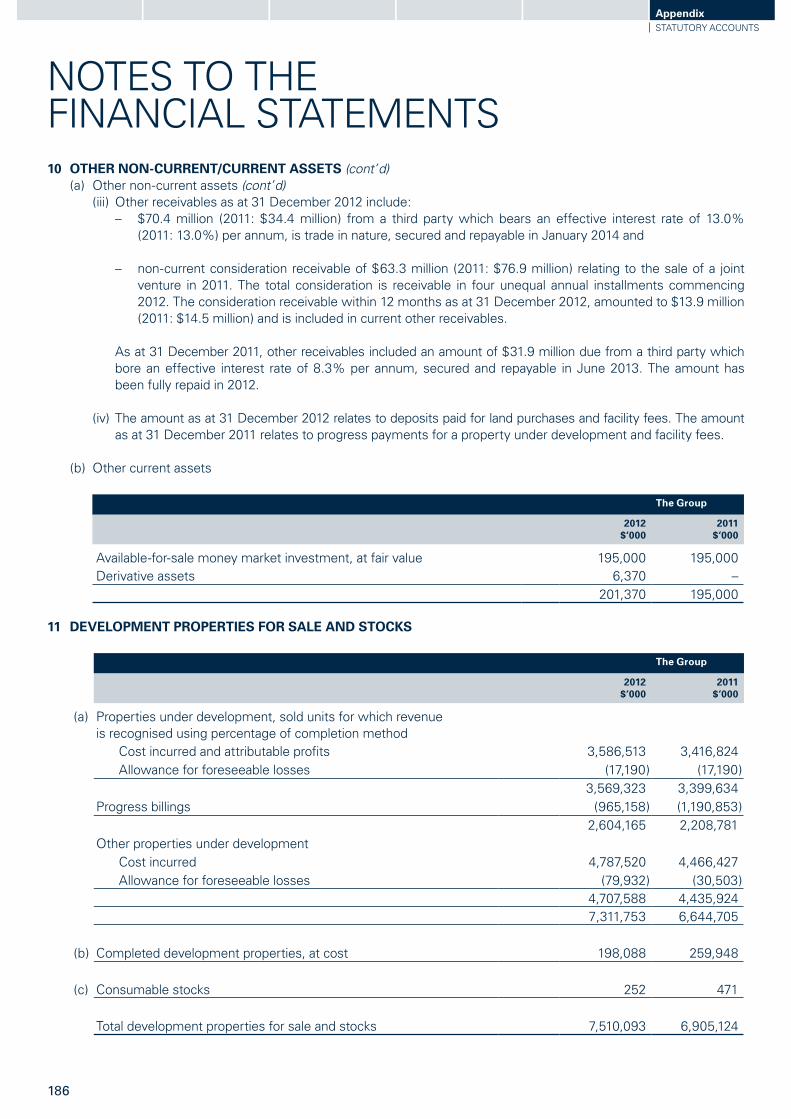
186
appendixSTATUTORY ACCOUNTS
NOTeS TO THe FiNANCiAL STATeMeNTS10 other non-Current/Current assets (cont’d) (a) Other non-current assets (cont’d) (iii) Other receivables as at 31 december 2012 include: – $70.4 million (2011: $34.4 million) from a third party which bears an effective interest rate of 13.0%
(2011: 13.0%) per annum, is trade in nature, secured and repayable in January 2014 and
– non-current consideration receivable of $63.3 million (2011: $76.9 million) relating to the sale of a joint venture in 2011. The total consideration is receivable in four unequal annual installments commencing 2012. The consideration receivable within 12 months as at 31 december 2012, amounted to $13.9 million (2011: $14.5 million) and is included in current other receivables.
As at 31 december 2011, other receivables included an amount of $31.9 million due from a third party which bore an effective interest rate of 8.3% per annum, secured and repayable in June 2013. The amount has been fully repaid in 2012.
(iv) The amount as at 31 december 2012 relates to deposits paid for land purchases and facility fees. The amount as at 31 december 2011 relates to progress payments for a property under development and facility fees.
(b) Other current assets
the group
2012$‘000
2011$‘000
Available-for-sale money market investment, at fair value 195,000 195,000derivative assets 6,370 –
201,370 195,000 11 DeveLoPMent ProPerties For saLe anD stoCKs
the group
2012$‘000
2011$‘000
(a) properties under development, sold units for which revenue is recognised using percentage of completion method Cost incurred and attributable profits 3,586,513 3,416,824 Allowance for foreseeable losses (17,190) (17,190)
3,569,323 3,399,634 progress billings (965,158) (1,190,853)
2,604,165 2,208,781 Other properties under development Cost incurred 4,787,520 4,466,427 Allowance for foreseeable losses (79,932) (30,503)
4,707,588 4,435,9247,311,753 6,644,705
(b) Completed development properties, at cost 198,088 259,948
(c) Consumable stocks 252 471
Total development properties for sale and stocks 7,510,093 6,905,124
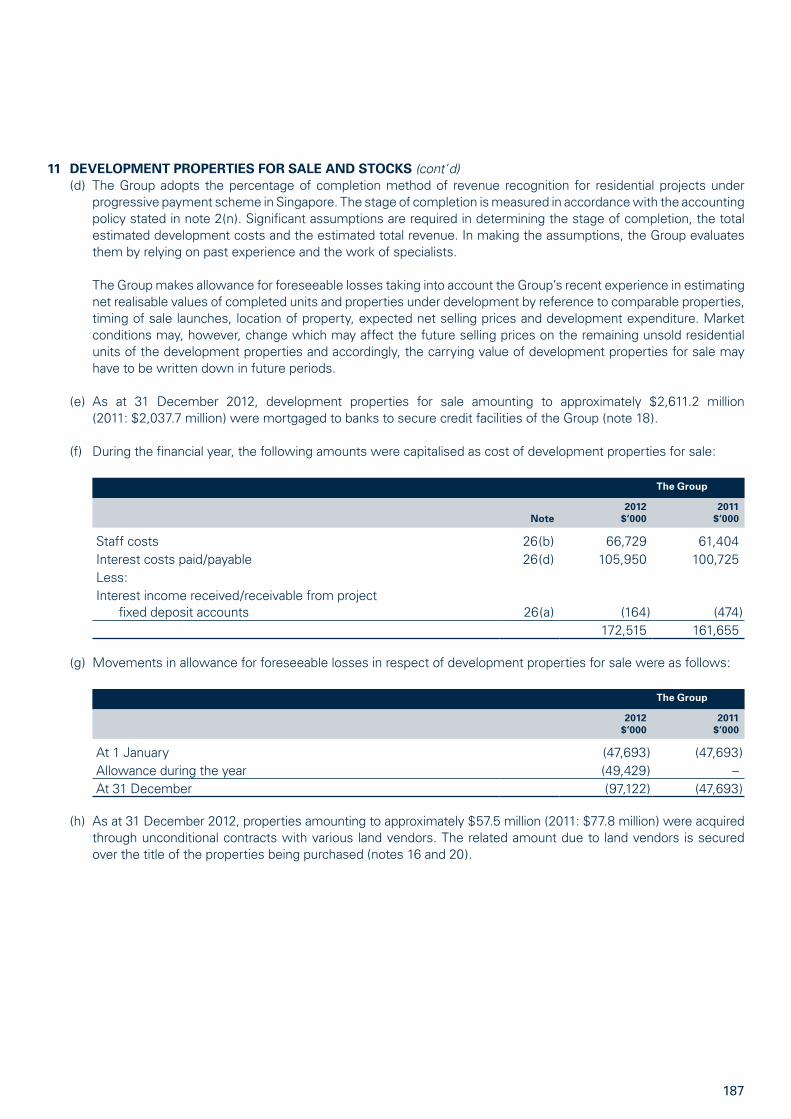
187
11 DeveLoPMent ProPerties For saLe anD stoCKs (cont’d) (d) The Group adopts the percentage of completion method of revenue recognition for residential projects under
progressive payment scheme in Singapore. The stage of completion is measured in accordance with the accounting policy stated in note 2(n). Significant assumptions are required in determining the stage of completion, the total estimated development costs and the estimated total revenue. in making the assumptions, the Group evaluates them by relying on past experience and the work of specialists.
The Group makes allowance for foreseeable losses taking into account the Group’s recent experience in estimating net realisable values of completed units and properties under development by reference to comparable properties, timing of sale launches, location of property, expected net selling prices and development expenditure. Market conditions may, however, change which may affect the future selling prices on the remaining unsold residential units of the development properties and accordingly, the carrying value of development properties for sale may have to be written down in future periods.
(e) As at 31 december 2012, development properties for sale amounting to approximately $2,611.2 million (2011: $2,037.7 million) were mortgaged to banks to secure credit facilities of the Group (note 18).
(f) during the financial year, the following amounts were capitalised as cost of development properties for sale:
the group
note2012
$‘0002011
$‘000
Staff costs 26(b) 66,729 61,404interest costs paid/payable 26(d) 105,950 100,725Less:interest income received/receivable from project fixed deposit accounts 26(a) (164) (474)
172,515 161,655
(g) Movements in allowance for foreseeable losses in respect of development properties for sale were as follows:
the group
2012$‘000
2011$‘000
At 1 January (47,693) (47,693)Allowance during the year (49,429) –At 31 december (97,122) (47,693)
(h) As at 31 december 2012, properties amounting to approximately $57.5 million (2011: $77.8 million) were acquired through unconditional contracts with various land vendors. The related amount due to land vendors is secured over the title of the properties being purchased (notes 16 and 20).
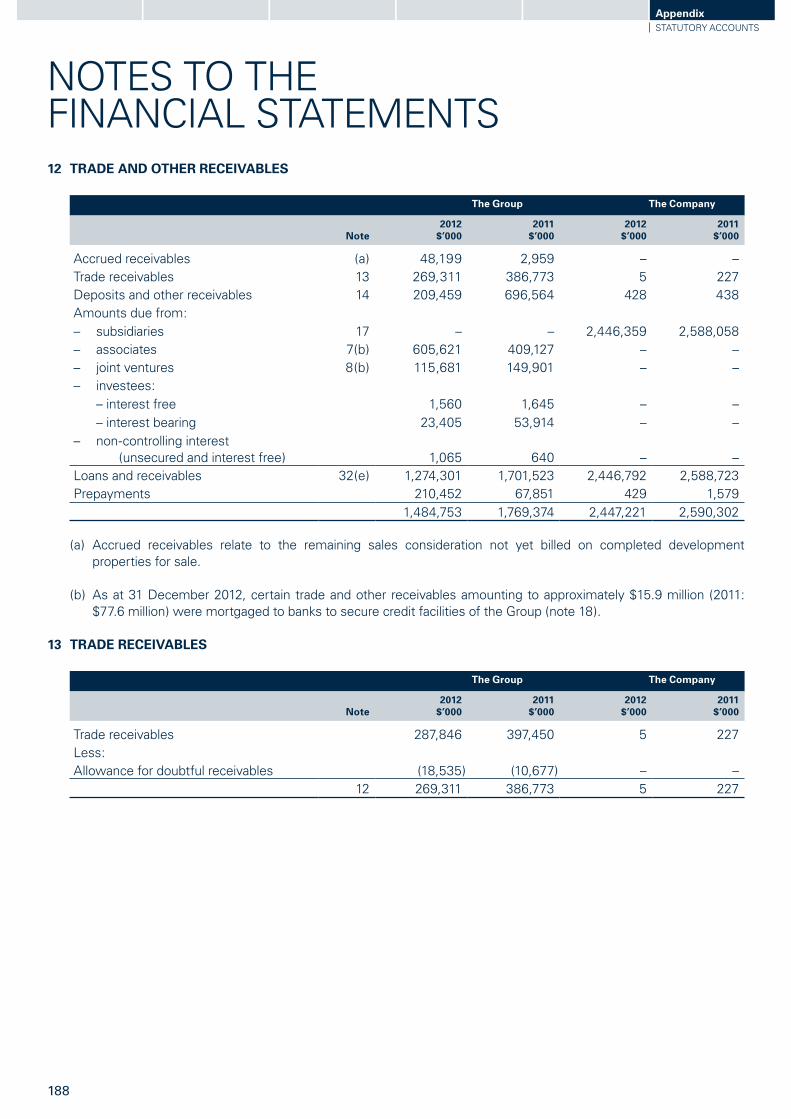
188
appendixSTATUTORY ACCOUNTS
NOTeS TO THe FiNANCiAL STATeMeNTS12 traDe anD other reCeivabLes
the group the Company
note2012
$’0002011
$’0002012
$’0002011
$’000
Accrued receivables (a) 48,199 2,959 – –Trade receivables 13 269,311 386,773 5 227deposits and other receivables 14 209,459 696,564 428 438Amounts due from:– subsidiaries 17 – – 2,446,359 2,588,058– associates 7(b) 605,621 409,127 – –– joint ventures 8(b) 115,681 149,901 – –– investees: – interest free 1,560 1,645 – – – interest bearing 23,405 53,914 – –– non-controlling interest (unsecured and interest free) 1,065 640 – –Loans and receivables 32(e) 1,274,301 1,701,523 2,446,792 2,588,723prepayments 210,452 67,851 429 1,579
1,484,753 1,769,374 2,447,221 2,590,302
(a) Accrued receivables relate to the remaining sales consideration not yet billed on completed development properties for sale.
(b) As at 31 december 2012, certain trade and other receivables amounting to approximately $15.9 million (2011: $77.6 million) were mortgaged to banks to secure credit facilities of the Group (note 18).
13 traDe reCeivabLes
the group the Company
note2012
$’0002011
$’0002012
$’0002011
$’000
Trade receivables 287,846 397,450 5 227Less:Allowance for doubtful receivables (18,535) (10,677) – –
12 269,311 386,773 5 227
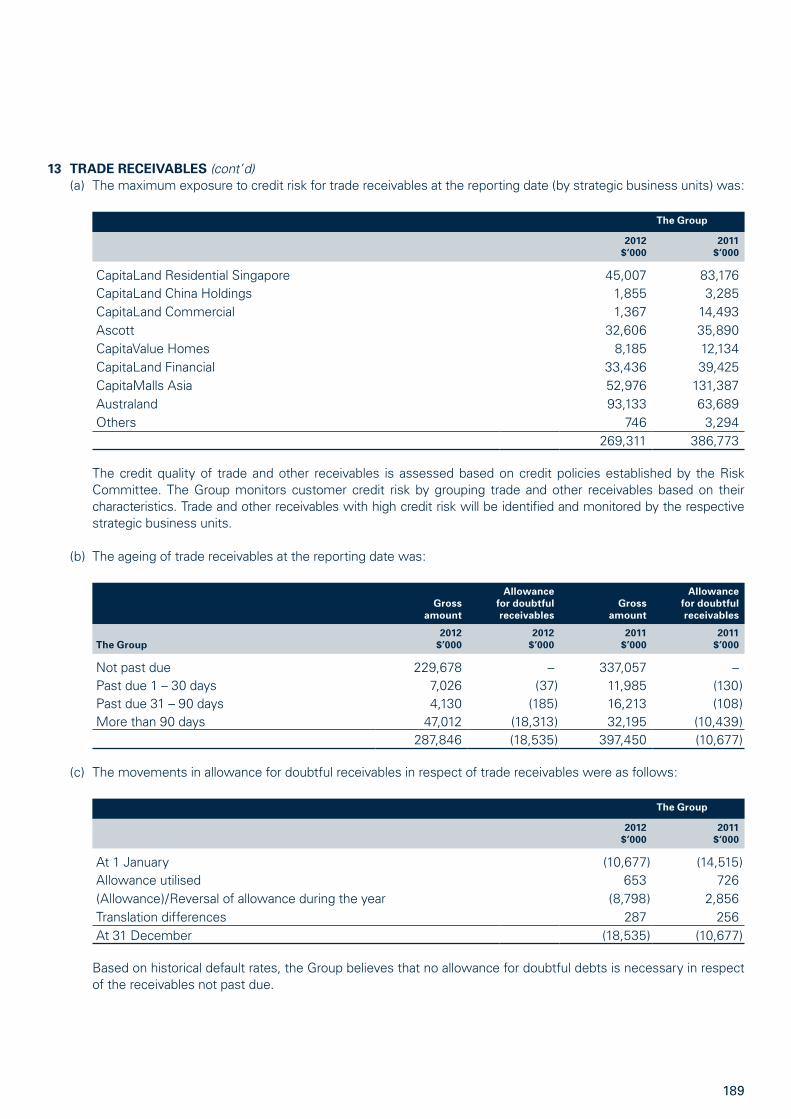
189
13 traDe reCeivabLes (cont’d) (a) The maximum exposure to credit risk for trade receivables at the reporting date (by strategic business units) was:
the group
2012$‘000
2011$‘000
CapitaLand Residential Singapore 45,007 83,176CapitaLand China Holdings 1,855 3,285CapitaLand Commercial 1,367 14,493Ascott 32,606 35,890Capitavalue Homes 8,185 12,134CapitaLand Financial 33,436 39,425CapitaMalls Asia 52,976 131,387Australand 93,133 63,689Others 746 3,294
269,311 386,773 The credit quality of trade and other receivables is assessed based on credit policies established by the Risk
Committee. The Group monitors customer credit risk by grouping trade and other receivables based on their characteristics. Trade and other receivables with high credit risk will be identified and monitored by the respective strategic business units.
(b) The ageing of trade receivables at the reporting date was:
gross amount
allowance for doubtful receivables
gross amount
allowance for doubtful receivables
the group2012
$’0002012
$’0002011
$’0002011
$’000
Not past due 229,678 – 337,057 –past due 1 – 30 days 7,026 (37) 11,985 (130)past due 31 – 90 days 4,130 (185) 16,213 (108)More than 90 days 47,012 (18,313) 32,195 (10,439)
287,846 (18,535) 397,450 (10,677) (c) The movements in allowance for doubtful receivables in respect of trade receivables were as follows:
the group
2012$‘000
2011$‘000
At 1 January (10,677) (14,515)Allowance utilised 653 726(Allowance)/Reversal of allowance during the year (8,798) 2,856Translation differences 287 256At 31 december (18,535) (10,677)
Based on historical default rates, the Group believes that no allowance for doubtful debts is necessary in respect of the receivables not past due.
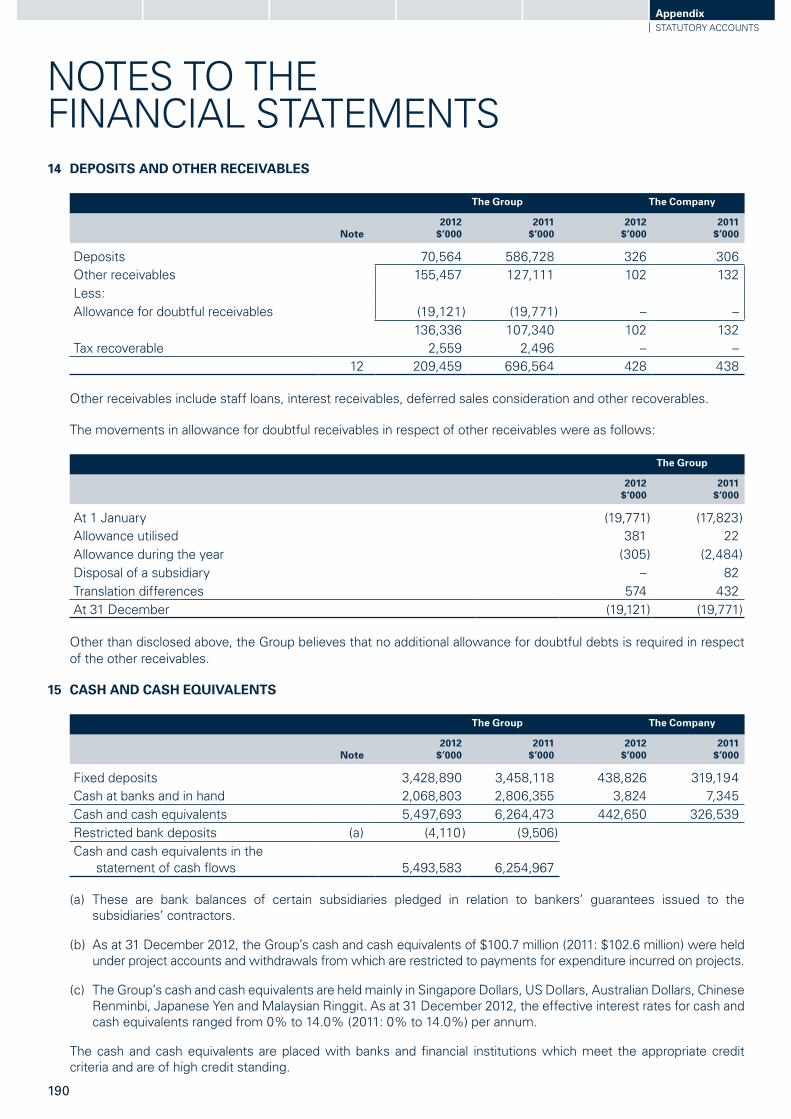
190
appendixSTATUTORY ACCOUNTS
NOTeS TO THe FiNANCiAL STATeMeNTS14 DePosits anD other reCeivabLes
the group the Company
note2012
$’0002011
$’0002012
$’0002011
$’000
deposits 70,564 586,728 326 306Other receivables 155,457 127,111 102 132Less:Allowance for doubtful receivables (19,121) (19,771) – –
136,336 107,340 102 132Tax recoverable 2,559 2,496 – –
12 209,459 696,564 428 438 Other receivables include staff loans, interest receivables, deferred sales consideration and other recoverables.
The movements in allowance for doubtful receivables in respect of other receivables were as follows:
the group
2012$‘000
2011$‘000
At 1 January (19,771) (17,823)Allowance utilised 381 22Allowance during the year (305) (2,484)disposal of a subsidiary – 82Translation differences 574 432At 31 december (19,121) (19,771)
Other than disclosed above, the Group believes that no additional allowance for doubtful debts is required in respect
of the other receivables. 15 Cash anD Cash equivaLents
the group the Company
note2012
$’0002011
$’0002012
$’0002011
$’000
Fixed deposits 3,428,890 3,458,118 438,826 319,194Cash at banks and in hand 2,068,803 2,806,355 3,824 7,345Cash and cash equivalents 5,497,693 6,264,473 442,650 326,539Restricted bank deposits (a) (4,110) (9,506)Cash and cash equivalents in the statement of cash flows 5,493,583 6,254,967
(a) These are bank balances of certain subsidiaries pledged in relation to bankers’ guarantees issued to the subsidiaries’ contractors.
(b) As at 31 december 2012, the Group’s cash and cash equivalents of $100.7 million (2011: $102.6 million) were held
under project accounts and withdrawals from which are restricted to payments for expenditure incurred on projects. (c) The Group’s cash and cash equivalents are held mainly in Singapore dollars, US dollars, Australian dollars, Chinese
Renminbi, Japanese Yen and Malaysian Ringgit. As at 31 december 2012, the effective interest rates for cash and cash equivalents ranged from 0% to 14.0% (2011: 0% to 14.0%) per annum.
The cash and cash equivalents are placed with banks and financial institutions which meet the appropriate credit
criteria and are of high credit standing.

191
16 traDe anD other PaYabLes
the group the Company
note2012
$’0002011
$’0002012
$’0002011
$’000
Trade payables 112,670 115,382 1,126 84Accruals (a) 484,918 587,685 43,601 44,106Accrued development expenditure 277,694 278,770 – –Accrued capital expenditure (b) 42,703 42,563 – –Other payables (c) 325,164 317,426 969 975Rental and other deposits 38,106 33,291 3 3derivative liabilities 49,255 58,175 – –provisions 20(a) 24,736 18,596 – –Liability for employee benefits 21 50,762 38,644 25,550 20,221Amounts due to:– subsidiaries 17 – – 5,445 5,445– associates 7(b) 335,442 269,905 – –– joint ventures 8(b) 58,796 31,139 – –Non-controlling interests (unsecured):– interest free 88,217 55,142 – –– interest bearing 773 105,000 – –progress billings 470,362 318,770 – –
2,359,598 2,270,488 76,694 70,834 (a) Accruals included accrued interest payable, accrued expenditure for property, plant and equipment purchases and
accrued administrative expenses.
(b) Accrued capital expenditure relates to amounts due from a subsidiary of the Group to land vendors under certain unconditional contracts entered into to purchase properties for future developments. The total acquisition cost of the properties has been included in development properties for sale and the amount payable is secured over the relevant development properties.
(c) Other payables included retention sums and amounts payable in connection with capital expenditure incurred.
17 aMounts Due FroM/(to) subsiDiaries
the Company
note2012
$‘0002011
$‘000
CurrentAmounts due from subsidiaries:– current accounts, mainly non-trade and interest bearing 23,895 24,977– current loan – interest free 361,733 367,573 – interest bearing 2,090,106 2,226,133
2,451,839 2,593,706Less: Allowance for doubtful receivables (29,375) (30,625)
2,422,464 2,563,08112 2,446,359 2,588,058
Amounts due to subsidiaries:– current loan and interest free (5,445) (5,445)
16 (5,445) (5,445)
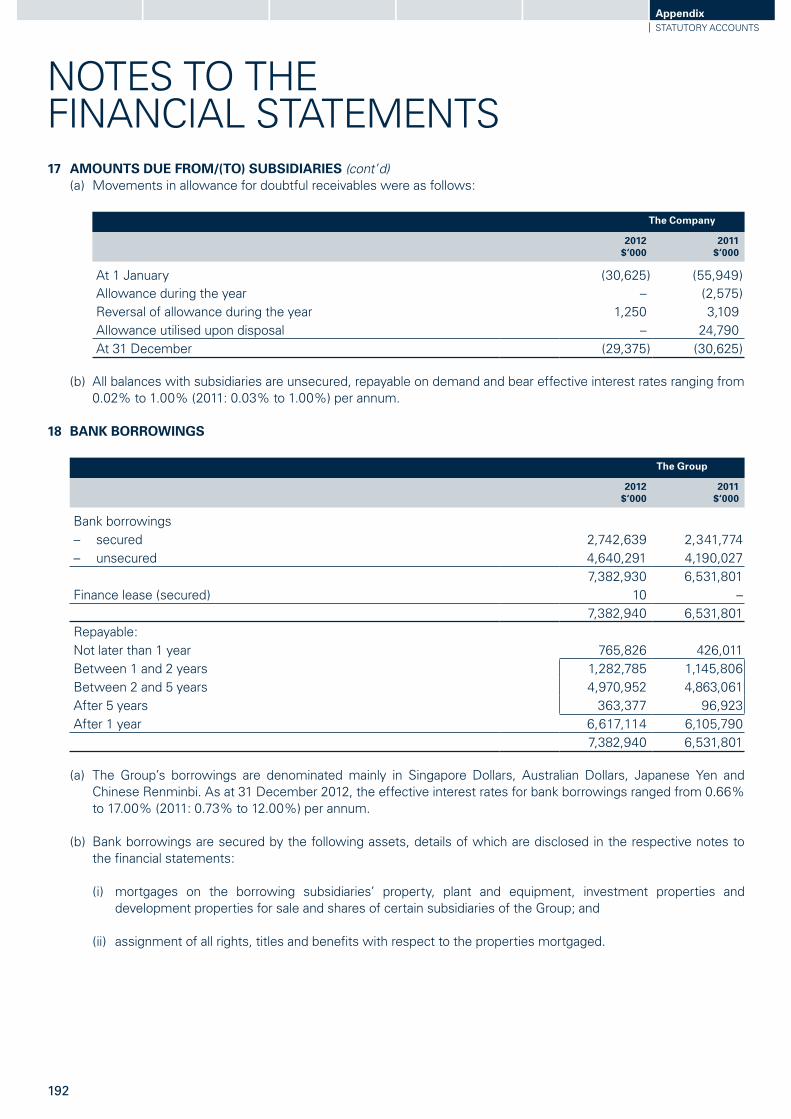
192
appendixSTATUTORY ACCOUNTS
NOTeS TO THe FiNANCiAL STATeMeNTS17 aMounts Due FroM/(to) subsiDiaries (cont’d) (a) Movements in allowance for doubtful receivables were as follows:
the Company
2012$‘000
2011$‘000
At 1 January (30,625) (55,949)Allowance during the year – (2,575)Reversal of allowance during the year 1,250 3,109Allowance utilised upon disposal – 24,790At 31 december (29,375) (30,625)
(b) All balances with subsidiaries are unsecured, repayable on demand and bear effective interest rates ranging from 0.02% to 1.00% (2011: 0.03% to 1.00%) per annum.
18 banK borrowings
the group
2012$‘000
2011$‘000
Bank borrowings– secured 2,742,639 2,341,774– unsecured 4,640,291 4,190,027
7,382,930 6,531,801Finance lease (secured) 10 –
7,382,940 6,531,801Repayable:Not later than 1 year 765,826 426,011Between 1 and 2 years 1,282,785 1,145,806Between 2 and 5 years 4,970,952 4,863,061After 5 years 363,377 96,923After 1 year 6,617,114 6,105,790
7,382,940 6,531,801
(a) The Group’s borrowings are denominated mainly in Singapore dollars, Australian dollars, Japanese Yen and Chinese Renminbi. As at 31 december 2012, the effective interest rates for bank borrowings ranged from 0.66% to 17.00% (2011: 0.73% to 12.00%) per annum.
(b) Bank borrowings are secured by the following assets, details of which are disclosed in the respective notes to the financial statements:
(i) mortgages on the borrowing subsidiaries’ property, plant and equipment, investment properties and developmentpropertiesforsaleandsharesofcertainsubsidiariesoftheGroup;and
(ii) assignment of all rights, titles and benefits with respect to the properties mortgaged.
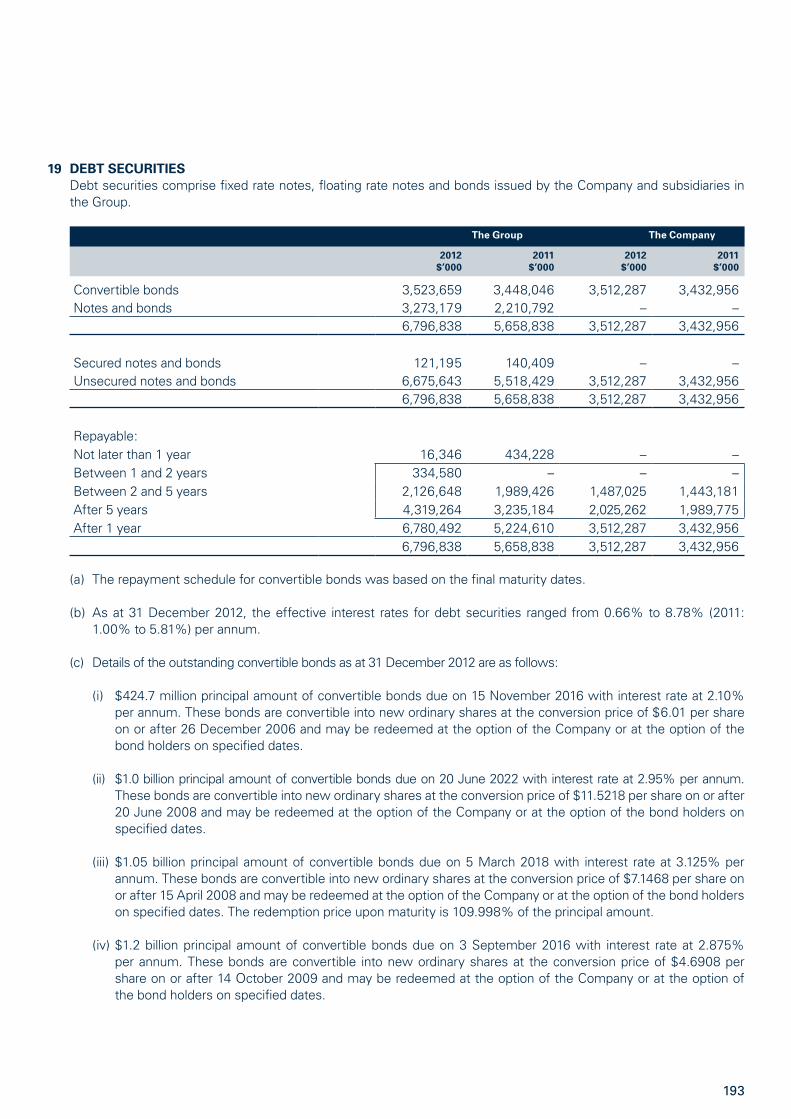
193
19 Debt seCurities debt securities comprise fixed rate notes, floating rate notes and bonds issued by the Company and subsidiaries in
the Group.
the group the Company
2012$’000
2011$’000
2012$’000
2011$’000
Convertible bonds 3,523,659 3,448,046 3,512,287 3,432,956Notes and bonds 3,273,179 2,210,792 – –
6,796,838 5,658,838 3,512,287 3,432,956
Secured notes and bonds 121,195 140,409 – –Unsecured notes and bonds 6,675,643 5,518,429 3,512,287 3,432,956
6,796,838 5,658,838 3,512,287 3,432,956
Repayable:Not later than 1 year 16,346 434,228 – –Between 1 and 2 years 334,580 – – –Between 2 and 5 years 2,126,648 1,989,426 1,487,025 1,443,181After 5 years 4,319,264 3,235,184 2,025,262 1,989,775After 1 year 6,780,492 5,224,610 3,512,287 3,432,956
6,796,838 5,658,838 3,512,287 3,432,956
(a) The repayment schedule for convertible bonds was based on the final maturity dates.
(b) As at 31 december 2012, the effective interest rates for debt securities ranged from 0.66% to 8.78% (2011: 1.00% to 5.81%) per annum.
(c) details of the outstanding convertible bonds as at 31 december 2012 are as follows:
(i) $424.7 million principal amount of convertible bonds due on 15 November 2016 with interest rate at 2.10% per annum. These bonds are convertible into new ordinary shares at the conversion price of $6.01 per share on or after 26 december 2006 and may be redeemed at the option of the Company or at the option of the bond holders on specified dates.
(ii) $1.0 billion principal amount of convertible bonds due on 20 June 2022 with interest rate at 2.95% per annum. These bonds are convertible into new ordinary shares at the conversion price of $11.5218 per share on or after 20 June 2008 and may be redeemed at the option of the Company or at the option of the bond holders on specified dates.
(iii) $1.05 billion principal amount of convertible bonds due on 5 March 2018 with interest rate at 3.125% per annum. These bonds are convertible into new ordinary shares at the conversion price of $7.1468 per share on or after 15 April 2008 and may be redeemed at the option of the Company or at the option of the bond holders on specified dates. The redemption price upon maturity is 109.998% of the principal amount.
(iv) $1.2 billion principal amount of convertible bonds due on 3 September 2016 with interest rate at 2.875% per annum. These bonds are convertible into new ordinary shares at the conversion price of $4.6908 per share on or after 14 October 2009 and may be redeemed at the option of the Company or at the option of the bond holders on specified dates.
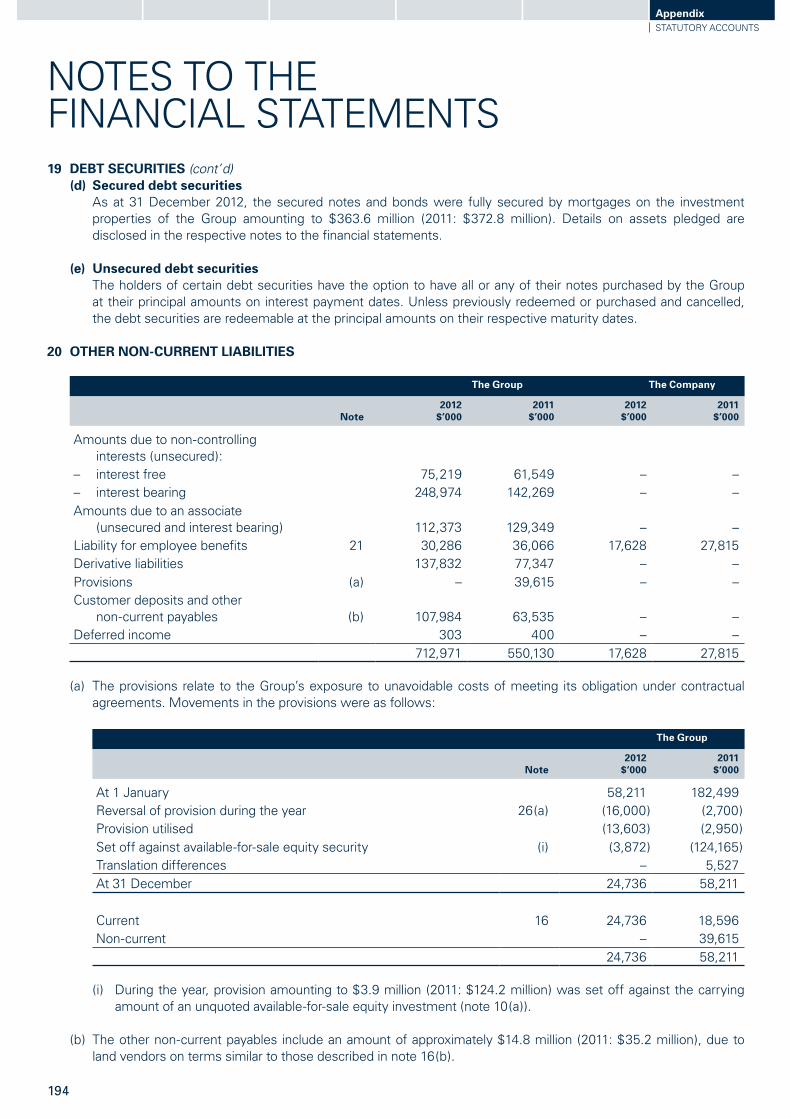
194
appendixSTATUTORY ACCOUNTS
NOTeS TO THe FiNANCiAL STATeMeNTS19 Debt seCurities (cont’d) (d) secured debt securities As at 31 december 2012, the secured notes and bonds were fully secured by mortgages on the investment
properties of the Group amounting to $363.6 million (2011: $372.8 million). details on assets pledged are disclosed in the respective notes to the financial statements.
(e) unsecured debt securities The holders of certain debt securities have the option to have all or any of their notes purchased by the Group
at their principal amounts on interest payment dates. Unless previously redeemed or purchased and cancelled, the debt securities are redeemable at the principal amounts on their respective maturity dates.
20 other non-Current LiabiLities
the group the Company
note2012
$’0002011
$’0002012
$’0002011
$’000
Amounts due to non-controlling interests (unsecured):– interest free 75,219 61,549 – –– interest bearing 248,974 142,269 – –Amounts due to an associate (unsecured and interest bearing) 112,373 129,349 – –Liability for employee benefits 21 30,286 36,066 17,628 27,815derivative liabilities 137,832 77,347 – –provisions (a) – 39,615 – –Customer deposits and other non-current payables (b) 107,984 63,535 – –deferred income 303 400 – –
712,971 550,130 17,628 27,815
(a) The provisions relate to the Group’s exposure to unavoidable costs of meeting its obligation under contractual agreements. Movements in the provisions were as follows:
the group
note2012
$‘0002011
$‘000
At 1 January 58,211 182,499Reversal of provision during the year 26(a) (16,000) (2,700)provision utilised (13,603) (2,950)Set off against available-for-sale equity security (i) (3,872) (124,165)Translation differences – 5,527At 31 december 24,736 58,211
Current 16 24,736 18,596Non-current – 39,615
24,736 58,211 (i) during the year, provision amounting to $3.9 million (2011: $124.2 million) was set off against the carrying
amount of an unquoted available-for-sale equity investment (note 10(a)).
(b) The other non-current payables include an amount of approximately $14.8 million (2011: $35.2 million), due to land vendors on terms similar to those described in note 16(b).
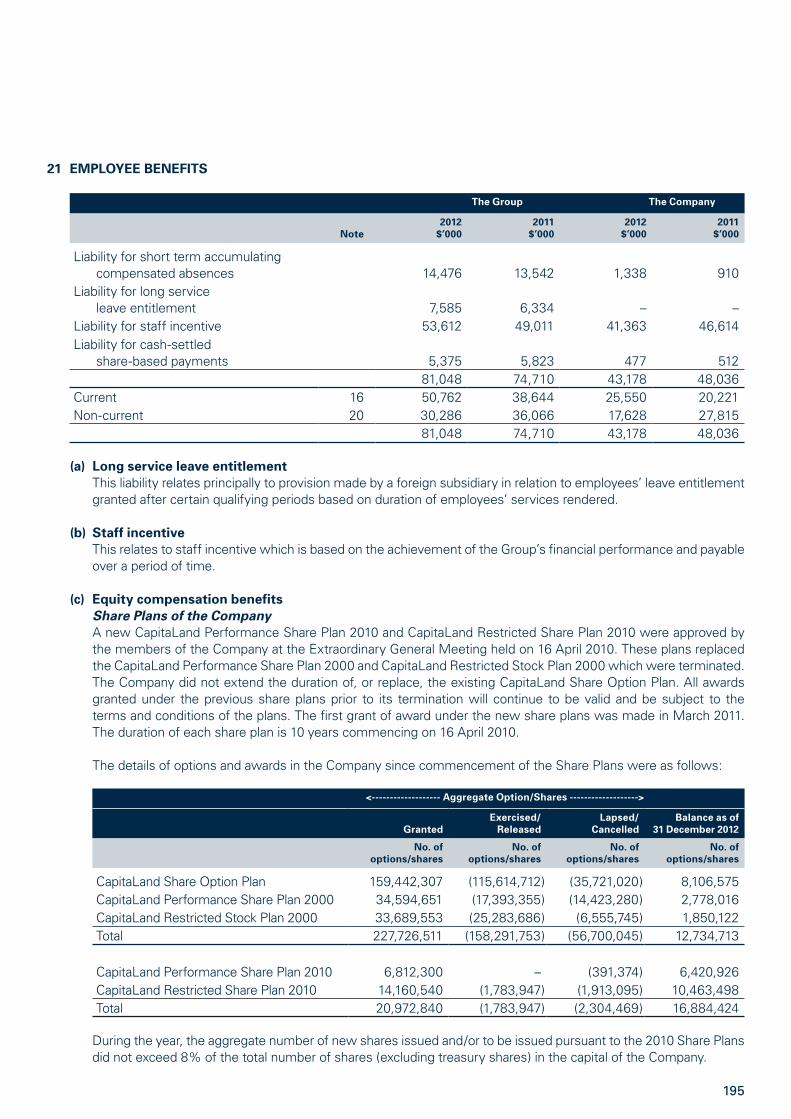
195
21 eMPLoYee beneFits
the group the Company
note2012
$’0002011
$’0002012
$’0002011
$’000
Liability for short term accumulating compensated absences 14,476 13,542 1,338 910Liability for long service leave entitlement 7,585 6,334 – –Liability for staff incentive 53,612 49,011 41,363 46,614Liability for cash-settled share-based payments 5,375 5,823 477 512
81,048 74,710 43,178 48,036Current 16 50,762 38,644 25,550 20,221Non-current 20 30,286 36,066 17,628 27,815
81,048 74,710 43,178 48,036 (a) Long service leave entitlement This liability relates principally to provision made by a foreign subsidiary in relation to employees’ leave entitlement
granted after certain qualifying periods based on duration of employees’ services rendered.
(b) staff incentive This relates to staff incentive which is based on the achievement of the Group’s financial performance and payable
over a period of time.
(c) equity compensation benefits Share Plans of the Company A new CapitaLand performance Share plan 2010 and CapitaLand Restricted Share plan 2010 were approved by
the members of the Company at the extraordinary General Meeting held on 16 April 2010. These plans replaced the CapitaLand performance Share plan 2000 and CapitaLand Restricted Stock plan 2000 which were terminated. The Company did not extend the duration of, or replace, the existing CapitaLand Share Option plan. All awards granted under the previous share plans prior to its termination will continue to be valid and be subject to the terms and conditions of the plans. The first grant of award under the new share plans was made in March 2011. The duration of each share plan is 10 years commencing on 16 April 2010.
The details of options and awards in the Company since commencement of the Share plans were as follows:
<------------------- aggregate option/shares ------------------->
grantedexercised/
releasedLapsed/
Cancelledbalance as of
31 December 2012
no. of options/shares
no. of options/shares
no. of options/shares
no. of options/shares
CapitaLand Share Option plan 159,442,307 (115,614,712) (35,721,020) 8,106,575CapitaLand performance Share plan 2000 34,594,651 (17,393,355) (14,423,280) 2,778,016CapitaLand Restricted Stock plan 2000 33,689,553 (25,283,686) (6,555,745) 1,850,122Total 227,726,511 (158,291,753) (56,700,045) 12,734,713
CapitaLand performance Share plan 2010 6,812,300 – (391,374) 6,420,926CapitaLand Restricted Share plan 2010 14,160,540 (1,783,947) (1,913,095) 10,463,498Total 20,972,840 (1,783,947) (2,304,469) 16,884,424
during the year, the aggregate number of new shares issued and/or to be issued pursuant to the 2010 Share plans
did not exceed 8% of the total number of shares (excluding treasury shares) in the capital of the Company.
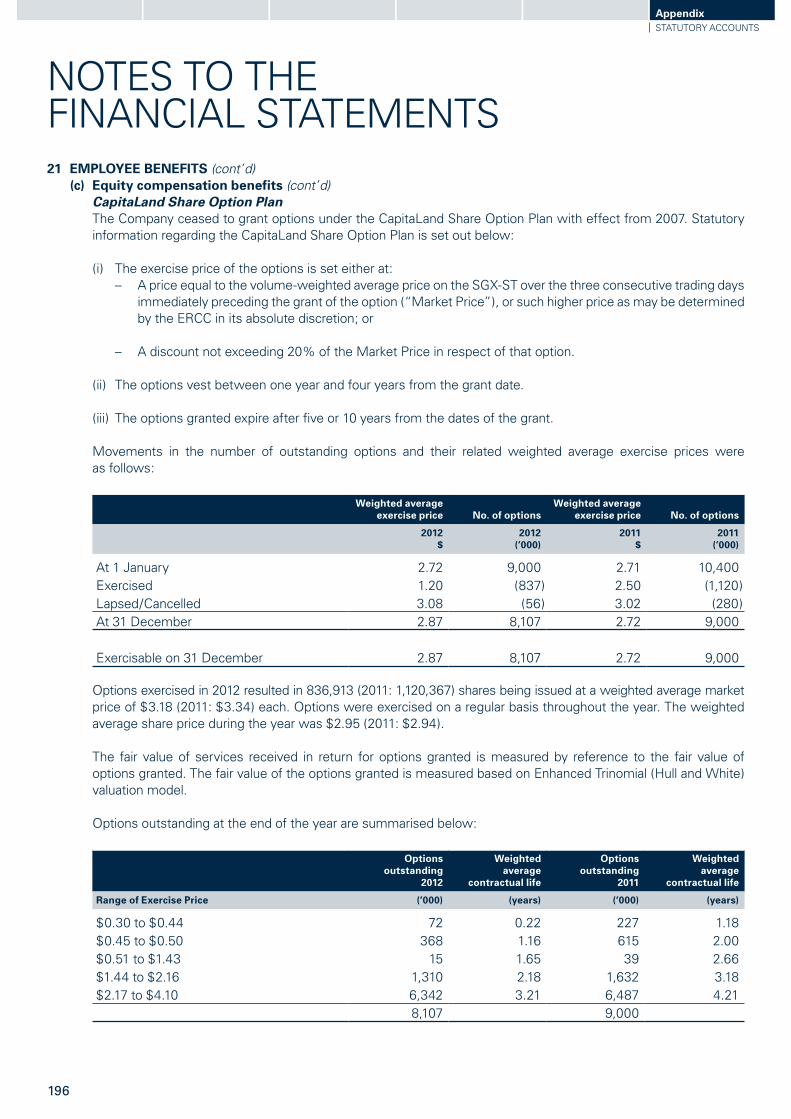
196
appendixSTATUTORY ACCOUNTS
NOTeS TO THe FiNANCiAL STATeMeNTS21 eMPLoYee beneFits (cont’d) (c) equity compensation benefits (cont’d) CapitaLand Share Option Plan The Company ceased to grant options under the CapitaLand Share Option plan with effect from 2007. Statutory
information regarding the CapitaLand Share Option plan is set out below:
(i) The exercise price of the options is set either at: – A price equal to the volume-weighted average price on the SGX-ST over the three consecutive trading days
immediately preceding the grant of the option (“Market price”), or such higher price as may be determined bytheERCCinitsabsolutediscretion;or
– A discount not exceeding 20% of the Market price in respect of that option.
(ii) The options vest between one year and four years from the grant date.
(iii) The options granted expire after five or 10 years from the dates of the grant.
Movements in the number of outstanding options and their related weighted average exercise prices were as follows:
weighted average exercise price no. of options
weighted average exercise price no. of options
2012$
2012 (‘000)
2011$
2011 (‘000)
At 1 January 2.72 9,000 2.71 10,400exercised 1.20 (837) 2.50 (1,120)Lapsed/Cancelled 3.08 (56) 3.02 (280)At 31 december 2.87 8,107 2.72 9,000
exercisable on 31 december 2.87 8,107 2.72 9,000
Options exercised in 2012 resulted in 836,913 (2011: 1,120,367) shares being issued at a weighted average market price of $3.18 (2011: $3.34) each. Options were exercised on a regular basis throughout the year. The weighted average share price during the year was $2.95 (2011: $2.94).
The fair value of services received in return for options granted is measured by reference to the fair value of options granted. The fair value of the options granted is measured based on enhanced Trinomial (Hull and White) valuation model.
Options outstanding at the end of the year are summarised below:
options outstanding
2012
weighted average
contractual life
options outstanding
2011
weighted average
contractual life
range of exercise Price (‘000) (years) (‘000) (years)
$0.30 to $0.44 72 0.22 227 1.18$0.45 to $0.50 368 1.16 615 2.00$0.51 to $1.43 15 1.65 39 2.66$1.44 to $2.16 1,310 2.18 1,632 3.18$2.17 to $4.10 6,342 3.21 6,487 4.21
8,107 9,000

197
21 eMPLoYee beneFits (cont’d) (c) equity compensation benefits (cont’d) CapitaLand Performance Share Plan This relates to compensation costs of the Company’s performance Share plan reflecting the benefits accruing to
the employees over the service period to which the performance criteria relate.
Movements in the number of shares outstanding under the CapitaLand performance Share were summarised below:
2012(‘000)
2011(‘000)
At 1 January 9,269 9,219Granted 3,488 3,324Lapsed/Cancelled (3,558) (3,274)At 31 december 9,199 9,269
The final number of shares to be released will depend on the achievement of pre-determined targets over a three-year performance period. No share will be released if the threshold targets are not met at the end of the performance period. Conversely, if superior targets are met, more shares than the baseline award could be released. For awards granted prior to 2012, the maximum is 200% of the baseline award. From 2012, the maximum will be 175% of the baseline award.
The fair values of the shares are determined using Monte Carlo simulation method at the measurement date which projects future share price assuming log normal distribution based on Geometric Brownian Motion Theory. The fair value and assumptions are set out below:
Year of award 2012 2011
Weighted average fair value of shares and assumptionsWeighted average fair value at measurement date $3.79 $2.52expected volatility based on 36 months closing share price prior to grant date 32.40% 34.61%MSCi Asia pacific ex-Japan Real estate index annualised volatility based on 36 months prior to grant date 27.72% 28.76%Share price at grant date $3.11 $3.33Risk-free interest rate equal to the implied yield on zero-coupon Singapore Government bond with a term equal to the length of vesting period 0.30% 0.44%expected dividend yield over 12 months volume-weighted average share price prior to the grant date 2.24% 1.67%Correlation of return between MSCi Asia pacific ex-Japan Real estate index and the Company’s share price measured over 36 months prior to the grant date 78.30% 71.47%
CapitaLand Restricted Stock/Share Plan – Equity-settled/Cash-settled This relates to compensation costs of the Company’s Restricted Stock/Share plan reflecting the benefits accruing
to the employees over the service period to which the performance criteria relate. The Company granted awards of shares under the CapitaLand Restricted Stock/Share plan in place of options with effect from 2007.
The eRCC of the Company has instituted a set of share ownership guidelines for senior management who receives shares under the CapitaLand Restricted Stock/Share plan. Under these guidelines, members of the senior management team are required to retain a portion of the total number of CapitaLand shares acquired through the CapitaLand Restricted Stock/Share plan which will vary according to their job grades and base salaries.
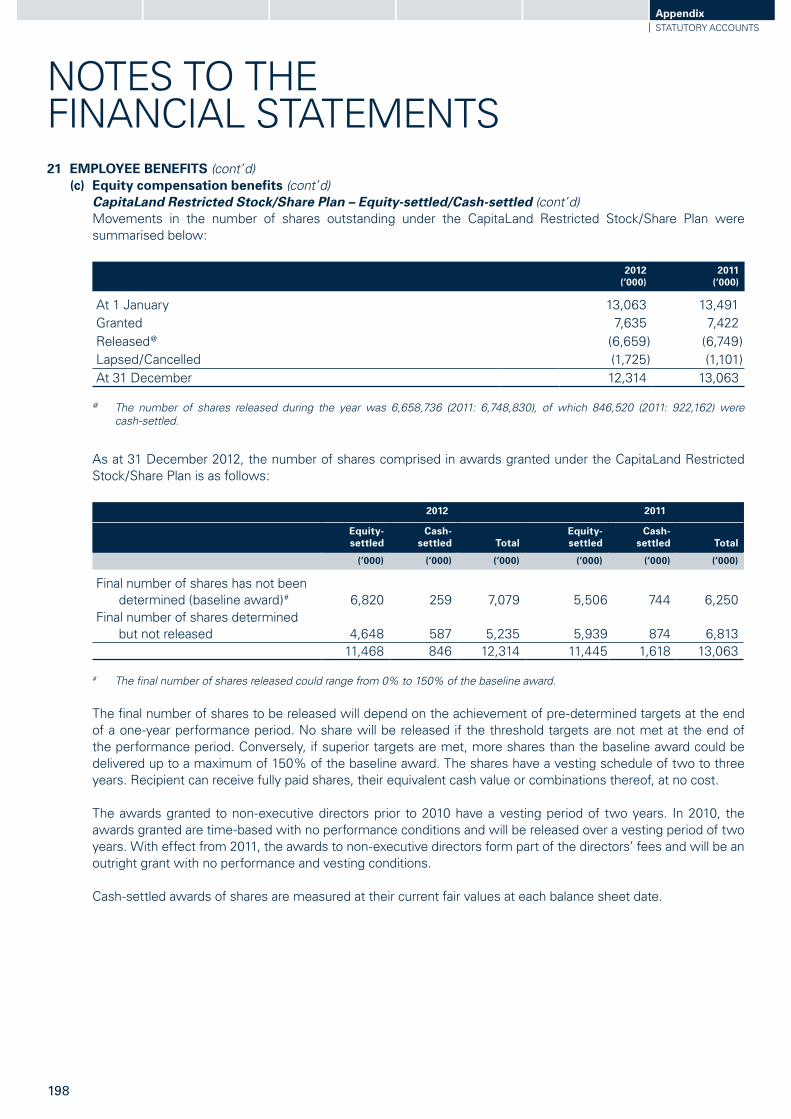
198
appendixSTATUTORY ACCOUNTS
NOTeS TO THe FiNANCiAL STATeMeNTS21 eMPLoYee beneFits (cont’d) (c) equity compensation benefits (cont’d) CapitaLand Restricted Stock/Share Plan – Equity-settled/Cash-settled (cont’d) Movements in the number of shares outstanding under the CapitaLand Restricted Stock/Share plan were
summarised below:
2012(‘000)
2011(‘000)
At 1 January 13,063 13,491Granted 7,635 7,422Released@ (6,659) (6,749)Lapsed/Cancelled (1,725) (1,101)At 31 december 12,314 13,063
@ The number of shares released during the year was 6,658,736 (2011: 6,748,830), of which 846,520 (2011: 922,162) were
cash-settled.
As at 31 december 2012, the number of shares comprised in awards granted under the CapitaLand Restricted Stock/Share plan is as follows:
2012 2011
equity-settled
Cash- settled total
equity- settled
Cash- settled total
(‘000) (‘000) (‘000) (‘000) (‘000) (‘000)
Final number of shares has not been determined (baseline award)# 6,820 259 7,079 5,506 744 6,250Final number of shares determined but not released 4,648 587 5,235 5,939 874 6,813
11,468 846 12,314 11,445 1,618 13,063
# The final number of shares released could range from 0% to 150% of the baseline award.
The final number of shares to be released will depend on the achievement of pre-determined targets at the end
of a one-year performance period. No share will be released if the threshold targets are not met at the end of the performance period. Conversely, if superior targets are met, more shares than the baseline award could be delivered up to a maximum of 150% of the baseline award. The shares have a vesting schedule of two to three years. Recipient can receive fully paid shares, their equivalent cash value or combinations thereof, at no cost.
The awards granted to non-executive directors prior to 2010 have a vesting period of two years. in 2010, the awards granted are time-based with no performance conditions and will be released over a vesting period of two years. With effect from 2011, the awards to non-executive directors form part of the directors’ fees and will be an outright grant with no performance and vesting conditions.
Cash-settled awards of shares are measured at their current fair values at each balance sheet date.
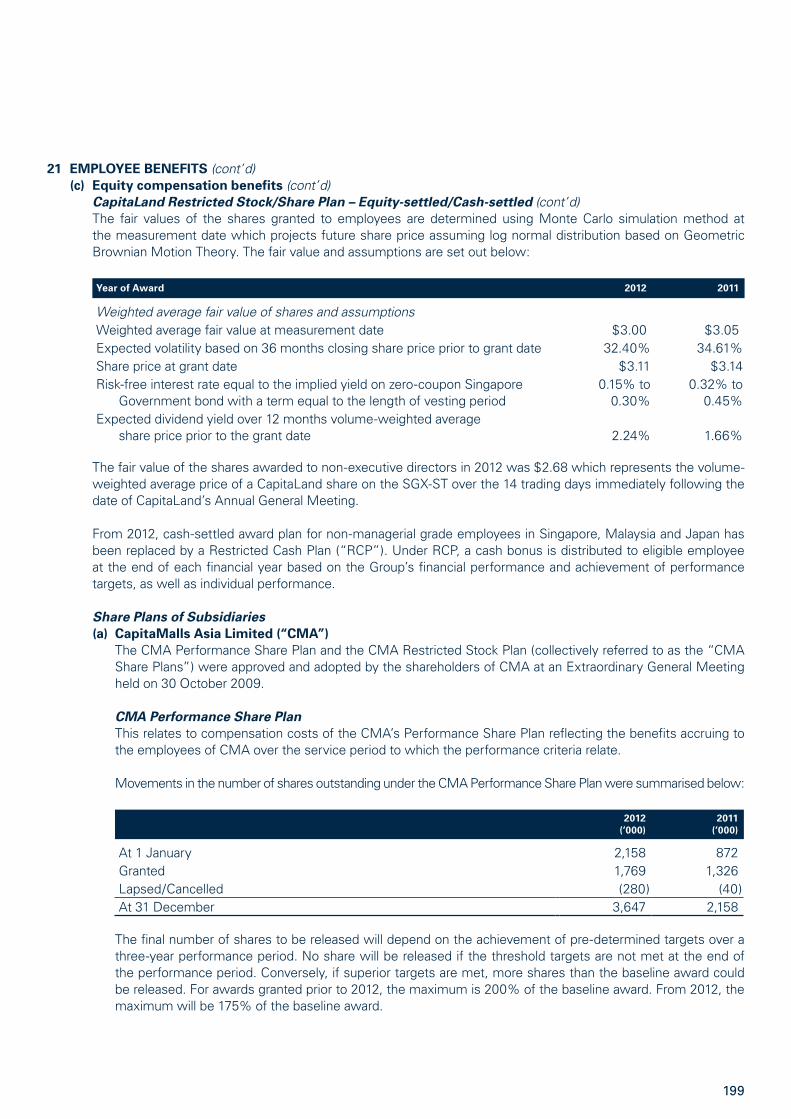
199
21 eMPLoYee beneFits (cont’d) (c) equity compensation benefits (cont’d) CapitaLand Restricted Stock/Share Plan – Equity-settled/Cash-settled (cont’d) The fair values of the shares granted to employees are determined using Monte Carlo simulation method at
the measurement date which projects future share price assuming log normal distribution based on Geometric Brownian Motion Theory. The fair value and assumptions are set out below:
Year of award 2012 2011
Weighted average fair value of shares and assumptionsWeighted average fair value at measurement date $3.00 $3.05expected volatility based on 36 months closing share price prior to grant date 32.40% 34.61%Share price at grant date $3.11 $3.14Risk-free interest rate equal to the implied yield on zero-coupon Singapore Government bond with a term equal to the length of vesting period
0.15% to 0.30%
0.32% to 0.45%
expected dividend yield over 12 months volume-weighted average share price prior to the grant date 2.24% 1.66%
The fair value of the shares awarded to non-executive directors in 2012 was $2.68 which represents the volume-weighted average price of a CapitaLand share on the SGX-ST over the 14 trading days immediately following the date of CapitaLand’s Annual General Meeting.
From 2012, cash-settled award plan for non-managerial grade employees in Singapore, Malaysia and Japan has been replaced by a Restricted Cash plan (“RCp”). Under RCp, a cash bonus is distributed to eligible employee at the end of each financial year based on the Group’s financial performance and achievement of performance targets, as well as individual performance.
Share Plans of Subsidiaries (a) CapitaMalls asia Limited (“CMa”) The CMA performance Share plan and the CMA Restricted Stock plan (collectively referred to as the “CMA
Share plans”) were approved and adopted by the shareholders of CMA at an extraordinary General Meeting held on 30 October 2009.
CMA Performance Share Plan This relates to compensation costs of the CMA’s performance Share plan reflecting the benefits accruing to
the employees of CMA over the service period to which the performance criteria relate.
Movements in the number of shares outstanding under the CMA performance Share plan were summarised below:
2012(‘000)
2011 (‘000)
At 1 January 2,158 872Granted 1,769 1,326Lapsed/Cancelled (280) (40)At 31 december 3,647 2,158
The final number of shares to be released will depend on the achievement of pre-determined targets over a
three-year performance period. No share will be released if the threshold targets are not met at the end of the performance period. Conversely, if superior targets are met, more shares than the baseline award could be released. For awards granted prior to 2012, the maximum is 200% of the baseline award. From 2012, the maximum will be 175% of the baseline award.

200
appendixSTATUTORY ACCOUNTS
NOTeS TO THe FiNANCiAL STATeMeNTS21 eMPLoYee beneFits (cont’d) (c) equity compensation benefits (cont’d) Share Plans of Subsidiaries (cont’d) (a) CapitaMalls asia Limited (“CMa”) (cont’d) CMA Performance Share Plan (cont’d) The fair values of the shares are determined using Monte Carlo simulation method at the measurement date
which projects future share price assuming log normal distribution based on Geometric Brownian Motion Theory. The fair value and assumptions are set out below:
Year of award 2012 2011
Weighted average fair value of shares and assumptionsWeighted average fair value at measurement date $2.06 $1.19expected volatility based on average of peers’ 36 months closing share price prior to grant date 32.42% 25.70%MSCi Asia pacific ex-Japan Real estate index annualised volatility based on 36 months prior to grant date 27.70% 26.92%Share price at grant date $1.65 $1.77Risk-free interest rate equal to the implied yield on zero-coupon Singapore Government bond with a term equal to the length of vesting period 0.30% 0.44%expected dividend yield over 12 months volume-weighted average share price prior to the grant date 2.27% 1.15%Correlation of return between MSCi Asia pacific ex-Japan Real estate index and CMA’s share price measured over 36 months prior to the grant date 69.97% 69.36%
CMA Restricted Stock Plan – Equity-settled/Cash-settled This relates to compensation costs of the CMA’s Restricted Stock plan reflecting the benefits accruing to the
employees of CMA over the service period to which the performance criteria relate.
Movements in the number of shares outstanding under the CMA Restricted Stock plan were summarised below:
2012(‘000)
2011 (‘000)
At 1 January 7,987 4,117Granted 7,384 6,036Released@ (3,419) (1,520)Lapsed/Cancelled (1,018) (646)At 31 december 10,934 7,987
@ The number of shares released during the year was 3,418,735 (2011: 1,520,317), of which 995,898 (2011: 438,490) were cash-settled.
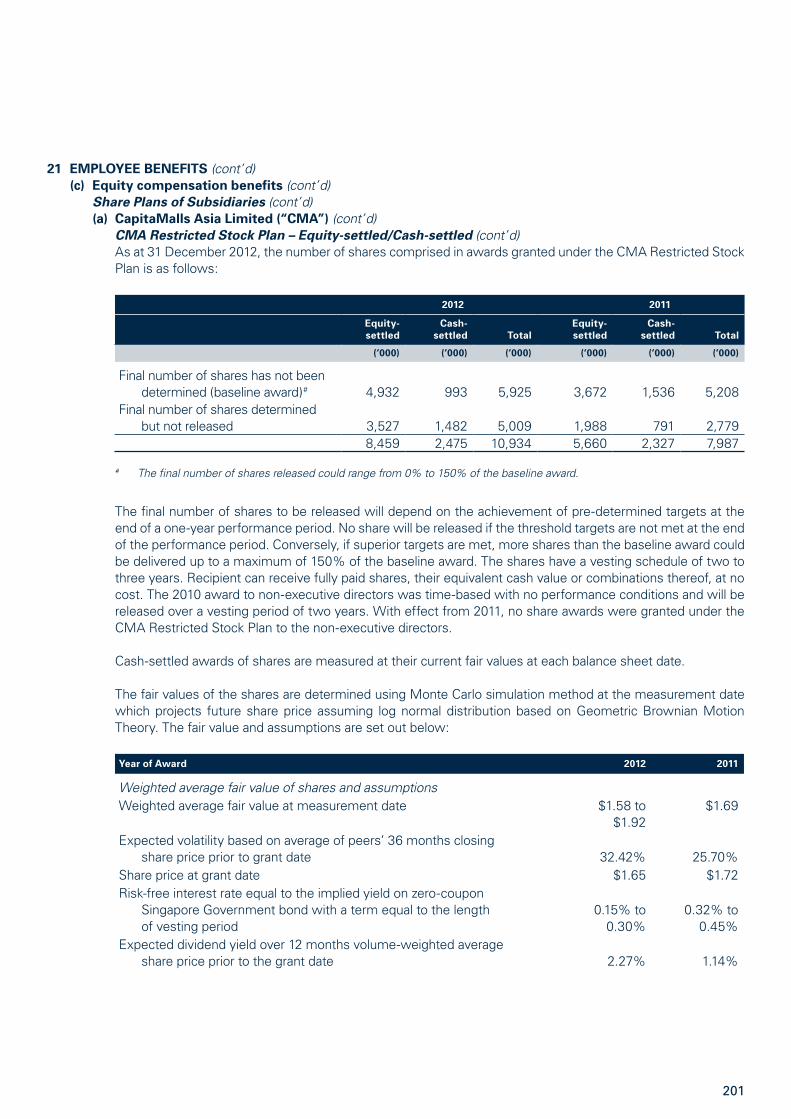
201
21 eMPLoYee beneFits (cont’d) (c) equity compensation benefits (cont’d) Share Plans of Subsidiaries (cont’d) (a) CapitaMalls asia Limited (“CMa”) (cont’d) CMA Restricted Stock Plan – Equity-settled/Cash-settled (cont’d) As at 31 december 2012, the number of shares comprised in awards granted under the CMA Restricted Stock
plan is as follows:
2012 2011
equity-settled
Cash- settled total
equity- settled
Cash- settled total
(‘000) (‘000) (‘000) (‘000) (‘000) (‘000)
Final number of shares has not been determined (baseline award)# 4,932 993 5,925 3,672 1,536 5,208Final number of shares determined but not released 3,527 1,482 5,009 1,988 791 2,779
8,459 2,475 10,934 5,660 2,327 7,987 # The final number of shares released could range from 0% to 150% of the baseline award.
The final number of shares to be released will depend on the achievement of pre-determined targets at the end of a one-year performance period. No share will be released if the threshold targets are not met at the end of the performance period. Conversely, if superior targets are met, more shares than the baseline award could be delivered up to a maximum of 150% of the baseline award. The shares have a vesting schedule of two to three years. Recipient can receive fully paid shares, their equivalent cash value or combinations thereof, at no cost. The 2010 award to non-executive directors was time-based with no performance conditions and will be released over a vesting period of two years. With effect from 2011, no share awards were granted under the CMA Restricted Stock plan to the non-executive directors.
Cash-settled awards of shares are measured at their current fair values at each balance sheet date.
The fair values of the shares are determined using Monte Carlo simulation method at the measurement date which projects future share price assuming log normal distribution based on Geometric Brownian Motion Theory. The fair value and assumptions are set out below:
Year of award 2012 2011
Weighted average fair value of shares and assumptionsWeighted average fair value at measurement date $1.58 to
$1.92$1.69
expected volatility based on average of peers’ 36 months closing share price prior to grant date 32.42% 25.70%Share price at grant date $1.65 $1.72Risk-free interest rate equal to the implied yield on zero-coupon Singapore Government bond with a term equal to the length of vesting period
0.15% to 0.30%
0.32% to 0.45%
expected dividend yield over 12 months volume-weighted average share price prior to the grant date 2.27% 1.14%
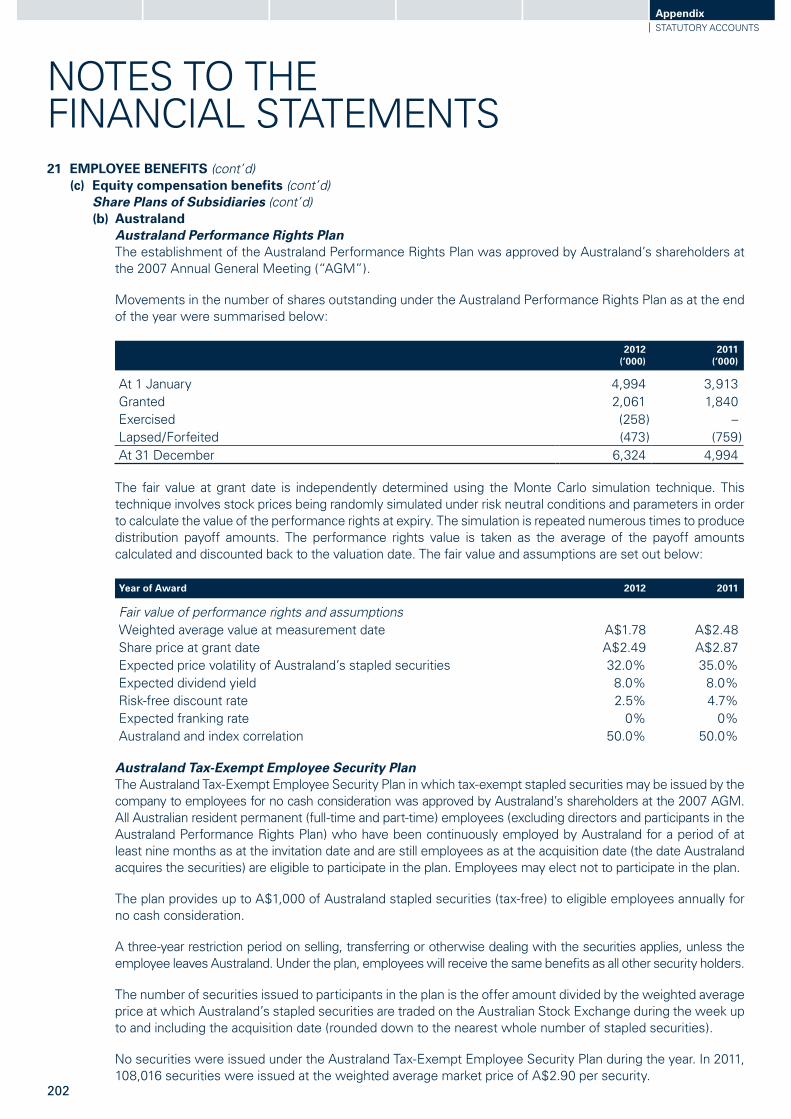
202
appendixSTATUTORY ACCOUNTS
NOTeS TO THe FiNANCiAL STATeMeNTS21 eMPLoYee beneFits (cont’d) (c) equity compensation benefits (cont’d) Share Plans of Subsidiaries (cont’d) (b) australand Australand Performance Rights Plan The establishment of the Australand performance Rights plan was approved by Australand’s shareholders at
the 2007 Annual General Meeting (“AGM”).
Movements in the number of shares outstanding under the Australand performance Rights plan as at the end of the year were summarised below:
2012(‘000)
2011 (‘000)
At 1 January 4,994 3,913Granted 2,061 1,840exercised (258) –Lapsed/Forfeited (473) (759)At 31 december 6,324 4,994
The fair value at grant date is independently determined using the Monte Carlo simulation technique. This technique involves stock prices being randomly simulated under risk neutral conditions and parameters in order to calculate the value of the performance rights at expiry. The simulation is repeated numerous times to produce distribution payoff amounts. The performance rights value is taken as the average of the payoff amounts calculated and discounted back to the valuation date. The fair value and assumptions are set out below:
Year of award 2012 2011
Fair value of performance rights and assumptionsWeighted average value at measurement date A$1.78 A$2.48Share price at grant date A$2.49 A$2.87expected price volatility of Australand’s stapled securities 32.0% 35.0%expected dividend yield 8.0% 8.0%Risk-free discount rate 2.5% 4.7%expected franking rate 0% 0%Australand and index correlation 50.0% 50.0%
Australand Tax-Exempt Employee Security Plan The Australand Tax-exempt employee Security plan in which tax-exempt stapled securities may be issued by the
company to employees for no cash consideration was approved by Australand’s shareholders at the 2007 AGM. All Australian resident permanent (full-time and part-time) employees (excluding directors and participants in the Australand performance Rights plan) who have been continuously employed by Australand for a period of at least nine months as at the invitation date and are still employees as at the acquisition date (the date Australand acquires the securities) are eligible to participate in the plan. employees may elect not to participate in the plan.
The plan provides up to A$1,000 of Australand stapled securities (tax-free) to eligible employees annually for no cash consideration.
A three-year restriction period on selling, transferring or otherwise dealing with the securities applies, unless the employee leaves Australand. Under the plan, employees will receive the same benefits as all other security holders.
The number of securities issued to participants in the plan is the offer amount divided by the weighted average price at which Australand’s stapled securities are traded on the Australian Stock exchange during the week up to and including the acquisition date (rounded down to the nearest whole number of stapled securities).
No securities were issued under the Australand Tax-exempt employee Security plan during the year. in 2011, 108,016 securities were issued at the weighted average market price of A$2.90 per security.

203
22 share CaPitaL
the Company
issued and fully paid, with no par value
2012no. of shares
(’000)
2011no. of shares
(’000)
At 1 January 4,269,439 4,262,492issue of shares pursuant to the:– exercise of options 837 1,120– Restricted Stock plans 63 5,827– payment of directors’ fees 152 –At 31 december, including treasury shares 4,270,491 4,269,439Less: Treasury shares (19,612) (25,209)At 31 december, excluding treasury shares 4,250,879 4,244,230
(a) The holders of ordinary shares (excluding treasury shares) are entitled to receive dividends as declared from time
to time and are entitled to one vote per share at meetings of the Company. All shares (excluding treasury shares) rank equally with regards to the Company’s residual assets.
(b) At 31 december 2012, there were 8,106,575 (2011: 9,000,244) options under the CapitaLand Share Option plan, a maximum of 17,548,384 (2011: 18,538,108) shares under the CapitaLand performance Share plan and 14,878,434 (2011: 14,197,716) shares under the CapitaLand Restricted Stock/Share plan, details of which are disclosed in note 21(c).
(c) As at 31 december 2012, the convertible bonds issued by the Company which remained outstanding were as follows:
Principal amount Final Maturity Date Conversion Price Convertible into
$ million Year $
424.75 2016 6.01 70,673,876 new ordinary shares1,000.00 2022 11.5218 86,791,994 new ordinary shares1,050.00 2018 7.1468 146,918,900 new ordinary shares1,200.00 2016 4.6908 255,819,903 new ordinary shares
There has been no redemption or conversion by the bondholders of any of the above convertible bonds in 2012 and 2011.
(d) Movements in the Company’s treasury shares were as follows:
the Company
2012no. of shares
(’000)
2011no. of shares
(’000)
At 1 January 25,209 –purchase of treasury shares – 25,209Treasury shares transferred pursuant to employee share plans (5,597) –At 31 december 19,612 25,209

204
appendixSTATUTORY ACCOUNTS
NOTeS TO THe FiNANCiAL STATeMeNTS22 share CaPitaL (cont’d) Capital Management The Group’s policy is to build a strong capital base so as to maintain investor, creditor and market confidence and to
sustain future development of the business. The Group monitors the return on capital, which the Group defines as total shareholders’ equity, excluding non-controlling interests, and the level of dividends to ordinary shareholders.
The Group also monitors capital using a net debt equity ratio, which is defined as net borrowings divided by total equity (including non-controlling interests).
the group
2012$’000
2011$’000
Bank borrowings and debt securities 14,179,778 12,190,639Cash and cash equivalents (5,497,693) (6,264,473)Net debt 8,682,085 5,926,166
Total equity 19,443,784 19,239,471
Net debt equity ratio 0.45 0.31 The Group seeks to strike a balance between the higher returns that might be possible with higher level of borrowings
and the liquidity and security afforded by a sound capital position.
in addition, the Company has a share purchase mandate as approved by its shareholders which allows the Company greater flexibility over its share capital structure with a view to improving, inter alia, its return on equity. The shares which are purchased are held as treasury shares which the Company may transfer for the purposes of or pursuant to its employee share-based incentive schemes so as to enable the Company to take advantage of tax deductions under the current taxation regime. The use of treasury shares in lieu of issuing new shares would also mitigate the dilution impact on existing shareholders.
Five of the Group’s subsidiaries (2011: Six) are required to maintain certain minimum base capital and financial resources, or shareholders’ funds as they are holders of Capital Markets Services licenses registered with the Monetary Authority of Singapore or the Securities Commission Malaysia to conduct the regulated activity of Real estate investment Trust management. These subsidiaries have complied with the applicable capital requirements throughout the year.
There were no changes in the Group’s approach to capital management during the year.
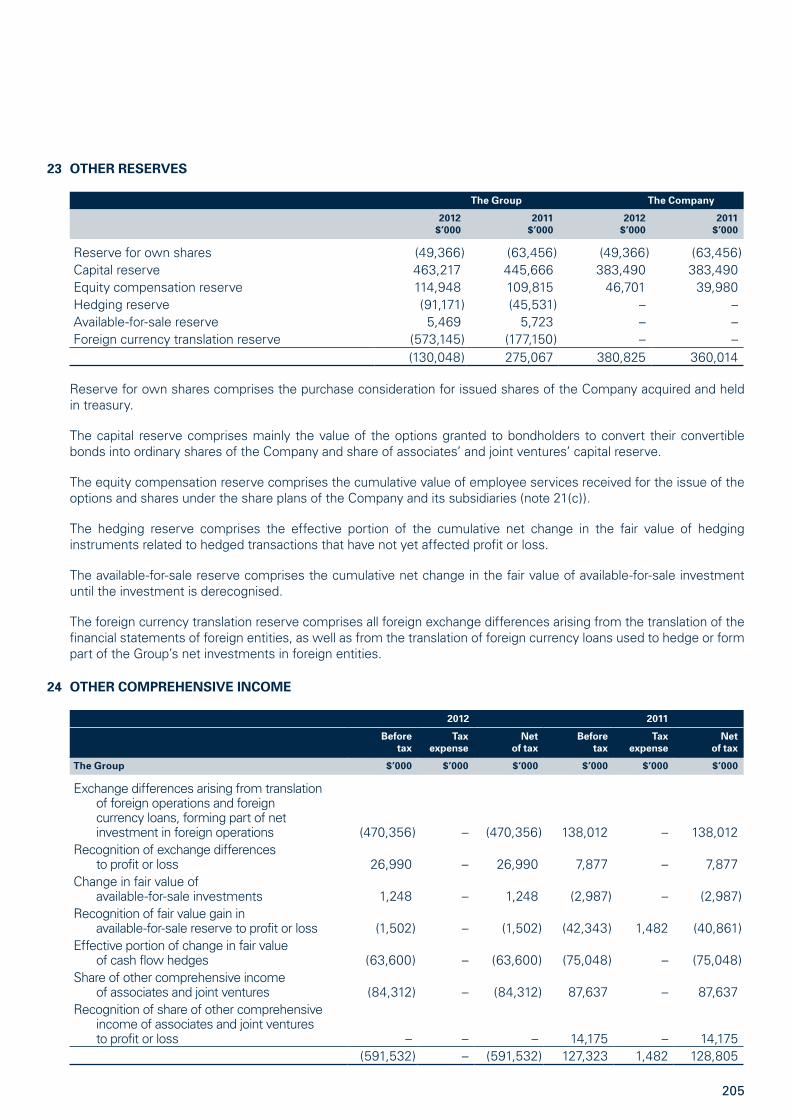
205
23 other reserves
the group the Company
2012$’000
2011$’000
2012$’000
2011$’000
Reserve for own shares (49,366) (63,456) (49,366) (63,456)Capital reserve 463,217 445,666 383,490 383,490equity compensation reserve 114,948 109,815 46,701 39,980Hedging reserve (91,171) (45,531) – –Available-for-sale reserve 5,469 5,723 – –Foreign currency translation reserve (573,145) (177,150) – –
(130,048) 275,067 380,825 360,014
Reserve for own shares comprises the purchase consideration for issued shares of the Company acquired and held in treasury.
The capital reserve comprises mainly the value of the options granted to bondholders to convert their convertible bonds into ordinary shares of the Company and share of associates’ and joint ventures’ capital reserve.
The equity compensation reserve comprises the cumulative value of employee services received for the issue of the options and shares under the share plans of the Company and its subsidiaries (note 21(c)).
The hedging reserve comprises the effective portion of the cumulative net change in the fair value of hedging instruments related to hedged transactions that have not yet affected profit or loss.
The available-for-sale reserve comprises the cumulative net change in the fair value of available-for-sale investment until the investment is derecognised.
The foreign currency translation reserve comprises all foreign exchange differences arising from the translation of the financial statements of foreign entities, as well as from the translation of foreign currency loans used to hedge or form part of the Group’s net investments in foreign entities.
24 other CoMPrehensive inCoMe
2012 2011
before tax
tax expense
net of tax
before tax
tax expense
net of tax
the group $’000 $’000 $’000 $’000 $’000 $’000
exchange differences arising from translation of foreign operations and foreign currency loans, forming part of net investment in foreign operations (470,356) – (470,356) 138,012 – 138,012Recognition of exchange differences to profit or loss 26,990 – 26,990 7,877 – 7,877Change in fair value of available-for-sale investments 1,248 – 1,248 (2,987) – (2,987)Recognition of fair value gain in available-for-sale reserve to profit or loss (1,502) – (1,502) (42,343) 1,482 (40,861)effective portion of change in fair value of cash flow hedges (63,600) – (63,600) (75,048) – (75,048)Share of other comprehensive income of associates and joint ventures (84,312) – (84,312) 87,637 – 87,637Recognition of share of other comprehensive income of associates and joint ventures to profit or loss – – – 14,175 – 14,175
(591,532) – (591,532) 127,323 1,482 128,805
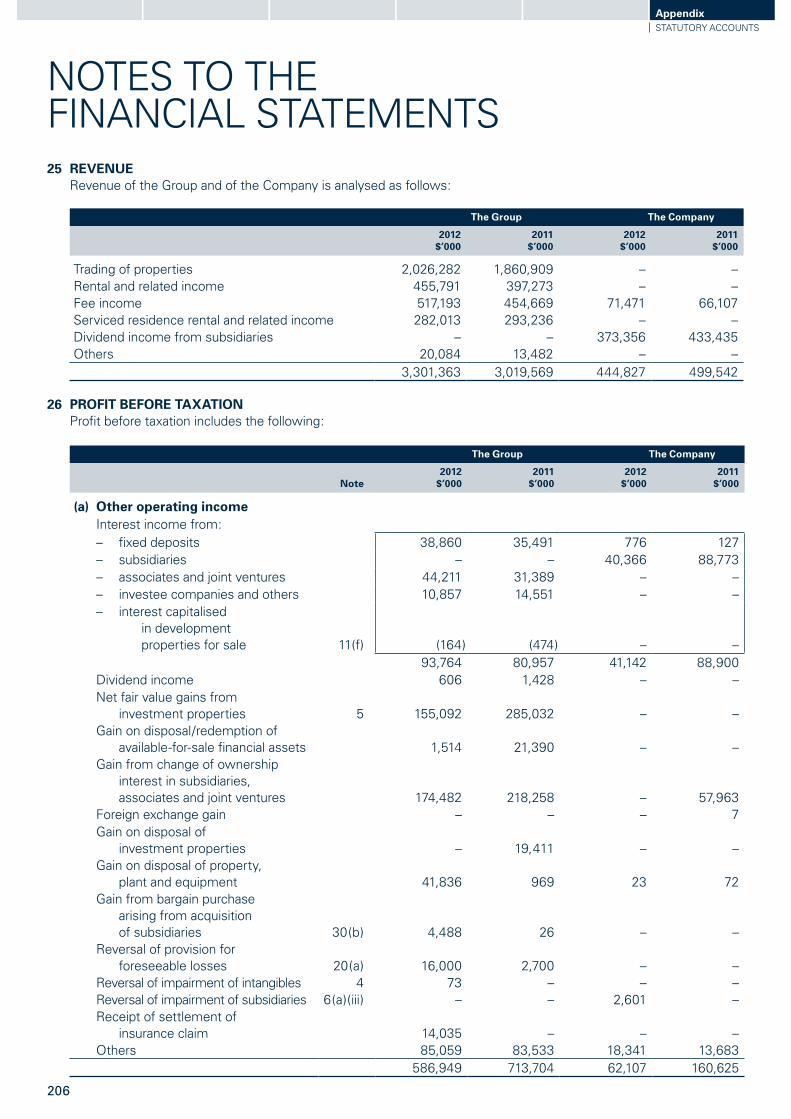
206
appendixSTATUTORY ACCOUNTS
NOTeS TO THe FiNANCiAL STATeMeNTS25 revenue Revenue of the Group and of the Company is analysed as follows:
the group the Company
2012$’000
2011$’000
2012$’000
2011$’000
Trading of properties 2,026,282 1,860,909 – –Rental and related income 455,791 397,273 – –Fee income 517,193 454,669 71,471 66,107Serviced residence rental and related income 282,013 293,236 – –dividend income from subsidiaries – – 373,356 433,435Others 20,084 13,482 – –
3,301,363 3,019,569 444,827 499,542 26 ProFit beFore taxation profit before taxation includes the following:
the group the Company
note2012
$’0002011
$’0002012
$’0002011
$’000
(a) other operating income interest income from: – fixed deposits 38,860 35,491 776 127 – subsidiaries – – 40,366 88,773 – associates and joint ventures 44,211 31,389 – – – investee companies and others 10,857 14,551 – – – interest capitalised in development properties for sale 11(f) (164) (474) – –
93,764 80,957 41,142 88,900 dividend income 606 1,428 – – Net fair value gains from investment properties 5 155,092 285,032 – – Gain on disposal/redemption of available-for-sale financial assets 1,514 21,390 – – Gain from change of ownership interest in subsidiaries, associates and joint ventures 174,482 218,258 – 57,963 Foreign exchange gain – – – 7 Gain on disposal of investment properties – 19,411 – – Gain on disposal of property, plant and equipment 41,836 969 23 72 Gain from bargain purchase arising from acquisition of subsidiaries 30(b) 4,488 26 – – Reversal of provision for foreseeable losses 20(a) 16,000 2,700 – – Reversal of impairment of intangibles 4 73 – – – Reversal of impairment of subsidiaries 6(a)(iii) – – 2,601 – Receipt of settlement of insurance claim 14,035 – – – Others 85,059 83,533 18,341 13,683
586,949 713,704 62,107 160,625

207
26 ProFit beFore taxation (cont’d)
the group the Company
note2012
$’0002011
$’0002012
$’0002011
$’000
(b) staff costs Wages and salaries 484,763 437,041 40,947 39,433 Contributions to defined contribution plans 49,991 46,262 2,564 2,398 Share-based expenses – equity-settled 41,844 31,766 9,485 6,932 – cash-settled 4,808 2,577 427 166 increase in liability for short term accumulating compensated absences 1,168 1,350 427 188 Staff benefits, training/ development costs and others 77,957 73,253 4,453 3,835
660,531 592,249 58,303 52,952 Less: Staff costs capitalised in development properties for sale 11(f) (66,729) (61,404) – –
593,802 530,845 58,303 52,952 Recognised in: Cost of sales (c)(i) 250,320 233,479 – – Administrative expenses (c)(ii) 343,482 297,366 58,303 52,952
593,802 530,845 58,303 52,952
(c)(i) Cost of sales include: Staff costs (b) 250,320 233,479 – – provision for foreseeable losses/ Write down on development properties for sale 49,429 39,155 – – Operating lease expenses 81,470 88,191 – – Operating expenses arising from investment properties that generated rental income 110,125 94,962 – – depreciation of property, plant and equipment 3 28 19 – – Amortisation of intangible assets – 242 – –
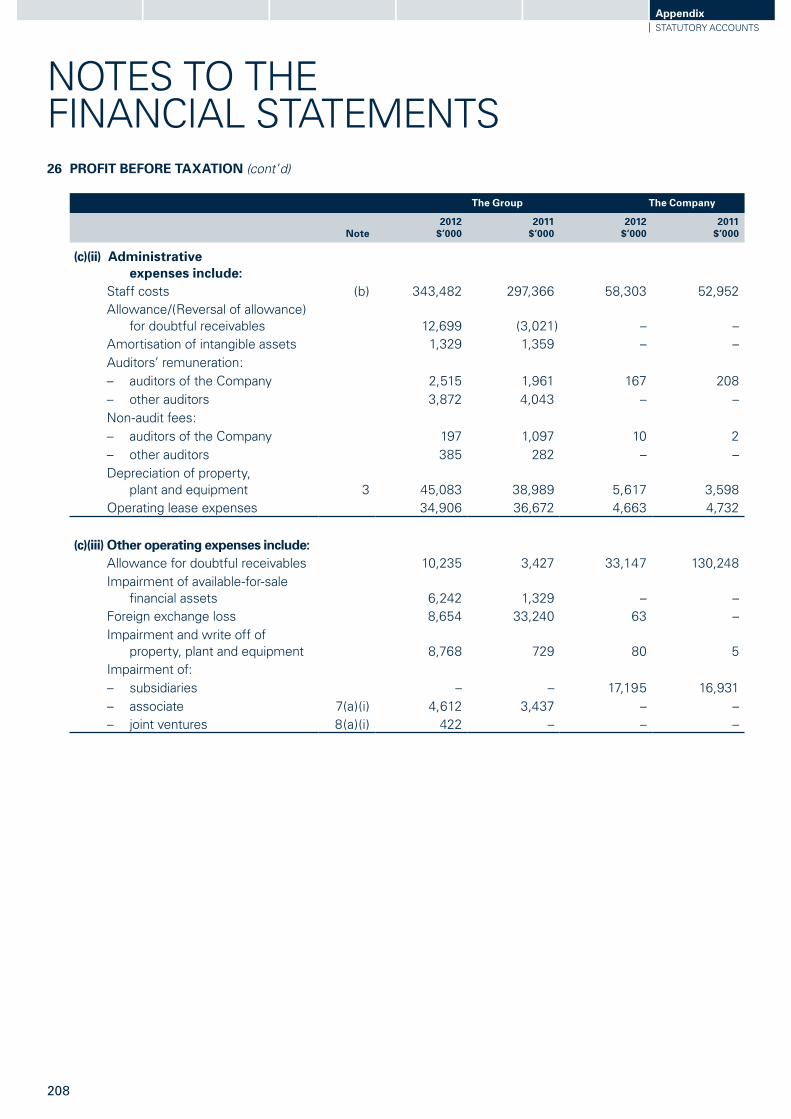
208
appendixSTATUTORY ACCOUNTS
NOTeS TO THe FiNANCiAL STATeMeNTS26 ProFit beFore taxation (cont’d)
the group the Company
note2012
$’0002011
$’0002012
$’0002011
$’000
(c)(ii) administrative expenses include: Staff costs (b) 343,482 297,366 58,303 52,952 Allowance/(Reversal of allowance) for doubtful receivables 12,699 (3,021) – – Amortisation of intangible assets 1,329 1,359 – – Auditors’ remuneration: – auditors of the Company 2,515 1,961 167 208 – other auditors 3,872 4,043 – – Non-audit fees: – auditors of the Company 197 1,097 10 2 – other auditors 385 282 – – depreciation of property, plant and equipment 3 45,083 38,989 5,617 3,598 Operating lease expenses 34,906 36,672 4,663 4,732
(c)(iii) other operating expenses include: Allowance for doubtful receivables 10,235 3,427 33,147 130,248 impairment of available-for-sale financial assets 6,242 1,329 – – Foreign exchange loss 8,654 33,240 63 – impairment and write off of property, plant and equipment 8,768 729 80 5 impairment of: – subsidiaries – – 17,195 16,931 – associate 7(a)(i) 4,612 3,437 – – – joint ventures 8(a)(i) 422 – – –

209
26 ProFit beFore taxation (cont’d)
the group the Company
note2012
$’0002011
$’0002012
$’0002011
$’000
(d) Finance costs interest costs paid and payable: – on bank loans and overdrafts 281,732 240,385 – – – on debt securities 113,195 82,803 – – – to non-controlling interests 6,211 5,423 – – Convertible bonds: – interest expense 105,991 105,673 105,991 105,673 – amortisation of bond discount 63,584 63,584 63,584 63,584 – accretion of bond premium 10,517 10,479 10,517 10,479 derivative financial instruments 21,555 29,957 – – Others 55,663 61,769 5,238 1,311 Total borrowing costs 658,448 600,073 185,330 181,047 Less: Borrowing costs capitalised in: – property, plant and equipment 3(d) (965) (3,093) – – – investment properties 5(d) (52,580) (23,470) – – – development properties for sale 11(f) (105,950) (100,725) – –
(159,495) (127,288) – –498,953 472,785 185,330 181,047
27 taxation
the group the Company
2012$’000
2011$’000
2012$’000
2011$’000
Current tax expense– Based on current year’s results 203,283 167,520 – –– Over provision in respect of prior years (37,415) (19,252) – –– Group relief (14,686) (4,703) (1,908) (778)
151,182 143,565 (1,908) (778)Deferred tax expense– Origination and reversal of temporary differences 47,922 47,652 (10,514)
(10,558)
– Under/(Over) provision in respect of prior years 2,803 (333) – –
50,725 47,319 (10,514) (10,558)Total 201,907 190,884 (12,422) (11,336)
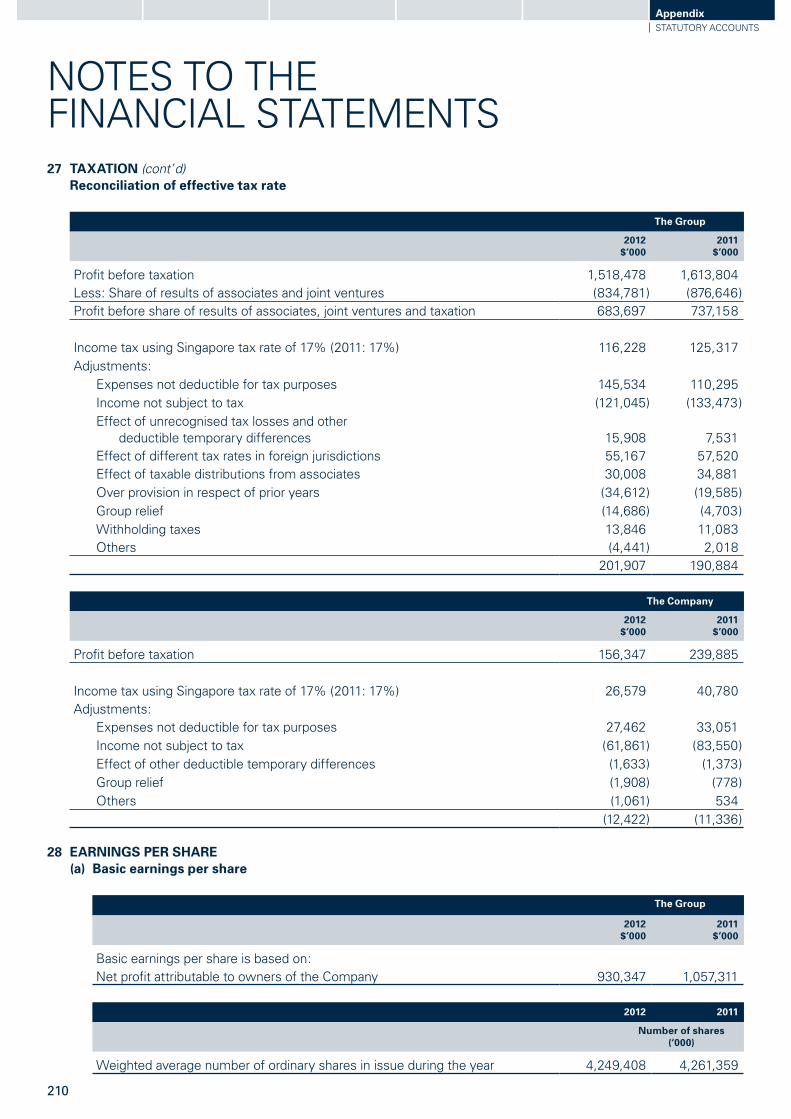
210
appendixSTATUTORY ACCOUNTS
NOTeS TO THe FiNANCiAL STATeMeNTS27 taxation (cont’d) reconciliation of effective tax rate
the group
2012$’000
2011$’000
profit before taxation 1,518,478 1,613,804Less: Share of results of associates and joint ventures (834,781) (876,646)profit before share of results of associates, joint ventures and taxation 683,697 737,158
income tax using Singapore tax rate of 17% (2011: 17%) 116,228 125,317Adjustments: expenses not deductible for tax purposes 145,534 110,295 income not subject to tax (121,045) (133,473) effect of unrecognised tax losses and other deductible temporary differences 15,908 7,531 effect of different tax rates in foreign jurisdictions 55,167 57,520 effect of taxable distributions from associates 30,008 34,881 Over provision in respect of prior years (34,612) (19,585) Group relief (14,686) (4,703) Withholding taxes 13,846 11,083 Others (4,441) 2,018
201,907 190,884
the Company
2012$’000
2011$’000
profit before taxation 156,347 239,885
income tax using Singapore tax rate of 17% (2011: 17%) 26,579 40,780Adjustments: expenses not deductible for tax purposes 27,462 33,051 income not subject to tax (61,861) (83,550) effect of other deductible temporary differences (1,633) (1,373) Group relief (1,908) (778) Others (1,061) 534
(12,422) (11,336)
28 earnings Per share (a) basic earnings per share
the group
2012$’000
2011$’000
Basic earnings per share is based on:Net profit attributable to owners of the Company 930,347 1,057,311
2012 2011
number of shares (‘000)
Weighted average number of ordinary shares in issue during the year 4,249,408 4,261,359

211
28 earnings Per share (cont’d) (b) Diluted earnings per share in calculating diluted earnings per share, the net profit attributable to owners of the Company and weighted
average number of ordinary shares in issue during the year are adjusted for the effects of all dilutive potential ordinary shares:
the group
2012$’000
2011$’000
Net profit attributable to owners of the Company 930,347 1,057,311profit impact of conversion of the potential dilutive shares – 78,097Adjusted net profit attributable to owners of the Company 930,347 1,135,408
2012 2011
number of shares (‘000)
Weighted average number of ordinary shares used in the calculation of basic earnings per share 4,249,408 4,261,359
Adjustments for potential dilutive shares under:– CapitaLand Share Option plan 916 1,408– CapitaLand performance Share plan 17,548 18,538– CapitaLand Restricted Stock/Share plan 14,879 14,198– convertible bonds – 324,596
33,343 358,740Weighted average number of ordinary shares used in the calculation of diluted earnings per share 4,282,751 4,620,099
29 DiviDenDs The Board of directors of the Company has proposed a tax-exempt ordinary dividend of 7.0 cents per share in respect
of the financial year ended 31 december 2012. This would amount to a payout of approximately $297.6 million based on the number of issued shares (excluding 19,611,437 treasury shares) as at 31 december 2012. The tax-exempt dividends are subject to shareholders’ approval at the forthcoming Annual General Meeting of the Company.
For the financial year ended 31 december 2011, a tax-exempt ordinary dividend of 6.0 cents per share and a tax-exempt special dividend of 2.0 cents per share were approved at the Annual General Meeting held on 30 April 2012. The said dividends of $340.0 million were paid in May 2012.
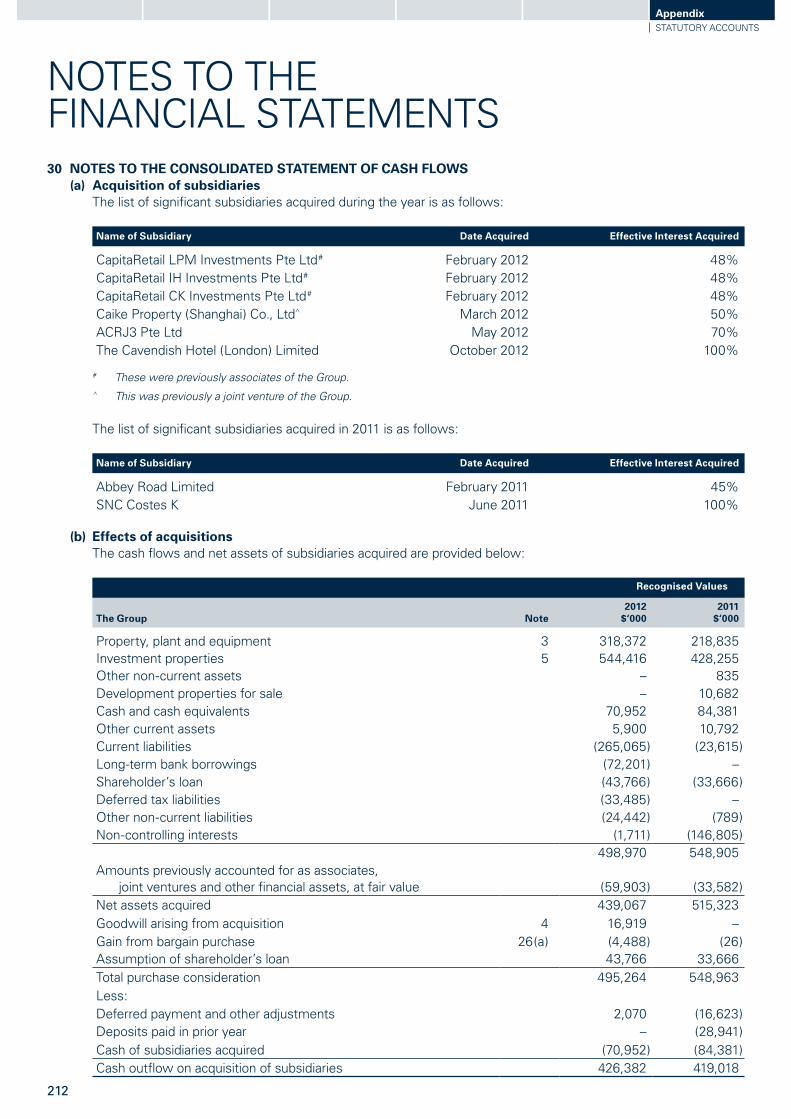
212
appendixSTATUTORY ACCOUNTS
NOTeS TO THe FiNANCiAL STATeMeNTS30 notes to the ConsoLiDateD stateMent oF Cash FLows (a) acquisition of subsidiaries The list of significant subsidiaries acquired during the year is as follows:
name of subsidiary Date acquired effective interest acquired
CapitaRetail LpM investments pte Ltd# February 2012 48%CapitaRetail iH investments pte Ltd# February 2012 48%CapitaRetail CK investments pte Ltd# February 2012 48%Caike property (Shanghai) Co., Ltd^ March 2012 50%ACRJ3 pte Ltd May 2012 70%The Cavendish Hotel (London) Limited October 2012 100%
# These were previously associates of the Group.
^ This was previously a joint venture of the Group.
The list of significant subsidiaries acquired in 2011 is as follows:
name of subsidiary Date acquired effective interest acquired
Abbey Road Limited February 2011 45%SNC Costes K June 2011 100%
(b) effects of acquisitions The cash flows and net assets of subsidiaries acquired are provided below:
recognised values
the group note2012
$‘0002011
$‘000
property, plant and equipment 3 318,372 218,835investment properties 5 544,416 428,255Other non-current assets – 835development properties for sale – 10,682Cash and cash equivalents 70,952 84,381Other current assets 5,900 10,792Current liabilities (265,065) (23,615)Long-term bank borrowings (72,201) –Shareholder’s loan (43,766) (33,666)deferred tax liabilities (33,485) –Other non-current liabilities (24,442) (789)Non-controlling interests (1,711) (146,805)
498,970 548,905Amounts previously accounted for as associates, joint ventures and other financial assets, at fair value (59,903) (33,582)Net assets acquired 439,067 515,323Goodwill arising from acquisition 4 16,919 –Gain from bargain purchase 26(a) (4,488) (26)Assumption of shareholder’s loan 43,766 33,666Total purchase consideration 495,264 548,963Less:deferred payment and other adjustments 2,070 (16,623)deposits paid in prior year – (28,941)Cash of subsidiaries acquired (70,952) (84,381)Cash outflow on acquisition of subsidiaries 426,382 419,018

213
30 notes to the ConsoLiDateD stateMent oF Cash FLows (cont’d) (c) Disposal of subsidiaries The list of significant subsidiaries disposed during the year is as follows:
name of subsidiary Date Disposed effective interest Disposed
Franco investment Limited March 2012 100%Growing State Holdings Limited# June 2012 65%CapitaRetail China developments d18 (HK) Limited# June 2012 65%Hong Kong Yong Zheng Group Company Limited^ September 2012 100%Citadines Ashley TST (Hong Kong) Limited October 2012 100%
# These subsidiaries were sold to CapitaMalls China Development Fund III in which the Group has an effective interest of 32.7% as at 31 December 2012.
^ This subsidiary was sold to Ascott Residence Trust in which the Group has an effective interest of 49.4% as at 31 December 2012.
The disposed subsidiaries previously contributed net profit of $5.8 million from 1 January 2012 to the dates of disposal.
The list of significant subsidiaries disposed in 2011 is as follows:
name of subsidiary Date Disposed effective interest Disposed
BR properties pte Ltd May 2011 100%Hemliner pte Ltd* July 2011 100%Shanghai CapitaLand Xin Chuang Real estate development Co., Ltd. december 2011 100%
* This subsidiary was sold to Ascott Serviced Residence (China) Fund in which the Group has an effective interest of 36.1% as at 31 December 2011.
The disposed subsidiaries previously contributed net profit of $6.5 million from 1 January 2011 to the dates of disposal.
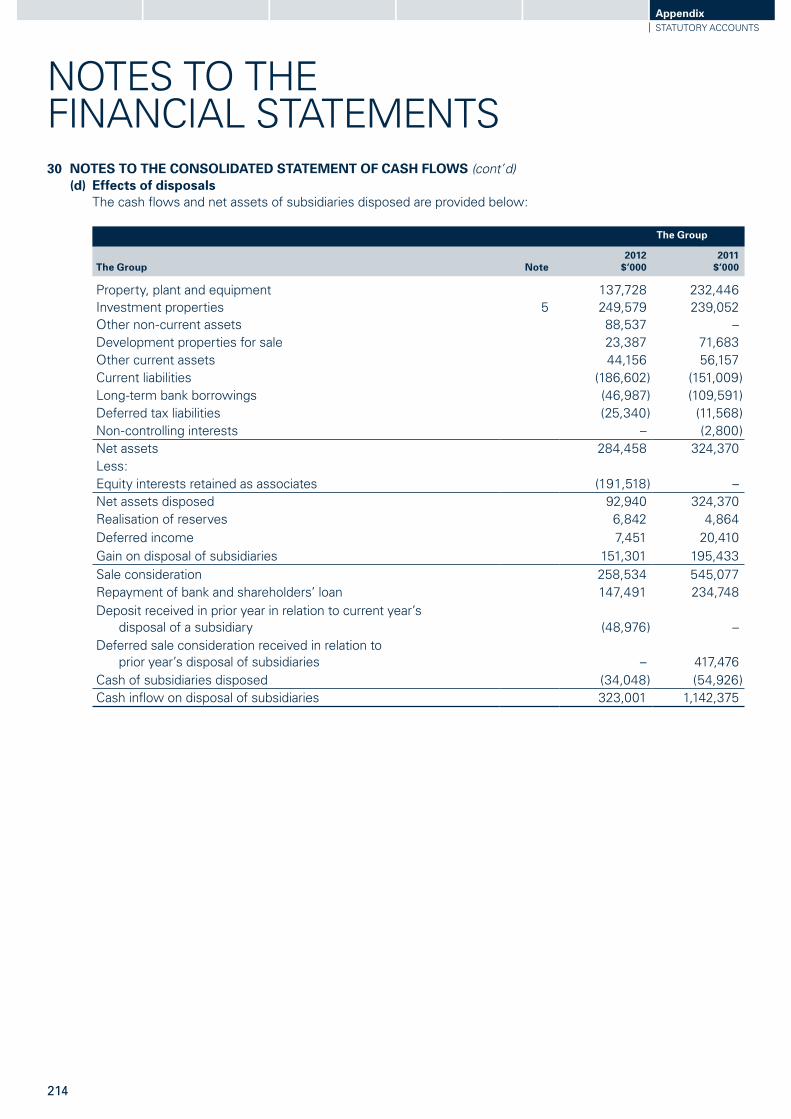
214
appendixSTATUTORY ACCOUNTS
NOTeS TO THe FiNANCiAL STATeMeNTS30 notes to the ConsoLiDateD stateMent oF Cash FLows (cont’d) (d) effects of disposals The cash flows and net assets of subsidiaries disposed are provided below:
the group
the group note2012
$‘0002011
$‘000
property, plant and equipment 137,728 232,446investment properties 5 249,579 239,052Other non-current assets 88,537 –development properties for sale 23,387 71,683Other current assets 44,156 56,157Current liabilities (186,602) (151,009)Long-term bank borrowings (46,987) (109,591)deferred tax liabilities (25,340) (11,568)Non-controlling interests – (2,800)Net assets 284,458 324,370Less:equity interests retained as associates (191,518) –Net assets disposed 92,940 324,370Realisation of reserves 6,842 4,864deferred income 7,451 20,410Gain on disposal of subsidiaries 151,301 195,433Sale consideration 258,534 545,077Repayment of bank and shareholders’ loan 147,491 234,748deposit received in prior year in relation to current year’s disposal of a subsidiary (48,976) –deferred sale consideration received in relation to prior year’s disposal of subsidiaries – 417,476Cash of subsidiaries disposed (34,048) (54,926)Cash inflow on disposal of subsidiaries 323,001 1,142,375
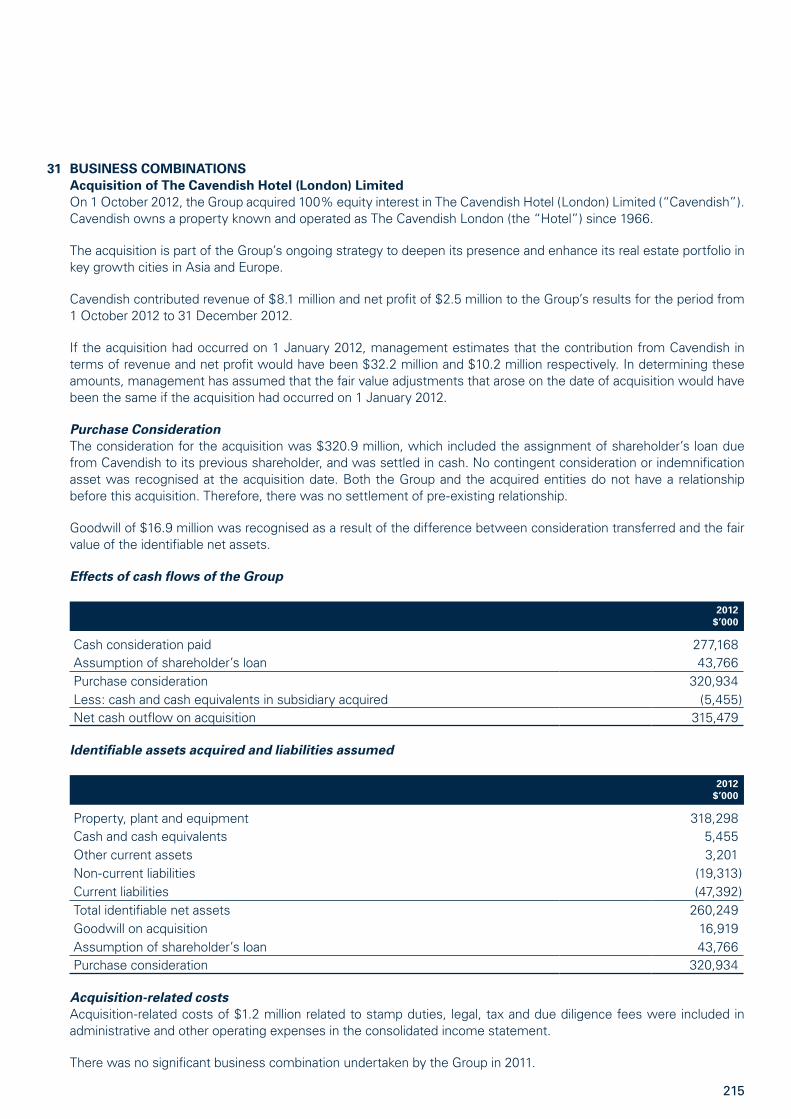
215
31 business CoMbinations acquisition of the Cavendish hotel (London) Limited On 1 October 2012, the Group acquired 100% equity interest in The Cavendish Hotel (London) Limited (“Cavendish”).
Cavendish owns a property known and operated as The Cavendish London (the “Hotel”) since 1966.
The acquisition is part of the Group’s ongoing strategy to deepen its presence and enhance its real estate portfolio in key growth cities in Asia and europe.
Cavendish contributed revenue of $8.1 million and net profit of $2.5 million to the Group’s results for the period from 1 October 2012 to 31 december 2012.
if the acquisition had occurred on 1 January 2012, management estimates that the contribution from Cavendish in terms of revenue and net profit would have been $32.2 million and $10.2 million respectively. in determining these amounts, management has assumed that the fair value adjustments that arose on the date of acquisition would have been the same if the acquisition had occurred on 1 January 2012.
Purchase Consideration The consideration for the acquisition was $320.9 million, which included the assignment of shareholder’s loan due
from Cavendish to its previous shareholder, and was settled in cash. No contingent consideration or indemnification asset was recognised at the acquisition date. Both the Group and the acquired entities do not have a relationship before this acquisition. Therefore, there was no settlement of pre-existing relationship.
Goodwill of $16.9 million was recognised as a result of the difference between consideration transferred and the fair value of the identifiable net assets.
Effects of cash flows of the Group
2012$’000
Cash consideration paid 277,168Assumption of shareholder’s loan 43,766purchase consideration 320,934Less: cash and cash equivalents in subsidiary acquired (5,455)Net cash outflow on acquisition 315,479
Identifiable assets acquired and liabilities assumed
2012$’000
property, plant and equipment 318,298Cash and cash equivalents 5,455Other current assets 3,201Non-current liabilities (19,313)Current liabilities (47,392)Total identifiable net assets 260,249Goodwill on acquisition 16,919Assumption of shareholder’s loan 43,766purchase consideration 320,934
Acquisition-related costs Acquisition-related costs of $1.2 million related to stamp duties, legal, tax and due diligence fees were included in
administrative and other operating expenses in the consolidated income statement.
There was no significant business combination undertaken by the Group in 2011.

216
appendixSTATUTORY ACCOUNTS
NOTeS TO THe FiNANCiAL STATeMeNTS32 FinanCiaL risK ManageMent (a) Financial risk management objectives and policies The Group and the Company are exposed to market risk (including interest rate, foreign currency and price risks),
credit risk and liquidity risk arising from its diversified business. The Group’s risk management approach seeks to minimise the potential material adverse effects from these exposures. The Group uses financial instruments such as currency forwards, interest rate swaps and caps as well as foreign currency borrowings to hedge certain financial risk exposures.
The Board of directors has overall responsibility for the establishment and oversight of the Group’s risk management framework. The Board has established the Risk Committee to strengthen its risk management processes and framework. The Risk Committee is assisted by an independent unit called the Risk Assessment Group (“RAG”). RAG generates a comprehensive portfolio risk report to assist the committee. This quarterly report measures a spectrum of risks, including property market risks, construction risks, interest rate risks, refinancing risks and currency risks.
(b) Market risk Market risk is the risk that changes in market prices, such as interest rates, foreign exchange rates and equity
prices will have on the Group’s income or the value of its holdings of financial instruments. The objective of market risk management is to manage and control market risk exposures within acceptable parameters, while optimising the return on risk.
(i) Interest rate risk The Group’s exposure to market risk for changes in interest rate environment relates mainly to its investment
in financial products and debt obligations.
The investments in financial products are short term in nature and they are not held for trading or speculative purposes. The financial products comprise fixed deposits or short term commercial papers which yield better returns than cash at bank.
The Group manages its interest rate exposure by maintaining a prudent mix of fixed and floating rate borrowings.
The Group actively reviews its debt portfolio, taking into account the investment holding period and nature of its assets. This strategy allows it to capitalise on cheaper funding in a low interest rate environment and achieve certain level of protection against rate hikes. The Group also uses hedging instruments such as interest rate swaps and caps to minimise its exposure to interest rate volatility. The Group classifies these interest rate swaps and caps as cash flow hedges. in addition, the Group also uses other derivative instruments such as callable swaps to manage the cost of funding.
The fair value loss of interest rate swaps and caps as at 31 december 2012 was $183.0 million (2011: $111.7 million), comprising derivative liabilities of $183.0 million (2011: $111.9 million) and derivative assets of nil (2011: $0.2 million).
Sensitivity analysis For interest rate derivative instruments used for hedging and other variable rate financial liabilities, it is
estimated that an increase of 100 basis point in interest rate at the reporting date would lead to a reduction in the Group’s profit before tax (and revenue reserves) by approximately $33.0 million (2011: $37.8 million). A decrease in 100 basis point in interest rate would have an equal but opposite effect. This analysis assumes that all other variables, in particular foreign currency rates, remain constant, and has not taken into account the effects of qualifying borrowing costs allowed for capitalisation, the associated tax effects and share of non-controlling interests.
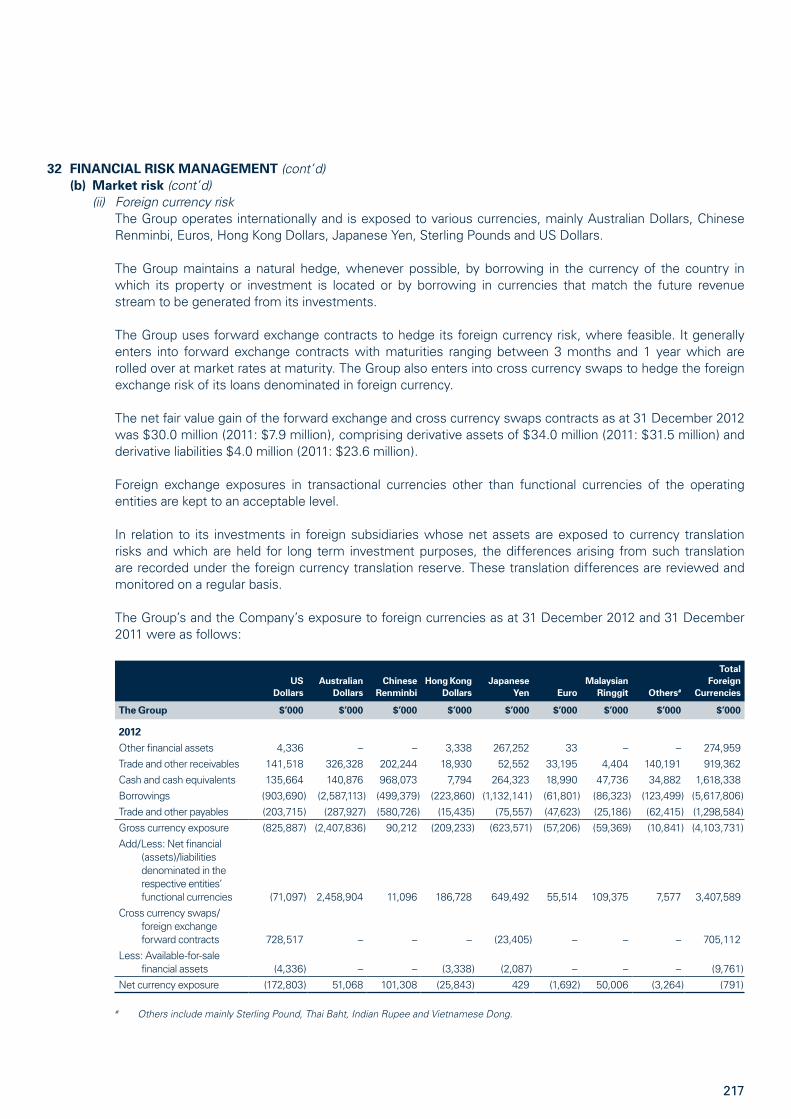
217
32 FinanCiaL risK ManageMent (cont’d) (b) Market risk (cont’d) (ii) Foreign currency risk The Group operates internationally and is exposed to various currencies, mainly Australian dollars, Chinese
Renminbi, euros, Hong Kong dollars, Japanese Yen, Sterling pounds and US dollars.
The Group maintains a natural hedge, whenever possible, by borrowing in the currency of the country in which its property or investment is located or by borrowing in currencies that match the future revenue stream to be generated from its investments.
The Group uses forward exchange contracts to hedge its foreign currency risk, where feasible. it generally enters into forward exchange contracts with maturities ranging between 3 months and 1 year which are rolled over at market rates at maturity. The Group also enters into cross currency swaps to hedge the foreign exchange risk of its loans denominated in foreign currency.
The net fair value gain of the forward exchange and cross currency swaps contracts as at 31 december 2012 was $30.0 million (2011: $7.9 million), comprising derivative assets of $34.0 million (2011: $31.5 million) and derivative liabilities $4.0 million (2011: $23.6 million).
Foreign exchange exposures in transactional currencies other than functional currencies of the operating entities are kept to an acceptable level.
in relation to its investments in foreign subsidiaries whose net assets are exposed to currency translation risks and which are held for long term investment purposes, the differences arising from such translation are recorded under the foreign currency translation reserve. These translation differences are reviewed and monitored on a regular basis.
The Group’s and the Company’s exposure to foreign currencies as at 31 december 2012 and 31 december 2011 were as follows:
us Dollars
australian Dollars
Chinese renminbi
hong Kong Dollars
Japanese Yen euro
Malaysian ringgit others#
total Foreign
Currencies
the group $’000 $’000 $’000 $’000 $’000 $’000 $’000 $’000 $’000
2012Other financial assets 4,336 – – 3,338 267,252 33 – – 274,959Trade and other receivables 141,518 326,328 202,244 18,930 52,552 33,195 4,404 140,191 919,362Cash and cash equivalents 135,664 140,876 968,073 7,794 264,323 18,990 47,736 34,882 1,618,338Borrowings (903,690) (2,587,113) (499,379) (223,860) (1,132,141) (61,801) (86,323) (123,499) (5,617,806)Trade and other payables (203,715) (287,927) (580,726) (15,435) (75,557) (47,623) (25,186) (62,415) (1,298,584)Gross currency exposure (825,887) (2,407,836) 90,212 (209,233) (623,571) (57,206) (59,369) (10,841) (4,103,731)Add/Less: Net financial (assets)/liabilities denominated in the respective entities’ functional currencies (71,097) 2,458,904 11,096 186,728 649,492 55,514 109,375 7,577 3,407,589Cross currency swaps/ foreign exchange forward contracts 728,517 – – – (23,405) – – – 705,112Less: Available-for-sale financial assets (4,336) – – (3,338) (2,087) – – – (9,761)Net currency exposure (172,803) 51,068 101,308 (25,843) 429 (1,692) 50,006 (3,264) (791)
# Others include mainly Sterling Pound, Thai Baht, Indian Rupee and Vietnamese Dong.
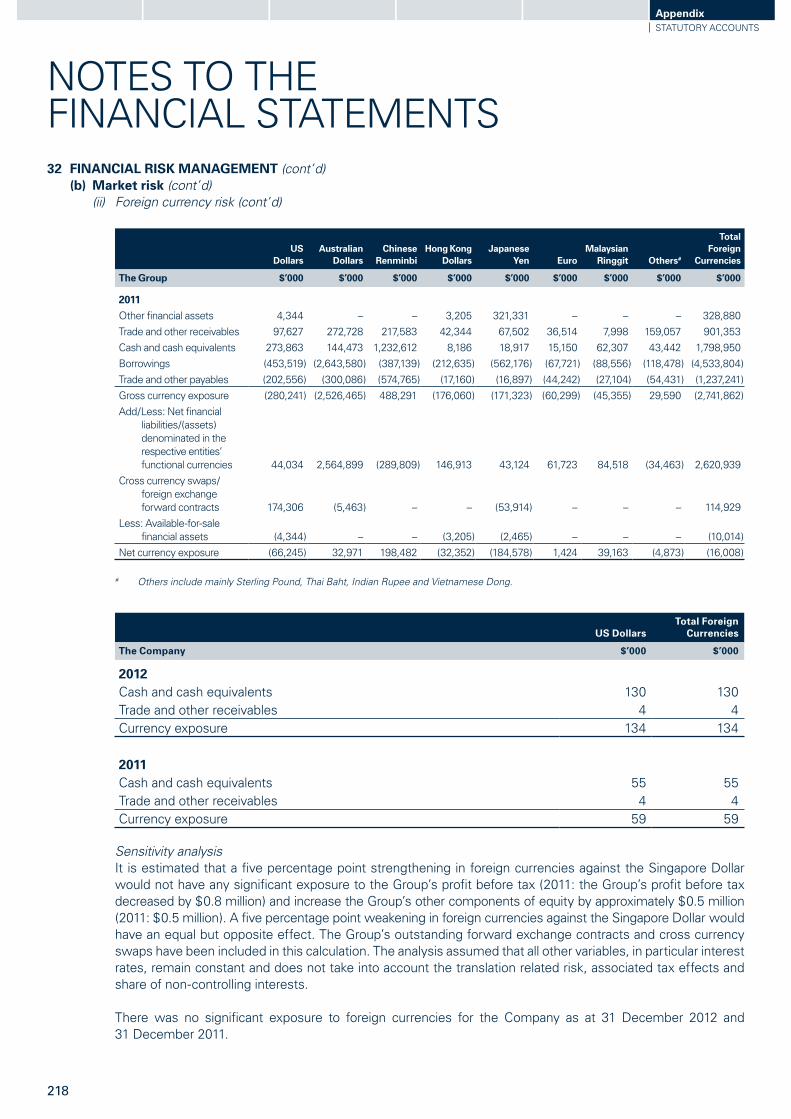
218
appendixSTATUTORY ACCOUNTS
NOTeS TO THe FiNANCiAL STATeMeNTS32 FinanCiaL risK ManageMent (cont’d) (b) Market risk (cont’d) (ii) Foreign currency risk (cont’d)
us Dollars
australian Dollars
Chinese renminbi
hong Kong Dollars
Japanese Yen euro
Malaysian ringgit others#
total Foreign
Currencies
the group $’000 $’000 $’000 $’000 $’000 $’000 $’000 $’000 $’000
2011Other financial assets 4,344 – – 3,205 321,331 – – – 328,880Trade and other receivables 97,627 272,728 217,583 42,344 67,502 36,514 7,998 159,057 901,353Cash and cash equivalents 273,863 144,473 1,232,612 8,186 18,917 15,150 62,307 43,442 1,798,950Borrowings (453,519) (2,643,580) (387,139) (212,635) (562,176) (67,721) (88,556) (118,478) (4,533,804)Trade and other payables (202,556) (300,086) (574,765) (17,160) (16,897) (44,242) (27,104) (54,431) (1,237,241)Gross currency exposure (280,241) (2,526,465) 488,291 (176,060) (171,323) (60,299) (45,355) 29,590 (2,741,862)Add/Less: Net financial liabilities/(assets) denominated in the respective entities’ functional currencies 44,034 2,564,899 (289,809) 146,913 43,124 61,723 84,518 (34,463) 2,620,939Cross currency swaps/ foreign exchange forward contracts 174,306 (5,463) – – (53,914) – – – 114,929Less: Available-for-sale financial assets (4,344) – – (3,205) (2,465) – – – (10,014)Net currency exposure (66,245) 32,971 198,482 (32,352) (184,578) 1,424 39,163 (4,873) (16,008)
# Others include mainly Sterling Pound, Thai Baht, Indian Rupee and Vietnamese Dong.
us Dollarstotal Foreign
Currencies
the Company $’000 $’000
2012Cash and cash equivalents 130 130Trade and other receivables 4 4Currency exposure 134 134
2011Cash and cash equivalents 55 55Trade and other receivables 4 4Currency exposure 59 59
Sensitivity analysis it is estimated that a five percentage point strengthening in foreign currencies against the Singapore dollar
would not have any significant exposure to the Group’s profit before tax (2011: the Group’s profit before tax decreased by $0.8 million) and increase the Group’s other components of equity by approximately $0.5 million (2011: $0.5 million). A five percentage point weakening in foreign currencies against the Singapore dollar would have an equal but opposite effect. The Group’s outstanding forward exchange contracts and cross currency swaps have been included in this calculation. The analysis assumed that all other variables, in particular interest rates, remain constant and does not take into account the translation related risk, associated tax effects and share of non-controlling interests.
There was no significant exposure to foreign currencies for the Company as at 31 december 2012 and 31 december 2011.

219
32 FinanCiaL risK ManageMent (cont’d) (b) Market risk (cont’d) (iii) Equity price risk The Group has available-for-sale investments in equity securities and is exposed to price risk. The securities
are listed in Japan.
Sensitivity analysis if prices for equity securities listed in Japan change by 5% with all other variables including tax rate being held
constant, the impact on available-for-sale reserve will be as follows:
2012 2011
the group5% increase
$’0005% decrease
$’0005% increase
$’0005% decrease
$’000
Available-for-sale reserve 104 (104) 123 (123)
(c) Credit risk Credit risk is the risk of financial loss to the Group if a customer or counterparty to a financial instrument fails to
meet its contractual obligations. For trade receivables, the Group has guidelines governing the process of granting credit as a service or product provider in its respective segments of business. Trade and other receivables relate mainly to the Group’s customers who bought its residential units and tenants from its commercial buildings, shopping malls and serviced residences. investments and financial transactions are restricted to counterparties that meet the appropriate credit criteria and are of high credit standing.
The principal risk to which the Group and the Company is exposed in respect of financial guarantee contracts is credit risk in connection with the guarantee contracts it has issued. To mitigate the risks, management continually monitors the risks and has established processes including performing credit evaluations of the parties it is providing the guarantee on behalf of. Guarantees are only given for its subsidiaries and related parties. The maximum exposure to credit risk in respect of these financial guarantees at the balance sheet date is disclosed in note 34.
The Group has a diversified portfolio of businesses and as at balance sheet date, there were no significant concentration of credit risk with any entity. The maximum exposure to credit risk is represented by the carrying amount of each financial asset in the balance sheet, including derivative financial instruments as well as any irrevocable loan undertaking to associates and joint ventures.
(d) Liquidity risk Liquidity risk is the risk that the Group will not be able to meet its financial obligations as they fall due. The Group
actively manages its debt maturity profile, operating cash flows and the availability of funding so as to ensure that all refinancing, repayment and funding needs are met. As part of its overall prudent liquidity management, the Group maintains sufficient level of cash or cash convertible investments to meet its working capital requirement. in addition, the Group strives to maintain available banking facilities at a reasonable level to its overall debt position. As far as possible, the Group will constantly raise committed funding from both capital markets and financial institutions and prudently balance its portfolio with some short term funding so as to achieve overall cost effectiveness.

220
appendixSTATUTORY ACCOUNTS
NOTeS TO THe FiNANCiAL STATeMeNTS32 FinanCiaL risK ManageMent (cont’d) (d) Liquidity risk (cont’d) The following are the expected contractual undiscounted cash flows of financial liabilities, including interest
payments and excluding the impact of netting agreements:
<-------------------------- Contractual cash flows ------------------------->
Carryingamount total
not later than 1 year
between1 and 5 years
after5 years
the group $’000 $’000 $’000 $’000 $’000
2012Financial liabilities, at amortised costBank borrowings 7,382,940 7,963,958 958,430 6,625,330 380,198debt securities 6,796,838 8,530,756 184,909 3,411,084 4,934,763Trade and other payables# 2,273,336 2,276,522 1,778,959 426,836 70,727
16,453,114 18,771,236 2,922,298 10,463,250 5,385,688derivative financial liabilities, at fair value 187,087 45,276 25,794 23,788 (4,306)
16,640,201 18,816,512 2,948,092 10,487,038 5,381,382
2011Financial liabilities, at amortised costBank borrowings 6,531,801 7,649,276 665,250 6,866,220 117,806debt securities 5,658,838 7,104,747 570,780 2,821,646 3,712,321Trade and other payables# 2,258,817 2,301,579 1,837,547 411,153 52,879
14,449,456 17,055,602 3,073,577 10,099,019 3,883,006derivative financial liabilities, at fair value 135,522 60,265 40,151 20,153 (39)
14,584,978 17,115,867 3,113,728 10,119,172 3,882,967
<-------------------------- Contractual cash flows ------------------------->
Carryingamount total
not later than 1 year
between1 and 5 years
after5 years
the Company $’000 $’000 $’000 $’000 $’000
2012Financial liabilities, at amortised costdebt securities 3,512,287 4,390,211 81,576 2,004,459 2,304,176Trade and other payables# 51,144 51,144 51,144 – –
3,563,431 4,441,355 132,720 2,004,459 2,304,176
2011Financial liabilities, at amortised costdebt securities 3,432,956 4,496,201 81,834 2,047,879 2,366,488Trade and other payables# 50,613 50,613 50,613 – –
3,483,569 4,546,814 132,447 2,047,879 2,366,488
# Excludes quasi-equity loans, progress billings, liability for employee benefits and provisions.
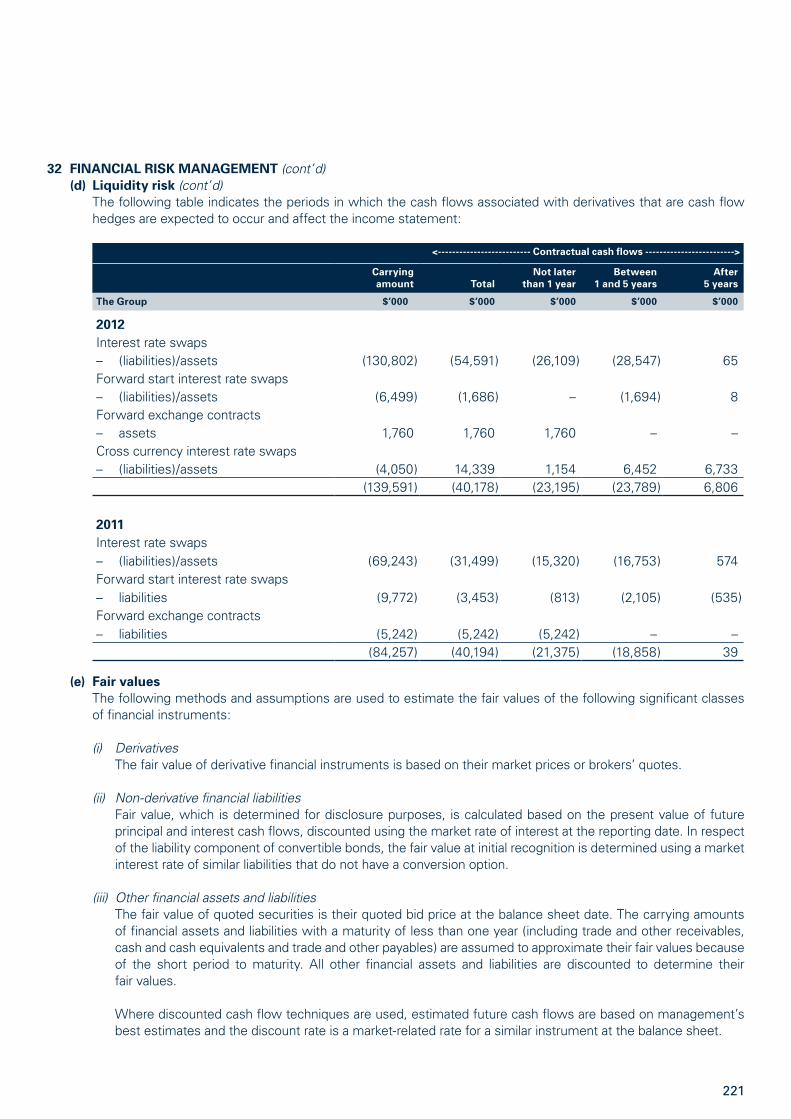
221
32 FinanCiaL risK ManageMent (cont’d) (d) Liquidity risk (cont’d) The following table indicates the periods in which the cash flows associated with derivatives that are cash flow
hedges are expected to occur and affect the income statement:
<-------------------------- Contractual cash flows ------------------------->
Carryingamount total
not later than 1 year
between1 and 5 years
after5 years
the group $’000 $’000 $’000 $’000 $’000
2012interest rate swaps– (liabilities)/assets (130,802) (54,591) (26,109) (28,547) 65Forward start interest rate swaps– (liabilities)/assets (6,499) (1,686) – (1,694) 8Forward exchange contracts– assets 1,760 1,760 1,760 – –Cross currency interest rate swaps– (liabilities)/assets (4,050) 14,339 1,154 6,452 6,733
(139,591) (40,178) (23,195) (23,789) 6,806
2011interest rate swaps– (liabilities)/assets (69,243) (31,499) (15,320) (16,753) 574Forward start interest rate swaps– liabilities (9,772) (3,453) (813) (2,105) (535)Forward exchange contracts– liabilities (5,242) (5,242) (5,242) – –
(84,257) (40,194) (21,375) (18,858) 39 (e) Fair values The following methods and assumptions are used to estimate the fair values of the following significant classes
of financial instruments:
(i) Derivatives The fair value of derivative financial instruments is based on their market prices or brokers’ quotes.
(ii) Non-derivative financial liabilities Fair value, which is determined for disclosure purposes, is calculated based on the present value of future
principal and interest cash flows, discounted using the market rate of interest at the reporting date. in respect of the liability component of convertible bonds, the fair value at initial recognition is determined using a market interest rate of similar liabilities that do not have a conversion option.
(iii) Other financial assets and liabilities The fair value of quoted securities is their quoted bid price at the balance sheet date. The carrying amounts
of financial assets and liabilities with a maturity of less than one year (including trade and other receivables, cash and cash equivalents and trade and other payables) are assumed to approximate their fair values because of the short period to maturity. All other financial assets and liabilities are discounted to determine their fair values.
Where discounted cash flow techniques are used, estimated future cash flows are based on management’s best estimates and the discount rate is a market-related rate for a similar instrument at the balance sheet.

222
appendixSTATUTORY ACCOUNTS
NOTeS TO THe FiNANCiAL STATeMeNTS32 FinanCiaL risK ManageMent (cont’d) (e) Fair values (cont’d) (iv) Fair value hierarchy The table below analyses financial instruments carried at fair value, by valuation method as at 31 december
2012. The different levels have been defined as follows:
Level 1: quoted prices (unadjusted) in active markets for identical assets or liabilities.
Level 2: inputs other than quoted prices included within Level 1 that are observable for the asset or liability, either directly (i.e., as prices) or indirectly (i.e., derived from prices).
Level 3: inputs for the asset or liability that are not based on observable market data (unobservable inputs).
Level 1 Level 2 Level 3 total
the group $’000 $’000 $’000 $’000
2012Available-for-sale financial assets 2,087 195,000 268,681 465,768derivative financial assets – 34,092 – 34,092
2,087 229,092 268,681 499,860derivative financial liabilities – (187,087) – (187,087)
2,087 42,005 268,681 312,773
2011Available-for-sale financial assets 2,465 195,000 322,258 519,723derivative financial assets – 31,720 – 31,720
2,465 226,720 322,258 551,443derivative financial liabilities – (135,522) – (135,522)
2,465 91,198 322,258 415,921 For the fair value measurements in Level 3, changing one or more of the assumptions to other reasonably
possible alternative assumptions would not have a significant effect on the Group’s financial statements. The movements of financial assets classified under Level 3 are presented as follows:
the group
the group note2012
$‘0002011
$‘000
Balance as at 1 January 322,258 141,144Additions 22,673 298,088Capital distribution (39,088) –impairments recognised in income statement (1,430) (1,329)Amount set off against provisions 20(a)(i) (3,872) (124,165)Fair value gain recognised in available-for-sale financial assets 123 97disposal – (24,012)Translations differences (31,983) 32,435Balance as at 31 december 268,681 322,258

223
32 FinanCiaL risK ManageMent (cont’d) (e) Fair values (cont’d) (v) Accounting classifications and fair values The fair values of financial assets and liabilities, together with the carrying amounts shown in the balance
sheets, are as follows:
Fair value – hedging
instrumentsLoans and
receivablesavailable-
for-sale
other financial liabilities within
the scope of Frs 39
totalcarrying amount
Fairvalue
the group note $’000 $’000 $’000 $’000 $’000 $’000
2012Trade and other receivables 12 – 1,274,301 – – 1,274,301 1,274,301Cash and cash equivalents 15 – 5,497,693 – – 5,497,693 5,497,693Other non-current assets 27,722 390,085 284,731 – 702,538 702,538Other current assets 10(b) 6,370 – 195,000 – 201,370 201,370
34,092 7,162,079 479,731 – 7,675,902 7,675,902
Trade and other payables# – – – 2,273,336 2,273,336 2,273,336Bank borrowings 18 – – – 7,382,940 7,382,940 7,387,743debt securities 19 – – – 6,796,838 6,796,838 7,220,308derivative financial liabilities 187,087 – – – 187,087 187,087
187,087 – – 16,453,114 16,640,201 17,068,474
2011Trade and other receivables 12 – 1,701,523 – – 1,701,523 1,701,523Cash and cash equivalents 15 – 6,264,473 – – 6,264,473 6,264,473Other non-current assets 31,720 363,264 349,343 – 744,327 744,327Other current assets 10(b) – – 195,000 – 195,000 195,000
31,720 8,329,260 544,343 – 8,905,323 8,905,323
Trade and other payables# – – – 2,258,817 2,258,817 2,258,817Bank borrowings 18 – – – 6,531,801 6,531,801 6,531,801debt securities 19 – – – 5,658,838 5,658,838 5,608,008derivative financial liabilities 135,522 – – – 135,522 135,522
135,522 – – 14,449,456 14,584,978 14,534,148
# Excludes quasi-equity loans, progress billings, liability for employee benefits and provisions.

224
appendixSTATUTORY ACCOUNTS
NOTeS TO THe FiNANCiAL STATeMeNTS32 FinanCiaL risK ManageMent (cont’d) (e) Fair values (cont’d) (v) Accounting classifications and fair values (cont’d)
Loans and receivables
other financial liabilities within
the scope of Frs 39total
carrying amount Fair value
the Company note $’000 $’000 $’000 $’000
2012Trade and other receivables 12 2,446,792 – 2,446,792 2,446,792Cash and cash equivalents 15 442,650 – 442,650 442,650
2,889,442 – 2,889,442 2,889,442
Trade and other payables# – 51,144 51,144 51,144debt securities 19 – 3,512,287 3,512,287 3,830,561
– 3,563,431 3,563,431 3,881,705
2011Trade and other receivables 12 2,588,723 – 2,588,723 2,588,723Cash and cash equivalents 15 326,539 – 326,539 326,539
2,915,262 – 2,915,262 2,915,262
Trade and other payables# – 50,613 50,613 50,613debt securities 19 – 3,432,956 3,432,956 3,498,891
– 3,483,569 3,483,569 3,549,504
# Excludes quasi-equity loans, progress billings, liability for employee benefits and provisions.
33 CoMMitMents As at the balance sheet date, the Group and the Company had the following commitments: (a) operating lease The Group leases a number of offices, motor vehicles, office equipments and serviced apartments under operating
leases. The leases have tenure ranging from one to twenty years, with an option to renew the lease after that date. Lease payments are usually revised at each renewal date to reflect the market rate. Future minimum lease payments for the Group and the Company on non-cancellable operating leases are as follows:
the group the Company
2012$’000
2011$’000
2012$’000
2011$’000
Lease payments payable: Not later than 1 year 110,688 114,475 4,359 3,151 Between 1 and 5 years 268,985 280,770 34,275 1,353 After 5 years 70,220 94,490 88,463 33
449,893 489,735 127,097 4,537
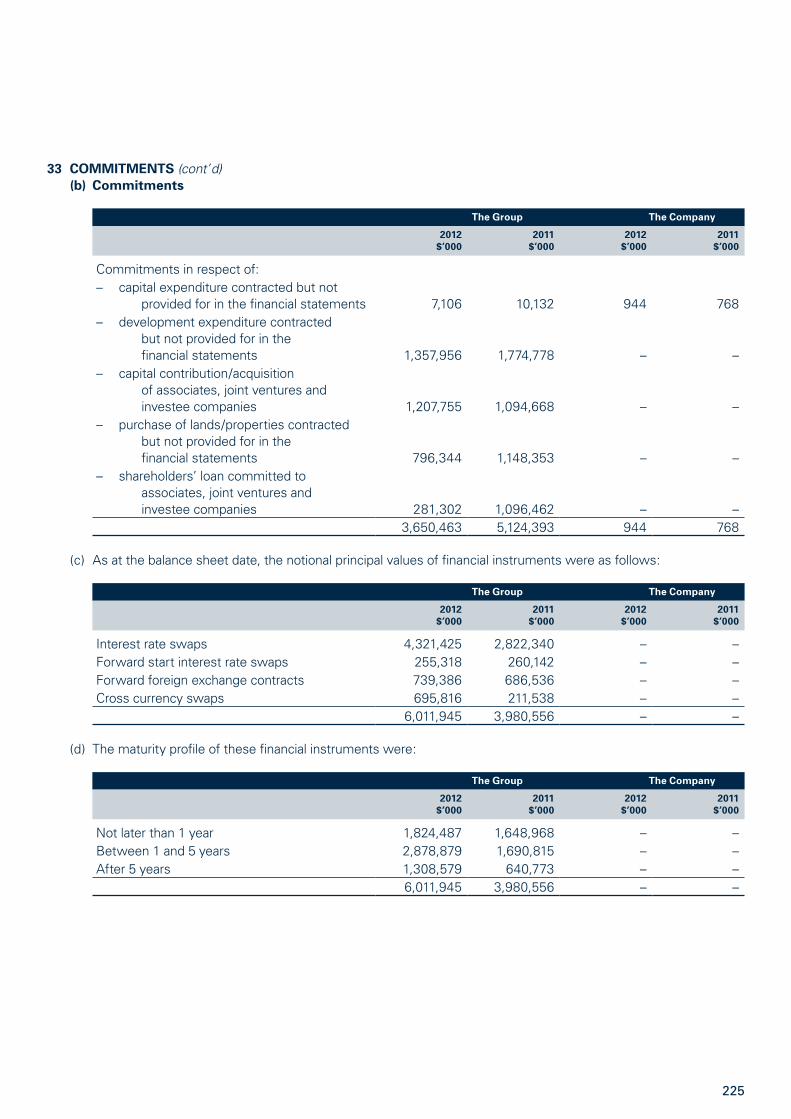
225
33 CoMMitMents (cont’d) (b) Commitments
the group the Company
2012$’000
2011$’000
2012$’000
2011$’000
Commitments in respect of:– capital expenditure contracted but not provided for in the financial statements 7,106 10,132 944 768– development expenditure contracted but not provided for in the financial statements 1,357,956 1,774,778 – –– capital contribution/acquisition of associates, joint ventures and investee companies 1,207,755 1,094,668 – –– purchase of lands/properties contracted but not provided for in the financial statements 796,344 1,148,353 – –– shareholders’ loan committed to associates, joint ventures and investee companies 281,302 1,096,462 – –
3,650,463 5,124,393 944 768 (c) As at the balance sheet date, the notional principal values of financial instruments were as follows:
the group the Company
2012$’000
2011$’000
2012$’000
2011$’000
interest rate swaps 4,321,425 2,822,340 – –Forward start interest rate swaps 255,318 260,142 – –Forward foreign exchange contracts 739,386 686,536 – –Cross currency swaps 695,816 211,538 – –
6,011,945 3,980,556 – – (d) The maturity profile of these financial instruments were:
the group the Company
2012$’000
2011$’000
2012$’000
2011$’000
Not later than 1 year 1,824,487 1,648,968 – –Between 1 and 5 years 2,878,879 1,690,815 – –After 5 years 1,308,579 640,773 – –
6,011,945 3,980,556 – –
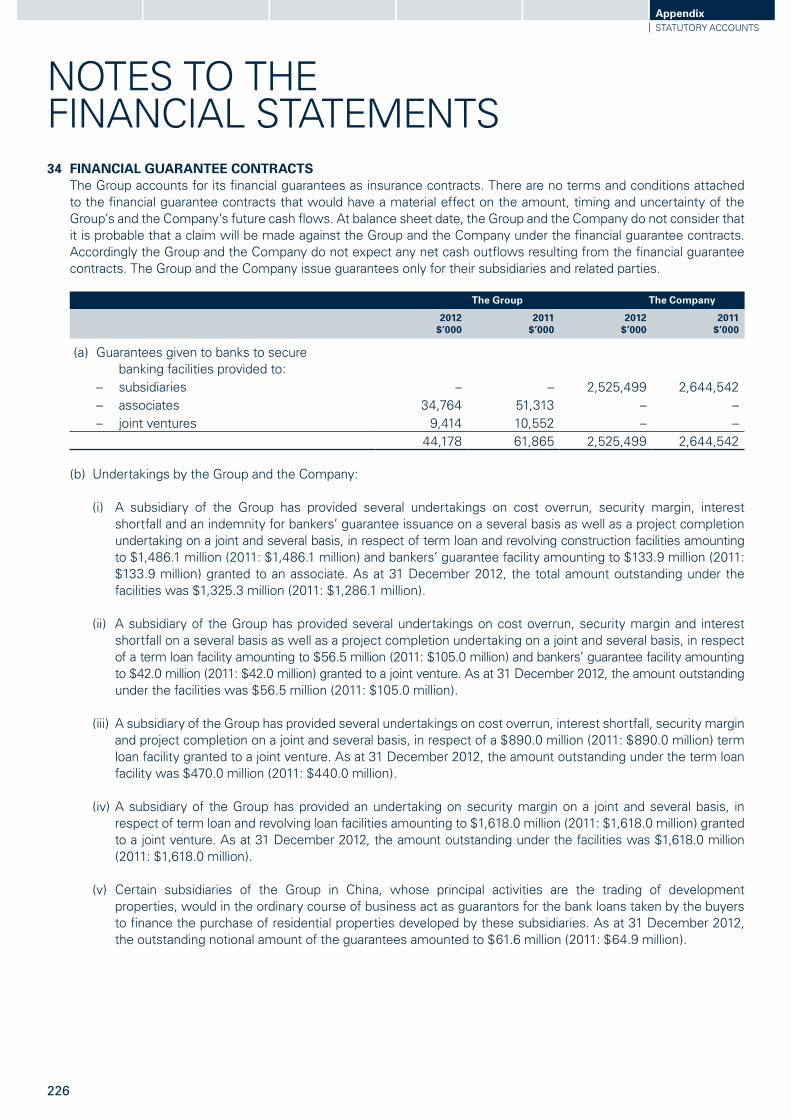
226
appendixSTATUTORY ACCOUNTS
NOTeS TO THe FiNANCiAL STATeMeNTS34 FinanCiaL guarantee ContraCts The Group accounts for its financial guarantees as insurance contracts. There are no terms and conditions attached
to the financial guarantee contracts that would have a material effect on the amount, timing and uncertainty of the Group’s and the Company’s future cash flows. At balance sheet date, the Group and the Company do not consider that it is probable that a claim will be made against the Group and the Company under the financial guarantee contracts. Accordingly the Group and the Company do not expect any net cash outflows resulting from the financial guarantee contracts. The Group and the Company issue guarantees only for their subsidiaries and related parties.
the group the Company
2012$’000
2011$’000
2012$’000
2011$’000
(a) Guarantees given to banks to secure banking facilities provided to: – subsidiaries – – 2,525,499 2,644,542 – associates 34,764 51,313 – – – joint ventures 9,414 10,552 – –
44,178 61,865 2,525,499 2,644,542
(b) Undertakings by the Group and the Company:
(i) A subsidiary of the Group has provided several undertakings on cost overrun, security margin, interest shortfall and an indemnity for bankers’ guarantee issuance on a several basis as well as a project completion undertaking on a joint and several basis, in respect of term loan and revolving construction facilities amounting to $1,486.1 million (2011: $1,486.1 million) and bankers’ guarantee facility amounting to $133.9 million (2011: $133.9 million) granted to an associate. As at 31 december 2012, the total amount outstanding under the facilities was $1,325.3 million (2011: $1,286.1 million).
(ii) A subsidiary of the Group has provided several undertakings on cost overrun, security margin and interest shortfall on a several basis as well as a project completion undertaking on a joint and several basis, in respect of a term loan facility amounting to $56.5 million (2011: $105.0 million) and bankers’ guarantee facility amounting to $42.0 million (2011: $42.0 million) granted to a joint venture. As at 31 december 2012, the amount outstanding under the facilities was $56.5 million (2011: $105.0 million).
(iii) A subsidiary of the Group has provided several undertakings on cost overrun, interest shortfall, security margin and project completion on a joint and several basis, in respect of a $890.0 million (2011: $890.0 million) term loan facility granted to a joint venture. As at 31 december 2012, the amount outstanding under the term loan facility was $470.0 million (2011: $440.0 million).
(iv) A subsidiary of the Group has provided an undertaking on security margin on a joint and several basis, in respect of term loan and revolving loan facilities amounting to $1,618.0 million (2011: $1,618.0 million) granted to a joint venture. As at 31 december 2012, the amount outstanding under the facilities was $1,618.0 million (2011: $1,618.0 million).
(v) Certain subsidiaries of the Group in China, whose principal activities are the trading of development properties, would in the ordinary course of business act as guarantors for the bank loans taken by the buyers to finance the purchase of residential properties developed by these subsidiaries. As at 31 december 2012, the outstanding notional amount of the guarantees amounted to $61.6 million (2011: $64.9 million).
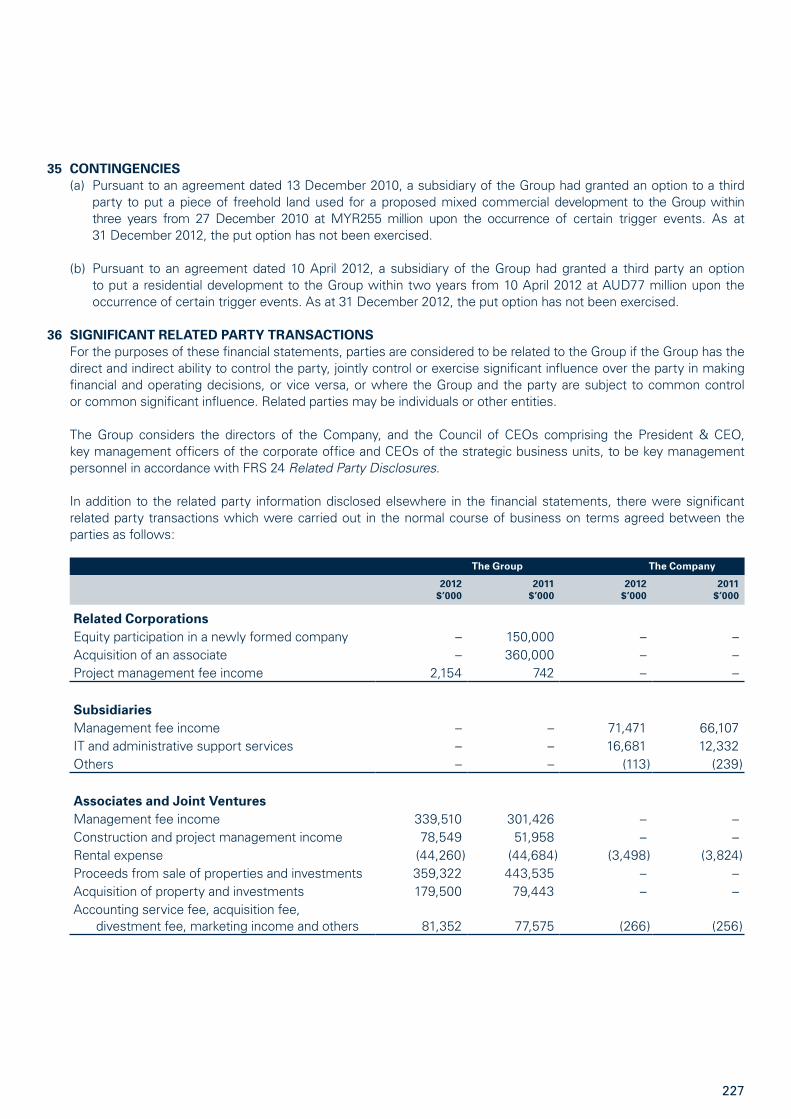
227
35 ContingenCies (a) pursuant to an agreement dated 13 december 2010, a subsidiary of the Group had granted an option to a third
party to put a piece of freehold land used for a proposed mixed commercial development to the Group within three years from 27 december 2010 at MYR255 million upon the occurrence of certain trigger events. As at 31 december 2012, the put option has not been exercised.
(b) pursuant to an agreement dated 10 April 2012, a subsidiary of the Group had granted a third party an option to put a residential development to the Group within two years from 10 April 2012 at AUd77 million upon the occurrence of certain trigger events. As at 31 december 2012, the put option has not been exercised.
36 signiFiCant reLateD PartY transaCtions For the purposes of these financial statements, parties are considered to be related to the Group if the Group has the
direct and indirect ability to control the party, jointly control or exercise significant influence over the party in making financial and operating decisions, or vice versa, or where the Group and the party are subject to common control or common significant influence. Related parties may be individuals or other entities.
The Group considers the directors of the Company, and the Council of CeOs comprising the president & CeO, key management officers of the corporate office and CeOs of the strategic business units, to be key management personnel in accordance with FRS 24 Related Party Disclosures.
in addition to the related party information disclosed elsewhere in the financial statements, there were significant related party transactions which were carried out in the normal course of business on terms agreed between the parties as follows:
the group the Company
2012$’000
2011$’000
2012$’000
2011$’000
related Corporationsequity participation in a newly formed company – 150,000 – –Acquisition of an associate – 360,000 – –project management fee income 2,154 742 – –
subsidiariesManagement fee income – – 71,471 66,107iT and administrative support services – – 16,681 12,332Others – – (113) (239)
associates and Joint venturesManagement fee income 339,510 301,426 – –Construction and project management income 78,549 51,958 – –Rental expense (44,260) (44,684) (3,498) (3,824)proceeds from sale of properties and investments 359,322 443,535 – –Acquisition of property and investments 179,500 79,443 – –Accounting service fee, acquisition fee, divestment fee, marketing income and others 81,352 77,575 (266) (256)
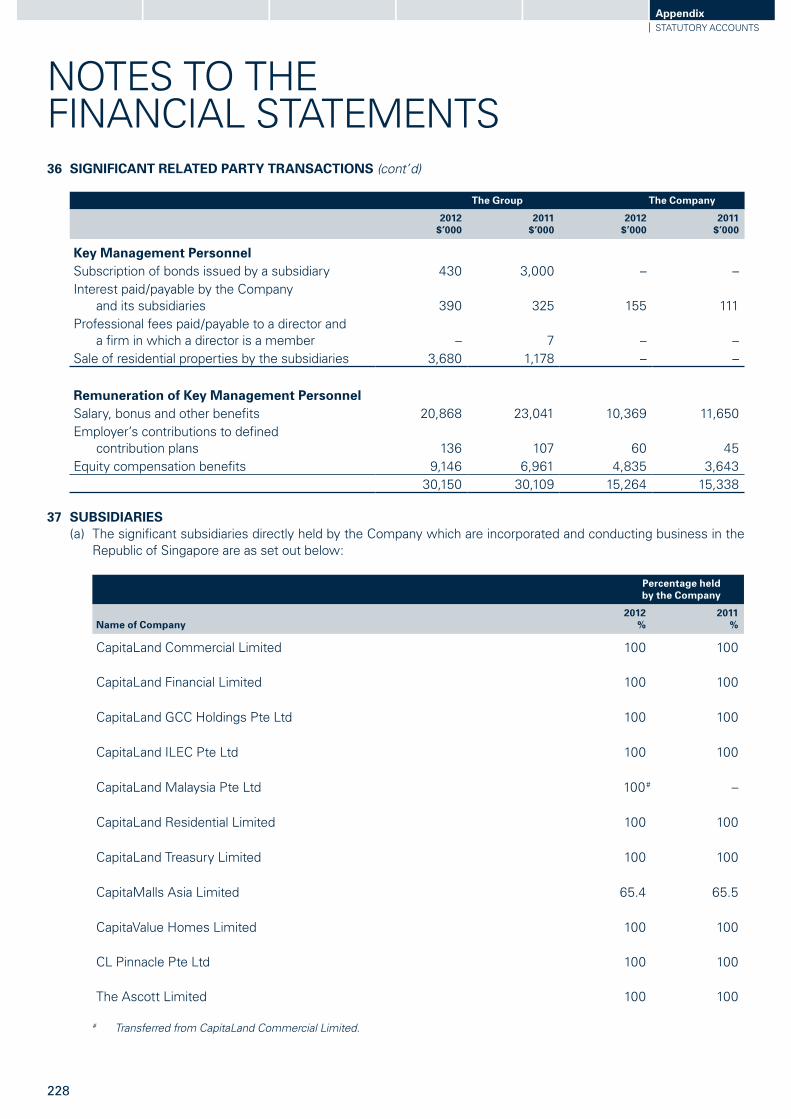
228
appendixSTATUTORY ACCOUNTS
NOTeS TO THe FiNANCiAL STATeMeNTS36 signiFiCant reLateD PartY transaCtions (cont’d)
the group the Company
2012$’000
2011$’000
2012$’000
2011$’000
Key Management PersonnelSubscription of bonds issued by a subsidiary 430 3,000 – –interest paid/payable by the Company and its subsidiaries 390 325 155 111professional fees paid/payable to a director and a firm in which a director is a member – 7 – –Sale of residential properties by the subsidiaries 3,680 1,178 – –
remuneration of Key Management PersonnelSalary, bonus and other benefits 20,868 23,041 10,369 11,650employer’s contributions to defined contribution plans 136 107 60 45equity compensation benefits 9,146 6,961 4,835 3,643
30,150 30,109 15,264 15,338
37 subsiDiaries (a) The significant subsidiaries directly held by the Company which are incorporated and conducting business in the
Republic of Singapore are as set out below:
Percentage held by the Company
name of Company2012
%2011
%
CapitaLand Commercial Limited 100 100
CapitaLand Financial Limited 100 100
CapitaLand GCC Holdings pte Ltd 100 100
CapitaLand iLeC pte Ltd 100 100
CapitaLand Malaysia pte Ltd 100# –
CapitaLand Residential Limited 100 100
CapitaLand Treasury Limited 100 100
CapitaMalls Asia Limited 65.4 65.5
Capitavalue Homes Limited 100 100
CL pinnacle pte Ltd 100 100
The Ascott Limited 100 100
# Transferred from CapitaLand Commercial Limited.
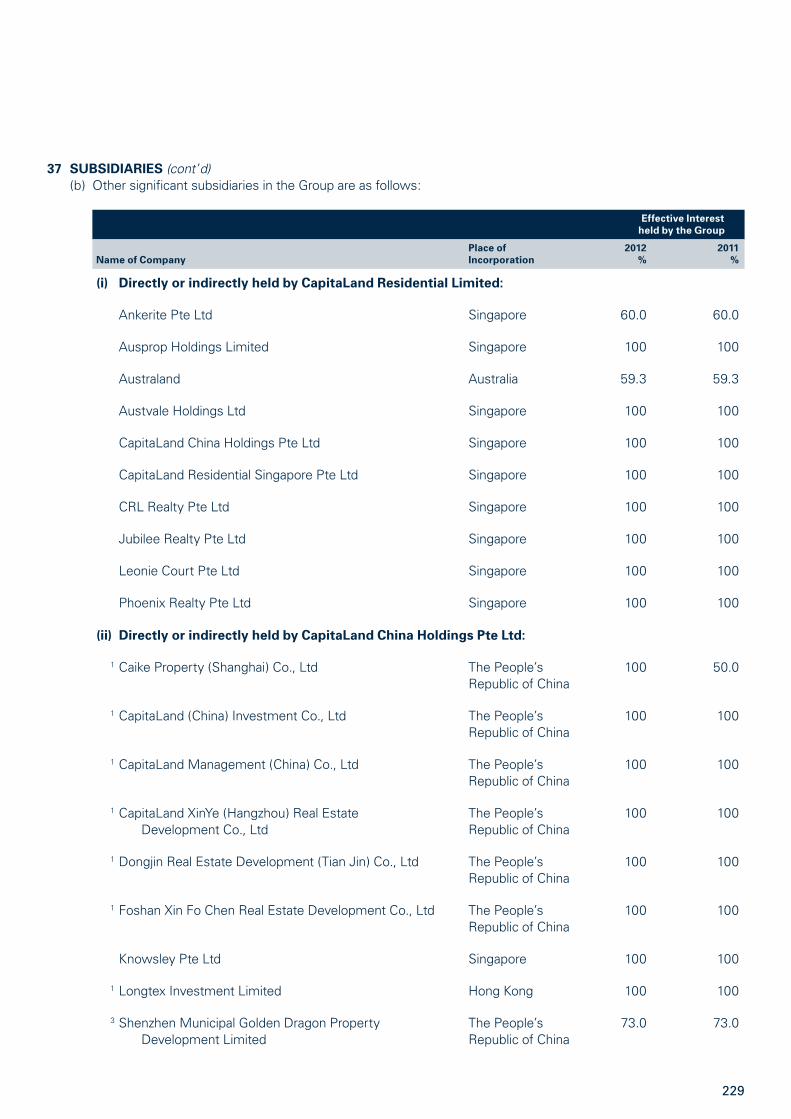
229
37 subsiDiaries (cont’d) (b) Other significant subsidiaries in the Group are as follows:
effective interest held by the group
name of CompanyPlace of incorporation
2012%
2011%
(i) Directly or indirectly held by CapitaLand residential Limited:
Ankerite pte Ltd Singapore 60.0 60.0
Ausprop Holdings Limited Singapore 100 100
Australand Australia 59.3 59.3
Austvale Holdings Ltd Singapore 100 100
CapitaLand China Holdings pte Ltd Singapore 100 100
CapitaLand Residential Singapore pte Ltd Singapore 100 100
CRL Realty pte Ltd Singapore 100 100
Jubilee Realty pte Ltd Singapore 100 100
Leonie Court pte Ltd Singapore 100 100
phoenix Realty pte Ltd Singapore 100 100
(ii) Directly or indirectly held by CapitaLand China holdings Pte Ltd:
1 Caike property (Shanghai) Co., Ltd The people’s Republic of China
100 50.0
1 CapitaLand (China) investment Co., Ltd The people’s Republic of China
100 100
1 CapitaLand Management (China) Co., Ltd The people’s Republic of China
100 100
1 CapitaLand XinYe (Hangzhou) Real estate development Co., Ltd
The people’s Republic of China
100 100
1 dongjin Real estate development (Tian Jin) Co., Ltd The people’s Republic of China
100 100
1 Foshan Xin Fo Chen Real estate development Co., Ltd The people’s Republic of China
100 100
Knowsley pte Ltd Singapore 100 100
1 Longtex investment Limited Hong Kong 100 100
3 Shenzhen Municipal Golden dragon property development Limited
The people’s Republic of China
73.0 73.0
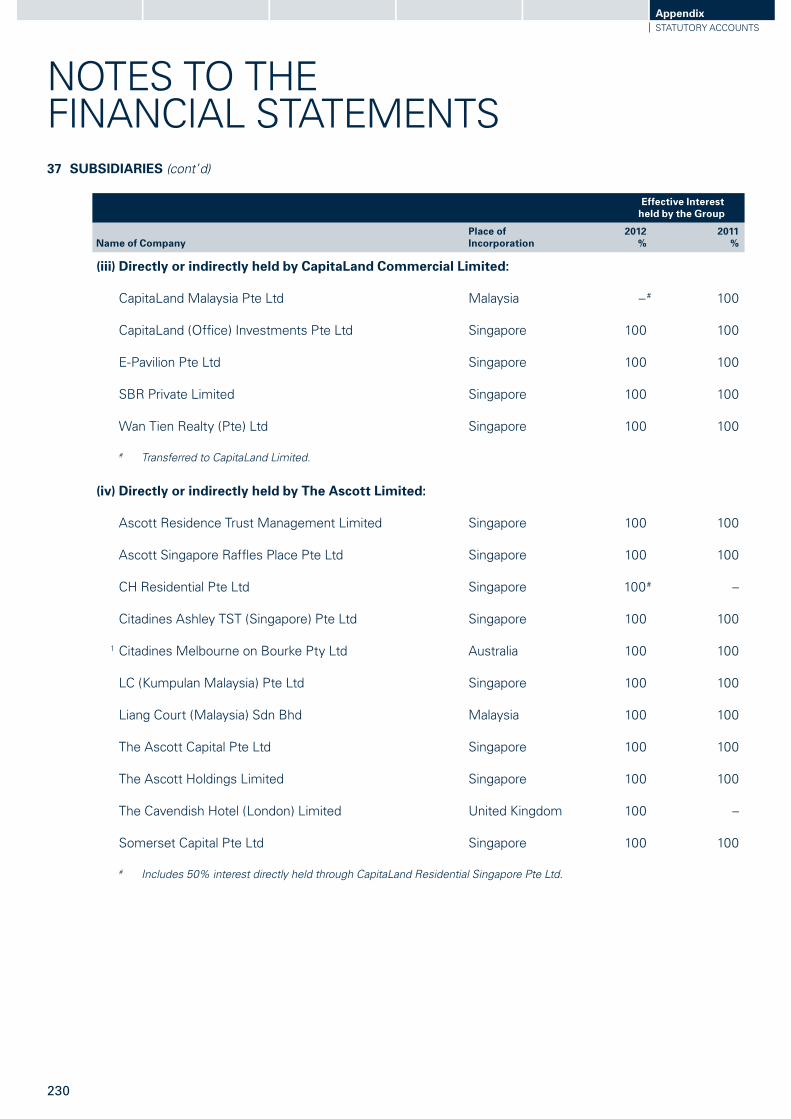
230
appendixSTATUTORY ACCOUNTS
NOTeS TO THe FiNANCiAL STATeMeNTS37 subsiDiaries (cont’d)
effective interest held by the group
name of CompanyPlace of incorporation
2012%
2011%
(iii) Directly or indirectly held by CapitaLand Commercial Limited:
CapitaLand Malaysia pte Ltd Malaysia –# 100
CapitaLand (Office) investments pte Ltd Singapore 100 100
e-pavilion pte Ltd Singapore 100 100
SBR private Limited Singapore 100 100
Wan Tien Realty (pte) Ltd Singapore 100 100
# Transferred to CapitaLand Limited.
(iv) Directly or indirectly held by the ascott Limited:
Ascott Residence Trust Management Limited Singapore 100 100
Ascott Singapore Raffles place pte Ltd Singapore 100 100
CH Residential pte Ltd Singapore 100# –
Citadines Ashley TST (Singapore) pte Ltd Singapore 100 100
1 Citadines Melbourne on Bourke pty Ltd Australia 100 100
LC (Kumpulan Malaysia) pte Ltd Singapore 100 100
Liang Court (Malaysia) Sdn Bhd Malaysia 100 100
The Ascott Capital pte Ltd Singapore 100 100
The Ascott Holdings Limited Singapore 100 100
The Cavendish Hotel (London) Limited United Kingdom 100 –
Somerset Capital pte Ltd Singapore 100 100
# Includes 50% interest directly held through CapitaLand Residential Singapore Pte Ltd.
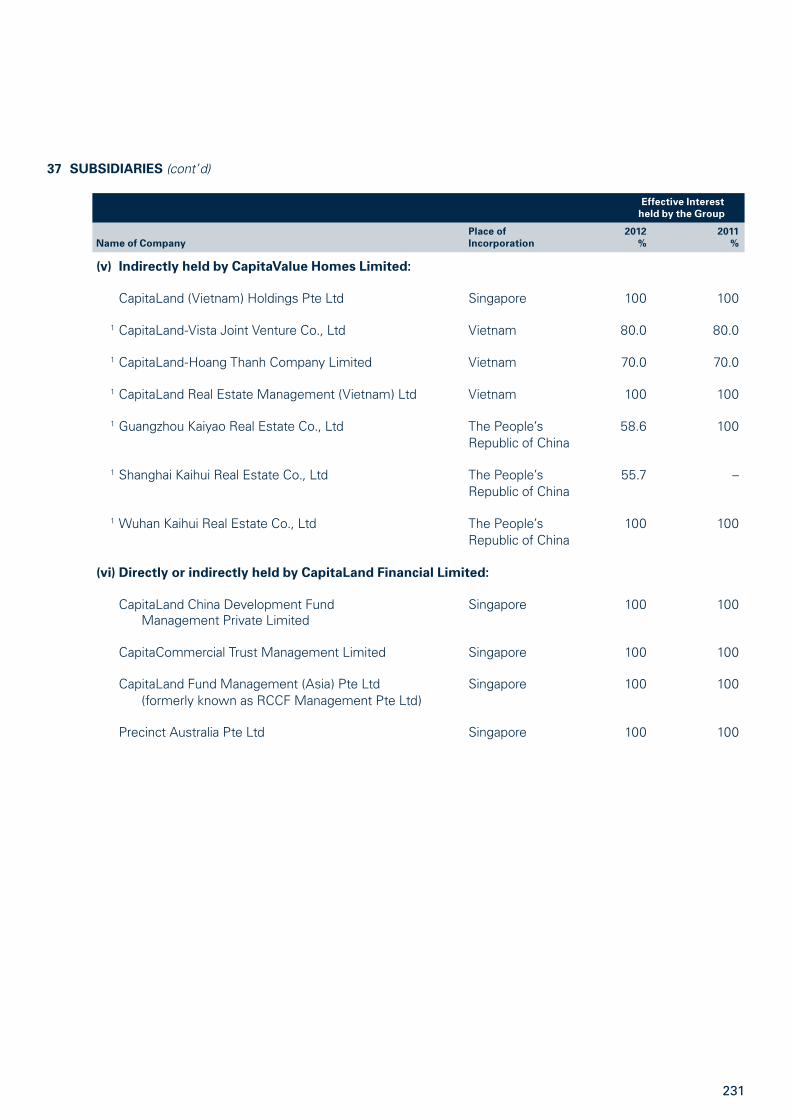
231
37 subsiDiaries (cont’d)
effective interest held by the group
name of CompanyPlace of incorporation
2012%
2011%
(v) indirectly held by Capitavalue homes Limited:
CapitaLand (vietnam) Holdings pte Ltd Singapore 100 100
1 CapitaLand-vista Joint venture Co., Ltd vietnam 80.0 80.0
1 CapitaLand-Hoang Thanh Company Limited vietnam 70.0 70.0
1 CapitaLand Real estate Management (vietnam) Ltd vietnam 100 100
1 Guangzhou Kaiyao Real estate Co., Ltd The people’s Republic of China
58.6 100
1 Shanghai Kaihui Real estate Co., Ltd The people’s Republic of China
55.7 –
1 Wuhan Kaihui Real estate Co., Ltd The people’s Republic of China
100 100
(vi) Directly or indirectly held by CapitaLand Financial Limited:
CapitaLand China development Fund Singapore 100 100 Management private Limited
CapitaCommercial Trust Management Limited Singapore 100 100
CapitaLand Fund Management (Asia) pte Ltd (formerly known as RCCF Management pte Ltd)
Singapore 100 100
precinct Australia pte Ltd Singapore 100 100

232
appendixSTATUTORY ACCOUNTS
NOTeS TO THe FiNANCiAL STATeMeNTS37 subsiDiaries (cont’d)
effective interest held by the group
name of CompanyPlace of incorporation
2012%
2011%
(vii) Directly or indirectly held by CapitaMalls asia Limited:
CapitaLand Retail China pte Ltd Singapore 65.4 65.5
CapitaLand Retail (MY) pte Ltd Singapore 65.4 65.5
CapitaLand Retail Singapore investments pte Ltd Singapore 65.4 65.5
CapitaLand Retail Hong Kong investments Two (Bv) Limited
British virgin islands
65.4 65.5
CapitaMall Trust Management Limited Singapore 65.4 65.5
CapitaRetail China investments pte Ltd Singapore 65.4 65.5
CMA Japan Holdings pte Ltd Singapore 65.4 65.5
pyramex investments pte Ltd Singapore 65.4 65.5
1 Shanghai Yongwei Real estate Co., Ltd The people’s Republic of China
43.2 43.2
(viii) Directly or indirectly held by australand:
2 Australand Finance Limited Australia 59.3 59.3
2 Australand Funds Management Limited Australia 59.3 59.3
2 Australand HK Company Limited Hong Kong 59.3 59.3
2 Australand investments Limited Australia 59.3 59.3
2 Australand property Group pty Limited Australia 59.3 59.3
2 Australand property Trust Australia 59.3 59.3
2 Australand property Limited Australia 59.3 59.3
2 Australand property Trust No.4 Australia 59.3 59.3
2 Australand property Trust No.5 Australia 59.3 59.3

233
37 subsiDiaries (cont’d)
effective interest held by the group
name of CompanyPlace of incorporation
2012%
2011%
(ix) Directly held by CapitaLand iLeC Pte Ltd:
CapitaLand iLeC One pte Ltd Singapore 100 100
Kestrel pte Ltd Singapore 100 100
(x) Directly held by CapitaLand gCC holdings Pte Ltd:
1 CapitaLand Bahrain Bay Business Services WLL Bahrain 100 100
CapitaLand GCC (Abu dhabi) pte Ltd Singapore 100 100
CapitaLand GCC (Bahrain) pte Ltd Singapore 100 100
Notes:
All significant subsidiaries are audited by KPMG LLP Singapore except for the following:
1 Audited by other member firms of KPMG International.
2 Audited by PricewaterhouseCoopers and its associated firms.
3 Audited by Shenzhen Yida Certified Public Accountants.
4 Audited by Beijing Zhong Jing Heng Tai Certified Public Accountants.
38 assoCiates details of significant associates are as follows:
effective interest held by the group
name of CompanyPlace of incorporation
2012%
2011%
(i) Directly held by CL Pinnacle Pte Ltd:
Surbana Corporation pte Ltd Singapore 40.0 40.0
(ii) indirectly held by CapitaLand China holdings Pte Ltd:
CapitaLand China development Fund pte Ltd Singapore 37.5 37.5
1 Central China Real estate Ltd Cayman islands 27.1 27.1
2 Lai Fung Holdings Limited Cayman islands 20.0 20.0
Raffles City China Fund Ltd Cayman islands 45.4^ 45.3^
^ Includes 9.8% interest indirectly held through CapitaMalls Asia Limited.
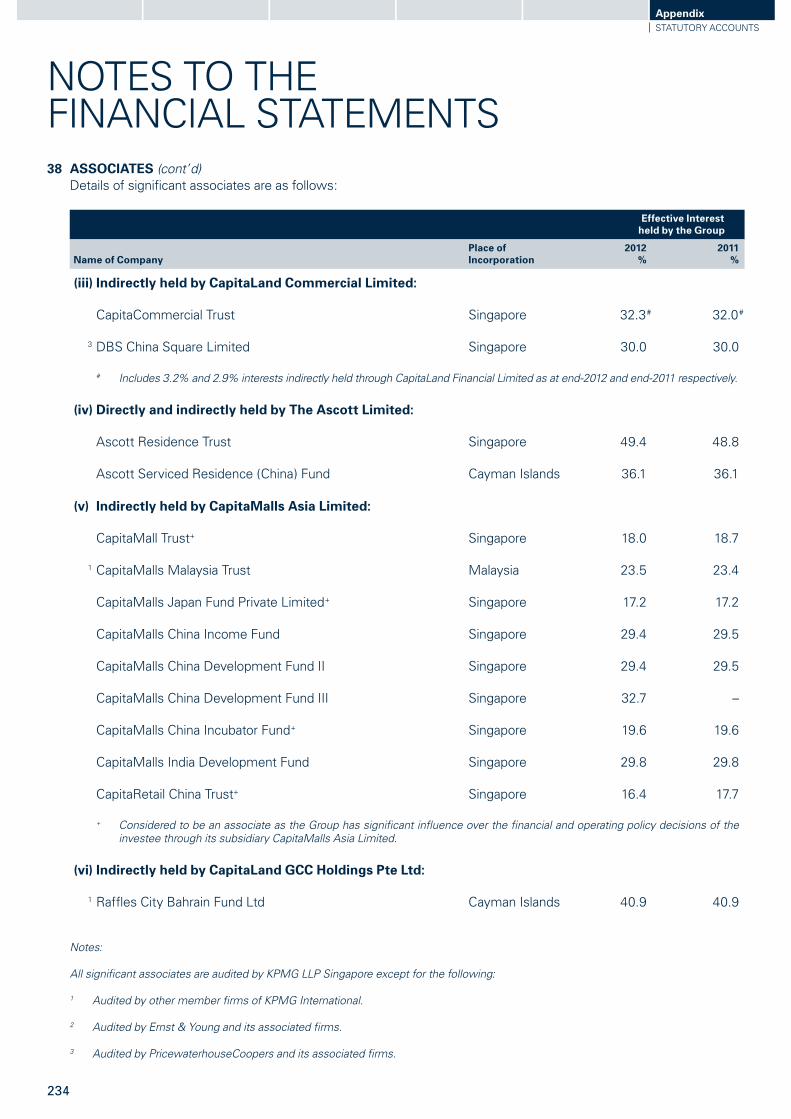
234
appendixSTATUTORY ACCOUNTS
NOTeS TO THe FiNANCiAL STATeMeNTS38 assoCiates (cont’d) details of significant associates are as follows:
effective interest held by the group
name of CompanyPlace of incorporation
2012%
2011%
(iii) indirectly held by CapitaLand Commercial Limited:
CapitaCommercial Trust Singapore 32.3# 32.0#
3 dBS China Square Limited Singapore 30.0 30.0
# Includes 3.2% and 2.9% interests indirectly held through CapitaLand Financial Limited as at end-2012 and end-2011 respectively.
(iv) Directly and indirectly held by the ascott Limited:
Ascott Residence Trust Singapore 49.4 48.8
Ascott Serviced Residence (China) Fund Cayman islands 36.1 36.1
(v) indirectly held by CapitaMalls asia Limited:
CapitaMall Trust+ Singapore 18.0 18.7
1 CapitaMalls Malaysia Trust Malaysia 23.5 23.4
CapitaMalls Japan Fund private Limited+ Singapore 17.2 17.2
CapitaMalls China income Fund Singapore 29.4 29.5
CapitaMalls China development Fund ii Singapore 29.4 29.5
CapitaMalls China development Fund iii Singapore 32.7 –
CapitaMalls China incubator Fund+ Singapore 19.6 19.6
CapitaMalls india development Fund Singapore 29.8 29.8
CapitaRetail China Trust+ Singapore 16.4 17.7
+ Considered to be an associate as the Group has significant influence over the financial and operating policy decisions of the investee through its subsidiary CapitaMalls Asia Limited.
(vi) indirectly held by CapitaLand gCC holdings Pte Ltd:
1 Raffles City Bahrain Fund Ltd Cayman islands 40.9 40.9
Notes:
All significant associates are audited by KPMG LLP Singapore except for the following:
1 Audited by other member firms of KPMG International.
2 Audited by Ernst & Young and its associated firms.
3 Audited by PricewaterhouseCoopers and its associated firms.
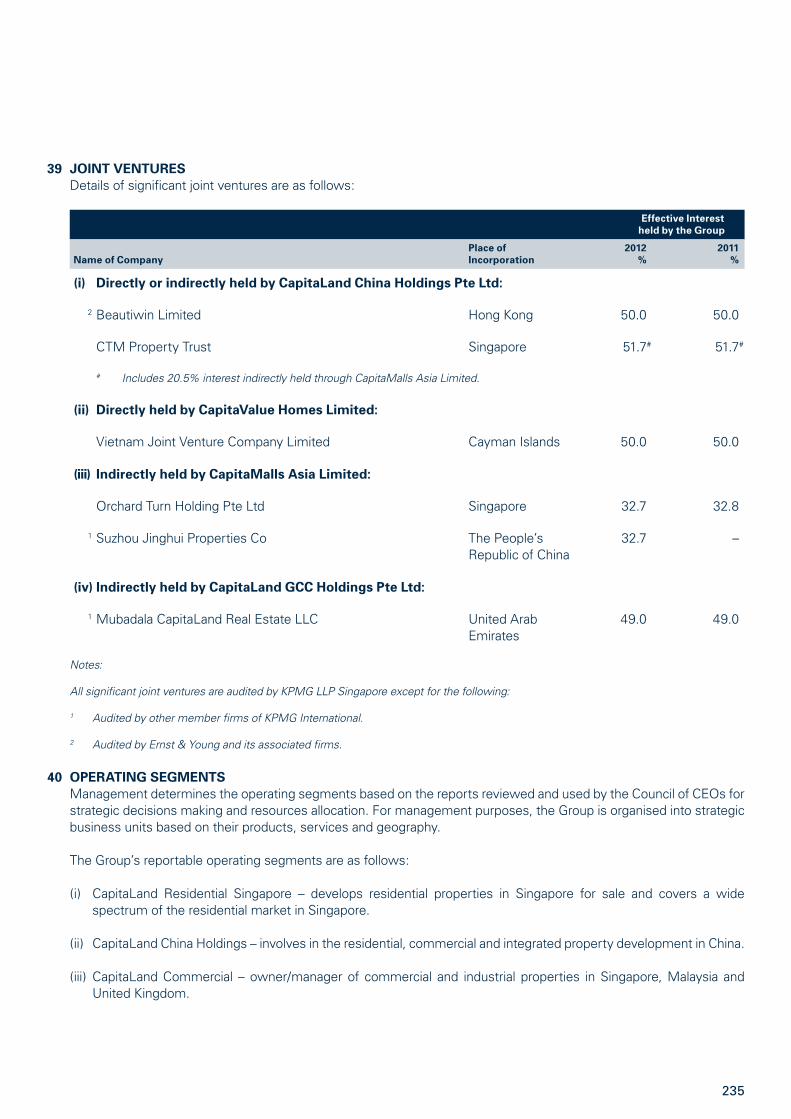
235
39 Joint ventures details of significant joint ventures are as follows:
effective interest held by the group
name of CompanyPlace of incorporation
2012%
2011%
(i) Directly or indirectly held by CapitaLand China holdings Pte Ltd:
2 Beautiwin Limited Hong Kong 50.0 50.0
CTM property Trust Singapore 51.7# 51.7#
# Includes 20.5% interest indirectly held through CapitaMalls Asia Limited.
(ii) Directly held by Capitavalue homes Limited:
vietnam Joint venture Company Limited Cayman islands 50.0 50.0
(iii) indirectly held by CapitaMalls asia Limited:
Orchard Turn Holding pte Ltd Singapore 32.7 32.8
1 Suzhou Jinghui properties Co The people’s Republic of China
32.7 –
(iv) indirectly held by CapitaLand gCC holdings Pte Ltd:
1 Mubadala CapitaLand Real estate LLC United Arab emirates
49.0 49.0
Notes:
All significant joint ventures are audited by KPMG LLP Singapore except for the following:
1 Audited by other member firms of KPMG International.
2 Audited by Ernst & Young and its associated firms.
40 oPerating segMents Management determines the operating segments based on the reports reviewed and used by the Council of CeOs for
strategic decisions making and resources allocation. For management purposes, the Group is organised into strategic business units based on their products, services and geography.
The Group’s reportable operating segments are as follows:
(i) CapitaLand Residential Singapore – develops residential properties in Singapore for sale and covers a wide spectrum of the residential market in Singapore.
(ii) CapitaLand China Holdings – involves in the residential, commercial and integrated property development in China.
(iii) CapitaLand Commercial – owner/manager of commercial and industrial properties in Singapore, Malaysia and United Kingdom.

236
appendixSTATUTORY ACCOUNTS
NOTeS TO THe FiNANCiAL STATeMeNTS40 oPerating segMents (cont’d) (iv) Ascott – an international serviced residence owner-operator with operations in key cities of Asia pacific, europe
and the Gulf region. it operates three brands, namely Ascott, Somerset and Citadines.
(v) CapitaLand Financial – involves in real estate fund management and financial advisory services.
(vi) Capitavalue Homes – develops value housing projects in China and vietnam.
(vii) CapitaMalls Asia – shopping mall owner/manager with portfolio in Singapore, China, india, Japan and Malaysia.
(viii) Australand – a major diversified property group with activities in residential, commercial and industrial developments and investment properties across Australia.
(ix) Others – includes Corporate Office, Group Treasury and Surbana.
information regarding the operations of each reportable segment is included below. Management monitors the operating results of each of its business unit for the purpose of making decisions on resource allocation and performance assessment. performance is measured based on segment earnings before interest and tax (“eBiT”). eBiT is used to measure performance as management believes that such information is the most relevant in evaluating the results of certain segments relative to other entities that operate within these industries. Group financing (including finance costs) and income taxes are managed on a group basis and are not allocated to operating segments. Segment assets and liabilities are presented net of inter- segment balances. inter-segment pricing is determined on arm’s length basis.
Geographically, management reviews the performance of the businesses in Singapore, China, Other Asia, Australia and europe. in presenting information on the basis of geographical segments, segment revenue is based on the geographical location of customers. Non-current assets and total assets are based on the geographical location of the assets.
On 3 January 2013, CapitaLand announced that it will realign and simplify the Group’s organisational structure to sharpen its focus on key markets and further accelerate its growth potential.
The Group will be realigned into four main businesses – CapitaLand Singapore, CapitaLand China, CapitaMalls Asia (CMA) and The Ascott Limited (Ascott). Under the simplified organisational structure, the Group’s businesses in Singapore and China excluding that of CMA and Ascott, will be consolidated into CapitaLand Singapore and CapitaLand China respectively. CMA and Ascott will be the other two main business units and they will operate across geographies that CapitaLand is in.
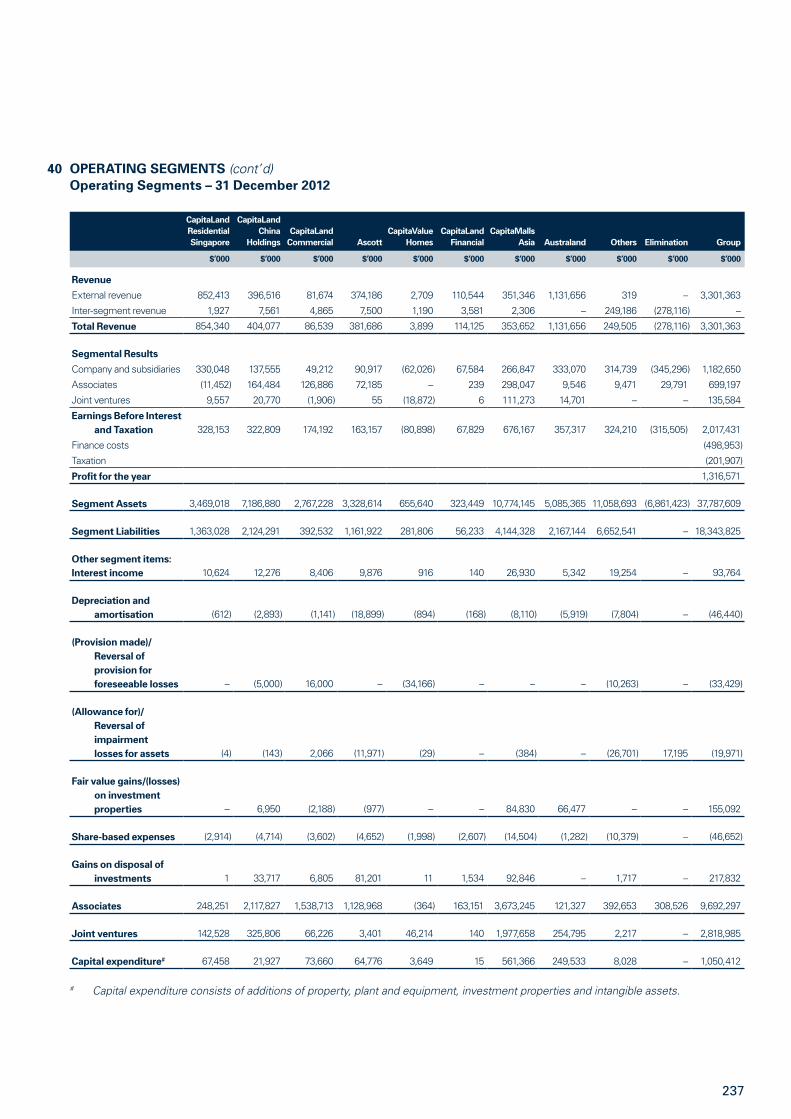
237
40 oPerating segMents (cont’d) operating segments – 31 December 2012
CapitaLand residential singapore
CapitaLand China
holdingsCapitaLand
Commercial ascottCapitavalue
homesCapitaLand
FinancialCapitaMalls
asia australand others elimination group
$’000 $’000 $’000 $’000 $’000 $’000 $’000 $’000 $’000 $’000 $’000
revenue
external revenue 852,413 396,516 81,674 374,186 2,709 110,544 351,346 1,131,656 319 – 3,301,363
inter-segment revenue 1,927 7,561 4,865 7,500 1,190 3,581 2,306 – 249,186 (278,116) –
total revenue 854,340 404,077 86,539 381,686 3,899 114,125 353,652 1,131,656 249,505 (278,116) 3,301,363
segmental results
Company and subsidiaries 330,048 137,555 49,212 90,917 (62,026) 67,584 266,847 333,070 314,739 (345,296) 1,182,650
Associates (11,452) 164,484 126,886 72,185 – 239 298,047 9,546 9,471 29,791 699,197
Joint ventures 9,557 20,770 (1,906) 55 (18,872) 6 111,273 14,701 – – 135,584
earnings before interest and taxation 328,153 322,809 174,192 163,157 (80,898) 67,829 676,167 357,317 324,210 (315,505) 2,017,431
Finance costs (498,953)
Taxation (201,907)
Profit for the year 1,316,571
segment assets 3,469,018 7,186,880 2,767,228 3,328,614 655,640 323,449 10,774,145 5,085,365 11,058,693 (6,861,423) 37,787,609
segment Liabilities 1,363,028 2,124,291 392,532 1,161,922 281,806 56,233 4,144,328 2,167,144 6,652,541 – 18,343,825
other segment items:interest income 10,624 12,276 8,406 9,876 916 140 26,930 5,342 19,254 – 93,764
Depreciation and amortisation (612) (2,893) (1,141) (18,899) (894) (168) (8,110) (5,919) (7,804) – (46,440)
(Provision made)/ reversal of provision for foreseeable losses – (5,000) 16,000 – (34,166) – – – (10,263) – (33,429)
(allowance for)/ reversal of impairment losses for assets (4) (143) 2,066 (11,971) (29) – (384) – (26,701) 17,195 (19,971)
Fair value gains/(losses) on investment properties – 6,950 (2,188) (977) – – 84,830 66,477 – – 155,092
share-based expenses (2,914) (4,714) (3,602) (4,652) (1,998) (2,607) (14,504) (1,282) (10,379) – (46,652)
gains on disposal of investments 1 33,717 6,805 81,201 11 1,534 92,846 – 1,717 – 217,832
associates 248,251 2,117,827 1,538,713 1,128,968 (364) 163,151 3,673,245 121,327 392,653 308,526 9,692,297
Joint ventures 142,528 325,806 66,226 3,401 46,214 140 1,977,658 254,795 2,217 – 2,818,985
Capital expenditure# 67,458 21,927 73,660 64,776 3,649 15 561,366 249,533 8,028 – 1,050,412
# Capital expenditure consists of additions of property, plant and equipment, investment properties and intangible assets.
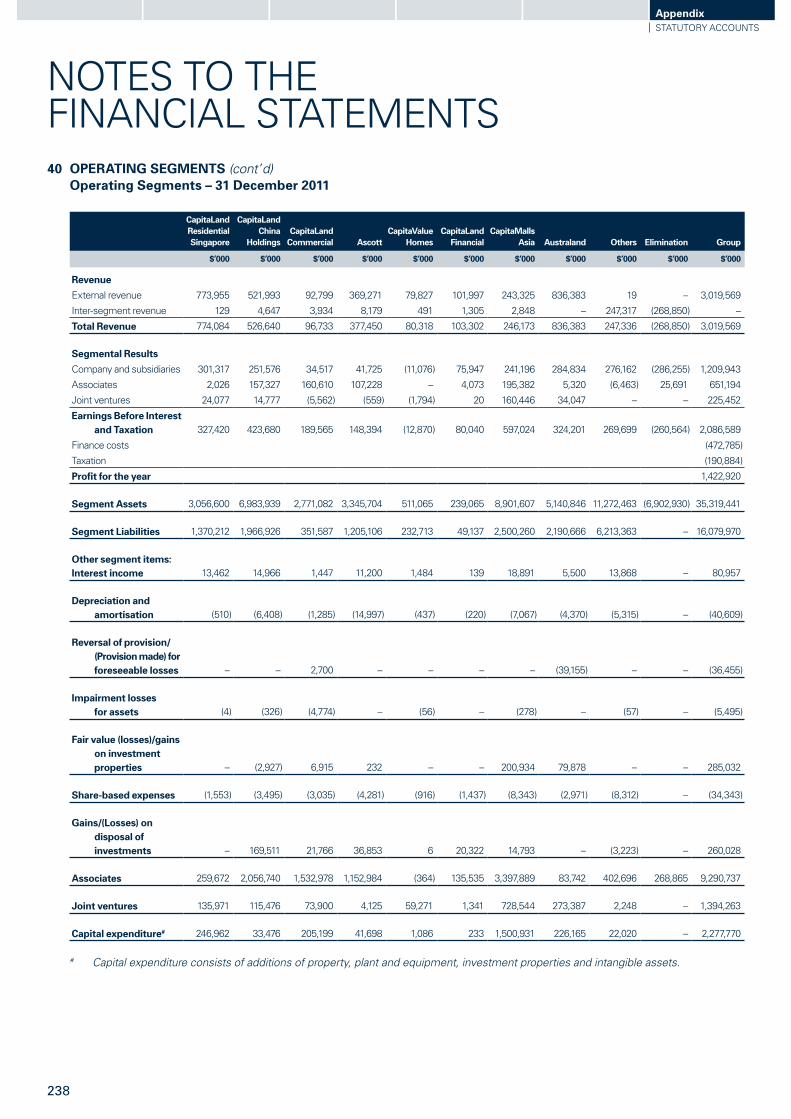
238
appendixSTATUTORY ACCOUNTS
NOTeS TO THe FiNANCiAL STATeMeNTS40 oPerating segMents (cont’d) operating segments – 31 December 2011
CapitaLand residential singapore
CapitaLand China
holdingsCapitaLand
Commercial ascottCapitavalue
homesCapitaLand
FinancialCapitaMalls
asia australand others elimination group
$’000 $’000 $’000 $’000 $’000 $’000 $’000 $’000 $’000 $’000 $’000
revenue
external revenue 773,955 521,993 92,799 369,271 79,827 101,997 243,325 836,383 19 – 3,019,569
inter-segment revenue 129 4,647 3,934 8,179 491 1,305 2,848 – 247,317 (268,850) –
total revenue 774,084 526,640 96,733 377,450 80,318 103,302 246,173 836,383 247,336 (268,850) 3,019,569
segmental results
Company and subsidiaries 301,317 251,576 34,517 41,725 (11,076) 75,947 241,196 284,834 276,162 (286,255) 1,209,943
Associates 2,026 157,327 160,610 107,228 – 4,073 195,382 5,320 (6,463) 25,691 651,194
Joint ventures 24,077 14,777 (5,562) (559) (1,794) 20 160,446 34,047 – – 225,452
earnings before interest and taxation 327,420 423,680 189,565 148,394 (12,870) 80,040 597,024 324,201 269,699 (260,564) 2,086,589
Finance costs (472,785)
Taxation (190,884)
Profit for the year 1,422,920
segment assets 3,056,600 6,983,939 2,771,082 3,345,704 511,065 239,065 8,901,607 5,140,846 11,272,463 (6,902,930) 35,319,441
segment Liabilities 1,370,212 1,966,926 351,587 1,205,106 232,713 49,137 2,500,260 2,190,666 6,213,363 – 16,079,970
other segment items:interest income 13,462 14,966 1,447 11,200 1,484 139 18,891 5,500 13,868 – 80,957
Depreciation and amortisation (510) (6,408) (1,285) (14,997) (437) (220) (7,067) (4,370) (5,315) – (40,609)
reversal of provision/ (Provision made) for foreseeable losses – – 2,700 – – – – (39,155) – – (36,455)
impairment losses for assets (4) (326) (4,774) – (56) – (278) – (57) – (5,495)
Fair value (losses)/gains on investment properties – (2,927) 6,915 232 – – 200,934 79,878 – – 285,032
share-based expenses (1,553) (3,495) (3,035) (4,281) (916) (1,437) (8,343) (2,971) (8,312) – (34,343)
gains/(Losses) on disposal of investments – 169,511 21,766 36,853 6 20,322 14,793 – (3,223) – 260,028
associates 259,672 2,056,740 1,532,978 1,152,984 (364) 135,535 3,397,889 83,742 402,696 268,865 9,290,737
Joint ventures 135,971 115,476 73,900 4,125 59,271 1,341 728,544 273,387 2,248 – 1,394,263
Capital expenditure# 246,962 33,476 205,199 41,698 1,086 233 1,500,931 226,165 22,020 – 2,277,770
# Capital expenditure consists of additions of property, plant and equipment, investment properties and intangible assets.

239
40 oPerating segMents (cont’d) geographic information
singapore China+ other asia# australia europe others@ total
2012 $’000 $’000 $’000 $’000 $’000 $’000 $’000
external revenue 1,169,706 587,933 139,896 1,182,289 196,687 24,852 3,301,363
non-current assets^ 7,497,499 8,049,872 2,179,149 3,685,159 794,713 – 22,206,392
total assets 14,631,134 13,391,858 3,242,914 5,444,832 1,076,871 – 37,787,609
2011
external revenue 1,074,765 665,599 156,354 890,213 200,508 32,130 3,019,569
non-current assets^ 6,821,378 6,520,896 1,674,865 3,526,515 750,190 – 19,293,844
total assets 14,275,555 12,021,215 2,715,061 5,461,780 845,830 – 35,319,441
+ China includes Hong Kong and Macau.
# Other Asia includes Indonesia, Japan, Malaysia, Philippines, Thailand, Korea, India, Vietnam and Gulf Cooperation Council countries.
@ Others includes the Cayman Islands.
^ Non-current assets comprised property, plant and equipment, intangible assets, investment properties and associates and joint ventures.
41 new aCCounting stanDarDs anD interPretations not Yet aDoPteD A number of new standards, amendments to standards and interpretations are effective for annual periods beginning
on or after 1 January 2013, and have not been applied in preparing these financial statements. Those new standards, amendments to standards and interpretations are set out below.
Applicable for the Group’s 2013 financial statements
• FRS19Employee Benefits (revised 2011) amended the definition of short term employee benefits and requires employee benefits to be classified as short-term based on expected timing of settlement rather than the employee’s entitlement to the benefits.
The Group currently has a bonus plan based on economic value Added (evA) that was awarded to its key executives. The evA bonus accrued during the financial year is credited into the bonus account and one-third of the balance in the bonus account will be paid out annually. As at 31 december 2012, the bonus payable is measured on an undiscounted basis.
Upon adoption of this standard, the Group will need to measure the bonus payable after one year at the present value of the amount payable.
These amendments will be applied retrospectively and prior periods in the Group’s 2013 financial statements will be restated. The Group does not expect any significant financial impact on its financial position or performance from the adoption of the revised FRS 19.
240
appendixSTATUTORY ACCOUNTS
NOTeS TO THe FiNANCiAL STATeMeNTS41 new aCCounting stanDarDs anD interPretations not Yet aDoPteD (cont’d) Applicable for the Group’s 2013 financial statements (cont’d)
• FRS113Fair Value Measurement, which replaces the existing guidance on fair value measurement in different FRSs with a single definition of fair value. The standard also establishes a framework for measuring fair values and sets out the disclosure requirements for fair value measurements.
The adoption of this standard will require the Group to re-assess the bases used for determining the fair values computed for both measurement and disclosures purposes and would result in more extensive disclosures on fair value measurements.
in accordance with the transitional provisions, the Group will apply FRS 113 prospectively as of 1 January 2013. On initial application of the standard, the Group does not expect substantial changes to the bases used for determining fair values.
Applicable for the Group’s 2014 financial statements
• AmendmentstoFRS32Financial Instruments: presentation – Offsetting Financial Assets and Financial Liabilities, which clarifies the existing criteria for net presentation on the face of the statement of financial position. Under the amendments, to qualify for offsetting, the right to set off a financial asset and a financial liability must not be contingent on a future event and must be enforceable both in the normal course of business and in the event of default, insolvency or bankruptcy of the entity and all counterparties.
The Group currently offsets receivables and payables due from/to the same counterparty if the Group has the legal right to set off the amounts when it is due and payable based on the contractual terms of the arrangement with the counterparty, and the Group intends to settle the amounts on a net basis. Based on the local laws and regulations in certain jurisdictions in which the counterparties are located, the set-off rights are set aside in the event of bankruptcy of the counterparties.
The amendments will be applied retrospectively and prior periods in the Group’s 2014 financial statements will be restated. On adoption of the amendments, the Group will have to present the respective receivables and payables on a gross basis as the right to set-off is not enforceable in the event of bankruptcy of the counterparty.
• FRS110Consolidated Financial Statements, which changes the definition of control such that an investor controls an investee when it is exposed, or has rights, to variable returns from its involvement with the investee and has the ability to affect those returns through its power with the investee. FRS 110 introduces a single control model with a series of indicators to assess control. FRS 110 also adds additional context, explanation and application guidance based on the principle of control.
The Group has re-evaluated its involvement with investees under the new control model. Based on its assessment as at 31 december 2012, the Group has control over an associated company by virtue of the aggregate economic interests derived from the entity.
This standard will be applied retrospectively and prior periods in the Group’s 2014 financial statements will be restated. While the Group is continuing to evaluate the application of this standard, based on FY2012 financial information, the estimated effect of the application of FRS 110 is a decrease in equity attributable to owners of the Company of $573.8 million, an increase in non-controlling interests of $713.8 million and a decrease in profit for 2012 of $141.0 million.

241
41 new aCCounting stanDarDs anD interPretations not Yet aDoPteD (cont’d) Applicable for the Group’s 2014 financial statements (cont’d)
• FRS 111 Joint Arrangements, which establishes the principles for classification and accounting of joint arrangements. The adoption of this standard would require the Group to re-assess and classify its joint arrangements as either joint operations or joint ventures based on its rights and obligations arising from the joint arrangements. Under this standard, interests in joint ventures will be accounted for using the equity method whilst interests in joint operations will be accounted for using the applicable FRSs relating to the underlying assets, liabilities, revenue and expense items arising from the joint operations.
As the Group is currently applying the equity method of accounting for its joint ventures, there will be no impact to the Group’s profit or net assets when the Group adopts FRS 111 in 2014.
• FRS112Disclosure of Interests in Other Entities, which sets out the disclosures required to be made in respect of all forms of an entity’s interests in other entities, including subsidiaries, joint arrangements, associates and unconsolidated structured entities. The adoption of this standard would result in more extensive disclosures being made in the Group’s financial statements in respect of its interests in other entities.
As FRS 112 is primarily a disclosure standard, there will be no financial impact on the results and financial position of the Group and the Company upon adoption of this standard by the Group in 2014.
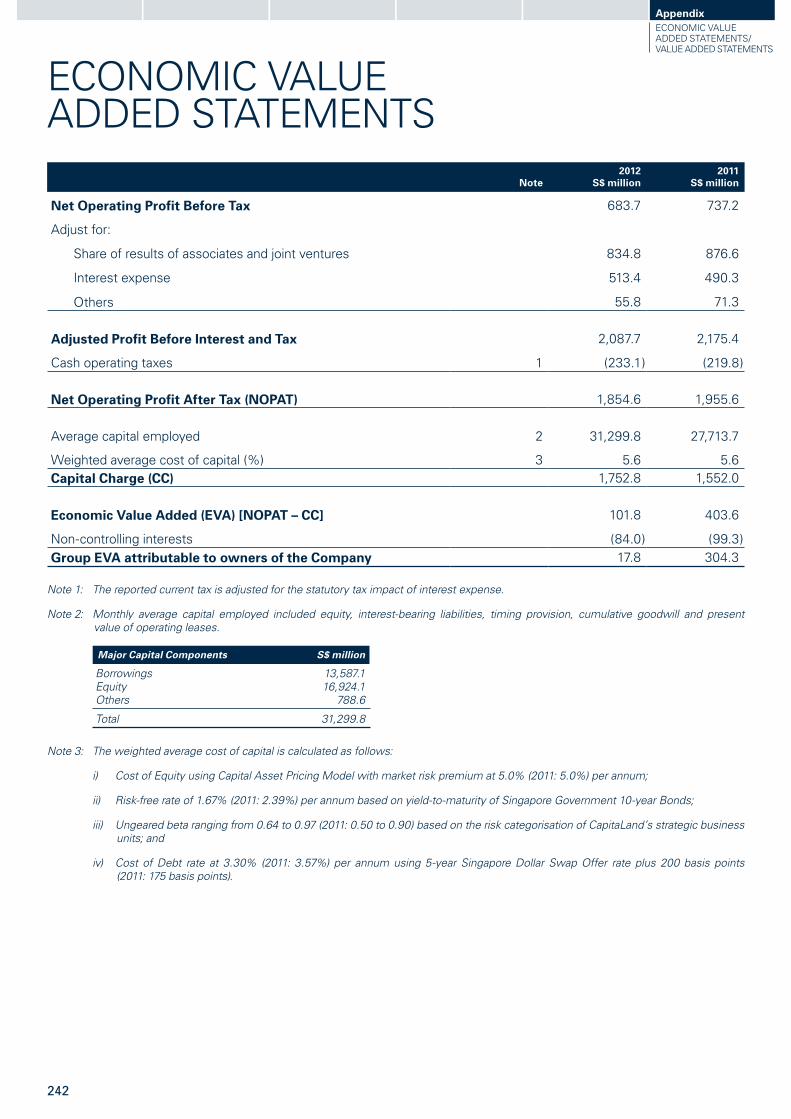
242
appendixeCONOMiC vALUe Added STATeMeNTS/ vALUe Added STATeMeNTS
eCONOMiC vALUe Added STATeMeNTS
Note 1: The reported current tax is adjusted for the statutory tax impact of interest expense.
Note 2: Monthly average capital employed included equity, interest-bearing liabilities, timing provision, cumulative goodwill and present value of operating leases.
Major Capital Components S$ million
Borrowings 13,587.1 Equity 16,924.1 Others 788.6
Total 31,299.8
Note 3: The weighted average cost of capital is calculated as follows:
i) Cost of Equity using Capital Asset Pricing Model with market risk premium at 5.0% (2011: 5.0%) per annum;
ii) Risk-free rate of 1.67% (2011: 2.39%) per annum based on yield-to-maturity of Singapore Government 10-year Bonds;
iii) Ungeared beta ranging from 0.64 to 0.97 (2011: 0.50 to 0.90) based on the risk categorisation of CapitaLand’s strategic business units; and
iv) Cost of Debt rate at 3.30% (2011: 3.57%) per annum using 5-year Singapore Dollar Swap Offer rate plus 200 basis points (2011: 175 basis points).
note2012
s$ million2011
s$ million
net operating Profit before tax 683.7 737.2
Adjust for:
Share of results of associates and joint ventures 834.8 876.6
interest expense 513.4 490.3
Others 55.8 71.3
adjusted Profit before interest and tax 2,087.7 2,175.4
Cash operating taxes 1 (233.1) (219.8)
net operating Profit after tax (noPat) 1,854.6 1,955.6
Average capital employed 2 31,299.8 27,713.7
Weighted average cost of capital (%) 3 5.6 5.6Capital Charge (CC) 1,752.8 1,552.0
economic value added (eva) [noPat – CC] 101.8 403.6
Non-controlling interests (84.0) (99.3)group eva attributable to owners of the Company 17.8 304.3

243
vALUe Added STATeMeNTS
2012s$ million
2011s$ million
value added From:
Revenue earned 3,301.4 3,019.6
Less: Bought in materials and services (1,886.6) (1,775.9)
gross value added 1,414.8 1,243.7
Share of results of associates and joint ventures 834.8 876.6
exchange losses (net) (8.7) (33.2)
Other operating income (net) 445.9 623.0 1,272.0 1,466.4
total value added 2,686.8 2,710.1
Distribution:
To employees in wages, salaries and benefits 589.4 526.1
To government in taxes and levies 263.0 261.9
To providers of capital in:
– Net interest on borrowings 462.5 458.2
– dividends to shareholders 340.0 256.2 1,654.9 1,502.4
balance retained in the business:
depreciation and amortisation 46.5 40.6
Revenue reserves net of dividends to owners of the Company 590.3 801.1
Non-controlling interests 386.2 365.6 1,023.0 1,207.3
non-Production Costs/(income):
Allowance for doubtful receivables 22.9 0.4
Receipt of settlement of insurance claims (14.0) – total Distribution 2,686.8 2,710.1
Productivity analysis:
value added per employee (S$’000)# 194 167
value added per dollar of employment cost (S$) 2.40 2.36
value added per dollar sales (S$) 0.43 0.41
# Based on average 2012 headcount of 7,284 (2011: 7,447).

244
appendixSUppLeMeNTAL iNFORMATiON
SUppLeMeNTAL iNFORMATiON1 DisCLosure oF DireCtors’ interests Pursuant to sgx-st Listing ruLe 1207(7) pursuant to Rule 1207(7) of the Listing Manual of the Singapore exchange Securities Trading Limited, Mr Lim Ming
Yan who was appointed as director of the Company on 1 January 2013 had interests in the shares and convertible securities of the Company as at 21 January 2013 as follow:
interests as at 21 January 2013
Ordinary shares 1,200,923
Contingent award of performance shares1 to be delivered after 2012 (152,437 shares) 0 to 304,8743
Contingent award of performance shares1 to be delivered after 2013 (143,700 shares) 0 to 287,4003
Contingent award of performance shares1 to be delivered after 2014 (144,000 shares) 0 to 252,0003
Unvested Restricted shares2 to be delivered after 2010 33,1565
Unvested Restricted shares2 to be delivered after 2011 50,3966
Contingent award of Restricted shares2 to be delivered after 2012 (110,000 shares) 0 to 165,0004
$1.3 billion convertible bonds 3.125% due 2018 (Aggregate principal amount of bonds which remains outstanding is $1.05 billion) $500,000
$1.2 billion convertible bonds 2.875% due 2016 $1,000,000
Mr Stephen Lee Ching Yen who was also appointed as director of the Company on 1 January 2013 had no interests in the shares and convertible securities of the Company as at 21 January 2013.
Footnotes:
1 Performance shares are shares under awards pursuant to the CapitaLand Performance Share Plan 2000 and CapitaLand Performance Share Plan 2010 (collectively referred to as “CapitaLand Performance Share Plan”).
2 Restricted shares are shares under awards pursuant to the CapitaLand Restricted Stock Plan 2000 and CapitaLand Restricted Share Plan 2010 (collectively referred to as “CapitaLand Restricted Stock/Share Plan”).
3 The final number of shares released will depend on the achievement of pre-determined targets over a three-year performance period. No share will be released if the threshold targets are not met at the end of the performance period. On the other hand, if superior targets are met, more shares than the baseline award could be released. For awards granted prior to 2012, the maximum is 200% of the baseline award. From 2012, the maximum will be 175% of the baseline award.
4 The final number of shares released will depend on the achievement of pre-determined targets at the end of a one-year performance period and the release will be over a vesting period of three years. No share will be released if the threshold targets are not met at the end of the performance period. On the other hand, if superior targets are met, more shares than the baseline award could be delivered up to a maximum of 150% of the baseline award.
5 Being the unvested one-third of the award.
6 Being the unvested two-thirds of the award.

245
2 interesteD Person transaCtions interested person transactions carried out during the financial year which fall under Chapter 9 of the Listing Manual
of the Singapore exchange Securities Trading Limited are as follows:
the group2012
$’000
transactions with temasek holdings (Private) Limited and its associates:
Sale of goods and services 197,136purchase of goods and services 18,198
transaction with singapore airlines Limited:
purchase of goods and services 199
transactions with starhub Limited and its associate:
purchase of goods and services 282
transactions with directors and their associates:
Sale of a residential unit 3,680Appointment of a former director as senior advisor to the Board of directors of the Company 120
3 aPPointMent oF auDitors The Company confirms that it has complied with Rules 712 and 715 or 716 of the Listing Manual of the Singapore
exchange Securities Trading Limited in relation to its auditing firms.

246
appendixSHAReHOLdiNG STATiSTiCS / NOTiCe OF ANNUAL GeNeRAL MeeTiNG
share CaPitaL paid-up Capital S$6,346,142,745.81Number of issued and paid-up Shares (including Treasury Shares) 4,270,735,848Number of Treasury Shares 19,611,437Number of issued and paid-up Shares (excluding Treasury Shares) 4,251,124,411Class of Shares Ordinary Sharesvoting Rights One vote per share. The Company cannot exercise any
voting rights in respect of shares held by it as treasury shares.
twentY Largest sharehoLDers As shown in the Register of Members and depository Register name no. of shares %(1)
1 Temasek Holdings (private) Limited 1,680,704,140 39.54 2 Citibank Nominees Singapore pte Ltd 638,022,082 15.01 3 dBS Nominees pte Ltd 479,090,878 11.27 4 dBSN Services pte Ltd 302,759,094 7.12 5 HSBC (Singapore) Nominees pte Ltd 232,798,495 5.48 6 United Overseas Bank Nominees pte Ltd 144,167,515 3.39 7 Raffles Nominees (pte) Ltd 73,855,974 1.74 8 BNp paribas Securities Services Singapore Branch 30,786,507 0.72 9 Morgan Stanley Asia (Singapore) Securities pte Ltd 24,391,326 0.57 10 Merrill Lynch (Singapore) pte Ltd 23,019,609 0.54 11 Bank of Singapore Nominees pte Ltd 20,767,467 0.49 12 pei Hwa Foundation Limited 11,727,335 0.28 13 OCBC Nominees Singapore private Limited 11,333,799 0.27 14 dB Nominees (S) pte Ltd 11,212,716 0.26 15 OCBC Securities private Ltd 10,772,305 0.25 16 BNp paribas Nominees Singapore pte Ltd 10,482,239 0.25 17 Lee pineapple Company pte Ltd 10,000,000 0.23 18 phillip Securities pte Ltd 9,373,042 0.22 19 UOB Kay Hian pte Ltd 6,906,953 0.16 20 dBS vickers Securities (S) pte Ltd 4,705,603 0.11 total 3,736,877,079 87.90
substantiaL sharehoLDers As shown in the Register of Substantial Shareholders as at 28 February 2013 Direct interest Deemed interest substantial shareholder no. of shares %(1) no. of shares %(1)
Temasek Holdings (private) Limited 1,680,704,140 39.53 59,333,134(2) 1.40
siZe oF hoLDings no. of no. of shares excluding size of shareholdings shareholders % treasury shares %(1)
1 – 999 987 1.80 340,039 0.01 1,000 – 10,000 44,784 81.78 174,382,741 4.10 10,001 – 1,000,000 8,950 16.35 306,668,135 7.21 1,000,001 and above 39 0.07 3,769,733,496 88.68
total 54,760 100.00 4,251,124,411 100.00 Approximately 58.97%(1) of the issued ordinary shares are held in the hands of the public. Rule 723 of the Listing Manual of the Singapore exchange Securities Trading Limited is complied with. Notes: (1) Percentage is calculated based on the total number of 4,251,124,411 issued shares, excluding treasury shares.
(2) Temasek Holdings (Private) Limited is deemed to have an interest in 59,333,134 ordinary shares in which its subsidiary and associated companies have or are deemed to have an interest.
SHAReHOLdiNG STATiSTiCSas at 28 February 2013

247
NOTiCe iS HeReBY GiveN that the Annual General Meeting of the Company will be held at The Star Theatre, Level 5, The Star performing Arts Centre, 1 vista exchange Green, Singapore 138617 on Friday, 26 April 2013 at 10.00 a.m. to transact the following business:
as orDinarY business
1 To receive and adopt the directors’ Report and Audited Financial Statements for the year ended 31 december 2012 and the Auditors’ Report thereon.
2 To declare a first and final 1-tier dividend of S$0.07 per share for the year ended 31 december 2012.
3 To approve directors’ fees of S$2,032,059 for the year ended 31 december 2012 comprising:
(a) S$1,474,641.30tobepaidincash(2011:S$1,519,548.30);and (b) S$557,417.70 to be paid in the form of share awards under the CapitaLand Restricted Share plan 2010, with any
residual balance to be paid in cash (2011: S$400,052.70).
4 To re-elect the following directors, who are retiring by rotation pursuant to Article 95 of the Articles of Association of the Company and who, being eligible, offer themselves for re-election:
(a) Mr Ng Kee Choe (b) Mr peter Seah Lim Huat
5 To re-elect the following directors, who are retiring pursuant to Article 101 of the Articles of Association of the Company and who, being eligible, offer themselves for re-election:
(a) Tan Sri Amirsham Bin A Aziz (b) Mr Stephen Lee Ching Yen (c) Mr Lim Ming Yan
6 To re-appoint KpMG LLp as Auditors of the Company and to authorise the directors to fix their remuneration.
as sPeCiaL business
7 To consider and, if thought fit, to pass with or without any modification, the following resolutions as Ordinary Resolutions:
7A That pursuant to Section 161 of the Companies Act, authority be and is hereby given to the directors of the Company to:
(a) (i) issuesharesinthecapitaloftheCompany(”shares”)whetherbywayofrights,bonusorotherwise;and/or
(ii) make or grant offers, agreements or options (collectively, ”instruments”) that might or would require shares to be issued, including but not limited to the creation and issue of (as well as adjustments to) warrants, debentures or other instruments convertible into shares,
at any time and upon such terms and conditions and for such purposes and to such persons as the directors mayintheirabsolutediscretiondeemfit;and
(b) (notwithstanding the authority conferred by this Resolution may have ceased to be in force) issue shares in pursuance of any instrument made or granted by the directors while this Resolution was in force,
NOTiCe OF ANNUAL GeNeRAL MeeTiNG
CaPitaLanD LiMiteD(Company Registration No. 198900036N) (incorporated in the Republic of Singapore)

248
appendix
as sPeCiaL business (cont’d)
provided that:
(1) the aggregate number of shares to be issued pursuant to this Resolution (including shares to be issued in pursuance of instruments made or granted pursuant to this Resolution) does not exceed fifty per cent. (50%) of the total number of issued shares (excluding treasury shares) in the capital of the Company (as calculated in accordance with sub-paragraph (2) below), of which the aggregate number of shares to be issued other than on a pro rata basis to shareholders of the Company (including shares to be issued in pursuance of instruments made or granted pursuant to this Resolution) does not exceed ten per cent. (10%) of the total number of issued shares (excluding treasuryshares)inthecapitaloftheCompany(ascalculatedinaccordancewithsub-paragraph(2)below);
(2) (subject to such manner of calculation as may be prescribed by the Singapore exchange Securities Trading Limited (“SGX-ST”)) for the purpose of determining the aggregate number of shares that may be issued under sub-paragraph (1) above, the total number of issued shares (excluding treasury shares) shall be based on the total number of issued shares (excluding treasury shares) in the capital of the Company at the time this Resolution is passed, after adjusting for:
(i) new shares arising from the conversion or exercise of any convertible securities or share options or vesting of shareawardswhichareoutstandingorsubsistingatthetimethisResolutionispassed;and
(ii) anysubsequentbonusissue,consolidationorsubdivisionofshares; (3) in exercising the authority conferred by this Resolution, the Company shall comply with the provisions of the
Listing Manual of the SGX-ST for the time being in force (unless such compliance has been waived by the SGX-ST) andtheArticlesofAssociationforthetimebeingoftheCompany;and
(4) (unless revoked or varied by the Company in general meeting) the authority conferred by this Resolution shall continue in force until the conclusion of the next Annual General Meeting of the Company or the date by which the next Annual General Meeting of the Company is required by law to be held, whichever is the earlier.
7B That the directors of the Company be and are hereby authorised to:
(a) grant awards in accordance with the provisions of the CapitaLand performance Share plan 2010 (the “performance SharePlan”)and/ortheCapitaLandRestrictedSharePlan2010(the“RestrictedSharePlan”);and
(b) allot and issue from time to time such number of shares in the capital of the Company as may be required to be issued pursuant to the vesting of awards under the performance Share plan and/or the Restricted Share plan,
provided that the aggregate number of shares to be issued, when aggregated with existing shares (including treasury shares and cash equivalents) delivered and/or to be delivered pursuant to the performance Share plan, the Restricted Share plan and all shares, options or awards granted under any other share schemes of the Company then in force, shall not exceed eight per cent. (8%) of the total number of issued shares (excluding treasury shares) in the capital of the Company from time to time.
By Order of the Board
Low sai ChoYCoMPanY seCretarY
singapore 22 March 2013
NOTiCe OF ANNUAL GeNeRAL MeeTiNG
NOTiCe OF ANNUAL GeNeRAL MeeTiNG

249
notes:
A member of the Company entitled to attend and vote at the Annual General Meeting is entitled to appoint not more than two proxies to attend and vote instead of him. Where a member appoints more than one proxy, he shall specify the proportion of his shareholdings to be represented by each proxy. A proxy need not be a member of the Company. The instrument appointing a proxy or proxies must be deposited at the office of the Company’s Share Registrar, M & C Services private Limited, 112 Robinson Road, #05-01, Singapore 068902 not less than 48 hours before the time appointed for holding the Annual General Meeting. Additional information relating to the Notice of Annual General Meeting:
1 in relation to item 3 under the heading “As Ordinary Business”, the total compensation of the non-executive directors for 2012 of an aggregate amount of S$2,032,059, if approved, will be paid as to S$1,474,641.30 in cash, and S$557,417.70 in the form of share awards under the CapitaLand Restricted Share plan 2010. Consequently, and in accordance with the “directors’ Fee policy”, a non-executive director who served on the Board during 2012 (with the exception of dr Hu Tsu Tau, Mr Richard edward Hale and dr Fu Yuning, who retired from the Board during 2012) will be remunerated as to about 70 per cent. (70%) of his total directors’ fees in cash and about 30 per cent. (30%) of his total directors’ fees in the form of shares in the Company. The actual number of shares to be awarded will be based on the volume-weighted average price of a share on the SGX-ST over the 14 trading days from (and including) the ex-dividend date following the Company’s Annual General Meeting, rounded down to the nearest share, and any residual balance settled in cash. The awards will consist of the grant of fully paid shares, with no performance conditions attached and no vesting periods imposed. each of dr Hu Tsu Tau, Mr Richard edward Hale and dr Fu Yuning will receive all of their directors’ fees in cash.
2 in relation to item 4 under the heading “As Ordinary Business”, Mr Liew Mun Leong, a non-independent director, retires by rotation pursuant to Article 95 of the Company’s Articles of Association at the Annual General Meeting and is not seeking re-election. in relation to items 4(a) and (b) under the heading “As Ordinary Business”, Mr Ng Kee Choe will, upon re-election, continue to serve as Chairman of the Board, Chairman of the investment Committee, a member of the Nominating Committee, a member of the Finance and Budget Committee and a member of the executive ResourceandCompensationCommitteerespectively;andMrPeterSeahLimHuatwill,uponre-election,continue to serve as deputy Chairman of the Board, Chairman of the Nominating Committee, Chairman of the Finance and Budget Committee and Chairman of the executive Resource and Compensation Committee respectively. Mr Ng will replace Mr Seah as Chairman of the executive Resource and Compensation Committee from 27 April 2013. Mr Ng and Mr Seah are considered as independent directors. please refer to the “Board of directors” section of the Company’s Annual Report 2012 for information on the current directorships in other listed companies and other principal commitments of Mr Ng and Mr Seah respectively.
3 in relation to items 5(a), (b) and (c) under the heading “As Ordinary Business”, Tan Sri Amirsham Bin A Aziz will, upon re-election, continue to serve as a member of the Audit Committee and a member of the Risk Committee respectively; Mr Stephen Lee Ching Yen will, upon re-election, continue to serve as a member of the Executive ResourceandCompensationCommitteeandamemberoftheRiskCommitteerespectively;andMrLimMingYan will, upon re-election, continue to serve as a member of the investment Committee, a member of the Finance and Budget Committee and a member of the Corporate disclosure Committee respectively. Tan Sri Amirsham and Mr Lee are considered as independent directors. Mr Lim is the president and Group Chief executive Officer of the Company. please refer to the “Board of directors” section of the Company’s Annual Report 2012 for information on the current directorships in other listed companies and other principal commitments of Tan Sri Amirsham, Mr Lee and Mr Lim respectively.
250
appendixNOTiCe OF ANNUAL GeNeRAL MeeTiNG
notes: (cont’d)
4 Ordinary Resolution No. 7A under the heading ”As Special Business”, if passed, will empower the directors to issue shares in the Company and to make or grant instruments (such as warrants or debentures) convertible into shares, and to issue shares in pursuance of such instruments from the date of the Annual General Meeting until the date of the next Annual General Meeting. The aggregate number of shares which the directors may issue (including shares to be issued pursuant to convertibles) under this Resolution must not exceed fifty per cent. (50%) of the total number of issued shares (excluding treasury shares) in the capital of the Company with a sub-limit of ten per cent. (10%) for issues other than on a pro rata basis. For the purpose of determining the aggregate number of shares that may be issued, the total number of issued shares (excluding treasury shares) in the capital of the Company will be calculated based on the total number of issued shares (excluding treasury shares) in the capital of the Company at the time that Ordinary Resolution No. 7A is passed, after adjusting for (a) new shares arising from the conversion or exercise of any convertible securities or share options or vesting of share awards which are outstanding or subsisting at the time that Ordinary Resolution No. 7A is passed, and (b) any subsequent bonus issue, consolidation or subdivision of shares. The sub-limit of ten per cent. (10%) for issues other than on a pro rata basis is below the twenty per cent. (20%) sub-limit permitted by the Listing Manual of the SGX-ST. The directors believe that the lower sub-limit of ten per cent. (10%) would sufficiently address the Company’s present need to maintain flexibility while taking into account shareholders’ concerns against dilution.
5 Ordinary Resolution No. 7B under the heading ”As Special Business”, if passed, will empower the directors to grant awards under the performance Share plan and the Restricted Share plan, and to allot and issue shares pursuant to the vesting of such awards provided that the aggregate number of shares to be issued, when aggregated with existing shares (including treasury shares and cash equivalents) delivered and/or to be delivered pursuant to the performance Share plan, the Restricted Share plan and all shares, options or awards granted under any other share schemes of the Company then in force, does not exceed eight per cent. (8%) of the total number of issued shares (excluding treasury shares) in the capital of the Company from time to time.
NOTiCe OF ANNUAL GeNeRAL MeeTiNG
CaPitaLanD LiMiteD(Regn. No.: 198900036N)(incorporated in the Republic of Singapore)
ProxY ForMannuaL generaL Meeting
i/We, _________________________________ (Name) _____________________________ (NRiC/passport/Company Regn. No.)
of _________________________________________________________________________________________________ (Address)
being a member/members of CapitaLand Limited (the “Company”) hereby appoint:
name address nriC/Passport no.
Proportion of shareholdings
no. of shares %
and/or (delete as appropriate)
name address nriC/Passport no.
Proportion of shareholdings
no. of shares %
as my/our proxy/proxies to attend and to vote for me/us on my/our behalf at the Annual General Meeting of the Company to be held at The Star Theatre, Level 5, The Star performing Arts Centre, 1 vista exchange Green, Singapore 138617, on Friday, 26 April 2013 at 10.00 a.m., and at any adjournment thereof. i/We direct my/our proxy/proxies to vote for or against the Resolutions to be proposed at the Annual General Meeting as indicated hereunder. if no specific direction as to voting is given, the proxy/proxies will vote or abstain from voting at his/their discretion, as he/they will on any other matter arising at the Annual General Meeting.
no. resolutions relating to: For* against*
orDinarY business
1 Adoption of directors’ Report, Audited Financial Statements and Auditors’ Report
2 declaration of a First and Final dividend
3 Approval of directors’ Fees
4(a) Re-election of Mr Ng Kee Choe as director
4(b) Re-election of Mr peter Seah Lim Huat as director
5(a) Re-election of Tan Sri Amirsham Bin A Aziz as director
5(b) Re-election of Mr Stephen Lee Ching Yen as director
5(c) Re-election of Mr Lim Ming Yan as director
6 Re-appointment of KpMG LLp as Auditors
sPeCiaL business
7A Authority for directors to issue shares and to make or grant instruments pursuant to Section 161 of the Companies Act, Cap. 50
7B Authority for directors to grant awards, and to allot and issue shares, pursuant to the CapitaLand performance Share plan 2010 and the CapitaLand Restricted Share plan 2010
total number of shares held
iMPortant: 1. For investors who have used their CpF monies to buy the Company's shares, this
Summary Report/Annual Report is forwarded to them at the request of their CpF Approved Nominees and is sent solely FOR iNFORMATiON ONLY.
2. This proxy Form is not valid for use by CpF investors and shall be ineffective for all intents and purposes if used or purported to be used by them.
3. CpF investors who wish to attend the Meeting as observers must submit their requests through their CpF Approved Nominees within the time frame specified. if they also wish to vote, they must submit their voting instructions to their CpF Approved Nominees within the time frame specified to enable them to vote on their behalf.
* If you wish to exercise all your votes “For” or “Against”, please indicate with a “ ” within the box provided. Alternatively, please indicate the number of votes as appropriate.
dated this ______________________ day of ______________________ 2013
Signature(s) of Member(s) or Common Seal
iMpORTANT: pLeASe ReAd NOTeS TO pROXY FORM ON ReveRSe pAGe.
notes to ProxY ForM:1 A member entitled to attend and vote at the Meeting is entitled to appoint one or two proxies to attend and vote in his stead. A proxy need not be a member of
the Company.
2 Where a member appoints more than one proxy, the appointments shall be invalid unless he specifies the proportion of his holding (expressed as a percentage of the whole) to be represented by each proxy.
3 Completion and return of this instrument appointing a proxy or proxies shall not preclude a member from attending and voting at the Meeting. Any appointment of a proxy or proxies shall be deemed to be revoked if a member attends the Meeting in person, and in such event, the Company reserves the right to refuse to admit any person or persons appointed under the instrument of proxy or proxies, to the Meeting.
4 A member should insert the total number of shares held. if the member has shares entered against his name in the depository Register (as defined in Section 130A of the Companies Act, Cap. 50 of Singapore), he should insert that number of shares. if the member has shares registered in his name in the Register of Members of the Company, he should insert that number of shares. if the member has shares entered against his name in the depository Register as well as shares registered in his name in the Register of Members, he should insert the aggregate number of shares. if no number is inserted, the instrument of proxy will be deemed to relate to all the shares held by the member.
5 The instrument appointing a proxy or proxies must be deposited at the office of the Company’s Share Registrar, M & C Services private Limited, 112 Robinson Road, #05-01, Singapore 068902, not less than 48 hours before the time appointed for holding the Meeting.
6 The instrument appointing a proxy or proxies must be under the hand of the appointor or of his attorney duly authorised in writing. Where the instrument appointing a proxy or proxies is executed by a corporation, it must be executed either under its common seal or under the hand of its attorney or a duly authorised officer.
7 Where an instrument appointing a proxy or proxies is signed on behalf of the appointor by an attorney, the letter or power of attorney or a duly certified copy thereof must (failing previous registration with the Company) be lodged with the instrument of proxy, failing which the instrument may be treated as invalid.
8 A corporation which is a member may authorise by resolution of its directors or other governing body such person as it thinks fit to act as its representative at the Meeting, in accordance with Section 179 of the Companies Act, Cap. 50 of Singapore.
general The Company shall be entitled to reject the instrument appointing a proxy or proxies which is incomplete, improperly completed, illegible or where the true intentions of the appointor are not ascertainable from the instructions of the appointor specified in the instrument appointing a proxy or proxies. in addition, in the case of shares entered in the depository Register, the Company may reject any instrument appointing a proxy or proxies lodged if the member, being the appointor, is not shown to have shares entered against his name in the depository Register at least 48 hours before the time appointed for holding the Meeting, as certified by The Central depository (pte) Limited to the Company.
2nd fold here
1st fold here
postage will be paid
by addressee
For posting in Singapore only.
CaPitaLanD LiMiteDc/o M & C Services private Limited
112 Robinson Road #05-01
Singapore 068902
business rePLY serviCe PerMit no. 04910
3rd fold here, glue along the dotted line and fold flap
notes to ProxY ForM:1 A member entitled to attend and vote at the Meeting is entitled to appoint one or two proxies to attend and vote in his stead. A proxy need not be a member of
the company.
2 Where a member appoints more than one proxy, the appointments shall be invalid unless he specifies the proportion of his holding (expressed as a percentage of the whole) to be represented by each proxy.
3 completion and return of this instrument appointing a proxy or proxies shall not preclude a member from attending and voting at the Meeting. Any appointment of a proxy or proxies shall be deemed to be revoked if a member attends the Meeting in person, and in such event, the company reserves the right to refuse to admit any person or persons appointed under the instrument of proxy or proxies, to the Meeting.
4 A member should insert the total number of shares held. if the member has shares entered against his name in the depository register (as defined in section 130A of the companies Act, cap. 50 of singapore), he should insert that number of shares. if the member has shares registered in his name in the register of Members of the company, he should insert that number of shares. if the member has shares entered against his name in the depository register as well as shares registered in his name in the register of Members, he should insert the aggregate number of shares. if no number is inserted, the instrument of proxy will be deemed to relate to all the shares held by the member.
5 the instrument appointing a proxy or proxies must be deposited at the office of the company’s share registrar, M & c services private Limited, 112 robinson road, #05-01, singapore 068902, not less than 48 hours before the time appointed for holding the Meeting.
6 the instrument appointing a proxy or proxies must be under the hand of the appointor or of his attorney duly authorised in writing. Where the instrument appointing a proxy or proxies is executed by a corporation, it must be executed either under its common seal or under the hand of its attorney or a duly authorised officer.
7 Where an instrument appointing a proxy or proxies is signed on behalf of the appointor by an attorney, the letter or power of attorney or a duly certified copy thereof must (failing previous registration with the company) be lodged with the instrument of proxy, failing which the instrument may be treated as invalid.
8 A corporation which is a member may authorise by resolution of its directors or other governing body such person as it thinks fit to act as its representative at the Meeting, in accordance with section 179 of the companies Act, cap. 50 of singapore.
general the company shall be entitled to reject the instrument appointing a proxy or proxies which is incomplete, improperly completed, illegible or where the true intentions of the appointor are not ascertainable from the instructions of the appointor specified in the instrument appointing a proxy or proxies. in addition, in the case of shares entered in the depository register, the company may reject any instrument appointing a proxy or proxies lodged if the member, being the appointor, is not shown to have shares entered against his name in the depository register at least 48 hours before the time appointed for holding the Meeting, as certified by the central depository (pte) Limited to the company.
2nd fold here
1st fold here
postage will be paid
by addressee
For posting in singapore only.
caPitaLanD LiMiteDc/o M & c services private Limited
112 robinson road #05-01
singapore 068902
business rePLY service PerMit no. 04910
3rd fold here, glue along the dotted line and fold flap

CApItAlAnD lIMIteD168 Robinson Road #30-01 Capital Tower Singapore 068912Tel +65 6823 3200Fax +65 6820 2202(Reg No. 198900036N)
www.capitaland.com
This annual report is printed on environmentally friendly paper containing recycled pulp from post-consumer waste and Forest Stewardship Council (FSC) certified. The paper is also manufactured with a totally chlorine free process (TCF) and has been granted the SEC (Singapore Environment Council) Green Label certification.