FM Top Companies 2015.pdf
64
2015 T COMPANIES P ANNUAL REPORT WWW.FINANCIALMA The Winners pg 10 • SA Giants pg 18 • Top Performer SA’s leading review of listed companies
-
Upload
khangminh22 -
Category
Documents
-
view
0 -
download
0
Transcript of FM Top Companies 2015.pdf

Financial Mail Page 1 -12/06/15 03:01:44 PM
2015
TCOMPANIES
P
ANNUAL REPORT WWW.FINANCIALMAIL.CO.ZA
The Winners pg 10 • SA Giants pg 18 • Top Performers pg 71
SA’s leading
review of
listed companies
JUN
E 2
015
TO
P C
OM
PA
NIE
S

Financial Mail Page 2 -12/06/15 12:45:26 PM
om
ms
06.2
015 L
8016
To a future where financial wellbeing is within reach of all our people.
That is why we have committed close to R30 billion of our R950 billion funds under management to education, affordable housing, renewable energy, agriculture and infrastructure.
By driving long-term economic growth in Africa, we can positively impact the lives of all our customers and communities on the continent.
Assuring your future financial wellbeing.
www.oldmutual.co.za
Old Mutual is a Licensed Financial Services Provider.
Funds quoted relate to Old Mutual Emerging Markets investments as at 31 March 2015.
INVESTMENTS I SAVINGS I PROTECTION
There’s one thing better than looking back with pride. Looking forward with hope and determination.
ENABLING DREAMS170 YEARS OF

Financial Mail Page 3 -17/06/15 10:21:01 AM
Ed i to r i a lFinancial Mail Editor: Tim CohenTop Companies editor: David WilliamsProjects editor: Luleka MangqukuProjects co-ordinator: Matshepo GumedeWriters: Claire Bisseker, Stephen Cranston, RuanJooste, Maarten Mittner, Thabiso Mochiko, JoanMuller, Stafford ThomasProofreader: Dave LandauLayout & cover: Colleen Wilson
Ed i to r-i n - c h i e f : Peter BruceGroup managing editor: Michael Biberauer
Adver tisingContact: (011) 280-3710/3183.Project head: Kay NaidooSales: Cris StockProduction: Jamie KinnearBack copies: To order, call the Library Helpdeskon (011) 280-3933Pictures syndication: Tel: (011) 280-3916. E-mailsy n d i c a t i o n @ t i m e s m e d i a . co . z aPictures archive: Tel (011) 280-3933
P ublisher: Mike RobertsonC FO : Ashok LachmanHead office: 4 Biermann Avenue, Rosebank 2196Box 1744, Saxonwold 2132. Tel (011) 280-3000. Fax(011) 280-3337/8/9Cape Town: 12th Floor, 2 Long Street, Cape Town8000. Box 2447, CT 8000. Tel (021) 488-1700. Fax(021) 488-1737Durban: 635 Ridge Road, Overport. Box 51163,Musgrave 4062. Tel (031) 250-8500. Circulation(031) 250-8533Financial Mail (ISSN 0015/2013) is published bythe proprietors, BDFM Publishers (Pty) Ltd, 4Biermann Avenue, Rosebank 2196, SA and printedby Paarlmedia, 48 Milkyway Ave, Linbro Park,Gau te n g
“It always seems impossible until it’s done.”
���Ğů�ŽŶ��ĂŶĚĞůĂ�
MyWorld of Tomorrow believes that the African
innovators of tomorrow will be the pioneers who
refuse to accept the impossible.
Are you, or your company a pioneer?
We Invite you to participate in the inaugural
SA INNOVATION AWARDS.
SA INNOVATION AWARDS
CATEGORIES
�������������ŶŶŽ�Ă�ŽŶ�ŽĨ��ŚĞ��ĞĂ�
�������������ŶŶŽ�Ă�Ž�ŽĨ��ŚĞ��ĞĂ
��������Ž�ŽĂ�Ğ��ŶŶŽ�Ă�ŽŶ�ŽĨ��ŚĞ��ĞĂ
��������Ž�ŽĂ�Ğ��ŶŶŽ�Ă�Ž�ŽĨ��ŚĞ��ĞĂ
��������ďůŝĐ��ĞĐ�Ž��ŶŶŽ�Ă�ŽŶ�ŽĨ��ŚĞ��ĞĂ
��������ďůŝĐ��ĞĐ�Ž��ŶŶŽ�Ă�Ž�ŽĨ��ŚĞ��ĞĂ
��������Žŵŵ�Ŷŝ����ŶŶŽ�Ă�ŽŶ��ĂĚ
• Hall of Fame
��������ŽůůĂďŽĂ��Ğ��ŶŶŽ�Ă�ŽŶ�ŽĨ��ŚĞ��ĞĂ
CONTACT
[email protected] | 011 280 5254
twitter.com/MWO2M
youtube.com/mwotafricafacebook.com/mwotafrica
mwotafrica.com

Financial Mail Page 4-5 -12/06/15 03:02:27 PM
o nte nts
6 Definitions8 Methodology
FRONT OF THE BOOK SECTO R S
INVESTING IN TOP COMPANIES
SE RV I C ES34 Chemicals: Sting of low oil prices still hurts38 Industrial metals & mining: Market flooding a bad act40 Mining: Value in battered mining42 Gold: A blurry reality awaits43 Platinum: Glory days still way in the past44 Construction: Small is beautiful for now46 General industries: There’s good in some stocks48 Transport: Business strategies evolve50 Food & beverages: Structured plans work best51 Travel & leisure: Battles on many fronts52 Household goods: Tenacity the quality to pursue53 Health & pharmaceuticals: Exits shrink the sector55 Retail: Local appetite limited58 Media: One share shines brighter59 Telecommunications: Hope for better services
60 Banks: Fairly decent growth63 Life assurance: Big moves to shape growth of firms64 Short-term insurance: Subdued economic growth
stunts market65 Financial services: Eclectic but surely set to grow67 IT: Demand for mores services a big boost68 Property: Good value to be hadWINNERS
SA GIANTS
10 The impossible becomes possible1 4-1 6 The Top 2018 Cashing in on a weaker rand
20 The international view21 Asset heavyweights22-3 3 Table: SA Giants
71 Top performers: A solid feat out of hard work73 -77 Table: Top Performers78 JSE: A good disconnect79 State-owned companies: New model required82 Unit trusts: Alsi exploits refocus attention84 Economy: Disconnect is in the air86 Corporate governance: King 4 to help equip directors
88 Legal advisers: A commitment to real change89 Table*: Legal advisers & corporate clients92 Accounts: Marked change in standards93 Table*: Auditors & corporate clients94 Tax: A move to right a wrong95 Settlements: Platform gets even more efficient96 Table*: Sponsors & corporate clients97 Medical aid: More to have access to better care98 Table*: Medical aid schemes & corporate clients100 Advertising agencies: Mobile is where it’s at101 Table*: Advertising agencies & corporate clients1 03 PR agencies: A new kind of dance104 Table*: PR agencies & corporate clients
* Due to space constraints, these tables have been shortened
To fi nd out about growth prospects for South African businesses,
read the Grant Thornton International Business Report (IBR)
which provides insight into the views and expectations of more
than a thousand South African businesses each year. We are
Grant Thornton and we help our clients understand the issues that
impact on their business decisions. Contact us to help unlock
your potential for growth.
To access the latest Grant Thornton IBR go to www.gt.co.za
2015 Grant Thornton South Africa. All rights reserved. Grant Thornton South Africa is a member firm of Grant Thornton International Ltd (GTIL). GTIL and the member firms are not a worldwide partnership. Services are delivered by the member firms. GTIl and its member firms are not agents of, and do not obligate, one another and are not liable for one another’s acts or omissions. Please see www.gt.co.za for further details.
Are growth prospects looking brighter?

Financial Mail Page 6 -12/06/15 03:02:55 PM
FINANCIAL MAIL • TOP COMPANIES • 20156
DEFIN
ITION
S Figures in tables provided by INET BFA were calculatedaccording to the definitions below. Consolidated auditedfinancial statements received before the end of March 2015were used. For certain companies with financial year-endstowards the end of the calendar year, statistics may thus referto financial years ended during 2013.
STANDARDISATION OF FINANCIAL DATAThe figures used in this publication differ from those publishedby the companies. INET BFA standardises all the publishedfinancial statements because the accounting conventions usedby companies differ, making it practically impossible tocompare and rank companies using their published data. TheJSE-listed companies to be compared with each other arediverse. There are also many financial items to be consideredin the process of standardisation. It is therefore impossible todescribe, in a few words, what is done with each item in theprocess of standardisation to achieve the goal ofcomparability. In interpreting and allocating specific items,however, basic accounting principles are followed.
INTERNAL RATE OF RETURNThe internal rate of return is a market-related return takinginto account, by way of a discounted cash flow calculation,both share price movements and dividends paid. The shareprice five years ago (end-March 2010) is taken as a cashoutflow and all annual dividends for the next five years (bothcash dividends and dividends in specie) as well as the shareprice at end-March 2015 are taken as cash inflows. Theinternal rate of return is then quantified by finding thediscount rate that equates the present value of all dividendsand the share price at end-March 2015 with the share pricefive years ago (end-March 2010). All data is adjusted for sharesplits and share consolidations.
GOLD COMPANIES, FINANCIAL COMPANIES & THE RESTThe structure of the financial statements in the database ofINET BFA differs between gold companies and all othercompanies. The reason for this is basically the difference inthe nature of business of the two categories. The definitionsof the ratios of the two categories of companies thereforediffer, but the meaning and quantification are the same.Financial companies — comprising the banking, short-terminsurance, long-term insurance and financial services sectors —are also treated differently in defining the various ratios. Againthis is done because of the difference in the nature of thebusiness. In all cases care is taken to maintain thecomparability of the performance and other measures. Forexample, all the ratios are calculated before takingextraordinary and exceptional items in the income statementinto consideration. Naturally, these items include the profit orloss on transactions in the financial markets. Thesetransactions have been treated as “in the normal course ofb u s i n ess” for financial companies, but as extraordinary for allother companies. As no turnover in the normal sense of theword exists for banks, the total of interest received,commission earnings, currency exchange earnings and otherfee earnings have been used instead of turnover.
DEFINITIONS OF THE MOST VITAL VARIABLES USED❍ Turnover: Total turnover as published by the company (forbanks refer to the paragraph above).❍ Total assets: Fixed assets and current assets are included.Investments are at market value or directors' valuation atlatest Statement of Financial Position date. Other assets, suchas land and buildings, are at book value. Where revaluationsare not taken into the statement of financial position, theseare ignored. Where cash balances are netted off against bankoverdrafts, the cash balances are added back. Tax paid inadvance is netted off against tax payable and only the netamount included. Cost of control and intangible assets, such asgoodwill, patents and licences, are not included — miningassets are, however, included. Where amounts invoiced oncontracts in progress exceed the value of the contracts inprogress, the difference is included with retained income; or, ifthe amounts received consist of deposits received, thedifference is included with creditors. If inventories are valuedusing last in first out (Lifo), it is adjusted to reflect the first infirst out (Fifo) or average value.❍ Market capitalisation: Market capitalisation equals themarket value of all fully paid and issued ordinary shares
calculated at the closing price of the last trading day of March20 1 5.❍ Equity funds: Equity funds (ordinary shareh o l d e rs’ f u n d s)consist of ordinary share capital, all capital reserves anddistributable reserves, adjusted for the same items as the“total assets” a b ove.Provisions included with credit balances such as warrantyprovisions, provisions for self-insurance and provisions formaintenance are included with long-term loans or creditors inthe case of short-term provisions. Deferred tax is regarded asretained profit.❍ Net profit: Net profit is defined as taxed profit attributableto ordinary shareholders, excluding extraordinary andexceptional items. Deferred tax and amounts transferred toreserves, is excluded from the calculation of net profit anddirectly handled in retained profit, thus increasing taxed profit.Provisions are treated as disclosed under the equity fundsdefinition above. Currency conversion gains and losses areexcluded in all cases as not all companies treat this item in thesame manner. Also excluded are items such as cost of controlwritten off and prospecting expenditure. The pretax differencein profit between Lifo and Fifo or average inventory values isadded to net profit.❍ Pretax profit: The effect of extraordinary and exceptionalitems is excluded from pretax profit (profit after interest paidbut before taxation). Apart from this, pretax profit has beenadjusted with all the variables as described in “net profit”a b ove.❍ Earnings per share: Headline earnings per share aspublished by the companies are used in all instances. Wherehistorical EPS (as in the case of growth in EPS) is used, this isadjusted for stock splits and consolidations.❍ Dividend per share: Dividends per share consist of the totalof cash dividends and stock dividends (as a proxy for cashdividends), declared in respect of the years under review.❍ Debt: Total debt (the sum of long-term interest-bearing debtand short-term interest-bearing debt) is used in all ratios.
DEFINITIONS OF SOME OF THE RATIOS❍ Compound growth: In earnings per share and pretax profit.The compound growth in the above variables is calculatedusing the available data for the latest five years available.Where a company has not been listed for five years, thecompound growth has been calculated for the shorter period.Where either the beginning or ending figures or both arenegative, N/A is indicated because the calculation would resultin bias.❍ Average dividend yield: The average dividend yield for thefive years ending March 2015 is calculated. If a firm is listed forless than five years, the average dividend yield for the shorterperiod is given.❍ Return on assets: Profit before interest but after tax asdefined above, divided by total assets as defined above.❍ Return on equity: Net profit as defined above, expressed asa percentage of equity as defined above.❍ Interest and financial lease cover: Profit before interest,operating financial lease charges, tax and extraordinary itemsdivided by the total of interest and operating financial leasecharges paid.❍ Debt to equity: The total of long-term interest-bearing debtplus the total of short-term interest-bearing debt (includingoverdraft facilities utilised) divided by total equity as defineda b ove.❍ Total serviced debt: The total of long-term interest-bearingdebt plus the total of short-term interest-bearing debt(including overdraft facilities utilised).❍ Cash and cash equivalents: The total of cash, positive bankbalances and short-term loans advanced.❍ Currency conversion: In cases where a company publishesits financial statements in some foreign currency, all financialfigures are converted to rand before the ratios for such acompany is calculated. For figures in the statement of financialposition the exchange rate at financial year-end is used in theconversion calculation. For figures in the income statement anaverage exchange rate is used in the conversion calculation.❍ Annualisation: Financial statements not covering 12 monthsare annualised. If more than one financial period is reportedon in a calendar year, the results are consolidated and thenannualised. ■

Financial Mail Page 7 -12/06/15 12:47:27 PM

Financial Mail Page 8 -12/06/15 03:03:07 PM
FINANCIAL MAIL • TOP COMPANIES • 20158
METH
ODOL
OGY
Value-add co u n t sTo make the Top 20, pastperformance matters as
much as perceived futuregains
T he Financial Mail Top Companiespublication has, for more than a decade,supplemented the traditionalvoluminous data with value-addingassessments.
The aim is to identify not only thosecompanies that performed well in the previousyear by the various measures, but which amongthem are likely to perform well again and alsoappear to offer investors value.
The Top 20 winners are accordingly chosenthrough a combination of historic financialperformance and the analysis and judgment ofthe Financial Mail’s team of investment writers.
The financial performance of all listedcompanies has been assessed by INET BFA. Usingtheir figures, we first eliminated all companiesbelow R1bn in market cap to focus theassessment on large companies with significantinvestment potential.
Over the years INET BFA’s numbers have beenquestioned because they do not always match aco m p a ny ’s own financials, but the research firm’sapproach is consistent and is explained in detailunder Definitions (see page 6).
INET BFA aims to eliminate inconsistencies bystandardising the treatment of the figures. Forexample, the ways companies treat foreignexchange conversions are brought into acommon formula.
We then weighed various financialperformance indicators: earnings-per-sharegrowth and internal rate of return weremeasured over five years to ensure that the TopCompanies were long-term performers. Thesetwo factors counted 40% each. The remaining20% represented the most recent year’s return onequity to ensure the Top Companies were currentp e r fo r m e rs .
We then took the top 40 companies that wereidentified, based on financial performance, andassessed each one. The Financial Mail te a mexamined a number of factors: corporate
governance; empowerment commitment;strength of management; investability (value buyand tradability); as well as industry and companyprofit prospects.
Scores were given in each of these areas, withoverall weighting being 60% for these qualitativefactors and 40% for the historic quantitativei n fo r m a t i o n .
Thus there is both an objective and a subjec-tive element to the assessment and ultimateselection of the companies that make the Top 20.The point about the table is not that thesecompanies are just outstanding performers —which they all are — but that they are expected toagain do much better than their peers.
The Financial Mail acknowledges that rankingthe JSE’s property companies on a net profitbasis, particularly property loan stock companies(PLSs) — including sector heavyweights such asGrowthpoint, Redefine and Hyprop — is notnecessarily the best way to compare the per-formance of individual property stocks. PLSs payout profits in the form of an interest distributionto shareholders, which can render the net profitnumber meaningless.
However, most PLS companies have already(or are in the process of) converted to the newreal estate investment trust (Reit) structure thatwas adopted by the JSE in 2013. Under the Reitdispensation, interest distributions are effectivelytreated as dividends, which makes it more viableto rank property stocks in a similar way togeneral equities.
The Top 20 is not meant to be a list of blue-chip companies — in fact, as a glance reveals,many of the JSE traditional blue chips are notthere. Rather, it’s an attempt to identify thosecompanies that represent the best investmentopportunities.
To perform well in one year makes it eventougher the next year. Investors will reward a topperformer, which means that in time there willbe less value on offer in the share price. Evenoutstanding companies can be too expensive. Iftheir price-to-projected-earnings ratio is toohigh, it could take decades for the initialpremium to be repaid, if ever.
The Top 20 companies, therefore, are thosethat have unquestionably done well, but alsohave the potential (in the view of the Fi n a n c i a lMa i l analysts) to deliver yet again even if theylook expensive. ■

Financial Mail Page 9 -12/06/15 12:47:37 PM
33765_Sanlam Old Fashioned_FinMail_273x210.indd 1 2015/06/03 3:28 PM

Financial Mail Page 10-11 -12/06/15 03:03:31 PM
FINANCIAL MAIL • TOP COMPANIES • 201510 FINANCIAL MAIL • TOP COMPANIES • 2015 11
THE
WINN
ERS THE WINNERS
The impossiblebecomes possible
A strong run and the ability to outperform the marketproduce a remarkable feat for Coronation — again
M any of the names from last year’sTop 20 ranking are still here in 2015.The placing, though, is different,with one exception: C o ro n a t i o nFund Managers. Coronation has
achieved what most observers would havethought was impossible to do: three consecutivenumber one rankings in the Top 20.
Of course, the strong run in global equitymarkets played its part here, with the bull marketthat began in March 2009 still very much intact,both in SA and beyond. This has been one of the
longest equity bull markets in history, so it isperhaps not so surprising, in retrospect, thatCoronation has done so well these past threeyears. Having said that, one has to acknowledgethat Coronation’s investment team hasoutperformed the market during that time andthis, of course, is the trick to sustaining high-netinflows of funds from investors.
But Coronation’s win this year is the closest ithas ever been, with second placed LibertyHo l d i n g s breathing hard down its neck. Only anelusive couple of points separated the first two
positions, which is probablythe closest shave in the Top20 in recent years.
While Coronation’s highscore is due mainly to itsvery high return on equity(RoE), Liberty Holdings’ highscore is due largely toextremely high five-yearcompound annual growthrate (CAGR) in earnings.Liberty’s investmentperformance was severelydented a few years ago.Since then it hastransformed successfully andnow operates in 16 countriesin Africa. Much of the creditfor this profound turnaroundmust go to former CEOBruce Hemphill and currentCEO Thabo Dloti. After abrief spell back at Liberty’sowner, Standard Bank,Hemphill has now taken upthe CEO position at Ol dMu t u a l .
Assets under management at Liberty wereR646bn at end-March 2015. It is the third-largestlife assurance company in SA after Old Mutualand Sa n l a m and its investment arm, St a n l i b , isright up there with the big boys of theinvestment management industry.
Mr Price came roaring up the rankings to takethird position. Currently the darling of the SAretail industry, this company has scarcely put afoot wrong. Not only does its philosophy ofproviding quality fashion at a low price appeal toa wide demographic, it has in more recent timesbeen able to beat all of its clothing competitorshands down when it comes to online retailing.Moreover, it has also managed to penetrate deepinto the African continent, where its degree ofrecognition is surprisingly high. Its CAGR of 23%over a 28-year period in earnings and 25% individends per share is perhaps unparalleled inJSE listing history.
Calgro M3’s prodigious share price growth isthe main reason this company finds itself in thetop three. Even without a five-year track recordin earnings, this nimble and innovative companyhas managed to find itself within spittingdistance of top honours. Though its mainbusiness remains mixed-use and integratedresidential development, it has more recentlydiversified into the burial business with theestablishment of memorial parks.
Woolworths Holdings, affectionately known inthe retail industry as Woolies, has gradually
reinvented itself, first underthe watch of former CEOSimon Susman and morerecently with his successorIan Moir. Almost 20 yearsago, when it was stillamalgamated with Truworthswithin Wooltru, the companywas languishing. A hybrid offood, clothing and generalmerchandising retailing,Woolies gradually got itsfocus right over the years,especially with respect to itsclothing offering. Foodalways was and remains anoutstanding performer in thegroup and the desire wasalways to match the qualityof the clothing offering tothat of its food, so thatcustomers would cross-shopin the stores and synergieswould result. That aim waslargely achieved some yearsago and now Woolies has
embarked upon a highly ambitious new journeyinto Australian retailing with the recentacquisition of David Jones. This audacious movehas propelled the group into the top 10 ofdepartment store retailers in the entire southernh e m i s p h e re .
Consolidated Infrastructure Group (C IG ),ranked number 12 last year, has moved rapidlyup the rankings this year to sixth position. Afavourite among small-cap analysts, this firmoperates in the electrical transmission and otherinfrastructural areas in SA, but more importantlythe rest of the continent. CIG operates in 19African countries and aims to have at least 50%of its revenue sources from outside SA.
Another firm favourite among small capanalysts is Ad a p tI T, a highly innovative ITservices and solutions provider. Mainlyblack-owned and with a large number ofacquisitions under its belt, its strategy is toconcentrate on growth in the public sector aswell as into the rest of Africa.
Largely down and out five years ago amid ascandal and a collapse in earnings, Super Grouphas risen from the ashes in recent years and hasestablished an enviable track record once more.Ranked number 13 last year, its outstandingfive-year CAGR in earnings has propelled it up toeight position this year.
For decades, sceptics have warned that retailproperty development is reaching saturationpoint in SA and that investment in shoppingmalls is not a good long-term strategy. Of course,
Thabo Dloti
Jack
ie C
laus
en
Mar
tin
Rho
des
Afrocentric, with its health-care provider model, makes it into the Top 20 this year

Financial Mail Page 12 -12/06/15 03:03:47 PM
FINANCIAL MAIL • TOP COMPANIES • 201512
THE
WINN
ERS
quite the opposite has been true and Re s i l i e n t is ablue-chip player in the retail property industry.As with most other real estate investment trusts(Reits), the market likes it, even though its RoE isfairly pedestrian.
E OH has been a regular inclusion in both TopPerformer and the Top 20 in recent years.Founded by charismatic CEO Asher Bohbot, EOHhas managed to carve out a special niche foritself in the IT sector of the JSE. Not satisfied withrelying on its wide range of local companies forsupport, EOH has, in recent years, expandedaggressively into the rest of the African continentand has been remarkably successful at that. Andthe market still likes the share, which explains itshigh five-year internal rate of return (IRR) in itsshare price, even though both its RoE and CAGRin earnings appear to have matured, admittedlyat very high levels.
Number three in last year’s rankings, Clickshas slipped a bit this year to 11th position, but itis, nevertheless, in an enviable position among itspeers. Guided by CEO David Kneale, formerly ofthe UK’s Boots group, Clicks has managed toretain a loyal customer following over the years,aided in no small measure by its highly success-ful loyalty card.
Tr u s tco is a Namibian-based financial servicescompany that was the first company to be listedon the African board of the JSE in 2009. Nowlisted on the JSE main board, its main interestsare in insurance, banking and finance.
Sekunjalo was rebranded in April 2015 asAfrican Equity Empowerment Investments,partly to avoid confusion with its unlistedholding company, Sekunjalo InvestmentHo l d i n g s .
Not even an 87% RoE could prevent C l i e n te l efrom falling from the second to 14th position thisyear. Its other parameters, while respectable,
were just not quite good enough to keep it in theTop 10.
A previous Top Companies winner, Fa m o u sBra n d s is still defying the sceptics and exhibitingoutstanding returns for shareholders. The groupnow has more than 2 500 outlets in SA, the rest ofAfrica, the Middle East and London. And while itstill expects to be able to get real growth from itsSA operations, its geographical diversification ofrecent years has also been a strong driver.
Though the construction sector of the JSE hasbeen out of favour for some time now, a fewniche players such as Afrimat still manage to dowell. Benefiting from government spending onsmaller projects as well as gaining a gradualfootprint in the rest of Africa, Afrimat hasdemonstrated a strong and sustainable trackre co rd .
Omnia Holdings has been around for manyyears in both the mining and agriculturalfertiliser arenas. Though its earnings growth hasbeen strong in recent years, the poor outlook formining, coupled with the drought in SA, areresulting in profound headwinds.
The brainchild of SA investment legend JannieMouton, PSG Group has managed to attract andretain a loyal following among both private andinstitutional investors over the years. The group’sfive-year CAGR in earnings has averaged arespectable, though not outstanding, 17% while itsRoE is a relatively disappointing 12%.Nevertheless, the market loves the “Mo u to nf a c to r ” and its share price movement has beenex ce l l e n t .
Cofounded by formerSABMiller CEO and chairmanMeyer Kahn, A f ro ce n t r i c is ablack-owned diversifiedinvestment holding companywhose interests are directedmainly towards thehealth-care providermodel.
Under the aegisof outgoing CEOJulian Roberts, Ol dMu t u a l l a rge lyreinvented itselfover much of thepast decade. Thegroup divesteditself of many ofits ill-conceivedacquisitions fromthe late 1990s andearly 2000s and hasfocused on its corestrengths and abilities.
Staff writer
Ian Moir
David Kneale
Trev
or S
amso
n
Het
ty Z
antm
an

Financial Mail Page 13 -12/06/15 12:47:46 PM
responsible leadership.

Financial Mail Page 14-15 -12/06/15 03:04:09 PM
FINANCIAL MAIL • TOP COMPANIES • 201514 FINANCIAL MAIL • TOP COMPANIES • 2015 15
1 CORONATIONTotal score: 70,1
Historic score: 31,1 FM’s score: 39
Notwithstanding Coronation’s outstanding feat incoming top in this ranking for the past threeyears, there are signs that the group’sexemplary fundamental performance is slowing.First-half inflows slowed substantially to R7,5bnand net fee margin fell to 60 basis points, duemainly to a decline in performance fees.However, its assets under management (AUM)are still growing strongly — at year-end theywere R588bn, due mainly to favourable marketmovements. But equity market volatility is rising,which means that AUM growth may not be asstrong this year. RoE remains well above 90%and this factor alone should ensure thatCoronation is still in with a shot when it comesto appearing in the top three of this publicationnext year.
2 LIBERTY HOLDINGSTotal score: 68,4
Historic score: 28,2 FM’s score: 40,2
Liberty’s strong momentum continues, with apositive trading update in late May 2015. Assetsunder management were reported at R646bn, anincrease of 2,1% from its year-end, with itsStanlib investment management businessrecording a 1,9% increase. Life sales in the restof Africa increased four-fold, admittedly from alow base. In the retail affluent segment, in whichLiberty tends to dominate, sales growth of only3% was slightly disappointing. It will befascinating to compare and contrast Coronationwith Liberty during the course of 2015 to see ifthey end up vying for the top spot once again.
3 MR PRICETotal score: 63,4
Historic score: 16,6 FM’s score: 46,8
Many SA clothing retailers pay lip service toonline retailing by having websites that onlyhave a marketing role. But Mr Price has graspedthe online challenge effectively. It offers amultichannel approach to payment and deliveryand is not daunted by SA’s relatively poorlogistics options. Its “click and collect” approachhas been successful. In a languishing economy,an increasing number of shoppers should beattracted to the Mr Price value proposition. Itsdecades-long unbroken earnings and dividendtrack record are the envy of most listed firms.This SA icon seems destined to keep turning outabove-average growth for many years to come.
4 CALGRO M3Total score: 61,7
Historic score: 19,1 FM’s score: 42,6
By ploughing back all of its earnings into thecompany and not paying a dividend, Calgro M3 isdemonstrating a huge vote of confidence in itsability to grow its niche within the SA construc-tion industry. This is especially important andrevealing at a time when many companies arehanding back increasing amounts of money toshareholders because they don’t have growthavenues to exploit. The company has thecapacity to convert its pipeline into tangibleprojects and thus build sustainability well intothe future. Diversification into burial sites andrenewable energy will be followed with interest.
5 WOOLWORTHSTotal score: 61,4
Historic score: 14 FM’s score: 47,4
The Woolworths Group is benefiting from twomain sources of interest from investors: Woolieshas become the destination food shop of choicefor the aspiring emerging middle class and thegroup’s Australian businesses give it a real randhedge quality. Though the group still has apresence in the rest of Africa, the main focus ofattention as far as offshore expansion isconcerned will remain in the hard currencyAustralian market. These are potent and veryunique differentiators for Woolies and ones whichare likely to continue to please investors. Thisgroup now has global size and scale and is anexcellent rand hedge.
6 CIGTotal score: 59,6
Historic score: 18,2 FM’s score: 41,4
Though the African growth story has faltered alittle, with the large drop in the oil price in 2015,it nevertheless remains well above that of SAand is likely to remain so for the foreseeablefuture. CIG is committed to sourcing more thanhalf of its earnings from outside SA and has“paid its dues” as far as operating in the rest ofAfrica is concerned. The demand for energy,especially renewable energy, is growingexponentially in Africa and CIG is well placed tohelp satisfy that demand. The group enjoys a fairdegree of “first mover advantage” in Africa andthe barriers to entry are high.
11 CLICKSTotal score: 55,7
Historic score: 11,9 FM’s score: 43,8
Clicks is a solid business that has come rightwith a vengeance under current CEO DavidKneale. But it seems to have a few vulnera-bilities, notably its relatively small exposure tothe rest of Africa. Musica remains vulnerable toenhanced and cheaper broadband rollout in SA.Clicks recently relaunched its ClubCard loyaltyprogramme, replacing cumbersome voucherswith card-based rewards. UPD, its pharma-ceutical wholesaling arm, remains the stalwartoperation in the group and continued innovationin this business is paying off. But if competitorDis-Chem ever considers a JSE listing, that couldtake away much of the attraction of Clicks.
12 TRUSTCOTotal score: 55
Historic score: 11,2 FM’s score: 43,8
Total group revenue for the nine months toend-December 2014 rose by 28,8%, with netprofit up by 52,5% for the group that definesitself as having “an original and unmistakableNamibian flair”. Headline earnings growth was132,5%. The star performer in the group was theinvestment portfolio, which grew by 95,8%during the period. Insurance operations in therest of the continent contributed a loss of9,07c/share to earnings per share for the period(2013: loss of 9,48c/share). The loss was due tothe ongoing operational cost of the insurancebusiness in SA, with the launch of a new productline and distribution channel in the 2015 financialyear. The board intends to pursue opportunitiesin the resources sector during the 2016 financialyear.
13 SEKUNJALOTotal score: 54,4
Historic score: 19 FM’s score: 35,4
Renaming this firm may well go a long way indistancing itself from its controversial founderand major shareholder, Iqbal Survé. Thefundamental growth in the business is out-standing and this is reflected in the share price.For the six months to end-February 2015,headline earnings per share rose by 188% andthe company paid a maiden dividend to share-holders. Due to the seasonal nature of thegroup, the results are expected to be muchstronger in the second half of the financial year.But only time will tell whether this type ofexplosive growth is sustainable.
8 SUPER GROUPTotal score: 58,5
Historic score: 25,5 FM’s score: 33
In its latest interim results to end-December2014, operating profit margin declined to 8,2%(December 2013: 9,1%) as a result of continuedcompetitive and inflationary pressures; extremelydisappointing performances by African Logisticsand FleetAfrica; and an impairment charge ofR8,4m relating to the closure of a business withinSupply Chain SA, directly attributable to thecrippling impact of the SA steel industry strike in2014. Total gearing remains low at around 15%,even after the acquisition of Allen Ford (UK). Adecision was taken not to declare a dividend forthe interim period.
9 RESILIENTTotal score: 57,8
Historic score: 11,6 FM’s score: 46,2
Notwithstanding the languishing SA economy andelectricity disruptions, Resilient still managed arespectable 16,3% increase in its dividendpayment to end-December 2014. Progress in therest of Africa continues unabated and in Novem-ber 2014 it increased its interest in ResilientAfrica, a joint venture for the development ofproperties in Nigeria, from 50,98% to 60,94%.Shoprite Checkers, its joint venture partner,increased its interest from 32,68% to 39,06%.Electricity blackouts had a negative impact onRe s i l i e n t ’s performance through reduced tradinghours and loss of parking revenue. Steps arebeing taken to facilitate continued trading.
10 EOHTotal score: 57,5
Historic score: 17,3 FM’s score: 40,2
Some analysts have expressed the view thatEO H ’s virtually exponential growth rate inearnings has to flatten out, while otherscomplain about a lack of transparency when itcomes to segmental earnings contribution.Neither view has made much difference to theappetite among investors to own EOH shares,and the price keeps rising. Globally, growth in ITdemand is much higher than global GDP growth,suggesting that IT spend will continue unabated,almost regardless of the strength of the globaleconomy. And there is even more growth onoffer in the longer term in the rest of Africa.
7 ADAPTITTotal score: 59,6
Historic score: 19,4 FM’s score: 40,2
Ad a p t I T ’s relatively small size (R1,1bn cap) meansthe effect of acquisitions can be meaningful. Inthe past five years, it has not only made oneacquisition per year, but it has improvedoperating margins noticeably and sustainably.Little wonder then that the market has rewardedit with a relatively high p:e rating of over 21.Even SA’s languid economy still provides greatopportunities for consolidation in the highlyfragmented IT field and AdaptIT will be looking tocapitalise on that. Only around 10% of revenuecomes from the rest of Africa and now that thescourge of ebola has subsided, that figure islikely to grow considerably.
14 CLIENTELETotal score: 54,1
Historic score: 12,7 FM’s score: 41,4
For the six months to December 2014 the valueof new business rose by 23% to R400,5m. Ofthis figure, Clientele Life contributed about 86%and remains by far the largest contributor toClientele’s overall business. Clientele is a nicheplayer in the SA insurance industry and its boardis committed to providing products that arerelevant and meet the individual policyholder’sneeds. In addition, the board is committed todelivering these products to the marketconveniently and efficiently as well as creatingand nurturing mutually beneficial partnershipswith all its stakeholders that add value on asustainable basis.
The growing demand forenergy puts CIG in a goodspot for growth
Calgro M3 is diversifyinginto other industries
Sekunjalo paid amaiden dividendto itss h a re h o l d e rs
C l i c ks’s limited exposure to the restof Africa is one of its vulnerabilities
Gal
lo I
mag
es/H
erm
an V
erw
ey
The
Tim
es
Bus
ines
s D
ay
Rob
ert
Tsha
bala
la

Financial Mail Page 16 -12/06/15 03:05:10 PM
FINANCIAL MAIL • TOP COMPANIES • 201516
15 FAMOUS BRANDSTotal score: 53,9
Historic score: 11,3 FM’s score: 42,6
Famous Brands has an enviable five-year CAGR of14% in revenue and 17% in profit. It is easily themost diversified quick-service restaurant groupin the country. In addition, the group hasdemonstrated over many years that it is able totake on the multinational players and beat themat their own game. Offshore expansion isgrowing apace, with more than 440 out of atotal of 2 545 outlets being outside SA. Even theUK Wimpy operation has at last turned thecorner. With no debt in the company, the focusis on building capability and capacity acrossbrands, logistics and manufacturing to competeaggressively in the leisure and consumer productspace.
16 AFRIMATTotal score: 53,6
Historic score: 11 FM’s score: 42,6
The construction sector in the country is in thedoldrums and the situation is likely to remainthat way until the local economy starts gainingsome traction. Any growth is currently comingeither from the rest of Africa or the Australasiaregion. But Afrimat is in a highly nichedenvironment in the construction space. Becauseit is relatively small, it can benefit from smallprojects and thus does not have to rely on thecrumbs from grandiose projects. In addition,Af r i m a t ’s activities revolve around supplyingmining and construction companies with thematerials that they require, rather than havingto satisfy an end-consumer. Its margin mix isalso changing, with a greater emphasis onhigher-margin work.
17 OMNIATotal score: 53,2
Historic score: 17,8 FM’s score: 35,4
Omnia is a well managed company and has beena firm favourite among small cap analysts for awhile, but the allure began to wane last year. Itstwo main areas of activity — mining andagriculture — are experiencing strong headwindsthat are unlikely to abate any time soon. Thefertiliser business, especially, could be in for atough time if drought conditions persist in theSouthern African region for a protracted periodof time. The SA mining industry faces a varietyof challenges, ranging from cost increasesthrough industrial action and this could affectdemand for explosives in future.
18 PSGTotal score: 52,4
Historic score: 11 FM’s score: 41,4
PSG owns 30,7% of Capitec, which in turnaccounts for 42% of PSG’s asset base as atJune 1 2015. Capitec has emerged from theaftermath of the African Bank disaster in verygood shape and intends to expand its productoffering considerably. PSG Konsult listedsuccessfully in June 2014 and this solid businessaccounts for 16% of PSG. But Curro, accountingfor 19% of PSG’s assets, was mired incontroversy recently and its rating appearsparticularly high relative to its earnings. Zeder,the agricultural arm, continues to perform welland accounts for 10% of assets. Don’t besurprised if founder Jannie Mouton pulls out anacquisition from far left field in the future.
19 AFROCENTRICTotal score: 52,2
Historic score: 10,8 FM’s score: 41,4
Late last year, Afrocentric announced two dealsthat further enhance the appeal of this nimbleand innovative company. The first was Sanlam’sacquisition of a 28,7% stake in ACT HealthcareAssets, formerly a wholly owned Afrocentricasset. Unlike its main competitors in the lifeassurance space, Sanlam doesn’t own its health -care administrator, so this deal indirectly givesSanlam a stake in Medscheme, which is ownedby ACT Healthcare. The second deal was Afro-centric’s acquisition of pharmaceutical distributorPharmacy Direct. There appears to be a numberof synergies between Medscheme and PharmacyDirect and the cash that Afrocentric got fromSanlam will undoubtedly be invested in some-thing complementary to the group as a whole.
20 OLD MUTUALTotal score: 52,2
Historic score: 10,8 FM’s score: 41,4
Notwithstanding the general view that lifecompanies have experienced a steady loss ofassets to unit trusts in recent years, Old Mutualis looking much better than it was even a fewyears ago. Outgoing CEO Julian Roberts did agreat job in streamlining the business, andincoming CEO Bruce Hemphill now has the taskof taking this venerable institution to the nextlevel. The first quarter interim managementstatement contained few surprises, except forthe fact that net client cash flows were wellbelow expectations, recording net inflows of onlyR500m against consensus of R1,8bn.
This FamousBrands fast-foodrestaurant has agrowing footprinton the continent
Old Mutual is looking farbetter than it has in years
Omnia has beena favouriteamong smallcaps for a while
Sun
day
Tim
es
Gal
lo I
mag
es/A
FP/P
abal
lo T
heki
so
Sun
day
Tim
es

Financial Mail Page 17 -17/06/15 10:22:04 AM
INET Expert
The data you want, the way you want it
INET Expert provides visibility to the many investment opportunities on the African continent, irrespective of whether they are listed or non-listed. Perform in-depth analysis, compare opportunities, benchmark peer companies and analyse the economic and political environment.
INET Expert is designed for:
��������������������� ��������������������������������������������������������� ���������������������
Visit www.inetbfa.com today for a free 14 day trial and see how INET Expert can help you identify investment opportunities on the African continent.
� Audit, Tax and Advisory������������������������������������������������� ��������������� � �������!��������
INET Expert is a web-based African research platform designed for flexibility, ease of use and depth of content. It can be used on devices ranging from your tablet to your desktop computer, making it the ideal companion for business people on the move.

Financial Mail Page 18-19 -12/06/15 03:05:35 PM
FINANCIAL MAIL • TOP COMPANIES • 201518 FINANCIAL MAIL • TOP COMPANIES • 2015 19
SA G
IANT
S SA GIANTS
Ca s h i n g in ona weaker randOffshore exposure seems to be an important factor not only
for investors but for firms’ strong performance
T hese are the largest listed companies inSA: the “royal companies”, so namedbecause their size and scale imparts asense of longevity and purpose toinvesting in them. They are invariably in
the portfolios of most, if not all of the largefinancial institutions in the country and havebeen for many years and decades. And in morerecent years they have found their way intoforeign portfolios, as some of them have duallistings in Johannesburg and London.
The top five companies in this ranking are alldual-listed entities and two of them — G l e n co reand BHP Billiton — have three listings, in London,Hong Kong and Johannesburg, in the case ofGlencore, and London, Sydney andJohannesburg for Billiton. The weaknessof the rand that has been so apparentin the past couple of years hasobviously inflated the values of all themetrics relating to these giantcompanies in the ranking tables.
But what this also means is that theco m p o sition of the JSE all share indexis heavily skewed towards large,multinational companies, asreflected in the top tier of SAGiants. From an investors’perspective, it means that justby buying the all share index,one is effectively getting ahigh degree of offshoreexposure. This is perhaps oneof the reasons that foreigninvestors like the all shareindex, with its heavy exposureto non-SA dynamics and whythis index has been one of thestar performers among globalequity indices in recent years.
These companies are monitored closely by theresearch divisions of the global investment banksand this research serves many purposes. Forexample, it is used by financial institutions tohelp make buy or sell decisions. However, it canalso be used by the advisory and other areas ofinvestment banks to help in merger andacquisition activity. Because of the sheer scale ofthese companies, both in terms of marketcapitalisation and turnover, they provide morethan ample opportunities for investment andinvestment related activities.
Glencore tops the ranking of SA Giants, with aturnover almost three times the size of its closestcompetitor, BHP Billiton. Of all the largediversified mining houses, Glencore exhibited thebest performance for financial 2014. Commodity
stocks had a torrid time last year as demandfell and production of certain metalscontinued unabated. Glencore, however —perhaps because of its unique structure and
small exposure to iron ore — emerged in thebest shape of all of the large mining stocks.Earnings per share fell by 13% to US33c but
the dividend was increased by 9% to 18c.BHP Billiton caught a number of
negatives in 2014 and into 2015,notably the continuing decline in
the prices of both iron ore andpetroleum. But its obsession
with driving down costsand improvingproductivity in all of itsareas is now showingpositive results.
In early 2015, BHPBilliton gave greater clarity
on the reorganisation of its assetsinto two companies — BH PBilliton and South32. The new
Glencore had the best performance in 2014 among its large diversified mining peers
BHP Billiton will be focused on tier 1, upstreamassets with long resources life. It will have a coreportfolio of 19 assets, with a smaller geographicalspread and a higher proportion of commoncharacteristics. This simplification is designed tofacilitate greater focus on improving performanceand driving substantial additional productivitybenef its.
South32 will be a globally diversified metalsand mining business with a complementaryportfolio of high-quality assets, but on a differentscale to those in BHP Billiton’score portfolio. Eligible BHPBilliton shareholders willreceive one South32 share foreach BHP Billiton share theyow n .
Anglo American has had aplummeting share price ascommodity prices tumble, butthankfully its diamondinterests have held up, andthere is no oil exposure. Someanalysts have been calling thecurrent share level — abouthalf of its record high — a“generational low” and sayingit now presents a lifetimeopportunity for long-terminvestors to get into this stock.
The turnaround in Anglo has to come from aturnaround in the platinum market, as its otherdivisions remain solid. The diamond business ispumping and even though iron ore prices havedived, it still earns good margins from thisincome stream.
With platinum being the swing factor, therehas to be a revival in the European autocatalystmarket. With the collective European economiesstill languishing, there seems little hope of revivalin anything but the long term.
Investment in, ordisinvestment from, AngloAmerican is an ongoing themeamong institutional fundmanagers in SA. On the onehand, the relatively low shareprice appears seductive, but onthe other, the weakcommodity background andthe fact that Anglo still needssurgery weighs against thatpositive sentiment.
The company has long tiesto SA, even though its mainlisting is now in London.Having said that, around halfof its assets are still in SA — amuch higher proportion thanany of its competitors. Mark
SA GIANTS
Source: INET BFA Share prices based to 100
2014 2015J F M A M J J A S O N D J F M MA
130
120
115
100
80
74
125
95
110
105
85
90
BHP Billiton Plc
BAT Plc
SABMiller Plc
Anglo American Plc
Glencore Plc
Mark Cutifani
Rus
sell
Rob
erts
Gal
lo I
mag
es/A
FP
Financial Mail Page 20-21 -12/06/15 03:05:59 PM
FINANCIAL MAIL • TOP COMPANIES • 201520 FINANCIAL MAIL • TOP COMPANIES • 2015 21
SA G
IANT
S SA GIANTS
ONCE AGAIN, AND predictably so, financialservices and mining companies dominate theasset heavyweight listing.
Old Mutual is the only company in this reportto have an asset base of more than R2 trillion —increasing from R1,9 trillion at end-2013 toR2,4 trillion at end-2014. Group CEO JulianRoberts announced a surprise departure inApril 2015, but his replacement was quicklyannounced. Taking over the global helm isBruce Hemphill, who previously headed Libertyand more recently was a Standard Bankexe cu t i ve.
The financial crisis resulted in the Old Mutualshare price plummeting to R4/share, doingbadly in the US life savings market and hit byrelated interests in developed market junkbonds. Operationally, things have come rightsince then and the group is now more focused,looking at East Africa — with a big stake in UAP— and moving away from the Scandinavianmarkets. In late 2014 it listed its US assetmanagement operations. With its vast array ofservices, the group should enjoy growth inemerging markets and a recovery in the UK.
The second-highest asset base, atR1,7 trillion, is another financial services group,Standard Bank, 20% held by China’s ICBC. Thegroup is now a solid African play, havingoffloaded international assets to its Chineseshareholder. It is hoped that this will provideuplift to its lagging return on equity (RoE). Thedual CEO structure continues to be criticised bysome analysts, though it seems to be workingat the moment.
In fifth place is financial group Ba rc l aysAfrica Group, formerly listed as Absa Group. Itspent a few years in the wilderness, but themarket is now warming to the stock as itsAfrican strategy takes hold. Also, its huge
mortgage book write-downs are now out of thesystem, while the RoE starts to tick up andearnings growth creeps up to around 11%.
Mining heavyweights are G l e n co re and BHPBi l l i to n . The Switzerland-based Glencore, whichnow includes Xstrata, is not only a metalsproducer, but also a commodities supplier andtrader. It has a diversified basket of commodityexposures, with a huge chunk of earningscoming from copper. A notable positive is thereis no production facilities exposure to hard-hitiron ore. Speculation continues on corporateaction involving Rio Tinto or Anglo American,and though prices for these target mininggiants would be low in currently depressedcommodity markets, the commensuratefinance-raising would be challenging.
Anglo-Australian mining giant BHP Billiton,by far the largest of the diversified globalplayers, has a strong balance sheet, newleadership, has had some restructuring and isenjoying successful cost cutting. But it is lookingat how it can maintain its good dividend policy.Its iron ore, copper and oil interests have beenaffected by brutal commodity price dives. It ishoped prices will not collapse any further andthe dividend policy can stay intact. Thoughcopper and oil are expected to recover, theconcern is the outlook for the iron ore market —Billiton iron ore operations, however, are stillmaking profits at these depressed basecommodity price levels. Analysts are debatingwhether mining groups such as Billiton shouldbe pulling back on their huge capitalexpenditure plans, or look through the cycle ona long-term basis and continue with capitalspend. A rationalisation strategy has it spinningout some marginal southern hemisphere assetsinto South32.
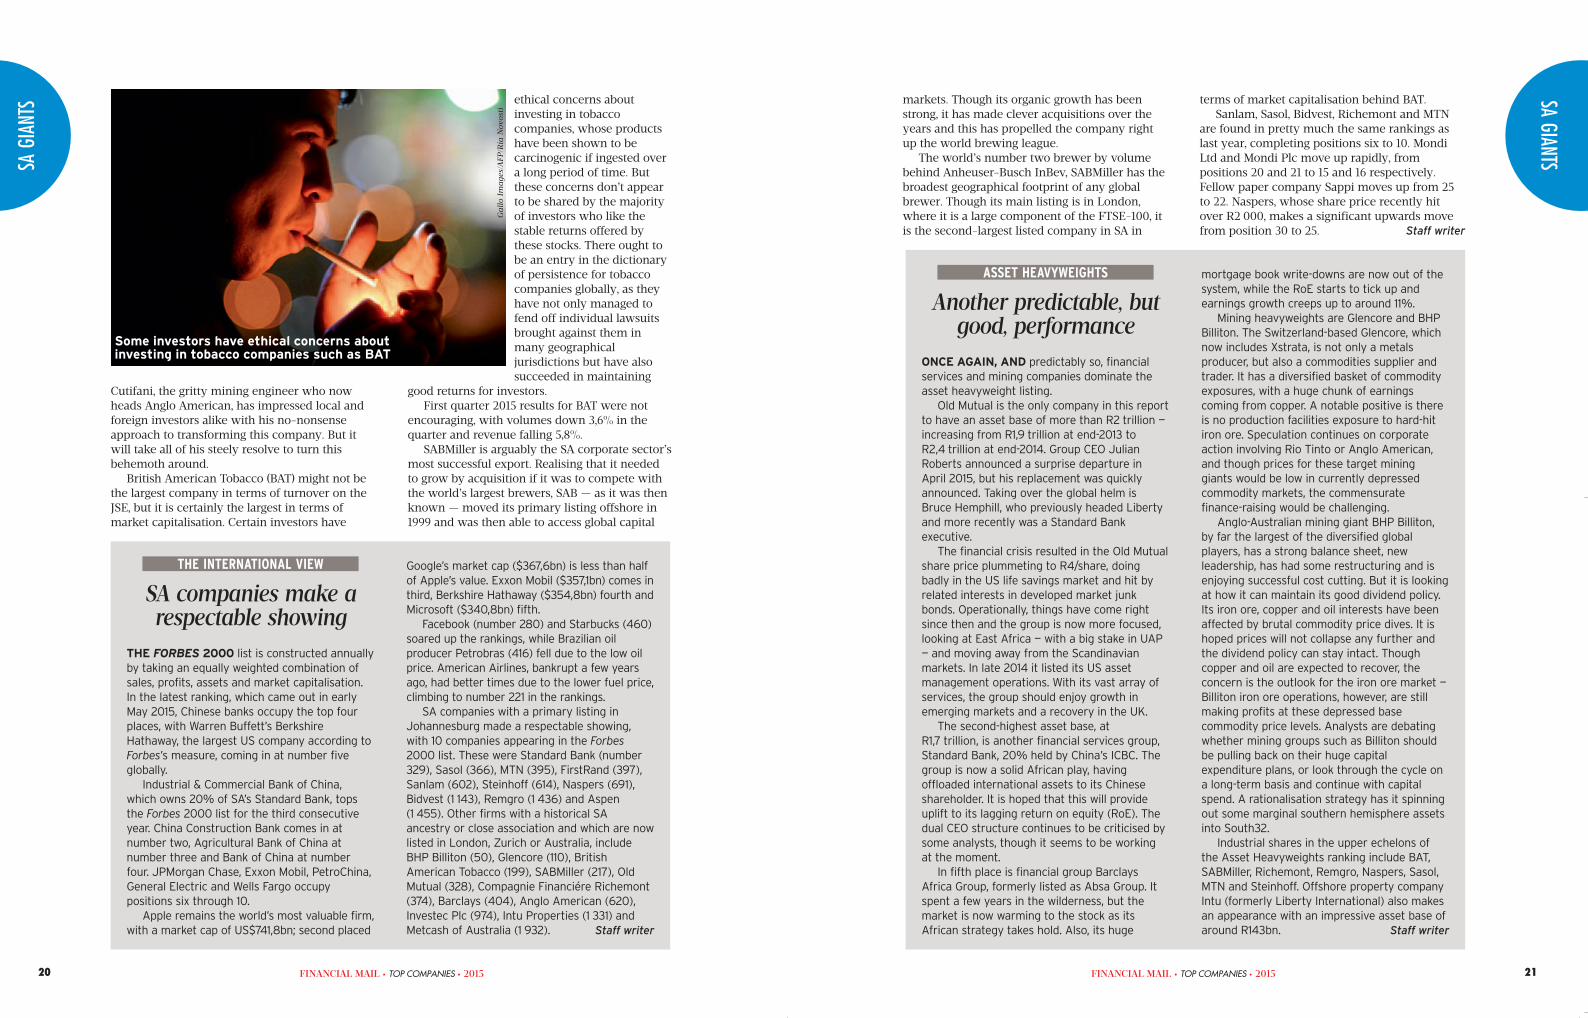
Industrial shares in the upper echelons ofthe Asset Heavyweights ranking include B AT,SA B M i l l e r, R i c h e m o nt, Re m g ro, N a s p e rs, Sa so l ,MTN and Ste i n h off. Offshore property companyIntu (formerly Liberty International) also makesan appearance with an impressive asset base ofaround R143bn. Staff writer
Another predictable, butgood, performance
ASSET HEAVYWEIGHTS
Cutifani, the gritty mining engineer who nowheads Anglo American, has impressed local andforeign investors alike with his no-nonsenseapproach to transforming this company. But itwill take all of his steely resolve to turn thisbehemoth around.
British American Tobacco (BAT ) might not bethe largest company in terms of turnover on theJSE, but it is certainly the largest in terms ofmarket capitalisation. Certain investors have
ethical concerns aboutinvesting in tobaccocompanies, whose productshave been shown to becarcinogenic if ingested overa long period of time. Butthese concerns don’t appearto be shared by the majorityof investors who like thestable returns offered bythese stocks. There ought tobe an entry in the dictionaryof persistence for tobaccocompanies globally, as theyhave not only managed tofend off individual lawsuitsbrought against them inmany geographicaljurisdictions but have alsosucceeded in maintaining
good returns for investors.First quarter 2015 results for BAT were not
encouraging, with volumes down 3,6% in thequarter and revenue falling 5,8%.
SA BM i l l e r is arguably the SA corporate sector’smost successful export. Realising that it neededto grow by acquisition if it was to compete withthe world’s largest brewers, SAB — as it was thenknown — moved its primary listing offshore in1999 and was then able to access global capital
markets. Though its organic growth has beenstrong, it has made clever acquisitions over theyears and this has propelled the company rightup the world brewing league.
The world’s number two brewer by volumebehind Anheuser-Busch InBev, SABMiller has thebroadest geographical footprint of any globalbrewer. Though its main listing is in London,where it is a large component of the FTSE-100, itis the second-largest listed company in SA in
THE FO R B ES 20 0 0 list is constructed annuallyby taking an equally weighted combination ofsales, profits, assets and market capitalisation.In the latest ranking, which came out in earlyMay 2015, Chinese banks occupy the top fourplaces, with Warren Buffett’s BerkshireHathaway, the largest US company according toFo r b es ’s measure, coming in at number fiveg l o ba l l y.
Industrial & Commercial Bank of China,which owns 20% of SA’s Standard Bank, topsthe Fo r b es 2000 list for the third consecutiveyear. China Construction Bank comes in atnumber two, Agricultural Bank of China atnumber three and Bank of China at numberfour. JPMorgan Chase, Exxon Mobil, PetroChina,General Electric and Wells Fargo occupypositions six through 10.
Apple remains the world’s most valuable firm,with a market cap of US$741,8bn; second placed
G o o g l e’s market cap ($367,6bn) is less than halfof Apple’s value. Exxon Mobil ($357,1bn) comes int h i rd , Berkshire Hathaway ($354,8bn) fourth andMicrosoft ($340,8bn) fifth.
Facebook (number 280) and Starbucks (460)soared up the rankings, while Brazilian oilproducer Petrobras (416) fell due to the low oilprice. American Airlines, bankrupt a few yearsago, had better times due to the lower fuel price,climbing to number 221 in the rankings.
SA companies with a primary listing inJohannesburg made a respectable showing,with 10 companies appearing in the Fo r b es2000 list. These were Standard Bank (number329), Sa so l (366), MTN (395), F i rst Ra n d ( 397 ) ,Sa n l a m (602), Ste i n h off (614), N a s p e rs (69 1),Bi d vest (1 143), Re m g ro (1 436) and Aspen(1 455). Other firms with a historical SAancestry or close association and which are nowlisted in London, Zurich or Australia, includeBHP Billiton (50), G l e n co re (110), BritishAmerican Tobacco (199), SA B M i l l e r (217), OldMutual (328), Compagnie Financiére R i c h e m o nt(374), Ba rc l ays (404), Anglo American ( 620 ) ,Investec Plc (974), Intu Properties (1 331) andMetcash of Australia (1 932 ) . Staff writer
SA companies make arespectable showing
THE INTERNATIONAL VIEW
terms of market capitalisation behind BAT.Sa n l a m , Sa s o l , Bi dve s t , Richemont and MTN
are found in pretty much the same rankings aslast year, completing positions six to 10. Mo n d iLtd and Mondi Plc move up rapidly, frompositions 20 and 21 to 15 and 16 respectively.Fellow paper company Sa p p i moves up from 25to 22. Naspers, whose share price recently hitover R2 000, makes a significant upwards movefrom position 30 to 25. Staff writer
Some investors have ethical concerns aboutinvesting in tobacco companies such as BAT
Gal
lo I
mag
es/A
FP/R
ia N
ovos
ti

Financial Mail Page 22-23 -12/06/15 03:08:18 PM
FINANCIAL MAIL • TOP COMPANIES • 201522 FINANCIAL MAIL • TOP COMPANIES • 2015 23
NO. 5 SABMILLER PLCThe group’s US$117m saving inthe past financial year throughwater and energy relatedinitiatives shows commitment
SA GIANTSRanked bytu r n ove r
Co m p a ny Tu r n ove rRm
Total assetsRm
Market capRm
Equity fundsRm
Net profitRm
Financialyear -end
1 Glencore Plc 2 398 1 51 ,0 0 1 629 582 ,0 0 685 032 937,0 0 858 478 ,0 0 27 825,0 0 Dec 141 2 245 255,0 0 1 501 0 0 1 ,0 0 726 992 69 9,0 0 775 4 41 ,0 0 20 6 0 1 ,0 0 Dec 13
2 BHP Billiton Plc 729 036 ,0 0 1 601 838 ,0 0 567 862 1 79,0 0 1 179 938 ,0 0 160 4 49,0 0 Jun 142 636 523,0 0 1 319 793,0 0 694 837 0 42 ,0 0 975 81 6 ,0 0 120 1 1 0,0 0 Jun 13
3 Anglo American Plc 293 6 82 ,0 0 697 30 5,0 0 258 254 7 15,00 482 0 0 1 ,0 0 22 39 0,0 0 Dec 143 283 1 20,0 0 683 736 ,0 0 377 522 7 16,00 514 5 0 4,0 0 27 625,0 0 Dec 13
4 British American Tobacco Plc 230 528 ,0 0 479 2 1 1 ,0 0 1 190 907 9 0 0,0 0 300 652 ,0 0 63 8 41 ,0 0 Dec 136 197 792 ,0 0 367 1 28 ,0 0 1 004 420 8 6 0,0 0 238 59 9,0 0 52 892 ,0 0 Dec 12
5 SABMiller Plc 225 7 16,00 293 1 77,0 0 1 065 559 985,0 0 311 48 0,0 0 40 0 93,0 0 Mar 144 215 46 4,00 286 1 73,0 0 879 557 457,0 0 306 5 49,0 0 35 7 17,00 Mar 13
6 Sa n l a m 207 376 ,0 0 604 4 30,0 0 169 786 395,0 0 43 6 6 0,0 0 5 36 0,0 0 Dec 145 206 951 ,0 0 555 45 0,0 0 124 658 787,0 0 38 8 8 4,0 0 2 585,0 0 Dec 13
7 Sa so l 202 6 83,0 0 273 48 6 ,0 0 268 277 70 8 ,0 0 202 59 0,0 0 39 696 ,0 0 Jun 147 181 269,0 0 244 6 0 8 ,0 0 383 206 7 13,00 180 69 1,00 31 8 0 8 ,0 0 Jun 13
8 The Bidvest Group 183 6 45,00 67 0 02 ,0 0 110 161 424,0 0 30 65 4,0 0 5 381 ,0 0 Jun 148 153 4 0 5,0 0 56 51 9,0 0 91 306 0 57,0 0 25 457,0 0 4 576 ,0 0 Jun 13
9 Compagnie Fin Richemont 152 839,0 0 206 295,0 0 510 046 20 0,0 0 153 0 89,0 0 29 523,0 0 Mar 1410 123 6 41,00 177 8 67,0 0 527 115 6 0 0,0 0 127 03 4,0 0 27 0 67,0 0 Mar 13
10 MTN Group 136 495,0 0 186 1 67,0 0 403 555 659,0 0 112 76 8 ,0 0 28 833,0 0 Dec 139 135 1 1 2 ,0 0 145 45 6 ,0 0 304 145 0 48 ,0 0 86 989,0 0 25 0 4 3,0 0 Dec 12
11 Steinhoff International Holdings 135 8 65,0 0 134 41 1 ,0 0 262 286 73 1 ,0 0 87 8 0 9,0 0 9 453,0 0 Jun 1411 115 48 6 ,0 0 103 2 1 1 ,0 0 108 364 75 0,0 0 64 26 6 ,0 0 6 96 4,00 Jun 13
12 Standard Bank Group 112 358 ,0 0 1 670 6 47,00 224 600 570,0 0 126 38 8 ,0 0 14 935,0 0 Dec 1312 109 1 1 7,0 0 1 528 0 1 9,0 0 190 230 820,0 0 108 829,0 0 14 4 0 6 ,0 0 Dec 12
13 Imperial Holdings 103 5 67,0 0 51 1 4 3,0 0 40 089 736 ,0 0 17 1 41 ,0 0 3 2 1 3,0 0 Jun 1414 92 382 ,0 0 45 41 7,0 0 39 576 723,0 0 16 420,0 0 3 66 4,00 Jun 13
14 Shoprite Holdings 102 20 4,0 0 38 837,0 0 94 105 676 ,0 0 15 797,0 0 3 9 0 4,0 0 Jun 1413 92 747,0 0 31 85 0,0 0 90 836 25 0,0 0 13 8 0 5,0 0 3 8 0 6 ,0 0 Jun 13
15 Mondi 83 0 48 ,0 0 79 8 63,0 0 21 877 252 ,0 0 39 289,0 0 5 77 1,00 Dec 1320 61 29 9,0 0 65 795,0 0 14 729 965,0 0 31 38 6 ,0 0 3 0 4 0,0 0 Dec 12
16 Mondi Plc 83 0 48 ,0 0 79 8 63,0 0 67 851 41 1 ,0 0 39 289,0 0 5 77 1,00 Dec 1321 61 29 9,0 0 65 795,0 0 45 721 48 0,0 0 31 38 6 ,0 0 3 0 4 0,0 0 Dec 12
17 F i rst Ra n d 77 455,0 0 943 39 9,0 0 313 233 8 0 9,0 0 75 0 4 4,0 0 18 75 4,0 0 Jun 1417 67 03 1 ,0 0 870 98 6 ,0 0 203 529 694,0 0 71 25 4,0 0 14 307,0 0 Jun 13
18 Barclays Africa Group 77 293,0 0 955 298 ,0 0 126 314 851 ,0 0 73 657,0 0 12 032 ,0 0 Dec 1316 68 587,0 0 804 953,0 0 111 322 55 6 ,0 0 65 4 6 6 ,0 0 9 1 1 7,0 0 Dec 12
19 Vodacom Group 75 7 11,00 55 3 1 2 ,0 0 197 436 61 6 ,0 0 18 229,0 0 15 357,0 0 Mar 1415 69 9 17,00 49 972 ,0 0 193 419 1 4 0,0 0 15 1 42 ,0 0 13 878 ,0 0 Mar 13
SA GIANTS20 Massmart Holding 72 263,0 0 22 535,0 0 29 852 559,0 0 3 99 1,00 1 1 41 ,0 0 Dec 1319 64 8 8 8 ,0 0 19 659,0 0 41 267 0 1 8 ,0 0 3 78 4,0 0 1 6 67,0 0 Dec 12
21 Ba r l owo r l d 64 8 8 4,0 0 40 19 1,00 21 446 6 6 0,0 0 16 079,0 0 2 355,0 0 Sep 1418 65 1 02 ,0 0 36 774,0 0 25 484 0 8 6 ,0 0 14 673,0 0 2 078 ,0 0 Sep 13
22 Sa p p i 64 0 9 9,0 0 59 767,0 0 26 492 963,0 0 13 294,0 0 1 470,0 0 Sep 1425 54 9 96 ,0 0 56 239,0 0 20 033 51 0,0 0 13 249,0 0 1 1 0 5,0 0 Sep 13
23 Pick n Pay Stores 63 1 1 7,0 0 12 9 0 5,0 0 24 098 0 8 8 ,0 0 2 1 1 8 ,0 0 835,0 0 Feb 1422 59 27 1,00 11 89 9,0 0 24 788 5 0 1 ,0 0 1 9 10,00 65 0,0 0 Feb 13
24 Pick n Pay Holdings 63 1 1 7,0 0 12 9 0 5,0 0 11 335 855,0 0 1 0 02 ,0 0 5 65,0 0 Feb 1423 59 27 1,00 11 89 9,0 0 11 847 28 6 ,0 0 9 0 6 ,0 0 394,0 0 Feb 13
25 N a s p e rs 62 728 ,0 0 96 1 20,0 0 783 910 48 8 ,0 0 64 8 0 6 ,0 0 8 987,0 0 Mar 1430 50 249,0 0 76 35 0,0 0 483 049 8 02 ,0 0 52 81 3,0 0 9 9 12,00 Mar 13
26 Nedbank Group 61 297,0 0 741 255,0 0 115 093 95 4,0 0 59 24 0,0 0 9 20 0,0 0 Dec 1324 57 26 8 ,0 0 675 559,0 0 97 190 0 1 3,0 0 53 58 0,0 0 7 6 0 5,0 0 Dec 12
27 D a ta te c 59 6 8 4,0 0 25 4 63,0 0 12 216 878 ,0 0 9 238 ,0 0 920,0 0 Feb 1432 47 961 ,0 0 21 533,0 0 9 621 785,0 0 8 787,0 0 9 15,00 Feb 13
28 Old Mutual Plc 55 9 10,00 2 382 8 41 ,0 0 173 402 51 7,0 0 115 730,0 0 14 533,0 0 Dec 1331 48 5 0 4,0 0 1 924 26 6 ,0 0 137 658 52 1 ,0 0 95 9 12,00 12 839,0 0 Dec 12
29 Anglo American Platinum 55 626 ,0 0 92 6 42,00 80 235 75 4,0 0 85 57 1,00 1 2 1 3,0 0 Dec 1428 52 822 ,0 0 93 429,0 0 127 734 825,0 0 84 51 5,0 0 4 222 ,0 0 Dec 13
30 The Spar Group 54 483,0 0 14 35 6 ,0 0 32 691 397,0 0 2 387,0 0 1 351 ,0 0 Sep 1433 47 387,0 0 9 37 1,00 21 050 235,0 0 2 624,0 0 1 1 95,0 0 Sep 13
31 AngloGold Ashanti 54 478 ,0 0 146 672 ,0 0 73 716 1 32 ,0 0 44 307,0 0 6 9 95,0 0 Dec 1327 53 8 6 8 ,0 0 167 526 ,0 0 82 512 722 ,0 0 61 1 98 ,0 0 8 352 ,0 0 Dec 12
32 Ave n g 52 959,0 0 28 6 0 0,0 0 4 683 381 ,0 0 12 239,0 0 265,0 0 Jun 1429 51 70 4,0 0 27 457,0 0 8 833 73 1 ,0 0 12 265,0 0 1 22 ,0 0 Jun 13
33 Kumba Iron Ore 47 597,0 0 50 028 ,0 0 50 245 41 1 ,0 0 29 1 39,0 0 11 36 4,00 Dec 1426 54 4 61 ,0 0 43 61 8 ,0 0 121 748 498 ,0 0 22 98 6 ,0 0 15 28 6 ,0 0 Dec 13
34 Woolworths Holdings 39 707,0 0 18 524,0 0 87 530 795,0 0 4 894,0 0 3 28 4,0 0 Jun 1436 35 227,0 0 9 025,0 0 62 152 32 1 ,0 0 4 0 1 2 ,0 0 2 722 ,0 0 Jun 13
35 Murray & Roberts Holdings 38 06 4,00 18 63 4,0 0 6 088 4 37,0 0 5 41 7,0 0 981 ,0 0 Jun 1435 39 3 1 1 ,0 0 23 1 25,0 0 10 936 0 61 ,0 0 6 537,0 0 -1 58 ,0 0 Jun 13
36 Liberty Holdings 35 782 ,0 0 349 81 0,0 0 35 589 265,0 0 19 838 ,0 0 2 458 ,0 0 Dec 1341 30 720,0 0 291 745,0 0 34 344 28 4,0 0 17 574,0 0 3 479,0 0 Dec 12
37 MMI Holdings 34 6 85,0 0 400 969,0 0 51 591 423,0 0 26 633,0 0 3 7 13,00 Jun 1438 32 670,0 0 332 267,0 0 38 617 17 1,00 26 8 4 3,0 0 3 0 1 1 ,0 0 Jun 13
38 JD Group 33 5 67,0 0 16 36 0,0 0 7 191 333,0 0 6 9 98 ,0 0 -1 1 1 6 ,0 0 Jun 1445 27 4 0 1 ,0 0 19 20 0,0 0 6 215 0 6 8 ,0 0 9 0 96 ,0 0 79 1,00 Jun 13
39 Telkom SA Soc 32 723,0 0 36 551 ,0 0 41 246 0 8 4,0 0 22 774,0 0 4 81 5,0 0 Mar 1439 32 5 0 1 ,0 0 38 9 9 0,0 0 17 524 378 ,0 0 17 827,0 0 298 ,0 0 Mar 13
NO. 34 WO O LWO RT H SH O L D I N GS The group’sAustralia acquisition, DavidJones, is now planning to enterthe New Zealand market

Financial Mail Page 24-25 -12/06/15 03:08:45 PM
FINANCIAL MAIL • TOP COMPANIES • 201524 FINANCIAL MAIL • TOP COMPANIES • 2015 25
SA GIANTSRanked bytu r n ove r
Co m p a ny Tu r n ove rRm
Total assetsRm
Market capRm
Equity fundsRm
Net profitRm
Financialyear -end
40 ArcelorMittal SA 32 42 1 ,0 0 32 5 63,0 0 14 937 1 53,0 0 22 4 65,0 0 -372 ,0 0 Dec 1340 32 29 1,00 30 74 0,0 0 12 677 1 9 0,0 0 24 361 ,0 0 - 8 49,0 0 Dec 12
41 N etca re 31 783,0 0 23 70 8 ,0 0 61 680 629,0 0 10 593,0 0 2 278 ,0 0 Sep 1444 27 8 0 1 ,0 0 20 0 42 ,0 0 34 458 273,0 0 7 767,0 0 2 076 ,0 0 Sep 13
42 Gold Fields 30 628 ,0 0 126 1 6 6 ,0 0 31 229 09 1,00 46 1 8 0,0 0 2 633,0 0 Dec 1334 45 4 69,0 0 143 9 97,0 0 52 008 5 45,0 0 63 9 11,00 6 99 1,00 Dec 12
43 Mediclinic International 30 495,0 0 60 989,0 0 105 882 1 1 4,0 0 30 855,0 0 3 6 47,00 Mar 1448 24 5 62 ,0 0 49 207,0 0 61 881 2 1 6 ,0 0 22 8 62 ,0 0 1 23 4,0 0 Mar 13
44 Tiger Brands 30 259,0 0 22 51 4,0 0 58 656 2 1 6 ,0 0 14 585,0 0 2 879,0 0 Sep 1443 28 09 1,00 22 5 4 0,0 0 52 152 629,0 0 15 1 6 6 ,0 0 2 5 45,0 0 Sep 13
45 Aspen Pharmacare Holdings 29 51 5,0 0 36 30 8 ,0 0 175 237 838 ,0 0 28 55 0,0 0 5 3 1 3,0 0 Jun 1455 19 30 8 ,0 0 20 035,0 0 128 362 976 ,0 0 22 3 1 0,0 0 3 953,0 0 Jun 13
46 Impala Platinum Holdings 29 028 ,0 0 79 1 9 0,0 0 37 193 1 65,0 0 107 3 47,0 0 -277,0 0 Jun 1442 30 032 ,0 0 80 1 5 6 ,0 0 75 865 7 13,00 107 583,0 0 5 6 03,0 0 Jun 13
47 Oando Plc 27 870,0 0 36 423,0 0 9 908 1 1 3,0 0 17 741 ,0 0 57,0 0 Dec 1337 34 83 1 ,0 0 25 74 6 ,0 0 1 933 0 0 0,0 0 13 223,0 0 74 0,0 0 Dec 12
48 Allied Electronics Corp 27 772 ,0 0 14 1 20,0 0 1 479 367,0 0 4 022 ,0 0 69 0,0 0 Feb 1447 25 0 49,0 0 11 24 4,0 0 2 583 61 0,0 0 4 577,0 0 1 41 1 ,0 0 Feb 13
49 Wilson Bayly Holmes-Ovcon 25 777,0 0 12 3 1 9,0 0 7 436 220,0 0 4 1 29,0 0 3 1 1 ,0 0 Jun 1449 23 773,0 0 11 427,0 0 9 094 8 0 0,0 0 4 1 0 5,0 0 555,0 0 Jun 13
50 Re m g ro 24 62 1 ,0 0 116 5 4 3,0 0 127 878 073,0 0 109 6 43,00 6 75 6 ,0 0 Jun 1460 16 4 4 6 ,0 0 97 725,0 0 98 597 939,0 0 90 8 89,0 0 4 592 ,0 0 Jun 13
51 Discover y 23 0 9 0,0 0 67 20 0,0 0 80 799 0 07,0 0 20 41 1 ,0 0 4 326 ,0 0 Jun 1457 17 893,0 0 50 8 4 4,0 0 49 936 273,0 0 15 959,0 0 2 89 9,0 0 Jun 13
52 Sa n ta m 22 7 10,00 23 927,0 0 26 920 97 1,00 6 6 0 0,0 0 1 729,0 0 Dec 1450 20 63 1 ,0 0 21 3 41 ,0 0 23 190 202 ,0 0 5 76 4,00 1 239,0 0 Dec 13
53 Sibanye Gold 21 781 ,0 0 49 838 ,0 0 23 688 937,0 0 20 4 4 3,0 0 1 783,0 0 Dec 1454 19 33 1 ,0 0 35 1 1 0,0 0 16 886 61 1 ,0 0 14 227,0 0 2 924,0 0 Dec 13
54 Pioneer Food Group 21 29 0,0 0 12 2 1 7,0 0 41 338 20 5,0 0 6 495,0 0 1 1 96 ,0 0 Sep 1451 20 551 ,0 0 11 0 93,0 0 19 313 895,0 0 7 029,0 0 696 ,0 0 Sep 13
55 Nampak 20 9 0 1 ,0 0 18 327,0 0 28 589 481 ,0 0 7 570,0 0 1 353,0 0 Sep 1453 19 362 ,0 0 18 826 ,0 0 25 188 1 23,0 0 6 9 0 9,0 0 1 1 53,0 0 Sep 13
56 RCL Foods 20 20 4,0 0 14 1 1 2 ,0 0 16 032 022 ,0 0 10 557,0 0 255,0 0 Jun 1478 10 23 1 ,0 0 11 30 9,0 0 13 826 957,0 0 8 1 5 0,0 0 52 ,0 0 Jun 13
57 Clicks Group 19 1 5 0,0 0 5 59 0,0 0 22 506 837,0 0 1 1 1 3,0 0 8 0 9,0 0 Aug 1458 17 5 4 3,0 0 4 937,0 0 16 134 330,0 0 1 03 1 ,0 0 738 ,0 0 Aug 13
58 Blue Label Telecoms 18 98 4,0 0 4 9 93,0 0 5 868 228 ,0 0 3 0 83,0 0 48 6 ,0 0 May 1356 18 722 ,0 0 4 41 1 ,0 0 5 321 876 ,0 0 2 778 ,0 0 452 ,0 0 May 12
SA GIANTSRanked bytu r n ove r
Co m p a ny Tu r n ove rRm
Total assetsRm
Market capRm
Equity fundsRm
Net profitRm
Financialyear -end
59 Distell Group 17 74 0,0 0 13 987,0 0 33 965 728 ,0 0 8 6 83,0 0 1 41 4,0 0 Jun 1462 15 858 ,0 0 12 659,0 0 28 441 1 1 4,0 0 7 292 ,0 0 1 074,0 0 Jun 13
60 Omnia Holdings 16 259,0 0 10 025,0 0 11 780 6 03,0 0 6 0 55,0 0 1 073,0 0 Mar 1467 13 5 4 3,0 0 8 535,0 0 14 193 075,0 0 5 06 4,00 938 ,0 0 Mar 13
61 A EC I 15 942 ,0 0 12 659,0 0 16 286 624,0 0 6 278 ,0 0 7 19,00 Dec 1364 14 51 6 ,0 0 11 294,0 0 13 085 725,0 0 5 30 1 ,0 0 736 ,0 0 Dec 12
62 KAP Industrial Holdings 15 793,0 0 14 1 8 0,0 0 12 913 58 8 ,0 0 7 351 ,0 0 941 ,0 0 Jun 1463 15 38 6 ,0 0 13 724,0 0 8 704 357,0 0 6 763,0 0 79 0,0 0 Jun 13
63 Tongaat Hulett 15 7 16,00 23 5 6 8 ,0 0 18 172 632 ,0 0 12 46 4,00 1 26 8 ,0 0 Mar 1465 14 373,0 0 20 923,0 0 12 501 0 51 ,0 0 10 1 28 ,0 0 1 261 ,0 0 Mar 13
64 Harmony Gold Mining Company 15 6 82 ,0 0 67 41 0,0 0 9 219 033,0 0 35 4 62 ,0 0 225,0 0 Jun 1459 16 776 ,0 0 66 9 0 5,0 0 14 247 739,0 0 36 948 ,0 0 36 8 ,0 0 Jun 13
65 G r i n d ro d 15 524,0 0 27 5 48 ,0 0 15 319 51 5,0 0 11 8 83,0 0 679,0 0 Dec 1346 27 1 57,0 0 21 249,0 0 11 993 30 6 ,0 0 10 0 4 4,0 0 59 0,0 0 Dec 12
66 Group Five 15 36 0,0 0 9 8 87,0 0 2 820 75 0,0 0 2 553,0 0 38 4,0 0 Jun 1473 11 1 9 9,0 0 8 74 6 ,0 0 4 945 783,0 0 2 0 69,0 0 229,0 0 Jun 13
67 Mr Price Group 15 227,0 0 6 1 96 ,0 0 65 830 337,0 0 2 94 6 ,0 0 1 8 63,0 0 Mar 1469 13 26 6 ,0 0 4 658 ,0 0 39 538 852 ,0 0 2 48 6 ,0 0 1 526 ,0 0 Mar 13
68 Super Group 14 297,0 0 9 7 12,00 10 957 859,0 0 4 1 30,0 0 787,0 0 Jun 1472 11 7 18,00 8 262 ,0 0 9 065 85 4,0 0 3 472 ,0 0 6 48,00 Jun 13
69 The Foschini Group 14 1 59,0 0 16 627,0 0 38 101 1 82 ,0 0 6 320,0 0 1 792 ,0 0 Mar 1470 12 896 ,0 0 14 962 ,0 0 23 787 8 41 ,0 0 6 237,0 0 1 723,0 0 Mar 13
70 Exxaro Resources 13 5 6 8 ,0 0 76 81 2 ,0 0 50 136 1 70,0 0 69 8 89,0 0 5 89 0,0 0 Dec 1361 16 1 22 ,0 0 62 1 1 4,0 0 58 435 0 93,0 0 54 3 49,0 0 6 0 1 9,0 0 Dec 12
71 Capitec Bank Holdings 13 526 ,0 0 45 778 ,0 0 60 705 326 ,0 0 8 981 ,0 0 2 0 8 8 ,0 0 Feb 1476 10 6 81 ,0 0 37 939,0 0 22 425 4 6 0,0 0 7 520,0 0 1 5 69,0 0 Feb 13
72 Illovo Sugar 13 1 9 0,0 0 13 4 32 ,0 0 10 956 1 72 ,0 0 7 2 1 0,0 0 1 1 36 ,0 0 Mar 1474 11 1 29,0 0 12 227,0 0 12 902 0 49,0 0 6 56 4,00 1 1 5 0,0 0 Mar 13
73 Life Healthcare Group Holdings 13 0 4 6 ,0 0 9 238 ,0 0 44 095 894,0 0 4 1 6 8 ,0 0 1 8 85,0 0 Sep 1471 11 8 4 3,0 0 8 792 ,0 0 40 135 497,0 0 5 072 ,0 0 1 8 4 4,0 0 Sep 13
74 Adcorp Holdings 11 8 02 ,0 0 2 6 8 4,0 0 3 491 1 1 5,0 0 2 0 1 9,0 0 277,0 0 Feb 1485 8 61 7,0 0 2 378 ,0 0 3 152 89 0,0 0 1 82 1 ,0 0 220,0 0 Feb 13
75 Reuner t 10 838 ,0 0 8 78 8 ,0 0 10 983 227,0 0 6 1 38 ,0 0 65 4,0 0 Sep 1475 11 1 0 0,0 0 6 49 1,00 12 077 737,0 0 4 51 2 ,0 0 95 0,0 0 Sep 13
76 Sun International 10 825,0 0 13 0 59,0 0 14 380 3 1 1 ,0 0 1 56 4,00 529,0 0 Jun 1477 10 267,0 0 12 3 1 6 ,0 0 10 774 961 ,0 0 2 357,0 0 702 ,0 0 Jun 13
77 Rand Merchant Insurance Holdings 10 8 0 1 ,0 0 40 593,0 0 68 727 942 ,0 0 27 8 85,0 0 3 233,0 0 Jun 1487 8 4 42 ,0 0 34 1 51 ,0 0 42 787 824,0 0 23 3 41 ,0 0 2 079,0 0 Jun 13
NO. 53 SIBANYE GOLDOperational performanceimproved at the end of Q1,following disruptions duringJanuary and February
NO. 67 MR PRICE GROUPThe retailer’s cash-basedfashion-value model producedstrong results for the 52 weeksended March 28 2015

Financial Mail Page 26 -12/06/15 03:09:01 PM
FINANCIAL MAIL • TOP COMPANIES • 201526
SA GIANTSRanked bytu r n ove r
Co m p a ny Tu r n ove rRm
Total assetsRm
Market capRm
Equity fundsRm
Net profitRm
Financialyear -end
78 Tsogo Sun Holdings 10 767,0 0 13 773,0 0 28 957 4 0 6 ,0 0 10 61 4,0 0 2 0 0 9,0 0 Mar 1479 9 9 10,00 10 8 82 ,0 0 29 947 63 4,0 0 9 0 1 5,0 0 1 5 67,0 0 Mar 13
79 Combined Motor Holdings 10 753,0 0 2 452 ,0 0 1 275 833,0 0 472 ,0 0 1 6 8 ,0 0 Feb 1484 8 972 ,0 0 2 61 3,0 0 1 170 9 18,00 69 9,0 0 207,0 0 Feb 13
80 Invicta Holdings 10 4 65,0 0 12 39 0,0 0 7 892 9 92 ,0 0 1 972 ,0 0 523,0 0 Mar 1493 7 558 ,0 0 11 251 ,0 0 8 711 075,0 0 1 673,0 0 41 8 ,0 0 Mar 13
81 Truworths International 10 458 ,0 0 7 76 4,00 37 760 6 69,0 0 5 827,0 0 2 4 32 ,0 0 Jun 1480 9 765,0 0 6 989,0 0 32 535 283,0 0 5 470,0 0 2 3 41 ,0 0 Jun 13
82 AV I 10 267,0 0 5 9 10,00 28 620 1 4 6 ,0 0 3 873,0 0 1 293,0 0 Jun 1482 9 252 ,0 0 5 36 0,0 0 19 499 367,0 0 3 3 45,0 0 1 0 97,0 0 Jun 13
83 Lonmin Plc 10 20 5,0 0 43 652 ,0 0 12 350 49 9,0 0 72 03 4,0 0 -1 20 6 ,0 0 Sep 1466 14 1 0 9,0 0 45 93 1 ,0 0 28 541 426 ,0 0 71 927,0 0 251 ,0 0 Sep 13
84 African Rainbow Minerals 10 0 0 4,0 0 35 9 0 6 ,0 0 21 500 3 1 9,0 0 33 85 6 ,0 0 3 947,0 0 Jun 1452 19 8 4 4,0 0 37 593,0 0 45 185 29 0,0 0 35 557,0 0 3 1 47,0 0 Jun 13
85 Eqstra Holdings 9 978 ,0 0 13 623,0 0 1 851 1 55,0 0 4 1 1 1 ,0 0 279,0 0 Jun 1483 9 1 5 4,0 0 13 1 63,0 0 2 920 7 12,00 3 83 4,0 0 4 4 3,0 0 Jun 13
86 Astral Foods 9 6 02 ,0 0 4 20 6 ,0 0 7 696 61 7,0 0 2 273,0 0 361 ,0 0 Sep 1486 8 524,0 0 3 79 1,00 3 626 9 11,00 2 0 47,0 0 1 85,0 0 Sep 13
87 Stefanutti Stocks Holdings 9 424,0 0 5 0 02 ,0 0 993 0 6 6 ,0 0 2 263,0 0 9 0,0 0 Feb 1481 9 330,0 0 4 9 0 4,0 0 1 720 938 ,0 0 2 073,0 0 1 57,0 0 Feb 13
88 Hosken Consolidated Investments 9 20 1 ,0 0 23 8 48 ,0 0 15 253 8 07,0 0 14 522 ,0 0 1 1 22 ,0 0 Mar 1489 8 2 1 4,0 0 21 424,0 0 17 920 470,0 0 15 3 1 6 ,0 0 1 29 1,00 Mar 13
89 PPC 9 039,0 0 10 932 ,0 0 11 096 6 0 8 ,0 0 2 779,0 0 1 0 0 9,0 0 Sep 1488 8 3 1 6 ,0 0 8 575,0 0 17 701 30 0,0 0 2 0 4 0,0 0 1 30 5,0 0 Sep 13
90 Clover Industries 8 530,0 0 4 1 47,0 0 3 403 5 65,0 0 2 393,0 0 2 1 0,0 0 Jun 1491 7 9 96 ,0 0 3 976 ,0 0 3 525 48 6 ,0 0 2 203,0 0 26 0,0 0 Jun 13
91 Hulamin 8 039,0 0 6 1 8 4,0 0 2 716 573,0 0 4 20 6 ,0 0 3 1 8 ,0 0 Dec 1492 7 5 6 0,0 0 5 66 4,00 2 141 873,0 0 3 78 0,0 0 - 457,0 0 Dec 13
92 Mpact 7 698 ,0 0 5 1 07,0 0 4 444 35 0,0 0 2 8 87,0 0 41 8 ,0 0 Dec 1395 6 82 1 ,0 0 4 772 ,0 0 3 826 03 4,0 0 2 626 ,0 0 4 38 ,0 0 Dec 12
93 PSG Group 7 5 69,0 0 34 1 55,0 0 36 459 4 0 6 ,0 0 9 74 4,0 0 1 1 69,0 0 Feb 141 39 2 0 02 ,0 0 27 427,0 0 19 264 298 ,0 0 9 332 ,0 0 1 3 4 0,0 0 Feb 13
94 Metair Investments 7 279,0 0 6 624,0 0 6 683 935,0 0 4 339,0 0 61 7,0 0 Dec 14106 5 227,0 0 6 1 74,0 0 8 516 595,0 0 3 9 19,00 42 1 ,0 0 Dec 13
95 EOH Holdings 7 1 9 9,0 0 3 4 47,0 0 20 825 3 1 4,0 0 2 073,0 0 572 ,0 0 Jul 14108 5 07 1,00 2 294,0 0 9 355 25 4,0 0 1 303,0 0 377,0 0 Jul 13
96 Pinnacle Holdings 7 1 03,0 0 3 1 79,0 0 1 780 7 19,00 1 2 1 3,0 0 26 6 ,0 0 Jun 1496 6 596 ,0 0 2 930,0 0 2 432 493,0 0 1 0 03,0 0 32 1 ,0 0 Jun 13
NO. 91 HULAMIN De s p i tethe costs, the installation of a6 MW generator will help keepproduction going wheneverthere is load-shedding

Financial Mail Page 27 -17/06/15 10:23:09 AM

Financial Mail Page 28-29 -12/06/15 03:09:47 PM
FINANCIAL MAIL • TOP COMPANIES • 201528 FINANCIAL MAIL • TOP COMPANIES • 2015 29
SA GIANTSRanked bytu r n ove r
Co m p a ny Tu r n ove rRm
Total assetsRm
Market capRm
Equity fundsRm
Net profitRm
Financialyear -end
97 Ca s h b u i l d 6 781 ,0 0 2 574,0 0 5 894 41 5,0 0 1 1 6 0,0 0 28 4,0 0 Jun 1497 6 377,0 0 2 0 1 5,0 0 3 425 81 4,0 0 1 0 52 ,0 0 273,0 0 Jun 13
98 Growthpoint Prop 6 6 0 5,0 0 81 98 6 ,0 0 68 920 4 3 4,0 0 49 428 ,0 0 3 476 ,0 0 Jun 14101 5 782 ,0 0 62 8 0 0,0 0 51 754 79 0,0 0 1 4 62 ,0 0 -4 1 96 ,0 0 Jun 13
99 Tre n co r 6 59 0,0 0 44 30 4,0 0 11 527 1 27,0 0 7 95 0,0 0 1 1 61 ,0 0 Dec 13112 4 553,0 0 30 6 0 5,0 0 12 748 896 ,0 0 5 70 9,0 0 6 83,0 0 Dec 12
100 Business Connexion Group 6 51 2 ,0 0 2 9 18,00 2 522 978 ,0 0 2 1 62 ,0 0 95,0 0 Aug 1498 6 1 73,0 0 2 8 48 ,0 0 2 348 8 4 0,0 0 2 1 57,0 0 265,0 0 Aug 13
101 Basil Read Holdings 6 495,0 0 4 1 48 ,0 0 1 178 6 63,0 0 1 836 ,0 0 6 6 ,0 0 Dec 1394 6 83 4,0 0 4 451 ,0 0 1 567 1 61 ,0 0 1 4 35,0 0 - 9 9,0 0 Dec 12
1 02 Raubex Group 6 325,0 0 4 5 4 6 ,0 0 3 390 675,0 0 3 363,0 0 3 41 ,0 0 Feb 141 03 5 636 ,0 0 4 075,0 0 4 125 1 25,0 0 3 0 89,0 0 352 ,0 0 Feb 13
1 03 Bell Equipment 6 3 1 9,0 0 4 498 ,0 0 1 806 79 1,00 2 4 0 8 ,0 0 297,0 0 Dec 131 02 5 670,0 0 3 278 ,0 0 2 078 98 0,0 0 1 896 ,0 0 277,0 0 Dec 12
104 Net 1 UEPS Technologies Inc 6 3 1 0,0 0 12 51 9,0 0 8 330 4 3 4,0 0 5 1 74,0 0 977,0 0 Jun 14116 4 29 9,0 0 10 63 1 ,0 0 6 079 397,0 0 3 659,0 0 25 4,0 0 Jun 13
105 Co m a i r 6 282 ,0 0 3 989,0 0 2 421 4 47,0 0 1 1 79,0 0 274,0 0 Jun 14105 5 387,0 0 3 5 61 ,0 0 1 783 0 65,0 0 1 1 0 9,0 0 296 ,0 0 Jun 13
106 Zeder Investments 6 0 1 1 ,0 0 7 0 42 ,0 0 12 041 658 ,0 0 4 30 0,0 0 322 ,0 0 Feb 1423 6 328 ,0 0 4 027,0 0 4 087 385,0 0 3 298 ,0 0 51 8 ,0 0 Feb 13
1 07 African Oxygen 5 83 4,0 0 5 825,0 0 4 662 79 9,0 0 3 51 6 ,0 0 3 1 7,0 0 Dec 14100 5 825,0 0 5 89 9,0 0 6 788 487,0 0 3 70 1 ,0 0 241 ,0 0 Dec 13
108 Caxton CTP Publishers & Printers 5 39 0,0 0 6 30 1 ,0 0 6 694 951 ,0 0 5 0 0 4,0 0 30 1 ,0 0 Jun 141 07 5 1 57,0 0 6 676 ,0 0 6 674 6 81 ,0 0 5 58 0,0 0 51 9,0 0 Jun 13
109 Redefine Properties 5 372 ,0 0 52 1 8 8 ,0 0 46 680 337,0 0 31 932 ,0 0 2 0 1 7,0 0 Aug 14119 3 77 1,00 42 9 9 9,0 0 29 327 8 42 ,0 0 20 423,0 0 632 ,0 0 Aug 13
110 Northam Platinum 5 339,0 0 14 637,0 0 18 332 694,0 0 23 725,0 0 - 96 ,0 0 Jun 14114 4 42 1 ,0 0 14 3 48 ,0 0 15 478 026 ,0 0 23 202 ,0 0 4 6 8 ,0 0 Jun 13
111 Distribution & Warehousing Network 5 1 92 ,0 0 3 225,0 0 1 574 578 ,0 0 1 4 32 ,0 0 9 9,0 0 Jun 14111 4 58 8 ,0 0 2 75 0,0 0 2 321 69 1,00 1 389,0 0 1 37,0 0 Jun 13
112 Evraz Highveld Steel & Vanadium 5 1 9 0,0 0 3 526 ,0 0 879 4 61 ,0 0 1 41 1 ,0 0 -357,0 0 Dec 13115 4 3 4 6 ,0 0 3 58 8 ,0 0 1 983 0 0 1 ,0 0 1 659,0 0 - 922 ,0 0 Dec 12
113 Oceana Group 5 039,0 0 2 836 ,0 0 12 024 33 1 ,0 0 1 4 39,0 0 627,0 0 Sep 14109 4 9 97,0 0 2 748 ,0 0 10 823 0 93,0 0 1 51 5,0 0 4 47,0 0 Sep 13
114 Times Media Group 4 9 15,00 2 20 9,0 0 2 605 0 81 ,0 0 1 4 41 ,0 0 20 1 ,0 0 Jun 1499 6 0 1 3,0 0 2 6 0 6 ,0 0 2 732 1 5 4,0 0 1 0 4 6 ,0 0 1 94,0 0 Jun 13
115 Adcock Ingram Holdings 4 820,0 0 4 5 62 ,0 0 9 138 55 0,0 0 2 752 ,0 0 -2 1 4,0 0 Jun 14104 5 4 4 6 ,0 0 5 369,0 0 10 363 0 4 0,0 0 3 761 ,0 0 6 42,00 Sep 13
SA GIANTSRanked bytu r n ove r
Co m p a ny Tu r n ove rRm
Total assetsRm
Market capRm
Equity fundsRm
Net profitRm
Financialyear -end
116 Coronation Fund Managers 4 774,0 0 75 6 07,0 0 34 367 761 ,0 0 1 06 4,00 1 95 0,0 0 Sep 14121 3 635,0 0 71 73 4,0 0 34 630 1 1 1 ,0 0 1 0 85,0 0 1 4 0 6 ,0 0 Sep 13
117 M u ste k 4 76 4,00 2 61 2 ,0 0 999 329,0 0 857,0 0 1 25,0 0 Jun 14110 4 737,0 0 2 1 5 6 ,0 0 699 393,0 0 78 8 ,0 0 1 30,0 0 Jun 13
118 Hudaco Industries 4 48 0,0 0 2 295,0 0 3 876 425,0 0 1 55 0,0 0 42 ,0 0 Nov 14118 3 942 ,0 0 2 1 55,0 0 3 570 41 0,0 0 1 70 8 ,0 0 35 0,0 0 Nov 13
119 Iliad Africa 4 46 4,00 1 28 6 ,0 0 988 257,0 0 670,0 0 9 0,0 0 Dec 13113 4 493,0 0 1 592 ,0 0 691 0 8 8 ,0 0 7 18,00 69,0 0 Dec 12
1 20 Zurich Insurance Company SA 4 0 85,0 0 4 898 ,0 0 3 227 5 67,0 0 1 742 ,0 0 -241 ,0 0 Dec 131 20 3 767,0 0 5 0 0 1 ,0 0 3 020 51 6 ,0 0 2 0 03,0 0 -1 1 ,0 0 Dec 12
121 Lewis Group 4 073,0 0 7 989,0 0 7 589 6 8 6 ,0 0 5 24 6 ,0 0 795,0 0 Mar 14117 4 1 0 5,0 0 7 249,0 0 5 687 361 ,0 0 4 7 16,00 9 0 9,0 0 Mar 13
1 22 Seardel Investment Corp 3 9 92 ,0 0 4 4 0 0,0 0 925 247,0 0 3 1 1 8 ,0 0 1 8 ,0 0 Mar 141 29 2 51 3,0 0 2 470,0 0 1 215 478 ,0 0 1 427,0 0 1 4,0 0 Mar 13
1 23 Royal Bafokeng Platinum 3 76 8 ,0 0 21 20 1 ,0 0 10 005 374,0 0 34 59 0,0 0 65 6 ,0 0 Dec 141 24 3 251 ,0 0 18 51 8 ,0 0 11 573 572 ,0 0 30 9 95,0 0 4 33,0 0 Dec 13
1 24 Merafe Resources 3 6 0 9,0 0 5 38 8 ,0 0 1 983 45 6 ,0 0 7 0 1 5,0 0 26 6 ,0 0 Dec 141 23 3 497,0 0 5 0 0 4,0 0 2 668 763,0 0 6 65 0,0 0 28 6 ,0 0 Dec 13
1 25 Quantum Foods Holdings 3 5 61 ,0 0 2 036 ,0 0 909 6 69,0 0 1 6 48,00 26 ,0 0 Sep 14
1 26 BSI Steel 3 3 47,0 0 1 651 ,0 0 424 7 14,00 61 8 ,0 0 62 ,0 0 Mar 141 26 2 8 0 5,0 0 1 51 5,0 0 402 830,0 0 533,0 0 1 8 ,0 0 Mar 13
1 27 Country Bird Holdings 3 237,0 0 1 83 1 ,0 0 556 720,0 0 676 ,0 0 1 7,0 0 Jun 13
1 28 Sa n tova 3 222 ,0 0 5 6 6 ,0 0 484 4 30,0 0 1 85,0 0 26 ,0 0 Feb 141 27 2 6 40,00 4 4 4,0 0 231 98 0,0 0 1 38 ,0 0 2 1 ,0 0 Feb 13
1 29 Famous Brands 2 826 ,0 0 8 0 5,0 0 11 178 9 92 ,0 0 1 0 97,0 0 39 9,0 0 Feb 141 30 2 49 9,0 0 696 ,0 0 9 850 8 0 4,0 0 892 ,0 0 329,0 0 Feb 13
1 30 Pan African Resources Plc 2 762 ,0 0 5 9 18,00 3 754 56 4,00 3 6 0 9,0 0 4 45,0 0 Jun 141 38 2 0 1 7,0 0 6 8 65,0 0 4 536 279,0 0 3 92 1 ,0 0 525,0 0 Jun 13
131 I ta l t i l e 2 7 14,00 2 6 87,0 0 11 624 9 94,0 0 2 0 81 ,0 0 4 67,0 0 Jun 141 33 2 1 41 ,0 0 2 628 ,0 0 7 853 329,0 0 2 1 67,0 0 426 ,0 0 Jun 13
1 32 Consolidated Infrastructure Group 2 636 ,0 0 3 451 ,0 0 3 869 281 ,0 0 2 20 9,0 0 251 ,0 0 Aug 141 36 2 037,0 0 2 295,0 0 3 324 833,0 0 1 620,0 0 1 0 8 ,0 0 Aug 13
1 33 A st ra p a k 2 620,0 0 2 1 29,0 0 567 551 ,0 0 1 1 59,0 0 - 9 0,0 0 Feb 141 28 2 636 ,0 0 2 24 4,0 0 966 1 8 8 ,0 0 1 2 1 4,0 0 272 ,0 0 Feb 13
134 Tharisa Plc 2 5 4 6 ,0 0 3 837,0 0 1 528 6 83,0 0 5 249,0 0 -26 ,0 0 Sep 14
NO. 105 COMAIR The airlinereported capacity consistencywith the previous year for theinterim period leading up toDecember 2014
NO. 121 LEWIS GROUPThe group reported a strongsecond-half performance forthe year to March 2015, withmarket share gains

Financial Mail Page 30-31 -12/06/15 03:11:19 PM
FINANCIAL MAIL • TOP COMPANIES • 201530 FINANCIAL MAIL • TOP COMPANIES • 2015 31
SA GIANTSRanked bytu r n ove r
Co m p a ny Tu r n ove rRm
Total assetsRm
Market capRm
Equity fundsRm
Net profitRm
Financialyear -end
1 35 Hyprop Investments 2 51 5,0 0 26 8 61 ,0 0 28 704 2 1 8 ,0 0 12 81 8 ,0 0 253,0 0 Jun 141 32 2 1 9 9,0 0 22 970,0 0 18 669 9 0 5,0 0 10 8 4 4,0 0 63 4,0 0 Jun 13
1 36 Aquarius Platinum 2 4 4 4,0 0 7 457,0 0 2 479 4 47,0 0 7 81 7,0 0 -320,0 0 Jun 141 22 3 51 4,0 0 7 365,0 0 3 049 89 1,00 4 45 0,0 0 -2 767,0 0 Jun 13
1 37 Rhodes Food Group Holdings 2 4 4 4,0 0 1 5 0 4,0 0 4 771 39 0,0 0 30 4,0 0 81 ,0 0 Sep 14
1 38 ELB Group 2 3 49,0 0 1 9 0 0,0 0 1 468 8 0 5,0 0 7 10,00 96 ,0 0 Jun 141 41 1 985,0 0 1 6 0 1 ,0 0 1 422 1 20,0 0 594,0 0 1 2 1 ,0 0 Jun 13
1 39 E so r 2 3 1 7,0 0 1 339,0 0 75 0 85,0 0 787,0 0 -1 55,0 0 Feb 14131 2 326 ,0 0 1 824,0 0 158 074,0 0 1 1 79,0 0 8 6 ,0 0 Feb 13
140 M et m a r 2 28 0,0 0 1 496 ,0 0 176 422 ,0 0 4 3 4,0 0 -1 1 1 ,0 0 Feb 141 37 2 025,0 0 1 4 6 8 ,0 0 387 594,0 0 653,0 0 - 8 0,0 0 Feb 13
1 41 Datacentrix Holdings 2 276 ,0 0 833,0 0 677 376 ,0 0 494,0 0 96 ,0 0 Feb 14146 1 9 15,00 8 0 6 ,0 0 841 589,0 0 4 42 ,0 0 82 ,0 0 Feb 13
1 42 ARB Holdings 2 2 1 7,0 0 1 1 36 ,0 0 1 433 5 0 0,0 0 6 8 6 ,0 0 1 1 2 ,0 0 Jun 14143 1 945,0 0 1 0 5 0,0 0 1 339 5 0 0,0 0 62 1 ,0 0 97,0 0 Jun 13
143 Nu-World Holdings 2 1 0 8 ,0 0 975,0 0 588 8 0 8 ,0 0 723,0 0 70,0 0 Aug 14144 1 94 3,0 0 822 ,0 0 396 3 1 3,0 0 655,0 0 83,0 0 Aug 13
144 Ellies Holdings 2 1 0 6 ,0 0 1 81 2 ,0 0 521 0 1 6 ,0 0 1 0 49,0 0 89,0 0 Apr 14140 1 9 96 ,0 0 1 45 6 ,0 0 1 299 0 0 4,0 0 95 0,0 0 2 1 2 ,0 0 Apr 13
1 45 Value Group 1 975,0 0 1 4 63,0 0 769 6 69,0 0 85 6 ,0 0 1 41 ,0 0 Feb 141 42 1 945,0 0 1 367,0 0 1 032 822 ,0 0 779,0 0 1 35,0 0 Feb 13
146 Capital & Counties Properties Plc 1 975,0 0 55 5 41 ,0 0 60 791 374,0 0 45 3 1 8 ,0 0 -1 63,0 0 Dec 141 49 1 81 0,0 0 39 6 81 ,0 0 46 989 9 95,0 0 31 5 4 3,0 0 529,0 0 Dec 13
1 47 Brimstone Investment Corp 1 96 8 ,0 0 7 8 0 6 ,0 0 733 292 ,0 0 3 8 42 ,0 0 28 8 ,0 0 Dec 141 45 1 93 1 ,0 0 6 630,0 0 631 46 4,00 3 742 ,0 0 574,0 0 Dec 13
1 48 Afrocentric Investment Corp 1 958 ,0 0 872 ,0 0 2 947 487,0 0 94 4,0 0 224,0 0 Jun 14150 1 770,0 0 81 9,0 0 2 053 8 83,0 0 765,0 0 1 38 ,0 0 Jun 13
1 49 Marshall Monteagle Plc 1 947,0 0 1 30 5,0 0 325 227,0 0 70 4,0 0 24,0 0 Sep 131 51 1 695,0 0 1 1 78 ,0 0 247 41 6 ,0 0 574,0 0 24,0 0 Sep 12
150 Af r i m a t 1 893,0 0 1 3 1 3,0 0 2 464 1 1 3,0 0 925,0 0 1 55,0 0 Feb 141 61 1 332 ,0 0 1 0 5 4,0 0 2 034 326 ,0 0 825,0 0 1 1 1 ,0 0 Feb 13
1 51 Argent Industrial 1 8 8 0,0 0 1 558 ,0 0 420 69 9,0 0 1 1 83,0 0 1 8 ,0 0 Mar 141 47 1 85 0,0 0 1 76 0,0 0 482 453,0 0 1 41 1 ,0 0 96 ,0 0 Mar 13
1 52 Atlatsa Resources Corp 1 83 1 ,0 0 7 55 6 ,0 0 2 799 1 5 6 ,0 0 7 1 51 ,0 0 -1 94,0 0 Dec 131 79 96 6 ,0 0 6 826 ,0 0 443 945,0 0 5 22 1 ,0 0 - 81 8 ,0 0 Dec 12
1 53 DRDGold 1 8 0 9,0 0 4 1 9 0,0 0 817 0 1 3,0 0 1 827,0 0 1 4,0 0 Jun 141 35 2 076 ,0 0 4 420,0 0 1 526 1 1 9,0 0 1 9 96 ,0 0 265,0 0 Jun 13
SA GIANTSRanked bytu r n ove r
Co m p a ny Tu r n ove rRm
Total assetsRm
Market capRm
Equity fundsRm
Net profitRm
Financialyear -end
154 JSE 1 779,0 0 28 8 6 8 ,0 0 10 698 1 07,0 0 2 0 07,0 0 636 ,0 0 Dec 141 53 1 578 ,0 0 21 074,0 0 8 278 5 6 6 ,0 0 1 759,0 0 6 0 6 ,0 0 Dec 13
1 55 A sso re 1 769,0 0 18 93 1 ,0 0 18 567 73 1 ,0 0 16 728 ,0 0 4 0 49,0 0 Jun 1468 13 5 0 1 ,0 0 20 222 ,0 0 56 959 65 6 ,0 0 26 36 6 ,0 0 3 269,0 0 Jun 13
156 Ad v Te c h 1 76 6 ,0 0 1 4 4 6 ,0 0 3 201 74 6 ,0 0 775,0 0 1 73,0 0 Dec 131 52 1 6 87,0 0 1 1 3 4,0 0 2 948 976 ,0 0 7 12,00 1 55,0 0 Dec 12
1 57 Peregrine Holdings 1 75 6 ,0 0 20 796 ,0 0 5 806 651 ,0 0 1 79 0,0 0 422 ,0 0 Mar 14154 1 524,0 0 18 038 ,0 0 3 995 893,0 0 1 4 4 6 ,0 0 4 45,0 0 Mar 13
1 58 Village Main Reef 1 725,0 0 3 0 98 ,0 0 601 0 02 ,0 0 1 35 0,0 0 2 1 1 ,0 0 Jun 141 25 3 020,0 0 3 7 14,00 447 49 9,0 0 1 235,0 0 228 ,0 0 Jun 13
1 59 South Ocean Holdings 1 69 1,00 937,0 0 156 378 ,0 0 578 ,0 0 35,0 0 Dec 131 58 1 4 0 6 ,0 0 8 6 8 ,0 0 243 95 0,0 0 698 ,0 0 5 6 ,0 0 Dec 12
160 Howden Africa Holdings 1 6 82 ,0 0 1 225,0 0 2 892 738 ,0 0 530,0 0 3 1 8 ,0 0 Dec 131 62 1 3 1 7,0 0 1 036 ,0 0 2 037 6 02 ,0 0 25 4,0 0 1 53,0 0 Dec 12
1 61 Wilderness Holdings 1 678 ,0 0 969,0 0 1 275 353,0 0 4 37,0 0 65,0 0 Feb 14160 1 351 ,0 0 839,0 0 808 5 0 0,0 0 387,0 0 49,0 0 Feb 13
1 62 Ascendis Health 1 63 4,0 0 1 255,0 0 4 075 942 ,0 0 1 230,0 0 1 51 ,0 0 Jun 14
1 63 Workforce Holdings 1 61 9,0 0 4 4 4,0 0 108 0 0 0,0 0 1 92 ,0 0 3,0 0 Dec 13156 1 4 61 ,0 0 4 48 ,0 0 115 20 0,0 0 2 1 2 ,0 0 27,0 0 Dec 12
16 4 Sentula Mining 1 593,0 0 1 70 9,0 0 99 7 15,00 1 352 ,0 0 - 51 1 ,0 0 Mar 14134 2 0 85,0 0 2 6 6 0,0 0 123 1 77,0 0 2 358 ,0 0 -20 0,0 0 Mar 13
1 65 Gijima Group 1 51 9,0 0 4 62 ,0 0 118 6 43,00 -1 1 4,0 0 -1 4 3,0 0 Jun 141 48 1 8 48 ,0 0 6 83,0 0 132 939,0 0 37,0 0 -292 ,0 0 Jun 13
166 Vukile Property Fund 1 4 4 3,0 0 11 376 ,0 0 11 025 394,0 0 3 1 1 3,0 0 81 ,0 0 Mar 14166 1 1 72 ,0 0 9 229,0 0 8 525 1 5 6 ,0 0 2 632 ,0 0 5,0 0 Mar 13
1 67 Holdspor t 1 41 8 ,0 0 58 8 ,0 0 2 106 1 62 ,0 0 8 81 ,0 0 1 78 ,0 0 Feb 141 59 1 375,0 0 5 03,0 0 1 768 727,0 0 8 07,0 0 1 74,0 0 Feb 13
168 C l i e n te l e 1 4 0 6 ,0 0 2 597,0 0 5 941 232 ,0 0 376 ,0 0 326 ,0 0 Jun 1416 4 1 224,0 0 2 9 10,00 4 935 225,0 0 292 ,0 0 30 1 ,0 0 Jun 13
1 69 Sovereign Food Investments 1 39 1,00 1 074,0 0 629 595,0 0 78 6 ,0 0 58 ,0 0 Feb 141 63 1 26 8 ,0 0 1 032 ,0 0 434 4 6 6 ,0 0 739,0 0 8 8 ,0 0 Feb 13
1 70 Keaton Energy Holdings 1 373,0 0 1 1 5 4,0 0 448 8 85,0 0 1 51 8 ,0 0 1 03,0 0 Mar 141 81 9 19,00 1 378 ,0 0 565 263,0 0 1 7 11,00 - 6 8 ,0 0 Mar 13
17 1 York Timber Holdings 1 324,0 0 3 1 4 3,0 0 745 29 1,00 2 893,0 0 67,0 0 Jun 141 70 1 1 32 ,0 0 3 09 1,00 1 291 838 ,0 0 2 828 ,0 0 1 42 ,0 0 Jun 13
1 72 Resilient Property Income Fund 1 30 1 ,0 0 24 51 5,0 0 35 589 753,0 0 16 1 1 2 ,0 0 1 732 ,0 0 Jun 1420 6 626 ,0 0 18 0 61 ,0 0 16 673 392 ,0 0 11 249,0 0 767,0 0 Jun 13
NO. 135 HYPROPINVESTMENTS Costs fromrenovating the Rosebank Mallshould start being recouped inthe next financial year
NO. 154 JSE The stockexchange is once againimproving its systems andadopting internationalsettlement standards

Financial Mail Page 32-33 -12/06/15 03:11:41 PM
FINANCIAL MAIL • TOP COMPANIES • 201532 FINANCIAL MAIL • TOP COMPANIES • 2015 33
SA GIANTSRanked bytu r n ove r
Co m p a ny Tu r n ove rRm
Total assetsRm
Market capRm
Equity fundsRm
Net profitRm
Financialyear -end
1 73 Fountainhead Property Trust 1 282 ,0 0 12 6 0 1 ,0 0 11 975 9 10,00 8 8 42 ,0 0 7 17,00 Aug 141 72 1 0 89,0 0 11 59 9,0 0 8 743 577,0 0 8 249,0 0 623,0 0 Aug 13
1 74 Bu i l d m a x 1 274,0 0 1 25 0,0 0 110 593,0 0 767,0 0 6 4,00 Feb 141 65 1 1 8 6 ,0 0 1 1 97,0 0 487 69 9,0 0 695,0 0 6 4,00 Feb 13
1 75 Mix Telematics 1 272 ,0 0 1 262 ,0 0 2 608 4 35,0 0 1 672 ,0 0 1 6 8 ,0 0 Mar 141 67 1 17 1,00 48 8 ,0 0 3 607 0 9 0,0 0 823,0 0 1 79,0 0 Mar 13
1 76 New Europe Property Investments Plc 1 253,0 0 21 37 1,00 39 129 8 4 3,0 0 17 587,0 0 1 0 45,0 0 Dec 14216 5 41 ,0 0 14 789,0 0 17 877 1 6 6 ,0 0 11 02 1 ,0 0 755,0 0 Dec 13
1 77 Tra n s p a co 1 247,0 0 6 48,00 633 032 ,0 0 4 0 4,0 0 70,0 0 Jun 1417 1 1 1 23,0 0 587,0 0 588 9 0 0,0 0 36 0,0 0 65,0 0 Jun 13
1 78 Homechoice International Plc 1 2 1 3,0 0 2 0 52 ,0 0 3 308 20 5,0 0 1 48 8 ,0 0 4 03,0 0 Dec 14
1 79 Niveus Investments 1 1 55,0 0 2 58 8 ,0 0 2 805 792 ,0 0 1 23 1 ,0 0 1 20,0 0 Mar 141 75 1 0 1 7,0 0 2 0 0 9,0 0 2 772 278 ,0 0 859,0 0 26 ,0 0 Mar 13
180 Master Drilling Group 1 1 55,0 0 1 6 63,0 0 1 705 0 53,0 0 1 0 0 6 ,0 0 1 75,0 0 Dec 1326 6 89,0 0 1 336 ,0 0 1 186 1 23,0 0 796 ,0 0 9,0 0 Dec 12
1 81 Redefine International Plc 1 1 48 ,0 0 20 9 12,00 15 224 377,0 0 8 1 35,0 0 262 ,0 0 Aug 141 93 73 4,0 0 16 935,0 0 11 941 0 89,0 0 4 36 0,0 0 9 02 ,0 0 Aug 13
1 82 Wescoal Holdings 1 1 47,0 0 61 2 ,0 0 386 7 13,00 4 3 1 ,0 0 - 6 8 ,0 0 Mar 141 98 677,0 0 235,0 0 397 0 58 ,0 0 20 6 ,0 0 24,0 0 Mar 13
1 83 Atta cq 1 1 4 0,0 0 18 1 0 5,0 0 19 425 51 7,0 0 10 8 0 1 ,0 0 20 4,0 0 Jun 14190 76 4,00 13 3 4 0,0 0 12 913 076 ,0 0 6 1 4 0,0 0 - 48 ,0 0 Jun 13
184 Transaction Capital 1 1 33,0 0 9 38 4,0 0 5 126 6 63,0 0 2 9 9 9,0 0 3 1 7,0 0 Sep 1423 0 38 0,0 0 13 247,0 0 3 058 551 ,0 0 3 72 1 ,0 0 6 0 8 ,0 0 Sep 13
1 85 Emira Property Fund 1 1 1 6 ,0 0 11 639,0 0 9 164 374,0 0 7 0 0 5,0 0 N /A Jun 141 77 1 0 0 8 ,0 0 10 1 1 5,0 0 6 903 778 ,0 0 6 6 0 9,0 0 769,0 0 Jun 13
186 Morvest Group 1 1 0 1 ,0 0 4 63,0 0 184 8 0 0,0 0 220,0 0 6 4,00 May 14180 95 6 ,0 0 458 ,0 0 193 6 0 0,0 0 1 74,0 0 63,0 0 May 13
1 87 Wi n h o l d 1 0 9 9,0 0 570,0 0 63 1 07,0 0 257,0 0 1 4,0 0 Sep 141 74 1 0 4 3,0 0 533,0 0 82 039,0 0 24 4,0 0 5,0 0 Sep 13
188 City Lodge Hotels 1 0 63,0 0 1 6 85,0 0 5 954 230,0 0 572 ,0 0 238 ,0 0 Jun 141 78 976 ,0 0 1 453,0 0 5 048 1 83,0 0 51 7,0 0 207,0 0 Jun 13
1 89 Jasco Electronics Holdings 1 035,0 0 6 0 4,0 0 131 039,0 0 263,0 0 8 ,0 0 Jun 141 69 1 1 4 6 ,0 0 758 ,0 0 196 559,0 0 20 5,0 0 - 8 ,0 0 Jun 13
190 SA Corporate Real Estate Fund 1 03 4,0 0 11 26 8 ,0 0 9 918 395,0 0 7 6 03,0 0 652 ,0 0 Dec 14184 85 4,0 0 9 4 4 3,0 0 7 920 372 ,0 0 7 28 0,0 0 636 ,0 0 Dec 13
19 1 Onelogix Group 1 03 4,0 0 8 4 6 ,0 0 1 404 329,0 0 41 6 ,0 0 79,0 0 May 141 73 1 0 5 0,0 0 70 5,0 0 727 458 ,0 0 361 ,0 0 6 6 ,0 0 May 13
SA GIANTSRanked bytu r n ove r
Co m p a ny Tu r n ove rRm
Total assetsRm
Market capRm
Equity fundsRm
Net profitRm
Financialyear -end
1 92 Pet m i n 1 020,0 0 2 035,0 0 778 826 ,0 0 1 99 1,00 1 39,0 0 Jun 14186 833,0 0 2 1 4 0,0 0 1 401 8 8 6 ,0 0 2 20 6 ,0 0 4 63,0 0 Jun 13
1 93 Rolfes Holdings 1 0 0 1 ,0 0 573,0 0 346 46 4,00 302 ,0 0 32 ,0 0 Jun 141 87 8 02 ,0 0 48 4,0 0 477 859,0 0 26 8 ,0 0 39,0 0 Jun 13
1 94 CSG Holdings 978 ,0 0 281 ,0 0 834 0 1 9,0 0 235,0 0 35,0 0 Mar 142 29 387,0 0 70,0 0 1 028 079,0 0 5 6 ,0 0 27,0 0 Jun 13
1 95 Stellar Cap Partners 94 3,0 0 4 0 5,0 0 119 1 1 6 ,0 0 20 9,0 0 - 9 0,0 0 Aug 131 76 1 0 1 7,0 0 5 4 0,0 0 202 6 82 ,0 0 4 67,0 0 -24,0 0 Aug 12
1 96 Insimbi Refractory & Alloy Supplies 939,0 0 33 1 ,0 0 169 0 0 0,0 0 1 1 8 ,0 0 1 8 ,0 0 Feb 141 85 8 4 0,0 0 274,0 0 156 0 0 0,0 0 1 1 1 ,0 0 5,0 0 Feb 13
1 97 Phumelela Gaming & Leisure 927,0 0 720,0 0 1 272 1 81 ,0 0 429,0 0 9 1,00 Jul 141 82 876 ,0 0 577,0 0 1 418 674,0 0 379,0 0 77,0 0 Jul 13
1 98 Cargo Carriers 9 15,00 835,0 0 355 0 0 0,0 0 493,0 0 38 ,0 0 Feb 141 94 727,0 0 8 4 0,0 0 450 0 0 0,0 0 45 6 ,0 0 3 1 ,0 0 Feb 13
199 Digicore Holdings 892 ,0 0 4 6 8 ,0 0 683 5 67,0 0 56 4,00 1 ,0 0 Jun 141 83 8 63,0 0 65 0,0 0 549 825,0 0 652 ,0 0 1 9,0 0 Jun 13
20 0 Andulela Investment Holdings 89 1,00 572 ,0 0 248 03 4,0 0 41 0,0 0 5,0 0 Dec 131 55 1 472 ,0 0 6 0 1 ,0 0 788 8 03,0 0 4 30,0 0 -1 4,0 0 Dec 12
NO. 182 W ESCOA LHOLDINGS Bo a rd ro o mclashes might have drawn them a rke t ’s attention away fromthis firm’s impressive prospects
NO. 196 INSIMBIREFRACTORY & ALLOYS U P P L I ES With good results,the firm declared a final grossdividend of 2,5c/share in May
Source: INET BFA

Financial Mail Page 34-35 -12/06/15 03:12:05 PM
FINANCIAL MAIL • TOP COMPANIES • 201534 FINANCIAL MAIL • TOP COMPANIES • 2015 35
145 000 barrels from 69 200barrels in the full year. There iscontinued focus on developingthe Cypress A acreage to deriskthe asset, and on productionfrom wetter areas. Crude oiloutput from the Gabon assetswas 1,12m barrels from 1,59mbarrels in the full year,reflecting oversupply in theface of weak oil prices and thesouring of wells.
Normalised volumes ofsales of base chemicals,stripping out the SasolPolymers Middle East andSolvents Germany businesses,which have been disposed of,were 2,43 Mt in nine months versus 3,19 Mt in theprevious 12 months. Sasol says full-yearnormalised sales volumes are expected to beslightly higher than last year.
Sasol implemented a new reporting format,making comparisons with previous periodsdifficult. But Nedbank Capital Securities analystMohamed Kharva says extrapolating from thepreviously reported periods, it seems there isnothing unexpected in the nine-month perfor-mance. That the volume of liquid fuel sales willbe slightly above previous guidance suggestsSasol is running its plants harder to help offsetweak selling prices.
In the year to May the basket price of basechemicals — including polymers, solvents,fertilisers and explosives — fell 10% comparedwith last year. This was better than the 29%decline in oil prices over the same period.
Construction of Sasol’s ethane cracker, locatednear Westlake, Louisiana, is scheduled to befinished by 2017, with a capacity of 1,5 Mt / y e a rwhen fully operational. Sasol began the FrontEnd Engineering Design (Feed) phases for theethane cracker GTL plant in December 2012.Given lower energy prices, the group said inJanuary it would slow downpreliminary work on the plant anddelay a final investment decision.
“The ethane project is the largestsingle manufacturing investment inthe history of Louisiana and alsorepresents one of the largest foreigndirect investment manufacturingprojects in the history of the US,” Sa s o lsaid at the time.
The GTL plant is expected toproduce, among others, several highlyvolatile, flammable liquid mixtures ofhydrocarbons distilled from petroleum,coal tar and natural gas.
SECT
ORS SECTORS
Sting of low oilprices still hurts
But as the market regains its equilibrium, prices shouldstart maintaining an upward trend
B etween the end of the 2015 first quarterand mid-May, crude oil prices rose byaround 30%, despite inventories rising torecord levels. Rather than focus oninventories, the market was responding
to one of the sharpest drops in the US rig counton record and the potential for a weakening USproduction trend.
Edison, a global investment intelligence firm,says in its oil and gas macro outlook that thoughthe lows for this cycle have probably been reached,the price trend could soften near-term. That wouldbe a reflection of hefty inventories and buoyantsupply by members of the Organisation of thePetroleum Exporting Countries (Opec).
Iranian exports could also weigh on pricesahead of the final agreement between the world’smajor powers and Iran over its nuclearprogramme. “Looking at the balance of 2015,however, we expect an upward trend in prices asthe market regains its equilibrium, driven byslowing non-Opec supply growth and firmingd e m a n d ,” says Edison.
The firm upgraded its 2015brent crude oil price forecasts,calling for increases f ro mUS$52,50/bbl to $58,50/bbl. Brentcrude forecasts for 2016 remainunchanged at $72,5/bbl.
Many oil-producing countriesfelt the pinch when oil droppedto $50/bbl at the beginning ofthe year. The oil price tumbledafter global supply ex ce e d e ddemand. This was driven bynew energy produced by thehydraulic fracturing (fracking)industry in the US.
International oil prices in thequarter to December were down
89%, losing another 4% in the three months toMarch. By mid-May they had recovered by 18%.
In SA, though consumers enjoyed the relief oflower fuel prices, Sasol’s earnings were severelyaffected. The company produces synthetic fuelfrom coal at its Secunda plant and its earnings,largely domestic, are materially affected by therand/oil price.
Sa s o l also holds a majority interest in the88 000 bbl/day Natref refinery in Sasolburg, alongwith Total SA. It is involved in coal mining andmarketing of natural gas and oil products. Itmines 40 Mt of saleable coal per year and sellsabout 2,8 Mt/year. It also distributes and marketsnatural gas produced in Mozambique. This isexported to SA via a pipeline Sasol partially owns.
Sa s o l’s share price dropped by close to 30% inthe December quarter and a further 4,37% in theMarch quarter. It took another dip in the first weekof May following a terse update on its productionfor the nine months to March. It produced 24,6mbarrels of synfuels refined product in nine months,compared with 32,4m barrels for the preceding 12
months. It produced 42,7m barrelsof white liquid fuels and 3,4mbarrels of black liquid fuels,compared with 54,5m barrels and4,3m barrels respectively.
The firm has operationsaround the world. It has a 49%stake in Qatar’s Oryx GTL plant(Qatar Petroleum owns 51%) thatcame online in 2007. Sasol alsohas GTL projects in Nigeria andUzbekistan, and is consideringdeveloping plants in the US andCa n a d a .
Condensate production fromthe Canadian shale gas assetsshowed a stronger trend, at
The group delivered a decentset of results for the interimperiod to December 2014,despite a volatile tradingenvironment and a sharpdecline in oil prices. Revenueincreased by 2% to R99,8bn,supported by higher salesvolumes in liquid fuels.Adjusted operating profit beforedepreciation and amortisationincreased by 19% to R36,9bn —supported by a 9% weakeningin the average rand/US dollarexchange rate — partly offset bya 19% decline in average brentcrude oil prices.
Ultimately, headlineearnings came in 6% higher at R20,88/s h a re ,limited by a 22% decline in profits fromassociates and a 30% increase in incomeattributable to noncontrolling interests.Consequently, normalised EPS declined by 23%due to the effect of one-off charges, movementsin share-based payments and unrealised profitson inventory. The group says a revised dividendpolicy will be based on a dividend cover ofbetween 2,2 and 2,8 times, with a 40:60 splitbetween interim and year-end pay-out. A grossinterim dividend of 700c/share was declared, 13%lower than the prior period. This translated into anet payable dividend of 595c/share.
CEO David Constable, who will step downwhen his contract expires in 2016, expects theglobal economic environment to remain volatile.
Management expects oil prices to be at least30% lower in the second half of the year, butwith a possibility of increased volatility due tothe trend towards interest rate normalisationacross key economies and geopolitical tension.
A $1/bbl movement down in the oil price willaffect operating profit by R799m, while a 10cmovement in the $/rand exchange rate will affectprofit by R605m. Ruan Jooste
CHEMICALS, OIL & GAS
Source: INET BFA Share prices based to 100
2014 2015J F M A M J J A S O N D J F M MA
125
115
110
100
80
120
95
105
85
90
73
Chemicals index
Oil & gas index
All share index
David Constable
Mar
tin
Rho
des
✥ CHEMICALS ✥ ✥ CHEMICALS ✥
1 Sa so l 39 696 ,0 273 48 6 ,0 268 277 70 8 ,0 202 59 0,02 Omnia Holdings 1 073 ,0 10 025 ,0 11 780 6 03,0 6 0 55,03 A EC I 7 19,0 12 6 59,0 16 286 6 24,0 6 278 ,04 African Oxygen 3 1 7,0 5 8 25,0 4 662 79 9,0 3 51 6 ,05 Oando Plc 5 7,0 36 4 23,0 9 908 1 1 3,0 17 741 ,06 Rolfes Holdings 32 ,0 5 73,0 346 4 6 4,0 302 ,07 SacOil Holdings 1 4,0 1 30 5,0 784 76 0,0 1 296 ,08 Delta EMD 1 2 ,0 5 4 4,0 221 736 ,0 4 42 ,09 S p a n j a a rd 2 ,0 72 ,0 48 8 57,0 48 ,0
Ranked bynet profit
Name Net profitRm
Total assetsRm
Market capRm
Equity fundsRm
TOP NINE CHEMICALS
Source: INET BFA

Financial Mail Page 36-37 -12/06/15 03:43:41 PM
THE RIGHT PARTNERSUCCESS STARTS WITH
���������������� �� visit www.masana.biz
���������������������� ����������������������������������������������� ���� �������� �
� ��������� ������������ �������������!������������ ������������� �������� ���
����������� �����"#""$$��������� �
"������� ��������������������� ��� ����� ��!������������������������ ������ ����
��������!�������� �������� ��� ���������������������������� ���� ��!�����!�� ������
JHB
74549B
74549B-82003 Generic -BEE- Ad for Financial Mail Top Companies.indd 1 2015/06/12 10:30 AM

Financial Mail Page 38-39 -12/06/15 03:12:30 PM
FINANCIAL MAIL • TOP COMPANIES • 201538 FINANCIAL MAIL • TOP COMPANIES • 2015 39
Chinese imports of iron ore from countriesother than Australia and Brazil are now runningat 80 Mt/year, lower than this time last year, thefirm says in a note to clients. “Of the approxi-mately 120 Mt that remain, very little is likely tobe sustainably cash-flow positive at currentprices and two of the largest and highest-qualityproducers in that bracket, Iron Ore Company ofCanada and SA’s Kumba, are struggling to breakeven on a cash basis,” it says.
London-based Liberum’s Richard Knights andBen Davis say a large proportion of the remainingsupply will stay sticky unless prices move lower toa point where significant losses on a per ton basisare being sustained. Pressure from vested interests,cross-subsidisation, currency devaluation, Chineseownership or an unsurpassable freight/locationadvantage will contribute to keeping “m a rg i n a lsupply open”, they say.
As the next wave of supply hits the market inthe weeks ahead from Rio Tinto’s Pilbaraexpansion (60 Mt/year), and later in the year withthe commissioning of Roy Hill (55 Mt / y e a r) ,prices will need to move much lower to drivefurther supply rationalisation, they say.
Citi has already downgraded the price of thesteel-making ingredient to $37/t in the secondhalf of this year from $47/t currently.
Beleaguered Kumba Iron Ore’s share price hastaken a nosedive, bringing losses since the startof the year to a staggering 46%.
IG SA market analyst Shaun Murison tells theFinancial Mail that iron ore has historically beenone of the most profitable resources, but recordoutput and slow demand have depressed the oreprice. INET BFA has a sell recommendation onthe mining counter stock.
Kumba delivered a subdued set of results forthe year to December. Revenue declined by 13%to R47,6bn. Export sales volumes were up 4% to40,5 Mt, with volumes to China accounting for57% of total export sales. Gross profit declined24% to R29,5bn, resulting in a lower gross profitmargin of 62% (2013: 71,2%). Adjusted operatingprofit before depreciation declined 26% to
R22bn, affected by the 9% increasein operating costs mainly due toincreased costs relating to the 37 Mtgrowth in total mining volumes.Above-inflation increases in labourcosts, diesel, mining contractors, railand port tariffs, freight costs andwaste stripping also contributed tothe higher operating costs, it says.
Unit cash costs at Sishen mines inthe Northern Cape were contained atR272/t (2013: R267/t) as input costpressures and the increased costsrelating to higher mining volumes
SECT
ORS SECTORS
✥ INDUSTRIAL METALS & MINING ✥✥ INDUSTRIAL METALS & MINING ✥
Ma rke tfloodinga bad act
Appetite to gain moremarket share adds to global
price pressures
T alk of expanding production facilities bythe world’s leading iron ore miners hasadded to the pressures that are drivingdown global prices of the commodity.Industry critics argue that large
companies have driven this by flooding themarket to gain more market share. The biggestiron ore producers — Rio Tinto, BHP Billiton andVale — are all in expansion mode.
The price of iron ore fell to US$47/t in April,but recovered somewhat towards the end of themonth when BHP Billiton indicated a slowing ofits iron ore growth plans. In May iron ore wastrading at about $57/t. The slight recovery followsRio Tinto’s move last year to delay thedevelopment of its Silvergrass iron ore mine inWestern Australia. Anglo American’s manage-ment at its Minas-Rio iron ore project in Brazil isalso looking to cut iron ore production.
Bra z i l’s Vale, the world’s largest iron oreproducer, is also considering cutting production.Ku m b a , SA’s largest iron-ore miner, is barelyprofitable at prevailing prices, according tobrokerage house Liberum.
were offset by higher production volumes anddeferred stripping. However, Kolomela nearPostmasburg and Thabazimbi unit cash costsincreased by 14% to R208/t (2013: R182/t) and 6%to R682/t respectively. Diluted Heps came in 29%lower. Cash generation remained strong for theperiod under review. A final gross dividend of773c/share was declared, 61% lower than the priorperiod, resulting in the total dividend declining42% to 2334c/share.
Kumba CEO Norman Mbazima told journalistsat the Mining Indaba earlier this year that theoutlook for 2015 was dire. Hepredicted no rise in the iron oreprice this year because of expectedincreases in supply from the majorglobal iron ore producerscombined with declining demandfrom major consumer China.
He said the annual growth inChinese crude steel production hadslowed to 4,5% in 2014 from 6,5%in 2013 and was expected to slowdown further to between 1,5% and2% in 2015.
Management will in the shortterm reduce production costs, capital expenditureand headcount. In the longer term, it willreconsider the future of Thabazimbi mine,restructure support services and improveoperational and supply chain efficiencies.
The group has targeted export sales volumesabove 43 Mt in 2015, while domestic salesvolumes are estimated at 6,25 Mt, in line with theArcelorMittal SA (Amsa) supply agreement.
Management says it intends to continuepaying dividends after considering growth andinvestment opportunities, while remainingwithin its committed debt facilities. Me a nwh i l e ,the long-term strategy will include theassessment of various opportunities in targetcountries in Central and West Africa.
Independent Fundamental Research (IFR)analysts say: “The group remains vulnerable to anumber of external variables such as commodityprices and exchange rates, which have asignificant effect on group profitability, but arenot under the control of management.
“This leads to significantly higher forecastingrisk. Accordingly, short-term investors should becognisant of market dynamics and developmentswhen considering an investment in the share. Wefeel the share is fairly valued at current levels andwould recommend that investors hold theirshares. The share offers an attractive dividendyield of 10%, but we doubt that it is sustainable.”
RMB’s global markets research team saysthere has been an uptick in iron ore prices, whichhave pushed above $55/t recently. “Though iron
ore still remains oversupplied in a market that isfacing a slowdown in demand, speculation thatthe Chinese government will provide additionalstimulus has supported the short-term gains.”
Meanwhile, Goldman Sachs said in a note itdid not expect the major iron ore producers toalter their plans. Investec agrees: “The recent blipup in iron ore prices was merely a seasonalrestocking event that happens every year afterChinese new year. Iron ore prices will nowrecommence their downward trajectory.”
Standard & Poor’s downgraded AngloAmerican, the owner of the newMinas-Rio iron ore mine in Brazil,to a BBB rating as it expects theiron ore market to be in “a severesupply and demand imbalance inthe next two years”. Standard &Po o r ’s estimates an average ironore price of $45/t for the rest of thisyear and $50/t next year.
The iron ore market has beensavaged as new, low-cost supplieshave come online — mainly fromAustralia and Brazil — wh i l eChinese demand is reduced as its
economy slows.Though there are some signs that commodity
prices might be stabilising, the outlook is stillfairly gloomy. Meanwhile, there also might beinvestment opportunities in steelmakingcompanies until the market turns.
Analysts warn that short-term investorsshould be cognisant of market dynamics anddevelopments when considering an investmentin Amsa. Trading at a 50% discount to its netasset value (based on the financial year results toDecember), the share does offer speculativeappeal with earnings on a cyclical low, but thereare a lot of uncertainties surrounding the group.
Amsa is the largest steel producer in Africa,with a production capacity of 7,8 Mt of liquidsteel per annum and the group’s earnings arehighly geared towards production volumes andmetal prices as well as the exchange rate.
There is also a reasonable prospect of businessrescue of Evraz Highveld Steel & Vanadium, asthere is potential for recovery when steel marketsturn. That’s according to Piers Marsden ofMatuson Associates and Daniel Terblanche ofMazars Recovery & Restructuring, thepractitioners appointed to assess the company’sf u t u re .
Shares in SA’s second-largest steel maker weresuspended a few months ago after the Russian-backed group said it did not have “a d e q u a tefunding” to meet its short-term obligations andthat it had voluntarily entered into businessre s c u e . Ruan Jooste
1 Kumba Iron Ore 11 36 4,0 50 028 ,0 50 245 41 1 ,0 29 1 39,02 BSI Steel 62 ,0 1 651 ,0 424 7 14,0 61 8 ,03 Insimbi Refractory & A l l oy 1 8 ,0 33 1 ,0 169 0 0 0,0 1 1 8 ,04 Ferrum Crescent -1 8 ,0 1 8 ,0 41 5 02 ,0 9, 05 M et m a r -1 1 1 ,0 1 496 ,0 176 422 ,0 4 3 4,06 ZC I -3 1 1 ,0 83 1 ,0 277 83 1 ,0 1 3 41 ,07 Evraz Highveld Steel & Va n a d i u m -35 7,0 3 526 ,0 879 4 61 ,0 1 41 1 ,08 ArcelorMittal SA -372 ,0 32 5 63,0 14 937 1 53,0 22 4 65,0
Ranked bynet profit
Name Net profitRm
Total assetsRm
Market capRm
Equity fundsRm
TOP EIGHT INDUSTRIAL METALS & MINING
Source: INET BFA
NormanM ba z i m a
Mar
tin
Rho
des

Financial Mail Page 40-41 -12/06/15 03:13:12 PM
FINANCIAL MAIL • TOP COMPANIES • 201540 FINANCIAL MAIL • TOP COMPANIES • 2015 41
SECT
ORS SECTORS
✥ MINING ✥ ✥ MINING ✥
Value inb a t te re dmining
Investors see potentialbenefits in South32, whileZa m b ez i ’s BEE deal raises
old concerns
N ot long ago, the prospect of AngloAmerican being outside the top 10 onthe JSE in terms of market capitalisa-tion was not contemplated. But thatwas almost the case in early June,
when Anglo was in 10th place with a market capof R267bn (2,3% of the exchange) — and in fact ithad slipped out of the top 10 briefly earlier in2015. Anglo’s market cap is slightly more thanhalf that of BHP Billiton (R 530bn,sixth) and way behind G l e n co re(R713bn, third).
Bi l l i to n’s market cap was, ofcourse, reduced when it created anew vehicle, South32, for Billitoninterests in zinc, silver, nickel,thermal coal, aluminium andmanganese operations inSouthern Africa, Australia andColombia. South32 was listed onMay 18 in the UK, Australia andSA .
The consequence is thatBilliton remains listed on the JSE,but has no operational interests inSA. Billiton shareholders receivedone new South32 share for everyBilliton share they hold. Billiton’sfocus is now on iron ore, cokingcoal, copper and petroleum.Chairman Jac Nasser announcedthat the spin-off “will delivermore value for Billiton’s share-holders than other options,including asset sales”.
In early June South32’s market
cap was at R107bn (20th), substantially higherthan that of another former giant of the JSE,Anglo American’s Amplats (R76bn, 29th). Thespin-off of South32 was the biggest mining listingglobally in four years, and was seen as a test ofwhether investors are starting to see value inbattered mining.
The answer seemed to be in the affirmative.The week after the listing of South32, theFinancial Mail reported that its price “f irmedsteadily as investors took a positive view of itsprospects. The shares traded as high as R22,33from an opening of R18,97. Adding that to theBilliton share price of R263,49 showed Billitonshareholders gained 7% in a week on Billiton’spre-demerger price of R265,66”.
SP Angel analyst John Meyer says “i nve s to rsare buying South32 because they like the basketof assets, the potential benefits that more focusedmanagement can bring, the leverage to metalsprices and the potential for corporate action”. Buthe warns that “management will have to benimble to avoid predators such as Mick Davis ofX2 or Ivan Glasenberg of Glencore” b e c au s eSo u t h 3 2 ’s assets would fit well into Glencore andthere is no obvious regulatory impediment.
South32 CEO Graham Kerr says there areopportunities around existing assets andmanagement is open to making value-addinga cq u i s i t i o n s .
In a report rebasing forecasts for BHP Billitonafter the demerger, Investec analyst Hunter
Hillcoat upgraded his recommendation onBilliton shares to “h o l d” from “s e l l”. After thedivestment, and with commodities prices at theirlowest since 2009, Billiton is likely to reportdecade-low earnings in its first year post-merger.But in future years, earnings are likely to grow byabout 3%/year, based on Investec’s outlook for itskey commodities.
In other major corporate activity, ZambeziPl a t i nu m , the new BEE vehicle for Northam,listed on the JSE in late May. Zambezi Platinum isa special-purpose vehicle (SPV) for holding a31,4% BEE stake in Northam. Another 4% ofNortham is held by black employees. Zambezihas 10 000 issued ordinary shares held by BEEconsortia, including Atisa Platinum (headed bycurrent Northam chairman Lazarus Zim, whoalso headed the Afripalm consortium), Mpilo andMalundi. They cannot sell for 10 years. It also has159,9m issued preference shares, and one N-shareheld by Northam, which gives Northam certainpowers if a defined “trigger event” o cc u rs .
It has been argued that structures that preventblack empowerment shareholders from sellingfor a specified period — to save the companyfrom having to go to all the trouble and expenseof finding new partners — are hollow becauseencumbered shares that cannot be sold areworthless. But the Zambezi SPV is seen asdifferent, says Zim, because it is usingshareholder financing, not bank financing. So, itis more flexible, and the upfront payment is faircompensation for the 10-year lock-in.
However, as the Financial Mail noted at thetime of the Zambezi listing in May, “the ZambeziSPV does not address the other unresolved issuearound BEE deals, on which mining companiesand the department of mineral resources haveagreed to seek a court ruling. That is whetheronce empowered, always empowered applies tomining companies whose BEE shareholders havetaken profits on their shares.
“BEE deals are expensive for companies. Ittakes months or years to find partners, the bill foradvisers and financiers is high, and companiesusually issue shares at a discount,” the articlesaid. “If the courts rule that companies have tokeep replacing their BEE shareholders, either theduration of lock-ins will have to increase orcompanies will have to impose an obligation ontheir BEE partners to sell only to other BEEentities, both of which are problematic.”
A counterpoint to the general gloom about thecommodities cycle was provided by the intenseinterest in the newly launched Junior Indaba,which took place in early June 2015. (The obviousname, “Junior Mining Indaba”, was apparentlynot used because of copyright issues related tothe established Investing in Mining Indaba.) High
on the agenda was the global capital crisis —seeking capital is much more of an issue forjunior miners — and the quest for innovativeglobal solutions. “Answers will be sought,” itcame out at the Junior Indaba, “on why Africa isnot getting more of the global exploration spend.”
Investors expected to hear updates on howjunior companies are performing in Africancountries such as Botswana, Mozambique,Zambia, Zimbabwe, Tanzania, SA and Ghana,across commodity sectors, including bulkcommodities, base metals, industrial minerals,gold, precious metals, diamonds and PGMs.
Keith Scott, CEO of lead sponsor MSA, said:“A f r i c a’s mineral endowment is exceptional, withlarge tracts of the continent unexplored.Economic and political development in sub-Saharan Africa is opening up new opportunitiesfor exploration and mining. It’s vital that weunderstand and share what is needed to fosterexploration, so we can develop a framework tobest promote investment and stimulate the juniormining sector, and therefore create a betterenvironment for new entrants.”
Bernard Swanepoel, former CEO of Harmonyand chairman of the highly successful annualJoburg Indaba, said: “It is the junior sector thatcan unlock the potential of the minerals underthe ground, but this sector of the industry has notbeen properly organised and represented. Nor doI believe there has been a tax regime sufficientlyinvestor-friendly to the high-risk dollars that arerequired for exploration.” David Williams
Bernard Swanepoel
Graham Kerr
Pux
ley
Mak
gath
o
Mar
tin
Rho
des
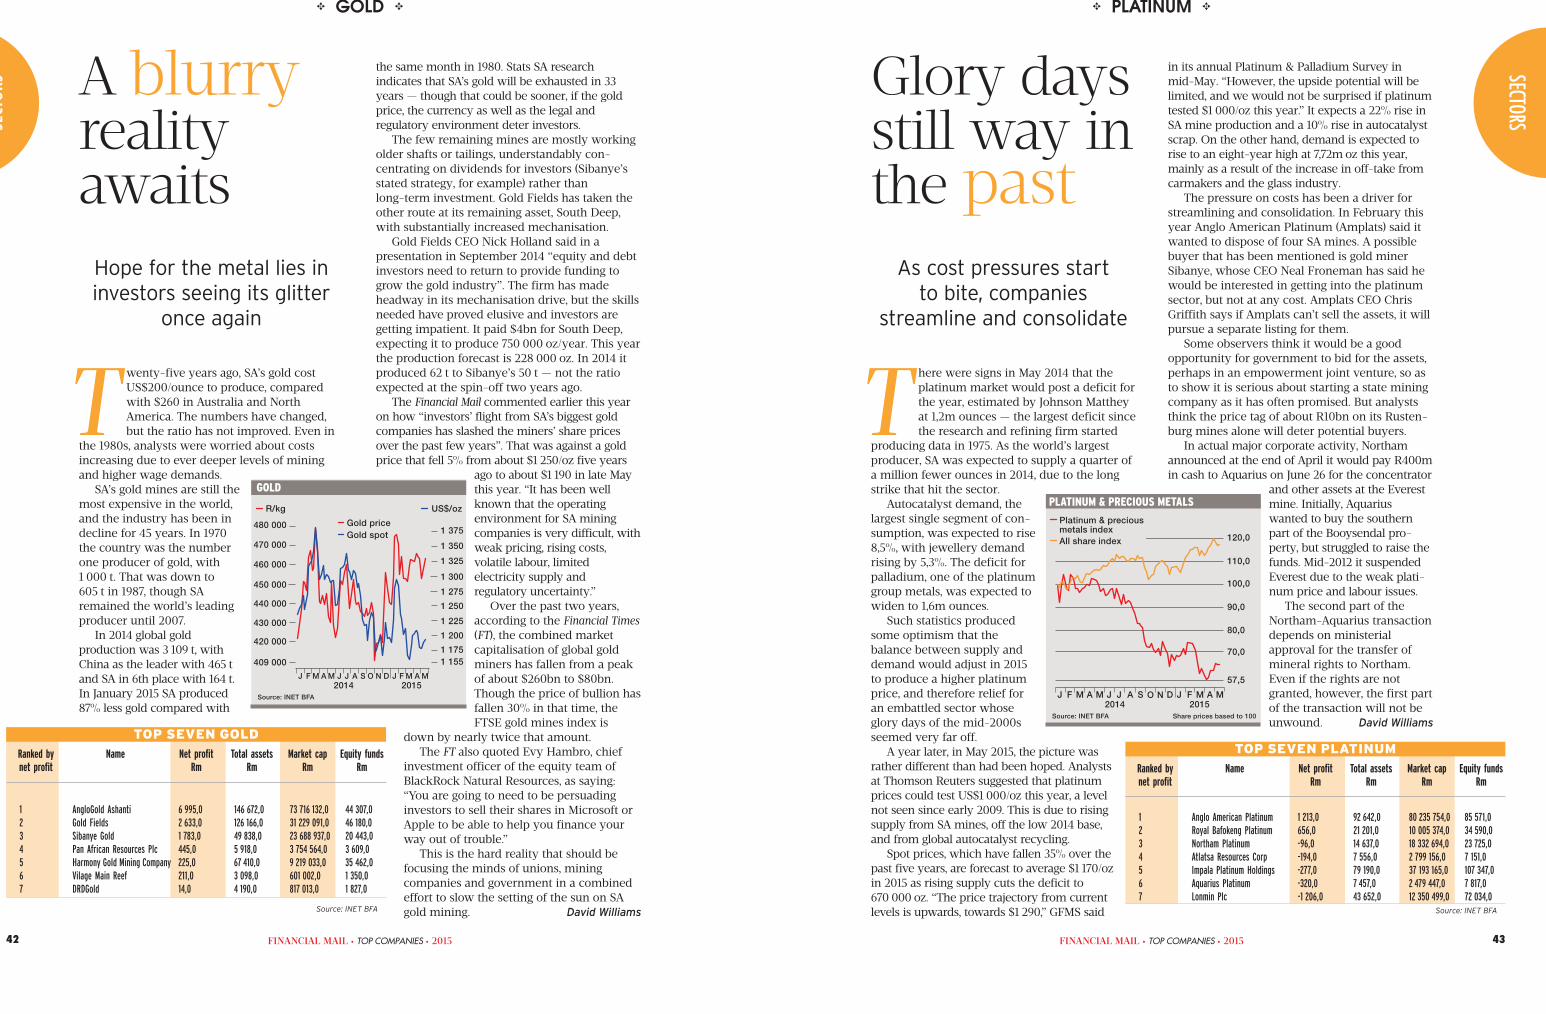
Financial Mail Page 42-43 -17/06/15 12:51:01 PM
FINANCIAL MAIL • TOP COMPANIES • 201542 FINANCIAL MAIL • TOP COMPANIES • 2015 43
the same month in 1980. Stats SA researchindicates that SA’s gold will be exhausted in 33years — though that could be sooner, if the goldprice, the currency as well as the legal andregulatory environment deter investors.
The few remaining mines are mostly workingolder shafts or tailings, understandably con-centrating on dividends for investors (Si b a ny e’sstated strategy, for example) rather thanlong-term investment. Gold Fields has taken theother route at its remaining asset, South Deep,with substantially increased mechanisation.
Gold Fields CEO Nick Holland said in apresentation in September 2014 “equity and debtinvestors need to return to provide funding togrow the gold industry”. The firm has madeh e a dway in its mechanisation drive, but the skillsneeded have proved elusive and investors aregetting impatient. It paid $4bn for South Deep,expecting it to produce 750 000 oz/year. This yearthe production forecast is 228 000 oz. In 2014 itproduced 62 t to Si b a ny e’s 50 t — not the ratioexpected at the spin-off two years ago.
The Financial Mail commented earlier this yearon how “i nve s to rs’ flight from SA’s biggest goldcompanies has slashed the miners’ share pricesover the past few years”. That was against a goldprice that fell 5% from about $1 250/oz five years
ago to about $1 190 in late Maythis year. “It has been wellknown that the operatinge nv i ro n ment for SA miningcompanies is very difficult, withweak pricing, rising costs,volatile labour, limitedelectricity supply andregulatory uncertainty.”
Over the past two years,according to the Financial Times(FT), the combined marketcapitalisation of global goldminers has fallen from a peakof about $260bn to $80bn.Though the price of bullion hasfallen 30% in that time, theFTSE gold mines index is
down by nearly twice that amount.The FT also quoted Evy Hambro, chief
investment officer of the equity team ofBlackRock Natural Resources, as saying:“You are going to need to be persuadinginvestors to sell their shares in Microsoft orApple to be able to help you finance yourway out of trouble.”
This is the hard reality that should befocusing the minds of unions, miningcompanies and government in a combinedeffort to slow the setting of the sun on SAgold mining. David Williams
SECT
ORS SECTORS
✥ GOLD ✥
A blurryre a l i t yawa i t s
Hope for the metal lies ininvestors seeing its glitter
once again
T wenty-five years ago, SA’s gold costUS$200/ounce to produce, comparedwith $260 in Australia and NorthAmerica. The numbers have changed,but the ratio has not improved. Even in
the 1980s, analysts were worried about costsincreasing due to ever deeper levels of miningand higher wage demands.
S A’s gold mines are still themost expensive in the world,and the industry has been indecline for 45 years. In 1970the country was the numberone producer of gold, with1 000 t. That was down to605 t in 1987, though SAremained the world’s leadingproducer until 2007.
In 2014 global goldproduction was 3 109 t, withChina as the leader with 465 tand SA in 6th place with 164 t.In January 2015 SA produced87% less gold compared with
✥ PLATINUM ✥
Glory daysstill way inthe past
As cost pressures startto bite, companies
streamline and consolidate
T here were signs in May 2014 that theplatinum market would post a deficit forthe year, estimated by Johnson Mattheyat 1,2m ounces — the largest deficit sincethe research and refining firm started
producing data in 1975. As the world’s largestp ro d u ce r, SA was expected to supply a quarter ofa million fewer ounces in 2014, due to the longstrike that hit the sector.
Autocatalyst demand, thelargest single segment of con-sumption, was expected to rise8,5%, with jewellery demandrising by 5,3%. The deficit forpalladium, one of the platinumgroup metals, was expected towiden to 1,6m ounces.
Such statistics producedsome optimism that thebalance between supply anddemand would adjust in 2015to produce a higher platinumprice, and therefore relief foran embattled sector whoseglory days of the mid-2000sseemed very far off.
A year later, in May 2015, the picture wasrather different than had been hoped. Analystsat Thomson Reuters suggested that platinumprices could test US$1 0 0 0/oz this year, a levelnot seen since early 2009. This is due to risingsupply from SA mines, off the low 2014 base,and from global autocatalyst recycling.
Spot prices, which have fallen 35% over thepast five years, are forecast to average $1 1 7 0/ozin 2015 as rising supply cuts the deficit to670 000 oz . “The price trajectory from currentlevels is upwards, towards $1 2 9 0,” GFMS said
in its annual Platinum & Palladium Survey inmid-May. “However, the upside potential will belimited, and we would not be surprised if platinumtested $1 000/oz this year.” It expects a 22% rise inSA mine production and a 10% rise in autocatalystscrap. On the other hand, demand is expected torise to an eight-year high at 7,72m oz this year,mainly as a result of the increase in off-take fromcarmakers and the glass industry.
The pressure on costs has been a driver forstreamlining and consolidation. In February thisyear Anglo American Platinum (A m p l a t s) said itwanted to dispose of four SA mines. A possiblebuyer that has been mentioned is gold minerSi b a ny e , whose CEO Neal Froneman has said hewould be interested in getting into the platinumsector, but not at any cost. Amplats CEO ChrisGriffith says if Amplats can’t sell the assets, it willpursue a separate listing for them.
Some observers think it would be a goodopportunity for government to bid for the assets,perhaps in an empowerment joint venture, so asto show it is serious about starting a state miningcompany as it has often promised. But analyststhink the price tag of about R10bn on its Rusten-burg mines alone will deter potential buyers.
In actual major corporate activity, No r t h a mannounced at the end of April it would pay R400min cash to Aquarius on June 26 for the concentrator
and other assets at the Everestmine. Initially, Aquariuswanted to buy the southernpart of the Booysendal pro-perty, but struggled to raise thefunds. Mid-2012 it suspendedEverest due to the weak plati-num price and labour issues.
The second part of theNortham-Aquarius transactiondepends on ministerialapproval for the transfer ofmineral rights to Northam.Even if the rights are notgranted, however, the first partof the transaction will not beu nwo u n d . David Williams
1 Anglo American Platinum 1 2 1 3,0 92 6 42 ,0 80 235 75 4,0 85 57 1,02 Royal Bafokeng Platinum 65 6 ,0 21 20 1 ,0 10 005 374 ,0 34 59 0,03 Northam Platinum - 96 ,0 14 6 37,0 18 332 69 4 ,0 23 725 ,04 Atlatsa Resources Corp -1 94,0 7 55 6 ,0 2 799 1 5 6 ,0 7 1 51 ,05 Impala Platinum Holdings -27 7,0 79 1 9 0,0 37 193 1 65,0 107 3 47,06 Aquarius Platinum -32 0,0 7 4 57,0 2 479 4 47,0 7 81 7,07 Lonmin Plc -1 20 6 ,0 43 652 ,0 12 350 49 9,0 72 03 4,0
Ranked bynet profit
Name Net profitRm
Total assetsRm
Market capRm
Equity fundsRm
TOP SEVEN PLATINUM
Source: INET BFA
PLATINUM & PRECIOUS METALS
Source: INET BFA Share prices based to 100
2014 2015J F M A M J J A S O N D J F M MA
120,0
57,5
90,0
80,0
110,0
100,0
70,0
Platinum & preciousmetals index
All share index
GOLD
Source: INET BFA
2014 2015
J F M A M J J A S O N D J F M MA
1 375
1 350
1 275
1 225
1 155
1 325
1 200
480 000
R/kg US$/oz
470 000
460 000
450 000
440 000
430 000
409 000
420 000
1 300
1 250
1 175
Gold price
Gold spot
1 AngloGold Ashanti 6 9 95,0 146 672 ,0 73 716 1 32 ,0 44 3 07,02 Gold Fields 2 6 3 3,0 126 1 6 6 ,0 31 229 09 1,0 46 1 8 0,03 Sibanye Gold 1 78 3,0 49 838 ,0 23 688 937, 0 20 4 4 3,04 Pan African Resources Plc 4 45,0 5 9 18,0 3 754 5 6 4,0 3 6 0 9,05 Harmony Gold Mining Co m p a ny 2 25,0 67 41 0,0 9 219 03 3,0 35 4 62 ,06 Vilage Main Reef 2 1 1 ,0 3 0 98 ,0 601 0 02 ,0 1 35 0,07 DRDGold 1 4,0 4 1 9 0,0 817 0 1 3,0 1 8 27,0
Ranked bynet profit
Name Net profitRm
Total assetsRm
Market capRm
Equity fundsRm
TOP SEVEN GOLD
Source: INET BFA

Financial Mail Page 44-45 -12/06/15 03:14:04 PM
FINANCIAL MAIL • TOP COMPANIES • 201544 FINANCIAL MAIL • TOP COMPANIES • 2015 45
The introduction of external contractors togrow the group’s construction capacity to deliveron projects has proven successful. It said: “Wi t hnine projects currently running consecutivelyand with the potential of a further two projectscommencing during the 2015/2016 financial year,the group’s risk profile has been significantlydiversified. With an ever increasing barrier toentry into the integrated market segment, thegroup has benefited from the introduction, by thenational department of human settlements inpartnership with provinces, of new housingp ro g ra m m e s .”
Calgro M3 also announced an interestingexpansion into the cemetery sector — or “p r iva tememorial parks”. This project is “founded on theprinciple of utilising Calgro M3-owned landparcels not suitable for residential development”.It is still in the pilot phase of development. It isalso expected to assist government in meeting thegrowing demand for safer and better maintainedalternatives to the cemeteries available in themarket. Calgro M3 CEO Ben-Pierre Malherbe saysthis is viewed as a complementary business toCalgro M3’s existing business model, and will notdistract the company from its core business ofproperty development.
Calgro M3’s market cap is around R2,1bn,indicating that, for now, small is beautiful in thissector. The largest company in the sector, Mu r ray& Roberts (M&R), has a market cap that at roundR11bn is more than three times that of the nextlargest company. Its fortunes reflect the strugglesof the construction sector as a whole since theglobal financial crisis of 2007/2008. If you hadinvested R1 000 in M&R 10 years ago, at the endof June 2015 you would have made a profit ofabout R50 — a return of 5% over a decade. If you
had invested such a sum at anypoint since 2008, your returnwould have been severely negative.
The company reported dismalresults for the six months toDecember 2014. Profit for theperiod fell to R369m from R863mlast year, as headline earnings pershare from continuing anddiscontinued operations stayed flat.However, the group states that ithas “restored financial stability,returned to profitability andresumed the payment of dividends,during the last three years of itsrecovery and growth strategy”.More than 90% of its profits comefrom outside SA at the earningsbefore interest and tax level, alongwith 65% of revenue. CEO HenryLaas says the company has never
SECT
ORS SECTORS
✥ CONSTRUCTION ✥ ✥ CONSTRUCTION ✥
Small isb e au t i f u lfor now
Delays on constructionprojects and poor economic
g row t hhit the sector hard
F or Calgro M3 — a specialist in lower-market housing development supportedby state funding — the 2015 financialyear has been highlighted by astrengthened pipeline, investment in
new ventures that will result in diversificationand an increased focus on sustainable cons-truction practices. Its business model is definedby a turnkey approach to property development,and the diversification of risk through thedevelopment of products that target a broadspectrum of the residential market.
The company is one of the winners in thisyear’s Top Companies Top 20 (see page 14) —which makes it an outstanding exception to theoverall trend of stagnant anddeclining financial performance inSA for the construction sector.
It has become customary forconstruction companies tocomplain about government’sfailure to translate its commitmentto infrastructure spending intoaction, or to pay in time for workcompleted. However, Calgro said atits annual results presentation inMay, “the expected decrease in theg ro u p’s exposure to infrastructuredevelopment after the 2014elections did not materialise, andan increase in urgency fromgovernment towards the provisionof low- to medium-costhousing-related infrastructure isexpected to continue to the 2016local elections”.
had such a high proportion ofearnings coming from outsidethe domestic market.
The SA market was hit bybig delays on constructionprojects and broadly by pooreconomic growth. To counterthis, the group has undergonea three-year restructuringprocess to focus on oil and gas,underground mining, energy,industrial projects as well asi n f ra structure and building.The order book fell to R37,8bnfrom R44,9bn a year ago,mainly because of the changesto its oil and gas unit — which moved to smallerand shorter-term contracts — and a drop in newprojects as a result of the oil price spike. Theeffect of a sharply lower oil price in early 2015has yet to come through for the group.
Nedbank Capital said early this year spendingon new infrastructure in SA halved last yearcompared with 2013. This is also reflected in theearnings of Group Five, whose core operatingprofit dropped 35,5% in the half-year toDecember. Group Five says its civil engineeringbusiness is the problem. Apart from poor stateinfrastructure spending in SA, it has had difficultywith various projects in the country and also inthe rest of Africa.
Another of the larger players, Ave n g , has hadits revenue fall 14% as net operating earningsdropped 19% and headline earnings per share fell58%. Aveng says it is feeling pressure from a fallin mining investment and the slow roll-out ofgovernment infrastructure in SA. It also has majoroutstanding claims to deal with on an Australiannatural gas project.
For some players, performance has been good,in parts. Wilson Bayly Holmes-Ovcon (W BHO),for instance, reporting on the year to December,says its building divisions “continue toperform well under the current favourablemarket conditions. In Gauteng, strongrevenue growth was supported byconstruction at eight different shoppingcentres and mixed-use developments, sevenof which were completed and handed overin the current six-month period.
“Construction at the Mall of Africashopping centre in Waterfall in Midrand willcontinue well into 2016. Ongoingconstruction at various corporate officeprecincts contributed significantly during theperiod, following the commencement of newphases at both Menlyn Maine and Alice Lanein Tshwane and Sandton respectively.”
WBHO reported a 5% increase, from
R36,2bn to R38,1bn, in its orderbook over the six months toend-December 2014. Thisincluded a 14% increase in theAustralian book, while theroads and earthworks orderbook declined by 22%. “Th i shas resulted in further dilutionof the contribution from Africa(including SA) to 31%,” saidW BHO.
It expects the strengthcurrently being experienced inthe local building market tocontinue over the short tomedium term. “The building
and civil engineering division’s order book,which has grown significantly over the past twoyears, has been maintained at R8bn.”
Es o r, one of the smaller constructioncompanies, seemed to put the worst of itsproblems behind it. However, in May it warned ofa basic loss per share of between 24c and 29c anda headline loss per share of between 17c and 20c,as against 43,5c and 11,3c in the previous financialyear. However, it pointed out that the loss fromcontinuing operations “represents a markedimprovement in financial performance”.
“The losses have, to a large extent, resultedfrom a further loss on the N4 Mooinooi Roadcontract (R56m),” said Esor. “This project wascompleted in November 2014.” A fair-valueadjustment loss of R35,4m and the impairment ofgoodwill in the civils business of R29,7m also hadmaterial effects. Esor says its work on hand andits future pipeline remain healthy, with a securedoutstanding two-year order book in excess ofR2,4bn and imminent pending awards of aboutR600m.
Esor CEO Bernie Krone has stepped up to therole of chairman and CFO Wessel van Zyl hassucceeded him. David Williams
Source: INET BFA Share prices based to 100
2014 2015J F M A M J J A S O N D J F M MA
120
55
90
110
100
80
70
60
CONSTRUCTION
Construction &
materials index
All share index
1 PPC 1 0 0 9,0 10 932 ,0 11 096 6 0 8 ,0 2 7 7 9,02 Murray & Roberts Holdings 981 ,0 18 63 4,0 6 088 4 37,0 5 41 7,03 Group Five 38 4,0 9 8 87,0 2 820 75 0,0 2 5 5 3,04 Raubex Group 3 41 ,0 4 5 4 6 ,0 3 390 675 ,0 3 3 6 3,05 Wilson Bayly Holmes-Ovcon 3 1 1 ,0 12 3 1 9,0 7 436 22 0,0 4 1 29,06 Ave n g 26 5,0 28 6 0 0,0 4 683 381 ,0 12 2 3 9,07 Af r i m a t 1 55,0 1 3 1 3,0 2 464 1 1 3,0 925 ,08 Distribution & Warehousing N et 9 9,0 3 2 25,0 1 574 578 ,0 1 4 32 ,09 Stefanutti Stocks Holdings 9 0,0 5 0 02 ,0 993 0 6 6 ,0 2 26 3,010 Basil Read Holdings 6 6 ,0 4 1 48 ,0 1 178 6 63,0 1 836 ,011 E so r -1 55,0 1 3 39,0 75 0 85,0 78 7,0
Ranked bynet profit
Name Net profitRm
Total assetsRm
Market capRm
Equity fundsRm
TOP ELEVEN CONSTRUCTION
Source: INET BFA
Henry Laas
Arn
old
Pro
nto

Financial Mail Page 46-47 -12/06/15 03:14:20 PM
FINANCIAL MAIL • TOP COMPANIES • 201546 FINANCIAL MAIL • TOP COMPANIES • 2015 47
SECT
ORS SECTORS
✥ GENERAL INDUSTRIALS ✥ ✥ GENERAL INDUSTRIALS ✥
Th e re’s good in someof these stocks
Investors should look onlyat those firms that haverobust business models
A s a sector, general industrials has of latebeen very much a curate’s egg: good,even excellent, in parts, but to be stayedwell clear of in others. Leaving no doubtabout which side of the divide it lies is
KAP Industrial. This mid-cap’s recent blisteringshare price rise left its sector peers in the dust.KAP’s attraction is what investors have come toexpect from its parent Ste i n h of f : the promise ofaggressive growth.
KAP CE Gary Chaplin clearly spells out theg ro u p’s growth ambitions. “We have spent threeyears cleaning up assets and it is now time tochange the focus to growing the business,” hetold the Financial Mail re ce n t ly .
The clean-up resulted inKAP selling three noncoreunits — Brenner Mills, BullBrand and Jordan Footwear —inherited through the R8,9bnreverse listing by Steinhoff ofits Unitrans logistics as well asPG Bison timber and mattresscomponent units into KAP inApril 2012.
The highly cash-generativeKAP now has a lot ofheadroom to take on debt tomake acquisitions. KAP hasalready struck with its firstbig acquisition, mattressmanufacturer Restonic, in adeal closed in January 2015. There are moreacquisitions in the pipeline, promises KAPexecutive deputy chairman Jo Grové.
Well conceived acquisitions can add big value,as small-cap general industrial stalwart Hu d a cohas shown. Hudaco’s acquisition strategy wasborn out of need. Faced by steep declines in thekey target markets for its engineering consu-mables products, mining and manufacturing,Hudaco embarked on a diversification drive in
2010. The strategy has worked wonders, enablingthe 124-year-old Hudaco, under CE GrahamDunford, to do what few companies havemanaged: execute a successful transformation.
Into Hudaco’s value-added distribution foldhave come power tools (Makita), automotiveaftermarket products, security equipment,specialised batteries, and communicationsequipment. Now diversified across sevenoperating sectors, its reliance on engineeringconsumables is falling fast — their contribution in2015 of about 50% of sales was well down from63% in 2011.
KAP and Hudaco are still of a size whereacquisitions can add meaningful earnings value.However, this becomes increasingly difficultwhen a company reaches mega-size. This isshowing in Bidvest, a company that founder CEOand master-acquisitor Brian Joffe has grown froman R8m cash shell in 1988 into a group withR210bn annual revenue spanning five continents.
Disappointing investors, Bidvest’s headlineEPS (Heps) growth rate hasslowed appreciably, coming inat an annual average of 5,8%over the past three rolling12-month periods. Also dis-appointing was the heavy-we i g h t ’s showing in its mostrecent reporting period — thesix months to December 2014.
Affected negatively by itsproblem-ridden acquisition ofa 34,5% stake in SA pharma-ceuticals firm Adcock Ingram,Bi dve s t ’s interim Heps was up5,2% year-on-year. Adjustedfor the negative Adcockimpact, Heps was up a still
modest 8,4%.Bi dve s t ’s showing reflects tough conditions in
SA, which still accounts for 41% of its revenueand just on 55% of trading profit. Given SA’smuted economic prospects, Bidvest’s growthappears set to continue relying heavily on itsforeign operations, dominated by its R100bnannual turnover food distribution subsidiary,Fo o d s e rv i ce .
Operating in 30 countries across Europe, the
Middle East, South Americaand the Pacific region,Foodservice has deliveredsolid growth, upping revenue20,6% and trading profit31,6% in Bidvest’s latestinterim reporting period. Forinvestors, this makesBi dve s t ’s decision in 2014 notto list Foodservice on theLondon Stock Exchange allthe more disappointing. Thevalue-unlock could havebeen considerable.
It is a different situationwith Re m g ro , the diversifiedindustrials sector’s biggestcompany and the JSE’s 20thbiggest by market cap. Listedinvestments Mediclinic, RMIHoldings, FirstRand/RMB,RCL Foods, Distell andGrindrod made up 70% ofRe m g ro’s intrinsic value atthe end of its six months to December 2014. Thiswas up from 54% three years earlier.
Investors have to make a call: invest directly inRe m g ro’s underlying listed investments, or followits management’s ability to make astute businessdecisions, particularly in the unlisted space, andtake advantage of its share price’s discount tointrinsic value, now around 10%. The patientinvestor may be well advised to do the latter.
With Ba rl owo rl d , investors face a conundrumof a different type. The company comes with thecredentials of able management, good operationalcash flow and a not-too-demanding rating.
However, Barloworld has vulnerabilities, mostnotably a high exposure to the mining sectorthrough its Caterpillar equipment operations insub-Saharan Africa (SSA) and in Russia. InBa rl owo rl d’s six months to March 2015 the SSAoperation accounted for 47% of operating profit,and the Russian operation 6%.
Facing headwinds in the mining sector,Barloworld expects revenue movement in SSA torange between a 4,3% fall and a 5,3% rise in itsyear to September 2015. In Russia a 21%-34% fallis expected.
The next biggest contributor is Barloworld’sautomotive retail, leasing and rental division at45% of operating profit. Though the division offersstability, it operates in a tough, mature market inwhich Barloworld expects its revenue to grow by4,5%-8,2% in its year to September 2015.
Barloworld did well to lift its interim Heps by16%. However, it remains a company in whichinvestors must be prepared to accept high shareprice volatility driven heavily by sentiment
towards commodities.Barloworld shareholders
have fared far better thanthose who have backedEq s t ra since its unbundlingby Imperial in May 2008. Asorry tale, Eqstra’s shareprice has lost over two-thirdsof its value since listing. ItsHeps, locked in a sidewaysdrift since 2011, remains 45%below the 2008 level.
Eqstra has been doggedby problems and profitcollapses in divisions thatwere once key: mining andconstruction equipmentdistribution as well ascontract mining. Distributionwas exited and contractmining left to largely winddown, but was still a drainon financial resources. In2012 focus swung to growing
Eq s t ra’s fleet management as well as industrialequipment leasing and rental operations. Both arecapital-hungry pursuits as reflected in Eqstra’svery high 2,4:1 debt-to-equity ratio.
This has proven to be the Achilles heel forEqstra, now starved of bank funding and lockedin survival mode. Eqstra has, as it says, “m ove dfrom a growth strategy to a cash preservation andbalance sheet strengthening strategy”. Eqstra hasalso mooted abandoning its current businessmodel. Little wonder the likes of Coronation AssetManagement and RECM have been big sellers.
Howden Africa, the general equity sector shareto beat for many years, has also come underselling pressure of late. Though Howden is farfrom being financially strapped, the drivers of itsfive-year winning streak — demand from minesand Eskom for its fans and heat exchangerequipment — have stalled.
First to stall was the mining sector, whereHowden CE Thomas Bärwald describes the fall indemand over the past two years as “d ra m a t i c ”.
More recent and far more serious are severefinancial constraints being faced by Eskom,which accounts for 70% of Howden’s revenue.The Eskom picture is bleak, with the utilitypredicting a R225bn revenue shortfall over thenext five years.
Headwinds being faced by general industrialsector companies appear likely to get strongerbefore they abate. It makes it imperative to investin companies with robust business models,particularly those with a penchant forundertaking meaningful, earnings-addinga cq u i s i t i o n s . Stafford Thomas
GENERAL INDUSTRIALS
Source: INET BFA Share prices based to 100
2014 2015J F M A M J J A S O N D J F M MA
125
110
90
105
120
115
100
95
General industrials index
All share index
G ra h a mD u nfo rd
Mar
tin
Rho
des

Financial Mail Page 48-49 -12/06/15 03:14:52 PM
FINANCIAL MAIL • TOP COMPANIES • 201548 FINANCIAL MAIL • TOP COMPANIES • 2015 49
SECT
ORS SECTORS
✥ TRANSPORT ✥✥ TRANSPORT ✥
Businesss t ra te g i e sevo lveWith SA’s economy stunted,
the focus is on boostingprofit growth from outside
m a r kets
I mperial Group has invented an acronym todescribe the environment in which itoperates: Vucca (volatile, uncertain, complex,chaotic, ambiguous). In Imperial’s response tothis environment, the hand of CEO Mark
Lamberti, appointed in March 2014, is clearlya p p a re n t .
In his results presentation for the year to June2014, Lamberti said: “The size and complexity ofImperial demands strategic clarity at two levels:corporate strategy as a group, being moreexpansive and precise as tothe value added and theparenting advantage createdby Imperial Holdings; andbusiness strategy at thedivisional and company level,by determining precisely thebases for competitiveadvantage, clarifying howeach client-facing businesscompetes and wins in itschosen market.”
In terms of capitalallocation, Imperial wants togrow the logistics business bydrawing on strong revenuefrom the motor business. Thishas been thriving in a toughmarket, with 86 passenger car dealerships, and anincrease in the shareholding in Renault SA from49% to 60% for R65m. The car rental business isstrong, with leading brands Europcar (formerlyImperial Car Rental) and Tempest. In the motortrade, Imperial is linked to 14 locally based originalequipment manufacturers, and it has an extensive
dealer footprint owning 85% of propertieso cc u p i e d .
At the interim stage of the 2015 financial year,Imperial reported that its portfolio of businesses“performed to expectation in deterioratingtrading conditions. Revenue growth of 9% toR56bn was attributable mainly to acquisitions.Operating profit decreased 9% to R2,9bn, duemainly to depressed margins caused by thedelayed impact of a weakening rand”.
The profitability of the logistics internationaldivision “was depressed by low and decliningactivity levels in most eurozone logistics sectors,and the financial services division’s results weredepressed by weaker equity markets”. Thesedisappointments were offset by “an excellentp e r fo r m a n ce” from the logistics division servingthe rest of Africa, and by the vehicle retail, rentaland after-market parts division. Headlineearnings per share were down 9%.
I m p e r i a l’s comment on the environmentmight have been provided by just about any largeSA corporate linked to the local economy:“Consumer and business confidence in SAremained fragile exacerbated by electricityshortages. Continually deteriorating businessconditions were generally more challenging thanin the comparable period.”
G r i n d ro d is a company still not fullyunderstood by many investors. Former chairmanIvan Clark used to say that being headquarteredin Durban rather than Johannesburg and CapeTown seemed to keep the company under theradar, when in fact it is almost alone on the JSE
in offering exposure to globalshipping growth. Thatproposition has been enhancedby the deliberate investment inthe logistics chain beyondshipping lanes and ports.
Grindrod reported an 11%drop in revenue for the yearended December, as depressedcommodity market pricesdelayed recovery in dry bulkshipping markets andindustrial action in SA hurt itsbusinesses. “This has led tospeculation that the companymay separately list its shippingb u s i n e s s ,” reported Bu s i n e s sDay , “most likely in Singapore,
which is a benchmark for the global maritimei n d u s t r y .” Including joint ventures, revenueincreased just 2% to R32,7bn. CEO Alan Oliviersays the group has seen some of the lowestshipping rates “in a long time”. Headline earningsper share were down 9%, but this was caused bythe issue of new shares, resulting in the weighted
average number of issuedshares increasing by 15%. Theamount raised was R2,4bn.
Ron Klipin, portfoliomanager at Cratos Capital,says the most important factorin Grindrod’s results is thepossibility of it splitting off itsshipping division. “They areopen for a separate listing inshipping provided they have asubstantial stake,” he says.“Listing in Singapore wouldunlock a lot of value. It mightbe a good time to slim theentity down and keep a largestake in shipping.”
Grindrod has been a bigspender on infrastructure forsome time. Growing its network of port and railoperations allows the group to diversify awayfrom international shipping, which can beextremely cyclical. With many important rail andport facilities spread through Africa, whereinfrastructure development is generally poor ornonexistent, Grindrod often has to invest in andbuild, or improve, the facilities it needs. Thismakes the whole transport process — wh i c hoften starts in coal or iron ore mines and endswith the raw materials on Grindrod vessels beingexported overseas — more efficient.
Capital spending is focused on raildevelopment, with the company stepping inwhere large state-owned companies such asTransnet have failed to be sufficiently agile incompeting with road and in increasingport-to-land transfer efficiencies. Furtherexpansion at the Maputo and Richards Bay coalterminals has been mentioned.
The Financial Mail reported in February thatlogistics specialist O n eL o g i x has started aconcerted drive into selected African markets, aninitiative that could markedly boost theco m p a ny ’s overall trading margins.
CEO Ian Lourens says margins in its recentlylaunched vehicle transport operations in Tanzaniaand Kenya are likely to be “north of 18%”. Thiscompares very favourably with the9%-12% margin achieved in the coreSA operations and the 12%-18% earnedin neighbouring countries.
In Tanzania, OneLogix will bemoving mainly second-hand Japanesevehicles from Dar-es-Salaam to theinterior. “We have pushed the buttonon this operation. We do the clearingand storage of these vehicles as well,and are targeting 5% of the market tomake it profitable. We’ve already been
operating for a few weeks,and the margins are nice,” hes ay s .
Lourens says OneLogix haspartnered a Swissmultinational logistics playerin Kenya. “We ’ll beoperational in May or June,and will be running thes h ow.”
He says there is apossibility of competition forOneLogix in these markets,but believes the company hasfirst-mover advantage. “Th e reare only a few small vehiclecarriers, and most of themarket is self-drive service.We have newer equipment
plus the expertise.” He says a foothold in Kenyaand Tanzania can open up roads into Rwanda,South Sudan and Ethiopia.
OneLogix reinforced its African presence withits recent acquisition of Jackson & Buffelshoek.This specialist logistics group moves agriculturalproducts into various African markets. Lourenssays: “Currently 15%-20% of profits are earnedoutside SA. We want to grow this to 30%.”
For the fourth major industrial transportationgroup in this sector, Super Group, reducingreliance on SA to drive profit growth is also apriority. Boosting its non-SA pretax profit abovethe 50% mark, the Super Group snapped up AllenFord, the number two independent Ford dealernetwork in the UK, in December for R614m. Eightproperties related to the deal could add anotherR329m to the cost.
“Allen Ford has 13 franchised Ford motordealerships across Ford’s UK heartland marketcounties and two Kia dealerships,” says SuperGroup CEO Peter Mountford. In a full year, AllenFord will contribute 14% of total group pretaxprofit, he says. That will take Super Group’snon-SA pretax profits from about 47% of the totalto just on 60%, with the lion’s share (40%) comingfrom 53%-owned listed Australian fleetmanagement company SG Fleet. David Williams
TRANSPORT
Source: INET BFA Share prices based to 100
2014 2015J F M A M J J A S O N D J F M MA
120
105
75
100
95
115
110
90
85
80
Automobiles & parts index
Industrial transportationindex
All share index
1 Imperial Holdings 3 2 1 3,0 51 1 4 3,0 40 089 736 ,0 17 1 41 ,02 Tre n co r 1 1 61 ,0 44 30 4,0 11 527 1 27,0 7 95 0,03 Super Group 78 7,0 9 7 12,0 10 957 8 59,0 4 1 30,04 Value Group 1 41 ,0 1 4 63,0 769 6 69,0 85 6 ,05 OneLogix Group 7 9,0 8 4 6 ,0 1 404 3 2 9,0 41 6 ,0 0
Ranked bynet profit
Name Net profitRm
Total assetsRm
Market capRm
Equity fundsRm
TOP FIVE TRANSPORT
Source: INET BFA
MarkLamber ti
Mar
tin
Rho
des

Financial Mail Page 50-51 -12/06/15 03:15:17 PM
FINANCIAL MAIL • TOP COMPANIES • 201550 FINANCIAL MAIL • TOP COMPANIES • 2015 51
SECT
ORS SECTORS
S t r u c t u re dplanswork best
Talk of major corporateaction could change the
look of the sector
S A BM i l l e r, the world’s second-biggestbrewer by volume, covers Africa well, incontrast to its larger competitor AB InBev,which has no African exposure. Th ebrewer is adept at moving into new
markets, taking existing brands, tidying them upand marketing them with skill. Its periods of soft-ness on the market tend to mirror emergingmarket sell-offs in general. But this is partlycounterbalanced by its MillerCoors operations inthe US, the beer world’s largest profit pool.
C h i n a’s alcohol consump-tion is relatively low in worldterms so there is still oppor-tunity in this region. However,further consolidation of itsmany breweries will need tooccur before its real profitpotential is fully exploited. Thesame applies in India. SAB-Miller is well positioned inboth of these m a rke t s .
Chatter on corporate actionregarding number one andnumber two continues. Regu-latory approval would berequired only in the US and
China. In the rest of the world there are few, ifany, regulatory hurdles to surmount.
AB InBev wants to absorb SABMiller and seemsto have the balance sheet capability to do so.Rumours abounded in 2014 of a large capital-raising exercise having taken place in Europe, withthe aim being to buy out SABMiller minorities, butnothing materialised.
Towards end-2014, SABMiller made overturesto the board of Heineken, the world’s third-largestbrewer, about a possible amalga mation. Heinekenseemed to rebuff the approach and the suggestionwas that SABMiller had miscalculated by showingits hand to Heineken. But further investigationsuggested that the Heineken board had enter -tained the idea before the controlling shareholder(Charlene de Carvalho, Freddie Heineken’sdaughter) scotched the deal. With a fortuneestimated at around US$12bn, she really doesn’tneed the money and there also appears to be astrong sentimental attachment to the family firm.
The smart money is now on AB InBev makinga bid for SABMiller, which would create a globalconsumer goods giant, with hu ge buying power.
Tiger Brands, a large manufacturer andmarketer of FMCG products in Southern Africa,has been criticised for its Dangote acquisition inNigeria. That misstep resulted in hugewrite-downs, and some analysts have criticisedmanagement for not keeping enough of the localson board, thus imposing the SA way of doingthings on this foreign operation. However, the
group strongly believes thatNigeria, and the rest of Africa,is a market in which apresence is essential.
Over the past decade thegroup has gone into WestAfrican countries such asCameroon and acquiredbusinesses that have thenbeen rejigged, rather than justestablishing supply lines as itssmaller competitors havedone. As it expands, itswell-known SA brands faceglobal competition. Can AllGold tomato sauce hold itsown against Heinz tomato
ketchup, or Koo baked beans pit itselfsuccessfully against Campbell labels?
D i s te l l , which owns many premiumliquor brands, has always been plagued bypoor liquidity, with a shareholder spread ofnot much more than 12%. With 29% ownedeach by SABMiller and the Remgro/Capevinconsortium, there is talk that corporateaction in the form of SABMiller selling itsholding to the consortium is a possibility. Bu t
LEADING QUICK-SERVICE restaurant groupFamous Brands has been the darling of thissector, from an investment perspective, over thelong and medium term. And it has grownorganically and through acquisition.
Its downside risks are that this space isbecoming a little crowded. Also, its plethora ofsmaller holdings such as Wakaberry and Tasha’scould divert management’s attention from thelarger core operations.
Spur Corp is well positioned in the quick-service restaurant space — benefiting fromcustomers who downgrade from more formaldining and those who upgrade from takeawayfoods. Most Spurs have liquor licences, socustomers stay a little longer and this helpsincrease spend. Cash conversion is excellent andthe dividend payout ratio is appealing.
City Lodge is recovering well from a period ofdepressed occupancies. Its occupancy figures sitat around 68% and this is reflected in the shareprice. It’s unique in always owning its properties,and there are also no gaming interests in thisgroup. It exports its model into the rest of
Af r i ca . But this is a conservative and solidcompany. The group recently bought out itspartners in Kenya in a move that underlines itsconfidence in that country’s potential. As with allventures in Africa, land prices and availabilitypresent ongoing challenges to developers.
The Tsogo Sun Group earns most of itsrevenues from the gambling side of itsoperations. It has expanding interests in the restof Africa and SA properties are being revamped.A recent attempt to acquire the Grand Paradeinterests in GrandWest in the Western Cape wasblocked by the competition authorities. AndSA B M i l l e r has exited its noncore holding in thisgaming and hotel group, after at least a decadeof speculation as to when this would happen.
There is pressure from government revenuesas civil servant travel budgets have beentightened, leading to an edict that allows for aR1 300 travel budget per night for staff. This hasto include accommodation, breakfast, dinnerand parking. And it’s suitable for Tsogo’slower-end establishments, as it is for CityLo d g e’s Road Lodge and Town Lodge chains.
Rather disappointingly, the weak rand hasnot, as yet, made an appreciable difference tothe number of foreign travellers staying inTso g o’s more upmarket hotels. And recentxenophobic violence, among other issues, won’thelp to attract foreign visitors. Staff writer
Battles on many frontsto contend with
TRAVEL & LEISURE
branded products, instead of being built oncommodity products. The group was previouslyinefficient, run with a co-op mentality, but itsstrategy seems to be coming right. The shareprice has responded recently to the overhaul ofthe group and the taint of the bread price-fixingscandal is fading. But will it follow its peers andstart setting up operations in the rest of Africa?
RCL Foods merged with Foodcorp in 2013 andshortly thereafter acquired Remgro’s TSB Sugar.Though seen as a bold move at the time, it madeperfect sense to derisk the notoriously volatilechicken business by merging it with the far morestable food-manufacturing businesses of Food-corp. The group has been plagued by tariffproblems on the chicken side and global sugarprices are under pressure. As it’s controlled byRemgro, analysts hope this shareholder will putthe group in order and bed down acquisitions.
Rhodes Food Group — a food production andprocessing company that has a major relationshipwith Wo o lwo r t h s — has no dividend yield as yet,as it recently listed. It has made small acqui-sitions in juice and packaging. Earnings from theBull Brand acquisition are starting to comethrough nicely. Staff writer
SABMiller tends to defend its holding in Distell onthe grounds that Distell’s wines and spirits are nottoo different to those of SABMiller’s, and thedynamics that drive alcoholic beverageconsumption are common to both companies.
AV I is, perhaps, an incongruous inclusion inthe food and beverage sector and should beregarded as more of a brand company. It has anextensive and well diversified branded portfolioof beverages, snacks, convenience foods,cosmetics, shoes & accessories and apparel. Theshare price has flatlined over 2012-2014 onconcerns that luxury brand sales could run out ofsteam, with the stock being geared to theconsumer cycle. Still, the group’s luxury brandshave managed to buck the trend co nv i n c i n g ly .
Tongaat Hulett is still about the highlyprofitable Moreland property development side.Some investors hold this stock just for theseproperty interests. For sugar, Mozambique is anexciting part of this division, as is Zimbabwe, butthe latter is facing some indigenisation issues.
Pioneer Foods’ Bokomo brand bravely takeson Kellogg’s products, and its Sasko and Ceresbrands are strong. With the unbundling ofQuantum Foods, the group is now focused on
FOOD & BEVERAGES
Source: INET BFA Share prices based to 100
2014 2015J F M A M J J A S O N D J F M MA
145,0
125,0
92,5
120,0
115,0
140,0
130,0
135,0
110,0
105,0
100,0
Beverages index
Food producers index
All share index
✥ FOOD & BEVERAGES ✥ ✥ FOOD & BEVERAGES ✥
1 SABMiller Plc 40 0 93,0 293 1 77,0 1 065 559 9 85,0 311 48 0,02 Tiger Brands 2 87 9,0 22 51 4,0 58 656 2 1 6 ,0 14 5 8 5,03 Distell Group 1 41 4,0 13 9 87,0 33 965 728 ,0 8 6 83,04 AV I 1 2 93,0 5 9 10,0 28 620 1 4 6 ,0 3 8 73,05 Tongaat Hulett 1 26 8 ,0 23 5 6 8 ,0 18 172 632 ,0 12 4 6 4,0
Ranked bynet profit
Name Net profitRm
Total assetsRm
Market capRm
Equity fundsRm
TOP FIVE FOOD & BEVERAGES
Source: INET BFA

Financial Mail Page 52-53 -12/06/15 03:15:43 PM
FINANCIAL MAIL • TOP COMPANIES • 201552 FINANCIAL MAIL • TOP COMPANIES • 2015 53
SECT
ORS SECTORS
✥ HOUSEHOLD GOODS ✥ ✥ HEALTH & PHARMACEUTICALS ✥
Exits areshrinkingthe sectorBut firms continue to forgedeals that will expand their
exposure into other markets
J SE-listed drug maker Aspen Pharmacarerecently entered into an agreement to sellpart of its SA business for a cash consi-deration of R1,6bn to Litha Pharma, accordingto a regulatory announcement released in
May. Aspen has also agreed to sell a portfolio ofproducts to Indian firm Stride Arcolab.
Litha Pharma is the pharmaceutical divisionof Litha Healthcare, which delisted from the JSEearlier this year. This was after the acquisition ofits holding company, Paladin Labs, by US multi-national Endo, which is listed on the Nasdaq.L i t h a’s exit followed the decision by its Canadianparent company Paladin Labs to buy outminority shareholders at R2,75/share.
The smallest of the JSE’s health providers,Litha listed on the main board through thereverse-listing of Myriad Medical Holdings inMay 2010, after raising R100m from a rights issueat 80c/share. It has threedivisions: pharmace u t i c a l s ,medical devices and vaccines.
Considering the price atwhich it was delisted, inves to rswho had been with the groupfor the five years to the Feb-ruary delisting would have littleto complain about. Says chieffinancial officer Martin Kaha-n ov i t z : “We are happy with ourperformance. We think we’vedone well for shareholders interms of the return.”
Though industry players feelthat Litha’s prospects arebrighter with the backing of abigger holding company, itsdeparture from the JSE is a loss
to SA investors as the pharmaceutical sector losessubstance. The group delisted just 18 months afterCipla Medpro exited from the exchange when itwas bought by its long-term partner Cipla India.Adcock Ingram is likely to follow the same routewhen the Bidvest buyout of the pharmace u t i c a lcompany is finalised.
The Aspen unit up for sale has a productportfolio comprising injectables and establishedbrands and the company says this portfolio hasproduced revenue of R362m and a directcontribution to profit before tax of R136m for theyear to June 2014.
Aspen says the transactions form part of itsstrategic intent to focus attention in areas wheremost value can be added and to lessencomplexity. But it would not discuss the details ofthe transactions beyond what it published onSens, nor would it disclose the brands it wasselling. The transaction was conditional upon theapproval of competition authorities.
After the reporting cut-off for the 12 months toDecember, the group entered into an agreementwith Swiss-listed Novartis AG for the acquisitionof Mono-Embolex, an injectable anticoagulant, fora consideration of US$142,3m. The group says theproduct presents an excellent strategic fit withrecent acquisitions in this therapeutic area, andwill be positioned as a simple-to-use once-dailyprophylaxis treatment supporting Aspen’s othercurrent anticoagulant offerings. “As the product isonly commercialised in Germany, Switzerlandand Austria, it presents Aspen with an oppor-tunity to launch it in other countries,” the firmsays. The transaction is subject to the approval ofthe German competition authorities.
Aspen also acquired a 50% interest in NewZealand New Milks (NZNM), an Auckland-basedproducer of infant milk. The operation is one of alimited number of firms that hold the required
e n d o rs e ments from theChinese regulatory authoritiesto produce infant milk formulafor this key territory. Since the2008 baby milk scandal —when thousands of babiessuffered kidney problems dueto contaminated milk —Chinese authorities imposedstringent regulations and nowprefer reputable internationalsuppliers to local producers.
“The investment in NZNMrepresents another steptowards Aspen’s aspirations toenter the Chinese infant milkformula sector, valued at about$ 1 5 b n ,” Aspen said when thedeal was announced last year.
HEALTH
Source: INET BFA Share prices based to 100
2014 2015J F M A M J J A S O N D J F M MA
150
85
120
110
140
130
100
90
Health care equipment& services index
Pharmaceutical &biotechnology index
All share index
Te n a c i t ythe qualityto pursue
Stronger margins, globalpresence and diversification
keep the sector steady
Though global cigarette consumption is decliningat around 1%/annum, BAT’s volumes, at least indeveloping economies, are defying this trend andare increasing. It is viewed as an emergingmarket growth story.
Some analysts are cautious of this stock in thelight of increased smoking regulation, taking theview that eventually tighter and tighter govern-ment regulation will overwhelm tobacco firms. Inreality, BAT and the other tobacco companies haveproven to be adaptable to the effects of govern-ment regulations. The stock serves SA investorsespecially well in a bearish rand environment.
As an integrated retailer that manufactures,sources and retails furniture and household goodsin Europe, Africa and Australasia, Steinhoff is aheavyweight in the personal and household goodssector and its share price performance has beenstrong since mid-2013. Most of its profits comefrom Europe. And though this economy is stillsluggish, group store refurbishments should payoff when the recovery eventually materialises.The group is led by risk-taking founder MarkusJooste, a master in extracting efficiencies andreducing the tax rate, and his team is certainly notafraid of adding debt to the balance sheet.
Not one for the faint-hearted, this great randhedge recently acquired Pepkor in the biggestdeal in SA corporate history at R64bn, giving itexposure to emerging market consumers. As thegroup has expanded and diversified, its cyclicalityhas reduced. Famous for its vertical integrationstrategy, the group is working on a Frankfurt
listing, which should lower itsborrowing costs, and make it anotable consumer goodscomponent of the DAX 30.
Listed since 1998, Steinhoffhas an outstanding earningstrack record, but it is onlyre ce n t ly that SA investors havebeen prepared to impart adecent rating to the group. Itwill be instructive to see howthe group stands up to investorscrutiny in the wake of theFrankfurt listing.
Se a rd e l and Nu-Wo rl d a resmall players. As an importerand distributor of electrical
appliances, Nu-World sources manyproducts from Asia, and has some decentbrands. But a deteriorating rand hurts it asan importer. Being family-controlled, theshare is choppy and tightly held.
Seardel has transformed from a langui-shing clothing manufacturer into a diver-sified media group owned by Ho s ke nConsolidated Investments. Staff writer
1 Compagnie Fin Richemont 29 5 23,0 206 29 5,0 510 046 20 0,0 153 0 89,02 Steinhoff International Hldgs 9 4 53,0 134 41 1 ,0 262 286 73 1 ,0 87 8 0 9,03 Nu-World Holdings 70, 0 9 75 ,0 588 8 0 8 ,0 72 3,04 Seardel Investment Co r p 1 8 ,0 4 4 0 0,0 925 24 7,0 3 1 1 8 ,0
Ranked bynet profit
Name Net profitRm
Total assetsRm
Market capRm
Equity fundsRm
TOP FOUR PERSONAL & HOUSEHOLD
Source: INET BFA
R ichemont is linked to the Rupert familyand holds some of the world’s super-premium luxury goods brands. It hasstrong pricing power and its commodityinput costs, such as for gold, are
declining. It has done well in expanding into Asia.And the group is highly cash-generative.
Over a five-year period, the share price hasperformed well, but recently it has languished.The price took a knock in mid-January 2015when the Swiss National Bank decided to end thepeg of the Swiss franc to the euro. It also sufferedin late April due to a technicalloss in derivatives trading,which resulted in a 36%decline in income.
At end-March, Richemontannounced that it had mergedits Net-a-Porter business withYoox and would have a 50%stake in the combined entity.
BAT products are in almostevery country and theJSE-listed share has beensteadily increasing itsdividend yield and improvingmargins, increasing its priceseven in declining markets.
STEINHOFF
Source: INET BFA Share prices based to 100
2014 2015
J F M A M J J A S O N D J F M MA
175,0
97,5
160,0
150,0
140,0
130,0
170,0
120,0
110,0
Steinhoff
All share index

Financial Mail Page 54-55 -12/06/15 03:16:01 PM
FINANCIAL MAIL • TOP COMPANIES • 201554 FINANCIAL MAIL • TOP COMPANIES • 2015 55
SECT
ORS SECTORS
✥ HEALTH & PHARMACEUTICALS ✥ ✥ RETAIL ✥
36One Asset Management analyst Jean PierreVerster says the deal is strategic in that it opens upmany possibilities for Aspen in China. “Infantformula is a lucrative market. It’s not considered tobe core by many pharmaceutical companiesbecause it’s a fast-moving consumer goodsproduct. But if you already have distributionchannels to retailers, you can easily load infantformula in the same truck.”
Also late last year, TesoRx Pharma LLC, aspeciality pharmaceutical, announced that it hadlicensed select international rights to TSX-002 —the first unmodified oral testosterone replace-ment therapy — to Aspen. As part of this agree-ment, Aspen will invest a total of $15m in TesoRx.
Aspen is a supplier of branded and genericpharmaceuticals in more than 150 countries aswell as consumer and nutritional products inselected territories. The company has gone fromstrength to strength in its 17 years of existence.
In 1998, Aspen Pharmacare founders CEOStephen Saad and deputy CEO Gus Attridge tooktheir ambitions public through the reverse take-over of JSE-listed Medhold by their one-year-oldbusiness. A year later they pulled off a R2,4bnhostile takeover of the well resourced but poorlymanaged SA Druggists. And the rest is history.Now Aspen is represented in SA, Australia, HongKong, Malaysia, Philippines, Taiwan, Japan,Kenya, Nigeria, Tanzania, Uganda, Ireland, UnitedArab Emirates, France, Germany, the Netherlands,Mauritius, Brazil, Mexico, Venezuela and the US.
Acquisitions in 2013 have further extended theg ro u p’s emerging market presence to Russia andother former Soviet republics, as well as toCentral and Eastern Europe.
In the six months to December the groupdelivered a solid set of results. Revenue rose 51%to R18bn, while gross profit was 52% higher atR8,5bn, supporting a higher gross margin at 47%(2013: 46,6%). Normalised headline earnings anddiluted normalised headline earnings grew 22%to R2,6bn, benefiting from a slightly lowereffective tax rate. And management says thisperformance remains exposed to a stronger USdollar against their primary trading currencies,
the euro, Australian dollar and the rand.The group has, through acquisitions, success-
fully internalised the supply chain for injectableanticoagulants. Management said at the publi-cation of the results in March that it will focus onprofit-enhancing opportunities, including theeffective integration of this supply chain andextracting value from economies of scale.
“Emphasis will be placed on enhancingprocurement and production processes for thekey anticoagulant portfolio,” the company said,adding that the addition of Mono-Embolex to theproduct range in Germany would benefit theportfolio even more. Measures have been taken tosecure additional production of the activepharmaceutical ingredient for the blood thinnerOrgaran, as management is optimistic about itsgrowth once supply constraints have been lifted.
Aspen snapped up a selection of drugs and amanufacturing plant from MSD for about $1bn in2013. Under the deal, Aspen bought itself MSD’sAPI manufacturing business in the Netherlandsand its satellite facility and sales office in the US.The group also announced with its results thatprocesses to reduce the cost of nutritionalproducts were under way.
IFR analysts say the global business is at riskof political turmoil in Venezuela and Russia —countries that management has highlighted asniche growth markets. Currency devaluation hasreduced the value of the Russian business.
But Aspen management believes that the AsiaPacific business will report subdued results dueto the exit from certain businesses, products andlicences. “Furthermore, the Australian businesswill be affected by a weaker currency and afurther price cut in the second half. Aspen Japan,which is expected to begin trading in July 2015,has been marked as a material step towardsestablishing the brand in the country that isranked second by pharmaceutical sales,” it says.
In SA, Aspen is confident that it can sustainthe strong momentum achieved in the privatesector. Government approved a 7,5% increase inthe single exit price, which is expected to relievemargin pressures driven by raw material inputs
as the rand d e p re c i a te s .“Aspen is a good firm with an impressive
track record,” says IFR. “In addition, thegroup has a growing presence in internationalmarkets, which is continuously beingbolstered by additional acquisitions.”
Though pickings are slim for investors inS A’s pharmaceutical sector, Aspen hasrewarded investors well over the years. Thegroup will furthermore implement plans toachieve greater market penetration withinthe global brands portfolio and improvedproduction efficiencies. Ruan Jooste
Locala p p e t i tel i m i te d
Valuations make foreigninvestors more likely tocontinue directing this
sector ’s fate
F acing the challenges of a stallingeconomy and consumers under pressure,the retail sector should by all accounts bebest avoided. But far from it — anddefying the odds — many retailers have
continued to shine.The sector has not been short of
surprises, producing new challengersfor the position of sector leader. Notleast of these challengers is the Sp a rG ro u p , which has swapped its dullbut reliable image for one of a firmwith dynamic growth potential. Theimage changer for Spar Group hasbeen its acquisition of an 80% stakein Irish Spar brand-holder BWG inAugust 2014 for €55m. BWG’sbusiness model parallels Spar Group’sin SA: centralised, wholesale distri-bution to owner-run Spar-affiliatedstores. The Irish group brought withit 850 Spar and Mace branded storesin Ireland and 250 Spar stores inSouth West England, a region of eight counties.
Acquired at a bargain 4,8 p:e, BWG adds€1,2bn (30%) to Spar Group’s annual revenue andin its first full year of consolidation will, says SparGroup CE Graham O’Connor, boost group head-line EPS (Heps) by 15%-18%. This will be just thestart, says O’Connor, who predicts that BWG willbe accretive to Spar Group’s earnings over thenext five to 10 years. Adding momentum, BWGhas embarked on an internally funded €100m,five-year expansion drive. It comes at a timewhen Ireland has emerged as the EuropeanUn i o n’s fastest-growing economy.
In the tough SA market, Spar is also more thanholding its own, despite minimal expansion ofthe Spar store base. The most recent figuresreleased by Spar reveal sales volumes across thegroup (excluding BWG) growing at 2,8% year-on-year, well ahead of food retail sector volumegrowth of under 2%. Its dynamic growthpotential has caused its rating to soar to a recordhigh and its share price performance trouncedthose of its food sector rivals.
A notable underperformer has been sectormarket-share leader Sh o p r i te , which has had itsshare price meander largely sideways since 2013. Itis a far cry from its average annual share price riseof more than 40% over the previous decade.However, Shoprite is far from being relegated tothe ex-growth ranks. A period of share priceunderperformance was inevitable after a blisteringrun, which elevated its rating to what proved to bean unsustainable 34 p:e in December 2012.
From a business performance perspective,Shoprite continues to excel and gain market sharein SA. Supermarket sales in SA in the six months toDecember 2014 increased by 12% year-on-year.Sales volume adjusted for internal food inflationwas up 6,8%. It also continues to build on itsfirst-mover status in Africa. African operations,which account for 19% of group sales, have been
described by CE Whitey Basson as“our future growth driver”.
Leaving no doubt about itsaggressive expansion ambitions,Shoprite will in its year to June 2015have pumped R1,5bn into Africanexpansion, primarily in Angola andNigeria. Its more than doubleplanned spending of R697m in SAwill lead to the opening of 30 super-markets, taking the total in 15African countries to 195.
The food retail sector’s onceundisputed top company Pick n Payremains the wild card. In a parlousstate just two years ago, Pick n Payhas under Richard Brasher, its CEsince March 2013, been placed firmly
on the road to recovery. Brasher’s strategy isdivided into three phases. The first was to restorestability, a task he has declared “s u b s t a n t i a l lya c h i eve d”. Now at its start is what he terms the“trajectory phase” aimed at accelerating there t a i l e r ’s growth. Though it’s still early days, thefirst notable sign of acceleration was the retailer’sresults in the 52 weeks to March 1 2015. Thiscame in a key indicator, trading margin, whichlifted to 2,14% in the second half of the reportingperiod from 1,2% in the first.
Pick n Pay needs to generate far stronger salesgrowth, an objective Brasher says the recently
1 Aspen Pharmacare Holdings 5 3 1 3,0 36 30 8 ,0 175 237 838 ,0 28 55 0,02 Mediclinic International 3 6 47,0 60 9 89,0 105 882 1 1 4,0 30 8 55,03 N etca re 2 278 ,0 23 70 8 ,0 61 680 6 29,0 10 593 ,04 Life Healthcare Group Hldgs 1 8 85,0 9 238 ,0 44 095 89 4 ,0 4 1 6 8 ,05 Afrocentric Investment Corp 2 24 ,0 872 ,0 2 947 4 87,0 94 4,06 Ascendis Health 1 51 ,0 1 25 5,0 4 075 942 ,0 1 23 0,07 Adcock Ingram Holdings -2 1 4,0 4 5 62 ,0 9 138 55 0,0 2 752 ,0
Ranked bynet profit
Name Net profitRm
Total assetsRm
Market capRm
Equity fundsRm
TOP SEVEN HEALTH CARE
Source: INET BFA
Graham O’Co n n o r
Jack
ie C
laus
en

Financial Mail Page 56-57 -12/06/15 03:16:27 PM
FINANCIAL MAIL • TOP COMPANIES • 201556 FINANCIAL MAIL • TOP COMPANIES • 2015 57
SECT
ORS SECTORS
✥ RETAIL ✥ ✥ RETAIL ✥
finalised store operating model andrising centralised distributionefficiency position it to achieve.Backing this objective, it will ploughR2bn into capex in the currentfinancial year and R3bn in the next.
Pick n Pay has re-emerged as acompany worthy of serious invest-ment consideration.
Still entrenched as one of SA’soutstanding retailers is Wo o lwo r t h s .But it is now a changed company,following its acquisition in August2014 of then struggling Australianapparel retailer David Jones (DJ) for more thanR22bn. DJ adds about R12bn (30%) to Woolworths’annual sales and together with its Country Roadapparel subsidiary takes the Australian contri-bution to group sales to almost 40%.
Woolworths paid a hefty 23,8 p:e for DJ in adeal financed by R10bn in cash, A$600m newdebt and a R10bn rights issue. The overall effectindicates a consensus forecast by 11 analystspolled by INET BFA who say this will limitWo o lwo r t h s’ Heps growth in its year to June 2015to 10%, down sharply on the 27,4%/year averagein the previous five financial years.
Woolworths CE Ian Moir’s strategy is to extractvalue from DJ by upping its margins. There ishuge scope, with DJ’s 3,3% operating margin at afraction of Woolworths SA apparel division’s17,6%. Based on Moir’s record, the strategy’sexecution risk is low.
DJ serves another strategic role: increasingscale in a global apparel sector where, to competeeffectively with apparel giants such as Zara andH&M, Moir argues scale is essential. DJ does thatfor Woolworths, taking its apparel sales to morethan US$2,8bn and positioning it to become thedominant southern hemisphere apparel retailer.
Another apparel retailer that has been makinga big impression is The Foschini Group (T FG ) .Enthusiastic investors have boosted TFG’s share
price into record high territory and itsp:e rating to its highest level in 17y e a rs .
TFG has been doing the right thingsto attract investor interest, starting in2014 with the sale of its 55% stake inRCS, its joint personal loan and private-label credit card venture with StandardBank. Though a rock-solid business,RCS was tainted by fallout from theAfrican Bank and JD Group’s unsecuredlending debacles. Adding to its attrac-tion, TFG has also worked wonders inreducing its reliance on credit sales by
increasing cash sales to about 44% of total sales in2014 compared with 37% three years earlier. Cashsales could soon approach 50%, if there is norecovery in the credit cycle, according to TFG CEDoug Murray.
The sale of RCS also gave TFG more financialflexibility, bringing in R1,45bn in cash and freeingT FG’s balance sheet of R3,3bn in RCS-relatedexternal funding.
TFG has put its stronger position to good use,snapping up an 85% stake in UK-based upmarketwo m e n’s fashion retailer Phase Eight in a £140mcash deal. Phase Eight came with a record ofgrowing sales by 18,9%/year over the previousfive years and profit before interest, tax, depre-ciation and amortisation by 27,5%/year.
“Phase Eight is a perfect fit,” noted TFGfinancial director Ronnie Stein at the time of thedeal. Adding R2,6bn to TFG’s annual retail sales ofmore than R14bn, Phase Eight has the makings ofa game changer for TFG by providing globalexposure. In the UK and Ireland Phase Eightoperates 107 stores and 203 outlets in leadingdepartment stores. A further eight countries areto be added to the line-up.
Though TFG has excelled, the once darling ofthe fashion retail sector, Tr uwo r t h s , has faltered.Tr uwo r t h s’ efforts to grow cash sales have so farfailed. In the 26 weeks to December 28, its c re d i t
sales lifted by only 5,4% and cash sales by aneven lower 4,7%. This left cash sales at 29%of total sales, a level little changed for manyyears. Many analysts are also expressingconcern about Truworths’ focus on the uppersegment of the fashion market, which is themost vulnerable to the growing number offoreign fashion retailers entering SA.
By contrast, analysts praise TFG forpositioning itself to have far lower exposureto foreign retailer encroachment. Not leastof TFG’s strengths is diversification across 18brands and most consumer income groups.
Change could be in store for Truworths.Potentially heralding it is the appointmentof Frenchman Jean-Christophe Garbino to
succeed Michael Mark, who has stepped downafter 23 years as the retailer’s CE. Garbino is theformer CE of French fashion retailer Kiabi. Acash-only discounter with stores located outsidemajor cities, Kiabi is as different from Truworthsas it could be.
Garbino could just be what Truworths needs,says Sasfin Securities analyst Alec Abraham, whosees a strong possibility that the new CE willaggressively expand Truworths’ m i d-i n co m e -focused value fashion chain Identity, whichgenerates only 15% of group sales. The marketwill be watching Garbino’s progress with i n te re s t .But this introduces an element of uncertainty.
In contrast, Mr Price has had its rating boostedto dizzy heights. The attraction is simple. In thecurrent environment its value-fashion, primarilycash-sales model, provides resilience. Addingattraction is its proven ability to enhance marginsthrough initiatives such as retail spaceoptimisation. Mr Price also comes with a growthrecord second to none, itsHeps having grown by22%/year on average over thepast 10 and 20 years. Aconsensus forecast by analystspolled by INET BFA indicates asimilar growth pace over thetwo years to March 2017.
Certainty has also workedstrongly in Clicks Group’sfavour, which in 2015 has alsohad its p:e boosted to highsthat rank it as one of the mosthighly rated retail shares.Attracting investors, of whichabout 61% are offshore, is itscash-only, in-store pharmacy,health-care and beauty drug store model, whichhas generated earnings, dividend and powerfulcash flow growth even in harsh consumere nv i ro n m e n t s .
Unlike many SA retailers, Clicks Group hasscope to increase its store footprint. Leading theway is the core Clicks stores chain, which is set toincrease stores to 600, from 485, within five toseven years. However, it is not immune to theh e a dwinds of the current tough consumer market.There has been a sharp fall in its Heps growth rate,from an average of 27%/year between 2005 and2010 to 11%/year between 2010 and 2015.
In all respects Clicks Group is a well managed,blue-chip firm. But its high rating has becomehard to justify, suggesting that its share priceperformance could be muted for some time.
A stronger share price is what investors in SA’ssecond-largest retailer by sales, Ma s s mart, havebeen hoping for since 2011, when Walmartfinalised its acquisition of a 53% stake. But they
have faced profit perfo r mance disappointment,with Massmart’s Heps in its year to December 2014still wallowing 22% below its peak in 2008. Thebiggest drag on its p e r fo r mance has been its Gameunit housed in its Massdiscounters division.Though Massdiscounters’ sales grew from R11,2bnin 2009 to R17,96bn in 2014, its trading profit beforeinterest slumped by R500m to R180,7m.
In 2009 Massmart transformed Ga m e’s businessmodel, introducing food retail through the Foodcobrand and reducing exposure to consumerelectronics. As for when Game will again pull itsweight remains to be seen, with Massmart onlynoting in a recent results presentation that it is“hopeful of a better performance in 2015”.
Sterling growth is what a far smaller retailer,It a l t i l e , has delivered even during the deeprecession that its key market, residentialupgrades and renovations, experienced between2011 and 2013. It finds itself in a sweet spot at atime when its biggest competitors — small,
independent tile retailers —have their backs to the wall.Dependent on imports, theyare being pounded by a weakrand. Leaving Italtile largelyimmune is that about 75% ofits tiles are produced in SA. Italso capitalised on its positionin the six months to December2014, lifting sales volume 10%,while Heps jumped 29%.
It a l t i l e’s growth story is farfrom over, says Warren Jarvis ofOld Mutual Investment Group.“It has a sustainable competi -tive advantage.”
Another retailer that hasrecently found itself at a competitive advantage isLewis, thanks to the demise of Ellerines, a formerbig player in the lower-income credit-drivenfurniture market segment. However, furnitureretail as a sector is under pressure. Stats SAreports that furniture sales value in the threemonths to May 2015 was up a mere 2,2%year-on-year compared with total retail marketsales value growth of 7%.
Retail will remain one of the market’s mostclosely followed sectors. Of some concern is thatmany retail shares have run hard — far harderindeed than most SA analysts had expected,thanks largely to buying by foreign investors.
The run has left the retail sector as a wholestretched in terms of its valuation at a time whenconsumer confidence remains fragile. With mostlocal market players showing little appetite forthe broad retail sector at current valuations, itsfate is likely to continue being determined byforeign investors for some time. Stafford Thomas
RETAILERS
Source: INET BFA Share prices based to 100
2014 2015J F M A M J J A S O N D J F M MA
150
130
85
120
110
140
100
90
Food & drug retailers index
General retailers index
All share index
1 Shoprite Holdings 3 9 0 4,0 38 8 37,0 94 105 676 ,0 15 7 97,02 Woolworths Holdings 3 28 4,0 18 5 24,0 87 530 79 5,0 4 89 4 ,03 Truworths International 2 4 32 ,0 7 76 4,0 37 760 6 69,0 5 8 27,04 Mr Price Group 1 8 63,0 6 1 96 ,0 65 830 3 37,0 2 94 6 ,05 The Foschini Group 1 792 ,0 16 6 27,0 38 101 1 82 ,0 6 32 0,06 The Spar Group 1 351 ,0 14 35 6 ,0 32 691 3 97,0 2 3 87,07 Massmart Holdings 1 1 41 ,0 22 5 35,0 29 852 5 59,0 3 99 1,08 Pick n Pay Stores 8 35,0 12 9 0 5,0 24 098 0 8 8 ,0 2 1 1 8 ,09 Clicks Group 8 0 9,0 5 59 0,0 22 506 8 37,0 1 1 1 3,010 Lewis Group 79 5,0 7 9 89,0 7 589 6 8 6 ,0 5 24 6 ,0
Ranked bynet profit
Name Net profitRm
Total assetsRm
Market capRm
Equity fundsRm
TOP 10 RETAILERS
Source: INET BFA
Fred
dy M
avun
da
DougM u r ray

Financial Mail Page 58-59 -17/06/15 12:51:21 PM
FINANCIAL MAIL • TOP COMPANIES • 201558 FINANCIAL MAIL • TOP COMPANIES • 2015 59
T he telecommunications industry hasbeen going through some consolidationover the past year, and this is set tocontinue this year as the market awaitsthe outcome of the proposed R7bn
acquisition of Neotel by Vo d a co m .As consolidation is shrinking the sector in terms
of the number of players, the market is likely toexperience increased convergence of services suchas information technology;fixed and mobile data as wellas voice; and video on demand.
Te l ko m’s R2,6bn acquisitionof Business Connexion wasapproved recently and this willstrengthen Telkom’s business inthe enterprise market, wherethere is growth opportunity forthe fixed-line business. Theglobal trend is for operators todevelop greater capabilities inboth fixed and wirelessmarkets and present increa-singly converged products andservices as a single provider.
Ultimately, the market maybe left with fewer operatorsand service providers but with enoughsufficiency to maintain a competitiveenvironment. These operators will also bestronger and better able to service futurebusiness and consumer needs, says AfricaAnalysis MD Dobek Pater.
Though Telkom’s share price hascontinued its strong run, the group’s declinein revenue from its traditional fixed-linebusiness, especially in the consumersegment, continues. But this has not stopped
SECT
ORS SECTORS
✥ MEDIA ✥
One shareshinesb r i g h te r
Despite the continuingonslaught on print media
h o u ses
N a s p e rs has surpassed market expecta-tions and become the first company tobreak through the R2 000/share barrier— thanks to its China-based associatecompany Tencent. But the share price
has reverted to trading under R2 000, though itmay end the year back at that level. Naspers’sshare price is correlated closely with the sharemovement of Tencent, which accounts for almostall Naspers’s value. Tencent operations includeonline games and instant chats e rv i ce s . Naspers has over theyears transitioned from amedia house into Africa’sbiggest Internet provider. TheInternet operations co n t r i b u te58% of sales.
The latest leg-up in itsshares has revived va l u a t i o nconcerns for some marketwatchers. Some of the shareprice moves experienced thisyear from both firms wereattributed to a relaxation inshare ownership rules forChinese investors. Though
ex i s t i n g investors are reaping the rewards of earlyi nve s t ments, the base is elevated and it won’t bepossible to get similar returns at the entry point.
Abdul Davids, Kagiso Asset Management headof Research, says the investment case for buyingNaspers at these levels is based on a successfulexecution of the company’s e-commercestrategy. Also of importance is the expansion ofits global and regional market share in a fastgrowing market, as well as Tencent continuing tosuccessfully execute its online games and socialnetworks strategy on mobile phone platforms.
But as JM Busha head of equities Farai Mapfinyawa r n s : “Our risk adjusted allocation to the sharehas been continually coming down. As the sharegoes up, the margin of safety is really getting quitetight and very narrow at current levels.”
Na s p e rs’s local media operations continue toh ave low growth as consumption of traditionalmedia platforms wanes. Naspers and its rivalsCa x to n and Times Media Group (TMG) arebattling with shrinking readership and fallingnewspaper sales. The trading environment hasbeen difficult, forcing companies to restructuretheir businesses, a step that has includeddiversifying into new markets.
TMG, which will delist from the JSE following abuyout of minority shareholders by majorityinvestor Blackstar, has diversified into radio broad-casting in Africa. It said in a secular in Februarythat in the face of digital media and the decline of
print media, it has limited scopefor investment and “t h e re fo relimited opportunity to optimiseshareholder returns”.
Caxton has strengthened itspackaging business through theacquisition of Nampak Cartons& Labels.
Worldwide, the biggestchallenge for newspapers is toremain relevant in today’svolatile media environment.Though all the traditional mediahouses are investing heavily inonline platforms, it will be awhile before returns areev i d e n t . Caxton says the
challenge will be to translate onlinereadership into advertising revenue. But theprogress it has already made in this area “isreason for optimism,” it said in August at therelease of its 2014 financial year results.
It warned that the investment is negativelyaffecting its bottom line. This is a generaltrend for firms diversifying into new areas.However, the benefits will be rewarding asbroadband access becomes widely availableand prices come down. Thabiso Mochiko
MEDIA
Source: INET BFA Share prices based to 100
2014 2015J F M A M J J A S O N D J F M MA
180
160
90
150
140
130
170
120
110
100
Media index
All share index
1 N a s p e rs 8 9 87,0 96 1 20,0 783 910 48 8 ,0 64 8 0 6 ,02 Caxton CTP Publishers & P r i n te rs 30 1 ,0 6 30 1 ,0 6 694 951 ,0 5 0 0 4,03 Times Media Group 20 1 ,0 2 20 9,0 2 605 0 81 ,0 1 4 41 ,04 African Media Enter taintment 4 0,0 2 1 2 ,0 715 9 92 ,0 1 4 6 ,05 Moneyweb Holdings -3 ,0 2 9,0 34 48 6 ,0 25 ,0
Ranked bynet profit
Name Net profitRm
Total assetsRm
Market capRm
Equity fundsRm
TOP FIVE MEDIA
Source: INET BFA
Hope forb e t te rs e rv i ce s
Convergence of offeringslikely to be the next big
move as the sector shrinks
investors from buying the stock. The group hasspent the past two years cutting costs and this hasrecently led to it outsourcing some o p e ra t i o n s .
It is also benefiting from the lower mobiletermination rates that have resulted in a reductionin its payments to mobile network operators.Mobile termination rates are fees that operatorspay to carry each other’s calls. The cuts wiped outR2bn from Vodacom’s top line and R1,2bn from itsbottom line in the year to March 2015. Vodacomrelies heavily on its local operations, but it plansto ramp up its international businesses, includingmaking new acquisitions. In Tanzania and theDemocratic Republic of Congo it competes withAirtel and has stiff competition from state-ownedmcel in Mozambique. Lesotho does not make anymaterial difference, even though Vodacom is theleading player in that market because of its size.
Unlike Vodacom, MTN is cushioned by its vastgeographical footprint. Though many of thosemarkets are small, they have potential for growth.But MTN’s subscriber numbers in SA have beendeclining due to, among other issues, weaknessesin the distribution network.
All operators, including unlisted Cell C, haveincreased their expenditure in networkinfrastructure. This is because demand for datacontinues. Also, this expenditure increase willenable them to improve coverage, the userexperience and quality. Growth in voice is slow
— hence the focus on data.Data contributes on average25% of the total revenues ofmobile network operators.Though price competition onvoice and data will continue,Pater says pricing will start“stabilising” as operators beginto reach a point of lowprofitability on products ands e rv i ce s .
Meanwhile, the low ter-mination rates have resulted inthe closure of service providerAltech Autopage — a year afterits rival Nashua Mobile closedshop. Thabiso Mochiko
✥ TELECOMMUNICATIONS ✥
1 MTN Group 28 833,0 0 186 1 67,0 0 403 555 659,0 0 112 76 8 ,0 02 Vodacom Group 15 357,0 0 55 3 1 2 ,0 0 197 436 61 6 ,0 0 18 229,0 03 Telkom SA SOC 4 81 5,0 0 36 551 ,0 0 41 246 0 8 4,0 0 22 774,0 04 Blue Label Telecoms 48 6 ,0 0 4 9 93,0 0 5 868 228 ,0 0 3 0 83,0 05 Telemasters Holdings 4,0 0 39,0 0 60 9 0 0,0 0 29,0 0
Ranked bynet profit
Name Net profitRm
Total assetsRm
Market capRm
Equity fundsRm
TOP FIVE TELECOMS
Source: INET BFA
TELECOMS
Source: INET BFA Share prices based to 100
2014 2015
J F M A M J J A S O N D J F M MA
120,0
90,0
112,5
110,0
107,5
105,0
117,5
115,0
102,5
100,0
97,5
95,0
92,5
Telecommunications index
All share index

Financial Mail Page 60-61 -12/06/15 03:17:11 PM
FINANCIAL MAIL • TOP COMPANIES • 201560 FINANCIAL MAIL • TOP COMPANIES • 2015 61
SECT
ORS SECTORS
Fa i rlyd e ce n tg row t h
With average double-digitgains, it has not been a
dismal year overall
A part from African Bank, local banksexperienced a satisfactory 2014, liftingearnings to double-digit territory onaverage, with capital still comfortablyabove regulatory levels.
New challenges are developing, however. Andof note are rising bad debt, pressure on Africanearnings and the low local growth environment,which is not being conducive for earningsgrowth and improved lending activities.
Banking earnings in 2014 came in somewhatlower than in 2013, indicating that furtherpressure is to be expected in 2015. For example,Fi rs tR a n d reported earnings growth of 25% then.Now it is 15%, due mainly to an uptick in baddebt from WesBank and at FNB’s businessdivision. Standard Bankdelivered 15% in 2013, now itis an overall 1%.
The big four’s share pricesrose in 2014, lifting theaverage price:earnings ratiofor the banking sector toaround 14. The highly valuedstocks are Standard Bank andFirstRand, trading above themarket average, with Ne d bankand Barclays Africa lagging theaverage. Smaller bankingoutfit Ca p i te c continues toshow phenomenal growth.But at a p:e of 24 it is nowregarded as very expensive.
The strong run in banking shares in 2014 hasled to questions about where growth will comefrom. Banks need to continue delivering superiorearnings growth to justify present valuations, butlocal GDP growth at around 2% is still subdued.
Shifts in the traditional revenue bases ofbanks already became evident in 2014, withmore reliance on increasing traditional interestincome than fleecing customers by increasingfees, with Capitec the exception.
Net interest income — what banks earn onnormal lending such as personal loans andmortgages — will struggle to record growth above10% for this year as indebted consumers focus onpaying down debt, rather than increasingborrowings. There have been interesting develop-ments on noninterest revenue (NIR) — wh a tbanks earn on commissions and fees. It was acash cow for banks for many years, but somehave scaled down growth in this segment. Forexample, NIR grew only 4,9% at Nedbank, onceregarded as the most expensive local bank.
Nedbank now regards NIR as a strategicallyimportant area for the future, maintainingtransactional fees at 2013 levels. Credit lifepricing has also been reduced.
Barclays Africa followed a similar plan in 2014,with NIR increasing only 2%. The net interestmargin improved to 4,65% from 4,46% as loansadvances grew a pedestrian 5% in the year.
Future revenue at banks will, to a large extent,depend on past investments. In this respect, thetide is finally turning for Standard Bank’s retailside. It set itself an ambitious target years ago tobecome the top retail bank at a time that otherbanks, notably Absa, were pulling back on masslending practices in the retail sector.
St a n d a rd’s headline earnings from continuingoperations increased 20% in 2014, a figure thatovershadowed FirstRand’s overall 15% interimgrowth result. St a n d a rd’s personal and bankingdivision recorded 17% growth and corporate and
investment banking g rewstrongly by 26%.
Obviously, the overall 1%headline earnings per sharegrowth does not flatterStandard, and it reflects thecontinued bad debt emanatingfrom its global operations. Thegood news is that Standard in2014 finally rid itself of theseinterests in London Plc, afterselling a 60% stake to majorityshareholder Industrial &Commercial Bank of China.
For 2014 Standard still hadto write off a hefty R4bn,including a further R1,6bn
written off in China on the fraudulent aluminiumcontracts of which the bank had become avictim. But in addition to that, anotherunexpected R1,6bn as part of the R4bn waspayable on discontinued operations, with losses
✥ BANKS ✥ ✥ BANKS ✥
mainly from oil-trading operations.This again led to questions about Standard’s
overall strategy. The trend of offshore losses hasnow become so endemic that it has tarnished theg ro u p’s image and reputation, obscuring its goodlocal recovery and increased earnings growthfrom African operations.
However, co-CEOsSim Tshabalala and BenKruger have painted anoptimistic picture of thefuture. They say thebank has closed thechapter on its globaloperations, whichstarted before 2008 butwere damaged heavilyin the global financialcrisis which followed.
Tshabalala is alsokeen to indicate theprogress Standard hasmade on reducing baddebts, pointing to Africa as the area where themain reductions have occurred. However, newproblems have arisen, notably in the oil-richeconomies of Nigeria and Angola, whereStandard has a strong presence.
Already, before the release of the 2014 results,rumours were doing the rounds that Standardwould be hard hit by the adverse conditions inAngola, where revenue has sagged drastically dueto lower oil prices affecting the Angolaneconomy. However, Standard pointed out thatactivities in Angola were in fact profitable for thefirst time in 2014. But the jury is still out as towhat extent strong results will be carried forward.
FirstRand remains a sizeable force among thebig four, with its market cap at mid-April still acomfortable R36bn, ahead of Standard, theprevious market cap leader. FirstRand’s return onequity (RoE) of 24% is way above the rest,showing clearly it has invested capital moreprofitably for shareholders than the other banks.
At first glance, the interim 15% growthreported by FirstRand seems disappointing. Buton closer inspection it seems the group made aprudent step to increase provisions at theexpense of earnings growth to account forexpected higher impairments in future.
Already there was some evidence of bad debtpressure building up, with WesBank’s credit lossratio upping to 3,01% from 2,67%. RMBexperienced a similar problem, with the creditloss ratio increasing to 0,61% from 0,30%.
However, at FNB nonperforming loans —where bad debts emanate before actualimpairment write-downs — as a percentage ofadvances dropped from 3,55% to 2,82%, and the
credit loss ratio improved to 0,87% from 0,95%,painting a much rosier picture.
The more conservative financial stance camewhen CEO Sizwe Nxasana stepped down, afterfour years during which the group recoveredadmirably from the reverses it suffered due to theglobal financial crisis. Nxasana handed over the
baton to financial andoperational stalwartJohan Burger, whoprefers to keep a lowprofile. But there isprobably nobody elsewho knows the ins andouts of the group betterthan him. Questionswere asked about whyNxasana was notsucceeded by anotherblack CEO, possiblyindicating deficiencies inthe group’s successionplanning process. Bu t
there can be little doubt about Burger’s talents.He is now expected to push FirstRand’s Africanstrategy further. At the same time, FNB andWesBank are expected to remain top performersfor the group, with FNB reporting interim earn-ings up 17% and African operations growing 25%.
Unfortunately, the bad debt picture does notappear that rosy at Barclays Africa, still tradinglocally under the Absa trademark. The credit lossratio has come down strongly since 2011, but at1,02% still remains higher on average than thoseof competitors. Barclays Africa has been reluctantto meaningfully increase lending, with retailbanking only increasing loans by 2%. Mortgagesactually decreased by 2%.
However, CEO Maria Ramos has largelydelivered a creditable performance in 2014,though the diluted headline earnings growth of10% is rather average, even surpassed by theearnings growth reported by parent companyBarclays Plc.
Barclays Africa as a group has still not madethat dramatic breakthrough some analysts havebeen clamouring for. But with its RoE of 16,7%from 15,5%, Ramos has probably done enough forBarclays as a majority shareholder to be happy, asit surpasses Standard’s RoE of 14,1%.
What is worrying is that Barclays Africa’sAfrican operations appear to be under strain, asretail and business banking headline earningsdecreased by 19% in the year. By earning apedestrian R785m from Africa in 2014, afterpaying R18bn for Barclays’ African interests,Barclays Africa is set to rely even more on its localAbsa operations to generate revenue. The problemis local retail banking grew headline earnings by
BANKS
Source: INET BFA Share prices based to 100
2014 2015J F M A M J J A S O N D J F M MA
160,0
140,0
130,0
120,0
87,5
150,0
100,0
110,0
FirstRand
Nedbank
Standard Bank
Barclays Africa
Ben KrugerSim Tshabalala
Rus
sell
Rob
erts
Sun
day
Tim
es

Financial Mail Page 62-63 -17/06/15 12:51:38 PM
FINANCIAL MAIL • TOP COMPANIES • 201562 FINANCIAL MAIL • TOP COMPANIES • 2015 63
SECT
ORS SECTORS
✥ BANKS ✥
about Capitec’s capital levels accommodating thebad debt of a credit card, for example. Capitec’sRoE of 25% has dropped markedly over the pasttwo years, which is an indication it has probablyreached the limits of the present growth cycle.Introducing further products will further reduceRoE and capital, at least initially.
For now, Capitec has proven it is no AfricanBank. Though the average loan amount hasincreased 15% to R6 887, Capitec managementhas clearly learnt from the failures of others.
African Bank was the big disappointment of2014. Despite strenuous efforts by CEO LeonKirkinis to prove that an unsecured lending outfitcan be a standalone success, he had to throw inthe towel in August 2014, resulting in African Bankbeing put in curatorship. It has since been dividedinto a “good bank”, to be listed next year, and a“bad bank” supported by the Reserve Bank andwith a capital injection from the big four banks.
In hindsight, African Bank went the well-trodden path of failure of previous microlendingoutfits, foundering on a shoal of high debt andreduced lending. It also exposed the fundamentalflaw of a banking group specialising in theunsecured lending market without diversifyingincome streams.
To remain profitable an unsecured group hasto up lending to higher amounts, with paybacksover longer terms to replace initial profits madeon shorter-term lending. Shorter-term lendinginitially is highly profitable. But as the marketgrows, and new players enter the lucrativemarket, higher lending amounts of up toR280 000 and longer payback terms, sometimesover seven years, are introduced to boost profits.
Over time these extended loans also becomeless profitable, inducing the unsecured lender toconsolidate loans into bigger amounts, so thatcustomers pay off previous debts in a newlending product. That also cannot last.
Kirkinis was confident that he had theexpertise to prevent this cycle from repeatingitself by writing off bad debt more aggressively.But after African Bank recovered nicely from the2008 crisis, management was duped into growingstrongly again from 2011, and became more lax in
writing off bad debt, which kept on growing.The witch’s brew just became worse whenlending income contracted.
In the nature of African Bank, its failurewas not going to be a systemic threat to thesector. But creditors were unhappy, andforeign investors had put a lot of money intoits bonds. For a long time it continued tohold high capital-adequacy levels, but it wasineffectual in the end, indicating thedevastating effect a change of sentiment inthe industry can have. Maarten Mittner
only 7%, even though credit impairments fell 51%.The group is clearly not investing for the future,with retail costs up only 2% and earnings fromexisting lending flat or lower. Past transactionscan also be questioned as Barclays Africa reporteda R9m loss from the Edcon portfolio.
At 14%, Nedbank’s headline earnings growthwas the best annual growth reported among thebig four, as the green bank continued to makeprogress with its selected strategies.
I nve s te c recovered well from a torrid periodafter 2009, following the global financial crisis, asin 2014 it reduced debt and upped the perfor-mance at the asset management and wealthdivisions. It also continues to be bedevilled bycurrency movements as the annual results toend-March 2015 were affected negatively by theweaker rand. Investing in a local outfit such asCapitec would have been more rewarding for localinvestors betting on a weaker rand. At thebeginning of April, Investec Plc’s market value wasactually surpassed by that of Capitec momentarily.
Capitec remains the wunderkind in the localbanking sector, with its share price climbing over150% in the 12 months to end-March. Withearnings growth of 25% reported to end-February,the question of what the bank has up its sleeve tojustify this rating remains. It certainly is notincreasing lending, as interest income was up only14% and net loan fee income down 26%. Bad debtis under control, with impairments up only 1%, butthat is just an indication of the lower lendingstrategy. It is winning more customers, with activeclients totalling 6,1m, on par with Nedbank.
The results show Capitec is increasinglybecoming dependent on transaction fee income,which grew 35%. These are the fees and commi-ssions customers are charged on use of theiraccounts. Capitec now plans to increase thenumber of primary clients — those who use it astheir bank of preference — by encouraging themto deposit salaries into a Capitec account. Theproblem is a primary client usually uses otherbanking products, such as a home loan, vehiclefinance or credit card, which increases the bank’sincome. Capitec has none of these products.
The reluctance is surely related to doubts
1 F i rst Ra n d 18 75 4,0 943 39 9,0 313 233 8 0 9,0 75 0 4 4,02 Standard Bank Group 14 935 ,0 1 670 6 47,0 224 600 5 70,0 126 38 8 ,03 Barclays Africa Group 12 032 ,0 955 298 ,0 126 314 851 ,0 73 6 57,04 Nedbank Group 9 20 0,0 741 25 5,0 115 093 95 4,0 59 24 0,05 Capitec Bank Holdings 2 0 8 8 ,0 45 778 ,0 60 705 326 ,0 8 981 ,0
Ranked bynet profit
Name Net profitRm
Total assetsRm
Market capRm
Equity fundsRm
TOP FIVE BANKS
Source: INET BFA
✥ LIFE INSURANCE ✥
Big industry moves toshape growth of firms
Expansion plans into therest of the continent set toopen up more opportunities
T his year there’s a changing of the guardat Sa n l a m , with Johan van Zyl leavingafter 12 highly successful years andhanding over to former Sa n t a m CE IanKirk. It will be hard for Kirk to repeat
Van Zyl’s success — the share price went from R6to R70 over the past 12 years. But Kirk acquiredhis reputation for putting administrative systemstogether at Capital Alliance and then improvingan already successful business at Santam.
He has already identified the risk business asan area in which Sanlam needs to increase itsmarket share. Health is another area in whichSanlam is underrepresented, and there is room tocreate an entirely newcategory of business from thetax-free savings accounts.
Another big move will beBruce Hemphill taking overfrom Julian Roberts as CE ofOld Mutual Plc. Hemphill hasnot revealed his plans butmost of the heavy lifting hasalready been done. Thisincludes the sale of US Life,Skandia Nordic and most ofthe subscale continentalEuropean business.
He will inherit a s t ro n gentry-level-market businessin Mass Foundation. In thefirst quarter of the year, its gross sales wereup 10%. The more troubled part of thebusiness, retail affluent, had a good start tothe year, with sales up 15% driven by theXtraMax enhanced endowment product andthe rollout of Old Mutual Wealth.
In the past two years there has been arerating of the life assurance sector. This wasonce seen as mature and overtraded in SA.And nimbler independent investment firmswere expected to eat into the savings
business, which is still the bedrock of the SAindustry. Two years ago it was the norm for lifeoffices to trade at a discount to the main way tomeasure the businesses — embedded value (EV).EV takes no account of future profits and it puts novalue at all on the book of nonlife business such asunit trusts, short-term insurance and health.
Says MMI Holdings CEO Nicolaas Kruger: “Wetrade on a huge premium to EV and this is becausethe industry has reinvented itself by becomingmore diversified.” MMI is not even one of the moreexpensive life offices. Standard Bank Group analystRisto Ketola reckons it is on a 20% premium to hisadjusted EV, while Sanlam and D i s cove r y a recloser to 50%. Liberty, which lagged, has caught upunder new CE Thabo Dloti and is on a 10%premium. Even Old Mutual, now that it has soldmost of its problem businesses, is on par with EV.
Kruger says though SA has one of the highestpenetrations of long-term insurance g l o b a l ly ,there is no safety net. “The insurance gap studies
show that a great deal moreneeds to be sold to protectpeople from the loss of incomecaused by death or disability.”
He says the industry isenjoying some credit for itsexpansion into the rest ofAfrica, where there is a growingmiddle class, but he says thereis a long runway. Libertydeputy CEO Steven Braudoagrees: “You can’t set up onMonday and expect to startmaking profits on Tuesday. Wed o n’t expect to get muchtraction even after a year.”
LIFE INSURANCE
Source: INET BFA Share prices based to 100
2014 2015J F M A M J J A S O N D J F M MA
140,0
130,0
92,5
125,0
120,0
115,0
110,0
135,0
105,0
100,0
95,0
Life insurance index
All share index
1 Old Mutual Plc 14 53 3,0 2 382 8 41 ,0 173 402 51 7,0 115 73 0,02 Sa n l a m 5 36 0,0 604 4 30,0 169 786 39 5,0 43 6 6 0,03 Discover y 4 326 ,0 67 20 0,0 80 799 0 07,0 20 41 1 ,04 MMI Holdings 3 7 13,0 400 9 69,0 51 591 4 23,0 26 6 3 3,05 Liberty Holdings 2 458 ,0 349 81 0,0 35 589 26 5,0 19 838 ,06 C l i e n te l e 326 ,0 2 59 7,0 5 941 232 ,0 376 ,0
Ranked bynet profit
Name Net profitRm
Total assetsRm
Market capRm
Equity fundsRm
TOP SIX INSURANCE
Source: INET BFA

Financial Mail Page 64-65 -17/06/15 12:52:06 PM
FINANCIAL MAIL • TOP COMPANIES • 201564 FINANCIAL MAIL • TOP COMPANIES • 2015 65
SECT
ORS SECTORS
✥ FINANCIAL SERVICESS ✥
Ec l e c t i cbut surelyd e te r m i n e dto g rowWith failed acquisitions, andexits and new listings, this
group has lessons to impart
T he financial services sector is an eclecticmix of businesses. It includes businessesthat probably should be on the bankingboard, such as I nve s te c and Sasf in.Investec is the largest share in the s e c to r,
with a combined market capitalisation —between the Ltd and Plc shares — of R108bn. Ithas not had an easy time in recent years, withfailed acquisitions in the UK and Irish mortgagemarket as well as in the Australian propertysector. But a sharp fall in bad debt in the year toMarch 2015 led to a respectable 10,2% rise inearnings. Impairments fell by 38,8% to £3 9, 4 m .
CE Stephen Koseff says Investec will focus onthree core businesses: asset management, aconsistent earnings stream run by the hard-drivingHendrik du Toit; wealth andinvestment, comprisingprivate banking andstockbroking; and specialistbanking, mainly merchantbanking. It still earns 60% ofits profits from SA.
Specialist banking’soperating profit was up18,4% during the year to£392,3m — with coreadvances and loans up15,4% to £16,5bn. But it wasa slow year for asset mana-ge ment, with operatingprofit up just 3,6% to £149m,but third-party assets undermanagement increased by13,7% to £124bn.
The other heavyweights are Bra i t (R 57bnmarket cap) and PSG ( R4 7 b n ) . Brait ceased towork in traditional private equity and manybelieved it would become another passiveholding company for Pepkor, Premier Foods andIceland in the UK. But instead it has sold itsinterest in Pepkor to Ste i n h of f (for a combinationof shares and cash) and bought control of twobusinesses — the Virgin Active gym chain forabout R12bn and a further R14bn for the UKdiscount fashion chain New Look.
PSG will never be a passive company, as itschairman Jannie Mouton and his son, Piet, arenatural dealmakers. The highlight of the year wasthe listing of PSG Konsult. With a market cap ofR10,4bn, it is a substantial business in its ownright, similar in size to Alexander Forbes. Thecore of PSG Konsult is the financial planningbusiness, which has a particularly strongfranchise in smaller towns. Konsult is known forits annual rally with thousands of enthusiasticadvisers. It ends in songs and a torchlit parade.
PSG Konsult, however, also includes thelow-key PSG Asset Management, an underratedbusiness that is raising its profile under MD AnetAhern and chief investment officer Greg Hopkins.And the third leg is an insurance broking businessthat white-labels products through Santam.
The biggest single part of the PSG group is its37% holding in Ca p i te c Bank, which accounts forabout half the net asset value. But it also controlsthe agricultural investment trust Zeder, the mainshareholder in Pioneer Foods as well as in Curro,which runs a chain of schools.
Financial services consists of a number of assetmanagers, of which C o ro n a t i o n , with a market capof R32bn, is by far the biggest. Coronation is takinga breather after a phenomenal run. It hadcompound annual revenue growth of 43% in thefive years to September 2014, but revenue fell by
6% in the six months toMarch. However, CE AntonPillay says the beauty of theCoronation model is that ahigh proportion of costs arevariable — such as itsadministration throughMaitland, whose majority ofremuneration comes throughbonuses, and the rebates itpays to linked-producthouses that put its unit trustson their platforms. Variablecosts fell by 4% to R807mand this was 78% of totaloperating expenses. Variableincome, though, was also hitas performance fees werere d u ce d .
Fred
dy M
avun
da
Stephen Koseff
✥ LIFE ASSURANCE ✥
Liberty numbers in the rest of Africa are gettingbetter, with index insurance (100% of recurringpremiums and 10% of single premiums)increasing from R32m to R120m. Its fo c u sremains on its tied sales force and singlepremium sales, particularly, which in the firstthree months of the year increased by 10% toR5bn. Its recurring sales were flat.
Discovery has so far avoided employeebenefits and group schemes, focusing on theindividual market. It had the advantage of settingup a large health-care administration businessbefore going into life, giving it a mine of dataabout people’s health. Discovery Life is now alarger contributor to the group. In the six monthsto December, operating profit increased by 17% toR1,46bn. Its cash flow from existing business wasR1,07bn in the second half of 2014.
Discovery Life provides conservatively in itsEV assumptions, and has found that since June2010, lapses and surrenders have come in R765mbelow assumptions, and mortality and morbidity
R653m. Discovery has a demanding minimumrequirement of risk-free plus 10%.
Elsewhere in the world, Discovery’s focus hasbeen on its Vitality programme, which is beingadopted all over the Asia Pacific region throughAIA. In the US it is run by the Vitality Group.
Life assurers, however, have to cope with pagesof tedious laws. Liberty’s Braudo says key changesinclude the Retail Distribution Review (RDR),wh i c h will ban commission on investmentproducts; Solvency Assessment & Managementwill change minimum solvency levels for allinsurers; Treating Customers Fairly; and theProtection of Personal Information Act, which willchange the way financial services businesseshandle personal information.
He says these laws will not stifle productinnovation, but will lead to opportunities to bemore creative. In any case, he says, regulationsuch as RDR will not be staggered over severaly e a rs . So, it seems regulations will keep theindustry busy for some time. Stephen Cranston
THE BIG NEWS in short-term insurance hasbeen a change in the CE of the largestcompany, Sa nta m , from Ian Kirk to LizeL a m b re c hts.
Lambrechts had previously run the coreSa n l a m Personal Finance long-term insurancebusiness. It will take time for her to learn theshort-term business, but at least she isinheriting a business that is in good shape. Theunderwriting margin increased from 2,8% in2013 to 8,7%: the extensive hail damage of thefourth quarter of 2013 was not repeated.Santam also weeded out poorer-quality risks inthe motor and property books and madeselected increases in premium rates.
But Lambrechts argues that it is not an easyenvironment. There is subdued economicgrowth, and premium growth is correlatedclosely to GDP; intense competition is puttingpressure on profitability; and changes inregulation are affecting short-term insurers asmuch as life assurers.
The claims of intense competition might leadto scepticism. If you look at the listings on theJSE, the short-term (or property and casualty)insurance business looks like a one-horse race.Santam, with a R26,4bn market capitalisation,dwarfs Zurich SA on R2,9bn. And Zurich has not
made a profit for the past two years, in additionto making little progress in specialist fields suchas liability insurance or reinsurance.
But there aren’t just lame horses facingSantam. Its unlisted historic enemy Mutual &Fe d e ra l turned from a negative underwritingmargin of 4,9% in 2013 to a positive 1,4% lastyear — though this hardly makes it Santam’speer — and it is establishing a highly profitableline of business in the rest of Africa, where themargin is 6,7%.
The real game changer, however, has beenO u ts u ra n ce, which has proved the demand for adirect model is high. Because it does not paythe standard 15% commission, Outsurance’sunderwriting margins are higher — in 2014 itsmargin was 17,5%. It makes up about a third ofthe profit from Rand Merchant Insurance, whichis also the shareholder of reference forD i scove r y and MMI.
And there are strong players in the unlistedsector. Telesure, started by the flamboyantDouw Steyn in 1985, now controls a range ofbrands from Auto & General to Dial Direct,Budget and First for Women. It is jointlycontrolled by the Enthoven family, which alsocontrols the highly entrepreneurial HollardGroup. Hollard is the third-largest short-terminsurer in terms of premiums and it has asizeable life business. It operates on a partner-ship model for many of its businesses as itargues that 50% of a business with a goodpartner is worth far more than 100% of abusiness without one. Stephen Cranston
Subdued economicgrowth stunts market
SHORT-TERM INSURANCE

Financial Mail Page 66-67 -12/06/15 03:20:09 PM
FINANCIAL MAIL • TOP COMPANIES • 201566 FINANCIAL MAIL • TOP COMPANIES • 2015 67
SECT
ORS SECTORS
✥ INFORMATION TECHNOLOGY ✥✥ FINANCIAL SERVICES ✥
De m a n dfor moreservices abig boost
As IT spending increasesworldwide, though at a
slightly slower rate
W ith two companies exiting the JSEthis year, the information andtechnology (IT) index is shrin-king. The exit leaves the indexwith few big companies and a
number of small but cash generating entities.Gijima delisted following a buyout of minorityshareholders by Guma Investments, which isowned by Gijima chairman Robert Gumede.Business Connexion will delist once the compe-tition tribunal approves its takeover by Te l ko m .
There are some gains that will come from theremaining listed firms such asE OH , one of the marketdarlings; Pinnacle Technology;and Da t a te c . Smaller ones likeAd a p tI T are expected to comeup the ranks in a bid to attractmore investments andimprove liquidity.
Worldwide, IT spending ison track to total US$3,8 trillionthis year, a 2,4% increase fromlast year, according to globalresearch company Gartner.This growth rate, however, isdown from earlier projectionsof 3,9%. The slower outlookfor 2015 is largely attributed tothe rising dollar as well as a modest reduction ingrowth expectations for devices, IT services andtelecommunications services, says Gartner.
Growing public and private sector IT spending,together with maturing and increasingly
competitive business environments, are alsodriving IT services demand, says consulting firmInternational Data Corp.
AdaptIT has maintained its ranking as thesecond top-performing company. The smallsoftware firm has topped the list in the IT sectordue to its consistent performance in the marketsin which it operates. There has been an uptrendin AdaptIT’s share price and overall earnings overa number of years. Early this year, one of itsinvestors, Sanlam, increased its stake to 5%.
Ranked fourth, EOH continues to show strongperformance, with growth expected to continue.However, some analysts have warned that futurereturns may be lower but solid results willcontinue. EOH is looking at increasing its blackeconomic empowerment stake, which is currentlyat 34%. It recently bought shares in Twenty ThirdCentury Systems, which has a presence acrossAfrica. The deal will further strengthen itsbusiness outside SA.
A big turnaround is expected from PinnacleTechnology, which arguably had the toughestyear in 2014. Its share price tumbled due toallegations of bribery levelled against one of itsexecutives. But that case was subsequentlydismissed. Judging by its 2015 half-yearperformance, the business is moving in the rightdirection, with analysts optimistic of a recoveryin full-year earnings. Also, its current share priceoffers a good buying opportunity for investors.
Pinnacle, which owns 34,99% in Da t a ce n t r i x ,has increased its share. Datacentrix has alsorecorded strong full-year financial results. Themomentum should continue as it has securednew contracts worth about R500m.
Datatec ranks 27th, up from 32 last year in theSA Giants index. It hascontinued its steady increasein earnings, thanks to itsexposure to various markets.
“Datatec has high operatingleverage and, as we have seenfrom the results, any top-lineboost has a multiplier effect onthe bottom line. However, thesame applies when the top lineis under pressure and off thecurrent base we continue tosee some challenges inachieving sustained double-digit top line,” says FaraiMapfinya, head of equities atJM Busha. Datatec, like its
rivals, is seeing growth in cloud computing,which is still being adopted by clients.
Datatec is also an “almost perfect” rand hedgeand the weakening rand should bode well for itsSA investors, says Mapfinya. Thabiso Mochiko
SOFTWARE & COMPUTER SERVICES
Source: INET BFA Share prices based to 100
2014 2015J F M A M J J A S O N D J F M MA
160
140
90
130
150
120
110
100
Software &computerservices index
All share index
CE Jonathan Hertz says theinterest in the offshorebusiness Stenham has risenfrom 50% to 81%. The globalbusinesses are expected toprovide about a third of profitin the current financial year.
Ca d i z , at one time, looked asthough it could be a similarbusiness to Peregrine. But witha market cap of less thanR280m, Cadiz is a shadow ofthe financial conglomerate itmight have been. It paidR200m for African Harvest’sasset management businessand most of the intellectualcapital from that deal haswa l ke d . There is a strongpossibility that Cadiz will notbe listed this time next year.
One of its high-flyers wasAfrican Bank, now under
curatorship. It is unlikely to come back to themarket for another two years, but curator TomWinterboer has made progress dividing thebusiness between a “go o d” and a “b a d” bank,with former WesBank MD Brian Riley taking overthe “go o d” bank.
The quality relisting of the past year has beenAlexander Forbes, which under charismatic andmedia-friendly CE Edward Kieswetter has shedmany of its business units — its insurancebroking was sold to Marsh, its cell captive insurerGuardrisk to Momentum. It now focuses on assetmanagement, financial planning, pension fundadministration and consulting as well asshort-term insurance. Its first results since listingwere surprisingly good, with revenue up 12% toR4,85bn and operating profit up 7% to R782m.
Forbes has pushed up the value chain. It has1m members under administration, and for everyrand preserved, 86c stays with Forbes and 78c
goes to its wholly owned multim a n a ge rInvestment Solutions. This is the biggestcontributor to the operating profit of theg ro u p . It has more than R300bn undermanagement or administration.
Forbes has historically been weak in thepublic sector. But as a long-time public-sector employee, Kieswetter is determinedto crack this. And the company is gainingtraction. Revenue was up 12% with newbusiness worth R14m/year and it had a totalof 38 new clients on board. Forbes is alsogrowing its African business, AfriNet, whichremains a regional business focused mainlyon Namibia and Botswana, but Kenya isg row i n g . Stephen Cranston
Coronation had a dis-appointing year, at least inequity funds. But it has anextraordinary franchise,growing to R636bn undermanagement without thebenefit of a life insurancebusiness to feed it assets. Thelong-term record is exceptional,making it the default choice forindependent financial advisersalongside unlisted Allan Gray.Last year’s highlight was therebuilding of its internationaloperation. It was an earlyadopter of the fund-of-hedge-funds model, and thecore of its global strategy is nowa long-only fund of funds.
But it has been rolling outits own direct funds — runfrom Cape Town and startingin 2008 — in areas in which itcould claim a competitive advantage, Africa andGlobal Emerging Markets (GEM). The Africa Fundhas had an annual outperformance (or alpha) of8%, GEM of 5,5%. In November it launched aGlobal Frontiers Fund under African Fundveteran Peter Leger as well as the long-awaitedGlobal Equity Select Fund run by former chiefinvestment officer Louis Stassen.
One of the more interesting shares in the assetm a n a ge rs’ subsector is Pe re g r i n e . This has arelatively small institutional asset manager,having recently merged Cannon with thein-house equity team at Citadel, the wealthmanager. Citadel itself is the biggest part ofPe re g r i n e’s earnings and it is very stable. But inthe year to March 2015 substantially bettergrowth was provided by its local hedge funds,where the assets are up 50%, as well as PeregrineSecurities, which is one of the top three brokersby volume on the JSE.
1 Investec Plc 5 51 8 ,0 849 4 32 ,0 62 332 6 0 0,0 56 037, 02 I nveste c 5 072 ,0 814 98 4,0 28 720 59 4 ,0 53 76 5,03 Brait SE 2 36 4,0 18 4 23,0 43 126 9 16,0 15 9 96 ,04 Coronation Fund Managers 1 95 0,0 75 6 07,0 34 367 761 ,0 1 0 6 4,05 PSG Group 1 1 69,0 34 1 55,0 36 459 4 0 6 ,0 9 74 4,06 JSE 636 ,0 28 8 6 8 ,0 10 698 1 07,0 2 0 07,07 Peregrine Holdings 422 ,0 20 796 ,0 5 806 651 ,0 1 79 0,08 Sasfin Holdings 19 1,0 8 0 94,0 1 718 75 9,0 1 79 0,09 P resc i e n t 93 ,0 7 428 , 407 6 6 8 ,0 692 ,010 Efficient Group 1 0,0, 1 2 1 ,0 407 6 6 8 ,0 19 1,0
Ranked bynet profit
Name Net profitRm
Total assetsRm
Market capRm
Equity fundsRm
TOP 10 FINANCIAL SERVICES
Source: INET BFA
Jannie Mouton
Rus
sell
Rob
erts

Financial Mail Page 68 -17/06/15 12:52:23 PM
FINANCIAL MAIL • TOP COMPANIES • 201568
SECT
ORS
✥ PROPERTY ✥
Se l e c te dva l u eto be had
Ongoing search for yieldsdrives stellar performanceamong some stocks, while
others fail to impress
D espite recent weakness in share prices,the JSE’s R440bn listed property sectorhas delivered a decent return forinvestors over the past year. Latestfigures from Cape-based Catalyst Fund
Managers show that the listed property index(J253), which comprises about 40 counters,achieved a total return of just more than 38% forthe 12 months ending April. The sector’s stellarperformance has no doubt been driven by anongoing search for yield and thebetter-than-expected earnings growth reportedby a number of real estatecompanies in recent months.
The top five performingcounters have all delivered atotal return exceeding 63% inthe 12 months ending April.These include Fortress B,offshore-focused Ro c kc a s t l eGlobal Real Estate Company,mall owners Re s i l i e n tProperty Income Fund andHyprop Investments as well asRomanian-based New EuropeProperty Investments (Nepi).Fortress B, which has asizeable exposure tocommuter malls that servelower-income shoppers as well as to rand-hedgesister funds Rockcastle and Nepi, achieved ahefty 237% total return over the 12-monthperiod.
However, not all property stocks have mademoney for investors over the past year. Ninecounters delivered a total return of less than 10%
over the 12 months ending April. The three worstperformers were hotel fund Hospitality B, with anegative total return of -41%, followed by newlylisted African-focused Delta International (-9%)and Synergy B (-3%), which has been involved in aprotracted takeover bid by Vukile Property Fund.
Analysts warn that property investors shouldnot expect the same level of super returns infuture. The general forecast is for a total return ofno more than 5%-10% over the next 12 months.
In fact, the sector has already come underpressure in recent weeks. The index weakenedby about 7% in May, which analysts say could bedue partly to growing perceptions that propertystocks are in overvalued territory.
Neil Stuart-Findlay, portfolio manager atInvestec Asset Management, says inflation-beating returns remain achievable over themedium term, given the sector’s healthydistribution growth outlook. So far this year,property companies that have reported resultshave declared growth in dividend payouts ofabove 9% on average, despite a tough operatingenvironment and stalling economy.
“The recent results season has beenencouraging, which again bore witness to thefact that the vast majority of listed propertycounters are either meeting or beating marketexpectations. This is illustrative of the assetc l a s s’s defensive earnings capability derived fromits fixed-lease escalations and high proportion offixed debt,” says Stuart-Findlay.
Old Mutual Investment Group propertyportfolio manager Evan Robins has a similarview. “If you had told me a few years ago that SA
property companies couldproduce the level ofdistribution growth they arecurrently delivering in such atough environment, I wouldnot have believed it. A keyquestion, though, is whetherthese companies can sustainthis performance.”
Robins says while the sectoris no doubt looking expensiveon a headline level relative tobonds, not all property stocksare overvalued. He says thereare anomalies in the index thatmay be skewing the overallperception. “Th o u g h
nondividend payers such as developers At t a cqand P ivot a l , offshore counters Rockcastle andNepi and retail-dominated Fortress B, Resilientand Hyprop have performed exceptionally, thereare others that have delivered a fairly pedestrianperformance. Some of the more vanilla offerings,such as sector heavyweight G row t h p o i n t
PROPERTY
Source: INET BFA Share prices based to 100
2014 2015J F M A M J J A S O N D J F M MA
135
125
93
120
115
130
110
105
100
SA listed property index
All share index

Financial Mail Page 69 -17/06/15 10:24:01 AM
Our subscribers get more. So much more.Their secret? TimesPLUS. Get the Sunday Times and The Times delivered to your door for only R86.67 per month, plus instant rewards with our TimesPLUS rewards programme.
Terms and conditions apply
To subscribe or upgrade call 0860 525 200 or log on to TimesLIVE.co.za and click on the “Subscribe” button.
Dining + holidays + days out + more

Financial Mail Page 70-71 -17/06/15 12:52:46 PM
FINANCIAL MAIL • TOP COMPANIES • 201570 FINANCIAL MAIL • TOP COMPANIES • 2015 71
SECT
ORS
INVESTMENT✥ PROPERTY ✥
P ro p e r t i e s , are looking far less expensive.”He says there is still value in the sector
long-term, and this will come from the increasein distributions (dividends) over time notavailable from bonds. Of course, this comes withcapital risk as both listed property and bondyields rise and fall with the market.
Analysts agree stock-picking is now the nameof the game. The key question is: whichindividual property counters are likely tooutperform the market over the next 12 months?
Stuart-Findlay says Investec will continue toseek out counters that show sustainable,above-average distribution growth at reasonableprices. This has to be backed by quality assets,strong balance sheets and experiencedmanagement teams. In the large cap universe, hesingles out Redefine Properties, the sector’ssecond-largest counter with a market capexceeding R45bn, and Hyprop as preferredex p o s u re s .
At the smaller end of the spectrum, portfoliofavourites are high-yielding A r rowh e a dP ro p e r t i e s and office-dominated Texton PropertyFu n d . Stuart-Findlay says they remain cautiouson prospects for the rand given stubbornly hightwin deficits and the volatile global riskenvironment. As such, they will continue to ownNepi shares.
“Ne p i ’s recently released strong set of resultsreflects its ever strengthening position as thenumber one retail landlord in Romania. Evenmore encouraging is that its exceptionaldevelopment pipeline should drive anacceleration of growth in the short to mediumte r m .”
Macquarie First South Securities propertyanalyst Leon Allison also ranks Hyprop and Nepias top picks for 2015. Blue chip mall ownerHyprop surprised the market with dividendgrowth of a healthy 13,7% for the six months toDecember when it reported interim results inearly March, comfortably ahead of market
expectations of 10%-12%. It has a portfolio of 13shopping centres across SA, Ghana and Zambia,and these include Canal Walk in Cape Town,Rosebank Mall in Johannesburg and ClearwaterMall on the West Rand.
Allison says Hyprop’s recent set of resultsagain reinforces Macquarie’s view that prime,regional shopping centres that are well managedshow the highest growth through the cycle andare also the most defensive in a downturn.Though Hyprop is trading at a lower yield thanthe sector, Allison says the stock should continueto deliver higher dividend growth than the sector— around 200 basis points above the marketaverage — and should therefore continue tooutperform on the total return front.
M a’Alot Investments’ Maurice Shapiro singlesout Redefine Properties, Octodec Investmentsand Vukile as his current top picks. He saysRedefine has over the past five years madeimpressive headway to restructure andmodernise its underlying portfolio throughredevelopments, acquisitions and disposals.Management has also successfully restructuredits offshore offering, with plans to further grow itsrand-hedge exposure.
Though the market still perceives Redefine ashaving a poorer quality portfolio compared topeer Growthpoint, Shapiro says both companiesproduce predictable and quality income streams.Another positive is that Redefine is likely tofinalise the long-awaited acquisition ofFountainhead Property Trust’s assets later thisy e a r.
Shapiro says Octodec’s strategy to focus on thePretoria and Johannesburg CBDs is playing outnicely with the successful conversion of officesinto residential properties. “Last year’s mergerwith sister fund Premium Properties will mean afurther focus on this strategy. The ability toconvert vacant space into a regular residentialincome stream will drive consistent distributiongrowth over the next three to five y e a rs .”
Shapiro says Vukile’s core competence isthat management really knows its portfoliowell and is very active in the assetmanagement of its properties. “Vukile is oneof the few companies that can tell you everymetric about its individual assets.”
He says a positive is that earnings fromthe asset management of the Sanlamportfolio will no longer distort Vukile’sincome stream, which will allow analysts tobetter forecast distribution growth. The fundhas also cleverly restructured itssovereign/government-tenanted portfoliowhile improving its BEE rating, whichallows the fund to participate actively in thiss p a ce . Joan Muller
✥ TOP PERFORMERS ✥
A solid feat outof h a rd wo rk
With a lot of opportunities in the lower to middle propertymarket, this group’s performance can improve
T op Performers is arguably the mostexciting section in the Financial Mail’s To pCompanies publication, as it highlightsthose companies that have performedbest on the JSE over the past five years.
The ranking methodology uses an internal rate ofreturn for the latest five years (in this year’s caseto end-March 2015) in the share price of eachcompany. Over the years, many outstandingcompanies have been identified in this ranking,including Ca p i te c and C o ro n a t i o n .
Of course, not all of the companies in theupper echelons of the Top Performers rankingmanage to sustain their performance and oftenthey fade from the scene. But the “o n e -h i two n d e rs” — those companies that have little orno underlying fundamental strength — can easilybe identified by cross-referencing their five-yearshare performance with other metrics such asreturn on equity (RoE) or compound annualgrowth rate (CAGR) in earnings per share.
This year’s Top Performer is lower-to-middleLSM property group Calgro M3, which has aR17bn pipeline of property projects. Started bythe Steyn brothers and the Malherbe family, ithas run very hard recently. However, there is stillso much scope in the market it serves,considering the acute shortage of low-costhousing, estimated at around 1,6m units. It hasthe state as a client, which can sometimes lead tolate payments and contractual disputes, and thisputs pressure on working capital. But it willbenefit significantly from government’s housingsubsidy for earners below R15 000/month. It hasgood relations with financiers and townshipdevelopment authorities. This can sometimes bea competitive and difficult sector, as seen withcompetitors RBA and SeaKay. The share is mostlyheld by its directors. Despite being in a sweetspot at the moment, it is unlikely that Calgro
would be the target of an acquisition as the biggerconstruction companies do not have the cash tospend at present. It is also moving into the burialbusiness.
Ad a p tI T is an application solutions providertouching on all sectors of the economy, includingthe manufacturing, mining, higher education andfinancial services sectors. Founded by SbuShabalala, it merged into the Infowave listing. Thequestion is, can AdaptIT step into the shoes ofPinnacle and fill that space as the brightsmall-cap stock in this sector? It is constantlywinning government and corporate work, postingsequential growth in earnings, and is controlledand owned by dynamic blackentrepreneurs. It has brokenthrough the billion-rand marketcap mark but has liquidityco n s t ra i n t s .
M i c ro m e ga — with diversifiedinterests in informationtechnology, financial, occupationalhealth & safety and labour supplyservices — is controlled by thecolourful Glaswegian DaveKing, whose tax dispute withthe SA Revenue Service (Sars)was long-running and wellcovered by the media.Among its conglomerate ofinterests, the company has avaluable division thatprovides operational healthand safety gradings forother businesses. Called“the reincarnation ofSpecialised Outsourcing” —King’s previous business —the company follows astrong acquisitive growth
Ben Malherbe
Rus
sell
Rob
erts
1 Growthpoint Properties 3 476 ,0 81 98 6 ,0 68 920 4 3 4,0 49 428 ,02 Redefine Properties 2 0 1 7,0 52 1 8 8 ,0 46 680 3 37,0 31 932 ,03 Resi1ient Property Income 1 732 ,0 24 51 5,0 35 589 75 3,0 16 1 1 2 ,04 Rockcastle Global Real E sta te 1 4 65,0 18 48 0,0 25 444 961 ,0 10 9 70,05 New Europe Property Inv Plc 1 0 45,0 21 37 1,0 39 129 8 4 3,0 17 5 87,06 Intu Properties Plc 75 3,0 9 558 ,0 82 407 725 ,0 4 5 24,07 Fountainhead Property Trust 7 17,0 12 6 0 1 ,0 11 975 9 10,0 8 8 42 ,08 SA Corporate Real Estate Fu n d 652 ,0 11 26 8 ,0 9 918 39 5,0 7 6 03,09 Investec Property Fund 30 9,0 6 5 5 3,0 7 422 4 6 8 ,0 4 8 0 5,010 Redefine International Plc 262 ,0 20 9 12,0 15 224 37 7,0 8 1 35,0
Ranked bynet profit
Name Net profitRm
Total assetsRm
Market capRm
Equity fundsRm
TOP 10 REAL ESTATE
Source: INET BFA

Financial Mail Page 72-73 -17/06/15 12:53:00 PM
FINANCIAL MAIL • TOP COMPANIES • 201572 FINANCIAL MAIL • TOP COMPANIES • 2015 73
INVE
STME
NTINVESTMENT
Ra n k i n gIRR
Co m p a ny IRR5 years toMar 2015
EPSgrowth over
5-year period
Return onequity over
5-year period
Return onassets over
5-year period
Dividendyield 5-year
ave ra g e
Pretax profitgrowth over
7-year period
TOP PERFORMERS
1 Calgro M3 Holdings 106,80 N /A 24 ,76 1 2 ,0 0 N /A N /A2 AdaptIT Holdings 86,7 1 23,1 5 22 , 25 26 , 22 3, 82 23, 553 Micromega Holdings 7 1,17 20, 26 22 ,0 8 29,9 6 0, 39 1 9, 5 04 EOH Holdings 7 1,14 23, 35 27, 6 0 1 9,07 2 ,1 0 36 ,725 Coronation Fund Managers 69, 8 8 32 ,70 1 83, 27 2 , 59 7, 30 3 1 , 206 Sekunjalo Investments 6 8 ,42 4 3, 82 1 2 , 52 1 5,47 0, 53 2 7, 077 Finbond Group 5 9,75 N /A 1 2 ,07 8 ,45 0,1 5 N /A8 Onelogix Group 59,0 1 1 9,1 4 1 8 ,9 9 1 3,1 4 1 ,1 2 13, 379 Poynting Holdings 58 , 20 N /A 25,9 6 2 , 24 N /A -1 4,9 9
10 Sa n tova 55, 28 1 41 ,75 13,9 1 7, 47 0,4 3 35,1 211 Trustco Group Holdings 5 4,1 8 8, 31 1 4,70 1 1 , 24 3 ,75 22 ,0 112 Taste Holdings 52 ,1 6 1 1 ,4 6 1 5,0 8 1 5, 85 2 ,0 6 1 5,4 613 Mr Price Group 49, 35 22 , 5 4 63, 24 30,0 5 3, 6 8 23, 8914 Sa bvest 48,9 1 38 , 61 26 ,1 2 2 3,70 1 ,07 37, 5115 Kaydav Group 47, 51 42 , 89 1 6 ,76 1 1 ,0 8 N /A 20, 8716 Indequity Group 47, 34 21,50 26 ,9 9 1 8 ,0 6 1 , 28 2 9,7517 Rand Merchant Ins Holdings 45, 38 N /A 11,88 8 ,9 9 4 ,97 N /A18 PSG Group 45, 34 1 7, 2 1 1 2 ,0 0 5, 53 1 ,73 3 ,7819 Af r i m a t 4 3,96 1 6 , 27 1 6 ,74 14, 34 4 ,02 1 7, 5 020 N a s p e rs 4 3,1 5 11, 36 1 3, 87 12,64 0, 65 11,9 1
✥ TOP PERFORMERS ✥ ✥ TOP PERFORMERS ✥
strategy and has some interesting internationalprojects. The share price only picked up whenKing settled with Sars and could then devotehimself full-time to the group. Some investorstend to follow this one for the man rather thanthe underlying operations. At lofty valuations, itscomponents are under pressure to deliver onex p e c t a t i o n s .
Under the visionary leadership of CEO AsherBhobot, IT consulting group E OH continues togrow through spectacular organic growth andshrewd acquisitions. It has been a fantasticfive-year story, buying up entrepreneurial ITbusinesses at good relative price:earnings ratios,offering enticing medium-term earn-out terms tothe selling management team, so that everyonemakes money.
Bhobot is a phenomenal leader, a hands-onmanager, who scrutinises every detail, clearlyassigns responsibility, rarely puts a foot wrongand earns constant accolades and awards. Thereis still substantial growth and scope as the grouplooks at the rest of Africa.
Coronation Fund Managers is a phenomenally
private equity firm Se k u n j a l o , led by controver-sial businessman Iqbal Survé. Sekunjalo hit theheadlines in the past decade when one of itsmajor holdings — LeisureNet Health & RacquetClub — went bust. Since then, the group hasconcentrated on accumulating media assets suchas Independent News & Media, which it acquiredin 2013. The media house includes titles such asThe Star and the Cape Argus.
Fi n b o n d , coming in at number seven in therankings, is an incongruous inclusion as itsunderlying fundamental metrics are dismal, withno five-year earnings record to speak of and apedestrian RoE of just over 12%. It’s a plucky littleoperator, however, having managed to survivethe aftermath of the Abil debacle of 2014, whichtainted many smaller lending operations such asFinbond. What appears to have saved Finbond isthe nature of its lending, which is short-term andthus far less risky compared with what Abil wasof fe r i n g .
OneLogix Group has been around for a while,offering a variety of services in the logisticsarena, including — until December 2014 — thepopular PostNet operation, which it sold forR190m. Companies in the stable include VehicleDelivery Services, Commercial Vehicle DeliveryServices, OneLogix Projex, OneLogix ProjexCargo Solutions, Madison, Onelogix Linehaul,UnitedBulk, Atlas360, DriveRisk and QSA. Thegroup employs about 1 600 people and has anextensive footprint throughout SA andneighbouring countries, with logistics capabilityextending to Namibia, Botswana, the DemocraticRepublic of Congo, Malawi, Mozambique, Zambiaand Zimbabwe.
Poynting Holdings, now known as AlarisHo l d i n g s , comes in at number nine in TopPerformers. It is a technology group specialisingin defence and specialised antennas and digitaltelevision broadcast equipment. The primarymarkets for antennas are Europe, the US and theMiddle East, while the digital TV market focuseson SA and the rest of Africa. This is a small, nichetechnology company that employs only 120people, but has an enviable profit track record. Itseight-year compound annual growth rate (CAGR)in sales is 30% and its eight-year CAGR inoperating profit is 27%. Little wonder, then, that ithas attracted the attention of PSG as a significantshareholder, with 28% of its issued equity.
At number 10 is Sa n tova , formerly known asSpectrum Shipping, a specialist supply chainsolutions group. Its five-year CAGR in earningsper share of 141,75% is truly outstanding and iseasily the best in the Top 10 of Top Performers.Not surprising, then, that its share priceperformance has been so strong in the past fivey e a rs .
With Tr u s tco at number 11, Taste Holdingscomes in at number 12 in the rankings, eventhough its underlying financial metrics are solidrather than inspiring. Led by the charismaticCarlo Gonzaga, Taste has an interesting mixtureof franchise businesses, ranging from fast-food tojewellery. Recently it acquired the SA franchisefor Domino’s Pizza and has been steadilyconverting its Scooters Pizza chain into Domino’soutlets. During 2014 it also acquired jewellerychain Arthur Kaplan Jewellers and chickenfast-food chain Zebro’s. The Fish & ChipCompany and Maxi’s complete the brand lineup.
Mr Price’s underlying financial metrics arereally impressive and the group has an almost30-year unbroken track record of graduallyincreasing earnings and dividends per share. It isone of only a small handful of SA retailers thatcan genuinely claim to have a serious onlineoffering and its expansion into the rest of theAfrican continent is growing apace. The formulais seductively simple: offer fashion at a low priceand make it an exciting destination shoppingex p e r i e n ce .
Sa bve s t is very much an “u n d e r- t h e -ra d a r ”type of operation, but one that has an excellenttrack record over its almost 30 years of existenceas a listed entity. An investment holding
company, it has investments in Brait, Datatec,Metrofile, Torre and Transaction Capital as well asa variety of unlisted entities such as SA Bias.
The only surprising thing about Na s p e rs’sposition at number 20 in Top Performers is that itis not a lot higher. As at early May 2015 its shareprice was trading at around R2 000, a first for anylisted entity on the JSE. Tencent in China is thebig driver in Naspers’s life and there are few, ifany, signs that Tencent’s growth is slowing down.After a short sabbatical, former CEO Koos Bekkerrejoined the board on April 20 2015 as non-executive chairman. Staff writer
successful third-party fund managementcompany, with assets under managementshowing a rocketing trend over time. It is an SAstory, making its founders exceptionally wealthyand creating quite a few billionaires over time. Itsimpeccable fund performance track recordrecently came in for some criticism with regardto the African Bank (Abil) debacle. Coronationwas one of the first fund managers to put up itshands regarding the Abil saga and this honestcommunication served it well. Its risks are a hugemarket blowout, as the business is highlydependent on an upward market trend. Thebusiness is well diversified, being in credit, bonds,equities and alternative assets.
Coming in at number six in the rankings is
Bre
tt E
loff
Het
ty Z
antm
an
Iqbal Survé
Dave King

Financial Mail Page 74-75 -12/06/15 03:21:35 PM
FINANCIAL MAIL • TOP COMPANIES • 201574 FINANCIAL MAIL • TOP COMPANIES • 2015 75
INVE
STME
NTINVESTMENT
Ra n k i n gIRR
Co m p a ny IRR5 years toMar 2015
EPSgrowth over
5-year period
Return onequity over
5-year period
Return onassets over
5-year period
Dividendyield 5-year
ave ra g e
Pretax profitgrowth over
7-year period
TOP PERFORMERS
21 New Europe Property Investments Plc 42 , 51 32 , 2 1 5,9 4 4 ,9 4 5, 32 70, 2 122 Capital & Counties Properties Plc 42 ,1 5 0, 5 4 -0, 36 0, 39 0, 65 N /A23 Capitec Bank Holdings 41 ,1 6 27,1 6 23, 47 9, 26 2 ,73 34, 3024 Seardel Investment Corp 4 0,4 4 N /A 0, 59 5,4 8 N /A N /A25 Metair Investments 3 9,78 9,9 0 1 4, 89 1 1 , 57 4, 27 1 4,9726 Trematon Capital Investments 37,9 7 N /A 2,80 5, 20 1, 38 1 02 ,7027 Mondi Plc 37, 87 5 4,42 1 4, 69 9 ,76 3,4 0 26 , 5528 Aspen Pharmacare Holdings 37, 87 1 6 ,0 5 1 8 , 61 1 9,0 0 0,1 3 1 9,0229 Pioneer Food Group 3 7,78 33,9 5 1 9,1 1 1 1 ,0 4 1, 39 3, 6530 Super Group 3 7,78 1 1 2 ,0 6 1 9,0 5 1 2 , 59 N /A 38 , 5831 Famous Brands 3 7,72 1 4, 53 36, 39 51 , 6 4 3, 89 14, 3232 Conduit Capital 37, 52 27, 83 3 1 ,1 7 1 4,03 0, 61 39,1 833 Mediclinic International 36 , 8 4 1 7,76 1 1 , 82 8 ,1 2 2 ,0 5 2 3,0234 Afrocentric Investment Corp 36, 38 9,9 1 25, 37 29, 5 0 1 , 53 20, 2335 ENX Group 36 , 2 1 3, 24 5,9 0 5, 5 6 2, 32 - 4, 5 436 Brait SE 36 , 20 22, 39 1 5,9 0 1 4,1 1 3,0 5 47, 8537 Vukile Property Fund 35, 8 6 -3 1 ,42 2,60 9,0 5 8 ,49 5 6 , 8738 Woolworths Holdings 35, 5 6 1 7, 28 69, 2 1 1 9, 57 4,0 1 21, 3739 Workforce Holdings 35, 52 -24, 2 1 1 ,76 4, 35 N /A - 47,7040 Resilient Property Income Fund 3 4, 65 32 ,1 9 1 0,75 1 0,9 0 5, 30 32 ,1 041 Zeder Investments 3 4, 28 8, 32 7, 5 0 6 ,41 1 , 51 29,9 042 Mondi 3 4,0 0 5 4,42 1 4, 69 9 ,76 3, 39 26 , 5543 AV I 3 3,93 1 5, 8 8 33, 38 22, 39 5, 22 1 5, 6 444 ELB Group 3 3,72 14, 33 1 3, 5 6 7,0 6 2 ,93 1 9,0 545 Discover y 3 3,07 1 4, 22 2 1 , 53 6 , 87 1,9 1 1 3,7646 Life Healthcare Group Holdings 32 ,97 22 , 87 45, 23 26 ,4 0 3, 5 0 11,6847 Steinhoff International Holdings 32 ,96 1 1 ,74 1 0,94 1 0,0 1 1 ,1 9 2 0,9448 Oceana Group 32 ,72 12, 38 4 3, 55 2 3,93 5, 5 0 1 1 , 6349 Howden Africa Holdings 32 ,1 2 25, 53 59,9 9 26 ,1 1 3, 45 27, 6 650 Imbalie Beauty 3 1 ,95 N /A 8 ,4 6 1 0, 62 N /A N /A51 Invicta Holdings 3 1 ,4 4 1 1 , 65 29, 87 11,56 3, 85 1 5,4152 Pan African Resources Plc 30,7 1 1 6 ,1 3 12, 34 11, 38 3,4 4 1 7,4553 Sa n l a m 30,1 4 9, 8 8 1 2 , 28 1 ,1 5 4,1 8 -1 , 8154 F i rst Ra n d 3 0,03 1 3, 58 25, 37 5,1 0 4, 25 12, 3955 Consolidated Infrastructure Group 30,0 1 78 ,03 11, 35 9, 2 1 N /A 1 8 ,0 456 RMB Holdings 29,9 5 8 , 69 8 , 57 8 , 23 4 ,78 7,9 157 Diamondcorp Plc 29,4 6 N /A -1 4,0 9 - 9,0 0 N /A N /A58 Ca s h b u i l d 29, 33 9, 8 0 24, 52 1 1 , 23 3,7 1 8 , 5559 M u ste k 29, 2 1 1 1 ,75 1 4, 55 6 , 59 3, 39 1 5, 6160 Compagnie Fin Richemont 28 ,94 37,4 4 1 9, 28 1 4, 6 0 1 4,41 30,9 061 N etca re 28 , 5 0 10, 39 2 1 ,94 1 1 ,94 2 ,77 9, 6162 Clicks Group 28 ,1 9 9,9 9 72 ,74 15, 31 1,7 1 1 1 ,1 563 Mix Telematics 28 ,02 1 5,77 1 0,0 4 1 3, 51 3, 47 1 0,4 364 Marshall Monteagle Plc 27, 59 N /A 3,4 0 4 ,78 3, 39 N /A65 I ta l t i l e 27, 36 1 1 ,72 22 ,4 4 18,68 6 ,07 1 1 ,98
Ra n k i n gIRR
Co m p a ny IRR5 years toMar 2015
EPSgrowth over
5-year period
Return onequity over
5-year period
Return onassets over
5-year period
Dividendyield 5-year
ave ra g e
Pretax profitgrowth over
7-year period
TOP PERFORMERS
66 Metrofile Holdings 27, 35 21, 30 26 , 53 24,9 6 1 , 82 2 0,7667 Grand Parade Investments 27, 33 -27,0 6 3, 87 2 ,94 3, 65 -2 ,0 468 ARB Holdings 26 , 87 1 1 ,48 16, 33 1 3,0 8 4, 59 1 2 ,9 069 SABMiller Plc 26 ,4 6 1 7, 63 1 2 , 87 1 8 ,1 3 2 , 24 1 5,1 270 Vodacom Group 26, 38 1 1 ,93 8 4, 24 30,4 3 6, 34 8 , 5571 Spur Corp 26 , 27 1 0, 28 22 , 8 4 33,4 0 4, 57 7, 5972 Sephaku Holdings 26 ,1 9 N /A - 0,1 4 2 , 83 N /A N /A73 The Foschini Group 26 ,07 1 1 ,76 28, 36 1 2 , 63 4, 53 9, 5374 Old Mutual Plc 25, 8 0 35 ,03 1 3,1 7 2 ,02 5,1 5 1 2 ,4 475 Compu-Clearing Outsourcing 25 ,78 1 0, 63 31,86 23, 34 7, 2 1 1 0,7376 Pinnacle Holdings 25, 36 1 5,42 2 1 ,94 11,21 2 ,1 3 1 3,9277 Re m g ro 25, 32 13, 37 6 ,1 6 6 , 65 2 ,1 9 1 2 ,9278 African Media Entertaintment 25, 23 1 4,47 27,1 1 2 1 ,4 0 3,0 0 11,5479 Cognition Holdings 24, 81 5,9 9 24 ,97 1 9, 65 5 ,75 6 ,7880 A H -Vest 24, 57 N /A -1 69,93 -24,1 6 N /A N /A81 Omnia Holdings 24,4 4 7 7,70 1 7,72 1 2 ,0 9 1 , 58 52 ,4 382 The Spar Group 24,1 7 7, 8 4 56,60 9,7 2 3,9 6 7,0 883 British American Tobacco Plc 24,1 5 9,9 6 2 1 , 23 1 6 ,1 9 4,4 6 1 0, 2584 Interwaste Holdings 2 3,73 2,68 1 0, 6 0 9, 03 N /A 3 ,9285 Sa n ta m 23, 47 1 ,1 3 26 , 20 7,9 8 5, 69 - 0,1 986 Huge Group 23, 36 9,1 9 9,0 4 1 8 ,41 N /A 21, 3387 MMI Holdings 22 , 89 2 ,73 1 4,1 1 1 ,07 1 1 ,72 2 1 ,1 388 Hyprop Investments 22 , 63 3,4 4 1 ,98 6 ,96 6,21 1 ,4289 Purple Group 22 , 52 N /A - 9, 89 -13,7 1 N /A N /A90 London Finance & Investment Group Plc 22, 39 N /A - 0,97 - 0, 82 2 , 83 N /A91 Nampak 22 , 28 9, 41 1 7, 87 9, 67 4, 5 0 1,8692 CSG Holdings 22 , 28 38 , 89 1 4,79 1 9, 5 6 1 ,02 1 8 ,9793 C l i e n te l e 22 , 2 1 1 3, 6 8 8 6 , 81 1 2 ,9 9 5,7 9 1 1 , 6994 Rolfes Holdings 21,9 1 9, 31 1 0, 53 9, 6 8 4, 45 9, 3495 Peregrine Holdings 21,84 1 1 , 20 23, 59 4, 33 5, 47 8 ,7896 Fairvest Property Holdings 21,84 N /A - 594, 87 2 ,47 7, 35 N /A97 The Bidvest Group 2 1 , 83 1 0,1 4 1 7, 55 1 0, 20 2 ,94 1 0,1 498 Adrenna Prop Group 2 1 ,75 N /A 3,4 2 5,0 8 N /A N /A99 ISA Holdings 21,68 -1 , 89 30, 39 23,1 2 8 ,1 1 - 4, 58
100 Liberty Holdings 21, 39 1 48 , 6 8 1 2 ,4 0 0,9 6 3,1 6 24,4 2101 Tre n co r 2 1 ,1 4 42 , 52 1 4, 6 0 6 ,78 5, 4 9 45,4 81 02 Telkom SA Soc 20, 89 65, 8 8 2 1 ,1 4 1 5, 24 1 4, 61 -25,1 11 03 S p a n j a a rd 20, 6 4 -7,4 3 3, 5 0 4,0 5 3,9 8 - 0, 85104 Distell Group 20, 61 8 ,9 9 1 6 , 29 1 1 ,75 3, 24 5, 57105 Octodec Investments 20, 58 N /A 8 ,74 10, 36 7,1 7 67, 61106 Shoprite Holdings 20, 41 8 ,9 0 24 ,75 1 1 , 27 2, 32 9, 651 07 Cargo Carriers 20, 28 1 4,0 6 7, 65 7, 36 2,56 1 1 ,73108 Amalgamated Electronic Electronic Corp 1 9, 52 -1 ,96 1 2 ,70 12,56 4 ,74 -2 ,96109 G row t h p o i n t 1 9,1 1 N /A 7, 03 6,86 6 , 82 N /A110 Phumelela Gaming & Leisure 1 9,1 1 1 0, 83 2 1 ,1 4 1 2 ,76 6 ,4 0 1 , 28
✥ TOP PERFORMERS ✥ ✥ TOP PERFORMERS ✥

Financial Mail Page 76-77 -12/06/15 03:22:00 PM
FINANCIAL MAIL • TOP COMPANIES • 201576 FINANCIAL MAIL • TOP COMPANIES • 2015 77
INVE
STME
NTINVESTMENT
Ra n k i n gIRR
Co m p a ny IRR5 years toMar 2015
EPSgrowth over
5-year period
Return onequity over
5-year period
Return onassets over
5-year period
Dividendyield 5-year
ave ra g e
Pretax profitgrowth over
7-year period
TOP PERFORMERS
111 Ingenuity Property Investments 1 9,0 0 33, 25 6 , 29 6 ,70 1, 31 47,1 2112 SA Corporate Real Estate Fund 1 8 ,93 -3,4 4 8 , 57 7, 5 0 8, 36 1 , 27113 KAP Industrial Holdings 1 8 ,70 9,9 9 12,80 9, 30 1,56 47,1 6114 Imperial Holdings 1 8 ,45 10, 37 1 8 ,74 9,0 2 4,0 5 1 2 , 81115 MTN Group 18,21 1 1 , 53 25, 57 20, 20 4,1 8 5, 5 6116 Brimstone Investment Corp 1 7, 65 -7, 51 7,4 8 6, 34 2 ,48 16, 30117 Cullinan Holdings 1 7,03 1 7, 85 11, 31 6 ,0 9 0, 53 1 6 ,0 4118 Sycom Property Fund 1 7,02 6 ,48 8, 33 7,0 9 7, 34 1 8 ,0 1119 Tra n s p a co 1 6 ,9 9 1 , 55 17, 30 1 1 , 20 5, 28 3,7 11 20 JSE 1 6 ,9 9 1 1 ,0 0 31,68 7,1 0 3, 6 6 8 , 20121 Acucap Properties 1 6 ,78 N /A 1 ,0 6 6 , 82 7,7 1 N /A1 22 Reinet Investments SCA 1 6 , 57 -28, 36 2 , 25 2 , 25 N /A -28, 381 23 Fortress Income Fund 1 6 ,42 2 ,48 1 4, 5 6 1 3, 5 0 1 0,1 5 100, 391 24 D a ta te c 1 6 ,41 2 1 ,07 9,9 6 5,0 0 N /A 1 6 ,1 01 25 Ba r l owo r l d 16, 30 38 , 87 1 4, 65 9,0 6 2 ,74 39, 271 26 Clover Industries 1 6 ,1 4 -24, 83 8 ,79 6 ,70 1 ,93 - 4,781 27 A EC I 1 5,79 1 7,98 11,50 7,4 2 2,64 17, 331 28 Blue Label Telecoms 1 5, 5 0 4,4 6 1 5,76 1 2 ,74 2, 34 2 ,021 29 Truworths International 1 5,49 8 , 83 41 ,74 31, 32 4,1 3 7, 611 30 Redefine Properties 1 5,4 6 - 5, 6 0 6, 32 9,7 2 8 , 65 1 8 , 82131 Nedbank Group 15, 37 1 3, 28 1 5, 53 4, 6 4 4 ,03 1 1 , 521 32 Hosken Consolidated Investments 1 5,0 8 26 , 22 8, 31 6 , 61 0, 61 - 5,021 33 City Lodge Hotels 1 5,0 6 7,0 5 48 , 22 1 7,1 4 3,4 3 1 , 85134 Co m a i r 1 4, 65 21, 31 23, 20 8,80 1 , 82 1 6 ,4 31 35 Hudaco Industries 1 4, 6 4 - 62 ,42 2 ,72 4, 22 4, 62 1 1 , 241 36 Tra d e h o l d 1 4, 25 75, 47 6,68 5, 69 1 , 27 6 0, 271 37 Tiger Brands 1 4,1 6 5,4 4 1 9,74 1 4,4 4 2,86 3, 851 38 Astral Foods 1 3,96 -2 ,0 9 1 5, 8 8 9, 28 5,1 1 -3,1 71 39 Investec Plc 1 3, 89 4 ,9 4 1 0,95 3, 37 3,4 8 9,1 8140 MAS Real Estate Inc 1 3,79 N /A 0,4 3 0, 62 2 , 65 N /A1 41 Fountainhead Property Trust 1 3,79 0, 5 4 8 ,1 1 7, 63 7, 47 5,4 81 42 Emira Property Fund 1 3,77 9,1 2 1 0, 26 8 ,4 3 8 , 62 8 , 67143 Oasis Crescent Property Fund 1 3,1 8 - 9,07 3,9 9 3, 8 4 7, 25 -3,9 9144 Crookes Bros 1 2 ,78 4 9,74 24, 36 20, 87 3 ,74 1 07,1 31 45 Lewis Group 1 2 ,72 7, 47 1 5,1 6 1 1 ,41 6,68 5, 6 6146 I nveste c 1 2 , 57 3,1 9 1 0,49 3, 23 3, 30 7, 361 47 C h ro m etco 1 2 ,48 N /A -1 ,0 6 -2 ,4 6 1 2 ,94 N /A1 48 Ca fca 11,84 1 7, 55 1 3,79 1 2 , 26 N /A 18,801 49 Insimbi Refractory & Alloy Supplies 1 1 ,76 15, 37 15, 36 7, 53 4, 52 9,9 5150 Combined Motor Holdings 11,66 15, 36 35, 6 4 1 0, 5 0 4,0 6 1 5,021 51 Infrasors Holdings 1 1 ,49 -1 6 ,1 8 1 ,0 5 4, 63 N /A -20, 271 52 Ad v Te c h 1 1 , 29 - 0,76 22 , 28 1 2 ,1 5 2,54 0,0 41 53 Wescoal Holdings 1 1 , 28 29, 57 -1 5,79 - 6 ,78 1 ,07 N /A154 Standard Bank Group 1 0,92 7,0 5 1 2 ,0 9 3,0 8 4 ,07 8 , 671 55 Sasfin Holdings 1 0, 85 6 ,48 1 7,70 7, 03 4,0 5 8 ,75
Ra n k i n gIRR
Co m p a ny IRR5 years toMar 2015
EPSgrowth over
5-year period
Return onequity over
5-year period
Return onassets over
5-year period
Dividendyield 5-year
ave ra g e
Pretax profitgrowth over
7-year period
TOP PERFORMERS
156 Tsogo Sun Holdings 1 0, 85 1 1 , 23 1 8 ,93 1 8 ,1 4 2, 38 4 3,4 31 57 Sa so l 1 0, 59 1 7,76 1 9,9 9 1 5,74 4,0 4 1 5, 8 61 58 P u t p ro p 1 0,42 3, 2 1 1 0,78 1 0,4 4 5,0 5 12,601 59 Intu Properties Plc 10, 39 N /A 1 6 , 25 7, 69 3, 36 1 1 ,77160 Barclays Africa Group 10, 32 4 ,92 16, 34 4, 22 5, 58 13, 391 61 Rex Trueform Clothing Company 1 0, 2 1 N /A - 4, 8 6 - 4,0 1 N /A N /A1 62 Massmart Holdings 9,7 1 0, 34 28 , 59 6 , 58 3,4 8 - 0, 551 63 Adcorp Holdings 9, 6 8 - 0,76 1 4,0 0 1 3,1 4 5, 35 1 3,1 3164 Hospitality Property Fund 9,0 5 9, 89 0, 31 7, 85 1 1 ,42 N /A1 65 Sa p p i 8 , 59 3 4,98 1 1 ,0 6 5, 89 N /A 1 6 , 82166 African & Overseas Enterprises 8 , 58 N /A - 6 ,4 0 - 4,4 0 N /A N /A1 67 Sun International 8 , 53 N /A 33, 82 1 0,03 2 , 23 - 0, 8 8168 Nu-World Holdings 8 ,47 1,60 9, 6 4 7,9 6 2 ,49 - 0,1 11 69 Zurich Insurance Company 8 ,4 6 N /A -1 3, 85 - 4, 51 0, 5 6 N /A1 70 A n sys 8 ,45 N /A -38 ,4 0 -1 2 , 8 0 N /A N /A17 1 Ecs p o n e n t 8 ,45 N /A 30, 53 1 0,0 9 N /A N /A1 72 Morvest Group 8, 35 15, 33 29,1 7 25,0 8 2 ,77 1 8 ,1 91 73 Tongaat Hulett 7,9 8 3, 69 1 0,1 7 8, 35 2 ,76 1 1 ,1 91 74 Value Group 7, 51 5, 41 1 6 ,4 4 1 1 ,0 1 4, 59 3, 6 61 75 Pick n Pay Holdings 7,0 4 -8, 39 56, 33 7, 57 3, 28 - 6 , 611 76 Eastern Platinum 6 ,73 N /A - 6 , 24 -1 3,1 8 N /A N /A1 77 Bowler Metcalf 6 , 58 -2, 31 13, 38 11,84 4, 32 -3, 811 78 Business Connexion Group 6 ,47 -1 2 ,95 4,4 0 6 ,42 4, 5 6 3,1 21 79 Reuner t 5,9 9 N /A 1 0, 6 6 8 ,0 9 5, 23 -3, 58180 Pick n Pay Stores 5, 35 -8, 32 39,4 3 7, 59 2,88 - 6 , 581 81 Orion Real Estate 4 ,93 4 4,0 4 0,1 3 2,50 N /A 59,7 91 82 Nictus Beperk 4, 85 -25,0 1 4,4 8 0, 85 8 ,77 -22 , 2 11 83 G r i n d ro d 4 ,75 - 8 ,94 6 ,1 8 4,7 1 2, 38 -2,9 1184 Net 1 UEPS Technologies Inc 4, 69 21,66 1 8 , 89 8 ,45 N /A 11,841 85 BHP Billiton Plc 4, 55 1 1 ,02 1 3, 6 0 1 1 , 62 3, 5 6 6, 31186 Caxton CTP Publishers & Printers 4, 41 5, 27 6 ,02 4 ,9 4 3, 2 1 -3,0 41 87 RCL Foods 4,1 6 N /A 2 ,41 5, 34 3,0 4 -1 4, 25188 Wilderness Holdings 3, 89 -1 8 , 61 1 4, 89 8 ,0 9 1 ,78 28 ,0 01 89 Verimark Holdings 3,7 9 6, 39 1 2 ,1 2 1 1 ,78 6 ,0 9 - 5, 8 4190 SacOil Holdings 3,7 1 6 ,96 1 ,1 1 1, 32 N /A 8 0,1 519 1 Gooderson Leisure Corp 2,86 - 4,1 5 2 ,94 3, 34 1 ,75 - 5,951 92 Datacentrix Holdings 2 , 69 2 ,1 5 1 9, 51 1 2 ,0 5 5, 45 1,681 93 BSI Steel 2 , 67 11,9 1 1 0,0 5 7,4 2 5, 53 20, 341 94 Randgold & Exploration Company 2 , 65 -30,1 2 3,1 6 2 , 89 3,1 9 -37, 871 95 A sso re 2 , 27 - 8 ,07 24, 53 21,84 2 , 23 1 3, 271 96 Wilson Bayly Holmes-Ovcon 1 ,75 -7, 81 7, 53 1, 38 2 ,78 -1 8 ,971 97 Iliad Africa 1 , 27 - 5, 62 1 3,4 0 9, 38 3, 24 - 0,1 01 98 Sovereign Food Investments 1,21 1 3, 26 7,4 0 6, 33 1, 37 27, 89199 Silverbridge Holdings 0, 58 -1 5, 6 0 23, 5 6 22 ,97 0, 6 8 -1 6 ,4820 0 Trans Hex Group 0,4 2 -1 2 , 8 6 -1 ,0 1 - 0, 29 N /A - 62 ,73
✥ TOP PERFORMERS ✥ ✥ TOP PERFORMERS ✥
Source: INET BFA

Financial Mail Page 78-79 -17/06/15 12:53:19 PM
FINANCIAL MAIL • TOP COMPANIES • 201578 FINANCIAL MAIL • TOP COMPANIES • 2015 79
INVE
STME
NTINVESTMENT
✥ JSE ✥ ✥ STATE-OWNED COMPANIES ✥
A go o dd i s co n n e c t
Despite a declining SAeconomy, the stock
exchange produces someimpressive numbers
T he JSE Ltd makes money in proportionto the amount of trading on theexchange — for it, volatile times aregood times. And it has been a period ofrecord highs for trading. At the end of
April, for example, the equity market had arecord of 1,025m trades — well above theprevious high of 1,018m, which was recorded inJuly 1999 when Old Mutual listed.
“This is an encouraging milestone for the JSEas it reinforces our value proposition as anenabler of capitalm a rke t s ,” says LeanneParsons, director of theequity market. “Incomparison to thecorresponding period in2014, the daily averagevolume traded on theJSE has increased 15% to281m shares, furtherillustrating the growth inmarket sentiment led byresource stocks.”
Though the JSE notesin its report for the yearto March 2015 that itsfinancial performance“was delivered against the backdrop of adeclining economy”, in fact it has becomeincreasingly disconnected from the SA economy.Investors know this very well.
More than half of the market capitalisation ofthe JSE is provided by 10 companies, and morethan a fifth by just two. The 10 are: BAT (12%),SABMiller (9%), Na s p e rs (7%), G l e n co re (6 % ) ,Richemont (5%), Bi l l i to n (5%), MTN (3%),Fi rs tR a n d (3%), Sa s o l (2%) and Ste i n h of f (2%).
All these companies are global in theiroperations or at least substantially exposed to
economies beyond SA. On the exchange as awhole, it seems there are few companiesreporting these days without reference tomaterial expansion in other African countries.Those not exposed to the rest of Africa, but onlyto the SA economy, have generally been reportingflat numbers.
Billable value traded on the equity marketgrew by 7% year-on-year, which resulted in an11% increase in revenue to R426m (2013: R385m).That was supported by post-trade services,including rebates given in the prior year,producing growth of 20% to R299m (2013:R249m). The other major source of revenue is inthe provision of market data, where revenuegrew 15% to R203m (2013: R177m). This wasascribed to growth in the number of dataterminals and increased passive tracking.Earnings per share (EPS) rose to 742c (up 25%)and headline earnings per share to 735c (14%),with a total dividend of R417m.
The JSE expects the technology component ofits costs to increase, “though we are clearlymindful of the need to keep a tight handle onthese costs”.
Last year the JSE said goodbye to chairmanHumphrey Borkum, ending an individual andfamily association going back many decades. Thisyear it was the turn of another legend. GeoffRot h s c h i l d’s association with the JSE began in the
mid-1960s, when hebegan auditing workfor a stockbroker. In1991 he was elected tothe JSE committee andserved on the JSEboard until 2008.During this period hewas deputy chairmanand then chairman( 2 0 0 0/ 2 0 0 1 ) .Rothschild workedfull-time for the JSEfrom 2003 and his lastrole — from which heretired at the end ofMarch — was head of
government and international affairs.In 2015, the JSE’s “top priorities are progressing
the move of the equity market to a three-daysettlement cycle (T+3) and to the integration ofour trading and clearing platforms”, says CEONicky Newton-King. “Much of our corporateenergy and investment will be dedicated to these.At the same time, we are conscious that thefinancial market landscape is changing fast andso we continue to work on initiatives that willprovide compelling and cost-effective services toour clients.” David Williams
Ne wmodelre q u i re d
Partial privatisation couldbe the only route to make
these entities more efficientand not a drain on state
reso u rces
T he problem with Es ko m is not that it is astate-owned company (SOC), but that itsconfused governance model has createdunaccountability, with dire conse-quences for operational efficiency and
financial accountability.For many years after the Electricity Supply
Commission (known as the ESC or Escom) wasfounded in 1923, there was no doubt that it was astate entity. Escom’s brief was to build generatingcapacity, and later it took an increasing role indistribution. If it failed in these tasks, there wasno doubt who would be held ultimatelyaccountable: government, with the minister thefirst point of call.
Escom became Eskom in 1987, and over the
past two decades the utility has increasinglytaken on the status and trappings of a largeprivate company. It paid tax. Its human resourcespractices became a benchmark. It produced thecheapest power in the world, efficiently. Flushedwith success, it built an opulent corporateheadquarters, Megawatt Park, on prime landnorth of Sandton. The GM became a senior GM,and then a CEO. This title inflation was matchedby ever bigger executive packages and bonuses,and ever fancier annual reports.
The entity developed highly sophisticatedbudgeting processes, with the kind of fundraisingexpertise and management of risk normallyfound in big banks (a far cry from the singleaccountant employed in 1923). Yet Eskomremained, and remains, a 100% state-ownedentity — even though, like Transnet, it likes totalk about its “s h a re h o l d e r ”.
Though it has a board of well-paid non-executives, they all know who is the real boss —not the chairman but the minister of publicenterprises. However, the board is nominally incharge, which means the minister can claimignorance if anything goes wrong. So thecorporate history has produced a kind of multiplepersonality. When it suits government, it likes totreat Eskom as an independent company. Atother times, Eskom must do government’sbidding — and also endure instructions andappointments that are politically inspired.
At the heart of good corporate governance isabsolute clarity on the lines of authority andresponsibility. Shareholders appoint the board,and the board then elects its chairman. The board— which should include members who have abalance of skills and experience relevant to thecompany — decides on the strategic agenda forthe company, appoints the senior executives andlets them get on with day-to-day management.
Very little of this has beenin evidence at Eskom inrecent years.
The dangers of acommand that is not onlydivided, but divided in anopaque way, came home toroost with the suspensionof four senior Eskomexecutives, including theCEO, towards the end of2014. This was bizarre: thefour had hardly been inoffice long enough to makeany difference to a large,complex organisation, andit was specifically statedthat they were not accusedof doing anything wrong.
Nicky Newton-King
Fred
dy M
avun
da
Brian Molefe
Trev
or S
amso
n

Financial Mail Page 80-81 -12/06/15 03:22:44 PM
FINANCIAL MAIL • TOP COMPANIES • 201580 FINANCIAL MAIL • TOP COMPANIES • 2015 81
INVE
STME
NTINVESTMENT
✥ STATE OWNED COMPANIES ✥ ✥ STATE OWNED COMPANIES ✥
By the end of May, two of the four had resignedor departed, presumably with generousseverance packages that are not provided for inthe public service regulations and will remains e c re t .
Transnet is the one major SOC that has beenwell run and has been able to sustain itselffinancially. Over the next five years its marketdevelopment strategy projects big increases in theexport tonnage of iron ore (53 Mt in 2013 to 83 Mt )and coal (68 Mt to 98 Mt). But the lion’s share ofits capital spending will go to the two dedicatedlines from Ermelo to Richards Bay (coal) andSishen to Saldanha (iron ore). Those two links,with some feeder lines from the mining areas,could in theory exist as self-contained railways.They support the broader network only byrevenue gained, not operationally.
Strategically, the crucial expansion is intendedto be in the national general freight business(GFB), comprising commodities that are suited torail (such as fertiliser and grain) and containertraffic. The GFB had declined steadily for morethan two decades, and in some cases rail-friendly traffic has largely been lost to the roads.Transnet will have to recapture that work if itexpects to achieve its target of raising the GFBtonnage in seven years from 80 Mt to 170 Mt ,including the doubling of the number ofcontainers on rail between 2012 and 2018.Internal coal traffic will also be important as railaims to recapture some of the Eskom supply lostto road.
The reward, if it can be called that, forTransnet CEO Brian Molefe was to be secondedin April this year by public enterprises minister
Lynne Brown to be acting CEO of Eskom. It wasnot clear if he would have the political clout toresist interference from government, but he sentsome refreshing signals in his first weeks inoff ice.
For years paying consumers have beenoutraged that Eskom is owed huge amounts(R8bn by mid-2015) because of bills unpaid bymunicipalities and Soweto (most of which issupplied directly by Eskom). For political reasonsthat have their roots in boycotts in the 1980s and1990s, the household defaulters’ lights are notswitched off. Molefe made it clear that thiscannot continue, and the municipal debts startedbeing collected. The Soweto problem will not beas easy to solve, especially as the ruling party’seyes turn increasingly to the municipal electionsnext year.
There have been welcome indications thatgovernment is again prepared to considerpublic-private partnerships for aspects of Eskom’soperation. There is little option to this route.Private companies must be encouraged, both byEskom and through tax concessions, to sustainthemselves where possible and to deliver surpluspower to the national grid. Some industrial andagricultural companies are already doing this. Butare they being sufficiently rewarded?
Renewable energy sources such as solar andwind power are never going to provide the bulkof SA’s energy needs, but they could make thedifference when the network is under strain.They are not fully reliable, but SA is second onlyto Chile when it comes to days of sunshine peryear, and there is no shortage of coastal wind.Again, private operators must be given incentives.
Further electricity priceincreases are inevitable, buthere too creativity is needed.The price increase schedule canbe extended from three yearsto, say, 10 years, so that bondholders have clarity about thecapacity of Eskom to meetfuture financial commitments.
Above all, Eskom needscompetent leaders andtechnicians. There is talk ofretrenchments (often anunimaginative response tobudgetary pressure), but littleabout retaining and hiring thebest people. The people of thecountry are the realshareholders in Eskom (notgovernment), and we want tosee a few big appointments inproject management andoperations. It remains to be
seen if the appointment of Molefe is the answer— and, if he is effective, whether he will beappointed permanently.
Government loves to describe itself as the“s h a re h o l d e r ” in SOCs. The obvious point is that,if government wants to tell Eskom what to do, itshould abolish the board and have the CEOreport to the director-general of publicenterprises. Without a board to blame, thepoliticians would be much more circumspect intheir promises and demands — and more carefulabout whom they appoint to key positions.
The governance record at SA Airways (SAA)has been even worse than at Eskom. As AnsieRamalho, CEO of the Institute of Directors inSouthern Africa, has pointed out, “there is awidespread, fundamental misunderstanding ofwhat corporate governance actually is. Policies,structures and processes are just ways to positionthe company to achieve good governance, buttrust is required to make corporate governance aliving reality that delivers benefits. And buildingtrust requires good relationships”.
Nowhere has the consequences of a lack oftrust between directors themselves, and betweenthe board and some executives, been morevividly illustrated than at SAA. Suspensions,
acting appointments, the minister wishing toremove the chair but being prevented from doingso by the president — such behaviour hasbecome routine.
Behind the poor governance is an organisationthat government argues is “s t ra te g i c ” and musttherefore remain state-owned, but has receivedmore than R22bn in taxpayer funding.Competitor C o m a i r, listed on the JSE andprofitable in every year of its 60-year history, hasrepeatedly resorted to court action to preventgovernment giving further support to theloss-making national carrier.
“For as long as government provides fundingto SAA, it can continue to operate in ananticompetitive and noncommercial manner inthe domestic market,” Comair has argued. “SA A’sexcessive capacity and pricing at below costcauses market distortion.” The result is thatcompeting, private-sector airlines are “unable toearn reasonable profits to allow them to coveroperating costs, replace aircraft, provide a returnto shareholders and remain in business”.
Comair has also argued that the billions instate funding given to SAA since 1991 go againstthe Domestic Aviation Transport Policy andcontravene the SAA Act, the Promotion ofAdministrative Justice Act, the Public FinanceManagement Act and the constitution.
In a court case this year, Comair argued thatgovernment is using the guarantees it gives toSAA as a “d ev i ce” to raise funding fromcommercial banks, thus delaying the payments itwould eventually have to make on behalf of theairline. Comair said SAA would never be able topay its debts, and was instead raising debt againstfresh guarantees to pay for interest on older debt.Comair also argued that parliament rather thanthe minister needed to authorise bailoutpayment, but this application was dismissed bythe court in early June.
The model for a future route for major SOCssuch as Eskom and SAA is surely provided byTe l ko m . It was partially privatised 15 years ago,with 40% of the equity owned by governmentand 10% by the Public Investment Corp (PIC), thelargest investor on the JSE with the funds itinvests on behalf of the Government Employees’Pension Fund. This effectively gives the state acontrolling share, though the PIC insists it actsindependently and is not an agent of government.
In 2014 the Telkom share price touched lowsaround R12, but has since recovered markedlyunder the steady and innovative leadership ofCEO Sipho Maseko. It was trading at around R68in early June, boosted by the confirmation in Maythat it intended to acquire the entire issued sharecapital of listed IT company Business Connexion.
David Williams
Tra n s n et’s coal exports could increase
Confirmation of Telkom’s acquisition plans boosted its shares
Rus
sell
Rob
erts
Fred
dy M
avun
da

Financial Mail Page 82-83 -17/06/15 01:03:26 PM
FINANCIAL MAIL • TOP COMPANIES • 201582 FINANCIAL MAIL • TOP COMPANIES • 2015 83
INVE
STME
NTINVESTMENT
Alsiex p l o i t sre fo c u sa t te n t i o n
Multi-assets momentarilylose out to SA equityportfolios as the Alsiperforms well in Q1
T he SA unit trust industry has for the pastdecade been dominated by multi-assetfunds. These are funds in which thefund manager is given discretion toallocate between equities, bonds, cash
and property. They account for 49% of the totalindustry, which has R1,77 trillion underm a n a ge m e n t .
In the SA industry there is a mind numbingchoice of 1 211 funds, of which about half aremulti-asset. But SA investors suddenly threwcaution to the wind in the first quarter of 2015,turning to SA equity portfolios with a view totapping into the strong performance delivered bythe JSE all share index (Alsi) at the beginning ofthis year.
The Collective Investment Schemes industrystatistics for the quarter and year ending March2015, released by the Association for Savings &Investment SA (Asisa), show that for the first timein a number of years quarterly net inflows intoSA equity portfolios exceeded net inflows into SAmulti-asset portfolios by more than double.
SA equity portfolios attracted R8,8bn in netinflows for the first quarter of this year, with thebulk of the money flowing into SA general equityportfolios, while SA multi-asset portfoliosrecorded R4,3bn.
Pieter Koekemoer, head of retail investmentsat Coronation, warns that these figures aresomewhat distorted. “There have been a numberof amalgamations of management companiessuch as the old SIS funds into Old Mutual. Stanlib
Multimanager has brought on board funds thatused to be managed by Investment Solutions, andfunds are moving from the Metropolitanmanagement company to Boutique CollectiveInvestments (run by former Metropolitanmanagement company head Robert Walton). “Bu tthere has been a revival of interest in SA equities,quite contrary to the industry consensus that themarket is overvalued.”
Money market funds continued their decline,with a R35bn outflow in the year to March 31.This was partly brought about by reaction tolosses the funds suffered from short-dated Abilpaper when the business collapsed. In theprevious year, money market inflows were flat.
Asisa CEO Leon Campher points out thatthough SA equity portfolios have been attractingunusually high net inflows over the year endedMarch 2015, this was the first quarter where netinflows actually exceeded those into SAmulti-asset portfolios.
As a result, net inflows for the 12 months toend-March 2015 amounted to R83bn for SAmulti-asset portfolios and R27bn for SA equityportfolios. Total net flows for the 12 months toMarch were R98bn.
In the 12-month period to end-March 2014, SAequity portfolios suffered net outflows of R2bn,while SA multi-asset portfolios attracted netinflows of R115bn. Campher notes that the netinflows attracted by SA equity portfolios in the 12months ending March 2015 are higher than the
✥ UNIT TRUSTS ✥ ✥ UNIT TRUSTS ✥
total net inflows recorded by these portfolios inthe previous five years.
He says it will be interesting to see whether SAgeneral equity portfolios will continue drawingthe bulk of net inflows during the current quarter,with world markets having lost some of theirmomentum at the beginning of May. The JSE Alsireached a record high of 55 188 points on April 26,but has weakened since then due to re a l i g n e dinvestor sentiment. “Though having sufficientgeneral equity exposure in a portfolio is a goodthing, we sincerely hope that the sudden surge ininterest in general equity portfolios is not a caseof investors trying to time the market, but ratherinvestors taking a long-term view on equitiesaimed at helping them achieve their financialgo a l s ,” says Campher.
Anthony Katakuzinos, chief operating officerof Stanlib Retail, says he shares the sentimentthat it is a time to be cautious, though the inflowsinto the Stanlib equity funds have been moremuted than the industry trend.
Campher says unfortunately many investorsstill believe they can time the market and end upmaking emotional investment decisions based oneither fear or greed. He reminds investors thatproper diversification is critical, since differentasset classes will perform differently whenmarket conditions change.
Multi-asset portfolios invest across the equity,bond, money and property markets, with theasset manager deciding how much money toinvest in each asset class. These portfolios havebecome popular with investors and advisers alikesince they provide diversification across assetclasses within one portfolio, with an expertdeciding on the appropriate mix. Portfoliosranging from low-equity to high-equity exposureare available within the multi-asset category.
In the past year, the top performer in theflexible category was the Baobab Flexible Oppor-tunity Fund (44,7% return); in high equity PlexusWealth Balanced Fund (23%); in medium equityClarus Wealth Accumulator (19,7%); and in lowequity Plexus Wealth Conservative Fund (19,3%).
None of these funds is well known to thegeneral public. Koekemoer says in terms of flows,a handful of companies — such as Coronation,Foord and Prudential — dominate. “It sounds likea lot, that there are 1 211 funds, but in reality theindustry is highly concentrated with 100 fundsaccounting for a large majority of the flows.”Even within the fund groups, usually only six orseven core funds are marketed.
Investec Asset Management SA boss ThaboKhojane says retail investors are guided to thecore range, which includes Diversified Income,Cautious Managed, Opportunity, Equity, Value,Global Franchise and Global Strategic Managed.
And even in this small menu, the bestsellers byfar are Cautious Managed, Opportunity andGlobal Franchise — all managed by the so-calledquality team run by Clyde Rossouw.
But Koekemoer concedes that a few boutiquesare getting some attention, notably Truffle,Harvard House (winner of the Morningstar Awardfor best general equity fund in March 2015),Anchor and 36One.
Campher says 32% of the inflows into the CISindustry in the 12 months to end-March 2015came directly from investors. He points out,however, that this does not mean that theseinvestors acted without advice since a number ofdirect investors pay for advice and then directlyimplement the choice of portfolio.
Intermediaries contributed 21% of newinflows, while linked investment servicesproviders generated 24% of sales and 23% ofsales was received from institutional investorssuch as pension and provident funds.
Locally registered foreign portfolios held assetsunder management of R318bn at the end ofMarch 2015, compared to R283bn at the end ofDecember 2014. These foreign portfolios recordednet inflows of R3,6bn for the first quarter of thisyear, a drop from the R5,8bn in net inflows at theend of December 2014.
Foreign currency unit trust portfolios aredenominated in currencies such as the dollar,pound, euro and yen and are offered by foreignunit trust firms. These portfolios can only beactively marketed to SA investors if they areregistered with the Financial Services Board.Local investors wanting to invest in them mu s tcomply with Reserve Bank regulations and willbe using their foreign capital allowance.
There are 363 foreign currency denominatedportfolios on sale in SA. Stephen Cranston
A nt h o nyKa ta ku z i n os
Thabo Khojane
Jere
my
Gly
n
Het
ty Z
antm
an
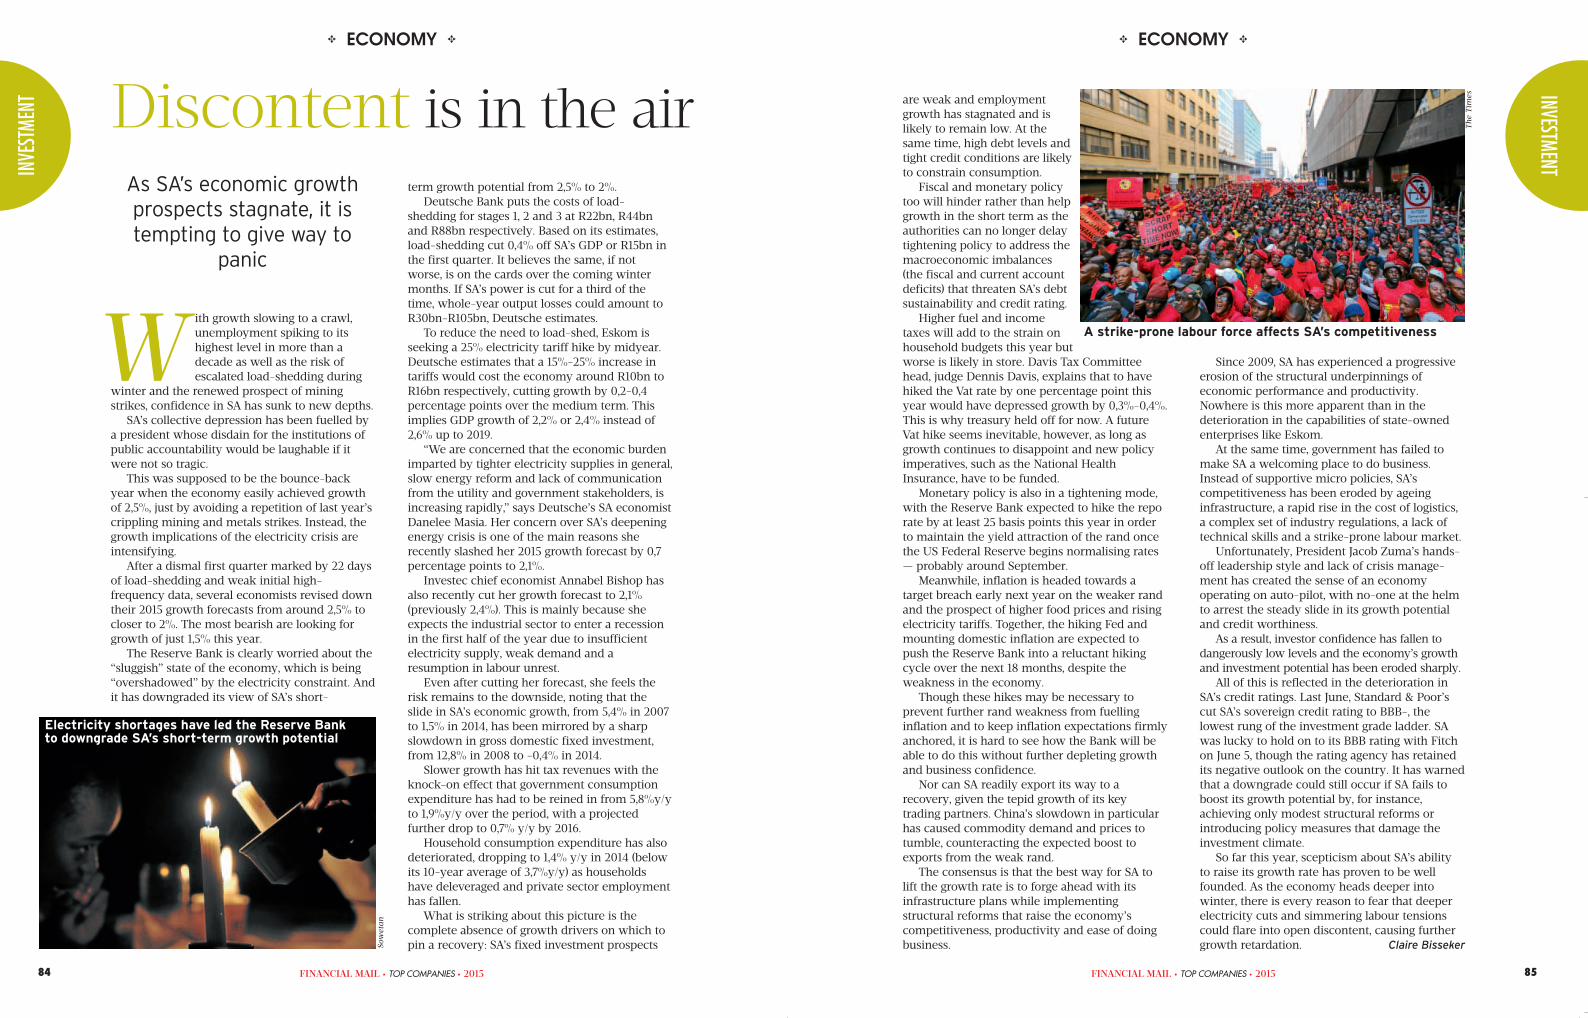
Financial Mail Page 84-85 -12/06/15 03:23:28 PM
FINANCIAL MAIL • TOP COMPANIES • 201584 FINANCIAL MAIL • TOP COMPANIES • 2015 85
INVE
STME
NTINVESTMENT
✥ ECONOMY ✥
D i s co n te n t is in the airAs SA’s economic growthprospects stagnate, it istempting to give way to
pa n i c
W ith growth slowing to a crawl,unemployment spiking to itshighest level in more than adecade as well as the risk ofescalated load-shedding during
winter and the renewed prospect of miningstrikes, confidence in SA has sunk to new depths.
S A’s collective depression has been fuelled bya president whose disdain for the institutions ofpublic accountability would be laughable if itwere not so tragic.
This was supposed to be the bounce-backyear when the economy easily achieved growthof 2,5%, just by avoiding a repetition of last year’scrippling mining and metals strikes. Instead, thegrowth implications of the electricity crisis arei n te n s i f y i n g .
After a dismal first quarter marked by 22 daysof load-shedding and weak initial high-frequency data, several economists revised downtheir 2015 growth forecasts from around 2,5% tocloser to 2%. The most bearish are looking forgrowth of just 1,5% this year.
The Reserve Bank is clearly worried about the“s l u gg i s h” state of the economy, which is being“ove rs h a d owe d” by the electricity constraint. Andit has downgraded its view of SA’s short-
term growth potential from 2,5% to 2%.Deutsche Bank puts the costs of load-
shedding for stages 1, 2 and 3 at R22bn, R44bnand R88bn respectively. Based on its estimates,load-shedding cut 0,4% off SA’s GDP or R15bn inthe first quarter. It believes the same, if notworse, is on the cards over the coming wintermonths. If SA’s power is cut for a third of thetime, whole-year output losses could amount toR30bn-R105bn, Deutsche estimates.
To reduce the need to load-shed, Eskom isseeking a 25% electricity tariff hike by midyear.Deutsche estimates that a 15%-25% increase intariffs would cost the economy around R10bn toR16bn respectively, cutting growth by 0,2-0,4percentage points over the medium term. Thisimplies GDP growth of 2,2% or 2,4% instead of2,6% up to 2019.
“We are concerned that the economic burdenimparted by tighter electricity supplies in general,slow energy reform and lack of communicationfrom the utility and government stakeholders, isincreasing rapidly,” says Deutsche’s SA economistDanelee Masia. Her concern over SA’s deepeningenergy crisis is one of the main reasons sherecently slashed her 2015 growth forecast by 0,7percentage points to 2,1%.
Investec chief economist Annabel Bishop hasalso recently cut her growth forecast to 2,1%(previously 2,4%). This is mainly because sheexpects the industrial sector to enter a recessionin the first half of the year due to insufficientelectricity supply, weak demand and aresumption in labour unrest.
Even after cutting her forecast, she feels therisk remains to the downside, noting that theslide in SA’s economic growth, from 5,4% in 2007to 1,5% in 2014, has been mirrored by a sharpslowdown in gross domestic fixed investment,from 12,8% in 2008 to -0,4% in 2014.
Slower growth has hit tax revenues with theknock-on effect that government consumptionexpenditure has had to be reined in from 5,8%y/yto 1,9%y/y over the period, with a projectedfurther drop to 0,7% y/y by 2016.
Household consumption expenditure has alsodeteriorated, dropping to 1,4% y/y in 2014 (belowits 10-year average of 3,7%y/y) as householdshave deleveraged and private sector employmenthas fallen.
What is striking about this picture is thecomplete absence of growth drivers on which topin a recovery: SA’s fixed investment prospects
✥ ECONOMY ✥
are weak and employmentgrowth has stagnated and islikely to remain low. At thesame time, high debt levels andtight credit conditions are likelyto constrain consumption.
Fiscal and monetary policytoo will hinder rather than helpgrowth in the short term as theauthorities can no longer delaytightening policy to address themacroeconomic imbalances(the fiscal and current accountdeficits) that threaten SA’s debtsustainability and credit rating.
Higher fuel and incometaxes will add to the strain onhousehold budgets this year butworse is likely in store. Davis Tax Committeehead, judge Dennis Davis, explains that to havehiked the Vat rate by one percentage point thisyear would have depressed growth by 0,3%-0,4%.This is why treasury held off for now. A futureVat hike seems inevitable, however, as long asgrowth continues to disappoint and new policyimperatives, such as the National HealthInsurance, have to be funded.
Monetary policy is also in a tightening mode,with the Reserve Bank expected to hike the reporate by at least 25 basis points this year in orderto maintain the yield attraction of the rand oncethe US Federal Reserve begins normalising rates— probably around September.
Meanwhile, inflation is headed towards atarget breach early next year on the weaker randand the prospect of higher food prices and risingelectricity tariffs. Together, the hiking Fed andmounting domestic inflation are expected topush the Reserve Bank into a reluctant hikingcycle over the next 18 months, despite theweakness in the economy.
Though these hikes may be necessary toprevent further rand weakness from fuellinginflation and to keep inflation expectations firmlyanchored, it is hard to see how the Bank will beable to do this without further depleting growthand business confidence.
Nor can SA readily export its way to arecovery, given the tepid growth of its keytrading partners. China’s slowdown in particularhas caused commodity demand and prices totumble, counteracting the expected boost toexports from the weak rand.
The consensus is that the best way for SA tolift the growth rate is to forge ahead with itsinfrastructure plans while implementingstructural reforms that raise the economy’scompetitiveness, productivity and ease of doingbusiness.
Since 2009, SA has experienced a progressiveerosion of the structural underpinnings ofeconomic performance and productivity.Nowhere is this more apparent than in thedeterioration in the capabilities of state-ownedenterprises like Eskom.
At the same time, government has failed tomake SA a welcoming place to do business.Instead of supportive micro policies, SA’scompetitiveness has been eroded by ageinginfrastructure, a rapid rise in the cost of logistics,a complex set of industry regulations, a lack oftechnical skills and a strike-prone labour market.
Unfortunately, President Jacob Zuma’s hands-off leadership style and lack of crisis manage-ment has created the sense of an economyoperating on auto-pilot, with no-one at the helmto arrest the steady slide in its growth potentialand credit worthiness.
As a result, investor confidence has fallen todangerously low levels and the economy’s growthand investment potential has been eroded sharply.
All of this is reflected in the deterioration inS A’s credit ratings. Last June, Standard & Poor’scut SA’s sovereign credit rating to BBB-, thelowest rung of the investment grade ladder. SAwas lucky to hold on to its BBB rating with Fitchon June 5, though the rating agency has retainedits negative outlook on the country. It has warnedthat a downgrade could still occur if SA fails toboost its growth potential by, for instance,achieving only modest structural reforms orintroducing policy measures that damage theinvestment climate.
So far this year, scepticism about SA’s abilityto raise its growth rate has proven to be wellfounded. As the economy heads deeper intowinter, there is every reason to fear that deeperelectricity cuts and simmering labour tensionscould flare into open discontent, causing furthergrowth retardation. Claire Bisseker
Electricity shortages have led the Reserve Bankto downgrade SA’s short-term growth potential
A strike-prone labour force affects SA’s competitiveness
Sow
e ta n
The
Tim
es

Financial Mail Page 86-87 -17/06/15 12:54:50 PM
FINANCIAL MAIL • TOP COMPANIES • 201586 FINANCIAL MAIL • TOP COMPANIES • 2015 87
INVE
STME
NTINVESTMENT
✥ CORPORATE GOVERNANCE ✥ ✥ CORPORATE GOVERNANCE ✥
King 4 tohelp betterequipd i re c to rs
Revised codes will aim totighten governance and
address loopholes in King 3
W hy do cars have brakes? “So theycan go faster.” This, according toAnsie Ramalho, former CEO ofthe Institute of Directors of SA(IoD), is a vivid way of capturing
the usefulness of governance codes. In SA theyhave become known as the King codes, aftergove r nance guru, businessman and former judgeMervyn King. Ramalho has left the CEO positionat the IoD in order to be the project leader for thelatest revision of the codes.
“Speaking of brakes,” says Ramalho, “co n s i d e rthe following realities of the SA governancelandscape. A fair number of public-sector entitieshave come to a virtual standstill, with acting CEsholding the fort. In some instances this is aconsequence of protracted disciplinaryproceedings against an incumbent CE, but inothers the reasons for allowing an acting CE to bein charge for extended periods are vaguer.
“Nevertheless, the governance failures in theseinstances are patently obvious: deficient exe-cutive appointment processes; an inability to dealeffectively with management oversight anddisciplinary issues; lack of clarity on account-ability and reporting lines; and lack of successionp l a n n i n g .”
Another governance area where brakes havenot been applied, to apply the metaphordifferently, is that of excessive executive remu-neration. “Admittedly, there are underlyingsystemic issues that worsen the problem. Bu tthere is no denying that boards and remunera-tion committees have to acknowledge theircontribution to the escalation of executive pay
over the past 20 years,” she says. Another keyissue is integrated reporting, and King 4 alsoneeds to be aligned and linked with the changinginternational thinking on responsible investingand with the code for responsible investing in SA.
These are some of the issues that will beaddressed as the IoD prepares to facilitate therevision of the King codes. But how will the newversion be different?
“The fundamental philosophy and concepts ascurrently espoused by King 3 will not change andcompanies should continue following King 3 as its t a n d s ,” says the IoD. “Simplification and ease ofinterpretation and access will be a key tenet ofKing 4. One of the ways that this will be achievedis by clearly differentiating principles frompractice recommendations.
“Principles will be stated as higher orderobjectives. For example, the board should beconstituted so that power is balanced anddecision-making is objective. A practice bymeans of which this can be achieved is to have amajority of independent directors on the board.”
This is already recommended for listedcompanies, but may be difficult for smallerunlisted companies. So, different and moreappropriate practices will be explored. Thisapproach is intended to put the emphasis on theprinciple, and the outcome envisaged by theprinciple, and allows for flexibility of application.
“The purpose of the King 3 update is not topresent a compliance hurdle, but rather to equipdirectors and other officials charged withgovernance duties to become more nimble in anever-increasing complex and unpredictablee nv i ro n m e n t ,” says Ramalho. “SA and the Kingcommittee have received many accolades for theprogressive thinking and philosophies behindKing 3. However, from the vantage point of theIoD , it is clear that not all are partaking andbenefiting from this achievement.”
She says public entities are using a protocol ongovernance that is based on an earlier version ofKing, testimony to the lacklustre reception forKing 3. And there are some organisations in thenonprofit sector that think King 3 is “wh o l lyu n a c h i eva b l e”, due to a lack of resources to meetthe perceived requirement for expensive andcomplicated structures. She says this perceptionshows that there is a void that needs to be filled.
“It is recognising this that clinched the decisionby the King committee to rewrite King 3. Weneed better regulation, not more,” she says.
There have also been corporate developments,locally and globally, that need to be taken intoaccount and provided for in King 4. Greatersuccinctness and streamlining will position King4 for accessibility on mobile devices. The aim isto make it possible for companies and other
entities to disclose their application on King 4online.
“The intent is for the drafting process to bewidely consultative so that the resultant productis truly for South Africans and by South Africans,”says Ramalho. “Our invitation therefore goes toconstituents and particularly corporations acrossall sectors to participate in this endeavour tomove us faster towards our goals as a nation.”
What will not change in King 4 are the “f ivefundamental values” included in the first chapterof King 3:❑ Conscience: A director should act withintellectual honesty and independence of mindin the best interests of thecompany and all itsstakeholders, in accordance withthe inclusive stakeholderapproach to corporategovernance. Conflicts of interestshould be avoided.❑ Inclusivity of stakeholders isessential to achieving sustain-ability and the legitimateinterests and expectations ofstakeholders must be taken intoaccount in decision-making ands t ra te g y .❑ Competence: A directorshould have the knowledge andskills required for governing acompany effectively. Thiscompetence should becontinually developed.❑ Commitment: A directorshould be diligent in performinghis duties and devote sufficienttime to company affairs.Ensuring company performance and compliancerequires unwavering dedication and appropriatee f fo r t .❑ Courage: A director should have the courage totake the risks associated with directing andcontrolling a successful, sustainable enterprise,and also the courage to act with integrity in allboard decisions and activities.
Due to the consultative process to be followed,the IoD envisages that King 4 will be completedin the second half of 2016.
Another area of focus for the IoD has been thecompetence of directors of boards. Two years agoit launched Chartered Director (SA), a profes-sional designation based on a rigorous qualifyingprocess. The IoD’s Michele Serfontein says theproject has not been deliberately marketed untilnow because of the initial focus on internalprocesses. However, 28 chartered directors (CDs)have been added since the launch, joining thegroup of senior directors who were awarded the
certification without examination in recognitionof their long and broad experience on boards.
As at March 26 2015, the register of the 38individuals awarded the CD (SA) certificationincluded former Sanlam chairman and JSEpresident Roy Andersen, former Nedbank CEOTom Boardman, former MTN CEO ThulaniGcabashe, Nedbank chairman Reuel Khoza,Imperial CEO Mark Lamberti, former ReserveBank governor Tito Mboweni and formerSABMiller finance director Malcolm Wyman.
All IoD board members have been, or aregoing, through the certification process, and morethan 90 individuals are registered on the
programme. “The benefits arenot yet evident,” says Serfontein,“given that there are thousandsof directors in SA. But we aregetting traction. We arebenchmarked against the IoD inthe UK, and are aiming to getglobal recognition for the CD(SA). It does take courage toallow assessment of individualboard members, but more andmore boards are accepting theneed for this.”
To become a CD, the maincriteria are that one needs to beat least 30 years of age, and tohave been a practising directorof a company or an equivalentoffice for at least three years.Once registration is approved,the candidate is asked to collatea portfolio of qualifications andex p e rience (PQE), a time-consuming process. Successful
candidates proceed to an examination, which isfollowed by an interview by a CD governing bodythat is separate from the IoD board.
“The exam is a professional examination thattests insight into the role of director,” according tothe IoD’s guide to the CD (SA) designation.“Though candidates can touch up on theirknowledge of underpinning theory andlegislation, the examination cannot be passedwithout experience and insight into this role.Successful candidates are then able to proceed tothe peer interview where governing bodymembers are able to finalise the application. Thefinal outcomes of these three assessments arecollated and submitted to the governing body forsign-off. Successful candidates are certified andtheir name is added to the national register ofchartered directors. Designees are issued acertificate with a unique CD (SA) number.”
Details are available on the IoDSA website atw w w. i o d s a . co . z a /c h a r te re d d i re c to r. David Williams
Ansie Ramalho

Financial Mail Page 88-89 -12/06/15 03:24:35 PM
FINANCIAL MAIL • TOP COMPANIES • 201588 FINANCIAL MAIL • TOP COMPANIES • 2015 89
SERV
ICES SERVICES
✥ LEGAL ADVISERS ✥✥ LEGAL ADVISERS ✥
A commitmentto real c h a n geA transformed profession will translate into more faith in the
justice system for South Africans
T he transformation of the legal professionis not only an economic and moralimperative. But the maintenance of therule of law is dependent on it. Without atransformed judiciary, the majority of
S A’s population will have little faith in the justicesy s te m .
However, based on research from the Centrefor Applied Legal Studies in partnership with theFoundation for Human Rights, the industry stillhas some way to go. “The top positions in theprofession — from senior partners of law firms tosenior counsel at the bar and senior members ofthe judiciary — remain largely homogenous,” s ay sthe 2013 Legal Fellows Network survey.
“These positions are dominated by white men,with a marked absence of diversity on the basisof race, gender and other marginalisingc h a ra c te r i s t i c s .”
Says Stephen Thomson,managing partner at ThomsonWilks Attorneys: “Good work isbeing done around employmentequity and transformation acrossthe profession.
“However, though theachievement of appropriatelyrepresentative demographic targetsis undoubtedly a vital requirementin the transformation of anyindustry in SA, true sustainabletransformation requires thatstakeholders in the legal professiongo further than merely meetingequity targets.”
The legal profession has a vitalpart to play in the country’ssuccess at redressing inequalities ofthe past, Thomson says. “It requiresmore than creating study and job
opportunities, but also includes a continuedcommitment by law firms to assist in thedevelopment of newly qualified individuals oncethey enter the profession.”
He says any transformation commitmentworth its salt needs to include a dedicatedmentorship programme that focuses particularlyon providing junior law practitioners with the fullbenefit of their more senior colleagues’ industryexperience — particularly hands-on exposure tocomplex legal issues and challenges.
“If we allow our young graduates to work andsurvive on mundane and largely administrativetasks such as postponements and unopposedapplications, the comprehensive transformationof our profession will take decades longer than its h o u l d ,” he says.
“And though mentorship is obviously aimed atthe transfer of skills to young legalprofessionals, the benefits extendfar beyond mere experience. Byhelping them to become betterskilled and more successful, theretention rate of these youngprofessionals by the industry willalso improve.”
In recognition of this need formentored exposure of legal juniorsto complex litigation challenges,Thomson Wilks Attorneys hasdesigned what it hopes willbecome the standard forskills-based transformation in theSA legal profession. “The success ofthis [mentorship] programme isreliant upon the support of the BarCouncil which, fortunately, hasbeen receptive to the idea,” s ay sTh o m s o n .
Rob Otty, MD at Norton Rose
Fulbright SA, says law firms play a far wider rolein transforming the economy generally. This isbecause well trained lawyers who leave lawfirms most often find themselves in seniorpositions within the corporate world, where theyuse the skills and the training they received whileemployed by the industry to good effect.
“We consider our network of alumni to bepart of our transformation story and we believethat our focused training, support and mentor-ship programmes deliver real value,” he says.
He says the law firm’s intake of black lawyershas increased year-on-year. “We are fortunate tobe in a position to employ a number of traineesand candidate attorneys, and have the resourcesto provide bespoke and ongoing training toyounger lawyers, not only in their period ofarticles but throughout their careers.”
Norton Rose Fulbright has a number ofprogrammes that have been designed specificallyfor its lawyers. The programmes includeinternational academies, diversity and inclusionprogrammes, internship programmes and formalmentorship for all the firm’s young lawyers.
Otty concedes that younger lawyers do tendto find some practice areas more difficult thanothers, particularly with regard to finding awork-life balance. “But this is not somethingspecific to black lawyers, it applies to all youngl aw y e rs ,” he says.
He says the law fraternity is constrained bythe fact that only admitted attorneys can beequity participants in the business. “This doesnot, however, mean that we are unable to provideopportunities to a large number of black lawyersand business support staff,” he says.
“We do believe that in the future regulation islikely to change to allow broader participation inlaw firms, particularly to allow law firms to morequickly transform at ownership level.”
Safiyya Patel is a partner and the CorporateBusiness Unit head at Webber Wentzel. As amember of the transformation committee at the
law firm, she says empowerment is a key focusarea at the organisation. “We strive to accuratelyreflect the demographics of the SA populationwithin our structure. Our recruitment, trainingand development initiatives reflect thisco m m i t m e n t .”
Webber Wentzel is owned by its equitypartners, with about 25% being owned bypreviously disadvantaged individuals. About 40%of the firm’s legal staff and 60% of the businessservices staff are black.
“But transformation for us is not just anumbers game,” says Patel. “What is imperativeto the transformation agenda is that it has tobecome part of the culture and values of a firm.Employees must have respect and tolerance foreach other. We want our employees to be happyand enthused to come to work every day becausethat is how one recruits and retains goodl aw y e rs .”
The firm ensures that the majority of itsannual candidate attorney intake comprisespreviously disadvantaged people. In addition, itengages in a number of guidance and mentoringarrangements; offers bursaries to previouslydisadvantaged law students at SA universities;and invites law students to take up internshippositions at the firm. Webber Wentzel also offersa three-month secondment for previouslydisadvantaged practitioners through the LawSociety of SA’s empowerment project.
Patel says one of the biggest challenges to thetransformation of the legal sector is ensuring thatblack lawyers have real opportunities; visibility;exposure; and training in high-value, high-levelmatters. In some cases, this may entail a shift inlong-standing relationships, which both clientsand client-relationship lawyers need tounderstand and accept.
“This may be a difficult process, but it is notimpossible. It certainly is an imperative for ourfirm, as it should be for the rest of the legals e c to r,” she says. Ruan Jooste
■ ABSA LEGAL SERVICESSA Giants: B-Africa (18)Top Performers: B -Af r i ca(160)
■ ADAMS & ADAMSSA Giants: Woolies (34)Top Performers: Trustco (11),Woolies (38)
■ ALLEN & OVERY LLP (UK)SA Giants: Lonmin (83)
■ BAKER & MCKENZIESA Giants: Bidvest (8),Adcorp (74), Tharisa (131)Top Performers: Bi d vest(97), Adcorp (163)
■ BARNARD INCTop Performers: Calgro (1)
■ BERKOWITZ COHENWA RTS K ITop Performers: G o o d e rso n(19 1)
■ BERNADT VUKIC POTASH &GETZ ATTORNEYSSA Giants: Mr Price (67),Invicta (80)Top Performers: Mr Price(13), Trematon (26), Invicta(51), Spurcorp (71)
■ BLAKISTON & CRABB
(AU ST RA L I A)SA Giants: Gfields (42)
■ BOTOULAS KRAUSE & DASILVA INCSA Giants: EOH (95)Top Performers: EOH (4)
■ BOWMAN GILFILLANSA Giants: Stanbank (12),Barworld (21), Datatec (27),Nampak (55), Tongaat (63),ARM (84), Clover (90),Hulamin (91), Northam (110),Value (145), DRDGold (153)Top Performers: N a m pa k(91), Datatec (124), Barworld
LEGAL ADVISERS AND CORPORATE CLIENTS
Mar
tin
Rho
des
Ste p h e nTh o m so n
Financial Mail Page 90 -17/06/15 11:00:43 AM

Financial Mail Page 91 -12/06/15 03:24:51 PM
FINANCIAL MAIL • TOP COMPANIES • 2015 91
SERVICES✥ LEGAL ADVISERS ✥
(125), Clover (126), Stanbank(154), Tongaat (173), Value(174), Trnshex (200)
■ BRIAN KAHN INCSA Giants: S Ocean (159)
■ CHRISTELIS ARTEMIDESAT TO R N EYSSA Giants: Fambrands (129)Top Performers: Fa m b ra n d s( 31 )
■ COERTZEN WILLIAMSAT TO R N EYSTop Performers: Calgro (1)
■ COGHLAN WELSH & GUEST( Z I M BA BW E )Top Performers: Cafca (148)
■ COLLINS NEWMAN & CO( BOTSWA N A)SA Giants: Wildrness (161)Top Performers: Wi l d r n ess(188)
■ COREUS (FRANKFURT)SA Giants: Steinhoff (11)Top Performers: Ste i n h off( 47 )
■ COUZYNS INCSA Giants: Omnia (60)Top Performers: Omnia (81)
■ COX YEATS ATTORNEYSSA Giants: Tongaat (63),Hulamin (91)Top Performers: To n g a a t( 1 73 )
■ DE CHALAINSSA Giants: BCX (100)Top Performers: BCX (178)
■ DLA CLIFFE DEKKERH O F M EY RSA Giants: Richmont (9),Steinhoff (11), Massmart (20),Medclin (43), WBHO (49),Remgro (50), Omnia (60),LifeHC (73), Sunint (76),Metair (94), BCX (100),Net1UEPS (104), DAWN (111),Brimston (147), Atlatsa (152),Sentula (164), Homechoice(170), Petmin (192)Top Performers: AEEI (6),Metair (25), Conduit (32),Medclin (33), LifeHC (46),Steinhoff (47), Richmont(60)
■ DEREK H RABIN &ASSO C I AT ESSA Giants: Itltile (131)Top Performers: Itltile (65)
■ DI SIENA ATTORNEYSTop Performers: M i c ro m e g a(3)
■ ENSafrica (EDWARDNATHAN SONNENBERGS)SA Giants: Sanlam (6),Bidvest (8), Massmart (20),Picknpay (23), Pikwik (24),Nedbank (26), Woolies (34),Gfields (42), Tigbrands (44),Discovery (51), RCLFoods(56), Distell (59), Harmony(64), Grindrod (65), Foschni
(69), Truwths (81), Astral(86), HCI (88), Trencor (99),BCX (100)
■ EOH LEGAL SERVICESSA Giants: Exxaro (70)
■ EDELSTEIN-BOSMAN INCTop Performers: Ansys (170)
■ ELVINGER, HOSS &PRUSSEN (LUXEMBOURG)Top Performers: Reinet (122)
■ EV E RS H E DSSA Giants: Itltile (131),Workforce (163), Insimbi( 1 96 )Top Performers: Taste (12),Workforce (39), Itltile (65),Insimbi (149)
■ FALCON & HUME INCAT TO R N EYSSA Giants: ELBGroup (138)Top Performers: E L BG ro u p(44)
■ FARBER SABELOE D E LST E I NSA Giants: Growpnt (98)Top Performers: G row p nt(109)
■ FASKEN MARTINEAU(INCORPORATED IN SA ASBELL DEWAR)SA Giants: Implats (46),Wildrness (161)Top Performers: Wi l d r n ess(188)
■ FLUXMANS INCSA Giants: Suprgrp (68),Caxton (108), Winhold (187)Top Performers: Alaris (9),Suprgrp (30), Compclear(75), AME (78), Caxton (186)
■ GARLICKE & BOUSFIELDINCSA Giants: Spar (30),Tongaat (63)Top Performers: Spar (82),Tongaat (173)
■ GIDE LOYRETTE NOUELA.A.R.P.I. (PARIS)SA Giants: Steinhoff (11)Top Performers: Ste i n h off( 47 )
■ GILDENHUYS MALATJI INCTop Performers: Silverb (199)
■ GIRARD HAYWARD INCSA Giants: York (171)
■ GLYN MARAIS INCSA Giants: Sanlam (6),Growpnt (98), Andulela( 20 0 )Top Performers: Sa n l a m(53), Growpnt (109), Invltd(146), Verimark (189)
■ GRAYSTON ELLIOTSA Giants: Zeder (106)Top Performers: Zeder (41)
■ HR LEVIN ATTORNEYSSA Giants: Fambrands (129)Top Performers: Fa m b ra n d s(31), Amecor (108)
■ HERBERT SMITHFREEHILLS LLPSA Giants: Lonmin (83)
■ HOGAN LOVELLSTop Performers: Trustco (11)
■ HOWES INCTop Performers: Trustco (11)
■ HUTCHEON ATTORNEYSTop Performers: Ad re n n a( 98 )
■ JAVA CAPITAL (PTY) LTDSA Giants: BlueTel (58),Redefine (109), Hyprop (135),Ellies (144), Buildmax (174),Mixtel (175), Redefintl (181),Onelogix (191), Andulela (200)Top Performers: Onelogix (8),Kaydav (15), enX (35), Mixtel(63), Hyprop (88), BlueTel(128), Redefine (130)
■ KEITH SUTCLIFFE &ASSOCIATES INCTop Performers: Trustco (11)
■ LEVIN VAN ZYL INCTop Performers: Indeqty (16)
■ LINKLATERS LLPSA Giants: Anglo (3),Steinhoff (11), Gfields (42),Mpact (92), Capco (146)Top Performers: Capco (22),Steinhoff (47)
■ LIVINGSTON LEANDY INCSA Giants: Santova (128)Top Performers: Santova (10),Crookes (144)
■ M PARTNERS S.A.R.LTop Performers: Brait (36),MAS (140)
■ MARTINI & PATLANSKYAT TO R N EYSTop Performers: AME (78)
■ MCPHERSON KRUGERAT TO R N EYSSA Giants: Dcentrix (141)Top Performers: D ce nt r i x( 1 92 )
■ MICHAEL KRAWITZ & COTop Performers: Rex True(161), Af & Ovr (166)
■ MILBANK TWEED HADLEY &MCCLOY LLPSA Giants: Steinhoff (11)
■ Top Performers:Ste i n h off( 47 )
■ MINTER ELLISON(AU ST RA L I A)SA Giants: Gfields (42)
■ NORTON ROSE FULBRIGHTSOUTH AFRICASA Giants: Kumba (33),Omnia (60), ARM (84),Growpnt (98), DAWN (111),Assore (155)Top Performers: Omnia (81),Huge (86), Growpnt (109),Sacoil (190), Assore (195)
■ PSG CAPITALSA Giants: Zeder (106)Top Performers: Zeder (41)
LEGAL ADVISERS AND CORPORATE CLIENTS

Financial Mail Page 92-93 -12/06/15 03:25:40 PM
FINANCIAL MAIL • TOP COMPANIES • 201592 FINANCIAL MAIL • TOP COMPANIES • 2015 93
SERV
ICES SERVICES
✥ ACCOUNTANTS ✥ ✥ ACCOUNTANTS ✥
A markedchange ins t a n d a rd s
More informative andtransparent reports will
strengthen the credibility ofa u d i ts
N ew and revised auditor reportingstandards released by the InternationalAuditing & Assurance Standards Board(IAASB) will significantly improveau d i to rs’ reports for investors and
other users of financial statements.The new and revised standards released by
the IAASB in January — after six years ofdevelopment — come amid increasinglyvociferous calls from users of financialstatements for more transparent, informative andrelevant insights into the audits performed onpublicly traded companies.
“Business has over the past few yearsbecome more complex and financialreporting has had to evolve, increasing thejudgment, estimates and uncertaintyunderlying the financial statements,” s ay sGeorge Tweedy, audit risk leader atDe l o i t te .
“These standards will enhance thetransparency of audits by elevating theconversations that generally take placebehind closed doors betweenmanagement and the audit teaminto the public domain. That willallow auditors to contextualisesome of the numbers, whichcan only serve to enhance thecredibility of the audit as wellas the role that auditors playin the fair presentation offinancial information thatinvestors use to maked e c i s i o n s ,” he says.
Penny Binnie, audit
partner at Deloitte, says the auditing processremains largely misunderstood by the generalpublic.
“According to the old standards, auditors wereessentially able to give either a pass or fail markto a company, which didn’t really facilitateabsolute transparency in terms of the issues thatwere debated with the client,” she says. “The newstandards will provide much greater scope forauditors to voice their opinions on key auditmatters, which we believe will allow for muchmore openness and honesty.
“In many of the judgments that an auditormakes there is no absolute answer. There isusually a range of answers and the nuances creepin when there is a difference of opinion in termsof where the auditor’s opinion lies versus that ofmanagement within that acceptable range. Thenew and revised standards will allow us to shedmore light on these judgments.”
The new and revised standards are effectivefor audits of financial statements for periodsending on or after December 15 2016.
However, auditors are allowed to adopt thestandards concerned early. It is expected that thenew and revised standards will be adopted by theIndependent Regulatory Board for Auditors(IRBA), the local regulator, in May 2016.
The adoption of these standards by IRBAcould well assist SA in maintaining its worldwidenumber one ranking for the strength of itsauditing and reporting standards in the “Wo rl dEconomic Forum’s Global CompetitivenessRe p o r t ”.
Calls have also been made to the localindustry to adopt the standards as early as
possible. “We certainly believe that there is alot of merit in being among the earliest
adopters of these new and reviseds t a n d a rd s ,” says Binnie. “This applies to usas a firm as well as clients and, indeed, the
SA auditing profession as a whole.”Julius Mojapelo, project director for
Public Sector & Assurance at the SA Instituteof Chartered Accountants (Saica), advises
that “auditors should appreciate thatthese standards require timely
a t te n t i o n”. “Apart from the reportitself, the changes will have aneffect throughout the auditprocess and, in particular, theau d i to r ’s interaction with thosecharged with governance suchas the board of directors and
the audit committee.”The new standards will likely
increase the length of a typicalaudit opinion free of qualificationsfrom one page to four.
Willie Botha, senior executive for Assurance &Practice at Saica adds that the most notableenhancement of audit rules is a new requirementfor listed companies, where the auditor has tocommunicate “key audit matters”. Those arematters that the auditor finds are the mostsignificant in the financial statements.
The new standards also enhance the auditors’role in reporting on going concern matters,including disclosures in the financial statementswhere material uncertainty exists, and requiremore transparency in terms of disclosure aroundthe audit process.
The auditor’s report will now also prominentlyplace the audit opinion and basis for the opinionat the top of the report. It will also include anaffirmative statement about the auditor’sindependence and compliance with other ethicalrequirements; an enhanced description of theresponsibilities of the auditor; and the name ofthe engagement partner to be disclosed for auditsof listed companies.
The code of professional conduct forregistered auditors in SA stipulates a signingconvention that already requires the disclosure ofthe engagement partner’s name. Ruan Jooste
■ AM SMITH & COMPANY INCTop Performers: Johndan(171)
■ BDO NAMIBIATop Performers: Trustco (11)
■ BDO SA INCORPORATEDSA Giants: WBHO (49),Sentula (164), Winhold (187),Andulela (200)Top Performers: Trustco (11),Taste (12), Huge (86), Purple(89), Fairvest (96), Ansys(170), WBHO (196)
■ BAKER TILLY SVGSA Giants: Value (145)Top Performers: Value (174)
■ D E LO I T T ESA Giants: Bidvest (8),Steinhoff (11), Imperial (13),Mondi (15), Vodacom (19),Barworld (21), Sappi (22),Nedbank (26), Datatec (27),Amplats (29), Spar (30),Kumba (33), M&R Hld (35),JDGroup (38), ArcMittal(40), Nampak (55), KAP(62), Tongaat (63)Top Performers: Adaptit (2),Santova (10), Sabvest (14),Resilient (40), Mondi (42),Steinhoff (47), Oceana (48),Invicta (51), PanAfric (52),Mustek (59), Metrofile (66)
■ DELOITTE LLPSA Giants: Glencore (1),Anglo (3), MondiPlc (16)Top Performers: MondiPlc( 27 )
■ DELOITTE LLP (CANADA)Top Performers: Ea st p l a ts( 1 76 )
■ ERNST & YOUNG INCSA Giants: Sanlam (6),B-Africa (18), Massmart (20),Anggold (31), Aveng (32),Woolies (34), Telkom (39),Tigbrands (44), Clicks (57),Mr Price (67), Truwths (81),ARM (84), Clover (90)Top Performers: Coronat (5),Mr Price (13), Woolies (38),Howden (49), Sanlam (53),
Clicks (62), Itltile (65),Granprade (67), Telkom (102)
■ ERNST & YOUNG LLPTop Performers: Invplc (139),Invltd (146)
■ GRANT THORNTONSA Giants: Netcare (41), HCI(88), Hudaco (118), Seardel(122), CIL (132), Hyprop (135),Metmar (140), Argent (151),Vukile (166), Mastdrill (180)Top Performers: Indeqty (16),Seardel (24), Conduit (32),Vukile (37), CIL (55), Netcare(61), Hyprop (88), HCI (132),Hudaco (135), Sasfin (155),Gooderson (191)
■ GRANT THORNTON (CPT)Top Performers: AEEI (6)
■ GRANT THORNTON (JHB)SA Giants: Comair (105),Caxton (108), Redefine (109),Ellies (144), Buildmax (174),Niveus (179), MSHolding (194)Top Performers: Kaydav (15),enX (35), Sephaku (72), AME(78), Foneworx (79),MSHolding (92), Redefine(130), Comair (134), Caxton(186)
■ HORWATH LEVETONBO N E RSA Giants: Workforce (163)Top Performers: Wo r kfo rce( 39 )
■ KPMG AUDIT LLCTop Performers: MAS (140)
■ KPMG AUDIT PLC (UK)SA Giants: Lonmin (83)
■ KPMG INCSA Giants: Stanbank (12),Picknpay (23), Pikwik (24),Nedbank (26), Gfields (42),Altron (48), Sibanye (53),AECI (61), Suprgrp (68),Foschni (69), AVI (82), ARM(84), Growpnt (98), Trencor(99), BCX (100)Top Performers: Finbond (7),Alaris (9), Suprgrp (30), AVI(43), ELBGroup (44),Spurcorp (71), Foschni (73),
Compclear (75), Interwaste(84), Pergrin (95)
■ KPMG LLPSA Giants: BHPBill (2),OldMutual (28), Redefintl( 1 81 )Top Performers: O l d M u tu a l(74), BHPBill (185)
■ KPMG (CYPRUS)SA Giants: Tharisa (131)
■ MAZARS (GAUTENG) INCSA Giants: EOH (95), Digicor(199)Top Performers: EOH (4)
■ MAZARS INCSA Giants: Stefstock (87),Afrimat (150), Morvest (186)Top Performers: Afrimat (19),Trematon (26), ISA (99),Spanjaard (103), Amecor(108), Ingenuity (111), Culinan(117), Infrasors (151), Putprop(158), Morvest (172), Bowcalf(177), Orion (181)
■ NEXIA SAB&TTop Performers: M i c ro m e g a(3), Imbalie (50), AH-Vest(80)
■ PwC (SWITZERLAND)SA Giants: Richmont (9)Top Performers: R i c h m o nt(60)
■ PwC (ZIMBABWE)Top Performer: Cafca (148)
■ Pwc LLCSA Giant: NEPI (176)Top Performer: NEPI (21)
■ PwC LLPSA Giants: BATS (4), SAB (5),Capco (146)Top Performers: Capco (22),Diamondcp (57), SAB (69),BATS (83), Intuprop (159)
■ PwC SARLTop Performer: Reinet (122)
■ RSM BETTY & DICKSONSA Giants: Fambrands (129),Nuworld (143)Top Performers: Fa m b ra n d s(31), Adrenna (98), Chro-metco (147), Nuworld (168)
AUDITORS AND CORPORATE CLIENTS
George Tweedy
Mar
tin
Rho
des
Financial Mail Page 94-95 -17/06/15 12:55:12 PM
FINANCIAL MAIL • TOP COMPANIES • 201594 FINANCIAL MAIL • TOP COMPANIES • 2015 95
SERV
ICES SERVICES
✥ SETTLEMENTS ✥✥ TAX ✥
A moveto righta wrongTo promote investment, SA
needs to address lack ofcertainty with laws
T he ink of a new anti-avoidanceprovision included in tax legislation lastyear had barely dried in SA law bookswhen national treasury in Marchdecided to scrap it. The new rule would
have triggered capital gains tax (CGT) when anSA firm issued shares in exchange, directly orindirectly, for shares in an offshore company.
“The rule was introduced to counter a specificavoidance scheme, which was concocted by anSA company recently. But it may be interpretedso widely that it is applicable to all SA companiesissuing shares to acquire foreign entities, even inthe absence of any tax avoidance,” says CorKraamwinkel, international tax director at PwC.“General international practice dictates that theissue of shares should not be a taxable event, soS A’s new rule is unique.”
But national treasury has admitted that the taxtrigger was not the intention of the new rule, andas a result it was announced in the minister off inance’s budget speech that the provision wouldbe reviewed. After a public meeting in March,treasury agreed that the collateral damage of theprovision was too grave a risk and that amend-ments to tax law will be made.
That is the good news. What companies are todo in the interim and how treasury intends toaddress the loophole it intended to redress in thefirst place is another story. The amendment mustfirst go through the legislative and parliamentaryprocess, which can take months to finalise, andthere is no certainty on whether it will beapplied retrospectively.
In the interim, it is hoped that nationaltreasury and the SA Revenue Service (Sars) willfind a way of facilitating a more restrictiveinterpretation of the provision in cases where
there is clearly no tax avoidance, so as to providecertainty to what are otherwise legitimatebusiness transactions favourable to SA.
Says Deborah Tickle, a partner at KPMGspecialising in global corporate tax and transferpricing: “This is another example of clashingpolicies when it comes to enacting legislation.Government has stated its desire to increase jobsand grow the economy, but when it comes to thedetail, the legislation does not reflect this desire.”
S A’s tax system is seen in some respects asbeing one of the best in the world. But it does notpromote inward investment, due to complexityand lack of certainty. Geographically, SA is ideallypositioned to become the preferred trade andinvestment gateway destination into the rest ofAfrica. But, to enhance this positioning, taxlegislation should be investor-friendly.
Geoff Kroon, tax director at Deloitte, says theCGT legislation deters foreign firms from usingSA as a gateway destination. “Share exchanges ofthis nature could typically be fairly substantial invalue and the imposition of CGT calculated at aneffective 18,6% on the value of the shares issuedhas closed down this form of offshore expansion.The relaxation of the provisions imposing CGT onthe initial exchange will be a big relief totaxpayers considering expanding abroad.”
The imposition of CGT also counteracts taxrules that were introduced a few years back,which intended to encourage high-payingheadquartered jobs to be located in SA asopposed to neighbouring countries.
“The CGT anti-avoidance legislationintroduced in 2014 not only deters the creation orenhancement of headquarter companies, but alsoother multinational investments in respect of alllocal companies,” says Kraamwinkel.
Says Tickle: “The headquarter companyregime is beautifully crafted, but its benefits andmethod of application are difficult to understand.In Mauritius the regime has been the same formany years, while the SA headquarter companyhas benefits if this and if that. And those may alsonot apply in, say, three years’ time. Hence, whenfaced with the option for a gateway into Africathrough a company that simply has low tax in,s ay , Mauritius, investors often choose the easilyunderstood and certain route of the island state.”
The scrapping of the article 6 foreign taxcredit, also announced in the budget speech,further supports this notion. Currently, if acompany is headquartered in SA and deliversservices to other African countries and has paid awithholding tax there, it could claim a tax creditin SA. In future this will not be possible. “Th i salso counteracts the headquarter regime’s aim ofpositioning senior executives in the country,”says Kraamwinkel. Ruan Jooste
Pl a t fo r mgets evenm o reeff icient
Harmonising settlementwith international standardswill attract foreign investors
T he JSE is moving closer to aligning theSA market with global best practice interms of settlement days, whilesimultaneously improving efficiencyand credibility.
The T+3 project, which refers to the three daysit will take to settle a trade, has made greatstrides and is about to enter its final phase.Currently it takes five days (T+5) for a seller ofsecurity to receive payment and the buyer totake ownership on the JSE.
Phase one — which wasfinalised in July 2013 —introduced a series oftechnical changes. Phase two— completed in October 2014— entailed theimplementation of theequities clearing system andchanges to other JSE systems,including the broker dealeraccounting system.
With sights set firmly onthe final phase, Leila Fourie,executive director respon-sible for Post Trade &Information Services at theJSE, says apart frommitigating systemic andsettlement risk, T+3 has numerous benefits. Theseinclude attracting foreign investors byharmonising settlement with internationalstandards and boosting liquidity as assets arereleased from the settlement process quicker.
“The mitigation of systemic and settlement
risk is a key benefit to the market in that at anypoint in time, the industry will face only threedays of unsettled trades rather than five, thusreducing the value of unsettled trades that mightbe subject to losses in the event of a default,” shes ay s .
The plan to move to T+3 has been on thenational financial services radar for some time,but the formal implementation project was notinitiated until 2012 due to supporting projectsthat were required as a result of systemsdependencies. The JSE submitted an implemen -tation plan to the Financial Services Board (FSB)in 2012 detailing what was required to move theSA market from T+5 to T+3 in three phases.
The FSB accepted the proposal and mandatedthe move to T+3 as a licensing requirement.
Phase 3 entails the entire market makingchanges and Fourie says the market is makingexcellent progress in delivering these changeswith integrated testing across participants due tostart in September 2015. “The JSE has announceda go-live date between May and July 2016. Oncecertain key readiness milestones are confirmedacross the market, the final go-live date will bea n n o u n ce d ,” she says.
Prior to the global financial crisis, manymarkets had already settled on T+3 since 1995.The EU is now considering moving to T+2. TheEuropean Commission set up the Harmonisationof Settlement Cycles Working Group in 2009 andrecommended a T+2 for certain securitiestransactions across the EU.
The first trade day on T+2 settlement volumesin some EU countries was inOctober last year. Some arestill in the process of doing so.
“The Central SecuritiesDepositories Regulation cameinto play on January 1, whichis a contributory factor inachieving the widerambitions of Target 2Securities, the EuropeanCentral Bank initiative tostreamline Europe’s securitiessettlement structure, which isexpected to go live in June,”according to an HSBC newsbrief sent to its clients onfinancial regulation.
The US changed thesettlement cycle for stocks,
municipal and corporate bonds from T+5 to T+3in the mid-1990s. However, over the past 20years, despite changes in technology, the T+3settlement cycle over there hasn’t changed sincethen.
The Depository Trust & Clearing Corp
The settlementcycle is out ofstep with globalp re ce d e nt
Sun
day
Tim
es

Financial Mail Page 96-97 -12/06/15 03:26:28 PM
FINANCIAL MAIL • TOP COMPANIES • 201596 FINANCIAL MAIL • TOP COMPANIES • 2015 97
SERV
ICES SERVICES
✥ MEDICAL AID ✥
More toh avea cce s s tobetter careLow-cost benefit options will
expand coverage ofpreviously uncovered
se c to rs
T he Council for Medical Schemes (CMS) isin the process of drafting regulationsthat will set the stage for the provisionof affordable health cover to morepeople. Paresh Prema, GM of the
Benefits Management Unit at CMS, says theintroduction of these options falls within themandate of the organisation to regulate theindustry by ensuring that more people receivefair and equal access to medical aid.
The broad outline of the regulatory framewo rkwas provided in a circular earlier this year, afterwhich the CMS embarked on aconsultative process to develop guidelinesfor the industry. “The guidelines willprovide interested parties with theminimum requirements from the CMS inorder to introduce low-cost benefit options(LCBOs) into the market,” says Prema.
The council has representation from thedepartment of health as well as its fullsupport in this initiative.
The aim of LCBOs is to increase theparticipation of individuals in the risk pool,which would not have been possiblep rev i o u s ly .
Challenges to expand coverage topreviously uncovered sectors of the marketare related to the affordability of thecurrent minimum benefits package andthe absence of benefits dealing withhealth-care needs at a day-to-day level, hes ay s .
Though the Medical Schemes Act allows forschemes to apply for exemptions where aparticular provision cannot be complied with,schemes are required to provide exceptionalcircumstances for the application to besuccessfully granted. “Over the years, CMS hasconsidered ways to bring about a mechanismthat caters to affordability as well as the needs ofthe market,” says Prema.
A consideration has been made by the CMSfor the introduction of LCBOs that medicalschemes will be allowed to introduce. These willhave to be premised on particular principles,which could result in these products beingexempt from the provisions of the act, whileremaining sustainable.
Prema says the organisation is in the processof consulting with industry, after it introducedthe framework in March at the CMS Indaba. “Wehave received valuable input from industryplayers that are interested in offering lower-costhealth cover, and we hope to release theguidelines for further comment later this year.Further sessions with service providers will thencommence to refine the guidelines before theyare approved by the council.”
He says only about 8,9m lives are covered bymedical schemes in the country, which means ahuge opportunity exists for the private sector.The soon-to-be-announced demarcation rulesfor the medical schemes industry will furtherwiden the scope of opportunity.
The regulations will specify which types ofhealth insurance policies, such as top-up cover,are permissible under the long and short-terminsurance acts. And those health insurancepolicies meeting the definition of the business ofa medical scheme will be regulated under the
■ ABSA CAPITALSA Giants: Glencore (1),B-Africa (18), Mastdrill (180)Top Performers: B -Af r i ca(160)
■ AFRASIA CORPORATEFINANCETop Performers: Huge (86)
■ ARBOR CAPITAL SPONSORSSA Giants: Caxton (108),Winhold (187), Cargo (198)Top Performers: AME (78),AH-Vest (80), Adrenna (98),Spanjaard (103), Cargo (107),Culinan (117), Bowcalf (177),Orion (181), Caxton (186)
■ BRAVURA CAPITALSA Giants: Village (158)Top Performers: Tradeh (136)
■ BRIDGE CAPITAL ADVISORSSA Giants: Stefstock (87),lliad (119), Afrimat (150),Advtech (156), Insimbi (196)Top Performers: Afrimat (19),Insimbi (149), Infrasors (151),Advtech (152), lliad (197)
■ DELOITTE SPONSORS E RV I C ES
SA Giants: Adcorp (74),Invicta (80), Pinnacle (96),DAWN (111), Mustek (117),Pergrin (157), Converge (195)Top Performers: Invicta (51),Mustek (59), Pinnacle (76),Purple (89), Pergrin (95),Adcorp (163)
■ DEUTSCHE SECURITIES SASA Giants: Sanlam (6), Sasol(7), MTN Group (10),Stanbank (12), Massmart(20), Anggold (31), M&R Hld(35), Implats (46), Suprgrp(68), Exxaro (70)Top Performers: Coronat (5),Suprgrp (30), Sanlam (53),MTN Group (115), Stanbank(154), Tsogo Sun (156)
■ EXCHANGE SPONSORSSA Giants: Wescoal (182)Top Performers: I m ba l i e(50), Wescoal (153), Ansys(170), Gooderson (191)
■ GRINDROD BANKSA Giants: Grindrod (65),Basread (101), ARB (142),Jasco (189), Rolfes (193)Top Performers: Calgro (1),
Finbond (7), ARB (68), Inter-waste (84), Rolfes (94),Grindrod (183), Verimark (189)
■ IJG SECURITIESTop Performers: Trustco (11)
■ INVESTEC BANKSA Giants: Bidvest (8),Picknpay (23), Pikwik (24),Naspers (25), Aspen (45),Altron (48)Top Performers: N a s p e rs(20), Seardel (24), Aspen(28), Clicks (62), Santam(85), Bidvest (97), Growpnt(109), Phumelela (110)
■ JPMORGAN CAZENOVE (UK)SA Giants: SAB (5), Barworld(21)Top Performers: SAB (69),Barworld (125)
■ JPMORGAN EQUITIES SASA Giants: B-Africa (18),Barworld (21), Aveng (32),ArcMittal (40), Gfields (42),Tigbrands (44), Sibanye (53),Top Performers: Ba r wo r l d(125), Cityldg (133), Tigbrands(137), Astral (138), B-Africa(160)
SPONSORS AND CORPORATE CLIENTS
conducted a detailed cost benefit analysis ofT+2/T+1 settlement cycles in 2012 and drafted aroadmap to achieve a T+2 cycle by 2016 in the US.
The JSE’s settlement cycle is notably out ofstep with global precedent and it might havemissed out on some money-making or cost-cutting opportunities.
“The 2007/2008 global financial crisis andliquidity problems have led to an increased focuson risks in trade clearing and settlementprocesses. The risk on outstanding exposure tocounterparties in the settlement process isdependent on the settlement time and marketvolatility. Therefore, the need for increased focuson shorter settlement cycles has emerged,” s ay sRakesh Jangili, senior consultant at capitalmarkets solutions group Virtusa, onF T SEg l o b a l m a rke t s . co m .
“Shorter settlement cycles will result in costsavings, due to optimal capital, and reduced risk.Lower clearing fund requirements, as a result ofshorter timelines, will result in lower interestcosts. The benefit will be even larger in high-volatility periods.
“Tighter timelines provide flexibility toreinvest cash quickly. The settlement processinvolves credit risk, where counterparties maydefault prior to completing settlement on theunsettled amount at any given time. The shortersettlement cycle will decrease the amount ofoutstanding unsettled trades, which in turnwould decrease the credit exposure,” says Jangili.
“With similar lines of thought, settlementcycles of T+0 may look ideal, but are difficult toachieve, as that would mean the trader must havethe full amount of money at hand even beforeplacing a trade. Such a restrictive funding timelinewould lead to lower volumes, lower liquidity andlower leverage in markets and might lead tohigher settlement failures,” he says.
According to a 2011 report by Omgeo,settlement failures were high in both Russian andIsraeli markets, which were operating on a T+0settlement cycle. Since 2013, Russia has beenmoving to T+2 settlements and Israel moved to aT+1 cycle back in March 2012.
Markets moving to shorter settlement cyclesmight see more settlement failures if they don’tprepare well for the transformation. “The JSEdoes pride itself on its zero failed-trade record,”says Fourie. “That said, we believe that thebenefits associated with a move to T+3 outweighthe zero failed-trade track record.
“Much focus has been placed on mitigatingactions to reduce the amount of failed tradeswith the shortening of the settlement cycle.”
The JSE is preparing for more failed trades andhas introduced the new equities clearing systemto allow for the automation and flexibilityrequired to manage higher volumes of failedt ra d e s .
The FSB is comfortable with the JSE moves toa T+3 settlement cycle first, before considering amove to a shorter settlement cycle. Ruan Jooste
✥ SPONSORS ✥
JonathanB ro o m b e rg
Sun
day
Tim
es

Financial Mail Page 98-99 -12/06/15 03:26:51 PM
FINANCIAL MAIL • TOP COMPANIES • 201598 FINANCIAL MAIL • TOP COMPANIES • 2015 99
SERV
ICES SERVICES
■ AECI MEDICAL AIDSO C I E T YSA Giants: AECI (61)Top Performers: AECI (127)
■ AFROX MEDICAL AIDSO C I E T YSA Giants: Afrox (107)
■ ANGLO MEDICAL SCHEMESA Giants: Anglo (3), Mondi(15)Top Performers: Mondi (42)
■ ANGLOVAAL GROUPMEDICAL SCHEMESA Giants: AVI (82), ARM(84)Top Performers: AVI (43)
■ BUPA (UK)SA Giants: Anglo (3)
■ BA N K M E DSA Giants: Stanbank (12),B-Africa (18), Net1UEPS (104)Top Performers: Sta n ba n k(154), B-Africa (160),Net1UEPS (184)
■ BARLOWORLD MEDICALSC H E M ESA Giants: Barworld (21)Top Performers: Ba r wo r l d( 1 25 )
■ BESTMED MEDICALSC H E M ESA Giants: Sanlam (6), Sappi(22), Telkom (39), Harmony(64), Suprgrp (68)Top Performers: Su p rg r p(30), Sanlam (53), Telkom(102), Sappi (165)
■ BONITAS MEDICAL FUNDSA Giants: Vodacom (19),
Telkom (39), BlueTel (58),Exxaro (70), Hulamin (91),EOH (95)Top Performers: EOH (4),Vodacom (70), Telkom (102),BlueTel (128), Infrasors (151)
■ BUILDING &CONSTRUCTION INDUSTRYMEDICAL AID FUNDSA Giants: Stefstock (87)
■ CAPE MEDICAL PLANSA Giants: Caxton (108),Afrimat (150)Top Performers: Afrimat (19),Caxton (186)
■ C H A RT E R E DACCOUNTANTS (SA)MEDICAL AID FUNDSA Giants: MTN Group (10)Top Performers: MTN Group(115)
■ COMPCARE WELLNESSMEDICAL SCHEMESA Giants: Basread (101)
■ DISCOVERY HEALTHMEDICAL SCHEMESA Giants: Steinhoff (11),Vodacom (19), Anggold (31),Telkom (39), Gfields (42),Implats (46), Altron (48),WBHO (49), Discovery (51),Sibanye (53), Nampak (55),Clicks (57), BlueTel (58),Omnia (60), KAP (62),Tongaat (63), Mr Price (67),Suprgrp (68), Exxaro (70),Capitec (71), LifeHC (73),Adcorp (74), Reunert (75),Tsogo Sun (78), CMH (79),Invicta (80), Astral (86),
Clover (90), Hulamin (91),PSG (93), Metair (94), EOH(95), Pinnacle (96), Growpnt(98), Trencor (99), BCX (100),Raubex (102), Net1UEPS(104), Comair (105), Caxton(108), DAWN (111), EHSV*(112), Oceana (113), Timesmed(114), Mustek (117), lliad (119),Zurich SA (120), Lewis (121),Seardel (122), Merafe (124),BSI (126), Santova (128),Fambrands (129), Itltile (131),CIL (132), Astrapak (133),ELBGroup (138), Esorfrank(139), Metmar (140), Dcentrix(141), ARB (142), Nuworld(143), Value (145), Afrimat(150), Argent (151), DRDGold(153), JSE (154), Advtech(156), Pergrin (157), Ascendis(157), S Ocean (159), Howden(160), Workforce (163),Keaton (170), York (171),Buildmax (174), Morvest(186), Winhold (187), Cityldg(188), Jasco (189), MSHolding(194), Phumelela (197), Cargo( 1 98 )Top Performers: Adaptit (2),Micromega (3), EOH (4), AEEI(6), Santova (10), Mr Price(13), PSG (18), Afrimat (19),Capitec (23), Seardel (24),Metair (25), Suprgrp (30),Fambrands (31), Conduit (32),Brait (36), Workforce (39),ELBGroup (44), Discovery(45), LifeHC (46), Steinhoff(47), Oceana (48), Howden(49), Invicta (51), CIL (55),
MEDICAL AID SCHEMES/SOCIETIES AND CORPORATE CLIENTS
✥ MEDICAL AID ✥ ✥ MEDICAL AID ✥
Medical Schemes Act.Prema says the proposed framework will
ensure that low-cost options fall under theMedical Schemes Act, but exempt them fromcertain provisions to make them more affordable.He says until now the need for lower-costoptions was covered by insurance companies.CMS, however, is in a better position to protectmembers of such products and regulate theindustry.
The issue with low-cost benefit providersfalling within the ambit of insurance laws is thatproducts they provide may exclude certainindividuals due to their risk rating, whichincludes age, gender and general wellbeing,Prema says.
Discovery Health CEO Jonathan Broombergsays this is a good and greatly needed approach.It will allow hundreds of thousands oflow-income individuals to afford well-structuredhealth-care cover through medical schemes.“Providing affordable access to full medicalscheme cover is critical, as many low-income
households spend a large proportion of theirdisposable income on private cover without thebenefit of risk pooling and insurance, whichmedical schemes can provide,” he says.
The design, registration and marketing oflower-cost products will be handled by theprivate sector, with CMS playing an oversightro l e .
Prema says a large part of the economy isemployed informally and CMS wants serviceproviders to target this income group. Surveysconducted by CMS in the past indicate that about6m people fall within this group, which excludesdependants. “This will alleviate a lot of pressureon government resources,” he says.
Elsabé Conradie, GM of Stakeholder Relationsat CMS, says reaching the whole informal sectorwill be a challenge. “We will dedicate a lot oftime to consumer education,” she says. “We areplanning to embark on roadshows and to getmunicipalities and other governmentdepartments involved in engaging with thep u b l i c .” Ruan Jooste
Mustek (59), Clicks (62),Itltile (65), Metrofile (66),ARB (68), Vodacom (70),Spurcorp (71), Compclear(75), Pinnacle (76), AME (78),Omnia (81), Huge (86),Nampak (91), MSHolding (92),Pergrin (95), ISA (99),Trencor (101), Telkom (102),Octodec (105), Cargo (107),Growpnt (109), Phumelela(110), KAP (113), JSE (120),Clover (126), BlueTel (128),Cityldg (133), Comair (134),Astral (138), Crookes (144),Lewis (145), Invltd (146), CMH(150), Infrasors (151), Advtech(152), Sasfin (155), Tsogo Sun(156), Rex True (161), Adcorp(163), Af & Ovr (166),Nuworld (168), Zurich SA(169), Morvest (172), Tongaat(173), Value (174), Bowcalf(177), BCX (178), Reunert(179), Net1UEPS (184),Caxton (186), Verimark (189),Gooderson (191), Dcentrix(192), BSI (193), Rangold(194), WBHO (196), lliad (197)
■ FEDHEALTH MEDICALSC H E M ESA Giants: Implats (46),Reunert (75), Astral (86),Growpnt (98), Zurich SA(120), Insimbi (196)Top Performers: G row p nt(109), Astral (138), Invltd(146), Insimbi (149), ZurichSA (169), Reunert (179)
■ FOSCHINI GROUP MEDICALAID SCHEMESA Giants: Foschni (69)Top Performers: Foschni (73)
■ GEN-HEALTH MEDICALSC H E M ETop Performers: Cafca (148)
■ GENESIS MEDICAL SCHEMESA Giants: Vodacom (19),Reunert (75)Top Performers: Vo d a co m(70), Reunert (179)
■ HORIZON MEDICALSC H E M ESA Giants: Clicks (57)Top Performers: Clicks (62)
■ INGWE HEALTH PLANSA Giants: Telkom (39),Foschni (69), Truwths (81),Mustek (117)Top Performers: Mustek (59),Foschni (73), Telkom (102),Truwths (129)
■ LIBERTY MEDICAL SCHEMESA Giants: Lib Hold (36),Converge (195)Top Performers: Lib Hold(100), Spanjaard (103)
■ MALCOR MEDICAL SCHEMESA Giants: Aspen (45),Omnia (60)Top Performers: Aspen (28),
Omnia (81)■ MASSMART HEALTH PLAN
SA Giants: Massmart (20)Top Performers: Massmar t( 1 62 )
■ MEDIHELPSA Giants: Dcentrix (141)Top Performers: D ce nt r i x( 1 92 )
■ MEDSHIELD MEDICALSC H E M ETop Performers: Tr n s h ex( 20 0 )
■ METROPOLITAN MEDICALSC H E M ESA Giants: Implats (46)
■ MOMENTUM HEALTHSA Giants: Suprgrp (68),Illovo (72), Stefstock (87),Bell (103), Caxton (108),Metmar (140), Marshall(149), Afrimat (150)Top Performers: Af r i m a t(19), Suprgrp (30), Marshall(64), Caxton (186)
■ MOTO HEALTH CARESA Giants: CMH (79)Top Performers: CMH (150)
■ NAMIBIA MEDICAL CARESA Giants: Exxaro (70)
■ NAMMED MEDICAL AIDFUNDTop Performers: Nictus (182)
■ NASPERS MEDICAL FUNDSA Giants: Naspers (25)Top Performers: N a s p e rs( 20 )
■ NATIONAL MEDICAL PLANSA Giants: Invicta (80)Top Performers: Invicta (51)
■ NEDGROUP MEDICAL AIDSC H E M ESA Giants: Nedbank (26)Top Performers: N e d ba n k( 1 31 )
■ NETCARE MEDICALSC H E M ESA Giants: Netcare (41)Top Performers: Netcare (61)
■ OXYGEN MEDICAL SCHEMESA Giants: Caxton (108)Top Performers: AME (78),Caxton (186)
■ PHAROS MEDICAL PLANSA Giants: RCLFoods (56),Exxaro (70)Top Performers: RC L Fo o d s(187), Gooderson (191)
■ PICK N PAY MEDICALSC H E M ESA Giants: Picknpay (23),Pikwik (24)Top Performers: Pikwik (175),Picknpay (180)
■ PLATINUM HEALTHSA Giants: Amplats (29),Atlatsa (152)
■ PRO SANO MEDICALSC H E M E
SA Giants: Telkom (39)Top Performers: Telkom (102)
■ QUANTUM MEDICAL AIDSO C I E T YSA Giants: Sunint (76)Top Performers: Sunint (167)
■ REMEDI MEDICAL AIDSC H E M ESA Giants: Medclin (43),Remgro (50), Distell (59)Top Performers: Medclin(33), Remgro (77), Distell(104), Trnshex (200)
■ RESOLUTION HEALTHMEDICAL SCHEMETop Performers: Rex True(161), Af & Ovr (166)
■ RETAIL MEDICAL SCHEMESA Giants: Shoprit (14)Top Performers: Shoprit(106)
■ SASO L M E DSA Giants: Sasol (7)Top Performers: Sasol (157)
■ SISONKE HEALTH MEDICALSC H E M ESA Giants: Sibanye (53)
■ SIZWE MEDICAL FUNDSA Giants: Sappi (22),Exxaro (70), DAWN (111),EHSV* (112), Timesmed (114),Adcock (115), Buildmax (174)Top Performers: Sappi (165)
■ SA BREWERIES MEDICALSC H E M ESA Giants: SAB (5)Top Performers: SAB (69)
■ S P ECT RA M E DSA Giants: Phumelela (197)Top Performers: Phumelela(110)
■ SUREMED HEALTHSA Giants: Northam (110)
■ TIGER BRANDS MEDICALSC H E M ESA Giants: Spar (30),Tigbrands (44), Adcock (115)Top Performers: Spar (82),Tigbrands (137)
■ TOPMED MEDICAL SCHEMESA Giants: Sanlam (6)Top Performers: Sanlam (53)
■ UMVUZO HEALTH MEDICALSC H E M ESA Giants: Sibanye (53),Exxaro (70), Clover (90),Adcock (115)Top Performers: Clover (126)
■ WITBANK COALFIELDSMEDICAL AID SCHEMESA Giants: Exxaro (70)
■ WOOLTRU HEALTHCAREFUNDSA Giants: Woolies (34),Truwths (81)Top Performers: Wo o l i es(38), Truwths (129)* Su s p e n d e d
MEDICAL AID SCHEMES/SOCIETIES AND CORPORATE CLIENTS

Financial Mail Page 100-101 -12/06/15 03:27:10 PM
FINANCIAL MAIL • TOP COMPANIES • 2015100 FINANCIAL MAIL • TOP COMPANIES • 2015 101
SERV
ICES SERVICES
✥ ADVERTISING ✥ ✥ ADVERTISING ✥
Mo b i l e iswhere it’sat, for now
But locally there are stillplenty of opportunities with
traditional media
S A’s digital footprint is growing at warpspeed, with more people every day usingmobile devices to access the Internet. Asurvey published at the end of last yearby ourmobileplanet.com found that 29m
South Africans use a mobile phone, with 20,5m ofthem using a smartphone for Internet access.
The study found that of the country’s mobileusers, 57% hardly ever use a desktop computeranymore, reinforcing the perspective that mobileis the key to SA’s rapidly evolving digitaladvertising scene.
Market research company eMarketer estimatesthat in 2015 various kinds of mobile phoneactivities — such as gaming, social media andvoice-calling functions like Skype — will helpboost smartphone user growth in SA to theseventh-highest rate worldwide, six percentagepoints above the global average.
The research house expects slightly slowersmartphone user growth in SA in 2015, at 22,8%.“In comparison, growth in the global smartphoneaudience will slow even more next year, by 8,2percentage points,” it says on its website. “Th i strend will continue through 2018, when thenumber of smartphone users worldwide willincrease by 7,6%. More smartphones translateinto more people using the mobile platform torun searches, utilise content, communicate viasocial media and conduct transactions.”
This means advertisers have had to change theway they target SA consumers.
Ted Dhanik, CEO of engage:BDR, a digitaladvertising company based in California, writeson Entrepreneur.com that people know a greatad when they see one, but getting that ad to theright people at the right time is an art unto itself.He says as innovation in advertising technology
renders old tactics obsolete, it also creates newopportunities to reach your audience.
Globally, mobile is where it’s at, and where itwill remain for the next few years, and thepotential audience in SA is huge as the countryboasts a mobilepenetration rate of135%.
However, industryplayers warn that localonline marketerswould be foolish topour all of their effortsand budgets intomobile advertising
■ ARTIFACT ADVERTISINGTop Performers: Taste (12)
■ BASE TWOSA Giants: B-Africa (18)Top Performers: B -Af r i ca(160)
■ BASTION GRAPHICSSA Giants: Aspen (45),Implats (46)Top Performers: Aspen (28)
■ BLUE PARROT ADVERTISING
SA Giants: Adcock (115)■ COOLE ADVERTISING &
P RO M OT I O N SSA Giant: Implats (46)
■ CREATIVITY ADVERTISING& DESIGNSA Giant: lliad (119)Top Performer: lliad (197)
■ DAWN MARKETING &D ES I G NSA Giants: DAWN (111)
■ DIESELBROOK BRANDCONSULTING CCSA Giant: Tsogo Sun (78)Top Performer: Tsogo Sun(156)
■ d ot J W TSA Giants: Altron (48)
■ eCREATIVE DESIGN STUDIOTop Performers: Calgro (1)
■ FCB REDLINESA Giants: Anggold (31),
ADVERTISING AGENCIES AND CORPORATE CLIENTS
alone — especially if they’re after the majority ofSA consumers.
Mobile, while growing rapidly, is still thesmallest revenue stream, accounting for R172m(out of R1,3bn) in 2013. This is according to theinaugural Internet Advertising Revenue Reportcompiled by PwC for the Internet AdvertisingBureau (IAB) of SA.
Even though data prices are coming down,and smartphones are getting cheaper, the hugedivide between rich and poor in SA means thatthe majority of the population (estimated at70,6%) still use feature phones. But that doesn’tmean the feature phone market can’t be reached.In the feature phone market digital advertisingconsists of USSD strings, SMS marketing andover-the-top (OTT) messaging campaigns, alongwith the basic feature-phone-friendly search andFacebook news feed advertising.
That means global and local advertisers can
still reach millionsof consumers. APwC report on theSA entertainmentand media industrysays Internetadvertising willaccount for anestimated R71,6bnby 2018, accountingfor 37,6% of totalrevenues. Withinthe Internetsegment, mobileInternet accessspending will takein the most revenue,adding more thanR4 0 b n .
“I n te r n e ta dve r t i s i n g ’sa n t i c i p a te dcompound annualgrowth rate of 22,7%will be driven by
search and mobile advertising, with Google, themost visited site in the country, holding the vastmajority of the SA search market. Mobileadvertising will be driven by an increase insmartphone penetration,” the report says.
Vicki Myburgh, Entertainment & MediaIndustries leader for PwC SA, says: “Growth inthe SA entertainment and media industry isbeing driven largely by the Internet and byco n s u m e rs’ love of new technology, in particularmobile technology, such as smartphones andtablets, as well as applications powered by dataanalytics and cloud services. Technology isincreasingly being driven by consumers’ needsand expectations.”
However, she says even though the future maywell be digital in SA, as with the rest of the world,progress in the local entertainment and mediamarket will be gradual and there are still plentyof opportunities for “o l d” and “t ra d i t i o n a l” media.
Ruan Jooste
Smartphones arebecoming key toS A’s evolvingadvertising scene
Vicki Myburgh

Financial Mail Page 102-103 -17/06/15 12:55:34 PM
FINANCIAL MAIL • TOP COMPANIES • 2015102 FINANCIAL MAIL • TOP COMPANIES • 2015 103
SERV
ICES SERVICES
✥ ADVERTISING ✥
Nampak (55), RCLFoods (56)Top Performers: N a m pa k(91), RCLFoods (187)
■ FCB SASA Giants: Firstrand (17),Tigbrands (44), Adcock (115)Top Performers: F i rst ra n d(54), Tigbrands (137)
■ GAMEPLAN ADVERTISINGSA Giants: Adcock (115)
■ GLOBAL MOUSESA Giants: Discovery (51)Top Performers: D i scove r y( 45 )
■ G RA P H I CO RSA Giants: Sovfood (169)Top Performers: Sov fo o d( 1 98 )
■ GREYMATTER & FINCHSA Giants: PSG (93)Top Performers: PSG (18),Sephaku (72)
■ HKLMSA Giants: WBHO (49), AECI( 61 )Top Performers: AECI (127),WBHO (196)
■ IDEA ENGINEERSSA Giants: Tsogo Sun (78)Top Performers: Tsogo Sun(156)
■ INCESA Giants: Massmart (20),Altron (48), Suprgrp (68),Illovo (72), Astral (86),Hulamin (91), Metair (94),Santova (128), DRDGold (153)Top Performers: Sa ntova(10), Metair (25), Suprgrp(30), Astral (138), Massmart( 1 62 )
■ INITIATIVE MEDIA SATop Performers: Taste (12)
■ INTIMEDIASA Giants: Growpnt (98)Top Performers: G row p nt(109)
■ IRELAND DAVENPORTSA Giants: Vodacom (19),Altron (48)Top Performers: Vo d a co m( 70 )
■ J WALTER THOMPSONSA Giants: Lewis (121)Top Performers: Lewis (145)
■ JOE PUBLICSA Giants: Nedbank (26),Amplats (29), Clover (90),Adcock (115)Top Performers: Clover (126),Nedbank (131)
■ KASHAN ADVERTISINGSA Giants: Argent (151)
■ KING JAMES GROUPSA Giants: Sanlam (6),Tigbrands (44), Comair (105)Top Performers: Sa n l a m(53), Comair (134), Tigbrands( 1 37 )
■ LOWE & PARTNERS SASA Giants: Adcock (115)
■ ME GRAPHICSSA Giants: Adcock (115)
■ MARKETING CONCEPTSSA Giants: Growpnt (98)Top Performers: O c to d e c(105), Growpnt (109)
■ MAXXMEDIAI N T E R N AT I O N A LSA Giants: Afrimat (150)Top Performers: Afrimat (19)
■ MCCANN WORLDGROUPSA Giants: Zurich SA (120)Top Performers: Zurich SA( 1 69 )
■ MORTIMER HARVEYSA Giants: B-Africa (18),Altron (48)Top Performers: B -Af r i ca(160)
■ N I N E T Y 9 C E N TSSA Giants: Shoprit (14),Capitec (71)Top Performers: Ca p i te c(23), Shoprit (106)
■ OGILVY & MATHERSA Giants: Itltile (131)Top Performers: Itltile (65)
■ OGILVYONE WORLDWIDESA Giants: Sunint (76)Top Performers: Sunint (167)
■ ONE KINGDOM CREATIVEST U D I OSA Giants: BCX (100)Top Performers: BCX (178)
■ PHD SASA Giants: Capitec (71)Top Performers: Capitec (23)
■ PATON TUPPERASSO C I AT ESSA Giants: Tongaat (63)Top Performers: To n g a a t( 1 73 )
■ PRIMA PLUSTop Performers: Acu ca p #(121)
■ PRIME MEDIATop Performers: Alaris (9)
■ PURPLE FROGCO M M U N I CAT I O N SSA Giants: Wildrness (161),Andulela (200)Top Performers: Wi l d r n ess(188), Verimark (189)
■ RED ROCKET DESIGN &A DV E RT I S I N GTop Performers: Taste (12)
■ SMART STRATEGICMARKETINGSA Giants: Dcentrix (141)Top Performers: D ce nt r i x( 1 92 )
■ SPECTRUM NOTES &P RO M OT I O N SSA Giants: Adcock (115)
■ SWITCH BRANDING &D ES I G N
SA Giants: MTN Group (10)Top Performers: MTN Group(115), Invplc (139), Invltd (146)
■ T BWASA Giants: Stanbank (12),Spar (30), Tigbrands (44),Cityldg (188)Top Performers: Spar (82),Cityldg (133), Tigbrands (137),Stanbank (154)
■ T E R RA N OVASA Giants: Cargo (198)Top Performers: Cargo (107)
■ THE AGENCY FORADVERTISING &MARKETINGSA Giants: Telkom (39)Top Performers: Telkom (102)
■ THE FIRE TREE DESIGNCO M PA N YTop Performers: G o o d e rso n(19 1)
■ THE HARDY BOYSSA Giants: RCLFoods (56)Top Performers: RC L Fo o d s( 1 87 )
■ THE JUPITER DRAWINGROOM (JOHANNESBURG)SA Giants: B-Africa (18)Top Performers: B -Af r i ca(160)
■ THE JUPITER DRAWINGROOM (SA)SA Giants: Medclin (43)Top Performers: Medclin (33)
■ THE MEDIASHOPSA Giants: Mustek (117)Top Performers: Mustek (59)
■ THE NEW BLACKSA Giants: Growpnt (98)Top Performers: G row p nt(109)
■ THE RED PHONESA Giants: Nampak (55),AECI (61)Top Performers: Nampak (91),AECI (127)
■ TROIKA IMAGINEERINGWO R KSSA Giants: Sappi (22)Top Performers: Sappi (165)
■ V I S I O N E E RSSA Giants: Pergrin (157)Top Performers: Pergrin (95)
■ WISDOM & YOUTHADVERTISING AGENCYSA Giants: Mr Price (67)Top Performers: Mr Price (13)
■ YOUNG & RUBICAM SASA Giants: Picknpay (23),Pikwik (24)Top Performers: Pikwik (175),Picknpay (180)# Delisted
ADVERTISING AGENCIES AND CORPORATE CLIENTS
✥ PR AGENCIES ✥
A n ewkind ofd a n ceTechnology has introduceda different set of challenges
to how companies shouldhandle public relations
T he eye-witness consumer is a growingrisk for business, now that social mediacan broadcast questionable behaviourby businesses at the touch of a button.The danger was highlighted recently by
an incident at a Braamfontein KFC outlet inJohannesburg, where employees scatteredchicken pieces on the ground and hosed themdown. The scene was caught on camera andfootage was then posted on social media,provoking scathing comments from countlessco n s u m e rs .
A statement issued by KFC said the chicken inthe images had not met its quality standards andwas never intended to be sold to the public. “Th eBraamfontein store had set it aside for disposal,”read the statement. The KFC statement assured
consumers the brand follows strict food disposalprocesses, adding that KFC had dealt firmly withthe store owner and those involved. The storewas closed for a few days while the situation wasbeing investigated.
“You can issue denials. You can post yourversion of events on your website. You canrelease a press statement. It doesn’t matter,” s ay sAki Kalliatakis. managing partner of TheLeadership Launchpad, a consultancy dedicatedto sustainable improvements in customer service.“By the time you react, considerable reputationaldamage will have been done. You can’t eradicatepowerful images with a corporate statement.”
Last year Cell C faced a similar challengewhen a customer placed ahuge banner next to ahighway complaining about“u s e l e s s” service. Cell C tooklegal action, only for thejudge to rule that criticismcontaining fair comment isprotected. The issue receivedextensive play on socialmedia.
The PR industry has hadto be very flexible over thepast few years, says IngridLotze, director at join.the.dotsand vice-president of thePublic Relations Institute ofSouthern Africa (Prisa).“We ’ve had to be on top ofthe game, relevant and opento change. There are more
Keeping the public informed during an extortion campaignenhanced Pick n Pay’s reputation
Aki Kalliatakis
Rob
ert
Tsha
bala
la
Rob
ert
Tsha
bala
la

Financial Mail Page 104-105 -12/06/15 03:28:09 PM
FINANCIAL MAIL • TOP COMPANIES • 2015104 FINANCIAL MAIL • TOP COMPANIES • 2015 105
SERV
ICES SERVICES
✥ PR AGENCIES ✥✥ PR AGENCIES ✥
■ ANNE DUNNCO M M U N I CAT I O N SSA Giants: Tigbrands (44)Top Performers: Ti g b ra n d s( 1 37 )
■ APRIO STRATEGICCO M M U N I CAT I O N S
SA Giants: Implats (46),PanAfric (130)Top Performers: Pa n Af r i c( 52 )
■ ARIEL ASSOCIATESTop Performers: Cafca (148)
■ AT M OS P H E R E
CO M M U N I CAT I O N SSA Giants: Sanlam (6),Capitec (71), Comair (105)Top Performers: Capitec (23),Sanlam (53), Comair (134)
■ BA I R D ’S RENAISSANCESA Giants: EHSV* (112)
PUBLIC RELATIONS AGENCIES AND CORPORATE CLIENTS
■ BELL POTTINGERFINANCIAL & CORPORATESA Giants: Richmont (9),PanAfric (130)Top Performers: Pa n Af r i c(52), Richmont (60)
■ BRIAN GIBSON ISSUEM A N AG E M E N TTop Performers: Ra n g o l d( 1 94 )
■ BRUNSWICK (SA)SA Giants: Anglo (3), MTNGroup (10), B-Africa (18),Massmart (20), Sappi (22),Gfields (42), Omnia (60), lliad(119), Advtech (156)Top Performers: Omnia (81),MTN Group (115), Invltd (146),Advtech (152), B-Africa (160),Massmart (162), Sappi (165),lliad (197)
■ CA L I B ROCO M M U N I CAT I O N SSA Giants: Shoprit (14)Top Performers: Shoprit(106)
■ CARDEW GROUP (UK)SA Giants: Lonmin (83)
■ CORPORATE IMAGECONSULTANTS INCSA Giants: Vodacom (19),Picknpay (23), Pikwik (24),Mr Price (67), Oceana (113)Top Performers: Mr Price(13), Oceana (48), Granprade(67), Vodacom (70), Pikwik(175), Picknpay (180)
■ DINATLA INDUSTRIESSA Giants: Howden (160)Top Performers: Howden (49)
■ ENVISAGE INVESTOR &CORPORATE RELATIONSSA Giants: Esorfrank (139),Afrimat (150), Morvest (186)Top Performers: Afrimat (19),Morvest (172)
■ EPIC COMMUNICATIONSTop Performers: M et rofi l e(66)
■ FCB REDLINESA Giants: MMI (37),RCLFoods (56)Top Performers: MMI (87),RCLFoods (187)
■ FTI CONSULTINGSA Giants: Anglo (3), Mondi(15), Redefintl (181)Top Performers: Mondi (42)
■ F I N S B U RYSA Giants: OldMutual (28)Top Performers: O l d M u tu a l( 74 )
■ HG STRATEGICCO M M U N I CAT I O N SSA Giants: DAWN (111), Jasco( 1 89 )
■ HEIDI ROLFE STRATEGIESSA Giants: DAWN (111)
■ HILL & KNOWLTONST RAT EG I ES
SA Giants: JSE (154)Top Performers: JSE (120)
■ HUDSON SANDLERSA Giants: Capco (146)Top Performers: Capco (22)
■ INCESA Giants: Spar (30),Santova (128)Top Performers: Sa ntova(10), Spar (82)
■ INSTINCTIF PARTNERSSA Giants: Barworld (21),Illovo (72), Clover (90),Metair (94), Raubex (102),Zurich SA (120), Capco (146)Top Performers: Capco (22),Metair (25), Octodec (105),Barworld (125), Clover (126),Intuprop (159), Zurich SA(169), Sacoil (190)
■ I N V ESTO RCO M M U N I CAT I O N SSA Giants: Fambrands (129),Itltile (131)Top Performers: Fa m b ra n d s(31), Itltile (65)
■ JOE PUBLICSA Giants: Adcock (115)
■ KEYTER RECH INVESTORSO LU T I O N SSA Giants: Suprgrp (68),Astral (86), Stefstock (87),ARB (142), Afrimat (150),Wescoal (182)Top Performers: Afrimat (19),Suprgrp (30), ARB (68),Astral (138), Wescoal (153)
■ LANGE STRATEGICCO M M U N I CAT I O N SSA Giants: Foschni (69)Top Performers: Foschni (73)
■ LOWE & PARTNERS SASA Giants: Adcock (115)
■ LUXURY BRANDS CCSA Giants: Ascendis (157)
■ M AC M I L L A NCO M M U N I CAT I O N SSA Giants: Cityldg (188)Top Performers: Cityldg (133)
■ MAGNA CARTASA Giants: Stanbank (12)Top Performers: Sta n ba n k(154)
■ MAKINSON COWELL (UK)SA Giants: OldMutual (28)Top Performers: O l d M u tu a l( 74 )
■ MARKETING CONCEPTSSA Giants: Growpnt (98),Vukile (166)Top Performers: Vukile (37),Growpnt (109)
■ M E RO PACO M M U N I CAT I O N SSA Giants: Woolies (34)Top Performers: Woolies (38)
■ OGILVY PUBLICR E L AT I O N SSA Giants: Discovery (51)
Top Performers: D i scove r y( 45 )
■ PR CONNECTIONSSA Giants: Dcentrix (141)Top Performers: D ce nt r i x( 1 92 )
■ PR WORXTop Performers: Taste (12)
■ PROOF COMMUNICATIONA F R I CASA Giants: Petmin (192)
■ PURPLE FROGCO M M U N I CAT I O N SSA Giants: Andulela (200)
■ RUSSELL & ASSOCIATESSA Giants: Northam (110),Atlatsa (152), DRDGold (153),Village (158)Top Performers: Diamondcp( 57 )
■ SERENDIPITY CCSA Giants: Afrox (107)
■ SHAUNEEN BEUKESCO M M U N I CAT I O N SSA Giants: Aspen (45)Top Performers: Aspen (28)
■ STONE CONSULTINGSA Giants: Medclin (43)Top Performers: Medclin (33)
■ STRATEGIC PUBLICRELATIONS GROUPSA Giants: Tsogo Sun (78)Top Performers: Tsogo Sun(156)
■ T E R RA N OVASA Giants: Cargo (198)Top Performers: Cargo (107)
■ THE FIRE TREE DESIGNCO M PA N YTop Performers: G o o d e rso n(19 1)
■ THE RED PHONESA Giants: Nampak (55)Top Performers: Nampak (91)
■ TIELLE COMMUNICATIONSSA Giants: Metmar (140)Top Performers: Hosp (164)
■ TIER 1 INVESTORR E L AT I O N SSA Giants: Clicks (57), Lewis(121)Top Performers: Clicks (62),Lewis (145)
■ WAGGENER EDSTROMCO M M U N I CAT I O N SSA Giants: Mustek (117)Top Performers: Mustek (59)
■ WATT COMMUNICATIONSTop Performers: Adaptit (2)*Suspended #Delisted
PUBLIC RELATIONS AGENCIES AND CORPORATE CLIENTS
vying for the same talent in digital, video,creative, content and other disciplines, and wehave to up our game at every turn just to keep upwith the advertising and digital agencies that arekeen to eat our part of the marketing-mix pie.
“Now we’re seeing a move towards contentcreation in all forms — from digital, video, design,animation and other specialities,” she says. “Th eindustry is shifting and morphing toaccommodate for brands being their ownproducers of content. So, there is a renewed focuson content amplification — not justgetting it out there, but alsomaximising it with paid support,promotion and repurposing it.”
Lotze says crisiscommunications is a delicateinternal dance that requires thecommunicators, management, thepeople at the coalface and the legaldepartment to all be fully informedand appraised of the situation andits risks. Then there’s a need to stepin time with one another to allowfor timeous internal and externalcommunications as well as fastoperational responses that addressthe crisis with precision andi m m e d i a cy .
“Timing of this dance is critical
and the PR practitioners cannotonly help with the drafting ofthe key articulation, officialannouncements and collateraldevelopment. They can also bethe vital bridge between allparties and the choreographerin the interplay between all keypeople involved in the crisis,”she says.
She uses Pick n Pay as anexample. The company was avictim of an extortioncampaign in 2003 when adisgruntled individual placedpoisoned products on storeshelves. “They kept the publicinformed as the crisisdeveloped until the blackmailer
was caught and the products removed,” s ay sL ot z e .
The way government handled NelsonMa n d e l a’s illness, and the communication of thecause and effects of Eskom’s generation problemsare examples of what not to do. “Because they donot keep us informed we view them as publicenemy number one."
A PR practitioner can usually give all of theadvice necessary to deal with a crisis, such asbeing open and honest, staying transparent
throughout the situation andconsistently keeping targetaudiences up to date through thevarious media channels. “All of thisis good and well, but ifmanagement does not lead theway, we get situations like Eskom— where all trust is broken,” s ay sL ot z e .
In the past, 80% of mediacoverage and information aboutthe brand was influenced by publicrelations. “However, a single tweetfrom a celebrity can do moredamage than can be corrected byyour entire advertising budget, andit holds the power to either makeor break your reputation in undera second,” she says. Ruan Jooste
Cell C’s response to this caused some damage to the firm
Ingrid Lotze
Gal
lo I
mag
es/S
unda
y Ti
mes
/Sim
phiw
e N
kwal
i

Financial Mail Page 106 -12/06/15 03:28:27 PM
FINANCIAL MAIL • TOP COMPANIES • 2015106
INDE
XA , B ,CAVI . . . . . . . . . . . . . . . . . . . . . . . . . . . . . . . . . . . . . . . . . . . . . . . . 51AdaptIT . . . . . . . . . . . . . . . . . . . . . . . . . . . . . . . . . . . . . . . . . . . 1 1 ,67Adcock Ingram . . . . . . . . . . . . . . . . . . . . . . . . . . . . . . . . . . . . . . . 53African Equity Empowerment Investments . . . . . . . . . . . . . . . . . . . 11Afrimat . . . . . . . . . . . . . . . . . . . . . . . . . . . . . . . . . . . . . . . . . . . . . . 11Afrocentric . . . . . . . . . . . . . . . . . . . . . . . . . . . . . . . . . . . . . . . . . . . 11Alexander Forbes . . . . . . . . . . . . . . . . . . . . . . . . . . . . . . . . . . . . . 66Amplats . . . . . . . . . . . . . . . . . . . . . . . . . . . . . . . . . . . . . . . . . . 4 0,43Anglo American . . . . . . . . . . . . . . . . . . . . . . . . . . . . . . . . . . 1 9, 2 0, 3 8Arrowhead Properties . . . . . . . . . . . . . . . . . . . . . . . . . . . . . . . . . . 70Aspen . . . . . . . . . . . . . . . . . . . . . . . . . . . . . . . . . . . . . . . . . . . . 2 0,53Attacq . . . . . . . . . . . . . . . . . . . . . . . . . . . . . . . . . . . . . . . . . . . . . . 68BAT . . . . . . . . . . . . . . . . . . . . . . . . . . . . . . . . . . . . . . . . . . . . 1 9,5 2 ,78BHP Billiton . . . . . . . . . . . . . . . . . . . . . . . . . . . . . . . . . . 1 8, 2 0, 3 8,4 0Barclays . . . . . . . . . . . . . . . . . . . . . . . . . . . . . . . . . . . . . . . . . . 2 0,6 0Barloworld . . . . . . . . . . . . . . . . . . . . . . . . . . . . . . . . . . . . . . . . . . 47Bidvest . . . . . . . . . . . . . . . . . . . . . . . . . . . . . . . . . . . . . . . . . . . 1 9, 2 0Billiton . . . . . . . . . . . . . . . . . . . . . . . . . . . . . . . . . . . . . . . . . . . . . 78Brait . . . . . . . . . . . . . . . . . . . . . . . . . . . . . . . . . . . . . . . . . . . . . . . 65British American Tobacco . . . . . . . . . . . . . . . . . . . . . . . . . . . . . . . 20CIG . . . . . . . . . . . . . . . . . . . . . . . . . . . . . . . . . . . . . . . . . . . . . . . . . 11Cadiz . . . . . . . . . . . . . . . . . . . . . . . . . . . . . . . . . . . . . . . . . . . . . . 66Calgro M3 . . . . . . . . . . . . . . . . . . . . . . . . . . . . . . . . . . . . . . . . . . . . 11Capitec . . . . . . . . . . . . . . . . . . . . . . . . . . . . . . . . . . . . . . . . . . . 6 0,6 5Caxton . . . . . . . . . . . . . . . . . . . . . . . . . . . . . . . . . . . . . . . . . . . . . 58Cell C . . . . . . . . . . . . . . . . . . . . . . . . . . . . . . . . . . . . . . . . . . . . . 1 03City Lodge . . . . . . . . . . . . . . . . . . . . . . . . . . . . . . . . . . . . . . . . . . 51Clicks . . . . . . . . . . . . . . . . . . . . . . . . . . . . . . . . . . . . . . . . . . . . . . . 11Clicks Group . . . . . . . . . . . . . . . . . . . . . . . . . . . . . . . . . . . . . . . . . 57Clientele . . . . . . . . . . . . . . . . . . . . . . . . . . . . . . . . . . . . . . . . . . . . . 11Comair . . . . . . . . . . . . . . . . . . . . . . . . . . . . . . . . . . . . . . . . . . . . . 81Coronation . . . . . . . . . . . . . . . . . . . . . . . . . . . . . . . . . . . . . . . . . . 65Coronation Fund Managers . . . . . . . . . . . . . . . . . . . . . . . . . . . . . . 10
D, E , FDatacentrix . . . . . . . . . . . . . . . . . . . . . . . . . . . . . . . . . . . . . . . . . . 67Datatec . . . . . . . . . . . . . . . . . . . . . . . . . . . . . . . . . . . . . . . . . . . . . 67Delta International . . . . . . . . . . . . . . . . . . . . . . . . . . . . . . . . . . . . 68Discovery . . . . . . . . . . . . . . . . . . . . . . . . . . . . . . . . . . . . . . . . . 6 3,6 4Distell . . . . . . . . . . . . . . . . . . . . . . . . . . . . . . . . . . . . . . . . . . . . . . 50EOH . . . . . . . . . . . . . . . . . . . . . . . . . . . . . . . . . . . . . . . . . . . . . 1 1 ,67Eqstra . . . . . . . . . . . . . . . . . . . . . . . . . . . . . . . . . . . . . . . . . . . . . . 47Eskom . . . . . . . . . . . . . . . . . . . . . . . . . . . . . . . . . . . . . . . . . . . . . 79Famous Brands . . . . . . . . . . . . . . . . . . . . . . . . . . . . . . . . . . . . . 1 1 ,5 1FirstRand . . . . . . . . . . . . . . . . . . . . . . . . . . . . . . . . . . . . . . 2 0,6 0,78Fortress B . . . . . . . . . . . . . . . . . . . . . . . . . . . . . . . . . . . . . . . . . . . 68
G,H,IGlencore . . . . . . . . . . . . . . . . . . . . . . . . . . . . . . . . . . . . . 1 8, 2 0,4 0,78Gold Fields . . . . . . . . . . . . . . . . . . . . . . . . . . . . . . . . . . . . . . . . . . 42Growthpoint Properties . . . . . . . . . . . . . . . . . . . . . . . . . . . . . . . . . 70Hosken Consolidated Investments . . . . . . . . . . . . . . . . . . . . . . . . 52Hospitality B . . . . . . . . . . . . . . . . . . . . . . . . . . . . . . . . . . . . . . . . . 68Howden Africa . . . . . . . . . . . . . . . . . . . . . . . . . . . . . . . . . . . . . . . 47Hudaco . . . . . . . . . . . . . . . . . . . . . . . . . . . . . . . . . . . . . . . . . . . . . 46Hyprop Investments . . . . . . . . . . . . . . . . . . . . . . . . . . . . . . . . . . . 68Investec . . . . . . . . . . . . . . . . . . . . . . . . . . . . . . . . . . . . . . . 2 0,6 2 ,6 5Italtile . . . . . . . . . . . . . . . . . . . . . . . . . . . . . . . . . . . . . . . . . . . . . . 57
J, K , LJSE . . . . . . . . . . . . . . . . . . . . . . . . . . . . . . . . . . . . . . . . . . . . . . . . 95KAP Industrial . . . . . . . . . . . . . . . . . . . . . . . . . . . . . . . . . . . . . . . 46Kumba . . . . . . . . . . . . . . . . . . . . . . . . . . . . . . . . . . . . . . . . . . . . . 38Liberty . . . . . . . . . . . . . . . . . . . . . . . . . . . . . . . . . . . . . . . . . . . . . 63Liberty Holdings . . . . . . . . . . . . . . . . . . . . . . . . . . . . . . . . . . . . . . 10
M , N,OMMI . . . . . . . . . . . . . . . . . . . . . . . . . . . . . . . . . . . . . . . . . . . . . 6 3,6 4MTN . . . . . . . . . . . . . . . . . . . . . . . . . . . . . . . . . . . . . . . . 1 9, 2 0,59,78Massmart . . . . . . . . . . . . . . . . . . . . . . . . . . . . . . . . . . . . . . . . . . . 57Mondi . . . . . . . . . . . . . . . . . . . . . . . . . . . . . . . . . . . . . . . . . . . . . . 19Mr Price . . . . . . . . . . . . . . . . . . . . . . . . . . . . . . . . . . . . . . . . . . . . . 11Mutual & Federal . . . . . . . . . . . . . . . . . . . . . . . . . . . . . . . . . . . . . 64Naspers . . . . . . . . . . . . . . . . . . . . . . . . . . . . . . . . . . . . . . . 2 0,5 8,78Nedbank . . . . . . . . . . . . . . . . . . . . . . . . . . . . . . . . . . . . . . . . . . . . 60Nu-World . . . . . . . . . . . . . . . . . . . . . . . . . . . . . . . . . . . . . . . . . . . 52Octodec Investments . . . . . . . . . . . . . . . . . . . . . . . . . . . . . . . . . . 70Old Mutual . . . . . . . . . . . . . . . . . . . . . . . . . . . . . . . . . . . 1 1 , 2 0,6 3,8 2Omnia Holdings . . . . . . . . . . . . . . . . . . . . . . . . . . . . . . . . . . . . . . . 11Outsurance . . . . . . . . . . . . . . . . . . . . . . . . . . . . . . . . . . . . . . . . . . 64
P,Q, RPSG . . . . . . . . . . . . . . . . . . . . . . . . . . . . . . . . . . . . . . . . . . . . . 1 1 ,6 5Peregrine . . . . . . . . . . . . . . . . . . . . . . . . . . . . . . . . . . . . . . . . . . . 66Pick n Pay . . . . . . . . . . . . . . . . . . . . . . . . . . . . . . . . . . . . . . . 5 5, 10 4Pinnacle Technology . . . . . . . . . . . . . . . . . . . . . . . . . . . . . . . . . . . 67Pivotal . . . . . . . . . . . . . . . . . . . . . . . . . . . . . . . . . . . . . . . . . . . . . 68RCL Foods . . . . . . . . . . . . . . . . . . . . . . . . . . . . . . . . . . . . . . . . . . 51Redefine Properties . . . . . . . . . . . . . . . . . . . . . . . . . . . . . . . . . . . 70Remgro . . . . . . . . . . . . . . . . . . . . . . . . . . . . . . . . . . . . . . . . . . . 2 0,47Resilient . . . . . . . . . . . . . . . . . . . . . . . . . . . . . . . . . . . . . . . . . . . . . 11Resilient Property Income Fund . . . . . . . . . . . . . . . . . . . . . . . . . . 68Rhodes Food Group . . . . . . . . . . . . . . . . . . . . . . . . . . . . . . . . . . . 51Richemont . . . . . . . . . . . . . . . . . . . . . . . . . . . . . . . . . . . 1 9, 2 0,5 2 ,78Rockcastle Global Real Estate Company . . . . . . . . . . . . . . . . . . . . 68
S ,T,USABMiller . . . . . . . . . . . . . . . . . . . . . . . . . . . . . . . . . . 1 9, 2 0,5 0,5 1 ,78Sanlam . . . . . . . . . . . . . . . . . . . . . . . . . . . . . . . . . . . . 1 1 , 1 9, 2 0,6 3,6 4Santam . . . . . . . . . . . . . . . . . . . . . . . . . . . . . . . . . . . . . . . . . . . 6 3,6 4Sappi . . . . . . . . . . . . . . . . . . . . . . . . . . . . . . . . . . . . . . . . . . . . . . 19Sasfin . . . . . . . . . . . . . . . . . . . . . . . . . . . . . . . . . . . . . . . . . . . . . . 65Sasol . . . . . . . . . . . . . . . . . . . . . . . . . . . . . . . . . . . . . . . 1 9, 2 0, 34,78Seardel . . . . . . . . . . . . . . . . . . . . . . . . . . . . . . . . . . . . . . . . . . . . . 52Shoprite . . . . . . . . . . . . . . . . . . . . . . . . . . . . . . . . . . . . . . . . . . . . 55Sibanye . . . . . . . . . . . . . . . . . . . . . . . . . . . . . . . . . . . . . . . . . . . 4 2 ,43Spar Group . . . . . . . . . . . . . . . . . . . . . . . . . . . . . . . . . . . . . . . . . . 55Spur Corp . . . . . . . . . . . . . . . . . . . . . . . . . . . . . . . . . . . . . . . . . . . 51Standard Bank . . . . . . . . . . . . . . . . . . . . . . . . . . . . . . . . . . . 1 1 , 2 0,6 0Stanlib . . . . . . . . . . . . . . . . . . . . . . . . . . . . . . . . . . . . . . . . . . . . . . 11Steinhoff . . . . . . . . . . . . . . . . . . . . . . . . . . . . . . . . . . . 2 0,4 6,5 2 ,6 5,78Super Group . . . . . . . . . . . . . . . . . . . . . . . . . . . . . . . . . . . . . . . . . . 11Synergy B . . . . . . . . . . . . . . . . . . . . . . . . . . . . . . . . . . . . . . . . . . . 68Telkom . . . . . . . . . . . . . . . . . . . . . . . . . . . . . . . . . . . . . . . . . 59,67,8 1Texton Property Fund . . . . . . . . . . . . . . . . . . . . . . . . . . . . . . . . . . 70The Foschini Group . . . . . . . . . . . . . . . . . . . . . . . . . . . . . . . . . . . . 56Tiger Brands . . . . . . . . . . . . . . . . . . . . . . . . . . . . . . . . . . . . . . . . . 50Times Media Group . . . . . . . . . . . . . . . . . . . . . . . . . . . . . . . . . . . 58Tongaat Hulett . . . . . . . . . . . . . . . . . . . . . . . . . . . . . . . . . . . . . . . 51Trustco . . . . . . . . . . . . . . . . . . . . . . . . . . . . . . . . . . . . . . . . . . . . . . 11Truworths . . . . . . . . . . . . . . . . . . . . . . . . . . . . . . . . . . . . . . . . . . . 56Tsogo Sun Group . . . . . . . . . . . . . . . . . . . . . . . . . . . . . . . . . . . . . 51
V, WVodacom . . . . . . . . . . . . . . . . . . . . . . . . . . . . . . . . . . . . . . . . . . . . 59Vukile Property Fund . . . . . . . . . . . . . . . . . . . . . . . . . . . . . . . . . . 68Woolworths . . . . . . . . . . . . . . . . . . . . . . . . . . . . . . . . . . . . . . . . 5 1 ,5 6Woolworths Holdings . . . . . . . . . . . . . . . . . . . . . . . . . . . . . . . . . . . 11
X ,Y, ZZambezi Platinum . . . . . . . . . . . . . . . . . . . . . . . . . . . . . . . . . . . . . 41Zurich SA . . . . . . . . . . . . . . . . . . . . . . . . . . . . . . . . . . . . . . . . . . . 64

Financial Mail Page 107 -12/06/15 12:48:08 PM
INET BFA © 2014 All Rights Reserved
A world of market
data and analyticsThe new INET Fronteer terminal integrates real-time market data, news, charting and analytics, all in a single interface that is easy to learn and efficient to use. INET Fronteer is streamlined for the real-world needs of finance professionals – eliminating unused features and unnecessary costs.The INET Fronteer terminal includes a comprehensive set of real-time and delayed market data covering all major asset classes, professional news from leading sources and analytics data from across the world.
Experience INET Fronteer for yourself
Get a full-featured trial of the INET Fronteer terminal complete with real-time data, news and analytics – free for 14 days. Register at: INETBFA.com
INET Fronteer
NEW!Ver 6.2

Financial Mail Page 108 -12/06/15 12:48:16 PM
CH
AR
LIE
BR
AV
O #
44
5-1
5
NEED BETTER SPACE?
If you need less space, more space or just better
space, contact Redefine Properties today. We have the
place you need to work smarter. To view our portfolio,
go to www.redefine.co.za or call 0860DEFINE.
OFFICE | INDUSTRIAL | RETAIL We’re not landlords. We’re people.
Job 445-15 Financial Mail Top Companies 273x210mm.indd 1 2015/05/28 1:23 PM


![48216 Baack Final Proof [FM]](https://static.fdokumen.com/doc/165x107/631bfe5b3e8acd997705b218/48216-baack-final-proof-fm.jpg)