A statistical method for source apportionment of riverine nitrogen loads
Upload
nagasaki-uCategory
view
1download
0
1
Flux of Organic Carbon in a Riverine Mangrove Wetland in the Florida Coastal
Everglades 2
Melissa M. Romigh1, Stephen E. Davis, III1a, Victor H. Rivera-Monroy2, and Robert R. Twilley2 4
1Department of Wildlife & Fisheries Sciences, 2258 TAMU, Texas A&M University, College 6
Station, TX 77843 USA
8
2Wetland Biogeochemistry Institute, Department of Oceanography & Coastal Science, Louisiana
State University, Baton Rouge, LA 70803 USA 10
Keywords: DOC, mangrove forest, wetland-water column fluxes, Everglades National Park 12
Note: This paper has not been submitted elsewhere in identical or similar form, nor will it be 14
during the first three months after its submission to Hydrobiologia.
16
18
20
22
a Corresponding Author
24

2
ABSTRACT
Short term (daily) and seasonal variations in concentration and flux of dissolved organic carbon 2
(DOC) were examined over 15 tidal cycles in a riverine mangrove wetland along Shark River,
Florida in 2003. Due to the influence of seasonal rainfall and wind patterns on Shark River’s 4
hydrology, samplings were made to include wet, dry and transitional (Norte) seasons. We used a
flume extending from a tidal creek to a basin forest to measure vertical (vegetated soil/water 6
column) and horizontal (mangrove forest/tidal creek) flux of DOC. We found significant
(p<0.05) variations in surface water temperature, salinity, conductivity, pH and mean 8
concentration of DOC with season. Water temperature and salinity followed seasonal patterns of
air temperature and rainfall, while mean DOC concentration was highest during the dry season 10
(May), followed by the wet (October) and ‘Norte’ (December) seasons. This pattern of DOC
concentration may be due to a combination of litter production and inundation pattern of the 12
wetland. In contrast to daily (between tides) variation in DOC flux between the mangrove forest
and tidal creek, daily variations of mean water quality were not significant. However, within-14
tide variation of DOC flux, dissolved oxygen content and salinity was observed. This indicated
that the length of inundation and water source (freshwater vs. saltwater) variation across tidal 16
cycles influenced water quality and DOC flux in the water column. Net DOC export was
measured in October and December, suggesting the mangrove forest was a source of DOC to the 18
adjacent tidal creek during these periods. Net annual export of DOC from the fringe mangrove
to both the tidal creek and basin mangrove forest was 56 g C m-2 y-1. The seasonal pattern in our 20
flux results indicates that DOC flux from this mangrove forest may be governed by both
freshwater discharge and tidal range. 22
3
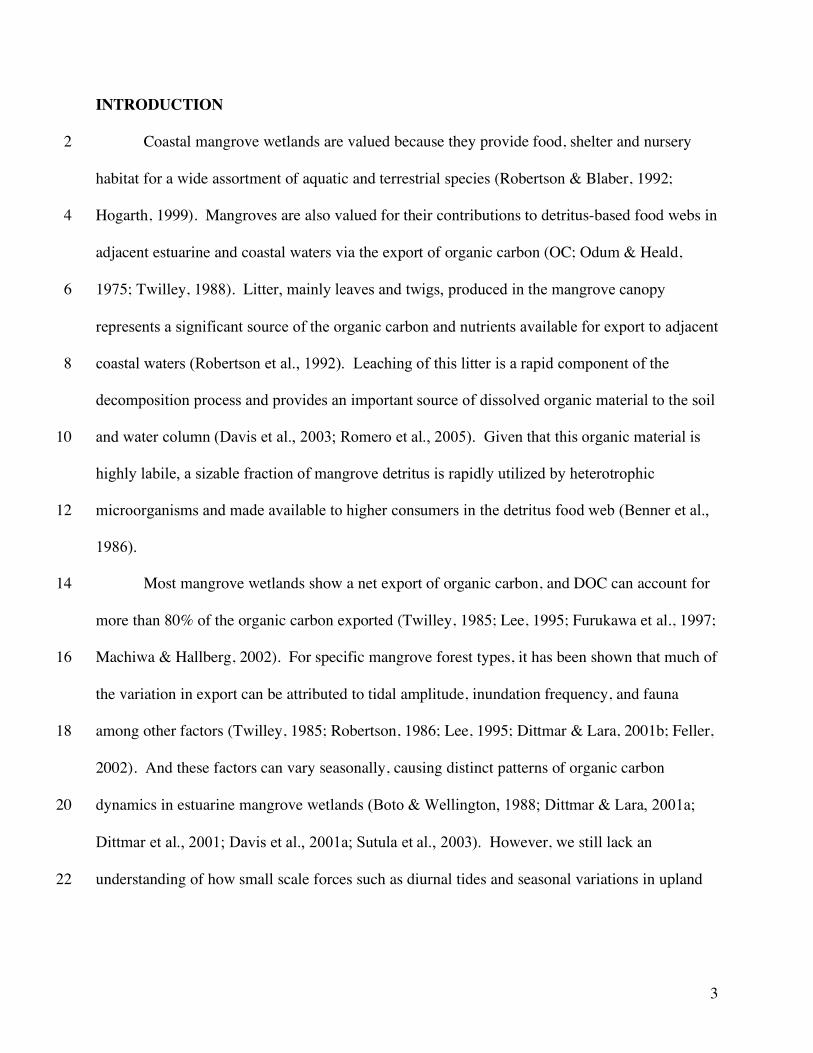
INTRODUCTION
Coastal mangrove wetlands are valued because they provide food, shelter and nursery 2
habitat for a wide assortment of aquatic and terrestrial species (Robertson & Blaber, 1992;
Hogarth, 1999). Mangroves are also valued for their contributions to detritus-based food webs in 4
adjacent estuarine and coastal waters via the export of organic carbon (OC; Odum & Heald,
1975; Twilley, 1988). Litter, mainly leaves and twigs, produced in the mangrove canopy 6
represents a significant source of the organic carbon and nutrients available for export to adjacent
coastal waters (Robertson et al., 1992). Leaching of this litter is a rapid component of the 8
decomposition process and provides an important source of dissolved organic material to the soil
and water column (Davis et al., 2003; Romero et al., 2005). Given that this organic material is 10
highly labile, a sizable fraction of mangrove detritus is rapidly utilized by heterotrophic
microorganisms and made available to higher consumers in the detritus food web (Benner et al., 12
1986).
Most mangrove wetlands show a net export of organic carbon, and DOC can account for 14
more than 80% of the organic carbon exported (Twilley, 1985; Lee, 1995; Furukawa et al., 1997;
Machiwa & Hallberg, 2002). For specific mangrove forest types, it has been shown that much of 16
the variation in export can be attributed to tidal amplitude, inundation frequency, and fauna
among other factors (Twilley, 1985; Robertson, 1986; Lee, 1995; Dittmar & Lara, 2001b; Feller, 18
2002). And these factors can vary seasonally, causing distinct patterns of organic carbon
dynamics in estuarine mangrove wetlands (Boto & Wellington, 1988; Dittmar & Lara, 2001a; 20
Dittmar et al., 2001; Davis et al., 2001a; Sutula et al., 2003). However, we still lack an
understanding of how small scale forces such as diurnal tides and seasonal variations in upland 22
4
runoff—as indicated by freshwater inflows—control organic carbon dynamics in these
ecosystems. 2
Few studies have quantified mangrove-water column interactions in situ, and there have
been even fewer such studies conducted in mangrove forests of Everglades National Park (ENP; 4
Davis et al., 2001a; Davis et al., 2001b; Sutula et al., 2003). This coastal region is of particular
interest where landscape-scale hydrologic restoration efforts are underway. The focus of our 6
study was on the short term (daily) and seasonal variability in organic carbon dynamics
(concentration and fluxes) between a riverine mangrove wetland and the Shark River estuary 8
(FL, USA). We hypothesized that seasonal variations in freshwater flow originating from the
Everglades and local diurnal tides were important in regulating organic carbon exchange in this 10
wetland. We further hypothesized that the high productivity common to riverine mangrove
forests and the high tidal range in Shark River (relative to other estuaries in the Gulf of Mexico) 12
would result in a net export of organic carbon for the year.
14
METHODS
16 Site Description
Everglades National Park is located in southern Florida and comprises 610,483 ha, of 18
which 144,447 ha are mangrove forest (Lewis et al., 1985; Welch et al., 1999). Average annual
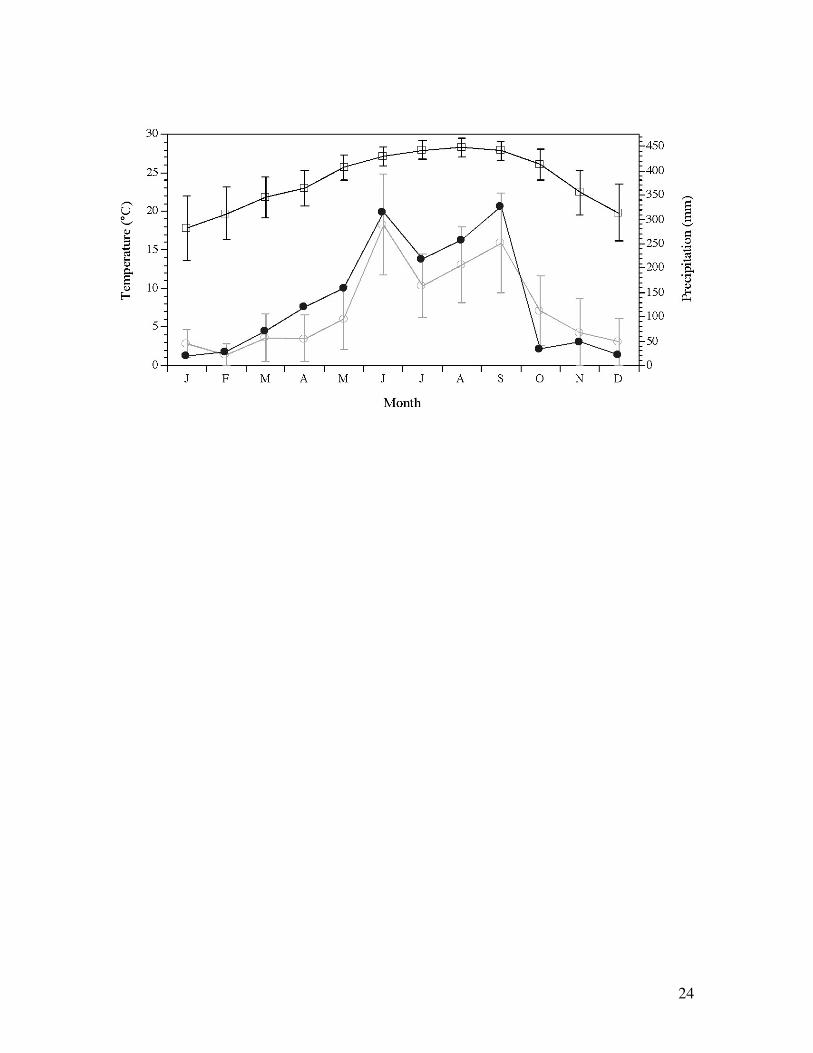
rainfall in the region is 138 cm, with distinct wet (approximately 60% average annual rainfall 20
from June to September) and dry (approximately 25% average annual rainfall from November to
April) seasons (Figure 1). Shark River is a mangrove-dominated tidal river along the southwest 22
coast of ENP and is one of the largest estuaries in South Florida. Discharge of freshwater from
Shark River Slough to the estuary follows patterns of intra-annual (i.e., seasonal) and inter-24

5
annual rainfall (Chen & Twilley, 1999; Childers et al., 2005). Tides in Shark River are
predominantly semi-diurnal with mean amplitude of 0.5–1.0 m. 2
Our site was located approximately 4 km upstream from the mouth of the estuary at SRS-
6 (25°21.852 N, 81°04.667 W), a site routinely sampled as part of the Florida Coastal Everglades 4
(FCE) LTER program. Specifically, our sampling site was located along a small tidal creek that
connects the mangrove wetland at SRS-6 to Shark River (Figure 2). The width of the tidal creek 6
is approximately 2 m and the distance from the sampling sites to Shark River was approximately
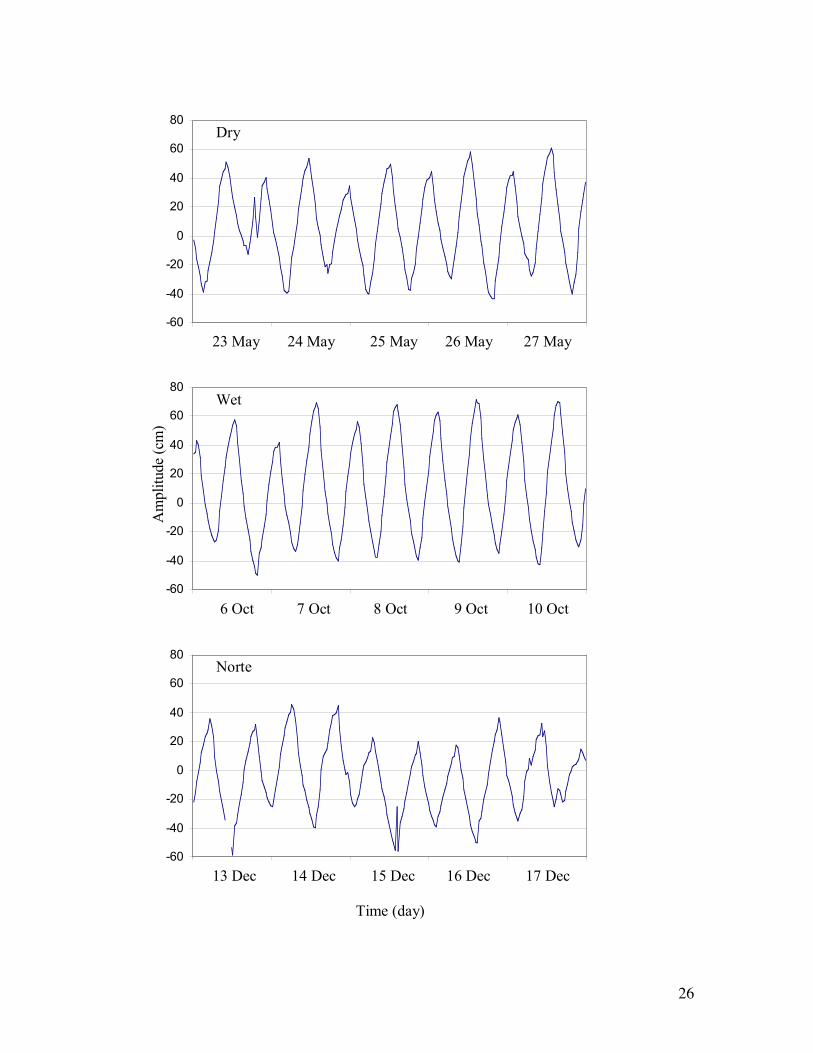
30 m. The riverine mangrove forest at this location is tidally inundated twice per day (Figure 3) 8
and is dominated by three species of mangroves (Rhizophora mangle, Avicennia germinans, and
Laguncularia racemosa). 10
Field Sampling 12
Samplings were made in 2003 in three seasons: dry (May), wet (October) and the
transitional ‘Norte’ season (December) to understand the importance of season in driving organic 14
carbon dynamics. Also, we sampled across multiple, consecutive tidal cycles (4-6 tides per
season) to capture the range of variability in concentration and fluxes within each season. 16
We used a flow-through flume to measure organic carbon fluxes between the wetland
surface and the water column (vertical) and exchanges between the wetland and Shark River 18
(horizontal). The experimental flume was open to surface water flow at both ends and measured
approximately 2 m wide and 12.5 m in length, extending from the tidal creek into the mangrove 20
forest. The flume walls were positioned perpendicular to the tidal creek and parallel to the
direction of flow of the flooding tidal water, so as to mimic natural flooding patterns in the 22
enclosed area of wetland. Panels on the flumes, consisting of clear, corrugated fiberglass, were

6
removed after each sampling to prevent long-term panel effects such as shading, edge scouring,
and detritus accumulation (Childers & Day, 1988). 2
During each sampling period, an ISCO auto-sampler was placed at each end of the flume
and programmed to collect a 1-liter water sample every 30 minutes from a single point inside the 4
flume. Samples were collected simultaneously from each end of the flume during flood and ebb
half tides. Samples were retrieved every 12 hours, packed in ice and transported to the 6
laboratory for processing. In addition, we continuously monitored temperature, salinity, pH,
conductivity and dissolved oxygen (DO) concentration of tidal creek surface water with a pre-8
calibrated mini-sonde. We also utilized data on water level and salinity collected continuously at
SRS-6 as part of the FCE-LTER program. Lastly, the microtopography of the wetland within the 10
flume was surveyed in August 2003 to build a detailed map of elevation. These elevation data
were used in conjunction with water level data to estimate the volume of water in the flume 12
during each sampling and the change in volume (volume flux) between samplings.
14
Laboratory Analyses
Water samples were filtered through pre-rinsed (triplicate 5 ml rinses with de-ionized 16
water), pre-combusted (4 hr at 500°C) and pre-weighed 47 mm Whatman GF/F papers.
Filtration was performed within 24 hr of collection and both filtered and unfiltered samples were 18
refrigerated at 4 ºC in 125 ml bottles. Particulate matter trapped on the filter was dried at 70 ºC
for 24 hr and weighed for calculation of total suspended sediment (TSS) concentration, then 20
combusted (500 ºC for 4 hr) to determine losses on ignition.
DOC and TOC concentrations in filtered and unfiltered samples were quantified using 22
high temperature catalytic oxidation (HTCO) and infrared detection with a Shimadzu TOC-5000.

7
Organic carbon concentrations were determined against potassium hydrogen phthalate standards.
Samples were measured in triplicate with a fixed coefficient of variation of 2%. Duplicate 2
samples were analyzed periodically to check for reproducibility of results and to evaluate the
precision of measurements. 4
Statistical Analyses and Flux Calculations 6
Tidal (flood, ebb) and seasonal (dry, wet, ‘Norte’) differences in temperature, salinity,
conductivity, pH, dissolved oxygen, [TSS] and [DOC] were analyzed using a two-way ANOVA 8
to test for interaction effects of the two factors. In the case of unequal variances during the two-
way ANOVA analysis, separate one-way ANOVA and LSD or Dunnett’s T3 post-hoc tests 10
(p<0.05) were used to analyze differences between seasons and simple one-way ANOVA tests
(p<0.05) were used to analyze differences between flood and ebb tides. 12
We used formulas for ‘instantaneous flux’ and ‘net flux’ described in Childers & Day
(1988) for this study. Net fluxes were obtained by adding flood and ebb instantaneous fluxes for 14
each tidal cycle. We also employed an equation developed by Rivera-Monroy et al. (1995) for
calculating net areal fluxes in a tidally flooded mangrove forest in Mexico (Equation 1). 16
total fluxupstream – total fluxdownstream (1) Net areal flux (g m-2 h-1) =
Flume area x total time
Using a hypsometric approach, we inferred fluxes of water from changes in water level
collected at 30-minute intervals during several whole-tides. Direct measurements of water level 18
within the flume over the course of one complete tidal inundation were regressed with the
continuous water level recorder data supplied by the FCE-LTER station along Shark River (SRS-20
6). The relationship generated was used to predict water level within the flume for all additional

8
sampling periods. To best relate water level in a system with asymmetrical tides, we developed
separate correlation curves for flood and ebb tides (adjusted R2 values of 0.999 and 0.997 for 2
ebb- and flood-tide correlations, respectively).
Paired t-tests between mean upstream and downstream organic carbon concentrations 4
over each half tide were used to determine if fluxes of organic carbon within the flume were
significant (p<0.05). We used instantaneous flux measurements from individually paired organic 6
carbon concentrations to calculate total flux values independently for each half-tide. No
difference in concentration between upstream and downstream pairs was interpreted as no net 8
flux over a given half-tide (net area flux = 0 mg C m-2h-1). For example, higher concentrations
during flood tide at the streamside end (upstream) indicated a net uptake of organic carbon by the 10
wetland, while lower concentrations at the streamside end indicated a net release (Rivera-
Monroy et al., 1995). We calculated net areal fluxes only when water was present at both ends 12
of the flume and a significant difference in mean [DOC] was observed between paired upstream
and downstream sample pairs. 14
RESULTS 16
The two-way ANOVA tests for half tide or seasonal differences in temperature, salinity,
conductivity, pH, dissolved oxygen and [DOC] showed an interaction effect of half-tide and 18
season, though all data exhibited unequal variance. One-way ANOVA tests indicated none of
the variables, except pH, varied significantly between flood and ebb tides. The water column pH 20
had a small range; however, and was circum-neutral (7.3–7.6) throughout the study period
(Romigh, 2005). 22
9
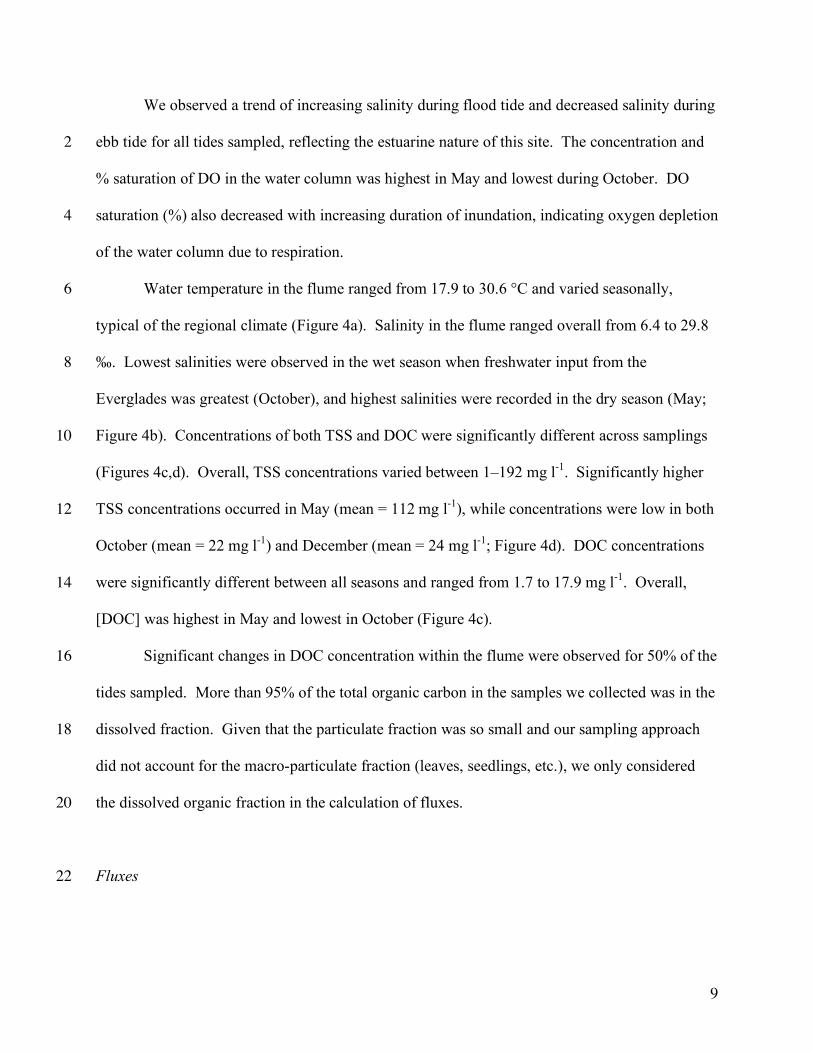
We observed a trend of increasing salinity during flood tide and decreased salinity during
ebb tide for all tides sampled, reflecting the estuarine nature of this site. The concentration and 2
% saturation of DO in the water column was highest in May and lowest during October. DO
saturation (%) also decreased with increasing duration of inundation, indicating oxygen depletion 4
of the water column due to respiration.
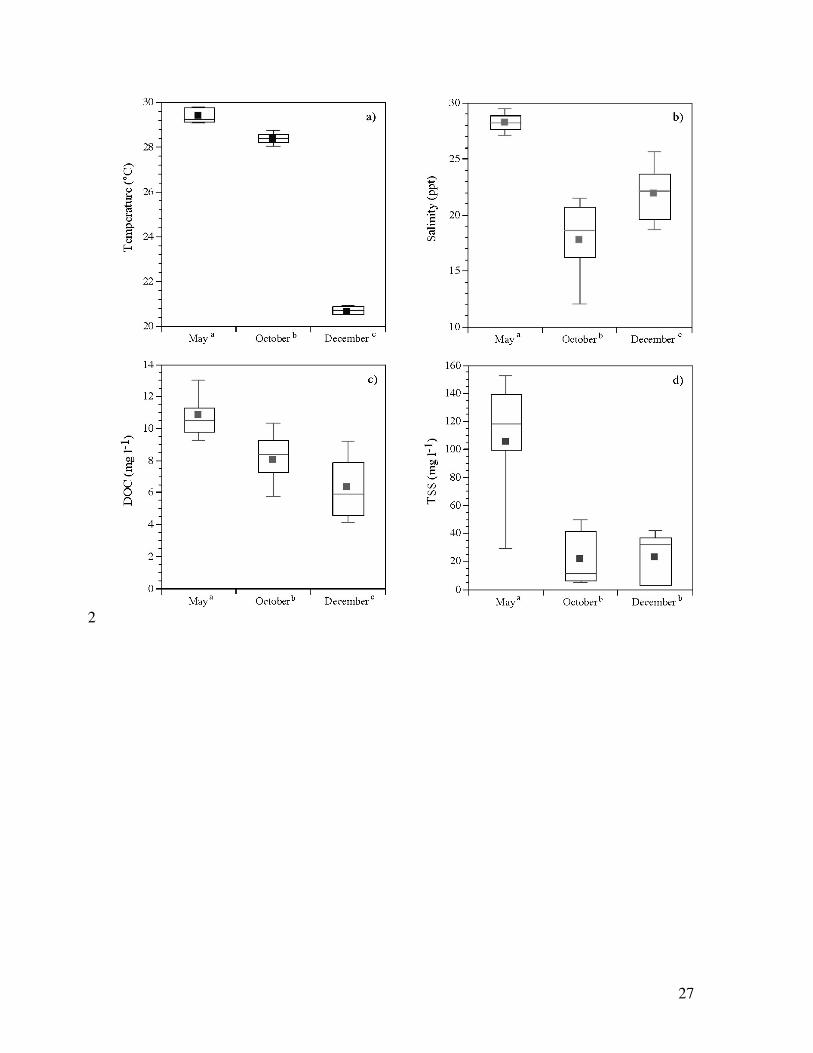
Water temperature in the flume ranged from 17.9 to 30.6 °C and varied seasonally, 6
typical of the regional climate (Figure 4a). Salinity in the flume ranged overall from 6.4 to 29.8
‰. Lowest salinities were observed in the wet season when freshwater input from the 8
Everglades was greatest (October), and highest salinities were recorded in the dry season (May;
Figure 4b). Concentrations of both TSS and DOC were significantly different across samplings 10
(Figures 4c,d). Overall, TSS concentrations varied between 1–192 mg l-1. Significantly higher
TSS concentrations occurred in May (mean = 112 mg l-1), while concentrations were low in both 12
October (mean = 22 mg l-1) and December (mean = 24 mg l-1; Figure 4d). DOC concentrations
were significantly different between all seasons and ranged from 1.7 to 17.9 mg l-1. Overall, 14
[DOC] was highest in May and lowest in October (Figure 4c).
Significant changes in DOC concentration within the flume were observed for 50% of the 16
tides sampled. More than 95% of the total organic carbon in the samples we collected was in the
dissolved fraction. Given that the particulate fraction was so small and our sampling approach 18
did not account for the macro-particulate fraction (leaves, seedlings, etc.), we only considered
the dissolved organic fraction in the calculation of fluxes. 20
Fluxes 22

10
We were able to calculate net areal fluxes of DOC for 12 of the 15 tidal cycles measured
in this study. Of those, export from the mangrove wetland was the majority of significant fluxes 2
(Figure 5). Half-tide vertical DOC fluxes ranged from -5.52 to 8.9901 g C m-2 h-1 in May, -
14.4591 to 1.3664 g C m-2 h-1 in October and -2.4017 to 3.7240 g C m-2 h-1 in December. 4
Overall, total exchanges of DOC were greater at the creek-side end of the flume compared with
the forest side. 6
Most fluxes calculated in the dry season indicated a net import of DOC to the mangrove
wetland, with much of that occurring at the tidal creek end of the flume (Figure 5). The highest 8
significant import of DOC to our mangrove site occurred during May sampling at 0.3227 g C m-2
h-1. The tidal creek was the source of this material (Figure 5). We also measured a single 10
instance of significant DOC export from the forest in May (Figure 5). Overall, the average
import rate of DOC to the mangrove wetland during this dry season sampling was 0.0908 g C m-12
2 h-1, and 86% of this import took place during flood tide.
There was a net export of DOC from our mangrove site at SRS-6 during the wet season. 14
The highest export rate of DOC to the water column (-0.5784 g C m-2 h-1) occurred in October,
and the average of significant fluxes for this sampling was -0.0606 g C m-2 h-1 (Figure 5). 16
Approximately, 65% of the DOC exported from the mangrove occurred during ebb tide, with the
remainder being exported from the wetland within the flume and transported to interior forest 18
during flood tide. Difficulties in sampling attributed to low tidal range during the December
sampling resulted in the calculation of net areal flux for two of the four tidal cycles measured. 20
These fluxes indicated both import and export of DOC with an average DOC import of 0.0265 g
C m-2 h-1 during the ‘Norte’ season. 22
11
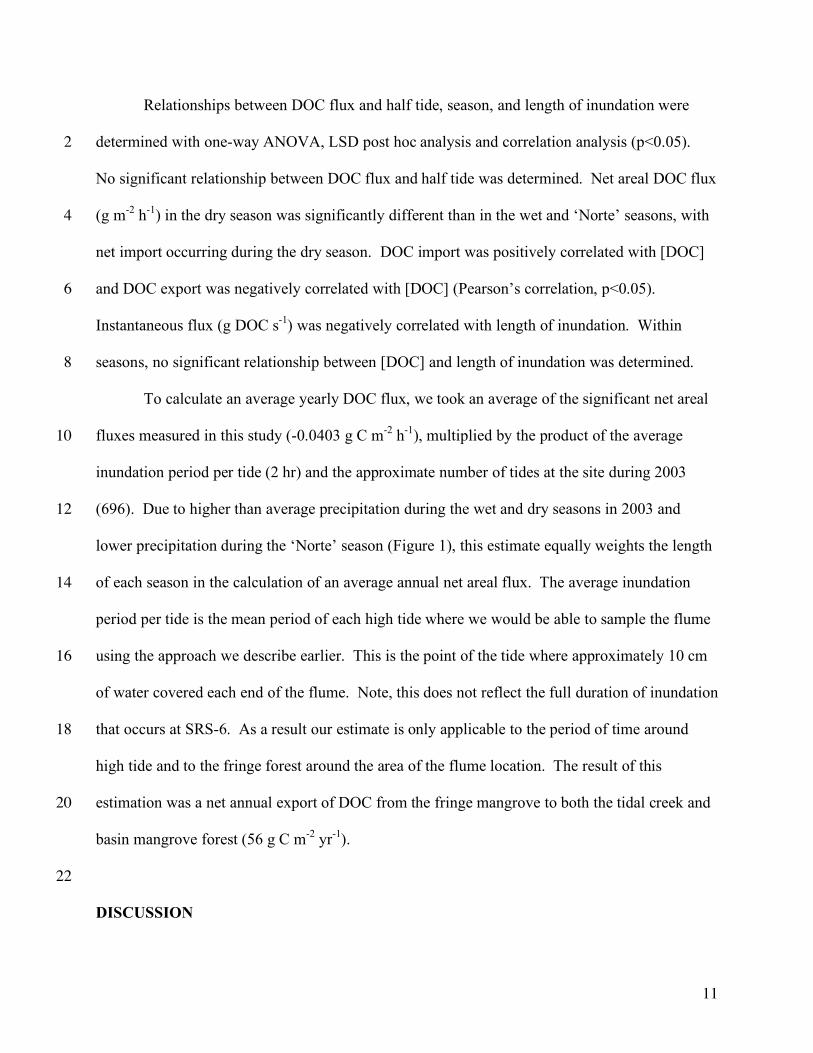
Relationships between DOC flux and half tide, season, and length of inundation were
determined with one-way ANOVA, LSD post hoc analysis and correlation analysis (p<0.05). 2
No significant relationship between DOC flux and half tide was determined. Net areal DOC flux
(g m-2 h-1) in the dry season was significantly different than in the wet and ‘Norte’ seasons, with 4
net import occurring during the dry season. DOC import was positively correlated with [DOC]
and DOC export was negatively correlated with [DOC] (Pearson’s correlation, p<0.05). 6
Instantaneous flux (g DOC s-1) was negatively correlated with length of inundation. Within
seasons, no significant relationship between [DOC] and length of inundation was determined. 8
To calculate an average yearly DOC flux, we took an average of the significant net areal
fluxes measured in this study (-0.0403 g C m-2 h-1), multiplied by the product of the average 10
inundation period per tide (2 hr) and the approximate number of tides at the site during 2003
(696). Due to higher than average precipitation during the wet and dry seasons in 2003 and 12
lower precipitation during the ‘Norte’ season (Figure 1), this estimate equally weights the length
of each season in the calculation of an average annual net areal flux. The average inundation 14
period per tide is the mean period of each high tide where we would be able to sample the flume
using the approach we describe earlier. This is the point of the tide where approximately 10 cm 16
of water covered each end of the flume. Note, this does not reflect the full duration of inundation
that occurs at SRS-6. As a result our estimate is only applicable to the period of time around 18
high tide and to the fringe forest around the area of the flume location. The result of this
estimation was a net annual export of DOC from the fringe mangrove to both the tidal creek and 20
basin mangrove forest (56 g C m-2 yr-1).
22
DISCUSSION

12
The magnitude and direction of material fluxes in estuarine systems involve processes
occurring at different spatial and temporal scales. Small-scale processes occurring directly at 2
wetland interfaces (i.e. water-soil, water-atmosphere or soil-atmosphere) are influenced by short-
term variability in environmental conditions (i.e., material concentration, wind and rain events, 4
duration of inundation, flushing time). Intermediate-scale processes occurring across areas of
similar or adjacent habitats (i.e. tidal creek-fringing wetland, fringing wetland-inland wetland) 6
are influenced by longer temporal scale processes such as seasonal and annual variability in
environmental conditions. At larger spatial scales, such as the interface between the mangrove 8
forest and river, we see an incorporation of more general processes related to estuarine mixing
and long-term climate patterns controlling carbon and nutrient dynamics. 10
Water flux estimates and paired upstream/downstream measurements of [DOC] in our
study were used to quantify fluxes between the mangrove surface (soil, prop root, epibiont 12
communities, etc.) and inundating water column of a riverine mangrove wetland. Sampling over
multiple consecutive tides within a season allowed for the examination of short-term variability 14
in flux that occurs in the natural environment. We measured vertical flux and found daily
variability in DOC exchange between the mangrove soil and inundating water column. The 16
differences in vertical fluxes between tides were attributed to the length of inundation and
flushing rate of the mangrove soil and the DOC concentration in the water column. We also 18
found seasonal variation in flux and found net import of DOC to the mangrove wetland during
the dry season (May), net export to the inundating water column during the wet season 20
(October), and import to the mangrove soil during the ‘Norte’ season (December) in 2003. We
used vertical flux and directional flow measurements to calculate horizontal flux and found 22
during the dry season, the net DOC import was mainly from the tidal creek during flood tide and

13
during the wet season, the net export of DOC was mainly to the tidal creek from the wetland
during ebb tide. 2
Particulate organic carbon (POC) can represent a significant amount of the organic matter
export from mangrove systems, though it most often varies with season. Export of POC 4
measured in an Australian riverine mangrove forest was 420 g C m-2 yr-1 (Boto & Bunt, 1981)
whereas studies in Florida have measured 64 g C m-2 yr-1 (Twilley, 1985) and 186 g C m-2 yr-1 6
(Heald, 1971). For all sampling periods in our study, DOC accounted for >95% of the TOC in
the water column. However, nets were not used in this study to capture leaf-size particulate 8
matter, which may make up a significant portion of export from mangrove forests (Boto & Bunt,
1981; Twilley, 1985). Several other mangrove studies have also measured a high DOC fraction 10
of TOC in the water column. Twilley (1985) estimated that up to 75% of all carbon exchanged
in a basin mangrove forest in Florida was DOC, Davis et al. (2001b) estimated >90% of the TOC 12
in mangrove island enclosures was DOC and Sutula et al. (2003) found that in Taylor River,
Florida approximately 98% of TOC was dissolved. 14
Due to the sampling technique and asymmetrical tidal patterns, water samples could only
be collected in the mangrove flume during high tide, and only during those high tides when the 16
mangrove forest was inundated. Samples at the beginning and end of a high tide may have been
influenced by the re-suspension of particulates produced by stronger currents flowing across the 18
soil surface. However, no significant difference in organic carbon content was detected between
filtered and unfiltered samples, indicating very low POC in the water column and little influence 20
of particulate re-suspension on the water samples.
Concentrations of DOC in this riverine mangrove system were slightly higher than 22
reported values for other mangrove systems (Table 1). At SRS-6, DOC concentrations were

14
highest in May 2003, possibly due to relatively high litter fall production (4 gdw m-2 d-1) that
month (Twilley & Rivera-Monroy, unpublished data). Coincidentally, freshwater inflow was 2
lowest—as indicated by salinity—and tidal amplitude was also quite low (0.7 m) during this
sampling period. 4
Tidal amplitude and freshwater inflow play a factor in regulating DOC flux from
estuarine wetland soils by influencing the amount of time the soil interacts with the inundating 6
water column and by regulating the amount of water discharged across the surface. Increased
freshwater input has been shown to increase DOC flux from estuaries to adjacent coastal waters, 8
sometimes by as much as 300% (Miller, 1999). Vertical flux data in this study indicate that the
highest export of DOC from the wetland soil to the inundating water column occurred during the 10
wet season, when tidal amplitude was greatest (0.9 m) and freshwater inflow from the
Everglades was highest. These flux results indicate DOC export from the wetland is controlled 12
to a greater extent by freshwater discharge and tidal range, and is not necessarily positively
correlated with DOC concentrations. 14
Flux estimates for our riverine fringe mangrove site were similar in magnitude to findings
of previous mangrove carbon flux studies (Table 2). Seasonal fluxes indicated net import of 16
DOC to the wetland soil during the dry season and export of DOC to the inundating water
column during the wet season, with an overall net DOC export of 56 g DOC m-2 yr-1 from the 18
mangrove wetland to the adjacent tidal creek. Based on leaching rates of mangrove litter (leaves
and wood) from this site, leaching losses under conditions of inundation can account for about 20
43% of the DOC exported from the forest (Romigh, 2005). Previous estimates of total carbon
export from mangroves range from 2 to 400 g C m-2 yr-1 with an average of about 200 g C m-2 yr-22
1, while salt marshes typically export about half this amount (Twilley, 1998). In a ‘eulerian’,

15
creek flux study in Australia, Boto & Wellington (1988) were unable to detect a net flux of
dissolved materials (including DOC) from a fringe mangrove forest. However, the site they 2
sampled received little or no freshwater inflows from adjacent uplands (Boto & Wellington,
1988). 4
Generally, terrestrially derived DOM undergoes conservative mixing down the estuarine
gradient, forming an inverse linear relationship between salinity and concentration. A previous 6
study conducted in Shark River, FL (Jaffe et al., 2004) found that fluxes of DOC are controlled
to a great extent by discharge rather than concentration, indicating lower DOC concentration 8
with increasing freshwater input. The wet and ‘Norte’ season data from our study show a similar
inverse linear relationship of salinity vs. DOC, supporting these findings by Jaffe et al. (2004; 10
Figure 6). Consistent high salinities (25–30 ‰)—due to low freshwater input to Shark River
during May—coupled with high variation in DOC concentration indicate both import and export 12
processes occurring at the wetland soil-water column interface even during the dry season.
However, the non-linear relationship between salinity and DOC concentration during May might 14
be an indication that these processes are not occurring at the same rate as those during other
seasons. The energy signature of riverine mangrove forests is higher than in fringe, basin and 16
scrub forests (Twilley, 1995), which may help explain why fluxes from the forest at SRS-6 were
higher than those reported in other mangrove systems. 18
Conclusions 20
Results from our study support the hypothesis that highly productive, riverine mangrove
forests are sources of organic carbon to adjacent coastal waters. The flux of DOC at the 22
mangrove soil-water column interface is seasonal, perhaps in response to regional freshwater

16
inflow, as inferred from Shark River salinity patterns. There was variation in the direction and
magnitude of organic carbon flux between consecutive tides. However, when sampling over 2
multiple tidal cycles, trends in DOC flux emerged—with import of DOC to the mangrove soil
during the dry season and export to the water column during the wet season. Overall, this 4
mangrove forest showed a net annual export of 56 g DOC m-2 yr-1.
Import of DOC to the mangrove during the dry season and export during the wet season 6
suggests that freshwater discharge may indeed have a strong influence on the direction of organic
carbon flux to this system. It is unclear, however, whether carbon exchange between the forest 8
canopy and atmosphere mimic these patterns. It is also unclear whether an increase in freshwater
flow to the Everglades would significantly affect DOC flux. 10
This study only addressed a one-year period and cannot identify long-term trends in
organic carbon flux for this system. Continued research would help determine the effect of long-12
term hydrologic influences (drought or regulated increases in freshwater flow) on carbon cycling
in mangroves. Combining the quantitative flux data from the mangrove soil-water column 14
interface with atmospheric flux data would certainly help to estimate the carbon budget in these
wetlands. 16
ACKNOWLEDGEMENTS 18
We thank Justin Baker, Dan Bond and Edward Castañeda for their help in flume design
and construction. We greatly appreciate the support and assistance provided by Dan Childers, 20
the Wetland Ecosystems Lab at Florida International University, and Rachel Butzler. We would
also like to thank Dan Childers and an anonymous referee for their comments on the manuscript. 22
This study was partially funded by the Texas Water Resources Institute and the Sustainable

17
Coastal Margins Program at Texas A&M University. This material is based upon work
supported by the National Science Foundation under Grant No. 9910514.2

18
LITERATURE CITED
Benner, R., E. Peele, & R. E. Hodson. 1986. Microbial utilization of dissolved organic 2 matter from leaves of the red mangrove, Rhizophora mangle, in the Fresh Creek Estuary, Bahamas. Estuarine, Coastal and Shelf Science 23:607-619. 4 Boto, K. G. & J. S. Bunt. 1981. Tidal export of particulate organic matter from a northern 6 Australian mangrove system. Estuarine, Coastal and Shelf Science 13:247-255. 8 Boto, K. G. & J. T. Wellington. 1988. Seasonal variations in concentrations and fluxes of dissolved organic and inorganic materials in a tropical, tidally-dominated, mangrove 10 waterway. Marine Ecology Progress Series 50:151-160. 12 Chen, R. & R. R. Twilley. 1999. Patterns of mangrove forest structure and soil nutrient dynamics along the Shark River Estuary, Florida. Estuaries 22:955-970. 14 Childers, D. L. & J. W. Day Jr. 1988. A flow-through flume technique for quantifying 16 nutrient and materials fluxes in microtidal estuaries. Estuarine, Coastal and Shelf Science 27:483-494. 18 Childers, D. L., J. N. Boyer, S. E. Davis, C. J. Madden, D. T. Rudnick & F. H. Sklar. 20 2005. Relating precipitation and water management to nutrient concentrations in the oligotrophic “upside down” estuaries of the Florida Everglades. Limnology and 22 Oceanography in press. 24 Davis, S., D. Childers, J. Day Jr., D. Rudnick, & F. Sklar. 2001a. Nutrient dynamics in vegetated and unvegetated areas of a Southern Everglades mangrove creek. Estuarine, 26 Coastal and Shelf Science 52:753-768. 28 Davis, S., D. Childers, J. Day Jr., D. Rudnick, & F. Sklar. 2001b. Wetland-water column exchanges of carbon, nitrogen, and phosphorus in a Southern Everglades dwarf 30 mangrove. Estuaries 24:610-622. 32 Davis, S., C. Corronado-Molina, D. Childers, & J. W. Day Jr. 2003. Temporally dependent C, N, and P dynamics associated with the decay of Rhizophora mangle L. leaf 34 litter in oligotrophic mangrove wetlands of the Southern Everglades. Aquatic Botany 75:199-215. 36 Dittmar, T. & R. J. Lara. 2001a. Do mangroves rather than rivers provide nutrients to 38 coastal environments south of the Amazon River? Evidence from long-term flux measurements. Marine Ecology Progress Series 213:67-77. 40 Dittmar, T. & R. J. Lara. 2001b. Driving forces behind nutrient and organic matter 42 dynamics in a mangrove tidal creek in North Brazil. Estuarine, Coastal and Shelf Science 52:249-259. 44
19
Dittmar, T., R. J. Lara, & G. Kattner. 2001. River or mangrove? Tracing major organic matter sources in tropical Brazilian coastal waters. Marine Chemistry 73:253-271. 2 Feller, I. C. 2002. The role of herbivory by wood-boring insects in mangrove ecosystems 4 in Belize. Oikos 97:167-176. 6 Furukawa, K., E. Wolanski, & H. Mueller. 1997. Currents and sediment transport in mangrove forests. Estuarine, Coastal and Shelf Science 44:301-310. 8 Heald, E. 1971. The production of organic detritus in a South Florida estuary. University 10 of Miami: Sea Grant Technical Bulletin 6:110. 12 Hogarth, P. J. 1999. The Biology of Mangroves. Oxford University Press. UK. 228 p. 14 Jaffe, R., J. N. Boyer, X. Lu, N. Maie, C. Yang, N. M. Scully, & S. Mock. 2004. Source characterization of dissolved organic matter in a subtropical mangrove-dominated estuary 16 by fluorescence analysis. Marine Chemistry 84:195-210. 18 Lee, S. Y. 1995. Mangrove outwelling: a review. Hydrobiologia 295:203-212. 20 Lewis III, R. R., R. G. Gilmore Jr., D. W. Crewz, & W. E. Odum. 1985. Mangrove habitat and fishery resources of Florida. p. 281-336. In Seaman Jr., W. E. (ed.) Florida 22 Aquatic Habitat and Fishery Resources. Florida Chapter of the American Fisheries Society, Kissimmee, Florida. 24 Machiwa, J. F. & R. O. Hallberg. 2002. An empirical model of the fate of organic carbon 26 in a mangrove forest partly affected by anthropogenic activity. Ecological Modelling 147:69-83. 28 Miller, A. E. J. 1999. Seasonal investigations of dissolved organic carbon dynamics in the 30 Tamar Estuary, U.K. Estuarine, Coastal and Shelf Science 49:891-908. 32 Moran, M. A., R. J. Wicks, & R. E. Hodson. 1991. Export of dissolved organic matter from a mangrove swamp ecosystem: evidence from natural fluorescence, dissolved lignin 34 phenols, and bacterial secondary production. Marine Ecology Progress Series 76:175-184. 36 Odum, W. E. & E. J. Heald. 1975. The detritus-based food web of an estuarine mangrove 38 community. p. 265-286. In L. E. Cronin, editor. Estuarine Research, Volume 1. Academic Press, Inc., New York. 40 Rivera-Monroy, V. H., J. Day, R. Twilley, F. Vera-Herrera, & C. Coronado-Molina. 42 1995. Flux of nitrogen and sediment in a fringe mangrove forest in Terminos Lagoon, Mexico. Estuarine, Coastal and Shelf Science 40:139-160. 44
20
Robertson, A. I. 1986. Leaf-burying crabs: their influence on energy flow and export from mixed mangrove forests (Rhizophora spp.) in northeastern Australia. Journal of 2 Experimental Marine Biology and Ecology 102:237-248. 4 Robertson, A. & S. Blaber. 1992. Plankton, epibenthos, and fish communities. p. 173-224. In A. Robertson & D. Alongi (eds.) Tropical Mangrove Ecosystems, Coastal and 6 Estuarine Studies Series, American Geophysical Union, Washington, D.C. 8 Robertson, A., D. Alongi & K. Boto. 1992. Food chains and carbon fluxes. p. 293-326. In A. Robertson & D. Alongi (eds.) Tropical Mangrove Ecosystems, Coastal and 10 Estuarine Studies Series, American Geophysical Union, Washington, D.C. 12 Romero, L.M., T.J. Smith, III, & J. Fourqurean. 2005. Changes in mass and nutrient content of wood during decomposition in a south Florida mangrove forest. Journal of 14 Ecology 93:618-631. 16 Romigh, M. 2005. Organic carbon flux at the mangrove soil-water column interface in the Florida Coastal Everglades. M.S. Thesis. Texas A&M University, College Station, 18 Texas. 45 pp. 20 Sutula, M., B. Perez, E. Reyes, D. Childers, S. Davis, J. Day, Jr., D. Rudnick, & F. Sklar. 2003. Factors affecting spatial and temporal variability in material exchange between the 22 Southern Everglades wetlands and Florida Bay (USA). Estuarine, Coastal and Shelf Science 57:757-781. 24 Twilley, R. 1985. The exchange of organic carbon in basin mangrove forests in a 26 southwest Florida estuary. Estuarine, Coastal and Shelf Science 20:543-557. 28 Twilley, R. 1988. Coupling of mangroves to the productivity of estuarine and coastal waters. Lecture Notes on Coastal and Estuarine Studies 22:155-180. 30 Twilley, R. 1995. Properties of mangrove ecosystems related to the energy signature of 32 coastal environments. p. 43-62. In C. A. S. Hall (ed.) Maximum Power. University Press of Colorado, Niwot. 34 Twilley, R. 1998. Mangrove Wetlands. p. 445-473. In M. G. Messina & W. H. Conner, 36 editors. Southern Forested Wetlands: Ecology and Management. Lewis Publishers, Boca Raton, Florida. 38 Welch, R., M. Madden, & R. Doren. 1999. Mapping the Everglades. Photogrammetric 40 Engineering and Remote Sensing. 65:163-170.
21
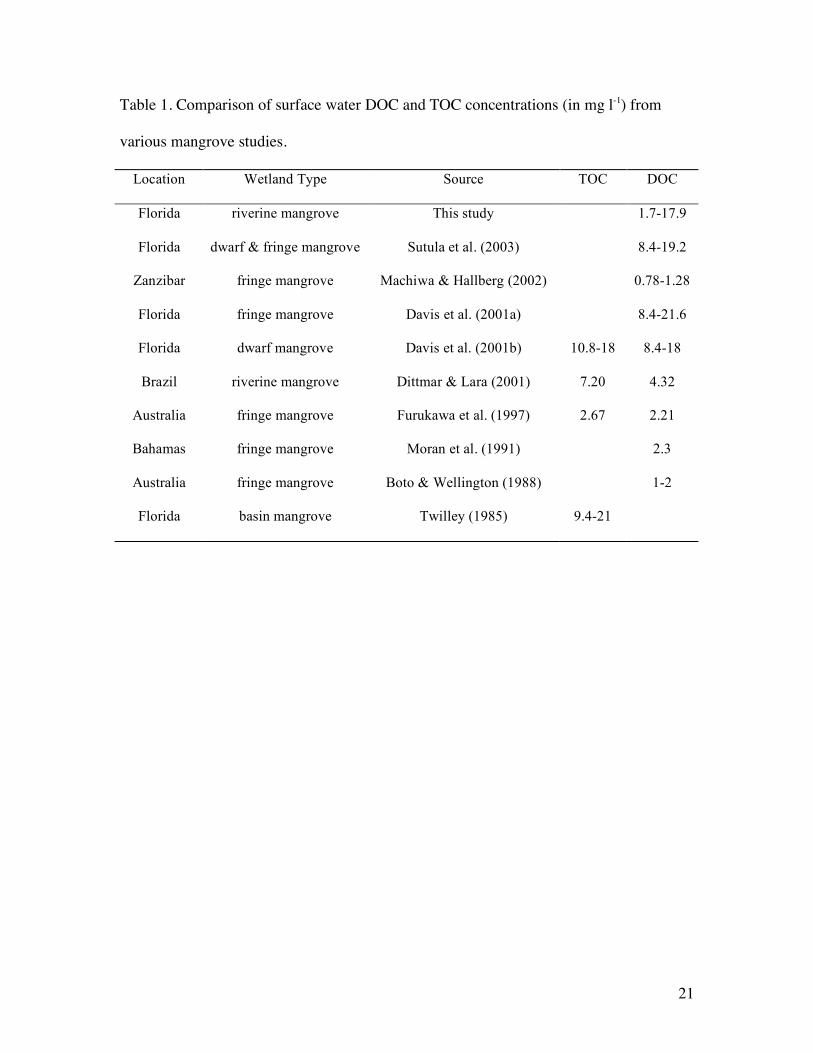
Table 1. Comparison of surface water DOC and TOC concentrations (in mg l-1) from
various mangrove studies.
Location Wetland Type Source TOC DOC
Florida riverine mangrove This study 1.7-17.9
Florida dwarf & fringe mangrove Sutula et al. (2003) 8.4-19.2
Zanzibar fringe mangrove Machiwa & Hallberg (2002) 0.78-1.28
Florida fringe mangrove Davis et al. (2001a) 8.4-21.6
Florida dwarf mangrove Davis et al. (2001b) 10.8-18 8.4-18
Brazil riverine mangrove Dittmar & Lara (2001) 7.20 4.32
Australia fringe mangrove Furukawa et al. (1997) 2.67 2.21
Bahamas fringe mangrove Moran et al. (1991) 2.3
Australia fringe mangrove Boto & Wellington (1988) 1-2
Florida basin mangrove Twilley (1985) 9.4-21

22
Table 2. Estimates of net annual flux of TOC and DOC (g C m-2 yr-1) from various
mangrove wetlands.
Location TOC DOC Method Source
Florida -56 flume This Study
Florida -7.1 creek flux Sutula et al. (2003)
Florida 3.04 in-channel flume Davis et al. (2001a)
Florida - 381 mangrove enclosures Davis et al. (2001b)
Florida -64 flume Twilley (1985)
Australia 7.3 creek flux Boto & Wellington (1988)
World Average -210 review of literature Twilley (1998)
23
List of Figures
Figure 1. Seasonal pattern of mean (± sd) temperature (open squares) and precipitation 2
(open circles) in south Florida from 1994–2003 (from USGS). Data from 2003 (closed
circles) mirrored the seasonal pattern exhibited across this 10-year record. 4
Figure 2. Map of South Florida with the location of the experimental flume study site 6
(SRS-6) along Shark River (Everglades National Park).
8
Figure 3. Plots of predicted water level in the flume during each 2003 sampling event.
Flume water levels calculated from a regression relationship between periodic flume 10
water level measurements and a permanent gauge along Shark River (SRS-6).
12
Figure 4. Box-and-whisker plots of (a) temperature, (b) salinity, (c) DOC concentration
and (d) TSS concentration at the study site for each 2003 sampling. Different letters 14
indicate significant differences among sampling periods (ANOVA, p<0.05).
16
Figure 5. Net areal fluxes of DOC measured in each tidal cycle of the 2003 sampling
periods (M = May, O = October, and D = December). Positive values indicate uptake by 18
the wetland; negative values indicate release to the inundating water column. Asterisks
indicate fluxes that were not significantly different from zero. 'nd’ = No flux data. 20
Figure 6. Scatter plot of salinity vs. DOC concentration at SRS-6 for all three sampling 22
periods in 2003.
24

25
26
-60
-40
-20
0
20
40
60
80
-60
-40
-20
0
20
40
60
80
Dry
Wet
-60
-40
-20
0
20
40
60
80
23 May 24 May 25 May 26 May 27 May
6 Oct 7 Oct 8 Oct 9 Oct 10 Oct
13 Dec 14 Dec 15 Dec 16 Dec 17 Dec
Time (day)
Am
pli
tude
(cm
)
Norte
27
2

28
-0.6
-0.4
-0.2
0
0.2
0.4
0.6
M M M M M M O O O O O D D D D
DO
C (
g m
-2 h
-1 )
Import from tidal creek Import from basin forest
Export to tidal creek Export to basin forest
DRY WET NORTE
nd nd
nd
Import from tidal creek Export to tidal creek
Import from mangrove forest Export to mangrove forest

29
Copyright © 2022 FDOKUMEN