CLON: Overlay Networks and Gossip Protocols for Cloud Environments

0022-1554/91/$3.30 The Journal of His tdemis try and Cytochemistry Copyright 0 1991 by The Histochemical Society, Inc.
Technical Note
Vol. 43, No. 7. pp. 711-722, 1995 Printed in U5.A.
Fluorescence Overlay Antigen Mapping of the Epidermal Basement Membrane Zone: 11. Color Fidelity
SIERT BRUINS, MARCELUS c. J. M. DE JONG,’ KLAAS HEERES, MICHAEL H. E WILKINSON, MARCEL E JONKMAN, and JAN B. VAN DER MEER Departments of Demaio/ogy (SB, MCJMdeJ,KH,Mu, JBudM) and Medica/ Microbiology ( M H W ) , Universiiy Hospiial, Groningen, The Netbedands.
Received for publication October 5 , 1994 and in revised form January 26, 1995; accepted March 7, 1995 (4T3495).
In this second report on the fluorescence overlay antigen map- ping (FOAM) technique, we highlight some of the errors that may influence faithful color rendition of slide prepara-
liable interpretation of multicolor fluorescence images re- quires that the o b r can unambiguously assign each color in these images to the presence of a specific combination of the labeled antigens. This is possible only when the im- age fidelity meets certain standards. The present study con- cenuates on color fidelity which is easily undermined by spec- tral matchiug errors, image contrast mrs, and exposure time errors. Evaluation of these errors, using the photomiao- graphic overlay variant of FOAM, showed the potential
tions using triple antigen immullofluorrscence staining. Re-
unrehbility of the simultaneous use ofmultiple fluorophores for immunofluorescence microscopy. The procedures de- scribed here may serve as a solid starting point in formulat- ing technical conditions that allow reliable color rendition in multicolor immunofluonscmce microscopy. Futthermore, these procedures can be adapted to studies other than the analysis of basement membrane zone antigens, to which they have been fmt applied. (JHsrochem Cytochem 43:715-722, 1995) KEY WORDS: Antigen mapping; Collagen Type VII; Color fidelity; Epidermal basement membrane zone: Extracellular mauix proteins; Integrins; Multicolor immunofluorescence; Overlay imaging; Pho- tomicrography.
Introduction The fluorescence overlay antigen mapping technique (FOAM) com- bines multiple wavelength band immunofluorescence and overlay imaging procedures, yielding composed multicolor images. These multicolor overlay images, whether produced by photomicrogra- phy or videomicroscopy, should enable reliable identification of the relative position of antigen distributions close to the resolving power of the light microscope (2).
In multicolor immunofluorescence methodology, it is essential that the emission be filtered in such a way that the observer can decide unambiguously which label is fluorescing (6). Within the framework of FOAM, this means that the observer can unambigu- ously assign each color in the multicolor overlay to the presence of a specific combination of labeled antigens. This is possible only when image fidelity meets certain standards. In a previous study we described procedures to ensure the geometric fidelity of overlay images (2). The present study concentrates on color fidelity (see Materials and Methods).
Problems of color fidelity may present the proverbial “thorns
Correspondence to: Marcelus C.J.M. de Jong, Dept. Dermatology, University Hospital, Oostersingel59,9713 EZ Groningen, The Netherlands.
in the sides” of all who employ multicolor (immuno)fluorescencc techniques. These problems depend largely but not exclusively on the spectral composition of the fluorescence transmitted by filter sets intended to isolate fluorescence signals of “distinct” wavelength bands. According to the RGB color model of light (see below), ad- ditive mixing of different intensities of the primary colors of red (R), green (G), and blue (B) can produce all the colors of the RGB spectrum (25 ) . We have implemented this principle in the FOAM technique, using only three distinct wavelength bands that cover these primary colors. Mixtures of red, green, and/or blue fluores- cence in the overlay image should provide additional information about the co-localization of antigenic sites in close proximity, e.g., structural antigens of the epidermal basement membrane zone (EBMZ) (1). In such cases, faithful color rendition of the tissue prep- aration stained cannot be taken for granted. This is easy to under- stand by describing the observed (measured) fluorescence signals R, G, and B by a set of three (simplified) linear equations:
R = rR + gR + bR (1) G = ZG + gG + bG (2) B rB + gg + bB (3)
where the terms rR, gR. bR, etc. denote the fluorescence of fluoro- phores r, g, and b transmitted by the filter set intended for trans-
715
by guest on December 10, 2015jhc.sagepub.comDownloaded from

716 BRUINS, DE JONG, HEERES, WIWNSON, JONKMAN, VAN DER MEER
mission of the R(ed) wavelength band. Likewise, the terms rG, gG, bG denote the fluorescence of the respective fluorophores trans- mitted by the filter set intended for the G(reen) wavelength band, etc. It is possible to decide unambiguously the meaning of each color only when: (a) each of the RGB filter sets transmits only fluores- cence of a single fluoroprobe (only the terms rR, gG, and bB should contribute to the respective R, G, and B signal); (b) each of the RGB filter sets yields an image that is represented purely in differ- ent intensities of a single primary color; (c) the output of each of the RGB filter sets combines additively in the multicolor overlay; and last but not least, (d) the multipar'meter (immuno)staining reaction is devoid of undesired staining reactivity and autofluores- cence. These requirements are easily undermined by errors result- ing from imperfections of reagents, staining procedures, optical filters, and the image reproduction equipment. In practice, the following errors are considered of major importance: (a) spectral matching error, (b) image contrast error, and (c) exposure time er- ror. To study the obstructive effects of these errors in the photomicro- graphic variant of the FOAM technique, we used single, double, and triple immunofluorescence staining of extracellular matrix pro- teins of the EBMZ.
Our study shows that the complex problems of color fidelity warrant due consideration using multicolor (i"uno)fluorescence microscopy. Although we have no pretension of adding to basic knowledge in the field of color science (24,25), the problems stud- ied enabled us to formulate technical conditions that would other- wise have been less reliable. The procedures developed may be of help in identifying lack of color fidelity. Furthermore, the FOAM technique can be adapted to studies other than the analysis of EBMZ antigens, to which it has been first applied.
Materials and Methods
Zminology Some terms used in this study may have different meanings in other con- texts (6,16,21,25). To avoid semantic confusion, we consider it relevant to define the following terms within the context of multicolor overlay immu- nofluorescence microscopy:
RGB colors: primary colors of the RGB color model based on additive properties of transmitted light that mixes R(ed), G(reen), and B(1ue) to create all the colors of the RGB spectrum. Ideally, mixing equal intensities of primary colors of red, green, and blue results in the color perception of white (or gray).
RGB filter set: optical filters intended to isolate fluorescence of dis- tinct wavelength bands covering the R(ed), G(reen), and B(1ue) wavelengths.
Fluoroprobe: conjugate of a carrier molecule (e.g., antibody, avidin) and a fluorescent dye (fluorophore, fluorochrome). A fluoroprobe need not have the same spectral characteristics as the fluorophore used to label the carrier molecule.
Overlay: composed image obtained by photomicrographic or videomicroscopic superposition of two or three distinct fluorescence images of the same object field ofview, each representing the fluores- cence output transmitted by the respective RGB filter sets used to isolate the R(ed), G(reen), and B(1ue) wavelength bands.
Color fidelity: representation of fluorophorelprobe-derived colored light in such a way that the observer can unambiguously assign each color in the multicolor overlay to the presence of a specific combination
of the desired specific fluorescent objects (antigens). Lack of color fidelity may arise from (a) spectral matching errors, (b) image con- trast errors, and (c) exposure time errors.
Spectral matching error (SME): mismatch of RGB filter sets and fluoroprobes, given their spectral characteristics. This may result in ambiguous fluorescence output (see equations in Introduction) due to: (a) spillover of fluorescence between RGB filter sets, (b) transmis- sion of fluorescence of a single fluoroprobe not perceived as a pri- mary color, (c) suboptimal transmission of signal strength (non-linear color rendition).
Image contrast error: low ratio of desired specific fluorescence and un- desired fluorescence, and/or improper detectorlfilm saturation (see below). At the slide preparation level, undesired fluorescence includes autofluorescence and all staining reactivity other than the specific staining that an antiserum or fluoroprobe is meant to perform (6).
Exposure time error (ETE): incorrect exposure times of the individual red, green, and blue images in an overlay (see above), given the fluores- cence intensity output of each RGB filter set. In photomicrographic recording this may result in: (a) improper hue (e.g., bright green ap- pearing as yellow), (b) unbalanced brightness values one to each other of the red, green, and blue fluorescence, giving rise to ambiguous mixed colors in the overlay, (c) non-linear color rendition (two times longer exposure does not yield twice the brightness), and (d) film andlor detector saturation yielding low image contrast (applying as well to, e.g., CCD cameras used in videomicroscopy).
Skin Specimens We used clinically normal skin from white patients, obtained by punch biopsy (4 mm) under local anesthesia with 2% lidocaine. The skin speci- mens were instantly placed in aluminum vials, snap-frozen in liquid nitro- gen, and stored at -80°C until use.
Antibodies and Fluoroprobes To identify the Structural EBMZ antigens laminin-l,laminin-5 (niceinlkali- nin), extracellular p4 integrin and collagen Type VII, we used the follow- ing primary antibodies: (a) polyclonal rabbit Ig anti-laminin-1, dilution 1:lOO (Telios Pharmaceuticals; San Diego, CA); (b) monoclonal mouse IgGl anti-laminin-5, dilution 1:500, described as MAb (monoclonal antibody) GB3, obtained through the courtesy of Dr. J.P. Ortonne (20); (c) monoclo- nal rat IgG2, antLP4 integrin, dilution 1:50, described as MAb 439-9B, kindly provided by Dr. SJ. Kennel (14); and (d) monoclonal mouse IgGl anti-collagen Type VII, dilution 1:30, described as MAb LH7:2, kindly provided by Dr. I.M. Leigh (17). Secondary polyclonal antibodies included (a) Cascade blue (CB1ue)-conjugated goat Ig anti-rabbit IgG, dilution 1:30 (Molecular Probes; Eugene, OR), (b) fluorescein isothiocyanate (FIX)- conjugated goat Ig anti-rat IgG, dilution 1:30 (Southern Biotechnology; Birmingham, AL), (c) biotinylated yl-specific goat Ig anti-mouse IgG1, di- lution 1:120 (Southern Biotechnology; Birmingham, AL), (d) biotinylated horse IgG anti-mouse IgG, dilution 1:2W (Vector Laboratories; Burlingame, CA), and (e) biotinylated rabbit Ig (Fab)s anti-goat IgG, dilution 1:120 (Jackson ImmunoResearch; Avondale, PA).
The biotinylated antibodies were visualized by incubation with one of the following streptavidin (SAv) fluoroprobes: (a) SAvlTRSC (Texas red sul- fonyl chloride), dilution 1:400 (Jackson ImmunoResearch); (b) SAvlLRSC (lissamine rhodamine sulfonyl chloride), dilution 1:400 (Jackson Im- munoResearch); (c) SAvlTRITC (tetramethyl isothiocyanate), dilution 1:80 (Jackson ImmunoResearch); (d) SAv/BPY (BODIPY-FL2: 3-alky1, >-alkyl. 7-alkyl,4,4-difluoro-4-bora-3a.4a-diaza-s-indacene), dilution 1:80 (Molecular Probes); (e) SAvIDTAF (dichlorotriazinyl-amino-fluorescein), dilution 1:200 (Jackson ImmunoResearch); (f) SAvlCBlue (Cascade Blue), dilution 1:500
by guest on December 10, 2015jhc.sagepub.comDownloaded from
FLUORESCENCE OVERLAY ANTIGEN MAPPING 717
(Molecular Probes); and (g) SAvlAMCA (7-amino-4-methyl coumarin-3- acetic acid), dilution 1:20. The latter reagent was prepared according to an adapted protocol (15). Briefly, 22 pg ofthe reactive N-hydroxysuccinimide (NHS) ester derivative of AMCA (BioCarb Chemicals; Lund, Sweden) in 10 p1 dimethyl sulfoxide (Merck Amsterdam, The Netherlands) was added to 100 pg strcptavidin (Sigma; St Louis, MO) in 100 p1 borate buffer (0.05 M and 0.1 M NaCI, pH 8.5). After mixing, the reactants were incubated at O’C for 4 hr. The SAv/AMCA reaction product was purified by filtration on a 30 x 0.9 cm Sephadex G5O column (Pharmacia; Uppsala, Sweden), monitored at 280 nm. The SAv/AMCA fraction was stored at -80°C in PBS containing BSA 1% (w/v) and sodium azide 0.1% (wlv).
All antibody and fluoroprobe dilutions were made in PBS (0.01 M, pH 7.3). supplemented with 5 x crystallized ovalbumin 2-4% (w/v) (Serva; Heidelberg, Germany). Spectral characteristics of the (conjugated) fluoro- phores are detailed in Table 1.
Slide Preparation Cryosections (4 pm) were mounted either on silane-coated or chromaluml
gelatin-coated glass slides, air-dried before a fan for 30 min, encircled with a hydrophobic liquid (Dako pen), and pre-washed in PBS for 5 min. The sections were then overlaid with 50-80 pl of the proper antibody or fluoroprobe (see below) and incubated in a moist chamber at ambient tem- perature. The staining steps of 30 min each were alternated with three wash- ing steps of 5 min in PBS. Sections were mounted in fresh PBSlglycerol [50% (vlv), pH 7.51 containing 1.5 mg/ml of the anti-fading reagent p-phenylenediamine (Sigma).
Immunofluorescence Microscopy The sections were examined with an Orthoplan microscope (LeitzlLeica; Wetzlar, Germany) equipped with a Xenon short arc lamp (XBO 75W/2), a Mercury short arc lamp (HBO 5oWlACIL2). a stepless turnable mechani- cal stage, and an eyepiece with cross-hairs. For selection of wavelength bands we used switchable filter sets contained in a 41 Ploemopak unit for inci- dent light excitation (Table 2). For collection of data presented in Table 3, we used a PL Fluotar objective lens x 500ll.OOW and Periplan GW x 4 eyepieces.
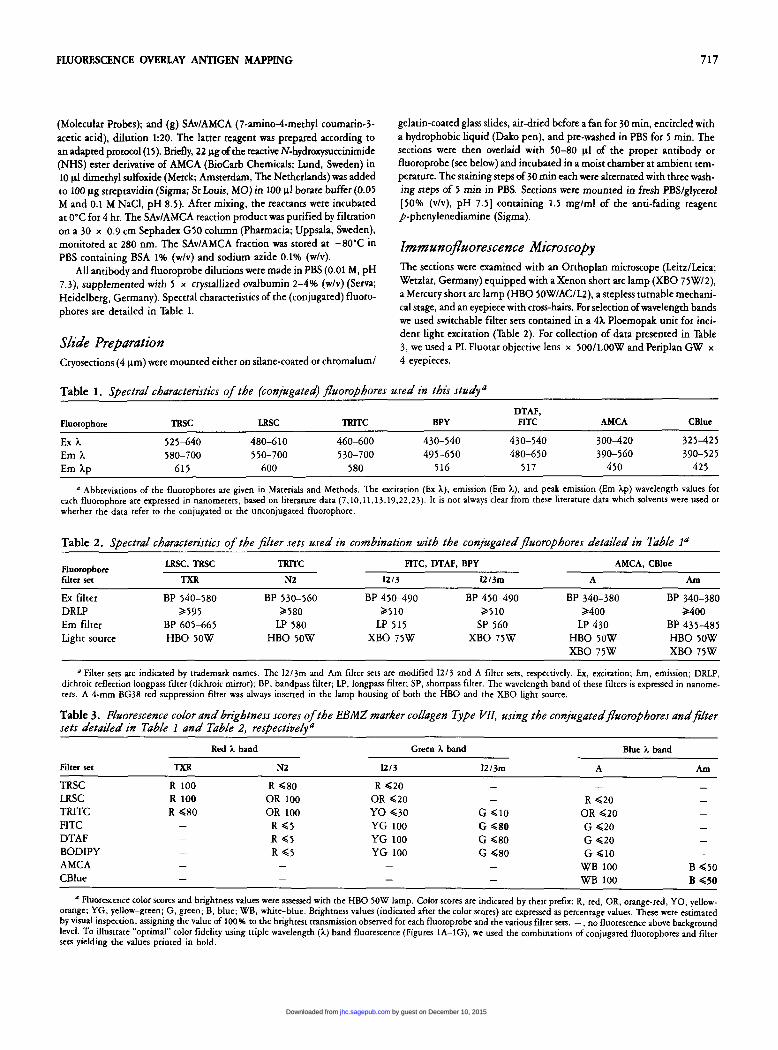
Table 1. Spectral characteristics of the (conjugated) fiuorophores used in this studya
Fluorophore TRSC LRSC TRITC BPY FITC AMCA CBlue
Ex X 525-640 480-610 460-600 430-540 430-540 300-420 325-425
Em Xp 615 600 580 5 16 517 450 425
DTAF,
Em X 580-700 550-700 530-700 495-650 480-650 390-560 390-525
Abbreviations of the fluorophores are given in Materials and Methods. The excitation (Ex h), emission (Em A), and peak emission (Em hp) wavelength values for each fluorophore are expressed in nanometers, based on literature data (7,10.11.13,19,22,23). It is not always clear from these literature data which solvents were used or whether the data refer to the conjugated or the unconjugated fluorophore.
Table 2. Sgectral characteristics of the filter sets used in combination with the conjugated fluorophores detailed in Table la
LRSC, TRSC TRITC FITC, DTAF, BPY AMCA, CBlue Fluorophore filter set TXR N2 12/3 U/3m A Am
~~
Ex filter BP 540-580 BP 530-560 BP 450-490 BP 450-490 BP 340-380 BP 340-380 DRLP 2595 2580 2510 2510 2400 2400 Em filter BP 605-665 LP 580 LP 515 SP 560 LP 430 BP 435-485 Light source HBO SOW HBO TOW XBO 75W XBO 75W HBO 50W HBO IOW
XBO 75W XBO 75W
a Filter sets are indicated by trademark names. The I2/3m and Am filter sets are modified 1213 and A filter sets, respectively. Ex, excitation; Em. emission; DRLP, dichroic reflection longpass filter (dichroic mirror); BP. bandpass filter; LP, longpass filter; SP, shortpass filter. The wavelength band of these filters is expressed in nanome- ters. A 4-mm BG38 red suppression filter was always inserted in the lamp housing of both the HBO and the XBO light source.
Table 3. Fluorescence color and brightness scores of the EBMZ marker collagen Type VU, using the conju~atedfiuorophores and filter sets detailed in Table 1 and Table 2, respectively a
Red h band Gmn I band Blue 1 band
Filter set m NZ u/3 U/3m A Am
- - TRSC R 100 R (80 R (20 - LRSC R 100 OR 100 OR 620 - R (20 - TRITC R d80 OR 100 YO (30 G (10 OR (20 -
FITC - R ( 5 YG 100 G (80 G (20 - DTAF - R ( 5 YG 100 G (80 G (20 - BODIPY - R ( 5 YG 100 G ( 8 0 G 610 - AMCA - - - CBlue -
- WB 100 B ( 5 0 - WB 100 B (50
Fluorescence color scores and brightness values were assessed with the HBO SOW lamp. Color scores are indicated by their prefut: R, red, OR, orange-red, YO, yellow- orange; YG. yellow-green; G, green; B, blue; WB, white-blue. Brightness values (indicated after the color scores) are expressed as percentage values. These were estimated by visual inspection, assigning the value of 100% to the brightest transmission observed for each fluoroprobe and the various filter sets. -, no fluorescence above background level. To illustrate “optimal” color fidelity using triple wavelength ( h ) band fluorescence (Figures 1A-IG). we used the combinations of conjugated fluorophores and filter sets yielding the values printed in bold.
- -
by guest on December 10, 2015jhc.sagepub.comDownloaded from

718 BRUINS, DE JONG, HEERES, WILKINSON, JONKMAN, VAN DER MEER
Color Fidelity To study unwanted effects of spectral matching errors, particularly spillover and non-primary color rendition, we used monostained preparations show- ing the structural EBMZ antigen collagen Type VI1 in the desired red, green, or blue fluorescence color. For this purpose we used the following three- step staining protocol: [l] mouse IgGl anti-collagen Type VII, [2] bi- otinylated horse anti-mouse IgG, and [3] one of the following probes: (a) SAvITRSC, (b) SAvILRSC, (c) SAvITRITC, (d) SAvIBPY, (e) SAvIDTAF, (f) SAvIAMCA, or (g) SAvICBlue. The EBMZ fluorescence colors (Table 3) were estimated visually by two observers not suffering from apparent color blindness (SB, MCJMdJ). The fluorescence brightness values (Table 3) were estimated both visually and (semi)quantitatively by measurement of the exposure times of the EBMZ fluorescence, using the Vario Orthomat-2 measuring device (LeitzILeica). A spectral matching error was identified in case of spillover of the red, green, or blue EBMZ fluorescence between the RGB filter sets and/or transmission of fluorescence colors not perceived as primary red, green, and blue. To illustrate “optimal” color fidelity (Figures 1A-lG), using the data collected in Table 3 (see footnote), the EMBZ anti- gens laminin-5, extracellular 84 integrin, and laminin-1 were stained red. green, and blue respectively. The following seven-step, triple antigen staining protocol was used: [ 11 mouse IgGl anti-laminin-5, [2] biotinylated horse IgG anti-mouse IgG, [3] SAvILRSC, [4] rat IgG2, antLP4 integrin, [5] goat Ig anti-rat IgGIFITC, [GI rabbit IgG anti-laminin-1, [7] goat Ig anti-rabbit IgGICBlue. To ensure the desired staining specificity, we used well- established principles of replacement of the relevant antibodies and fluoroprobes by irrelevant ones and/or by reagents yielding purposely un- desired specific staining (12). Furthermore, single-colored fluorescence of the antigens also residing in tissue structures other than the EBMZ served as internal control.
To illustrate lack of color fidelity resulting from spectral matching er- rors, image contrast errors and exposure time errors, we used both single and double staining of the structural EBMZ antigen collagen Type VI1 (Figures 2-5). The protocol for single red, green, and blue staining of the EBMZ was the same as used for collection of the data in Table 3. The pro- tocol for double red and green staining of collagen Type VI1 was as fol- lows: [I] mouse IgGl anti-collagen Type VII, [2] biotinylated goat anti-mouse IgG1, [3] SAvITRITC, (41 biotinylated rabbit Ig F(ab)i anti- goat IgG, (51 SAvIDTAF.
Photomicrographic Overlay The photomicrographic overlay procedure, including correction of the image shift difference, has been recently described (2). Single recordings and dou- bleluiple overlay recordings were made on Fujichrome 400 ASA color reversal film, using the Vario Orthomat-2 device set at non-automatic film trans- port and manual exposure time. Color reproductions were made by the Cibachrome procedure (Ilford; Fribourg, Switzerland). The final magnifi- cation of the color photographs (Figure SB) was assessed by concomitant reproduction of the photomicrographic image of a stage micrometer, record- ed under identical conditions.
Results To study lack of color fidelity involving spillover and non-primary color transmission, we used monostained slide preparations each showing the respective red, green, and blue fluorescence pattern of the EBMZ antigen collagen Type VII. The color and brightness scores of representative fields of view of the EBMZ fluorescence pat- terns were estimated for each RGB filter set, using the HBO SOW lamp. The results of these scores are presented in Table 3, showing various combinations of fluoroprobes and filter sets suffering from spectral matching errors. It is almost trivial to note that quite differ- ent results (not shown) were obtained with the XBO 75W lamp. In particular, the image contrast, which counts most for visual evalu- ation, varied considerably for each fluoroprobe with light sources of differing excitation outputs. Autofluorescence of epidermal struc- tures and dermal fibers appeared particularly obvious with the “red” and “blue” filter sets using the HBO 50W lamp. In addition, we noted that the EBMZ fluorescence produced by the TRSC fluoro- probe, and to a lesser extent by the LRSC probes, showed peculiar diffusion on excitation with the HBO 50W lamp for longer than 60-120 sec. This phenomenon was not observed with the XBO 75W lamp.
To illustrate “optimal” color fidelity in the photomicrographic variant of the FOAM technique, we used the combinations of fluoroprobes and filter sets shown in Table 3. The results, using
Figure 1. Photomicrographs of triple-color immunofluorescence of the EBMZ antigens (A) laminin-5, (8) 84 integrin, and (C) laminin-1 in cryosections of normal human skin (elbow). This set of images is intended to illustrate “optimal” color fidelity, using the matched fluoroprobes and filter sets marked in Table 3. (A-C) The desired primary colors and image contrast. (D-0) The shift-corrected overlays of (D) the red and green image, (E) the green and blue image, (F) the red and blue image, and (G) the red, green, and blue image. Note that the borders of basal keratinocytes (arrow) and the inner layer of a vessel wall (double-headed arrow) show relatively weak, specific 84 staining in addition to the bright fluorescence at the EBMZ (8). Similarly, there is additional bright laminin-1 staining (double- headed arrow) across the vessel wall (C). In contrast, laminin-5 staining is confined to the EBMZ (A), indicating the specificity of the staining procedure. Triple staining (LRSC, FITC, and CBlue fluoroprobes), light source HBO 50W for TXR and Am filter set, XBO 75W for 12/3m filter set. Bar = 20 pm.
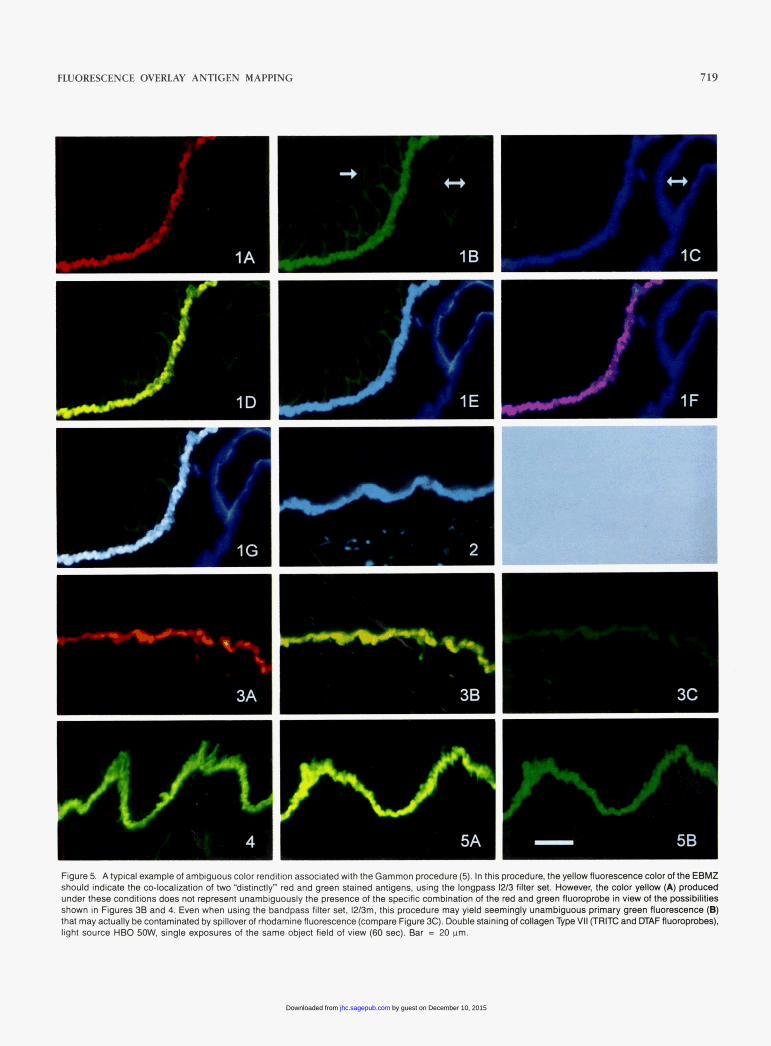
Figures 2-5. Photomicrographs of single and double immunofluorescence staining patterns of the structural EBMZ antigen collagen Type VI1 in cryosections of normal human skin (elbow). These images were obtained under various conditions to illustrate lack of color fidelity.
Figure 2. The combined effect of spectral matching error (longpass emission filter), image contrast error, and exposure time error on the representation of the single-stained EBMZ, intended to be primary blue (compare Figure 1C). The resulting cyan blue is difficult to distinguish from the mixed color of the green and blue overlay (compare Figure 1E). Single staining (AMCA fluoroprobe), longpass filter set A, light source HBO 5OW, slight over-exposure (15 sec). Bar = 20 pm.
Figure 3. Errors that may typically occur with TRlTC fluoroprobes. (A) The combined effect of spectral matching error (no primary color rendition) and exposure time error on the representation of the single TRlTC-stained EBMZ, using the longpass filter set N2 and slight overexposure (6 sec). The resulting orange-yellow to orange-red clearly differs from the color perceived as primary red (compare Figure 1A). (E) Spillover of TRlTC fluorescence in the longpass filter Set, 1213, intended for bright transmission of green-emitting fluorophores such as FITC. The resulting orange to yellow hue may be difficult to distinguish from mixed Colors of red and green (compare, e.g., Figure 1D). (C) Even with the bandpass filter set, 12/3m, spillover of TRlTC fluorescence may be observed due to transmission of the front tail (530-560 nm) of its emission spectrum. Single staining (TRITC fluoroprobe), light source HBO 50W. Single exposures of the same object field of view. Bar = 20 wm.
Figure 4. Effect of spectral matching error (no primary color rendition) and exposure time error on the representation of the single green stained EBMZ, using the longpass filter set, 12/3, and overexposure (120 sec). The yellowish-green hue, typically resulting from overexposure of fluorescein-stained substrates and the use of longpass emission filters, may be difficult to distinguish from mixed colors of red and green (compare Figure 1D). Single staining (DTAF fluoroprobe), light source HBO 50W. Bar = 20 Wm.
by guest on December 10, 2015jhc.sagepub.comDownloaded from
FLUORESCENCE OVERLAY ANTIGEN MAPPING 719
I
I
3A 3B 3 c
I 4 5A - 5B
Figure 5. A typical example of ambiguous color rendition associated with the Gammon procedure (5). In this procedure, the yellow fluorescence color of the EBMZ should indicate the co-localization of two "distinctly" red and green stained antigens, using the longpass 1213 filter set. However, the color yellow (A) produced under these conditions does not represent unambiguously the presence of the specific combination of the red and green fluompmbe in view of the possibilities shown in Figures 38 and 4. Even when using the bandpass filter set, 1213m. this procedure may yield seemingly unambiguous primary green fluorescence (e) that may actually be contaminated by spillover of rhodamine fluorescence (compare Figure X). Double staining of collagen Type VI1 (TRITC and WAF fluompmbes), light source HBO SoW. single exposures of the same object field of view (60 sec). Bar = 20 vm.
by guest on December 10, 2015jhc.sagepub.comDownloaded from

720 BRUINS, DE JONG, HEERES, WILKINSON, JONKMAN, VAN DER MEER
single, double, and triple photomicrographic recording of the dis- tinctly colored EBMZ antigens laminin-5, p4 integrin, and laminin- 1, are shown in Figures 1A-1G. Because the presence of each EBMZ antigen is represented by a primary color (Figures 1A-1C) largely devoid of the type of errors studied here, each mixture of these colors in the overlay images (Figures 1D-1G) could be assigned un- ambiguously to a specific combination of the labeled antigens. The additional specific staining of p4 integrin (Figure 1B) and laminin-1 (Figure IC) on tissue structures other than the EBMZ (confirmed in monostained preparations) served as an internal control. This differential localization of the antigens, in addition to their co- localization at the EBMZ, was easily recognized by the presence of primary colors in the multicolor overlay (Figure 1G). It can be added here that control over color fidelity during the color reproduc- tion process may present a rather frustrating problem. In particu- lar, the primary color of blue is difficult to handle as compared with, e.g., primary green (compare Figures 1B and IC). Some ex- amples illustrating lack of color fidelity resulting from spectral matching errors, image contrast errors, and exposure time errors are shown in Figures 2-5. In case of AMCA fluoroprobes, the use of longpass emission filters intended to provide high fluorescence yield may produce colors in the range from blue to white-blue. Additional overexposure to record faintly fluorescent objects as well may further impede faithful color rendition (Figure 2). Similarly, TRITC and similar fluoroprobes may yield non-primary colors in the range from red to yellow (Figure 3A). In addition, spillover of TRITC fluorescence in both the “green” (Figure 3B) and ‘‘blue” filter sets may occur. Even the use of narrow bandpass emission filters may result in spillover of TRITC fluorescence, mimicking faint FITC fluorescence (Figure 3C). The representation of bright FITC fluorescence in the green-yellow range may further impair color fidelity (Figure 4). For these reasons, the simultaneous use of FITC(-like) and TRITC(-like) fluoroprobes is highly prone to am- biguous results (Figure 5), particularly when the “Gammon proce- dure” is used (5).
Discussion The results presented in Eble 3 confirm the findings of Wessen- dorf (22) and show the potential unreliability of the simultaneous use of “distinct” fluorophores for multicolor (immuno)fluorescence microscopy. These results should be interpreted against the back- ground of the definition of color fidelity, and in particular of spec- tral matching errors. These may involve improper matching as well as imperfectness of the filter sets intended to isolate fluorescence of “distinct” wavelength bands, also referred to as spectral distinc- tion (3), signal isolation (U), and spectral separation (16). The con- clusions reached about the presence of spillover, based on the bright- ness percentage values (Table 3), did not essentially alter using (more objective) exposure time measurements. It is questionable, there- fore, whether rigorous quantitative measurements would add sub- stantially to the information obtained by simple visual inspection. In any event, the results emphasize earlier statements about being careful in using the filter sets supplied with fluorescence micro- scopes (16). This, however, appears to be only part of the problem, as signal isolation in multicolor fluorescence essentially involves proper separation of the emission bands of the fluoroprobes used.
Therefore, selecting the appropriate filter sets always involves care- ful matching with the proper fluoroprobes, and vice versa. In other words, appropriate filter sets on their own do not exist. This is most dearly illustrated in Figure 3C. In this example of a spectral matching error, the use of an interference shortpass filter (SP560) did not prevent spillover of TRITC fluorescence into the filter set intended for green fluorescence. This finding can be expected from the spec- tral data for TRITC (Eble 1) and the principle of spectral isolation by narrowband filtering (11). It should be noted, however, that such spectral data are obtained under conditions (spectrophotofluorom- etry) differing from those in fluorescence microscopy. Furthermore, the emission spectra of fluorescent dyes are often depicted in such a way that the tail, potentially giving rise to spillover, is missing (7). These facts alone indicate the need for performance testing of spectral matching errors. In the case of TRITC, the emission spec- trum frequently referred to (7) probably has a tail just passing the green shortpass filter, making this fluorophore unsuitable for use in simultaneous red and green (immuno)fluorescence (Figure 5 ) . This fact, known for years (19). has not prevented the TRITC fluoro- phore from continuing to be popular in “selective” dual and even triple wavelength band (immuno)fluorescence microscopy (18). However, TRITC fluoroprobes may fulfill the restrictions of spec- tral matching when used in combination with blue emission probes, such as AMCA and Cascade Blue (Eble 3). The use of TRSC or LRSC, instead of TRITC, appears an attractive alternative for selec- tive red and green immunofluorescence. In our hands, the antigen staining in skin tissue with TRSC probes proved less stable than that with LRSC probes. The instability of TRSC staining, observed during prolonged exposure (>60 sec) to the HBO 50W light source, probably results from hydrolysis of TRSC in the aqueous mount- ing medium (9.19). Therefore, we prefer the use of LRSC conjugates, awaiting the marketing of stable alternatives with the desired nar- row excitation spectrum and Stokes shift. It remains to be verified, using performance testing, whether the new dye CY3 (indocar- bocyaninin) offers the desired alternative (10). The fluorophore BODIPY (BPY) is claimed to have a narrower emission spectrum than F I E and DTAF (8). In our performance test for spectral match- ing errors, conjugated BODIPY/FLZ showed a minimal difference only with FJTC and MiW fluoroprobes (Table 3). It is important to realize here that the conclusions reached about spectral match- ing errors are dependent not only on the filter sets and fluoroprobes used but also on the intensity of the specific (EBMZ) fluorescence. This variable is influenced, among other conditions, by the output of the excitation source. We cannot exclude that using a high-power broadband excitation source, e.g., HBO 200W lamp, may result in increased spillover and differing color output. It is certain that using such a lamp will introduce an image contrast error resulting from increased autofluorescence, at least in skin tissue. Ideally, an (immun0)fluorescence image should exhibit only the desired spe- cific staining and should be devoid of undesired fluorescence (6). Minimizing undesired fluorescence not only requires due consider- ation of nonspecific staining and autofluorescence but also of un- desired specific staining. An example of the latter type of staining is the specific but undesired staining of human IgG (normally pres- ent) in the dermal interstitium, along with the staining of autoim- mune IgG deposits at the EBMZ. Such simultaneous desired and undesired specific (immuno)staining often results in low image con- trast and consequently in lack of color fidelity. The use of mono-
by guest on December 10, 2015jhc.sagepub.comDownloaded from
FLUORESCENCE OVERLAY ANTIGEN MAPPING 72 1
clonal instead of (non-affinity-purified) polyclonal antibodies, es- pecially in FOAM applied to immunodermatopathology (Bruins et al., manuscript in preparation), may help to reduce undesired staining. To reduce autofluorescence without sacrificing the signal strength of the desired fluorescence, one would like to have the availability of low-cost lamps with narrow intensity peaks that can be matched with the excitation peaks of the fluoroprobes. As a compromise, our microscope is equipped with an XBO 7 5 W and HBO 5 0 W lamp, each of which is used according to circumstances (Table 2). At the recording level, particularly in triple photomicro- graphic overlay recording, impairment of color fidelity due to in- correct exposure times may present a rather troublesome problem. Proper balancing of the red, green, and blue fluorescence in over- lay images is by no means trivial and involves knowledge of the saturation properties and spectral sensitivity of the recording tools. The use of an automatic exposure device may yield disappointing results, especially when small-sized objects such as the EBMZ are involved. So does the use of films suffering from color shifts, e.g., in the green-yellow range. Therefore, optimal exposure times for the output of each RGB filter set often must be assessed by trial and error. Use of monostained slide preparations, processed in par- allel to the triple-stained ones, may be helpful to check image con- trast and primary color rendition. Use of monostained preparations is also recommended in videomicroscopic overlay procedures using gray-scale imaging. Overlaying of digitized gray-scale images has the advantage of easy control over the representation of primary colors. Moreover, digital processing permits the images to be cor- rected more easily for errors of intensity and geometric position (4). It should be realized, however, that the advantage of automated color assignment can be nullified by overlooking the other errors interfering with color fidelity, such as spillover between RGB filter sets. In this case also, the use of monostained preparations should help to avoid such errors.
With the advent of confocal microscopy and multiband filter sets, most of the problems mentioned here appear to be overcome. Although confocal microscopy offers the benefit of increased resolv- ing power, it is unwise to assume that this advanced tool offers the kind of “one-fix solution” most users are looking for. Problems of image contrast may still obstruct color fidelity as long as undesired specific staining and/or crossreactive staining are involved. These types of staining are not selectively eliminated by optical section- ing that usually minimizes out-of-focus fluorescence. Furthermore, the combined use of laser excitation and multiband filter sets is no guarantee at all of reaching the desired color fidelity. Under these conditions, it is also not trivial to find a set of three fluoro- phores that fulfill the requirements of spectral matching. The use of multiband filter sets, which fundamentally requires narrow wave- length band filtering for selective emission, may result in subop- timal signal strength requiring longer exposure times. This, in tum, may lead to increased photobleaching and consequently to even lower signal strength. A multicolor image produced under such conditions may suffer from considerable lack of color fidelity due to non-linear mixing of weak fluorescence signals. Another prob- lem to be faced, with the use of multiband filter sets is the greater difficulty of reaching the desired color balance between the RGB signals. Tiken together, faithful simultaneous identification of three distinctly colored antigens in tissue substrates remains troublesome,
whether conventional or advanced fluorescence microscopy tech- niques are used. Evaluation of the multicolor images by visual in- spection is another problem, involving variables such as the spec- tral sensitivity of the human eye (25). Although not trivial either, this problem is beyond the scope of this study.
In conclusion, it is almost trivial to note that reliable use of mul- ticolor (immuno)fluorescence microscopy requires due considera- tion of the various aspects of color fidelity. Both color fidelity and geometric fidelity (2) are taken for granted too often. Verification of color fidelity should include performance testing, taking into consideration the following practical points: (a) the use of mono- stained slide preparations (in addition to the multistained one) to check spillover of fluorescence between RGB filter sets, (b) the use of these preparations to vedy the representation of primary colors, (c) the use of both narrow bandpass excitation and emission whenever possible, (d) the use of LRSC instead of TRSC when prolonged exposure is needed, (e) the use of an exposure device set at non-automatic film transport and manual exposure (the use of digitized overlay procedures is to be preferred), (f) the use of monoclonal or affinity-purified polyclonal antibodies, and (g) rig- orous specificity testing of the staining procedures by established methods (6) and identification of both co-localized and differen- tially localized antigenic sites whenevtr possible. To this can be added that reliable interpretation of multicolor (immunofluorescence im- ages requires additional performance testing of the geometric fi- delity as recently described (2). When a d k d properly, both color fidelity and geometric fidelity may contribute not only to the beauty of multicolor fluorescence images but also to their scientific impact.
Acknowledgments We thank Mr Peter van der Syde for s k g f i l assistance in tbe processing of color reproductions andDr Hendri H. Par for advice in the preparation of the SAdAMCA flrromprobe.
Literature Cited 1. Bruins S, de Jong MCJM, Heeres K. Wilkinson MHF, Jonkman MF,
van der Meer J B Fluorescence overlay antigen mapping of the epider- mal basement membrane zone: 111. Topographic staining and effective resolution. J Histochem Cytochem 43:649, 1995
2. Bruins S, De Jong MCJM. Heeres K, Wilkinson MHF, Jonkman MF, van der MeerJEk Fluorescence overlay antigen mapping of the epider- mal basement membrane zone: I. Geometric errors. J Histochem Cytochem 42:555, 1994
3. DeBiasio R, Bright GR, Emst LA, Waggoner AS, Lansing ‘Tiylor D: Five-parameter fluorescence imaging: wound healing of living Swiss 3T3 cells. J Cell Biol 105:1613, 1987
4. Galbnith W, Wagner MCE, Chao J, A k a M, Ernst LA, Nederlof MA, Hartsock RJ, Lansing ‘Tiylor D, Waggoner AS Imaging cytometry by mdtiparametcr fluorescence. Cytomeuy 12579, 1991
5. Gammon WR. Robinson T, Briggaman RA, Wheeler CE: Double im- munofluorcscence microscopy: a method for localizing immune dcposits in skin diseases associated with linear basement membrane zone im- munofluorescence. J Invest Dermatol 79:312, 1982
6. Haaijman JJ: Quantitative immunofluorescence microscopy methods and applications. Thais, University of Leiden. Rijswijk, The Nether- lands, Institute for Experimental Gerontology of the Organization for Health Research TNO, 1977
by guest on December 10, 2015jhc.sagepub.comDownloaded from
722 BRUINS, DE JONG, HEERES, WILKINSON, JO”, VAN DER MEER
9
10.
11.
12.
13.
14.
15.
16.
7. Hansen PA: Spectral data of fluorescent tracers. Acta Histochem
8. Haugland RP Succinimidyl esters and carboxylic acids. In Larison KD,
chemicals. 5th ed. Eugene, OR, Molecular Probes 1992-1994, 24 . Haugland RPL Sulfonyl chlorides. In Larison KD, ed. Molecular probes.
Handbook of fluorescent Drobes and research chemicals. 5th ed.
17. Leigh IM, hrk is PE, Bruckner-Tuderman L: LH7.2 monoclonal anti- body detects type VI1 collagen in the sublamina densa zone of ectodermally-derived epithelia, including skin. Epithelia 1:17, 1987
cence ratio measurements of double-labeled probes for multiple in situ hybridization by digital imaging microscopy. Cytometry 13339, 1992
Red, a hydrophilic,
7(suppl):167, 1965
ed, Molecular probes, Handbook of fluorescent probes and research 18. Nederlof PM, van der Flier S, VrolijkJ, Tanke HJ* h a p AK: F1uoreS-
19. TitUJA, Haugland R, shFow so, Se@DM: gene, OR, Molecular Proies, 1992-1994, 33 Jackson ImmunoResearch: Immunological reagents for research. West Grove, PA, Jackson ImmunoResearch, 1993 Johnson I: Optical properties of fluorescent probes. In Larison KD, ed. Molecular probes. Handbook of fluorescent probes and research chemicals. 5th ed. Eugene, OR, Molecular Probes, 1992-1994, 1
Jonkman MF, De Jong MCJM, Heeres K, Sonnenberg A: Expression of integrin a6P4 in junctional epidermolysis bullosa. J Invest Dermatol 99:489, 1992 Kang HC, Haugland RP, Fisher PJ, Prendergast FG: Spectral proper- ties of 4-sulfonato-3,3’,5,5’-tetramethyl-2,2’-pyrromethen-l,l’~boron- difluoride complex (Bodipy), its sodium salt, and protein derivatives. Proc SOC Photoopt Inst Engin 1063:68, 1989 Kennel SJ, Foote LJ, Falcioni R, Sonnenberg A, Stringer CD, Crouse C, Hemler ME: Analysis ofthe tumor-associated antigen TSP-180. Iden- tity with a6P4 in the integrin superfamily. J Biol Chem 264:15515, 1989 Khalfan H, Abuknesha R. Rand-Weaver M, Price RG, Robinson D: Aminomethyl coumarin acetic acid: a new fluorescent labelling agent for proteins. Histochem J 18:497, 1986 Lansing Taylor D, Salmon ED: Basic fluorescence microscopy. Methods Cell Biol 29:207, 1989
red-emitting fluorophore for use with fluorescein in dual parameter flow microfluorometric and fluorescence microscopic studies. J Immunol Methods 50:193, 1982
20. Verrando P, Hsi BL, Yeh CJ, Pisani A, Serieys N, Ortonne JP: Monoclo- nal antibody GB3, a new probe for the study of human basement mem- branes and hemidesmosomes. Exp Cell Res 170:116, 1987
21. Waggoner A, DeBiaso R. Conrad P, Bright GR, E m L, Ryan K, Nederlof M, Eylor D: Multiple spectral parameter imaging. Methods Cell Biol 30:449, 1989
22. Wessendorf MW, Appel NM, Molitor TW, Elde RP A method for im- munofluorescent demonstration of three coexisting neurotransmitters in rat brain and spinal cord, using the fluorophores fluorescein, lissa- mine rhodamine, and 7-amino-4-methylcoumarin-3-acetic acid. J Histochem Cytochem 38:1959, 1990
23. Whitaker JE, Haugland RP, Moore PL, Hewitt PC, Rees M, Haugland Rp: Caxade blue derivatives: water soluble. reactive, blue emission dyes evaluated as fluorescent labels and tracers. Anal Biochem 198:119. 1991
24. Wittgenstein L: Remarks on colour (Bemerkungen iiber die Farben). Oxford, Basil Blackwell, 1977
25. Wyszecki G, Stiles WS: Color science: concepts and methods, quan- titative data and formulae. 2nd ed. New York, John Wiley & Sons, 1982
by guest on December 10, 2015jhc.sagepub.comDownloaded from
Copyright © 2022 FDOKUMEN