Effects of Concrete Cure Time on Epoxy Overlay and Sealant ...
140
Effects of Concrete Cure Time on Epoxy Overlay and Sealant Performance FINAL REPORT – June 2022 Department of Civil & Construction Engineering College of Engineering and Applied Sciences Western Michigan University
-
Upload
khangminh22 -
Category
Documents
-
view
0 -
download
0
Transcript of Effects of Concrete Cure Time on Epoxy Overlay and Sealant ...

Effects of Concrete Cure Time on Epoxy Overlay and Sealant Performance
FINAL REPORT – June 2022
Department of Civil & Construction Engineering College of Engineering and Applied Sciences
Western Michigan University
Intentionally left blank

1. Report No.SPR-1698
2. Government Accession No.N/A
3. MDOT Project ManagerJohn Belcher, P.E.
4. Title and SubtitleEffects of Concrete Cure Time on Epoxy Overlay and SealantPerformance
5. Report Date 06/15/20226. Performing Organization CodeN/A
7. Author(s)Upul Attanayake, Ph.D., P.E.Neil Berke, Ph.D.Abul Fazal Mazumder, M.Sc.
8. Performing Org. Report No.N/A
9. Performing Organization Name and AddressWestern Michigan University1903 West Michigan AvenueKalamazoo, Michigan 49008
10. Work Unit No. (TRAIS)N/A11. Contract No.
2016-0069 11(a). Authorization No.
Z6 12. Sponsoring Agency Name and AddressMichigan Department of TransportationResearch Administration8885 Ricks RoadP.O. Box 30049Lansing, MI 48909
13. Type of Report & PeriodCovered
Final Report 07/01/2018 – 12/31/2020
14. Sponsoring Agency CodeN/A
15. Supplementary Notes
16. AbstractApplying flood coats (thin epoxy overlays and healer sealers) improves bridge deck condition and extends service life. The current Michigan Department of Transportation (MDOT) policy is to maintain a total curing period comprising 28 days of wet and dry curing before applying a flood coat on bridge decks with new concrete for patches and repairs. Consequently, the contractors must wait 28 days to start surface preparation for a flood coat application, which increases project completion time, traffic management, and user costs. Therefore, there is an interest to evaluate the possibility of applying a flood coat during the dry curing period. Hence, two performance-based procedures were developed to identify the minimum concrete age to receive a thin epoxy overlay or a healer sealer. Two epoxy overlays and two healer sealers were identified from MDOT approved product lists to evaluate their performance on the standard bridge deck joint repair (BDJR) and Grade DM concrete mixes. The overlay performance was evaluated under standard laboratory conditions, simulated summer exposure conditions, wet and dry conditions, and the outdoor conditions representing southwest Michigan exposure. The performance under outdoor conditions was evaluated during the fall, winter, and summer seasons. The overlay performance was assessed primarily by conducting the tensile bond pull-off strength test. Also, the effectiveness of the overlay against chloride ingress was evaluated. The performance of healer sealers was assessed by evaluating the effectiveness of sealers to prevent chloride ingress through sealed cracks. The experimental results support applying overlays and healer sealers during the dry curing period. The rational and implementable procedures developed through this research evaluate the minimum age of concrete to receive epoxy overlays or healer sealers without compromising concrete durability and overlay/healer sealer performance. Even though the process requires evaluating several parameters, this process needs to be implemented only once per each standard or approved mix resulting in significant savings from project and road user costs.17. Key WordsBridge deck, Bond strength, Concrete, Cracking, Curing,Epoxy overlay, Healer sealer, Moisture, Road user cost
18. Distribution StatementNo restrictions. This document is available tothe public through the Michigan Department ofTransportation.
19. Security Classification - reportUnclassified
20. Security Classification - pageUnclassified
21. No. of Pages140
22. PriceN/A

Intentionally left blank

Effects of Concrete Cure Time on Epoxy Overlay and Sealant Performance
Final Report (2018-2020)
Project Manager: John Belcher, P.E.
Submitted to:
Submitted by:
Upul Attanayake, Ph.D., P.E. Presidential Innovation Professor and Director Center of Excellence for Structural Durability
(269) 276 – 3217 [email protected]
Neal Berke, Ph.D. Vice President Research
Tourney Consulting Group, LLC (269) 384 – 9980
Abul Fazal Mazumder, M.Sc. Graduate Research Assistant
Center of Excellence for Structural Durability (269) 276 – 3210
Western Michigan University Department of Civil & Construction Engineering
College of Engineering and Applied Sciences Kalamazoo, MI 49008-5316
Fax: (269) 276 – 3211
vi Effects of Concrete Cure Time on Epoxy Overlay and Sealant Performance
DISCLAIMER
“This publication is disseminated in the interest of information exchange. The Michigan
Department of Transportation (hereinafter referred to as MDOT) expressly disclaims any liability,
of any kind, or for any reason, that might otherwise arise out of any use of this publication or the
information or data provided in the publication. MDOT further disclaims any responsibility for
typographical errors or accuracy of the information provided or contained within this information.
MDOT makes no warranties or representations whatsoever regarding the quality, content,
completeness, suitability, adequacy, sequence, accuracy or timeliness of the information and data
provided, or that the contents represent standards, specifications, or regulations.”
“This material is based upon work supported by the Federal Highway Administration under SPR
OR17-201. Any opinions, findings and conclusions or recommendations expressed in this
publication are those of the author(s) and do not necessarily reflect the views of the Federal
Highway Administration.”
vii Effects of Concrete Cure Time on Epoxy Overlay and Sealant Performance
ACKNOWLEDGEMENTS
This project is funded by the Michigan Department of Transportation (MDOT). The authors would
like to acknowledge the support and effort of Mr. John Belcher and Mr. Jason DeRuyver for
initiating this research. The authors also wish to acknowledge the continuing assistance of the
Research Advisory Panel (RAP) members in contributing to the advancement of this study.
Authors appreciate the contribution of graduate students (Harsha Amunugama, Asutosh
Annamreddy, Kanchani Basnayake, Johanes Perwata, and Shresta Wosti) and undergraduate
students (Ethan Carpenter, Joshua Janovsky, Alexander Keifer, Kavya Kuruppuarachchi, Tristan
Richardson, and Stephen Timmer) for the successful completion of the experimental activities.
The authors extend special appreciation to former graduate student Ali Inceefe for his contribution
to project activities. Special thanks are due to Larry Wachowski and Joe Duke of Tourney
Consulting Group (TCG) for their contribution to the project. Thanks are due to TCG staff Brad
Ade, Mike Wachowski, Dave Agopian, and Lee Thornburg for their help during specimen
fabrication. Authors offer their gratitude to John Cernius and Mike Konkel of WMU for their help
in successful completion of the project.

viii Effects of Concrete Cure Time on Epoxy Overlay and Sealant Performance
Intentionally left blank
ix Effects of Concrete Cure Time on Epoxy Overlay and Sealant Performance
EXECUTIVE SUMMARY
INTRODUCTION
The Michigan Department of Transportation (MDOT) applies flood coatings (thin epoxy overlays
and healer sealers) as Capital Preventive Maintenance (CPM) and Capital Scheduled Maintenance
(CSM) activities to bridge or seal cracks to improve a bridge deck’s condition and extend the
service life. Depending on the condition, decks are patched or repaired before a flood coating
application. The current MDOT policy requires maintaining a total curing period of 28 days (7-
days wet and 21-days dry) before applying a flood coating on bridge decks with new concrete for
patches and repairs. Consequently, the contractors must wait 28 days to start surface preparation
for a flood coat application. This requirement delays project completion time and increases traffic
management and user costs. Therefore, there is an interest to evaluate the possibility of applying
a flood coat during the dry curing period. This requires identifying the minimum concrete age to
receive a flood coat. The minimum concrete age to receive a flood coat and the performance of
the system depend on several parameters including concrete cracking, moisture, and strength.
Such parameters depend on concrete mixture ingredients and wet and dry curing periods.
Therefore, there is an interest to evaluate if a prescription- or a performance-based approach is
better for deciding the minimum concrete age to receive a flood coating.
The objective is to determine if a procedure or a set time is better for deciding when to place an
epoxy overlay or a healer sealer on MDOT standard concrete materials and special/patching
materials. To achieve the objective, the project was organized into six tasks as follows:
1) Research criteria and benefits of epoxy overlay and sealant placement timing with regards
to standard materials and special/patching materials.
2) Develop a testing plan that encompasses the material used by MDOT.
3) Prepare specimens and conduct QAQC testing.
4) Evaluate overlay/sealant performance vs. crack development and curing.
5) Analyze results and quantify the cost savings.
6) Recommend a procedure for determining overlay/sealant placement timing based on
material/mix design.

x Effects of Concrete Cure Time on Epoxy Overlay and Sealant Performance
PERFORMANCE EVALUATION OF EPOXY OVERLAYS AND HEALER SEALERS
Two performance-based procedures were developed to identify the minimum concrete age to
receive a flood coating: one for thin epoxy overlays and the other for healer sealers. The robustness
of both procedures was demonstrated through a comprehensive experimental study.
Thin epoxy overlays are expected to bridge the cracks and protect the entire deck surface by
preventing the ingress of chloride ions and other harmful chemicals. A tensile bond pull-off
strength test is used to evaluate the system performance. The performance is satisfactory when
the bond strength is greater than or equal to 250 psi. The minimum concrete age to receive an
overlay depends on concrete wet curing duration, cracking age, concrete age to achieve an
acceptable substrate moisture condition, and concrete age to develop the required minimum tensile
strength. Thin epoxy overlay performance depends on concrete strength, bond strength, thermal
compatibility between overlay and concrete, epoxy performance under various exposure
conditions, and workmanship. Considering all these parameters, a comprehensive procedure was
developed to evaluate the minimum age of concrete to receive an overlay as a function of (i)
concrete wet curing duration, (ii) concrete age at the time of cracking, (iii) concrete age to achieve
acceptable substrate moisture, (iv) concrete age to develop the specified minimum tensile strength,
and (v) concrete age at the time of epoxy application to develop the specified bond strength. This
procedure was implemented using two MDOT standard concrete mixes and two thin epoxy
overlays. The bridge deck joint repair (BDJR) and Grade DM standard mixes were selected. E-
bond 526 Lo-Mod and Unitex Pro-Poxy Type III DOT epoxy overlays were selected from the
MDOT approved product list. Moreover, there is an interest to evaluate the possibility of
developing a hybrid bridge deck protection system with penetrating sealers and thin epoxy
overlays to complement the overlay performance by retarding chloride ingress into the concrete
through pinholes and other anomalies formed during overlay application and while in service.
Therefore, the experimental study was extended to evaluate the impact of silane pretreatment on
overlay bond strength. SIL-ACT ATS-100, a 100% silane penetrating sealant in the MDOT
approved product list, was selected for pretreating the specimens fabricated with BDJR concrete.
Healer sealers are expected to seal the cracks by penetrating and bonding the cracks while
maintaining the integrity under repeated loading that demands opening and closing of the sealed
cracks. The performance can be assessed by evaluating the ability of the sealed cracks to resist
xi Effects of Concrete Cure Time on Epoxy Overlay and Sealant Performance
chloride ion ingress and reduce corrosion risk probability of the embedded reinforcing steel. The
minimum concrete age to receive a healer sealer depends on concrete wet curing duration, cracking
age, and concrete age to achieve an acceptable substrate moisture condition. Several parameters
(including concrete moisture, workmanship, etc.) influence healer sealer performance.
Considering all these parameters, a comprehensive procedure was developed to evaluate the
minimum age of concrete to receive a healer sealer as a function of (i) concrete wet curing duration,
(ii) concrete age at the time of cracking, (iii) concrete age to achieve acceptable substrate moisture,
and (iv) concrete age at the time of healer sealer application to achieve comparable performance
to 28 days. This procedure was implemented using two MDOT standard concrete mixes (BDJR
and Grade DM) and two healer sealers (Sikadur 55 SLV and Unitex Pro-Poxy 40 LV LM) selected
from the MDOT approved product list.
CONCLUSIONS AND RECOMMENDATIONS
The following conclusions and recommendations were derived from the experimental
investigations conducted to evaluate the minimum concrete age to receive thin epoxy overlays and
healer sealers:
• Rational and implementable procedures are presented to evaluate the minimum age of
concrete to receive epoxy overlays and healer sealers without compromising concrete
durability and overlay/sealant performance. Even though the processes require evaluating
several parameters, these procedures need to be implemented only once per each standard or
approved mix resulting in significant savings from project and road user costs. It is
recommended to include the procedures as part of the flood coat acceptance testing program.
• The overlay bond strength evaluated at or below 73o F was more than the specified limit of
250 psi regardless of the epoxy application age, concrete mix, and epoxy type. The average
substrate moisture condition at 14 days was 5.6% and 4.2% for BDJR and Grade DM
concretes, respectively. The moisture contents are comparable to the limits specified by New
York and Wisconsin DOTs.
• Irrespective of the application age, the bond strength of epoxy overlays under elevated
temperature was less than 250 psi. The primary failure type was a bond failure at the
concrete/overlay interface. A certain degree of epoxy softening was observed under
prolonged and repeated exposure to temperatures above 100o F.

xii Effects of Concrete Cure Time on Epoxy Overlay and Sealant Performance
• The bond strength recovers when the temperature reaches room temperature following a
heating cycle. However, bond strength decreases under repeated exposure to heating cycles:
an evidence of having a certain degree of permanent damages to the integrity of the system.
• The Unitex Pro-Poxy Type III DOT epoxy overlay performed consistently better than the E-
bond 526 Lo-Mod epoxy overlay irrespective of concrete mix, epoxy application age, and
exposure conditions.
• Pretreatment using SIL-ACT ATS-100, a 100% silane penetrating sealant, shows no adverse
impact on the overlay performance; rather, it improves the bond strength under elevated
temperature when applied on 21 or 28 days old concrete. Pretreatment improved the
recovered bond strength following heating cycles.
• The total chloride content along the depth of concrete evaluated after 135 days following the
healer sealer application shows similar values and trends for all three application ages. The
total chloride content at least 1.0 in. deep into the sealed crack remains constant and similar
to the background chloride content (i.e. 231~270 ppm), an indication of the effectiveness of
the crack sealant. The total chloride content at the unprotected crack (reference specimen) is
much greater than 500 ppm up to a 3 in. depth.
• Both sealers (Sikadur 55 SLV and Unitex Pro-Poxy 40 LV LM) show similar performance
irrespective of the sealant application age and concrete mix.
• Concrete cracking age under standard laboratory exposure conditions became the decisive
parameter for determining the concrete age to receive thin epoxy overlays and healer sealers.
Since thin epoxy overlays and healer sealers can be applied on 18 days old BDJR concrete
and 20 days old Grade DM concrete to achieve comparable performance to 28 days, a 21-day
application age is specified. The 18-day and 20-day waiting periods were decided based on
the concrete cracking age. The use of non-shrink bridge deck repair and/or patch materials
could potentially reduce this waiting period.
• Maintaining traffic on a typical bridge with a 5,000 ft2 deck area and the average annual daily
traffic (AADT) of about 5,000 to 12,000 could save road user costs, in Michigan, of more
than $30,482 to $84,824 per day. The above cost calculation demonstrates the benefits of
completing overlay and healer sealer application operations during the dry curing period
rather than extending the bridge closure at least one or two days beyond the 28-day closure.

xiii Effects of Concrete Cure Time on Epoxy Overlay and Sealant Performance
• The concrete with slag improves overlay bond strength under elevated temperature and
reduces chloride ingress. The concrete with slag has a low volume of total permeable voids
and smaller pore size that results in lower permeability and very little increase in the internal
relative humidity (IRH) under elevated temperature. Therefore, low permeable concrete, such
as mixes with supplementary cementitious materials (SCMs), is recommended to improve
bridge deck durability, along with overlay and sealant performance.
• Even though the MDOT standard practice is 7 days of moist curing, the current stipulations
in the Standard Specifications for Construction provide flexibility for extending the curing
duration beyond 7 days by specifying 7-day minimum compressive and flexural strength
requirements. However, these curing requirements do not specifically address the extended
curing required to develop a discontinuous capillary pore structure with a minimum volume
of total permeable voids in concrete with SCMs, a durability performance requirement.
Therefore, it is recommended to include the bulk electrical conductivity and porosity testing
in the curing specifications to establish moist curing requirements that assure both the strength
and durability requirements.

xiv Effects of Concrete Cure Time on Epoxy Overlay and Sealant Performance
Intentionally left blank
xv Effects of Concrete Cure Time on Epoxy Overlay and Sealant Performance
TABLE OF CONTENTS
DISCLAIMER.............................................................................................................................. vi
ACKNOWLEDGEMENTS ....................................................................................................... vii
EXECUTIVE SUMMARY ......................................................................................................... ix
TABLE OF CONTENTS ........................................................................................................... xv
LIST OF TABLES ................................................................................................................... xviii
LIST OF FIGURES .................................................................................................................... xx
1 Introduction ........................................................................................................................... 1
1.1 Overview ......................................................................................................................... 1
1.2 Objective and Tasks ........................................................................................................ 2
1.3 Report Organization ........................................................................................................ 2
2 State-of-the-Art and Practice Literature Review ............................................................... 3
2.1 Overview ......................................................................................................................... 3
2.2 Guidelines and Practice of Highway Agencies ............................................................... 3
2.2.1 Concrete Curing .......................................................................................................... 8
2.2.2 Substrate Preparation .................................................................................................. 9
2.2.3 Application Requirements ........................................................................................ 10
2.2.4 Performance Evaluation ............................................................................................ 11
2.3 Manufacturer Recommendations .................................................................................. 11
2.4 Epoxy Overlay and Sealant Performance ..................................................................... 12
2.4.1 Performance Evaluation under Field and Laboratory Conditions ............................ 12
2.4.2 Performance Evaluation by Field Inspection and Surveys ....................................... 17
2.4.3 Anticipated Fix Life with Overlays and Sealants ..................................................... 18
2.5 Concrete Properties and Practices for Deciding the Minimum Concrete Age to Receive a Flood Coat .............................................................................................................................. 19
2.5.1 Performance of Epoxy Overlays ............................................................................... 19
2.5.2 Performance of Healer Sealers .................................................................................. 22
2.6 Concrete Property and Flood Coat Performance Evaluation ........................................ 23
2.6.1 Concrete Wet Curing Duration ................................................................................. 24
2.6.2 Concrete Cracking Age ............................................................................................. 25
2.6.3 Substrate Moisture Condition ................................................................................... 25
2.6.4 Strength Development of Concrete ........................................................................... 26
2.6.5 Tensile Bond Pull-Off Strength ................................................................................ 26

xvi Effects of Concrete Cure Time on Epoxy Overlay and Sealant Performance
2.6.6 Resistance to Chloride Ingress .................................................................................. 26
2.7 Summary ....................................................................................................................... 27
3 Performance of Thin Epoxy Overlays............................................................................... 28
3.1 Overview ....................................................................................................................... 28
3.2 Evaluation of the Minimum Concrete Age to Receive a Thin Epoxy Overlay ............ 28
3.2.1 Procedure for Deciding the Minimum Concrete Age ............................................... 28
3.2.2 Implementation of the Proposed Procedure .............................................................. 31
3.2.3 Results and Discussion ............................................................................................. 40
3.2.4 Minimum Concrete Age to Receive a Thin Epoxy Overlay ..................................... 54
3.3 Impact of Penetrating Sealant Pretreatment on Thin Epoxy Overlay Performance ..... 56
3.3.1 Overlay Performance Evaluation .............................................................................. 56
3.3.2 Epoxy Overlay Performance ..................................................................................... 59
3.3.3 Results and Discussion ............................................................................................. 60
3.4 Summary ....................................................................................................................... 66
4 Performance of Healer Sealers .......................................................................................... 68
4.1 Overview ....................................................................................................................... 68
4.2 Evaluation of the Minimum Concrete Age to Receive a Healer Sealer ....................... 68
4.2.1 Concrete Age at the Time of Healer Sealer Application .......................................... 68
4.3 Implementation of the Proposed Procedure .................................................................. 70
4.3.1 Bond Strength ........................................................................................................... 72
4.3.2 Concrete Age at the Time of Healer Sealer Application .......................................... 72
4.4 Results and Discussion ................................................................................................. 75
4.4.1 Bond Strength ........................................................................................................... 76
4.4.2 Concrete Age at the Time of Healer Sealer Application .......................................... 76
4.5 Minimum Concrete Age to Receive a Healer Sealer .................................................... 84
4.6 Summary ....................................................................................................................... 86
5 Road User Cost Savings from Early Application of Flood Coatings ............................. 87
5.1 Overview ....................................................................................................................... 87
5.2 Road User Cost ............................................................................................................. 87
5.3 Cost Savings from Two Typical Projects ..................................................................... 89
5.3.1 M-100 Over CN Railroad ......................................................................................... 89
5.3.2 US-131 Over 3 Mile Road ........................................................................................ 90
5.3.3 Road User Costs ........................................................................................................ 91
5.4 Summary ....................................................................................................................... 95
xvii Effects of Concrete Cure Time on Epoxy Overlay and Sealant Performance
6 Summary, Conclusions, and Recommendations .............................................................. 96
6.1 Summary ....................................................................................................................... 96
6.2 Conclusions and Recommendations ............................................................................. 97
6.2.1 Epoxy Overlays ......................................................................................................... 97
6.2.2 Healer Sealers ........................................................................................................... 99
6.2.3 Other ....................................................................................................................... 100
6.3 Recommendations for Furher Studies ......................................................................... 101
7 References .......................................................................................................................... 103
Appendix A: Abbreviations .................................................................................................... 112
Appendix B: Notations ............................................................................................................ 116

xviii Effects of Concrete Cure Time on Epoxy Overlay and Sealant Performance
LIST OF TABLES
Table 2-1. Epoxy Overlay Application Requirements and Performance Evaluation: Highway
Agency Practice .............................................................................................................................. 6
Table 2-2. Healer Sealer Application Requirement and Performance Evaluation: Highway
Agency Practice .............................................................................................................................. 7
Table 2-3. Specified Curing Duration for Mixes with SCMs ........................................................ 9
Table 2-4. Application Requirements of MDOT Approved Epoxy Overlays ............................. 12
Table 2-5. Application Requirements of MDOT Approved Healer Sealers ................................ 12
Table 2-6. Concrete Mix Designs Used by Shearrer et al. (2015) ............................................... 15
Table 2-7. RCP and Apparent Chloride Diffusion Coefficients for Mixes with SCMs (Lawler et
al. 2007) ........................................................................................................................................ 22
Table 2-8. Concrete Properties and Practices to Decide the Minimum Concrete Age to Receive a
Flood Coat ..................................................................................................................................... 23
Table 2-9. Parameters for Deciding the Minimum Concrete Age to Receive a Flood Coating .. 27
Table 3-1. Mix Design: BDJR and Grade DM Concrete (per yd3) .............................................. 32
Table 3-2. Experimental Plan to Assess the Minimum Concrete Age to Receive an Epoxy
Overlay .......................................................................................................................................... 33
Table 3-3. QAQC Results: Fresh Concrete Properties ................................................................ 41
Table 3-4. Total Chloride Content (ppm) in the Slabs Fabricated with BDJR Mix .................... 52
Table 3-5. Total Chloride Content (ppm) in the Slabs Fabricated with Grade DM Mix ............. 52
Table 3-6. The Average Compressive Strength Evaluation Using Cylinders Extracted from Slabs
Fabricated with BDJR and Grade DM Concrete Mixes ............................................................... 53
Table 3-7. Total Volume of Permeable Voids (%) in BDJR and Grade DM Concrete Slabs ..... 54
Table 3-8. The Minimum Age of Concrete to Receive a Thin Epoxy Overlay ........................... 56
Table 3-9. BDJR Concrete Mix Design (per yd3) ........................................................................ 57
Table 3-10. Experimental Plan to Assess the Influence of Silane Pretreatment on Epoxy Overlay
Performance .................................................................................................................................. 58
Table 3-11. Fresh Properties of BDJR Concrete ......................................................................... 60
Table 4-1. Experimental Program to Assess the Bond Strength and the Minimum Concrete Age
to Receive a Healer Sealer ............................................................................................................ 71
Table 4-2. Specimen Description ................................................................................................. 72
xix Effects of Concrete Cure Time on Epoxy Overlay and Sealant Performance
Table 4-3. Slant Shear Bond Strength of Healer Sealers ............................................................. 76
Table 4-4. 135th–Day Water-Soluble Chloride Content (ppm) Within 4.5 to 5.0 in. Depth of
BDJR Concrete Specimens ........................................................................................................... 80
Table 4-5. 135th–Day Water-Soluble Chloride Content (ppm) Within 4.5 to 5.0 in. Depth of
Grade DM Concrete Specimens .................................................................................................... 80
Table 4-6. Total Chloride Content (ppm) Within 1 to 1.5 in. Depth in BDJR Concrete
Specimens ..................................................................................................................................... 81
Table 4-7. Total Chloride Content (ppm) Within 1 to 1.5 in. Depth in Grade DM Concrete
Specimens ..................................................................................................................................... 81
Table 4-8. Half-Cell Potential Limits for Evaluating Corrosion Potential (ASTM C876) .......... 82
Table 4-9. The Minimum Age of Concrete to Receive a Healer Sealer ...................................... 85
Table 5-1. Road User Cost Calculation Parameters and Data (2020 Rates) ................................ 93
Table 5-2. Year and Consumer Price Index (CPI) (U.S. Bureau of Labor Statistics 2020b) ...... 94
Table 5-3. Road User Cost for Two Bridge Sites ........................................................................ 94
Table 5-4. Surface Preparation Rate, Production Rate, and Curing Duration for Epoxy Overlays
and Healer Sealers (DeRuyver and Schiefer 2016) ...................................................................... 95
Table 5-5. Bridge Closure Duration for Epoxy Overlay and Healer Sealer Application ............ 95
xx Effects of Concrete Cure Time on Epoxy Overlay and Sealant Performance
LIST OF FIGURES
Figure 2-1. ICRI (2013) concrete surface profile (CSP) classification ....................................... 10
Figure 2-2. Performance of epoxy overlays evaluated by Sprinkel et al. (1993) ........................ 14
Figure 2-3. Performance of epoxy overlays evaluated by Wilson and Henley (1995) ................ 14
Figure 2-4. Performance of epoxy overlays evaluated by Shearrer et al. (2015) ........................ 16
Figure 3-1. Procedure for deciding the minimum concrete age to receive a thin epoxy overlay 29
Figure 3-2. Slab specimen fabrication and preparation procedures ............................................. 36
Figure 3-3. Insulated chamber for performance evaluation under elevated temperature ............ 37
Figure 3-4. Slabs in the open parking lot and getting exposed to southwest Michigan weather . 39
Figure 3-5. Experimental results to determine wet curing duration ............................................ 42
Figure 3-6. Steel ring strain variation with time .......................................................................... 43
Figure 3-7. MVER and moisture content variation with the age of concrete .............................. 43
Figure 3-8. Thin epoxy overlay bond strength performance on BDJR concrete slabs ................ 48
Figure 3-9. Thin epoxy overlay bond strength performance on Grade DM concrete slabs ......... 49
Figure 3-10. Failure modes under different exposure conditions ................................................ 50
Figure 3-11. IRH and temperature variation during elevated temperature cycles ....................... 51
Figure 3-12. Total chloride content in the slabs fabricated with BDJR and Grade DM concrete
mixes ............................................................................................................................................. 54
Figure 3-13. MVER and moisture concrete variation with the age of concrete .......................... 61
Figure 3-14. Impact of silane pretreatment on thin epoxy overlay bond strength ....................... 64
Figure 3-15. IRH and temperature variation during three elevated temperature cycles .............. 65
Figure 3-16. Total chloride content along the depth of the slab with and without silane
pretreatment .................................................................................................................................. 66
Figure 4-1. The procedure for deciding the minimum concrete age to receive a healer sealer ... 69
Figure 4-2. Healer sealer performance evaluation – specimen detail and coring locations ........ 75
Figure 4-3. Chloride content along the depth of BDJR concrete specimens ............................... 78
Figure 4-4. Chloride content along the depth of Grade DM concrete specimens........................ 79
Figure 4-5. Half-cell potential with respect to the age of healer sealer ....................................... 82
Figure 4-6. Variation of absolute integrated current with sealant age ......................................... 83
Figure 4-7. The condition of reinforcing steel removed from reference and treated BDJR
concrete specimens ....................................................................................................................... 84
xxi Effects of Concrete Cure Time on Epoxy Overlay and Sealant Performance
Figure 5-1. M-100 over CN Railroad bridge location (42.632492, -84.739096) (Google map) . 90
Figure 5-2. Detour assigned to passenger and commercial vehicles ........................................... 90
Figure 5-3. US-131 over 3 Mile Road bridge (43.511442, -85.485965) (Google map) .............. 91
Figure 5-4. Detour assigned to passenger and commercial vehicles ........................................... 91

xxii Effects of Concrete Cure Time on Epoxy Overlay and Sealant Performance
Intentionally left blank

1 Effects of Concrete Cure Time on Epoxy Overlay and Sealant Performance
1 INTRODUCTION
1.1 OVERVIEW
Bridge decks that are exposed to deicing salts, harsh environmental conditions, and traffic loading
(while sheltering the rest of the bridge components from such adverse conditions) need to be well
maintained to enhance the service life of the structure. Bridge preservation activities include
Capital Preventive Maintenance (CPM), Capital Scheduled Maintenance (CSM), and
Rehabilitation and Replacement (MDOT 2008, MDOT 2010, USDOT 2018). The wet and dry
curing practices and the quality assurance and quality control (QAQC) procedures implemented
on the typical concrete mixes used for bridge decks and repairs are expected to result in durable
bridge decks. However, randomly dispersed cracking because of tensile stresses developed in the
decks under volume change loads, such as concrete shrinkage and daily temperature changes, and
the constraints provided by the girders and other components are documented (Aktan et al. 2003).
The durability of such decks can be improved by bridging or sealing the cracks using flood coatings
[i.e., thin epoxy overlays or healer sealers] (DeRuyver and Schiefer 2016). The deck condition,
cracking intensity, causes of cracking, need for increased skid resistance, available funding, and
project costs are the decision parameters for selecting a flood coating (DeRuyver and Schiefer
2016). Applying thin epoxy overlays is preferred over healer sealers while evaluating the
preventive maintenance options (DeRuyver and Schiefer 2016). The healer sealers are primarily
selected “because of [the] present-day required budgetary savings or mobility restrictions”
(DeRuyver and Schiefer 2016). Depending on the condition, decks are patched or repaired before
a flood coating application. The typical practice of the Departments of Transportation (DOTs) is
to maintain a 28-day total wet and dry curing period for new concrete in patches and repairs before
applying a flood coat. Consequently, the contractors have to wait for 28 days to start surface
preparation for an application. This requirement delays project completion time and increases
traffic management and user costs (Yavuz et al. 2017). However, the minimum concrete age to
receive a flood coat and the performance of the system depend on several parameters including,
but not limited to, concrete cracking intensity, moisture condition, and strength. Such parameters
depend on concrete mixture ingredients and wet and dry curing periods. Therefore, prescribing a
fixed curing period before a flood coating application is a concern. Hence, there is an interest to
evaluate whether a prescription-based or a performance-based approach is better for deciding the
application of flood coatings on bridge decks with new concrete in patches and repairs.

2 Effects of Concrete Cure Time on Epoxy Overlay and Sealant Performance
1.2 OBJECTIVE AND TASKS
The objective is to determine if a procedure or a set time is better for deciding when to place an
epoxy overlay or a healer sealer on Michigan Department of Transportation (MDOT) standard
concrete materials and special/patching materials.
To achieve the objective, the project was organized into six tasks as follows:
1) Research criteria and benefits of epoxy overlay and sealant placement timing with regards
to standard materials and special/patching materials.
2) Develop a testing plan that encompasses the material used by MDOT.
3) Prepare specimens and conduct QAQC testing.
4) Evaluate overlay/sealant performance vs. crack development and curing.
5) Analyze results and quantify the cost savings.
6) Recommend a procedure for determining overlay/sealant placement timing based on
material/mix design.
1.3 REPORT ORGANIZATION
This report is organized into 7 chapters.
Chapter 1 includes the introduction and research project objectives and tasks.
Chapter 2 documents guidelines and practices of highway agencies, manufacturer requirements,
the performance of epoxy overlays and healer sealers, concrete property affecting epoxy
overlay and healer sealer performance, and methods to evaluate concrete property and
performance of epoxy overlays and healer sealers.
Chapter 3 describes the testing plan to evaluate epoxy overlay performance and results.
Chapter 4 describes the testing plan to evaluate healer sealer performance and results.
Chapter 5 describes potential user cost savings from epoxy overlay and healer sealer application
before the end of the specified 28-day curing period.
Chapter 6 includes a summary, conclusions, and recommendations.
Chapter 7 presents the cited references.
3 Effects of Concrete Cure Time on Epoxy Overlay and Sealant Performance
2 STATE-OF-THE-ART AND PRACTICE LITERATURE REVIEW
2.1 OVERVIEW
For many years, a mix of fixes has been used to extend the service life of bridges with a minimum
cost. In 1950, a single layer of coal tar epoxy was broomed onto the concrete substrate and seeded
with fine aggregate. This overlay could not perform as a durable, impermeable layer. To improve
the performance, in 1960, an oil-extended epoxy was used. In the mid-1970s, polyester-styrene
resins and methyl methacrylate monomer systems were applied (Fowler and Whitney 2011). Since
1990, epoxy overlays and healer sealers have been used to protect and increase the service life of
concrete bridge decks. Epoxy is a mixture of two components: a resin and binder. Usually, the
mixing proportions vary from 1:1 to 4:1. The mixture of these two parts produces a thermosetting
resin that can tolerate substrate moisture influence to a certain extent (Potter 1975). The overlay
system can bridge micro-cracks and create a good skid-resistant driving surface when an aggregate
layer is broadcasted. The typical thickness of an epoxy overlay is ⅜ to ½ in. (Sika Corporation
2011) while the sealant is 3/16 in. thick. An epoxy overlay or a healer sealer application requires
shotblasting the deck surface following a minimum specified concrete curing duration, cleaning
the surface, and maintaining a period for overlay or healer sealer curing before opening to traffic.
This chapter discusses guidelines and practices of highway agencies, requirements in epoxy
manufacturer technical datasheets, the performance of epoxy overlays and healer sealers, concrete
properties affecting epoxy overlay and healer sealer performance, standard methods to evaluate
concrete properties, and finally, standard methods to evaluate the performance of epoxy overlays
and healer sealers.
2.2 GUIDELINES AND PRACTICE OF HIGHWAY AGENCIES
Wet and dry curing requirements, substrate preparation methods, application requirements, and
performance evaluation methods of 11 state highway agencies for epoxy overlays and 3 state
highway agencies for healer sealers were reviewed and summarized in Table 2-1 and Table 2-2,
respectively. The information is primarily compiled from the respective agency web publications
and through limited communications. Applying a flood coating on new concrete starts after
completing a specified wet and dry curing period. MDOT’s standard practice is to maintain a 28-
day curing period (7 days of wet curing and 21 days of dry curing) for standard bridge deck
concrete mixes. Even though the MDOT standard practice is 7 days of moist curing, the current
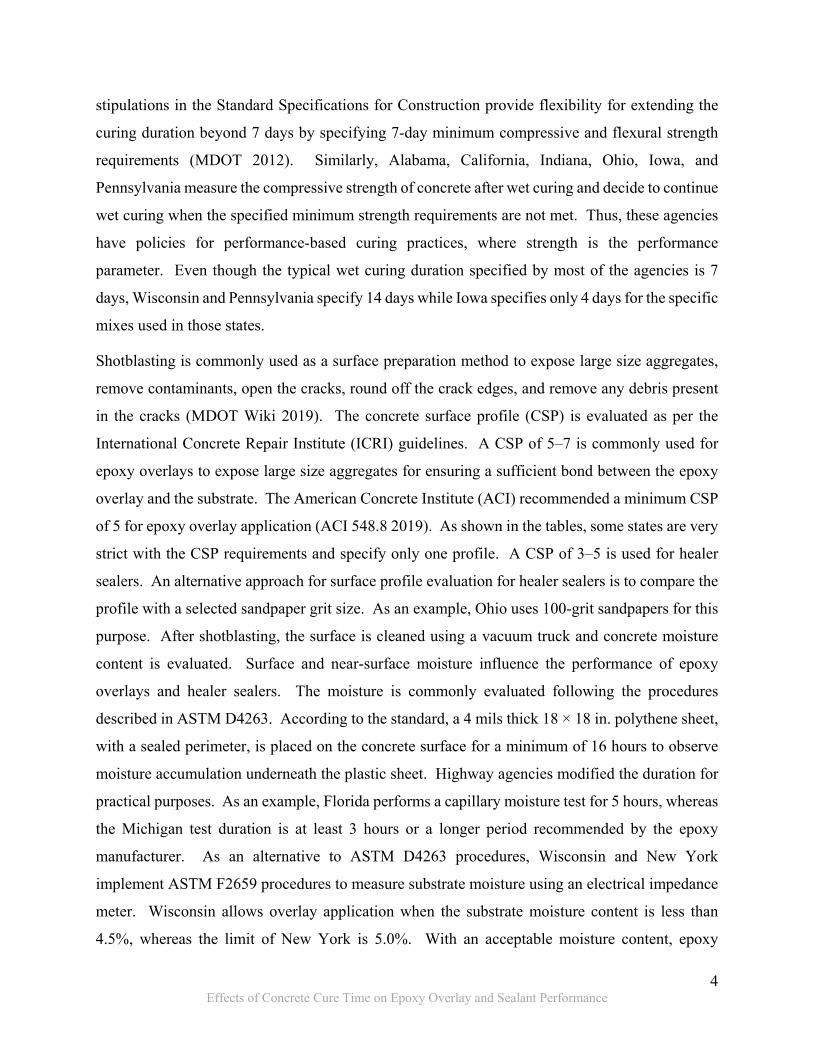
4 Effects of Concrete Cure Time on Epoxy Overlay and Sealant Performance
stipulations in the Standard Specifications for Construction provide flexibility for extending the
curing duration beyond 7 days by specifying 7-day minimum compressive and flexural strength
requirements (MDOT 2012). Similarly, Alabama, California, Indiana, Ohio, Iowa, and
Pennsylvania measure the compressive strength of concrete after wet curing and decide to continue
wet curing when the specified minimum strength requirements are not met. Thus, these agencies
have policies for performance-based curing practices, where strength is the performance
parameter. Even though the typical wet curing duration specified by most of the agencies is 7
days, Wisconsin and Pennsylvania specify 14 days while Iowa specifies only 4 days for the specific
mixes used in those states.
Shotblasting is commonly used as a surface preparation method to expose large size aggregates,
remove contaminants, open the cracks, round off the crack edges, and remove any debris present
in the cracks (MDOT Wiki 2019). The concrete surface profile (CSP) is evaluated as per the
International Concrete Repair Institute (ICRI) guidelines. A CSP of 5–7 is commonly used for
epoxy overlays to expose large size aggregates for ensuring a sufficient bond between the epoxy
overlay and the substrate. The American Concrete Institute (ACI) recommended a minimum CSP
of 5 for epoxy overlay application (ACI 548.8 2019). As shown in the tables, some states are very
strict with the CSP requirements and specify only one profile. A CSP of 3–5 is used for healer
sealers. An alternative approach for surface profile evaluation for healer sealers is to compare the
profile with a selected sandpaper grit size. As an example, Ohio uses 100-grit sandpapers for this
purpose. After shotblasting, the surface is cleaned using a vacuum truck and concrete moisture
content is evaluated. Surface and near-surface moisture influence the performance of epoxy
overlays and healer sealers. The moisture is commonly evaluated following the procedures
described in ASTM D4263. According to the standard, a 4 mils thick 18 × 18 in. polythene sheet,
with a sealed perimeter, is placed on the concrete surface for a minimum of 16 hours to observe
moisture accumulation underneath the plastic sheet. Highway agencies modified the duration for
practical purposes. As an example, Florida performs a capillary moisture test for 5 hours, whereas
the Michigan test duration is at least 3 hours or a longer period recommended by the epoxy
manufacturer. As an alternative to ASTM D4263 procedures, Wisconsin and New York
implement ASTM F2659 procedures to measure substrate moisture using an electrical impedance
meter. Wisconsin allows overlay application when the substrate moisture content is less than
4.5%, whereas the limit of New York is 5.0%. With an acceptable moisture content, epoxy

5 Effects of Concrete Cure Time on Epoxy Overlay and Sealant Performance
overlays and healer sealers are applied following the procedures and requirements stipulated in
highway agency manuals, guides, and special provisions, or manufacturer technical datasheets.
Other than the CSP and substrate moisture requirements, ambient conditions (temperature,
humidity, and wind), rain forecast, substrate temperature, and material temperature are considered.
As shown in the tables, ambient humidity and wind speed are not considered by many agencies.
For epoxy overlays, several agencies specified the maximum limit of substrate temperature to 100o
F while the Ohio limit is 120o F. An epoxy overlay is a two-layer coating system whereas a healer
sealer is a single coat system. The thickness of each epoxy layer is 3/16 in. A layer of aggregate is
broadcasted following an application of each epoxy layer. Typically, trap rock, chipped flint,
bauxite, or silica sand is used for epoxy overlays and fine aggregate is used for healer sealers
(DeRuyver and Schiefer 2016). At the end of the specified epoxy overlay curing period, a tensile
bond pull-off strength test is conducted as per the ASTM C1583 procedure to evaluate the
performance. The specified minimum bond strength limit is 250 psi (MDOT 2019a). A field
performance evaluation method for healer sealers is not currently available.
6 Effects of Concrete Cure Time on Epoxy Overlay and Sealant Performance
Table 2-1. Epoxy Overlay Application Requirements and Performance Evaluation: Highway Agency Practice

7 Effects of Concrete Cure Time on Epoxy Overlay and Sealant Performance
Table 2-2. Healer Sealer Application Requirement and Performance Evaluation: Highway Agency Practice
Note: min = minimum; fc = required compressive strength at the end of specified wet curing duration; fr = required flexural strength at the end of specified wet
curing duration; Y = yes; N = no; MS = epoxy manufacturer specification; na = not applicable; ASTM = American Society for Testing and Materials. aIn 2018, FDOT developed specification 403 to implement a 21-day DC period

8 Effects of Concrete Cure Time on Epoxy Overlay and Sealant Performance
A detailed discussion on concrete curing, substrate preparation, application requirements, and
performance evaluation is given below.
2.2.1 Concrete Curing
Concrete structures, such as bridge decks, are exposed to various loads and harsh exposure
conditions during their service life. For this reason, such structures are designed considering both
strength and durability. Exposure to deicing salts, surface abrasion, and freeze-thaw conditions
contribute to the rapid deterioration of concrete. In the absence of cracks, the amount and rate of
moisture and aggressive chemical ingress, such as chlorides, depend on the total volume of
permeable voids in concrete and the continuity of the capillary pore structure. Therefore, the
concrete wet curing duration needs to be maintained until a discontinuous capillary pore structure
with a minimum volume of total permeable voids is developed (Basnayake et al. 2020). The
required wet curing duration depends on the content and composition of the concrete mixture,
physical and chemical properties of the ingredients, expected hardened concrete properties, and
their rate of development (ACI 308R-16 2016). The rate of strength gain is slower in concrete
mixes with Class F fly ash or ground granulated blast furnace slag (GGBFS) compared to a
concrete mix with Type I cement; thus, 10 to 14 days of wet curing is recommended (Poole 2006,
USDOT 2003). On the other hand, concrete mixes with Class C fly ash or silica fume gain strength
faster compared to Type I cement concrete (Poole 2006, IMCP 2007). Therefore, specifying a
fixed curing period is not suitable for concrete mixes with SCMs.
Curing periods specified by Alabama, Florida, Iowa, Michigan, Pennsylvania, and Rhode Island
are presented in Table 2-3. The table lists the specified 28-day strength limits, curing periods,
cement content, water-cementitious material (w/cm) ratio, and the percentage of SCMs. Alabama,
Iowa, and Pennsylvania perform a minimum of 7, 4, and 14 days of wet curing, respectively. As
an example, Pennsylvania evaluates compressive strength after 14 days of wet curing and decides
to continue wet curing if the specified compressive strength is not achieved. Rhode Island starts
dry curing if the concrete flexural strength is 525 psi or greater after 7 days of wet curing. Similar
performance-based specifications are used in several other states, including Michigan (MDOT
2012). However, the performance parameter is limited to strength.

9 Effects of Concrete Cure Time on Epoxy Overlay and Sealant Performance
Table 2-3. Specified Curing Duration for Mixes with SCMs
Highway agency Concrete mix
Specified 28-day
strength (psi)
Wet curing period (days)
Cement content (lbs/yd3)
(min/max) w/cm Fly ash GGBFS Silica
fume
Alabama naa 4000 7 + fc Contractorb 0.45 Max 30 Max 50 Max 10 Florida Type II 4500 7 611/687 0.40 25 na na
Iowa HPC–D 4500–5000 4 + fc 625/na 0.40 20 Min 30 na
CV–HPC–D 4500–5000 4 + fc 651/na 0.40 20 na na
Michigan
D 4500 7 (min) + fc/fr 658/na 0.44 na na na DM 4500 7 (min) + fc/fr Variablec 0.44 Max 35 Max 40 na
SFMC 4500 7 (min) + fc/fr 618/na 0.44 na na 6 LMC 4500 24 or 48 hrs 658/na 0.30 na na na
Pennsylvania AAAP 4000 14 + fc 560/752 0.45 Max 15 Min 25 5–10 HPC 4000 14 + fc 560/690 0.45 na na na
Rhode Island HP 4500 7 + fr 705/799 0.40 na na na Note: Min = minimum; max = maximum; w/cm = water-cementitious material ratio; GGBFS = ground granulated
blast furnace slag; fc = required compressive strength at the end of wet curing; fr = required flexural strength at the end of wet curing.
ana – information is not provided in the literature bMix design is submitted by the contractor to meet the DOT specifications. cCement content depends on the fly ash and GGBFS in the mix.
2.2.2 Substrate Preparation
Surface preparation methods include acid etching, shotblasting, and the use of pressurized water.
Hydrochloric/muriatic or buffered phosphoric acids are used for acid etching. Acid etching cannot
remove curing compounds and oily deposits. It is difficult to predict and control chemical
reactions after applying the chemical on the deck surface, and over-etching is possible. Over
etching makes the deck surface more porous, promotes moisture ingress during deck cleaning, and
accelerates reinforcement corrosion (Mailvaganam et al. 1998). On the other hand, it can only
produce CSP 1 or 2. Therefore, ACI Committee 515 (1985) recommends using this method in the
absence of other alternatives.
The use of pressurized water increases substrate moisture (Attanayake et al. 2006) and makes it
impossible to apply epoxy overlays or healer sealers on the same day. As shown in Table 2-1, this
method is not used for surface preparation prior to epoxy overlay applications. Only Ohio uses
pressurized water to clean the surface for healer sealer application (Table 2-2).
Shotblasting uses steel balls propelled by a rotating wheel to clean and scour concrete surfaces
(Mailvaganam et al. 1998). Shotblasting to a higher CSP, such as 7, exposes large size aggregates
and increases the aggregate surface area available for epoxy adhesion. The bond strength can be
10 Effects of Concrete Cure Time on Epoxy Overlay and Sealant Performance
improved by exposing large aggregates since the adhesion is primarily controlled by the aggregates
that are stronger than the cement matrix. Further, moisture migration through aggregates is lower.
Shotblasting does not alter surface moisture and allows cleaning the surface using a vacuum truck
(DeRuyver and Schiefer 2016). Therefore, shotblasting is the preferred concrete surface
preparation method for epoxy overlay or healer sealer application.
2.2.3 Application Requirements
Concrete surface profile, substrate moisture content, overlay material properties, and ambient
conditions impact the formation of a concrete/overlay interface zone and the mechanical
interlocking between substrate and overlay material to influence interface bond strength
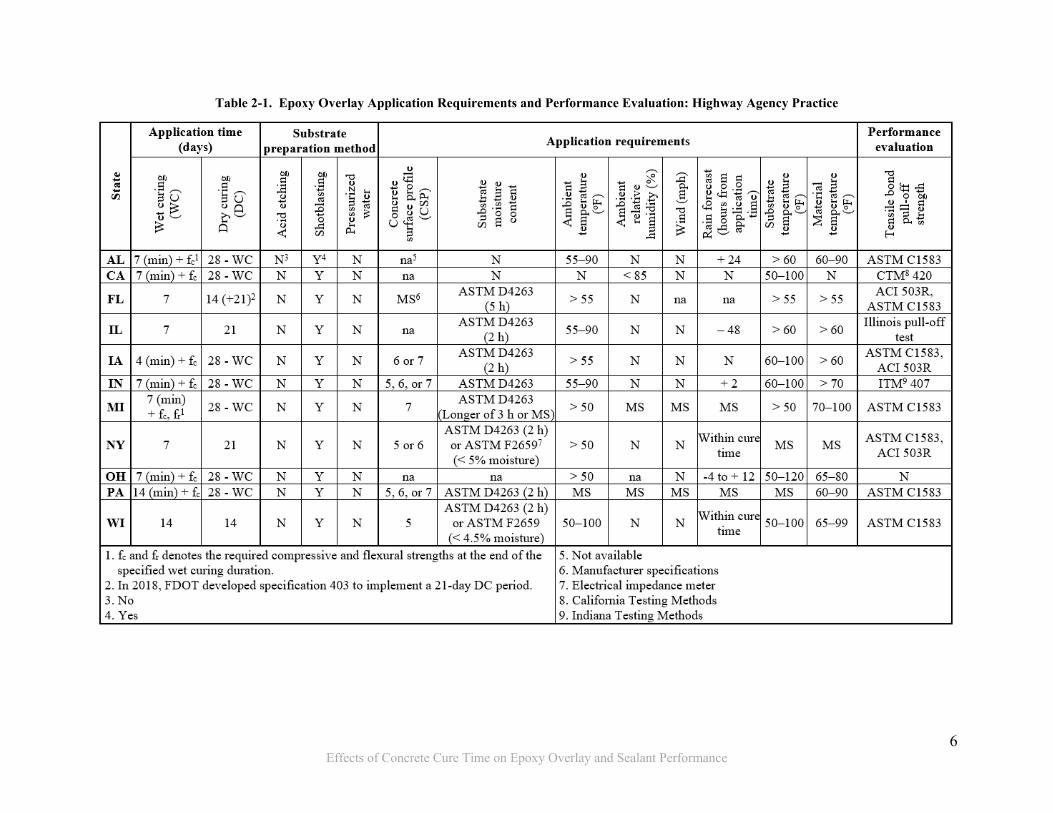
(Bissonnette et al. 2012, Garbacz et al. 2004). According to Winkler (2014), one of the major
reasons for the protective system/repair failure is poor surface preparation. To improve
consistency in practice and specifications, the ICRI developed a CSP classification ranging from
CSP 1 (nearly flat) to CSP 10 (amplitude > ¼ in.) (Figure 2-1). The recommended CSP range for
epoxy overlays is 5–9, and for healer sealers it is 3–5 (ICRI 2013).
Figure 2-1. ICRI (2013) concrete surface profile (CSP) classification
Substrate moisture is one of the key parameters that influence the performance of epoxy overlays
or healer sealers (Table 2-1 and Table 2-2). The presence of an excessive amount of substrate
moisture could influence epoxy overlay bonding and develop vapor pressure at the
concrete/overlay interface under elevated temperatures (Shearrer et al. 2015). The polythene sheet
test (ASTM D4263) is a qualitative measure of substrate moisture within the top ½ in. (Kanare
2008). This test method could provide false indications when the air above the deck is at the dew
point. Wisconsin and New York DOTs use electrical impedance meters to measure concrete
11 Effects of Concrete Cure Time on Epoxy Overlay and Sealant Performance
moisture as per ASTM F2659 and limit the substrate moisture content to 4.5% and 5.0%,
respectively.
2.2.4 Performance Evaluation
The tensile bond pull-off strength test is used to evaluate epoxy overlay performance. All highway
agencies implement the procedure in ASTM C1583 or similar practices. A few DOTs include
ASTM C1583 procedures with or without modifications in their testing manuals and use agency
names to introduce the test rather than directly referring to the ASTM. As an example, Illinois
DOT adopted ASTM C1583 procedures and renamed them the Illinois pull-off test. There is no
standard or agency-specific test method to evaluate healer sealer performance in the field.
2.3 MANUFACTURER RECOMMENDATIONS
Manufacturers present application requirements and procedures. The MDOT approved epoxy
overlays are supplied by BASF, E-Bond, E-Chem, Euclid Chemical, Poly-Carb, Sika, Transpo,
and Unitex (MDOT 2018a). The approved healer sealers are supplied by E-Chem, Euclid
Chemical, Poly-Carb, Sika, and Unitex (MDOT 2018b). Table 2-4 and Table 2-5 summarize the
requirements in technical datasheets. The minimum age of concrete, concrete surface profile,
optimum moisture content, along with ambient and substrate temperature are the listed parameters.
Epoxy overlays or healer sealers supplied by Sika and Unitex can be applied on 21 days or older
concrete. Concrete must be at least 28 days or older to receive overlays or healer sealers supplied
by the other manufacturers. The application of an epoxy overlay requires a CSP of 5–7 while a
healer sealer requires a CSP of 2–5. Iowa and Pennsylvania perform acid etching to remove loose
material and laitance during deck surface preparation. However, BASF and Euclid Chemical do
not recommend acid etching (BASF 2016 and Euclid Chemical 2016). The deck concrete must be
neutralized using a water/baking soda or a water/ammonia mixture followed by a clean water rinse
before applying an epoxy overlay or a healer sealer when acid etching is used (Euclid Chemical
2016). The required level of substrate moisture content or moisture vapor emission rate (MVER)
is not stated in many technical datasheets. Even though E-Chem EP50 is insensitive to moisture,
the application of Euclid Chemical products requires a lower MVER. Only Unitex has indicated
moisture content requirements for overlays and healer sealers. The moisture content of < 4% and
vapor pressure of ≤ 3 lbs/1000 ft2 is required for a Pro-Poxy Type III DOT overlay and Pro-Poxy
40 LV LM healer sealer, respectively.

12 Effects of Concrete Cure Time on Epoxy Overlay and Sealant Performance
Table 2-4. Application Requirements of MDOT Approved Epoxy Overlays
Supplier Product Minimum age of concrete (days) CSP Moisture
content Substrate
temperature (°F) Ambient
temperature (°F) BASF MasterSeal 350 28 5 na ≥ 50 ≥ 50 E-Bond 526 Lo-Mod 28 5 na ≥ 50 ≥ 50 E-Chem EP50 28 5 Insensitive na ≥ 50
Euclid Chemical
Flexolith Flexolith Summer Grade Flexolith HD
28 4–6 MVER
should not be high
40–90 40–90
Poly-Carb
Flexogrid Mark-163 Flexogrid Mark-154 na na na ≥ 50 ≥ 50
Sika Sikadur 22-Lo Mod 21–28 3–4 na ≥ 40 ≥ 40 Transpo T-48 Chip Seal na 5 na 50–100 50–100 Unitex Pro-Poxy Type III DOT 21–28 6–7 < 4% ≥ 50 ≥ 50 Note: CSP = concrete surface profile; na = not available; MVER = moisture vapor emission rate.
Table 2-5. Application Requirements of MDOT Approved Healer Sealers
Supplier Product Minimum age of concrete (days) CSP Moisture
content Substrate
temperature (°F) Ambient
temperature (°F) E-Chem EP100 28 na insensitive ≥ 50 ≥ 50 Euclid Chemical
Dural 335 Dural 50 LM 28 2–5
insensitive 50–90 50–90
tolerant Poly-Carb Mark 127 na na na na na Sika Sikadur 55 SLV 21–28 na na 40–95 40–95
Unitex Pro-Poxy 40 LV LM 21–28 na Vapor pressure ≤ 3 lbs/1000 ft2 ≥ 50 ≥ 50
Note: CSP = concrete surface profile; na = not available.
2.4 EPOXY OVERLAY AND SEALANT PERFORMANCE
2.4.1 Performance Evaluation under Field and Laboratory Conditions
Sprinkel (1983) conducted an experimental study using two types of epoxy overlays to determine
the thermal compatibility between concrete and thin polymer epoxy overlays. The scope of the
study included the evaluation of dynamic modulus of elasticity, coefficient of thermal expansion,
shear strength, tensile bond pull-off strength at the interface, rapid chloride permeability, and
delamination. The temperature cycles between 10o F to 100o F were maintained. The increase in
the number of thermal cycles reduced shear strength and bond strength at the concrete/overlay
interface and increased delamination and permeability.
Gama (1999) studied the durability of thin epoxy overlays. Gama’s study included the following
tests on concrete specimens with overlays: a falling-head water permeability test, a rapid chloride
ion penetration test, a water absorption test, a flexure strength test of saturated specimens, a thermal

13 Effects of Concrete Cure Time on Epoxy Overlay and Sealant Performance
compatibility test under -58o F to 104o F temperature for 103 cycles, and the interface water vapor
pressure test. The impact of water vapor pressure on the integrity of the overlay bond was
evaluated using ultrasonic pulse velocity (UPV) and tensile bond pull-off strength tests. The
concrete portion of the specimens was submerged in water, and the overlay was exposed to an
elevated temperature of 122o F using an ultraviolet heat lamp for two weeks. The UPV and bond
strength tests were conducted before placing the specimens in water and after the specimens cooled
down to room temperature and immediately after removal from the water bath. According to
Gama (1999), the integrity of the concrete-overlay system was not affected by the temperature
cycles of -58 o F to 104 o F or the water vapor pressure. However, wet and dry curing periods,
concrete age at the time of overlay application, surface preparation methods, and surface profiles
were not described.
Sprinkel et al. (1993) evaluated the performance of overlay systems and epoxy sealants by
considering chloride ion ingress, corrosion of reinforcing bars, skid resistance and wear, direct
bond and shear strengths at the interface, cracking, delamination, and spalls as the performance
indicators. The results indicated that 13, 25, and 77 years of exposure are required to achieve a
chloride content of 1 lb/yd3 at a depth of 1.75 in. from the top surface for concrete without any
protection, concrete with epoxy sealers, and concrete with epoxy overlays, respectively. Tensile
bond pull-off strength tests were performed on 24 in-service bridges across 7 states with 13
different epoxy overlays. The data collected in subsequent years following epoxy applications
indicated inconsistent performance. Figure 2-2 shows the average bond strength values recorded
at different ages. Unfortunately, additional data such as substrate temperature and moisture
condition at the time of overlay application and testing are not available to evaluate the potential
impact of such parameters on overlay performance or to clarify the reasoning behind performance
inconsistencies.

14 Effects of Concrete Cure Time on Epoxy Overlay and Sealant Performance
Figure 2-2. Performance of epoxy overlays evaluated by Sprinkel et al. (1993)
Wilson and Henley (1995) evaluated the performance of epoxy overlays and methyl methacrylate
(MMA) by considering the resistance to chloride ion penetration (AASHTO T277), friction, and
tensile bond pull-off strength (ACI 503R). Both polymers provided excellent resistance to chloride
ingress. The tensile bond pull-off strength was evaluated on 13 bridge decks with 4 epoxy
overlays. The average bond strength evaluated immediately following application shows a
significant variation, especially the bond strength of E4 epoxy. The bond strength of E4 epoxy
overlay degraded significantly after it was in service for 3 to 4 years (Figure 2-3). Unfortunately,
adequate information, including the substrate and ambient temperature histories, is not available
to evaluate the possible causes for lower bond strengths.
Figure 2-3. Performance of epoxy overlays evaluated by Wilson and Henley (1995)
To evaluate the possibility of applying thin epoxy overlays within the dry curing period, Shearrer
et al. (2015) developed an experimental program using five epoxy overlays and three different
concrete mixes. The mix designs are presented in Table 2-6. Among these mixes, the fly ash
15 Effects of Concrete Cure Time on Epoxy Overlay and Sealant Performance
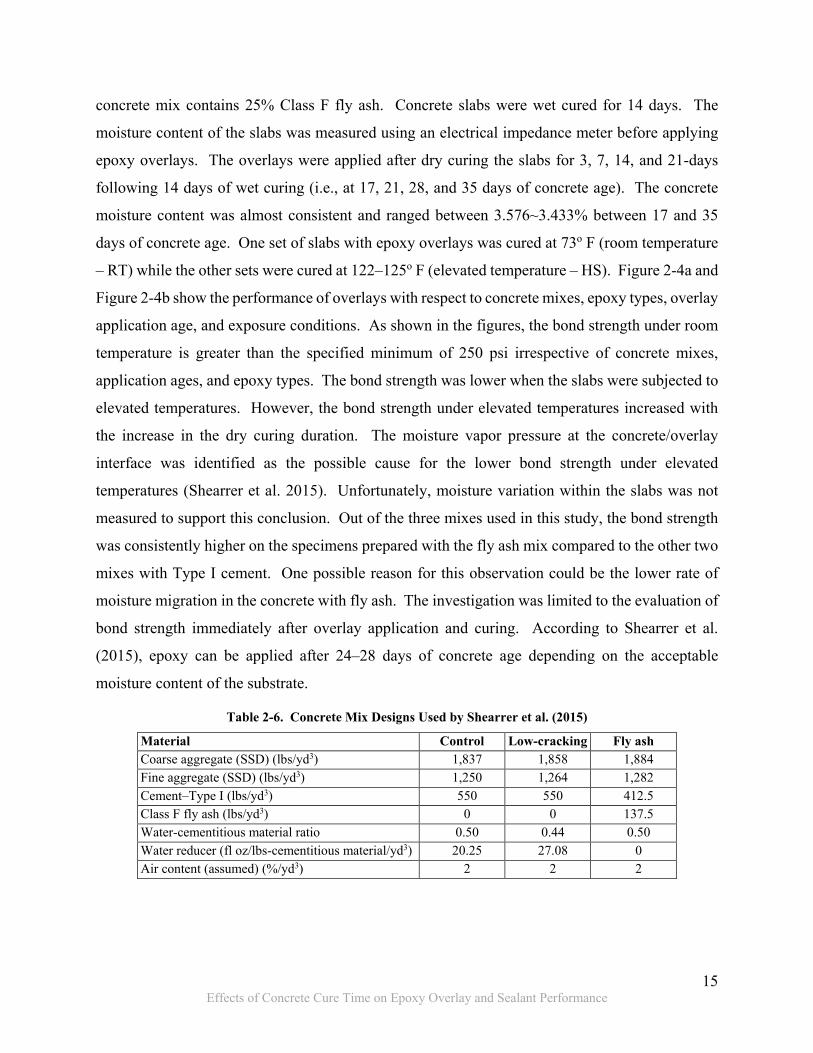
concrete mix contains 25% Class F fly ash. Concrete slabs were wet cured for 14 days. The
moisture content of the slabs was measured using an electrical impedance meter before applying
epoxy overlays. The overlays were applied after dry curing the slabs for 3, 7, 14, and 21-days
following 14 days of wet curing (i.e., at 17, 21, 28, and 35 days of concrete age). The concrete
moisture content was almost consistent and ranged between 3.576~3.433% between 17 and 35
days of concrete age. One set of slabs with epoxy overlays was cured at 73o F (room temperature
– RT) while the other sets were cured at 122–125o F (elevated temperature – HS). Figure 2-4a and
Figure 2-4b show the performance of overlays with respect to concrete mixes, epoxy types, overlay
application age, and exposure conditions. As shown in the figures, the bond strength under room
temperature is greater than the specified minimum of 250 psi irrespective of concrete mixes,
application ages, and epoxy types. The bond strength was lower when the slabs were subjected to
elevated temperatures. However, the bond strength under elevated temperatures increased with
the increase in the dry curing duration. The moisture vapor pressure at the concrete/overlay
interface was identified as the possible cause for the lower bond strength under elevated
temperatures (Shearrer et al. 2015). Unfortunately, moisture variation within the slabs was not
measured to support this conclusion. Out of the three mixes used in this study, the bond strength
was consistently higher on the specimens prepared with the fly ash mix compared to the other two
mixes with Type I cement. One possible reason for this observation could be the lower rate of
moisture migration in the concrete with fly ash. The investigation was limited to the evaluation of
bond strength immediately after overlay application and curing. According to Shearrer et al.
(2015), epoxy can be applied after 24–28 days of concrete age depending on the acceptable
moisture content of the substrate.
Table 2-6. Concrete Mix Designs Used by Shearrer et al. (2015)
Material Control Low-cracking Fly ash Coarse aggregate (SSD) (lbs/yd3) 1,837 1,858 1,884 Fine aggregate (SSD) (lbs/yd3) 1,250 1,264 1,282 Cement–Type I (lbs/yd3) 550 550 412.5 Class F fly ash (lbs/yd3) 0 0 137.5 Water-cementitious material ratio 0.50 0.44 0.50 Water reducer (fl oz/lbs-cementitious material/yd3) 20.25 27.08 0 Air content (assumed) (%/yd3) 2 2 2

16 Effects of Concrete Cure Time on Epoxy Overlay and Sealant Performance
Figure 2-4. Performance of epoxy overlays evaluated by Shearrer et al. (2015)
Note: RT = room temperature; HS = elevated temperature (heated slabs).
The performance of epoxy overlays on two adjacent bridges near I-57 in Clifton, Illinois, was
evaluated by Pfeifer and Kowalski (1999) considering chloride permeability, bond pull-off
strength, and skid resistance as performance parameters. The results indicated that the epoxy
overlays have the potential to perform as impermeable layers with high skid resistance for at least
15 years. Adam and Gansen (2001) evaluated the friction number and percent of delamination on
one bridge deck with a MARK-163 Flexogrid epoxy overlay system. The overlay was applied in
1986, and the friction number and percent delamination were measured over 5 years. The friction
number remained almost unchanged after epoxy application while the percent of delamination
increased to 3.8% in 1991. The blisters in the overlay allowed moisture ingress and freezing
caused delamination. Soltesz (2010) evaluated skid resistance and delamination of eight thin
polymer overlay systems applied on two bridge decks. The products included Mark 154, Flexolith,
Safetrack HW, Kwik Bond PPC MLS, Tyregrip, SafeLane HDX, Urefast PF60, and Unitex Pro-
Poxy Type III DOT. The skid resistance was measured in the field using ASTM E274 procedures.
After 3 years of service, only Tyregrip showed skid numbers of 50 and 54 in both bridges. Other
epoxy overlays showed skid numbers less than the bare concrete. The overlay condition was
visually inspected after 33 to 35 months following application. Tyregrip, Safetrack HW, and
Unitex Pro-Poxy Type III DOT showed the highest numbers of delaminated areas. Fifteen (15)
percent of Safetrack HW epoxy coated wheel paths were worn out after about 3 years of service.
Soltesz (2010) evaluated the water absorption of epoxy resin and abrasion resistance of the overlay
system. The Urefast PF60 and Mark 154 epoxy resins absorbed the highest amount of water, 5.0%
and 4.5% respectively. The water absorption of other products was less than 2.5%. The SafeLane
HDX epoxy with Dolomitic limestone aggregate showed the highest weight loss of 1.2 g after 10
17 Effects of Concrete Cure Time on Epoxy Overlay and Sealant Performance
minutes of grinding during the abrasion resistance test. Other epoxy overlays showed a weight
loss of 0.3~0.8 g. Soltesz (2010) evaluated mechanical properties such as tensile strength and
tensile elongation of epoxy resin, along with flexural and compressive strengths of the overlay
system. These properties were evaluated at 0, 70, and 140º F. The tensile strength and tensile
elongation were also measured at 70º F after 0, 500, 1000, and 1500 hours of simulated sunlight
exposure. The terrestrial sunlight exposure was simulated using ultraviolet light following ASTM
G155. The tensile strength of resin along with the flexural and compressive strengths of overlay
systems were significantly reduced under elevated temperatures. Even though the tensile
elongation increased with temperature, the tensile elongation capacity decreased with the exposure
duration to elevated temperatures. Pantelides and Weber (2011) evaluated tensile bond pull-off
strength (ASTM C1583) and the water-soluble chloride content (ASTM C1218) along the depth
of concrete to assess the performance of epoxy overlays on precast deck panels. The bond strength
was evaluated before and after placing the panels on the bridge. The bond strength was more than
the Utah DOT specified limit of 200 psi. Specimens for chloride content tests were ponded with
a 3% NaCl solution for 90 days. The overlays were able to prevent chloride ingress. Young et al.
(2014) evaluated the performance of SafeLane and Flexogrid. The tensile bond pull-off strength
test (ASTM C1583) caused a failure in the substrate at a tensile strength greater than 250 psi. The
acid-soluble chloride content test (ASTM C1152) results indicated that the overlays were effective
in sealing concrete from moisture ingress. Tabatabai et al. (2016) evaluated the performance of
thin polymer overlays. The tensile bond pull-off strength tests were performed after exposing the
specimens to freeze-thaw cycles, elevated temperatures, ultraviolet rays, and rain exposure cycles.
Also, the accelerated corrosion test and tire wear test were conducted to assess the performance.
The results indicated that the epoxy overlay systems provide the best performance compared to
the other overlay systems.
2.4.2 Performance Evaluation by Field Inspection and Surveys
Issa et al. (1995) visually inspected 22 bridges (2 bridges in Illinois, 1 in Connecticut, 1 in Virginia,
1 in Maryland, 1 in Iowa, 2 in California, 8 in New York, 2 in Alaska, 1 in Ohio, and 4 in
Pennsylvania) with latex-modified overlays, silica fume concrete overlays, epoxy overlays, and
high-molecular-weight methacrylate crack sealants. The bridge decks with epoxy overlays and
sealer materials performed better than the other overlays. However, the product names of epoxy
overlays and sealing materials were not documented in the publication. Alger et al. (2003)

18 Effects of Concrete Cure Time on Epoxy Overlay and Sealant Performance
administered a questionnaire to understand the anti-icing performance on bridge decks with epoxy
overlays. Based on the results, a total of 37 bridges were selected to investigate the current coating
conditions and the ease of snow removal, frost resistance, and skid resistance during winter. Also,
a limited number of tensile bond pull-off strength tests were performed on 2 bridge decks. The
bond strength of well-bonded epoxy overlays was more than the specified limit of 250 psi. The
poorly bonded epoxy overlay strength was lower than 250 psi. It was presumed that an epoxy
overlay coating would last for 15 years and a third layer applied by the end of 15 years would seal
the deck for another 10 to 15 years, providing significant savings in terms of maintenance costs
and safety. Nelson (2005) surveyed highway agency transportation engineers and maintenance
specialists to understand the decision-making process for selecting urethanes, silicon-based
sealers, and epoxy overlays for protecting bridge decks from chloride ingress and maintaining an
acceptable level of skid resistance. Nelson (2005) suggested applying epoxy overlays when both
chloride barrier and improved skid resistance are desired. Harper (2007) studied 98 bridge decks
with epoxy overlays in Missouri and documented cracking, pitting, delamination, peeling, missing
areas of epoxy, cracks, spalling, and post overlay patches as defects. The recommendations to
improve overlay performance include (i) avoiding an epoxy polymer overlay application when
more than 5% of the deck area needs to be repaired, (ii) performing bond strength on patches and
repairs to ensure adequate bond strength between concrete and repair/patch material, (iii)
performing a moisture patch test following ASTM D4263, and (iv) properly mixing epoxies to
remove air bubbles. Johnson (2013) conducted a survey and an extensive literature review to
document the performance evaluation parameters and methods for penetrating silane sealers, film
formers, and crack sealants. Considering the extent of cracking, Johnson (2013) recommended
using healer sealers to treat bridge decks with randomly dispersed cracking.
2.4.3 Anticipated Fix Life with Overlays and Sealants
ElBatanouny et al. (2017) developed a service life model and conducted a life-cycle cost analysis
(LCCA) to determine the best capital preventive maintenance options for bridge decks. For
Northern bridge decks with 50 years of expected service life, penetrating silane sealers are
recommended to be applied immediately after deck construction. Epoxy overlays are applied
within 5 years of service. For a bridge deck with 100 years of expected service life, the epoxy
overlays are applied immediately after construction and reapplied at every 25-year interval.
Balakumaran and Weyers (2019) studied the long-term performance of epoxy overlays on 133

19 Effects of Concrete Cure Time on Epoxy Overlay and Sealant Performance
bridge decks in Virginia. The year built or reconstructed for the deck, roadway type, chloride
application rate, and superstructure type (simple span or continuous span) and material were
identified through multiple regression analysis as the major parameters affecting the overlay
service life. The results indicated the range of service life to be 18 to 22 years at a 95 percent
confidence level. According to the MDOT Bridge Deck Preservation Matrix (MDOT 2017), the
anticipated fix life with healer sealers and epoxy overlays ranges from 8 to 10 years and 15 to 20
years, respectively. The anticipated fix life of Michigan decks with epoxy overlays is comparable
to the average service life of epoxy overlays on Virginia bridge decks. Alger et al. (2003)
evaluated 37 Michigan bridge decks with epoxy overlays and presumed that an epoxy overlay
would last for 15 years and a third layer applied at the end of 15 years would seal the deck for
another 10 to 15 years.
The epoxy overlay performance is evaluated using the tensile bond pull-off strength test and the
resistance to chloride ingress. The strength of the substrate is examined to assure adequate strength
for the integrity of the system. The healer sealer performance is evaluated by considering the
resistance to chloride ingress.
2.5 CONCRETE PROPERTIES AND PRACTICES FOR DECIDING THE MINIMUM
CONCRETE AGE TO RECEIVE A FLOOD COAT
The focus of this study is to determine the suitability of a prescription-based or a performance-
based procedure for deciding the minimum age of concrete to receive an epoxy overlay or a healer
sealer. Concrete properties and practices that are critical to identifying the minimum concrete age
to receive a flood coat are discussed in the following sections.
2.5.1 Performance of Epoxy Overlays
Thin epoxy overlays are applied on bridge decks with new concrete in patches and repairs after a
28-day prescribed curing period (MDOT 2018a). Within this period, it is expected that the new
concrete undergoes a majority of (anticipated) shrinkage, develops related cracking, and
establishes an acceptable level of internal moisture. Therefore, the concrete age at cracking and
at the time of achieving an acceptable substrate moisture content are two parameters to decide on
the minimum age of concrete to receive an epoxy overlay. This specific concrete age depends on
several parameters including concrete mix ingredients, curing conditions, moisture diffusion
coefficient, the moisture profile along the depth, and exposure conditions. Once an overlay is

20 Effects of Concrete Cure Time on Epoxy Overlay and Sealant Performance
applied and the required conditions and duration are maintained for curing, tensile bond pull-off
strength tests are performed as per the ASTM C1583 (2013) to evaluate the performance.
Four different failure modes are observed during tensile bond pull-off strength tests (ASTM C1583
2013). A failure in the substrate is preferred at any age of concrete. A failure in the substrate
occurs during a tensile bond pull-off strength test when the tensile strength of concrete is lower
than the tensile strength and bond strength of the epoxy overlay (Sprinkel 1983). The bond failure
at the concrete/overlay interface occurs when the bond strength is lower than the tensile strength
of the epoxy overlay and concrete (Sprinkel 1983). These failure modes and associated concrete
parameters are discussed in the following sections.
2.5.1.1 Failure in the Substrate
A weaker substrate results in a substrate failure with a lower tensile bond pull-off strength than the
specified limit (typically, 250 psi). To improve substrate strength, the proper curing conditions
and duration need to be maintained. Strength and the rate of strength gain depend on many
parameters such as concrete mix ingredients, w/cm ratio, type and quantity of SCMs, along with
exposure and curing conditions (Poole 2006, IMCP 2007). A longer wet curing period is required
for concrete mixes with SCMs to ensure adequate strength development. Recent studies suggest
10 to14 days of wet curing for such mixes (Poole 2006, USDOT 2003). The duration of curing
for a specific mix needs to be established based on the rate of strength development (ACI 308R-
01 2008). Therefore, the curing duration needs to be a parameter when deciding the minimum
concrete age to receive an overlay.
2.5.1.2 Bond Failure at the Concrete/Overlay Interface
Bond failure at the concrete/overlay interface is mostly observed under elevated temperatures due
to (i) the reduction in mechanical and adhesion properties of the epoxy overlay, (ii) shear stress
development at the interface due to thermal incompatibility, (iii) moisture vapor pressure built up
at the interface, or a combination thereof (Sprinkel 1983, Gama 1999, and Shearrer et al. 2015).
Also, the epoxy resin loses tensile strength and elongation capacities as well as softening during
prolonged and repeated exposure to elevated temperatures resulting in failure at the
concrete/overlay interface bond (Soltesz 2010). Another possible reason for interface bond failure
is the reduction of an effective bond area because of concrete cracking after an epoxy overlay
application (Bakhsh 2010).
21 Effects of Concrete Cure Time on Epoxy Overlay and Sealant Performance
Concrete and epoxy overlay properties (such as modulus of elasticity, tensile strength, shear
strength, and the coefficient of thermal expansion) are dissimilar. When the concrete-epoxy
combined system is subjected to an elevated temperature, the magnitude of expansion in epoxy
and concrete is different. This results in shear stresses at the interface. When concrete is exposed
to an elevated temperature, moisture vapor travels towards the heated surface through connected
capillary pores (Lyon 2014). The rate of moisture migration increases with the rise of surface
temperature, and the rate is faster after concrete reaches a certain threshold temperature. The
moisture accumulates at the interface when an impermeable barrier is placed on the surface. As a
result, the accumulated moisture creates vapor pressure which negatively affects the bond strength.
The moisture migration in concrete depends on many parameters including the moisture content
along the depth of concrete specimen, pore structure, exposure conditions, and drying period
(Lawler et al. 2007). A discontinuous capillary pore structure with a minimum volume of total
permeable voids is expected to be developed within the wet curing period. The development of a
discontinuous capillary pore structure and a minimum volume of total permeable voids depends
on concrete mix ingredients and wet curing duration and conditions. As an example, a concrete
mix with Type I cement and a 0.45 water-cement (w/c) ratio develops a discontinuous capillary
pore structure within 7 days of wet curing; while a mix with 65% Type I cement and 35% GGBFS
takes about 10 days to develop such a pore structure (Powers et al. 1959, Hearn et al. 2006,
Basnayake et al. 2020). Therefore, wet and dry curing periods need to be defined for the mixes
used in patches and repairs to minimize moisture influence on the overlay performance.
SCMs impact moisture migration in fresh and hardened concrete. The bleeding rate of Class C
and Class F fly ash and silica fume concrete is much lower than Type I cement concrete while the
effect of GGBFS on bleeding varies (IMCP 2007). The rapid chloride permeability (RCP) and the
apparent chloride diffusion coefficient may or may not be lower in concrete mixes with SCMs than
in Type I cement. Lawler et al. (2007) fabricate specimens using four concrete mixes to evaluate
RCP values as per AASHTO T277 at 56 days of concrete age and the apparent chloride diffusion
coefficients as per AASHTO T259/T260 (modified). A set of 12 × 12 × 6 in. specimens were
ponded with a 15% NaCl solution after wet and dry curing them for 14 and 28 days, respectively.
Following 6 months of ponding, acid-soluble chloride content was evaluated down to a depth of 3
in. from the top of the specimen by following AASHTO T260 procedures. Table 2-7 shows RCP
values and the apparent chloride diffusion coefficients. As shown in the table, the chloride

22 Effects of Concrete Cure Time on Epoxy Overlay and Sealant Performance
diffusion is lower in concrete with SCMs; thus, the moisture migration through the pore structure
is lower. Even though the chloride diffusion is lower in concrete with SCMs, the magnitude
depends on the type and the amount of SCMs. This difference can be attributed to the capillary
pore structure discontinuity and the total permeable void volumes. Since the rate of strength and
microstructure development is different with the type and the amount of SCMs, the required curing
duration to develop a discontinuous capillary pore structure with a minimum volume of total
permeable voids need to be evaluated and maintained.
Table 2-7. RCP and Apparent Chloride Diffusion Coefficients for Mixes with SCMs (Lawler et al. 2007)
Cement (lbs/yd3) w/cm SCM (%) RCP data at 56 days (Coulombs)
Apparent chloride diffusion coefficient (× 10-12 in.2/s)
658 0.40 NA 2878 1.221 560 0.37 15% Class C fly ash 3398 1.088 395 0.37 40% Class F fly ash 2072 1.106 428 0.37 35% GGBFS 1136 0.251
Note: NA = not applicable.
Concrete cracking after an overlay application reduces the effective bonded area between overlay
and substrate (Bakhsh 2010). The cracked concrete has a greater surface area for moisture
migration. Further, moisture migration through cracks is faster and easier. Thus, concrete
cracking after overlay application could result in lower bond strength because of (i) reduction in
the effective bonded area and (ii) a greater amount of moisture accumulation at the
concrete/overlay interface. Therefore, it is necessary to consider the concrete cracking age as a
parameter for deciding the minimum concrete age to receive an epoxy overlay.
2.5.2 Performance of Healer Sealers
A healer sealer is applied on a bridge deck with new concrete after a 28-day prescribed curing
period (MDOT 2018b). Within this period, it is expected that a majority of shrinkage cracks will
develop along with an acceptable level of internal moisture content within the concrete. Therefore,
concrete cracking age and time to achieve acceptable substrate moisture are selected as two
decision parameters for healer sealer application. The concrete cracking age and the time to
achieve acceptable substrate moisture depend on several parameters as discussed in Section 2.5.1.
With an acceptable moisture content, a flood coating healer sealer is applied to seal the cracks for
preventing chloride laden moisture ingress. Therefore, the resistance to chloride ion ingress is a
performance parameter (Sprinkel et al. 1993). Chloride content along the depth is evaluated using

23 Effects of Concrete Cure Time on Epoxy Overlay and Sealant Performance
acid-soluble and/or water-soluble chloride content tests following ASTM C1152 and ASTM
C1218, respectively. The decks become vulnerable to chloride since the coating wears off due to
traffic. Subsequently, the chloride diffuses through concrete within such unprotected areas and
starts corroding reinforcing steel, although the cracks are sealed from chloride ingress. Since
chloride ingress is faster through a continuous pore structure, wet curing needs to be continued
until a discontinuous capillary pore structure is developed with a minimum volume of total
permeable voids (Basnayake et al. 2020). The development of a discontinuous capillary pore
structure with a minimum volume of total permeable voids depends primarily on concrete mix
ingredients and wet curing duration and conditions. Therefore, the minimum concrete age for
healer sealer application depends on concrete wet curing duration, cracking age, and substrate
moisture condition.
As discussed in Section 2.5.1 and 2.5.2, several concrete properties and practices are important to
assess the need of developing a prescription-based or a performance-based approach to identify
the minimum concrete age to receive an epoxy overlay or a healer sealer. Table 2-8 shows concrete
properties and practices that need to be evaluated to identify the minimum concrete age to receive
a flood coat. As an example, concrete wet curing duration, cracking age, moisture condition, and
tensile strength are the parameters to be considered for deciding the minimum concrete age to
receive an epoxy overlay. Table 2-8. Concrete Properties and Practices to Decide the Minimum Concrete Age to Receive a Flood Coat
Epoxy overlay Healer sealer a) Wet curing duration b) Concrete cracking age c) Substrate moisture condition d) Concrete tensile strength
a) Wet curing duration b) Concrete cracking age c) Substrate moisture condition
2.6 CONCRETE PROPERTY AND FLOOD COAT PERFORMANCE EVALUATION
Table 2-8 shows the concrete properties to be evaluated for deciding the minimum concrete age
receiving epoxy overlays or healer sealers. The performance of epoxy overlays is evaluated using
a tensile bond pull-off strength test and the performance of healer sealers is evaluated by measuring
the chloride content along the depth. The evaluation methods for concrete properties and the
performance of epoxy overlays and healer sealers are discussed in the following sections.

24 Effects of Concrete Cure Time on Epoxy Overlay and Sealant Performance
2.6.1 Concrete Wet Curing Duration
Concrete structures, such as bridge decks, are exposed to various loads and harsh conditions during
their service life. For this reason, such structures are designed considering both strength and
durability. Exposure to deicing salts, surface abrasion, and freeze-thaw conditions contribute to
the rapid deterioration of concrete. In the absence of cracks, the amount and rate of moisture and
aggressive chemical ingress, such as chlorides, depend on the total volume of permeable voids in
concrete and the continuity of capillary pore structure. Therefore, permeability is a major
parameter that defines concrete durability. The coefficient of permeability is used as a measure of
permeability. For a freshly mixed cement paste, the coefficient of permeability is in the order of
4 × 10⁻⁴ to 4 × 10⁻⁵ in./s and reduces with the degree of cement hydration (Mehta and Monteiro
2006). The reduction in permeability is attributed to the increase in capillary pore discontinuity
(Powers et al. 1959). Powers et al. (1959) developed a semi-theoretical equation to represent the
development of a discontinuous capillary pore structure with the degree of hydration. Hearn et al.
(2006) presented a relationship between permeability and porosity. This relationship was
graphically presented with available data to demonstrate that the permeability-porosity
relationship of mixes with various w/cm ratios follows a specific line once the mixes develop
discontinuous capillary pore structures. Nokken (2004) used concrete mixes with SCMs and
various w/cm ratios to evaluate the concepts presented by Powers et al. (1959). The presence of a
capillary pore structure discontinuity relationship for mortar and concrete mixes was confirmed by
measuring the electrical conductivity of the samples using the rapid chloride permeability test
(Nokken 2004). All the work presented in these references (Powers et al. 1959, Hearn et al. 2006,
Nokken 2004) indicates very little change in permeability once a discontinuous capillary pore
structure is developed. Therefore, the curing duration for a given concrete mix can be determined
by knowing the time required to develop a discontinuous capillary pore structure (Nokken 2004).
The formation of a discontinuous capillary pore structure is evaluated through permeability and
porosity. The saturated water permeability test and ionic diffusion test are two common methods
for evaluating concrete permeability. The solvent displacement technique (water, isopropanol,
methanol, etc.) and mercury intrusion porosimetry are two common methods used to quantify
porosity. These test methods have their own merits and demerits (Hearn et al. 2006, Nokken 2004,
Abell et al. 1998). Even though most of the listed methods provide a direct permeability reading,
the implementation of such methods for repeated measurements is laborious. As a result,
25 Effects of Concrete Cure Time on Epoxy Overlay and Sealant Performance
nondestructive evaluation of concrete properties using electrical methods is becoming popular.
Conductivity or resistivity measurements are used to indirectly evaluate concrete permeability.
The conductivity of concrete is influenced by the volume and connectivity of pores, and the
conductivity of pore solution. With the development of pore structure over time, the conductivity
of concrete decreases. Bulk electrical conductivity was proposed as a suitable indicator of concrete
permeability and as a potential method to determine the required wet curing duration (Nokken
2004). Typically, a reduction in the bulk electrical conductivity is expected with the concrete age
(Nokken 2004). A significant decrease in the rate of reduction of electrical conductivity is
observed after achieving the capillary discontinuity. Therefore, the bulk electrical conductivity
test method specified in the ASTM C1760 is a suitable test method to evaluate the required time
for achieving capillary discontinuity. In addition, the porosity test described in ASTM C642 is
suitable to determine the time to achieve a minimum volume of total permeable voids. Therefore,
the required wet curing duration can be considered as the maximum of (i) time to achieve the
specified strength, (ii) time to achieve a discontinuous pore structure, and (iii) time to achieve a
minimum volume of total permeable voids.
2.6.2 Concrete Cracking Age
Epoxy overlays and healer sealers are applied to enhance the durability of cracked concrete.
Therefore, the age of concrete cracking must be determined so that the epoxy overlay and healer
sealer can be applied after concrete cracks. The restrained shrinkage test (ASTM C1581) is
commonly used to identify the cracking age of concrete. The cracking age obtained from the
restrained shrinkage test can be correlated to the field conditions (Fu 2013).
2.6.3 Substrate Moisture Condition
The substrate moisture is another parameter considered for flood coat application. Most highway
agencies evaluate substrate moisture by following a modified version of the procedure described
in ASTM D4263. However, several qualitative and quantitative methods are available to assess
substrate moisture. The qualitative techniques include a capillary moisture patch test, a mat bond
test, a primer or adhesive strip test, and an electrical resistance test using an electrical conductance
meter. The quantitative methods include (i) using an electrical impedance meter, a nuclear gauge,
and the gravimetric process, (ii) a moisture vapor emission rate (MVER) measurement, (iii) a
surface relative humidity (RH) measurement, and (iv) an internal relative humidity (IRH)

26 Effects of Concrete Cure Time on Epoxy Overlay and Sealant Performance
measurement. These qualitative and quantitative methods have limitations. The flooring industry
uses MVER, surface RH, and IRH measurement techniques. Wisconsin and New York DOTs use
electrical impedance meters.
2.6.4 Strength Development of Concrete
The compressive and flexural strength tests are conducted to evaluate the concrete strength
development against the age of concrete by following ASTM C39 and ASTM C78, respectively.
These tests are conducted primarily for quality assurance and quality control purposes. Both
compressive and flexural strengths are important to assure adequate substrate strength during
shotblasting to minimize concrete damage and provide sufficient tensile strength for satisfying the
minimum tensile bond pull-off strength requirements.
2.6.5 Tensile Bond Pull-Off Strength
The performance of epoxy overlays is evaluated using the tensile bond pull-off strength test
following ASTM C1583. The test is conducted after a 24-hour epoxy curing period. The other
available test standards are ACI 503R, ASTM D4541, and ASTM D7234. ACI 503R and ASTM
C1583 are similar.
2.6.6 Resistance to Chloride Ingress
Healer sealers are applied on bridge decks to seal cracks and prevent moisture-laden chloride
ingress. Several methods are available to measure chloride content in concrete. The acid-soluble
and water-soluble chloride content is evaluated following ASTM C1152 and C1218 procedures,
respectively. The ASTM C1152 procedure is used to measure the total chloride content bound on
aggregate and hydrated cement as well as the available chloride to cause corrosion. The threshold
total chloride content to initiate steel corrosion is 500 ppm (parts per million). The ASTM C1218
procedure is used to measure the water-soluble chloride content available to cause steel corrosion.
This test does not evaluate the bound chloride in aggregates and hydrated cement. However, the
chloride content evaluated following ASTM C1218 can show higher chloride content due to
aggregate crushing and highly variable data depending on the particle size and core extraction time
and temperature (Concrete Construction 1998). ACI 222R-19 (2019) defines the threshold limit
for water-soluble chloride content as 75–80% of the acid-soluble limit of 500 ppm. Therefore, the
threshold limit for the water-soluble chloride content is 375–400 ppm.
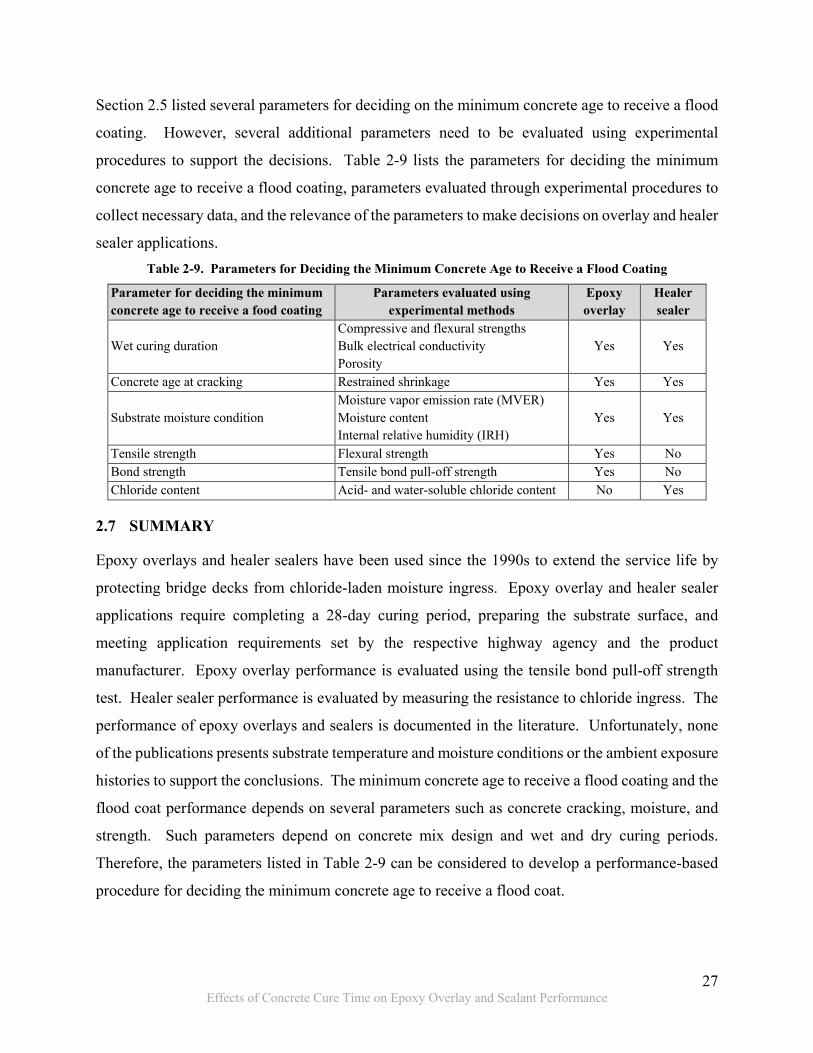
27 Effects of Concrete Cure Time on Epoxy Overlay and Sealant Performance
Section 2.5 listed several parameters for deciding on the minimum concrete age to receive a flood
coating. However, several additional parameters need to be evaluated using experimental
procedures to support the decisions. Table 2-9 lists the parameters for deciding the minimum
concrete age to receive a flood coating, parameters evaluated through experimental procedures to
collect necessary data, and the relevance of the parameters to make decisions on overlay and healer
sealer applications. Table 2-9. Parameters for Deciding the Minimum Concrete Age to Receive a Flood Coating
Parameter for deciding the minimum concrete age to receive a food coating
Parameters evaluated using experimental methods
Epoxy overlay
Healer sealer
Wet curing duration Compressive and flexural strengths Bulk electrical conductivity Porosity
Yes Yes
Concrete age at cracking Restrained shrinkage Yes Yes
Substrate moisture condition Moisture vapor emission rate (MVER) Moisture content Internal relative humidity (IRH)
Yes Yes
Tensile strength Flexural strength Yes No Bond strength Tensile bond pull-off strength Yes No Chloride content Acid- and water-soluble chloride content No Yes
2.7 SUMMARY
Epoxy overlays and healer sealers have been used since the 1990s to extend the service life by
protecting bridge decks from chloride-laden moisture ingress. Epoxy overlay and healer sealer
applications require completing a 28-day curing period, preparing the substrate surface, and
meeting application requirements set by the respective highway agency and the product
manufacturer. Epoxy overlay performance is evaluated using the tensile bond pull-off strength
test. Healer sealer performance is evaluated by measuring the resistance to chloride ingress. The
performance of epoxy overlays and sealers is documented in the literature. Unfortunately, none
of the publications presents substrate temperature and moisture conditions or the ambient exposure
histories to support the conclusions. The minimum concrete age to receive a flood coating and the
flood coat performance depends on several parameters such as concrete cracking, moisture, and
strength. Such parameters depend on concrete mix design and wet and dry curing periods.
Therefore, the parameters listed in Table 2-9 can be considered to develop a performance-based
procedure for deciding the minimum concrete age to receive a flood coat.

28 Effects of Concrete Cure Time on Epoxy Overlay and Sealant Performance
3 PERFORMANCE OF THIN EPOXY OVERLAYS
3.1 OVERVIEW
The specifications and special provisions require 28 days of curing for new concrete before
applying a thin epoxy overlay. This requirement extends project duration, impacts mobility, and
increases the overall cost. Thus, it is necessary to evaluate the possibility of applying epoxy
overlays (for patches and repairs) earlier than 28 days on decks with new concrete without
compromising the intended performance. This chapter presents a performance-based procedure
to evaluate the minimum age of concrete to receive an overlay, implementation of the procedure,
and the results. Meanwhile, there is an interest in evaluating the possibility of developing a hybrid
bridge deck protection system with penetrating sealers and thin epoxy overlays to complement the
overlay performance by retarding chloride ingress into the concrete through pinholes and other
anomalies formed during overlay application and damages during service. This chapter also
presents the experimental studies conducted to evaluate the overlay bond strength performance in
the presence of a penetrating sealant, along with the findings of said studies.
3.2 EVALUATION OF THE MINIMUM CONCRETE AGE TO RECEIVE A THIN
EPOXY OVERLAY
3.2.1 Procedure for Deciding the Minimum Concrete Age
The objective of this study is to identify the minimum concrete age to receive a thin epoxy overlay.
The decision depends on concrete wet curing duration, cracking age, concrete age to achieve an
acceptable substrate moisture condition, and concrete age to achieve a required minimum tensile
strength. Thin epoxy overlay performance depends on concrete strength, bond strength, thermal
compatibility between overlay and concrete, and epoxy performance under various exposure
conditions. A tensile bond pull-off strength test is used to evaluate the system performance. The
performance is satisfactory when the bond strength is greater than or equal to 250 psi (MDOT
2019a). Figure 3-1 depicts the procedure to evaluate the minimum age of concrete to receive an
overlay (t), which is defined as a function of (i) concrete wet curing duration, (ii) concrete age at
the time of cracking, (iii) concrete age to achieve acceptable substrate moisture, (iv) concrete age
to develop the specified minimum tensile strength, and (v) concrete age at the time of epoxy
application to achieve the specified bond strength. The significance of each parameter is described
in the following sections.
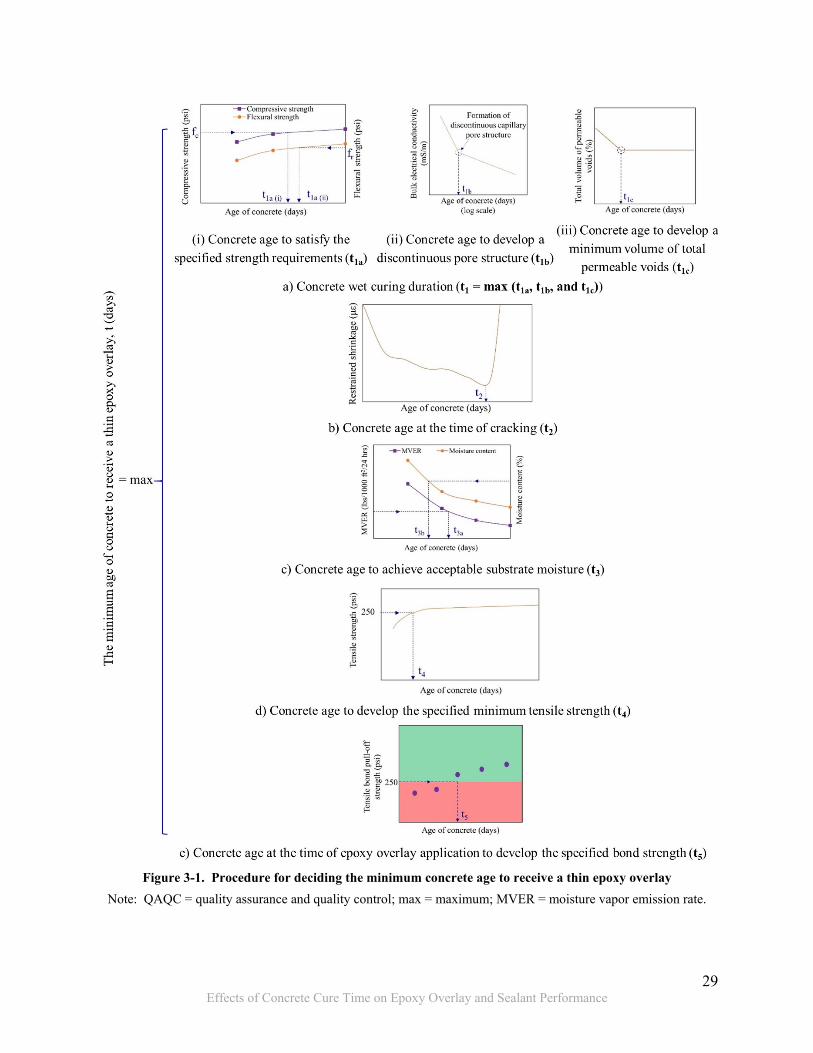
29 Effects of Concrete Cure Time on Epoxy Overlay and Sealant Performance
Figure 3-1. Procedure for deciding the minimum concrete age to receive a thin epoxy overlay
Note: QAQC = quality assurance and quality control; max = maximum; MVER = moisture vapor emission rate.

30 Effects of Concrete Cure Time on Epoxy Overlay and Sealant Performance
3.2.1.1 Concrete Wet Curing Duration
The wet curing duration is typically defined based on the time to achieve the specified compressive
and/or flexural strength of concrete. Figure 3-1a(i) shows the variation of concrete strength against
time. This relationship can be used to decide on the wet curing duration (t1a) to achieve the
required strength. However, a favorable curing condition needs to be maintained until a
discontinuous pore structure with a minimum volume of total permeable voids is developed for
assuring durability and managing moisture transfer. Figure 3-1a(ii) shows the variation of bulk
electrical conductivity against time. The time to develop a discontinuous pore structure (t1b) is
represented by the change in slope. Figure 3-1a(iii) shows the variation of the total volume of
permeable voids against time. The time to achieve a minimum volume of total permeable voids
(t1c) is represented by the change in slope. Hence, the wet curing duration (t1) should be continued
beyond the longest duration of t1a, t1b, and t1c to satisfy both the strength and durability
requirements.
3.2.1.2 Concrete Age at the Time of Cracking
An overlay is decided based on concrete crack density and propensity for future crack growth.
Even though the ASTM C1581 test does not simulate field conditions, this method allows
evaluating the cracking propensity of different mixes and the time it takes to crack under restraint
conditions. This method is expected to provide the earliest possible concrete cracking time for a
given mix under similar exposure conditions. Figure 3-1b shows the variation of strain in the steel
ring due to concrete shrinkage against time and the criterion used to select the cracking time (t2).
The concrete age at the time of epoxy overlay application needs to be equal or greater than t2.
3.2.1.3 Concrete Age to Achieve Acceptable Substrate Moisture
The third parameter considered for overlay application is substrate moisture. Most of the highway
agencies evaluate substrate moisture by following a modified version of the procedure described
in ASTM D4263. The standard practice of the flooring industry is to evaluate the moisture vapor
emission rate (MVER) with a maximum limit of 3 lbs/1000 ft2/24 hrs (Gaughen 1999). A few
highway agencies, such as New York and Wisconsin, evaluate substrate moisture using electrical
impedance meters. New York applies epoxy overlays when the substrate moisture content is less
than 5.0%, whereas the Wisconsin limit is 4.5%. Figure 3-1c shows the procedure to determine
the time to reach the required maximum permissible MVER or substrate moisture (t3).
31 Effects of Concrete Cure Time on Epoxy Overlay and Sealant Performance
3.2.1.4 Concrete Age to Develop the Specified Minimum Tensile Strength
Concrete needs to develop a direct tensile strength greater than the required minimum bond
strength evaluated using the tensile bond pull-off strength test. This can be a requirement above
and beyond the typical QAQC specifications. As an example, MDOT special provision 12SP-
712C-03 specifies a minimum bond strength of 250 psi (MDOT 2019a). Hence, adequate time
should be allowed for concrete to develop this required strength.
The flexural strength is evaluated using a four-point bending test on 6 × 6 × 20 in. beams (ASTM
C78). Recommendations by Lin et al. (2013) can be implemented to estimate, the direct tensile
strength from the flexural strength evaluated following ASTM C78. Since the direct tensile
strength is approximately 63~73% of the flexural strength (Lin et al. 2013), 60% of the flexural
strength can be conservatively used as the direct tensile strength of concrete to estimate the
minimum required curing duration. The time requirement is depicted in Figure 3-1d. The concrete
age at the time of epoxy overlay application (t) should be greater than t4 to achieve a minimum
flexural strength of 417 psi (i.e., 250/0.6).
3.2.1.5 Concrete Age at the Time of Epoxy Overlay Application to Achieve the Specified Bond
Strength
Several other parameters, including the amount of moisture in concrete, moisture profile, moisture
vapor transmission under elevated temperatures, workmanship, etc., influence overlay bond
strength. Hence, bond strength needs to be evaluated after applying overlays on concrete at
different ages. Satisfactory performance is achieved when the bond strength is equal to or greater
than 250 psi, as shown in Figure 3-1e. The concrete age at the time of overlay application to
achieve the specified bond strength (t) should be equal to or great than t5, the concrete age at the
time of receiving an overlay to satisfy the performance requirement.
3.2.2 Implementation of the Proposed Procedure
E-bond 526 Lo-Mod and Unitex Pro-Poxy Type III DOT were selected from the MDOT approved
product list (MDOT 2018a). These products were selected based on their application frequency
on Michigan bridge decks. The performance of these overlays was evaluated on specimens
fabricated using bridge deck joint repair (BDJR) and the Grade DM concrete mixes. The BDJR
mix is used for expansion joint repair and deck patching. Grade DM is the standard bridge deck

32 Effects of Concrete Cure Time on Epoxy Overlay and Sealant Performance
concrete mix. Table 3-1 shows the mix designs. As shown in the table, the BDJR mix contains
only Type I cement while the Grade DM mix contains 35% ground granulated blast furnace slag
(GGBFS). A hydration controlling admixture was used in Grade DM concrete to increase the
setting time during casting. The basic QAQC testing on fresh properties was performed on the
casting day as per the Manual for the Michigan Test Methods (MTM 2018). Table 3-2 presents
the experimental plan to identify the minimum concrete age to receive an overlay. The table
columns a to g list the evaluation parameter, measurand, ASTM standard, size of the specimen,
concrete age at the time of overlay application, curing and exposure condition, along with concrete
age at the time of testing. For the specimens that required ASTM curing (column f), submerged
wet curing was provided continuously through the testing ages according to ASTM C192. All the
other specimens were dry-cured at 73o F in the laboratory following 7 days of moist curing. The
testing plan included the evaluation of epoxy overlay performance against chloride ingress and the
impact of epoxy application during the dry curing period. The testing plan for each evaluation
parameter is discussed in the following sections.
Table 3-1. Mix Design: BDJR and Grade DM Concrete (per yd3)
Material BDJR Grade DM Coarse aggregate (SSD) (lb) 1,488 1,644 Fine aggregate (SSD) (lb) 1,557 1,356 Cement–Type I (lb) 656 397 GGBFS (lb) 0 214 Air entraining admixture (fl oz) 5.07 10.78 Hydration controlling admixture (fl oz) 0 18.56 Water reducing admixture (fl oz) 58.67 54.44 Water (lbs) 246 238 Water-cementitious material ratio 0.38 0.39

33 Effects of Concrete Cure Time on Epoxy Overlay and Sealant Performance
Table 3-2. Experimental Plan to Assess the Minimum Concrete Age to Receive an Epoxy Overlay
Evaluation parameter (a)
Measurand (b)
ASTM standard
(c)
Size of the specimen (in.)
(d)
Concrete age at the time of overlay
application (e)
Curing and exposure condition
(f)c
Concrete age at the time of testing (days)
(g)
Concrete wet curing duration (t1)
Compressive strength C39 4 × 8 NA ASTM 7, 14, 21, and 28 Flexural strengtha C78 6 × 6 × 20 NA ASTM 7, 14, 21, and 28 Bulk electrical conductivityb C1760 4 × 8 NA ASTM 1, 3, 7, 14, 21, and 28 Porosity C642 4 × 2 NA ASTM 3, 7, 14, 21, and 28
Concrete age at the time of cracking (t2)
Restrained shrinkage C1581 As per the ASTM NA RT Until cracking
Concrete age to achieve acceptable substrate moisture (t3)
Moisture vapor emission rate (MVER) F1869 40 × 40 × 9 NA RT 14, 21, and 28
Moisture content F2659 40 × 40 × 9 NA RT 7, 14, 21, and 28 Internal relative humidity (IRH) F2170 40 × 40 × 9 NA RT Starting from 7-day until the end
of testing Concrete age to develop the specified minimum tensile strength (t4)
Flexural strengtha C78 6 × 6 × 20 NA ASTM 7, 14, 21, and 28
Concrete age at the time of epoxy application to develop the specified bond strength (t5)
Tensile bond pull-off strength C1583
40 × 40 × 9 14 RT–RT 17, 21, 28, 42, 105, and outdoord RT–HS 17, 21, 28, 42, 105, and outdoord
RT–WDe, f 17, 28, 42, 105, and outdoor
40 × 40 × 9 21 RT–RT 24, 28, 35, 49, 112, and outdoor RT–HS 24, 28, 35, 49, 112, and outdoor RT–WD 24, 35, 49, 112, and outdoor
40 × 40 × 9 28 RT–RT 31, 35, 42, 56, 119, and outdoor RT–HS 31, 35, 42, 56, 119, and outdoor RT–WD 31, 42, 56, 119, and outdoor
Note: ASTM = American Society for Testing and Materials; NA = not applicable aBeam specimens of 4 × 4 × 14 in. were used for Grade DM. bOne-day data was recorded only for the BDJR concrete mix. cASTM, RT, HS, and WD represent curing conditions. ASTM – continuous submerged wet curing until testing, RT – room temperature, HS – elevated temperature, and WD – one-week alternate wet and dry cycles. RT–RT, RT–HS, and RT–WD represent concrete during following the 7-day wet curing and overlay exposure before or during testing.
dThe overlay performance under outdoor conditions was evaluated on BDJR concrete specimens at 226, 227, 337, 477, 479, 483, and 484 days of concrete age and Grade DM concrete specimens at 268, 269, 385, 519, 521, 525, and 526 days of concrete age.
eWD specimens are used at 14, 21, and 28-day application ages for Grade DM and only at 28-day application age for BDJR. fThe performance under outdoor conditions was evaluated on WD slabs fabricated with BDJR mix at 337 days and Grade DM mix on 385 days of concrete age.

34 Effects of Concrete Cure Time on Epoxy Overlay and Sealant Performance
3.2.2.1 QAQC Testing
Temperature, slump, density, and air content were measured on the day of casting as per the ASTM
C1064, C143, C138, and C231 specifications. Concrete cylinders and beams were fabricated and
cured through testing ages as per ASTM C192 to evaluate compressive and flexural strengths. The
required QAQC tests and the number of tests were decided as per the Manual for the Michigan
Test Methods (MTM 2018) and the MDOT Standard Specifications for Construction (MDOT
2012).
3.2.2.2 Concrete Wet Curing Duration
In addition to compressive and flexural strengths, bulk electrical conductivity and porosity tests
were performed to evaluate the required wet curing duration to develop a discontinuous pore
structure with a minimum volume of total permeable voids. The bulk electrical conductivity test
was performed according to ASTM C1760 on 4 × 8 in. cylinders. The total volume of permeable
voids was evaluated following the porosity test procedures described in ASTM C642. A single 4
× 8 in. cylindrical specimen provides two 4 × 2 in. specimens for porosity tests. The top 0.5 in. of
the cylinder is discarded, and two 4 × 2 in. cylindrical sections are cut from the remaining part of
the cylinder to obtain the specimens.
3.2.2.3 Concrete Age at the Time of Cracking
A restrained shrinkage test was performed following the ASTM C1581 procedure to determine the
cracking age of concrete. The specimens were covered with wet burlaps and plastic during the 7-
day moist curing period. Following moist curing, specimens were exposed to 73o F and 50%
relative humidity (RH). The steel ring strain data was recorded until the concrete rings cracked.
3.2.2.4 Concrete Age to Achieve Acceptable Substrate Moisture
Substrate moisture variation against time was evaluated using MVER and moisture content
measurements following ASTM F1869 and F2659 procedures, respectively. A 40 × 40 × 9 in.
slab specimen was used for this purpose. Following a 7-day wet curing, all the surfaces of the
slab, except the top surface, were epoxy painted to simulate one-dimensional moisture transfer.
After the wet curing period, the slab was placed under standard laboratory conditions for dry curing
through the testing ages. MVER and moisture content were measured at 14, 21, and 28 days of
concrete age. Internal relative humidity (IRH) of the slabs with epoxy overlays was measured by
35 Effects of Concrete Cure Time on Epoxy Overlay and Sealant Performance
placing RH probes. The same probes were used to evaluate moisture migration under elevated
temperature and moisture redistribution under room temperature following a heat cycle. The
probes were installed at 1.0 and 3.6 in. depths from the top surface. The probes at 1.0 in. provided
IRH near the top. The probes at 3.6 in. provided IRH at a depth of 40% of the specimen thickness
for one-way drying (ASTM F2170). IRH measurements started on the 7th day following sample
fabrication and continued until the end of testing.
3.2.2.5 Concrete Age to Develop the Specified Minimum Tensile Strength
Flexural strength was evaluated by following the procedures given in ASTM C78. Four-point
bending was performed at 7, 14, 21, and 28 days of concrete age to evaluate flexural strength. All
the specimens were moist cured following ASTM C192 procedures until the testing age. As
described in Section 3.2.1.4, recommendations by Lin et al. (2013) were implemented to estimate
the direct tensile strength from the flexural strength evaluated following ASTM C78.
3.2.2.6 Concrete Age at the Time of Epoxy Application to Develop the Specified Bond Strength
A total of thirty-two (32) 40 × 40 × 9 in. slab specimens were fabricated. Eighteen (18) slabs were
fabricated with Grade DM concrete in January 2019. Fourteen (14) slabs were fabricated with
BDJR concrete in March 2019. Epoxy overlays were applied at 14, 21, and 28 days of concrete
age. Figure 3-2 shows formwork, specimen curing, specimen arrangement for shotblasting, the
top surface after shotblasting and cleaning, the surface with a single coat of epoxy, and a specimen
after completing overlay application. The one-way moisture migration was ensured by sealing all
the sides, except the top surface, with epoxy paint, to replicate the presence of stay-in-place
formwork. Following the 7-day wet curing period, the slabs were cured under standard laboratory
conditions. At 14 days of concrete age, the top surface of all the slabs was shotblasted and cleaned.
The slabs that were designated to receive an overlay at 14 days received the first coat on the same
day. Figure 3-2e shows a specimen with the first layer of epoxy. The second coat was applied on
the 15th day. This allowed a 24-hour curing period for the first coat. A layer of flint aggregate
was broadcasted following the application of each epoxy layer. A similar process was followed
for the specimens that were designated to receive overlays at 21 and 28 days of concrete age.
Figure 3-2f shows a specimen with a two-coat epoxy overlay. The overlay performance was
evaluated primarily by conducting direct pull-off strength tests under laboratory and outdoor
exposure conditions.

36 Effects of Concrete Cure Time on Epoxy Overlay and Sealant Performance
Figure 3-2. Slab specimen fabrication and preparation procedures
3.2.2.7 Performance Evaluation under Simulated Exposure Conditions
The overlay performance was evaluated under three exposure conditions: (i) room temperature
(RT), (ii) elevated temperature (heated slab – HS), and (iii) one-week alternate wet and dry cycles
(WD). The RT specimens were stored at 73o F after epoxy application. The maximum design
temperature for Michigan bridges with prestressed girders and steel girders is 100o F and 110o F,
respectively (AASHTO 2016). Therefore, one specimen from each application age was heated to
about 110⁰ F using two infrared lights to evaluate the impact of hot summer conditions on overlay

37 Effects of Concrete Cure Time on Epoxy Overlay and Sealant Performance
bond strength. Figure 3-3a shows the insulated heating chamber. The temperature was
continuously controlled and recorded using an auto-shutoff temperature controller and recorder,
respectively. Figure 3-3b and Figure 3-3c show the temperature controller and recorder,
respectively. The bond strength was evaluated at the elevated temperature and after allowing the
slabs to cool down to room temperature following a heat cycle. The WD specimens were exposed
to one week of alternate wet and dry cycles after epoxy application. During the wetting period, a
3% NaCl solution was used to flood the top surface continuously to evaluate the impact of salt
solution on overlay performance. Bond strength was evaluated at 3, 7, 14, 28, and 91 days
following epoxy application. As an example, the concrete age at testing for a 14-day epoxy coated
slab was 17, 21, 28, 42, and 105 days. Table 3-2 shows the concrete age at the time of testing.
Each pull-off strength test area was immediately sealed using epoxy paint to prevent moisture loss.
Figure 3-3. Insulated chamber for performance evaluation under elevated temperature
3.2.2.8 Performance Evaluation under Outdoor Exposure Conditions
In June and July of 2019, all 32 slabs were moved to an uncovered parking area to get them exposed
to southwest Michigan weather (Figure 3-4). The overlay performance was evaluated during fall
2019 and winter and summer 2020. Testing on both concrete mixes was performed on the same
day, except during the winter cycle. Tensile bond pull-off strength tests were conducted at 226,

38 Effects of Concrete Cure Time on Epoxy Overlay and Sealant Performance
227, 337, 477, 479, 483, and 484 days of concrete age on the BDJR concrete specimens that
received overlays at the concrete age of 14 days. Since Grade DM specimens were fabricated 42
days before BDJR specimens, concrete ages at the time of epoxy overlay performance evaluation
on 14-day Grade DM specimens were 268, 269, 385 (with a 6-day delay), 519, 521, 525, and 526
days.
The bond strength was evaluated in October 2019 on RT and HS specimens. The ambient
temperature during testing was 48~50o F. Among the three application ages, the slabs that received
overlays at the age of 14 days (i.e., on the 7th day after a 7-day wet curing) were expected to retain
the highest amount of internal moisture and had the greatest potential to be damaged under freezing
conditions. Hence, bond strength on those slabs was evaluated in February 2020. The BDJR and
Grade DM slabs were subjected to 89 and 96 freezing cycles, respectively. The ambient
temperature at the time of testing was 34~38o F. The last sets of bond strength tests were conducted
in July 2020. One set of data was collected when the ambient temperature was 87~91o F. The
other data set was collected in the morning when the temperature was about 73o F. One cycle of
bond strength tests was performed on the WD slabs. The WD slabs were continuously exposed to
a 3% NaCl solution for 135 days before evaluating the bond strength. Tensile bond pull-off
strength tests on WD slabs were performed on summer mornings when the ambient temperature
was about 73o F. Each pull-off strength test area was sealed using epoxy paint.
3.2.2.9 Epoxy Overlay Performance Against Chloride Ingress
Thin epoxy overlays are expected to work as impermeable barriers against chloride ingress to
protect bridge decks. Therefore, the ability of overlays to protect concrete from chloride ingress
was also evaluated. Two 2.13 in. diameter and 2 in. deep cores were extracted from two WD slabs
fabricated with BDJR concrete at the concrete age of 503 days. The top 0.25 in. of each core,
measured from the top of the overlay, was discarded. The chloride content was evaluated from
0.25 in. to 1.75 in. at an interval of 0.5 in. following ASTM C1152 procedures. Similarly, chloride
content on six WD slabs, fabricated with Grade DM concrete, was evaluated at the concrete age
of 545 days. The background chloride content was also evaluated to identify the increase in
chloride content due to 42 days of 3% NaCl exposure under laboratory conditions (6 weeks during
wet-dry cycles) and 135 days of continuous exposure to outdoor conditions.

39 Effects of Concrete Cure Time on Epoxy Overlay and Sealant Performance
Figure 3-4. Slabs in the open parking lot and getting exposed to southwest Michigan weather

40 Effects of Concrete Cure Time on Epoxy Overlay and Sealant Performance
3.2.2.10 Impact of Epoxy Overlay Application on Concrete Strength and Durability
Applying epoxy overlays at 14, 21, and 28 days of concrete age, following a 7-day moist curing,
causes the slabs to retain varying amounts of moisture. The availability of moisture could promote
the hydration of the remaining cementitious material to improve microstructure and strength.
Nevertheless, having a great amount of moisture entrapped within the slab could cause damages
to concrete under freezing conditions. Therefore, compressive strength and pore structure integrity
were evaluated. A set of 4 × 8 in. cylinders were extracted from bare slabs and the slabs with
epoxy overlays applied at 14, 21, and 28 days of concrete age. Bare slabs were cored at 28, 120,
and 539 days of concrete age to extract cylinders for strength tests. In addition, cylinders were
extracted from the slabs with overlays at 120 and 539 days of concrete age. Moreover,
compressive strength tests were conducted a day after core extraction, except for the testing of
cores extracted from the 28-day old concrete.
The age of BDJR and Grade DM concrete was 454 and 406 days when the cores were extracted to
evaluate pore structure integrity. By that time, the BDJR and Grade DM slabs were subjected to
149 and 116 freezing cycles, respectively. The top 0.5 in. of each specimen was saw cut and
discarded. The remaining portion of the specimens was used for testing. A subset of specimens
was used to evaluate porosity. The remaining specimens were used to evaluate the resistance to
chloride ingress. One specimen from each mix was selected for background chloride testing. The
circumferential area of the remaining cylinders was epoxy painted and ponded with 3% NaCl at
the top. Chloride content down to a depth of 3.0 in. was evaluated at the end of 137 days of
ponding by following ASTM C1152 procedures.
3.2.3 Results and Discussion
3.2.3.1 QAQC Testing
Table 3-3 presents fresh concrete properties. These results comply with MDOT specifications.
Figure 3-5 and Figure 3-5b show the variation of the compressive and flexural strength with time.
Both BDJR and Grade DM concrete mixes showed greater strengths than the minimum required.
Since Grade DM contains 35% of GGBFS, the early-age strength is lower than BDJR.
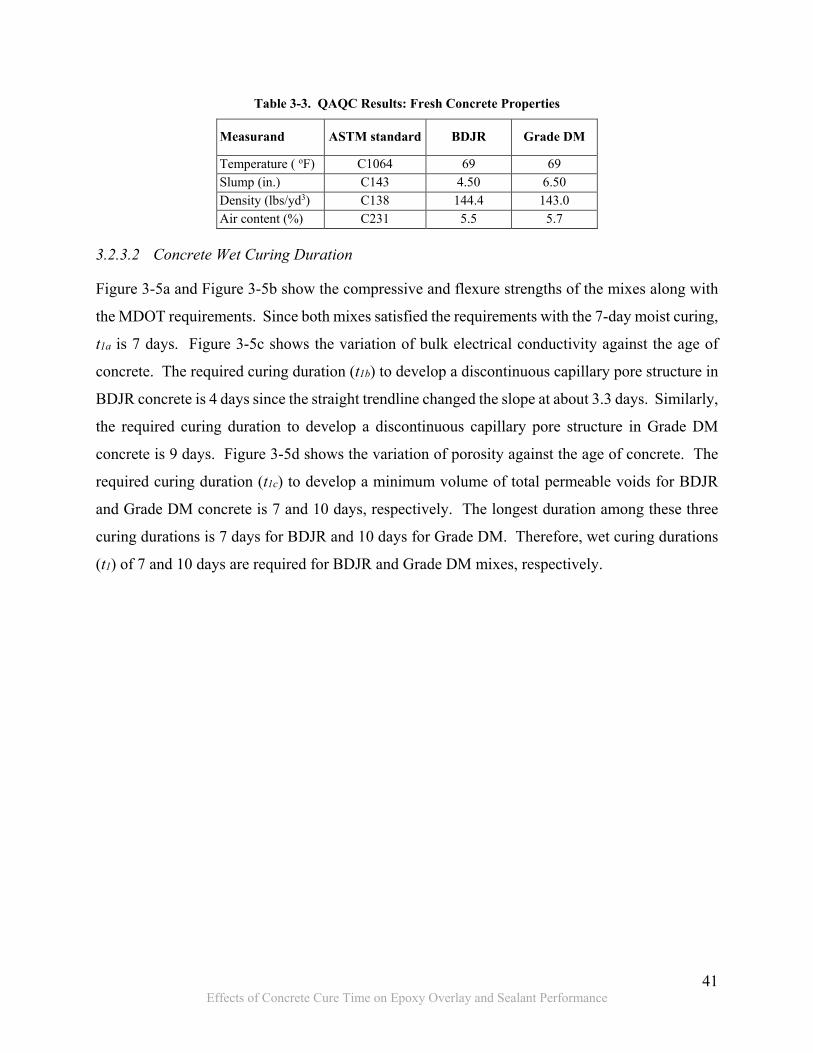
41 Effects of Concrete Cure Time on Epoxy Overlay and Sealant Performance
Table 3-3. QAQC Results: Fresh Concrete Properties
Measurand ASTM standard BDJR Grade DM
Temperature ( oF) C1064 69 69 Slump (in.) C143 4.50 6.50 Density (lbs/yd3) C138 144.4 143.0 Air content (%) C231 5.5 5.7
3.2.3.2 Concrete Wet Curing Duration
Figure 3-5a and Figure 3-5b show the compressive and flexure strengths of the mixes along with
the MDOT requirements. Since both mixes satisfied the requirements with the 7-day moist curing,
t1a is 7 days. Figure 3-5c shows the variation of bulk electrical conductivity against the age of
concrete. The required curing duration (t1b) to develop a discontinuous capillary pore structure in
BDJR concrete is 4 days since the straight trendline changed the slope at about 3.3 days. Similarly,
the required curing duration to develop a discontinuous capillary pore structure in Grade DM
concrete is 9 days. Figure 3-5d shows the variation of porosity against the age of concrete. The
required curing duration (t1c) to develop a minimum volume of total permeable voids for BDJR
and Grade DM concrete is 7 and 10 days, respectively. The longest duration among these three
curing durations is 7 days for BDJR and 10 days for Grade DM. Therefore, wet curing durations
(t1) of 7 and 10 days are required for BDJR and Grade DM mixes, respectively.

42 Effects of Concrete Cure Time on Epoxy Overlay and Sealant Performance
Figure 3-5. Experimental results to determine wet curing duration
3.2.3.3 Concrete Age at the Time of Cracking
Figure 3-6a and Figure 3-6b show the variation of steel ring strain against the age of BDJR and
Grade DM concrete. Four specimens were fabricated from each mix. Since the rings made of
BDJR concrete cracked on the 14th, 15th (two specimens), and 18th-day following fabrication, the
age of BDJR concrete at cracking (t2) is conservatively assumed as 18 days. The rings made of
Grade DM concrete cracked on the 13th, 15th, and 20th (two specimens) day following casting.
Therefore, the age of Grade DM concrete at cracking (t2) is conservatively assumed as 20 days.
However, Ring 1 and 2 data for Grade DM mix showed a somewhat uncommon variation of strain
against time, and the data did not influence the selected cracking age.
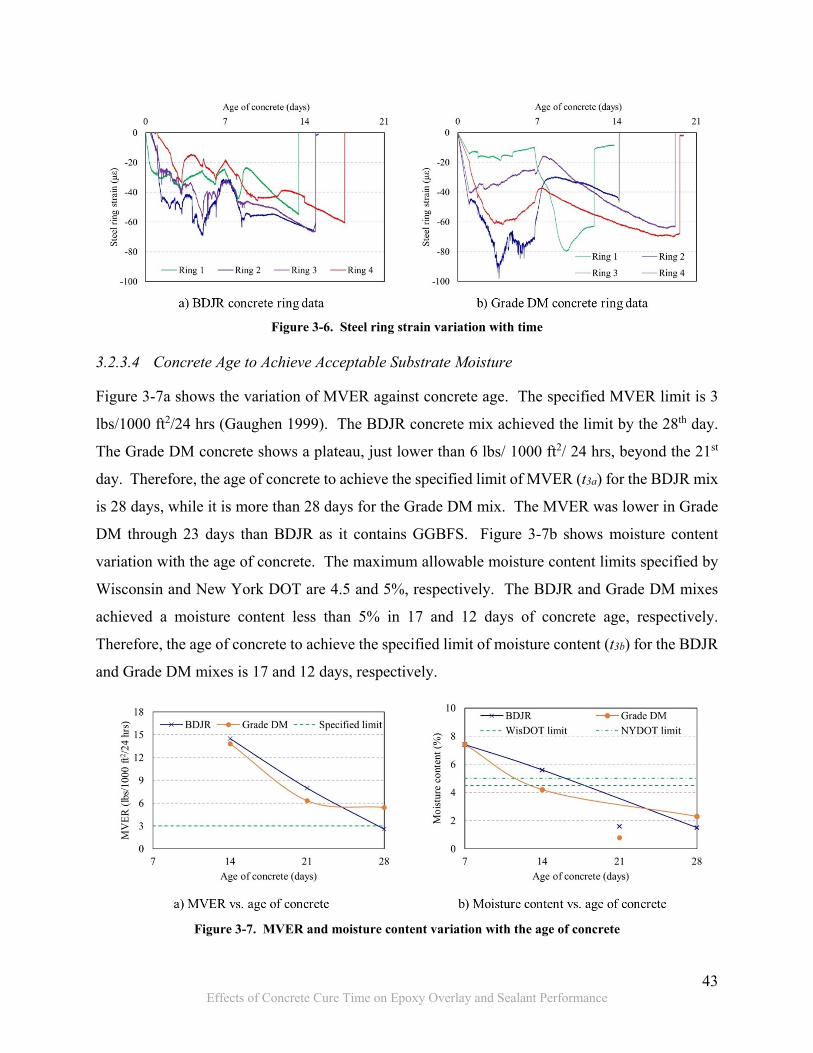
43 Effects of Concrete Cure Time on Epoxy Overlay and Sealant Performance
Figure 3-6. Steel ring strain variation with time
3.2.3.4 Concrete Age to Achieve Acceptable Substrate Moisture
Figure 3-7a shows the variation of MVER against concrete age. The specified MVER limit is 3
lbs/1000 ft2/24 hrs (Gaughen 1999). The BDJR concrete mix achieved the limit by the 28th day.
The Grade DM concrete shows a plateau, just lower than 6 lbs/ 1000 ft2/ 24 hrs, beyond the 21st
day. Therefore, the age of concrete to achieve the specified limit of MVER (t3a) for the BDJR mix
is 28 days, while it is more than 28 days for the Grade DM mix. The MVER was lower in Grade
DM through 23 days than BDJR as it contains GGBFS. Figure 3-7b shows moisture content
variation with the age of concrete. The maximum allowable moisture content limits specified by
Wisconsin and New York DOT are 4.5 and 5%, respectively. The BDJR and Grade DM mixes
achieved a moisture content less than 5% in 17 and 12 days of concrete age, respectively.
Therefore, the age of concrete to achieve the specified limit of moisture content (t3b) for the BDJR
and Grade DM mixes is 17 and 12 days, respectively.
Figure 3-7. MVER and moisture content variation with the age of concrete

44 Effects of Concrete Cure Time on Epoxy Overlay and Sealant Performance
3.2.3.5 Concrete Age to Develop the Specified Minimum Tensile Strength
Figure 3-5b shows the variation of flexural strength against the age of concrete for both concrete
mixes. The average flexural strength at 7 days of concrete age for BDJR and Grade DM mixes
was 742 and 715 psi, respectively. As discussed in Section 3.2.1.4, recommendations by Lin et al.
(2013) can be implemented to estimate the direct tensile strength from the flexural strength
evaluated following ASTM C78. Accordingly, a flexural strength of 417 psi is required to develop
a direct tensile strength of 250 psi. Since both concrete mixes achieved a flexural strength of more
than 417 psi within 7 days of wet curing, the concrete age to achieve the specified tensile strength
(t4) is less than 7 days.
3.2.3.6 Concrete Age at the Time of Epoxy Application to Develop the Specified Bond Strength
Figure 3-8 and Figure 3-9 show the tensile bond pull-off strength for both epoxy overlays applied
to the slabs fabricated using BDJR and Grade DM mixes. Figure 3-10 shows the failure modes
under different exposure conditions. Figure 3-11 shows the variation of IRH and concrete
temperature within the slabs. ‘E1’ and ‘E2’ are the labels given to E-bond 526 Lo-Mod and Unitex
Pro-Poxy Type III DOT, respectively. The performance of E1 and E2 epoxy overlays under
laboratory and outdoor exposure conditions are discussed in the following sections.
3.2.3.6.1 Performance under Simulated Exposure Conditions
The tensile bond pull-off strength variation against time for 14, 21, and 28-day epoxy application
ages under three different exposure conditions is presented in Figure 3-8 and Figure 3-9 for BDJR
and Grade DM concrete mixes, respectively. When evaluated under room temperature (RT), the
average bond strength of more than 250 psi was recorded with a failure in the substrate, regardless
of the epoxy application ages, concrete mixes, epoxy types, or substrate moisture at the time of
overlay application. Figure 3-10a(i) shows the failure mode under room temperature. Therefore,
the concrete age for overlay application (t5) can be as early as 14 days if the overlay is subjected
to room temperature (73o F) or similar conditions.
When evaluated under room temperature following a series of wet (3% NaCl) and dry (WD)
exposure cycles, the average bond strength of more than 250 psi was recorded with a failure in the
substrate, regardless of the epoxy application ages, concrete mixes, epoxy types, substrate moisture
at the time of overlay application, or the presence of NaCl for a duration of 90 days. Figure
3-10a(ii) shows the failure mode under WD exposure conditions. Therefore, the concrete age for
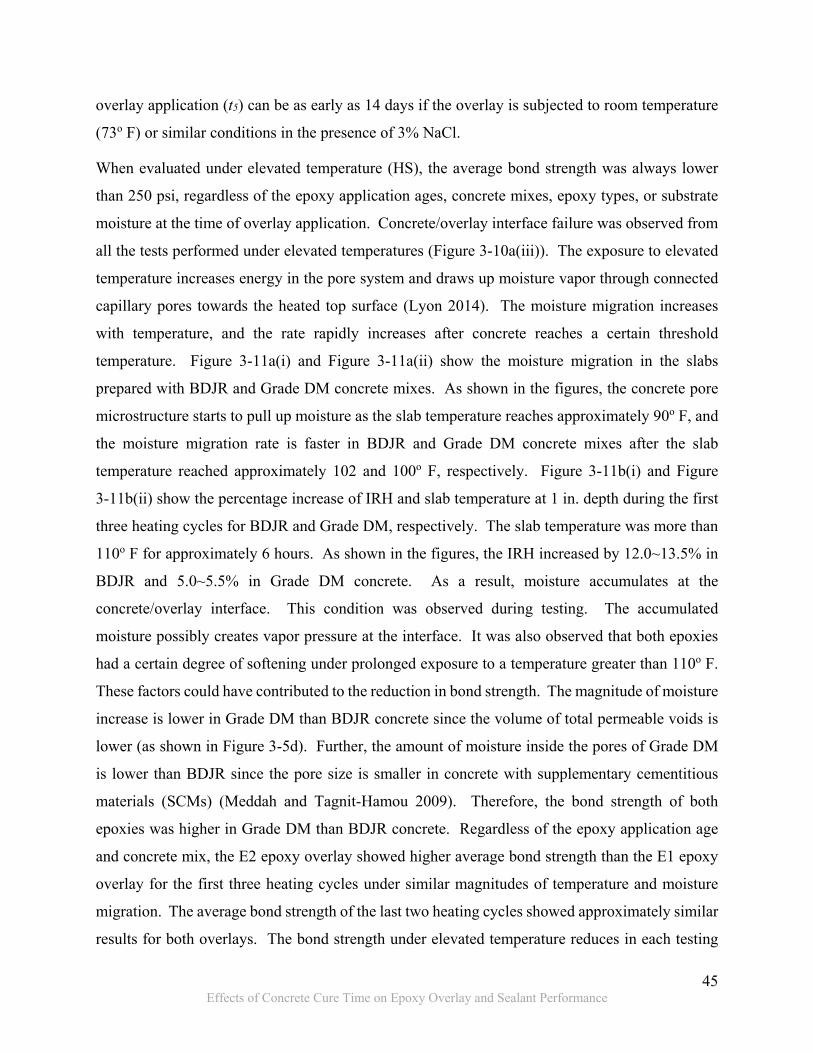
45 Effects of Concrete Cure Time on Epoxy Overlay and Sealant Performance
overlay application (t5) can be as early as 14 days if the overlay is subjected to room temperature
(73o F) or similar conditions in the presence of 3% NaCl.
When evaluated under elevated temperature (HS), the average bond strength was always lower
than 250 psi, regardless of the epoxy application ages, concrete mixes, epoxy types, or substrate
moisture at the time of overlay application. Concrete/overlay interface failure was observed from
all the tests performed under elevated temperatures (Figure 3-10a(iii)). The exposure to elevated
temperature increases energy in the pore system and draws up moisture vapor through connected
capillary pores towards the heated top surface (Lyon 2014). The moisture migration increases
with temperature, and the rate rapidly increases after concrete reaches a certain threshold
temperature. Figure 3-11a(i) and Figure 3-11a(ii) show the moisture migration in the slabs
prepared with BDJR and Grade DM concrete mixes. As shown in the figures, the concrete pore
microstructure starts to pull up moisture as the slab temperature reaches approximately 90o F, and
the moisture migration rate is faster in BDJR and Grade DM concrete mixes after the slab
temperature reached approximately 102 and 100o F, respectively. Figure 3-11b(i) and Figure
3-11b(ii) show the percentage increase of IRH and slab temperature at 1 in. depth during the first
three heating cycles for BDJR and Grade DM, respectively. The slab temperature was more than
110o F for approximately 6 hours. As shown in the figures, the IRH increased by 12.0~13.5% in
BDJR and 5.0~5.5% in Grade DM concrete. As a result, moisture accumulates at the
concrete/overlay interface. This condition was observed during testing. The accumulated
moisture possibly creates vapor pressure at the interface. It was also observed that both epoxies
had a certain degree of softening under prolonged exposure to a temperature greater than 110o F.
These factors could have contributed to the reduction in bond strength. The magnitude of moisture
increase is lower in Grade DM than BDJR concrete since the volume of total permeable voids is
lower (as shown in Figure 3-5d). Further, the amount of moisture inside the pores of Grade DM
is lower than BDJR since the pore size is smaller in concrete with supplementary cementitious
materials (SCMs) (Meddah and Tagnit-Hamou 2009). Therefore, the bond strength of both
epoxies was higher in Grade DM than BDJR concrete. Regardless of the epoxy application age
and concrete mix, the E2 epoxy overlay showed higher average bond strength than the E1 epoxy
overlay for the first three heating cycles under similar magnitudes of temperature and moisture
migration. The average bond strength of the last two heating cycles showed approximately similar
results for both overlays. The bond strength under elevated temperature reduces in each testing

46 Effects of Concrete Cure Time on Epoxy Overlay and Sealant Performance
cycle and shows a similar trend for all three application ages and converges to about 80 psi. This
might be due to the repeated exposure to elevated temperature (Soltesz 2010). The bond strength
was also evaluated after allowing the slab temperature to reach room temperature following a heat
cycle. The data is presented using red and pink bullets with a blue border. Failure in the substrate,
bond failure at the concrete/overlay interface, and a partial failure in the bond and the substrate
were observed. Figure 3-10a(iv) shows the combined failure mode at room temperature following
a heat cycle. The results show a recovery of the bond strength. The magnitude of recovered bond
strength was higher in Grade DM concrete for both epoxy overlays. The recovered bond strength
of the E2 epoxy overlay is higher than the E1 epoxy overlay for both concrete mixes.
3.2.3.6.2 Performance under Outdoor Exposure
Figure 3-8 and Figure 3-9 present overlay performance under outdoor exposure for BDJR and
Grade DM concrete mixes, respectively. Regardless of the epoxy application ages, concrete mixes,
epoxy types, and substrate moisture at the time of overlay application, the average bond strength
is more than the specified limit when the performance was evaluated in October (fall 2019).
Substrate failure was observed. A similar performance was recorded in February (winter 2020).
The average bond strength evaluated in July (summer 2020) under 87~91o F is lower than 250 psi,
but it is greater than the strength observed under simulated heated conditions in the lab. Partial
failure in overlay, bond, and substrate was commonly observed. Figure 3-11c(i) and Figure
3-11c(ii) show IRH and internal temperature variation in the slabs under summer conditions. Even
though the slab temperature was more than 110o F for about 8 hours, the IRH increased by
approximately 2% and 1% in BDJR and Grade DM slabs, respectively. As concrete ages, the
internal moisture content decreases if no external moisture source is provided. This might be the
reason for having a greater bond strength under summer conditions than the simulated conditions
in the lab. The moisture migration is lower in the Grade DM than in the BDJR concrete mix.
Figure 3-10b and Figure 3-10c show the failure surface of the E1 and E2 epoxy overlay,
respectively. A higher degree of softening is visible in the E1 epoxy under elevated temperatures.
The bond strength was also evaluated in the morning (July, summer 2020) when the temperature
was close to 73o F. The bond strength is more than the specified limit.
The bond strength of both epoxy overlays exposed to 3% NaCl solution for 135 days under outdoor
exposure conditions was more than 250 psi. Most of the tests showed failure in the substrate.

47 Effects of Concrete Cure Time on Epoxy Overlay and Sealant Performance
However, in a few cases, the failure was through the concrete/overlay interface and the substrate.
This might be due to the elevated temperature exposure in the outdoors.
Both epoxies showed comparatively similar performance; however, E2 had a slightly better overall
performance. Low permeable concrete (such as Grade DM) improves overlay performance. Slabs
with overlays subjected to an elevated temperature at an early age result in lower bond strength
due to high internal moisture. Therefore, applying overlays on new concrete in the fall is
recommended to provide adequate time to stabilize internal moisture before the subsequent
summer months. However, this is not practical in most of the climatic regions where seasonal
changes are not favorable to maintain a bridge deck temperature below 95 to 100o F. Hence, the
use of concrete with a dense microstructure (lower permeability) is recommended. Further, epoxy
properties need to be enhanced to sustain under high temperatures, at least up to 150o F.

48 Effects of Concrete Cure Time on Epoxy Overlay and Sealant Performance
Figure 3-8. Thin epoxy overlay bond strength performance on BDJR concrete slabs
Note: RT = room temperature; HS= elevated temperature; WD = wet-dry cycle.

49 Effects of Concrete Cure Time on Epoxy Overlay and Sealant Performance
Figure 3-9. Thin epoxy overlay bond strength performance on Grade DM concrete slabs
Note: RT = room temperature; HS= elevated temperature; WD = wet-dry cycle.

50 Effects of Concrete Cure Time on Epoxy Overlay and Sealant Performance
Figure 3-10. Failure modes under different exposure conditions

51 Effects of Concrete Cure Time on Epoxy Overlay and Sealant Performance
Figure 3-11. IRH and temperature variation during elevated temperature cycles
3.2.3.7 Epoxy Overlay Performance Against Chloride Ingress
The total average background chloride content along the depth of BDJR and Grade DM specimens
is 231 ppm and 270 ppm, respectively. Table 3-4 and Table 3-5 show the chloride content along
the depth of the slabs, overlaid with the E1 and E2 epoxies, and ponded with 3% NaCl. Each data
point represents the chloride content within a half-inch depth. Since the top 0.25 in. was discarded
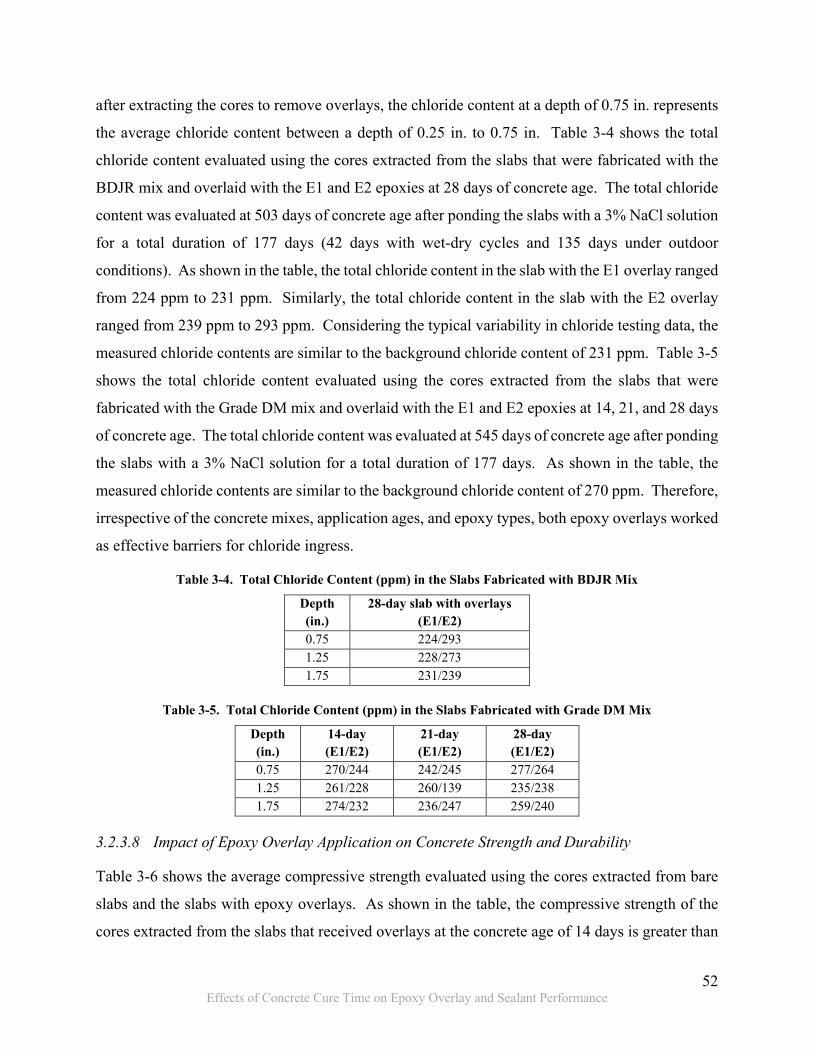
52 Effects of Concrete Cure Time on Epoxy Overlay and Sealant Performance
after extracting the cores to remove overlays, the chloride content at a depth of 0.75 in. represents
the average chloride content between a depth of 0.25 in. to 0.75 in. Table 3-4 shows the total
chloride content evaluated using the cores extracted from the slabs that were fabricated with the
BDJR mix and overlaid with the E1 and E2 epoxies at 28 days of concrete age. The total chloride
content was evaluated at 503 days of concrete age after ponding the slabs with a 3% NaCl solution
for a total duration of 177 days (42 days with wet-dry cycles and 135 days under outdoor
conditions). As shown in the table, the total chloride content in the slab with the E1 overlay ranged
from 224 ppm to 231 ppm. Similarly, the total chloride content in the slab with the E2 overlay
ranged from 239 ppm to 293 ppm. Considering the typical variability in chloride testing data, the
measured chloride contents are similar to the background chloride content of 231 ppm. Table 3-5
shows the total chloride content evaluated using the cores extracted from the slabs that were
fabricated with the Grade DM mix and overlaid with the E1 and E2 epoxies at 14, 21, and 28 days
of concrete age. The total chloride content was evaluated at 545 days of concrete age after ponding
the slabs with a 3% NaCl solution for a total duration of 177 days. As shown in the table, the
measured chloride contents are similar to the background chloride content of 270 ppm. Therefore,
irrespective of the concrete mixes, application ages, and epoxy types, both epoxy overlays worked
as effective barriers for chloride ingress.
Table 3-4. Total Chloride Content (ppm) in the Slabs Fabricated with BDJR Mix
Depth (in.)
28-day slab with overlays (E1/E2)
0.75 224/293 1.25 228/273 1.75 231/239
Table 3-5. Total Chloride Content (ppm) in the Slabs Fabricated with Grade DM Mix
Depth (in.)
14-day (E1/E2)
21-day (E1/E2)
28-day (E1/E2)
0.75 270/244 242/245 277/264 1.25 261/228 260/139 235/238 1.75 274/232 236/247 259/240
3.2.3.8 Impact of Epoxy Overlay Application on Concrete Strength and Durability
Table 3-6 shows the average compressive strength evaluated using the cores extracted from bare
slabs and the slabs with epoxy overlays. As shown in the table, the compressive strength of the
cores extracted from the slabs that received overlays at the concrete age of 14 days is greater than
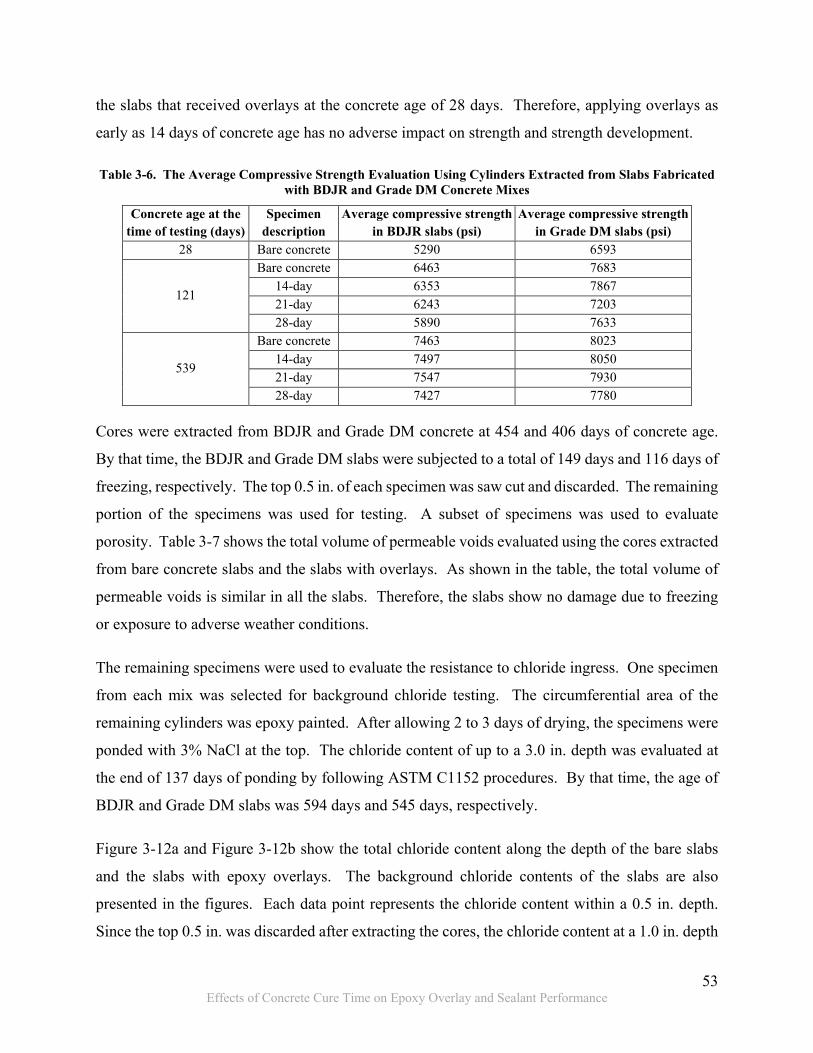
53 Effects of Concrete Cure Time on Epoxy Overlay and Sealant Performance
the slabs that received overlays at the concrete age of 28 days. Therefore, applying overlays as
early as 14 days of concrete age has no adverse impact on strength and strength development.
Table 3-6. The Average Compressive Strength Evaluation Using Cylinders Extracted from Slabs Fabricated with BDJR and Grade DM Concrete Mixes
Concrete age at the time of testing (days)
Specimen description
Average compressive strength in BDJR slabs (psi)
Average compressive strength in Grade DM slabs (psi)
28 Bare concrete 5290 6593
121
Bare concrete 6463 7683 14-day 6353 7867 21-day 6243 7203 28-day 5890 7633
539
Bare concrete 7463 8023 14-day 7497 8050 21-day 7547 7930 28-day 7427 7780
Cores were extracted from BDJR and Grade DM concrete at 454 and 406 days of concrete age.
By that time, the BDJR and Grade DM slabs were subjected to a total of 149 days and 116 days of
freezing, respectively. The top 0.5 in. of each specimen was saw cut and discarded. The remaining
portion of the specimens was used for testing. A subset of specimens was used to evaluate
porosity. Table 3-7 shows the total volume of permeable voids evaluated using the cores extracted
from bare concrete slabs and the slabs with overlays. As shown in the table, the total volume of
permeable voids is similar in all the slabs. Therefore, the slabs show no damage due to freezing
or exposure to adverse weather conditions.
The remaining specimens were used to evaluate the resistance to chloride ingress. One specimen
from each mix was selected for background chloride testing. The circumferential area of the
remaining cylinders was epoxy painted. After allowing 2 to 3 days of drying, the specimens were
ponded with 3% NaCl at the top. The chloride content of up to a 3.0 in. depth was evaluated at
the end of 137 days of ponding by following ASTM C1152 procedures. By that time, the age of
BDJR and Grade DM slabs was 594 days and 545 days, respectively.
Figure 3-12a and Figure 3-12b show the total chloride content along the depth of the bare slabs
and the slabs with epoxy overlays. The background chloride contents of the slabs are also
presented in the figures. Each data point represents the chloride content within a 0.5 in. depth.
Since the top 0.5 in. was discarded after extracting the cores, the chloride content at a 1.0 in. depth
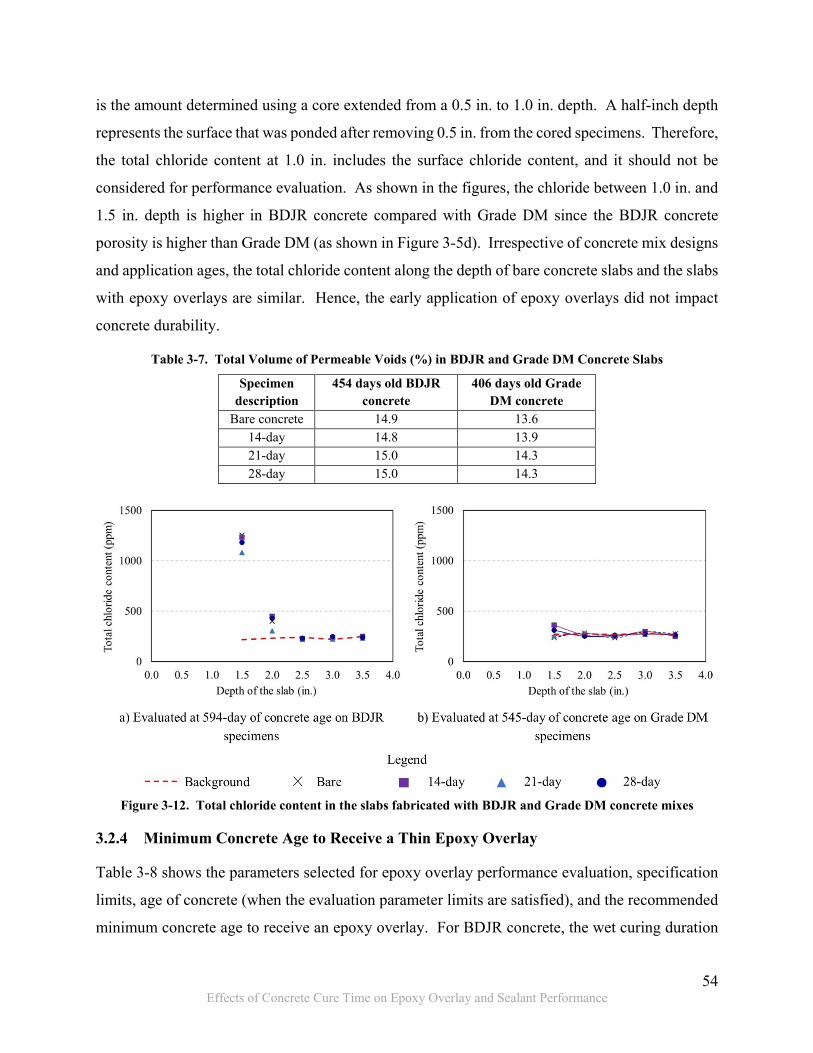
54 Effects of Concrete Cure Time on Epoxy Overlay and Sealant Performance
is the amount determined using a core extended from a 0.5 in. to 1.0 in. depth. A half-inch depth
represents the surface that was ponded after removing 0.5 in. from the cored specimens. Therefore,
the total chloride content at 1.0 in. includes the surface chloride content, and it should not be
considered for performance evaluation. As shown in the figures, the chloride between 1.0 in. and
1.5 in. depth is higher in BDJR concrete compared with Grade DM since the BDJR concrete
porosity is higher than Grade DM (as shown in Figure 3-5d). Irrespective of concrete mix designs
and application ages, the total chloride content along the depth of bare concrete slabs and the slabs
with epoxy overlays are similar. Hence, the early application of epoxy overlays did not impact
concrete durability.
Table 3-7. Total Volume of Permeable Voids (%) in BDJR and Grade DM Concrete Slabs
Specimen description
454 days old BDJR concrete
406 days old Grade DM concrete
Bare concrete 14.9 13.6 14-day 14.8 13.9 21-day 15.0 14.3 28-day 15.0 14.3
Figure 3-12. Total chloride content in the slabs fabricated with BDJR and Grade DM concrete mixes
3.2.4 Minimum Concrete Age to Receive a Thin Epoxy Overlay
Table 3-8 shows the parameters selected for epoxy overlay performance evaluation, specification
limits, age of concrete (when the evaluation parameter limits are satisfied), and the recommended
minimum concrete age to receive an epoxy overlay. For BDJR concrete, the wet curing duration

55 Effects of Concrete Cure Time on Epoxy Overlay and Sealant Performance
to achieve the required minimum strength and a discontinuous capillary pore structure with a
minimum volume of total permeable voids for durability (t1) is 7 days. Similarly, the Grade DM
concrete needs 10 days of wet curing to satisfy the minimum strength and durability requirements.
Therefore, the required minimum wet curing duration (t1) for Grade DM concrete is 10 days.
Concrete age at the time of cracking (t2) is conservatively selected for BDJR and Grade DM
concrete as 18 and 20 days, respectively. The age of concrete to achieve an acceptable MVER
(t3a) is not considered since the specified MVER limit was not achieved until 28 days, and the
performance of the epoxy overlay was not impacted by high MVER. As an example, bond strength
was higher on Grade DM slabs compared to BDJR slabs even though MVER was higher in Grade
DM slabs. However, Grade DM concrete moisture content was less than 5% when the concrete
age was 12 days. The moisture content of BDJR concrete reached the 5% limit in 17 days. New
York DOT allows overlay application when the moisture content is equal to or less than 5%.
Considering the moisture content limit of 5%, the concrete age to achieve an acceptable moisture
content (t3b) for BDJR and Grade DM concrete mixes is selected as 17 and 12 days, respectively.
The concrete age to develop the specified minimum tensile strength (t4) for both mixes is 7 days.
Epoxy overlays can be applied on the BDJR and Grade DM concrete in 14 days if only the
performance of the overlays against bond strength is considered. However, concrete age needs to
be at least 18 and 20 days for the BDJR and Grade DM concrete mixes to allow adequate time to
develop cracking, the primary reason for the epoxy overlay application. Even though the epoxy
overlay application on uncracked concrete could delay cracking, the overlay would not be able to
prevent it from happening. As a result, the system integrity is compromised since concrete
cracking after overlay application is difficult to identify through visual inspection. Hence, the
cracking age is the decisive parameter for determining the concrete age to receive a thin epoxy
overlay. Considering all the parameters, the minimum age of the BDJR and Grade DM concrete
to receive an epoxy overlay needs to be 18 and 20 days, respectively.
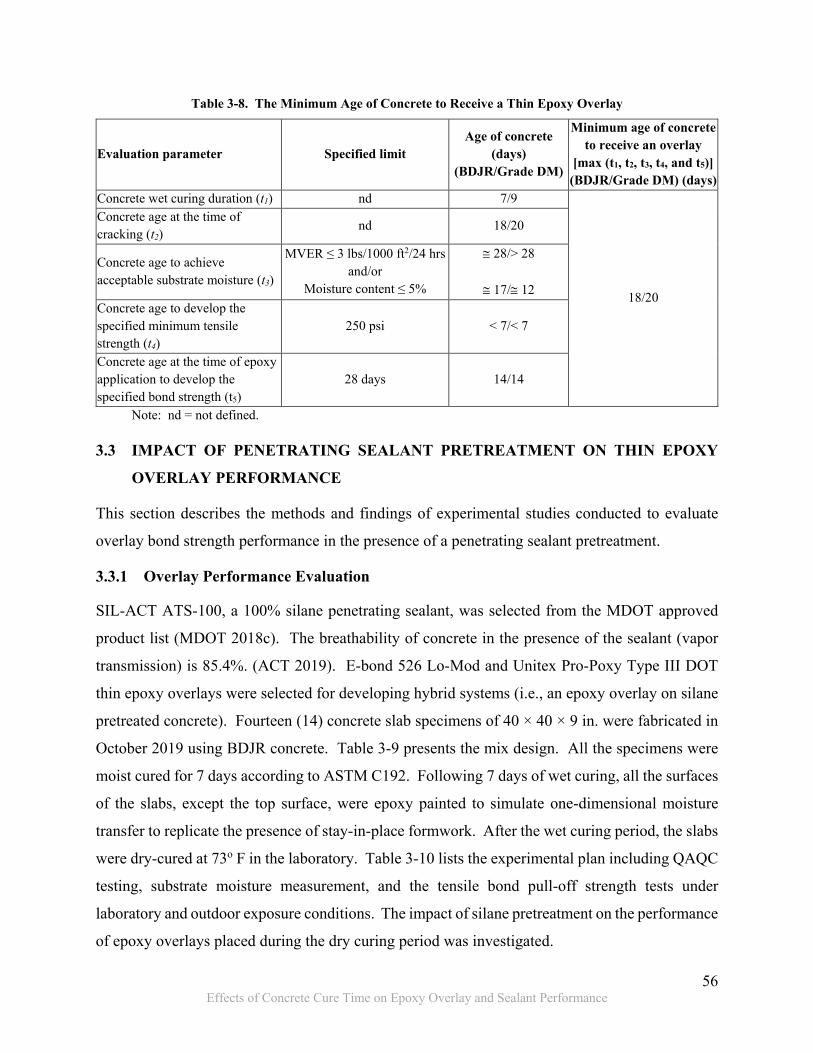
56 Effects of Concrete Cure Time on Epoxy Overlay and Sealant Performance
Table 3-8. The Minimum Age of Concrete to Receive a Thin Epoxy Overlay
Evaluation parameter Specified limit Age of concrete
(days) (BDJR/Grade DM)
Minimum age of concrete to receive an overlay
[max (t1, t2, t3, t4, and t5)] (BDJR/Grade DM) (days)
Concrete wet curing duration (t1) nd 7/9
18/20
Concrete age at the time of cracking (t2)
nd 18/20
Concrete age to achieve acceptable substrate moisture (t3)
MVER ≤ 3 lbs/1000 ft2/24 hrs and/or
Moisture content ≤ 5%
≅ 28/> 28
≅ 17/≅ 12 Concrete age to develop the specified minimum tensile strength (t4)
250 psi < 7/< 7
Concrete age at the time of epoxy application to develop the specified bond strength (t5)
28 days 14/14
Note: nd = not defined.
3.3 IMPACT OF PENETRATING SEALANT PRETREATMENT ON THIN EPOXY
OVERLAY PERFORMANCE
This section describes the methods and findings of experimental studies conducted to evaluate
overlay bond strength performance in the presence of a penetrating sealant pretreatment.
3.3.1 Overlay Performance Evaluation
SIL-ACT ATS-100, a 100% silane penetrating sealant, was selected from the MDOT approved
product list (MDOT 2018c). The breathability of concrete in the presence of the sealant (vapor
transmission) is 85.4%. (ACT 2019). E-bond 526 Lo-Mod and Unitex Pro-Poxy Type III DOT
thin epoxy overlays were selected for developing hybrid systems (i.e., an epoxy overlay on silane
pretreated concrete). Fourteen (14) concrete slab specimens of 40 × 40 × 9 in. were fabricated in
October 2019 using BDJR concrete. Table 3-9 presents the mix design. All the specimens were
moist cured for 7 days according to ASTM C192. Following 7 days of wet curing, all the surfaces
of the slabs, except the top surface, were epoxy painted to simulate one-dimensional moisture
transfer to replicate the presence of stay-in-place formwork. After the wet curing period, the slabs
were dry-cured at 73o F in the laboratory. Table 3-10 lists the experimental plan including QAQC
testing, substrate moisture measurement, and the tensile bond pull-off strength tests under
laboratory and outdoor exposure conditions. The impact of silane pretreatment on the performance
of epoxy overlays placed during the dry curing period was investigated.

57 Effects of Concrete Cure Time on Epoxy Overlay and Sealant Performance
Temperature, slump, density, and air content were measured as fresh concrete properties. The top
surface of each specimen was shotblasted to CSP 7 and cleaned when the age of concrete was 14
days. Thin epoxy overlays were applied on the silane pretreated slabs at 14, 21, and 28 days of
concrete age. Four slabs were selected for each application age. Two slabs were treated with
silane before the overlay application and labeled as ST (i.e., Silane Treated). Following the sealant
drying period as per the manufacturer’s specifications, the first coat of epoxy overlay was applied
on the same day. The other two slabs were overlaid with epoxies without any pretreatment and
labeled as RS (i.e., Reference Specimen). The second epoxy layer was applied on the following
day. This allowed a 24-hour curing period for the first epoxy layer. A layer of flint aggregate was
broadcasted following the application of each epoxy layer. The tensile bond pull-off strength was
conducted according to ASTM C1583 (2013) under laboratory and outdoor exposure conditions
to evaluate the impact of silane pretreatment on the bond strength.
After selecting 4 slabs for each overlay application age, two slabs remained from the total of 14.
One of those slabs was used without any treatment (i.e., with a bare concrete surface). The other
slab was treated with the penetrating sealant at the concrete age of 14 days. MVER was measured
on both slabs at 14, 21, and 28 days of concrete age. The moisture content of both slabs was
measured from the end of the 7-day wet curing. IRH was measured starting at the end of the 7-
day wet curing until the end of testing by placing probes at the depths of 1 and 3.6 in. from the top
surface. IRH of the slabs with epoxy overlays was measured to evaluate moisture migration and
redistribution under different exposure conditions.
Table 3-9. BDJR Concrete Mix Design (per yd3)
Material Quantity Coarse aggregate (SSD) (lb) 1,500 Fine aggregate (SSD) (lb) 1,553 Cement – Type I (lb) 655 Water (lb) 235 Hydration controlling admixture (fl oz) (to increase setting time during casting) 33.33
Water reducing admixture (fl oz) 58.33 Air entraining admixture (fl oz) 6.33 Water-cement ratio 0.36

58 Effects of Concrete Cure Time on Epoxy Overlay and Sealant Performance
Table 3-10. Experimental Plan to Assess the Influence of Silane Pretreatment on Epoxy Overlay Performance
Evaluation parameter
(a)
Measurand
(b)
ASTM standard
(c)
Specimen dimensions (in.)
(d)
Concrete age at the time of overlay application
(e)
Treatment conditions
(f)
Concrete age at the time of testing (days)
(g)
QAQC
Temperature C1064 As per the
ASTM NA NA NA Slump C143 Density C138 Air content C231
Substrate moisture
MVER F1869 40 × 40 × 9 NA RSa and STb 14, 21, and 28 Moisture content F2659 40 × 40 × 9 NA RS and ST 7, 14, 21, and 28
IRH F2170 40 × 40 × 9 NA RS and ST Starting from 7-day until the end of testing
Tensile bond pull-off strength
Tensile bond pull-off strength C1583
40 × 40 × 9 14 RS and ST Lab: 17c, 24d, 28d, 42d, and 70d
Outdoorse: 146, 156, 271, 274, and 275
40 × 40 × 9 21 RS and ST Lab: 24, 28, 35, 49, and 77 Outdoors: 271, 274, and 275
40 × 40 × 9 28 RS and ST Lab: 31, 35, 42, 56, and 84 Outdoors: 271, 274, and 275
Note: NA = not applicable aRS – Reference specimen. Overlays were placed without silane pretreatment. bST – Silane treated specimen. Overlays were placed with silane pretreatment. cTensile bond pull-off strength tests were performed at room temperature in the laboratory. dTensile bond pull-off strength tests were performed under simulated elevated temperature in the laboratory. eSlabs were moved outdoors when the concrete age was 100 days and exposed to southwest Michigan weather through the testing age.

59 Effects of Concrete Cure Time on Epoxy Overlay and Sealant Performance
3.3.2 Epoxy Overlay Performance
3.3.2.1 Performance Evaluation under Simulated Exposure Conditions
The performance of both epoxy overlays was evaluated in the laboratory using (i) slabs under room
temperature (RT) (73o F) and (ii) elevated temperature (Heated Slabs - HS) (~110o F). The tensile
bond pull-off strength tests were performed on each RS and ST specimen for five cycles. The first
cycle of testing was performed under room temperature, and the remaining four cycles were
performed under the elevated temperature. The bond strength was also evaluated after allowing
the slabs to cool down to room temperature following a heat cycle. The performance was evaluated
at 3, 7, 14, 28, and 56 days following epoxy overlay application. As an example, the 14-day slabs
were tested at 17, 24, 28, 42, and 70 days of concrete age. Among these testing ages, the first
cycle of testing at day 17 was performed under room temperature. Testing at 24, 28, 42, and 70
days was performed under elevated temperature. Each pull-off strength test area was sealed using
epoxy paint to prevent moisture loss.
3.3.2.2 Performance Evaluation under Outdoor Exposure Conditions
Following the performance evaluation under simulated exposure conditions in the laboratory, all
12 slabs were moved to an open parking lot in January 2020 to get them exposed to elements. The
tensile bond pull-off strength tests were performed under winter and summer exposure conditions.
The slabs that received overlays at the age of 14 days were expected to retain the highest amount
of internal moisture and had the greatest potential to be damaged under freezing conditions.
Hence, bond strength was evaluated in March 2020 after these slabs were subjected to 44 and 52
freezing cycles. The ambient temperature during testing was 34~38o F. The last sets of bond
strength tests were conducted in July 2020. One set of data was collected when the ambient
temperature was 87~91o F. The other data set was collected in the morning when the temperature
was about 73o F. The performance of both epoxy overlays was evaluated on 14-day slabs at 146,
156, 271, 274, and 275 days of concrete age. The other slabs were tested at 271, 274, and 275
days of concrete age. Each pull-off strength test area was sealed using epoxy paint.
3.3.2.3 Impact of Hybrid Protective System on Concrete Durability
Among the three application ages considered in this study, the slabs that received the overlay
hybrid system earlier than 28 days of concrete age had a greater potential to be damaged under
freezing conditions. This was due to the high amount of internal moisture retained by the time the
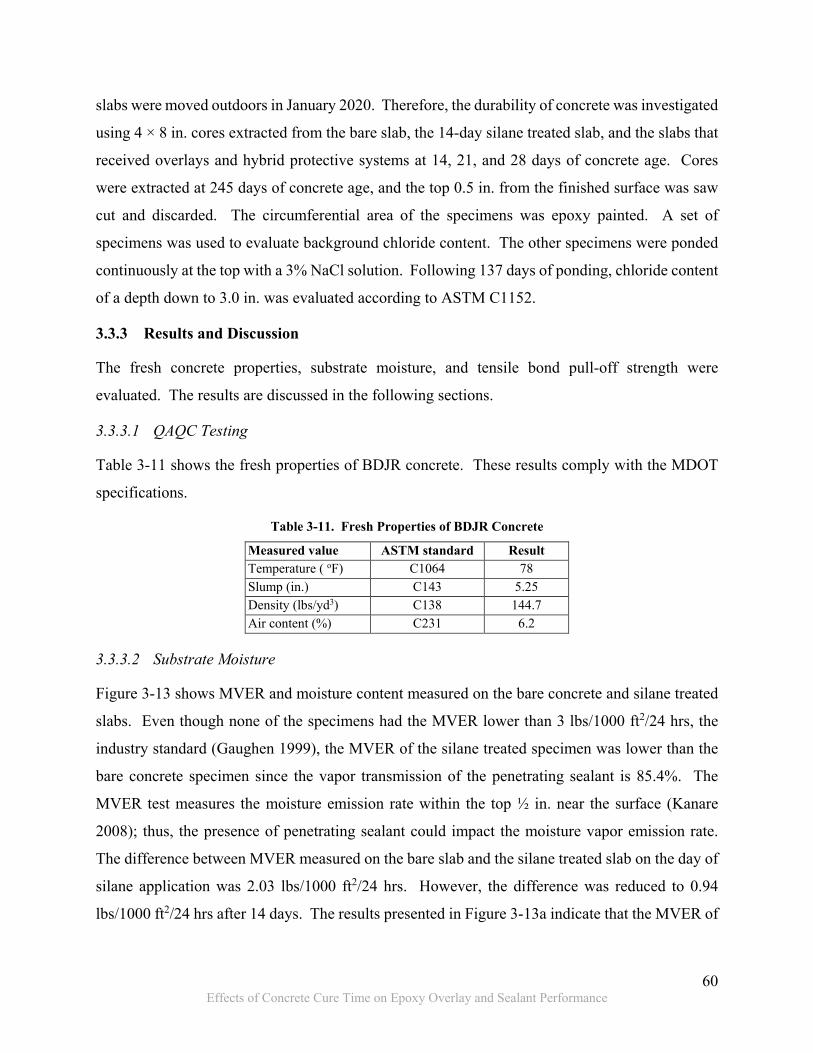
60 Effects of Concrete Cure Time on Epoxy Overlay and Sealant Performance
slabs were moved outdoors in January 2020. Therefore, the durability of concrete was investigated
using 4 × 8 in. cores extracted from the bare slab, the 14-day silane treated slab, and the slabs that
received overlays and hybrid protective systems at 14, 21, and 28 days of concrete age. Cores
were extracted at 245 days of concrete age, and the top 0.5 in. from the finished surface was saw
cut and discarded. The circumferential area of the specimens was epoxy painted. A set of
specimens was used to evaluate background chloride content. The other specimens were ponded
continuously at the top with a 3% NaCl solution. Following 137 days of ponding, chloride content
of a depth down to 3.0 in. was evaluated according to ASTM C1152.
3.3.3 Results and Discussion
The fresh concrete properties, substrate moisture, and tensile bond pull-off strength were
evaluated. The results are discussed in the following sections.
3.3.3.1 QAQC Testing
Table 3-11 shows the fresh properties of BDJR concrete. These results comply with the MDOT
specifications.
Table 3-11. Fresh Properties of BDJR Concrete
Measured value ASTM standard Result Temperature ( oF) C1064 78 Slump (in.) C143 5.25 Density (lbs/yd3) C138 144.7 Air content (%) C231 6.2
3.3.3.2 Substrate Moisture
Figure 3-13 shows MVER and moisture content measured on the bare concrete and silane treated
slabs. Even though none of the specimens had the MVER lower than 3 lbs/1000 ft2/24 hrs, the
industry standard (Gaughen 1999), the MVER of the silane treated specimen was lower than the
bare concrete specimen since the vapor transmission of the penetrating sealant is 85.4%. The
MVER test measures the moisture emission rate within the top ½ in. near the surface (Kanare
2008); thus, the presence of penetrating sealant could impact the moisture vapor emission rate.
The difference between MVER measured on the bare slab and the silane treated slab on the day of
silane application was 2.03 lbs/1000 ft2/24 hrs. However, the difference was reduced to 0.94
lbs/1000 ft2/24 hrs after 14 days. The results presented in Figure 3-13a indicate that the MVER of
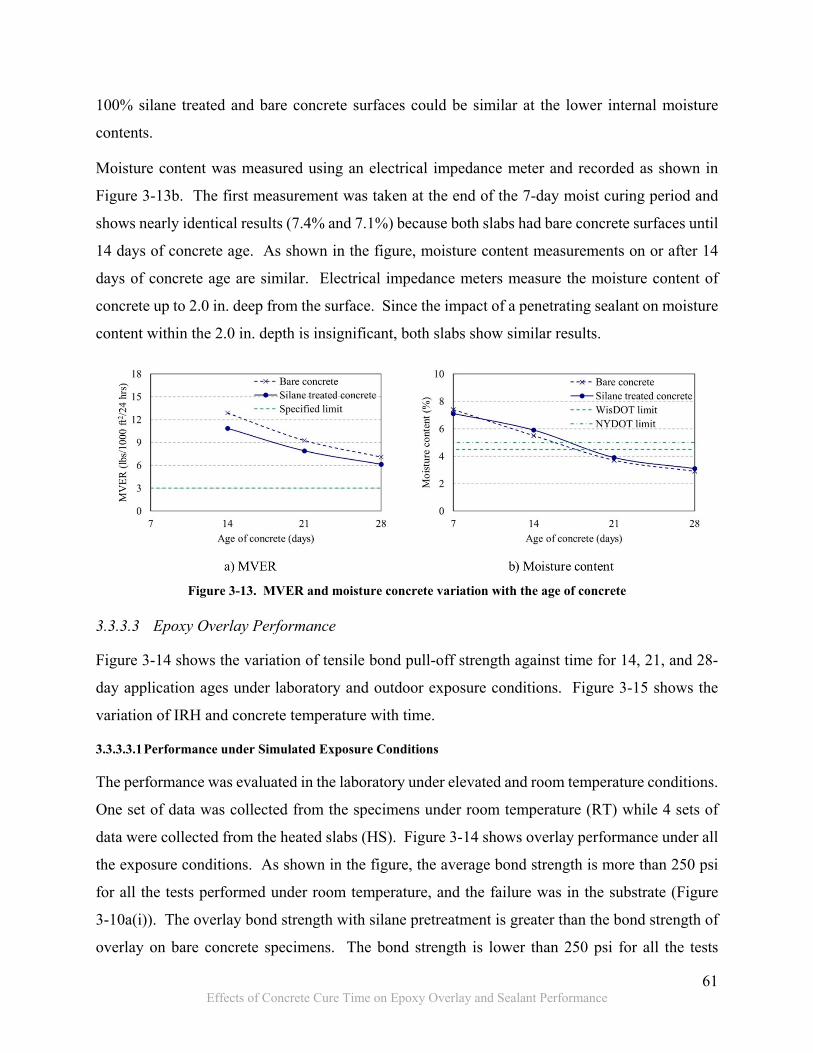
61 Effects of Concrete Cure Time on Epoxy Overlay and Sealant Performance
100% silane treated and bare concrete surfaces could be similar at the lower internal moisture
contents.
Moisture content was measured using an electrical impedance meter and recorded as shown in
Figure 3-13b. The first measurement was taken at the end of the 7-day moist curing period and
shows nearly identical results (7.4% and 7.1%) because both slabs had bare concrete surfaces until
14 days of concrete age. As shown in the figure, moisture content measurements on or after 14
days of concrete age are similar. Electrical impedance meters measure the moisture content of
concrete up to 2.0 in. deep from the surface. Since the impact of a penetrating sealant on moisture
content within the 2.0 in. depth is insignificant, both slabs show similar results.
Figure 3-13. MVER and moisture concrete variation with the age of concrete
3.3.3.3 Epoxy Overlay Performance
Figure 3-14 shows the variation of tensile bond pull-off strength against time for 14, 21, and 28-
day application ages under laboratory and outdoor exposure conditions. Figure 3-15 shows the
variation of IRH and concrete temperature with time.
3.3.3.3.1 Performance under Simulated Exposure Conditions
The performance was evaluated in the laboratory under elevated and room temperature conditions.
One set of data was collected from the specimens under room temperature (RT) while 4 sets of
data were collected from the heated slabs (HS). Figure 3-14 shows overlay performance under all
the exposure conditions. As shown in the figure, the average bond strength is more than 250 psi
for all the tests performed under room temperature, and the failure was in the substrate (Figure
3-10a(i)). The overlay bond strength with silane pretreatment is greater than the bond strength of
overlay on bare concrete specimens. The bond strength is lower than 250 psi for all the tests
62 Effects of Concrete Cure Time on Epoxy Overlay and Sealant Performance
performed under elevated temperature, and the failure was at the concrete/overlay interface (Figure
3-10a (iii)). Figure 3-15a shows the change in IRH and slab temperature for three heating cycles
simulated in the laboratory. The slab temperature was more than 110o F for approximately 6 hours.
The IRH increased by approximately 9%. As shown in the figure, the concrete pore microstructure
started to pull up moisture when the slab temperature was approximately 90o F, and moisture
migration is faster after the slab temperature was approximately 102o F. As a result, moisture
accumulates at the concrete/overlay interface and possibly creates vapor pressure on the overlay.
In addition, a certain degree of epoxy softening was observed under prolonged and repeated
exposure to elevated temperature. These factors could have been the reasons for lower bond
strengths observed under elevated temperatures. However, the bond strength of both epoxies on
silane pretreated slabs of the 28-day application age is greater than 250 psi during the first heating
cycle. Irrespective of the application age and epoxy type, the bond strength of overlay on silane
pretreated specimens was greater than the bond strength of overlay on bare concrete specimens
when evaluated at an early age under similar exposure and substrate moisture conditions.
However, the bond strength was almost the same when evaluated at 70 days following overlay
placement. As shown in Figure 3-13a, the impact of silane on MVER decreases with the reduction
in concrete moisture. Therefore, the positive impact of silane on bond strength is reduced. The
E2 overlay resulted in a higher bond strength than the E1 overlay regardless of the application age
and pretreatment condition. The bond strength was also performed after allowing adequate time
for the slabs to reach room temperature following a heating cycle. The data is presented using red
and pink bullets with blue borders. Failure in substrate, bond failure at the concrete/overlay
interface, and partial failure in the bond and substrate were observed. The results show a recovery
of the bond strength. The magnitude of recovered bond strength was higher in silane treated
specimens irrespective of epoxy application age and epoxy type. Therefore, the presence of silane
on concrete shows no adverse impact on the overlay performance rather than improving the bond
strength at an early age. The magnitude of recovered bond strength was higher with the E2 overlay
than with the E1 overlay, regardless of the treatment condition. In general, the E2 epoxy overlay
performed consistently better than the E1 epoxy overlay under simulated exposure conditions in
the laboratory.
63 Effects of Concrete Cure Time on Epoxy Overlay and Sealant Performance
3.3.3.4 Performance under Outdoor Exposure Conditions
Figure 3-14 shows the overlay bond strength performance under outdoor exposure conditions. In
March 2020, the bond strength was evaluated after the specimens were subjected to 44 and 52
freezing cycles. The temperature at the time of testing was 34~38o F. As shown in the figure, the
average bond strength is greater than 250 psi, with a failure in the substrate. Irrespective of
application age, epoxy type, and treatment condition, the average bond strength evaluated in July
(summer 2020) under 87~91o F is lower than the specified minimum of 250 psi. Combined failure
in the substrate and bond failure at the concrete/overlay interface was observed in most cases
regardless of the application age, epoxy type, and surface treatment. Figure 3-15b shows the
change in slab moisture and temperature under outdoor exposure conditions for three consecutive
days. As shown in the figure, IRH increased by 4.5~5%. The slab temperature was more than
110o F for a duration of approximately 8 hours. Both bare concrete and silane treated specimens
show similar bond strengths under elevated temperature, regardless of the application age and
epoxy type. Irrespective of the application age, epoxy type, and treatment condition, the recovered
bond strength following a heating cycle is more than 250 psi when evaluated at about 73o F.
Therefore, the silane treatment shows no negative impacts on bond strength under hot weather
conditions in summer.
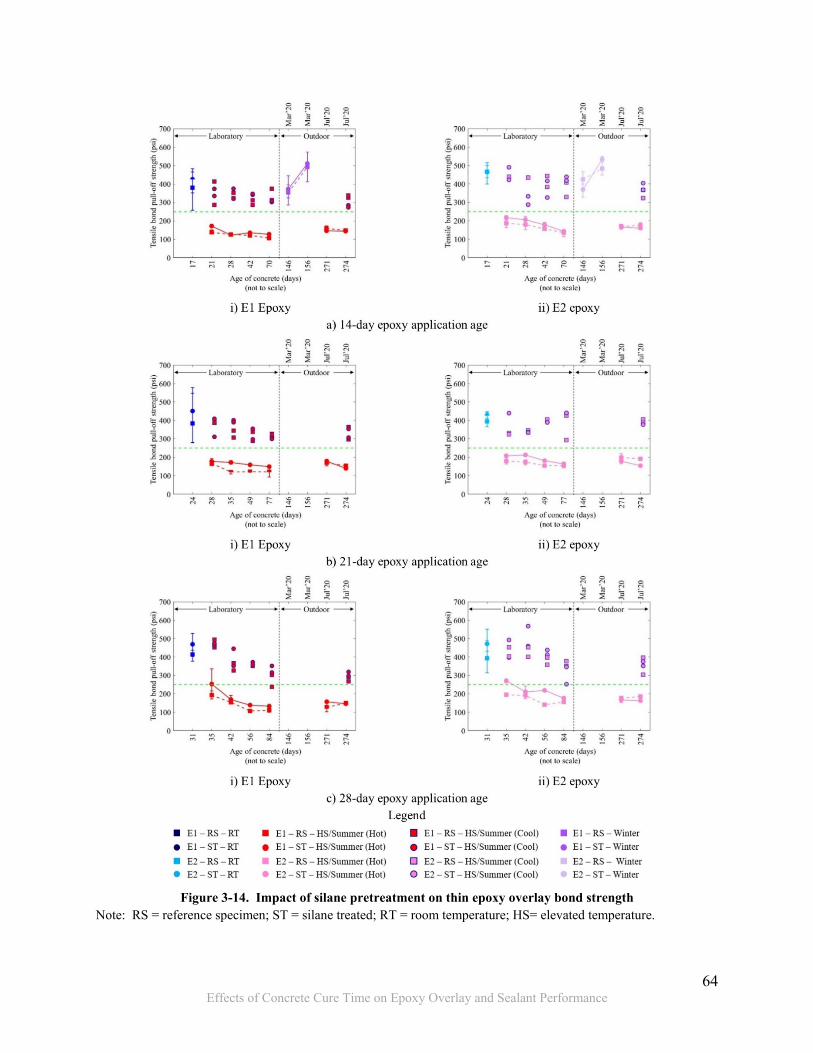
64 Effects of Concrete Cure Time on Epoxy Overlay and Sealant Performance
Figure 3-14. Impact of silane pretreatment on thin epoxy overlay bond strength
Note: RS = reference specimen; ST = silane treated; RT = room temperature; HS= elevated temperature.

65 Effects of Concrete Cure Time on Epoxy Overlay and Sealant Performance
Figure 3-15. IRH and temperature variation during three elevated temperature cycles
3.3.3.5 Impact of Hybrid Protective System on Concrete Durability
Figure 3-16a and Figure 3-16b show the total chloride content along the depth of the bare and
silane treated slabs, respectively, with and without an epoxy overlay. The background chloride
contents along the depth of the slabs are also presented in the figures. Each data point represents
the chloride content within a 0.5 in. depth. The top 0.5 in. was discarded following coring and
ponded with a 3% NaCl solution at the top. The chloride content reported at a 1.0 in. depth
represents the average chloride content between a depth of 0.5 in. to 1.0 in., which is influenced
by the surface chloride at a 0.5 in. depth. Hence, the data reported at a 1.0 in. depth was excluded
from further consideration. The total chloride content presented in the graph at a 2 in. depth
represents the average chloride content within a 1.5 to 2 in. depth. Hence, it is safe to state that
the total chloride content beyond a 1.75 in. depth is similar to the background chloride content.
Applying overlays with and without silane pretreatment during the dry curing period has no
adverse impact on concrete durability because all the specimens have similar chloride profiles after
being subjected to more than 40 freezing cycles and ponded with 3% NaCl.

66 Effects of Concrete Cure Time on Epoxy Overlay and Sealant Performance
Figure 3-16. Total chloride content along the depth of the slab with and without silane pretreatment
3.4 SUMMARY
A procedure was developed to identify the minimum age of concrete to receive an epoxy overlay.
The procedure was demonstrated using two concrete mixes and two thin epoxy overlays. These
overlays were applied on concrete specimens fabricated using BDJR and Grade DM concrete
mixes at 14, 21, and 28 days of concrete age. The performance was evaluated under laboratory
and outdoor exposure conditions. Tensile bond pull-off strength tests were conducted in the
laboratory under room temperature (RT) and two simulated exposure conditions: elevated
temperatures (HS) and wet-dry (WD) cycles. Bond strength was also evaluated after allowing
adequate time for the slabs to reach room temperature following a heat cycle. After completing
laboratory investigations, the slabs were moved outdoors and exposed to typical southwest
Michigan elements. Tensile bond pull-off strength tests were conducted in fall, winter, and
summer to evaluate the performance under different exposure conditions. The bond strength of
both overlays was greater than 250 psi under all the exposure conditions, except under elevated
temperatures. The findings support applying overlays on BDJR and Grade DM concrete on or
after 18 and 20 days of concrete age, respectively.
The exposure to elevated temperature increases energy in the pore system and draws up moisture
vapor through connected capillary pores towards the heated top surface. The moisture migration
increases with the rise of temperature and the rate increases after the concrete temperature reaches
a certain threshold. As a result, moisture accumulates at the concrete/overlay interface and

67 Effects of Concrete Cure Time on Epoxy Overlay and Sealant Performance
develops vapor pressure. In addition, a certain degree of epoxy softening was observed under
prolonged and repeated exposure to above 100o F temperature. These factors could have
contributed to the reduction in bond strength under elevated temperatures. Bond strength
evaluation of silane pretreated BDJR concrete specimens shows no adverse impact of silane sealers
on thin epoxy overlay performance. Bond strength of silane pretreated specimens is slightly better
under elevated temperatures. The results encourage applying silane sealers when overlays are
applied on concrete during the dry curing period. The early age performance of the E2 epoxy
overlay is slightly better than the performance of the E1 overlay.
68 Effects of Concrete Cure Time on Epoxy Overlay and Sealant Performance
4 PERFORMANCE OF HEALER SEALERS
4.1 OVERVIEW
The current specifications and special provisions require contractors to maintain a 28-day curing
period before applying healer sealers on bridge decks with new concrete in partial or full-depth
deck patches and repairs. There is an interest in evaluating the possibility of applying healer
sealers on decks with new concrete before 28 days without compromising the intended
performance. Therefore, a performance-based procedure was developed to evaluate the minimum
concrete age to receive healer sealers. This chapter presents the performance-based procedure to
evaluate the minimum concrete age to receive a healer sealer, the implementation of the procedure,
and the findings.
4.2 EVALUATION OF THE MINIMUM CONCRETE AGE TO RECEIVE A HEALER
SEALER
The objective of this study is to identify the minimum concrete age to receive a healer sealer. The
decision depends on concrete wet curing duration, cracking age, and concrete age to achieve an
acceptable substrate moisture condition. Figure 4-1 depicts the procedure to evaluate the minimum
age of concrete to receive a healer sealer application (t), which is a function of (i) concrete wet
curing duration, (ii) concrete age at the time of cracking, (iii) concrete age to achieve acceptable
substrate moisture, and (iv) concrete age at the time of healer sealer application to achieve a
performance comparable to the 28 days (t4) standard.
The significance of all the parameters is described in Chapter 3, except the concrete age at the time
of healer sealer application to achieve a performance comparable to the 28 days standard.
4.2.1 Concrete Age at the Time of Healer Sealer Application
Several parameters, including concrete moisture, workmanship, etc., influence healer sealer
performance. The performance of a sealer is evaluated considering its ability to resist chloride ion
ingress and reduce corrosion risk probability of embedded reinforcing steels, as shown in Figure
4-1d. The chloride content, half-cell potential, and voltage difference across a 10 Ω resistor
connected to embedded reinforcement steel can be measured to evaluate the performance after a
healer sealer is applied on concrete at specific ages of concrete. This data will indicate the
effectiveness of healer sealers in reducing chloride ingress and corrosion potential of reinforcing

69 Effects of Concrete Cure Time on Epoxy Overlay and Sealant Performance
steel. The data collected from the specimens that were treated with a healer sealer at the concrete
age of 28 days can be used as the benchmark. Therefore, the concrete age at the time of healer
sealer application (t) should be equal to or greater than t4, the concrete age at the time of receiving
a healer sealer and performing equal to or better than the concrete that received the sealer at the
concrete age of 28 days.
Figure 4-1. The procedure for deciding the minimum concrete age to receive a healer sealer

70 Effects of Concrete Cure Time on Epoxy Overlay and Sealant Performance
4.3 IMPLEMENTATION OF THE PROPOSED PROCEDURE
Sikadur 55 SLV and Unitex Pro-Poxy 40 LV LM healer sealers were selected from the MDOT
approved product list (MDOT 2018b). These products were selected based on their application
frequency on the Michigan bridge decks. Throughout this report, Sikadur 55 SLV and Unitex Pro-
Poxy 40 LV LM are labeled as ‘S1’ and ‘S2’, respectively. The performance of these sealers was
evaluated on specimens fabricated using BDJR and Grade DM concrete mixes. Table 3-1 shows
the mix design for both concrete mixes. The basic QAQC testing of fresh properties was
performed on the casting day as per the Manual for the Michigan Test Methods (MTM 2018). The
bond strength of healer sealers was evaluated following ASTM C882 and manufacturer
requirements. Table 4-1 shows the experimental program to evaluate the bond strength and the
minimum concrete age to receive a healer sealer. The table columns a to g list the evaluation
parameter, measurand, ASTM standard, specimen size, concrete age at the time of healer sealer
application, curing condition, and concrete age at the time of testing. For the specimens that
required ASTM curing (column f), submerged wet curing was provided continuously through the
testing ages according to ASTM C192. All the other specimens were dry-cured at 73o F in the
laboratory following a 7-day moist curing period.
The testing plan for all evaluation parameters is described in Chapter 3 except the bond strength
and the concrete age at the time of the healer sealer application.
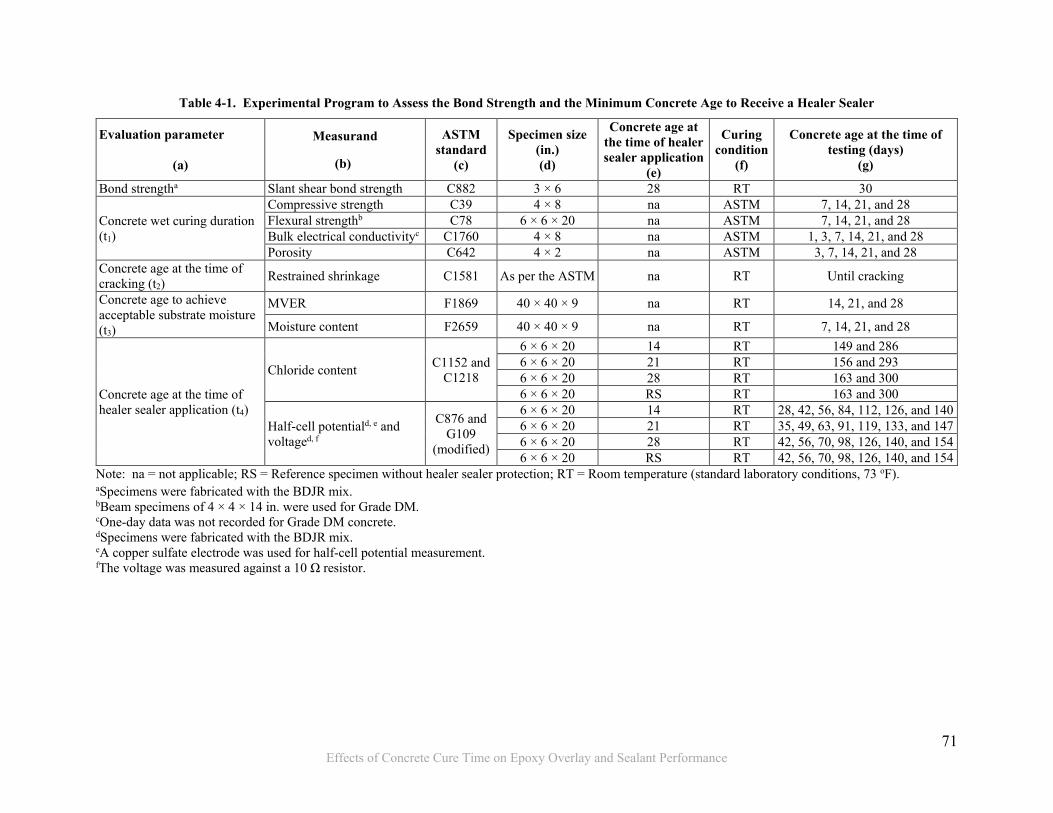
71 Effects of Concrete Cure Time on Epoxy Overlay and Sealant Performance
Table 4-1. Experimental Program to Assess the Bond Strength and the Minimum Concrete Age to Receive a Healer Sealer
Evaluation parameter
(a)
Measurand
(b)
ASTM standard
(c)
Specimen size (in.) (d)
Concrete age at the time of healer sealer application
(e)
Curing condition
(f)
Concrete age at the time of testing (days)
(g)
Bond strengtha Slant shear bond strength C882 3 × 6 28 RT 30
Concrete wet curing duration (t1)
Compressive strength C39 4 × 8 na ASTM 7, 14, 21, and 28 Flexural strengthb C78 6 × 6 × 20 na ASTM 7, 14, 21, and 28 Bulk electrical conductivityc C1760 4 × 8 na ASTM 1, 3, 7, 14, 21, and 28 Porosity C642 4 × 2 na ASTM 3, 7, 14, 21, and 28
Concrete age at the time of cracking (t2)
Restrained shrinkage C1581 As per the ASTM na RT Until cracking
Concrete age to achieve acceptable substrate moisture (t3)
MVER F1869 40 × 40 × 9 na RT 14, 21, and 28
Moisture content F2659 40 × 40 × 9 na RT 7, 14, 21, and 28
Concrete age at the time of healer sealer application (t4)
Chloride content C1152 and C1218
6 × 6 × 20 14 RT 149 and 286 6 × 6 × 20 21 RT 156 and 293 6 × 6 × 20 28 RT 163 and 300 6 × 6 × 20 RS RT 163 and 300
Half-cell potentiald, e and voltaged, f
C876 and G109
(modified)
6 × 6 × 20 14 RT 28, 42, 56, 84, 112, 126, and 140 6 × 6 × 20 21 RT 35, 49, 63, 91, 119, 133, and 147 6 × 6 × 20 28 RT 42, 56, 70, 98, 126, 140, and 154 6 × 6 × 20 RS RT 42, 56, 70, 98, 126, 140, and 154
Note: na = not applicable; RS = Reference specimen without healer sealer protection; RT = Room temperature (standard laboratory conditions, 73 oF). aSpecimens were fabricated with the BDJR mix. bBeam specimens of 4 × 4 × 14 in. were used for Grade DM. cOne-day data was not recorded for Grade DM concrete. dSpecimens were fabricated with the BDJR mix. eA copper sulfate electrode was used for half-cell potential measurement. fThe voltage was measured against a 10 Ω resistor.
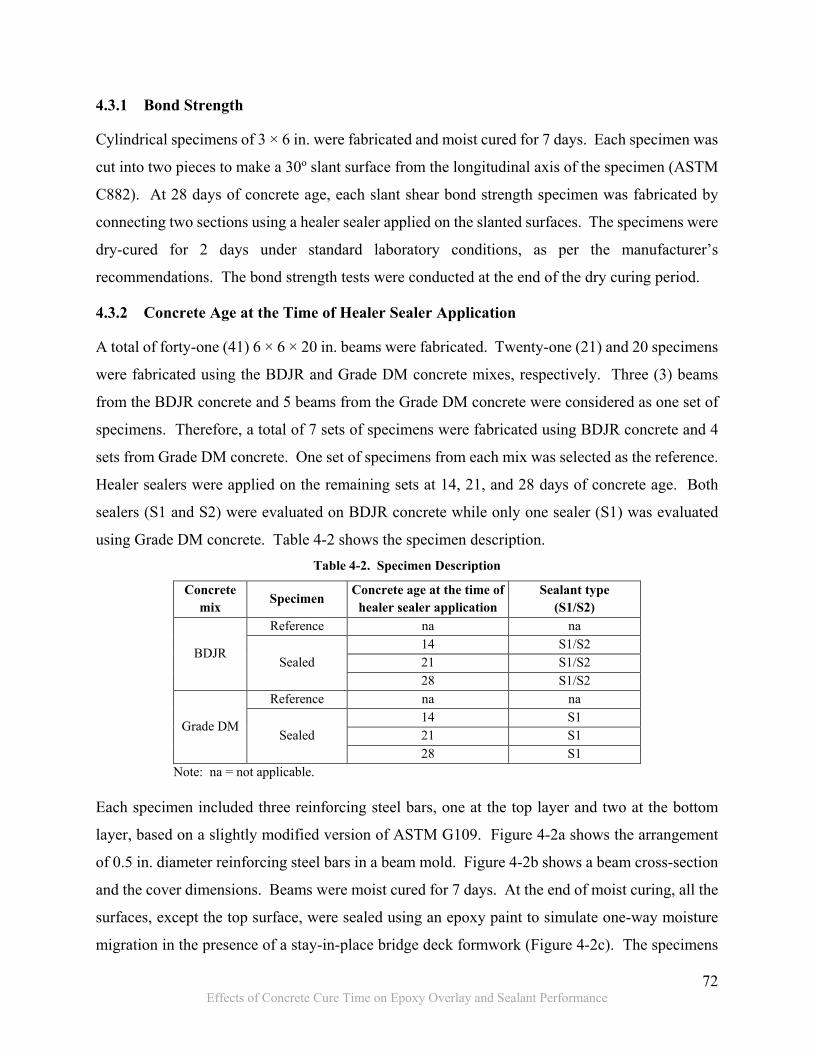
72 Effects of Concrete Cure Time on Epoxy Overlay and Sealant Performance
4.3.1 Bond Strength
Cylindrical specimens of 3 × 6 in. were fabricated and moist cured for 7 days. Each specimen was
cut into two pieces to make a 30o slant surface from the longitudinal axis of the specimen (ASTM
C882). At 28 days of concrete age, each slant shear bond strength specimen was fabricated by
connecting two sections using a healer sealer applied on the slanted surfaces. The specimens were
dry-cured for 2 days under standard laboratory conditions, as per the manufacturer’s
recommendations. The bond strength tests were conducted at the end of the dry curing period.
4.3.2 Concrete Age at the Time of Healer Sealer Application
A total of forty-one (41) 6 × 6 × 20 in. beams were fabricated. Twenty-one (21) and 20 specimens
were fabricated using the BDJR and Grade DM concrete mixes, respectively. Three (3) beams
from the BDJR concrete and 5 beams from the Grade DM concrete were considered as one set of
specimens. Therefore, a total of 7 sets of specimens were fabricated using BDJR concrete and 4
sets from Grade DM concrete. One set of specimens from each mix was selected as the reference.
Healer sealers were applied on the remaining sets at 14, 21, and 28 days of concrete age. Both
sealers (S1 and S2) were evaluated on BDJR concrete while only one sealer (S1) was evaluated
using Grade DM concrete. Table 4-2 shows the specimen description. Table 4-2. Specimen Description
Concrete mix Specimen Concrete age at the time of
healer sealer application Sealant type
(S1/S2)
BDJR
Reference na na
Sealed 14 S1/S2 21 S1/S2 28 S1/S2
Grade DM
Reference na na
Sealed 14 S1 21 S1 28 S1
Note: na = not applicable.
Each specimen included three reinforcing steel bars, one at the top layer and two at the bottom
layer, based on a slightly modified version of ASTM G109. Figure 4-2a shows the arrangement
of 0.5 in. diameter reinforcing steel bars in a beam mold. Figure 4-2b shows a beam cross-section
and the cover dimensions. Beams were moist cured for 7 days. At the end of moist curing, all the
surfaces, except the top surface, were sealed using an epoxy paint to simulate one-way moisture
migration in the presence of a stay-in-place bridge deck formwork (Figure 4-2c). The specimens

73 Effects of Concrete Cure Time on Epoxy Overlay and Sealant Performance
were dry-cured at 73o F until testing. On the 14th day, two sets of BDJR and one set of Grade DM
specimens were selected, and a 0.2 in. wide by 0.25 in. deep notch (a saw cut) was provided at
mid-length and across the uncoated top surface of each specimen. The beams were loaded using
a four-point loading configuration to develop a crack at the saw-cut. Figure 4-2d shows the loading
configuration. Figure 4-2e shows the simulated crack. A shim was placed in the crack to maintain
a crack width of 0.0125 in. through the sealant application and testing ages. The top surface of the
beams was cleaned using a wire brush and a vacuum. Healer sealers were applied on the top
surface using a brush. A similar process was followed for the other specimens.
Following the sealant application, the beams were dry-cured at room temperature for one week.
During the dry curing period, a plastic pond was attached to the top surface of the beam, as shown
in Figure 4-2e. At the end of the one-week dry curing period, the pond was filled with a 3% NaCl
solution, and ponding was maintained for one week. Subsequently, the NaCl solution and the pond
were removed to flex the beams up to 75% of the 28-day flexural strength for five cycles using the
four-point loading setup (Figure 4-2d) to simulate crack opening and closing under loads. After
one-week of dry curing, the pond was attached for the next ponding cycle. This process was
continued for a period of 135 days from sealant application. At the end of these 135 days, chloride
content was tested to evaluate the performance of healer sealers as a crack sealant. Following this
period, all the specimens were stored and allowed to dry-cure under room temperature. The
chloride content of a selected number of specimens was evaluated after 272 days following sealant
application. The same process was implemented for the specimens that received a sealant upon
reaching 21 and 28 days of concrete age. The beams were subjected to nine dry-wet exposure
cycles and four cycles of flexing before being evaluated for chloride content along the depth of the
beam. The dry-wet exposure cycles and flexing schedules were the same for the reference and the
28-day treated specimens.
Four 1.86 in. diameter cores were extracted within the ponded area of each specimen for the testing
conducted after 135 days of sealant application: two 3.5 in. deep cores from the top surface and
two 2.0 in. deep cores from the bottom surface. Figure 4-2f and Figure 4-2g show the coring
locations on the top and bottom surfaces, respectively. Cores were extracted directly over the
crack and 3.86 in. away from the crack. The cores were sliced at 0.5 in. intervals and oven-dried
for 24 hours. Figure 4-2h shows a few 0.5 in. slices. The slices were ground and the particles
passing US sieve #20 were used for chloride testing. For the 135th-day testing, the chloride content

74 Effects of Concrete Cure Time on Epoxy Overlay and Sealant Performance
from 3.0 in. below the top surface and at 1.0–1.5 in. from the bottom surface was evaluated using
the acid-soluble chloride content test method described in ASTM C1152. The chloride content at
1.0–1.5 in. from the bottom surface was also evaluated using the water-soluble chloride content
test method as per ASTM C1218. The exposed areas due to coring were epoxy coated, and the
specimens were stored under room temperature. Another set of cores was extracted after 272 days
of sealant application, one over the crack and the other 3.86 in. away from the crack. The chloride
content was evaluated at 1.0–1.5 in. from the top surface using the acid-soluble chloride content
test following ASTM C1152.
The half-cell potential and the voltage across a 10 Ω resistor were measured after completing each
dry-wet cycle, i.e., at 14, 28, 42, 70, 98, 112, and 126 days following sealant application. As an
example, the measurements on 14-day treated specimens were recorded at 28, 42, 56, 84, 112, 126,
and 140 days of concrete age. The measurements were taken immediately after draining the NaCl
solution. The half-cell potential measurements were recorded using a copper sulfate electrode at
three locations inside the ponded area – at the crack and on either side of the crack. The procedures
described in ASTM C876 (2015) and ASTM G109 (2013) were slightly modified as per the project
objectives and schedule. As an example, the voltage measurements were taken once every two
weeks during this project for the first 3 cycles, whereas the ASTM G109 (2013) suggested
frequency is once every four weeks.

75 Effects of Concrete Cure Time on Epoxy Overlay and Sealant Performance
Figure 4-2. Healer sealer performance evaluation – specimen detail and coring locations
4.4 RESULTS AND DISCUSSION
The basic QAQC and bond strength tests were conducted along with the required activities to
determine the minimum concrete age to receive a healer sealer. The results of several evaluation
parameters are described in Chapter 3. This section presents (i) bond strength, chloride content,
half-cell potential, and the total integrated current data, (ii) the condition of the rebars removed
from the beams at the end of testing, and (iii) a discussion of the results. As noted in Section 4.3,
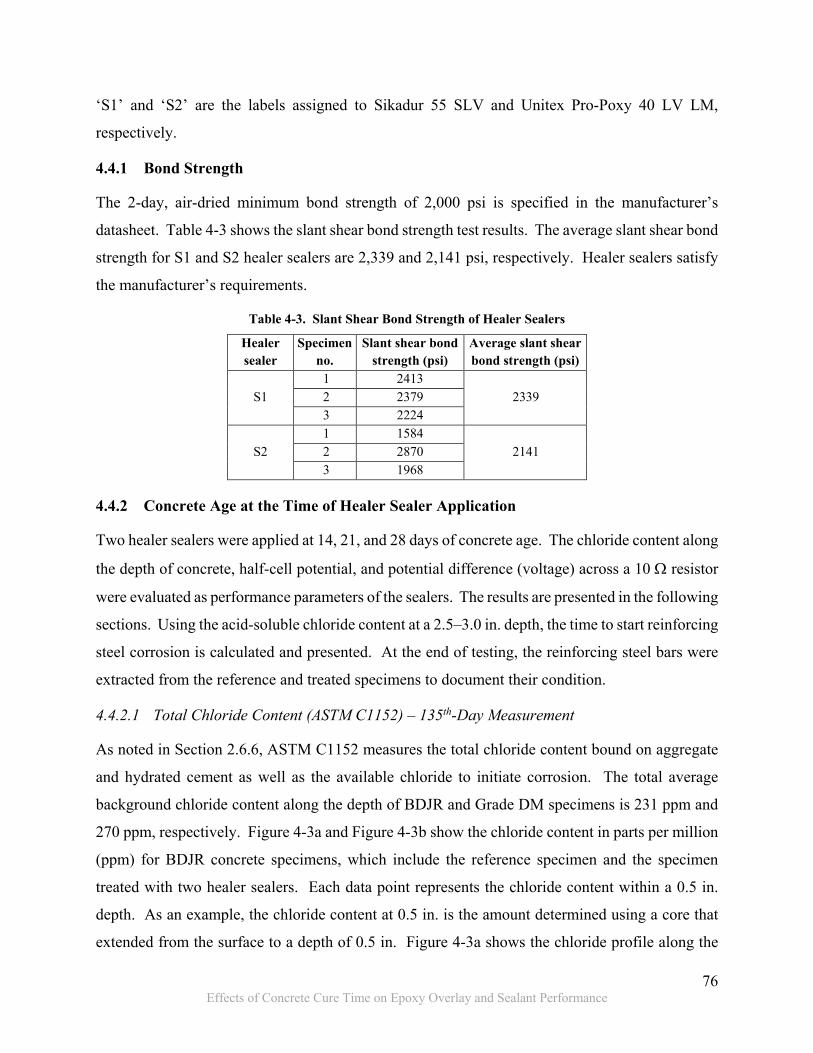
76 Effects of Concrete Cure Time on Epoxy Overlay and Sealant Performance
‘S1’ and ‘S2’ are the labels assigned to Sikadur 55 SLV and Unitex Pro-Poxy 40 LV LM,
respectively.
4.4.1 Bond Strength
The 2-day, air-dried minimum bond strength of 2,000 psi is specified in the manufacturer’s
datasheet. Table 4-3 shows the slant shear bond strength test results. The average slant shear bond
strength for S1 and S2 healer sealers are 2,339 and 2,141 psi, respectively. Healer sealers satisfy
the manufacturer’s requirements.
Table 4-3. Slant Shear Bond Strength of Healer Sealers
Healer sealer
Specimen no.
Slant shear bond strength (psi)
Average slant shear bond strength (psi)
S1 1 2413
2339 2 2379 3 2224
S2 1 1584
2141 2 2870 3 1968
4.4.2 Concrete Age at the Time of Healer Sealer Application
Two healer sealers were applied at 14, 21, and 28 days of concrete age. The chloride content along
the depth of concrete, half-cell potential, and potential difference (voltage) across a 10 Ω resistor
were evaluated as performance parameters of the sealers. The results are presented in the following
sections. Using the acid-soluble chloride content at a 2.5–3.0 in. depth, the time to start reinforcing
steel corrosion is calculated and presented. At the end of testing, the reinforcing steel bars were
extracted from the reference and treated specimens to document their condition.
4.4.2.1 Total Chloride Content (ASTM C1152) – 135th-Day Measurement
As noted in Section 2.6.6, ASTM C1152 measures the total chloride content bound on aggregate
and hydrated cement as well as the available chloride to initiate corrosion. The total average
background chloride content along the depth of BDJR and Grade DM specimens is 231 ppm and
270 ppm, respectively. Figure 4-3a and Figure 4-3b show the chloride content in parts per million
(ppm) for BDJR concrete specimens, which include the reference specimen and the specimen
treated with two healer sealers. Each data point represents the chloride content within a 0.5 in.
depth. As an example, the chloride content at 0.5 in. is the amount determined using a core that
extended from the surface to a depth of 0.5 in. Figure 4-3a shows the chloride profile along the
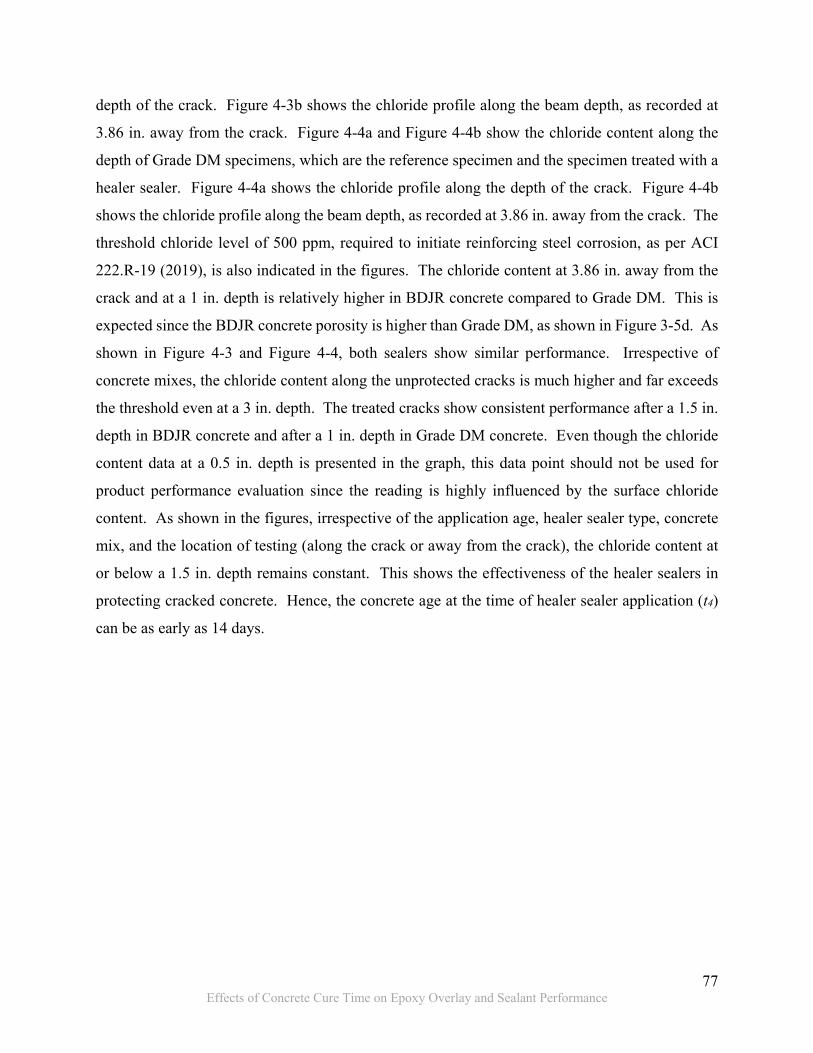
77 Effects of Concrete Cure Time on Epoxy Overlay and Sealant Performance
depth of the crack. Figure 4-3b shows the chloride profile along the beam depth, as recorded at
3.86 in. away from the crack. Figure 4-4a and Figure 4-4b show the chloride content along the
depth of Grade DM specimens, which are the reference specimen and the specimen treated with a
healer sealer. Figure 4-4a shows the chloride profile along the depth of the crack. Figure 4-4b
shows the chloride profile along the beam depth, as recorded at 3.86 in. away from the crack. The
threshold chloride level of 500 ppm, required to initiate reinforcing steel corrosion, as per ACI
222.R-19 (2019), is also indicated in the figures. The chloride content at 3.86 in. away from the
crack and at a 1 in. depth is relatively higher in BDJR concrete compared to Grade DM. This is
expected since the BDJR concrete porosity is higher than Grade DM, as shown in Figure 3-5d. As
shown in Figure 4-3 and Figure 4-4, both sealers show similar performance. Irrespective of
concrete mixes, the chloride content along the unprotected cracks is much higher and far exceeds
the threshold even at a 3 in. depth. The treated cracks show consistent performance after a 1.5 in.
depth in BDJR concrete and after a 1 in. depth in Grade DM concrete. Even though the chloride
content data at a 0.5 in. depth is presented in the graph, this data point should not be used for
product performance evaluation since the reading is highly influenced by the surface chloride
content. As shown in the figures, irrespective of the application age, healer sealer type, concrete
mix, and the location of testing (along the crack or away from the crack), the chloride content at
or below a 1.5 in. depth remains constant. This shows the effectiveness of the healer sealers in
protecting cracked concrete. Hence, the concrete age at the time of healer sealer application (t4)
can be as early as 14 days.

78 Effects of Concrete Cure Time on Epoxy Overlay and Sealant Performance
Figure 4-3. Chloride content along the depth of BDJR concrete specimens
Note: ppm = parts per million.

79 Effects of Concrete Cure Time on Epoxy Overlay and Sealant Performance
Figure 4-4. Chloride content along the depth of Grade DM concrete specimens
Note: ppm = parts per million.
4.4.2.2 Water-Soluble Chloride Content (ASTM C1218) – 135th-Day Measurement
As noted in Section 2.6.6, the ASTM C1218 procedure theoretically measures the water-soluble
chloride content that is available to cause corrosion. The threshold limit for water-soluble chloride
content to initiate steel corrosion is 375–400 ppm.
The water-soluble chloride content was evaluated within a 0.5 in. depth located between 4.5 in.
and 5.0 in. depths using the cores extracted from all the beam specimens at the crack and away
from the crack. Table 4-4 and Table 4-5 show the chloride content in BDJR and Grade DM
specimens, respectively. In all the specimens, the water-soluble chloride content is lower than the
threshold limit. Irrespective of the concrete mix proportions, the chloride content of reference
specimens is higher at the crack compared to 3.86 in. away from the crack. This shows the impact
of the presence of an untreated crack in the concrete. The chloride content of the reference
specimen at 3.86 in. away from the crack is similar to the chloride content at the treated cracks.
This indicates the effectiveness of healer sealers in protecting cracked concrete.
80 Effects of Concrete Cure Time on Epoxy Overlay and Sealant Performance
Table 4-4. 135th–Day Water-Soluble Chloride Content (ppm) Within 4.5 to 5.0 in. Depth of BDJR Concrete Specimens
Specimen description
Specimen-1 (Ca/Ab)
Specimen-2 (C/A)
Specimen-3 (C/A)
Average (C/A)
Reference 374/35 147/41 262/34 261/37 14-day S1 sealed 33/31 34/34 31/31 33/32 14-day S2 sealed 33/33 33/38 30/30 32/34 21-day S1 sealed 33/33 36/29 42/33 37/32 21-day S2 sealed 31/31 29/34 31/30 31/32 28-day S1 sealed 40/29 33/29 38/31 37/30 28-day S2 sealed 361c/46 36/30 31/38 33/38
aAverage chloride content at the crack. bAverage chloride content at 3.86 in. away from the crack cOutlier
Table 4-5. 135th–Day Water-Soluble Chloride Content (ppm) Within 4.5 to 5.0 in. Depth of Grade DM Concrete Specimens
Specimen description
Specimen-1 (Ca/Ab)
Specimen-2 (C/A)
Specimen-3 (C/A)
Specimen-4 (C/A)
Specimen-5 (C/A)
Average (C/A)
Reference 69/54 99/56 92/51 94/63 192/47 109/54 14-day S1 sealed 62/73 45/35 40/47 50/50 53/294c 50/51 21-day S1 sealed 44/46 45/46 92/80 52/47 49/47 56/53 28-day S1 sealed 275c/46 54/47 54/49 48/54 51/44 52/48
aAverage chloride content at the crack bAverage chloride content at 3.86 in. away from the crack cOutlier
4.4.2.3 Total Chloride Content (ASTM C1152) – 272nd-Day Measurement
The specimens were dry-cured for 137 days following the 135th-day of chloride testing. On the
272nd-day (i.e., 135 + 137 days), the chloride content within a 1.0 to 1.5 in. depth was also
investigated on a selected number of specimens. Two reference specimens from each mix and one
specimen representing each sealant type and a treatment age were selected. Table 4-6 and Table
4-7 show the total chloride content within a 1.0 to 1.5 in. depth in the BDJR and Grade DM
specimens. The 135th-day data is also included in the tables. The chloride content of the reference
specimens measured at the crack is 1432 ppm and 1545 ppm for BDJR and Grade DM specimens,
respectively. The chloride content is much higher than the threshold of 500 ppm. Irrespective of
the sealant application age, sealant type, and concrete mix, the chloride content of the treated
specimens was less than 250 ppm for BDJR and less than 300 ppm for the Grade DM. With a
background chloride content of 270 ppm in Grade DM concrete, the chloride content in uncracked
concrete and the concrete with sealed cracks is similar.

81 Effects of Concrete Cure Time on Epoxy Overlay and Sealant Performance
Table 4-6. Total Chloride Content (ppm) Within 1 to 1.5 in. Depth in BDJR Concrete Specimens
Specimen description At 135th-day (Ca/Ab)
At 272nd-day (C/A)
Reference 1438c/229c 1432c/231c 14-day S1 sealed 249/230 253/233 14-day S2 sealed 254/206 226/212 21-day S1 sealed 267/244 209/204 21-day S2 sealed 249/208 217/214 28-day S1 sealed 265/206 211/222 28-day S2 sealed 279/223 240/233
aAverage chloride content at the crack bAverage chloride content at 3.86 in. away from the crack cAverage of two beams
Table 4-7. Total Chloride Content (ppm) Within 1 to 1.5 in. Depth in Grade DM Concrete Specimens
Specimen description At 135th-day (Ca/Ab)
At 272nd-day (C/A)
Reference 1433c/299c 1545c/289c 14-day S1 sealed 293/254 287/296 21-day S1 sealed 241/412d 297/291 28-day S1 sealed 295/268 283/285
aAverage chloride content at the crack bAverage chloride content at 3.86 in. away from the crack cAverage of two beams dOutlier
4.4.2.4 Half-Cell Potential
ASTM C876 (2015) defines the limits for the potentials measured with a copper-copper sulfate
reference electrode to identify the probability of reinforcing steel corrosion. Table 4-8 presents a
summary of the ASTM limits and definitions. As shown in the table, the probability of not having
corrosion is greater than 90% when the half-cell potential is more positive than -200 mV. When
the measurements show more negative potentials than -350 mV, the probability of having steel
corrosion is greater than 90%. The corrosion potential of reinforcing steel in the beams fabricated
with BDJR concrete was evaluated. Beams with untreated cracks were used as the reference
specimens. The cracks in the other beams were treated using two healer sealers at the concrete
age of 14, 21, and 28 days. The half-cell potentials were measured over the crack and at 3.86 in.
away from the crack using a copper-copper sulfate reference electrode. Figure 4-5a shows the
half-cell potential measured at the crack with respect to the age of the healer sealer in the crack.
Figure 4-5b shows the half-cell potential recorded at 3.86 in. away from the crack with respect to
the age of the healer sealer in the crack. Irrespective of the measurement location, the average

82 Effects of Concrete Cure Time on Epoxy Overlay and Sealant Performance
half-cell potential readings of reference specimens show more negative potentials than -350 mV.
Therefore, “there is a greater than 90 % probability that reinforcing steel corrosion is occurring in
that area at the time of measurement” (ASTM C876 2015). Regardless of the sealant type, the
location of measurements, and the age of the healer sealer in the crack, the half-cell potentials of
the specimens treated with healer sealers are more positive than -200 mV. This shows the
effectiveness of the healer sealers in protecting cracked concrete. Hence, the concrete age at the
time of healer sealer application (t4) can be as early as 14 days.
Table 4-8. Half-Cell Potential Limits for Evaluating Corrosion Potential (ASTM C876)
Half-cell potential (mV) Corrosion potential for the copper-copper sulfate reference electrode
> -200 Probability of no corrosion > 90% -200 to -350 Uncertain
< -350 Probability of corrosion > 90%
Figure 4-5. Half-cell potential with respect to the age of healer sealer
4.4.2.5 Absolute Integrated Current
Following ASTM G109 (2013) procedures, the voltage across a 10 Ω resistor was measured. The
current passing through the resistor was calculated and recorded as a time series. The data was
used to calculate the absolute integrated current. The half-cell potential and the voltage across the
10 Ω resistor were measured using the same specimens. Figure 4-6a shows the absolute integrated
current evaluated using the reference specimens. Figure 4-6b shows the absolute integrated current

83 Effects of Concrete Cure Time on Epoxy Overlay and Sealant Performance
evaluated using the specimens with treated cracks. As per ASTM G109 (2013), an integrated
current of 150 C is adequate to have a sufficient amount of corrosion for visual evaluation. As
shown in Figure 4-6a, the average absolute integrated current recorded during the measurement
period is much greater than the threshold of 150 C. As shown in Figure 4-6b, the integrated current
recorded on all the treated specimens during the entire measurement period is less than 50 C even
though the specimens were subjected to aggressive chloride exposure and 5 cycles of flexing
during each drying period. The results prove the effectiveness of healer sealers in protecting
cracked concrete. Since all the treated specimens show somewhat similar performance, the
concrete age at the time of healer sealer application (t4) can be as early as 14 days.
Figure 4-6. Variation of absolute integrated current with sealant age
4.4.2.6 Reinforcing Steel Condition
The reference specimens had a chloride content of more than 500 ppm within a 1.0 to 1.5 in. depth
at the crack, with the half-cell potential of less than -350 mV, and with an absolute integrated
current of more than 150 C. Therefore, the top reinforcing steel of the reference specimens was
expected to have sufficient corrosion at the crack for visual evaluation. At the concrete age of 300
days, the reinforcing steel was removed from the reference specimens fabricated using BDJR
concrete. Figure 4-7a shows the top and bottom reinforcing steels taken out from one of the
reference specimens. As shown in the figure, the top reinforcing steel is corroded at the simulated
crack location. The reinforcing steel at the bottom layer was not corroded since the chloride
content within the 4.5 to 5.0 in. depth is less than 500 ppm.

84 Effects of Concrete Cure Time on Epoxy Overlay and Sealant Performance
On the 272nd-day following healer sealer application, the reinforcing steel at the top and bottom
layers of the BDJR concrete specimens was removed. Figure 4-7b shows the condition of top
reinforcing steels from a reference specimen and one treated specimen for each healer sealer
application ages. None of the reinforcing steels removed from the treated specimens had corrosion.
This observation was expected since the chloride content, half-cell potential, and absolute
integrated current results presented in the previous sections were well below the corrosion
initiation thresholds.
Figure 4-7. The condition of reinforcing steel removed from reference and treated BDJR concrete specimens
4.5 MINIMUM CONCRETE AGE TO RECEIVE A HEALER SEALER
Table 4-9 shows the parameters selected for healer sealer performance evaluation, specification
limits, age of concrete (when the evaluation parameter limits are satisfied), and the recommended
minimum concrete age to receive a healer sealer. For BDJR concrete, the wet curing duration to
achieve the required minimum strength and a discontinuous capillary pore structure with a

85 Effects of Concrete Cure Time on Epoxy Overlay and Sealant Performance
minimum volume of total permeable voids for durability (t1) is 7 days. Similarly, the Grade DM
concrete needs 10 days of wet curing to satisfy minimum strength and durability requirements.
Therefore, the wet curing duration (t1) for Grade DM concrete is 10 days. Concrete age at the time
of cracking (t2) is conservatively selected for BDJR and Grade DM concrete as 18 and 20 days,
respectively. The age of concrete to achieve an acceptable MVER (t3a) is not considered since the
specified MVER limit was not reached until 28 days, and the healer sealer performance was not
impacted by the concrete moisture content at the time of healer sealer application. However, the
BDJR and Grade DM concrete mixes achieved the moisture content limit of 5%, specified by the
New York DOT, in 17 and 12 days respectively. The moisture content was measured using an
electrical impedance meter. Therefore, it is safe to assume that the concrete moisture content of
about 5% did not adversely impact the healer sealer performance. Considering the moisture
content limit of 5%, the concrete age to achieve an acceptable moisture content (t3b) for BDJR and
Grade DM concrete mixes is selected as 17 and 12 days, respectively. The healer sealer can be
applied on BDJR and Grade DM concrete in 14 days if only the performance of the sealer against
chloride ingress and corrosion probability is considered. However, concrete age needs to be at
least 18 and 20 days to develop cracking for BDJR and Grade DM concrete mixes, the primary
reason for the healer sealer application. Considering all the parameters, the minimum age of BDJR
and Grade DM concrete to receive a healer sealer needs to be 18 and 20 days, respectively.
Table 4-9. The Minimum Age of Concrete to Receive a Healer Sealer
Evaluation parameter Specified limit Age of concrete
(days) (BDJR/Grade DM)
Minimum age of concrete to receive a healer sealer [max (t1, t2, t3, and t4)]
(BDJR/Grade DM) (days)
Concrete wet curing duration (t1) nd 7/10
18/20
Concrete age at the time of cracking (t2)
nd 18/20
Concrete age to achieve acceptable substrate moisture (t3)
MVER ≤ 3 lbs/1000 ft2/24 hrs and/or
Moisture content ≤ 5%
≅ 28/> 28
≅ 17/≅ 12 Concrete age at the time of healer sealer application (t4)
28 days 14/14
Note: nd = not defined.
86 Effects of Concrete Cure Time on Epoxy Overlay and Sealant Performance
4.6 SUMMARY
A procedure was developed to identify the minimum age of concrete to receive a healer sealer. An
implementation of the procedure was demonstrated using two concrete mixes and two healer
sealers. These sealers were applied on concrete specimens fabricated using BDJR and Grade DM
concrete mixes at 14, 21, and 28 days of concrete age. The performance of both sealers was
evaluated based on the ability of sealers to resist chloride ingress and reduce the corrosion
probability. The findings support applying healer sealers on BDJR and Grade DM concrete on or
after 18 and 20 days of concrete age, respectively.
87 Effects of Concrete Cure Time on Epoxy Overlay and Sealant Performance
5 ROAD USER COST SAVINGS FROM EARLY APPLICATION OF
FLOOD COATINGS
5.1 OVERVIEW
As per the current specifications, thin epoxy overlays and healer sealers are applied on bridge
decks after maintaining a 28-day curing period for new concrete in partial or full-depth patches
and repairs. Considering the time required under ideal conditions for surface preparation,
production, and curing, healer sealer application requires a minimum of a one-day bridge closure
beyond 28 days. Similarly, thin epoxy overlay operations require a minimum of a 2-day bridge
closure. However, bridge closure duration is extended beyond the required minimum because of
several parameters including site-specific weather conditions, capabilities of the equipment, the
size of the bridge deck, and curing time (MDOT 2019a). As noted in Chapter 3 and Chapter 4, the
findings of the experimental studies conducted for this project strongly support applying a flood
coat during the dry-curing period that allows opening the bridge to traffic at the end of the 28-day
curing period. This chapter presents the cost savings that could be realized by implementing the
recommendations of this project. Even though the cost savings could be realized from many
activities, only the road user cost savings are presented using two projects as case studies.
5.2 ROAD USER COST
Several models are available to calculate construction project impact in terms of costs. Aktan and
Attanayake (2017) present a comprehensive model to evaluate the impact of construction projects
in terms of road user costs, environmental cost, and business revenue change. Aktan and
Attanayake (2017) present models to calculate road user costs for passenger and commercial
vehicles; environmental costs for air pollution, water pollution, and climate change; and business
revenue change for surrounding businesses. This chapter only presents the road user cost (RUC)
impact due to complete bridge closure for flood coat application. As shown in Eq. 5-1, RUC
includes the delay cost (DC), vehicle operating cost (VOC), and accident cost (AC).
𝑅𝑅𝑅𝑅𝑅𝑅 = 𝐷𝐷𝑅𝑅 + 𝑉𝑉𝑉𝑉𝑅𝑅 + 𝐴𝐴𝑅𝑅 (5-1)
The road user cost for a passenger vehicle is calculated using Eq. 5-2 to 5-5. Passenger vehicle
related costs include (i) passenger vehicle delay cost (PVDC), (ii) passenger vehicle operating cost
(PVOC), (iii) passenger vehicle accident cost (PVAC), and (iv) passenger accident cost (PAC).

88 Effects of Concrete Cure Time on Epoxy Overlay and Sealant Performance
Commercial vehicle related costs such as (i) commercial vehicle driver delay cost (CVDDC), (ii)
commercial vehicle operating cost (CVOC), and (iii) commercial vehicle accident cost (CVAC)
are calculated using Eq. 5-6 to 5-8.
𝑃𝑃𝑉𝑉𝐷𝐷𝑅𝑅 = (𝑇𝑇𝐷𝐷𝐷𝐷𝐷𝐷 − 𝑇𝑇𝑊𝑊𝑊𝑊𝐷𝐷𝐷𝐷) ∙ 𝑃𝑃𝐴𝐴𝐴𝐴𝐷𝐷𝑇𝑇 ∙ 𝐴𝐴𝑉𝑉𝑉𝑉 ∙ 𝑤𝑤𝐷𝐷𝐷𝐷 (5-2)
𝑃𝑃𝑉𝑉𝑉𝑉𝑅𝑅 = (𝑇𝑇𝐷𝐷𝐷𝐷𝐷𝐷 − 𝑇𝑇𝑊𝑊𝑊𝑊𝐷𝐷𝐷𝐷) ∙ 𝑃𝑃𝐴𝐴𝐴𝐴𝐷𝐷𝑇𝑇 ∙ 𝑟𝑟𝐷𝐷𝐷𝐷 (5-3)
𝑃𝑃𝑉𝑉𝐴𝐴𝑅𝑅 = (𝐿𝐿𝐷𝐷𝐷𝐷𝐷𝐷 − 𝐿𝐿𝑊𝑊𝑊𝑊𝐷𝐷𝐷𝐷) ∙ 𝑃𝑃𝐴𝐴𝐴𝐴𝐷𝐷𝑇𝑇 ∙ 𝐴𝐴𝑛𝑛𝐷𝐷𝐷𝐷 ∙ 𝑅𝑅𝑎𝑎 (5-4)
𝑃𝑃𝐴𝐴𝑅𝑅 = (𝐿𝐿𝐷𝐷𝐷𝐷𝐷𝐷 − 𝐿𝐿𝑊𝑊𝑊𝑊𝐷𝐷𝐷𝐷) ∙ 𝑃𝑃𝐴𝐴𝐴𝐴𝐷𝐷𝑇𝑇 ∙ 𝐴𝐴𝑛𝑛𝐷𝐷𝐷𝐷 ∙ 𝑅𝑅𝑎𝑎𝐷𝐷 ∙ (𝐴𝐴𝑉𝑉𝑉𝑉 − 1) (5-5)
𝑅𝑅𝑉𝑉𝐷𝐷𝐷𝐷𝑅𝑅 = (𝑇𝑇𝐷𝐷𝐷𝐷𝐷𝐷 − 𝑇𝑇𝑊𝑊𝑊𝑊𝐷𝐷𝐷𝐷) ∙ 𝑅𝑅𝐴𝐴𝐴𝐴𝐷𝐷𝑇𝑇 ∙ 𝑤𝑤𝐷𝐷𝐷𝐷 (5-6)
𝑅𝑅𝑉𝑉𝑉𝑉𝑅𝑅 = (𝑇𝑇𝐷𝐷𝐷𝐷𝐷𝐷 − 𝑇𝑇𝑊𝑊𝑊𝑊𝐷𝐷𝐷𝐷) ∙ 𝑅𝑅𝐴𝐴𝐴𝐴𝐷𝐷𝑇𝑇 ∙ 𝑟𝑟𝐷𝐷𝐷𝐷 (5-7)
𝑅𝑅𝑉𝑉𝐴𝐴𝑅𝑅 = (𝐿𝐿𝐷𝐷𝐷𝐷𝐷𝐷 − 𝐿𝐿𝑊𝑊𝑊𝑊𝐷𝐷𝐷𝐷) ∙ 𝑅𝑅𝐴𝐴𝐴𝐴𝐷𝐷𝑇𝑇 ∙ 𝐴𝐴𝑛𝑛𝐷𝐷𝐷𝐷 ∙ 𝑅𝑅𝑎𝑎 (5-8)
where:
PAADT = volume of passenger vehicle traffic on the roadway to be closed during
construction (vehicles/day)
Ancv = normal accident rate for commercial vehicles (accident/100 million vehicle-
mile)
Anpv = normal accident rate for passenger vehicles (accident/10 million vehicle-
mile)
AVO = average vehicle occupancy, including the driver (number of people)
CAADT = volume of commercial vehicle traffic on the roadway to be closed during
construction (vehicles/day)
Ca = average cost per accident (includes damage to the driver and the vehicle)
($/accident)
Cap = average medical cost per accident per person (i.e., accident cost excluding
cost of damages to the vehicle) ($/person/accident)
LDcv = length of detour for commercial vehicles (miles)
LDpv = length of detour for passenger vehicles (miles)
LWZcv = length of the road segment closed to commercial vehicles during
construction (miles)

89 Effects of Concrete Cure Time on Epoxy Overlay and Sealant Performance
LWZpv = length of the road segment closed to passenger vehicles during construction
(miles)
rcv = average hourly vehicle operating cost for commercial vehicles ($/hr)
rpv = average hourly vehicle operating cost for passenger vehicles ($/hr)
TDcv = time to travel via detour for commercial vehicles (hrs)
TDpv = time to travel via detour for passenger vehicles (hrs)
TWZcv = time to travel along a distance equal to the closed road segment due to
construction at the normal posted speed for commercial vehicles (hrs)
TWZpv = time to travel along a distance equal to the road segment closed due to
construction at the normal posted speed for passenger vehicles (hrs)
wcv = hourly rate for a commercial vehicle driver ($/hr)
wpv = hourly rate for both passenger and driver ($/hr)
5.3 COST SAVINGS FROM TWO TYPICAL PROJECTS
Two bridge sites were selected to demonstrate the road user cost savings from flood coat
applications within the concrete dry curing period.
5.3.1 M-100 Over CN Railroad
This bridge (R01 of 23071) is in Potterville, Michigan and carries M-100 traffic over the CN
Railroad (Figure 5-1). The bridge deck length and width are 107 ft – 6 in. and 54 ft. The deck
width includes two 12 ft wide traffic lanes, two 10 ft wide shoulders, and a 10 ft wide walkway.
The total area of the deck is 5,805 ft2. When the bridge is closed to traffic, the passenger and
commercial vehicles are routed along two different roadways (Figure 5-2). In 2019, the passenger
vehicle annual average daily traffic (PAADT) and commercial vehicle annual average daily traffic
(CAADT) on the bridge were 4,857 and 123, respectively. The work zone length for passenger
and commercial vehicles were 1.6 and 8.5 miles, respectively. The posted speed limit of the road
segment is 55 mph. The detour length for passenger vehicles is 4.5 miles and the posted speed
limit is 35 mph. The detour length for commercial vehicles is 13.4 miles, with two segments at 60
and 55 mph speeds.

90 Effects of Concrete Cure Time on Epoxy Overlay and Sealant Performance
Figure 5-1. M-100 over CN Railroad bridge location (42.632492, -84.739096) (Google map)
Figure 5-2. Detour assigned to passenger and commercial vehicles
5.3.2 US-131 Over 3 Mile Road
This bridge (S04 of 54013) is in Aetna, Michigan, and carries US-131 freeway traffic over 3 Mile
Road (Figure 5-3). The bridge deck length and width are 86 ft and 53 ft – 8 in. The total area of
the deck is 4,615 ft2. When the bridge is closed to traffic, the passenger and commercial vehicles
are routed along the same route as shown in Figure 5-4. In 2019, PAADT and CAADT on the
northbound (NB) bridge were 11,343 and 1,463, respectively. The length of the work zone is 6.53
miles. The posted speed limit of the road segment is 75 mph for passenger vehicles and 65 mph

91 Effects of Concrete Cure Time on Epoxy Overlay and Sealant Performance
for commercial vehicles. The length of the detour is 10.28 miles, and the average posted speed
limit is 55 mph.
Figure 5-3. US-131 over 3 Mile Road bridge (43.511442, -85.485965) (Google map)
Figure 5-4. Detour assigned to passenger and commercial vehicles
5.3.3 Road User Costs
Table 5-1 shows the road user cost calculation parameters and the data for each bridge site. The
PAADT and CAADT are collected from the Annual Average Daily Traffic (AADT) Map of
Michigan (MDOT 2020). The length of work zones and detours, speed limits, and travel times

92 Effects of Concrete Cure Time on Epoxy Overlay and Sealant Performance
were calculated using existing roadway data. The data for the rest of the parameters are determined
as described below.
• The average vehicle occupancy (AVO) is 1.7 (FHWA 2018).
• The passenger and passenger vehicle driver hourly rates are assumed to be the same. Since
the work zone and detour routes for the M-100 over the CN Railroad bridge site are located
within the Eaton County, the hourly rate was calculated using the annual per capita income
of the county. The 2018 annual per capita income of $31,982 (U.S. Census Bureau 2020)
was divided by 2080 hours to calculate the hourly rate. The hourly rate of $14.58 for the
US-131 over 3 Mile Road bridge site was calculated using the 2018 statewide annual per
capita income of $30,336 and 2080 hours per year (U.S. Census Bureau 2020).
• Michigan’s commercial vehicle driver hourly rate in 2019 was $20.74 (U.S. Bureau of
Labor Statistics 2020a).
• The average operational cost per mile for a passenger vehicle is $0.575 (IRS 2020) and a
commercial vehicle in the Midwest is $1.727 (Murray and Glidewell 2019). These rates
are multiplied with the average vehicle speed of the road segments to calculate the average
hourly vehicle operating cost.
• The normal accident rate for passenger vehicles (Anpv) is calculated by dividing the number
of total injury-level accidents by annual vehicle miles traveled. To calculate a normalized
accident rate for passenger vehicles, the ratio is multiplied by the percentage of
involvement. In 2019, the total injury-level accidents in Michigan was 54,539 and the
percentage involvement for passenger vehicles was 81.8% (MOHSP 2019). In 2018, a
total of 101.7 billion miles were recorded by all the vehicles in Michigan (MDOT 2019b).
Similarly, the normal accident rate for commercial vehicles (Ancv) is calculated using 6.8%
as the percentage involvement.
• The average cost per accident (Ca) and average medical cost per person per accident (Cap)
are calculated based on the injury level (serious/moderate/minor). The level of injury was
assumed based on the posted speed limit of the detour route. As an example, the injuries
from the accidents on road segments with speed limits above 55 mph, at 55 mph, and below
55 mph were assumed to be serious, moderate, and minor. The cost per accident for each
injury level was adopted from Kostyniuk et al. (2017).
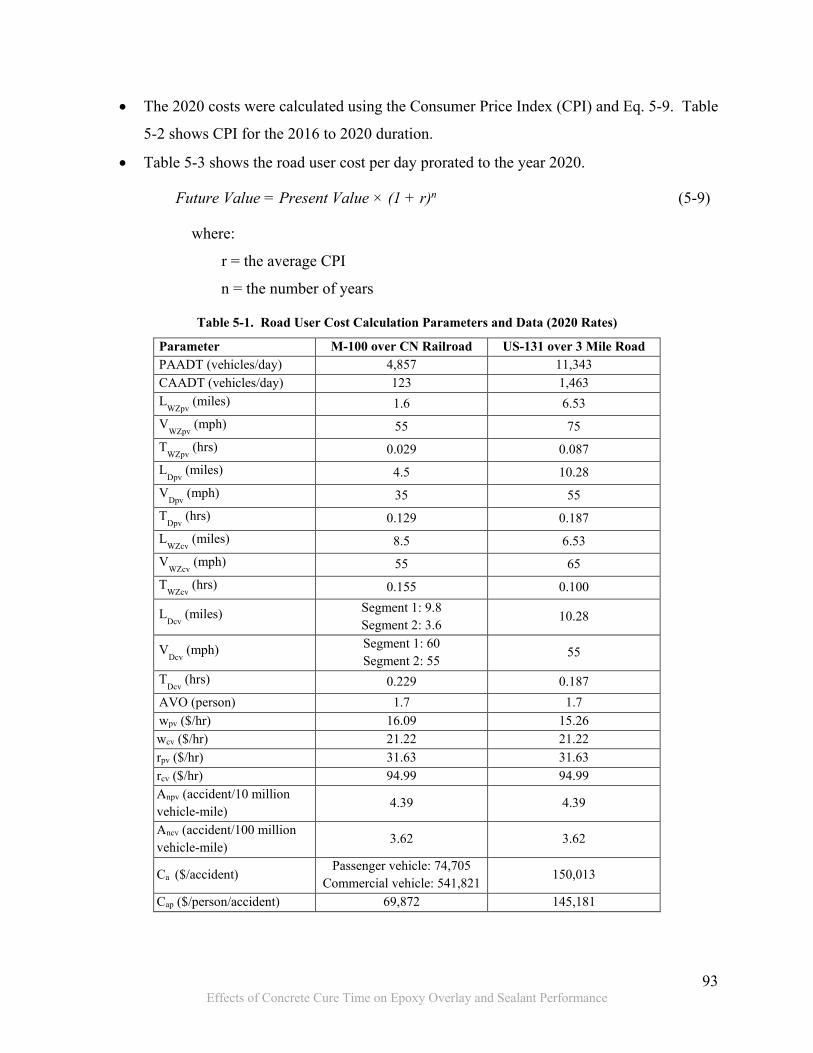
93 Effects of Concrete Cure Time on Epoxy Overlay and Sealant Performance
• The 2020 costs were calculated using the Consumer Price Index (CPI) and Eq. 5-9. Table
5-2 shows CPI for the 2016 to 2020 duration.
• Table 5-3 shows the road user cost per day prorated to the year 2020.
Future Value = Present Value × (1 + r)n (5-9)
where:
r = the average CPI
n = the number of years
Table 5-1. Road User Cost Calculation Parameters and Data (2020 Rates)
Parameter M-100 over CN Railroad US-131 over 3 Mile Road PAADT (vehicles/day) 4,857 11,343 CAADT (vehicles/day) 123 1,463 L
WZpv (miles) 1.6 6.53
VWZpv
(mph) 55 75 T
WZpv (hrs) 0.029 0.087
LDpv
(miles) 4.5 10.28 V
Dpv (mph) 35 55
TDpv
(hrs) 0.129 0.187 L
WZcv (miles) 8.5 6.53
VWZcv
(mph) 55 65 T
WZcv (hrs) 0.155 0.100
LDcv
(miles) Segment 1: 9.8 Segment 2: 3.6 10.28
VDcv
(mph) Segment 1: 60 Segment 2: 55 55
TDcv
(hrs) 0.229 0.187 AVO (person) 1.7 1.7 wpv ($/hr) 16.09 15.26 wcv ($/hr) 21.22 21.22 rpv ($/hr) 31.63 31.63 rcv ($/hr) 94.99 94.99 Anpv (accident/10 million vehicle-mile) 4.39 4.39
Ancv (accident/100 million vehicle-mile) 3.62 3.62
Ca ($/accident) Passenger vehicle: 74,705 Commercial vehicle: 541,821 150,013
Cap ($/person/accident) 69,872 145,181

94 Effects of Concrete Cure Time on Epoxy Overlay and Sealant Performance
Table 5-2. Year and Consumer Price Index (CPI) (U.S. Bureau of Labor Statistics 2020b)
Year Consumer price index (CPI), r (%) 2016 2.1 2017 2.1 2018 1.9 2019 2.3 2020 2.3
Table 5-3. Road User Cost for Two Bridge Sites
Cost component Equation no.
M-100 over CN railroad
US-131 over 3 Mile Road
Passenger vehicle delay cost (PVDC) ($/day) 5-2 13,285 29,426 Passenger vehicle operating cost (PVOC) ($/day) 5-3 15,363 35,878 Passenger vehicle accident cost (PVAC) ($/day) 5-4 462 2,801 Passenger accident cost (PAC) ($/day) 5-5 302 1,898 Commercial vehicle driver delay cost (CVDDC) ($/day) 5-6 193 2,701 Commercial vehicle operating cost (CVOC) ($/day) 5-7 865 12,090 Commercial vehicle accident cost (CVAC) ($/day) 5-8 12 30 Road user cost (RUC) ($/day) 5-1 30,482 84,824
Table 5-4 shows the typical surface preparation rate, production rate, and curing duration. The
deck area that requires a flood coating on M-100 over the CN Railroad and US-131 over the 3
Mile Road bridges is 5,805 ft2 and 4,615 ft2, respectively. The time required to complete flood
coating jobs on these bridge decks is presented in Table 5-5. Flood coats are required to be applied
and cured in daylight. As shown in the table, a healer sealer job on any of these bridges requires
closing the bridge for one or two days depending on the deck preparation and production rates. In
addition, site-specific weather influences the duration. A thin epoxy overlay job requires closing
the bridge for two to three days.
As shown in Table 5-3, the road user costs for M-100 over the CN Railroad and US-131 over the
3 Mile Road projects are $30,482 per day and $84,824 per day, respectively. Therefore, the
reduction of one to two days of the road closure, beyond the standard 28-day requirement, could
save the users at least $30,482 to $60,964 from the M-100 over the CN Railroad project and
$84,824 to $169,648 from the US-131 over the 3 Mile Road project.

95 Effects of Concrete Cure Time on Epoxy Overlay and Sealant Performance
Table 5-4. Surface Preparation Rate, Production Rate, and Curing Duration for Epoxy Overlays and Healer Sealers (DeRuyver and Schiefer 2016)
Flood coat Surface preparation
(ft2/hr) (min/max)
rate Production rate (ft2/hr)
(min/max)
Flood coat curing duration (hrs/layer)
Epoxy overlay 600/850 1,000/3,500 2 Healer sealer 1,600/1,700 1,000/3,500 2 Note: min = minimum; max = maximum.
Table 5-5. Bridge Closure Duration for Epoxy Overlay and Healer Sealer Application
Bridge site Flood coat Surface preparation
duration (hrs) (min/max)
Production duration (hrs)
(min/max)
Curing duration
(hrs)
Job duration (hrs)
(min/max)
Bridge closure duration
(days) M-100 over CN railroad
Epoxy overlay 6.8/9.7 3.3/11.6 4.0 14.1/25.3 2~3 Healer sealer 3.4/3.6 1.7/5.8 2.0 7.1/11.4 1~2
US-131 over 3 Mile Road
Epoxy overlay 5.4/7.7 2.6/9.2 4.0 12.0/20.9 2~3 Healer sealer 2.7/2.9 1.3/4.6 2.0 6.0/9.5 1~2
Note: min = minimum; max = maximum.
5.4 SUMMARY
The objective of this study is to develop a performance-based procedure to identify the minimum
concrete age to receive a flood coat. The experimental results support applying a flood coat during
the concrete dry curing period without compromising the performance compared to a flood coat
applied on the 28 days old concrete. Implementation of this project recommendations could save
road users more than $30,482 to $84,824 per day on bridge decks of about 5,000 ft2 in area.
96 Effects of Concrete Cure Time on Epoxy Overlay and Sealant Performance
6 SUMMARY, CONCLUSIONS, AND RECOMMENDATIONS
6.1 SUMMARY
A flood coating (thin epoxy overlay or healer sealer) application improves bridge deck condition
and extends the service life. Depending on the condition, decks are patched or repaired before a
flood coating application. Typically, the highway agency policies and manufacturer specifications
require maintaining a curing period of 28 days (7-day wet and 21-day dry) before applying a flood
coating on bridge decks with new concrete. Consequently, the contractors must wait 28 days to
start surface preparation for a flood coat application. Delaying flood coat application increases
project completion time, user cost, and the cost of construction and mobility management.
Therefore, two performance-based procedures were developed to identify the minimum concrete
age to receive a flood coating – one for thin epoxy overlays and the other for healer sealers. The
robustness of both procedures was demonstrated through a comprehensive experimental study.
Thin epoxy overlays are expected to bridge the cracks and protect the entire deck surface to prevent
the ingress of chloride ions and other harmful chemicals. A tensile bond pull-off strength test is
used to evaluate the system performance. The performance is satisfactory when the bond strength
is greater than or equal to 250 psi. The minimum concrete age to receive an overlay depends on
concrete wet curing duration, cracking age, concrete age to achieve an acceptable substrate
moisture condition, and concrete age to develop the required minimum tensile strength. Thin
epoxy overlay performance depends on concrete strength, bond strength, thermal compatibility
between overlay and concrete, epoxy performance under various exposure conditions, and
workmanship. Considering all these parameters, a comprehensive procedure was developed to
evaluate the minimum age of concrete to receive an overlay as a function of (i) concrete wet curing
duration, (ii) concrete age at the time of cracking, (iii) concrete age to achieve acceptable substrate
moisture, (iv) concrete age to develop the specified minimum tensile strength, and (v) concrete
age at the time of epoxy application to develop the specified bond strength. This procedure was
implemented using two MDOT standard concrete mixes and two thin epoxy overlays. Bridge deck
joint repair (BDJR) and Grade DM concrete mixes were selected for this study. E-bond 526 Lo-
Mod and Unitex Pro-Poxy Type III DOT epoxy overlays were selected from the MDOT approved
product list. Moreover, there is an interest to evaluate the possibility of developing a hybrid bridge
deck protection system with penetrating sealers and thin epoxy overlays to complement the overlay
97 Effects of Concrete Cure Time on Epoxy Overlay and Sealant Performance
performance by retarding chloride ingress into concrete through pinholes and other anomalies
formed during overlay application and service life. Therefore, the experimental study was
extended to evaluate the impact of silane pretreatment on overlay bond strength. SIL-ACT ATS-
100, a 100% silane penetrating sealant in the MDOT approved product list, was selected for
pretreating the concrete specimens fabricated with BDJR concrete.
Healer sealers are expected to seal the cracks by penetrating and bonding the cracks while
maintaining the integrity under repeated loading that demands opening and closing of the sealed
cracks. The performance can be assessed by evaluating the ability of the sealed crack to resist
chloride ion ingress and reduce the probability of corrosion risk on the embedded reinforcing steel.
The minimum concrete age to receive a healer sealer depends on concrete wet curing duration,
cracking age, and concrete age to achieve an acceptable substrate moisture condition. Several
parameters, including concrete moisture, workmanship, etc., influence healer sealer performance.
Considering all these parameters, a comprehensive procedure was developed to evaluate the
minimum age of concrete to receive a healer sealer as a function of (i) concrete wet curing duration,
(ii) concrete age at the time of cracking, (iii) concrete age to achieve acceptable substrate moisture,
and (iv) concrete age at the time of healer sealer application to achieve comparable performance
to the concrete that received the sealer at the concrete age of 28 days. This procedure was
implemented using two MDOT standard concrete mixes (BDJR and Grade DM) and two healer
sealers (Sikadur 55 SLV and Unitex Pro-Poxy 40 LV LM) selected from the MDOT approved
product list.
6.2 CONCLUSIONS AND RECOMMENDATIONS
6.2.1 Epoxy Overlays
The following conclusions and recommendations were derived from the experimental
investigations conducted to evaluate the minimum concrete age to receive an epoxy overlay:
• A rational and implementable procedure is presented to evaluate the minimum age of
concrete to receive epoxy overlays without compromising concrete durability and overlay
performance. Even though the process requires evaluating several parameters, this process
needs to be implemented only once per each standard or approved mix resulting in

98 Effects of Concrete Cure Time on Epoxy Overlay and Sealant Performance
significant savings on project and road user costs. It is recommended to include the
procedures as part of the thin epoxy overlay acceptance testing program.
• Since thin epoxy overlays with comparable properties to E-bond 526 Lo-Mod and Unitex
Pro-Poxy Type III DOT can be applied on 18-days old BDJR concrete and 20-days old
Grade DM concrete to achieve comparable performance to the 28-days standard, a 21-day
application age can be specified. The 18-day and 20-day waiting periods were decided
upon based on the concrete cracking age. Even though epoxy overlay application on
uncracked concrete could potentially delay cracking, the overlay would not be able to
prevent it from happening. As a result, the system integrity is compromised since concrete
cracking after an overlay application is difficult to identify through visual inspection.
Hence, concrete cracking age under standard laboratory exposure conditions became the
decisive parameter for determining the concrete age to receive a thin epoxy overlay.
• The overlay bond strength evaluated at or below 73o F was more than the specified limit
of 250 psi regardless of the epoxy application age, concrete mix, and epoxy type. The
average substrate moisture condition at 14 days of concrete age was 5.6% and 4.2% for
BDJR and Grade DM concretes, respectively. The moisture contents are comparable to
the limits specified by Wisconsin and New York DOTs.
• Irrespective of the application age, the bond strength of epoxy overlays under elevated
temperature was less than 250 psi. The primary failure type was a bond failure at the
concrete/overlay interface. The exposure to elevated temperature increases energy in the
pore system and draws up moisture vapor through connected capillary pores towards the
heated top surface. The moisture migration increases with temperature and the rate
increases after the concrete temperature reaches a certain threshold. As a result, moisture
accumulates at the concrete/overlay interface and develops vapor pressure on the overlay
resulting in lower bond strength. In addition, a certain degree of epoxy softening was
observed under prolonged and repeated exposure to above 100o F.
• The bond strength recovers when the epoxy reaches room temperature following a heating
cycle. However, bond strength decreases under repeated exposure to heating cycles, an
evidence of having a certain degree of permanent damages to the integrity of the system.
The recovered bond strength of E-bond 526 Lo-Mod epoxy overlay on BDJR concrete is
consistently lower than 250 psi when applied during the dry curing period.

99 Effects of Concrete Cure Time on Epoxy Overlay and Sealant Performance
• The moisture vapor emission rate (MVER) recorded on the slabs fabricated using BDJR
and Grade DM mixes did not satisfy the commonly required moisture vapor evaporation
rate of 3 lbs/1000 ft2/24 hrs within 21 days of concrete age. However, the moisture content
measured using an electrical impedance meter under standard laboratory conditions was
less than 5% by the concrete age of 17 days and 12 days for BDJR and Grade DM mixes,
respectively. The 5% moisture content is the limit specified by the New York Department
of Transportation.
• The bond strength of both overlays under elevated temperatures is higher on concrete with
slag compared to the mix with Type I cement. The concrete with slag has a low volume of
total permeable voids and smaller pore size that results in very slight increase in the internal
relative humidity (IRH) under elevated temperatures. Therefore, low permeable concrete,
such as mixes with SCMs, is recommended to improve bridge deck durability and overlay
performance.
• The Unitex Pro-Poxy Type III DOT epoxy overlay performed consistently better than the
E-bond 526 Lo-Mod epoxy overlay irrespective of concrete mix, epoxy application age,
and exposure conditions.
• Pretreatment using SIL-ACT ATS-100, a 100% silane penetrating sealant, shows no
adverse impact on the overlay performance; it rather improves the bond strength under
elevated temperatures when applied on 21 or 28 days old concrete. Pretreatment improved
the recovered bond strength following heating cycles.
• The application of overlays on concrete as young as 14 days did not compromise concrete
durability.
6.2.2 Healer Sealers
The following conclusions and recommendations were derived from the experimental
investigations conducted to evaluate the minimum concrete age to receive a healer sealer:
• A rational and implementable procedure is presented to evaluate the minimum age of
concrete to receive healer sealers without compromising concrete durability and sealant
performance. Even though the process requires evaluating several parameters, this process
needs to be implemented only once per each standard or approved mix resulting in

100 Effects of Concrete Cure Time on Epoxy Overlay and Sealant Performance
significant savings from project and road user costs. It is recommended to include the
procedures as part of the healer sealer acceptance testing program.
• The total chloride content along the depth of concrete evaluated after 135 days following
the healer sealer application shows similar values and trends for all three application ages.
The total chloride content measured within the top 0.5 in. needs to be excluded from
consideration since it is contaminated with the chloride at the ponded surface. The total
chloride content at least 1.0 in. deep into the sealed crack remains constant and similar to
the background chloride content (i.e., 231~270 ppm), an indication of the effectiveness of
the crack sealant. The total chloride content at the unprotected crack (reference specimen)
is much greater than 500 ppm up to a 3 in. depth. The performance data support healer
sealer application on or after 14 days of concrete age. However, considering the concrete
cracking age under standard laboratory exposure conditions, a 21-day application age can
be specified.
• The steel rebars removed from the specimens at the concrete age of 300 days were visually
inspected. The top reinforcing steel of the reference specimens had light corrosion while
the reinforcing steel removed from the treated specimens showed no sign of corrosion. The
measurements of chloride content, half-cell potentials, and the absolute integrated current
supported the visual observations.
• Both sealers (Sikadur 55 SLV and Unitex Pro-Poxy 40 LV LM) show similar performance
irrespective of application age and concrete mix.
6.2.3 Other
The following additional conclusions and recommendations were derived from the activities
completed during this project:
• The use of low permeable concrete improves the bond strength of epoxy overlays.
• Concrete cracking age under standard laboratory exposure conditions became the decisive
parameter for determining the concrete age to receive thin epoxy overlays or healer sealers.
Therefore, the use of non-shrink bridge deck repair and/or patch material allows for the
application of flood coatings much earlier than the 21-day waiting period identified for
BDJR and Grade DM concrete.
101 Effects of Concrete Cure Time on Epoxy Overlay and Sealant Performance
• Even though the MDOT standard practice is 7 days of moist curing, the current stipulations
in the Standard Specifications for Construction provide flexibility for extending the curing
duration beyond 7 days by specifying 7-day minimum compressive and flexural strength
requirements. However, these curing requirements do not specifically address the extended
curing required to develop a discontinuous capillary pore structure with a minimum volume
of total permeable voids in concrete with supplementary cementitious materials (SCMs), a
durability performance requirement.
• The activities conducted during this project demonstrated the viability of using the bulk
electrical conductivity and porosity testing to evaluate the duration of moist curing needed
to develop a discontinuous capillary pore structure with a minimum volume of total
permeable voids to assure concrete durability. It is recommended to include these two
methods in the curing specifications to establish moist curing requirements assuring both
the strength and durability requirements.
• Maintaining traffic on a typical bridge with a 5,000 ft2 deck area and the average annual
daily traffic (AADT) of about 5,000 to 12,000 could save road users in Michigan more than
$30,482 to $84,824 per day.
6.3 RECOMMENDATIONS FOR FURHER STUDIES
The recommendations for further studies are specific to evaluating (i) the minimum age of special
concrete mixes as well as the repair and patch materials to receive a thin epoxy overlay or a healer
sealer, (ii) thin epoxy overlay and healer sealer application and performance through pilot projects,
(iii) thin epoxy overlay performance under outdoor exposure for an extended period and (iv)
concrete moisture measurement methods.
• Rational and implementable procedures were developed to evaluate the minimum age of
concrete to receive epoxy overlays and healer sealers without compromising concrete
durability and overlay/sealant performance. Only two standard concrete mixes (BDJR and
Grade DM) were evaluated during this project. It is recommended to implement the
procedures to evaluate the suitability of other standard and special concrete mixes as well
as the repair and patch materials to receive an overlay or a sealer.
• The minimum concrete age to receive a thin epoxy overlay was established after
conducting a comprehensive experimental study using two standard concrete mixes and

102 Effects of Concrete Cure Time on Epoxy Overlay and Sealant Performance
two thin epoxy overlays. Even though 56 large concrete slab specimens (40 × 40 × 9 in.)
were used for this study to evaluate the overlay performance under various exposure
conditions, including the southwest Michigan outdoor exposure, it is recommended to
implement the findings on a couple of pilot projects to evaluate the performance before
incorporating the recommendations into MDOT standard practice.
• Fifty-six (56) large concrete slab specimens (40 × 40 × 9 in.) were fabricated for this study
using BDJR and Grade DM mixes. Two epoxy overlays were applied with and without
silane pretreatment. These specimens are currently being exposed to southwest Michigan
outdoor conditions. So far, the slabs were in the outdoors for about a year. Initial
laboratory data indicated a certain degree of bond strength degradation with exposure to
repeated thermal cycles, especially under elevated temperatures. Hence, it is recommended
to evaluate the performance of the overlays on those 56 specimens for a couple more years
to develop a better understanding of overlay performance.
• The minimum concrete age to receive a healer sealer was established after conducting a
comprehensive experimental study using two standard concrete mixes and two healer
sealers. It is recommended to implement the finding on a couple of pilot projects to
evaluate the healer sealer performance before incorporating the recommendations into
MDOT standard practice. In order to evaluate the field performance, cores can be extracted
from the treated area to evaluate the depth of penetration and the resistance of the treated
cracks to chloride ion ingress. Further, the performance of the bridge decks needs to be
monitored for several years to evaluate the effectiveness of the treatments.
• The plastic sheet patch test is widely accepted as a near-surface moisture evaluation
method. Due to several challenges associated with this qualitative measurement technique,
a few DOTs use moisture content measurements to support the epoxy overlay and healer
sealer application decisions. Hence, it is recommended to identify such technologies and
evaluate their performance and reliability to be used as a standard method for concrete
moisture content measurement.

103 Effects of Concrete Cure Time on Epoxy Overlay and Sealant Performance
7 REFERENCES
1. AASHTO (2016). AASHTO LRFD Bridge Design Specifications, American Association of
State Highway and Transportation Officials (AASHTO), 444 North Capitol Street, NW, Suites
249, Washington, DC 20001.
2. Abell, A. B., Willis, K. L., Lange, D. A. (1998). Mercury Intrusion Porosimetry and Image
Analysis of Cement-Based Materials, Journal of Colloid and Interface Science, Vol. 211, Issue
1, pg. 39–44.
3. ACI 222.R-19 (2019). Guide to Protection of Reinforcing Steel in Concrete Against Corrosion,
American Concrete Institute (ACI), 38800 Country Club Drive, Farmington Hills, MI 48331.
4. ACI 308R-01 (2008). Guide to Curing Concrete, American Concrete Institute (ACI), 38800
Country Club Drive, Farmington Hills, MI 48331.
5. ACI 308R-16 (2016). Guide to External Curing of Concrete, American Concrete Institute
(ACI), 38800 Country Club Dr., Farmington Hills, MI 48331.
6. ACI 548.8 (2019). Specification for Type EM (Epoxy Multi-Layer) Polymer Overlay for Bridge
and Parking Garage Decks, American Concrete Institute (ACI), 38800 Country Club Drive,
Farmington Hills, MI 48331.
7. ACT (2019). SIL-ACT® Product Data: ATS-100, Advanced Chemical Technologies, Inc., 9608
North Robinson Ave., Oklahoma City, OK 73114.
8. Adam, J. F. and Gansen, E. (2001). Performance of Poly-Carb, Inc. Flexogrid Bridge Overlay
System, Iowa Department of Transportation, Office of Material, 800 Lincoln Way, Ames, IA
50010.
9. Aktan, H. M., Fu, G., Dekelbab, W., and Attanayake, U. (2003). Investigate Causes and
Develop Methods to Minimize Early-Age Deck Cracking on Michigan Bridge Decks, MDOT
RC-1437, CSD 2003-02, Report to the Michigan Department of Transportation, Detroit, MI
48226.
10. Aktan, H. M. and Attanayake, U. (2017). Evaluation and Standardization of Accelerated
Bridge Construction Techniques, MDOT RC-1618C, CSD 2013-0069, Report to the Michigan
Department of Transportation, Lansing, MI 48909.
11. Alger, R., Gruenberg, S., and Wegleitner, J. (2003). Field Performance of Polymer Bridge
Deck Overlays in Michigan, Michigan Technological University (MTU), Keweenaw Research
Center, 1400 Townsend Dr., Houghton, MI 49931.

104 Effects of Concrete Cure Time on Epoxy Overlay and Sealant Performance
12. ASTM C876 (2015). Standard Test Method for Corrosion Potentials of Uncoated Reinforcing
Steel in Concrete, American Society of Testing and Materials (ASTM) International, 100 Barr
harbor Drive, West Conshoshocken, PA 19428.
13. ASTM C1583 (2013). Standard Test Method for Tensile Strength of Concrete Surface and the
Bond Strength or Tensile Strength of Concrete Repair and Overlay Materials by Direct
Tension (Pull-off Method), American Society of Testing and Materials (ASTM) International,
100 Barr harbor Drive, West Conshoshocken, PA 19428.
14. ASTM F2170 (2019). Standard Test Method for Determining Relative Humidity in Concrete
Floor Slabs Using in situ Probes, American Society of Testing and Materials (ASTM)
International, 100 Barr harbor Drive, West Conshoshocken, PA 19428.
15. ASTM G109 (2013). Standard Test Method for Determining Effects of Chemical Admixture
on Corrosion of Embedded Steel Reinforcement in Concrete Exposed to Chloride
Environments, American Society of Testing and Materials (ASTM) International, 100 Barr
harbor Drive, West Conshoshocken, PA 19428.
16. Attanayake, U., Liang, X., Ng, S., and Aktan, H. (2006). Penetrating Sealants for Concrete
Bridge Decks-Selection Procedures, Journal of Bridge Engineering, American Society of Civil
Engineers (ASCE), 1801 Alexander Bell Dr., Reston, VA 20191.
17. Bakhsh, K. N. (2010). Evaluation of Bond Strength between Overlay and Substrate in Concrete
Repairs, MS Thesis, KTH Architecture and the Built Environment, KTH Royal Institute of
Technology, 100 44 Stockholm, Sweden.
18. Balakumaran, S. S. G. and Weyers, R. E. (2019). Performance of Bridge Deck Overlays in
Virginia: Phase II: Service Life Performance, Report No. FHWA/VTRC 20-R6, Virginia
Department of Transportation and Federal Highway Administration (FHWA), Richmond, VA
23219.
19. Basanayake, K., Mazumder, A. F., Attanayake, U., and Berke, N. (2020). Assessment of
Concrete Curing Duration using Bulk Electrical Conductivity and Porosity, Transportation
Research Record (TRR), Transportation Research Board (TRB), 500 Fifth Street NW,
Washington, DC 20001.
20. Bissonnette, B., Vaysburd, A. K., and Fay, K. F. V. (2013). Surface Preparation of the
Concrete Substrate Moisture Content Requirements for Repair, Part 1: Concrete Repair

105 Effects of Concrete Cure Time on Epoxy Overlay and Sealant Performance
Testing, Report No. MERL-2013-63, Reclamation Managing Water in the West, 1849 C Street
NW, Washington, DC 20240.
21. Concrete Construction (1998). Chloride Limits in the ACI 318 Building Code Requirements,
Publication No. J980869, P.O. Box 3494, Northbrook, IL 60065.
22. DeRuyver, J. and Schiefer, P. (2016). Thin Epoxy Overlay/Healer Sealer Treatments on Bridge
Decks, Region Bridge Support Unit Bridge Field Services, Michigan Department of
Transportation, 425 W. Ottawa St., Lansing, MI 48909.
23. ElBatanouny, M., K., Nadelman, E. I., Kurth, J. C., and Krauss, P. D. (2017). Use of Polymer
Overlays or Sealers on New Bridges, Iowa Department of Transportation, Iowa Highway
Research Board (IHRB), 800 Lincoln Way, Ames, IA 50010.
24. FHWA (2018). Average Vehicle Occupancy Factors for Computing Travel Time Reliability
Measures and Total Peak Hour Excessive Delay Metrics, 1200 New Jersey Ave SE,
Washington, DC 20590.
25. Fowler, D. W. and Whitney, D. W. (2011). Long-Term Performance of Polymer Concrete for
Bridge Decks, NCHRP Web-Only Document 423, National Cooperative Highways Research
Program (NCHRP), Transportation Research Board (TRB), 500 Fifth Street NW, Washington,
DC 20001.
26. Fu, T. (2013). Shrinkage Study of High Performance Concrete for Bridge Decks, Ph.D.
Dissertation, Oregon State University, Corvallis, OR 97331.
27. Gama, N. (1999). Durability of Epoxy Polymer Concrete Overlays for Bridge Decks, M. Engg.
Thesis, Civil Engineering and Applied Mechanics, McGill University, Montreal, Canada.
28. Garbacz, A., Gorka, M., and Courard, L. (2005). Effect of Concrete Surface Treatment on
Adhesion in Repair Systems, Magazine of Concrete Research, Portland Cement Institute (PCI),
Vol. 57, Issue 1, pp. 49–60.
29. Gaughen, C. D. (1999). Concrete Floor Condition Assessment, User Guide UG-2038-SHR,
Naval Facilities Engineering Service Center, Post Hueneme, CA 93043.
30. Harper, J. (2007). Investigation of Failures of Epoxy Polymer Overlays in Missouri, Missouri
Department of Transportation, Organizational Results, Jefferson City, MO 65102.
31. Hearn, N., Hooton, R. D., and Nokken, M. R. (2006). Pore Structure, Permeability, and
Penetration Resistance Characteristics of Concrete, ASTM Stock No. STP169D, American

106 Effects of Concrete Cure Time on Epoxy Overlay and Sealant Performance
Society for Testing Materials (ASTM) International, 100 Barr Harbor Drive, PO Box C-700,
West Conshohocken, PA 19428.
32. ICRI (2013). Selecting and Specifying Concrete Surface Preparation for Sealers, Coatings,
Polymer Overlays, and Concrete Repair, International Concrete Repair Institute (ICRI), 10600
West Higgins Road, Suite 607, Rosemont, IL 60018.
33. IMCP (2007). Integrated Material and Construction Practices for Concrete Pavement: A
State-of-the-Practice Manual, FHWA Publication No. HIF – 07 – 004, U.S. Department of
Transportation (USDOT), Federal Highway Administration, Office of Pavement Technology,
400 7th Street S. W., Washington, DC 20590.
34. Issa, M. A., Issa, M. A., Khayyat, S. Y., Yousif, A. A., and Kaspar, I. I. (1995). Field
Performance of Full Depth Precast Concrete Panels in Bridge Deck Reconstruction,
Precast/Prestressed Concrete Institute, 200 West Adams St., Suites 2100, Chicago, IL 60606.
35. IRS (2020). Standard Mileage Rates.
<https://www.irs.gov/tax-professionals/standard-mileage-rates>
(Last accessed October 6, 2020)
36. Johnson, K. A. (2013). Crack and Concrete Deck Sealant Performance, MS Thesis, University
of Minnesota, Minneapolis, MN 55455.
37. Kanare, H. M. (2008). Concrete Floors and Moisture, Portland Cement Association (PCA)
and National Ready Mixed Concrete Association, 5420 Old Orchard Road, Skokie, IL 60077.
38. Kostyniuk, L. P., Louis, R. M. St., Zakrajsek, J., Stanciu, S. C., Zanier, N., and Molnar, L. J.
(2017). Societal Costs of Traffic Crashes and Crime in Michigan: 2017 Update, The University
of Michigan Transportation Research Institute, Ann Arbor, MI 48109.
39. Lawler, J. S., Connolly, J. D., Krauss, P. D., Tracy, S. L., and Ankenman, B. E. (2007).
Supplementary Cementitious Materials to Enhance Durability of Concrete Bridge Decks,
NCHRP Web-Only Document 110, National Cooperative Highways Research Program
(NCHRP), Transportation Research Board (TRB), 500 Fifth Street NW, Washington, DC
20001.
40. Lin, W. T., Cheng, A., Huang, R., and Cheng, T. C. (2013). A Method for Testing the Strength
of Concrete Using Uniaxial Direct Tension, Journal of the Chinese Institute of Engineers,
Taylor & Francis Group, Volume 36, No. 3, pg. 295–303.

107 Effects of Concrete Cure Time on Epoxy Overlay and Sealant Performance
41. Lyon, N. (2014). Moisture In Concrete: Storage, Migration, Measurement, American Concrete
Institute (ACI), Free Online Education Presentation.
ACI Free Education Presentation (Last visited October 6, 2020)
42. Mailvaganam, N. P., Pye, G. B., and Arnott, M. R. (1998). Surface Preparation of the Concrete
Substrate, Construction Technology Updates, National Research Council of Canada, Ottawa
K1A 0R6, Canada.
43. MDOT (2008). Bridge Rehabilitation and Replacement, Michigan Department of
Transportation, 425 W. Ottawa St., Lansing, MI 48909.
44. MDOT (2010). Bridge Rehabilitation and Replacement, Michigan Department of
Transportation, 425 W. Ottawa St., Lansing, MI 48909.
45. MDOT (2012). Standard Specification for Construction, Michigan Department of
Transportation, 425 W. Ottawa St., Lansing, MI 48909.
46. MDOT (2017). Bridge Deck Preservation Matrix – Decks with Epoxy Coated Rebar (ECR),
Michigan Department of Transportation, 425 W. Ottawa St., Lansing, MI 48909.
47. MDOT (2018a). Special Provision for Thin Epoxy Polymer Bridge Deck Overlay: 12SP-712B-
04, Michigan Department of Transportation, 425 W. Ottawa St., Lansing, MI 48909.
48. MDOT (2018b). Special Provision for Penetrating Healer Sealer on Bridge Decks: 12SP-
710B-03, Michigan Department of Transportation, 425 W. Ottawa St., Lansing, MI 48909.
49. MDOT (2018c). Special Provision for Silane Treatment for Concrete Bridge Surfaces on Job
Number 202704: 12DS710(N845), Michigan Department of Transportation, 425 W. Ottawa
St., Lansing, Michigan 48909.
50. MDOT (2019a). Special Provision for Performance Warranty, Thin Epoxy Polymer Bridge
Deck Overlay: 12SP-712C-03, Michigan Department of Transportation, 425 W. Ottawa St.,
Lansing, MI 48909.
51. MDOT (2019b). Fast Facts 2019. Michigan Mobility Data (Last accessed October 6, 2020)
52. MDOT (2020). Annual Average Daily Traffic (AADT) Map
Michigan Traffic Data (Last accessed October 6, 2020)
53. MDOT Wiki (2019). 712: Bridge Rehabilitation – Concrete.
MDOT 2012 Standard Specifications for Construction - Section 712
(Last accessed October 6, 2020)

108 Effects of Concrete Cure Time on Epoxy Overlay and Sealant Performance
54. Meddah, M. S. and Tagnit-Hamou, A. (2009). Pore Structure of Concrete with Mineral
Admixtures and Its Effect on Self-Desiccation Shrinkage, American Concrete Institute (ACI)
Material Journal, Vol. 106, No. 3.
55. Mehta, P. K. and Monteiro, P. J. (2006). Concrete: Microstructure, Properties, and Materials,
Third Edition, The McGraw-Hill Companies, Inc., 1221 Avenue of the Americas, New York,
NY 10020.
56. MOHSP (2019). Michigan Traffic Crash Facts: Fact Sheets, Michigan Office of Highway
Safety Planning, Lansing, MI.
57. MTM (2018). Manual for the Michigan Test Methods (MTM), Michigan Department of
Transportation, 425 W. Ottawa St., Lansing, MI 48909.
58. Murray, D. and Glidewell, S. (2018). An Analysis of the Operational Costs of Trucking: 2019
Update, American Transportation Research Institute (ATRI), 905 N. Glebe Road, Suite 210,
Arlington, Virginia 22203.
59. Nokken, M. R. (2004). Development of Discontinuous Capillary Porosity in Concrete and its
Influence on Durability, Ph.D. Dissertation, University of Toronto, Toronto, Ontario, ON
M5S, Canada.
60. Pantelides, C. P. and Weber, E. D. (2011). Evaluation of Bridge Deck Seal Treatment for ABC
Bridge Decks Using Precast Panels, University of Utah, Department of Civil and
Environmental Engineering, 110 S. Central Campus Dr., Room 2115, Salt Lake City, UT
84112.
61. Pfeifer, B. A. and Kowlaski, G. (1999). Evaluation of Thin Lift Polymer Bridge Deck Overlays on
I-57Bridges at Clifton, IL, Report No. IL-PRR-132, Illinois Department of Transportation
(ILDOT), pp. 29.
62. Poole, T. S. (2006). Guide for Curing of Portland Cement Concrete Pavements, Volume II,
Report No. FHWA-HRT-05-038, U.S. Department of Transportation (USDOT), Federal
Highway Administration (FHWA), Research, Development, and Technology, Turner-
Fairbank Highway Research Center, 6300 Georgetown Pike, McLean, VA 22101.
63. Potter, W. (1975). Use of Epoxy Resin, London, UK: Newnes-Butterworths.
64. Powers, T. C., Copeland, L. E., and Mann, H. M. (1959). Capillary Continuity or Discontinuity
in Cement Pastes, Portland Cement Association (PCA), Journal of the Portland Cement
Association (PCA) Research and Development Laboratories, Vol. 1, No. 2, pp. 38–48.
109 Effects of Concrete Cure Time on Epoxy Overlay and Sealant Performance
65. Shearrer, A. J., Riding, K. A., and Peterman, R. J. (2015). Effect of Concrete Moisture on
Polymer Overlay Bond Over New Concrete, Report No. K-Tran: KSU-13-3, Kansas
Department of Transportation, Dwight D. Eisenhower State Office Building, 700 S.W.
Harrison Street, Topeka, KS 66603.
66. Soltesz, S. (2010). Evaluation of Thin Overlays for Bridge Decks, Report No. FHWA-OR-RD-
11-05, Oregon Department of Transportation, Research Section, 200 Hawthorne Avenue, SE,
Suite B-240, Salem, OR 97301.
67. Sprinkel, M. M. (1983). Thermal Compatibility of Thin Polymer-Concrete Overlays,
Transportation Research Record (TRR), Transportation Research Board (TRB), 500 Fifth
Street NW, Washington, DC 20001.
68. Sprinkel, M. M., Sellars, A. R., and Weyers, R. E. (1993). Concrete Bridge Protection and
Rehabilitation: Chemical and Physical Techniques, Strategies Highway Research Program
(SHRP), National Research Council, 2101 Constitution Avenue, N. W., Washington, DC
20418.
69. Tabatabai, H., Sobolev, K., Ghorbanpoor, A., Nabizadeh, A., Lee, C. W., and Lind, M. (2016).
Evaluation of Thin Polymer Overlays for Bridge Decks, University of Wisconsin–Milwaukee,
Department of Civil and Environmental Engineering, 3200 North Cramer Street, Milwaukee,
WI 53211.
70. U.S. Bureau of Labor Statistics (2020a). May 2019 State Occupational Employment and Wage
Estimates Michigan. Michigan Occupational Employment and Wage Estimates May 2019
(Last accessed October 6, 2020)
71. U.S. Bureau of Labor Statistics (2020b). TED: The Economics Daily.
The Consumer Price Index (Last accessed October 6, 2020)
72. U.S. Census Bureau (2020). QuickFacts: Eaton County, Michigan
Quick Facts about Eaton County, Michigan (Last accessed October 6, 2020)
73. USDOT (2003). Standard Specifications for Construction of Roads and Bridges on Federal
Highway Projects: FP 03, Report No. FHWA-FLH-03-002, U.S. Department of
Transportation (USDOT), Federal Highway Administration, Office of Federal Lands
Highway, 1200 New Jersey Avenue, SE, Washington, DC 20590.
74. USDOT (2018). Bridge Preservation Guide: Maintaining a Resilient Infrastructure to
Preserve Mobility, U.S. Department of Transportation (USDOT), Publication No. FHWA-
110 Effects of Concrete Cure Time on Epoxy Overlay and Sealant Performance
HIF-18-022, Turner-Fairbank Highway Research Center, 6300 Georgetown Pike, McLean,
VA 22101.
75. Wilson, D. L. and Henley, W. H. (1995). Thin Polymer Bridge Deck Overlays, Washington
State Department of Transportation, Bridge and Structures Office, 4500 3rd Avenue SE,
Lacey, Washington 98503.
76. Winkler, P. (2014). Introduction to ICRI Technical Guideline No. 310.2R – 2013: Selecting
and Specifying Concrete Surface Preparation for Sealers, Concrete Repair Bulletin,
International Concrete Repair Institute (ICRI), 10600 West Higgins Road, Suite 607,
Rosemont, IL 60018.
77. Yavuz, F., Attanayake, U., and Aktan, H. (2017). Economic Impact Analysis on Bridge
Construction, Transportation Research Record (TRR), National Research Council, 500 Fifth
Street NW, Washington, DC 20001.
78. Young, L. M., Durham, S., and Liu, R. (2014). Performance of Thin Bonded Epoxy Overlays
on Asphalt and Concrete Bridge Deck Surfaces, Colorado Department of Transportation,
Applied Research and Innovative Branch, 4201 E Arkansas Ave., Denver, CO 80222.
Technical Data Sheet of MDOT Approved Epoxy Overlays
BASF (2016). MasterSeal® 350, Rapid-Setting, Epoxy-Based Concrete Overlay System.
E-Bond. 526 Lo-mod, Epoxy Rapid Set Multi-Layer/High Friction Treatment Standard &
Thixotropic Systems for Concrete & Asphalt Surfaces.
E-Chem (2014). EP50-Overlay, Low Modulus, Epoxy-Polymer.
Euclid Chemical (2016). Flexolith Summer Grade, Low Modulus Epoxy Coating and Broadcast
Overlay for Warmer Temperatures.
Euclid Chemical (2016). Flexolith HD, Low-Modulus Epoxy Coating and Broadcast Overlay
System.
Poly-Carb (1988). Mark-163, REMR MDS CM-OL-1.1.
Sika Corporation (2011). Sikadur 22, Lo-Mod, Low-Modulus, Medium-Viscosity, Epoxy Resin
Binder.
Transpo Industries Company Inc. (2013). Polysulfide Epoxy Coat, T-48 Chip Seal.
Unitex (2015). Pro-Poxy Type III DOT, Low Modulus, Low Viscosity, Epoxy/Urethane Binder
and Adhesive.
Technical Data Sheet of MDOT Approved Healer Sealers
111 Effects of Concrete Cure Time on Epoxy Overlay and Sealant Performance
E-Chem (2014). EP100-Seal, Super Low-Viscosity, Low Surface Tension, 100% Solids Epoxy.
Euclid Chemical (2016). Dural 335, Ultra-Low, Viscosity, Penetrating Epoxy Crack Healer-
Sealer.
Euclid Chemical (2017). Dural 50 LM, Ultra-Low Viscosity, Low Modulus, Acrylated Epoxy,
Crack Healer-Sealer.
Sikadur (2014). Sikadur® 55 SLV, Super Low-Viscosity, Moisture-Tolerant Epoxy Resin, Crack
Healer/Penetrating Sealer.
Unitex (2015). Pro Poxy 40 LVLM, Epoxy Sealer.
112 Effects of Concrete Cure Time on Epoxy Overlay and Sealant Performance
APPENDIX A: ABBREVIATIONS

113 Effects of Concrete Cure Time on Epoxy Overlay and Sealant Performance
A
AADT Annual Average Daily Traffic
AASHTO American Association of State Highway and Transportation Officials
AC Accidental Cost
ACI American Concrete Institute
ASTM American Society for Testing and Materials
AVO Average Vehicle Occupancy
C
CAADT Commercial Annual Average Daily Traffic
CPI Consumer Price Index
CPM Capital Preventive Maintenance
CSM Capital Scheduled Maintenance
CSP Concrete Surface Profile
CVAC Commercial vehicle accident cost
CVDDC Commercial vehicle driver delay cost
CVOC Commercial vehicle operating cost
D
DC Delay Cost
DDC Driver Delay Cost
DOT Department of Transportation
F
FHWA Federal Highway Administration
G
GGBFS Ground Granulated Blast Furnace Slag
H
HS Elevated Temperature
I
ICRI International Concrete Repair Institute
114 Effects of Concrete Cure Time on Epoxy Overlay and Sealant Performance
IRH Internal Relative Humidity
IRS Internal Revenue Service
M
MDOT Michigan Department of Transportation
MMA Methyl Methacrylate
MOHSP Michigan Office of Highway Safety Planning
MTM Michigan Test Methods
MVER Moisture Vapor Emission Rate
N
NA Not applicable
na Not available
NB Northbound
NCHRP National Cooperative Highways Research Program
nd Not defined
P
PAADT Passenger vehicle annual average daily traffic
PAC Passenger Accident Cost
ppm Parts Per Million
PVAC Passenger vehicle accident cost
PVDC Passenger Vehicle Delay Cost
PVOC Passenger vehicle operating cost
Q
QAQC Quality Assurance and Quality Control
R
RAP Research Advisory Panel
RCP Rapid Chloride Penetration
RH Relative Humidity
RS Reference Specimens

115 Effects of Concrete Cure Time on Epoxy Overlay and Sealant Performance
RT Room Temperature
RUC Road User Cost
S
SCM Supplementary Cementitious Material
ST Silane Treated
T
TCG Tourney Consulting Group
U
UPV Ultrasonic Pulse Velocity
USA United States of America
V
V Vehicle Operating Cost
W
w/c Water-Cement Ratio
w/cm Water-Cementitious Material Ratio
WD Wet and Dry Cycle

116 Effects of Concrete Cure Time on Epoxy Overlay and Sealant Performance
APPENDIX B: NOTATIONS

117 Effects of Concrete Cure Time on Epoxy Overlay and Sealant Performance
Ancv Normal accident rate for commercial vehicles
Anpv Normal accident rate for passenger vehicles
Ca Average cost per accident
Cap Average medical cost per accident per person
fc Specified compressive strength of concrete
fr Specified flexural strength of concrete
K Coefficient of permeability
LDcv Length of detour for commercial vehicles
LDpv Length of detour for passenger vehicles
LWZcv Length of the road segment closed to commercial vehicles during construction
LWZpv Length of the road segment closed to passenger vehicles during construction
n Number of years
p Capillary porosity
r Consumer Price Index (CPI)
rcv Average hourly vehicle operating cost for commercial vehicles
rpv Average hourly vehicle operating cost for passenger vehicles
TDcv Time to travel via detour for commercial vehicles
TDpv Time to travel via detour for passenger vehicles
TWZcv Time to travel along a distance equal to the closed road segment due to construction at
the normal posted speed for commercial vehicles
TWZpv Time to travel along a distance equal to the road segment closed due to construction at
the normal posted speed for passenger vehicles
t The minimum concrete age to receive an epoxy overlay or a healer sealer
t1 Concrete wet curing duration
t1a Time to achieve the specified strengths for QAQC requirements
t1b Time to achieve a discontinuous pore structure
t1c Time to achieve a minimum volume of total permeable voids
t2 Concrete age at the time of cracking
t3 Concrete age to achieve acceptable substrate moisture

118 Effects of Concrete Cure Time on Epoxy Overlay and Sealant Performance
t4 Concrete age to develop the specified minimum tensile strength
Concrete age at the time of healer sealer application
t5 Concrete age at the time of epoxy application to achieve the specified bond strength
VDcv Posted speed of detour for commercial vehicles
VDpv Posted speed of detour for passenger vehicles
VWZcv Posted speed of the road segment closed for commercial vehicles during construction
VWZpv Posted speed of the road segment closed for passenger vehicles during construction
wpv Hourly rate for both passenger and driver
wcv Hourly rate for a commercial vehicle driver