Performance optimization of VoIP using an overlay network
27
1 Performance Optimization of VoIP using an Overlay Network Raj Kumar Rajendran, Samrat Ganguly, Rauf Izmailov, Dan Rubenstein NEC Laboratories America Princeton, NJ Email: {raj,danr}@ee.columbia.edu,{samrat,rauf}@nec-labs.com Abstract Voice traffic on the Internet (VoIP) is poised to grow rapidly but the Internet is not engineered for such delay- sensitive applications. We show how the end-user quality of many VoIP calls can be improved by rerouting them in an intermediate overlay network and thought the use of various path-diversity and error-coding techniques. We present an overlay network (OverPhone) that is tuned to optimize VoIP quality and provide experimental results based on its implementation on the PlanetLab testbed. We show that about a third of the VoIP calls show noticable performance improvement when re-routed through the overlay while using the G.711 codec. We believe that this benefit extends to other well known and proprietary codecs as well. We also investigate the benefits and trade-offs of using techniques such as path-diversity and parity-coding. We find that path-diversity is useful in sustaining throughput at high loads, and that parity-codes can be used to trade-off bandwidth for path-quality. Keywords: VoIP, Overlay Networks, Traffic Engineering, Measurement Technical Area(s): Networking I. I NTRODUCTION The number of Voice over Internet Protocol (VoIP) telephone calls is increasing dramatically. The Federal Communication Committee’s (FCC) latest data indicates that there will be 3-7 million residential VoIP lines by the end of 2005. It projects that this number will grow to 27 million by 2010, accounting for approximately 20% of the 180 million telephone subscribers in the US [8]. The number of corporate telephone lines that use voice over the Internet is also projected to leap from 4% today to 44% by 2008 [11]. In addition Skype [16], the popular Internet telephone company, has recorded over 10 billion minutes of calls in its first year of inception. There is a clear need for understanding the effect of techniques such as rerouting, path-diversity and error-coding on the quality of VoIP calls and on the additional load placed on the Internet by the use of such techniques. While VoIP is a delay-critical application and is therefore sensitive to the paths over which its packets travel, routing over the Internet is determined by a complex interplay of the routing algorithms that are run within The first and last authors are primarily affiliated with Columbia University. This work was done while they were visiting NEC Laboratories.
-
Upload
independent -
Category
Documents
-
view
2 -
download
0
Transcript of Performance optimization of VoIP using an overlay network

1
Performance Optimization of VoIP using an
Overlay NetworkRaj Kumar Rajendran, Samrat Ganguly, Rauf Izmailov, Dan Rubenstein
NEC Laboratories America
Princeton, NJ
Email: {raj,danr}@ee.columbia.edu,{samrat,rauf}@nec-labs.com
Abstract
Voice traffic on the Internet (VoIP) is poised to grow rapidly but the Internet is not engineered for such delay-
sensitive applications. We show how the end-user quality of many VoIP calls can be improved by rerouting them in an
intermediate overlay network and thought the use of various path-diversity and error-coding techniques. We present
an overlay network (OverPhone) that is tuned to optimize VoIP quality and provide experimental results based on its
implementation on the PlanetLab testbed. We show that about a third of the VoIP calls show noticable performance
improvement when re-routed through the overlay while using the G.711 codec. We believe that this benefit extends to
other well known and proprietary codecs as well. We also investigate the benefits and trade-offs of using techniques
such as path-diversity and parity-coding. We find that path-diversity is useful in sustaining throughput at high loads,
and that parity-codes can be used to trade-off bandwidth for path-quality.
Keywords: VoIP, Overlay Networks, Traffic Engineering, Measurement
Technical Area(s): Networking
I. INTRODUCTION
The number of Voice over Internet Protocol (VoIP) telephone calls is increasing dramatically. The Federal
Communication Committee’s (FCC) latest data indicates that there will be 3-7 million residential VoIP lines by the
end of 2005. It projects that this number will grow to 27 million by 2010, accounting for approximately 20% of the
180 million telephone subscribers in the US [8]. The number of corporate telephone lines that use voice over the
Internet is also projected to leap from 4% today to 44% by 2008 [11]. In addition Skype [16], the popular Internet
telephone company, has recorded over 10 billion minutes of calls in its first year of inception. There is a clear need
for understanding the effect of techniques such as rerouting, path-diversity and error-coding on the quality of VoIP
calls and on the additional load placed on the Internet by the use of such techniques.
While VoIP is a delay-critical application and is therefore sensitive to the paths over which its packets travel,
routing over the Internet is determined by a complex interplay of the routing algorithms that are run within
The first and last authors are primarily affiliated with Columbia University. This work was done while they were visiting NEC Laboratories.

2
Autonomous Systems (ASes), and the relationships and interaction between these ASes. Such autonomous routing
does not necessarily make for the best routing for specific time-critical applications. Therefore applications where
delay and packet-loss is crucial should engineer their routing where possible. Overlay networks have been suggested
as one possible tool to customize routing according to the needs of the application [3], [14]. The idea is that the
overlay nodes run an application-specific routing algorithm, so that once a packet is handed to an overlay node, the
overlay ensures that the packet makes its way through overlay nodes to the target through a route that best suits
the application.
In addition it has been hypothesized that path-redundancy and error-coding techniques can be used to improve
the quality of VoIP streams [10]. There however is little information about the conditions under which quality can
be improved, the amounts by which quality can be improved, and the cost of such improvement on the underlying
infrastructure.
In this paper we introduce OverPhone, an overlay network that is specifically tuned to find routes that maximize
the quality of VoIP calls. It can be used to engineer routing based on the needs of VoIP calls and to implement VoIP
quality-improvement techniques such as path-diversity, and error-coding. We report on the results of experiments
we conducted using OverPhone on the PlanetLab testbed testing the effectiveness of re-routing, path-diversity and
parity-codes. Specifically we provide the following:
A. Contributions
• We present the design of two VoIP-specific overlay enhancements: a simple model and a more complex,
scalable model.
• We demonstrate how such an overlay can be deployed on a testbed such as PlanetLab.
• We show how path-diversity, packet-duplication and parity-coding can be implemented on this overlay.
• We design tools and experiments that test the efficacy of re-routing, path-diversity and coding techniques.
• We provide experimental results that show that
– Re-routing improves the quality of over a third of the paths and that the perceived quality of 10% of
talk-spurts improves from low to medium while another 10% improves from medium to high.
– Path-diversity reduces low-quality talk-spurts by 20% at large loads.
– Packet duplication improves voice quality but at a large cost.
– Parity-codes can be used to trade-off quality for bandwidth and that 50% additional bandwidth reduces
low-quality talk-spurts by nearly 30%.
B. Prior Work
The limitations of using standard routing for VoIP applications has been recognized. In [18] Shu Tao et al show
that when multiple paths are available from source to destination, performance can be improved by monitoring the
paths and choosing the path that offers the best performance for VoIP. In [2] Yair Amir et al suggest the use of
overlays to improve VoIP performance. They suggest storing packets in a ring-buffer at the overlay node so that if

3
a packet is noticed to be missing, it can be retrieved from the closest overlay node that possesses a copy rather than
from the source. The idea behind this scheme is that in cases where the delay incurred in fetching a missing packet
from the host may render it unusable, it may be possible to usefully retrieve the packet from the ring buffer of a
closer overlay-node. Our work differs in that unlike their work we are not buffering packets nor are we attempting
to reduce just network error, rather we attempt to increase the overall quality of the calls instead of any one aspect
of quality. Additionally our experience has been that network losses are small, and that jitter losses play a far bigger
role in determining the quality of VoIP calls.
In [17] the authors present OverQos, a wide-area overlay network that can provide Qos guarantees, smooth
packet-losses and provide packet-prioritization. OverPhone differs from OverQos in that it is not concerned with
improving the performance of a small fraction of the traffic but rather with rerouting all VoIP streams to take
advantage of the particular requirement of these streams. DoNet[19] is an example of an application-driven overlay
network. Nodes use the overlay to access media-streams not directly available to it. Like OverPhone, DoNet used
the PlanetLab environment for testing.
In [4] the authors look at the advantage of path-redundancy in the presence of congestion triggered loss and
path failure. They conclude that the advantage redundant-paths provide in these situations is small. Unlike them
we use redundant-paths to reduce both delay and loss. In [10] the authors improve voice quality by sending the
different descriptions of a Multiple Description Coded (MDC) voice stream over independent network paths. When
all descriptions are not received in time, the receiver settles for the quality the available descriptions provide. This
work’s approach is similar to our work where we use parity codes. However we ruled out the use of MDC coding
since it is not clear how approximately reconstructed MDC packets affect voice quality. In addition their work
considers two static routes in its experiments in contrast to our use of an overlay network.
Some works [15], [13] have investigated the use of parity codes to compensate for network loss. Our approach
differs in that we use parity codes to reduce not just network loss but also delay and jitter-loss. In [12] the authors
demonstrate the need to consider the interactions between adaptive jitter-buffers and FEC codes when they are used
in conjunction and propose new algorithms that take these interactions into consideration. Our works uses a static
buffering scheme where the interactions are easier to analyze.
The rest of the paper is organized as follows. We introduce VoIP in Sec. II and OverPhone our overlay network
in Sec. III. The experimental setup is laid out in Sec. IV. In Sec. V we analyze the performance of the OverPhone
overlay. Sec. VI describes our experiments with path-diversity while Sec. VII discusses our experience with
duplication and error-coding techniques. Sec. VIII notes some of the caveats and limitations of our results while
Sec. IX briefly notes directions for future work. Sec. X concludes the paper.
II. VOIP
In this section we discuss the VoIP process and show how the R-factor, a measure of the quality of a VoIP call
is computed.

4
R-factor Quality of Voice Rating MOS
90 < R < 100 Best 4.34 - 4.5
80 < R < 90 High 4.03 - 4.34
70 < R < 80 Medium 3.60 - 4.03
60 < R < 70 Low 3.10 - 3.60
50 < R < 60 Poor 2.58 - 3.10
Fig. 1. R-factor and MOS
Codec condition γ1 γ2 γ3
G.711 random loss 0 30 15
G.711 bursty loss 0 19 70
G.729 random loss 11 40 10
Fig. 2. γi values for various codecs
A. VoIP Quality
The VoIP software at the user-nodes are responsible for digitizing, encoding, streaming, decoding and playing
out the voice signal. First, the voice signal is sampled and digitized. Then it is encoded with one of many available
codecs ( G.711, G.723.1, G.729, etc.), packetized and transmitted using RTP/UDP/IP. At the receiver’s side, data is
de-packetized and forwarded to a jitter buffer, which smooths out the variation in network delay (jitter). The voice
data is then reconstructed and delivered to the listener. Packet loss and delay affect the perceived quality of a VoIP
stream in a complex manner. Packet loss and delay are caused by both the network and the VoIP application itself.
Packets can be lost in the network or be dropped by the playout buffer due to large delay jitter. Delay is caused in
the packetization process, in encoding and decoding data, and in the jitter buffer. Perceived quality is also affected
by the nature of losses. Packet losses that are randomly distributed along the stream are perceived to be less of an
impairment than losses that are clustered together. Since the delays caused by encoding and packetization are fixed
for a particular codec, the goal of routing the call is to minimize the negative impact caused by network delay,
network loss, jitter delay, jitter loss and the clustering of errors.
The ITU-T E-Model [1] is an analytic model of voice quality that can be used to estimate the relative voice quality
between two connections. The E-Model can be used to calculate the R-factor which is a simple measure of voice
quality ranging from a best case of 100 to a worst case of 0. The R-factor uniquely determines the Mean Opinion
Score which is the arithmetic average of opinion where 1 is “unacceptable” and 5 is “excellent. The R-factor is
related in a non-linear fashion to the MOS through the following equation [6].
MOS = 1 + 0.035R + 7× 10⁻⁶R(R − 60)(100− R) (1)
The relationship of R-factor values to MOS and the typical categorization of R-factor values are tabulated in
Table 1. It can be seen that connections with R-factors of less than 60 are expected to provide “poor” quality while
R-factors of 80 and above provide “high” quality.
According to the E-model the R-factor is made up of many parameters. Choosing ITU-T default values for
parameters not related to our discussion it reduces to:
R = 94.2− Ie − Id (2)

5
where Id is the impairment caused by the mouth-to-ear delay of the path, and Ie covers the impairments caused
by all types of losses.
B. Estimating the Impact of Delay
The end-to-end delay D, determines the interactivity of voice communication. As D goes up the impairment
to the perceived quality of the voice communication goes up as well. For one-way delays of less than 177 ms,
conversations occur naturally, whereas at delays of 177 ms or more, conversations begin to strain and breakdown
and often degenerate into simplex communication[6]. This impairment due to delay Id has been quantified and
captured as a function of the delay D and is given by:
Id = 0.024D + 0.11(D − 177.3) ∗ H(D − 177.3) (3)
where D is the one-way-delay in milliseconds, and H(x) is the Heavyside or step function where H(x) = 0 if
x < 0 and 1 otherwise.
The delay D is made up of three components:
• Network delay (dnetwork) is the propagation and queuing delay introduced by the network.
• Codec-related delay (dcodec), includes the delay incurred in packetization, in look-ahead processing and
encoding itself.
• Jitter buffer delay (djitter−buffer) is the delay incurred in the jitter buffer at the receiver in the process of
smoothing out the variation in network delay.
One component dcodec, is associated with the codec used. For example the G.711 codec samples voice data every
15 ms and constructs a frame of data which is then encapsulated into one RTP packet. Since it cannot transmit
the data until all that information for the frame is available, the encoder introduces a packetization delay of 15
ms. So dcodec for G.711 is 15 ms. Other codecs may introduce different dcodec values. For example the G.729
codec samples voice every 10 ms, packetized two frames in an RTP packet and uses a 5ms lookahead buffer for
an encoding delay of 25 ms.
The delay introduced by the jitter buffer at the receiver djitter−buffer helps smooth out the delay jitter introduced
in the network and is specific to the implementation of the playout buffer. Two kinds of jitter-buffers are popularly
used: static buffers and dynamic buffers. In a static scheme, djitter−buffer is chosen to be a constant value (e.g. 60
ms) and the buffer is sized to contain twice the number of packets that can be generated (2b) in time djitter−buffer
to avoid buffer overflow ( 4 packets for the G.711 codec). In the static scheme the first packet within a given talk
spurt is buffered until the bth and b + 1th packets arrive. Upon the receipt of the b + 1th packet the decoder will
start playing out the speech samples from the first packet. In a dynamic buffering scheme, the receiver continuously
adapts the size of the jitter-buffer and attempts to control the loss-rate due to jitter-loss. However such a dynamic
scheme reduces jitter-loss at the cost of increasing the delay at the jitter-buffer.

6
In our analysis and experiments, we will assume a static jitter-buffer and assume that the receiver uses a static
buffer of 8 packets. Therefore when 4 packets are in the buffer, playout starts. Because of this buffering a delay of
4 packets or 4 × 15 ms = 60 ms is assumed.
C. The Impact of Packet Loss
Three elements contribute to Ie the impairment factor due to packet loss. First we have the channel packet-loss.
Second the de-jitter buffer smooths out delay variations at the expense of increased packet-loss and delay. And
third, the codec uses an error-concealment algorithm. All three factors contribute to Ie. No analytic expressions are
available for Ie but instead it must be obtained from subjective measurements of voice quality for different codecs
and various operating conditions. It has been shown that an expression of the form
Ie = γ1 + γ2 ∗ ln(1 + γ3E) (4)
where E is the total loss rate, and the γi are fitting parameters, fits measured data well for various codecs. The
specific values of γi for different codecs are tabulated in Table 2 [7]. The equipment impairment factor Ie as a
function of packet-loss % for various codecs is charted in Fig. 1.
In this paper, we focus on G.711 as the reference codec and use the parameters for the G.711 codec provided in
Table 2 to estimate the impact of loss on voice quality for a given path.
D. The Impact of Clustering
While it is known that the burstiness of packet-loss affects the perceived quality of voice data, it is not well
understood [6]. The G.711 codec has been studied under random and bursty loss conditions [5]. For low loss
conditions (E < 0.04) the measured values of Ie (G.711 with packet loss concealment) under random and bursty
loss conditions are similar. However for larger loss conditions (E ≥ 0.04), Ie differs dramatically as shown in Fig.
4, and the bursty loss causes a marked degradation in the voice quality. In the case of bursty loss a different set
of γi values were shown to fit the observed Ie [6] and are tabulated in Table 2. We take this into account in the
calculation of R-factors throughout this paper.
We can now calculate the R-factor given the codec, the delays due to the network, codec and jitter-buffer,
and the losses due to the network and jitter-buffer. We also need an indication whether the losses are random
or bursty. The R-factor under random and bursty loss conditions are given by 94.2 − Id − (30ln(1 + 15E)) and
94.2 − Id − (19ln(1 + 70E)) for the G.711 codec where Id is given by Eq. 3. Therefore the R-factor can be
computed given just the total delay, the total loss rate, and burstiness.
III. THE OVERPHONE OVERLAY ENHANCEMENT
We first present a simple pared-down design for the OverPhone overlay which can be used when the number of
users is small. We then show how this design can be modified to make it scalable when a large number of users
are present.

7
0
5
10
15
20
25
30
0 2 4 6 8 10 12 14 16
Ie F
acto
r
Packet Loss %
Ie vs. Packet-Loss %
G.711G.729AG.723.1
Fig. 3. Loss Impairments (Ie)
2.2
2.4
2.6
2.8
3
3.2
3.4
3.6
3.8
4
4.2
0 2 4 6 8 10 12 14 16
Mea
m O
pini
on S
core
(MO
S)
Packet Loss %
Effect of Burstiness
RandomBursty
Fig. 4. Effect of Burstiness
A. Simple Model
The simplified OverPhone overlay consists of two classes of nodes. Machines that originate and receive VoIP
calls, called user-nodes, make up the user-layer and machines that additionally participate in overlay-routing, called
overlay-nodes, make up the overlay-layer as pictured in Fig. 5(a). In this simple scheme, at startup, the full list
of overlay nodes is made available to the user-nodes while the lists of all user-nodes and overlay-nodes are made
available to the overlay-nodes. When a user-node starts up, it probes the quality of its connection to each overlay-
node and choose as its entry-point the overlay node that provides it the best quality VoIP connection to the overlay.
It also registers registers with this overlay-node and requests it to be its exit-point from the overlay.
When a user-node wishes to originate a call to another target user-node, it contacts its entry-point overlay node
which informs the originating node if the overlay provides a better-quality route than the direct route for the VoIP
call (we describe later how the overlay-node determines this). When a better quality route is available through the
overlay, the originating user-node passes the packets of the VoIP stream to the originator which are then routed
through the overlay to the target user-node.
The roles and design of the user and overlay nodes are shown in Fig. 5(b) and summarized below.
Overlay Nodes
User Nodes Data Layer
Probe−Layer
Data Layer Data LayerData
Overlay Node Overlay Node
Control Layer Control LayerControl
Route−compute Layer Route−compute Layer
Probe LayerProbe Layer
Data Layer
Probe−Layer
User Node User Node
Fig. 5. Simple Model

8
User Nodes
Beacon Nodes
Overlay Nodes
Data−Path
Data Layer
Beacon−Layer
Probe−Layer
Data Layer
Beacon−Layer
Probe−Layer
Data Layer Data LayerData
Quality Probe
User−Layer
Beacon Node
Overlay Node Overlay Node
Control Layer Control LayerControl
Route−compute Layer Route−compute Layer
Probe Layer
Probe Layer
Probe Layer
User Node User Node
Fig. 6. Scalable Design
• [User-node] Runs VoIP application. On startup probes overlay-nodes and registers with one overly-node which
provides the best connectivity to the overlay.
Is made up of two layers: a Path-probe layer with which it probes its connectivity to overlay-nodes and a
Data-layer that transmits and receives VoIP streams from the Data-layer of overlay-nodes.
• [Overlay-Node] Special user-node that routes VoIP streams. Responsible for calculating the best routes between
pairs of user-nodes through the overlay and for routing VoIP streams from and to user-nodes. Serves as entry-
point and exit-point to the user-nodes registered with it.
Is made up of four layers: the Control-layer, the Route-compute layer, the Data-layer and a Path-probe layer.
The Control-layer communicates routing information to other overlay-nodes. It broadcasts requests for route
information and processes route-information that has been sent to it.
The Route-compute layer is responsible for computing the best routes to other overlay-nodes. It uses the
Control-layer to broadcasts routes and route-requests and to receives route-information from other overlay-
nodes. It also uses the Path-probe layer to asses the quality of the links to each user-node. It then computes
the best routes based on the link information and routing information received form other overlay-nodes.
The Data-layer is responsible for the receipt and routing of VoIP packets. It periodically receives route-updates
from the Route-compute layer which indicates the next-hop overlay-node (or an indication that the direct-path
is best) of the best route to each beacon-node.
The Path-probe layer is used to evaluate the quality of the link to overlay-nodes.
B. Scalable Model
In this section we present a scalable version of the simple model presented in Sec. III-A, and can be skipped on
first reading without loss of continuity.
The simple OverPhone model described in Sec. III-A is sufficient for a small number of users. However the simple
model does not scale due to two reasons. First it assumes a static topology and that nodes do not join and leave.
Second, as the number of user-nodes increase, the cycle-time T between the reevaluation of routes proportionately
9
increases. We present a scalable design which addresses these two issues.
1) Beacon-Nodes: One reason for lack of scalability in the simple model is because each overlay-node in the
simple model periodically reevaluates the quality of its VoIP connectivity to each user-node by sending it a sample
VoIP stream. This evaluation of the VoIP quality to each user-node needs to be carried out sequentially since
simultaneous evaluations may interfere with each other. Therefore as the number of user-nodes increases, the cycle-
time T between the reevaluation of routes proportionately increases. However the cycle-time T needs to be kept
small enough so that the overlay responds to dynamic changes in the condition of the network.
One solution to the problem is to group user-nodes together based on proximity, and use one user-node in each
group to represent the group for VoIP quality measurements. Such a strategy is practical as variations in network
delays and losses occur mostly at the access points to the network rather than on the network long-hop backbones.
With this strategy, each overlay-node periodically probes and measures the VoIP quality to the representative or
beacon node in each group and uses this measurement to compute the best routes to all user-nodes in the group.
The role and design of these representative nodes, called beacon-nodes, is illustrated in Fig. 6 and described below.
• [Beacon-node] Beacon nodes are specialized user-nodes that serve as the representatives of a group of user-
nodes to the overlay. They respond to queries from user-nodes at startup with a list of their best entry-points
to the overlay and its quality of its connection to each. They also represent all user-nodes registered with it to
the overlay for routing purposes. Finally they work in conjunction with all overlay-nodes to periodically assess
the quality of the network channel between them. Beacon-nodes are made up of a Path-probe layer that is
used to evaluate the quality of the channel to overlay-nodes and a User-layer that responds to the limited-range
broadcasts from user-nodes querying for beacon-nodes.
Overlay nodes in the scalable model perform the same role they do in the simple model, but compute the best
routes between pairs of beacon-nodes rather than between pairs of user-nodes in the simple model.
2) Discovery Phase: In the simple model, on startup, user-nodes are assumed to possess a list of overlay-nodes
and overlay-nodes are assumed to possess a list of user-nodes. This is not practical for large dynamic networks.
We therefore introduce a discovery phase in the scalable model where user-nodes, on startup, identify their best
entry-points to the overlay and register their presence with the overlay so that calls can be routed to them.
To implement discovery, user-nodes in the scalable model possess an additional Beacon-layer which on startup
sends out a limited broadcast (one that dies after a predetermined number of hops) querying for beacon-nodes.
Beacon-nodes in the vicinity respond with a list of their best entry-points to the overlay and the quality (R-factor)
of their connection to each entry-point. User-nodes then use their Path-probe layer to probe and measure the quality
of each of these entry-point directly and chooses the overlay-node that provides it the best connectivity to the
overlay as its entry-point to the overlay. The user-node also registers with the beacon-node whose connectivity to
the entry-point is closest to its own to be its exit-point.
Introducing beacon-nodes and modifying the user-nodes to use beacon-nodes and go through a discovery phase
improves the scalability of the simple model presented earlier.

10
C. Estimating Link Quality
We now look at the details of how overlay-nodes and beacon-nodes assess the quality of the link between them
(a link is the network channel between overlay-nodes or between overlay-nodes and beacon-nodes). Recall that the
link-quality is measured by the R-factor which is a function of delay, the network-loss rate, the jitter-loss rate, and
cluster-factor. We define each of these parameters, then discuss how we measure them for a individual link.
• [Delay (d)] d = r − s where s and r are the packet send and receive-time in milliseconds. Note that d is
network-delay while the total delay used in the calculation of the R-factor is D = d + dcodec + djitter−buffer .
For our experiments dcodec = 15ms and djitter−buffer = 60ms. So D = d + 75.
• [Network-loss rate (n)] n = P (packet-is-not-received) and is computed as (packets-sent−packets-received)/packets-
sent.
• [Jitter-loss rate (j)] is P ((d − d1) > T ) where T is the jitter-buffer threshold and d1 is the delay of the first
packet in a talk-spurt (we will discuss talk-spurts in the next section). T in our experiments is 60ms.
• [Cluster-factor (c)] is P (pi+1 is lost |pi is lost), where pi indicates the ith packet.
We next discuss how we measure each of these parameters for an individual link with our path-quality probe.
We start by describing the probe itself.
1) The Quality Probe: All overlay-nodes and beacon-nodes posses a Path-probe which they use to periodically
assess the quality of the channel between them. The Path-probe works by transmitting a 15 second VoIP talk-spurt
and observing the loss and delay on this spurt. The talk-spurt consists of 5 initialization control packets, followed
by 1000 132-byte data packets p1 . . . p1000 sent at 15 ms intervals, followed by 5 more control packets indicating
the end of the spurt. Each data packet pi contains i its sequence-number in the talk-spurt and the send time si. Upon
receipt of the initialization control-packets, the receiving Path-probe begins recording statistics about the spurt. In
particular, it records network-loss n, jitter-loss j, and the cluster-factor c. It also estimates the average delay in
the receipt of packets from their time-stamps. Upon receipt of the last packet of the stream the server returns the
network-loss, jitter-loss and the loss cluster-factor to the transmitting Path-probe. Additionally it returns the deviation
of the delay of the last packet from the average delay (we explain later why it sends this information rather than
just the average delay). The transmitting Path-probe uses this information to calculate the quality (R-factor) of the
channel. We discuss each measurement in detail.
2) Link Delay (d): Since the Path-probes at the overlay-nodes and the beacon-nodes communicate bidirectionally,
multiple options are available in measuring the path delay. The packets in the talk-spurt are timestamped just before
they are sent out, therefore the Path-probe at the receiver can compute the average delay by comparing its current
time with the timestamps on the packets. However this requires that the clocks at the overlay nodes and beacon-nodes
be synchronized to within a millisecond or two, which may not be the case.
The second option is for the nodes to estimate delay from Round-Trip Times (RTT). This is possible since the
beacon-node responds to the last packet in the stream by sending back loss statistics. The client can record the
time elapsed from when the last packet in the talk-spurt is sent out to the time the packet containing loss statistics

11
is received. This method suffers from the drawback that the return-trip time may differ from the forward-trip time,
and therefore estimating delay from RTT may be inaccurate. In addition, the last packet may suffer a delay that
deviates from the mean delay.
We use a combination of the two options in estimating delay. The receiving Path-probe, in addition to calculating
average delay d, computes the deviation in delay of the last packet received from the mean ddev = dlast − d and
returns this information back to the client as part of the returned statistics. The sending Path-probe then computes
the time that elapsed from when the last packet in the talk-spurt is sent to when the statistics packet is returned.
From this it estimates delay. Then it corrects this estimate by ddev . Such an estimate of delay, while not exact,
provides a measure that we observed to be reasonably consistent over time.
3) Link Jitter Loss (j): In our experiments we assume that the receiver use a static buffer that stores 8 frames.
Playback of the first frame starts when the buffer reaches its halfway mark or 4 frames. Since frames encode 15ms
of data in the G.711 codec, the jitter-buffer delay is 4 x 15 = 60 ms.
We use the time-stamp information contained in the packets in our talk-spurt to calculate jitter-loss. When
a receiving Path-probe encounters the first packet of a talk-spurt, it calculates and stores the first-packet delay
d1 = r1 − s1. Then for each subsequent packet pi received, it calculates the jitter-delay to be the delay relative
to the first-packet ji = ri − si − d1. If jitter-delay ji is negative, the packet arrived ahead of schedule. However
if it is positive and larger than the jitter-delay threshold of 4 x 15 = 60 ms, the packet is determined to have
arrived too late to be of use, and is noted as a loss. At the end of the talk-spurt, it estimates the jitter-loss rate
j = (1000−packets-lost-to-jitter)/1000.
4) Link Network Loss (n): The Path-probe at the receiver keeps track of the number of packets received from the
sending client. At the end of the talk-spurt it estimates the network-loss rate n = (1000−packets-received)/1000.
5) Link Cluster-Factor (c): Packets in the probe-stream contain their sequence-number i. The Path-probe records
these numbers upon receipt of a packet, and computes the cluster-factor c from these recorded sequence numbers
at the end of the spurt.
Upon receipt of control-packets indicating the end of the talk-spurt, the Path-probe returns four pieces of
information back to the sender: n, j, c and ddev . The sender records n, j, c and estimates d = rlast−packet/2 + ddev
where rlast−packet is the round-trip time it recorded for the last packet in the spurt.
D. Estimating Path quality
In the above section we discussed how d, n, j and c for a single link is estimated. From theses estimates the
R-factor of the link can be computed. However a route or path through the overlay can comprise multiple links
and the routing-algorithm needs to be able to evaluate the quality of these multi-hop paths to choose the best
path among many available. It therefore needs to to compute the R-factor of multi-hop paths. However R-factors
are non-linear so are not additive. Therefore to calculate the R-factor of the path, we needs the overall d, n, j
and c for the whole path. Since we do not directly measure d, n, j and c for multi-hop paths (doing so would be
computationally prohibitive as the number of multi-hop paths increases exponentially in the number of hops) the
12
solution is to estimate d, n, j and c for the multi-hop paths from the corresponding values of the individual links
and compute the R-factor for the whole path from these estimate. We discuss how we do this next.
1) Path Delay (d): Calculating the combined delay is simple. Assuming that processing delays are small relative to
network delays, the total delay of a multi-hop path is just the sum of the delays of the individual links dab = da+db.
2) Path Network Loss (n): Network errors are multiplicative. If two links a and b have loss rates of ea and eb the
combined loss rate along the path comprising of links a and b is 1− ((1− ea)(1− eb)). For small values of ei the
combined loss rate can be approximated by summing the losses. I.e., for small ei, 1− ((1− ea)(1− eb)) ≈ ea + eb.
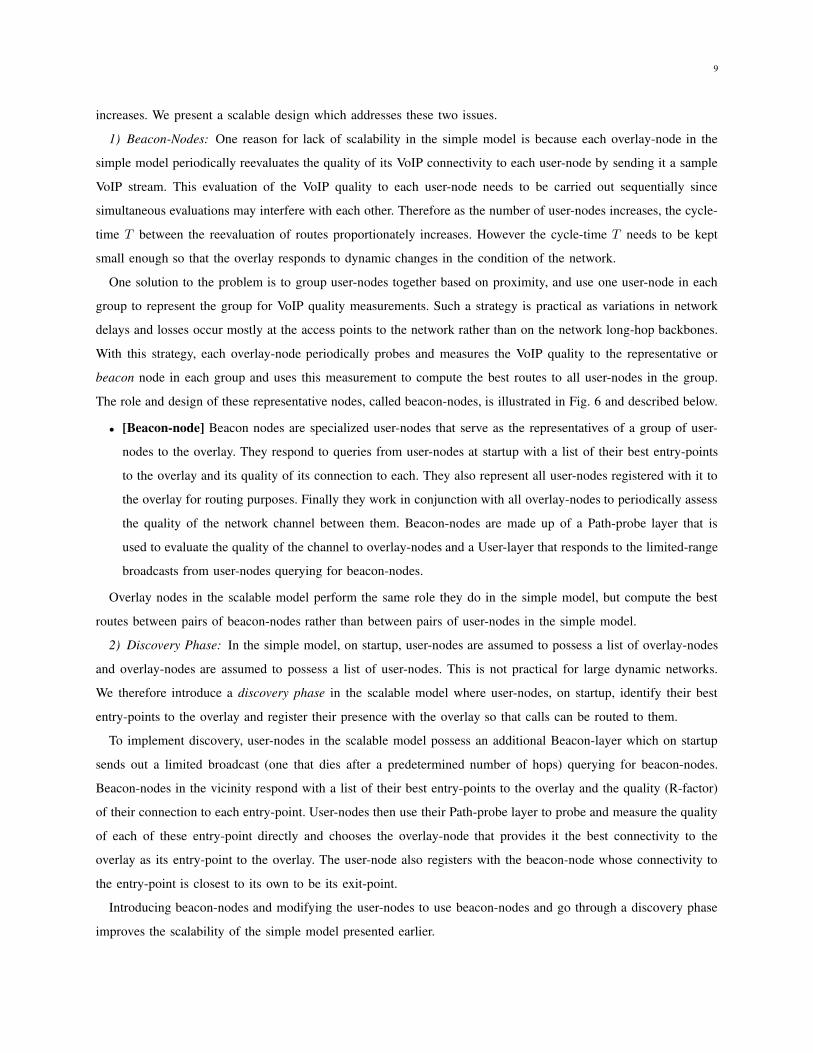
3) Path Jitter Loss (j): Estimating jitter loss for a multi-hop path from the jitter-losses of individual links is
more complicated. Consider the static jitter-buffer scenario where all packets that have a delay larger than the
first-packet-delay plus the jitter-buffer threshold T are considered lost. Suppose packets traversing link i show a
delay distributions pi(t), then the jitter-loss probability is as given below.
ji =
∫∞
di1+T
pi(t)dt
where di1 is the first-packet-delay and T the jitter-buffer threshold. Assuming that the distributions are independent,
and processing delay is small compared to the delays, the delay distribution of packets traversing the two links a
and b sequentially is given by pab(t) = pa(t) ◦ pb(t) where ◦ is the convolution operator. The jitter loss jab for the
two links is given by
jab =
∫∞
da1+db
1+T
pab(t)dt
Therefore to compute the jitter-loss rate of a multi-hop path, we need the delay-distributions and first-packet delay
of the individual links.
Distributions are cumbersome to pass around, so we experimented with ways to estimate the multi-hop jitter-
loss rate without having to estimate or store distributions. We captured the delay distributions from the different
suffixes, and conducted experiments on different methods of estimating the multi-hop rate from the distributions.
We discovered that a simple sum worked sufficiently well. In all cases where the jitter-loss rate of individual links
was significant (> 0.01) estimating the multi-hop jitter-loss as jab ≈ ja + jb was very close to the actual value
for jab or overestimated it. We concluded that summing the jitter-losses of the individual links to estimate the
jitter-loss of a multi-hop path is a conservative overestimate and we chose to use this method in our overlay rather
than storing and exchanging delay distributions and first-packet delays.
4) Path Cluster-Factor (c): The cluster-factor can be computed for a multi-hop path as a sum weighted by the
loss rate (since the cluster-factor is only computed for lost packets). So cab = (ea × ca + eb × cb)/eab.
Since we can estimate d, n, j and c for a multi-hop path from the values of the individual segments, we can now
compute the R-factor for multi-hop paths and therefore we are in the position to compare the quality of two routes
irrespective of whether they are single-hop or multi-hop. We next describe our routing algorithm.

13
E. The Modified Distance-Vector Algorithm
Our routing algorithm is a variant of the Distance-Vector algorithm [9] where each overlay-node periodically
recomputes its best routes. In each cycle each overlay node first estimates the quality of its link to each beacon-node
using the Path-probe. It then iteratively exchanges route-information with all other overlay-nodes and computes the
best route to each beacon-node. The exchanged information consists of the delay d, network loss rate n, jitter loss
rate j, cluster-factor c and next-hop neighbor h. The algorithm works as follows.
• Set the next-hop h to “direct” and estimate (d, n, j, c) for the links to all beacon-nodes.
• Broadcast this information to all other overlay-nodes.
• Iteratively do the following until the recomputed routes do not change
– Collect route-information from all other overlay-nodes.
– For each beacon-node, compute (d, n, j, c) through each overlay-node and calculate the R-factor to it.
– If the R-factor for a beacon-node through another overlay-node is better than the current route, choose
the best available.
– Reset (d, n, j, c) to be the new values and reset the next-hop h to be the overlay-node that provides the
best route.
– If routes changed during this iteration, broadcast new routes to all other overlay-nodes.
This modified version of the Distance-Vector algorithm is run periodically. In each cycle each overlay-node
computes the best route to each beacon-node and records either the next-hop overlay-node or that the direct-path
provides the best route. It then passes this information to the Data-layer. The algorithm is more formally described
in Fig. 7.
IV. EXPERIMENTAL SETUP
In this section we describe the deployment of our experimental overlay on the PlanetLab environment and our
experimental setup. We start by briefly introducing the PlanetLab Environment.
A. PlanetLab
PlanetLab is a collection of academic, industrial, and government institutions cooperating to provide a testbed for
Networking research and consists of 578 machines hosted by 275 sites spanning 25 countries and supporting 275
active research projects. Each research project is run in a slice. Each slice consists of a set of machines, running
a modified Linux OS that makes it appear that the project is the only user of the system (when in reality multiple
projects share the machine’s resources).
Our experimental PlanetLab slice consisted of 115 machines. However of these only about 40 machines were from
unique institutions, as many institutions contribute multiple machine to the PlanetLab environment. Since multiple
machines from a single institution are likely to be geographically close and topologically similar, we eliminated
duplicate machines from the same institution. This left us 31 machines that were alive and from unique institutions

14
• For each node i do
– Probe and determine di, ni, ji, ci the delay, network-error and
jitter-error on the link to i.
– Compute ri the R-factor for the link to i.
– Set hi the next-hop neighbor to be direct (hi = i).
• done (for)
• Do
– Broadcast di, ni, ji, ci to other overlay-nodes.
– Collect dj
i, n
j
i, j
j
i, c
j
ifrom other overlay-nodes j.
– Set changes = 0;
– For each set of routes from overlay-node j do
∗ Let dij , nij , jij , cij be the delay, network-error, jitter-
error, cluster-factor to i reported by j.
∗ Compute dj
i, n
j
i, j
j
i, c
j
ithe delay, network-error, jitter-error
to i through j.
∗ Compute rj
ithe R-factor of the path to i through j.
∗ If rj
i> ri do
· di = dj
i.
· ni = nj
i.
· ji = jj
i.
· ci = cj
i.
· ri = rj
i.
· hi = j.
· changes + +.
done (if)
– done (for)
• Until (changes == 0)
Fig. 7. The Modified Distance-Vector Algorithm
Spurt−1 endsSpurt 2 starts
Spurt 2 endss
Spurt N starts
Spurt N ends
Call Ends
Call OriginatesSpurt−1 starts
Spurt−1 starts
Call Originates
Spurt−1 endsStats sent back for Spurt−1
Spurt−1 statisticsreceived
Spurt−N statisticsreceived
Call statisticscomputed
Stats sent back for Spurt−N
Originator Receiver
Tim
e
Fig. 8. Call Timeline
at the time of the experiments. The number of hosts in each domain or suffix, the Round-Trip-Time and bandwidth
measured from the home-machine, and the 15 minute load-average for these machines are tabulated in Table I.
B. Choosing the Overlay Nodes
Since the number of machines, or nodes, available to us in the experimental testbed was small, we implemented
the simple architecture described in Sec. III-A. In this simple VoIP System we envision, there are many user-nodes,
and fewer fewer overlay-nodes. We needed to apportion the chosen machines in the PlanetLab environment to these
different roles. Since machines can play multiple roles, we chose all machines to play the roles of user-nodes.
However we wished to have a smaller subset of machines play the role of overlay-nodes.
We decided to choose those machines that proved to be the best routing-intermediaries to be the overlay-nodes.
In other words we chose those machines that provided the best shortcuts between other nodes on a static snapshot
of the network. More specifically, over a short time-span, each host recorded its R-factor to each of the other N-1
hosts in the network. Then using all N such snapshots, each host looked for the best alternative path to each host
through single or multiple intermediate nodes. If the best alternative path provided a larger R-factor than the direct

15
Domain Category Number RTT (ms) BW (B/s) Load
edu Education 11 30 8.6 15
org Organization 1 16 6.2 5
net Networking 5 62 4.5 8
com Commercial 2 80 3.5 4
uk U.K. 1 72 - -
fr France 2 88 1.8 7
be Belgium 1 107 2.1 8
de Germany 1 96 2.2 9
ch Switzerland 1 91 2.2 14
dk Denmark 1 115 0.9 12
il Israel 2 178 1.4 8
kr Korea 1 317 1.1 -
in India 2 770 - 2
Total 31 104
TABLE I
PLANETLAB NODES IN EXPERIMENTAL SETUP
Parameter Value
Codec G.711
Bitrate 64 Kbps
Sampling Rate 15 ms
Frame size 120 bytes
Frame Rate (simplex) 67 frames/sec
Frame Rate (duplex) 133 frames/sec
Packet size (RTP) 132 bytes
Packet Bitrate (duplex+RTP) 141 Kbps
Packet size (RTP+UDP+IP) 160 bytes
Packet Bitrate (duplex+RTP+UDP+IP) 171 Kbps
Jitter Buffer size 8 frames
Jitter Buffer size 960 bytes
Jitter Buffer delay 4 frames
Jitter Buffer delay 60 ms
TABLE II
G.711 CODEC PARAMETERS
path, each intermediate host in the alternative was credited with providing a shortcut. After analyzing all N 2 such
host-pairs, we chose the O hosts which figured in the most shortcuts to be overlay-nodes. We illustrate this selection
process with a simple example. Suppose A, B and C are the three hosts under consideration and let rAB indicate
the R-factor A calculates for a direct connection to B while rACB be the R-factor for a connection from A to B
through C. If rACB > rAB then C gets a credit for being a shortcut node. Similarly if rBCA > rBA host C would
get a second credit. Since in a three-host network each node could be a shortcut for two paths each host has a
shortcut-credit of 0,1 or 2. Similarly hosts A and B would have their shortcut-credits calculated. The nodes which
had the largest number of shortcut-credits would become the overlay nodes.
In our experiment, we had all hosts record snapshots of their R-factors to all other hosts over a half-hour period.
We then calculated the shortcut-credit for each host. There were nineteen hosts which had shortcut-credits and there
were eleven hosts which had three or more shortcut-credits. We chose these eleven hosts as overlay nodes. The
distribution of these nodes by suffixes is given in Table. 9.
C. The G.711 codec
The makeup of VoIP streams, and the analysis of received streams for quality depends on the specific codec used.
Of these, the best known are the G.723, G.729 and G.711 codecs. The G.723 and the G.729 are low bandwidth
codecs (6 Kbps and 8 Kbps), while the G.711 codec is is high-bandwidth codec (64 Kbps). Since the Internet is
a relatively high-bandwidth environment (relative to wireless networks) we use the G.711 codes throughout our
experiments.
Throughout, we use the G.711 codec with a 15 millisecond (ms) sampling interval. This creates frames of size

16
Suffix # Overlay-Nodes
edu 4
net 3
com 2
de 1
be 1
Total 11
Fig. 9. Overlay Nodes and their Suffixes
Call beginning Talk−spurt Talk−spurt Call endTalk−spurt
Spurt−beginning Spurt−end1000 packets of 132 bytes every 15 ms
Fig. 10. A VoIP-Tester Call
64 × 15/8 = 120 bytes. Since each is encapsulated into one RTP packet before being sent out, a 12 byte RTP
header is added making a 132 byte RTP packet. Frames are generated at a rate of 67 frames/second for a simplex
connection. Since VoIP connections are duplex, 133 packets of size 132 bytes are generated every second for a
call. The system adds an 8 byte UDP header and a 20 byte IP header creating a 160 byte packet resulting in a
bandwidth of 171 Kbps per call. The largest load we use in our tests is 5 simultaneous calls which uses a total
bandwidth of 855 Kbps. We tabulate these important parameters of the G.711 codec and related numbers in Table
II.
D. The VoIP Tester
For our experiments we created a VoIP-tester (VT) application that runs on user-nodes. The VoIP-tester (VT) is
capable of generating VoIP calls to other user-nodes. Calls consist of sequences of talk-spurts of 15 seconds or 1000
packets each (similar to the path-prober). Each talk-spurt of 1000 packets is surrounded by 5 control packets on
either side, indicating the beginning and end of a talk-spurt. The whole call, consisting of a sequence of talk-spurts
is also surrounded by 5 control packets on either side indicating the beginning and end of a VoIP call. The control
packets allow the receiving VT application to set-up and tear-down calls. It also allows the receiving VT application
to gather statistics. The constituents of a VT call are pictured in Fig. 10.
The receiving VT application collects statistics for each talk-spurt and sends it back to the sender at the receipt
of the control packets indicating the end of a talk-spurt. The sender has a asynchronous process that gathers the
returned statistics for the individual talk-spurts and computes information about the overall quality of the call. The
timeline of this process is pictured in Fig. 8.
V. ROUTING
In this section we describe the performance of the overlay network.
1) Performance: We collected performance information while running the overlay uninterrupted for a full day.
The modified Distance-Vector algorithm ran to convergence every 10 minutes. Each of the overlay node recorded
the following statistics:
• The percentage of beacon-nodes to which the overlay provided a better path than the direct link.

17
• The average amount by which the R-factor increased for those routes which routed through the overlay rather
than directly.
• The percentage of nodes for which the quality of the VoIP increased from “low” (R-factor < 70 ) to “medium”
or better (R-factor ≥ 70 ).
• The percentage of nodes for which the quality of the VoIP increased from “medium” or worse (R-factor < 80
) to high or better (R-factor ≥ 80 ).
The first statistic indicates how many nodes benefit from the overlay. The second statistic indicates whether the
benefit is significant. However an improvement in quality from poorer to poor (say from an R-factor of 20 to 30)
of from high to higher (say R-factor of 80 to 85) is not significant as the perceived quality remains essentially
the same. To take this into account, we captured the last two statistics which indicate the percentage of calls that
improve perceptually rather than mathematically.
The average values of these parameters from a day’s records of approximately 150 sample points for each of the
overlay nodes is shown in Table III. We found that these numbers were quite stable and did not change significantly
over the course of the day. On average the R-factor of 41% of the paths improved in being routed through the
overlay rather than directly. The R-factor also increased by an average value of 26 for these paths. Additionally
11% of routes improved in perceived quality from low (or worse) to medium (or better), and 11% improved from
medium (or lower) to high (or better).
While collecting our statistics we noted that some overlay-nodes were not able to directly communicate with
some beacon-nodes. When an overlay-node does not have a direct-path to a beacon-node, the channel is assigned
node suffix Increase
in
% paths that improve
R-
factor
from low-
medium
from
medium-
high
1 edu 26 42 10 9
2 edu 22 42 8 8
3 edu 39 43 16 16
4 edu 23 42 8 8
5 net 20 40 8 7
6 net 27 46 14 16
7 net 23 42 10 9
8 com 20 35 6 6
9 com 28 41 12 12
10 de 28 39 10 10
11 be 27 43 13 13
Mean 26 41 11 11
TABLE III
PERFORMANCE IMPROVEMENT DUE TO OVERPHONE
node suffix Increase
in
% paths that improve
R-
factor
from low-
medium
from
medium-
high
1 edu 4 27 1 2
2 edu 4 29 0 1
3 edu 4 22 1 1
4 edu 4 29 0 2
5 net 5 29 2 3
6 net 7 30 4 9
7 net 6 30 3 5
8 com 5 25 2 3
9 com 4 26 1 4
10 de 6 25 2 4
11 be 11 31 6 8
Mean 7 28 2 4
TABLE IV
LOWER-BOUND OF IMPROVEMENT

18
an R-factor of 0. These overlay-nodes however discovered paths to these directly unreachable nodes through the
overlay. In the statistics collected, these nodes would show an improvement in performance from an R-factor of
0 to the R-factor of the route through the overlay. It is possible that such routes inflate the performance of the
overlay, since the improvement in performance is measured from 0 rather than some other baseline.
Therefore we also collected the above mentioned statistics, discounting increases in performance from 0; i.e, if
we noticed that a node showed an improvement in performance from a R-factor of 0 to some value, we did not
include it in our statistics. The previously mentioned measures discounting these increases are shown in Table IV.
It should be noted that this statistic understates the performance of the overlay as it is likely that 30-40% of these
paths not taken into account would have also shown improvement in performance. The data in the table can be
seen as a lower-bound on the improvement in performance. Even in this underestimate of performance, 28% of
nodes show improved quality by an average R-factor of 7. Additionally the perceived quality of 2% of the nodes
improved from low (or worse) to medium (or better) and 4% improved from medium (or lower) to high (or better).
2) Stability: Another area we were concerned about with regard to the performance of our overlay was the
stability of the computed routes over time. Each overlay-node recomputes the best routes every 10 minutes. The
question was whether these routes stayed close to being the best in the intervening interval. This is an important
question in our case because of the use of talk-spurts to assess the quality of data channels. When a new routing-
cycle starts, the overlay-node computes the quality of the direct-path to each overlay-node anew. Since our talk-spurt
takes approximately 15 seconds for each node, the inter-cycle time cannot be reduced dramatically from the default
of 10 minutes used. Therefore the stability and utility of routes is important.
To assess stability we recorded two statistics for each overlay node at each route-calculation cycle: the percentage
of routes that changed from the last cycle, and the amount by which it changed. Studying the statistics recorded
over a day, we noted that approximately 43% of nodes had new routes in each cycle indicating that there was a
fair amount of change in routing between cycles. However the average change in the R-factor of these changed
routes was only 3%. This number is very small compared to the approximately 17% improvement in R-factor noted
earlier for routes over the overlay. This indicates that the overlay provides multiple routes of similar quality, and
depending on the conditions during the measurement of channels in each cycle, different routes may be chosen
among these routes. However all these routes provide nearly equivalent performance so we therefore concluded that
the large time-interval between route-calculation cycles was not an issue of concern.
VI. PATH DIVERSITY
One of the facilities, not normally available, offered by an overlay is multiple-paths to a destination. It has been
hypothesized that using multiple-paths increases the bandwidth available from a source to a destination. In a VoIP
application we are interested not just in increased bandwidth but in increased capacity. This can be measured as the
increase in the number of calls of equal quality that can be put through, or equivalently the increase in the quality
of calls when the number of calls are held constant.
We used OverPhone to test whether increased path-diversity does indeed give us more capacity. We compared

19
50
55
60
65
70
75
80
85
90
edu
net
com
org
eur
il edu
net
com
org
eur
il edu
net
com
org
eur
Single Path 2 Path benefit
Single Path 3 Path benefit
Single Path 4 Path benefit
4 Paths3 Paths2 Paths
Fig. 11. Path-Diversity’s effect on R-factor
0
10
20
30
40
50
60
70
80
edu
net
com
org
eur
il edu
net
com
org
eur
il edu
net
com
org
eur
2 PathBenefit
3 PathBenefit
4 PathBenefit
4 Paths3 Paths2 Paths
Fig. 12. Path Diversity’s reduction of low-quality spurts
two channels from the same source to the same destination where the first used a single-path and the second used
multiple-paths. We fed the same number of calls to both channels and observed the difference in quality between
the calls in the two channels. We then slowly ratcheted up the the number of calls sent, correspondingly increasing
the path-diversity of the second channel, and observed the difference in performance between the two channels. We
present the results below.
A. Results
We began by sending two calls through each channel. The first channel used a single path for both calls, while
the packets in the second channel were passed to two different overlay-nodes. Recall that each duplex G.711 call
uses a bandwidth of 170 Kbps. Therefore the load in this experiment was 340 Kbps. The source was always a
user-node in the “columbia.edu” domain while the targets were all the user-nodes in our PlanetLab environment.
All calls lasted 5 minutes.
We recorded two parameters in the tests. The first was R, the average R-factor of talk-spurts in the call, and the
second was L the percent of talk-spurts that were perceived to have low or worse quality (R-factor < 70). The
difference in performance between the single-path channel and the two-path channel for user-nodes in the different
suffixes is tabulated in the first set of histograms in Figs. 11 and 12. 1
In Fig. 11 the improvement in R of multiple paths is stacked on top of the R values of the single paths, and in
Fig. 12 the additional L suffered by single-paths is stacked on top of the L value of multiple paths. It can be seen
that path-diversity does indeed improve performance. Tests in all suffixes showed improvement and on average the
R-factor improved by 4 while low quality talk-spurts fell by 11%.
1When multiple user-nodes were present in a in a suffix, we averaged their results. We also show the combined value of European suffixes
under the label “eur” to enhance visual clarity.

20
-5
0
5
10
15
20
1 1.5 2 2.5 3 3.5 4
R-fa
ctor
impr
ovem
ent
Diversity
Improvemnet in R-factor vs. Diversity
.edu.net
.com.org.eur
.il
Fig. 13. Diversity vs. R-factor
-10
0
10
20
30
40
50
1 1.5 2 2.5 3 3.5 4
Red
uctio
n in
bad
seg
men
ts
Diversity
Reduction in bad segments vs. Diversity
.edu.net
.com.org.eur
.il
Fig. 14. Diversity vs. % low quality spurts
We next tested how this improvement in performance changed as the number of calls and path-diversity increases.
The results of the test with 3 calls (bandwidth of 540 Kbps) is tabulated in the second set of histograms in Figs.
11 and 12. It can be seen that nearly all suffixes showed even larger improvements in performance. The average
improvement in R-factor went up to 11, and the low quality talk-spurts fell by 21%.
We next conducted the tests with a path-diversity of 4 and with 4 calls that used a bandwidth of 680 Kbps. At
this bandwidth the test started breaking down and calls did not complete to some targets. The results of this test
are tabulated in the third set of histograms in Figs. 11 and 12. The average improvement in R-factor went up to
12, and the percent of low quality talk-spurts fell by 22, but the channels started to saturate and the overall quality
of the calls dropped.
The improvement in quality as the load and path-diversity increases is charted in Figs. 13 and 14. The first graph
shows the average improvement in R-factor for the different suffixes and the second records the reduction in the
percent of low-quality spurts (the European suffixes were combined to make the charts less cluttered).
It can be clearly from the histograms and graphs that the difference in quality between channels that use path-
diversity and those that do not widens as load and diversity go up. However it can also be noticed that the overall
quality falls. This is beacuse a single route uses the best available path, but as as path-diversity increases more
sub-optimal paths are used to route the stream. Threfore using more path-diversity necessarily reduces the average
quality of the paths.
VII. CODING
We wished to explore if is was possible to improve the quality of a VoIP call by using additional bandwidth. If
the quality of a call is suffering due to delays, network and jitter-losses, but additional bandwidth is available, can
we improve the quality of the call and if so by what amount under what conditions? We wished to also gauge the
consequences of using additional bandwidth on other users since it has been hypothesized that proprietary codecs
use such techniques to improve quality. We report on experiments that explore these questions in this section.

21
The quality of VoIP calls deteriorate due to large delays, network losses and large jitter. Even in the best route
these are unavoidable at certain times, but perhaps these properties temporally vary along different paths in an
indeterminate manner and at a timescale too small for the routing algorithms to react to. Is it however possible to
take advantage of these variations?
A simple brute-force solution, since we have an overlay network available to us, is to send duplicate packets
along different paths, and use the packet that arrives earliest. Such an approach will definitely use the best available
route at a very small timescale. So in our first experiment we studied the consequences of packet-duplication along
multiple paths.
A. Packet Duplication
We conducted our experiments by comparing the performance of two channels when two calls were made
simultaneously from the same source to the same destination. The first was “regular” call that lasted 5 minutes. The
second call lasted an equal amount of time but used packet-duplication. The first experiment used a duplication-
ratio of 2 where every packet was duplicated and both packets were sent to the target. The VoIP application at
the target user-node used the first of the two duplicates to arrive, and discarded the second. Since we wished to
isolate the effect of packet-duplication in the experiment we used a path-diversity of 2 for both channels, i.e. the
packets in both calls were randomly handed to two different overlay-nodes for forwarding to the target. Note that
the duplicate-channel utilizes twice the bandwidth (340 Kbps) of the regular channel (170 Kbps).
In the experiments the source user-node was always in the “columbia.edu” domain, and the test was conducted to
every user-node in our PlanetLab test environment. We gathered two statistics for each test: R the average R-factor
of each talk-spurt and L the % of talk-spurts that had a quality perceived to be “low” or worse ( R-factor < 70).
The performance of the two channels and the improvement in performance of the duplicate-channels to targets in
the different suffixes is tabulated in Figs. 15 and 16. When there were multiple nodes in a suffix, the results were
averaged. In Fig. 15 the improvement in the R-factors due to path duplication is stacked on top of the R-factors of
the regular channel. In Fig. 16 the additional L suffered by the regular channel is stacked on top of the L for the
duplication channels. The advantages of duplication can clearly be seen. All suffixes showed improved performance
and the R-factor went up on average by 18 and low quality talk-spurts went down by 27%. So there is significant
improvement in quality in sending duplicate packets.
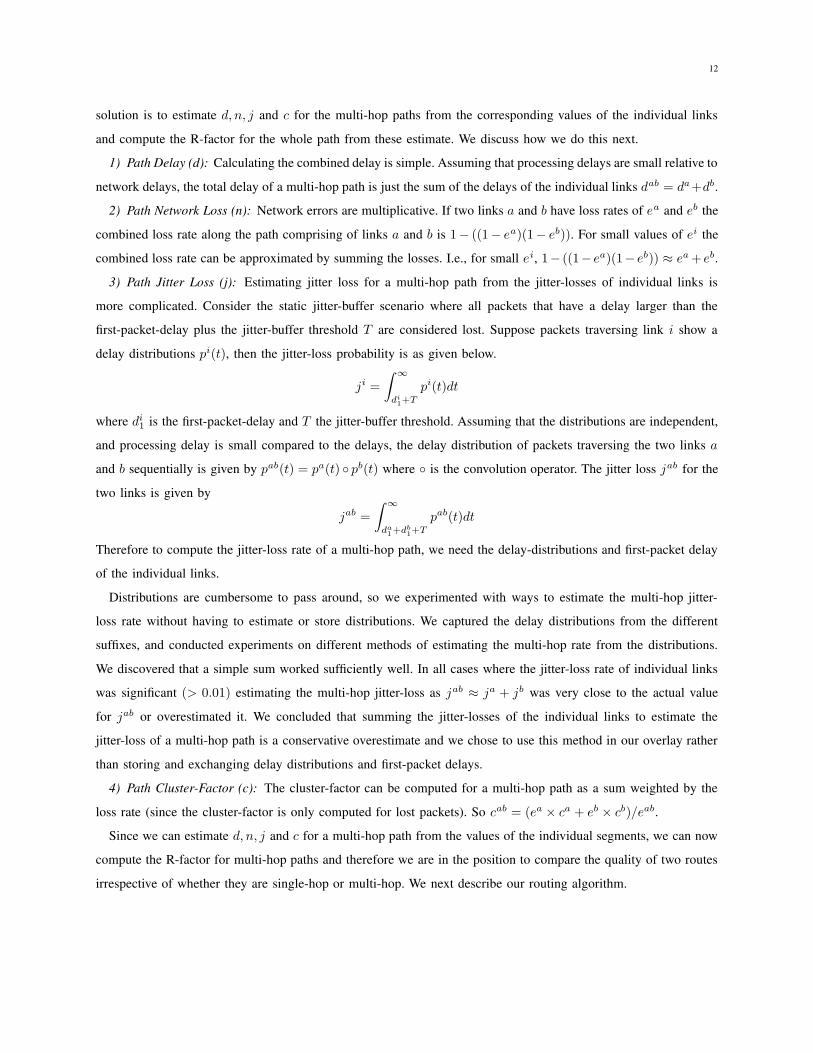
We wished to study the improvement as a function of the duplication ratio. So we also conducted the experiment
where 2 duplicates were sent out (in addition to the original packet). In this case a path-diversity of 3 was used for
both channels and the duplicate channel used a bandwidth of 510 Kbps while the regular channel used a bandwidth
of 170 Kbps for a total of 680 Kbps. The results are tabulated in the second set of histograms in Figs. 15 and 16.
The improvement in R-factor goes up to a very large 34, and the number of low quality talk-spurts fell by a full
48%.
We also conducted the experiment where the packet and 3 duplicates were sent out. In this case a path-diversity
of 4 was used for both channels and the duplicate channel used a bandwidth of 680 Kbps while the regular channel
22
0
10
20
30
40
50
60
70
80
90
100
edunetcomorgfr be dk il in edunetcomorgfr be dk il in edunetcomorgfr be dk il in
Regular 1 Duplicate benefit
Regular 2 Duplicate benefit
Regular 3 Duplicate benefit
3 Duplicates2 Duplicates1 Duplicate
Fig. 15. Packet Duplication effects on R-factor
0
20
40
60
80
100
edunetcomorgfr be dk il in edunetcomorgfr be dk il in edunetcomorgfr be dk il in
1 DuplicateBenefit
2 DuplicatesBenefit
3 DuplicatesBenefit
3 Duplicates2 Duplicates1 Duplicate
Fig. 16. % Reduction in low-quality spurts due to Packet Duplication
used a bandwidth of 170 Kbps for a total of 850 Kbps. Some calls failed to complete in this scenario indicating
that many channels were saturated by the load. The results are tabulated as the third set of histograms in Figs. 15
and 16. The improvement in R-factor goes up even further to 44, and the number of low quality talk-spurts fell on
average by 64%.
However the steady decline in performance of the regular channel as the number of duplicates go up should be
noted. Essentially the duplicate channel improves at the expense of the regular channel.
B. Error Coding
It is clear that sending duplicate packets improves the performance. However duplication consumes a large amount
of additional bandwidth. An obvious question is whether some of the benefits and improvements in quality that
duplication offers can be had for a smaller increase in bandwidth. In other words, can we have fractional duplication
ratios?
The answer is yes, but we need to group packets together in blocks of size k and introduce duplicates for each
block. For example if we block every two packets together, and introduce a duplicate packet for this block of two,
we have created a duplication ratio of 0.5. Using terminology from Error-Correcting-Codes we use a (n, k) scheme
if packets are grouped together in blocks of size k and a total of n packets are sent out for this block of k packets.
The next question that arises is this. What data do we include in the duplicate packet? Should we just duplicate
one of the packets or can we do better. The answer to this question becomes apparent if we consider the nature
of losses in a VoIP channel. Delay and jitter-losses are the major causes of deterioration in performance of VoIP
channels. Packet duplication brought great benefits because the target could use the earlier-arriving packet, reducing
both delay and jitter-loss. Therefore we would like to preserve this ability.
Parity Codes lend themselves well to satisfy this requirement. If we use (k + 1, k) codes, where the duplicate
packet is the parity of the k packets in the block, the receiver can construct all the packets in the block as soon
as any k packets arrive. In particular if the parity packet arrives ahead of the kth packet, the receiver can use the

23
parity packet to reconstruct the kth packet. In the following experiments we test the benefits of using two such
parity codes: the (3,2) code and the (4,3) code.
We first present the results of experiments using the (3,2) code. In this scenario, an additional parity packet is
sent out along with every second packet in the VoIP stream and the receiver uses the earlier-arriving packet among
the parity packet and the second packet in the block. The performance of this channel is compared as before with a
simultaneous “regular” call. Both calls use a path-diversity of 3. The (3,2) channel use a bandwidth of 255 Kbps as
opposed to the 170 Kbps used by the regular channel. The R-factors are tabulated in Fig. 17 where the improvement
in the R-factor due to coding is stacked on top of the R-factor of the regular calls. The fraction of low-quality
spurts L is recorded in Fig. 18 where the additional L suffered by the regular channel is stacked on top of the L
for the coded channel. It can be seen that all suffixes show improved performance for the (3,2) channel with the
average R-factor increasing by 16 and the number of low quality talk-spurts falling by 27%. This improvement in
performance is only marginally smaller than the performance of the (2,1) channel (where a duplicate copy of every
packet was sent out) while saving 85 Kbps of bandwidth!
We next tested the performance of the (4,3) code. In this case an additional parity packet is sent out along with
every third packet and the receiver uses the earlier-arriving packet among the parity packet and the third packet
in the block. The (4,3) channel uses 56 Kbps more than the regular channel. The results tabulated in the second
set of histograms in Figs. 17 and 18 show two interesting effects. First, the average R-factor increases by 11 and
the number of low quality talk-spurts falls by 20%. This performance, as expected, is slightly worse than the (3,2)
code while using about 18 Kbps less bandwidth. Second, the overall quality has fallen relative to the (3,2) code
despite using a code that is less redundant. This is the result of our decision to use a path-diversity of 4 for the
(4,3) code and a path-diversity of 3 for the (3,2) code. When more diverse paths are used, the average quality of the
paths necessarily falls (since a path-diversity of one just uses the best path). This fall in overall quality when using
more diverse (and therefore less optimal) paths is what we would expect from our experiments with path-diversity
in Sec. VI.
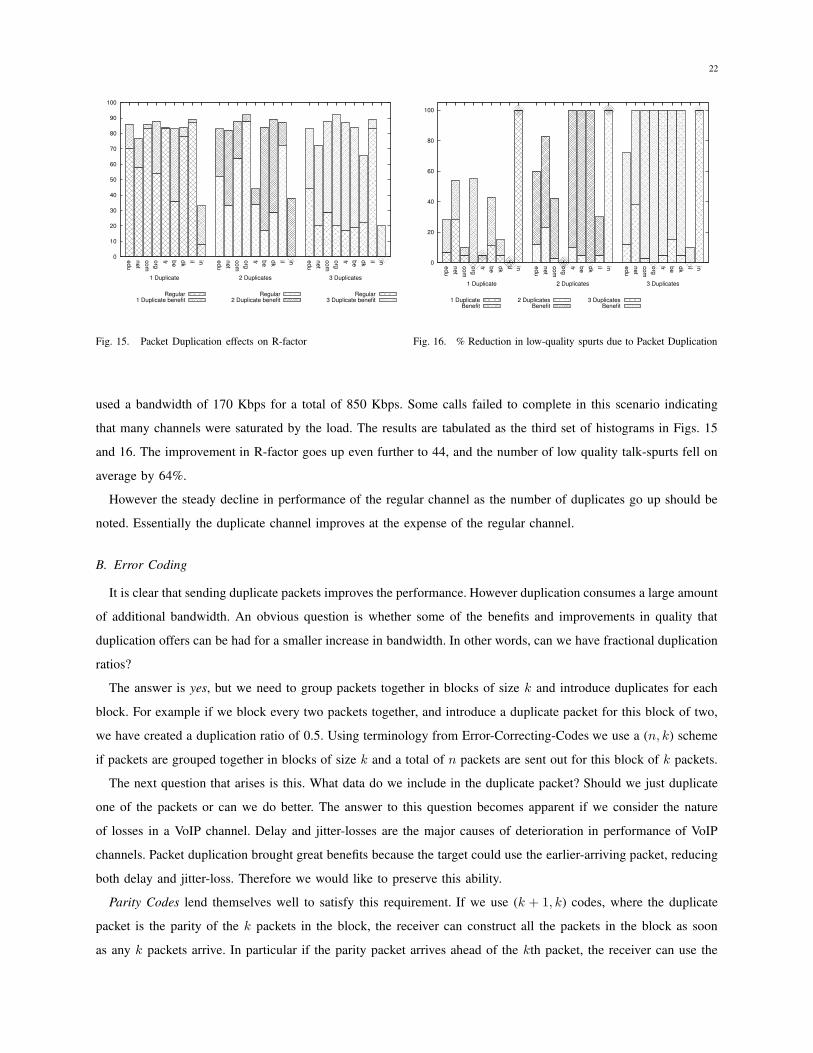
It can clearly be seen that packet-duplication and data-redundancy improve performance. The improvement in
performance as a function of the redundancy is shown in Figs. 19 and 20.
One aspect of redundancy that we should note is that while it improves performance of the redundant channel, it
causes the deterioration of co-existing regular channels by using up more of the available bandwidth. This is very
clearly illustrated in Figs. 15 and 16 where the performance of the “regular” channel steadily deteriorates as the
load due to the redundant channel goes up in. Therefore we don’t advocate packet duplication. However the coding
techniques do increase performance while consuming less resources and may be useful if adequate bandwidth is
available.
VIII. LIMITATIONS AND CAVEATS
• Hosts in the PlanetLab environment are occasionally unavailable. Our experimental results are gathered from
the hosts in our test environment that are available at the time of the experiment. Therefore every experiment

24
0
10
20
30
40
50
60
70
80
90
100
edu
net
com
org
fr be dk il in edu
net
com
org
fr be dk il in
Regular Benefit of (3,2) code
RegularBenefit of (4,3) code
(4,3) code(3,2) code
Fig. 17. Parity Coding’s effects on R-factor
0
20
40
60
80
100
edu
net
com
org
fr be dk il in edu
net
com
org
fr be dk il in
(3,2) codeBenefit of Coding
(4,3) codeBenefit of Coding
(4,3) code(3,2) code
Fig. 18. % Reduction in low-quality spurts due to Coding
0
10
20
30
40
50
60
70
80
1 1.5 2 2.5 3 3.5 4
R-fa
ctor
impr
ovem
ent
Redundancy
Improvement in R-factor vs. Redundancy
.edu.net
.com.org.eur
.il
Fig. 19. R-factor vs. Redundancy
0
20
40
60
80
100
1 1.5 2 2.5 3 3.5 4
Red
uctio
n ib
bad
-seg
men
ts
Redundancy
Reduction in bad-segments vs. redundancy
.edu.net
.com.org.eur
.il
Fig. 20. Reduction in bad quality spurts vs. Redundancy
will not necessarily include all hosts and all nodes.
• Hosts in the PlanetLab environment experience much larger loads that one would expect on machines serving
VoIP traffic in the real world. These heavy loads in the PlanetLab environment makes the OverPhone overlay
nodes less efficient. Therefore OverPhone should run more efficiently in a real environment.
• Because of the changing nature of network conditions, measurements that were carried out over short periods
of time such as the effect of coding and path-diversity varied considerably. For example the quality of a call
between two hosts could vary by as much as 30% between two measurements. We compensated for this by
comparing the quality to a baseline measurement carried out simultaneously. This compensated for the large
variation. Our hope is our large number of measurements subsumes this variation and accurately points to the
general trend.

25
IX. FUTURE WORK
A. Scalability
In our scalable architecture of Sec. III-B, each user-node is represented by just one beacon-node. Such a limitation
is not strictly necessary and relaxing this limitation to allow multiple beacon-nodes to represent a user-node may
improve performance. Consider two calls destined to one target user-node but originating at different parts of the
network. The best route to the target for these two calls may be through through different exit-points of the overlay.
If we impose the restriction that each user-node is represented by just one beacon-node both calls will have to be
routed through the exit-point of that one beacon-node.
Relaxing the restriction and allowing multiple beacon-nodes to represent a user-node will mean, however, that
multiple routes to the target user-node through different exit-points will become available to internal routes when
routing. This can be easily resolved by choosing the route that provides the best quality. Therefore for a small
addition in the size of the routing-tables of internal nodes, better quality routes can be discovered. It would be very
interesting to study the trade-off between routing-table size and the route-quality as a function of the number of
beacon-nodes that are allowed to represent a single user-node.
Additionally, while the hierarchy of user-nodes, beacon-nodes and overlay-nodes introduces scalability in Over-
Phone, it may not suffice at very large scales. Quality probes to different beacon nodes cannot be carried out
simultaneously by overlay-nodes implying a trade-off between the inter-cycle interval and the number of beacon-
nodes. If t is the probe-time (or time it takes an overlay-node to probe the quality of its connection to a beacon-node)
and T is the cycle-time (or the time between recalculation of routes by the overlay-nodes), then T ≥ t×N where
N is the number of beacon-nodes. Therefore for very large scales it may be necessary to introduce more layers
and a deeper hierarchy, or use a light-weight probe.
B. Load Balancing
If k, the average length of a call, is small relative to T (the cycle-time) load-balancing may be necessary. Consider
the situation where T is much larger than k and the number of calls placed from a single user-node to a single
target node increases quickly. Since T is much larger than k, routes are unlikely to be recalculated while the many
calls are being placed. Then all calls are likely to be routed through the same path even though the quality of the
path deteriorates as more calls are placed. However if T is similar to k (or smaller) routes will be recomputed as
more calls are placed and the different calls (or the latter parts of the calls) will be routed through different paths.
Therefore if T is large relative to k, load-balancing should be considered.
One possible load-balancing scheme is to distribute calls among the best routes based on the quality of their routes.
In this scheme, each overlay node chooses r different candidate paths for a destination so that the quality of the worst
path qr lies within a pre-determined fraction M of the quality of the best path q1. That is qr > q1×M, (0 < M < 1).
It then uses path x with probability P (x) = qx/∑r
1qi. This will have the effect of distributing calls among the
best routes available in proportion to the quality they afford. Additionally M can be chosen to ensure that only the
best routes are chosen.

26
C. Stability
In the OverPhone system, if the routes change during the middle of a VoIP call, the new packets are routed
through the newly computed routes. It would be interesting to study if it is beneficial to continue routing a call in
its entirety through a single route that is determined at the beginning of the call.
D. Further Experiments
The performance of OverPhone on the PlanetLab environment is limited by the large load on the hosts and
the inability to set the priority of the OverPhone node processes. It would be interesting to observe the additional
performance gain when OverPhone is run on an overlay where hosts are not subject to such limitations.
The PlanetLab testbed make available only a limited number of nodes (approximately 100) to each experimenter
and therefore we had to limit our experiments to the simple architecture described in Sec. III-A. It would be useful
to discover a much larger testbed where thousands of nodes are available and implement our scalable architecture
proposed in Sec. III-B and validate its scalability.
E. Coding
While we have investigated the use of parity-codes as a method of increasing redundancy, the field of coding-
theory is rich with codes. It would be interesting to investigate if other codes such as Hamming codes and MDC
codes offer performance gains. MDC codes sometimes provide incomplete or approximate reconstruction. It would
be interesting to investigate how such approximate reconstructions affect VoIP quality.
X. CONCLUSION
We presented OverPhone our overlay network for VoIP, and showed that the quality of VoIP calls can be
significantly improved by engineering the routing through the use of such an overlay network. More than a third
of all paths show improved performance, and the perceived quality of more that 10% of talk-spurts improved from
low to medium and another 10% improved from medium to high. Additionally we show that path-diversity offered
by an overlay network can be used to reduce low quality talk-spurts by 20% under large loads. Finally we show
that when adequate bandwidth is available parity-coding techniques can be used to effectively trade-off bandwidth
for quality. An additional bandwidth of 50% reduces the percentage of bas talk-spurts by approximately 30%.
XI. ACKNOWLEDGMENTS
We wish to thank Dragos Niculescu, Aniruddha Bohra, Akhilesh Saxena and Sudeept Bhatnagar of NEC Labs
America for important information about VoIP, PlanetLab and for valuable discussions.

27
REFERENCES
[1] The e-model, a computational model for use in transmission planning. In ITU-T Recommendation G.107, March 2003.
[2] Y. Amir, C. Danilov, S. Goose, D. Hedqvist, and A. Terzis. 1-800-overlays: Using overlay networks to improve voip quality. In NOSSDAV,
2005.
[3] D. Andersen, H. Balakrishnan, F. Kaashoek, and R. Morris. Resilient overlay networks. In SOSP ’01: Proceedings of the eighteenth ACM
symposium on Operating systems principles, pages 131–145, New York, NY, USA, 2001. ACM Press.
[4] D. G. Andersen, A. C. Snoeren, and H. Balakrishnan. Best-path vs. multi-path overlay routing. In IMC ’03: Proceedings of the 3rd ACM
SIGCOMM conference on Internet measurement, pages 91–100, New York, NY, USA, 2003. ACM Press.
[5] A. D. Clark. Modeling the effect of burst packet loss and recency on subjective voice quality.
[6] R. G. Cole and J. H. Rosenbluth. Voice over ip performance monitoring. SIGCOMM Comput. Commun. Rev., 31(2):9–24, 2001.
[7] L. Ding and R. A. Goubran. Speech quality prediction in voip using the extended e-model. In IEEE GLOBECOM, December 2003.
[8] Federal communications committee. From http://www.fcc.gov.
[9] J. F. Kurose and K. W. Ross. Computer Networking: A Top-Down Approach Featuring the Internet Package. Addison-Wesley Longman
Publishing Co., Inc., Boston, MA, USA, 2000.
[10] Y. J. Liang, E. G. Steinbach, and B. Girod. Real-time voice communication over the internet using packet path diversity. In MULTIMEDIA
’01: Proceedings of the ninth ACM international conference on Multimedia, pages 431–440, New York, NY, USA, 2001. ACM Press.
[11] Radicati. Available from http://www.radicati.com.
[12] J. Rosenberg, L. Qiu, and H. Schulzrinne. Integrating packet FEC into adaptive voice playout buffer algorithms on the internet. In
INFOCOM (3), pages 1705–1714, 2000.
[13] J. Rosenberg and H. Schulzrinne. An rtp payload format for generic forward error correction, 1999.
[14] S. Savage, T. Anderson, A. Aggarwal, D. Becker, N. Cardwell, A. Collins, E. Hoffman, J. Snell, A. Vahdat, G. Voelker, and J. Zahorjan.
Detour: Informed internet routing and transport. IEEE Micro, 19(1):50–59, 1999.
[15] N. Shacham and P. McKenney. Packet recovery in high-speed networks using coding and and buffer management. In INFOCOM 1990,
pages 124–131, June 1990.
[16] Skype. Available from http://www.skype.com.
[17] L. Subramanian, I. Stoica, H. Balakrishnan, and . K. Randy H. Overqos: An overlay based architecture for enhancing internet qos. In
Proceedings of the First Symposium on networked Systems Design and Implementation. USENIX Assn., 2004.
[18] S. Tao, K. Xu, A. Estepa, T. Fei, L. Gao, R. Guerin, J. Kurose, D. Towsley, and Z.-L. Zhang. Improving voip quality through path
switching. In INFOCOM 2004, march 2004.
[19] X. Zhang, J. Liu, B. Li, and T.-S. P. Yum. Coolstreaming/donet: A data-driven overlay network for efficient live media streaming. In
INFOCOM 2005, 2005.