Fluid flow, alteration and polysulphide mineralisation associated with a low-angle reverse shear...
20
Fluid flow, alteration and polysulphide mineralisation associated with a low-angle reverse shear zone in the Lower Palaeozoic of the Anglo-Brabant fold belt, Belgium K. Piessens a , Ph. Muchez a, * , S. Dewaele a , A. Boyce b , W. De Vos c , M. Sintubin d , T.N. Debacker e , E.A.J. Burke f , W. Viaene a a Fysico-chemische Geologie, K.U. Leuven, Celestijnenlaan 200C, B-3001 Leuven, Belgium b Isotope Geosciences Unit, SURRC, Rankine Avenue, East Kilbride, Glasgow G75 0QF, UK c Geological Survey of Belgium, Jennerstraat 13, B-1000 Brussel, Belgium d Structurele Geologie en Tektoniek, K.U. Leuven, Redingenstraat 16, B-3000 Leuven, Belgium e Vakgroep Geologie en Bodemkunde, Universiteit Gent, Krijgslaan 281 S8, B-9000 Gent, Belgium f Faculty of Earth Sciences, Vrije Universiteit, De Boelelaan 1085, NL-1081 HV Amsterdam, The Netherlands Received 11 November 2000; accepted 12 June 2001 Abstract In the Lower Palaeozoic rocks of the Brabant Massif (Belgium), a recently discovered polysulphide mineralisation is related to a low-angle reverse shear zone. This shear zone has been attributed to the main early Devonian deformation event. Data from boreholes and outcrops allow a detailed investigation of the alteration pattern and palaeofluid flow along this shear zone. Macroscopic observations of the mineralogy and quantitative changes in the phyllosilicate mineralogy indicate that this shear zone is characterised by an envelope of intense sericitisation and silicification. In addition, chloritisation is associated with this alteration. The alteration zone may reach a thickness of 250 m. Ore mineralisation occurred synkinematically and is spatially related to the shear zone. The mineralisation consists of pyrite, marcasite, arsenopyrite, pyrrhotite, chalcopyrite, sphalerite, galena, stibnite and smaller amounts of tetrahedrite and other sulphosalts. It is concentrated in quartz – sulphide veins or occurs diffusely in the host rock. The mineralising fluids have a low-salinity H 2 O–CO 2 –CH 4 – NaCl – (KCl) composition and a minimum temperature of 250 – 320 jC. The d 18 O values of quartz vary between + 12.3xand + 14.5xSMOW, and dD compositions of the fluid inclusions in the quartz crystals range from 65x to 35x V-SMOW. The dD and the calculated d 18 O values of the mineralising fluids fall in the range typical for metamorphic fluids and partly overlap with that for primary magmatic fluids. The d 34 S values, between + 4.7xand + 10.6xCDT, fall outside the interval typical for I-type magmas. Important migration of likely metamorphic fluids, causing a widespread alteration and a polysulphide mineralisation along a low-angle shear zone, has, thus, been identified for the first time in the Caledonian Anglo-Brabant fold belt. D 2002 Elsevier Science B.V. All rights reserved. Keywords: Brabant Massif; Fluid inclusions; Low-angle shear zone; Lower Palaeozoic; Polysulphide mineralisation; Sericitisation; Stable isotopes 0040-1951/02/$ - see front matter D 2002 Elsevier Science B.V. All rights reserved. PII:S0040-1951(01)00250-5 * Corresponding author. Tel.: +32-16-327-584; fax: +32-16-327-981. E-mail address: [email protected] (Ph. Muchez). www.elsevier.com/locate/tecto Tectonophysics 348 (2002) 73– 92
-
Upload
independent -
Category
Documents
-
view
4 -
download
0
Transcript of Fluid flow, alteration and polysulphide mineralisation associated with a low-angle reverse shear...

Fluid f low, alteration and polysulphide mineralisation associated
with a low-angle reverse shear zone in the Lower Palaeozoic
of the Anglo-Brabant fold belt, Belgium
K. Piessens a, Ph. Muchez a,*, S. Dewaele a, A. Boyce b, W. De Vos c, M. Sintubin d,T.N. Debacker e, E.A.J. Burke f, W. Viaene a
aFysico-chemische Geologie, K.U. Leuven, Celestijnenlaan 200C, B-3001 Leuven, BelgiumbIsotope Geosciences Unit, SURRC, Rankine Avenue, East Kilbride, Glasgow G75 0QF, UK
cGeological Survey of Belgium, Jennerstraat 13, B-1000 Brussel, BelgiumdStructurele Geologie en Tektoniek, K.U. Leuven, Redingenstraat 16, B-3000 Leuven, Belgium
eVakgroep Geologie en Bodemkunde, Universiteit Gent, Krijgslaan 281 S8, B-9000 Gent, BelgiumfFaculty of Earth Sciences, Vrije Universiteit, De Boelelaan 1085, NL-1081 HV Amsterdam, The Netherlands
Received 11 November 2000; accepted 12 June 2001
Abstract
In the Lower Palaeozoic rocks of the Brabant Massif (Belgium), a recently discovered polysulphide mineralisation is related
to a low-angle reverse shear zone. This shear zone has been attributed to the main early Devonian deformation event. Data from
boreholes and outcrops allow a detailed investigation of the alteration pattern and palaeofluid flow along this shear zone.
Macroscopic observations of the mineralogy and quantitative changes in the phyllosilicate mineralogy indicate that this shear
zone is characterised by an envelope of intense sericitisation and silicification. In addition, chloritisation is associated with this
alteration. The alteration zone may reach a thickness of 250 m. Ore mineralisation occurred synkinematically and is spatially
related to the shear zone. The mineralisation consists of pyrite, marcasite, arsenopyrite, pyrrhotite, chalcopyrite, sphalerite,
galena, stibnite and smaller amounts of tetrahedrite and other sulphosalts. It is concentrated in quartz–sulphide veins or occurs
diffusely in the host rock. The mineralising fluids have a low-salinity H2O–CO2–CH4–NaCl–(KCl) composition and a
minimum temperature of 250–320 jC. The d18O values of quartz vary between + 12.3xand + 14.5xSMOW, and dDcompositions of the fluid inclusions in the quartz crystals range from � 65xto � 35xV-SMOW. The dD and the calculated
d18O values of the mineralising fluids fall in the range typical for metamorphic fluids and partly overlap with that for primary
magmatic fluids. The d34S values, between + 4.7xand + 10.6xCDT, fall outside the interval typical for I-type magmas.
Important migration of likely metamorphic fluids, causing a widespread alteration and a polysulphide mineralisation along a
low-angle shear zone, has, thus, been identified for the first time in the Caledonian Anglo-Brabant fold belt. D 2002 Elsevier
Science B.V. All rights reserved.
Keywords: Brabant Massif; Fluid inclusions; Low-angle shear zone; Lower Palaeozoic; Polysulphide mineralisation; Sericitisation; Stable
isotopes
0040-1951/02/$ - see front matter D 2002 Elsevier Science B.V. All rights reserved.
PII: S0040 -1951 (01 )00250 -5
* Corresponding author. Tel.: +32-16-327-584; fax: +32-16-327-981.
E-mail address: [email protected] (Ph. Muchez).
www.elsevier.com/locate/tecto
Tectonophysics 348 (2002) 73–92

1. Introduction
Fluid flow in the deeper subsurface is often largely
influenced by faults, which can act as highly perme-
able pathways. In an extensional tectonic regime,
substantial quantities of fluids are expelled during
normal faulting (Muir-Wood and King, 1993). Fluid
migration is often dominated by the convective cir-
culation of chemically evolved meteoric water (Nes-
bitt and Muehlenbachs, 1989; Kyser and Kerrich,
1990; Trave et al., 1998). In a region of compressional
deformation, arrays of subhorizontal extension frac-
tures develop by hydraulic fracturing adjacent to
reverse faults prior to failure (Sibson, 1994). These
fractures form a substantial lithostatically pressured
fluid reservoir. Failure of the reverse faults allows
fluids from the overpressured reservoirs to migrate
upwards. Typical examples of such a fault-valve
action are the mesothermal gold–quartz lodes hosted
in steep reverse faults and brittle–ductile shear zones
(Sibson et al., 1988; Cox et al., 1991; Robert et al.,
1995). The major mesothermal deposits occur in
Archaean greenstone sequences (Kerrich, 1987; Rob-
erts, 1987), but important gold production has also
come from Palaeozoic (Murphy and Roberts, 1997;
Mason, 1997; Bottrell et al., 1988), Mesozoic (Sibson
et al., 1988) and Cenozoic (Pettke et al., 1999) vein
systems. Polysulphide mineralisation is often associ-
ated with the gold-bearing fluids (Touray et al., 1989;
Duller et al., 1997; Ixer et al., 1997), but these do not
reach economic grades.
These mineralisations are widespread and mostly
situated along deep-seated, high-angle shear zones.
Although low-angle shear zones are also quite com-
mon, mineralisations associated with these zones seem
to be rare. Examples of these are the gold-bearing
Hyde–Macreas Shear Zone in New Zealand (Teagle et
al., 1990; Craw et al., 1999) and the Revenge gold
mine in West Australia (Nguyen et al., 1998).
Both in the Archaean (Huizenga, 1995) and in the
Phanerozoic (Murphy and Roberts, 1997), lode gold
deposits are not only spatially associated with reverse
faults or shear zones but also with granitic intrusions.
The origin of the mineralising fluids has often been a
matter of debate (cf. Groves, 1993). Only a multi-
disciplinary study, including structural, petrographic,
mineralogical and geochemical analyses, allows to
determine the origin of the mineralising fluids.
The southwestern margin of the predominantly
concealed, Lower Palaeozoic Brabant Massif, just
northeast of the Caledonian deformation front (Sintu-
bin, 1999), is characterised by a complex and partic-
ular deformation history. This is primarily due to the
inferred presence of a rigid granitoid basement block
at depth (Everaerts et al., 1996; Sintubin, 1999). South
vergent overthrusting on top of this basement block
has been demonstrated. The low-angle reverse shear
zone, identified in the Marcq area (Debacker, 1999), is
an example of this particular tectonic setting.
The aim of this study is to demonstrate that impor-
tant fluid migration accompanied shear zone develop-
ment and is responsible for synkinematic alteration and
mineralisation. The area has been selected for a detailed
investigation since geochemical and geophysical pro-
spection indicated that the WNW–ESE trending area,
parallel to the structural grain of the southwestern
Brabant Massif, shows disperse but persistent occur-
rences of sulphides in boreholes. It was considered to
have the largest metallogenic potential. The area fur-
thermore allows specifying the processes active along a
polysulphide mineralised low-angle shear zone, which
is to our knowledge, unique within the Anglo-Brabant
fold belt. The regional significance of this observation
with respect to the Caledonian deformation history of
the Anglo-Brabant fold belt will be discussed.
2. Geological setting
The Lower Palaeozoic Brabant Massif in Belgium
forms the southeastern extremity of the Anglo-Bra-
bant fold belt (Pharaoh et al., 1995), itself forming the
eastern branch of the British–Belgian Caledonides.
This Caledonian slate belt is moulded around the
Cadomian Midlands Microcraton, forming the core
of the East Avalonia microcontinent (Blundell et al.,
1992).
The overall architecture of the Brabant Massif (Fig.
1) consists of a predominantly Cambrian core bor-
dered by Ordovician–Silurian foreland basins (Van
Grootel et al., 1997). Based on aeromagnetic data
(Chacksfield et al., 1993), a major, high-angle tectonic
break is considered to limit the Cambrian core to the
south. This break is currently interpreted as a major
dextral transpressional shear zone, the Asquempont
Shear Zone (ASZ) (Sintubin et al., 1998; Sintubin,
K. Piessens et al. / Tectonophysics 348 (2002) 73–9274

1999), which largely coincides with the trace of the
Asquempont Fault as defined by Legrand (1967) in
outcrop. A late Ordovician magmatic arc has been
postulated between the Cambrian core and the Ordo-
vician–Silurian foreland basin (Van Grootel et al.,
1997). Based on gravimetric data (Everaerts et al.,
1996), a granitoid body is inferred at depth. It has been
interpreted as a granitic batholith underlying the mag-
matic arc (Mansy et al., 1999) or as a granitoid base-
ment block of Cadomian age (Sintubin, 1999). To the
southwest of the Cambrian core, a NW–SE trending
fault zone, the Nieuwpoort–Asquempont Fault Zone,
is also apparent on the aeromagnetic map (Chacksfield
et al., 1993). This fault zone is still seismically active,
as proven by the 1938 Oudenaarde earthquake. How-
ever, its origin is unknown (Mansy et al., 1999). The
geological subcrop maps of the Brabant Massif (Leg-
rand, 1967; De Vos et al., 1993) furthermore show
some NE–SW trending transverse faults segmenting
the entire Lower Palaeozoic basement.
One major tectonometamorphic event has been
identified, affecting the whole Cambrian to Silurian
sedimentary pile (Van Grootel et al., 1997; Debacker
et al., 1999). Metamorphism ranges from diagenetic to
greenschist. Its spatial distribution suggests a struc-
tural and stratigraphical control. Due to the limited
degree of exposure, regional fold structures can only
be based on the spatial distribution of the distinct
lithostratigraphical domains, as expressed on the sub-
crop map (De Vos et al., 1993), and on the interpre-
tation of the aeromagnetic lineaments (Sintubin, 1997,
1999; Sintubin et al., 1998). Secondary fold struc-
tures, which are occasionally observed in the field,
suggest an overall SW to S vergence along the south-
Fig. 1. Subcrop map of the Brabant Massif (after De Vos et al., 1993), with indication of the study area. NAFZ: Nieuwpoort –Asquempont Fault
Zone; ASZ: Asquempont Shear Zone.
K. Piessens et al. / Tectonophysics 348 (2002) 73–92 75

western and southern margin of the Brabant Massif.
Broadly coeval with the main folding event, a perva-
sive cleavage developed.
The Lower Palaeozoic basement is unconformably
overlain by Givetian deposits, lacking any regional
cleavage development or metamorphism. Metamor-
phism, folding and cleavage development in the Bra-
bant Massif, thus, predates the Givetian and postdates
the Gorstian, the youngest sediments affected. The
tectonometamorphic event affecting the Lower Palae-
ozoic of the Brabant Massif most probably took place
during the early Devonian (Andre et al., 1981; Ver-
niers and Van Grootel, 1991). This event can be
ascribed to a post-accretionary intracontinental accom-
Fig. 2. Compilation of the structural data of the Marcq area with the orientation of the fold hinge lines, the cleavage/bedding intersections and
the stretching lineations. Also shown are the mean trend of the NE-dipping cleavage, the deduced position of the low-angle shear zone and
patterns of the fold hinge lines (after Debacker, 1999). Numbers refer to the outcrops and B4–B8 to the location of the boreholes studied. The
profile A–AV is given in Fig. 3.
Fig. 3. Simplified cross-section through the outcrop area showing the sigmoidal change in cleavage dip and the probable orientation of the shear
zone. Numbers refer to the outcrops and B6 to the location of borehole B6. The position of the profile is indicated in Fig. 2.
K. Piessens et al. / Tectonophysics 348 (2002) 73–9276
modation within the East Avalonia microcontinent
related to the closure of the Rheic Ocean along the
southern margin of East Avalonia (Pickering and
Smith, 1995; Cocks et al., 1997; Rey et al., 1997).
Mesozoic and Cenozoic cover sequence conceal to a
large extent the Lower Palaeozoic basement. The
outcrop area is localised along its southern margin,
just north of the Hercynian (Givetian) unconformity.
Exposures are limited to the upper courses of the
tributaries of the Schelde and Meuse rivers and to a
number of quarries.
The study area is situated in the valley of the Marcq
river near Sint–Pieters–Kapelle. A detailed study of
the outcrops in the area revealed the presence of a low-
angle reverse shear zone (Debacker, 1999). However,
its regional significance is yet unknown. A conver-
gence at depth with the Asquempont Shear Zone is
currently proposed (Sintubin, 1999). The Marcq area is
situated on top of the gravimetric anomaly, suggesting
the presence at depth of a granitoid body (Everaerts et
al., 1996). The metasedimentary sequence in the
Marcq area consists of an alternation of siltstones
and pelites, reflecting a turbiditic environment. These
metasediments belong to the Tremadocian Chevlipont
Formation (Verniers et al., in press). Some volcanic
horizons are intercalated in this formation. Although
the magmatism in the southern Brabant Massif is
considered of Ashgillian age (Van Grootel et al.,
1997), the volcanic deposits in the Marcq area seem
to be of Tremadocian age.
3. Methodology
Five boreholes have macroscopically been de-
scribed and more than 200 samples have been taken
for further petrographic, mineralogical and geochem-
ical investigations. Thin sections were prepared to
determine the mineralogy of the vein minerals, the
alteration zones and the host rocks. Examination of
polished surfaces led to the identification of the ore
minerals and a detailed description of the paragenetic
sequence. The mineralogy of the fine-grained crystals
(e.g. sericite and other phyllosilicates) in the altered
and unaltered rocks and along small faults was deter-
mined and quantified by X-ray diffraction using a
Philips automated powder-diffraction system. Short-
wave infrared (SWIR) reflected spectra were used to
determine the phyllosilicate composition of samples
from all five boreholes. A total of f 340 spectra,
taken at an equidistance of 4 m, were collected using a
PIMA-II device from Integrated Spectronics. This
system operates in the SWIR-band between 1.3 and
2.5 Am with a spectral resolution of about 20 A.
Spectral processing, including adaptive noise removal
Fourier filtering and unmixing procedures, was per-
formed by Hunt Spectral Consultancy.
Doubly polished sections (300 Am thick) were
prepared for the study of fluid inclusions in the
gangue minerals. A detailed description of the sample
preparation technique and of the measurement proce-
dure has been given by Muchez et al. (1994). Micro-
thermometric analyses of fluid inclusions were carried
out on a fluid-adapted U.S.G.S. gas flow heating–
freezing system, mounted on an Olympus BX60
microscope. Reproducibility was within 0.2 jC for
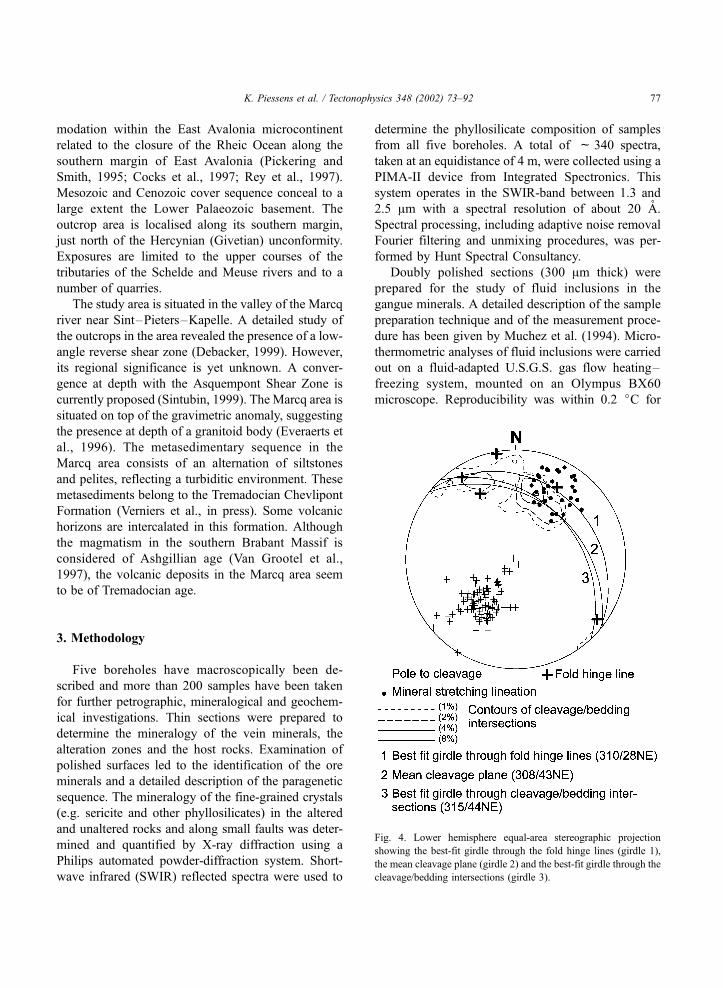
Fig. 4. Lower hemisphere equal-area stereographic projection
showing the best-fit girdle through the fold hinge lines (girdle 1),
the mean cleavage plane (girdle 2) and the best-fit girdle through the
cleavage/bedding intersections (girdle 3).
K. Piessens et al. / Tectonophysics 348 (2002) 73–92 77

the melting temperatures and < 3 jC for the total
homogenisation temperature (Th Tot). Raman analyses
have been made with a Dilor Microdil-28 multichan-
nel Raman microspectrometre in the Institute of Earth
Sciences, Vrije Universiteit Amsterdam, the Nether-
lands, using a 514-nm Ar-ion laser as source of
excitation. The instrument and the measurement con-
ditions have been described by Burke and Lusten-
houwer (1987) and by Burke (2000).
The isotopic composition of quartz in veins (d18O),fluid inclusions in vein quartz (dD) and sulphides
(d34S) was measured to determine the origin of the
mineralising fluids. Quartz samples were selected
based on their occurrence in the paragenetic sequence
and hand picked. All separates were then analysed
using a laser fluorination procedure, involving total
sample reaction with excess ClF3 using a CO2 laser as a
heat source. Reproducibility is better than 0.3x(1r).Results were reported in standard notation (d18O) as permil (x) deviations from the Standard Mean Ocean
Water (V-SMOW) standard. Sulphides were prepared
for isotopic analysis by standard heavy liquid, mag-
netic, diamond microdrilling and hand picking techni-
ques. They were analysed by standard techniques
Fig. 5. Profile through the boreholes with macroscopically measured cleavage indicated in degrees (j). Borehole B8 is corrected for the
deviation of the borehole. The core of alteration and sericitisation and the zones with the minima in the cleavage dip are indicated.
K. Piessens et al. / Tectonophysics 348 (2002) 73–9278

(Robinson and Kusakabe, 1975) in which SO2 gas was
liberated by combusting the sulphides with excess
Cu2O at 1075 jC in vacuo. Liberated gases were
analysed on a VG Isotech SIRA II mass spectrometer.
Reproducibility is better than 0.2x(1r). Data are
reported in d34S notation as per mil (x) variations
from the Canyon Diablo Troilite (CDT) standard.
Samples selected for measurement of inclusion fluid
dD were deemed suitable only if (a) they were ‘clean’
with regard to phases such as chlorite, micas and
feldspar, and (b) dominated by a single type of fluid
inclusions. The technique involves decrepitation of
fluid inclusion in vacuo using bulk samples ( > 600
mg quartz) following the technique of Fallick et al.
(1987). Data are reported in dDnotation as per mil (x)
variations from the Standard Mean Ocean Water (V-
SMOW) standard. Reproducibility of this procedure is
around 5x.
4. Structural analysis
Based on the aeromagnetic lineament map, the
overall structural grain in the study area is NW–SE
trending. The local structural geology of the Marcq
area has been constrained by observations on six
outcrops (Debacker, 1999) and corroborated with
observations in the boreholes that are subject of the
current study (Figs. 2 and 3).
The mean cleavage attitude (308/43NE, Figs. 3 and
4) coincides with the trend of the aeromagnetic linea-
ments in the area (Sintubin, 1997). Cleavage dip,
Fig. 6. (A) Photograph showing the pervasive cleavage present in the central part of shear zone. (B) Photomicrograph with typical j-typewinged quartz inclusions in a sericite matrix. (C) Curved muscovite fibres in a strain fringe, indicating a top-to-the-southwest displacement (top-
to-right on photomicrograph). (B) and (C) with crossed polars. Scale bar is 135 Am.
K. Piessens et al. / Tectonophysics 348 (2002) 73–92 79
however, shows a systematic variation along a profile
perpendicular to the strike of the cleavage. Cleavage
dip gradually decreases towards dips below 30j (Fig.
3). This gradual variation indicates a sigmoidal pat-
tern. This sigmoidal pattern has also been observed in
borehole B6 between 140 and 190 m depth (Debacker,
1999). Extrapolating towards the surface the zone
with lowest cleavage dip should surface just south-
west of outcrops 3 and 5 (Figs. 2 and 3). In order to
check the regional presence of this sigmoidal cleavage
pattern, 664 cleavage dips measured on non-oriented
cores from the five boreholes (B4–B8) and covering a
total length of 1410 m were reexamined (Fig. 2).
Linear trends applied to parts of the data show that the
cleavage dip changes 0.01–0.1j/m over intervals of
50 m or more. These gentle trends, together with the
scattering of the results, require a statistical approach.
Data were slightly smoothed by averaging them over
10-m intervals and were then divided into five quan-
tiles which can be visualised using a grey scale. The
pattern observed in Fig. 5 is clearly more complex
than one sigmoidal variation, since several minima
occur throughout each drilled section.
The central zone, with minimal cleavage dip, is
moreover characterised by the most pervasive cleav-
age development (Fig. 6A), the occurrence of a down-
dip stretching lineation and a pronounced sericitisa-
tion. Small-scale features, such as r-type winged
inclusions (Fig. 6B) and curved fibers in strain fringes
(Fig. 6C), indicate a top-to-the-SW displacement.
Based on the sigmoidal cleavage pattern, the strain
localisation and the presence of shear sense indicators,
the presence of a low-angle, NE-dipping reverse shear
zone has been put forward (Debacker, 1999). The
down-dip stretching lineation is interpreted to reflect
the local tectonic transport direction (f 210j EN).
Secondary folds, which developed largely coeval
with the cleavage and, thus, the shear deformation, are
typically asymmetric and non-cylindrical. The overall
SW vergence corroborates the top-to-the-SW dis-
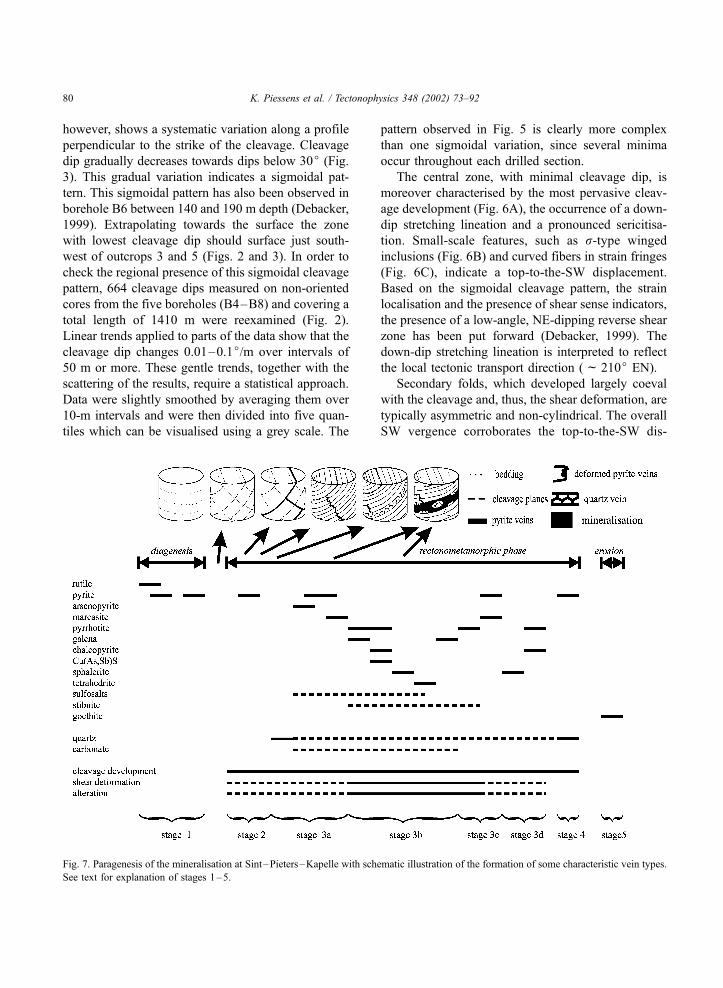
Fig. 7. Paragenesis of the mineralisation at Sint–Pieters–Kapelle with schematic illustration of the formation of some characteristic vein types.
See text for explanation of stages 1–5.
K. Piessens et al. / Tectonophysics 348 (2002) 73–9280

placement. Fold hinge lines all lie within the cleavage
plane, but are highly variable in trend and plunge (Fig.
2). This particular pattern of fold hinge lines is
interpreted by Debacker (1999) to be caused by
differential movement within the reverse shear zone,
leading to NW–SE trending folds along the frontal tip
line to NS or even NE–SW trending folds along
lateral tip lines. The inferred presence of the tip line
of the shear zone indicates that the displacement along
the shear zone was minimal in the study area.
5. Petrography and mineral paragenesis
A polysulphide mineralisation is associated with
the shear zone. Pyrite, marcasite, chalcopyrite, spha-
lerite, galena and stibnite are the main sulphide min-
erals. They occur in veins, often associated with quartz
and diffusely distributed in the host rock. The miner-
alised veins are often oriented parallel to the cleavage.
A detailed scheme of the mineral paragenesis is
presented in Fig. 7. The paragenesis can be summar-
ised in five main mineralising stages, which have a
temporal link with the tectonic deformation.
The earliest sulphides (stage 1) consist of framboi-
dal pyrites, which are probably synsedimentary or
early diagenetic and not related to the main phase of
mineralisation. The first mineralised veinlets (stage 2)
are at most a few millimetres thick and form along
(early stage) cleavage or parallel to bedding planes.
Stage 2 pyrites also occur as individual crystals along
cleavage planes. They are corroded and deformed and
show a well-developed pressure shadow (Fig. 8A).
The veins show an antitaxial growth of pyrite. These
veins have subsequently been deformed, as indicated
by small boudinage and fold structures. Stage 3 starts
Fig. 8. (A) Corroded and deformed stage 2 pyrite (a) with a well-developed pressure shadow. Plane polarised light. Scale bar is 135 Am. (B)
Polymorph of marcasite (a) after stage 2 pyrite and (b) in an antitaxial vein. Partly crossed nicols. Scale bar is 135 Am. (C) Pyrite (a) and
enclosing arsenopyrite (b). Plane polarised light. Scale bar is 135 Am. (D) Arsenopyrite crystals oriented parallel to the cleavage. Shearing along
the cleavage planes has deformed the crystals. Plane polarised light. Scale bar is 135 Am.
K. Piessens et al. / Tectonophysics 348 (2002) 73–92 81
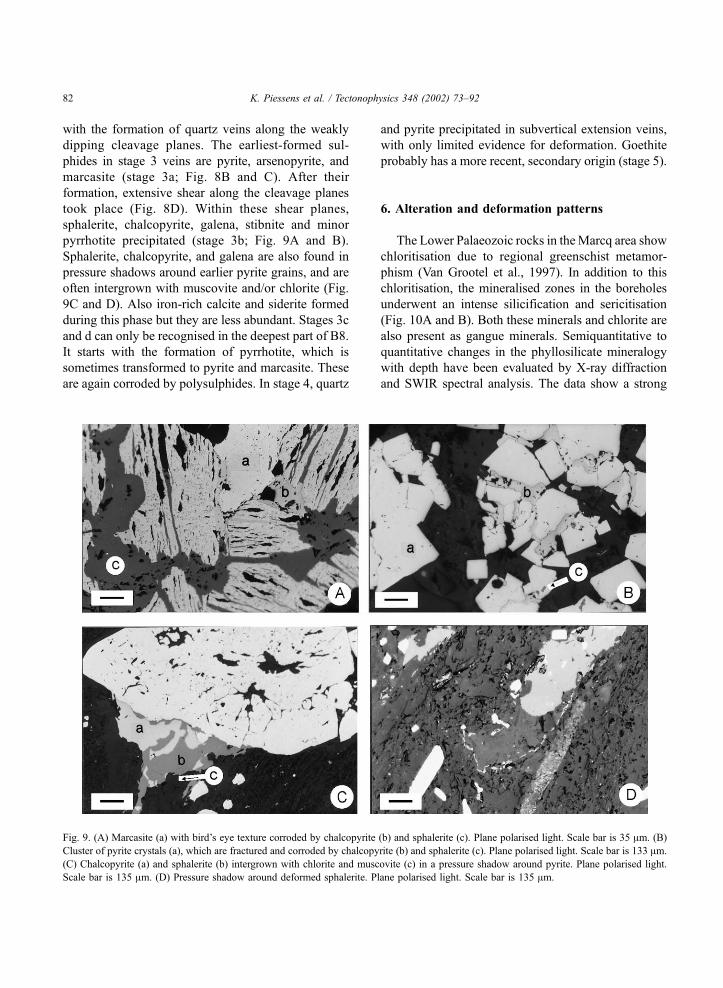
with the formation of quartz veins along the weakly
dipping cleavage planes. The earliest-formed sul-
phides in stage 3 veins are pyrite, arsenopyrite, and
marcasite (stage 3a; Fig. 8B and C). After their
formation, extensive shear along the cleavage planes
took place (Fig. 8D). Within these shear planes,
sphalerite, chalcopyrite, galena, stibnite and minor
pyrrhotite precipitated (stage 3b; Fig. 9A and B).
Sphalerite, chalcopyrite, and galena are also found in
pressure shadows around earlier pyrite grains, and are
often intergrown with muscovite and/or chlorite (Fig.
9C and D). Also iron-rich calcite and siderite formed
during this phase but they are less abundant. Stages 3c
and d can only be recognised in the deepest part of B8.
It starts with the formation of pyrrhotite, which is
sometimes transformed to pyrite and marcasite. These
are again corroded by polysulphides. In stage 4, quartz
and pyrite precipitated in subvertical extension veins,
with only limited evidence for deformation. Goethite
probably has a more recent, secondary origin (stage 5).
6. Alteration and deformation patterns
The Lower Palaeozoic rocks in theMarcq area show
chloritisation due to regional greenschist metamor-
phism (Van Grootel et al., 1997). In addition to this
chloritisation, the mineralised zones in the boreholes
underwent an intense silicification and sericitisation
(Fig. 10A and B). Both these minerals and chlorite are
also present as gangue minerals. Semiquantitative to
quantitative changes in the phyllosilicate mineralogy
with depth have been evaluated by X-ray diffraction
and SWIR spectral analysis. The data show a strong
Fig. 9. (A) Marcasite (a) with bird’s eye texture corroded by chalcopyrite (b) and sphalerite (c). Plane polarised light. Scale bar is 35 Am. (B)
Cluster of pyrite crystals (a), which are fractured and corroded by chalcopyrite (b) and sphalerite (c). Plane polarised light. Scale bar is 133 Am.
(C) Chalcopyrite (a) and sphalerite (b) intergrown with chlorite and muscovite (c) in a pressure shadow around pyrite. Plane polarised light.
Scale bar is 135 Am. (D) Pressure shadow around deformed sphalerite. Plane polarised light. Scale bar is 135 Am.
K. Piessens et al. / Tectonophysics 348 (2002) 73–9282

variation in the muscovite and chlorite contents (Fig.
11). The unaltered rocks, that occur in the uppermost
part of the Lower Palaeozoic at drill-sites B5 to B8, do
not contain macroscopically recognisable sulphides,
with the exception of pyrite. Downwards, the fabric
changes due to silicification and sericitisation. The
Fig. 10. (A) Layer of quartz with irregular crystal boundaries between intensely sericitised layers. The opaque minerals represent pyrite. Crossed
nicols. Scale bar is 135 Am. (B) Intensely altered rock, mainly consisting of muscovite and quartz. Crossed nicols. Scale bar is 135 Am. (C)
Clearly distinguishable cleavage (a), showing a low angle to the bedding (b). Crossed nicols. Scale bar is 135 Am. (D) Presence of pressure
shadows around deformed pyrite (opaque minerals) parallel to the shear direction. Crossed nicols. Scale bar is 135 Am. (E) Secondary inclusions
in quartz, which formed coeval with sulphide precipitation, characterised by the presence of two-phase aqueous–gaseous inclusions. Scale bar
is 135 Am. (F) Detail of the trail showing two-phase aqueous–gaseous fluid inclusions. Scale bar is 135 Am.
K. Piessens et al. / Tectonophysics 348 (2002) 73–92 83

most strongly altered rocks, resembling talc, consist of
fine-grained muscovite. Below these strongly altered
rocks, silicification and a second phase of chloritisation
become more important again. Since silicification is
difficult to quantify, efforts to visualise alteration have
been focused on the muscovite and chlorite content.
Spatial visualisation of the SWIR-spectra shows a
clearly delineated muscovite-rich zone, with an aver-
age relative muscovite content greater than 63 vol.%.
These zones occur in the central parts of B6, B7, B8 and
compose a large part of B4 and B5. The shallower and
deeper rocks in B6 to B8 contain more chlorite. The
non- to weakly altered rocks are characterised by a
relatively high chlorite content. The width of the
muscovite-rich zone is variable, and ranges between
70 and 200 m. The alteration pattern dips 0–30j to theNE in the profile formed by the five boreholes. This is
in agreement with the general orientation of the shear
zone proposed by Debacker (1999). The cleavage dips
at a slightly steeper angle than both shear zone and
alteration pattern.
Chlorite–muscovite slickenfibers on the cleavage
planes formed during cleavage-parallel shear and are
cogenetic with the Cu–Pb–Zn mineralisation, since
the deformed ore minerals also occur along the
cleavage. The variation in the mineralogy of the fibers
is similar to the alteration pattern present in the host
rocks, suggesting that sericitisation was associated
with this period of deformation. In the boreholes,
shear folds with a wavelength of a few decimetres
can be observed. They are easily recognised where the
strike of the cleavage and the stratification are parallel
(Fig. 10C), but also occur where this relation is
oblique. The shear fold geometry indicates dip-slip
shear movement along the cleavage planes. The for-
mation of these folds is coeval with the slickenfibers
on the cleavage planes and with the Cu–Pb–Zn
mineralisation and quartz precipitation (Fig. 10D).
The sulphides are found as pressure shadows around
other grains, or as deformed grains, parallel to the
shear direction.
7. Microthermometry
Seventeen quartz veins that are considered to have
been formed during stage 3 of the paragenesis were
microthermometrically investigated. Primary inclu-
sions in these veins are rare. However, textures such
as fluid inclusions in recrystallisation rims of quartz
related to other stage 3 minerals, and fluid inclusions
in trails (Fig. 10E) associated with sulphide precip-
itation, allow the distinction of 256 inclusions which
were trapped during stage 3 of the paragenesis. Fluid
inclusions that formed later are present, but have not
further been analysed in this study.
Microthermometry indicates that all early-formed
inclusions are two-phase (L +V) aqueous–gaseous
inclusions at room temperature (Fig. 10F). The temper-
ature of melting of CO2 (Tm CO2) is between � 69 and
� 56.6 jC (Fig. 12A). In a few inclusions, the eutectic
melting temperature of the aqueous phase could be
measured and is around � 23 jC, indicative for the
presence of KCl in addition to H2O–NaCl (Shepherd
et al., 1985). The ice-melting temperatures vary be-
Fig. 11. Relative intensity of the sericitic alteration versus depth in
borehole B7. The shaded area delineates the most strongly altered
interval. The full and open circles correspond to the relative mineral
compositions of host-rock and of the slickenfibers, respectively.
K. Piessens et al. / Tectonophysics 348 (2002) 73–9284
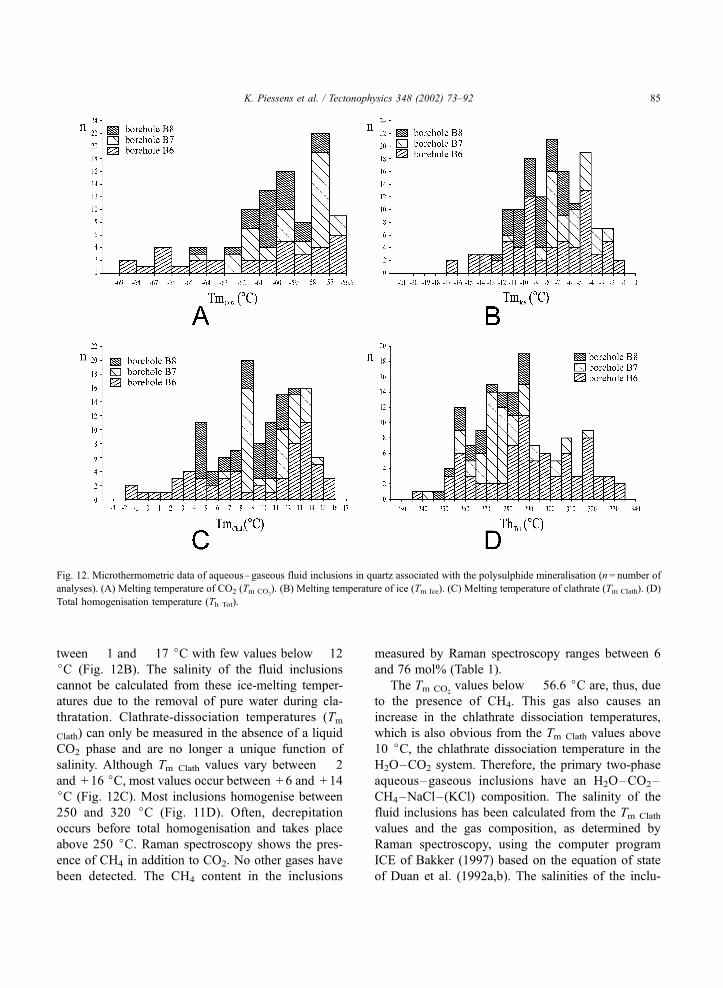
tween � 1 and � 17 jC with few values below � 12
jC (Fig. 12B). The salinity of the fluid inclusions
cannot be calculated from these ice-melting temper-
atures due to the removal of pure water during cla-
thratation. Clathrate-dissociation temperatures (Tm
Clath) can only be measured in the absence of a liquid
CO2 phase and are no longer a unique function of
salinity. Although Tm Clath values vary between � 2
and + 16 jC, most values occur between + 6 and + 14
jC (Fig. 12C). Most inclusions homogenise between
250 and 320 jC (Fig. 11D). Often, decrepitation
occurs before total homogenisation and takes place
above 250 jC. Raman spectroscopy shows the pres-
ence of CH4 in addition to CO2. No other gases have
been detected. The CH4 content in the inclusions
measured by Raman spectroscopy ranges between 6
and 76 mol% (Table 1).
The Tm CO2values below � 56.6 jC are, thus, due
to the presence of CH4. This gas also causes an
increase in the chlathrate dissociation temperatures,
which is also obvious from the Tm Clath values above
10 jC, the chlathrate dissociation temperature in the
H2O–CO2 system. Therefore, the primary two-phase
aqueous–gaseous inclusions have an H2O–CO2–
CH4–NaCl–(KCl) composition. The salinity of the
fluid inclusions has been calculated from the Tm Clath
values and the gas composition, as determined by
Raman spectroscopy, using the computer program
ICE of Bakker (1997) based on the equation of state
of Duan et al. (1992a,b). The salinities of the inclu-
Fig. 12. Microthermometric data of aqueous–gaseous fluid inclusions in quartz associated with the polysulphide mineralisation (n= number of
analyses). (A) Melting temperature of CO2 (Tm CO2). (B) Melting temperature of ice (Tm Ice). (C) Melting temperature of clathrate (Tm Clath). (D)
Total homogenisation temperature (Th Tot).
K. Piessens et al. / Tectonophysics 348 (2002) 73–92 85

sions for which both parameters are known lie
between 1.6 and 7.3 eq. wt.% NaCl (Table 2).
8. Stable isotope analyses
Eleven quartz veins have been selected for stable
isotope analyses. Seven of these veins are syntectonic
(stage 3) and four are late-syntectonic (stage 4). The
isotopic composition of all quartz veins (d18O), of fluidinclusions in four vein quartz (dD) and of nine sul-
phides (d34S) was measured to determine the origin of
Table 1
Results of Raman spectroscopy of aqueous–gaseous fluid inclu-
sions in quartz associated with the polysulphide mineralisation at
Marcq (expressed in mole percent)
Sample Inclusion Percent CH4 Percent CO2
10990B6 1c 58 42
10990B6 3c 47 53
10990B6 3d 55 45
10990B6 2d 41 59
10990B6 4b 76 24
19100B7 2 44 56
19100B7 20 23 77
19100B7 23 20 80
19100B7 8 21 79
19100B7 14 35 65
19100B7 15 19 81
19100B7 1 41 59
19100B7 18 11 89
19100B7 19 27 73
23000B7 12 6 94
23000B7 5 6 94
23000B7 14 12 88
23000B7 19 9 91
Table 2
Calculated compositions of the H2O–CO2–CH4–NaCl– (KCl) inclusions
Sample Inclusion Total inclusion Aqueous solution
Density
(g/cm3)
Molar volume
(cm3/mol)
H2O
(mol%)
CO2
(mol%)
CH4
(mol%)
NaCl
(mol%)
NaCl
(molality)
NaCl
(massa%)
10990B6 4b 0.697 36.53 86.3 3.6 8.8 0.62 0.40 2.3
10990B6 1c 0.697 27.45 87.9 5.4 5.7 0.47 0.30 1.7
10990B6 3c 0.685 28.05 88.4 6.0 3.9 0.79 0.50 2.9
10990B6 2d 0.704 27.89 88.3 7.1 3.7 0.44 0.28 1.6
10990B6 3d 0.660 28.41 89.7 4.6 3.8 1.00 0.62 3.6
19100B7 1 0.772 24.68 90.3 5.4 2.5 0.87 0.53 3.1
19100B7 2 0.769 24.75 91.2 5.0 2.5 0.62 0.38 2.2
19100B7 8 0.763 25.15 90.2 6.3 1.1 1.19 0.73 4.3
19100B7 14 0.676 28.62 89.4 6.5 2.5 0.83 0.51 3.0
19100B7 15 0.891 21.85 90.3 6.9 1.1 0.87 0.54 3.1
19100B7 18 0.668 29.40 89.9 7.6 0.6 0.94 0.58 3.4
19100B7 19 0.667 28.98 89.3 6.7 1.7 1.14 0.71 4.2
19100B7 20 0.735 26.68 89.8 7.2 1.5 0.71 0.44 2.6
23000B7 14 0.725 25.80 90.0 5.5 0.4 2.02 1.25 7.3
23000B7 19 0.731 25.82 90.3 5.8 0.3 1.79 1.10 6.4
Table 3
Results of stable isotope analyses of quartz (d18O), fluid inclusions
in quartz (dD) and sulphides (d34S) in veins at Marcq
Sample Mineral d18OV-SMOW
(x)
dDV-SMOW
(x)
d34SCDT(x)
03155B6 quartz 14.5 – –
10985B6 sphalerite – – 8.0
10985B6 chalcopyrite – – 7.3
10985B6 pyrite – – 8.1
10985B6 pyrite – – 6.4
10990B6 quartz 13.2 � 35 –
12780B6 quartz 12.6 – –
13245B6 pyrite – – 8.6
13260B6 quartz 13.3 � 50 –
13375B6 quartz 13.7 – –
21670B6 quartz 12.5 – –
23560B6 quartz 12.3 – –
24070B6 quartz 12.3 – –
19100B7 quartz 13.0 � 65 –
06815B8 quartz 13.2 � 39 –
06815B8 chalcopyrite – – 10.0
06815B8 marcasite – – 9.5
06815B8 sphalerite – – 8.3
06815B8 pyrite – – 9.8
21670B8 quartz 12.5 – –
V-SMOW: Vienna standard mean ocean water, CDT: Canyon
Diablo meteorite troilite.
K. Piessens et al. / Tectonophysics 348 (2002) 73–9286

the mineralising fluids (Table 3). The analysed sul-
phides belong to stages 2, 3a, 3b and 4. To calculate
the d18O and d34S compositions of the ambient fluids,
the formation temperatures of the quartz veins and the
associated sulphides have to be known. The precip-
itation temperature can be estimated from the homog-
enisation temperature of the fluid inclusions in the
quartz veins. For the sulphides, a temperature has been
assumed similar to that of the quartz vein in which they
occur. The temperatures used are the mean homoge-
nisation temperatures with a deviation of 2r. These areof course only estimates, however, the presence of
marcasite in phase 2a suggests that this could not be
much higher (Murowchick and Barnes, 1986; Piessens
et al., 1999). If the precipitation temperature was 100
jC higher, the d18O values increase by less than 4xand d34S by less than 0.5 x.
The calculated oxygen (d18O) and sulphur (d34S)isotopic compositions of the ambient fluid fall, respec-
tively, between + 3xand + 8xV-SMOW and be-
tween + 4.7xand + 10.6xCDT. In a d18O–dD plot
(Fig. 13), the values cluster in the field typical for
metamorphic fluids and partly overlap with that for
primary magmatic fluids (Fig. 13). The d34S values
(Fig. 14) fall outside the interval typical for I-type
magmas (� 3xto + 3xCDT; Ohmoto and Rye,
1979; Ohmoto, 1986).
9. Discussion
In the boreholes studied, the polysulphide mineral-
isation zones are restricted to the altered intervals. The
mineralising and altering fluids must have followed
the same migration pathways. This close relationship
is further confirmed by the association of chalcopyrite,
sphalerite and galena with muscovite and chlorite in
veins. The cleavage-parallel orientation of the miner-
alised veins and the subsequent deformation of the
sulphides in these veins demonstrate that the minerali-
sation took place during a protracted simple shear de-
formation in which cleavage planes are reactivated as
shear planes. The composition of the minerals, along
these reactivated cleavage planes, shows the same evo-
lution in the sericite–chlorite pattern as the surround-
ing altered host rocks. These two arguments suggest
Fig. 13. Calculated d18O values and dD values of the mineralising fluids, indicated by crosses and the isotopic fields of metamorphic and
primary magmatic fluids and volcanic-associated massif sulphide (Kuroko type) deposits (after Yurtsever and Gat, 1981; Pisutha-Arnond and
Ohmoto, 1983; Ohmoto, 1986; Sheppard, 1986).
K. Piessens et al. / Tectonophysics 348 (2002) 73–92 87

that alteration and deformation were also coeval.
Therefore, mineralisation, alteration and deformation
occurred largely during the same progressive deforma-
tion event, slightly post-dating the development of the
cleavage fabric. Since at present there is only evidence
for one single major deformation event in the Brabant
Massif, occurring during the early Devonian, it is pro-
posed that precipitation of the polysulphides occurred
during the final stages of this deformation event.
The alteration pattern, evident from the relative
abundance of muscovite and chlorite, shows well-
defined low-angle NE-dipping alteration zones (Fig.
15). Such a well-defined pattern indicates a strong
control on the hydrothermal migration of the fluids.
Regarding the structural setting, the NE-dipping shear
zone forms an ideal structural feature in focussing the
upward migration of the mineralising fluids. Since the
zones with the lowest cleavage dip, present in the
sericite-rich rocks, do not line up along one plane, it is
unlikely that the shear zone is a narrow and well-
defined structure. Therefore, a broader anastomosing
shear zone is proposed, in which strain localisation
occurred in a more irregular way (Fig. 15).
The mineralising fluids have an H2O–CO2–CH4–
NaCl–(KCl) composition, a low salinity (2–7 eq.
wt.% NaCl) and temperatures above 250 jC. Thesecharacteristics are comparable with the Phanerozoic
polysulphide and gold mineralisation in the Caledo-
nides of the British Isles (Mason, 1997; Steed and
Morris, 1997; Lowry et al., 1997). The ore deposits in
these areas are often associated with granitic intru-
sions. In addition, magmatic rocks are present in the
Brabant Massif. Except for the magmatic rocks in the
study area itself, magmatic activity (rhyodacitic and
andesitic) in the Brabant Massif is mostly restricted to
the Ashgillian (late Ordovician), with some minor
evidence of volcanism during the Llandovery (early
Silurian). This indicates that volcanism preceded the
early Devonian mineralisation by at least 30 Ma. Mag-
matic fluids can therefore be ruled out as the dominant
Fig. 14. d34S values of the sulphides in the mineralisation associated with the shear zone. The rectangles indicate the calculated values (middle
line) with the level of significance, based on the error of the measurement and the formation temperature. Shaded area indicates the range typical
for I-type magmas.
K. Piessens et al. / Tectonophysics 348 (2002) 73–9288

source or transport medium for the mineralisation. The
alternative explanation, involving mainly metamor-
phic fluids, is in complete agreement with the tecto-
nometamorphic framework of the mineralisations.
The source rocks for the metamorphic fluids could
theoretically be I- or S-type magmatic or sedimentary
rocks. Since only part of the d18O and dDdata and none
of the d34S correspond to I-type magmatic rocks, these
can be regarded as a less likely source. Isotope data are
compatible with both S-type magmatic and metamor-
phic fluids. However, the volume of volcanic rocks is
relatively small compared to the volumes needed to
produce sufficient fluids for the mineralisation. There-
fore, fluids are interpreted to have been expelled during
metamorphic reactions within clastic sediments. In
addition, the presence of CH4 in the fluid inclusions,
resulting from the breakdown of organic material, is a
good indication of this metamorphic origin.
To our knowledge, no other study has demonstra-
ted in detail a close spatial and temporal relationship
between alteration, polysulphide mineralisation and
the early Devonian deformation in the Brabant Massif.
Extensive migration of metamorphic fluids accompa-
nied progressive deformation along a low-angle
reverse shear zone. The structural setting of the Marcq
area is unique. Most probably, the presence of a rigid
granitoid body at depth inhibited the southward-
migrating deformation causing thrusting in the hang-
ing wall of the granitoid basement block. Sintubin
(1999) proposed that several thrusts, like the one
identified in the Marcq area, root into the Asquempont
Shear Zone, bordering the central steep belt to the SW.
A larger-scale structural and geochemical study of the
veining associated with the Asquempont Shear Zone
will elucidate if a common fluid flow system is
present. Such a study will eventually allow putting
the results of the current study in the Marcq area into
the broader perspective of the tectonic history at the
southern extremity of the Anglo-Brabant fold belt.
10. Conclusions
The intense alteration and polysulphide minerali-
sation in the Lower Palaeozoic rocks of the Brabant
Massif in the Marcq area are spatially associated with
a low-angle, NE-dipping shear zone. Temporarily, it is
related to a shear reactivation of the cleavage planes,
Fig. 15. Schema of the shear zone. The NE-dipping zone of alteration and mineralisation with the position of the boreholes is indicated.
K. Piessens et al. / Tectonophysics 348 (2002) 73–92 89

indicative of a progressive simple shear deformation
history. The zone of alteration and mineralisation
extends over a maximum thickness of 250 m, that
corresponds to the maximum thickness of the anasto-
mosing shear zone. The ambient fluids, with an H2O–
CO2–CH4–NaCl–(KCl) composition and minimum
temperatures of 250–320 jC, most likely had a
metamorphic origin. They caused the precipitation
of the sulphide minerals and the sericitisation and
silicification of the host rock. Although from a tec-
tonic point of view of local significance, the evidence
of extensive migration of metamorphic fluids along
shear zones during the early Devonian deformation
event in the Brabant Massif has to be reckoned with
when establishing the tectonic history in the Anglo-
Brabant fold belt.
Acknowledgements
We are grateful to Patrick Ledru and an anonymous
reviewer for their constructive and thoughtful review.
ANRE (Division of Natural Resources and Energy) of
the Flemish Community, under supervision of its
former division head P. Vansteelandt, funded this 3-
year project. Additional funding was provided by the
Fund of Scientific Research of Flanders (F.W.O.-
Vlaanderen, Belgium) project G.0274.99. The cores
studied are the property of the company Terex and the
Flemish community. We are grateful to both for
permission to publish the results. We also thank J.
Coppens-Vander Auwera, editor of Geologica Belg-
ica, for the permission to reproduce figures from the
paper published by Debacker in Geologica Belgica.
Herman Nijs carefully prepared thin sections and the
doubly polished wafers. SWIR spectra were measured
using the PIMA-II device, put at our disposal by F.
van der Meer and P. van Dijk from the ITC (The
Netherlands), who also assisted in the interpretation of
the results. Manuel Sintubin and Timothy Debacker
are, respectively, Postdoctoral Fellow and Research
Assistant of the F.W.O.-Vlaanderen (Belgium).
References
Andre, L., Deutsch, S., Michot, J., 1981. Donnees geochronologi-
ques concernant le developpement tectono-metamorphique du
segment Caledonien Brabanc�on. Ann. Soc. Geol. Belg. 104,241–253.
Bakker, R.J., 1997. Clathrates: computer programs to calculate fluid
inclusion V–X properties using clathrate melting temperatures.
Comput. Geosci. 23, 1–18.
Blundell, D.J., Freeman, R., Mueller, S., 1992. A continent re-
vealed. The European Geotraverse. Cambridge Univ. Press,
Cambridge.
Bottrell, S.H., Shepherd, T.J., Yardley, B.W.D., Dubessy, J., 1988. A
fluid inclusion model for the genesis of the ores of the Dolgellau
Gold Belt, North Wales. J. Geol. Soc. (London) 145, 139–145.
Burke, E.A.J., 2000. Raman microspectrometry of fluid inclusions.
Lithos 55, 139–158.
Burke, E.A.J., Lustenhouwer, W.J., 1987. The application of a mul-
tichannel laser Raman microprobe (Microdil-28R) to the anal-
ysis of fluid inclusions. Chem. Geol. 61, 11–17.
Chacksfield, B.C., De Vos, W., D’Hooge, L., Dusar, M., Lee, M.K.,
Poitevin, C., Royles, C.P., Verniers, J., 1993. A new look at
Belgian aeromagnetic and gravity data through image-based dis-
play and integrated modelling techniques. Geol. Mag. 130,
583–591.
Cocks, L., McKerrow, W., Van Staal, C., 1997. The margins of
Avalonia. Geol. Mag. 134, 627–636.
Cox, S.F., Wall, V.J., Etheridge, M.A., Potter, T.F., 1991. Deforma-
tional and metamorphic processes in the formation of mesother-
mal vein-hosted gold deposits—examples from the Lachlan
Fold Belt in central Victoria, Australia. Ore Geol. Rev. 6,
391–423.
Craw, D., Windle, S.J., Angus, P.V., 1999. Gold mineralization
without quartz veins in a ductile–brittle shear zone, Macraes
Mine, Otago Schist, New Zealand. Miner. Deposita 34, 382–
394.
Debacker, T.N., 1999. Folds trending at various angles to the trans-
port direction in the Marcq area, Brabant Massif, Belgium.
Geol. Belg. 2, 159–172.
Debacker, T.N., Sintubin, M., Verniers, J., 1999. Cleavage/fold re-
lationships in the Silurian metapelites, southeastern Anglo-Bra-
bant fold belt (Ronquieres, Belgium). Geol. Mijnbouw 78, 47–
56.
De Vos, W., Verniers, J., Herbosch, A., Vanguestaine, M., 1993. A
new geological map of the Brabant Massif, Belgium. Geol.
Mag. 130, 605–611.
Duan, Z., Moller, N., Weare, J.H., 1992a. An equation of state for
the CH4–CO2–H2O system: I. Pure systems from 0 to 1000 jCand 0 to 8000 bar. Geochim. Cosmochim. Acta 56, 2605–2617.
Duan, Z., Moller, N., Weare, J.H., 1992b. An equation of state for
the CH4–CO2–H2O system: II. Mixtures from 50 to 1000 jCand 0 to 1000 bar. Geochim. Cosmochim. Acta 56, 2605–2617.
Duller, P.R., Gallagher, M.J., Hall, A.J., Russell, M.J., 1997. Glen-
dinning deposit—an example of turbidite-hosted arsenic–anti-
mony–gold mineralization in the Southern Uplands, Scotland.
Trans. Inst. Min. Metall., Sect. B: Appl. Earth Sci. 106, 119–
134.
Everaerts, M., Poitevin, C., De Vos, W., Sterpin, M., 1996. Inte-
grated geophysical/geological modelling of the western Brabant
Massif and structural implications. Bull. Soc. Belge Geol. 105,
41–59.
K. Piessens et al. / Tectonophysics 348 (2002) 73–9290
Fallick, A.E., Jocely, J., Hamilton, P.J., 1987. Oxygen and hydrogen
stable isotope systematics in Brazilian agates. In: Rodriquez
Clemente, E. (Ed.), Geochemistry of the Earth Surface and Pro-
cesses of Mineral Formation. Instituto de Geologica (CSIC),
Madrid, pp. 99–117.
Groves, D.I., 1993. The crustal continuum model for late-Archean
lode-gold deposits of the Yilgarn Block, Western Australia.
Miner. Deposita 28, 366–374.
Huizenga, J.M., 1995. Fluid evolution in shear zones from the late
Archean Harare-Shamva-Bindura greenstone belt (NE Zim-
babwe): thermodynamic calculations of the C-O-H system ap-
plied to fluid inclusions. PhD thesis, Vrije Universiteit Amster-
dam, The Netherlands.
Ixer, R.A.F., Pattrick, R.A.D., Stanley, C.J., 1997. Geology, miner-
alogy and genesis of gold mineralization at Calliachar-Urlar
Burn, Scotland. Trans. Inst. Min. Metall., Sect. B: Appl. Earth
Sci. 106, 99–108.
Kerrich, R., 1987. The stable isotope geochemistry of Au–Ag vein
deposits in metamorphic rocks. In: Kyser, T.K. (Ed.), Stable
Isotope Geochemistry of Low Temperature Fluids. Mineral. As-
soc. Canada Short Course Handbook, vol. 13, pp. 287–336.
Kyser, T.K., Kerrich, R., 1990. Geochemistry of fluids in tectoni-
cally active crustal regions. In: Nesbitt, B.E. (Ed.), Fluids
in Tectonically Active Regimes of the Continental Crust. Min-
eral. Assoc. Canada Short Course, Handbook, vol. 18, pp.
133–230.
Legrand, R., 1967. Ronquieres. Documents geologiques. Mem.
Cartes Geol. Miner. Belg. 6, 1–60.
Lowry, D., Boyce, A.J., Fallick, A.E., Stephens, W.E., 1997. Sources
of sulphur, metals and fluids in granitoid-relatedmineralization of
the Southern Uplands, Scotland. Trans. Inst. Min. Metall., Sect.
B: Appl. Earth Sci. 106, 157–168.
Mansy, J.L., Everaerts, M., De Vos, W., 1999. Structural analysis of
the adjacent Acadian and Variscan fold belts in Belgium and
Northern France from geophysical and geological evidence.
Tectonophysics 309, 99–116.
Mason, J.S., 1997. Regional polyphase and polymetallic vein min-
eralization in the Caledonides of the Central Wales Orefield.
Trans. Inst. Min. Metall., Sect. B: Appl. Earth Sci. 106, 135–
143.
Muchez, Ph., Marshall, J.D., Touret, J.L.R., Viaene, W.A., 1994.
Origin and migration of palaeofluids in the Upper Visean of the
Campine Basin, northern Belgium. Sedimentology 41, 133–
145.
Muir-Wood, R., King, G., 1993. Hydrological signatures of earth-
quake strain. J. Geophys. Res. 98, 22035–22068.
Murowchick, J.B., Barnes, H.L., 1986. Marcasite precipitation from
hydrothermal solutions. Geochim. Cosmochim. Acta 50, 2615–
2629.
Murphy, P.J., Roberts, S., 1997. Evolution of a metamorphic fluid
and its role in lode gold mineralisation in the Central Iberian
Zone. Miner. Deposita 32, 459–474.
Nesbitt, B., Muehlenbachs, K., 1989. Origins and movement of
fluids during deformation and metamorphism in the Canadian
Cordillera. Science 245, 733–736.
Nguyen, P.T., Cox, S.F., Harris, L.B., Powell, Ch. McA., 1998.
Fault-valve behaviour in optimally oriented shear zones: an ex-
ample at Revenge gold mine, Kambalda, Western Australia. J.
Struct. Geol. 20, 1625–1640.
Ohmoto, H., 1986. Stable isotope geochemistry of ore deposits. In:
Valley, J.W., Taylor, H.P., O’Neil, J.R. (Eds.), Stable Isotopes in
High Temperature Geological Processes. Rev. Mineral. 16,
419–559.
Ohmoto, H., Rye, R.O., 1979. Isotopes of sulfur and carbon. In:
Barnes, H.L. (Ed.), Geochemistry of Hydrothermal Ore Depos-
its. Wiley, New York, pp. 509–567.
Pettke, T., Diamond, L.W., Villa, I.M., 1999. Mesothermal gold
veins and metamorphic devolatilization in the northwestern
Alps: the temporal link. Geology 27, 641–644.
Pharaoh, T.C., England, R., Lee, M.K., 1995. The concealed Cale-
donide basement of eastern England and the southern North
Sea—a review. Stud. Geophys. Geod. 39, 330–346.
Pickering, K.T., Smith, A.G., 1995. Arcs and backarc basins in the
Early Paleozoic Iapetus Ocean. Isl. Arc 4, 1–67.
Piessens, K.,Muchez, Ph., Viaene,W., DeVos,W., 1999. Syntectonic
polysulphide mineralisation in the Brabant Massif, Belgium. In:
Stanley, C. (Ed.), Mineral Deposits: Processes to Processing.
Balkema, Rotterdam, The Netherlands, pp. 963–966.
Pisutha-Arnond, V., Ohmoto, H., 1983. Thermal history, and chem-
ical and isotopic compositions of the ore-forming fluids respon-
sible for the Kuroko massive sulfide deposits in the Hokuroku
district of Japan. In: Ohmoto, H., Skinner, B.J. (Eds.), The
Kuroko and Related Volcanogenic Massive Sulfide Deposits.
Economic Geology Monograph 5, 523–558.
Rey, P., Burg, J.-P., Casey, M., 1997. The Scandinavian Caledonides
and their relationship to the Variscan belt. In: Burg, J.-P., Ford,
M. (Eds.), Orogeny Through Time. Geol. Soc. London, Spec.
Publ. 121, 179–200.
Robert, F., Boullier, A.-M., Firdaous, K., 1995. Gold–quartz veins
in metamorphic terrains and their bearing on the role of fluids in
faulting. J. Geophys. Res. 100, 12861–12879.
Roberts, R.G., 1987. Ore deposit models # 11. Archaean lode gold
deposits. Geosci. Can. 14, 37–51.
Robinson, B.W., Kusakabe, M., 1975. Quantitative preparation of
SO2 for34S/32S analysis from sulfides by combustion with cup-
rous oxide. Anal. Chem. 47, 1179–1181.
Shepherd, T.J., Rankin, A.H., Alderton, D.H.M., 1985. A practical
guide to fluid inclusions studies. Blackie, London.
Sheppard, S.M.F., 1986. Characterization and isotopic variations in
natural waters. In: Valley, J.W., Taylor, H.P., O’Neil, J.R. (Eds.),
Stable Isotopes in High Temperature Geological Processes. Rev.
Mineral. 16, 165–183.
Sibson, R., 1994. Crustal stress, faulting and fluid flow. In: Parnell,
J. (Ed.), Geofluids: Origin, Migration and Evolution of Fluids in
Sedimentary Basins. Geol. Soc. Spec. Publ., vol. 78, pp. 69–84.
Sibson, R.H., Robert, F., Poulsen, K.H., 1988. High-angle reverse
faults, fluid pressure cycling and mesothermal gold–quartz de-
posits. Geology 16, 551–555.
Sintubin, M., 1997. Cleavage– fold relationships in the Lower Pa-
leozoic Brabant Massif (Belgium). Aardk. Meded. Univ. Leuven
8, 161–164.
Sintubin, M., 1999. Arcuate fold and cleavage patterns in the south-
eastern part of the Anglo-Brabant Fold belt (Belgium): tectonic
implications. Tectonophysics 309, 81–97.
K. Piessens et al. / Tectonophysics 348 (2002) 73–92 91
Sintubin, M., Brodkom, F., Laduron, D., 1998. Cleavage– fold re-
lationship in the Lower Cambrian Tubize Group, southeast An-
glo-Brabant Fold Belt. Geol. Mag. 135, 217–226.
Steed, G.M., Morris, J.H., 1997. Isotopic evidence for the origins of
a Caledonian gold–arsenopyrite–pyrite deposit at Clontibret,
Ireland. Trans. Inst. Min. Metall., Sect. B: Appl. Earth Sci.
106, 109–118.
Teagle, D.A.H., Norris, R.J., Craw, D., 1990. Structural controls on
gold-bearing quartz mineralization in a duplex thrust system,
Hyde–Macreas Shear zone, Otago schist, New Zealand. Econ.
Geol. 85, 1711–1719.
Touray, J.-C., Marcoux, E., Hubert, P., Proust, D., 1989. Hydro-
thermal processes and ore-forming fluids in the Le Bourneix
gold deposit, central France. Econ. Geol. 84, 1328–1339.
Trave, A., Calvet, F., Soler, A., Labaume, P., 1998. Fracturing and
fluid migration during Palaeogene compression and Neogene
extension in the Catalan Coastal Ranges, Spain. Sedimentology
45, 1063–1082.
Van Grootel, G., Verniers, J., Geerkens, B., Laduron, J., Verhaeren,
M., Hertogen, J., De Vos, W., 1997. Timing of magmatism,
foreland basin development, metamorphism and inversion in
the Anglo-Brabant fold belt. Geol. Mag. 134, 607–616.
Verniers, J., Van Grootel, G., 1991. Review of the Silurian in the
Brabant Massif, Belgium. Ann. Soc. Geol. Belg. 114, 163–193.
Verniers J., Herbosch, A., Vanguestaine, M., Geukens, F., Delcam-
bre, B., Pingot, J., Belanger, I., Hennebert, M., Debacker, T.,
Sintubin, M., De Vos, W. Cambrian–Ordovician–Silurian lith-
ostratigraphical units (Belgium). Geologica Belgica, in press.
Yurtsever, Y., Gat, J.R., 1981. Atmospheric waters. In: Gat, J.R.,
Gonfiantini, R. (Eds.), Stable Isotope Hydrology: Deuterium
and Oxygen-18 in the Water Cycle. Int. Atomic Energy Agency,
Vienna, Techn. Reports Series 210, 103–142.
K. Piessens et al. / Tectonophysics 348 (2002) 73–9292