SCALE IN REGIONAL ENVIRONMENTAL PLANNING: THE RECONSTRUCTION OF NORTH-BRABANT, THE NETHERLANDS
27
SCALE IN REGIONAL ENVIRONMENTAL PLANNING: THE RECONSTRUCTION OF NORTH-BRABANT, THE NETHERLANDS ANDRE KOOIMAN SERVIR-Africa Regional Centre for Mapping of Resources for Development Kasarani Road, Nairobi, Kenya SUKHAD SUBODH KESHKAMAT * Faculty of Geoinformation Science and Earth Observation University of Twente Enschede, The Netherlands [email protected] Received 6 April 2011 Revised 15 November 2011 Accepted 23 December 2011 Selection of scale in science and planning is often guided by ad-hoc decisions and arguments of accuracy and availability of existing data and resources. A more analytical approach to selection of scale and a bridge between theoretical insight and practical application is required. This paper reviews recent developments in thinking on theoreti- cal concepts on scale from the perspective of geo-information science and compares these with a real life case. The concept of scale is framed as a three dimensional boundary object that explains scale choice as resultant of rationalities in reality-, model- and data scales. It is applied to a case-study of how issues of scale were handled in the Reconstruction program of the Province of North Brabant in The Netherlands. The Reconstruction is an ongoing regional spatial planning exercise that started in the year 2000 in response to major veterinary, environmental, social and economic problems in areas with concen- trations of intensive livestock keeping. It combines legislation and policies at international, national, regional and municipal levels. Geographic information was produced to support and present the results of the plan process and related SEA. Scale of various intermediate * Corresponding author. Journal of Environmental Assessment Policy and Management Vol. 14, No. 1 (March 2012) 1250004 (27 pages) © Imperial College Press DOI: 10.1142/S1464333212500044 1250004-1
-
Upload
independent -
Category
Documents
-
view
0 -
download
0
Transcript of SCALE IN REGIONAL ENVIRONMENTAL PLANNING: THE RECONSTRUCTION OF NORTH-BRABANT, THE NETHERLANDS
SCALE IN REGIONAL ENVIRONMENTALPLANNING: THE RECONSTRUCTION
OF NORTH-BRABANT, THE NETHERLANDS
ANDRE KOOIMAN
SERVIR-AfricaRegional Centre for Mapping of Resources for Development
Kasarani Road, Nairobi, Kenya
SUKHAD SUBODH KESHKAMAT*
Faculty of Geoinformation Science and Earth ObservationUniversity of Twente
Enschede, The [email protected]
Received 6 April 2011Revised 15 November 2011Accepted 23 December 2011
Selection of scale in science and planning is often guided by ad-hoc decisions andarguments of accuracy and availability of existing data and resources. A more analyticalapproach to selection of scale and a bridge between theoretical insight and practicalapplication is required. This paper reviews recent developments in thinking on theoreti-cal concepts on scale from the perspective of geo-information science and compares thesewith a real life case. The concept of scale is framed as a three dimensional boundary objectthat explains scale choice as resultant of rationalities in reality-, model- and data scales. Itis applied to a case-study of how issues of scale were handled in the Reconstructionprogram of the Province of North Brabant in The Netherlands. The Reconstruction is anongoing regional spatial planning exercise that started in the year 2000 in response tomajor veterinary, environmental, social and economic problems in areas with concen-trations of intensive livestock keeping. It combines legislation and policies at international,national, regional and municipal levels. Geographic information was produced to supportand present the results of the plan process and related SEA. Scale of various intermediate
*Corresponding author.
Journal of Environmental Assessment Policy and ManagementVol. 14, No. 1 (March 2012) 1250004 (27 pages)© Imperial College PressDOI: 10.1142/S1464333212500044
1250004-1
and final geo-information products varied from 1:5000–1:400,000 and was dependent onthe plan stage, plan status and target audience, plan instrument, level of participation, datacharacteristics, costs and technology. By comparing theory with the case study we bringout the criteria and conditions of selection of appropriate scale whereby the usefulness ofacademic research in geographic information science for planning and decision makingcould be improved.
Keywords: Geo-information; multi-scale planning; issues of scale in spatial planning andassessment; Environment Assessment; reconstructie intensieve veehouderij (reconstructionof intensive livestock-keeping areas); North Brabant.
Introduction: Scale in Planning and Assessment Practice
Scale is one of the most overworked and yet, continuously ambiguous terms inanalysis. It may be used to refer to the magnitude of a study (i.e. its extent), thedegree of detail of the study (i.e. its resolution) or a means of comparing objectsin a study. It has been used in the context of space, time, individuals, hierarchy,perceptions, turnover, levels of governance and more. Every discipline claims it asits own, as an intrinsic component of scientific inquiry in the discipline, with itsown “universal definition” of it, thus making its use in for spatial informationmanagement multidisciplinary contexts, such as infrastructure assessment andplanning, all the more difficult.
According to Quattrochi and Goodchild (1997) in the field of the geography,5 types of scales have been identified: operational, temporal, cartographic,observational, measurement; and yet, these represent only the technical aspectsbehind scale choices. Cash et al. (2006b) and Lebel et al. (2005) take on thesocietal aspects of scale choice, observing that “scale represents a class of keychoices, commitments and constraints that actors contest or are forced to accept”.Karstens et al. (2007); Karstens (2009) takes on the managerial and politicalaspects of scale choice to show how problems can be magnified or shifted bypolitical decisions taken to solve small scale problems without a full analysis.
In common day to day practice, however, practitioners in the fields of assess-ment, planning and governance must face different types of scales concurrently —
some explicit, others not so explicit, some as technical limitations, some sub-jective, yet others statutory — and make the best choice, or combination ofchoices, from amongst them. The choices that they make influence the quality ofinformation and alternatives that they will ultimately deliver to the decisionmaking process (Cash et al., 2003, 2006a). This choice is often based on anegotiation and compromise between different rationalities at play in the situation.Diesing (1962) offered an understanding and classification of such rationalities,which can be applied to any practical context. These rationalities are economic,
A. Kooiman & S. S. Keshkamat
1250004-2
social, legal, technical and political. Sager (1999) connects rationality to corequestions in land-use planning:
(1) How to rationally select which kind of rationality to apply?(2) Can rationality types be utilized simultaneously? If so, how?(3) What is required to switch easily between rationality types?
Although we would be well advised to ask these questions at the outset ofplanning process, in most situations, proponents specify the level, and practitionerszero down to a certain scale based on the “most workable” solution that can beexpeditiously arrived at within given resources. Several planners and impactassessment professionals, especially those working in developing countries, agreethat in addition to political rationality and institutional capacity, availability of dataof appropriate quality is often the driving rationality (Paliwal, 2006; Coskun andTurker, 2010; Wood, 2003), rather than the other way round. Data availability,strong institutional support, systematic information management and a finemeshing of all these is a rare luxury in practice. It is also a problem that, informationwhich is salient and legitimate to a certain audience at a certain scale, will generallynot be so at a different scale — either higher or lower (Goodchild, 2011). There aredifferent stakeholders at different scales and so also are their concerns and prioritiesdifferent at different levels. Making an appropriate choice of scale is thus a coreissue that inevitably turns up in practitioner work-agendas. The reconstructionprocess of the province of Brabant in the Netherlands offers a notable example ofhow a detailed top-down and bottom-up approach were merged into complex multi-scalar, multilevel outcomes that are capable of evolving over time, to address newerupcoming issues that arise in the specific sectors.
The reconstruction process has received a lot of attention along its way, muchof it journalistic and some scientific publications. However, it is interesting to notethat very little of this attention highlighted the spatial information components,although it was virtually the technological — GIS based — backbone whichenabled the entire assessment, participation, planning, and negotiation processes.This article aims to unravel the practitioners’ scale choices using a boundary objecton scale choice, whose component dimensions are reality, model and data.
Background of the case study
The province of North Brabant, one of the 11 provinces of The Netherlands, lies innorthwest Europe at the hub of industrialized Europe. Of the 5,000 km2 regionabout 11% consists of towns and cities, 26% are ecological zones and theremaining 63% is agriculture or agricultural industries.
Scale in Regional Environmental Planning
1250004-3
From the late 70s onwards, intensive livestock rearing farms, housing severalthousand pigs each, or tens of thousands of chickens on (relatively) smaller parcelsof land began dominating the economic structure and growth of this province. Inrecent years however, this practice came under threat when several livestockepidemics broke out in quick succession. The 1997 the outbreak of swine feverresulted in the culling of all the pigs on 1800 farms, at an estimated loss of 2billion. In 2001 followed the foot-and-mouth outbreak, due to which 260,000cattle at 2900 farms had to be culled. Aviary influenza, with similar poultryculling, followed in 2003 and 2005. Most recently in 2006, blue tongue fever andQ-fever broke out and resulted in the first human casualties. The enormous human,animal and economic costs of these outbreaks led to an awareness, both at theDutch and European levels that the animal husbandry sector in this region haddeveloped in a manner unacceptable to society (Hart, 2005).
Authorities realized that a major effort was required to balance the spatialclaims of these interests in an integrated manner. Nationwide, a consensusdeveloped that a major reconstruction of the rural areas in North Brabant, andother Dutch provinces with a sizable intensive livestock sector, was required. Thisled to the drafting and approval of the Reconstruction Act by Dutch Parliament inthe year 2000, which came into effect in 2002. Environmental issues on ammonia,particulate matter, stench and the nature conservation policy, which were alreadymandated by European Union (EU) regulations, were linked to the reconstructionlaw to enable an integrated approach (Hart, 2005).
The main objective of the Act, which covered the provinces of North Brabant,Gelderland, Overijssel and Limburg (Figure 1) was the development of a properspatial structure, especially in relation to agriculture, nature, forest, recreation,water, environment and infrastructure. However, the goals also included theimprovement of quality of life, work and alternative economic opportunities forthe people. Specifically, it also included the coordinated and integrated, definitionand implementation of activities that would improve:
. The spatial structure of the agricultural sector in order to reduce veterinary risksassociated with a high livestock density,
. The natural areas and the countryside,
. The quality of environment and water and,
. The rules regarding public health, economic structure and social services.
A boundary object for scale selection
Keshkamat (2011) proposed a framework to understand, explain and/or negotiate theprocess of scale selection in research and practice. The framework (Fig. 2) serves as a
A. Kooiman & S. S. Keshkamat
1250004-4

boundary object Star and Griesemer (1989) which can be applied in the inter- andtransdisciplinary context (as defined by Baumgärtner et al., 2008) required by acomplex study. It was proposed byKeshkamat (2012) that this boundary object can beused in cases where the relevance, credibility and legitimacy of the process anddecisions is substantially influenced by the practitioners’ scale choices.
Scale can be represented as a framework of three interdependent axes:
(1) The scale of reality — framing an “observation window in which it is decidedwhich problems, policies and legislations should be extracted and addressed.
(2) The scale of models — applying legislation and stakeholders’ concerns toappropriate spatial models, and,
(3) The depiction and depiction scale, including scales of maps etc.
The interactions between these axes are described as three facets:
(4) Theory facet, representing the interaction between reality and model scale,where the researcher/analyst chooses which/how much part of the systemshould be studied and modeled and at what detail.
(5) Empirical facet, representing the interaction between model and data scale,where data scale is linked to the model scale which converts collected data toinformation by adding meaning and interpretation to otherwise neutral facts.
Fig. 1. Areas of the Netherlands covered by the reconstruction act and detail of province NorthBrabant (source: VROM, 2003).
Scale in Regional Environmental Planning
1250004-5

(6) Acquisition facet, representing the interaction between reality and data scale.Aspects of scale in primary data collection, sampling strategies, costs, andother aspects of access to data, copyright, privacy issues link to this facet.
Technical, social, economic, political, legal rationalities guide the ultimate choiceof scale in each facet. In the following section it will be shown how practitioners inthis case-study made their scale choices in a similar step-wise manner.
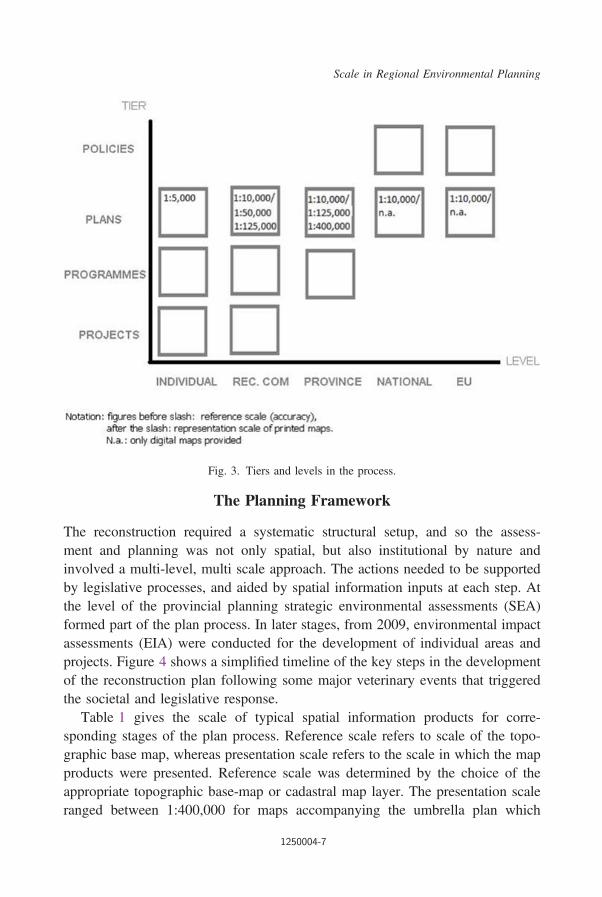
The planning framework of the reconstruction process took a tiered structureimplemented at different levels. Figure 3 shows the different tier-level combi-nations that were dealt with, with scale selection for each set of reality, model anddepiction in the plan tier.
Reconstruction planning as described in this paper focused on the plan tier. Forthat tier however, it included several lower levels — to facilitate public participationand legal procedures — and higher levels — to facilitate linkages with guidelinesand goals of higher authorities. As a result cross-tiering, cross-checking and multi-scale approaches were required for the production of related spatial information.
Fig. 2. A boundary object framework for scale selection (adapted from: Keshkamat, 2012).
A. Kooiman & S. S. Keshkamat
1250004-6
The Planning Framework
The reconstruction required a systematic structural setup, and so the assess-ment and planning was not only spatial, but also institutional by nature andinvolved a multi-level, multi scale approach. The actions needed to be supportedby legislative processes, and aided by spatial information inputs at each step. Atthe level of the provincial planning strategic environmental assessments (SEA)formed part of the plan process. In later stages, from 2009, environmental impactassessments (EIA) were conducted for the development of individual areas andprojects. Figure 4 shows a simplified timeline of the key steps in the developmentof the reconstruction plan following some major veterinary events that triggeredthe societal and legislative response.
Table 1 gives the scale of typical spatial information products for corre-sponding stages of the plan process. Reference scale refers to scale of the topo-graphic base map, whereas presentation scale refers to the scale in which the mapproducts were presented. Reference scale was determined by the choice of theappropriate topographic base-map or cadastral map layer. The presentation scaleranged between 1:400,000 for maps accompanying the umbrella plan which
Fig. 3. Tiers and levels in the process.
Scale in Regional Environmental Planning
1250004-7

provided the initial guidelines for the plan-process at the start of reconstruction, to1:5,000 maps that were produced in the “corrected revision”, 2008, in response tothe council of state ruling in 2007. For every step in the plan process, GISoperations were applied to build thematic information layers at the proper accu-racy, to combine these with the appropriate base-map and to create the final spatialinformation products at the best scale (-range). Detail was adjusted based on therequirements of the stage of the plan process. For instance, detail was maximized,for the production of the draft proposal by advisory boards and reduced for theproduction of development visions by reconstruction committees.
Institutional setup and organization
The Reconstruction Act, which was drafted at the national level, made the pro-vincial governments responsible for the overall spatial framework and environ-mental problems of provincial interest (VROM, 2003). The law required thatprovinces institute a competent authority and play a directing role. Thereby theplans of higher level authorities are to be incorporated in the town and countryplans of lower authorities, which should in turn integrate higher level policies withtheir own priorities (Padt, 2006). This nested hierarchy is an example of whatHajer and Zonneveld (2000) labeled a “Matroushka” system of interrelated stra-tegic plans on three levels of government, and is typical for Dutch spatial planning.
Considering the legitimacy-requirements of the plan process, and the need toinclude diverse local concerns, circumstances, ideas and initiatives within thetargets of policy and legislation at the larger scale, a participative approach wasdeveloped. In the province of North Brabant the provincial scale of implemen-tation was considered too coarse for the intricate balancing of such an array oflocal interests. On the other hand, 67 municipalities planning at the local level
Fig. 4. Timeline of relevant events in the Reconstruction process.
A. Kooiman & S. S. Keshkamat
1250004-8

Table
1.Scale
with
respectto
planning
tiers,institu
tionallevelsandextents.
Stage
Year
Institu
tionallevel
Extent
Scale
1:reference/
presentatio
n/inpu
tou
tput
Law
onreconstructio
n20
00(200
2)natio
nal
coun
tryn.a.
n.a.
Provincialpo
intof
departure
2000
prov
ince
prov
ince
n.a.
n.a.
Umbrella
plan
March
2001
prov
ince
prov
ince
250,00
040
0,00
0reconstructio
nBaselinestud
ies
Okt
2001
prov
ince
area
100,00
012
5,00
0reconstructio
nreconstructio
nDevelopmentvision
Nov
2001
committees
area
50,000
125,000
reconstructio
nSEA
scop
ingdo
cuments
end20
01prov
ince
area
100,00
012
5,00
0Nationalevalutioncriteria
(guidelin
es)
2002
natio
nal
coun
try
n.a.
n.a.
Draftprop
osals
2003–20
04advisory
boards
mun
icipality
10,000
25,000
reconstructio
nreconstructio
n10
,000
50,000
1stdraftreconstructio
nplans
Feb
2004
committees
area
&10
0,00
0&12
5,00
02n
ddraftreconstructio
nplans
andSEA
Jun20
04reconstructio
nreconstructio
n10
,000
50,000
committees
area
&10
0,00
0&12
5,00
0reconstructio
nreconstructio
n10
,000
50,000
Designplansþ
SEA
Jul20
04committees
area
&10
0,00
0&12
5,00
0reconstructio
n10
,000
50,000
App
rovedreconstructio
nplans
Apr
2005
prov
ince
area
þprov
ince
&10
0,00
0&12
5,00
0natio
naljudiciaryon
individu
alCou
ncilof
State
rulin
gs20
07complaints
farm
n.a.
n.a
Corrected
revision
2008
prov
ince
(inrespon
seto
abov
e)prov
ince
5,00
05,00
0–20
,000
Ordnance
2011
prov
ince
prov
ince
10,000
100,00
0
Scale in Regional Environmental Planning
1250004-9
would create an unpractical number of stakeholders. Furthermore there was thelack of capacity for rural planning at many of the local governments (ProvincieNoord-Brabant, 2005a). Therefore it was decided to divide the province into nineareas of seven to eight municipalities each.
In each area the provincial government installed a reconstruction committee toadvise provincial authorities on the plan development and SEA, to ensure com-munication with stakeholders and their active participation. The reconstructioncommittees included representatives from provincial and national government (inadvisory positions), water boards, the municipalities, farmers’ unions, environ-ment and nature, landscape and recreation sectors. In addition, stakeholder groupsat every municipality constituted one advisory board, which had representativesfrom the same sectors and institutions, to act as a sounding board. Several advisoryboards of interested and knowledgeable groups and persons were established(around 150 people/organizations per reconstruction area) to advise reconstructioncommittees, to channel public perceptions and ensure local support. The recon-struction committees were responsible for developing the reconstruction plans,which were then to be approved by the provincial executive council. National levelorganizations were involved as budget holders for impact-studies. Relevant EUlevel regulations were incorporated in the process, thus providing assessmentcriteria and opportunities to fund elements of the program. Figure 5 depicts theinstitutional setup along with the complex multi-level interactions graphically.
Guidelines, instructions and input information flowed from EU and nationallevel institutes, to the provincial authorities to be passed on to the reconstructioncommittees. Raw plan information from the lowest participation levels flowedback to the provincial government. Processed plan information flowed fromthe provincial organization to both lower and higher hierarchical levels. Atthe provincial level a project unit was established that advised provincialcouncil, supported reconstruction committees, coordinated planning and projectimplementation and developed the spatial information management program. Thisinstitutional setup enabled the program to best integrate policies and legislationat all levels. It was the basis for the definition of the users of the plans andcorresponding spatial information, and the related scale (see Fig. 3).
Legislation and instruments
In order that it should not breach any existing laws and open fronts for litigationswhich could bog down the process, the reconstruction plan with its SEA was to fitinto current policies and yet anticipate policy that was still being developed.Legislation spelled out planning instruments through which policies have to be
A. Kooiman & S. S. Keshkamat
1250004-10

Fig. 5. The institutional framework.
Scale in Regional Environmental Planning
1250004-11

implemented. Dutch policy is constantly changing in response to awareness ofproblems, opportunities and public pressure at international (especially EU),national, provincial and local levels. As legislation follows suit with policy,reconstruction processes had to be flexible enough to incorporate change in policies.In the original reconstruction plans policies as of spring 2004 were considered andsubsequent developments incorporated into later adjustments of the plans.
The reconstruction plans combined spatial and environmental legislation andpolicies. Together with the spatial planning law (Infomil, 2010) and legislation onenvironmental impact assessment (VROM, 1994), the most important frameworklegislation for the reconstruction process is the Reconstruction law 2000 (Staat derNederlanden, 2002). It describes which existing legislation and policies are con-sidered, and which themes relate to the regulatory spatial instruments that legallybind both the Municipal Town and Country Plan (MTCP), and the Provincial Townand Country Plan (PTCP) (Provinciale Staten van Noord-Brabant, 2004). The mostimportant instrument is the Integrated Zoning (IZ) instrument which specifies landuse zones, possibilities and allowable intensities for livestock-keeping in thesezones. It has legal powers to instruct and overrule the existing MTCPs and PTCP.
In addition, the reconstruction plans include goals and aims in the environment,social and economic sectors. To achieve these goals, stimulating instruments likesubsidies for land use change, land mobility, management support and support fortranslocation or termination of intensive livestock activities were also planned.Table 2 presents the prominent sectors, themes and corresponding legislation andpolicies illustrating the representation of legislation and policies from differentinstitutional levels in the spatial planning instruments. The legally bindinginstruments, like IZ, had to be delineated at “parcel level”, whereas instrumentsthat were stimulatory by nature are not linked to spatial planning legislation andcould be represented at global scale levels (Provincie Noord-Brabant, 2001b).Thus the legislative and policy framework addressed a wide range of spatial andspatio-temporal scales of ground-reality.
Main themes and models
The previous sections discussed the scales in institutional and legislative organ-ization. However due to the holistic multi-sectoral nature of the planning, thevarious themes and environmental models associated with the sectors also had tohave a multi-level framework. The reconstruction aimed at the achievement ofseveral detailed goals over 3 five-year periods. Too minute to enumerate here, theycan be thematically divided as shown in Table 3, and are reflected in the productoutputs.
A. Kooiman & S. S. Keshkamat
1250004-12

Table
2.Legislatio
n,po
liciesandinstrumentsby
sector
andlevel(adapted
from
Provincie
Noo
rd-Brabant,20
05b).
Sector
Legislatio
nandpo
licy
Institu
tionallevel
Instruments(For
extensificatio
nareas)
Framew
ork
Recon
structionlaw
2002
National
Provincialpo
intsof
departuremem
orandu
m(PUN),19
99Province
Umbrella
plan
reconstructio
n,20
01Integrated
zoning
Water
andsoil
Europ
eanwater
directive,
2000
EU
Nationalwater
policy21
stcentury,
2000
National
Regionalwater
harvestin
g,room
forrivers
Provincialtownandcoun
tryplan
2002
Province
Water
harvestin
gareas
Desired
grou
ndandsurfacewater
goals(G
GOR)20
03Province
Env
iron
ment-am
mon
iaEU
Integrated
pollu
tionpreventio
ngu
ideline(IPPC),19
96EU
Nationalgo
alsam
mon
iaredu
ctionNMP4,
2001
EU
Law
ammon
iaandliv
estock
(WAV),20
02National
Vulnerable(B)andvery
vulnerable
(A)
areasþ
220meter
zone
Env
iron
ment-stench
Nationalgu
idelines
onliv
estock
andstench,19
96National
Law
onstench
emission
,20
02Mun
icipal
Stenchsensitive
objectsþ
250meter
zone
New
law
stench
andliv
estock,20
07National
National
Nature
EU
bird
guidelineandhabitatgu
ideline19
79and19
92EU
Bird-
andhabitatgu
idelineareas
Nationalnature
conservatio
nlaw,19
98–20
02National
Natureconservatio
nareas-
Natura20
00Nationalstructurescheme“Green
space”,19
95National
Ecologicalmainstructure(EHS)
Flora
andfaun
alaw,20
02National
Provincialtownandcoun
tryplan,20
02Province
Green
structure
Scale in Regional Environmental Planning
1250004-13
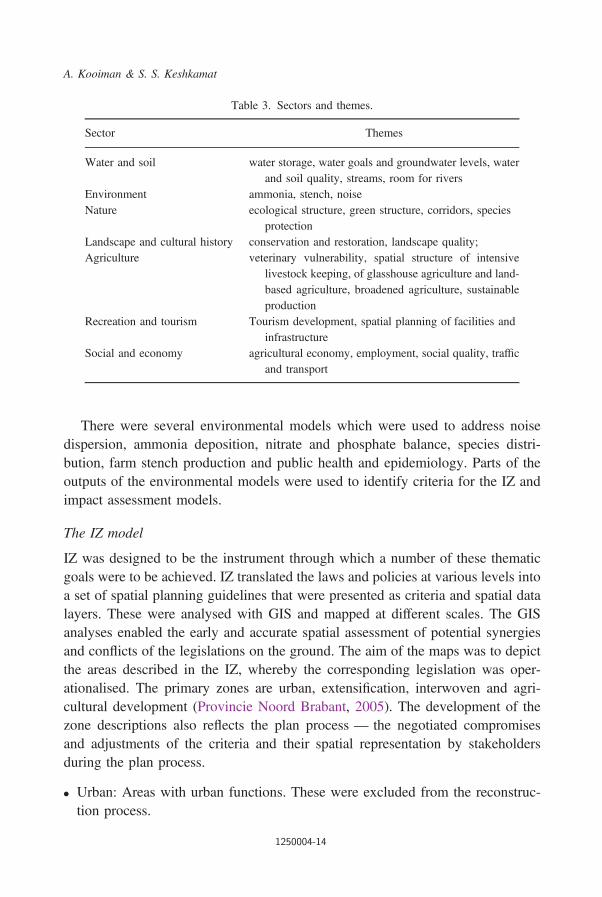
There were several environmental models which were used to address noisedispersion, ammonia deposition, nitrate and phosphate balance, species distri-bution, farm stench production and public health and epidemiology. Parts of theoutputs of the environmental models were used to identify criteria for the IZ andimpact assessment models.
The IZ model
IZ was designed to be the instrument through which a number of these thematicgoals were to be achieved. IZ translated the laws and policies at various levels intoa set of spatial planning guidelines that were presented as criteria and spatial datalayers. These were analysed with GIS and mapped at different scales. The GISanalyses enabled the early and accurate spatial assessment of potential synergiesand conflicts of the legislations on the ground. The aim of the maps was to depictthe areas described in the IZ, whereby the corresponding legislation was oper-ationalised. The primary zones are urban, extensification, interwoven and agri-cultural development (Provincie Noord Brabant, 2005). The development of thezone descriptions also reflects the plan process — the negotiated compromisesand adjustments of the criteria and their spatial representation by stakeholdersduring the plan process.
. Urban: Areas with urban functions. These were excluded from the reconstruc-tion process.
Table 3. Sectors and themes.
Sector Themes
Water and soil water storage, water goals and groundwater levels, waterand soil quality, streams, room for rivers
Environment ammonia, stench, noiseNature ecological structure, green structure, corridors, species
protectionLandscape and cultural history conservation and restoration, landscape quality;Agriculture veterinary vulnerability, spatial structure of intensive
livestock keeping, of glasshouse agriculture and land-based agriculture, broadened agriculture, sustainableproduction
Recreation and tourism Tourism development, spatial planning of facilities andinfrastructure
Social and economy agricultural economy, employment, social quality, trafficand transport
A. Kooiman & S. S. Keshkamat
1250004-14

. Extensification: Areas where expansion, re-location and establishment ofintensive livestock farms are impossible, or will be made impossible during thereconstruction.
. Interwoven: areas where the agricultural, living and nature functions arecombined. Re-allocation or expansion of intensive livestock keeping ispossible as long as the spatial quality of the other functions in the area is notaffected.
. Agricultural development areas are predominantly agricultural areas wherepossibilities already exist, or will be created, for expansion, re-location or newestablishment of intensive livestock farms. New establishment of intensivelivestock farms can only be allowed when strict conditions are met and when allremaining agricultural development area has been fully utilized. These areas aresub-categorized into:
○ Primary agricultural development area: In these areas, development ofnew intensive livestock farms can take place.
○ Primary agricultural development area with thicket-bird and badgerhabitat: These are areas that overlap with habitats for thicket birds orbadgers as per the provincial town and country plan (2002). In these areasintensive livestock keeping is only possible if habitat of these species canbe preserved undisturbed and if landscape structure is strengthened.
○ Secondary agricultural development area: These are agricultural devel-opment areas which overlap with vulnerable functions:
� 1000–1500m buffers around EU-protected bird- and habitatguideline and nature conservation areas,
� potential areas for floodplain expansion,� habitats of grassland birds and,� potential water protection areas.
In these areas the establishment of new livestock farms is not permitted, unlesslegislation on or delineation of these vulnerable functions changes.
The IZ is legally binding for all other present and future MTCPs and PTCP,and therefore so important, that it had to be delineated at “parcel” level. The IZoutcomes were produced in the following steps:
(1) Based on the Reconstruction Law, sandy areas (i.e. historically the regions ofactive livestock keeping) were identified and included, and urban areas as in2001, were mapped and excluded.
(2) Based on the criteria in the Umbrella plan (Provincie Noord-Brabant, 2001b),in 2003, preparatory maps of IZ were produced for each reconstruction area.
Scale in Regional Environmental Planning
1250004-15

In addition to the primary zones of the IZ mentioned above, the maps showedurban fringes, ecological main structure, nature areas for vulnerable species,areas vulnerable to acidification, intensive livestock keeping areas with theirammonia zones, and water-harvesting areas. The umbrella plan is furtherdiscussed under information management.
(3) The stench zoning was indicated separately as an indicative 250 meter bufferaround stench sensitive objects based on municipal environmental licensingrecords.1
(4) Reconstruction committees then hand-drew the zoning they desired. Care wastaken to follow existing parcel boundaries and map existing agriculturalconstruction parcels unambiguously in one or another zone. In addition to theobligatory areas, Reconstruction committees considered other areas theywished to zone as extensification, interwoven or agricultural developmentareas based on current policies and data.
(5) GIS professionals then digitized the resultant maps by copying these lines intoa new data-layer. The resulting map formed the basis for the first draft plans.
(6) To ensure the reconstruction did not conflict with PTCP of 2002 (ProvincialeStaten van Noord-Brabant, 2004), they were matched and compared, especiallyfor future rural-to-urban transformation zones. Recent adjustments in the deli-neation of the ecological main structure, following council of state rulings werealso included. The delineations by the reconstruction committees were assessedby the Provincial Council against EU regulations on habitat- and bird-guidelineareas, national rules on ammonia zones, provincial regulations on green zones,reservation areas for rivers and floodplains and water harvesting areas.
(7) Upon the conclusion of these steps, the design plan was published for publicreview in 2004.
(8) An adjustment in the criteria and categories of agricultural development areaand approved adjustments, as proposed by the review, were included in theapproved reconstruction plan in 2005.
This shows how the planning, even in the preparatory stages was at a fine car-tographic scale to match the detail at parcel level as required by the enacted spatialplanning instrument. However, to facilitate holistic decision making by theProvincial Council and obtain approvals at the national level, the plans of thereconstruction areas were aggregated into one data layer for the entire province,thus sacrificing the level of detail, for extent.
1This figure was obtained by municipalities from environmental licensing and not by spatialregulation. Therefore this zone did not have the same legal status as other themes that make up theextensification areas.
A. Kooiman & S. S. Keshkamat
1250004-16

Assessment models
The environmental assessments in reconstruction planning were carried out atdifferent scales that related to the level of decision making and the plan phase.They incorporated various sectoral models as mentioned previously. The initialSEAs were carried out in accordance with the law on environmental impactassessment on the first draft plans of the reconstruction committees (Kant et al.,2004). The SEAs described impacts of several alternatives that were incorporatedin the subsequent planning versions. Yet, these were conducted at the scale ofreconstruction areas. Integration and aggregation was required to upscale theassessments to the provincial level.
Several assessments were carried out parallel to the IZ stream to assess theimpact of zoning scenarios in the plans on achievement of provincial objectives.The studies aimed to advise and to support decision making by the provincialcouncil and executive on rules and criteria for zoning and on approval of thereconstruction plans. At the national level similar ad hoc assessments were carriedout to advise ministries and support decision making of the plans. Some examplesincluded:
. Fact finding study, 2003: A fact finding study was undertaken to assess theconsequences of IZ on the intensive livestock sector (Hart, 2003). An analysisof the number, size and economic perspective of farms in each zone wasconducted.
. Plan damage: When existing interests are affected by government plans, plandamages can be claimed. IZ might affect some farmers adversely, so a study ofpossible plan damage claims was conducted by analyzing the number of farmsin extensification area (Kooiman, 2005).
. The analysis outcome was then allocated to specific levels of government basedon the underlying legislation which was responsible for the damage.
. Impact of plan changes: Impacts of changes in the delineation between differentversions of the plan were assessed. Area calculations of most important plancategories and updated information on the locations and types of livestock farmskept track of achievement of aims per sector. Given the duration of the planningperiod (2001–2016), it was important to monitor autonomous and internaldevelopments using the latest version of datasets in the assessments.
The SEA in the reconstruction plans considered the impacts of zoning alternativesper reconstruction area. The so called agricultural development areas includedpossibilities for expansion and establishment of new intensive livestock farms. Forthe realization of these, each agricultural development area required a separate
Scale in Regional Environmental Planning
1250004-17

plan and a detailed EIA at municipal scale (for instance, RMB and Gemeenten,2009), as stipulated in provincial guidelines (Provincie Noord-Brabant, 2003),whereas environmental licensing may require a further EIA at the level of indi-vidual farms if that farm is to host large numbers of livestock (VROM, 1994).
In recent years public concerns about the impact of the intensive livestocksector on environment and public health have tremendously increased. This hasled to increased pressure on local, but also higher level authorities to carry outstudies at the local level on impacts on ammonia, endotoxins, bacteria, particulatematter before decisions are made. These are to be incorporated in future EIAstudies at the program and project level.
Information management
The purpose of the spatial information management program was to integrateguidelines, criteria, thematic information and models, thus providing salient andcredible information to and from stakeholders and authorities at all levels. Thisincluded defining the standards for the production of new plan information so thatresults of the stakeholder participation process in each of the reconstruction areascould be aggregated and integrated at the provincial level.
In addition to these visualization and aggregation functions, the spatial infor-mation management program also served a key function as an expert advisoryspatial decision support system (SDSS) to the provincial executive council. Thisfunction included data analyses, generation of alternative scenarios and inter-mediate map products showing impacts of alternatives. It also served as theinformation hub to national level organizations, ministries, research institutes andthe EIA commission to facilitate plan approval.
Different plan processes have different information requirements. Several GISproducts (Table 3) were generated to serve these functions, mainly as printedmaps, but also digital (on CDs, internet). Creation of these products involveddealing with a variety of scales — sequence (temporal scale), plan process (ana-lytical scale), representation (cartographic scale), thematic goals (model scale),background documents (data scale), which represent the scale choices that prac-titioners contended with in order to provide salient and credible information. Insequence these are:
(1) Umbrella plan, 2001: This document intended to inform all professionalstakeholders of the basis for the reconstruction program. It translated legalbackground and policy framework to the points of departure for the recon-struction planning and described the responsibilities, process and themes.Maps illustrated the multidisciplinary nature of the program and were
A. Kooiman & S. S. Keshkamat
1250004-18
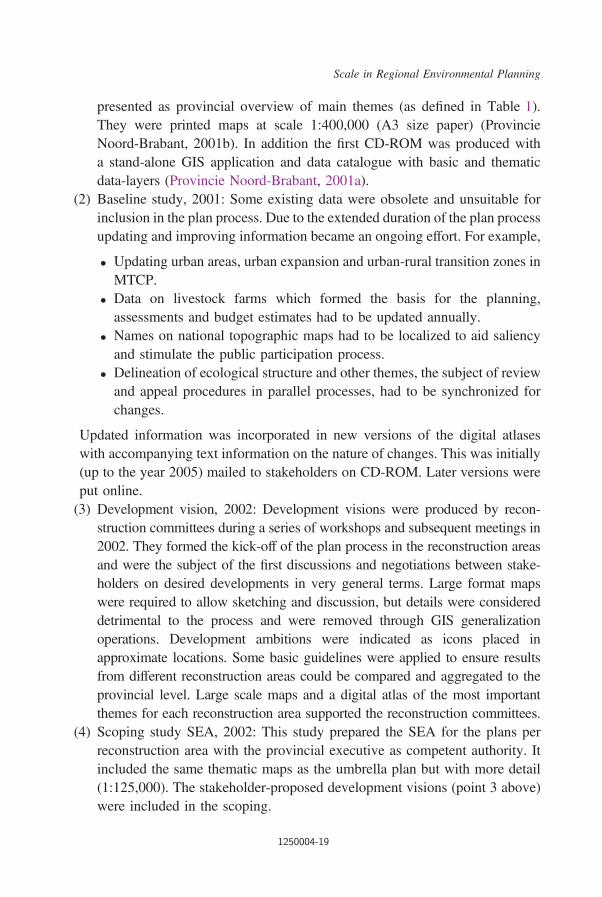
presented as provincial overview of main themes (as defined in Table 1).They were printed maps at scale 1:400,000 (A3 size paper) (ProvincieNoord-Brabant, 2001b). In addition the first CD-ROM was produced witha stand-alone GIS application and data catalogue with basic and thematicdata-layers (Provincie Noord-Brabant, 2001a).
(2) Baseline study, 2001: Some existing data were obsolete and unsuitable forinclusion in the plan process. Due to the extended duration of the plan processupdating and improving information became an ongoing effort. For example,
. Updating urban areas, urban expansion and urban-rural transition zones inMTCP.
. Data on livestock farms which formed the basis for the planning,assessments and budget estimates had to be updated annually.
. Names on national topographic maps had to be localized to aid saliencyand stimulate the public participation process.
. Delineation of ecological structure and other themes, the subject of reviewand appeal procedures in parallel processes, had to be synchronized forchanges.
Updated information was incorporated in new versions of the digital atlaseswith accompanying text information on the nature of changes. This was initially(up to the year 2005) mailed to stakeholders on CD-ROM. Later versions wereput online.(3) Development vision, 2002: Development visions were produced by recon-
struction committees during a series of workshops and subsequent meetings in2002. They formed the kick-off of the plan process in the reconstruction areasand were the subject of the first discussions and negotiations between stake-holders on desired developments in very general terms. Large format mapswere required to allow sketching and discussion, but details were considereddetrimental to the process and were removed through GIS generalizationoperations. Development ambitions were indicated as icons placed inapproximate locations. Some basic guidelines were applied to ensure resultsfrom different reconstruction areas could be compared and aggregated to theprovincial level. Large scale maps and a digital atlas of the most importantthemes for each reconstruction area supported the reconstruction committees.
(4) Scoping study SEA, 2002: This study prepared the SEA for the plans perreconstruction area with the provincial executive as competent authority. Itincluded the same thematic maps as the umbrella plan but with more detail(1:125,000). The stakeholder-proposed development visions (point 3 above)were included in the scoping.
Scale in Regional Environmental Planning
1250004-19
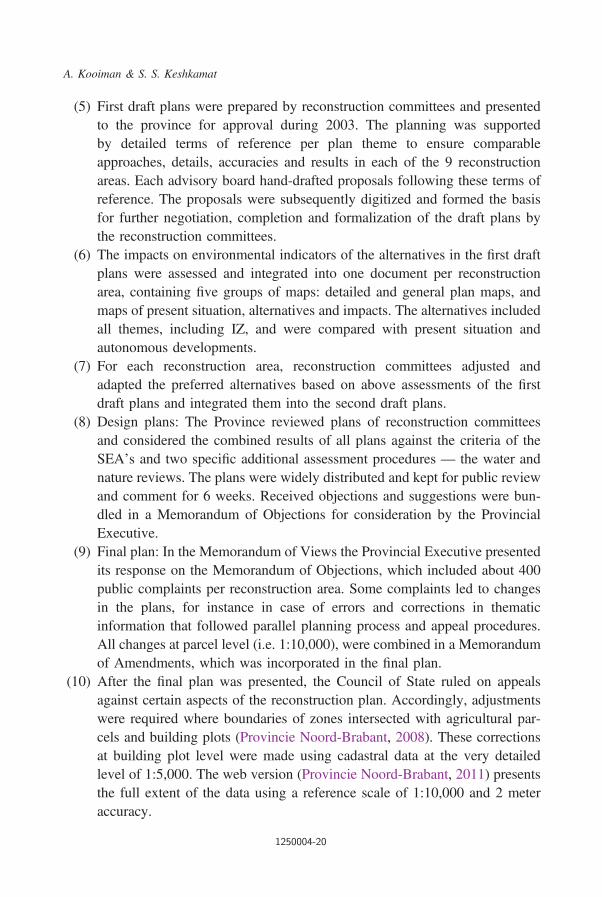
(5) First draft plans were prepared by reconstruction committees and presentedto the province for approval during 2003. The planning was supportedby detailed terms of reference per plan theme to ensure comparableapproaches, details, accuracies and results in each of the 9 reconstructionareas. Each advisory board hand-drafted proposals following these terms ofreference. The proposals were subsequently digitized and formed the basisfor further negotiation, completion and formalization of the draft plans bythe reconstruction committees.
(6) The impacts on environmental indicators of the alternatives in the first draftplans were assessed and integrated into one document per reconstructionarea, containing five groups of maps: detailed and general plan maps, andmaps of present situation, alternatives and impacts. The alternatives includedall themes, including IZ, and were compared with present situation andautonomous developments.
(7) For each reconstruction area, reconstruction committees adjusted andadapted the preferred alternatives based on above assessments of the firstdraft plans and integrated them into the second draft plans.
(8) Design plans: The Province reviewed plans of reconstruction committeesand considered the combined results of all plans against the criteria of theSEA’s and two specific additional assessment procedures — the water andnature reviews. The plans were widely distributed and kept for public reviewand comment for 6 weeks. Received objections and suggestions were bun-dled in a Memorandum of Objections for consideration by the ProvincialExecutive.
(9) Final plan: In the Memorandum of Views the Provincial Executive presentedits response on the Memorandum of Objections, which included about 400public complaints per reconstruction area. Some complaints led to changesin the plans, for instance in case of errors and corrections in thematicinformation that followed parallel planning process and appeal procedures.All changes at parcel level (i.e. 1:10,000), were combined in a Memorandumof Amendments, which was incorporated in the final plan.
(10) After the final plan was presented, the Council of State ruled on appealsagainst certain aspects of the reconstruction plan. Accordingly, adjustmentswere required where boundaries of zones intersected with agricultural par-cels and building plots (Provincie Noord-Brabant, 2008). These correctionsat building plot level were made using cadastral data at the very detailedlevel of 1:5,000. The web version (Provincie Noord-Brabant, 2011) presentsthe full extent of the data using a reference scale of 1:10,000 and 2 meteraccuracy.
A. Kooiman & S. S. Keshkamat
1250004-20

Table
4.Produ
ctgrou
psperplan
stage.
Typeandform
atof
geo-inform
ation
Printed,form
alDigital
Stage
inplan
process
Year
Extent
Internal
assessments
andsupport
maps
Present
situation&
autono
mou
sdevelopm
ent
Vision
andgo
als
Alternatives
Effects
Plan/preferred
alternative
Implem
entatio
npd
fGIS
Cd-Dvd
GIS
www
Ordinance
spatial
planning
2011
prov
ince
XX
X
Corrected
revision
reconstructio
nreconstructio
nplan
2008
area/local
XX
X
App
rovedreconstruc-
tionplan
þEIA
2005
prov
incial
XX
XX
XX
XX
Xreconstructio
nDesignplan
þEIA
2004
area
XX
XX
XX
XX
Xreconstructio
nDraftplan
þEIA
2003
area
/mun
icipal
XX
XX
XX
reconstructio
n
EIA
/SEA
scoping
document
2002
area
X
Develop
mentvision
2001-
reconstructio
n
2015
2002
area
XX
Xreconstructio
nBaselinestudy
2001
area
XX
Umbrella
plan
2001
prov
ince
XX
Scale in Regional Environmental Planning
1250004-21

Scale issues
The choice of scale also has a very important role in providing salient information,within technical constraints and at reasonable cost. The choice of product scaleshad to balance quality and accuracy requirements, technical constraints and costs.For example, the support maps for Advisory Boards at municipal level wereprinted at large scales (1:20,000) for municipal areas as local detail was required.Support maps for reconstruction committees were presented at coarser scales of1:50,000. However, for provincial authorities these fine scale maps could notprovide the required overview and so were expanded to 1:125,000 by combiningwith the national generalized topographic layer (1:100,000). In combination withthe spatial extent of the reconstruction areas, these scales could be represented onstandard paper formats that enabled reproduction at reasonable cost. This wasimportant given the large number of color maps in each plan (more than 40) andthe considerable circulation of copies that was required due to the participatorynature and public interest in the planning exercise (600–900 per reconstruc-tion area). All maps and texts were also copied onto CD-ROM to facilitatedissemination at minimal cost.
Digital material was produced in the form of a series of atlases i.e. (ProvincieNoord Brabant, 2005; Provincie Noord-Brabant, 2001a). Considering the limitedcoverage and speed of internet connections with the general public, these wereinitially produced on CD-ROM/DVD. All data layers were presented at provinciallevel and were also made accessible via the provincial intranet. The final versionswere also made available through internet at 1:10,000. Since January 2010, thespatial planning has been made fully digital which means that spatial plansare digitally prepared, approved, published and managed (VROM, 2008). Infor-mation is now made available online with a “Flamingo” data viewer — an open-source, easy-to-use, browser-based map-viewer for panning, zooming and print-ing (Flamingo Mapcomponents, 2006–2009). It connects to a separate downloadapplication, which facilitates sending selected data from the officially approveddataset to email addresses.
All the spatial information products, intermediate as well as final, outcomes aswell as preparatory material had to be worked, so that the information was pre-sented in a manner that presents relevant facts to its audience. This section showedhow the digital spatial information and GIS tools formed the backbone thatenabled practitioners to successfully manage vast amounts of spatial data, deli-vering the right contextual information, within technological and financial limits,to and from stakeholders, assessment professionals, authorities and decisionmakers, thus aiding legitimacy of the reconstruction plan.
A. Kooiman & S. S. Keshkamat
1250004-22
Reflection and Discussion
Through the description of the case study, the disciplines, multiple levels, spatialscales and temporal scales at which the assessment, planning and management(or governance) of the reconstruction took place were elaborated. Public partici-pation took place at the grassroots level, with aggregation and assimilation ofoutcomes taking place at higher levels. Decisions taken at higher levels passed tolower levels for reassessment and were implemented at the mid-level (provincial).At the same time legislative support was provided to the institutional frameworkfrom top down. Although it was not apparent to the decision makers and stake-holders, in the background the spatial information, GIS, assessment proceduresand the selection of scale played an important role at each step of the process.It was seen in the previous sections how practitioners in this case-study made theirscale choices in a similar step-wise manner. Scales were chosen for representingreality through mathematical and spatial models, depicting reality (through maps,in this case) and generating scenarios and alternatives using the models anddepicting those using maps. In this, the component of the argumentation for scalechoices clearly link with the described theoretical model of scale as boundaryobject.
This case-study is particularly noteworthy because the scale choices werearrived at through documented iterations and multi-rational bases, which is notalways the case. It was the strong GIS backbone of the Plan process that enabledthe practitioners to carry out such iterations in appropriate formats and within tighttime frames.
It is also pertinent to highlight here a few relevant issues of significance, albeitof secondary importance, to this plan and the scale choices. These included:
Scale of time: As seen in Fig. 4, the Reconstruction plan period was specifiedas 2001–2016. Over this period, even as it is being executed, the plan and itsunderlying spatial information layers continue to evolve, with ongoing actualiza-tion needed to incorporate autonomous developments, achievements of planimplementation and any legislative and policy changes, which were not consideredbefore. In relation to the theoretical model this issue is related to the facet of theory.
Data ownership and copyright: Data ownership influenced access to digital data,especially the use of topographic base data. For printed material, the detailed1:10,000 topographic map could be used. However, although it was readilyavailable for internal access by provincial staff, copyright limited the incorporationof the digital version of this dataset on the CD-ROM that was sent to externalstakeholders. A generalized version at the smaller scale of 1:25,000 was therefore
Scale in Regional Environmental Planning
1250004-23

included on the CD version. Though not considered desirable from the perspectiveof equal access to all data sources by all stakeholders, copyright limitations forcedthe program authorities to accept these differences.
Copyright and data access were also important in work that was contractedto external parties, for example the SEA and other impact-studies. Intermediatesteps and final results of contracted work were distributed in the form of printedmaps and their PDF versions. However, the original GIS equivalent of the pro-ducts could not always be made available and thus was not fully verifiable bystakeholders.
Privacy Issues: The issues of data ownership and privacy typically relate to theacquisition facet as described in the 3D model. Farmers’ privacy arguments wereinitially used to limit access to the database on livestock farms, although the originof the database — municipal environmental licenses — was public and thisinformation was of prime importance for all parties involved in the planning.Given the participatory nature of the plan process, this information also had to bemade available to stakeholders other than government. Considerable negotiationswere conducted between provincial and municipal governments to ensure that thisdataset and its updates could be made available and distributed to all stakeholdersin reconstruction planning.
Conclusion and Future Developments
In the preceding sections we brought out the enormous utility of GIS in spatialplanning and environmental assessment in a multi scalar, transdisciplinary, multi-level environment, wherein a large number of stakeholders of varying capacities areinvolved. It sought to highlight the intrinsic understanding of scale that practitionersmust have, and the “juggling” they must do, in order to deliver good quality infor-mation to the decision making process. Such an extensive management of infor-mation in a participatory spatial planning process, in a cost- and time-effectivemanner, could only be managed because of the stable spatial information backbone.
Several authors have attempted to explain and develop the theory of theselection (and impact) of scale in assessment and planning. At the same timepractitioners, with their tacit understanding of scale, continue to “get the jobdone”. To try to bridge the gap between theory and practice, we sought to takeapart this tacit manipulation of scales in a complex planning framework and shelveit into reality — (legal and institutional frameworks), model — and representationframes. In practice, scale of spatial information does not strictly follow tiers andinstitutional levels on a one-to-one correspondence. One tier may be linked to
A. Kooiman & S. S. Keshkamat
1250004-24

several institutional levels as in this case study. Therefore some degree of iterationsand cross-checking will often be required before appropriate scales are found. Theuse of GIS enables cost- and time-efficient multi-scalarity in such situations. Basedthe boundary object of Keshkamat (2012), practitioners’ considerations scale can bedivided into those on institutions and institutional processes which relate to the axisof reality; those on themes and criteria which relate to the model axis, whereas thoseregarding the acquisition andmanagement of basic data which relate to the data axis.The interactions between these axes (facets) are the key to finding the appropriateoperational scale.
We find that data issues such as temporal scales, copyright ownership, privacyand cross-scale manipulations, although very important, are being dealt withseparately from the main issues. We also find that if the provision of good qualityinformation to decision-making follows the 3 precepts of salience, credibility andlegitimacy, spatial data and GIS can form an indispensable tool for environmentalassessment, spatial planning and stakeholder engagement processes. Makingan appropriate choice of scale in analyses, modelling, data collection and rep-resentation plays an important role in the quality of information that will beprovided.
References
Baumgärtner, S, C Becker, K Frank, B Müller and M Quaas (2008). Relating the phil-osophy and practice of ecological economics: The role of concepts, models, and casestudies in inter-and transdisciplinary sustainability research. Ecological Economics, 67,384–393.
Cash, DW, WC Clark, F Alcock, NM Dickson, N Eckley, DH Guston, J Jäger and RBMitchell (2003). Knowledge systems for sustainable development. Proceedings of theNational Academy of Sciences of the United States of America, 100, 8086.
Cash, DW, WN Adger, F Berkes, P Garden, L Lebel, P Olsson, L Pritchard and O Young(2006a). Scale and cross-scale dynamics: Governance and information in a multilevelworld. Ecology and Society, 11, 8–8.
Cash, DW, W Adger, F Berkes, P Garden, L Lebel, P Olsson, L Pritchard and O Young(2006b). Scale and cross-scale dynamics: Governance and information in a multilevelworld. Ecology and Society, 11.
Coskun, AA and O Turker (2010). Analysis of environmental impact assessment (EIA)system in Turkey. Environmental Monitoring and Assessment, 1–14.
Diesing, P (1962). Reason in Society; Five Types of Decisions and Their Social Con-ditions. Urbana, University of Illinois Press.
Flamingo Mapcomponents (2006–2009). Flamingo Mapviewer. 3.2 ed.
Scale in Regional Environmental Planning
1250004-25
Goodchild, MF (2011). Scale in GIS: An overview. Geomorphology, 130, 5–9.Goodchild, MF and DA Quattrochi (1997). Scale, Multiscaling, Remote Sensing and GIS.
In Goodchild, MF and DA Quattrochi (eds.) Scale in Remote Sensing and GIS. BocaRaton, FL: CRC Lewis.
Hajer, M. and W Zonneveld (2000). Spatial planning in the network society-rethinking theprinciples of planning in the Netherlands. European Planning Studies, 8, 337–356.
Hart, GT (2003). Resultaten feitenonderzoek reconstructie. ’s-Hertogenbosch: ProvincieNoord-Brabant.
Hart, GT (2005). Het proces in vogelvlucht, PS-dossier 22 april 2005, bijlage 10’s-Hertogenbosch: Provincie Noord-Brabant.
Infomil (2010). Handreiking Ruimtelijke Ordening en milieu. Den Haag: Ministerie vanVolkshuisvesting, Ruimtelijke Ordening en Milieubeheer.
Kant, P, S Eijtjes, A Spierings (Reconstructiecommissie de Peel) (2004). Reconstructie-plan/MER De Peel, 1ste concept. Deel A. 58.
Karstens, S (2009). Bridging Boundaries: Making Scale Choices in Multi-actor PolicyAnalysis on Water Management. Deltares Select Series.
Karstens, SAM, PWG Bots and JH Slinger (2007). Spatial boundary choice and the viewsof different actors. Environmental Impact Assessment Review, 27, 386–407.
Keshkamat, SS (2012). The road less travelled: Scale in assessment and planning ofinfrastructure. Ph.D. dissertation, University of Twente, The Netherlands.
Kooiman, A (2005). Vergelijking typen intensieve veehouderij in extensiveringsgebieden.In RLG (ed.). ed. ’s-Hertogenbosch: Provincie Noord-Brabant.
Lebel, L, P Garden and M Imamura (2005). The politics of scale, position, and place in thegovernance of water resources in the Mekong region. Ecology and Society, 10, 18–18.
Padt, F (2006). Regional environmental planning in the Netherlands: An unstable settlementof policy arrangements. Institutional Dynamics in Environmental Governance, 203–223.
Paliwal, R. (2006). EIA practice in India and its evaluation using SWOT analysis. Environ.Impact Assess. Rev., 26, 492–510.
Provinciale Staten van Noord-Brabant (2004). Streekplan Noord-Brabant 2002 ’Brabant inBalans’.
Provincie Noord-Brabant (2001a). Digitale Atlas RLG, Deel 1. ’s-Hertogenbosch.Provincie Noord-Brabant (2001b). Revitalisering Landelijk gebied. Reconstructie aan zet.
Koepelplan Reconstructie Concentratiegebieden. ’s-Hertogenbosch.Provincie Noord-Brabant (2003). Handleiding duurzame locaties en duurzame projectlo-
caties voor de intensieve veehouderij.Provincie Noord-Brabant (2005a). Reconstructieplan/Milieueffectrapport Deel A: Baronie,
Beerze Reusel, Boven Dommel, Maas en Meijerij, Meijerij, Peel en Maas, De Peel.’s-Hertogenbosch.
Provincie Noord-Brabant (2005b). Reconstructieplan/Milieueffectrapport, deel B: Baronie,Beerze Reusel, Boven Dommel, Maas en Meijerij, Meijerij, Peel en Maas, De Peel.’s-Hertogenbosch.
A. Kooiman & S. S. Keshkamat
1250004-26
Provincie Noord-Brabant (2008). Ontwerp correctieve herziening reconstructieplan: Bar-onie, Beerze Reusel, Boven Dommel, Maas en Meijerij, Meijerij, Peel en Maas, DePeel. ’s-Hertogenbosch: OBT bv, Den Haag.
Provincie Noord-Brabant (2011). Kaarten Landbouwontwikkelingsgebieden [Online].’s-Hertogenbosch. Available: http://www.brabant.nl/kaarten/ruimtelijke-ordening-kaar-ten/landbouwontwikkelingsgebieden.aspx [Accessed 15 March 2011].
Provincie Noord Brabant (2005). Digitale atlas revitalisering landelijk gebied (RLG) 2005.In Directie Roh, PNB (ed.). ’s-Hertogenbosch.
RMB and AV Gemeenten (2009). Plan-M.E.R. bestemmingsplan LOG Graspeel.Gemeenten Landerd en Mill & Sint Hubert. Reconstructiegebied Peel en Maas. Cuijck.
Sager, T (1999). The rationality issue in land-use planning. Journal of ManagementHistory (Archive), 5, 87–107.
Staat der Nederlanden (2002). Reconstructiewet concentratiegebieden. Den Haag: SDUPublishers.
Star, SL and JR Griesemer (1989). Institutional Ecology, “Translations” and BoundaryObjects: Amateurs and Professionals in Berkeley’s Museum of Vertebrate Zoology,1907–39. Social Studies of Science, 19, 387–420.
VROM (1994). Besluit milieueffectrapportage. In VROM (ed.). Den Haag.VROM (2003). De reconstructiewet. Reconstructie en ruimtelijke ordening in de praktijk.
Den Haag.VROM (2008). GIDEON-Basisvoorziening geo-informatie Nederland, visie en imple-
mentatiestrategie (2008–2011) 56.Wood, C (2003). Environmental impact assessment in developing countries: An overview.
International Development Planning Review, 25, 301–321.
Scale in Regional Environmental Planning
1250004-27