
Revised systematics of Palaeozoic 'horseshoe crabs' and the myth of monophyletic Xiphosura

Available online at www.sciencedirect.com
(2007) 98–115www.elsevier.com/locate/tecto
Tectonophysics 445
3-D electromagnetic imaging of a Palaeozoic plate-tectonic boundarysegment in SW Iberian Variscides (S Alentejo, Portugal)
N. Vieira da Silva a, A. Mateus b, F.A. Monteiro Santos a,⁎, E.P. Almeida a,c, J. Pous d
a Uni. de Lisboa, CGUL-IDL, Ed. C8, Piso 6, Campo Grande, 1749-016 Lisboa, Portugalb Uni. de Lisboa, Dep. Geologia and CREMINER, Ed. C6, Piso 4, Campo Grande, 1749-016 Lisboa, Portugal
c Instituto Politécnico de Tomar, 2300 Tomar, Portugald Dep Geodinàmica i Geofísica, Uni. Barcelona, Marti Franques s/n, 08028 Barcelona, Spain
Received 1 December 2005; accepted 25 June 2007Available online 28 July 2007
Abstract
In SW Iberian Variscides, the boundary between the South Portuguese Zone (SPZ) and the OssaMorena Zone (OMZ) correspondsto a major tectonic suture that includes the Beja Acebuches Ophiolite Complex (BAOC) and the Pulo do Lobo Antiform Terrane(PLAT). Three sub-parallel and approximately equidistant MT profiles were performed, covering a critical area of this Palaeozoicplate-tectonic boundary in Portugal; the profiles, running roughly along an NE–SW direction, are sub-perpendicular to the mainVariscan tectonic features. Results of the three-dimensional (3-D) modelling of MT data allow to generate, for the first time, a 3-Delectromagnetic imaging of the OMZ–SPZ boundary, which reveals different conductive and resistive domains that displaymorphological variations in depth and are intersected by two major sub-vertical corridors; these corridors coincide roughly with theNE–SW, Messejana strike–slip fault zone and with the WNW–ESE, Ferreira–Ficalho thrust fault zone. The distribution of theshallow resistive domains is consistent with the lithological and structural features observed and mapped, integrating the expectedelectrical features produced by igneous intrusions and metamorphic sequences of variable nature and age. The development in depthof these resistive domains suggests that: (1) a significant vertical displacement along an early tectonic structure, subsequently re-takenby the Messejana fault-zone in Late-Variscan times, has to be considered to explain differences in deepness of the base of thePrecambrian–Cambrian metamorphic pile; (2) hidden, syn- to late-collision igneous bodies intrude the meta-sedimentary sequencesof PLAT; (3) the roots of BAOC are inferred from 12 km depth onwards, forming a moderate resistive band located between twomiddle-crust conductive layers extended to the north (in OMZ) and to the south (in SPZ). These conductive layers overlap the IberianReflective Body (evidenced by the available seismic reflection data) and are interpreted as part of an important middle-crustdécollement developed immediately above or coinciding with the top of a graphite-bearing granulitic basement.© 2007 Elsevier B.V. All rights reserved.
Keywords: Electromagnetic imaging; 3-D modelling; Magnetotellurics; SW Iberian Variscides
1. Introduction
The SW Iberian Variscides represents one of the keysegments of the EuropeanVariscan FoldBelt (Lötze, 1945;
⁎ Corresponding author.E-mail address: [email protected] (N. Vieira da Silva).
0040-1951/$ - see front matter © 2007 Elsevier B.V. All rights reserved.doi:10.1016/j.tecto.2007.06.006
Julivert et al., 1980; Ribeiro, 1981; Quesada, 1991), whosestructure resulted from the oblique continental collisionoperated in Carboniferous involving three main geotec-tonic units, from north to south: the Central-Iberian Zone(CIZ), the Ossa Morena Zone (OMZ) and the SouthPortuguese Zone (SPZ). The boundaries of these unitscorrespond, therefore, to major suture zones, regardless of

99N. Vieira da Silva et al. / Tectonophysics 445 (2007) 98–115
diverse controversial issues concerning particular litholog-ical and structural data that record the early stages of theirgeodynamic evolution (Bard et al., 1973; Matte, 1986;Munhá et al., 1989; Ribeiro et al., 1990; Ábalos and DíazCusí, 1995; Simancas et al., 2001; San José et al., 2004).
In the past two decades, many studies were devoted tothe OMZ–SPZ boundary in order to decipher its con-stitution and internal architecture, thus contributing to abetter understanding of this suture zone. Critical advanceswere made after comprehensive geological mapping andstructural analysis, coupled by detailed investigations onstratigraphy, geochemistry and (metamorphic and igne-ous) petrology (see references in Section 2). Concurrently,important progresses were recorded on geochronology(see references in Section 2), bringing light to severalcritical questions and limiting hypotheses postulated insome geodynamic models. Data obtained from thesemultidisciplinary research programmes were recentlycomplemented bymagnetotelluric (MT) surveys intended
Fig. 1. A— The main geotectonic units of SW Iberian Variscides and schemathe OMZ southern border, Exotic Terranes and SPZ northern border (adapteOliveira and E. Pereira, compilers). The aligned dots represent the sites of th
to elucidate the structural arrangement at depth (MonteiroSantos et al., 1999; Almeida et al., 2001; Monteiro Santoset al., 2002; Pous et al., 2004; Almeida et al., 2005).Additionally, a deep seismic reflection profile wasperformed, but crossing only the Spanish counterpart ofthe OMZ–SPZ boundary (Simancas et al., 2003, 2004;Carbonell et al., 2004). Despite all the available data,many issues are still open to debate, clearly demonstratingthe inherent complexity of this plate-tectonic boundary.This justifies added efforts in order to provide supple-mentary elements that enable to improve the existingknowledge on the SW Iberian Variscides.
One of the issues that need further investigationconcerns the lateral continuity of deep structures in theOMZ–SPZ boundary, therefore helping to precise thesuture geometry and the extension/morphology of majordécollements expected to exist at middle to lower crustaldepths in both sides of the suture. This can be done bydifferent means, although MT survey has already proved
tic representation of the OMZ belts. B— Simplified geological map ofd from the Geological Map of Portugal, 1:500,000 scale, 1992 — J.T.e three MT profiles performed.

Fig. 1 (continued ).
100 N. Vieira da Silva et al. / Tectonophysics 445 (2007) 98–115
to be an adequate tool for unravelling a significant part ofthat pattern, mostly because of the presence of highconductivity contrasts and of the profusion of late verticalstructures. In the Spanish counterpart of the OMZ–SPZboundary, the confronting of MT with seismic reflectiondata (Simancas et al., 2003; Carbonell et al., 2004; Pouset al., 2004) provided important evidences for theinterpretation of deep structures and opened to debate anew problem: the meaning of a 2 s thick reflective andconductive band, known as Iberian Reflective Body
(IRB). In the Portuguese sector of the boundary, a thirdMT profile was recently carried out, thus complementingresults previously gathered in two other sub-parallelprofiles (Almeida et al., 2001; Monteiro Santos et al.,2002; Almeida et al., 2005). Therefore, data from theseMT profiles can be used to produce, for the first time, a 3-D electromagnetic imaging of this plate-tectonic bound-ary, allowing also discussing the earlier interpretationsproposed for IRB. This two-fold objective is, consequent-ly, the aim of the present work.

101N. Vieira da Silva et al. / Tectonophysics 445 (2007) 98–115
2. Geological setting
The three sub-parallel and approximately equidistantMT profiles, roughly running NE–SW, cross a criticalregion of the SW Iberia Variscides (Fig. 1A). This regionincludes both the borders of OMZ, to the north, and SPZ,to the south, besides the exotic terranes positionedbetween them: the Beja Acebuches Ophiolite Complex(BAOC) and the Pulo do Lobo Antiform Terrane (PLAT).A general outline of the geological background presentedby this region will be made according to the multidisci-plinary data available for each unit and terrane, from northto south. In this overall assessment, particular emphasiswill be given to the lithological and structural character-istics considered relevant for the interpretation ofMT data.
On the basis of palaeogeographic, igneous, meta-morphic and structural features it is usual to organise theOMZ into different belts, the most widely accepteddivision being that reported in Apalategui et al. (1990).The region of concern encompasses the two southern-most OMZ belts separated by a major thrust zone, i.e.the SE part of the South-Central Belt and the SouthernCrystalline Complexes (Fig. 1B).
The SE part of the South-Central Belt is largelydominated by different sedimentary and volcanicsequences from Cambrian to Devonian ages (Oliveiraet al., 1991) that are locally intruded by Late-Variscangranitoids (the Reguengos de Monsaraz granodioritebeing the most outstanding igneous body) and coveredby Cainozoic clastic sediments. In short, the LowerCambrian sequences are dominated by meta-dolostoneswith several intercalations of meta-volcanic rocks andtopped by a discontinuous silico-ferruginous horizon. TheUpper Cambrian–Ordovician sequences are made ofmarbles and (bimodal) meta-volcanics, sometimes con-taining intercalated meta-pelitic/psammitic levels. TheOrdovician sequences are essentially composed of meta-pelites and psammites, whose base includes differenthorizons of bimodal meta-volcanics, evolving to quart-zites towards the top. The Silurian–Lower Devoniansequences are mostly composed of slaty and meta-psammites. The Upper Devonian comprises a flysh-typeseries where greywackes prevail. All these rocks showstrong recrystallisation and deformation developed duringthe Variscan Orogeny; metamorphism grades fromgreenschist to transitional greenschist–amphibolite faciesconditions (Quesada and Munhá, 1990); deformation ismultiphase and its effects observed at all scales (Araújo,1995; Fonseca, 1995). Late strike–slip fault zones,developed in the waning stages of the Carboniferouscontinental collision, intersect all the previous structures.One of the most remarkable elements of the Late-Variscan
fracture network (Arthaud andMatte, 1975;Marques et al.,2002) is the Messejana strike–slip fault, which can befollowed for approximately 530 km. This fault zone wassuccessively re-activated during the Alpine Orogeny, asdocumented both by multiple injections of dolerite rocks(Martins, 1991; Cebriá et al., 2003) and distinct displace-ments caused in geological formations of different ages.
The Southern Crystalline belt internal architecture ismore complex than the one showed by the SE part of theSouth-Central Belt. This complexity is due to differentcauses, but mostly to the following (Jesus et al., 2007): 1)high abundance of igneous intrusions that form differentpetrogenetic suites generated and emplaced under distinctconditions from Early to Late-Variscan times; 2) wide-spread development of Early Variscan thrust zones,leading to significant tectonic stacking and strain par-titioning; and 3) extensive formation of Variscan, sub-vertical shear zones, often contributing to considerablehorizontal displacement and strong dismembering of thepre-existent geological framework.
Although still open to controversial issues, thecorrelations so far carried out in different sectors of theSouthern Crystalline Complexes (Oliveira et al., 1991;Araújo, 1995; Rosas, 2003), allow the re-construction of ageneral litho-stratigraphic column. The older sequences(Upper Proterozoic) arewell represented in theNWpart ofthe belt and comprise a tectonically imbricate series ofblack schists and meta-cherts, mica-schists, amphibolitesand strongly re-crystallised felsic meta-volcanics; locally,levels of black quartzites, slates and meta-greywackes canalso be identified. The Cambrian to Ordovician sequencesare lithologically similar to those in the SE part of theSouth-Central Belt, although showing a more complexinternal framework because of multiphase thrusting. Insequences dated of Silurian, slates and psammites prevailover lidites and meta-volcanic rocks, forming a relativelymonotonous, rather deformed and thick series interpretedby some authors (Araújo et al., 2005) as tectonic mé-langes. The uppermost sequences (Devonian to Carbon-iferous) are present in small windows preserved amongsome components of the igneous complexes outcroppingin the NW part of the belt; they comprise mostly meta-limestones, different types of clastic meta-sediments,abundant meta-volcanic rocks of variable chemical natureand scarse coal beds. Two Variscan metamorphic eventscan be put in evidence in the Southern Crystalline belt: theolder one is recorded by eclogite/blueschist rocks pre-served in early nappe systems (Fonseca et al., 1999;Moitaet al., 2005a); the later one, developed during the obliquecontinental collision, has a regional character and gradesfrom greenschist to transitional greenschist–amphibolitefacies conditions (Quesada and Munhá, 1990). Effects of

102 N. Vieira da Silva et al. / Tectonophysics 445 (2007) 98–115
the multiphase Variscan deformation are strong andobserved at all scales (Silva et al., 1990b; Araújo, 1995;Araújo and Ribeiro, 1995; Fonseca, 1995; Rosas, 2003).
As referred above, late- to post-collision igneousbodies are profuse in the SouthernCrystalline Complexes,locally developing evident aureoles of contact metamor-phism (Andrade, 1983; Santos et al., 1990; Dallmeyeret al., 1993; Pin et al., 1999; Gomes, 2000; Jesus et al.,2003;Moita et al., 2005b,c). FromNW to SE it is worth tonote: (1) the large Évora Massif, mostly composed ofgranitoid rocks that in the Montemor-o-Novo region areclearly related to anatexis processes; (2) the huge andmultiphase igneous complex of Beja, comprising a widerange of gabbroic, diorite and granitoid porphyry rocks;and (3) the relatively extensive late granite body of Pias-Pedrogão. Together, these three major igneous massesform an almost continuous, wide curved band that is put incontact with the southern exotic terranes through re-activated Variscan shear zones or Late-Variscan strike–slip fault zones.
The BAOC forms a tectonically dismembered ophio-lite sequence incorporated in the South Iberia VariscanSuture (Munhá et al., 1986, 1989; Quesada, 1991;Fonseca and Ribeiro, 1993; Quesada et al., 1994;Figueiras et al., 2002; Diáz Aspiroz et al., 2004). Thelower and intermediate sections of BAOC comprisemeta-peridotites and meta-gabbroic rocks, respectively, andpreserve early anisotropic fabrics indicating northwardsshearing, being affected by late multistage metasomatismin domains adjoining the Variscan shear zones. The uppersections of BAOC consist essentially of amphibolitesderived from basaltic lavas of tholeiitic nature. Both thenorthern and southern limits of BAOC are tectonic,actually corresponding to (re-activated) reverse-sinistralWNW–ESE shear zones with strong dip towards SSW(Mateus et al., 1999; Figueiras et al., 2002).
The Ferreira–Ficalho thrust zone marks the presentcontact between PLAT and OMZ or BAOC and PLAT,being displaced by the ENE–WSW, sub-vertical Aroche–Ficalho strike–slip fault. From the available data (Mateuset al., 1999; Figueiras et al., 2002), the Ferreira–Ficalhothrust zone does not represent the original BAOC-PLATcontact, but simply a shallow expression of a re-activateddeep and more complex structure developed in the courseof the OMZ–SPZ late-collision stages.
The PLAT is composed of distinct meta-sedimentarysuccessions that locally include bimodal meta-volcanicrocks (with prevalence of the mafic, tholeiitic terms) anddisplay strong multiphase Variscan deformation. Thesesuccessions can be grouped in three main stratigraphicFormations that, according to the available palynologicaldata, range from Lower–Middle Devonian to Givetian–
Frasnian (Carvalho et al., 1976;Oliveira et al., 1986;Gieseet al., 1988; Oliveira, 1990). Metamorphic conditions areof lower greenschist facies, although rocks belonging tothe uppermost Formation may reveal anchimetamorphicfeatures (Munhá, 1990). Even pointing out severaldissimilarities in geometry or in structural interpretation,the works performed in several sectors of PLAT enable torecognise different phases of folding/axial plane cleavagedevelopment, besides important thrust systems withprevailing southwards shear sense (Silva et al., 1990a,b;Onézime et al., 2002). In this context, it should beemphasised the presence of the late- to post-collisiongranodiorite of Gil Marquez in the Spanish counterpart ofPLAT, regardless of the absence of similar igneous bodiesoutcropping in Portugal.
The SPZ northern border corresponds approximatelyto the Iberian Pyrite Belt (IPB), which comprises asuccession of three Palaeozoic stratigraphic Formationsaffected by low-grade metamorphism. The older meta-sedimentary sequence, whose footwall remains cryptic,is the Phyllite–Quartzite Formation dated of Fammenian(Van den Boorgard, 1963; Pereira et al., 1996). Lyingupon, the Volcano–sedimentary Complex is composedof a bimodal volcanic suite (despite of the largepredominance of felsic units, hosting world-class VMSdeposits) inter-fingered with diverse meta-sedimentaryrocks (Schermerhorn, 1971; Strauss et al., 1981; Munhá,1983a,b; Carvalho et al., 1999; Relvas, 2000; Abad et al.,2001). The VS Complex is diachronic, ranging fromEarly Fammenian to Late Visean (Oliveira, 1983;Marcoux et al., 1992; Nesbitt et al., 1999; Barrie et al.,2002; Oliveira et al., 2004). The later stratigraphicsequence in IPB consists of the Flysch Group, LowerCarboniferous in age (Schermerhorn, 1971; Oliveira,1983). Themajor structural feature of IPB corresponds toa south verging thrust–fold belt that defines a thin-skinned structural arrangement developed on top of amajor cryptic décollement believed to coincide with thelower–upper Devonian transition within PQ Formation(Prodehl et al., 1975; Ribeiro and Silva, 1983; Silvaet al., 1990a,b; Quesada, 1998; Onézime et al., 2002;Soriano and Casas, 2002).
3. Magnetotelluric data
The MT method allows the investigation of theelectrical conductivity distribution downward the earthfrom simultaneous measurements of natural variations ofthe surface electric (E) and magnetic fields (H) over abroad band of frequencies (see, e. g., Vozoff, 1991). Forplane wave source fields, the horizontal components ofelectric and magnetic fields are connected via the linear
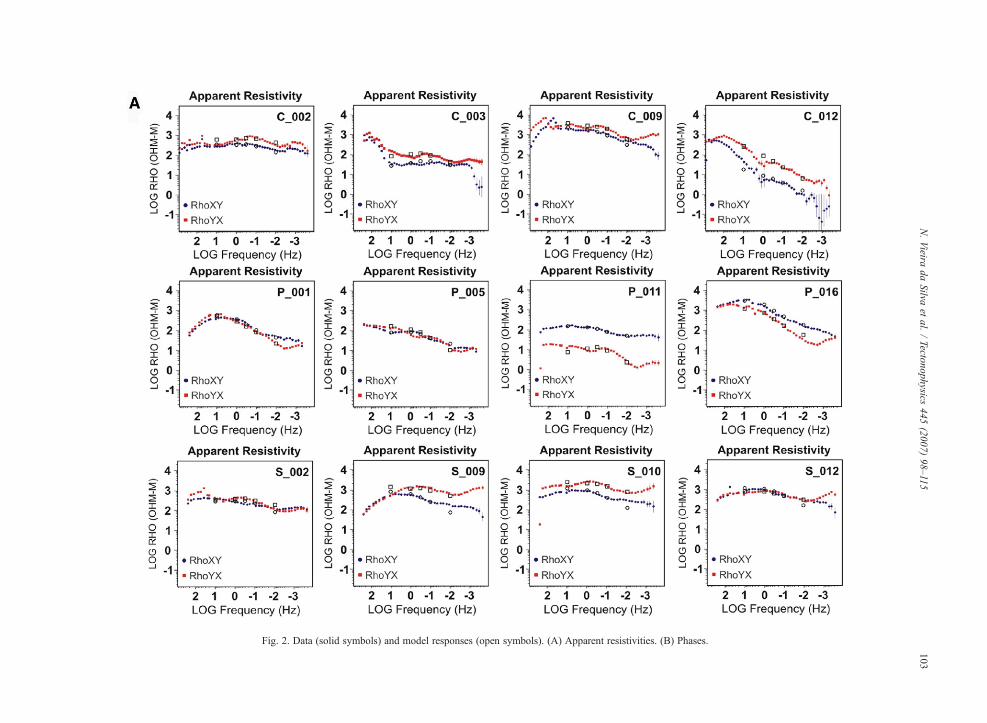
Fig. 2. Data (solid symbols) and model responses (open symbols). (A) Apparent resistivities. (B) Phases.
103N.Vieira
daSilva
etal.
/Tectonophysics
445(2007)
98–115

Fig.2(con
tinued).
104 N. Vieira da Silva et al. / Tectonophysics 445 (2007) 98–115

Fig. 3. Horizontal slices of the 3-D resistivity model. (A) General view of the 3-Dmodel core with the Atlantic Ocean effect included. (B) Uppermost sliceof the 3-D model in the study area. (C) Slice of the 3-Dmodel in the study area at 1.0 km. (D) Slice of the 3-Dmodel in the study area at 1.5 km. (E) Sliceof the 3-D model in the study area at 3.7 km. (F) Slice of the 3-Dmodel in the study area at 8.4 km. (G) Slice of the 3-Dmodel in the study area at 12 km.(H) Slice of the 3-Dmodel in the study area at 22 km. Vertical cross-sections of the 3-D model approximately coincident with theMT profiles P, C and S.
105N. Vieira da Silva et al. / Tectonophysics 445 (2007) 98–115

Fig. 3 (continued ).
106 N. Vieira da Silva et al. / Tectonophysics 445 (2007) 98–115
relationship: E=Z H. The anti-diagonal elements of theimpedance tensor (Z), that describe the resistivitystructure beneath themeasuring site, are used to calculatethe apparent resistivity functions, ρxy and ρyx and thephase functions, ϕxy and ϕyx, that are defined as:
qxy ¼ jZxyj2=ðxloÞqyx ¼ jZyxj2=ðxloÞ/xy ¼ argðZxyÞ/yx ¼ argðZyxÞ
where ω represents the angular frequency and μo is themagnetic permeability of the vacuum.
Fig. 2 shows the apparent resistivities and phases for12 sites (four sites from each of the profiles). Theapparent resistivity and phase curves are shown in themeasurement referential (N–S and E–W). The apparentresistivity curves of sites on profile C shows an increasein the slope as the structures are crossed from south tonorth. These types of trends are also observed inMT datafrom profile P but not in the data from sites located in theprofile S. This suggests that the resistivity distribution inthe western part of the survey is different from that one inthe eastern part. The changes in the resistivity distribu-tion seem to be controlled by the Messejana fault.
The Groom-Bailey tensor decomposition was appliedto the measured data set associated with each profile,resolving the single-site regional strike angles. After that,the multi-site, multi-period analysis was applied to thedata in order to check a common strike direction for eachprofile. Thismethod calculates a common strike for all thesites in a determined frequency range by minimising theglobal χ2 misfit. The determination of such strike is afundamental step for 2-D model inversion. Prior to theinversion procedure, the static shift galvanic distortionmust be considered. This distortion shifts the rotatedlogarithmic apparent resistivity curves by a frequency-independent factor while the phase curves remainunchanged. The scattering in levels of the apparentresistivity curves within each zone was less than onedecade and the levels of the curves were shiftedaccordingly. During the inversion procedure some staticshifts were corrected at those sites with a poor fit.
4. 3-D modelling
For 3-D modelling, the 2-D models obtained from theinversion of each profile complemented with the geolog-ical information available for that area were considered.The 2-D inversion of rotated apparent resistivity andphases for bothmodeswas carried out using theREBOCCcode (Siripunvaraporn and Egbert, 2000). For theinversion procedure, the Atlantic Ocean, at southward,was included as a fixed parameter and an approximatebathymetry representation and resistivity value of 0.3Ωmwere accounted. To achieve a good fit in 2-D models, theinversion was carried out using an iterative scheme. First,the rotated geomagnetic transfer functions (real andimaginary) were inverted from a homogeneous half-space. Second, the final model was used as an initial onefor the inversion of TM data and rotated geomagnetictransfer functions. Finally, the resultingmodel was used asan initial one for the joint inversion of TE and TM androtated geomagnetic transference functions. The finalresistivity models have RMSmisfits between 2.9 and 4.9.

107N. Vieira da Silva et al. / Tectonophysics 445 (2007) 98–115
The three-dimensionalmodellingwas performed usingthe Mackie 3-D forward code (Mackie et al., 1994). Amesh of 71×70×34 cells, in the N–S, E–Wand verticaldirections, respectively, was used in the calculations. Itshould be noted that even with such a mesh the complexgeology of the area is only roughly represented.Considering that adjacent MT sites are spaced 5–10 km,some small-scale superficial structures were omitted inmodelling. The Atlantic Ocean was also included in the 3-D model, considering a rough bathymetry representation.The conductivity model considered for the lithospherebeneath the ocean was the one presented in MonteiroSantos et al. (2003). Model responses were calculated for5 periods covering the data range (0.1, 1, 3.12, 10 and100 s) and for 47 soundings around Messejana andFerreira–Ficalho fault zones. This period range ensuresthat numerical instabilities will not occur. In fact, it issufficient that |k|z≤0.3 (Mackie et al., 1994) with |k|=2/δ,where k is the wave number, δ is the skin depth and z isthe thickness of the first layer. The upper layers of our gridare discretized at 100 m intervals. If we consider a surfaceresistivity of 100Ωm, then theminimum critical period is0.02 s. This ensures that the 3-D model period range willnot cause numerical instability. The 2-D boundaryconditions of the 3-D model were imposed at a distanceof 280 km from the old suture and the 1-D boundarycondition was imposed at the bottom of the earth model ata depth of 300 km. Fig. 3 shows the final 3-D modelobtained by trial and error and Fig. 2 shows the apparentresistivity and phase curves (3-Dmodel response and fielddata). The xx and yy components of the impedance tensorwere not considered on the trial and error procedure to fitthe model parameters, because of the high noise level onthem.
Seven parallel slices of the final 3-D model for thesurveyed region are reported in Fig. 3, forming an orderedsequence that increases in depth. The obtained electro-magnetic imaging put in evidence different conductive(C) and resistive (R) domains that display morphologicalvariations at depth and are intersected by two major sub-vertical corridors roughly oriented NE–SW and WNW–ESE. These corridors coincide with the location of theMessejana strike–slip fault zone and the Ferreira–Ficalhothrust fault zone, respectively.
The area covering the geological formations belongingto OMZ (sites 12 to 15 in Profile S, sites 7 to 15 in ProfileC and sites 5 to 18 in Profile P) exhibits an overallresistivity higher than 500 Ω m in the first 8.4 km depth,despite the split created by the sub-vertical NE–SWcorridor after 3.7 km depth. At greater depths (≥8.4 km),this corridor separates a relatively high-resistive sector(500–1000Ω m), towards NW, from a moderate- to low-
resistive sector (b200 Ω m), towards SE, that include aW–E conductor (b20Ωm)well defined from 12 to 22 kmdepth. However, a careful observation of slices in Fig. 3allows differentiating several features that are believed tocharacterise the internal architecture of both the shallowestresistive block and the two deepest major sectors. Indeed,the R1 domain (500–1000Ωm) appears to be confined todepths ranging from 1.0 to 8.4 km, its NW limit beingcontrolled by theNE–SW sub-vertical corridor. In the first0.5 km of depth, the large R2 domain (1000–2000 Ω m)overlaps the R1 signal. Between 1.0 and 1.5 km depths R2is limited to narrow area, completely disappearing insubsequent deeper slices. In shallower sections, the NWedge of R2 is apparently connected to a high-resistive(2000–5000 Ω m) WNW–ESE band that roughlypreserves its location and direction till 1.5 km depth,slightly rotating towards W and moving to SSW forgreater depths. This S-SW dipping element is no longerobserved after 12 km depth; it seems, therefore, that theWNW–ESE band does not have the same geologicalmeaning of R2. For depths above 8.4 km, the prevalentresistive structure is replaced by a conductive one, beingworth noting the R1 rupture already caused by a higherconductive zone (50–100 Ω m) at that depth. Two sub-parallel conductive (5–10 Ω m) bands (C2 and C2⁎)emerge at 12 km depth, separated by a slightly resistive(50–100 Ω m) and somewhat diffuse narrow area. Thesouthern band seems to be more important, extending andenlarging towards deeper levels; at 22 kmdepth, its S-limitcoincides with the WNW–ESE sub-vertical corridor. TheW extension of C2⁎ at 12 km depth appears to reinforcethe conductive feature related to the NE–SW sub-verticalcorridor. According to the results obtained, it is plausibleto admit that C2 and C2⁎ correspond to a sole conductor,roughly occupying the area beneath R1 and going deeper,at least till 22 km.
The area covering the geological formations belongingto SPZ–PLAT–BAOC (sites 1 to 11 in Profile S, sites 1 to6 in Profile C and sites 11 to 14 in Profile P) shows twodistinct domains separated by the NE–SW sub-verticalcorridor. The first one occupies the entire NW sector andis characterised by an extensive resistive domain (R3,usually 500–1000Ωm) that can be followed till the depthof 22 km. The R3 domain reveals an internalWNW–ESEhigh-resistive band (2000–5000 Ω m) that, in deeperslices, is drifted towards SW, possibly experiencing anoblique tectonic displacement at ca 3.7 km depth andalmost disappearing at 22 km; alternatively and consid-ering the occurrence of two, sub-parallel, bands at 3.7 kmdepth with different resistive behaviour, one may infer thepresence of two distinct SW-dipping bodies spatiallyorganised en échelon. The SE sector of this southern area

108 N. Vieira da Silva et al. / Tectonophysics 445 (2007) 98–115
displays, on the contrary, moderate- to low-resistivity(b500Ωm), beingworth to note the presence of aW–E toWNW–ESE conductor (C1) at 12 km depth (b10 Ω m).This conductor is incipiently developed at 8.4 km depth(roughly corresponding to a 50 Ω m band) but it can beclearly delimited from 12 kmonwards. In the first 3 slices,a narrow resistive (1000–2000Ωm) zone (R4) is seen todevelop vertically above C1 and immediately southwardsof the WNW–ESE sub-vertical corridor. At 8.4 km depthR4 collates R1, being replaced in the final slices by amoderate resistivity zone (100–200 Ω m), bordering thenorthern limit of C1. This strongly suggests the presenceof an independent, N-NNE dipping, deep resistive body.
5. Sensitivity analysis
Due to the relatively large spacing between adjacentprofiles and the loss of resolution with depth inherit toelectromagnetic methods there are limits to what the MTdata can resolve. This section is devoted to the analysis ofthe sensitivity of theMT responses to some features of the3-D model. The importance of the high resistivity bodies
Fig. 4. Apparent resistivities and phases at three sites used in the sensitivityand the circles correspond to the responses of the model shown in Fig. 4.model. A—Correspond to the response of the model when the north-westB—Correspond to the responses of the model where the body C2 has 50 Ω mfault is represented by a 10 Ω m structure.
(2000 to 5000Ωm) in the north-western part of themodelwas investigated by computing the response for a modelin which those bodies were replaced by bodies withresistivity of 500 Ω m. Fig. 4A shows the comparisonbetween the responses of our preferred model (squaresand circles symbols) and this model (stars and trianglessymbols) at site 11 of profile S. Making the north-westernpart uniformly resistive cause a larger misfit in the YXapparent resistivity and phase data in the 1 to 30 s periodrange. These calculations illustrate the necessity of thoseNW–SE resistive structures.
The influence of the conductive body labelled C2 wasinvestigated comparing the response of a model in whichthe resistivity of this body was slightly changed to 50Ωm, with the response of our preferred model. The resultsare shown in Fig. 4B for site 4 of the profile P. Increasingthe resistivity of the body C2, the YXmodel responses atperiods longer than 10 s deviate from the observed data.Clearly, this structure must have resistivity lesser than50 Ω m.
Next, the geoelectric behaviour of the Messejana faultwas addressed making the fault zone more conductive.
tests. The solid symbols correspond to the measured data. The squaresThe stars and triangles correspond to the responses of the modifiedern resistive bodies are replaced by uniform resistivity of 500 Ω m.. C—Correspond to the responses of the model where the Messejana

109N. Vieira da Silva et al. / Tectonophysics 445 (2007) 98–115
This was made filling the fault zone with a 10 Ω mresistivity (5 km width and 20 km thick) body. Theresponse of this model for site 3 in profile C is shown inFig. 4C.A small increasing of themisfit can be observed inthe 1 to 10 s period range, for the YX curves and for longerperiods for the XY apparent resistivity curve. Althoughdifferences between this model and our favoured modelare not significant, the results of the test indicate that theMessejana fault is not a conductive structure (which iscompatible with the presence of dolerite infillings), but itseparates two different geoelectric domains (the moreconductive one positioned to the east).
6. Discussion
The first slice in Fig. 3 offers the possibility to roughlycorrelate the electromagnetic imaging with the outcrop-ping geological features. Using this correlation andconsidering the lithological diversity of each geotectonicunit reported in Section 2, a plausible interpretation anddiscussion of the electrical resistivity patterns can beperformed, thus bringing some light to the nature andstructure of the crust along the OMZ–SPZ boundary.
The NE–SW and WNW–ESE sub-vertical corridorsrepresent an outstanding feature of the 3-D electromag-netic imaging, clearly separating crustal domains withdistinct resistivity values. These corridors correspondindeed to two very important tectonic structures, known asthe Messejana strike–slip fault zone and the Ferreira–Ficalho thrust zone, respectively. The results obtainedprove that the Messejana fault zone is a very deepstructure, as inferred in previous geological studies. Theyare also compatible with the geological deduction for theFerreira–Ficalho thrust fault zone, strongly suggesting thatthe root of the WNW–ESE corridor represents the tracingof the early tectonic contact between BAOC and PLAT.
The lithological and structural features observed inOMZ are also reflected in the electromagnetic imagingobtained. In the first 500 m depth, the R2 domain integerscombined effects of different igneous intrusions andmetamorphic sequences of variable nature and age.Whenproperly limited, at 1.5 km depth, R2 matches with thedeep section of the Reguengos de Monsaraz granodioritepluton, the high-resistivity WNW–ESE band towards Wcorresponding to the NE border of the Évora Massif. Thislatter band is seen to develop till 8.4 km depth, probablyrepresenting the deeper crust level where anatecticgranitoids can be found. Following this interpretationand considering the geological information so far compiled(Fig. 1A), the adjoining resistive domain (500–1000Ωm)characterises the Proterozoic–Cambrian metamorphicsequences, which is consistent with the extension and
the electrical resistivity nature of R1. From this, a two-foldconclusion emerges: (1) the older metamorphic pile in theNW sector of the surveyed area goesmuchmore deep thanits counterpart in the SE sector, reaching at least a depthplaced in the 12–22 km interval; and (2) an importanttectonic structure, further re-taken by the Messejanastrike–slip fault, should have had a major role in thecrust configuration, bringing to shallow depths (8.4 to12 km) the base of that pile. At this point it should beemphasised that the vertical component of movementrevealed by the Messejana fault cannot justify alone thatblock rising, because the maximum magnitude of theaccumulated vertical displacement along this structure isknown to reach in some places just a few hundreds ofmeters. Moreover, if the Proterozoic–Cambrian metamor-phic sequences were raised in the SE sector, then the C2conductor (evident from 12 to 22 km depth) shouldrepresent the graphite-bearing granulitic basement ofOMZ, as proposed in earlier studies (Almeida et al.,2001; Monteiro Santos et al., 2002; Almeida et al., 2005);note that a graphite fraction of 0.006–0.02% (occurring asinterconnected films) is enough to explain the range ofelectrical resistivity range estimated on the basis of MTmodels (see calculations reported inMonteiro Santos et al.,2002). Consequently, the moderate resistivity value foundabove C2 (from 8.4 km onwards) is compatible either withC-enriched, meta-sedimentary rocks that underwent high-Tmetamorphism (Pous et al., 2004) or with the occurrenceof a major décollement controlled by the rheologicalboundary formerly developed along the contact of theolder metamorphic sequence with the crustal granuliticbasement (Almeida et al., 2005).
In what concerns the OMZ unit, it should also benoted that the Variscan thrust zone separating the South-Central Belt from the Southern Crystalline Complexesdoes not become visible in the present electromagneticimaging. This is probably due to poor resistive rockcontrasts or boundary problems inherent to the con-struction of the 3-D model, since this important structurecoincides with a moderate-resistive band in the 2-Dimaging of Profile P (site 15 — for details see Almeidaet al., 2001; Monteiro Santos et al., 2002).
The narrow and tectonically bounded belt of BAOCcomprises rocks with high electrical resistivity to befound just between the OMZ border and PLAT. Meta-sediments of the latter terrane shows, typically,relatively high resistivity values, being electricallyindistinct (non-contrasting) from the Palaeozoicsequences that make up the SPZ northern border; notethat the available data cannot enable a real assessment ofthe crust structure beneath IPB. It seems thus very hardto distinguish all these geological units on the basis of
110 N. Vieira da Silva et al. / Tectonophysics 445 (2007) 98–115
MT data, therefore limiting any assessment of theirinternal structure and spatial arrangement. However, acareful examination of the relative position of R3, R4and C1 in the slices depicted in Fig. 3 gives someinteresting clues that have to be discussed.
Generally, the R3 domain embraces the meta-sedi-mentary sequences belonging to PLAT and SPZ. TheNNW–SSE tectonic contact between PLAT and OMZmapped in the NW sector of the surveyed region is notresolved by the electromagnetic imaging. Instead, close tothis contact, a high-resistive WNW–ESE band developswithin PLAT from 0.5 to 12 km depth. As pointed out inSection 5, this band may represent a single bodytectonically displaced or two distinct SW-dipping, enéchelon bodies. Both possibilities are, however, compat-ible with the presence of hidden igneous intrusionsequivalent to the Gil Marquez granodiorite in the Spanishcounterpart of PLAT, whose emplacement is shown to bestrongly controlled by tectonic structures related to thegeodynamic evolution of this terrane (an accretionarywedge). The R4 resistive domain has probably the samegeological meaning, showing continuity in the first1.5 km depth. If so, the apparent extension towards Sdisplayed by R1 and its connection with R3 from 3.7 to8.4 km depths can be interpreted as a result of the R1juxtaposition with an additional resistive band. Acceptingthis interpretation implies to set the base of the PLATmeta-sedimentary pile at ca. 3.5–5 km and to considerthe WNW–ESE moderate resistivity band boundingC1 to the north as the roots of BAOC (upright duringLate-Variscan tectonic adjustments). In this context, thefavoured interpretation for the C1 conductor consists in itscorrespondence with the graphite-bearing granuliticbasement of SPZ.
The depth found for C1 and C2 domains agrees withthe values reported by Pous et al. (2004) for similarstructures in the Spanish counterpart of the region hereexamined, also on the basis of MT data. In Spain,however, a straight spatial correspondence between thosemiddle-crust conductors and the IRB is shown to exist,thus justifying the assessment of the geological plausibil-ity of the earlier interpretations for this sub-horizontalband of high reflectivity and irregular thickness in face ofthe results now available.
Although accounting the possibility of IRB representa signal of a major crustal décollement, Simancas et al.(2003, 2004) strongly favoured the hypothesis of thishuge band (extending all over the OMZ, even thoughlocally disturbed) correspond to a large layered sill,presumably the source of Lower Carboniferous mag-mas. This interpretation was adopted by several authorsin order to explain the spatial distribution of early-to
late-collision magmatism in OMZ, as well as someparticular geochemical features that point to relativelyhomogeneous crustal reservoirs (Tornos and Chiaradia,2004; Tornos and Casquet, 2005). However, as noted byPous et al. (2004), the presence of that igneous sillshould produce a resistive rather than conductivefeature, unless a multiple sheet-like intrusion separatedby screens of graphite-bearing metamorphic rocks isconsidered. In this alternative explanation, the localincrease of the conductivity is ascribed to the incorpo-ration of variable amounts of graphite-bearing meta-morphic xenoliths by the sheeted intrusion, thereforeremaining open the proposition of a multiphase magmaemplacement in a (very) special rheological crust level.The development of a wholesale, middle-crust igneoussill in such circumstances poses, even so, a majorquestion that cannot be easily circumvented: Whatwould be the geodynamic background suitable for along-lived and widespread magma feeding (at least forca. 15 Ma, if the U–Pb isotopic ages available for theless differentiated, outcropping igneous rocks are used)?
Considering the common thermal models for litho-sphere (Turcotte and Schubert, 1982; England andThomp-son, 1984; Davies, 1999; Poirier, 2000) and the geologicalframework developed during the OMZ–SPZ obliquecollision, the middle-crust emplacement of that hugeigneous sill implies a particular rheological framework,involving a significant crustal strength reduction that mustbe sustained for a relatively large time span. This can beachieved through continuous heat flow maintenance(or enhance) into the base of the crust, possibly coupledwith an important mechanical discontinuity (alike to aregional décollement on top of the granulitic basement).The required high thermal regime in the crust should,therefore, involve a dominant heat source that can beobtained by substantial removal of the lithosphericmantle,or via crustal thickening without significant changes inmantle thickness. Delamination of the mechanical-lithosphere mantle is often invoked to explain the formerprocess. However, evidence for an extensive mantledelamination during Variscan Orogeny seems unlikely,and even its partial elimination is extremely controversialin face of the LP–HT metamorphism and magmatismtiming, besides the spatial distribution of different igneousrocks (Turpin et al., 1998; Menzies and Bodinier, 1993;Henk et al., 2000; Wittenberg et al., 2000). The secondpossibility should include necessarily the gradual removalof the thermal boundary layer (TBL) as collision proceeds(Houseman et al., 1981) in order to explain the long-livedand pervasive magma feeding demanded for the silldevelopment alongside with the thermo-tectonic LP–HTVariscanmetamorphism.As a result, the hot asthenospheric

111N. Vieira da Silva et al. / Tectonophysics 445 (2007) 98–115
mantle replacing the detached TBL heats the mechanical-lithosphere base, thereby producing magmas that willascend and intrude at or near the Moho, advecting heatinto the crust. Without magma underplating, temperaturesin the crust would still rise conductively and may causethe crustal melting needed to feed the large sill, as the heatflow at the base of the lithosphere is increased. Additionalconstraints are, nevertheless, necessary because theformation of a (multiphase) sheet-like intrusion preserv-ing (variably assimilated) screens of metamorphic(graphite-bearing) rocks claims for a particular contrastin viscosity and density values between the rising magmaand the middle-crust rocks; and the accomplishment ofthese special conditions could be fortuitous.
Although strongly appealing, the TLB removal canhardly play a decisive role in the thermal regime adjust-ment of the OMZ crust during the oblique continentalcollision in Carboniferous times, even considering justthe distribution of the geochemically similar, primitiveigneous rocks. In fact, according to the available multi-disciplinary data, the OMZ–SPZ plate boundary shouldhave evolved through the formation of a kinematicallycoupled system including a pro-wedge domain (IPB),an axial zone (PLAT) and a retro-wedge domain (theSouthern Crystalline Complexes). This evolution was
Fig. 5. Very simplified and interpretative section across the SPZ–OMZ boundarthe displacements caused by late shear zones and strike–slip fault zones. The t
favoured by a low angle subduction zone, determiningthe development of early-collision magmatism (ca 355–345 Ma), whose onset was primarily triggered by thebreak-off of the subducted plate (Jesus et al., 2007).Simultaneously, the stacking of fertile upper-crustallithologies over a period of ca. 20 Ma (from ca. 360 Maonwards) would have provide the (radiogenic) heatneeded to sustain the LP–HT metamorphism and theinitial steps of the late-collision magmatism, involvingmixing of mantle-derived and crust-derived melts. Thiswas followed by an important (moderate to) rapid crustaluplift episode dated of ca. 340±5Ma (Jesus et al., 2007)that caused a new thermal readjustment in the crust,the heat flow anomalies thus created allowing the pro-duction of late- to post-collision melts (dated from ca330 to 300 Ma) and their emplacement at progressivelyshallower depths. In such a geodynamic scenario, thefactors that ultimately may support the formation of theigneous sill presumably corresponding to the IRB onlyvery hardly can be attained. Therefore, we are forced toconclude that the IRB should, indeed, represent a veryimportant middle-crust décollement, largely developedimmediately above or coinciding with the top of theOMZ granulitic basement, as schematically representedin Fig. 5.
y, laterally projecting the major geological formations and not consideringransversal white line indicates roughly the present-day surface.

112 N. Vieira da Silva et al. / Tectonophysics 445 (2007) 98–115
7. Conclusions
The 3-D electromagnetic imaging obtained for theOMZ–SPZ plate-tectonic boundary shows differentconductive and resistive domains that display morpho-logical variations in depth and are intersected by twomajor sub-vertical corridors, which coincide with theMessejana strike–slip fault zone and the Ferreira–Ficalhothrust fault zone. The former (Late-Variscan) structure,striking approximately NE–SW, divides the surveyedarea into an NW and SE sector with distinct resistivebehaviour at depth; the latter structure, with a generalWNW–ESE direction, separates BAOC from PLAT andthe correspondent resistivity contrast is particularlyevident in the SE sector.
The distribution of the shallow resistive domains isconsistent with the lithological and structural featuresobserved and mapped, integrating the expected electricalbehaviour produced both by igneous intrusions andmetamorphic sequences of variable nature and age. Theextension in depth of these resistive domains and theirspatial arrangement suggest that: (1) the Precambrian–Cambrianmetamorphic pile in the NW sector goes deeper(placed between 12 to 22 km depth) than its counterpart inthe SE sector (located within the 8.4–12 km depthinterval), thus indicating a significant vertical displace-ment along an early tectonic structure, subsequently re-taken by theMessejana fault-zone in Late-Variscan times;(2) hidden, syn- to late-collision igneous bodies intrudethe meta-sedimentary sequences of PLAT whose baseseems to lie within the 3.5–5 km depth interval; and(3) the roots of BAOC are inferred from 12 km depthonwards, forming a moderate resistive zone located bet-ween two middle-crust conductive layers extended to thenorth (in OMZ) and to the south (in SPZ).
The middle-crust conductive layers evidenced byMTdata overlap the IRB deduced on the basis of seismicreflection data (Pous et al., 2004). Thus, the 2 s thickreflective body is also conductive, favouring thepossibility of that major crustal feature correspond toan important middle-crust décollement, developedimmediately above or coinciding with the top of agraphite-bearing granulitic basement (either in OMZ orin SPZ). This interpretation is consistent with thegeodynamic evolution of the OMZ–SPZ plate boundaryin Palaeozoic times and, particularly, with the geologicalrecord of the correlative thermal regime.
Comparatively to the 2-D inverted models, the 3-Dmodel presented in this paper cannot resolve thesuperficial small scale geological structures. Neverthe-less it has the advantage of giving a lateral definition ofthe main geological structures on the survey area.
Acknowledgements
The authors acknowledge the funding obtainedthrough the Acções Integradas Luso-Espanholas andthe MEC project BTE2003-03046. They appreciate alsothe comments and suggestions of Dr Mark Everett andof an anonymous reviewer.
References
Abad, I., Mata, M.P., Nieto, F., Velilla, N., 2001. The phyllosilicates indiagenetic-metamorphic rocks of the South Portuguese Zone,Southwestern Portugal. Can. Mineral. 39, 1571–1589.
Abalos, B., Díaz Cusí, J., 1995. Correlation between seismic anisotropyand major geological structures in SW Iberia: a case study oncontinental lithosphere deformation. Tectonics 14, 1021–1040.
Almeida, E.P., Pous, J.,Monteiro Santos, F.A., Fonseca, P.,Marcuello, P.,Queralt, P., Nolasco, R.,MendesVictor, L.A., 2001. Electromogneticimaging of a transpressional tectonics in SW Iberia. Geophys. Res.Lett. 28, 439–442.
Almeida, E.P., Monteiro Santos, F., Mateus, A., Heis, W., Pous, J.,2005. Magnetotelluric measurements in SW Iberia: new data forthe Variscan crustal structures. Geophys. Res. Lett. 32, L08312.
Andrade A.S., 1983. Contribuition à l’analyse de la suture HercyniènnedeBeja (Portugal), perspectivesmetallogéniques. Ph.D. thesis, INLP,Univ. Nancy, Nancy, France.
Apalategui, O., Eguiluz, L., Quesada, C., 1990. Structure. In:Dallmeyer, R.D., Martinez-Garcia, E. (Eds.), Pre-MesozoicGeology of Iberia. Springer-Verlag, Berlin, Germany, pp. 280–291.
Araújo A., 1995. Estrutura de uma getransversal entre Brinches eMourão (Zona de Ossa-Morena). Implicações na evoluçãogeodinâmica da margem sudoeste do Terreno Atóctone Ibérico.PhD Thesis, Univ. Évora, Évora, Portugal.
Araújo, A., Ribeiro, A., 1995. Tangential transpressive strain regime inthe Évora-Aracena Domain (Ossa Morena Zone). Bol. Geol. Min.106, 111–117.
Araújo, A., Fonseca, P.,Munhá, J., Moita, P., Pedro, J., Ribeiro, A., 2005.The Moura Phyllonitic Complex: an accretionary complex relatedwith obduction in the Southern Iberia Variscan Suture. Geodin. Acta18/5, 375–388.
Arthaud, F., Matte, Ph., 1975. Les décrochements Tardi-Hercyniens duSudoest de l'Éurope. Géometrie et essai de reconstituition de ladefórmation. Tectonophysics 25, 139–171.
Bard, J.P., Capdevilla, R., Matte, Ph., Ribeiro, A., 1973. Geotectonicmodel for the Iberian Variscan Orogen. Nat., Phys. Sci. 241, 50–52.
Barrie, C.T., Amelin, Y., Pascual, E., 2002. U–Pb geochronology ofVMSmineralization in the Pyrite Belt. Miner. Depos. 37, 684–703.
Carbonell, R., Simancas, F., Juhlin, C., Pous, J., Pérez-Estaún, A.,Gonzalez-Lodeiro, F., Muñoz, G., Heise, W., Ayarza, P., 2004.Geophysical evidence of a mantle derived intrusion in SW Iberia.Geophys. Res. Lett. 31, L11601. doi:10.1029/2004GL019684.
Carvalho, D., Correia, H.A.C., Inverno, C.M.C., 1976. Contribuiçãopara o conhecimento geológico do Grrupo Ferreira–Ficalho. Suasrelações com a Faixa Piritosa e o Grupo Pulo do Lobo. Mem. Not.Mus. Lab. Fac. Ciências de Coimbra 82, 145–169.
Carvalho, D., Barriga, F.J.A.S., Munhá, J., 1999. Bimodal-siliciclasticsystems — the case of the Iberian Pyrite Belt. In: Barrie, C.T.,Hannington, M.D. (Eds.), Volcanic-associated Massive SulfideDeposits: Processes and Examples in Moderna and Ancient Settings.Reviews in Econ. Geol., vol. 8, pp. 375–408.

113N. Vieira da Silva et al. / Tectonophysics 445 (2007) 98–115
Cebriá, J.M., López-Ruiz, J., Doblas, M., Martins, L.T., Munhá, J.,2003. Geochemistry of the Early Jurassic Messejana-Placenciadyke (Portugal–Spain); implications on the origin of the CentralAtlantic Magmatic Province. J. Petrol. 44, 547–568.
Dallmeyer, R.D., Fonseca, P.E., Quesada, C., Ribeiro, A., 1993.40Ar/39Ar mineral age constraints for the tectonothermal evolutionof a Variscan suture in southwest Iberia. Tectonophysics 222,177–194.
Davies, G.F., 1999. Dynamic Earth; Plates, Plumes and MantleConvection. Cambridge University Press, UK.
Diáz Aspiroz, M., Castro, A., Fernández, C., López, S., FernándezCaliani, J.C., Moreno-Ventas, I., 2004. The contact between theOssa Morena and the South Portuguese zones. Characteristics andsignificance of the Aracena metamorphic belt in its central sectorbetween Aroche and Aracena (Huelva). J. Iber. Geol. 30, 25–51.
England, P.C., Thompson, A.B., 1984. Pressure–temperature–timepaths of regional metamorphism. Part I: heat transfer during theevolution of regions of thickened continental crust. J. Petrol. 25,894–928.
Figueiras, J., Mateus, A., Gonçalves, M.A., Waerenborgh, J.C.,Fonseca, P., 2002. Geodynamic evolution of the South VariscanIberian Suture as recorded by mineral transformations. Geodin.Acta 15, 45–61.
Fonseca P., 1995. Estudo da sutura Varisca no SW Ibério nas regiõesde Serpa-Beja-Torrão e Alvito-Viana do Alentejo. PhD Thesis,Univ. Lisboa, Lisboa, Portugal.
Fonseca, P., Ribeiro, A., 1993. The tectonics of Beja-AcebuchesOphiolite: a major suture in the Iberian Variscan Fold Belt. Geol.Rundsch. 3, 440–447.
Fonseca, P., Munhá, J., Pedro, J., Rosas, F., Moita, P., Araújo, A., Leal,N., 1999. Variscan ophiolites and high-pressure metamorphism inSouthern Iberian. Ophioliti 24, 259–268.
Giese, U., Reitz, E., Walter, R., 1988. Contribution to the stratigraphyof the Pulo do Lobo succession in southwest Spain. Comun. Serv.Geol. Port. 74, 79–84.
Gomes, E., 2000. Metamorfismo de Rochas Carbonatadas Siliciosasda Região de Alvito (Alentejo, Sul de Portugal). PhD Univ.Coimbra, Coimbra, Portugal.
Henk, A., Blanckenburg, F., Finger, F., Schaltegger, U., Zulauf, G., 2000.Syn-orogenic high-temperature metamorphism and magmatism inthe Variscides: a discussion of potential heat sources. In: Frank, W.,Haak, V., Oncken, O., Tanner, D. (Eds.), Orogenic Processes: Quan-tification and Modelling in the Variscan Belt. Special Publications,179. Geological Society, London, pp. 387–399.
Houseman, G.A., McKenzie, D.P., Molnar, P., 1981. Convectiveinstability of a thickened boundary layer and its relevance for thethermal evolution of continental convergent belts. J. Geophys. Res.86, 6115–6132.
Jesus, A., Mateus, A., Waerenborgh, J.C., Figueiras, J., Cerqueira, L.,Oliveira, V., 2003. Hypogene Ti–Vmaghemitic accumulations in alayered gabbroic complex (Odivelas, Beja, SE Portugal). Can.Mineral. 41, 1105–1124.
Jesus, A., Munhá, J., Mateus, A., Tassinari, C.C., Nutman, A.P., 2007.The Beja Layered Gabbroic Sequence (Ossa-927 Morena Zone,Southern Portugal): geochronology and geodynamic implications.Geodin. Acta 20 (3), 139–157.
Julivert, M., Martínez, F.J., Ribeiro, A., 1980. The Iberian segment ofthe EuropeanHercynian Foldbelt. In: Cogné, J., Slansky,M. (Eds.),Géologie de l'Europe. Société Géologique du Nord/BRGM,Mémories du BRGM, vol. 108, pp. 132–158.
Lötze, F., 1945. Zur gliederung dês Variscides der Iberischen Meseta.Geotekton. Forsch. 6, 78–92.
Mackie, R.L., Smith, J.T., Madden, T., 1994. Three-dimensionalelectromagnetic modelling using finite difference equations: themagnetotelluric example. Radio Sci. 29, 923–936.
Marcoux, E., Leitel, J.A., Sobol, F., Milesi, J.P., Lascuyer, J.L., Leça,X., 1992. Signature isotopique du plomb des amas sulfures de laprovince de Huelva, Espagne. Conséquences Métallogéniques etGéodynamiques. CR Acad. Sci. Paris 314, 1469–1476.
Marques, F.O., Mateus, A., Tassinari, C., 2002. The Late-Variscanfault network in Central-Northern Portugal. Tectonophysics 359,255–270.
Martins, L.T., 1991. Actividade Ígnea Mesozóica em Portugal. PhDUniv. Lisboa, Lisboa, Portugal.
Mateus, A., Figueiras, J., Gonçalves, M.A., Fonseca, P., 1999.Evolving fluid circulation within the Variscan Beja-AcebuchesOphiolite Complex (SE, Portugal). Ofioliti 24, 269–282.
Matte, Ph., 1986. Tectonics and plate tectonics for the Variscan FoldBelt in Western Europe. Tectonophysics 126, 329–374.
Menzies, M.A., Bodinier, J.L., 1993. Growth of the Europeanlithospheric mantle-dependence of upper-mantle peridotite fáciesand chemical heterogeneity on tectonics and age. Phys. EarthPlanet. Inter. 79, 219–240.
Moita, P., Munhá, J., Fonseca, P.E., Pedro, J., Tassinari, C.C.G.,Araújo, A., Palácios, T., 2005a. Phase Equilibria and Geochro-nology of Ossa-Morena Eclogites. XIV Semana de Geoquímica/VIII Congresso de Geoquímica dos Países de Língua Portuguesa,Aveiro, Portugal, pp. 463–466.
Moita, P., Munhá, J., Fonseca, P.E., Tassinari, C.C.G., Araújo, A.,Palácios, T., 2005b. Dating Orogenic Events in Ossa-MorenaZone. XIV Semana de Geoquímica/VIII Congresso de Geoquímicados Países de Língua Portuguesa, Aveiro, Portugal, pp. 459–461.
Moita, P., Santos, J.F., Pereira, M.F., 2005c. Dados Geocronológicosde Rochas Intrusivas Sin-tectónicas do Maciço dos Hospitais(Montemor-o-Novo, Zona de Ossa-Morena). XIV Semana deGeoquímica/VIII Congresso de Geoquímica dos Países de LínguaPortuguesa, Aveiro, Portugal, pp. 471–474.
Monteiro Santos, F.A., Pous, J., Almeida, E.P., Queralt, A., Marcuello,A., Mati, H., Mendes Victor, L.A., 1999. Magnetotelluric surveyof the electrical conductivity of the crust across the Ossa MorenaZone and South Portuguese Zone suture. Tectonophysics 313,449–462.
Monteiro Santos, F.A., Mateus, A., Almeida, E.P., Pous, J., Mendes-Victor, L.A., 2002. Are some deep crustal conductive featuresfound in SW Iberia caused by graphite. Earth Planet. Sci. Lett. 201,353–367.
Monteiro Santos, F.A., Soares, A., Nolasco, R., Rodrigues, H., Luzio, R.,Palshin, N., ISO-3D team, 2003. Lithosphere conductivity structureusing CAM-1 (Lisbon-Madeira) submarine cable. Geophys. J. Int.155, 1–10.
Munhá, J., 1983a. Hercynian magmatism in the Iberian Pyrite Belt. In:Lemos de Sousa, M.J., Oliveira, J.T. (Eds.), The Carboniferous ofPortugal. Mem. Serv. Geol. Portugal, vol. 29, pp. 39–81.
Munhá, J., 1983b. Low-grade regional metamorphism in the IberianPyrite Belt. Comun. Serv. Geol. Port. 69, 3–35.
Munhá, J., 1990. Metamorphic evolution of the South Portuguese/Pulodo Lobo Zone. In: Dallmeyer, R.D., Martinez-Garcia, E. (Eds.),Pre-Mesozoic Geology of Iberia. Springer-Verlag, Berlin, Ger-many, pp. 363–368.
Munhá, J., Oliveira, J.T., Ribeiro, A., Oliveira, V., Quesada, C.,Kerrich, R., 1986. Beja-Acebuches ophiolite; characterization andgeodynamic significance. Maleo 2 (13), 31.
Munhá, J., Ribeiro, A., Fonseca, P., Oliveira, J.T., Castro, P., Quesada,C., 1989. Accreted terranes in Southern Iberia: Beja-Acebuches

114 N. Vieira da Silva et al. / Tectonophysics 445 (2007) 98–115
ophiolite and related oceanic sequences. 28th Int. Geol. Cong.(Washington, U.S.A.). Abs. with programs, vol. 2, pp. 481–482.
Nesbitt, R.W., Pascual, E., Fenning, C.M., Toscano, M., Saez, R.,Almodovar, R.G., 1999. U–Pb dating of the stockwork zirconsfrom the eastern Iberian Pyrite Belt. J. Geol. Soc. (Lond.) 156,7–10.
Oliveira, J.T., 1983. The marine Carboniferous of south Portugal: astratigraphic and sedimentological approach. In: Lemos de Sousa,M.J., Oliveira, J.T. (Eds.), The Carboniferous of Portugal. Mem.Serv. Geol. Portugal, vol. 29, pp. 3–37.
Oliveira, J.T., 1990. Stratigraphy and syn-sedimentary tectonism in theSouth Portuguese Zone. In: Dallmeyer, R.D., Martinez-Garcia, E.(Eds.), Pre-Mesozoic Geology of Iberia. Springer-Verlag, Berlin,Germany, pp. 334–347.
Oliveira, J.T., Cunha, T., Streel, M., Vanguestaine, M., 1986. Datingthe Horta da Torre Formation, a new lithostratigraphic unit of theFerreira–Ficalho Group, South Portuguese Zone: geologicalconsequences. Comun. Serv. Geol. Port. 72, 26–34.
Oliveira, J.T., Oliveira, V., Piçarra, J.M., 1991. Traços gerais da evoluçãotectono-estratigráfica da Zona de Ossa-Morena, em Portugal. Cuad.Lab. Xeol. Laxe 16, 221–250.
Oliveira, J.T., Pereira, Z., Carvalho, P., Pacheco, N., Korn, D., 2004.Stratigraphy of the tectonically imbricated lithological successionof the Neves Corvo mine área, Iberian Pyrite Belt, Portugal. Miner.Depos. 39, 422–436.
Onézime, J., Charvet, J., Faure, M., Chauvet, A., Panis, D., 2002.Structural evolution of the southernmost segment of the WestEuropean Variscides. The South Portuguese Zone (SW Iberia).J. Struct. Geol. 24, 451–468.
Pereira, Z., Saéz, R., Pons, J.M., Oliveira, J.T., Moreno, C., 1996.Edad devonica (Struniense) de las mineralizationes de Aznalcollar(Faja Pirítica Iberica) en base a planinologia. Geogaceta 20,1609–1612.
Pin, C., Paquette, J.-L., Fonseca, P., 1999. 350 Ma (U–Pb zircon)igneous emplacement age and Sr–Nd isotopic study of the Bejagabbroic complex (S. Portugal). In: Gamez, J.A., Eguiluz, L.,Palacios, T. (Eds.), XV Reunion de Geologia del Oeste Peninsular.Diputación de Badajoz, Badajoz, Spain, pp. 190–194.
Poirier, J.-P., 2000. Introduction to the Physics of the Earth's Interior,2nd edition. Cambridge University Press, UK.
Pous, J., Muñoz, G., Heise, W., Melgarejo, J.C., Quesada, C., 2004.Electromagnetic imaging of Variscan crustal structures in SWIbéria: the role of interconnected graphite. Earth Planet. Sci. Lett.217, 435–450.
Prodehl, C., Moreira, V.S., Mueller, St., Mendes, A.S., 1975. Deep-seismic sounding experiments in Central and Southern Portugal.General Assembly of the European Seismological Commission(14th - Berlin), pp. 261–266.
Quesada, C., 1991. Geological constraints on the Paleozoic tectonicevolution of tectonostratigraphic terranes in the Iberian Massif.Tectonophysics 185, 225–245.
Quesada, C., 1998. A reappraisal of the structure of the Spanishsegment of the Iberian Pyrite Belt. Miner. Depos. 33, 31–44.
Quesada, C., Munhá, J., 1990. Metamorphism. In: Dallmeyer, R.D.,Martinez-Garcia, E. (Eds.), Pre-Mesozoic Geology of Iberia.Springer-Verlag, Berlin, Germany, pp. 314–320.
Quesada, C., Fonseca, P., Munhá, J., Oliveira, J.T., Ribeiro, A., 1994.The Beja-Acebuches Ophiolite (Southern Iberian Variscan foldbelt): geologic characterization and geodynamic significance. Bol.Geol. Min. 105, 3–44.
Relvas J.M.R.S., 2000. Geology and metallogenesis at the Never Corvodeposit, Portugal. PhD Thesis, Univ. Lisboa, Lisboa, Portugal.
Ribeiro, A., 1981. A geotransverse through the Variscan fold belt inPortugal. In: Zwart, H.J., Dornsiepen, V.F. (Eds.), The VariscanOrogen in Europe. Geol. Mijnbouw, vol. 60, pp. 41–44.
Ribeiro, A., Silva, J.B., 1983. Structure of the South Portuguese Zone.In: Lemos de Sousa, M.J., Oliveira, J.T. (Eds.), The Carboniferousof Portugal. Mem. Serv. Geol. Portugal, vol. 29, pp. 83–89.
Ribeiro, A., Quesada, C., Dallmeyer, R.D., 1990. Geodynamicevolution of the Iberian Massif. In: Dallmeyer, R.D., Martinez-Garcia, E. (Eds.), Pre-Mesozoic Geology of Iberia. Springer-Verlag, Berlin, Germany, pp. 397–410.
Rosas, F., 2003. Estudo tectónico do sector de Viana do Alentejo -Alvito; evolução geodinâmica e modelação analógica de estruturasem afloramentos chave (Ramo Sul ds Cadeia Varisca Ibérica —SW da Zona de Ossa-Morena). PhD Univ. Lisboa. 364 pp.
San José, M.A., Herranz, P., Pieren, A.P., 2004. A review of the Ossa-Morena and its limits. Implications for the definition of theLusitan-Marianic Zone. J. Iber. Geol. 30, 7–22.
Santos, J.F., Andrade, S.A., Munhá, J., 1990. Magmatismo orogénicoVarisco no limite meridional da Zona de Ossa-Morena. Comun.Serv. Geol. Port. 76, 91–124.
Schermerhorn, L.J.G., 1971. An outline stratigraphy of the IberianPyrite Belt. Bol. Geol. Min. 82, 239–268.
Simancas, J.F., Martínez Poyatos, D., Expósito, I., Azor, A., GonzálezLodeiro, F., 2001. The structure of a major structure zone in SWIberian Massif: the Ossa Morena/Central Iberian contact. Tecto-nophysics 332, 295–308.
Simancas, J.F., Carbonell, R., González Lodeiro, F., Pérez Estaún, A.,Juhlin, C., Ayarza, P., Kashubin, A., Azor, A., Martínez Poyatos, D.,Almodóvar, G.R., Pascual, E., Sáez, R., Expósito, I., 2003. The crustalstructure of the transpressional Variscan orogen of SW Iberia. TheIBERSEIS deep seismic profile. Tectonics 22, 1062. doi:10.1029/2002TC001479.
Simancas, J.F., Carbonell, R., González Lodeiro, F., Pérez Estaún, A.,Juhlin, C., Ayarza, P., Azor, A., Poyatos Martínez, D., Almodóvar,G.R., Pascual, E., Sáez, R., Kashubin, A., ALonso, F., AlvarezMarrón, J., Bohoyo, F., Castillo, S., Donaire, T., Expósito, I.,Flecha, I., Galadí, E., Galindo Zaldívar, J., González, F., GonzálezCuadra, P., Macias, I., Martí, D., Martín, A., Martín Parra, L.M.,Nieto, J.M., Palm, H., Ruano, P., Ruiz, M., Toscano, M., 2004. Theseismic crustal structure of the Ossa-Morena Zone and itsgeological interpretation. J. Iber. Geol. 30, 133–142.
Silva, J.B., Oliveira, J.T., Ribeiro, A., 1990a. Structural outline of theSouth Portuguese Zone. In: Dallmeyer, R.D., Martinez-Garcia, E.(Eds.), Pre-Mesozoic Geology of Iberia. Springer-Verlag, Berlin,Germany, pp. 348–362.
Silva, J.B., Oliveira, J.T., Ribeiro, A., Piçarra, J.M., Araújo, A., 1990b.Thrust tectonics in the Ossa Morena Zone (South Portugal).International Conference on Paleozoic Orogens in Central Europe,Gottingen-Giesse. IGCP 233 (Abstracts).
Siripunvaraporn, W., Egbert, G., 2000. An Efficient data-subspace inver-sion method for 2-D magnetotelluric data. Geophysics 65, 791–803.
Soriano, C., Casas, J.M., 2002. Variscan tectonics in the Iberian PyriteBelt, South Portuguese Zone. Int. J. Earth Sci. 91, 882–896.
Strauss, G.K., Roger, G., Lécollle, M., Lopera, E., 1981. Geochemicaland geological study on the volcano–sedimentary sulphide orebodyof La Zarza, Huelva Province, Spain. Econ. Geol. 76, 1975–2000.
Tornos, F., Casquet, C., 2005. A new scenario for the related IOCG andNi–(Cu) mineralization: the relationship with giant mid-crustalmafic sills, Variscan Iberian Massif. Terra Nova 17, 236–241.
Tornos, F., Chiaradia, M., 2004. Plumbotectonic evolution of the OssaMorena Zone, Iberian Península: tracing the influence of mantle–crust interaction in ore-forming processes. Econ. Geol. 99, 965–985.

115N. Vieira da Silva et al. / Tectonophysics 445 (2007) 98–115
Turcotte, D.L., Schubert, G., 1982. Geodynamics. Application ofContinuum Physics to Geological Problemas. John Wiley & Sons,New York, USA.
Turpin, L., Velde, D., Pinte, G., 1998. Geochemical comparisonbetween minettes and kersantites from the Western EuropeanHercynian origen: trace element and Pb–Sr–Nd isotope constraintson their origin. Earth Planet. Sci. Lett. 87, 73–86.
Van den Boorgard, M.V., 1963. Conodonts of the upper Devonian andlower Carboniferous age from Southern Portugal. Geol. Mijnb. 42,248–259.
Vozoff, K., 1991. The magnetotelluric method. In: Nabighian, M.N.(Ed.), Electromagnetic Methods in Applied Geophysics II: Soc.Exp. Geophys, pp. 641–711.
Wittenberg, A., Vellmer, C., Kern, H., Mengel, K., 2000. The Variscanlower continental crust: evidence for crustal delamination fromgeochemical and petrophysical investigations. In: Frank, W., Haak,V., Oncken, O., Tanner, D. (Eds.), Orogenic Processes: Quantifi-cation and Modelling in the Variscan Belt. Special Publications,vol. 179. Geological Society, London, pp. 401–414.
Copyright © 2022 FDOKUMEN