Fluid ability, crystallized ability, and performance across ...
249
University of Iowa Iowa Research Online eses and Dissertations 2011 Fluid ability, crystallized ability, and performance across multiple domains: a meta-analysis Benne Eugene Postlethwaite University of Iowa Copyright 2011 Benne Postlethwaite is dissertation is available at Iowa Research Online: hp://ir.uiowa.edu/etd/1255 Follow this and additional works at: hp://ir.uiowa.edu/etd Part of the Business Administration, Management, and Operations Commons Recommended Citation Postlethwaite, Benne Eugene. "Fluid ability, crystallized ability, and performance across multiple domains: a meta-analysis." PhD (Doctor of Philosophy) thesis, University of Iowa, 2011. hp://ir.uiowa.edu/etd/1255.
-
Upload
khangminh22 -
Category
Documents
-
view
1 -
download
0
Transcript of Fluid ability, crystallized ability, and performance across ...

University of IowaIowa Research Online
Theses and Dissertations
2011
Fluid ability, crystallized ability, and performanceacross multiple domains: a meta-analysisBennett Eugene PostlethwaiteUniversity of Iowa
Copyright 2011 Bennett Postlethwaite
This dissertation is available at Iowa Research Online: http://ir.uiowa.edu/etd/1255
Follow this and additional works at: http://ir.uiowa.edu/etd
Part of the Business Administration, Management, and Operations Commons
Recommended CitationPostlethwaite, Bennett Eugene. "Fluid ability, crystallized ability, and performance across multiple domains: a meta-analysis." PhD(Doctor of Philosophy) thesis, University of Iowa, 2011.http://ir.uiowa.edu/etd/1255.

1
FLUID ABILITY, CRYSTALLIZED ABILITY, AND PERFORMANCE ACROSS
MULTIPLE DOMAINS: A META-ANALYSIS
by
Bennett Eugene Postlethwaite
An Abstract
Of a thesis submitted in partial fulfillment of the requirements for the Doctor of
Philosophy degree in Business Administration in the Graduate College of
The University of Iowa
July 2011
Thesis Supervisor: Professor Frank L. Schmidt

1
1
Cognitive ability is one of the most frequently investigated individual differences
in management and psychology. Countless studies have demonstrated that tests
measuring cognitive ability or intelligence predict a number of important real-world
outcomes such as academic performance, vocational training performance, and job
performance. Although the relationship between intelligence and real-world performance
is well established, there is a lack of consensus among scholars with regard to how
intelligence should be conceptualized and measured. Of the more traditional theories of
intelligence, two perspectives are particularly dominant: the Cattell-Horn model of fluid
and crystallized intelligence and the theory of General Cognitive Ability (GCA or g).
Fluid ability (Gf) represents novel or abstract problem solving capability and is
believed to have a physiological basis. In contrast, crystallized ability (Gc) is associated
with learned or acculturated knowledge. Drawing on recent research in neuroscience, as
well as research on past performance, the nature of work, and expert performance, I argue
that compared to measures of fluid ability, crystallized ability measures should more
strongly predict real-world criteria in the classroom as well as the workplace.
This idea was meta-analytically examined using a large, diverse set of over 400
primary studies spanning the past 100 years. With regard to academic performance,
measures of fluid ability were found to positively predict learning (as measured by
grades). However, as hypothesized, crystallized ability measures were found to be
superior predictors of academic performance compared to their fluid ability counterparts.
This finding was true for both high school and college students.
Likewise, similar patterns of results were observed with regard to both training
performance and job performance. Again, crystallized ability measures were found to be

2
2
better predictors of performance than fluid measures. This finding was consistent at the
overall level of analysis as well as for medium complexity jobs. These findings have
important implications for both intelligence theory and selection practice.
Contemporary intelligence theory has placed great emphasis on the role of fluid
ability, and some researchers have argued that Gf and g are essentially the same
construct. However, the results of this study, which are based on criterion-related
validities rather than factor-analytic evidence, demonstrate that Gc measures are superior
predictors in comparison to Gf measures. This is contrary to what one would expect if Gf
and g were indeed the same construct. Rather, the findings of this study are more
consistent with General Cognitive Ability theory, which predicts that Gc indicators will
be the best predictors of future learning and performance.
Given that Gc measures demonstrate higher criterion-related validities than Gf
measures, Gc measures are likely to be preferred for selection purposes. Further, Gf
scores are known to decline with age while Gc scores remain relatively stable over the
lifespan. Thus, when used for selection purposes, Gf tests may underpredict the
performance of older workers. In contrast, research has shown that Gc measures are
predictively unbiased. Additional implications for theory and practice are discussed,
along with study limitations and opportunities for future research.
Abstract Approved: ____________________________________ Thesis Supervisor
____________________________________ Title and Department
____________________________________ Date

1
FLUID ABILITY, CRYSTALLIZED ABILITY, AND PERFORMANCE ACROSS
MULTIPLE DOMAINS: A META-ANALYSIS
by
Bennett Eugene Postlethwaite
A thesis submitted in partial fulfillment of the requirements for the Doctor of
Philosophy degree in Business Administration in the Graduate College of
The University of Iowa
July 2011
Thesis Supervisor: Professor Frank L. Schmidt

2
Copyright by
BENNETT EUGENE POSTLETHWAITE
2011
All Rights Reserved

Graduate College The University of Iowa
Iowa City, Iowa
CERTIFICATE OF APPROVAL
_______________________
PH.D. THESIS
_______________
This is to certify that the Ph.D. thesis of
Bennett Eugene Postlethwaite
has been approved by the Examining Committee for the thesis requirement for the Doctor of Philosophy degree in Business Administration at the July 2011 graduation.
Thesis Committee: ___________________________________ Frank L. Schmidt, Thesis Supervisor
___________________________________ Kenneth G. Brown
___________________________________ Maria L. Kraimer
___________________________________ Michael K. Mount
___________________________________ Steven B. Robbins

ii
2
For Sandra Jane White (1943 – 2011)

iii
3
ACKNOWLEDGEMENTS
I could not have completed a project of this magnitude on my own. A number of
individuals have provided valuable assistance throughout the dissertation process. I am
extremely grateful for their help and encouragement.
I want to thank my committee members for their feedback, questions, and time.
My study has been greatly improved as a result of their ideas. In particular, I want to
thank my advisor and committee chair, Frank Schmidt. Frank has won mentoring awards
at the University and national level. My experience during this dissertation has proven
that these awards are very well deserved. Frank identified the need to examine the
criterion-related validities of Gf and Gc in 2005, and the current study is an evolution of
his original idea.
Tamara Giluk’s involvement with this project predates my own. Throughout the
entire study, Tamara’s assistance has been invaluable. Tamara played a key role during
the literature search phase, and she spent many long days coding data. I look forward to
our continued collaboration in the future.
The staff of the Interlibrary Loan Department at the University of Iowa Libraries
was extremely helpful in accessing many difficult to obtain studies. In addition, I am
grateful to Michael Aamodt for sharing the most recent version of his Law Enforcement
Selection: Research Summaries. These detailed summaries were very useful in
identifying additional primary studies from the law enforcement domain. I am also
indebted to In-Sue Oh for his continual willingness to share his expertise on the technical
aspects of meta-analysis.
Finally, I want to thank my family for their love and support. They have
continually encouraged me to succeed in each endeavor that I have chosen to embark
upon. This dissertation was no exception.

iv
4
ABSTRACT
Cognitive ability is one of the most frequently investigated individual differences
in management and psychology. Countless studies have demonstrated that tests
measuring cognitive ability or intelligence predict a number of important real-world
outcomes such as academic performance, vocational training performance, and job
performance. Although the relationship between intelligence and real-world performance
is well established, there is a lack of consensus among scholars with regard to how
intelligence should be conceptualized and measured. Of the more traditional theories of
intelligence, two perspectives are particularly dominant: the Cattell-Horn model of fluid
and crystallized intelligence and the theory of General Cognitive Ability (GCA or g).
Fluid ability (Gf) represents novel or abstract problem solving capability and is
believed to have a physiological basis. In contrast, crystallized ability (Gc) is associated
with learned or acculturated knowledge. Drawing on recent research in neuroscience, as
well as research on past performance, the nature of work, and expert performance, I argue
that compared to measures of fluid ability, crystallized ability measures should more
strongly predict real-world criteria in the classroom as well as the workplace.
This idea was meta-analytically examined using a large, diverse set of over 400
primary studies spanning the past 100 years. With regard to academic performance,
measures of fluid ability were found to positively predict learning (as measured by
grades). However, as hypothesized, crystallized ability measures were found to be
superior predictors of academic performance compared to their fluid ability counterparts.
This finding was true for both high school and college students.

v
5
Likewise, similar patterns of results were observed with regard to both training
performance and job performance. Again, crystallized ability measures were found to be
better predictors of performance than fluid measures. This finding was consistent at the
overall level of analysis as well as for medium complexity jobs. These findings have
important implications for both intelligence theory and selection practice.
Contemporary intelligence theory has placed great emphasis on the role of fluid
ability, and some researchers have argued that Gf and g are essentially the same
construct. However, the results of this study, which are based on criterion-related
validities rather than factor-analytic evidence, demonstrate that Gc measures are superior
predictors in comparison to Gf measures. This is contrary to what one would expect if Gf
and g were indeed the same construct. Rather, the findings of this study are more
consistent with General Cognitive Ability theory, which predicts that Gc indicators will
be the best predictors of future learning and performance.
Given that Gc measures demonstrate higher criterion-related validities than Gf
measures, Gc measures are likely to be preferred for selection purposes. Further, Gf
scores are known to decline with age while Gc scores remain relatively stable over the
lifespan. Thus, when used for selection purposes, Gf tests may underpredict the
performance of older workers. In contrast, research has shown that Gc measures are
predictively unbiased. Additional implications for theory and practice are discussed,
along with study limitations and opportunities for future research.

vi
6
TABLE OF CONTENTS
LIST OF TABLES ............................................................................................................. ix
LIST OF FIGURES .............................................................................................................x
CHAPTER 1 INTRODUCTION .........................................................................................1 Background .......................................................................................................1 The Cattell-Horn Theory of Fluid and Crystallized Intelligence .....................2
Fluid Intelligence .......................................................................................3 Crystallized Intelligence ............................................................................3
General Cognitive Ability .................................................................................4 Study Purpose & Method..................................................................................8 Value to Management & Applied Psychology ...............................................10 Overview of Subsequent Chapters ..................................................................12
CHAPTER 2 LITERATURE REVIEW ...........................................................................14 Chapter Overview ...........................................................................................14 The Historical Development of Intelligence Testing ......................................14 The Historical Development of Gf-Gc Theory ...............................................21 Cattell’s Investment Theory ...........................................................................28 PPIK ................................................................................................................34 Carroll’s (1993) Human Cognitive Abilities ..................................................35 The g-factor and Gf –Gc Theory ....................................................................37 Gf and Gc: An Alternate Interpretation ..........................................................42 The Stability of Gf and Gc..............................................................................44
Within-person Stability of Cognitive Ability Scores over Time ............44 Cognitive Ability and Age .......................................................................45
Gf and Age .......................................................................................48 Gc and Age .......................................................................................49
Improving Scores on Measures of Fluid Intelligence ..............................49
CHAPTER 3 HYPOTHESIS DEVELOPMENT .............................................................54 Chapter Overview ...........................................................................................54 The Criterion-related Validity of Fluid and Crystallized Ability ..................54 Past Performance ............................................................................................56 The Nature of Work ........................................................................................57 Expert Performance ........................................................................................59 Age and Job Performance ...............................................................................60 Primary Hypotheses ........................................................................................62 Supplemental and Confirmatory Hypotheses ................................................64
High vs. Low Stakes Testing ...................................................................64 Occupational Complexity ........................................................................67
CHAPTER 4 METHODS .................................................................................................70 Chapter Overview ...........................................................................................70 Operationalization of Criteria .........................................................................70
Academic Performance ...........................................................................70

vii
7
Training Performance ..............................................................................72 Job Performance ......................................................................................74
Literature Search .............................................................................................75 Electronic Database Searches ..................................................................75 Manual Searches ......................................................................................76
Inclusion Criteria ............................................................................................77 Data Set Reduction .........................................................................................79 Coding.............................................................................................................81
Phase One: Initial Coding of Studies ......................................................81 Phase Two: Classification of Cognitive Ability Measures. ....................82
Moderators ......................................................................................................84 Moderators Relevant to All Studies ........................................................85 Moderators Relevant to Academic Performance ....................................86
Testing Stakes ..................................................................................88 Moderators Relevant to Training Performance ......................................89 Moderators Relevant to Job Performance ...............................................89
Occupational Complexity .................................................................90 Detection of Duplicate Samples .....................................................................92
Treatment of Duplicate Samples .............................................................95 Conceptual Replication ...................................................................................95 Meta-Analytic Methods ..................................................................................96
Artifact Data ............................................................................................97 Predictor Reliability .........................................................................97 Criterion Reliability ..........................................................................99 Range Restriction ...........................................................................100
Credibility and Confidence Intervals .....................................................103 Analytic Strategy ..........................................................................................104
CHAPTER 5 RESULTS .................................................................................................115 Chapter Overview .........................................................................................115 Notation ........................................................................................................115 Cognitive Ability and Academic Performance ............................................117
Fluid Ability and Academic Performance ............................................117 Crystallized Ability and Academic Performance .................................118 General Cognitive Ability and Academic Performance .......................120 High Stakes vs. Low Stakes Testing .....................................................121
Cognitive Ability and Training Performance ..............................................123 Fluid Ability and Training Performance ..............................................123 Crystallized Ability and Training Performance ...................................124 General Cognitive Ability and Training Performance ..........................126
Cognitive Ability and Job Performance ......................................................127 Fluid Ability and Job Performance .......................................................127 Crystallized Ability and Job Performance ............................................128 General Cognitive Ability and Job Performance ..................................129
CHAPTER 6 DISCUSSION ...........................................................................................145 Chapter Overview .........................................................................................145 Summary of Research Findings ....................................................................145 Implications for Theory ................................................................................148 Implications for Practice ...............................................................................152 Future Research ............................................................................................156 Limitations ....................................................................................................157

viii
8
Conclusion ....................................................................................................159
APPENDIX CLASSIFICATION OF COGNITIVE ABILITY MEASURES ...............161
REFERENCES ................................................................................................................167

ix
9
LIST OF TABLES
Table 1. Common Tests Used to Measure Gf, Gc, and GCA ..............................................7
Table 2. Stability of General Cognitive Ability Scores Over Time ..................................46
Table 3. ux Artifact Distributions for Academic Performance ........................................106
Table 4. ux Artifact Distributions for Training Performance ..........................................109
Table 5. ux Artifact Distributions for Job Performance .................................................112
Table 6. Fluid Ability (Gf) and Academic Performance ................................................131
Table 7. Crystallized Ability (Gc) and Academic Performance .....................................133
Table 8. General Cognitive Ability (GCA) and Academic Performance .......................135
Table 9. Fluid Ability (Gf) and Training Performance ....................................................137
Table 10. Crystallized Ability (Gc) and Training Performance ......................................139
Table 11. General Cognitive Ability (GCA) and Training Performance .........................140
Table 12. Fluid Ability (Gf) and Job Performance ..........................................................141
Table 13. Crystallized Ability (Gc) and Job Performance ...............................................143
Table 14. General Cognitive Ability (GCA) and Job Performance .................................144
Table A1. Measures of Fluid Ability (Gf) ......................................................................161
Table A2. Measures of Crystallized Ability (Gc) ............................................................162
Table A3. Measures of General Cognitive Ability (GCA) .............................................165

x
10
LIST OF FIGURES
Figure 1. Example of a Simple Graphical Item Used to Assess Gf .....................................5
Figure 2. Example of a Verbal Analogy Item Used to Assess Gf .......................................5
Figure 3. Example of a Question Assessing Gc ...................................................................6
Figure 4. Example of a Question Assessing Gc ...................................................................6
Figure 5. Cattell-Horn Two-stratum Model of Intelligence..............................................27
Figure 6. Cattell’s Investment Model ................................................................................29
Figure 7. Carroll’s Three-stratum Model of Intelligence ..................................................39
Figure 8. GCA Model of Intelligence ...............................................................................40
Figure 9. Lohman’s (1993) Novelty-Transfer Continuum ................................................43
Figure 10. A Transfer Continuum for Multiplication Problems ........................................43
Figure 11. Age Differences in Broad Abilities During Adulthood ....................................50
1
1
CHAPTER 1
INTRODUCTION
Background
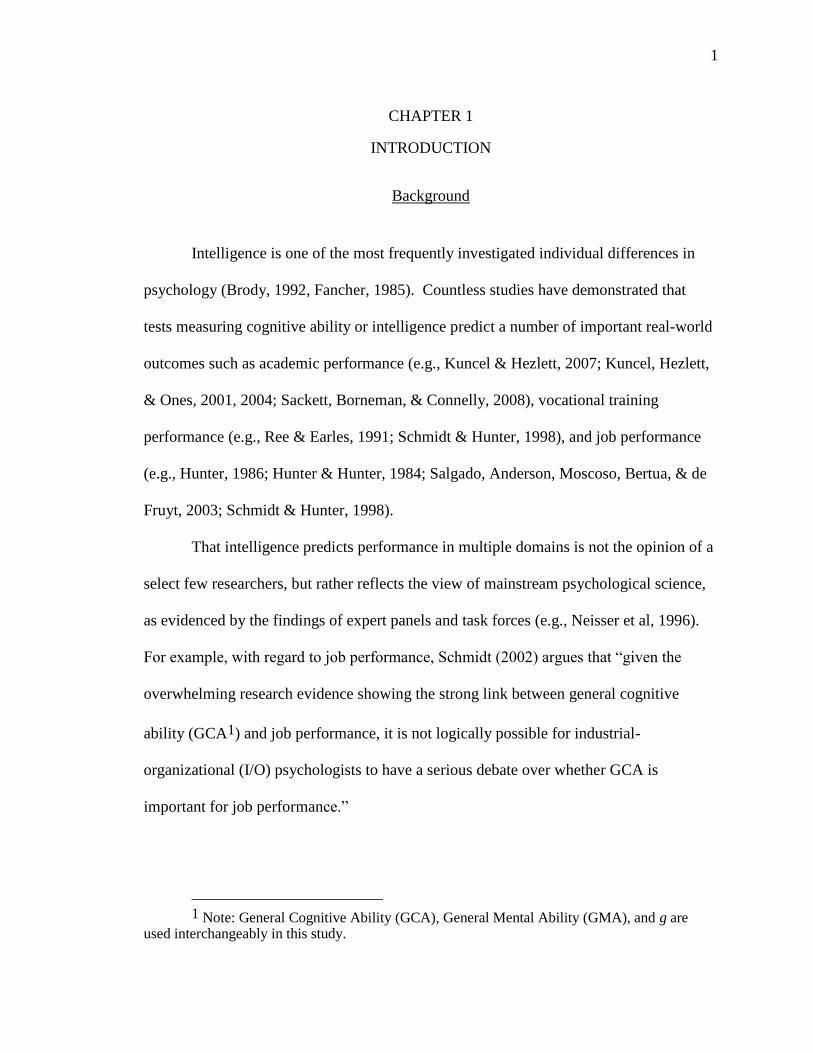
Intelligence is one of the most frequently investigated individual differences in
psychology (Brody, 1992, Fancher, 1985). Countless studies have demonstrated that
tests measuring cognitive ability or intelligence predict a number of important real-world
outcomes such as academic performance (e.g., Kuncel & Hezlett, 2007; Kuncel, Hezlett,
& Ones, 2001, 2004; Sackett, Borneman, & Connelly, 2008), vocational training
performance (e.g., Ree & Earles, 1991; Schmidt & Hunter, 1998), and job performance
(e.g., Hunter, 1986; Hunter & Hunter, 1984; Salgado, Anderson, Moscoso, Bertua, & de
Fruyt, 2003; Schmidt & Hunter, 1998).
That intelligence predicts performance in multiple domains is not the opinion of a
select few researchers, but rather reflects the view of mainstream psychological science,
as evidenced by the findings of expert panels and task forces (e.g., Neisser et al, 1996).
For example, with regard to job performance, Schmidt (2002) argues that ―given the
overwhelming research evidence showing the strong link between general cognitive
ability (GCA1) and job performance, it is not logically possible for industrial-
organizational (I/O) psychologists to have a serious debate over whether GCA is
important for job performance.‖
1 Note: General Cognitive Ability (GCA), General Mental Ability (GMA), and g are
used interchangeably in this study.

2
2
Although the relationship between intelligence and real-world performance is
well established, there is a lack of consensus among scholars with regard to how
intelligence should be conceptualized and measured. Given the complex and ubiquitous
nature of intelligence, such lack of consensus is not surprising. While developmental and
biological approaches have been taken, psychometric approaches have been particularly
dominant (Neisser et al., 1996). A survey of the literature reveals that approaches to
understanding intelligence are incredibly diverse. For example, Sternberg (1988;
Sternberg et al., 2000) emphasizes the importance of ―practical intelligence,‖ Gardner
(1983) argues for the existence of multiple ―intelligences,‖ and Goleman (1995)
advocates the concept of ―emotional intelligence.‖ Of the more traditional theories of
intelligence, two perspectives are particularly dominant: the Cattell-Horn model of fluid
and crystallized intelligence (Gf-Gc Theory: e.g., Cattell, 1943, 1971, 1987; Horn, 1965,
1968; Horn & Cattell, 1966) and the theory of General Cognitive Ability (GCA or g: e.g.,
Jensen, 1998; Spearman, 1904). Each of these perspectives is examined in turn.
The Cattell-Horn Theory of
Fluid and Crystallized Intelligence
As part of a long-standing program examining cognitive ability, Raymond Cattell
(1941, 1943) proposed that intelligence is not a unitary construct (such as Spearman‘s g),
rather it assumes two broad but distinct types, fluid intelligence (Gf) and crystallized
intelligence (Gc). Cattell‘s doctoral student John Horn was actively involved in refining
and empirically testing Gf-Gc theory and in recognition of his efforts the theory is now
referred to as the Cattell-Horn theory of intelligence. Gf-Gc theory has found wide
acceptance among cognitive ability researchers. For example, Caroll (1993, p. 62) argues

3
3
that the Cattell-Horn model ―appears to offer the most well-founded and reasonable
approach to an acceptable theory of the structure of cognitive abilities.‖
Fluid Intelligence
According to the theory, fluid intelligence represents novel or abstract problem
solving capability and is believed to have a physiological basis. According to Cattell
(1987, p. 97), the label reflects the construct‘s ‗―fluid‖ quality of being directable to
almost any problem.‖ Gf is typically assessed with items of a nonverbal or graphical
format using tests such as Raven‘s Progressive Matrices (see Figure 1 for an example
item). However, verbal items (such as analogies) can also be used to assess Gf if the
word pairs contain simple words that are familiar to the population of test takers (Cattell,
1987; Jensen, 1998). Figure 2 provides an example of such an item. Examples of some
tests commonly used to measure Gf are presented in the left column of Table 1.
Crystallized Intelligence
Crystallized intelligence is associated with learned or acculturated knowledge.
That is, Gc is a result of learning and knowledge acquired over one‘s lifetime. According
to Gf-Gc theory, fluid intelligence causes crystallized intelligence. More specifically,
Cattell‘s (1971, 1987) Investment Theory proposes that individuals have a fixed amount
of Gf which they can choose to ―invest‖ in, or apply to, learning in specific ―crystallized
skills‖ or domains. Gc is typically measured with verbal items, particularly those
assessing vocabulary. Figures 3 and 4 provide examples of items designed to assess

4
4
crystallized intelligence. Examples of some tests commonly used to measure Gc are
presented in the center column of Table 1.
As Carroll (1993) notes, Gf and Gc are in fact correlated. While some scholars
view this as evidence for the higher level construct of g (Ackerman, Beier, & Boyle,
2005), traditional Gf-Gc theorists choose not to extract the general factor, a choice that
reflects their view that g is merely a statistical artifact rather than a meaningful
psychological construct (Hunt, 2000).
General Cognitive Ability
The theory of general cognitive ability (g) provides an alternative to Gf-Gc
theory. Following Spearman (1904), g theorists (e.g., Gottfredsen, 1997; Jensen, 1998)
advocate a single, top-level intelligence construct. This is represented by a single general
factor g, which is a latent variable that causes the correlations between different measures
of cognitive ability. That is, g refers to the shared variance between cognitive ability
measures, or rather what different measures of ability share in common. A number of
scholars have attempted to interpret g in terms that are less statistical in nature. For
example, Ackerman and colleagues (2005, p. 32) describe g as ―a generic representation
for the efficiency of intellectual processes.‖ Gottfredsen (1997, p. 79) argues that g is
―essentially the ability to deal with cognitive complexity, in particular, with complex
information.‖ Schmidt and Hunter maintain that general cognitive ability is ―essentially
the ability to learn‖ (Hunter, 1986; Hunter & Schmidt, 1996; Schmidt, 2002, p. 188).
Although these definitions vary to some extent, each represents g as a cognitive construct

5
5
Figure 1. Example of a Simple Graphical Item Used to Assess Gf
Source: Adapted from Figure A5 of Raven‘s Standard Progressive Matrices (Raven, 1938; original item A5 reprinted in Greenfield, 2009, p. 69, Figure 1)
Temperature is to cold as Height is to
(a) hot
(b) inches
(c) size
(d) tall
(e) weight
Figure 2. Example of a Verbal Analogy Item Used to Assess Gf
Source: Adapted from Jensen (1998, p.123)

6
6
PRESENT/RESERVE, Do these words:
a) have similar meanings;
b) have contradictory meanings
c) mean neither the same nor opposite?
Figure 3. Example of a Question Assessing Gc
Source: Sample item from the Wonderlic Personnel Test
Figure 4. Example of a Question Assessing Gc
Source: Adapted from Jensen (1998, p. 123)
Bizet is to Carmen as Verdi is to
(a) Aida
(b) Elektra
(c) Lakme
(d) Manon
(e) Tosca

7
7
Table 1. Common Tests Used to Measure Gf, Gc, and GCA
Fluid Ability
(Gf) Tests
Crystallized Ability
(Gc) Tests
General Cognitive Ability
(GCA) Tests
Raven‘s Standard
Progressive Matrices
Raven‘s Advanced
Progressive Matrices
Culture Fair Intelligence
Test
Differential Aptitude
Test (Abstract
Reasoning)
ACT
SAT
Mill Hill Vocabulary
Test
Armed Services
Vocational Aptitude
Battery (ASVAB)
General Aptitude Test
Battery (GATB)
Wonderlic Personnel
Test
Otis Quick-Scoring Test
of Mental Ability
Stanford-Binet
Intelligence Test
Wechsler Adult
Intelligence Scale
that is broader in scope than either Gf or Gc. Further, viewed from the perspective of Gf
– Gc theory, GCA tests are combinations of Gf and Gc measures. Examples of some tests
commonly used to measure general cognitive ability are presented in the right column of
Table 1.
Most g theorists do not deny the existence of Gf and Gc; however, they maintain
that Gf and Gc are merely different kinds of indicators of the higher-order latent variable
g. The larger and more diverse the number of indicators used, the more construct valid
will be the final estimate of g. Because Gf and Gc are different indicators, they have
unique properties (e.g., Gf indicators decline more with age than Gc indicators; Gc
indicators better assess past use of g to learn skills and knowledge).

8
8
As stated previously, Gc tests measure how well a person has learned a wide
variety of things in the past. A fundamental principle in psychology is that past behavior
is the best predictor of future behavior (Oullette & Wood, 1998). Thus, when defining g
as the ability to learn, g theory predicts that Gc indicators will be the best predictors of
future learning and performance (which depends on learning).
Study Purpose & Method
Previous studies have typically examined Gf and Gc using factor analysis.
Although factor analysis can be informative, it can also be problematic in that results can
vary substantially depending on the specific combinations of tests examined. For
example, Hunt (2000) points out that it is possible (and indeed quite simple) to
manipulate the extraction of a general factor by selecting certain combinations of tests to
analyze. That is, ―interpretation of any summarizing statistic, including a general factor,
depends upon what is being summarized‖ (Hunt, 2000, p. 126). More importantly,
although factor analysis can help distinguish the statistical structure of constructs such as
Gf and Gc (Hunt, 2000), it offers no information with regard to the ability of those
constructs to predict real-world outcomes. Given that cognitive tests are used in a
number of high-stakes employment, admissions, and educational placement decisions, it
is imperative to assess the criterion-related validity of these tests.
Accordingly, it is beneficial to examine the usefulness of Gf and Gc measures
using an alternate methodology. Meta-analysis is an ideal tool for this task as it is a
robust statistical method for synthesizing quantitative research results from multiple
studies (Hunter & Schmidt, 2004). Likewise, meta-analysis can correct for the biasing

9
9
effects of sampling error, measurement error, and range restriction inherent in individual
primary studies. The results of meta-analytic investigations can be highly informative.
Meta-analysis can be used to examine relationships between constructs (such as the
strength of correlation between Gf and Gc). For example, Ackerman and colleagues
(2005) recently used meta-analysis to dispel a widely held belief that working memory
and intelligence are isomorphic constructs. After correcting for measurement error and
sampling error (but not range restriction), they estimated that the correlation between
working memory and g was less than unity ( =.479).
Meta-analysis is also frequently used to examine a measure‘s predictive validity.
A number of previous meta-analyses have examined the criterion-related validity of
various cognitive ability measures, particularly general cognitive ability (g or GCA; e.g.,
Bertua, Anderson, & Salgado, 2005; Hülsheger, Maier, & Stumpp, 2007; Hunter, 1986;
Hunter & Hunter, 1984; Ree & Earles, 1991; Salgado et al., 2003a; Schmidt & Hunter,
1998), with each study finding a strong correlation between GCA and performance
criteria. However, the criterion-related validities of fluid and crystallized measures have
yet to be separately meta-analyzed and compared with each other or to the validity of
omnibus GMA measures. Furthermore, the majority of previous meta-analyses were
conducted prior to the recent development of advanced methods which allow for the
correction of indirect range restriction (Hunter, Schmidt, & Le, 2006; Le, 2003; Le &
Schmidt, 2006; Schmidt, Oh, & Le, 2006).
In this study, I meta-analyze a large number of published and unpublished
primary studies that have examined the relationship between measures of intelligence
(Gf, Gc, or GCA) and at least one of three types of performance criteria: academic

10
10
performance, vocational/training performance, and job performance. The results of these
meta-analyses provide quantitative evidence to address the question of whether fluid or
crystallized measures are stronger predictors of future learning and performance.
Value to Management & Applied Psychology
By estimating and comparing the criterion-related validities of Gf, Gc, and GCA,
this study makes an important contribution to our cumulative knowledge regarding
intelligence and real-world performance. The findings will have implications for theory
as well as practice.
Organizations have a continual need to identify and select the individuals who are
most likely to be successful when hired (or accepted to an academic program). Indeed,
research has shown that even seemingly small increases in test validity can yield
substantial utility through increases in future production and performance (Schmidt &
Hunter, 1998). Since Gf and Gc measures are both used for selection purposes, it is
important for decision makers to understand which measures are the better predictor of
future performance. In a recent review of crystallized intelligence, Hunt (2000, p. 126)
provides additional impetus for why it is important to estimate the validity of Gf and Gc
measures used for selection purposes:
I suspect strongly that many of the tests in common industrial use also have a heavy Gc loading. This is probably the case for the tests used in the studies reviewed by Schmidt and Hunter (1998), and which provided evidence for the general factor measure as a predictor of job performance.
Hunt bases his argument in part on Roberts et al.‘s (2000) finding that the Armed
Services Vocational Aptitude Battery (ASVAB) primarily measures Gc rather than Gf.

11
11
Likewise, McGrew (1997) evaluated the content of major intelligence batteries using the
Gf-Gc framework. He concluded crystallized and visual/spatial (Gv) abilities were the
most frequently represented abilities, while pure measures of Gf were much less
common. Validities for intelligence batteries are often reported at the overall or
composite level, and this validity is a function of the validities of the constituent scales.
If there is indeed an imbalance in the representation of Gf and Gc in current intelligence
assessments, it is especially important to understand the predictive validity of each
construct as these validities will impact overall test validity.
In addition, scientists have made important observations regarding patterns of
change in intelligence scores both within individuals and between cohorts of individuals
over time. These findings provide additional motivation to investigate the criterion-
related validity of Gf and Gc measures. First, large increases in intelligence scores have
been observed within cohorts of test takers over the past century. This phenomenon has
become known as the Flynn effect (e.g., Flynn, 1987). Flynn observed that IQ scores
appear to have risen an average of 20 points per generation (i.e., every 30 years; Flynn,
1998). However, a closer look at the data reveals increases are visible primarily in Gf
measures (such as the Raven‘s Progressive Matrices) and not in Gc measures (such as the
SAT verbal scores) (Flynn, 1987, 1998; Raven, 2000). Meta-analytic results can
contribute to the discussion as to whether Gf score increases are real or artifactual.
Furthermore, it is widely established that cognitive ability declines to some extent
with age (Brody, 1992; Schaie, 1994; Verhaeghen & Salthouse, 1997). Although some
of the research in this area has appeared conflicting, Hough and colleagues (2001)
maintain that ―seemingly conflicting data regarding the relationship between age and

12
12
cognitive ability become consistent and interpretable when cognitive abilities are grouped
according to crystallized and fluid intelligence‖ (p. 159-160; see also Horn & Donaldson,
1976). This is due to that fact that rates of cognitive decline are quite different for Gf vs.
Gc. The largest declines are seen with measures of fluid intelligence. In contrast,
crystallized intelligence remains relatively stable until an extremely advanced age.
Cattell proposed this general pattern of results in his early (1943) presentation of Gf-Gc
theory. Some organizations use fluid assessments for selection purposes because the tests
are thought to reduce adverse impact towards underrepresented groups (due to a lack of
culturally-biased test content) and non-native speakers (due to a lack of verbal content),
although not all researchers agree with such characterizations (e.g., Greenfield, 1998).
However, because fluid intelligence declines with age, using Gf measures for selection
may also have the unintended consequence of adversely impacting older workers (c.f.,
Hough et al., 2001). This may be particularly problematic given the increasingly aging
workforce. The problem is likely to be exacerbated if Gf measures are found to be less
valid predictors of performance than Gc measures. This underscores the need to develop
a better understanding of the relationship between Gf, Gc, and performance.
Overview of Subsequent Chapters
This study unfolds as follows:
Chapter 2 provides a review of the literature on cognitive ability and performance.
The historical background and contemporary state of Gf-Gc and g theory are discussed.

13
13
Hypotheses are developed in Chapter 3. In particular, I draw on the relevant
research that has examined past performance, the nature of work, expert performance,
and the relationship between age and job performance.
Chapter 4 provides details on the meta-analytic methodology to be employed.
This includes details on the comprehensive literature search strategy, classification of
cognitive ability measures according to Gf-Gc theory, coding of studies, and correction
for artifacts such as criterion unreliability and range restriction.
The results of the study are presented in Chapter 5. The findings are
discussed in Chapter 6, along with implications for theory, future research, and practice.

14
14
CHAPTER 2
LITERATURE REVIEW
Chapter Overview
In this chapter I review the literature on cognitive ability, placing particular
emphasis on fluid and crystallized ability. I begin by discussing the historical
development of intelligence testing in general, and Gf-Gc theory in specific. I then
review applications of Gf-Gc theory including Cattell‘s (1971/1987) Investment Theory,
Carroll‘s (1993) three-stratum model of ability, and changes in ability scores over time.
The Historical Development of Intelligence Testing
Philosophers and scholars have debated the nature, source, and application of
cognitive abilities throughout recorded history. Likewise, the idea that cognitive abilities
can and should be measured is not limited to modern times. Bowman (1989) argues that
the origins of cognitive ability testing can be traced to ancient China. In approximately
150 BCE, emperors of the Qin or early Han dynasties established an examination
program. Chinese examinations functioned as selection tests, providing the primary route
for entry into the civil service. The degree of importance placed on these civil service
examinations was such that DuBois (1965) summarily characterized China as being a
―test-dominated society.‖
By the time of the Ming dynasty (1368-1644), the civil service examination
system had become elaborate and formal, a core element of Chinese society that
prevailed until the early twentieth century (Bowman, 1989; Franke, 1960). Testing was a

15
15
multistage process, with increasingly difficult tests being administered at the local
(prefectural), regional (provincial), and national (metropolitan) levels (Hanson, 1992).
By advent of the Sung dynasty (960-1279), civil service examinations were open to
nearly all Chinese, regardless of background. According to Lai (1970), there were some
individuals and their immediate descendants who were ineligible for examinations. For
example, excluded occupations included jailers, coroners, detectives, actors, musicians,
boat-people, and beggars. Nevertheless, access to the wealth and prestige afforded to the
bureaucratic elite was dependent to a large degree on merit (i.e., exam performance)
rather than parentage or family history (Hanson, 1992).
Chinese examination procedures were incredibly rigorous (Kracke, 1953;
Miyazaki, 1981). Examinations were broad in scope, consisting of essays on classics,
history, and politics. To insure fairness, tests were marked by at least two examiners.
Further, in an attempt to maintain anonymity, examination scripts were ―identified only
by number and reproduced by professional copyists to prevent identification of the author
by name or distinctive calligraphy‖ (Hanson, 1992, p. 190). Miyazaki (1981) provides a
fascinating account of the extreme measures that were taken to maintain test security in
one southern province. During examination periods, candidates were placed in small cells
within specially-constructed walled compounds for three days and two nights. Gates to
the compound were latched and sealed and were not to be opened under any
circumstance. The level of security was such that if a candidate died during the
examination, his body was thrown over the compound wall.
After the Boxer Rebellion (1898-1901), the Chinese government announced plans
for a new system of education. As a result, traditional civil service examinations were

16
16
formally abolished in 1905. Nevertheless, Hanson (1992, p. 191) concludes that given its
―amazing persistence, together with the central role it played in imperial Chinese society,
the Chinese civil service examination must certainly be credited as the most successful
system of testing the world has ever known.‖
While ability testing played a central role in ancient China, it was certainly not
absent in the ancient West. For example, Doyle (1974, p. 202) argues that ―ancient
Greece, if not a test-dominated society, was certainly a test-influenced one.‖ Although
ancient Greeks placed a heavy emphasis on physical ability testing, they also engaged in
achievement and mental aptitude testing (Doyle, 1974; Freeman, 1912; Marrou, 1956).
Further, Greek philosophers theorized about mental abilities as well as the utility of tests
designed to measure them. Doyle maintains that Plato‘s view of ability testing was based
on his belief in individual differences. In his Republic, Plato (428/7-348/7 BCE) argues
that ―we are not all alike; there are diversities of natures among us which are adapted to
different occupations‖ (Republic 370, p. 48-49). Consequently, ―all things are produced
more plentifully and easily and of a better quality when one man does one thing which is
natural to him‖ (Republic 370, p. 49).
Several scholars (e.g., Deary, 2000; Detterman, 1982; Shields, 1975) have
credited Juan Huarte de San Juan (c. 1530-1592), a Spanish physician, with having made
the first extensive theoretical examination of individual differences in cognitive ability. In
1575, Huarte published Examen de ingenios para las ciencias (The examination of men’s
wits). In his book, Huarte argues that men differ in ―wits‖ (or cognitive abilities). These
differences are proposed to be biological in nature, and in turn have implications for the
types of education and occupations to which individuals are suited. For example,

17
17
before I received any scholar into my schoole, I would grow to many trials and experiments with him, until I might discover the qualite of his wit, and if I found it by nature directed to that science whereof I made profession, I would willingly receive him, for it breeds a great contentment in the teacher to instruct one of good towardliness: and if not, I would counsaile him to studie that science, which were most agreeable with his wit. But if I saw that he had no disposition or capacitie for any form of learning, I would friendly and with gentle words tell him; brother, you have no means to prove a man of that profession which you have undertaken, take care not to loose your time or your labour, and provide you some other trade or living, which requires not so great an habilitie as appertaineth to learning. (Huarte, 1575, p. 4).
Huarte‘s basic view of individual differences in cognitive ability echoes that of
Plato, whose work he reviews in Examen de ingenios, along with that of other ancient
scholars including Socrates (c. 470-399 BCE), Hippocrates (c. 460-c. 377 BCE.),
Aristotle (384-322 BCE), and Galen (129-216). However, Huarte developed his theory
of cognitive abilities in considerably more depth than earlier scholars. Of particular
interest is his distinction between imagination- and memory-based problem solving,
which Hunt (2011) maintains is analogous to Cattell‘s distinction between fluid and
crystallized ability. Hunt notes that Cattell developed Gf-Gc theory independently of
Huarte, whose work was largely forgotten until being reintroduced by Spanish
psychologists during the 1980s.
Many scholars attribute the advent of contemporary ability testing to the work of
British polymath Francis Galton (1822 – 1911). A half-cousin of Charles Darwin, Galton
made a number of significant contributions in diverse areas including geography and
travel (Galton, 1853; Galton, 1855), meteorology (Galton, 1863), fingerprint analysis
(1892), and statistics (Galton, 1888). Galton was heavily influenced by Darwin‘s (1859)
On the Origin of Species, and he believed that Darwin‘s theory of natural selection could
be fruitfully applied to the domain of human cognitive abilities. Accordingly, Galton

18
18
(1865, 1869) presented evidence suggesting that intellectual ability was hereditary in
nature. A consequence of this, Galton believed, was that human intellectual stock could
be improved by encouraging persons of the highest intellectual ability to mate and
produce offspring. However, to enact such a plan would require some standardized
method for identifying persons of high ability. Galton (1865, p. 165) proposed that this
might be accomplished using ―a system of competitive examinations,‖ and he later went
on to adopt and develop a series of tests designed to measure ability. In 1884, Galton
began to administer such tests in his Anthropometric Laboratory located at the
International Health Exhibition in London. After the exhibition closed, the laboratory
was relocated to the nearby South Kensington Museum and the number of tests was
expanded. Members of the general public each paid a small fee to complete various tests
designed to measure physical characteristics (height, weight, arm span, eye color),
muscular strength, reaction time, and sensory acuity (vision, line and weight perception,
hearing/tone perception) (Galton, 1883, 1888). Several scholars (e.g., Carroll, 1982;
Wasserman and Tulsky, 2005) have noted that of all the tests used by Galton, only the
digit span test (Jacobs, 1887) is still used by psychologists.
Galton‘s approach to measuring mental ability was enthusiastically adopted by
James McKeen Cattell2 (1860 – 1944), an American psychologist who had studied under
Wilhelm Wundt. In an 1890 paper, Cattell describes ten tests for measuring mental
ability, a number of which had been used by Galton. These included dynamometer
pressure, sensation areas, reaction time for sound, weight differentiation, and bisection of
2 Note: James McKeen Cattell should not be confused with Raymond Cattell. The two
psychologists were not related.

19
19
a 50 cm line, among others. However, Cattell‘s enthusiasm for this approach dampened
after Clark Wissler published a study (Wissler, 1901) that suggested Cattell‘s mental tests
were correlated neither with each other, nor with student grades. Wissler, a graduate
student of Cattell‘s at Columbia University, based his findings on a large sample of
undergraduate students at Columbia. A similar conclusion was reached by Stella Sharp
(1898-1899), a graduate student at Cornell working under Titchener.
Wissler‘s (1901) and Sharp‘s (1898-1899) studies have often been cited as having
dealt a fatal blow to efforts to measure intelligence using measures of sensory
discrimination (c.f., Boring, 1950; Carroll, 1982; Eckberg, 1979; Fancher, 1985).
However, Deary (2000) is highly critical of such characterizations. He maintains both
studies were flawed. For example, Wissler‘s results were based on a highly range-
restricted sample (students at one of the country‘s premier universities). Further, Wissler
calculated less than 10% of all of the possible correlation coefficients in the data set
(Jensen, 1980, p. 139-140). Sharp‘s conclusions were based on a sample of only seven
graduate students, hardly a sufficient sample size to make a definitive conclusion.
An alternate approach to measuring intelligence was developed by French
psychologist Alfred Binet (1857 – 1911) and his colleagues. Binet was skeptical of
attempts to assess intelligence using only sensory measures. Five years prior to the
publication of Wissler‘s (1901) paper, Binet and Henri (1896) argued that
if one wishes to study the differences existing between two individuals it is necessary to begin with the most intellectual and complicated processes, and it is only a second line that one must consider the simple and elementary processes; it is, however, just the opposite which is done by the great majority of authors who have taken up this question (p. 417; translation cited in Fancher, 1985, p. 67)

20
20
Using an inductive approach, Binet and his graduate student Theodore Simon
(1873 – 1961) worked to develop a battery of scales (Binet & Simon, 1905a, 1905b,
1905c) to assess the degree to which French schoolchildren were developmentally-
delayed for their ages. While other researchers focused on simple reaction measures,
Binet and Simon found that scales assessing more complex abilities such as imagination,
verbal fluency, memory, and judgment permitted better discrimination between high and
low performing students. Thus, they concluded that ―to judge well, to comprehend well,
to reason well, these are the essential ingredients of intelligence‖ (Binet & Simon, 1905b,
p. 197, translation cited in Mackintosh, 1998, p. 13).
Binet and Simon‘s intelligence scales had enormous impact. According to
Mackintosh (1998), the scales ―formed the basis of modern IQ tests…and became the
norm against which later tests were judged‖ (p. 14). The scales were translated into
English and adapted for use in the United Kingdom by Cyril Burt (Burt, 1921) and in the
United States by Lewis Terman, a Stanford University psychologist (Terman, 1916;
Terman & Childs, 1912; Terman & Merrill, 1937). The Stanford-Binet remained the
dominant intelligence test until the release of the Wechsler scales (e.g., Wechsler, 1939)
(Mackintosh, 1998). Nevertheless, the Stanford-Binet continues to be published and is
currently in its fifth edition (SB5).
Mackintosh (1998) notes that the Stanford-Binet, and the Wechsler scales which
followed, are individual intelligence tests. As such, they are administered by a trained
psychological examiner to one client at a time. While this allows for an in-depth
assessment, it proves costly and inefficient if a large number of individuals need to be
tested. This was the case during World War I. The war brought a strong desire to apply

21
21
psychological principles to aid the war effort. Robert Yerkes (1876 – 1956), then
president of the American Psychological Association and chairman of the Committee on
the Psychological Examination of Recruits, led an effort to develop group intelligence
tests which could be administered to large numbers of U. S. Army recruits. The resulting
tests, the Army Alpha for literate recruits and the Army Beta for illiterate recruits, were
administered to nearly 1.7 million men by the end of the war (Ackerman, 1996; Fancher,
1985). According to Ackerman, ―the Army Alpha Test (and, to some degree the
nonverbal Army Beta Test) stand out as the vehicles for fixing the paradigm for adult
ability assessment‖ (p. 229). Following the war, a number of group intelligence tests
(e.g., the Otis-Lennon Ability Test, the Thorndike Intelligence Examination for High
School Graduates, and the National Intelligence Test) became commercially available.
Accordingly, the adoption of such tests for educational and occupational purposes grew
rapidly (for example, see Toops, 1926). A new era of ability testing had begun.
The Historical Development of Gf-Gc Theory
After receiving an undergraduate degree in Chemistry from the University of
London at age 19, British-born Raymond Cattell (1905-1998) decided to change course
and pursue a PhD in psychology. Cattell (1974) would later recollect that his decision
was based on a desire to apply science to real social problems, and he felt psychology
offered the best potential for making a significant impact. Cattell studied under Charles
Spearman, receiving his PhD from the University of London in 1929. In 1937, Cattell
joined Columbia University as a research associate at the invitation of E. L. Thorndike.
Cattell would remain in the United States for the remainder of his life, holding positions

22
22
at several institutions including Clark University, Harvard, the University of Illinois, and
the University of Hawaii.
Ackerman (1996, p. 232) rightly observes that the ―origins of Cattell‘s (1984)
bifurcation of intelligence into fluid and crystallized domains are somewhat murky.‖
One notable attempt to clarify this issue was made by Carroll (1984), who traced the
historical development of Gf-Gc as part of his review of Cattell‘s contributions to
cognitive ability theory. Carroll notes that from the 1930‘s through 1950‘s, much of
Cattell‘s attention was devoted to the development of intelligence tests which emphasized
universal content rather than culturally-acquired knowledge, and ―undoubtedly, the work
on ‗culture-free‘ or ‗culture-fair‘ tests planted the seeds for the theory of ‗fluid‘ and
‗crystallized‘ intelligences associated with Cattell‘s name‖ (1984, p. 302).
As early as 1933 (e.g., Cattell & Bristol, 1933), Cattell argued that the majority of
existing intelligence tests placed undue emphasis on acquired knowledge. In 1940
Cattell described the development of a nonverbal, ―culture-free‖ intelligence test built
upon the premise that it was indeed possible to find ―among different cultural groups a
common ground of knowledge, on which operations of reasoning could be performed‖
(Cattell, 1940, p. 165). The test was comprised of graphical items adapted from other
recently developed cognitive tests. These included mazes (Porteus, 1937), picture series,
item classification (Line, 1931; Spearman, 1933), progressive matrices (Penrose &
Raven, 1936), and mirror images. Cattell, Feingold, and Sarason (1941) evaluated the
test against traditional intelligence tests popular at the time such as the Binet and the
American Council of Education (ACE) Psychological Test. They found that among
groups of children and immigrants, the culture-free test displayed the highest loading on

23
23
general intelligence factor (g). That is, the nonverbal test items were highly g-saturated.
However, for the educated sample (consisting primarily of teachers), traditional
intelligence tests displayed higher g-loadings. The authors also observed reduced g-
loadings for the culture-free test when subjects, particularly children, were retested.
Cattell does not use the terms ―fluid‖ or ―crystallized‖ intelligence in these papers on the
culture-free intelligence test (Carroll, 1984), however, it is important to note the content
of the culture-free tests closely mirrors tests which Cattell and other scholars (e.g., Horn
& Cattell, 1967) would later classify as pure measures of fluid intelligence (e.g., the
Raven‘s Progressive Matrices).
Cattell‘s presentation at the 1940 American Psychological Meeting (Cattell, 1941)
is frequently credited as his first public presentation of Gf-Gc theory (see for example,
Cattell, 1979; Horn, 1968), although Carroll (1984) notes the original paper is
unavailable. Gf-Gc theory appears for the first time in print in a 1943 Psychological
Bulletin article in which Cattell reviews the state of adult intelligence testing. In this
article Cattell made four assertions (p. 178) that would become the backbone of Gf-Gc
theory:
(1) Adult mental capacity is of two kinds, the chief characteristics of which may
be best connoted by the use of the terms "fluid" and "crystallized.‖
(2) Fluid ability has the character of a purely general ability to discriminate and
perceive relations between any fundaments, new or old. It increases until
adolescence and then slowly declines. It is associated with the action of the
whole cortex. It is responsible for the intercorrelations, or general factor,
found among children's tests and among the speeded or adaptation-requiring
tests of adults.
(3) Crystallized ability consists of discriminatory habits long established in a
particular field, originally through the operation of fluid ability, but not longer
requiring insightful perception for their successful operation.

24
24
(4) Intelligence tests test at all ages are the combined resultants of fluid and
crystallized ability, but in childhood the first is predominant whereas in adult
life, owing to the recession of fluid ability, the peaks of performance are
determined more by the crystallized abilities.
A number of scholars (e.g., Ackerman, 1996; Brody, 1992; Carroll, 1984; Horn,
1968) as well as Cattell himself (1943), have noted the similarity between Gf-Gc theory
and the ideas on intelligence proposed by D. O. Hebb (1941, 1942, 1949). Hebb (1941,
1942) carefully examined the cases of individuals who had suffered brain damage at
different stages of their lives. He observed that individuals who suffered brain injury as
mature adults often showed little to no decrement in vocabulary or IQ after their injuries.
On the other hand, infants who suffered brain injury at birth showed notably low
vocabulary and IQ scores during adolescence. Hebb believed that these findings
suggested that ―intelligence‖ can have two meanings One such meaning, Intelligence A,
is biological in nature. It represents ―innate potential, the capacity for development, a
fully innate property that amounts to the possession of a good brain and a good neural
metabolism‖ (Hebb, 1949, p. 294). The second meaning, Intelligence B, is ―the
functioning of a brain in which development has gone on, determining an average level
of performance or comprehension by the partly grown or mature person‖ (Hebb, 1949, p.
294). Brody (1992) and Carroll (1984) refer to Hebb‘s Intelligence A and B as ―types‖ of
intelligence akin to Cattell‘s Gf and Gc. Although the concepts are indeed similar, Hebb
(1949, p. 294) emphasizes that Intelligence A and B ―are not two parallel kinds of
intelligence, coexistent, but two meanings of ‗intelligence.‘‖ In a 1968 review of Gf-Gc
theory, Horn (p. 242) argues that Cattell‘s ―Gf-Gc formulation is preferable to the
Hebbian conceptualization because the principal concepts in this theory have specifiable
and measurable behavioral referents, whereas in Hebb's theory intelligence A does not

25
25
refer to measurable behavior but to neurological potential.‖ Horn‘s argument clearly
reflects the behaviorist influences which were dominant in psychology at the time.
However, such an argument appears be much less valid in contemporary times,
particularly given the growing importance of cognitive psychology and the rapid
developments in neuroscience which have been facilitated by new technologies such as
fMRI (see for example Gray, Chabris, & Braver, 2003).
After proposing Gf and Gc in the early 1940‘s, Cattell proceeded to dedicate the
majority of his empirical research efforts during the next two decades to the investigation
of personality (e.g., Cattell, 1946, 1950, 1957, 1965) rather than intelligence. However,
he did make several explications of Gf-Gc theory on selected occasions during this period
(Cattell, 1950, pp. 477-491; Cattell, 1957a, pp. 871-879), in addition to revising his
culture-free intelligence assessment (i.e., The IPAT Culture Fair Intelligence Scales;
Cattell, 1957b).
It was not until the 1960‘s that Cattell began to examine Gf-Gc theory
empirically. In his initial empirical effort, Cattell (1963) examined the factor structure of
intelligence using a sample of 277 7th
and 8th
grade students who had taken the Thurstone
Primary Ability Tests, the Culture Fair Intelligence Scales, and the HSPQ personality
inventory. Cattell found evidence for two separate general ability factors which he
subsequently labeled as Gf and Gc. While most of the Culture Fair subtests
(Classification, Matrices, Topology) loaded heavily on the fluid ability factor, Thurstone
Verbal, Reasoning, and Number ability tests loaded heavily on the crystallized ability
factor. Though optimistic about these results, Cattell acknowledged that a thorough test
of the theory would require replication using more heterogeneous samples. Specifically,

26
26
Cattell believed that the distinction between Gf and Gc would be more clearly evident in
samples that were heterogeneous with respect to educational background:
The general theory also argues that in viewing the Gf-Gc distinction from the point of view of individual differences study, it will be most clear-cut in a sample of people wherein a wide variety of background influences would have operated to produce presently measureable abilities. When educational opportunities are closely tied to capacity, as represented in Gf, the development of Gc will tend to be closely tied to the development of Gf and the distinction will be difficult to draw in empirical analyses. But when individuals differ considerably with respect to a variety of background influences, then it is likely that in many cases educational opportunities will be premised on many factors other than the capacity represented by Gf. Hence the distinction between Gf and Gc will show up most clearly wherein there is heterogeneity with respect to background variables. (Horn & Cattell, 1966, pp. 259-260).
The 1960‘s also marked the advent of a long-standing collaboration between Cattell and
his then doctoral student John Horn (1928 – 2006). Although initially interested in
personality, Horn quickly embraced the theory of fluid and crystallized intelligence. Horn
continued to expand and refine Gf-Gc theory over his entire career. Accordingly,
intelligence scholars now attribute the theory to both Cattell and Horn (e.g., Cattell-Horn
theory). In his (1965) dissertation, Horn expanded the Gf-Gc dichotomy to
include two additional ability factors, General visualization (Gv) and General
speediness (Gs). Over time, additional factors were added to the model (Alfonso,
Flanagan, & Radwan, 2005; McGrew, 2005). These included short-term memory
(Gsm) or short-term apprehension and retrieval (SAR), long-term memory (Glm)
or tertiary storage and retrieval (TSR), and auditory processing (Ga). The most
recent additions to the model include correct decision speed (CDS), quantitative
ability (Gq), and reading/writing ability (Grw). An overview of these abilities is
presented in Figure 5 (stratum II). According to Gf-Gc theory, each of these is a

27
Figure 5. Cattell-Horn Two-stratum Model of Intelligence
Source: Adapted from Flanagan, Ortiz, Alfonso, & Mascolo (2002) and Alfonso, Flanagan, & Radwan (2005, p. 187, Figure 9.1)

28
28
broad, second-order (stratum II) ability factor that emerges when a large, diverse set of
tests measuring narrow (stratum I) abilities are factor analyzed. Further, these broad
second-order abilities are proposed to be correlated yet independent (Horn & Blankson,
2005). That is, they are believed to display differential validities with other variables
such as age or performance.
Cattell‘s Investment Theory
One of the core ideas underlying Gf – Gc theory is that Gf and Gc are causally
related, whereby the acquisition of Gc is dependent, to a large degree, on Gf. Other
factors such as personality, motivation, and educational opportunity are also proposed to
impact the development of Gc, although to a lesser extent than fluid ability. A converse
or reciprocal relationship is not part of the theory. That is, ―level of gf is considered to be
unaffected by previous gc acquisitions‖ (Schmidt & Crano, 1974, p. 255). Schmidt and
Crano maintain that the proposed causal relationship between Gf and Gc is rather unique
among major theories of intelligence. For example, the intelligence theories proposed by
Thurstone (1938), Burt (1949, 1955), Vernon (1961), and Guilford (1967) do not contain
causal arguments of the kind advanced by Cattell, even though some of these theories do
propose the existence of factor pairs (e.g., verbal/educational vs. practical; Vernon,
1961).
Although not explicitly referred to as such, the basic principles of Investment
Theory are evident in Cattell‘s early work on cognitive ability. For example, in his first
presentation of Gf – Gc theory in a 1943 Psychological Bulletin article, Cattell argues
that:

29
29
Crystallized ability consists of discriminatory habits long established in a particular field, originally through the operation of fluid ability, but no longer requiring insightful perception for their successful operation (1943, p. 178, emphasis added).
By 1963, Cattell was explicitly referring to ―investments.‖ For example:
When such deeper analysis is eventually undertaken it would be well to keep in mind that I might split again into a number of personality and dynamic factors (e.g., super ego strength, emotional stability) affecting the investment of fluid intelligence in crystallized intelligence skills (1963, p. 10).
Cattell presents the most comprehensive treatment of Investment Theory in two
books completed during the latter portion of his career. The first, Abilities: Their
structure, growth and action, was published in 1971. This was followed by a 1987
revision, Intelligence: Its structure, growth and action (see Section 5, pp. 138-146). A
simplified model of Cattell‘s Investment Theory is presented in Figure 6.
Figure 6. Cattell‘s Investment Model
Source: Adapted from Cattell (1987, Figure 6.3, p. 146)

30
30
Consistent with his previous discussions, Cattell defines Gf as ―a single, general,
relation-perceiving ability connected with the total, associational, neuron development of
the cortex‖ (Cattell, 1987, p. 138). The term fluid is meant to imply that this type of
intelligence ―is not tied to any specific habits or sensory, motor, or memory area‖
(Cattell, 1987, p. 138). An important feature of this model is that two types of fluid
ability are included, historical Gf and present day Gf. If at the present time an individual
is administered a fluid intelligence assessment, such as the Raven‘s Progressive Matrices
or Culture Fair Intelligence Test, the resulting score would indicate that individual‘s
present day fluid intelligence. In contrast, historical Gf refers to fluid ability measured at
some point in the past.
Cattell (1987, p. 139) defines Gc as ―complex, acquired abilities, in the form of
high-level judgmental skills in particular perceptual and motor areas.‖ The term
crystallized is meant to imply that ―their expression is tied to a series of particular areas‖
(Cattell, 1987, p. 139) or that they have become frozen ―in a specific shape of what was
once fluid ability‖ (Cattell, 1987, p. 140). If an individual is administered a crystallized
intelligence assessment, such as the Mill Hill Vocabulary scales or a general knowledge
test, the resulting score reflects the individual‘s current crystallized intelligence (Cattell
implies this is present day crystallized knowledge, though he does not explicitly use this
terminology). As shown in the model, Gc is a function of historical Gf and Common
Learning Investment (a gestalt of time, interest, and memory). That is, ―this year‘s
crystallized ability level is a function of last year‘s fluid ability level – and last year‘s
interest in school work and abstract problems generally‖ (Cattell, 1987, p. 139).
Although individuals choose where to invest their Gf, Cattell argues that a person who

31
31
demonstrates high ability in one crystallized ability area is likely to also be high in other
areas. Thus, crystallized abilities will tend to exhibit a positive manifold.
To summarize, Investment Theory ―says that gc arises and has its particular form
as a result of investing a general capacity, gf(h), in suitable learning experiences‖ (Cattell,
1987, p. 146). Although the theory is rather straightforward, Cattell and Horn (1978)
acknowledge that it has been rather difficult to test empirically. Nevertheless, a small
number of scholars have sought to do so. Not surprisingly, the results of these studies
have been mixed, and in most cases less than conclusive.
Schmidt and Crano (1974) used cross-lagged panel analysis (Campbell, 1963;
Pelz & Andrews, 1964) to test Investment Theory in two large samples of Milwaukee
elementary school students. Fluid and crystallized intelligence were each assessed in
Grade 4 and Grade 6, and the cross-lagged correlations were compared. Schmidt and
Crano found support for Investment Theory in the sample of middle-socioeconomic
students. That is, they found that the correlations between Gf measured in Grade 4 and
Gc measured in Grade 6 were greater than the correlations between Gc measured in
Grade 4 and Gf measured in Grade 6. However, they were surprised to find the opposite
pattern of results among students who were from low-socioeconomic status backgrounds.
Although Schmidt and Crano‘s study represents an important initial effort to empirically
examine Investment Theory, the cross-lagged panel analysis method they employed was
subsequently shown to be flawed. Rogosa (1980, p. 245) demonstrated that ―cross-
lagged correlation is not a useful procedure for the analysis of longitudinal panel data. In
particular, the difference between the cross-lagged correlations is not a sound basis for
causal inference.‖ According to Rogosa (1980, p. 250), cross-lagged methodology is

32
32
based upon a number of ―very restrictive‖ assumptions that are often ignored. These
include stationarity (the assumption that causal structures are stable over time),
synchronicity (measures within each wave are collected at the same time), and
homogenous stability (see Kenny, 1975). Further, cross-lagged correlation has very low
power and requires large sample sizes. Because of these large samples, very minor
differences in correlations result in the null hypothesis being rejected (Rogosa, 1980, p.
257). Taken together, Rogosa (1980, p. 257) argues that ―no justification was found for
the use of CLC. In CLC both determinations of spuriousness and causal predominance
are unsound.‖ Given the problems with cross-lagged analysis, the generalizability of
Schmidt and Crano‘s findings is somewhat limited.
Schweizer and Koch (2001) revisited Investment Theory by proposing a revision
to Cattell‘s model. These authors propose that ―learning mediates the influence of fluid
intelligence on crystallized intelligence‖ (p. 66). Specifically, they argue that fluid
intelligence impacts learning, which in turn ―controls the transfer of knowledge to
permanent memory‖ (p. 66). Thus, it is through learning that crystallized knowledge is
created. Although Schweizer and Koch present this idea as novel, the basic premise is
inherent in Cattell‘s (1987) presentation of Investment Theory. The authors tested this
hypothesis in two small subsamples of German students. One subsample consisted of
students aged 19-23 years (n = 51), the other subsample consisted of students aged 24-30
(n = 53). Learning, as measured by associative and complex learning tasks, was found to
mediate the relationship between Gf and Gc in the younger subsample but not in the older
subsample. The authors maintain that their results offer support for Cattell‘s contention
that ―professional specialization impairs the observability of the relationship between

33
33
fluid and crystallized intelligence‖ (p. 57). Indeed, Cattell (1987) does argue that one of
the challenges of measuring crystallized intelligence is that as individuals grow older and
leave school, they invest their Gf in increasingly specialized areas. As a result, assessing
Gc becomes increasingly difficult with age as most crystallized assessments have tended
to focus on the common body of knowledge learned in school rather than domain-specific
knowledge acquired throughout adulthood (c.f. Ackerman, 2000; Horn & Blankson,
2005).
Kvist and Gustafsson (2008) set out to examine one prediction based on
Investment Theory, specifically the idea that Gf and g would be equal in samples where
individuals had equal opportunity to learn knowledge and skills. The authors proposed
this would not be the case when individuals were heterogeneous with regard to
opportunity to learn. They tested this idea by examining the factor structure of
intelligence in an overall sample of Swedish workers, as well as subsamples of immigrant
and non-immigrant populations. Kvist and Gustafsson found support for their
proposition. The relationship of Gf and g was found to be .83 in the overall heterogenous
sample while the relationship between Gf and g was found to be unity in each of the
homogenous subsamples. However, the data these researchers examined was cross-
sectional in nature. Accordingly, although the data permitted an examination of the
general factor structure of intelligence using the Gf-Gc framework, it did not permit an
examination of the central thesis of Investment Theory, that Gf and Gc are causally
related.
Investment theory was most recently examined by Rindermann, Flores-Mendoza,
and Mansur-Alves (2010). These researchers analyzed cross-lagged effects to investigate

34
34
the reciprocal effects of Gf and Gc in samples from Brazil and Germany. Results of the
study were mixed. Contrary to Investment Theory, they found that fluid intelligence
influenced crystallized intelligence and vice-versa. In partial support of Investment
Theory, they found that parental education and socioeconomic status had a slightly
stronger effect on Gc than Gf. However, despite statements by authors to the contrary,
the methodology employed in the study was problematic in that the cross-lagged path
analyses conducted by the authors appear to suffer from many of the same limitations of
cross-lagged correlation analysis (e.g., Rogosa, 1980). This limits the generalizability of
their results.
In sum, several well-intentioned attempts have been made to empirically test
components of Cattell‘s (1971/1987) Investment Theory. However, results from each of
these studies have been mixed at best. In many cases results are unclear or
uninterpretable due to the limitations imposed by sample size and analytic strategy. As a
result, Investment Theory remains primarily a theoretical contention rather than a robust,
empirically supported phenomenon.
PPIK
Cattell‘s Investment Model is largely similar to Ackerman‘s (1996) PPIK Theory.
PPIK represents Ackerman‘s integrative attempt to explain how adult intelligence
develops. According to Ackerman (p. 227), ―the PPIK theory of adult intellectual
development integrates intelligence-as-process, personality, interests, and intelligence-as-
knowledge.‖ Like Cattell, Ackerman acknowledges that development of intelligence is
dependent to some extent upon interests or motivation. However, Ackerman maintains
that PPIK differs from Investment Theory by focusing not on Gf and Gc, but rather on

35
35
process and knowledge as two broad factors of intelligence. According to Ackerman,
―intelligence-as-process‖ results in the development of Gf-type abilities. On the other
hand, intelligence-as-knowledge results in the development of Gc-type abilities (see
Ackerman, 1996, Figure 3, p. 238). Ackerman‘s PPIK model also places more attention
on domain-specific knowledge (such as specific legal knowledge for lawyers, or medical
knowledge for physicians). Ackerman (2000) has referred to domain-specific knowledge
as the ―dark matter‖ of adult intelligence, and he acknowledges it is very difficult to
measure given its unique nature. In contrast, Cattell‘s concept of Gc appears to be wider
in scope. Accordingly, Gc has typically come to refer to broad, culturally acquired
knowledge rather than job- or domain-specific knowledge. However, it should be
acknowledged that the latter idea of domain-specific knowledge would be considered a
special case of the more broadly conceived construct of Gc. In this way, all domain-
specific knowledge would be considered crystallized, but not all crystallized knowledge
is domain-specific. The current study is concerned with Gc as it refers to broad,
acculturated learning rather than development or demonstration of domain-specific
knowledge.
Carroll‘s (1993) Human Cognitive Abilities
By the latter half of the twentieth century, researchers had conducted hundreds of
empirical studies examining the structure of intelligence. This body of evidence was vast
and often confusing. Amidst this backdrop, educational psychologist John Carroll
increasingly ―sensed the field‘s need for a thoroughgoing survey and critique of the
voluminous results in the factor-analytic literature on cognitive ability‖ (Carroll, 1993, p.
vii). To address this need, Carroll began collecting and systematically evaluating
empirical studies of cognitive ability. Some twelve years after he had begun, Carroll had

36
36
managed to gather and factor-analyze over 461 unique data sets. He subsequently
synthesized these findings to construct a three-stratum model of cognitive abilities. His
efforts culminated in 1993 with the publication of his seminal book Human Cognitive
Abilities. The book has been very highly regarded (e.g., Burns, 1994; Eysenck, 1994,
Jensen, 2004). For example, McGrew (2009, p. 2) has argued that Human Cognitive
Abilities
represents to the field of applied psychometrics a work similar in stature to other principia publications in other scientific fields (e.g., Newton's three volume, The Mathematical Principles of Natural Philosophy, or Principia as it became known and Whitehead & Russell's, Principia Mathematica).
The near universal high acclaim and subsequent impact of Carroll‘s (1993) work
can likely be attributed to several factors. The first of these is scope. Lubinski (2000, p.
412) claims that Carroll‘s three-stratum model is ―in many respects, not new. Embryonic
outlines are seen in earlier psychometric work (Burt, Cattell, Guttman, Humphreys, and
Vernon, among others).‖ Rather, according to Lubinski, the importance of Carroll‘s
(1993) contribution stems from the ―unparalleled‖ bases of evidence upon which his
model is built.
Using the results of his many analyses, Carroll (1993) ultimately constructed a
three-stratum model (presented in Figure 6) that is in many ways analogous to the Gf-Gc
theory advanced by Cattell and Horn. A model representing Cattell and Horn‘s Gf-Gc
theory was presented earlier in Figure 5. Within both models, Gf and Gc are conceived
as unique, broad (stratum II) abilities that lie alongside other broad abilities such as short
term memory and processing speed. These broad abilities can be measured by a number
of narrow (stratum I) abilities. In the case of fluid intelligence, these narrow stratum I
abilities would include performance on matrices tests and Gf-loaded verbal analogies.

37
37
Carroll does not disguise this fact, and in Human Cognitive Abilities (1993, p. 62) he
acknowledges that the Cattell-Horn model ―appears to offer the most well-founded and
reasonable approach to an acceptable theory of the structure of cognitive abilities.‖ As
McGrew (2005) and Alfonso et al. (2005) have shown, when the models are compared
side-by-side, the stratum II ability factors are much the same with the exception of some
minor differences in terminology. Likewise, both the Carroll and Cattell-Horn models
acknowledge that these broad, stratum II abilities cause multiple narrow abilities which
constitute the lowest level (stratum I) of both models. As Kvist and Gustafsson (2008, p.
422) note, these narrow abilities largely ―correspond to factors previously identified by
Thurstone (1938), Guilford (1967) and other researchers working in the tradition of
multiple factor analysis.‖ The primary difference between Carroll‘s model and the
Cattell-Horn Gf – Gc model is that Carroll argues for the existence of a general factor (or
g-factor) at stratum III, superordinate over the broad stratum II abilities. The existence
and nature of this general factor has aroused considerable discussion among intelligence
researchers. This is described in the section which follows.
The g-factor and Gf –Gc Theory
Carroll (1993) is not alone in his belief that both theory and empirical evidence
suggest the presence of a general factor. Following Spearman (1904, 1927), a number of
researchers advocate the existence of a g-factor, including Jensen (1998), Gottfredsen
(1997), Schmidt and Hunter (e.g., Hunter, 1986; Schmidt, 2002; Schmidt and Hunter,
1992, 1998, 2004), Ree and Earles (1991), and Gustafsson and colleagues (Gustafsson,
1988; Kvist & Gustafsson). Nevertheless, there is continuing debate regarding what the
g-factor represents (Kvist & Gustafsson, 2008).

38
38
In the current study, the general factor g or GCA is considered a latent variable
that causes the correlations between different measures of cognitive ability. That is, g
refers to the shared variance between cognitive ability measures, or rather what different
measures of ability share in common. g emerges when a diverse set of abilities are
measured. Most g theorists do not deny the existence of Gf and Gc; however, they
maintain that Gf and Gc are merely different kinds of indicators of the higher-order latent
variable g and not unique types or kinds of intelligence. The GCA model of intelligence
is presented in Figure 8.
As shown in Figure 5, the Cattell-Horn model in its current form does not include
a general factor. As Kvist and Gustafsson (2008, p. 423) note, this is largely due to the
fact that ―Horn (see, e.g., Horn & Blankson, 2005; Horn & Noll, 1997) has strongly
objected to the idea of a general factor, favoring instead a hierarchical model with broad
correlated factors at stratum II.‖ Specifically, Horn argues that a g-factor at stratum III
lacks ―factorial invariance.‖ That is, the g-factor is simply a statistical artifact that
emerges from unique combinations of stratum II ability tests. Horn and Blankson (2005,
p. 53) are particularly emphatic in their denial of a general factor:
The structural evidence thus does not support a theory of g. The developmental evidence is even less supportive. In general, construct validation evidence is counter to a theory that human intelligence is organized in accordance with one common principle or influence. The evidence from several sources points in the direction of several distinct kinds of factors.
However, Cattell himself was more sympathetic to the idea of a general factor at
stratum III. For example, Cattell (1963) maintained that the positive correlations among
broad abilities should not be interpreted as

39
Figure 7. Carroll‘s Three-stratum Model of Intelligence
Source: Adapted from: Flanagan et al. (2002) and Alfonso et al. (2005, p. 187, Figure 9.1)

40
Figure 8. GCA Model of Intelligence

41
41
―fluid and crystallized ability form a single third-order factor,‖ but rather that a single influence, which is fluid ability as it stood during the formative period of crystallized ability, is causative to the present levels of both. (p. 15).
Thus, Cattell viewed the g-factor as synonymous with historical fluid ability.
This is shown in the investment model of Figure 6, whereby historical Gf (stratum III) is
proposed as the cause of present-day Gf and Gc (stratum II).
Consistent with this line of reasoning, some researchers such as Undheim (1981a,
1981b) and Gustafsson (1984) have argued that ―the characteristics of the g-factor as
described by Spearman (1904, 1927) agree so well with the characteristics of the Gf-
factor as described by Horn and Cattell (1966), that g and Gf should be considered to be
one and the same factor‖ (Kvist & Gustafsson, 2008, p. 423). In support of this idea,
several scholars (Gustafsson, 1984, 1988, 1994, 2002; Keith, 2005; Reynolds & Keith,
2007; Undheim, 1981a, 1981b; Undheim & Gustafsson, 1987) have presented evidence
suggesting that Gf is perfectly related, or equivalent, to g.
However, other researchers have disagreed with the assertion that g and Gf are
equivalent constructs (e.g., Blair, 2006; Carroll, 1993; Gignac, 2006; Robinson, 1999).
For example, Gignac (2006) examined correlation matrices from several major test
batteries using the single trait-correlated uniqueness (STCU) CFA method. He found that
verbal intelligence subtests, especially crystallized subtests, were strongly correlated with
a general factor, thereby providing evidence that Gc measures are ―the best indicators of
‗g‘‖ (Gignac, 2006, p. 29). However, some researchers (e.g., Ashton & Lee, 2006; Kvist
& Gustafsson, 2008) have questioned Gignac‘s conclusions based on the analytic
approach he employed.

42
42
Gf and Gc: An Alternate Interpretation
In contrast to the Cattell-Horn Gf –Gc theory, Lohman (1993, p. 13) proposes that
problems or tests measuring fluid and crystallized abilities can be viewed as lying along a
continuum (Figure 9). The horizontal line in his model represents both the novelty of the
problem (familiar vs. novel) as well as the degree of transfer required (near transfer vs.
far transfer). Lohman argues that his use of the term transfer is consistent with Gagne‘s
(1970) idea of lateral transfer. As such, it refers to ―how broadly the individual can
generalize what he has learned to a new situation‖ (Gagne, 1970, p. 336). Tests or
problems requiring only rote memory would lie to the far left of the continuum.
Accordingly, ―as one moves to the right on this scale, problems become increasingly
novel and thus require increasing transfer‖ (Lohman, 1993, p. 13). Lohman maintains
that he is far from unique in suggesting that cognitive abilities can be conceptualized in
such a manner, with similar models (some of which predate Gf-Gc theory) having
previously been presented by a number of scholars including Stern (1914), Anastasi
(1937), Cronbach (1970), Elshout (1983), Raaheim (1984), and Sternberg (1985).
As an illustration of this model, Figure 10 presents a sample transfer continuum
for multiplication problems (adapted from Lohman, 1993, p. 14). The example problem
on the far left (2 x 8) assumes a student learns multiplication when numbers are presented
in a horizontal format (e.g., duplication or rote memory). Changing the position of the
numbers to a vertical format requires some degree of transfer, which in turn increases
when a multiplication problem is presented using words or stories. As illustrated on the
far right, further transfer would be needed to solve a multiplication problem presented in
a novel or abstract form, such as a Raven‘s Matrix.

43
43
Near
Transfer
Gc
Crystallized
Abilities
(Achievement)
Gf
Fluid
Abilities
(Aptitude)
Far
Transfer
Familiar
Tasks
Novel
Tasks
Figure 9. Lohman‘s (1993) Novelty-Transfer Continuum
Source: Adapted from Lohman (1993, Figure 1, p. 13)
Near
Transfer
Far
Transfer
2 x 8 = ?
6
x 3
The local cinema
charges $7 per
ticket. Sue needs
4 tickets, how
much will…
?
Identical
Format
Similar
Format
Word
Problem
Matrix
Problem
Familiar
Tasks
Novel
Tasks
Figure 10. A Transfer Continuum for Multiplication Problems
Source: Adapted from Lohman (1993, Figure 2, p. 14)

44
44
Lohman (1993, p. 13) maintains that placing fluid and crystallized abilities ―on
the same line implies that these are best seen as two aspects of the same thing rather than
qualitatively different things.‖ Snow (1980) also appears to adhere to this line of
reasoning:
…[Crystallized ability] represents the long-term accumulation of knowledge and skills, organized into functional cognitive systems by prior learning, that are…units for use in future learning… Thus [Gc] may represent prior assemblies of performance processes retrieved as a system and applied anew in instructional or other…situations not unlike those experienced in the past, while [fluid ability] may represent new assemblies of performance processes needed for more extreme adaptations to novel situations….Both functions develop through exercise, and perhaps both can be understood as variations on a central production system development (p. 37)
Such reasoning lies in contrast to Cattell and Horn who clearly view Gf and Gc as
independent, albeit related, constructs.
The Stability of Gf and Gc
Within-person Stability of
Cognitive Ability Scores over Time
A number of studies conducted over the past half-century have demonstrated that
individual differences in cognitive ability remain quite stable over time (Conley, 1984;
Deary, 2000, 2001). As Deary and colleagues (Deary; 2000; Deary, Whalley, Lemon,
Crawford, & Starr, 2000, p. 50) note, researchers have examined the stability of cognitive
ability scores using different time frames including within childhood (e.g., Humphreys,
1989), within adulthood/old age (e.g., Mortensen & Kleven, 1993; Nisbet, 1957; Owens,
1966; Schwartzman, Gold, Andres, Arbuckle, & Chaikelson, 1987), and between

45
45
childhood and adulthood/old age (e.g., Deary et al., 2000; Kangas & Bradway, 1971).
Table 2 presents a summary of key studies which have examined this stability.
Deary et al.‘s (2000) study is of particular interest as it examined the
stability of IQ over an especially long interval. In 1932, all Scottish children born in
1921 took the Moray House Test, a validated measure of intelligence, as part of the
Scottish Mental Survey. In 1998, Deary and colleagues administered the Moray House
Test to 101 individuals who participated in the Scottish Mental Survey some 66 years
earlier. 97 of these individuals, now aged 77, also completed Raven‘s Progressive
Matrices. Deary et al. found that IQ measured with the Moray House Test at age 11
correlated .63 with IQ measured with the Moray House Test at age 77 (95% CI = .50 -
.74). This raw correlation increases to .73 when corrected for range restriction, and the
authors acknowledge that the correlation would be even larger if a correction for
attenuation due to measurement error were made. In addition, the 1932 Moray House
Test correlated .48 with the 1998 Raven‘s Progressive Matrices scores, a magnitude
similar to the .57 correlation observed between the Moray House and Raven‘s tests
administered in 1998.
Although cognitive ability scores do appear to be relatively stable over time, there
is a general pattern whereby scores within persons appear to be considerably more stable
over shorter time periods (more proximal) vs. longer (more distal) time periods.
Research on Gf, Gc, and age offers some illumination into this phenomenon.
Cognitive Ability and Age
Corno et al. (2002) maintain that although Cattell‘s initial (1940) distinction
between fluid and crystallized intelligence attracted some attention shortly after its
release, it was not until the 1960‘s that the distinction between Gf and Gc became

46
Table 2. Stability of General Cognitive Ability Scores Over Time
Study Interval
(Years)
Mean Age
(Initial Test)
Mean Age
(Retest) N Test
Test-retest r
(Observed)
Deary et al. (2000) 66 11 77 101 Moray House Test .63
Dauphinais & Bradley (1979) 49 13 62 80 Stanford-Binet/WAIS .62
Owens (1966) 42 19 61 96 Army Alpha .78
31 19 50 96 Army Alpha .79
11 50 61 96 Army Alpha .92
Schwartzman et al. (1987) 40 25 65 260 Revised Examination
―M‖
.78
Kangas & Bradway (1971) 38 4 42 48 Stanford-Binet .41
28 14 42 48 Stanford-Binet .68
13 29 42 48 WAIS .73
Nisbet (1957) 24 22 47 141 Simplex Group Test .48
Honzik & Macfarlane (1973) 22 18 40 110 Weschler-
Bellevue/WAIS
.74
Mortensen & Kleven (1993) 20 50 70 141 WAIS .90
10 50 60 141 WAIS .94
10 60 70 141 WAIS .91
Tuddenham et al. (1968) 13 30 43 164 AGCT .64-.79
Dodrill (1983) 5 33 38 30 Wonderlic .94
5 33 38 30 WAIS .96

47
47
prominent. Corno et al. argue that this newfound prominence can largely be attributed to
research by Horn and Cattell (e.g., Horn & Cattell, 1966; Horn & Cattell, 1967) that
showed Gf and Gc demonstrate differential relationships with age.
Using data from a sample of 297 adults, Horn and Cattell (1966) observed a
general pattern whereby Gf abilities correlated negatively with age while Gc abilities
correlated positively with age. Horn and Cattell (1967) used the same sample to examine
this ability-age phenomenon in more detail. Horn and Cattell (1967, p. 124) noted that
much of the earlier research on age and intelligence appeared contradictory: ―Several
studies have shown that intelligence declines with age in adulthood, others have shown
that it increases, and still others have shown that it remains more or less constant.‖ Horn
and Cattell argued that these different findings could be explained by the fact that earlier
studies measured Gf and Gc to differing degrees. A large volume of subsequent research
has utilized the Gf – Gc framework to examine the relationship between age and
intelligence. As shown in the discussion which follows, findings have largely been
consistent with Horn and Cattell‘s (1966, 1967) initial observations. On average,
Performance IQ scores (largely analogous to Gf) have been found to decline substantially
with age while scores on verbal measures (largely analogous to Gc) have been found to
remain relatively stable (Wang & Kaufman, 1993). Botwinick (1977) has referred to this
as the ―classic intellectual aging pattern‖ (although Wang and Kaufman point out that he
attributed the phenomenon to speeded vs. non-speeded tasks rather than the Gf – Gc
dichotomy).

48
48
Gf and Age
On average, Gf has been found to increase throughout young adulthood, peaking
between ages 26 and 35, after which time it begins a period of steady, continuing decline
(Kaufman, Johnson, & Liu, 2008; Wang & Kaufman, 1993). Horn and Blankson (2005,
p. 48-49) note that decline in fluid ability has been observed in multiple types of Gf test
measures including syllogisms and concept formation (e.g., McGrew, Werder, &
Woodcock, 1991), metaphors and analogies (e.g., Salthouse, Kausler, & Saults, 1990),
number, letter, and figure series (e.g., Babcock, 1994; Noll & Horn, 1998; Salthouse et
al., 1990), and mental rotation and matrices (e.g., Babcock, 1994; Cattell, 1979). The
relationship between age and performance on the Raven‘s Advanced Progressive
Matrices (RAPM) is particularly illustrative of this pattern of decline. For example
Babcock (1994) administered the RAPM to 183 adults between the ages of 21 and 83.
She found that age correlated -.46 with RAPM performance. Age-related declines in Gf
have largely been attributed to decrements in working memory, processing speed, and
rule application (Babcock, 1994; Salthouse, 1991). Given that Gf demonstrates
substantial decline throughout much of adult age range, Horn and colleagues (Horn,
1991; Horn & Blankson, 2005) have referred to it as a vulnerable ability (Horn &
Blankson, 2005). Working memory (Gsm/SAR) and processing speed (Gs) are also
classified as vulnerable abilities.

49
49
Gc and Age
In contrast to fluid ability, crystallized ability has been found to increase with age
throughout most of adulthood (e.g., Harwood & Naylor, 1971; Horn, 1998; Horn &
Cattell, 1967; Horn & Hofer, 1992; Kaufman et al., 2008; Rabbitt & Abson, 1991;
Schaie, 1996; Stankov, 1988; Stankov & Horn, 1980; Wang & Kaufman, 1993). Gc has
been estimated to increase until approximately age 70 (Schaie, 1996), after which it may
decrease slightly. However, some studies (e.g., Harwood & Naylor, 1971) have found
that Gc may continue to increase even into the 80s. Along these same lines, compared
with young adults, middle-aged adults have been found to score significantly higher on
assessments of domain-specific knowledge (Ackerman, 2000). Given that Gc
demonstrates little or no decline throughout much of the age range, Horn and colleagues
(Horn, 1991; Horn & Blankson, 2005) have referred to it as a maintained ability.
Evidence also suggests that long-term memory (Glm/TSR) and reading/writing (Grw) are
also maintained abilities (Horn & Blankson, 2005; Kaufman et al., 2008). A summary of
the age differences in broad abilities during adulthood is presented in Figure 11 (from
Horn, 1986, p. 52, Figure 2.3).
Improving Scores on Measures of Fluid Intelligence
Given that fluid intelligence is known to decline throughout adulthood, there has
been increasing interest in the extent to which this decline can be retarded or reversed.
Training interventions have been advanced as one such mechanism by which this might
occur. Two recent studies have examined the extent to which fluid intelligence scores can

50
50
Figure 11. Age Differences in Broad Abilities During Adulthood
Source: Adapted fron Horn (1986, p. 52, Figure 2.3)
be increased through training. Basak, Boot, Voss, and Kramer (2008) examined this
issue in a sample of 19 older adults (mean age = 70.05, SD 4.94). Participants
participated in 23.5 hours of training in a real-time strategy video game, Rise of Nations.
When compared to a control group of 19 individuals who did not receive training,
trainees displayed score increases (from 44% of items correct pre-training to 59% of
items correct post-training) on an abbreviated measure of the Raven‘s Advanced
Progressive Matrices. No increases in Gf were observed for individuals assigned to the
control group.

51
51
In a similar study, Jaeggi, Buschkuehl, Jonides, and Perrig (2008) investigated the
effect of working memory training on fluid intelligence scores. Participants were young
adults (mean age 25.6, SD 3.3) who completed between 8 and 19 days of training on a
demanding working memory task (a computer-administered dual n-back task; Jaeggi et
al., 2007). Compared with individuals assigned to matched control groups, trainees
displayed greater increases on a shortened measure of fluid intelligence (either the
Ravens‘ Advanced Progressive Matrices or the Bochumer-Matrizen Test). Jaeggi et al.
(2008, p. 6831) propose that this training-related gain in Gf ―emerges because of the
inherent properties of the training task.‖ That is, the working memory task may have
engaged executive processes and increased participants‘ ability to control attention.
Recent research by Bors and Vigneau (2003) has shown that tests of fluid ability
are subject to substantial practice effects. These researchers administered the Raven‘s
Advanced Progressive Matrices to a sample of 67 individuals on three separate occasions.
They found that subjects correctly answered an average of approximately two additional
questions (out of 36 possible) with each subsequent administration of the test. Further,
fewer questions were left unanswered during later test administrations. Bors and
Vigneau (2003, p. 301) found that the individual RAPM item reliabilities were quite low,
suggesting that ―the improvements in performance were not based on the acquisition or
on the retention of item-specific information, but rather on the development or refinement
of some process or activity more general in nature.‖ Thus, it appears individual
performance on Gf tests may improve as persons become accustomed to what initially
appears to be a novel question format. Greenfield (1998) has argued that global rises in
nonverbal IQ (i.e., the Flynn effect; Flynn, 1987) in Western countries can be explained

52
52
by the fact that individuals have become increasingly exposed to communication
technology in the form of TV, film, computers, and video games. She proposes that the
iconic imagery and visual-spatial content of these modern communication modalities
have resulted in fluid intelligence items, such as matrix reasoning problems, being
viewed as less novel than in earlier times.
A recent study by Fox and Charness (2010) demonstrates that even simple
variations in the way fluid ability tests are measured can impact the scores that are
obtained. These researchers administered a shortened version of the Raven‘s Advanced
Progressive Matrices and other cognitive tests to samples of older (mean age = 73) and
younger (mean age = 19) adults. Compared with older adults who completed the tests in
the typical manner, older adults who were instructed to think aloud while taking the test
performed significantly better (d = .73 and d = .92) on the RAPM. According to the
authors, this equates to a score gain of approximately 11 IQ points. Similar gains were
not observed for tests other than the RAPM, nor were these effects found in the young
adult sample. A limitation of the study was that the researchers did not examine within-
person score improvements. Each participant completed the RAPM only once (under
either the standard or talk aloud condition), and conclusions were drawn based on
standardized differences of the randomly assigned group means. Further, as is typical in
experimental research, sample sizes were quite small thereby increasing the possibility
that the results obtained were due to sampling error.
The results of these studies suggest that scores on fluid ability tests are malleable
to some degree. However, there has yet to be research establishing whether gains in Gf
are long-lasting rather than temporary. More importantly, research has not yet

53
53
established whether any of the observed gains in Gf demonstrate appreciable
relationships with real-world outcomes, such as increases in daily functioning, learning,
or job performance. Given that Gf is posited to have a biological basis, it is unlikely that
training, practice, or administration manipulations would meaningfully impact the
underlying trait. Consistent with this line of reasoning, a recent meta-analysis by te
Nijenhuis, van Vianen, & van der Flier (2007) suggests score gains on cognitive tests are
not related to g.
What are the implications of these findings for Gf – Gc theory? The theory
includes both the theoretical notion of Gf and the proposition that certain types of tests or
items (e.g., the Raven‘s) measure Gf. The theory postulates that Gf is basic and is not
dependent on learning, while Gc and its measures directly reflect past learning. At
minimum, these findings show that Gf measures have a problem: they should not be
affected by learning and practice but they are. This seems to make it impossible to
measure Gf independent of past learning and practice.

54
54
CHAPTER 3
HYPOTHESIS DEVELOPMENT
Chapter Overview
In this chapter I consider the criterion-related validity of fluid and crystallized
ability in the context of research on past performance, the nature of work, and expert
performance. I conclude the chapter by arguing that compared to measures of fluid
ability, crystallized ability measures should more strongly predict real-world criteria such
as academic, training, and job performance. In developing my hypotheses, I adopt the
perspective of General Mental Ability Theory. That is, I conceptualize Gf and Gc not as
unique types of intelligence, but rather as indicators of the higher-order construct of g.
The Criterion-related Validity of
Fluid and Crystallized Ability
Thus far, the vast majority of the discussion regarding the relative importance of
Gf and Gc has been structural in nature. That is, researchers have largely focused on the
results of exploratory and confirmatory factor analyses. As discussed earlier, a large
body of research has also focused on the relative stability of fluid and crystallized
abilities during adulthood. Although these areas of inquiry can indeed be informative,
structural evidence and age-related evidence alone do not present a complete picture of
the relative importance of Gf and Gc, nor do they address the actual usefulness of these
constructs for predicting performance in the real world. The current study adopts a
different approach by focusing on the criterion-related validity of ability constructs
within the Cattell-Horn-Carroll (CHC) framework. Specifically, I will examine the

55
55
extent to which Gf and Gc are related to real-world outcomes including academic
performance, training performance, and job performance. Because Gf and Gc are
conceptualized as independent, albeit related, constructs, they are expected to relate
differently to external measures of performance (Horn & Blankson, 2005). That is, Gf
and Gc should display different criterion-related validities.
A number of earlier meta-analyses and quantitative reviews have examined the
relationship between cognitive ability and academic performance (e.g., Kuncel & Hezlett,
2007; Kuncel, Hezlett, & Ones, 2001, 2004; Sackett, Borneman, & Connelly, 2008),
vocational training performance (e.g., Ghiselli, 1966; Ree & Earles, 1991; Schmidt &
Hunter, 1998), and job performance (e.g., Ghiselli, 1966; Hunter, 1986; Hunter & Hunter,
1984; Salgado et al., 2003a; Schmidt & Hunter, 1998). These studies have found that
cognitive ability is one of the best predictors of real-world performance. However, no
previous meta-analyses have examined the ability – performance relationship using the
CHC framework. Thus, the summary evidence of the relative validity of Gf and Gc has
been extremely sparse and anecdotal in nature (e.g., Jensen, 1998).
Further, although there are several exceptions, theorists have been generally silent
with regard to the issue of criterion-related validity. Since fluid intelligence has played a
central role in theoretical and structural models of intelligence, one might assume that Gf
measures will be expected to predict real-world performance to a greater extent than Gc
measures. Indeed, a number of researchers have operationalized cognitive ability using
only Gf measures (e.g., Côté & Miners, 2006; DiFabio & Busoni, 2007; DiFabio &
Palazzechi, 2009). However, I argue that the opposite pattern of results is more likely to
be the case. There are a number of reasons to expect that crystallized ability measures

56
56
will be the stronger predictors of performance. In outlining this argument I draw on
research literatures that have examined past performance, the nature of work
performance, the development of expertise, and the relationship between age and job
performance.
Past Performance
Fluid ability primarily reflects an ability to deal with novel information. In
contrast, crystallized ability reflects the extent and efficiency with which one has learned
in the past. As such, Gc measures serve as broad and robust indicators of past
performance. One of the most established phenomena in psychology is that performance
in the past is one of the best predictors of performance in the future (e.g., Locke,
Frederick, Lee, & Bobko, 1984; Oullette & Wood, 1998; Triandis, 1977, 1980). For
example, grades attained during high school are particularly good predictors of grades
attained during college (Harris, 1940; Hezlett et al., 2001). Likewise, undergraduate
GPA has been found to predict a number of desirable academic outcomes for graduate
students including overall graduate GPA, first-year graduate GPA, comprehensive exam
performance, faculty ratings of performance, degree attainment, and time to degree
completion (Kuncel et al., 2001). More recent research has suggested that the quality of
management scholars‘ early publications is strongly related to the quality of their later
publications (r = .62; Bedeian, Cavazos, Hunt, & Jauch, 2010). According to GCA
theory, past performance predicts future performance because both share the same cause:
g or GCA.

57
57
An alternate, and more behavioristic, explanation for the relationship between
past and future performance has been offered by Oullette and Wood (1998). They have
shown that past behavior impacts future behavior through two primary processes, habit
and intention:
Well-practiced behaviors in constant contexts recur because the processing that initiates and controls their performance becomes automatic. Frequency of past behavior then reflects habit strength and has a direct effect on future performance. Alternately, when behaviors are not well learned or when they are performed in unstable or difficult contexts, conscious decision making is likely to be necessary to initiate and carry out the behavior. Under these conditions, past behavior (along with attitudes and subjective norms) may contribute to intentions, and behavior is guided by intentions. (p. 54)
Gc measures are efficient assessments of both the ability and non-ability (motivation,
time, opportunity, memory) aspects of past performance. This is a key idea in Cattell‘s
(1971/1987) Investment Model, whereby time, interests, and memory all contribute to
Gc. At least this is true for narrow or specific measures. As I discuss later, this
prediction of the theory may not hold for broad or generic measures of Gc. This idea also
underlies Ackerman‘s (1996) PPIK Theory. Individuals scoring high on Gc assessments
demonstrate that they not only have been able to learn material in the past, they were also
willing to invest time and energy to some extent in doing so. As a result, when
compared to Gf measures, Gc measures are expected to correlate more highly with real-
world performance, which is also determined by both ability and effort.
The Nature of Work
The very nature of work suggests that Gc measures will demonstrate superior
validity to Gf measures. Work performance is largely dependent on the mastery of a core

58
58
body of job knowledge, just as academic performance is largely dependent on the
mastery of a core body of subject knowledge. After an initial period of learning, work
becomes increasingly routine (Goldberg, 2005; Horn & Blankson, 2005). Although there
are certainly fields where workers encounter novelty to a greater degree (e.g., theoretical
physics, abstract mathematics, certain creative fields), these are the exception rather than
the rule. Hunter, Schmidt, and colleagues (e.g., Hunter, 1983; Hunter, 1986; Schmidt,
Hunter, & Outerbridge, 1986; Schmidt & Hunter, 1992; Schmidt & Hunter, 1993) have
demonstrated that cognitive ability does not impact supervisory ratings of job
performance directly, but rather does so indirectly through job knowledge:
the major causal impact of mental ability was not on performance capability (work sample performance), but rather on the acquisition of job knowledge. What appears to happen is this: People with higher mental ability acquire more job knowledge, and job knowledge, in turn, is the major determinant of work sample performance. (Schmidt & Hunter, 1992, p. 90).
Job knowledge refers to the extent to which workers are familiar with the tasks,
procedures, and other aspects necessary to successfully function in a particular job
(Schmidt et al., 1986). Meta-analyses have shown that performance on job knowledge
tests strongly correlates with job performance (ρ = .48; Schmidt & Hunter, 1998). Ree,
Carretta, and Teachout (1995) have found support for a similar model whereby g impacts
training performance through prior job knowledge as well as job knowledge gained
during training. As noted earlier, within the CHC framework job knowledge would be
considered a special case of crystallized ability (specific Gc). That is, it does not reflect
abstract reasoning (Gf) ability, but rather reflects specific knowledge that has been gained
through learning and experience.

59
59
Expert Performance
The growing literature on expertise development and expert performance also
supports the idea that crystallized ability is especially important in determining real-
world performance. Ericsson and Charness (1994, p. 731) define expert performance as
―consistently superior performance on a set of representative tasks for the domain that
can be administered to any subject.‖ Research has shown that expertise takes extensive
time to develop, at least 10 years in many cases (Ericsson & Charness, 1994; Ericsson &
Lehmann, 1996). Given requisite levels of cognitive ability, expertise development is
largely a function of the extent to which individuals have engaged in deliberate practice
(Ericsson, Krampe, & Tesch-Römer, 1993). Expert performance has been empirically
examined in a number of fields including chess (e.g., Charness, 1981; Chase & Simon,
1973; de Groot, 1946/1978), medicine (e.g., Norman, Coblentz, Brooks, & Babcock,
1992; Patel & Groen, 1991; Schmidt, Norman, & Boshuizen, 1990), accounting (e.g.,
Johnson, Jamal, & Berryman, 1991; Johnson, Grazioli, Jamal, & Zualkerman, 1992), and
typewriting (Genter, 1988; Salthouse, 1986).
A wealth of research indicates that experts reason differently than novices
(Ericsson & Charness, 1994; Ericsson & Lehmann, 1996; Horn & Blankson, 2005).
Novices tend to approach problems inductively. That is, they reason backward in their
search for a solution (Ericsson & Charness, 1994). This is the type of reasoning
characteristic of Gf (Horn & Blankson). In contrast, experts tend to employ deductive or
forward reasoning. This type of reasoning relies on the complex, stored knowledge that is
characteristic of Gc. According to Ericsson and Charness (1994, p. 734), ―experts form
an immediate representation of the problem that systematically cues their knowledge.‖

60
60
A 1993 study by Rabbitt illustrates the relationship (or rather the lack thereof)
between Gf and expert performance. Rabbitt examined the relationship between age, Gf,
and the ability to solve crossword puzzles. Among novices, puzzle performance was
negatively correlated with age (r = -.25) and strongly correlated with Gf (r = .72).
However, among crossword experts, puzzle performance was positively correlated with
age (r = .24) and uncorrelated to Gf. Gf appears to play little role in performance among
experts. Thus, fluid abilities become less important as crystallized abilities develop.
Experts continue to develop these complex, domain-specific crystallized knowledge
structures over their lifetimes. For example, Charness (1981) showed that older expert
chess players were able to identify optimal chess moves with less planning than younger
expert players of approximately the same skill level. Charness suggests this is possible
because older experts have more extensive domain knowledge.
Horn and Blankson (2005, p. 61) argue that
it is possible that increase in expertise abilities necessarily results in decline in nonexpertise abilities, for the devotion of time, energy, and other resources to the development of expertise may of necessity take time, energy, and other resources away from maintenance of Gf, SAR, and Gs.
However, Ericsson and Charness (1994, p. 731) review evidence which suggests another
possibility: ―acquired skill can allow experts to circumvent basic capacity limits of short
term memory and of the speed of basic reactions, making potential basic limits
irrelevant.‖
Age and Job Performance
Research on age and job performance also supports the idea that crystallized
ability is superior to Gf in determining job performance. In a recent meta-analysis, Ng
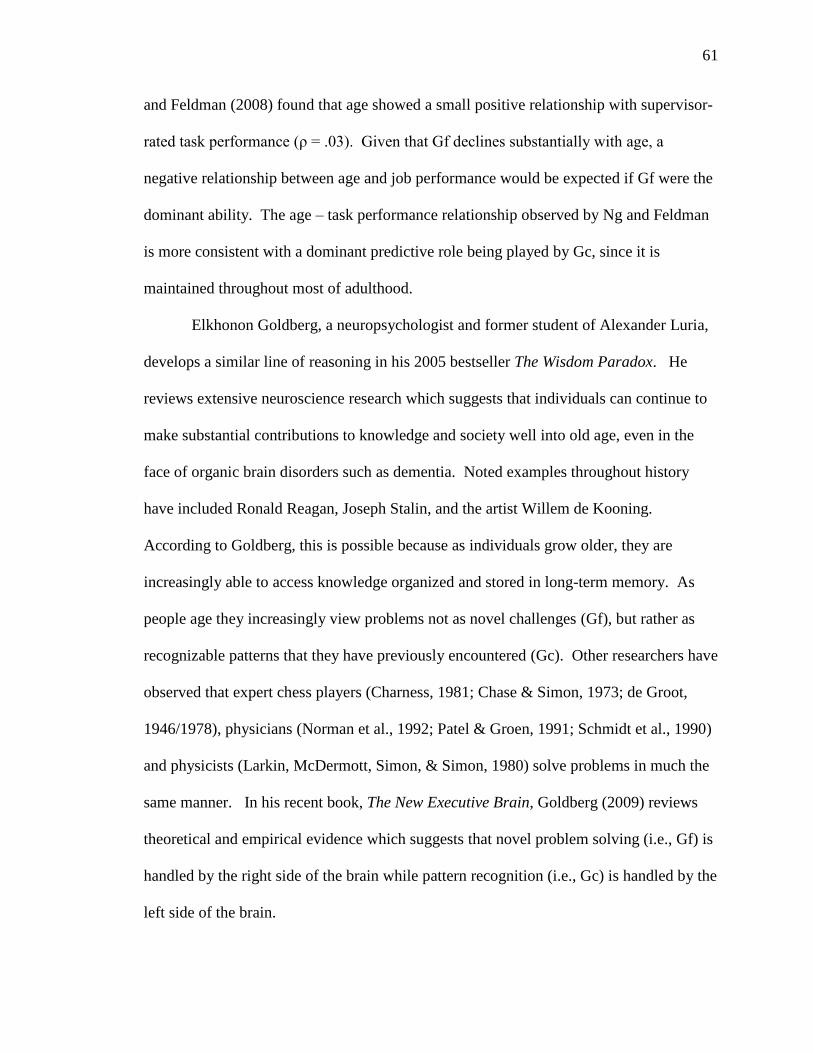
61
61
and Feldman (2008) found that age showed a small positive relationship with supervisor-
rated task performance (ρ = .03). Given that Gf declines substantially with age, a
negative relationship between age and job performance would be expected if Gf were the
dominant ability. The age – task performance relationship observed by Ng and Feldman
is more consistent with a dominant predictive role being played by Gc, since it is
maintained throughout most of adulthood.
Elkhonon Goldberg, a neuropsychologist and former student of Alexander Luria,
develops a similar line of reasoning in his 2005 bestseller The Wisdom Paradox. He
reviews extensive neuroscience research which suggests that individuals can continue to
make substantial contributions to knowledge and society well into old age, even in the
face of organic brain disorders such as dementia. Noted examples throughout history
have included Ronald Reagan, Joseph Stalin, and the artist Willem de Kooning.
According to Goldberg, this is possible because as individuals grow older, they are
increasingly able to access knowledge organized and stored in long-term memory. As
people age they increasingly view problems not as novel challenges (Gf), but rather as
recognizable patterns that they have previously encountered (Gc). Other researchers have
observed that expert chess players (Charness, 1981; Chase & Simon, 1973; de Groot,
1946/1978), physicians (Norman et al., 1992; Patel & Groen, 1991; Schmidt et al., 1990)
and physicists (Larkin, McDermott, Simon, & Simon, 1980) solve problems in much the
same manner. In his recent book, The New Executive Brain, Goldberg (2009) reviews
theoretical and empirical evidence which suggests that novel problem solving (i.e., Gf) is
handled by the right side of the brain while pattern recognition (i.e., Gc) is handled by the
left side of the brain.

62
62
Primary Hypotheses
In sum, current theory and empirical evidence supports the following
hypothesized patterns of criterion-related validity:
Hypothesis 1a: Compared to fluid ability (Gf) measures, crystallized ability (Gc)
measures will more strongly predict academic performance.
Hypothesis 1b: Compared to fluid ability (Gf) measures, crystallized ability (Gc)
measures will more strongly predict vocational training
performance.
Hypothesis 1c: Compared to fluid ability (Gf) measures, crystallized ability (Gc)
measures will more strongly predict job performance.
Although validities for Gf and Gc measures will be analyzed separately whenever
possible, many extant measures of cognitive ability do not measure Gf or Gc separately.
These assessments are ―blended measures‖ that tap both fluid and crystallized abilities,
either proportionately or disproportionately. Such assessments are often presented as
General Cognitive Ability or overall IQ (e.g., Full-Scale WAIS IQ). As previously noted,
Hunt (2000, p. 126) has argued that many ability assessments used for selection are likely
to have a heavy Gc loading. This line of reasoning is supported by scholars such as
McGrew (1997, 2005) and Alfonso et al. (2005) who have noted that historically, many
of the major test batteries have not included adequate measures of Gf.
In essence, overall, blended, or GCA estimates are composites of their constituent
indicators. According to g theory, the General Mental Ability factor emerges when two
or more specific abilities are measured. As noted previously, specific abilities (such as
verbal, quantitative, or technical ability) are merely indicators of a latent general factor.

63
63
Gf and Gc are also indicators of this latent general factor g. The larger and more diverse
the number of indicators used, the more construct valid will be the final estimate of g. In
turn, the g measure should be a stronger predictor of performance when tests sample from
a diverse set of cognitive abilities rather than a single, narrow, specific aptitude. That is,
as the number of indicators of g increases, so does its predictive power. Using this line of
reasoning, a cognitive test measuring both fluid and crystallized ability should be a better
measure of g than either fluid or crystallized ability in isolation. In sum, because they
sample from more abilities (or indicators), blended, or GCA measures are expected to be
stronger predictors of performance than Gf measures, and equal or stronger predictors of
performance than Gc measures:
Hypothesis 2a: Overall, blended, or GCA measures will be stronger predictors of
academic performance than fluid ability (Gf) measures, and equal
or stronger predictors of academic performance than crystallized
(Gc) measures.
Hypothesis 2b: Overall, blended, or GCA measures will be stronger predictors of
vocational training performance than fluid ability (Gf) measures,
and equal or stronger predictors of vocational training
performance than crystallized (Gc) measures.
Hypothesis 2c: Overall, blended, or GCA measures will be stronger predictors of
job performance than fluid ability (Gf) measures, and equal or
stronger predictors of job performance than crystallized (Gc)
measures.

64
64
Testing these hypotheses will provide important information regarding which
indicators are more closely related to academic, training, and job performance. That is,
testing these hypotheses will increase our understanding of whether or not one‘s
performance at school and in the workplace is linked more closely to the ability to solve
novel problems (Gf), or whether it is more strongly linked to his or her ability to establish
and access patterns of acquired knowledge and information in the environment (Gc).
Furthermore, since both Gf and Gc tests are currently being used for assessment and
selection purposes, obtaining accurate estimates of operational validity will provide
practitioners with useful information for choosing the most efficient selection tool.
Supplemental and
Confirmatory Hypotheses
High vs. Low Stakes Testing
One of the assumptions underlying ability testing is that individuals exert
maximal effort during testing. Thorndike (1924, p. 224) captured this idea nearly a
century ago: ―All our measurements assume that the individual in question tries as hard
as he can to make a high a score as possible…however, we rarely know the relation of
any person‘s effort to his possible maximum effort.‖ Revelle (1993, pp. 352-353) has
noted that ―although individual differences in cognitive ability are assumed to exist,
differences in motivation are ignored.‖ Nevertheless, test motivation may impact the
means and standard deviations of cognitive test scores. In a recent Proceedings of the
National Academy of Science article, Duckworth and colleagues (Duckworth, Quinn,
Lynam, Loeber, & Stouthamer-Lober, 2011) have argued that under certain

65
65
circumstances, differences in motivation will affect not only the scores on cognitive tests,
but their validities as well.
A major factor that may affect test motivation is the circumstances or stakes of the
testing. Although most individuals should be motivated during high stakes testing (such
as when tests are administered for selection or promotion purposes), individuals may be
less motivated when tests are administered for low-stakes purposes such as research.
Duckworth et al. (2011) recently examined the role of test motivation in intelligence
testing in a two-part study. Their first study was a meta-analysis (k = 46, N = 2,008)
which examined the role of incentives on IQ test scores. They found that offering
incentives to test-takers resulted in higher mean baseline IQ scores (g = .64, 95% CI = .39
- .89)3. Further, this effect was stronger for samples with a lower mean IQ (g = .94, 95%
CI = .54 – 1.35) vs. a higher mean IQ (g = .26, 95% CI = .10 – .41). Thus, test
motivation appears to be more of an issue with lower IQ subjects. It is important to note
that the majority of the subjects included in the analysis were children under the age of 12
who were offered monetary or other incentives for better test performance. It is unclear
whether or not this effect would also be visible when scores on high stakes
(selection/assessment) vs. low stakes (research) tests are compared in a natural or field
setting.
Duckworth et al.‘s (2011) second study examined the relationships between IQ,
test motivation, and subsequent life outcomes (academic achievement, criminal
convictions, employment) in a sample of 251 adolescent boys (mean age = 12.5) from the
Note: g = Hedge‘s gamma, a value comparable to Cohen‘s d, but corrected for small-sample size

66
66
Pittsburgh Youth Study. Each subject was videotaped while taking a short form of the
Wechsler Intelligence Scale for Children (WISC-R). The test motivation of the subjects
was rated by trained observers who viewed 15-minute, thin-slice video segments for each
subject. Follow-up information was attained in early adulthood (ages 24-26). IQ and
ratings of test motivation were found to correlate at .26. Further, IQ and ratings of test
motivation (TM) were both found to correlate with a number of outcomes including
academic performance (r IQ = .70, r TM = .31), years of education (r IQ = .47, r TM =
.24), employment (r IQ = .21, r TM = .21), and criminal convictions (r IQ = -.42, r TM =
-.18). The authors used structural equation modeling to examine the effects of IQ and
test motivation. Their results suggested that ―failing to account for the influence of
motivation on IQ scores resulted in an overestimation of the association between latent
intelligence and all four life outcomes…‖ (Duckworth et al., 2011, p.7718). This effect
was less pronounced for academic outcomes (academic achievement, years of education)
than for nonacademic outcomes (employment, criminal convictions). In addition, the
authors point out that after controlling for test motivation, intelligence remained a
statistically significant predictor for all outcomes. Drawing on the results of both studies,
Duckworth et al. (2011, p. 7718) concluded that
test motivation poses a less serious threat to the internal validity of studies using higher-IQ samples, such as college undergraduates… On the other hand, test motivation may be a serious confound in studies including participants who are below-average in IQ and who lack external incentives to perform at their maximal potential.
Duckworth et al‘s findings suggest that for high school students, cognitive ability
tests should display lower observed validities under high stakes testing conditions since
the test motivation of subjects should be more uniform. Given this, standard deviations

67
67
of cognitive tests administered under high stakes conditions should be smaller, resulting
in greater range restriction (i.e., smaller ux values). In contrast, cognitive ability tests
should demonstrate higher observed validities under low stakes testing conditions due to
the variable effects of test motivation, which in turn produce more variability in test
scores (i.e., higher ux values). In college samples, low stakes and high stakes cognitive
ability tests should demonstrate similar validities, since students in these samples tend to
have higher IQs and research has demonstrated that test motivation has less of an effect
on test scores for high ability individuals.
Given this, the following supplemental hypotheses are proposed:
Hypothesis 3a: For high school students, compared to high stakes cognitive
ability tests, low stakes cognitive ability tests will display larger
observed validities.
Hypothesis 3b: For college students, high stakes and low stakes cognitive ability
tests will demonstrate similar observed validities.
Occupational Complexity
Although cognitive ability is a valid predictor of job performance across all
occupations, previous research has shown that this validity increases as the level of
occupational complexity increases (e.g., Ghiselli, 1973; Hunter, 1980; Hunter & Hunter,
1984). The general argument for the observed phenomenon is that cognitive ability tests
are more valid predictors in complex jobs because these jobs have greater cognitive
demands (Hunter & Hunter, 1984; Schmidt & Hunter, 1998). In contrast, Hunter (1980;
Hunter & Hunter, 1984) has shown that psychomotor tests demonstrate the opposite

68
68
pattern of validities. That is, the validity of psychomotor tests increases as job
complexity decreases.
The most compelling evidence that cognitive test validities increase with
complexity has been presented by Hunter (1980; Hunter & Hunter, 1984), and is based on
his analysis of General Aptitude Test Battery (GATB) validity data. Using 515 GATB
validity studies, Hunter classified occupations into five complexity families using an
adaption of Fine‘s (1955) Data/Things dimensions that are available for all jobs in the
Dictionary of Occupational Titles. Hunter found that the validity of cognitive ability for
predicting job performance varied between categories, ranging from .23 for feeding/
offbearing jobs (low complexity jobs such as shrimp picker and cannery worker) to .58
for synthesizing/coordinating jobs (high complexity jobs such as biologist). However,
some scholars have questioned the adequacy of the five job families that Hunter utilized
(e.g., Hartigan & Wigdor, 1989). Given this, occupations in the current study will be
classified using the O*NET Job Zone system, which is described in detail in the
following chapter. Validities will then be assessed for high, medium, and low complexity
jobs.
Interestingly, a similar gradient has not been observed for training performance
(Hunter, 1980; Hunter & Hunter, 1984). That is, when training performance is the
criterion, cognitive test validities at different complexity levels tend to be similar. This
finding suggests a potential ceiling effect, whereby cognitive ability predicts at or near its
maximum across all training situations. Given that Hunter‘s meta-analytic results were
based on a large number of primary studies (all of which used the GATB as a predictor),
a confirmatory hypothesis was developed along these lines (Hypothesis 4a).

69
69
Nevertheless, some studies have found that cognitive ability is a stronger
predictor of training performance for more complex occupations. For example, Brown,
Le, and Schmidt (2006) examined the validity of the ASVAB for predicting performance
in a number of Navy training schools. They found that the validity of cognitive ability
increased as the complexity of the training program increased. Specifically, they found
that the zero-order correlation between cognitive ability validity and length of training
program (a proxy measure for complexity) was .77 while the zero-order correlation
between cognitive ability validity and the ability requirements of the occupation (as rated
by experts) was .33. Brown et al.‘s finding suggests that the observed training validity
gradient may reflect the increased cognitive demands of more complex occupations.
Based on the previous research, the following confirmatory hypotheses are
proposed:
Hypothesis 4a: Cognitive ability measures will demonstrate similar validities
for training performance across job complexity levels.
Hypothesis 4b: Cognitive ability measures will be stronger predictors of job
performance for higher complexity occupations vs. lower
complexity occupations.
I describe the methods that I used to examine the primary and supplemental
hypotheses in the chapter which follows.

70
70
CHAPTER 4
METHODS
Chapter Overview
In this chapter I present the methods that I used to test the hypotheses presented in
the previous chapter. First, I provide an overview of how academic, training, and job
performance were operationalized in the current study. Next, I describe the literature
search process, coding procedures, and potential moderators. I then discuss the general
meta-analytic strategy I employed, as well as procedures for addressing data duplication,
predictor and criterion unreliability, and range restriction. I conclude the chapter by
reviewing the hypotheses developed in Chapter 3, and then describing how I tested each
of these hypotheses.
Operationalization of Criteria
Academic Performance
Individuals in the developed world spend a large portion of their early lives in
school. Consequently, a great deal of effort goes into evaluating academic performance.
A number of performance measures have been developed to measure academic success.
For example, in secondary school and college, academic performance can be measured
using grades, class rank, graduation status, membership in academic honor societies, and
performance on standardized achievement tests. These measures are also used to assess
performance at the graduate level, in addition to indicators such as faculty ratings,

71
71
comprehensive exam performance, number of publications, and time to degree
completion (Kuncel, Hezlett, & Ones, 2001).
However, at all educational levels grades are by far the most frequently used
method for assessing academic performance (Aiken, 1963; Fishman & Pasanella, 1960;
Hoyt, 1965; Kuncel et al., 2001). As Hoyt (1965) notes, grades are often the only way
performance is measured. Although grades are typically considered as criterion measures
of academic performance, they have also been shown to be useful as predictors of future
academic (e.g., Harris, 1940; Hezlett et al., 2001; Kuncel et al., 2001) and occupational
performance (Dye & Reck, 1988, 1989; Roth, Bevier, Switzer, and Schippmann, 1996;
Roth & Clarke, 1998). Further, research suggests that many hiring managers consider
applicants‘ grades when making employment decisions (Campion, 1978; Brown &
Campion, 1994; Dipboye, Fromkin, & Wiback, 1975; Oliphant & Alexander, 1982;
Reilly & Warech, 1993; Rynes, Orlitzky, & Bretz, 1997; Thoms, McMasters, Roberts,
and Dombrowski, 1999; Zikmund, Hitt, & Pickens; 1978), with higher grades typically
leading to more favorable evaluations (however, see McKinney, Carlson, Mecham,
D‘Angelo, and Connerley (2003) for a contrarian perspective).
Kuncel (2001) offers several additional reasons why grade point averages (GPAs)
are preferred measures of academic performance. First, GPAs reflect not only content
mastery, but also persistence and motivation. GPAs are largely under students‘ own
control and most students perceive them as important. Second, GPAs are based on
multiple ratings (course grades) based on multiple performance measures (exams,
projects, papers, etc.) assigned by multiple raters (instructors). Third, GPAs reflect
performance over an extended time period. Kuncel argues that these characteristics

72
72
produce ―a number of desirable results‖ such as relatively high internal consistency
reliabilities and temporal stability (p. 25). Based on these factors, and its wide
availability, GPA was chosen as the academic performance criterion of interest in the
current study.
Training Performance
Goldstein (1980) defines training as the ―acquisition of skills, concepts, or
attitudes that results in improved performance in an on-the-job environment‖ (p. 230). A
key component of this definition is its emphasis on application within work contexts, a
core feature which distinguishes training from broader, yet related, concepts such as
learning. Organizations invest in training to improve performance at the individual,
team, and organizational levels, and ―as organizations strive to compete in the global
economy, differentiation on the basis of the skills, knowledge, and motivation of their
workforce takes on increasing importance‖ (Aguinis & Kraiger, 2009, p. 452).
Investments in training are far from trivial (e.g., Bassi & Van Buren, 1999;
McKenna, 1990). For example, a recent American Society of Training and Development
(ASTD) report (Paradise, 2008) estimates that despite the economic downturn, firms in
the United States spent in excess of $134 billion, or an average of $1,068 per employee,
on employee learning initiatives in 2008. As these are only estimates for the U.S., the
total financial investment in training across the globe is substantially greater.
Although a number of frameworks have been proposed for evaluating training
programs, Donald Kirkpatrick‘s four-level model (1959a, 1959b, 1960a, 1960b) has been
the one most frequently adopted by practitioners (Alliger, Tannenbaum, Bennett, Traver,

73
73
& Shotland, 1997; Sugrue & Rivera, 2005; Twitchell, Holton, and Trott, 2001).
Although Kirkpatrick has subsequently revised and expanded upon his original
contribution (e.g., Kirkpatrick. 1976; Kirkpatrick, 1996; Kirkpatrick, 1998), his training
evaluation approach ―has remained basically the same‖ (Kirkpatrick, 1996, p. 54).
Kirkpatrick‘s four levels are concerned with trainee reactions, learning, transfer, and
financial and organizational results following training program implementation.
Despite its popularity among practitioners, Kirkpatrick‘s model has been
criticized for being atheoretical. Accordingly, additional theory-based models of training
evaluation have been developed. One of the most established of these models is the one
proposed by Kraiger, Ford, and Salas (1993). Kraiger et al.‘s model focuses on learning
as the primary objective of training (c.f., Campbell, 1988; Shuell, 1986). Kraiger et al.
propose a classification scheme by which learning can be classified into three categories
of outcomes: cognitive outcomes, skill-based outcomes, and affective outcomes.
Cognitive outcomes are the primary training criteria of interest in the current study.
These include verbal knowledge, knowledge organization, and cognitive strategies.
Cognitive outcomes are most frequently assessed via exams, the results of which are
often reported as grades. Skill-based outcomes focus on compilation and automaticity.
Skills are often measured using behavioral observation or skills testing. Finally, affective
outcomes are concerned with the attitudinal and motivational states of trainees. The
affective category includes ―all those learning outcomes that that are neither cognitively
based nor skill based‖ (Kraiger et al., 1993, p. 319). According to the Kraiger et al.
typology, the affective learning outcome category can be distinguished from reaction
measures (e.g., satisfaction with training or ―smile sheets,‖ Alliger et al., 1997; Brown,

74
74
2005; Kirkpatrick, 1998). Although they are not included in the affective learning
outcomes category, reaction data can indeed be useful to organizations (Brown, 2005;
Brown & Gerhardt, 2002; Ford & Wroten, 1984; Kraiger, 2002). Despite their utility,
both affective learning outcomes and reaction measures were considered to be beyond the
scope of the current study.
Job Performance
Contemporary scholars consider job performance to be a multidimensional
construct (e.g., Campbell, McHenry, & Wise, 1990; Hattrup, O‘Connell, & Wingate,
1998; Motowidlo & Van Scotter, 1994; Murphy, 1989; Rotundo & Sackett, 2002;
Viswesvaran & Ones, 2000), although there does also appear to be a general factor in job
performance ratings (Viswesvaran & Ones, 2000; Viswesvaran, Ones, & Schmidt, 2005).
In the current study, job performance was classified as either overall job performance, or
into one of the three broad dimensions of job performance outlined by Viswesvaran and
Ones (2000) and Rotundo and Sackett (2002). These dimensions include task
performance (Borman & Motowidlo, 1997; Fleishman, 1967; Motowidlo & Van Scotter,
1994; Murphy, 1989), organizational citizenship behavior (OCB; Brief & Motowidlo,
1986; LePine, Erez, & Johnson, 2002; Organ, 1997; Podsakoff, MacKenzie, Paine, &
Bachrach, 2000), and counterproductive work behavior (CWB; Gruys & Sackett, 2003;
Ones, Viswesvaran, & Schmidt, 1993; Robinson & Bennett, 1995; Sackett, 2002).
Although alternative models of job performance do exist (e.g., Griffin, Neal, & Parker,
2007), the task performance – OCB – CWB taxonomy is the most widely accepted and

75
75
utilized in the management and applied psychology literatures (Aguinis, 2008).
Accordingly, the current study used these as measures of job performance.
Literature Search
An extensive search was conducted to locate published and unpublished research
that has examined the relationship between cognitive ability and any of the three criteria
of interest: academic performance, training performance, or job performance. Multiple
search methods were utilized. These methods are described below.
Electronic Database Searches
Ben Postlethwaite and Tamara Giluk conducted a comprehensive search of
PsycINFO (1887 – 2009) using a combination of predictor and criterion keywords.
Predictor keywords included cognitive ability, general mental ability, intelligence, fluid
intelligence, and crystallized intelligence. Criterion keywords included performance,
academic performance, grades, GPA, training performance, job performance. This
initial search resulted in over 26,000 abstracts. Each abstract was examined for relevance
and copies of over 1,000 potential studies were obtained. In addition, similar paired
keyword searches were conducted using Google Scholar.
Electronic searches were also conducted using additional databases including
EBSCOhost (Academic Search Elite), ProQuest, ERIC, JSTOR, and Web of Science as
well as publisher-specific databases including Elsevier ScienceDirect, Emerald Library,
Informaworld, IngentaConnect, and Wiley Interscience. An extensive search for
unpublished dissertations and theses from the United States was made using ProQuest

76
76
Dissertations and Theses. Foreign dissertations were located using electronic resources
such as the Australasian Digital Theses Program, EThoS (United Kingdom), Theses
Canada, and the Center for Research Libraries Foreign Doctoral Dissertations.
Manual Searches
In addition, reference lists from prior qualitative (e.g., Harris, 1940) and meta-
analytic reviews (e.g., Aamodt, 2004, 2011; Bertua et al., 2005; Donnon, Paolucci, &
Violato, 2007; Hunter & Burke, 1994; Kuncel et al., 2001, 2004, 2007; Sackett, Kuncel,
Arneson, Cooper, & Waters, 2009; Salgado et al., 2003a, 2003b) and from all articles
identified for inclusion were searched manually along with the CVs of researchers active
in this area. A manual search of key education and psychology journals was also
conducted. These journals included Educational and Psychological Measurement,
Journal of Applied Psychology, and Personnel Psychology. Finally, reverse citation
searches of prior reviews, book chapters, and studies previously identified for inclusion
were conducted using Web of Science and Google Scholar. To date, approximately
1,800 potentially usable studies have been located using the search strategies described
above. This total includes over 400 of the original written reports for the General
Aptitude Test Battery (GATB) validation studies conducted by the United States
Employment Service between the late 1940‘s and early 1970‘s. A somewhat larger set of
these studies (some of the original written reports are no longer publicly available) was
previously analyzed by Hunter (1980, k = 515). The 515 Hunter studies, along with an
additional 264 newer GATB studies were analyzed by a special National Research

77
77
Council committee tasked with investigating the validity of the GATB (Hartigan and
Wigdor, 1989).
Inclusion Criteria
Each study identified during the literature search as having potential for inclusion
was evaluated against several a priori criteria. First, the study must have included at least
one measure of psychometric cognitive ability (e.g., fluid intelligence, crystallized
intelligence, general cognitive ability, IQ). Studies reporting results for specific cognitive
abilities or aptitudes (e.g., Brown, Le, & Schmidt, 2006) were retained if the specific
abilities, or a composite of those abilities, could be classified as being a measure of fluid
ability, crystallized ability, or general cognitive ability. Consistent with previous
research (e.g., Frey & Detterman, 2004; Koenig, Frey, & Detterman, 2008; Kuncel et al.,
2004; Sackett, Borneman, & Connelly, 2008), well-established examinations used for
undergraduate and graduate admissions purposes were treated as measures of cognitive
ability. Examples of such examinations used for admissions at the undergraduate level
include the ACT Assessment, the American Council on Education (ACE) Psychological
Examination, the Ohio State University Psychological Examination, and the Scholastic
Aptitude Test (SAT). Standardized examinations utilized at the graduate level include
the Dental Admission Test (DAT), Graduate Management Admissions Test (GMAT),
Graduate Record Examination (GRE), Law School Admission Test (LSAT), Miller
Analogies Test (MAT), and Medical College Admissions Test (MCAT). In addition to
containing a measure of cognitive ability, each study must have reported a correlation
between cognitive ability and one of the three performance criteria of interest: academic

78
78
performance, training performance, or job performance. If correlations between
cognitive ability and any of the three performance criteria were not provided, the study
must have reported alternate statistics that permit the calculation of correlations
(standardized mean difference scores, χ2 values, t or F test results). Further, to qualify for
inclusion in the meta-analysis, each study had to report sample size(s). Finally, to qualify
for inclusion, cognitive ability measures must have been obtained by the researchers
either directly (e.g., assessments administered by the researchers) or from reliable
archival sources (e.g., IQ scores found in official school records). Studies containing
only self-reported ability or admissions test scores were excluded.
When academic performance was the criterion, studies must have included some
measure of grades at the course, semester, or cumulative level (e.g., GPA), or have
reported student rankings that were determined solely on the basis of grades. Likewise,
grades must have been reported at the secondary level (U.S. high school grades 9-12 or
equivalent) or higher. Studies that only reported grades from students enrolled in
elementary or junior high schools (U.S. grades K-8 or equivalent) were excluded from
consideration. Likewise, for the purposes of the current study, studies examining
cognitive ability and graduate student performance were excluded. Thus, this study
examines the relationship between cognitive ability and academic performance for high
school and college students.
Although research has shown that self-reported grades are fairly consistent with
grades obtained from official school records (Kuncel, Credé, & Thomas, 2005), studies
were excluded if the grades reported were not obtained from official sources.
Furthermore, some studies have utilized alternate measures of academic performance

79
79
such as standardized achievement test scores, time to degree completion, and graduation
status. Such studies were excluded if a measure of grades was not also reported.
When training performance was the criterion, studies must have reported some
measure of cognitive, skill-based, or overall training performance (final training course
grade) that was obtained during or following completion of a vocational or on-the-job
training program. Since this dissertation focuses on the relationship between cognitive
ability and real-world performance, training studies conducted in a laboratory setting
were excluded. Studies containing only self-reports of learning following training were
excluded, as were affective reactions to training.
When job performance was the criterion, studies must have reported some
measure of objective (e.g., sales performance, productivity, absences) or subjective (e.g.,
peer or supervisor ratings of performance) job performance. Subjective job performance
was considered broadly, and included the dimensions described earlier: task performance,
organizational citizenship behavior (OCB), counterproductive work behavior (CWB), and
overall job performance. Studies containing only self-rated job performance were
excluded.
Data Set Reduction
Given the very large number of primary studies identified and obtained during the
literature search, the committee supervising this thesis suggested that I test the study
hypotheses using a representative sample of primary studies. Accordingly, for each
criterion of interest at least 100 independent samples (or the maximum number of
samples if k < 100) of Gc and GCA were coded and analyzed. For each criterion of

80
80
interest, all of the Gf samples identified during the literature search were coded and
analyzed. Likewise, when either training or job performance was the criterion, all of the
GCA samples identified during the literature search phase were coded. For the remaining
predictor – criterion pairs (GCA and academic performance; Gc and academic, training,
and job performance) a representative sample of primary studies was selected. In
choosing these studies, emphasis was placed on the extent to which the predictor
measures were a good measure of either Gc or GCA. Studies in which scales were not
adequately described were eliminated. Further, an attempt was made to draw studies
from multiple time periods. Finally, studies were not selected based exclusively on the
above factors and not on their reported validities. In sum, while these studies were not
chosen purely at random, they are representative of those found in the larger data set.
The final data set consisted of validities gathered from 419 unique primary
studies. Some studies contained multiple independent samples. Likewise, some studies
reported data for both job and training performance. Details for the final data set are as
follows:
Academic Performance (132 studies)
Gf – 34 studies (k = 67, N = 7,991)
Gc – 65 studies (k = 157, N = 199,642)
GCA – 54 studies (k = 110, N = 29,739)
Training Performance (81 studies)
Gf – 15 studies (k = 20, N = 3,724)
Gc – 65 studies (k = 114, N = 38,793)
GCA – 18 studies (k = 24, N = 7,563)

81
81
Job Performance (229 studies)
Gf – 12 studies (k = 23, N = 3,273)
Gc – 156 studies (k = 199, N = 18,619)
GCA – 53 studies (k = 84, N = 8,070)
Coding
The coding of studies entailed a two phase process. The first phase involved the
initial coding of primary studies according to predetermined criteria. The second phase
was concerned with classifying each cognitive ability measure identified in the first phase
into one of three types of ability: fluid, crystallized, or general cognitive ability. Each
phase will be discussed in turn.
Phase One:
Initial Coding of Studies
Each primary study was coded for basic variables including author(s), year,
journal/publication title with volume and page numbers, and outlet type (e.g., journal
article, conference presentation, book chapter, technical manual, thesis/dissertation). For
each independent sample reported in the study, a brief description of the sample was
recorded along with sample size, the country of data collection, and a summary of
demographic details (sex, race, and age). All relevant predictors and criteria were listed,
along with means, standard deviations, and reliabilities (and reliability type) when such
information was provided. Time intervals between the collection of predictor and criteria
measures were recorded if reported in the primary study. Relevant moderators were
coded according to the guidelines presented later in this chapter. For each predictor-

82
82
criterion relationship, correlations, or other measures of effect size converted to
correlations, were recorded. During this phase, cognitive ability measures (predictors)
were recorded by assessment name and test form (e.g., GATB - General Aptitude Test
Battery - Form B-1001; or, Raven‘s Advanced Progressive Matrices – 1938 Series). As
unique cognitive ability measures were encountered, they were added to a master list
containing all cognitive ability measures.
I personally coded the majority (>80%) of samples included in the data set. To
assess coding reliability, a minimum of 10% of all independent samples were double
coded by an additional trained coder (Tamara Giluk). Initial agreement on key coding
categories (e.g., study design, cognitive ability measure, criteria, and effect size)
exceeded 95%. Any disagreements were resolved through discussion. Dr. Giluk was the
sole coder for approximately 20% of the samples included in the final data set, although I
frequently verified this data during data entry.
Phase Two: Classification of
Cognitive Ability Measures.
During the second phase, in consultation with Frank Schmidt, Tamara Giluk and I
classified each unique cognitive ability measure identified in Phase One into one of three
ability categories: fluid, crystallized, or general cognitive ability. Cognitive ability
measures not classified into one of these categories were disregarded for the purposes of
the current study. After agreement on measure classification was reached, the
classification information was matched to the Phase One data. It was believed that
classifying cognitive ability measures separately after all the unique tests had been
identified increased the accuracy of coding decisions, as all attention was devoted to the
83
83
task. Furthermore, additional details about the nature of the measures emerged
throughout the phase one coding process. In situations where the classification of a
measure was unclear, the measure in question was discussed with Frank Schmidt. An
effort was made to only retain measures that clearly reflected the constructs of fluid,
crystallized, and general cognitive ability.
Measure classification was guided by previous research. Certain tests such as
Raven‘s Progressive Matrices and Cattell‘s Culture-Fair Intelligence Test are well-
established measures of fluid ability, while the Mill Hill Vocabulary Scale is considered
an established measure of crystallized ability. For example, Carpenter, Just, and Shell
(1990) conducted a thorough analysis of the cognitive processes required to score highly
on the Raven‘s tests. They confirmed that the Raven‘s primarily measures the ability to
discern abstract relations and manage problem solving goals in working memory,
processes consistent with the definition of fluid ability.
We also utilized McGrew‘s (1997) cross-battery classification system. McGrew
provides a comprehensive framework which classifies the scales found in major
intelligence test batteries according to the CHC Gf-Gc model. These batteries include the
Kaufman Adult Intelligence Test (KAIT), the Wechsler Adult Intelligence Scale (WAIS),
the Woodcock Johnson-Revised test (WJ-R), and the Differential Abilities Scale (DAS).
Similarly, Ackerman et al. (2005, Appendix) also present a framework for classifying a
number of frequently encountered cognitive ability measures. When existing frameworks
did not provide information with regard to how a test should be classified, supplemental
material such as test manuals, Buros Mental Measurement Yearbook, and factor analytic
evidence were consulted. In some cases, our classification decisions ran contrary to the

84
84
stated viewpoints of the primary study authors. For example, Furnham and colleagues
(e.g., Chamorro-Premuzic & Furnham, 2008; Furnham & Monsen, 2009) have frequently
utilized the three-minute Baddeley Reasoning Test as a measure of fluid intelligence.
However, upon closer examination we determined that the Baddeley test is more likely a
measure of working memory, a construct shown to be related to but distinct from Gf (c.f.,
Ackerman et al., 2005). The final classification of cognitive ability measures according
to Gf, Gc, and GCA are presented in Appendices A.
Moderators
The magnitude of relationship between cognitive ability and performance may
vary according to factors related to the nature of the predictors or criteria, as well as to
factors related to the subjects and research settings. To explore these possibilities, studies
were coded for a number of relevant potential moderators to be examined in the current
study, or at a time in the future. For the purposes of this dissertation, primary emphasis
will be placed on testing the hypotheses presented in Chapter 3. However, a number of
potential moderators were also coded in order to facilitate the examination of additional
research questions after the current study has been completed. In order to minimize
second-order sampling error (Hunter & Schmidt, 2004), moderators should usually only
be examined when k ≥ 5 or when the overall sample size is large enough to reduce
second-order error. However, in some cases moderators with k < 5 and a small total
sample size are presented for illustrative purposes. Such results should be interpreted
with caution. Moderators were examined hierarchically where sample size permits.

85
85
While some of the proposed moderators apply to all studies, others are specific to the
performance criteria of interest. Proposed moderators are described below.
Moderators Relevant to All Studies
To facilitate an examination of potential publication bias in future work with this
data set, the publication status of each primary study was coded as either published or
unpublished. Studies appearing in peer-reviewed journals were coded as published.
Conference papers, technical reports, dissertations, and theses were coded as
unpublished.
As noted previously, studies were coded with regard to the specific cognitive
ability measures used. In addition to facilitating assignment to fluid, crystallized, and
general cognitive ability categories, this coding scheme permits the analysis, reporting,
and comparison of test-specific validities for commonly used cognitive ability tests. In
the current study, specific test validities (and validities for families of like tests) were
examined for measures of fluid ability.
Each study was coded with regard to the year of data collection. When date
information is reported by the primary study author, it was recorded as such. If the data
collection date was not reported, and there was no indication that the data was archival in
nature, the year of data collection was calculated as the year of publication minus two
years. This information will allow the validities and ux values of cognitive ability
measures to be examined over time (e.g., decades or other meaningful time periods).
Although they are beyond the scope of the current study, moderator analyses for time
may be interesting given that this data set includes nearly 100 years of validity data.

86
86
Examining validities over time may also inform our understanding of the Flynn effect, as
well as address recent assertions by Schmitt (2007) that the validities of cognitive tests
may have shifted over time due to changes in predictor quality and the nature of work
itself. With regard to Schmitt‘s claim, Schmidt, Le, Oh, and Shaffer (2007, p. 64) have
countered that examining the validity of cognitive ability over time is unlikely to change
our current understanding of GMA and work performance, arguing that ―changes over
time in the nature of work and jobs, including changes in the employee-employer
psychological contract, have not resulted in any noticeable changes in the role that mental
ability plays in job performance.‖
Moderators Relevant to
Academic Performance
It is well established that the validity of cognitive ability for predicting academic
performance decreases as educational level increases (Jensen, 1998; Kuncel, 2003).
Several explanations for this phenomenon have been proposed. First, samples become
increasingly range restricted at higher educational levels due to the fact that some
students with lower cognitive ability levels choose not to continue their studies, while
others are not allowed to. Further, there is less variability in the grades that are assigned
at higher levels of study. For example, in many graduate programs almost all students
earn A‘s and B‘s. Finally, there is some evidence that at higher levels of study, certain
(often less capable) students may select less demanding classes and programs of study
(c.f., Elliott & Strenta, 1988; Strenta & Elliott, 1987). Accordingly, for each study that
examines academic performance, samples will be coded according to the level of study
(High School or Undergraduate).

87
87
Recent research by Berry and Sackett (2009) suggests that standardized tests are
better predictors of individual course grades (ICGs) compared to cumulative GPAs.
They argue that (p. 823):
using ICGs instead of GPA should yield a less contaminated criterion by holding differences in course selection constant. Certainly, if one is simply interested in predicting GPA, then predicting ICGs is not appropriate. However, if one is interested in assessing how well SAT scores and high school GPAs predict academic performance, of which GPA is just an imperfect indicator, then analyses using ICGs as the criterion should provide a better estimate.
After analyzing the relationship between SAT scores and over 5 million
individual course grades for 167,816 students, they found that the percent variance
explained by high school grades and SAT scores was 30-40% lower when the criteria
were GPAs vs. individual course grades. They attribute this finding both to student
course choice and grading idiosyncrasies between instructors.
Given this, each academic performance variable was classified according to
whether it represents performance in an individual course vs. performance in multiple
courses (such as a single semester GPA or cumulative GPA). When relationships
between cognitive ability and single course grades were reported, the academic area of
study for the course was coded (e.g., Mathematics, Social Science, Language Arts, etc.).
Although individual course grades were coded as they were encountered, the results
presented in Chapter 5 are based solely on samples reporting composite grades (GPAs)
for at least one academic semester.
Research by Humphreys (e.g., Humphreys, 1968; Humphreys & Taber, 1973)
demonstrates that when predicting grades, the validities of cognitive tests are stronger
predictors of performance in earlier semesters. That is, cognitively loaded tests correlate

88
88
most strongly with freshman grades. This is largely attributable to increased range
restriction in subsequent semesters. For example, Humphreys (1968) found that the
validity of the ACT was .48 for predicting first semester college GPA and .16 for
predicting final (8th
) semester GPA. Thus, when single semester or cumulative GPAs
are reported, the average number of units contributing to the overall GPA, or the number
of semesters completed to date, was also recorded. For example, first semester college
grades were coded as UGPA-C1 (cumulative GPA based on one semester) while grades
for student‘s entire undergraduate career were coded as UGPA-C8 (cumulative GPA
based on eight semesters).
Testing Stakes
Testing stakes were coded when information presented in the primary study
sample allowed such a determination to be made. The perspective of the test taker was
considered when making all high stakes vs. low stakes categorization decisions. When
cognitive ability tests within a sample were administered for selection or assessment
purposes, the sample was assigned to the high stakes category. The high stakes testing
category included traditional academic selection tests such as the ACT, SAT, and PSAT,
as well as cognitive tests administered by schools or universities for assessment or
placement purposes. Samples in which cognitive ability tests were administered
primarily for research purposes were coded as low stakes. Within academic samples,
some tests were used exclusively for high stakes purposes. For example, the ACT and
SAT are administered as high stakes selection tests, and are perceived as such by
examinees. Nevertheless, scores may later be used for research purposes. Within the
academic samples included in this study, some tests such as the Wonderlic Personnel Test
were administered solely for low stakes research purposes. Depending on the individual

89
89
primary study, tests such as the Otis Quick Scoring Mental Ability Test or Wechsler
Adult Intelligence Scale may have been administered for either low stakes or high stakes
purposes.
Moderators Relevant to
Training Performance
When training performance was the criterion, performance was coded according
to Kraiger et al‘s (1993) typology. That is, training performance was coded as to whether
it represented learning outcomes that were cognitive (knowledge assessed during or
following a training program) or skill-based (behavioral/skill demonstrations measured
via an assessment center, work sample test, or other subjective skills evaluation made by
an instructor or trained rater). Given that the vast majority of training studies in the
current data set focused on cognitive knowledge expressed through overall training
course grades or post-training exams, the results which follow focus on relationships
between Gf, Gc, GCA, and cognitive learning outcomes. However, many primary
studies often did not report how an overall training grade was calculated. It is likely that
in some of these samples the overall training performance grade represents both cognitive
and skill-based learning outcomes. Studies that examined only skill-based learning
outcomes were not examined in the analyses which follow.
Moderators Relevant to Job Performance
As described earlier, job performance was classified as either overall job
performance, or into one of the three broad components of job performance outlined by
Viswesvaran and Ones (2000) and Rotundo and Sackett (2002). These components

90
90
include task, citizenship (OCBs), and counterproductive (CWBs) performance. However,
the number of studies reporting relationships between cognitive ability and CWBs or
OCBs was very limited. In a recent search for studies of this type, Schmidt, Shaffer, and
Oh (2008) were only able to locate a very small number of studies that examined these
variables. Henig (1927), Dilchert, Ones, Davis, and Rostow (2007) and Postlethwaite,
Robbins, & McKinniss (2009) are notable exceptions. When multiple measures of job
performance were provided, a composite of overall job performance was formed.
Additional details regarding calculation of composites are presented in the discussion on
conceptual replication later in this chapter.
Research has demonstrated that much of the variance in performance ratings is
due to idiosyncratic rater effects (Mount, Judge, Scullen, Sytsma, & Hezlett, 1998;
Scullen, Mount, & Goff, 2000; Viswesvaran et al., 2005). Differences may also occur
based on whether performance is objectively or subjectively measured. Given this, each
job performance criterion was coded as either an objective measure of performance (e.g.,
sales performance, productivity) or a subjective rating of performance. The majority of
studies coded used subjective performance ratings. Subjective performance assessments
were further classified according to the source of the ratings: supervisor(s), peer(s), or
subordinate(s). Supervisors were the source of ratings for the vast majority of samples
that were coded. As noted previously, correlations between cognitive ability and self-
reported work performance were not examined in the current study.
Occupational Complexity

91
91
Previous meta-analyses have shown that the validity of cognitive ability for
predicting training and job performance increases as the level of occupational complexity
increases (Hunter, 1980; Hunter & Hunter, 1984, Salgado et al., 2003b; Schmidt &
Hunter, 1998). Given these findings, in the current study, samples were coded according
to occupation as well as level of occupational complexity. When a sample examined
training or job performance for a specific occupation (or group of very similar
occupations), the occupation investigated was recorded and matched with a
corresponding occupation title and code in the national O*NET database (Peterson et al.,
2001). O*NET is a rigorously developed system that has integrated previous job
classification information (such as found in the Dictionary of Occupational Titles) with
contemporary job analysis data. The O*NET system contains detailed information on
over 900 unique occupations. If primary studies reported occupation data in the form of
DOT job codes (as is the case with all of the GATB validation studies), these codes were
transformed to current O*NET occupation codes using published crosswalks.
Occupational complexity was measured using O*NET job zones (see Le et al.,
2011). Trained O*NET staff assign all occupations in the O*NET database to one of five
job zones based on the tasks and requirements of the occupation, the education, training,
and experience levels required for the occupation, and previously determined complexity
levels. For example, occupations in Job Zone 1 require little preparation and less than a
high school education. Sample occupations in this job zone include Food Preparation
Workers (35-2021.00), Landscaping and Groundskeeping Workers (37-3011.00), and
Maids and Housekeeping Cleaners (37-2012.00). In contrast, occupations in Job Zone 5
require extensive skills and education, with most requiring a graduate degree. Sample

92
92
occupations in this job zone include Lawyers (23-1011.00), Surgeons (29-1067.00), and
Clinical Psychologists (19-3031.02). For the purposes of this study, the five O*NET Job
Zones were collapsed into three categories representing low (Job Zones 1 and 2), medium
(Job Zone 3), and high complexity occupations (Job Zones 4 & 5). Validities were
analyzed for each of these three levels when the number of independent samples
permitted such an analysis.
An additional advantage of using the O*NET system to classify occupations is
that the system contains extensive data for calculating occupational complexity (as well
as a number of other occupation-relevant constructs) using alternate methods. For
example, Dierdorff and Morgeson (2009) used O*NET to estimate occupational
complexity using 21 items which assess the importance of cognitive ability within each
occupation.
Detection of Duplicate Samples
A basic assumption of meta-analysis is that the effect sizes contained in the
analysis are independent from one another. The existence of duplicate effect sizes within
a meta-analytic data set violates this assumption and ―may lead to erroneous conclusions‖
(Wood, 2008). Although duplication is frequently mentioned in the context of meta-
analysis, Schmidt (2008, p, 97) argues:
It is important to be clear that the problem of nonindependent studies is not a problem specific to meta-analysis. There is nothing about meta-analysis per se that creates this problem. If the traditional alternative to meta-analysis—the narrative review—is used, duplicate studies are just as much a problem for that method of reviewing literatures. The problem of duplicate studies…is a problem related to the broader issue of attainment of accurate cumulative knowledge in science.

93
93
Duplication has been observed in diverse fields of study. When they evaluated
141 systematic reviews in the medical literature, von Elm, Poglia, Walder, and Tramer
(2004) observed that 40% of authors had identified duplicate studies. In some cases,
articles had been republished up to five times. Duplication has also been observed in the
organizational sciences. For example, Stewart and Roth (2004) maintain that Miner and
Raju‘s (2004) meta-analysis of entrepreneurial risk propensity contains dependent
samples.
Duplication can take various forms, including dependence of data in longitudinal
studies (Gurevitch & Hedges, 1999), reuse of identical or substantially similar data sets to
address different research questions (von Elm et al., 2004), and ―covert duplication‖
whereby identical data are republished without citing the original study (Tramer,
Reynolds, Moore, & McQuay, 1997; von Elm et al., 2004). Schmidt (2008, p. 97)
believes that duplication can likely be attributed, at least in part, to ―the greatly increased
pressure to publish today, especially among untenured faculty seeking tenure.‖ A cursory
examination of the initial set of studies identified for potential inclusion revealed that
duplication was likely between several pairs of studies. For example, Allworth and
Hesketh (1999) and Allworth and Hesketh (2000) report highly similar correlations
between job performance and cognitive ability (measured in both cases using Raven‘s
Progressive Matrices, the Ball Clerical Speed and Accuracy Test, and the Ball Numerical
Reasoning Test) in overall samples of 325 hotel employees. In this case, the primary
research questions differed between studies, and the later study did cite the earlier
publication. Similarly, Dhaliwal and Sharma (1975) and Dhaliwal and Sharma (1976)
report identical data on the relationship between cognitive ability and academic

94
94
performance in a sample of 75 Indian high school students; however, in this case the
1976 study failed to cite the earlier 1975 publication.
With regard to the statistical effects of duplication, Schmidt (2008, p. 97) states
that including duplicate studies in a meta-analysis can ―inflate the estimate of the
variance of population parameters.‖ When there is lack of independence, total sample
size is overestimated and sampling error variance is underestimated. This results in an
undercorrection for sampling error and an overestimation of the standard deviation of the
population effect size (SDρ). In meta-analyses with a small number of effect sizes,
duplicate studies can pose a more acute problem by producing second order sampling
error. That is, mean effect sizes can be skewed and sampling error variance may be less
than what is expected when independence is maintained (Schmidt, 2008).
To date, most researchers have attempted to identify duplicate samples using
subjective, informal procedures (Schmidt, 2008). However, Wood (2008) has developed
a systematic procedure for detecting duplication. His duplication heuristic (Wood, 2008,
Figure 1, p. 81) consists of multiple steps including comparison of authorship, content
analysis of methodology, and comparison of sample sizes, response rates, demographics,
constructs/measures, and study effects. To detect duplication within the studies identified
for inclusion in this dissertation, Wood‘s duplication heuristic was applied whenever a
study shared one or more authors in common with another study. In addition, care was
taken to identify duplication that can occur when studies without shared authors analyze a
common third-party data set (e.g., the General Social Survey or National Longitudinal
Survey of Youth). One limitation of Wood‘s heuristic is that it does not allow for such a
possibility, as studies without shared authors are coded as non-duplicate.

95
95
Treatment of Duplicate Samples
Researchers have proposed different methods for handling samples which have
been identified as duplicate or non-independent. Although it is sometimes possible to
statistically adjust for non-independence (Hedges & Olkin, 1985; Strube, 1987), such
adjustments require one to calculate the covariance of the non-independent study effects.
However, data for such calculations is rarely available, making such adjustments
unfeasible in most cases (Wood, 2008). Other researchers (e.g., Tramer et al., 1997) have
proposed using data from only the original or ―main‖ study. Although this approach does
eliminate non-independence, it is also problematic in that it may be difficult for meta-
analysts to determine which study is the ―main study‖ (Wood, 2008). In addition,
utilizing only the main or original study can result in the loss of any data which are
reported in only duplicate studies (Schmidt, 2008). According to Wood (2008, p. 92),
―some meta-analysts suggest the optimal solution is to aggregate the study effects of the
suspected dependent studies.‖ Schmidt (2008, p. 97) agrees with this recommendation, on
the basis that aggregating ―salvages the information contained in the duplicate studies,
while at the same time preserving statistical independence among the entries into the
meta-analysis.‖ Accordingly, in the current study, samples identified as duplicates were
combined using the methods Hunter and Schmidt (2004, Ch. 10) present for dealing with
conceptual replication.
Conceptual Replication

96
96
In some studies, multiple assessments of the same cognitive ability type were
included for a single independent sample. In such cases, I calculated composite
correlations between the multiple predictors and the criterion using the methods
described in Hunter and Schmidt (2004) and Nunnally and Bernstein (1994). I followed
similar procedures when multiple performance measures of the same type are reported for
the same sample. Specifically, I used formula 10.11 provided by Hunter and Schmidt
(2004, p.435) when calculating composites:
∑
√ ̅
where x is the single predictor variable, Y is a composite criterion measure derived from
the individual criterion measures y1, y2…yi,, n is the total number of individual criterion
measures included in the composite measure, and ̅ is the average correlation between y
measures.
If the scale intercorrelations necessary to compute composite calculation were not
available from either the study itself or the literature as a whole, the individual predictor-
criterion correlations were averaged to form a single correlation. However, it is
acknowledged that this latter method is not ideal as it routinely leads to underestimation
of the effect size. In all cases, care was taken to insure that the statistical independence
of the samples was maintained.
Meta-Analytic Methods
Mean observed ( r ) and corrected correlations ( ) were estimated using Hunter
and Schmidt‘s artifact distribution method of meta-analysis (Hunter & Schmidt, 2004).

97
97
The Hunter-Schmidt method of meta-analysis assumes a random effects model. Random
effects models ―allow for the possibility that population parameters (ρ or δ) vary from
study to study‖ (Hunter & Schmidt, 2004, p. 204). In general, meta-analyses based on
the random effects model provide more accurate and less biased estimates than meta-
analyses based on the fixed-effects model (Field, 2001; Hunter & Schmidt, 2000;
Schmidt, Oh, & Hayes, 2009). Further, since population effect sizes are known to vary to
some extent in almost all cases, it is almost never appropriate to make the fixed-effects
assumption that there will be no variance in population parameters from study to study.
Artifact Data
Predictor Reliability
An initial inspection of a random selection of studies that meet the inclusion
criteria reveals that many primary studies failed to report data on the reliabilities of the
specific psychometric ability scales that were administered. When reliabilities are
reported, they are almost always estimates of internal consistency reliability (Coefficient
of Equivalence, e.g., KR-20) or test-retest reliability (Coefficient of Stability). Hunter
and Schmidt (2004) maintain that internal consistency reliability estimates (CE) fail to
correct for transient error, while test-retest reliabilities (CS) fail to adequately correct for
specific factor error. Accordingly, they advocate using the Coefficient of Equivalence
and Stability whenever possible. Le, Schmidt, and Putka (2009) extend this logic across
multiple scales with the Generalized Coefficient of Equivalence and Stability (GCES).
However, CES and GCES estimates are often not readily available for cognitive
measures, as many test publishers report only alpha reliabilities. Schmidt, Le, and Ilies

98
98
(2003) provide an estimate of the amount of transient error in measures of General
Cognitive Ability (.05 for the Wonderlic Personnel Test). This value was used to adjust
alpha reliabilities to correspond to CES estimates. Thus, all corrections for predictor
measurement error were made using CES estimates rather than coefficient alpha. In
cases where adequate reliability information was not available for a particular type of
measure (e.g., Gf), the reliability value for General Mental Ability was applied.
Previous research has shown that cognitive measures demonstrate acceptable test-
retest reliabilities. For example, based on an examination of 31 GCA test-retest
reliability estimates, Salgado et al. (2003a) estimated a mean unrestricted (applicant)
reliability estimate of .83 (SDxx = .09, mean test-retest interval = 24 weeks).
Nevertheless, since both CE and CS estimates fail to correct for all sources of error, they
should be considered as overestimates of reliability. Similar GCA unrestricted reliability
estimates have been presented by Bertua et al. (2005; rxx = .85, based on a UK data) and
Hunter et al. (2006; rxx = .81, based on Hunter‘s 1980 analyses of GATB data). In the
current study, an unrestricted rxx value of .83 was used to correct for unreliability in
cognitive ability measures in the analyses examining job and training performance. In
the analyses examining academic performance, an unrestricted rxx value of .85 was used
to correct for unreliability in cognitive ability measures. When applying the indirect
range restriction procedure, unrestricted applicant rxx values are converted to restricted
incumbent rxx values with the range restriction formula (Hunter, Schmidt, & Le, 2006, p.
604).
Predictor reliabilities were used when making corrections for indirect range
restriction, as well as when calculating true score validities. By definition, operational

99
99
validities are not corrected for predictor unreliability. Thus, operational validities
represent true score validities in which predictor unreliability has been reintroduced:
ρop = ρts ( √ )
Criterion Reliability
When criterion measures are unreliable, the observed correlations between
predictors and criteria are attenuated. To address this situation, corrections will be made
for criterion unreliability. Values used to correct for criterion unreliability will vary
according to the specific criteria under investigation.
With regard to academic performance, Kuncel, Credé, and Thomas (2007, p. 59)
note that ―unlike typical internal consistency estimates based on a single test administered
at one point in time, estimates are from final grades (typically based on multiple
subevaluations) from multiple raters over the course of months or years.‖ That is,
cumulative grade point averages are expected to be quite reliable since they are based on
multiple ratings (course grades) from multiple raters (instructors). Likewise, single
course grades should be less reliable than cumulative averages based on multiple courses.
Using reliability data from Barritt (1966; ryy = .84), Bendig (1953; ryy = .80), and Reilly
and Warech (1993; ryy = .84), Kuncel et al. (2001) determined the overall mean reliability
of GPAs to be .83 (reliability index = √.83 = .91). This reliability value has been used in
a number of subsequent meta-analyses by Kuncel and colleagues (Kuncel et al., 2004;
Kuncel et al., 2005; Kuncel et al., 2007; Kuncel, Wee, Serafin, & Hezlett, 2010) as well
as other scholars (Oh, Schmidt, Shaffer, and Le, 2008). Given the lack of reliability data

100
100
presented in primary studies, I adopted Kuncel‘s ryy estimate of .83 as the reliability
estimate for GPA.
Corrections for criterion unreliability were also made when training performance
was assessed. In their meta-analysis, Alliger et al. (1997) obtained mean criterion
reliabilities of .75 for measures of knowledge-based learning obtained immediately
following training (k = 14) and .53 for delayed measures of knowledge (k = 2). Likewise,
they estimated the reliability of learning assessed via behavioral/skill assessments to be
.84 (k = .84). Unfortunately, Alliger et al. do not report whether their meta-analytic
values are CE, CS, inter-rater reliabilities, or some combination thereof. To correct for
unreliability in training performance, I adopted the ryy value of .90 adopted by Brown,
Le, & Schmidt (2006).
When job performance is the criterion, the appropriate reliabilities to consider are
inter-rater reliabilities rather than coefficients of equivalence (such as Cronbach‘s α) or
coefficients of stability. Internal consistency (CE) reliabilities and stability coefficients
(CS) fail to account for rater idiosyncrasy (i.e., error specific to the rater). As a result,
corrections made using alpha or CS result in substantial underestimates of operational
validity. In this study, unreliability in job performance ratings was corrected using the
relevant meta-analytic estimates of inter-rater reliability for a single rater reported by
Viswesvaran, Ones, and Schmidt (1996). For overall job performance, they report inter-
rater reliabilities ranging from .42 for peer ratings to .52 for supervisor ratings.
Range Restriction

101
101
When the range of cognitive ability scores is restricted, correlations between
cognitive ability and performance will be attenuated. For this reason, range restriction is
a form of biased sampling (Sackett & Yang, 2000). To address this bias, it is appropriate
to correct for range restriction when estimating operational and true score validities for
predicting academic, training, or job performance (or when estimating the corresponding
true score correlations between these constructs). Most studies to date have corrected
only for direct range restriction (Hunter & Schmidt, 2004). However, in reality, range
restriction is almost always indirect, a fact noted by Thorndike (1949) more than half a
century ago. Schmidt and his colleagues recently developed a new correction method
(Case IV) for indirect range restriction (IRR; e.g., Hunter et al., 2006; Schmidt et al.,
2006). This new IRR method was analytically derived (see Hunter et al., 2006 for
statistical derivations) and shown to be accurate via extensive Monte-Carlo simulations
(Le, 2003; Le & Schmidt, 2006). Previously, many researchers believed that correcting
for direct range restriction when indirect range restriction is known to be the case would
result in relatively accurate corrections. However, recent research has shown that when
range restriction is indirect, correcting for direct range restriction produces considerable
underestimates of validity. Schmidt et al. (2008) have shown that this is especially the
case for cognitive ability measures. For example, they found that GCA validities
corrected for IRR represented validity increases of between 16% and 34% over DRR
when predicting job performance and between 8% and 27% over DRR when predicting
training performance.
Correlations were corrected for indirect range restriction using the methods
presented by Hunter and Schmidt (2004) and described in additional detail by Hunter et

102
102
al. (2006). Distributions of ux values for cognitive ability measures were assembled by
extracting the ux values reported in primary studies or calculating ux values by comparing
the ratio of standard deviations for enrolled students or job incumbents (the restricted
population) to the standard deviations reported for normative groups or applicant samples
(the unrestricted population). The determination of the appropriate unrestricted reference
population is related to particular research question at hand. In the current study, general
population norms were used. This offered two key advantages. First, many of the tests
included in the data set were traditional measures of cognitive ability with scores reported
as deviation IQ‘s. For such tests, the population mean is 100 with a standard deviation of
15 (16 in the case of the Stanford-Binet). Second, correcting to the population norm
allowed college and high school samples to be compared along a common baseline. This
helps address the issue of increasing range restriction at higher levels of education.
When academic performance was the criterion, the majority of crystallized ability
measures utilized were college admissions tests such as the ACT and SAT. These tests
are normed to the college applicant population rather than the general population. Given
this, for meta-analyses of Gc and academic performance, I corrected for range restriction
by applying a weighted composite based on the percentage of high school and college
students using the respective high school and college ux values from the GCA
distribution.
When academic performance was the criterion, cognitive ability ux distributions
were constructed by first calculating sample size weighted ux estimations for high school
and college students separately. Next, an overall effective ux value for the combined
sample was estimated by weighting the HS and college ux values according to the

103
103
percentage of high school and college students represented in the overall sample. This is
detailed in Table 3.
In some cases utilizing military data (e.g., Brown et al., 2006; Personnel Resonnel
Research Board Studies, 1957-1959) researchers reported corrected rather than observed
correlations. To prevent overestimation of observed validities when entering this data, I
attenuated these correlations using a ux value of .60. The ux artifact distributions that
were obtained when training and job performance was the criterion are presented in
Tables 4 and 5 at the end of this chapter. There was a significant lack of normative
values and primary study data necessary to calculate ux values for Gf measures. Given
this, the respective ux distribution for GCA was used to correct Gf validities for range
restriction.
Credibility and Confidence Intervals
It is important to consider the extent to which there is variability in the mean
corrected correlations. While zero variability precludes the presence of moderators,
large variability suggests that moderators may be operating (Schmidt & Hunter, 1999).
Variability around is frequently expressed using both credibility and confidence
intervals. Credibility intervals are estimates of the distribution of population values
(Hunter & Schmidt, 2004; Schmidt & Hunter, 1999; Whitener, 1990). That is, they
―provide an estimate of the variability of individual [population] correlations across
studies‖ (Judge & Ilies, 2002, p.800) independent of sampling error. Confidence
intervals estimate the variability in the mean correlation due to sampling error rather than
the distribution of population correlations (Hunter & Schmidt, 2004; Whitener, 1990).

104
104
The width of the confidence interval is determined by the amount of sampling error in the
estimate of the mean value. By contrast, credibility intervals are computed after the
removal of sampling error. When presenting results for each meta-analysis, I calculated
and report the 80% credibility and 95% confidence intervals around each mean corrected
correlation ( ) using the methodology appropriate for artifact distribution meta-analysis
provided by Hunter & Schmidt (2004, p. 207).
Analytic Strategy
At this point I describe how I used the results of the meta-analyses to test the
hypotheses presented in Chapter 2. As a reminder, in Chapter 3, I proposed that
compared to measures of fluid ability (Gf), crystallized ability measures (Gc) will more
strongly predict academic (Hypothesis 1a), training (Hypothesis 1b), and job performance
(Hypothesis 1c). Likewise, I also proposed that overall, blended, or GCA measures will
be stronger predictors of academic (Hypothesis 2a), vocational training (Hypothesis 2b),
and job performance (Hypothesis 2c) than fluid ability (Gf) measures, and equal or
stronger predictors of these types of performance than crystallized (Gc) ability measures.
For each meta-analysis, I examined the the 80% credibility intervals to assess
whether the mean corrected validities ( values) are meaningfully different from zero.
That is, 80% credibility intervals excluding zero suggest results are generalizable. In this
study, credibility intervals are not as important as mean values and the confidence
intervals surrounding them. Next, for each criterion of interest, I compared the mean
corrected validities obtained for crystallized measures to those obtained for fluid
measures (and to the validities for GCA to test hypotheses 2a, 2b, and 2c). Strong

105
105
support for my hypotheses is suggested if the validities for Gc measures are greater than
the validities for Gf measures and the 95% confidence intervals around the values for
each type of measure exclude zero and do not overlap. If a small degree of overlap in the
95% confidence intervals is observed, this will indicate some support for my hypotheses.
In contrast, if the 95% confidence intervals overlap completely, or to a large degree, this
will indicate that the hypotheses are not supported. Likewise, if the validities for Gf
measures are greater than the validities for Gc measures and the 95% confidence intervals
around the values for each type of measure exclude zero and do not overlap, this
suggests a pattern of results opposite to that which was hypothesized.
Furthermore, to examine moderators such as level of education, job complexity,
and type of test, I also compared the variability around values for the moderators to the
variability around values for the overall sample. When the SDρ values are smaller for
the moderators, compared to the SDρ values at the overall level, this provides evidence of
a moderation effect. Likewise, if there is a moderation effect, the 80% credibility
intervals for the moderator variables are expected to be narrower than the 80% credibility
interval for the overall level.

106
Table 3. ux Artifact Distributions for Academic Performance
General Cognitive Ability
Category ux Method High School College Effective ux
(Total Sample)
Overall Sample Size
Weighted
ux = .88
SDux = .12
k = 13
N = 1,399
ux = .64
SDux = .06
k = 28
N = 7,700
ux = .75
k = 110
N = 29,739
High School Sample Size
Weighted
ux = .88
SDux = .12
k = 13
N = 1,399
Not
Applicable
ux = .88
k = 32
N = 13,290
College Sample Size
Weighted
Not
Applicable
ux = .64
SDux = .06
k = 28
N = 7,700
ux = .64
k = 78
N = 16,449
High Stakes
(Overall)
Sample Size
Weighted
ux = 1.00
SDux = .06
k = 3
N = 395
ux = .59
SDux = .04
k = 3
N = 496
ux = .83
k = 52
N = 18,525

107
Table 3. Continued
General Cognitive Ability
Category ux Method High School College Effective ux
(Total Sample)
High Stakes
(High School)
Sample Size
Weighted
ux = 1.00
SDux = .06
k = 3
N = 395
Not
Applicable
ux = 1.00
k = 14
N = 11,028
High Stakes
(College)
Sample Size
Weighted
Not
Applicable
ux = .59
SDux = .04
k = 3
N = 496
ux = .59
k = 38
N = 7,497
Low Stakes
(Overall)
Sample Size
Weighted
ux = .83
SDux = .09
k = 9
N = 834
ux = .70
SDux = .08
k = 24
N = 2,405
ux = .73
k = 46
N = 4,731
Low Stakes
(High School)
Sample Size
Weighted
ux = .83
SDux = .09
k = 9
N = 834
Not
Applicable
ux = .83
k = 13
N = 1,261

108
Table 3. Continued
General Cognitive Ability
Category ux Method High School College Effective ux
(Total Sample)
Low Stakes
(College)
Sample Size
Weighted
Not
Applicable
ux = .70
SDux = .08
k = 24
N = 2,405
ux = .70
k = 33
N = 3,470

109
Table 4. ux Artifact Distributions for Training Performance
Crystallized Ability
Category ux Method Military Studies
(Assumed ux)
Other Studies
(Calculated ux)
Effective ux
(Total Sample)
Overall Sample Size
Weighted
ux = .60
SDux = .00
k = 33
N = 22,701
ux = .63
SDux = .03
k = 29
N = 3,368
ux = .61
k = 114
N = 38,793
Low Complexity Sample Size
Weighted
ux = .60
SDux = .00
k = 7
N = 5,249
ux = .63
SDux = .05
k = 7
N = 393
ux = .61
k = 29
N = 8,152
Medium Complexity Sample Size
Weighted
ux = .60
SDux = .00
k = 29
N = 12,768
ux = .63
SDux = .02
k = 20
N = 2,911
ux = .61
k = 66
N = 22,100
High Complexity Sample Size
Weighted
No
Values
No
Values
ux = .63
k = 4
N = 596

110
Table 4. Continued
Category ux Method Military Studies
(Assumed ux)
Other Studies
(Calculated ux)
Effective ux
(Total Sample)
Police Sample Size
Weighted
Not
Applicable
ux = .67
SDux = .06
k = 3
N = 965
ux = .67
k = 25
N = 7,762
General Cognitive Ability
Overall Sample Size
Weighted
No
Values
ux = .60
SDux = .06
k = 10
N = 4,144
ux = .60
k = 24
N = 7,563
Low Complexity Sample Size
Weighted
No
Values
No
Values
ux = .60
k = 2
N = 156
Medium Complexity Sample Size
Weighted
No
Values
ux = .66
SDux = .08
k = 8
N = 1,320
ux = .66
k = 14
N = 2,581

111
Table 4. Continued
Category ux Method Military Studies
(Assumed ux)
Other Studies
(Calculated ux)
Effective ux
(Total Sample)
High Complexity Sample Size
Weighted
No
Values
ux = .57
SDux = .03
k = 2
N = 2,824
ux = .57
k = 2
N = 2,824
Police Sample Size
Weighted
Not
Applicable
ux = .65
SDux = .09
k = 4
N = 1,011
ux = .65
k = 10
N = 2,272

112
Table 5. ux Artifact Distributions for Job Performance
Crystallized Ability
Category ux Method Military Studies
(Assumed ux)
Other Studies
(Calculated ux)
Effective ux
(Total Sample)
Overall Sample Size
Weighted
ux = .60
SDux = .00
k = 17
N = 3,312
ux = .74
SDux = .06
k = 135
N = 10,776
ux = .71
k = 199
N = 18,619
Low Complexity Sample Size
Weighted
ux = .60
SDux = .00
k = 5
N = 1,370
ux = .76
SDux = .05
k = 77
N = 5,759
ux = .74
k = 108
N = 9,307
Medium Complexity Sample Size
Weighted
ux = .60
SDux = .00
k = 12
N = 1,942
ux = .72
SDux = .07
k = 37
N = 3,247
ux = .68
k = 58
N = 6,603
High Complexity Sample Size
Weighted
No
Values
ux = .70
SDux = .05
k = 21
N = 1,770
ux = .69
k = 27
N = 2,214

113
Table 5. Continued
General Cognitive Ability
Category ux Method Military Studies
(Assumed ux)
Other Studies
(Calculated ux)
Effective ux
(Total Sample)
Overall Sample Size
Weighted
No
Values
ux = .78
SDux = .09
k = 27
N = 3,088
ux = .78
k = 86
N = 8,070
Low Complexity Sample Size
Weighted
No
Values
ux = .80
SDux = .05
k = 14
N = 1,581
ux = .80
k = 37
N = 3,420
Medium Complexity Sample Size
Weighted
No
Values
ux = .75
SDux = .02
k = 8
N = 736
ux = .75
k = 31
N = 2,456
High Complexity Sample Size
Weighted
No
Values
ux = .70
SDux = .16
k = 4
N = 462
ux = .70
k = 11
N = 861

114
Table 5. Continued
General Cognitive Ability
Category ux Method Military Studies
(Assumed ux)
Other Studies
(Calculated ux)
Effective ux
(Total Sample)
OCB Sample Size
Weighted
No
Values
ux = .80
SDux = .05
k = 7
N = 871
ux = .80
k = 7
N = 871

115
115
CHAPTER 5
RESULTS
Chapter Overview
In this chapter I present the results of the meta-analyses conducted to test the
hypotheses proposed in Chapter 3. Given that the primary objective of my study is to
examine the relative differences in predictive validity between fluid and crystallized
ability, I focus the presentation of results on this issue. I begin by presenting the results
for academic performance, proceed to training performance, and then conclude by
presenting the results for job performance. Within each of these criteria, I first present
the results for fluid ability, as it serves as the comparative reference point for each of the
hypotheses. I follow this by presenting the results for crystallized ability and general
cognitive ability. When testing each hypothesis, I utilized the analytic strategy described
in Chapter 4.
Notation
Some readers may be unfamiliar with meta-analysis and the notation used for
presenting meta-analytic results. Others may be familiar with meta-analysis, but
accustomed to a different notation system. Accordingly, I provide a brief summary of the
specific notation used within this chapter as well as the results tables which follow:
k –the number of independent (correlations) samples that contributed to each
meta-analysis;
N – the total sample size;

116
116
robs - the sample-size weighted mean observed correlation between cognitive
ability and the performance criterion of interest;
SDr – the standard deviation of the sample-size weighted mean observed
correlation;
ρop – the mean operational validity. This is the mean observed validity after it
has been corrected for indirect range restriction in the predictor and
measurement error in the criterion. Operational validities are sometimes
referred to as ―true‖ validities;
SDρop - the standard deviation of the ρop;
80% CrI – 80% Credibility Interval, a measure of variability in the
distribution of population correlations. Credibility intervals are used to test
for generalizability. Results are assumed to be generalizable when this
interval excludes zero. Credibility intervals are computed after removal of
sampling error;
95% CI – 95% Confidence interval; Confidence intervals estimate the
variability due to sampling error in the mean correlation rather than the entire
distribution of correlations;
ρts – the true score correlation. This is the mean observed correlation after it
has been corrected for indirect range restriction in the predictor and
measurement error in both the criterion and predictor. True score correlations
are an indication of the construct-level relationship between two variables (in
this study, the construct-level relationship between cognitive ability and
performance). Given that study is primarily concerned with the differential

117
117
validities of Gf, Gc, and GCA for predicting real-world performance, true
score correlations are not the focus of this chapter. Nevertheless, these
validities are presented in each of the results tables which follow;
SDρts – the standard deviation of the true score correlation.
Cognitive Ability and
Academic Performance
Fluid Ability and
Academic Performance
Results for the meta-analyses examining fluid ability and academic performance
are presented in Table 6. The overall observed validity of Gf for predicting academic
performance is .26 (SD = .14). After corrections were made for indirect range restriction
and criterion unreliability, the correlation increased to .40 (SDρop = .14). The 80%
credibility interval excluded zero, indicating the results are generalizable. That is, we can
say that there is a positive relationship between fluid ability and academic performance.
Although the observed validity for Gf was stronger for high school samples (r = .30)
compared to college samples (r = .22), the operational validities are closer in magnitude
(HS ρop = .38, College ρop=.44). However, there was considerable overlap in both the
80% credibility intervals and 95% confidence intervals for the high school and college
samples. This finding suggests that the validity of Gf is similar at both educational
levels.
Although many associate fluid ability exclusively with traditional tests such as
Raven‘s Standard or Advanced Progressive Matrices, or with Cattell‘s Culture Fair
Intelligence Test (CFIT), my data set reveals that researchers also measure fluid ability

118
118
using a number of other scales. Given this, moderator analyses were performed to
examine the possibility that these tests vary in their predictive power (which in turn might
also suggest that these scales are in fact measuring different underlying constructs). The
D-48 (a nonverbal, Gf-loaded test based on domino series) and tests of abstract or
inductive reasoning share similar operational validities (ρop = .46 and .44 respectively),
with both displaying a higher operational validity than traditional tests such as Raven‘s
Progressive Matrices or Cattell‘s Culture Fair Intelligence Test (CFIT) (ρop = .37).
However, there is considerable overlap between tests with regard to both the 80%
credibility intervals and 95% confidence intervals.
It is interesting to note the relatively large SDρop (.20) for traditional Gf tests
administered to college students. This variability may be due in part to the fact that some
samples were administered Standard versions of the test while others were given
Advanced versions. McLaurin and Farrar (1973) have noted that the Standard
Progressive Matrices are too simplistic to be of use within most college samples. They
observed notably higher correlations when using the Advanced version of the Raven‘s.
However, when considering abstract and inductive reasoning tests, variability was greater
within high school (SDρop = .18) vs. college samples (SDρop = .10).
Crystallized Ability and
Academic Performance
The results for crystallized ability and academic performance are presented in
Table 7. The observed validity of crystallized ability for predicting academic
performance is .36 (SD = .09). After corrections for indirect range restriction and
criterion unreliability were made, the correlation increased to .65 (SDρop = .10). These

119
119
validity estimates are based on a large number of independent correlations (k = 157) as
well as a large total sample size (N = 199,642). The sample size is largely due to the
inclusion of a study conducted by Sackett et al. (2009). In this study, Sackett and
colleagues presented SAT validity data for over 150,000 students from multiple colleges
and universities in the United States (k = 41). Given the very large sample size of this
single study, I calculated results both including and excluding the study data. Both sets
of validities are reported in Table 7. When the data from this study was excluded, the
observed validity increased to .41 (SD = .12) and the operational validity increased to .69,
however the pattern of relationships remains consistent regardless of whether or not the
data is included. In discussing the results for Gc, I refer to the results which include the
Sackett et al. data unless otherwise noted. Analyses at the high school level did not
contain any data from the Sackett et al. study.
The operational validity of Gc for predicting academic performance is large and
positive in both the high school (ρop = .53, SDρop = .17) and college subgroups (ρop = .65,
SDρop = .10). For all levels of analysis, the 80% credibility intervals excluded zero
indicating that the results are generalizable. When comparing the validities of Gc to those
of Gf, it is clear that Gc measures are stronger predictors of academic performance. This
is true at the overall (ρop = .65 for Gc vs. .40 for Gf), high school (ρop = .53 for Gc vs. .38
for Gf), and college levels (ρop = .65 for Gc vs. .44 for Gf). Furthermore, there is no
overlap in the 95% confidence intervals for the overall and college levels. Only the end-
point (.01) of the 95% CI‘s overlap for the high school samples (95% CI for Gc = .44 -
.63 vs. 95% CI for Gf = .33-.44). Taken together, these results provide support for
Hypothesis 1a.

120
120
General Cognitive Ability
and Academic Performance
The results for General Cognitive Ability (GCA) and academic performance are
presented in Table 8. The observed validities of GCA are .47 at the overall level, .53 at
the high school level, and .42 at the college level. After corrections for indirect range
restriction and criterion unreliability were made, the correlations increased to .68 at the
overall level (SDρop = .06), .65 at the high school level (SDρop = .05), and .72 at the
college level (SDρop = .08). The standard deviations surrounding ρop were small, despite
the fact that data was collected from a wide variety of countries, settings, and time
periods. This offers support for the notion that GCA is a robust and stable predictor of
academic performance.
It is interesting to note that the mean operational validity of GCA for predicting
academic performance in college (ρop = .72, 95% CI = .68 - .76) is higher than that of
GCA for predicting academic performance in high school (ρop = .65, 95% CI = .63 - .68),
with only the end points of the 95% confidence intervals overlapping. Similar results are
also evident for crystallized ability (College ρop = .65, 95% CI = .63 - .68 vs. HS College
ρop = .53, 95% CI = .44 - .63). These results appear contrary to most previous research
which has found that the validity of cognitive ability decreases as the level of education
increases. Consistent with previous research, the observed validities for Gc and GCA
were indeed lower for college students. However, unlike most previous studies, range
restriction corrections in the current study were based on population level norms (i.e.,
Mean IQ = 100, SD = 15) rather than norms specific to high school or college students.
This use of a common baseline has the effect of controlling for differences in range

121
121
restriction between the two levels of education. The higher operational validities for
college students that were found after correcting for range restriction may reflect the
increased cognitive demands of college coursework.
As hypothesized (Hypothesis 2a), the operational validities of GCA were higher
than those for Gf at all levels of analysis: .68 vs. .40 for the overall samples, .65 vs. .38
for the high school samples, and .72 vs. .44 for the college samples. Furthermore, there
was no overlap between the 95% confidence intervals, suggesting these are indeed true
differences in validity. When comparing the operational validities of GCA to Gc, the
validities were similar in magnitude for the overall and college samples, and there was
considerable overlap between the 95% confidence intervals. In HS samples GCA
displayed a higher validity than Gc (ρop =.65 vs. .53), with only the endpoint of the 95%
confidence intervals overlapping (95% CI = .63 - 68 for GCA vs. .44 - .63 for Gc).
Taken together, these results provide strong support for Hypothesis 2a.
High Stakes vs. Low Stakes Testing
All of the studies that assessed fluid ability and academic performance were
conducted for low stakes research purposes, thus a comparison between high and low
stakes testing situations was not possible for Gf measures. However, the data set did
permit the analysis of high stakes vs. low stakes testing for academic samples that
utilized crystallized and general cognitive ability measures.
Hypothesis 3a proposed that for high school students, cognitive ability tests would
demonstrate higher observed validities under low stakes testing conditions. This
hypothesis was supported for Gc measures. The observed validities of Gc are .48 (k = 9,
N = 953) under low stakes testing conditions and .40 (k = 9, N = 1147) under high stakes

122
122
testing conditions. Some caution should be exercised in interpreting this finding given the
small total sample sizes. Further, due to data limitations, range restriction estimates were
not available for Gc measures at the high school level. Thus, it was not possible to
determine whether high stakes samples were more restricted (i.e., demonstrated less
variability in test scores) than low stakes samples. Hypothesis 3a was not supported for
GCA measures. The observed validity of GCA tests was .53 in both samples (High
Stakes: k = 14, N = 11,028; Low Stakes: k = 13, N = 1,261). Again, caution should be
advised in interpreting this result given the relatively small total sample size for low
stakes GCA tests. In addition, contrary to what was expected, the mean sample size
weighted ux value was higher for high stakes GCA tests (mean ux = 1.00, SD = .06, k = 3,
N = 395) compared to low stakes GCA tests (mean ux = .83, SD = .09, k = 9, N = 834).
However, the mean ux value for high stakes tests was based on only three studies with a
combined sample size of 395 students. This is significantly smaller than the overall 14
studies with a combined sample size of 11,028 students. Therefore, the obtained ux value
may not be representative of the entire high stakes GCA high school sample.
Hypothesis 3b proposed that the observed validities of cognitive ability tests for
college students would be similar under high and low stakes testing conditions. This
hypothesis was supported for Gc measures. The observed validity for Gc tests was .41
under high stakes conditions (.36 including the Sackett et al., 2009 data) and .40 under
low stakes conditions (the low stakes samples did not include any data from Sackett et
al.). With regard to GCA measures administered in college samples, as expected, ux
values were smaller for high stakes samples (mean ux = .59, SD = .04, k = 3, N = 496)
compared to low stakes samples (mean ux = .70, SD = .08, k = 24, N = 2,405). However,

123
123
contrary to Hypothesis 3b, the mean observed validity of GCA measures administered
under high stakes conditions (r = .47) was higher than the mean observed validity of
GCA measures given under low stakes conditions (r = .31).
Cognitive Ability
and Training Performance
Fluid Ability
and Training Performance
Table 9 presents the results for the meta-analyses examining the relationship
between fluid ability and training performance. At the overall level, the observed validity
of Gf is .25. This validity increases to .54 (SDρop = .17) when corrections for indirect
range restriction and criterion unreliability are made. Likewise, the 80% credibility
intervals exclude zero, an indication that the results are generalizable. The mean
operational validity of Gf for predicting training performance in high complexity jobs
(ρop = .67) is greater than that for medium complexity jobs, (.ρop = .44). However, a
closer inspection reveals there is substantial overlap between the 95% confidence
intervals (95% CI for medium complexity jobs = .32 to .56 for medium complexity jobs
vs. .36 to .97 for high complexity jobs), suggesting the validities are similar in
magnitude. There were no low complexity jobs in the Gf – training performance sample.
Taken together, these findings provide support for Hypothesis 4a. Further, when training
performance is the criterion, the operational validities of Gf are similar for traditional
fluid measures such as Raven‘s Progressive Matrices and the Culture Fair Intelligence
Test (ρop = .51, SDρop = .23, 95% CI = .27 - .74) compared to measures of abstract or
inductive reasoning (ρop = .56, SDρop = .14, 95% CI = .43 - .69).

124
124
Crystallized Ability
and Training Performance
Table 10 presents the results for the meta-analyses examining crystallized ability
and training performance. Gc measures were strong, positive predictors of training
performance. When all jobs are considered together, the observed validity of crystallized
ability for predicting training performance is .38. This validity increases to .70 (SDρop =
.14) after corrections for indirect range restriction and criterion unreliability are made.
Likewise, the 80% credibility intervals exclude zero, an indication that the results are
generalizable. Operational validity estimates at the overall level were based on a large
number of independent samples (k = 114) and a relatively large total sample size (N = 38,
793). Further, the operational validities of Gc are strong and positive at all levels of job
complexity, with 80% credibility intervals excluding zero: .73 for low complexity jobs,
.74 for medium complexity jobs, and .75 for high complexity jobs. Although the mean
validity values do increase with complexity, the 95% confidence intervals overlap
considerably suggesting the validities are effectively the same at all levels of complexity.
This finding provides support for Hypothesis 4a.
Although both fluid and crystallized measures were positively related to training
performance, Gc measures are stronger predictors of performance at the overall level (ρop
= .70 for Gc vs. .54 for Gf), as well as for medium complexity jobs (ρop = .74 for Gc vs.
.44 for Gf). Further, at the overall level only the end points (.01) of the 95% confidence
intervals overlap (95% CI = .66 - .75 for Gc vs. .42 - .66 for Gf). For medium complexity
jobs, the 95% confidence intervals surrounding ρop do not overlap. Taken together, these
results offer support for Hypothesis 1b.

125
125
For high complexity jobs, the mean operational validity is higher for Gc measures
(ρop = .75; 95% CI = .59 - .92) compared to Gf measures (ρop = .67; 95% CI = .36 - .97).
However, the 95% confidence intervals overlap completely, indicating that it is not
possible to conclude that the validities for Gc and Gf differ meaningfully for predicting
training performance in high complexity jobs. Caution is warranted in interpreting
results at high complexity levels given that the k‘s and N‘s are quite small for both Gf (k
= 5, N = 569) and Gc (k = 4, N = 596).
Nearly 25% of the studies in the data set examined the relationship between
cognitive ability and training performance in police academies (these are typically long-
term training programs ranging from 12 to 24 weeks in duration). This allowed
comparisons to be made between the validities of Gf and Gc for predicting training
performance within a single occupation. In this regard, the mean operational validity of
Gc measures (.66) for predicting police training performance was higher than that of Gf
measures (.45). However, there was overlap between the 95% confidence intervals for
these measures (95% CI = .58 - .74 for Gc vs. .20 - .70 for Gf). The wider confidence
intervals for Gf are largely the function of the small number of independent samples (k =
5) contributing to this analysis. In contrast, operational validity estimates for Gc and
police training performance were based on a larger number of independent correlations as
well as a larger total sample size (k = 25, N = 7,762).

126
126
General Cognitive Ability
and Training Performance
Table 11 presents the results for the meta-analyses examining general cognitive
ability and training performance. Compared to the results for Gc measures (k = 114), a
surprisingly small number of independent samples (k = 24) examined general cognitive
ability and training performance. While this may be a function of the current data set, the
disparity may also be due to the fact that previous meta-analyses have likely classified
tests such as the General Aptitude Test Battery (GATB) or Armed Forces Vocational
Aptitude Battery (ASVAB) as measures of GCA. In contrast, in the current study, verbal
and quantitative scores from these test batteries were combined to estimate crystallized
ability.
At the overall level, the observed validity of GCA for predicting training
performance is .28. This validity increases to .59 (SDρop = .15) after corrections for
indirect range restriction and criterion unreliability are made. The 80% credibility
intervals exclude zero at all levels of analysis, suggesting validities for GCA and training
performance are generalizable. The operational validities of GCA were strong and
positive for low (.53), medium (.56), and high (.57) complexity jobs. However, there was
considerable overlap in the 95% confidence intervals between complexity levels. This
finding is consistent with previous research (Hunter, 1980; Hunter & Hunter, 1984) as
well as Hypothesis 4a, which proposed that cognitive test validities would be similar
across job complexity levels. However, the results for GCA and training performance for
low complexity jobs and high complexity jobs are both based on only 2 independent

127
127
samples each (compared with 14 for medium complexity jobs). This makes a meaningful
test of Hypothesis 4a prohibitive with regard to GCA.
Compared to Gf, the mean operational validity of GCA was stronger for
predicting training performance in medium complexity jobs (ρop = .56 for GCA vs. .44
for Gf). However, there was some overlap in the 95% confidence intervals for these two
types of measures (95% CI for GCA = .42 - .70; 95% CI for Gf = .32 - .56). On average,
the validities of GCA for predicting training performance were smaller than those of Gc,
with only minor overlap of the 95% confidence intervals. This finding lies in contrast to
the pattern of validities hypothesized by Hypothesis 2c. Nevertheless, the operational
validities for both types of measures are strong and positive, suggesting these are both
good predictors of training performance.
Cognitive Ability
and Job Performance
Fluid Ability
and Job Performance
Table 12 presents the results for fluid ability and job performance. The observed
validity of Gf measures for predicting job performance is .14 with a large standard
deviation (SDr = .17). The validity of Gf increased to .27 (SDρop = .26) after correcting
for indirect range restriction and criterion unreliability. However, the 80% credibility
interval included zero, indicating that the results are not generalizable at the overall level.
At low levels of job complexity, the operational of Gf was found to be -.01, and the
credibility intervals included zero (80% CrI = -.49 - .46), suggesting that the results are
not generalizable. However, it is important to note that this analysis was based on only
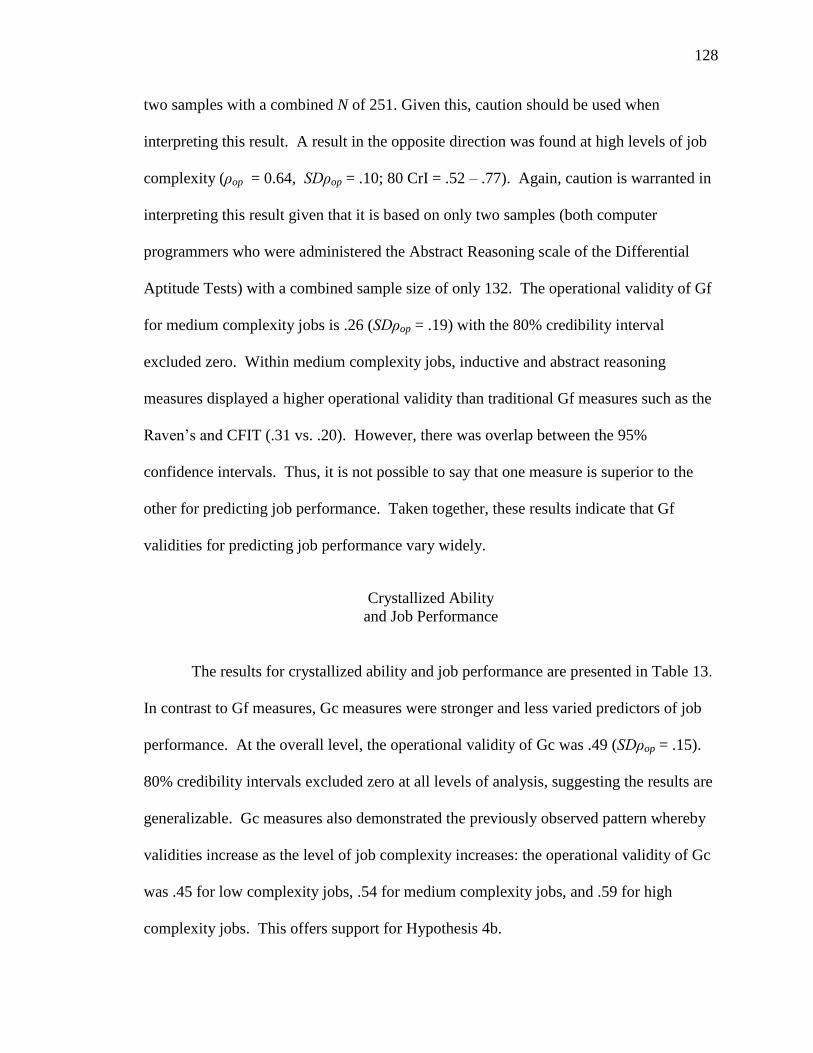
128
128
two samples with a combined N of 251. Given this, caution should be used when
interpreting this result. A result in the opposite direction was found at high levels of job
complexity (ρop = 0.64, SDρop = .10; 80 CrI = .52 – .77). Again, caution is warranted in
interpreting this result given that it is based on only two samples (both computer
programmers who were administered the Abstract Reasoning scale of the Differential
Aptitude Tests) with a combined sample size of only 132. The operational validity of Gf
for medium complexity jobs is .26 (SDρop = .19) with the 80% credibility interval
excluded zero. Within medium complexity jobs, inductive and abstract reasoning
measures displayed a higher operational validity than traditional Gf measures such as the
Raven‘s and CFIT (.31 vs. .20). However, there was overlap between the 95%
confidence intervals. Thus, it is not possible to say that one measure is superior to the
other for predicting job performance. Taken together, these results indicate that Gf
validities for predicting job performance vary widely.
Crystallized Ability
and Job Performance
The results for crystallized ability and job performance are presented in Table 13.
In contrast to Gf measures, Gc measures were stronger and less varied predictors of job
performance. At the overall level, the operational validity of Gc was .49 (SDρop = .15).
80% credibility intervals excluded zero at all levels of analysis, suggesting the results are
generalizable. Gc measures also demonstrated the previously observed pattern whereby
validities increase as the level of job complexity increases: the operational validity of Gc
was .45 for low complexity jobs, .54 for medium complexity jobs, and .59 for high
complexity jobs. This offers support for Hypothesis 4b.

129
129
When compared directly with the operational validities of Gf measures, the
validity for Gc measures was higher for the overall sample of jobs (.49 vs. .29), for low
complexity jobs (.45 vs. -.01), and for medium complexity jobs (.48 vs. .26) with no
overlap between the 95% confidence intervals. Again caution should be used when
interpreting the comparison for low level jobs since the Gf analysis only included two
samples. For high complexity jobs, the mean operational validity of Gc was similar to
but slightly smaller than Gf (.59 vs. .64), with complete overlap between the 95%
confidence intervals. Again, caution should be used when interpreting this result since
the Gf analysis was based on only two samples of a single job (computer programmers).
It is possible this high validity is a unique characteristic of the computer programmer job,
and it is likely that Gc tests would also display very high validities for computer
programmers. In this regard, Schmidt, Gast-Rosenberg, and Hunter (1980) conducted a
validity generalization study for computer programmer jobs. They found that a battery of
cognitive tests (number series, figural analogies, and arithmetic reasoning) displayed
mean operational validities of .71 for job performance and .91 for training performance.
Taken as a whole, these results suggest that compared with Gf measures, Gc
measures are better predictors of job performance for low and medium complexity jobs.
These findings provide support for Hypothesis 1c.
General Cognitive Ability
and Job Performance
Table 14 presents the meta-analytic results for General Cognitive Ability and job
performance. As was the case with academic performance, GCA was a strong and
positive predictor of job performance. Considering all jobs and samples together at the

130
130
overall level of analysis, the observed validity of GCA is .23. After correcting for range
restriction and criterion unreliability, the correlation increased to .43 (SDρop = .15). 80%
credibility intervals excluded zero at all levels of analysis, suggesting the results are
generalizable. GCA measures also demonstrated the previously observed pattern
whereby validities increase as the level of job complexity increases: the operational
validity of GCA was .37 for low complexity jobs, .48 for medium complexity jobs, and
.60 for high complexity jobs. This provides additional support for Hypothesis 4b.
When compared directly with Gf measures, GCA measures were higher for the
overall sample of jobs (.43 vs. .29), for low complexity jobs (.37 vs. -.01), and for
medium complexity jobs (.48 vs. .26) with no overlap between the 95% confidence
intervals. As noted above, caution should be used when interpreting the comparison for
low level jobs since the Gf analysis only included two samples. For high complexity
jobs, the mean operational validity of GCA was similar to but slightly smaller than Gf
(.60 vs. .64); however, there was complete overlap between the 95% confidence intervals.
Again, caution should be used when interpreting this result since the Gf analysis was
based on only two samples of a single job (computer programmers). Finally, a small
number of studies (k = 7, N= 871) reported relationships between GCA and
organizational citizenship behaviors. The operational validity of GCA for predicting
OCB‘s was .18 (SDρop = .11), with the 80% credibility interval excluding zero. Taken
together, these results provide support for Hypothesis 2c.

131
Table 6. Fluid Ability (Gf) and Academic Performance
Predictor/Test
(1) (2) (3) (4) (5) (6) (7) (8) (9) (10)
k N robs SDr ρop SDρop 80% CrI 95% CI
ρts SDρts LL UL LL UL
Validity of Fluid Ability by Educational Level
Overall 67 7,991 0.26 0.14 0.40 0.14 0.22 0.58 0.35 0.45 0.43 0.15
High School 26 4,134 0.30 0.13 0.38 0.13 0.21 0.55 0.32 0.44 0.41 0.14
College 41 3,857 0.22 0.14 0.44 0.17 0.23 0.65 0.36 0.53 0.48 0.18
Validity of Fluid Ability by Scale Type
Traditional Gf Measures
(Raven‘s & Culture Fair) 32 4,658 0.25 0.13 0.37 0.13 0.20 0.53 0.30 0.43 0.40 0.14
High School 12 3,094 0.28 0.10 0.36 0.10 0.24 0.49 0.29 0.44 0.39 0.11
College 20 1,564 0.19 0.16 0.38 0.20 0.12 0.63 0.24 0.52 0.41 0.22
D-48 (Dominoes Test) 14 1,159 0.27 0.14 0.46 0.11 0.32 0.60 0.33 0.58 0.50 0.12
High School 4 341 0.25 0.16 0.32 0.15 0.13 0.51 0.12 0.52 0.35 0.16
College 10 818 0.27 0.13 0.54 0.11 0.39 0.68 0.38 0.69 0.58 0.12

132
Table 6. Continued
Predictor/Test
(1) (2) (3) (4) (5) (6) (7) (8) (9) (10)
k N robs SDr ρop SDρop 80% CrI 95% CI
ρts SDρts LL UL LL UL
Abstract & Inductive
Reasoning 24 2,471 0.26 0.15 0.44 0.17 0.23 0.66 0.34 0.55 0.48 0.18
High School 10 699 0.39 0.18 0.48 0.18 0.26 0.71 0.34 0.62 0.52 0.19
College 14 1,772 0.21 0.10 0.44 0.10 0.31 0.57 0.33 0.55 0.48 0.11
Note: Column content is as follows: (1) k = number of independent samples (correlations); (2) N = total sample size; (3) robs =
sample-size weighted mean observed correlation; (4) SDr = standard deviation of the sample-size weighted mean observed
correlation; (5) ρop = operational validity (sample-size weighted mean observed correlation corrected for indirect range
restriction and criterion unreliability); (6) SDρop = standard deviation of the operational validity (ρop); (7) 80% CrI = 80%
Credibility Interval around ρop; (8) 95% CI = Confidence Interval around ρop; (9) ρts = true score correlation (sample-size
weighted mean observed correlation corrected for indirect range restriction and unreliability in both the criterion and
predictor); (10) SDρts = standard deviation of the true score correlation (ρts).

133
Table 7. Crystallized Ability (Gc) and Academic Performance
Predictor/Test
(1) (2) (3) (4) (5) (6) (7) (8) (9) (10)
k N robs SDr ρop SDρop 80% CrI 95% CI
ρts SDρts LL UL LL UL
Validity of Crystallized Ability by Educational Level
Overall 157 199,642 0.36 0.09 0.65 0.10 0.53 0.78 0.63 0.68 0.71 0.11
Excluding Sackett et al. (1999) 116 31,936 0.41 0.12 0.69 0.11 0.55 0.82 0.65 0.72 0.74 0.12
High School 18 2,100 0.43 0.17 0.53 0.17 0.32 0.75 0.44 0.63 0.58 0.18
College 139 197,542 0.36 0.08 0.65 0.10 0.53 0.78 0.63 0.68 0.71 0.11 Excluding Sackett et al.
(1999) 98 29,836 0.41 0.11 0.70 0.11 0.56 0.84 0.66 0.74 0.76 0.12
Validity of Crystallized Ability by Testing Purpose and Educational Level
High Stakes Testing
(Selection & Assessment) 133 196,746 0.36 0.08 0.71 0.09 0.60 0.83 0.69 0.74 0.77 0.10
Excluding Sackett et al.(1999) 92 29,040 0.41 0.11 0.74 0.09 0.62 0.86 0.70 0.78 0.81 0.10
High School 9 1,147 0.40 0.21 0.44 0.21 0.17 0.70 0.29 0.58 0.47 0.23
College 124 195,599 0.36 0.08 0.71 0.09 0.60 0.83 0.69 0.74 0.78 0.10 Excluding Sackett et al.
(1999) 83 27,893 0.41 0.11 0.76 0.09 0.65 0.87 0.72 0.80 0.83 0.10

134
Table 7. Continued
Predictor/Test
(1) (2) (3) (4) (5) (6) (7) (8) (9) (10)
k N robs SDr ρop SDρop 80% CrI 95% CI
ρts SDρts LL UL LL UL
Low Stakes Testing
(Research) 16 1,950 0.44 0.12 0.63 0.09 0.51 0.75 0.54 0.71 0.68 0.10
High School 9 953 0.48 0.08 0.62 0.04 0.58 0.67 0.55 0.69 0.68 0.04
College 7 997 0.40 0.13 0.63 0.13 0.47 0.80 0.48 0.79 0.68 0.14
Note: Column content is as follows: (1) k = number of independent samples (correlations); (2) N = total sample size; (3) robs =
sample-size weighted mean observed correlation; (4) SDr = standard deviation of the sample-size weighted mean observed
correlation; (5) ρop = operational validity (sample-size weighted mean observed correlation corrected for indirect range
restriction and criterion unreliability); (6) SDρop = standard deviation of the operational validity (ρop); (7) 80% CrI = 80%
Credibility Interval around ρop; (8) 95% CI = Confidence Interval around ρop; (9) ρts = true score correlation (sample-size
weighted mean observed correlation corrected for indirect range restriction and unreliability in both the criterion and
predictor); (10) SDρts = standard deviation of the true score correlation (ρts).

135
Table 8. General Cognitive Ability (GCA) and Academic Performance
Predictor/Test
(1) (2) (3) (4) (5) (6) (7) (8) (9) (10)
k N robs SDr ρop SDρop 80% CrI 95% CI
ρts SDρts LL UL LL UL
Validity of General Cognitive Ability by Educational Level
Overall 110 29,739 0.47 0.10 0.68 0.06 0.60 0.76 0.65 0.71 0.74 0.07
High School 32 13,290 0.53 0.06 0.65 0.05 0.59 0.72 0.63 0.68 0.71 0.06
College 78 16,449 0.42 0.10 0.72 0.08 0.62 0.82 0.68 0.76 0.78 0.09
Validity of General Cognitive Ability by Testing Purpose and Educational Level
High Stakes Testing
(Selection & Assessment) 52 18,525 0.51 0.07 0.66 0.00 0.66 0.66 0.63 0.68 0.71 0.00
High School 14 11,028 0.53 0.05 0.58 0.04 0.53 0.64 0.55 0.61 0.63 0.05
College 38 7,497 0.47 0.08 0.82 0.04 0.77 0.87 0.77 0.86 0.89 0.04
Low Stakes Testing
(Research) 46 4,731 0.37 0.14 0.57 0.14 0.39 0.75 0.51 0.63 0.62 0.15
High School 13 1,261 0.53 0.11 0.68 0.09 0.57 0.79 0.60 0.76 0.74 0.09
College 33 3,470 0.31 0.11 0.53 0.08 0.44 0.63 0.47 0.59 0.58 0.08

136
Table 8. Continued
Note: Column content is as follows: (1) k = number of independent samples (correlations); (2) N = total sample size; (3) robs =
sample-size weighted mean observed correlation; (4) SDr = standard deviation of the sample-size weighted mean observed
correlation; (5) ρop = operational validity (sample-size weighted mean observed correlation corrected for indirect range
restriction and criterion unreliability); (6) SDρop = standard deviation of the operational validity (ρop); (7) 80% CrI = 80%
Credibility Interval around ρop; (8) 95% CI = Confidence Interval around ρop; (9) ρts = true score correlation (sample-size
weighted mean observed correlation corrected for indirect range restriction and unreliability in both the criterion and
predictor); (10) SDρts = standard deviation of the true score correlation (ρts).

137
Table 9. Fluid Ability (Gf) and Training Performance
Predictor/Test
(1) (2) (3) (4) (5) (6) (7) (8) (9) (10)
k N robs SDr ρop SDρop 80% CrI 95% CI
ρts SDρts LL UL LL UL
Validity of Fluid Ability by Level of Job Complexity
Overall 20 3,724 0.25 0.13 0.54 0.17 0.32 0.76 0.42 0.66 0.59 0.19
Medium (Job Zone 3) 11 2,658 0.23 0.11 0.44 0.15 0.25 0.63 0.32 0.56 0.48 0.16
Police 5 740 0.24 0.15 0.45 0.20 0.19 0.71 0.20 0.70 0.49 0.22
High (Job Zones 4 & 5) 5 569 0.32 0.16 0.67 0.19 0.42 0.91 0.36 0.97 0.73 0.21
Validity of Fluid Ability by Scale Type and Level of Job Complexity
Traditional Gf Measures
(Raven‘s, Culture Fair, &
IPAT-G) 7 1,283 0.23 0.15 0.51 0.23 0.21 0.80 0.27 0.74 0.55 0.25
Abstract/Inductive
Reasoning, & Other
Measures 13 2,441 0.25 0.11 0.56 0.14 0.38 0.74 0.43 0.69 0.61 0.15

138
Table 9. Continued
Note: Column content is as follows: (1) k = number of independent samples (correlations); (2) N = total sample size; (3) robs =
sample-size weighted mean observed correlation; (4) SDr = standard deviation of the sample-size weighted mean observed
correlation; (5) ρop = operational validity (sample-size weighted mean observed correlation corrected for indirect range
restriction and criterion unreliability); (6) SDρop = standard deviation of the operational validity (ρop); (7) 80% CrI = 80%
Credibility Interval around ρop; (8) 95% CI = Confidence Interval around ρop; (9) ρts = true score correlation (sample-size
weighted mean observed correlation corrected for indirect range restriction and unreliability in both the criterion and
predictor); (10) SDρts = standard deviation of the true score correlation (ρts).

139
Table 10. Crystallized Ability (Gc) and Training Performance
Predictor/Test
(1) (2) (3) (4) (5) (6) (7) (8) (9) (10)
k N robs SDr ρop SDρop 80% CrI 95% CI
ρts SDρts LL UL LL UL
Validity of Crystallized Ability by Level of Job Complexity
Overall 114 38,793 0.38 0.13 0.70 0.14 0.53 0.88 0.66 0.75 0.77 0.15
Low (Job Zones 1 & 2) 29 8,152 0.41 0.12 0.73 0.11 0.59 0.88 0.65 0.81 0.80 0.12
Medium (Job Zone 3) 66 22,100 0.42 0.12 0.74 0.11 0.60 0.88 0.69 0.79 0.81 0.12
Police 25 7,762 0.41 0.13 0.66 0.13 0.49 0.83 0.58 0.74 0.72 0.15
High (Job Zones 4 & 5) 4 596 0.45 0.10 0.75 0.07 0.67 0.84 0.59 0.92 0.83 0.07
Note: Column content is as follows: (1) k = number of independent samples (correlations); (2) N = total sample size; (3) robs =
sample-size weighted mean observed correlation; (4) SDr = standard deviation of the sample-size weighted mean observed
correlation; (5) ρop = operational validity (sample-size weighted mean observed correlation corrected for indirect range
restriction and criterion unreliability); (6) SDρop = standard deviation of the operational validity (ρop); (7) 80% CrI = 80%
Credibility Interval around ρop; (8) 95% CI = Confidence Interval around ρop; (9) ρts = true score correlation (sample-size
weighted mean observed correlation corrected for indirect range restriction and unreliability in both the criterion and
predictor); (10) SDρts = standard deviation of the true score correlation (ρts).

140
Table 11. General Cognitive Ability (GCA) and Training Performance
Predictor/Test
(1) (2) (3) (4) (5) (6) (7) (8) (9) (10)
k N robs SDr ρop SDρop 80% CrI 95% CI
ρts SDρts LL UL LL UL
Validity of General Cognitive Ability by Level of Job Complexity
Overall 24 7,563 0.28 0.11 0.59 0.15 0.39 0.78 0.49 0.68 0.64 0.17
Low (Job Zones 1 & 2) 2 156 0.22 0.00 0.53 0.00 0.53 0.53 0.53 0.53 0.58 0.00
Medium (Job Zone 3) 14 2,581 0.32 0.16 0.56 0.19 0.31 0.81 0.42 0.70 0.61 0.21
Police 10 2,272 0.31 0.16 0.55 0.21 0.28 0.82 0.37 0.72 0.60 0.23
High (Job Zones 4 & 5) 2 2,824 0.22 0.06 0.57 0.10 0.44 0.70 0.34 0.79 0.62 0.11
Note: Column content is as follows: (1) k = number of independent samples (correlations); (2) N = total sample size; (3) robs =
sample-size weighted mean observed correlation; (4) SDr = standard deviation of the sample-size weighted mean observed
correlation; (5) ρop = operational validity (sample-size weighted mean observed correlation corrected for indirect range
restriction and criterion unreliability); (6) SDρop = standard deviation of the operational validity (ρop); (7) 80% CrI = 80%
Credibility Interval around ρop; (8) 95% CI = Confidence Interval around ρop; (9) ρts = true score correlation (sample-size
weighted mean observed correlation corrected for indirect range restriction and unreliability in both the criterion and
predictor); (10) SDρts = standard deviation of the true score correlation (ρts).
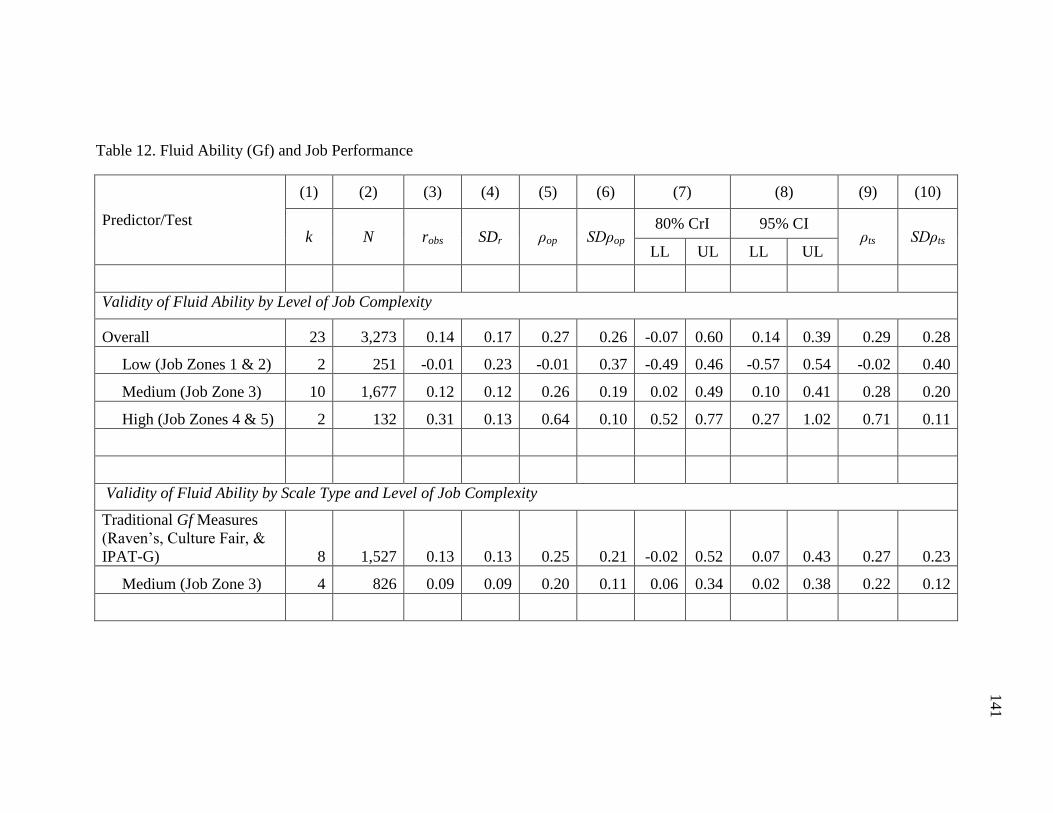
141
Table 12. Fluid Ability (Gf) and Job Performance
Predictor/Test
(1) (2) (3) (4) (5) (6) (7) (8) (9) (10)
k N robs SDr ρop SDρop 80% CrI 95% CI
ρts SDρts LL UL LL UL
Validity of Fluid Ability by Level of Job Complexity
Overall 23 3,273 0.14 0.17 0.27 0.26 -0.07 0.60 0.14 0.39 0.29 0.28
Low (Job Zones 1 & 2) 2 251 -0.01 0.23 -0.01 0.37 -0.49 0.46 -0.57 0.54 -0.02 0.40
Medium (Job Zone 3) 10 1,677 0.12 0.12 0.26 0.19 0.02 0.49 0.10 0.41 0.28 0.20
High (Job Zones 4 & 5) 2 132 0.31 0.13 0.64 0.10 0.52 0.77 0.27 1.02 0.71 0.11
Validity of Fluid Ability by Scale Type and Level of Job Complexity
Traditional Gf Measures
(Raven‘s, Culture Fair, &
IPAT-G) 8 1,527 0.13 0.13 0.25 0.21 -0.02 0.52 0.07 0.43 0.27 0.23
Medium (Job Zone 3) 4 826 0.09 0.09 0.20 0.11 0.06 0.34 0.02 0.38 0.22 0.12

142
Table 12. Continued
Predictor/Test
(1) (2) (3) (4) (5) (6) (7) (8) (9) (10)
k N robs SDr ρop SDρop 80% CrI 95% CI
ρts SDρts LL UL LL UL
Abstract/Inductive
Reasoning, & Other
Measures 15 1,746 0.15 0.19 0.28 0.29 -0.09 0.66 0.11 0.46 0.31 0.32
Low (Job Zones 1 & 2) 2 251 -0.01 0.23 -0.01 0.37 -0.49 0.46 -0.57 0.54 -0.02 0.40
Medium (Job Zone 3) 6 851 0.15 0.14 0.31 0.22 0.03 0.59 0.08 0.54 0.34 0.24
High (Job Zones 4 & 5) 2 132 0.31 0.13 0.64 0.10 0.52 0.77 0.27 1.02 0.71 0.11
Note: Column content is as follows: (1) k = number of independent samples (correlations); (2) N = total sample size; (3) robs =
sample-size weighted mean observed correlation; (4) SDr = standard deviation of the sample-size weighted mean observed
correlation; (5) ρop = operational validity (sample-size weighted mean observed correlation corrected for indirect range
restriction and criterion unreliability); (6) SDρop = standard deviation of the operational validity (ρop); (7) 80% CrI = 80%
Credibility Interval around ρop; (8) 95% CI = Confidence Interval around ρop; (9) ρts = true score correlation (sample-size
weighted mean observed correlation corrected for indirect range restriction and unreliability in both the criterion and
predictor); (10) SDρts = standard deviation of the true score correlation (ρts).

143
Table 13. Crystallized Ability (Gc) and Job Performance
Predictor/Test
(1) (2) (3) (4) (5) (6) (7) (8) (9) (10)
k N robs SDr ρop SDρop 80% CrI 95% CI
ρts SDρts LL UL LL UL
Validity of Crystallized Ability by Level of Job Complexity
Overall 199 18,619 0.23 0.13 0.49 0.15 0.31 0.68 0.46 0.53 0.54 0.16
Low (Job Zones 1 & 2) 108 9,307 0.22 0.12 0.45 0.11 0.30 0.60 0.40 0.50 0.50 0.13
Medium (Job Zone 3) 58 6,603 0.23 0.11 0.54 0.13 0.38 0.70 0.47 0.60 0.59 0.14
High (Job Zones 4 & 5) 27 2,214 0.29 0.15 0.59 0.17 0.38 0.81 0.48 0.71 0.65 0.18
Note: Column content is as follows: (1) k = number of independent samples (correlations); (2) N = total sample size; (3) robs =
sample-size weighted mean observed correlation; (4) SDr = standard deviation of the sample-size weighted mean observed
correlation; (5) ρop = operational validity (sample-size weighted mean observed correlation corrected for indirect range
restriction and criterion unreliability); (6) SDρop = standard deviation of the operational validity (ρop); (7) 80% CrI = 80%
Credibility Interval around ρop; (8) 95% CI = Confidence Interval around ρop; (9) ρts = true score correlation (sample-size
weighted mean observed correlation corrected for indirect range restriction and unreliability in both the criterion and
predictor); (10) SDρts = standard deviation of the true score correlation (ρts).

144
Table 14. General Cognitive Ability (GCA) and Job Performance
Predictor/Test
(1) (2) (3) (4) (5) (6) (7) (8) (9) (10)
k N robs SDr ρop SDρop 80% CrI 95% CI
ρts SDρts LL UL LL UL
Validity of General Cognitive Ability by Level of Job Complexity
Overall 86 8,070 0.23 0.13 0.43 0.15 0.23 0.62 0.37 0.48 0.47 0.17
Low (Job Zones 1 & 2) 37 3,420 0.20 0.13 0.37 0.14 0.20 0.55 0.30 0.45 0.41 0.15
Medium (Job Zone 3) 31 2,456 0.25 0.15 0.48 0.18 0.25 0.71 0.38 0.58 0.53 0.20
High (Job Zones 4 & 5) 11 861 0.30 0.15 0.60 0.17 0.38 0.82 0.42 0.78 0.66 0.19
GCA and OCBs 7 871 0.09 0.11 0.18 0.11 0.04 0.32 0.03 0.33 0.20 0.12
Note: Column content is as follows: (1) k = number of independent samples (correlations); (2) N = total sample size; (3) robs =
sample-size weighted mean observed correlation; (4) SDr = standard deviation of the sample-size weighted mean observed
correlation; (5) ρop = operational validity (sample-size weighted mean observed correlation corrected for indirect range
restriction and criterion unreliability); (6) SDρop = standard deviation of the operational validity (ρop); (7) 80% CrI = 80%
Credibility Interval around ρop; (8) 95% CI = Confidence Interval around ρop; (9) ρts = true score correlation (sample-size
weighted mean observed correlation corrected for indirect range restriction and unreliability in both the criterion and
predictor); (10) SDρts = standard deviation of the true score correlation (ρts).

145
145
CHAPTER 6
DISCUSSION
Chapter Overview
I begin this chapter by briefly reviewing the key meta-analytic results from the
previous chapter. I then discuss implications of the study findings for theory in light of
recent research in the field of neuroscience. I conclude by discussing implications for
practice, opportunities for future research, and study limitations.
Summary of Research Findings
The primary objective of the current study was to examine the relative validities
of fluid and crystallized ability for predicting real-world performance. Drawing on
findings from a diverse body of research on past performance, the nature of work, and
expert performance, I argued that compared to measures of fluid ability, crystallized
ability measures should more strongly predict real-world performance in the classroom as
well as the workplace. My proposed hypotheses were meta-analytically examined using
a large, diverse set of over 400 primary studies spanning the past 100 years. With regard
to academic performance, measures of fluid ability were found to positively predict
learning (as measured by grades). However, as hypothesized, crystallized ability
measures were found to be superior predictors of academic performance compared to
their fluid ability counterparts. This finding was true for both high school and college
students.
Consistent with my hypotheses, similar patterns of results were observed with
regard to both training and job performance. Again, crystallized ability measures were

146
146
found to be better predictors of performance than fluid measures. This finding was
consistent at the overall level of analysis as well as for medium complexity jobs. The
very small number of studies examining the relationship between fluid ability and
performance for low and high complexity occupations severely limits the ability to make
meaningful comparisons at these levels of analysis. However, this presents an interesting
opportunity for future research. Likewise, for job and training performance, the
relatively high validitites for fluid ability observed in a small number of high-complexity
samples suggests that it is possible that compared to typical occupations, certain high
complexity occupations are particularly reliant on fluid ability, thus making Gf equal to
or greater than the validity of crystallized ability. For example, Goldberg (2009) has
noted that some very complex computational tasks require both the left (the area
responsible for pattern recognition) and the right (the area responsible for processing
novel information) parts of the brain.
Hypotheses 4a and 4b were confirmatory in nature and addressed the previously
observed gradient in test validity according to occupational complexity. Support was
found for Hypothesis 4a, which argued that the validity of cognitive ability will increase
as the level of job complexity increases. Although this idea was tested using an
alternative method of assigning jobs to complexity categories, and using diverse
measures of cognitive ability, the results remain consistent with Hunter‘s (Hunter, 1980;
Hunter & Hunter, 1984) earlier findings which were based solely on GATB data.
Likewise, support was found for Hypothesis 4b, which proposed that no such gradient
will be visible for training performance. Consistent with this idea, the validities of Gc

147
147
and GCA measures for predicting training performance were found to be similar across
low, medium, and high complexity occupations.
The question of whether the validities of cognitive ability tests differ under high
vs. low stakes testing conditions is indeed an interesting one. The results in this regard
were mixed. For crystallized tests, the results suggest that for high school students, low
stakes testing situations produce somewhat higher observed validities than high stakes
testing situations. However, this may be attributed to increased range restriction in high
stakes testing situations. Sample size limitations prevented a more in-depth analysis of
this issue in the current study. As hypothesized, Gc tests administered to college students
displayed similar (or identical) validities under both high and low stakes conditions.
For GCA measures, the results were less than conclusive, and in some cases
counter to hypothesis. The reason for this difference compared to the supporting findings
for Gc measures is unclear; however there are several possible explanations. First, it is
possible that the tests used to measure GCA under low stakes conditions varied
qualitatively from those administered under high stakes conditions, and this in turn
affected the validities. For example, under low stakes conditions, the Wonderlic
Personnel Test was a frequently adopted assessment. On the other hand, under high
stakes conditions traditional intelligence tests were more frequently employed. Likewise,
it is possible that the coding scheme used to assign samples to low stakes and high stakes
categories was less than satisfactory. Tests administered for both selection and
assessment purposes were classified as high stakes. It is possible that a clearer difference
would be seen had only selection tests been used. However, given that very few general
cognitive ability tests were administered for selection purposes, this would have greatly

148
148
reduced the number of samples available for analysis. Finally, there is the possibility that
Hypotheses 3a and 3b are misspecified. Duckworth et al. (2011) acknowledged that test
motivation differences between high and low stakes testing situations had less effect for
predicting academic performance, compared with later life outcomes such as employment
or criminal convicetions. Thus, the phenomenon may be more apparent when more distal
criteria are examined. Each of these possibilities will be examined in the future as an
expanded data set is compiled.
Regardless of the findings, utilizing validities which have been corrected using
accurate range restriction values should alleviate any major differences between high and
low stakes testing situations, should they truly exist. In their discussion of the issue,
Duckworth et al. (2011) do not acknowledge this as a possible solution to the potentially
inflated validities that may arise from low stakes testing. It is certainly worthy of
consideration.
Implications for Theory
Contemporary intelligence theory has placed great emphasis on the role of fluid
ability. For example, Vernon and Parry (1949, p. 234) have argued that Raven‘s
Progressive Matrices are ―an almost pure g test‖ while Jensen (1998, p. 646) has
maintained that ―factorially the PM apparently measures g and little else. . .‖ Following
this, researchers in management and psychology have adopted these tests as measures of
general cognitive ability (e.g., Edwards, Day, Arthur, & Bell, 2006; Schuelke et al.,
2009). Well-known intelligence batteries such as the Stanford-Binet have recently been
revised to include more explicit measures of fluid ability. Using structural and factor
analytic evidence, researchers such as Undheim (1981a, 1981b) and Gustaffson (1984)

149
149
have argued that Gf and g are essentially the same construct. However, the results of this
study, which are based on criterion-related validty rather than factor-analytic evidence,
demonstrate that Gc measures are superior predictors to Gf measures. This is contrary to
what one would expect if Gf and g were indeed the same construct. Rather, the findings
of this study are more consistent with General Cognitive Ability theory, which predicts
that Gc indicators will be the best predictors of future learning and performance (which
depends on learning).
Furthermore, it useful to consider some additional reasoning as to why Gf
measures are not as robust predictors of performance as might be expected. The field of
neuroscience offers some valuable insights in this regard. As briefly mentioned in
Chapter 3, Goldberg (2009) summarizes rather persuasive evidence that the structure of
the brain is functionally segmented to deal with both novelty (analogous to Gf) and
pattern recognition (analogous to Gc). Specifically, recent research has shown that right
side of the brain, which has been traditionally considered to handle most visual-spatial
tasks, appears to be responsible for processing novel information. In contrast, the left
side of the brain, traditionally known for language processing, appears to be the center of
pattern recognition. When an individual encounters a novel situation, an unfamiliar face
or symbol for example, both the left and right sides of the brain are activated
simultaneously (Martin, Wiggs, & Weisberg, 1997). However, almost immediately, a
process which Goldberg refers to as ―cognitive gravity‖ begins to occur. This is a shift in
responsibility from the right side of the brain to the left side of the brain. As the once
novel face or symbol becomes familiar, the novel processing parts in the left side of the
brain are no longer activated. When an individual encounters the once unfamiliar face in

150
150
the future, only the left (Gc) pattern processing part of the brain is activated. This
phenomenon has been demonstrated across a number of different types of tasks.
Furthermore, this shift can occur very rapidly, even while a single assessment instrument
is being administered (Goldberg, 2009).
Academic, training, and job performance do require the processing of novel
information. However, evidence from neuroscience suggests that once processed, novel
information quickly becomes crystallized. When this information is relied upon in the
future, it is recalled from the brain structures responsible for pattern recognition, not
those responsible for novelty. Therefore, it logically follows that efficiency in pattern
recognition is largely responsible for real-world performance. Cattell‘s Investment
Model proposed a similar ―cognitive gravity‖ shift from Gf to Gc. However, in his
model the shift (from historical Gf to present Gc, Figure 6) was thought to take far longer
than is now known to be the case.
In the current study, the Gc measures adopted were broad measures which assess
the efficiency with which an individual has learned a variety of material over a long
period of time, in some cases 20 years or more. In contrast, fluid assessments measure
novel problem solving ability within a much shorter time frame, often under an hour.
This is a key difference in the scope of assessment, and may help explain the larger
validities for Gc measures. Even so, broad Gc measures are underestimates of the extent
to which an individual has learned over time. This is particularly the case for older
indiviudals. Both Cattell (1987) and Ackerman (2000) have noted that as individuals
grow older, they gain knowledge and expertise in increasingly narrower domains. In
turn, this poses a serious challenge for assessment as it is difficult to assess such

151
151
specialized knowledge across a diverse set of individuals. In contrast, broad Gc measures
tend to assess the extent to which individuals have learned a common body of general
material such as that learned during school. Gc includes a large number of g indicators,
while Gf measures contain either fewer or only one indicator. This is another reason to
expect Gc measures to have both higher construct validity and higher predictive validity.
The impact of Gf theory is also evident in newer models of ability assessment.
Fagan and Holland (2009) have recently proposed an alternate method for assessing
ability whereby students were ―given information as to the meanings of previously
unknown words, sayings, similarities, and analogies‖ (p. 62). Students‘ ability to learn
these new words, sayings, similarities, and analogies was found to predict both class
exam scores (uncorrected r = .41, corrected r = .50) as well as scores on a brief version of
the SAT (uncorrected r = .66, corrected r = .83). These authors argue that this method
offers a culture-fair method of predicting academic achievement. It is important to note
that the content of the new knowledge items mirrored that of novel language items that
are known to activate the left (novelty of Gf ) side of the brain. Likewise, the entire
training and testing session lasted only 40 minutes. This suggests Fagan and Holland‘s
measure is likely assessing Gf or working memory.
The current study also raises questions about assumptions which are inherent in
Cattell‘s Investment Model as well as PPIK. Both theories suggest that motivation plays
a key role in the development of Gc. However, this may not be the case. For example,
Roznowski (1987) administered gender-specific knowledge tests to male and female high
school students. Tests were constructed using 400 general knowledge items designed to
have a male advantage (e.g., mechanics, farming, fishing, sports) or female advantage

152
152
(e.g., home economics, theatre and ballet, etiquette, clerical checking). Roznowski found
that scores for both males and females were correlated with scores on a traditional Gc
intelligence assessment. In fact, after making corrections for measurement error, scores
on the interest tests correlated nearly perfectly with Gc. The fact that the knowledge tests
measured a large number of interest domains, and the fact that male knowledge items
were predictive for females and vice versa suggests that motivation was not a primary
factor in acquiring the knowledge. Given this, future theoretical and empirical work
should revisit the role of motivation in acquiring crystallized knowledge. It may very
well be the case that capable individuals learn regardless of the specific interests or
motivation.
Implications for Practice
Human resource decision makers are frequently tasked with the challenge of
identifying selection tools which will help them optimize their workforces. Likewise,
academic administrators at selective institutions are constantly seeking to identify the
most capable students. Cognitive ability tests are one of the strongest predictors of
academic performance (Kuncel et al. 2001, Kuncel et al., 2004), and the single best
predictor of job performance (Schmidt & Hunter, 1998). As such, these tests are often
utilized for student and personnel selection purposes. Practitioners have numerous
choices when choosing cognitive ability tests, and they must consider multiple factors
when selecting specific tests for use within their organizations. Although test validity is
among the most important, other factors include price, delivery format, administration
time, and legal defensibility. The findings of this study offer some important information
with regard to the issue of the validity of fluid, crystallized, and general cognitive ability
tests.

153
153
Crystallized tests are the dominant tests used for academic selection purposes
(Hunt, 2000), although general cognitive ability tests are also often used for assessment
purposes in primary and secondary school systems. Although fluid ability tests do
predict academic performance, the current results indicate that these tests are less valid
than tests of crystallized or general cognitive ability. Given this, there appears to be little
reason to consider adopting fluid ability tests for academic selection purposes,
particularly if they are to be the sole cognitive assessment to be utilized. However, this
does not mean that Gf tests are not useful for research purposes in academic
environments, indeed they are. As previously noted, more research on the criterion-
related validity is needed at all levels.
Within the workplace, crystallized and general cognitive ability tests dominate the
landscape. However, it is important to note that fluid ability tests are also being used for
personnel selection purposes, and these tests are actively marketed to HR decision
makers. However, considerably fewer validation studies have examined the relationship
between Gf and performance. Rather than provide primary validity data, some test
publishers point to meta-analytic results (e.g., Schmidt & Hunter, 1998) which
demonstrate that general cognitive ability measures are the best predictors of job
performance. Such assertions suggest that the extant validity data on general cognitive
ability tests generalizes to nonverbal, fluid tests. However, the findings of the current
study suggest that this may not be the case. Across the overall sample of jobs, fluid
ability tests were found to demonstrate lower validities than either crystallized ability
measures or measures of general cognitive ability such as the Wonderlic or Otis. Further,
at the overall level, the 80% credibility intervals for the operational validity of Gf
included zero, suggesting the validity of Gf is not generalizable across all jobs. It should
be noted that fluid ability tests such as the Raven‘s do appear to be valid predictors of job
performance for medium-complexity jobs, which represent the majority of jobs in the
U.S. economy (Hunter & Hunter, 1984, Schmidt & Hunter, 1998). Since they are valid

154
154
predictors, Gf tests will have selection utility (Schmidt & Hunter, 1998). Nevertheless, in
the sample of studies examined in this thesis, fluid tests were less valid predictors than
their crystallized or general cognitive ability counterparts. HR decision makers should be
aware of these differences, as well as the fact that the existing validity evidence for fluid
tests is based on considerably fewer primary studies than is the case for Gc or GCA tests.
Even if they are aware of lower validities, some decision makers may be attracted
to the claim that nonverbal ability tests reduce group differences. Test publishers need to
provide compelling evidence that this indeed the case. In fact, research and theory
suggest that fluid tests may still demonstrate group differences despite the fact that they
are nonverbal assessments (Brown & Day, 2006; Higgins & Sivers, 1958; Irwing &
Lynn, 2005; Lynn & Irwing, 2004; Raven, 1989; Rushton, Skuy, & Fridjohn; 2002;
Tulkin & Newbrough, 1968). For example, Lynn and Irwing (2004; see also Irwing &
Lynn, 2005) have found that compared to females, males tend to obtain higher mean
scores on Raven‘s Progressive Matrices tests. In a meta-analysis of 57 studies, they
estimated that the male advantage was .33 d, a difference equivalent to 5 IQ points (Lynn
& Irwing, 2004). Likewise, other studies have observed that black individuals tend to
score approximately one standard deviation lower than white individuals (e.g., Brown &
Day, 2006; Higgins & Stivers, 1958; Rushton, et al., 2002). Finally, researchers have
observed that there is a positive relationship between socioeconomic status and scores on
fluid tests (e.g., Raven, 1989; Tulkin & Newbrough, 1968). For example, in the British
standardization sample, Raven (1989) found a correlation of .22 between SES and
Standard Progressive Matrices scores. He maintains that this is equivalent to a within-
age correlation of .30.

155
155
Test-takers from developed economies are likely to be exposed to a variety of
modern media (television, video games, puzzles/mazes) that result in their receiving
higher scores on fluid ability tests. Greenfield (1998) presents a compelling case for this
line of reasoning in her discussion of the Flynn Effect. Individuals from non-developed
or less-developed countries, or lower socioeconomic backgrounds, may tend to score
lower on such assessments as they have had less experience with the type of information
being assessed in fluid tests. This line of evidence suggests that contrary to Gf – Gc
theory, Gf scores may be more dependent on learning and on individual differences in
motivation and interests than are broad (generic) Gc measures. This is the opposite of
what is postulated in Gf – Gc theory.
Although sex, race, and socioeconomic status are important categories to consider
with regard to potential group differences, the results of the current study suggest that age
may be an even more important concern. As discussed in Chapter 2, there is strong
empirical evidence that fluid ability scores decline with age. Fluid ability peaks between
ages 26 and 35, then begins a steady, continual decline. In contrast, crystallized ability
remains relatively stable. Consider two individuals that have the same level of Gc, one
aged 25 and one aged 50. In this situation, the older individual will very likely score
lower on a fluid ability test. Thus, when used for selection purposes, Gf tests will
underpredict the performance of older workers, because research has shown that Gc
measures are predictively unbiased. This is an acute concern given that the population is
rapidly aging and the number of older workers is increasing.
Finally, decision makers are often rightfully concerned with applicant reactions to
selection procedures. Applicants tend to react more positively when they perceive that

156
156
selection procedures have content validity or ―face validity‖ (Rynes & Connerley, 1993).
That is, applicants prefer selection tools to be job related. In this regard, Smither and
colleagues (Smither, Reilly, Millsap, Pearlman, & Stoffey, 1993) have found that both
recently hired managers and recruiting/employment managers tend to rate cognitive tests
with concrete items such as vocabulary, written English, and mathematical word
problems as more job-related than cognitive ability tests that consist of more abstract
item types. Given this, applicants may react more negatively to fluid ability tests.
Smither et al. have argued that applicant reactions to selection procedures may affect test
motivation, the willingness to accept a position if offered, and the propensity to engage in
litigation if they perceive a selection procedure is unfair.
Future Research
As noted earlier, there is a need for additional primary studies that measure fluid
ability and performance. Research examining the validity of Gf at specific levels of
occupational complexity is acutely needed. Likewise, given that fluid ability declines
throughout the lifespan while Gc remains relatively stable, it would be interesting to
investigate the extent to which Gf and Gc differentially predict performance for
employees of different age groups. This may become increasingly important given the
aging population.
Researchers may also benefit from examining the role of Gf throughout the
employee‘s tenure. It may be the case that fluid ability measures are more important
early in an employee‘s tenure, as they are faced with novel tasks. Gf may become less
important over time, as skills become crystallized and workers access information from
recognizable patterns that have become established in the brain over one‘s working

157
157
lifetime (c.f., Goldberg, 2005, 2009). However, as discussed earlier in this chapter, it
appears that novel information becomes crystallized at a rapid rather than a slow pace.
To the extent this is indeed the case, validity differences according to job tenure would
not be visible. Furthermore, research has found that as a predictor of job performanmce,
GCA remains stable (Schmidt, Hunter, Outerbridge, & Goff, 1988) or increases
(McDaniel, 1985) throughout an individual‘s work tenure (see Hunter & Schmidt, 1996
for a review). Thus, any finding that the validity of Gf declines with tenure would lie
counter to this established phenomenon.
Finally, although Gf and Gc are posited to be independent constructs, they are in
fact correlated. Given this, it would be useful to meta-analytically examine the strength
of this relationship. Although such an investigation was beyond the scope of the current
study, accurate meta-analytic estimates of the correlation between Gf and Gc would be
useful in testing models of intelligence that contain both constructs.
Limitations
This study has several limitations. First, as mentioned previously, there were
considerably fewer primary studies included in the meta-analyses that utilized measures
of fluid ability. Likewise, the psychometric and normative data for these measures was
notably lacking when compared to studies that utilized GCA or Gc measures of ability.
These factors limit the ability to make meaningful comparisons, particularly at lower
levels of analysis for moderators such as job complexity. In addition, a lack of
appropriate primary study and normative data prevented the construction of artifact
distributions specifically for fluid ability. As a result, artifact corrections in the Gf
analyses were made using distributions from the GCA samples. It is possible that the true

158
158
artifact values in the collection of Gf samples differed substantively from those in the
respective GCA distributions, although there is no reason to suspect this was actually the
case. Nevertheless, as this data set is expanded in the future, an attempt will be made to
locate more primary studies that have examined the relationship between fluid ability and
performance.
Second, the classification procedure used to categorize measures into fluid and
crystallized ability was qualitative in nature. Although a sincere effort was made to
classify measures in the clearest manner possible, it is possible that some measures could
be classified differently. This is most likely an issue when coding decisions were made
between crystallized and GCA measures. To address this, measures were evaluated by
two coders. Likewise, only measures that were overall or omnibus measures of ability
were classified as GCA. Nevertheless, it is likely that much of the content of GCA
measures is indeed crystallized in nature, as Hunt (2000) has argued. However,
classification contamination, to the extent that it does exist, should serve to make the
results presented here conservative estimates rather than overestimations.
Finally, due to time and resource constraints, as well as the large size of primary
studies that met the inclusion criteria, this study used a representative sample of primary
Gc and GCA studies rather than the entire population of available studies. Studies were
selected to be representative of the population of available studies. Likewise, the current
study was large by meta-analytic standards, incorporating data from 419 unique primary
studies. Nevertheless, it is possible that the studies analyzed are not representative of the
larger population of studies. To address this, future research is planned using a larger
number of Gc and GCA studies. Given the sheer volume of validity data for cognitive

159
159
measures, it is unlikely that a fully comprehensive synthesis including all extant data will
be accomplished. In this situation it is necessary to weigh the benefit of knowledge
gained from examining a large, but less than comprehensive data set against the
significant resources required to locate, code, and analyze the full population of studies.
As Hunter and Schmidt (2004, p. 493) have noted, the latter is often impossible due to
availability bias. They argue that this criticism ―applies equally well to the narrative
review, the usual alternative to meta-analysis. That a narrative review is not quantitative
in no way mitigates the effects of any bias in the sample of studies.‖
Conclusion
Nearly a century ago, Boring (1924, p.35) concluded that ―Intelligence is what the
tests test.‖ Although intelligence is certainly a latent construct that is greater than any
one test, there is some truth to his famous statement. Assumptions that fluid ability tests
are the sin quo non or gold standard measure of intelligence may be incorrect. Rather,
the criterion-related validity evidence presented in the current study suggests that it is
crystallized and general cognitive ability measures that appear to be the better predictors
of performance. As such, general cognitive ability theory suggests that compared to Gf
measures, Gc and GCA measures are better indicators of the construct of intelligence.
Although this thesis has focused on individual differences in ability and
performance, it is perhaps useful to close with Goldberg‘s (2009, p.80) reminder that
similar phenomenon to the ones examined here are visible in the larger culture as a
whole:
It can be argued that the whole history of human civilization has been characterized by a relative shift from the right hemisphere to the left hemisphere owing to the accumulation of ready-made

160
160
cognitive ―templates‖ of various kinds. These cognitive templates are stored externally through various cultural means, including language, and are internalized by individuals in the course of learning as cognitive ―prefabricates‖ of sorts. Any attempt to translate Vygotskian cultural-historical psychology into neuroanatomical terms will inevitably lead to this conclusion.

161
161
APPENDIX
CLASSIFICATION OF COGNITIVE ABILITY MEASURES
Table A1. Measures of Fluid Ability (Gf)
Abbreviation Test Name
APIL-CFT Ability Processing of Information and Learning Battery –
Concept Formation Test
AR Abstract Reasoning (Study-specific scale)
BTIS-F Berlin Test of Intelligence Structure – Fluid Factor
CAB-IR Comprehensive Abilities Battery – Inductive Reasoning
CFIT Culture Fair Intelligence Test
D-48 D-48 Test (Dominoes Test)
DAT-AR Differential Aptitude Tests – Abstract Reasoning
ETS-IR ETS Test Kit – Inductive Reasoning
Gf Fluid Ability Composite
GRT2-AR General Reasoning Tests – Abstract Reasoning
GT-70/23 Group Test 70/23
IPAT-G Institute of Personality and Ability Testing – Nonverbal Test of G
IR Inductive Reasoning (Study-specific scale)
PMA-R Primary Mental Abilities Tests – Inductive Reasoning Scale
PPP Penrose Pattern Perception
RAPM Raven‘s Advanced Progressive Matrices
RSPM Raven‘s Standard Progressive Matrices

162
162
Table A2. Measures of Crystallized Ability (Gc)
Abbreviation Test Name
ACB-AR Army Classification Battery – Arithmetic Reasoning
ACB-RV Army Classification Battery – Reading & Vocabulary
ACT ACT Test – Composite
ACT-E ACT – English
AFQT Armed Forces Qualifying Test
ASVAB-AR Armed Forces Vocational Aptitude Battery –
Arithmetic Reasoning
ASVAB-MK Armed Forces Vocational Aptitude Battery –
Mathematics Knowledge
ASVAB-PC Armed Forces Vocational Aptitude Battery –
Paragraph Comprehension
ASVAB-WK Armed Forces Vocational Aptitude Battery –
Word Knowledge
BSQT Bell Systems Qualification Test
BST-RC Basic Skills Test – Reading Comprehension
BST-LS Basic Skills Test – Language Skills
BST-M Basic Skills Test – Mathematical Skills
CAB-V Comprehensive Abilities Battery – Verbal Ability
CAB-N Comprehensive Abilities Battery – Numerical Ability
CIVIL-RV Civil Service Exam – Reading & Vocabulary (Study Specific)
COOP-R Cooperative Inter-American Tests of Reading
CTBS-R Comprehensive Test of Basic Skills – Reading
DAT-LU Differential Aptitude Tests – Language Usage
DAT-NA Differential Aptitude Tests – Numerical Ability
DAT-SN Differential Aptitude Tests - Sentences
DAT-SP Differential Aptitude Tests – Spelling
DAT-VR Differential Aptitude Tests – Verbal Reasoning
EAS-VR Employee Aptitude Survey – Verbal Reasoning
EAT Educational Achievement Test (Math and Physics Proficiency)

163
163
Table A2. Continued
Abbreviation Test Name
FIT-GRAM Flannigan Industrial Tests – Grammar
GATB-N General Aptitude Test Battery – Numerical Scale
GATB-V General Aptitude Test Battery – Verbal Scale
Gc Crystallized Ability Composite
GKT General Knowledge Test (Study-specific)
GRT2-NR General Reasoning Tests – Numerical Reasoning
GRT2-VR General Reasoning Tests – Verbal Reasoning
HVT Hebrew Verbal Test
IHSC Iowa High School Content Examination
LT-V Lorge-Thorndike Intelligence Test – Verbal Battery
LOGIC/DR Logic/Deductive Reasoning (Study-specific)
MATH Mathematical Reasoning (Study-specific)
MH Mill Hill Vocabulary Scales
NDRT Nelson-Denny Reading Test – Total Score
NDRT-C Nelson-Denny Reading Test - Comprehension
NDRT-V Nelson-Denny Reading Test - Vocabulary
NUM Numerical Reasoning (Study-specific)
PAF-N Personnel Assessment Form – Numerical
PAF-V Personnel Assessment Form – Verbal
PL/PQ ACER Higher Tests PL-PQ (Verbal & Quantitative Reasoning)
PMA-VM Primary Mental Abilities Tests – Verbal Meaning
PMA-VF Primary Mental Abilities Tests – Word Fluency
POST Police Officer Selection Test – Total Score
POST-RW Police Officer Selection Test – Reading & Writing
PROSEL Humanities, Science, & Social Science Knowledge
(Study- specific)

164
164
Table A2. Continued
Abbreviation Test Name
PSAT Preliminary Scholastic Aptitude/Assessment Test - Total
PTI-V Personnel Tests for Industry – Numerical
PTI-V Personnel Tests for Industry – Verbal
READ Reading Comprehension (Study-specific)
SAT Scholastic Aptitude Test – Total
SAT-M Scholastic Aptitude Test - Math
SAT-V Scholastic Aptitude Test - Verbal
SET-N Short Employment Tests – Numerical
SET-V Short Employment Tests – Verbal
SFPS-GKT State Farm Personnel Survey – General Knowledge Test
SRA-A SRA – Arithmetic
SRA-N SRA – Numerical Ability
SRA-V SRA – Verbal Ability
STAN-AR Stanford Arithmetic Test
TABE-R Test of Adult Basic English – Reading Scale
TEST21 Test 21 – District of Columbia (Verbal Reasoning)
VERBAL Verbal Reasoning (Study-specific)
VOCAB Vocabulary (Study-specific)
WAIS-C Wechsler Adult Intelligence Scale - Completion
WAIS-I Wechsler Adult Intelligence Scale – Information
WAIS-S Wechsler Adult Intelligence Scale - Similarities
WAIS-V Wechsler Adult Intelligence Scale - Vocabulary
WRVT Wide Range Vocabulary Test

165
165
Table A3. Measures of General Cognitive Ability (GCA)
Abbreviation Test Name
ACE American Council on Education Psychological Examination
ADAPT Adaptability Test
ALPHA Army Alpha Examination
ALPHA-R Revised Alpha Examination
AFQT-g Air Force Qualifying Test – g Factor
CFAT Canadian Forces Aptitude Test
CTMM California Test of Mental Maturity
D-70 D-70 Intelligence Test
GATB-g General Aptitude Test Battery – g Factor
GCA General Cognitive Ability Composite
H-N Henmon-Nelson Test of Mental Maturity for College Students
IQ IQ – Mixed scales
K-A Kuhlmann-Anderson Intelligence Tests
L-T Lorge-Thorndike Intelligence Test
MILLER Miller Test for High School Pupils
MORAY Moray House Test
O-L Otis-Lennon Mental Abilities Test
OSU Ohio State University Psychological Test
OTIS Otis Mental Ability Test
OTIS-SA Otis Self-administering Mental Ability Test
OTIS-Q Otis Quick Scoring Mental Ability Test
PINT Pintner General Ability Test
PSI Performance Skills Index
S-B Stanford-Binet Intelligence Test
SIT Slosson Intelligence Test
TERM Terman Intelligence Test

166
166
Table A3. Continued
Abbreviation Test Name
T-M Terman-McNemar Tests of Mental Ability
TCS Test of Cognitive Skills
W-B Wechsler-Bellevue Full-Scale
WAIS Wechsler Adult Intelligence Scale – Full Scale
WISC Wechsler Intelligence Scale for Children – Full Scale
WPT Wonderlic Personnel Test

167
167
REFERENCES
Aamodt, M. G. (2004). Research in law enforcement selection. Boca Raton, FL:
BrownWalker.
Aamodt, M. G. (2011). Law enforcement selection: Research summaries. Washington,
DC: Police Executive Research Forum.
Ackerman, P. L. (1996). A theory of adult intellectual development: Process, Personality,
Interests, and Knowledge. Intelligence, 22, 227-257.
Ackerman, P. L. (2000). Domain-specific knowledge as the ―dark matter‖ of adult
intelligence: Gf/Gc, personality, and interest correlates. Journals of Gerontology:
Series B, 55, 69-84.
Ackerman, P. L., Beier, M. E., & Boyle, M. O. (2005). Working memory and
intelligence: The same or different constructs? Psychological Bulletin, 131, 30-60.
Aguinis, H. (2008). Performance management (2nd
ed.). New York: Prentice Hall.
Aguinis, H., & Kraiger, K. (2009). Benefits of training and development for individuals,
teams, organizations, and society. Annual Review of Psychology, 60, 451-474.
Aiken, L. R., Jr. (1963). The grading behavior of a college faculty. Educational and
Psychological Measurement, 23, 319-322.
Alfonso, V. C., Flanagan, D. P., & Radwan, S. (2005). The impact of the Cattell–Horn–
Carroll theory on test development and interpretation of cognitive and academic
abilities. In D. P. Flanagan & P. L. Harrison (Eds.), Contemporary intellectual
assessment: Theories, tests, and issues (2nd ed., pp. 185–202). New York:
Guilford Press.
Alliger, G. M., Tannenbaum, S. I., Bennett, W., Jr., Traver, H., & Shotland, A. (1997). A
meta-analysis of the relations among training criteria. Personnel Psychology, 50,
341-358.
Allworth, E., & Hesketh, B. (1999). Construct-oriented biodata: Capturing change-related
and contextually relevant future performance. International Journal of Selection
and Assessment, 7, 97-111.
Allworth, E., & Hesketh, B. (2000). Job requirements biodata as a predictor of
performance in customer service roles. International Journal of Selection and
Assessment, 8, 137-147.
Anastasi, A. (1937). Differential psychology. New York: Macmillan.
Ashton, M. C., & Lee, K. (2006). ―Minimally biased‖ g-loadings of crystallized and non-
crystallized abilities. Intelligence, 34, 469−477.

168
168
Babcock, R. L. (1994). Analysis of adult age differences on the Raven‘s Advanced
Progressive Matrices Test. Psychology and Aging, 9, 303-314.
Baddeley, A. (1968). A 3 min reasoning test based on grammatical transformation.
Psychonomic Science, 10, 341–342.
Barritt, L. S. (1966). The consistence of first-semester college grade point average.
Journal of Educational Measurement, 3, 261-262.
Basak, C., Boot, W. R., Voss, M. W., & Kramer, A. F. (2008). Can training in real-time
strategy video game attenuate cognitive decline in older adults? Psychology and
Aging, 23, 765-777.
Bassi, W., Benson, G., & Cheney, S. (1996). The top ten trends. Training and
Development, 50, 28-42.
Bedeian, A. G., Cavazos, D. E., Hunt, J. G., & Jauch, L. R. (2010). Doctoral degree
prestige and the academic marketplace: A study of career mobility within the
management discipline. Academy of Management Learning and Education, 9, 11-
25.
Bendig, A. W. (1953). The reliability of letter grades. Educational and Psychological
Measurement, 13, 311-321.
Berry, C. M., & Sackett, P. R. (2009). Individual differences in course choice result in
underestimation of the validity of college admissions systems. Psychological
Science, 20, 822-830.
Bertua, C., Anderson, N., & Salgado, J. F. (2005). The predictive validity of cognitive
ability tests: A UK meta-analysis. Journal of Occupational and Organizational
Psychology, 78, 387-409.
Binet, A., & Henri, V. (1896). La psychologie individuelle. L‗Anée Psychologique, 2,
411-465.
Binet, A. & Simon T. (1905a). Sur la necessite d‘etablir un diagnostic scientifique des
etats inferieurs de l‘intelligence.. L‗Anée Psychologique, 11, 163-190.
Binet, A. & Simon T. (1905b). Méthodes nouvelles pour la diagnostic du niveau
intellectuel des anormaux. L‗Anée Psychologique, 11, 191-244.
Binet, A. & Simon T. (1905c). Application des methods nouvelles au diagnostic du
niveau intellectuel chez des enfants normaux et anormaux d‘hospice et d‘ecole
primaire. L‗Anée Psychologique, 11, 245-336.
Blair, C. (2006). How similar are fluid cognition and general intelligence? A
developmental neuroscience perspective on fluid cognition as an aspect of human
cognitive ability. Behavioral and Brain Science, 29, 109-160.
Boring, E. G. (1923). Intelligence as the tests test it. New Republic, 35, 35-37.

169
169
Boring, E. G. (1950). A history of experimental psychology. New York: Appleton
Century Crofts.
Borman, W. C., & Motowidlo, S. J. (1997). Task performance and contextual
performance: The meaning for personnel selection research. Human Performance,
10, 99-109.
Bors, D. A., & Vigneau, F. (2003). The effect of practice on Raven‘s Advanced
Progressive Matrices. Learning and Individual Differences, 13, 291-312.
Botwinick, J. (1977). Intellectual abilities. In J. E. Birren & K. W. Schaie (Eds.),
Handbook of the psychology of aging (pp. 580-605). New York: Van Nostrand
Reinhold
Bowman, M. L. (1989). Testing individual differences in ancient China. American
Psychologist, 44, 576-578.
Brief, A. P., & Motowidlo, S. J. (1986). Prosocial organizational behaviors. Academy of
Management Review, 11, 710-725.
Brody, N. (1992). Intelligence (2nd ed.). San Diego, CA: Academic Press.
Brown, B. K., & Campion, M. A. (1994). Biodata phenomenology: Recruiters‘
perceptions and use of biographical information in resume screening. Journal of
Applied Psychology, 79, 897-908.
Brown, R. P., & Day, E. A. (2006). The difference isn‘t black and white: Stereotype
threat and the race gap on Raven‘s Advanced Progressive Matrices. Journal of
Applied Psychology, 91, 979-985.
Brown, K. G. (2005). An examination of the structure and nomological network of
trainee reactions: A closer look at ―smile sheets.‖ Journal of Applied Psychology,
90, 991-1001.
Brown, K. G., & Gerhardt, M. W. (2002). Formative evaluation: An integrated practice
model and case study. Personnel Psychology, 55, 951–983.
Brown, K. G., Le, H., & Schmidt, F. L. (2006). Specific aptitude theory revisited: Is there
incremental validity in training performance. International Journal of Selection
and Assessment, 14, 87-100.
Burns, R. B. (1994). Surveying the cognitive terrain. Educational Researcher, 23(2),
35−37.
Burt, C. (1921). Mental and scholastic tests. London: King and Son.
Burt, C. (1949). The structure of the mind. British Journal of Educational Psychology,
19, 190.
Burt, C. (1955). The evidence for the concept of intelligence. British Journal of
Educational Psychology, 25, 158-177.

170
170
Campbell, D. T. (1963). From description to experimentation: Interpreting trends as
quasi-experiments. In C. W. Harris (Ed.), Problems in measuring change.
Madison: University of Wisconsin Press.
Campbell, J. P. (1988). Training design for productivity improvement. In J. P. Campbell
& R. J. Campbell (Eds.), Productivity in organizations (pp. 177-215). San
Francisco: Jossey-Bass.
Campbell, J. P., McHenry, J. J., & Wise, L. L. (1990). Modeling job performance in a
population of jobs. Personnel Psychology, 43, 313-333.
Campion, M. A. (1978). Identification of variables most influential in determining
interviewers‘ evaluations of applicants in a college placement center.
Psychological Reports, 42, 947-952.
Carpenter, P. A., Just, M. A., & Shell, P. (1990). What one intelligence test measures: A
theoretical account of the processing in the Raven Progressive Matrices Test.
Psychological Review, 97, 404-431.
Carroll, J. B. (1982) . The measurement of intelligence. In R. J. Stemberg (Ed.),
Handbook of human intelligence (pp. 29-120). New York: Cambridge University
Press.
Carroll, J. B. (1984). Raymond B. Cattell‘s contributions to the theory of cognitive
abilities. Multivariate Behavioral Research, 19, 300-306.
Carroll, J. B. (1993). Human cognitive abilities: A survey of factor-analytic studies. New
York: Cambridge University Press.
Cattell, J. M. (1890). Mental tests and measurement. Mind, 59, 373-381.
Cattell, R. B. (1940). A culture-free intelligence test I. Journal of Educational
Psychology, 31, 161-179.
Cattell, R.B. (1941). Some theoretical issues in adult intelligence testing [Abstract].
Psychological Bulletin, 38, 592.
Cattell, R. B. (1943). The measurement of adult intelligence. Psychological Bulletin, 40,
153–193.
Cattell, R. B. (1946). The description and measurement of personality. New York: World
Book.
Cattell, R. B. (1950). Personality, a systematic theoretical and factual study. New York:
McGraw-Hill.
Cattell, R. B. (1957). Personality and motivation structure and measurement. New York:
World Book.
Cattell, R. B. (1963). Theory of fluid and crystallized intelligence: A critical experiment.
Journal of Educational Psychology, 54, 1–22.

171
171
Cattell, R. B. (1965). The scientific analysis of personality. London: Penguin.
Cattell, R. B. (1971). Abilities: Their structure, growth, and action. Boston: Houghton
Mifflin.
Cattell, R. B. (1974). Autobiography. In G. Lindsey (Ed.), A history of psychology in
autobiography. Englewood Cliffs, NJ: Prentice Hall.
Cattell, R. B. (1979). Are culture-fair intelligence tests possible and necessary? Journal
of Research and Development in Education, 12, 1-13.
Cattell, R.B. (1984). The voyage of a laboratory. Multivariate Behavioral Research, 19,
121-174.
Cattell, R.B. (1987). Intelligence: Its structure, growth, and action. New York: North-
Holland.
Cattell, R. B., & Bristol, H. (1933). Intelligence tests for mental ages four to eight years.
British Journal of Educational Psychology, 3, 142-169.
Cattell, R. B., Feingold, S. N., & Sarason, S. B. (1941). A culture-free intelligence test II:
Evaluation of cultural influence on test performance. Journal of Educational
Psychology, 32, 81-100.
Chamorro-Premuzic, T., Furnham, A., & Ackerman, P. L. (2006). Incremental validity of
the Typical Intellectual Engagement Scale as a predictor of differential academic
performance measures. Journal of Personality Assessment, 87, 261-268.
Charness, N. (1981). Search in chess: Age and skill differences. Journal of Experimental
Psychology: Human Perception and Performance, 7, 467-476.
Chase, W. G., & Simon, H. A. (1973). The mind's eye in chess. In W. G. Chase (Ed.),
Visual information processing (pp. 215-281). New York: Academic Press.
Conley, J. J. (1984). The hierarchy of consistency: A review and model of longitudinal
findings on adult individual differences in intelligence, personality and self-
opinion. Personality and Individual Differences, 5, 11-25.
Cronbach, L. J. (1970). Essentials of psychological testing (3rd
ed). New York: Harper &
Row.
Cronbach, L. J. (Ed.). (2002). Remaking the concept of aptitude: Extending the legacy of
Richard E. Snow. Mahwah, NJ: Lawrence Erlbaum.
Darwin, C. (1859). On the origin of species by means of natural selection, or The
preservation of favoured races in the struggle for life. London: John Murray.
Dauphinais, S. M., & Bradley, R. W. (1979). IQ and occupational level: A longitudinal
study with Third Harvard Growth Study participants. Journal of Vocational
Behavior, 15, 367-375.

172
172
Deary, I. J. (2000). Looking down on human intelligence: From psychometrics to the
brain. Oxford: Oxford University Press.
Deary, I. J. (2001). Intelligence: A very short introduction. New York: Oxford University
Press.
Deary, I. J., Whalley, L. J., Lemmon, H., Crawford, J. R., & Starr, J. M. (2000). The
stability of individual differences in mental ability from childhood to old age:
Follow up of the 1932 Scottish Mental Survey. Intelligence, 28, 49-55.
de Groot, A. (1978). Thought and choice and chess. The Hague, The Netherlands:
Mouton. (Original work published 1946)
Detterman, D. K. (1982). Does ―g‖ exist? Intelligence, 6, 99-108.
Dhalilal, A. S., & Sharma, J. P. (1975). Unravelling of an irrelevant factor which distorts
genuine relationship between intelligence and academic achievement. Journal of
Psychometry and Education, 6, 28-35.
Dhalilal, A. S., & Sharma, J. P. (1976). Relationship between intelligence and academic
achievement. Journal of Psychological Researches, 20, 28-32.
Dierdorff, E. C., & Morgeson, F. P. (2009). Effects of descriptor specificity and
observability on incumbent work analysis ratings. Personnel Psychology, 62, 601-
628.
Dilchert, S., Ones, D. S., Davis, R. D., & Rostow, C. D. (2007). Cognitive ability predicts
objectively measured counterproductive work behaviors. Journal of Applied
Psychology, 92, 616-627.
Dipboye, R. L., Fromkin, H. L., & Wiback, K. (1975). Relative importance of applicant
sex, attractiveness, and scholastic standing in evaluation of job applicant résumés.
Journal of Applied Psychology, 60, 39-43.
Dodrill, C. B. (1983). Long-term reliability of the Wonderlic Personnel Test. Journal of
Consulting and Clinical Psychology, 51, 316-317.
Donnon, T., Paolucci, E. O., & Violato, C. (2007). The predictive validity of the MCAT
for medical school performance and medical board licensing examinations: A
meta-analysis of published research. Academic Medicine, 82, 100-106.
Doyle, K. O., Jr. (1974). Theory and practice of ability testing in ancient Greece. Journal
of the History of Behavioral Sciences, 10, 202-212.
DuBois, P. H. (1965). A test-dominated society: China, 1115 BC-1905 AD. Proceedings
of the 1964 invitational conference on testing problems. Princeton, N.J.:
Educational Testing Service.

173
173
Duckworth, A. L., Quinn, P. D., Lynam, D. R., Loeber, R., Stouthamer-Loeber, M.
(2011). Role of test motivation in intelligence testing. Proceedings of the National
Academy of Science, 108, 7716-7720. doi:10.1073/pnas.1018601108
Duval, S., & Tweedie, R. (2000). A nonparametric ―Trim and Fill‖ method of accounting
for publication bias in meta-analysis. Journal of the American Statistical
Association, 95, 89-98.
Dye, D. A., & Reck, M. (1988). A literature review and meta-analysis of education as a
predictor of job performance (Technical Report No. OPRD-88-9). Washington,
DC: U.S. Office of Personnel Management, Office of Personnel Research and
Development
Dye, D. A., & Reck, M. (1989). College grade point average as a predictor of adult
success: A reply. Public Personnel Management, 18, 235-241.
Eckberg, D. L. (1979). Intelligence and race. New York: Praeger.
Edwards, B. D., Day, E. A., Arthur, W., Jr., & Bell, S. T. (2006). Relationships among
team ability composition, team mental models, and team performance. Journal of
Applied Psychology, 91, 727-736.
Elliott, R., & Strenta, A. C. (1988). Effects of improving the reliability of the GPA on
prediction generally and on comparative predictions for gender and race
particularly. Journal of Educational Measurement, 25, 333-347.
Elshout, J. J. (1983). Is measuring intelligence still useful? In S. B. Anderson & J. S.
Helmick (Eds.), On educational testing (pp. 45-56). San Francisco: Jossey-Bass.
Ericsson, K. A., & Charness, N. (1994). Expert performance: Its structure and
acquisition. American Psychologist, 49, 725-747.
Ericsson, K. A., Krampe, R. Th., & Tesch-Römer, C. (1993). The role of deliberate
practice in the acquisition of expert performance. Psychological Review, 100,
363-406.
Ericsson, K. A., & Lehmann, A. C. (1996). Expert and exceptional performance:
Evidence of maximal adaptation to task constraints. Annual Review of
Psychology, 47, 273-305.
Eysenck, H. J. (1994). Special review. Personality and Individual Differences, 16, 199.
Fagan, J. F., & Holland, C. R. (2009). Culture-fair prediction of academic achievement.
Intelligence, 37, 62-67.
Fancher, R. E. (1985). The intelligence men: makers of the IQ controversy. New York:
W. W. Norton.
Field, A. P. (2001). Meta-analysis of correlation coefficients: A Monte Carlo comparison
of fixed- and random-effects methods. Psychological Methods, 6, 161-180.

174
174
Fine, S. A. (1955). A structure of worker functions. Personnel and Guidance Journal, 34,
66-73.
Fishman, J. A., & Pasanella, A. K. (1960). College admission-selection studies. Review of
Educational Research, 30, 298-310.
Flanagan, D. P., Ortiz, S. O., Alfonso, V. C, & Mascolo, J. T. (2002). The achievement
test desk reference (ADTR): Comprehensive assessment and learning disabilities.
Boston: Allyn & Bacon.
Fleishman, E. A. (1967). Performance assessment based on an empirically derived task
taxonomy. Human Factors, 9, 349-366.
Flynn, J. R. (1987). Massive IQ gains in 14 Nations. What IQ tests really measure.
Psychological Bulletin, 101, 171-191.
Flynn, J. R. (1998) IQ gains over time: Toward finding the causes. In U. Neisser (ed.),
The Rising Curve: Long-term Gains in IQ and Related Measures. Washington,
DC: American Psychological Association.
Ford, J. K., & Wroten, S. P. (1984). Introducing new methods for conductingtraining
evaluation and for linking training evaluation to program redesign. Personnel
Psychology, 37, 651–666.
Fox, M. C., & Charness, N. (2010). How to gain eleven IQ points in ten minutes:
Thinking aloud improves Raven‘s Matrices performance in older adults. Aging,
Neuropsychology, and Cognition, 17, 191-204.
Franke, W. (1960). The reform and abolition of the traditional Chinese examination
system. Harvard East Asian Monographs 10. Cambridge, MA: East Asian
Research Center, Harvard University.
Freeman, K. J. (1912). Schools of Hellas (2nd
edition). London: Macmillan.
Frey, M. C., & Detterman, D. K. (2004). Scholastic assessment of g? The relationship
between the Scholastic Assessment Test and general cognitive ability.
Psychological Science, 15, 373-378.
Gagne, R. M. (1970). The conditions of learning (2nd ed.). New York: Holt, Rinehart &
Winston.
Galton, F. (1853). The narrative of an explorer in tropical South Africa. London: John
Murray.
Galton, F. (1855). The art of travel; or Shifts and contrivances available in wild
countries. London: John Murray.
Galton, F. (1863). Meterographica, or Methods of mapping the weather. London:
Macmillan.

175
175
Galton, F. (1865). Hereditary talent and character. Macmillans Magazine, 12, 157-166,
318-327.
Galton, F. (1869). Hereditary genius; An inquiry into its laws and consequences. London:
Macmillan.
Galton, F. (1883). Final report of the anthropometric committee. Report of the British
Association for the Advancement of Science, 253-306.
Galton, F. (1888). Co-relations and their measurement, chiefly from anthropometric data.
Proceedings of the Royal Society, 45, 135-145.
Galton, F. (1892). Finger prints. London: Macmillan.
Gardner, H. (1983). Frames of mind: the theory of multiple intelligences. New York:
Basic Books.
Gentner, D. R. (1988). Expertise in typewriting. In M. T. H Chi, R. Glaser, & M. J. Farr,
(Eds.), The nature of expertise (pp. 1-22). Hillsdale, NJ: Erlbaum.
Ghiselli, E. E. (1966). The validity of occupational aptitude tests. New York: John Wiley
& Sons.
Ghiselli, E. E. (1973). The validity of aptitude tests in personnel selection. Personnel
Psychology, 26, 461-467. doi:10.1111/j.1744-6570.1973.tb01150.x
Gignac, G. (2006). Evaluating subtest ‗g‘ saturation levels via the single-trait correlated
uniqueness (STCU) SEM approach: Evidence in favor of crystallized subtests as
the best indicators of ‗g‘. Intelligence, 34, 29−46.
Goldberg, E. (2005). The Wisdom Paradox. New York: Gotham Books.
Goldberg, E. (2009). The Executive Brain. Oxford, UK: Oxford University Press.
Goldstein, I. L. (1980). Training in work organizations. Annual Review of Psychology,
31, 229-272.
Goleman, D. (1995). Emotional intelligence. New York: Bantam.
Gottfredsen, L. S. (1997). Why g matters: The complexity of everyday life. Intelligence,
24, 79-132.
Gray, J. R., Chabris, C. F., & Braver, T. S. (2003). Neural mechanisms of general fluid
intelligence. Nature Neuroscience, 6, 316-322.
Greenfield, P. M. (1998). The cultural evolution of IQ. In U. Neisser (Ed.), The rising
curve: Long term gains in IQ and related measures (pp. 81–123). Washington,
DC, US7 American Psychological Association.

176
176
Greenfield, P. M. (2009). Technology and informal education: What Is taught, what is
learned. Science, 323, 69-71. doi:10.1126/science.1167190
Griffin, M., Neal, A., & Parker, S. K. (2007). A new model of work role performance:
Positive behavior in uncertain and interdependent contexts. Academy of
Management Journal, 50, 327-347.
Gruys, M. L., & Sackett, P. R. (2003). Investigating the dimensionality of
counterproductive work behavior. International Journal of Selection and
Assessment, 11, 30-42.
Guilford, J. P. (1967). The nature of human intelligence. New York: McGraw-Hill.
Gurevitch, J., & Hedges, L. V. (1999). Statistical issues in ecological meta-analysis.
Ecology, 80, 1142-1149.
Gustafsson, J. –E. (1984). A unifying model for the structure of intellectual abilities.
Intelligence, 8, 179-203.
Gustafsson, J. -E. (1988). Hierarchical models of individual differences in cognitive
abilities. In R. J. Sternberg (Ed.), Advances in the psychology of human
intelligence, Vol. 4 (pp.35–71). Hillsdale, New Jersey: Lawrence Erlbaum.
Gustafsson, J. -E. (1994). Hierarchical models of intelligence and educational
achievement. In A. Demetriou & A. Efklides (Eds.), Intelligence, mind and
reasoning: Structure and development. Amsterdam: North-Holland/Elsevier.
Gustafsson, J.-E. (2002). Measurement from a hierarchical point of view. In H. I. Braun,
D. N. Jackson, & D. E. Wiley (Eds.), The role of constructs in psychological and
educational measurement (pp. 73–95). Hillsdale, NJ: Lawrence Erlbaum.
Hanson, F. A. (1992). Testing testing: Social consequences of the examined life.
Berkeley, CA: University of California Press.
Harris, D. (1940). Factors affecting college grades: A review of the literature, 1930-1937.
Psychological Bulletin, 37, 125-166.
Hartigan, J. A., & Wigdor, A. K. (Eds.). (1989). Fairness in employment testing: Validity
generalization, minority issues, and the General Aptitude Test Battery.
Washington, DC: National Academy Press.
Harwood, E., & Naylor, G. F. K. (1971). Changes in the constitution of the WAIS
intelligence pattern with advancing age. Australian Journal of Psychology, 23,
297-303.
Hattrup, K., O‘Connell, M. S., & Wingate, P. H. (1998). Prediction of multidimensional
criteria: Distinguishing task and contextual performance. Human Performance,
11, 305-319.

177
177
Hebb, D.O. (1941). Clinical evidence concerning the nature of normal adult test
performance [Abstract]. Psychological Bulletin, 38, 593.
Hebb, D.O. (1942). The effect of early and late brain injury upon test scores, and the
nature of normal adult intelligence. Proceedings of the American Philosophical
Society, 85, 275-292.
Hebb, D. O. (1949). The organization of behavior; a neuropsychological theory. New
York: Wiley.
Hedges, L. V., & Olkin, I. (1985). Statistical methods for meta-analysis. New York:
Academic Press.
Henig, M. S. (1927). Intelligence and safety. Journal of Educational Research, 16, 81-86.
Hezlett, S. A., Kuncel, N. R., Vey, M. A., Ahart, A., Ones, D. S., Campbell, J. P., &
Camara, W. (2001, April). The predictive validity of the SAT: A comprehensive
meta-analysis. In D. S. Ones & S. A. Hezlett (Chairs), Predicting performance:
The interface of I/O psychology and educational research. Symposium conducted
at the annual condernce of the Society for Industrial and Organizational
Psychology, San Diego, CA.
Higgins, C., & Sivers, C. H. (1958). A comparison of Stanford-Binet and Colored
Progressive Matrices IQs for children with low socioeconomic status. Journal of
Consulting Psychology, 22, 465-468.
Honzik, M. P., & Macfarlane, J. W. (1973). Personality development and intellectual
functioning from 21 months to 40 years. In L. F. Jarvik, C. Eisdorfer, & J. E.
Blum (Eds). Personality development and intellectual functioning in adults:
Psychological and Biological Influences. New York: Springer.
Horn, J. L. (1965). Fluid and crystallized intelligence: A factor analytic study of the
structure among primary mental abilities. Unpublished doctoral dissertation.
Urbana, IL: University of Illinois.
Horn, J. L. (1968). Organization of abilities and the development of intelligence.
Psychological Review, 75, 242-259.
Horn, J. L. (1986). Intellectual ability concepts. In R. J. Sternberg (Ed.), Advances in the
psychology of human intelligence (pp. 25–77). Hillsdale, NJ: Erlbaum.
Horn, J. L. (1991). Measurement of intellectual capabilities: A review of theory. In K. S.
McGrew, J. K. Werder, & R.W. Woodcock, Woodcock–Johnson technical
manual (pp. 197–246). Allen, TX: DLM Teaching Resources.
Horn, J. L. (1998). A basis for research on age differences in cognitive capabilities. In J.
J. McArdle & R. Woodcock (Eds.), Human cognitive abilities in theory and
practice (pp. 57-91). Chicago: Riverside.

178
178
Horn, J. L. & Blankson, N. (2005). . Foundations for better understanding of cognitive
abilities. In D. P. Flanagan & P. L. Harrison (Eds.), Contemporary intellectual
assessment: Theories, tests, and issues, 2nd
ed. (pp. 41-67). New York: Guilford
Press.
Horn, J. L., & Cattell, R. B. (1966). Refinement and test of the theory of fluid and
crystallized intelligence. Journal of Educational Psychology, 57, 253-270.
Horn, J. L., & Cattell, R. B. (1967). Age differences in fluid and crystallized intelligence.
Acta Psychologica, 26, 107-129.
Horn, J. L., & Donaldson, G. (1976) On the myth of intellectual decline in adulthood.
American Psychologist, 31, 701-719.
Horn, J. L., & Hofer, S. M. (1992) Major abilities and development in the adult period. In
R. J. Sternberg & C. A. Berg (Eds.), Intellectual development (pp. 44-99). New
York: Cambridge University Press.
Horn, J. L., & Noll. J. (1997). Human cognitive capabilities: Gf-Gc Theory. In D. P.
Flanagan, J. L. Genshaft, & P. L. Harrison (Eds.), Contemporary intellectual
assessment: Theories, tests, and issues (pp. 53-91). New York: Guilford Press.
Hough, L. M., Oswald, F. L., & Ployhart, R. E. (2001). Determinants, detection and
amelioration of adverse impact in personnel selection procedures: Issues,
evidence and lessons learned. International Journal of Selection and Assessment,
9, 152–194.
Hoyt ,D. P. (1965). The relationship between college grades and adult achievement: A
review of the literature (ACT Research Reports No. 7). Iowa City: American
College Testing Program. (ERIC Document Reproduction Service No. ED 023
343)
Huarte, J. de San Juan. (1594). Examen de ingenios, or, A trial of witts (The examination
of mens wits) (R. Carew, Trans. Italian to English; M. Camilli Trans. Spanish to
Italian). London: Printed by Adam Islip for Richard Watkins. (Original work
published in Spanish, 1575).
Hülsheger, U. R., Maier, G., & Stumpp, T. (2007). Validity of general mental ability for
the prediction of job performance and training success in Germany: A meta-
analysis. International Journal of Selection and Assessment, 15, 3-18.
Humphreys, L. G. (1968). The fleeting nature of the prediction of college academic
success. Journal of Educational Psychology, 59, 375-380.
Humphreys, L. G. (1989). Intelligence: Three kinds of instability and their consequences
for policy. In R. L. Linn (Ed.), Intelligence: Measurement, theory, and public
policy (pp. 193-216). Urbana: University of Illinois Press.

179
179
Humphreys, L. G., & Taber, T. (1973). Postdiction study of the Graduate Record
Examination and eight semesters of college grades. Journal of Educational
Measurement, 10, 179-184.
Hunt, E. (2000). Let‘s hear it for crystallized intelligence. Learning and Individual
Differences, 12, 123-129.
Hunt, E. (2011). Human intelligence. New York: Cambridge University Press.
Hunter, D. R., & Burke, E. F. (1994). Predicting aircraft pilot-training success: A meta-
analysis of published research. International Journal of Aviation Psychology, 4,
297-313.
Hunter, J. E. (1980). Test validation for 12,000 jobs: An application of synthetic validity
and validity generalization to the General Aptitude Test Battery (GATB).
Washington, DC: U.S. Employment Service.
Hunter, J. E. (1983). A causal analysis of cognitive ability, job knowledge, job
performance, and supervisory ratings. In F. Landy, S. Zedeck, & J. Cleveland
(Eds.), Performance measurement and theory (pp. 257-266). Hillsdale, NJ:
Erlbaum.
Hunter, J. E. (1986). Cognitive ability, cognitive aptitudes, job knowledge, and job
performance. Journal of Vocational Behavior, 29, 340–362.
Hunter, J. E., & Hunter, R. F. (1984). Validity and utility of alternative predictors of job
performance. Psychological Bulletin, 96, 72–98.
Hunter, J. E. & Schmidt, F. L. (1983). Quantifying the effects of psychological
interventions on employee job performance and work-force productivity.
American Psychologist, 38, 473-478.
Hunter, J. E., & Schmidt, F. L. (1996). Intelligence and job performance: Economic and
social implications. Psychology, Public Policy, and Law, 2, 447-472.
Hunter, J. E., & Schmidt, F. L. (2000). Fixed effects vs. random effects meta-analysis
models: Implications for cumulative research knowledge. International Journal of
Selection and Assessment, 8, 275-292.
Hunter, J. E., & Schmidt, F. L. (2004). Methods of meta-analysis: Correcting error and
bias in research findings (2nd
ed.). Thousand Oaks, CA: Sage.
Hunter, J. E., Schmidt, F. L., & Le., H. (2006). Implications of direct and indirect range
restriction for meta-analysis methods and findings. Journal of Applied
Psychology, 91, 594-612.
Irwing, P., & Lynn, R. (2005). Sex differences in means and variability on the
progressive matrices in university students: A meta-analysis. British Journal of
Psychology, 96, 505-524.

180
180
Jacobs, J. (1887) Experiments on "prehension." Mind, 12, 75-79.
Jaeggi, S. M., Buschkuehl, M., Etienne, A., Ozdoba, C., Perrig, W. J., & Nirkko, A. C.
(2007). On how high performers keep cool brains in situations of cognitive
overload. Cognitive, Affective, and Behavioral Neuroscience, 7(2), 75-89.
Jaeggi, S. M., Buschkuehl, M., Jonides, J., & Perrig, W. J. (2008). Improving fluid
intelligence with training on working memory. Proceeding of the National
Academy of Science, 105, 6829-6833.
Jensen, A. R. (1980). Bias in mental testing. New York: Free Press.
Jensen, A. R. (1998). The g factor: The science of mental ability. Westport, CT: Praeger.
Jensen, A. R. (2004). Obituary—John Bissell Carroll. Intelligence, 32, 1-5.
Johnson, P. E., Grazioli, S., Jamal, K., & Zualkerman, I. A. (1992). Success and failure in
expert reasoning. Organizational Behavior and Human Decision Processes, 53,
173–203
Johnson, P. E., Jamal, K., Berryman, R. G. (1991). Effects of framing on auditor
decisions. Organizational Behavior and Human Decision Processes, 50, 75–105
Judge, T. A., & Bono, J. E. (2001). Relationship of core self-evaluation traits – self-
esteem, generalized self-efficacy, locus of control, and emotional stability – with
job satisfaction and job performance: A meta-analysis. Journal of Applied
Psychology, 86, 80-92.
Judge, T. A., & Ilies, R. (2002). Relationship of personality to performance motivation: A
meta-analytic review. Journal of Applied Psychology, 87, 797-807.
Kangas, J., & Bradway, K. (1971). Intelligence at middle age: A thirty-eight-year follow-
up. Developmental Psychology, 5, 333-337.
Kaufman, A. S., Johnson, C. K., & Liu, X. (2008). A CHC theory-based analysis of age
differences on cognitive abilities and academic skills at ages 22 to 90 years.
Journal of Psychoeducational Assessment, 26, 350-381.
Keith, T. Z. (2005). Using confirmatory factor analysis to aid in understanding the
constructs measured by intelligence tests. In D. P. Flanagan, & P. L. Harrison
(Eds.), Contemporary intellectual assessment: Theories, tests, and issues (2nd
ed.) (pp. 581−614). New York: Guilford Press.
Kenny, D. A. (1975). Cross-lagged panel correlation: A test for spuriousness.
Psychological Bulletin, 82, 887-903.
Kirkpatrick, D. L. (1959a). Techniques for evaluating training programs: Pt. 1. Reactions.
Journal of the American Society for Training Directors, 13(11), 3–9.

181
181
Kirkpatrick, D. L. (1959b). Techniques for evaluating training programs: Pt. 2. Learning.
Journal of the American Society for Training Directors, 13(12), 21–26.
Kirkpatrick, D. L. (1960a). Techniques for evaluating training programs: Pt. 3. Behavior.
Journal of the American Society for Training Directors, 14(1), 13–18.
Kirkpatrick, D. L. (1960b). Techniques for evaluating training programs: Pt. 4. Results.
Journal of the American Society for Training Directors, 14(2), 28–32.
Kirkpatrick, D. L. (1976). Evaluation of training. In R. L. Craig (Ed.), Training and
Development Handbook. New York: McGraw-Hill.
Kirkpatrick, D. (1996). Revisiting Kirkpatrick‘s four-level model. Training &
Development, 50(1), 54-59.
Kirkpatrick, D. L. (1998). Evaluating training programs: The four levels (2nd
ed.). San
Francisco: Berrett-Koehler.
Koenig, K. A., Frey, M. C., & Detterman, D. K. (2008). ACT and general cognitive
ability. Intelligence, 36, 153-160.
Kracke, E. A., Jr. (1953). Civil service in early Sung China, 960–1067 . Harvard
Yenching Institute Monographs 13. Cambridge, MA: Harvard University Press.
Kraiger, K. (2002). Decision-based evaluation. In K. Kraiger (Ed.), Creating,
implementing, and managing effective training and development: State-of-the-art
lessons for practice (pp. 331–376). San Francisco: Jossey-Bass.
Kuncel, N. R. (2003). The prediction and structure of academic performance.
Unpublished doctoral dissertation. Minneapolis, MN: University of Minnesota.
Kuncel, N. R., Credé, M., & Thomas, L. L. (2005). The validity of self-reported grade
point averages, class ranks, and test scores: A meta-analysis of the literature.
Review of Educational Research, 75, 63-82.
Kuncel, N. R., Credé, M., & Thomas, L. L. (2007). A meta-analysis of the predictive
validity of the Graduate Management Admission Test (GMAT) and
undergraduate grade point average (UGPA) for graduate student academic
performance. Academy of Management Learning and Education, 6, 51-68.
Kuncel, N. R., Credé, M., Thomas, L. L., Klieger, D. M., Seiler, S. N., & Woo, S. F.
(2005). A meta-analysis of the validity of the Pharmacy College Admission Test
(PCAT) and grade predictors of pharmacy student performance. American
Journal of Pharmaceutical Education, 69, 339-347.
Kuncel, N. R., & Hezlett, S. A. (2007). Standardized tests predict graduate students‘
success. Science, 315, 1080-1081.

182
182
Kuncel, N. R., Hezlett, S. A., & Ones, D. S. (2001). A comprehensive meta-analysis of
the predictive validity of the Graduate Record Examinations: Implications for
graduate student selection and performance. Psychological Bulletin, 127, 162-
181.
Kuncel, N. R., Hezlett, S. A., & Ones, D. S. (2004). Academic performance, career
potential, creativity, and job performance: Can one construct predict them all?
Journal of Personality and Social Psychology, 86, 148-161.
Kuncel, N. R., Wee, S., Serafin, L., & Hezlett, S. A. (2010). The validity of the Graduate
Record Examination for master‘s and doctoral programs: A meta-analytic
investigation. Educational and Psychological Measurement, 70, 340-352.
Kvist, A. V., & Gustafsson, J.-E. (2008). The relation between fluid intelligence and the
general factor as a function of cultural background: A test of Cattell's Investment
theory. Intelligence, 36, 422-436.
Lai, T. C. (1970). A scholar in Imperial China. Hong Kong: Kelly & Walsh.
Larkin, J. H., McDermott, J., Simon, D. P., & Simon, H. A. (1980). Models of
competence in solving physics problems. Cognitive Science, 4, 317-345.
Le, H. (2003). Correcting for indirect range restriction in meta-analysis: Testing a new
meta-analysis method. Unpublished doctoral dissertation, University of Iowa,
Iowa City, IA.
Le, H., Oh, I-S., Robbins, S. B., Ilies, R., Holland, E., & Westrick, P. (2011). Too much
of a good thing: Curvilinear relationships between personality traits and job
performance. Journal of Applied Psychology, 96, 113-133.
Le, H., & Schmidt, F. L. (2006). Correcting for indirect range restriction in meta-
analysis: Testing a new analytic procedure. Psychological Methods, 11, 416-438.
Le, H., Schmidt, F. L., & Putka, D. J. (2007). The multifaceted nature of measurement
artifacts and its implication for estimating construct-level relationships.
Organizational Research Methods, 12, 165-200.
LePine, J. A., Erez, A., & Johnson, D. E. (2002). The nature and dimensionality of
organizational citizenship behavior: A critical review and meta-analysis. Journal
of Applied Psychology, 87, 52-65.
Line, W. (1931). The growth of visual perception in children. British Journal of
Psychology Monograph Supplements, 15.
Locke, E. A., Frederick, E., Lee, C., & Bobko, P. (1984). Effect of self-efficacy, goals,
and task strategies on task performance. Journal of Applied Psychology, 69, 241-
251.

183
183
Lohman, D. F. (1993). Teaching and testing to develop fluid abilities. Educational
Researcher, 22(12), 12-23.
Lubinski, D. (2000). Scientific and social significance of assessing individual differences:
"Sinking shafts at a few critical points." Annual Review of Psychology, 51, 405-
444.
Lynn, R., & Irwing, P. (2004). Sex differences on the progressive matrices: A meta-
analysis. Intelligence, 32, 481-498.
Mackintosh, N. J. (1998). IQ and human intelligence. Oxford, UK: Oxford University
Press.
Martin, A., Wiggs, C. L., & Weisberg, J. (1997). Modulation of human medial temporal
lobe activity by form, meaning, and experience. Hippocampus, 7, 587-593.
Marrou, H. I. (1956). A history of education in antiquity (G. Lamb, Trans.). New York:
Sheed and Ward.
McDaniel, M. A. (1985). The evaluation of a causal model of job performance: The
interrelationships of general mental ability, job experience, and job performance.
Unpublished doctoral dissertation, George Washington University.
McGrew, K. S. (1997). Analysis of the major intelligence batteries according to a
proposed comprehensive Gf–Gc framework. In D. P. Flanagan, J. L., Genshaft, &
P. L. Harrison (Eds.), Contemporary intellectual assessment: Theories, tests, and
issues (pp. 151–179). New York: Guilford Press.
McGrew, K. S. (2005). The Cattell–Horn–Carroll theory of cognitive abilities: Past,
present, and future. In D. P. Flanagan & P. L. Harrison (Eds.), Contemporary
Intellectual Assessment: Theories, Tests, and Issues, 2nd
ed. (pp. 136−181). New
York: Guilford Press.
McGrew, K. S. (2009). CHC theory and the human cognitive abilities project: Standing
on the shoulders of the giants of psychometric intelligence research. Intelligence,
37, 1−10.
McGrew, K. S., Werder, J. K., & Woodcock, R. W. (1991). WJ-R Technical Manual.
Chicago: Riverside.
McKinney, A. P., Carlson, K. D., Mecham, R. L., III, D‘Angelo, N. C., & Connerley, M.
L. (2003). Recruiters‘ use of GPA in initial screening decisions: Higher GPAs
don‘t always make the cut. Personnel Psychology, 56, 823-845.
Miner, J. B., & Raju, N. S. (2004). Risk propensity differences between managers and
entrepreneurs and between low- and high-growth entrepreneurs: A reply in a more
conservative vein. Journal of Applied Psychology, 89, 3–13.
Miyazaki, I. (1981). China's examination hell: The civil service examinations of Imperial
China (C. Schirokauer, Trans.). New Haven, CT: Yale University Press.

184
184
Mortensen, E. L., & Kleven, M. (1993). A WAIS longitudinal study of cognitive
development during the life span from ages 50 to 70. Developmental
Neuropsychology, 9, 115-130.
Motowidlo, S. J., & Van Scotter, J. R. (1994). Evidence that task performance should be
distinguished from contextual performance. Journal of Applied Psychology, 79,
475-480.
Mount, M. K., Judge, T. A., Scullen, S. E., Sytsma, M. R., & Hezlett, S. A. (1998). Trait,
rater, and level effects in 360-degree performance ratings. Personnel Psychology,
51, 557-576.
Murphy, K. R. (1989). Dimensions of job performance. In R. Dillon and J. Pellegrino
(Eds.), Testing: Applied and Theoretical Perspectives (pp. 218-47). New York:
Praeger.
Neisser, U., Boodoo, G., Bouchard, T. J., Jr., Boykin, A. W., Brody, N., Ceci, S., et al.
(1996). Intelligence: Knowns and unknowns. American Psychologist, 51, 77-101.
Ng, T. W. H., & Feldman, D. C. (2008). The relationship of age to ten dimensions of job
performance. Journal of Applied Psychology, 93, 392-423.
Nisbet, J. D. (1957). Contributions to intelligence testing and the theory of intelligence-
IV. Intelligence and age: with twenty-four years interval. British Journal of
Educational Psychology, 27, 190-198.
Noll, J, & Horn, J. L. (1998). Age differences in processes of fluid and crystallized
intelligence. In J. J. McArdle & R. W. Woodcock (Eds.), Human cognitive
abilities in theory and practice (pp. 263-281). Chicago: Riverside.
Norman, G. R., Coblentz, C. L., Brooks, L. R., & Babcook, C. J. (1992). Expertise in
visual diagnosis: a review of the literature. Academic Medicine, 67, 78–83
Nunnally, J. C. (1978). Psychometric theory. New York, NY: McGraw-Hill.
Nunnally, J. C., & Bernstein, I. H. (1994). Psychometric theory (3rd ed.). New York:
McGraw-Hill.
Oh, I.-S., Schmidt, F. L., Shaffer, J. A., & Le, H. (2008). The Graduate Management
Admission Test (GMAT) is even more valid than we thought: A new
development in meta-analysis and its implications for the validity of the GMAT.
Academy of Management Learning & Education, 7, 563-570.
Oliphant, V. N., & Alexander, E. R., III. (1982). Reactions to resumes as a function of
resume determinateness, applicant characteristics, and sex of raters. Personnel
Psychology, 35, 829-842.

185
185
Ones, D. S., Viswesvaran, C., & Schmidt, F. L. (1993). Comprehensive meta-analysis of
integrity test validities: Findings and implications for personnel selection and
theories of job performance. Journal of Applied Psychology Monographs, 78,
679-703.
Organ, D. W. (1997). Organizational citizenship behavior: It‘s construct clean-up time.
Human Performance, 10, 85-97.
Oullette, J. A., & Wood, W. (1998). Habit and intention in everyday life: The multiple
processes by which past behavior predicts future behavior. Psychological
Bulletin, 124, 54-74.
Owens, W.A. (1966). Age and mental abilities: A second adult follow-up. Journal of
Educational Psychology, 57, 311-325.
Paradise, A. (2008). State of the industry report: ASTD’s annual review of trends in
workplace learning and performance. Alexandria, VA: American Society for
Training and Development.
Patel, V. L., & Groen, G. J. (1991). The general and specific nature of medical expertise:
A critical look. In K. A. Ericsson & J. Smith (Eds.), Toward a general theory of
expertise (pp. 93-125). Cambridge, UK: Cambridge University Press.
Pelz, D. C., & Andrews, F. M. (1964). Detecting causal priorities in panel study data.
American Sociological Review, 29, 836-848.
Penrose, L. S., & Raven, J. C. (1936). A new series of perceptual tests: Preliminary
communication. British Journal of Medical Psychology, 16, 97–104.
Peterson, N.G., Mumford, M.D., Borman, W.C., Jeanneret, P.R., Fleishman, E.A.,
Campion, M.A., et al (2001). Understanding work using the occupational
information network (O*NET): Implications for practice and research. Personnel
Psychology, 54, 451-492.
Plato. (1881). The republic (B. Jowett, Trans.). Oxford, UK: Clarendon Press.
Podsakoff, P. M., MacKenzie, S. B., Paine, J. B., & Bachrach, D. G. (2000).
Organizational citizenship behaviors: A critical review of the theoretical and
empirical literature and suggestions for future research. Journal of Management,
26, 513-563.
Porteus, S. D. (1937). Primitive intelligence and environment. New York: Macmillan.
Postlethwaite, B., Robbins, S., Rickerson, J., & McKinniss, T. (2009). The moderation of
conscientiousness by cognitive ability when predicting workplace safety behavior.
Personality and Individual Differences, 47, 711-716.
Raaheim, K. (1988). Intelligence and task novelty. In R. J. Sternberg (Ed.), Advances in
the psychology of human intelligence (Vol. 4, pp. 73-98). Hillsdale, NJ: Lawrence
Earlbaum.

186
186
Rabbitt, P. (1993). Crystal quest: A search for the basis of maintenance of practice skills
into old age. In A. Baddeley & L. Weiskrantz (Eds.), Attention: Selection,
awareness, and control (pp. 188-230). Oxford: Clarendon Press.
Rabbitt, P., & Abson, V. (1991). Do older people know how good they are? British
Journal of Psychology, 82, 137-151.
Raven, J. C. (1938). Progressive matrices: A perceptual test of intelligence. London: H.
K. Lewis.
Raven, J. (2000). The Raven‘s Progressive Matrices: Change in stability over culture and
time. Cognitive Psychology, 41, 1-48.
Ree, M. J., & Earles, J. A. (1991). Predicting training success: Not much more than g.
Personnel Psychology, 44, 321-332.
Ree, M. J., Caretta, T. R., & Teachout, M. S. (1995). Role of ability and prior job
knowledge in complex training performance. Journal of Applied Psychology, 80,
721-730.
Reilly, R. R., & Warech, M. A. (1993). The validity and fairness of alternatives to
cognitive tests. In L. C. Wing & B. R. Gifford (Eds.), Policy issues in employment
testing (pp. 131-224). Boston: Kluwer.
Revelle, W. (1993). Individual differences in personality and motivation: ―Non-
cognitive‖ determinants of cognitive performance. In A. Baddeley & L.
Weiskrantz (Eds.), Attention: selection, awareness, and control: A tribute to
Donald Broadbent. Oxford, UK: Oxford University Press.
Reynolds, M. R., & Keith, T. Z. (2007). Spearman's law of diminishing returns in
hierarchical models of intelligence for children and adolescents. Intelligence, 35,
267−281.
Rindermann, H., Flores-Mendoza, C., & Mansur-Alves, M. (2010). Reciprocal effects
between fluid and crystallized intelligence and their dependence on parents‘
socioeconomic status and education. Learning and Individual Differences, 20,
544-548.
Roberts, R. D., Goff, G. N., Anjoul, F., Kyllonen, P. C., Pallier, G., & Stankov, L.
(2000). The Armed Services Vocational Aptitude Battery (ASVAB): little more
than acculturated learning (Gc)!? Learning and Individual Differences, 12, 81-
103.
Robinson, D. L. (1999). The ‗IQ‘ factor. Implications for intelligence theory and
measurement. Personality and Individual Differences, 27, 715−735.
Robinson, S. L., & Bennett, R. J. (1995). A typology of deviant workplace behaviors: A
multi-dimensional scaling study. Academy of Management Journal, 38, 555-572.

187
187
Rogosa, D. (1980). A critique of cross-lagged correlation. Psychological Bulletin, 88,
245-258.
Roznowski, M. (1987). Use of tests manifesting sex differences as measures of
intelligence: Implications for measurement vias. Journal of Applied Psychology,
72, 480-483.
Roth, P. L., BeVier, C. A., Switzer, F. S., III, & Schippmann, J. S. (1996). Meta-analzing
the relationship between grades and job performance. Journal of Applied
Psychology, 81, 548-556.
Roth, P. L., & Clarke, R. L. (1998). Meta-analyzing the relation between grades and
salary. Journal of Vocational Behavior, 53, 386-400.
Rotundo, M., & Sackett, P. R. (2002). The relative importance of task, citizenship, and
counterproductive performance to global ratings of job performance: A policy-
capturing approach. Journal of Applied Psychology, 87, 66-80.
Rushton, J. P., Skuy, M., & Fridjohn, P. (2002). Jensen effects among African, Indian,
and White engineering students in South Africa on Raven‘s Standard Progressive
Matrices. Intelligence, 30, 409-423.
Rynes, S. L., & Connerley, M. L. (1993). Applicant reactions to alternative selection
procedures. Journal of Business and Psychology, 7, 261-277.
Rynes, S. L., Orlitzky, M. O., & Bretz, R. D. (1997). Experienced hiring versus college
recruiting: Practices and emerging trends. Personnel Psychology, 50, 309-339.
Sackett, P. R. (2002). The structure of counterproductive work behaviors: Dimensionality
and relationships with facets of job performance. International Journal of
Selection and Assessment, 10, 5-11.
Sackett, P. R., Borneman, M. J., & Connelly, B. S. (2008). High-stakes testing in higher
education and employment: Appraising the evidence for validity and fairness.
American Psychologist, 63, 215-227.
Sackett, P. R., Kuncel, N. R., Arneson, J. J., Cooper, S. R., & Waters, S. D. (2009). Does
socioeconomic status explain the relationship between admissions tests and post-
secondary academic performance? Psychological Bulletin, 135, 1-22.
Sackett, P. R., & Yang, H. (2000). Correction for range restriction: An expanded
typology. Journal of Applied Psychology, 85, 112-118.
Salgado, J. F., Anderson, N., Moscoso, S., Bertua, C., & de Fruyt, F. (2003a).
International validity generalization of GMA and cognitive abilities: A European
Community meta-analysis. Personnel Psychology, 56, 573-605.

188
188
Salgado, J. F., Anderson, N., Moscoso, S., Bertua, C., de Fruyt, F., & Rolland, J. P.
(2003b). A meta-analytic study of general mental ability validity for different
occupations in the European Community. Journal of Applied Psychology, 88,
1068-1081.
Salthouse, T. A. (1984). Effects of age and skill in typing. Journal of Experimental
Psychology: General, 13, 345-371.
Salthouse, T. A., Kausler, D. H., & Saults, J. S. (1990). Age, self-assessed health-status,
and cognition. Journal of Gerontology, 45, 156-160.
Salthouse, T. A. (1991). Mediation of adult age differences in cognition by reductions in
working memory and speed of processing. Psychological Science, 2, 179-183.
Schaie, K. W. (1994). The course of adult intellectual development. American
Psychologist, 49, 304-313.
Schaie, K. W. (1996). Intellectual development in adulthood: The Seattle longitudinal
study. Cambridge, UK: Cambridge University Press.
Schmidt, F. L. (2002). The role of general cognitive ability and job performance: Why
there cannot be a debate. Human Performance, 15, 187–210.
Schmidt, F. L. (2008). Meta-analysis: A constantly evolving research tool.
Organizational Research Methods, 11, 96-113.
Schmidt, F. L., & Crano, W. D. (1974). A test of the theory of fluid and crystallized
intelligence in middle- and low-socioeconomic-status children: A cross-lagged
panel analysis. Journal of Educational Psychology, 66, 255-261.
Schmidt, F. L., Gast-Rosenberg, I., & Hunter, J. E. (1980). Validity generalization results
for computer programmers. Journal of Applied Psychology, 65, 643-661.
doi:10.1037//0021-9010.65.6.643
Schmidt, F. L., & Hunter, J. E. (1992). Development of a causal model of processes
determining job performance. Current Directions in Psychological Science, 1, 89-
92.
Schmidt, F. L., & Hunter, J. E. (1993). Tacit knowledge, practical intelligence, general
mental ability, and job knowledge. Current Directions in Psychological Science,
2, 8-9.
Schmidt, F. L., & Hunter, J. E. (1998). The validity and utility of selection methods in
personnel psychology: Practical and theoretical implications of 85 years of
research findings. Psychological Bulletin, 124, 262–274.
Schmidt, F. L., & Hunter, J. E. (1999). Comparison of three meta-analysis methods
revisited: An analysis Johnson, Mullen, and Salas (1995). Journal of Applied
Psychology, 84, 144-148.

189
189
Schmidt, F. L., & Hunter, J. E. (2004). General mental ability in the world of work:
Occupational attainment and job performance. Journal of Personality and Social
Psychology, 86, 162-173.
Schmidt, F. L., Hunter, J. E., & Outerbridge, A. N. (1986). Impact of job experience and
ability on job knowledge, work sample performance, and supervisory ratings of
job performance. Journal of Applied Psychology, 71, 432-439.
Schmidt, F. L., Hunter, J. E., Outerbridge, A. N., & Goff, S. (1986). The joint relation of
experience and ability with job performance: A test of three hypotheses. Journal
of Applied Psychology, 73, 46-57.
Schmidt, F. L., Le, H., & Ilies, R. (2003). Beyond alpha: An empirical examination of the
effects of different sources of measurement error on reliability estimates for
measures of individual-differences constructs. Psychological Methods, 8, 206-
224.
Schmidt, F. L., Le, H., Oh, I-S., & Shaffer, J. (2007). General mental ability, job
performance, and red herrings: Responses to Osterman, Hauser, and Schmitt.
Academy of Management Perspectives, 21(4), 64-76.
Schmidt, F. L., Oh, I.-S., & Hayes, T. L. (2009). Fixed- versus random-effects models in
meta-analysis: Model properties and an empirical comparison of differences in
results. British Journal of Mathematical and Statistical Psychology, 62, 97-128.
Schmidt, F. L., Oh, I.-S., & Le, H. (2006). Increasing the accuracy of corrections for
range restriction: Implications for selection procedure validities and other
research results. Personnel Psychology, 59, 281-305.
Schmidt, F. L., Shaffer, J. A., & Oh, I.-S. (2008). Increased accuracy for range restriction
corrections: Implications for the role of personality and general mental ability in
job and training performance. Personnel Psychology, 61, 827-868.
Schmidt, H. G., Norman, G. R., Boshuizen, H. P. A. (1990). A cognitive perspective on
medical expertise: theory and implications. Academic Medicine, 65, 611–621.
Schmitt, N. (2007). The value of personnel selection: Reflections on some remarkable
claims. Academy of Management Perspectives, 21(3), 19-23.
Schuelke, M. J., Day, E. A., McEntire, L. E., Boatman, P. R., Boatman, J. E., Kowolik,
V., & Wang, X. (2009). Relating indices of knowledge structure coherence and
accuracy to skill-based performance: Is there utility in using a combination of
indices? Journal of Applied Psychology, 94, 1076-1085.
Schwartzman, A. E., Gold, D., Andres, D., Arbuckle, T. Y., & Chaikelson, J. (1987).
Stabiliy of intelligence: A 40-year follow-up. Canadian Journal of Psychology,
41, 244-256.
Schweizer, K., & Koch, W. (2002). A revision of Cattell‘s Investment Theory: Cognitive
properties influencing learning. Learning and Individual Differences, 13, 57-82.

190
190
Scullen, S. E., Mount, M. K., & Goff, M. (2000). Understanding the latent structure of
job performance ratings. Journal of Applied Psychology, 85, 956-970.
Sharp, S. E. (1898-1899). Individual psychology: A study in psychological method.
American Journal of Psychology, 10, 329-391.
Shields, S. (1975). Functionalism, Darwinism, and the psychology of women: A study in
social myth. American Psychologist, 30, 739-754.
Shuell, T. J. (1986). Contributions of cognitive psychology to learning from instruction in
Air Force training. In I. L. Goldstein, R. M. Gagne, R. Glaser, J. M. Royer, T. J.
Shuell, & D. L. Payne (Eds.), Learning research laboratory: Proposed research
issues (AFHRL-TP-85-54, pp. 29-44). Brooks Air Force Base, TX: Manpower
and Personnel Division, Air Force Human Resources Laboratory.
Smither, J. W., Reilly, R. R., Millsap, R. E., Pearlman, K., & Stoffey, R. (1993).
Applicant reactions to selection procedures. Personnel Psychology, 46, 49-76.
Snow, R. E. (1980). Aptitude processes. In R. E. Snow, P –A. Federico, & W. E.
Montague (Eds.). Aptitude, learning, and instruction: Volume 1, Cognitive
process analysis of aptitude (pp. 27-63). Hillsdale, NJ: Lawrence Earlbaum.
Spearman, C. (1904). ―General intelligence,‖ objectively determined and measured. The
American Journal of Psychology, 15, 201–293.
Spearman, C. (1927). The abilities of man. New York: Macmillan.
Spearman, C. (1933). The Spearman Visual Perception Test.
Stankov, L. (1988). Aging, attention, and intelligence. Psychology and Aging, 3, 59-74.
Stankov, L., & Horn, J. L. (1980). Human abilities revealed through auditory tests.
Journal of Educational Psychology, 72, 21-44.
Stern, W. (1914). The psychological methods of testing intelligence (Educational
Psychology Monographs, No. 13). (G.M. Whipple, trans.). Baltimore, MD:
Warwick & York.
Sternberg, R. J. (1985). Beyond IQ: A triarchic theory of human intelligence. New York:
Cambridge University Press.
Sternberg, R. J. (1988). The triarchic mind: a new theory of human intelligence. New
York: Viking.
Sternberg, R. J., Forsythe, G. B., Hedlund, J., Horvath, J. A., Wagner, R. K., Williams,
W. M., Snook, S. A., & Grigorenko, E. L. (2000). Practical intelligence in
everyday life. New York: Cambridge University Press.
Stewart, W. H., & Roth, P. L. (2004). Data quality affects meta-analytic conclusions: A
response to Miner and Raju (2004) concerning entrepreneurial risk propensity.
Journal of Applied Psychology, 89, 14-21.

191
191
Strenta, A. C., & Elliott, R. (1987). Differential grading standards revisited. Journal of
Educational Measurement, 24, 281-291.
Strube, M. J. (1987). A general model for estimating and correcting the effects of
nonindependence in metaanalysis. Multiple Linear Regression Viewpoints, 16(2),
40-47
Sugrue, B., & Rivera, R. J. (2005). State of the Industry: ASTD’s Annual Review of
Trends in Workplace Learning and Performance. Alexandria, VA: ASTD.
te Nijenhuis, J., van Vianen, A. E. M., & van der Flier, H. (2007). Score gains on g-
loaded tests: No g. Intelligence, 35, 283-300.
Terman, L. M. (1916). The measurement of intelligence. Boston, MA: Houghton Mifflin.
Terman, L. M., & Childs, H. G. (1912). A tentative revision and extension of the Binet-
Simon measuring scale of intelligence. Journal of Educational Psychology, 3, 61-
74.
Terman, L. M., & Merrill, M. A. (1937). Measuring intelligence: A guide to the
administration of the Revised Stanford-Binet Tests of Intelligence. Boston, MA:
Houghton Mifflin.
Thoms, P., McMasters, R., Roberts, M. R., & Dombrowski, D, A. (1999). Resume
characteristics as predictors of an invitation to interview. Journal of Business and
Psychology, 13, 339-356.
Thorndike, E. L. (1924). Measurement of intelligence. Psychological Review, 31, 219-
252.
Thorndike, R. L. (1949). Personnel selection. New York: Wiley.
Thurstone, L. L. (1938). Primary mental abilities. Psychometric Monographs, 1.
Toops. H.A. (1926). The status of university intelligence tests in 1923-24. Journal of
Educational Psychology, 17, 22-36, 110-124.
Tramer, M. R., Reynolds, D.J.M., Moore, R. A., & McQuay, H. J. (1997). Impact of
covert duplicate publication on meta-analysis: A case study. British Medical
Journal, 315, 635-640.
Triandis, H. C. (1977). Interpersonal behavior. Monterey, CA: Brooks/Cole.
Triandis, H.C. (1980). Values, attitudes, and interpersonal behavior. In H. E. Howe, Jr. &
M.M. Page (Eds.), Nebraska Symposium on Motivation: Beliefs, attitudes, and
values, 1979 (Vol. 27, pp. 195-259). Lincoln: University of Nebraska Press.
Tuddenham, R. D., Blumenkrantz, J., & Wilkin, W. R. (1968). Age changes on AGCT: A
longitudinal study of average adults. Journal of Consulting and Clinical
Psychology, 32, 659-663.

192
192
Twitchell, S., Holton, E. F., III, & Trott, J. R., Jr. (2001). Technical training evaluation
practices in the United States. Performance Improvement Quarterly, 13, 84–109.
Undheim, J. O. (1981a). On intelligence II: A neo-Spearman model to replace Cattell's
theory of fluid and crystallized intelligence. Scandinavian Journal of Psychology,
22, 181−187.
Undheim, J. O. (1981b). On intelligence IV: Toward a restoration of general intelligence.
Scandinavian Journal of Psychology, 22, 251-265.
Undheim, J. O., & Gustafsson, J. –E. (1987), The hierarchical organization of cognitive
abilities: Restoring general intelligence through the use of linear structural
relations (LISREL). Multivariate Behavioral Research, 22, 149-171.
Verhaeghen, P., & Salthouse, T. A. (1997). Meta-analyses of age-cognition relations in
adulthood: Estimates of linear and nonlinear age effects and structural models.
Psychological Bulletin, 122, 231-249.
Vernon, P. E. (1961). The structure of human abilities. London: Methuen.
Viswesvaran, C., & Ones, D. S. (2000). Perspectives on models of job performance.
International Journal of Selection and Assessment, 8, 216-226.
Viswesvaran, C., Ones, D. S., & Schmidt, F. L. (1996). Comparative analysis of the
reliability of job performance ratings. Journal of Applied Psychology, 5, 557-574.
Viswesvaran, C., Schmidt, F. L., & Ones, D. S. (2005). Is there a general factor in ratings
of job performance? A meta-analytic framework for disentangling substantive and
error influences. Journal of Applied Psychology, 90, 108-131.
von Elm, E., Poglia, G., Walder, B., & Tramer, M. R. (2004). Different patterns of
duplicate publication: An analysis of articles in systematic reviews. Journal of the
American Medical Association, 291(8), 974-980.
Wang, J-J., & Kaufman, A. S. (1993). Changes in fluid and crystallized intelligence
across the 20- to 90-year age range on the K-BIT. Journal of Psychoeducational
Assessment, 11, 29-37.
Wasserman, J. D., & Tulsky, D. S. (2005). A history of intelligence assessment. In D.
P.Flanagan & P. L.Harrison (Eds.), Contemporary intellectual assessment:
Theories, tests, and issues (2nd ed., pp. 3–22) New York: Guilford Press.
Wechsler, D. (1939). The measurement of adult intelligence. Baltimore, MD: Williams &
Wilkins.
Whitener, E. M. (1990). Confusion of confidence intervals and credibility intervals in
meta-analysis. Journal of Applied Psychology, 75, 315-321.
Wissler, C., 1901. The correlation of mental and physical tests. Psychological Review,
Monograph No. 3, pp. 1–62., 16(Suppl. 3), 1-62. (Suppl. 3), 1

193
193
Wood, J. A. (2008). Methodology for dealing with duplicate study effects in a meta-
analysis. Organizational Research Methods, 11, 79-95.
Zikmund, W. G., Hitt, M. A., & Pickens, B. A. (1978). Influence of sex and scholastic
performance on reactions to job applicant résumés. Journal of Applied
Psychology, 63, 252-254.
Academic Studies Included in the Meta-Analyses
Ainsworth, L. L., & Fox, A. M. (1967). Otis IQ: Forecasting efficiency for undergraduate
education courses. Educational and Psychological Measurement, 27, 431.
doi:10.1177/001316446702700224
Alteneder, L. E. (1940). The value of intelligence, personality, and vocational interest
tests in a guidance program. Journal of Educational Psychology, 31, 449-459.
doi:10.1037/h0053686
Ames, V. (1943). Factors related to high-school achievement. Journal of Educational
Psychology, 34, 229-236. doi:10.1037/h0056752
Anderson, E. E., Anderson, S. F., Ferguson, C., Gray, J., Hittinger, J., McKinstry, E.,
Motter, M. E., & Vick, G. (1942). Wilson College Studies in Psychology: I. A
comparison of the Wechsler-Bellevue, Revised Stanford-Binet, and American
Council on Education Tests at the college level. Journal of Psychology, 14, 317-
326. doi:10.1080/00223980.1942.9917130
Arlitt, A, H., & Hall, M. (1923). Intelligence tests versus entrance examinations as a
means of predicting success in college. Journal of Applied Psychology, 7, 330-
338. doi:10.1037/h0071292
Atchison, C. O. (1968). Relationships between some intellectual and non-intellectual
factors of high anxiety and low anxiety Negro college students. Journal of Negro
Education, 37, 174-178. doi:10.2307/2294246
Averill, L. A. (1923). A mental survey of fifty-nine normal school students: Some
correlations and criticisms. Journal of Educational Research, 7, 331-337.
Bachman, J. G. (1964). Prediction of academic achievement using the Edwards Need
Achievement Scale. Journal of Applied Psychology, 48, 16-19.
doi:10.1037/h0045329
Barchard, K. A. (2003). Does emotional intelligence assist in the prediction of academic
success? Educational and Psychological Measurement, 63, 840-858.
doi:10.1177/0013164403251333
194
194
Binder, D. M., Jones, J. G., & Strowing, R. W. (1970). Non-intellective self-report
variables as predictors of scholastic achievement. Journal of Educational
Research, 63, 364-366.
Bowers, J. (1969). Interactive effects of creativity and IQ on ninth-grade achievement.
Journal of Educational Measurement, 6, 173-177. doi:10.1111/j.1745-
3984.1969.tb00675.x
Boyd, M. E., & Ward, G., II. (1967). Validities of the D-48 test for use with college
students. Educational and Psychological Measurement, 27, 1137-1138.
doi:10.1177/001316446702700467
Brown, W. F., & Holtzman, W. H. (1955). A study-attitudes questionnaire for predicting
academic success. Journal of Educational Psychology, 46, 75-84.
doi:10.1037/h0039970
Burton, L. J., & Dowling, D. J. (2010, July). The effects of gender on the success of a
cohort of engineering students. Paper presented at the 2010 Engineering
Education Conference in Birmingham, UK.
Butcher, D. F., & Muth, W. A. (1985). Predicting performance in an introductory
computer science course. Communications of the ACM, 28, 263-268.
doi:10.1145/3166.3167
Butsch, R. L. C. (1939). Improving the prediction of academic success through
differential weighting. Journal of Educational Psychology, 30, 401-420.
doi:10.1037/h0056269
Chambers, O. R. (1925). Character trait tests and the prognosis of college achievement.
Journal of Abnormal and Social Psychology, 20, 303-311. doi:10.1037/h0075636
Chamorro-Premuzic, T., & Furnham, A. (2006). Self-assessed intelligence and academic
performance. Educational Psychology, 26, 769-779.
doi:10.1080/01443410500390921
Chamorro-Premuzic, T., & Furnham, A. (2008). Personality, intelligence, and approaches
to learning as predictors of academic performance. Personality and Individual
Differences, 44, 1596-1603. doi:10.1016/j.paid.2008.01.003
Chansky, N. M. (1965). Aptitude, personality, and achievement in six college curricula.
Educational and Psychological Measurement, 25, 1117-1124.
doi:10.1177/001316446502500419
Chissom, B. S., & Lanier, D. (1975). Prediction of first quarter freshman GPA using SAT
scores and high school grades. Educational and Psychological Measurement, 35,
461-463. doi:10.1177/001316447503500227

195
195
Church, A. G. (1976). Academic achievement, IQ, level of occupational plans, and ethnic
stereotypes for Anglos and Navahos in a multi-ethnic high school. Southern
Journal of Educational Research, 10, 184-201.
Colom, R., Escorial, S., Shih, P. C., & Privado, J. (2007). Fluid intelligence, memory
span, and temperament difficulties predict academic performance of young adults.
Personality and Individual Differences, 42, 1503-1514.
doi:10.1016/j.paid.2006.10.023
Conry, R., & Plant, W. T. (1965). WAIS and group test predictions of an academic
success criterion: High school and college. Educational and Psychological
Measurement, 25, 493-500. doi:10.1177/001316446502500218
Coyle, T. R., & Pillow, D. R. (2008). SAT and ACT predict college GPA after removing
g. Intelligence, 36, 719-729. doi:10.1016/j.intell.2008.05.001
Craig, H. M. (1987). The relationship of motives, subjective perceptions, occupational
aspirations and cognitive ability to career salience and scholastic achievement
for eighth-grade and tenth-grade students. Unpublished doctoral dissertation,
State University of New York at Buffalo.
Cutrona, C. E., Cole, V., Colangelo, N., Assouline, S. G., & Russell, D. W. (1994).
Perceived parental support and academic achievement: An attachment theory
perspective. Journal of Personality and Social Psychology, 66, 369-378.
doi:10.1037/0022-3514.66.2.369
Day, A. L., & Carroll, S. A. (2003). Situational and patterned behavior description
interviews: A comparison of their validity, correlates, and perceived fairness.
Human Performance, 16, 25-47. doi:10.1207/S15327043HUP1601_2
Day, L., Hanson, K., Maltby, J., Proctor, C., & Wood, A. (2010). Hope uniquely predicts
objective achievement above intelligence, personality, and previous academic
achievement. Journal of Research in Personality, 44, 550-553.
doi:10.1016/j.jrp.2010.05.009
Di Fabio, A., & Busoni, L. (2007). Fluid intelligence, personality traits and scholastic
success: Empirical evidence in a sample of Italian high school students.
Personality and Individual Differences, 43, 2095-2104.
doi:10.1016/j.paid.2007.06.025
Di Fabio, A., & Palazzeschi, L. (2009). An in-depth look at scholastic success: Fluid
intelligence, personality traits or emotional intelligence? Personality and
Individual Differences, 46, 581-585. doi:10.1016/j.paid.2008.12.012

196
196
Domino, G. (1964). Comparison of the D 48, Cattell Culture Fair, and Army Beta tests in
a sample of college males. Journal of Consulting Psychology, 28, 468-469.
doi:10.1037/h0040964
Domino, G., & Morales, A. (2000). Reliability and validity of the D-48 with Mexican
American college students. Hispanic Journal of Behavioral Sciences, 22, 382-
389. doi:10.1177/0739986300223007
Furnham, A., & Monsen, J. (2009). Personality traits and intelligence predict academic
school grades. Learning and Individual Differences, 19, 28-33.
doi:10.1016/j.lindif.2008.02.001
Furnham, A., Monsen, J., & Ahmetoglu, G. (2009). Typical intellectual engagement, Big
Five personality traits, approaches to learning and cognitive ability predictors of
academic performance. British Journal of Educational Psychology, 79, 769-782.
doi:10.1348/978185409X412147
Furnham, A., Zhang, J., & Chamorro-Premuzic, T. (2005-2006). The relationship
between psychometric and self-estimated intelligence, creativity, personality, and
academic achievement. Imagination, Cognition, and Personality, 25, 119-145.
doi:10.2190/530V-3M9U-7UQ8-FMBG
Gadzella, B. M., Cochran, S. W., Parham, L., & Fournet, G. P. (1976). Accuracy and
differences among students in their predictions of semester achievement. Journal
of Educational Research, 70, 75-81.
Gallessich, J. (1970). An investigation of correlates of academic success of freshmen
engineering students. Journal of Counseling Psychology, 17, 173-176.
doi:10.1037/h0028912
Gardner, R. C., & Lambert, W. E. (1965). Language aptitude, intelligence, and second-
language aptitude. Journal of Educational Psychology, 56, 191-199.
doi:10.1037/h0022400
Garton, B. L., Dyer, J. E., & King, B. O. (2000). The use of learning styles and admission
criteria in predicting academic performance and retention of college freshmen.
Journal of Agricultural Education, 41, 46-53.
Garton, B. L., Ball, A. L., & Dyer, J. E. (2002). The academic performance and retention
of agriculture students. Journal of Agricultural Education, 43, 46-56.
Goff, M., & Ackerman, P. L. (1992). Personality-intelligence relations: Assessment of
typical intellectual engagement. Journal of Educational Psychology, 84, 537-552.
doi:10.1037/0022-0663.84.4.537

197
197
Goh, D. S., & Moore, C. (1978). Personality and academic achievement in three
educational levels. Psychological Reports, 43, 71-79.
Goodstein, L. D., & Heilbrun, A. B., Jr. (1962). Prediction of college achievement from
the Edwards Personal Preference Schedule at three levels of intellectual ability.
Journal of Applied Psychology, 46, 317-320. doi:10.1037/h0042012
Gordon, E., & Baker, H. J. (1920). Intelligence tests and academic standing. Journal of
Applied Psychology, 4, 361-363. doi:10.1037/h0075519
Gordon, J. R. (1968). Listening, attitude, and intelligence tests to predict academic
achievement. Unpublished doctoral dissertation, Colorado State College.
Gough, H. G. (1964a). A cross-cultural study of achievement motivation. Journal of
Applied Psychology, 48, 191-196. doi:10.1037/h0047156
Gough, H. G. (1964b). Academic achievement in high school as predicted from the
California Psychological Inventory. Journal of Educational Psychology, 55, 174-
180. doi:10.1037/h0046186
Green, R. L., & Farquhar, W. W. (1965). Negro academic motivation and scholastic
achievement. Journal of Educational Psychology, 56, 241-243.
doi:10.1037/h0022482
Hackett, G., Betz, N. E., Casas, J. M., & Rocha-Singh, I. A. (1992). Gender, ethnicity,
and social-cognitive factors predicting academic achievement of students in
engineering. Journal of Counseling Psychology, 39, 527-538. doi:10.1037/0022-
0167.39.4.527
Hakstian, A. R., & Bennet, R. W. (1978). Validity studies using the Comprehensive
Ability Battery (CAB): I. Academic achievement criteria. Educational and
Psychological Measurement, 37, 425-437. doi:10.1177/001316447703700217
Hakstian, A. R., & Gale, C. A. (1979). Validity studies using the Comprehensive Ability
Battery (CAB): III. Performance in conjunction with personality and motivational
traits. Educational and Psychological Measurement, 39, 389-400.
doi:10.1177/001316447903900218
Hall, A.S., Kelly, K. R., Hansen, K., & Gutwein, A. K. (1996). Sources of self-
perceptions of career-related abilities. Journal of Career Assessment, 4, 331-343.
doi:10.1177/106907279600400307

198
198
Halpin, G., Halpin, G., & Schaer, B. B. (1981). Relative effectiveness of the California
Achievement Tests in comparison with the ACT Assessment, College Board
Scholastic Aptitude Test, and high school grade point average in predicting
college grade point average. Educational and Psychological Measurement, 41,
821-827. doi:10.1177/001316448104100323
Himelstein, P. (1965). Validities and intercorrelations of MMPI subscales predictive of
college achievement. Educational and Psychological Measurement, 25, 1125-
1128. doi:10.1177/001316446502500420
Huws, N., Reddy, P. A., & Talcott, J. B. (2009). The effects of faking on non-cognitive
predictors of academic performance in university students. Learning and
Individual Differences, 19, 476-480. doi:10.1016/j.lindif.2009.04.003
Jones, R. L. (1962). A study of the validity of the Pre-Engineering Ability Test.
Educational and Psychological Measurement, 22, 393-396.
doi:10.1177/001316446202200214
Jordan, A. M. (1922). Correlations of four intelligence tests with grades. Journal of
Educational Psychology, 13, 419-429. doi:10.1037/h0070371
Kahn, J. H., & Nauta, M. M. (2001). Social-cognitive predictors of first-year college
persistence: The importance of proximal assessment. Research in Higher
Education, 42, 633-652. doi:10.1023/A:1012225510213
Keiller, S. W. (1997). Type A behavior pattern and locus of control as predictors of
college academic performance. Unpublished doctoral dissertation, Kent State
University.
Kern, C. W., Fagley, N. S., & Miller, P. S. (1998). Correlates of college retention and
GPA: Learning and study strategies, testwiseness, attitudes, and ACT. Journal of
College Counseling, 1, 26-34.
Kirkpatrick, F. H. (1940). With the technicians: Four mental tests and college marks.
Journal of Higher Education, 11, 38-39. doi:10.2307/1973799
Kornhauser, A. W. (1927). Test and high-school records as indicators of success in an
undergraduate school of business. Journal of Educational Research, 16, 342-356.
Kundu, R. (1975). An investigation into the relationship between abstract intelligence and
attainments in different subjects of higher secondary course. Journal of
Psychological Researches, 20, 71-75.

199
199
Kunina, O., Wilhelm, O., Formazin, M., Jonkmann, K., & Schroeders, U. (2007).
Extended criteria and predictors in college admission: Exploring the structure of
study success and investigating the validity of domain knowledge. Psychology
Science, 49, 88-114.
Labovitz, E. M. (1974). Fulfillment of college aspirations: A simple causal analysis.
Pacific Sociological Review, 17, 379-397.
Laidra, K., Pullmann, H., & Allik, J. (2007). Personality and intelligence as predictors of
academic achievement: A cross-sectional study from elementary to secondary
school. Personality and Individual Differences, 42, 441-451.
doi:10.1016/j.paid.2006.08.001
Lamar, G. (1985). The Raven or I-E locus of control as measures of high ability.
Unpublished doctoral dissertation, University of Denver.
Lehn, T., Vladovic, R., & Michael, W. B. (1980). The short-term predictive validity of a
standardized reading test and of scales reflecting six dimensions of academic self-
concept relative to selected high school achievement criteria for four ethnic
groups. Educational and Psychological Measurement, 40, 1017-1031.
doi:10.1177/001316448004000429
Lenning, O. T., & Maxey, E. J. (1973). ACT versus SAT prediction for present-day
colleges and students. Educational and Psychological Measurement, 33, 397-406.
doi:10.1177/001316447303300222
Leonard, D. L., & Niebuhr, B. R. (1986). Admissions variables as predictors of
performance in basic science coursework. Occupational Therapy Journal of
Research, 6, 105-113.
Lins, L. J., Abell, A. P., Hutchins, H. C. (1966). Relative usefulness in predicting
academic success of the ACT, the SAT, and some other variables. Journal of
Experimental Education, 35, 1-29.
Longstaff, H. P., & Porter, J. P. (1929). Objective measures of ability and achievement in
general psychology. Journal of Applied Psychology, 13, 173-187.
doi:10.1037/h0073561
Lopes, P. N., Salovey, P., Côte, S., & Beers, M. (2005). Emotion regulation abilities and
the quality of social interaction. Emotion, 5, 113-118. doi:10.1037/1528-
3542.5.1.113
Lorenz, A. B., & McClure, W. E. (1935). The influence of color blindness on intelligence
and achievement of college men. Journal of Applied Psychology, 19, 320-330.
doi:10.1037/h0059366

200
200
Maher, H. (1959). Follow-up on the validity of a forced-choice study activity
questionnaire in another setting. Journal of Applied Psychology, 43, 293-295.
doi:10.1037/h0047069
Manuel, H. T., Adams, F. J., Jeffress, S., Tomlinson, H., & Cragg, D. B. (1940). The new
Stanford-Binet at the college level. Journal of Educational Psychology, 31, 705-
709. doi:10.1037/h0063380
Martel, J., McKelvie, S. J., & Standing, L. (1987). Validity of an intuitive personality
scale: Personal responsibility as a predictor of academic achievement.
Educational and Psychological Measurement, 47, 1153-1162.
doi:10.1177/0013164487474033
Martin, J. D., & Rudolph, L. (1972). Correlates of the Wechsler Adult Intelligence Scale,
the Slosson Intelligence Test, ACT scores and grade point average. Educational
and Psychological Measurement, 32, 459-462.
doi:10.1177/001316447203200226
McKelpin, J. P. (1965). Some implications of the intellectual characteristics of freshmen
entering a liberal arts college. Journal of Educational Measurement, 2, 161-166.
doi:10.1111/j.1745-3984.1965.tb00411.x
McKelvie, S. J. (1989). The Wonderlic Personnel Test: Reliability and validity in an
academic setting. Psychological Reports, 65, 161-162.
McLaurin, W. A., & Farrar, W. E. (1973). Validity of the progressive matrices tests
against IQ and grade point average. Psychological Reports, 32, 803-806.
McLaurin, W. A., Pendergrass, P., & Kennedy, S. (1973). Relationships of the D 48 with
Otis IQ and grade point average. Educational and Psychological Measurement,
33, 453-457. doi:10.1177/001316447303300229
Merkel, S. P., & Hall, V. C. (1982). The relationship between memory for order and
other cognitive tasks. Intelligence, 6, 427-441. doi:10.1016/0160-2896(82)90028-
9
Merrill, R. M., & Heathers, L. B. (1953). A comparison of the Wechsler-Bellevue and
ACE tests on a university counseling center group. Journal of Consulting
Psychology, 17, 63-66. doi:10.1037/h0060097
Mikitovics, A., & Crehan, K. D. (2002). Pre-professional skills test scores as College of
Education Admission Criteria. Journal of Educational Research, 95, 215-223.
doi:10.1080/00220670209596594
Moline, A. E. (1987). Financial aid and student persistence: An application of causal
modeling. Research in Higher Education, 26, 130–147. doi:10.1007/BF00992025

201
201
Naderi, H., Abdullah, R., Hamid, T. A., & Sharir, J. (2008). Intelligence and gender as
predictors of academic achievement among undergraduate students. European
Journal of Social Sciences, 7, 199-207.
Newsome, S., Day, A. L., & Catano, V. M. (2000). Assessing the predictive validity of
emotional intelligence. Personality and Individual Differences, 29, 1005-1016.
doi:10.1016/S0191-8869(99)00250-0
Noftle, E. E., & Robins, R. W. (2007). Personality predictors of academic outcomes: Big
five correlates of GPA and SAT scores. Journal of Personality and Social
Psychology, 93, 116-130. doi:10.1037/0022-3514.93.1.116
O‘Connor, R. M., Jr., & Little, I. S. (2003). Revisiting the predictive validity of
emotional intelligence self-report versus ability-based measures. Personality and
Individual Differences, 35, 1893-1902. doi:10.1016/S0191-8869(03)00038-2
Ogunlade, J. O. (1978). The predictive validity of the Raven Progressive Matrices with
some Nigerian children. Educational and Psychological Measurement, 38, 465-
467. doi:10.1177/001316447803800232
Olive, H. (1972). The relationship of divergent thinking to intelligence, social class, and
achievement in high-school students. Journal of Genetic Psychology, 121, 179-
186.
Oliver, P. H., Guerin, D. W., & Gottfried, A. W. (2007). Temperamental task orientation:
Relation to high school and college educational accomplishments. Learning and
Individual Differences, 17, 220-230. doi:10.1016/j.lindif.2007.05.004
Omizo, M. M. (1980). The Differential Aptitude Tests as predictors of success in a high
school for engineering program. Educational and Psychological Measurement,
40, 197-203. doi:10.1177/001316448004000132
Orieux, J. A. (1989). Correlates of creative ability and performance in high school
students. Unpublished doctoral dissertation, University of Alberta.
Pervin, L. A. (1967). Aptitude, anxiety, and academic performance: A moderator variable
analysis. Psychological Reports, 20, 215-221.
Pesta, B. J., & Poznanski, P. J. (2008). Black-white differences on IQ and grades: The
mediating role of elementary cognitive tasks. Intelligence, 36, 323-329.
doi:10.1016/j.intell.2007.07.004
Peterson, R. E. (1968). Predictive validity of a brief test of academic aptitude.
Educational and Psychological Measurement, 28, 441-444.
doi:10.1177/001316446802800226

202
202
Pretorius, M. (2010). Validation of a selection battery used by the South African Military
Academy. Unpublished master‘s thesis, University of Stellenbosch.
Primi, R., Santos, A. A. A., & Vendramini, C. M. (2002). Habilidades básicas e
desempenho acadêmico em universitários ingressantes. [Basic abilities and
scholastic achievement in freshmen students]. Estudos de Psicologia, 7, 47-55.
doi:10.1590/S1413-294X2002000100006
Quaid, T. D. D. (1938). A study in the prediction of college freshman marks. Journal of
Experimental Education, 6, 350-375.
Quereshi, M. Y., & Miller, J. M. (1970). The comparability of the WAIS, WISC, and
WBII. Journal of Educational Measurement, 7, 105-111. doi:10.1111/j.1745-
3984.1970.tb00703.x
Remmers, H. H., Elliott, D. N., & Gage, N. L. (1949). Curricular differences in predicting
scholastic achievement: Applications to counseling. Journal of Educational
Psychology, 7, 385-394. doi:10.1037/h0058401
Rohde, T. E., & Thompson, L. A. (2007). Predicting academic achievement with
cognitive ability. Intelligence, 35, 83-92. doi:10.1016/j.intell.2006.05.004
Rigg, M. G. (1939). The relation of college achievement tests to grades and to
intelligence. Journal of Educational Psychology, 30, 397-400.
doi:10.1037/h0061135
Rosopa, P. J., & Schroeder, A. N. (2009). Core self-evaluations interact with cognitive
ability to predict academic achievement. Personality and Individual Differences,
47, 1003-1006. doi:10.1016/j.paid.2009.07.028
Royer, J. M., Abranovic, W. A., & Sinatra, G. M. (1987). Using reading comprehension
performance as a predictor of performance in college classes. Journal of
Educational Psychology, 79, 19-26. doi:10.1037//0022-0663.79.1.19
Sackett, P. R., Kuncel, N. R., Arneson, J. J., Cooper, S. R., & Waters, S. D. (2009). Does
socioeconomic status explain the relationship between admissions tests and post-
secondary academic performance? Psychological Bulletin, 135, 1-22.
doi:10.1037/a0013978
Sartain, A. Q. (1946a). A comparison of the New Revised Stanford-Binet, the Bellevue
Scale, and certain group tests of intelligence. Journal of Social Psychology, 23,
237-239. doi:10.1080/00224545.1946.9712329

203
203
Sassenrath, J. M., & Pugh, R. (1965). Relationships among CEEB Scholastic Aptitude
Test and American College Test scores and grade point average. Journal of
Educational Measurement, 2, 199-205.
Schwinger, M., Steinmayr, R., & Spinath, B. (2009). How do motivational regulation
strategies affect achievement: Mediated by effort management and moderated by
intelligence. Learning and Individual Differences, 19, 621-627.
doi:10.1016/j.lindif.2009.08.006
Scott, C. M. (1938). Background and personal data as factors in the prediction of
scholastic success in college. Journal of Applied Psychology, 22, 42-49.
doi:10.1037/h0059916
Singh, R., & Varma, S, K. (1995). The effect of academic aspiration and intelligence on
scholastic success of XI graders. Indian Journal of Psychometry and Education,
26, 43-48.
Snyder, V., & Elmore, P. B. (1983). The predictive validity of the Descriptive Test of
Language Skills for developmental students over a four-year college program.
Educational and Psychological Measurement, 43, 1113-1122.
doi:10.1177/001316448304300420
Song, L. J., Huang, G., Peng, K. Z., Law, K. S., Wong, C., & Chen, Z. (2010). The
differential effects of general mental ability and emotional intelligence on
academic performance and social interactions. Intelligence, 38, 137-143.
doi:10.1016/j.intell.2009.09.003
Steinberg, M., Segel, R. H., & Levine, H. D. (1967). Psychological determinants of
academic success: A pilot study. Educational and Psychological Measurement,
27, 413-422. doi:10.1177/001316446702700220
Stock, W., Schmid, R. F., & Heinen, J. R. K. (1977). Self-made predictions of academic
success: A further study. Journal of Educational Research, 71, 73-75.
Swanson, E. O., & Berdie, R. F. (1961). Predictive validities in an institute of technology.
Educational and Psychological Measurement, 21, 1001-1008.
doi:10.1177/001316446102100428
Thompson, M. E. (1976). The prediction of academic achievement by a British study
habits inventory. Research in Higher Education, 5, 365-372. doi:
10.1007/BF00993435
Thorlindsson, T., & Bjornsson, S. (1979). Some determinants of scholastic performance
in urban Iceland. Scandinavian Journal of Educational Research, 23, 155-167.

204
204
Tilford, M. P., & Allen, D. E. (1974). Science and non-science majors in three
predominantly Black colleges. Journal of Negro Education, 43, 117–126.
doi:10.2307/2966949
Vasilopoulos, N. L., Cucina, J. M., Dyomina, N. V., Morewitz, C. L., & Reilly, R. R.
(2006). Forced-choice personality tests: A measure of personality and cognitive
ability? Human Performance, 19, 175-199. doi:10.1207/s15327043hup1903_1
Wallace, R. K., Orme-Johnson, D. W., Mills, P. J., & Dillbeck, M. C. (1984). Academic
achievement and the paired Hoffman reflex in students practicing meditation.
International Journal of Neuroscience, 24, 261-266.
Wesley, J. C. (1994). Effects of ability, high school achievement, and procrastinatory
behavior on college performance. Educational and Psychological Measurement,
54, 404-408. doi:10.1177/0013164494054002014
Willard, J. M. (1993). The relationship of problem-solving ability to
persistence/withdrawal behavior and to academic success at a private university.
Unpublished doctoral dissertation, State University of New York at Buffalo.
Williams, J. R., DeWitt, W. R., & Hurt, R. W. (1971). Ability, likability, and motivation
of students as they relate to prediction of achievement. Journal of Educational
Research, 65, 155-158.
Williams, N. (1952). A study of the validity of the Verbal Reasoning subtest and the
Abstract Reasoning subtest of the Differential Aptitude Tests. Educational and
Psychological Measurement, 12, 129-131. doi:10.1177/001316445201200115
Wong, J. L. (1993). Comparison of the Shipley versus WAIS-R subtests and summary
scores in predicting college grade point average. Perceptual and Motor Skills, 76,
1075-1078.
Wong, M. M., & Csikszentmihalyi, M. (1991). Motivation and academic achievement:
The effects of personality traits and quality of experience. Journal of Personality,
59, 539-574. doi:10.1111/j.1467-6494.1991.tb00259.x
Wright, R. J., & Bean, A. G. (1974). The influence of socioeconomic status on the
predictability of college performance. Journal of Educational Measurement, 11,
277–284. doi:10.1111/j.1745-3984.1974.tb01000.x
Young, J. W. (2007). Predicting college grades: The value of achievement goals in
supplementing ability measures. Assessment in Education: Principles, Policy &
Practice, 14, 233-249. doi:10.1080/09695940701479709

205
205
Training Performance Studies Included in the Meta-analysis
Alkhader, O., Clarke, D. D., & Anderson, N. (1998). Equivalence and predictive validity
of paper-and-pencil and computerized adaptive formats of the Differential
Aptitude Tests. Journal of Occupational and Organizational Psychology, 71, 205-
217.
Aramburu-Zabala, L., & Casals, M. (2001). Predictive validity and adverse impact in the
professional certification programmes: The case of gender differences. European
Review of Applied Psychology, 51, 179-187.
Barbas, C. (1992). A study to predict the performance of cadets in a police academy
using a modified CLOZE Reading Test, a civil service aptitude test, and
educational level. Unpublished doctoral dissertation, Boston University.
Bennett, G. K., Seashore, H. G., & Wesman, A. G. (1991). Differential Aptitude Tests for
Personnel and Career Advancement: Technical Manual. Psychological
Corporation.
Black, J. (2000). Personality testing and police selection: Utility of the ―Big Five.‖ New
Zealand Journal of Psychology, 29(1), 2-9.
Boehm, N. C., Honey, R., & Kohls, J. (1983). Predicting success in academy training:
The POST Reading and Writing Test Battery. Police Chief, 50(10), 28-31.
Brown, K. G., Le, H., & Schmidt, F. L. (2006). Specific aptitude theory revisited: Is there
incremental validity for training performance? International Journal of Selection
and Assessment, 14, 87-100. doi:10.1111/j.1468-2389.2006.00336.x
Campa, E. E. (1993). The relationship of reading comprehension and educational
achievement levels to academy and field training performance of police cadets.
Unpublished doctoral dissertation, Texas A&M University.
Campbell, S. K., & Catano, V. M. (2004). Using measures of specific abilities to predict
training performance in Canadian Forces operator occupations. Military
Psychology, 16, 183-201. doi:10.1207/s15327876mp1603_3
Das, R. S. (1961). Validity information exchange No. 14-05. Personnel Psychology, 14,
459-460. doi:10.1111/j.1744-6570.1961.tb01246.x
de Kock, F., & Schlechter, A. (2009). Fluid intelligence and spatial reasoning as
predictors of pilot performance in the South African Air Force (SAAF). SA
Journal of Industrial Psychology, 35(1), Art #753, 8 pages.
doi:10.4102/sajip.v35i1.753

206
206
Dean, M. A., Conte, J. M., & Blankenhorn, T. R. (2006). Examination of the predictive
validity of Big Five personality dimensions across training performance criteria.
Personality and Individual Differences, 41, 1229-1239.
doi:10.1016/j.paid.2006.04.020
Distefano, M. K., Jr., & Pryer, M. W. (1984). Meta-analysis of the validity of a verbal
ability selection test with psychiatric aides. Psychological Reports, 54, 676-678.
Distefano, M. K., Jr., Pryer, M. W., & Craig, S. H. (1980). Job-relatedness of a
posttraining job knowledge criterion used to assess validity and test fairness.
Personnel Psychology, 33, 785-793. doi:10.1111/j.1744-6570.1980.tb02368.x
Distefano, M. K., Jr., Pryer, M. W., & Crotty, G. B. (1988). Comparative validities of
two cognitive ability tests in predicting work performance of psychiatric aides.
Educational and Psychological Measurement, 48, 773-777.
doi:10.1177/0013164488483026
Feehan, R. L. (1977). An investigation of police performance utilizing mental ability
selection scores, police academy training scores, and supervisory ratings of the
job performance of patrol officers. Unpublished doctoral dissertation, Georgia
Institute of Technology.
Feltham, R. (1988). Validity of a police assessment centre: A 1-19-year follow-up.
Journal of Occupational Psychology, 61, 129-144.
Gael, S., & Grant, D. L. (1972). Employment test validation for minority and
nonminority telephone company service representatives. Journal of Applied
Psychology, 56, 135-139. doi:10.1037/h0032659
Gael, S., Grant, D. L., & Ritchie, R. J. (1975a). Employment test validation for minority
and nonminority telephone operators. Journal of Applied Psychology, 60, 411-
419. doi:10.1037/h0076909
Gael, S., Grant, D. L., & Ritchie, R. J. (1975b). Employment test validation for minority
nonminority clerks with work sample criteria. Journal of Applied Psychology, 60,
420-426. doi:10.1037/h0076908
Gordon, M. E., & Kleiman, L. S. (1976). The prediction of trainability using a work
sample test and an aptitude test: A direct comparison. Personnel Psychology, 29,
243-253. doi:10.1111/j.1744-6570.1976.tb00412.x
Greb, J. T. (1982). The Nelson-Denny Reading Test as a predictor of police recruit
training success and the impact of basic reading skill levels over a six-year
period. Unpublished doctoral dissertation, Florida Atlantic University.

207
207
Hankey, R. O. (1968). Personality correlates in a role of authority: The police.
Unpublished doctoral dissertation, University of Southern California.
Hausknecht, J. P., Trevor, C. O., & Farr, J. L. (2002). Retaking ability tests in a selection
setting: Implications for practice effects, training performance, and turnover.
Journal of Applied Psychology, 87, 243-254. doi:10.1037//0021-9010.87.2.243
Hickman, K. G. (1983). Measuring job performance success for female officers of the
Los Angeles Police Department. Unpublished doctoral dissertation, Claremont
Graduate School.
Jeanneret, P. R., Moore, J. R., Blakley, B. R., Koelzer, S. L., & Menkes, O. (1991).
Development and validation of trooper physical ability and cognitive ability tests:
Final report submitted to the Texas Department of Public Safety. Houston, TX:
Jeanneret & Associates.
Keith, D. V. (2003). Reading ability as a predictor of police academy performance and
post academy performance. Unpublished doctoral dissertation, University of
Southern Mississippi.
Kleiman, L. S., & Gordon, M. E. (1986). An examination of the relationship between
police training academy performance and job performance. Journal of Police
Science and Administration, 14, 293-299.
Krause, D. E., Kerstig, M., Heggestad, E. D., & Thornton, G. C., III. (2006). Incremental
validity of assessment center ratings over cognitive ability tests: A study at the
executive management level. International Journal of Selection and Assessment,
14, 360-371. doi:10.1111/j.1468-2389.2006.00357.x
Laney, A. R., Jr. (1951). Validity of employment tests for gas-appliance service
personnel. Personnel Psychology, 4, 199-208. doi:10.1111/j.1744-
6570.1951.tb01473.x
Lyons, T. J.., Bayless, J. A., & Park, R. L. (2001). Relationship of cognitive,
biographical, and personality measures with the training and job performance of
detention enforcement officers in a Federal Government agency. Applied HRM
Research, 6, 67-70.
Mace, C. A. (1950). The human problems of the building industry: Guidance, selection,
and training. Occupational Psychology, 24, 96-104.
Matheny, W. G. (1941). The effectiveness of aptitude testing in the civilian pilot training
program. Transactions of the Kansas Academy of Science, 44, 363-365.
doi:10.2307/3624906

208
208
McEuen, O. L. (1981). Assessment of some personality traits that show a relationship to
academy grades, being dismissed from the department, and work evaluation
ratings for police officers in Atlanta, Georgia. Unpublished doctoral dissertation,
The Fielding Institute.
Montgomery, G. W. G. (1962). Predicting success in engineering. Occupational
Psychology, 36, 59-80.
Moran, A. P. (1986). The reliability and validity of Raven‘s Standard Progressive
Matrices for Irish apprentices. International Review of Applied Psychology, 35,
533-538.
Olea, M. M., & Ree, M. J. (1994). Predicting pilot and navigator criteria: Not much more
than g. Journal of Applied Psychology, 79, 845-851. doi:10.1037//0021-
9010.79.6.845
Ostrich, T. M. (2007). Biodata prediction of municipal police academy performance.
Unpublished doctoral dissertation, Indiana University of Pennsylvania.
Personnel Research Branch, The Adjutant General‘s Office, Department of the Army.
(1957a). Validity information exchange No. 10-33. Personnel Psychology, 10,
465-467. doi:10.1111/j.1744-6570.1957.tb01618.x
Personnel Research Branch, The Adjutant General‘s Office, Department of the Army.
(1957b). Validity information exchange No. 10-34. Personnel Psychology, 10,
468-470. doi:10.1111/j.1744-6570.1957.tb01618.x
Personnel Research Branch, The Adjutant General‘s Office, Department of the Army.
(1957c). Validity information exchange No. 10-35. Personnel Psychology, 10,
471-473. doi:10.1111/j.1744-6570.1957.tb01618.x
Personnel Research Branch, The Adjutant General‘s Office, Department of the Army.
(1957d). Validity information exchange No. 10-36. Personnel Psychology, 10,
474-475. doi:10.1111/j.1744-6570.1957.tb01618.x
Personnel Research Branch, The Adjutant General‘s Office, Department of the Army.
(1957e). Validity information exchange No. 10-37. Personnel Psychology, 10,
476-477. doi:10.1111/j.1744-6570.1957.tb01618.x
Personnel Research Branch, The Adjutant General‘s Office, Department of the Army.
(1957f). Validity information exchange No. 10-38. Personnel Psychology, 10,
478-480. doi:10.1111/j.1744-6570.1957.tb01618.x
Personnel Research Branch, The Adjutant General‘s Office, Department of the Army.
(1957g). Validity information exchange No. 10-39. Personnel Psychology, 10,
481-482. doi:10.1111/j.1744-6570.1957.tb01618.x

209
209
Personnel Research Branch, The Adjutant General‘s Office, Department of the Army.
(1957h). Validity information exchange No. 10-40. Personnel Psychology, 10,
483-484. doi:10.1111/j.1744-6570.1957.tb01618.x
Personnel Research Branch, The Adjutant General‘s Office, Department of the Army.
(1957i). Validity information exchange No. 10-43. Personnel Psychology, 10,
490-491. doi:10.1111/j.1744-6570.1957.tb01618.x
Personnel Research Branch, The Adjutant General‘s Office, Department of the Army.
(1957j). Validity information exchange No. 10-44. Personnel Psychology, 10,
492-493. doi:10.1111/j.1744-6570.1957.tb01618.x
Personnel Research Branch, The Adjutant General‘s Office, Department of the Army.
(1957k). Validity information exchange No. 10-46. Personnel Psychology, 10,
496-497. doi:10.1111/j.1744-6570.1957.tb01618.x
Personnel Research Branch, The Adjutant General‘s Office, Department of the Army.
(1957l). Validity information exchange No. 10-47. Personnel Psychology, 10,
498-499. doi:10.1111/j.1744-6570.1957.tb01618.x
Personnel Research Branch, The Adjutant General‘s Office, Department of the Army.
(1958a). Validity information exchange No. 11-2. Personnel Psychology, 11, 99-
101. doi:10.1111/j.1744-6570.1958.tb00007.x
Personnel Research Branch, The Adjutant General‘s Office, Department of the Army.
(1958b). Validity information exchange No. 11-3. Personnel Psychology, 11, 102-
104. doi:10.1111/j.1744-6570.1958.tb00007.x
Personnel Research Branch, The Adjutant General‘s Office, Department of the Army.
(1958c). Validity information exchange No. 11-13. Personnel Psychology, 11,
242-244. doi:10.1111/j.1744-6570.1958.tb00017.x
Personnel Research Branch, The Adjutant General‘s Office, Department of the Army.
(1958d). Validity information exchange No. 11-14. Personnel Psychology, 11,
245-247. doi:10.1111/j.1744-6570.1958.tb00017.x
Personnel Research Branch, The Adjutant General‘s Office, Department of the Army.
(1958e). Validity information exchange No. 11-15. Personnel Psychology, 11,
248-250. doi:10.1111/j.1744-6570.1958.tb00017.x
Personnel Research Branch, The Adjutant General‘s Office, Department of the Army.
(1958f). Validity information exchange No. 11-16. Personnel Psychology, 11,
251-253. doi:10.1111/j.1744-6570.1958.tb00017.x
210
210
Personnel Research Branch, The Adjutant General‘s Office, Department of the Army.
(1958g). Validity information exchange No. 11-17. Personnel Psychology, 11,
254-256. doi:10.1111/j.1744-6570.1958.tb00017.x
Personnel Research Branch, The Adjutant General‘s Office, Department of the Army.
(1958h). Validity information exchange No. 11-18. Personnel Psychology, 11,
257-259. doi:10.1111/j.1744-6570.1958.tb00017.x
Personnel Research Branch, The Adjutant General‘s Office, Department of the Army.
(1959a). Validity information exchange No. 12-4. Personnel Psychology, 12, 133-
144. doi:10.1111/j.1744-6570.1959.tb00803.x
Personnel Research Branch, The Adjutant General‘s Office, Department of the Army.
(1959b). Validity information exchange No. 12-5. Personnel Psychology, 12, 135.
doi:10.1111/j.1744-6570.1959.tb00803.x
Personnel Research Branch, The Adjutant General‘s Office, Department of the Army.
(1959d). Validity information exchange No. 12-7. Personnel Psychology, 12, 138-
140. doi:10.1111/j.1744-6570.1959.tb00803.x
Petrie, A., & Powell, M. B. (1951). The selection of nurses in England. Journal of
Applied Psychology, 35, 281-286. doi:10.1037/h0062760
Provines, J. L. (2006). Investigation of police officer selection procedures. Unpublished
doctoral dissertation, Wichita State University.
PsyTech International, Ltd. (n.d.). General & Graduate Reasoning Tests. Unpublished
technical manual. Bedfordshore, UK: Author.
Rafilson, F., & Sison, R. (1996). Seven criterion-related validity studies conducted with
the national Police Officer Selection Test. Psychological Reports, 78, 163-176.
Rose, J. E. (1995). Consolidation of law enforcement basic training academies: An
evaluation of pilot projects. Unpublished doctoral dissertation, Northern Arizona
University.
Ross, J. (1962). Predicting practical skill in engineering apprentices. Occupational
Psychologist, 36, 69-74.
Signori, E. I. (1949). The Arnprior Experiment: A study of World War II pilot selection
procedures in the RCAH and RAF. Canadian Journal of Psychology, 3, 136-150.
doi:10.1037/h0084091
Spaulding, H. C. (1980). Predicting police officer performance: The development of
screening and selection procedures based on criterion-related validity.
Unpublished master‘s thesis, University of South Florida.

211
211
Stark, D. W. (1994). The validity of cognitive and non-cognitive predictors over time.
Unpublished doctoral dissertation, University of Tulsa.
Tate, F. E. (1965). The relationship between the General Aptitude Test Battery and
achievement of eleventh grade students in selected vocational and technical
courses. Unpublished doctoral dissertation, University of Missouri.
te Nijenhuis, J., & van der Flier, H. (2000). Differential prediction of immigrant versus
majority group training performance using cognitive ability and personality
measures. International Journal of Selection and Assessment, 8, 54-60.
Traxler, H. W. (1966). Determining the usefulness of the General Aptitude Test Battery in
predicting student success in a technical vocational high school. Unpublished
doctoral dissertation, University of Denver.
Tziner, A., & Dolan, S. (1982). Evaluation of a traditional selection system in predicting
success of females in officer training. Journal of Occupational Psychology, 55,
269-275.
United States Employment Service (1966, August). Development of USES Aptitude Test
Battery for Automobile-Service-Station Mechanic (auto ser.) 620.381.
Washington, DC: U.S. Department of Labor, Manpower Administration (ERIC
Document Reproduction Service No. ED 066 509)
United States Employment Service (1967, January). Development of USES Aptitude Test
Battery for Bench Carpenter (any ind.) 760.884. Washington, DC: U.S.
Department of Labor, Manpower Administration. (ERIC Document Reproduction
Service No. 066 517)
United States Employment Service (1967, February). Development of USES Aptitude Test
Battery for Hospital-Admitting Clerk (medical ser.) 237.368. Washington, DC:
U.S. Department of Labor, Manpower Administration. (ERIC Document
Reproduction Service No. ED 067 409)
United States Employment Service (1969, January). Cross-validation of the General
Aptitude Test Battery and development of a weighted application blank for
Computer Technology Trainee 828.XX. Washington, DC: U.S. Department of
Labor, Manpower Administration. (ERIC Document Reproduction Service No.
ED 068 546)
Waugh, L. (1996). Police officer recruit selection: Predictors of academy performance.
Queensland, Australia: Queensland Police Academy

212
212
Wetrogan, L. I., & Cundiff, C. H. (1976). Validation of Test 21 for entry level DC police
officers (technical memorandum 76-7). Washington, D.C.: Personnel Research
and Development Center, U.S. Civil Service Commission.
Whitton, W. M. (1990). The Nelson-Denny Reading Test as a predictor of academic
performance of police recruits and the impact of nine related variables on recruit
academic performance. Unpublished doctoral dissertation, The Union Institute.
Job Performance Studies Included in the Meta-Analyses
Allworth, E., & Hesketh, B. (1999). Construct-oriented biodata: Capturing change-related
and contextually relevant future performance. International Journal of Selection
and Assessment, 7, 97-111. doi:10.1111/1468-2389.00110
Anonymous. (1954). Validity information exchange No. 7-065. Personnel Psychology, 7,
301. doi:10.1111/j.1744-6570.1954.tb01601.x
Arneson, S., Millikin-Davies, M., & Hogan, J. (1993). Validation of personality and
cognitive measures for insurance claims examiners. Journal of Business and
Psychology, 7, 459-473. doi:10.1007/BF01013759
Avis, J. M. (2001). An examination of the prediction of overall, task, and contextual
performance for a service-type organization. Unpublished doctoral dissertation,
University of Southern Mississippi.
Barrick, M. R., Mount, M. K., & Strauss, J. P. (1993). Conscientiousness and
performance of sales representatives: Test of the mediating effects of goal setting.
Journal of Applied Psychology, 78, 715-722. doi:10.1037/0021-9010.78.5.715
Bass, B. M., Karstendiek, B., McCullough, G., & Pruitt, R. C. (1954). Validity
information exchange No. 7-024. Personnel Psychology, 7, 159-160.
doi:10.1111/j.1744-6570.1954.tb02265.x
Bass, B. M. (1957). Validity information exchange No. 10-25. Personnel Psychology, 10,
343-344. doi:10.1111/j.1744-6570.1957.tb00787.x
Bennett, G. K., Seashore, H. G., & Wesman, A. G. (1991). Differential Aptitude Tests for
Personnel and Career Advancement: Technical Manual. Psychological
Corporation.

213
213
Bergman, M. E., Donovan, M. A., Drasgow, F., Overton, R. C., & Henning, J. B. (2008).
Test of Motowidlo et al.‘s (1997) theory of individual differences in task and
contextual performance. Human Performance, 21, 227-253.
doi:10.1080/08959280802137606
Bettin, P. J. (1983). The role of relevant experience and intellectual ability in determining
the performance of military leaders: A contingency model explanation.
Unpublished doctoral dissertation, University of Washington.
Bing, M. N., & Lounsbury, J. W. (2000). Openness and job performance in U. S.-based
Japanese manufacturing companies. Journal of Business and Psychology, 14, 515-
521. doi:10.1023/A:1022940519157
Brewster, J., & Stoloff, M. (2003). Relationship between IQ and first-year overall
performance as a police officer. Applied H.R.M. Research, 8, 49-50.
Bridgman, C. S., Spaethe, M., & Dignan, F. (1958). Validity information exchange No.
11-21. Personnel Psychology, 11, 264-265. doi: 10.1111/j.1744-
6570.1958.tb00017.x
Bromer, J. A., Johnson, J. M., & Sevransky, P. (1962). Validity information exchange
No. 15-02. Personnel Psychology, 15, 107-109. doi:10.1111/j.1744-
6570.1962.tb01852.x
Bruce, M. M. (1957). Validity information exchange No. 10-3. Personnel Psychology,
10, 77-78. doi:10.1111/j.1744-6570.1957.tb00769.x
Busch, A. C., & Woodward, R. H. (1959). Validity information exchange No. 12-18.
Personnel Psychology, 12, 481. doi: 10.1111/j.1744-6570.1959.tb01339.x
Campion, M. A., Campion, J. E., & Hudson, J. P., Jr. (1994). Structured interviewing: A
note on incremental validity and alternative question types. Journal of Applied
Psychology, 79, 998-1002. doi:10.1037//0021-9010.79.6.998
Carter, G. C. (1952). Measurement of supervisory ability. Journal of Applied Psychology,
36, 393-395. doi:10.1037/h0057782
Christiansen, N. D., Janovics, J. E., & Siers, B. P. (2010). Emotional intelligence in
selection contexts: Measurement method, criterion-related validity, and
vulnerability to response distortion. International Journal of Selection and
Assessment, 18, 87-101. 10.1111/j.1468-2389.2010.00491.x
Colonia-Willner, R. (1998). Practical intelligence at work: Relationship between aging
and cognitive efficiency among managers in a bank environment. Psychology and
Aging, 13, 45-57. doi:10.1037/0882-7974.13.1.45

214
214
Côté, S., & Miners, C. T. H. (2006). Emotional intelligence, cognitive intelligence, and
job performance. Administrative Science Quarterly, 51, 1-28.
doi:10.2189/asqu.51.1.1
Crant, J. M. (1995). The proactive personality scale and objective job performance
among real estate agents. Journal of Applied Psychology, 80, 532-537.
doi:10.1037/0021-9010.80.4.532
Dayan, K., Kasten, R., & Fox, S. (2002). Entry-level police candidate assessment center:
An efficient tool or a hammer to kill a fly? Personnel Psychology, 55, 827-849.
doi:10.1111/j.1744-6570.2002.tb00131.x
Distefano, M. K., Jr., & Paulk, K. D. (1990). Further evaluation of verbal ability selection
test and work performance validity with psychiatric aides. Psychological Reports,
67, 845-846. doi:10.2466/PR0.67.7.845-846
Distefano, M. K., Jr., & Pryer, M. W. (1985). Verbal selection test and work
performance: Validity with aides from three psychiatric hospitals. Psychological
Reports, 56, 811-815.
Distefano, M. K., Jr., & Pryer, M. W. (1987). Evaluation of selected interview data in
improving the predictive validity of a verbal ability test with psychiatric aide
trainees. Educational and Psychological Measurement, 47, 189-192.
doi:10.1177/0013164487471027
Distefano, M. K., Jr., Pryer, M. W., & Crotty, G. B. (1988). Comparative validities of
two cognitive ability tests in predicting work performance of psychiatric aides.
Educational and Psychological Measurement, 48, 773-777.
doi:10.1177/0013164488483026
Distefano, M. K., Jr., Pryer, M. W., & Erffmeyer, R. C. (1983). Application of content
validity methods to the development of a job-related performance rating criterion.
Personnel Psychology, 36, 621-631. doi:10.1111/j.1744-6570.1983.tb02239.x
Feltham, R. (1988). Validity of a police assessment centre: A 1-19-year follow-up.
Journal of Occupational Psychology, 61, 129-144.
Fitzpatrick, E. D., & McCarty, J. J. (1955). Validity information exchange No. 8-35.
Personnel Psychology, 8, 501-504. doi:10.1111/j.1744-6570.1955.tb01225.x
Fritzsche, B. A., Powell, A. B., & Hoffmann, R. (1999). Person-environment congruence
as a predictor of customer service performance. Journal of Vocational Behavior,
54, 59-70. doi:10.1006/jvbe.1998.1645

215
215
Gellatly, I. R., Paunonen, S. V., Meyer, J. P., Jackson, D. N., & Goffin, R. D. (1991).
Personality, vocational interest, and cognitive predictors of managerial job
performance and satisfaction. Personality and Individual Differences, 12, 221-
231. doi:10.1016/0191-8869(91)90108-N
Gluskinos, U., & Brennan, T. F. (1971). Selection and evaluation procedure for operating
room personnel. Journal of Applied Psychology, 55, 165-169.
doi:10.1037/h0030790
Goldhor, H. (1956). Validity information exchange No. 9-33. Personnel Psychology, 9,
378. doi:10.1111/j.1744-6570.1956.tb01075.x
Hakstian, A. R., Woolsey, L. K., & Schroeder, M. L. (1987). Validity of a large-scale
assessment battery in an industrial setting. Educational and Psychological
Measurement, 47, 165-178. doi:10.1177/0013164487471025
Henderson, N. D. (1979). Criterion-related validity of personality and aptitude scales: A
comparison of validation results and voluntary and actual test conditions. In C. D.
Spielberger (Ed.), Police selection and evaluation: Issues and techniques. New
York: Praeger.
Hochwarter, W. A., Witt, L. A., & Kacmar, K. M. (2000). Perceptions of organizational
politics as a moderator of the relationship between conscientiousness and job
performance. Journal of Applied Psychology, 85, 472-478. doi:10.1037//0021-
9010.85.3.472
Holmes, F. J. (1950a). Validity of tests for insurance office personnel. Personnel
Psychology, 3, 57-69. doi:10.1111/j.1744-6570.1950.tb01683.x
Holmes, F. J. (1950b). Validity of tests for insurance office personnel. Personnel
Psychology, 3, 217-220. doi:10.1111/j.1744-6570.1950.tb01697.x
Horvath-Shriner, A. (1999). The place of interpersonal orientation as compared with
cognitive ability measures in the prediction of job performance for health care
support personnel. Unpublished doctoral dissertation, Wayne State University.
Hunthausen, J. (2000). Predictors of task and contextual performance: Frame-of-
reference effects and applicant reaction effects on selection system validity.
Unpublished doctoral dissertation, Portland State University.
Huttner, L., & Stene, D. M. (1958). Foremen selection in light of a theory of supervision.
Personnel Psychology, 11, 403-409. doi:10.1111/j.1744-6570.1958.tb00028.x
Jennings, E. E. (1953). The motivation factor in testing supervisors. Journal of Applied
Psychology, 37, 168-169. 10.1037/h0061332

216
216
Kinney, L. B. (1933). The relationship of certain factors to success in clerical positions.
Journal of Applied Psychology, 17, 55-62. doi:10.1037/h0072628
Knauft, E. B. (1954). Validity information exchange No. 7-070. Personnel Psychology, 7,
405-406. doi:10.1111/j.1744-6570.1954.tb01609.x
LaHuis, D. M., Martin, N. R., & Avis, J. M. (2005). Investigating nonlinear
conscientiousness-job performance relations for clerical employees. Human
Performance, 18, 199-212. doi:10.1207/s15327043hup1803_1
Laney, A. R., Jr. (1951). Validity of employment tests for gas-appliance service
personnel. Personnel Psychology, 4, 199-208. doi:10.1111/j.1744-
6570.1951.tb01473.x
Lao, R. Y. (2001). Faking in personality measures: Effects on the prediction of job
performance. Unpublished doctoral dissertation, North Carolina State University,
Raleigh.
Lyons, T. J.., Bayless, J. A., & Park, R. L. (2001). Relationship of cognitive,
biographical, and personality measures with the training and job performance of
detention enforcement officers in a Federal Government agency. Applied HRM
Research, 6, 67-70.
McCarty, J. J. (1954). Validity information exchange No. 7-077. Personnel Psychology,
7, 420-421. doi:10.1111/j.1744-6570.1954.tb01609.x
McCarty, J. J. (1957). Validity information exchange No. 10-15. Personnel Psychology,
10, 204-205. doi:10.1111/j.1744-6570.1957.tb00778.x
McCulloch, M. C., & Turban, D. B. (2007). Using person-organization fit to select
employees for high-turnover jobs. International Journal of Selection and
Assessment, 15, 63-71. doi:10.1111/j.1468-2389.2007.00368.x
Motowidlo, S. J., Brownlee, A. L., & Schmit, M. J. (2008). Effects of personality
characteristics on knowledge, skill, and performance in servicing retail customers.
International Journal of Selection and Assessment, 16, 272-281.
doi:10.1111/j.1468-2389.2008.00433.x
Mount, M. K., Barrick, M. R., & Strauss, J. P. (1999). The joint relationship between
conscientiousness and ability with performance: Test of interaction hypotheses.
Journal of Management, 25, 707-721. doi:10.1016/S0149-2063(99)00022-7
Mount, M. K., Oh, I-S., & Burns, M. (2008). Incremental validity of perceptual speed and
accuracy over general mental ability. Personnel Psychology, 61, 113-139.
doi:10.1111/j.1744-6570.2008.00107.x

217
217
Mount, M. K., Witt, L. A., & Barrick, M. R. (2000). Incremental validity of empirically
keyed biodata scales over GMA and the five factor personality constructs.
Personnel Psychology, 53, 299-323. doi:10.1111/j.1744-6570.2000.tb00203.x
Pegorsch, D. S. (1997). The development, psychometric evaluation, and validation of a
low-fidelity situational judgement inventory for personnel selection: An
alternative approach to cognitive assessment. Unpublished doctoral dissertation,
University of Southern Mississippi.
Personnel Research Branch, The Adjutant General‘s Office, Department of the Army.
(1957a). Validity information exchange No. 10-33. Personnel Psychology, 10,
465-467. doi:10.1111/j.1744-6570.1957.tb01618.x
Personnel Research Branch, The Adjutant General‘s Office, Department of the Army.
(1957b). Validity information exchange No. 10-34. Personnel Psychology, 10,
468-470. doi:10.1111/j.1744-6570.1957.tb01618.x
Personnel Research Branch, The Adjutant General‘s Office, Department of the Army.
(1957j). Validity information exchange No. 10-44. Personnel Psychology, 10,
492-493. doi:10.1111/j.1744-6570.1957.tb01618.x
Personnel Research Branch, The Adjutant General‘s Office, Department of the Army.
(1957k). Validity information exchange No. 10-46. Personnel Psychology, 10,
496-497. doi:10.1111/j.1744-6570.1957.tb01618.x
Personnel Research Branch, The Adjutant General‘s Office, Department of the Army.
(1957l). Validity information exchange No. 10-47. Personnel Psychology, 10,
498-499. doi:10.1111/j.1744-6570.1957.tb01618.x
Personnel Research Branch, The Adjutant General‘s Office, Department of the Army.
(1958a). Validity information exchange No. 11-2. Personnel Psychology, 11, 99-
101. doi:10.1111/j.1744-6570.1958.tb00007.x
Personnel Research Branch, The Adjutant General‘s Office, Department of the Army.
(1958b). Validity information exchange No. 11-3. Personnel Psychology, 11, 102-
104. doi:10.1111/j.1744-6570.1958.tb00007.x
Personnel Research Branch, The Adjutant General‘s Office, Department of the Army.
(1958c). Validity information exchange No. 11-13. Personnel Psychology, 11,
242-244. doi:10.1111/j.1744-6570.1958.tb00017.x
Personnel Research Branch, The Adjutant General‘s Office, Department of the Army.
(1958d). Validity information exchange No. 11-14. Personnel Psychology, 11,
245-247. doi:10.1111/j.1744-6570.1958.tb00017.x

218
218
Personnel Research Branch, The Adjutant General‘s Office, Department of the Army.
(1958e). Validity information exchange No. 11-15. Personnel Psychology, 11,
248-250. doi:10.1111/j.1744-6570.1958.tb00017.x
Personnel Research Branch, The Adjutant General‘s Office, Department of the Army.
(1958f). Validity information exchange No. 11-16. Personnel Psychology, 11,
251-253. doi:10.1111/j.1744-6570.1958.tb00017.x
Personnel Research Branch, The Adjutant General‘s Office, Department of the Army.
(1958g). Validity information exchange No. 11-17. Personnel Psychology, 11,
254-256. doi:10.1111/j.1744-6570.1958.tb00017.x
Personnel Research Branch, The Adjutant General‘s Office, Department of the Army.
(1958h). Validity information exchange No. 11-18. Personnel Psychology, 11,
257-259. doi:10.1111/j.1744-6570.1958.tb00017.x
Personnel Research Branch, The Adjutant General‘s Office, Department of the Army.
(1959a). Validity information exchange No. 12-4. Personnel Psychology, 12, 133-
144. doi:10.1111/j.1744-6570.1959.tb00803.x
Personnel Research Branch, The Adjutant General‘s Office, Department of the Army.
(1959b). Validity information exchange No. 12-5. Personnel Psychology, 12, 135.
doi:10.1111/j.1744-6570.1959.tb00803.x
Personnel Research Branch, The Adjutant General‘s Office, Department of the Army.
(1959c). Validity information exchange No. 12-6. Personnel Psychology, 12, 136-
137. doi:10.1111/j.1744-6570.1959.tb00803.x
Personnel Research Branch, The Adjutant General‘s Office, Department of the Army.
(1959d). Validity information exchange No. 12-7. Personnel Psychology, 12, 138-
140. doi:10.1111/j.1744-6570.1959.tb00803.x
Peterson, S. J., & Byron, K. (2008). Exploring the role of hope in job performance:
Results from four studies. Journal of Organizational Behavior, 29, 785-803.
doi:10.1002/job.492
PsyTech International, Ltd. (n.d.). General & Graduate Reasoning Tests. Unpublished
technical manual,
Roman, M. A. (1997). Exploring the upper bound of predictive validity of personality in
selection decisions. Unpublished doctoral dissertation, Northern Illinois
University.
Rusmore, J., & Martin, F. (1954). Validity information exchange No. 7-053. Personnel
Psychology, 7, 289. doi:10.1111/j.1744-6570.1954.tb01601.x

219
219
Salvendy, G. (1973). The non-linearity of intellectual abilities for the selection of
operators: The G. T. 70/23 Nonverbal Intelligence Test – Norms, reliabilities and
validities. Studia Psychologia, 15, 79-83.
Sartain, A. Q. (1946b). Relation between scores on certain standard tests and supervisory
success in an aircraft factory. Journal of Applied Psychology, 30, 328-332. doi:
10.1037/h0060901
Schneider, B. M. (2002). Using the Big-Five personality factors in the Minnesota
Multiphasic Perssonality Inventory, California Psychological Inventory, and
Inwald Personality Inventory to predict police performance. Unpublished
doctoral dissertation, Florida International University.
Shore, R. P. (1958a). Validity information exchange No. 11-22. Personnel Psychology,
11, 435-436. doi:10.1111/j.1744-6570.1958.tb00031.x
Shore, R. P. (1958b). Validity information exchange No. 11-23. Personnel Psychology,
11, 437. doi:10.1111/j.1744-6570.1958.tb00031.x
Shore, R. P. (1958c). Validity information exchange No. 11-24. Personnel Psychology,
11, 438-439. doi:10.1111/j.1744-6570.1958.tb00031.x
Shuman, J. T. (1945). The value of aptitude tests for supervisory workers in the aircraft
engine and propeller industries. Journal of Applied Psychology, 29, 185-190.
doi:10.1037/h0060773
Slaughter, A. J. (2004). Cognitive ability, personality, and experience: Evidence for
differential impact on job performance factors. Unpublished master‘s thesis,
Texas A & M University.
Tracey, J. B., Sturman, M. C., & Tews, M. J. (2007). Ability versus personality: Factors
that predict employee job performance. Cornell Hotel and Restaurant
Administration Quarterly, 48, 313-322.
Turnage, J. J., & Muchinsky, P. M. (1984). A comparison of the predictive validity of
assessment center evaluations versus traditional measures in forecasting
supervisory performance: Interpretive implications of criterion distortion for the
assessment paradigm. Journal of Applied Psychology, 69, 595-602.
doi:10.1037/0021-9010.69.4.595
U. S. Department of Labor, Bureau of Employment Security. (1952, August). Technical
report on standardization of the General Aptitude Test Battery for Manager,
Theater 0-98.54. Washington, DC: Author. (ERIC Document Reproduction
Service No. ED 060 019)

220
220
U. S. Department of Labor, Bureau of Employment Security. (1953, March). Technical
report on standardization of the General Aptitude Test Battery for File Clerk II 1-
17.02. Washington, DC: Author. (ERIC Document Reproduction Service No. ED
060 073)
U. S. Employment Service. (1954, November). Technical report on standardization of
the General Aptitude Test Battery for Stock Clerk II 1-38.01. Washington, DC: U.
S. Department of Labor, Bureau of Employment Security. (ERIC Document
Reproduction Service No. ED 059 282)
U. S. Employment Service. (1957, June). Technical report on standardization of the
General Aptitude Test Battery for Employment Clerk 205.368. Washington, DC:
U. S. Department of Labor, Manpower Administration. (ERIC Document
Reproduction Service No. ED 061 310)
U. S. Employment Service. (1958, June). Technical report on standardization of the
General Aptitude Test Battery for Fireman II 2-63.10. Washington, DC: U. S.
Department of Labor, Bureau of Employment Security. (ERIC Document
Reproduction Service No. ED 061 325)
U. S. Employment Service. (1959, January). Technical report on standardization of the
General Aptitude Test Battery for Presser, Machine (any ind.; laund.) 7-57.511.
Washington, DC: U. S. Department of Labor, Bureau of Employment Security.
(ERIC Document Reproduction Service No. ED 062 410)
U. S. Employment Service. (1959, April). Technical report on standardization of the
General Aptitude Test Battery for Medical Technologist 0-50.01. Washington,
DC: U. S. Department of Labor, Bureau of Employment Security. (ERIC
Document Reproduction Service No. ED 062 420)
U. S. Employment Service. (1961, August). Technical report on standardization of the
General Aptitude Test Battery for Waitress 2-27.12. Washington, DC: U. S.
Department of Labor, Bureau of Employment Security. (ERIC Document
Reproduction Service No. ED 062 442)
U. S. Employment Service. (1961, October). Technical report on standardization of the
General Aptitude Test Battery for Case Worker 0-27.20. Washington, DC: U. S.
Department of Labor, Bureau of Employment Security. (ERIC Document
Reproduction Service No. ED 062 438)
U. S. Employment Service. (1962, September). Technical report on standardization of
the General Aptitude Test Battery for Audit Clerk 1-01.32. Washington, DC: U. S.
Department of Labor, Bureau of Employment Security. (ERIC Document
Reproduction Service No. ED 063 385)

221
221
U. S. Employment Service. (1962, September). Technical report on standardization of
the General Aptitude Test Battery for Claim Adjuster (insurance) 1-57.40.
Washington, DC: U. S. Department of Labor, Bureau of Employment Security.
(ERIC Document Reproduction Service No. ED 072 069)
U. S. Employment Service. (1962, November). Technical report on standardization of
the General Aptitude Test Battery for Salesman, Real Estate 1-63.10. Washington,
DC: Author. (ERIC Document Reproduction Service No. ED 065 573)
U. S. Employment Service. (1962, November). Technical report on standardization of
the General Aptitude Test Battery for Welder, Inert Gas 4-85.025. Washington,
DC: Author. (ERIC Document Reproduction Service No. ED 063 393)
U. S. Employment Service. (1963, March). Technical report on standardization of the
General Aptitude Test Battery for Exterminator 389.884. Washington, DC:
Author. (ERIC Document Reproduction Service No. ED 063 416)
U. S. Employment Service. (1963, March). Technical report on standardization of the
General Aptitude Test Battery for Manager, Retail Food (ret. Tr.) 0-72.21 .
Washington, DC: Author. (ERIC Document Reproduction Service No. ED 063
410)
U. S. Employment Service. (1963, April). Technical report on standardization of the
General Aptitude Test Battery for Forester (profess. and kin.) 0-35.07.
Washington, DC: Author. (ERIC Document Reproduction Service No. ED 065
567)
U. S. Employment Service. (1963, May). Technical report on standardization of the
General Aptitude Test Battery for Air Traffic Control Specialist (air trans.) 0-
61.60. Washington, DC: U. S. Department of Labor, Bureau of Employment
Security. (ERIC Document Reproduction Service No. ED 065 580)
U. S. Employment Service. (1963, June). Technical report on standardization of the
General Aptitude Test Battery for Fish and Game Warden (Gov. Ser.) 0-94.94.
Washington, DC: Author. (ERIC Document Reproduction Service No. ED 065
609)
U. S. Employment Service. (1963, June). Technical report on standardization of the
General Aptitude Test Battery for Fish Cutter (fish.) 3-89.04. Washington, DC:
Author. (ERIC Document Reproduction Service No. ED 065 610)
U. S. Employment Service. (1963, June). Technical report on standardization of the
General Aptitude Test Battery for Shrimp Picker (can. & preserv.) 8-04.10.
Washington, DC: Author. (ERIC Document Reproduction Service No. ED 065
611)

222
222
U. S. Employment Service. (1963, July). Technical report on standardization of the
General Aptitude Test Battery for Custodian, School (any ind.) 381.887.
Washington, DC: Author. (ERIC Document Reproduction Service No. ED 065
621)
U. S. Employment Service. (1963, July). Technical report on standardization of the
General Aptitude Test Battery for Oil-Burner-Installation-and-Serviceman (any
ind.) 5-83.026. Washington, DC: Author. (ERIC Document Reproduction Service
No. ED 065 619)
U. S. Employment Service. (1963, July). Technical report on standardization of the
General Aptitude Test Battery for Processor, Solid Propellant (chem.) 6-52.773.
Washington, DC: Author. (ERIC Document Reproduction Service No. ED 065
625)
U. S. Employment Service. (1963, September). Technical report on standardization of
the General Aptitude Test Battery for Nurse Aide (med. ser.) 2-42.20.
Washington, DC: Author. (ERIC Document Reproduction Service No. ED 065
628)
U. S. Employment Service. (1963, October). Technical report on standardization of the
General Aptitude Test Battery for Operating Room Technician (medical ser.) 0-
50.15; Surgical Technician (medical ser.) 0-50.015. Washington, DC: Author.
(ERIC Document Reproduction Service No. ED 063 415)
U. S. Employment Service. (1963, October). Technical report on standardization of the
General Aptitude Test Battery for Sales Clerk (ret. tr.) 1-70.10. Washington, DC:
Author. (ERIC Document Reproduction Service No. ED 065 624)
U. S. Employment Service. (1963, October). Technical report on standardization of the
General Aptitude Test Battery for Sales Clerk, General (ret. tr.) 1-75.71.
Washington, DC: Author. (ERIC Document Reproduction Service No. ED 065
622)
U. S. Employment Service. (1964, Feb). Technical report on standardization of the
General Aptitude Test Battery for Classifier, Laundry 7-57.012. Washington, DC:
Author. (ERIC Document Reproduction Service No. ED 065 637)
U. S. Employment Service. (1964, March). Technical report on standardization of the
General Aptitude Test Battery for Cake Finisher (bake. prod.) 6-02.97.
Washington, DC: Author. (ERIC Document Reproduction Service No. ED 066
458)

223
223
U. S. Employment Service. (1964, March). Technical report on standardization of the
General Aptitude Test Battery for Manager, Retail Automotive Service (ret. tr.) 0-
72.12; Proprietor-Manager, Retail Automotive Service (ret. tr.). Washington, DC:
Author. (ERIC Document Reproduction Service No. ED 066 460)
U. S. Employment Service. (1964, April). Technical report on standardization of the
General Aptitude Test Battery for Mushroom Inspector (can. & preserv.) 9-68.60.
Washington, DC: Author. (ERIC Document Reproduction Service No. ED 066
464)
U. S. Employment Service. (1964, April). Technical report on standardization of the
General Aptitude Test Battery for Tea-Bag Operator (coffee, tea, and sp.) 7-
68.910. Washington, DC: Author. (ERIC Document Reproduction Service No.
ED 066 463)
U. S. Employment Service. (1964, June). Technical report on standardization of the
General Aptitude Test Battery for Conveyor-Loader, Plastic Toy Parts (toys and
games) 9-13.01. Washington, DC: Author. (ERIC Document Reproduction
Service No. ED 066 465)
U. S. Employment Service. (1964, June). Technical report on standardization of the
General Aptitude Test Battery for Electronic Resistance Spot Welder (electronics)
6-98.027. Washington, DC: Author. (ERIC Document Reproduction Service No.
ED 066 466)
U. S. Employment Service. (1964, June). Technical report on standardization of the
General Aptitude Test Battery for Gluing-Machine Operator (paper goods) 6-
42.390. Washington, DC: Author. (ERIC Document Reproduction Service No.
ED 066 468)
U. S. Employment Service. (1964, October). Technical report on standardization of the
General Aptitude Test Battery for Creditman (ret. tr.; whole. tr.) 0-85.11.
Washington, DC: Author. (ERIC Document Reproduction Service No. ED 066
482)
U. S. Employment Service. (1964, October). Technical report on standardization of the
General Aptitude Test Battery for Waitress (medical ser.) 2-27.89. Washington,
DC: Author. (ERIC Document Reproduction Service No. ED 066 467)
U. S. Employment Service. (1964, November). Technical report on standardization of
the General Aptitude Test Battery for Systems Analyst, Business Electronic Data
Processing (profess. & kin.) 0-69.985. Washington, DC: Author. (ERIC
Document Reproduction Service No. ED 066 477)

224
224
U. S. Employment Service. (1965, March). Technical report on standardization of the
General Aptitude Test Battery for Precision Lens Grinder (optical goods) 5-
08.071. Washington, DC: Author. (ERIC Document Reproduction Service No.
ED 069 778)
U. S. Employment Service. (1965, March). Technical report on standardization of the
General Aptitude Test Battery for Tube-Machine Operator (elec. equip.) 7-
00.216. Washington, DC: Author. (ERIC Document Reproduction Service No.
ED 069 779)
U. S. Employment Service. (1965, April). Technical report on standardization of the
General Aptitude Test Battery for Surveyor (profess. & kin.) 0-64.10.
Washington, DC: Author. (ERIC Document Reproduction Service No. ED 070
773)
U. S. Employment Service. (1965, October). Technical report on development of USES
Aptitude Test Battery for Electronics Foreman (electronics) 5-92.621 (726.134).
Washington, DC: U.S. Department of Labor, Manpower Administration. (ERIC
Document Reproduction Service No. ED 069 649)
U. S. Employment Service. (1965, November). Technical report on development of
USES Aptitude Test Battery for Inspector, Mechanical and Electrical (elec.
equip.) 6-99.435 (710.384). Washington, DC: U.S. Department of Labor,
Manpower Administration. (ERIC Document Reproduction Service No. ED 069
652)
U. S. Employment Service. (1965, November). Technical report on development of
USES Aptitude Test Battery for Offset-Web-Press Man (print. & pub.) 4-48.033.
Washington, DC: U.S. Department of Labor, Manpower Administration. (ERIC
Document Reproduction Service No. ED 069 650)
U. S. Employment Service. (1966, February). Technical report on development of USES
Aptitude Test Battery for Inspector and Machine Operator, Diode Subassemblies
(electronics) 726.685. Washington, DC: U.S. Department of Labor, Manpower
Administration. (ERIC Document Reproduction Service No. ED 066 515)
U. S. Employment Service. (1966, March). Technical report on development of USES
Aptitude Test Battery for Garment Packer (any ind.) 9-68.30. Washington, DC:
U.S. Department of Labor, Manpower Administration. (ERIC Document
Reproduction Service No. ED 072 061)
U. S. Employment Service. (1966, March). Technical report on development of USES
Aptitude Test Battery for Napkin Packager (paper goods) 920.885. Washington,
DC: U.S. Department of Labor, Manpower Administration. (ERIC Document
Reproduction Service No. ED 069 767)

225
225
U. S. Employment Service. (1966, March). Technical report on development of USES
Aptitude Test Battery for Printer-Slotter Operator (paper goods) 4-42.315
(651.782). Washington, DC: U.S. Department of Labor, Manpower
Administration. (ERIC Document Reproduction Service No. ED 069 764)
U. S. Employment Service. (1966, March). Technical report on development of USES
Aptitude Test Battery for Psychiatric Aid (medical ser.) 2-42.22 (355.878).
Washington, DC: U.S. Department of Labor, Manpower Administration. (ERIC
Document Reproduction Service No. ED 065 633)
U. S. Employment Service. (1966, July). Technical report on development of USES
Aptitude Test Battery for Stacker (pottery & porc.) 774.884. Washington, DC:
U.S. Department of Labor, Manpower Administration. (ERIC Document
Reproduction Service No. ED 065 614)
U. S. Employment Service. (1966, August). Technical report on development of USES
Aptitude Test Battery for Dental-Laboratory Technician (medical ser.) 712.381.
Washington, DC: U.S. Department of Labor, Manpower Administration. (ERIC
Document Reproduction Service No. ED 065 631)
U. S. Employment Service. (1966, August). Technical report on development of USES
Aptitude Test Battery for Flexographic Press Man (print. & pub.) I 651.782.
Washington, DC: U.S. Department of Labor, Manpower Administration. (ERIC
Document Reproduction Service No. ED 069 766)
U. S. Employment Service. (1966, August). Technical report on development of USES
Aptitude Test Battery for Micrologic Assembler (electronics) 726-884-080.
Washington, DC: U.S. Department of Labor, Manpower Administration. (ERIC
Document Reproduction Service No. ED 066 510)
U. S. Employment Service. (1966, September). Technical report on development of
USES Aptitude Test Battery for Cottage Parent (medical ser.) 355.878.
Washington, DC: U.S. Department of Labor, Manpower Administration. (ERIC
Document Reproduction Service No. ED 066 516)
U. S. Employment Service. (1967, January). Technical report on development of USES
Aptitude Test Battery for Accountant (profess. & kin.) 160.188; Auditor (profess.
& kin.) 160.188. Washington, DC: U.S. Department of Labor, Manpower
Administration. (ERIC Document Reproduction Service No. ED 061 319)
U. S. Employment Service. (1967, January). Technical report on development of USES
Aptitude Test Battery for Mounter (electronics) I 726.887. Washington, DC: U.S.
Department of Labor, Manpower Administration. (ERIC Document Reproduction
Service No. ED 059 287)

226
226
U. S. Employment Service. (1967, February). Technical report on development of USES
Aptitude Test Battery for Assembler, Microwave Tube (electronics) 725.884.
Washington, DC: U.S. Department of Labor, Manpower Administration. (ERIC
Document Reproduction Service No. ED 067 408)
U. S. Employment Service. (1967, February). Technical report on development of USES
Aptitude Test Battery for Log Scaler (logging; paper & pulp; sawmill) 941.488.
Washington, DC: U.S. Department of Labor, Manpower Administration. (ERIC
Document Reproduction Service No. ED 066 518)
U. S. Employment Service. (1967, February). Technical report on development of USES
Aptitude Test Battery for Radiographer (any ind.) 199.381. Washington, DC: U.S.
Department of Labor, Manpower Administration. (ERIC Document Reproduction
Service No. ED 066 519)
U. S. Employment Service. (1967, July). Technical report on development of USES
Aptitude Test Battery for Blown Plastic Container Machine Operator (fabric.
plastic prod.) 556.885. Washington, DC: U.S. Department of Labor, Manpower
Administration. (ERIC Document Reproduction Service No. ED 067 412)
U. S. Employment Service. (1967, July). Technical report on development of USES
Aptitude Test Battery for Coin-Vending-Machine Collector (bus. ser.) 492.483.
Washington, DC: U.S. Department of Labor, Manpower Administration. (ERIC
Document Reproduction Service No. ED 067 413)
U. S. Employment Service. (1967, July). Technical report on development of USES
Aptitude Test Battery for Corrugator Operator (paper goods) 643.782-010.
Washington, DC: U.S. Department of Labor, Manpower Administration. (ERIC
Document Reproduction Service No. ED 067 411)
U. S. Employment Service. (1967, July). Technical report on development of USES
Aptitude Test Battery for Radiologic Technologist (medical ser.) 078.368.
Washington, DC: U.S. Department of Labor, Manpower Administration. (ERIC
Document Reproduction Service No. ED 060 119)
U. S. Employment Service. (1967, October). Technical report on development of USES
Aptitude Test Battery for Teacher Aid, Elementary School (education) 099.368.
Washington, DC: U.S. Department of Labor, Manpower Administration. (ERIC
Document Reproduction Service No. ED 067 414)
U. S. Employment Service. (1967, November). Technical report on development of
USES Aptitude Test Battery for Painter, Automobile (auto serv.) 845.781.
Washington, DC: U.S. Department of Labor, Manpower Administration. (ERIC
Document Reproduction Service No. ED 067 417)

227
227
U. S. Employment Service. (1967, December). Technical report on development of
USES Aptitude Test Battery for Vending-Machine Repairman (bus. ser.; coin
mach.) 639.381. Washington, DC: U.S. Department of Labor, Manpower
Administration. (ERIC Document Reproduction Service No. ED 067 418)
U. S. Employment Service. (1968, February). Technical report on development of USES
Aptitude Test Battery for Quality Control Worker (can. & preserv.) 529.387.
Washington, DC: U.S. Department of Labor, Manpower Administration. (ERIC
Document Reproduction Service No. ED 067 422)
U. S. Employment Service. (1968, February). Technical report on development of USES
Aptitude Test Battery for Set-Up Man, Sheet Metal (any ind.) 616.380.
Washington, DC: U.S. Department of Labor, Manpower Administration. (ERIC
Document Reproduction Service No. ED 067 421)
U. S. Employment Service. (1968, March). Technical report on development of USES
Aptitude Test Battery for Coding Clerk (clerical) 219.388. Washington, DC: U.S.
Department of Labor, Manpower Administration. (ERIC Document Reproduction
Service No. ED 068 541)
U. S. Employment Service. (1968, March). Technical report on development of USES
Aptitude Test Battery for Programmer, Business (profess. & kin.) 020.188.
Washington, DC: U.S. Department of Labor, Manpower Administration. (ERIC
Document Reproduction Service No. ED 066 476)
U. S. Employment Service. (1968, March). Technical report on development of USES
Aptitude Test Battery for Programmer, Engineering & Scientific (profess. & kin.)
020.188. Washington, DC: U.S. Department of Labor, Manpower Administration.
(ERIC Document Reproduction Service No. ED 066 478)
U. S. Employment Service. (1968, June). Technical report on development of USES
Aptitude Test Battery for Telephone Ad Taker (print. & pub.) 249.368.
Washington, DC: U.S. Department of Labor, Manpower Administration. (ERIC
Document Reproduction Service No. ED 068 548)
U. S. Employment Service. (1968, July). Technical report on development of USES
Aptitude Test Battery for Department Head-Buyer (ret. tr.) 229.138. Washington,
DC: U.S. Department of Labor, Manpower Administration. (ERIC Document
Reproduction Service No. ED 068 551)
U. S. Employment Service. (1968, October). Technical report on development of USES
Aptitude Test Battery for Polisher (jewelry) 700.887. Washington, DC: U.S.
Department of Labor, Manpower Administration. (ERIC Document Reproduction
Service No. ED 068 555)

228
228
U. S. Employment Service. (1968, September). Technical report on development of
USES Aptitude Test Battery for Radiation Monitor (profess. & kin.) 199.187.
Washington, DC: U.S. Department of Labor, Manpower Administration. (ERIC
Document Reproduction Service No. ED 068 553)
U. S. Employment Service. (1968, November). Technical report on development of
USES Aptitude Test Battery for Manager, Restaurant or Coffee Shop (hotel &
rest.) 187.168. Washington, DC: U.S. Department of Labor, Manpower
Administration. (ERIC Document Reproduction Service No. ED 068 556)
U. S. Employment Service. (1968, December). Technical report on development of
USES Aptitude Test Battery for Spooler Operator, Automatic (textile) 689.886.
Washington, DC: U.S. Department of Labor, Manpower Administration. (ERIC
Document Reproduction Service No. ED 068 558)
U. S. Employment Service. (1969, February). Technical report on development of
USTES Aptitude Test Battery for Automobile Mechanic (auto ser.) 620.281;
Foreign Car Mechanic (auto ser.) 620.281. Washington, DC: U.S. Department of
Labor, Manpower Administration. (ERIC Document Reproduction Service No.
ED 060 083)
U. S. Employment Service. (1969, January). Technical report on development of USTES
Aptitude Test Battery for Librarian 100.168. Washington, DC: U.S. Department
of Labor, Manpower Administration. (ERIC Document Reproduction Service No.
ED 066 641)
U. S. Employment Service. (1969, January). Technical report on development of USTES
Aptitude Test Battery for Rewinder Operator (paper goods) . Washington, DC:
U.S. Department of Labor, Manpower Administration. (ERIC Document
Reproduction Service No. ED 068 560)
U. S. Employment Service. (1969, March). Technical report on development of USTES
Aptitude Test Battery for Part Programmer, Numerical Control (mach. shop.) 0.
Washington, DC: U.S. Department of Labor, Manpower Administration. (ERIC
Document Reproduction Service No. ED 068 562)
U. S. Employment Service. (1969, April). Technical report on development of USTES
Aptitude Test Battery for Packager, Machine (any ind.) 920.885. Washington,
DC: U.S. Department of Labor, Manpower Administration. (ERIC Document
Reproduction Service No. ED 068 565)
U. S. Employment Service. (1969, July). Technical report on development of USTES
Aptitude Test Battery for Parking Enforcement Officer (gov. ser.) 375.588.
Washington, DC: U.S. Department of Labor, Manpower Administration. (ERIC
Document Reproduction Service No. ED 068 568)

229
229
U. S. Employment Service. (1969, November). Technical report on development of
USTES Aptitude Test Battery for Production Mechanic, Tin Cans (tinware)
619.380. Washington, DC: U.S. Department of Labor, Manpower Administration.
(ERIC Document Reproduction Service No. ED 069 765)
U. S. Employment Service. (1969, November). Technical report on development of
USTES Aptitude Test Battery for Welder, Production Line (welding) 810.884-
018. Washington, DC: U.S. Department of Labor, Manpower Administration.
(ERIC Document Reproduction Service No. ED 069 634)
U. S. Employment Service. (1970, May). Technical report on development of USTES
Aptitude Test Battery for Counselor (profess. & kin.) II 045.108-010.
Washington, DC: U.S. Department of Labor, Manpower Administration. (ERIC
Document Reproduction Service No. ED 069 638)
U. S. Employment Service. (1970, June). Technical report on development of USTES
Aptitude Test Battery for Correction Officer (gov. ser.) 372.868. Washington, DC:
U.S. Department of Labor, Manpower Administration. (ERIC Document
Reproduction Service No. ED 072 051)
U. S. Employment Service. (1970, June). Technical report on development of USTES
Aptitude Test Battery for Boilermaker (boilermaking) I 805.281-010.
Washington, DC: U.S. Department of Labor, Manpower Administration. (ERIC
Document Reproduction Service No. ED 065 608)
U. S. Employment Service. (1970, June). Technical report on development of USTES
Aptitude Test Battery for Cutting-and-Creasing Pressman (paper goods) 649.782-
010. Washington, DC: U.S. Department of Labor, Manpower Administration.
(ERIC Document Reproduction Service No. ED 066 462)
U. S. Employment Service. (1970, June). Technical report on development of USTES
Aptitude Test Battery for Die Maker (paper goods) 739.381-022. Washington,
DC: U.S. Department of Labor, Manpower Administration. (ERIC Document
Reproduction Service No. ED 066 469)
U. S. Employment Service. (1970, June). Technical report on development of USTES
Aptitude Test Battery for Draftsman, Architectural (profess. & kin.) 001.281;
Draftsman, Civil (profess. & kin.) 001.281; Draftsman, Geological (petrol.
production) 001.281; Draftsman, Mechanical (profess. & kin.) 007.281;
Draftsman, Structural (profess. & kin.) 005.281; Detailer (profess. & kin.)
017.281 . Washington, DC: U.S. Department of Labor, Manpower
Administration. (ERIC Document Reproduction Service No. ED 065 612)

230
230
U. S. Employment Service. (1970, June). Technical report on development of USTES
Aptitude Test Battery for Nurse, Licensed, Practical (medical ser.) 079.378.
Washington, DC: U.S. Department of Labor, Manpower Administration. (ERIC
Document Reproduction Service No. ED 065 616)
U. S. Employment Service. (1970, June). Technical report on development of USTES
Aptitude Test Battery for Insulation Worker (const.) 863.884. Washington, DC:
U.S. Department of Labor, Manpower Administration. (ERIC Document
Reproduction Service No. ED 068 563)
U. S. Employment Service. (1970, June). Technical report on development of USTES
Aptitude Test Battery for Lather (const.) 842.781-010. Washington, DC: U.S.
Department of Labor, Manpower Administration. (ERIC Document Reproduction
Service No. ED 069 770)
U. S. Employment Service. (1970, June). Technical report on development of USES
Aptitude Test Battery for Operating Engineer (const.) II 859.883. Washington,
DC: U.S. Department of Labor, Manpower Administration. (ERIC Document
Reproduction Service No. ED 072 046)
U. S. Employment Service. (1970, June). Technical report on development of USTES
Aptitude Test Battery for Sewing Machine Repairman (any ind.) 639.281.
Washington, DC: U.S. Department of Labor, Manpower Administration. (ERIC
Document Reproduction Service No. ED 066 481)
U. S. Employment Service. (1970, June). Technical report on development of USTES
Aptitude Test Battery for Stationary Engineer (any ind.) 950.782. Washington,
DC: U.S. Department of Labor, Manpower Administration. (ERIC Document
Reproduction Service No. ED 072 057)
U. S. Employment Service. (1970, June). Technical report on development of USTES
Aptitude Test Battery for Steam-Power-Plant Operator (light, heat & power)
952.782-040. Washington, DC: U.S. Department of Labor, Manpower
Administration. (ERIC Document Reproduction Service No. ED 070 774)
U. S. Employment Service. (1970, June). Technical report on development of USTES
Aptitude Test Battery for Twister-Tender (asbestos prod.; glass mfg.; synthetic
fibers; textile) 681.885. Washington, DC: U.S. Department of Labor, Manpower
Administration. (ERIC Document Reproduction Service No. ED 069 639)
U. S. Employment Service. (1970, July). Technical report on development of USTES
Aptitude Test Battery for General Office Clerk (clerical) 219.388. Washington,
DC: U.S. Department of Labor, Manpower Administration. (ERIC Document
Reproduction Service No. ED 066 491)

231
231
U. S. Employment Service. (1970, July). Technical report on development of USTES
Aptitude Test Battery for Screw-Machine Set-Up Operator, Jobbing (mach. shop)
604.380-028. Washington, DC: U.S. Department of Labor, Manpower
Administration. (ERIC Document Reproduction Service No. ED 069 640)
U. S. Employment Service. (1970, August). Technical report on development of USTES
Aptitude Test Battery for Assembler, Small Products 739.887-034. Washington,
DC: U.S. Department of Labor, Manpower Administration. (ERIC Document
Reproduction Service No. ED 069 643)
U. S. Employment Service. (1970, October). Technical report on development of USTES
Aptitude Test Battery for Medical Assistant 079.386-022. Washington, DC: U.S.
Department of Labor, Manpower Administration. (ERIC Document Reproduction
Service No. ED 065 561)
U. S. Employment Service. (1970, December). Technical report on development of
USTES Aptitude Test Battery for Cannery Mechanic (can. & preserv.) 638.281-
022. Washington, DC: U.S. Department of Labor, Manpower Administration.
(ERIC Document Reproduction Service No. ED 069 626)
U. S. Employment Service. (1971, April). Technical report on development of USTES
Aptitude Test Battery for Chemical Engineer (profess. & kin.) 008.081; Civil
Engineer (profess & kin.) 005.081; Electrical Engineer (profess. & kin) 003.081;
Mechanical Engineer (profess. & kin.) 007.081. Washington, DC: U.S.
Department of Labor, Manpower Administration. (ERIC Document Reproduction
Service No. ED 060 076)
U. S. Employment Service. (1971, June). Technical report on development of USTES
Aptitude Test Battery for Court Clerk 249.368. Washington, DC: U.S.
Department of Labor, Manpower Administration. (ERIC Document Reproduction
Service No. ED 060 069)
U. S. Employment Service. (1971, August). Technical report on development of USTES
Aptitude Test Battery for Customer-Engineering Specialist (office mach.)
828.281. Washington, DC: U.S. Department of Labor, Manpower Administration.
(ERIC Document Reproduction Service No. ED 069 648)
U. S. Employment Service. (1971, August). Technical report on development of USTES
Aptitude Test Battery for Technician, Automated Equipment (office mach.)
823.281. Washington, DC: U.S. Department of Labor, Manpower Administration.
(ERIC Document Reproduction Service No. ED 069 651)
U. S. Employment Service. (1972, February). Technical report on development of
USTES Aptitude Test Battery for Manager, Beauty Shop (per. Ser.) 187.168.
Washington, DC: U.S. Department of Labor, Manpower Administration. (ERIC
Document Reproduction Service No. ED 078 069)

232
232
U. S. Employment Service. (1972, November). Technical report on development of
USES Aptitude Test Battery for Covering-Machine Operator (textile) 681.885.
Washington, DC: U.S. Department of Labor, Manpower Administration. (ERIC
Document Reproduction Service No. ED 078 070)
U. S. Employment Service. (1974, August). Technical report on development of USES
Aptitude Test Battery for Fork-Lift-Truck Operator (any ind.) 922.883.
Washington, DC: U.S. Department of Labor, Manpower Administration. (ERIC
Document Reproduction Service No. ED 103 450)
U. S. Employment Service. (1974, October). Technical report on development of USES
Aptitude Test Battery for Drafter, Civil (profess. & kin.) 005.281; Drafter,
Geological (petrol. Production) 010.281; Drafter, Mechanical (profess. & kin.)
007.281; Drafter, Structural (profess. & kin.) 005.281. Washington, DC: U.S.
Department of Labor, Manpower Administration. (ERIC Document Reproduction
Service No. ED 103 489)
U. S. Employment Service. (1974, December). Technical report on development of
USES Aptitude Test Battery for Clerk, General Office 219.388. Washington, DC:
U.S. Department of Labor, Manpower Administration. (ERIC Document
Reproduction Service No. ED 103 491)
U. S. Employment Service. (1975). Technical report on development of USES Aptitude
Test Battery for Teller (banking) 212.368. Washington, DC: U.S. Department of
Labor, Manpower Administration. (ERIC Document Reproduction Service No.
ED 103 495)
U. S. Employment Service. (1982). Technical report on development of USES Specific
Aptitude Test Battery for Respiratory Therapist (medical ser.) 079.361-010.
Washington, DC: U.S. Department of Labor, Employment and Training
Administration. (ERIC Document Reproduction Service No. ED 223 723)
Varca, P. E., & James-Valutis, M. (1993). The relationship of ability and satisfaction to
job performance. Applied Psychology: An International Review, 42, 265-275.
doi:10.1111/j.1464-0597.1993.tb00742.x
Westberg, W. C., Fitzpatrick, E. D., & McCarty, J. J. (1954a). Validity information
exchange No. 7-073. Personnel Psychology, 7, 411-412. doi:10.1111/j.1744-
6570.1954.tb01609.x
Westberg, W. C., Fitzpatrick, E. D., & McCarty, J. J. (1954b). Validity information
exchange No. 7-074. Personnel Psychology, 7, 413. doi:10.1111/j.1744-
6570.1954.tb01609.x

233
233
Witt, L. A., & Spitzmuller, C. (2007). Person-situation predictors of maximum and
typical performance. Human Performance, 20, 305-315.
doi:10.1080/08959280701333529
Wright, P. M., Kacmar, K. M., McMahab, G. C., & Deleeuw, K. (1995). P=f(M X A):
Cognitive ability as a moderator of the relationship between personality and job
performance. Journal of Management, 21, 1129-1139.
Yoon, K. (1997). General mental ability and the Big Five personality dimensions: An
investigation of the cross-cultural generalizability of their construct and
criterion-related validities in Korea. Unpublished doctoral dissertation,
University of Iowa.