Fluctuation of systemic immunity in melanoma and implications for timing of therapy
18
Biorhythmic fluctuation of systemic immunity in melanoma Fluctuation of systemic immunity in melanoma and implications for timing of therapy Alexey A. Leontovich 2 , Roxana S. Dronca 3 , Vera J. Suman 2 , Martin L.Ashdown 4 , Wendy K. Nevala 1 , Michael A. Thompson 1 , Andrew Robinson 5 , Lisa A. Kottschade 3 , Judith S. Kaur 3 , Robert R. McWilliams 3 , Leonid V. Ivanov 6 , Gary A. Croghan 3 , Svetomir N. Markovic 1,3 1 Department of Hematology, Mayo Clinic, Rochester, MN, USA, 2 Department of Health Science research, Mayo Clinic, Rochester, MN, USA, Division of Biomedical Statistics and Informatics, Mayo Clinic, Rochester, MN, USA, 3 Department of Medical Oncology, Mayo Clinic, Rochester, MN, USA, 4 Department of Medicine University of Melbourne Melbourne, Victoria, Australia, 5 Department of Mathematics and Statistics University of Melbourne Parkville, Melbourne, Victoria, Australia , 6 College and Alumni Relations, Grinnell College, IA, USA TABLE OF CONTENTS 1. Abstract 2. Introduction 3. Materials and methods 3.1. Patient population and study design 3.2. Immunological studies 3.2.1. Peripheral blood mononuclear cell (PBMC) immunophenotyping for immune cell subsets. 3.2.2. Plasma cytokine profiling. 3.3. Statistical considerations 3.4. Data analysis 4. Results 4.1. Patient characteristics and clinical outcomes 4.2. Dynamic changes of systemic immunity in metastatic melanoma 4.3. Identification of immunologically favorable time point in the immune response cycle (rhythm) for chemotherapy administration based on fluctuating systemic immune biomarkers 4.4. Full data integration and correlation with clinical outcome (clustering analysis) 4.5. The simulation model 5. Discussion 6. Acknowledgments 7. References 1. ABSTRACT Evidence suggests that immunological response in chronic inflammation is dynamic, oscillating between active immunity and tolerance. We hypothesized that a similar dynamic exists in melanoma and administration of therapy during a unique phase of such oscillation could impact clinical outcome. Patients with metastatic melanoma eligible to undergo temozolomide underwent serial measurements of C-reactive protein (CRP) and immune biomarkers every 2-3 days for 2 weeks before starting therapy. Treatment was initiated prior to the estimated next CRP peak, or on day 14 post-registration if a peak was not identified. Time profiles of measured biomarkers were analyzed by fitting serially measured data points to 9 mathematical functions and were correlated to time of therapy and outcome. Data suggested that metastatic melanoma patients exhibit a dynamic immune response. The fluctuation of several biomarkers fitted cosine functions with periods which were multiples of 3-4 days. Chemotherapy delivery during a unique phase of this cycle seemed to correlate with improved response. Individualized conventional chemotherapy delivery by synchronizing treatment with pre-existing patient-specific biorhythms may improve clinical outcomes in metastatic melanoma. 2. INTRODUCTION The incidence of melanoma has been increasing over the last two decades at a rate higher than most malignancies (1). It is currently estimated that one in every 40 people in the Unites States will be diagnosed with melanoma during their lifetime (1, 2). While potentially curable when diagnosed early, the median survival of patients with metastatic disease remains less than 1 year, and less than 5% of patients are alive at 5 years (3). Melanoma is notoriously refractory to most chemotherapeutic agents, but does show sporadic and dramatic responsiveness to immune modulating therapies. One explanation for the isolated successes of immunotherapeutics is the increasingly recognized variability in systemic immune dysfunction in patients with disseminated disease. The abnormalities of immune competence in stage IV melanoma have been extensively studied; recent evidence suggests the existence of varying degrees of immune suppression in the tumor microenvironment, as well as systemic immune “exhaustion” brought upon by tumor-driven chronic inflammation (systemic helper T cells, Th2 dominance) (4). Different levels of such immune compromise in un-selected patients with stage IV melanoma may render different levels of “responsiveness” to immune stimulating drugs
-
Upload
mayoclinic -
Category
Documents
-
view
2 -
download
0
Transcript of Fluctuation of systemic immunity in melanoma and implications for timing of therapy

Biorhythmic fluctuation of systemic immunity in melanoma
Fluctuation of systemic immunity in melanoma and implications for timing of therapy Alexey A. Leontovich2, Roxana S. Dronca3, Vera J. Suman2, Martin L.Ashdown4, Wendy K. Nevala1, Michael A. Thompson1, Andrew Robinson5, Lisa A. Kottschade3, Judith S. Kaur3, Robert R. McWilliams3, Leonid V. Ivanov6, Gary A. Croghan3, Svetomir N. Markovic1,3 1Department of Hematology, Mayo Clinic, Rochester, MN, USA, 2Department of Health Science research, Mayo Clinic, Rochester, MN, USA, Division of Biomedical Statistics and Informatics, Mayo Clinic, Rochester, MN, USA, 3Department of Medical Oncology, Mayo Clinic, Rochester, MN, USA, 4Department of Medicine University of Melbourne Melbourne, Victoria, Australia, 5Department of Mathematics and Statistics University of Melbourne Parkville, Melbourne, Victoria, Australia , 6 College and Alumni Relations, Grinnell College, IA, USA TABLE OF CONTENTS 1. Abstract 2. Introduction 3. Materials and methods
3.1. Patient population and study design 3.2. Immunological studies
3.2.1. Peripheral blood mononuclear cell (PBMC) immunophenotyping for immune cell subsets. 3.2.2. Plasma cytokine profiling.
3.3. Statistical considerations 3.4. Data analysis
4. Results 4.1. Patient characteristics and clinical outcomes 4.2. Dynamic changes of systemic immunity in metastatic melanoma 4.3. Identification of immunologically favorable time point in the immune response cycle (rhythm) for chemotherapy administration based on fluctuating systemic immune biomarkers 4.4. Full data integration and correlation with clinical outcome (clustering analysis) 4.5. The simulation model
5. Discussion 6. Acknowledgments 7. References 1. ABSTRACT
Evidence suggests that immunological response in chronic inflammation is dynamic, oscillating between active immunity and tolerance. We hypothesized that a similar dynamic exists in melanoma and administration of therapy during a unique phase of such oscillation could impact clinical outcome. Patients with metastatic melanoma eligible to undergo temozolomide underwent serial measurements of C-reactive protein (CRP) and immune biomarkers every 2-3 days for 2 weeks before starting therapy. Treatment was initiated prior to the estimated next CRP peak, or on day 14 post-registration if a peak was not identified. Time profiles of measured biomarkers were analyzed by fitting serially measured data points to 9 mathematical functions and were correlated to time of therapy and outcome. Data suggested that metastatic melanoma patients exhibit a dynamic immune response. The fluctuation of several biomarkers fitted cosine functions with periods which were multiples of 3-4 days. Chemotherapy delivery during a unique phase of this cycle seemed to correlate with improved response. Individualized conventional chemotherapy delivery by synchronizing treatment with pre-existing patient-specific biorhythms may improve clinical outcomes in metastatic melanoma.
2. INTRODUCTION
The incidence of melanoma has been increasing over the last two decades at a rate higher than most malignancies (1). It is currently estimated that one in every 40 people in the Unites States will be diagnosed with melanoma during their lifetime (1, 2). While potentially curable when diagnosed early, the median survival of patients with metastatic disease remains less than 1 year, and less than 5% of patients are alive at 5 years (3). Melanoma is notoriously refractory to most chemotherapeutic agents, but does show sporadic and dramatic responsiveness to immune modulating therapies. One explanation for the isolated successes of immunotherapeutics is the increasingly recognized variability in systemic immune dysfunction in patients with disseminated disease. The abnormalities of immune competence in stage IV melanoma have been extensively studied; recent evidence suggests the existence of varying degrees of immune suppression in the tumor microenvironment, as well as systemic immune “exhaustion” brought upon by tumor-driven chronic inflammation (systemic helper T cells, Th2 dominance) (4). Different levels of such immune compromise in un-selected patients with stage IV melanoma may render different levels of “responsiveness” to immune stimulating drugs
Biorhythmic fluctuation of systemic immunity in melanoma
2
(e.g. ipilumumab) with varied clinical outcomes. It is therefore possible that the rare patients in whom systemic immunity has not yet been fully compromised are those who exhibit dramatic responses to immunotherapeutics and that simply “boosting” unknown pre-existing endogenous immunity may not be sufficient to achieve clinical benefit.
Many approaches have been used to generate
endogenous anti-tumor immunity in metastatic melanoma (5-7). Recently, adoptive transfer studies have definitively demonstrated that some form of “re-setting” (lymphodepleting) endogenous immune homeostasis may be necessary for the success of infused, in vitro prepared, tumor specific cytotoxic T cells (8, 9). This approach implies that the state of cancer-associated immune dysfunction is established and static, requiring depletion. However, increasing pre-clinical data suggest that immunity to cancer is a cyclical process, which oscillates between active immune responsiveness and tolerance (10-12). This “on-off” cycle of systemic anti-tumor immunity is modulated, among others, by periodical clonal expansion of regulatory T-cells (Treg) and possibly other immunosuppressive elements (13-15). In animal models, Treg appear to undergo synchronous clonal expansion approximately 10 to 14 days post viral or tumor inoculation (16) and act to suppress the activity of effector T cells undergoing clonal expansion some days prior (13,17). Application of a single dose of cytotoxic (lymphodepleting) chemotherapy at the time when Treg enter mitosis and are particularly vulnerable to alkylating agent destruction has resulted in an “unblocked” immune response leading to prevention of murine AIDS progression (16), or immunologically mediated regression of advanced lymphoma in mice (18), with no effect on non-cycling tumor specific CD8+ T-cells. Thus, an alternative strategy to circumvent melanoma-associated immune dysfunction may be to utilize spontaneously developed anti-tumor immunity and exploit these dynamic (oscillating) changes of host immune homeostatic response by therapeutically depleting the elements of immune tolerance, thereby favoring active anti-tumor immunity.
In the current study, we hypothesized that
systemic (homeostatic) immunity in patients with metastatic melanoma exists in a state of dynamic equilibrium and that delivery of lymphodepleting cytotoxic chemotherapy (temozolomide, TMZ) in a unique phase of this cycle may favor active immunity over tolerance, yielding clinical benefit. As serum C-reactive protein (CRP) levels appeared to inversely correlate with regulatory T cell (Treg) frequency in patients with chronic inflammatory diseases (19), we used serial CRP measurements as a surrogate for Treg frequency to detect oscillations of systemic immunity and empirically select a time during said cycle to deliver TMZ (10,19). We postulated that delivery of TMZ just prior to the presumed peak of Treg concentration in the blood may yield maximum Treg depletion, favoring persistence of active systemic immunity.. The study objectives were: (1) ascertain whether or not CRP (and other biomarkers of inflammation) is predictably variable over time in patients with advanced melanoma (i.e. is systemic immune
competence is a dynamic process oscillating between states of “active” immunity and tolerance); and (2) therapeutically utilize this information and devise a treatment strategy to selectively lymphodeplete the immune down-regulating phase of systemic immunity.
3. MATERIALS AND METHODS 3.1. Patient population and study design
Eligible patients had unresectable, histologically confirmed stage IV disease, age over 18 years, measurable disease as defined by the Response Evaluation Criteria in Solid Tumors (RECIST), Eastern Cooperative Oncology Group (ECOG) performance status (PS) of 0-2, and life expectancy ≥ 3 months. Both previously untreated patients and patients who have had prior therapy for their metastatic disease (excluding prior exposure to TMZ) were eligible. All patients provided signed informed written consent, and the study was approved by the Mayo Clinic Rochester Institutional Review Board. The TMZ dose was 150 mg/m2 on days 1-5 of cycle 1 and was increased to 200 mg/m2 for all subsequent cycles if well tolerated. Patients were treated every 28 days until progression, unacceptable toxicity or patient refusal. Prior to initiation of first chemotherapy cycle, eligible patients underwent serial peripheral blood testing for CRP and associated immunological biomarkers every 2-3 days (to account for weekend days) for a period of two weeks. CRP concentration was measured using a clinical laboratory test (20) in real time in order to identify the optimal time for chemotherapy delivery. The time series of serial CRP concentration measurements was fitted to a sine curve and the next peak of CRP concentration was predicted based on the periodicity of CRP oscillations. Treatment with TMZ was initiated immediately prior to the estimated time of the next CPR peak, or on day 14 post-registration if the peak could not be identified. 3.2. Immunological studies In order to study the global behavior of the anti-tumor immune response in metastatic melanoma, peripheral blood samples obtained prior to initiation of TMZ therapy were subsequently analyzed for plasma concentration of 29 different cytokines and 22 immune cell subsets (described below). All biospecimens were collected, processed, and stored following established and validated standard operating procedures in our laboratory (4). To reduce inter-assay variability, all assays were batch-analyzed after study completion. All blood samples were collected at approximately the same time of day (between 0800h and 0100 h ) in order to minimize the contribution of circadian variation to the fluctuation of immune parameters. 3.2.1. Peripheral blood mononuclear cell (PBMC) immunophenotyping for immune cell subsets
Blood was separated into platelet poor plasma and PBMC using a density gradient (Ficol-hypaque, Amersham, Uppsala, Sweden). Plasma samples were stored at -70 ºC, and PBMC were stored in liquid nitrogen. Immunophenotyping of PBMC was performed by flow cytometry using FITC- and PE-conjugated antibodies to CD3, CD4, CD8, CD16, CD56, CD62L, CD69, TIM3 (T-cell immunoglobulin domain and mucin domain 3), CD294,

Biorhythmic fluctuation of systemic immunity in melanoma
3
HLA-DR, CD11c, CD123, CD14, CD197, CD206, and B7-H1 (Becton-Dickinson, Franklin Lakes, NJ). In addition, intracellular staining for FoxP3 (BioLegend, San Diego, CA) was performed according to the manufacturer’s instructions. Data were processed using Cellquest software (Becton-Dickinson, Franklin Lakes, NJ). PBMC bio-specimens were analyzed for the frequencies of T cells (CD3+), T helper cells (CD3+4+), CTL (CD3+8+), natural killer cells (NK, CD16+56+), T helper 1 (Th1) cells (CD4+TIM3+), Th2 cells (CD4+294+), T regulatory cells (Treg, CD4+25+FoxP3+), type 1 dendritic cells (DC1, CD11c+HLA-DR+), type 2 dendritic cells (DC2, CD123+HLA-DR+), type 1 macrophages (M1, CD14+197+), type 2 macrophages (M2, CD14+206+) and for the activation status of these cell types. In order to access the Th1/Th2 balance we stained PBMC with anti-human CD4, CD294, and TIM-3. The stained cells were analyzed on the LSRII (Becton Dickinson Franklin Lakes, NJ). The CD4 positive population was gated and the percent of CD4 cells positive for either CD294 or TIM-3 was determined. Our preliminary data suggests that CD4/CD294 positive Th2 cells exclusively produce IL-4 and not IFN-gamma upon PMA and ionomycin stimulation (data not shown). Conversely, CD4/TIM-3 positive Th1 cells exclusively produce IFN-gamma and not IL-4 following the same in vitro stimulation. Enumeration of Treg was performed using intracellular staining for FoxP3 of CD4/25 positive lymphocytes.
3.2.2. Plasma cytokine profiling
Protein levels for 29 cytokines, chemokines, and growth factors, including IL-1beta, IL-1r alpha, IL-2, IL-4, IL-5, IL-6, IL-7, IL-8, IL-9, IL-10, IL-12(p70), IL-13, IL-15, IL-17, basic fibroblast growth factor (FGF), Eotaxin, granulocyte colony-stimulating factor (G-CSF), granulocyte-macrophage colony-stimulating factor (GM-CSF), interferon gamma (IFN-gamma), 10 kDa interferon-gamma-induced protein (IP-10), macrophage chemoattractant protein 1 (MCP-1), migration inhibitory protein 1alpha (MIP-1alpha), MIP-1beta, platelet-derived growth factor (PDGF), Regulated upon Activation Normal T-cell Expressed and Secreted (RANTES), tumor necrosis factor alpha (TNF-alpha), vascular endothelial growth factor (VEGF) were measured using the BioRad human 27-plex cytokine panel (Cat # 171-A11127, Bio-Rad, San Diego CA) as per manufacturer's instructions. Transforming growth factor beta (TGF-beta1) was measured separately using a quantitative ELISA test and CRP concentration was measured in real time using a clinical laboratory test (20). All plasma cytokine measurements were performed in duplicates. Normal values for plasma cytokine concentrations were generated by analyzing 30 plasma samples from healthy donors (blood donors at the Mayo Clinic Dept. of Transfusion Medicine). A set of three normal plasma samples (standards) were run alongside all batches of plasma analysis in this study. If the cytokine concentrations of the “standard” samples differed by more than 20%, results were rejected and the plasma samples re-analyzed.
3.3. Statistical considerations
The current study was designed to assess the anti-tumor activity of timed administration of TMZ. A two-stage Simon design was chosen so that for a significance level of 0.10 there would a 90% chance of detecting that the objective tumor response rate (as defined by the RECIST criteria) is at least 20% when the true objective tumor
response rate is at least 5%. The clinical trial was stopped prior to achieving its accrual goals due to slow enrollment rate. Thus, the reported clinical results are only descriptive. Progression-free survival was defined as the time from registration to documentation of disease progression or death without disease progression documented.
3.4. Data analysis
Serially measured peripheral blood biomarkers were analyzed using CurveExpert 1.4 software (Daniel G. Hyams Hixson, TN) and GraphPad Prizm 4.0 software (GraphPad Software Inc. La Jolla CA) to construct time-dependent profiles of plasma cytokine/immune cell counts by fitting data points to selected mathematical functions. Technical reproducibility was assessed by the coefficient of variation (CV) among duplicates (average CV was 5.13% for 1593 data points). We used the correlation coefficient calculated by CurveExpert as the first criterion for goodness-of-fit, where St considers the distribution around a constant line and is calculated as and Sr
considers the deviation from the fitting curve
and is calculated as . Using GraphPad
Prizm we obtained R2 values, 95% confidence intervals for the parameters of the fitted functions, and 95% confidence bands for the fitted curves. R2 is calculated as R2=1- (Sr/St). These parameters were used as selection criteria in different steps of the analysis as described in the results section.
Most patients discontinued testing once the required
number of data points needed for sine curve fitting and prediction of the CRP peak was obtained. Consequently, we extrapolated the value for cytokines/immune cell counts on the day of treatment. We also calculated the first derivative (FD) of the fitted function; this shows whether the function increases (positive value), decreases (negative value) or is steady (zero), and the magnitude of FD reflects the magnitude of the trend. The range of plasma cytokine concentrations and cell counts varied significantly among study subjects and they were converted into relative values with the following formula: (Cmax- Cex)/(Cmax- Cmin), where Cmax is the maximum concentration within the observed time period, Cmin is the minimum concentration within the same period, and Cex is the extrapolated concentration on the day of treatment. The same conversion was applied to FD values. In cases in which both maximum and minimum FD were negative we applied the formula: -1*(1-(Dmax- Dex)/(Dmax- Dmin)), where Dmax – maximum FD within the observed time period, Dmin – minimum FD within the same period, Dex – FD of the function for the extrapolated point corresponding to the day of treatment, in order to compensate for the subtraction of two negative numbers. Secondary data analysis and visualisation was done using Partek GS 6.5 software (Partek Inc. Saint Louis, MO). 4. RESULTS 4.1. Patient characteristics and clinical outcomes
Twelve patients with unresectable stage IV malignant melanoma were enrolled in the study between June 2006 and November 2008 (Table 1). One patient canceled participation in the trial prior to starting TMZ therapy. Median age at enrollment

Biorhythmic fluctuation of systemic immunity in melanoma
Table 1. Clinical and demographic characteristics of the 11 patients with metastatic melanoma enrolled in the study Sex/
Age,y Original diagnosis/ Anatomic site
Metastatic Disease
Nr. of prior treatments1
Treatment start (# days after enrollment)
Nr. of TMZ cycles on study
PFS (days)
Patient #1
M/67 Nodular melanoma / ear
Lung Paratracheal LN
0 18 35 916
Patient #2
M/55 Desmoplastic melanoma/scalp
Lung; liver Spleen; pancreas bone
0 12 1 37
Patient #3
M/42 Nodular melanoma / limb
Subcutaneous limb/ trunk; adrenal glands bone
0 7 2 74
Patient #4
M/82 Nodular melanoma / scalp
Soft tissue scalp/ neck/ upper limbs
0 11 24 841
Patient #5
M/52 Cutaneous melanoma / scalp
Liver; Retroperitoneal LN
2 14 2 91
Patient #63
F/71 Cutaneous melanoma / scalp
Lung 1 17 4 132
Patient #7
M/71 Cutaneous melanoma / limb
Lung; liver; pelvic LN
3 14 2 68
Patient #8
M/51 Choroidal melanoma
Liver; bone 0 18 2 71
Patient #9
F/72 Choroidal melanoma
Liver; spleen 0 20 2 74
Patient #10
F/51 Cutaneous melanoma / scalp
Lung; soft tissue abdominal wall
2 15 2 70
Patient #11
F/56 Acral melanoma Lung; liver; soft tissue trunk; bone
4 2 0
Patient #12
F/72 Amelanotic melanoma / limb
Lung; liver; soft tissue trunk; mesentery; mediastinal & retroperitoneal LN
0 20 2 77
1 Refers to prior chemotherapy, biochemotherapy (IL-2, IFN), GM-CSF, or melanoma vaccine, 2 Patient required hospitalization for complications secondary to metastatic disease soon after enrollment and did not receive any further therapy, 3 Insufficient number of peripheral blood samples obtained prior to initiation of treatment.
Figure 1. Time-dependent profiles of plasma cytokines and immune cell subsets fitted to 9 different mathematical models (functions) in 10 patients with metastatic melanoma. Function codes: F0= No Fit/No data, F1= Linear function y=ax +b; F2= Exponential function: y=ae^(bx); F3= Exponential Association: y=a(1-exp(-bx); F4= Logistic function: y=a/(1+b*exp(-cx)); F5= Quadratic function: y=a+bx+cx^2; F6= Cosine function: y=a+b*cos(cx+d) ; F7= Rational function: y=(a+bx)/(1+cx+dx^2); F8= Gaussian function: y=a*exp((-(b-x)^2)/(2*c^2)); F9= MMF Model: y=(a*b+c*x^d)/(b+x^d); The goodness-of-fit was estimated using the correlation coefficient (CC) calculated by CurveExpert 1.4 software. The frequency distribution of the correlation coefficient was computed across all profiles and all patients and the value of the 75th percentile (0.86) was accepted as a cut-off to eliminate profiles which did not fit a model well. Black boxes represent the range of values from 25th to 75 th percentiles and whiskers represent the range from 10th to 90th percentiles.
Biorhythmic fluctuation of systemic immunity in melanoma
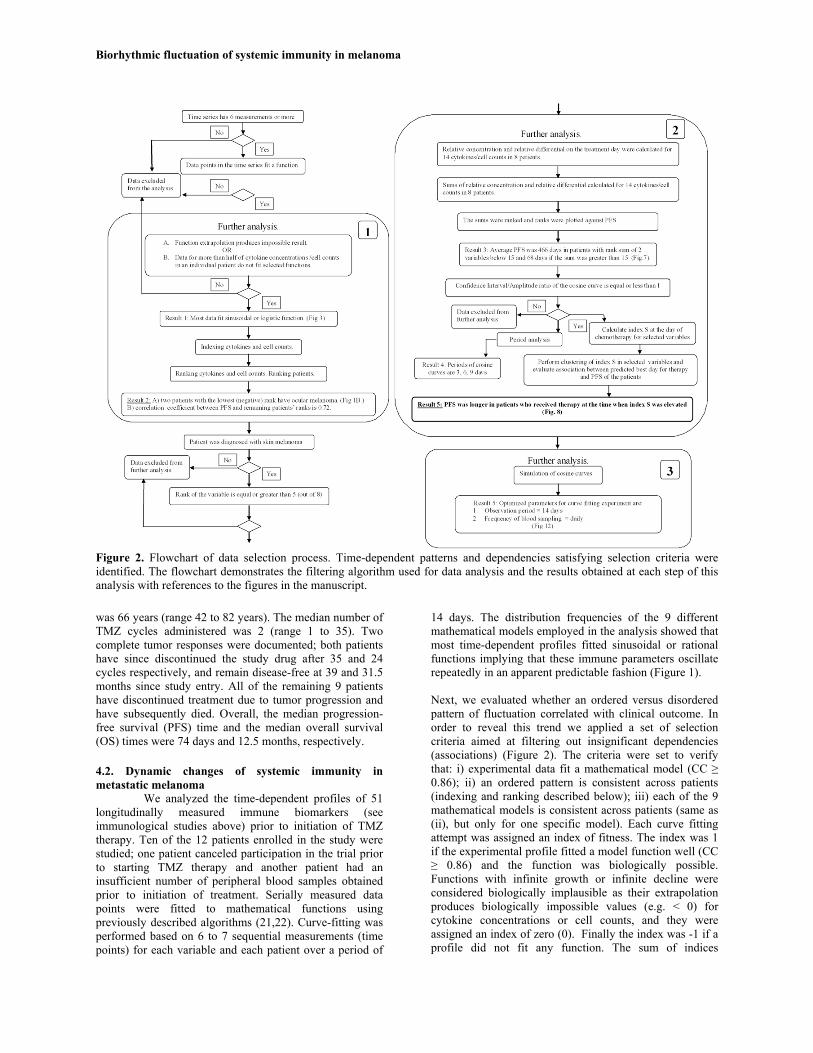
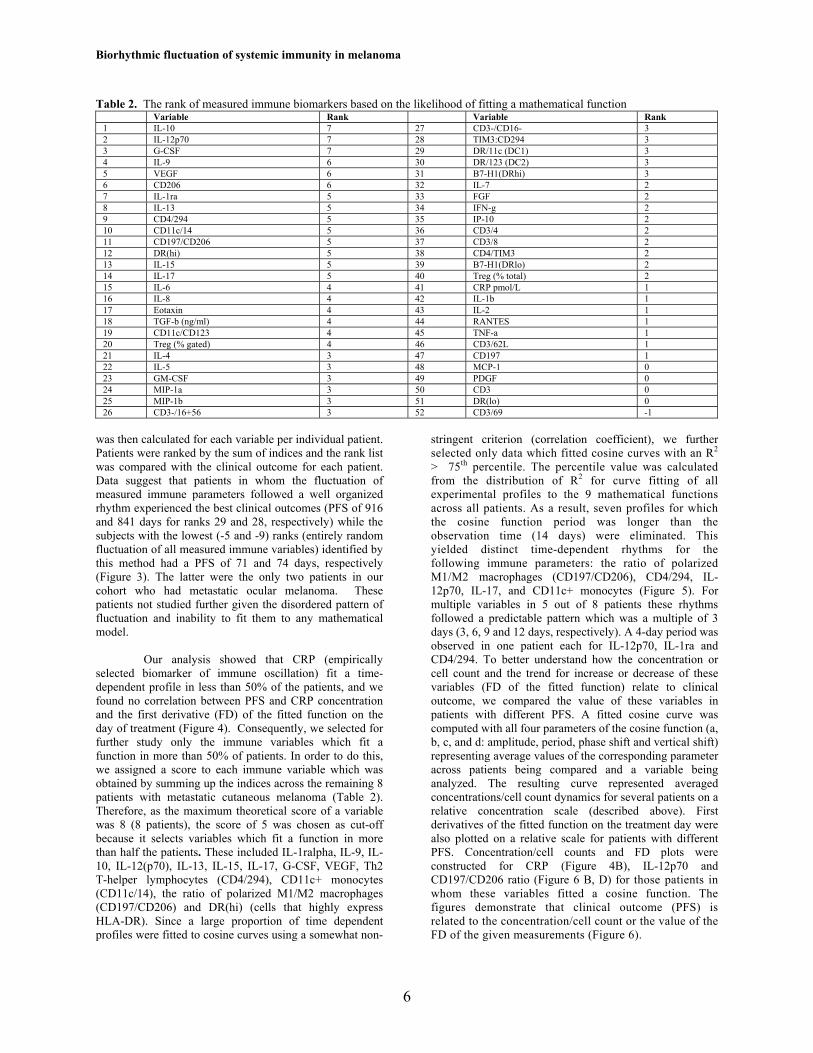
Figure 2. Flowchart of data selection process. Time-dependent patterns and dependencies satisfying selection criteria were identified. The flowchart demonstrates the filtering algorithm used for data analysis and the results obtained at each step of this analysis with references to the figures in the manuscript. was 66 years (range 42 to 82 years). The median number of TMZ cycles administered was 2 (range 1 to 35). Two complete tumor responses were documented; both patients have since discontinued the study drug after 35 and 24 cycles respectively, and remain disease-free at 39 and 31.5 months since study entry. All of the remaining 9 patients have discontinued treatment due to tumor progression and have subsequently died. Overall, the median progression-free survival (PFS) time and the median overall survival (OS) times were 74 days and 12.5 months, respectively.
4.2. Dynamic changes of systemic immunity in metastatic melanoma
We analyzed the time-dependent profiles of 51 longitudinally measured immune biomarkers (see immunological studies above) prior to initiation of TMZ therapy. Ten of the 12 patients enrolled in the study were studied; one patient canceled participation in the trial prior to starting TMZ therapy and another patient had an insufficient number of peripheral blood samples obtained prior to initiation of treatment. Serially measured data points were fitted to mathematical functions using previously described algorithms (21,22). Curve-fitting was performed based on 6 to 7 sequential measurements (time points) for each variable and each patient over a period of
14 days. The distribution frequencies of the 9 different mathematical models employed in the analysis showed that most time-dependent profiles fitted sinusoidal or rational functions implying that these immune parameters oscillate repeatedly in an apparent predictable fashion (Figure 1).
Next, we evaluated whether an ordered versus disordered pattern of fluctuation correlated with clinical outcome. In order to reveal this trend we applied a set of selection criteria aimed at filtering out insignificant dependencies (associations) (Figure 2). The criteria were set to verify that: i) experimental data fit a mathematical model (CC ≥ 0.86); ii) an ordered pattern is consistent across patients (indexing and ranking described below); iii) each of the 9 mathematical models is consistent across patients (same as (ii), but only for one specific model). Each curve fitting attempt was assigned an index of fitness. The index was 1 if the experimental profile fitted a model function well (CC ≥ 0.86) and the function was biologically possible. Functions with infinite growth or infinite decline were considered biologically implausible as their extrapolation produces biologically impossible values (e.g. < 0) for cytokine concentrations or cell counts, and they were assigned an index of zero (0). Finally the index was -1 if a profile did not fit any function. The sum of indices
Biorhythmic fluctuation of systemic immunity in melanoma
6
Table 2. The rank of measured immune biomarkers based on the likelihood of fitting a mathematical function Variable Rank Variable Rank 1 IL-10 7 27 CD3-/CD16- 3 2 IL-12p70 7 28 TIM3:CD294 3 3 G-CSF 7 29 DR/11c (DC1) 3 4 IL-9 6 30 DR/123 (DC2) 3 5 VEGF 6 31 B7-H1(DRhi) 3 6 CD206 6 32 IL-7 2 7 IL-1ra 5 33 FGF 2 8 IL-13 5 34 IFN-g 2 9 CD4/294 5 35 IP-10 2 10 CD11c/14 5 36 CD3/4 2 11 CD197/CD206 5 37 CD3/8 2 12 DR(hi) 5 38 CD4/TIM3 2 13 IL-15 5 39 B7-H1(DRlo) 2 14 IL-17 5 40 Treg (% total) 2 15 IL-6 4 41 CRP pmol/L 1 16 IL-8 4 42 IL-1b 1 17 Eotaxin 4 43 IL-2 1 18 TGF-b (ng/ml) 4 44 RANTES 1 19 CD11c/CD123 4 45 TNF-a 1 20 Treg (% gated) 4 46 CD3/62L 1 21 IL-4 3 47 CD197 1 22 IL-5 3 48 MCP-1 0 23 GM-CSF 3 49 PDGF 0 24 MIP-1a 3 50 CD3 0 25 MIP-1b 3 51 DR(lo) 0 26 CD3-/16+56 3 52 CD3/69 -1
was then calculated for each variable per individual patient. Patients were ranked by the sum of indices and the rank list was compared with the clinical outcome for each patient. Data suggest that patients in whom the fluctuation of measured immune parameters followed a well organized rhythm experienced the best clinical outcomes (PFS of 916 and 841 days for ranks 29 and 28, respectively) while the subjects with the lowest (-5 and -9) ranks (entirely random fluctuation of all measured immune variables) identified by this method had a PFS of 71 and 74 days, respectively (Figure 3). The latter were the only two patients in our cohort who had metastatic ocular melanoma. These patients not studied further given the disordered pattern of fluctuation and inability to fit them to any mathematical model.
Our analysis showed that CRP (empirically
selected biomarker of immune oscillation) fit a time-dependent profile in less than 50% of the patients, and we found no correlation between PFS and CRP concentration and the first derivative (FD) of the fitted function on the day of treatment (Figure 4). Consequently, we selected for further study only the immune variables which fit a function in more than 50% of patients. In order to do this, we assigned a score to each immune variable which was obtained by summing up the indices across the remaining 8 patients with metastatic cutaneous melanoma (Table 2). Therefore, as the maximum theoretical score of a variable was 8 (8 patients), the score of 5 was chosen as cut-off because it selects variables which fit a function in more than half the patients. These included IL-1ralpha, IL-9, IL-10, IL-12(p70), IL-13, IL-15, IL-17, G-CSF, VEGF, Th2 T-helper lymphocytes (CD4/294), CD11c+ monocytes (CD11c/14), the ratio of polarized M1/M2 macrophages (CD197/CD206) and DR(hi) (cells that highly express HLA-DR). Since a large proportion of time dependent profiles were fitted to cosine curves using a somewhat non-
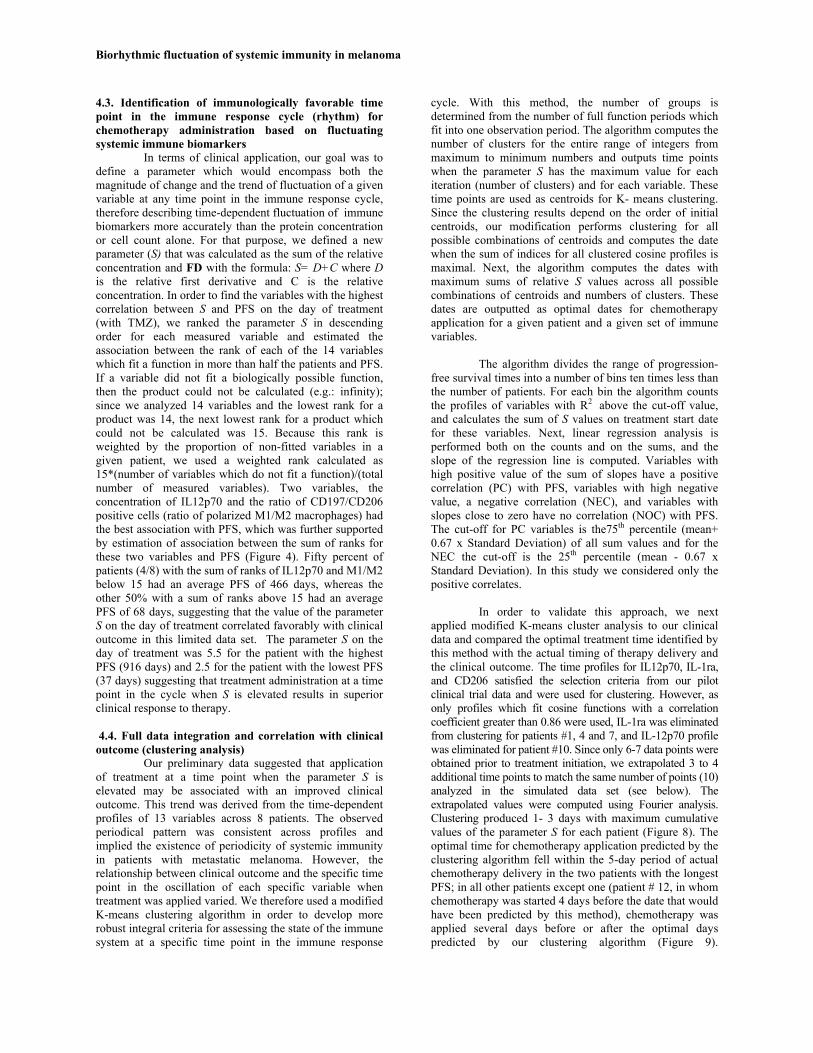
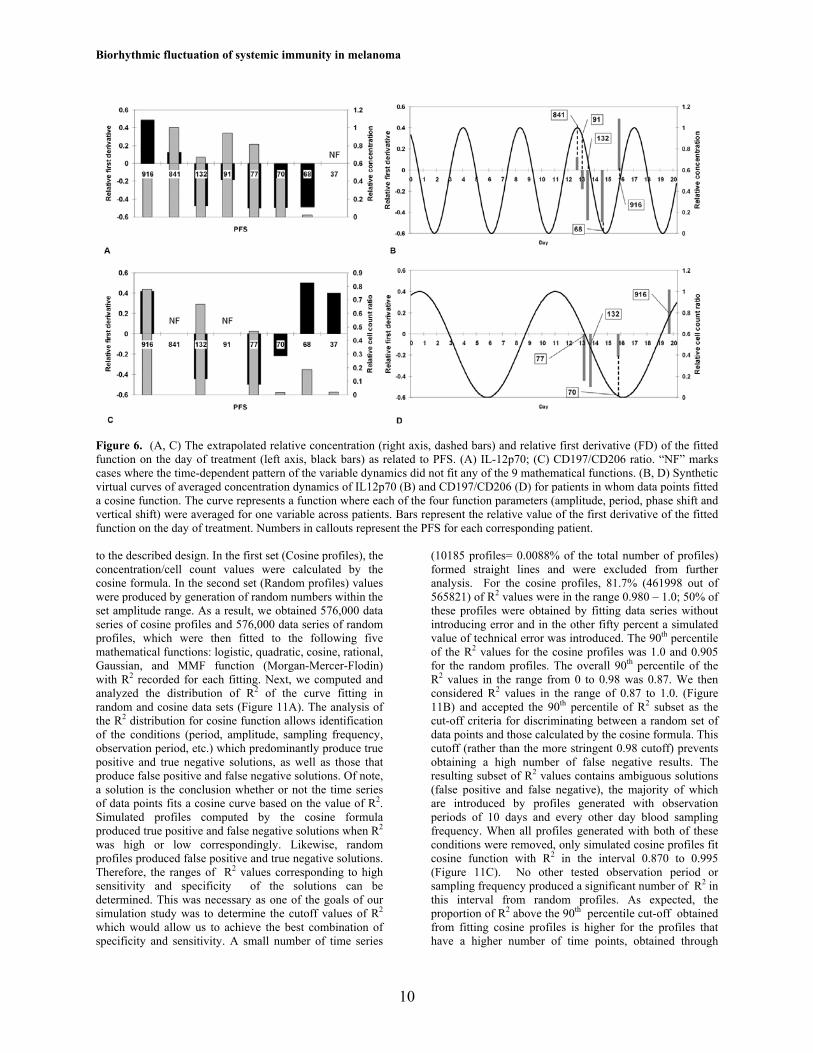
stringent criterion (correlation coefficient), we further selected only data which fitted cosine curves with an R2 > 75th percentile. The percentile value was calculated from the distribution of R2 for curve fitting of all experimental profiles to the 9 mathematical functions across all patients. As a result, seven profiles for which the cosine function period was longer than the observation time (14 days) were eliminated. This yielded distinct time-dependent rhythms for the following immune parameters: the ratio of polarized M1/M2 macrophages (CD197/CD206), CD4/294, IL-12p70, IL-17, and CD11c+ monocytes (Figure 5). For multiple variables in 5 out of 8 patients these rhythms followed a predictable pattern which was a multiple of 3 days (3, 6, 9 and 12 days, respectively). A 4-day period was observed in one patient each for IL-12p70, IL-1ra and CD4/294. To better understand how the concentration or cell count and the trend for increase or decrease of these variables (FD of the fitted function) relate to clinical outcome, we compared the value of these variables in patients with different PFS. A fitted cosine curve was computed with all four parameters of the cosine function (a, b, c, and d: amplitude, period, phase shift and vertical shift) representing average values of the corresponding parameter across patients being compared and a variable being analyzed. The resulting curve represented averaged concentrations/cell count dynamics for several patients on a relative concentration scale (described above). First derivatives of the fitted function on the treatment day were also plotted on a relative scale for patients with different PFS. Concentration/cell counts and FD plots were constructed for CRP (Figure 4B), IL-12p70 and CD197/CD206 ratio (Figure 6 B, D) for those patients in whom these variables fitted a cosine function. The figures demonstrate that clinical outcome (PFS) is related to the concentration/cell count or the value of the FD of the given measurements (Figure 6).

Biorhythmic fluctuation of systemic immunity in melanoma
7
Figure 3. Patient ranking based on ordered versus disordered pattern of fluctuation of serially measured immune parameters as related to clinical outcome (PFS). The ranks represent the sum of indices across 51 serially measured cytokine concentrations and immune cell counts for each patient over time; the maximum possible index value is 51.
Figure 4. (A) The extrapolated relative CRP concentration (right axis, dashed bars) and relative first derivative (FD) of the fitted function on the day of treatment (left axis, black bars) as related to PFS. “NF” marks cases where the time-dependent pattern of the variable dynamics did not fit any of the 9 mathematical functions. (B) Synthetic virtual curve of the averaged concentration dynamics of CRP for patients in whom data points fitted a cosine function. The curve represents a function where each of the four function parameters (amplitude, period, phase shift and vertical shift) were averaged for one variable across patients. Bars represent the relative value of the first derivative of the fitted function on the day of treatment. The numbers in callouts represent the PFS for each corresponding patient.
Biorhythmic fluctuation of systemic immunity in melanoma
4.3. Identification of immunologically favorable time point in the immune response cycle (rhythm) for chemotherapy administration based on fluctuating systemic immune biomarkers
In terms of clinical application, our goal was to define a parameter which would encompass both the magnitude of change and the trend of fluctuation of a given variable at any time point in the immune response cycle, therefore describing time-dependent fluctuation of immune biomarkers more accurately than the protein concentration or cell count alone. For that purpose, we defined a new parameter (S) that was calculated as the sum of the relative concentration and FD with the formula: S= D+C where D is the relative first derivative and C is the relative concentration. In order to find the variables with the highest correlation between S and PFS on the day of treatment (with TMZ), we ranked the parameter S in descending order for each measured variable and estimated the association between the rank of each of the 14 variables which fit a function in more than half the patients and PFS. If a variable did not fit a biologically possible function, then the product could not be calculated (e.g.: infinity); since we analyzed 14 variables and the lowest rank for a product was 14, the next lowest rank for a product which could not be calculated was 15. Because this rank is weighted by the proportion of non-fitted variables in a given patient, we used a weighted rank calculated as 15*(number of variables which do not fit a function)/(total number of measured variables). Two variables, the concentration of IL12p70 and the ratio of CD197/CD206 positive cells (ratio of polarized M1/M2 macrophages) had the best association with PFS, which was further supported by estimation of association between the sum of ranks for these two variables and PFS (Figure 4). Fifty percent of patients (4/8) with the sum of ranks of IL12p70 and M1/M2 below 15 had an average PFS of 466 days, whereas the other 50% with a sum of ranks above 15 had an average PFS of 68 days, suggesting that the value of the parameter S on the day of treatment correlated favorably with clinical outcome in this limited data set. The parameter S on the day of treatment was 5.5 for the patient with the highest PFS (916 days) and 2.5 for the patient with the lowest PFS (37 days) suggesting that treatment administration at a time point in the cycle when S is elevated results in superior clinical response to therapy. 4.4. Full data integration and correlation with clinical outcome (clustering analysis)
Our preliminary data suggested that application of treatment at a time point when the parameter S is elevated may be associated with an improved clinical outcome. This trend was derived from the time-dependent profiles of 13 variables across 8 patients. The observed periodical pattern was consistent across profiles and implied the existence of periodicity of systemic immunity in patients with metastatic melanoma. However, the relationship between clinical outcome and the specific time point in the oscillation of each specific variable when treatment was applied varied. We therefore used a modified K-means clustering algorithm in order to develop more robust integral criteria for assessing the state of the immune system at a specific time point in the immune response
cycle. With this method, the number of groups is determined from the number of full function periods which fit into one observation period. The algorithm computes the number of clusters for the entire range of integers from maximum to minimum numbers and outputs time points when the parameter S has the maximum value for each iteration (number of clusters) and for each variable. These time points are used as centroids for K- means clustering. Since the clustering results depend on the order of initial centroids, our modification performs clustering for all possible combinations of centroids and computes the date when the sum of indices for all clustered cosine profiles is maximal. Next, the algorithm computes the dates with maximum sums of relative S values across all possible combinations of centroids and numbers of clusters. These dates are outputted as optimal dates for chemotherapy application for a given patient and a given set of immune variables.
The algorithm divides the range of progression-
free survival times into a number of bins ten times less than the number of patients. For each bin the algorithm counts the profiles of variables with R2 above the cut-off value, and calculates the sum of S values on treatment start date for these variables. Next, linear regression analysis is performed both on the counts and on the sums, and the slope of the regression line is computed. Variables with high positive value of the sum of slopes have a positive correlation (PC) with PFS, variables with high negative value, a negative correlation (NEC), and variables with slopes close to zero have no correlation (NOC) with PFS. The cut-off for PC variables is the75th percentile (mean+ 0.67 x Standard Deviation) of all sum values and for the NEC the cut-off is the 25th percentile (mean - 0.67 x Standard Deviation). In this study we considered only the positive correlates.
In order to validate this approach, we next
applied modified K-means cluster analysis to our clinical data and compared the optimal treatment time identified by this method with the actual timing of therapy delivery and the clinical outcome. The time profiles for IL12p70, IL-1ra, and CD206 satisfied the selection criteria from our pilot clinical trial data and were used for clustering. However, as only profiles which fit cosine functions with a correlation coefficient greater than 0.86 were used, IL-1ra was eliminated from clustering for patients #1, 4 and 7, and IL-12p70 profile was eliminated for patient #10. Since only 6-7 data points were obtained prior to treatment initiation, we extrapolated 3 to 4 additional time points to match the same number of points (10) analyzed in the simulated data set (see below). The extrapolated values were computed using Fourier analysis. Clustering produced 1- 3 days with maximum cumulative values of the parameter S for each patient (Figure 8). The optimal time for chemotherapy application predicted by the clustering algorithm fell within the 5-day period of actual chemotherapy delivery in the two patients with the longest PFS; in all other patients except one (patient # 12, in whom chemotherapy was started 4 days before the date that would have been predicted by this method), chemotherapy was applied several days before or after the optimal days predicted by our clustering algorithm (Figure 9).
Biorhythmic fluctuation of systemic immunity in melanoma
9
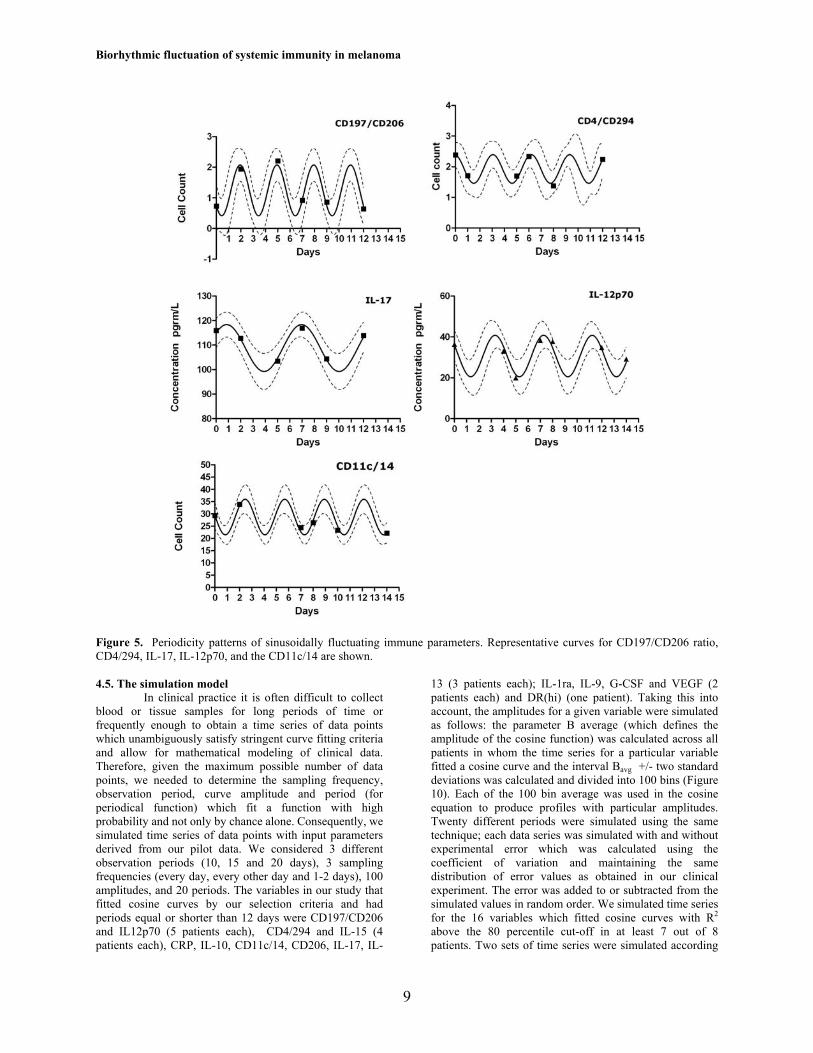
Figure 5. Periodicity patterns of sinusoidally fluctuating immune parameters. Representative curves for CD197/CD206 ratio, CD4/294, IL-17, IL-12p70, and the CD11c/14 are shown.
4.5. The simulation model
In clinical practice it is often difficult to collect blood or tissue samples for long periods of time or frequently enough to obtain a time series of data points which unambiguously satisfy stringent curve fitting criteria and allow for mathematical modeling of clinical data. Therefore, given the maximum possible number of data points, we needed to determine the sampling frequency, observation period, curve amplitude and period (for periodical function) which fit a function with high probability and not only by chance alone. Consequently, we simulated time series of data points with input parameters derived from our pilot data. We considered 3 different observation periods (10, 15 and 20 days), 3 sampling frequencies (every day, every other day and 1-2 days), 100 amplitudes, and 20 periods. The variables in our study that fitted cosine curves by our selection criteria and had periods equal or shorter than 12 days were CD197/CD206 and IL12p70 (5 patients each), CD4/294 and IL-15 (4 patients each), CRP, IL-10, CD11c/14, CD206, IL-17, IL-
13 (3 patients each); IL-1ra, IL-9, G-CSF and VEGF (2 patients each) and DR(hi) (one patient). Taking this into account, the amplitudes for a given variable were simulated as follows: the parameter B average (which defines the amplitude of the cosine function) was calculated across all patients in whom the time series for a particular variable fitted a cosine curve and the interval Bavg +/- two standard deviations was calculated and divided into 100 bins (Figure 10). Each of the 100 bin average was used in the cosine equation to produce profiles with particular amplitudes. Twenty different periods were simulated using the same technique; each data series was simulated with and without experimental error which was calculated using the coefficient of variation and maintaining the same distribution of error values as obtained in our clinical experiment. The error was added to or subtracted from the simulated values in random order. We simulated time series for the 16 variables which fitted cosine curves with R2 above the 80 percentile cut-off in at least 7 out of 8 patients. Two sets of time series were simulated according
Biorhythmic fluctuation of systemic immunity in melanoma
10
Figure 6. (A, C) The extrapolated relative concentration (right axis, dashed bars) and relative first derivative (FD) of the fitted function on the day of treatment (left axis, black bars) as related to PFS. (A) IL-12p70; (C) CD197/CD206 ratio. “NF” marks cases where the time-dependent pattern of the variable dynamics did not fit any of the 9 mathematical functions. (B, D) Synthetic virtual curves of averaged concentration dynamics of IL12p70 (B) and CD197/CD206 (D) for patients in whom data points fitted a cosine function. The curve represents a function where each of the four function parameters (amplitude, period, phase shift and vertical shift) were averaged for one variable across patients. Bars represent the relative value of the first derivative of the fitted function on the day of treatment. Numbers in callouts represent the PFS for each corresponding patient.
to the described design. In the first set (Cosine profiles), the concentration/cell count values were calculated by the cosine formula. In the second set (Random profiles) values were produced by generation of random numbers within the set amplitude range. As a result, we obtained 576,000 data series of cosine profiles and 576,000 data series of random profiles, which were then fitted to the following five mathematical functions: logistic, quadratic, cosine, rational, Gaussian, and MMF function (Morgan-Mercer-Flodin) with R2 recorded for each fitting. Next, we computed and analyzed the distribution of R2 of the curve fitting in random and cosine data sets (Figure 11A). The analysis of the R2 distribution for cosine function allows identification of the conditions (period, amplitude, sampling frequency, observation period, etc.) which predominantly produce true positive and true negative solutions, as well as those that produce false positive and false negative solutions. Of note, a solution is the conclusion whether or not the time series of data points fits a cosine curve based on the value of R2. Simulated profiles computed by the cosine formula produced true positive and false negative solutions when R2 was high or low correspondingly. Likewise, random profiles produced false positive and true negative solutions. Therefore, the ranges of R2 values corresponding to high sensitivity and specificity of the solutions can be determined. This was necessary as one of the goals of our simulation study was to determine the cutoff values of R2 which would allow us to achieve the best combination of specificity and sensitivity. A small number of time series
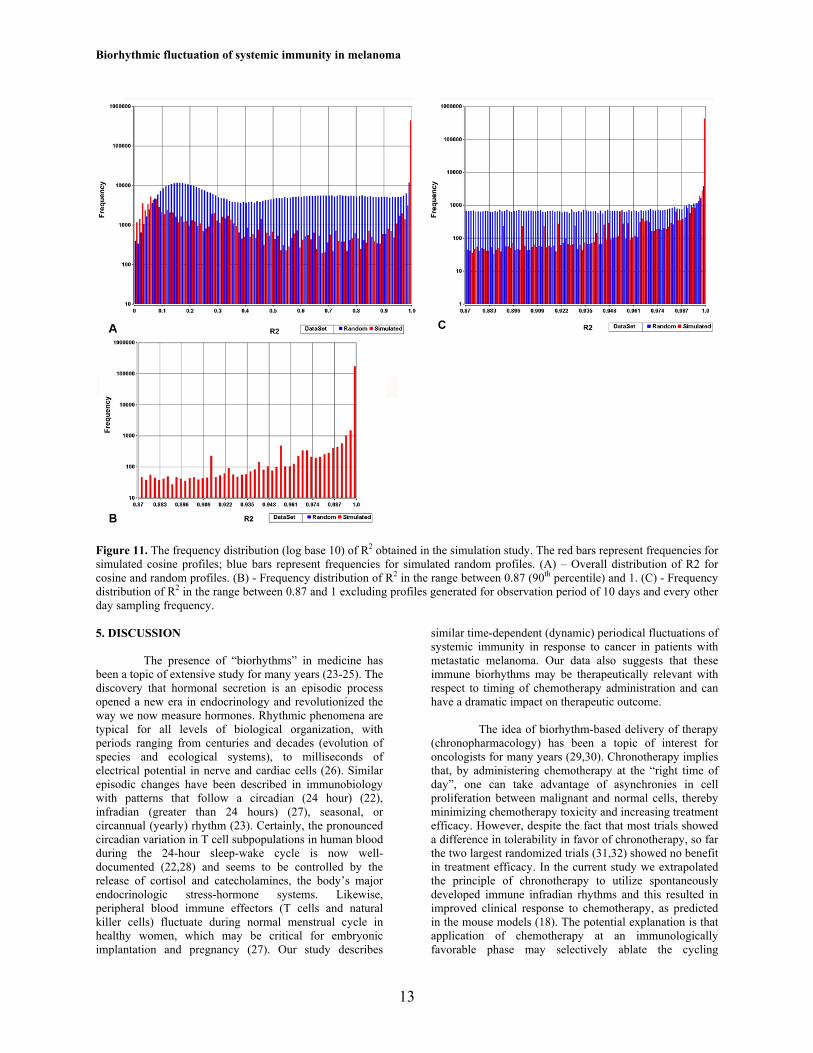
(10185 profiles= 0.0088% of the total number of profiles) formed straight lines and were excluded from further analysis. For the cosine profiles, 81.7% (461998 out of 565821) of R2 values were in the range 0.980 – 1.0; 50% of these profiles were obtained by fitting data series without introducing error and in the other fifty percent a simulated value of technical error was introduced. The 90th percentile of the R2 values for the cosine profiles was 1.0 and 0.905 for the random profiles. The overall 90th percentile of the R2 values in the range from 0 to 0.98 was 0.87. We then considered R2 values in the range of 0.87 to 1.0. (Figure 11B) and accepted the 90th percentile of R2 subset as the cut-off criteria for discriminating between a random set of data points and those calculated by the cosine formula. This cutoff (rather than the more stringent 0.98 cutoff) prevents obtaining a high number of false negative results. The resulting subset of R2 values contains ambiguous solutions (false positive and false negative), the majority of which are introduced by profiles generated with observation periods of 10 days and every other day blood sampling frequency. When all profiles generated with both of these conditions were removed, only simulated cosine profiles fit cosine function with R2 in the interval 0.870 to 0.995 (Figure 11C). No other tested observation period or sampling frequency produced a significant number of R2 in this interval from random profiles. As expected, the proportion of R2 above the 90th percentile cut-off obtained from fitting cosine profiles is higher for the profiles that have a higher number of time points, obtained through

Biorhythmic fluctuation of systemic immunity in melanoma
11
Figure 7. The relationship between PFS (days) and the sum of weighted ranks of IL-12p70 and CD197/CD206 ratio.
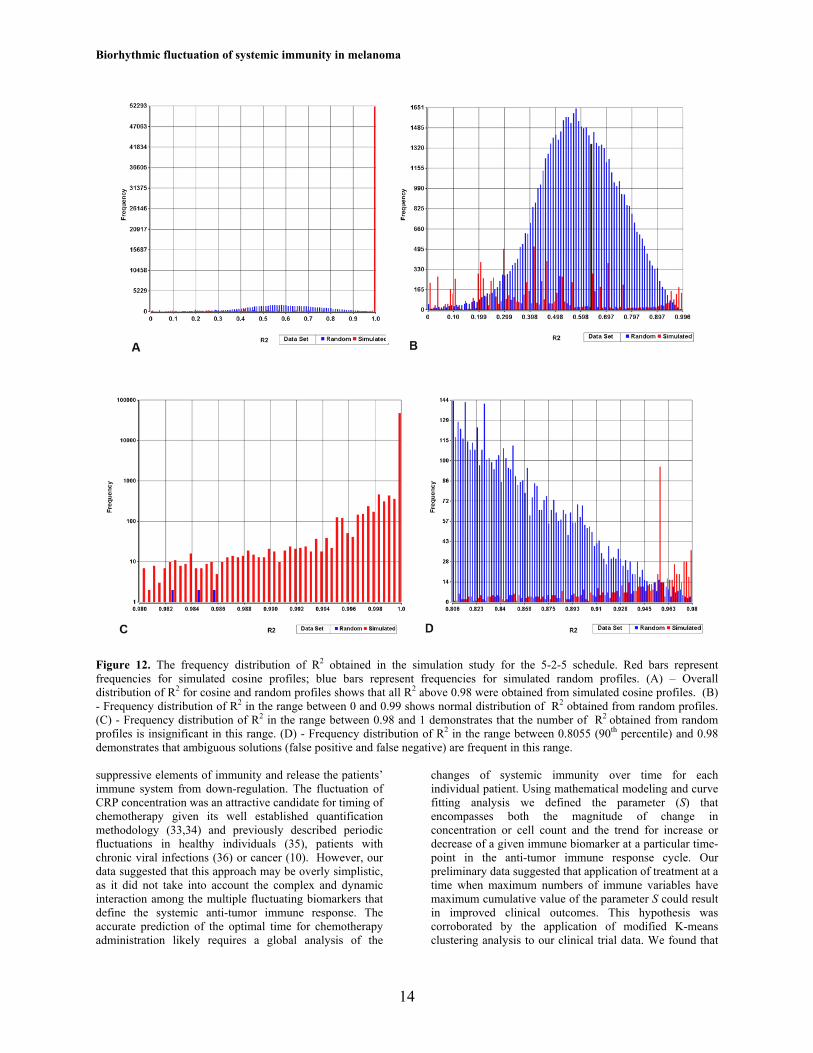
Figure 8. Clustering analysis identifies the optimal time for chemotherapy delivery. The association between the 5-day period of TMZ oral chemotherapy delivery (orange bars) in relationship to the optimal time predicted by the clustering algorithm (black arrows) and PFS. longer observation periods or more frequent sampling, which is often a limiting factor in clinical practice. As a result, we used simulation studies to define the best clinical trial design that meets both the demands of curve fitting methods and clinical constraints. A schedule satisfying these conditions is 5 sequential days of blood sample collection followed by 2 days of rest and another 5 days of collection, which gives 6 degrees of freedom for data fitting to a cosine function. Further in the text we will refer to this schedule as 5-2-5. We next simulated time series for this schedule. All R2 values (56,119 out of 56,128) above 0.980 were generated by fitting simulated cosine profiles (Figure 12 A, C). The R2 obtained from fitting random profiles to
cosine functions were largely in the range 0.000 to 0.980. The distribution of R2 in this range is quasi- normal (Figure 12B) and the 90th percentile of this subset of R2 values is 0.8055. Therefore, if 90th percentile is selected as a cut-off criteria for discriminating between the random set of data points and those calculated by the cosine formula, the ambiguous solutions will lie in the R2 value range from 0.8055 to 0.980 (Figure 12D). When we performed the receiver operating characteristic (ROC) analysis of 16 variables for this interval of R2 values, the best performing variable was IL-1ra (area under the curve (AUC) = 0.955) and the worst performing variable was CRP (AUC= 0.734).

Biorhythmic fluctuation of systemic immunity in melanoma
12
Figure 9. Clustering of time-dependent profiles for IL-12p70 (red) and IL-1ra (black). The parameter S was calculated for each variable and clustering was performed by modified k-means clustering (see section 4.4) to find the optimal time for chemotherapy delivery on the days when the sum of the parameter S for the two variables was highest (vertical black lines). The day when chemotherapy was actually applied is represented by a yellow line. The analysis for patient # 1 (PFS= 916 days) is shown.
Figure 10. Data simulation design. 100 amplitudes (A) and 20 periods (B) were derived from the average values and standard deviations (SD) of measurements of these parameters in 5-7 patients for each of 16 variables (F). Data sets were simulated for cosine and for random distribution of data points. The simulation was performed for three different sampling frequencies (C), three observation periods (D), and with or without technical error of the measurement (E).
Biorhythmic fluctuation of systemic immunity in melanoma
13
Figure 11. The frequency distribution (log base 10) of R2 obtained in the simulation study. The red bars represent frequencies for simulated cosine profiles; blue bars represent frequencies for simulated random profiles. (A) – Overall distribution of R2 for cosine and random profiles. (B) - Frequency distribution of R2 in the range between 0.87 (90th percentile) and 1. (C) - Frequency distribution of R2 in the range between 0.87 and 1 excluding profiles generated for observation period of 10 days and every other day sampling frequency. 5. DISCUSSION
The presence of “biorhythms” in medicine has been a topic of extensive study for many years (23-25). The discovery that hormonal secretion is an episodic process opened a new era in endocrinology and revolutionized the way we now measure hormones. Rhythmic phenomena are typical for all levels of biological organization, with periods ranging from centuries and decades (evolution of species and ecological systems), to milliseconds of electrical potential in nerve and cardiac cells (26). Similar episodic changes have been described in immunobiology with patterns that follow a circadian (24 hour) (22), infradian (greater than 24 hours) (27), seasonal, or circannual (yearly) rhythm (23). Certainly, the pronounced circadian variation in T cell subpopulations in human blood during the 24-hour sleep-wake cycle is now well-documented (22,28) and seems to be controlled by the release of cortisol and catecholamines, the body’s major endocrinologic stress-hormone systems. Likewise, peripheral blood immune effectors (T cells and natural killer cells) fluctuate during normal menstrual cycle in healthy women, which may be critical for embryonic implantation and pregnancy (27). Our study describes
similar time-dependent (dynamic) periodical fluctuations of systemic immunity in response to cancer in patients with metastatic melanoma. Our data also suggests that these immune biorhythms may be therapeutically relevant with respect to timing of chemotherapy administration and can have a dramatic impact on therapeutic outcome.
The idea of biorhythm-based delivery of therapy
(chronopharmacology) has been a topic of interest for oncologists for many years (29,30). Chronotherapy implies that, by administering chemotherapy at the “right time of day”, one can take advantage of asynchronies in cell proliferation between malignant and normal cells, thereby minimizing chemotherapy toxicity and increasing treatment efficacy. However, despite the fact that most trials showed a difference in tolerability in favor of chronotherapy, so far the two largest randomized trials (31,32) showed no benefit in treatment efficacy. In the current study we extrapolated the principle of chronotherapy to utilize spontaneously developed immune infradian rhythms and this resulted in improved clinical response to chemotherapy, as predicted in the mouse models (18). The potential explanation is that application of chemotherapy at an immunologically favorable phase may selectively ablate the cycling
Biorhythmic fluctuation of systemic immunity in melanoma
14
Figure 12. The frequency distribution of R2 obtained in the simulation study for the 5-2-5 schedule. Red bars represent frequencies for simulated cosine profiles; blue bars represent frequencies for simulated random profiles. (A) – Overall distribution of R2 for cosine and random profiles shows that all R2 above 0.98 were obtained from simulated cosine profiles. (B) - Frequency distribution of R2 in the range between 0 and 0.99 shows normal distribution of R2 obtained from random profiles. (C) - Frequency distribution of R2 in the range between 0.98 and 1 demonstrates that the number of R2 obtained from random profiles is insignificant in this range. (D) - Frequency distribution of R2 in the range between 0.8055 (90th percentile) and 0.98 demonstrates that ambiguous solutions (false positive and false negative) are frequent in this range.
suppressive elements of immunity and release the patients’ immune system from down-regulation. The fluctuation of CRP concentration was an attractive candidate for timing of chemotherapy given its well established quantification methodology (33,34) and previously described periodic fluctuations in healthy individuals (35), patients with chronic viral infections (36) or cancer (10). However, our data suggested that this approach may be overly simplistic, as it did not take into account the complex and dynamic interaction among the multiple fluctuating biomarkers that define the systemic anti-tumor immune response. The accurate prediction of the optimal time for chemotherapy administration likely requires a global analysis of the
changes of systemic immunity over time for each individual patient. Using mathematical modeling and curve fitting analysis we defined the parameter (S) that encompasses both the magnitude of change in concentration or cell count and the trend for increase or decrease of a given immune biomarker at a particular time-point in the anti-tumor immune response cycle. Our preliminary data suggested that application of treatment at a time when maximum numbers of immune variables have maximum cumulative value of the parameter S could result in improved clinical outcomes. This hypothesis was corroborated by the application of modified K-means clustering analysis to our clinical trial data. We found that
Biorhythmic fluctuation of systemic immunity in melanoma
15
the time of chemotherapy application predicted by the clustering algorithm fell within the 5-day period of actual chemotherapy application only in the two patients with the longest PFS, while virtually all other patients received chemotherapy several days before or after the optimal days predicted by clustering. The two patients (25%) that were accurately selected for timing of therapy by our method had a complete response (CR) to treatment delivered based on the studied immune biorhythms. This response rate is much higher than the CR rate of 3 % of TMZ treated historical controls (37).
It has been know for some time that disruption of
biological rhythms may have clinical consequences. For instance, carefully designed observational studies have shown that people whose circadian rhythms are chronically disrupted are more prone to developing cancer (e.g. night-shift workers and breast cancer risk) (38, 39). Likewise, cancer growth may disturb biorhythms in the host (40, 41). These observations are consistent with our findings that patients with a disorganized (non-curve-fitting) anti-tumor immune response experienced a decreased disease-free survival (average PFS of 69 days), relative to those in whom the measured immune parameters followed a predictable biorhythm (average PFS of 465 days). Surprisingly, the subjects with an entirely random fluctuation of cytokine concentrations/cell counts identified by this method were the only two patients with metastatic ocular melanoma enrolled in this study. Ocular melanoma has previously been shown to differ markedly from other melanoma subtypes both in clinical behavior and molecular makeup and our findings raise the question whether these patients may have a distinctive immunological signature as well. On the other hand, the best clinical responses were observed in the two patients who maintained a well synchronized anti-tumor immune response, possibly overcoming the global immune dysfunction of malignancy. Timed delivery of chemotherapy in that context may have allowed for a more precise therapeutic intervention leading to putative depletion of immune down-regulatory signals in favor of effective anti-tumor immunity.
While cytotoxic anticancer drugs are intended to
primarily affect cancer cells directly, many such agents also exhibit “side effects” impacting cells of the immune system (bone marrow). Hematologic (bone marrow) toxicity of cytotoxic chemotherapy is the most common side effect of modern anti-cancer therapy and the principal determinant of the design of cancer chemotherapy treatment schedules. This common (nearly universal) side effect of chemotherapy is seldom considered in the interpretation of clinical efficacy for a given anti-cancer agent. Although the underlying rationale is not yet certain, it is possible that the common hematologic toxicities of TMZ yield alterations of systemic immunity which may influence clinical outcome, as has been previously suggested (42). This effect appears to be related to Treg function (17, 42). Pharmacokinetic studies have demonstrated that PBMC exposed to five subsequent TMZ treatments (concentration and schedule comparable to that obtainable in the clinic) exhibited a significant inhibition of their proliferative response (43). Although TMZ administration would
theoretically inhibit desirable effector T cells as well, we propose that timed administration of this agent may selectively suppress Treg who lag behind T effectors in their clonotypic expansion (17). By that time, effector T cells would have proliferated and become activated and may be therefore less susceptible to the effects of TMZ chemotherapy. Clearly, administration of the same agent (TMZ) at the same dose/schedule only delivered at a different time in the “immune biorhythm” of the patient may have an entirely different cumulative effect (depletion of clonotypic tumor specific CTL) on immune homeostasis and possibly on clinical outcome.
Albeit intriguing and suggestive, our present data
can only be interpreted as hypothesis generating due primarily to the small number of patients and specimens studied. At the time of the original design of this study we had no appreciation of the underlining immune biorhythms and therefore had to design a clinical trial in which we empirically selected an arbitrary pre-treatment observation period (14 days) in which we would collect an arbitrary number of blood samples (5-8) collected at arbitrary intervals (every 2-3 days). The presented data have now given us the necessary information to design a follow-up clinical trial that will be better suited to truly test the hypothesis proposed herein. The development of a strong mathematical model, central to our understanding of dynamic processes requires an adequate number of serial measurements. Fitting of 6 or 7 data points to a function with four parameters (sinusoidal and rational functions) can be ambiguous even if the goodness-of-fit metrics are satisfactory (R2 and coefficient of variation are close to 1.0, confidence interval is narrow.). Therefore, in order to design a sample collection schedule which permits obtaining a sufficient number of time points but keeps the blood collection burden as low as possible for our patients, we used simulation and modeling studies for different observation periods and sampling frequencies. The goal was to identify a clinical trial design which meets both the analytical (mathematical modeling) and clinical (burden to patient) requirements. The result of these analyses suggested that a schedule satisfying these conditions is 5 sequential days of blood sample collection followed by 2 days of rest and another 5 days of collection (5-2-5 schedule) yielding sufficient statistical power to address the question at hand. Based on these findings we were able to design a clinical trial that directly tests the hypothesis generated by our presented data which suggests that synchronizing conventional chemotherapy delivery with pre-existing, patient-specific (individualized) biorhythms, may yield improved clinical outcomes using mechanisms believed to only be a toxic side-effect of therapy (lymphodepletion). Said validation study is currently under way. 6. ACKNOLEDGEMENTS.
Alexey A. Leontovich and Roxana S. Dronca contributed equally to this work. We are thankful to Ms. Megan Welsh for valuable help with data analysis. We also thank Yaw Nti-Addea and Kabenla Armah for their input in software development. This study was funded by the Melvin S. Cohen Foundation and ImmunAid Pty. Ltd..

Biorhythmic fluctuation of systemic immunity in melanoma
16
7. REFERENCES 1. E Linos, SM Swetter, MG Cockburn, GA Colditz, CA Clarke: Increasing burden of melanoma in the United States. J Invest Dermatol, 129:1666-74. (2009) 2. A Jemal, R Siegel, E Ward, Y Hao, J Xu, MJ Thun: Cancer statistics, CA Cancer J Clin, 59:225-49 (2009) 3. CM Balch, JE Gershenwald, SJ Soong, JF Thompson, MB Atkins, DR Byrd, AC Buzaid, AJ Cochran, DG Coit, S Ding, AM Eggermont, KT Flaherty, PA Gimotty, JM Kirkwood, KM McMasters, MC Mihm Jr, DL Morton, MI Ross, AJ Sober, VK Sondak: Final version of the American Joint Committee on Cancer staging system for cutaneous melanoma. J Clin Oncol, 19:3635-48 (2001) 4. WK Nevala, CM Vachon, AA Leontovich, CG Scott, MA Thompson, SN Markovic: Evidence of systemic Th2-driven chronic inflammation in patients with metastatic melanoma. Clin Cancer Res,15:1931-1939 (2009) 5. J Weber: Immunotherapy for melanoma. Curr Opin Oncol (2010) 6. JM Kirkwood, AA Tarhini, MC Panelli, SJ Moschos, HM Zarour, LH Butterfield, HJ Gogas. Next generation of immunotherapy for melanoma.: J Clin Oncol, 26:3445-3455 (2008) 7. G Parmiani, C Castelli, M Santinami, L Rivoltini: Melanoma immunology: past, present and future. Curr Opin Oncol, 19:121-127 ( 2007) 8. ME Dudley, JC Yang, R Sherry, MS Hughes, R Royal, U Kammula, PF Robbins, J Huang, DE Citrin, SF Leitman, J Wunderlich, NP Restifo, A Thomasian, SG Downey, FO Smith, J Klapper, K Morton, C Laurencot, DE White, SA Rosenberg: Adoptive cell therapy for patients with metastatic melanoma: evaluation of intensive myeloablative chemoradiation preparative regimens. J Clin Oncol, 26:5233-239 (2008) 9. JJ Hong, SA Rosenberg, ME Dudley, JC Yang, DE White, JA Butman, RM Sherry: Successful treatment of melanoma brain metastases with adoptive cell therapy. Clin Cancer Res, 16:4892-4898 (2010) 10. BJ Coventry, ML Ashdown, MA Quinn, SN Markovic, SL Yatomi-Clarke, AP Robinson: CRP identifies homeostatic immune oscillations in cancer patients: a potential treatment targeting tool? J Transl Med,7:102 (2009) 11. WE Biddison, JC Palmer: Development of tumor cell resistance to syngeneic cell-mediated cytotoxicity during growth of ascitic mastocytoma P815Y. Proc Natl Acad Sci U S A, 74:329-333(1977) 12. E Celis, AH Hale, JH Russell, HN Eisen.: Cyclical changes in susceptibility of a myeloma tumor (LPC-1) to immune destruction. I. Changes in reactivity with cytotoxic
T lymphocytes and anti-H-2d sera. J Immunol, 122:954-958 (1979) 13. RJ North, I Bursuker: Generation and decay of the immune response to a progressive fibrosarcoma. I. Ly-1+2- suppressor T cells down-regulate the generation of Ly-1-2+ effector T cells. J Exp Med, 159:1295-1311 (1984) 14. T Hiura, H Kagamu, S Miura, A Ishida, H Tanaka, J Tanaka, F Gejyo, H Yoshizawa: Both regulatory T cells and antitumor effector T cells are primed in the same draining lymph nodes during tumor progression. J Immunol, 175:5058-5066 (2005) 15. MP Colombo, S Piconese: Regulatory-T-cell inhibition versus depletion: the right choice in cancer immunotherapy. Nat Rev Cancer, 7:880-887 (2007) 16. MW Beilharz, LM Sammels, A Paun, K Shaw, P van Eeden, MW Watson, ML Ashdown: Timed ablation of regulatory CD4+ T cells can prevent murine AIDS progression. J Immunol, 172:4917-4925 (2004) 17. AB Heimberger, W Sun, SF Hussain, M Dey, L Crutcher, K Aldape, M Gilbert, SJ Hassenbusch, R Sawaya, B Schmittling, GE Archer, DA Mitchell, DD Bigner, JH Sampson: Immunological responses in a patient with glioblastoma multiforme treated with sequential courses of temozolomide and immunotherapy: case study. Neuro Oncol, 10:98-103 (2008) 18. RJ North, M Awwad: Elimination of cycling CD4+ suppressor T cells with an anti-mitotic drug releases non-cycling CD8+ T cells to cause regression of an advanced lymphoma. Immunology, 71:90-95 (1990) 19. MR Ehrenstein, JG Evans, A Singh, S Moore, G Warnes, DA Isenberg, C Mauri: Compromised function of regulatory T cells in rheumatoid arthritis and reversal by anti-TNFalpha therapy. J Exp Med, 200:277-285 (2004) 20. N Tietz, C Burtis, E Ashwood: Tietz Textbook of Clinical Chemistry. 3rd edition. WB Saunders Company; Philadelphia (1999) 21. H Motulsky, A Christopoulos: Fitting models to biological data using linear and nonlinear regression: a practical guide to curve fitting. Oxford University Press, (2004) 22. S Dimitrov, C Benedict, D Heutling, J Westermann, J Born, T Lange: Cortisol and epinephrine control opposing circadian rhythms in T cell subsets. Blood, 113:5134-5143 (2009) 23. E Haus, DJ Lakatua, J Swoyer, L Sackett-Lundeen: Chronobiology in hematology and immunology. Am J Anat, 168:467-517 (1983) 24. MS Bray, ME Young: The role of cell-specific circadian clocks in metabolism and disease. Obes Rev, 10 Suppl 2:6-13 (2009)
Biorhythmic fluctuation of systemic immunity in melanoma
17
25. O Castanon-Cervantes, M Wu, JC Ehlen, K Paul, KL Gamble, RL Johnson, RC Besing, M Menaker, AT Gewirtz, AJ Davidson : Dysregulation of inflammatory responses by chronic circadian disruption. J Immunol, 185:5796-5805 (2010) 26. A Goldbeter: Computational approaches to cellular rhythms. Nature, 420:238-45 (2002) 27. S Lee, J Kim, B Jang, S Hur, U Jung, K Kil, B Na, M Lee, Y Choi, A Fukui, A Gilman-Sachs, JY Kwak-Kim: Fluctuation of peripheral blood T, B, and NK cells during a menstrual cycle of normal healthy women. J Immunol, 185:756-762 (2010) 28. T Abo, T Kawate, K Itoh, K Kumagai: Studies on the bioperiodicity of the immune response. I. Circadian rhythms of human T, B, and K cell traffic in the peripheral blood. J Immunol, 126:1360-1363 (1981) 29. WJ Hrushesky: Circadian timing of cancer chemotherapy. Science, 228:73-75 (1985) 30. WJ Hrushesky, GA Bjarnason: Circadian cancer therapy. J Clin Oncol, 11:1403-1417 (1993) 31. TJ Price, PJ Ross, T Hickish, D Tait, AR Norman, HE Ford, G Middleton, K Sumpter, M Hill, J Oates, D Cunningham: Phase III study of mitomycin-C with protracted venous infusion or circadian-timed infusion of 5-fluorouracil in advanced colorectal carcinoma. Clin Colorectal Cancer, 3:235-242 (2004) 32. S Giacchetti, B Perpoint, R Zidani, N Le Bail, R Faggiuolo, C Focan, P Chollet, JF Llory, Y Letourneau, B Coudert, F Bertheaut-Cvitkovic, D Larregain-Fournier, A Le Rol, S Walter, R Adam, JL Misset, F Levi: Phase III multicenter randomized trial of oxaliplatin added to chronomodulated fluorouracil-leucovorin as first-line treatment of metastatic colorectal cancer. J Clin Oncol, 18:136-147 (2000) 33. J Hartweg, M Gunter, R Perera, A Farmer, C Cull, C Schalkwijk, A Kok, H Twaalfhoven, R Holman, A Neil: Stability of soluble adhesion molecules, selectins, and C-reactive protein at various temperatures: implications for epidemiological and large-scale clinical studies. Clin Chem, 53:1858-1860 (2007) 34. JL Clarke, JL Anderson, JF Carlquist, RF Roberts, BD Horne, TL Bair, MJ Kolek, CP Mower, AM Crane, WL Roberts, JB Muhlestein: Comparison of differing C-reactive protein assay methods and their impact on cardiovascular risk assessment. Am J Cardiol, 95:155-158 (2005) 35. AR Rudnicka, A Rumley, GD Lowe, DP Strachan: Diurnal, seasonal, and blood-processing patterns in levels of circulating fibrinogen, fibrin D-dimer, C-reactive protein, tissue plasminogen activator, and von Willebrand factor in a 45-year-old population. Circulation, 115:996-1003 (2007)
36. M French, ML Ashdown: Intensive monitoring of viral load and C-reactive protein in HIV patients who have chosen to cease highly active anti-retroviral therapy (HAART) Unpublished data from ongoing study, Ongoing study (2003) 37. MR Middleton, JJ Grob, N Aaronson, G Fierlbeck, W Tilgen, S Seiter, M Gore, S Aamdal, J Cebon, A Coates, B Dreno, M Henz, D Schadendorf, A Kapp, J Weiss, U Fraass, P Statkevich, M Muller, N Thatcher: Randomized phase III study of temozolomide versus dacarbazine in the treatment of patients with advanced metastatic malignant melanoma. J Clin Oncol, 18:158-166 (2000) 38. ES Schernhammer, F Laden, FE Speizer, WC Willett, DJ Hunter, I Kawachi, GA Colditz: Rotating night shifts and risk of breast cancer in women participating in the nurses' health study. J Natl Cancer Inst, 93:1563-1568 (2001) 39. J Hansen: Increased breast cancer risk among women who work predominantly at night. Epidemiology 12:74-77 (2001) 40. LG Keith, JJ Oleszczuk, M Laguens: Circadian rhythm chaos: a new breast cancer marker. Int J Fertil Womens Med, 46:238-247 (2001) 41. MC Mormont, AM Langouet, B Claustrat, A Bogdan, S Marion, J Waterhouse, Y Touitou, F Levi: Marker rhythms of circadian system function: a study of patients with metastatic colorectal cancer and good performance status. Chronobiol Int, 19:141-155 (2002) 42. C Banissi, F Ghiringhelli, L Chen, AF Carpentier: Treg depletion with a low-dose metronomic temozolomide regimen in a rat glioma model. Cancer Immunol Immunother, 58:1627-1634 (2009) 43. E Alvino, R Pepponi, E Pagani, PM Lacal, C Nunziata, E Bonmassar, S D'Atri: O(6)-benzylguanine enhances the in vitro immunotoxic activity of temozolomide on natural or antigen-dependent immunity. J Pharmacol Exp Ther, 291:1292-1300 (1999) Abbreviations: CRP: C-reactive protein ; Treg: T- regulatory cells; Th cells: T-helper cells; TMZ: temozolomide; IL: interleukin; FGF: basic fibroblast growth factor (FGF); G-CSF: granulocyte colony-stimulating factor; GM-CSF: granulocyte-macrophage colony-stimulating factor; IFN-gamma: interferon gamma; IP-10:interferon-gamma-induced protein; MCP-1: macrophage chemoattractant protein 1; MIP-1alpha: migration inhibitory protein 1alpha; PDGF: platelet-derived growth factor; RANTES: Regulated upon Activation Normal T-cell Expressed and Secreted; TNF-alpha: tumor necrosis factor alpha; VEGF: vascular endothelial growth factor ; TGF-beta1: Transforming growth factor beta; PBMC: periferal blood mononuclear cell; RECIST: Response Evaluation Criteria in Solid Tumors; ECOG:

Biorhythmic fluctuation of systemic immunity in melanoma
18
Eastern Cooperative Oncology Group; FD: first derivative; CC: correlation coefficient; PFS: progression- free survival Key Words: Cancer, Biorhythm, Infradian, Inflammation, Oscillation, Dynamics, Cytokines, Immune Cells, Computer Simulation
Send all correspondence to: Alexey A. Leontovich, Mayo Clinic, 200 First Street, SW, Rochester, MN, 55901, Tel: 507-284-4850, Fax: 507-538-0850, E-mail: [email protected]