Flow through an orifice
20
iii Table of Contents 1.0. INTRODUCTION ........................................................................................................... 1 1.1. AIMS AND OBJECTIVES ......................................................................................... 2 1.2. LITERATURE REVIEW ............................................................................................ 2 2.0. METHODOLOGY .......................................................................................................... 5 2.1. EXPERIMENTAL APPARATUS .............................................................................. 5 2.2. PROCEDURE ............................................................................................................. 6 3.0. DATA COLLECTION AND ANALYSIS ..................................................................... 7 4.0. DISCUSSION ................................................................................................................. 8 4.1. SOURCES OF ERROR ............................................................................................... 8 4.2. PRECAUTIONS .......................................................................................................... 9 4.3. IMPROVEMENTS ...................................................................................................... 9 5.0. RISK ASSESSMENT ................................................................................................... 10 6.0. CONCLUSION ............................................................................................................. 11 7.0. REFERENCES .............................................................................................................. 12 APPENDIX A: Derivation of formulas ................................................................................... 13
Transcript of Flow through an orifice
iii
Table of Contents 1.0. INTRODUCTION ........................................................................................................... 1
1.1. AIMS AND OBJECTIVES ......................................................................................... 2
1.2. LITERATURE REVIEW ............................................................................................ 2
2.0. METHODOLOGY .......................................................................................................... 5
2.1. EXPERIMENTAL APPARATUS .............................................................................. 5
2.2. PROCEDURE ............................................................................................................. 6
3.0. DATA COLLECTION AND ANALYSIS ..................................................................... 7
4.0. DISCUSSION ................................................................................................................. 8
4.1. SOURCES OF ERROR ............................................................................................... 8
4.2. PRECAUTIONS .......................................................................................................... 9
4.3. IMPROVEMENTS ...................................................................................................... 9
5.0. RISK ASSESSMENT ................................................................................................... 10
6.0. CONCLUSION ............................................................................................................. 11
7.0. REFERENCES .............................................................................................................. 12
APPENDIX A: Derivation of formulas ................................................................................... 13

iv
LIST OF TABLES
Table 1: Tabulated recorded and calculated data ....................................................................... 7
LIST OF FIGURES
Figure 1: True orifice flow and features of orifice ..................................................................... 1
Figure 2: Observed jet during experiment .................................................................................. 2
Figure 3: Tank with small orifice in the side ............................................................................. 3
Figure 4: x and y distances on the jet ......................................................................................... 4
Figure 5: Head measurement through transparent tube.............................................................. 6
Figure 6: Diameter measurement of orifice using Vernier Calliper ........................................... 6
Figure 7: Dangling wires .......................................................................................................... 10
Figure 8:Slippery floor ............................................................................................................. 10
Figure 9:Tank with smallorifice in the side ............................................................................. 13
Figure 10: x and y distances on the jet ..................................................................................... 14

v
ABSTRACT
In this report it has been attempted to determine the coefficient of discharge, coefficient of
velocity and coefficient of contraction. This has been achieved by studying the flow through
an orifice found in the side of a tank and collecting the discharge. The results obtained have
been compared with known values for the coefficients which have been established from
previous experiments less affected by errors. The results have not been to the expectations as
they have exceeded these values. Flawed apparatus have been found to be the subject of most
of the errors which have been deduced to be systematic. All in all the results have been found
to be precise but inaccurate.
1
1.0. INTRODUCTION
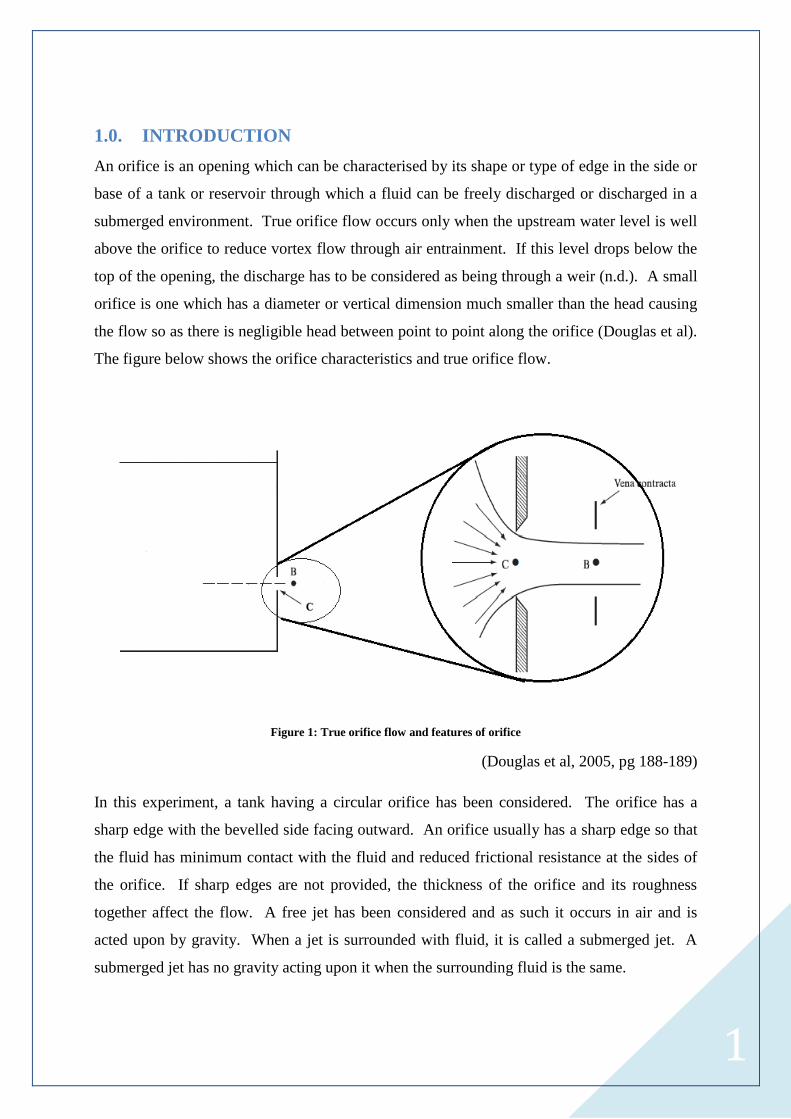
An orifice is an opening which can be characterised by its shape or type of edge in the side or
base of a tank or reservoir through which a fluid can be freely discharged or discharged in a
submerged environment. True orifice flow occurs only when the upstream water level is well
above the orifice to reduce vortex flow through air entrainment. If this level drops below the
top of the opening, the discharge has to be considered as being through a weir (n.d.). A small
orifice is one which has a diameter or vertical dimension much smaller than the head causing
the flow so as there is negligible head between point to point along the orifice (Douglas et al).
The figure below shows the orifice characteristics and true orifice flow.
Figure 1: True orifice flow and features of orifice
(Douglas et al, 2005, pg 188-189)
In this experiment, a tank having a circular orifice has been considered. The orifice has a
sharp edge with the bevelled side facing outward. An orifice usually has a sharp edge so that
the fluid has minimum contact with the fluid and reduced frictional resistance at the sides of
the orifice. If sharp edges are not provided, the thickness of the orifice and its roughness
together affect the flow. A free jet has been considered and as such it occurs in air and is
acted upon by gravity. When a jet is surrounded with fluid, it is called a submerged jet. A
submerged jet has no gravity acting upon it when the surrounding fluid is the same.

2
1.1. AIMS AND OBJECTIVES
The aims of the experiment were to determine for a circular sharp edged orifice:
The coefficient of velocity,
The coefficient of contraction,
The coefficient of discharge
The objectives of the experiment were to:
Maintain a constant head for each experiment
Measure the x and y distances
Measure the discharge
1.2. LITERATURE REVIEW
When the fluid flows from the upstream level to the orifice there is an increase in velocity and
it will contract from all angles towards the orifice. Consequently the streamlines have a
perpendicular velocity directed towards the centre of the orifice causing the emerging jet to
contract resulting in it having a smaller diameter than the orifice it passed through. The
contraction continues till its maximum at the vena contracta where all the streamlines are
assumed to be horizontal (Spencer, 2013). Beyond the vena contracta, friction with the air
(fluid) slows down the jet and the cross sectional area increases per force. However this
divergence is negligible and the jet is considered as almost cylindrical with a constant
velocity. The surface tension maintains the jet, which has a stronger effect the smaller the
diameter of the jet. The figure below shows the observed jet during experiment.
Figure 2: Observed jet during experiment

3
The figure below shows a tank with a small orifice in the side. Calculations are based by
taking the datum at the centre of the orifice
Figure 3: Tank with small orifice in the side
(Douglas et al, 2005, pg. 188)
Applying the principle of conservation of energy in the form of the Bernoulli’s equation at A
and B, the velocity at the vena contracta can be obtained. Full derivation of the equations can
be found in appendix A.
……. Bernoulli’s equation
√ ……..velocity at vena contracta
This is the Torricelli’s theorem which states that the velocity of the issuing jet is proportional
to the square root of the head.
Due to energy losses, the coefficient of velocity is included in the equation and is found from
theory as:
√

4
Since the actual velocity, V, cannot be accurately measured, an alternate solution is used. The
figure below illustrates the method of calculating the coefficient of velocity used in the
experiment.
Figure 4: x and y distances on the jet
(Douglas et al, 2005, pg. 191)
From,
…….(1)
…….(2)
√
The coefficient of discharge is obtained from
√
Where A is area of orifice
The coefficient of contraction is obtained from the equation

5
Rearrangement gives
It should be noted that practically, the area at the vena contracta cannot be measured as it
cannot be accurately determined. Full derivation of the equations can be found in appendix
A.
Previous experiments have shown typical values for coefficient of velocity to be in the order
of 0.96. For the coefficient of discharge it is in the order of 0.62 and for the coefficient of
contraction it is about 0.64.
2.0. METHODOLOGY
2.1. EXPERIMENTAL APPARATUS
Tank with an orifice in the side
Channel canal
Collector tank
Stopwatch
Vernier calliper
Ruler

6
2.2. PROCEDURE
1) A constant head of H m was maintained above the centre line of the orifice by
adjusting the flow from the water supply using the tap as shown below.
Figure 5: Head measurement through transparent tube
2) After reaching steady conditions the discharge from the orifice was collected over a
convenient time measured using a stopwatch and the initial and final height, Z1 and Z2,
during this time of the collected discharge in the discharge tank was noted.
3) The vertical fall, y, of the centre-line of the jet over a horizontal distance x was
obtained by means of a hook gauge and scale.
4) The procedure was repeated for different heads H and the values tabulated.
5) The diameter of the orifice was measured by means of a Vernier calliper as shown
below.
Figure 6: Diameter measurement of orifice using Vernier Calliper
7
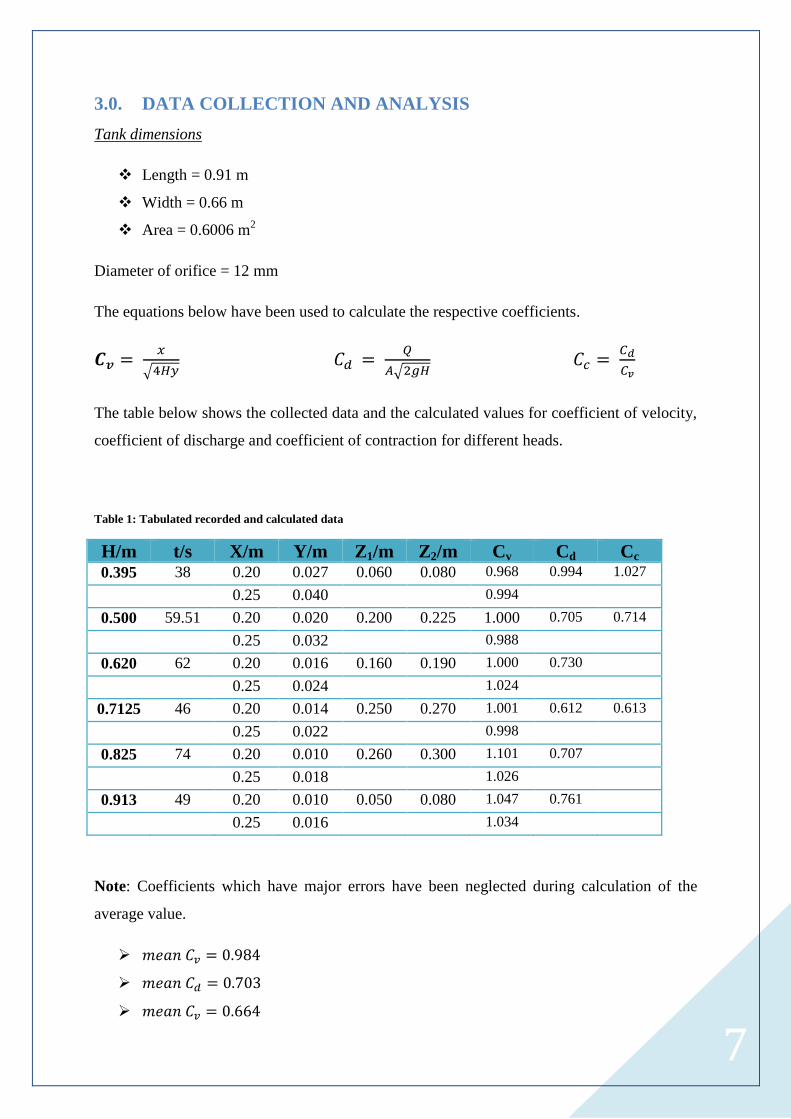
3.0. DATA COLLECTION AND ANALYSIS
Tank dimensions
Length = 0.91 m
Width = 0.66 m
Area = 0.6006 m2
Diameter of orifice = 12 mm
The equations below have been used to calculate the respective coefficients.
√
√
The table below shows the collected data and the calculated values for coefficient of velocity,
coefficient of discharge and coefficient of contraction for different heads.
Table 1: Tabulated recorded and calculated data
H/m t/s X/m Y/m Z1/m Z2/m Cv Cd Cc 0.395 38 0.20 0.027 0.060 0.080 0.968 0.994 1.027
0.25 0.040 0.994
0.500 59.51 0.20 0.020 0.200 0.225 1.000 0.705 0.714
0.25 0.032 0.988
0.620 62 0.20 0.016 0.160 0.190 1.000 0.730
0.25 0.024 1.024
0.7125 46 0.20 0.014 0.250 0.270 1.001 0.612 0.613
0.25 0.022 0.998
0.825 74 0.20 0.010 0.260 0.300 1.101 0.707
0.25 0.018 1.026
0.913 49 0.20 0.010 0.050 0.080 1.047 0.761
0.25 0.016 1.034
Note: Coefficients which have major errors have been neglected during calculation of the
average value.
8
4.0. DISCUSSION
Typical values of coefficient of velocity, coefficient of discharge and coefficient of
contraction include 0.96, 0.62 and 0.64 respectively. As it can be observed errors have been
introduced within the experiment most of them systematic as the values although precise are
not accurate. The experimental procedure has been observed to be flawed in the following
respect.
4.1. SOURCES OF ERROR
Adjusting the flow for a constant head resulted in the head being an estimation of the
true value due to the readings on the tank not being accurate enough.
The transparent tube through which water was entering for measurement of the head
was bent.
It was difficult to accurately measure the vertical fall y as the centreline of the jet was
not well defined.
Significant water losses were generated as the water tended to splash out of the
channel which was canalising the water to the collector tank.
The tank having the orifice may not be vertical and may not have a smooth surface
due to rust. It is known to increase the coefficient of discharge as much as 0.72
(Spencer, 2013).
The transparent tube on the collector tank which allowed measurement of the change
in height as the collected volume increased was bent.
The meniscus was difficult to locate due to lack of light and the tube being not
completely transparent.
Leakages were observed to be found at localised areas in the apparatus.

9
4.2. PRECAUTIONS
Within the limits of experimental procedure, the following precautions were taken:
The minimum head to obtain valid heads was not exceeded which stands at 0.20m.
Parallax error was avoided by carefully taking the readings
End errors was avoided by taking intermediate values
4.3. IMPROVEMENTS
The readings on the tank could be made more accurate.
A clean fully transparent tube and straight tube could be used.
The discharge could have been collected directly into the collector tank.
The tank from which flow is occurring should have clean vertical surfaces without
rust.
All leakages should be plugged.
The liquid could have been coloured.
10
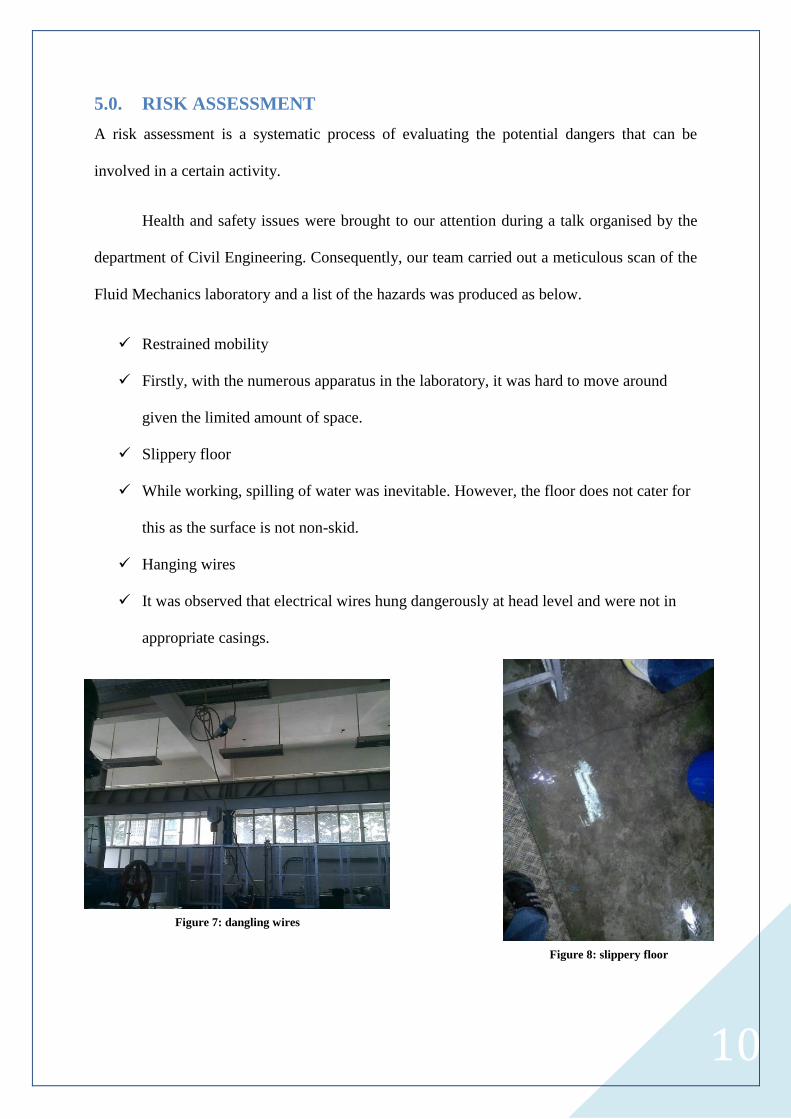
5.0. RISK ASSESSMENT
A risk assessment is a systematic process of evaluating the potential dangers that can be
involved in a certain activity.
Health and safety issues were brought to our attention during a talk organised by the
department of Civil Engineering. Consequently, our team carried out a meticulous scan of the
Fluid Mechanics laboratory and a list of the hazards was produced as below.
Restrained mobility
Firstly, with the numerous apparatus in the laboratory, it was hard to move around
given the limited amount of space.
Slippery floor
While working, spilling of water was inevitable. However, the floor does not cater for
this as the surface is not non-skid.
Hanging wires
It was observed that electrical wires hung dangerously at head level and were not in
appropriate casings.
Figure X : Slippery floor
Figure 7: dangling wires
Figure 8: slippery floor
11
6.0. CONCLUSION
Experimental errors have significantly affected the values of the coefficients. The precision
of the results show that the errors are mostly systematic and hence procedure wise it is
deemed to be successful. However these are not reliable as evidenced by previous similar
experiments. The experimental values for the coefficients are therefore not a good
approximation of the true value.

12
7.0. REFERENCES
1. Anon, (n.d.). 1st ed. [ebook] pp.269-271. Available at:
http://content.alterra.wur.nl/Internet/webdocs/ilri-publicaties/publicaties/Pub20/pub20-
h8.0.pdf [Accessed 28 Apr. 2014]
2. Contraction of issuing jet [diagram] In: Douglas, J. F. ,Gasiorek, J. M. and Swaffield,
J. A. ed., 2005. Fluid Mechanics. England: Pearson Education Limited.
3. Determination of the coefficient of velocity [diagram] In: Douglas, J. F. ,Gasiorek, J.
M. and Swaffield, J. A. ed., 2005. Fluid Mechanics. England: Pearson Education
Limited.
4. Douglas, J. F. ,Gasiorek, J. M. and Swaffield, J. A. ed., 2005. Fluid Mechanics.
England: Pearson Education Limited.
5. Flow through small orifice [diagram] In: Douglas, J. F. ,Gasiorek, J. M. and Swaffield,
J. A. ed., 2005. Fluid Mechanics. England: Pearson Education Limited.
6. Spencer, P. (2013). INVESTIGATION OF DISCHARGE BEHAVIOUR FROM A
SHARP-EDGED CIRCULAR ORIFICE IN BOTH WEIR AND ORIFICE FLOW
REGIMES USING AN UNSTEADY EXPERIMENTAL PROCEDURE. 1st ed. [ebook]
pp.6-11. Available at:
http://ir.lib.uwo.ca/cgi/viewcontent.cgi?article=3020&context=etd [Accessed 28 Apr.
2014].

13
APPENDIX A: Derivation of formulas
Theoretical velocity at vena contracta
Figure 9: tank showing the bernoulli principle
(Douglas et al, 2005, pg. 188)
Using Bernoulli’s equation, the theoretical velocity is given by
Taking,
Since,
Replacing in the equation
√

14
Coefficient of velocity
However the actual velocity is less than the theoretical value which is given by,
√
To find CV, the actual velocity is calculated using the projectile motion analogy
Figure 10: x and y distances on jet
(Douglas et al, 2005, pg. 188)
…….(1)
…….(2)

15
Making v & t the subject of formula
……. (3) √
……. (4)
√
Eliminating t gives the actual velocity in terms of x and y:
√
Substituting in the equation for CV
√
√
√
√

16
Coefficient of discharge
Taking A as the area of the orifice, the theoretical discharge is given by
Where V is the theoretical velocity
√
√
√
Where A is area of orifice
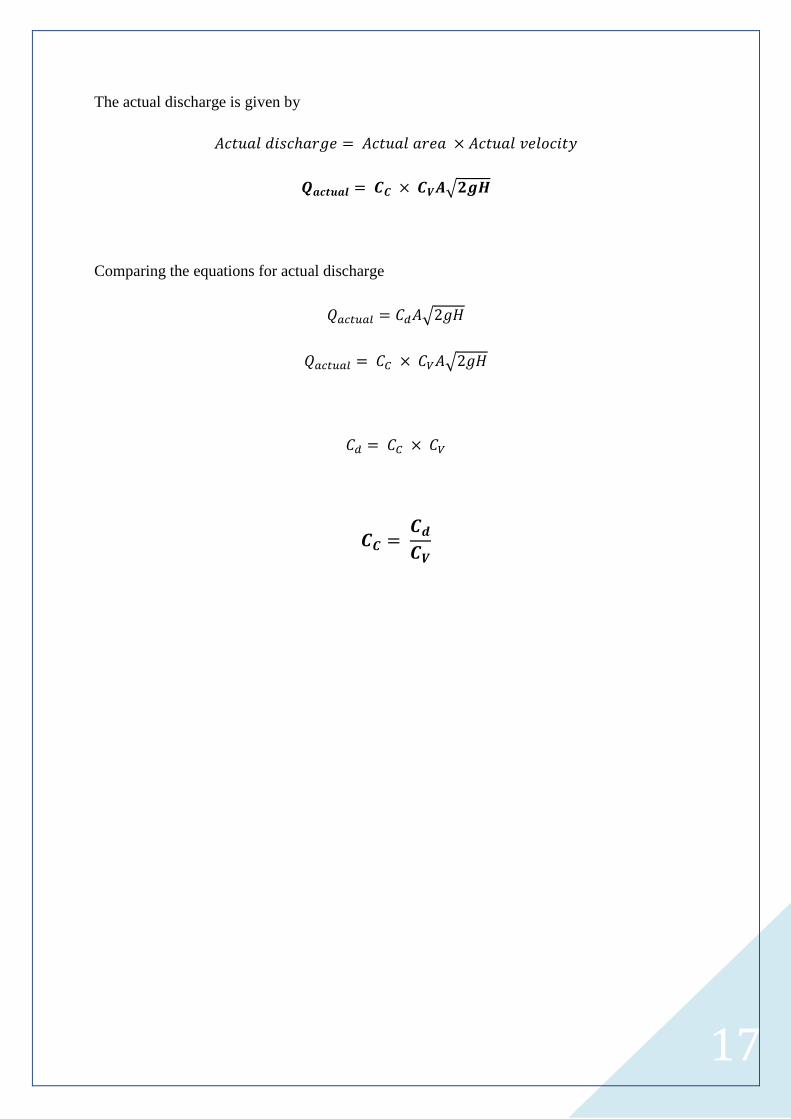
Coefficient of contraction
The coefficient of contraction is given by
17
The actual discharge is given by
√
Comparing the equations for actual discharge
√
√