FLORA AND FAUNA SURVEYS 2017 - City of Ryde
251
FLORA AND FAUNA SURVEYS 2017 TERRY’S CREEK, KITTY’S CREEK, FIELD OF MARS RESERVE & BUFFALO CREEK TRIBUTARIES PREPARED FOR THE CITY OF RYDE DECEMBER 2017 www.appliedecology.com.au
-
Upload
khangminh22 -
Category
Documents
-
view
4 -
download
0
Transcript of FLORA AND FAUNA SURVEYS 2017 - City of Ryde

FLORA AND FAUNA SURVEYS 2017
TERRY’S CREEK, KITTY’S CREEK, FIELD OF MARS
RESERVE & BUFFALO CREEK TRIBUTARIES
PREPARED FOR THE CITY OF RYDE
DECEMBER 2017
www.appliedecology.com.au

1 SUMMARY |
appliedecology
Applied Ecology Pty Limited reserves all legal rights and remedies in relation to any infringement of its rights in respect of its confidential information.
DOCUMENT VERIFICATION
Project Title CITY OF RYDE FLORA AND FAUNA PROJECT
Document Title FLORA AND FAUNA SURVEYS 2017
TERRY’S CREEK, KITTY’S CREEK, FIELD OF MARS RESERVE &
BUFFALO CREEK TRIBUTARIES
Client CITY OF RYDE
Client contact SANDRA PAYNE
Revision Prepared by Reviewed by Date
Draft (D) Anne Carey & Meredith Brainwood Internal December 2017
D_2 Anne Carey & Meredith Brainwood City of Ryde January 2018
F_1 Anne Carey & Meredith Brainwood February 2018
COMMERCIAL IN CONFIDENCE
All intellectual property rights, including copyright, in designs developed and documents created by APPLIED ECOLOGY Pty Limited remain the property of that company. Any use made of any such design or document without the prior written approval APPLIED ECOLOGY Pty Limited will constitute an infringement of the rights of that company which reserves all legal rights and remedies in respect of any such infringement. The information, including the intellectual property, contained in this document is confidential and proprietary to APPLIED ECOLOGY Pty Limited. It may only be used by the person to whom it is provided for the stated purpose for which it is provided, and must not be imparted to any third person without the prior written approval of APPLIED ECOLOGY Pty Limited. APPLIED ECOLOGY Pty Limited reserves all legal rights and remedies in relation to any infringement of its rights in respect of its confidential information.
DISCLAIMER
This report is prepared by APPLIED ECOLOGY Pty Limited for its clients' purposes only. The contents of this report are provided expressly for the named client for its own use. No responsibility is accepted for the use of or reliance upon this report in whole or in part by any third party. This report is prepared with information supplied by the client and possibly other stakeholders. While care is taken to ensure the veracity of information sources, no responsibility is accepted for information that is withheld, incorrect or that is inaccurate. This report has been compiled at the level of detail specified in the report and no responsibility is accepted for interpretations made at more detailed levels than so indicated.
ACKNOWLEDGMENTS
APPLIED ECOLOGY Pty Limited wishes to thank all representing organisations and individuals who assisted with fieldwork and contributed to the production or commented on the content of this report, including:
Sandra Payne and Kylie McMahon from the City of Ryde Council
Special thanks to Jenny Stiles who has contributed images (most local) of rare and difficult to photograph species.
Cover photo: Male Variegated fairy-wren Lucknow Park , Terrys Creek corridor (Applied Ecology 2017)

SUMMARY 2
DOCUMENT VERIFICATION .................................................................................................................... 1
1 SUMMARY .................................................................................................................................... 11
1.1 The Study sites ...................................................................................................................... 12
2 FAUNA METHODOLOGY ............................................................................................................... 16
Camera trapping ........................................................................................................................... 16
Call Playback.................................................................................................................................. 17
Spotlighting Survey ....................................................................................................................... 18
Bat ultrasonic (Anabat) call recording .......................................................................................... 18
Diurnal Bird Census ....................................................................................................................... 20
Reptile and Amphibian Searches .................................................................................................. 20
Nocturnal Frog Searches ............................................................................................................... 21
Hair tubing .................................................................................................................................... 21
Searches for Evidence ................................................................................................................... 22
Searches for Invertebrates ............................................................................................................ 23
Searches for Fish ........................................................................................................................... 23
Research Licensing ........................................................................................................................ 23
2.1 Key dates and equipment locations ...................................................................................... 24
3 FLORA METHODOLOGY ................................................................................................................ 27
3.1 General survey ...................................................................................................................... 27
3.2 Quadrat surveys .................................................................................................................... 27
3.3 Ground truthing vegetation mapping ................................................................................... 29
3.4 General reserve-based flora surveys .................................................................................... 37
3.5 Targeted searches for threatened species............................................................................ 37
4 FAUNA SURVEY RESULTS ............................................................................................................. 38
4.1 FAUNA ................................................................................................................................... 39
4.2 BIRDS ..................................................................................................................................... 52
4.2.1 LARGE GROUND DWELLERS .......................................................................................... 52
Australian Brush-turkey Alectura lathami ............................................................................ 52
Superb Lyrebird Menura novaehollandiae ........................................................................... 52
4.2.2 BIRDS OF THE EDGE ...................................................................................................... 53
Australian White Ibis Threskiornis molucca ........................................................................... 53
Australian Magpie Cracticus tibicen ....................................................................................... 53
Australian Raven Corvus coronoides ...................................................................................... 53
Channel-billed Cuckoo Scythrops novaehollandiae .............................................................. 54
Crested Pigeon Ocyphaps lophotes ....................................................................................... 54
Eastern Koel Eudynamys orientalis ....................................................................................... 55
3 SUMMARY |
appliedecology
Grey Butcherbird Cracticus torquatus ................................................................................... 55
Magpie-lark Grallina cyanoleuca ........................................................................................... 55
Masked Lapwing Vanellus miles ............................................................................................ 56
Pied Currawong Strepera graculina ...................................................................................... 56
Noisy Miner Manorina melanocephala ................................................................................. 56
Welcome Swallow Hirundo neoxena ..................................................................................... 57
4.2.3 PARROTS ....................................................................................................................... 58
Australian King-Parrot Alisterus scapularis ........................................................................... 58
Crimson Rosella Platycercus elegans ..................................................................................... 58
Eastern Rosella Platycercus eximius ..................................................................................... 58
Galah Eolophus roseicapillus ............................................................................................... 59
Little Corella Cacatua sanguinea ........................................................................................... 59
Musk Lorikeet Glossopsitta concinna ................................................................................... 59
Rainbow Lorikeet Trichoglossus haematodus ....................................................................... 59
Sulphur-crested Cockatoo Cacatua galerita ......................................................................... 60
Yellow-tailed Black Cockatoo Calyptorhynchus funereus ...................................................... 60
4.2.4 LARGER BUSH BIRDS ..................................................................................................... 61
Black-faced Cuckoo-shrike Coracina novaehollandiae .......................................................... 61
Dollar Bird Eurystomus orientalis ........................................................................................... 61
Eastern Whipbird Psophodes olivaceus ................................................................................. 61
Laughing Kookaburra Dacelo novaeguineae ......................................................................... 62
Little Wattlebird Anthochaera chrysoptera ........................................................................... 62
Noisy Friarbird Philemon corniculatus .................................................................................. 62
Olive-backed Oriole Oriolus sagittatus .................................................................................. 62
Red Wattlebird Anthochaera carunculata ............................................................................ 63
Sacred Kingfisher Todiramphus sanctus ................................................................................ 63
Satin Bowerbird Ptilonorhynchus violaceus .......................................................................... 63
White-headed Pigeon Columba leucomela ........................................................................... 63
White-winged Triller Lalage sueurii ....................................................................................... 64
Willie Wagtail Rhipidura leucophrys ..................................................................................... 64
4.2.5 SMALLER BUSH BIRDS ................................................................................................... 65
Black-faced Monarch Monarcha melanopsis ......................................................................... 65
Brown Gerygone Gerygone mouki ......................................................................................... 65
Brown Thornbill Acanthiza pusilla ......................................................................................... 65
Eastern Spinebill Acanthorhynchus tenuirostris .................................................................... 66
Eastern Yellow Robin Eopsaltria australis ............................................................................. 66

SUMMARY 4
Golden Whistler Pachycephala pectoralis ............................................................................. 66
Grey Fantail Rhipidura albiscapa ........................................................................................... 66
Leaden Flycatcher Myiagra rubecula ..................................................................................... 67
Lewins Honeyeater Meliphaga lewinii .................................................................................. 67
New Holland Honeyeater Phylidonyris novaehollandiae ....................................................... 67
Red-browed Finch Neochmia temporalis .............................................................................. 68
Rufous Fantail Rhipidura rufifrons ........................................................................................ 68
Rufous Whistler Pachycephala rufiventris ............................................................................ 68
Scarlet Honeyeater Myzomela sanguinolenta ....................................................................... 69
Silvereye Zosterops lateralis westernensis/lateralis lateralis ............................................... 69
Spotted Pardalote Pardalotus punctatus ............................................................................... 69
Superb Fairy-wren Malurus cyaneus ..................................................................................... 69
Variegated Fairy-wren Malurus lamberti .............................................................................. 70
White-browed Scrubwren Sericornis frontalis ...................................................................... 70
White-cheeked Honeyeater Phylidonyris niger ..................................................................... 70
White-throated Tree-creeper Cormobates leucophaea ........................................................ 71
Yellow Thornbill Acanthiza nana .......................................................................................... 71
Yellow-faced Honeyeater Lichenostomus chrysops chrysops ................................................ 71
4.2.6 “WATER” BIRDS ............................................................................................................. 72
Australian Wood Duck Chenonetta jubata ........................................................................... 72
Chestnut Teal Anas castanea ................................................................................................ 72
Little Pied Cormorant Microcarbo melanoleucos ................................................................. 72
Pacific Black Duck Anas superciliosa ...................................................................................... 73
White-faced Heron Egretta novaehollandiae ....................................................................... 73
4.2.7 BIRDS OF PREY............................................................................................................... 74
Grey Goshawk Accipiter novaehollandiae ............................................................................ 74
Brown Goshawk Accipiter fasciatus ...................................................................................... 74
4.2.8 NOCTURNAL BIRDS ....................................................................................................... 75
Australian Owlet-nightjar Aegotheles cristatus .................................................................... 75
Powerful Owl Ninox strenua .................................................................................................. 76
Tawny Frogmouth Podargus strigoides ................................................................................. 79
4.2.9 INTRODUCED BIRDS ...................................................................................................... 80
Red-whiskered Bulbul Pycnonotus jocosus ........................................................................... 80
Common Myna Sturnus tristis ............................................................................................... 80
Spotted Turtle-Dove Streptopelia chinensis ......................................................................... 80
4.1 AMPHIBIANS ......................................................................................................................... 81

5 SUMMARY |
appliedecology
4.1.1 Southern frogs (families Myobatrachidae & Limnodynastidae) ................................... 82
Striped Marsh Frog Limnodynastes peronii .......................................................................... 82
Common Eastern Froglet Crinia signifera .............................................................................. 83
4.1.2 Tree frogs (Family Hylidae) ........................................................................................... 84
Leaf-green Tree Frog Litoria phyllochroa ............................................................................... 84
Perons Tree Frog Litoria peronii ............................................................................................. 85
4.2 REPTILES ................................................................................................................................ 86
4.2.1 DRAGONS ...................................................................................................................... 86
Eastern Water Dragon Intellagama lesueurii ........................................................................ 86
4.2.2 GECKOES ....................................................................................................................... 88
Broad-tailed gecko Phyllurus platurus ................................................................................... 88
4.2.3 SKINKS ........................................................................................................................... 89
Dark-flecked Garden Sunskink Lampropholis delicata.......................................................... 89
Pale-flecked Garden Sunskink Lampropholis guichenoti ...................................................... 90
Eastern Blue-tongue Lizard Tiliqua scincoides ....................................................................... 91
Eastern Water-skink Eulamprus quoyii .................................................................................. 92
Bar-sided Skink Concinna tenuis ........................................................................................... 93
Elegant Snake-eyed Skink Cryptoblepharus pulcher ............................................................. 94
Three-toed Skink Saiphos equalis .......................................................................................... 95
Weasel Skink Saproscincus mustelinus .................................................................................. 96
Red-bellied Black Snake Pseudechis porphyriacus ................................................................. 97
Eastern Long-necked Turtle Chelodina longicollis ................................................................. 98
4.3 MAMMALS ............................................................................................................................ 99
Common Brushtail Possum Trichosurus vulpecula ................................................................ 99
Common Ringtail Possum Pseudocheirus peregrinus .......................................................... 101
Grey-headed Flying-fox Pteropus poliocephalus FED-V ....................................................... 102
Long-nosed Bandicoot Perameles nasuta ........................................................................... 103
Short-beaked echidna Tachyglossus aculeatus .................................................................. 105
Sugar Glider Petaurus breviceps ......................................................................................... 106
Swamp Wallaby Wallabia bicolor ........................................................................................ 107
4.3.1 MICROBATS ................................................................................................................. 109
White-striped Free-tailed Bat Austronomus australis ........................................................ 109
Gould's Wattled Bat Chalinolobus gouldii ........................................................................... 110
Chocolate Wattled Bat Chalinolobus morio ........................................................................ 111
Eastern Bentwing-bat Miniopterus orianae oceanensis ...................................................... 112
Ride's Free-tailed Bat Mormopterus ridei ........................................................................... 113

SUMMARY 6
Large-footed Myotis Myotis macropus ................................................................................ 114
a Long-eared Bat Nyctophilus sp .......................................................................................... 115
Yellow-bellied Sheath-tailed Bat Saccolaimus flaviventris ................................................. 116
Large Forest Bat Vespadelus darlingtoni ............................................................................. 117
4.4 INTRODUCED MAMMALS ................................................................................................... 118
Black Rat Rattus rattus ....................................................................................................... 118
Cat Felis catus .................................................................................................................... 119
Dog Canis lupus familiaris .................................................................................................. 120
House Mouse Mus musculus ............................................................................................... 121
Rabbit Oryctolagus cuniculus ............................................................................................ 121
Red Fox Vulpes vulpes ....................................................................................................... 122
4.5 OTHER SURVEY RESULTS ..................................................................................................... 123
4.5.1 SCAT COLLECTION ....................................................................................................... 123
4.5.2 HAIR AND PELLET ANALYSIS ........................................................................................ 126
4.5.3 FISH ............................................................................................................................. 127
4.5.4 INVERTEBRATES .......................................................................................................... 128
Invertebrates in quadrats ....................................................................................................... 128
Invertebrates in corridors/reserves ........................................................................................ 128
Habitat use by invertebrates .................................................................................................. 130
Dural Land Snail ...................................................................................................................... 132
5 SUMMARY OF FAUNA RESULTS ................................................................................................. 133
5.1 Bird species richness, autumn and spring, 2017 ................................................................. 133
5.1.1 Creek corridors/reserves............................................................................................. 133
5.1.2 Quadrats ...................................................................................................................... 133
5.2 Changes over time – 2007 to 2017 ..................................................................................... 134
5.3 Reptiles and Amphibians and mammal species richness ................................................... 135
5.3.1 Reptiles and Amphibians............................................................................................. 135
5.3.2 Mammalian fauna ....................................................................................................... 135
5.4 Total vertebrate diversity ................................................................................................... 136
5.5 What native birds live where .............................................................................................. 137
5.5.1 Terrys Creek north section .......................................................................................... 137
5.5.2 Terrys Creek south section .......................................................................................... 138
5.5.3 Kittys Creek corridor ................................................................................................... 139
5.5.4 Buffalo Creek corridor ................................................................................................. 140
5.5.5 Field of Mars Reserve .................................................................................................. 141
6 COMPARISON WITH PREVIOUS SURVEYS ................................................................................. 142

7 SUMMARY |
appliedecology
6.1 Statistical analysis methods ................................................................................................ 142
6.2 Birds 2007 to 2017 .............................................................................................................. 143
6.3 Reptiles and Amphibians 2007 to 2017 .............................................................................. 144
6.4 Mammal fauna 2007 to 2017.............................................................................................. 146
6.5 Fish ...................................................................................................................................... 147
6.6 Invertebrates ....................................................................................................................... 148
Terrys Creek ............................................................................................................................ 148
Kittys Creek ............................................................................................................................. 149
Buffalo Creek ........................................................................................................................... 150
7 DISCUSSION ................................................................................................................................ 152
7.1 MICROBATS SURVEYS ......................................................................................................... 153
7.1.1 Overview of species present ....................................................................................... 153
7.1.2 Distribution of species ................................................................................................ 157
7.1.3 Habitat partitioning in Lane Cove River catchments in Ryde LGA .............................. 159
7.1.4 DISCUSSION ................................................................................................................. 162
Microbats in urban areas ........................................................................................................ 162
Resources required for feeding and drinking ......................................................................... 162
Habitat preferences ................................................................................................................ 163
Predatory and competitive birds ............................................................................................ 164
7.1.5 MAIN IMPACTS FOR MICROBATS ................................................................................ 165
Artificial lighting ...................................................................................................................... 165
Effects of noise for microbats ................................................................................................. 165
Microbats and fire ................................................................................................................... 166
Summary of potential impacts for microbats ......................................................................... 166
8 FLORA SURVEY RESULTS ............................................................................................................ 167
8.1 Summary of 2017 surveys ................................................................................................... 168
8.2 Comparison of 2017 surveys with 2007 surveys................................................................. 170
8.2.1 Terrys Creek Corridor .................................................................................................. 170
8.2.2 Kittys Creek Corridor ................................................................................................... 171
8.2.3 Buffalo Creek Creek Corridor & Field of Mars Reserve ............................................... 172
8.3 Regionally significant plant species .................................................................................... 174
8.4 Access database for reserves species lists .......................................................................... 174
8.5 PIDDING PARK QUADRAT .................................................................................................... 175
8.5.1 Quadrat location and description ............................................................................... 175
8.5.2 Summary of species: 2007-2017 ................................................................................. 176
8.5.3 Changes in cover ......................................................................................................... 176

SUMMARY 8
8.6 STRANGERS CREEK QUADRAT ............................................................................................. 178
8.6.1 Quadrat location and description ............................................................................... 178
8.6.2 Summary of species: 2007-2017 ................................................................................. 179
8.6.3 Changes in cover ......................................................................................................... 179
8.7 PIMELEA CURVIFLORA QUADRAT ....................................................................................... 181
8.7.1 Quadrat location and description ............................................................................... 181
8.7.2 Summary of species: 2007-2017 ................................................................................. 182
8.7.3 Changes in cover ......................................................................................................... 182
8.8 BURROWS PARK QUADRAT ................................................................................................. 184
8.8.1 Quadrat location and description ............................................................................... 184
8.8.2 Summary of species: 2007-2017 ................................................................................. 185
8.8.3 Changes in cover ......................................................................................................... 185
8.9 KITTYS CREEK QUADRAT ..................................................................................................... 187
8.9.1 Quadrat location and description ............................................................................... 187
8.9.2 Summary of species: 2007-2017 ................................................................................. 188
8.9.3 Changes in cover ......................................................................................................... 188
8.10 LUCKNOW PARK QUADRAT ................................................................................................ 190
8.10.1 Quadrat location and description ............................................................................... 190
8.10.2 Summary of species: 2007-2017 ................................................................................. 191
8.10.3 Changes in cover ......................................................................................................... 191
8.11 PEMBROKE SOUTH QUADRAT ............................................................................................ 193
8.11.1 Quadrat location and description ............................................................................... 193
8.11.2 Summary of species: 2007-2017 ................................................................................. 194
8.11.3 Changes in cover ......................................................................................................... 194
8.12 PEMBROKE - TERRYS CREEK QUADRAT ............................................................................... 196
8.12.1 Quadrat location and description ............................................................................... 196
8.12.2 Summary of species: 2007-2017 ................................................................................. 197
8.12.3 Changes in cover ......................................................................................................... 197
8.13 PEMBROKE NORTH QUADRAT ............................................................................................ 199
8.13.1 Quadrat location and description ............................................................................... 199
8.13.2 Summary of species: 2007-2017 ................................................................................. 200
8.13.3 Changes in cover ......................................................................................................... 200
8.14 SUMMARY OF VEGETATION CHANGES OVER TIME ............................................................ 202
8.14.1 Species richness .......................................................................................................... 202
8.14.2 Vegetation condition .................................................................................................. 202
9 GROUND TRUTHING VEGETATION COMMUNITY MAPPING .................................................... 204

9 SUMMARY |
appliedecology
10 VEGETATION COMMUNITY DESCRIPTIONS ........................................................................... 211
10.1 PCT#1776 Smooth-barked Apple - Red Bloodwood open forest on enriched sandstone slopes around Sydney and the Central Coast ................................................................................. 211
10.2 PCT#1250 Sydney Peppermint-Smooth-barked Apple-Red Bloodwood shrubby open forest on slopes of moist sandstone gullies, eastern Sydney Basin .......................................................... 212
10.3 PCT#1237 Sydney Blue Gum-Blackbutt-Smooth-barked Apple moist shrubby open forest on shale ridges of the Hornsby Plateau, Sydney Basin ........................................................................ 213
10.4 PCT#1841 Smooth-barked Apple-Blackbutt-Peppermint moist shrubby forest in sandstone gullies forests on coastal plateaux of the Sydney Basin ................................................................. 214
10.5 PCT# 1845 Coastal Shale Sandstone Forest ........................................................................ 215
10.6 PCT#1281 Turpentine-Grey Ironbark open forest on shale in the Sydney Basin ............... 216
10.7 PCT#1828 Coastal Sandstone Gallery Rainforest ................................................................ 217
11 TARGETED THREATENED SPECIES SEARCHES ........................................................................ 218
11.1 KEY THREATENED SPECIES PROFILES .................................................................................. 218
Deane's Paperbark - profile .................................................................................................... 218
Epacris purpurascens var. purpurascens - profile ................................................................... 219
Pimelea curviflora var. curviflora - profile .............................................................................. 221
11.2 MELALEUCA DEANEI ........................................................................................................... 222
11.2.1 Previous sightings ....................................................................................................... 222
11.2.2 Results of searches ...................................................................................................... 222
11.3 EPACRIS PURPURASCENS VAR PURPURASCENS ................................................................. 222
11.3.1 Previous sightings ....................................................................................................... 222
11.3.2 Results of searches ...................................................................................................... 223
11.4 PIMELEA CURVIFLORA VAR CURVIFLORA ........................................................................... 226
11.4.1 Previous sightings ....................................................................................................... 226
11.4.2 Results of searches ...................................................................................................... 226
12 DISCUSSION ............................................................................................................................ 230
12.1 Vegetation changes over time ............................................................................................ 230
12.1.1 Bioturbation ................................................................................................................ 231
12.2 How much change is reasonable? ...................................................................................... 233
13 CONCLUSIONS ........................................................................................................................ 234
14 RECOMMENDATIONS ............................................................................................................. 235
14.1 Management of reserves for fire ........................................................................................ 235
14.2 Managing for specific fauna species/groups ...................................................................... 236
14.2.1 Bird fauna .................................................................................................................... 236
14.2.2 Other animals .............................................................................................................. 237
14.3 Management of corridors/reserves .................................................................................... 238

SUMMARY 10
14.3.1 General recommendations ......................................................................................... 238
14.3.2 Field of Mars Reserve .................................................................................................. 238
14.3.3 Terrys Creek corridor .................................................................................................. 239
14.3.4 Kittys Creek corridor ................................................................................................... 239
14.3.5 Buffalo Creek corridor ................................................................................................. 240
15 REFERENCES & FURTHER READING ........................................................................................ 241
15.1 MICROBAT REFERENCES ..................................................................................................... 244
15.2 FIRE IMPACTS REFERENCES ................................................................................................. 247
15.3 POWERFUL OWL REFERENCES ............................................................................................ 250
16 APPENDICES ............................................................................................................................ 251

11 SUMMARY |
appliedecology
1 SUMMARY This report was commissioned by the City of Ryde to determine fauna and flora diversity in three disjunct bushland areas. These bushland areas are located in three creek catchments that ulimately flow to the Lane Cove River and include creeks and tributaries within:
Kittys Creek catchment;
Buffalo Creek catchment; and
Terrys Creek catchment.
Data was collected using a methodology devised when baseline data was collected in 2006 and 2007 that is repeatable and suitable for quantitative analysis.
Summary results include:
Vertebrate Fauna
114 vertebrate species were detected during the survey including:
5 threatened species 2 species listed under the Bonn convention 10 exotic species
72 species of bird, 22 mammals, 4 amphibians, 12 reptiles, 4 fish were recorded.
Flora
Terrys creek corridor: 253 native species, 141 introduced species
Kittys Creek corridor: 181 native species, 67 introduced species
Buffalo Creek trib corridor: 187 native species, 132 introduced species
Field of Mars Reserve: 298 native species, 81 introduced species

SUMMARY 12
1.1 The Study sites
The study included three bushland corridors or contiguous bushland areas, some with connectivity outside the LGA, as illustrated in Figure 1 overleaf consisting of a subset of named reserves as listed in Table 1 below: Table 1 Corridor overview
Flora and Fauna Study Sites
Catchment Park Name SStreet Address Suburb Area (m2) Previous
survey Quadrats
Buffalo Creek
AITCHANDAR PARK 40 Aitchandar Road Ryde 5901 2008 BARTON RESERVE 2 Pidding Road Ryde 34533 2007
BURROWS PARK 32 Princes Street Ryde 23080 2007 1
FIELD OF MARS RESERVE Strangers Ck Quadrat Pimelia curviflora Quadrat
220 Pittwater Road North Ryde 467246 2007 2
LAUREL PARK and adjoining road reserve
117 Buffalo Road Ryde 1080 -----
MINGA RESERVE 13a Minga Street Ryde 3017 2007
PIDDING PARK 84 Cressy Road Ryde 13122 2007 1
TYRELL PARK 100 Cressy Road Ryde 6107 2008
Kittys Creek
KITTYS CREEK RESERVE 332 Pittwater Road East Ryde 36936 2007
MARTIN RESERVE 27 Cox's Road East Ryde 17432 2007
PORTIUS PARK 107 Cressy Road East Ryde 43946 2007 1
PRYOR PARK 109 Cressy Road North Ryde 8030 2007
Terrys Creek
FORRESTER PARK 47 Vimiera Road Eastwood 8457 2007
FORSYTH PARK 2 Abuklea Road Eastwood 16644 2007
IVANHOE RESERVE 186a Waterloo Road Marsfield 8101 2007
JIM WALSH PARK Graham Avenue Eastwood 9695 2008
LUCKNOW PARK 83 Crimea Road Marsfield 48626 2007
PEMBROKE PARK 1 Crimea Road Marsfield 130353 2007 3
SOMERSET PARK Crimea Road Marsfield 15675 2007 1
YARRAMAR RESERVE 45 Vimera Road Eastwood 1374 -----
13 SUMMARY |
appliedecology
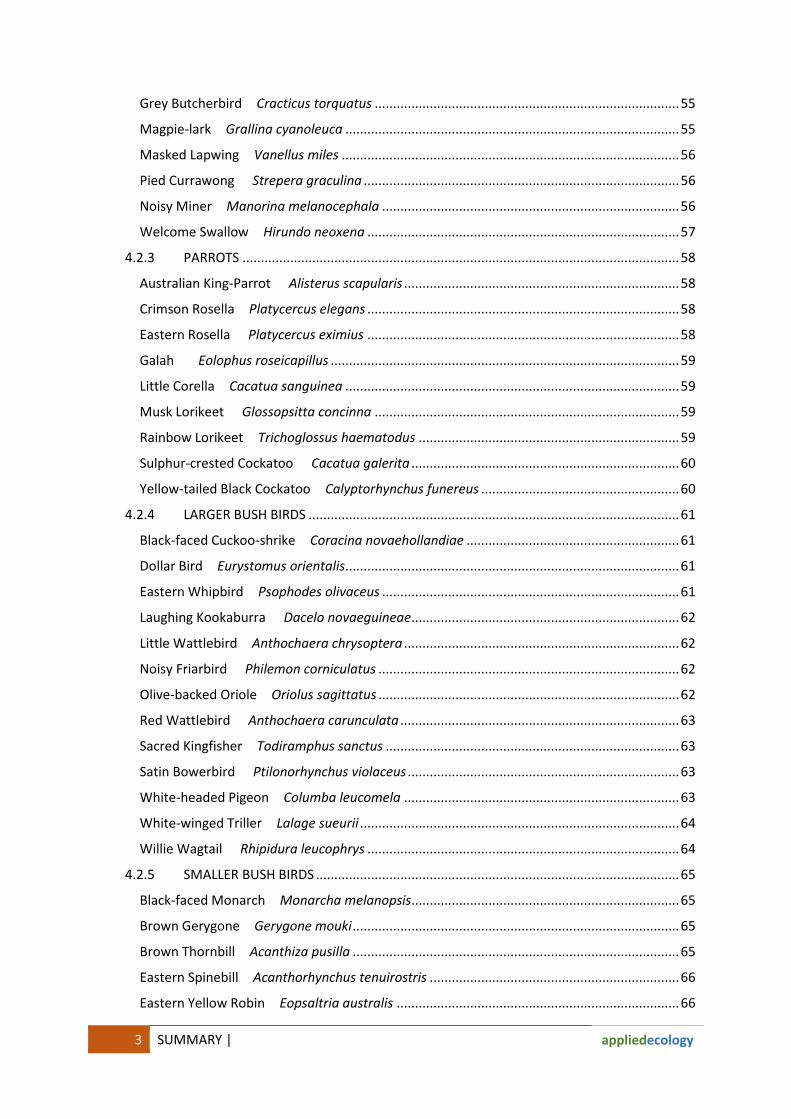
Figure 1 Study site locations –overview
The named reserves within each of the three bushland corridors are named in the Figures overleaf along with the name of quadrats that were first established in 2006 and 2007. For the purposes of the fauna reporting the large corridors were broken up into “south of Epping Road” and “north of Epping Road” for Terrys Creek corridor and “Buffalo Creek tributaries” and Field of Mars Reserve along Buffalo Creek.

SUMMARY 14
Figure 2 Terrys Creek Bushland Corridor

15 SUMMARY |
appliedecology
Figure 3 Kittys Creek, Field of Mars Reserve, Buffalo Creek Bushland Corridor
FAUNA METHODOLOGY 16
2 FAUNA METHODOLOGY The following techniques were used in conjunction with ad hoc observations collected while traversing the study site. See section 3.1 for key sampling dates.
Camera trapping Remote cameras were deployed in each reserve in each major habitat in rotation throughout the sampling period (autumn and spring 2017). The number of nights of sampling reflects the size and habitat complexity within a corridor and extra effort to detect particular species in certain locations.
Table 2 Camera trapping survey effort
CORRIDOR TERRYS CREEK
NORTH TERRYS CREEK
SOUTH FIELD OF MARS
RESERVE BUFFALO
CREEK KITTYS CREEK
NIGHTS 80 118 204 61 150
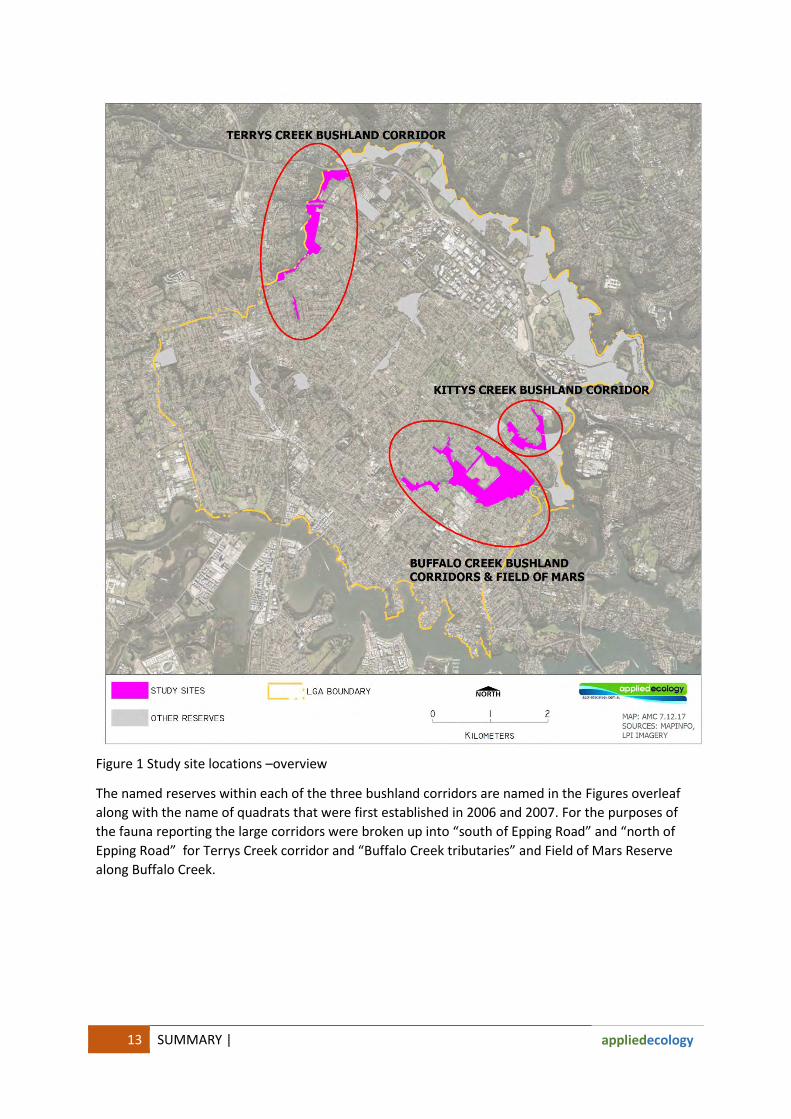
Cameras were not deployed on tracks due to the potential for tampering but were set off track in suitable locations such as along animal pads or, when targeting arboreal mammals, in preferred feed trees such as Corymbia gummifera. Baiting stations were set up at each camera site to attract animals into the field of view of the camera. Universal bait (peanut butter, honey & rolled oats) in a pvc canister were used at all sites. Baits were deployed up trees, on the ground, and (where Black Rats Rattus rattus were an issue) hung by a wire from an appropriate height.
Figure 4 Bait canister deployed approximately at ground level (left), Common Ringtail visits canister (right). “Pimelia Quad”- Field of Mars Reserve, September 2017 2017.

17 FAUNA METHODOLOGY |
appliedecology
Figure 5 Solar powered cameras with batterybackup were the deployed for up to 4 weeks in one location. Typically cameras were moved after 7-14 days and bait boxes/lures rebaited after 7 days. Camera at Pembroke Park, June 2017.
Call Playback Call playback is commonly used as a technique for detecting nocturnal birds (Kavanagh et al. 1995, Wintle et al. 2005, DEC (2004) unpublished) who may respond to vocalisations of their own species within their territories by “calling back”. Call playback was undertaken after spotlighting on 6 occasions. Calls of each species were broadcast for 5 minutes followed by a ten minute listening period. Calls were broadcast using a 25W megaphone that were effective (clearly audible to the human ear) for approximately 600m.The calls broadcast were of four owl species: the Barking Owl (Ninox connivens), the Eastern Barn Owl (Tyto delicatula), the Masked Owl (Tyto novaehollandiae) and the Sooty Owl (Tyto tenebricosa tenebricosa). We excluded the Powerful Owl (Ninox strenua) and Southern Boobook (Ninox boobook) from this process due to its known occurrence in the study area(s) and ongoing research by others – further calling is unlikely to reveal new information and risks disturbing resident individuals and pairs.
Figure 6 Call playback gear

FAUNA METHODOLOGY 18
In addition, the “yipping” call of the Sugar glider was played during spotlighting sessions from a handheld speaker attached to a smartphone in habitats where there was some evidence of occupation.
Spotlighting Survey
Spotlighting was undertaken for all terrestrial and arboreal mammals, amphibians and nocturnal birds within the study area. Spotlighting was undertaken using 50- 100 watt hand held spotlights as appropriate which were used to sweep surrounding vegetation in search of eye-shine or animal movements. Time was spent listening for calls at 10 minute intervals for 1 minute. All fauna heard or observed during spotlighting meanders were recorded. Spotlighting was undertaken in all vegetation communities in the study area.
Table 3 Spotlighting survey effort
CORRIDOR TERRYS CREEK
NORTH TERRYS CREEK
SOUTH FIELD OF MARS
RESERVE BUFFALO
CREEK KITTYS CREEK
NIGHTS 4 4 6 4 4
Bat ultrasonic (Anabat) call recording
The method requires the recording and identification of high frequency, echolocation calls made by bats, which, except for one or two species, are ultrasonic, that is, inaudible to humans.
The recording equipment consisted of an Anabat II® SD detector and digital flash card recorder, housed within a Tupperware box for weather protection and two Anabat Express® units positioned in a fixed location for multiple nights. Locations were selected during the day to target areas most likely to have higher levels of microbat activity within the reserve rather than placing units on “flyways” for example, over open waterways on the eastern side of Field of Mars Reserve. Units were deployed in open forest and woodland where possible to target species foraging in the reserves rather than travelling
along waterways. In some locations, where the reserves are narrow, some sampling along creek lines was inevitable. Multiple locations were surveyed in larger reserves to ensure adequate sampling for the reserve size. Surveys were conducted in two sessions between 9th April 2017 to the 29th of May 2017 and 13th of September 23rd to November 2017. Microbat call identification is a specialised process. Anabat recordings were transferred
Figure 7 Anabat express at Martin Park, East Ryde
19 FAUNA METHODOLOGY |
appliedecology
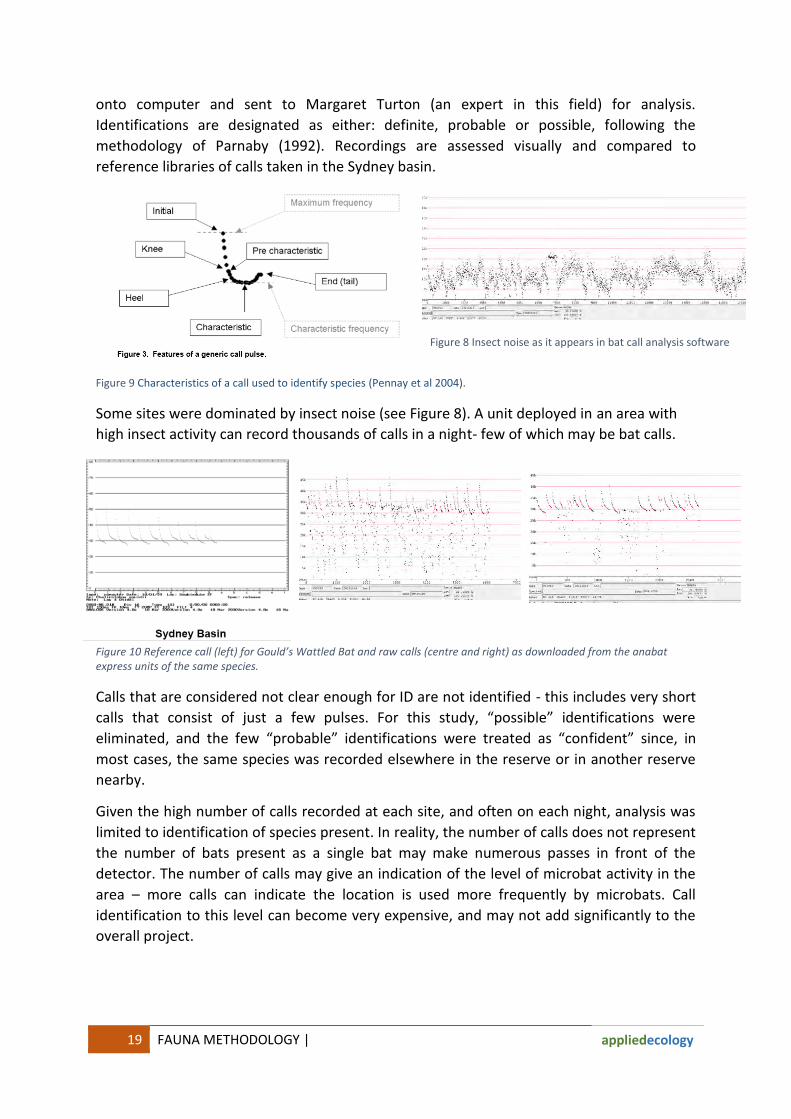
onto computer and sent to Margaret Turton (an expert in this field) for analysis. Identifications are designated as either: definite, probable or possible, following the methodology of Parnaby (1992). Recordings are assessed visually and compared to reference libraries of calls taken in the Sydney basin.
Figure 9 Characteristics of a call used to identify species (Pennay et al 2004).
Some sites were dominated by insect noise (see Figure 8). A unit deployed in an area with high insect activity can record thousands of calls in a night- few of which may be bat calls.
Figure 10 Reference call (left) for Gould’s Wattled Bat and raw calls (centre and right) as downloaded from the anabat express units of the same species.
Calls that are considered not clear enough for ID are not identified - this includes very short calls that consist of just a few pulses. For this study, “possible” identifications were eliminated, and the few “probable” identifications were treated as “confident” since, in most cases, the same species was recorded elsewhere in the reserve or in another reserve nearby.
Given the high number of calls recorded at each site, and often on each night, analysis was limited to identification of species present. In reality, the number of calls does not represent the number of bats present as a single bat may make numerous passes in front of the detector. The number of calls may give an indication of the level of microbat activity in the area – more calls can indicate the location is used more frequently by microbats. Call identification to this level can become very expensive, and may not add significantly to the overall project.
Figure 8 Insect noise as it appears in bat call analysis software

FAUNA METHODOLOGY 20
Table 4 Anabat sampling effort
NIGHTS TERRYS CREEK
NORTH TERRYS CREEK
SOUTH FIELD OF MARS
RESERVE BUFFALO
CREEK KITTYS CREEK
Autumn 8 8 15 7 7 Spring 7 7 32 18 8
Diurnal Bird Census
Bird surveys were both targeted and opportunistic. Systematic surveys designed to capture peak activity (dawn chorus, morning, and late afternoon) at marked quadrats were undertaken on a minimum of two days each season. These surveys were for a fixed period of 20 minutes. The majority of sites do not contain quadrats and 40 minute slow random meanders were undertaken in different habitat types within the corridors to record birds present. A total of 40 minutes were spent at each habitat type or, for large reserves, reserve zone with any birds sighted or heard calling during that period recorded. In reality up to 20 ha contributes to each random meander survey with observers walking towards species sighted or heard to confirm identification and to count the number of individuals present. Individuals were counted exactly or estimated to the nearest “5” to a maximum of 20. For example, a social group of Superb Fairy-wrens can be hard to count exactly so an estimate of numbers to the nearest 5 was made. For abundant species in one location such as Noisy Miners and Sulphur-crested Cockatoos a maximum of “20” was recorded for any given survey despite the likelihood of higher local abundance. Only species flying within the canopy, roosting or foraging were recorded. For example Australian Pelicans or Australian Magpies flying at height over a reserve were not included in the records for that location, although some of the species recorded by Biosphere (2007), for example, White-throated Needletails and Australian Pelicans, were only spotted flying near or above a reserve. Any species observed during other survey activities and during general traverses of the site were also recorded.
Table 5 Diurnal bird census survey effort
Minutes TERRYS CREEK NORTH
TERRYS CREEK SOUTH
FIELD OF MARS RESERVE
BUFFALO CREEK
KITTYS CREEK
autumn
# Quadrat survey 40 (2) 120(6) 80(4) 80(4) 100 (5)
# 40 min random meanders 160(4) 200(5) 320(8) 120(3) 240(6) spring
# Quadrat survey 60(3) 120(6) 80(4) 80(4) 40(2)
# 40 min random meanders 240(6) 480(12) 520(13) 400(10) 480(12)
Totals 500 min,
15 surveys
920 min, 29 surveys
1000 mins, 30 surveys
680mins, 21 surveys
860 mins, 25 surveys
Reptile and Amphibian Searches
Reptiles and amphibians were surveyed within the study area by timed diurnal searches in suitable areas in addition to ad hoc surveys in areas with rocks, logs, rough-barked tree
21 FAUNA METHODOLOGY |
appliedecology
species, debris and other material, which provides suitable cover for Reptiles and Amphibians. Likely habitat was searched or observed and any species observed recorded. 20 minute timed searches were also undertaken in all quadrats, twice per season.
Table 6 Reptiles and Amphibians timed searched survey effort
NIGHTS TERRYS CREEK
NORTH TERRYS CREEK
SOUTH FIELD OF MARS
RESERVE BUFFALO
CREEK KITTYS CREEK
Autumn 2 6 4 4 2 Spring 2 6 4 4 2
Nocturnal Frog Searches
During the evening calling frogs were identified on the basis of their characteristic calls. Spotlighting traverses included wet areas within the study site with the objective to detect calling or active frogs. See spotlighting section for survey effort across the reserves.
Hair tubing
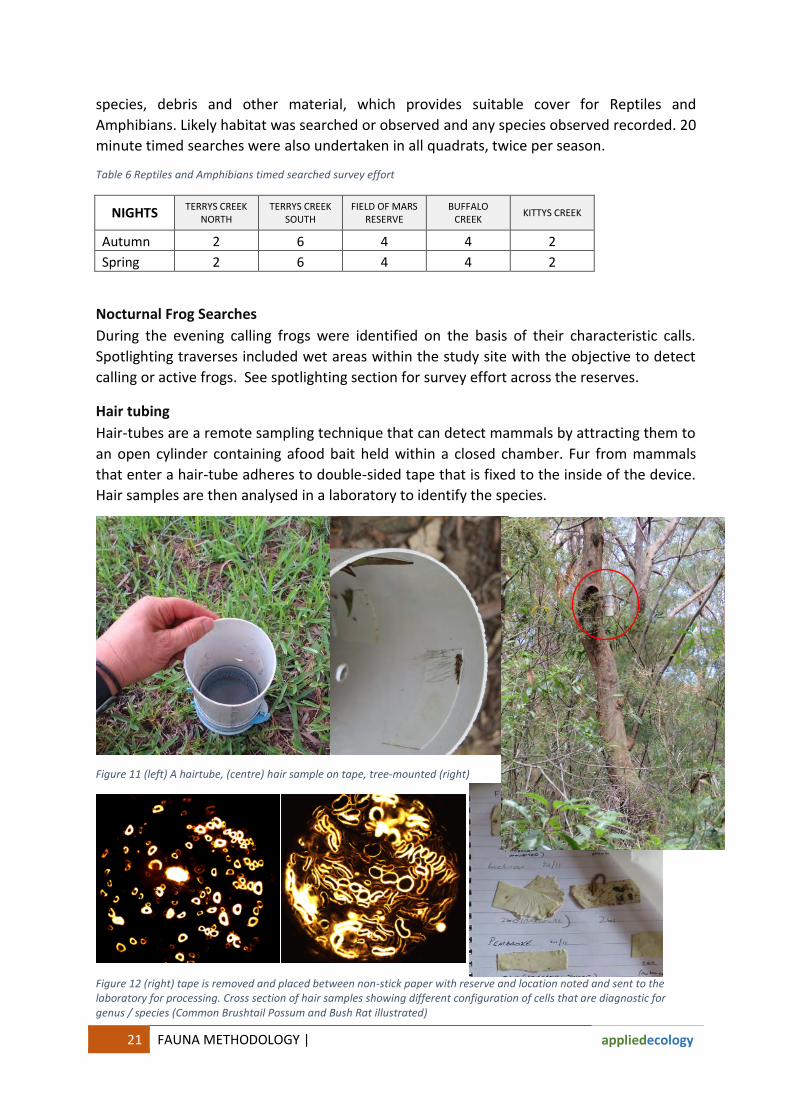
Hair-tubes are a remote sampling technique that can detect mammals by attracting them to an open cylinder containing afood bait held within a closed chamber. Fur from mammals that enter a hair-tube adheres to double-sided tape that is fixed to the inside of the device. Hair samples are then analysed in a laboratory to identify the species.
Figure 11 (left) A hairtube, (centre) hair sample on tape, tree-mounted (right)
Figure 12 (right) tape is removed and placed between non-stick paper with reserve and location noted and sent to the laboratory for processing. Cross section of hair samples showing different configuration of cells that are diagnostic for genus / species (Common Brushtail Possum and Bush Rat illustrated)

FAUNA METHODOLOGY 22
Hair tubes were deployed in transects of 10 with each tube deployed approximately 40-50 metres apart. 1 tube per transect of 10 was tree-mounted. In large reserves tubes were deployed in each zone of the reserve and every major habitat type sampled.
Table 7 Hairtube sampling - survey effort
NIGHTS TERRYS CREEK
NORTH TERRYS CREEK
SOUTH FIELD OF MARS
RESERVE BUFFALO
CREEK KITTYS CREEK
Autumn 100 100 200 50 150 Spring 110 130 240 100 150
Searches for Evidence
Scats were collected when encountered during any of the survey activities. Systematic surveys for scats were not undertaken however a targeted survey for swamp wallaby scats was undertaken in Field of Mars Reserve and the Buffalo Creek tributaries when other methods failed to detect this species. Areas below powerful Owl roost trees were surveyed for pellets. Fox and wild dog scats were collected when encountered on walking trails. Scats and pellets were placed in brown paper bags and stored in an airtight container prior to delivery to “Scatsabout” a company specialising in the field of hair and scat analysis. During these walks characteristic signs, tracks, and scats and other indirect evidence of fauna species from all fauna groups were recorded when observed.
Figure 13 Fox scats are easily distinguishable from domestic dog scats in the field. Identifiable elements of the animal’s diet are evident such as seeds, beetle carapaces, hairs, feathers and bones. Detailed analysis of scats can determine the genus and often the species of vertebrate prey through hair/fur analysis.

23 FAUNA METHODOLOGY |
appliedecology
Searches for Invertebrates
Invertebrates were surveyed in the project quadrats as well as opportunistically. Invertebrate searches were combined with the reptile searches in each quadrat (i.e. two mornings of twenty minutes search effort per season).
Opportunistic searches were also carried out throughout the rest of the reserve comprising dip-netting in creeks, searching undergrowth for spiders, insects and other soft-bodied creatures and using small battery operated night lights for two evenings to collect night-flying and other insects
Table 8 Invertebrate timed searched survey effort
NIGHTS TERRYS CREEK
NORTH TERRYS CREEK
SOUTH FIELD OF MARS
RESERVE BUFFALO
CREEK KITTYS CREEK
Autumn 2 6 4 4 2 Spring 2 6 4 4 2
Searches for Fish
Spotlighting, dip nets and/or small hand nets were used to survey waterways/water bodies within each study site. Fish and aquatic macroinvertebrates were identified to Order or Family or genus/species for fish. Twenty minutes was spent sampling each tributary/waterway with suitable water levels within each corridor to a maximum of 3 sites per corridor
Table 9 Fish & aquatics timed searched survey effort
20 minute surveys
TERRYS CREEK NORTH
TERRYS CREEK SOUTH
FIELD OF MARS RESERVE
BUFFALO CREEK KITTYS CREEK
Autumn 1 2 1 2 2 Spring 1 2 1 2 2
Research Licensing
The survey and research of fauna during the 2017-2018 was undertaken under the following licences and approvals in accordance with the Animal Research Act (1991).
Principal: Anne Carey; Associates: Meredith Brainwood, Caroline Forest
Office of Environment and Heritage Scientific Licence SL101080
Department of Primary Industries Animal Research Authority Trim 12/4893 (2)
Department of Primary Industries Director-General’s Animal Care and Ethics Committee DG ACEC Trim 12/4893

FAUNA METHODOLOGY 24
2.1 Key dates and equipment locations
Table 10 Key survey dates
SPOTLIGHTING DIURNAL BIRD CENSUS
HERPS/ INVERTS
QUAD SEARCHES
CAMERAS DEPLOYMENT DATES ANABAT UNITS
TERRYS CREEK CORRIDOR
17.5.17 24.5.17 27.9.17
12.10.17 9.11.17
28.11.17
9.4.17 15.4.17 23.4.17 30.4.17 17.5.17 24.5.17 1.6.17
11.9.17
20.9.17 27.9.17
12.10.17 31.10.17 9.11.17
22.11.17 28.11.17
18.9.17 19.9.17 26.9.17 27.9.17 5.10.17 6.10.17 9.11.17
10.11.17 16.11.17 17.11.17
9.4.17 15.4.17 23.4.17 30.4.17 17.5.17 24.5.17
11.9.17 20.9.17
12.10.17 31.10.17 9.11.17
9.4.17 15.4.17 30.4.17 24.5.17 20.9.17 27.9.17
24.10.17
FIELD OF MARS RESERVE/BUFFALO CREEK
CORRIDOR
11.4.17 22.5.17 13.9.17
24.10.17 7.11.17 20.9.17 27.9.17
12.10.17 9.11.17
22.11.17
15.4.17 30.4.17 30.4.17 6.5.17
13.5.17 22.5.17 29.5.17 13.9.17 20.9.17 27.9.17 27.9.17
12.10.17 24.10.17
31.10.2017 31.10.2017
7.11.17 16.11.17 21.11.17 28.11.17
11.4.17 15.4.17 23.4.17 30.4.17 13.5.17 22.5.17 29.5.17
1.6.17 13.9.17
12.10.17 24.10.17 7.11.17
16.11.17
15.4.17 23.4.17 30.4.17 6.5.17
22.5.17 13.9.17 20.9.17 27.9.17 7.11.17
16.11.17
KITTY’S CREEK CORRIDOR
17.5.17 25.5.17 26.9.17 6.10.17
31.10.17
11.4.17 23.4.17 30.4.17 13.5.17 22.5.17 28.5.17 13.9.17 20.9.17
27.9.17 12.10.17 24.10.17 24.10.17 31.10.17 7.11.17
24.11.17
11.4.17 23.4.17 30.4.17 13.5.17 13.9.17 27.9.17
24.10.17
23.4.17 13.5.17 13.9.17
25 FAUNA METHODOLOGY |
appliedecology
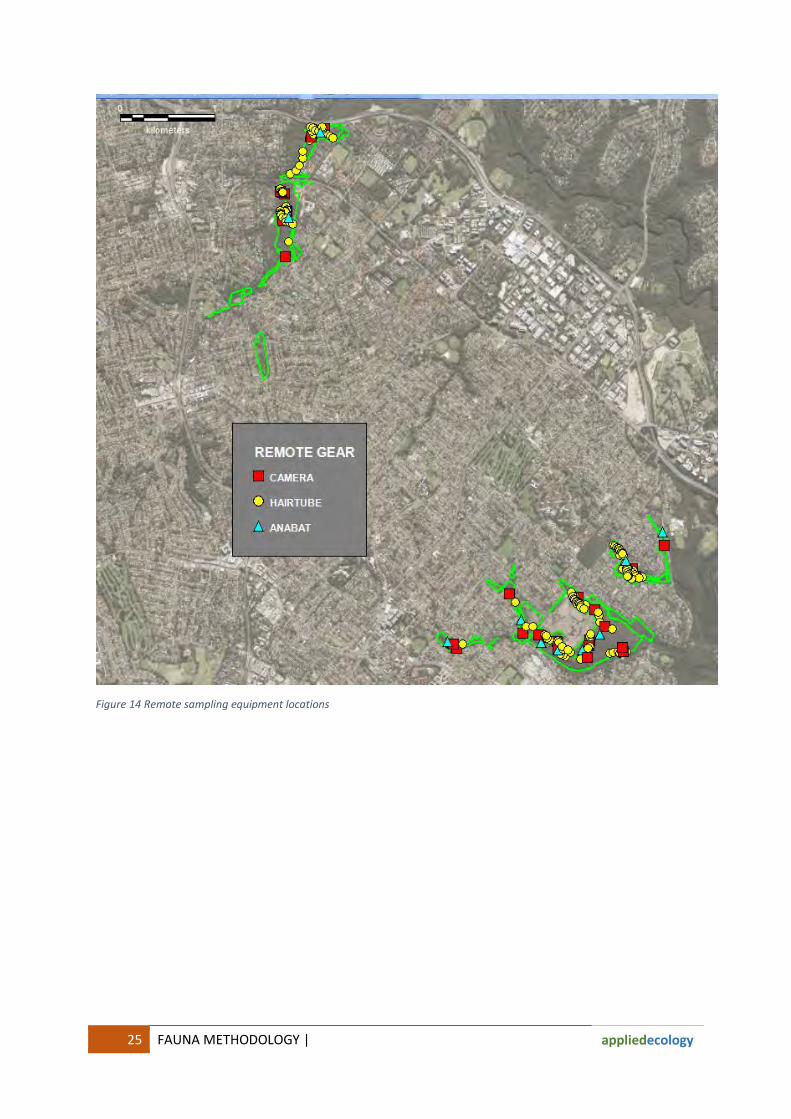
Figure 14 Remote sampling equipment locations

FAUNA METHODOLOGY 26
Figure 15 Fish sampling locations

27 FLORA METHODOLOGY |
appliedecology
3 FLORA METHODOLOGY The main goal of the methodology was to replicate the one used in 2007 at the same sites by Biosphere (see Biosphere, 2006 and 2007). This comprised:
1) A general survey of the plant species in each reserve 2) Quadrat based surveys at previously specified locations in each reserve, using a 7 stage
Braun-Blanquet technique 3) An additional component involved ground truth vegetation mapping for the reserves based
on that developed by OEH (2013)
3.1 General survey
Biosphere (2007) described the process for general flora surveys as follows:
“Initially, the reserves were explored to compile lists of local native plants and non-local native/exotic
plant species and to assess the vegetation communities. A draft report Native Plants of the Ryde
District: The Conservation Significance of Ryde’s Bushland Plants (Kubiak, 2005) was used as a
baseline species list on which to base observation in this study. Native Species Checklists for
[Parramatta River – excluded from this study] Terrys Creek, Kittys Creek and Buffalo Creek
Catchments and two quadrats from the Field of Mars Reserve are in Appendix 1. This list has been
added to as new observations have been made during the survey. A Checklist of exotic and non-local
native plants for those catchments was also compiled (Appendix 2). Species nomenclature follows
The Flora of NSW (Harden, G (Ed.), 1990-1993).”
We repeated this process using the random meander method described by Cropper (1993). The whole of the site was traversed at regular intervals, and plant species recorded. Particular attention was given to areas with any signs of differences in vegetation, or potential differences, for example, through proximity to water, change in soil characteristics, disturbance, rocky outcrops, steep slopes, etc. The aim was to record as many of the flora species present as possible. These were done for whole reserve corridors, although separate lists were retained for individual reserves within each corridor. Some inaccuracies in flora species lists for each reserve may have arisen from difficulties in identifying the boundary between one bushland reserve and the next in a continuous bushland corridor. These lists of flora species were compared with those recorded by Biosphere in 2007.
3.2 Quadrat surveys
The quadrat locations were selected and then established initially in 2007. This process was described as follows (Biosphere, 2007):
“Survey sites were selected in areas of representative vegetation communities in each reserve. For
example, Pembroke Park had three identifiable vegetation communities present; one survey site was
established in each of these communities in areas where there were minimal external impacts. This
meant that the final location in each community was away from paths and roads where possible,
contained a relatively high proportion of representative canopy, shrub and ground cover species (and
correspondingly fewer invasive or non-representative species) and was unlikely to be significantly
disturbed in the foreseeable future.”

FLORA METHODOLOGY 28
The following quadrats were established in 2007, and were resurveyed in 2017 (Table 11).
Table 11 Location and features of the survey quadrats (Biosphere, 2007)
The quadrat establishment process was described as follows (Biosphere, 2007):
“Each survey site consisted of a 20 m by 20 m square i.e. 400 square metres quadrat. Survey
pegs and string lines were used to mark the boundaries of each quadrat and the location of
each corner peg was plotted by GPS (in case they were interfered with or removed).”
Steel star posts measuring 450mm were used to mark each corner so that around 200-250mm was visible above ground, and capped with a yellow post cap for safety, and a waypoint provided for the centre to assist with relocating the quadrat. This waypoint gave an approximate location for the centre (most handheld GPS units are accurate to around 3m), and a search was commenced for a corner post. Once a corner peg had been located, this was used in conjunction with the centre waypoint to orient the rest of the corners. At least one corner peg was located for each quadrat, although often the remaining pegs were missing. There was no quadrat that had all four corner pegs in place.
Survey methodology aimed to replicate the work done previously by Biosphere in 2007 in the same quadrats, and also to be in line with work done as part of the repeat surveys for other reserves in the City of Ryde (ACA 2016, replicating Biosphere 2006).
“Quadrats were placed in areas of highest diversity of local native plants with consideration
of the required size of the quadrat and the narrowness of the reserves. In order to assess
abundance a Braun-Blanquet scale was used. While this method involves a subjective or
qualitative description, it also provides for a quantitative, or measurable documentation for
comparison of plant community characteristics, especially species richness. Therefore, an
inventory of plant species and approximate species numbers was completed for each quadrat
then each species was assigned a Braun-Blanquet Cover Class.”
Park or Vegetation Community Area
Reserve Represented (m2)
Terrys Pembroke ‘Pembroke’ Dis turbed Western Sandstone 400
Creek Gul ly Forest*
Pembroke ‘Acacia binervia ’ Dis turbed Western Sandstone Gul ly Forest*400
Disturbed Sandstone Ridgetop
Pembroke ‘Coachwood / Xmas Bush’ Woodland* 400
Somerset ‘Somerset’ Sandstone Ridgetop Woodland 400
Kittys
Creek
Buffa lo Pidding ‘Pidding’ Sydney Turpentine-Ironbark Forest 400
Creek And
Western Sandstone Gul ly Forest
Burrows ‘Burrows’ Sydney Turpentine-Ironbark Forest 400
Strangers Field of Mars ‘Strangers Creek’ Most l ikely Shale / Sandstone 400
CreekTrans i tion Forest (high sandstone
influence)‘Pimel ia curvi flora ’ Turpentine Ironbark Margin Forest 400
400
Catchment Quadrat Name
Portius Wolfe Road Western Sandstone Gul ly Forest

29 FLORA METHODOLOGY |
appliedecology
Cover abundance scores (1 to 7) for the Braun-Blanquet Cover Classes were provided in Biosphere (2006, p. 16) and interpreted by ACA in the 2016 survey as follows (Table 12):
Table 12 Braun-Blanquet Cover Classes as provided by Biosphere (2006) and interpreted by ACA (2016)
While the Braun-Blanquet scoring system provides a subjective estimate of abundance, it does assign the abundance for each species to a ranked grouping, and this can be used to determine whether observed changes in cover should be considered significant.
3.3 Ground truthing vegetation mapping
Native vegetation mapping has been compiled by Office of Environment & Heritage (OEH) through a project that was started by the Sydney Metro Catchment Management Authority, and since updated several times by OEH. The most recent release of a revised dataset occurred in 15/12/2016. This version has been used throughout this report. Over time, ground truthing has contributed to our understanding of the floristic composition of various vegetation communities, and their extant distribution in the Sydney Basin. As a result, there have been changes to the names of communities, the composition of vegetation in communities, and the mapped extent of these communities in bushland reserves in Ryde. This project looked at the current understanding of the distribution of each vegetation community present in the Buffalo Creek, Kittys Creek, Terrys Creek and Strangers Creek (Field of Mars Reserve) reserve corridors, and compared this with observed vegetation on ground for each mapped patch, except where the patch was very small in size.
Several methods for collecting ground truthing data were used, in line with the methodology described by OEH (2016) in The Native Vegetation of the Sydney Metropolitan Area. Volume 1:
Technical Report. Version 3.0, and those used by ACA in 2016. These were based on the species recorded in a plot of 0.4ha, or within a 20m x 20m quadrat or the equivalent. Quadrat data recorded to assess changes in vegetation over time was included in this second dataset, along with spot quadrat sampling in each of the mapped vegetation communities in each of the reserves. For some vegetation patches in Field of Mars Reserve there was good quadrat survey data from ACA’s survey in 2016, and this was used for these patches. In other cases, where the reserve was small and moderately degraded the flora list from random meander searches was used.
Table 13 shows the survey methods used for each mapped vegetation community in each reserve/park in each of the three creek corridors surveyed. For some vegetation patches, if the floristic analysis failed to comply with diagnostic requirements it was retested as the most likely alternative and noted in the “retested”. The “surveyed” column identifies whether the quadrat was
COVER CLASS Interpreted in 2016 as
few individuals (three or less)
and cover <5%
more than three but not
consistently throughout the plot)
and cover <5%
consistent throughout the plot
and cover <5%
Very abundant cover <5% OR
cover >5% but <20%
5 Cover >20% but <50% 21% – 49% cover in quadrat6 Cover >50% but <75% 51% – 74% cover in quadrat7 Cover >75% but <100% 76% – 99% cover in quadrat
BIOSPHERE (2006)
3Common
cover <5% throughout the quadrat
4 6–19% cover in quadrat
1Rare
≤ 3 individuals AND <5% cover
2Uncommon
>3 individuals AND cover <5%
FLORA METHODOLOGY 30
surveyed for % cover (NAME OF QUADRAT), spot meander, random meander, or data from 2016 taken from ACA’s report (ACA NAME OF QUADRAT). Figure 16 and Figure 17 show the locations of ground truthing survey areas.
Vegetation was ground truthed by Biosphere in 2007 based on mapping that was formalised in 2009 (SMCMA, 2009). This draft mapping was reviewed and updated in 2013 (Sydney Metropolitan Area Native Vegetation Mapping, OEH, 2013). As part of a comprehensive review of native vegetation mapping in NSW, vegetation communities are now referred to as Plant Community Types (PCTs), with an aim for consistency across bioregions, the old CMA boundaries, and the current LLS boundaries. This has brought a new round of name changes with it, and in some cases minor differences in how the communities are described and understood. For the reserves in the current study the description of the current PCT matches previous descriptions for the vegetation communities. Each of the previous names for the relevant communities are provided in the following table to ensure that subsequent studies that repeat these surveys are able to be correctly mapped and tracked against previous iterations.

31 FLORA METHODOLOGY |
appliedecology
Table 13 Survey methods used for each mapped vegetation community, with updated nomenclature and conservation status, for each reserve in Kittys, Terrys and Buffalo Creek Creeks corridors
CATCHMENT RESERVE/PARK SYDNEY METRO MAP UNIT (OEH, 2013) EEC? CODE SURVEYED RETESTED
BUFFALO CREEK Aitchandar Park Sydney Turpentine-Ironbark Forest NSW, Aust
S_WSF09 RANDOM MEANDER
BUFFALO CREEK Barton Reserve Coastal Enriched Sandstone Moist Forest
S_WSF02 RANDOM MEANDER
BUFFALO CREEK Barton Reserve Sydney Turpentine-Ironbark Forest
NSW, Aust
S_WSF09 RANDOM MEANDER
BUFFALO CREEK Burrows Park Coastal Enriched Sandstone Moist Forest
S_WSF02 SPOT MEANDER
BUFFALO CREEK Burrows Park Sydney Turpentine-Ironbark Forest
NSW, Aust
S_WSF09 BURROWS
BUFFALO CREEK Field of Mars Reserve (cemetery)
Coastal Shale Sandstone Forest S_WSF06 ACA GT QA
BUFFALO CREEK Field of Mars Reserve (main)
Coastal Enriched Sandstone Moist Forest (CESMF east)
S_WSF02 SPOT MEANDER
BUFFALO CREEK Field of Mars Reserve (main)
Coastal Enriched Sandstone Moist Forest S_WSF02 SPOT MEANDER
BUFFALO CREEK Field of Mars Reserve (main)
Coastal Enriched Sandstone Dry Forest (CESDF centre)
S_DSF04 ACA FOM#5
BUFFALO CREEK Field of Mars Reserve (main)
Coastal Enriched Sandstone Dry Forest (CESDF centre)
S_DSF04 ACA GT QC
BUFFALO CREEK Field of Mars Reserve (main)
Coastal Enriched Sandstone Dry Forest (CESDF centre)
S_DSF04 SPOT MEANDER
BUFFALO CREEK Field of Mars Reserve (main)
Coastal Enriched Sandstone Dry Forest (CESDF east)
S_DSF04 SPOT MEANDER
BUFFALO CREEK Field of Mars Reserve (main)
Coastal Enriched Sandstone Dry Forest (CESDF west)
S_DSF04 SPOT MEANDER
BUFFALO CREEK Field of Mars Reserve (main)
Coastal Shale Sandstone Forest (CSSF centre)
S_WSF06 PIMELEA
BUFFALO CREEK Field of Mars Reserve Coastal Shale Sandstone Forest S_WSF06 STRANGERS

FLORA METHODOLOGY 32
CATCHMENT RESERVE/PARK SYDNEY METRO MAP UNIT (OEH, 2013) EEC? CODE SURVEYED RETESTED
(main) (CSSF north) BUFFALO CREEK Field of Mars Reserve
(main) Coastal Shale Sandstone Forest (CSSF south)
S_WSF06 SPOT MEANDER
BUFFALO CREEK Field of Mars Reserve (main)
Coastal Shale Sandstone Forest (CSSF west)
S_WSF06 SPOT MEANDER
BUFFALO CREEK Field of Mars Reserve (main)
Sydney Turpentine-Ironbark Forest (STIF east)
NSW, Aust
S_WSF09 SPOT MEANDER
BUFFALO CREEK Field of Mars Reserve (main)
Sydney Turpentine-Ironbark Forest (STIF west)
NSW, Aust
S_WSF09 ACA GT QD
BUFFALO CREEK Laurel Park Coastal Enriched Sandstone Moist Forest S_WSF02 RANDOM MEANDER
BUFFALO CREEK Minga Reserve Sydney Turpentine-Ironbark Forest
NSW, Aust
S_WSF09 RANDOM MEANDER
BUFFALO CREEK Pidding Park Coastal Enriched Sandstone Dry Forest
S_DSF04 PIDDING
BUFFALO CREEK
Tyrell Park Sydney Turpentine-Ironbark Forest
NSW, Aust
S_WSF09 SPOT MEANDER
KITTYS CREEK Kittys Creek Reserve Coastal Enriched Sandstone Dry Forest
S_DSF04 RANDOM MEANDER
KITTYS CREEK Kittys Creek Reserve Coastal Sandstone Gully Forest S_DSF09 RANDOM MEANDER
KITTYS CREEK Martin Reserve Coastal Enriched Sandstone Dry Forest
S_DSF04 RANDOM MEANDER
KITTYS CREEK Portius Park Coastal Enriched Sandstone Dry Forest S_DSF04 SPOT MEANDER
KITTYS CREEK Portius Park Coastal Enriched Sandstone Dry Forest S_DSF04 SPOT MEANDER
KITTYS CREEK Portius Park Coastal Sandstone Gallery Rainforest S_RF02 SPOT MEANDER
KITTYS CREEK Portius Park Coastal Sandstone Gully Forest S_DSF09 WOLFE RD

33 FLORA METHODOLOGY |
appliedecology
CATCHMENT RESERVE/PARK SYDNEY METRO MAP UNIT (OEH, 2013) EEC? CODE SURVEYED RETESTED
KITTYS CREEK Pryor Park Sydney Turpentine-Ironbark Forest NSW,
Aust S_WSF09 RANDOM
MEANDER
TERRYS CREEK Forrester Park Sydney Turpentine-Ironbark Forest
NSW, Aust
S_WSF09 RANDOM MEANDER
TERRYS CREEK Forsyth Park Coastal Enriched Sandstone Dry Forest
S_DSF04 RANDOM MEANDER
TERRYS CREEK Ivanhoe Reserve Coastal Sandstone Gully Forest S_DSF09 RANDOM MEANDER
TERRYS CREEK Ivanhoe Reserve Coastal Enriched Sandstone Dry Forest S_DSF04 RANDOM MEANDER
TERRYS CREEK Jim Walsh Park Blue Gum High Forest NSW, Aust
S_WSF01 RANDOM MEANDER
TERRYS CREEK Lucknow Park Coastal Enriched Sandstone Dry Forest S_DSF04 LUCKNOW TERRYS CREEK Lucknow Park Coastal Sandstone Gallery Rainforest S_RF02 SPOT
MEANDER
TERRYS CREEK Lucknow Park Coastal Sandstone Gully Forest S_DSF09 SPOT MEANDER
TERRYS CREEK Pembroke Park Coastal Enriched Sandstone Dry Forest S_DSF04 SPOT MEANDER
TERRYS CREEK Pembroke Park Coastal Enriched Sandstone Dry Forest
S_DSF04 PEM-S
TERRYS CREEK Pembroke Park Coastal Sandstone Gully Forest
S_DSF09 PEM-N
TERRYS CREEK Pembroke Park Coastal Sandstone Gallery Rainforest
S_RF02 PEM-N
TERRYS CREEK Pembroke Park Coastal Sandstone Gully Forest
S_DSF09 PEM-TC
TERRYS CREEK Pembroke Park Coastal Sandstone Gallery Rainforest
S_RF02 PEM-TC
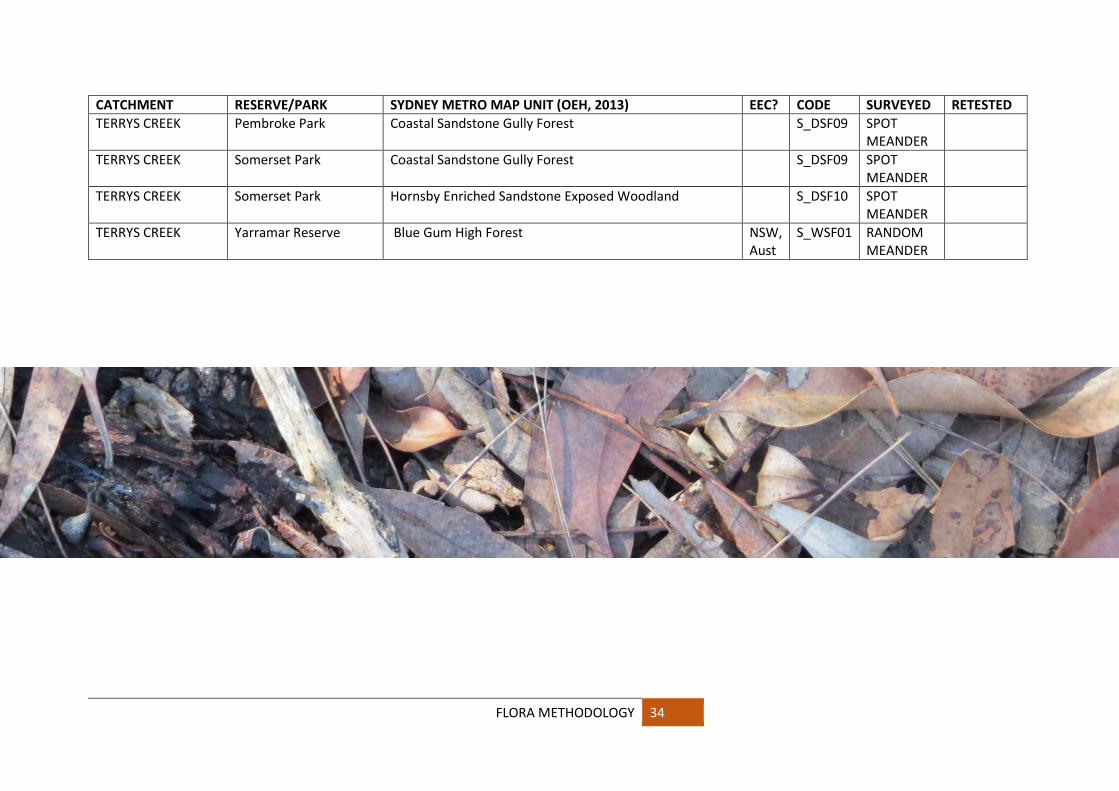
FLORA METHODOLOGY 34
CATCHMENT RESERVE/PARK SYDNEY METRO MAP UNIT (OEH, 2013) EEC? CODE SURVEYED RETESTED
TERRYS CREEK Pembroke Park Coastal Sandstone Gully Forest S_DSF09 SPOT MEANDER
TERRYS CREEK Somerset Park Coastal Sandstone Gully Forest S_DSF09 SPOT MEANDER
TERRYS CREEK Somerset Park Hornsby Enriched Sandstone Exposed Woodland S_DSF10 SPOT MEANDER
TERRYS CREEK Yarramar Reserve Blue Gum High Forest NSW, Aust
S_WSF01 RANDOM MEANDER

35 FLORA METHODOLOGY |
appliedecology
Figure 16 Locations of ground truthing survey areas and quadrats for Kittys Creek, Buffalo Creek Creek and Field of Mars Reserve

FLORA METHODOLOGY 36
Figure 17 Locations of ground truthing survey areas and quadrats for Terrys Creek reserves
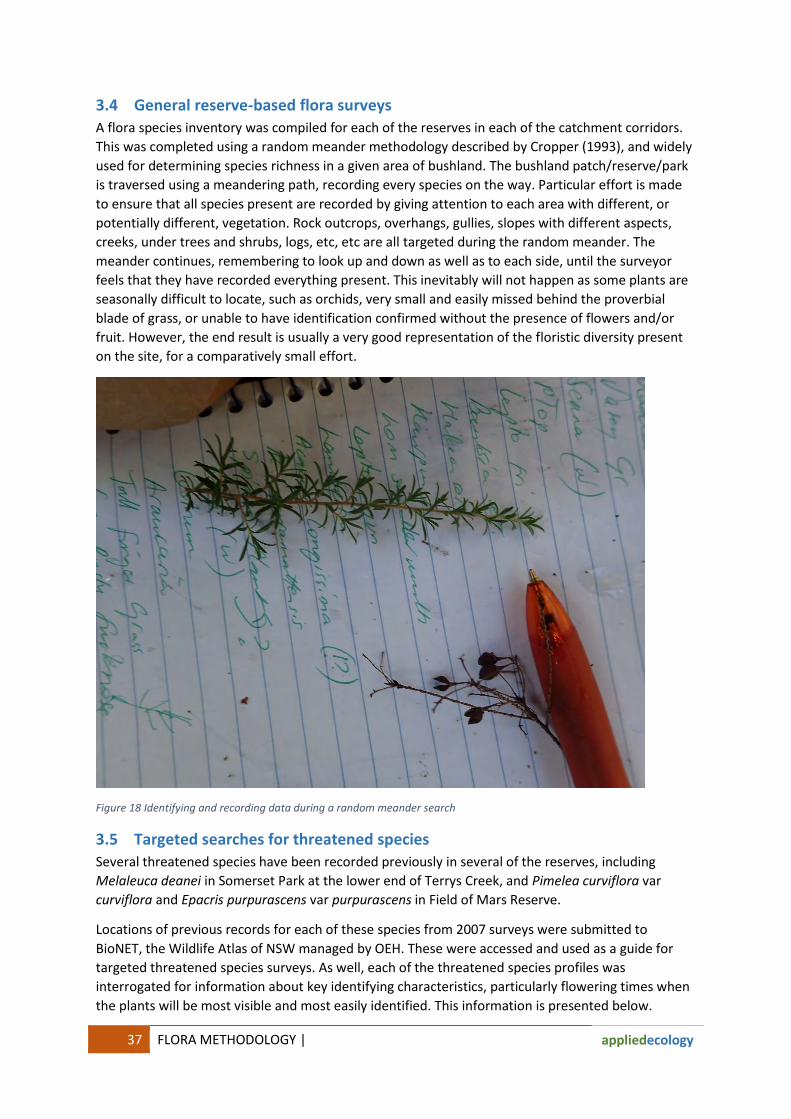
37 FLORA METHODOLOGY |
appliedecology
3.4 General reserve-based flora surveys
A flora species inventory was compiled for each of the reserves in each of the catchment corridors. This was completed using a random meander methodology described by Cropper (1993), and widely used for determining species richness in a given area of bushland. The bushland patch/reserve/park is traversed using a meandering path, recording every species on the way. Particular effort is made to ensure that all species present are recorded by giving attention to each area with different, or potentially different, vegetation. Rock outcrops, overhangs, gullies, slopes with different aspects, creeks, under trees and shrubs, logs, etc, etc are all targeted during the random meander. The meander continues, remembering to look up and down as well as to each side, until the surveyor feels that they have recorded everything present. This inevitably will not happen as some plants are seasonally difficult to locate, such as orchids, very small and easily missed behind the proverbial blade of grass, or unable to have identification confirmed without the presence of flowers and/or fruit. However, the end result is usually a very good representation of the floristic diversity present on the site, for a comparatively small effort.
Figure 18 Identifying and recording data during a random meander search
3.5 Targeted searches for threatened species
Several threatened species have been recorded previously in several of the reserves, including Melaleuca deanei in Somerset Park at the lower end of Terrys Creek, and Pimelea curviflora var curviflora and Epacris purpurascens var purpurascens in Field of Mars Reserve.
Locations of previous records for each of these species from 2007 surveys were submitted to BioNET, the Wildlife Atlas of NSW managed by OEH. These were accessed and used as a guide for targeted threatened species surveys. As well, each of the threatened species profiles was interrogated for information about key identifying characteristics, particularly flowering times when the plants will be most visible and most easily identified. This information is presented below.

FAUNA SURVEY RESULTS 38
4
Figure 19 Powerful Owl Fledgling/Juvenile - Buffalo Creek Field of Mars Reserve, November 2017

39 FAUNA SURVEY RESULTS |
appliedecology
4.1 FAUNA See Appendix A for detailed project species list.
114 vertebrate species were detected during the survey including:
5 threatened species 2 species listed under the Bonn convention 10 exotic species
72 species of bird, 22 mammals, 4 amphibians, 12 reptiles, 4 fish were recorded.
Species richness for each corridor varied considerably but was correlated to the patch size, current disturbance regime, vegetation/habitat types and location in the landscape (connectivity). Further analysis of the results can be found in chapter 5 of this report.
Most species were directly observed (most birds, most mammals and all reptiles) or heard (owls, frogs) or a combination of both. This did vary from corridor to corridor. One arboreal species, the Sugar Glider, was only detected by remote techniques. All microbats were detected by anabat. A total of 9 species of microbats were identified. Of these, 3 species are listed as Vulnerable under the NSW Threatened Species Conservation Act 1995. One genus of microbats cannot be identified to species using echolocation calls, and has been assumed to be a single species. Further discussion on threatened microbat species can be found in Section 7.1
Scat & hair analysis provided the best understanding of the distribution of terrestrial mammal species while arboreal mammals were spotlighted or heard or captured by remote cameras or a combination of these techniques. A detailed analysis of indirect evidence (scat, hair, pellet analysis) is provided in Chapter 4.5 of this report.
One component of this project was to build upon baseline data collected in 2006 and 2007 by Biosphere Environmental Consultants Pty Limited (BEC) and subsequent surveys by Clements (2016) in the Field of Mars Reserve. This project repeats surveys, albeit using slightly different techniques, equipment and effort. It is worth noting that while final species richness numbers are interesting they are influenced, in this study, by differences in data collection and do not necessarily reflect the quality of habitat available or the number of species utilizing a given bushland corridor. BEC included species such as White-throated Needletails and Australian Pelicans in species lists for various corridors and while these species would have been sighted flying overhead by an observer in the corridor these species cannot be considered part of the extant fauna of the reserves. Increases in mammalian species richness can be linked to increased effort to detect microbat species. Between surveys there was a considerable turnover in bird species. Detailed analysis of species turnover is provided in section 5.2 of this report. Of importance is a turnover in species that could be considered sedentary as the presence and absence of migratory species is linked to factors outside the Sydney Basin including prevailing and general weather conditions and seasonal flowering events. For example typical summer migrants including Black-faced Monarchs and Rufous fantails were late

FAUNA SURVEY RESULTS 40
arriving, if at all, during this survey period whilst they were commonly observed in the area the previous year (see ebird records, personal observations). It is noted that several species, some largely sedentary or seasonal residents, that were widely recorded by BEC in 2006-07 were not detected in reserves during the 2017 surveys. These species are uncommon in the urban areas of Sydney in 2017. These species include the Dusky Woodswallow (at Kittys Creek), Jacky Winter (all corridors), Crested Shrike-tits (Terrys Creek), and Grey Shrike-thrushes (Buffalo Creek and Terrys Creek). It is important to note that most bird species, even sedentary species, will move in response to resource availability.
Summary findings are as follows for each bushland corridor:
Kittys Creek Corridor
Kittys Creek corridor is a narrow set of reserves along Kittys Creek in East Ryde. It contains bush of varying quality from relatively good bush in places to weed thickets in other areas. Both these provide habitat for some surprising species and in a relatively small area are probably equally as important. Weed thickets provide areas of diurnal refuge for Swamp Wallabies and provide deep shade for birds which is necessary during hot weather and for Powerful Owls for roosting to avoid mobbing and constant harassment by other birds during the day. Weedy areas also provide food resources (particularly privet species) for the frugivores observed in the corridor. Areas of good bush contain mature trees that are hollow bearing- particularly in Portius Park and the northern portion of Pryor Park. It is important to note the close proximity of Lane Cove National Park to this corridor – a proximity that allows for movement of species into the corridor if suitable habitat/resources are avaialble.
Figure 20 Powerful Owlet on Kittys Creek 2017. Location of breeding hollow is currently unknown but large Angophoras within the corridor may have suitable hollows for this large species.(Photo: Applied Ecology)

41 FAUNA SURVEY RESULTS |
appliedecology
Figure 21 (left) Mature figs in Portius Park provide resources for frugivores and are a favourite with Grey-headed Flying-foxes.(centre) The mix of mature trees and dense weeds provides several niche habitats but made surveying difficult. (right) Kittys Creek did not have base flow for parts of the survey but surface water was always available in deeper pools.
Table 14 Species richness by class
CLASS 2007 2017
BIRDS 47 36 REPTILES 7 6 FROGS 3 4 MAMMALS 7 17 TOTAL 64 63
Figure 22 (left) Eastern Water Dragons were very common throughout the corridor and (right) Swamp Wallabies were detected in Portius Park and Martin Park.

FAUNA SURVEY RESULTS 42
Figure 23 Species richness by class
Noisy miners are the dominant bird species in the corridor and they were observed aggressively chasing and mobbing other species during this survey. Species that are not routinely harassed by Noisy Miners were common in the corridor including parrots, Eastern Whipbirds and Pied Currawongs. The latter species attracts Channel-billed Cuckoos and these large cuckoos, whilst under constant attack in spring, were frequently observed in the corridor.
Figure 24 Noisy Miner at Portius Park
Figure 25 (left) A Crimson Rosella bathing Kittys Creek, (centre) the only Rufous fantail observed during surveys was located in Portius Park, (right) Australian King Parrots were regularly observed in the corridor suggesting the presence of resident pairs.

43 FAUNA SURVEY RESULTS |
appliedecology
Figure 26 Large species were very common in the corridor including Channel-billed Cuckoos (left) and Australian Brush-turkeys (right) – here a male tends his mound in Martin Reserve.
Figure 27 Bird species turnover- Kittys Creek
Key seasonal movers and migrants absent from Kittys Creek in 2017 that were present in 2007 included Black-faced Monarchs, White-plumed Honeyeaters, Fan-tailed Cuckoos, New Holland Honeyeaters and Yellow-faced Honeyeater.
Species gained includes the Australian Brush-turkey, Eastern Yellow Robin, Powerful Owl, Eastern Whipbird, Masked Lapwing, White-browed Scrubwren, Brown Gerygone and the Satin Bowerbird.
Figure 28 Number of generally resident species vs others by survey
212715
KITTYS CREEK CORRIDOR
aves species richness
2017
both
2007
2
EXOTIC SPECIES
29 4 3 36
2017 - CURRENT SURVEYS
SEDENTARY ALL OTHERS
SEASONALMOVEMENT/MIGRANTS
2007 - PAST SURVEYS
SEDENTARY ALL OTHERS
SEASONAL
MOVEMENT/MIGRANTS
34 10 3 47

FAUNA SURVEY RESULTS 44
Terrys Creek Corridor
Terrys Creek corridor consists of reserves on the eastern side of Terrys Creek (which forms the western boundary of the LGA) and is bound by the M2 motorway in the north. A similar area is managed by the City of Parramatta on the western side of the creek and the corridor, in reality, consists of over 40ha of continuous bushland south of the M2. There is good connectivity through to the Lane Cove National Park via an underpass at the M2. Much of the corridor consists of good bush abutting the riparian corridor. The riparian zone is dominated by large privet trees that offer refugia and cool, deep shade to bird species in the corridor. The relatively large area combined with connectivity has allowed the establishment and/or persistence of species absent in smaller, disjunct reserves in the area. Fauna “highlights” include apparently comparatively abundant (and breeding) populations of Swamp Wallabies and Long-nosed Bandicoots, high bushland bird diversity and several established pairs of Powerful Owls.
Figure 29 M2 underpass at Terrys Creek
Table 15 Species richness by class for all of corridor
CLASS 2007 2017
BIRDS 63 53 REPTILES 11 9 FROGS 5 4 MAMMALS 13 19 TOTAL 92 87
Figure 30 species richness by class
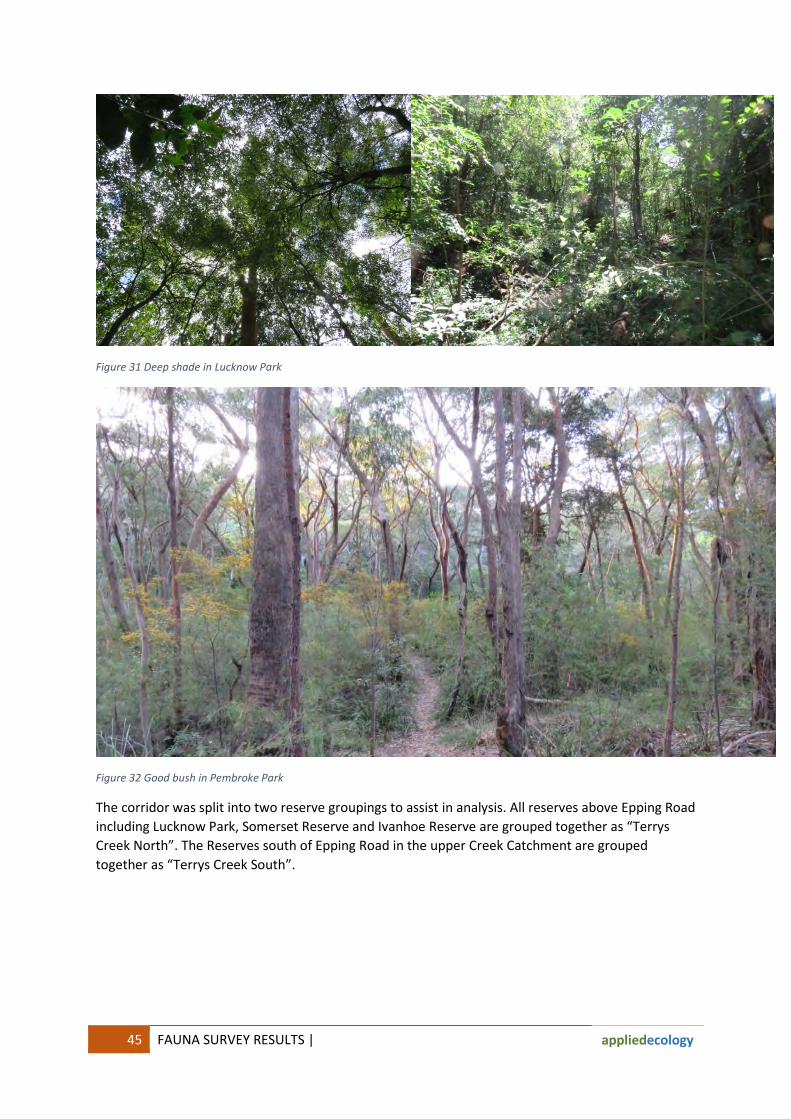
45 FAUNA SURVEY RESULTS |
appliedecology
Figure 31 Deep shade in Lucknow Park
Figure 32 Good bush in Pembroke Park
The corridor was split into two reserve groupings to assist in analysis. All reserves above Epping Road including Lucknow Park, Somerset Reserve and Ivanhoe Reserve are grouped together as “Terrys Creek North”. The Reserves south of Epping Road in the upper Creek Catchment are grouped together as “Terrys Creek South”.

FAUNA SURVEY RESULTS 46
Table 16 Epping Road is a pinch point in the corridor with fauna movements possible under the bridge. Improvements can be made in this location to encourage safe passage through this area.
Table 17 Terrys Creek North - Species richness by Class Table 18 Terrys Creek South- Species richness by Class
CLASS 2007 2017
BIRDS 49 41 REPTILES 6 8 FROGS 3 4 MAMMALS 12 17 TOTAL 70 70
Figure 33 Abundant smaller "bush" birds are a feature of the Birds in the corridor. Black-faced Monarch (left), White-throated Treecreeper (centre), Eastern Spinebill (right)
CLASS 2007 2017
BIRDS 55 48 REPTILES 11 7 FROGS 5 4 MAMMALS 11 16 TOTAL 82 75

47 FAUNA SURVEY RESULTS |
appliedecology
Figure 34 Terrys Creek North- Bird species turnover Figure 35 Terrys Creek South- Bird species turnover
Key seasonal movers and migrants absent from Terrys Creek in 2017 that were present in 2007 included Rufous fantails, White-plumed Honeyeaters, Fan-tailed Cuckoos, New Holland Honeyeaters and nocturbal birds including Southern Boobooks and Australian Night-jars and more sedentary species including Golden-headed Cisticolas and Grey Butcherbirds.
Species gained includes the Australian Brush-turkey, Superb Lyrebird, Eastern Rosella, White-browed Scrubwren, Satin Bowerbird and the White-throated Treecreeper.
Figure 36 Number of generally resident species vs others by survey
26 1823
4 2
Bird species richness
2017
both
2007
EXOTIC SPECIES
32
3 1
1623
Bird species richness
2017
both
2007
EXOTIC SPECIES

FAUNA SURVEY RESULTS 48
Buffalo Creek and Field of Mars Reserve
Two Buffalo Creek tributaries flow in a easterly direction though two vegetated corridors upstream of their confluence in Barton Park just west of Pidding Road. Both tributaries are named Buffalo Creek. From the confluence Buffalo Creek passes under Pidding Road into the Field of Mars Reserve. Within these two minor corridors the further the reserves are from the confluence the more depauperate they become in terms of fauna. Burrows Park and Minga Reserve form the terminus of the two corridors and both are dominated by aggressive Bird species- Noisy Miners and Rainbow Lorikeets. Barton Park, by comparison, has better diversity and contains some quite magnificent old hollow bearing trees, and a variety of other niche habitats.
Figure 37 Mature, hollow bearing trees in Barton Park.
Field of Mars Reserve is an interesting reserve for fauna. The dry woodland in the northern and eastern portions of the reserve is all good bush but the highest faunal diversity is found on the south side of the reserve between Wellington Road and Buffalo Creek. This area is somewhat wetter, weedier, sheltered and habitat niches more complex. A degraded area planted out with early flowering shrub species just south of Wellington Road is a hotspot for nectivore activity in spring. Buffalo Creek to the east, where it becomes more estuarine in nature supports a different suite of bird species.

49 FAUNA SURVEY RESULTS |
appliedecology
Figure 38 A lack of hollows was noted over the eastern and northern section of Field of Mars Reserve and mammal species observed in quite vulnerable positions during the day
Figure 39 Area of high faunal diversity within Field of Mars Reserve

FAUNA SURVEY RESULTS 50
Faunal “highlights” for this reserve are the thriving Long-nosed Bandicoot population, diversity of microbat species including threatened species, resident breeding pairs of Powerful Owls and Brown Goshawks and a rich variety of small sedentary and migratory birds.
Table 19 Buffalo Creek tributaries - Species richness by Class Table 20 Field of Mars Reserve- Species richness by Class
CLASS 2007 2017
BIRDS 42 47 REPTILES 5 6 FROGS 3 4 MAMMALS 8 13 TOTAL 58 70
Figure 40 (left) Resident Powerful owl, (centre) Brown Goshawk+ nestling, (right) Scarlet Honeyeater all photographed within the identified hotspot depicted in Figure 39.
Figure 41 Species richness by Class- Buffalo Creek Figure 42 Species richness by Class- Field of Mars Reserve
CLASS 2006 2016 2017
BIRDS 43 61 63 REPTILES 10 10 9 FROGS 4 4 4 MAMMALS 15 15 17 TOTAL 72 90 93

51 FAUNA SURVEY RESULTS |
appliedecology
Figure 43 Field of Mars Reserve- Bird species turnover Figure 44 Buffalo Creek - Bird species turnover
Not surprising, in the Field of Mars Reserve, the surveys conducted in 2016 and 2017 had 51 species in common compared to the survey conducted in 2006 with 28 and 31 species in common respectively. Species not detected in Field of Mars Reserve in 2016 & 2017 that were present in 2006 include the Jacky winter, Nankeen night-heron and Rufous Whistler. Numerous species have been gained that would be considered very common within the reserve including the Brown Gerygone, Brown Thornbill, Golden Whistler, Leaden Flycatcher, Eastern Koel, White-cheeked Honeyeater, Yellow-faced Honeyeater and White-throated Treecreepers.
Figure 45 Number of generally resident species vs others by survey – Field of Mars Reserve
Figure 46 Number of generally resident species vs others by survey – Buffalo Creek
Bird species richness Bird species
richness

FAUNA SURVEY RESULTS 52
The following section contains species profiles for fauna detected during the
2017 survey period.
Species profile information is drawn predominantly from “Birds in Backyards” profiles, http://www.birdsinbackyards.net with additional information from Morecombe, M. 2009. Field Guide to Australian Birds. Steve Parish Publishing, Archerfield, Qld and Menkhorst et al. (2017) The Australian Bird Guide, CSIRO Publishing.
Nomenclature used is consistent with that used in Menkhorst et al. (2017) The Australian Bird Guide, CSIRO Publishing. There are minor differences between this nomenclature and that used by the IOC at the time of development of this report.
4.2 BIRDS
4.2.1 LARGE GROUND DWELLERS
Australian Brush-turkey Alectura lathami
Superb Lyrebird Menura novaehollandiae
Status: Abundant FoM Terrys Ck Kittys Ck
Sedentary 2006-07 RESULTS
Guild: ground omnivore 2016 RESULTS (FoM only)
Size: 60 cm to 75 cm 2017 RESULTS
Average weight: 2 274g
Clutch Size: 50 eggs (from several females)
Incubation: 49 days
Feeding: insects, seeds and fallen fruits, which are exposed by raking the leaf l itter or breaking open rotten logs with their large feet. The majority of food is obtained from the ground, with birds occasionally observed feeding on ripening fruits among tree branches.
Breeding: Eggs are incubated in a large mound of organic matter. The male maintains a constant temperature of 33 - 38°C by digging holes in the mound and inserting his bil l to check the heat, then adding and removing vegetable matter as required. After hatching, the chicks burrow out of the mound, at which point they are left to fend for themselves. These hatchlings are fully feathered and are able to walk and fend for themselves immediately.
Superb Lyrebird Status: rare FoM/BT Terrys Ck Kittys Ck
Sedentary 2006-07 RESULTS
Guild: Sedentary/ dispersive 2016 RESULTS (FoM only)
Size:80-100cm 2017 RESULTS
Rare within the LGA. Occurs in the Lane Cove National Park and is rare visitor south to the Terrys Creek
corridor south of the M2 (Photo: Applied Ecology 2016)
Feeding: feeds on insects, spiders, worms and, occasionally, seeds. It finds food by scratching with its feet through the leaf-litter.Breeding: The male secures a territory, attracting potential mates by singing and dancing on one of several mounds within it, while throwing the tail forward over the body and shaking it in display. The male will mate with several females. The female alone builds the nest, incubates the eggs and cares for the young.

53 FAUNA SURVEY RESULTS |
appliedecology
4.2.2 BIRDS OF THE EDGE Some species of birds have been able to adapt to, and ultimately exploit, changes made to the natural environment by urbanisation such as the Noisy Miner. Other species, such as the Welcome Swallow, often hawk over open space and water bodies near suitable roosting habitat. The species in this section were observed in the bushland corridors but primarily
on the edges or in open space within the corridors. Many people will readily identify these species from their backyards, urban parks and sportsfields.
Australian White Ibis Threskiornis molucca
Australian Magpie Cracticus tibicen
Australian Raven Corvus coronoides
Status: Locally common, restricted 2006-07 RESULTS FoM Terrys Ck Kittys Ck
Sedentary and/seasonally dispersive
Guild: insectivore/carnivore 2016 RESULTS (FoM only)
Size: 69 cm to 76 cm 2017 RESULTS
An Aust. White Ibis foraging at Burrows park, Ryde (photos: Applied Ecology 2017)
Feeding: The Australian White Ibis' range of food includes terrestrial and aquatic invertebrates and human scraps.Breeding: Australian White Ibis nest in large colonies, often with the Straw-necked Ibis, T. spinicollis. Young are born naked and helpless. One or two broods may be reared in a year.
Status: Common, Widespread 2006-07 RESULTS FoM Terrys Ck Kittys Ck
Sedentary
Guild: ground insectivore /carnivore 2016 RESULTS (FoM only)
Lifespan: 25 years 2017 RESULTS
Mass: 220 – 350 g (Adult) Clutch size: Female: 2 – 5 (Adult)
Adult male Australian Magpie at Field of Mars, Ryde (Photo: AE 2017)
Feeding: Walks along the ground searching for insects and their larvaeBreeding: The nest is a platform of sticks and twigs (occasionally wire), with a
small interior bowl lined with grass and hair. The nest is constructed in the outer
branches of a tree, up to 15 m above the ground
Status: Common, Widespread FoM Terrys Ck Kittys Ck
Sedentary 2006-07 RESULTS
Guild: Carnivore 2016 RESULTS (FoM only)
Size: 46–53 cm 2017 RESULTS
Lifespan: 22 years
Adult Australian Raven at Field of Mars, Ryde (Photo: AE 2017)
Breeding: construct a large untidy nest, normally consisting of bowl or platform of sticks, lined with grasses, bark and feathers. Both sexes construct the nest and feed the young. The incubation of the eggs is performed solely by the female, and only one brood is raised in a year.
Feeding: The Australian Raven is mainly carnivorous - diet may include grains, fruits, insects, small animals, eggs, refuse and carrion.

FAUNA SURVEY RESULTS 54
Channel-billed Cuckoo Scythrops novaehollandiae
Crested Pigeon Ocyphaps lophotes
Status: Common FoM Terrys Ck Kittys Ck
Migratory 2006-07 RESULTS
Guild: Arboreal frugivore 2016 RESULTS (FoM only)
Size: 58–66 cm 2017 RESULTS
Channel-billed Cuckoos were
commonly heard and observed
during the survey- (left) at Kittys
Creek, (right) a pair at Pidding
Park (photo: Applied Ecology
2017)
Feeding: The favoured foods of the Channel-billed Cuckoo are native figs and native fruits, though some seeds, insects and even baby birds are also taken.
World's largest cuckoo. Large, grey cuckoo, down-curved bill with long barred tail. The feet and legs are black, and the eye is surrounded by prominent red skin. Juvenile’s bill is dirty pink in colour, and the skin around the eye is not red.
Breeding: The Channel-billed Cuckoo lays its eggs in the nests of the Australian Magpie, Gymnorhina tibicen, the Pied Currawong, Strepera graculina and members of the crow family (Corvidae)
Sedentary
Guild: ground granivoreSize: 31-35 cm
FoM Terrys Ck Kittys Ck
2006-07 RESULTS
2016 RESULTS (FoM only)
2017 RESULTS
Status: Locally moderately common
Feeding: diet consists mostly of native seeds, as well as those of introduced crops and weeds. Some leaves and insects are also eatenBreeding: Builds a delicate nest of twigs, placed in a tree or dense bush. Both sexes share the incubation of the eggs, and both care for the young.
A Crested Pigeon utilising open space adjoining houses at Portius Park on Kittys Creek (photo: Applied Ecology 2017)

55 FAUNA SURVEY RESULTS |
appliedecology
Eastern Koel Eudynamys orientalis
Grey Butcherbird Cracticus torquatus
Magpie-lark Grallina cyanoleuca
Status: Locally common FoM Terrys Ck Kittys Ck
Migratory 2006-07 RESULTS
Guild: Arboreal frugivore 2016 RESULTS (FoM only)
Size: 40-46 cm 2017 RESULTS
Male Eastern Koel (Photo: AE 2017)
Breeding: brood parasite, that is, it lays its eggs in the nests of other bird species. Common hosts are the Red Wattlebird, Anthochaera carnunculata, friarbirds, the Magpie-lark, Grallina cyanoleuca, and figbirds. A single egg is laid in the host's nest and once hatched the chick forces the other eggs and hatchlings out of the nest.
Male Eastern Koel glossy black plumage, tinged with blue and green, and striking red eye. The female has glossed brown upperparts, heavily spotted with white, and a black crown. The underparts are generally buff-cream with numerous fine black bars. Young birds resemble the adult female, but have considerably more buff and a dark eye.Feeding: Food consists of fruits, especially figs, taken directly from the tree.
Status: Locally, moderately common FoM Terrys Ck Kittys Ck
Sedentary 2006-07 RESULTS
Guild: ground insectivore/carnivore 2016 RESULTS (FoM only)
Size: 25-30cm 2017 RESULTS
Grey Butcherbird (photo: Applied Ecology 2017)
Feeding: Aggressive predators. They prey on small animals, including birds, lizards and insects, as well as some fruits and seeds. Uneaten food may be stored in the fork or a branch or impaled.Breeding: Nest is bowl-shaped, normally located within 10 m of the ground. The eggs are incubated by the female and the young birds are fed by both parents. Young remain in the breeding territory and help the parents raise the young of the following season.
Status: Widespread, common FoM Terrys Ck Kittys CkSedentary/seasonal migrant 2006-07 RESULTS
Guild: ground insectivore 2016 RESULTS (FoM only)
Size: 26-30 cm 2017 RESULTS
Magpie-larks were commonly observed around edges of
reserves, flushing off the ground for refuge in trees in the
reserves- seen here at Pidding Park, Ryde ( Photo: Applied
Ecology 2017)
Feeding: Usually seen slowly searching on the ground for a variety of insects and their larvae, as well as earthworms and freshwater invertebrates.
Breeding: Builds an unusual mud nest and generally breed from August to December. aggressively defend their nest and territory, which may occupy up to 10 ha. Both parents share the incubation duties and care for the young.
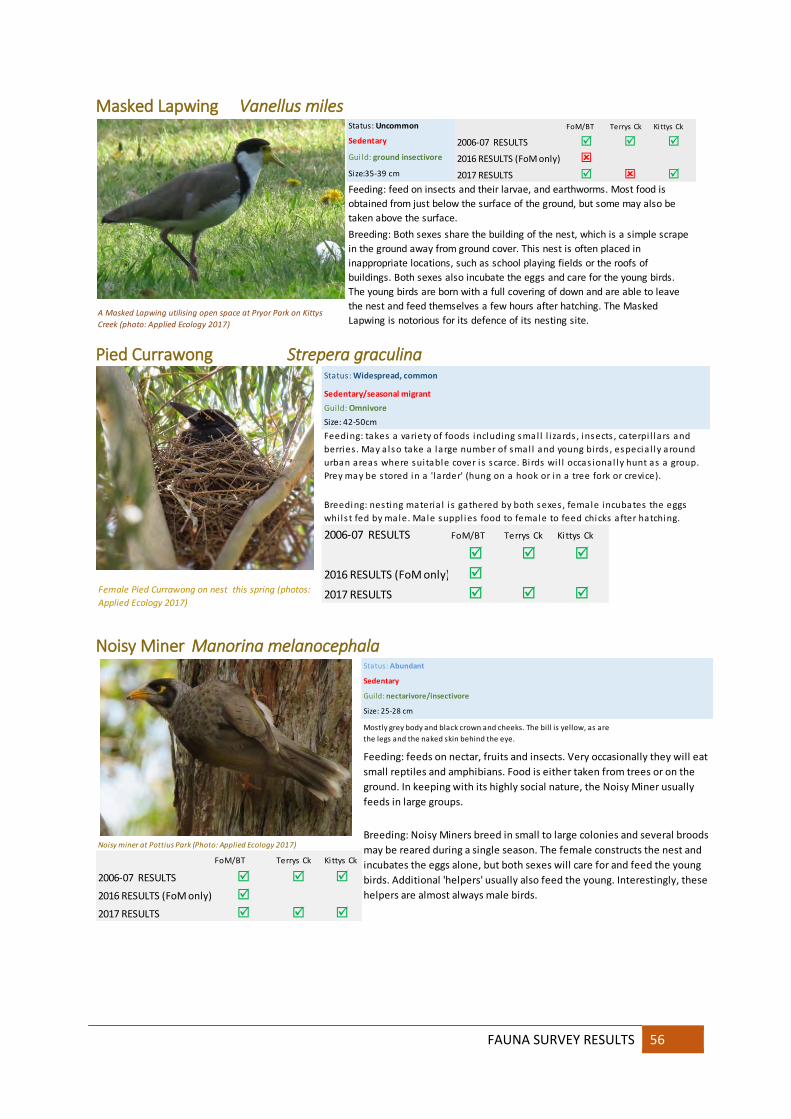
FAUNA SURVEY RESULTS 56
Masked Lapwing Vanellus miles
Pied Currawong Strepera graculina
Noisy Miner Manorina melanocephala
Status: Uncommon FoM/BT Terrys Ck Kittys Ck
Sedentary 2006-07 RESULTS
Guild: ground insectivore 2016 RESULTS (FoM only)
Size:35-39 cm 2017 RESULTS
Feeding: feed on insects and their larvae, and earthworms. Most food is obtained from just below the surface of the ground, but some may also be taken above the surface.
A Masked Lapwing utilising open space at Pryor Park on Kittys
Creek (photo: Applied Ecology 2017)
Breeding: Both sexes share the building of the nest, which is a simple scrape in the ground away from ground cover. This nest is often placed in inappropriate locations, such as school playing fields or the roofs of buildings. Both sexes also incubate the eggs and care for the young birds. The young birds are born with a full covering of down and are able to leave the nest and feed themselves a few hours after hatching. The Masked Lapwing is notorious for its defence of its nesting site.
Status: Widespread, common
Sedentary/seasonal migrant
Guild: Omnivore
Size: 42-50cm
2006-07 RESULTS FoM/BT Terrys Ck Kittys Ck
2016 RESULTS (FoM only)
2017 RESULTS
Breeding: nesting materia l i s gathered by both sexes , female incubates the eggs whi ls t fed by male. Male suppl ies food to female to feed chicks after hatching.
Female Pied Currawong on nest this spring (photos:
Applied Ecology 2017)
Feeding: takes a variety of foods including smal l l i zards , insects , caterpi l lars and berries . May a lso take a large number of smal l and young birds , especia l ly around urban areas where sui table cover i s scarce. Bi rds wi l l occas ional ly hunt as a group. Prey may be s tored in a 'larder' (hung on a hook or in a tree fork or crevice).
Status: Abundant
Sedentary
Guild: nectarivore/insectivore
Size: 25-28 cm
Noisy miner at Pottius Park (Photo: Applied Ecology 2017)
FoM/BT Terrys Ck Kittys Ck
2006-07 RESULTS
2016 RESULTS (FoM only)
2017 RESULTS
Breeding: Noisy Miners breed in small to large colonies and several broods may be reared during a single season. The female constructs the nest and incubates the eggs alone, but both sexes will care for and feed the young birds. Additional 'helpers' usually also feed the young. Interestingly, these helpers are almost always male birds.
Mostly grey body and black crown and cheeks. The bill is yellow, as are the legs and the naked skin behind the eye.
Feeding: feeds on nectar, fruits and insects. Very occasionally they will eat small reptiles and amphibians. Food is either taken from trees or on the ground. In keeping with its highly social nature, the Noisy Miner usually feeds in large groups.
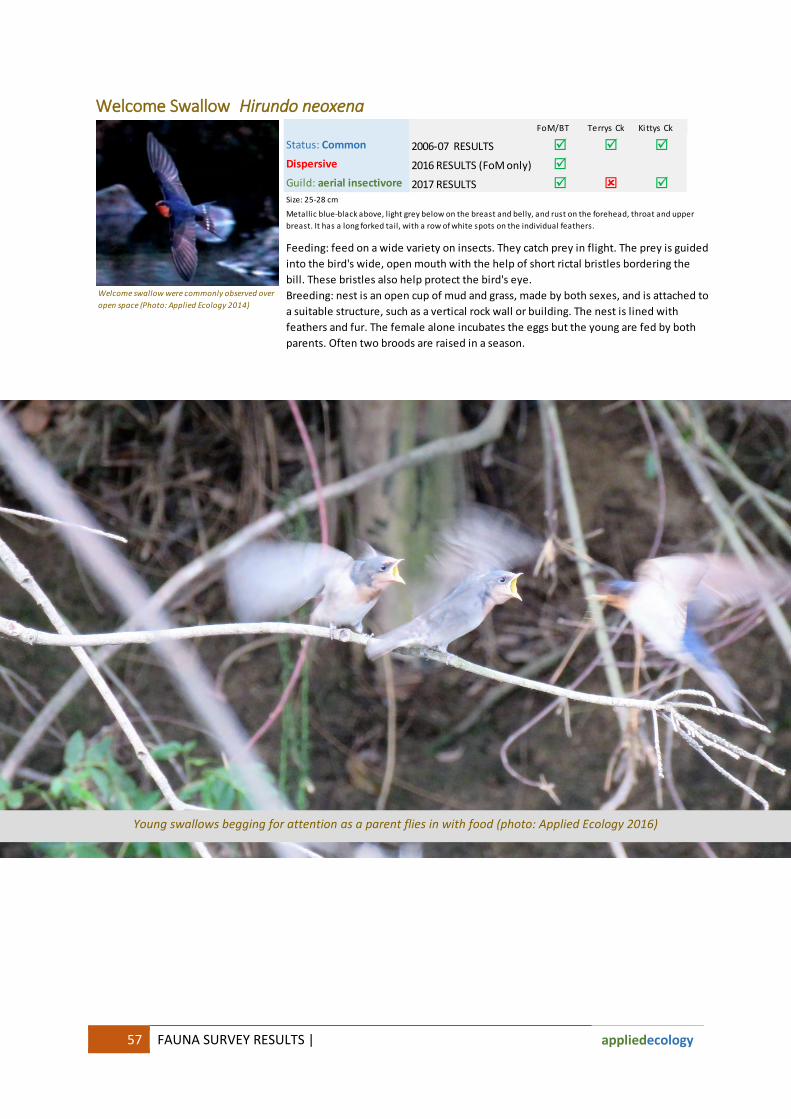
57 FAUNA SURVEY RESULTS |
appliedecology
Welcome Swallow Hirundo neoxena
FoM/BT Terrys Ck Kittys Ck
Status: Common 2006-07 RESULTS
Dispersive 2016 RESULTS (FoM only)
Guild: aerial insectivore 2017 RESULTS
Size: 25-28 cm
Metallic blue-black above, light grey below on the breast and belly, and rust on the forehead, throat and upper breast. It has a long forked tail, with a row of white spots on the individual feathers.
Feeding: feed on a wide variety on insects. They catch prey in flight. The prey is guided into the bird's wide, open mouth with the help of short rictal bristles bordering the bill. These bristles also help protect the bird's eye. Breeding: nest is an open cup of mud and grass, made by both sexes, and is attached to a suitable structure, such as a vertical rock wall or building. The nest is lined with feathers and fur. The female alone incubates the eggs but the young are fed by both parents. Often two broods are raised in a season.
Welcome swallow were commonly observed over
open space (Photo: Applied Ecology 2014)
Young swallows begging for attention as a parent flies in with food (photo: Applied Ecology 2016)
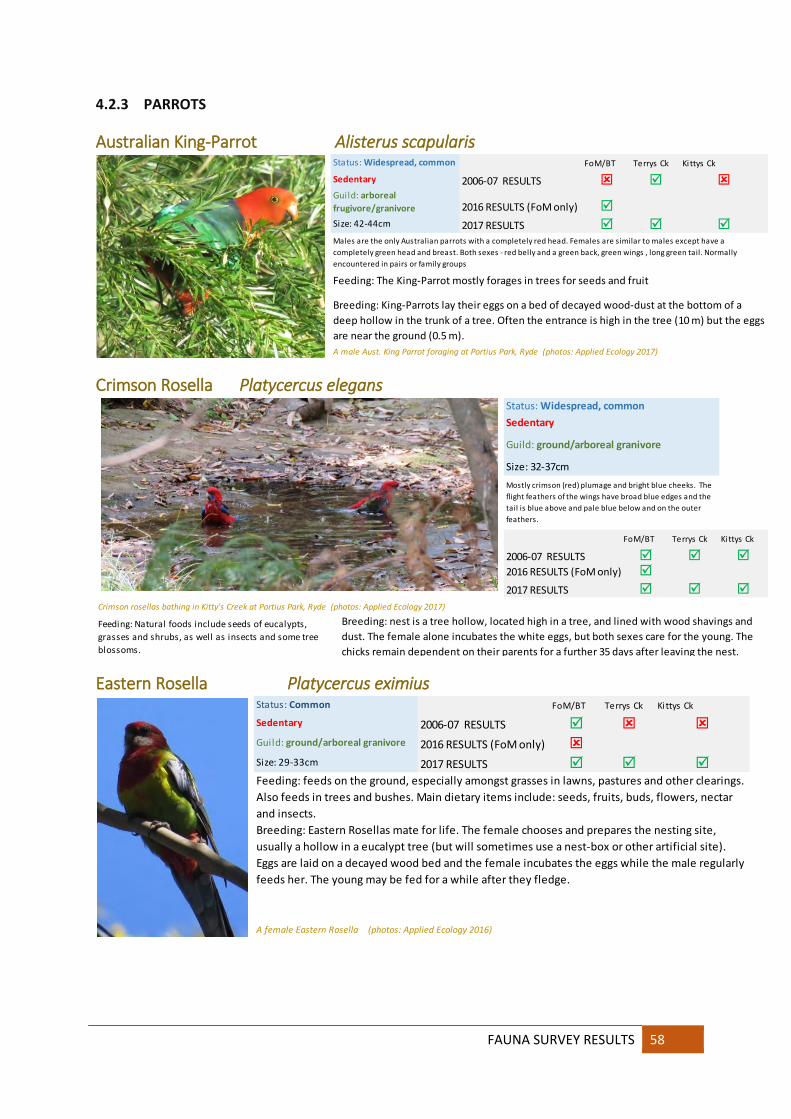
FAUNA SURVEY RESULTS 58
4.2.3 PARROTS
Australian King-Parrot Alisterus scapularis
Crimson Rosella Platycercus elegans
Eastern Rosella Platycercus eximius
Status: Widespread, common FoM/BT Terrys Ck Kittys Ck
Sedentary 2006-07 RESULTS
Guild: arboreal
frugivore/granivore 2016 RESULTS (FoM only)
Size: 42-44cm 2017 RESULTS
Feeding: The King-Parrot mostly forages in trees for seeds and fruit
A male Aust. King Parrot foraging at Portius Park, Ryde (photos: Applied Ecology 2017)
Males are the only Australian parrots with a completely red head. Females are similar to males except have a completely green head and breast. Both sexes - red belly and a green back, green wings , long green tail. Normally encountered in pairs or family groups
Breeding: King-Parrots lay their eggs on a bed of decayed wood-dust at the bottom of a deep hollow in the trunk of a tree. Often the entrance is high in the tree (10 m) but the eggs are near the ground (0.5 m).
Status: Widespread, common
Sedentary
Guild: ground/arboreal granivore
Size: 32-37cm
FoM/BT Terrys Ck Kittys Ck
2006-07 RESULTS
2016 RESULTS (FoM only)
2017 RESULTS
Crimson rosellas bathing in Kitty's Creek at Portius Park, Ryde (photos: Applied Ecology 2017)
Mostly crimson (red) plumage and bright blue cheeks. The flight feathers of the wings have broad blue edges and the tail is blue above and pale blue below and on the outer feathers.
Feeding: Natural foods include seeds of eucalypts, grasses and shrubs, as well as insects and some tree blossoms.
Breeding: nest is a tree hollow, located high in a tree, and lined with wood shavings and dust. The female alone incubates the white eggs, but both sexes care for the young. The chicks remain dependent on their parents for a further 35 days after leaving the nest.
Status: Common FoM/BT Terrys Ck Kittys Ck
Sedentary 2006-07 RESULTS
Guild: ground/arboreal granivore 2016 RESULTS (FoM only)
Size: 29-33cm 2017 RESULTS
A female Eastern Rosella (photos: Applied Ecology 2016)
Feeding: feeds on the ground, especially amongst grasses in lawns, pastures and other clearings. Also feeds in trees and bushes. Main dietary items include: seeds, fruits, buds, flowers, nectar and insects.Breeding: Eastern Rosellas mate for life. The female chooses and prepares the nesting site, usually a hollow in a eucalypt tree (but will sometimes use a nest-box or other artificial site). Eggs are laid on a decayed wood bed and the female incubates the eggs while the male regularly feeds her. The young may be fed for a while after they fledge.

59 FAUNA SURVEY RESULTS |
appliedecology
Galah Eolophus roseicapillus
Little Corella Cacatua sanguinea
Musk Lorikeet Glossopsitta concinna
Rainbow Lorikeet Trichoglossus haematodus
FoM/BT Terrys Ck Kittys Ck
2006-07 RESULTS
Sedentary/seasonal migrant 2016 RESULTS (FoM only)
Guild: ground granivore 2017 RESULTS
Feeding: feed on seeds, mostly from the ground.
Status: Uncommon in
reserves
Galahs are most commonly sighted feeding in pairs or larger groups on grassed open space adjoining
the reserves (photos: Applied Ecology 2017)
Rose-pink head, neck and underparts, with paler pink crown, and grey back, wings and under tail and on the outer feathers. Lifespan: 40 years.
Breeding: Galahs form permanent pair bonds, although a bird will take a new partner if the other one dies. The nest is a tree hollow or similar location, lined with leaves. Both sexes incubate the eggs and care for the young
FoM/BT Terrys Ck Kittys Ck
2006-07 RESULTS
Sedentary/seasonal migrant 2016 RESULTS (FoM only)
Guild: ground granivore 2017 RESULTS
Status: Uncommon in
reserves
Feeding: feed mainly on the ground, and have to drink on a daily basis. The most common foods are grains and grass seeds. Some bulbs and fruits may also be eaten.
Breeding: pair for l ife and will start breeding at the start of a long period of rain. Nest site is a suitable tree hollow, both sexes incubate the eggs and both care for the young chicks. Breeding pairs nest in large colonies, and several nests may be found in the same tree
Heard flying over reserves more often than observedwithin reserves- sighted feeding in pairs or larger
groups on grassed open space adjoining the reserves (photos: Applied Ecology 2017)
Status: uncommon, sporadic in response to flowering events, not widespread FoM/BT Terrys Ck Kittys Ck
Nomadic 2006-07 RESULTS
Guild: arboreal nectivore 2016 RESULTS (FoM only)
Size: 21-23cm 2017 RESULTS
Feeding: feed in all levels of the canopy and are very active when foraging. Mainly eats pollen and nectar, also eat seeds, fruits and insects and their larvae. Breeding: breed in hollow branches and holes in living eucalypts, often near watercourses. The entrance holes are usually very small, so they have to squeeze in. Eggs are laid on a base of chewed or decayed wood. The female incubate the eggs and both parents roost in the hollow at night.A "Muskie" inspects a hollow at Burrows Park. Large numbers were present when Blackbutts flowered (photo:
Applied Ecology 2017)
Status: Abundant, widespread FoM/BT Terrys Ck Kittys Ck
Sedentary 2006-07 RESULTS
Guild: nectivore 2016 RESULTS (FoM only)
Size: 26-31cm 2017 RESULTS
Feeding: forages on the flowers of shrubs or trees to harvest nectar and pollen, but also eats fruits, seeds and some insects.Breeding: Eggs laid on chewed, decayed wood, usually in a hollow limb of a eucalypt tree. Both sexes prepare the nest cavity and feed the young, but only the female incubates the eggs
A Rainbow Lorikeet at a hollow in Pembroke Park (photo: Applied Ecology 2017)

FAUNA SURVEY RESULTS 60
Sulphur-crested Cockatoo Cacatua galerita
Yellow-tailed Black Cockatoo Calyptorhynchus funereus
Figure 47 A pair of Yellow-tailed Black Cockatoos near Strangers Creek 2017
Status: Abundant, widespread FoM/BT Terrys Ck Kittys Ck
Sedentary 2006-07 RESULTS
Guild: ground granivore 2016 RESULTS (FoM only)
Feeding: diet consists of berries, seeds, nuts and roots. Size: 45-50cm 2017 RESULTS
Large flock roost at night in many reserves often preferring
the tallest trees such as Blackbutts (photo: Applied Ecology
2017)
Breeding: The eggs are laid in a suitable tree hollow, which is prepared by both sexes. Both birds also incubate and care for the chicks. The chicks remain with the parents all year round and family groups will stay together indefinitely
Status: uncommon, not widespreadFoM/BT Terrys Ck Kittys Ck
Nomadic 2006-07 RESULTS
Guild: primarily arboreal granivore 2016 RESULTS (FoM only)
Size: 55-65cm 2017 RESULTS
Feeding: The favoured food is seeds of native trees and pinecones, but birds also feed on the seeds of ground plants. Some insects are also eaten.Breeding: Both sexes construct the nest, which is a large tree hollow, lined with wood chips. The female alone incubates the eggs, while the male supplies her with food. Usually only one chick survives, and this will stay in the care of its parents for about six months.A make Yellow-tailed Black Cockatoo (left). A family group of YTBC were observed sheltering from the heat in
privet along Terry's Creek on hot days (photo: Applied Ecology 2017)
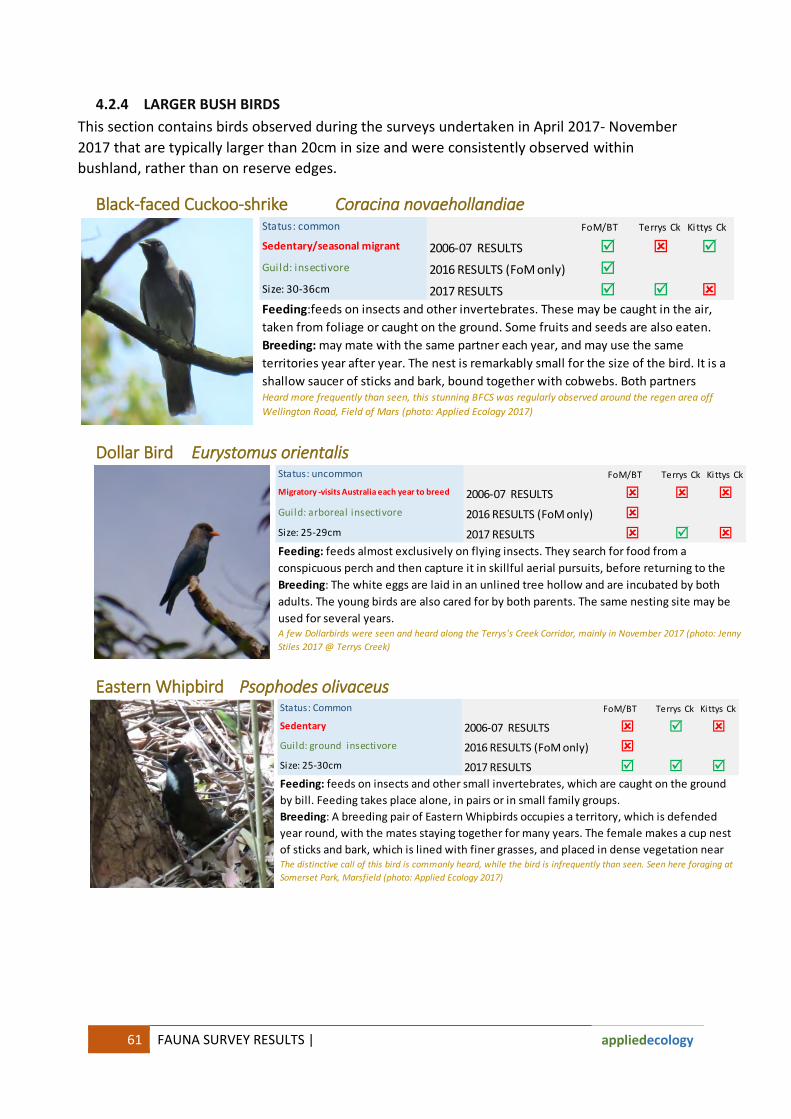
61 FAUNA SURVEY RESULTS |
appliedecology
4.2.4 LARGER BUSH BIRDS
This section contains birds observed during the surveys undertaken in April 2017- November 2017 that are typically larger than 20cm in size and were consistently observed within bushland, rather than on reserve edges.
Black-faced Cuckoo-shrike Coracina novaehollandiae
Dollar Bird Eurystomus orientalis
Eastern Whipbird Psophodes olivaceus
Status: common FoM/BT Terrys Ck Kittys Ck
Sedentary/seasonal migrant 2006-07 RESULTS
Guild: insectivore 2016 RESULTS (FoM only)
Size: 30-36cm 2017 RESULTS
Feeding:feeds on insects and other invertebrates. These may be caught in the air, taken from foliage or caught on the ground. Some fruits and seeds are also eaten. Breeding: may mate with the same partner each year, and may use the same territories year after year. The nest is remarkably small for the size of the bird. It is a shallow saucer of sticks and bark, bound together with cobwebs. Both partners Heard more frequently than seen, this stunning BFCS was regularly observed around the regen area off
Wellington Road, Field of Mars (photo: Applied Ecology 2017)
Status: uncommon FoM/BT Terrys Ck Kittys Ck
Migratory -visits Australia each year to breed 2006-07 RESULTS
Guild: arboreal insectivore 2016 RESULTS (FoM only)
Size: 25-29cm 2017 RESULTS
Feeding: feeds almost exclusively on flying insects. They search for food from a conspicuous perch and then capture it in skillful aerial pursuits, before returning to the Breeding: The white eggs are laid in an unlined tree hollow and are incubated by both adults. The young birds are also cared for by both parents. The same nesting site may be used for several years.A few Dollarbirds were seen and heard along the Terrys's Creek Corridor, mainly in November 2017 (photo: Jenny
Stiles 2017 @ Terrys Creek)
Status: Common FoM/BT Terrys Ck Kittys Ck
Sedentary 2006-07 RESULTS
Guild: ground insectivore 2016 RESULTS (FoM only)
Size: 25-30cm 2017 RESULTS
Feeding: feeds on insects and other small invertebrates, which are caught on the ground by bill. Feeding takes place alone, in pairs or in small family groups.Breeding: A breeding pair of Eastern Whipbirds occupies a territory, which is defended year round, with the mates staying together for many years. The female makes a cup nest of sticks and bark, which is lined with finer grasses, and placed in dense vegetation near The distinctive call of this bird is commonly heard, while the bird is infrequently than seen. Seen here foraging at
Somerset Park, Marsfield (photo: Applied Ecology 2017)

FAUNA SURVEY RESULTS 62
Laughing Kookaburra Dacelo novaeguineae
Little Wattlebird Anthochaera chrysoptera
Noisy Friarbird Philemon corniculatus
Olive-backed Oriole Oriolus sagittatus
Status: Abundant FoM/BT Terrys Ck Kittys Ck
Sedentary 2006-07 RESULTS
Guild: gcarnivore/nsectivore 2016 RESULTS (FoM only)
Size: 40-47cm 2017 RESULTS
Feeding: feeds mostly on insects, worms and crustaceans, although small snakes, mammals, frogs and birds may also be eaten. Breeding: believed to pair for life. The nest is a bare chamber in a naturally occurring tree hollow or in a burrow excavated in an arboreal (tree-dwelling) termite mound. Both sexes share the incubation duties and both care for the young. Other Laughing Kookaburras, Family groups of LKs were commonly observed and heard at all reserves, here at Lucknow Park, Marsfield
(photo: Applied Ecology 2017)
Status: Uncommon FoM/BT Terrys Ck Kittys Ck
Sedentary/dispersive 2006-07 RESULTS
Guild: nectarivore/insectivore 2016 RESULTS (FoM only)
Size: 28-35cm 2017 RESULTS
Feeding: Primarily nectar- but also insects, flowers, berries and some seeds.Breeding: Female constructs the nest, which is a large cup of twigs and grass, lined with soft materials, such as feathers and wool. The nest may be placed in a range of places from the ground up to about 15m. The female also incubates the eggs alone. Both sexes care for the young chicks. Can have up to 3 broods a year.Observed in good numbers around the early flowering shrubs in the regen area off Wellington Road, Field of
Mars, Ryde (photo: Applied Ecology 2017)
Status: Uncommon FoM/BT Terrys Ck Kittys Ck
Seasonal migrant 2006-07 RESULTS
Guild: nectarivore/insectivore 2016 RESULTS (FoM only)
Size: 30-35cm 2017 RESULTS
This species was observed during a Blackbutt flowering event at Burrows Park. Seen here at Terrys Creek,
Epping.Not common locally – best seen during flowering events photos: Jenny Stiles 2014)
Feeding: eats nectar, fruit, insects and other invertebrates and sometimes eggs or baby birds. They spend most of their time feeding on nectar high up in trees.Breeding:forms long-term pairs, with both parents defending the nest and surrounds. The female builds the large, deep cup-shaped nest from bark and grass, bound with spider webs, slinging it in a tree-fork. She alone incubates the eggs, but both parents feed the
Status: Uncommon FoM/BT Terrys Ck Kittys Ck
Seasonal migrant 2006-07 RESULTS
Guild: nectarivore/insectivore 2016 RESULTS (FoM only)
Size: 26-28cm 2017 RESULTS
Feeding: feeds on insects and fruit in canopy trees.
Breeding: female bui lds a cup-shaped nest attached by i ts rim to a horizontal fork on the outer-edge of the fol iage of a tree or ta l l shrub, usual ly around 10 m above the ground. Bui l t of s trips of bark and grass , bound with spider web. The male does not bui ld the nest, or incubate the eggs , but he feeds the young after the eggs hatch.
Most commonly observed near Epping Road. Absent for most of the survey period (Photo: Applied Ecology 2017)

63 FAUNA SURVEY RESULTS |
appliedecology
Red Wattlebird Anthochaera carunculata
Sacred Kingfisher Todiramphus sanctus
Satin Bowerbird Ptilonorhynchus violaceus
White-headed Pigeon Columba leucomela
Status: common FoM/BT Terrys Ck Kittys Ck
Sedentary 2006-07 RESULTS
Guild: nectarivore/insectivore 2016 RESULTS (FoM only)
Size: 32-36cm 2017 RESULTS
Feeding: feeds on nectar, some insects are also eaten, taken either from foliage or caught in mid-air. Berries and the honeydew produced by some insects add to the bird's diet.Breeding: raise one or two broods in a season. Both sexes have been recorded sharing incubation duties, but often the female will do this alone. Both parents feed the young.
Very common species in surburban areas adjoining reserves and within reserves (Photo: Applied Ecology 2017)
Status: Moderately Common FoM/BT Terrys Ck Kittys Ck
Seasonal Migrant 2006-07 RESULTS
Guild: carnivore/insectivore 2016 RESULTS (FoM only)
Size: 19-24cm 2017 RESULTS
Seen and heard frequently in last month of surveys. Absent for most of the survey period. Pictured- Field of
Mars, Ryde.(Photo: Applied Ecology 2017)
Breeding:For most of the year Sacred Kingfishers are mainly solitary, pairing only for the breeding season. Usually two clutches are laid in a season. Both sexes excavate the nest, which is normally a burrow in a termite mound, hollow branch or river bank. The nest chamber is unlined and can be up to 20m above the ground. Both sexes also incubate the eggs and care for the young.
Feeding: forage mainly on the land, only occasionally capturing prey in the water. They feed on crustaceans, reptiles, insects and their larvae and, infrequently, fish. The birds
Status: Moderately Common FoM/BT Terrys Ck Kittys Ck
Sedentary/ dispersive 2006-07 RESULTS
Guild: nectarivore/insectivore 2016 RESULTS (FoM only)
Size: 28-34cm 2017 RESULTS
Feeding: feeds on nectar, some insects are also eaten, taken either from foliage or caught in mid-air. Berries and the honeydew produced by some insects add to the bird's diet.
Potentially increasing in numbers-female or juvenile pictured here at Kitty's Creek. (Photo: Applied Ecology 2017)
Breeding:The male constructs a bower consisting of two parallel walls of sticks, is built on the ground, and is used as a courtship arena during the breeding season. The male decorates it with bright blue coloured objects that it collects.
Status: Rare FoM Terrys Ck Kittys Ck
Locally nomadic 2006-07 RESULTS
Guild: frugivore/granivore 2016 RESULTS (FoM only)
Size: 38-42cm 2017 RESULTS
A White-headed Pigeon hiding amongst the privet along Terrys Creek (photo: Applied Ecology 2017)
Feeding: feeds on rainforest fruits and seeds, but strongly prefers laurels, such as the introduced Camphor Laurel .Breeding: builds a platform of sticks in dense tree foliage or in tangled vines. Both members of breeding pairs incubate and care for the single young.
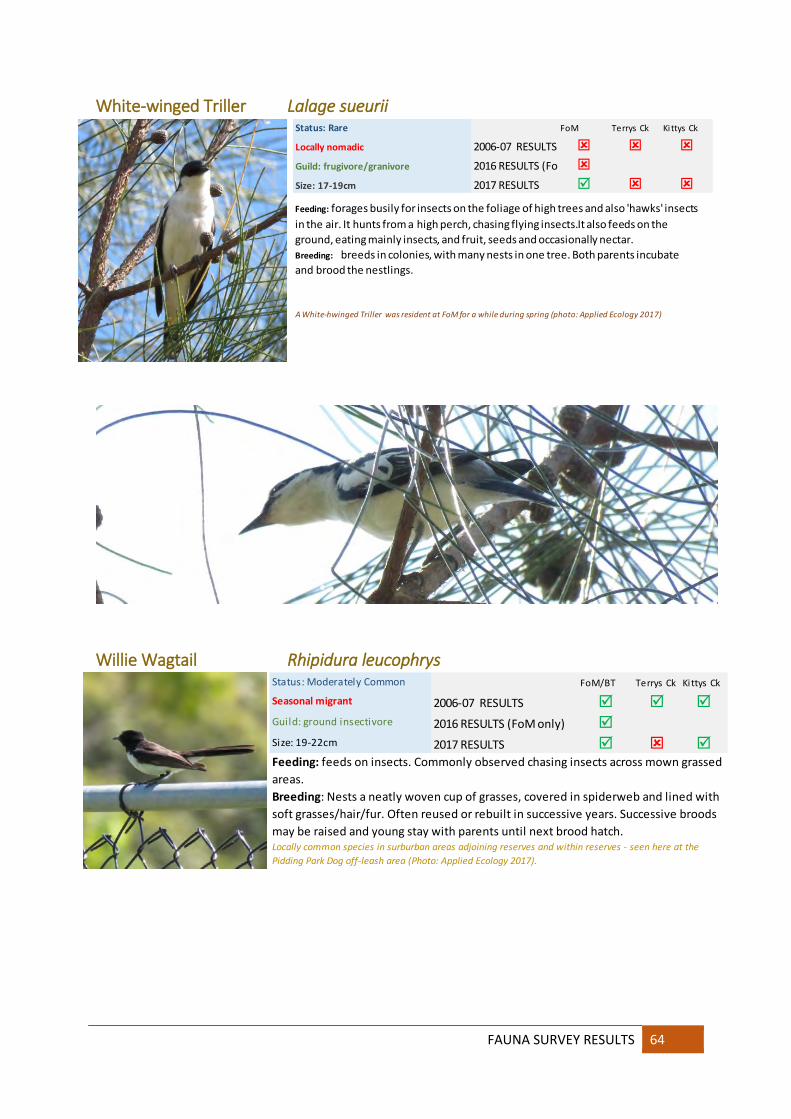
FAUNA SURVEY RESULTS 64
White-winged Triller Lalage sueurii
Willie Wagtail Rhipidura leucophrys
Status: Rare FoM Terrys Ck Kittys Ck
Locally nomadic 2006-07 RESULTS
Guild: frugivore/granivore 2016 RESULTS (FoM only)
Size: 17-19cm 2017 RESULTS
A White-hwinged Triller was resident at FoM for a while during spring (photo: Applied Ecology 2017)
Feeding: forages busily for insects on the foliage of high trees and also 'hawks' insects in the air. It hunts from a high perch, chasing flying insects.It also feeds on the ground, eating mainly insects, and fruit, seeds and occasionally nectar.Breeding: breeds in colonies, with many nests in one tree. Both parents incubate and brood the nestlings.
Status: Moderately Common FoM/BT Terrys Ck Kittys Ck
Seasonal migrant 2006-07 RESULTS
Guild: ground insectivore 2016 RESULTS (FoM only)
Size: 19-22cm 2017 RESULTS
Feeding: feeds on insects. Commonly observed chasing insects across mown grassed areas.Breeding: Nests a neatly woven cup of grasses, covered in spiderweb and lined with soft grasses/hair/fur. Often reused or rebuilt in successive years. Successive broods may be raised and young stay with parents until next brood hatch.Locally common species in surburban areas adjoining reserves and within reserves - seen here at the
Pidding Park Dog off-leash area (Photo: Applied Ecology 2017).

65 FAUNA SURVEY RESULTS |
appliedecology
4.2.5 SMALLER BUSH BIRDS
Black-faced Monarch Monarcha melanopsis
Brown Gerygone Gerygone mouki
Brown Thornbill Acanthiza pusilla
Status: Uncommon FoM/BT Terrys Ck Kittys Ck
Seasonal migrant - summer breeding2006-07 RESULTS
Guild: arboreal/aerial insectivore2016 RESULTS (FoM only)
Size: 18-20cm 2017 RESULTS
Seen in the later stages of the project. Pictured here at Pembroke Park , Marsfield (Photo: Applied
Ecology 2017)
Breeding: arrives in September and returning northwards in March. It may also migrate to Papua New Guinea in autumn and winter.builds a deep cup nest of casuarina needles, bark, roots, moss and spider web in the fork of a tree, about 3 m to 6 m above the ground. Only the female builds the nest, but both sexes incubate the eggs and feed the young.
Feeding: forages for insects among foliage, or catches flying insects on the wing.
Status: Abundant FoM/BT Terrys Ck Kittys Ck
Sedentary 2006-07 RESULTS
Guild: insectivore 2016 RESULTS (FoM only)
Size: 9.5-11cm 2017 RESULTS
Feeding: forages at all heights of the canopy, snapping up flying insects while fluttering around the foliage.Breeding: builds a rounded dome nest with a tapering 'tail' from roots, plant fibres, spider web, moss and lichens, which is suspended from a low branch or vine. Both parents feed the young.
Locally common species especially within riparian zones with deep cover. Seen here at Pembroke Park,
Marsfield (Photo: Applied Ecology 2017)
Status: Common FoM/BT Terrys Ck Kittys Ck
Sedentary 2006-07 RESULTS
Guild: insectivore 2016 RESULTS (FoM only)
Size: 9.5-110.5cm 2017 RESULTS
Breeding: Breeding pairs hold territories all year round for feeding and breeding purposes, and the bonds between pairs are long-lasting. Females build a small oval, domed nest with a partially hooded entrance near the top out of grasses, bark and other materials, lining it with feathers, fur or soft plant down. The nest is usually low down, in low, prickly bushes, grass clumps, or ferns. The female incubates the eggs and both parents feed the young, who stay with the parents until early autumn.
Busy and noisy -this species is often observed in the reserves. Seen here at Lucknow Park, Marsfield
(Photo: Applied Ecology 2017)
Feeding: feeds mainly on insects, but may sometimes eat seeds, nectar or fruit. They feed, mainly in pairs, at all levels from the ground up, but mostly in understorey shrubs and low trees.
FAUNA SURVEY RESULTS 66
Eastern Spinebill Acanthorhynchus tenuirostris
Eastern Yellow Robin Eopsaltria australis
Golden Whistler Pachycephala pectoralis
Grey Fantail Rhipidura albiscapa
Status: Common FoM/BT Terrys Ck Kittys Ck
Mainly sedentary, some local movements 2006-07 RESULTS
Guild: nectarivore/insectivore 2016 RESULTS (FoM only)
Size: 9.5-10.5cm 2017 RESULTS
Feeding: feeds on insects and nectar while perched or while hovering.
Breeding: nest is a small cup of twigs, grass and bark, combined with hair and spider's web, built in a tree fork, generally between 1 and 5 metres from the ground. Only the female builds the nest and incubates the eggs, but both parents feed the young when they hatch.
With a distinctive call and sound as it flys this species is easy to find in local reserves. Seen here at
Lucknow Park, Marsfield (Photo: Applied Ecology 2017)
Status: Common FoM/BT Terrys Ck Kittys Ck
Sedentary 2006-07 RESULTS
Guild: ground insectivore 2016 RESULTS (FoM only)
Size: 15-16cm 2017 RESULTS
Breeding: Female builds the nest and incubates the eggs. The nest is a woven cup of bark, grasses and other vegetation, bound together with spider web and lined with finer material and leaves. Both parents, and sometimes some other helpers, care for the young birds.
Often inquisitive- this species is a common sight on most reserve visits. Seen here at Lucknow Park,
Marsfield (Photo: Applied Ecology 2017)
Feeding: Feeds on insects, spiders and other arthropods. These are caught mostly on the ground, and are pounced on from a low perch.
Status: Moderately Common, widespread FoM/BT Terrys Ck Kittys Ck
Sedentary 2006-07 RESULTS
Guild: arboreal insectivore 2016 RESULTS (FoM only)
Size: 16-18cm 2017 RESULTS
Feeding: : feed on insects, spiders and other small arthropods. Berries are also eaten
Female (left) photographed at Field of Mars, Male (right) photographed at Pembroke Park (Photo:
Applied Ecology 2017).
Breeding: Both sexes build the nest, share incubation and rearing of young. Nest a shallow bowl of twigs, bark bound with spider’s web.
Status: Common FoM/BT Terrys Ck Kittys Ck
Seasonal migrant 2006-07 RESULTS
Guild: arboreal insectivore 2016 RESULTS (FoM only)
Size: 16-18cm 2017 RESULTS
Often inquisitive- this species is often observed in the company of other small birds (Photo: Applied
Ecology 2017)
Breeding: Both sexes build the nest, share incubation and rearing of young. Nest is made of fine grass bound together with large amounts of spider web and built in a tree fork usually 2-5 metres above ground.
Feeding: feeds on flying insects, which it catches by chasing them from the edge of foliage at all levels in the canopy.
67 FAUNA SURVEY RESULTS |
appliedecology
Leaden Flycatcher Myiagra rubecula
Lewins Honeyeater Meliphaga lewinii
New Holland Honeyeater Phylidonyris novaehollandiae
Status: Uncommon FoM/BT Terrys Ck Kittys Ck
Seasonal migrant 2006-07 RESULTS
Guild: arboreal/aerial insectivore 2016 RESULTS (FoM only)
Size: 15-16cm 2017 RESULTS
This species arrived late in the survey period-Female leaden Flycatcher at Pembroke Park (Photo: Applied
Ecology 2017)
Feeding: feeds on insects caught while on the wing or gleaned from foliage.
Breeding: : Both sexes build the nest, share incubation and rearing of young. Nest is a shallow, cup-shaped made of bark and grass held together by spider web and decorated with pieces of bark and lichen.
Status: Locally common FoM/BT Terrys Ck Kittys Ck
Sedentary 2006-07 RESULTS
Guild: : frugivore/insectivore 2016 RESULTS (FoM only)
Size: 19-22cm 2017 RESULTS
Commonly heard along the Terrys Creek corridor, this species is less common elsewhere (Photo: Applied
Ecology 2017)
Feeding: feed mostly on fruits, favouring berries and small fruits, but also eat insects and nectar. Breeding: It is unclear what roles each parent performs in nest building and incubation, but both care for the young birds. Nest is a large cup of vegetation and other materials, bound together with spider web and lined with soft material
Status: Rare FoM/BT Terrys Ck Kittys Ck
Seasonal migrant 2006-07 RESULTS
Guild: : nectivore/insectivore 2016 RESULTS (FoM only)
Size: 18cm 2017 RESULTS
Despite being common elsewhere in the region, and in 2006-7, it does not appear to be common in the
LGA recently (Photo: Applied Ecology 2017)
Feeding: mostly eat the nectar of flowers. Other food items include fruit, insects and spiders.Breeding: builds cup-shaped nest is made of bark and grasses, bound together with spider web, l ined with soft material and is placed in a bush or tree, anywhere from ground level up to 6 m. Both sexes feed the chicks. A pair of adults may raise two or three broods in a year.

FAUNA SURVEY RESULTS 68
Red-browed Finch Neochmia temporalis
Rufous Fantail Rhipidura rufifrons
Rufous Whistler Pachycephala rufiventris
Status: Locally common FoM/BT Terrys Ck Kittys Ck
Sedentary 2006-07 RESULTS
Guild: : ground granivore 2016 RESULTS (FoM only)
Size: 11-12cm 2017 RESULTS
Commonly observed species - often in small parties near edge of tracks (Photo: Applied Ecology 2017)
Feeding: feeds on seeds and insects on the ground, but sometimes perches on seeding grass heads.Breeding: builds large and domed nest, with a side tunnel for an entrance. It is a rough construction of twigs and grass stems built in a dense shrub between 1 and 2 metres from the ground. Both parents share nest-building, incubation of the eggs and feeding of the young when they hatch.
Status: Rare FoM/BT Terrys Ck Kittys CkSeasonal migrant – leaves NSW
completely over winter 2006-07 RESULTS
Guild: : shrub insectivore 2016 RESULTS (FoM only)
Size: 15-16cm 2017 RESULTS
One individual spotted in Kittys Creek - Portius Park (pictured) in Autumn. The ususal spring migrants did
not arrive during the survey period (Photo: Applied Ecology 2017)
Feeding: feeds on insects, which it gleans from the middle and lower levels of the canopy.Breeding: builds a small compact cup nest, of fine grasses bound with spider webs, that is suspended from a tree fork about 5 m from the ground. The bottom of the nest is drawn out into a long stem. Both sexes share nest-building, incubation and feeding of the young. One or two broods may be raised in a season.
Status: Rare FoM/BT Terrys Ck Kittys Ck
Seasonal migrant 2006-07 RESULTS
Guild: : arboreal insectivore 2016 RESULTS (FoM only)
Size: 16-18cm 2017 RESULTS
One individual female was spotted in Terry's Creek - Pembroke Park in Spring. Not commonly
encountered in the region (Photo: jenny Stiles SOPA 2017)
Feeding: eats insects, and sometimes seeds, fruit or leaves. It usually forages at higher levels than other whistlers, and rarely is seen on the ground.Breeding: The Rufous Whistler breeds in monogamous pairs, and both sexes incubate the eggs and care for the young. The female builds a fragile, cup-shaped nest from twigs, grass, vines and other materials, bound and attached to a tree fork with spider web. Two broods may be produced in a season

69 FAUNA SURVEY RESULTS |
appliedecology
Scarlet Honeyeater Myzomela sanguinolenta
Silvereye Zosterops lateralis westernensis/lateralis lateralis
Spotted Pardalote Pardalotus punctatus
Superb Fairy-wren Malurus cyaneus
Status: Common FoM/BT Terrys Ck Kittys Ck
Seasonal migrant 2006-07 RESULTS
Guild: : nectivore/insectivore 2016 RESULTS (FoM only)
Size: 10-11cm 2017 RESULTS
They were observed in good numbers during spring . Often high in the canopy their distinctive call is the
best, and usually first, indication of their presence. Seen here feeding in the regen area on Wellington
Road, Ryde (Photo: Applied Ecology 2017)
Feeding: mostly eat the nectar of flowers. Other food items include fruit, insects and spiders.Breeding: builds cup-shaped nest is made of bark and grasses, bound together with spider web, l ined with soft material and is placed in a bush or tree, anywhere from ground level up to 6 m. Both sexes feed the chicks. A pair of adults may raise two or three broods in a year.
Status: Common FoM/BT Terrys Ck Kittys Ck
Seasonal migrant 2006-07 RESULTS
Guild: : omnivore 2016 RESULTS (FoM only)
Size: 11-13cm 2017 RESULTS
Commonly observed species - often in small foraging parties (Photo: Applied Ecology 2017)
Feeding: feeds on insect prey and large amounts of fruit and nectarBreeding: pairs actively defend a small territory. Nest- small, neatly woven cup of grasses, hair, fine vegetation, bound with spider web in a horizontal tree fork up to 5m above the ground. The nest is constructed by both sexes, who both also incubate the bluish-green eggs. If conditions are suitable two to three clutches will be raised in a season.
Status: Common FoM/BT Terrys Ck Kittys Ck
Sedentary/seasonal movement 2006-07 RESULTS
Guild: : omnivore 2016 RESULTS (FoM only)
Size: 8-10cm 2017 RESULTS
Commonly heard species throughout study areas (Photo: Applied Ecology 2017)
Feeding: forages on the foliage of trees for insects, especially psyllids, and sugary exudates from leaves and psyllids.Breeding: pairs actively defend a small territory. Nest- small, neatly woven cup of grasses, nest is an enlarged, l ined chamber at the end of narrow tunnel, excavated in an earth bank. Sometimes they nest in tree hollows and occasionally in artificial structures. Both parents share nest-building, incubation of the eggs and feeding of the young when they hatch.
Status:Abundant FoM/BT Terrys Ck Kittys Ck
Sedentary 2006-07 RESULTS
Guild: : ground insectivore 2016 RESULTS (FoM only)
Size: 10cm 2017 RESULTS
Commonly encountered species throughout study areas. Female left, male right. (Photos: Applied
Ecology 2017)
Feeding: feeds on insects and other small arthropods. These are caught mostly on the ground, but may also be taken from low bushes. Feeding takes place in small social groups.Breeding: nest-dome-shaped structure of grasses and other fine material, usually placed in a low bush - constructed by the female. The female incubates the eggs alone, both

FAUNA SURVEY RESULTS 70
Variegated Fairy-wren Malurus lamberti
White-browed Scrubwren Sericornis frontalis
White-cheeked Honeyeater Phylidonyris niger
Status: Locally common FoM/BT Terrys Ck Kittys Ck
Sedentary 2006-07 RESULTS
Guild: ground insectivore 2016 RESULTS (FoM only)
Size: 10cm 2017 RESULTS
Commonly encountered species throughout study areas. Female left, male right. (Photos: Applied
Ecology 2017)
Feeding: feeds on insects and a small amount of seeds.Breeding: Male does not have a harem – the small groups actually consist of an adult female with younger or non-breeding birds. Nest is an oval -shaped dome, constructed of grasses, and placed in a low shrub. The female alone constructs the nest and incubates the eggs, but is assisted by other group members in feeding the chicks.
Status: Abundant FoM/BT Terrys Ck Kittys Ck
Sedentary 2006-07 RESULTS
Guild: : ground insectivore 2016 RESULTS (FoM only)
Size: 11-13cm 2017 RESULTS
Commonly encountered species throughout study areas. . (Photos: Applied Ecology 2016)
Feeding: feed mostly on insects and other small arthropods. Occasionally, they eat some seeds.Breeding: Breed communally-nest consists of a large ball of grasses and other plant material, a side entrance tunnel leading to a cup lined with feathers. This is normally located on or near to the ground, in thick vegetation, but may be in a tree fork a few metres high. The eggs are pale blue to pale purple and are spotted with brown at the base.
Status: Locally common FoM/BT Terrys Ck Kittys Ck
Sedentary/blossoming events nomad 2006-07 RESULTS
Guild: : nectivore/insectivore 2016 RESULTS (FoM only)
Size: 16-19cm 2017 RESULTS
They were observed in good numbers during spring. Seen here feeding in the regen area on Wellington
Road, Ryde (Photo: Applied Ecology 2017)
Feeding: feed mainly at flowers, in foliage, on bark or in the air and mainly eat nectar, but also insects.Breeding: pair monogamously for the breeding season, with males defending breeding territories that can be held for several years. Female builds a cup-shaped nest from twigs, bark, and other plant materials, l ined with pieces of flowers. The nest is placed low in forked branches of trees or shrubs, often close to the ground, but well -concealed in dense foliage or in grass below shrubs and ferns. Both parents feed young.

71 FAUNA SURVEY RESULTS |
appliedecology
White-throated Tree-creeper Cormobates leucophaea
Yellow Thornbill Acanthiza nana
Yellow-faced Honeyeater Lichenostomus chrysops chrysops
Status: Locally common FoM/BT Terrys Ck Kittys Ck
Sedentary 2006-07 RESULTS
Guild: insectivore 2016 RESULTS (FoM only)
Size: 14cm 2017 RESULTS
Frequently heard & sometimes observed in several key locations including boundary area of Lucknow &
Somerset Parks, central area of Pembroke Park, Kunzea Track Field of Mars. Also observed roosting in
the overhang at Pembroke Park.(Photo@FoM: Applied Ecology 2017)
Feeding: feeds mainly on ants, but will eat other invertebrates as well as nectar. Forages in an upward direction.Breeding: female builds the nest and incubates the eggs, but both sexes care for the young. Two broods may be raised in a season. The nest is made in a tree cavity, which is l ined with bark, fur and hair.
Status: Locally common FoM/BT Terrys Ck Kittys Ck
Sedentary 2006-07 RESULTS
Guild: canopy mid-storey insectivore 2016 RESULTS (FoM only)
Size: 10cm 2017 RESULTS
Occassionally heard & observed in good bush areas. Sometimes in company/mixed flocks(Photo: Applied
Ecology 2017)
Feeding: feeds mainly on insects, but may sometimes eat seeds.Breeding: female builds the nest and incubates the eggs, but both sexes Sometimes with helpers) care for the young. Females build a rounded domed nest, with a narrow, hooded entrance near the top out of grass/bark l ining with fur or soft plant material.
Status: Common FoM/BT Terrys Ck Kittys Ck
Migratory 2006-07 RESULTS
Guild: nectarivore/insectivore 2016 RESULTS (FoM only)
Size: 16-18cm 2017 RESULTS
Migrating flocks observed in several location. Single birds and small flocks observed sporadically in
reserves (Photo: Applied Ecology 2017)
Feeding: feed on nectar, pollen, fruit, seeds, insects and their products.Breeding: Breeding pairs of YFHEs defend territories during the season. The female builds a neat, woven, sometimes fragile, cup from green materials such as moss, in the understorey of forests or in hedges, vines and other garden shrubs. She incubates the eggs alone, but both parents feed the young.

FAUNA SURVEY RESULTS 72
4.2.6 “WATER” BIRDS
Australian Wood Duck Chenonetta jubata
Chestnut Teal Anas castanea
Little Pied Cormorant Microcarbo melanoleucos
Status: Locally common FoM Terrys Ck Kittys Ck
Sedentary/ Dispersive 2006-07 RESULTS
Guild: herb/gran/insectivore 2016 RESULTS (FoM only)
Size: 45-60 cm 2017 RESULTS
A pair of Australian Wood Ducks at Field of Mars Reserve (photo: Applied Ecology 2017)
Feeding:. eats grasses, clover and other herbs, and occasionally, insects. Prefers dabbling in shallow water, or on grass.Breeding: forms monogamous breeding pairs that stay together year round. It nests in tree holes, above or near water, often re-using the same site. Both parents feed young and young birds remain with them up to a month after fledging.
Status: Locally common FoM Terrys Ck Kittys Ck
Sedentary, local movements 2006-07 RESULTS
Guild: herb/gran/insectivore 2016 RESULTS (FoM only)
Size: 38-48 cm 2017 RESULTS
This species was only observed on Buffalo Creek. A male is pictured (photo: Applied Ecology 2017)
Feeding:. eats seeds and insects, along with some vegetation + molluscs and crustaceans in more coastal habitats.Breeding: monogamous pairs that stay together outside the breeding season. Both parents choose and defend a nest site and the males stay with the female while she incubates the eggs. The nest is usually located over water, in a down-lined tree hollow about 6 m to 10 m high. Sometimes nests are placed on the ground, among clumps of grass near water. Young hatch ready to swim and walk within a day, are strongly defended by both parents.
Status: Uncommon FoM Terrys Ck Kittys Ck
Sedentary, ldispersive 2006-07 RESULTS
Guild: carnivore 2016 RESULTS (FoM only)
Size:50-66 cm 2017 RESULTS
Pictured here on the Buffalo Creek boardwalk-This species was only observed roosting in this area but
observed flying elsewhere over the subject reserves (photo: Applied Ecology 2017)
Feeding: feed on a wide variety of aquatic animals, from insects to fish.Breeding: breed either in colonies or, less commonly, in single pairs. The nest is a flat platform of sticks, l ined with green leaves and is usually placed in a tree. Both adults share in egg incubation and care of the young.

73 FAUNA SURVEY RESULTS |
appliedecology
Pacific Black Duck Anas superciliosa
White-faced Heron Egretta novaehollandiae
Status: Common FoM Terrys Ck Kittys Ck
Nomadic 2006-07 RESULTS
Guild: herb/gran/insectivore 2016 RESULTS (FoM only)Size: 50-60 cm 2017 RESULTS
A Pacific Black Duck at Burrows Reserve (photo: Applied Ecology 2017)
Feeding: mainly vegetarian, feeding on seeds of aquatic plants. Also small crustaceans, molluscs and aquatic insects.Breeding: coincides with availability of sufficient food and water, and often with the onset of heavy rains or when waterways are at their peak. Female often initiates breeding , and, other than copulation, the male helps l ittle in the breeding process. Often, two broods will be raised in a year.
Status: Locally common FoM Terrys Ck Kittys Ck
Sedentary/Dispersive 2006-07 RESULTS
Guild: Ground carnivore/insectivore2016 RESULTS (FoM only)Size: 60-70 cm 2017 RESULTS
A white-faced heron was often observed foraging in the grass along the edge of bushland at
Pidding Park (photo: Applied Ecology 2017)
Feeding: feeds on a wide variety of prey, including fish, insects and amphibiansBreeding: White-faced Herons may breed outside the breeding season in response to rainfall. Both sexes share the building of the nest, incubation of the eggs and care of the young. The nest is an untidy structure of sticks, placed in a tree. Normally only one brood of young is raised in a year.
A pair of Pacific Black ducks cruising up Terrys Creek near Epping Road. (Photo: Applied Ecology 2017)

FAUNA SURVEY RESULTS 74
4.2.7 BIRDS OF PREY
Grey Goshawk Accipiter novaehollandiae
Brown Goshawk Accipiter fasciatus
Status: Rare FoM Terrys Ck Kittys Ck
Sedentary/Dispersive 2006-07 RESULTS
Guild: Carnivore/insectivore 2016 RESULTS (FoM only)
Size: 38-55 cm 2017 RESULTS
One bird was observed in Pembroke park during the survey. Known to breed near Browns waterhole.
(Photograhed here by Jenny Stiles at Terrys Creek 2017)
Feeding: preys on birds, small mammals, reptiles and insects. It pursues its prey in flight, striking at speed.Breeding: forms permanent pairs that defend a home territory year round. Both sexes constructs a stick nest lined with leaves high in a tree fork, and often re-use the same nest. Female does most of the incubation, the male relieves her when she needs to feed, and catches most of the food for the young.
Status: Uncommon FoM Terrys Ck Kittys Ck
Sedentary/Dispersive 2006-07 RESULTS
Guild: Carnivore/insectivore 2016 RESULTS (FoM only)
Size: 37-55 cm ♀ larger 2017 RESULTS
A Brown Goshawk on her nest at Field of Mars this spring (above) and nestlings/fledglings a few weeks
later -"Where's Mum?" (photos: Applied Ecology 2017)
Note that nest photography has the potential to disturb nesting birds to the point where they will abandon nests. These photos were taken from 60 metres away with a powerful telephoto lens. Practice ethical birding at all times.
Feeding: feeds on small mammals, with rabbits a particularly important prey i tem, as well as birds, repti les and insects and sometimes, carrion (dead animals).Breeding: Established pairs will reuse the same area year after year, and often use the same nest. The female incubates the eggs, with the male helping when she needs to leave the nest to feed. The male does the bulk of the hunting to feed the young, which remain dependent on their parents for up to three weeks after fledging. Young birds disperse widely.
75 FAUNA SURVEY RESULTS |
appliedecology
4.2.8 NOCTURNAL BIRDS
Australian Owlet-nightjar Aegotheles cristatus
Status: Rare FoM Terrys Ck Kittys Ck
Sedentary 2006-07 RESULTS
Guild: Insectivore 2016 RESULTS (FoM only)
Size: 20-25 cm 2017 RESULTS
Smallest of the nocturnal birds (night birds) found in Australia. It has two colour variations russet-brown (rufous), and the more common grey. In both forms the birds are paler below, and are faintly barred with black. There are two wide black stripes that extend over the head from the top of the eyes, and meet on the back of the neck.Photograph: Jenny Stiles 2016
Feeding: feeds at night on a variety of insects. Birds will readily take flying prey, or will pounce on prey either on the ground or in trees.Breeding: Both sexes construct the nest, which is a bed of green leaves, placed in a suitable tree hollow or rock crevice. Both birds also incubate the eggs and care for the chicks. The birds form permanent bonds, and pairs occupy the same territory throughout the year.
FAUNA SURVEY RESULTS 76
THREATENED SPECIES
supply of food during the early part of this nesting period with the female emerging later in the nesting period to hunt for food along with the male . Young birds remain with the parents for several months after fledging and may stay within their parents' territory for over a year. Breeding productivity is 0.4-1.4 young per pair per year, depending on habitat quality (low in dry, fragmented inland forest, high in productive coastal forest). Bain et al. (2014) reports the average annual fledging rate in Sydney from 2011 to 2014 as 1.22 chicks, noting this was similar to the annual fledging success of 1.28 chicks (51 fledglings from 40 breeding attempts) reported by Kavanagh (2003).
Powerful Owl Ninox strenua
Feeding: The Powerful Owl is a carnivore, eating mainly medium to large tree-dwelling mammals, particularly the Common Ringtail Possum and various gliders. It will also take roosting birds, flying-foxes and sometimes small ground-dwelling mammals. It forages mainly in trees, attacking silently, taking prey with its feet. Most of the prey biomass for the species is from mammals (Higgins 1999; Kavanagh 2002a).
Status: Locally common
Sedentary
Guild: carnivore Size: 55 cm
Breeding and social biology: mates for life (over 30 years in some cases) and pairs defend exclusive nesting territories within larger, defended home ranges of 400-4000 ha, depending on habitat quality and prey densities. Habitat modelling in the Sydney basin was undertaken by Bain et al. (2014) using data collected by the Birdlife Australia’s “Powerful Owl Project” revealing pairs in high density breeding site areas (includes the City of Parramatta) is one site (one pair of owls) per 569 ha of modelled foraging habitat. Powerful Owls nest in large hollows up to 1 m wide and 2 m deep in big old trees (usually alive but sometimes dead). The male prepares the nest. A clutch of usually two eggs is laid in autumn to winter, with a single attempt per year. The incubation period is 38 days. The female incubates the eggs and broods the young. The nestling period is two months, and the male provides the female and young with a constant
Adult at Terrys Creek.(Photo: Applied Ecology 2017)
A pair roosting at Kitty’s Creek (photo: Applied Ecology 2017)
FoM Terrys Ck Kittys Ck
2006-07 RESULTS
2016 RESULTS (FoM only)
2017 RESULTS

77 FAUNA SURVEY RESULTS |
appliedecology
Applied Ecology can confirm the presence of a breeding pair in Terry’s Creek, Kitty’s Creek and Buffalo Creek in Filed of Mars (south side) this spring. Owlets have been observed in all these locations with aprent(s) nearby. The location of breeding hollows is unknown.
Threatened species determination
All the large forest owls in NSW including the largest, the Powerful Owl, were included in the Endangered fauna (Interim Protection) Act 1991 and automatically transferred to schedule 2 (Vulnerable) when the Threatened Species Act came into effect in 1995. Literature pertaining to the species was reviewed in 2008 to assess status of the species.
Reviewed September 2008 as a VULNERABLE SPECIES in Part 1
of Schedule 2 of the Act and transferred listing to the
Boidiversity Conservation Act in 2016
The reasons contributing to the listing of the Powerful Owl were: population size between 1,000 and 10,000 individuals, population suspected to be declining, current distribution within NSW is between 10001 – 100 000 Km. Area of occupancy within this range is about 20 000 km2. The number of mature individuals of the Powerful Owls has been estimated as 7 000 globally (Garnett & Crowley 2000), of which over half would occur in NSW on the basis of geographic range, or more than 3 500 birds. This estimate is assigned a medium level of reliability (Garnett & Crowley 2000). Other estimates suggest a minimum population in NSW of 2 000 pairs, or 10 000 birds (DEC 2006).
Bain et al. (2014) estimates the population of Powerful owls in Sydney to be 120 adult birds. Based on observations made during this survey habitat in the LGA is a very important as roosting/breeding/refugia. The deep shade offered by weedy creek lines is a very important habitat for this species.
The “Kitty’s Creek owlet” (photo: Applied
Ecology 2017) – 3 weeks younger below.

FAUNA SURVEY RESULTS 78
The NSW Scientific Committee details the threats to this species in the committee’s review of literature and includes the following key issues, most of which are applicable to the resident owls of the LGA:
Land clearing Loss of hollow bearing trees – with OEH (2014) noting the species require “large tree
hollows (at least 0.5 m deep), in large eucalypts (diameter at breast height of 80-240 cm) that are at least 150 years old”
Competition for hollows (nest sites and prey nest sites) by feral honey bees Inbreeding- Powerful Owls are known to disperse up to 18 km, including across sparsely
wooded areas (Higgins 1999; Cooke & Hogan 2008), so population fragmentation is unlikely. However, dispersal may be somewhat inhibited in urbanised areas, with consequent inbreeding (Hogan et al. 2008)
Predation of owlets by the Red Fox Too frequent fires Reliance on protocols and codes to protect breeding & roost sites Injury or death from vehicle collisions, overhead wires, entanglement on fences
In addition to these threats Bain et al. (2014) has documented disturbance of breeding sites by bird watchers and photographers (including one site in Carlingford) that ultimately resulted in Powerful Owls abandoning the site. In the sixteen nesting failures documented between 2011 – 2014 by the Powerful Owl Project, two were directly attributed to Sulphur-crested Cockatoos taking over a breeding site prior to resident Powerful Owl chicks fledging, with a further two failures also likely to be directly attributable to Sulphur-crested Cockatoos. Competition for breeding sites with Sulphur-crested Cockatoos is likely to be a key threat in the City of Ryde, noting that locally abundant parrot species also compete for hollows with key prey species.
It is strongly recommended that the location of roosting sites are not dessiminated widely by Council or Bushcare volunteers that work within the reserves , this includes the removal of all GPS-embedded data from any images prior to sharing particularly on any form of social media. Nest sites locations should never be publicised with Birdlife Australia recommending that the location of nesting sites of rare species or species of conservation significance only being divulged to relevant conservation authorities.
It is recommended that Council actively promote ethical bird watching through signage and its education programmes.
Pembroke Park adult Powerful Owl (photo:
Applied Ecology 2017)

79 FAUNA SURVEY RESULTS |
appliedecology
Tawny Frogmouth Podargus strigoides
Status: Locally common FoM Terrys Ck Kittys Ck
Sedentary 2006-07 RESULTS
Guild: carnivore 2016 RESULTS (FoM only)
Size: 34-53 cm 2017 RESULTS
This species was usually observed during spotlighting and quite common in Field of Mars. A breeding pair successfully raised
chicks in Barton Park (photos: Applied Ecology 2017)
Feeding: diet is made up of nocturnal insects, worms, slugs and snails. Small mammals, reptiles, frogs and birds are also eaten. Most food is obtained by pouncing to the ground from a tree or other elevated perch. Some prey items, such as moths, are caught in fl ightBreeding: August – December. Both sexes incubate the eggs. The male sits during the day, but both sexes share sitting at night. The nest is a loose platform of sticks, which is usually placed on a horizontal forked tree branch. Normally only one brood is raised.

FAUNA SURVEY RESULTS 80
4.2.9 INTRODUCED BIRDS
Red-whiskered Bulbul Pycnonotus jocosus
Common Myna Sturnus tristis
Spotted Turtle-Dove Streptopelia chinensis
FoM Terrys Ck Kittys Ck
2006-07 RESULTS
2016 RESULTS (FoM only)
2017 RESULTS
Very common in suitable habitat - particularly in areas of dense weeds.Pictured here at Strangers Creek (Photo: Appl ied Ecology 2017)
FoM Terrys Ck Kittys Ck
2006-07 RESULTS
2016 RESULTS (FoM only)
2017 RESULTS
Common on reserve edges- does not penetrate into areasof good bush.
(Photo: Appl ied Ecology 2017)
FoM Terrys Ck Kittys Ck
2006-07 RESULTS
2016 RESULTS (FoM only)
2017 RESULTS
Often heard calling from nearby backyards. Only on edges
(Photo: Appl ied Ecology 2016)

81 FAUNA SURVEY RESULTS |
appliedecology
The following species profiles contain species information, species image and a table showing prescence/absence by corridor in this survey and previous surveys by others. Presence during this survey is not an indication of the species abundance or distribution within a corridor.
4.1 AMPHIBIANS Four species of frogs were recorded in the LGA during this survey.
The following profiles are primarily compiled from Cogger (2014) Reptiles and Amphibians of Australia, 2https://frogs.org.au, OEH species profiles and Robinson (2002). A Field Guide to Frogs of Australia, and calling periods from : 3 Lemckert, F. and Mahony, M. 2008. Core calling periods of the frogs of temperate New South Wales, Australia. Herpetological Conservation and Biology 3: 71-76.
Figure 48 An unfortunate Brown Marsh Frog (Limnodynastes peronii) makes a hearty meal for this Laughing Kookaburra. Photographed near the “Pimelia” quad in Field of Mars Reserve 2017.
FAUNA SURVEY RESULTS 82
4.1.1 Southern frogs (families Myobatrachidae & Limnodynastidae)
Brown or Striped Marsh Frog Limnodynastes peronii
Status Protected
Other Common Names Striped marsh Frog Call A "tock" or "poc" with similar inflections to a hen's "cluck".
Description A large wetland-dwelling frog and voracious hunter, this frog eats almost any animal smaller than itself, including small frogs.
Adult length: 45-75mm. Range from pale fawn to golden-brown with dark brown or black longitudinal stripes along the back. Juveniles may have only a series of longitudinally aligned spots or streaks. Tadpoles are usually light brown or silvery grey on both body and fins.
Habitat Found in open forests and usually associated with permanent water. This species does well in disturbed habitats
Habitat availability in CoR Widespread but not in large numbers, small localised populations call from specific areas - particularly drainage lines entering the larger creek lines.
Breeding Males call from the water concealed in vegetation or sometimes concealed under the egg masses. Females lay their eggs in floating foam masses attached to vegetation in still waters. Tadpoles grow to a maximum length of 60 mm.
2 Jan Feb Mar Apr May Jun Jul Aug Sept Oct Nov Dec Breeding 3Calling Eggs Tadpoles
Adult Striped Marsh Frog (left) and foam mass(below) at Buffalo Creek,
Field of Mars Reserve (Photos: Applied Ecology)
FoM Terrys Ck Kittys Ck
2006-07 RESULTS
2016 RESULTS (FoM only)
2017 RESULTS

83 FAUNA SURVEY RESULTS |
appliedecology
Common Eastern Froglet Crinia signifera
A “Crinia” in the drainage line along Wellington Road, Field of Mars Reserve. One individual in the hand (above) and
another floats in the water (below)-(Photos: Applied Ecology 2017).
Status Protected
Other Common Names Common Froglet, “Crinia” Call Cricket-like heard year long. Series of three to five pulsed calls, with a chirping
quality, rapidly repeated in a long series - "crick crick crick crick crick". Description A small ground dwelling frog, it is one of Eastern Australia's most common and
widespread species. Adult length: 18-28mm. Highly variable even within a single location. They have a
granular belly which is white or muddy white, heavily mottled with black or dark brown. The patterning on the back is variable but three patterns (morphs) are common: [1] ridged (longitudinal ridges along back); [2] lyrate (boomerang shaped ridges over the shoulder and on the back); and [3] smooth (back smooth, unpatterned, or with small warts). Tadpoles are light grey or brown all over with scattered dark flecks.
Habitat Found in natural and disturbed areas - shelters under logs and other debris, usually in moist depressions or near water. It is not uncommon to find dozens of individuals under one log or rock. Eggs and tadpoles are aquatic and can be found in ponds, dams, swamps, flooded grassland, ditches and hollows.
Habitat availability in CoR Widespread but not common anywhere. More common in small drainage lines than in mapped creeklines.
Breeding Males call from among vegetation at the waters edge or floating in open water supported by vegetation.
FoM Terrys Ck Kittys Ck
2006-07 RESULTS
2016 RESULTS (FoM only)
2017 RESULTS

FAUNA SURVEY RESULTS 84
4.1.2 Tree frogs (Family Hylidae)
Leaf-green Tree Frog Litoria phyllochroa
This species is typically green but can be quite variable -a classic green individual at Terrys Creek (left), a dark individual
from Kittys Creek (centre) and a drab green individual at Somerset Park.(Photos: Applied Ecology 2017).
Status Protected
Other Common Names
Leaf Green Frog
Call Variable - often ‘erk...erk...erk’ sound Description A small, secretive frog, rarely seen
Adult length 40mm. Light green to dark olive green in colour, but can change rapidly to match its surrounding environment. It has a pale yellow or gold stripe running down its sides from behind its eyes, underlined with a black or brown stripe. The armpits, groin and the backs of its thighs are dark red. Its belly is granular and white with occasional darker flecks. The skin on its back is smooth. Irises are gold.
Habitat Waterside vegetation lining rocky streams, swamps and mountain streams CoR Fairly common but nowhere abundant during this survey- found around shallow pools in
many of the larger streams where there was some baseflow. Breeding The male can be heard calling from the ground near water or hidden in waterside vegetation.
The female lays her eggs in clumps on submerged vegetation in streams and ponds.
Jan Feb Mar Apr May Jun Jul Aug Sept Oct Nov Dec 3Calling Breeding
FoM Terrys Ck Kittys Ck
2006-07 RESULTS
2016 RESULTS (FoM only)
2017 RESULTS
85 FAUNA SURVEY RESULTS |
appliedecology
Perons Tree Frog Litoria peronii
Status Protected
Other Common Names
Laughing Tree Frog, Emerald-spotted Tree Frog, Maniacal Cackle Frog
Call The call is very long and drawn out, slowly pulsed and increasing in loudness - "cra-ah-ah-ah-ah-ah-ah-ah-ahhk" , drill-like.
Description A large and agile, climbing frog. Note silver eyes with cross shaped pupil. Adult length 40mm. The Peron's Tree Frog has the ability to quickly change colour. By
day it is usually a pale green-grey colour that changes to a reddish brown with emerald green flecks at night. It also has bright black and yellow markings on its thighs. It has a cross-shaped pupil and a silver iris.
Habitat Adults frequent wet and dry forest, woodlands, shrublands, and open areas; often long distances from the water where they spawn during breeding season.
CoR Fairly common & widespread, not abundant at any one location. Patchily distributed. Breeding Eggs and tadpoles are found in still water in swamps, dams, streamside ponds, and
lagoons
Jan Feb Mar Apr May Jun Jul Aug Sept Oct Nov Dec 3Calling
FoM Terrys Ck Kittys Ck
2006-07 RESULTS
2016 RESULTS (FoM only)
2017 RESULTS
Peron’s Tree Frog at Pembroke Park (Photos: Applied Ecology 2017).

FAUNA SURVEY RESULTS 86
4.2 REPTILES Twelve species of reptile were observed during current surveys.
The following profiles are primarily compiled from Cogger (2014) Reptiles and Amphibians of Australia, Atlas of Living Australia http://bie.ala.org.au, Australian Museum https://australianmuseum.net.au and OEH species profiles
4.2.1 DRAGONS
Eastern Water Dragon Intellagama lesueurii
Status Protected
Other Common Names
Water Dragon
Description Large semi-aquatic, arboreal dragon. A male Water Dragon can reach a length of 90-100cm and weigh about 1 kg. Two-thirds of the length of a Water Dragon is its tail. Females are notably smaller and less robust.
Distinctively deep angular head and nuchal crest of spinose scales that joins the vertebral crest extending down the length of its body to the tail. The jowls are large and ear is exposed and of almost equal size of the eye. The dorsal ridge and tail are laterally compressed and the limbs are strong and robust with particularly long toes on the hind legs. The tail is capable of regeneration when lost, furthermore, regenerated tails can also grow back if severed.
Habitat Flowing water with ample tree cover and basking sites appear to be the key to habitat preference for this species. Water dragons will be found in built-up urban areas provided that the above conditions can be found and water quality is fair.
Diet Insectivorous as juveniles, however as they grow they become more omnivorous with
A male basking at Kittys Creek (Photos: Applied Ecology 2017).
87 FAUNA SURVEY RESULTS |
appliedecology
vegetable matter gradually making up to almost half of the diet CoR Widespread and common
Biology/Breeding Groups of dragons are usually comprised of several females, juveniles of various ages and a dominant male who will defend as much of the territory as possible from other males. Water Dragons communicate through a variety of dominant and submissive signals including head-bobbing, saluting and substrate licking. In the Sydney region, the breeding season begins in September, when courtship and mating begins, and concludes in January when the last clutches of eggs are laid. Usually active in the Sydney region from September to June, becoming inactive during the cooler months. To survive the low winter temperatures Water Dragons will enter established burrows or scrape their own between boulders and logs in or near creek banks and pack dirt into the opening to seal themselves off. Once entombed they will slow their metabolism and enter a state of brumation until spring arrives.
FoM Terrys Ck Kittys Ck
2006-07 RESULTS
2016 RESULTS (FoM only)
2017 RESULTS
A large male basking at Barton Park (left) and a female at Pembroke Park (below) (Photos: Applied Ecology 2017).

FAUNA SURVEY RESULTS 88
4.2.2 GECKOES
Broad-tailed gecko Phyllurus platurus
Status Protected
Other Common Names
Leaf-tail Gecko, Southern Leaf-tailed Gecko
Description A moderately-large gecko with a flat body and a broad flat tail tapering to a point. Brown to grey with a mottled pattern that resembles the habitat where it lives. It has rough, scaly skin. Females tend to be larger than males. Body length up to 9.9 cm.
Habitat Coastal sandstone woodland and heath where sandstone escarpment is present, including urban areas
Diet Insectivorous CoR Common where suitable habitat exists
Biology/Breeding Nocturnal species. Females usually lay two eggs in a crevice; after eight to ten weeks the young hatch and have to fend for themselves.
Beautifully camouflaged on sandstone – Lucknow Park (Photo: Applied Ecology 2017)
FoM Terrys Ck Kittys Ck
2006-07 RESULTS
2016 RESULTS (FoM only)
2017 RESULTS

89 FAUNA SURVEY RESULTS |
appliedecology
4.2.3 SKINKS
Eight species of skink were observed during the current surveys. Four of these are the “little brown lizards” commonly observed. Of these the Dark-flecked Garden Sunskink or Garden Skink was the most abundant. The Pale-flecked Sunskink or Grass Skink was also very common. The other two “little brown skinks”, the Weasel Skink and the Elegant Snake-eyed Skink typically occupy different niches and are not as readily confused by observers.
Dark-flecked Garden Sunskink Lampropholis delicata
Status Protected
Other Common Names
Delicate Skink, Garden Skink, Garden Sun-skink.
Description Average snout-vent length of about 40mm, up to 51mm with total length 90mm. Grey to copper-brown above with a broad dark brown zone on the upper flanks. The flank and back colours are often separated by a thin pale line. A well-defined white stripe may be present on the lower flanks.
Habitat Found in open and closed forests, woodlands, coastal heaths and modified landscapes Diet Insectivorous CoR Common to abundant throughout
Biology/Breeding Communal nesting is well-known in this genus and the eggs of many females can be found in the same nest site. Eggs are laid by the females within a short time of each other so they hatch more or less together. Because of their small size, this species is sometime preyed on by invertebrate predators. It has been found tangled in spider webs and is also captured by huntsman spiders. This species reaches sexual maturity within one year. Females lay a clutch of 1–7 eggs.
Close-up showing pale line that separates flank colouring from the back which is evident on most individuals, (Photos: Applied Ecology @ Kittys Creek 2017)
FoM Terrys Ck Kittys Ck
2006-07 RESULTS
2016 RESULTS (FoM only)
2017 RESULTS

FAUNA SURVEY RESULTS 90
Pale-flecked Garden Sunskink Lampropholis guichenoti
Status Protected
Other Common Names
Grass Skink, Grass Sun-skink, Common Garden Skink
Description Average snout-vent length of about 40mm, up to 51mm with total length 90mm. Grey-brown to copper-brown above with dark and pale flecking usually with darker
vertebral stripe. Habitat Broad array of habitats -found in open and closed forests, woodlands, coastal heaths
and modified landscapes – often with L. delicata. Diet Insectivorous CoR Common throughout
Biology/Breeding Communal nesting is well-known in this genus and the eggs of many females can be found in the same nest site. Eggs are laid by the females within a short time of each other so they hatch more or less together. Because of their small size, this species is sometime preyed on by invertebrate predators. It has been found tangled in spider webs and is also captured by huntsman spiders. This species reaches sexual maturity within one year. Females lay a clutch of 1–7 eggs.
FoM Terrys Ck Kittys Ck
2006-07 RESULTS
2016 RESULTS (FoM only)
2017 RESULTS
Note the darker dorsal stripe, not always present, but useful for quick ID (Photos: Applied Ecology @ Field of Mars Reserve 2017)

91 FAUNA SURVEY RESULTS |
appliedecology
Eastern Blue-tongue Lizard Tiliqua scincoides
Status Protected
Other Common Names Common Blue-tongue Skink, Blue-tongue, Bluey Description Average snout-vent length of about 300mm with a total length up to 600mm.
Variable colouring but is overall silvery-grey or white with broad dark brown or blackish bands across the back and tail. Sometimes bright flushes of yellow or orange can be present, usually on the skinks sides, often has a black stripe between the eye and the ear which can extend backwards along the neck
Habitat Inhabits open areas including woodlands and grasslands with plenty of ground cover such as tussock grasses, rocks or logs under which they shelter at night or during cold periods. Within urban environments Common Blue-tongues have adapted to shelter under a variety of human debris (tin, tiles), garden plants, or buildings and are common inhabitants of many suburban yards in Eastern Australia.
Diet Omnivorous – slow moving prey such as the introduced garden snail, low growing flowers, fleshy leBirds and some fruits.
CoR Rare during this survey, likely uncommon Biology/Breeding Between September and November males pursue females and mating occurs.
Birth takes place between December and January. They do not lay eggs, instead giving birth to live young. The embryos develop in the female's oviduct with the help of a placenta, which is as well-developed as that of many mammals. When the young are born, they are covered in a placental membrane, which they eat. Within a few days, they shed their skin for the first time and are ready to look after themselves, dispersing into the bush.
Only one EBTL was observed during this survey – a large adult observed at Kittys Creek (Photo: Applied Ecology 2017)
FoM Terrys Ck Kittys Ck
2006-07 RESULTS
2016 RESULTS (FoM only)
2017 RESULTS

FAUNA SURVEY RESULTS 92
Eastern Water-skink Eulamprus quoyii Revision of this genus is ongoing and potential splitting of the genus may occur. Shea (2010) excludes Eulamprus heatwolei from the Sydney Reptiles and Amphibians and Eulamprus tenuis, previously recorded in by Biosphere in 2006 &2007 has been shown to be a composite of five
species, and has been separated into the genus Concinnia (see next page).
Status Protected
Other Common Names Eastern Water Skink Description Average snount to vent 95mm, total length up to 300mm.
Golden olive brown above with black flecks and with a narrow whitish to pale yellow dorsolateral stripe from the eye extending back midway along the body or to the upper tail. The under-surface is white to pale yellow, often with fine grey or black specks.
Habitat Often found near creeklines but can also also be found on ridges away from water.
Diet Omnivorous – small invertebrates, worms, insects and, occasionally, fruits and berries.
CoR Abundant Biology/Breeding After a spring mating, female water skinks carry the developing young until they
are born in summer. Up to nine tiny skinks may be born in one litter.
Common throughout all corridors in a variety of micro habitats. Found around pathways in Burrows to good bush in the heart of
Pembroke park.All photos taken at Barton and Burrows Parks (Applied Ecology 2017)
FoM Terrys Ck Kittys Ck
2006-07 RESULTS
2016 RESULTS (FoM only)
2017 RESULTS
93 FAUNA SURVEY RESULTS |
appliedecology
Bar-sided Skink Concinna tenuis
FoM Terrys Ck Kittys Ck
2006-07 RESULTS
2016 RESULTS (FoM only)
2017 RESULTS
Status Protected
Other Common Names Bar-sided Forest Skink Description Average snout to vent 85mm, total length up to 300mm.
Coppery to pale brown above with small black blotches. Irregular dark bands on tail.
Habitat Often found near rocky outcrops, on trees, sheltering in park, agile, arboreal active.
Diet Omnivorous – small invertebrates, worms, insects and, occasionally, fruits and berries.
CoR Uncommon, potentially locally common Biology/Breeding Live-bearing
Only observed at Field of Mars Reserve.
Note barring on tail on individual (left) vs
no barring on tail of individual (above)
that has a regenerating tail.
Both these lizards were photographed on
large mature trees along Wellington Road.
(Applied Ecology 2017)

FAUNA SURVEY RESULTS 94
Elegant Snake-eyed Skink Cryptoblepharus pulcher Revision of this genus has recently occurred. Cryptoblepharus virgatus, previously recorded in the LGA, has been renamed in this location C. pulcher subsp. pulcher
FoM Terrys Ck Kittys Ck
2006-07 RESULTS
2016 RESULTS (FoM only)
2017 RESULTS
Status Protected
Other Common Names Fence Skink, Wall Skink, White-lined Skink Description Snout to vent is typically 50mm. Coppery-brown with a pair of dark-edged pale
stripes along its back. Habitat Arboreal – often seen on tree tunks, fences.
Diet Insectivorous - an active hunter and feeds on invertebrates such as small insects. CoR Locally common
Biology/Breeding Lays a clutch of 2 eggs
This Elegant Snake-eyed Skink (left) shared a tree with a Bar-sided Skink. Both species were observed on mature to scenecent trees only during this survey.
(Photos: Applied Ecology 2017)
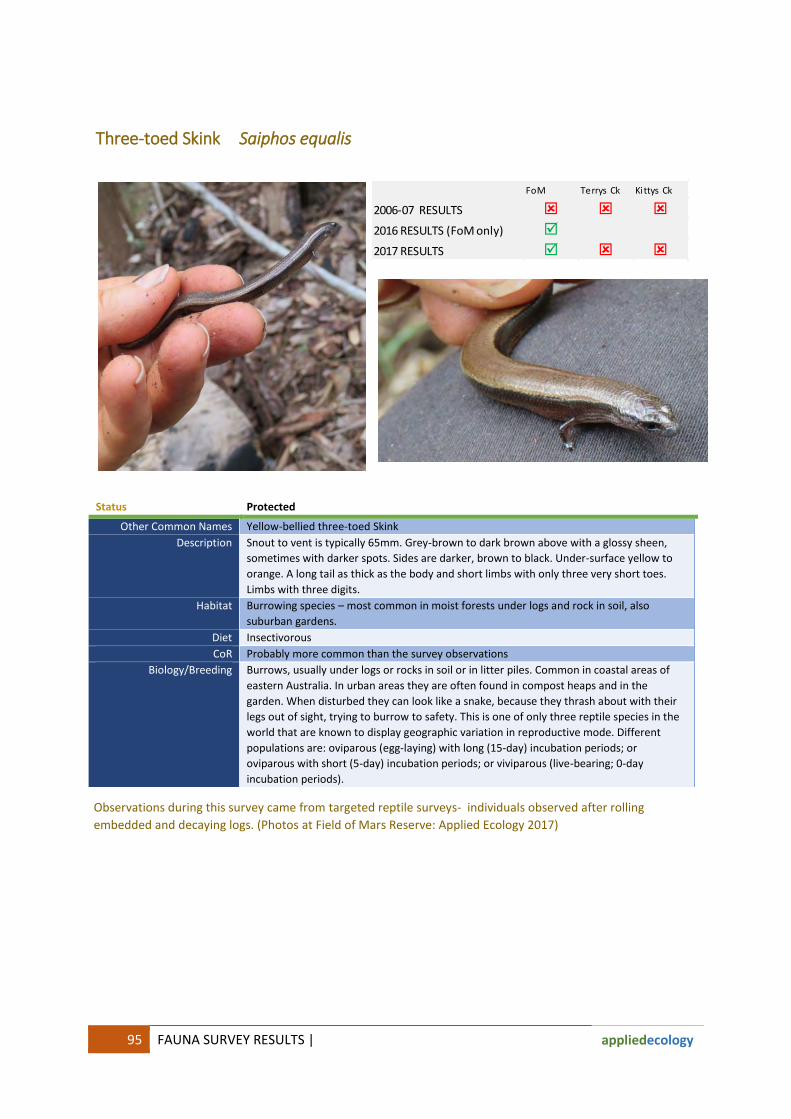
95 FAUNA SURVEY RESULTS |
appliedecology
Three-toed Skink Saiphos equalis
Status Protected
Other Common Names Yellow-bellied three-toed Skink Description Snout to vent is typically 65mm. Grey-brown to dark brown above with a glossy sheen,
sometimes with darker spots. Sides are darker, brown to black. Under-surface yellow to orange. A long tail as thick as the body and short limbs with only three very short toes. Limbs with three digits.
Habitat Burrowing species – most common in moist forests under logs and rock in soil, also suburban gardens.
Diet Insectivorous CoR Probably more common than the survey observations
Biology/Breeding Burrows, usually under logs or rocks in soil or in litter piles. Common in coastal areas of eastern Australia. In urban areas they are often found in compost heaps and in the garden. When disturbed they can look like a snake, because they thrash about with their legs out of sight, trying to burrow to safety. This is one of only three reptile species in the world that are known to display geographic variation in reproductive mode. Different populations are: oviparous (egg-laying) with long (15-day) incubation periods; or oviparous with short (5-day) incubation periods; or viviparous (live-bearing; 0-day incubation periods).
FoM Terrys Ck Kittys Ck
2006-07 RESULTS
2016 RESULTS (FoM only)
2017 RESULTS
Observations during this survey came from targeted reptile surveys- individuals observed after rolling embedded and decaying logs. (Photos at Field of Mars Reserve: Applied Ecology 2017)

FAUNA SURVEY RESULTS 96
Weasel Skink Saproscincus mustelinus
Status Protected
Other Common Names None Description Snout to vent is typically 65mm. Light brown to golden above, with scattered
paler flecks. Lateral surface (sides) similar, but with a distinctive cream-white spot at the corner of the eye and an orange-red dorsolateral hip-stripe that runs above the hind limbs to the base of tail and continues over much of its upper surface. Underneath white with yellowish flush to abdomen. Body size up to 6.5 cm.
Habitat Surface active species – most common in moist forests, also suburban gardens. Diet Insectivorous CoR Probably more common than the survey observations
Biology/Breeding Surface active; usually only seen amongst leaf litter or ground debris at dusk or shortly after dark on warm nights. It feeds on small invertebrates. Females lay up to four eggs per clutch, sometimes in a communal nest containing the eggs of numerous females
FoM Terrys Ck Kittys Ck
2006-07 RESULTS
2016 RESULTS (FoM only)
2017 RESULTS
Observations during this survey came from targeted reptile surveys - individuals observed after rolling embedded and decaying logs. (Photos at Field of Mars Reserve: Applied Ecology 2017)

97 FAUNA SURVEY RESULTS |
appliedecology
Red-bellied Black Snake Pseudechis porphyriacus
Status Protected
Other Common Names Black Snake Description Body black and shiny, underneath red to white often extending along the side. Up
to 1.7 m long. Habitat Usually near streams, swamps or lagoon areas.
Diet Carnivore – primarily frogs but also other reptiles (including snakes), small mammals and birds.
CoR More common than the survey observations suggest –contact with local residents suggests they are uncommon but widespread in suitable habitat.
Biology/Breeding Live-bearer- gives birth to up to 20 live young.
FoM Terrys Ck Kittys Ck
2006-07 RESULTS
2016 RESULTS (FoM only)
2017 RESULTS
Only two RBBS were observed during the survey. Both were large adults – one at the north end of Barton Park and the other deep within Terrys Creek corridor (Photos at Somerset Park-: Applied Ecology 2017)

FAUNA SURVEY RESULTS 98
Eastern Long-necked Turtle Chelodina longicollis
FoM Terrys Ck Kittys Ck
2006-07 RESULTS
2016 RESULTS (FoM only)
2017 RESULTS
Status Protected
Other Common Names Snake-necked Turtle Description Carapace up to 28cm, black to brown. Neck is long, typically 60% of shell length.
Females larger with deeper body. Habitat Broad range of freshwater aquatic habitats but is more abundant in shallow,
ephemeral wetlands often remote from permanent rivers Diet Carnivore that feeds on a broad range of plankton, nekton and benthic macro-
invertebrates, carrion, as well as terrestrial organisms that fall upon the water. CoR Appears to be nowhere abundant - this status is likely to be threatened in the
future due to nest predation by foxes. Biology/Breeding It is relatively slow to mature (7–8 yrs for males and 10–12 yrs for females), lays
between 6 and 23 hard-shelled eggs during spring and late summer, and can produce up to 3 clutches per year.
Only two LNT were observed during the survey. Both were near Epping Road basking on rocks along Terrys Creek (Photos at Terrys Creek -: Applied Ecology 2016)
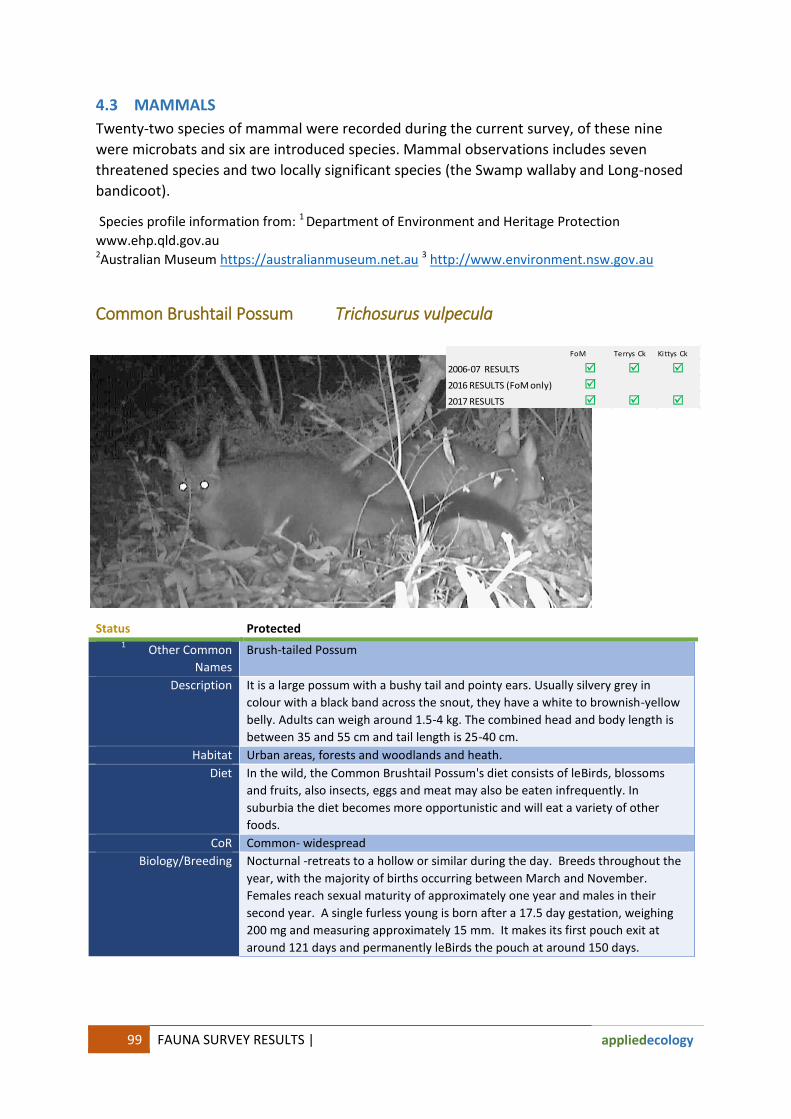
99 FAUNA SURVEY RESULTS |
appliedecology
4.3 MAMMALS
Twenty-two species of mammal were recorded during the current survey, of these nine were microbats and six are introduced species. Mammal observations includes seven threatened species and two locally significant species (the Swamp wallaby and Long-nosed bandicoot).
Species profile information from: 1 Department of Environment and Heritage Protection www.ehp.qld.gov.au 2Australian Museum https://australianmuseum.net.au 3 http://www.environment.nsw.gov.au
Common Brushtail Possum Trichosurus vulpecula
Status Protected 1 Other Common
Names Brush-tailed Possum
Description It is a large possum with a bushy tail and pointy ears. Usually silvery grey in colour with a black band across the snout, they have a white to brownish-yellow belly. Adults can weigh around 1.5-4 kg. The combined head and body length is between 35 and 55 cm and tail length is 25-40 cm.
Habitat Urban areas, forests and woodlands and heath. Diet In the wild, the Common Brushtail Possum's diet consists of leBirds, blossoms
and fruits, also insects, eggs and meat may also be eaten infrequently. In suburbia the diet becomes more opportunistic and will eat a variety of other foods.
CoR Common- widespread Biology/Breeding Nocturnal -retreats to a hollow or similar during the day. Breeds throughout the
year, with the majority of births occurring between March and November. Females reach sexual maturity of approximately one year and males in their second year. A single furless young is born after a 17.5 day gestation, weighing 200 mg and measuring approximately 15 mm. It makes its first pouch exit at around 121 days and permanently leBirds the pouch at around 150 days.
FoM Terrys Ck Kittys Ck
2006-07 RESULTS
2016 RESULTS (FoM only)
2017 RESULTS

FAUNA SURVEY RESULTS 100
Common Brushtail Possums were regularly captured on remote cameras deployed during the survey revealing the wide variety of habitats they persist in. They were also one of the most common species detected by hairtubing. These remote techniques were more successful in detecting the species than spotlighting.

101 FAUNA SURVEY RESULTS |
appliedecology
Common Ringtail Possum Pseudocheirus peregrinus
Status Protected 2 Other Common
Names Ringtail Possum
Description Body 300 mm - 350 mm, Tail 300 mm - 350 mm, weight 700 - 1100 g. Short rounded ears, rounded head with dlightly bulging eyes, variable grey to near-black back, sometimes tinged red-orange, white to red-orange below; red-orange legs. Tapering prehensile tail with a white tip, naked underside, furred above.
Carried in coil when not used. Habitat Exclusively tree-dwelling, the Common Ringtail Possum lives in in forests,
woodlands, rainforests, dense scrub and suburban gardens Diet Herbivore-eats a variety of leBirds of both native and introduced plants, as well
as flowers and fruits. By eating its own faecal pellets, it digests its food twice to extract the maximum amount of nutrients.
CoR Widespread, common Biology/Breeding During the day, the Common Ringtail Possum sleeps in its spherical nest or 'drey'
made from grass and shredded bark. It builds the drey in a tree hole, tree fork or dense vegetation, and several individuals may share the one nest. The majority of the young are born between May and July. The average litter is made up two young and very occasionally triplets. They leave their mother's pouch at 120–130 days. However, lactation usually continues until 180–220 days after birth. When the mother is feeding, the male carries the young on his back and cares for them.
FoM Terrys Ck Kittys Ck
2006-07 RESULTS
2016 RESULTS (FoM only)
2017 RESULTS
Common Ringtail Possums were one of the most commonly observed species during spotlighting – seen here under a red filter at Pembroke Park (Photos at Terrys Creek -: Applied Ecology 2017). They were also detected by remote cameras..

FAUNA SURVEY RESULTS 102
THREATENED SPECIES
Grey-headed Flying-fox Pteropus poliocephalus FED-V
Status Threatened 3 Other Common
Names Fruit Bat
Description Largest Australian bat, with a head and body length of 23 - 29 cm. It has dark grey fur on the body, lighter grey fur on the head and a russet collar encircling the neck. The wing membranes are black and the wingspan can be up to 1 m. It can be distinguished from other flying-foxes by the leg fur, which extends to the ankle.
Habitat Subtropical and temperate rainforests, tall sclerophyll forests and woodlands, heaths and swamps as well as urban gardens and cultivated fruit crops.
Diet Nectar and pollen of native trees, in particular Eucalyptus, Melaleuca and Banksia, and fruits of rainforest trees and vines. Also gardens and crops.
CoR Widespread- observed feeding in most corridors – particularly in response to flowering events
Biology/Breeding Roosting camps are generally located within 20 km of a regular food source and are commonly found in gullies, close to water, in vegetation with a dense canopy. Individual camps may have tens of thousands of animals and are used for mating, and for giving birth and rearing young. Annual mating commences in January and conception occurs in April or May; a single young is born in October or November. Site fidelity to camps is high; some camps have been used for over a century. Can travel up to 50 km from the camp to forage; commuting distances are more often <20 km
GHFF were one of the most commonly observed species during spotlighting. They were seen feeding in all corridors in response to flowering events and feeding in figs in Kittys Creek and Privet along Buffalo Creek and Terrys Creek.
FoM Terrys Ck Kittys Ck
2006-07 RESULTS
2016 RESULTS (FoM only)
2017 RESULTS

103 FAUNA SURVEY RESULTS |
appliedecology
Long-nosed Bandicoot Perameles nasuta
Status Protected 3 Other Common
Names None
Description Nocturnal marsupial of medium size. Adults range from 310 - 425 mm in head and body length, tail length varies from 120 - 155 mm and body weight may vary from 850 - 1100 grams. Males are larger than females. Colour is typically dark, greyish-brown above and creamy white below. The forefeet and upper surfaces of the hindfeet are also creamy white. The muzzle is long and pointed and the ears are distinctly larger and more pointed than short-nosed bandicoots of the genus Isoodon.
Habitat Lives in forests and woodlands, and heath Diet Forages mainly at or after dusk, digging for invertebrates, fungi and tubers. The
conical holes it leBirds in the soil are often seen on tracks
CoR Common in FoM and Pembroke Park and lower numbers north of Epping Road – absent elsewhere
Biology/Breeding Shelters during the day in a well-concealed nest based on a shallow hole lined with leBirds and grass, sometimes under debris, sometimes hidden with soil and with the entrance closed for greater concealment. Mating takes place at night and may occur throughout the year in the Sydney region, although there is a trough in breeding activity from late autumn (April) to mid-winter (June). Has a very high reproductive capacity. There are 8 teats in the pouch and litter sizes range from one to five but usually two to three. Birth takes place during the daylight hours after a gestation of only 12.5 days. The young are carried in the pouch for 50 to 54 days and are then left in the nest. When the young are
FoM Terrys Ck Kittys Ck
2006-07 RESULTS
2016 RESULTS (FoM only)
2017 RESULTS

FAUNA SURVEY RESULTS 104
about 50 days old the mother may mate again and produce another litter several days after the previous one has been weaned. In good years, females may produce up to 4 litters. Female bandicoots may begin breeding at about four months of age and males at about five months.
Despite evidence the species is common in Pembroke Park and Field of Mars Reserve only two individuals were observed during spotlighting.
Remote cameras and indirect evidence (such as conical diggings typical of the species (bottom left) were the best techniques for detecting the presence of the species and understanding their distribution within the reserves.
Bandicoot scats at FoM (top left) and a dead LNB (centre) on the Buffalo Creek Boardwalk (2017)

105 FAUNA SURVEY RESULTS |
appliedecology
Short-beaked echidna Tachyglossus aculeatus
FoM Terrys Ck Kittys Ck
2006-07 RESULTS
2016 RESULTS (FoM only)
2017 RESULTS
Status Protected 2 Other Common
Names None
Description Easily recognised by its sharp spines, short legs and long snout. Habitat forests and woodlands, heath, grasslands and arid environments.
Diet Breaks into ant and termite nests and catches its prey by flicking its long sticky tongue in and out. It also catches a lot of dirt in the process and this is expelled in the droppings.
CoR Moderately common Biology/Breeding the Short-beaked Echidna is an egg-laying mammal or monotreme and lays one
egg at a time. The eggs hatch after about 10 days and the young, emerge blind and hairless. Clinging to hairs inside the mother's pouch, the young echidna suckles for two or three months. Once it develops spines and becomes too prickly, the mother removes it from her pouch and builds a burrow for it. It continues to suckle for the next six months.
SBE were detected by remote cameras in Field of Mars Reserve and in Somerset Park (image below), by spotlighting in Pembroke Park and during a diurnal survey in Forrester Park (Pictured left and below)

FAUNA SURVEY RESULTS 106
Sugar Glider Petaurus breviceps
Status Protected 2 Other Common
Names None
Description Small arboreal marsupial- head-body length of 16 – 21 cm and a 16 – 21 cm tail. Adults weigh 100 – 160 grams, with males slightly heavier than females. The body is covered with grey to brown fur with a prominent dark dorsal stripe that extends to the forehead. Its tail is long, well-furred and prehensile. It has a membrane extending from its fifth finger to its ankle enabling it to glide up to 50 m between trees.
Habitat Occurs in forest & woodland where suitable hollows are available Diet Food includes acacia gum, invertebrates, eucalypt sap and pollen. In in collecting
eucalypt sap it leBirds distinctive “glider chews” on trees.
CoR Uncommon– Corymbia gummifera and Acacia decurrens are potentially important local species for Sugar gliders
Biology/Breeding The Sugar Glider is most active at night, sleeping by day in nests made of leBirds in tree hollows. Groups of up to seven adults and their young may form a 'clan' and share a nest. Among their own clan they are playful and social but will defend their territory aggressively and noisily if threatened by other animals or approached by Sugar Gliders from a different clan. Dominant males mark other clan members and the territory around the nest with secretions from scent glands on their chest. The Sugar Glider commonly gives birth to twins, which remain in the pouch for just over two months. They then leave the nest to forage for food, usually with their mother.
FoM Terrys Ck Kittys Ck
2006-07 RESULTS
2016 RESULTS (FoM only)
2017 RESULTS
This species was detected by hairtube samples in the Terrys Creek corridor and in Field of Mars Reserve. Targeted surveys as a follow up to hair tubing failed to detect the species indicating they are likely to be persisting in low numbers.
Indirect evidence such as old chew marks at Field of Mars Reserve (right) indicates there may have been a higher density of animals in the past.

107 FAUNA SURVEY RESULTS |
appliedecology
Swamp Wallaby Wallabia bicolor
This species was detected by a variety of techniques and appears to be well established (and breeding ) south of Epping Road in the Terrys Creek corridor at Pembroke Park. It occurs in low densities in Field of Mars Reserve. Wallaby tracks (pictured overleaf) were observed under the bridge and wallaby scats were found in Barton Park. The open woodland across much of FoM does not provide the refugia this species requires. It is likely to utilize the moister bush and weed thickets on the southern side of the reserve. Wallabies were detected by remote cameras in Portius Park and wallaby scats were collected in Martin Park.
Status Protected 2 Other Common
Names Black Wallaby
Description Upper body fur dark brown with underparts yellow to orange-brown. Face dark, often with a white stripe. Hops with head and shoulders low, and tail held horizontal. Body up to 85 cm, tail up to 86 cm.
Habitat Forest, woodland and heath where there are patches of dense undergrowth for cover during the day
Diet Swamp Wallabies feed on the leBirds of shrubs, ferns, fungi and grasses.
CoR Uncommon to locally common Biology/Breeding A solitary species, home ranges often overlap substantially. Breeding occurs
throughout the year. The pouch life of each joey is eight to nine months, although they may continue to suckle until 15 months of age.
FoM Terrys Ck Kittys Ck
2006-07 RESULTS
2016 RESULTS (FoM only)
2017 RESULTS
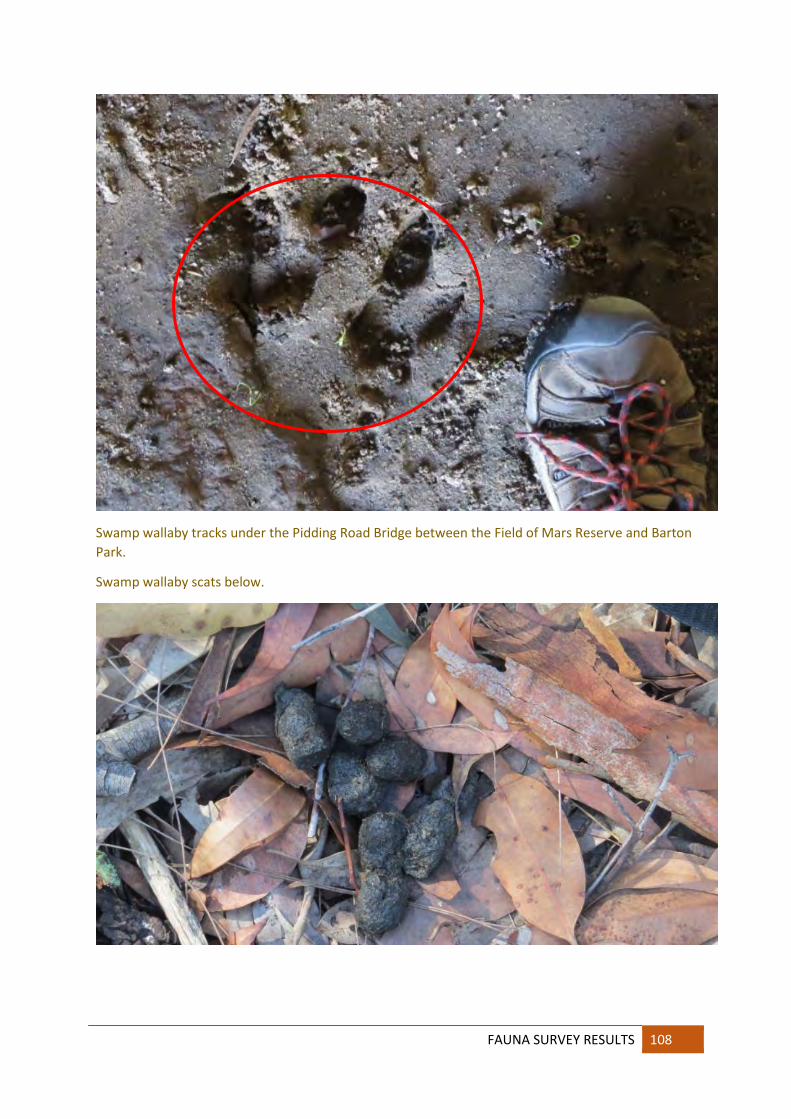
FAUNA SURVEY RESULTS 108
Swamp wallaby tracks under the Pidding Road Bridge between the Field of Mars Reserve and Barton Park.
Swamp wallaby scats below.

109 FAUNA SURVEY RESULTS |
appliedecology
4.3.1 MICROBATS
White-striped Free-tailed Bat Austronomus australis
Austronomus australis - White-striped Free-tailed Bat (Photo Michael Pennay, http://bie.ala.org.au)
NSW status: Protected
Distribution: Most of Australia, except for Tasmania and northern Australia (north of tropic of Capricorn)
City of Ryde Widely distributed, mainly in larger reserves Distinguishing features:
Large distinctive species with white stripes along the sides of the belly and on to the wings. Some individuals have white patches on the chest. Prominent throat pouch present in both sexes. Very low frequency echolocation makes this one of the few microbats with an audible call – heard as a regular metallic ting… ting… ting… ting…
Habitat: Urban areas, forest, woodland, shrubland, open agricultural landscapes with scattered trees. In summer they move south to cooler areas, in the north they tend to forage later in the night. Migration is driven by average minimum temperature of the area – below 21°C to dissipate heat generated by flying.
Roosting: Tree dwellers, roosting in small groups up to 25, usually less than 10, often solitary. Maternity colonies up to 300, usually in large trunk cavities with multiple entrances, sometimes sharing with possums but rarely with other microbats. Become torpid but do not hibernate.
Foraging: Fast flying species to 60km/h, poor manoeuvrability, usually catch prey 50m or more above the ground. Very agile on the ground, but prefer to climb something before taking off.
Diet: Moths, beetles, grasshopper, also ants and non-flying beetles which they catch on the ground.
Reproduction: Copulate, ovulate, fertilise late August. Young born December to January, young are weaned by May, and females are sexually mature by August.
FoM Terrys Ck Kittys Ck
2006-07 RESULTS
2016 RESULTS (FoM only)
2017 RESULTS

FAUNA SURVEY RESULTS 110
Gould's Wattled Bat Chalinolobus gouldii
Photo:: weekendnotes.com
NSW status: Protected
Distribution: Throughout Australia, except Cape York Peninsula and Nullabor Plain City of Ryde Widely distributed throughout LGA, most commonly recorded species Distinguishing features:
Fur is brown on the back and belly, with blackish fur on the head and shoulders. Muzzle is short, ears are short and broad, and there is a large lobe of skin (wattle) at the corner of the mouth, and a secondary long lobe along the lower lip. Often emerge early after sunset while there is still a lot of light. Vulnerable to predation by owls, falcons, butcherbirds, currawongs, feral cats
Habitat: Found from alpine regions to tropical rainforests, eucalypt forest, woodland, shrubland, agricultural landscapes and urban areas.
Roosting: Most commonly in tree hollows, especially river red gums and cypress pine, but also buildings and other roost sites. Males are usually solitary, females form colonies up to 80, generally less than 40, depending on the roost size. Hibernate in cooler areas, torpor in other areas. Use torpor to regulate water loss in arid areas. Alternate daily between roost sites within a small area.
Foraging: Usually forage 5-10km from the roost site, but can forage up to 15km away. Fast agile fliers up to 36km/h, feeding just below or within the lower level of the tree canopy, along forest edges and creeklines.
Diet: Moths and bugs, also winged ants, cockroaches, stoneflies, katydids, field crickets, cicadas, beetles, flies, caterpillars.
Reproduction: Copulate May to June, female stores sperm over winter, ovulate and fertilise late August. Usually bear twins, young are born in late September in the north, becoming later further south, until late November. Young reach adult size and independence in 6 weeks.
FoM Terrys Ck Kittys Ck
2006-07 RESULTS
2016 RESULTS (FoM only)
2017 RESULTS

111 FAUNA SURVEY RESULTS |
appliedecology
Chocolate Wattled Bat Chalinolobus morio
Photo Michael Pennay http://bie.ala.org.au NSW status: Protected
Distribution: Southern Australia, including Tasmania, along east coast north to Townsville, with several isolated inland populations
City of Ryde Sparsely distributed throughout LGA, not a common species Distinguishing features:
Fur is uniform milk chocolate brown on the back and belly, sometimes paler on the belly. Head is steeply domed with a short muzzle and a distinct ridge of fur across the muzzle. Ears are short and broad, and a small lobe (wattle) at the corner of the mouth, but the secondary long lobe along the lower lip is semicircular and easily seen. Usually the last to enter hibernation and the first to emerge in spring.
Habitat: Rainforests, eucalypt forest, woodland, shrubland, and water courses in inland areas. Prefer continuous forest to small patches.
Roosting: Roost in tree hollows, houses, under bark, in fairy martin nests, culverts, bridges and cBirds (in some areas), but mostly in trees. Males are usually solitary, females form colonies of 6 to 70, although larger colonies will develop in buildings. Alternate daily between roost sites within a small area.
Foraging: Usually forage up to 5km from the roost site, using the same area each night. Mostly forage in the open zone between the top of the understorey and the canopy. Flight is usually fast and direct (up to 28km/h), often using a gliding attack combined with sudden vertical drops.
Diet: Moths and bugs, also termites, flies, bugs, ants, lacewings and wasps. Choice of prey tends to reflect the availability of aerial insects.
Reproduction: Copulate autumn to winter, young are born late spring to early summer. Lactation is complete by early February.
FoM Terrys Ck Kittys Ck
2006-07 RESULTS
2016 RESULTS (FoM only)
2017 RESULTS

FAUNA SURVEY RESULTS 112
THREATENED SPECIES
Eastern Bentwing-bat Miniopterus orianae oceanensis NSW-V
Photo: Flora and Fauna Research Collective
NSW status: Vulnerable
Distribution: East coast of Australia, from Cape York Peninsula to Castlemaine, Victoria City of Ryde Sparsely distributed in the east of the LGA, mainly around Parramatta River Distinguishing features:
Dark reddish brown to dark brown fur on its back, slightly paler on its belly. Muzzle is short, with a domed head. The bent-wing name comes from its unique anatomy - with on the third 'finger' of its wing the last bone is four times longer than the middle one, giving a bent appearance.
Habitat: Rainforests, wet and dry schlerophyll forest, open woodland, and open grasslands. Roosting: Cave dwelling, but also use abandoned mines and culverts. Populations are centred
on a maternity cave that is used annually. Each population disperses to other cBirds during the rest of the year. In the south, bats overwinter in hibernation cBirds, while in the north they remain active and forage nightly.
Foraging: High flying species that forages from just above the canopy to many times canopy height. Also open areas where they forage just above the ground. Fast flying with swift shallow dives, foraging long distances from the roost site (up to 65km in one night).
Diet: Moths, also flies, cockroaches, and beetles. Reproduction: Mating occurs May to June, conception occurs but implantation is delayed till August.
Up to 100,000 females congregate in October into maternity colonies, and give birth December to January. Young are left in creches while the mothers forage. They can fly by 7 weeks, reach adult size and are weaned by 10 weeks. The mothers then disperse to their winter roost, followed by a mass exodus of juveniles, and the maternity colony is deserted by April.
FoM Terrys Ck Kittys Ck
2006-07 RESULTS
2016 RESULTS (FoM only)
2017 RESULTS

113 FAUNA SURVEY RESULTS |
appliedecology
Ride's Free-tailed Bat Mormopterus ridei
Photo Lindy Lumsden in Australian Bats 2nd Ed, Sue Churchill 2008
NSW status: Protected
Distribution: Eastern coastal Australia, from Cape York Peninsula to Geelong, Victoria, and along the Murray River
City of Ryde Widely distributed throughout LGA, a commonly recorded species Distinguishing features:
Medium sized species, fur on the back is usually a rich brown colour with a light creamy base to the hairs, belly fur is slightly paler. The skin of the face, ears and wing is dark grey. The common name is derived from a length of "free" tail, projecting beyond the end of the uropatagium – the membrane that connects the base of the tail to the hind legs.
Habitat: Rainforests, tall open forest, river red gum and yellow box woodland, riparian open forest, and dry sclerophyll forest.
Roosting: Most commonly in tree hollows and under bark, also buildings and cracks in posts. Colonies up to several hundred, and will share with other microbat species, eg. Chalinolobus gouldii, Scotorepens orion.
Foraging: Usually forage in spaces between trees, active in riparian habitats. Diet: Bugs, flies and beetles, with some ants, moths and spiders. Reproduction: Young are born in November, usually single. Lactation occurs until mid to late January
when young are free flying.
FoM Terrys Ck Kittys Ck
2006-07 RESULTS
2016 RESULTS (FoM only)
2017 RESULTS

FAUNA SURVEY RESULTS 114
FoM Terrys Ck Kittys Ck
2006-07 RESULTS
2016 RESULTS (FoM only)
2017 RESULTS
THREATENED SPECIES
Large-footed Myotis Myotis macropus NSW-V
Photos: Applied Ecology- Meredith Brainwood
NSW status: Vulnerable
Distribution: Primarily coastal, from Kimberleys around northern and eastern Australia Cape York Peninsula to Victoria, and along the Murray River
City of Ryde Widely distributed throughout LGA, a commonly recorded species Distinguishing features:
Distinguished by its disproportionally large feet, over 8mm long, greater than half the length of the tibia, giving rise to the common name for the species. Fur colour varies from dark grey to reddish brown.
Habitat: Strong association with streams and permanent waterways, mostly in flat to undulating country, and usually vegetated rather than cleared, but will live anywhere as long as it is near water.
Roosting: Near water in cBirds, tree hollows, among vegetation, bridges, old mines, tunnels, culverts, stormwater drains.
Foraging: Usually forage in spaces between trees, active in riparian habitats. Diet: Bugs, flies and beetles, with some ants, moths and spiders. Reproduction: Young are born in November, usually single. Lactation occurs until mid to late January
when young are free flying.

115 FAUNA SURVEY RESULTS |
appliedecology
a Long-eared Bat Nyctophilus sp for example:
Nyctophilus geoffroyi Lesser Long-eared Bat
Nyctophilus geoffroyi Photo Meredith Brainwood
NSW status: Protected
Distribution: Throughout NSW and most of Australia, except for east coast of northern Queensland
City of Ryde Widely distributed throughout LGA, a very commonly recorded species Distinguishing features:
Distinguished by its very long ears, light grey fur over the back, and distinctly lighter often grey fur on the belly. Has ears that join across the top of the head, and a high muzzle ridge with a distinctive “Y” shaped groove.
Habitat: Widespread in wet to dry sclerophyll forests, woodlands, grasslands, mangroves, agricultural and urban areas.
Roosting: Common in crevices, under lifting and peeling bark, in tree hollows, fairy martin nests, and buildings. Usually roost alone or in small groups of two or three, but maternity colonies of 10 to 15. Occasionally in cBirds.
Foraging: Slow and highly manoeuvrable flyers, foraging close to vegetation and into the canopy. Flight is characterised by sharp and sudden changes in direction.
Diet: Moths, crickets and grasshoppers, but also ants, spiders, beetles, cockroaches, bugs, flies and lacewings.
Reproduction: Mating starts in April, females store sperm till spring. Usually twins, born in October to November, young can fly by December, and weaned by early February.
FoM Terrys Ck Kittys Ck
2006-07 RESULTS
2016 RESULTS (FoM only)
2017 RESULTS
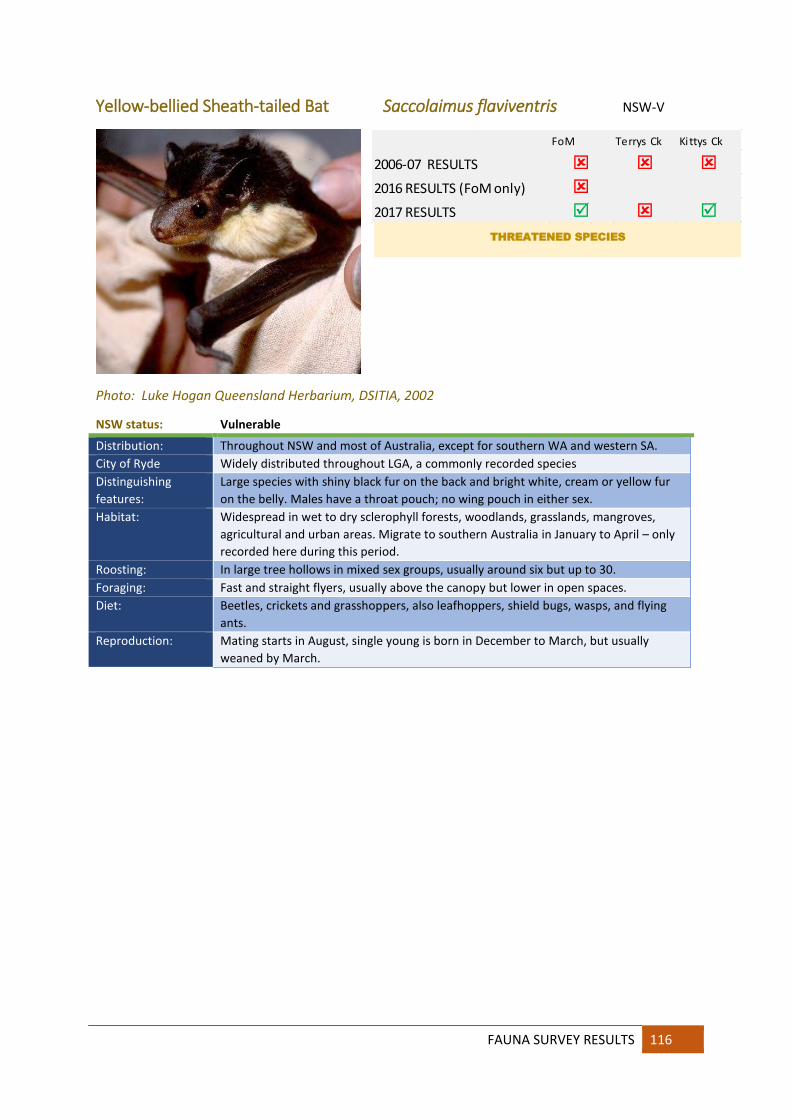
FAUNA SURVEY RESULTS 116
THREATENED SPECIES
Yellow-bellied Sheath-tailed Bat Saccolaimus flaviventris NSW-V
Photo: Luke Hogan Queensland Herbarium, DSITIA, 2002
NSW status: Vulnerable
Distribution: Throughout NSW and most of Australia, except for southern WA and western SA. City of Ryde Widely distributed throughout LGA, a commonly recorded species Distinguishing features:
Large species with shiny black fur on the back and bright white, cream or yellow fur on the belly. Males have a throat pouch; no wing pouch in either sex.
Habitat: Widespread in wet to dry sclerophyll forests, woodlands, grasslands, mangroves, agricultural and urban areas. Migrate to southern Australia in January to April – only recorded here during this period.
Roosting: In large tree hollows in mixed sex groups, usually around six but up to 30. Foraging: Fast and straight flyers, usually above the canopy but lower in open spaces. Diet: Beetles, crickets and grasshoppers, also leafhoppers, shield bugs, wasps, and flying
ants. Reproduction: Mating starts in August, single young is born in December to March, but usually
weaned by March.
FoM Terrys Ck Kittys Ck
2006-07 RESULTS
2016 RESULTS (FoM only)
2017 RESULTS

117 FAUNA SURVEY RESULTS |
appliedecology
FoM Terrys Ck Kittys Ck
2006-07 RESULTS
2016 RESULTS (FoM only)
2017 RESULTS
Large Forest Bat Vespadelus darlingtoni
Photo Robert Bender
NSW status: Protected
Distribution: Along the Great Dividing Range from Gold Coast to Adelaide Hills, SA City of Ryde Presumed to be widely distributed but rarely recorded in the LGA in the current study Distinguishing features:
Distinctive Vespadelus species with long fur and comparatively large size, dark brown to rusty brown fur all over. Dark skin on the ears and wings.
Habitat: Rainforest, wet to dry sclerophyll forests, open forest, woodlands, forested wetlands and regrowth areas.
Roosting: Found in tree hollows, usually smooth barked species, and 15-20m above the ground. Solitary males, colonies of 5 or 6 females, but up to 80 bats. Sexes do not share roosts; also found occasionally in older buildings
Foraging: Less manoeuvrable than most Vespadelus species. Fly fast and avoid cluttered regrowth, foraging mainly in the spaces between trees, or between the canopy and the understorey. Flight is characterised by rapid wing beats that are interrupted by gliding changes in direction to catch insects.
Diet: Ants, beetles, bugs, flies and moths and spiders. Adapted to cool climates, able to forage during mild winters
Reproduction: Mating in March, females store sperm till spring. Single young, born in late November to December, and weaned by early February.
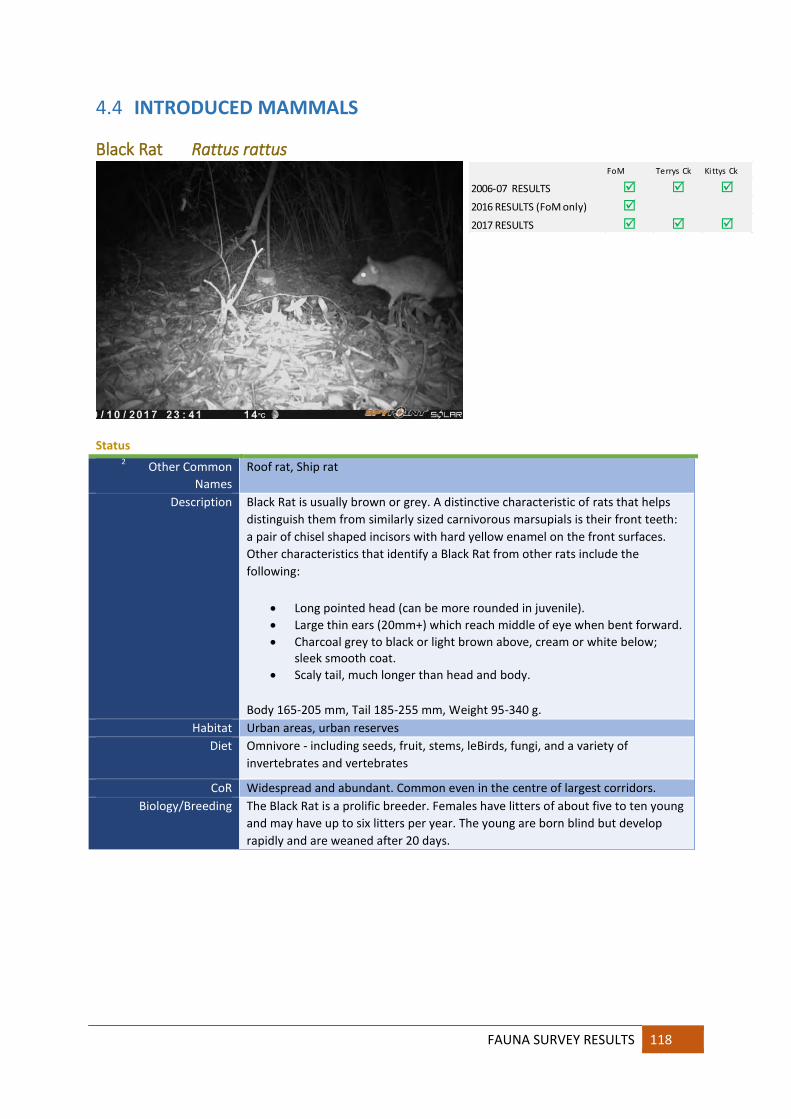
FAUNA SURVEY RESULTS 118
4.4 INTRODUCED MAMMALS
Black Rat Rattus rattus
Status 2 Other Common
Names Roof rat, Ship rat
Description Black Rat is usually brown or grey. A distinctive characteristic of rats that helps distinguish them from similarly sized carnivorous marsupials is their front teeth: a pair of chisel shaped incisors with hard yellow enamel on the front surfaces. Other characteristics that identify a Black Rat from other rats include the following:
Long pointed head (can be more rounded in juvenile). Large thin ears (20mm+) which reach middle of eye when bent forward. Charcoal grey to black or light brown above, cream or white below;
sleek smooth coat. Scaly tail, much longer than head and body.
Body 165-205 mm, Tail 185-255 mm, Weight 95-340 g. Habitat Urban areas, urban reserves
Diet Omnivore - including seeds, fruit, stems, leBirds, fungi, and a variety of invertebrates and vertebrates
CoR Widespread and abundant. Common even in the centre of largest corridors. Biology/Breeding The Black Rat is a prolific breeder. Females have litters of about five to ten young
and may have up to six litters per year. The young are born blind but develop rapidly and are weaned after 20 days.
FoM Terrys Ck Kittys Ck
2006-07 RESULTS
2016 RESULTS (FoM only)
2017 RESULTS

119 FAUNA SURVEY RESULTS |
appliedecology
FoM Terrys Ck Kittys Ck
2006-07 RESULTS
2016 RESULTS (FoM only)
2017 RESULTS
Cat Felis catus During the survey cats were spotlighted, observed during the day and detected by remote cameras. They were also noted on the edges of reserves in several locations. It is likely that most of the cats observed or recorded by remote techniques were roaming domestic pets (as evidenced by lack of fear of observer, good body condition, collars)
Left – Cat, clearly domestic, investigating a bait canister, Strangers Creek
Below- another cat deep in the Field of Mars Reserve

FAUNA SURVEY RESULTS 120
Dog Canis lupus familiaris Numerous dogs were observed during the survey. Most were on leash with their owners on defined tracks. Some dogs were off leash but were clearly domestic as evidenced by collars, demeanour and condition.
Scats were collected that were dog, and in all probability are wild dog. Grooming hairs in the scats were identified as dog and the scats contained prey items like birds, beetles, rabbits and seeds.
FoM Terrys Ck Kittys Ck
2006-07 RESULTS
2016 RESULTS (FoM only)
2017 RESULTS

121 FAUNA SURVEY RESULTS |
appliedecology
House Mouse Mus musculus House Mice were observed in the Terrys Creek corridor during spotlighting on 2 occassions . The species was not captured on remote cameras nor detected by hairtubes.
Rabbit Oryctolagus cuniculus
Rabbits were commonly observed along the eastern boundary of Pembroke Park, the northern boundary of Pidding Park and along Wellington Road at Field of Mars Reserve. They were also detected by remote camera and in hairtubes.
FoM Terrys Ck Kittys Ck
2006-07 RESULTS
2016 RESULTS (FoM only)
2017 RESULTS
FoM Terrys Ck Kittys Ck
2006-07 RESULTS
2016 RESULTS (FoM only)
2017 RESULTS

FAUNA SURVEY RESULTS 122
FoM Terrys Ck Kittys Ck
2006-07 RESULTS
2016 RESULTS (FoM only)
2017 RESULTS
Red Fox Vulpes vulpes
Status Introduced, predation identified as Key Threatening Process 2 Other Common
Names Fox, European fox
Description Body red or sandy coloured with thin black legs. Chin and throat are white. Tail thick and often white at the tip. Body up to 74 cm, tail up to 45 cm.
Habitat Widely distributed- urban, rural, forested areas, arid zone Diet Omnivore- eats introduced animals such as the rabbit and native animals, also
insects and fruits.
CoP Abundant , widespread Biology/Breeding Primarily nocturnal the species emerges at dusk to hunt (although it can be seen
during the day – particularly early morning). Both males and females are sexually mature at the age of one year. Litters, averaging four cubs, are born during August and September, and emerge from natal dens in late spring. The cubs move away from the family territory in late summer or autumn.
This introduced predator was directly observed (young cub above in Barton Park 2017), captured on remote camera (right, with unidentified prey) and detected and identified by hairtubes and scat collection numerous times across all three corridors.
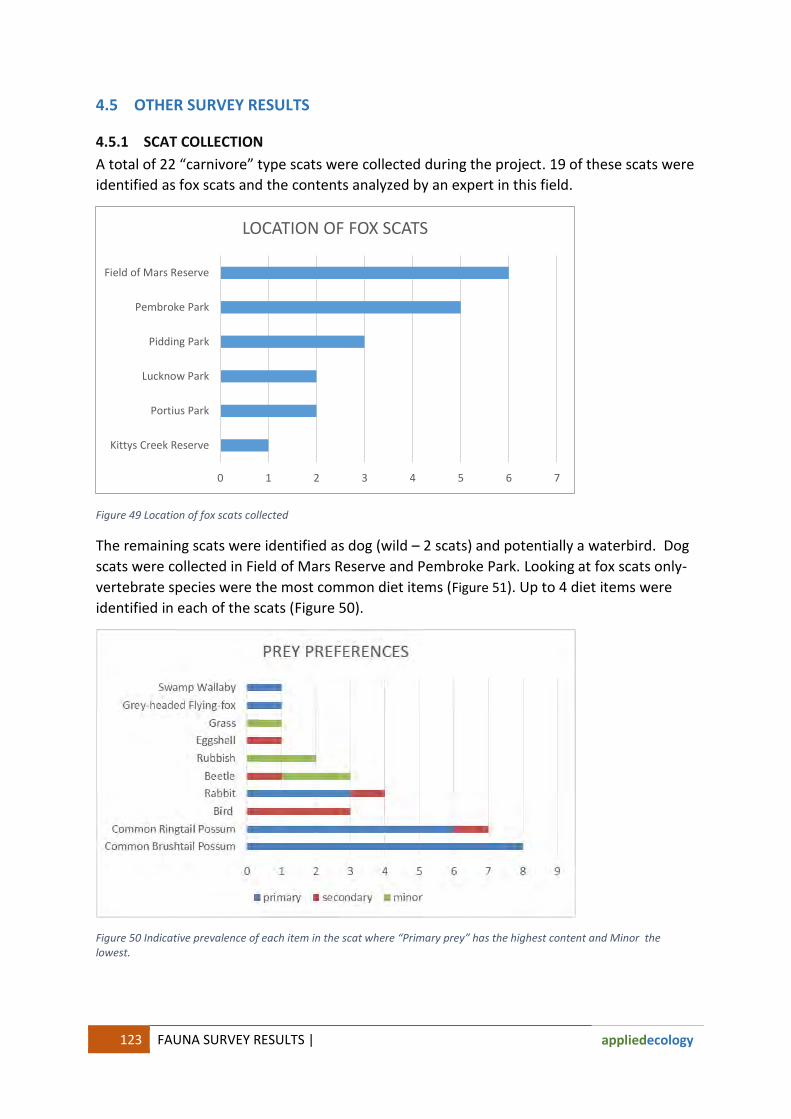
123 FAUNA SURVEY RESULTS |
appliedecology
4.5 OTHER SURVEY RESULTS
4.5.1 SCAT COLLECTION
A total of 22 “carnivore” type scats were collected during the project. 19 of these scats were identified as fox scats and the contents analyzed by an expert in this field.
Figure 49 Location of fox scats collected
The remaining scats were identified as dog (wild – 2 scats) and potentially a waterbird. Dog scats were collected in Field of Mars Reserve and Pembroke Park. Looking at fox scats only- vertebrate species were the most common diet items (Figure 51). Up to 4 diet items were identified in each of the scats (Figure 50).
Figure 50 Indicative prevalence of each item in the scat where “Primary prey” has the highest content and Minor the lowest.
0 1 2 3 4 5 6 7
Kittys Creek Reserve
Portius Park
Lucknow Park
Pidding Park
Pembroke Park
Field of Mars Reserve
LOCATION OF FOX SCATS

FAUNA SURVEY RESULTS 124
Figure 51 Proportion of scats containing a given prey item. Most scats contain more than one item.
Wild dog scats predominantly contained Common Ringtail Possum, Common Brushtail Possum and also bird, eggshell and beetles.

125 FAUNA SURVEY RESULTS |
appliedecology
Figure 52 Wild dog scat in Pembroke Park – it predominantly contained Common Ringtail Possum

FAUNA SURVEY RESULTS 126
4.5.2 HAIR AND PELLET ANALYSIS
36 samples of fur obtained from hairtubes baited with peanut butter, honey and rolled oats were analysed to determine genus/ species. Results are illustrated in Figure 53.
Figure 53 Hairtube hair analysis results
Four Powerful Owl pellets were collected. Three consisted solely of Common Brushtail Possum with the exception of one pellet which contained both Common Ringtail Possum and Common Brushtail Possum.

127 FAUNA SURVEY RESULTS |
appliedecology
4.5.3 FISH
Native fish were largely absent in the waterways of the subject sites. This may be a reflection of low rainfall the previous summer causing creeks to dry completely.
Four species of fish were detected during fish surveys and other inspections of Waterways.
These species are :
Small-mouthed Hardyhead Atherinosoma microstoma Buffalo Creek
Striped Gudgeon Gobiomorphius australis Pembroke Park
Long-finned Eel Anguilla reinhardtii Buffalo Creek (between Burrows Park and Laurel Park)
Unidentified Eels – likely Sort-finned Eels (x2) Buffalo Creek, Field of Mars Reserve
Plague Minnow * Gambusia holbrooki Field of Mars Reserve
Figure 54 Long-finned Eel near Laurel Park Figure 55 Small-mouthed Hardyhead at Buffalo Creek
*introduced species
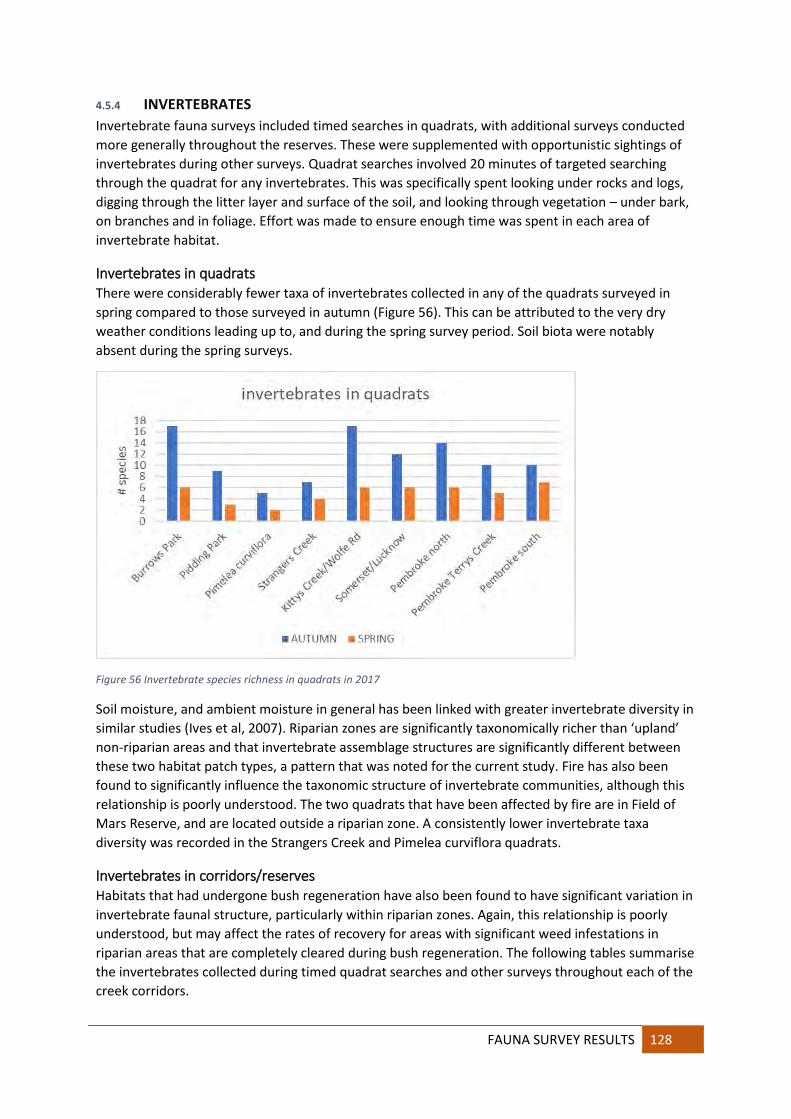
FAUNA SURVEY RESULTS 128
4.5.4 INVERTEBRATES
Invertebrate fauna surveys included timed searches in quadrats, with additional surveys conducted more generally throughout the reserves. These were supplemented with opportunistic sightings of invertebrates during other surveys. Quadrat searches involved 20 minutes of targeted searching through the quadrat for any invertebrates. This was specifically spent looking under rocks and logs, digging through the litter layer and surface of the soil, and looking through vegetation – under bark, on branches and in foliage. Effort was made to ensure enough time was spent in each area of invertebrate habitat.
Invertebrates in quadrats There were considerably fewer taxa of invertebrates collected in any of the quadrats surveyed in spring compared to those surveyed in autumn (Figure 56). This can be attributed to the very dry weather conditions leading up to, and during the spring survey period. Soil biota were notably absent during the spring surveys.
Figure 56 Invertebrate species richness in quadrats in 2017
Soil moisture, and ambient moisture in general has been linked with greater invertebrate diversity in similar studies (Ives et al, 2007). Riparian zones are significantly taxonomically richer than ‘upland’ non-riparian areas and that invertebrate assemblage structures are significantly different between these two habitat patch types, a pattern that was noted for the current study. Fire has also been found to significantly influence the taxonomic structure of invertebrate communities, although this relationship is poorly understood. The two quadrats that have been affected by fire are in Field of Mars Reserve, and are located outside a riparian zone. A consistently lower invertebrate taxa diversity was recorded in the Strangers Creek and Pimelea curviflora quadrats.
Invertebrates in corridors/reserves Habitats that had undergone bush regeneration have also been found to have significant variation in invertebrate faunal structure, particularly within riparian zones. Again, this relationship is poorly understood, but may affect the rates of recovery for areas with significant weed infestations in riparian areas that are completely cleared during bush regeneration. The following tables summarise the invertebrates collected during timed quadrat searches and other surveys throughout each of the creek corridors.

129 FAUNA SURVEY RESULTS |
appliedecology
Table 21 Numbers of families and taxa recorded in seasonal surveys in Terrys Creek corridor
TERRYS CREEK AUTUMN SPRING
TAXONOMIC GROUP COMMON NAMES FAMILY TAXA FAMILY TAXA
Areneae spiders 4 5 2 2 Collembolae springtails 1 2 0 0 Blatodea cockroaches 3 3 1 1 Dipterae true flies, mosquitos 2 2 2 2 Hemiptera true bugs 1 1 1 1 Hymenoptera ants, wasps, bees 4 10 3 3 Isopoda woodlice 3 3 0 0 Lepidoptera butterflies, moths 3 3 2 2 Diplopoda millipedes 2 2 1 1 Isoptera termites 3 2 2 2 Oligocheata earthworms 1 1 0 0 Acari ticks, mites 1 1 0 0 Collembolae springtails 1 2 0 0 Coleoptera beetles 2 2 1 1 Neuroptera antlions, lacewings 1 1 1 1 32 40 16 16
Table 22 Numbers of families and taxa recorded in seasonal surveys in Buffalo Creek corridor
BUFFALO CREEK AUTUMN SPRING
TAXONOMIC GROUP COMMON NAMES FAMILY TAXA FAMILY TAXA
Diplopoda millipedes 2 2 0 0 Aranea spiders 4 9 1 1 Dipteria true flies, mosquitos 3 4 1 1 Ephemeroptera mayflies 1 1 0 0 Gastropoda snails 1 1 0 0 Hemiptera true bugs 7 7 6 6 Hydrophilidae water beetles 1 1 0 0 Hymenoptera ants, wasps, bees 3 4 1 1 Isoptera termites 1 1 1 1 Lepidoptera butterflies, moths 4 4 4 3 Megradrilacea earthworms 2 3 1 1 Odonata dragonflies/damselflies 5 6 0 0 34 43 15 14
Table 23 Numbers of families and taxa recorded in seasonal surveys in Kittys Creek corridor
KITTYS CREEK AUTUMN SPRING
TAXONOMIC GROUP COMMON NAMES FAMILY TAXA FAMILY TAXA
Areneae spiders 5 5 0 0 Collembolae springtails 1 1 0 0 Blatodea cockroaches 1 1 1 1 Dipterae flies, mosquitoes 2 2 2 2 Hemiptera true bugs 2 2 3 2

FAUNA SURVEY RESULTS 130
KITTYS CREEK AUTUMN SPRING
TAXONOMIC GROUP COMMON NAMES FAMILY TAXA FAMILY TAXA
Hymenoptera ants, wasps, bees 3 5 3 4 Isopoda woodlice 1 3 0 0 Lepidoptera butterflies, moths 1 1 2 3 Diplopoda millipedes 1 1 0 0 Isoptera termites 1 1 2 2 Coleoptera beetles 4 6 1 1 Chilopoda centipedes 1 1 0 0 Odonata dragonflies, damselflies 1 1 3 3 Pseudoscorpionida pseudoscorpion 1 1 0 0 25 31 17 18
Habitat use by invertebrates To better understand the reduced invertebrate taxa, they were allocated to broad habitat preferences, based on where found and literature support. Soil biota formed the smallest component, possibly because many of these organisms are microinvertebrates. Greatest reductions in taxa were reported for leaf litter/under bark dwelling organisms. There was some reduction in canopy taxa as well, and both these trends may have been exacerbated by dry weather.
Figure 57 Habitat preferences for invertebrates recorded in surveys in 2017
Figure 58 Common Crows (Euploea core) and Blue Triangle (Graphium sarpedon) were frequently sighted during surveys – photographed here at Buffalo Creek.
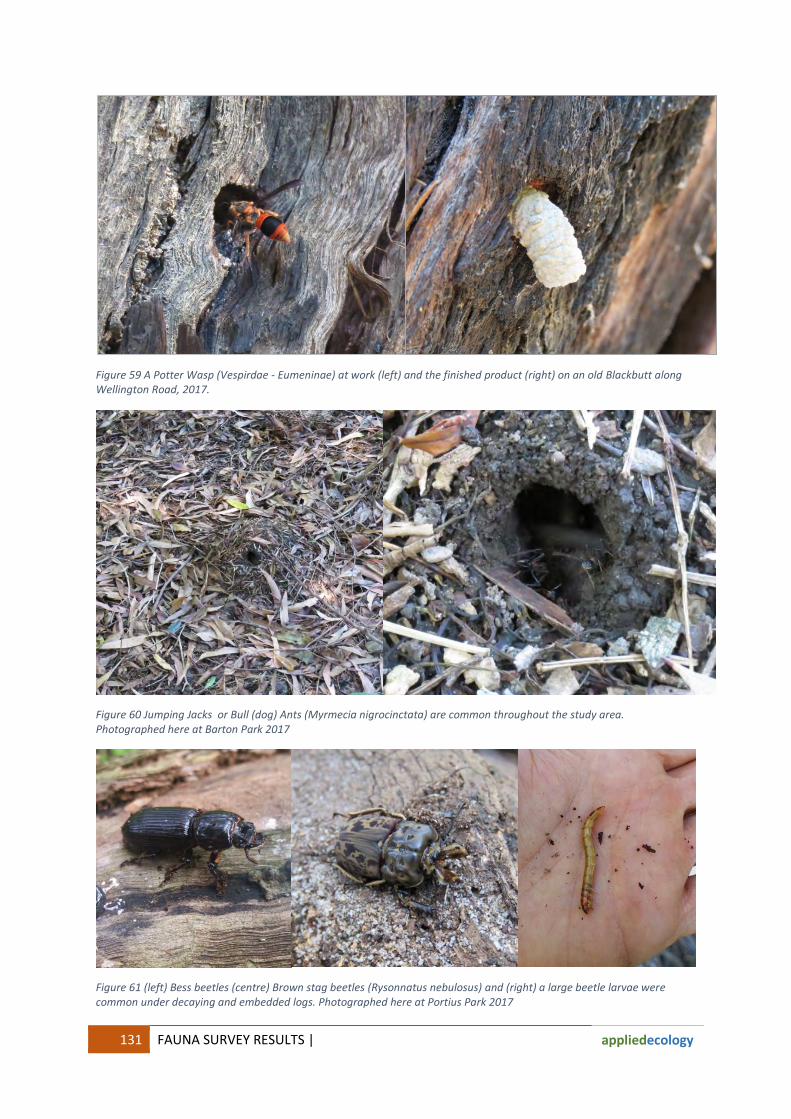
131 FAUNA SURVEY RESULTS |
appliedecology
Figure 59 A Potter Wasp (Vespirdae - Eumeninae) at work (left) and the finished product (right) on an old Blackbutt along Wellington Road, 2017.
Figure 60 Jumping Jacks or Bull (dog) Ants (Myrmecia nigrocinctata) are common throughout the study area. Photographed here at Barton Park 2017
Figure 61 (left) Bess beetles (centre) Brown stag beetles (Rysonnatus nebulosus) and (right) a large beetle larvae were common under decaying and embedded logs. Photographed here at Portius Park 2017
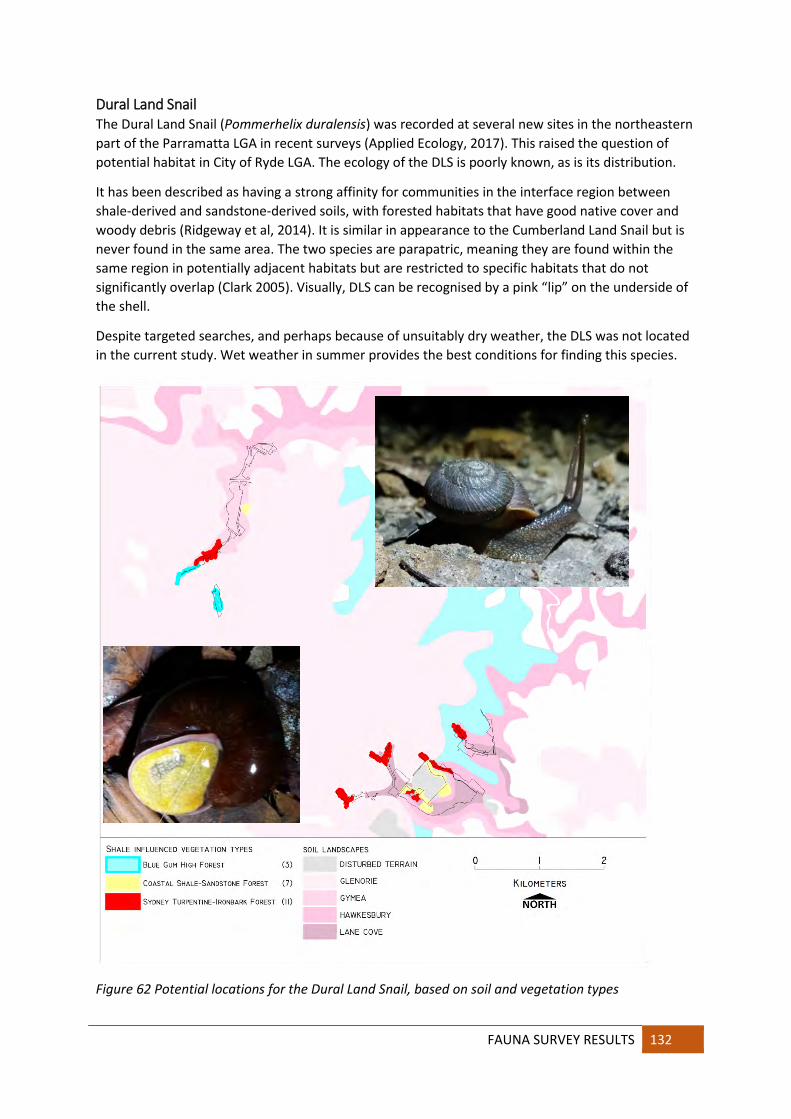
FAUNA SURVEY RESULTS 132
Dural Land Snail The Dural Land Snail (Pommerhelix duralensis) was recorded at several new sites in the northeastern part of the Parramatta LGA in recent surveys (Applied Ecology, 2017). This raised the question of potential habitat in City of Ryde LGA. The ecology of the DLS is poorly known, as is its distribution.
It has been described as having a strong affinity for communities in the interface region between shale-derived and sandstone-derived soils, with forested habitats that have good native cover and woody debris (Ridgeway et al, 2014). It is similar in appearance to the Cumberland Land Snail but is never found in the same area. The two species are parapatric, meaning they are found within the same region in potentially adjacent habitats but are restricted to specific habitats that do not significantly overlap (Clark 2005). Visually, DLS can be recognised by a pink “lip” on the underside of the shell.
Despite targeted searches, and perhaps because of unsuitably dry weather, the DLS was not located in the current study. Wet weather in summer provides the best conditions for finding this species.
Figure 62 Potential locations for the Dural Land Snail, based on soil and vegetation types

133 SUMMARY OF FAUNA RESULTS |
appliedecology
5 SUMMARY OF FAUNA RESULTS
5.1 Bird species richness, autumn and spring, 2017
5.1.1 Creek corridors/reserves
For the current study in 2017, Bird species richness was greatest in Terrys Creek in spring, followed by Field of Mars Reserve (Figure 63). Diversity was greater in both these reserve corridors in spring, compared to autumn of the same year, in contrast to Buffalo Creek, where there were slightly fewer species in spring.
Figure 63 Bird species richness in reserve corridors in 2017
5.1.2 Quadrats
Timed searches were conducted in each of the nine 20x20m quadrats, giving a consistent survey area and survey effort. Greatest diversity was reported in spring for the Somerset/Lucknow Park quadrat, closely followed by the more urban affected Pembroke south quadrat (Figure 64). There was no consistent pattern in diversity in the quadrats, with some reporting greater diversity in autumn and others in spring.
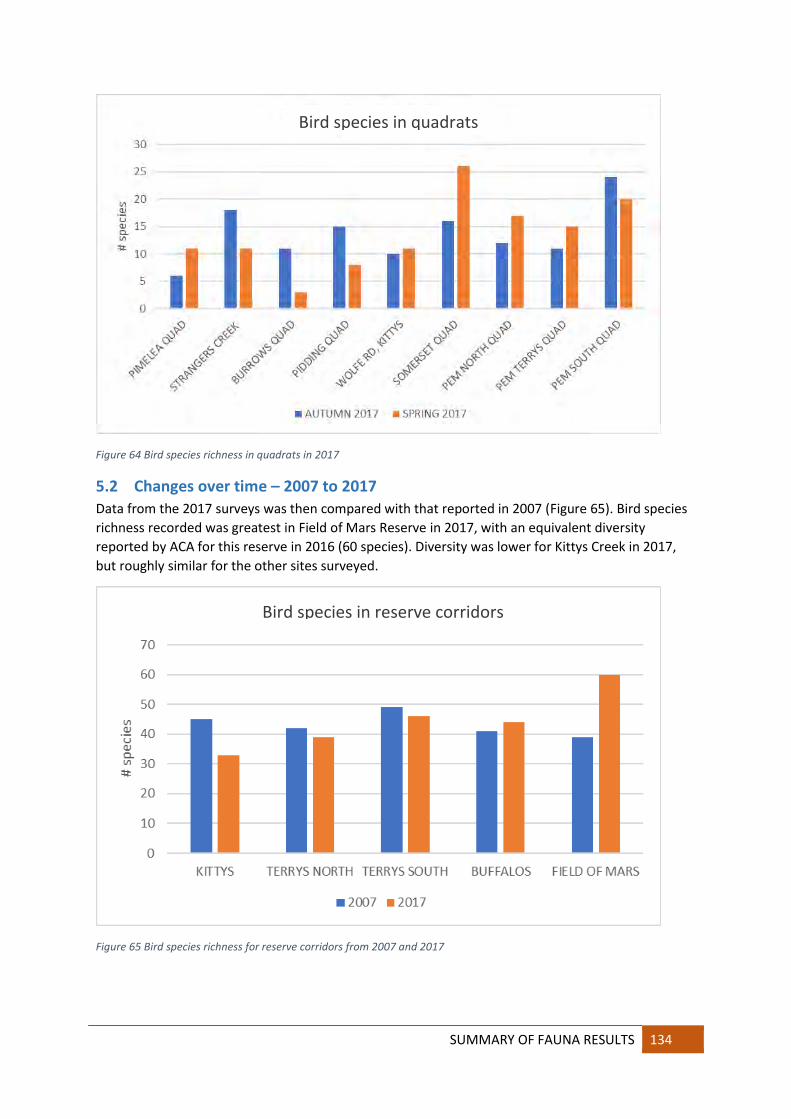
SUMMARY OF FAUNA RESULTS 134
Figure 64 Bird species richness in quadrats in 2017
5.2 Changes over time – 2007 to 2017
Data from the 2017 surveys was then compared with that reported in 2007 (Figure 65). Bird species richness recorded was greatest in Field of Mars Reserve in 2017, with an equivalent diversity reported by ACA for this reserve in 2016 (60 species). Diversity was lower for Kittys Creek in 2017, but roughly similar for the other sites surveyed.
Figure 65 Bird species richness for reserve corridors from 2007 and 2017
Bird species in quadrats
Bird species in reserve corridors

135 SUMMARY OF FAUNA RESULTS |
appliedecology
5.3 Reptiles and Amphibians and mammal species richness
5.3.1 Reptiles and Amphibians
The greatest diversity of Reptiles and Amphibians was recorded in Terrys Creek southern section in 2007, and appears an anomaly as this is a highly urbanised part of this creek corridor (Figure 66). Elsewhere, diversity was greatest in Field of Mars Reserve consistently for the three years of survey data.
Figure 66 Reptiles and Amphibians species richness for reserve corridors from 2007 and 2017
5.3.2 Mammalian fauna
There was a consistent trend of greater numbers of mammal species recorded in 2017 surveys for all reserves (Figure 67). Fewer introduced mammals were recorded in Field of Mars Reserve in 2017, while more introduced mammals were recorded in Terrys Creek southern section in 2017..
Figure 67 Mammalian fauna species richness for reserve corridors from 2007 and 2017

SUMMARY OF FAUNA RESULTS 136
5.4 Total vertebrate diversity
All of the data from the previous sections was then combined to give an understanding of the vertebrate fauna populations of each reserve corridor (Figure 68). Collectively, species richness was greatest in Field of Mars Reserve in 2016 and 2017, with around 90 species recorded in each survey. Of note is the unusually high diversity in Terrys Creek southern section for 2007. In reality, much of the perceived variations in diversity recorded may simply be an artefact of survey effort – better equipment, better analysis (especially for microbat species), and more time spent on the ground. What is apparent is that each reserve corridor supports a fairly consistent level of diversity, and they all make an important contribution to the conservation of native fauna in the City of Ryde LGA.
Figure 68 Vertebrate species richness for reserve corridors from 2007 and 2017
Figure 69 Variations in diversity recorded may simply be an artefact of survey effort

137 SUMMARY OF FAUNA RESULTS |
appliedecology
5.5 What native birds live where
5.5.1 Terrys Creek north section
Bird species were allocated to a series of categories for a range of life history characteristics. Bird fauna in the northern reserves of Terrys Creek Corridor is dominated by small to medium, sedentary and insectivorous species. In general, more species were recorded in each category in 2007 compared to 2017. Carnivores and nectarivores were well represented, and seasonal migrants were also present in low numbers. Extensive areas of forest with dense understorey exist in this reserve, providing good habitat for small birds.
Figure 70 Feeding guilds, body size, and adult mobility patterns for Birds in Terrys Creek north section

SUMMARY OF FAUNA RESULTS 138
5.5.2 Terrys Creek south section
Bird fauna in the southern reserves on Terrys Creek were dominated by insectivorous small and medium birds. Most of the other feeding guilds were also represented, and there were more frugivores and granivores in 2017 than 2007. Adult birds were predominantly sedentary, although there were a number of seasonal migrants present. Vegetation in this part of the corridor is more degraded, but still provides plenty of habitat resources.
Figure 71 Feeding guilds, body size, and adult mobility patterns for Birds in Terrys Creek south section

139 SUMMARY OF FAUNA RESULTS |
appliedecology
5.5.3 Kittys Creek corridor
There were fewer species of birds recorded in Kittys Creek in 2017 than in 2007, overall and for each guild and category. Also, in 2007 birds flying overhead (Silver Gulls, Australian Pelicans etc) were included in the survey results. In 2017 these types of observations were excluded. Like the Terrys Creek corridor, Kittys Creek Birds was dominated by insectivores, with some carnivores, granivores and nectarivores. Birds were predominantly small to medium, although there were fewer species of small birds in 2017. Most species were sedentary, and the seasonal migrants recorded in 2007 were notably absent in 2017.
Figure 72 Feeding guilds, body size, and adult mobility patterns for Birds in Kittys Creek corridor

SUMMARY OF FAUNA RESULTS 140
5.5.4 Buffalo Creek corridor
Birds in the Lane Cove River catchment in the Ryde LGA follow a very similar pattern of predominantly insectivorous small to medium species that are most sedentary with some seasonal migrants. In this catchment, slightly more species were recorded in 2017 compared to 2007. Large areas of dense weeds are interspersed with newer and more established bush regeneration sites. Key issues for this corridor are the very narrow reserves along much of the creekline.
Figure 73 Feeding guilds, body size, and adult mobility patterns for Birds in Buffalo Creek corridor

141 SUMMARY OF FAUNA RESULTS |
appliedecology
5.5.5 Field of Mars Reserve
Field of Mars Reserve has a much larger core bushland area, with good quality habitat, and had considerably more species of birds recorded, especially in 2016 and 2017. Despite this, the local Birds followed the same pattern as other reserves, with predominantly insectivorous small and medium birds that are sedentary or seasonally migratory. Other feeding guilds were also reasonably well represented in this reserve.
Figure 74 Feeding guilds, body size, and adult mobility patterns for Birds in Field of Mars Reserve

COMPARISON WITH PREVIOUS SURVEYS 142
6 COMPARISON WITH PREVIOUS SURVEYS
6.1 Statistical analysis methods
Data was collated for each of the fauna groups assessed during this study, namely (i) Birds, (ii) Reptiles and Amphibians, and (iii) mammal fauna. We used PRIMER-e version 7 for analysis. This program is specifically designed to analyse large datasets with suites of species present at a number of sites. Datasets with large numbers of zeros for species not recorded at a given site are accommodated during pre-treatment of the data. Data was standardised by transforming to presence/absence to reduce any bias from different survey effort.
A similarity matrix for species at survey sites was calculated from this using Bray-Curtis similarity scores. Sample sites were grouped based on these similarity scores using a CLUSTER routine to produce a dendrogram that demonstrates similarity relationships between sites. Sites were compared based on when they were surveyed. Non-metric Multi-Dimensional Scaling (nMDS) was applied to the resemblance matrix to produce an nMDS plot. This grouped the sites based on the similarity between each site and every other site. The resulting network of relationships is then compressed into 2 dimensional space, which causes some “stress” to the visual representation. A stress of 0.11 or less indicates the 2 dimensional representation is a good approximation.
Dendrograms and nMDS plots provide a good visual overview of relationships between different groups of sites – in this case, 2007 (included FOM in 2016) and 2017 (included FOM in 2016). We then used Analysis Of Similarity (ANOSIM) to determine whether the level of difference is significant. This produces a global R statistic, which gives an indication of the degree of difference between sites (effectively the dissimilarity). The closer the global R statistic is to 1, the greater the difference in the suites of Birds present at the survey sites. The statistical significance of this value is also calculated – a value less than 5% equates with p < 0.05, and indicates that the difference is real.

143 COMPARISON WITH PREVIOUS SURVEYS |
appliedecology
6.2 Birds 2007 to 2017
The bird fauna recorded at survey sites in 2006/7 was different to that recorded at the same sites in 2016/7. Clustering showed that sites surveyed in 2006/7 had birds that was more similar to other sites surveyed in that study than any sites surveyed in 2016/7 (Figure 75).
Figure 75 A dendrogram of clustering of for transformed data for suites of Birds in Lane Cove River catchments of Ryde LGA
An nMDS plot was produced to further understand similarities between sites surveyed (Figure 76).
Figure 76 nMDS plot of dissimilarities between suites of Birds recorded in Lane Cove River catchments in Ryde LGA
2017 2007

COMPARISON WITH PREVIOUS SURVEYS 144
From this it can be seen that in 2006/7 the Bird population at Field of Mars Reserve was most like that at Buffalo Creek, and not very similar to other sites. In 2007 the two Terrys Creek sections had similar bird fauna, and this was also similar to Kittys Creek. In 2017, the two Terrys Creek sections had similar bird fauna to Field of Mars Reserve and Buffalo Creek, but Kittys Creek was different again.
Interpretation: In addition to differences between years, there were differences between the suites of birds present in reserves in the same year. For each survey, the birds in Terrys Creek sections were very similar, and Buffalo Creek were similar to Field of Mars Reserve. Despite its proximity, Kittys Creek Birds were quite different to Field of Mars Reserve.
ANOSIM was then used to understand the degree of difference between sites, and whether this was statistically significant. The resulting global R statistic = 0.0.643, with a significance level of 0.2% (equivalent to p value of 0.002). Thus suites of birds at sites in different years and in several different creek corridors/reserves have a real difference, and this difference is moderately large.
Interpretation: In addition to changes over time, there is some partitioning of habitat, and resources, between the various creek corridors, so that each contributes resources to a different suite of species.
6.3 Reptiles and Amphibians 2007 to 2017
Clustering of reptiles and amphibians recorded at survey sites in 2006/7 was not clearly different to that recorded at the same sites in 2016/7. Clustering showed that sites surveyed in 2006/7 had Birds that was more similar to other sites surveyed in that study than any sites surveyed in 2016/7 (Figure 77).
Figure 77 A dendrogram of clustering of for transformed data for suites of Reptiles and Amphibians in Lane Cove River catchments of Ryde LGA
An nMDS plot was produced to further understand similarities between sites surveyed (Figure 76).
2007 2017
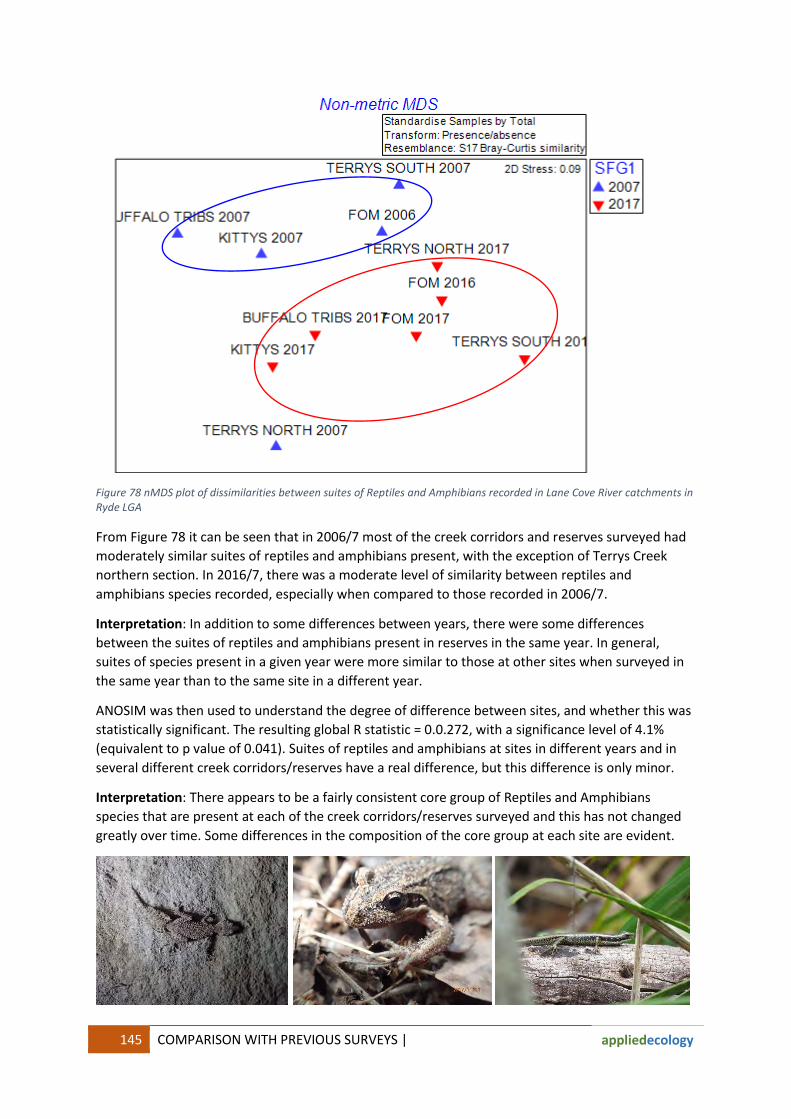
145 COMPARISON WITH PREVIOUS SURVEYS |
appliedecology
Figure 78 nMDS plot of dissimilarities between suites of Reptiles and Amphibians recorded in Lane Cove River catchments in Ryde LGA
From Figure 78 it can be seen that in 2006/7 most of the creek corridors and reserves surveyed had moderately similar suites of reptiles and amphibians present, with the exception of Terrys Creek northern section. In 2016/7, there was a moderate level of similarity between reptiles and amphibians species recorded, especially when compared to those recorded in 2006/7.
Interpretation: In addition to some differences between years, there were some differences between the suites of reptiles and amphibians present in reserves in the same year. In general, suites of species present in a given year were more similar to those at other sites when surveyed in the same year than to the same site in a different year.
ANOSIM was then used to understand the degree of difference between sites, and whether this was statistically significant. The resulting global R statistic = 0.0.272, with a significance level of 4.1% (equivalent to p value of 0.041). Suites of reptiles and amphibians at sites in different years and in several different creek corridors/reserves have a real difference, but this difference is only minor.
Interpretation: There appears to be a fairly consistent core group of Reptiles and Amphibians species that are present at each of the creek corridors/reserves surveyed and this has not changed greatly over time. Some differences in the composition of the core group at each site are evident.

COMPARISON WITH PREVIOUS SURVEYS 146
6.4 Mammal fauna 2007 to 2017
The mammal fauna recorded at survey sites in 2006/7 was different to that recorded at the same sites in 2016/7. Clustering showed that sites surveyed in 2006/7 had mammal fauna that was more similar to other sites surveyed in that study than any sites surveyed in 2016/7 (Figure 79).
Figure 79 A dendrogram of clustering of for transformed data for suites of mammal fauna in Lane Cove River catchments of Ryde LGA
An nMDS plot was produced to further understand similarities between sites surveyed (Figure 80).
Figure 80 nMDS plot of dissimilarities between suites of mammal fauna recorded in Lane Cove River catchments in Ryde LGA
2007 2017

147 COMPARISON WITH PREVIOUS SURVEYS |
appliedecology
From Figure 80 it can be seen that in 2006/7 most of the creek corridors and reserves surveyed had very similar suites of mammal fauna present. In 2016/7, there was also a high level of similarity between suites of mammal fauna species recorded. However, when compared to those recorded in 2006/7 there were some clear differences.
Interpretation: There were marked differences between mammal fauna recorded in different years. These differences were greater for the same site in different surveys than for different sites surveyed in the same year.
ANOSIM was then used to understand the degree of difference between sites, and whether this was statistically significant. The resulting global R statistic = 0.0.813, with a significance level of 0.2% (equivalent to p value of 0.002). From this, suites of mammal fauna at the same sites in different years have a real difference, and this difference is very large.
Interpretation: There have been considerable changes over time to the native mammalian fauna recorded in reserves on Lane Cove River catchments in Ryde LGA. The changes have been consistent across reserves so that in each survey year the resulting mammal fauna is more like other reserves surveyed in the same year than the same reserve surveyed in a different year.
Some potential reasons for these results are discussed in the following sections of this report.
6.5 Fish
Survey results from 2007 were separated by season and were provided as a list of species collected for each creek corridor surveyed. In 2007 higher diversity was recorded in spring. This pattern of observation was repeated in 2017 surveys. A higher diversity of species was detected in 2017 than in 2007 (Figure 81) with the highest diversity detected in the Field of Mars Reserve in 2006 (Figure 82).
Figure 81 Number of creeks each species were observed

COMPARISON WITH PREVIOUS SURVEYS 148
Figure 82 Number of species detected in each creek corridor
It is worth noting that spotlighting (at night) was the best method for detecting species during the 2017 surveys. Attempts were made to then confirm identification by capturing specimens with hand nets. Some species were able to be caught at night such as the Small-mouthed Hardyhead , or identification confirmed by observation without needing capture such as the Striped Gudgeon. In the Field of Mars Reserve many fish observed, specifically very small species, were not able to be caught thus total species diversity is likely to be considerably underestimated. These small species were highly elusive and/or sort refuge in debris and vegetation in the water. The use of passive “minnow traps” and active enclosure tarps (pop drop and throw) may be useful techniques to increase species detected.
6.6 Invertebrates
Survey results from 2007 were not separated by season, but were provided as a list of taxa collected for each creek corridor surveyed. These summary lists from 2007 were compared with similar summaries from 2017.
Terrys Creek A total of 69 taxa were reported from 2007, while 57 taxa were recorded in 2017. A number of the more unusual insect families were present in 2007 but not recorded in 2017. Several of these are sensitive to habitat degradation. For most taxonomic groups, more taxa were recorded in 2007 than in 2017.

149 COMPARISON WITH PREVIOUS SURVEYS |
appliedecology
Figure 83 Comparison of invertebrate fauna taxa recorded at Terrys Creek in 2007 and 2017
To gain an understanding of how the available habitats are partitioned by invertebrates, taxa were allocated to broad habitat groupings, and these were compared over the two survey periods.
Figure 84 Comparison of distribution of invertebrate taxa in different habitat niches at Terrys Creek
Species richness was greatest for flying insects and invertebrates that live in the canopy – also predominantly insects. Detritivores were common in soils and leaf litter and play an important role in the ecosystem. Overall, for Terrys Creek, species richness of taxa in each habitat niche was greater in 2007 than in 2017. Using pooled data for the comparison did not compensate for the reduced invertebrate diversity recorded in spring 2017 which would be expected to be more diverse compared to autumn 2017.
Kittys Creek A total of 70 taxa were reported from 2007, while 48 taxa were recorded in 2017. A number of the more unusual insect families were present in 2007 but not recorded in 2017. Several of these are
02468
101214
# ta
xa
invertebrate fauna at Terrys Creek
2007 2017
0
5
10
15
20
25
30
35
40
SOIL/ROCKS/LOGS LEAF LITTER AERIAL/CANOPY AQUATIC
# ta
xa
invertebrate habitat preferences
2007 2017

COMPARISON WITH PREVIOUS SURVEYS 150
sensitive to habitat degradation. For the more common insect families, more taxa were recorded in 2007 than in 2017, and there was a notably greater invertebrate diversity in 2007 overall.
Figure 85 Comparison of invertebrate fauna taxa recorded at Kittys Creek in 2007 and 2017
To gain an understanding of how the available habitats are partitioned by invertebrates, taxa were allocated to broad habitat groupings, and these were compared over the two survey periods.
Figure 86 Comparison of distribution of invertebrate taxa in different habitat niches at Kittys Creek
Like Terrys Creek, invertebrate diversity was greatest for flying insects and arboreal insects. Overall, for Kittys Creek, species richness of taxa in each habitat niche was greater in 2007 than in 2017. Like Terrys Creek, using pooled data for the comparison did not compensate for the reduced invertebrate diversity recorded in spring 2017 which would be expected to be more diverse compared to autumn 2017.
Buffalo Creek A total of 44 taxa were reported from 2007, while 54 taxa were recorded in 2017. A number of the more unusual insect families were present in 2007 but not recorded in 2017. Several of these are
02468
1012
# ta
xa
invertebrate fauna at kittys creek
2007 2017

151 COMPARISON WITH PREVIOUS SURVEYS |
appliedecology
sensitive to habitat degradation. For the more common insect families, more taxa were recorded in 2017 than in 2007.
Figure 87 Comparison of invertebrate fauna taxa recorded at Buffalo Creek in 2007 and 2017
To gain an understanding of how the available habitats are partitioned by invertebrates, taxa were allocated to broad habitat groupings, and these were compared over the two survey periods.
Figure 88 Comparison of distribution of invertebrate taxa in different habitat niches at Buffalo Creek
Distribution trends for invertebrate fauna in Buffalo Creek were similar to those observed for Terrys and Kittys Creeks. Unlike these other creek corridors, for Buffalo Creek the overall species richness of taxa in each habitat niche was greater in 2017 than in 2007. Since sensitive taxa were not recorded in 2017, possible explanations are reduced predation of invertebrates by resident vertebrate fauna, although this is not particularly likely.

DISCUSSION 152
7 DISCUSSION The previous sections have presented summary data for fauna recorded in surveys during autumn and spring in 2017 and provided comparisons between 2007 and 2017 species inventories. While diversity remains high, there has been multiple “losses and gains” in species recorded. This needs to be taken with caution, however, and a good understanding of some of the contextual factors that may have contributed to the perceived changes.
In the ten years since 2007 there have been massive changes in technology, including the now very affordable remote cameras which captured unquestionably some of the more secretive of the nocturnal fauna. Bat detectors for microbats have become more durable and weather resistant, and can be left for days on end chained up a tree, increasing the likelihood of recording less common species. These passive sampling techniques drastically increase the “time on the ground” that is required to collect a more comprehensive understanding of fauna diversity in urban reserves. As well, urban fauna species have often developed avoidance behaviours that mean they are rarely seen by people, but will be captured by non-invasive passive monitoring. For other species, actual time on the ground will contribute to sightings – as the old saying goes, “don’t look, won’t find”. The 2017 survey has the benefit of hindsight as well – a record of a more cryptic species 10 years ago was enough to encourage targeted searches in the current survey.
Other mitigating factors are the normal crop of unpredictable, and often severe, changes in environmental conditions that can influence transitional trajectories for populations – fire, flood and drought. For example, the majority of Field of Mars Reserve was seriously burnt about 15 years ago, so that in 2007 the fauna population would still have been in a recovery trajectory. Ten years on from that the trajectory would be more stable, unless there was another stochastic event, such as drought. Extremely dry weather during winter and spring, and into summer, for the City of Ryde LGA (and much of coastal Sydney) has reduced food resources, inhibited breeding success, and contributed directly to the loss of animals from populations. Seasonal migrants were late arriving due to the unfavourable conditions. Even the invertebrate fauna failed to produce the normal spring explosion of animals due to the dry conditions, and soil dwelling invertebrates were almost absent in spring.
These responses to unpredictable events help to highlight the fragility of life for urban fauna. Moving to an area with more favourable conditions is not always an option. Simply staying alive can be difficult, and not just avoiding being eaten. Food resources become very limited, and the effects for animal populations are very real. For some faunal groups, such as microbats, reduced insect numbers due to drought can compound other stressors for some species. This, combined with loss of old growth, hollow bearing trees may be enough to lead to local extinction, as appears to be happening for the forest bats (Vespadelus species). When this is happening in other areas, a series of local extinctions becomes potential extinction for the species. Or at a minimum, urgent listing on the new Biodiversity Conservation Act’s threatened species register.
Active and adequate conservation management is required if these and other species are not to join those other common species that have become rare. In all probability, urbanisation will be an ongoing and escalating process, with the ensuing negative impacts for flora and fauna in the shrinking urban reserve network continuing unabated. Even simple things will help, like installing bat boxes in Field of Mars Reserve, where the trees are predominantly mature regrowth which is unlikely to develop good habitat hollows for another 50 to 100 years. A series of specific
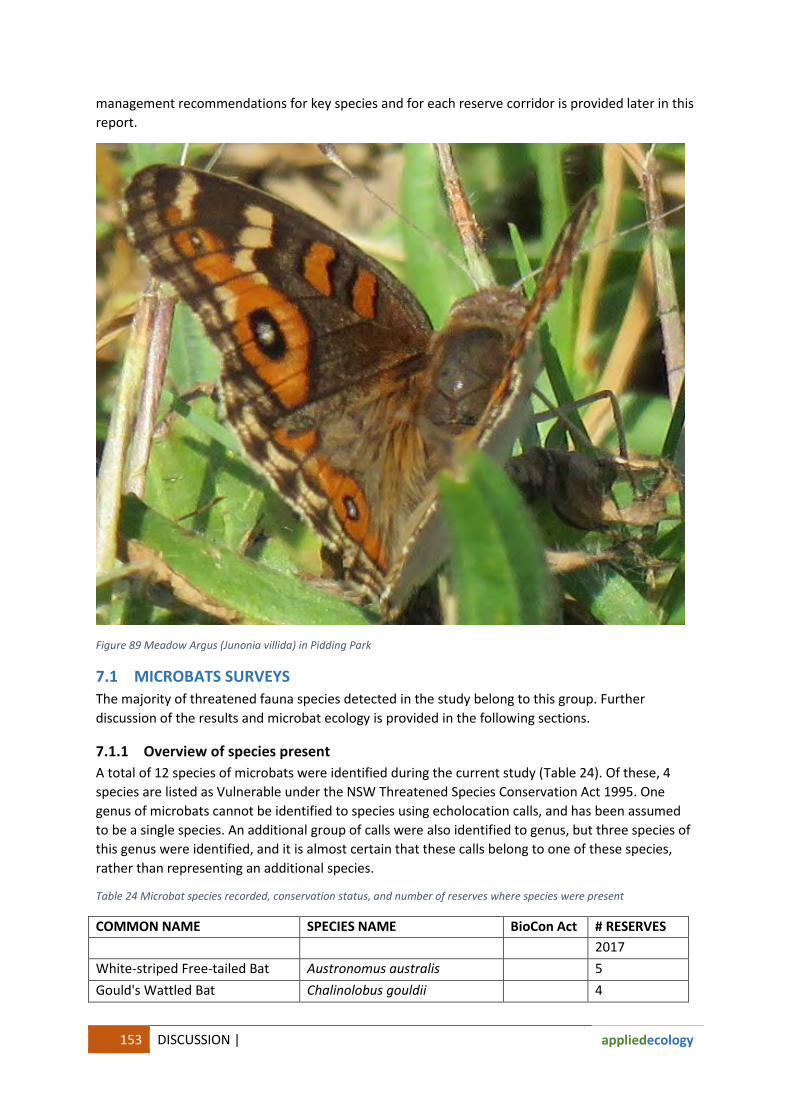
153 DISCUSSION |
appliedecology
management recommendations for key species and for each reserve corridor is provided later in this report.
Figure 89 Meadow Argus (Junonia villida) in Pidding Park
7.1 MICROBATS SURVEYS
The majority of threatened fauna species detected in the study belong to this group. Further discussion of the results and microbat ecology is provided in the following sections.
7.1.1 Overview of species present
A total of 12 species of microbats were identified during the current study (Table 24). Of these, 4 species are listed as Vulnerable under the NSW Threatened Species Conservation Act 1995. One genus of microbats cannot be identified to species using echolocation calls, and has been assumed to be a single species. An additional group of calls were also identified to genus, but three species of this genus were identified, and it is almost certain that these calls belong to one of these species, rather than representing an additional species.
Table 24 Microbat species recorded, conservation status, and number of reserves where species were present
COMMON NAME SPECIES NAME BioCon Act # RESERVES
2017 White-striped Free-tailed Bat Austronomus australis 5 Gould's Wattled Bat Chalinolobus gouldii 4

DISCUSSION 154
Chocolate Wattled Bat Chalinolobus morio 3 Eastern Bentwing-bat Miniopterus orianae oceanensis V 4 East-coast Free-tailed Bat Mormopterus norfolkensis V 1 Ride's Free-tailed Bat Mormopterus ridei 5 Large-footed Myotis Myotis macropus V 2 a Long-eared Bat Nyctophilus sp 5 Yellow-bellied Sheath-tailed Bat Saccolaimus flaviventris V 4 Large Forest Bat Vespadelus darlingtoni 1 Southern Forest bat Vespadelus regulus 1 A forest bat Vespadelus sp N/A Little Forest Bat Vespadelus vulturnus 1
The White Striped Free-tailed Bat (Austronomus australis), Ride’s Free-tailed Bat (Mormopterus ridei), and a Long-eared Bat (Nyctophilus sp) were recorded in all the creek corridors and in Field of Mars Reserve. Of the threatened species, two were recorded in four of the five reserve areas, namely the Eastern Bentwing Bat (Miniopterus orianae oceanensis) and the Yellow-bellied Sheath-tailed Bat (Saccolaimus flaviventris). Interestingly, this puts them among the more common species in the survey areas.
For this part of the study, the Terrys Creek Corridor was divided into two sections: Terrys Creek South, which includes the more urbanised sections of the corridor, is separated by Epping Road from Terrys Creek North, and this is constrained by the M2 motorway at the downstream end. Some reserves also had more microbat species recorded present, and the observed species diversity was compared between autumn and spring for 2017, and between the current study and the previous study in 2007. For Field of Mars Reserve, additional data was available for 2016 (Table 25).

155 DISCUSSION |
appliedecology
Table 25 Distribution of microbat species in bushland reserve corridors, 2007 and 2017
COMMON NAME SPECIES NAME KITTYS TERRYS NORTH TERRYS SOUTH BUFFALO CREEK FOM
2007 2017 2007 2017 2007 2017 2007 2017 2006 2016 2017
White-striped Free-tailed Bat
Austronomus
australis
x x x x x x x x x
Gould's Wattled Bat Chalinolobus gouldii x x x x x x x x x Chocolate Wattled Bat
Chalinolobus morio x x x x x
Eastern Bentwing-bat
Miniopterus orianae
oceanensis
x x x x
East-coast Free-tailed Bat
Mormopterus
norfolkensis
x
Ride's Free-tailed Bat
Mormopterus ridei x x x x x
Large-footed Myotis Myotis macropus x x x a Long-eared Bat Nyctophilus sp x x x x x Yellow-bellied Sheath-tailed Bat
Saccolaimus
flaviventris
x x x* x
Large Forest Bat Vespadelus
darlingtoni
x
Southern Forest bat Vespadelus regulus x a Forest Bat Vespadelus sp x Little Forest Bat Vespadelus
vulturnus
x x
1 9 3 6 2 3 0 6 5 6 8 *possible

DISCUSSION 156
Table 26 Distribution of microbat species in bushland reserve corridors, autumn and spring 2017
SPECIES NAME COMMON NAME KITTYS TERRYS NORTH
TERRYS SOUTH
BUFFALO CREEK
FOM # RESERVES
autu
mn
sprin
g
autu
mn
sprin
g
autu
mn
sprin
g *
autu
mn
sprin
g
autu
mn
sprin
g
autu
mn
sprin
g
Austronomus australis White-striped Free-tailed Bat x x x x x x 4 2
Chalinolobus gouldii Gould's Wattled Bat x x x x x x x 3 4
Chalinolobus morio Chocolate Wattled Bat x x x x x 3 2
Miniopterus orianae oceanensis
Eastern Bentwing-bat x x x x x x x x 4 4
Mormopterus norfolkensis East-coast Free-tailed Bat 0 0
Mormopterus ridei Ride's Free-tailed Bat x x x x x x x x x 5 4
Myotis macropus Large-footed Myotis x x 1 1
Nyctophilus sp a Long-eared Bat x x x x x x x 3 4
Saccolaimus flaviventris Yellow-bellied Sheath-tailed Bat
x x x x 1 3
Vespadelus darlingtoni Large Forest Bat x 1 0
Vespadelus regulus Southern Forest bat 0 0
Vespadelus vulturnus Little Forest Bat 0 0
7 7 5 4 3 0 4 6 6 7
* note: detector failed at Terrys Creek South in spring

157 DISCUSSION |
appliedecology
Nyctophilus species cannot be identified to species based on echolocation calls (Pennay et al, 2004). Four Nyctophilus species have been recognised in NSW, of which three have been reported from the Sydney Basin (NSW Wildlife Atlas, OEH, 2017). These are N. corbeni (Corben’s Long-eared Bat), a threatened species, and the more common N. geoffroyi (Lesser Long-eared Bat) and N. gouldi (Gould’s Long-eared Bat). Both N. geoffroyi and N. gouldi have been reported in the vicinity of the City of Parramatta LGA, with identification confirmed by trapping, making either of these the most likely species present.
Vespadelus species can also be difficult to identify to species from echolocation calls alone (Pennay et al, 2004). Vespadelus darlingtoni calls can have overlapping frequencies with V. vulturnus and a third species, V. regulus. As well, there is potential for confusion with Miniopterus schreibersii
oceanensis in the Sydney Basin. By referring call analysis to a specialist, we aim to have avoided this as much as possible.
7.1.2 Distribution of species
The number of microbat species recorded in each creek corridor/reserve was consistently greater in 2017 than in 2007 (Figure 90). The most likely explanation for this is increased survey effort – the current study aimed to maximise the number of species recorded, and Anabat detectors were positioned in fixed locations for several nights at a time. Several habitats were surveyed for each reserve, for example, detectors over waterways would record large numbers of calls but generally only from a few species. Detectors were also positioned in forested areas away from creeklines to maximise the number of species recorded. Improvements in technology over the 10 years may have also contributed to the increased survey effort. Until recently, Anabat detectors were very susceptible to moisture, and it was common practice to walk around with them for surveys, or leave them in a stationary location for several hours. Now, with waterproof housings, there is an option to leave them in a safe location for up to several days.
Figure 90 Comparison of microbat species richness for the current study with previous studies
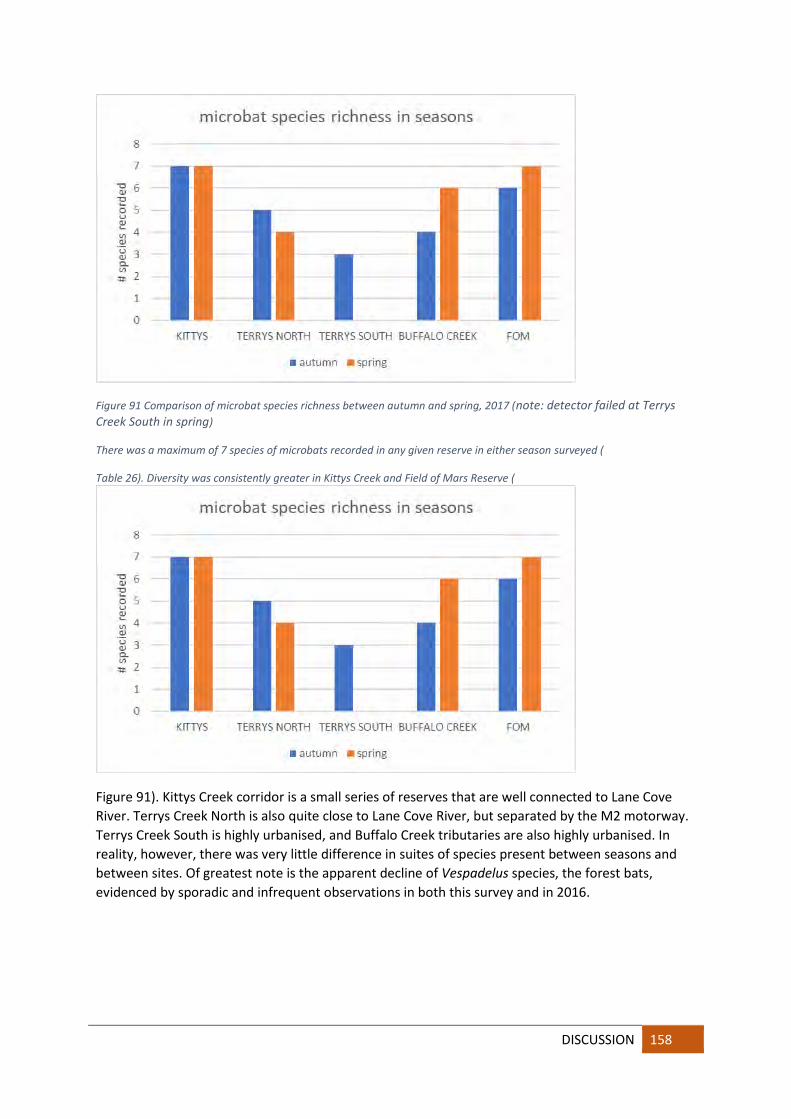
DISCUSSION 158
Figure 91 Comparison of microbat species richness between autumn and spring, 2017 (note: detector failed at Terrys Creek South in spring)
There was a maximum of 7 species of microbats recorded in any given reserve in either season surveyed (
Table 26). Diversity was consistently greater in Kittys Creek and Field of Mars Reserve (
Figure 91). Kittys Creek corridor is a small series of reserves that are well connected to Lane Cove River. Terrys Creek North is also quite close to Lane Cove River, but separated by the M2 motorway. Terrys Creek South is highly urbanised, and Buffalo Creek tributaries are also highly urbanised. In reality, however, there was very little difference in suites of species present between seasons and between sites. Of greatest note is the apparent decline of Vespadelus species, the forest bats, evidenced by sporadic and infrequent observations in both this survey and in 2016.

159 DISCUSSION |
appliedecology
7.1.3 Habitat partitioning in Lane Cove River catchments in Ryde LGA
Microbat echolocation calls fall within a spectrum of frequencies. Lower frequency calls travel further but are not always able to locate very small insects and other items. Higher frequency calls do not travel as far, but are very good for locating small insects close by. Combining this with flight speed and manoeuvrability means that some microbats are better suited to foraging in open sky while others are well adapted to foraging in or around the canopy and shrub layers. Some of the observed foraging niche selection is also influenced by potential exposure to predation.
Key life history characteristics for microbats in City of Ryde LGA are summarised in Table 27.

DISCUSSION 160
Table 27 Key life history characteristics for microbats recorded in City of Ryde LGA in 2017 (see below for data sources)
SPECIES NAME COMMON NAME ECHOLOCATION FREQUENCY
FLIGHT PATTERNS FORAGING NICHE**
SENSITIVE TO URBANISATION*
CORRIDORS PRESENT #
Austronomus australis White-striped Free-tailed Bat
low fast, low manoeuvrability
Open tolerant 5 #
Chalinolobus gouldii Gould's Wattled Bat low fast, high manoeuvrability
Edge tolerant 4 #
Chalinolobus morio Chocolate Wattled Bat high fast, moderate manoeuvrability
Edge moderately sensitive
3 #
Miniopterus orianae oceanensis
Eastern Bentwing Bat medium fast, moderate manoeuvrability
Edge tolerant 4 #
Mormopterus norfolkensis East-coast Free-tailed Bat low fast, low manoeuvrability
Open moderately sensitive
2016 only
Mormopterus ridei Ride's Free-tailed Bat low medium, moderate manoeuvrability
Open tolerant 5 #
Myotis macropus Large-footed Myotis linear medium, moderate manoeuvrability
Clutter very sensitive 2
Nyctophilus sp a Long-eared Bat linear slow, high manoeuvrability
Clutter moderately sensitive
5 #
Saccolaimus flaviventris Yellow-bellied Sheath-tailed Bat
low fast, low manoeuvrability
Open unknown 4
Vespadelus darlingtoni Large Forest Bat medium fast, moderate manoeuvrability
Clutter unknown 1
Vespadelus regulus Southern Forest Bat medium fast, moderate manoeuvrability
Clutter moderately sensitive
2016 only
Vespadelus vulturnus Little Forest Bat high fast, high manoeuvrability
Clutter moderately sensitive
2016 only #
# also recorded by Joanna Haddock in FOM in 2017
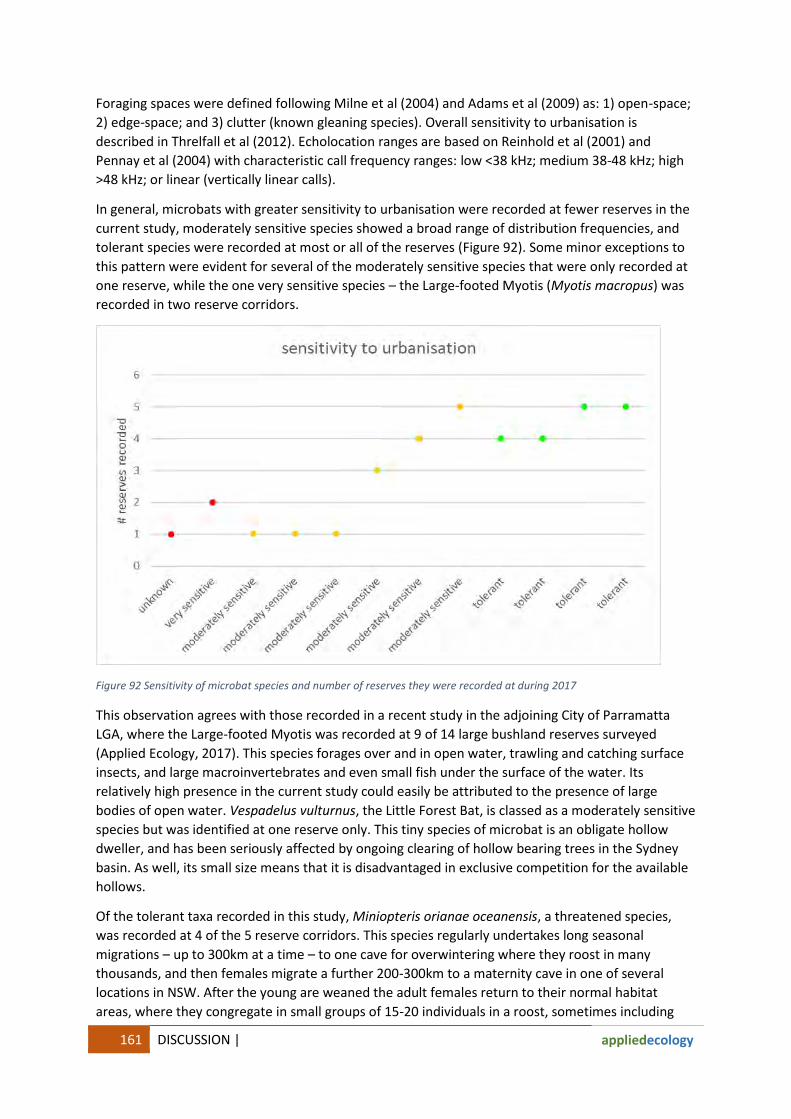
161 DISCUSSION |
appliedecology
Foraging spaces were defined following Milne et al (2004) and Adams et al (2009) as: 1) open-space; 2) edge-space; and 3) clutter (known gleaning species). Overall sensitivity to urbanisation is described in Threlfall et al (2012). Echolocation ranges are based on Reinhold et al (2001) and Pennay et al (2004) with characteristic call frequency ranges: low <38 kHz; medium 38-48 kHz; high >48 kHz; or linear (vertically linear calls).
In general, microbats with greater sensitivity to urbanisation were recorded at fewer reserves in the current study, moderately sensitive species showed a broad range of distribution frequencies, and tolerant species were recorded at most or all of the reserves (Figure 92). Some minor exceptions to this pattern were evident for several of the moderately sensitive species that were only recorded at one reserve, while the one very sensitive species – the Large-footed Myotis (Myotis macropus) was recorded in two reserve corridors.
Figure 92 Sensitivity of microbat species and number of reserves they were recorded at during 2017
This observation agrees with those recorded in a recent study in the adjoining City of Parramatta LGA, where the Large-footed Myotis was recorded at 9 of 14 large bushland reserves surveyed (Applied Ecology, 2017). This species forages over and in open water, trawling and catching surface insects, and large macroinvertebrates and even small fish under the surface of the water. Its relatively high presence in the current study could easily be attributed to the presence of large bodies of open water. Vespadelus vulturnus, the Little Forest Bat, is classed as a moderately sensitive species but was identified at one reserve only. This tiny species of microbat is an obligate hollow dweller, and has been seriously affected by ongoing clearing of hollow bearing trees in the Sydney basin. As well, its small size means that it is disadvantaged in exclusive competition for the available hollows.
Of the tolerant taxa recorded in this study, Miniopteris orianae oceanensis, a threatened species, was recorded at 4 of the 5 reserve corridors. This species regularly undertakes long seasonal migrations – up to 300km at a time – to one cave for overwintering where they roost in many thousands, and then females migrate a further 200-300km to a maternity cave in one of several locations in NSW. After the young are weaned the adult females return to their normal habitat areas, where they congregate in small groups of 15-20 individuals in a roost, sometimes including

DISCUSSION 162
mixed species in the colony. Increasing pressure on this species in any of its life history locations or phases can drastically affect ongoing success for the species.
7.1.4 DISCUSSION
Microbats in urban areas Microbats comprise a major component of remnant mammalian fauna in urban areas. Urbanisation can negatively affect bat communities through noise, artificial lighting, collisions with cars and predation from domestic animals (Gehrt and Chelsvig 2004). Overseas studies on the effects of urbanisation on bats in Europe and North America identified the high ecological value of habitat remnants, and this is generally true for Australia as well (Basham et al. 2011; Threlfall et al. 2011).
Microbat assemblages along the urban gradient appear to be influenced by a complex interaction between the extent of habitat available (site area), the degree of urban development, past land use practices, particularly clearing of old growth trees, as well as the current availability of important habitat features such as hollow-bearing trees and tree species diversity. There does not appear to be a clear trend for the effects of urbanisation on microbats. In reality, the needs of different species vary greatly, and many species have quite specialised habitat needs and behaviours. As well, there tends to be a rather ad hoc arrangement of forested parks within larger cities, such as the larger bushland corridors in City of Ryde LGA. These may offset the habitat loss caused by urbanisation, and to some degree mitigate any negative impacts for microbats at the regional scale.
A review of studies on microbats in urban environments (Jung & Threlfall, 2016) reported relatively high bat activity and species richness in areas with remaining vegetation such as older residential areas, riverine habitats or parklands. Certain bat species appear to thrive in these urban environments, and success has been linked to species-specific traits (Duchamp and Swihart 2008). Favoured bat species are those with high wing loadings and aspect ratios that are adapted to foraging in open areas, and which also roost primarily in human structures; these species appear well adjusted to urban environments, provided that there is sufficient tree cover (Dixon 2012).
In general, there is a clear trend of a positive relationship with native remnant vegetation in urban areas in Australian cities and larger towns. Some studies report a reduced richness and greater dominance of a few species in highly urbanised areas (Jung and Kalko 2011), but in other cases there is greater species richness in urban parks and residential areas (Hourigan et al. 2010; Threlfall et al. 2012). Old growth trees in remnant native vegetation provide the essential roost sites and forage availability that ensure the persistence of microbat species in urban environments. The availability of these resources can be affected by past and present land-use practices, such as clearing and urban development, and particularly by the current trend of medium density housing following complete clearing of the subdivision area. Other considerations for microbats include interspecific competition for roost sites, especially tree hollows (Threlfall et al. 2013).
Resources required for feeding and drinking Most microbats are highly mobile species, and can forage up to 5km from their roost sites. As well, they may alternate between several roost sites in different parts of their range. They have been described as the most persistent group of native fauna following the ongoing impacts of urbanisation – their mobility, combined with their capacity to roost almost opportunistically so long as there are suitable locations, have contributed to the persistence of these species.
Within the microbats there are notable differences in feeding behaviours, speed and manoeuvrability in flight, all of which contribute to the development of preferred niches for individual species. Like other animals, microbats need water for drinking, and will access this in

163 DISCUSSION |
appliedecology
rivers, creeks, ponds, dams, pools and wetlands – anywhere with suitable open water. Concentrations of insects, especially flying insects, tends to be higher on or around water, thus bats are able to access most of their required intakes in these areas. All the reserve corridors in the current study are centred on or near a named watercourse.
Differences in distribution in the current study are not likely to be related to the distance from water, but the observed species may be present at least in part because of these streams, especially in the more degraded bushland reserves. Increasing urbanisation has been linked to a decrease in abundance of nocturnal insects (Wilson et al, 2012). This has also been linked to diversity and abundance of microbat species, with more bats from more species present in areas with greater nocturnal insect abundance. Within the urban matrix, there tends to be greater insect abundance in riparian areas, bushland remnants and residential areas than in golf courses, industrial areas and urban parks.
Differences in abundance and biomass for nocturnal insect biomass have been linked to soil fertility, with shale influenced soils generally supporting more insects than the nutrient poor sandstone based soils (Threlfall et al, 2012a). Consequently, the feeding activity of bats tends to be much greater in bushland and riparian areas on more fertile soils. Variation in insect biomass is not directly linked to microbat foraging activity, however, as there tends to be reduced feeding activity in highly urbanised areas due to avoidance of overlit areas by some species.
Habitat preferences Trees are important for bats because they provide focal points for navigation and foraging (Law, Chidel & Turner 2000; Lumsden & Bennett 2005). Tree density has also been related to microbat activity, with both species richness and activity peaking at intermediate tree densities (Hanspach et al, 2012). Areas with low tree cover tend to be dominated by larger, fast flying species, while areas with high tree cover tend to be dominated by smaller, highly manoeuvrable species, a pattern that has been consistently reported from studies around the world.
Presence of hollow bearing trees is a major determinant in microbat diversity and abundance. Nearly 60% of all microbat species in Australia are dependent on tree hollows for roosting habitat and/or maternity habitat. Research indicates that hollow-bearing trees are in decline across all forest types within Australia, and particularly in urban areas. In urban landscapes, the persistence of hollow-dependent bats arguably depends upon the protection of roosting habitat, the hollow bearing trees. Key differences in microbat diversity have been linked to the presence of hollow bearing trees, on which a number of bat species are almost completely dependent (Treby & Castley, 2016). For the microbat species recorded in the Lane Cove River catchments in Ryde, obligate hollow dwelling microbats include the Vespadelus species, and these were notably absent from the current study.
Other species that are affected by urbanisation include the threatened Mormopterus norfolkensis which has been noted to avoided urban areas (McConville et al, 2014), in contrast with other Mormopterus species, such as M. ridei, which occurred frequently in urban bushland. In the current study, M. ridei was recorded in every reserve in both seasons – and was the only species recorded this frequently.
Nyctophilus gouldi, one of the more common Long-eared bats, has been reported to have a preference for trees with a greater amount of understory and canopy cover, and only roosted where the extent of forest cover in the local landscape was greatest (Threlfall et al, 2012). Maternity roosts also tend to be predominately located in gullies, and closer to creek lines, making all of the reserves in the current study important for this species. Birds have been observed occupying bat roosts on days following bat occupancy, but microbats tend to roost in trees where there were fewer hollow-

DISCUSSION 164
using birds. Thus abundant, urban-adapted, hollow nesting birds may render hollows a limiting resource to hollow-users such as bats in urban landscapes.
Reserve size/area has a significant effect on many microbat species (Beninde et al, 2015). One well documented example of this is the threatened species, Miniopteris orianae ocenaensis, which has only been recorded in larger and more intact areas (Treby & Castley, 2016). Despite this, M. orianae
oceanensis is believed to be relatively tolerant to urbanised landscapes, mainly because it will utilise man-made structures for roosting sites, including stormwater drains, tunnels and culverts, and buildings. Miniopteris orianae ocenaensis was recorded in every reserve corridor but Terrys Creek South, which includes the more urbanised part of the creek corridor, and was recorded in each reserve in autumn and spring. This may be a fortunate artefact of the timing of surveys in these reserves, as the species is a seasonal migrant to overwintering cBirds in Wellington, Cliefden (near Canowindra), Colong, Jenolan, and several other cave systems. Males return to their normal foraging areas in spring, while females will raise their young in large nurseries in maternity cBirds located at Wee Jasper and Bungonia, rejoining the males after weaning the young.
Chalinobolus gouldii is reported to be very tolerant to the effects of urbanisation with a widespread distribution throughout larger and smaller urban areas (Threlfall et al 2012a). It is a hollow-using species that favours large flyways and low level of forest clutter. This preference for an open understorey (Lloyd et al. 2006) makes the species highly adapted to foraging in cities, with the result that they are one of the most common city microbats in Australia (Richards et al. 2012). This species was recorded in every reserve but Terrys Creek South, and nearly always in both seasons.
Austronomus australis has been found to make extensive use of the urban matrix where it has been recorded more frequently foraging above cleared and grassy flood-plains (Threlfall et al 2012a). In the current study it was recorded in every reserve corridor, but generally only in autumn. The preference for open spaces may mean that A. australis tends to forage away from bushland as a first preference, returning to forage over the canopy in autumn when nocturnal insect numbers are lower. Another explanation is that the location of Anabat detectors away from flyways during many of the survey nights did not favour detection of this species.
Clutter tolerant species, such as Vespadelus regulus and V. darlingtonia, and clutter dependent species, such as V. vulturnus, belong to a group of microbats that are most vulnerable to the effects of habitat fragmentation and urbanisation (Threlfall et al. 2012a). These species were poorly represented in the current study, with one record of V. darlingtonia in autumn in Kittys Creek. This absence of forest bats is a pattern that was noted in a recent study in the adjoining City of Parramatta LGA, and is of concern. Other microbat researchers around Sydney are also reporting significant reduction in numbers for Vespadelus species.
Predatory and competitive birds The following bird species recorded in this study are considered potential predators of bats (adapted from Luck et al, 2013): laughing kookaburra (Dacelo novaeguineae), grey butcherbird (C. torquatus), pied currawong (Strepera graculina) and Australian raven (Corvus coronoides).
The following hollow-nesting bird species were considered potential competitors of bats: little corella (Cacatua sanguinea), Galah (Eolophus roseicapillus), Sulphur-crested cockatoo (C. galerita), Rainbow lorikeet (Trichoglossus haematodus), Musk lorikeet (Glossopsitta concinna), Australian king parrot (Alisterus scapularis), Crimson rosella (Platycercus elegans), Eastern rosella (P. eximiusa) and the Common myna (S. tristis).

165 DISCUSSION |
appliedecology
7.1.5 MAIN IMPACTS FOR MICROBATS
Despite their comparative ability to persist and thrive with increasing levels of urbanisation, microbats are still detrimentally affected by several environmental factors. These are discussed in the following sections.
Artificial lighting Fast flying bats exploit insect attraction to city lighting and road lighting (Beier, 2006). Slow flying gleaner and flutter detector bats avoid street lighting (Rydell, 2006). In some areas this has led to competitive exclusion of species when two species both hunt the same prey but one species hunts in the lit zone and the other avoids the lit zone, while the prey is attracted to the lit zone.
Artificial lighting influences both microbats and their prey species. Impacts on bats and their prey depend on the light spectra produced by street lights. Ultraviolet (UV) wavelengths attract more insects and consequently insectivorous bats (Rowse et al, 2016). Bat responses to lighting are species-specific and reflect differences in flight morphology and performance; fast-flying aerial hawking species frequently feed around street lights, whereas relatively slow flying bats that forage in more confined spaces are often light-averse. Increasing light levels have a negative influence on microbat species that are tolerant of ‘clutter’ in the environment, such as Myotis and Vespadelus species, regardless of the type of artificial lighting.
Insectivorous bats that hunt in open spaces above the canopy (open-space foragers) or along vegetation edges such as forest edges, tree lines or hedgerows (edge foragers) are the most tolerant of artificial lighting (Jung and Threlfall 2016). When foraging at street lights, open-space foragers typically fly above the lamps, diving into the light cone to catch insects (Jung and Kalko 2010). Edge foragers tend to be more manoeuvrable than open-space foragers (Kalko et al. 2008), and some conduct circuits inside the light cone when hunting insects at street lights.
In highly urbanised areas, roosts and insect habitats are both lacking, and those insects which are present tend not to aggregate at street lamps because the pervasive artificial lighting in city centres causes a dilution effect, rendering the lights less attractive for bats (Jung & Threlfall 2016). Lighting technologies are changing rapidly, with the use of light-emitting diode (LED) lamps increasing. Rapid changes in street lighting offer the potential to explore mitigation methods such as part-night lighting (PNL), dimming, directed lighting, and motion-sensitive lighting that may have more beneficial consequences for light-averse bat species.
Most forest-dwelling bat species emerge from their roosts relatively late in the evening, presumably to minimise predation risk from diurnal birds of prey (Jones and Rydell 1994) and so may be ‘hard-wired’ to be light-averse. Furthermore, these slow-hawking forest bats use echolocation calls that are adapted for short-range prey detection among clutter, and so these may not be suitable for orientation in semi-open habitats where most street lights are positioned. As an example, the chocolate wattled bat Chalinolobus morio, recorded in the current study at Kittys Creek, Buffalo Creek and Field of Mars Reserve, was reported to avoid parks when lights were switched on (Scanlon and Petit 2008).
Effects of noise for microbats Ambient noise influences the availability and use of acoustic information in animals in many ways. For example, Nyctophilus and Myotis species are part of an especially vulnerable group of gleaning bats that rely on listening for prey rustling sounds to find food. This strategy of ‘passive listening’ is adopted by bat species specialized to glean arthropods from vegetation or the ground where prey echoes are masked by overlapping, strong background echoes. For such ‘passive listening’ bats, it is

DISCUSSION 166
conceivable that environmental noise interferes with the detection of prey. As these bats use echolocation for spatial orientation, the reception of relevant echoes could potentially be impaired by noise as well (Gillam and McCracken, 2007).
Microbats and fire Fire in bushland is most commonly a result of anthropogenic ignition, either accidentally or as deliberate burns for landscape management (Abbott & Burrows, 2003). This has led to considerable debate over whether current fire regimes are beneficial for many species of flora and fauna (Green & Sanecki, 2006), leading to numerous studies investigating the responses of various animals and plants to disturbance by fire. Despite this there have been very few studies of the effects of fire on microbats (Simmons & Wetterer, 2010), and even less have investigated the immediate effects of fire on microbat activity and community structure (Inkster-Draper et al, 2013).
In general, immediately post fire there may be an increase in activity for some species, but a decrease in activity for others. Most of of this can be attributed to the change in vegetation structure following fire, in particular the reduction in “clutter”. Loeb and Wardrop (2008) attributed this type of trend to an increase in prey availability, although it is more likely to be an increase in prey accessibility.
Changes to the bat community structure following fire are consistent with the relationships between body and wing morphology, and flying behaviour and habitat. Thus, the physical structure of the environment provides a significant influence on bat community assemblage. The reduction in vegetation clutter makes the habitat more favourable for less manoeuvrable, faster flying species, and less favourable for highly manoeuvrable species that are adapted to hunting within the canopy.
No studies seem to recognise the loss of individual animals as a result of fire, since most prescribed burns occur during the day when microbats are asleep in their tree hollow or tree bark roosts. For well managed burns the height of flames is kept at or below 2m, but the reality is that many of these burns are not well managed, and can even be the start of serious wildfire events. Unlike prescribed burns, wildfire will ignite canopy vegetation as well as groundlayer and shrub layers, and will ignite loose bark, burn through hollow trees, and create extremely high temperatures within tree trunks that can be seen post fire through trunk scarring and splitting. Even when flame height is kept below 2m, there is often a significant amount of smoke created, with a great potential for lung damage for microbats and other very small animals.
Summary of potential impacts for microbats Main potential impacts identified for microbats from literature and the current study include:
Reduced clutter through simplification of vegetation, eg following too frequent fire Increasing density of urbanisation Loss of hollow bearing trees and other roost sites Disruption to flyways, especially for regionally migratory species Artificial lighting Exposure to predation Lack of understanding, eg vilification as ‘disease-ridden vermin’

167 FLORA SURVEY RESULTS |
appliedecology
8

FLORA SURVEY RESULTS 168
8.1 Summary of 2017 surveys
Full flora species lists were compiled for each of the subject reserve in each reserve corridor. These lists are provided in Appendix 3 of this report. Species richness for native flora and introduced species is summarised in Table 28 for each reserve, and for each creek corridor.
Table 28 Summary of 2017 flora surveys
2017 SURVEY RESULTS # NATIVE SP # INTRODUCED
TERRYS CREEK CORRIDOR (253 sp) (141 sp)
Jim Walsh Park 34 52 Yarramar Reserve 5 not recorded Forsyth Park 85 58 Forrester Park 54 63 Pembroke Park 174 74 Lucknow/Somerset Parks 178 50 Ivanhoe Park 79 49 KITTYS CREEK CORRIDOR (181 sp) (67 sp)
Pryor Park 78 27 Portius Park 93 40 Kittys Creek Reserve 61 17 Martin Reserve 68 30 BUFFALO CREEK CORRIDOR (187 sp) (132 sp)
Burrows Park 115 64 Laurel Park 42 51 Barton Park 67 66 Aitchander Park 50 56 Minga Reserve 50 44 Pidding Park 118 57 Tyrell Park 20 not recorded FIELD OF MARS RESERVE (298 sp) (81 sp)
Native flora species diversity was greatest in Field of Mars Reserve. This is most likely to be a result of the reserve’s larger size, smaller perimeter to area ratio resulting in a larger core area, and diversity of vegetation communities in the reserve. The Terrys Creek Corridor also had a high overall species diversity, despite the areas of narrow, degraded reserves at the top of the catchment.
The Kittys Creek Corridor is much smaller, but still has areas of intact and diverse vegetation. In contrast, the Buffalo Creek Corridor, which comprises two main tributaries, has mainly narrow and degraded reserves surrounded by housing. This is reflected in the lower diversity of native flora recorded in the corridor.

169 FLORA SURVEY RESULTS |
appliedecology
In most cases, the opposite situation existed for introduced flora species, most of which are considered environmental weeds in bushland areas, or noxious weeds (now known as priority control weeds under the new NSW Biosecurity Act 2016).
Weed diversity was greatest in Terrys Creek Corridor and Buffalo Creek Corridor. Terrys Creek Corridor has several small but highly degraded reserves at the top of the corridor. This creek has a complex management history with three LGAs responsible for different sections. The upper catchment is in Parramatta LGA, while the subject section of the corridor has the LGA boundary running along the creekline itself. Until recently the reserves on the northern side of the creek were in The Hills Shire, but following the reorganisation of Sydney’s council boundaries, many of these reserves are now managed by City of Parramatta, and The Hills Shire retains just a few reserves at the downstream end of the creek.
The Buffalo Creek Corridor also has a series of reserves interspersed with degraded private lands. Long established urbanisation directly impacting on narrow reserves based around a watercourse has created a situation where there is a source of weeds and a means to convey them through the whole series of reserves, with the result that Buffalo Creek Corridor has high weed diversity and lower native flora diversity.
Parts of the Field of Mars Reserve are downstream from the Buffalo Creek Corridor, and are directly impacted by this legacy of weeds being introduced from the upstream environment. Some parts of the reserve are quite degraded as a result, but most of the degraded areas fall outside the Field of Mars Reserve boundary.
Kittys Creek Corridor has a much smaller catchment, and also comprises a series of mainly narrow reserves along two tributaries of the creek. Bush regeneration in the upper section of the creek is having a positive effect on native species diversity as well as on weed diversity. The lower section of this creek, however, has large areas of very degraded bushland, especially immediately around the creek itself. Many of the ongoing weed management issues can be attributed, at least in part, to poor water quality. High nutrient levels favour weed growth over native flora species, which are adapted to nutrient poor conditions that were the norm in Australia before European settlement set in train an ongoing series of degrading land management practices. Urbanisation is one of the most significant of these.

FLORA SURVEY RESULTS 170
8.2 Comparison of 2017 surveys with 2007 surveys
Flora species data was collected for many of these reserves 10 years ago by Biosphere (2007; see Appendix 3). Numbers of species for each reserve, and reserve corridor group, were compared to see how many species were present in each study, how many of these were recorded in both studies, and how many were only recorded in one of the studies. This final comparison gave an indication of species turnover during the 10 year interval. This assessment was completed for 4 reserves in Terrys Creek Corridor, 3 reserves in Kittys Creek Corridor, 4 reserves in Buffalo Creek Creek Corridor, and for Field of Mars Reserve.
8.2.1 Terrys Creek Corridor
Native flora diversity recorded in Terrys Creek Reserves was greatest in Pembroke Park and Somerset/Lucknow Parks in 2007 and again in 2017 (Table 29). The species richness for these reserves was fairly consistent in the two surveys, although there was a turnover of species of around 15-50%. For Ivanhoe Reserve and Forsyth/Forrester Reserves native species richness doubled from one survey to the next. Despite the differences in species diversity for individual reserves, the net change for the corridor was 15-25%.
Table 29 Summary of changes in native flora species richness 2007 to 2017 for Terrys Creek Corridor
TERRYS CREEK 2007 2017 TOTAL
RECORDED
IN BOTH
SURVEYS
IN 2007
ONLY
IN 2017
ONLY
Forsyth/Forrester Reserves 60 108 125 43 17 (-13%) 65 (+52%) Pembroke Park 153 174 215 112 41 (-19%) 62 (+29%) Somerset/Lucknow Parks 185 178 228 135 50 (-22%) 43 (+19%) Ivanhoe Reserve 45 79 96 28 17 (-18%) 51 (+53%) TERRYS CREEK CORRIDOR 229 253 302 180 49 (-16%) 73 (+24%)
Collectively, there was some increase in native flora species richness from 2007 to 2017, and around 25-30% turnover of species between surveys (Figure 93).
Figure 93 Comparison of species richness from 2007 to 2017 for Terrys Creek Corridor
180 species 49 species 73 species
2007
(229 species)
2017
(253 species)
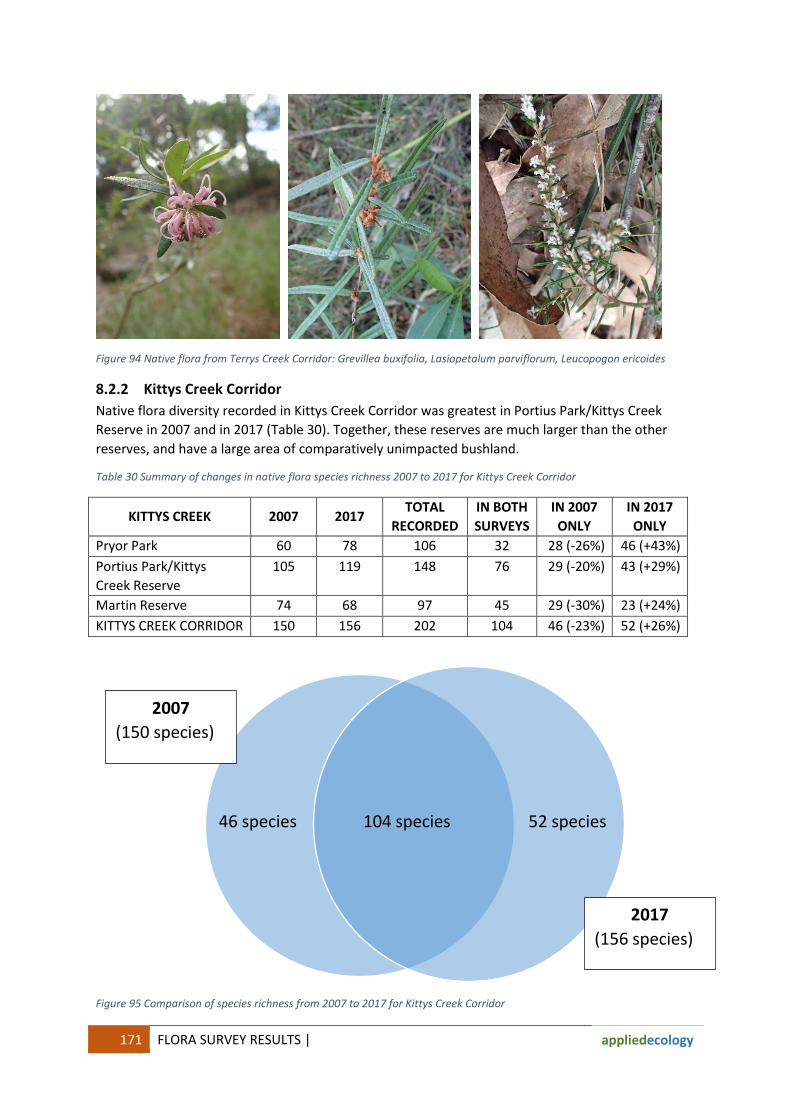
171 FLORA SURVEY RESULTS |
appliedecology
Figure 94 Native flora from Terrys Creek Corridor: Grevillea buxifolia, Lasiopetalum parviflorum, Leucopogon ericoides
8.2.2 Kittys Creek Corridor
Native flora diversity recorded in Kittys Creek Corridor was greatest in Portius Park/Kittys Creek Reserve in 2007 and in 2017 (Table 30). Together, these reserves are much larger than the other reserves, and have a large area of comparatively unimpacted bushland.
Table 30 Summary of changes in native flora species richness 2007 to 2017 for Kittys Creek Corridor
KITTYS CREEK 2007 2017 TOTAL
RECORDED
IN BOTH
SURVEYS
IN 2007
ONLY
IN 2017
ONLY
Pryor Park 60 78 106 32 28 (-26%) 46 (+43%) Portius Park/Kittys Creek Reserve
105 119 148 76 29 (-20%) 43 (+29%)
Martin Reserve 74 68 97 45 29 (-30%) 23 (+24%) KITTYS CREEK CORRIDOR 150 156 202 104 46 (-23%) 52 (+26%)
Figure 95 Comparison of species richness from 2007 to 2017 for Kittys Creek Corridor
104 species 46 species 52 species
2007
(150 species)
2017
(156 species)
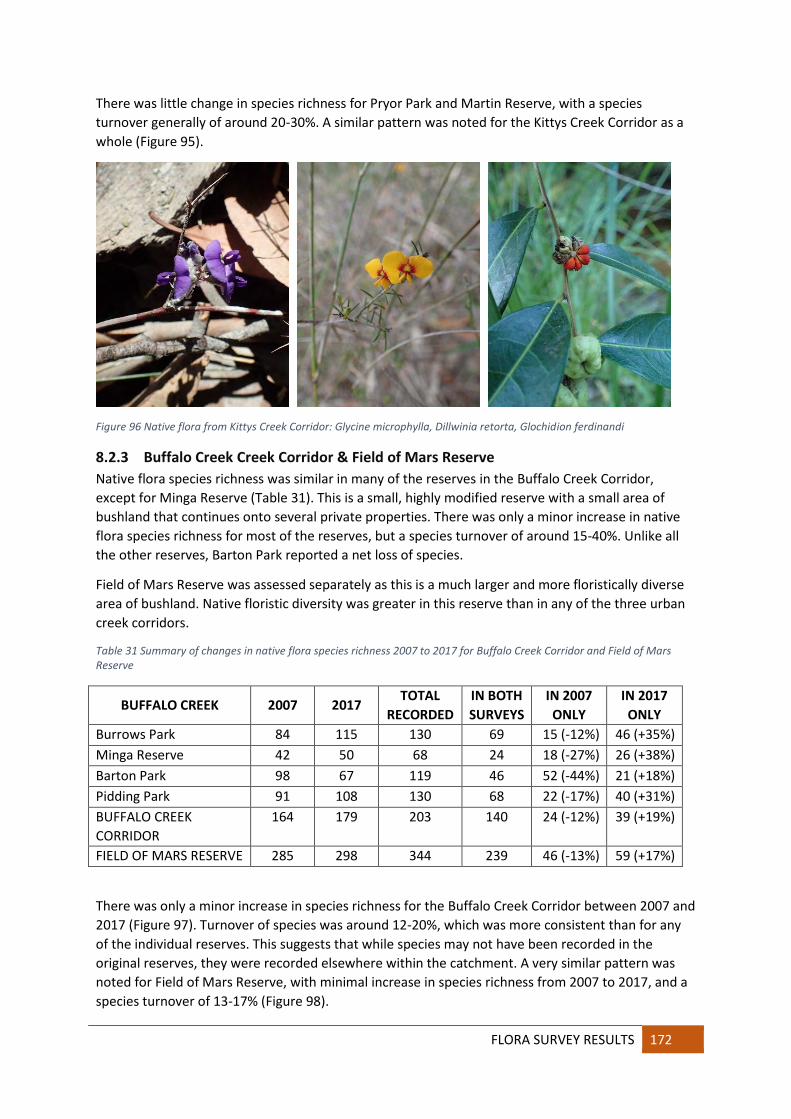
FLORA SURVEY RESULTS 172
There was little change in species richness for Pryor Park and Martin Reserve, with a species turnover generally of around 20-30%. A similar pattern was noted for the Kittys Creek Corridor as a whole (Figure 95).
Figure 96 Native flora from Kittys Creek Corridor: Glycine microphylla, Dillwinia retorta, Glochidion ferdinandi
8.2.3 Buffalo Creek Creek Corridor & Field of Mars Reserve
Native flora species richness was similar in many of the reserves in the Buffalo Creek Corridor, except for Minga Reserve (Table 31). This is a small, highly modified reserve with a small area of bushland that continues onto several private properties. There was only a minor increase in native flora species richness for most of the reserves, but a species turnover of around 15-40%. Unlike all the other reserves, Barton Park reported a net loss of species.
Field of Mars Reserve was assessed separately as this is a much larger and more floristically diverse area of bushland. Native floristic diversity was greater in this reserve than in any of the three urban creek corridors.
Table 31 Summary of changes in native flora species richness 2007 to 2017 for Buffalo Creek Corridor and Field of Mars Reserve
BUFFALO CREEK 2007 2017 TOTAL
RECORDED
IN BOTH
SURVEYS
IN 2007
ONLY
IN 2017
ONLY
Burrows Park 84 115 130 69 15 (-12%) 46 (+35%) Minga Reserve 42 50 68 24 18 (-27%) 26 (+38%) Barton Park 98 67 119 46 52 (-44%) 21 (+18%) Pidding Park 91 108 130 68 22 (-17%) 40 (+31%) BUFFALO CREEK CORRIDOR
164 179 203 140 24 (-12%) 39 (+19%)
FIELD OF MARS RESERVE 285 298 344 239 46 (-13%) 59 (+17%)
There was only a minor increase in species richness for the Buffalo Creek Corridor between 2007 and 2017 (Figure 97). Turnover of species was around 12-20%, which was more consistent than for any of the individual reserves. This suggests that while species may not have been recorded in the original reserves, they were recorded elsewhere within the catchment. A very similar pattern was noted for Field of Mars Reserve, with minimal increase in species richness from 2007 to 2017, and a species turnover of 13-17% (Figure 98).
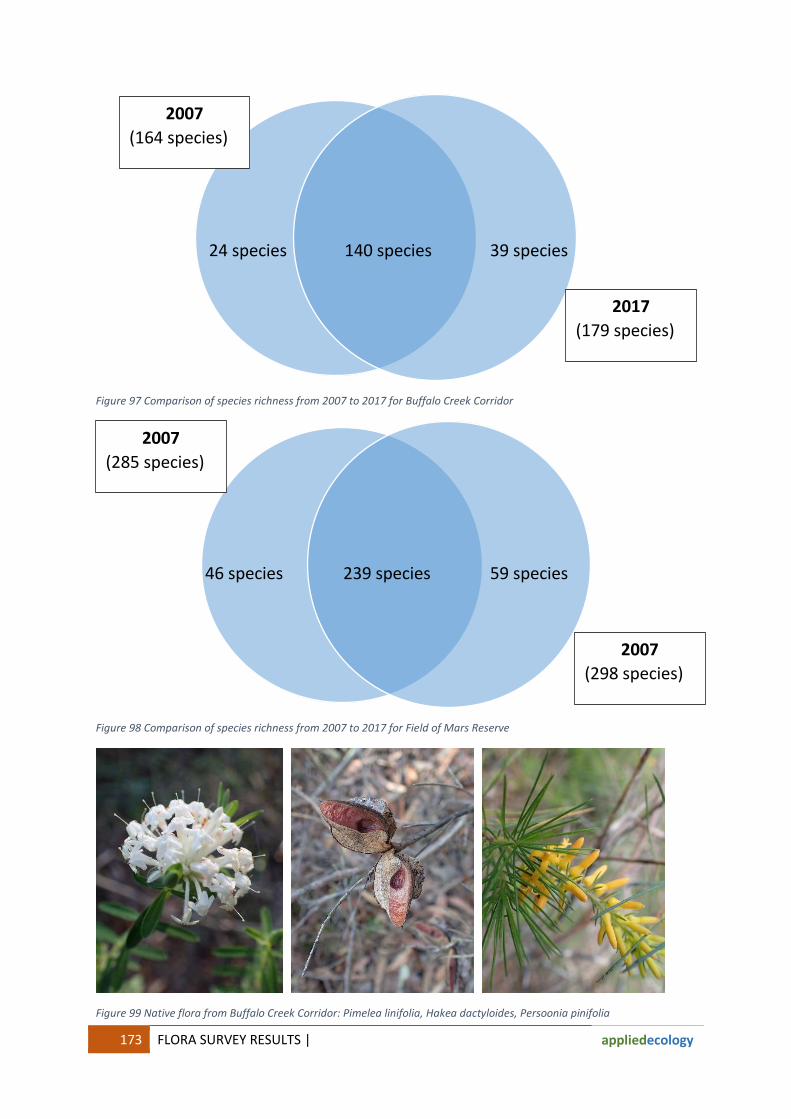
173 FLORA SURVEY RESULTS |
appliedecology
Figure 97 Comparison of species richness from 2007 to 2017 for Buffalo Creek Corridor
Figure 98 Comparison of species richness from 2007 to 2017 for Field of Mars Reserve
Figure 99 Native flora from Buffalo Creek Corridor: Pimelea linifolia, Hakea dactyloides, Persoonia pinifolia
140 species 24 species 39 species
2007
(164 species)
2017
(179 species)
239 species 46 species 59 species
2007
(285 species)
2007
(298 species)

FLORA SURVEY RESULTS 174
8.3 Regionally significant plant species
Regionally significant plant species were noted for each of the three Creek corridors. Regionally significant status was based on Kubiak’s (2005) report Native Plants of the Ryde District -The Conservation Significance of Ryde’s Bushland Plants, with supplementary assessments taken from Rare Bushland Plants of Western Sydney (James, McDougall & Benson, 1999).
8.4 Access database for reserves species lists
Each of the species recorded in any of the previous surveys (general reserve random meander, ground truthing, targeted threatened species searches) was entered into an Access® database for future use by City of Ryde Council staff.

175 FLORA SURVEY RESULTS |
appliedecology
8.5 PIDDING PARK QUADRAT
8.5.1 Quadrat location and description
Pidding Park quadrat is located just off Pidding Rd at the eastern end of the reserve (Figure 100).
Figure 100 Location of Pidding quadrat in Pidding Park
Figure 101 Typical view of Pidding Park quadrat (corner marked with orange flagging tape)

FLORA SURVEY RESULTS 176
Bushland condition in the quadrat at the time of survey was very dry, with a thick layer of leaf litter between trees and shrubs in open woodland (Figure 101).
8.5.2 Summary of species: 2007-2017
There was a notable change in species richness between 2007 and 2017, with 2 native flora species gained since 2007, and 16 native flora species not recorded in the subsequent 2017 survey (Table 32). Most of the species not recorded were forbs (5 species) and small shrubs (7 species). Extremely dry conditions would have affected the germination success for forbs on site, and these species may still be present as underground structures or in the soil seedbank. Similarly, small shrubs show less resilience in prolonged dry conditions, and this may have affected the observed species composition. Like forbs, it is very likely that the ‘missing’ shrubs are present in the soil seedbank.
In native bushland, introduced species are considered weeds. Reduction in diversity is generally the result of weed control activities (contract bush regeneration, bushcare). Increase in species numbers is due to invasion by new species to the area, in this case, the survey quadrat. Three species of introduced forbs were not recorded in 2017, and may be absent from the current survey due to dry weather conditions. Additional species were recorded in 2017, including a vine, small shrub and tree, suggesting that there has been little or no weed control in the area over recent years.
Table 32 Change in species numbers in Pidding Park quadrat for plants with different growth habits between 2007 and 2017
PLANT FORM NATIVE SPECIES INTRODUCED SPECIES
2007 2017 CHANGES 2007 2017 CHANGES
Ferns 2 3 +1 0 0 No change Herbs 9 4 -5 4 1 -3 Grasses 14 12 -2 3 3 No change Scrambler/vines 7 7 +1,-1 2 2 +1,-1 Small shrubs 19 12 -7 2 3 +1 Tall shrubs 6 5 -1 1 1 No change Trees 3 3 No change 2 3 +1 TOTAL 60 46 +2, -16 14 13 +3, -4
8.5.3 Changes in cover
Changes in vegetation composition are the result of two factors: a change in the species present, and a change in the relative cover of those species that are present. Species were grouped as native or introduced, and then categorised according to growth form. For each native species, the cover class either (i) was unchanged, (ii) increased, or (iii) decreased (Figure 102). For forbs and small shrubs, more than half the species present showed a reduction in cover in 2017 when compared to 2007. Both of these species groups therefore showed a reduction in species richness and a reduction in cover, or unchanged cover extent by each of the species present in 2017. Very few of these species showed an increase in cover.
The same was observed for introduced forb species in the quadrat, with all species showing a reduction in cover. Introduced species in each of the other floristic habit groups showed a fairly consistent increase in cover extent (Figure 103).

177 FLORA SURVEY RESULTS |
appliedecology
Figure 102 Numbers of native flora species with increased/decreased or unchanged cover in Pidding quadrat
Figure 103 Numbers of introduced flora species with increased/decreased or unchanged cover in Pidding quadrat
Given the net decrease in native species richness (-14 species), and decrease or absence of increase in cover extent for native flora, coupled with a general increase in the cover extent for introduced species, the condition trajectory for this quadrat is degrading.

FLORA SURVEY RESULTS 178
8.6 STRANGERS CREEK QUADRAT
8.6.1 Quadrat location and description
Strangers Creek quadrat is located just off the Sand Track at the northwestern end of Field of Mars Reserve (Figure 104).
Figure 104 Location of Strangers Creek quadrat in Field of Mars Reserve
Figure 105 Typical view of Strangers Creek quadrat (left of orange flagging tape which marks the western boundary)

179 FLORA SURVEY RESULTS |
appliedecology
Vegetation in Strangers Creek quadrat shows the effects of a lengthy dry period, with limited flowering and seeding observed, some wilting of vegetation, and a noteworthy layer of leaf litter (Figure 105).
8.6.2 Summary of species: 2007-2017
There was a notable change in species richness between 2007 and 2017, with 7 native flora species gained since 2007, and 19 native flora species not recorded in the subsequent 2017 survey (Table 33). While there was some loss of forbs (-4 species), most of the species not recorded were small shrubs (11 species). Extremely dry conditions may have affected the germination success for forbs on site, and these species would still be present in the soil seedbank.
The Field of Mars Reserve Fires devastated part of the reserve by bush fires in 2002 (Wikipedia, accessed December 2017). Five years later, during the first survey in 2007, there were numerous Acacia species recorded. Acacias are good colonisers and will respond rapidly post fire, resulting in a major presence in the quadrat in 2007. Ten years later, however, the vegetation has become more stabilised, and colonising species tend to be less well represented. Many of the smaller Acacias have reached the end of their lifespan between 5 and 15 years post fire, and it is not surprising that there were notably fewer of these species present. As well, small shrubs show less resilience in prolonged dry conditions, and this may have affected the observed species composition. These species may also have been affected by browsing or grazing, possibly by rabbits, bandicoots or macropods. Like the forbs, it is very likely that the ‘missing’ shrubs are present in the soil seedbank.
In native bushland, introduced species are considered weeds. Reduction in diversity is generally the result of weed control activities (contract bush regeneration, bushcare). Increase in species numbers is due to invasion by new species to the area, in this case, the survey quadrat. Two species of introduced flora were not recorded in 2017, and may be absent from the current survey due to dry weather conditions, or possibly as a result of ongoing targeted weed control activities. No additional species of introduced flora were recorded in 2017. The absence of change in species numbers for small shrubs and tall shrubs since 2007 supports the observed reduction in species numbers being due to weather as woody weeds are generally among the first to be targeted during bush regeneration.
Table 33 Change in species numbers in Strangers Creek quadrat for plants with different growth habits between 2007 & 2017
PLANT FORM NATIVE SPECIES INTRODUCED SPECIES
2007 2017 SPECIES 2007 2017 SPECIES
Ferns 3 2 -1 0 0 No change Herbs 11 7 -4 0 0 No change Grasses 16 15 +1,-2 2 1 -1 Scrambler/vines 6 7 +1 1 0 -1 Small shrubs 28 19 +2,-11 3 3 No change Tall shrubs 2 3 +2,-1 1 1 No change Trees 3 4 +1 0 0 No change TOTAL 69 57 +7, -19 7 5 -2
8.6.3 Changes in cover
Changes in vegetation composition are the result of two factors: a change in the species present, and a change in the relative cover of those species that are present. Species were grouped as native

FLORA SURVEY RESULTS 180
or introduced, and then categorised according to growth form. For each native species, the cover class either (i) was unchanged, (ii) increased, or (iii) decreased (Figure 106). For forbs and small shrubs, more than half the species present showed a reduction in cover in 2017 when compared to 2007. Both of these species groups therefore showed a reduction in species richness and a reduction in cover, or unchanged cover extent by each of the species present in 2017. Very few of these species showed an increase in cover.
The same was observed for introduced forb species in the quadrat, with all species showing a reduction in cover. Introduced species in each of the other floristic habit groups showed a fairly consistent increase in cover extent (Figure 107).
Figure 106 Numbers of native flora species with increased/decreased or unchanged cover in Strangers Creek quadrat
Figure 107 Numbers of introduced flora species with increased/decreased or unchanged cover in Strangers Creek quadrat

181 FLORA SURVEY RESULTS |
appliedecology
8.7 PIMELEA CURVIFLORA QUADRAT
8.7.1 Quadrat location and description
The Pimelea curviflora quadrat is located behind crypts in Field of Mars Reserve Cemetery (Figure 108).
Figure 108 Location of Pimelea curviflora quadrat in Field of Mars Reserve
Figure 109 Typical view of Pimelea curviflora quadrat (corner tagged with orange flagging tape, string line showing boundary)

FLORA SURVEY RESULTS 182
Vegetation in Pimelea curviflora quadrat shows the effects of a lengthy dry period, with limited flowering and seeding observed, some wilting of vegetation, and a thick layer of leaf litter (Figure 109).
8.7.2 Summary of species: 2007-2017
There was no net change in species richness between 2007 and 2017, with 8 native flora species gained since 2007, and 8 native flora species not recorded in the subsequent 2017 survey (Table 34), although this is a proportionally high turnover of species. The greatest changes in diversity were for small shrubs, with 3 species gained and 5 species ‘lost’. The Field of Mars Reserve Fires devastated part of the reserve by bush fires in 2002 (Wikipedia, accessed December 2017). Five years later, during the first survey in 2007, there were numerous Acacia species recorded. Acacias are good colonisers and will respond rapidly post fire, resulting in a major presence in the quadrat in 2007. Ten years later, however, the vegetation has become more stabilised, and colonising species tend to be less well represented. Many of the smaller Acacias have reached the end of their lifespan between 5 and 15 years post fire, and it is not surprising that there were notably fewer of these species present. As well, small shrubs show less resilience in prolonged dry conditions, and this may have affected the observed species composition. These species may also have been affected by browsing or grazing, possibly by rabbits, bandicoots or macropods. Like the forbs, it is very likely that the ‘missing’ shrubs are present in the soil seedbank.
In native bushland, introduced species are considered weeds. Reduction in diversity is generally the result of weed control activities (contract bush regeneration, bushcare). Increase in species numbers is due to invasion by new species to the area, in this case, the survey quadrat. Three species of introduced forbs were not recorded in 2017, and may be absent from the current survey due to dry weather conditions. Additional species were recorded in 2017, including a vine, small shrub and tree, suggesting that there has been little or no weed control in the area over recent years.
Table 34 Change in species numbers in Pimelea quadrat for plants with different growth habits between 2007 and 2017
PLANT FORM NATIVE SPECIES INTRODUCED SPECIES
2007 2017 CHANGES 2007 2017 CHANGES
Ferns 0 0 No change 0 0 No change Herbs 8 6 -2 0 0 No change Grasses 14 14 +1,-1 0 0 No change Scrambler/vines 4 5 +1 0 1 +1 Small shrubs 20 18 +3, -5 0 1 +1 Tall shrubs 3 5 +2 0 0 No change Trees 4 5 +1 0 1 +1 TOTAL 53 53 +8, -8 0 3 +3
8.7.3 Changes in cover
Changes in vegetation composition are the result of two factors: a change in the species present, and a change in the relative cover of those species that are present. Species were grouped as native or introduced, and then categorised according to growth form. For each native species, the cover class either (i) was unchanged, (ii) increased, or (iii) decreased (Figure 110). For most floristic forms, most of the species present remained unchanged or showed an increase in cover in 2017 compared to 2007. Overall, species richness was unchanged and cover extent was unchanged or increased for each of the species present in 2017.

183 FLORA SURVEY RESULTS |
appliedecology
In contrast, for introduced species in the quadrat, there was a fairly consistent increase in cover extent (Figure 111) that accompanied the net increase in species numbers.
Figure 110 Numbers of native flora species with increased/decreased or unchanged cover in Pimelea curviflora quadrat
Figure 111 Numbers of introduced flora species with increased/decreased or unchanged cover in Pimelea curviflora quadrat
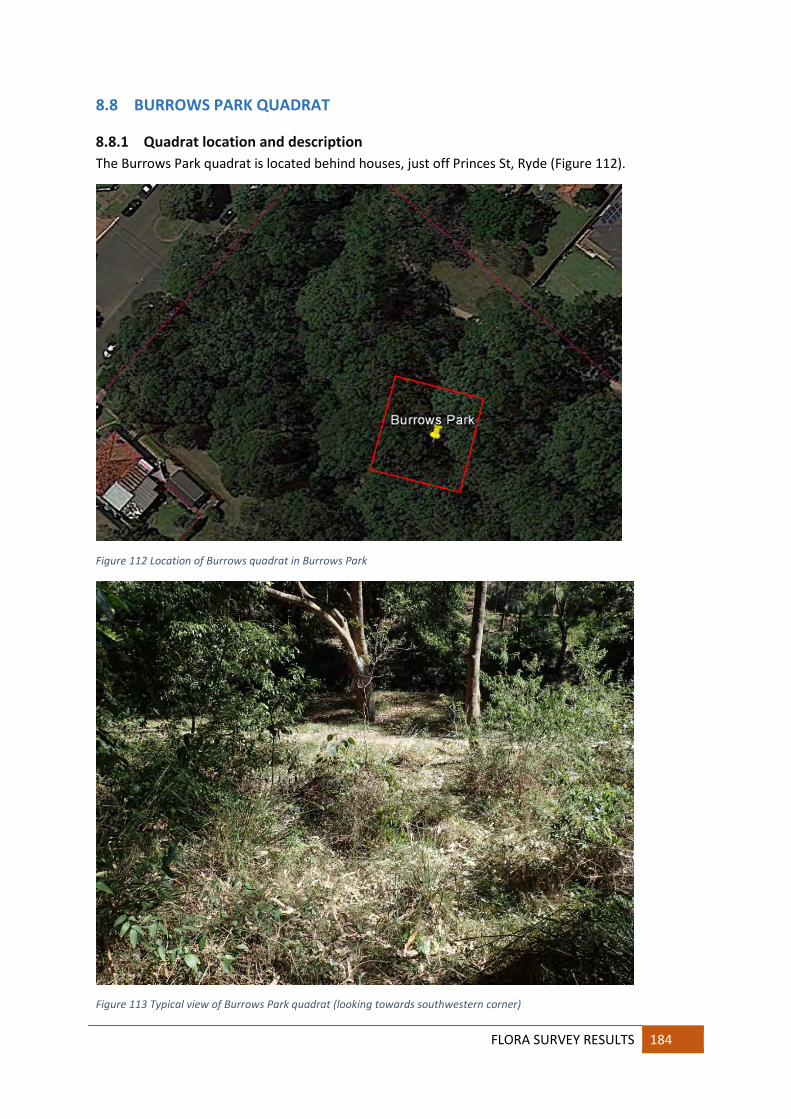
FLORA SURVEY RESULTS 184
8.8 BURROWS PARK QUADRAT
8.8.1 Quadrat location and description
The Burrows Park quadrat is located behind houses, just off Princes St, Ryde (Figure 112).
Figure 112 Location of Burrows quadrat in Burrows Park
Figure 113 Typical view of Burrows Park quadrat (looking towards southwestern corner)

185 FLORA SURVEY RESULTS |
appliedecology
Vegetation in Burrows quadrat shows the effects of a lengthy dry period, with limited flowering and seeding observed, extensive wilting of vegetation, and a thick layer of leaf litter (Figure 113).
8.8.2 Summary of species: 2007-2017
There was a notable change in species richness between 2007 and 2017, with 4 native flora species gained since 2007, and 13 native flora species not recorded in the subsequent 2017 survey (Table 35). Many of the species not recorded were forbs (6 species), although ‘loss’ of species was noted for most floristic forms. Extremely dry conditions would have affected the germination success for forbs on site, and these species may still be present as underground structures or in the soil seedbank. Similarly, many of the other floristic forms would have been affected by prolonged dry conditions, and this may have affected the observed species composition. Like forbs, it is very likely that the ‘missing’ species are present in the soil seedbank.
In native bushland, introduced species are considered weeds. Reduction in diversity is generally the result of weed control activities (contract bush regeneration, bushcare). Increase in species numbers is due to invasion by new species to the area, in this case, the survey quadrat. Eight species of introduced forbs were not recorded in 2017, and may be absent from the current survey due to dry weather conditions. Five additional species were recorded in 2017, and these may have been introduced to the site from neighbouring properties. Despite this, there is evidence of bush regeneration on site, and there were less weeds recorded in the current survey than in 2007. Other evidence for bush regeneration activities on site include the absence of corner posts for the quadrat. Three were unable to be located, and the fourth was found accidentally after more than an hour of searching, hidden in a dense clump of Lomandras. The other three posts may have been removed during bush regeneration works.
Table 35 Change in species numbers in Burrows quadrat for plants with different growth habits between 2007 and 2017
PLANT FORM NATIVE SPECIES INTRODUCED SPECIES
2007 2017 CHANGES 2007 2017 CHANGES
Ferns 1 0 -1 0 0 No change Herbs 8 2 -6 7 2 -5 Grasses 12 10 -2 2 1 -1 Scrambler/vines 8 6 -2 4 3 +1,-2 Small shrubs 8 8 +2,-2 1 2 +1 Tall shrubs 1 4 +2 2 4 +2 Trees 3 3 No change 2 3 +1 TOTAL 41 33 +4, -13 18 15 +5, -8
8.8.3 Changes in cover
Changes in vegetation composition are the result of two factors: a change in the species present, and a change in the relative cover of those species that are present. Species were grouped as native or introduced, and then categorised according to growth form. For each native species, the cover class either (i) was unchanged, (ii) increased, or (iii) decreased (Figure 114). In Burrows Park quadrat, there was a significant reduction in cover extent for forbs in 2017 when compared to 2007. Many of the other species groups also showed a reduction in cover, or unchanged cover extent by each of the species present in 2017. Few species showed an increase in cover.
Changes in cover extent were mixed for introduced species. Most floristic groups showed consistent increases in cover for introduced species, but some groups also had a number of species that had

FLORA SURVEY RESULTS 186
reduced cover. In particular, around two thirds of the species of forbs had reduced cover extent in 2017 compared to 2007 (Figure 115).
Figure 114 Numbers of native flora species with increased/decreased or unchanged cover in Burrows quadrat
Figure 115 Numbers of introduced flora species with increased/decreased or unchanged cover in Burrows quadrat

187 FLORA SURVEY RESULTS |
appliedecology
8.9 KITTYS CREEK QUADRAT
8.9.1 Quadrat location and description
The Portius Park survey quadrat is located behind houses off Blue Gum Drive/Wolfe Rd (Figure 116).
Figure 116 Location of Wolfe Rd quadrat in Portius Park
Figure 117 Typical view of Wolfe Rd quadrat (corner marked with orange flagging tape)
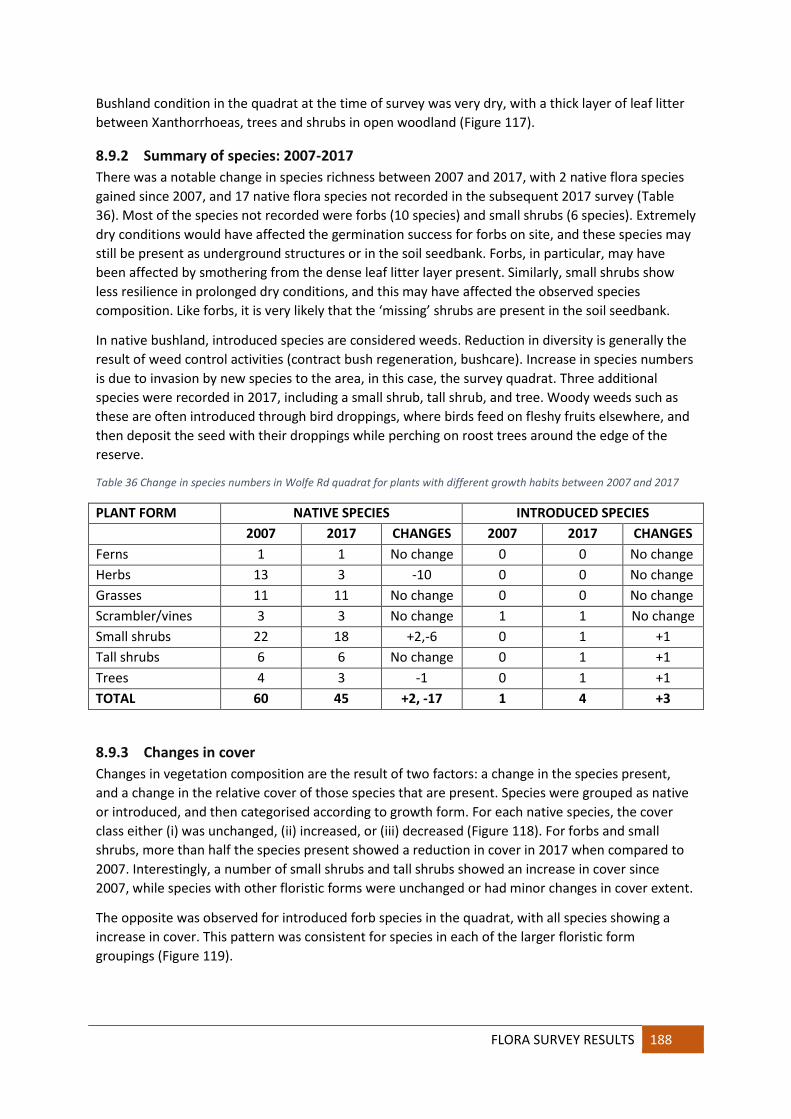
FLORA SURVEY RESULTS 188
Bushland condition in the quadrat at the time of survey was very dry, with a thick layer of leaf litter between Xanthorrhoeas, trees and shrubs in open woodland (Figure 117).
8.9.2 Summary of species: 2007-2017
There was a notable change in species richness between 2007 and 2017, with 2 native flora species gained since 2007, and 17 native flora species not recorded in the subsequent 2017 survey (Table 36). Most of the species not recorded were forbs (10 species) and small shrubs (6 species). Extremely dry conditions would have affected the germination success for forbs on site, and these species may still be present as underground structures or in the soil seedbank. Forbs, in particular, may have been affected by smothering from the dense leaf litter layer present. Similarly, small shrubs show less resilience in prolonged dry conditions, and this may have affected the observed species composition. Like forbs, it is very likely that the ‘missing’ shrubs are present in the soil seedbank.
In native bushland, introduced species are considered weeds. Reduction in diversity is generally the result of weed control activities (contract bush regeneration, bushcare). Increase in species numbers is due to invasion by new species to the area, in this case, the survey quadrat. Three additional species were recorded in 2017, including a small shrub, tall shrub, and tree. Woody weeds such as these are often introduced through bird droppings, where birds feed on fleshy fruits elsewhere, and then deposit the seed with their droppings while perching on roost trees around the edge of the reserve.
Table 36 Change in species numbers in Wolfe Rd quadrat for plants with different growth habits between 2007 and 2017
PLANT FORM NATIVE SPECIES INTRODUCED SPECIES
2007 2017 CHANGES 2007 2017 CHANGES
Ferns 1 1 No change 0 0 No change Herbs 13 3 -10 0 0 No change Grasses 11 11 No change 0 0 No change Scrambler/vines 3 3 No change 1 1 No change Small shrubs 22 18 +2,-6 0 1 +1 Tall shrubs 6 6 No change 0 1 +1 Trees 4 3 -1 0 1 +1 TOTAL 60 45 +2, -17 1 4 +3
8.9.3 Changes in cover
Changes in vegetation composition are the result of two factors: a change in the species present, and a change in the relative cover of those species that are present. Species were grouped as native or introduced, and then categorised according to growth form. For each native species, the cover class either (i) was unchanged, (ii) increased, or (iii) decreased (Figure 118). For forbs and small shrubs, more than half the species present showed a reduction in cover in 2017 when compared to 2007. Interestingly, a number of small shrubs and tall shrubs showed an increase in cover since 2007, while species with other floristic forms were unchanged or had minor changes in cover extent.
The opposite was observed for introduced forb species in the quadrat, with all species showing a increase in cover. This pattern was consistent for species in each of the larger floristic form groupings (Figure 119).

189 FLORA SURVEY RESULTS |
appliedecology
Figure 118 Numbers of native flora species with increased/decreased or unchanged cover in Wolfe Rd quadrat
Figure 119 Numbers of introduced flora species with increased/decreased or unchanged cover in Wolfe Rd quadrat

FLORA SURVEY RESULTS 190
8.10 LUCKNOW PARK QUADRAT
8.10.1 Quadrat location and description
The Lucknow/Somerset quadrat is located in the road reserve between the two parks, off Crimea Rd in Marsfield (Figure 120).
Figure 120 Location of Lucknow/Somerset quadrat between Lucknow and Somerset Parks
Figure 121 Typical view of Lucknow/Somerset quadrat (looking toward northeastern corner)

191 FLORA SURVEY RESULTS |
appliedecology
Vegetation in Lucknow/Somerset quadrat shows the effects of a lengthy dry period, with limited flowering and seeding observed, some wilting of vegetation, and a thick layer of leaf litter (Figure 121).
8.10.2 Summary of species: 2007-2017
There was a small net change in species richness between 2007 and 2017, with 4 native flora species gained since 2007, and 9 native flora species not recorded in the subsequent 2017 survey (Table 37). Most of the species not recorded were small shrubs (5 species). Extremely dry conditions would have affected the germination success for many species on site, and these species may still be present as underground structures or in the soil seedbank. Similarly, small shrubs show less resilience in prolonged dry conditions, and this may have affected the observed species composition. The observed changes in this quadrat raise questions about a reasonable or expectable level of turnover of species within a bushland patch, or vegetation community patch.
In native bushland, introduced species are considered weeds. No introduced species were recorded in this quadrat in 2007 or in 2017.
Table 37 Change in species numbers in Lucknow/Somerset quadrat for plants with different growth habits between 2007 and 2017
PLANT FORM NATIVE SPECIES INTRODUCED SPECIES
2007 2017 CHANGES 2007 2017 CHANGES
Ferns 1 1 No change 0 0 No change Herbs 12 10 -2 0 0 No change Grasses 16 15 -1 0 0 No change Scrambler/vines 3 4 +1 0 0 No change Small shrubs 30 27 +2,-5 0 0 No change Tall shrubs 5 5 +1,-1 0 0 No change Trees 2 2 No change 0 0 No change TOTAL 69 64 +4, -9 0 0 No change
8.10.3 Changes in cover
Changes in vegetation composition are the result of two factors: a change in the species present, and a change in the relative cover of those species that are present. Species were grouped as native or introduced, and then categorised according to growth form. For each native species, the cover class either (i) was unchanged, (ii) increased, or (iii) decreased (Figure 102). For most of the floristic form groupings, more than half the species present showed no change in cover extent in 2017 when compared to 2007. Small shrub species showed a reduction in cover extent, or unchanged cover extent in 2017. Very few of the floristic form groupings showed a notable increase in cover.
Again, there were no introduced species recorded in the quadrat in 2007 or in 2017, and so there was no observed change in cover extent. This was accompanied by a high native species richness (Figure 123).
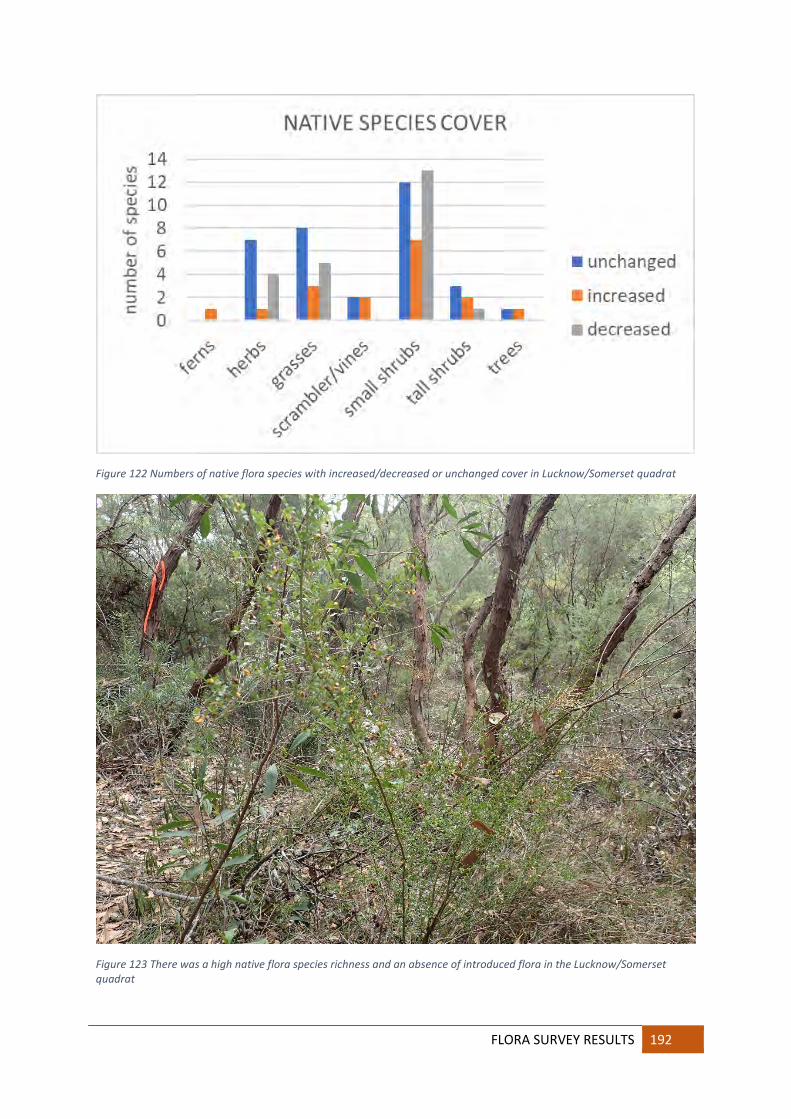
FLORA SURVEY RESULTS 192
Figure 122 Numbers of native flora species with increased/decreased or unchanged cover in Lucknow/Somerset quadrat
Figure 123 There was a high native flora species richness and an absence of introduced flora in the Lucknow/Somerset quadrat

193 FLORA SURVEY RESULTS |
appliedecology
8.11 PEMBROKE SOUTH QUADRAT
8.11.1 Quadrat location and description
Pembroke South quadrat is located behind the APZ for houses on Menzies Rd, Marsfield (Figure 124).
Figure 124 Location of Pembroke South quadrat in Pembroke Park
Figure 125 Typical view of Pembroke South quadrat (looking towards southwestern corner, marked with orange tape)
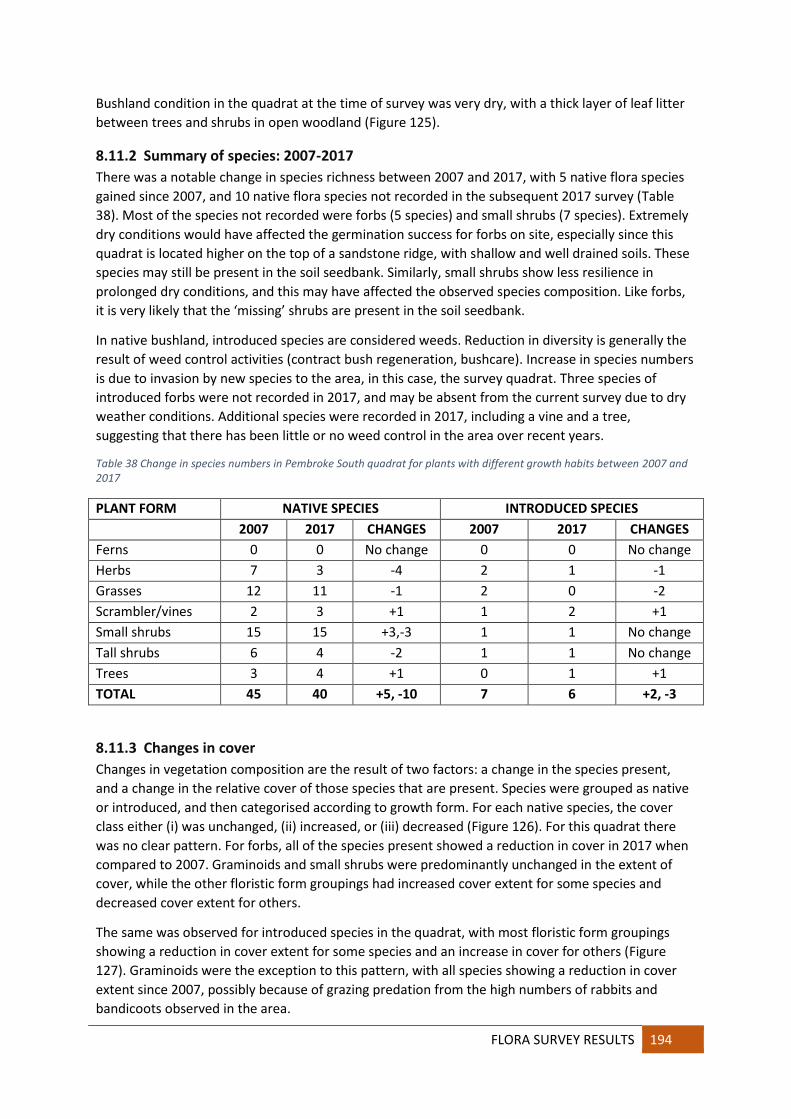
FLORA SURVEY RESULTS 194
Bushland condition in the quadrat at the time of survey was very dry, with a thick layer of leaf litter between trees and shrubs in open woodland (Figure 125).
8.11.2 Summary of species: 2007-2017
There was a notable change in species richness between 2007 and 2017, with 5 native flora species gained since 2007, and 10 native flora species not recorded in the subsequent 2017 survey (Table 38). Most of the species not recorded were forbs (5 species) and small shrubs (7 species). Extremely dry conditions would have affected the germination success for forbs on site, especially since this quadrat is located higher on the top of a sandstone ridge, with shallow and well drained soils. These species may still be present in the soil seedbank. Similarly, small shrubs show less resilience in prolonged dry conditions, and this may have affected the observed species composition. Like forbs, it is very likely that the ‘missing’ shrubs are present in the soil seedbank.
In native bushland, introduced species are considered weeds. Reduction in diversity is generally the result of weed control activities (contract bush regeneration, bushcare). Increase in species numbers is due to invasion by new species to the area, in this case, the survey quadrat. Three species of introduced forbs were not recorded in 2017, and may be absent from the current survey due to dry weather conditions. Additional species were recorded in 2017, including a vine and a tree, suggesting that there has been little or no weed control in the area over recent years.
Table 38 Change in species numbers in Pembroke South quadrat for plants with different growth habits between 2007 and 2017
PLANT FORM NATIVE SPECIES INTRODUCED SPECIES
2007 2017 CHANGES 2007 2017 CHANGES
Ferns 0 0 No change 0 0 No change Herbs 7 3 -4 2 1 -1 Grasses 12 11 -1 2 0 -2 Scrambler/vines 2 3 +1 1 2 +1 Small shrubs 15 15 +3,-3 1 1 No change Tall shrubs 6 4 -2 1 1 No change Trees 3 4 +1 0 1 +1 TOTAL 45 40 +5, -10 7 6 +2, -3
8.11.3 Changes in cover
Changes in vegetation composition are the result of two factors: a change in the species present, and a change in the relative cover of those species that are present. Species were grouped as native or introduced, and then categorised according to growth form. For each native species, the cover class either (i) was unchanged, (ii) increased, or (iii) decreased (Figure 126). For this quadrat there was no clear pattern. For forbs, all of the species present showed a reduction in cover in 2017 when compared to 2007. Graminoids and small shrubs were predominantly unchanged in the extent of cover, while the other floristic form groupings had increased cover extent for some species and decreased cover extent for others.
The same was observed for introduced species in the quadrat, with most floristic form groupings showing a reduction in cover extent for some species and an increase in cover for others (Figure 127). Graminoids were the exception to this pattern, with all species showing a reduction in cover extent since 2007, possibly because of grazing predation from the high numbers of rabbits and bandicoots observed in the area.

195 FLORA SURVEY RESULTS |
appliedecology
Figure 126 Numbers of native flora species with increased/decreased or unchanged cover in Pembroke South quadrat
Figure 127 Numbers of introduced flora species with increased/decreased or unchanged cover in Pembroke South quadrat

FLORA SURVEY RESULTS 196
8.12 PEMBROKE - TERRYS CREEK QUADRAT
8.12.1 Quadrat location and description
Pembroke Terrys Creek quadrat is located on Terrys Creek Walk, at the bottom of an informal track from Menzies Rd, Marsfield (Figure 128).
Figure 128 Location of Pembroke Terrys Creek quadrat in Pembroke Park
Figure 129 Typical view of Pembroke Terrys Creek Park quadrat (looking across quadrat from southeastern corner)
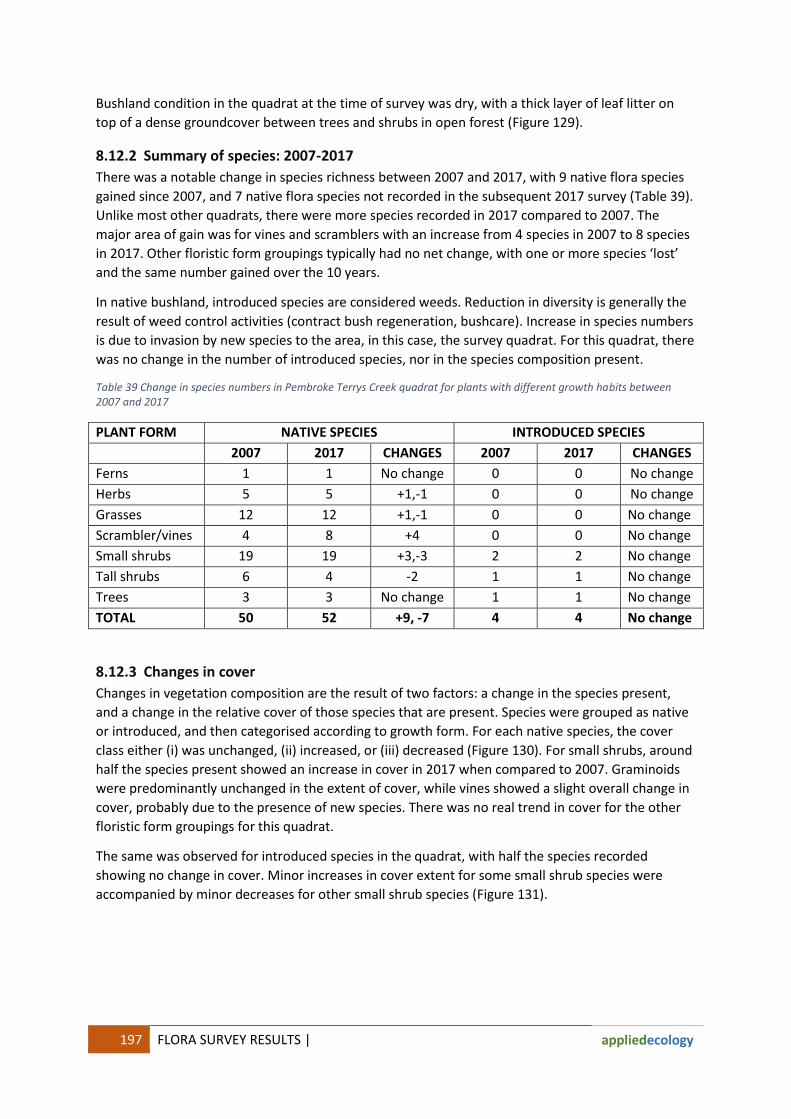
197 FLORA SURVEY RESULTS |
appliedecology
Bushland condition in the quadrat at the time of survey was dry, with a thick layer of leaf litter on top of a dense groundcover between trees and shrubs in open forest (Figure 129).
8.12.2 Summary of species: 2007-2017
There was a notable change in species richness between 2007 and 2017, with 9 native flora species gained since 2007, and 7 native flora species not recorded in the subsequent 2017 survey (Table 39). Unlike most other quadrats, there were more species recorded in 2017 compared to 2007. The major area of gain was for vines and scramblers with an increase from 4 species in 2007 to 8 species in 2017. Other floristic form groupings typically had no net change, with one or more species ‘lost’ and the same number gained over the 10 years.
In native bushland, introduced species are considered weeds. Reduction in diversity is generally the result of weed control activities (contract bush regeneration, bushcare). Increase in species numbers is due to invasion by new species to the area, in this case, the survey quadrat. For this quadrat, there was no change in the number of introduced species, nor in the species composition present.
Table 39 Change in species numbers in Pembroke Terrys Creek quadrat for plants with different growth habits between 2007 and 2017
PLANT FORM NATIVE SPECIES INTRODUCED SPECIES
2007 2017 CHANGES 2007 2017 CHANGES
Ferns 1 1 No change 0 0 No change Herbs 5 5 +1,-1 0 0 No change Grasses 12 12 +1,-1 0 0 No change Scrambler/vines 4 8 +4 0 0 No change Small shrubs 19 19 +3,-3 2 2 No change Tall shrubs 6 4 -2 1 1 No change Trees 3 3 No change 1 1 No change TOTAL 50 52 +9, -7 4 4 No change
8.12.3 Changes in cover
Changes in vegetation composition are the result of two factors: a change in the species present, and a change in the relative cover of those species that are present. Species were grouped as native or introduced, and then categorised according to growth form. For each native species, the cover class either (i) was unchanged, (ii) increased, or (iii) decreased (Figure 130). For small shrubs, around half the species present showed an increase in cover in 2017 when compared to 2007. Graminoids were predominantly unchanged in the extent of cover, while vines showed a slight overall change in cover, probably due to the presence of new species. There was no real trend in cover for the other floristic form groupings for this quadrat.
The same was observed for introduced species in the quadrat, with half the species recorded showing no change in cover. Minor increases in cover extent for some small shrub species were accompanied by minor decreases for other small shrub species (Figure 131).
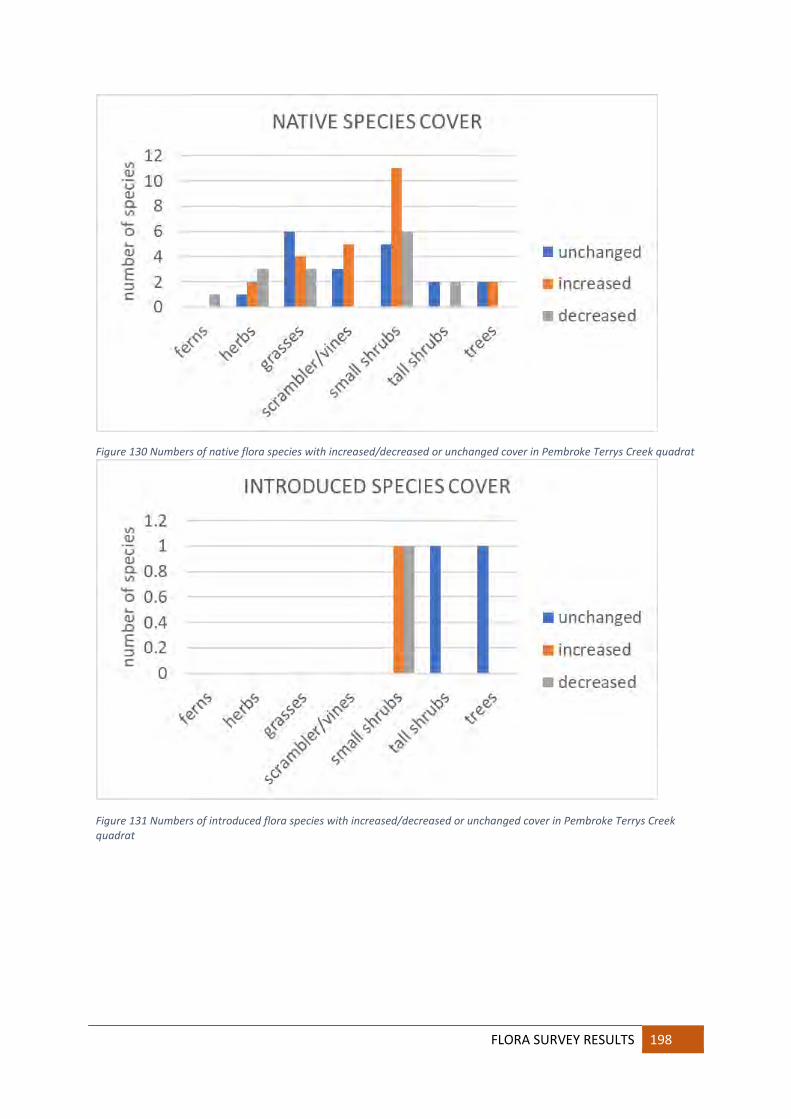
FLORA SURVEY RESULTS 198
Figure 130 Numbers of native flora species with increased/decreased or unchanged cover in Pembroke Terrys Creek quadrat
Figure 131 Numbers of introduced flora species with increased/decreased or unchanged cover in Pembroke Terrys Creek quadrat

199 FLORA SURVEY RESULTS |
appliedecology
8.13 PEMBROKE NORTH QUADRAT
8.13.1 Quadrat location and description
Pembroke North quadrat is also located on Terrys Creek Walk, behind CSIRO premises (Figure 132).
Figure 132 Location of Pembroke North quadrat in Pembroke Park
Figure 133 Typical view of Pembroke North quadrat (corner marked with orange flagging tape)

FLORA SURVEY RESULTS 200
Bushland condition in the quadrat at the time of survey was dry, with a scattered layer of leaf litter between trees and shrubs in open woodland (Figure 133). Areas of bare or nearly bare earth could easily be attributed to the activities of Brush Turkeys on the site, with a very large mound beside Terrys Creek Walk, just outside the quadrat boundary.
8.13.2 Summary of species: 2007-2017
There was a notable change in species richness between 2007 and 2017, with 4 native flora species gained since 2007, and 13 native flora species not recorded in the subsequent 2017 survey (Table 40). Most of the species not recorded were forbs (5 species) and graminoids (4 species). Extremely dry conditions would have affected the germination success for forbs on site, and these species may still be present as underground structures or in the soil seedbank. Reduction in cover extent for graminoids may be the result of grazing by rabbits and bandicoots, although, like forbs, it is very likely that the ‘missing’ shrubs are present in the soil seedbank. Ongoing scratching and scraping of the litter layer and soil surface by Brush Turkeys may have had an impact on the observed species richness, especially when coupled with the very dry weather conditions.
In native bushland, introduced species are considered weeds. Reduction in diversity is generally the result of weed control activities (contract bush regeneration, bushcare). Increase in species numbers is due to invasion by new species to the area, in this case, the survey quadrat. For this quadrat, there was very little change in species composition for introduced species.
Table 40 Change in species numbers in Pembroke North quad for plants with different growth habits between 2007 and 2017
PLANT FORM NATIVE SPECIES INTRODUCED SPECIES
2007 2017 CHANGES 2007 2017 CHANGES
Ferns 1 1 no change 0 0 No change Herbs 6 1 -5 1 0 -1 Grasses 12 10 +2,-4 0 0 No change Scrambler/vines 5 5 +1,-1 0 1 +1 Small shrubs 11 10 +1,-2 2 2 No change Tall shrubs 4 3 -1 1 1 No change Trees 4 4 no change 3 2 -1 TOTAL 43 34 +4, -13 7 6 +1, -2
8.13.3 Changes in cover
Changes in vegetation composition are the result of two factors: a change in the species present, and a change in the relative cover of those species that are present. Species were grouped as native or introduced, and then categorised according to growth form. For each native species, the cover class either (i) was unchanged, (ii) increased, or (iii) decreased (Figure 135). For this quadrat, changes
Figure 134 Brush Turkey mound near the quadrat
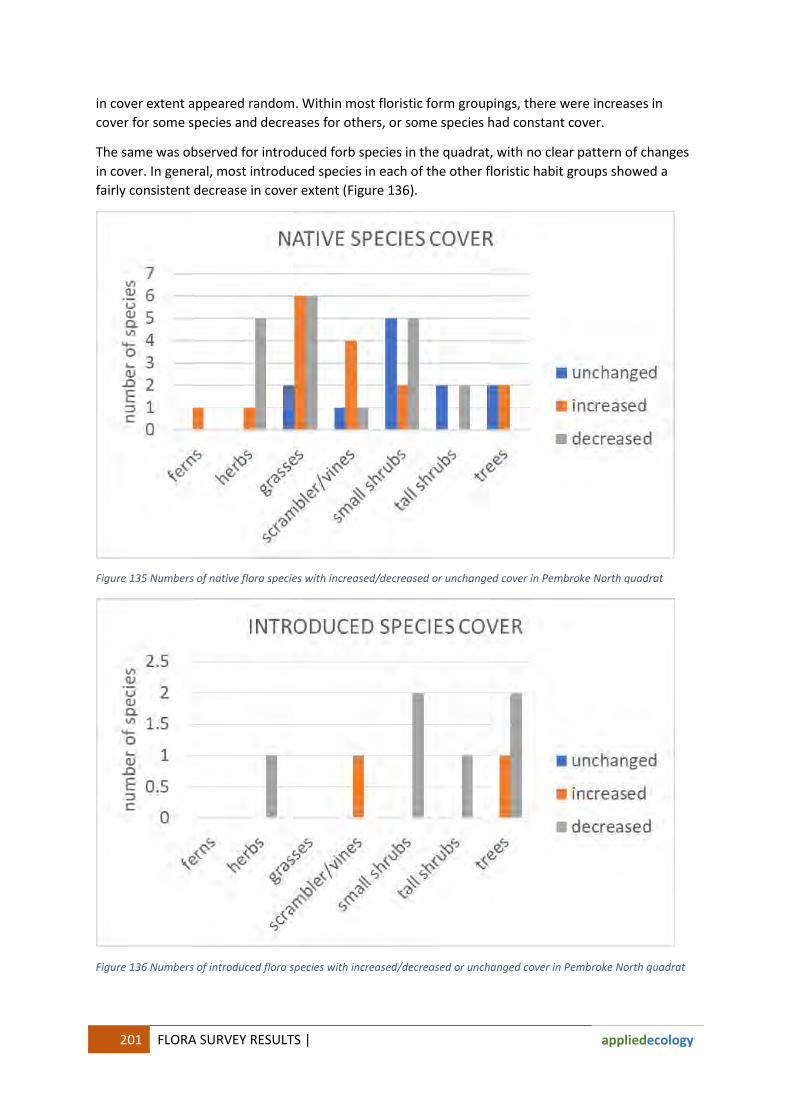
201 FLORA SURVEY RESULTS |
appliedecology
in cover extent appeared random. Within most floristic form groupings, there were increases in cover for some species and decreases for others, or some species had constant cover.
The same was observed for introduced forb species in the quadrat, with no clear pattern of changes in cover. In general, most introduced species in each of the other floristic habit groups showed a fairly consistent decrease in cover extent (Figure 136).
Figure 135 Numbers of native flora species with increased/decreased or unchanged cover in Pembroke North quadrat
Figure 136 Numbers of introduced flora species with increased/decreased or unchanged cover in Pembroke North quadrat
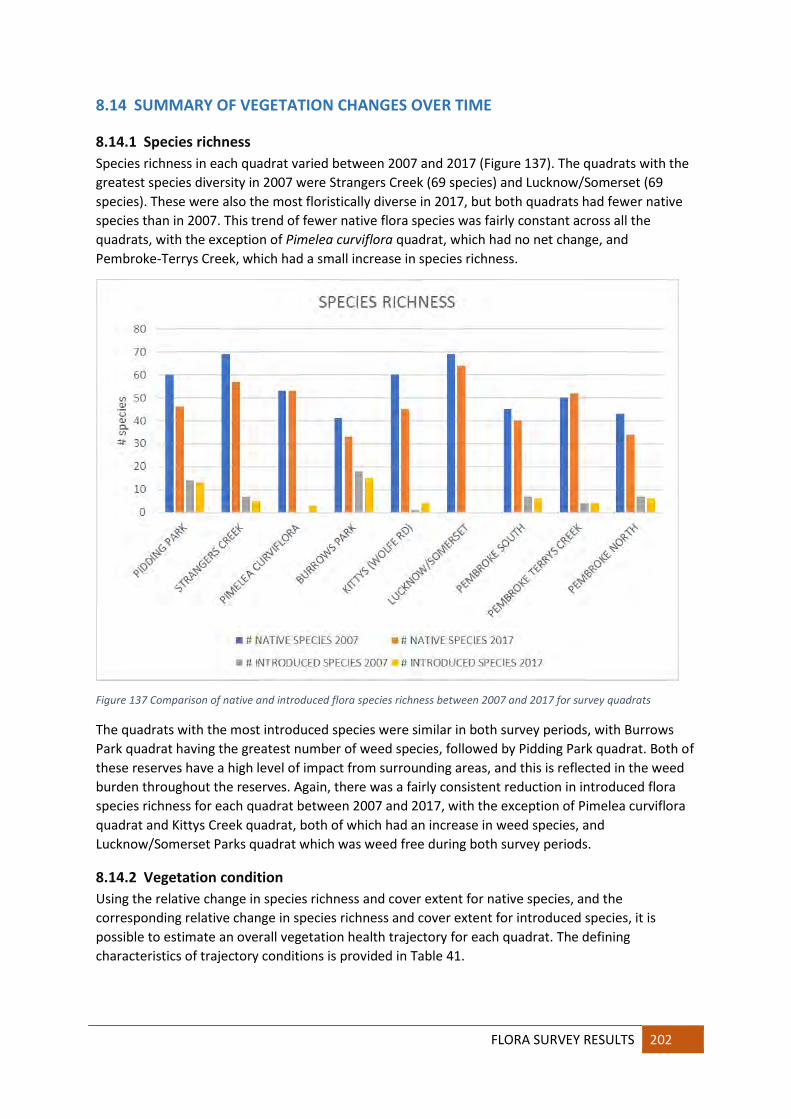
FLORA SURVEY RESULTS 202
8.14 SUMMARY OF VEGETATION CHANGES OVER TIME
8.14.1 Species richness
Species richness in each quadrat varied between 2007 and 2017 (Figure 137). The quadrats with the greatest species diversity in 2007 were Strangers Creek (69 species) and Lucknow/Somerset (69 species). These were also the most floristically diverse in 2017, but both quadrats had fewer native species than in 2007. This trend of fewer native flora species was fairly constant across all the quadrats, with the exception of Pimelea curviflora quadrat, which had no net change, and Pembroke-Terrys Creek, which had a small increase in species richness.
Figure 137 Comparison of native and introduced flora species richness between 2007 and 2017 for survey quadrats
The quadrats with the most introduced species were similar in both survey periods, with Burrows Park quadrat having the greatest number of weed species, followed by Pidding Park quadrat. Both of these reserves have a high level of impact from surrounding areas, and this is reflected in the weed burden throughout the reserves. Again, there was a fairly consistent reduction in introduced flora species richness for each quadrat between 2007 and 2017, with the exception of Pimelea curviflora quadrat and Kittys Creek quadrat, both of which had an increase in weed species, and Lucknow/Somerset Parks quadrat which was weed free during both survey periods.
8.14.2 Vegetation condition
Using the relative change in species richness and cover extent for native species, and the corresponding relative change in species richness and cover extent for introduced species, it is possible to estimate an overall vegetation health trajectory for each quadrat. The defining characteristics of trajectory conditions is provided in Table 41.

203 FLORA SURVEY RESULTS |
appliedecology
Table 41 Defining characteristics for species richness and cover extent of native and introduced species for vegetation condition trajectories
TRAJECTORY DEFINING CHARACTERISTICS
DEGRADING decrease in numbers and cover extent for native species with increase in numbers or cover extent for introduced species
MINOR DEGRADING
decrease in numbers or cover extent for native species with unchanged numbers or cover extent for introduced species OR unchanged numbers or cover extent for native species with increased numbers or cover extent for introduced species
STABLE little or no change in numbers or cover extent for native species with no change in numbers or cover extent for introduced species
IMPROVING no change or increase in numbers or cover extent for native species with no change or decrease in numbers or cover extent for introduced species
Data collected for each of the detailed condition survey quadrats was assessed to determine the overall vegetation condition changes and express this as a vegetation health trajectory (Table 42). Species numbers and cover extent were considered to be unchanged if the net change (species gained minus species not recorded) was 0, and included +/-1 species. A change of more than 1 species counted as an increase or decrease in species richness or number of species with a change in cover class.
Table 42 Changes in species richness and cover extent of native and introduced species used to determine vegetation condition trajectories for detailed survey quadrats
QUADRAT NO. NATIVE
SPECIES NO. INTRODUCED
SPECIES COVER EXTENT
NATIVES
COVER EXTENT INTRODUCED
SPECIES
OVERALL CONDITION TRAJECTORY
BUFFALO CREEK CORRIDOR
BURROWS PARK
decreased decreased decreased or unchanged
increased DEGRADING
PIDDING PARK decreased unchanged decreased or unchanged
increased DEGRADING
FIELD OF MARS RESERVE ADDITIONAL QUADRATS
STRANGERS CREEK
decreased decreased decreased or unchanged
unchanged MINOR DEGRADING
PIMELEA CURVIFLORA
unchanged increased unchanged or increased
increased MINOR DEGRADING
KITTYS CREEK CORRIDOR
KITTYS (WOLFE RD)
decreased increased decreased or unchanged
increased DEGRADING
TERRYS CREEK CORRIDOR
LUCKNOW-SOMERSET
decreased absent unchanged or decreased
absent STABLE
PEMBROKE NORTH
decreased unchanged decreased or unchanged
decreased MINOR DEGRADING
PEMBROKE TERRYS CREEK
increased unchanged increased or unchanged
unchanged IMPROVING
PEMBROKE SOUTH
decreased unchanged decreased or unchanged
unchanged MINOR DEGRADING
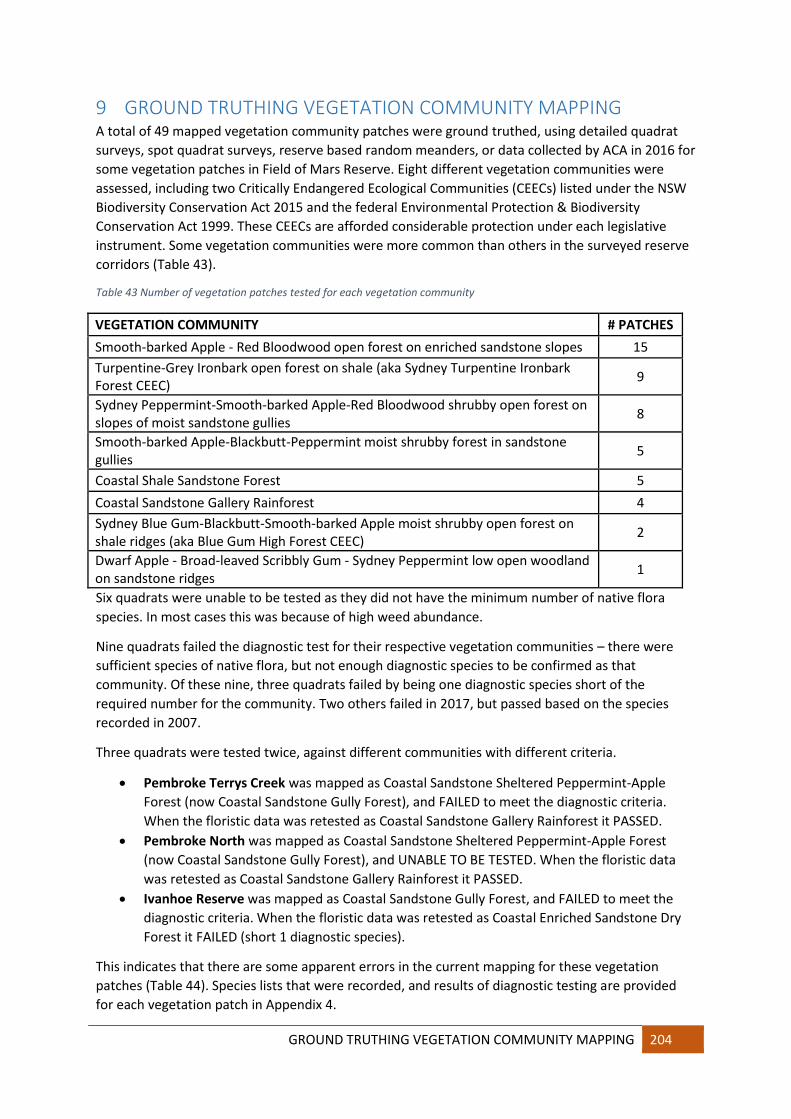
GROUND TRUTHING VEGETATION COMMUNITY MAPPING 204
9 GROUND TRUTHING VEGETATION COMMUNITY MAPPING A total of 49 mapped vegetation community patches were ground truthed, using detailed quadrat surveys, spot quadrat surveys, reserve based random meanders, or data collected by ACA in 2016 for some vegetation patches in Field of Mars Reserve. Eight different vegetation communities were assessed, including two Critically Endangered Ecological Communities (CEECs) listed under the NSW Biodiversity Conservation Act 2015 and the federal Environmental Protection & Biodiversity Conservation Act 1999. These CEECs are afforded considerable protection under each legislative instrument. Some vegetation communities were more common than others in the surveyed reserve corridors (Table 43).
Table 43 Number of vegetation patches tested for each vegetation community
VEGETATION COMMUNITY # PATCHES
Smooth-barked Apple - Red Bloodwood open forest on enriched sandstone slopes 15 Turpentine-Grey Ironbark open forest on shale (aka Sydney Turpentine Ironbark Forest CEEC) 9
Sydney Peppermint-Smooth-barked Apple-Red Bloodwood shrubby open forest on slopes of moist sandstone gullies 8
Smooth-barked Apple-Blackbutt-Peppermint moist shrubby forest in sandstone gullies 5
Coastal Shale Sandstone Forest 5 Coastal Sandstone Gallery Rainforest 4 Sydney Blue Gum-Blackbutt-Smooth-barked Apple moist shrubby open forest on shale ridges (aka Blue Gum High Forest CEEC) 2
Dwarf Apple - Broad-leaved Scribbly Gum - Sydney Peppermint low open woodland on sandstone ridges 1
Six quadrats were unable to be tested as they did not have the minimum number of native flora species. In most cases this was because of high weed abundance.
Nine quadrats failed the diagnostic test for their respective vegetation communities – there were sufficient species of native flora, but not enough diagnostic species to be confirmed as that community. Of these nine, three quadrats failed by being one diagnostic species short of the required number for the community. Two others failed in 2017, but passed based on the species recorded in 2007.
Three quadrats were tested twice, against different communities with different criteria.
Pembroke Terrys Creek was mapped as Coastal Sandstone Sheltered Peppermint-Apple Forest (now Coastal Sandstone Gully Forest), and FAILED to meet the diagnostic criteria. When the floristic data was retested as Coastal Sandstone Gallery Rainforest it PASSED.
Pembroke North was mapped as Coastal Sandstone Sheltered Peppermint-Apple Forest (now Coastal Sandstone Gully Forest), and UNABLE TO BE TESTED. When the floristic data was retested as Coastal Sandstone Gallery Rainforest it PASSED.
Ivanhoe Reserve was mapped as Coastal Sandstone Gully Forest, and FAILED to meet the diagnostic criteria. When the floristic data was retested as Coastal Enriched Sandstone Dry Forest it FAILED (short 1 diagnostic species).
This indicates that there are some apparent errors in the current mapping for these vegetation patches (Table 44). Species lists that were recorded, and results of diagnostic testing are provided for each vegetation patch in Appendix 4.
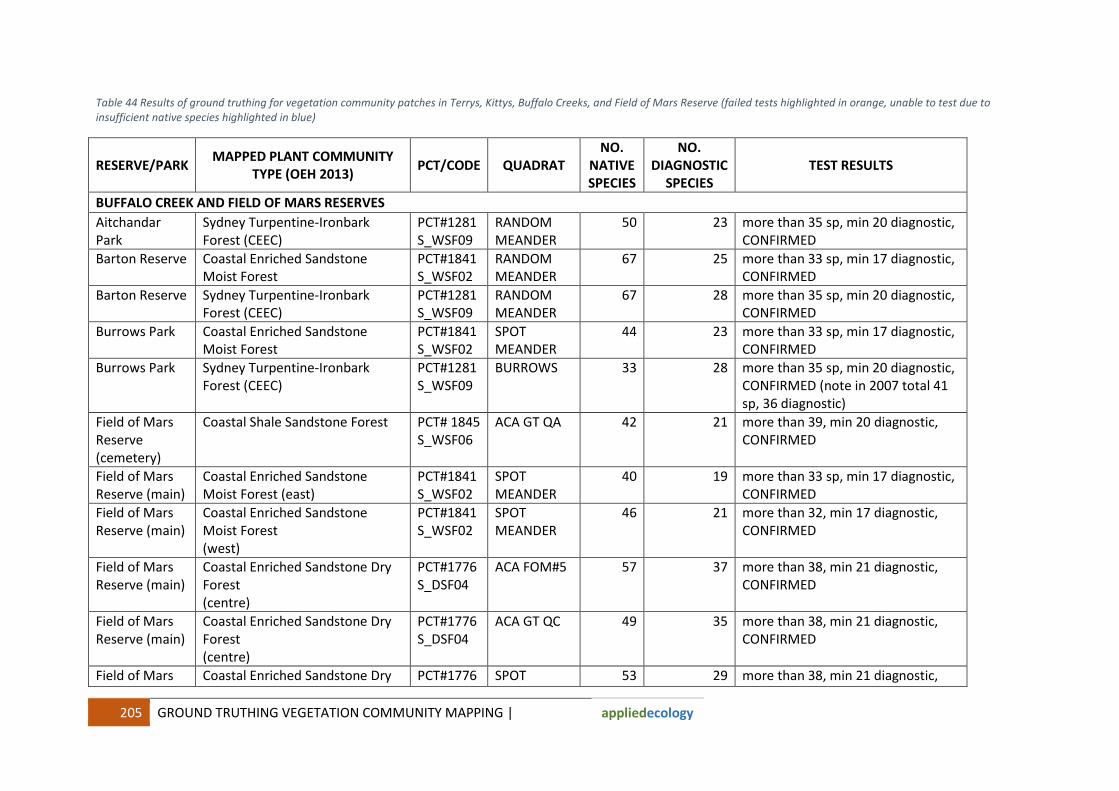
205 GROUND TRUTHING VEGETATION COMMUNITY MAPPING |
appliedecology
Table 44 Results of ground truthing for vegetation community patches in Terrys, Kittys, Buffalo Creeks, and Field of Mars Reserve (failed tests highlighted in orange, unable to test due to insufficient native species highlighted in blue)
RESERVE/PARK MAPPED PLANT COMMUNITY
TYPE (OEH 2013) PCT/CODE QUADRAT
NO. NATIVE SPECIES
NO. DIAGNOSTIC
SPECIES TEST RESULTS
BUFFALO CREEK AND FIELD OF MARS RESERVES
Aitchandar Park
Sydney Turpentine-Ironbark Forest (CEEC)
PCT#1281 S_WSF09
RANDOM MEANDER
50 23 more than 35 sp, min 20 diagnostic, CONFIRMED
Barton Reserve Coastal Enriched Sandstone Moist Forest
PCT#1841 S_WSF02
RANDOM MEANDER
67 25 more than 33 sp, min 17 diagnostic, CONFIRMED
Barton Reserve Sydney Turpentine-Ironbark Forest (CEEC)
PCT#1281 S_WSF09
RANDOM MEANDER
67 28 more than 35 sp, min 20 diagnostic, CONFIRMED
Burrows Park Coastal Enriched Sandstone Moist Forest
PCT#1841 S_WSF02
SPOT MEANDER
44 23 more than 33 sp, min 17 diagnostic, CONFIRMED
Burrows Park Sydney Turpentine-Ironbark Forest (CEEC)
PCT#1281 S_WSF09
BURROWS 33 28 more than 35 sp, min 20 diagnostic, CONFIRMED (note in 2007 total 41 sp, 36 diagnostic)
Field of Mars Reserve (cemetery)
Coastal Shale Sandstone Forest PCT# 1845 S_WSF06
ACA GT QA 42 21 more than 39, min 20 diagnostic, CONFIRMED
Field of Mars Reserve (main)
Coastal Enriched Sandstone Moist Forest (east)
PCT#1841 S_WSF02
SPOT MEANDER
40 19 more than 33 sp, min 17 diagnostic, CONFIRMED
Field of Mars Reserve (main)
Coastal Enriched Sandstone Moist Forest (west)
PCT#1841 S_WSF02
SPOT MEANDER
46 21 more than 32, min 17 diagnostic, CONFIRMED
Field of Mars Reserve (main)
Coastal Enriched Sandstone Dry Forest (centre)
PCT#1776 S_DSF04
ACA FOM#5 57 37 more than 38, min 21 diagnostic, CONFIRMED
Field of Mars Reserve (main)
Coastal Enriched Sandstone Dry Forest (centre)
PCT#1776 S_DSF04
ACA GT QC 49 35 more than 38, min 21 diagnostic, CONFIRMED
Field of Mars Coastal Enriched Sandstone Dry PCT#1776 SPOT 53 29 more than 38, min 21 diagnostic,

GROUND TRUTHING VEGETATION COMMUNITY MAPPING 206
RESERVE/PARK MAPPED PLANT COMMUNITY
TYPE (OEH 2013) PCT/CODE QUADRAT
NO. NATIVE SPECIES
NO. DIAGNOSTIC
SPECIES TEST RESULTS
Reserve (main) Forest (centre)
S_DSF04 MEANDER CONFIRMED
Field of Mars Reserve (main)
Coastal Enriched Sandstone Dry Forest (east)
PCT#1776 S_DSF04
SPOT MEANDER
43 17 more than 38, min 21 diagnostic, FAILED
Field of Mars Reserve (main)
Coastal Enriched Sandstone Dry Forest (west)
PCT#1776 S_DSF04
SPOT MEANDER
35 21 more than 38, min 21 diagnostic, CONFIRMED
Field of Mars Reserve (main)
Coastal Shale Sandstone Forest (centre)
PCT# 1845 S_WSF06
PIMELEA 61 29 more than 39, min 20 diagnostic, CONFIRMED
Field of Mars Reserve (main)
Coastal Shale Sandstone Forest (north)
PCT# 1845 S_WSF06
STRANGERS 57 38 more than 39, min 20 diagnostic, CONFIRMED
Field of Mars Reserve (main)
Coastal Shale Sandstone Forest (south)
PCT# 1845 S_WSF06
SPOT MEANDER
42 20 more than 39, min 20 diagnostic, CONFIRMED
Field of Mars Reserve (main)
Coastal Shale Sandstone Forest (west)
PCT# 1845 S_WSF06
SPOT MEANDER
48 20 more than 39, min 20 diagnostic, CONFIRMED
Field of Mars Reserve (main)
Sydney Turpentine-Ironbark Forest (CEEC) (east)
PCT#1281 S_WSF09
SPOT MEANDER
29 13 more than 35 sp, min 20 diagnostic, UNABLE TO TEST
Field of Mars Reserve (main)
Sydney Turpentine-Ironbark Forest (CEEC) (west)
PCT#1281 S_WSF09
ACA GT QD 53 30 more than 35 sp, min 20 diagnostic, CONFIRMED
Laurel Park Coastal Enriched Sandstone Moist Forest
PCT#1841 S_WSF02
RANDOM MEANDER
42 16 more than 33 sp, min 17 diagnostic, FAILED (short 1 diagnostic species)
Minga Reserve Sydney Turpentine-Ironbark Forest (CEEC)
PCT#1281 S_WSF09
RANDOM MEANDER
50 21 more than 35 sp, min 20 diagnostic, CONFIRMED
Pidding Park Coastal Enriched Sandstone Dry Forest *
PCT#1776 S_DSF04
PIDDING 46 33 more than 38, min 21 diagnostic, CONFIRMED
Tyrell Park Sydney Turpentine-Ironbark Forest (CEEC)
PCT#1281 S_WSF09
SPOT MEANDER
21 14 more than 35 sp, min 20 diagnostic, UNABLE TO TEST

207 GROUND TRUTHING VEGETATION COMMUNITY MAPPING |
appliedecology
RESERVE/PARK MAPPED PLANT COMMUNITY
TYPE (OEH 2013) PCT/CODE QUADRAT
NO. NATIVE SPECIES
NO. DIAGNOSTIC
SPECIES TEST RESULTS
KITTYS CREEK RESERVES
Kittys Creek Reserve
Coastal Enriched Sandstone Dry Forest
PCT#1776 S_DSF04
RANDOM MEANDER
60 26 more than 38, min 21 diagnostic, CONFIRMED
Kittys Creek Reserve
Coastal Sandstone Gully Forest PCT#1250 S_DSF09
RANDOM MEANDER
61 21 more than 45 sp, min 32 diagnostic, FAILED
Martin Reserve Coastal Enriched Sandstone Dry Forest
PCT#1776 S_DSF04
RANDOM MEANDER
68 20 more than 38, min 21 diagnostic, FAILED (short 1 diagnostic species)
Portius Park Coastal Enriched Sandstone Dry Forest (north)
PCT#1776 S_DSF04
SPOT MEANDER
46 20 more than 38, min 21 diagnostic, FAILED (short 1 diagnostic species)
Portius Park Coastal Enriched Sandstone Dry Forest(south)
PCT#1776 S_DSF04
SPOT MEANDER
47 25 more than 38, min 21 diagnostic, CONFIRMED
Portius Park Coastal Sandstone Gallery Rainforest
PCT#1250 S_DSF09
SPOT MEANDER
43 10 more than 15 sp, min 3 diagnostic, CONFIRMED
Portius Park Coastal Sandstone Gully Forest PCT#1250 S_DSF09
WOLFE RD 45 35 more than 45 sp, min 32 diagnostic, CONFIRMED (note in 2007 total 60 sp, 43 diagnostic)
Pryor Park Sydney Turpentine-Ironbark Forest (CEEC)
PCT#1281 S_WSF09
RANDOM MEANDER
78 22 more than 35 sp, min 20 diagnostic, CONFIRMED
TERRYS CREEK RESERVES
Forrester Park Sydney Turpentine-Ironbark Forest (CEEC)
PCT#1281 S_WSF09
RANDOM MEANDER
54 17 more than 35 sp, min 20 diagnostic, FAILED (note in 2007 total 60 sp, 31 diagnostic)
Forsyth Park Coastal Enriched Sandstone Dry Forest
PCT#1776 S_DSF04
RANDOM MEANDER
85 29 more than 38, min 21 diagnostic, CONFIRMED
Ivanhoe Reserve
Coastal Sandstone Gully Forest (mapped) OR…
PCT#1250 S_DSF09
RANDOM MEANDER
79 23 more than 45 sp, min 32 diagnostic, FAILED
Ivanhoe Reserve
RETESTED AS: Coastal Enriched Sandstone Dry
PCT#1776 S_DSF04
RANDOM MEANDER
79 20 more than 38, min 21 diagnostic, FAILED (short 1 diagnostic species)

GROUND TRUTHING VEGETATION COMMUNITY MAPPING 208
RESERVE/PARK MAPPED PLANT COMMUNITY
TYPE (OEH 2013) PCT/CODE QUADRAT
NO. NATIVE SPECIES
NO. DIAGNOSTIC
SPECIES TEST RESULTS
Forest Jim Walsh Park Blue Gum High Forest(CEEC) PCT#1237
S_WSF01 RANDOM MEANDER
34 7 more than 33 sp, min 22 diagnostic, FAILED
Lucknow Park Coastal Enriched Sandstone Dry Forest
PCT#1776 S_DSF04
LUCKNOW 64 25 more than 38, min 21 diagnostic, CONFIRMED
Lucknow Park Coastal Sandstone Gallery Rainforest
PCT#1828 S_RF02
SPOT MEANDER
31 9 more than 15 sp, min 3 diagnostic, CONFIRMED
Lucknow Park Coastal Sandstone Gully Forest PCT#1250 S_DSF09
SPOT MEANDER
56 36 more than 45 sp, min 32 diagnostic, CONFIRMED
Pembroke Park Coastal Enriched Sandstone Dry Forest (north)
PCT#1776 S_DSF04
SPOT MEANDER
53 30 more than 38, min 21 diagnostic, CONFIRMED
Pembroke Park Coastal Enriched Sandstone Dry Forest (south)
PCT#1776 S_DSF04
PEM-C 39 23 more than 38, min 21 diagnostic, CONFIRMED
Pembroke Park Coastal Sandstone Gully Forest (mapped) OR…
PCT#1250 S_DSF09
PEM-TC 52 23 more than 45 sp, min 32 diagnostic, FAILED (note in 2007 total 50 sp, 23 diagnostic)
Pembroke Park RETESTED AS: Coastal Sandstone Gallery Rainforest
PCT#1828 S_RF02
PEM-TC 52 4 more than 15 sp, min 3 diagnostic, CONFIRMED
Pembroke Park Coastal Sandstone Gully Forest PCT#1250 S_DSF09
SPOT MEANDER
67 37 more than 45 sp, min 32 diagnostic, CONFIRMED
Pembroke Park Coastal Sandstone Gully Forest (mapped) OR…
PCT#1250 S_DSF09
PEM-N 34 16 more than 45 sp, min 32 diagnostic, UNABLE TO TEST
Pembroke Park RETESTED AS: Coastal Sandstone Gallery Rainforest
PCT#1828 S_RF02
PEM-N 34 6 more than 15 sp, min 3 diagnostic, CONFIRMED
Somerset Park Coastal Sandstone Gully Forest PCT#1250 SPOT 46 34 more than 45 sp, min 32 diagnostic,

209 GROUND TRUTHING VEGETATION COMMUNITY MAPPING |
appliedecology
RESERVE/PARK MAPPED PLANT COMMUNITY
TYPE (OEH 2013) PCT/CODE QUADRAT
NO. NATIVE SPECIES
NO. DIAGNOSTIC
SPECIES TEST RESULTS
S_DSF09 MEANDER CONFIRMED Somerset Park Hornsby Enriched Sandstone
Exposed Woodland on sandstone ridges
PCT#1782 S_DSF10
SPOT MEANDER
37 15 more than 38 sp, min 21 diagnostic, UNABLE TO TEST
Yarramar Reserve
Blue Gum High Forest(CEEC) PCT#1237 S_WSF01
RANDOM MEANDER
5 4 more than 33 sp, min 22 diagnostic, UNABLE TO TEST

| GROUND TRUTHING VEGETATION COMMUNITY MAPPING 210
Figure 138 Areas where current vegetation mapping is not supported by vegetation on the ground (shown in orange circles)

211 VEGETATION COMMUNITY DESCRIPTIONS |
appliedecology
10 VEGETATION COMMUNITY DESCRIPTIONS A description of each of the main vegetation communities in City of Ryde LGA is provided below. These are drawn from OEH’s (2016) Native Vegetation Mapping of the Sydney Metropolitan Area.
10.1 PCT#1776 Smooth-barked Apple - Red Bloodwood open forest on enriched
sandstone slopes around Sydney and the Central Coast
Formerly Coastal Enriched Sandstone Sheltered (Dry) Forest (S_DSF04)
Coastal Enriched Sandstone Dry Forest is commonly encountered on the upper slopes and dry gullies of Sydney urban areas. It is a tall open eucalypt forest with an understorey of dry sclerophyll shrubs with ferns and forbs amongst the ground cover. The commonly recorded eucalypts are smooth-barked apple (Angophora costata), red bloodwood (Corymbia gummifera) and Sydney Peppermint (Eucalyptus
piperita). Blackbutt (Eucalyptus pilularis) is common on gully slopes of the north shore. A sparse layer of small trees such as Allocasuarina littoralis and old-man banksia (Banksia serrata) is common above a variety of wattles, tea-trees, gee bungs and grass trees.
Figure 139 PCT#1776 Smooth-barked Apple - Red Bloodwood open forest, seen in Lucknow Park (Terrys Creek)
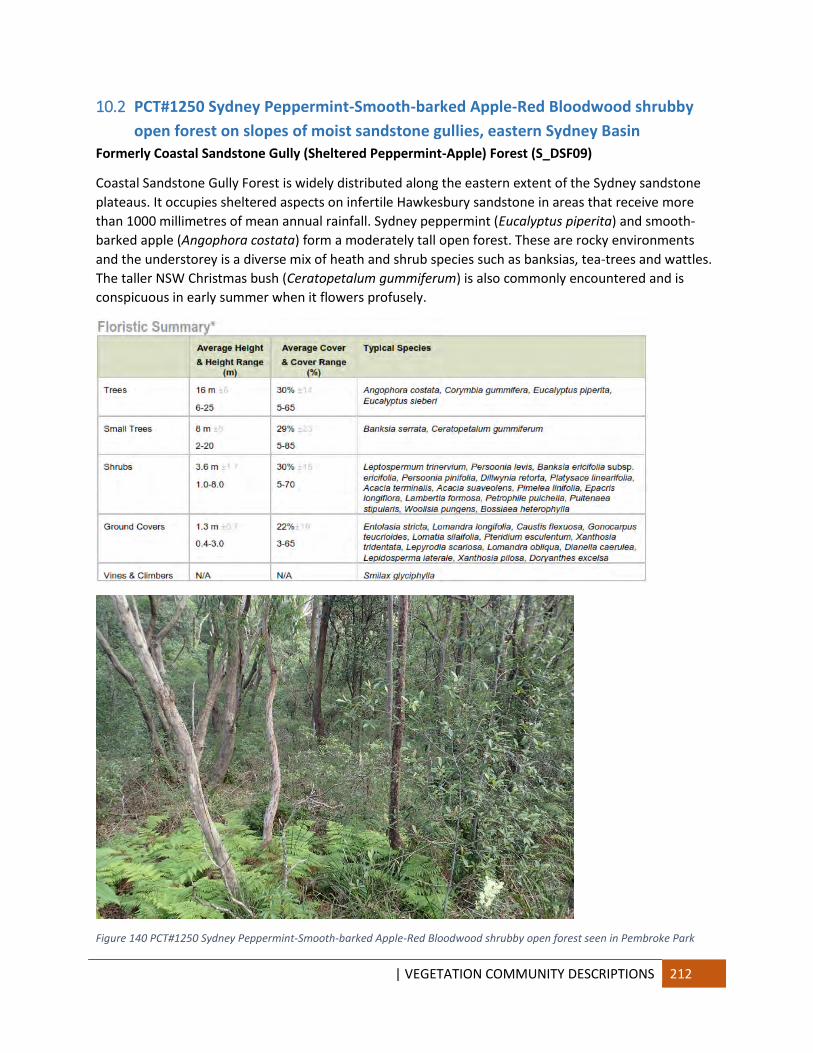
| VEGETATION COMMUNITY DESCRIPTIONS 212
10.2 PCT#1250 Sydney Peppermint-Smooth-barked Apple-Red Bloodwood shrubby
open forest on slopes of moist sandstone gullies, eastern Sydney Basin
Formerly Coastal Sandstone Gully (Sheltered Peppermint-Apple) Forest (S_DSF09)
Coastal Sandstone Gully Forest is widely distributed along the eastern extent of the Sydney sandstone plateaus. It occupies sheltered aspects on infertile Hawkesbury sandstone in areas that receive more than 1000 millimetres of mean annual rainfall. Sydney peppermint (Eucalyptus piperita) and smooth-barked apple (Angophora costata) form a moderately tall open forest. These are rocky environments and the understorey is a diverse mix of heath and shrub species such as banksias, tea-trees and wattles. The taller NSW Christmas bush (Ceratopetalum gummiferum) is also commonly encountered and is conspicuous in early summer when it flowers profusely.
Figure 140 PCT#1250 Sydney Peppermint-Smooth-barked Apple-Red Bloodwood shrubby open forest seen in Pembroke Park

213 VEGETATION COMMUNITY DESCRIPTIONS |
appliedecology
10.3 PCT#1237 Sydney Blue Gum-Blackbutt-Smooth-barked Apple moist shrubby
open forest on shale ridges of the Hornsby Plateau, Sydney Basin
Formerly Blue Gum High Forest (S_WSF01)
Blue Gum High Forest (Benson and Howell 1990) is a tall wet sclerophyll forest found on fertile shale soils in the high rainfall districts of Sydney’s north shore. It is dominated by Sydney blue gum (Eucalyptus
saligna), blackbutt (Eucalyptus pilularis) and turpentine (Syncarpia glomulifera) with a number of other eucalypts occurring patchily. A sparse to open cover of small trees is found at most sites and includes a variety of sclerophyllous and mesophyllous species. The ground layer is variable in both composition and cover. It may be ferny, grassy or herbaceous depending on topographic situation and disturbance history. At some sites vines and climbers are prolific. Blue Gum High Forest is found on a range of shale or shale-influenced substrates in areas receiving higher annual rainfall. It is most common across the ridgelines between Castle Hill and St Ives with small areas occurring in Ryde, Lane Cove and Willoughby where it is found at lower elevations.
Figure 141 PCT#1237 Sydney Blue Gum-Blackbutt-Smooth-barked Apple moist shrubby open forest in Forrester Park
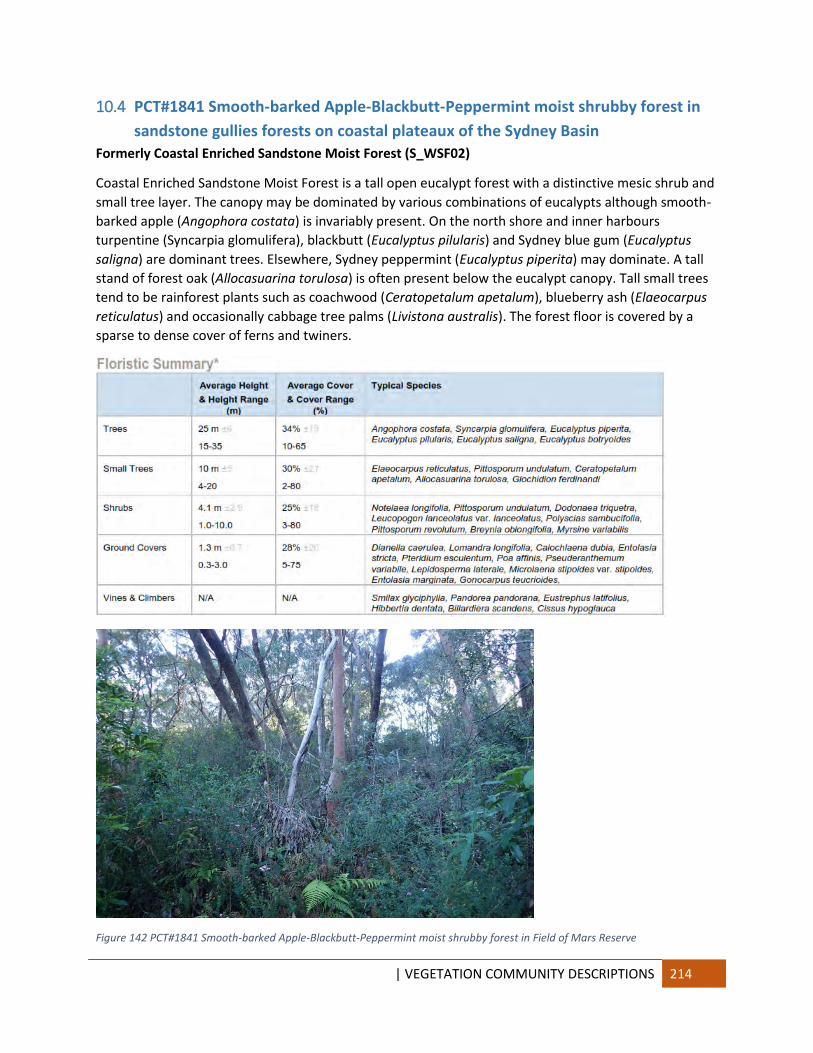
| VEGETATION COMMUNITY DESCRIPTIONS 214
10.4 PCT#1841 Smooth-barked Apple-Blackbutt-Peppermint moist shrubby forest in
sandstone gullies forests on coastal plateaux of the Sydney Basin
Formerly Coastal Enriched Sandstone Moist Forest (S_WSF02)
Coastal Enriched Sandstone Moist Forest is a tall open eucalypt forest with a distinctive mesic shrub and small tree layer. The canopy may be dominated by various combinations of eucalypts although smooth-barked apple (Angophora costata) is invariably present. On the north shore and inner harbours turpentine (Syncarpia glomulifera), blackbutt (Eucalyptus pilularis) and Sydney blue gum (Eucalyptus
saligna) are dominant trees. Elsewhere, Sydney peppermint (Eucalyptus piperita) may dominate. A tall stand of forest oak (Allocasuarina torulosa) is often present below the eucalypt canopy. Tall small trees tend to be rainforest plants such as coachwood (Ceratopetalum apetalum), blueberry ash (Elaeocarpus
reticulatus) and occasionally cabbage tree palms (Livistona australis). The forest floor is covered by a sparse to dense cover of ferns and twiners.
Figure 142 PCT#1841 Smooth-barked Apple-Blackbutt-Peppermint moist shrubby forest in Field of Mars Reserve
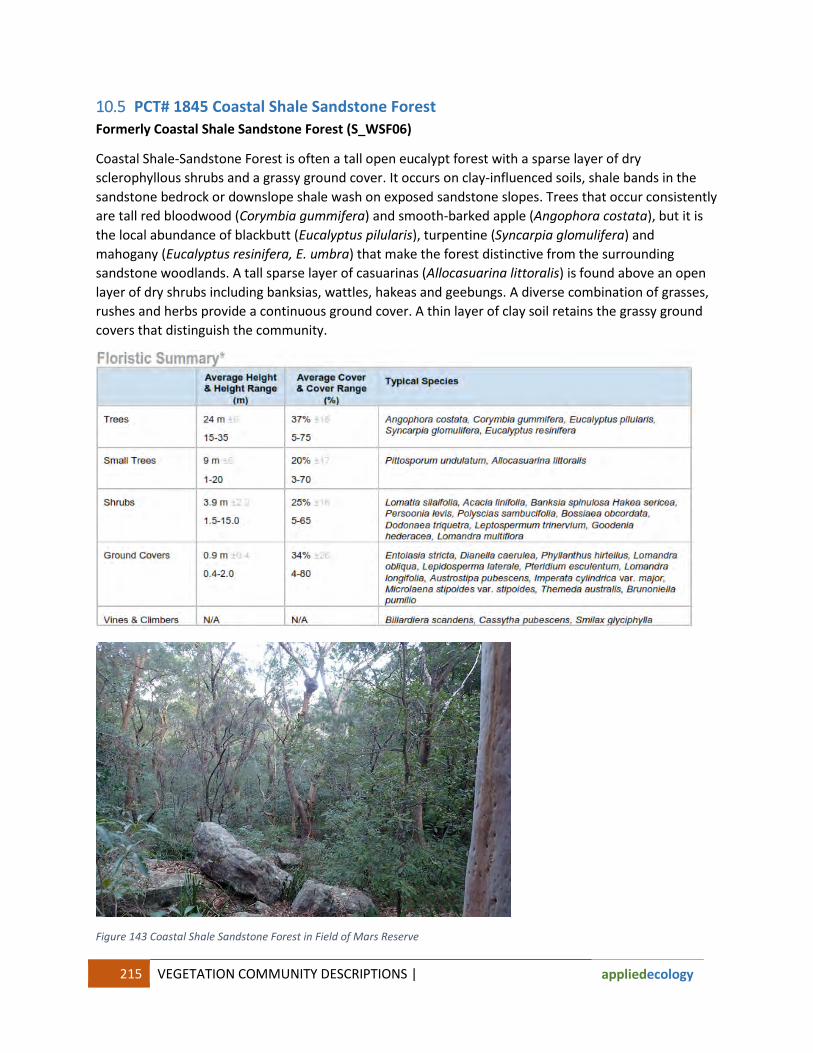
215 VEGETATION COMMUNITY DESCRIPTIONS |
appliedecology
10.5 PCT# 1845 Coastal Shale Sandstone Forest
Formerly Coastal Shale Sandstone Forest (S_WSF06)
Coastal Shale-Sandstone Forest is often a tall open eucalypt forest with a sparse layer of dry sclerophyllous shrubs and a grassy ground cover. It occurs on clay-influenced soils, shale bands in the sandstone bedrock or downslope shale wash on exposed sandstone slopes. Trees that occur consistently are tall red bloodwood (Corymbia gummifera) and smooth-barked apple (Angophora costata), but it is the local abundance of blackbutt (Eucalyptus pilularis), turpentine (Syncarpia glomulifera) and mahogany (Eucalyptus resinifera, E. umbra) that make the forest distinctive from the surrounding sandstone woodlands. A tall sparse layer of casuarinas (Allocasuarina littoralis) is found above an open layer of dry shrubs including banksias, wattles, hakeas and geebungs. A diverse combination of grasses, rushes and herbs provide a continuous ground cover. A thin layer of clay soil retains the grassy ground covers that distinguish the community.
Figure 143 Coastal Shale Sandstone Forest in Field of Mars Reserve

| VEGETATION COMMUNITY DESCRIPTIONS 216
10.6 PCT#1281 Turpentine-Grey Ironbark open forest on shale in the Sydney Basin
Formerly Sydney Turpentine Ironbark Forest (S_WSF09)
Sydney Turpentine-Ironbark Forest (Benson and Howell 1990) is a tall open forest found on shale and shale-enriched sandstone soils on the coast and hinterland of Sydney. It has been extensively cleared but was once widely distributed. The forest is characterised by open midstrata of mesic and sclerophyllous shrubs and small trees with a grassy ground cover. Typically, it is recognised by a canopy dominated by turpentine (Syncarpia glomulifera), red mahogany (Eucalyptus resinifera) and various ironbarks of which Eucalyptus paniculata is most often recorded. On the north shore these forests are found on shale-enriched sheltered sandstone slopes where ironbarks are less common and blackbutt (Eucalyptus pilularis) is prevalent, such as found in occurrences in City of Ryde.
Figure 144 Regenerating Turpentine-Grey Ironbark open forest at the upper end of Barton Park (Buffalo Creek catchment)

217 VEGETATION COMMUNITY DESCRIPTIONS |
appliedecology
10.7 PCT#1828 Coastal Sandstone Gallery Rainforest
Formerly Coastal Sandstone Gallery Rainforest (S_RF02)
This depauperate warm-temperate rainforest is found on sandy alluvium or rocky streams in deep protected sandstone gully systems across the greater Sydney region. Coachwood (Ceratopetalum
apetalum) usually dominates the tallest stratum with black wattle (Callicoma serratifolia), lilly pilly (Acmena smithii), water gum (Tristaniopsis laurina) and tree ferns (Cyathea spp.) forming a scattered cover of small trees in the sub-canopy layer. These are rainforests of low species diversity compared to more complex rainforests associated with richer soils. The array of lianes and climbers that are common in other rainforest assemblages are absent here. Instead, the ground cover is an open cover of ferns amongst sandstone boulders and fallen logs.
In the Sydney area these narrow ribbons of rainforest form small disjunct patches restricted to very incised Hawkesbury sandstone gullies and sandstone alluvium.
Figure 145 Coastal Sandstone Gallery Rainforest in Portius Park (Kittys Creek corridor)

| TARGETED THREATENED SPECIES SEARCHES 218
11 TARGETED THREATENED SPECIES SEARCHES
11.1 KEY THREATENED SPECIES PROFILES
Deane's Paperbark - profile Scientific name: Melaleuca deanei Conservation status in NSW: Vulnerable Commonwealth status: Vulnerable Gazetted date: 17 Sep 1999 Profile last updated: 07 Sep 2017 Description
Deane’s Paperbark is a shrub to 3 m high with fibrous, flaky bark. New stems are furry and white, though the mature stems are hairless. The smooth leBirds are not paired. They are narrow, to 25 mm long and 6 mm wide, with pointed tips. The many white flowers form spikes to 6 cm long, on a furry stem. The five petals are less than 5 mm long; each is paired with a bundle of 17 - 28 stamens. The woody fruits are barrel-shaped, to 7 mm in diameter. Distribution
Deane’s Paperbark occurs in two distinct areas, in the Ku-ring-gai/Berowra and Holsworthy/Wedderburn areas respectively. There are also more isolated occurrences at Springwood (in the Blue Mountains), Wollemi National Park, Yalwal (west of Nowra) and Central Coast (Hawkesbury River) areas.
Habitat and ecology
The species occurs mostly in ridgetop woodland, with only 5% of sites in heath on sandstone.
Flowers appear in summer but seed production appears to be small and consequently the species exhibits a limited capacity to regenerate.
Figure 146 Melaleuca deanei: (left) fruit and foliage, (right) foliage and form (Photos: © Steve Douglas, OEH profile)

219 TARGETED THREATENED SPECIES SEARCHES |
appliedecology
Epacris purpurascens var. purpurascens - profile Scientific name: Epacris purpurascens var. purpurascens
Conservation status in NSW: Vulnerable
Commonwealth status: Not listed
Gazetted date: 24 Dec 1999
Profile last updated: 01 Dec 2017
Description
An erect shrub, 50 - 180 cm high; older stems with prominent short, broad leaf scars. LeBirds are spreading and recurved above, ovate to heart-shaped, 7 - 21 mm long, 4.4 - 9 mm wide, with sharply pointed tips. Flowers are showy, 7 - 10 mm diam., covering much of the branchlets, white or sometimes pinkish. Fruit approximately 2 mm long.
Distribution
Recorded from Gosford in the north, to Narrabeen in the east, Silverdale in the west and Avon Dam vicinity in the South.
Habitat and ecology
Found in a range of habitat types, most of which have a strong shale soil influence. Lifespan is recorded to be 5-20 years, requiring 2-4 years before seed is produced in the
wild. Killed by fire and re-establishes from soil-stored seed.
Figure 147 Epacris purpurascens var purpurascens, various images from OEH profile © photographer

| TARGETED THREATENED SPECIES SEARCHES 220
Figure 148 Flowering branch of Epacris purpurascens var purpurascens. © Greg Steenbeeke, Orkology (from OEH profile)

221 TARGETED THREATENED SPECIES SEARCHES |
appliedecology
Pimelea curviflora var. curviflora - profile Scientific name: Pimelea curviflora var. curviflora
Conservation status in NSW: Vulnerable
Commonwealth status: Vulnerable
Gazetted date: 31 Jul 1998
Profile last updated: 01 Dec 2017
Description
A much-branched subshrub or shrub 20 to 120cm high with hairy stems. Flowers are red to yellow, hairy and occur in terminal heads of 4 - 12 flowers. LeBirds are 5 - 10 mm long, 2 - 4 mm wide, with a sparsely hairy lower surface. The curved fruit is 2 - 4 mm long.
Distribution
Confined to the coastal area of the Sydney and Illawarra regions. Populations are known between northern Sydney and Maroota in the north-west. New population discovered at Croom Reserve near Albion Park in Shellharbour LGA in August 2011. Formerly recorded around the Parramatta River and Port Jackson region including Five Dock, Bellevue Hill and Manly.
Habitat and ecology
Occurs on shaley/lateritic soils over sandstone and shale/sandstone transition soils on ridgetops and upper slopes amongst woodlands. Also recorded in Illawarra Lowland Grassy Woodland habitat at Albion Park on the Illawarra coastal plain.
Flowers October to May. Has an inconspicuous cryptic habit as it is fine and scraggly and often grows amongst
dense grasses and sedges. It may not always be visible at a site as it appears to survive for some time without any foliage after fire or grazing, relying on energy reserves in its tuberous roots.
Likely to be fire tolerant species capable of resprouting following fire due to the presence of a tap root. Seedlings have been observed following fire.

| TARGETED THREATENED SPECIES SEARCHES 222
Figure 149 Pimelea curviflora var curviflora: (left) flower, (right) form. ©Australian National Botanic Gardens (from OEH profile)
11.2 MELALEUCA DEANEI
11.2.1 Previous sightings
Melaleuca deanei was recorded at the downstream end of Terrys Creek in Somerset Park in February 2011. The description for the listing of the sighting included a reasonably accurate identification of the location of the sighting. The area around this point was searched to a distance of around 20m.
11.2.2 Results of searches
Targeted searches for Melaleuca deanei were undertaken in spring, although the species is reported to flower in summer. Searches were undertaken on 19th September, 27th September, 5th October, 9th November, 17th November 2017. No Melaleuca deanei were located during these searches.
11.3 EPACRIS PURPURASCENS VAR PURPURASCENS
11.3.1 Previous sightings
Epacris purpurascens var purpurascens has been recorded in several locations in Field of Mars Reserve (Figure 150), including near the Strangers Creek quadrat in 2006, and in the centre of the reserve in 2010. A wide search area was adopted to ensure that any and all specimens on site were located (Figure

223 TARGETED THREATENED SPECIES SEARCHES |
appliedecology
151). Searches were undertaken in September and October 2017 as this is the recorded flowering time for this species.
Figure 150 Epacris purpurascens var purpurascens: DATE OF SIGHTINGS, LEFT TO RIGHT: 1/9/2006, 16/5/2010, 1989
Without flowers, Epacris purpurascens var purpurascens is difficult to differentiate from a similar species, Epacris pulchella, which flowers most of the year, but has more sparse leBirds and flowers along its stems. Another confusing species, Woollsia pungens, has similar leBirds, but differs with white flowers that have a “crumpled” appearance.
11.3.2 Results of searches
Five individual plants were located for the target species, all of them fairly close to the edge of the path (Figure 151). Photos were taken to aid with future identification, including flowering stem (Figure 152), detail of flowers (Figure 153), and plant showing habit and habitat (Figure 154).

| TARGETED THREATENED SPECIES SEARCHES 224
Figure 151 Location of search area for Epacris purpurascens var purpurascens outlined in red, and locations of quadrats in Field of Mars Reserve
Figure 152 Epacris purpurascens var purpurascens flowering spike, Field of Mars Reserve (Photo: Meredith Brainwood)

225 TARGETED THREATENED SPECIES SEARCHES |
appliedecology
Figure 153 Epacris purpurascens var purpurascens detail of flowers, Field of Mars Reserve (Photo: Meredith Brainwood)
Figure 154 Epacris purpurascens var purpurascens habit and habitat, Field of Mars Reserve (Photo: Meredith Brainwood)

| TARGETED THREATENED SPECIES SEARCHES 226
11.4 PIMELEA CURVIFLORA VAR CURVIFLORA
11.4.1 Previous sightings
Pimelea curviflora var curviflora was recorded from the quadrat of that name in Field of Mars Reserve in 2007 (Figure 155).
Figure 155 Pimelea curviflora var curviflora: BioNET SIGHTING DATES, LEFT TO RIGHT: 2011, 1914, 1/3/2007
11.4.2 Results of searches
A wide area around the Pimelea quadrat was searched on on 19th September, 27th September, 5th October, 9th November, 17th November, and 12th December 2017. No Pimelea curviflora var curviflora were located during these searches.
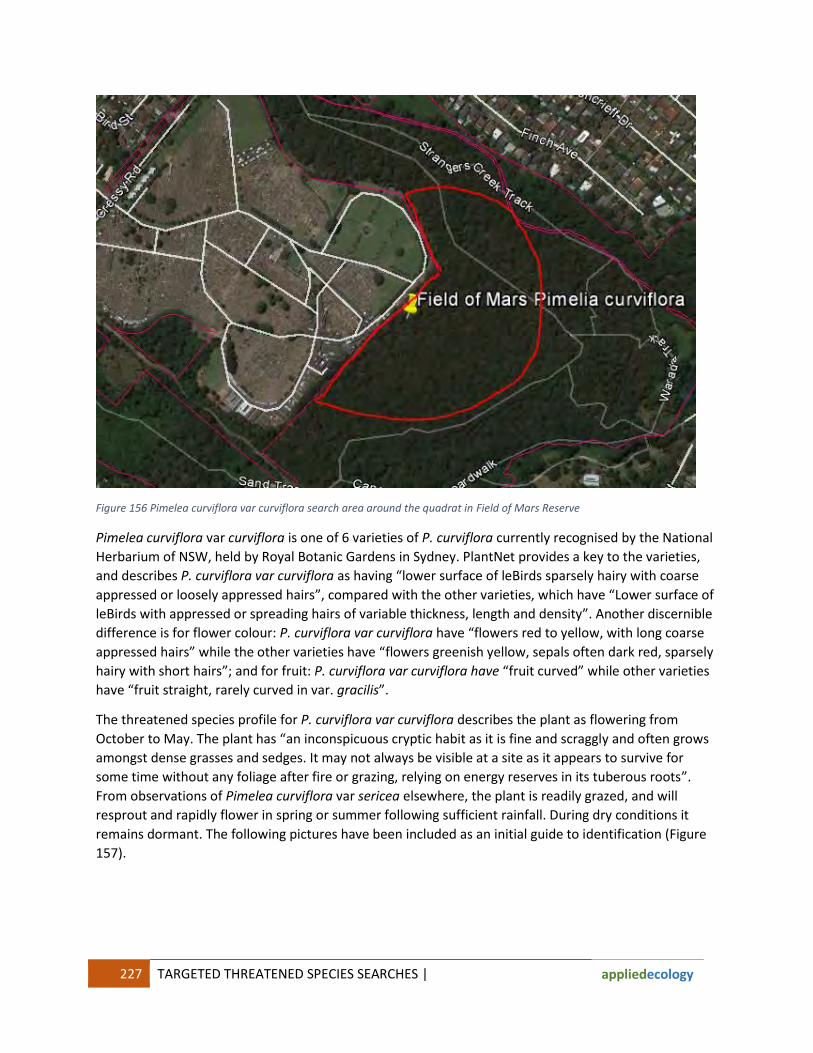
227 TARGETED THREATENED SPECIES SEARCHES |
appliedecology
Figure 156 Pimelea curviflora var curviflora search area around the quadrat in Field of Mars Reserve
Pimelea curviflora var curviflora is one of 6 varieties of P. curviflora currently recognised by the National Herbarium of NSW, held by Royal Botanic Gardens in Sydney. PlantNet provides a key to the varieties, and describes P. curviflora var curviflora as having “lower surface of leBirds sparsely hairy with coarse appressed or loosely appressed hairs”, compared with the other varieties, which have “Lower surface of leBirds with appressed or spreading hairs of variable thickness, length and density”. Another discernible difference is for flower colour: P. curviflora var curviflora have “flowers red to yellow, with long coarse appressed hairs” while the other varieties have “flowers greenish yellow, sepals often dark red, sparsely hairy with short hairs”; and for fruit: P. curviflora var curviflora have “fruit curved” while other varieties have “fruit straight, rarely curved in var. gracilis”.
The threatened species profile for P. curviflora var curviflora describes the plant as flowering from October to May. The plant has “an inconspicuous cryptic habit as it is fine and scraggly and often grows amongst dense grasses and sedges. It may not always be visible at a site as it appears to survive for some time without any foliage after fire or grazing, relying on energy reserves in its tuberous roots”. From observations of Pimelea curviflora var sericea elsewhere, the plant is readily grazed, and will resprout and rapidly flower in spring or summer following sufficient rainfall. During dry conditions it remains dormant. The following pictures have been included as an initial guide to identification (Figure 157).

| TARGETED THREATENED SPECIES SEARCHES 228
Figure 157 Pimelea curviflora var sericea, showing stems, leaf margins and lower leaf surface with appressed hairs, and upper leaf surface sparsely hairy and somewhat glabrous; flowers sparsely hairy with short coarse appressed hairs
Key differences for P. curviflora var curviflora include the sparsely hairy lower surface of leBirds, and more densely hairy floral tube, especially on the persistent base. The characteristic curved floral tube helps to distinguish this plant from similar species. Again, P. curviflora var curviflora may have a reddish flower, and will grow taller than P. curviflora var curviflora, but almost certainly look very similar in earlier growth stages (Figure 158).

229 TARGETED THREATENED SPECIES SEARCHES |
appliedecology
Figure 158 Pimelea curviflora var sericea showing habit and size relative to surrounding vegetation

| DISCUSSION 230
12 DISCUSSION
12.1 Vegetation changes over time
Like all the biological systems, plant communities are temporally and spatially dynamic; they change at all possible scales. Dynamism in vegetation is defined primarily as changes in species composition and/or vegetation structure. Temporally, a large number of processes or events can cause change, but for sake of simplicity they can be categorized roughly as either abrupt or gradual. Abrupt changes are generally major disturbances, and are often catastrophic and usually arise from an external origin. These can range from floods and fire to extreme wind and weather conditions, landslides and so on, and are natural processes that generally occur independently of the natural processes of the community, such as germination, growth, death, etc. Such events can change vegetation structure and composition very quickly and for long time periods, and they can do so over large areas. Very few ecosystems are without some type of disturbance as a regular and recurring part of the long term system dynamic.
Fire and localised flood (overtopping of banks) disturbances are particularly common causes of major changes in vegetation communities in urban reserves. Fire can destroy living plants, along with seeds and spores, although many native flora species in Australia have developed adaptations that enable the species to recover from fire. Too frequent fire, however, will result in removal of some species from an area over time, and is recognised as a key threatening process for bushland in NSW. Urban stormflows have a fast time of concentration, so that lots of water will quickly arrive at discharge points to creeks and bushland. This results in ongoing erosion and sedimentation – erosion at discharge points, and vulnerable points along the stream’s channel, and sedimentation at other points downstream. Both of these actions destroy habitat, one by washing it away and the other by smothering. For larger storms, more water is delivered more quickly, with greater potential erosive force. As well, urban stormwater inevitably carries high nutrient loads to bushland surrounding streams. Australian native flora species are adapted to nutrient poor soils, and do not perform well with high nutrient levels, thus they become disadvantaged. In contrast, introduced species do not always adapt well to the low nutrient soils, but quickly flourish in higher nutrient regimes.
Evidence of both these mechanisms of change was noted in each of the creek corridors (stormflows), and in Field of Mars Reserve (bushfire). Other changes happen more slowly, and are considered successional changes that arise as the vegetation itself modifies various environmental variables over time, including light, water and nutrient levels. These modifications change the suite of species most adapted to grow, survive and reproduce in an area, causing floristic changes. These floristic changes contribute to structural changes that are inherent in plant growth even in the absence of species changes (especially where plants have a large maximum size, i.e. trees), causing slow and broadly predictable changes in the vegetation. Succession can be interrupted at any time by disturbance, setting the system either back to a previous state, or off on another trajectory altogether. Because of this, successional processes may or may not lead to some stable, final state. Accurately predicting the characteristics of such a state, assuming it does arise, is not always possible. In reality, vegetative communities are subject to many variables that together set limits on the predictability of future conditions.
The two factors, fire and flood, can interact synergistically to affect native and introduced flora. In a recent study of several bushland sites on low fertility sandstone soils in Wahroonga and Pennant Hills, the effects of soil nutrient enrichment on post fire recovery was assessed (Thomson & Leishman, 2005).

231 DISCUSSION |
appliedecology
At these sites, fire did not promote the invasion of exotic plants into areas that were not nutrient-enriched. In nutrient-enriched areas after fire, the diversity of native species was lower than in the non-enriched areas. Some native species were able to survive and compete with the exotic species in terms of abundance, per cent cover and plant height. However, these successful species were a different suite of natives to those commonly found in the non-enriched areas.
Figure 159 Fifteen years post fire, blackened bark is still visible on some trees and large shrubs near Strangers Creek FoM
As a general rule, the larger an area, the more likely it is that the vegetation will be heterogeneous across it. Different areas will be at different developmental stages due to different local histories, particularly the times since last major disturbance. This factor interacts with inherent environmental variability, such as in soils, climate, topography, etc, which is also a function of area. Environmental variability constrains the suite of species that can occupy a given area, and the two factors together interact to create a mosaic of vegetation conditions across the landscape. In natural systems, there is always heterogeneity, although its scale and intensity will vary greatly.
12.1.1 Bioturbation
A recent driver for change in the Terrys Creek corridor and Field of Mars Reserve is the presence of vertebrate fauna that turn over and dig in the soil. This process is called bioturbation and species that facilitate this process are known as bioturbators. Bioturbation alters the chemical and structural properties of soil, increases water penetration and retention, creates microhabitats that capture organic matter (including seeds), facilitates germination, moves fungal spores around which in turn increases available nutrients and is thus generally associated with improved ecosystem health and function and promoting species diversity (Ceballos 1999, Davidson et al. 2008).
Many bioturbators have suffered significantly in the past 200 years from predation by introduced animals, changed fire regimens and loss of habitat and are now absent from many Australian landscapes. However, bioturbators have reappeared in good numbers in the study areas in the past 5-10 years. Evidence of bioturbation is obvious throughout the Field of Mars Reserve and around Terrys Creek, particularly the diggings of Long-nosed Bandicoots and scratchings of Australian Brush-turkeys,

| DISCUSSION 232
but other, less obvious species such as Swamp Wallabies and Short-beaked Echidnas also play a role in bioturbation. Swamp wallabies consume quite significant amounts of fungi with Hollis et al. (1986) reporting seasonal variation in fungi consumption forming an annual average of 15% of diet of Swamp wallabies in North eastern NSW. Claridge et al. (2001) found post-fire fungi consumption by Swamp wallabies to be comparable to heavily mycophagous (fungi eating) ground-dwelling mammals such as bandicoots, potoroos and bettongs, and suggests that Swamp Wallabies may fulfil a general spore dispersal role in disturbed habitats, and in the re-establishment of mycorrhizal fungi after fire. Long-nosed bandicoots are possibly the most significant bioturbators present in the reserves with a study by Valentine et al. (2013) showing how a similar sized species, the Southern brown bandicoot, turns over 3.9 tonnes of soil per year. The role that the bioturbators play in changing the health and floral diversity of the bushland reserves will likely become evident in future studies of the reserves particularly where large reserves without bioturbators can be compared to the Field of Mars Reserve and the Terrys Creek corridor.
Figure 160 Five main ecosystem functions of bioturbation particularly by digging mammals (text adapted from Fleming et al. 2013).
SOIL TURNOVER Altered soil mechanical
properties - density `, erosion _
Altered chemical properties by
bringing nutrients to soil surface
CAPTURE ORGANIC MATTER
Additional resources for soil biota -
nutrients _, soil biota _, nutrient cycling _
soil health _
Fires less frequent, cooler and more heterogeneous
WATER INFILTRATION
Increased soil moisture - water
infiltration _, water-holding
capacity _
Increased water and nutrient
availability for plants
FUNGAL DISPERSAL AND RECRUITMENT
Greater abundance and diversity of fungi - access to water and nutrients such as P and N
by plants _
SEED DISPERSAL AND PLANT
RECRUITMENT
More plant seeds in safe sites, seed
caching and capture _, seed predation
due to burial `
Improved seedling germination and
recruitment
IMPROVED
PLANT
RECRUITMENT
AND
PRODUCTIVITY
IMPROVED
PLANT
RESISTANCE TO
PATHOGENS
AND PESTS
ECOSYSTEM FUNCTIONS

233 DISCUSSION |
appliedecology
12.2 How much change is reasonable?
All of this raises the important question of what is a reasonable level of change over time? To address this, we undertook a literature search for studies on urban bushland in Sydney. Surprisingly, few papers have been published, and of these, less surprisingly, most focused on mechanisms of weed invasion rather than flora species dynamics in a ‘reference state’ bushland patch. After more than 200 years of aggressive change to the natural environment, most of the bushland reserves in Sydney have experienced some level of impact, and smaller reserves in more urbanised settings are exposed to higher levels of ongoing change.
Repeated decadal surveys using vegetation transects were undertaken at a reserve in Beecroft on Sydney’s North Shore, starting in 1976. The reserve had a small remnant of Blue Gum High Forest that was actively managed for long term conservation over the 32 years until the most recent survey in 2008 (Benson & Picone, 2009). Over the 30-year period the structure of the understorey changed markedly, and despite ongoing weeding programs, the frequency of species identified as significant for conservation continued to decrease. Changes in flora species were linked with plant form, for example, vines were seen to increase steadily in diversity and cover. This was noted for several quadrats in the current study, including the Pimelea quadrat (FoM), and Pembroke Terrys Creek, where the diversity for vines doubled and the extent of cover increased as well.
Other trends reported over the 30 year period were an increase followed by a decrease in cover for forbs and graminoids, and increase in tall shrubs but a decrease in small shrubs. Many of these trends were recorded for the detailed survey quadrats in the current study. However, the inconsistency in results from Benson and Picone’s (2009) study suggest that changes gleaned from what effectively amounts to a random snapshot across time need to be considered in the context of factors that drive vegetation successional change, ranging from climate to bush regeneration.
Benson and Picone (2009) noted that suites of flora species present in bushland sites include not only those species that are obvious in the existing above-ground vegetation. Many species have a soil-stored seedbank, supressed rootstock or soil-stored tubers, and others may be able to disperse into suitable habitat from adjacent areas. Some species require fire to stimulate germination, such as Fabaceae species. Others respond to disturbance, and only germinate when this has occurred. Still others respond well to good rainfall following one or more years of dry weather. Many of these are herbaceous species that are short-lived, and are likely to remain in the soil seedbank as viable seed for much longer than 10 years.
In a study of mechanisms promoting weed invasion into bushland in western Sydney, Hill et al (2004) found that areas within 2 m of a creek edge had higher exotic species richness and cover than areas further from the creek edge. This spatial relationship was apparent in Terrys Creek and Buffalo Creek Creek corridors, although the extent of weed invasion is much greater than 2m. Rate of spread within the stream corridor is quite likely to be affected by channel and bank forms, with steeper banks creating an environment that is colonised more slowly. Rate of spread is also likely to be affected by the nutrient levels in stormflows, and the frequency of bank overtopping storm events. For Terrys Creek, nutrient levels are often higher than average, and localised flooding is quite frequent during wet weather for the Ryde section of the creek.

| CONCLUSIONS 234
Figure 161 Weeds extended well beyond 2m from the creek (left) in Pembroke Park (TC), and (right) in Laurel Park (BC)
Factors such as site history and propagule pressure may be more important in determining exotic species success (Hill et al, 2004). Both of these are evident in the three creek corridors, and in Field of Mars Reserve. The Field of Mars Reserve Common was gazetted in 1804, then resumed as crown land in 1874 and cleared for streets and allotments. In the 1880s an area of 85 acres was proclaimed for public recreation, and Ryde Council became the trustee of the land. The reserve continued to be grazed and used as a source of building materials, and for general recreation until the mid 1950s, and then in the 1960s pressure started to increase to preserve, manage and develop the Field of Mars Reserve as a flora and fauna sanctuary, until in 1975 the reserve was proclaimed a wildlife refuge under the NSW National Parks and Wildlife Act. Despite this lengthy history of disturbance, the site has clearly retained a high level of resilience, and large areas appear as predominantly intact bushland. This suggests that the reserve has retained a high level of native seed in the soil, and there has been limited propagule pressure in these areas.
Propagule pressure was most apparent along all of the creek corridors. Areas downslope from roads, and areas along the immediate riparian corridor are the most susceptible to weed invasion (Hill et al, 2004). For the narrower creek corridors, such as Buffalo Creek Creek and upper sections of Terrys Creek, there is a combination of these two factors, resulting in a narrow strip of bushland being invaded from both sides. This is reflected in the diversity of native and introduced species reported from individual reserves in these areas, with Laurel Park (Buffalo Creek Creek) and Yarramar Reserve (Terrys Creek) being the most extreme examples.
13 CONCLUSIONS Decadal surveys are not enough to really understand vegetation dynamics. Results from a series of snapshot surveys over time need to be considered in the context of unpredictable events (climate and weather patterns), as well as localised changes (bush regeneration, increased bioturbation,erosion and stabilisation works, or bushfire). Good replication over extended periods of time can be adversely affected by simple things such as inability to relocate quadrat or transect markers (eg. Benson & Picone, 2009). This may result from poor recording of marker locations, or from the markers being disturbed or removed. Simple actions such as informing contractors of the importance of leaving markers in place, and why, will help to ensure their ongoing usefulness.

235 RECOMMENDATIONS |
appliedecology
Good understanding of reference condition for each of the relevant vegetation communities is also important. This should be used to guide management for conservation within a dynamic vegetation framework. Effective management needs to have clearly identified goals, and progress should be able to be measured against these goals over time. Conservation management of bushland reserves should also take into consideration the external impacts that are affecting vegetation dynamics within reserves and corridors. Sometimes, wins should be taken at a catchment or corridor level, and losses may not be final until many years have passed.
14 RECOMMENDATIONS
14.1 Management of reserves for fire
Urban reserves constitute very small remnants of the forest and woodland ecosystems that used to cover the whole of the Sydney Basin. The fire regimes that existed in this previous time helped to shape the flora and fauna that lived there. This in no way implies that any species of flora or fauna needs fire to live or reproduce, but does mean that most species have developed a response to fire that facilitates their short and long term survival. Today, however, the fires that most reserves experience are not the same as the fires that shaped the ecosystem millennia ago. Most burns are anthropogenic in origin, and mainly prescribed burns for hazard reduction, or arson. Naturally ignited fires are comparatively few and far between, and historically would have been contained, or at least constrained, by the landscape itself.
Gullies, wet vegetation and otherwise non-combustible vegetation, are among the landscape features that constrain the spread of fire. In the past, they provided important refuge areas for wildlife from a range of faunal groups. Today, however, these fire refuges are often all that remain of the original landscape, and are now being subject to the burns that once were excluded. The result of this is that we now target fauna refuge areas for hazard reduction burns, and in doing so, risk the destruction of the remaining sources for recolonization post fire.
Wildfire is a landscape forming event but is not a desirable event in modern landscapes. Burns for hazard reduction rarely achieve this over anything but very short term, and the observed fuel loads are comparable to unburnt areas within 2 years. Regular repeated burning destroys the whole ecosystem, including habitat features, flora and fauna refuges, sources for recolonization, and ultimately creates a homogenous landscape that will only support generalist species. To prevent this, the following management recommendations are provided:
Whole of reserve burns are to be avoided at all cost Mosaic burns should burn less than half of any reserve, and there should be good dispersal of
burnt and unburnt areas, ideally with a range of fire intensities for the burnt areas Native fauna species need to be able to move through the landscape to emigrate, access refuge
areas, or remain in in-situ refuges, if they are to survive a fire Some species are not able to avoid fire, such as the Dural Land Snail, and some areas should be
dedicated as ‘fire excluded’ for this species A more holistic approach to fire management be adopted by council and any relevant fire
authorities, such as NPWS, RFS, NSW Fire & Rescue
| RECOMMENDATIONS 236
14.2 Managing for specific fauna species/groups
Specific management actions for fauna species and/or faunal groups have been provided throughout this report. These are summarised here to facilitate the development of management plans for the protection of Ryde’s fauna biodiversity.
14.2.1 Bird fauna
Large ground dwelling birds (includes Brush Turkeys and Lyre Birds)
Encourage residents to keep cats inside at night and wear bells during the day Educate residents on the importance of responsible pet ownership
Hollow dependent birds (and other species)
Retain standing stags and dead limbs on trees. If necessary, fence around the tree to prevent limb drop in areas where there is risk of injury
Retain old growth trees on development sites adjoining reserves If hollow bearing trees are being removed, harvest hollow bearing branches before felling the
tree; relocated hollows in younger trees in areas of forest regeneration If stags are being removed, consider relocating to a reserve as a standing stag Consider hollow augmentation in younger mature trees in areas where there are little or no
natural hollows. Monitor and share the results, and monitor successes of other hollow augmentation projects, eg. Swift Parrot in Tasmania, Superb Parrot in Central Tablelands of NSW
Small woodland birds
Use staged removal of weedy shrubs Combine with revegetation planting to re-establish a comprehensive shrub layer for small birds;
ensure that supplementary planting includes a range of food resource species that are appropriate to that vegetation community
Exclude fire or limit to strictly monitored patchy burns, with less than half of the area burnt at any given time, and that there is a suitable inter-fire interval and time since fire
Birds of prey (includes Powerful Owls)
Where possible do not use feral animal control methods that might leave toxic carcasses, eg 1080, pindone
Ensure that large shrubby weed control along creeklines is conducted in a staged manner to prevent over disturbance to existing roost sites for Powerful Owls
Exclude fire from known roosting sites
Nocturnal birds (includes nightjars, boobooks and other owls, and tawny frogmouths)
Exclude fire from areas with ground nesting bird species, at least during their breeding seasons Consider establishing noise constraint areas around reserves with known breeding sites for
nocturnal birds, eg construction noise restrictions

237 RECOMMENDATIONS |
appliedecology
14.2.2 Other animals
Amphibians
Monitor and manage water quality in creeks to reduce impacts on frogs
Retain a range of vegetation around waterways to ensure a more diverse range of frog habitats
Exclude fire from areas around drainage lines to prevent inbreeding depression and loss of genetic diversity
Reptiles
Limit fire to patch burns, ensuring that no more than 50% of the area is burnt at any one time, and that there is a suitable inter-fire interval and time since fire
Possums and gliders
Maintain hollow bearing trees, supplement with nest boxes and translocated hollows
Limit fire to cool autumn burns with flame height less than 2m Exclude fire from smaller reserves, especially in areas with newer
urban development where there is limited opportunity for animals to escape using temporary emigration
Flying foxes
Maintain food resources for this species in the LGA Include food plants in revegetation planting species selections Promote a positive attitude in the community to flying foxes
Swamp Wallabies
Where possible do not use feral animal control methods that might affect swamp wallabies, such as pindone and 1080
Ensure that shrubby weed control is conducted in a staged manner to prevent over disturbance to existing refuge sites
Limit fire to patch burns, ensuring that no more than 50% of the area is burnt at any one time, and that there is a suitable inter-fire interval and time since fire
Microbats
Maintain street trees, especially larger and older trees, to provide navigation, foraging opportunities and refuge from predation
Prevent removal of hollow bearing trees, supplement available hollows with harvested limbs
Ensure that old structures such as buildings, culverts, bridges, etc are adequately surveyed for microbats before removal
Figure 162 Competition for available hollows in Lucknow/ Somerset Park, spring 2017

| RECOMMENDATIONS 238
Ensure that all new outdoor lighting is shielded with full cutoff covers; where possible use timers to turn lights off when they are not required, or use motion sensors
Encourage staged replacement of existing lighting with full cutoff covers and timers or motion sensors as part of maintenance activities
Maintain or improve vegetated corridors from bushland reserves to
Lane Cove River Promote a positive attitude in the community to microbats
Dural Land Snail
Monitor for this species in likely habitat in suitable season and weather conditions
Encourage bush regeneration contractors and bushcare volunteers to learn to identify the species; if found, structure works so that they can avoid trampling it or disturbing habitat for the Dural Land Snail
14.3 Management of corridors/reserves
This section provides key management actions for promotion of native fauna biodiversity in key bushland reserves. These are individually tailored for each reserve/corridor, and aim to address the main issues identified for significant fauna and/or significant impacting factors.
14.3.1 General recommendations
Maintain connectivity between reserves and corridors to ensure genetic diversity is maintained, and that animals have adequate access to refuge areas during fire and other perturbations
Consider introducing Wildlife Protection Areas for the most significant bushland reserves
Manage fire to ensure the ongoing persistence of sensitive species Use signage to educate and restrict reserve use to established tracks
and inform of key reserve wildlife assets Encourage landholders in neighbouring areas to plant local native
species as food for wildlife, and to minimise their use of fertilisers and chemicals to reduce impacts on water quality and invertebrate fauna.
Undertake to transition to more suitable (for fauna) lighting around public reserves
14.3.2 Field of Mars Reserve
Consider nest boxes/hollow augmentation- there is a lack of hollow bearing trees thus reduced opportunities for successful breeding events for a wide range of fauna.
The early flowering species planted in the regen area proved to be a hotspot of nectivore activity this spring- consider planting more of these species along disturbed edges or other areas requiring planting out.

239 RECOMMENDATIONS |
appliedecology
Dense weeds between Wellington Road and Buffalo Creek should not be allowed to expand but should not be removed until alternate habitat vegetation has been established. They provide the best refugia in the park for Swamp Wallabies and Bandicoots. Develop a stages removal/replacement plan for weed management in the reserve that accommodates these species
14.3.3 Terrys Creek corridor
Continue improvements to water quality to promote healthy populations of native fauna. Liaise and engage with City of Parramatta to manage stormwater and sewer issues as a joint problem
Use staged weed control with supplementary planting as required to ensure a good shrub layer is retained, especially along the creekline; liaise with Parramatta council to coordinate this.
Consider developing a joint management plan or masterplan for the Terrys Creek catchment with Parramatta Council and The Hills Shire.
Ensure any new trails do not reduce the amount of deep shade available to birds. Limit the development of informal tracks and track loops by cyclists – engage in community education to ensure they understand the impacts of this, and potential fines
Install logs, rocks etc with appropriate plantings to encourage fauna use of the area as an underpass for the M2 motorway
Exclude fire near Powerful Owl roosts and breeding hollows Monitor for Dural Land Snail in likely habitat in suitable season and
weather conditions
14.3.4 Kittys Creek corridor
Avoid over-clearing at Martin Park- Swamp Wallabies use the weed thicket.
Widen the riparian corridor on the northern side by planting a dense layer of shrubs/ground covers/ grasses to avoid creating more Noisy Miner habitat (avoid planting canopy trees).
Continued weed control is important in Kittys Reserve and Portius Park. Use staged weed control with supplementary planting to ensure a good shrub layer is retained, especially along the creekline
Exclude fire near Powerful Owl roosts and breeding hollows Consider Installing nest boxes to supplement existing hollows
Figure 163 Brightly coloured birds make a good focal point for conservation activities

| RECOMMENDATIONS 240
14.3.5 Buffalo Creek corridor
Install nest boxes to supplement existing hollows Manage impacts from informal “camp” area Avoid over-clearing in Barton Park, Laurel Park and road reserve, near the Pidding Rd bridge, and
Aitchander Park. Use staged weed control with supplementary planting as required to ensure a good shrub layer is retained, especially along the creekline
Manage exotic grasses (kikuyu) from adjoining sporting facilities; minimise use of fertilisers on the oval to avoid changes to soil nutrient levels in bushland below
241 REFERENCES & FURTHER READING |
appliedecology
15 REFERENCES & FURTHER READING Backyard Buddies (2010). Nest boxes for microbats http://www.backyardbuddies.net.au/PDFs/microbatRoostbox.pdf
Basham R, Law B, Banks P (2011) Microbats in a ‘leafy’ urban landscape: are they persisting, and what factors influence their presence? Austral Ecology 36:663–678
Benson DH, Howell J (2002) Cumberland Plain Woodland ecology then and now: interpretations and implications from the work of Robert Brown and others. Cunninghamia 7, 631-650.
Bureau of meteorology http://www.bom.gov.au/jsp/ncc/cdio/weatherData/
Buchalski MR, Fontaine JB, Heady PA III, Hayes JP, Frick WF (2013) Bat Response to Differing Fire Severity in Mixed-Conifer Forest California, USA. PLoS ONE 8(3): e57884. doi:10.1371/journal.pone.0057884
Chambers, J., Wilson J.C., Williamson I. (2006) Soil pH influences embryonic survival in Pseudophryne
bibronii (Anura: Myobatrachidae) Austral Ecology, Volume 31, Issue 1: 68-75.
Ceballos G (1999) Influence of prairie dogs (Cynomys ludovicianus) on habitat heterogeneity and mammalian diversity in Mexico. Journal of Arid Environments 41: 161–172
Claridge, A.W., Trappe, J.M. and Claridge, D.L., (2001) Mycophagy by the swamp wallaby (Wallabia bicolor). Wildlife Research 28, p. 643
Cogger, H. 2000. Reptiles and Amphibians of Australia. Chelsea Green Publishing Co, Sydney
Cox M P G , Dickman C R And Cox W G (2000) Use of habitat by the black rat (Rattus rattus) at North Head, New South Wales: an observational and experimental study Austral Ecology 25 pp. 375–385
Crawshaw, P. 2009, The Future of GreenWays in Sydney. Faculty of the Built Environment University of New South Wales. Accessed at http://www.fbe.unsw.edu.au/schools_and_engagement/resources/_notes/5A2_41.pdf
Davidson, A. and Lightfoot, D. (2008) Burrowing rodents increase landscape heterogeneity in a desert grassland. Journal of Arid Environments 72: 1133–1145.
Davidson, A., Lightfoot, D. and McIntyre, J. (2008) Engineering rodents create key habitat for lizards. Journal of Arid Environments 72: 2142–2149.
Debus, S.J.S., 2008. The effect of Noisy Miners on small bush birds: An unofficial cull and its outcome. Pacific Conservation Biology, 14, 185-190
Debus, S., 2009. The owls of Australia: a field guide to Australian night birds. Envirobook, Canterbury NSW
DEC. (2004) The Vertebrate Fauna of South Western Blue Mountains National Park.”Unpublished report funded by the Central Directorate Parks and Wildlife Division Biodiversity Survey Priorities Program by NSW Department of Environment and Conservation, Conservation Assessment and Data Unit, Metropolitan Branch, Environment Protection and Regulation Division.

| REFERENCES & FURTHER READING 242
DECCW, 2009. The Native Vegetation of the Sydney Metropolitan Catchment Management Authority Area (draft report). Department of Environment and Climate Change NSW, Hurstville.
Drinnan, I.N. (2005). The search for fragmentation thresholds in a Southern Sydney suburb. Biological
Conservation 124: 339-49.
Drinnan, I.N., 2010. Planning and implementing conservation networks in Sutherland Shire, New South Wales. Australasian Plant Conservation 18(3), p 5-6
Fleming, P., Anderson, H., Prendergast, A., Bretz, M., Valentine, L., and Hardy, G. (2013). Is the loss of Australian digging mammals contributing to a deterioration in ecosystem function? Mammal Review. 44. . 10.1111/mam.12014.
FitzGibbon S I Putland DA and Goldizen A W (2007) The importance of functional connectivity in the conservation of a ground-dwelling mammal in an urban Australian landscape, Landscape Ecology 22 pp 1513–1525
Ford H A, Barrett G W, Saunders D A and Recher H F (2001) Why have birds in the woodlands of Southern Australia declined? Biological Conservation 97 1 pp.71-88. Garden et al. 2010
Franklin, J. (2009) Mapping species distributions: spatial inference and prediction. Cambridge University Press, Cambridge, UK.
Gehrt SD, Chelsvig JE (2003) Bat activity in an urban landscape: patterns at the landscape and microhabitat scale. Ecological Applications 13:939–950
Gehrt SD, Chelsvig JE (2004) Species specific patterns of bat activity in an urban landscape. Ecological Applications 14:625–635
Gibbons, P, Lindenmayer, D.B. 2002. Tree Hollows and Wildlife Conservation in Australia. CSIRO Publishing, Melbourne, Australia
Gillam, E. H. and McCracken, G. F. (2007). Variability in the echolocation of Tadarida brasiliensis: effects of geography and local acoustic environment. Anim. Behav. 74, 277-286
Goerlitz, H. R., Greif, S. and Siemers, B. M. (2008). Cues for acoustic detection of prey: insect rustling sounds and the influence of walking substrate. J. Exp. Biol. 211, 2799-2806.
Green, K., and Sanecki, G. (2006). Immediate and short-term responses of bird and mammal assemblages to a subalpine wildfire in the Snowy Mountain, Australia. Austral Ecology 31, 673–681. doi:10.1111/j.1442-9993.2006.01629.x
Grey M. J., Clarke M. F. and Loyn R. H. (1997) Initial changes in the Bird communities of remnant eucalypt woodlands following a reduction in the abundance of Noisy Miners, Manorina melanocephala. Wildlife Research 24, 631–648.
Griffiths, K. 2006. Frogs and Reptiles of the Sydney Region. Reed New Holland, Sydney
Harden, G.J. (ed), 1990-2007. Flora of New South Wales, Volumes 1-4. New South Wales University Press, Kensington, NSW
243 REFERENCES & FURTHER READING |
appliedecology
Hollis, C. J., Robertshaw, J. D., and Harden, R. H. (1986). Ecology of the swamp wallaby (Wallabia bicolor) in north-eastern NSW. I. Diet. Australian Wildlife Research 13,p.355
Ipswich City Council (2009). Nest boxes for microbats http://www.ipswich.qld.gov.au/documents/environment/nest_box_specs_p4.pdf
Jellinek S, Driscoll D A, and Kirkpatrick J B (2004) Environmental and vegetation variables have a greater influence than habitat fragmentation in structuring lizard communities in remnant urban bushland. Austral Ecology 29 pp 294–304.
Jones, C., Parish, S. 2005. Field Guide to Australian Mammals. Parish Publishing, Sydney
Kavanagh , R,P., Debus, S., Tweediw, T. and Webster, R. 1995 Distribution of Nocturnal Forest Birds and Mammals in North-eastern New South Wales: Relationships with Environmental Variables and management History, Wildlife Research 22, pp 359-377
Keith D, Pellow B, Tozer M (2005) Can’t see the biodiversity for the trees? Implications of alternative landscape models for conservation of Cumberland Plain Woodlands. P6 in (Eds. B Pellow, C. Morris, M Bedward, S. Hill, J Sanders, J Clark) The ecology and management of Cumberland Plain habitats: a symposium (University of Western Sydney: Campbelltown).
Little S J, Harcourt R G and Clevenger A P (2002) Do wildlife passages act as prey-traps? Biological Conservation 107 2 pp. 135-145.
Lowe K, C Taylor and Major R (2011) Do Common Mynas significantly compete with native birds in urban environments? Journal of Ornithology: 1-13.
MacNally R. and Horrocks G. (2002) Relative influence of patch, landscape and historical factors on birds in an Australian fragmented landscape.Journal of Biogeography 29, 395–410.
Major R E, Gowing G and Kendal C E (1996) Nest predation in Australian urban environments and the role of the pied currawong, Strepera graculina. Australian Journal of Ecology 21 pp. 399–409.
May, S and Norton, TW. Influence of fragmentation and disturbance on the potential impact of feral predators on native fauna in Australian forest ecosystems. Wildlife Research 1996. 23:4, 387-400.
McLoughlin, L. (1994) The Natural Environment of Bankstown. Published and printed by Bankstown City Council, Civic Centre, Bankstown.
Morecombe, M. 2009. Field Guide to Australian Birds. Steve Parish Publishing, Archerfield, Qld
National Trust Bushland Management, 2005. Recovering Bushland on the Cumberland Plain: Best practice guidelines for the management and restoration of bushland. DECC, Sydney.
Parsons, H., Major, R.E. & French, K., 2006. Species interactions and habitat associations of birds inhabiting urban areas of Sydney, Australia. Austral Ecology.
Pellow B (2003) Flora study of the Defence Establishment Orchard Hills. Janet Cosh Herbarium, Wollongong.
Piper, S.D. & Catterall, C.P., 2003. A particular case and a general pattern: Hyperaggressive behaviour by one species may mediate Birdsl decreases in fragmented Australian forests. Oikos, 101(3), 602-614

| REFERENCES & FURTHER READING 244
Pizzey, G. 2000. The Australian Bird-Garden: Creating havens for native birds. Angus & Robertson, Sydney
Pizzey G. and Knight F. (2001) The Field Guide to the Birds of Australia. Harper Collins, Sydney, NSW.
Robinson, L. (1998). Field Guide to the Native Plants of Sydney (2nd ed). Kangaroo Press, East Roseville, NSW
Robinson, M. (2002). A Field Guide to Frogs of Australia. Australian Museum/Reed New Holland: Sydney
Saunders G and McLeod L (2007) Improving fox management strategies in Australia. Bureau of Rural Sciences, Canberra http://adl.brs.gov.au [ accessed June 2011]
Shaw, P., 2003. Multivariate statistics for the environmental sciences. Hodder Arnold, London, 233p
Shea, G.M., 2010. The suburban terrestrial reptile fauna of Sydney - winners and losers. In D. Lunney, P. Hutchings, & D. Hochuli, eds. The Natural History of Sydney. Sydney: Royal Zoological Society of NSW.
Triggs B, Brunner H and Cullen, J M (1984) . The Food of Fox, Dog and Cat in Croajingalong National Park, South-Eastern Victoria. Australian Wildlife Research 11 , 491–499.
Trounson, D., Trounson, M. 2008. Australian Birds: A concise photographic field guide. Murray David Publishing, Sydney
Valentine, L., Anderson ,H., Hardy, J. and Fleming, PA (2013) Foraging activity by the southern brown bandicoot (Isoodon obesulus) as a mechanism for soil turnover. Australian Journal of Zoology 60: 419–423.
Wilson, S., Swan, G. 2005. A complete guide to the Reptiles of Australia. Reed New Holland, Sydney
Wintle, .A., Kavanagh, R.P., Mccarthy, M.A. and Burgman, M.A. 2005. Estimating And Dealing With Detectability In Occupancy Surveys For Forest Owls And Arboreal Marsupials. Journal of Wildlife Management 69 (3), pp. 905-917
15.1 MICROBAT REFERENCES
Abbott, I., and Burrows, N. (2003). ‘Fire in Ecosystems of South-west Western Australia: Impacts and Management.’ (Backhuys Publishers: Leiden, The Netherlands.)
Adams, M. D. et al. 2009. Vegetation structure influences the vertical stratification of open- and edge-space aerial-foraging bats in harvested forests. For. Ecol. Manage. 258: 2090-2100.
Basham R, Law B, Banks P (2011) Microbats in a ‘leafy’ urban landscape: are they persisting, and what factors influence their presence? Austral Ecology 36:663–678
Beier P (2006) Effects of artificial night lighting on terrestrial mammals. In: Rich C, Longcore T, (eds) Ecological consequences of artificial night lighting. Island Press, Washington, DC, pp 19–42
Beninde J, Veith M, Hochkirch H (2015) Biodiversity in cities needs space: a meta-analysis of factors determining intra-urban biodiversity variation. Ecology Letters, 18:581–592
Dixon MD (2012) Relationship between land cover and insectivorous bat activity in an urban landscape. Urban Ecosystems, 15:683–695

245 REFERENCES & FURTHER READING |
appliedecology
Duchamp J, Swihart R, 2008. Shifts in bat community structure related to evolved traits and features of human-altered landscapes. Landscape Ecology, 23:849–860
Gehrt SD, Chelsvig JE (2004) Species specific patterns of bat activity in an urban landscape. Ecological Applications 14:625–635
Gillam, E. H. and McCracken, G. F. (2007). Variability in the echolocation of Tadarida brasiliensis: effects of geography and local acoustic environment. Anim. Behav. 74, 277-286
Green, K., and Sanecki, G. (2006). Immediate and short-term responses of bird and mammal assemblages to a subalpine wildfire in the Snowy Mountain, Australia. Austral Ecology 31, 673–681. doi:10.1111/j.1442-9993.2006.01629.x
Hanspach, J, Fischer, J, Ikin, K, Stott, J, Law, BS, 2012. Using trait-based filtering as a predictive framework for conservation: a case study of bats on farms in southeastern Australia. Journal of Applied Ecology, August, 2012. DOI: 10.2307/23259190
Hourigan CL, Catterall CP, Jones D, Rhodes M, 2010. The diversity of insectivorous bat assemblages among habitats within a subtropical urban landscape. Austral Ecology, 35:849–857
Inkster-Draper, TE, SheBirds, M, Johnson, CN, Robson, SKA, 2013. Prescribed fire in eucalypt woodlands: immediate effects on a microbat community of northern Australia. Wildlife Research, 40, 70–76. http://dx.doi.org/10.1071/WR12133
Jones G, Rydell J (1994) Foraging strategy and predation risk as factors influencing emergence time in echolocating bats. Phil Trans R Soc Lond B 346:445–455
Jung K, Kalko EKV (2010) Where forest meets urbanization: foraging plasticity of aerial insectivorous bats in an anthropogenically altered environment. J Mammal 91:144–153
Jung K, Kalko EKV (2011) Adaptability and vulnerability of high flying Neotropical aerial insectivorous bats to urbanization. Divers Distrib 17:262–274
Jung K, Threlfall CG (2016) Urbanisation and its effects on bats—a global meta-analysis approach. In: Bats in the Anthropocene: conservation of bats in a changing world. Springer International AG, Cham, pp. 13–28
Kalko EKV, Villegas SE, Schmidt M et al (2008) Flying high—assessing the use of the aerosphere by bats. Integr Comp Biol 48:60–73
Law, B.S., Chidel, M.& Turner, G. (2000) The use by wildlife of paddock trees in farmland. Pacific Conservation Biology, 6, 130–143.
Lloyd A, Law B, Goldingay R, 2006. Bat activity on riparian zones and upper slopes in Australian timber production forests and the effectiveness of riparian buffers. Biological Conservation 129: 207–220.
Loeb, S. C., and Waldrop, T. A. (2008). Bat activity in relation to fire and fire surrogate treatments in southern pine stands. Forest Ecology and Management 255,1–8.
Luck, GW, Smallbone, L, Threlfall, C, Law, B, 2013. Patterns in bat functional guilds across multiple urban centres in south-eastern Australia. Landscape Ecology, 28:455–469

| REFERENCES & FURTHER READING 246
Lumsden LF, Bennett AF (2005) Scattered trees in rural landscapes: foraging habitat for insectivorous bats in southeastern Australia. Biol Conserv 122:205–222
McConville,A, Law, BS, Mahony, MJ, 201. Are Regional Habitat Models Useful at a Local-Scale? A Case Study of Threatened and Common Insectivorous Bats in South-Eastern Australia. PLoS ONE 8(8): e72420. doi:10.1371/journal.pone.0072420
Milne, D. J. et al. 2004. A comparison of three survey methods for collecting bat echolocation calls and species-accumulation rates from nightly anabat recordings. Wildl. Res. 31: 57-63.
Pennay, M, Law, BD, Rheinhold, L. 2004. Bat calls of New South Wales: region-based guide to the echolocation calls of microchiropteran bats. NSW Dept of Environment and Conservation.
Reinhold, L., Law, B., Ford, G. and Pennay, M. 2001, Key to the bat calls of southeast Queensland and north-east New South Wales. Forest Ecosystem Research and Assessment Technical paper 2001-07, Department of Natural Resources and Mines, Queensland.
Richards G, Hall L, Parish S (2012) A natural history of Australian Bats. CSIRO, Collingwood
Rowse, EG, Lewanzik, D, Stone, EL, Harris, S, Jones, G, 2016. Dark Matters: the effects of artificial lighting on bats. In: C.C. Voigt and T. Kingston (eds.), Bats in the Anthropocene: Conservation of Bats in a Changing World, pp. 187-214. DOI 10.1007/978-3-319-25220-9_7
Rydell J (2006) Bats and their insect prey at streetlights. In: Rich C, Longcore T (eds) Ecological consequences of artificial night lighting. Island Press, Washington, DC, pp 43–60
Scanlon AT, Petit S, 2008. Effects of site, time, weather, and light on urban bat activity and richness: considerations for survey effort. Wildlife Research, 35:821–834
Threlfall CG, Law B, Banks PB (2012a) Influence of Landscape Structure and Human Modifications on Insect Biomass and Bat Foraging Activity in an Urban Landscape. PLoS ONE 7(6): e38800. doi:10.1371/journal.pone.0038800
Threlfall CG, Law B, Banks PB (2012) Sensitivity of insectivorous bats to urbanization: implications for suburban conservation planning. Biol Conserv 146:41–52
Threlfall CG, Law B, Banks PB (2013). Roost selection in suburban bushland by the urban sensitive bat Nyctophilus gouldi. Journal of Mammalogy, 94(2): 307-319
Threlfall, C., Law, B., Penman, T.& Banks, P.B. (2011) Ecological processes in urban landscapes: mechanisms influencing the distribution and activity of insectivorous bats. Ecography, 34, 814–826.
Treby, DL, Castley, JG, 2016. Determinants of microbat communities in urban forest remnants: a rapid landscape scale assessment. Urban Ecosystems, DOI 10.1007/s11252-016-0552-2
Wilson, c, van der Ree, R, Lumsden, L, Wintle, B, 2012. The effects of urbanisation on the diversity of abundance of nocturnal insects: Implications for microbat conservation. Conference paper, 97th ESA Annual Convention, August, 2012.

247 REFERENCES & FURTHER READING |
appliedecology
15.2 FIRE IMPACTS REFERENCES
Adams, M., Attiwill, P, 2011. Burning issues: sustainability and management of Australia’s southern forests. CSIRO Publishing, Melbourne, Victoria, Australia.
Banks, SC, Dujardin, M, McBurney, L, Blair, D, Barker, M, Lindenmayer, DB, 2011a. Starting points for small mammal population recovery after wildfire: Recolonisation or residual populations? Oikos 120:26–37.
Banks, SC, Knight, EJ, McBurney, L, Blair, D, Lindenmayer, DB, 2011b. The effects of wildfire on mortality and resources for an arboreal marsupial: resilience to fire events but susceptibility to fire regime change. PLoS ONE 6:e22952.
Bassett, M, Leonard, S, Chia, EK, Clarke, MF, Bennett, AF, 2017. Interacting effects of fire severity, time since fire and topography on vegetation structure after wildfire. Forest Ecology and Management 396:26-34. DOI: 10.1016/j.foreco.2017.04.006
Berry, LE, Driscoll, DA, Banks, SC, Lindenmayer, DB, 2015b. The use of topographic fire refuges by the Greater Glider (Petauroides volans) and the Mountain Brushtail Possum (Trichosurus cunninghami) following a landscape-scale fire. Australian Mammalogy 37:39–45.
Berry, LE, Driscoll, DA, Stein, JA, Blanchard, W, Banks, SC, Bradstock, RA, Lindenmayer, DB, 2015a. Identifying the location of fire refuges in wet forest ecosystems. Ecological Applications, 25(8), 2337–2348. https://doi.org/10.1071/WF15204
Boyles, J. G., and Aubrey, D. P. (2006). Managing forests with prescribed fire: implications for a cavity dwelling bat species. Forest Ecology and Management 222, 108–115. doi:10.1016/j.foreco.2005.09.024
Bradstock, RA, Hammill, KA, Collins, L, Price, O, 2010. Effects of weather, fuel and terrain on fire severity in topographically diverse landscapes of south-eastern Australia. Landscape Ecology 25:607–619.
Buchalski MR, Fontaine JB, Heady PA III, Hayes JP, Frick WF (2013) Bat Response to Differing Fire Severity in Mixed-Conifer Forest California, USA. PLoS ONE 8(3): e57884. doi:10.1371/journal.pone.0057884
Burgess, E, Maron, M, 2015. Does the response of bird assemblages to fire mosaic properties vary among spatial scales and foraging guilds? Landscape Ecology, DOI: 10.1007/s10980-015-0275-4
Chia, E. K., M. Bassett, D. G. Nimmo, S. W. J. Leonard, E. G. Ritchie, M. F. Clarke, and A. F. Bennett. 2015. Fire severity and fire-induced landscape heterogeneity affect arboreal mammals in fire-prone forests. Ecosphere 6(10):190. http://dx.doi.org/10.1890/ES15-00327.1
Christensen, PES, 1980. ‘The Biology of Bettongia penicillata Gray, 1837, and Macropus eugenii, (Desmarest, 1817) in Relation to Fire.’ Forests Department of Western Australia, Bulletin No. 91: Perth.
Clarke, MF, 2008. Catering for the needs of fauna in fire management: science or just wishful thinking? Wildlife Research, 35(5), 385-394
Collins, L, Bradstock, RA, Tasker, EM, Whelan, RJ, 2012a. Can gullies preserve complex forest structure in frequently burnt landscapes? Biological Conservation 153:177–186.

| REFERENCES & FURTHER READING 248
Collins, L, Bradstock, RA, Tasker, EM, Whelan, RJ, 2012b. Impact of fire regimes, logging and topography on hollows in fallen logs in eucalypt forest of south eastern Australia. Biological Conservation 149(1) 23-31.
Croft, P, Hunter, JT, Reid, N, 2016. Forgotten fauna: Habitat attributes of long-unburnt open forests and woodlands dictate a rethink of fire management theory and practice. Forest Ecology and Management, 366, 166
Dunham, J, Rosenberger, A, Luce, C, Rieman, B. 2007. Influences of wildfire and channel reorganization on spatial and temporal variation in stream temperature and the distribution of fish and amphibians. Ecosystems, 10, 335–346.
Engbrecht, NJ, Lannoo, MJ, 2012. Crawfish frog behavioral differences in postburned and vegetated grasslands. Fire Ecology, 8,63–76.
Foster, CN, Barton, PS, Sato, CF, Wood, JT, MacGregor, CI, Lindenmayer, DB, 2016. Herbivory and fire interact to affect forest understory habitat, but not its use by small vertebrates. Animal Conservation, 19(1), p15-25
Garvey, N., D. Ben-Ami, D. Ramp, and D. B. Croft. 2010. Survival behaviour of Swamp Wallabies during prescribed burning and wildfire. Wildlife Research 37:1–12.
Greenburg, CH, Waldrop, TA, 2008. Short-term response of reptiles and amphibians to prescribed fire and mechanical fuel reduction in a southern Appalachian upland hardwood forest. Forest Ecology Management, 255, 2883–2893.
Haslem, A, Kelly, KT, Nimmo, DG, Watson, SJ, Kenny, SA, Taylor, RS, Avitabile, SC, Callister, KE, Spence-Bailey, LM, Clarke, MF, Bennett, AF, 2011. Habitat or fuel? Implications of long-term, post-fire dynamics for the development of key resources for fauna and fire. Journal of Applied Ecology 2011, 48, 247–256. doi: 10.1111/j.1365-2664.2010.01906.x
Haslem, A, Avitabile, SC, Taylor, RS, Kelly, LT, Watson, SJ, Kenny, SA, Callister, KE, Spence-Bailey, LM, Bennett, AF, Clarke, MF, 2012. Time-since-fire and inter-fire interval influence hollow availability for fauna in a fire-prone system. Biological Conservation. 152, 212-221
Homan, P, 2012. Survival and recolonization following wildfire at Moyston West, Western Victoria. 1. Mammals. The Victorian Naturalist, 129(6), 192-202
Hope, B, 2012. Short-term response of the long-nosed bandicoot, Perameles nasuta, and the southern brown bandicoot, Isoodon obesulus obesulus, to low-intensity prescribed fire in heathland vegetation. Wildlife Research, 39(8), p6-16
Hossack, B.R., Lowe, W.H. & Corn, P.S. (2013) Rapid increases and time-lagged declines in amphibian occupancy after wildfire. Conservation Biology, 27, 219–228.
Kelly, L. T., Haslem, A, Holland, GJ, Leonard, SWJ, MacHunter, J, Bassett, M, Bennett, AF, Bruce, MJ, Chia, EK, Christie, FJ, Clarke, MF, Di Stefano, J, Loyn, R, McCarthy, MA, Pung, A, Robinson, N, Sitters, H, Swan, M, York, A, 2017. Fire regimes and environmental gradients shape vertebrate and plant distributions in temperate eucalypt forests. Ecosphere 8(4):e01781. 10.1002/ecs2.1781
249 REFERENCES & FURTHER READING |
appliedecology
Keyser, P.D., Sausville, D.J., Ford, W.M., Schwab, D.J. & Brose, P.H. (2004) Prescribed fire impacts to amphibians and reptiles in shelterwood-harvested oak-dominated forests. Virginia Journal of Science, 55,159–168.
Knox, K, Morrison, DA, 2005. Effects of inter‐fire intervals on the reproductive output of resprouters and obligate seeders in the Proteaceae. Austral Ecology 30(4):407 – 413. DOI: 10.1111/j.1442-9993.2005.01482.x
Lacki, M. J., Cox, D. R., Dodd, L. E., and Dickinson, M. B. (2009). Response of northern bats (Myotis
septentrionalis) to prescribed fires in eastern Kentucky forests. Journal of Mammalogy 90, 1165–1175. doi:10.1644/08-MAMM-A-349.1
Leonard, SWJ, Bennett, AF, Clarke, MF. 2014. Determinants of the occurrence of unburnt forest patches: potential biotic refuges within a large, intense wildfire in south-eastern Australia. Forest Ecology and Management 314:85–93.
Lindenmayer, DB, Blanchard, W, McBurney, L, Blair, D, Banks, SC, Driscoll, D, Smith, AL, Gill, AM. 2013. Fire severity and landscape context effects on arboreal marsupials. Biological Conservation 167:137–148.
Lindenmayer, DB, Wood, JT, Macgregor, C, 2008. How predictable are reptile responses to wildfire? Oikos, 117, 1086-1097
Loeb, S. C., and Waldrop, T. A. (2008). Bat activity in relation to fire and fire surrogate treatments in southern pine stands. Forest Ecology and Management 255,1–8.
McDonald, PJ, Luck, GW, Pavey, CR, Wassens, S, 2012. Importance of fire in influencing the occurrence of snakes in an upland region of arid Australia. Austral Ecology. 37(7), p855-864
Newsome, A. E., McIlroy, J., Catling, P. (1975). The effects of an extensive wildfire on populations of twenty ground vertebrates in south-east Australia. In ‘Managing terrestrial ecosystems’. (Eds J. Kikkawa and H. A. Nix.) pp. 107–123. (Ecological Society of Australia: Brisbane.)
Nimmo, DG, Kelly, LT, Farnsworth, LM, Watson, SJ, Bennett, AF. 2014. Why do some species have geographically varying responses to fire history? Ecography 37:805–813.
Potvin, DA, Parris, K, Smith Date, KL, Keely, CC, Bray, RD, Hale, J, Hunjan, S, Austin, J, Melville, J, 2017. Genetic erosion and escalating extinction risk in frogs with increasing wildfire frequency. Journal of Applied Ecology, 54(3), 945-954, DOI: 10.1111/1365-2664.12809
Robinson, NM, Leonard, SWJ, Bennett, AF, Clarke, MF. 2014. Refuges for birds in fire-prone landscapes: the influence of fire severity and fire history on the distribution of forest birds. Forest Ecology and Management 318:110–121. DOI: 10.1016/j.foreco.2014.01.008
Robinson, NM, Leonard, SWJ, Bennett, AF, Clarke, MF. 2016. Are forest gullies refuges for birds when burnt? The value of topographical heterogeneity to Bird diversity in a fire-prone landscape. Biological Conservation 200:1-7. DOI: 10.1016/j.biocon.2016.05.010
Robinson, NM, Leonard, SWJ, Ritchie, EG, Bassett, M, Chia, EK, Buckingham, S, Gibb, H, Bennett, AF, Clarke, MF. 2013. Refuges for fauna in fire-prone landscapes: their ecological function and importance. Journal of Applied Ecology 50:1321–1329.

| REFERENCES & FURTHER READING 250
Roman-Cuesta, RM, Gracia, M, Retana, J. 2009. Factors influencing the formation of unburned forest islands within the perimeter of a large forest fire. Forest Ecology and Management 258:71–80.
Sitters, H, Di Stefano, J, Christie, FJ, Sunnucks, P, York, A, 2015. Bird diversity increases after patchy prescribed fire: implications from a before–after control–impact study. International Journal of Wildland Fire, 24, 690–701. http://dx.doi.org/10.1071/WF14123
Swan, M, Galindez-Silva, C, Christie, FJ, York, A, Di Stefano, J, 2016. Contrasting responses of small mammals to fire and topographic refugia: SMALL MAMMAL RESPONSES TO PATCHY FIRE. Austral Ecology 41(4), 437-445
15.3 POWERFUL OWL REFERENCES
Bain, D., Kavanagh, R., Hardy, K. and Parsons, H. (2014). The Powerful Owl Project: Conserving owls in Sydney’s urban landscape. BirdLife Australia, Melbourne
Cooke R, Hogan F (2008) The more you learn, the less you know: using genetics to confirm breeding behaviour of Powerful Owls. Abstracts, p 17, Australasian Raptor Association conference, Coffs Harbour, August 2008. (Published in Boobook 27, 2009, p 27.)
Cooke R, Wallis R, Hogan F, White J, Webster A (2006) The diet of Powerful Owls (Ninox strenua) and prey
Garnett S, Crowley G (Eds) (2000) ‘The Action Plan for Australian Birds 2000.’ (Environment Australia: Canberra)
Higgins PJ (Ed.) (1999) ‘Handbook of Australian, New Zealand and Antarctic birds, vol. 4.’ (Oxford University Press: Melbourne)
Hogan F, Cooke R, Norman J (2008) Population genetic structure and dispersal of the Powerful Owls Ninox strenua in a fragmented landscape. Abstracts, p 18, Australasian Raptor Association conference, Coffs Harbour, August 2008. (Published in Boobook 27, 2009, p 27.)
Kavanagh RP (2002a) Comparative diets of the Powerful Owl (Ninox strenua), Sooty Owl (Tyto tenebricosa) and Masked Owl (Tyto novaehollandiae) in southeastern Australia. In ‘Ecology and Conservation of Owls’ (Eds I Newton, R Kavanagh, J Olsen, I Taylor) pp. 175-191. (CSIRO: Melbourne)
Kavanagh RP (2002b) Conservation and management of large forest owls in southeastern Australia. In ‘Ecology and Conservation of Owls’ (Eds I Newton, R Kavanagh, J Olsen, I Taylor) pp. 201-219. (CSIRO: Melbourne)
Kavanagh RP (2004) Conserving owls in Sydney’s urban bushland: current status and requirements. In ‘Urban wildlife: more than meets the eye’ (Eds. D Lunney, S Burgin) pp. 93-108. (Royal Zoological Society of NSW: Sydney)
McNabb EG, Kavanagh RP, Craig SA (2007) Further observations on the breeding biology of the Powerful Owl Ninox strenua. Corella 31, 6-9
OEH (2014) Powerful Owl – profile http://www.environment.nsw.gov.au/threatenedspeciesapp/profile.aspx?id=10562