Fish assemblages of shallow intertidal habitats of the Ria Formosa lagoon (South Portugal):...
15
MARINE ECOLOGY PROGRESS SERIES Mar Ecol Prog Ser Vol. 446: 259–273, 2012 doi: 10.3354/meps09455 Published February 2 INTRODUCTION Shallow intertidal habitats within saltmarsh areas can support important communities of fish species, especially the earlier life-history stages (juveniles), including those of many valuable commercial species (Weinstein 1979, Bozeman & Dean 1980, Kneib 1997). In many parts of the world, saltmarshes have been destroyed or considerably altered by human activities (Kneib 1997, Elliott et al. 2002). Therefore, a better understanding of the functioning of salt- marshes is crucial for protecting these vulnerable habitats. Most research on saltmarsh fish communities has been carried out in North America (Kneib 1997, Con- nolly 1999, Cattrijsse & Hampel 2006), with a more limited number of studies conducted in Australia (e.g. Morton et al. 1987, Connolly et al. 1997, Thomas & Connolly 2001) and South Africa (e.g. Paterson & Whitfield 1996, 2000a,b, 2003), and only very few carried out in Europe (e.g. Labourg et al. 1985, Cat- trijsse et al. 1994). However, geographic characteris- © Inter-Research 2012 · www.int-res.com *Email: [email protected] Fish assemblages of shallow intertidal habitats of the Ria Formosa lagoon (South Portugal): influence of habitat and season Joaquim Ribeiro*, Gonçalo M. Carvalho, Jorge M. S. Gonçalves, Karim Erzini Centro de Ciências do Mar (CCMAR), Faculdade de Ciências do Mar e do Ambiente, Universidade do Algarve, Campus de Gambelas, 8005-139 Faro, Portugal ABSTRACT: Fish assemblages in seagrass and unvegetated habitats located in shallow intertidal creeks within the saltmarsh area of the Ria Formosa coastal lagoon were sampled with a Riley push net at 3 sites on a monthly basis over a 1 yr period. The objective was to test if both habitats support similar fish assemblages in terms of abundance, diversity, assemblage structure, and size distribution, and to investigate how site and season affect the assemblages. Fish assemblages associated with these habitats were significantly different in terms of diversity, abundance, and assemblage structure. Seagrass supported a larger number of species and greater diversity, while unvegetated habitat supported greater fish numbers but only of a few species. The habitats were dominated by different groups of resident species that were responsible for major differences in fish assemblage structure between habitats. Pomatoschistus microps and young-of-the-year (YOY) Atherina presbyter dominated the unvegetated habitat, while seagrass was dominated by a diverse group of species, in particular syngnathids and small labrids, revealing different habitat preferences. Site and season were determinant factors conditioning the role of habitat in structur- ing fish assemblages. Distance between habitats, site elevation, and the amount of marsh drained affected fish assemblages in both habitats. Seasonal fluctuations in the presence and abundance of YOY from marine migrant and resident species were responsible for comparable changes in fish assemblage structure in both habitats. Both habitats provide a distinctive nursery area for dif- ferent species, while common species reveal ontogenic distributional changes between habitats, where smaller fish appear first in unvegetated creeks. KEY WORDS: Fish fauna · Coastal lagoon · Saltmarsh · Intertidal habitats · Seasonal variations · Habitat association · Ria Formosa · South Portugal Resale or republication not permitted without written consent of the publisher
Transcript of Fish assemblages of shallow intertidal habitats of the Ria Formosa lagoon (South Portugal):...
MARINE ECOLOGY PROGRESS SERIESMar Ecol Prog Ser
Vol. 446: 259–273, 2012doi: 10.3354/meps09455
Published February 2
INTRODUCTION
Shallow intertidal habitats within saltmarsh areascan support important communities of fish species,especially the earlier life-history stages (juveniles),including those of many valuable commercial species(Weinstein 1979, Bozeman & Dean 1980, Kneib1997). In many parts of the world, saltmarshes havebeen destroyed or considerably altered by humanactivities (Kneib 1997, Elliott et al. 2002). Therefore, abetter understanding of the functioning of salt-
marshes is crucial for protecting these vulnerablehabitats.
Most research on saltmarsh fish communities hasbeen carried out in North America (Kneib 1997, Con-nolly 1999, Cattrijsse & Hampel 2006), with a morelimited number of studies conducted in Australia(e.g. Morton et al. 1987, Connolly et al. 1997, Thomas& Connolly 2001) and South Africa (e.g. Paterson &Whitfield 1996, 2000a,b, 2003), and only very fewcarried out in Europe (e.g. Labourg et al. 1985, Cat-trijsse et al. 1994). However, geographic characteris-
© Inter-Research 2012 · www.int-res.com*Email: [email protected]
Fish assemblages of shallow intertidal habitats of the Ria Formosa lagoon (South Portugal):
influence of habitat and season
Joaquim Ribeiro*, Gonçalo M. Carvalho, Jorge M. S. Gonçalves, Karim Erzini
Centro de Ciências do Mar (CCMAR), Faculdade de Ciências do Mar e do Ambiente, Universidade do Algarve, Campus de Gambelas, 8005-139 Faro, Portugal
ABSTRACT: Fish assemblages in seagrass and unvegetated habitats located in shallow intertidalcreeks within the saltmarsh area of the Ria Formosa coastal lagoon were sampled with a Rileypush net at 3 sites on a monthly basis over a 1 yr period. The objective was to test if both habitatssupport similar fish assemblages in terms of abundance, diversity, assemblage structure, and sizedistribution, and to investigate how site and season affect the assemblages. Fish assemblagesassociated with these habitats were significantly different in terms of diversity, abundance, andassemblage structure. Seagrass supported a larger number of species and greater diversity, whileunvegetated habitat supported greater fish numbers but only of a few species. The habitats weredominated by different groups of resident species that were responsible for major differences in fish assemblage structure between habitats. Pomatoschistus microps and young-of-the-year(YOY) Atherina presbyter dominated the unvegetated habitat, while seagrass was dominated bya diverse group of species, in particular syngnathids and small labrids, revealing different habitatpreferences. Site and season were determinant factors conditioning the role of habitat in structur-ing fish assemblages. Distance between habitats, site elevation, and the amount of marsh drainedaffected fish assemblages in both habitats. Seasonal fluctuations in the presence and abundanceof YOY from marine migrant and resident species were responsible for comparable changes infish assemblage structure in both habitats. Both habitats provide a distinctive nursery area for dif-ferent species, while common species reveal ontogenic distributional changes between habitats,where smaller fish appear first in unvegetated creeks.
KEY WORDS: Fish fauna · Coastal lagoon · Saltmarsh · Intertidal habitats · Seasonal variations ·Habitat association · Ria Formosa · South Portugal
Resale or republication not permitted without written consent of the publisher

Mar Ecol Prog Ser 446: 259–273, 2012
tics of saltmarsh environments are extremely vari-able, in particular in terms of size, topography, andhydrology, which have relevant implications for fishuse of intertidal marsh areas (Kneib 1997, Cattrijsse& Hampel 2006). U.S. Atlantic marshes are oftenlocated below mean high water, and therefore areinundated more frequently and for longer periodsthan European marshes, which are located mostlyabove mean high water, being inundated and acces-sible to fish only during spring high tides. These dif-ferences reveal the need for research on a range ofsaltmarsh types and geographical locations (Paterson& Whitfield 2003).
In order to assess the fish use of intertidal marshhabitats, several studies have investigated their fishcommunities, particularly in unvegetated creeks(Cain & Dean 1976, Shenker & Dean 1979, Bozeman& Dean 1980, Rountree & Able 1992, Paterson &Whitfield 1996, Paterson & Whitfield 2003), seagrassbeds (Adams 1976, Pollard 1984, Smith et al. 1984,Bell & Pollard 1989), and vegetated habitats (e.g.Rozas & Minello 1998, Rozas & Zimmerman 2000).Other research compared the fish community pre-sent in different habitats, mostly between unvege-tated creeks and subtidal seagrass (Weinstein &Brooks 1983, Heck et al. 1989, Ferrell & Bell 1991,Sogard & Able 1991, Connolly 1994, Paterson &Whitfield 2000a). In general, fish assemblages withinintertidal marsh areas are formed mainly by estuar-ine resident and marine migrant species, with animportant presence of juvenile fish, revealing thatmarshes may play a relevant role as nursery grounds.Comparative studies showed that fish communitiesassociated with seagrass and unvegetated creekswithin intertidal marsh areas were structurally differ-ent, with unvegetated habitats dominated by rela-tively few species.
In Europe most studies on intertidalmarsh habitats concern unvegetatedcreeks and mud flats (Drake & Arias1991a, Cattrijsse et al. 1994, Laffailleet al. 2000, Mathieson et al. 2000, Sal-gado et al. 2004a, Veiga et al. 2006),with no research on the differencesbetween fish assemblages in intertidalseagrass beds and unvegetated creeks(Cattrijsse & Hampel 2006). In order tounderstand the role of these 2 shallowintertidal habitats in the overall ecol-ogy of the European saltmarshes, it iscrucial to know if they are utilized bydifferent ichthyofaunal communities.We tested the null hypotheses that: (1)
there are no differences between the 2 types of habi-tats with regard to diversity, abundance, assemblagestructure, and size distributions; (2) there is no effectof marsh location; and (3) there are no seasonalchanges in assemblage.
MATERIALS AND METHODS
Study area
This study was carried out in the western part of theRia Formosa (Ria Faro-Olhão). The Ria Formosa is alarge mesotidal coastal lagoon with a semi- diurnaltidal regime and an average spring tidal range of3.1 m, extending for about 55 km along the Atlanticsouth coast of Portugal (36° 58’ N, 8° 02’W to 37° 03’ N,7° 32’W), with a maximal width of 6 km (Fig. 1). De-tailed descriptions of the characteristics of the RiaFormosa are given in Ribeiro et al. (2006, 2008).
Sampling design
Over a 1 yr period, from April 2001 to March 2002,fish fauna were collected from 3 seagrass (Cymodo -cea nodosa) pools and 3 nearby muddy-sandy bottomunvegetated pools, all located within intertidal creeksof the Ria Formosa marsh area (Fig. 1). The 6 lo ca -tions are at 3 different marsh sites (A, B, and C), witheach containing 1 seagrass and 1 unvegetated pool.Seagrass locations are generally deeper than unvege-tated ones, with an average depth in seagrass of 0.70to 0.80 m (maximum depth around 1 m, except in siteA with 1.20 m) and around 0.50 m in unvegetatedcreeks (maximum depth around 0.70 m). Both ha bi -
260
Fig. 1. Western part of the Ria Formosa lagoon (Ria Faro-Olhão) showing the location of the 3 sampling sites
Ribeiro et al.: Fish assemblages of the Ria Formosa lagoon
tats at site A and the unvegetated habitat at site B arelocated approximately 1 m below high water springtide level, while the seagrass habitat at site B andboth habitats at site C are located right above the lowwater spring tide mark. In site C both habitats arecontiguous and connected during the low tide; but insite A both habitats are connected but 20 m apart;while in site B the 2 habitats are not connected duringlow tide and are at a distance of 100 m. The creek ateach site drained marsh areas with different sizes,with that at site B draining the largest area and that atsite C the smallest area. Each habitat was sampled ona monthly basis using a Riley push net (Holme &McIntyre 1984) 1.5 m wide and 0.5 m high at themouth, with a stretched mesh size of 2 mm in the codend. At each of the 6 locations, sampling took placeduring low (spring) tides, in day time, and consistedin 3 replicate transects, 30 m long, covering an area of45 m2. In order to minimize differences in catch effi-ciency among samples each replicate took 1 min(0.5 m s−1) (Eleftheriou & Holme 1984). In the labora-tory, all fish were identified to species, counted, andmeasured to the nearest mm.
Data analysis
Shannon-Wiener diversity index (H’) (Shannon &Wiener 1949) was calculated. Three factors wereconsidered: site (A, B, and C); habitat (seagrass andunvegetated); and season (spring, summer, autumn,and winter). A 3-way factorial analysis of variance(ANOVA) was used to test for differences in the num-ber of species, number of fish, and diversity indices,with all factors considered fixed (SAS Institute 1988).When significant main effects were detected in themultifactor ANOVAs, Tukey’s honestly significantdifference (HSD) test was used to find which meansdiffered. Analysis was performed on the data withthe level of significance set to p ≤ 0.01 to minimizethe chances of Type I errors occurring (Underwood1997). Significant interactions between factors wereexamined graphically. Paired t-tests were used tocompare average total length for the most importantfish species present in both habitats.
Changes in composition and abundance of fish spe-cies (fish assemblage structure) were tested accordingto the same 3-factor design using the semi-parametricpermutational multivariate analysis of variance (PER-MANOVA; Anderson 2001, 2005, McArdle & Ander-son 2001). Analysis was conducted using the Bray-Curtis measure on log10(x + 1) transformed data, andstatistical significance was tested using 9999 permuta-
tions of residuals under a re duced model to obtain p-values (Anderson & ter Braak 2003). When significantat the 0.05 level, interaction terms were investigatedthrough a posteriori pair-wise comparisons using 9999random permutations to obtain p-values (Anderson2005). To visualise significant effects obtained by theprevious analysis, principal coordinate analysis (PCo)(unconstrained ordination) and canonical analysis ofprincipal components analysis (constrained ordina-tion) were used (CAP; Anderson & Robinson 2003, An-derson & Willis 2003, Anderson 2004). The relativecontribution of species to the differences found wasassessed using the correlation coefficient resulting be-tween each species and the canonical axis in question,and the correlations of individual species (|r| > 0.40)with CAP axes 1 and 2 were plotted.
To compare the fish assemblage functional struc-ture in relation to each factor, species were classifiedaccording to an ecological guild classification adapt -ed from Elliott et al. (2007): catadromous (CA), mar -ine stragglers (MS), marine migrants (MM), and la -goon resident (LR) species (adapted from estuarineresident). This classification was chosen because it isa logical extension of previous conceptual models,focusing on a revision and standardization of previ-ous approaches. It also incorporates recent researchon the life cycles of fishes in estuaries and takes intoaccount the most recent management strategies forthese valuable ecosystems.
RESULTS
Fish abundance and diversity
A total of 67 666 fish weighing 29 066 g werecaught, representing at least 50 species and 17 fami-lies (Table 1). Average fish density at site A was 480.1fish 100 m−2 (37 species), 1498.6 fish 100 m−2 (38 spe-cies) at site B, and 109.7 fish 100 m−2 (32 species) atsite C . The seagrass habitat accounted for 36 speciesand 5.9% of the fish (70.2 fish 100 m−2), while 41 spe-cies and 94.1% of the fish (1123.2 fish 100 m−2) wererecorded in the unvegetated habitat. The overallnumber of species was higher in the unvegetatedhabitat, but within each site slightly more specieswere recorded in the seagrass habitat than in theunvegetated habitat (Table 1). Thirteen species werecommon to both habitats (8 LR and 5 MM), repre-senting more than 96% and around 54% of the fishcaught in the unvegetated habitat and seagrass,respectively. Ten species were present only in theseagrass and 14 only in unvegetated habitat (11 MS,
261
Mar Ecol Prog Ser 446: 259–273, 2012262
Sea
gra
ssU
nve
get
ated
Sp
ecie
s
E
G
S
ite
A
S
ite
B
S
ite
C
R
ang
e lt
Avg
. lt
S
ite
A
S
ite
B
S
ite
C
Ran
ge
TL
Avg
. TL
t
N
N
(%
) F
oc
N
N (
%)
Foc
N
N
(%
) F
oc
(m
m)
(
mm
)
N
N
(%
) F
oc
N
N (
%)
Foc
N
N
(%
) F
oc
(m
m)
(mm
)
An
gu
illa
an
gu
illa
C
A
0
.37
0
.6 1
3.9
0.0
6
0.1
2
.8
0
.56
0
.7 1
9.4
61-4
31
258
.2
0
.06
<0.
1
2.8
−
−
−
−
−
−
−
218
.0 *
Ap
hia
min
uta
M
S
−
−
−
−
−
−
−
−
−
−
−
−
−
−
0
.12
<0.
1
2.8
0.2
5
0.
1
5.6
3
0−40
34.2
Arn
oglo
ssu
s th
ori
L
R
−
−
−
−
−
−
−
−
−
−
−
−
−
−
−
−
−
0.0
6 <
0.1
2
.8
40
44.0
Ath
erin
a p
resb
yter
LR
4
.14
6
.3 4
7.2
2.2
8
2.3
27.
8
1
.60
2
.0 1
1.1
10−
93
47
.9
29
.08
3
.2 5
2.8
1
09.6
3
5.0
88.
9
42
.10
33
.3 3
6.1
1
0−81
22.3
*B
oop
s b
oop
s
M
M
−
−
−
0.0
6
0.1
2
.8
−
−
−
35
36.0
−
−
−
−
−
−
−
−
−
−
−
B
oth
us
pod
as
M
S
−
−
−
−
−
−
−
−
−
−
−
0.1
2 <
0.1
2
.8
−
−
−
−
−
−
35−
40
39
.0
C
alli
onym
us
mac
ula
tus
MS
−
−
−
−
−
−
−
−
−
−
−
0
.25
<0.
1
8.3
0.1
9 <
0.1
8
.3
−
−
−
3
0−55
42.9
Cal
lion
ymu
s re
ticu
latu
s
M
S
−
−
−
−
−
−
−
−
−
−
−
0.0
6 <
0.1
2
.8
−
−
−
−
−
−
40
42.0
Ch
elon
lab
rosu
s
M
M
0.
68
1.0
11.
1
−
−
−
−
−
−
73
−16
7
86
.9
−
−
−
6.6
0
0.3
36.
1
−
−
−
15−
118
37.3
*D
ente
x m
arro
can
us
MS
−
−
−
−
−
−
−
−
−
−
−
0
.06
<0.
1
2.8
−
−
−
−
−
−
30
33
.0
D
icen
trar
chu
s la
bra
x
MM
−
−
−
−
−
−
−
−
−
−
−
0
.19
<0.
1
2.8
13.5
2
0.5
27.
8
−
−
−
15−
145
45.8
Dip
leco
gas
ter
bim
acu
lata
LR
0
.12
0
.2
5.6
0.7
4
0.7
25.
0
0
.19
0
.2
8.3
10−
30
23
.5
−
−
−
−
−
−
−
−
−
−
−
Dip
lod
us
ann
ula
ris
MM
0.37
0
.6
5.6
0.5
6
0.6
19.
4
0
.68
0
.8 2
2.2
12−
109
53.6
−
−
−
−
−
−
0.1
2
0.
1
2.8
−
27
.0 *
Dip
lod
us
bel
lott
ii
MM
−
−
−
−
−
−
0.1
2
0.2
5
.6
1
0−65
45.0
−
−
−
−
−
−
−
−
−
−
−
D
iplo
du
s p
un
tazz
o
M
M
0.
31
0.5
8
.3
1
.85
1
.9 3
0.6
0.3
7
0.5
11.
1
1
4−69
37.0
−
−
−
−
−
−
0.4
9
0.
4 1
1.1
1
0−40
25.6
*D
iplo
du
s sa
rgu
s
M
M
3.
46
5.3
22.
2
0
.86
0
.9 1
6.7
0.4
3
0.5
11.
1
9−
96
23
.4
0
.37
<0.
1 1
1.1
1.9
1 <
0.1
16.
7
0
.62
0.4
2
.8
15−
50
22
.3 *
Dip
lod
us
vulg
aris
M
M
4.
94
7.5
30.
6
5
.49
5
.5 2
5.0
5.1
2
6.4
36.
1
1
0−75
33.8
4.2
6
0.5
19.
4
3
.21
0
.1 1
9.4
3.0
9
2.
2 2
2.2
1
2−65
27.4
*G
obiu
s co
uch
i
LR
0
.25
0
.4
5.6
0.6
2
0.6
25.
0
0
.06
0
.1
2.8
29−
79
58
.3
−
−
−
−
−
−
0
.12
0.1
2
.8
28−
55
41
.5 n
sG
obiu
s cr
uen
tatu
s
M
S
−
−
−
−
−
−
−
−
−
−
−
0.1
2 <
0.1
5
.6
0
.06
<0.
1
2.8
−
−
−
20−
40
31
.0
G
obiu
s n
iger
LR
4
.44
6
.8 4
4.4
11.6
0 1
1.6
83.
3
4
.07
5
.1 6
1.1
18−
114
64.5
14.2
5
1.6
86.
1
8
.33
0
.3 6
9.4
7.5
9
5.
5 7
7.8
17−
116
58.6
ns
Gob
ius
pag
anel
lus
LR
9
.32
14.
2 6
3.9
2.3
5
2.4
44.
4
1
.11
1
.4 2
7.8
44−
88
63
.1
0
.80
0
.1 1
9.4
0.7
4 <
0.1
19.
4
0
.25
0.2
11.
1 4
0−11
0
60
.8
H
ipp
ocam
pu
s g
utt
ula
tus
L
R
−
−
−
0.1
9
0.2
5
.6
0
.74
0
.9 1
3.9
10
3−13
7
11
.2
−
−
−
−
−
−
0
.12
0.1
8
.312
5−13
6
132
.0 n
sH
ipp
oc. h
ipp
ocam
pu
s
L
R
−
−
−
−
−
−
−
−
−
−
−
0.0
6 <
0.1
2
.8
0
.37
<0.
1
2.8
0.3
7
0.
3
8.3
65−
105
84.0
Lab
rus
viri
dis
M
S
−
−
−
−
−
−
0
.43
0
.5 1
3.9
50−
105
72.9
−
−
−
−
−
−
−
−
−
−
−
L
iza
aura
ta
M
S
0
.25
0
.4
8.3
11.6
7 1
1.7
5
.6
−
−
−
12−
90
32
.0
0
.06
<0.
1
2.8
1
69.5
1
2.9
44.
4
−
−
−
14−
124
33,2
ns
Mon
och
iru
s h
isp
idu
s
MS
−
−
−
−
−
−
−
−
−
−
−
−
−
−
−
−
−
0
.06
<0.
1
2.8
80
83
.0
M
ull
us
surm
ule
tus
MM
−
−
−
0
.06
0
.1
2.8
−
−
−
4
0
41
.0
−
−
−
−
−
−
−
−
−
−
−
Ner
oph
is l
um
bri
cifo
rmes
M
S
−
−
−
0.1
2
0.1
5
.6
0
.06
0
.1
2.8
1
45−
150
1
48.3
−
−
−
−
−
−
−
−
−
−
−
N
erop
his
op
hid
ion
LR
1
.30
2
.0 2
5.0
14.3
2 1
4.4
91.
7
8
.02
10.
0 6
3.9
90−
216
1
43.0
−
−
−
−
−
−
0.8
6
0.
6 2
2.2
82−
151
1
17.6
*P
agel
lus
bog
arav
eo
M
M
−
−
−
−
−
−
−
−
−
−
−
0.0
6 <
0.1
2
.8
−
−
−
−
−
−
30
33.0
Par
able
nn
ius
gat
toru
gin
e L
R
0.3
7
0.6
11.
1
0
.25
0
.2 1
1.1
0.0
6
0.1
2
.8
20
−11
5
6.
71
−
−
−
0.0
6 <
0.1
2
.8
−
−
−
20−
115
6.71
Par
able
nn
ius
pil
icor
nis
LR
0
.06
0
.1
2.8
−
−
−
−
−
−
55
54.0
−
−
−
−
−
−
−
−
−
−
−
P
arab
l. s
ang
uin
olen
tus
MS
−
−
−
0
.06
0
.1
2.8
−
−
−
5
0
55
.0
−
−
−
−
−
−
−
−
−
−
−
Pom
atos
chis
tus
mic
rop
s
L
R
7.9
0 1
2.1
41.
7
0
.93
0
.9 2
2.2
6.4
2
8.0
36.
1
5
0−45
28.3
8
38.0
2 9
3.6
1
00 2
663.
77 9
1.9
1
00
65
.19
46
.9
100
5
0−45
28.3
Pom
atos
chis
tus
min
utu
s
LR
0
.06
0
.1
2.8
−
−
−
−
−
−
25−
35
29
.2
1
.05
0
.1
2.8
−
−
−
−
−
−
2
5−35
29.2
Pom
atos
chis
tus
pic
tus
LR
0
.49
0
.8 1
1.1
0.6
8
0.7
11.
1
0
.25
0
.3
5.6
15−
35
24
.9
3
.58
0
.4 4
7.2
0.7
4 <
0.1
13.
9
0
.86
0.6
13.
9
15−
35
24
.9
S
alar
ia p
avo
LR
−
−
−
−
−
−
0.0
6
0.1
2
.8
10
0
104
.0
−
−
−
−
−
−
−
−
−
1
00
104
.0
S
ard
ina
pil
char
du
s
M
M
−
−
−
−
−
−
−
−
−
−
−
−
−
−
0
.12
<0.
1
5.6
−
−
−
20−
35
27
.5
S
arp
a sa
lpa
MM
0.12
0
.2
2.8
−
−
−
−
−
−
50−
55
52
.5
−
−
−
−
−
−
−
−
−
−
−
Sco
rpae
na
not
ata
M
M
0.
06
0.1
2
.8
−
−
−
−
−
−
5
5−95
73.3
0.1
2 <
0.1
2
.8
−
−
−
−
−
−
55−
95
73
.3
S
corp
aen
a p
orcu
s
MM
0.68
1
.0 2
5.0
1.3
0
1.3
30.
6
0
.49
0
.6 2
2.2
40−
160
88.9
0.7
4
0.1
25.
0
0
.62
<0.
1 1
6.7
0.1
9
0.
1
5.6
40−
160
88.9
Ser
ran
us
hep
atu
s
MS
−
−
−
−
−
−
−
−
−
−
−
0
.19
<0.
1
8.3
−
−
−
0
.06
<0.
1
2.8
2
0−45
31.3
Sp
aru
s au
rata
M
M
−
−
−
−
−
−
−
−
−
−
−
−
−
−
0
.25
<0.
1 1
1.1
−
−
−
20−
70
47
.5
S
pon
dyl
ioso
ma
can
thar
us
MM
1.11
1
.7 1
9.4
0.8
0
0.8
16.
7
13
.09
16.
3 4
7.2
10−
80
48
.7
0
.31
<0.
1 1
1.1
0.3
1 <
0.1
2
.8
1
.11
0.8
27.
8
10−
80
48
.7 *
Sym
ph
odu
s b
aill
oni
LR
3
.02
4
.6 4
4.4
3.0
2
3.0
58.
3
5
.99
7
.4 5
0.0
15−
140
66.7
0.8
0
0.1
22.
2
0
.56
<0.
1 1
1.1
0.1
2
0.
1
5.6
15−
140
66.7
Sym
ph
odu
s ci
ner
eus
L
R
1.1
1
1.7
22.
2
9
.75
9
.8 8
3.3
2.7
2
3.4
47.
2
10
−12
0
50
.8
0
.12
<0.
1
2.8
0.1
2 <
0.1
5
.6
1
.05
0.8
22.
2 1
0−12
0
50
.8
S
ymp
hod
us
rois
sali
MM
0.06
0
.1
2.8
0.6
8
0.7
19.
4
0
.43
0
.5 1
6.7
15−
75
40
.4
0
.06
<0.
1
2.8
0.0
6 <
0.1
2
.8
0
.06
0
.1
2.8
1
5−75
40.4
Syn
gn
ath
us
abas
ter
LR
17.
90 2
7.4
91.
7
11
.98
12.
0 6
9.4
13.9
5 1
7.3
58.
3
40
−11
0
75
.6
−
−
−
0.4
3 <
0.1
13.
9
3
.52
2.5
36.
1 4
0−11
0
75
.6
S
yng
nat
hu
s ac
us
L
R
0.7
4
1.1
27.
8
0
.49
0
.5 1
9.4
0.8
6
1.1
27.
8
35
−30
0
162
.3
0
.06
<0.
1
2.8
0.4
3 <
0.1
16.
7
0
.12
0.1
5
.6 3
5−30
0
162
.3
S
yng
nat
hu
s ty
ph
le
L
R
1.7
9
2.7
50.
0
16
.98
17.
0 8
8.9
12.5
3 1
5.6
91.
7
45
−26
5
121
.4
−
−
−
0.7
4 <
0.1
16.
7
10
.56
7.6
63.
9 4
5−26
5
121
.4
To
tal
no
. of
fish
65.
43
99.
75
80.
43
8
94.8
6
28
97.4
7
1
38.9
5
No.
of
spec
ies
(S)
2
8
28
27
2
6
2
5
2
5
Sp
ecie
s ri
chn
ess
(d)
3.9
95
3.6
55
3.5
45
2.6
03
2.2
25
2.9
46
Eve
nn
ess
(J’)
0.72
8
0.7
51
0.7
39
0.1
03
0.1
33
0.4
79
Sh
ann
on-W
ien
er (
H’)
2
.450
2
.501
2
.434
0
.335
0.4
297
1
.522
Tab
le 1
. F
ish
sp
ecie
s ca
ug
ht
over
sea
gra
ss a
nd
un
veg
etat
ed h
abit
ats,
nu
mb
er o
f fi
sh 1
00 m
−2
(N),
rel
ativ
e ab
un
dan
ce (
N%
), p
erce
nta
ge
of o
ccu
rren
ce (
Foc
) an
d e
colo
gic
al c
lass
ific
atio
n (
EG
), s
ize
ran
ge
(ran
ge
TL
), a
vera
ge
tota
l le
ng
th (
avg
. T
L),
an
d t
-tes
t re
sult
s co
mp
arin
g a
vera
ge
tota
l le
ng
th f
or t
he
mos
t im
por
tan
t fi
sh s
pec
ies
pre
sen
t in
bot
h h
abit
ats
(t).
ns:
not
sig
nif
ican
t. *
p <
0.0
01
Ribeiro et al.: Fish assemblages of the Ria Formosa lagoon
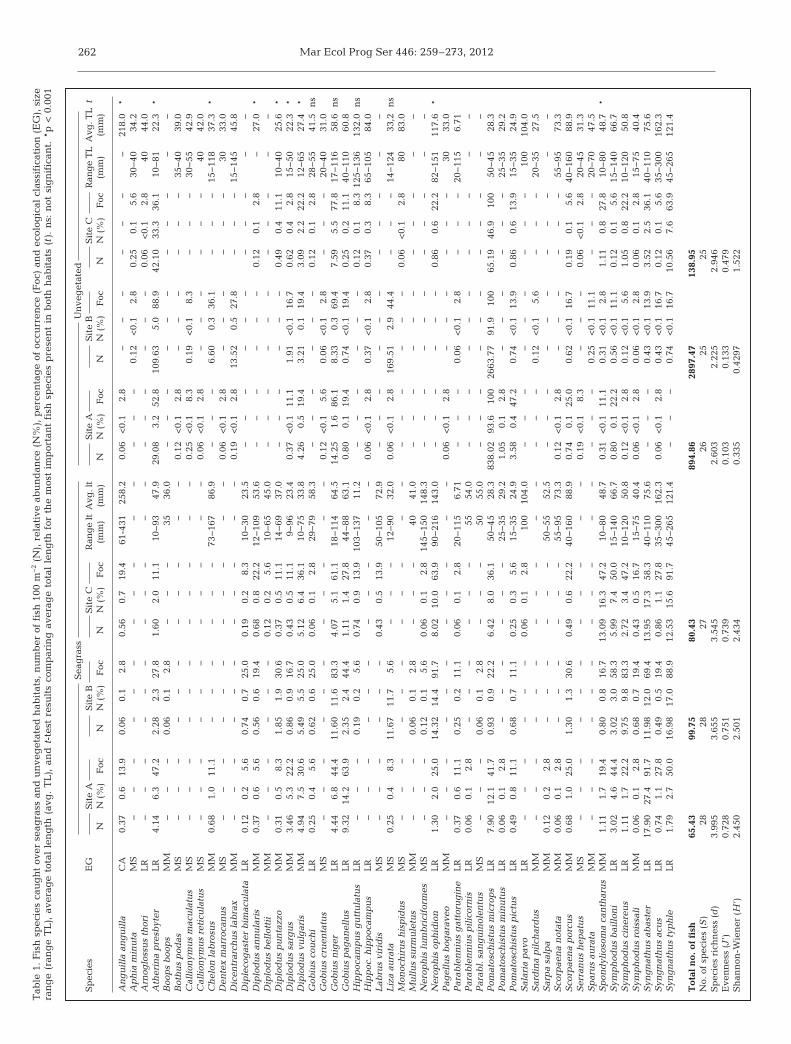
8 MM, and 3 LR), representing lessthan 1% of the catch in each habitat.Finally, 13 species were present in the2 habitats but not at all sites, repre-senting approximately 45% and 3%of the catch in each habitat.
The size range and the average sizeof fish caught in the 2 habitatsshowed both fish assemblages werealmost exclusively formed by YOY.However, for the species relativelyabundant in the 2 habitats, particu-larly for MM species, the averagesizes were significantly higher in theunvegetated habitat.
The 3-way ANOVA showed that site, habitat andseason, were responsible for significant differencesin mean number of species (Table 2). Tukey’s HSDtests revealed that site B had significantly highermean numbers of species than site A, while seagrasshabitats had significantly higher mean numbers ofspecies than unvegetated habitats, and mean num-ber of species was significantly lower in winter thanin the other seasons (Fig. 2).
All main effects were responsible for significantdifferences in mean number of fish, but site–habitatand habitat–season interactions were also signifi-cant, indicating that differences among and withineach interacting factor should be assessed (Table 2,Fig. 3). For site–habitat interaction, unvegetatedhabitat had significantly more fish than seagrasswithin sites A and B, where the 2 habitats are sepa-rated by more than 50 m, but not for site C wherehabitat locations were almost contiguous (Fig. 3b).Within the seagrass habitat there was no significantsite variation in fish abundance, while there weresignificant differences between all sites within theunvegetated habitat, with significantly more fish atsite B, where the creek drains a much larger inter-
263
Effects df No. of species No. of fish Shannon-WienerF p F p F p
Habitat 1 71.51 <0.001 101.20 <0.001 362.99 <0.001Site 2 5.74 0.006 46.53 <0.001 12.55 <0.001Season 3 8.08 <0.001 5.56 0.002 1.90 0.143Habitat × Site 2 0.22 0.803 44.85 <0.001 16.68 <0.001Habitat × Season 3 0.51 0.676 5.32 0.003 5.94 0.002Site × Season 6 0.81 0.567 2.37 0.044 1.73 0.135Habitat × Site 6 3.09 0.012 2.49 0.035 1.05 0.407× Season
Table 2. F values and significance levels for the 3-way ANOVA of mean num-ber of species, mean number of fish, and mean Shannon-Wiener index (H’),
testing for differences between habitat, sites, and season
0
2
4
6
8
10
12
A B C V NV Sp Su Au Wi
Mea
n nu
mb
er o
f sp
ecie
s HabitatSite Season
Fig. 2. Mean number of fish species for each factor level. Error bars represent +1 SE
Fig. 3. Mean number of fish for each factor level and for all significant interactions between factor levels. Error bars
represent +1 SE
Mar Ecol Prog Ser 446: 259–273, 2012
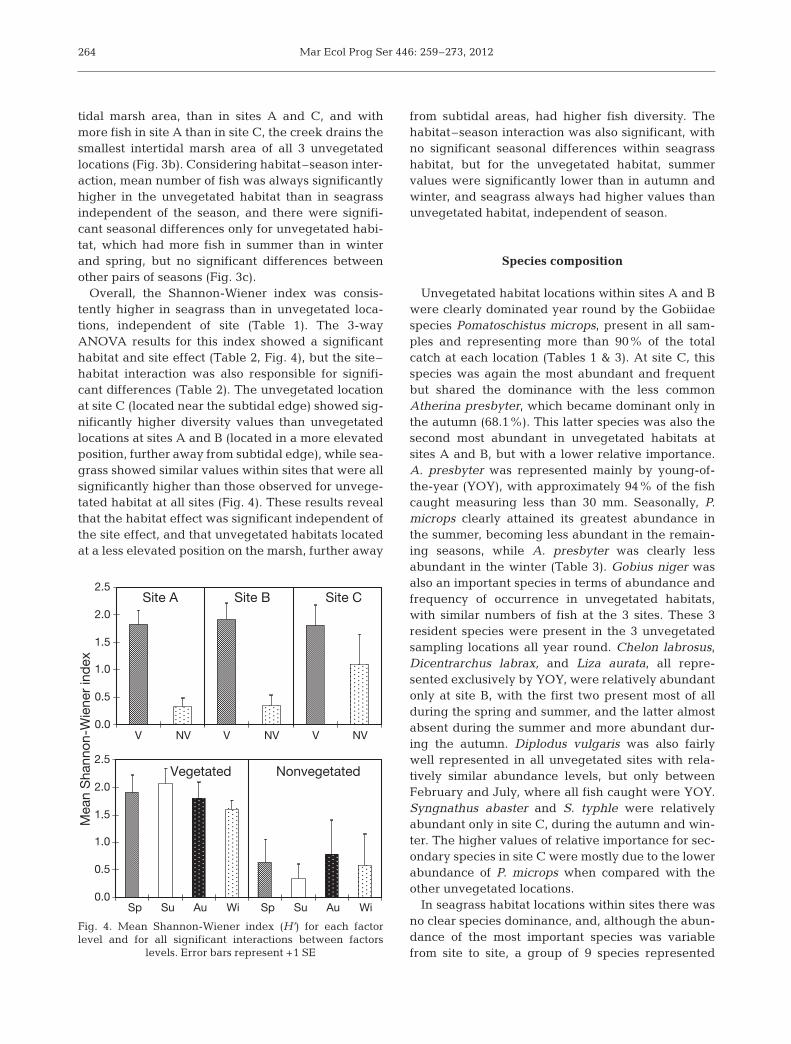
tidal marsh area, than in sites A and C, and withmore fish in site A than in site C, the creek drains thesmallest intertidal marsh area of all 3 unvegetatedlocations (Fig. 3b). Considering habitat–season inter-action, mean number of fish was always significantlyhigher in the unvegetated habitat than in seagrassindependent of the season, and there were signifi-cant seasonal differences only for unvegetated habi-tat, which had more fish in summer than in winterand spring, but no significant differences betweenother pairs of seasons (Fig. 3c).
Overall, the Shannon-Wiener index was consis-tently higher in seagrass than in unvegetated loca-tions, independent of site (Table 1). The 3-wayANOVA results for this index showed a significanthabitat and site effect (Table 2, Fig. 4), but the site–habitat interaction was also responsible for signifi-cant differences (Table 2). The unvegetated locationat site C (located near the subtidal edge) showed sig-nificantly higher diversity values than unvegetatedlocations at sites A and B (located in a more elevatedposition, further away from subtidal edge), while sea-grass showed similar values within sites that were allsignificantly higher than those observed for unvege-tated habitat at all sites (Fig. 4). These results revealthat the habitat effect was significant independent ofthe site effect, and that unvegetated habitats locatedat a less elevated position on the marsh, further away
from subtidal areas, had higher fish diversity. Thehabitat–season interaction was also significant, withno significant seasonal differences within seagrasshabitat, but for the unvegetated habitat, summer values were significantly lower than in autumn andwinter, and seagrass always had higher values thanun vegetated habitat, independent of season.
Species composition
Unvegetated habitat locations within sites A and Bwere clearly dominated year round by the Gobiidaespecies Pomatoschistus microps, present in all sam-ples and representing more than 90% of the totalcatch at each location (Tables 1 & 3). At site C, thisspecies was again the most abundant and frequentbut shared the dominance with the less commonAtherina presbyter, which became dominant only inthe autumn (68.1%). This latter species was also thesecond most abundant in unvegetated habitats atsites A and B, but with a lower relative importance.A. presbyter was represented mainly by young-of-the-year (YOY), with approximately 94% of the fishcaught measuring less than 30 mm. Seasonally, P.microps clearly attained its greatest abundance inthe summer, becoming less abundant in the remain-ing seasons, while A. presbyter was clearly lessabundant in the winter (Table 3). Gobius niger wasalso an important species in terms of abundance andfrequency of occurrence in unvegetated habitats,with similar numbers of fish at the 3 sites. These 3resident species were present in the 3 unvegetatedsampling locations all year round. Chelon labrosus,Dicentrarchus labrax, and Liza aurata, all repre-sented exclusively by YOY, were relatively abundantonly at site B, with the first two present most of allduring the spring and summer, and the latter almostabsent during the summer and more abundant dur-ing the autumn. Diplodus vulgaris was also fairlywell represented in all unvegetated sites with rela-tively similar abundance levels, but only betweenFebruary and July, where all fish caught were YOY.Syngnathus abaster and S. typhle were relativelyabundant only in site C, during the autumn and win-ter. The higher values of relative importance for sec-ondary species in site C were mostly due to the lowerabundance of P. microps when compared with theother unvegetated locations.
In seagrass habitat locations within sites there wasno clear species dominance, and, although the abun-dance of the most important species was variablefrom site to site, a group of 9 species represented
264
0.0
0.5
1.0
1.5
2.0
2.5
V NV V NV V NV
Mea
n S
hann
on-W
iene
r in
dex
Site A Site B Site C
0.0
0.5
1.0
1.5
2.0
2.5
Sp Su Au Wi Sp Su Au Wi
Vegetated Nonvegetated
Fig. 4. Mean Shannon-Wiener index (H’) for each factorlevel and for all significant interactions between factors
levels. Error bars represent +1 SE
Ribeiro et al.: Fish assemblages of the Ria Formosa lagoon
more than 70% of the catch in numbers at each sea-grass location. Species of the Syngnathidae familywere generally the most important, representing38.6% of the catch in the seagrass, where the mostimportant species were Syngnathus abaster, S.typhle, and Nerophis ophidion, which were moreabundant in the autumn and winter. Sparidae, repre-sented exclusively by YOY, was the second family interms of relative importance with 20.7% of the catch,with Diplodus sargus, D. vulgaris, and S. cantharusthe most important species, and particularly abun-dant in spring and/or summer but almost absent inthe winter. The Gobiidae family was also importantin terms of relative abundance, accounting for morethan 10% of the catch in each seagrass samplinglocation. Gobius niger, G. paganellus, and Poma -toschistus microps were the most important Gobiidaespecies, with the first species less abundant in winter,while the last two were more important in autumnand winter. Finally, the Labridae family representedmore than 6% of the catch in each seagrass location,with Symphodus cinereus and Symphodus baillonithe most important numerically and with higherabundances in the summer and autumn. In autumn,YOY of Liza aurata were particularly abundant in theseagrass habitat, but absent from site B except forNovember.
Fish assemblage structure
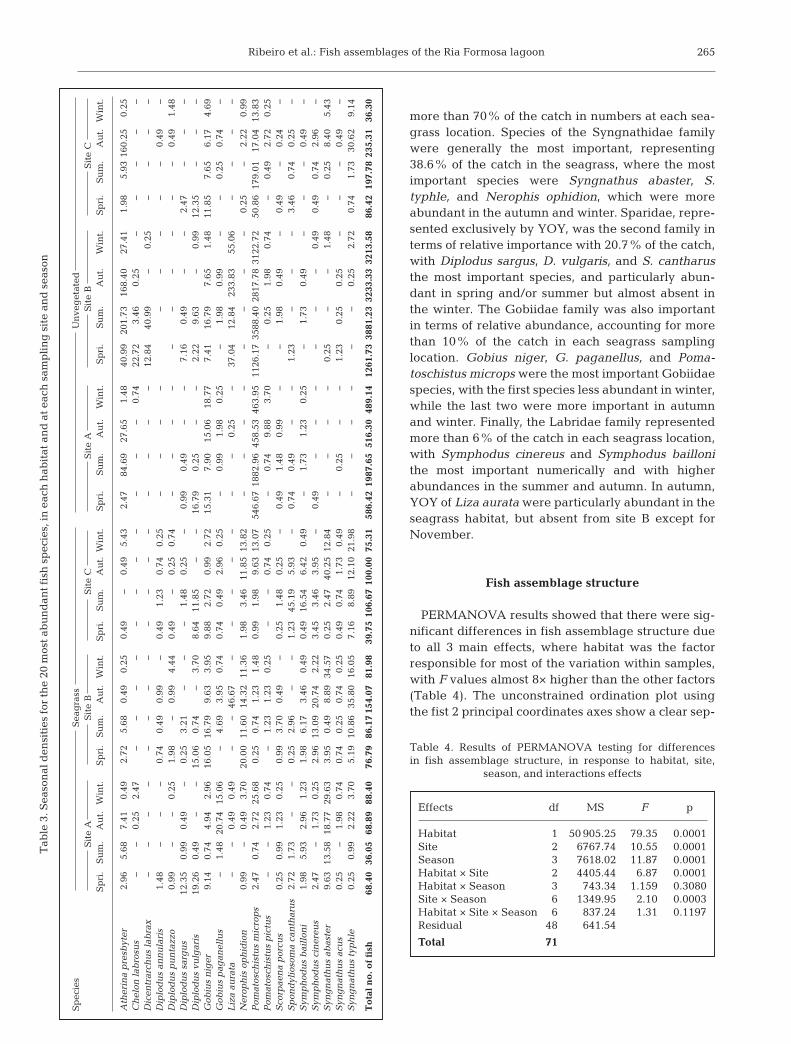
PERMANOVA results showed that there were sig-nificant differences in fish assemblage structure dueto all 3 main effects, where habitat was the factorresponsible for most of the variation within samples,with F values almost 8× higher than the other factors(Table 4). The unconstrained ordination plot usingthe fist 2 principal coordinates axes show a clear sep-
265
Sp
ecie
sS
eag
rass
Un
veg
etat
edS
ite
AS
ite
BS
ite
CS
ite
AS
ite
BS
ite
CS
pri
.S
um
.A
ut.
Win
t.S
pri
.S
um
.A
ut.
Win
t.S
pri
.S
um
.A
ut.
Win
t.S
pri
.S
um
.A
ut.
Win
t.S
pri
.S
um
.A
ut.
Win
t.S
pri
.S
um
.A
ut.
Win
t.
Ath
erin
a p
resb
yter
2.96
5.68
7.41
0.49
2.72
5.68
0.49
0.25
0.49
−0.
495.
432.
4784
.69
27.6
51.
4840
.99
201.
7316
8.40
27.4
11.
985.
9316
0.25
0.25
Ch
elon
lab
rosu
s−
−0.
252.
47−
−−
−−
−−
−−
−−
0.74
22.7
23.
460.
25−
−−
−−
Dic
entr
arch
us
lab
rax
−−
−−
−−
−−
−−
−−
−−
−−
12.8
440
.99
−0.
25−
−−
−D
iplo
du
s an
nu
lari
s1.
48−
−−
0.74
0.49
0.99
−0.
491.
230.
740.
25−
−−
−−
−−
−−
0.49
−D
iplo
du
s p
un
tazz
o0.
99−
−0.
251.
98−
0.99
4.44
0.49
−0.
250.
74−
−−
−−
−−
−−
−0.
491.
48D
iplo
du
s sa
rgu
s12
.35
0.99
0.49
−0.
253.
21−
−−
1.48
0.25
−0.
990.
49−
−7.
160.
49−
−2.
47−
−−
Dip
lod
us
vulg
aris
19.2
60.
49−
−15
.06
0.74
−3.
708.
6411
.85
−−
16.7
90.
25−
−2.
229.
63−
0.99
12.3
5−
−−
Gob
ius
nig
er9.
140.
744.
942.
9616
.05
16.7
99.
633.
959.
882.
720.
992.
7215
.31
7.90
15.0
618
.77
7.41
16.7
97.
651.
4811
.85
7.65
6.17
4.69
Gob
ius
pag
anel
lus
−1.
4820
.74
15.0
6−
4.69
3.95
0.74
0.74
0.49
2.96
0.25
−0.
991.
980.
25−
1.98
0.99
−−
0.25
0.74
−L
iza
aura
ta−
−0.
490.
49−
−46
.67
−−
−−
−−
−0.
25−
37.0
412
.84
233.
8355
.06
−−
−−
Ner
oph
is o
ph
idio
n0.
99−
0.49
3.70
20.0
011
.60
14.3
211
.36
1.98
3.46
11.8
513
.82
−−
−−
−−
−−
0.25
−2.
220.
99P
omat
osch
istu
s m
icro
ps
2.47
0.74
2.72
25.6
80.
250.
741.
231.
480.
991.
989.
6313
.07
546.
6718
82.9
645
8.53
463.
9511
26.1
735
88.4
028
17.7
831
22.7
250
.86
179.
0117
.04
13.8
3P
omat
osch
istu
s p
ictu
s−
−1.
230.
74−
1.23
1.23
0.25
−−
0.74
0.25
−0.
749.
883.
70−
0.25
1.98
0.74
−0.
492.
720.
25S
corp
aen
a p
orcu
s0.
250.
991.
230.
250.
993.
700.
49−
0.25
1.48
0.25
−0.
491.
480.
99−
−1.
980.
49−
0.49
−0.
24−
Sp
ond
ylio
som
a ca
nth
aru
s2.
721.
73−
−0.
252.
96−
−1.
2345
.19
5.93
−0.
740.
49−
−1.
23−
−−
3.46
0.74
0.25
−S
ymp
hod
us
bai
llon
i1.
985.
932.
961.
231.
986.
173.
460.
490.
4916
.54
6.42
0.49
−1.
731.
230.
25−
1.73
0.49
−−
−0.
49−
Sym
ph
odu
s ci
ner
eus
2.47
−1.
730.
252.
9613
.09
20.7
42.
223.
453.
463.
95−
0.49
−−
−−
−−
0.49
0.49
0.74
2.96
−S
yng
nat
hu
s ab
aste
r9.
6313
.58
18.7
729
.63
3.95
0.49
8.89
34.5
70.
252.
4740
.25
12.8
4−
−−
−0.
25−
−1.
48−
0.25
8.40
5.43
Syn
gn
ath
us
acu
s0.
25−
1.98
0.74
0.74
0.25
0.74
0.25
0.49
0.74
1.73
0.49
−0.
25−
−1.
230.
250.
25−
−−
0.49
−S
yng
nat
hu
s ty
ph
le0.
250.
992.
223.
705.
1910
.86
35.8
016
.05
7.16
8.89
12.1
021
.98
−−
−−
−−
0.25
2.72
0.74
1.73
30.6
29.
14
To
tal
no
. of
fish
68.4
036
.05
68.8
988
.40
76.7
986
.17
154.
0781
.98
39.7
510
6.67
100.
0075
.31
586.
4219
87.6
551
6.30
489.
1412
61.7
338
81.2
332
33.3
332
13.5
886
.42
197.
7823
5.31
36.3
0
Tab
le 3
. Sea
son
al d
ensi
ties
for
th
e 20
mos
t ab
un
dan
t fi
sh s
pec
ies,
in e
ach
hab
itat
an
d a
t ea
ch s
amp
lin
g s
ite
and
sea
son
Effects df MS F p
Habitat 1 50 905.25 79.35 0.0001Site 2 6767.74 10.55 0.0001Season 3 7618.02 11.87 0.0001Habitat × Site 2 4405.44 6.87 0.0001Habitat × Season 3 743.34 1.159 0.3080Site × Season 6 1349.95 2.10 0.0003Habitat × Site × Season 6 837.24 1.31 0.1197Residual 48 641.54
Total 71
Table 4. Results of PERMANOVA testing for differencesin fish assemblage structure, in response to habitat, site,
season, and interactions effects
Mar Ecol Prog Ser 446: 259–273, 2012
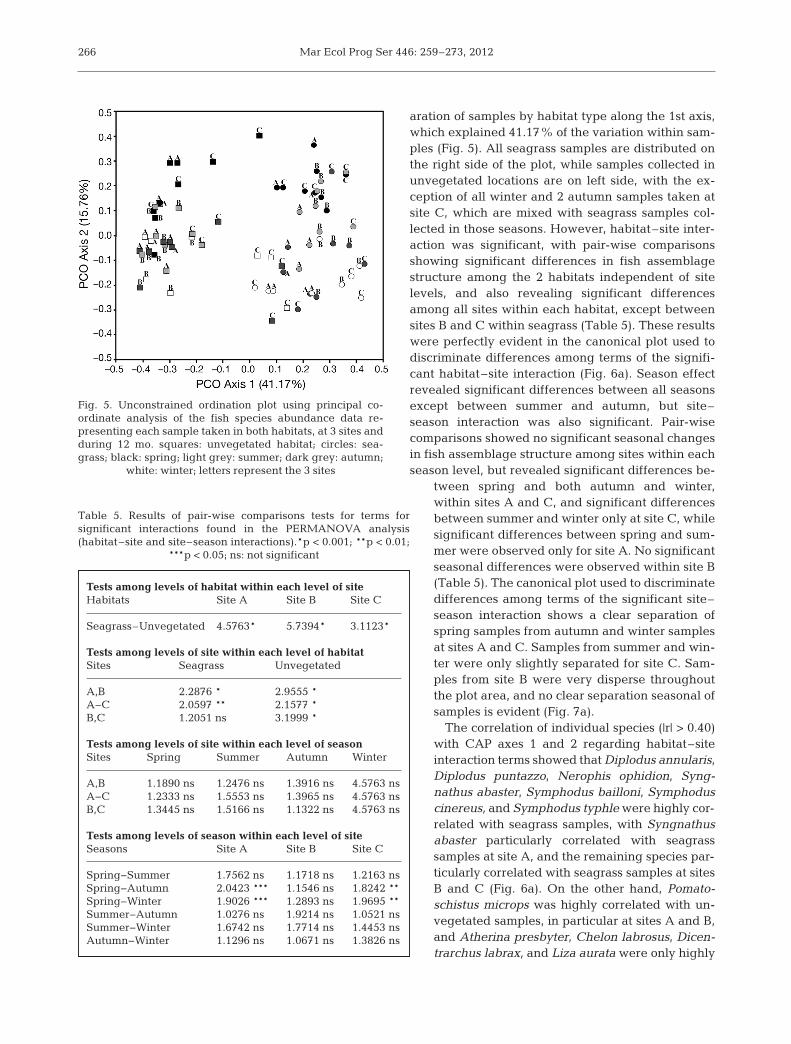
aration of samples by habitat type along the 1st axis,which explained 41.17% of the variation within sam-ples (Fig. 5). All seagrass samples are distributed onthe right side of the plot, while samples collected inunvegetated locations are on left side, with the ex -ception of all winter and 2 autumn samples taken atsite C, which are mixed with seagrass samples col-lected in those seasons. However, habitat–site inter-action was significant, with pair-wise comparisonsshowing significant differences in fish assemblagestructure among the 2 habitats independent of sitelevels, and also revealing significant differencesamong all sites within each habitat, except betweensites B and C within seagrass (Table 5). These resultswere perfectly evident in the canonical plot used todiscriminate differences among terms of the signifi-cant habitat–site interaction (Fig. 6a). Season effectrevealed significant differences between all seasonsexcept between summer and autumn, but site–season interaction was also significant. Pair-wisecomparisons showed no significant seasonal changesin fish assemblage structure among sites within eachseason level, but revealed significant differences be -
tween spring and both autumn and winter,within sites A and C, and significant differencesbe tween summer and winter only at site C, whilesig nificant differences between spring and sum-mer were observed only for site A. No significantseasonal differences were observed within site B(Table 5). The canonical plot used to discriminatedifferences among terms of the significant site–season interaction shows a clear separation ofspring samples from autumn and winter samplesat sites A and C. Samples from summer and win-ter were only slightly separated for site C. Sam-ples from site B were very disperse through outthe plot area, and no clear separation seasonal ofsamples is evident (Fig. 7a).
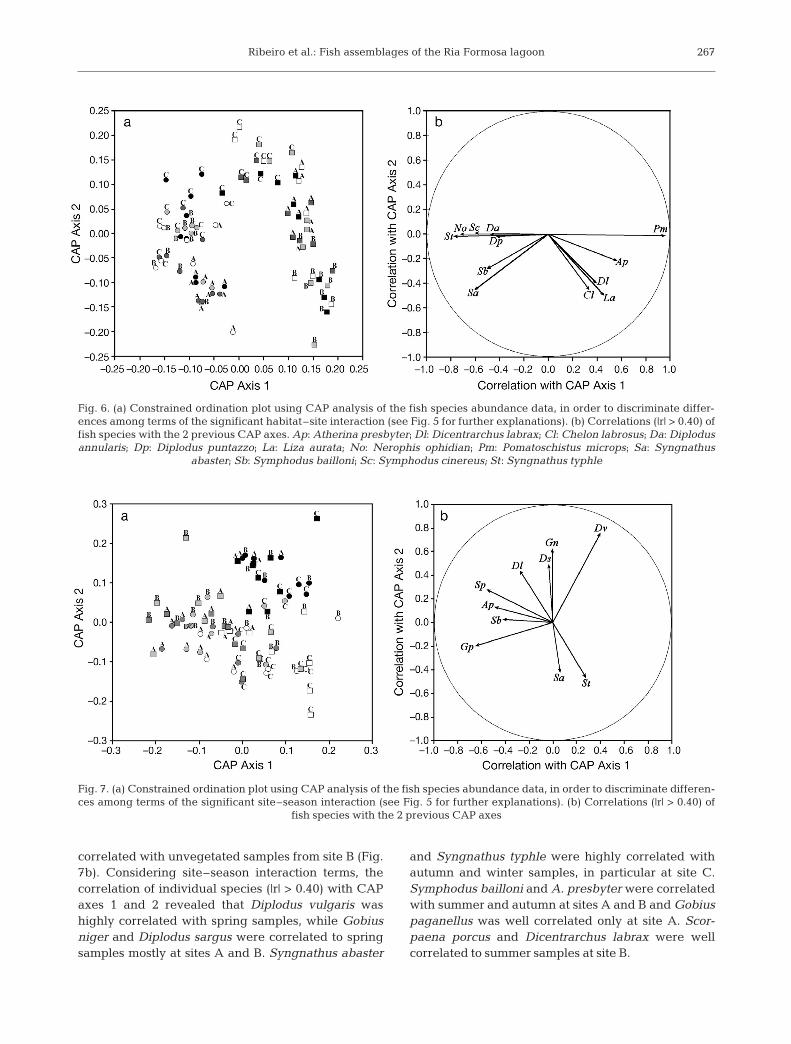
The correlation of individual species (|r| > 0.40)with CAP axes 1 and 2 regarding habitat–siteinter action terms showed that Diplodus annula ris,Diplodus puntazzo, Nerophis ophi dion, Syng-nathus abaster, Symphodus bailloni, Symphoduscine reus, and Symphodus typhle were highly cor-related with seagrass samples, with Syngnathusabaster particularly correlated with seagrasssamples at site A, and the remaining species par-ticularly correlated with seagrass samples at sitesB and C (Fig. 6a). On the other hand, Pomato -schistus microps was highly correlated with un-vegetated samples, in particular at sites A and B,and Atherina presbyter, Chelon labrosus, Dicen-trarchus labrax, and Liza aurata were only highly
266
Tests among levels of habitat within each level of siteHabitats Site A Site B Site C
Seagrass–Unvegetated 4.5763* 5.7394* 3.1123*
Tests among levels of site within each level of habitatSites Seagrass Unvegetated
A,B 2.2876 * 2.9555 *A−C 2.0597 ** 2.1577 *B,C 1.2051 ns 3.1999 *
Tests among levels of site within each level of seasonSites Spring Summer Autumn Winter
A,B 1.1890 ns 1.2476 ns 1.3916 ns 4.5763 nsA−C 1.2333 ns 1.5553 ns 1.3965 ns 4.5763 nsB,C 1.3445 ns 1.5166 ns 1.1322 ns 4.5763 ns
Tests among levels of season within each level of siteSeasons Site A Site B Site C
Spring−Summer 1.7562 ns 1.1718 ns 1.2163 nsSpring−Autumn 2.0423 *** 1.1546 ns 1.8242 **Spring−Winter 1.9026 *** 1.2893 ns 1.9695 **Summer−Autumn 1.0276 ns 1.9214 ns 1.0521 nsSummer−Winter 1.6742 ns 1.7714 ns 1.4453 nsAutumn−Winter 1.1296 ns 1.0671 ns 1.3826 ns
Table 5. Results of pair-wise comparisons tests for terms for sig nificant inter actions found in the PERMANOVA analysis(habitat–site and site–season interactions).*p < 0.001; **p < 0.01;
***p < 0.05; ns: not significant
Fig. 5. Unconstrained ordination plot using principal co -ordinate analysis of the fish species abundance data re -presenting each sample taken in both habitats, at 3 sites andduring 12 mo. squares: unvegetated habitat; circles: sea-grass; black: spring; light grey: summer; dark grey: autumn;
white: winter; letters represent the 3 sites
Ribeiro et al.: Fish assemblages of the Ria Formosa lagoon
correlated with unvegetated samples from site B (Fig.7b). Considering site–season interaction terms, thecorrelation of individual species (|r| > 0.40) with CAPaxes 1 and 2 revealed that Diplodus vulgaris washighly correlated with spring samples, while Gobiusniger and Diplodus sargus were correlated to springsamples mostly at sites A and B. Syngnathus abaster
and Syngnathus typhle were highly correlated withautumn and winter samples, in particular at site C.Symphodus bailloni and A. presbyter were correlatedwith summer and autumn at sites A and B and Gobiuspaganellus was well correlated only at site A. Scor-paena porcus and Dicentrarchus labrax were wellcorrelated to summer samples at site B.
267
Fig. 6. (a) Constrained ordination plot using CAP analysis of the fish species abundance data, in order to discriminate differ-ences among terms of the significant habitat–site interaction (see Fig. 5 for further explanations). (b) Correlations (|r| > 0.40) offish species with the 2 previous CAP axes. Ap: Atherina presbyter; Dl: Dicentrarchus labrax; Cl: Chelon labrosus; Da: Diplodusannularis; Dp: Diplodus puntazzo; La: Liza aurata; No: Nerophis ophidian; Pm: Pomatoschistus microps; Sa: Syngnathus
abaster; Sb: Symphodus bailloni; Sc: Symphodus cinereus; St: Syngnathus typhle
Fig. 7. (a) Constrained ordination plot using CAP analysis of the fish species abundance data, in order to discriminate differen -ces among terms of the significant site–season interaction (see Fig. 5 for further explanations). (b) Correlations (|r| > 0.40) of
fish species with the 2 previous CAP axes
Mar Ecol Prog Ser 446: 259–273, 2012
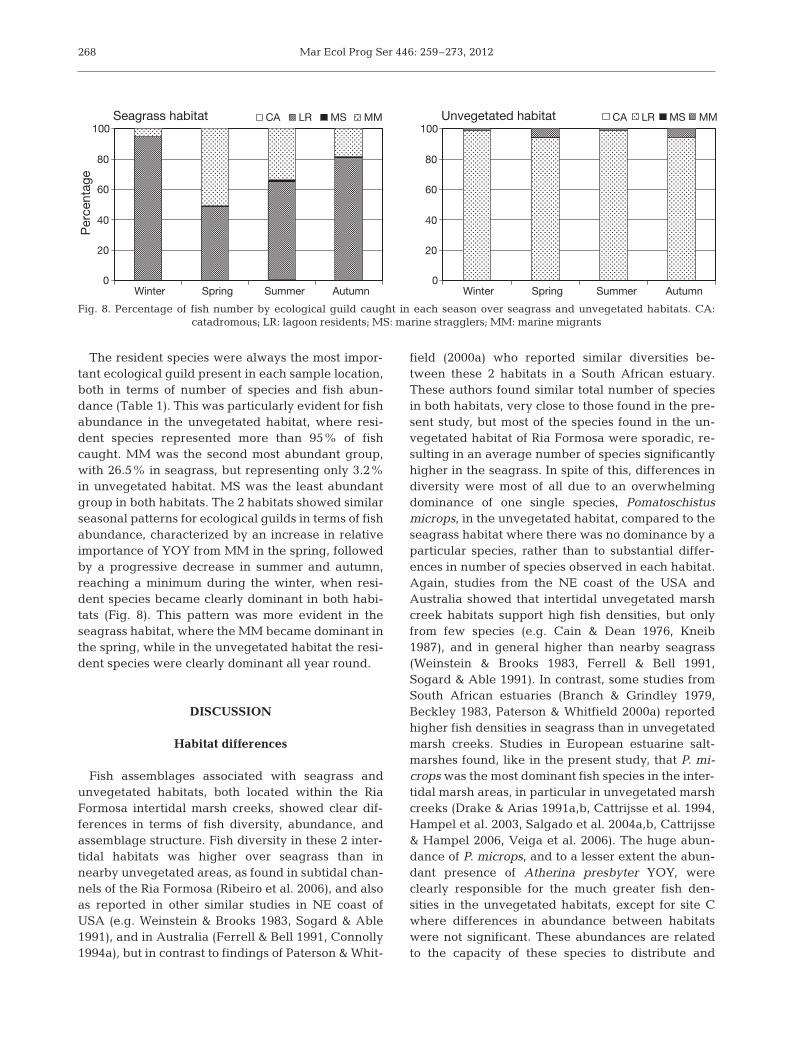
The resident species were always the most impor-tant ecological guild present in each sample location,both in terms of number of species and fish abun-dance (Table 1). This was particularly evident for fishabundance in the unvegetated habitat, where resi-dent species represented more than 95% of fishcaught. MM was the second most abundant group,with 26.5% in seagrass, but representing only 3.2%in unvegetated habitat. MS was the least abundantgroup in both habitats. The 2 habitats showed similarseasonal patterns for ecological guilds in terms of fishabundance, characterized by an increase in relativeimportance of YOY from MM in the spring, followedby a progressive decrease in summer and autumn,reaching a minimum during the winter, when resi-dent species became clearly dominant in both habi-tats (Fig. 8). This pattern was more evident in theseagrass habitat, where the MM became dominant inthe spring, while in the unvegetated habitat the resi-dent species were clearly dominant all year round.
DISCUSSION
Habitat differences
Fish assemblages associated with seagrass and unvegetated habitats, both located within the RiaFormosa intertidal marsh creeks, showed clear dif-ferences in terms of fish diversity, abundance, andassemblage structure. Fish diversity in these 2 inter-tidal habitats was higher over seagrass than innearby unvegetated areas, as found in subtidal chan-nels of the Ria Formosa (Ribeiro et al. 2006), and alsoas reported in other similar studies in NE coast ofUSA (e.g. Weinstein & Brooks 1983, Sogard & Able1991), and in Australia (Ferrell & Bell 1991, Connolly1994a), but in contrast to findings of Paterson & Whit-
field (2000a) who reported similar diversities be -tween these 2 habitats in a South African estuary.These authors found similar total number of speciesin both habitats, very close to those found in the pre-sent study, but most of the species found in the un-vegetated habitat of Ria Formosa were sporadic, re-sulting in an average number of species significantlyhigher in the seagrass. In spite of this, differences indiversity were most of all due to an overwhelmingdominance of one single species, Poma toschistus microps, in the unvegetated habitat, compared to theseagrass habitat where there was no dominance by aparticular species, rather than to substantial differ-ences in number of species ob served in each habitat.Again, studies from the NE coast of the USA andAustralia showed that intertidal unvegetated marshcreek habitats support high fish densities, but onlyfrom few species (e.g. Cain & Dean 1976, Kneib1987), and in general higher than nearby seagrass(Weinstein & Brooks 1983, Ferrell & Bell 1991,Sogard & Able 1991). In contrast, some studies fromSouth African estuaries (Branch & Grindley 1979,Beckley 1983, Paterson & Whitfield 2000a) reportedhigher fish densities in seagrass than in unvegetatedmarsh creeks. Studies in European estuarine salt-marshes found, like in the present study, that P. mi-crops was the most dominant fish species in the inter-tidal marsh areas, in particular in unvegetated marshcreeks (Drake & Arias 1991a,b, Cattrijsse et al. 1994,Hampel et al. 2003, Salgado et al. 2004a,b, Cattrijsse& Hampel 2006, Veiga et al. 2006). The huge abun-dance of P. microps, and to a lesser extent the abun-dant presence of Atherina presbyter YOY, wereclearly responsible for the much greater fish den -sities in the unvegetated habitats, except for site Cwhere differences in abundance between habitatswere not significant. These abundances are relatedto the capacity of these species to distribute and
268
Seagrass habitat
Per
cent
age
0
20
40
60
80
100
Winter Spring Summer Autumn
CA LR MS MM Unvegetated habitat
0
20
40
60
80
100
Winter Spring Summer Autumn
CA LR MS MM
Fig. 8. Percentage of fish number by ecological guild caught in each season over seagrass and unvegetated habitats. CA: catadromous; LR: lagoon residents; MS: marine stragglers; MM: marine migrants
Ribeiro et al.: Fish assemblages of the Ria Formosa lagoon
move along the tide edge, allowing them to use theintertidal marsh area during the high tide, and towithdraw during the ebb tide, returning to the veryshallow intertidal creeks and pools where they re-main concentrated during the low tide (Cattrijsse etal. 1994, Kneib 1997). The use of the intertidal marshsurface allows them to find shelter, avoid predation,and feed in the productive intertidal saltmarsh forag-ing grounds that are only available for short periodstwice a day during the high tide in the European salt-marshes (Hampel & Cattrijsse 2004).
Although the abundant presence of Atherinidaespecies (e.g. Atherina boyeri and A. presbyter) insouth European estuaries and coastal areas (Atlanticand Mediterranean) is well known (Labourg et al.1985, Bouchereau et al. 2000, Guidetti & Bessotti2000), the abundant presence of YOY from Athe -rinidae family in intertidal areas of European salt-marshes is not well documented. However, in shal-low littoral zones along the U.S. coast, species of theAtherinidae family (e.g. Menidia menidia) use thetidal edge in order to gain access to intertidal marshhabitats (Allen 1982, Rountree & Able 1992), and inparticular their larvae and juveniles use these habi-tats during the first period of their life history (Mid-daugh 1981, Middaugh & Takita 1983, Conover &Kynard 1984). The dynamic pattern of distributionalong the tide edge could explain why Pomatoschis-tus microps and A. presbyter YOY were so muchmore abundant at low tide in the unvegetated creekthan in seagrass, since the unvegetated habitats loca-tions were less deep, and therefore closer to the tidaledge.
Intertidal marsh habitats ichthyofaunal assem-blages were characterized by the presence of MMand LR, with LR dominating both assemblages, asreported in several studies (Rakocinski et al. 1992,Kneib & Wagner 1994, Thomas & Connolly 2001), butin contrast to Paterson & Whitfield (2000a) who re -ported the dominance of MM in unvegetated creekmarsh habitats. However, fish assemblage structureassociated with shallow intertidal seagrass differedfrom those found over unvegetated habitats, as re -ported in similar comparative studies (Weinstein &Brooks 1983, Heck et al. 1989, Ferrell & Bell 1991,Sogard & Able 1991, Connolly 1994, Paterson &Whitfield 2000a). Distinct fish assemblage structurewas mostly due to differences in abundance of com-mon species among habitats as found in the NE coastof the United States (Weinstein & Brooks 1983, Sogard & Able 1991), rather than species specificallypresent in one habitat, as found in a South Africanestuary (Paterson & Whitfield 2000a) and in the SW
coast of Australia (Ferrell & Bell 1991, Connolly1994). Nevertheless, the most abundant species ineach habitat were LR species predominantly repre-sented in one single habitat, reflecting a clear habitatpreference. Pomatoschistus microps and YOY ofAtherina presbyter were by far the predominant species in the unvegetated habitat, while the syngna -thids Nerophis ophidion, Syngnathus abaster, Syn -gnathus typhle, and small labrids Symphodus bail-loni and Symphodus cinereus were predominant inthe seagrass, and poorly represented in unvegetatedhabitats (except in site C, during autumn and winter).The close association of syngnathids, in particular theSyngnathus genera, to seagrass habitats in coastaland estuarine environments is well known inAtlantic-Mediterranean and Indo-Pacific regions,where they are among the most frequent and abun-dant species in these habitats (Pollard 1984, Howard& Koehn 1985, Rossi 1986, Franzoi et al. 1989). Differ-ences in fish assemblage structure, associated withhabitat preferences from LR species, reveal theirimportance as a structuring component of the fishassemblage in the intertidal marsh habitats in the RiaFormosa, and also indicate their potential importancein the functioning of the marsh ecosystem as a vectorin the transfer of intertidal production to subtidalareas (Kneib & Wagner 1994, Kneib 1997). Althoughsome YOY from MM species did not show any clearhabitat preference, in particular Diplodus vulgarisand Diplodus sargus, others showed preference forseagrass habitats, such as Diplodus annularis, Diplo-dus puntazzo, and Spondyliosoma cantharus, whileothers such as Chelon labrosus, Dicentrarchus la -brax, and Liza aurata preferred unvegetated habi-tats. These last 3 species were present almost exclu-sively in the unvegetated location at site B, probablybe cause recruitment into the intertidal areas is likelya random process for most MM species, but theirabsence or lower abundance in the nearby seagrasshabitat should indicate a habitat selection and pref-erence. The presence of YOY of Dicentrarchus la -brax and Mugilidae species (e.g. C. labrosus and L.aurata), as well as their foraging activities in the un -vegetated intertidal marsh creeks has been reportedin several west Atlantic European saltmarshes (Kel-ley 1988, Cattrijsse et al. 1994, Laffaille et al. 2000,2002, Hampel et al. 2005, Veiga et al. 2006), and inMediterranean coastal lagoons (La bourg et al. 1985,Bouchereau et al. 2000). The presence of mugilidYOY in intertidal creeks is also common in otherparts of the world (Shenker & Dean 1979, Bozeman &Dean 1980, Paterson & Whitfield 2000b, Thomas &Connolly 2001).
269
Mar Ecol Prog Ser 446: 259–273, 2012270
Habitat preferences could be the result of differ-ences in species dietary regimes (Burchmore et al.1984), since the 2 habitats provide distinct and abun-dant food resources (Whitfield 1988), but also a con-sequence of different predatory avoidance strategies(Bell & Pollard 1989), where seagrass, a structurallymore complex habitat (Orth et al. 1984), could pro-vide an opportunity to employ cryptic mechanisms toblend into background structure (e.g. labrids andsyngnathids), while the unvegetated environment ismore suitable for schooling (e.g. Atherina presbyterand Liza aurata) or camouflage against the sediment(e.g. Pomatoschistus microps), as observed by Pater-son & Whitfield (2000a). Diet studies of 0-group seabass in the Tagus estuary (Cabral & Costa 2001) andthe Po River delta (Ferrari & Chieregato 1981) haveshown that smaller sized stages (<30 mm standardlength) are predominantly planktophagous, whilelarger juveniles feed preferentially on macroplank-ton (Decapoda, Mysidacea, Isopoda, and fish larvae),that may be more abundant and easier to capture inthe structurally less complex, unvegetated habitat.The preference of syngnathids and labrids in sea-grass habitats in the Ria Formosa lagoon was alsoreported for subtidal areas within the main channels(Erzini et al. 2002, Ribeiro et al. 2006).
Site differences
Habitat has a major role in structuring the fishassemblages present in the Ria Formosa intertidalmarsh creeks, but significant habitat–site interac-tions showed that site was a determinant factor con-ditioning the habitat role. Site characteristics such assite elevation, distance to the marsh, water depth,and submergence duration have a relevant effect onthe fish assemblages present in the intertidal marsharea (Kneib & Wagner 1994, McIvor & Rozas 1996,Kneib 1997, Thomas & Connolly 2001). Differences infish assemblages between habitats, although signifi-cant at all sites, were less evident at site C, whereboth habitats were located near the subtidal edge,and only a few m distant from each other. Severalstudies have shown that fish assemblages associatedwith different habitats located within subtidal areastend to be more similar than those in intertidal areas,since subtidal areas are more accessible to all fishspecies (Kneib & Wagner 1994, Kneib 1997). On theother hand, Ferrell & Bell (1991) showed that differ-ences in fish assemblages between unvegetated andseagrass habitats were negatively related to distancebetween habitats.
In seagrass, differences among sites were not sig-nificant in terms of fish diversity and abundance, butin terms of assemblage structure there were signifi-cant differences between sites B and C, both locatednear the subtidal edge, and site A, located in a moreelevated intertidal position. These differences in thefish assemblage structure were mainly related tochanges in abundance of syngnathids and labrids,with the small syngnathid, Syngnathus abaster, moreabundant in a more elevated intertidal area of themarsh, while larger syngnathids such as Nerophisophidion and Syngnathus typhle, and the labrid Sym-phodus cinereus, are more abundant in the subtidalareas. Malavasi et al. (2007) reported a certain de -gree of habitat segregation between these 3 syn -gnathids in a Mediterranean coastal lagoon, probablyrelated with a combination of several factors, such asstructural complexity, predation, and competition.
Within the unvegetated habitat there were signifi-cant differences between sites in terms of fish abun-dance, fish diversity, and assemblage structure. Dif-ferences in fish diversity, although not tested, werenegatively related to site elevation, where siteslocated in more elevated locations within the marsh(sites A and B), and consequently further way fromsubtidal areas, presented a lower diversity than thesite located closer to the subtidal edge (site C). Simi-lar results were reported by Thomas & Connolly(2001) in Western Australia, with fish diversity de -creasing with distance from the marsh. In addition tosite elevation, it was possible to positively relate fishabundance with the amount of marsh area drainedthrough each unvegetated creek, since fish abun-dance was higher, in particular for Pomatoschistusmicrops and Atherina presbyter, in sites that drainedlarger saltmarsh areas. This supports the idea thatthese species follow the tide edge, becoming trappedwithin the marsh area and concentrated in very shal-low intertidal pools formed along tidal creeks at lowtide (Crabtree & Dean 1982, Kneib 1997).
Seasonal differences and nursery value
Annual fluctuations in the presence and abun-dance of YOY from MM and LR were responsible forcomparable seasonal changes in fish assemblagestructure in both habitats. The abundant presence ofYOY in the spring, in particular of MM species, rep-resented a clear seasonal discontinuity in the struc-tures of the fish assemblages of the 2 habitats. Duringthe summer and autumn, YOY abundance progres-sively decreases, becoming almost absent in winter.

Ribeiro et al.: Fish assemblages of the Ria Formosa lagoon
This seasonal pattern is related with the recruitmentof early life history stages of MM species, whichenter the lagoon in late winter and spring, with mostreturning to the adjacent coastal waters as juvenilesor maturing adults in late autumn and winter (Mon-teiro et al. 1987, Erzini et al. 2002, Ribeiro et al. 2006).The recruitment of MM species during the springand summer is consistent with the late winter andspring spawning season of most of these species(Gonçalves & Erzini 2000a,b). The decline in num-bers in autumn and winter, both in intertidal and sub-tidal areas is associated with migrations out of thelagoon to the adjacent coastal waters (Monteiro et al.1987, Erzini et al. 2002, Ribeiro et al. 2006).
Seasonal fluctuations in the dominant LR specieswere also responsible for changes in fish assem-blages, in particular in the unvegetated habitat,where Pomatoschistus microps abundance is higherin the summer and lower in spring, superimposinglower and higher diversity index values in summerand spring, respectively. Atherina presbyter was alsoabundant in the unvegetated habitat from summer toautumn, when the recruits settle in the intertidalmarsh area. In contrast, the syngnthids, the mostabundant group of resident species present in vege-tated habitats, are more abundant in the autumn andwinter when the YOY recruit after the reproductionseason during spring and summer.
Both seagrass and unvegetated shallow habitatswithin the Ria Formosa intertidal saltmarsh creekssustain significant populations of juvenile fish of LRand MM species, some of them commercially impor-tant. A number of studies carried out in differentparts of the world showed that these 2 habitats areimportant nursery habitats (Cain & Dean 1976, Wein-stein 1979, Bozeman & Dean 1980, Weinstein et al.1980, Rountree & Able 1992). The contrasting fishcommunity structure within the 2 habitats indicatesthat each provides a distinctive nursery area for dif-ferent fish species. Unvegetated intertidal creekswere an important habitat for early life stages fromLR species Atherina presbyter, and for MM speciessuch as Chelon labrosus, Dicentrarchus labrax, andLiza aurata, while seagrass has a similar role forsmall labrids and plays an important role in the set-tlement of juvenile syngnthids. The average lengthfor most important MM species and for the LR spe-cies A. presbyter was significantly different in bothhabitats. In the unvegetated habitat only very earlyjuvenile stages were present, while more advancedjuvenile stages were dominant in the seagrass, sug-gesting an ontogenetic change in habitat for thesespecies.
Acknowledgements. This research was funded in part bythe European Commission (EC-DG XIV/C1; Study projectno. 99/061) and was also sponsored by the Fundação paraCiência e Tecnologia through a PhD grant awarded to J.R.(grant reference: SFRH/BD/6812/2001, Portuguese Ministryof Science and Technology). The authors thank all the col-leagues and volunteers who assisted with the field samplingand laboratory work and also the Parque Natural da Ria Formosa.
LITERATURE CITED
Adams SM (1976) The ecology of eelgrass, Zostera marina(L.), fish communities. I. Structural analysis. J Exp MarBiol Ecol 22: 269−291
Allen LG (1982) Seasonal abundance, composition and pro-ductivity of the littoral fish assemblage in upper NewportBay, California. Fish Bull 80: 769−790
Anderson MJ (2001) A new method for non-parametric mul-tivariate analysis of variance. Austral Ecol 26: 32−46
Anderson MJ (2004) CAP: a FORTRAN computer programfor canonical analysis of principal coordinates. Depart-ment of Statistics, University of Auckland, Auckland
Anderson MJ (2005) PERMANOVA: a FORTRAN computerprogram for permutational multivariate analysis of vari-ance. Department of Statistics, University of Auckland,Auckland
Anderson MJ, Robinson J (2003) Generalised discriminantanalysis based on distances. Austral NZ J Stat 45: 301−318
Anderson MJ, ter Braak CJF (2003) Permutation tests formulti-factorial analysis of variance. J Statist ComputSimulation 73: 85−113
Anderson MJ, Willis TJ (2003) Canonical analysis of princi-pal coordinates: a useful method of constrained ordina-tion for ecology. Ecology 84: 511−525
Beckley LE (1983) The ichthyofauna associated with Zosteracapensis Setchell in the Swartkops Estuary, South Africa.S Afr J Zool 18: 15−24
Bell JD, Pollard DA (1989) Ecology of fish assemblages andfisheries associated with seagrasses. In: Larkum AWD,McComb AJ, Shepard SA (eds) Biology of seagrasses: atreatise on the biology of seagrasses with special refer-ence to the Australian region. Elsevier, Amsterdam,p 565−609
Bouchereau JL, Guelorget O, Vergne Y, Perthuisot JP (2000)L’Ichtyofaune dans l’organisation biologique d’un sys-teme paralique de type lagunaire: le complexe desetangs du Prevost et de l’Arnel (Languedoc, France). VieMilieu 50: 19−27
Bozeman EL, Dean JM (1980) The abundance of estuarinelarval and juvenile fish in a South Carolina intertidalcreek. Estuaries 3: 89−97
Branch GM, Grindley JR (1979) Ecology of southern Africanestuaries. XI. Mngazana: a mangrove estuary in theTranskei. S Afr J Zool 14: 149−170
Burchmore JJ, Pollard DA, Bell JD (1984) Community struc-ture and trophic relationships of the fish fauna of an estu-arine Posidonia australis seagrass habitat in Port Hack-ing, New South Wales. Aquat Bot 18: 71−87
Cabral H, Costa MJ (2001) Abundance, feeding ecology andgrowth of 0-group sea bass, Dicentrarchus labrax, withinthe nursery areas of the Tagus estuary. J Mar Biol AssocUK 81: 679−682
271
Mar Ecol Prog Ser 446: 259–273, 2012
Cain RL, Dean JM (1976) Annual occurrence, abundanceand diversity of fish in a South Carolina intertidal creek.Mar Biol 36: 369−379
Cattrijsse A, Hampel H (2006) European intertidal marshes: a review of their habitat functioning and value foraquatic organisms. Mar Ecol Prog Ser 324: 293−307
Cattrijsse A, Makwaia ES, Dankwa HR, Hamerlynck O,Hemminga MA (1994) Nekton communities of an inter-tidal creek of a European estuarine brackish marsh. MarEcol Prog Ser 109: 195−208
Connolly RM (1994) A comparison of fish assemblages fromseagrass and unvegetated areas of a southern Australianestuary. Aust J Mar Freshwater Res 45: 1033−1044
Connolly RM (1999) Saltmarsh as habitat for fish and nek-tonic crustaceans: challenges in sampling designs andmethods. Aust J Ecol 24: 422−430
Connolly RM, Dalton A, Bass DA (1997) Fish use of an inun-dated saltmarsh flat in a temperate Australian estuary.Aust J Ecol 22: 222−226
Conover DO, Kynard BE (1984) Field and laboratory obser-vations of spawning periodicity and behaviour of a north-ern population of Atlantic silverside, Menidia menidia(Pisces: Atherinidae). Environ Biol Fishes 11: 161−171
Crabtree RE, Dean JM (1982) The structure of two SouthCarolina estuarine tide pool fish assemblage. Estuaries5:2−9
Drake P, Arias AM (1991a) Composition and seasonal fluctu-ations of the ichthyoplankton community in a shallowtidal channel of Cadiz Bay (S.W. Spain). J Fish Biol 39: 245−263
Drake P, Arias AM (1991b) Ichthyoplankton of a shallowcoastal inlet in south-west Spain: factors contributing tocolonization and retention. Estuar Coast Shelf Sci 32: 347−364
Eleftheriou A, Holme NA (1984) Macrofaunal techniques.In: Holme NA, McIntyre AD (eds) Methods for the studyof marine benthos. Blackwell Scientific Publications,Oxford, p 140−216
Elliott M, Hemingway KL, Costello MJ, Duhamel S and oth-ers (2002) Links between fish and other trophic levels. In: Elliott M, Hemingway K (eds) Fishes in estuaries. Black-well Science, Oxford, p 124−217
Elliott M, Whitfield AK, Potter IC, Blaber SJM, Cyryus DP,Nordlie FG, Harrison TD (2007) The guild approach tocategorizing estuarine fish assemblages in estuaries: aglobal review. Fish Fish 8: 241−268
Erzini K, Bentes L, Coelho R, Correia C, Lino PG, MonteiroP, Ribeiro J, Gonçalves JMS (2002) Recruitment of seabreams (Sparidae) and other commercially importantspecies in the Algarve (southern Portugal). Final Report,DG XIV/C/1, Ref 99/061, University of Algarve, Faro
Ferrell DJ, Bell JD (1991) Differences among assemblages offish associated with Zostera capricorni and bare sandover a large spatial scale. Mar Ecol Prog Ser 72: 15−24
Ferrari I, Chieregato AR (1981) Feeding habits of juvenilestages of Sparus auratus L., Dicentrarchus labrax L. andMugilidae in a brackish embayment of the Po Riverdelta. Aquaculture 25: 243−257
Franzoi P, Trisolini R, Carrieri A, Rossi R (1989) Caratteris-tiche ecologiche del popolamento ittico ripario dellaSacca di Scadovari (Delta del Po). Nova Thalassia 10: 399−405
Gonçalves JMS, Erzini K (2000a) The reproductive biologyof Spondyliosoma cantharus (L) from the SW coast of Por-tugal. Sci Mar 64: 403−411
Gonçalves JMS, Erzini K (2000b) The reproductive biologyof the two banded sea bream (Diplodus vulgaris) fromthe southwest coast of Portugal. J Appl Ichthyology 16: 110−116
Guidetti P, Bessotti S (2000) Fish fauna of a mixed meadowcomposed by the seagrasses Cymodocea nodosa andZostera noltii in the western Mediterranean. OceanolActa 23: 759−770
Hampel H, Cattrijsse A (2004) Temporal variation in feedingrhythms in a tidal marsh population of the common gobyPomatoschistus microps (Kroyer, 1838). Aquat Sci 66: 315−326
Hampel H, Cattrijsse A, Vincx M (2003) Effect of tidal, dieland lunar cycle to the nekton communities in a saltmarsh of the Westerschelde. Estuar Coast Shelf Sci 56: 795−805
Hampel H, Cattrijsse A, Elliott M (2005) Feeding habit ofyoung predator fishes in marsh creeks situated along thesalinity gradient of the Westerschelde estuary, TheNetherlands. Helgol Mar Res 59: 151−162
Heck KL Jr., Able KW, Fahay MP, Roman CT (1989) Fishesand decapod crustaceans of Cape Cod eelgrass mead-ows: species composition seasonal abundance and com-parison with unvegetated substrates. Estuaries 12: 59−65
Holme NA, McIntyre AD (1984) Methods for the study ofmarine benthos. Blackwell Scientific Publishers, Oxford
Howard RK, Koehn JD (1985) Population dynamics andfeeding ecology of pipefish (Syngnathidae) associatedwith eelgrass beds of Western Port, Victoria. Aust J MarFreshwater Res 36: 361−370
Kelley DF (1988) The importance of estuaries for seabass,Dicentrarchus labrax (L.). J Fish Biol 33: 25−33
Kneib RT (1987) Predation risk and use of intertidal habitatsby young fishes and shrimp. Ecology 68: 379−386
Kneib RT (1997) The role of tidal marshes in the ecology ofestuarine nekton. Oceanogr Mar Biol Annu Rev 35: 163−220
Kneib RT, Wagner SL (1994) Nekton use of vegetated habi-tats at different stages of tidal inundation. Mar Ecol ProgSer 106: 227−238
Labourg PJ, Clus C, Lasserre G (1985) Preliminary results onthe distribution of juvenile fish assemblages occupying atidal marsh in Arcachon Bay (France). Oceanol Acta 8: 331−341
Laffaille P, Feunteun E, Lefeuvre JC (2000) Composition offish communities in a European macrotidal salt marsh(the Mont Saint-Michel Bay, France). Estuar Coast ShelfSci 51: 429−438
Laffaille P, Feunteun E, Lefebvre C, Radureau A, Sagan G,Lefeuvre JC (2002) Can thin-lipped mullet directlyexploit the primary and detritic production of Europeanmacrotidal salt marshes? Estuar Coast Shelf Sci 54: 729−736
Malavasi S, Franco A, Riccato F, Valerio C, Torricelli P,Franzoi P (2007) Habitat selection and spatial segrega-tion in three pipefish species. Estuar Coast Shelf Sci 75: 143−150
Mathieson S, Cattrijsse A, Costa MJ, Drake P, Elliott M,Gardner J, Marchand J (2000) Fish assemblages of Euro-pean tidal marshes: a comparison based on species, families and functional guilds. Mar Ecol Prog Ser 204: 225−242
McArdle BH, Anderson MJ (2001) Fitting multivariate mod-els to community data: a comment on distance-basedredundancy analysis. Ecology 82: 290−297
272
Ribeiro et al.: Fish assemblages of the Ria Formosa lagoon
McIvor C, Rozas LP (1996) Direct nekton use of intertidalsaltmarsh habitat and linkage with adjacent habitats: areview from the southeastern United States. In: Nord-strom KF, Roman CT (eds) Estuarine shores: evolution,environments and human alterations. Wiley & Sons, NewYork, NY p 311−334
Middaugh DP (1981) Reproduction ecology and spawningperiodicity of the Atlantic silverside, Menidia menidia(Pisces: Atherinidae). Copeia 1981: 766−776
Middaugh DP, Takita T (1983) Tidal and diurnal spawningcues in the silverside, Menidia menidia. Environ BiolFishes 8: 97−104
Monteiro C, Lam Hoai T, Lasserre G (1987) Chronologicalassemblages of fishes in 2 stations of the Ria Formosalagoon (Portugal). Oceanol Acta 10: 359−371
Morton RM, Pollock BR, Beumer JP (1987) The occurrenceand diet of fishes in tidal inlet to a saltmarsh in southernMoreton Bay, Queensland. Aust J Ecol 12: 217−237
Orth RJ, Heck KL Jr., van Montfrans J (1984) Faunal com-munities in seagrass beds: a review of the influence ofplant structure and prey characteristics on predator-preyrelationships. Estuaries 7: 339−350
Paterson AW, Whitfield AK (1996) The fishes associated withan intertidal salt marsh creek in Kariega Estuary, SouthAfrica. Trans R Soc S Afr 51: 195−218
Paterson AW, Whitfield AK (2000a) The ichthyofauna associ-ated with an intertidal creek and adjacent eelgrass bedsin the Kariega Estuary, South Africa. Environ Biol Fishes58: 145−156
Paterson AW, Whitfield AK (2000b) Do shallow-water habi-tats function as refugia for juvenile fishes? Estuar CoastShelf Sci 51: 359−364
Paterson AW, Whitfield AK (2003) The fishes associated withthree intertidal salt marsh creeks in a temperate south-ern African estuary. Wetlands Ecol Manage 11: 305−315
Pollard DA (1984) A reviewed of ecological studies on sea-grass-fish communities with particular reference torecent studies in Aust. Aquat Bot 18: 3−42
Rakocinski CF, Baltz DM, Fleeger JW (1992) Correspon-dence between environmental gradients and the com-munity structure of marsh-edge fishes in a Louisianaestuary. Mar Ecol Prog Ser 80: 135−148
Ribeiro J, Bentes L, Coelho R, Gonçalves JMS, Lino PG,Monteiro P, Erzini K (2006) Seasonal, tidal and diurnalchanges in fish assemblages in the Ria Formosa coastallagoon (Portugal). Estuar Coast Shelf Sci 67: 461−474
Ribeiro J, Bentes L, Coelho R, Gonçalves JMS, Lino PG,Monteiro P, Erzini K (2008) Long-term changes in fishcommunities of the Ria Formosa coastal lagoon (southernPortugal): comparison based on two studies made 20years apart. Estuar Coast Shelf Sci 76: 57−68
Rossi R (1986) Occurrence, abundance and growth of fish fryin Scardovari Bay, a nursery ground of the Po River delta(Italy). Arch Oceanogr Limnol 20: 259−280
Rountree RA, Able KW (1992) Fauna of polyhaline subtidalmarsh creeks in southern New Jersey: composition,
abundance and biomass. Estuaries 15: 171−185Rozas LP, Minello TJ (1998) Nekton use of salt marsh, sea-
grass, and nonvegetated habitats in a south Texas (USA)estuary. Bull Mar Sci 63: 481−501
Rozas LP, Zimmerman RJ (2000) Small-scale patterns ofnekton use among marsh and adjacent shallow nonveg-etated areas of the Galveston Bay Estuary, Texas (USA).Mar Ecol Prog Ser 193: 217−239
Salgado JP, Costa MJ, Cabral HN, Deegan L (2004a) Com-parisons of the fish assemblages in tidal salt marshcreeks and in adjoining mudflat areas in the Tejo estuary(Portugal). Cah Biol Mar 45: 213−224
Salgado JP, Cabral HN, Costa MJ, Deegan L (2004b) Nektonuse of salt marsh creeks in the upper Tejo estuary. Estu-aries 27: 818−825
SAS Institute (1988) SAS/STAT users Guide, release 6.03edition. SAS Institute, Cary, NC
Shannon CE, Wiener W (1949) The mathematical theory ofcommunication. University of Illinois Press, Urbana
Shenker JM, Dean JM (1979) The utilisation of an intertidalsalt marsh creek by larval and juvenile fishes: abun-dance, diversity and temporal variation. Estuaries 2: 154−163
Smith SM, Hoff JG, O’Neil SP, Weinstein MP (1984) Com-munity and trophic organisation of nekton utilising shal-low marsh habitats, York River, Virginia. Fish Bull US 82: 455−467
Sogard SM, Able KW (1991) A comparison of eelgrass, sealettuce macroalgae, and marsh creeks as habitats forepibenthic fishes and decapods. Estuar Coast Shelf Sci33: 501−519
Thomas BE, Connolly RM (2001) Fish use of subtropical salt-marshes in Queensland, Australia: relationships withvegetation, water depth and distance onto the marsh.Mar Ecol Prog Ser 209: 275−288
Underwood AJ (1997) Experiments in ecology. The logicaldesign and interpretation using analysis of variance.Cambridge University Press, Cambridge
Veiga P, Vieira L, Bexiga C, Sá R, Erzini K (2006) Structureand temporal variations of fish assemblages of the CastroMarim salt marsh, southern Portugal. Estuar Coast ShelfSci 70: 27−38
Weinstein MP (1979) Shallow marsh habitats as primarynurseries for fishes and shellfish, Cape Fear River, NorthCarolina. Fish Bull US 77: 339−357
Weinstein MP, Brooks HA (1983) Comparative ecology ofnekton residing in a tidal creek and adjacent seagrassmeadow: community composition and structure. MarEcol Prog Ser 12: 15−27
Weinstein MP, Weiss SL, Walters MF (1980) Multiple deter-minants of community structure in shallow marsh habi-tats, Cape Fear estuary, North Carolina, USA. Mar Biol58: 227−243
Whitfield AK (1988) The Swartvlei estuary fish communityand the influence of food availability on resource utiliza-tion. Estuaries 11: 160−170
273
Editorial responsibility: Konstantinos Stergiou, Thessaloniki, Greece
Submitted: June 22, 2011; Accepted: October 19, 2011Proofs received from author(s): January 18, 2012