Firms Patterns of e-Business Adoption - Academic Publishing
10
ISSN 1566-6379 47 ©Academic Conferences Ltd Reference this paper as: Oliveira, T, and Martins, M, F. (2010) “Firms Patterns of e-Business Adoption: Evidence for the European Union- 27” The Electronic Journal Information Systems Evaluation Volume 13 Issue 1 2010, (pp47 - 56), available online at www.ejise.com Firms Patterns of e-Business Adoption: Evidence for the European Union-27 Tiago Oliveira and Maria Fraga Martins ISEGI, Universidade Nova de Lisboa, Lisbon, Portugal [email protected] [email protected] Abstract: Research has shown that firms using e-business achieve considerable returns through efficiency improvements, inventory reduction, sales increase, customer relationship enhancement, new market penetration, and ultimately financial returns. However, there is little systematic research in terms of e-business adoption patterns in firms across countries and industries. This study addresses the research gap by analysing the pattern of e-business adoption by firms across European Union (EU) members. For that, we used the survey data from 6,964 businesses in EU27 members (excluding Malta and Bulgaria). The choice of variables that we will use in our study is based on the technology-organization-environment (TOE) theory. In the TOE framework, three aspects may possibly influence e-business adoption: technological context (technology readiness and technology integration), organizational context (firm size, expected benefits and barriers of e-business and improved products or services or internal processes) and environmental context (internet penetration and competitive pressure). We performed a factor analysis (FA) of multi-item indicators to evaluate the validity and to reduce the number of variables. We used the principal component technique with varimax rotation to extract four eigen- value, which were all greater than one. The first four factors explain 72.4% of variance contained in the data. The four factors found are: expected benefits and obstacles of e-business, internet penetration, technology readiness and technology integration. These factors are in accordance with the literature review. Afterwards, we performed a cluster analysis (CA) using variables obtained from the FA and the other variables were gathered directly (firm size, employees education, improved products or services or internal processes and competitive pressure) from the e-Business W@tch survey. In the CA we used hierarchical and non hierarchical methods. We obtained four distinct groups of e-business adoption. The pattern of these groups suggested that in the European context the most important factor to characterize e-business adoption is the specific characteristics of the industry and is not the country to which the firms belong. Keywords: e-business adoption, information and communication technology (ICT), technology-organizational- environment (TOE) framework, cluster analysis (CA), European Union (EU) members 1. Introduction The development of e-business capability is crucial since it is swiftly chaining the way that companies buy, sell, and deal with customers, becoming a more integral part of its business strategies (Abu- Musa 2004). E-business adoption becomes a significant research topic because it enables the firm to execute electronic transactions along value chain activities (Straub and Watson 2001, Zhu and Kraemer 2002). It represents a new way to integrate Internet-based technologies with core business potentially affecting the whole business (Zhu 2004a). The European Commission (2005) claims that more efforts are needed to improve e-business in European firms if the Lisbon targets of competitiveness are to be accomplished. European firms, under the pressure of their main international competitors, need to find new opportunities to reduce costs and improve performance. For this reason, it is fundamental to identify the patterns of e- business adoption among firms in European Union (EU) members. To the best of our knowledge, very limited empirical research has been performed to identify the patterns of e-business adoption among firms in EU27 using the technological, organizational and environmental (TOE) contexts. This study fills this gap. The main objectives of this study are the following: To identify distinct clusters of e-business adoption; To characterize the pattern of e-business adoption by firms across these clusters; To understand the extent to which industry e-business adoption characteristics are more or less relevant than country specific characteristics.
-
Upload
khangminh22 -
Category
Documents
-
view
0 -
download
0
Transcript of Firms Patterns of e-Business Adoption - Academic Publishing
ISSN 1566-6379 47 ©Academic Conferences Ltd
Reference this paper as: Oliveira, T, and Martins, M, F. (2010) “Firms Patterns of e-Business Adoption: Evidence for the European Union-27” The Electronic Journal Information Systems Evaluation Volume 13 Issue 1 2010, (pp47 - 56), available online at www.ejise.com
Firms Patterns of e-Business Adoption: Evidence for the European Union-27
Tiago Oliveira and Maria Fraga Martins ISEGI, Universidade Nova de Lisboa, Lisbon, Portugal [email protected] [email protected] Abstract: Research has shown that firms using e-business achieve considerable returns through efficiency
improvements, inventory reduction, sales increase, customer relationship enhancement, new market penetration, and ultimately financial returns. However, there is little systematic research in terms of e-business adoption patterns in firms across countries and industries. This study addresses the research gap by analysing the pattern of e-business adoption by firms across European Union (EU) members. For that, we used the survey data from 6,964 businesses in EU27 members (excluding Malta and Bulgaria). The choice of variables that we will use in our study is based on the technology-organization-environment (TOE) theory. In the TOE framework, three aspects may possibly influence e-business adoption: technological context (technology readiness and technology integration), organizational context (firm size, expected benefits and barriers of e-business and improved products or services or internal processes) and environmental context (internet penetration and competitive pressure). We performed a factor analysis (FA) of multi-item indicators to evaluate the validity and to reduce the number of variables. We used the principal component technique with varimax rotation to extract four eigen-value, which were all greater than one. The first four factors explain 72.4% of variance contained in the data. The four factors found are: expected benefits and obstacles of e-business, internet penetration, technology readiness and technology integration. These factors are in accordance with the literature review. Afterwards, we performed a cluster analysis (CA) using variables obtained from the FA and the other variables were gathered directly (firm size, employees education, improved products or services or internal processes and competitive pressure) from the e-Business W@tch survey. In the CA we used hierarchical and non hierarchical methods. We obtained four distinct groups of e-business adoption. The pattern of these groups suggested that in the European context the most important factor to characterize e-business adoption is the specific characteristics of the industry and is not the country to which the firms belong. Keywords: e-business adoption, information and communication technology (ICT), technology-organizational-
environment (TOE) framework, cluster analysis (CA), European Union (EU) members
1. Introduction
The development of e-business capability is crucial since it is swiftly chaining the way that companies buy, sell, and deal with customers, becoming a more integral part of its business strategies (Abu-Musa 2004). E-business adoption becomes a significant research topic because it enables the firm to execute electronic transactions along value chain activities (Straub and Watson 2001, Zhu and Kraemer 2002). It represents a new way to integrate Internet-based technologies with core business potentially affecting the whole business (Zhu 2004a). The European Commission (2005) claims that more efforts are needed to improve e-business in European firms if the Lisbon targets of competitiveness are to be accomplished. European firms, under the pressure of their main international competitors, need to find new opportunities to reduce costs and improve performance. For this reason, it is fundamental to identify the patterns of e-business adoption among firms in European Union (EU) members. To the best of our knowledge, very limited empirical research has been performed to identify the patterns of e-business adoption among firms in EU27 using the technological, organizational and environmental (TOE) contexts. This study fills this gap. The main objectives of this study are the following:
To identify distinct clusters of e-business adoption;
To characterize the pattern of e-business adoption by firms across these clusters;
To understand the extent to which industry e-business adoption characteristics are more or less relevant than country specific characteristics.
Electronic Journal Information Systems Evaluation Volume 13 Issue 1 2010 (47 – 56)
www.ejise.com 48 ©Academic Conferences Ltd
The paper is organized as follows. The next section presents the literature review of the factors affecting e-business adoption. After we describe the data used. Then, we define the methodology used and present the results obtained. Finally, we present conclusions and future research.
2. e-Business adoption by firms: literature review
Several authors (Hong and Zhu 2006, Iacovou et al. 1995, Kuan and Chau 2001, Lin and Lin 2008, Oliveira and Martins 2008, Pan and Jang 2008, Premkumar and Ramamurthy 1995, Thong 1999, Zhu et al. 2003, Zhu et al. 2006) used the TOE framework, developed by Tornatsky and Fleisher (1990), to analyse IT adoption by firms. Based on the TOE framework, we stipulate that three aspects may possibly influence e-business adoption: technological context (technology readiness and technology integration); organizational context (firm size, expected benefits and obstacles of e-business and improved products or services or internal processes); and environmental context (internet penetration and competitive pressure). Technological context Technology readiness can be defined as technology infrastructure and IT human resources. Technology readiness “is reflected not only by physical assets, but also by human resources that are complementary to physical assets” (Mata et al. 1995). Technology infrastructure establishes a platform on which internet technologies can be built; IT human resources provide the knowledge and skills to develop web applications (Zhu and Kraemer 2005). Theoretical assertions are supported by several empirical studies (Armstrong and Sambamurthy 1999, Hong and Zhu 2006, Iacovou et al. 1995, Kwon and Zmud 1987, Zhu 2004b, Zhu et al. 2003, Zhu and Kraemer 2005, Zhu et al. 2006, Pan and Jang 2008). Evidence from the literature suggests that technology integration helps improve firm performance by reduced cycle time, improved customer service, and lowered procurement costs (Barua et al. 2004). E-business demands close coordination of various components along the value chain. Correspondingly, a greater integration of existing applications and the internet platform represent a greater capacity of conducting business over the internet (Al-Qirim 2007, Mirchandani and Motwani 2001, Premkumar 2003, Zhu et al. 2006). Organizational context Firm size is one of the most commonly studied determinants of IT adoption (Lee and Xia 2006). Large firms are more likely to undertake innovation. Three major arguments support the positive role of firm size in determining IT adoption: appropriability (the benefits of the new IT), the greater availability of funds and the quicker capture of economies of scale. However, larger firms have multiple levels of bureaucracy and this can impede decision-making processes about new ideas and projects. Moreover, IT adoption often requires close collaboration and coordination that can be easily achieved in small firms. Empirical studies consistently found that perceived benefits have a significant impact in IT adoption (Beatty et al. 2001, Gibbs and Kraemer 2004, Iacovou et al. 1995, Kuan and Chau 2001, Lin and Lin 2008). Perceived obstacles are particularly relevant because the adoption process may be complicated and costly (Pan and Jang 2008, Zhu et al. 2006). Improved products or services or internal process that are enabled by or related to a subset of IT, namely e-business technologies (Koellinger 2008). Environmental context Internet penetration measures the adoption and diffusion of computer and internet of individual and household in the population of each country. It is a important factor for decision makers of e-business adoption because it reflects the potential market (Zhu et al. 2003). Competitive pressure refers to the degree of pressure felt by the firm from competitors within the industry. Porter and Millar (1985) analyzed the strategic rationale underlying competitive pressure as an innovation-diffusion driver. They suggested that, by using a new innovation, firms might be able to alter the rules of competition, affect the industry structure, and leverage new ways to outperform
Tiago Oliveira and Maria Fraga Martins
www.ejise.com 49 ISSN 1566-6379
rivals, thus changing the competitive landscape. This analysis can be extended to IT adoption. Empirical evidence suggests that competitive pressure is a powerful driver of IT adoption and diffusion (Al-Qirim 2007, Battisti et al. 2007, Dholakia and Kshetri 2004, Gibbs and Kraemer 2004, Grandon and Pearson 2004, Hollenstein 2004, Iacovou et al. 1995, Mehrtens et al. 2001, Zhu et al. 2003).
3. Data
Our data source is the e-Business W@tch (w@tch 2006a, w@tch 2006b), which collects data concerning the use of ICT and e-business in European enterprises. The data, collected by means of representative surveys of firms that used computers, are related to EU27 members and had a scope of 12,439 telephone interviews with decision-makers in enterprises. Interviews were carried out in March and April 2006, using computer-aided telephone interview (CATI) technology. The sample drawn was a random sample of companies from the respective sector population in each of the countries. According to the methodological recommendations of Eurostat, the situation of an operator that “did not answer” or “does not know” the answer to a specific question should not imply its imputation, in any case, based on the answer of the other operators. Consequently, we obtained a smaller sample that we compared, by a proportion test, with the original one. The proportion test for the variable e-business adoption reveals that the only country where statistically significant differences exist is Bulgaria. For this reason we excluded it from our analysis. We also used, as additional information, the Eurostat data (Survey on ICT Usage in Households and by Individuals 2006) to compute the internet penetration index by country. We excluded Malta because no data were available. The final sample includes 6,694 firms belonging to the EU27 members excluding Malta and Bulgaria. About 80 percent (79.0%) of the data was collected from owners, managing directors, heads of IT and other senior members of IT, suggesting the high quality of the data source.
4. Methodology and results
As a first step, we group the items to reduce the number of variables of the survey; for that we applied a factor analysis (FA). Then, to determine homogenous groups of firms in terms of e-business adoption, we applied cluster analysis (CA).
4.1 Factor analysis results
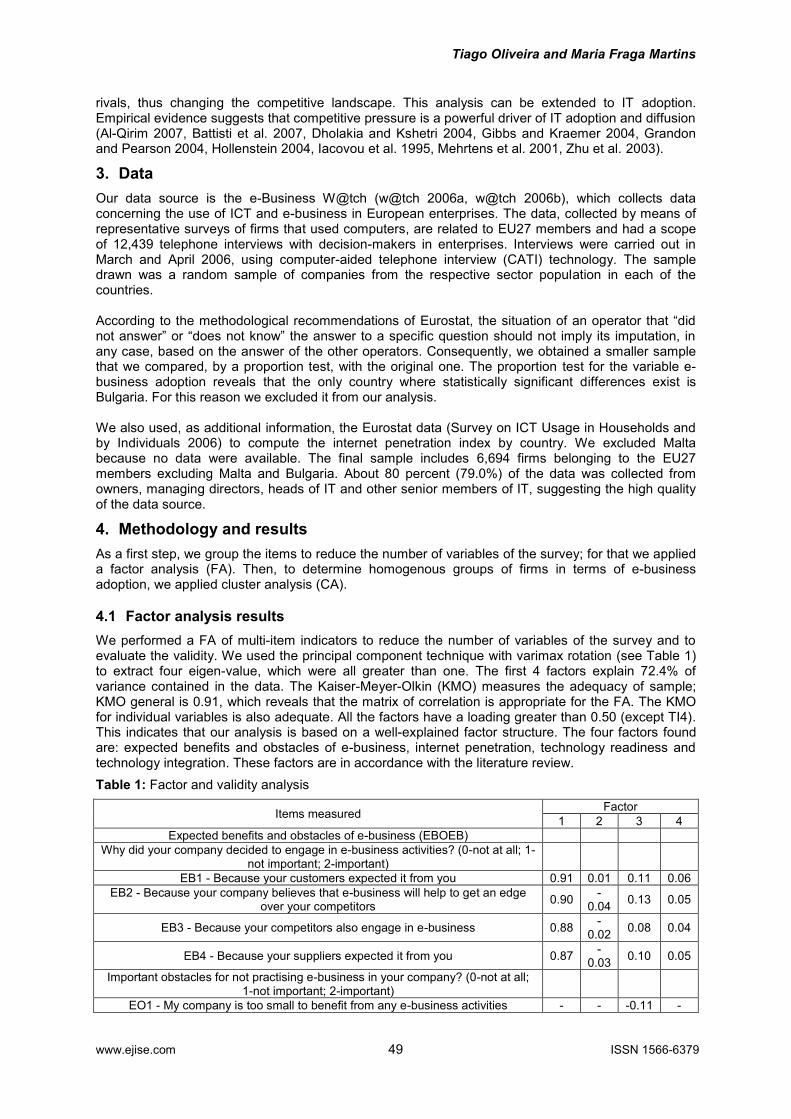
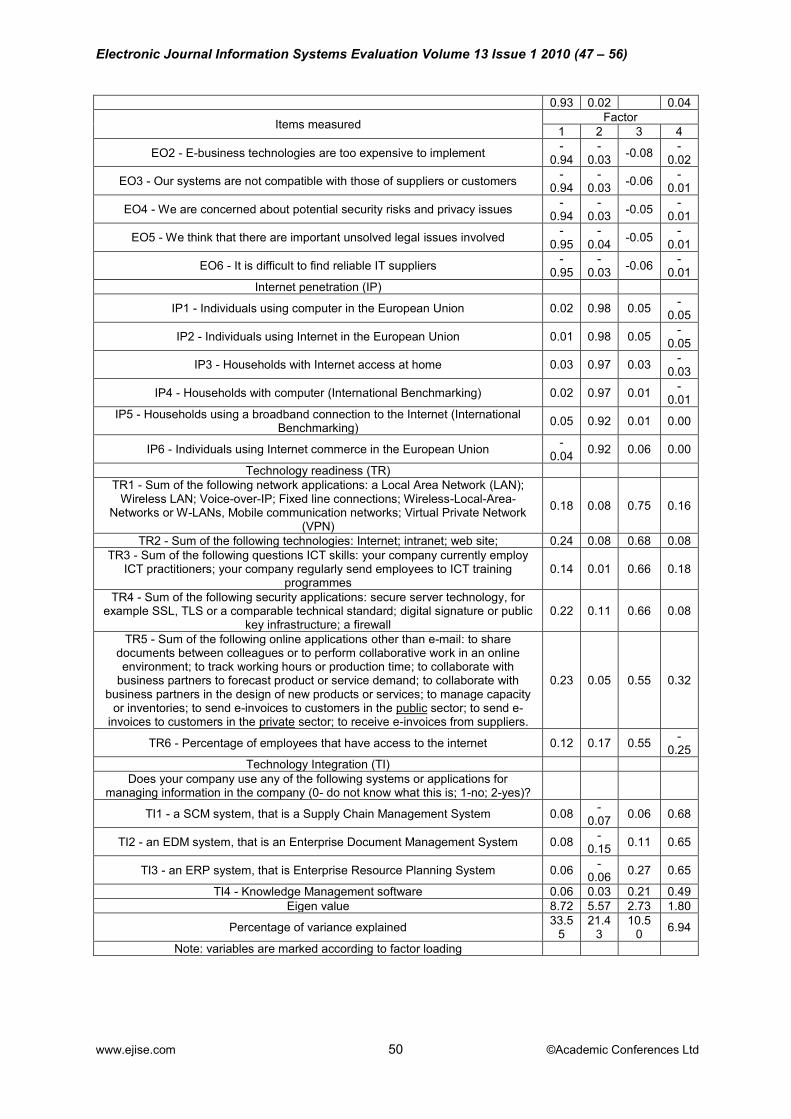
We performed a FA of multi-item indicators to reduce the number of variables of the survey and to evaluate the validity. We used the principal component technique with varimax rotation (see Table 1) to extract four eigen-value, which were all greater than one. The first 4 factors explain 72.4% of variance contained in the data. The Kaiser-Meyer-Olkin (KMO) measures the adequacy of sample; KMO general is 0.91, which reveals that the matrix of correlation is appropriate for the FA. The KMO for individual variables is also adequate. All the factors have a loading greater than 0.50 (except TI4). This indicates that our analysis is based on a well-explained factor structure. The four factors found are: expected benefits and obstacles of e-business, internet penetration, technology readiness and technology integration. These factors are in accordance with the literature review.
Table 1: Factor and validity analysis
Items measured Factor
1 2 3 4
Expected benefits and obstacles of e-business (EBOEB)
Why did your company decided to engage in e-business activities? (0-not at all; 1-not important; 2-important)
EB1 - Because your customers expected it from you 0.91 0.01 0.11 0.06
EB2 - Because your company believes that e-business will help to get an edge over your competitors
0.90 -
0.04 0.13 0.05
EB3 - Because your competitors also engage in e-business 0.88 -
0.02 0.08 0.04
EB4 - Because your suppliers expected it from you 0.87 -
0.03 0.10 0.05
Important obstacles for not practising e-business in your company? (0-not at all; 1-not important; 2-important)
EO1 - My company is too small to benefit from any e-business activities - - -0.11 -
Electronic Journal Information Systems Evaluation Volume 13 Issue 1 2010 (47 – 56)
www.ejise.com 50 ©Academic Conferences Ltd
0.93 0.02 0.04
Items measured Factor
1 2 3 4
EO2 - E-business technologies are too expensive to implement -
0.94 -
0.03 -0.08
-0.02
EO3 - Our systems are not compatible with those of suppliers or customers -
0.94 -
0.03 -0.06
-0.01
EO4 - We are concerned about potential security risks and privacy issues -
0.94 -
0.03 -0.05
-0.01
EO5 - We think that there are important unsolved legal issues involved -
0.95 -
0.04 -0.05
-0.01
EO6 - It is difficult to find reliable IT suppliers -
0.95 -
0.03 -0.06
-0.01
Internet penetration (IP)
IP1 - Individuals using computer in the European Union 0.02 0.98 0.05 -
0.05
IP2 - Individuals using Internet in the European Union 0.01 0.98 0.05 -
0.05
IP3 - Households with Internet access at home 0.03 0.97 0.03 -
0.03
IP4 - Households with computer (International Benchmarking) 0.02 0.97 0.01 -
0.01
IP5 - Households using a broadband connection to the Internet (International Benchmarking)
0.05 0.92 0.01 0.00
IP6 - Individuals using Internet commerce in the European Union -
0.04 0.92 0.06 0.00
Technology readiness (TR)
TR1 - Sum of the following network applications: a Local Area Network (LAN); Wireless LAN; Voice-over-IP; Fixed line connections; Wireless-Local-Area-
Networks or W-LANs, Mobile communication networks; Virtual Private Network (VPN)
0.18 0.08 0.75 0.16
TR2 - Sum of the following technologies: Internet; intranet; web site; 0.24 0.08 0.68 0.08
TR3 - Sum of the following questions ICT skills: your company currently employ ICT practitioners; your company regularly send employees to ICT training
programmes 0.14 0.01 0.66 0.18
TR4 - Sum of the following security applications: secure server technology, for example SSL, TLS or a comparable technical standard; digital signature or public
key infrastructure; a firewall 0.22 0.11 0.66 0.08
TR5 - Sum of the following online applications other than e-mail: to share documents between colleagues or to perform collaborative work in an online environment; to track working hours or production time; to collaborate with
business partners to forecast product or service demand; to collaborate with business partners in the design of new products or services; to manage capacity
or inventories; to send e-invoices to customers in the public sector; to send e-invoices to customers in the private sector; to receive e-invoices from suppliers.
0.23 0.05 0.55 0.32
TR6 - Percentage of employees that have access to the internet 0.12 0.17 0.55 -
0.25
Technology Integration (TI)
Does your company use any of the following systems or applications for managing information in the company (0- do not know what this is; 1-no; 2-yes)?
TI1 - a SCM system, that is a Supply Chain Management System 0.08 -
0.07 0.06 0.68
TI2 - an EDM system, that is an Enterprise Document Management System 0.08 -
0.15 0.11 0.65
TI3 - an ERP system, that is Enterprise Resource Planning System 0.06 -
0.06 0.27 0.65
TI4 - Knowledge Management software 0.06 0.03 0.21 0.49
Eigen value 8.72 5.57 2.73 1.80
Percentage of variance explained 33.5
5 21.4
3 10.5
0 6.94
Note: variables are marked according to factor loading
Tiago Oliveira and Maria Fraga Martins
www.ejise.com 51 ISSN 1566-6379
4.2 Cluster analysis results
To perform the CA we used the variables presented in Table 2 obtained from the FA (TR, TI, EBOEB and IP) and also some variables computed directly (SIZE, IPSIP and CP) from the e-Business W@tch survey.
Table 2: Description of variables used in CA
Technological context
Technology readiness (TR) AF index of technology readiness
Technology integration (TI) AF index of technology integration
Variables Description
Organizational context
Firm size (SIZE) The logarithm number of employees
Expected benefits and obstacles of e-business (EBOEB)
AF index of expected benefits and barriers of e-business
Improved products or services or internal processes (IPSIP)
Binary =1 if firms improved products or services or internal processes
Environmental context
Internet penetration (IP) AF index of internet penetration
Competitive pressure (CP) Binary =1 if firms think that ICT has an influence on
competition in their industry
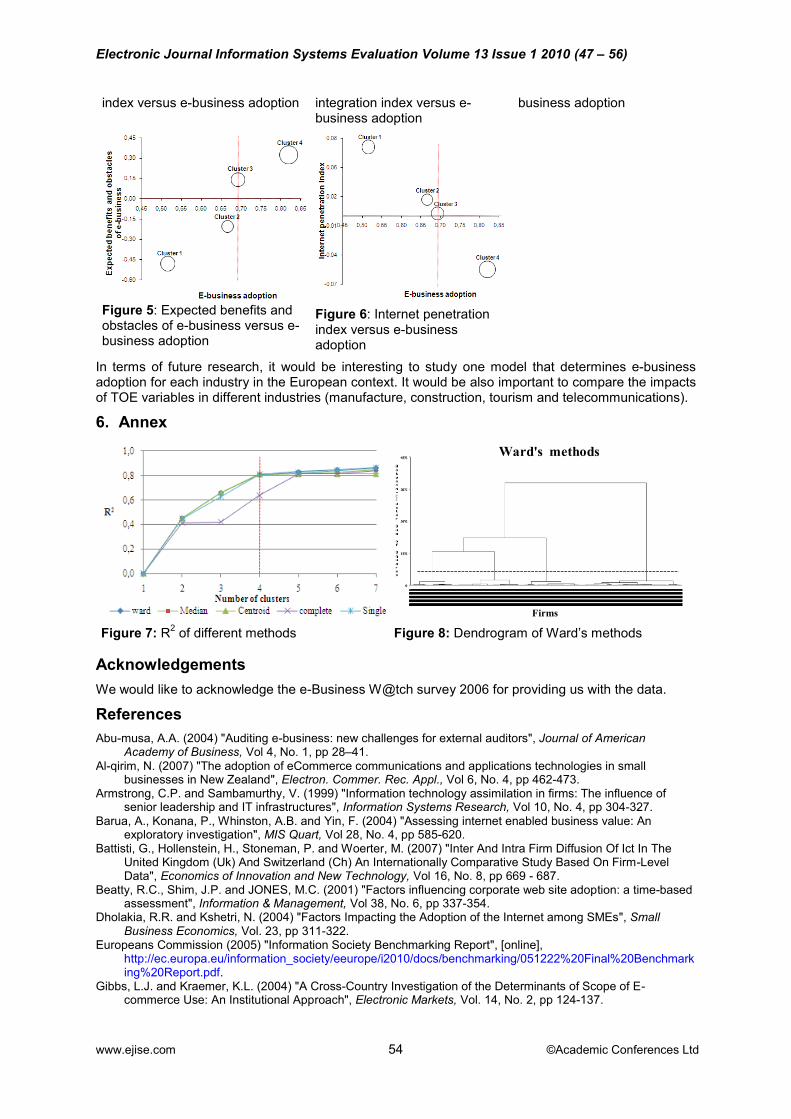
The objective of the CA is to classify firms in homogenous groups, so that firms from the same group are as similar as possible in what concerns the pattern of e-business adoption, and as different as possible from firms belonging to other groups. The variables used to perform the CA have measurement scales that are both quantitative and qualitative, and so, it was necessary to use the dissimilarity matrix calculated through the method proposed by Gower (Gower 1971). For that, we used the SAS software and the distance macros (SAS 2003). Once the dissimilarity matrix was computed, we performed, as usual, a hierarchical CA, through the most known methods: Ward, median, centroid, complete linkage and single linkage. From the results obtained from these five methods, it was possible to determine the optimal number of groups (four), as well as the method that best fits these data (Ward), (see annex). The centroids of the clusters obtained through Ward’s method were used as initial seeds for the non hierarchical model (k-means), which allowed us to refine the previous solution. According to Sharma (1996), this is the best solution to obtain clusters. To characterise the groups we used as auxiliary variables the firm size (by classes), industries and countries (Table 3).
Table 3: Description of adoptions and auxiliary variables
Variables Description
Adoption
E-business (EB) Binary =1 if firm adopts e-purchasing or e-selling
e-purchasing adoption (e1) Binary =1 if firm adopts e-purchasing
e-selling adoption (f4) Binary =1 if firm adopts e-selling
Auxiliary
Size by classes (micro, small, medium and large) Four binary variable for each size
Industry (manufacture, construction, tourism and telecommunications)
Four binary variables for each industry
EU27 members (excluding Malta and Bulgaria) Twenty-five binary variables for each country
Summary statistics for variables in each cluster are provided in Table 4. Clusters patterns were compared using chi-squared tests for binary variables and Kruskal-Wallis test for quantitative variables. All variables, except auxiliary variables related to countries, present statistically significant differences across clusters, suggesting that our cluster analysis generated groups of firms that are statistically distinct according to the variables characterising e-business adoption.
Table 4: Summary statistics for CA
All
Cluster
Statistic Test (p-value)
1 2 3 4
Number of firms 6,964 1,699 1,150 1,509 2,606
Percentage of firms 100.0% 24.4% 16.5% 21.7% 37.4%
TOE Variables
Technology readiness (TR) 0.000 -0.482 -0.041 -0.215 0.457 991.69
(<0.001)
Electronic Journal Information Systems Evaluation Volume 13 Issue 1 2010 (47 – 56)
www.ejise.com 52 ©Academic Conferences Ltd
Technology integration (TI) 0.000 -0.140 0.090 -0.155 0.141 83.76 (<0.001)
All
Cluster
Statistic Test (p-value)
1 2 3 4
Number of firms 6,964 1,699 1,150 1,509 2,606
Percentage of firms 100.0% 24.4% 16.5% 21.7% 37.4%
Adoption variables
Firm size (SIZE) 2.733 2.406 2.948 2.473 3.003 183.69
(<0.001)
Expected benefits and barriers of e-business (EBOEB) 0.000 -0.480 -0.205 0.141 0.322
710.83 (<0.001)
Improved products or services or internal processes (IPSIP) 0.539 0.000 1.000 0.000 1.000
3207.97 (<0.001)
Internet penetration (IP) 0.000 0.071 0.017 0.002 -0.055 52.43 (<0.001)
Competitive pressure (CP) 0.591 0.000 0.000 1.000 1.000 2848.98 (<0.001)
e-purchasing adoption 0.619 0.448 0.602 0.606 0.746 149.59
(<0.001)
e-selling adoption 0.310 0.169 0.250 0.307 0.430 242.62
(<0.001)
E-business 0.693 0.516 0.666 0.693 0.820 139.10
(<0.001)
Auxiliary variables
Micro 0.423 0.489 0.357 0.493 0.368 64.84 (<0.001)
Small 0.306 0.312 0.339 0.279 0.302 8.04 (0.045)
Medium 0.211 0.167 0.241 0.180 0.245 42.24 (<0.001)
Large 0.060 0.033 0.063 0.048 0.084 49.06 (<0.001)
Manufacture 0.512 0.504 0.647 0.427 0.507 62.33 (<0.001)
Construction 0.169 0.265 0.127 0.192 0.112 159.74
(<0.001)
Tourism 0.181 0.166 0.149 0.233 0.175 31.48 (<0.001)
Telecommunications 0.138 0.065 0.077 0.148 0.206 185.11
(<0.001)
Note: We also analyze summary statistics by cluster for each country but we do not identify any pattern. In
addition, several countries (Netherlands, Sweden, Germany, Ireland, Luxembourg, Italy, Slovakia, Cyprus and Latvia) did not have statistically differences by clusters.
A description of each of the clusters, drawn from Table 4 is given below: Cluster 1 (lowest e-business adoption).These firms had the lowest level of Technology readiness compared to the other three clusters; their expected benefits of e-business are the lowest, but they had the highest level of internet penetration index. They are therefore referred to here as lowest e-business adoption group, that is, firms who are at the very start of their e-business adoption but are currently operating in countries with a high internet penetration. The competitive pressure they faced is low. Most of the firms within this group are micro and small firms without improved products or services and the most common activity sector is the construction. This cluster contains 24.4% of the whole sample firms. Cluster 2 (medium e-business adoption with technology integration). The firms in this cluster were making some use of integrated technologies and most of them are improving their products or internal processes. They were presenting a medium level of Technology readiness but a low competitive pressure. Firms in cluster 2 are small and medium size firms coming from manufacturing industry and having a medium level of e-business adoption. This cluster includes 16.5% of the firms. Cluster 3 (medium e-business adoption with high competitive pressure). Firms in this cluster had the lowest index of technology integration and a low level of technology readiness. Contrarily to firms in cluster 2, most of them don’t improve their services or internal processes, but all of them are facing competitive pressure. In this group the most common firms are micro firms coming from the tourism industry. This cluster contains 21.7% of firms. Cluster 4 (highest e-business adoption). Firms in cluster 4 were found to have high levels of all variables, except for the internet penetration. Cluster 4 incorporates firms that operate in the telecommunications industry and had medium or large size. This is the biggest cluster with 37.4% of firms.
Tiago Oliveira and Maria Fraga Martins
www.ejise.com 53 ISSN 1566-6379
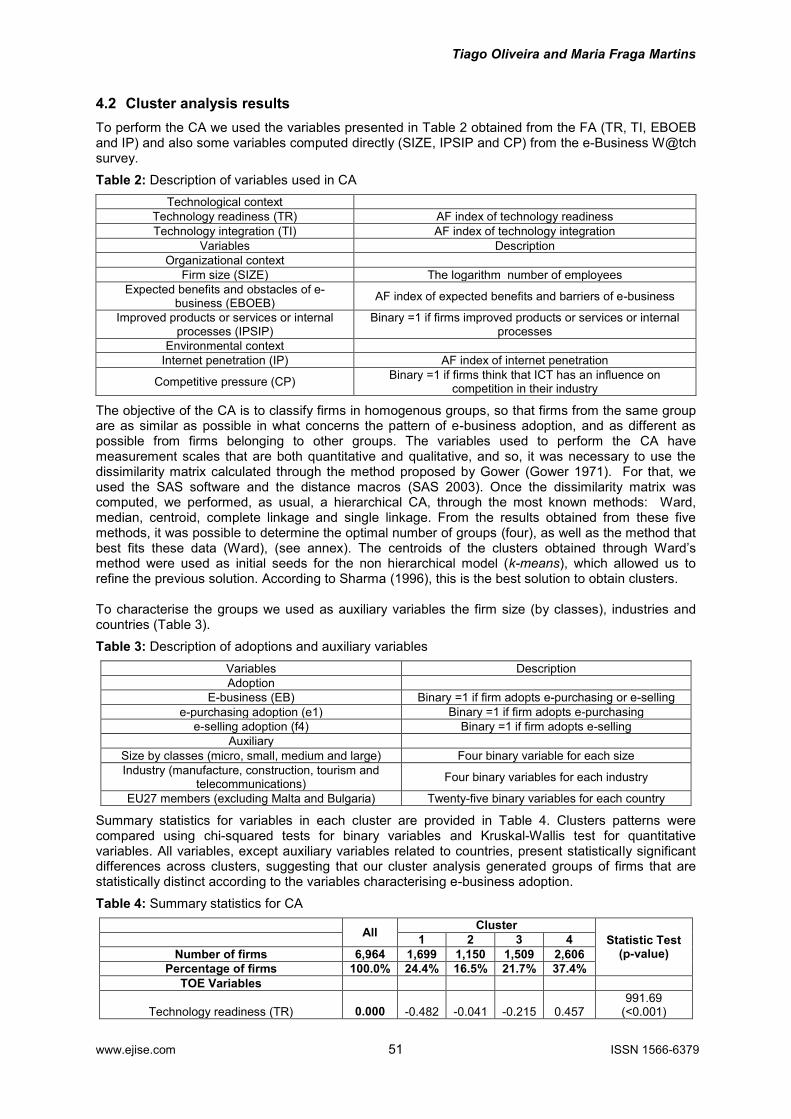
The findings suggest that the four clusters identified represent a set of e-business patterns (Figure 1) that are much more related to industry sector and firm size than to countries. Micro and small firms from the Construction Sector can be viewed as laggards and big firms from Telecommunications as the Pioneers. Moreover, our results also suggested a positive relationship between e-purchase and e-selling adoption.
Figure 1: Characteristics of four e-business groups
5. Conclusions and future research
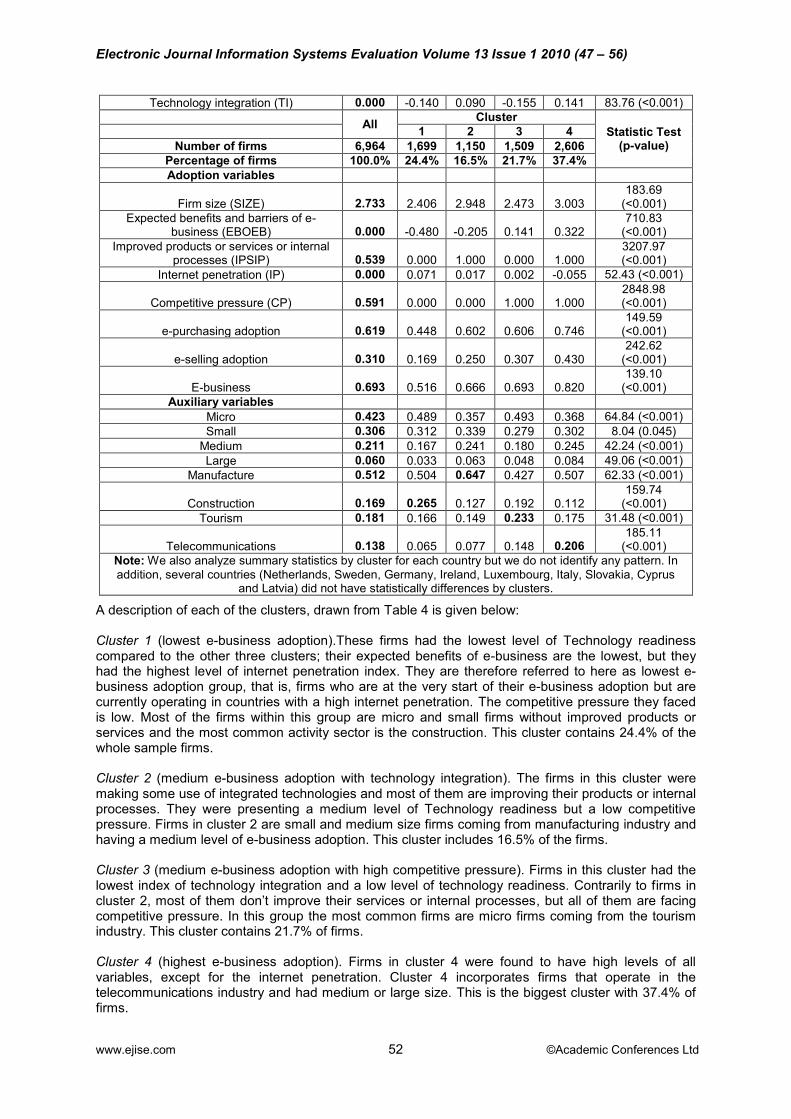
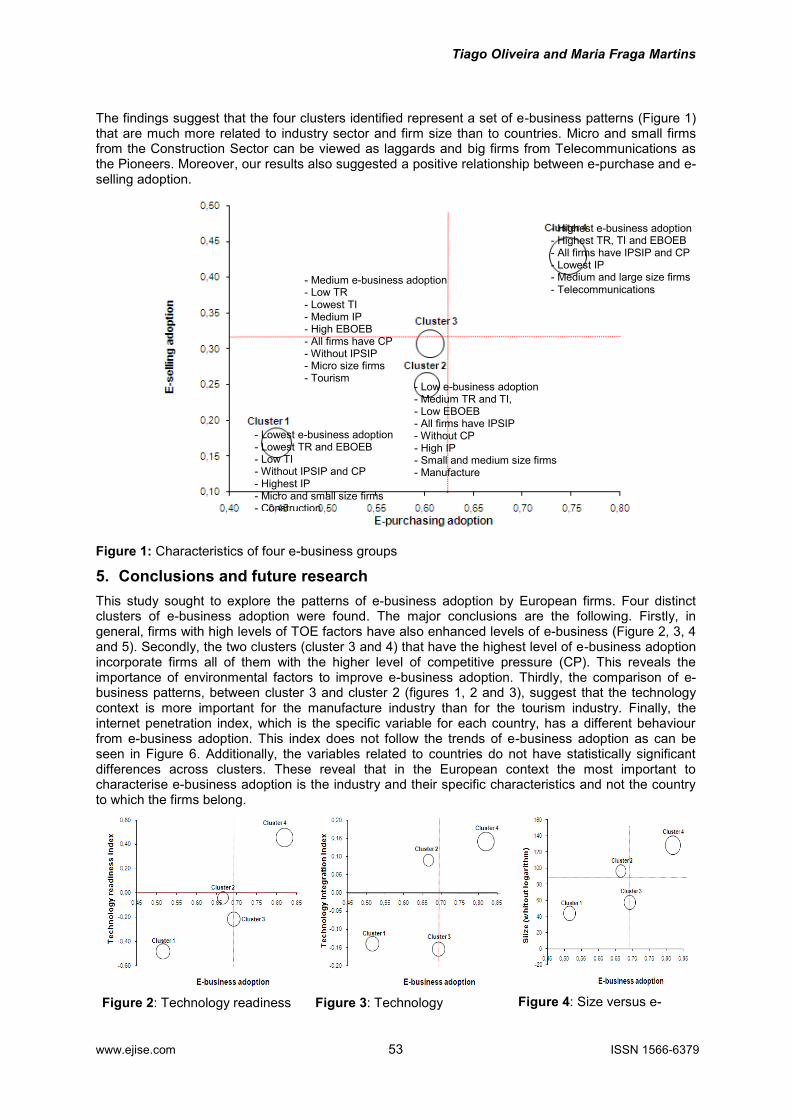
This study sought to explore the patterns of e-business adoption by European firms. Four distinct clusters of e-business adoption were found. The major conclusions are the following. Firstly, in general, firms with high levels of TOE factors have also enhanced levels of e-business (Figure 2, 3, 4 and 5). Secondly, the two clusters (cluster 3 and 4) that have the highest level of e-business adoption incorporate firms all of them with the higher level of competitive pressure (CP). This reveals the importance of environmental factors to improve e-business adoption. Thirdly, the comparison of e-business patterns, between cluster 3 and cluster 2 (figures 1, 2 and 3), suggest that the technology context is more important for the manufacture industry than for the tourism industry. Finally, the internet penetration index, which is the specific variable for each country, has a different behaviour from e-business adoption. This index does not follow the trends of e-business adoption as can be seen in Figure 6. Additionally, the variables related to countries do not have statistically significant differences across clusters. These reveal that in the European context the most important to characterise e-business adoption is the industry and their specific characteristics and not the country to which the firms belong.
Figure 2: Technology readiness
Figure 3: Technology
Figure 4: Size versus e-
- Lowest e-business adoption - Lowest TR and EBOEB - Low TI - Without IPSIP and CP - Highest IP - Micro and small size firms - Construction
- Highest e-business adoption - Highest TR, TI and EBOEB - All firms have IPSIP and CP - Lowest IP - Medium and large size firms - Telecommunications
- Medium e-business adoption - Low TR - Lowest TI - Medium IP - High EBOEB - All firms have CP - Without IPSIP - Micro size firms - Tourism
- Low e-business adoption - Medium TR and TI, - Low EBOEB - All firms have IPSIP - Without CP - High IP - Small and medium size firms - Manufacture
Electronic Journal Information Systems Evaluation Volume 13 Issue 1 2010 (47 – 56)
www.ejise.com 54 ©Academic Conferences Ltd
index versus e-business adoption integration index versus e-business adoption
business adoption
Figure 5: Expected benefits and obstacles of e-business versus e-business adoption
Figure 6: Internet penetration index versus e-business adoption
In terms of future research, it would be interesting to study one model that determines e-business adoption for each industry in the European context. It would be also important to compare the impacts of TOE variables in different industries (manufacture, construction, tourism and telecommunications).
6. Annex
Figure 7: R2 of different methods
Ward's methods
Firms
Figure 8: Dendrogram of Ward’s methods
Acknowledgements
We would like to acknowledge the e-Business W@tch survey 2006 for providing us with the data.
References
Abu-musa, A.A. (2004) "Auditing e-business: new challenges for external auditors", Journal of American Academy of Business, Vol 4, No. 1, pp 28–41.
Al-qirim, N. (2007) "The adoption of eCommerce communications and applications technologies in small businesses in New Zealand", Electron. Commer. Rec. Appl., Vol 6, No. 4, pp 462-473.
Armstrong, C.P. and Sambamurthy, V. (1999) "Information technology assimilation in firms: The influence of senior leadership and IT infrastructures", Information Systems Research, Vol 10, No. 4, pp 304-327.
Barua, A., Konana, P., Whinston, A.B. and Yin, F. (2004) "Assessing internet enabled business value: An exploratory investigation", MIS Quart, Vol 28, No. 4, pp 585-620.
Battisti, G., Hollenstein, H., Stoneman, P. and Woerter, M. (2007) "Inter And Intra Firm Diffusion Of Ict In The United Kingdom (Uk) And Switzerland (Ch) An Internationally Comparative Study Based On Firm-Level Data", Economics of Innovation and New Technology, Vol 16, No. 8, pp 669 - 687.
Beatty, R.C., Shim, J.P. and JONES, M.C. (2001) "Factors influencing corporate web site adoption: a time-based assessment", Information & Management, Vol 38, No. 6, pp 337-354.
Dholakia, R.R. and Kshetri, N. (2004) "Factors Impacting the Adoption of the Internet among SMEs", Small Business Economics, Vol. 23, pp 311-322.
Europeans Commission (2005) "Information Society Benchmarking Report", [online], http://ec.europa.eu/information_society/eeurope/i2010/docs/benchmarking/051222%20Final%20Benchmarking%20Report.pdf.
Gibbs, L.J. and Kraemer, K.L. (2004) "A Cross-Country Investigation of the Determinants of Scope of E-commerce Use: An Institutional Approach", Electronic Markets, Vol. 14, No. 2, pp 124-137.
Tiago Oliveira and Maria Fraga Martins
www.ejise.com 55 ISSN 1566-6379
Gower, J.C. (1971) "A general coefficient of similarity and some of its properties", Biometrics, Vol. 27, pp 857-872.
Grandon, E.E. and Pearson, J.M. (2004) "Electronic commerce adoption: an empirical study of small and medium US businesses", Information & Management, Vol. 42, No. 1, pp 197-216.
Hollenstein, H. (2004) "Determinants of the adoption of Information and Communication Technologies (ICT). An empirical analysis based on firm-level data for the Swiss business sector", Structural Change and Economic Dynamics, Vol. 15, pp 315-342.
Hong, W.Y. and Zhu, K. (2006) "Migrating to internet-based e-commerce: Factors affecting e-commerce adoption and migration at the firm level", Information & Management, Vol. 43, No. 2, pp 204-221.
Iacovou, C.L., Benbasat, I. and Dexter, A.S. (1995) "Electronic data interchange and small organizations: Adoption and impact of technology", Mis Quarterly, Vol. 19, No. 4, pp 465-485.
Koellinger, P. (2008) "The relationship between technology, innovation, and firm performance - Empirical evidence from e-business in Europe", Research Policy, Vol. 37, No. 8, pp 1317-1328.
Kuan, K.K.Y. and Chau, P.Y.K. (2001) "A perception-based model for EDI adoption in small businesses using a technology-organization-environment framework". Information & Management, Vol. 38, No. 8, pp 507-521.
Kwon, T.H. and Zmud, R.W. (1987) Unifying the fragmented models of information systems implementation. In critical issues in Information Systems Research (Boland RJ and Hirschheim RA, Eds). IN WILEY, J. (Ed.) New York.
Lee, G. and Xia, W.D. (2006) "Organizational size and IT innovation adoption: A meta-analysis", Information & Management, Vol. 43, No. 8, pp 975-985.
Lin, H.F. and Lin, S.M. (2008) "Determinants of e-business diffusion: A test of the technology diffusion perspective", Technovation, Vol. 28, No. 3, pp 135-145.
Mata, F., Fuerst, W. and Barney, J. (1995) "Information technology and sustained competitive advantage: A resource-based analysis", MIS Quart, Vol. 19, No. 4, pp 487–505.
Mehrtens, J., Cragg, P.B. and Mills, A.M. (2001) "A model of Internet adoption by SMEs", INFORMATION & MANAGEMENT, Vol. 39, pp 165-176.
Mirchandani, D.A. and Motwani, J. (2001) "Understanding small business electronic commerce adoption: An empirical analysis", Journal of Computer Information Systems, Vol. 41, No. 3, pp 70-73.
Oliveira, T. and Martins, M.F.O. (2008) "A comparison of web site adoption in small and large Portuguese firms", Ice-B 2008: Proceedings of the International Conference on E-Business, pp. 370-377, Oporto, Portugal, July.
Pan, M.J. and Jang, W.Y. (2008) "Determinants of the adoption of enterprise resource planning within the technology-organization-environment framework: Taiwan's communications", Journal of Computer Information Systems, Vol. 48, No. 3, pp 94-102.
Porter, M.E. and Millar, V.E. (1985) "How Information Gives You Competitive Advantage", Harvard Business Review, Vol. 63, No. 4, pp 149-160.
Premkumar, G. (2003) "A meta-analysis of research on information technology implementation in small business", Journal of Organizational Computing and Electronic Commerce, Vol. 13, No. 2, pp 91-121.
Premkumar, G. and Ramamurthy, K. (1995) "The role of interorganizational and organizational factors on the decision mode for adoption of interorganizational systems", Decision Sciences, Vol. 26, No. 3, pp 303-336.
SAS (2003) The Distance Macro. 8.2 ed., SAS Institute Inc. Sharma, S. (1996) Applied Multivariate Techniques, John Wiley & Sons, New York. Straub, D.W. and Watson, R.T. (2001) "Research commentary: Transformational issues in researching IS and
net-enabled organizations", Information Systems Research, Vol. 12, No. 4, pp 337-345. Thong, J.Y.L. (1999) "An Integrated Model of Information Systems Adoption in Small Businesses", Journal of
Management Information Systems, Vol. 15, No. 4, pp 187-214. Tornatsky, L. and Fleischer, M. (1990) The Process of Technology Innovation, Lexington, MA, Lexington Books. e-Business W@tch (2006a) "e-Business Decision Maker Survey in European enterprises", [online],
http://www.ebusiness-watch.org/about/documents/eBiz_Questionnaire_2006.xls. e-Business W@tch (2006b) "The e-Business Survey 2006 – Methodology Report", [online],
http://www.ebusiness-watch.org/about/documents/DMS2006_Methodology.pdf. Zhu, K. (2004a) "The complementarity of information technology infrastructure and e-commerce capability: A
resource-based assessment of their business value", Journal of Management Information Systems, Vol. 21, No. 1, pp 167-202.
Zhu, K. (2004b) "Information transparency of business-to-business electronic markets: A game-theoretic analysis", Management Science, Vol. 50, No. 5, pp 670-685.
Zhu, K., Kraemer, K. and Xu, S. (2003) "Electronic business adoption by European firms: a cross-country assessment of the facilitators and inhibitors", European Journal of Information Systems, Vol. 12, No. 4, pp 251-268.
Zhu, K. and Kraemer, K.L. (2002) "e-Commerce metrics for net-enhanced organizations: Assessing the value of e-commerce to firm performance in the manufacturing sector", Information Systems Research, Vol. 13, No. 3, pp 275-295.
Zhu, K. and Kraemer, K.L. (2005) "Post-adoption variations in usage and value of e-business by organizations: Cross-country evidence from the retail industry", Information Systems Research, Vol. 16, No. 1, pp 61-84.
Zhu, K., Kraemer, K.L. and Xu, S. (2006) "The process of innovation assimilation by firms in different countries: A technology diffusion perspective on e-business", Management Science, Vol. 52, No. 10, pp 1557-1576.

Electronic Journal Information Systems Evaluation Volume 13 Issue 1 2010 (47 – 56)
www.ejise.com 56 ©Academic Conferences Ltd