Firms' EPS Outlook Shows Solid Gains, But Leaders To Shift
44
IBD M O N D AY S PE C IAL VOL. 22, NO. 238 WWW.INVESTORS.COM MONDAY, MARCH 20, 2006 $2.00 BY BRIAN MITCHELL INVESTOR'S BUSINESS DAILY Immigration foes’ cheers turned to moans when it turned out that the new border-security bill pro- posed by Senate Majority Leader Bill Frist, R-Tenn., will not replace a broader immigration reform bill already in the works. Frist introduced his own bor- der-security bill late Thursday after leaking news of the new bill to The Washington Times the day before. “Our country needs security at our borders in order to slow the flow of illegal immigration and make America safer from foreign criminals and terrorists,” Frist said in a Thursday statement. The bill includes many provi- sions of the border-security bill that the House passed in Decem- ber. It includes beefed-up border pro- tections, sterner penalties for crim- inal aliens, increased workplace enforcement and expedited re- moval procedures. It does not include a guest-work- er program, a hike in legal immi- gration or any form of amnesty for illegal aliens. Frist Backs Off When Senate Judiciary Commit- tee Chairman Arlen Specter, R-Pa., complained Thursday that Frist’s bill would cause “chaos” on the Senate floor, Frist’s office promised to pull the bill if Spec- ter’s panel finishes work on a broader immigration bill by March 27. “Unfortunately it looks like we’re not going to get a clear shot at the Frist bill because he may withdraw it,” said David Durham, board chairman of the Carrying Capacity Network, which wants a moratorium on immigration. The fanfare over Frist’s threat to upstage Specter left some wonder- ing whether Frist was just grand- standing for Republican voters. The White House hopeful won a recent presidential straw poll at the Southern Republican Leader- ship Conference in Memphis, Tenn. But two out-of-state rivals, Massachusetts Gov. Mitt Romney and Virginia Sen. George Allen, drew more applause by standing against illegal immigration. The contrast may have prompt- ed Frist to move more forcefully on border control. “Frist is in his last eight months in the Senate,” said Larry Sabato, professor of politics at the Univer- sity of Virginia. “He’s much more interested in being a presidential candidate than majority leader at this point.” And GOP primary voters tend to favor a crackdown on illegal immi- gration. Deadline Spurs Action Spurred by the threat of an en- forcement-only bill, senators on the judiciary panel reached a com- promise on key issues. “The committee was turbo-charged yesterday com- pared to how it had been going,” Angela Kelley, deputy director of the National Immigration Forum, which favors more immigration. That’s kept alive the possibility of Senate legislation pieced togeth- er from three bills backed by panel members. All three contain some form of guest-worker program proposed by President Bush. Specter’s 300-page bill provides an earned amnesty for illegals al- ready here, a guest-worker pro- gram and 1.14 million green cards a year for employment-based, fam- ily-based and student immigrants. It did not include a border fence, an end to the visa lottery, mandato- ry work eligibility verification for employees, and other provisions of the House bill. Tough Love For Guest Workers Tougher enforcement provi- sions may be added from a bill backed by Sens. John Cornyn, R-Texas, and Jon Kyl, R-Ariz., in exchange for a guest-worker pro- gram more like that proposed by Sens. John McCain, R-Ariz., and Ted Kennedy, D-Mass. Cornyn and Kennedy have agreed on a compromise that would re- quire illegals to return home be- fore re-entering as guest workers. The government would waive that if the illegals’ employers say they can’t be missed or if they can prove a consistent work history. “Anything can happen in the Sen- ate,” said Caroline Espinosa of NumbersUSA, which opposes more immigration. “It’s very, very possible they’ll do some form of amnesty or some form of guest-worker program. But in the end it really boils down to what happens in conference.” IBD’S TOP 10 BY MARILYN ALVA INVESTOR'S BUSINESS DAILY After 15 straight quarters of dou- ble-digit profit growth, it looks like the double beat will continue in 2006. With 98% of the S&P 500 firms reporting, fourth-quarter 2005 earnings rose 14.5% vs. a year earli- er, according to Thomson Finan- cial. Analysts predict 11% earn- ings growth in the first quarter and 13.4% at the end of the year. But financial firms are expected to be the main driver by the sec- ond half of the year, taking over from energy. Goldman Sachs, Lehman Bros. and Bear Stearns last week posted much-better-than-expected quar- terly profits, citing heavy trading and strong merger advisory fees. Charles Schwab also reported big gains in February trading activity. Schwab’s strong February num- bers “bodes well for the retail bro- kerage industry overall,” wrote an- alyst Brad Hintz of Sanford C. Bernstein. It’s a good sign for stocks overall when financials, especially Wall Street firms, are doing well. Strong M&A activity and heavy trading suggest companies and in- vestors are optimistic. When energy profits are high, that means everyone else is pay- ing more for heat and electricity. Also, financials are still the big- gest group in the S&P 500, repre- senting 21% of the index’s market cap and 26% of its earnings. Financials have been mired in single-digit profit growth. Hurri- cane-hit insurers have weighed down the overall sector. But that impact should lessen as the year goes on. By the fourth quarter, analysts expect financials’ profits to climb 28%. Meanwhile, today’s leader, the energy sector, is seen as tomor- row’s laggard. Analysts expect 43% profit growth this quarter. But by the fourth quarter, energy earnings are expected to dip 3% vs. a year earlier. But it all depends on prices. “It’s a commodity business,” said Sandy Lincoln, chief market strategist with Wayne Hummer Asset Management. “Unless oil goes from $60 to $80 or $90 you don’t have much of a case for ener- gy stocks. They are going to have very tough comparisons, since 2005 was such a good year.” Profit for technology, telecom and industrials is expected to grow 16% to 18% this quarter. Materials’ earnings will dip 1%, analysts estimate. The sector in- cludes makers of petro- leum-based products such as plas- tics. These firms have been hurt by raw material cost spikes, while they’ve struggled to boost their own prices to match. But materials firms should im- prove, with profit growth ramp- ing up to 24% in the third quarter, Thomson Financial said. That would be second to financials. Despite the solid forecasts, nega- tive outlooks for the first quarter are running slightly higher than average. Negative views usually outnum- ber the positive since firms would rather err on the conservative side. Thomson tallies show negative outlooks for the first quarter run- ning 2.4-to-1 over positive ones. The average is 2.2-to-1. That might not be such a bad thing. When pre-announcements are abnormally negative, stocks have rallied 2.7% on average dur- ing the next reporting month, ac- cording to ISI Group. “All the bad news gets priced into the stocks and the company invariably reports to the upside,” said Nick Bohnsack, investment strategist with ISI. The negative-to-positive ratio was much higher earlier in March. But good news from brokers and others softened those figures. LT. COL. MICHAEL HARRIS receives kisses while marching with the Army’s 3rd Infantry Division in Savan- nah, Ga., during the annual St. Patrick’s Day parade Friday. Kissing uniformed members in the parade is a tra- dition during the celebration. The 3rd Division recently returned from its second tour of duty in Iraq. AP BY JONAH KERI INVESTOR'S BUSINESS DAILY Stocks edged up Friday, finishing off a bullish week for the major market indexes. The Nasdaq rose 0.3%, as did the small-cap S&P 600. The S&P 500 gained 0.1%, the Dow industrials 0.2%. Volume swelled to brisk lev- els due to the day’s quadru- ple-witching options expiration. The market’s strength was more pronounced looking back over the last week. The S&P 500 and Nas- daq each surged 2%. Investors remain fixated on the economy and its impact on inter- est rates. Bond yields spiked sharp- ly the prior week, creating twin sources of concern for investors. Strong economic data, including the biggest wage gain in 4 1/2 years, fueled speculation the Fed might hike short-term interest rates three more times to 5.25%. In addition, higher bond yields could draw money out of equities. But last week’s economic news assuaged many of those fears. Re- ports ranging from retail sales to the Fed’s beige book clocked in with soft readings. The news boosted Treasury pric- es, wiping out the prior week’s higher yields and then some. Mar- ket watchers also took the milder economic readings as a sign that only two more Fed hikes would come into play, the second one possibly delayed until June. The market has seen this scenar- io before. When the Fed signaled an end to rate hikes in early 1995, stocks took off, forging one of the bigger run-ups in market history. Historians see other precedents possibly coming into play. The Dow tanked for nearly three years from its 1929 crash to its mid-1932 bottom. Stocks vaulted to big gains over the next year, then went into a holding pattern last- ing until the spring of 1935. That pause formed a launching pad for the Dow, which rocketed 94% from March 1935 to March 1937. Friday marked the three-year an- niversary of the Nasdaq’s fol- low-through on a new bull mar- ket. Since that time, stocks have seen a strong uptrend, followed by two years of slight gains mixed with plenty of sideways action. An end to rate hikes isn’t the only factor standing in the way of a pos- sible rally. The Philadelphia semi- conductor index shed 1.2% for the week after a 6.6% drop a week ear- lier. Chip stocks control a big chunk of the Nasdaq’s moves. If they keep falling, the Nasdaq may lag. That would make a tougher environment for growth stocks. The Dow, S&P 500, NYSE com- posite and S&P 500 have already run out ahead of the Nasdaq, to five-year highs. Leading stocks have done their part. The IBD 100 gained 0.3% Fri- day, feeding a 3.4% gain for the week. That’s nearly a 180-degree turnaround from the prior week, when the index fell 3.8%. Strength among leaders and a healthy crop of breakouts usually bode well for the market. CONTENTS IBD is a trademark of Investor’s Business Daily Inc. E2006 Investor’s Business Daily Inc. THE BIG PICTURE Firms’ EPS Outlook Shows Solid Gains, But Leaders To Shift Financials Up, Energy Down? Brokerages are red hot, oil firms depend on price; S&P Q1 net seen up 11% DOLLAR-YEN (N.Y.) 115.87 -0.91 (-0.8%) Greenback hits 2-wk lows on rate concerns EURO 1.2191 +0.0013 (+0.1%) Dollar falls to 7-wk intraday low vs. euro REUTERS CRB FUT. 325.83 -1.72 (-0.5%) Crude oil slides 1.3%; copper at record high 00MORE COVERAGE ON B7 Frist’s Border Control-Only Bill Spurs Broad Immigration Deals Judiciary panel crafting guest worker legislation with more enforcement Market Ends With Modest Gains 1 The S&P 500 rose 0.1% and the Dow 0.2%; the Nasdaq, S&P 600 and midcap S&P 400 gained 0.3%. Quadruple witching lifted volume across the board. The S&P 500 and Nasdaq rose 2% for the week. Builders rallied while oils fell. The 10-year Treasury yield rose 3 basis points to 4.67% vs. 4.77% a week earlier. More on this page, B7 Attackers Target Pilgrims In Iraq 2 Bombs and shootings killed 5 people and wounded 14 heading to Karbala for Mon.’s Shiite holiday. Near Samarra, 1,500 U.S. and Iraqi forces in Operation Swarmer searched for insurgents. Rival factions met again on forming a gov’t. A Sunni group ob- jected to U.S.-Iran talks on Iraq; U.S. offi- cials said the planned talks should be in Baghdad and also involve Iraqi leaders. Crude Pulls Back, But For Week 3 April oil slid 81 cents to $62.70 a barrel as OPEC trimmed its global oil demand forecast and Iran agreed to talks with the U.S. Still, crude rose $2.74 for the week; $60 seems to be a key support level. April gaso- line slid 1.43 cents on Fri. to $1.8601 a gallon, but shot up last week on new fuel rules and low refinery run rates. More on B15 GM Falls 5% On $2 Bil Mistake 4 The ailing No. 1 automaker said it lost $2 bil more in ’05 than first reported. GM will file its annual report weeks late due to accounting errors at its finance arm, which it hopes to sell. Moody’s said the delay in- creases risk of default. Officials from GM, parts supplier Delphi and the UAW report- edly were trying late Fri. to agree on volun- tary early retirement of thousands. Fatah Not On Hamas Cabinet List 5 Hamas planned to finish its gov’t lineup Sat. and submit it to President Mah- moud Abbas. Absent from the list were more moderate groups like Abbas’ Fatah, which refused to join a Hamas-led gov’t. Hamas’ ex- iled leader said it’s ready for war with Israel. Several Fatah leaders urged Abbas to step down and dissolve the Palestinian Authority to protest an Israeli prison raid. Genentech Lifts Earnings Target 6 The biotech said ’06 profit ex items will rise 40%-50% — or $1.80-$1.92 a share — vs. its old forecast of 35%-45%. Wall St. ex- pects $1.82. Genentech plans to launch 15 major products — up from 10 — and begin de- veloping 20 new drug candidates by 2010, achieving 25% annual EPS growth over that span. Its shares surged 7% to 88.1. Moussaoui Judge OKs Remedy 7 The federal judge in the death penalty trial of 9-11 conspirator Zacarias Mous- saoui accepted a gov’t compromise that will let new aviation witnesses testify. The judge had barred FAA witnesses because a gov’t lawyer violated her rule against coaching them. The change bolsters chances Mous- saoui could be sentenced to death. Chairman Bids For William Lyon 8 Southwest home builder William Lyon Homes got a buyout offer from its chair- man and namesake for $93 a share. It’s the 2nd time in a year that William Lyon, who owns 47.6%, has offered to take the firm pri- vate. But shares jumped 31% to 99, a sign in- vestors think the builder is worth more. Other builders continued to rally as Toll Bros. downplayed housing cooling fears. Industrial Production Rose 0.7% 9 Feb.’s gain followed a 0.3% drop in Jan. Utility output bounced back 7.9% in Feb. after diving 11.5% in Jan. due to unusual- ly warm weather then. Manufacturing was flat in Feb. after Jan.’s 0.8% gain. Overall ca- pacity utilization rose to 81.2%. That’s the highest since Sept. 2000. That likely won’t alarm the Fed, though it’s keeping an eye on resource allocation. See Vital Signs on A2 Israel Says Bird Flu Killed Flocks 10 Thousands of turkeys and chickens on 2 farms died from the H5N1 virus, the most virulent strain of the bird flu, Israel said. 3 people who became ill after handling the birds were hospitalized. Sweden also confirmed its first bird flu case. Health offi- cials fear the bird flu, which has spread from Asia to Europe and Africa, could spur a glo- bal pandemic . More on A19 Stocks Tick Higher, Close Productive Rebound Week MARKET PULSE Friday’s action: Stocks edge higher, capping bullish week Current outlook: Market in confirmed rally Distribution days: 3 for Nasdaq, 2 for S&P 500 last four weeks Leaders up in volume: The9 Ltd NCTY , United Industrial UIC , RTI Int’l RTI , Applied Industrial AIT , Chemed CHE , Abaxis ABAX Leaders down in volume: j2 Global JCOM , Vimicro VIMC , Mobile Mini MINI , Wild Oats OATS , Encore Wire WIRE , Celadon CLDN 00INTRADAY MARKET UPDATES AVAILABLE FOUR TIMES A DAY AT INVESTORS.COM/MARKETS Amex Tables . . . . . . . . . . . . . B14 Commodity Futures .B15 Company Index . . . . . . . . . . A2 Credit Market . . . . . . . . . . . B16 Dividends News . . . . . . . . . . B11 Earnings News . . . . . . . . . B18 Editorials . . . . . . . . . . . . . . . . . . A18 Exchange Traded Funds .A14 Funds & Finance . . . . . . A12 General Market . . . . . . . . . . . . B7 Health & Medicine . . . . . . A8 IBD 100 . . . . . . . . . . . . . . . . . . . . . . . . . B1 Industry Groups . . . . . . . . . . . B8 Industry Snapshot . . . A20 Internet & Technology A5 Investor Education . . . . B19 Investor’s Corner . . . . . . . B19 Issues & Insights . . . . . . A18 Leaders & Success . . . . . A4 Managing For Success .A10 Nasdaq Charts . . . . . . . . . . . B14 Nasdaq Tables . . . . . . . . . . . B12 New America . . . . . . . . . . . . . . . A7 New Highs & Lows . . . . . . B8 New Issues . . . . . . . . . . . . . . . . B11 NYSE Charts . . . . . . . . . . . . . . . B12 NYSE Tables . . . . . . . . . . . . . . . . . B9 Option Tables . . . . . . . . . . . . B17 To The Point . . . . . . . . . . . . . . . . A2 World News Briefs . . . . . A2 ADVERTISING Corporate News . . . . . . . A16 Nat’l Bus. Marktplce A15 S&P 500 Profit Estimates Source: Thomson Financial *98% of companies reporting Q4 ’05* Q1 ’06 Q4 Cons. discretion 1% 7% 19% Cons. staples 6 3 10 Energy 53 43 -3 Financials 6 4 28 Health care 6 4 9 Industrials 17 12 16 Materials -1 -5 15 Tech 18 15 12 Telecom 16 23 6 Utilities 27 8 4 S&P 500 total 14.5 11 13.4 S&P 500 INDEX 1307.25 +1.92 (+0.1%) Benchmark index at highest since May ’01 DOW JONES IND. 11,279.65 +26.41 (+0.2%) GM falls 5%; ’05 loss bigger than expected NYSE VOL. (MIL) 2,009 +349 (+21.0%) Quadruple witching gives volume a boost NASDAQ 2306.48 +6.92 (+0.3%) The9 Ltd., Abaxis up on heavy turnover NASDAQ VOL. (MIL) 2,643 +242 (+10.1%) Trade sharply higher as contracts expire 10-YEAR T-NOTE 4.67% +0.03 (+0.6%) Treasury prices ease from Thursday’s rise LEADERS & SUCCESS / A4 Look Within To Motivate Your Staff HEALTH & MEDICINE / A8 Federal Avian Flu Funds Flutter Far MANAGING FOR SUCCESS / A10-11 Gird Against Patent Infringement ISSUES & INSIGHTS / A18-19 Hollywood Suffers A ‘Crash’ Landing INDUSTRY SNAPSHOT / A20 Are Network Firms Still Connecting?
-
Upload
khangminh22 -
Category
Documents
-
view
4 -
download
0
Transcript of Firms' EPS Outlook Shows Solid Gains, But Leaders To Shift

IBDM O N D A Y S P E C I A L
VOL. 22, NO. 238 W W W . I N V E S T O R S . C O M MONDAY, MARCH 20, 2006 $2.00
B Y B R I A N M I T C H E L LINVESTOR'S BUSINESS DAILY
Immigration foes’ cheers turnedto moans when it turned out thatthe new border-security bill pro-posed by Senate Majority LeaderBill Frist, R-Tenn., will not replacea broader immigration reform billalready in the works.
Frist introduced his own bor-der-security bill late Thursdayafter leaking news of the new billto The Washington Times the daybefore.
“Our country needs security atour borders in order to slow theflow of illegal immigration andmake America safer from foreigncriminals and terrorists,” Fristsaid in a Thursday statement.
The bill includes many provi-sions of the border-security billthat the House passed in Decem-ber.
It includes beefed-up border pro-tections, sterner penalties forcrim-inal aliens, increased workplaceenforcement and expedited re-moval procedures.
It does not include a guest-work-er program, a hike in legal immi-gration or any form of amnesty forillegal aliens.
Frist Backs OffWhen Senate Judiciary Commit-
tee Chairman Arlen Specter,R-Pa., complained Thursday thatFrist’s bill would cause “chaos” onthe Senate floor, Frist’s officepromised to pull the bill if Spec-ter’s panel finishes work on abroader immigration bill byMarch 27.
“Unfortunately it looks likewe’re not going to get a clear shotat the Frist bill because he maywithdraw it,” said David Durham,
board chairman of the CarryingCapacity Network, which wants amoratorium on immigration.
The fanfare over Frist’s threat toupstage Specter left some wonder-ing whether Frist was just grand-standing for Republican voters.
The White House hopeful won arecent presidential straw poll atthe Southern Republican Leader-ship Conference in Memphis,Tenn. But two out-of-state rivals,Massachusetts Gov. Mitt Romneyand Virginia Sen. George Allen,drew more applause by standingagainst illegal immigration.
The contrast may have prompt-ed Frist to move more forcefullyon border control.
“Frist is in his last eight monthsin the Senate,” said Larry Sabato,professor of politics at the Univer-sity of Virginia. “He’s much moreinterested in being a presidentialcandidate than majority leader atthis point.”
And GOP primary voters tend tofavor a crackdown on illegal immi-gration.
Deadline Spurs ActionSpurred by the threat of an en-
forcement-only bill, senators onthe judiciary panel reached a com-promise on key issues.
“The committee wasturbo-charged yesterday com-pared to how it had been going,”Angela Kelley, deputy director ofthe National Immigration Forum,which favors more immigration.
That’s kept alive the possibility
of Senate legislation pieced togeth-er from three bills backed by panelmembers. All three contain someform of guest-worker programproposed by President Bush.
Specter’s 300-page bill providesan earned amnesty for illegals al-ready here, a guest-worker pro-gram and 1.14 million green cardsa year for employment-based, fam-ily-based and student immigrants.
It did not include a border fence,an end to the visa lottery, mandato-ry work eligibility verification foremployees, and other provisionsof the House bill.
Tough Love For Guest WorkersTougher enforcement provi-
sions may be added from a billbacked by Sens. John Cornyn,R-Texas, and Jon Kyl, R-Ariz., inexchange for a guest-worker pro-gram more like that proposed bySens. John McCain, R-Ariz., andTed Kennedy, D-Mass.
CornynandKennedyhaveagreedon a compromise that would re-quire illegals to return home be-fore re-entering as guest workers.The government would waive thatif the illegals’ employers say theycan’t be missed or if they can provea consistent work history.
“Anything can happen in the Sen-ate,” said Caroline Espinosa ofNumbersUSA, which opposesmore immigration. “It’s very, verypossible they’ll do some form ofamnesty or some form ofguest-worker program. But in theend it really boils down to whathappens in conference.”
IBD’S TOP 10
B Y M A R I L Y N A L V AINVESTOR'S BUSINESS DAILY
After 15 straight quarters of dou-ble-digit profit growth, it lookslike the double beat will continuein 2006.
With 98% of the S&P 500 firmsreporting, fourth-quarter 2005earnings rose 14.5% vs.a year earli-er, according to Thomson Finan-cial. Analysts predict 11% earn-ings growth in the first quarterand 13.4% at the end of the year.
But financial firms are expectedto be the main driver by the sec-ond half of the year, taking overfrom energy.
Goldman Sachs, Lehman Bros.and Bear Stearns last week postedmuch-better-than-expected quar-terly profits, citing heavy tradingand strong merger advisory fees.
CharlesSchwabalso reported biggains in February trading activity.
Schwab’s strong February num-bers “bodes well for the retail bro-kerageindustry overall,” wrotean-alyst Brad Hintz of Sanford C.Bernstein.
It’s a good sign for stocks overallwhen financials, especially WallStreet firms, are doing well.
Strong M&A activity and heavytrading suggest companies and in-vestors are optimistic.
When energy profits are high,that means everyone else is pay-ing more for heat and electricity.
Also, financials are still the big-gest group in the S&P 500, repre-senting 21% of the index’s marketcap and 26% of its earnings.
Financials have been mired insingle-digit profit growth. Hurri-cane-hit insurers have weigheddown the overall sector. But thatimpact should lessen as the yeargoes on.
By the fourth quarter, analystsexpect financials’ profits to climb28%.
Meanwhile, today’s leader, theenergy sector, is seen as tomor-row’s laggard. Analysts expect43% profit growth this quarter.But by the fourth quarter, energyearnings are expected to dip 3%vs. a year earlier.
But it all depends on prices.
“It’s a commodity business,”said Sandy Lincoln, chief marketstrategist with Wayne HummerAsset Management. “Unless oilgoes from $60 to $80 or $90 youdon’t have much of a case for ener-gy stocks. They are going to havevery tough comparisons, since2005 was such a good year.”
Profit for technology, telecomand industrials is expected togrow 16% to 18% this quarter.
Materials’ earnings will dip 1%,analysts estimate. The sector in-cludes makers of petro-leum-based products such as plas-tics. These firms have been hurtby raw material cost spikes, whilethey’ve struggled to boost their
own prices to match.But materials firms should im-
prove, with profit growth ramp-ing up to 24% in the third quarter,Thomson Financial said. Thatwould be second to financials.
Despite the solid forecasts, nega-tive outlooks for the first quarterare running slightly higher thanaverage.
Negative views usually outnum-ber the positive since firms wouldrathererron theconservative side.
Thomson tallies show negativeoutlooks for the first quarter run-ning 2.4-to-1 over positive ones.The average is 2.2-to-1.
That might not be such a badthing. When pre-announcementsare abnormally negative, stockshave rallied 2.7% on average dur-ing the next reporting month, ac-cording to ISI Group.
“All the bad news gets pricedinto the stocks and the companyinvariably reports to the upside,”said Nick Bohnsack, investmentstrategist with ISI.
The negative-to-positive ratiowasmuch higher earlier in March.But good news from brokers andothers softened those figures.
LT.COL.MICHAELHARRISreceiveskisseswhilemarchingwiththeArmy’s3rdInfantryDivision inSavan-nah,Ga.,duringtheannualSt.Patrick’sDayparadeFriday.Kissinguniformedmembers intheparadeisatra-dition during the celebration. The 3rd Division recently returned from its second tour of duty in Iraq. AP
B Y J O N A H K E R IINVESTOR'S BUSINESS DAILY
Stocks edged up Friday, finishingoff a bullish week for the majormarket indexes.
The Nasdaq rose 0.3%, as did thesmall-cap S&P 600. The S&P 500gained 0.1%, the Dow industrials0.2%. Volume swelled to brisk lev-els due to the day’s quadru-ple-witching options expiration.
The market’s strength was morepronounced looking back over thelast week. The S&P 500 and Nas-daq each surged 2%.
Investors remain fixated on theeconomy and its impact on inter-est rates.Bond yieldsspiked sharp-ly the prior week, creating twinsources of concern for investors.
Strong economic data, includingthe biggest wage gain in 4 1/2years, fueled speculation the Fedmight hike short-term interestrates three more times to 5.25%.In addition, higher bond yieldscould draw money out of equities.
But last week’s economic newsassuaged many of those fears. Re-ports ranging from retail sales tothe Fed’s beige book clocked inwith soft readings.
The news boosted Treasury pric-es, wiping out the prior week’s
higher yields and then some. Mar-ket watchers also took the mildereconomic readings as a sign thatonly two more Fed hikes wouldcome into play, the second onepossibly delayed until June.
The market has seen this scenar-io before. When the Fed signaledan end to rate hikes in early 1995,stocks took off, forging one of thebigger run-ups in market history.
Historians see other precedentspossibly coming into play. TheDow tanked for nearly three yearsfrom its 1929 crash to its mid-1932bottom. Stocks vaulted to biggains over the next year, thenwent into a holding pattern last-ing until the spring of 1935.
That pause formed a launchingpad for the Dow, which rocketed94% from March 1935 to March1937.
Friday marked the three-year an-niversary of the Nasdaq’s fol-low-through on a new bull mar-ket. Since that time, stocks haveseen a strong uptrend, followedby two years of slight gains mixed
with plenty of sideways action.An end to rate hikes isn’t the only
factor standing in the way of a pos-sible rally. The Philadelphia semi-conductor index shed 1.2% for theweek after a 6.6% drop a week ear-lier. Chip stocks control a bigchunk of the Nasdaq’s moves. Ifthey keep falling, the Nasdaq maylag. That would make a tougherenvironment for growth stocks.
The Dow, S&P 500, NYSE com-posite and S&P 500 have alreadyrun out ahead of the Nasdaq, tofive-year highs.
Leading stocks have done theirpart.The IBD 100 gained 0.3% Fri-day, feeding a 3.4% gain for theweek. That’s nearly a 180-degreeturnaround from the prior week,when the index fell 3.8%.Strength among leaders and ahealthy crop of breakouts usuallybode well for the market.
CONTENTS
IBD is a trademark of Investor’s BusinessDaily Inc.E2006 Investor’s Business Daily Inc.
T H E B I G P I C T U R E
Firms’ EPS OutlookShows Solid Gains,But Leaders To ShiftFinancials Up, Energy Down?
Brokerages are red hot,oil firms depend on price;S&P Q1 net seen up 11%
DOLLAR-YEN (N.Y.)115.87-0.91 (-0.8%)
Greenback hits 2-wklows on rate concerns
EURO1.2191+0.0013 (+0.1%)
Dollar falls to 7-wkintraday low vs. euro
REUTERS CRB FUT.325.83-1.72 (-0.5%)
Crude oil slides 1.3%;copper at record high
00 M O R E C O V E R A G E O N B 7
Frist’s Border Control-Only BillSpurs Broad Immigration DealsJudiciary panel craftingguest worker legislationwith more enforcement
Market Ends With Modest Gains1 The S&P 500 rose 0.1% and the Dow
0.2%; the Nasdaq, S&P 600 and midcapS&P 400 gained 0.3%. Quadruple witchinglifted volume across the board. The S&P 500and Nasdaq rose 2% for the week. Buildersrallied while oils fell. The 10-year Treasuryyield rose 3 basis points to 4.67% vs. 4.77% aweek earlier.Moreonthispage,B7
Attackers Target Pilgrims In Iraq2 Bombs and shootings killed 5 people
and wounded 14 heading to Karbala forMon.’s Shiite holiday. Near Samarra, 1,500U.S. and Iraqi forces in Operation Swarmersearched for insurgents. Rival factions metagain on forming a gov’t. A Sunni group ob-jected to U.S.-Iran talks on Iraq; U.S. offi-cials said the planned talks should be inBaghdad and also involve Iraqi leaders.
Crude Pulls Back, But For Week3 April oil slid 81 cents to $62.70 a barrel as
OPEC trimmed its global oil demandforecast and Iran agreed to talks with theU.S. Still, crude rose $2.74 for the week; $60seems to be a key support level. April gaso-line slid 1.43 cents on Fri. to $1.8601 a gallon,but shot up last week on new fuel rules andlow refinery run rates.MoreonB15
GM Falls 5% On $2 Bil Mistake4 The ailing No. 1 automaker said it lost $2
bil more in ’05 than first reported. GMwill file its annual report weeks late due toaccounting errors at its finance arm, whichit hopes to sell. Moody’s said the delay in-creases risk of default. Officials from GM,parts supplier Delphi and the UAW report-edly were trying late Fri. to agree on volun-tary early retirement of thousands.
Fatah Not On Hamas Cabinet List5 Hamas planned to finish its gov’t lineup
Sat. and submit it to President Mah-moud Abbas. Absent from the list were moremoderate groups like Abbas’ Fatah, whichrefusedto join a Hamas-led gov’t. Hamas’ ex-iled leader said it’s ready for war with Israel.Several Fatah leaders urged Abbas to stepdown and dissolve the Palestinian Authorityto protest an Israeli prison raid.
Genentech Lifts Earnings Target6 The biotech said ’06 profit ex items will
rise 40%-50% — or $1.80-$1.92 a share— vs. its old forecast of 35%-45%. Wall St. ex-pects $1.82. Genentech plans to launch 15major products —up from 10 — and begin de-veloping 20 new drug candidates by 2010,achieving 25% annual EPS growth over thatspan. Its shares surged 7% to 88.1.
Moussaoui Judge OKs Remedy7 The federal judge in the death penalty
trial of 9-11 conspirator Zacarias Mous-saoui accepted a gov’t compromise that willlet new aviation witnesses testify. The judgehad barred FAA witnesses because a gov’tlawyer violated her rule against coachingthem. The change bolsters chances Mous-saoui could be sentenced to death.
Chairman Bids For William Lyon8 Southwest home builder William Lyon
Homes got a buyout offer from its chair-man and namesake for $93 a share. It’s the2nd time in a year that William Lyon, whoowns 47.6%, has offered to take the firm pri-vate. But shares jumped 31% to 99, a sign in-vestors think the builder is worth more.Other builders continued to rally as TollBros. downplayed housing cooling fears.
Industrial Production Rose 0.7%9 Feb.’s gain followed a 0.3% drop in Jan.
Utility output bounced back 7.9% inFeb. after diving11.5% in Jan. due to unusual-ly warm weather then. Manufacturing wasflat in Feb. after Jan.’s 0.8% gain. Overall ca-pacity utilization rose to 81.2%. That’s thehighest since Sept. 2000. That likely won’talarm the Fed, though it’s keeping an eye onresource allocation.SeeVitalSignsonA2
Israel Says Bird Flu Killed Flocks10 Thousands of turkeys and chickens
on 2 farms died from the H5N1 virus,the most virulent strain of the bird flu, Israelsaid. 3 people who became ill after handlingthe birds were hospitalized. Sweden alsoconfirmed its first bird flu case. Health offi-cials fear the bird flu, which has spread fromAsia to Europe and Africa, could spur a glo-bal pandemic .MoreonA19
Stocks Tick Higher, Close Productive Rebound WeekMARKET PULSE
Tk, tkFriday’s action:Stocks edge higher, capping bullish weekCurrent outlook:Market in confirmed rallyDistribution days:3 for Nasdaq, 2 for S&P 500 last four weeksLeaders up in volume:The9 LtdNCTY, United IndustrialUIC, RTI Int’lRTI, Applied IndustrialAIT, ChemedCHE, AbaxisABAX
Leaders down in volume:j2 GlobalJCOM, VimicroVIMC, Mobile MiniMINI, Wild OatsOATS, Encore WireWIRE, CeladonCLDN
00 I N T R A D A Y M A R K E T U P D A T E SA V A I L A B L E F O U R T I M E S A D A YA T I N V E S T O R S . C O M / M A R K E T S
Amex Tables ............. B14Commodity Futures .B15Company Index .......... A2Credit Market ........... B16Dividends News .......... B11Earnings News ......... B18Editorials .................. A18Exchange Traded Funds.A14Funds & Finance ...... A12General Market ............ B7Health & Medicine ...... A8IBD 100 ......................... B1Industry Groups ........... B8Industry Snapshot ... A20Internet & Technology A5Investor Education .... B19Investor’s Corner ....... B19
Issues & Insights ...... A18Leaders & Success ..... A4Managing For Success .A10Nasdaq Charts ........... B14Nasdaq Tables ........... B12New America ............... A7New Highs & Lows ...... B8New Issues ................ B11NYSE Charts ............... B12NYSE Tables ................. B9Option Tables ............ B17To The Point ................ A2World News Briefs ..... A2
ADVERTISINGCorporate News ....... A16Nat’l Bus. Marktplce A15
S&P 500 Profit Estimates
Source: Thomson Financial *98% of companies reporting
Q4 ’05* Q1 ’06 Q4Cons. discretion 1% 7% 19%Cons. staples 6 3 10Energy 53 43 -3Financials 6 4 28Health care 6 4 9Industrials 17 12 16Materials -1 -5 15Tech 18 15 12Telecom 16 23 6Utilities 27 8 4S&P 500 total 14.5 11 13.4
S&P 500 INDEX1307.25+1.92 (+0.1%)
Benchmark index athighest since May ’01
DOW JONES IND.11,279.65+26.41 (+0.2%)
GM falls 5%; ’05 lossbigger than expected
NYSE VOL. (MIL)2,009+349 (+21.0%)
Quadruple witchinggives volume a boost
NASDAQ2306.48+6.92 (+0.3%)
The9 Ltd., Abaxis upon heavy turnover
NASDAQ VOL. (MIL)2,643+242 (+10.1%)
Trade sharply higheras contracts expire
10-YEAR T-NOTE4.67%+0.03 (+0.6%)
Treasury prices easefrom Thursday’s rise
L E A D E R S & S U C C E S S / A 4
LookWithin ToMotivate Your StaffH E A L T H & M E D I C I N E / A 8
Federal Avian Flu Funds Flutter FarM A N A G I N G F O R S U C C E S S / A 1 0 - 1 1
Gird Against Patent InfringementI S S U E S & I N S I G H T S / A 1 8 - 1 9
Hollywood Suffers A ‘Crash’ LandingI N D U S T R Y S N A P S H O T / A 2 0
Are Network Firms Still Connecting?

A2 MONDAY, MARCH 20, 2006 INVESTORS.COM
COMPANY INDEX
French youth protests get violentPresident Jacques Chirac appealedfor calm after mass protests againstyouth job reforms erupted into riot-ing, and police prepared for evenbigger weekend demonstrations.Hundreds of thousands of studentsmarched and occupied universities.Paris police arrested 272 rioters.
THAILAND: Protesters burned post-ersof Singapore’s PM in a bid to oustThai PM Thaksin Shinawatra. Theyurged boycotting Singapore goodsbecause Thaksin resold a firm heheld to Singapore for $1.9 bil.
U.K.: Prime Minister Tony Blair’sLabour Party took $24.5 mil insecret loans ahead of elections lastyear. The party’s treasurer said hewas unaware of the loans.
TO THE POINT
Abaxis Inc .................. B12Akamai Tech ............ A20Amazon.Com ....... A5, A6American Cmrcl Lns ..... A7Andrx ............................ A8Applied Indust Tech ...... B9Bankrate .................... B12Barnes & Noble ............. A7Baxter Intl .................... A8Bed Bath & Beyond ... A10Berkley WR .................. B2Best Buy ........................ A5Biocryst Pharm ............. A8Boston Scientific ......... A8Brown Shoe ................... B9Caterpillar .................... B9*Cavco Industries .. B2,12Charming Shoppes .... B14Chemed Corp ............... B9Chicago Merc Xchng ..... A7China Life Insurance .B12Chiron ........................... A8Circuit City ................... A5Cisco .......................... A20Digital River .. A20, B12Drew Inds ...................... B2E`Trade Financial ........ B9EMC Insurance .............. B2Encore Wire Corp ........ B12Equinix Inc ............... A20F5 Networks .............. A20Garmin ........................... B2General Electric ............ A5Gilead Sciences ............ A8Glaxo Wellcome Plc .... A8Guidant ......................... A8Gymboree ...................... B2Hemisphrx Biophrm .... A8Hittite Microwave ....... B14
Illumina ....................... A8Inamed ......................... A8IntercontinentalEx ........ A7iPass Inc .................... A20iShares Leh Agg Bd ... A14Ishr Lehman 1–3Yr .... A14Johnson & Johnsn ....... A8Keycorp ....................... A11Lilly Eli & Co ................. A8Medcath ....................... A8Medicis Phrmct ........... A8Micronetics Inc ............ B2Mobile Mini Inc .......... B12News Corp Adr ............. A5NTT Docomo ................. A6Park Electrochem ...... B12Pharmaceut Pdt Dev ... B2Pike Electric Corp ........ B9PremierWest Banc ........ B2RTI Intl Metals ............... B9Sanofi Aventis ..... A4, A8SAP AG ADR ............... A20Seabright Insurance .. B12Sears Holdings Corp .... A5Sony Am Shrs .............. A5Southwstrn Energy ..... B19Sun Microsys ............ A20Symantec Corp ......... A20The9 Ltd Ads .............. B12Thor Industries .............. B2Time Warner Inc .......... A5Tower Group Inc ............ B2United Industrial ........... B9Verizon Commun ......... A6Vical Inc ........................ A8Virginia Comm Bank ... B2Vodafone ...................... A6Walt Disney .................. A5Watson Pharmac .......... A8
BUSINESS BRIEFS
RETAIL
Wild Oats declines on skepticismThe natural foods grocery chaintumbled 7.5% to 18.47 after FTNMidwest Securities said the compa-ny’s earnings forecast is overly opti-mistic, especially amid increasingcompetitive pressure from WholeFoods. FTN downgraded Wild Oatsto a sell rating. Wild Oats forecasts’06 earnings of 52-58 cents a share,above views of 37 cents. Wild Oats’stock has risen over 50% this year.
Doubts halt Costco sale of PicassoThe discount retailer pulled a draw-ing for sale on its Web site over con-cern about its authenticity. One ofPablo Picasso’s daughters ques-tioned the authenticity of a drawingrecently listed for sale, as well as 2others sold over the past 2 years asworks by the Spanish artist. Costcohas begun probing the authenticityof its prior sales by famous artists.Costco rose 1.5% to 55.88.00 Cracker Barrel Old CountryStore restaurant chain will borrow$1.25 bil and sell its Logan’s Road-house unit to fund an $800 mil stockbuyback and pare back outstandingdebt. Shares surged 6% to 47.
ENERGY
Pride Int’l misses, probes booksThe drilling contractor said Q4earnings from continuing opera-tions jumped 73% to 23 cents ashare,missing views by 6 cents. Rev-enue rose 23% to $551 mil. An inter-nal audit is investigating possibleimproper payments to Latin Ameri-can officials, causing Pride to delayfiling its annual report by 15 days.S&P warned the company’s creditrating could be downgraded.Shares fell 3.5% to 29.96.
TELECOM
Vodafone Japan sold to SoftBankTheworld’slargestmobilephoneop-eratorwillsell itsJapanesejointven-turetoSoftBank,alocalNetandgam-ing company, rejecting a possible$15 bil counteroffer by U.S. privateequity firms. SoftBank has long beenthe presumed buyer of VodafoneJapanandformallyannounceditsac-quisition Fri. Vodafone fell 1% to22.51.MoreonA6
SBA deal adds important assetsThe telecom infrastructure opera-tor SBA Communications will addover 2,000 transmission towers toits wireless network by acquiringAAT Communications. The $1 bilcash-and-stock deal nearly doublesSBA’s network of towers and boostsits transmission capacity. SBAsurged 10.5% to 23.86.
Ericsson buys Riverstone assetsThe telecom equipment maker willpay Riverstone Networks $178 milfor “substantially all of the compa-ny’s assets” which include Ethernetrouters for communications net-works. Ericsson has recently ex-panded its portfolio of broadbandproducts by acquiring rival Marco-ni. Ericsson rose 2% to 37.23.
METALS
Steel firm works with home builderSteel recycling firm Nucor and oneof the nation’s largest home build-ers, Lennar, said they’ve set up ajoint venture to provide light gaugesteel framing solutions for residen-tial construction. Called Nexframe,the new unit will be co-managed byboth companies. Nucor rose 2% to98.64, while Lennar edged up 11cents to 60.01.00 Coeur d’Alene Mines, one ofthe world’s biggest primary silverproducers, will sell 24 mil sharesfor $5.60 each. Coeur said it ex-pects net proceeds of about $127.7mil after fees. Shares rose 1.5%.
MEDIA
Viacom sells Spielberg film troveThe entertainment conglomerate’sstudio operation, Paramount Pic-tures, will sell the film library it ac-quired when it purchased Dream-Works SKG, a production companyfounded in part by Steven Spiel-berg. The $900 mil sale to financierGeorge Soros includes 59 movies.Paramount retained the exclusiveright to distribute the films for fiveyears. Shares rose 2% to 39.
NATIONECONOMY
WORLD
MCDONALD’SEMPLOYEES serve sample cups of PremiumRoast coffeeto morning commuters Friday in New York. The fast-food chain intro-duced the high-end brew to a nation of gourmet-java junkies last week. AP
UNITEDAUTO GROUP, an auto-sales chain, will acquire Motor-werks BMW/MINI, a Minn.-based dealership. The compa-ny expects the deal to contrib-ute $100 mil in annual revenue.BMW and MINI sales account-ed for 15%, or $1.5 bil, of Unit-edAuto’s revenue last year.
ARTHROCARE informed the SECthat “material weaknesses” inits internal financial controlswill delay its annual report. Themedical-device company willtake advantage of the SEC’s15-day grace period.
BRISTOL-MYERS SQUIBBswitched auditors, dismissingPricewaterhouseCoopers infavor of Deloitte & Touche.
VANDA PHARMACEUTICALS, amaker of gene-based therapies,will issue 5.75 mil shares at itsIPO for $12-$14 a share. It willtrade under the ticker VNDA.
DAYSTAR, a developer of filmsfor solar-power cells, narrowedits Q4 loss 3% to $1.35 a share.The company earned $625,000for contract research and devel-opment.
TECHNOLOGY
Rambus rallies on deal with IBMThe No. 1 semiconductor firm ral-lied 5.5% to 33.53 after it signed a li-censing agreement with IBM to letthe PC giant use its technologies tobuild servers, computing systemsand high-volume consumer elec-tronics products. Terms weren’t dis-closed. It was the first recent pricejump unrelated to Rambus’ 6-year-old suit against S. Korea’s Hynix,the No. 2 player. Hynix claimed lastweek that it shouldn’t have to payroyalties on computer memorychips because patents held by Ram-bus aren’t valid.
Icahn may block Lexar buyoutBillionaire Carl Icahn, whose fundshold about 6% of Lexar Media, saidhe is “studying” whether to opposeMicron Technology’s $680 mil bidfor Lexar, according to an SEC fil-ing. Icahn’s funds recently spent$35.8 mil buying Lexar stock. Icahnis expected to press Micron to raiseits bid. Lexar rose 6% to 9.39, whileMicron edged up 1% to 14.77.
Google puts off AOL investmentThe Internet search leader delayedmaking a $1 bil investment for a 5%stake in America Online, a unit ofTime Warner, until next quarterrather than by month’s end as origi-nally planned. An SEC filing saidGoogle requires more time to final-ize details of the relationship. Goo-gle rose 0.5% to 339.79, Time Warn-er fell 4 cents to 17.07.
TIP OF THE DAY: While menus and linkson investors.com are easy enough to use,you can also find shortcuts to our mostpopular features at investors.com/tip
TRENDS/INNOVATIONS
Older people go online for loveAs older Americans become morecomfortable using the Internet,they’re increasingly going onlinefor romance. Match.com says thosebetween ages 45-59 are its fastest-growing segment, comprising 22%of customers. And Yahoo Personalshas begun an advice column forreaders over 50. A Yahoo spokes-woman says the column has beenhelped by those who say they’vewatched their children successfullyfind mates via the Internet.
Low-carb diet incurs health risksA low-carb diet could cause serioushealth problems, U.S. doctors havewarned in a medical journal. One At-kins patient the journal followedlost weight on the low-carb, high-protein Atkins diet, but developed ablood condition called ketoacido-sis. It’s triggered in the liver wheninsulin levels fall due to starvationor diabetes. Doctors also said thatAtkins-type diets can increase therisk of constipation or diarrhea,headaches and bone loss.00 Overweight fishermen in theMexican southeast state of Yucatanhave become such a health concernthat they’ve been barred from work-ing on fishing boats in case theyneed prompt medical care. Abouthalf the area’s 30,000 fishermenare overweight, according to thecaptain of Yucatan’s Progreso port.
12655 Beatrice St., Los Angeles, CA 90066
Investor’s Business Daily (ISSN 1061-2890) is published Mon-day-Friday, except legal holidays and Good Friday. Periodicalspostage paid at Los Angeles, CA and other mailing offices.U.S. subscription rate (postage paid): 2 year $489, 1 year$295, 6 month $189, plus any sales tax. Foreign rates on re-quest. READERS: To subscribe or obtain delivery or other infor-mation, contact 800-831-2525 (310-448-6600 outsideU.S.) or www.investors.com. ADVERTISERS: All advertisingpublished in Investor’s Business Daily is subject to the applica-ble rate card, available at 310-448-6700. REPRINTS: Pleasee-mail us at [email protected]. POSTMASTER: Sendaddress changes to Investor’s Business Daily, P.O. Box92089, Los Angeles, CA 90009-2089.
All reproduction rights reserved
Industrial output
Industrial production rose 0.7% in Feb. after falling 0.3% in Jan. Utility output bounced back 7.9% after plunging 11.5% in Jan. due to unseasonably warm weather. Manufacturing was flat last month, the worst showing since Sept. Auto output was weak. Overall capacity utilization was the best since September 2000.
Industrial Output Rebounds On UtilitiesVITAL SIGNS
Monthly change
Yearly change Capacity utilization Industrial output summary
Sources: Federal Reserve, Datastream
Total 0.7% -0.3% 1.0% 3.3%Manufacturing 0 0.8 0.4 4.2 Autos/parts -0.8 2.4 -1.3 -2.1 Computers 0.3 0.4 1.4 11.7Mining -0.5 2.3 2.8 -3.5Utilities 7.9 -11.5 3.9 2.2
-6-4-20246%
’06’05’04’03’02’01’0073
75
77
79
81
83%
’06’05’04’03’02’01’00-1.5-1.0-0.5
00.51.01.52.0%
FJ ’06DNOS ’05
Total Manufacturing
Feb.:3.3%
Feb.:81.2%
Monthly changesFeb. Jan. Dec. YOY
AFTER THE CLOSERising RambusThe designer of memory chips has seen its shares double in the last 4 months
10
15
20
25
30
35
MFJ’06
DNOSAJJMAM’05
Higher FrequencyWireless tower operator SBA Communications has nearly tripled since April
5
10
15
20
25
MFJ’06
DNOSAJJMAM’05
MEDICAL
Generic threat fells ViroPharmaThe drug company’s shares tum-bled 33% to 10.86 on concerns that ageneric rival to its antibiotic Vanco-cin could enter the market as soonas ’08, 2 years earlier than expected.The FDA said a clinical trial of ge-neric Vancocin, or vancomycin,might not be necessary, speedingup the approval process for genericdrug makers. ViroPharma said itfiled for a stay of action with theFDA to press for more study.Akorn, which plans to make a gener-ic version, jumped 12.5% to 5.20.
Schering contraceptive approvedThe FDA cleared Schering’s oralcontraceptive, YAZ, for sale in theU.S. The company expects to begindistribution next month and antici-pates annual sales above $240 mil.Schering, the largest maker of birthcontrol pills, is fighting a hostile$17.6 bil takeover by German rivalMerck KGaA. Shares rose 1.5% to100.95 and ended the week up 27%.00 Northfield Labs said the SEC isinvestigating one of its key prod-ucts. PolyHeme is a blood substi-tute designed to be an alternative totransfusion for extreme blood loss.Shares of the medical companyrose 3% to 9.94.00 Hana Biosciences said it in-tends to license 3 modified chemo-therapy drugs from Canadian drugmaker Inex Pharma for up to $42mil in stock and cash. Shares of thebiotech firm climbed 3.5% to 9.49.
FINANCE
St. Paul mulls bid for Swiss insurerThe U.S. insurer St. Paul Travelersis in talks to buy much larger Swissrival Zurich Financial, according toa published report. Analysts said amerger could broaden revenuesources and lessen investmentrisks. But some expressed doubtsZurich’s management would ac-cept a deal after working to im-prove its underwriting business. St.Paul fell 3.5% to 41.55.
SCREEN OF THE DAY: All stocks in today’sscreen have a high Attractiveness Rating,a technical indicator that measures inves-tor demand. investors.com/screen
DAILY STOCK ANALYSIS: Cavco Indus-tries pulls back to its 10-week mov-ing average after forming a cup-with-handle base. investors.com/dsa
March consumer sentiment flatThe Univ. of Michigan’s consumersentiment index held at 86.7, miss-ing views for a small gain. The cur-rent conditions index edged up,while expectations inched down.The report follows a decline in theIBD/TIPP Economic OptimismIndex. President Bush’s unpopulari-ty and worries about Iraq seem tobe weighing on confidence.
Bank economists see slow easingTheAmerican Bankers Assoc.’s eco-nomic advisory committee said realGDP growth will slow to 3% and un-derlying inflation will stabilize at2.3% through ’07. “The balance ofrisk is shifting from inflation toslower growth,” said U.S. Trusteconomist Robert McGee. Thepanel sees the Fed raising the fedfunds rate by 25 basis points in lateMarch and possibly again in May,capping the rate at 5%. It doesn’tsee further increases in oil prices. Itexpects the jobless rate to hold at4.8% through ’07.00 A leading growth index fell to136.8 in the week ended March 10from an upwardly revised 137 in theprior week, said private forecasterthe Economic Cycle Research Insti-tute. The annualized growth ratefell to 3% in the latest week from anupwardly revised 3.1%.00 Euro zone industrial outputwas flat in Jan. vs. Dec., missingviews of 0.3% growth. Output rose2.5% from the year ago, said theEuropean Union. Durable consum-er goods rose 0.4% monthly, whilenondurables fell 0.6%.
China’s fixed investment surgesInvestment in factories, real estateand other fixed assets jumped26.6% to $65.9 bil in Jan. and Feb.vs. the year earlier. The rise comesdespite Beijing’s efforts to limitsuch investment and instead boostconsumer spending. The gov’t fearsthat too much fixed investmentcould stoke inflation or prompt fi-nancial problems for banks if com-panies overbuild.00 Japan’s leading economic indi-cators index was revised down to81.8 from a preliminary 85, said thegov’t. That’s still well ahead of theboom-bust mark of 50. Japan re-vised down its current economicconditions index to 95 vs. 100.
COMING UP TUESDAY00 Producer price index for Feb.,8:30 a.m. EST (forecast: -0.2%, core0.2%).
More deaths tied to abortion pillTwo more women have died afterusing the abortion pill RU-486, fed-eral health regulators said Fri. in awarning to doctors. At least 7 U.S.women have died of a rare infectionafter taking the pill, but the FDAsaid it remains unclear whether thedrug is at fault.
Senate OKs $2.8 tril budget planThe Senate adopted the budgetblueprint 51-49, dropping the presi-dent’s tax cuts, Medicare curbs andspending cap. It would allow defi-cits greater than $350 bil for boththis year and next. Its passage setsup a fight with the House, which islikely to call for less spending. Thevote came hours after Congresspushed the debt ceiling to $9 tril.
States block easing of EPA rulesA federal court sided with 14 statesand the District of Columbia to haltnew EPA rules that would allowolder power plants, refineries andfactories to modernize without in-stalling the latest pollution con-trols. The court said the new rulesviolate the Clean Air Act, but theEPA said there’s no evidence thechanges would add to pollution.
CA NJ CH OH FL GA TX CT VA SF WA IA CO
NEW CONCEPT!How to Sell Unwanted Life Insurance
in Excess of the Cash Value!Now, there’s a new life insurance concept that’sexploding in popularity. A business or individualscan sell a policy in the secondary market and receivecash 25% to 100% greater than the cash value in thepolicy. This is called a “life settlement.”xxxxxxxBusinesses and individuals who now have unneededlife insurance policies simply cancel the policy andreceive nothing for term insurance or receive onlythe current cash value of the policy from the primarycarrier.The President of LifeSettlementClearinghouse.com,Jerry Orefice, CLU, explains “homeowners don’tsell their home back to the builder, they sell the homein the open market! Now businesses and individualswith unneeded policies can shop for the highestbidder!”LifeSettlementClearinghouse.com obtains anappraisal of the fair market value of the life policyfor the insured at no charge.A policy should never lapse or be cancelled until theinsured has obtained the proper assessment fromtheir advisors”, states Jerry Orefice, CLU. Typically,minimum age 65 and minimum coverage of $250,000warrants an appraisal of the policy.The website, LifeSettlementClearinghouse.com,offers a clear and concise explanation of all theoptions or Jerry Orefice can be reached directly bycalling (800) 233-6481.
PAID ADVERTISEMENT

INVESTOR'S BUSINESS DAILY MONDAY, MARCH 20, 2006 A 3
Larry relies on the most complete, secure network from the new AT&T to anticipate
loads and prioritize data, helping translate what the markets are trying to tell him.
TheNewATT.com
The new
SBC a
nd the
SBC logo a
re tra
dem
arks
of AT&
T Know
ledge
Ventu
res. ©
2006 A
T&T
Know
ledge
Ventu
res. A
ll rights
res
erve
d. 3
6USC
220506

A4 MONDAY, MARCH 20, 2006 INVESTORS.COM
7 FOCUS YOUR TIME AND MONEY:Don’t let other people or thingsdistract you.
6 LEARN TO ANALYZE DETAILS:Get all the facts, all the input. Learnfrom yourmistakes.
10 BE HONEST AND DEPENDABLE; TAKE RESPONSIBILITY:Otherwise,Nos. 1-9won’tmatter.
B Y L A U R A M A N D A R OINVESTOR'S BUSINESS DAILY
As a young World War II seamanaboard a ship passing through thestraits near Cuba, Ewing MarionKauffmansawaproblem.Abigone.His sightings didn’t correspondwith the navigation officer’s read-ings, putting the convoy eight milesaheadofwherethatseniorofficeres-timated itwas.Kauffman (1916-93) reckoned ifthe convoy waited to make itsplanned turn, three of the shipswouldrunaground.Butasanenlist-edman,hewasafraid to tell thecap-tainofhisworries.Still, he couldn’t let the discrepan-cyrest. In themiddleof thenight,hebrokenaval regulationsbyusing theFathometer to takeadepthreading.The reading confirmed his fears.Hewoke uphis ship’s captain to tellhim he thought the senior officerhad erred. The captain said he bet-ter be right, then called the convoytomaketheearly turn.Kauffman’s calculations provedon themoney.When the ship got toNew York, the captain promotedhim to ensign andmade him a navi-gationofficer.“When you take a risk, sometimesyou lose but sometimes it pays offbig, and that certainly did,” Kauff-mansaidabout the incident.Kauffman wasn’t averse to takingthe odd risk. In fact, his cool but in-tense approach helped build hisdrugsupplycompany,MarionLabo-ratories, into a global health carecompany with nearly $1 billion insales and 3,400 employees by thetimehesold it.Kauffman made a much biggerleap in 1968. That year he engi-neered major league baseball’s re-turn to Kansas City, Mo., paying$5.3 million for an expansion fran-chise. Ineight years,he sawhisKan-sas City Royals win the AmericanLeague’sWesternDivision champi-onship.By 1985, theRoyalshadcap-tured aWorld Series title. The leapfrom expansion team to worldchampion in just 16 yearswasoneofthe fastest rises inbaseballhistory.
Outward BoundKauffman’s risk-taking and ambi-tion weren’t just aimed inward. Hebelieved that doing something goodfor others, whether they were em-ployees or community members,wouldreap itsownreward.A childhood illness actually in-spired Kauffman. When he was 11years old, doctors diagnosed himwith endocarditis, a life-threaten-ing heart infection. The activeyoungster, who enjoyed playingbaseball, had to lie flat on his backforayear.
To help pass the time, his motherbrought him 12 library books aweek. He devoured biographies ofthe presidents and frontiersmenandread theBible twice.He absorbed their lessons. Whenhe returned to Kansas City from hisWorld War II naval stint, he waseager to put his sales skills and posi-tive thinking to the test.He’dhonedthem as a child selling eggs and cat-fishdoor-to-door.Hefirst founda jobsellingpharma-ceuticals at Lincoln Labs. He readextensively about the drug industryand pushed hard. Working on justcommission — with no benefits —he earned more than the presidentof thecompany.Displeased, Lincoln managementcut down his commission. But thenext year, Kauffman again outper-formed, and Lincoln tried to carveuphis territory.He quit. With $5,000 he’d saved,hesetupMarionLaboratories,asell-er of vitamins and injectables. Atnight, he filled bottleswith pills andpastedon labels.At5a.m.hebound-edoutofbedandpreparedfora longday of door-to-door selling to doc-tors in Kansas City and the sur-roundingareas.He chose Marion, his middlename, for the company’s moniker.Herealized that ifhecalled itKauff-manLabsand introducedhimself asEwing Kauffman, “immediatelyyou’d get the idea it’s a pretty smalloperation.”In the early days, Marion Labscouldn’t offer its salesmen medicalbenefits andwouldpayonlyhalf ex-penses.But as thecompanygrew, sowould the employees’ prosperity,hepromised.
Hemade good on that promise. Asthe company flourished in the1950s, Marion expanded its healthbenefits and offered salesmen com-panycars.Believing that personal values im-pactprofessional life,he likedtopar-ticipate in the job interviewprocess.He asked about candidates’ familylifeandgenerally tried togaugehowhungrytheywereforwork.Heinvit-ed them to bring their wives to theinterview, in part to ascertain howmuch the women would push theirhusbands — and whether they’d beable to manage with husbands ontheroadforweeksata time.
Making It PersonalWhen the business got big enoughto hold national sales meetings,Kauffman invited salesmen to comeup and speak to him personally. Todo so, they had to hand him theirbusiness card with their sales goalfor theyearonthebackof it.A few months later, those who’dcome forward would receive a notefrom Kauffman extending thembestwisheswithmeeting thatgoal.True tohis earlier promise, in 1956Kauffman started a profit-sharingplan that put an amount equal to15% of the associates’ annual sala-ries into their account. The plan in-cludedeveryone fromsecretaries toforklift drivers to sales managers.ThenMarionofferedstockoptions.The result? When Kauffmanmerged the firm with Merrell Dowin1989,hundredsofMarionemploy-ees became millionaires overnight.Marion is now part of French druggiantSanofi-AventisSNY.In 1968 Kauffman was dismayedwhen Charlie Finley, the Kansas
City Athletics’ owner, moved thelanguishing teamtoOakland,Calif.That left Kansas City without aMajor League Baseball team. SoKauffman offered a $1million stakeanda letterofcredit for$6million—andwonthefranchise.TohelpKan-sasCityresidents feelasenseofown-ership, he held a citywide contest topickthe team’sname.As the new owner, he appliedsome of his business tactics to run-ning the team. He hired veteransandyoungmavericks tomanage theteam’s front office. He and his wifepersonally sold more than 3,000tickets for the first season.Unwilling to wait the usual 10years for an expansion team to ma-ture, Kauffman tried to rampup theprocess. In 1970 he started the Roy-als Baseball Academy. It tested7,600 high school graduates in 41statesforbaseballaptitudeandnatu-ral attributes that the Royals deter-minedmadesuccessfulballplayers.Kauffman later disbanded theacademy. But not before it discov-eredand trained futureAll-Star sec-ond baseman Frank White, whohelped lead the Royals to their 1985World Series triumph over the St.LouisCardinals.In the 1980s Kauffman became anenthusiastic philanthropist as hetried to help Kansas City’s low-in-comeresidents.Concernedwithhigh school drop-out rates, he started Project Choice,whichguaranteedfullgrants forcol-lege tuition and expenses to localstudents who graduated and avoid-eddrugsandalcohol.“You now have the power tochoose what you will make of yourlife,”hesaid to them.“Choosewell.”
Investor’s Business Daily has spent years analyzing leaders and suc-cessful people in all walks of life. Most have 10 traits that, when com-bined, can turn dreams into reality. Each day, we highlight one.
Kimball Trains His Students To Dive Into WinningInnovate To Succeed: Diving coach jackknifed through hardship to become one of the best in the world and get the gold
LEADERS & SUCCESS
4 NEVER STOP LEARNING:Go back to school or read books. Gettraining and acquire skills.
9 DEAL AND COMMUNICATE WITH PEOPLE EFFECTIVELY:Nopersonis an island. Learn to understand andmotivate others.
6Want to fire up your team?Look around you, expertssay. Novel ways to motivatelie in existing technologyandthework force itself.
Startby:00 Creating energy maps. Re-searcher Wayne Baker, co-authorof“MotivatingPeople forImprovedPerformance,” found that top per-formers often work in clusters, orwhat he calls “energy pockets” —with each worker fueled by theotherorby theirmanager.How’d he track the energy pock-ets?With a confidential survey thatasked employees “to rate the ener-gizing or de-energizing effect ofworking with each of the people intheirorganization”ordepartment.Workers rated “most energizing”werealso themostproductive.“High energy” and “energizing”aren’t necessarily synonymous,Baker says. An energizing person iscaring, motivating, goal-orientedand flexible about theway goals areachieved.Simply put: “Energizing behavioris about letting other people knowtheymatter,”hesaid.Why not follow Baker’s example?Track energy pockets in your firm,pinpoint what makes them tick —then turn them into benchmarkscompanywide.00 Structuring the firm to allowchoices. Implement cafeteria-stylebenefit plans that workers can tai-lor to theirneeds.AtFleetBostonFi-nancial, workers can buy or sell acertain number of vacation days —accommodatingworkerswhowantmoretimeofforneedmoremoney.00 Holding “stay” interviews.Michael Cassani, director of em-ploymentatPrivateHealthcareSys-
tems, suggestsmanagers hold regu-lar employee interviews — once ayearor every sixmonths— focusingon job satisfaction, new roles em-ployees would like to bring to theirworkor jobs they’d like todonext.00Being available.BruceMcLenith-am, plant manager at office-furni-ture maker Steelcase, became itsfirst foreman to move his office tothe factory floor.His reason?“I’m the factory manager, not theoffice manager,” he said. “You gowhere the customer is — and I lookateveryemployeeasacustomer.”The move boosted productivityand morale, and before long otherplantmanagersdid thesame.00 Coming from the future.Whendebriefing failure, look to the pastjust long enough to learn lessonswithyourteam,SteveChandlersaysin“100WaystoMotivateOthers.”Agoodmotivatoruses thepast as aspringboard to improved results:“What can we learn from the mis-take that will serve us in the fu-ture?”Chandler said.00 Pumping up your e-mails.“Every e-mail communication yousend to your team is an opportuni-ty”toenergize,Chandlersaid.“Real-ize that e-mail is a cold medium.There is no voice tone in it. There isno twinkle in the eye or warmth ofexpression. Even a neutral e-mail(can feel) chilly to therecipient.”Before sending your next e-mail,consider this: Surveys show posi-tive reinforcement works seventimes better than criticism tochangebehavior.Thatdoesn’tmeanbeinganannoy-ing cheerleader in a template. Itmeans finding quick, casualways tomotivate, inspireandexpressappre-ciation.CordCooper
2 DECIDE UPON YOUR TRUE DREAMS AND GOALS:Write downyour specific goals and develop a plan to reach them.
IBD’S 10 SECRETS TO SUCCESS
B Y M A R I L Y N M U C HINVESTOR'S BUSINESS DAILY
Thebestwaytodeveloptopathletesisn’t just throughphysical challeng-es, saysDickKimball. You also haveto convince them they can achieveanything.When Kimball saw Micki King(nowMickiKingHogue) in 1961, hesaw a potential diving star. In her,he saw strength, desire, a naturalspringandgreatathleticism.But King had her limitations. Shelacked confidence, and womenweren’t allowed to compete at thecollegevarsity level.Kimball, a champion diver him-self, believed women were capableof performing the same feats asmen. So the University ofMichigandiving coach had King work outwiththemen’sdiving team.He reassured her she had talent.He taught her to do men’s dives.And she did. She became the firstwoman tomaster anumberofdives,
including a 1 1/2 somersault with a2 1/2 twistona10-meter tower.With King as his pupil, Kimballbrokenewgroundinwomen’scolle-giatediving.Hepersuadeduniversi-ty officials to start a women’s team.For the last 27 years, Kimball hascoached Michigan’s women’s div-ing team. He’s coached the school’smen’sdiving teamfor43years.And he’s turned many of his ath-letes into great divers by focusingtheirattitude.Many thinkKimball is the greatestdivingcoach in theU.S.Nine of his Michigan diversearned Olympic medals, five ofwhich were gold. Also to his creditaresevenBigTenwomen’sdivingti-tlesandnine formen.While a student atMichigan,Kim-ball was a member of three straightNationalCollegiateAthleticAssoci-ation champion swimming and div-ingteams,winning twonationaldiv-ingtitles.He’samemberof the inter-nationalSwimmingHallofFame.
Kimball learned to dive as a child.It helped him recover from a boutwith polio. So he knows about chal-lenges.Andhemotivatesbyurgingpeopletoapproachgoals realistically.“It’s not realistic for athletes to
strive tobeOlympic champions,”hesaid.You have to create small goals asyougoalong, andthengobackto thedrawing broad to try to get better,hesays.KimballhadKingworktowardsuc-cess instate competitionand thenatthe national level, until in 1968 shecompeted in her first Olympics.King might have won a medal, butshehit theboardonher lastdiveandbroke her arm. She completed thediveanyway,but lostmomentum.Kimball urged her to try again. SoKing trained four more spring andsummer seasons with Kimball. Shemade a real comeback in the 1972Olympics, when she won the goldmedal in3-meterdiving.Kimball works hard. He gets up atabout4a.m. to in-line skate, runandswim. He often plans his day whileexercising. He writes himself notesand checks them off as he finisheseach task. He keeps training freshand stimulating by using innovative
techniques. Many of his divers, in-cluding 1976 gold medalist PhilBoggs, did dives before they wereonthebooks.“I’ve always had the attitude thatto advance a sport, you have to keeplearning and developing newideas,”hesaid.Long before it became commonpractice, he did dry-land workouts,putting his divers on somersaultandtwistingbelts.Using the belts, Kimball takes stu-dents through themotions of divingand teaches them dives. The meth-od speeds up learning and elimi-nates fear,he says.In 1960, he wrote an article aboutthe use of the eyes in diving, whichothers have followed ever since.Kimball’s technique involves thediver focusingoneachsomersault.So if a woman is doing a reverse3 1/2, she needs to see the water oneach of the three somersaults. Thenshe hangs on, kicks out and looks atthewateragain.
Kimball says the best way to learnis to see yourself in action. He hasstudents videotape theirdivesusinga system with a six-second delay.That gives them a real-time view ofhowtheydidadive.Tobuild confidence, his diversusevisual imagery. They picture a greatdiver, then try topicture themselvesdoing the same things. The morethey picture themselves as success-ful, the more likely they’ll do well,Kimball says. Kimball works toknowhisdivers and their personali-ties. Depending on who it is, he canencourage thembyputtinghishandon a shoulder or by telling jokes torelax them. He challenges his teamandthenrewards them.“I can be nice; I can be nasty; I canbe anything to make them do adive,” he said. “In the long run,they’re going to thank you for doingit.”
This story originally ran Dec. 31,2001,onLeaders&Success.
8 DON’T BE AFRAID TO INNOVATE; BE DIFFERENT: Following theherd is a sureway tomediocrity.
5 BE PERSISTENT AND WORK HARD: Success is amarathon, not asprint. Never give up.
B E S T O F L E A D E R S & S U C C E S S
LEARN TO ANALYZE DETAILS
The Motivation Sensation
A Salesman With A Royal PitchGolden Touch: Ewing Marion Kauffman built an empire with vitamins, baseball
Kimballknowsaboutchallenges.Helearned to dive as a child to help re-cover from a boutwith polio.
1 HOW YOU THINK IS EVERYTHING:Always be positive. Thinksuccess, not failure. Beware of a negative environment.
3 TAKE ACTION:Goals are nothingwithout action. Don’t be afraid toget started. Just do it.
Kauffman’s cool, intense approach helped build his drug supply company and bring the Royals to Kansas City.
WISDOM TO LIVE BY Blanchard On Decision MakingIf we want people on the front lines of companies to make good business decisions, they must have the same information that managers use.Kenneth Blanchard, motivational coach
Ash On GoalsA good goal is like a strenuous exercise — it makes you stretch. Mary Kay Ash, entrepreneur
Ohmae On TimingMore strategies fail because they are overripe than because they are premature.Kenichi Ohmae, management consultant
Jobs On ManagementMy No. 1 job here at Apple is to make sure the top 100 people are A+ players.Steve Jobs, entrepreneur
Mallet On ActionIt is not impossibilities that fill us with deepest despair, but possibilities that we have failed to realize. Robert Mallet, poet, playwright
Gates On EmpowermentWhen you give people new tools — breakthrough communication tools — it has a transformational effect.Bill Gates, entrepreneur
Reagan On LeadershipTo grasp and hold a vision — that is the very essence of successful leadership.Ronald Reagan, 40th U.S. president

INVESTOR'S BUSINESS DAILY MONDAY, MARCH 20, 2006 A 5
B Y M I K E A N G E L LINVESTOR'S BUSINESS DAILY
Emil DeToffol sells accessories forcell phones, but doesn’t own a cellphone. Neither, in fact, do many ofhis customers.
This seems like a riddle, but it’ssolved when you learn that DeTof-fol’s Albany, N.Y.-based store sellsproducts designed to protect peo-ple from electromagnetic fields —or radiation — given off by cellphones and electronic devices.
The existence of DeToffol’s store,called Less EMF, points at a largerriddle facing the cell phone indus-try:whether the electromagneticra-diation emitted by cell phonesposes a health risk.
Like the sun, cell phones do emitsome radiation. There’s no disput-ing that. There is dispute among re-searchers, however, over whetherthat radiation poses harm.
Many StudiesThe lack of a definitive answer to
thatquestion accounts for one-quar-ter of DeToffol’s business, he says.
Finland’s Radiation and NuclearSafety Authority is among the latestagency to take up the question ofcell phone radiation. This month, itconducted tests exposing people’sskin to a cell phone for one hour togauge whether there’s an effect onpeople’s health. The results are dueby year’s end.
Hundreds of studies have beendone in the past 20 years to find anylink between cell phone radiationand health problems.
The two U.S. agencies that moni-
tor this issue have much informa-tion on their Web sites. Both saycellphones are safe — whilealso fall-ing short of declaring definitivelythat there’s no problem.
The Federal CommunicationsCommission says this: “There is noscientific evidence to date thatproves that wireless phone usagecan lead to cancer or a variety ofotherhealth effects, including head-aches, dizziness or memory loss.However, studies are ongoing andkey government agencies, such asthe Food and Drug Administration,continue to monitor the results ofthe latest scientific research on thistopic.”
The FDA says: “The available sci-entific evidence does not show thatany health problems are associatedwith using wireless phones. Thereis no proof, however, that wirelessphones are absolutely safe.”
The U.S. regulates acceptable lev-els of radiation, and cell phones are
well below that threshold, empha-sizes Joe Farren, spokesman for theCellular Telecommunications & In-ternet Association.
In all the many studies on cellphone use, “there’s no evidence ofhealth effects,” Farren said.
DeToffol disagrees. He says he’sread many studies and he believesthere’s enough evidence to con-vince him of a link between healthproblems and cell phone use.
“It’s strange there’s still a contro-versy, because there’s a ton of stud-ies on the matter,” DeToffol said.
The latest study DeToffol citeswas reported in the Jan. 27 issue ofthe American Journal of Epidemiol-ogy. The study’s authors concludedthere was no overall increased riskof brain tumors occurring with cellphone use. They also noted a higherincidence of brain tumors in peoplewho had used a cell phone at least10 years vs. noncell phone users.
This slight uncertainty creates a
market for DeToffol and others.How many others is not known. Noresearch firm seems to track thismarket. A Google search for “EMFprotection products,” though,yields 322,000 results.
DeToffolestimates there are a cou-ple of dozen vendors of “legitimate”cell phone radiation protectionproducts, with hundreds of onlineretailers of such products.
Do these products work? A 2001study prepared for Britain’s con-sumer watchdog agency said manycell phone radiation safety prod-ucts did as they claim and substan-tially lowered radiation comingfrom a cell phone. That lowered ra-diation, however, came at the ex-pense of poorer reception andsound quality.
In addition to cell phone protec-tion products, DeToffol sells prod-ucts for lab, testing and safety equip-ment used by researchers and themilitary. About 25% of his sales arecell phone-related. A former den-tist and chemical engineer, DeTof-fol says his customers complainabout head and ear pain, sleepless-ness, memory loss and “warming”around the face and ear where a cellphone is held.
T-shirts For $64Those symptoms occur even with
noncell phone users, he insists.Some people are sensitive to the ra-diation coming from other people’scell phones, he says.
One of his most popular productsis a baseball cap that’s woven withcotton and impregnated with silverand copper. The metals act as a mir-ror, reflecting back radio frequen-cies, DeToffol says. The hat costs$30. A similarly designed T-shirtcosts $64.
Other items include a metal-linedleather case that fits over a cellphone to limit radiation, for $35.
Wireless carriers advise custom-ers concerned about radiation touse headsets, which will keepphones away from their head.
But an article in U.K. consumermagazine Which? questionsthe effi-cacy of such headsets, saying theycan actually increase radiation.
To avoid that problem, DeToffolsells an air-tube headset. Like astethoscope, it uses airwaves insidea small tube to send sound to theear, instead of using electromagnet-ic waves.
DeToffol, who started his busi-ness 11 years ago, won’t release hissales or customer numbers. Besideshis physical store, he sells productsonline.
He says only a small portion of thepopulation is aware of cell phone ra-diation as a possible problem. Evenamong those people, only a smallportion is concerned enough to dosomething about it, he says.
“It’s like flossing your teeth,” saidDeToffol. “Everyone knows theyshould do it, but only a small per-cent actually do.”
B Y P A T R I C K S E I T ZINVESTOR'S BUSINESS DAILY
The battle between two formatsseeking to become the high-defini-tion successor to the DVD officiallygets under way when Toshiba’s firstHD DVD player hits the marketApril 18, at the same time as the firstHD DVD movies arrive in stores.
Sony’sSNE rival Blu-ray Disc is ex-pected to follow two months later.Then it will be up to consumers topick a winner. The face-off of HDDVD and Blu-ray Disc promises tobe the biggest format war sinceVHS beat Betamax in the videocas-sette market in the 1980s.
Analysts say consumers’ choicelikely will come down to content.Hollywood movie studios are spliton the two formats, but more sidewith Blu-ray.
Still, HD DVD has some big stu-dios in its camp. They include TimeWarner’sTWX Warner Home Video,Viacom’sVIA Paramount PicturesHome Entertainment and GeneralElectric’sGEmajority owned Univer-sal Pictures.
Studios backing Blu-ray includeNews Corp.’sNWS 20th Century FoxHome Entertainment, Sony’s SonyPictures Home Entertainment andWalt Disney’sDISBuena Vista HomeEntertainment.
Some studios that first backed HDDVD have decided to support bothformats. Paramount and Warnersaid earlier this year they’d releasemovies on Blu-ray Disc as well as
HD DVD.“It still looks to me like Blu-ray is
ultimately going to win this battle,”because it has more studio support,said Ted Schadler, an analyst withForrester Research. But therecould be a long way to go.
“If the studios start shifting theirallegiance or if the volume of titlesreally ramps up on the HD DVDside and not the Blu-ray side, thatwould be notable,” Schadler said.“As far as I can tell, the studios areholding the line.”
HD DVD officials say their movielineup includes such hits as “Bat-man Begins,” “Harry Potter and theGoblet of Fire” and “King Kong.”
‘Million Dollar Baby’ First UpBlu-ray Disc has “more players on
their team. But the players we havehit a lot of home runs,” said MarkKnox, an adviser to the Toshiba HDDVD Promotion Division.
Warner Home Video said Thurs-day it was pushing back the releaseof its initial slate of HD DVD titlesto April 18 from March 28, andToshiba on Friday followed with asimilar announcement for its HDDVD player. At that time, Warnerwill offer just three movies: “Mil-lion Dollar Baby,” “The Phantom ofthe Opera” and “The Last Samu-rai.” The studio will release 17 moretitles in subsequent weeks.
Blu-ray Disc boasts seven big stu-dios supporting its format com-pared with three for HD DVD.
“What matters most is availabilityofcontent,”saidAndyParsons,chair-man of the Blu-ray Disc Associa-tion’s U.S. promotions committee.“If you’re a consumer, you’re look-ingatbothformatsandtryingtoeval-uate which one is going to give youthe maximum opportunity to enjoy
thecontentyouwanttosee.Ifyou’veonly got less than half of the studiossupportingyourformat,that’snotre-allya good startingposition.”
But HD DVD has somethingBlu-ray doesn’t: support from theadult video industry. Executivesfrom leading porn companies Digi-tal Playground and Wicked Pic-tures told IBD last month that theHD DVD camp has been receptiveto adult video firms, while Blu-rayhasn’t.
Adult video producers say theyaren’t getting access to Blu-ray au-thoringtechnology and disc replica-tion facilities, so the industry by de-fault is turning to HD DVD.
But a Blu-ray Disc official says hedoesn’t think there will be a prob-lem getting adult content onBlu-ray Disc. “I don’t really see anybig barriers,” said Parsons, whoalso is senior vice president at Pio-neer Electronics USA.
The adult film industry has a histo-ry of helping new technologies getadopted. Its early support of VHS,digital video discs, broadband Inter-net and video on demand helpedthose technologies succeed.
HD DVD has several other advan-tages on its side, including itstwo-month head start on Blu-rayDisc.
Also, the initial HD DVD playerscost far less than the early Blu-rayDisc players. Toshiba’s HD DVDplayers start at $499. The cheapestBlu-ray Disc players will cost about$1,000. Samsung expects to havethe first Blu-ray Disc player out onMay 23, along with content from atleast two studios. HD DVD andBlu-ray Disc players both will beable to play standard definitionDVDs.
HD, For High-DefHD DVD also benefits from its
name. People understand rightaway that it’s high-definition DVD,Knox says. It provides much sharp-er pictures that can take full advan-tage of today’s HDTVs.
HD DVD players have been avail-able for pre-order online from Ama-zon.comAMZN and Crutchfield sinceearly January. Later this month,they will be sold at Best BuyBBY andSearsSHLD stores.
Some major consumer electronics
retailers, including Circuit CityCC,haven’t committed to carrying HDDVD yet.
The much-talked-about formatwar between Blu-ray and HD DVDcould become a nonevent ifconsum-er electronicsmakers followthepat-tern of recordable DVD. In thatcase, hardware makers quickly de-veloped products that could handlemultiple formats.
LG Electronics of South Koreaplans to make a dual-formatBlu-ray Disc/HD DVD player.
“Probably the bulk of players afew years from now will be combi-nation players,” Knox said. “And atthat point, the studios are just goingto make the version of softwarethat’s the least expensive to manu-facture.
So ultimately from that point ofview, HD DVD would win just bythe fiscal reality of how efficient it isto make.”
At stake for the two formats is ahome video business that generat-ed $22.8 billion in DVD sales andrentals in the U.S. alone last year, ac-cording to the Digital Entertain-ment Group.
DATA BUS
Staying Online A Little LongerInternet users are spending more time on their computers than they used to. Analysts credit the spread of broadband networks, which let users watch videos and take on other engaging tasks. Traffic at video sites is way up.
Source: Nielsen/NetRatings (nielsen-netratings.com)
Computer time per person Percentage of Internet users with broadband access Web traffic to video sites
In February, in hours
20222426283032
’06’05’04’0330
40
50
60
70%
’06’05’04’03 0 2 4 6 8 10Yahoo video search
iFilm
Google Video
YouTube
MSN Video In February
In February, in millionsof visitors
Radiation From Electronics Devices Fuels A Retail NicheSome Fear Cell Phones
Less EMF is one retailerwith wares to ward offelectromagnetic fields
After Years Of Talk,High-Def DVD EraSet For Soft LaunchFirst Players Set For Release
There will be just three HDfilms available at first, andnot many for some months
BY THE ASSOCIATED PRESS
SAN FRANCISCO — Art lovers, his-tory buffs and science devotees,take note: To get the most out ofyour next museum visit, make sureyou have your cell phone with you.
Not to gab on, of course, but to lis-ten to audio tours that weave music,narration and recordings from his-torical archives designed to bringmore context to the exhibitions.For many visitors, it comes as a wel-come alternative to the decades-oldsystem of museums renting out ex-pensive handheld devices.
Museums across the country,once averse to noisy cell phones,are suddenly encouraging their use.In the past year, about a dozen art in-stitutions — including museums inLos Angeles, Berkeley, Calif., Taco-ma, Wash., Minneapolis and Green-wich, Conn. — have begun offeringcell phone tours, mostly for free.Dozens more are in the process ofimplementing the service.
One reason for the surge is theemergence of companies such asGuide by Cell of San Francisco, Ash-burn, Va.-based Spatial Adventuresand Minneapolis-based Muse-um411, which run computer serv-ers and phone systems so museumsdon’t have to.
“I generally don’t buy the audiotours when I go to a museum unlessit’s a Monet or somebody really im-pressive,” said Chris Mengarelli,53, who recently used her phone totour the exhibit “Visual Politics:The Art of Engagement,” at the SanJose Museum of Art.
“It was much more convenientthan having to rent a head set andworrying about what kind of germsare being transmitted.”
Museums have been makingaudio tours available over cellphones since at least 2002, whenSouthern Utah University openedan exhibit of historical photos docu-menting 100 years of local theater.Matt Nickerson, a professor of li-brary science, wrote the script andtaped old actors recalling their per-formances in Shakespearean plays.He recruited an actor and engineerto record and mix the audio tour.
“It turned out to be much simplerthan I thought,” he said.
Using the museum services is aseasy as dialing a number and select-ing the code that corresponds to theartwork a visitor is viewing.
Visitors generally can stay on thesame call throughout the tour andswitch from one exhibit to the nextby entering different numbers intotheir phones.
The San Jose Museum of Art’s ex-periment with cell phone audio hasalready changed the way some visi-tors take in art. Ben Patel, a29-year-old hotel worker who ar-rived just before closing time oneday, quickly snapped pictures of theimages on his digital camera, so hecould view them later on his PCwhile listening to the narration onhis phone.
Museum ToursNow EncourageCell Phone UseA New Tool For Audio Tours
Mobile phones provide analternative to having to renta pricey handheld system
INTERNET & TECHNOLOGY
EmilDeToffol’sLessEMFstore sellsmetersusedtogaugeradiation levelsand hats impregnatedwith silver and copper to ward off radiation. AP
John Hutchinson displays Blu-ray DVD format movies at the Sony booth at January’s International ConsumerElectronics Show. The high-definitionDVD erawill be launchedwithin twoweeks, by Blu-ray rival HDDVD. AP

A6 MONDAY, MARCH 20, 2006 INTERNET & TECHNOLOGY INVESTORS.COM
B Y S H E I L A R I L E YFOR INVESTOR'S BUSINESS DAILY
Animated computer-generatedcharacters are invading class-rooms.Unlike traditional cartoons,they’redesignednottoentertainbutto teach, persuade and motivate.Andeducators are taking them seri-ously.The characters—usually three di-mensional — go by a variety ofnames, including interface agents,pedagogical agents and intelligenceagents.Whattheydobest isencouragestu-dents.“The primary value for theseagents in education is when theyserve a motivational or coachingpurpose,” saidAmyBaylor, directorof Florida StateUniversity’s CenterforResearchofInnovativeTechnol-ogies forLearning inTallahassee.Sometimes it’s as simple as creat-ingacharacter thatastudent identi-fies with. One of the center’sprojects, fundedbytheNationalSci-ence Foundation, is looking at howanimated female characters affectyoung women’s stereotypes aboutengineering — often seen as a maleprofession.Another project features animat-ed agents encouraging educationstudents to adopt lesson-planningtechniques — something they’reusually not enthusiastic about, Bay-lor says.“What we found is just simplychanging things such as the gender,attractiveness or age of the agentcan have powerful effects on learn-ingandmotivation,”Baylorsaid.Agents can be set up as a “goodcop” or “bad cop” to get students tothink critically, Baylor says. And re-searchers are looking at ways forthe characters to adapt to a stu-dent’s academic strengths andweaknesses.
Anthropomorphic characters —thosehavinghumancharacteristics— can fundamentally alter the soul-less nature of computers. They’refar from being just a gimmick, Bay-lor says.Otheracademicsagree.“There isgreatpotential for intelli-gent agents in education becausethey are so compelling,” saidKatherineIsbister,associateprofes-sor of language, literature and com-municationatRensselaerPolytech-nicInstitute inTroy,N.Y.They couldworkparticularlywellin certain areas, such as adult sec-ondlanguage learning, shesays.Unlike people, computers haveperfect memories and don’t getbored doing repetitive tasks — use-ful attributes in the language teach-ingprocess.Andwith3-Dsoftwareguideslead-ing the way, student embarrass-ment at making mistakes could beeliminated, Isbister says.The guides also could benefit stu-dentswhoareuncomfortable in thesocial context of a classroom — forexample, those returning to educa-tionafteryears in theworkplace.“Real teachers are incredibly im-portant, but sometimes there areusesforanimatedcharacters,”Isbis-tersaid.Someeducatorsseetheusefulnessof online guides as limited, howev-er.“Truly excellent education willprove beyond the computer’s digi-
tal reach,” said James McQuivey, aBoston University assistant profes-sorofcommunication.Aformer techmarket researchan-alyst,McQuiveyseesthehumanele-ment in learning as critical. “Thereis no sense of studying at the feet ofthemaster when themaster is soft-ware,”McQuivey said.Oneof theappealsof theapproachis that you can control the way thelesson isgiven.Thatcouldmakeituseful fordiver-sity education or military training,now often done via videos, hand-outs and comprehensionquestions.No onewouldworry about the reli-ability and personal biases of train-ers in thosecases,McQuiveysays.But learning opportunities can’tbe neatly anticipated, he says.“What every teacher in the class-room learns is that real learning oc-curs in dynamic, unpredictable andunscriptedways,”McQuiveysaid.And there are practical consider-ations.Sophisticated graphics and inter-active software require the rightequipment, notes Brock Dubbels,aneighth-gradepublicschoolteach-er.“The big question I have is: Howwill this technology work in com-puter labs with machines that areeight years old?” saidDubbels, whoalso is a researcher at theCenter forHuman Factors Research and Sys-tems Design at the University ofMinnesota.Educators don’t always make theright decisions about equipment,he says. “Technology is often pur-chased without an eye to the fu-ture,”Dubbels said.Businesses also have hurdles inadopting software-created productguides, saysFloridaState’sBaylor.Pharmaceutical companies are acase in point. Characters on drugcompany sites often miss the mark,Baylor says. “They’re not appropri-ate for the audience that they’re di-recting themessage to,” shesaid.Amiddle-aged womanmight findan older man extolling the benefitsof a particular drug credible, but afemale in her age range might bemorepersuasive,Baylor says.
Animated Computer CharactersFind Role In Classrooms, TrainingHelping Engage And Motivate
Characters work best whenthey share the students’same demographic traits
BY THE ASSOCIATED PRESS
TOKYO — Internet services compa-ny SoftBank made official Fridaythat it would acquire the strugglingJapan unit of British mobile phonecompanyVodafone for$15billion.The move will greatly boost Soft-bank’s forayintothecellphonebusi-ness.The purchase of 97.7% ofVodafone Group’sVOD Japan unitwill let SoftBank takeover themorethan 15million Japanese userswhohave signed on to the carrier, aswell as its mobile network, insteadofbuilding it fromscratch.“Through the purchase ofVodafone in Japan, SoftBank cannow enter the mobile phone busi-ness quickly and fully,” said Soft-bankPresidentMasayoshiSon.Vodafone, the world’s largest mo-bile phone company by revenue,has faced tough competition fromthe two biggestmobile phone com-panies in Japan, NTT DoCoMoDCMandKDDICorp.That competitionwas expected tointensify further in the fall, whenconsumers inJapanwill be allowedtoswitchcarrierswithoutchangingphonenumbers.Vodafone Chief Executive ArunSarin had been under pressurefrom investors as the company’s
share of the Japanese market hasshrunkover thepast twoyears afterit delayed the launch of 3G servicesin the region. Third-generation cellphones relay data at faster speedsthan conventional phones and canbeused to enjoy larger data, such aslonger streaming video and musicdownloads.“We have been making progresson the turnaround in recentmonths,” Sarin said in a statement.“However, given the relative com-petitivepositionof thebusiness, thereduced prospects for superiorlong-term returns and a good offerfrom SoftBank, the board took thedecision tosell.”Sarin said the company’s agree-menttosell itsJapaneseunit toSoft-Bank is definitive and it will com-plete the deal even if a rival bidemerges.Bill Morrow, who headsVodafone’sJapanunit, saidotherof-fers were considered but SoftBankoffered thebestdeal.VodafoneGroupsaid itwill return$10.5 billion in cash to sharehold-ers, with the precisemethod of dis-tribution tobereleased inMay.Thecompanyalsoowns45%ofVe-rizon Wireless in the U.S. and hasbeen under some pressure to per-hapssell thatstaketo itspartner,Ve-rizonCommunicationsVZ.
BY THE ASSOCIATED PRESS
BOSTON — Fidelity InvestmentssaidFriday itwill sponsor an onlinefinancial services “store” on Ama-zon.com’s Web site, in the compa-ny’s first such dealwith amajor on-lineretaildistributor.The nation’s largest mutual fundcompany did not disclose terms ofits agreement to become the pre-mier sponsor of a new section ofAmazon’sAMZN Web site. The sec-tion provides financial planning in-formationandlinkscustomerstoof-ferings from Fidelity’s retirement,mutual fund, brokerage, tradingandcollegesavingsproducts.It also features tax tip productsandfinancial advicebooks.SeanBelka, a seniorvicepresidentat Boston-based Fidelity, said thedeal letsAmazonpromote financialproducts fromFidelity rivals on thenewsectionof itsWebsite.But Fidelity will remain the pre-mieresponsor,withthemostpromi-nent positioning for its services,Belkasaid.The main page of Amazon’s sitealso includes a link that takes visi-torsdirectly toFidelity’s site.CraigBerman,aspokesmanforSe-attle-basedAmazon, said thedeal ispartofabroader initiativebytheon-line retailer to expand into newproductcategories.JimLowell,whoruns an indepen-dent advisory newsletter called Fi-delity Investor, said the sponsor-ship is part of a move by Fidelity toexpand baby boomers’ access to re-tirementplanningtoolsandotherfi-nancial services that once werelargely limited to thewealthy.“Theywant to takeaprivatebank-ingmodel andapply it to somethinglike the Wal-Mart business modelso they can really deliver what hastraditionally been a very high-endinvesting service to Main Street,”Lowell said.
Fidelity, AmazonAnnounce PactFor Finance SiteStart New Amazon.com Store
Investment firm and onlineretailer looking to boostbusiness with middle class
C
Animated characters are designedtomake students feel comfortable.Under Pressure, U.K.’s Vodafone
Sells Japanese Unit To SoftBank
SoftBank’s Masayoshi Son, center, shakes hands with Vodafone’s JapanPresident Bill Morrow, left, at news conference Friday in Tokyo. AP
Get it FREE at www.worden.com
Start Monthly Service Now & You’ll Get: TeleChart 2005 Software – FREE!First 30 Days of Service for FREE (reg. $2999)FREE Access to Online TrainingFREE Tutorial Video Set
or call 1-800-776-4940TeleChart and MoneyStream are registered trademarks of Worden Brothers, Inc. A credit card is required to activate service.
ID245
Phone: M-F 9am-9pm ET, Sat & Sun 9am-3pm ET
+ Free Shipping!
See what makes the best charts better!We were honored to be named by the readers ofStocks & Commodities magazine as the Best StockSoftware Under $200 since 1993. This year, our category expanded to include packages costing up to$500 – but the result was the same. Only TeleChartputs total organization, daily education, and exclusiveanalysis tools in one fast, simple package. Try it todayand see the difference for yourself.
Download the entire stock market – for FREEGet it now at www.worden.com
or call 1-800-776-4940More than just a software download, you’ll get data for the entire US stock market through the mid1980’s on your PC in one relatively quick download.You’ll even get a DJ Industrials chart starting at1915! Indices, ETFs, industry groups and marketinternals – they’re all in there. But the real value is not the information, it’s what you’ll do with it all!
“Turning too much information into manageable chunks”This is the goal we relentlessly pursue at Worden.We start by automatically maintaining over 250WatchLists in your system every day. These consist of index components, industry groups,charts with your notes, exchange-traded funds,your custom lists and your EasyScans.
Focus your attention on the best opportunitiesThe charts with the most potential tend to comenear the top or bottom (outliers) of your sortedWatchLists. Sort from dozens of technical and fundamental criteria, your own custom formulas,or ANY indicator from the chart you are currentlyviewing. Just don’t look away because your resultswill be returned in 2 seconds.
Voted Best Since 1993!Speed, simplicity, and exclusivecharting tools have madeTeleChart the market’s favoritecharts for more than a decade. Here’s why:
Multiple perspectives make the picture focused Roll your mouse wheel to zoom in & out of the chart for a“last month” or “two-decade” view. If you don’t do anythingelse – do this. Checking multiple timeframes will probablyimpact your results more than anything else you can do. Most traders simply don’t take the time to do it. WithTeleChart, it’s so quick and easy – you will.
Know your industry – it pays offOne click gives you instant access to the current stock’sindustry WatchList, relative strength, and comparison chart.This allows you to easily get a feel for a stock’s strength withinits industry – as well as the industry’s overall strength – whilebrowsing charts.
Bringing back the lost art of chartingTraders underestimate the importance of scaling more thanany other aspect of charting. Long-term charts MUST be on a log scale. Comparison charting must be on common percentscales. And when comparing volatility, common scales helptremendously. We’re fanatical about scaling, so you get fivecustomizable scaling buttons to flip modes instantly – preconfigured our way when you receive the software.
Learn from yourself and othersThe note window is more than a place to file away andorganize your own thoughts. It includes an archive ofhundreds of real-life charting lessons (with illustrationsthat open up) built right into your system for on-the-flylearning. It’s updated daily by chart-reading professionalsDon & Peter Worden to keep you current on what’sworking best right now.

INVESTOR'S BUSINESS DAILY MONDAY, MARCH 20, 2006 A 7
Date Offering Current % change EPS RSCompany Symbol offering price price from offer Rating Rating Industry group Lead underwriter
THE NEW AMERICA
B Y S T E V E W A T K I N SFOR INVESTOR'S BUSINESS DAILY
Thanks to electronic trading, wemightwell be nearing the endof thedays when stock exchanges arecrowded with traders shouting outorders.If that’s thecase, Intercontinental-ExchangeICEwill looklikeatrendset-ter. A year ago the exchange closedits trading floor in London andmovedtoelectronic trading.“Shortly after that, volumes tookoff,” said Chief Executive Jeff Spre-cher. “It’s the immediacy of thescreenvs.pickingupthephone.”Thenumbers backhimup. InFeb-ruary, Intercontinental enjoyed an82%year-over-year increase intrad-ing volume for its futures segment.Its over-the-counter market sawtradinggain71%during themonth.Electronic trading provides moreefficiency, more transparency andmore fairness, says Joel Gomberg,analyst atWilliamBlair&Co. It alsocosts less for traders.Because electronic tradingmade iteasier for traders to get in on the ac-tion, Intercontinental no longerneeded a seat in London. Thathelped the firm extend its brand totheU.S. andelsewhere.Intercontinental, which raised$55 million when it went public inNovember, also benefits from atrend that has more hedge fundsandinstitutions jumpingintotheen-ergymarkets.“Energy tends to be a volatile assetclassand, ingeneral, traders likevol-
atility,”Gombergsaid.The switch also helps Interconti-nental keep its costs fixed and low,Sprechersays.Runninganelectron-icexchange is cheaper thanrunninga trading floor, so the added busi-ness falls straight to thebottomline.Duringthe2005fourthquarter, In-
tercontinental’s operating marginsrose nearly 80% to 50.7%. Profit forroughly doubled while revenuemovedup45%to$41.3million.FirstCall expects Intercontinentalto report earnings of $1.39 a sharethisyearand$1.88ashare in2007.Oil futures play a big part in Inter-
continental’s growth. The firm alsotradesnatural gas, power, kerosene,jet fuel and others. It keeps addingnewproducts tomeetdemand.Last month it added the ICEWestTexas Intermediate Crude Oil fu-turescontract.Thisproductaveraged40,000con-tracts a day in the first 10 days, giv-ing it the strongest start of any newproduct Intercontinental has everlaunched,Sprechersays.It topped 70,000 trades a dayMarch 7 and 8 and hit a milestoneMarch 10when it rose tomore than50% of the market for such con-tracts. Before the product waslaunched, Intercontinental had28% of the market, Sprecher says,while theNewYorkMercantileEx-change (Nymex)had therest.“That’s one of the most successfulproductintroductionsthefutures in-dustry has seen in such a shorttime,”Gomberg said.Another benefit of the new prod-uctwasthat ithelpedIntercontinen-tal gain more U.S. business. The
firm had specialized in Brent crudeoil,which iswhat’s traded overseas.Now it has a foothold in the U.S.,whereWestTexascrude is traded.The four biggest commodities ex-changes — including the ChicagoMercantile ExchangeCME — alsohave lookedatenergy trading.“It’s a big, important asset class,”Sprechersaid.“It’snotsurprisingev-erybody is lookingat this space.”WhileSprecherkeepsaneyeonri-vals, he says Intercontinental has anedge: It’s close to a core of energyplayers, including several that ownstakes in the firm.Meanwhile, other exchanges aremakingplans tomove into electron-ic trading.Nymex isoneof them.Ken Schiciano, managing directorat Boston-based private equity firmTAAssociates,callsNymexa“sleep-inggiant.” Still, he sounds confidentIntercontinental can handle theextracompetition.“They’ve proven to be successful.There’s no reason to think that’llchange,” said Schiciano, whose em-ployer holds shares in Interconti-nental.Another potential risk is that thevolatility of oil prices will end,which could dampen trading activi-ty. CEO Sprecher downplays thisrisk. Even during the late 1990s,when oil was at $18 a barrel, the in-tradayvolatilitywas aboutwhat it isnow,hesays.“Newseventsof thedaytendtorat-tle throughtheoilmarkets,”Sprech-ersaid. “Thosepriceshocksgetpeo-ple trading.”
Leading New Issues
I N T E R C O N T I N E N T A L E X C H A N G E Atlanta, Georgia
Move To Electronic Trading Is Paying Off For Exchange
AmericanCommercialLinesACLI rose2%Fri-day on medium volume to close at a newhigh of 44.07. The barge operator’s stockmaintained its altitude from a 12% jump onWednesday following an earnings reportwhere it raised 2006 guidance. ACL wentpubliconOct. 7 at21.
AFTER MARKET
Focus Media Holding ADS FMCN 7/13/05 17.00 55.70 227.7 76 99 Comml Svcs-Advertising Goldman Sachs & CoVistaprint Limited VPRT 9/30/05 12.00 33.25 177.1 84 97 Comml Svcs-Printing Goldman Sachs & CoIntercontinentalExchange ICE 11/16/05 26.00 68.10 161.9 96 97 Financial Services-Misc Morgan StanleyChipotle Mexican Grill A CMG 1/26/06 22.00 53.86 144.8 59 85 Retail-Restaurants Morgan StanleySuntech Power Hldgs ADS STP 12/14/05 15.00 35.06 133.7 35 95 Energy-Other Crdt Suisse Frst BosUnder Armour Inc Cl A UARM 11/18/05 13.00 30.07 131.3 84 66 Apparel-Clothing Mfg Goldman Sachs & CoSunPower Corp SPWR 11/17/05 18.00 40.78 126.6 64 92 Energy-Other Crdt Suisse Frst BosC B O T Holdings Inc BOT 10/19/05 54.00 117.00 116.7 98 88 Financial Services-Misc Crdt Suisse Frst Bos
NEW AMERICA REVISITED
FROM IBD NEWS SERVICES
Shares of Barnes & Noble (NewAmerica, Jan. 8, 2002) fell backsomeonFriday, adayafter thebookretailer’s stock shot up after ittopped quarterly profit views andforecast stronger-than-expectedearnings for thecurrentquarter.After the close on Thursday, Bar-nes&NobleBKS reportedearningsof$1.76 a share for the fiscal fourthquarter, which ended Jan. 28. Thatwas a penny ahead of First Callviews.Shares of Barnes & Noble, theworld’s No. 1 book retailer, in-creased 9.7% to close at 47.40 onThursday, making it one of theday’s top percentage gainers on theNewYorkStockExchange.On Friday, however, the NewYork-based firm’s stock fell back to46.46 inmidday trading.Barnes & Noble’s fourth-quartersales rose 5% from the prior year to$1.75 billion. Gains at the compa-ny’s namesake stores offset an 18%decline at its B. Dalton chain due tostoreclosings.SalesatBarnes&No-ble’s namesake Web site edged up1% for the quarter. Same-storessales rose 3.8% at B. Dalton and3.3%atBarnes&Noblestores.The company said earnings thisquarter are expected to be in therangeof 10 cents to 14 cents a share,in line with First Call’s estimate of11cents.
Book RetailerSettles DownAfter Big DayIcing On The Cake
IntercontinentalExchange’s futures trading volume has surged along with the industry’s, boosting margins
Sources: Company reports, Futures Industry Association *industry figure
Intercontinental futures volume
Global energy futures volume* Company operating margins
20
25
30
35
40
45
’05’04’03’02’01
50
100
150
200
250
’03’01’99’97’95
Contracts in millions
Contracts in millions
20
30
40
50
60%
’05’04
IntercontinentalExchangetheice.com
Ticker ICEShare price Near 6812-month sales $155 mil5-year profit growth rate 30%
IBD SmartSelect Corporate Ratings
See investors.com for more details
Earnings Per Share 96Relative Price Strength 96Industry Group Relative Strength ASales+Profit Margins+ROE AAccumulation/Distribution A-
ACL Holds Steady After Earnings JumpIBD New Issues Index
You have your own idea of whatto trade and which strategy is best.But, so does the next guy. And thenext. In fact, everyone has a differentidea of how to trade.
The one common thread?Everyone needs accurate data tomake successful trades. WitheSignal, you get the rock-solid, reliable data you need — directlyfrom the world’s exchanges. And,without reliable data, all the tradingtools in the world won’t amount to a hill of soybeans.
800.245.9434www.esignal.com/offer/ibd
eSignal is a division of Interactive Data Corporation (NYSE: IDC) *All fees willbe refunded to you, minus any taxes and applicable add-on service/ exchangefees, if you cancel within the first 30 days of service. Call for details. x13341
eSignal’s powerful offering now includes:
• Reliable, award-winning, stock,options and futures data
• Advanced charting with customizable indicators
• Market-moving news from the U.S., U.K., Europe and Asia
• Integrated trading with your choice of brokers
Call today for your risk-free, 30-day trial* and see for yourself howeSignal’s award-winning data anddecision support software can helpyou trade with confidence.
eSignal has been voted “Best Real-Time Data” and “BestDelayed Data” by the readers of Technical Analysis of Stocks& Commodities magazine every year since 1993.
eSignal has been voted “Best Real-Time Data,” “Best End-of-Day Data,” “Best Software for U.S. End-of-Day Traders” and “Best Software for U.S./U.K. Intra-Day Traders” by the members of the Trade2Win website.
Make more successful trades with eSignal’s reliable data, advanced charting, news and integratedtrading
“I trade with confidence, and
you can too.”
.
.
Advertisement
Technology Investment Newsletter Leads All Others in Performance, Up 318% over 3 years ended 2005. Top Performer Year to Date 2006.
Get free reports on the technology trends that are leading to these big profits.
For more information and Fred’s free investment guide visit: Fredhager.com
Hulbert Financial Digest, the nation’s leading financial newsletter watchdog, independently audits over 180 investment newsletters submitted by America’s foremost market authorities. Based on the latest Hulbert tracking, through the end of February 2006, Fredhager.com has the top performing stock newsletter over the past 1, 2, 3, and 4 year periods. Hager also leads Year to Date 2006.
With our long term focus and with so many newsletters out there, it’s a real honor to have the top performance over such an extended time. In an investment environment that has spawned a rash of trading schemes to time the market, Hager does it the old-fashioned way with minimal trading. He researches and invests in companies he be-lieves will appreciate signifi-cantly in value. His long term approach is once again defying the market and the wave of investment strategies aimed at frequent trading. An example of his approach is found on Hager’s website Fredhager.com where he high-lights research on technology trends shaping his investment decisions. Hager commented, “Our focus in on exceptional returns so occasionally we get excited when we find strong stocks
according to Hulbert. Hager’s longstanding Model portfolio B portfolio is the top performer over 3 years, up 600%! Hager’s newest portfolio (LEAPS2) is up 285% over the last 12 months. (thru 2/28/06) and has outperformed every other portfolio tracked by Hul-bert since it was introduced in 2004. “We like to think of our LEAPS portfolio as a hedge fund for individual investor. The powerful return has amazed some of our happy subscribers.”
How to make a fortune in stocks.
Our philosophy is simple. Make sure you own the stocks that will dominate their mar-kets and invest for the long term. This is the proven, suc-cessful method but it requires knowledge and confidence in your decisions. We tell you which stocks these are and give you solid research to back it up.
being underestimated. The market often misjudges the strength and strategies of companies in fast-growing markets. Although it over simplifies what we do, iden-tifying these opportunities is a huge part of our perform-ance success.”Our performance has been
so good in this market we have people doubt it as pos-sible. It really helps to point to independent audit results such as Hulbert’s. Hager’s latest newsletter performance is impressive. In addition to having the top overall newsletter Hager has the top individual portfolio. Hulbert tracks more than 600 portfolios contained in the newsletters he audits; so having the #1 portfolio of more than 600 is no easy feat. Hager has actually had the top overall portfolio on several occasions and cur-rently has two #1 portfolios

A8 MONDAY, MARCH 20, 2006 INVESTORS.COM
1 Abaxis Systems/Equip ABAX 21.68 -7.03 99 95 B 16 125 120 45Makes portable blood analysis systems for veterinary and human use to give clinicians rapid blood constituent measurements.
2 Quidel Products QDEL 11.92 -25.27 96 96 C 14 47 150 9Last week it formed a strategic partnership with Church & Dwight tomarket its pregancy and ovulation tests, and to settle a lawsuit.
3 Gilead Sciences Biomed/Biotech GILD 62.89 -1.69 99 90 A 15 116 50 65TheWorld Health Organization recently added Gilead’s Tenofovir to its list of recommended drugs for treating AIDS.
4 Schick Technologies Systems/Equip SCHK 47.46 -2.96 90 98 A 3 32 10.5 32Makes digital gear for X-rays and other types of examinations in dentists’ offices. Its stock has risen 165% in the last 12months.
5 Candela Systems/Equip CLZR 18.4 -9.89 92 95 B 14 171 53.8 34Its lasers are used in cosmetic andmedical procedures around the world. Analysts see profit up 48% this year to 74 cents a share.
6 Lifecell Biomed/Biotech LIFC 21.07 -17.6 99 88 A 22 175 28.6 64Develops and sells products made from human tissue for use in reconstructive, orthopedic and urogynecologic surgical procedures.
7 Express Scripts Medical/Dental-Srvcs ESRX 90.71 -4.52 95 92 C 13 45 25 18The leading pharmacy benefit manager has over 50millionmembers through HMOs, insurance carriers, employers and other plans.
8 HealthExtras Medical/Dental-Srvcs HLEX 36.11 7.09 93 94 B 28 25 15.4 18The pharmacy benefit manager’s stock rose sharply last week on news of a deal that will add over 225,000members.
9 ChinaMedical Tech Systems/Equip CMED 29.79 -33.7 96 89 A 3 44 .. 66Its ultrasound-based products treat solid cancers and benign tumors in China. It alsomakes an in-vitro diagnostics system.
10 Nighthawk Radiology Medical/Dental-Srvcs NHWK 25.04 -8.93 97 85 .. 43 .. 59The newly public company offers long-distance analysis of radiological images on nights and weekends. About 860 hospitals use it.
HEALTH & MEDICINE
Market-Leading Medical StocksThe top stocks in themedical sector, ranked by the total of their Earnings Per Share and Relative Price Strength Ratings.
A-, A, A+ Last Qtr Next Qtr Last Qtr% Off EPS Rel Str SMR Funds EPS EPS Sales
Rank Company Medical Subgroup Ticker Price High Rating Rating Rating In Stock Change Change Change
Lilly’s Gemzar Gets FDA RejectionA Food and Drug Administrationpanel nixed Lilly’sLLY bid to ex-pand the market for the compa-ny’s Gemzar cancer drug. Lillyhad wanted to use the drug for re-curring ovarian tumors. Gemzarhas U.S. approval for lung, breastand pancreatic cancers. The drughad $1.3 billion in sales last year.
Watson Announces Andrx BuyoutWatson PharmaceuticalsWPI an-nounced plans to buy AndrxADRXfor $1.9 billion. Both firmsmake ge-neric drugs. In terms of prescrip-tions filled, the merged companywould be theU.S.’ third-largest ge-neric drugmaker. Combined annu-al revenue of the two companies isabout $2.7 billion.
MED BRIEFSGuidant Warns On DefibrillatorsGuidantGDT warned doctors tocheck the voltage on two types ofthe firm’s implantable defibrilla-tors after it received 39 reports ofdefects in the devices. Earlier re-calls had clouded Guidant’s pur-chase by Boston ScientificBSX for$27 billion in a bidding war withJohnson& JohnsonJNJ.
Medicis Lands Rights To ReloxinShares of MedicisMRX rose after itsigned a deal to buy the rights toReloxin, a Botox-like treatmentmade by French drugmaker IpsenPromesses. Reloxin’s rights hadbeenwith InamedIMDC, whichAller-gan bought. To make the deal Al-lergan had to relinquish Reloxin.
B Y P E T E R B E N E S HINVESTOR'S BUSINESS DAILY
In labs around the world, scientistsare racing to find a way to prevent,treat or mitigate avian flu. They’reracing not only the advancing virus,butalsoeachother.Two drug firms that claim to bemaking progress on their respectivevaccines are ChironCHIR and SanofiPasteur, a unit of Sanofi-AventisSNY.Each has early-stage supply con-tracts fromtheU.S. and foreigngov-ernments.Baxter InternationalBAX says it candeactivate bird flu using commonprocessing techniques, such asvaporheating.Demand for products to treat orprevent avian flu reaches all sectorsof thehealthandmedicine industry,says analyst Vinny Jindal ofThinkEquityPartners.“Since avian flu has emerged as aglobal threat, biotech companieshave come out of the woodworkclaiming they have products thatwould be important in a pandemic,”hesaid.Many are lured by the $3.8 billionthe U.S. government has approvedfor avian flu preparedness. A smallpiece of that funding would go alongwayforasmall researchcompa-ny,Jindal says.One company eyeing a piece ofthat fundingisBioCrystPharmaceu-ticalsBCRX, a Birmingham,Ala.-basedbiotech. It’s promoting its antiviral
drug,Peramivir.Thedruguses the samebiomecha-nism as antivirals Relenza, made byGlaxoSmithKlineGSK, and Tamiflu,developed by Gilead SciencesGILDandmarketedbyRoche.Jindal predicts BioCryst will get“substantial developmental fund-ing” from Washington. In JanuaryPeramivir received fast-trackdesig-nation from the Food and Drug Ad-ministration.Peramivir could be a first-line oradd-on drug to Relenza and Tami-flu, Jindal says. “It’s clear tome thatPeramivir is theonly clinicaldrug indevelopment now that can adddepth to treatment, either first orsecond.”BioCryst could receive $200 mil-lion in research funds and stockpileorders, Jindal says. That’s a bigchunk of change, consideringBioCrystoperatesata lossandessen-tiallyhasnorevenue.
Healthy SectorBioCryst is one of 21 firms in anavian flu index compiled by DonLuskin, analystwithTrendMacro, aconsulting firm for institutional in-vestors. His index has risen 64%since September. That’s three timesthe rate of increase in the overallAmex biotech index, Luskin wroteinanarticle.One of the firms on Luskin’s indexis Philadelphia-based HemispherxBiopharmaHEB. It focuses on drugsto treat immune-based chronic dis-ordersandviraldisease, likethesex-ually transmitted human papillomavirus (HPV).Hemispherx’s Alferon drug iswidely used to treat HPV, while itsAmpligen drug is in development totreat Chronic Fatigue Syndrome
andHIV.How did Hemispherx make theleap into the avian flu race? Seren-dipity, says Dr. William Carter, thefirm’schief executive.Independent researchers in Utahand Japan, working on avian flu,found that Ampligen could boostthe effectivenessofTamiflu andRe-lenza. Also, tests at the ClevelandClinic show Alferon may stimulategenes that control production of thevirus-fightingprotein interferon.Carter says Ampligen could helpthe nearly 20%of children reportedbytheNewEnglandJournalofMed-icine to be resistant to Tamiflu. Hesees both drugs as add-ons to othertreatments.“One drug alone will not be suffi-cient,” he said. “The opportunityhere is to build components thatwouldgo into thecocktail.”Avian flu isn’t the only target forHemispherx. The drug might workagainst seasonal flu as well, Cartersays. That’s a bigmarket opportuni-ty. Seasonal flu kills about 36,000Americansayear.
IfAlferonandAmpligengetregula-tory approval for flu, the first cus-tomerswill be governments aroundtheworld,Carter says.Once clinical effectiveness andsafetyareproved, therewill“inevita-bly be interest from traditional buy-ers”suchaspatientsreferredbyphy-sicians, HMOs and other health or-ganizations,he says.CarterhopesforswiftFDAapprov-al andsomefederal funds.“That vote of confidencewould beverywelcome,”hesaid.A vote of confidence alsowould begood for San Diego-based VicalVICL.The company’s focus is DNA-basedvaccines and drugs to prevent ortreat infectious diseases, cancer andcardiovascular ills.In September Vical received a $3million federal grant to develop aDNA vaccine against avian flu. Themoney will come in stages as thecompanymeetsmilestones.Vical isworkingwithSt.JudeChil-dren’s Research Hospital in Mem-phis, Tenn., to design a vaccine thatcould be developed and manufac-
turedquicklyandsafely.It’sanothercaseofadaptingatech-nology to the avian flu cause, saysVicalChiefExecutiveVijaySamant.“Our DNA vaccine technology iswell suited to address the potentialthreats from emerging pathogenssuch as avian influenza virus,” hesaid.
Over EasyOne problem with all flu vaccinesis they take sixmonths tomakeafterthe virus is identified. Eggs are themedium for preparation of seasonalfluvaccines.Vical won’t use eggs. It’s using abacteria, like that in beer fermenta-tion, todevelop its vaccine.What could an avian flu productmeanforVical?“Itcouldbehuge,”Samant said. “Itcould be the platform for other dis-eases.”To get the vaccine ready, Samantsays he’s counting on the U.S. gov-ernment to spendmoney on humantestingand“comeupwithacreativeregulatorypathway.”
B Y G L O R I A L A UFOR INVESTOR'S BUSINESS DAILY
Abattlebetweendoctor-ownedspe-cialty hospitals and traditional gen-eral hospitals continues to pick upsteam.A provision in the 2003 Medicarelawplacedamoratoriumonthecon-struction of new specialty hospitalsuntil June2005.The plan was to give regulators achance to see if these hospitals havean unfair advantage over generalhospitals, or if they otherwise hurttheexistinghealthcaresystem.The moratorium was extendedthrough December. Since then, theeffect on specialty hospitals is un-changed. For now, Medicare’s fi-nancing arm is declining to reviewnew applications for reimburse-mentof specialtyhospitals.The American Hospital Associa-tion and other lobbying groups arepushing for a permanent moratori-um.TheAHAaccusesspecialtyhos-pitals of taking high-profit businessfrom general hospitals, leavingthem with a heavier percentage ofpoororuninsuredpatients.Specialty hospitals do have theirbenefits, however. In 1999, special-tyhospital operatorMedCathMDTHofCharlotte, N.C., hired consultingfirm The Lewin Group to study itspatientoutcomes.The study’s latest yearly results,based on 2003Medicare data, showthat MedCath patients have an 18%lower mortality rate than those atpeer community hospitals. Thislower rate comes despite the factthat Medcath tends to handle morecomplex cases which take moremoney and effort to treat. Med-Cath’s average heart patient staysjust 3.69 days vs. 4.79 days at peercommunityhospitals, thestudysays.Thomas Jeffry Jr., a partner at theLos Angeles office of Davis Wright
Tremaine LLP, recently spoke toIBDaboutthe legal issues facingspe-cialtyhospitals.IBD: What drives doctors to investin specialty hospitals?Jeffry: Many physicians havereached the conclusion that they’renot going to increase their incomejust practicing medicine. So moreof them are providing forms of an-cillary health care — in addition torunning their medical practices —to enhance their incomes.The eye surgeons who started op-erating Lasik surgery centers yearsago . . . I almost consider themearly trendsetters.These new emerging joint ven-tures are not necessarily (led by)the huge national companies, butare made up of orthopedists or car-diologists putting imaging centersnext to their office.These are the types of things thatyou used to refer patients to hospi-tals for. Now doctors are handlingthese procedures themselves.Specialty hospitals are usually setup to handle patients from one spe-cialty. Heart hospitals, orthopedichospitals and OB-GYN hospitalsare some of themost common.These specialty hospitals are a bigthreat to (general) and not-for-prof-it hospitals. Some general hospitalshave entered into joint ventureswith physicians (and their facili-ties). If you can’t beat them, jointhem. Better to share 50% of therevenue than to get none at all.IBD: What are the main legal is-sues?Jeffry:The Stark law, or anti-kick-back regulations, limit a physician’sability to refer patients to facilitiesthey have ownership in.The legal challenge is to structurethese arrangements so they fallwithin the exceptions. One excep-tion is if the doctors who refer pa-tients own 40% or less of a facility.
Then they just have to be paidbased on percent of ownership.Physicians can’t be reimbursedbased on the volume of referrals.You can’t tell the doctor that forevery patient you refer for surgery,we’ll pay you an extra $100.
The law doesn’t want physicians’financial interests tainting theirmedical judgment. One specialtyhospital group is MedCath. Theyput together a lot of these arrange-ments. Typically they own 60%.Cardiologists own 40%.IBD: Would you quantify the im-pact on public and private hospitals?Jeffry: From the (general) hospi-tal’s perspective, the concern is realunless the community is seeing sig-nificant (population) growth.The cardiologist could pull all the(high-payment) services out ofyour hospital. You have a real holeon the revenue side that you won’tbe able tomake up anyplace else.General hospitals worry about los-ing the high-revenue business, in-cluding open heart surgeries and or-thopedic surgeries. These concernsare especially real when we’re talk-ing about the more profitable pri-
vately insured patients. But evenMedicare reimburses well enoughfor profit margins with some ofthese procedures.General hospitals look to that reve-nue to offset losses they typicallytake in the emergency room and in-ternal medicine areas. Usually gen-eral hospitals rely on profits fromopen heart surgeries, orthopedicprocedures and other in-hospitalsurgeries.If a specialty hospital takes awaythe plusses, (old-style) hospitalsare left with the debts. Then what’sleft to cover? The sickest patients,the emergency room patients andthe uninsured? Though entire hos-pitals don’t always shut down, theydo close themoney-losing areas.Last year in Southern California,we had several emergency roomsshut down. The average personshould be concerned.
Legal Issues Cloud Shift In Nation’s Hospital Market
Federal Funds LureWide Mix Of FirmsInto Avian Flu BattleDifferent Strategies, One Goal
As virus spreads, so doesthe diversity of companieseyeing vaccines, treatments
UNDER THE MICROSCOPE
Illumina Inc.
San Diego, Calif.illumina.com
Just threeyearsago it lookedas if Il-luminawasheadedforoblivion.The company’s stock — whichtraded as high as 51.63 in Septem-ber 2000 — had reached a low of1.71byMarch2003.Illumina’sILMN main problem wasthat ithadaconceptbutnoproduct,says analyst Quintin Lai of RobertBaird & Co., which expects to dobusinesswithIllumina.Founded in 1998, Illumina’s stockrisewas tied to theexuberanceoverthe human genome market, Laisays. “Theskywas the limit.”But the sky came crashing downwhen theproject tomap thehumangenome ended successfully in2003. By that point, the marketwantedproducts—not ideas.Illumina got the message andwentabout thebusinessofdevelop-ingproducts.Theworkhaspaidoff.Illumina’s stock now trades near26, and the company is expected topost its first annualprofit thisyear.Part of that growth is due to itshigh-throughput genotyping tech-nology. Genotyping is screening toidentify specific genes and muta-tions that cause disease. Illumina’stechnology can find genetic varia-tionsbetween individuals.“It can help predict disease orevenapatient’s responsetoapartic-ular therapy,” said analyst EdwardTenthoffofPiperJaffray.The worldwide market for geno-typing systems and services willgrow40%to$350million this year ,Tenthoff says.HefiguresIllumina’sproduct sales will grow 68% to al-most $99 million this year and 51%to$146.5million in2007.Illumina is also gaining marketshare from itsmain competitor, Af-fymetrixAFFY.“Within genotyping and geneticanalysis, Illumina is the company towatch,” said analyst Zarak Khur-shidofCaris&Co.
THE FINANCIALS
Analysts reporting to First Callpredict Illuminawill earn22centsashare this year, rising to 59 cents in2007.Tenthoffexpects Illuminatogrowtotal revenue 64% this year and46%in2007.
THE COMPANY
Most of Illumina’s customers areacademic laboratories. They con-tribute 80%of revenue,with indus-trial customerscontributing20%.Lai expects continued strengthfrom the academic market. It’slargely fundedbytheNationalInsti-tutes of Health, which is “shiftingfocustothe functionsofgeneticma-terial,”hesays.Anothershift iscominginbiophar-ma, says Illumina Chief ExecutiveJohn Stuelpnagel. Big drug compa-niesaregettingmore involved inge-neticresearch.Andsomearefinanc-ingequipment foruniversity labs.“Weseethempartneringwithaca-demics to promote this type of re-search,” Stuelpnagel said. “Theycancutdrugdevelopmentcostsandspeed up their pipelines, instead ofmakingmore ‘me-too’products.”
LOOKING AHEAD
Thenext phase is to take genotyp-ing out of the lab and into theworldof patient care, Khurshid says. LastApril Illumina bought CyVera foritsdiagnostic-enabling technology.“It’s not clear when they’ll have aclinical product,” Khurshid said.“Whentheydo, it couldbe incanceror infectiousdisease.”Inthemeantime, theresearchmar-ket will keep growing, Stuelpnagelsays. “In a few years it will be over$1billionworldwide.”PeterBenesh
GenotypingTechnologySets It Apart
Warning for ContakRenewal 3 RFBotox has competition.
“Some general hospitals have entered into joint ventures with physicians (and their
facilities). Better to share 50% of the revenue than to get none at all.”Thomas Jeffry Jr., partnerDavis Wright Tremaine LLP
HemispherixBiopharmaquality controlmanagerBelkis Civelek,Hemispherx, tests the firm's Alferon for effec-tiveness against avian flu.Many biopharma companies are trying to adapt existing products to target the virus.
Q & A

INVESTOR'S BUSINESS DAILY MONDAY, MARCH 20, 2006 A 9
CAN SLIM™ Investment Workshop Series
Essential Strategies & Techniques for Successful Investing
A few rules can make all the difference...Imagine GAINING 54.4% during the dot-com crash of 2001 - then adding another 79% when themarket rebounded in 2003. That’s what CAN SLIM™ did in the American Association ofIndividual Investors’ 8-year, real-time, independent study of over 50 leading investment strategies.There are no guarantees in the stock market. But this landmark study proves that if you disciplineyourself to follow the CAN SLIM rules, you can help materially improve - and protect - your futurereturns. This workshop will show you how.
“It has made me a better investor.” – John J.
What You’ll Learn
How to Read the Market
How to Buy the Best Stocks at the Right Time
When to Sell to Lock in Profits and Avoid Big Losses
* Instructors vary by date and location. Content subject to change.Cancellations with full refund will be accepted two weeks prior to workshop. Two weeks through the date of the workshop, a $50 processing fee will be charged.
Your Instructors*
KIER MCDONOUGH – CAN SLIM™ Certified SpeakerRepresenting Investor’s Business Daily®
KEN SHREVE – Investors.com Content Editor
KATE STALTER – Investors.com Markets Desk Writer
Register today at www.IBDevents.comor call 1-800-827-8278
Mon–Fri 5:30 AM to 4:30 PM & Sat 7:00 AM to 12:00 NOON (PT)
“[The workshop] convinced me that you can be successful year in and out... you reallycan beat index or mutual fund investing without quitting your day job and doing this full-time.” – Dan W.
“Investor’s Business Daily puts on an excellent, no-nonsense seminar. It was exactlywhat I had hoped it would be. I would recommend it to anyone who wants to be a successful investor.” – Stephen B.
“The detailed explanations of the CAN SLIM approach and chart patterns wereespecially helpful. It was well worth the money.” – Mark M.
“The workbook alone was a HUGE GIFT. Using the visual aids and check points, Ifinally have been able to identify stocks approaching the BREAKOUT POINT beforeit happens.” – Madeline H.
BOSTON, MAWed., April 5, 20066:00 PM to 9:00 PM
Hyatt Regency Cambridge575 Memorial Drive
Cambridge, MA 02139
•••
PHILADELPHIA, PASat., April 8, 2006
9:00 AM to 12:00 PMPark Hyatt PhiladelphiaBroad & Walnut StreetsPhiladelphia, PA 19102
•••
WASHINGTON, D.C.Tue., April 18, 20066:00 PM to 9:00 PM
Sheraton Baltimore North903 Dulaney Valley Road
Baltimore, MD 21204
•••
NEW YORK, NYFri., April 21, 20066:00 PM to 9:00 PM
Grand Hyatt New YorkPark Ave. at Grand Central
New York, NY 10017
•••
SALT LAKE CITY, UTSat., May 6, 2006
9:00 AM to 12:00 PMHilton Garden Inn
Salt Lake City/Layton762 W. Heritage Park Blvd.
Layton, UT 84041
See Web site for more dates & locations
CAN SLIM™
S&P 500
Source: American Association of Individual Investors independent study
IBD®’s+860.3%+860.3%
+28.6%+28.6%
Jan 1998 – Dec 2005
$179Seating is Limited

A10 MONDAY, MARCH 20, 2006 INVESTORS.COM
Stopping Product ImitatorsIn Patent Infringement CasesLegal Moves Aren’t Costly
New York City accessoriesmaker fights knockoffoffenders on a budgetB Y G A R Y M . S T E R NFOR INVESTOR'S BUSINESS DAILY
Sometimes the best defense in busi-ness is a good offense.
This may be especially true inpatent infringement cases.
Built NY, an accessories makerbased in New York’s trendy SoHodistrict, was doing well in its firstyear of business in 2003. Then at atrade show it sold its distinctivetwo-bottle wine tote bag at a boothnext to a firm that made wine glass-es.
By show’s end, the wine glass com-pany was displaying an exact knock-off of Built NY’s patent-pendingwine tote bag.
Carter Weiss, Built NY’s 37-year-old CEO, hauled out his legal gunsand threatened the company with alawsuit. In the end, the wine glassmaker signed a settlement andagreed to stop producing the item.
New Yorkers might describe whatthe wine glass company did as chutz-pah or pure gall; attorneys call itpatent infringement.
Built NY’s success in haltingpatent infringers in their tracks of-
fers lessons for companies in similarstraits.
Many small businesses shun get-ting involved in patent infringe-ment cases, lacking the resources orinterest in paying high-priced trade-mark or patent attorneys.
Weiss discovered that if compa-nies “spend a little money, find apatent lawyer who knows trade-marks, you can work on a strategythat fits your budget.”
That bit of knowledge is going along way for Weiss, a Pennsylvanianative who’s one of Built NY’s threefounders and worked at HollingerCapital, a venture fund, before try-ing his hand at a small business.
Since the tote bag incident, BuiltNY is using Weiss’ strategy to laydown the gauntlet to any companythat’s trying to imitate its patenteddesigns. It will track them downwherever they are and sue them fordamages and lost income.
Built NY has already investigated20 patent infringements and initiat-ed six legal cases.
In 2005, Built NY spent $450,000,or 4% of its total revenue, on legalcosts to protect its patents. Like awell-known New York City parkingsign that says, “Don’t even think ofparking here,” Built NY is telling ri-vals: Don’t even consider ripping offour designs.
Sales at Built NY, which specializ-es in producing original tote and
lunch bags, rose from $300,000 in2003 to $8 million in 2005 and is ontarget for $18 million in 2006. Itsproducts are sold at gift, specialtyand department stores, includingOrvis, Container Stores and BedBath & BeyondBBBY.
Its unique designs are critical tothe company’s success, and Weisssays that protecting its trademarkand intellectual property has beenkey to preserving its growth.
“We’ve created an asset by havingpatents. We let our competitionknow not to tread or trade on ourname. Our customers are buying aseries of uniquely desirable prod-ucts. We want our competitor toknow that he can’t knock us off andcopy it,” Weiss declared.
Obtaining its first patent from theU.S. Patent and Trademark Office,which received 400,000 patent ap-plications in 2005, wasn’t easy.
Built NY applied for a patent on itstwo-bottle wine tote in 2003; it wasdenied. It reapplied and presentedarticles from design magazines andcatalogs to prove that its design wasas unique as the patented Coca-Colabottle and Absolut vodka bottle.The patent was granted.
By2006,Built NYhad four U.S.pat-ents and had a dozen product pat-ents pending.
Michael Heltzer, external rela-tions manager at the InternationalTrademark Association, which is
based in New York, noted: “Trade-mark laws are designed to protectowners of businesses, both largeand small. Any company that ig-nores that their trademark has beeninfringed on risks having their trade-mark become generic. If you don’tstop the first one, it snowballs, andeventually your trademark loses itsdistinctiveness.”
To limit its attorney fees, Built NYoften starts a case against an offend-ing company by sending its owncease and desist letter (the originalwas vetted by a patent attorney).These letters are usually a one-page
document, which identifies whichproduct is being infringed on, whatrights the company owns and asksthe company to respond in a reason-able period. It has resolved one-third of its cases this way.
While Weiss won’t name the com-panies that Built NY has sued, its in-fringement cases include the NewYork giftware company that wassellingits patented wine totes, a Brit-ish baby bib company and a HongKong promotional company. WithBuilt NY winning those cases, its ri-vals have had to destroy their inven-tory, pay licensing fees, abandon the
market, pay a percentage of salesand repay Built NY’s legal costs.
Globally, Built NY has relied ontwo U.S. lawyers who have a “net-work” of attorneys in other nations,Weiss says. He tells attorneys,“Here is the budget.” These lawyersthen hire associates in Denmark,Australia and other countries, andthose lawyers spend only the bud-geted sums to do their legal work.This keeps costs from spiraling.
How does Built NY know if rivalshave been knocking off its patenteddesigns? Built NY’s customers, dis-SEE BUILT NY ON A11
How much workers prepare for retirement varies based on generation. Baby boomers (ages 42-59) are more likely to go for 401(k) plans than so-called Gen X (ages 26-41) and Gen Y (ages 18-25) members. But over a quarter of baby boomers still don’t have a 401(k) plan.Source: Hewitt Associates
401(k) Retirements Contribution levels in 401(k) plans 401(k) plan balancesParticipation rate in 401(k) plans
0
20
40
60
80%
Baby boomersGeneration X Generation Y
0
24
6
8
10%
Baby boomersGeneration XGeneration Y
0
10,000
20,000
30,000
40,000
$50,000
Baby boomers Generation XGeneration Y
TOP DOWN
BuiltNYCEOCarterWeiss , left, and creative directors JohnRoscoeSwartz, right, andAaronLown checkprod-ucts on a fire escape outside their NewYork City office.Weiss says patent infringers shouldn’t be ignored. AP
MANAGING FOR SUCCESS

INVESTOR'S BUSINESS DAILY MONDAY, MARCH 20, 2006 A 11
EXECUTIVEBRIEFING
tributors, retailers andmakers noti-fy the company that someone’sbeen stealing its designs. Attending17tradeshowsannuallyhasbeenan-otherway todiscover rip-offs.In addition, Built NY staff search-es Internet retail sites to unearthtrademark infringements. Lastly, ithires private eyes through its inter-national law firms,whichWeissde-scribesas “relatively inexpensive.”“If we don’t protect these items,otherpeoplewill trade onournameand success and themarket will getconfused. We’ve learned that wemust protect our intellectual prop-erty. Our products, (their) look andshape, are as much a part of ourbrand as our name and logo,”Weisssaid.OriginaldesignsareBuiltNY’s sig-nature. In 2003, John RoscoeSwartz, a furniture designer; AaronLown, a fashion accessory designerfor Kate Spade and Calvin Klein;andWeiss,aventurecapitalist, com-binedto formBuiltNY.Its first design, the two-tote winebagsold for$17,anditsgourmetget-away lunchbagwent for$25. Itnowhas 29 full-term employees, its ownwarehouse in Waldwick, N.J., andmakes its products in China andthroughoutAsia.Built NY ismodeled after Dunhill,
the English leather company,which started with cigarette hold-ers and lighters and expanded intoclothing.It now offers 16 products and re-cently expanded into baby bottletotes,babybibsandadiaper tote.The trio raised $40,000 of theirownmoney to launch the company.Thatstartupcapital fundedtheir in-ventory, first product and its officein SoHo. They got their patentedtwo-bottle wine tote bag into NewYork’sprestigiousMuseumofMod-ernArtgift shopandCoppola’sTast-ing Room, a wine tasting room inCalifornia’s Napa Valley connectedto a winery owned by film directorFrancisFordCoppola.The tote bag product took off afterthat.Flush with success, the ownersraised $250,000 in the fourth quar-ter of 2003 fromventure capital an-gels, including $100,000 from UPS(UnitedParcelService)Capital, andanadditional$750,000 in2004.Despite devoting lots of energy inprotecting its patents, Weiss notesthat Built NY spends most of itstime designing new products toboost revenue. “Our marketing andsales are the sword, and that’s howwewin.TheIP(intellectualproper-ty) is our shield. You don’t want togo to battle without your shield,”Weisssaid.
BUILT NY FROM A10
Topersuadepeople, youneed toen-gagethem.The more you can talk with them,not at them, the greater the oddsthatyouwill gaincompliance.“You want to lead people to feelthat they have more control overthe outcome,” said Ellen Langer, aprofessor of psychology at HarvardUniversity. And the more you spurothers to actively participate in thediscussion, the greater their per-ceivedcontrol.Thatmeans if youwant a group tocollaborate more effectively, assignprojects that require them to worktogether.Lecturing employees to act a cer-tainway rarely engenders true buy-ins. Peoplemight comply grudging-ly, but their cooperation may erodeover time.Providing some choice increasesothers’ sense of control, saysLanger, author of “On Becoming an
Artist.” If you want an employee tohandle an urgent task, it’s better toask, “Canyoudo it at 6 p.m. today or9 tomorrow morning?” rather thansay, “Justget itdoneASAP.”“You don’t have to relinquish con-trol by giving someone a choice,”Langer said. “If you need it done by6 p.m., you can say, ‘You can eithercall or e-mail me with the informa-tionby6p.m. today.’ ”She compares this approach to amother who wants her children toeat eggs for breakfast. Placing aplate of eggs in front of themand in-sistingthat theyfinishcantriggerre-sistance. But asking the children,“Would you like your eggs poachedor scrambled?” raises the likelihoodthat they’ll chow down whenserved.Speakers exert more persuasivepower if theyare“actively engaged”in what they say, according toLanger.Shestudiedtwosetsofmag-azine salespeople. One read a script
verbatimand the other tweaked thescript to fit their personalities. Theladder group generated far greatersales.“Insituations like that, youwant tobe guided by a script, but not gov-erned by it,” she said. “When you’represent in themoment, you’ll noticenew things and improvise. Thatleads you to bemore liked andmoretrusted.”Inher 30years of research,Langeralso has found that people aremoreapt to comply with your request ifyouprovidearationale tosupport it.In an experiment, she asked li-brarypatronswaiting in line touseaphotocopier, “Excuse me, I havefive pages. May I use the copy ma-chine?”Sixtypercentagreed.She then approached a differentgroup by rewording her request:“Excuseme, Ihave fivepages.MayIuse the copy machine, because I’min a rush?”Ninety-fourpercent saidyes.MoreyStettner
In late 2000, KeyCorpKEY hit a lowthat proved to be a springboard to anewbeginning.The bank holding company wasfighting off takeover rumors amid aplunging stock price. Drastic costcuts sideswiped worker morale ascustomergripesgrew.Everyoneknewthecompanyneed-ed a fresh start, and it happened.Led by new Chief Executive HenryMeyer, Cleveland-based KeyCorpsearched for better ways to gaugeemployeeperformanceandraiseac-countability.KeyCorp also wanted to fosterteamworkacross itsdepartments.After weighing various perfor-mance managing systems, thebank’s executives chose the “bal-ancedscorecard”designedbyPalla-dium Group, a business consultingfirminLincoln,Mass.“Wewere looking fora tool tohelpus dig under the financial numbersand understand cause-effect rela-
tionships,” said Michele Seyranian,an executive vice president at Key-Corp who managed the new pro-gram. “Wewanted to gain perspec-tives tohelpmanageouremployees,client expectations, our sharehold-ersand internalprocesses.”Over the next few years, the bankcreated 23 balanced score cards forits different business lines and staffgroups. All salaried employees alsodevised their own score cards. Thebank’s leadersusedthesetools tode-fineobjectivesandset targets.“The score card shows us whereperformance is lagging and how toimprove it,” Seyranian said. “It alsounitesusaroundthethemeofbreak-ingdownsilos anddoingeverythingwecan tohelpourclients.”The score card nowplays a centralrole in employees’ performance ap-praisals. From tellers to salespeo-ple, staffersknowtheywillbeevalu-ated onhow their contributions im-pactKeyCorp’s statedgoals.Departmentheadsget scoresona1
to 10 scale based on measures suchas customer satisfaction surveysandclientattritionstatistics.Because Seyranian knows shewillbe measured every six months, shehas a clear graspofwhat actions shemust take to advance her unit’s ob-jectivesandKeyCorp’soverall strat-egy.By identifying specific metricsthat the bank uses to assess its per-formance—and theperformanceofits people — the score card boostsworker awareness of what consti-tutes success.It removes ambiguous and subjec-tivemeasuresso that“everyone’sonthesamepage,”Seyraniansaid.This discipline and transparencytranslates intobottom-lineresults.Internal surveys indicate that cli-ent retention rates gained 5% be-tween2002and2004.The bank’s net income rose from$903 million in 2003 to a record$1.12billion in2005.Morey Stettner
EXECUTIVES
CEOTurnoverRemainsHighOver 100 chief executives at U.S.firms switched jobs in February,down onlymoderately from arecord high of 139 in January.Challenger, Gray &Christmassays 112 CEOs left their posts lastmonth. The global outplacer saysmore top executives are beinglured away by other firms, thoughsome of February’s exits wereprompted by ethics and accountingissues.Challenger says it was the 10thtime in 13monthswhen themonth-ly tally of CEO departures topped100.The health care industry contin-ues to be the leading source of CEOturnovers, with 23%of lastmonth’s exits coming from thesector. An additional 14% camefrom services companies, with thecomputer industry accounting for13%.
WORKERS
Employers FillMore JobsWorker confidence rose in Febru-ary.Staffing expert Hudson’s employ-ment index climbed 5.6 points lastmonth to 108.2, one of the stron-gest readings on record.Hudson says the upbeat viewstems from expectations that com-pany hiring is up. Employees alsoexpect personal finances to im-prove.Themonthly survey found that33% ofworkers indicated theirfirms had plans to hire. This is themost positive they’ve been on thispoint sinceOctober 2004.Forty-five percent of private-sec-tormanagers saw an increase inemployee head counts, up from38% in January.Workerswho rated their financesas good or excellent were at arecord high in February, coming inat 46%. Forty-three percent saidtheir financeswere getting better.
The Art Of Knocking DownKnockoffs With Legal Blows
BuiltNYco-founderCarterWeiss,right, saysone-thirdofthefirm’strade-mark cases were solved by sending its own “cease and desist” letter. AP
Using Psychology To Sell More
Score Card Gives Bank Its Best Shot
R E A L S O L U T I O N S

A12 MONDAY, MARCH 20, 2006 INVESTORS.COM
36 Mos 2006 12 Wk 5 Yr NetPerformance % % After Asset NAVRating Fund Chg Chg Tax Rtn Value Chg
36 Mos Fund 2006 12 wk 5 Yr Net NAVPerformance % % After Asset ChgRating Chg Chg Tax% Value
36 Mos 2006 12 Wk 5 Yr NetPerformance % % After Asset NAVRating Fund Chg Chg Tax Rtn Value Chg
36 Mos Fund 2006 12 wk 5 Yr Net NAVPerformance % % After Asset ChgRating Chg Chg Tax% Value
36 Mos 2006 12 Wk 5 Yr NetPerformance % % After Asset NAVRating Fund Chg Chg Tax Rtn Value Chg
36 Mos Fund 2006 12 wk 5 Yr Net NAVPerformance % % After Asset ChgRating Chg Chg Tax% Value
36 Mos 2006 12 Wk 5 Yr NetPerformance % % After Asset NAVRating Fund Chg Chg Tax Rtn Value Chg
36 Mos Fund 2006 12 wk 5 Yr Net NAVPerformance % % After Asset ChgRating Chg Chg Tax% Value
36 Mos 2006 12 Wk 5 Yr NetPerformance % % After Asset NAVRating Fund Chg Chg Tax Rtn Value Chg
36 Mos 2006 12 Wk 5 Yr NetPerformance % % After Asset NAVRating Fund Chg Chg Tax Rtn Value Chg
36 Mos Fund 2006 12 wk 5 Yr Net NAVPerformance % % After Asset ChgRating Chg Chg Tax% Value
36 Mos Fund 2006 12 wk 5 Yr Net NAVPerformance % % After Asset ChgRating Chg Chg Tax% Value
36 Mos Fund 2006 12 wk 5 Yr Net NAVPerformance % % After Asset ChgRating Chg Chg Tax% Value
36 Mos 2006 12 Wk 5 Yr NetPerformance % % After Asset NAVRating Fund Chg Chg Tax Rtn Value Chg
36 Mos Fund 2006 12 wk 5 Yr Net NAVPerformance % % After Asset ChgRating Chg Chg Tax% Value
36 Mos 2006 12 Wk 5 Yr NetPerformance % % After Asset NAVRating Fund Chg Chg Tax Rtn Value Chg
36 Mos Fund 2006 12 wk 5 Yr Net NAVPerformance % % After Asset ChgRating Chg Chg Tax% Value
36 Mos 2006 12 Wk 5 Yr NetPerformance % % After Asset NAVRating Fund Chg Chg Tax Rtn Value Chg
For Friday, March 17, 2006
B Y D O N A L D J A Y K O R NFOR INVESTOR'S BUSINESS DAILY
Living trusts are popular asset man-agement tools.
You can use one to control howyour assets are used if you becomeincapacitated.
You can also use one to make sureassets are divvied up the way youwant after your death.
Living trusts have other benefitstoo. They speed up how assets aredished out. And they can help avoidfamily disputes.
How do you decide whether it’sworth the time, effort and cost to setone up? By weighing the benefits.
Start by understanding the basics.A trust is an entity formed to hold as-sets. A living trust is one establishedwhile the creator is alive.
Most are so-called revocabletrusts. They can be canceled by thegrantor, the person who creates it.
A revocable trust becomes irrevo-cable after your death. And an irre-vocable trust can’t be canceled.
That flexibility is part of why revo-cable trusts are popular. If youchange your mind, you can discon-tinue the arrangement.
You usually can be the trustee andbeneficiary of a revocable trust youcreate. That lets you keep control ofassets you place in the trust. Your fi-nances won’t be affected.
Why would you transfer assets
into a revocable trust?If you lose the ability to handle
your own affairs, a successor trusteecan take over management of thetrust assets. Your family will notneed to go to court to have a guard-ian named.
When you create a revocable trustand name yourself trustee, you alsoshould select a successor. And youcan spell out circumstances whenthe successor would take over.
For example, two doctors mighthave to state in writing that you areincapacitated. Then the successorcan become the trustee.
This can save time and avoid fami-ly disputes. Your successor trusteewill have a legal responsibility to actin your interests. Revocable trustscan offer benefits at your death, too.
Sidestepping ProbateAssets held in any trust don’t go
through probate. That’s the processin which a court determines who in-herits a decedent’s property.
In some states, probate is costlyand time consuming. If you holdproperty in more than one state,your survivors will have to deal withprobate for those properties inthose states.
That won’t happen to assets heldin a trust. Because the assets areheld by the trust, not by you, thoseassets are not subject to probate.
Ownership will pass to the heirsyou have named in the trust.
Another option is to have the as-sets remain in the trust.
Then people you’ve named in ad-vance become the new beneficiariesat your death or some other trigger-ing event.
The trustee’s job now will be to acton their behalf. By controlling howassets are used, your trust cuts thechances your survivors will squan-der them all at once.
“Creating a revocable trust canhave other benefits,” said MartinShenkman, an estate planning attor-ney is Teaneck, N.J. “Organizing as-sets and transferring them into atrust will help you manage your af-fairs as you grow older.”
Such diligence also will assist yourheirs in handling your estate.
With these positive features, whatare the drawbacks of revocabletrusts?
There will be costs involved. Legalfees typically range from $500 to$2,500. The more special instruc-tions you put into a trust, the higherthe fee will be. And fees are higherin certain areas of the U.S.
“After you create the trust, youshould meet with your lawyer eachyear to monitor the plan,” Shenk-
man said. A meeting might cost afew hundred dollars in lawyer fees.
Another drawback is the time andeffort you must invest to create a re-vocable trust. You’ll have to retitleassets.
Say your brokerage account isowned by John Smith. It would beretitled so that it’s owned by “TheJohn Smith Revocable Trust.”
Generally, paperwork you mustfile with your brokerage or mutualfund company is simple.
But renaming some assets can becomplicated. Your lawyer can helpif necessary.
Irrevocable trusts can help funnelassets in ways that cut estate taxes.
But there are no tax benefits in set-ting up a revocable trust and trans-ferring assets into it.
“The trust’s income will be taxedto you,” Shenkman said. “The trustassets will be in your taxable es-tate.”
Tax planning is possible, though.You can give trust assets to other re-cipients, which removes them fromyour estate. The usual gift tax rulesapply.
No NeedYou might not need a revocable
trust if most of your assets are heldjointly, with right of survivorship.That’s often how spouses own as-sets. If you become incompetent,your co-owner can control the jointassets.
At your death, your joint ownerwill become the sole owner. No pro-bate will be necessary.
Beneficiary designations also savefrom probate assets held in an IRAor another retirement account.
How To Read Mutual Fund Tables & GraphsFunds with at least $125 million in assets are listed in fund tables, while those with less than $125 million can be viewed atwww.investors.com/morefunds. O Denotes independent fund that does not belong to family listed above. Each moving36-Month Performance Rating, versus all other mutual funds, is recalculated each month on a total return basis. Alldividends and capital gains included. Daily accrual fund returns are calculated on a monthly basis. A+=Top 5%, A=Top10%, A#=Top 15%, B+=Top 20%, B=Top 25%, B#=Top 30%, C+=Top 35%, C=Top 40%, C#=Top 45%, D+=Top 50%,D=Top 60%, D#=Top 70%, E=Below 70%. A+, A, A# and B+ 36-Month Performance Ratings are all boldfaced. % changesare on a total return basis. Top 2% of funds in % performance yesterday are boldfaced. Performance of income funds maybe compared to other income funds, bond funds to other bond funds, etc. Fund family assets as of 02/28/06. b=assets usedto pay 12(b)(1) plan distribution costs, r=redemption charge may apply, n=no initial load and appears after Net AssetValue, m=multiple fees, p=previous day’s quote, s=split, x=ex-dividend or capital gains distribution. 5-Yr After Tax Rtn=5year after-tax return assuming an average ordinary income tax rate of 35% on dividends and a 20% long-term capital gainstax rate. Fund company family names are boldfaced. The top 20% of growth funds for the past 2 years that are beating theS&P 500 this year are shown graphically each day on the first Mutual Funds page. All figures are on a total return basis.Funds shown in the two daily performance lists, which appear below the IBD Mutual Fund Index, have at least $125million in assets and a 36-Month Performance Rating of B or better, unless otherwise noted.
Probate Not NecessaryAssets that pass directly to heirs and beneficiaries
Source: AARP
Property held in trust
Property owned jointly with right of survivorship
Assets with a named beneficiary
Life insurance proceeds
401(k) accounts
Pensions
Annuities
Growth Funds Leading The MarketThese S&P 500-beaters areamong the top 20% in 2- year performance
FUNDS & PERSONAL FINANCEUse A Living Trust To Dodge ProbateAvoid Family Disputes
Tools for speeding uphow assets are dishedout after your death
Mutual Fund Performance
WEEK IN FUNDS
Small caps took charge, with value edging past growth in all market cap sizes. Natural resources funds shot higher as energy prices rallied. Gold also recovered much of its week-ago loss. Latin America and Europe fueled world equity’s rebound. Bonds were broadly higher.Source: Lipper
Small Caps Lead ReboundDiversified stock funds, total returns through March 16 Sector funds Selected bond funds
Fund category YTD 1 week
Large-cap growth 2.76% 2.18%Large-cap core 4.50 2.53Large-cap value 5.41 2.73Multi-cap growth 4.44 2.60Multi-cap core 5.20 2.58Multi-cap value 5.70 2.76
Fund category YTD 1 week
Mid-cap growth 7.34% 2.95%Mid-cap core 6.44 2.96Mid-cap value 6.27 3.04Small-cap growth 9.55 3.17Small-cap core 9.21 3.25Small-cap value 8.32 3.24
Fund category YTD 1 week
S&P 500 funds 4.92% 2.63%Equity income 5.65 2.71Specialty diversified -0.90 0.10U.S. diversified equity 5.83 2.71World equity 8.67 3.50
Fund category YTD 1 week
Health/biotech 4.73% 1.58%Natural resources 8.06 6.06Science and technology 5.50 1.86Telecommunication 9.95 2.81Utility 5.69 3.11Financial services 5.61 2.98
Fund category YTD 1 week
Real estate 14.13% 3.77%Specialty/misc. 5.83 2.62Gold oriented 10.07 4.95
Fund category YTD 1 week
TIPS -0.75% 0.70%Interm. invest. grade 0.20 0.53GNMA 0.24 0.43Corp. debt A rated 0.09 0.50High yield 2.16 0.49World income 1.51 1.00General muni 0.82 0.25
—A—AARP Investment$ 8.3 bil 800–322–2282
D DWS Cap Gr r + 4 + 2 – 7 48.77n +.16A–DWS GlbThm +13 +12 +43 34.18n +.18E DWS IncGNMA 0 0 +15 14.76n –.01D DWS InvGrIn + 4 + 2 + 6 22.67n +.04E DWS MgdMuni r 0 + 1 +18 9.13n +.01E DWS Sh Bond + 1 + 1 + 8 9.94n ..E DWSCorePlIn 0 0 +16 12.66n ..
ABN AMRO Fds$ 5.6 bil 800–992–8151
D–Growth I + 5 + 3 0 23.65n +.08D–Growth N + 5 + 3 – 1 23.33n +.08B–Mid Cap N b + 7 + 6 +59 25.61n +.09D–Mont&CldGrI + 3 + 1 – 5 24.54n +.08D–Mont&CldGrN + 3 + 1 – 5 24.46n +.08A–TAMROSmlN b +17 +15 +91 18.92n ..B+Ver Agg Gr I + 9 + 6 .. 21.10n +.11B+Ver Agg Gr N + 8 + 6 0 20.84n +.11A+† AcadEmMkt +15 +15+260 29.20n +.24
Accessor Funds$ 867 mil 800–759–3504
D Growth + 4 + 2 + 5 25.57n +.04E Mort Secs 0 0 +14 12.34n –.01A–Small to Mid + 8 + 6 +67 30.33n +.09
Activa Funds$ 313 mil 800–346–2670
C+Value b + 5 + 4 +29 9.11n –.01Advance Cap I$ 1.0 bil 800–345–4783
D–Balanced b + 3 + 2 +23 18.40n +.01B–Equity Gr b + 6 + 4 +28 26.93n +.08E Retirement Inc 0 0 +23 9.74n –.01
AdvisorOne Funds$ 676 mil
C+Amerigo N + 6 + 5 +22 15.20n +.03D–Clermont N + 4 + 3 + 8 10.98n +.02B–† AegisVal + 5 + 5 +97 17.86n –.12
AFBA 5Star Funds$ 305 mil 800–243–9865
A Small Cap A m + 9 + 7 .. 17.98n +.14AIM Funds A$34.9 bil 800–959–4246
C AdvHlthSci b +13 +11 .. 18.84 +.05C Aggress Gr b + 9 + 7 + 8 11.94 +.05A AsianPacGr b +12 +12 +88 20.34 +.12D–Basic Bal b + 4 + 3 .. 12.74 +.01C Basic Value b + 5 + 4 +22 36.03 +.06D–Blue Chip b + 4 + 3 –12 12.57 +.05B Cap Dvlp b +10 + 8 +33 19.21 +.04D Charter b + 6 + 5 + 6 14.09 +.01D+Constlatn b + 5 + 4 0 26.13 +.11A+Develp Mkts b +15 +16+164 22.08 +.13C–Diverse Div b + 5 + 4 .. 13.06 +.01A+Energy b + 4 + 2 .. 42.26 –.39A+Euro Grwth b +14 +14 +80 35.66 +.15A+Euro Sm Co b +20 +21+209 26.02 +.14C–GlbHlthCare b + 7 + 6 +17 32.20 +.04A Glbl Agg Gr b +11 +11 +52 23.85 +.06B+Glbl Equity b + 8 + 7 +55 16.86 +.08C+Glbl Growth b + 8 + 7 +17 21.75 +.09
Grow Alloc b + 7 + 6 .. 13.13 +.04E Hi Inc Muni b + 1 + 2 +27 8.98 +.01D–High Yield b + 2 + 3 + 3 4.41 ..E Income b 0 0 +10 6.32 –.01A–Intl Growth + 9 +10 +47 25.68 +.09A+Intl Sml Co b +17 +18+221 23.93 ..E Intrmd Govt b 0 0 +11 8.62 –.01D+Leisure b + 4 + 4 .. 43.08 +.16D+Lrg Cap Gr m + 5 + 4 – 3 11.20 +.05C LrgBasVal b + 6 + 5 +21 15.18 +.02E LtdMatTrea b 0 0 + 8 10.03 –.01C Mid Core Eq b + 5 + 4 +40 29.98 +.07B MidBasicVal b + 4 + 3 .. 15.08 ..
Mod Alloc b + 5 + 4 .. 12.01 +.02B–MultiSector b + 5 + 4 .. 25.82 +.01E Muni Bond b 0 + 1 +18 8.06 ..D+Opportun I b + 4 + 2 + 7 12.65 +.02D Premier Eq + 5 + 4 –11 10.90 +.01A Real Estate b +16 +15+174 32.32 +.37C Select Eq r + 6 + 4 – 1 19.63 +.05B+Sml Cap Eq b + 9 + 7 +66 13.38 –.02B–Sml Cap Gr b +10 + 8 +20 30.20 +.09E Tax Free Int b 0 + 1 +13 10.97 ..D+Technology b + 6 + 4 .. 27.82 +.08
TrmrkSmCos b + 6 + 5 .. 15.08 +.01B Utilities b + 5 + 4 .. 14.34 –.06C–Weingarten b + 6 + 4 –11 14.82 +.06
AIM Funds B$10.7 bil 800–959–4246
C–Aggress Gr m + 8 + 7 + 4 11.24n +.05D–Basic Bal m + 4 + 3 .. 12.69n +.01C Basic Value m + 5 + 4 +18 33.73n +.05D–Blue Chip m + 4 + 2 –14 11.83n +.04B–Cap Dvlp m + 9 + 8 +28 17.59n +.03D Charter m + 6 + 4 + 3 13.53n +.01D Constellatn m + 5 + 3 – 3 24.25n +.09A+Energy m + 4 + 2 .. 41.02n –.38A+Euro Grwth m +14 +14 +74 33.86 +.15D+GlbHlthCare b + 7 + 5 +14 29.02n +.04A Glbl Agg Gr m +11 +11 +48 22.10n +.06D–High Yield m + 2 + 3 + 1 4.42n ..E Income m 0 0 + 7 6.32n –.01A–Intl Growth + 9 + 9 +42 23.93n +.08E Intrmd Govt m 0 0 + 9 8.65n –.01C–Mid Core Eq m + 5 + 4 +34 26.44 +.06
Mod Alloc m + 4 + 4 .. 11.94 +.02D–Premier Eq + 5 + 3 –14 10.03n +.02A Real Estate m +16 +15+168 32.39n +.37B Sml Cap Eq m + 9 + 7 +60 12.82n –.02D+Weingarten m + 6 + 4 –14 13.47n +.05
AIM Funds C$ 3.8 bil 800–959–4246
D–Basic Bal m + 4 + 3 .. 12.70n +.01C Basic Value m + 5 + 4 +18 33.73n +.05D–Blue Chip m + 4 + 2 –14 11.83n +.04D Constellatn m + 5 + 3 – 3 24.25n +.10A+Energy m + 4 + 2 .. 40.36n –.37A–Intl Growth b + 9 + 9 +42 23.95n +.08C–Mid Core Eq m + 5 + 4 +34 26.41n +.06D–Premier Eq m + 5 + 3 –14 10.04n +.02A Real Estate m +16 +15+168 32.32n +.37E Sh Trm Bd r 0 + 1 .. 9.85n –.01
AIM Funds Instl$ 1.6 bil 800–554–1156
C+Basic Value + 5 + 4 .. 36.83n +.06C–Constlatn + 6 + 4 .. 28.46n +.12
A–Intl Growth + 9 +10 .. 25.98n +.08Totl Ret Bd 0 0 .. 10.31 –.02AIM Funds Investor$ 9.1 bil 800–554–1156Basic Bal b + 4 + 3 .. 12.73 ..Diverse Div b + 5 + 4 .. 13.06 +.01
B–Dynamics + 9 + 8 – 1 19.86n +.05A+Energy + 4 + 2 +116 42.16n –.39
Euro Grwth b +14 +14 .. 35.61 +.15D+Finl Svcs + 4 + 3 +19 28.68n +.01
GlbHlthCare b + 7 + 6 .. 32.20 +.04A–Gold&Prec + 8 +10+262 5.23 ..
High Yield b + 2 + 3 .. 4.41 ..D+Leisure + 4 + 4 +20 43.01n +.16
Lrg Cap Gr b + 5 + 4 .. 11.27 +.05Muni Bond b 0 + 1 .. 8.07 ..
D+S&P500Idx m + 5 + 3 + 6 13.77n +.02B–Small Co Gr b +11 +10 +10 14.72n +.03D+Technology + 6 + 4 –39 27.56n +.08
AIM Funds P$ 2.4 bil 800–959–4246
C+Summit P b + 5 + 4 + 1 12.63n +.03A+† Al Frank m + 7 + 6+104 32.57 +.04
Alger Funds A$ 876 mil 800–992–3863
C+Capital Appr + 6 + 4 + 4 10.39 +.05C–Large Cp Gr + 1 – 1 – 3 11.09 +.05B Mid Cap Gr + 6 + 4 +23 9.14 +.04A–Small Grow +11 +10 +25 6.07 +.03
Alger Funds B$ 865 mil 800–992–3863
C Cap Appr m + 6 + 4 0 9.63n +.04D+Lg Cap Gr m + 1 – 1 – 7 10.23n +.05B–Mid Cap Gr m + 6 + 4 +18 8.32n +.04
Alger Instl$ 152 mil 800–992–3863
C Cap Appr + 6 + 4 + 6 14.82n +.06Allegiant A$ 518 mil 800–622–3863
D–LargeCapGr b + 3 + 2 –14 20.16 +.04B Multi SmVal +12 +10 +66 20.38 +.09
Allegiant I$ 5.0 bil 800–622–3863
D Bal Alloc b + 4 + 3 +17 10.85n +.01E Bond b 0 0 +17 9.91n –.01E Govt Mort 0 + 1 +14 9.07n –.01B+Intl Equity b +11 +11 +23 14.07n +.10E Intrmd Bond b 0 0 +16 10.49n –.01C Lg Cap Val b + 6 + 5 +31 19.01n +.01D LgCapCore I b + 5 + 3 + 9 12.73n +.01D–LgCapGro I b + 3 + 2 –13 20.45n +.04E Ltd Mat Bd b 0 + 1 +11 9.74n –.01B Multi SmVal b +12 +10 +68 21.43n +.09E OHIntTaxBd 0 + 1 +13 11.05n +.01D+S&P500Indx b + 5 + 3 + 8 11.27n +.02
SmallCpCore b +11 + 9 .. 12.74n ..E Tot Retrn b 0 0 +19 10.07n –.01E Ultra Sh Bd + 1 + 1 .. 9.85n ..
Alliance Brnstn A$18.5 bil 800–227–4618Bal Wealth b + 5 + 4 .. 12.88 +.03
D–Balanced b + 3 + 2 +21 17.13 ..E Corp Bond b 0 0 +16 11.82 ..C–EmMktDebt b + 2 + 3 +79 8.89 –.01D+Foc Gr Inc b + 4 + 2 +19 15.05 +.04C–Global Tech b + 4 + 2 –21 62.03 +.27
D–GloblGovInc + 1 + 1 +29 7.68 –.02C–Gr & Inc b + 4 + 3 + 9 4.01 ..B–Growth b + 1 0 + 8 38.23 +.20A+Intl Growth b +11 +11 +84 17.56 +.13A Intl Val b +12 +11 .. 20.09 +.09D+Lrg Cp Grow b + 1 – 1 –13 20.93 +.05A MidCapGr b + 8 + 6 +39 6.89 +.02E MultMkStr m 0 0 + 1 5.28 –.01E Mun II FL b 0 + 1 +20 10.26 ..E Mun Insrd b 0 + 1 +19 10.22 ..E Muni CA b + 1 + 1 +18 10.97 ..E Muni Natl b + 1 + 1 +16 10.11 ..E Muni NY b + 1 + 1 +17 9.88 –.01A Real Estate b +18 +17+146 25.97 +.28B+Sm Cap Gr +12 +11 +33 27.43 +.05B+Sml Mid Val + 6 + 5 .. 16.81 –.01D–TaxMgdBal b + 3 + 2 + 5 12.13 +.02E US Govt b – 1 – 1 +10 6.83 –.01C–Value + 6 + 5 .. 13.21 ..
Wealth Appr b + 7 + 6 .. 14.44 +.05Wealth Pres b + 3 + 3 .. 11.58 +.02Alliance Brnstn Adv$ 2.7 bil 800–227–4618
B+Glob Val m +10 + 9 .. 15.02n +.04C–Gr & Inc + 4 + 3 +10 4.03n +.01A Intl Val +13 +12 .. 20.36n +.09C–Lrg Cp Grow + 1 – 1 –12 21.64n +.06B Sm Mid Cap + 6 + 5 .. 17.00n –.02C Value m + 6 + 5 .. 13.28 ..
Wealth Appr + 7 + 6 .. 14.46n +.04Alliance Brnstn B$ 8.9 bil 800–227–4618Bal Wealth m + 5 + 4 .. 12.82n +.03
D–Balanced m + 3 + 2 +18 16.23n ..E Corp Bond b 0 0 +13 11.80n –.01D Foc Gr Inc m + 4 + 2 .. 14.46n +.03D+Global Tech m + 3 + 2 –24 55.73n +.24D–GloblGovInc + 1 + 1 +26 7.68n –.02D+Gr & Inc b + 4 + 3 + 7 3.94n +.01C+Growth m + 1 0 + 4 26.40n +.14A Intl Val m +12 +11 .. 19.82n +.08D Lrg Cp Grow m 0 – 2 –16 18.80n +.05E Muni NY b + 1 + 1 +14 9.87n –.01B+Sml Mid Val m + 6 + 5 .. 16.34n –.02C–Value m + 6 + 5 .. 13.17n ..
Wealth Appr m + 7 + 6 .. 14.30n +.04Alliance Brnstn C$ 4.9 bil 800–227–4618Bal Wealth m + 5 + 4 .. 12.82n +.03
D–Balanced m + 3 + 2 +18 16.30n ..D+Global Tech m + 3 + 2 –24 55.80n +.24D–GloblGovInc + 1 + 1 +26 7.70n –.02D+Gr & Inc m + 4 + 3 + 7 3.95n +.01C+Growth m + 1 0 + 4 26.47n +.14A Intl Val m +12 +11 .. 19.82n +.08D Lrg Cp Grow m 0 – 2 –16 18.86n +.05B–Sml Cap Val m + 6 + 5 .. 16.34n –.01
Wealth Appr m + 7 + 6 .. 14.30n +.04Alliance Brnstn I$ 2.1 bil 800–227–4618Intl Value +13 +12 .. 20.10 +.09
E Intmd Dur 0 0 .. 15.03n –.02A Real Estate +18 +16+137 16.46n +.18
Allianz A$ 5.7 bil 800–426–0107
B–CCM Mid Cap + 6 + 5 +26 28.25 +.11C–CCMCapAppr + 6 + 5 +11 20.56 +.07
NFJ Div Val m + 7 + 6 .. 15.26 +.01B–NFJSmlCpVal + 8 + 6 +94 31.21 +.06C–OCC Value + 4 + 3 +23 16.37 +.07
B+OCCRenaiss + 6 + 5 +45 22.73 +.07B–PEA Target + 8 + 7 + 4 20.91 +.08
Allianz Admin$ 1.1 bil 800–426–0107
B CCM Mid Cap b + 6 + 5 +26 28.56n +.10C–CCMCapAppr b + 7 + 5 +12 20.63n +.07B+OCCRenaiss b + 6 + 5 .. 23.00n +.06
Allianz B$ 2.4 bil 800–426–0107NFJ Div Val m + 7 + 6 .. 15.14n +.01
C+NFJSmlCpVal + 8 + 6 +87 30.27n +.06D+OCC Value m + 4 + 3 +18 15.77n +.06B+OCCRenaiss + 6 + 5 +39 20.92n +.06A RCM GlbTech m + 5 + 3 .. 39.72n +.14
Allianz C$ 4.5 bil 800–426–0107
D AMMAsstAllo m + 4 + 4 .. 12.05n +.02B–CCM Mid Cap + 6 + 4 +21 26.38n +.10C–CCMCapAppr + 6 + 5 + 7 19.23n +.07
NFJ Div Val m + 7 + 6 .. 15.12n ..C+NFJSmlVal b + 8 + 6 +88 30.30n +.06D+OCC Value m + 4 + 3 +18 15.80n +.07B+OCCRenaiss m + 6 + 5 +38 20.76n +.06D PEA Growth m + 5 + 4 –15 19.74n +.06A PEA Opportn m +14 +11 +42 21.51n +.01B–PEATarget m + 8 + 7 + 1 18.12n +.07A RCM GlbTech m + 5 + 3 .. 39.70 +.14
Allianz D$ 812 mil 800–426–0107
C+RCM Biotech b + 7 + 5 – 4 27.40n +.13A RCM GlbTech b + 5 + 3 + 3 40.60n +.14
Allianz Instl$ 3.9 bil 800–426–0107
B CCM Mid Cap + 6 + 5 +28 29.17n +.11C CCMCapApprc + 7 + 5 +13 21.08n +.07A–CCMEmergCos +11 + 9 +78 25.61n +.03B–NFJ Div Val + 7 + 6 +65 15.42n +.01B+NFJSmlCpVal + 8 + 6+111 32.13n +.06A RCM GlbTech + 5 + 3 + 5 41.62n +.15A RCM GlbTech m + 5 + 3 .. 40.99 +.15D RCM Lrg Gr + 3 + 2 – 3 14.54n +.02E † AlphaHedg r + 6 + 5 .. 12.82n +.03
Alpine Funds$ 2.2 bil 888–785–5578Dynamic Div r + 8 + 7 .. 12.93 +.04
A+Intl RealEst +15 +16+161 34.89n +.24A–RltyInc&GrY +12 +12+138 25.68n +.19A+US Real Est + 2 + 1+215 41.80n +.73
Am Beacon AMR$ 1.8 bil 800–388–3344
A Intl Equity + 9 + 9 +49 22.82n +.12B Large Cap Val + 6 + 4 +51 21.75n +.04A Sml Cap Val + 8 + 6+117 21.84n +.06
Am Beacon Inst$ 3.7 bil 800–388–3344
D–High Yld Bd + 3 + 3 +33 10.21n ..A Intl Equity + 9 + 9 +48 22.69n +.12B Large Cap Val + 6 + 4 +50 22.00n +.04D+S&P 500 + 5 + 3 + 8 17.78n +.03A Sml Cap Val + 8 + 6+118 21.93n +.07
Am Beacon Pln$ 3.4 bil 800–388–3344
A Intl Equity + 9 + 9 +47 22.48n +.12B Large Cap Val + 6 + 4 +48 21.07n +.03A Sml Cap Val + 7 + 6+115 21.51n +.06
Amana Funds$ 192 mil 800–728–8762
A–Growth + 7 + 6 +49 19.18n +.08Amer Cent A$ 731 mil 800–345–2021
C–Lrg Co Val b + 5 + 3 .. 6.80 ..Amer Cent Adv$ 6.4 bil 800–345–2021
C Equity Gr b + 4 + 3 +19 24.29n –.03D Equity Inc b + 5 + 4 +43 8.16n +.01C–Inc & Gr b + 4 + 2 +16 31.23n ..E Infltn Adj b – 1 – 1 .. 10.86n –.02B–Intl Growth b + 9 + 9 +11 11.01n +.08C–Lrg Co Val b + 5 + 3 .. 6.79n ..A Real Estate b +16 +15 .. 29.48n +.23A+Small Co + 9 + 7 .. 10.60n ..B+Sml Cap Val b + 7 + 6 .. 10.30n +.02D Str Alloc Mod b + 4 + 3 +24 6.96n +.01C–StrAllocAgg b + 5 + 4 +25 8.23n +.01D–StrAllocCon b + 2 + 2 +18 5.60n ..D–Ultra b 0 – 2 + 1 29.78n +.05C Value b + 5 + 4 +38 7.24n +.02B Vista b + 7 + 5 +24 16.65n +.06
Amer Cent Instl$ 8.1 bil 800–345–2021
E Divers Bd 0 0 +16 9.97n –.01C Equity Growth + 4 + 3 +21 24.31n –.03
D Equity Income + 5 + 4 .. 8.16n +.01D+Equity Index + 5 + 3 + 8 5.21n +.01D Growth + 3 + 2 .. 21.45n +.09C–Income & Gr + 4 + 3 +18 31.26n ..A+Intl Disc r +12 +13 +61 16.30n +.15B Intl Growth + 9 + 9 +13 11.04n +.07
Lrg Co Val + 5 + 3 .. 6.79n ..A Real Estate +16 +15+149 29.47n +.24D–Select 0 – 1 – 7 38.61n +.01B+Sm Cp Value + 7 + 6 .. 10.33n +.03A+Small Co + 9 + 8 .. 10.71n ..D–StrAllocCon + 3 + 2 .. 5.60n ..D StrAlloMod + 4 + 3 .. 6.96n +.01D Ultra 0 – 1 + 3 30.54n +.06C Value + 5 + 4 +40 7.25n +.02
Amer Cent Inv$64.6 bil 800–345–2021
D–Balanced + 3 + 2 +19 16.42n –.02E CA Hi Yld + 1 + 2 +26 10.24n ..E CA LgTmTxFr + 1 + 1 +18 11.36n ..E CA LtdTmTxFr 0 + 1 +10 10.43n ..E CA TxFreeBd 0 + 1 +14 11.14n ..C–Capital Val + 5 + 4 +36 7.53n ..E Divers Bd 0 0 +16 9.97n –.01A+Emerg Mkts +13 +14+100 8.34n +.04C Equity Growth + 4 + 3 +20 24.30n –.03D Equity Income + 5 + 4 +44 8.15n ..D+Equity Index + 5 + 4 + 7 5.21n +.01C+Giftrust +10 + 8 + 7 20.38n +.08E Ginnie Mae 0 0 +13 10.18n –.01B+Glbl Gold Eq + 8 +12+310 16.73n –.04B+Glbl Growth + 9 + 8 +28 9.91n +.08E Govt Bond – 1 – 1 + 9 10.40n –.01D Growth + 3 + 2 + 1 21.28n +.09B–Heritage +10 + 8 +21 15.80n +.06C–Income & Gr + 4 + 3 +17 31.25n ..E Infltn Adj – 1 0 +30 10.87n –.02E Intl Bond + 1 + 1 +45 13.12n –.01A+Intl Disc r +12 +13 +60 16.19n +.15B–Intl Growth + 9 + 9 +12 11.02n +.07A+Intl Oppor +11 +12 .. 11.23n +.11D+Life Sciences + 3 + 2 +11 5.55n +.02C Lrg Co Val + 5 + 3 .. 6.79n ..C New Opport r +11 + 9 + 7 6.60n +.03A Real Estate +16 +15+148 29.44n +.23D–Select 0 – 1 – 8 38.33n +.01E ShTerm Govt 0 + 1 + 9 9.35n ..B+Sm Cp Value + 7 + 6 +92 10.31n +.03A+Small Co + 9 + 7+130 10.69n ..C–Str Alloc Agg + 5 + 4 +26 8.24n +.02D–StrAllocCon + 2 + 2 +19 5.60n ..D StrAllocMod + 4 + 3 +25 6.97n +.01E Target 2010 0 0 +19 87.87n –.07E Target 2015 – 2 – 2 +32 75.22n –.18E Target 2020 – 3 – 3 +22 57.19n –.25E Target 2025 – 4 – 4 +41 50.12n –.26E Tax Free 0 + 1 +16 10.74n ..C+Technology + 8 + 8 –14 21.84n –.02D Ultra 0 – 1 + 2 30.21n +.06B Utilities + 4 + 3 + 4 13.91n –.06C Value + 5 + 3 +39 7.24n +.02C+Veedot r + 8 + 6 +23 6.30n +.01B+Vista + 7 + 5 +26 16.96n +.06
1ChoiceAggr + 5 + 5 .. 12.05n +.021ChoiceMod + 4 + 4 .. 11.52n +.02Amer Express A$ 4.3 bil 800–328–8300
D+Div Oppor + 6 + 5 – 9 7.89 –.01E Hi Yld Tax Ex 0 + 1 +16 4.38 ..
Amer Express B$ 197 mil 800–328–8300
E HiYldTxEx 0 + 1 +13 4.38n ..Amer Indepen$ 468 mil 888–266–8787
E KS TxExBd I + 1 + 1 +14 10.67n ..Amer Perform$ 294 mil 800–762–7085
E Sh Trm Inc 0 + 1 +14 10.12 ..American Fds A$ 598 bil 800–421–4120
D+AMCAP b + 3 + 2 +21 19.78 +.02D–Balanced b + 4 + 3 +31 18.35 +.01E Bd Fd Am b 0 + 1 +22 13.18 –.01D+CapIncBldr b + 5 + 4 +50 55.58 –.03B+CapWld G&I x + 6 + 6 +61x 38.67 –.07E CapWrldBd x + 1 + 1 +42x 18.58 –.14A EuroPac Gr b + 7 + 7 +54 43.97 +.19B–Fundmntl b + 7 + 6 +31 37.70 +.02C+Gr Fd Amer b + 4 + 3 +26 32.02 +.03E High Inc Muni + 1 + 1 +21 15.61 ..D–High Income b + 3 + 4 +27 12.29 ..D IncFd Amer b + 5 + 4 +36 19.00 ..
E Interm Bond b 0 0 +12 13.38 –.01D+Inv Co Am b + 5 + 4 +20 32.78 +.01E Ltd Tax Ex b + 1 + 1 +15 15.21 ..D Mutual x + 5 + 4 +28x 27.34 –.13B New Econ b + 4 + 3 +14 24.30 +.03B New Pers b + 5 + 5 +37 30.11 +.03A+New World +11 +12+100 43.02 +.16A Sm Cp Wrld b +10 + 9 +54 38.64 +.09E Tax Ex CA b + 1 + 1 +19 16.69 ..E Tax Ex MD b 0 0 +17 16.02 ..E Tax Ex VA b 0 0 +16 16.47 ..E Tax ExBdAm b + 1 + 1 +20 12.43 ..E US Gov Sec b 0 0 +14 13.35 –.02D Wash Mutl x + 6 + 4 +22x 32.39 –.15
American Fds B$39.4 bil 800–421–4120
D AMCAP m + 3 + 2 +17 19.11n +.02D–Balanced m + 3 + 2 +27 18.30n +.01E BondFdAm m 0 + 1 +19 13.18n –.01D CapIncBldr m + 5 + 4 +45 55.58n –.03B+CpWrldG&I x + 6 + 6 +58x38.52n +.01A–EuroPac Gr m + 7 + 7 +50 43.50n +.19B–Fundmntl m + 7 + 5 +28 37.64n +.02C+Gr Fd Amer m + 4 + 3 +22 31.03n +.03D–Hi Inc Tr m + 2 + 4 +23 12.29n ..D Inc Fd Am m + 5 + 4 +31 18.90n ..E Interm Bond m 0 0 + 9 13.38n –.01D Inv Co Am m + 5 + 4 +18 32.66n ..D Mutual x + 4 + 3 +25x27.19n –.07B–New Econ m + 3 + 3 +10 23.41n +.03B–New Pers m + 5 + 5 +33 29.65n +.03A New World m +11 +11 +94 42.41n +.16A SmCpWrld m + 9 + 9 +49 37.35n +.09E US Gov Sec m – 1 0 +11 13.35n –.02D Wash Mut x + 5 + 4 +19x32.23n –.09D–† Ameristock + 5 + 4 + 4 40.57n +.06
Aquila Funds$ 2.1 bil 800–228–4227
E AZ Tax Free A 0 0 +17 10.62 ..E CO Tax Free A 0 0 +14 10.38 ..E HI Tax Free A + 1 + 1 +16 11.39 ..E KY Tax Free A 0 + 1 +17 10.57 ..E OR Tax Free A 0 0 +17 10.82 ..E UT Tax Free A + 1 + 1 +21 10.10 ..
Ariel Mutual Fds$ 8.0 bil 800–292–7435
C Appreciation + 3 + 2 +54 48.08n –.03C+Ariel + 7 + 7 +71 53.69n +.15
Artisan Funds$22.6 bil 800–344–1770
A–Intl + 9 + 9 +34 27.64n +.23A+Intl Val I r +14 +14 .. 25.13n +.10A+IntlSmlCap r +13 +14 .. 22.44 +.20C+Mid Cap + 6 + 5 +28 32.92n +.07A–Mid Cap Val + 4 + 3 .. 19.41n +.06A–Small Cap +10 + 8 +55 19.05n +.01A–Small Cap Val + 6 + 5 +93 18.35n +.05
Asset Mgmt Fds$ 3.4 bil 800–527–3713
E IntermdMrtg 0 + 1 +10 9.25n ..E Short US Govt 0 + 1 +10 10.35n ..E Ultra Short b + 1 + 1 .. 9.73n ..E UltraShMort + 1 + 1 + 8 9.68n ..E US Govt Mortg 0 + 1 +13 10.16n –.01
AssetMark Funds$ 3.2 bil 800–664–5345
E Cor Pl Fxd b 0 0 .. 9.27n –.01A–Intl Eqty b + 9 + 9 .. 13.85n +.10D Lrg Cap Gr b 0 – 2 .. 9.98n +.05C Lrg Cap Val b + 6 + 4 .. 11.86n +.02C+Sml Mid Gr b +10 + 8 .. 10.35n +.03B–Sml Mid Val b + 7 + 6 .. 14.35n +.03E TxExFixdInc b 0 0 .. 10.89n +.01
Atlantic Whitehall$ 233 mil 800–994–2533Intl Instl + 9 + 9 .. 13.97n +.09Atlas Funds$ 2.6 bil 800–933–2852
E CA Muni Bond + 1 + 1 +17 11.62n ..A–Glbl Gro A m + 7 + 6 +42 25.30 +.13D+Gr Opps A + 4 + 3 +14 24.82n +.06E Natl Muni b + 1 + 1 +20 11.80 ..E Strat Inc b + 2 + 2 +26 4.55n ..E US Govt Secs 0 0 +13 9.88n –.01
—B—Bailard Funds$ 418 mil 800–882–8383
D+Enhanced Gr + 2 0 .. 9.19n +.03A Intl Equity +11 +10 +64 8.44n +.07
Baird Funds$ 535 mil 800–792–2473
E Aggregte Bond 0 0 +21 10.48n –.01
E IntmBdInst 0 0 +16 10.50n –.01Barclays Glob Inv$ 2.3 bil 888–204–3956
E Bond Index 0 0 +18 9.57 –.01D–Lfpth 2010 I + 3 + 3 +16 13.34n +.02D+Lfpth 2030 I + 5 + 4 +15 16.21n +.04D Lfpth2020 I + 4 + 4 +18 16.56n +.04C–Lfpth2040 I + 6 + 5 +17 19.29n +.06D+S&P 500 Stock + 5 + 3 + 7 157.80n +.23
Baron Funds$11.8 bil 800–992–2766
B+Asset + 7 + 6 +33 60.50n +.42B Cap Asset b + 9 + 8 +69 30.46 +.09B+Growth + 9 + 8 +84 49.60n +.22A+iOpport m + 5 + 3 +75 10.23n +.05A+Partners b +11 +10 +68 20.41n +.14B+Small Cap + 9 + 8 +84 25.22n +.20
BB & T Funds$ 3.1 bil 800–228–1872
B–Intl Equity + 9 + 8 +13 10.98n +.07E Intrm US Gov 0 + 1 +14 9.88n –.01D–Lrg Co Gr Tr + 3 + 1 –11 9.49n +.04C Lrg Co Val Tr + 7 + 6 +24 19.49n –.02B Md Cp Val + 7 + 6 +46 13.19n +.02A–MidCapGr Tr + 8 + 7 +29 14.56n +.02E Sh US Govt + 1 + 1 + 8 9.44n –.01E TotRetBdIns 0 0 +17 10.12n –.01
BBH Funds$ 1.3 bil 800–625–5759
E BrdMktFxd 0 0 .. 10.13 –.02E Idx Sec N – 1 – 1 +30 10.56n –.01B Intl Eq N + 8 + 8 +21 14.37n +.08
Bernstein Funds$22.4 bil 212–756–4097
E CA Muni 0 0 +12 14.14n +.01E Diversifd Muni 0 0 +13 13.97n ..A+Emerg Mkts +12 +12+216 39.36n +.13A–Intl Value II +10 + 9 +57 26.39n +.14E Intrmd Dur 0 0 +17 13.08n –.01E NY Muni 0 0 +13 13.80n ..E Sh Dur Plus 0 0 +11 12.28n –.01E ShDurDivMuni 0 0 + 8 12.46n ..A–Tx Mg Intl Val +10 +10 +55 26.53n +.13
Berwyn Funds$ 431 mil 800–992–6757
A Berwyn + 4 + 2+124 30.89n +.12E Income + 2 + 2 +43 12.13n +.02
Bishop Street$ 569 mil 800–262–9565
E Hi Grd Inc Ins – 1 0 +18 9.94n –.02E HI Muni Bond 0 + 1 +18 10.74n ..C+StratGr Ins + 4 + 3 .. 14.99n +.03
Bjurman, Barry Fds$ 609 mil 800–227–7264
A MicroCapGr b + 4 + 2+102 31.97n +.03Blackrock A$ 7.5 bil 800–441–7762AllGloblRes + 8 + 7 .. 14.32 –.09
D Asset Alloc b + 4 + 3 +12 15.62 +.02B+Aurora + 7 + 6 +56 36.48 +.12E CorBdTotRe 0 0 +16 9.45 –.01A+Glob Res + 5 + 4+295 69.73 –.41E Govt Inc 0 0 +21 10.72 –.02A Health Sci b + 7 + 5 .. 25.83 –.09D–Hi Yld Bd + 2 + 2 +26 7.90 ..D+Index Equity b + 5 + 3 + 7 25.04 +.04E Intl Bond + 1 + 1 +20 10.83 +.03A+Intl Opport b +10 +10+119 39.20 +.36E IntmdGovtBd 0 0 +12 10.14 –.01D+InvestTrust b + 5 + 3 – 1 13.55 +.01C+LgCapValInv b + 7 + 5 +13 15.69 +.01C+Mid Cap Gr + 6 + 4 + 4 10.63 +.01B MidCapValEq + 6 + 5 +39 13.04 +.02A–Sm Cap Gr b +10 + 8 +10 17.92 +.05B SmlMidGrow + 8 + 7 +56 15.53 ..
BlackRock B$ 2.0 bil 800–441–7762
D–Asset Alloc + 4 + 3 + 9 15.45n +.03B Aurora m + 7 + 5 +50 32.58n +.11D Index Equity b + 5 + 3 + 4 24.58n +.04D+InvestTrust + 5 + 3 – 4 12.94n +.01B MidCpValEq m + 6 + 5 +34 12.20n +.02
BlackRock BlRk$ 3.7 bil 800–441–7762
E Core Bd Tot + 1 0 +18 9.46n –.01E CorPlsTotRe .. .. no quoteD–Exchange + 6 + 5 + 7 570.37 +.88D Hi Yld Bd + 3 + 3 +29 7.90n ..E Intermd Bond + 1 + 1 +17 9.19n –.01E Low Dur Bond + 1 + 1 +11 9.86n ..
BlackRock C$ 1.5 bil 800–441–7762
B Aurora m + 7 + 5 +50 32.57n +.11A+Glob Res m + 5 + 4+280 62.71n –.37D Index Equity r + 5 + 3 + 4 24.56n +.03A+Intl Opport m + 9 + 9+111 37.39n +.35
BlackRock Instl$ 6.3 bil 800–441–7762
B+Aurora + 7 + 6 .. 38.19n +.13E Core Bd Tot 0 0 +17 9.44n –.01D–High Yield Bd + 3 + 3 +29 7.90n ..D+Index Equity + 5 + 3 + 9 25.23n +.03E Intermd Bond + 1 0 +17 9.19n –.01E Intl Bond + 1 + 1 +22 10.82n +.02A+Intl Opport +10 +10+123 40.41n +.37E IntmdGovtBd + 1 0 +14 10.12n ..C–InvestTrust + 5 + 3 0 13.72n +.01E Low Duration + 1 + 1 +11 9.87n ..E Managed Inc 0 0 +17 9.97n –.02E NJ Tax Free + 1 + 1 +16 11.43n +.01E PA Tax Free + 1 + 1 +12 10.29n ..A–Sm Cap Gr +10 + 8 +12 19.24n +.05E Tax Free Inc + 1 + 1 +13 10.88n ..
BlackRock Svc$ 1.4 bil 800–441–7762
E Core Bd Tot 0 0 +16 9.44n –.01Govt Income 0 0 .. 10.71 –.02
D–Hi Yld Bd + 2 + 2 +27 7.90n ..E Low Duration + 1 + 1 +10 9.87n ..
BNY Hamil Inst$ 3.0 bil 800–426–9363High Yield + 1 + 1 .. 9.81n +.01
B+Intl Equity r + 9 + 8 +19 13.72n +.08E Intrmd TxEx 0 0 +12 9.83n ..E ItmdInvCorBd 0 0 +13 9.90n –.01D–Large Cap Gr + 3 + 2 –19 8.00n +.02D LargeCapEq + 6 + 4 + 6 14.17n +.02C–Lrg Cap Val + 7 + 5 .. 11.94n +.02D Small Cap Gr + 8 + 7 + 8 16.02n +.01
SmlCpCoreEq +10 + 8 .. 12.23n +.04Bogle Funds$ 367 mil 781–283–5000
A+SmCapGr Inst +12 +11 +96 29.86n +.06A SmCapGr Inv +12 +11 +95 29.68n +.06E † Boston Bal + 3 + 2 +22 29.34n +.06
Bramwell Funds$ 150 mil 800–272–6227
D–Growth b + 6 + 4 – 8 19.45n +.05Brandes$ 743 mil 800–237–7119
A Intl Eq Inst + 9 + 8 +49 23.39n +.14Brandywine Fds$ 5.9 bil 800–656–3017
B–Advisors b + 6 + 5 +22 11.07n +.03C+Blue + 8 + 7 +26 32.05n +.09B–Brandywine + 8 + 7 +22 33.69n +.09
Bridgeway Fds$ 2.7 bil 800–661–3550
A Aggr Inv 2 +10 + 8 .. 18.09n ..A Aggrsv Inv 1 + 9 + 6 +61 61.34n –.03
Sm Cap Gr N + 8 + 6 .. 14.67n +.02Sm Cp Val N +11 + 9 .. 15.91n +.03
A+Ultra Small Co +13 +10+164 40.55n –.14A+UltSmCoMkt + 9 + 8+190 19.54n ..C–† Brown SmCo + 9 + 8 +14 34.08n +.20† Bruce + 9 + 7 .. 395.83n –1.31Buffalo Funds$ 3.0 bil 800–492–8332
C–Balanced + 5 + 4 +26 10.83n ..D–High Yield + 3 + 3 +30 11.28n +.03A–Mid Cap + 5 + 4 .. 15.26n +.06A Small Cap +10 + 8 +97 27.88n +.23E † BuildrFxInc – 1 – 1 – 2 14.32n –.02
—C—E † C&O MktOpp + 1 + 1 – 8 17.07n +.04
Calamos Funds$27.9 bil 800–823–7386
D–Convert A b + 4 + 3 +24 19.91 –.01D–Convert B b + 3 + 2 .. 22.83n –.01D–Convert C m + 3 + 2 +20 19.93n –.01C–Glb Gr&Inc m + 5 + 5 +40 9.90n +.05C–GlbGr&Inc A b + 5 + 5 +45 10.08 +.04C GlbGr&Inc I r + 5 + 5 +47 10.13n +.04D Gr & Inc A b + 5 + 4 +46 32.43 +.05D Gr & Inc B b + 5 + 4 .. 35.93n +.05D Gr & Inc C m + 5 + 4 +43 32.59n +.05B Growth A b + 4 + 2 +55 57.47 +.12B Growth B m + 4 + 2 .. 59.06n +.12B Growth C m + 4 + 2 +49 54.78n +.12D–High Yld A b + 4 + 4 .. 10.83 +.01E Mkt Neut A b + 3 + 3 +14 12.65 ..
California Fds$ 502 mil 800–225–8778
E CA Tax Fr Inc 0 + 1 +11 11.92n ..B S&P Mid Idx + 6 + 5 +59 24.01n +.07

INVESTOR'S BUSINESS DAILY MUTUAL FUND PERFORMANCE MONDAY, MARCH 20, 2006 A13
36 Mos 2006 12 Wk 5 Yr NetPerformance % % After Asset NAVRating Fund Chg Chg Tax Rtn Value Chg
36 Mos 2006 12 Wk 5 Yr NetPerformance % % After Asset NAVRating Fund Chg Chg Tax Rtn Value Chg
36 Mos 2006 12 Wk 5 Yr NetPerformance % % After Asset NAVRating Fund Chg Chg Tax Rtn Value Chg
36 Mos 2006 12 Wk 5 Yr NetPerformance % % After Asset NAVRating Fund Chg Chg Tax Rtn Value Chg
36 Mos 2006 12 Wk 5 Yr NetPerformance % % After Asset NAVRating Fund Chg Chg Tax Rtn Value Chg
36 Mos 2006 12 Wk 5 Yr NetPerformance % % After Asset NAVRating Fund Chg Chg Tax Rtn Value Chg
36 Mos Fund 2006 12 wk 5 Yr Net NAVPerformance % % After Asset ChgRating Chg Chg Tax% Value
36 Mos Fund 2006 12 wk 5 Yr Net NAVPerformance % % After Asset ChgRating Chg Chg Tax% Value
36 Mos Fund 2006 12 wk 5 Yr Net NAVPerformance % % After Asset ChgRating Chg Chg Tax% Value
36 Mos Fund 2006 12 wk 5 Yr Net NAVPerformance % % After Asset ChgRating Chg Chg Tax% Value
36 Mos Fund 2006 12 wk 5 Yr Net NAVPerformance % % After Asset ChgRating Chg Chg Tax% Value
36 Mos Fund 2006 12 wk 5 Yr Net NAVPerformance % % After Asset ChgRating Chg Chg Tax% Value
36 Mos Fund 2006 12 wk 5 Yr Net NAVPerformance % % After Asset ChgRating Chg Chg Tax% Value
36 Mos Fund 2006 12 wk 5 Yr Net NAVPerformance % % After Asset ChgRating Chg Chg Tax% Value
36 Mos Fund 2006 12 wk 5 Yr Net NAVPerformance % % After Asset ChgRating Chg Chg Tax% Value
36 Mos 2006 12 Wk 5 Yr NetPerformance % % After Asset NAVRating Fund Chg Chg Tax Rtn Value Chg
36 Mos 2006 12 Wk 5 Yr NetPerformance % % After Asset NAVRating Fund Chg Chg Tax Rtn Value Chg
36 Mos 2006 12 Wk 5 Yr NetPerformance % % After Asset NAVRating Fund Chg Chg Tax Rtn Value Chg
B+S&P Strs R + 8 + 6 + 3 32.36n +.10B S&P Strs T m + 8 + 6 0 30.72 +.09E Sel Muni Z + 1 + 1 +20 13.79n ..E ShIntmMunD 0 0 + 7 12.59n ..E ShTrmInc D 0 + 1 + 5 10.88n ..A SmCapVal A b + 9 + 7+104 23.36 +.04B StrAgVal A r + 6 + 5 +36 30.32 +.03C–Tech Gr A + 4 + 2 –16 24.90 +.07D–Third Cent Z + 4 + 3 –16 9.02n +.02D+Wrld Gr A + 6 + 4 + 9 37.44 +.01D Wrld Gr B m + 5 + 4 + 6 35.67n +.01
Driehaus Funds$ 1.1 bil 888–636–8835
A+Emerg Mkt Gr +14 +14+172 32.18n +.15A+Intl Disc + 8 +10+108 44.68n +.27
Dryden A$ 5.0 bil 800–225–1852
D ActvAlloc A b + 4 + 3 +24 13.85 +.02E CA Income + 1 + 1 +17 10.93 ..E Glb Tot Ret + 1 0 + 9 6.56 +.01E Govt Inc 0 0 +15 8.82 –.01D–HighYield b + 1 + 2 +13 5.69 ..E Muni Hi Inc 0 + 1 +21 10.38 ..E Muni Insrd 0 + 1 +14 10.77 ..E Muni NY 0 + 1 +14 11.30 ..E Natl Muni + 1 + 1 +15 15.10 ..E Sh Tm Corp 0 0 +11 10.77 ..E Tot Ret Bd 0 0 +15 12.57 –.02
Dryden B$ 949 mil 800–225–1852
D–HighYield m + 1 + 2 +11 5.68n ..Dryden Z&I$ 2.0 bil 800–225–1852
D ActvAlloc Z b + 4 + 3 +25 13.91n +.01D+Stock Idx I + 5 + 3 + 8 29.18n +.04D+Stock Idx Z + 5 + 3 + 8 29.17n +.04
Dupree Mutual$ 930 mil 800–866–0614
E KY Tax Fr Inc 0 + 1 +18 7.55n ..DWS Scudder A$19.4 bil 800–621–1048
D–Balanced + 3 + 2 + 3 9.47 +.01C+Blue Chip + 5 + 4 +14 20.99 +.03E CA Tax Free 0 + 1 +17 7.52 +.01D Cap Growth b + 4 + 2 .. 48.45 +.15E CorePlusInc b 0 0 .. 12.65 –.01C Dreman HRt + 4 + 3 +30 47.15 –.05A DremanSmVal +12 +10+110 36.37 +.11C+Equity Ptnr + 5 + 4 +29 29.11 +.02A+Globl Oppor +10 +11 +50 42.20 +.10D–High Income + 2 + 2 +21 5.41 ..E HiYld TxFr b 0 + 1 .. 12.84 ..B+Intl b +10 +10 .. 55.26 +.44D+Lrg Cap Val + 5 + 4 +29 22.89 +.01E Mgd Muni b 0 0 .. 9.11 ..E NY Tax Free 0 + 1 +17 10.89 ..A RREEFRealEs b +16 +15 .. 24.13 +.25D–Stratgc Inc + 1 + 1 +28 4.62 –.01E US Gov Secs 0 0 +14 8.42 ..D Value Bldr b + 2 + 2 +12 24.05 +.03
DWS Scudder B$ 1.8 bil 800–621–1048
C Dreman HRt + 4 + 2 +27 46.95n –.04D–High Income + 2 + 2 +18 5.40n ..
DWS Scudder C$ 1.8 bil 800–621–1048
C Dreman HRt + 4 + 2 +28 47.00 –.04A DremanSmVal b +12 +10 +101 33.96 +.11C+Equity Ptnr + 5 + 4 +30 29.31n +.02D–High Income + 2 + 2 +18 5.41 ..
DWS Scudder Instl$ 4.8 bil 800–621–1048
D–AdvLifLngRg + 3 + 3 +16 11.88n ..B+ Communicatn b + 6 + 5 –19 20.50 +.03E CoreFxdInc 0 – 1 +18 10.66n –.01A–EAFE EqIdx + 9 + 9 +32 14.31n +.08D+Eq 500 Idx + 5 + 3 + 8 148.59n +.22B–Mid Cap Gr +10 + 9 +33 17.27n +.09E Sh Trm Muni 0 0 +11 10.29n +.01
DWS Scudder Inv$ 1.9 bil 800–621–1048
D+Eq 500 Idx + 5 + 3 + 8 147.02n +.21B+Intl Equity +10 +10 +22 28.71n +.23E ShDurPlus r 0 0 +14 9.75n –.01C SmallCapGr + 7 + 5 +13 25.77n –.04
DWS Scudder S$13.1 bil 800–621–1048
E CA Tax Free 0 + 1 .. 7.50n ..E CorePlusInc 0 0 +16 12.65n –.01C GlbEmgMktIn + 5 + 5 +88 11.95n –.01A+Glob Oppor +10 +11 +52 43.13n +.11A–GlobalThem +13 +12 +43 34.12n +.18A Gold & Prec +10 +12+290 21.27n +.05D Growth & Inc + 4 + 2 + 6 22.64n +.04E HiYld TaxFr + 1 + 1 +22 12.86n +.01E Income GNMA 0 0 +14 14.74n –.01E InterTxFree 0 0 +14 11.16n ..B+Intl +10 +10 +22 55.51n +.45A–Intl Europe +16 +16 +20 34.55n +.08A+IntlEmrgMkt r +10 +10+145 23.83n +.11A+IntlLtnAmer +19 +18+183 54.39n –.33D–Inv LrgCoGr + 3 + 1 –10 26.15n +.08D+InvSP500Idx + 5 + 3 + 7 17.41n +.03
Lrg Cap Val r + 5 + 4 .. 22.91 +.01E MA Tax Free 0 + 1 +18 14.30n +.01E Mgd Muni Bd 0 0 +18 9.12n ..B+Sec Sm Val r +10 + 8 +79 26.60n +.09C–SecHlthCare r + 5 + 4 +22 26.06n +.10E Sh Trm Bond + 1 + 1 + 8 9.95n +.01
E`Trade Funds$ 477 mil 800–786–2575
D+S&P500 + 5 + 3 + 8 10.41n +.02Eaton Vance A$18.8 bil 800–225–6265
D Balanced + 5 + 5 +27 7.25 +.01E CA Muni + 2 + 3 .. 11.02 +.01E FL Muni + 2 + 2 .. 10.74 +.01
Float&HiInc r + 1 + 2 .. 10.33 ..Floating Rt + 1 + 2 .. 10.23 ..
E Govt Oblig 0 + 1 + 6 7.25 ..A+Greatr India m +21 +23+197 23.44 –.01E Hi Yld Muni + 3 + 4 +29 10.40 ..
High Inc r + 2 + 3 .. 5.18 ..D Inc Bostn + 2 + 3 +20 6.40 +.01C+Lrg Cap Val + 6 + 4 +36 19.41 ..E Muni Bond + 2 + 3 +26 9.92 +.01E Natl LtdMuni + 2 + 2 +19 10.33 +.01E Natl Muni + 2 + 3 +33 11.53 +.01E NY Muni + 2 + 2 .. 10.66 +.01E OH Muni + 2 + 2 .. 9.37 ..E PA Muni + 1 + 2 .. 9.99 +.01E Strat Inc b + 1 + 2 .. 7.96 –.01C+Tax Mgd Val + 7 + 5 +37 17.56 +.02D TaxMgGr 1.1 + 5 + 3 + 9 24.47 +.03D TaxMgGr 1.2 + 5 + 3 .. 11.01 +.01C TxEqAsstAl b .. .. no quote
TxMgdDivInc + 6 + 4 .. 12.80 ..D TxMgdGr 1.0 + 5 + 4 +10 574.50n +.69A–Utilities + 7 + 6 +38 12.21 –.05D+WW HlthSci b + 2 0 +15 11.69 +.12
Eaton Vance Adv$ 1.9 bil 800–225–6265
E Float Rate m + 1 + 2 .. 9.90n +.01E Float&HiInc m + 1 + 2 .. 9.72n +.01
Eaton Vance B$ 5.6 bil 800–225–6265
E Float&HiInc m + 1 + 2 +11 9.71 ..E Floating Rt m + 1 + 1 .. 9.89n ..E Govt Oblig m 0 0 + 4 7.25n ..E Hi Yld Muni m + 3 + 3 +26 10.37n +.01D High Inc m + 2 + 3 +17 5.17n ..E Inc Bostn m + 2 + 3 .. 6.39 ..C Lrg Cap Val + 6 + 4 +33 19.42n +.01E Strat Inc m + 1 + 2 +20 7.54 ..C TxEqAsstAl m .. .. no quoteC TxMgdVal m + 7 + 5 +32 16.57n +.01D TxMgGr1.1 m + 5 + 3 + 6 23.24n +.03D TxMgGr1.2 m + 5 + 3 .. 10.72n +.02D WW HlthSci m + 2 0 +11 12.30n +.12
Eaton Vance C$ 5.9 bil 800–225–6265
E Float&HiInc + 1 + 2 +11 9.71 ..E Floating Rt m + 1 + 1 .. 9.89n ..E Govt Oblig b 0 0 + 4 7.24n ..E Hi Yld Muni m + 3 + 4 +26 9.63n +.01E High Inc + 2 + 3 –72 5.17n ..E Inc Bostn m + 2 + 3 .. 6.39n ..C Lrg Cap Val m + 6 + 4 +32 19.42n +.01E Natl Muni m + 2 + 3 +29 11.53 +.01E Strat Inc m + 1 + 2 +20 7.54 ..C Tx Mg Val m + 7 + 5 +33 17.01n +.01C TxEqAsstAl m .. .. no quote
TxMgdDivInc + 6 + 4 .. 12.77 ..D TxMgGr 1.1 b + 5 + 3 + 6 22.26n +.03D TxMgGr 1.2 m + 5 + 3 .. 10.72n +.01E Utilities + 7 + 6 –67 12.23n –.05D WW HlthSci m + 2 0 +10 12.30n +.12
Emerald Funds$ 373 mil 800–232–0224
B+Growth A +12 +10 +41 15.23 +.05B–SelBank&Fin b + 5 + 3+132 28.96 +.03
Enterprise Cl A$ 2.2 bil 800–432–4320
C Capital Appr b + 4 + 2 +20 36.80 +.29D–Growth b + 3 + 1 – 7 17.74 +.07E Merg & Acq + 5 + 5 .. 11.95 +.01B–Sm Co Val b + 9 + 8 +53 12.38 +.04
Enterprise Cl B$ 1.0 bil 800–432–4320
D–Growth b + 3 + 1 – 9 16.60n +.06C+Sm Co Val b + 9 + 7 +48 11.47n +.04
Enterprise Cl C$ 605 mil 800–432–4320
D–Growth m + 3 + 1 – 9 16.83 +.06Eton Vance Instl$ 237 mil 800–225–6265
A+TxMgdEmMkt +12 +12+206 32.49n +.16Evergreen A$14.7 bil 800–343–2898
E Adj Rate + 1 + 1 +10 9.25 ..C Agg Growth + 4 + 3 +17 18.74 +.05D+Asset Alloc b + 4 + 3 .. 14.44 +.02D–Balanced + 4 + 2 +12 8.96 +.01
E Core Bond b 0 0 .. 10.38 –.01E Divrsfd Bd + 1 + 1 +16 14.46 –.02D+Equity Inc b + 6 + 4 +23 24.20 ..D+Equity Index b + 5 + 3 + 7 48.85 +.07E FL HiIncMuni + 1 + 1 +17 10.24 +.01C–Fundmtl Lrg + 5 + 3 +14 24.31 +.04A+Glbl Opport +11 +11 +84 31.53 +.21D–High Yld Bd + 3 + 3 +23 3.32 +.01B Hlth Care b + 8 + 7 +57 20.86 +.09B+Intl Eqty + 8 + 8 +42 10.51 +.06D Lg Co Gr m + 4 + 2 0 7.18 +.03B–Mid Cap Gr m + 9 + 8 +26 5.81 +.02E Muni Bond + 1 + 1 +20 7.47 ..C–Omega + 4 + 3 + 8 27.06 +.08A+Precious Mtls +11 +14+367 49.09 +.15A–Special Val b +10 + 8 +92 29.35 +.12E Strat Inc m + 1 + 1 +32 6.34 ..E Strat Muni + 1 + 1 +13 8.76 ..A Utility + 8 + 6 +10 12.67 –.03
Evergreen B$ 4.9 bil 800–343–2898
E Adj Rate m + 1 + 1 .. 9.25n ..D Asset Alloc m + 4 + 3 .. 14.27n +.02D–Balanced m + 3 + 2 + 9 8.96n +.01E Core Bond m 0 0 .. 10.38 –.01D Equity Index b + 5 + 3 + 4 48.62n +.07D+Fundmtl Lrg x + 5 + 3 +10x22.79n +.04E High Yld Bd m + 3 + 3 +20 3.32n +.01D+Omega m + 4 + 2 + 4 23.89n +.07B+Special Val b +10 + 8 .. 28.56n +.12
Evergreen C$ 6.2 bil 800–343–2898
E Adj Rate m + 1 + 1 .. 9.25 ..D Asset Alloc m + 4 + 3 .. 14.03 +.02E Core Bond m 0 0 .. 10.38 –.01D Equity Idx m + 5 + 3 + 4 48.68 +.07B–Growth m +11 + 9 +30 16.60 +.08E Hi Yld Bd m + 3 + 3 +20 3.32 +.01A+ Precious Mtls m +11 +14 +353 46.88 +.14B+Special Val b + 9 + 8 .. 28.61 +.11E Strat Muni b + 1 + 1 +10 8.79 ..
Evergreen I$22.9 bil 800–343–2898
E Adj Rate + 1 + 1 +11 9.25n ..D+Asset Alloc + 4 + 4 .. 14.53n +.02E Core Bond 0 0 +18 10.38n –.01A+EmgMktsGr +15 +16+154 20.22n +.15D+Equity IdxI + 5 + 3 + 8 48.88n +.07C–Equity Inc + 6 + 4 +24 24.19n ..E FL HiIncMuni + 1 + 1 +18 10.24n +.01E FL Muni Bond + 1 + 1 +14 9.26n ..C–Fundmtl Lrg + 5 + 3 +16 24.71n +.04E GA Muni Bd + 1 + 1 +16 10.04n ..B Growth +11 + 9 +38 19.21n +.10E Intl Bond I + 1 + 1 +48 10.60n +.03B+Intl Eqty + 8 + 8 +44 10.59n +.05E Intrmd Muni I + 1 + 1 +14 60.94n +.01C LargeCapEq + 6 + 4 +16 16.66n +.03E Muni Bond + 1 + 1 .. 7.47n ..E NC Muni + 1 + 1 +16 10.27n ..E NJ Muni Bd + 1 + 1 +15 10.89n ..E PA Muni + 1 + 1 +17 11.32n ..E SC Muni Bd + 1 + 1 +17 10.15n ..E Sel HiYld + 2 + 2 +23 9.21n +.01E Sh Intm Mun + 1 + 1 +12 9.92n ..E Sh Intmd Bd 0 0 +16 5.93n –.01B SmlCapVal + 8 + 7 +81 26.17n +.02B+Special Eq I + 8 + 7 +37 15.37n +.01A–Special Val +10 + 8 .. 29.52n +.12D Strat Gr I + 3 + 1 + 1 28.72n +.11D StrategicValI + 4 + 2 +12 22.80n +.02
UltraShtOpp b + 1 + 1 .. 9.77n –.01E US Govt 0 0 +16 9.90n –.01E VA Muni + 1 + 1 +16 10.22 ..
Evergreen Instl Fund$ 786 mil 800–343–2898
E AdjRate Svc b + 1 + 1 +10 9.25n ..DiscplinVal + 6 + 4 .. 16.35 +.01Excelsior Funds$11.8 bil 800–446–1012
D+Blended Eq + 7 + 5 + 5 37.22n +.05E Core Bond 0 0 +17 8.92n –.01A+Emerg Mkts r +12 +12+170 12.54n +.04A+Enrg&NatRes + 3 + 1 +93 24.86n –.16
Equity Inc + 5 + 4 .. 8.62n +.01D–High Yield b + 1 + 2 – 3 4.52n ..A International + 9 + 9 +31 16.43n +.05E Intmd Tax Ex 0 0 +14 9.35n ..E Intmed Bond 0 0 +17 7.06n ..C+LgCapGrow + 4 + 3 –15 9.92n +.06B MdValRstRtl + 8 + 7 +55 19.48n –.01E NY Tax Ex 0 + 1 +15 8.62n ..A–Pacific Asia + 3 + 4 +60 11.16n +.09E ShTm Gov Sec 0 + 1 +11 6.94n ..E ShTm TaxEx 0 0 + 6 7.10n ..A Small Cap +11 + 9 +72 18.44n +.02A–Val&Restrc + 6 + 5 +51 49.06n +.07
Excelsior Instl$ 685 mil 617–423–0800
E Total Ret Bd 0 0 +17 7.05n –.01Val&Restrc + 6 + 5 .. 49.06n +.07Exeter Funds$ 1.6 bil 800–466–3863
C Life Science + 5 + 4 .. 12.73n +.04D ProBlndExt A + 6 + 5 +32 15.90n ..C+ProBlndMax A + 7 + 6 +32 16.90n +.02D–ProBlndMod A + 4 + 4 +25 12.75n +.01A–Small Cap A +11 +10 +73 15.14n +.01A–World Opp A +13 +14 +60 9.58n +.03
—F—B+† Fairholme + 6 + 5 +87 26.70n –.08
FAM Funds$ 1.3 bil 800–932–3271
D Equity Inc + 5 + 4 +69 22.58n +.02C–Value + 5 + 4 +63 50.53n +.03
FBR Funds$ 1.5 bil 888–888–0025
B GasUtilIdx r + 3 + 1 +13 17.80n –.05A–SmallCap A +14 +13+170 47.94n +.68C–SmCpFinl A + 4 + 2+113 31.11n +.11
Federated A$15.7 bil 800–245–5051
D+Amer Ldrs + 4 + 2 + 8 24.26 +.01E Bond + 1 + 1 +22 8.80 ..D Capital Apprec + 5 + 3 + 7 26.31 –.01D Capital Inc + 4 + 4 –11 7.63 ..D+Equity Inc b + 6 + 5 +10 18.89 –.01D–Hi Inc Bond + 2 + 2 +16 7.85 +.01B+Intl Appr b + 9 + 8 +23 11.67 +.07B–Intl Equity + 8 + 8 + 3 20.77 +.06A+Intl Small Co + 8 + 9 +57 37.81 +.32A–Kaufmann b + 9 + 8 .. 6.08 +.01A+KaufSmlCap b +11 +11 .. 24.88 +.03B+Md Gr Strat + 8 + 7 +27 36.97 +.08E MI Intermed 0 + 1 +16 11.03 ..D–Mkt Opps b 0 0 +39 12.66 +.01E Muni Secs + 1 + 1 +18 10.65 ..E Muni Ultrshrt b 0 + 1 + 7 10.04 ..
Muni&Stock b + 3 + 3 .. 11.57 +.01E MuniHiYld A + 1 + 1 +23 9.93 ..E PA Muni Inc + 1 + 1 +20 11.65 ..D–Stock & Bd + 4 + 3 +13 19.32 ..
Strat Value b +10 + 9 .. 5.72 +.02D–Strategic Inc + 2 + 2 +30 8.69 ..E US Gov 1–3Y 0 + 1 .. 10.40n ..
E US Govt Secs 0 0 +15 7.64 –.01Federated B$ 5.9 bil 800–245–5051
D Amer Ldrs m + 3 + 2 + 6 24.33 +.01E Bond 0 + 1 +19 8.83n ..D–Capital Apprec + 5 + 3 + 4 25.60n –.01D Equity Inc + 6 + 5 + 7 18.87n –.02D–Hi Inc Bd m + 2 + 2 +13 7.84n ..A+Intl Small Co + 8 + 9 +51 35.15n +.29A–Kaufmann b + 9 + 8 .. 5.92n +.01A+KaufSmlCap b +11 +10 .. 24.49n +.02B+Md Gr Strat + 8 + 6 +22 33.71n +.08E Mkt Opps b 0 0 +35 12.59n +.01D–Strategic Inc + 2 + 2 +27 8.68n ..E US Gov Sec m 0 0 +12 7.64n ..
Federated C$ 3.4 bil 800–245–5051
D–Capital Apprec + 5 + 3 + 4 25.58 –.01D–Hi Inc Bond + 2 + 2 +13 7.84 ..A–Kaufmn C m + 9 + 8 .. 5.92 +.01A+KaufSmlCap b +11 +11 .. 24.49 +.03E Mkt Opps 0 0 +35 12.56 +.01D–Strategic Inc + 2 + 2 +27 8.68 ..
Federated F$ 1.2 bil 800–245–5051
E Bond + 1 + 1 +22 8.84 ..E Govt Inc Sec 0 0 +16 8.75 –.01E MuniHiYield + 1 + 1 +23 9.93 ..
Federated Instl$14.1 bil 800–341–7400
E AdjRate IS 0 0 + 9 9.46n ..E GNMA Instl 0 0 +14 10.86n –.02E Govt 1–3 Instl 0 + 1 + 8 10.40n ..E Govt 2–5 Instl 0 0 +13 10.89n –.01E GovUltSh + 1 + 1 + 7 9.88n ..D–High Yield + 2 + 2 +13 5.94n ..E Income Instl 0 0 +16 10.18n –.01E IntmCorpBd 0 0 +18 9.94n –.01E Intmd Muni 0 + 1 +15 10.34n ..A–Kaufmann K + 9 + 8 +59 6.09n +.02D+MaxCapIdx + 5 + 4 + 8 26.05n +.04D+MaxCpIdxSS + 5 + 3 + 7 25.98n +.04B Mid Cap Idx + 7 + 5 +54 23.62n +.07E Mortgage 0 + 1 +15 9.76n –.01E Muni Ultrshrt + 1 + 1 + 8 10.04n ..E ShTrmInc 0 + 1 + 8 8.35n ..E ShTrmMun 0 + 1 +10 10.12n ..D+Stock + 4 + 3 +15 32.51n –.03E Tot Ret Gov 0 0 +19 10.61n –.02E Tot Rtn Bd 0 0 +19 10.49n –.02E TotRtnBd Svc 0 0 +18 10.49n –.02E Ultra Sh Bd 0 0 + 6 9.33n ..E UltraShBdSvc 0 0 + 4 9.33n ..
FFTW Funds$ 764 mil 212–681–3000MortBackAdv 0 0 .. 9.92 –.01
E US ShortTrm x + 1 + 1 + 4x 9.29 ..E Worldwide + 1 + 1 +22 8.38n +.01
Fidelity Adv A$15.9 bil 800–522–7297
D–Balanced m + 4 + 3 +17 16.40 –.01D–Div Growth + 5 + 4 + 8 12.78 +.01A Divers Intl r + 8 + 8 +71 22.82 +.17D Equity Gr m + 4 + 2 – 8 49.96 +.15C Equity Inc b + 6 + 4 +28 29.33 +.03E FloatRtHiIn r + 1 + 2 +10 9.99 ..D Growth & Inc + 5 + 4 +11 18.78 +.03D Growth Opp b 0 – 2 + 8 32.69 +.08C HiInc Advt + 4 + 4 +34 10.02 +.02E Intmd Bd m 0 0 +18 10.76 –.01A+Lev Co Stk b + 8 + 6+195 30.50 –.07B+Mid Cap A b + 9 + 8 +41 25.48 +.01
Mid Cp II b + 7 + 6 .. 15.54 +.01E Muni Inc + 1 + 1 +22 12.89 ..
New Insight b + 4 + 3 .. 17.28 +.05E Sh Tm Fx m 0 + 1 +12 9.38 ..A–Small Cap b + 5 + 4 +47 23.54 +.04D–Strat Inc + 1 + 2 +25 11.59 –.01A–Value Strat b + 6 + 5 +49 30.53 +.03
Fidelity Adv B$ 5.7 bil 800–526–0084
D–Div Growth m + 5 + 4 + 5 12.41n ..D Equity Grow + 4 + 2 –12 46.87n +.14C–Equity Inc + 5 + 4 +24 29.37n +.02E FloatRtHiIn m + 1 + 1 + 9 9.98n ..D–Growth & Inc + 5 + 4 + 8 18.12n +.03D Growth Opp 0 – 2 + 5 31.96n +.08C–HiInc Advt m + 4 + 4 +29 9.97n +.01B Mid Cap b + 9 + 8 +36 24.61n +.01
New Insight b + 4 + 3 .. 16.94n +.05B+Small Cap m + 5 + 4 +41 22.00n +.04E Strategic Inc + 1 + 1 +33 11.62n ..A–Value Strat + 6 + 5 +43 28.98n +.03
Fidelity Adv C$ 7.4 bil 800–522–7297
D–Div Growth m + 5 + 4 + 5 12.44n +.01A–Divers Intl m + 8 + 8 +65 22.06n +.17D Equity Grow b + 4 + 2 –12 47.60n +.15C–Equity Inc m + 5 + 4 +24 29.42n +.03E FloatRtHiIn m + 1 + 1 +10 9.99n ..D–Gr & Inc m + 5 + 4 + 8 18.15n +.03C–HiInc Advt m + 4 + 4 +30 10.01n +.02A+Lev Co Stk r + 7 + 6+185 29.65n –.07B Mid Cap C b + 9 + 8 +36 24.64n +.02
Mid Cp II m + 7 + 6 .. 15.43n +.01New Insight m + 4 + 3 .. 16.96n +.05
E Sh Tm Fx m 0 + 1 + 9 9.39n ..B+Small Cap m + 5 + 4 +41 22.15n +.03E Strat Inc m + 1 + 1 +31 11.58n ..
Fidelity Adv Free A$ 963 mil 800–544–88882010 b + 3 + 2 .. 11.80 +.012020 b + 4 + 4 .. 12.85 +.022030 b + 5 + 4 .. 13.47 +.03Fidelity Adv Free T$ 1.0 bil 800–544–88882010 b + 3 + 2 .. 11.77 +.012020 b + 4 + 3 .. 12.84 +.022030 + 5 + 4 .. 13.43 +.022040 + 5 + 4 .. 13.78 +.03Fidelity Adv I$14.4 bil 800–526–0084
D–Div Growth + 5 + 4 + 9 12.90n ..A Divers Intl + 8 + 8 +73 23.13n +.18D Equity Grow + 4 + 2 – 6 52.94n +.16C Equity Inc + 6 + 4 +29 30.08n +.03E FloatRtHiIn + 1 + 2 +11 9.98n ..E Gov Invest 0 0 +17 9.82n –.01D Growth & Inc + 5 + 4 +13 18.89n +.03D Growth Opp 0 – 2 +10 33.22n +.09D–High Inc + 2 + 3 +28 9.15n ..C HiInc Advt + 4 + 4 +34 9.67n +.02E Intermed Bd 0 0 +19 10.78n –.01D+Large Cap + 5 + 4 + 4 18.04n +.03B+Mid Cap I +10 + 9 +43 26.21n +.02
Mid Cp II + 7 + 6 .. 15.59n +.01New Insight + 4 + 3 .. 17.42n +.04
A–Overseas + 8 + 8 +33 21.25n +.13E Sh Fxd Inc + 1 + 1 +13 9.38n ..E Sh Intmd Govt 0 + 1 +13 9.48n ..A–Small Cap + 5 + 4 +50 24.27n +.04E Strat Inc + 1 + 2 +25 11.69n ..
Fidelity Adv T$31.5 bil 800–526–0084
D–Balanced + 4 + 3 +16 16.49 –.01D–Div Growth b + 5 + 4 + 7 12.71 ..A Divers Intl b + 8 + 8 +69 22.60 +.17
C–Dyn Cap b + 7 + 6 +18 17.43 +.02D Equity Gr b + 4 + 2 – 9 50.04 +.15C Equity Inc + 5 + 4 +27 29.68 +.02E FloatRtHiIn m + 1 + 2 +10 9.98 ..E Gov Invest 0 0 +17 9.87 –.01D Growth & Inc + 5 + 4 +11 18.68 +.03D Growth Opp 0 – 2 + 8 33.19 +.09C HiInc Advt b + 4 + 4 +33 10.05 +.02E Intermed Bd 0 0 +17 10.77 ..B IntlCapAppr b + 4 + 5 +41 17.30 +.08D Large Cap + 5 + 4 + 2 17.45 +.03A+Lev Co Stk + 7 + 6+190 30.11 –.07B+Mid Cap b + 9 + 8 +40 25.72 +.01
Mid Cp II b + 7 + 6 .. 15.51 +.01E Muni Inc b + 1 + 1 +22 12.92 ..
New Insight b + 4 + 3 .. 17.19 +.05A–Overseas + 7 + 8 +30 21.31 +.13E ShTrm Fxd Inc 0 + 1 +12 9.38 ..B+Small Cap b + 5 + 4 +45 23.07 +.04D–Strategic Inc + 1 + 2 +35 11.59 ..A–Value Strat + 6 + 5 +48 31.25 +.02
Fidelity Freedom$44.1 bil 800–544–8888
E Income + 2 + 1 +14 11.51n ..E 2000 + 2 + 1 +14 12.42n ..
2005 + 3 + 2 .. 11.45n +.01D–2010 + 3 + 2 +19 14.48n +.01
2015 + 4 + 3 .. 11.97n +.01D 2020 + 4 + 3 +19 15.35n +.02
2025 b + 5 + 4 .. 12.50n +.02C–2030 + 5 + 4 +19 15.78n +.03
2035 + 5 + 4 .. 12.86n +.03C 2040 + 5 + 4 +18 9.31n +.03
Fidelity Invest$ 612 bil 800–544–8888
B Aggr Intl + 4 + 5 +47 17.69n +.07C Aggres Gr r + 5 + 4 –37 18.75n +.05D–Asset Mgr + 3 + 3 +12 16.57n ..C+Asset Mgr Ag + 5 + 4 + 5 12.64n +.03D–Asset Mgr Gr + 4 + 3 + 8 15.73n +.01D–Asset Mgr Inc + 2 + 2 +25 13.08n ..C–Balanced + 4 + 3 +44 19.53n –.01D–BlueChipGro + 3 + 1 – 5 44.40n +.12
BlueChipVal + 6 + 5 .. 14.32n +.02E CA Muni Inc + 1 + 1 +20 12.40n ..A+Canada + 7 + 8+141 46.10n –.53D+Cap & Inc r + 3 + 3 +31 8.51n ..B CaptlApprec + 7 + 6 +39 26.98n +.04B+China Rgn + 7 + 7 +45 20.59n +.10B–Contrafund + 4 + 3 +50 66.16n +.18D Convrt Secs + 6 + 5 +29 23.78n –.01E CT Muni Inc r 0 + 1 +17 11.36n ..D+Destiny I + 5 + 3 + 4 14.96n +.01D–Destiny II + 8 + 6 +12 12.81n +.01D–DestinyII A b + 8 + 6 + 9 12.56 +.01C Disciplnd Eq + 5 + 4 +21 29.19n +.06D–Discovery + 8 + 6 +12 12.29n +.01A Diversifd Intl + 9 + 9 +72 35.35n +.14D–Dividend Grow + 6 + 4 + 7 30.39n +.02A+Emrg Mkts +13 +14+152 20.78n +.11C Equity Inc + 6 + 4 +19 54.92n +.01C–Equity Inc II + 6 + 4 +22 23.93n ..A Euro CapApp +15 +15 +53 25.23n +.12A+Europe +12 +11 +52 40.17n +.11D+Exchange + 6 + 5 +18 293.75n –.38B–Exprt&Mltint + 3 + 1 +44 21.85n +.01D Fidelity Fund + 5 + 4 +10 33.54n +.09D Fifty r + 6 + 4 +37 24.02n +.08E FL Muni Inc r 0 + 1 +19 11.42n ..E FloatHiInc r + 1 + 2 .. 9.98n ..C+Focused Stk r + 3 + 2 – 5 12.31n +.03C Global Balncd + 5 + 4 +43 22.01n +.06E GNMA 0 0 +16 10.77n –.01E Govt Income 0 0 +17 10.04n –.01D–Gr & Inc + 4 + 2 + 3 35.86n +.05D Gr & Inc II + 5 + 4 +14 10.69n +.02B Grwth Cmpny + 6 + 5 +14 67.61n +.32D–High Income r + 2 + 3 +14 8.87n +.01C–Independnc + 7 + 5 +12 21.01n +.04E InflProtBd – 1 – 1 .. 10.85n –.02E Int Gov Inc 0 0 +16 9.97n –.01E Int Mun Inc 0 + 1 +18 9.95n ..A Intl Discov + 9 + 9 +66 34.36n +.21
IntlRealEst r +11 +12 .. 14.36n +.12A+IntlSmCap r +10 +11 .. 29.67n +.28
IntlSmlOpp r +11 +12 .. 13.91n +.17E Intmd Bond 0 0 +18 10.22n –.01E Inv Grade Bd 0 0 +19 7.33n ..A Japan – 1 0 +46 17.96n +.32A+Jpn Sm Cos – 8 – 6+110 15.44n +.23D Large Cap Stk + 5 + 4 0 16.43n +.03A+Latin Amer +19 +18+203 38.10n –.10A+Levrgd Co Stk + 7 + 6+185 27.97n –.08A–Low Pr Stk r + 8 + 7+111 44.06n +.05C+Lrg Cp Grow + 4 + 2 .. 11.68n +.07B–Lrg Cp Val + 7 + 5 .. 13.80n +.02E MA Muni Inc 0 + 1 +20 11.86n ..D Magellan + 5 + 4 + 4 111.94n +.51E MI Muni Inc 0 + 1 +20 11.81n ..B Mid Cap Stk +11 +10 +22 29.49n +.03B+Mid Cp Grow + 9 + 7 .. 14.11n +.05B+Mid Cp Val + 6 + 5 .. 15.75n +.05E MN Muni Inc 0 + 1 +18 11.40n ..E Mortg Secs 0 + 1 +19 11.01n –.01E Municipal Inc + 1 + 1 +22 12.79n ..C+New Millnm +12 +10 +30 38.25n +.13D+NewMktsInc r + 4 + 5 +72 14.82n ..E NJ Muni Inc r 0 + 1 +17 11.46n ..A+Nordic +14 +14 +49 33.99n +.25E NY Muni Inc + 1 + 1 +21 12.76n ..E OH Muni Inc 0 + 1 +19 11.63n ..C+OTC + 4 + 2 +13 39.42n +.19A–Overseas + 6 + 7 +37 44.19n +.25E PA Muni Inc r 0 + 1 +16 10.78n ..A Pacific Basin + 4 + 5 +64 26.68n +.24D Puritan + 4 + 3 +21 19.45n ..A Real Estate +15 +14+141 35.87n +.34D–RealEstInc r + 3 + 3 .. 11.76n +.02E Sh Int Muni 0 + 1 +12 10.18n +.01E Short Term Bd 0 + 1 +14 8.84n ..B–Sm Cap Retr + 7 + 5 +74 17.42n –.02A–Small Cap r +10 +10 +73 20.21n +.02B SmCpIndepen + 8 + 6 +65 22.06n ..
Sml Cp Grow r +10 + 9 .. 14.15n –.01Sml Cp Val r +11 +10 .. 14.12n +.05
A+SoEast Asia + 8 +10 +97 22.88n +.11C–StkSelector + 6 + 4 +16 26.16n +.03
StraDiv&Inc + 6 + 5 .. 12.92n +.02StraRealRet r – 1 – 1 .. 9.94n –.01
D–Strategic Inc + 1 + 2 +37 10.47n –.01E Tax Fr Bond r + 1 + 1 .. 10.71n ..E Total Bond 0 0 .. 10.36n –.01C–Trend + 5 + 4 +16 60.33n +.15E Ultra Sh Bd r + 1 + 1 .. 10.02n ..E US Bond Idx 0 0 +20 10.82n –.01B–Utility + 9 + 8 + 4 15.94n –.07B Val Disc + 7 + 5 .. 16.68n –.01A–Value + 6 + 5 +82 80.54n +.04A–Value Strat m + 7 + 5 +52 33.01n +.03B World Wide + 5 + 4 +41 20.55n +.08C–4–in–1 Idx + 5 + 4 +22 27.73n +.05
Fidelity Select$27.7 bil 800–544–8888
D Banking + 5 + 3 +31 37.32n +.15C+Biotechnlgy + 9 + 8 – 5 68.46n +.49A+Brokrge&Inv +12 +11 +71 77.39n +.33C Computers + 3 + 1 – 9 37.26n +.03
Calvert Group$ 8.6 bil 800–368–2745
E Income A b 0 0 +24 16.69 –.01E Income B m 0 0 +21 16.66n –.02E Income C m 0 0 .. 16.67 –.02B–LrgCapGrA m + 5 + 3 +37 31.92 +.07D NewVsnSm A b + 6 + 3 +15 17.50 –.07E ShDurInc A m + 1 + 1 .. 16.05 ..D–Social Bal A b + 3 + 2 +11 29.34 +.01E Social Bd A b 0 0 +22 15.76 –.01D–Social Eq A b + 4 + 2 +19 36.78 +.08E Tax Fr Ltd A + 1 + 1 + 8 10.59 ..B WrldValIntlA b + 9 + 9 +27 22.88 +.15
Cambiar Funds$ 849 mil 866–777–8227
B–OppPortInv + 6 + 4 +35 18.69n +.03Causeway Funds$ 4.4 bil 866–947–7000
A Intl Val Ins r +10 + 9 .. 18.20n +.13A Intl Val Inv r +10 + 9 .. 18.11n +.12
Century Funds$ 1.5 bil 800–321–1928
D+ShrsTr Inst + 3 + 2 +25 34.57n +.09B–SmlSel Instl + 6 + 5 +95 25.89n +.07B–SmlSel Inv + 6 + 5 +92 25.60n +.06
CG Cap Mkt Fds$ 6.4 bil 212–816–8725
E CoreFxdInc 0 0 +16 8.13n ..A+Emerg Mkts +10 +11+134 13.46n +.07D–High Yield + 2 + 2 + 9 4.71n +.01A Intl Equity + 9 + 9 +36 13.15n +.09E Intl Fixed Inc + 2 + 1 +23 7.78n –.01C Large Cap Gr + 1 0 + 3 13.59n +.09C Large Cap Val + 6 + 5 +20 11.84n +.01A–Small Cap Gr +10 + 8 +26 16.94n +.06A–Small Cap Val + 8 + 7 +75 13.99n +.04
CGM Funds$ 4.2 bil 800–345–4048
A+Cap Dvlp + 4 + 2 +51 29.56n –.03A+Focus +10 +10+199 36.79n ..B–Mutual + 4 + 4 +43 29.12n +.08A+Realty +15 +14+256 31.14n +.25C–† Chase Gr–VA + 4 + 3 +25 20.26n +.05
Chesapeake Fds$ 744 mil 800–525–3863
C Core Growth + 4 + 3 +17 17.65n +.03D–† ChestntStEx + 3 + 1 + 4 348.28n +.70
CitiStreet Funds$ 2.7 bil
E Divers Bond 0 0 .. 11.70n –.01B+Intl Stock +10 + 9 .. 16.82n +.12D+Large Co Stk + 4 + 2 .. 12.78n +.02B+Small Co Stk + 9 + 7 .. 15.56n +.01
Citizens Funds$ 727 mil 800–223–7010
D Core Gr Stnd + 4 + 2 – 3 22.14n +.03C+Emerg Gr Stnd +10 + 8 – 4 17.07n +.04D–† Clipper + 2 + 1 +24 90.31n +.06† CM Advsr m + 3 + 2 .. 12.16n –.01
E † CO Bond A + 1 + 1 +21 9.42 ..Cohen & Steers$ 5.1 bil 800–437–9912
A+Instl Realty +17 +16+133 53.16 +.53B+Realty Inc A b +14 +13+108 17.43 +.09B+Realty Inc B m +14 +13+102 16.77n +.08B+Realty Inc C m +14 +13+102 16.77n +.08B+Realty Inc I +14 +13+111 17.77n +.09A+Realty Shrs +17 +16+143 84.83 +.86
Columbia A$21.3 bil 800–345–6611
A Acorn m + 8 + 7 +89 29.85 +.03A+Acorn Intl m +14 +14 +66 37.71 +.20B–Acorn Sel m + 6 + 5 .. 23.79 +.04A–Acorn USA m + 5 + 4 .. 27.89 ..E CA Tax Expt + 1 + 1 +18 7.65 ..E ConsHiYield b + 1 + 1 .. 8.47 ..D Conv Secs + 4 + 3 +23 17.72 +.03E Fed Secs 0 0 +14 10.40 –.02D–Hi Yield Opp + 1 + 2 + 5 4.53 ..B Intl Stk b + 9 + 8 .. 18.23 +.11A Intl Value r +11 +11 +53 25.02 +.14E Intmd Bond m 0 0 .. 8.81 –.01D–Liberty + 4 + 3 +11 8.80 +.02
B–Lifegl Grow b + 8 + 6 .. 13.91 +.05D LifeglBalGr b + 4 + 4 .. 11.93 +.02C+Lrg Cap Val + 7 + 5 +26 14.75 +.02D LrgCapCore + 6 + 4 .. 13.49 +.03E MA Tax Ex 0 + 1 +18 7.84 ..C Marsico Gr m + 4 + 3 +23 19.60 +.15A Marsico21st m + 9 + 8 +73 13.39 +.06
Mid Cap Val + 8 + 7 .. 15.08 +.03C MrscoFocEq m + 4 + 3 +27 21.14 +.18B Sm Co Inv b +13 +11 +21 17.05 +.03B SmlCapCor m + 8 + 7 .. 19.83 +.03A–SmlCapVal I b +10 + 8 +84 48.40 +.12D–Strat Inc + 1 + 1 +25 5.96 –.01B–Strat Inv b + 5 + 4 .. 21.10 +.03E Tax Exempt b + 1 + 1 +20 13.62 ..B–Utilities b + 5 + 4 –18 14.28 –.07
Columbia B$ 6.2 bil 800–345–6611
A–Acorn m + 8 + 7 +83 28.77n +.02C+Acorn Sel m + 6 + 5 .. 22.95n +.04D–Hi Yld Opp + 1 + 2 + 3 4.53n ..B–Lifegl Gr m + 7 + 6 .. 13.28n +.05D LifeglBalGr m + 4 + 3 .. 11.85n +.02C+Lrg Cap Val + 7 + 5 +23 14.31n +.01C–Marsico Gr m + 4 + 2 +18 18.47n +.14
Mid Cap Val + 8 + 7 .. 14.87n +.03C–MrscoFocEq m + 4 + 3 +23 19.95n +.17A–SmlCapVal I +10 + 8 +77 42.16n +.10E Strat Inc m + 1 + 1 +22 5.95n –.01D–Tax Mgd Gr b + 3 + 1 – 4 14.52n +.05
Columbia C$ 4.0 bil 800–345–6611
A–Acorn m + 8 + 7 .. 28.73n +.03C+Acorn Sel m + 6 + 5 .. 22.92n +.04A Intl Value m +11 +10 +49 24.57n +.14C–Marsico Gr b + 4 + 2 +18 18.50n +.14A–Marsico21st m + 9 + 7 .. 12.81n +.06C–MrscoFocEq b + 4 + 3 +23 20.01n +.17
Columbia I,T&G$ 1.3 bil 800–345–6611
D–AsstAllo T + 4 + 3 + 8 16.12 +.03D CommonStk T + 4 + 3 + 1 13.64 +.03C+DscplnVal T + 7 + 6 +17 14.90 +.02D–Large Gr T + 4 + 2 –10 22.36 +.12B SmlCapCorT + 8 + 7 +78 19.64 +.02
Columbia Z$61.1 bil 800–345–6611
A Acorn + 8 + 7 +93 30.52n +.03A+Acorn Intl +14 +14 +69 38.01n +.20B–Acorn Sel + 6 + 5 +86 24.12n +.04A Acorn USA + 5 + 4 +90 28.44n –.01D Asset Alloc + 4 + 3 + 9 16.13n +.04D–Balanced + 2 + 2 +10 22.59n +.02D CommonStk Z + 4 + 3 + 2 13.77n +.03E ConsHiYield + 1 + 1 +15 8.47n ..D Conv Secs + 4 + 3 +24 17.73n +.03E CoreBond Z 0 0 +15 10.53n –.01E CT Intm Mun 0 + 1 +13 10.72n ..C Div Inc Z + 5 + 4 +21 12.76n +.01C+Dscpln Val + 7 + 6 +18 15.21n +.02E FL Intm Mun 0 + 1 +12 10.40n ..D–Growth Stk + 4 + 1 –26 9.40n +.03E Hi Yld Muni + 1 + 2 +20 11.39n +.01D–High Income + 2 + 2 +33 8.99n +.01E Income 0 0 +22 9.69n –.01A–Intl Equity +10 +10 +38 16.59n +.07B Intl Stk + 9 + 8 +31 18.34n +.10A Intl Value +11 +11 +54 25.13n +.14E Intm Bond 0 0 +14 9.36n ..E Intmd Bond 0 0 +18 8.81n –.01E IntmMuniBd 0 + 1 +14 10.32 ..D Large Gr + 4 + 2 – 8 22.88n +.12D+Lg Cap Idx + 5 + 4 + 8 25.38n +.04D LifeglBalGr + 4 + 4 +26 11.91n +.02B–LifegoalGro + 8 + 6 +29 14.00n +.05C+Lrg Cap Val + 7 + 6 +28 14.77n +.01D+LrgCapCore + 6 + 4 + 1 13.53n +.03C–LrgEnCore + 5 + 4 + 9 14.29n +.03E MA Intm Mun 0 + 1 +14 10.44n ..C Marsico Gr + 4 + 3 +24 19.89n +.15A MarsicoIntl r + 9 +10 .. 14.69n +.03C+MarsicoMdGr +11 + 9 – 7 15.38n +.06A Marsico21st + 9 + 8 .. 13.56n +.05
E MDIntmMuni 0 + 1 +11 10.64n ..C+Mid Cap Gr + 9 + 8 +19 25.95n +.11A–Mid Cap Val b + 8 + 7 .. 15.12n +.03B+MidCap Idx + 7 + 5 +55 12.39n +.03C MrscoFocEq m + 5 + 3 +29 21.48n +.18E Muni Income + 1 + 1 +14 10.84n ..E NC IntMuni 0 + 1 +14 10.46n ..E OR IntmMuni 0 + 1 +17 12.25n ..A–Real Est Eq +15 +14+102 28.33n +.30E SC Intm Mun 0 + 1 +14 10.32n ..E Sh Trm Bond 0 + 1 +12 9.75n –.01E Sh Trm Muni 0 + 1 + 9 10.16n ..A–Sm Cap Indx +10 + 8 +75 22.76n +.06B Small Co +13 +11 +23 17.54n +.03B+Small Gr I +14 +12 +38 32.16n +.12B Sml Co Eq +13 +11 +20 20.56n +.03B SmlCapCor + 8 + 7 +74 20.05n +.03A–SmlCapValII +11 + 9 .. 13.95n +.04D–Strat Inc + 1 + 1 .. 5.91n ..B–Strat Inv + 5 + 4 +85 21.14n +.03
Tax Exempt + 1 + 1 .. 13.62n ..E TotRet Bond 0 0 +16 9.66n –.01E TX Intm Mun 0 + 1 +14 10.10n ..E US Trea Idx – 1 0 +14 10.54n –.02E VA Intm Mun 0 + 1 +14 10.75n ..D Young Inv + 4 + 3 – 6 12.19n +.03
Commerce Funds$ 1.8 bil 800–305–2140
E Bond 0 0 +13 18.00n –.02D Core Equity I + 4 + 2 + 9 17.43n +.01D Growth + 4 + 2 0 24.61n +.14E MO Tax Fr Bd 0 + 1 +16 19.17n ..E Natl Tx Fr 0 + 1 +17 19.00n ..E Sh Term Govt 0 + 1 + 8 17.50n –.01E † ComntyRe b 0 0 +16 10.42n –.01
Constellation Funds$ 2.3 bil 866–242–5742
A ClovrSmValI +11 +10 +71 25.92n –.01A–Intl Eq II + 8 + 8 +20 9.85n +.06C PitDivValII + 6 + 5 +31 12.36n –.02
SandsCapGrI – 2 – 4 .. 11.57 +.10C+SandSelGrII – 2 – 5 +20 8.13n +.07E UltrShInc I 0 + 1 + 9 10.02n ..
Country Funds$ 336 mil 800–245–2100
D Growth b + 4 + 3 +11 24.72n +.06Credit Suisse ABCD$ 1.1 bilCommod Rtn – 4 – 4 .. 10.64 ..
D+LgCapVal A m + 4 + 2 +15 20.11 +.01C+SmCapVal A m + 6 + 4 +60 23.63 +.08
Credit Suisse Common$ 1.3 bil
D Cap Apprec + 3 + 1 –18 17.79n +.05B+Intl Focus b + 7 + 7 +30 15.09n +.08B–Mid Cp Grow + 5 + 4 +19 34.97n +.10
Credit Suisse Trust$ 1.1 bil
A+Emerg Mkt + 9 +10 +89 18.37n +.07A Glb Sml Cap + 8 + 8 +12 14.01n +.06B–SmlCapGr +12 +11 +13 16.72n +.04
CRM Funds$ 1.9 bil 800–276–2883
A–Mid Val Ins + 8 + 7 +89 29.17n +.13A Sml Val Ins + 6 + 5 +82 28.08n +.06A Sml Val Inv + 6 + 5 +79 27.06n +.06
—D—E—D † Davenport + 4 + 3 +16 14.33n –.01
Davis Funds A$22.3 bil 800–279–0279
D Apprec&Inc + 5 + 5 +37 29.35 +.04C+Financial + 3 + 3 +29 43.88 +.12C+NY Venture + 4 + 3 +29 35.09 +.02B Opportunity + 8 + 7 +47 26.12 +.08A Real Estate +17 +16+140 47.00 +.48
Davis Funds B$ 5.3 bil 800–279–0279
C Financial m + 3 + 2 +24 40.10n +.10C NY Venture + 4 + 3 +25 33.61n +.03
Davis Funds C&Y$ 9.8 bil 800–279–0279
C NY Venture C + 4 + 2 +25 33.82n +.02
C+NY Venture Y + 4 + 3 +30 35.49n +.02B Opportnty C m + 7 + 7 +41 24.02n +.08B+† Delafield + 9 + 8 +96 25.83n +.05
Delaware A$ 9.9 bil 800–523–4640
B+Amer Svcs b + 6 + 5 +99 17.51 +.02E Corp Bond b 0 0 +30 5.58 –.01D–Delaware Bal + 4 + 3 + 7 17.10 +.03D Delchester + 3 + 3 +15 3.28 ..
DividendInc b + 6 + 5 .. 11.57 +.04E DivrsInc A b + 1 + 1 +17 8.59 ..A+Emerg Mkts b + 8 + 9+181 19.04 –.02B Gr Opp b + 8 + 7 +29 24.82 +.05A–Intl Equity b + 9 + 8 +54 19.26 +.03D+LargeCapVal + 6 + 5 +15 18.83 +.07E LtdTrmGov b 0 0 +12 8.23 ..B+REIT +15 +13+104 21.98 +.24C+Select Grow b + 1 – 1 + 7 26.79 +.19A–Sm Cap Val b + 9 + 8 +88 39.50 +.09E Tax Fr AZ Ins 0 + 1 +18 11.35 ..E Tax Fr CO Ins + 1 + 1 +19 11.04 ..E Tax Fr MN + 1 + 1 +19 12.47 ..E Tax Fr MN Ins 0 + 1 +18 10.90 ..E Tax Fr PA b + 1 + 1 +20 8.08 ..E TaxFrUSA b + 1 + 1 +21 11.53 ..E TaxFrUSA Int b + 1 + 1 +23 11.45 ..B–Trend b +10 + 9 +39 24.57 +.03
Delaware B$ 899 mil 800–523–4640
D LargeCapVal + 6 + 5 +12 18.69n +.06C+Select Grow m + 1 – 1 + 3 24.48n +.17C+Trend m +10 + 8 +34 22.10n +.02
Delaware C$ 576 mil 800–523–4640
A–Intl Equity m + 9 + 8 +51 19.08n +.03B Sm Cap Val b + 9 + 7 +74 36.75n +.08C+Trend m +10 + 8 +34 22.49n +.02
Delaware Instl$ 1.6 bil 800–828–5052
E Corp Bond 0 0 +31 5.57n –.01A–Intl Equity + 9 + 8 +55 19.31n +.04B–Trend +10 + 9 +41 25.79n +.03D US Growth + 3 + 1 –10 14.22n +.10C Value + 7 + 5 +24 11.94n +.04
Delaware Pl Tr$ 4.3 bil 800–231–8002
E CorePlusFix + 1 + 1 .. 9.16n ..A+Emerg Mkts + 9 + 9+186 14.55n –.01E Global Fxd Inc + 1 + 1 +40 10.81n +.03A Intl Equity + 9 + 9 +65 22.40n +.03A–Labor Intl + 9 + 8 +64 19.61n +.04
DFA Investment$69.9 bil 310–395–8005
A+Emerg Mkts +11 +11+139 23.02n +.11A+Emerg Mkts II +11 +11+144 19.14n +.09A+Emg Mkt Sml +12 +13 .. 15.48n –.01
EmMktCoreEq +11 +11 .. 13.48n +.04A+EmrgMktsVal +13 +14+214 26.92 +.11D Enh US Lg Co + 5 + 3 + 8 10.12n +.01
Glbl60/40 I + 5 + 4 .. 11.88 +.03Global Eq I + 8 + 7 .. 13.63 +.04
A+Intl Small Co + 9 +10+131 17.85n +.11A+Intl SmCpVal +11 +11+173 19.69n +.13A+Intl Value +12 +11 +81 20.16n +.13A+Intl Value II +12 +11 +81 18.74n +.11A+Intl Value III +12 +11 +78 19.04n +.11A+Intl Value IV +12 +11 +80 16.28n +.10
IntlCoreEq +10 +10 .. 11.63 +.07E Intrm Govt 0 0 +17 11.20n –.01A+Japan Sm Co – 1 0+122 19.66n +.29A–Lg Cap Intl + 8 + 8 +36 21.52n +.09A+LWASIntlHiBk +12 +11 +73 19.43n +.12A Real Estate +17 +16+133 29.33n +.26E Sh Trm Muni 0 0 .. 9.97n ..A+TaxMg SmVal +11 + 9 +96 25.90n +.06A TaxMg US Sm +10 + 9 +79 25.31n +.06A+TxM Intl Val +12 +11 +76 17.83n +.11B+TxM US MkVl + 8 + 7 +33 16.38n +.01B+TxM US MkVl II + 8 + 7 +33 16.29n +.01C TxMgdUSEq + 5 + 4 .. 13.88n +.03
US Cor Eq 2 + 7 + 6 .. 10.91 +.02B US Lg Cap Val + 7 + 6 +47 23.16n ..D+US Lg Co Instl + 5 + 4 + 9 10.24n +.02
B US LgCapVal 2 + 7 + 6 +48 21.69n ..B US LgCapVal 3 + 7 + 6 +46 17.82n ..D+US Lrg Co + 5 + 3 + 9 38.36n +.05A US Micro Cap +11 + 9+105 16.36n +.03A+US Sm Val II +12 +10+121 28.59n +.08A US Small Cap +11 + 9 +75 21.55n +.05A+US Sml Val +12 +10+113 29.53n +.09A US SmXMVal + 9 + 8 +90 17.28n +.04E 1 Yr Fixed Inc + 1 + 1 + 9 10.13n ..E 2Yr Glbl Fxd + 1 + 1 +11 9.84n ..E 5 Yr Gov + 1 + 1 +18 10.31n ..E 5GlbFxdInc 0 0 +16 10.23n ..
Diamond Hill Funds$ 756 mil 614–255–3333
B FocLngShA b + 5 + 5 +52 17.34 ..A+SmallCap A r + 4 + 3 .. 24.94 –.01
Diversified Instl$ 4.9 bil 800–926–0044
E Core Bond b 0 0 .. 10.38n –.01D Equity Gr b + 2 + 1 .. 7.47n +.04D Grow & Inc b + 4 + 3 .. 6.83n +.01E Hi Qual Bd + 1 + 1 .. 10.31n ..B+Intl Equity b +10 +10 .. 9.83n +.05D–IntLngHoriz b + 4 + 3 .. 9.78n +.01D–IntmdHorizn b + 3 + 2 .. 10.00n ..D+LgHznAlloc b + 5 + 3 .. 9.37n +.02A–Mid Cap Val b + 8 + 7 .. 16.02n +.05B+Special Eq b + 8 + 6 .. 11.71n +.02D+StockIndex b + 5 + 3 .. 8.76n +.01C–Value & Inc b + 6 + 5 .. 12.35n –.02
Diversified Inv$ 8.6 bil 800–926–0044
C Aggr Equity b + 8 + 5 – 1 14.75n +.11D–Balanced b + 3 + 2 +13 15.36n +.01E Core Bond 0 0 +13 12.34n –.01D Equity Gr b + 2 + 1 – 2 20.86n +.10D Grow & Inc b + 4 + 3 + 1 21.25n +.03E Hi Qual Bd b + 1 + 1 + 8 11.40n ..D–Hi Yld Bd b + 3 + 3 +28 9.55n +.01B+Intl Equity b +10 +10 +30 17.46n +.08D IntLngHoriz + 4 + 3 +16 12.81n +.02D–IntmdHorizn + 3 + 1 +14 11.89n +.01D+LgHznAlloc + 5 + 4 +14 11.36n +.02C+Mid Cap Gr b + 7 + 5 .. 11.81n +.05A–Mid Cap Val b + 8 + 7 .. 14.79n +.04E ShIntAlloc + 2 + 1 +14 10.04n ..E ShortHorizn + 1 0 + 9 10.76n –.01B+Special Eq b + 8 + 6 +36 26.77n +.05C–StockIndex b + 5 + 3 + 9 10.20n +.01C–Value & Inc + 6 + 5 +25 25.14n –.03
Dodge&Cox$86.0 bil 800–621–3979
D+Balanced + 4 + 3 +50 84.75n +.03E Income 0 0 +22 12.60n –.01A+Intl Stock + 9 + 8 .. 38.13n +.18B Stock + 6 + 5 +62 145.58n +.14
Domini Soc Inv$ 1.6 bil 800–762–6814
D Equity + 4 + 3 + 4 31.26n +.06D Equity Instl + 5 + 3 + 7 18.92n +.04
Dreyfus$26.9 bil 800–645–6561
E A Bonds Plus 0 0 +12 13.44n –.01D–Appreciation + 3 + 2 + 1 40.99n –.03D+Bas S&P500 + 5 + 3 + 8 27.24n +.04E Bas US Mort 0 0 +17 14.82n –.02E Bd Mkt Inv b 0 0 +17 9.97n –.01E CA IntMun r 0 + 1 +15 14.00n ..E CT IntMun r 0 + 1 +13 13.74n ..D Disc Stock + 6 + 4 + 3 35.61n +.03D Dreyfus Fund + 5 + 3 + 6 10.77n +.02B+Emerg Leaders + 9 + 7 +40 45.06n +.08E FL IntMun r 0 + 1 +14 13.01n ..E Gen NY Mu m + 1 + 1 +15 19.33n ..E GNMA b 0 0 +15 14.37n –.01D Growth & Inc + 4 + 3 + 1 16.38n +.02D Growth Opport + 3 + 1 + 4 9.03n +.03E Insrd Muni m + 1 + 1 +16 17.83n ..A–Intl Stk Idx r + 9 + 8 +31 16.55n +.09E Intm Muni r 0 + 1 +12 13.29n ..E IntmTrmInc 0 0 +16 12.48n –.02A–Mid Cap Val r + 6 + 5 +38 33.54n –.02E Muni Bond r + 1 + 1 +15 11.82n ..E NJ IntmMun r 0 + 1 +15 13.87n ..E NY Tx Ex r + 1 + 1 +16 14.74n ..E NY Tx Ex In r 0 + 1 +13 17.97n ..B S&P MidIndx r + 7 + 4 +58 29.76n +.08D+S&P500 Idx m + 5 + 3 + 7 38.19n +.05E Sh Intm Govt 0 0 + 7 10.37n ..A+Small Co Val + 2 + 1 +29 25.63n –.03A–SmCpStkIdx r +10 + 7 +75 23.56n +.06E 100% US Tr In 0 0 +14 12.40n ..
Dreyfus Fndrs$ 1.4 bil 800–645–6561
C+Discovery F b + 9 + 7 + 2 31.01n +.11D+Eq Grow F + 5 + 4 + 4 5.45n +.02D Growth F b + 5 + 4 – 6 11.56n +.06
Dreyfus Premier$17.9 bil 800–242–8671
D Alpha Gr C m + 6 + 4 +36 23.37n ..D+Alpha Gr T m + 6 + 4 +42 24.36 ..
Bal Opp A + 4 + 2 .. 19.60 +.03Bal Opp B m + 4 + 2 .. 19.48 +.03Bal Opp C m + 4 + 2 .. 19.51 +.02
D–Bal Opp J + 4 + 3 +24 19.64n +.03E CA Tax Ex Z + 1 + 1 +20 14.80n ..E Core Bd A 0 0 +12 14.23 –.01E Core Bd B m 0 0 +10 14.25 –.01C–Core Val A b + 5 + 4 +11 33.07 –.01E CTMuniBd A m 0 + 1 +16 11.91 ..A+Emrg Mkts A +10 + 9+142 23.83 +.14A+Entrprse A + 9 + 8 .. 24.66 –.07D–High Inc A + 2 + 2 .. 13.59 +.01A–Intl Val A + 8 + 8 +47 20.13 +.11A+IntlSmlCp A r +12 +12 .. 25.96 +.22D–LtdHiYld A b + 2 + 2 + 7 7.26 +.01
MA Muni Z 0 + 1 .. 11.71 ..E MDMuniBd A 0 + 1 +17 12.24 ..E Muni Bd A + 1 + 1 +16 13.04 ..
Muni Bd Z + 1 + 1 .. 13.04 ..C+New Leadr A + 5 + 4 +38 49.46 +.03E NJMuniBd A 0 + 1 +17 13.09 ..E NYMuniBd A + 1 + 1 +17 14.65 ..E OHMuniBd A + 1 + 1 +17 12.65 ..E PAMuniBd A + 1 + 1 +18 16.12 ..B S&P Strs B m + 8 + 6 – 2 29.35n +.09B S&P Strs C m + 8 + 6 – 2 29.33n +.09
ProFunds Inv UltraSmlCap " 16 A" 184 milABN AMRO Fds TAMROSmlN " 15 A# 136 milJanus Venture " 14 A 1.4 bilKoppEmgGr " 14 A# 265 milFBR Funds SmallCap A " 13 A# 833 mil
Hennessy Funds CornrstGrII " 13 A" 271 milRydex H Mekros " 12 A" 145 milColumbia Z Small Gr I " 12 B" 207 milMarshall Sm Cap Gr Y " 12 A 181 milWinslwGrnGr " 12 A" 205 mil
Allianz C PEA Opportn " 11 A 150 milRoyce ValuePlsInv " 11 A" 392 milHennessy Funds Cornrst Gr " 11 A 1.3 bilWells Fargo Advtg Ad Sm Co Grow " 11 B" 599 milColumbia Z Small Co " 11 B 298 mil
Royce MicroCap I " 11 A 562 milColumbia Z Sml Co Eq " 11 B 149 milFederated A KaufSmlCap " 11 A" 489 milFirst Amer Y Sm Cap Sel " 11 A# 716 milBogle Funds SmCapGr Inv " 10 A 160 mil
Guardian PrkAvSmCpA " 10 B 142 milFirst Funds Cap Apprec I " 10 B 131 milTurner Funds Small Cap Gr " 10 A 279 milPreferred Small Cap Gr " 10 A 140 milPrincipal Funds PtrSmGrI In " 10 A# 139 mil
ProFunds Inv UltraSmlCap " 21 A" 184 milProFunds Inv Ultra MidCap " 11 A" 171 milHodges Fund " 11 A" 402 milFidelity Invest Levrgd Co Stk " 7 A" 3.8 bilFidelity Adv C Lev Co Stk " 7 A" 237 mil
Royce ValuePlsInv " 11 A" 392 milWinslwGrnGr " 14 A" 205 milFederated A KaufSmlCap " 11 A" 489 milRydex H Mekros " 16 A" 145 milCGM Focus " 10 A" 2.0 bil
Baron Funds Partners " 11 A" 1.2 bilBaron Funds iOpport " 5 A" 141 milDreyfus Premier Entrprse A " 9 A" 167 milPerritt Capital Mgmt Perritt Micro " 8 A" 596 milBridgeway Fds Ultra Small Co " 13 A" 128 mil
Hennessy Funds CornrstGrII " 13 A" 271 milLord Abbett A Sml Blend " 8 A" 830 milWilliam Blair I Sm Cp Gr " 9 A" 407 milAmer Cent Inv Small Co " 9 A" 1.1 bilCGM Cap Dvlp " 4 A" 465 mil
Hartford A Small Co " 10 A" 182 milJanus Contrarian " 9 A" 3.4 bilBogle Funds SmCapGr Inv " 12 A 160 milTurner Funds Micro Cap Gr " 10 A 580 milBuffalo Small Cap " 10 A 2.0 bil
Top Growth FundsLast 36 Months (All Total Returns)
Performance% Change Rating $ Net
Mutual Fund In 2006 36 Mos Assets
Top Growth FundsLast 3 Months (All Total Returns)
Performance% Change Rating $ Net
Mutual Fund Last 3 Mos 36 Mos Assets
303.770.3377 | www.imca.org
JOIN IMCA TODAY and join the world’s elite investment professionals.
No matter how large your library,you can never know enough
about investing your clients’ portfolios.
INV
ES
TM
EN
T
MA
NA
GE
ME
NT
C
ON
SU
LT
AN
TS
A
SS
OC
IAT
ION
Your advice and recommendations are only as good as the education you have. That’s why you need to be a member of the Investment Management Consultants Association (IMCA). With more than 5,000 members, plus hundreds of faculty, speakers and other experts on board, you get the very latest in professional thinking on a full range of issues regarding investment strategies and wealth management.
As the industry’s premier member organization, IMCA has become synonymous with top-notch education, impeccable ethics and unerring professionalism. When you join IMCA, you’ll gain access to high-level classes, conferences, publications and certification opportunities.
Reputation is built by the company you keep. Join IMCA and keep company with the industry’s leading minds and best resources.

A14 MONDAY, MARCH 20, 2006 EXCHANGE TRADED FUNDS INVESTORS.COM
36 Mos 2006 12 Wk 5 Yr NetPerformance % % After Asset NAVRating Fund Chg Chg Tax Rtn Value Chg
36 Mos Fund 2006 12 wk 5 Yr Net NAVPerformance % % After Asset ChgRating Chg Chg Tax% Value
36 Mos 2006 12 Wk 5 Yr NetPerformance % % After Asset NAVRating Fund Chg Chg Tax Rtn Value Chg
36 Mos Fund 2006 12 wk 5 Yr Net NAVPerformance % % After Asset ChgRating Chg Chg Tax% Value
36 Mos 2006 12 Wk 5 Yr NetPerformance % % After Asset NAVRating Fund Chg Chg Tax Rtn Value Chg
36 Mos Fund 2006 12 wk 5 Yr Net NAVPerformance % % After Asset ChgRating Chg Chg Tax% Value
36 Mos 2006 12 Wk 5 Yr NetPerformance % % After Asset NAVRating Fund Chg Chg Tax Rtn Value Chg
36 Mos Fund 2006 12 wk 5 Yr Net NAVPerformance % % After Asset ChgRating Chg Chg Tax% Value
36 Mos 2006 12 Wk 5 Yr NetPerformance % % After Asset NAVRating Fund Chg Chg Tax Rtn Value Chg
36 Mos 2006 12 Wk 5 Yr NetPerformance % % After Asset NAVRating Fund Chg Chg Tax Rtn Value Chg
36 Mos Fund 2006 12 wk 5 Yr Net NAVPerformance % % After Asset ChgRating Chg Chg Tax% Value
36 Mos Fund 2006 12 wk 5 Yr Net NAVPerformance % % After Asset ChgRating Chg Chg Tax% Value
36 Mos Fund 2006 12 wk 5 Yr Net NAVPerformance % % After Asset ChgRating Chg Chg Tax% Value
36 Mos 2006 12 Wk 5 Yr NetPerformance % % After Asset NAVRating Fund Chg Chg Tax Rtn Value Chg
36 Mos Fund 2006 12 wk 5 Yr Net NAVPerformance % % After Asset ChgRating Chg Chg Tax% Value
36 Mos 2006 12 Wk 5 Yr NetPerformance % % After Asset NAVRating Fund Chg Chg Tax Rtn Value Chg
36 Mos Fund 2006 12 wk 5 Yr Net NAVPerformance % % After Asset ChgRating Chg Chg Tax% Value
36 Mos 2006 12 Wk 5 Yr NetPerformance % % After Asset NAVRating Fund Chg Chg Tax Rtn Value Chg
Rel Str 1-wkETF Symbol Rtg % chg
23.4 90 B- 43.2 IS Msci Brazil EWZ 1.1 41.17 -0.58 -1016.8 87 D- 147.5 IS S&P Latin Am 40 ILF 1.2 143.47 -0.80 -2213.4 84 C+ 117.0 IS Msci South Africa EZA 1.8 111.44 0.96 -719.2 81 D 39.7 IS Msci Mexico EWW 1.2 39.01 0.20 -56
11.0 80 B 133.2 BDR Emrgng Mkts 50 ADRE .. 128.00 -0.26 -7323.5 79 D+ 21.1 PS Wh Clean Eng PBW .. 20.00 -0.06 -409.6 77 D 157.9 HT Oil Service OIH 0.4 141.18 -1.58 -28
11.5 77 D 101.4 IS Msci Emrgng Mkts EEM 1.0 98.44 0.69 -5817.0 76 C 37.2 IS GS Networking IGN .. 36.28 0.02 610.3 76 B- 68.3 VG Emrg Mkts Vipers VWO 1.6 67.17 0.24 -432.3 75 E 48.5 IS Msci South Korea EWY 0.2 45.76 0.46 -44
18.0 75 A- 87.9 IS Tr Cohen&Steers ICF 3.7 88.31 1.07 916.9 74 C+ 74.6 IS Ftse/Xinhua Chna FXI .. 72.05 0.08 -5117.2 74 C+ 79.3 ST Wilshr Reit RWR 5.5 79.09 0.34 -210.6 73 B 20.9 HT Broadband BDH .. 20.50 0.14 -6712.2 73 C+ 30.9 IS Msci Austria EWO .. 30.95 0.17 -494.7 73 C+ 122.7 IS S&P/Topix 150 ITF .. 121.45 1.62 -716.7 72 C 57.4 IS Comex Gold Trust IAU .. 55.20 -0.14 -748.6 72 B 82.5 IS Dj Transprtn Idx IYT 0.5 81.92 0.21 -846.9 72 D 57.3 ST Gold Trust GLD .. 55.12 -0.22 -523.5 71 B- 14.3 IS Msci Japan EWJ 0.3 13.99 0.20 -27
14.2 70 B+ 3.0 HT B2B Internet BHH10.0 2.90 0.04 -7319.7 70 B+ 4.6 HT Intrnt Infrstr IIH 0.2 4.62 0.08 2416.8 70 A- 74.6 IS Dj Us Real Est IYR 3.2 74.95 0.81 277.4 70 D+ 24.1 IS Msci Canada EWC 0.6 23.52 -0.33 -69
12.6 70 B- 22.9 IS Msci Germany EWG 0.5 22.87 -0.02 -6212.8 70 A 25.4 IS Msci Sweden EWD .. 25.60 0.29 -5113.5 70 B 20.3 PS Dynamic Semi Prt PSI .. 18.64 -0.01 -4317.0 70 A+ 69.5 VG Reit Vipers VNQ 6.7 69.68 0.62 -539.9 68 B 61.6 IS Msci Value Fund EFV .. 61.87 0.37 2827.8 68 B 83.6 IS Mstar Mid Growth JKH 0.2 83.34 0.28 -527.0 68 B 19.4 PS Dynamic Biotech PBE .. 18.51 -0.01 93
12.3 68 A- 18.2 PS Dynamic Bld&Con PKB 0.1 18.22 0.21 -7814.9 68 B- 16.6 PS Gld Drg Chna PGJ .. 15.94 -0.07 129.1 67 B+ 21.1 IS Msci Switzerland EWL 0.4 21.07 0.08 -678.1 67 B+ 85.7 IS Nasdaq Biotech IBB .. 83.52 -0.08 -57
10.5 66 B- 75.2 IS Mstar Small Gr JKK 0.0 74.41 0.11 -805.5 66 B+ 18.5 PS Dynamic Mid Gr PWJ .. 18.46 0.08 -58
17.1 66 A+ 18.3 PS Water Resources PHO 0.1 17.80 -0.06 -343.2 66 D+ 63.9 VG Pacific Vipers VPL 1.5 62.86 0.55 -41
10.5 66 B- 64.9 VG Small-Cap Grwth VBK 0.3 64.55 0.09 1412.3 65 B+ 87.1 IS Msci Emu Indx Fd EZU 1.5 87.22 0.27 -511.4 65 B+ 22.6 IS Msci Netherlands EWN 1.1 22.64 0.15 -2513.7 65 A- 41.2 IS Msci Spain EWP 1.5 41.14 0.05 1811.2 65 B- 77.9 IS Russell 2000 Grw IWO 0.4 77.46 0.26 -328.2 65 B- 79.6 IS S&P Glbl Finls IXG 1.5 79.58 0.23 -418.8 64 C+ 64.6 IS Msci Eafe Idx Fd EFA 1.7 64.65 0.26 -318.2 64 B- 61.0 IS Msci Growth Fund EFG .. 61.22 0.32 -60
11.7 64 B+ 80.4 IS Mstar Small Core JKJ 1.2 80.28 0.29 2510.4 64 A- 17.9 PS Dynamic Retail PMR 0.3 17.81 0.01 -2212.2 64 B- 17.7 PS Dynmic Netwrkng PXQ .. 17.53 0.15 -6210.4 64 B 46.9 ST Dj Euro 50 FEZ 0.4 46.77 0.02 -819.9 64 B 90.7 ST Dj Sm C Grt DSG .. 90.19 0.061093
11.7 63 A- 29.0 IS Msci France EWQ 1.0 29.03 0.14 -7910.0 63 B+ 17.0 PS Aero & Defense PPA 0.5 17.07 0.14 7410.2 63 B- 65.9 VG Small-Cap Viprs VB .. 65.64 0.22 579.0 62 B 78.7 BDR Dvlped Mkts 100 ADRD 1.5 78.50 0.07 -528.7 62 C+ 73.5 HT Europe 2001 EKH 1.2 73.25 0.01 -616.6 62 C+ 101.4 IS GS Nat Res IGE 1.0 94.18 -0.97 -17
11.0 62 B- 74.5 IS Russell 2000 Idx IWM 1.4 74.09 0.32 -1011.6 62 A- 71.5 IS S&P 600/Barra Vl IJS 0.8 71.32 0.27 -4410.8 62 A- 89.4 IS S&P Europe 350 IEV .. 89.46 0.26 -6311.0 61 B- 73.6 IS Russell 2000 Val IWN 1.9 73.21 0.17 1006.7 61 B 100.6 IS Russell Mdcp Grw IWP 0.7 100.28 0.26 105
10.7 61 D- 57.1 IS Russell Microcap IWC 0.6 56.60 0.05 -495.4 61 C 22.3 PS Dynamic Oil Svcs PXJ .. 19.07 -0.23 -635.9 61 B+ 17.5 PS Dynamic Pharma PJP 0.3 17.47 0.09 -687.0 61 B 18.4 PS Dynamic Sml Gr PWT .. 17.95 -0.04 -788.6 61 D- 18.8 PS Lux Nanotech PXN 0.2 17.81 0.02 -70
10.7 61 B- 58.2 VG European Vipers VGK .. 58.25 0.11 -317.5 61 B+ 97.5 VG Extd Mkt Idx Fd VXF .. 97.29 0.23 -249.1 61 A- 62.7 VG Industrl Vipers VIS 0.7 62.67 0.28 37.0 61 C 69.2 VG Mid-Cap Vipers VO 1.1 69.13 0.32 -60
12.7 61 A- 61.6 VG Telecom Svcs VOX 2.2 61.40 0.03 -28-0.9 60 C+ 212.3 HT Biotech BBH .. 198.96 4.73 -2614.0 60 A 30.3 HT Telecom TTH 3.1 30.06 -0.15 -6010.0 60 C 8.8 IS Msci Singapore EWS 3.1 8.69 0.02 188.6 60 A 76.7 IS S&P 400/Barra Vl IJJ 1.3 76.53 0.26 -61
10.0 60 A+ 63.9 IS S&P Smcp 600 IJR 0.6 63.58 0.26 -259.2 59 B- 78.7 BDR Europe 100 ADRU 2.1 78.43 -0.27 -527.3 59 B 78.4 IS Mstar Mid Core JKG 1.4 78.32 0.21 -857.6 59 A 94.7 IS Russell Mdcp Idx IWR 1.7 94.62 0.41 -629.5 59 B 17.0 PS Zack Micro PZI 0.2 16.59 0.01 -38
10.0 59 B- 59.8 ST Dj Wilshr Smcp DSC 0.5 59.42 -0.40 -828.6 59 D 65.4 VG Materials Viprs VAW 1.5 65.09 0.15 -57
10.6 58 B 64.6 HT Wireless WMH 1.4 64.15 0.12 -788.2 58 B 63.1 IS Dj Us Industrial IYJ .. 63.00 0.19 -45
10.8 58 D 21.2 IS Msci Belgium EWK 1.3 21.29 0.16 -448.3 58 C+ 134.8 IS Russell Mdcp Val IWS 2.6 134.72 0.42 -684.9 58 B+ 80.5 IS S&P 400/Barra Gw IJK 0.5 79.35 0.23 -548.6 58 B 126.7 IS S&P 600/Barra Gw IJT .. 126.04 0.14 -386.4 58 C 78.9 IS S&P Midcap 400 IJH 0.9 78.54 0.20 -426.1 58 B 143.9 S&P Midcap 400 MDY 0.9 142.95 0.12 -76.6 58 E 58.3 Spy Energy XLE 1.0 53.65 -0.85 -8
9.9 58 B 66.8 ST Dj Sm C Val DSV 2.4 66.46 -0.04 -269.4 57 B 77.3 IS Mstar Small Val JKL 2.9 77.15 0.26 -877.1 57 B 75.9 IS Nyse Composite NYC .. 75.89 0.14 -506.9 57 B 16.3 PS Dynamic Leis Ent PEJ 0.4 16.26 0.09 -617.0 57 A+ 17.3 PS Dynamic Lrg Val PWV 1.7 17.25 -0.01 -663.1 57 B- 18.4 PS Dynamic Software PSJ .. 17.95 0.07 -749.1 57 B 16.8 PS Dynmc H&C Elect PHW .. 16.80 0.10 1366.7 57 C+ 177.8 RX S&P 500 Eql Wghtd RSP .. 177.01 -0.18 289.0 57 B- 43.2 ST Dj Stoxx 50 FEU 1.1 43.02 -0.15 -607.2 57 B 60.6 ST Dj Wilshr Mdgr EMG 0.2 60.37 -0.21 -979.0 57 B 62.3 ST Kbw Cap Mkt KCE 0.1 59.57 -2.06 72
6.4 57 B- 83.3 VG Energy Vipers VDE .. 76.81 -0.69 -395.7 57 B+ 59.3 VG Financial Vipers VFH 2.8 59.20 0.10 -44
10.1 57 B- 66.9 VG Small-Cap Value VBR 1.7 66.80 0.23 -227.3 56 C+ 55.6 IS Dj Us Basic Mtrl IYM 2.4 55.32 0.10 -635.8 56 B 107.0 IS Dj Us Finl Indx IYF 2.1 106.96 0.37 -62
12.6 56 A- 25.9 IS Dj Us Telecom IYZ 1.8 25.75 -0.13 -213.8 56 D+ 68.6 IS GS Semicndctr IGW .. 63.28 0.02 -12
11.3 56 B 28.5 IS Msci Italy EWI 2.2 28.47 0.01 37.5 56 A 33.9 Spy Industrial XLI 2.2 33.79 0.13 16.3 56 C+ 32.6 Spy Materials XLB 2.9 32.19 -0.20 -387.9 55 B- 22.5 Frst Tr Dj Select Mirco FDM 0.1 22.36 0.06 -94
7.5 55 C 106.6 IS S&P Global Energy IXC .. 100.67 -1.03 -655.6 55 B 48.1 PS Dynamic Market PWC 1.1 47.87 -0.08 -254.8 55 B 52.2 PS Dynamic Otc PWO .. 51.56 0.11 -227.7 55 B 16.7 PS Dynamic Sml Val PWY 0.7 16.71 0.08 -486.7 55 B+ 16.6 PS Intl Div Ach PID 1.9 16.41 -0.15 -256.7 55 A- 55.2 ST Dj Wilshr Mdcp EMM 0.7 54.96 -0.09 -957.8 55 A- 56.5 ST Dj Wilshr Mdvl EMV 1.2 56.48 0.00 1366.2 54 C 98.2 IS DJ Us Energy Idx IYE 0.8 91.05 -0.93 -195.6 54 B 121.0 IS Dj Us Finl Svcs IYG 2.9 120.82 0.24 -51
10.2 54 B+ 20.5 IS Msci Untd Kingdm EWU 1.7 20.47 0.06 -434.5 54 B- 33.3 Spy Financial XLF 2.5 33.10 -0.08 -33
6.5 53 C 78.8 IS Mstar Mid Value JKI .. 78.71 0.06 -478.9 53 A- 16.4 PS Dynamc Tel&Wire PTE .. 16.10 -0.04 -644.1 53 B+ 17.1 PS Dynamic Insurnc PIC 1.1 17.02 -0.02 4734.9 53 B+ 16.7 PS Dynamic Lrg Gr PWB 0.1 16.63 0.07 -144.6 53 A- 17.7 PS Dynamic Mid Val PWP 2.8 17.20 0.00 -240.2 53 B- 19.3 S&P 500 Geared Fund GRE12.9 18.89 0.00 -60
.. 53 .. 54.4 Spy Biotech XBI .. 52.07 -0.13 -914.5 52 B 91.6 FD Nasdaq Comp Fd ONEQ 0.3 90.49 0.01 -915.5 52 B+ 148.5 HT Regional Bank RKH 3.2 148.20 0.46 -427.1 52 C 74.1 IS Russell 1000 Val IWD 2.5 73.95 -0.06 -147.2 52 B- 96.9 IS Russell 3000 Val IWW 2.6 96.76 0.16 -63
6.8 52 B- 69.7 IS S&P 500/Barra Vl IVE .. 69.45 0.03 -635.6 52 B- 55.0 IS S&P Glbl Hlthcr IXJ 0.7 55.12 0.37 23.6 52 D- 57.4 IS S&P Glbl Inf Tch IXN 0.0 55.13 0.08 -323.0 52 C 55.6 ST MS Hgh Tch MTK .. 53.48 0.19 484.0 52 C 52.0 VG Info Tech Viprs VGT 0.2 50.32 0.11 -663.9 50 D- 53.8 IS Dj Us Tech Indx IYW 1.5 51.64 0.18 -645.4 50 B 64.0 IS Dj Us Total Mrkt IYY .. 63.78 -0.01 -723.0 50 A 51.0 IS Gldmn Schs Tec Idx IGM .. 48.79 0.01 1786.9 50 B- 73.5 IS Mstar Large Val JKF 2.5 73.31 -0.04 -675.3 50 A 71.6 IS Russell 1000 Idx IWB 1.9 71.27 0.05 134.3 50 B 44.2 IS Russell 3000 Grw IWZ 0.9 43.22 0.13 -265.5 50 C+ 76.2 IS Russell 3000 Idx IWV 1.9 76.00 0.08 -825.4 50 C 117.3 IS S&P 1500 Indx Fd ISI 1.4 117.00 0.09 -625.3 50 B+ 131.7 IS S&P 500 Index Fd IVV 1.5 131.25 0.07 226.4 50 B 16.9 PS Dynamic Utiliti PUI 2.8 16.61 -0.14 7094.5 50 C+ 19.6 PS Dynmc Engy Expl PXE 0.3 17.52 -0.16 -805.6 50 B+ 16.1 PS Hi Growth Rt PHJ 2.1 16.11 -0.01 -765.4 50 B 74.5 ST Dj Lrg C Vl ELV .. 73.92 -0.53 -524.7 50 B- 95.0 ST Ttl Mkt Etf TMW 1.8 94.41 -0.13 -524.8 50 B- 58.3 VG Large-Cap Vipers VV 1.9 58.17 0.01 -685.6 50 B 130.6 VG Ttl Stk Mkt Idx VTI 2.1 130.20 0.10 -286.3 50 B 60.9 VG Value Vipers VTV 3.1 60.77 -0.04 -617.1 49 D+ 37.9 HT Intrnt Architc IAH 0.2 37.65 0.01 -956.4 49 C+ 13.9 IS Msci Hong Kong EWH 2.0 13.43 0.04 -394.9 49 B- 131.5 S&P 500 Dpstry Rcpts SPY 2.1 130.59 -0.44 -285.8 49 C+ 22.6 Spy Technology XLK 2.7 22.11 0.07 -563.9 48 B+ 55.3 IS Kld Select Social KLD 1.3 55.25 0.07 -825.0 48 E 69.8 IS Mstar Large Core JKD .. 69.84 0.13 -565.5 48 B+ 52.3 PS Ftse Rafi US 1k PRF .. 51.99 -0.16 -733.7 48 B 55.9 VG Growth Vipers VUG 1.0 55.47 0.04 -124.1 48 C+ 56.5 VG Health Care VHT 0.7 56.22 0.16 -325.3 47 B- 113.0 D J I Diamonds Trust DIA 2.2 112.67 -0.10 -193.6 47 B+ 66.0 IS Dj Us Healthcare IYH 0.6 65.29 0.39 -353.7 47 C 53.1 IS Russell 1000 Gwt IWF 1.0 52.91 0.10 -42.6 47 C 43.3 Nasdaq 100 QQQQ .. 41.45 0.08 -163.4 47 B 51.5 ST Dj Lrg C Gr ELG 0.6 51.10 -0.04 -645.2 45 B- 55.5 HT Market 2000+ MKH 0.6 55.49 0.07 -443.0 45 B 39.5 HT Software SWH 0.2 37.68 0.12 -605.4 45 D+ 106.1 IS Msci Pac Ex-Japn EPP 3.5 103.95 -0.56 -534.7 45 C 68.3 IS Nyse 100 Index NY 2.2 68.29 0.02 -803.8 45 B 61.7 IS S&P 500/Barra Gw IVW .. 61.52 0.14 -665.3 45 B+ 66.5 IS S&P Gbl 100 Indx IOO 1.8 66.27 0.22 -864.1 45 B- 15.7 PS Div Achv Prt PFM 2.2 15.65 -0.03 96.3 45 B- 16.9 PS Value Line Time PIV .. 16.25 0.00 -37
.. 45 .. 30.3 RX S&P 500 PureVal RPV .. 30.31 0.00 -95
.. 45 .. 39.2 RX S&P SC 600 PrGr RZG .. 39.64 0.44 -993.2 45 B+ 33.1 Spy Health Care XLV 1.3 32.72 -0.03 -634.2 45 B+ 68.2 ST Dj Gbl Ttn DGT 1.9 67.75 -0.41 -214.2 45 B 54.5 ST Kbw Bank KBE 1.0 54.13 -0.18 -775.0 44 B- 20.4 IS Msci Australia EWA 3.3 19.75 -0.20 -458.4 44 B 7.7 IS Msci Malaysia EWM 2.0 7.39 0.02 -401.6 43 B- 64.4 IS Mstar Large Gr JKE 0.4 62.16 0.02 -395.6 43 B+ 15.2 PS Dynamic Food Bev PBJ 0.7 15.17 0.04 -73
.. 43 .. 34.7 RX S&P 500 Pure Gwth RPG .. 34.70 -0.02 -75
.. 43 .. 51.8 RX S&P MC 400 PrGr RFG .. 52.07 0.27 -79
.. 43 .. 31.5 RX S&P MC 400 PrVl RFV .. 31.35 -0.07 -49
.. 43 .. 38.8 RX S&P SC 600 PrVl RZV .. 38.52 -0.10 -803.8 43 A- 56.5 Spy Dividend SDY 2.2 56.22 -0.16 -54
.. 43 .. 46.1 Spy Homebuilder XHB .. 46.14 0.82 262.3 43 C 59.8 ST Dj Wilshr Lgcp ELR 0.7 59.29 0.00 -504.9 42 B 104.0 HT Retail RTH 0.4 100.01 0.58 -314.0 42 B- 62.4 IS Dj Us Cnsmr Svcs IYC 0.1 62.02 0.19 -610.2 42 D- 14.1 IS Msci Taiwan EWT 0.6 12.50 0.08 -655.3 40 B- 76.5 HT Pharmaceutical PPH 2.3 73.33 0.37 -444.5 40 B 64.6 IS Dj Select Divdnd DVY 2.9 64.03 0.03 -362.3 40 B- 42.8 IS Gldmn Schs Sftwr IGV .. 41.19 0.18 -386.8 40 A- 53.1 IS S&P Glbl Telcom IXP 2.4 51.97 -0.15 1202.9 40 D- 96.7 RX Russell Top 50 Fd XLG 2.0 95.84 -0.68 572.0 40 B+ 55.6 ST Spy O-Strp OOO 0.2 53.53 -0.29 1133.9 40 B 56.3 VG Cnsmr Discrtnry VCR .. 54.65 0.07 -744.0 40 B- 58.3 VG Consumr Staples VDC 1.2 58.14 0.05 -242.9 39 A- 24.5 Spy Cnsumer Staples XLP 2.0 23.96 -0.14 -303.1 38 B- 123.2 Euro Currency Trust FXE 1.5 122.14 0.21 -490.9 37 B- 123.7 HT Utilities UTH 3.1 115.04 -0.73 -853.0 37 C+ 55.0 IS Dj Us Cnsmr Gds IYK 1.5 54.84 0.03 -732.8 37 D+ 83.3 IS Dj Us Utilities IDU 2.7 78.63 -0.37 -674.2 37 B- 35.0 Spy Cnsmr Discretnry XLY 2.0 34.02 0.05 1252.4 37 D+ 34.0 Spy Utilities XLU 3.6 32.15 -0.32 -493.2 37 B- 71.1 VG Utilities Viprs VPU 3.3 67.23 -0.23 416.8 32 C+ 20.1 Nvn Eqty Prm Opp JSN 9.5 18.58 -0.13 -120.7 32 B- 15.7 PS Hi Yld Eq Dv PEY 3.0 15.04 -0.06 -27
-0.9 32 B- 54.2 ST Kbw Insurnc KIE 0.9 52.60 -0.23 92-3.0 31 D- 40.6 HT Semiconductors SMH .. 35.55 -0.07 2-0.1 31 B 81.3 IS Lehman 1-3 Yr SHY 4.2 80.09 -0.02 -39-0.9 29 D+ 103.5 IS Lehman Agg Bd Fd AGG 4.5 99.72 -0.10 316.9 29 C+ 20.5 Nvn Eqty Prem Adv Fd JLA 9.6 18.78 -0.02 -22
11.9 29 C+ 20.0 Smll Cp Prm & Div Inc RCC 9.2 18.01 -0.01 -258.9 27 B 20.0 Enhncd S&P Cov Call BEO 6.0 18.32 -0.13 -261.3 27 C+ 15.1 PS Dynamic Media PBS 0.1 14.51 -0.03 -64
.. 27 .. 55.8 Spy Semiconductor XSD .. 52.04 -0.01 -97-0.9 26 D+ 112.5 IS GS $ Investop LQD 4.9 106.67 0.01 -59-3.3 26 D- 97.0 IS Lehman 20+ Yr TLT 4.3 88.85 -0.27 -11-1.8 26 D- 87.5 IS Lehman 7-10 Yr IEF 3.9 82.40 -0.12 -34-0.9 26 B- 107.9 IS Tr Lehman Tips TIP .. 101.89 -0.11 -255.2 26 C 20.8 Nvn Eqty Prem Inc Fd JPZ 9.3 18.29 0.00 -18
.. 22 .. 24.8 DB Commodity Index DBC .. 23.32 -0.11 -355.2 19 B- 20.4 S&P 500 Covered Call BEP11.6 17.26 -0.02 -36
-14.0 17 C+ 70.8 HT Internet HHH .. 56.62 -0.25 -693.9 13 E 20.0 Nvn Eqty Prem&Gr JPG 9.0 17.92 0.05 -78
’06 % Rel Acc 52-wk Div Close Vol %Chg Str Dist high Fund Symbol Yld Price Chg Chg
B Y M U R R A Y C O L E M A NINVESTOR'S BUSINESS DAILY
Exchange traded funds that holdstocks don’t distribute capital gainslike traditionalopen-endfunds.That can be an advantage of usingstock ETFs in a taxable account.ButbondETFshavenosuchedge.In stock funds and ETFs, most ofthe return comes from capitalgains,which are taxed at 15%on as-setsheldat least ayear.In bond funds and ETFs, most ofthe returnover timecomes fromin-terest payments. But interest istaxed as personal income, whichcanbeashighas35%.“There’s no major tax benefit tousing anETFover a traditionalmu-tual fund with bonds,” said DanCulloton, a Morningstar analyst.“Interest payments are still taxedthe sameway,whether you’re in anETFormutual fund.”
No Leg Up?BondETFsdon’t seemtoofferanyleg up on returns either.Why? Bet-ter selection and active manage-ment. Thus they may at times lackexposure toparts of themarket thatoutperform.“There are only a handful of bondETFs right now,” said Culloton.“They offer pretty plain vanil-la-type options for investing part ofaportfolio inbonds.”So how might ETFs be used in aportfolio? If interest rates keep ris-ing, you’re likely to lose money in afundholdingbondswith longerma-turities. A way to hedge your betwould be to put some assets intoshorter-term issues. A quick andeasy way to do that would be with
iSharesLehmanBros.1-3YearTrea-suryBondFundSHY.Another option, with more inter-mediate-termissues, is iSharesLeh-man Bros. Aggregate BondFundAGG. Bothhave lowexpensera-tios,20basispointsor less.The iShares 1-3 Year TreasuryBondFund’s total return,which in-cludes capital appreciation plus in-terest payments, is barely positivefor theyear.Butyoumaybeable to accomplishyour goal even better with amoneymarket fund. Vanguard TreasuryMoney Market FundVMPXX is yield-ing 4.14% and has returned 0.8% sofar in2006.
Fund VersionVanguard also offers a low-costopen-end mutual fund that com-petes against iShares Treasury.That’s the Vanguard Short-termTreasury FundVFIFX. The fund isyielding 4.57%, almost the same asthe iSharesETF.But its total returnis runningslightlyhigherat0.43%.“It’s pretty much a wash betweensimilar bond ETFs and low-cost,top-notch open-end funds rightnow,” said Nick Cockcroft, a SanFrancisco-based financialplanner.So how do you decide? For one, ifyou’re making small contributionson a regular basis, no-loadopen-end mutual funds would bewiser. That way you won’t have topay commissions on both ends ofyour transactions.A bond ETF might make sense,says Cockcroft, if you’re less in-clined to hold onto it. Even then,you should figure out howmuch incommissions you’ll pay when in-vestingsmaller amounts.
Weekly Winners & LosersBOTTOM 10
Nvn Eqty Prem Inc Fd JPZ 26 -1.7ST Kbw Cap Mkt KCE 57 -1.6Nvn Eqty Prm Opp JSN 32 -1.4HT Semiconductors SMH 31 -1.1Spy Cnsumer Staples XLP 39 -0.8Nvn Eqty Prem Adv Fd JLA 29 -0.7Nvn Eqty Prem&Gr JPG 13 -0.4PS Dynamic Semi Prt PSI 70 -0.1Spy Biotech XBI 53 -0.1Spy Semiconductor XSD 27 0.0
Spy Homebuilder XHB 43 8.5IS Msci South Africa EZA 84 6.6IS Msci Mexico EWW 81 6.0IS Msci Austria EWO 73 5.9IS Msci Sweden EWD 70 5.9PS Dynamic Bld&Con PKB 68 5.9HT Intrnt Infrstr IIH 70 5.5PS Dynmc Engy Expl PXE 50 5.3HT B2B Internet BHH 70 5.1HT Oil Service OIH 77 5.1
’06 % Rel Acc 52-wk Div Close Vol %Chg Str Dist high Fund Symbol Yld Price Chg Chg
’06 % Rel Acc 52-wk Div Close Vol %Chg Str Dist high Fund Symbol Yld Price Chg Chg
iShares Lehman 1-3 Year Treasury
RS 30B
SHY 80.11 +0.14 as of 3/16/06
80
80.5
81
3713026329521182hcraMyraurbeFy ’06raunaJrebmeceDr ’05ebmevoN
000,003
000,087
000,000,2
emuloV
Daily Graphs available at investors.com/DGO/IC
’06 % Rel Acc 52-wk Div Close Vol %Chg Str Dist high Fund Symbol Yld Price Chg Chg
Rel Str 1-wkETF Symbol Rtg % chg
’06 % Rel Acc 52-wk Div Close Vol %Chg Str Dist high Fund Symbol Yld Price Chg Chg
’06 % Rel Acc 52-wk Div Close Vol %Chg Str Dist high Fund Symbol Yld Price Chg Chg
Slim Pickings In ETFsThat Trade Treasuries
MUTUAL FUND PERFORMANCEContinued from A13
TOP 10
For Friday, March 17, 2006. Ranked by Relative Strength
A Const & Hse + 8 + 6+130 50.80n +.50A Devlp Com +12 +10 – 9 22.42n +.02A Dfnse&Aero +12 +11 +94 81.70n +.41B–Electronics + 4 + 2 – 3 45.43n –.09A+Energy + 8 + 7+102 50.69n –.42A Energy Svcs + 7 + 5 +77 70.44n –.82C Financl Svcs + 6 + 5 +32 122.20n +.24D Food&Agrclt + 6 + 5 +32 53.76n +.22B Gold r + 9 +11+241 36.15n –.04D Health Care + 3 + 2 +15 140.71n +.63D Home Fince + 4 + 2 +39 52.83n +.10A–Indl Materls + 7 + 7+114 47.40n +.07C+Insurance + 2 + 1 +58 69.64n –.14B–Leisure + 5 + 4 +32 82.53n +.92C Med Eq & Sys + 2 + 1 +64 24.83n +.16A+Medcl Dlvry + 1 – 1+123 55.02n –.06A+Natural Gas + 3 + 1 +86 40.00n –.37A+Natural Res r +10 + 9 +96 26.67n –.15C Netwk&Infr r +14 +12 –38 2.69n ..D Pharm + 8 + 7 .. 10.73n +.08D Sftwr&Cmp + 3 + 2 +20 54.23n +.26C Technology + 4 + 1 – 5 65.39n ..B–Telecommun +14 +12 – 7 44.12n –.16B+Utility Gr +10 + 9 – 2 47.45n –.29A+Wireless + 8 + 6 0 7.39n +.02
Fidelity Spartan$49.6 bil 800–544–8888ExtMkt Adv r + 7 + 6 .. 37.29n +.11
A–ExtMkt Inv + 7 + 6 +54 37.28n +.11E Govt Income 0 0 +18 10.80n –.02
IntlIdx Adv r + 9 + 8 .. 38.85n +.22A–IntlIdx Inv + 9 + 8 +36 38.85n +.22E Inv Grade Bd 0 0 +20 10.34n –.02
TotMkt Adv r + 6 + 4 .. 36.63n +.07C TotMkt Inv + 6 + 4 +19 36.63n +.07
US EqIdxAdv + 5 + 4 .. 46.45n +.07D+US EqIdxInv + 5 + 3 + 9 46.44n +.07
500 Idx Adv r + 5 + 4 .. 90.47n +.13D+500 Idx Inv r + 5 + 4 + 9 90.47n +.13
FidltyAdvFoc A$ 625 mil 800–522–7297
D Health Care r + 3 + 2 +16 24.76 +.12A+Natural Res m +10 + 8 +91 43.72 –.23B–Technology + 9 + 7 – 1 18.86 +.03
FidltyAdvFoc B$ 889 mil 800–522–7297
C Financl Svc + 6 + 5 +31 23.47n +.04D Health Care b + 3 + 1 +11 23.15n +.10C+Technology b + 9 + 7 – 4 17.70n +.02
FidltyAdvFoc C$ 343 mil 800–522–7297
D Health Care m + 3 + 1 +12 23.22n +.11FidltyAdvFoc T$ 1.1 bil 800–522–7297
C Financl Svc + 6 + 5 +34 23.95 +.05D Health Care + 3 + 1 +14 24.24 +.11A+Natural Res +10 + 8 +90 44.51 –.23B–Technology + 9 + 7 – 2 18.50 +.03
Fifth Third A$ 782 mil 800–334–0483
D LM ModAggr b + 5 + 4 .. 14.43 +.03D–Quality Gr + 5 + 3 –11 17.13 +.04
Fifth Third Inst$ 5.1 bil 800–334–0483
E Bond x 0 0 +15x 9.80n –.05C+DiscpLgVal x + 7 + 5 +29x14.48n –.04D+Eqty Index x + 5 + 4 + 8x24.80n –.07B+Intl Equity + 8 + 8 +35 12.70n +.08E Intm Bond x 0 0 +12x 9.59n –.04E Intm Muni x 0 + 1 + 8x10.07n –.02D LM ModAggr + 5 + 4 .. 14.46n +.02D–LM Moderate + 4 + 3 .. 12.79n +.01D+Lrg Cap Cor x + 6 + 4 + 4x15.46n –.01B–Mid Cap Gr + 9 + 8 +25 17.86n +.06B+MultCapVal x + 9 + 7 +57x26.17n –.02D–Quality Gr + 5 + 3 –10 17.46n +.03E Sh Trm Bd x + 1 + 1 + 8x 9.27n –.04B–Sm Cap Gr +14 +12 +23 15.55n ..
First Amer A$ 2.2 bil 800–677–3863
E Core Bond b 0 0 +15 10.94 –.02D+Equity Inc b + 6 + 4 +14 14.82 +.02D+Equity Index b + 5 + 3 + 7 24.49 +.04B MidCapGrOpp + 9 + 7 +50 42.14 +.11A Real Estate b +17 +16+137 23.28 +.23
First Amer Str$ 545 mil 800–677–3863
D G&I Allo A + 5 + 4 +17 10.99 +.02First Amer Y$17.5 bil 800–677–3863
D–Balanced + 4 + 3 +16 12.05n +.02E Core Bond 0 0 +16 10.94n –.01D+Equity Inc b + 6 + 5 +15 14.92n +.02D+Equity Index b + 5 + 3 + 8 24.48n +.03D–High Inc Bd + 2 + 3 +34 9.47n ..E Int Tax Fr b + 1 + 1 +16 10.81n ..E Int Trm Bd 0 0 +14 9.81n –.01B Intl + 9 + 9 +17 14.03n +.07D+Lg Cap Sel + 4 + 2 .. 14.75n +.02D LgCapGrOpp + 2 0 – 4 30.59n +.07
C Lrg Cap Val b + 7 + 5 +16 20.83n ..B+Mid Cap Val b + 8 + 7 +77 26.04n +.07B Mid Cp Idx + 7 + 5 +53 14.31n +.04B+MidCapGrOpp + 9 + 7 +55 44.30n +.11E MN IntTxFr b + 1 + 1 +15 10.01n +.01E MO Tax Fr + 1 + 1 +17 12.01n ..A Real Estate b +17 +16+139 23.45n +.24E Sh Tax Fr 0 0 .. 9.73n ..E Sh Trm Bd + 1 + 1 +10 9.88n –.01A–Sm Cap Idx +11 + 9 +58 15.85n +.05A–Sm Cap Sel +12 +11 +63 15.55n +.03A–Small Cap Val +10 + 8 +60 15.00n +.09A–SmCapGrOpp + 9 + 7 +41 22.84n +.05E Tax Free + 1 + 1 +21 11.06n ..E Total Retrn 0 0 +16 10.07n –.01E US Gov Mort 0 + 1 +15 10.41n –.01
First Eagle$17.6 bil 800–451–3623
D+Fund Amer Y + 7 + 6 +47 27.17n +.03B+Global A + 7 + 6+114 44.83 +.16B–Gold b + 6 + 9+357 21.63 –.07A Overseas A + 8 + 8+133 24.87 +.09
First Funds$ 875 mil 800–442–1941
B Cap Apprec I +12 +10 +47 13.62n +.08D–Core Eq I + 4 + 2 –14 17.61n ..E Intmd Bond I 0 0 +15 9.95n ..
First Invstrs A$ 5.1 bil 800–423–4026
C+All Cap Gr b + 3 + 2 +16 9.56 +.03D Blue Chip b + 5 + 3 – 9 22.00 +.04D–Fnd for Inc b + 2 + 2 +14 3.00 ..C+Global b + 6 + 5 +17 7.59 +.02E Government b 0 0 +13 10.76 –.01C–Gr & Inc b + 6 + 4 +10 14.81 +.03E Ins Tax Ex b + 1 + 1 +14 9.95 ..E Invest Grade b 0 0 +15 9.53 –.01B Md Cap Opp b + 6 + 5 +33 29.50 +.02E NY Tax Free b + 1 + 1 +15 14.36 ..B–Spec Stuatn b +10 + 8 +16 22.30 +.10D–Total Return b + 4 + 3 +10 14.65 +.01C Value b + 7 + 6 + 3 7.18 +.02
First Src Mono$ 316 mil 800–766–8938
B Income Eqty + 8 + 7 +50 14.07n +.03Firsthand Funds$ 651 mil 888–884–2675
A–Tech Value +10 + 8 –30 36.33n +.13E † FirstPac HI 0 + 1 +14 10.99n ..B † FMA Sml Co +11 + 9 +52 21.77n +.11
FMI Funds$ 1.6 bil 800–811–5311
B–Common Stk + 8 + 7 +73 26.27n +.14B–Focus + 7 + 6 +42 34.72n +.02
Forum Funds$ 1.3 bil 800–943–6786
A–BrownIntl I r + 9 + 8 .. 15.57n +.13C BrownValEq r + 5 + 3 .. 13.99n +.02
Forward Funds$ 621 mil 800–999–6809
A–Hoover SmCp +11 + 9 +67 21.53n +.08A+Intl SmCo I r +11 +12 +89 16.84n +.09
FPA Funds$ 6.2 bil 800–982–4372
B+Capital + 2 + 1+109 43.76 –.09C–Crescent I + 4 + 3 +94 26.08n ..E New Income 0 + 1 +17 10.89 ..A–Paramount + 5 + 4+102 16.40 –.01B+Perennial + 5 + 4+101 36.22 –.02
Frank/Tmp Fr A$ 113 bil 800–342–5236
E Adj US Gov b 0 + 1 + 8 8.90 ..D Age Hi Inc b + 2 + 3 +27 2.11 ..E AL Tax Fr b + 1 + 1 +21 11.47 ..E AZTaxFrInc b + 1 + 1 +19 11.05 ..B+Bal Sheet b + 8 + 7 +98 66.78 +.20B Biotch Dsc b + 9 + 8 + 1 61.93 +.26D Blue Chip b + 3 + 1 + 4 15.54 +.03E CA High Yld b + 1 + 1 +24 10.38 ..E CA InsTxFr b + 1 + 1 +20 12.67 ..E CA IntTxFr b 0 + 1 +16 11.49 ..E CA Tax Fr b + 1 + 1 +19 7.29 ..D Cap Growth + 4 + 2 – 8 11.58 +.05
China World b + 6 + 5 .. 24.28 +.01D–CnsrvTrgt b + 4 + 4 +25 13.18 +.01E CO Tax Fr b + 1 + 1 +20 11.99 ..C+Conv Secs b + 5 + 4 +34 16.81 +.02
CorefoAlloc b + 5 + 4 .. 13.20 +.05E CT TaxFrInc b + 1 + 1 +21 11.07 +.01E Double Tx Fr + 1 + 1 +20 11.94 ..C–Dynatech + 3 0 +24 26.82 +.10D Equity Inc b + 4 + 3 +16 21.25 –.01E FedIntTxFr b 0 + 1 +19 11.37 ..E FedTxFrInc b + 1 + 1 +20 12.09 +.01E FL InsTaxFr b + 1 + 1 +19 10.70 ..E FL Tax Fr b + 1 + 1 +21 11.88 ..E FltRateDly b + 1 + 2 .. 10.14 ..C+Flx Cap Gr + 6 + 4 +23 42.48 +.14
FoundAlloc b + 5 + 5 .. 12.95 +.02E GA Tax Fr b + 1 + 1 +20 12.08 ..
A Gold & Prec + 9 +13+206 28.06 +.05C Growth b + 6 + 4 +11 38.66 +.26E Hi Yld Tx Fr b + 1 + 1 +23 10.81 ..D Income b + 4 + 4 +34 2.47 ..E Ins Tax Fr b + 1 + 1 +19 12.28 ..E KY Tax Fr b + 1 + 1 +20 11.35 ..E LA Tax Fr b + 1 + 1 +19 11.48 ..D+Lg Cap Val m + 4 + 3 .. 15.46 +.01E LtdMatGovt 0 0 + 9 9.87 –.01E MA InsTaxFr b 0 + 1 +19 11.87 ..E MD Tax Fr b + 1 + 1 +20 11.73 ..E MI InsTxFr b + 1 + 1 +18 12.23 ..B+MicroCpVal b + 7 + 7+132 39.65 –.02E MN Ins Tax Fr + 1 + 1 +18 12.08 –.01E MO Tax Fr b + 1 + 1 +21 12.26 ..A+Nat Resrces b + 5 + 3 +85 32.70 –.24E NC Tax Fr b + 1 + 1 +21 12.27 ..E NJ Tax Fr b + 1 + 1 +20 12.11 +.01E NY InsTaxFr b + 1 + 1 +19 11.57 ..E NY IntTaxFr b 0 0 +17 10.89 +.01E NY Tax Fr b + 1 + 1 +19 11.83 ..E OH InsTaxFr b + 1 + 1 +19 12.55 ..E OR Tax Fr b + 1 + 1 +21 11.84 ..E PA Tax Fr b + 1 + 1 +20 10.41 ..A RealEstSecs x + 9 + 8 +116x28.09 +.18D Rising Divs b + 8 + 7 +58 34.97 +.21B SmCapGr II b +10 + 8 +39 13.64 +.05A–SmlCapVal b +11 + 9 +86 44.47 +.15B–SmMdCapGr + 6 + 5 +19 40.06 +.17D–Strat Inc b + 2 + 2 +31 10.19 ..E StratMortg 0 0 +16 9.59 –.01E TN Muni m + 1 + 1 +20 11.30 ..E Totl Retrn b 0 0 +20 9.88 –.01E US Gov Sec b 0 0 +13 6.45 ..B–Utilities b + 4 + 3 +35 12.16 –.04E VA Tax Fr b + 1 + 1 +20 11.81 ..
Frank/Tmp Fr B$ 8.9 bil 800–342–5236
D Age Hi Inc b + 2 + 2 +25 2.10n ..B+Bal Sheet m + 8 + 7 .. 65.96n +.19E CA Tax Fr b + 1 + 1 +16 7.28n ..E FedTxFrInc m + 1 + 1 +17 12.08n ..C+Flx Cap Gr b + 6 + 4 +19 40.20n +.13
FoundAlloc b + 5 + 5 .. 12.88n +.01C–Growth m + 6 + 4 + 8 37.37n +.25E Hi Yld Tx Fr b + 1 + 1 +21 10.88n ..D Income m + 5 + 4 .. 2.47n ..D Income 1 b + 4 + 4 +31 2.47n ..E NY Tax Fr b + 1 + 1 +17 11.81n +.01D Rising Div m + 8 + 6 .. 34.66n +.20E US Govt Secs 0 0 +11 6.44n ..C+Utilities m + 4 + 3 .. 12.15n –.04
Frank/Tmp Fr C$22.6 bil 800–342–5236
D Age Hi Inc m + 2 + 3 +25 2.12 ..B+Bal Sheet m + 8 + 7 .. 66.05 +.19E CA High Yld b + 1 + 1 +21 10.42 ..E CA InsTaxFr m + 1 + 1 +18 12.79 ..E CA Tax Fr m + 1 + 1 +16 7.28 ..D–Cap Growth + 4 + 2 –10 10.95 +.05C Conv Secs m + 5 + 4 +31 16.68 +.02
CorefoAlloc m + 5 + 4 .. 13.07 +.05D Equity Inc m + 4 + 3 +14 21.17 –.01E FedTxFrIn m + 1 + 1 +18 12.08 ..E FL Tax Fr m + 1 + 1 +19 12.03 ..E FltRateDly m + 1 + 2 .. 10.14n ..C+Flx Cap Gr b + 6 + 4 +19 40.28 +.13
FoundAlloc b + 5 + 5 .. 12.78n +.01A Gold & Prec + 9 +12+197 27.44 +.05C–Growth + 6 + 4 + 8 37.05 +.25E HiYldTxFr m + 1 + 1 +21 10.92 ..D Income m + 5 + 4 +30 2.49 ..E Ins Tax Fr b + 1 + 1 +17 12.39 ..E NJ Tax Fr b + 1 + 1 +18 12.20 ..E NY Tax Fr m + 1 + 1 +17 11.82 ..E OH Ins Tax Fr b + 1 + 1 +17 12.66 +.01A–RealEstSecs x + 9 + 8 +110x27.65 +.18D Rising Divs m + 8 + 6 +54 34.60 +.20A–SmCapVal b +10 + 9 +81 42.41 +.15B SmCpGr II m +10 + 8 +34 13.09 +.05B–SmMidCapGr b + 6 + 5 +15 37.95 +.16D–Strategic Inc b + 2 + 2 +29 10.19 ..E US Gov Sec m 0 0 +11 6.42 ..C+Utilities m + 4 + 3 +32 12.12 –.04
Frank/Tmp Fr R$ 853 mil 800–342–5236
B–Growth m + 6 + 5 .. 24.10n +.08D Income m + 4 + 4 .. 2.45n ..
Frank/Tmp FrAd$ 5.9 bil 800–342–5236
B+Bal Sheet m + 8 + 7 .. 66.83n +.19E FedTxFrInc + 1 + 1 .. 12.09n ..C Growth m + 6 + 4 +12 38.68n +.26D Income + 5 + 4 +33 2.46n ..B+SmCapGr II b +10 + 8 +41 13.88n +.05B–SmMidCapGr b + 6 + 5 +20 40.56n +.18E Totl Retrn 0 0 +21 9.89n –.01E US Govt Secs b 0 0 +14 6.46n –.01
Frank/Tmp Mutual A&B$13.6 bil 800–292–9293
C Beacon A + 7 + 6 +36 16.47 ..C Beacon B m + 7 + 6 .. 16.07n ..B+Discovery A + 9 + 9 +61 28.31 +.04B Discovery B m + 9 + 9 .. 27.76n +.04A–European A b +10 +11 +59 23.12 +.09B Finl Svcs A b +10 + 9 +83 23.70 +.05C+Qualified A m + 6 + 6 +44 20.95 +.03C–Shares A + 6 + 6 +36 25.23 +.01C–Shares B b + 6 + 6 +33 24.70n +.02
Frank/Tmp Mutual C$ 5.1 bil 800–342–5236
C Beacon m + 7 + 6 +34 16.33 +.01B Discovery m + 9 + 9 +57 28.11 +.03A–European b +10 +10 +57 23.08 +.09B–Finl Svcs b + 9 + 9 +80 23.55 +.04C+Qualified m + 6 + 6 +42 20.78 +.03C–Shares m + 6 + 6 +33 24.84 +.02
Frank/Tmp Mutual Z$20.9 bil 800–448–3863
C Beacon + 7 + 6 +37 16.56n ..B+Discovery + 9 + 9 +63 28.59n +.04A–European +10 +11 +61 23.47n +.09B Finl Svcs +10 + 9 +86 23.69n +.04B–Qualified + 6 + 6 +46 21.07n +.03C–Shares + 6 + 6 +37 25.40n +.02
Frank/Tmp Tp A$54.0 bil 800–354–9191
A+Dvlp Mkts b +11 +11+146 25.78 +.14B–Foreign b + 7 + 6 +44 13.51 +.04A Forgn Sm Co + 8 + 9 +75 22.00 +.03
Forgn Sm I r +10 +10 .. 19.90n +.04B+Glbl Opport b + 8 + 8 +34 17.94 +.05A+Glbl Sm Co b +11 +11 +81 9.23 +.02D–Glob Bond b + 4 + 4 +59 10.60 ..B–Growth b + 6 + 5 +49 24.29 +.08B World b + 6 + 5 +40 18.80 +.05
Frank/Tmp TpAd$ 6.7 bil 800–292–9293China World + 6 + 5 .. 24.40n +.01
A+Devlp Mkts +11 +11+150 25.77n +.13B Foreign + 7 + 6 +45 13.48n +.04B–Foreign R b + 7 + 6 .. 13.42n +.05D–Glob Bond b + 4 + 4 .. 10.58n ..B–Growth + 6 + 5 +50 24.31n +.07
Frank/Tmp TpB/C$ 6.2 bil 800–354–9191
A+Devlp Mkts C +11 +11+141 25.28 +.14B–Foreign B b + 6 + 6 +40 13.30n +.04B–Foreign C b + 6 + 6 +40 13.33 +.04D–Global Bd C b + 4 + 4 +56 10.62 ..C+Growth B b + 6 + 5 +45 23.85n +.07C+Growth C b + 6 + 5 +45 23.73 +.07B–World C + 6 + 5 +35 18.29 +.05
Franklin Temp$ 1.0 bil 800–292–9293
C Gr Trgt A b + 6 + 6 +28 14.96 +.03E Hard Curncy b + 3 + 3 +30 9.11 ..D Mod Trgt A b + 5 + 4 +28 13.73 +.01
FrankRuss Ins I$ 5.4 bil 800–975–0700
C Equity I + 6 + 4 +13 32.40n +.11B+Equity II +11 + 9 +47 33.87n +.05C–Equity Q + 5 + 4 +14 37.63n +.07E Fixed Inc I 0 0 +17 20.79n –.02E Fixed Inc III 0 0 +20 10.43n –.01A–Intl + 9 + 9 +37 46.95n +.26
FrankRuss LP C$ 2.6 bil 800–972–0700
C–Agg Strat b + 6 + 5 +26 11.87 +.03D Bal Strat b + 4 + 4 +26 11.71 +.02D+Divers Eq b + 5 + 4 .. 45.81n +.14B–Equity Agg b + 7 + 6 +26 11.41 +.04E Mod Strat b + 3 + 3 .. 11.25 +.01D+Quant Eq b + 5 + 3 .. 38.89n +.07
FrankRuss LP D$ 2.1 bil
C Agg Strat b + 6 + 5 .. 11.99 +.03D Bal Strat b + 5 + 4 .. 11.80 +.02B–Equity Agg b + 7 + 6 .. 11.71 +.04
FrankRuss LP E$ 1.6 bil 800–972–0700
C Agg Strat + 6 + 5 +29 11.98 +.04D Bal Strat + 5 + 4 +29 11.81 +.03E Con Strat b + 2 + 1 .. 10.91 +.01B–Equity Agg + 8 + 6 +30 11.72 +.04D–Mod Strat + 3 + 3 +23 11.32 +.02
FrankRuss LP S$ 1.2 bil 800–972–0700
C Agg Strat + 6 + 5 +32 12.04 +.04D Bal Strat + 5 + 4 +31 11.86 +.02B–Equity Agg + 8 + 6 +32 11.87 +.04
FrankRuss S$18.3 bil 800–972–0700
E Divers Bond 0 0 +18 23.20n –.02C–Divers Eqty + 6 + 4 +12 47.38n +.15A+Emerg Mkts +12 +12+147 20.84n +.13A–Intl Secs + 9 + 9 +35 73.64n +.40E MultiStr Bd 0 0 +20 10.28n –.01C–Quant Eqty + 5 + 4 +12 40.10n +.07A–Real EstSec +16 +15+119 51.60n +.56C+Select Value + 6 + 5 +30 11.98n +.02E ShDuratnBd + 1 + 1 +12 18.76n ..B+Special Gr +10 + 9 +51 55.49n +.09
E Tax Ex Bd + 1 + 1 +14 21.51n ..D+Tax Mg LgCp + 3 + 2 + 7 19.40n +.05B TxMg MidSml + 9 + 8 +51 14.00n +.05
Frontegra$ 1.2 bil
B+Iron Sm Cap + 9 + 6 .. 18.64n +.01NewStarIntl r + 8 + 8 .. 13.12 +.11
E Tot Rtrn Bd 0 0 +18 30.79n –.03B † Fund X Up p .. .. .. 38.67n +.11
Fund X Upgrader$ 244 mil 888–455–3863
A–FundXAggr p .. .. .. 42.78n +.07
—G—H— I—Gabelli A$ 1.0 bil 800–422–3554
C–Value m + 7 + 6 +27 19.33 ..Gabelli AAA$ 4.1 bil 800–422–3554
E ABC Fund b + 4 + 4 +17 10.26n ..C+Asset + 7 + 6 +37 44.08n +.07C–Equity Inc b + 6 + 5 +40 19.46n +.01B+Sm Cap Gr + 8 + 7 +74 30.56n +.12B–Utilities A + 6 + 5 + 8 8.52n –.01
Gamco AAA$ 1.9 bil 800–422–3554
B–Glb Telecom + 5 + 5 + 5 18.44n ..B+Gold + 9 +12+329 22.68n +.03C–Growth + 4 + 2 –10 29.83n +.09
Gartmore A$ 989 mil 800–485–2294
B MidMktIdx m + 6 + 5 .. 15.72 +.04Gartmore C$ 502 mil 800–485–2294
D–Inv DestMod b .. .. no quoteD+InvDstMdAg b .. .. no quote
Gartmore D$ 1.7 bil 800–485–2294
D+Growth + 4 + 2 – 2 7.38 +.03D+Nationwide + 5 + 4 +14 19.73 +.04E Tax Free r 0 + 1 +18 10.50 ..
Gartmore Instl$ 7.5 bil 800–485–2294
E Bond Idx 0 0 .. 10.74n –.01A–Intl Idx + 9 + 8 .. 9.86n +.04B MidMktIdx + 6 + 5 .. 15.83n +.04E MorEnhInc + 1 + 1 .. 9.10n ..D+S&P500 Idx + 5 + 3 + 8 11.23n +.02A–Small Idx +11 + 9 .. 13.31n +.04
Gartmore Svc$ 3.5 bil 800–485–2294
C+InvDestAggr b .. .. no quoteE InvDestCon b .. .. no quoteD–InvDestMod b .. .. no quoteC–InvDstMdAg b .. .. no quoteD–InvModCon b .. .. no quoteD+S&P500 Svc + 5 + 3 + 7 11.17n +.02
Gateway Funds$ 2.8 bil 800–354–6339
D–Gateway Fund + 3 + 2 +16 25.70n +.03GE Elfun S&S$11.7 bil 800–242–0134
D–Diversified + 5 + 2 +17 19.64n +.02E Income 0 + 1 +18 11.06n –.01E Income 0 + 1 +16 11.16n –.01A Intl Equity + 9 + 9 +39 23.80n +.10D S&S Program + 6 + 4 + 3 45.32n +.06E Tax Exempt + 1 + 1 +19 11.73n ..D–Trusts + 4 + 3 + 1 53.02n –.03
GE Funds A$ 1.2 bil 800–242–0134
E Fixed Inc b 0 0 +15 11.93 –.01E Governmt b – 1 0 +15 8.56 –.01D–PremrGrEq b + 4 + 2 + 4 27.88 –.02D–Strat Inc b + 5 + 4 +17 24.56 +.03D US Equity b + 6 + 4 + 4 28.92 +.04
GE Funds Y$ 794 mil 800–242–0134
D PremierGrEq + 4 + 2 + 5 28.32n –.01D US Equity + 6 + 4 + 5 28.79n +.03
GE Instl Funds$ 2.7 bil 800–242–0134
E Income 0 0 +16 9.37n –.01A Intl Equity + 9 + 9 +38 14.61n +.05D PremierGrSv b + 4 + 2 .. 10.98n –.01B–SmValEqInv +10 + 9 +54 16.08n +.06D–Stratgc Inv + 5 + 4 .. 11.49n +.02D US Equity Inv + 6 + 4 + 7 12.78n +.02
Glenmede Funds$ 2.3 bil 800–442–8299
E CoreFxdInc b 0 0 +18 10.56n –.01A+Intl Equity +11 +11 +78 21.12 +.15A–Phil Intl +11 +11 +47 20.97 +.14B–Sml Eq Adv +10 + 8 +61 18.99n +.07
GMO Trust II$ 1.8 bil 617–330–7500
A Foreign + 9 + 9 +70 17.16n +.09A Intl Intrn Val +10 + 9 +82 33.49n +.19
GMO Trust III$27.9 bil 617–330–7500
E CorePlusBd 0 0 +25 10.26n –.01C Cur Hdg Intl + 7 – 1 +17 9.30n +.02E Curr IntlBd – 2 – 9 +13 8.92n –.02
DevWorldStk r + 8 + 7 .. 22.78n +.08E Domestic Bd 0 0 +17 9.79n –.01
A+Emerg Cntry +10 +10+185 19.36n +.10B–Emerg Ctry Dt + 5 + 6+102 11.25n ..A+Emerg Mkts r +10 +11+196 22.58 +.05D–EmrgCtrDtShr + 5 + 6 .. 10.28n ..A+EmrgMktQlty r +10 + 9+148 10.48n +.06A–Foreign + 9 + 9 +69 17.22n +.08A+Foreign Sml +12 +12+126 18.56n +.12E Glob Bond 0 – 1 +19 8.52 +.02E Infl Idx Bd – 1 – 1 +29 11.00n –.03E Intl Bond + 1 0 +34 9.56n +.02
Intl Cor Eq + 9 + 8 .. 36.43n +.19Intl Gro Eq + 8 + 8 .. 30.84n +.09
A Intl Intrn Val +10 + 9 +82 33.74n +.20A+Intl Sm Cos +11 +11 +99 15.49n +.10D Tobacco Free + 5 + 3 + 8 12.64n +.03A TxMg Intl Eq + 9 + 9 +86 18.89n +.09
US Core Eq + 5 + 3 .. 14.73n +.04US Growth + 3 0 .. 18.44n +.05US Qual Eq + 6 + 4 .. 21.08 +.07GMO Trust IV$15.3 bil 617–330–7500CorePlusBd 0 0 .. 10.27 –.01DevWorldStk r + 8 + 7 .. 22.79n +.08
B–Emerg Ctry Dt + 5 + 6+100 11.25n ..A+Emerg Mkts +10 +11+208 22.53n +.05A–Foreign + 9 + 9 +69 17.23n +.09A+ForgnSmlCo +12 +12 .. 18.57n +.12
Intl Core Eq + 9 + 8 .. 36.41n +.19A Intl Intrn Val +10 + 9 +83 33.73n +.20D Tobacco Free + 5 + 3 .. 12.65n +.03
US Core Eq + 5 + 3 .. 14.71n +.04GMO Trust M$ 469 mil 617–330–7500US Core Eq b + 4 + 3 .. 14.70n +.03US Growth b + 2 + 1 .. 18.37n +.06GMO Trust V$ 341 mil 617–330–7500Emerg Mkts r +10 +11 .. 22.52n +.05GMO Trust VI$ 6.4 bil 617–330–7500Domestic Bd 0 0 .. 9.80 –.02Emerg Mkts r +10 +11 .. 22.54n +.05EmrgMktQlty r +10 + 9 .. 10.50 +.06US Core Eq + 5 + 3 .. 14.71n +.04GoldmnSachs A$19.1 bil 800–762–5035
B+Agg Gr Strat + 8 + 7 +44 14.93 +.08D–Balanced + 3 + 2 +15 20.56 +.01D Capital Gr + 5 + 3 – 3 21.63 +.06E Core Fxd Inc 0 0 +18 9.77 –.02A+Emerg Mkts b +13 +13+147 20.57 +.07E Global Income – 1 0 + 9 12.79 –.02E Govt Income b 0 0 +17 14.55 –.02C–Gr&Inc Strat + 5 + 5 +34 12.84 +.04C Growth & Inc + 6 + 5 +32 27.30 +.04C+Growth Opp + 6 + 4 +27 22.75 +.09B–Growth Strat + 7 + 6 +38 13.87 +.06E Hi Yld Muni b + 1 + 2 +30 11.32 ..D High Yield + 3 + 3 +29 7.96 +.01B Intl Equity +10 +10 +20 21.05 +.19C Lrg Cp Value + 5 + 4 +35 13.38 +.03B Mid Cap Val b + 6 + 5 +84 37.22 +.07E Muni Income + 1 + 1 +21 15.67 ..A Real Est Secs +15 +15+130 20.81 +.23E Sh Dur Govt 0 + 1 +12 9.64 ..B–Sm Cap Val + 9 + 7 +81 44.33 +.07D–Strat Gr + 5 + 3 –10 9.44 +.03D+Struc Lg Gr + 4 + 3 0 13.72 +.06B–Struc LgVal b + 7 + 5 +35 13.85 +.02B Struc Sm Eq b +10 + 7 +54 14.81 +.04C Struc US Eq + 5 + 3 +19 31.93 +.07A–StrucIntlEq b +10 + 9 +45 13.57 +.13C+Tollkeeper + 8 + 6 –17 8.66 +.04E UltShDurGv + 1 + 1 + 8 9.27 ..
GoldmnSachs B$ 1.4 bil 800–762–5035
D–Capital Gr b + 5 + 3 – 6 20.02n +.06B–Mid Cap Val b + 6 + 5 +73 36.22n +.07
GoldmnSachs C$ 833 mil 800–762–5035
C+Gr Strat b + 7 + 6 +34 13.79n +.06C–Gr&Inc Strat b + 5 + 5 +30 12.78n +.04C Growth Opp + 5 + 4 +22 21.56n +.08
GoldmnSachs In$14.2 bil 800–762–5035
D Capital Gr + 5 + 4 – 1 22.23n +.06E Core Fixed Inc 0 0 +20 9.81n –.01A+Emerg Mkts +13 +13+153 21.40n +.07E Enhanced Inc + 1 + 1 + 8 9.69n ..E Global Income 0 0 +11 12.78n –.01C+Growth Opp + 6 + 4 +30 23.40n +.09D High Yield + 3 + 3 +30 7.97n +.01E High Yld Muni + 1 + 2 +31 11.32n ..B+Mid Cap Val + 6 + 5 +89 37.50n +.08E Muni Income + 1 + 1 +22 15.67n ..A Real Est Secs +15 +15+133 20.90n +.24E Sh Dur Govt 0 + 1 +13 9.62n ..E Sh Dur Tax Fr 0 + 1 +11 10.16n ..B–Sm Cap Value + 9 + 7 +84 45.73n +.07C–Struc Lg Gr + 5 + 3 + 2 14.08n +.06B–Struc LgVal + 7 + 5 +36 13.84n +.02B Struc Sm Eq +10 + 7 +57 15.29n +.04C Struc US Eq + 5 + 4 +21 32.56n +.07A StrucIntlEq +10 + 9 +48 13.83n +.13E UltShDurGv + 1 + 1 + 9 9.28n –.01D–† Granum Val + 1 0 +24 36.71n +.16
Guardian Funds$ 3.6 bil 800–343–0817
E Bond 0 0 +14 11.82n –.02A+EmergeMkts +12 +13+171 21.54 +.14D–Prk Ave A + 5 + 3 – 2 33.90 +.14B PrkAvSmCpA +12 +10 +49 18.57 +.09D+S&P500 Idx A + 5 + 3 + 7 8.99 +.02D–Stock + 5 + 4 0 30.81n +.12
GuideStone G2$ 1.5 bil 800–262–0511Cap Opp I + 4 + 3 .. 13.12n +.04GlobEquityI + 5 + 4 .. 14.73n +.06GrwthEquity + 1 – 1 .. 11.30 +.07GrwthIncome + 3 + 2 .. 11.63n +.02Intl Equity + 8 + 8 .. 15.90n +.10ValueEquity + 6 + 5 .. 11.38n +.01GuideStone G4$10.6 bil 800–262–0511Cap Opp + 4 + 3 .. 16.05n +.04EquityIndex + 5 + 3 .. 17.85n +.03Ext–DurBond 0 0 .. 14.67n –.03FlexIncome + 2 + 1 .. 13.16n +.01GlobEquity + 5 + 4 .. 17.11n +.06GrwthEquity + 1 – 1 .. 17.90n +.10GrwthIncome + 3 + 2 .. 14.59n +.02Intl Equity + 8 + 8 .. 18.76n +.11LowDurBond + 1 + 1 .. 12.70n ..MedDurBond 0 0 .. 13.40n –.02SmallCapEq + 9 + 7 .. 17.02n +.05ValueEquity + 6 + 4 .. 18.52n +.01Hansberger$ 720 mil
A+Emrg Mkt +11 +11+127 10.19n +.07A Intl Val +10 +10 +58 14.94n +.09
Harbor Funds$28.0 bil 800–422–1050
E Bond Instl + 1 0 +23 11.68n –.01C CapAppr Ins + 1 0 + 4 33.13n +.12C CapAppr Inv b + 1 0 .. 32.86n +.12C CapAppr Ret b + 1 0 .. 33.00n +.12B+Intl Gr I r + 9 +10 – 4 11.97n +.01A Intl Instl r +12 +12 +77 55.15n +.25A Intl Inv m +12 +12 .. 54.77n +.24C–Lrg Val I + 3 + 2 +27 17.63n ..B+Sml Gr Inst +12 +10 + 2 14.11n +.05A Sml Gr Inv b + 8 + 6 .. 21.22n +.05A SmVal Instl + 8 + 6 .. 21.42n +.05
Harding Lvnr$ 1.7 bil 800–762–4848
A+Emerg Mkts r +10 +10 .. 38.38n +.12B Intl Equity + 8 + 7 +31 17.48 +.10
Harris Insight$ 3.0 bil 800–982–8782
E Bond 0 0 +15 9.91n –.01C Core Eq Inst + 6 + 4 +11 22.44n +.02A+EmergeMktI +10 +11+130 13.72n +.09B–Equity + 8 + 7 +34 14.98n +.03A–Intl + 9 + 9 +39 19.27n +.13E Intmd Tax Ex 0 + 1 +18 11.11n ..E Sh Intmd Bd 0 0 +13 9.97n –.01A Sm Cap Oppor + 8 + 6 +66 23.22n –.01A Sm Cap Value + 8 + 6 +77 51.06n +.28
Hartford A$18.8 bil 888–843–7824
D–Advisers b + 3 + 2 + 8 16.27 +.01Balanc All b + 4 + 3 .. 11.75 +.01
A–Cap Apprec b + 6 + 5 +41 37.79 +.05D+Discp Eq b + 4 + 3 + 6 12.71 ..C–Div & Gr b + 5 + 4 +24 19.94 –.03
Eqty Inc m + 7 + 5 .. 13.06 ..Float Rate b + 2 + 2 .. 10.17 ..
C+Global Hlth b + 5 + 3 +45 17.33 +.08C+Global Ldrs b + 6 + 5 +23 18.93 +.09A–Grow Oppor m + 7 + 6 .. 29.70 +.15
Growth All b + 5 + 4 .. 12.33 +.02D–High Yield b + 2 + 2 + 6 7.88 +.01E Infl Plus b – 1 – 1 .. 10.48 –.03B+Intl Opport b + 8 + 8 +29 15.12 +.06A–IntlCapAppr b + 9 + 9 .. 14.24 +.07B+Mid Cap b + 7 + 6 +58 25.54 +.13B+Mid Cap Val + 7 + 6 .. 13.89 +.06A+Small Co b +10 + 9 +55 22.13 +.08D Stock b + 4 + 3 – 2 20.09 +.04E TotlRetnBd b 0 0 +19 10.54 ..
Hartford B$ 4.2 bil 888–843–7824
D–Advisers + 2 + 1 + 6 16.09n +.01B+Cap Apprec b + 6 + 5 +34 34.71n +.04D+Div & Gr m + 5 + 4 +21 19.64n –.03B Mid Cap m + 7 + 6 +51 23.67n +.12D Stock m + 4 + 3 – 5 18.80n +.04
Hartford C$ 5.2 bil 888–843–7824
D–Advisers m + 2 + 1 + 6 16.25 +.01Balanc All m + 4 + 3 .. 11.71 +.01
B+Cap Apprec m + 6 + 5 +36 34.84 +.05D+Div & Gr m + 5 + 4 +22 19.61 –.02
Float Rate m + 2 + 2 .. 10.16 ..Growth All m + 5 + 4 .. 12.28 +.01
E Infl Plus m – 1 – 1 .. 10.48n –.03B Mid Cap m + 7 + 6 +52 23.78 +.12D Stock m + 4 + 2 – 4 18.93 +.04
Hartford HLS IA$48.2 bil 888–843–7824
D–Advisers + 3 + 2 + 4 23.13n +.02D BlueChpStk + 4 + 2 .. 19.43n +.07
E Bond 0 0 .. 11.28n –.01A–Cap Apprec + 6 + 5 .. 56.30n +.08C–Div & Gr + 5 + 4 .. 21.87n –.03
Eqty Inc + 6 + 5 .. 12.78 –.01D Glob Advsrs + 3 + 3 .. 12.90n +.04B–Global Hlth + 5 + 3 .. 18.60n +.09B–Global Ldrs + 6 + 5 .. 19.91n +.10D+Gr & Inc + 4 + 3 .. 13.22n ..C–Growth + 2 0 .. 12.83n +.03A–Grwth Opps + 7 + 6 .. 32.22n +.17D–High Yield + 2 + 2 .. 10.01n ..D+Index + 5 + 3 .. 33.61n +.05B+Intl Opport + 8 + 8 .. 14.70n +.06A+Intl Sml Co +11 +11 .. 16.52n +.11A–IntlCapAppr m + 9 + 9 .. 13.59n +.07B+Mid Cap + 7 + 6 .. 30.81n +.16B+Mid Cap Val + 7 + 6 .. 15.01n +.06E Mort Secs 0 0 .. 11.54n –.01A+Small Co +10 + 9 .. 21.70n +.07A Sml Cap Gr + 8 + 6 .. 22.46n –.01D Stock + 4 + 3 – 1 51.34n +.10E US Gov Sec 0 0 .. 11.11n –.01B+Value Opps + 6 + 5 .. 20.02n +.01
Hartford HLS IB$12.2 bil 888–843–7824
D–Advisers b + 3 + 2 .. 23.29n +.02E Bond b 0 0 .. 11.21n –.01A–Cap Apprec b + 6 + 5 .. 56.02n +.08C–Div & Gr b + 5 + 4 .. 21.79n –.03B–Global Hlth b + 5 + 3 .. 18.39n +.09B–Global Ldrs b + 6 + 5 .. 19.81n +.09D+Gr & Inc b + 4 + 3 .. 13.12n ..A–Grow Oppor + 7 + 6 .. 31.96n +.17C–Growth + 2 0 .. 12.70n +.03D–High Yield b + 2 + 2 .. 9.91n +.01D+Index b + 5 + 3 .. 33.46n +.05B+Intl Opport b + 8 + 8 .. 14.62n +.07A–IntlCapAppr b + 9 + 9 .. 13.50n +.08B+Mid Cap b + 7 + 6 .. 30.58n +.16B+Mid Cap Val b + 7 + 6 .. 14.95n +.06E Mort Secs b 0 0 .. 11.44n –.01A+Small Co b +10 + 9 .. 21.38n +.07A Sml Cap Gr b + 8 + 6 .. 22.40n –.01D Stock b + 4 + 3 .. 51.20n +.10E US Gov Sec b 0 0 .. 11.05n –.01C Value b + 8 + 6 .. 12.01n +.01B+Value Opps b + 6 + 5 .. 19.91n +.02
Hartford L$ 1.1 bil 888–843–7824
C–Growth + 2 0 +11 18.82 +.04A–Grwth Opps + 7 + 6 +28 30.11 +.16A Sml Cap Gr + 7 + 6 +33 32.37 –.01
Hartford Y$ 2.3 bil 888–843–7824
A–Cap Apprec + 6 + 5 +45 40.08n +.05D+Discp Eq + 4 + 3 + 8 13.04n ..B–Global Hlth + 5 + 3 +49 17.98n +.08B+Mid Cap + 7 + 6 +62 26.85n +.14E TotlRetnBd 0 0 +21 10.65n –.01
Heartland Funds$ 2.1 bil 800–432–7856
B+Select Value b + 9 + 8 +85 27.88n +.14A Value +13 +13+103 50.74n ..A–Value Plus + 5 + 4+121 27.21n –.01
Henderson Glb Fds$ 1.4 bil 888–832–6774
A+Euro Foc A m +15 +15 .. 29.24 +.31A Intl Opp A b + 9 + 8 .. 21.06 +.31A Intl Opp C b + 9 + 8 .. 20.42 +.30
Hennessy Funds$ 2.0 bil 800–966–4354
A Cornrst Gr +13 +11+104 21.88n –.04D+Cornrst Val + 6 + 5 +22 13.72n ..A+CornrstGrII +13 +13+101 33.28n +.09
Focus 30 r +15 +12 .. 13.04 +.05D † HensslerEq + 4 + 2 +16 15.03n +.03
Heritage Funds$ 2.4 bil 800–421–4184
C–Cap Appr A b + 6 + 5 +10 29.21 +.11C–Cap Appr C m + 6 + 4 + 6 26.83n +.09C+DiverGrow A b + 6 + 5 +53 28.67 +.06C+MidCapStkA b + 7 + 6 +60 29.03 +.06C MidCapStkC m + 7 + 6 +54 26.95n +.05B SmCapStk A b + 9 + 8 +52 36.44 +.08
Hibernia Funds$ 572 mil 800–999–0124
D Cap Apprec A + 5 + 3 + 5 19.35 +.04B–Mid Cap Eq A + 6 + 5 +49 18.37 +.05
HighMark Funds$ 1.7 bil 800–433–6884
E Bond 0 0 +16 10.53n –.01B–LargeCpVal A + 7 + 5 +22 13.68 ..B–LargeCpVal Fd + 7 + 5 +23 13.66n +.01B+Sm Cap Value + 8 + 6 +83 18.73n +.09C Val Mmnt Fi + 6 + 5 +13 23.30n +.04
Hirtle Callaghan$ 2.8 bil 800–981–8917
C–Growth Equity + 2 + 1 – 1 12.05n +.05A–Intl Equity + 7 + 7 +36 13.12n +.08A–Sm Cap Equity +11 + 9 +45 16.02n +.02C+Value Equity + 7 + 6 +25 16.27n +.02A+† Hodges Fund +11 + 9+136 25.36n +.05
Homestead$ 833 mil 800–258–3030
E Sh Term Bond 0 + 1 +10 5.12n ..B–Value + 7 + 6 +46 35.06n +.03
Hotchkis & Wiley$12.5 bil 866–493–8637Core Val A b + 4 + 3 .. 13.36 +.04Core Val C b + 4 + 3 .. 13.24 +.03Core Val I + 4 + 3 .. 13.39n +.03
B+LgCapVal A b + 5 + 4 .. 24.48 +.03B+LgCapVal C b + 5 + 4 .. 24.15n +.03B+LgCapVal I + 5 + 4 +76 24.57n +.03A MidCapVal A b + 7 + 6 .. 30.15 +.07A MidCapVal C b + 7 + 6 .. 29.23n +.07A+MidCapVal I + 7 + 6 .. 30.28 +.08A+SmCapVal A m + 6 + 6 .. 52.21 +.52A+SmCapVal I + 6 + 6+175 51.99n +.52
HSBC Investor$ 580 mil 800–782–8183
A–Intl Equity +12 +11 +40 20.19n +.11B Sm Cap Eq + 9 + 8 +27 16.93n +.04
Huntington$ 1.4 bil 800–253–0412
E Fixed Inco Tr 0 0 +16 20.58n –.02D–Growth Tr + 5 + 3 – 6 41.56n +.10D Inc Eq Trst + 4 + 3 +12 32.38n +.08A–Intl Eq Tr +11 +10 .. 13.11n +.08B–MidCorpAmT + 5 + 4 .. 16.20n +.02
Hussman Funds$ 2.6 bil 800–487–7626
D–Strat Gr + 2 + 2 +63 15.99n –.02E StraTotRet r + 1 + 1 .. 11.22n ..
ICAP Funds$ 2.0 bil 888–221–4227
C Equity + 8 + 6 +17 44.32n +.05A+Intl + 8 + 7 +67 35.55n +.15B Select Equity + 9 + 7 +36 39.33n –.01B † ICM SmCo +11 + 9 +91 40.20n +.22
ICON Funds$ 3.7 bil 800–764–0442
A Asia – 5 – 3 +36 12.76n +.07D+Consumer Disc + 7 + 5 +36 12.36n +.05A+Energy + 7 + 4+148 34.04n –.44C+Eqty Inc I b + 6 + 5 .. 15.52n ..B Financial + 6 + 5 +41 13.90n +.03B–Healthcare + 5 + 4 +58 18.75n ..A–Industrials +16 +14 +55 14.69n +.03C–Info Tech + 3 + 2 –12 9.04n ..A+Materials +14 +13+114 12.37n +.09
IMS Funds$ 212 mil 503–788–4200
B+Cap Value r + 8 + 6 +76 20.20n +.09ING Fds A$ 6.9 bil 800–992–0180
C+Corp Ldrs + 6 + 5 +41 19.86n –.03C+Finl Svcs b + 5 + 4 +43 23.76 +.07
Foreign b +12 +11 .. 17.35 +.12A+GlbRealEst b +14 +14 .. 19.66 +.17E GNMA Inc 0 0 +15 8.33 ..D IdxPlusLrg b + 5 + 4 + 6 16.75 +.02E Intermd Bd b 0 0 +23 10.22 –.01A+Intl Sml Cp b +10 + 9 +54 44.95 +.27A Intl Value b +11 +10 +45 19.76 +.12C–MagnaCap + 4 + 3 + 3 12.23 ..B–Mid Cap Op b +10 + 8 + 3 15.90 +.07A+Russia b +22 +22+643 47.93 +1.19
ING Fds B$ 2.8 bil 800–992–0180
A Intl Value b +10 +10 +43 19.43n +.12E Prin Pro IV m + 2 + 1 .. 10.60n ..E Prin Pro V m + 2 + 1 .. 9.99n ..
Prin Pro VI m + 2 + 1 .. 9.98n +.01PrinPro VII b + 1 + 1 .. 9.91n +.01
E PrinProtIII m + 1 + 1 .. 9.72n +.01E Prncpl Prtc m + 1 + 1 .. 9.84n ..E PrnPrtc II b + 1 + 1 .. 9.53n ..
ING Fds C$ 1.7 bil 800–992–0180
D–Convertible + 4 + 4 +15 19.93n +.04A Intl Value b +10 +10 +43 19.35n +.12
ING Fds T,M,Q&I$ 2.3 bil 800–992–0180
D IdxPlusLrg I + 5 + 4 + 7 16.87n +.03IntermdBd I 0 0 .. 10.22 –.01
A Intl Val I +11 +10 .. 19.77n +.12A Real Est I +18 +17+133 18.79n +.20
ING Partners$ 2.7 bil 800–992–0180
B JPMrgFl Intl + 9 + 9 .. 14.70n +.08D+MFS CapOppI + 4 + 3 .. 28.57n +.01C–PriceGrEq I + 5 + 3 .. 54.99n +.17B–SB AggrGr I + 5 + 3 .. 46.55n –.01C+UBSLrgEq I + 5 + 3 .. 9.73n +.01
ISI Funds$ 489 mil 800–955–7175
E N Am GvBd b – 1 – 1 +16 7.37 –.02E TotRt US Tr b – 1 – 1 +13 9.29 –.01
Ivy Funds$ 8.2 bil 800–777–6472
C–AssetStr A b + 8 + 7 .. 18.18 +.07C–AssetStr C m + 8 + 7 +48 17.97n +.07B CndlGlobVal b + 4 + 4 .. 15.58 +.12B CndlGlobVal + 4 + 4 .. 15.23n +.12

INVESTOR'S BUSINESS DAILY MUTUAL FUND PERFORMANCE MONDAY, MARCH 20, 2006 A1536 Mos 2006 12 Wk 5 Yr NetPerformance % % After Asset NAVRating Fund Chg Chg Tax Rtn Value Chg
36 Mos Fund 2006 12 wk 5 Yr Net NAVPerformance % % After Asset ChgRating Chg Chg Tax% Value
36 Mos 2006 12 Wk 5 Yr NetPerformance % % After Asset NAVRating Fund Chg Chg Tax Rtn Value Chg
36 Mos Fund 2006 12 wk 5 Yr Net NAVPerformance % % After Asset ChgRating Chg Chg Tax% Value
36 Mos 2006 12 Wk 5 Yr NetPerformance % % After Asset NAVRating Fund Chg Chg Tax Rtn Value Chg
36 Mos 2006 12 Wk 5 Yr NetPerformance % % After Asset NAVRating Fund Chg Chg Tax Rtn Value Chg
36 Mos Fund 2006 12 wk 5 Yr Net NAVPerformance % % After Asset ChgRating Chg Chg Tax% Value
36 Mos 2006 12 Wk 5 Yr NetPerformance % % After Asset NAVRating Fund Chg Chg Tax Rtn Value Chg
36 Mos Fund 2006 12 wk 5 Yr Net NAVPerformance % % After Asset ChgRating Chg Chg Tax% Value
36 Mos 2006 12 Wk 5 Yr NetPerformance % % After Asset NAVRating Fund Chg Chg Tax Rtn Value Chg
36 Mos Fund 2006 12 wk 5 Yr Net NAVPerformance % % After Asset ChgRating Chg Chg Tax% Value
36 Mos Fund 2006 12 wk 5 Yr Net NAVPerformance % % After Asset ChgRating Chg Chg Tax% Value
36 Mos Fund 2006 12 wk 5 Yr Net NAVPerformance % % After Asset ChgRating Chg Chg Tax% Value
36 Mos 2006 12 Wk 5 Yr NetPerformance % % After Asset NAVRating Fund Chg Chg Tax Rtn Value Chg
36 Mos Fund 2006 12 wk 5 Yr Net NAVPerformance % % After Asset ChgRating Chg Chg Tax% Value
36 Mos 2006 12 Wk 5 Yr NetPerformance % % After Asset NAVRating Fund Chg Chg Tax Rtn Value Chg
36 Mos Fund 2006 12 wk 5 Yr Net NAVPerformance % % After Asset ChgRating Chg Chg Tax% Value
36 Mos 2006 12 Wk 5 Yr NetPerformance % % After Asset NAVRating Fund Chg Chg Tax Rtn Value Chg
D Core Eq Cm + 6 + 4 – 3 9.80n+.03A+Euro Opp A b +13 +13 +89 33.46 +.29A+GlbNatRes b +11 +11+178 27.58n–.08A+GlbNatRes b +11 +11+178 27.06n–.09A+GlbNatRes A b +12 +11+188 29.08 –.08B–Intl A b + 8 + 8 +19 29.43 +.23C–LrgCapGr A b + 4 + 2 +14 11.66 +.05MortgSecs A b 0 0 .. 10.53 –.01
A+PacificOppA b + 8 + 9 +85 13.92 +.04Real Est A b +14 +13 .. 23.30 +.24Real Est Y b +14 +13 .. 23.30n +.24B Sci & Tech A b + 6 + 4 +32 27.15 +.02B–SmlCapGr A b + 7 + 5 .. 14.57 –.02B–SmlCapGr Cm + 6 + 4 +30 13.92n–.02B–SmlCapGr Y b + 7 + 5 .. 15.83n–.02
IXIS Advisor$ 2.7 bil 800–225–5478B–CGM TargEqA + 3 + 2 +25 10.55 –.02D HarrLgVal A + 3 + 1 + 4 13.74 +.05E LSCorePlBdB 0 + 1 +10 11.17n–.01C+US Divers A b + 7 + 5 +30 21.53 +.06C US Divers B b + 7 + 5 +25 19.20n+.05
— J—K—L—J Hancock A$13.8 bil 800–225–5291E Bond b 0 0 +18 14.82 –.02E CA Tax Fr b + 1 + 1 +17 10.91 ..B–ClassicVal b + 5 + 5 .. 25.95 +.07D Core Equity + 4 + 3 + 7 31.04 +.07C Finl Industr b + 6 + 5 +18 20.27 +.04E Govt Income b 0 0 +12 8.95 –.01C–HealthSci + 6 + 4 +22 47.91 +.19D High Yield b + 3 + 3 +35 5.20 +.01D+Lrg Cap Eq + 5 + 5 –11 18.50 ..D Regionl Bnk + 6 + 4 +39 40.62 +.17C+SmCapGr b +12 +10 + 9 11.04 +.04A–Sml Cap Eq + 9 + 6 +16 22.74 +.15D–Sov Invstrs b + 5 + 4 – 1 19.50 +.05E Strat Inc b + 1 + 1 +27 6.85 –.01E Tax Fr Bond + 1 + 1 +15 10.23 ..D Technology + 6 + 4 –47 3.69 +.01D–US Glb LdGr + 2 0 +12 29.02 +.06
J Hancock B$ 3.2 bil 800–225–5291C+ClassicValm + 5 + 5 .. 25.68n+.07D Core Equity b + 4 + 3 + 4 29.11n+.06C–Finl Industr b + 6 + 4 +14 19.36n+.03D High Yield + 3 + 3 +32 5.20n+.01D Lrg Cap Eq + 5 + 5 –14 17.43n–.01D Regnl Bnkm + 6 + 4 +36 40.18n+.17B+Sml Cap Eq + 9 + 6 +12 21.28n+.13D–Sov Invstrs b + 5 + 4 – 3 19.42n+.04E Strategic Inc + 1 + 1 +24 6.85n–.01D–US Glb LdGr b + 2 0 .. 28.27n+.06
J Hancock C$ 878 mil 800–225–5291E Strat Inc b 0 0 + 4 6.85 –.01D–US Glb LdGr b + 2 0 .. 28.27 +.06
J Hancock 1$16.4 bil 800–225–5291LifestylAgg + 7 + 6 .. 14.26n+.03LifestylBal + 5 + 4 .. 14.42n+.02LifestylGr + 5 + 5 .. 14.70n+.03LifestylMod + 3 + 3 .. 13.68n+.02D † JamGolBalA + 3 + 2 +41 17.52 –.01
Janus$67.9 bil 800–525–8983D–Balanced + 4 + 3 +20 23.39n ..A+Contrarian + 9 + 9 +52 16.45n+.04C+Core Equity + 7 + 6 +29 25.20n ..B+Enterprise + 7 + 6 + 1 45.04n+.13E Flex Bond 0 0 +19 9.39n ..B–Glob Opps + 2 + 1 .. 15.07n+.04C+Global Tech r + 6 + 5 –23 12.65n+.05C+GlobLifeSci r + 7 + 6 +17 21.54n+.04C Growth & Inc + 6 + 5 +17 38.12n–.06D–High Yield + 2 + 3 +21 9.60n+.01D Janus + 5 + 3 –11 26.78n+.07C–Mercury + 3 + 2 – 7 23.72n+.06B Mid Val Inst + 5 + 4 .. 23.50n+.01B Mid Val Inv + 5 + 4 +73 23.41n+.02C Olympus + 4 + 3 – 2 34.06n+.21A Orion + 9 + 9 +44 9.12n ..A+Overseas r +16 +17 +51 37.02n+.09C+RskMgd Stk + 6 + 4 .. 16.00n+.01E Short Term Bd 0 + 1 +10 2.87n ..B–Sml Val Inst + 5 + 4 +55 29.45n+.05B–Sml Val Inv + 5 + 4 +54 29.24n+.05C+Twenty + 3 + 1 +10 50.24n+.16A Venture +14 +14 +48 64.65n+.30D WorldWide r + 4 + 4 –12 45.14n+.08
Janus Adv A$ 262 mil 800–525–3713Forty b + 2 + 1 .. 29.48 +.13Janus Adv S$ 3.7 bil 800–525–3713D–Balanced + 4 + 3 +20 27.19n+.01C Forty + 2 + 1 +18 29.36n+.14C Growth&Inc b + 6 + 5 .. 19.25n–.03A+Intl Growth r +16 +16 +48 43.77n+.09D Lrg Growth + 4 + 3 –10 22.47n+.06D Worldwide + 4 + 3 –12 30.16n+.05
Janus Aspn Inst$ 6.0 bil 800–504–4440D–Balanced + 4 + 3 +20 26.77n ..E Flexible Bd 0 0 +18 11.36n–.01C Forty + 2 + 1 +18 28.33n+.13A+Intl Growth +17 +17 +45 41.43n+.11D Lrg Cp Grow + 5 + 4 – 9 21.95n+.06B+Mid Cap Gr + 8 + 6 + 3 31.22n+.09D WorldwideGr + 4 + 3 –12 29.10n+.05A † Japan – 2 – 2 +42 12.92n +.22
Jennison A$10.6 bil 800–225–1852B–Blend A + 3 + 2 +22 18.65 +.02C+Equity Opp + 8 + 6 +31 17.16 +.05
B–Global Gr + 5 + 4 +15 17.98 +.05C Growth + 1 0 + 1 16.42 +.06A+Health Sci +10 + 9 +73 22.39 +.15A+NaturlRsrc + 9 + 8+200 44.79 –.33A Small Co b +10 + 9 +75 20.22 +.08A US Emr Gr + 7 + 6 +24 21.54 +.09A+Utility + 8 + 7 +41 15.20 –.03B–Value b + 7 + 6 +31 21.21 –.01B+20/20 Focus + 5 + 3 +42 15.91 –.01
Jennison B$ 2.3 bil 800–225–1852C+Blend B + 3 + 2 +18 18.25n+.03C Equity Opp b + 7 + 6 +26 16.20n+.04C–Growth + 1 0 – 2 15.06n+.05A Health Sci +10 + 9 +66 21.06n+.14A+NaturlRsrc + 8 + 8+191 39.69n–.30A+Utility + 8 + 6 +37 15.17n–.03B 20/20 Focus + 5 + 3 +37 14.99n–.01
Jennison C$ 731 mil 800–225–1852
A Health Sci +10 + 9 +66 21.05 +.14B 20/20 Focus + 5 + 3 +37 15.00 –.01
Jennison Z&I$ 2.2 bil 800–225–1852C Growth Z + 1 0 + 3 16.88n+.06A+Hlth Sci Z +10 + 9 .. 22.89n+.16A US EmgGr Z + 7 + 6 +25 22.07n+.09† Jensen Ptf + 5 + 3 .. 24.90n+.01D–† Jensen Ptf + 5 + 3 +15 24.90n+.02
JP Morgan A$12.8 bil 800–521–5411B Cap Growth + 8 + 7 +27 42.42 +.13E Core Bond 0 0 +17 10.55 –.01Diversified b + 4 + 3 .. 14.58 +.01C+Divr Mid Gr + 9 + 7 +29 25.86 +.08D+Equity Idx b + 5 + 3 + 7 29.85 +.04E Govt Bond 0 – 1 +18 10.10 –.02D+Growth & Inc + 4 + 3 +13 34.98 +.05E Intermd Bd b 0 0 +15 10.32 –.01B+Intl Equity +10 + 9 .. 35.35 +.18B IntrepidMid + 8 + 7 +37 17.69 +.04E Inv Csrv Gr b + 2 + 2 +15 11.14 +.01D Inv Gr&Inc b + 4 + 3 +19 14.12 +.02C–Inv Growth b + 6 + 4 +20 15.44 +.03D–Invstr Bal b + 3 + 3 +18 12.59 +.01A+Japan b + 1 + 1 +57 10.39 +.13D Lg Cap Gr b + 3 + 1 – 9 16.67 +.03B–Mid Cap Val b + 7 + 6 .. 24.80 +.04B–Mid Cap Val + 6 + 5 +43 16.15 +.04Mult MktNtr m + 1 + 1 .. 10.66 ..
A Small Cap Eq + 9 + 8 +70 28.79 +.02B+Sml Cap Val b +10 + 8 +80 24.19 +.06E Ult ShTmBd b + 1 + 1 +10 9.76 ..D+US Equity b + 5 + 3 .. 11.54 +.02A+US Real Est b +18 +17+131 22.57 +.25
JP Morgan B$ 4.4 bil 800–521–5411Diversifiedm + 4 + 3 .. 14.56n+.01C+Divr Mid Gr + 8 + 7 +24 22.50n+.06D Equity Idxm + 5 + 3 + 5 29.68n+.04E Inv Csrv Gr m + 2 + 1 +12 11.14n+.01D Inv Gr&Inc b + 4 + 3 +16 14.04n+.01C–Inv Growthm + 6 + 4 +17 15.24n+.03D–Invstr Bal b + 3 + 2 +15 12.56n+.01D–Lg Cap Gr + 3 + 1 –12 15.26n+.02C+Mid Cap Val b + 6 + 5 .. 24.32n+.04
JP Morgan C$ 2.3 bil 800–521–5411C+Mid Cap Val b + 6 + 5 .. 24.37n+.04Mult MktNtr + 1 + 1 .. 10.51n–.01E Ultra ShTrmm + 1 + 1 .. 9.67n ..
JP Morgan Instl$ 6.0 bil 800–521–5411E Bond + 1 + 1 +17 9.27n–.01D+Disc Equity + 5 + 3 + 6 15.88n+.02D–Diversified + 4 + 3 +16 14.61n+.01E Enhan Inc + 1 + 1 .. 9.80n+.01E IntmTxFrBd 0 + 1 .. 10.62n ..A–IntrepidInt +10 + 9 .. 20.50n+.14B–Mid Cap Val + 7 + 6 +92 25.15n+.05A Realty Inc +16 +15+123 18.02n+.14E Sh Term Bond + 1 + 1 +11 9.56n+.01D+TxAwr Disc Eq + 5 + 3 + 8 17.56n+.02D TxAwr US Eq + 5 + 4 .. 12.70n+.01D+US Equity + 5 + 3 + 8 11.54n+.02Value Opps + 5 + 4 .. 18.04 ..JP Morgan Selct$38.3 bil 800–348–4782E Bond + 1 + 1 .. 9.27n–.01B+Cap Growth + 8 + 7 +30 44.86n+.15E Core Bond 0 0 +18 10.55n ..E CorePlusBd 0 0 +16 7.71n–.01C+Divr Mid Gr + 9 + 7 +31 26.84n+.08B–DivrMid Val + 6 + 5 +44 16.08n+.04A+EmrgMktsEq +12 +12 .. 15.56n ..D Equity Inc + 5 + 4 + 2 12.22n+.03D+EquityIndex + 5 + 3 + 8 29.86n+.04E Govt Bond 0 0 +19 10.09n–.02D–High Yield + 3 + 3 +26 8.27n+.01E Intermd Bd 0 0 +16 10.32n ..B+Intl Eq +10 + 9 +43 35.45n+.17A Intl Eq Idx + 9 + 9 +43 24.66n+.12E IntmTxFrBd 0 + 1 +14 10.63n ..Intrepid Gr + 5 + 3 .. 21.74n+.07B IntrepidMid + 8 + 7 +38 18.14n+.05Intrpd Amer + 6 + 4 .. 25.76n+.02D Lg Cap Gr + 3 + 1 – 8 16.43n+.03C Lg Cap Val + 5 + 4 + 7 16.63n ..E MIMuni Bd 0 + 1 +15 10.67n+.01B Mid Cap Eq + 8 + 6 +47 35.36n+.09B–Mid Cap Val + 7 + 6 .. 24.99n+.05B+Mkt Exp Idx + 8 + 7 +65 12.76n+.03Mult MktNtr r + 1 + 1 .. 10.71n ..E Muni Inc 0 + 1 +14 9.73n+.01E NYTaxFrBond 0 0 +13 7.08n ..E Sh Dur Bd + 1 + 1 +12 10.46n ..
E Sh Term Bd + 1 + 1 .. 9.55n ..E Sh Tr Muni 0 + 1 +12 10.14n ..E Sh Trm Bd II + 1 + 1 +10 9.92n ..A Small Cap Eq +10 + 8 +75 30.87n+.02B+Small Grow +11 +10 +49 12.53n ..A–Sml Cap Val +10 + 8 +86 24.86n+.06E Tax Fr Bond + 1 + 1 +17 12.71n+.01B+TrSmlEqCore +12 + 9 +56 49.09n+.08C TxAwLgVal + 6 + 5 +19 24.64n–.02D TxAwr US Eq + 5 + 4 + 2 18.12n+.01D–TxAwrLgGr + 3 + 1 –11 17.13n+.03E TxAwrShIntm 0 + 1 .. 9.76n ..E UltShTrmBd + 1 + 1 +10 9.76n ..D+US Equity + 5 + 3 .. 11.53n+.02
JP Morgan Ultra$ 3.1 bil 800–521–5411E Bond + 1 + 1 .. 9.27n–.01Core Bond 0 0 .. 10.55n ..Disc Equity + 5 + 3 .. 15.89n+.02Mrtge Back 0 0 .. 10.37 ..Sh Dur Bd + 1 + 1 .. 10.46n ..UltShTrmBd + 1 + 1 .. 9.76 ..Julius Baer$19.9 bil 800–435–4659
A IntlEqty A +13 +12 +79 39.87 +.32A IntlEqty I r +13 +12 +82 40.63 +.33IntlEqtyIIAm +11 +11 .. 13.13 +.11IntlEqtyIII r +11 +11 .. 13.18 +.12Tot Retrn I 0 0 .. 13.03n–.02B † KalmrSmCp + 8 + 7 +59 17.85n–.01A+† KeelySCpV b +11 + 9+129 48.30 +.06
Kelmoore Strat$ 417 mil 800–486–3717D Eagle A b + 4 + 2 –35 13.05 +.07
Kensington$ 1.4 bil 800–253–2949D–SelectInc A b + 4 + 4 .. 34.32 –.02D–SelectInc C b + 4 + 4 .. 34.00n–.03B–Str Rlty A b +11 +10 +94 51.19 +.25C+Str Rlty C b +11 +10 +89 50.64n+.24
Kinetics Funds$ 736 mil 800–930–3828C–Internet +12 + 9 +10 27.58n+.05A Paradigm +13 +12+115 22.98n–.03A–† KoppEmgGr +15 +14 –23 11.08 –.05
Laudus Rosenberg$ 5.4 bil 800–447–3332D BalMktM Inv + 4 + 3 +25 13.15n ..A+Intl Sm Instl +11 +12+121 20.62n+.15A+Intl Sm Inv +11 +12 .. 20.40n+.16A IntlMktMsInv + 9 + 9 +57 19.61n+.09IntlMktMsSel r + 9 + 9 .. 19.62 +.09
B+US Dscvry I r + 9 + 8 .. 18.82n+.03C–USMktM Inv + 5 + 3 +14 12.20n+.03B+US Sml Ins + 9 + 8 +82 13.70n–.01B+US Sml Invm + 9 + 8 +80 13.42n ..E ValLgSh Ins 0 0 +40 10.57n–.02
Lazard Instl$ 3.9 bil 800–823–6300
A+EmergMkts +10 +11+180 19.56n+.08B–Intl Equity + 9 + 9 +22 15.28n+.11A+Intl Sml Cp + 9 + 9 +86 18.61n +.17B–Mid Cap + 4 + 3 +51 13.73n+.03B Small Cap +10 + 9 +50 16.94n+.06
Lazard Open$ 488 mil 800–823–6300
A+EmergMkts b +10 +10 .. 19.71n+.08E † LebnthNYMu 0 + 1 +18 8.20 ..
Legacy Funds$ 486 mil 888–494–8510E Core Bd Tr 0 0 .. 9.52n–.01D MultCorEqTr + 4 + 3 .. 10.33n+.01
Legg Mason$31.9 bil 800–822–5544C Amer Ld Co b + 2 + 1 +27 24.62n+.03A+EmergMkt b +11 +12+155 21.94n+.08C+Growth Prim b – 2 – 4 +54 30.06n–.02D–High Yield b + 3 + 3 + 9 9.06n+.01A Intl Equity +10 +10 +63 17.66n+.11E Inv Grd Inc b 0 0 +23 10.33n–.01E Ltd Bd Prim 0 0 +10 10.19n ..E MD Tax Fr 0 0 +17 16.35 ..A Opport Pri m + 7 + 5 +70 17.95n +.17
OpportInstl + 8 + 6 .. 18.31n +.17B+Spec Inv Instl + 5 + 3 +79 54.76n–.09B+Special Invs b + 4 + 3 +72 46.50n–.08B+US SmCpVal b + 6 + 4 +82 14.31n+.03C+Value Fncl b + 1 – 1 .. 74.85n–.15C+Value Instl + 1 – 1 +30 76.07n–.15C+Value Tr b 0 – 1 +24 68.95n–.14
Leuthold Funds$ 1.7 bil 800–273–6886B–Core Inv + 3 + 2 +52 17.69n+.07
LKCM Funds$ 872 mil 800–688–5526
A SmCapEqInst +12 +10 +88 23.62n+.06LMIFA I & II$ 932 mil 626–844–9500B BatMchUSSml +11 + 9 +58 12.14n–.01
Longleaf Prtnrs$13.9 bil 800–445–9469
B+Intl + 5 + 4 +47 18.22n+.03D+Partners + 6 + 5 +49 32.89n–.08B+Small Cap + 3 + 2 +62 27.86n–.06
Loomis Syls$ 9.2 bil 800–633–3330D Bond Instl + 3 + 3 +55 13.98 –.02D–Bond Ret + 3 + 3 +53 13.94 –.02E Glob Bd Retm + 2 + 2 .. 14.79n+.02E GlobBd Inst + 2 + 2 +48 14.91 +.02C+Growth Y + 2 + 1 + 5 6.69n+.04E Ltd Govt A 0 0 +11 10.98 –.01B+SmCapVl Inst +10 + 9 +72 27.82n+.06B+SmCapVl Rt b +10 + 9 +70 27.63n+.06D Strat Inc A + 3 + 4 +61 14.31 –.02D Strat Inc B + 3 + 3 +58 14.37n–.02
D Strat Inc C + 3 + 3 +58 14.37 –.01Loomis Syls Inv$ 764 mil 800–633–3330D Fixed Income + 3 + 3 +53 13.34n–.02C+InstlHiInc + 6 + 7 +48 7.83n+.01D–InvGrad Fxd + 2 + 2 +48 12.40n–.03
Lord Abbett A$40.4 bil 800–201–6984C Affiliated b + 7 + 6 +18 15.01 +.02C+All Value + 8 + 7 +39 12.75 +.04A Alpha Strat +12 +11 +53 22.90 +.09D Bal Strat + 5 + 4 +19 11.63 +.01D–Bond Deben b + 3 + 3 +17 7.87 +.01E CA Tax Fr b + 1 + 1 +17 10.90 ..B Dvlp Grwth b +12 +10 +31 19.65 –.01C Growth Opp b + 8 + 6 +16 22.16 +.05HiYldMuniBd b + 2 + 3 .. 15.50 ..IntlCoreEqm + 9 + 9 .. 14.32 +.11B–Mid Cap Val b + 5 + 4 +58 22.81 +.03E MO Tax Fr b + 1 + 1 +19 5.32 ..E Natl Tax Fr b + 1 + 1 +19 11.50 +.01E NJ Tax Fr b + 1 + 1 +16 5.17 ..E NY Tax Fr b + 1 + 1 +18 11.24 +.01C–Res Lg Core b + 6 + 4 +15 29.21 +.03D+ResAmerVal b + 3 + 2 .. 12.55 ..A ResSmallVal +13 +11 +92 32.04 +.12A+Sml Blend b + 8 + 6 .. 18.09 +.15E Totl Retrn b 0 0 .. 10.31 –.01E US Gov Sec b 0 0 +15 2.56 ..
Lord Abbett B$ 4.9 bil 800–426–1130C–Affiliated b + 7 + 5 +16 15.06n+.02C All Value b + 8 + 6 +35 12.34n+.04D–Bond Deben b + 3 + 2 +15 7.88n+.01B–Mid Cap Val b + 5 + 4 +54 21.98n+.03
Lord Abbett C$ 5.9 bil 800–426–1130C–Affiliated b + 7 + 5 +16 15.03n+.02C All Value + 8 + 6 +36 12.30n+.04D–Bal Strat b + 4 + 4 +17 11.60n+.01D–Bond Deben b + 2 + 2 +15 7.88n ..B–Mid Cap Val b + 5 + 4 +54 21.91n+.03A+Sml Blendm + 8 + 6 .. 17.58n+.14
Lord Abbett P$ 1.8 bil 800–201–6984C Affiliated b + 7 + 6 +18 14.99n+.02B–Mid Cap Val b + 5 + 4 +58 22.33n+.03A ResSmallVal b +13 +11 .. 31.89n+.11
Lord Abbett Y$ 3.6 bil 800–426–1130C Affiliated + 7 + 6 +20 15.04n+.02D–Bond Debent + 3 + 3 +19 7.85n+.01B+Devel Growth +12 +10 +34 20.26n–.01B–Mid Cap Val b + 5 + 4 .. 22.79n+.04C Res Lg Core + 6 + 5 .. 29.25 +.03A Res Sm Cp Vl +13 +11 +96 33.26n+.12Totl Retrn 0 0 .. 10.33n–.01
B+† LSV Val Eq + 7 + 5 +66 17.29n+.01Lutheran Bro A$ 515 mil 800–328–4552Income 0 0 .. 8.54 –.01
—M—N—O—MainStay A Fds$ 8.5 bil 800–624–6782Balanced b + 4 + 3 .. 27.27 +.01D Capital Appr + 3 + 2 –16 32.75 +.06D–Convertible + 4 + 3 +22 14.22 +.02D+Equity Index + 5 + 3 + 6 44.33 +.06Float Rate x + 1 + 2 ..x 10.00 ..E Govt Plus 0 0 +13 8.17 –.01D High Yld Cp + 2 + 2 +32 6.30 +.01B–Intl Equity + 9 + 8 +50 14.75 +.06B–MAP b + 6 + 5 +38 36.82 +.11C+MidCapVal b + 6 + 5 +42 17.76 –.06S&P500 Idx + 5 + 3 .. 30.01 +.04E Tax Fr Bond 0 + 1 .. 9.68 ..D–Total Return + 4 + 2 + 2 19.43 ..C–Value + 6 + 5 +16 21.96 +.01
MainStay B Fds$ 3.7 bil 800–624–6782D Cap Apprm + 3 + 1 –19 29.92n+.04D–Convertiblem + 4 + 3 +19 14.23 +.02D Hi Yld Cpm + 2 + 2 +29 6.27n+.01Lrg Cp Grow b + 5 + 3 .. 5.80 +.02C+MAPm + 6 + 5 +33 35.02 +.11C MidCapVal b + 6 + 5 +37 17.20n–.06C+Sm Cap Gr b + 8 + 6 +10 15.98n+.06D–Total Retnm + 3 + 2 0 19.45 +.01D+Valuem + 6 + 5 +14 21.79 ..
MainStay C Fds$ 856 mil 800–624–6782Float Rate x + 1 + 2 ..x10.00n ..D Hi Yld CorpBd + 2 + 2 +29 6.27n ..C+MAPm + 6 + 5 +33 35.02n+.11
Mainstay I Fds$ 3.6 bilC AllCapGrow + 5 + 3 – 4 25.17 +.04D–Asset Mgr + 4 + 3 +16 14.25n+.01D Balanced + 4 + 3 +48 27.33n+.01E Indexed Bd 0 0 +17 10.66 –.02B MAP + 7 + 5 +43 37.35 +.12D+S&P500 Idx + 5 + 3 + 8 30.24n+.05A SmlCapOppr + 8 + 6+114 19.90n–.02
Mairs & Power$ 2.8 bil 800–304–7404C Growth + 5 + 4 +56 75.40n+.09
Managers Funds$ 8.3 bil 800–835–3879E Bond + 1 + 1 +29 24.12n–.01A+EmergMarkets +11 +11+141 22.31n+.14Fremont Bond 0 0 .. 10.31n–.01FremontGlob + 4 + 4 .. 13.97 +.02FremontMicI +11 +11 .. 15.37n–.08FremontMico +10 +10 .. 35.05n–.16
B+Intl Equity +11 +11 +28 59.62n+.38E Intm Dur Gov + 1 + 1 +19 10.48n ..
E Sh Dura Govt + 1 + 1 +11 9.63n ..B SpecialEq + 8 + 6 +37 93.48n+.06SpecialEq I + 8 + 6 .. 93.86n+.06TimsqSmGr I +11 +10 .. 13.46n ..TimsqSmGrPr +11 +10 .. 13.37n ..C–Value + 5 + 4 +16 29.40n+.03
Marshall Funds$ 3.4 bil 800–236–8560E Govt Income Y 0 0 +16 9.41n ..B+Intl Stck I + 9 + 9 +33 15.96 +.12B+Intl Stck Y + 8 + 8 +32 15.78 +.12E Intmd Bond Y 0 + 1 +14 9.22n–.01D Lg Cap Gr Y + 3 + 2 – 8 12.51n+.03D+Lg Cap Val Y + 6 + 5 +12 13.78n ..C–MidCapGr Y + 9 + 8 + 6 15.40n+.02B–MidCapVal Y + 5 + 4 +64 15.38 +.01A Sm Cap Gr Y +14 +12 +68 17.96n+.09
Marsico Funds$ 7.5 bil 888–860–8686C Focus b + 4 + 3 +25 19.03n+.16C Growth b + 4 + 2 +23 19.57n+.16A Intl Opp b + 9 + 9 +75 15.46n+.02A 21st Century b +10 + 8 +75 14.20n+.07
Mason Street A$ 1.7 bil 888–627–6678D+Aggres Gr b + 7 + 5 + 7 14.56 +.03D–AssetAlloc b + 4 + 1 +17 13.81 +.02D–Grwth Stk b + 3 + 2 – 5 14.45 +.03D–Hi Yld Bd b + 2 + 2 + 9 7.00 ..B Index 400 b + 6 + 5 +53 13.94 +.04D Index 500 b + 5 + 3 + 6 15.94 +.02B+Intl Equity b + 8 + 8 +37 12.66 +.04D LgCapCorStk + 4 + 2 – 2 10.17 ..E Select Bond b 0 0 +10 9.41 –.01
Mass Mutl Instl$ 1.5 bil 413–744–8956D–Growth Eq S + 2 0 –17 8.37n+.03C–LgCapVal A + 3 + 2 .. 11.66 +.01E Sh Dur Bd L + 1 + 1 +13 9.96n ..B+SmlCpGrEq S + 8 + 6 +37 17.48n+.01
Mass Mutl Prem$ 5.9 bil 413–744–8956D–Balanced S + 3 + 2 +13 9.93n+.01E Core Bond A b 0 0 .. 10.54 –.01E Core Bond L 0 0 +17 10.60n ..E Core Bond S 0 0 +17 10.68n–.01E Core Bond Y 0 0 +17 10.63n–.01E DiverseBd L 0 0 .. 10.43n–.01E DiverseBd S 0 0 +23 10.51n–.01IndexValIIS + 7 + 3 .. 10.42 ..InflProBd S – 1 – 1 .. 10.09 –.02
A+Intl Eq L + 9 + 9 +19 13.60n+.10A+Intl Eq S + 9 + 9 +20 13.74n+.10E Sh Dur Bd S + 1 + 1 +14 10.06n ..C–Sm Co Opp A + 7 + 5 +64 17.15 +.03Sm Co Opp S + 7 + 5 .. 17.27n+.03Value S + 3 + 1 .. 17.33n ..Mass Mutl Select$12.1 bil 413–744–8956C Agg Gr A b – 2 – 4 – 2 6.34 +.05C+Agg Gr L – 2 – 4 – 1 6.43n+.05C+Agg Gr S – 2 – 4 0 6.52n+.05D–BlueChipGrL + 3 + 1 .. 9.33n+.03DesRet2020L + 3 + 2 .. 11.24 +.02DesRet2030L + 4 + 3 .. 12.01 +.04DiversVal S + 7 + 4 .. 12.05 +.01C+Focus Val A b + 4 + 3 .. 17.40 +.07C+Focus Val L + 4 + 3 .. 17.62 +.06C+Focus Val S + 4 + 3 +77 17.85n+.07C Fund Val A b + 7 + 6 .. 11.96 ..B–Fund Val L + 7 + 6 .. 12.00n ..C Fund Val S + 7 + 6 .. 12.03n ..D–Growth Eq A b + 2 0 –19 8.18 +.02D–Growth Eq L + 2 + 1 –18 8.29n+.03D Index Eq A b + 5 + 3 + 6 12.04 +.02D+Index Eq L + 5 + 3 .. 12.09n+.02D+Index Eq S + 5 + 3 + 8 12.24n+.01D+Index Eq Y + 5 + 3 + 7 12.12n+.01D+Index Eq Z + 5 + 3 .. 12.25 +.02C LgCapVal L + 3 + 2 +24 11.70n+.01C LgCapVal S + 4 + 2 +25 11.76n+.02C LgCapVal Y b + 4 + 2 .. 11.74n+.02B+MidGrEqII A b + 6 + 4 .. 14.92 +.05B+MidGrEqII L + 6 + 4 +54 15.15n+.05B+MidGrEqII S + 6 + 4 +56 15.37n+.05B+MidGrEqII Y + 6 + 4 .. 15.30n+.05B+Overseas A b +10 +10 .. 12.02 +.10B+Overseas L +10 +10 .. 12.09n+.10B+Overseas S +10 +10 .. 12.15n+.10B+Overseas Y +10 +10 .. 12.13n+.10A–Sm Co Val A b +11 + 9 .. 15.85 +.01A–Sm Co Val L +11 + 9 .. 15.92n+.01A–Sm Co Val S +11 + 9 .. 16.05n+.01A–Sm Co Val Y +11 + 9 .. 16.00n+.01
Masters' Select$ 3.1 bil 800–960–0188C Equity + 3 + 1 +28 15.72n+.01A Intl + 8 + 7 +49 18.80n+.11Smaller Co r + 8 + 7 .. 15.27n+.02C+Value r + 5 + 3 +40 15.27n–.01D+† MatrxAdVal + 2 + 1 +28 54.00n+.07
Matthews Asian$ 5.9 bil 800–789–2742
B+China +15 +15 +97 17.01n+.12B+Gr & Inc + 6 + 6+127 18.12n+.05India r +17 +19 .. 13.28n–.02
A Japan + 1 + 2 +46 18.73n +.40A+Korea + 3 + 4+270 6.55n+.05A+Pac Tiger I + 5 + 6+127 20.28n+.04
Pacific r + 4 + 5 .. 15.52 +.16A–† McKeeIntlEq + 9 + 8 +50 14.44n+.09
McMorgan Fds$ 433 milD Equity Inv + 6 + 4 0 24.20n+.03E Intmd Fx Inc 0 0 +13 10.10 –.01
Mellon Funds$11.2 bil
D–BalancedM + 4 + 3 +23 13.29n+.01A+EmrgMkts M +10 +11 .. 24.83n+.15C–Inc Stk M + 6 + 4 +13 10.37n ..A–Intl M + 8 + 8 +50 17.03n+.10E Intm BondM 0 0 +12 12.19n–.01D Lrg StkM + 4 + 3 + 2 10.46n+.01E MA IntMuniM 0 + 1 .. 12.54 ..B+Mid Stk M + 9 + 7 +54 14.96n+.04E NatlIntMunM 0 + 1 +16 12.98n ..E NatlShMuniM 0 + 1 + 9 12.58n ..E PA IntMunM 0 + 1 +13 12.64n ..E ShTmUSGovM + 1 + 1 + 8 12.02n ..B Sml Stk M +11 + 8 +58 16.29n+.05
Mellon Instl$ 3.1 bil 800–221–4795
A Bos Sml Val + 9 + 8+112 23.25n+.02A BosIntlCore +10 + 9 +81 37.56n+.29A+BosIntlSml +12 +13 .. 23.57n+.20A–BosSmTxEq + 9 + 7 +33 43.02n+.19E StanFxdInc x 0 0+19x19.49n–.21
Mercantile Funds I$ 2.3 bil 800–551–2145
B+Cap Opps +11 + 9 +52 11.86n+.05A–DivrRealEst +16 +15+127 19.19n +.21D Growth & Inc + 4 + 2 + 8 19.79n+.01B Intl Equity + 9 + 8 +55 16.33n+.08E Ltd Mat Bd 0 0 +10 10.10n–.01E Tot Retn Bd 0 0 +15 9.63n–.01E † Merger Fund + 4 + 4 + 6 15.24n+.03
Meridian Funds$ 4.0 bil 800–446–6662B Growth + 9 + 8 +67 39.80n+.19C+Value + 8 + 7 +54 37.47n+.12
Merrill Lynch A$18.1 bil 800–637–3863D–Bal Cap b + 4 + 3 + 9 26.57 +.01C–Basic Value b + 6 + 5 +19 32.90 +.01E CA Insr Muni 0 + 1 +18 11.55 ..E Core Bond b + 1 + 1 +18 11.48 –.01E CorpBdIntm b 0 0 +19 11.64 –.01C+Equity Div + 6 + 5 +45 16.71 –.02A–Eurofund b +13 +12 +47 20.49 +.13C Focus Value b + 8 + 6 +32 14.76 –.02D Fundmnt Gr b + 3 + 2 – 8 19.35 –.02B–Glob Alloc b + 6 + 5 +54 17.90 +.05A–Glob Sm Cap + 8 + 8 +54 26.47 +.11A Glob Value b + 6 + 5 +46 17.83 +.05D HealthCare b + 5 + 4 +20 7.07 +.05D High Income + 4 + 4 +21 5.11 ..A–Intl Indexm + 9 + 8 +31 13.48n+.07A+Latin Amerm +20 +20+216 44.09 –.33B–Lg Cap Core b + 7 + 6 +45 13.94 +.03E Low Dur + 1 + 1 .. 9.99 ..B+Lrg Cap Val b + 7 + 5 +67 18.04 +.01E Muni Insrd b + 1 + 1 +19 7.84 ..E Muni Natl b + 1 + 1 +22 10.52 ..E MuniBdShtm 0 0 + 7 9.92 ..A+Natural Res b + 4 + 3+146 52.27 –.51E NYMuni b + 1 + 1 +17 11.01 +.01A–Pacific b + 8 + 7 +49 26.46 +.41D+S&P 500 Idx b + 5 + 3 + 7 16.04n+.03E US Govt 0 0 +15 9.98 –.01B+Value Opps + 8 + 6 +67 27.65 +.03
Merrill Lynch B$ 9.6 bil 800–995–6526D–Bal Capm + 4 + 3 + 7 25.82n+.01C–Basic Valuem + 6 + 5 +16 32.27n+.01E Core Bondm 0 0 +16 11.47n–.02D Fundmnt Gr m + 3 + 2 –11 17.73n–.01C+Glob Alloc m + 6 + 5 +50 17.53n+.06B Glob Grwthm + 7 + 7 + 1 11.83n+.03A Glob Valuem + 5 + 5 +41 17.19n+.04B+GlobSmCapm + 7 + 8 +49 25.67n+.10D–High Income + 4 + 4 +18 5.11n ..B Large Cp Val + 7 + 5 +61 17.28n+.01B–Lg Cap Core b + 7 + 5 +40 13.35 +.03E Muni Natl m + 1 + 1 +20 10.51n ..E US Govt 0 0 +13 9.98 –.01D–US Hi Yld m + 2 + 3 +16 6.34n ..B Value Oppsm + 8 + 6 +61 24.92n+.03
Merrill Lynch C$ 8.9 bil 800–637–3863C–Basic Valuem + 6 + 5 +15 31.42n+.01E Core Bondm 0 0 +16 11.47n–.02D Fundmnt Gr m + 3 + 2 –11 17.82n–.01C+Glob Alloc m + 6 + 5 +49 16.99n+.05B+Glob Sm Capm + 7 + 8 +49 25.23n+.10D–High Income + 4 + 4 +18 5.11n ..C Large Cp Gr b + 5 + 3 +18 10.02n+.04B Lg Cap Val b + 7 + 5 +61 17.24 +.01B–LgCapCorem + 7 + 5 +40 13.32 +.03E Low Dur b + 1 + 1 .. 9.97n ..E US Govt 0 0 +13 9.98 –.01B Value Opps + 8 + 6 +60 24.19n+.03
Merrill Lynch I$19.8 bil 800–637–3863E Aggreg Bd Idx 0 0 +18 10.41n–.02D–Bal Cap + 4 + 3 +10 26.65 +.02C Basic Value + 6 + 5 +20 33.05 +.01E Core Bondm + 1 + 1 +19 11.47 –.02E Corp BdIntm 0 0 +19 11.63 –.02C+Equity Div + 6 + 5 +46 16.72 –.02A–Eurofundm +13 +12 +48 20.72 +.13C+Focus Value + 8 + 6 +34 14.91 –.02D+Fundmnt Gr + 3 + 2 – 7 19.78 –.02B–Glob Alloc m + 6 + 5 +55 17.96 +.06A–Glob Sm Cap + 8 + 8 +55 26.74 +.11D+HealthCare + 5 + 4 +22 7.70 +.05D High Income + 4 + 4 +20 5.10 ..A Intl Val +11 +10 +46 29.95 +.23C+Large Cp Gr + 5 + 3 +25 10.69 +.05E Low Dur + 1 + 1 .. 10.00 ..B Lrg Cap Core + 7 + 6 +47 14.14 +.03E Muni Insured + 1 + 1 +20 7.85 ..E Muni Natl + 1 + 1 +23 10.51 ..E MuniBdSht 0 0 + 7 9.91 ..A–Pacific + 8 + 7 +50 26.62 +.42
D+S&P 500 Index + 5 + 3 + 8 16.08n+.02A–SmlCapGr +11 +10 +51 16.26 +.01E US Govt 0 0 +16 9.98 –.01B+Value Opps + 8 + 6 +68 27.95 +.04
Metro West$ 3.0 bil 800–241–4671C–Alpha Trak + 6 + 4 + 4 8.26n+.01E Low Dur Bd + 1 + 1 + 9 9.33n ..E Low Dur Bd I + 1 + 1 +10 9.33n–.01E Total Ret Bd 0 + 1 +14 9.53n–.01E Total Ret Bd I 0 + 1 +15 9.52n–.02UltraShBdM + 1 + 1 .. 5.11n ..MFS Funds A$46.8 bil 800–637–2929C+AggrGrAlloc b + 6 + 5 .. 14.98 +.04E Bond 0 0 +21 12.57 –.02E CAMunim + 1 + 1 +22 5.88 ..D Cap Opport + 4 + 3 –17 14.11 +.01E ConsrvAlloc + 3 + 2 .. 11.81 ..C–Core Equity + 4 + 3 +14 18.43 +.02D Core Growth + 4 + 3 –11 18.36 +.05C Emerg Grow + 6 + 4 –10 36.72 +.09A+EmrgMk Eq +11 +11+162 33.84 +.15B–Global Eq + 8 + 7 +41 27.94 +.07B–Global Grow + 7 + 6 +22 22.81 +.08D GlobalTotRetm + 6 + 5 +36 14.24 +.04E Gov Ltd Mtm + 1 + 1 + 7 7.78 ..E Govt Secs 0 0 +13 9.42 –.02C–Growth Allo + 5 + 4 .. 14.27 +.03D Growth Opp + 4 + 2 –11 9.27 +.02D–Hi Yld Opp + 2 + 3 .. 7.41 ..D–High Income + 2 + 3 +15 3.83 ..A–Intl Growth +10 +10 +51 23.99 +.09A+Intl Nw Ds +10 +10 .. 26.14 +.17A Intl Val +11 +11 +67 28.66 +.18IntlDivrs A +11 +11 .. 14.29 +.08E Ltd Maturity 0 + 1 + 9 6.40 –.01D+MA Inv Tr + 5 + 4 + 4 19.41 +.03D MA InvGrSk + 4 + 3 –13 13.40 +.04E MAMuni m + 1 + 1 +19 11.30 ..C Mid Cap Gr + 5 + 4 –23 9.68 +.04B MidCapVal b + 4 + 3 .. 13.76n+.04D–Mod Alloc + 4 + 3 .. 13.03 +.01E Muni Bond + 1 + 1 +18 10.55 ..E Muni High Incm + 1 + 2 +24 8.44..E Muni Inc + 1 + 1 +19 8.58 ..E Muni Ltd Mat 0 + 1 +12 7.71 ..E NCMuni 0 + 1 +18 11.93 ..C NewDiscov + 9 + 7 + 5 18.70 +.06B–New Endeavr + 5 + 4 .. 14.58n+.06C–Research + 4 + 2 + 1 22.49 ..A–Resrch Intl +11 +11 +51 18.69 +.11E Rsrch Bond 0 0 .. 10.01 –.01E SCMuni m + 1 + 1 +19 12.33 ..D–Str Growth + 4 + 3 –17 19.93 +.03E Str Income + 1 + 1 +20 6.68 ..C–Strat Val + 4 + 2 +23 14.65 +.03D–Total Ret + 3 + 2 +22 15.79 +.01A Utilities + 5 + 5 +22 13.31 –.05E VAMunim 0 + 1 +18 11.48 ..C Value + 7 + 5 +28 24.69 +.01E WVMuni m + 1 + 1 +18 11.55 ..
MFS Funds B$15.6 bil 800–637–2929C+AggrGrAlloc b + 6 + 5 .. 14.80n+.04E Bond 0 0 +19 12.53n–.02D Cap Opport + 4 + 3 –20 12.92n+.01E ConsrvAlloc + 2 + 2 .. 11.72n ..D Core Gr + 4 + 3 .. 17.67n+.05C Emerg Gr + 6 + 4 –13 33.77n+.09C+Global Eq + 8 + 7 +36 26.56n+.07E Govt Secs 0 0 +11 9.41n–.01D+Growth Allo + 5 + 4 .. 14.10n+.03D–Hi Yld Opp + 2 + 3 +25 7.44n ..D–High Inc + 2 + 2 +12 3.84n ..A+Intl Nw Dsm + 9 +10 .. 25.37n+.16D MA Inv Tr + 5 + 3 + 2 18.93n+.03D–MA InvGrSk + 4 + 3 –15 12.22n+.03C Mid Cap Gr + 5 + 4 –25 9.16n+.03D–Mod Alloc + 4 + 3 .. 12.93n+.02E Muni High Inc + 1 + 2 +21 8.45n+.01C–NewDiscov + 9 + 7 + 1 17.91n+.05C–Research + 4 + 2 – 1 21.02n+.01A–Rsrch Intl +11 +11 +46 17.96n+.10D–Str Growth + 4 + 3 –20 18.94n+.03D+Strat Val m + 4 + 2 .. 14.25n+.03D–Total Ret B + 3 + 2 +19 15.78n ..A–Utilities + 5 + 4 +19 13.26n–.05C–Value + 6 + 5 +26 24.52n+.01
MFS Funds C$ 7.3 bil 800–637–2929C+AggrGrAlloc b + 6 + 5 .. 14.79n+.04E ConsrvAlloc + 2 + 2 .. 11.71n+.01C Emerg Gr + 6 + 4 –13 33.57n+.08D+Growth Allo + 5 + 4 .. 14.09n+.03A+Intl Nw Ds + 9 +10 .. 25.33n+.16D MA Inv Tr + 5 + 4 + 2 18.84n+.03D–MA InvGrSk + 4 + 3 –15 12.17n+.04D–Mod Alloc + 4 + 3 .. 12.91n+.01C–Research + 4 + 2 – 1 21.03n ..A–Research Intl +11 +11 +46 17.90n+.10D+Strat Val + 4 + 2 .. 14.25n+.03D–Total Ret + 3 + 2 +19 15.84n ..A–Utilities + 5 + 4 +19 13.27n–.05C–Value + 6 + 5 +26 24.49n+.01
MFS Funds I$ 7.2 bil 800–637–2929E High Income + 1 + 1 .. 3.83n ..A+Intl Nw Ds +10 +10 .. 26.61n+.17E IntmInvGrdBd 0 0 .. 9.83n–.01C Mid Cap Gr + 5 + 4 –22 9.82n+.03B MidCapVal + 5 + 3 .. 13.99n+.04C–Research + 4 + 2 .. 22.90n+.01E Rsrch Bond 0 0 .. 10.02n–.01A Rsrch Intl +11 +11 .. 19.12n+.11D Strat Growth + 4 + 3 –16 20.47n+.04
D–Total Ret + 3 + 3 +23 15.79n+.01C Value + 7 + 5 +30 24.80n+.01
MFS Instl Funds$ 1.7 bil 800–637–2929
B+Intl Eq +10 +10 +59 18.99n+.07Morgan Stan$ 962 mil 800–869–6397E Ltd Dur + 1 + 1 + 8 9.04n ..E Ltd TermMuni + 1 + 1 +17 10.88n ..E LtdDurTre Tr 0 + 1 + 4 9.03n ..
Morgan Stan A$11.2 bil 800–869–6397D Amer Opp – 1 – 3 – 2 27.66 +.04A Cap Opps b + 3 + 1 – 9 19.34 –.06D Div Gr Secs + 3 + 1 – 1 34.02 +.08A Dvlp Gr Sec + 8 + 6 +32 28.71 +.02B–EqWtS&P500 b + 7 + 5 +44 41.17 +.11B–Euro Equity b +10 +10 +21 19.46 +.04C+Global Div Gr + 6 + 5 +33 15.26 +.04C–Health Sci b + 3 + 2 +17 18.02 +.08B+International b + 8 + 8 +36 12.26 +.08D+S&P500 Idx b + 5 + 3 + 7 14.13 +.02B+Special Val b + 8 + 7 .. 20.73 –.01D+Strategist + 5 + 4 +21 19.84 +.06E Tax Ex Secs + 1 + 1 +17 11.55 ..E US Govt Secs – 1 0 +16 8.98 –.01
Morgan Stan B$10.0 bil 800–869–6397C+Aggr Equity b + 4 + 2 + 8 11.68n–.03D Amer Opp – 1 – 3 – 6 25.88n+.03E CA Tax Fr + 1 + 1 +15 12.23n ..A–Cap Opps + 3 + 1 –13 18.20n–.05D Div Gr Secs + 3 + 1 – 2 34.16n+.08A–Dvlp Gr Sec + 8 + 6 +27 26.46n+.02B–EqWtS&P500 + 7 + 5 +40 40.78n+.11B–Euro Equity +10 +10 +20 18.83n+.04E Flex Inc + 1 + 1 + 9 6.08n ..C Glob Advtg b + 6 + 5 + 2 9.10n–.01C+Global Div Gr + 6 + 5 +30 15.44n+.04D+Growth 0 – 3 0 13.87n–.02D+Health Sci + 3 + 2 +13 16.45n+.07D–High Yld Secs + 2 + 2 –25 1.73n ..D Information + 3 + 1 –41 9.88n+.03B Intl b + 8 + 8 +33 12.16n+.08B–Intl Val Eqm + 8 + 7 .. 13.34n+.06D S&P500 Index + 5 + 3 + 4 13.73n+.02B SmMdSpValm + 6 + 5 .. 13.46n+.02B Special Value + 8 + 7 +66 19.20n–.01D Strategist + 5 + 4 +18 19.87n+.06C–TotMkt Idx b + 5 + 4 +13 11.14n+.02E US Govt Secs – 1 0 +15 8.99n–.01C+Utilities + 3 + 2 + 3 14.90n–.04C Value b + 4 + 2 +18 13.64n–.01
Morgan Stan C$ 1.2 bil 800–869–6397D S&P500 Index + 5 + 3 + 4 13.70n+.02
Morgan Stan D$ 4.1 bil 800–869–3863D Amer Opp – 1 – 3 – 1 28.29n+.04D Div Gr Secs + 3 + 1 0 34.06n+.08B–EqWtS&P500 + 7 + 5 +45 41.39n+.12C+Global Div Gr + 6 + 5 +34 15.29n+.04B Intl Val Eq + 8 + 7 .. 13.50 +.06D+S&P 500 Index + 5 + 3 + 8 14.25n+.02E Tax Ex Secs + 1 + 1 +17 11.55n ..E US Govt Secs 0 0 +16 8.99n ..
Morgan Stan Ins$27.6 bil 800–548–7786
B+ActvIntlAll A + 8 + 8 +40 13.48n+.08D Balanced + 3 + 2 +14 12.44n+.01E CorFxdInc 0 0 +21 10.75n–.01E CorPlFxdInv 0 0 +19 11.47n–.01E CorPlusFxd 0 0 +19 11.48n ..A+Emer Mkts A +13 +14+153 28.66n+.08A+Emer Mkts B b +13 +14 .. 28.33n+.08A+Euro Real Es A +15 +16+178 27.25n+.15D–Hi Yld + 2 + 2 – 4 5.27n ..B Intl Equity A + 8 + 8 +48 21.93n+.09B Intl Equity B b + 8 + 7 +49 21.76n+.09E Intl Fixed Inc + 1 0 +32 10.06n+.03A+Intl Sm Cap A +10 +11 +95 26.60n +.31E IntmdDuratn 0 0 +17 10.10n ..E InvGrdFxdIns 0 0 +21 11.16n–.01B–LgCpRelValA + 4 + 3 +22 11.52n+.01E Ltd Dur + 1 + 1 +11 10.30n ..A MdCpGrAdv b + 8 + 6 +18 26.06n+.02A Mid Cap Gr + 8 + 6 +19 26.73n+.02E Municipal + 2 + 2 +21 12.77n+.02A Sm Co Gr A + 9 + 8 +54 14.09n+.05A Sm Co Gr B b + 9 + 8 +52 13.45n+.05C–US LrgCpGrA 0 – 2 + 5 19.47n–.02B+US Sml Val + 8 + 7 +56 25.24n–.02A+USRealEst A +15 +15+137 26.99n +.33A+USRealEst B b +15 +15 .. 26.75n +.32C+Value + 4 + 3 +30 17.80n–.02C+Value Adv + 4 + 3 +28 17.78n–.02
Mosaic Funds$ 345 mil 888–670–3600D–Investors + 5 + 3 + 6 19.70n+.06C Mid Cap + 7 + 6 +51 12.79n ..
MPAM Funds$ 856 milE Bond 0 0 +14 12.30 –.01
MTB Funds$ 2.8 bil 800–836–2211E Income I 0 0 +14 9.68n–.01A Intl Eq I I + 9 + 8 +38 11.54n+.05E IntmTrmBd I 0 0 +15 9.76n–.01D LrgCapStk I + 4 + 2 – 5 8.57 +.02E PAMuni I I 0 + 1 +15 10.11n ..E ShDurGovt I 0 + 1 + 9 9.52 ..SmlCapStk I +10 + 9 .. 9.70n+.01E US Govt I I 0 0 + 9 9.22n–.01A–† Muhlnkmp + 2 + 1 +76 86.17n+.07
Munder A$ 2.5 bil 800–438–5789D+Index 500 b + 5 + 3 + 7 27.27 +.03
A–Internet + 1 – 2 –22 20.78 +.03A+Micro Cp Eq b + 5 + 4+114 45.57 –.11A–Mid Core Gr m + 9 + 8 .. 24.63 +.04
Munder C/II$ 708 mil 800–438–5789
B+MidCoreGrCm + 9 + 7 .. 23.76n+.04A SmlCpVal Cm + 8 + 6+114 28.36n+.06
Munder K$ 1.1 bil 800–438–5789D+Index 500 + 5 + 3 + 7 27.26n+.04E Intermd Bd 0 0 +12 9.17n–.01E TaxFrSh Bd b 0 0 + 8 10.11n ..
Munder Y$ 1.4 bil 800–239–3334
A–Mid Core Gr r + 9 + 8 .. 24.94n+.04A Sml Cap Val + 8 + 7+125 29.74n+.06
Navellier Perf$ 191 mil 800–887–8671B–Mid Cap Gr +11 + 9 +20 32.45n+.09
Needham$ 232 mil 800–625–7071
B+Growth b + 9 + 7 +46 38.87n–.13Neubg&Brm Adv$ 950 mil 800–877–9700B Genesis b + 4 + 3 +94 29.62n+.04B+Partners b + 5 + 4 +39 19.78n+.04
Neubg&Brm Instl$ 402 mil 800–628–2583Intl r +10 +10 .. 12.61n+.04Neubg&Brm Inv$12.2 bil 800–877–9700C Fasciano + 7 + 6 +50 45.32n+.16B Focus + 9 + 7 + 7 35.32n–.01B Genesis + 4 + 3 +93 35.49n+.05B+Genesis Instl + 5 + 3 +99 48.70n+.07C+Guardian + 3 + 2 +25 18.32n ..E High Inc Bd + 1 + 1 .. 9.09n ..A+Intl r +11 +11 +90 23.97n+.07E Ltd Mat Bond 0 + 1 + 9 9.09n ..B Manhattan + 9 + 8 + 7 8.60n+.03B+Partners + 5 + 4 +41 29.56n+.06C Soc Respons + 2 + 2 +36 23.27n+.02
Neubg&Brm Tr$ 8.4 bil 800–877–9700B Focus + 9 + 7 + 6 25.96n–.01B Genesis + 4 + 3 +97 50.72n+.07C+Guardian + 3 + 2 +24 14.43n ..B+Partners + 5 + 4 +41 22.81n+.04
ni Numeric Inv$ 468 mil 800–686–3742
A Emerg Gr +11 +10 +76 15.48n ..A Small Cap Val + 9 + 8 .. 18.46n–.02
Nicholas Group$ 3.4 bil 800–227–5987B Ltd Edit I + 7 + 6 +45 20.64n+.02C Nichol II I + 6 + 4 +27 23.43n+.06C Nicholas + 7 + 5 +14 61.99n+.06
North Track$ 988 mil 800–826–4600B–ArcaExTechA + 5 + 3 +11 25.31 +.12B–Geneva Gr A b + 7 + 6 .. 18.80 +.05E WI Tax Ex b 0 + 1 +18 10.42 ..
Northeast Inv$ 1.7 bil 800–225–6704C Growth + 5 + 4 +13 19.38 +.05D–Trust + 3 + 4 +16 7.54n+.01
Northern$11.4 bil 800–595–9111E Fixed Income 0 0 +14 9.82n–.02D–Growth Equity + 3 + 1 – 6 16.35n+.02D–Hi Yld Fx Inc + 2 + 2 +22 8.04n ..E High YldMuni + 1 + 1 +24 9.75n ..D–Income Eq + 4 + 3 +27 12.04n ..Intl Eq Idx r + 9 + 8 .. 11.99 +.06
B+Intl Growth Eq + 8 + 8 +26 12.58n+.06E Intmd Tax Ex 0 0 +15 10.23n ..C Lrg Cap Value + 6 + 5 +30 13.41n–.01C–Mid Cap Gr + 7 + 5 +18 14.95n ..Mid Cap Idx + 7 + 5 .. 11.83n+.03D–Select Equity + 4 + 3 –10 20.26n+.05E ShInt US Gv 0 0 +10 9.95n ..A–Sm Cap Index +11 + 9 +57 11.67n+.04A Sm Cap Val +11 +10 +94 17.18n+.03D+Stock Index + 5 + 3 + 7 16.19n+.02E Tax Ex 0 + 1 +18 10.54n+.01D+Technology + 5 + 3 –23 12.17n+.04E US Govt 0 0 +11 9.78n ..
Northern Instl$ 2.2 bil 800–637–1380E Bond A 0 0 +17 19.62n–.03E Core Bond A 0 0 .. 9.81n–.02D+Equity Index A + 5 + 3 + 6 16.04n+.02A–Intl Eq Idx A + 9 + 8 +37 13.84n+.08A–Intl Growth A + 8 + 8 +33 11.61n+.05E Sh Intm Bd A 0 0 +11 18.22n–.01
Nuveen Cl A$ 7.2 bil 800–257–8787E All AmMun b + 1 + 1 +19 10.91 +.01E CTMuni b + 1 + 1 +19 10.59 ..E FLMuni b + 1 + 1 +15 10.15 ..D–Hi YldMuni b + 2 + 2 .. 22.19 +.02E InsurMuni + 1 + 1 +17 10.81 ..E IntDurMuni b + 1 + 1 +14 8.97 +.01E KYMuni b + 1 + 1 +20 11.07 +.01C Lrg Cap Val b + 8 + 6 +16 27.61 +.03E LtdTrmMuni b 0 + 1 +13 10.61 ..E MIMuni b + 1 + 1 +21 11.56 +.01E MOMuni b + 1 + 1 +21 11.08 ..E NCMuni b + 1 + 1 +20 10.48 ..A–NWQMltVal b + 5 + 4 .. 23.45 +.01A NWQIntlVal b + 6 + 6 .. 29.89 +.09E NYMuni b + 1 + 1 +20 10.78 ..E OHMuni b + 1 + 1 +19 11.39 +.01E TNMuni b + 1 + 1 +20 11.32 ..E VAMuni b + 1 + 1 +19 10.84 +.01
Nuveen Cl B$ 587 mil 800–257–8787

A16 MONDAY, MARCH 20, 2006 MUTUAL FUND PERFORMANCE INVESTORS.COM
36 Mos 2006 12 Wk 5 Yr NetPerformance % % After Asset NAVRating Fund Chg Chg Tax Rtn Value Chg
36 Mos Fund 2006 12 wk 5 Yr Net NAVPerformance % % After Asset ChgRating Chg Chg Tax% Value
36 Mos 2006 12 Wk 5 Yr NetPerformance % % After Asset NAVRating Fund Chg Chg Tax Rtn Value Chg
36 Mos Fund 2006 12 wk 5 Yr Net NAVPerformance % % After Asset ChgRating Chg Chg Tax% Value
36 Mos 2006 12 Wk 5 Yr NetPerformance % % After Asset NAVRating Fund Chg Chg Tax Rtn Value Chg
36 Mos Fund 2006 12 wk 5 Yr Net NAVPerformance % % After Asset ChgRating Chg Chg Tax% Value
36 Mos 2006 12 Wk 5 Yr NetPerformance % % After Asset NAVRating Fund Chg Chg Tax Rtn Value Chg
36 Mos Fund 2006 12 wk 5 Yr Net NAVPerformance % % After Asset ChgRating Chg Chg Tax% Value
36 Mos 2006 12 Wk 5 Yr NetPerformance % % After Asset NAVRating Fund Chg Chg Tax Rtn Value Chg
36 Mos 2006 12 Wk 5 Yr NetPerformance % % After Asset NAVRating Fund Chg Chg Tax Rtn Value Chg
36 Mos Fund 2006 12 wk 5 Yr Net NAVPerformance % % After Asset ChgRating Chg Chg Tax% Value
36 Mos Fund 2006 12 wk 5 Yr Net NAVPerformance % % After Asset ChgRating Chg Chg Tax% Value
36 Mos Fund 2006 12 wk 5 Yr Net NAVPerformance % % After Asset ChgRating Chg Chg Tax% Value
36 Mos 2006 12 Wk 5 Yr NetPerformance % % After Asset NAVRating Fund Chg Chg Tax Rtn Value Chg
36 Mos Fund 2006 12 wk 5 Yr Net NAVPerformance % % After Asset ChgRating Chg Chg Tax% Value
36 Mos 2006 12 Wk 5 Yr NetPerformance % % After Asset NAVRating Fund Chg Chg Tax Rtn Value Chg
36 Mos Fund 2006 12 wk 5 Yr Net NAVPerformance % % After Asset ChgRating Chg Chg Tax% Value
36 Mos 2006 12 Wk 5 Yr NetPerformance % % After Asset NAVRating Fund Chg Chg Tax Rtn Value Chg
MONTREAL - TelePlus Enterprises, Inc.(NASDAQ OTCBB: TLPE)
(Frankfurt: YT3)(http://www.teleplus.ca)
New Listings
Medivation Common Stock Approvedfor Listing on the American
Stock Exchange
SAN FRANCISCO -- Medivation, Inc.(OTCBB: MDVN) today announced thatits common stock has been approved forlisting on the American Stock Exchange(“Amex”). Medivation’s common stock isexpected to commence trading on theAmex under the symbol “MDV” at marketopen on Wednesday, March 15, 2006.
David Hung, MD, President and ChiefExecutive Officer of Medivation, stated:“The approval of our shares for listing onthe Amex is an important milestone inthe growth of our company. Based onrecent discussions with investors, we be-lieve that an exchange listing may pro-vide Medivation a number of benefits,including increased visibility in the finan-cial community, greater liquidity for ourstock and a larger potential investorbase that includes those who cannot in-vest in unlisted securities. These poten-tial benefits are important as we continueto advance our development programs inAlzheimer’s disease, Huntington’s dis-ease and hormone-refractory prostatecancer, and search for promising newtechnologies to bring into our portfolio.”
Medivation, Inc. acquires promisingpharmaceutical and medical device tech-nologies in the late preclinical develop-ment phase, develops those technolo-gies quickly and cost-effectively throughhuman first proof-of-efficacy studies (gen-erally the end of Phase 2 clinical trials),and seeks to sell or partner successfulprograms with larger pharmaceutical,biotechnology and medical device com-panies for late-stage clinical studies andcommercialization.
For Further Information about Mediva-tion please visit: www.medivation.com
For Full Press Release Please Visit:www.Investors.com/corporatenews
Contacts:Medivation, Inc.Chief Financial OfficerPatrick Machado, 415-543-3470 x201orLippert/Heilshorn & AssociatesBruce VossDon Markley, 310-691-7100
Announcements
BSD Medical’s Cumulative PayoutFrom TherMatrx Sale Grows
to $33 Million
SALT LAKE CITY,-- BSD MedicalCorp.(Amex: BSM) announced that thecompany has received a payment of near-ly $5.9 million as quarterly proceedsthrough the earnout from the sale of Ther-Matrx, Inc., bringing total receiptsthus-far to approximately $33 million.The company also anticipates furthercompensation in the settlement of thetransaction. The recent payment will bereflected in the company’s third quarterof fiscal 2006, which began March 1,2006. A prior quarterly payment was alsoreceived and announced that will be simi-larly reflected in BSD’s second quarterresults that have not yet been reported.
BSD Medical produces precision-fo-cused microwave/RF systems that raisethe temperature in diseased sites of thebody as required by a number of medicaltherapies. BSD developed the TherMatrxsystem to provide a solution for condi-tions associated with benign enlarge-ment of the prostate as men age. Thecompany’s primary focus is on systemsthat produce better response to cancertreatment, increasing cancer survivaland patient quality of life.
For further information visit the BSD web-site at http://www.BSDMedical.com.
Investor Information:
Contact:Hyrum MeadTel. 801-972-5555orE-mail: [email protected]
TelePlus AnnouncesRecord-breaking January Results:
Revenues Reached $2.2M andEarnings (before taxes) of $130K
(“TelePlus” or the “Company”) todayannounced its January 2006 resultsand reported revenues of $2.2 milliondollars. Earnings (before taxes) were$130,000 dollars, EBIDTA was$230,000 dollars and Earning perShare (before tax) were $0.0015.TelePlus is very pleased to announcethese results as they represent thelargest revenue recorded in aone-month period and strongestearnings for the same period in thehistory of the Company. Totalrevenues for the month werecomposed of 41% in Wireless Salesand 59% in Telecom Sales. Althoughthe Retail division was stilloperational in January, these resultsdo not include any Retail Sales as theCompany has divested itself from thisdivision.
“These astounding results areevidence that TelePlus’ strategicpurchase of certain assets of LibertyWireless was the right move for theCompany. I’m very proud that wehave been able to fully integrate theWireless division into the TelePlusgroup of companies.” said MariusSilvasan, CEO of TelePlus. “We areextremely enthusiastic on the growththat TelePlus will take in theupcoming year.” added Silvasan
“We anticipate that the investorcommunity will react positively tothese historic financial results as theyclearly demonstrate that ourmanagement team is focused ondriving our future growth and meetthe competitive realities of themarket.” said Kelly McLaren,President of TelePlus. “We have
divested ourselves from themoney-losing retail division,therefore, these groundbreakingresults reflect the performance of ourbusiness without retail” addedMcLaren.
The Company invites its investorsand analysts to watch the interview,CEO Marius Silvasan gave on the floorof the AMEX on February 24 2006 athttp://media4.streamtoyou.com/cadavis/TLPE.wmv
About TelePlus (OTCBB: TLPE)http://www.TelePlus.ca
TelePlus Enterpr ises , Inc .(“TelePlus”) is a provider of Wirelessand Telecom products and servicesacross North America. TelePlusConnect, Corp. - is a reseller of avariety of Telecom services includinglandline, long distance and internetservices. TelePlus Wireless, Corp. -under the brand name “LibertyWireless” - operates a virtual wirelessnetwork selling cellular networkaccess to distributors in the UnitedStates. www.telepluswireless.com,www. l iber tywi re less .com andwww.vivaliberty.com are amongsome of the websites operated byTelePlus.
To hear more about TelePlusEnterprises Inc., from CEO MariusSilvasan, please visit:http://www.publiccoreport.net/featured/TLPE/company.asp
CONTACT:Retail and Institutional IR InquiriesInvestor RelationsPhone: 866-699-3388E-mail: [email protected]
To subscribe to our newsletters,please visit:
http://www.teleplus.ca/investors.php
RECEIVE BREAKING NEWS ON FIVE RESOURCE COMPANIES OF MERIT
Corporate News
Corporate News . . . a corporate news updateAdvertisement Advertisement
PROFILING TOP OIL & GAS AND MININGCOMPANIES SPENDING $1" MILLION ON
EXPLORATION AND DEVELOPMENT
The data presented here has been obtained or derived fromsources believed to be accurate, however, Investor's BusinessDaily, Inc. cannot and does not guarantee the accuracy of thesesources. This is not a prospectus; no effort with respect to saleor purchase of any securities is intended or implied and shouldnot be construed as an offer, solicitation, recommendation orrating to buy or sell any security. Officers, directors and/orshareholders of Investor'sBusinessDaily, Inc. and its affiliatesmayownsecuritiesorbuyorsell securitiesreferred tohere.
China’s New Gold Boom: Will this be theworld’s all-time greatest?Massive exploration underway. TheBoka-Huidong trend is the location ofMagnus International Resources Inc.marquee project in western China. Just nextdoor at South Western Resources’ Bokapart of this trend, analysts’ latest projectionshave soared to 14 million ounces. Only twocompanies control this trend and one ofthem is Magnus. High growth upside.www.magnusresources.comStock Symbol: OTC BB: MGNU1-888-888-1494 For Full Investor Package.
Universal Uranium: A leader in NorthAmerican exploration.Multi-phase program to commence in areathat has produced 103 million lbs of uranium.Major play positions Universal at the forefrontof North America’s burgeoning uraniumexploration sector. Company’s Lisbon Valleyclaims situated in region that has produced17 mines, with some the highest grades andthickest widths mined in the U.S. Highpotential for new uranium discovery.www.universaluranium.comStock Symbol: TSX.V: UUL.V1-604-662-3903 For Full Investor Package.
High-grade results support potential fornext major gold discovery.Backed by five advanced gold projectscovering 385,000 acres in four establishedgold districts in Argentina, Golden Peakscontinues to receive positive results frommulti-phase drilling on its La Fortunaprospect - a project many industry
observers believe could produce theregions next major discovery. Well-funded.Exceptional growth potential.www.goldenpeaks.comStock Symbol: GL.V:TSX1-888-223-1166 Ex. 2For Full Investor Package.
Copper/gold project provides platform forexceptional growth.Through a J/V with Inmet Mining and TeckCorporation, Petaquilla is advancing itsflagship Petaquilla copper/gold project inPanama into commercial production. Basedon a AMEC Engineering Feasibility studycompleted for the J/V partners under thedirection of Teck, the Minera Petaquilla copperproject contains a proven reserve totaling 9.4billion lbs of copper, 1.37 million ounces ofgold and 24.1 million ounces of silver.www.petaquilla.comStock Symbol: TSE: PTQ.TO - OTC BB:PTQMF1-877-694-0021 For Full Investor Package.
Increasing silver production, expandingreserves, new acquisitions.First Majestic Resource Corp. announcedincreased silver production at its 100%owned, La Parrilla Silver Mine located nearDurango, Mexico. Flagship project slated toproduce in excess of 1 million ounces ofsilver in its first year of production. Three newacquisitions to sharply boost silver reservesand production. Well funded to advanceproject. Strong future growth and earningsprojected for established, emerging mid-tiersilver producer.www.firstmajestic.comStock Symbol: FR:TSX.V1-866-529-2807 For Full Investor Package.
Record Results
Corporate NewsCall 310-448-6711
to publish your press release.Visit investors.com/corporate news
to receive additional information and access to current and archived newswire features.
D–Hi YldMuni b + 2 + 2 .. 22.17n+.02Nuveen Cl C$ 2.1 bil 800–257–8787D–Hi YldMuni m + 2 + 2 .. 22.18n+.02E LtdTrmMuni b 0 0 +11 10.59n+.01A–NWQMltVal m + 5 + 4 .. 23.12n+.01
Nuveen Cl R$ 4.6 bil 800–257–8787E CAMuni + 1 + 1 +18 10.37n+.01E CAInsurMuni + 1 + 1 +18 10.81n+.01D–HiYldMuniBd + 2 + 2 .. 22.20n+.02E InsurMuni + 1 + 1 +18 10.78n ..E IntmDurMuni + 1 + 1 +15 8.98n+.01A–NWQMltVal b + 6 + 4 .. 23.39n+.02A NWQIntlVal r + 6 + 6 .. 30.01n+.09E NYMuni + 1 + 1 +20 10.80n ..E NYInsurMuni + 1 + 1 +20 10.38n ..E OHMuni + 1 + 1 +20 11.37n ..
Oak Associates$ 1.1 bil 888–462–5386C+PinOakAgrStk – 6 – 7 –36 21.55n+.05D RedOak Tech – 1 – 3 –53 6.88n+.03D–WhtOakSelGr + 2 0 –34 32.84n+.16D † Oak Value + 1 0 + 5 30.24n+.01
Oakmark I$30.9 bil 800–625–6275D Equity & Inc r + 2 + 1 +58 25.50n ..A Global + 7 + 7+121 25.13n+.08A Intl r +10 +10 +69 24.86n+.09A+Intl Sm Cap r +12 +13+135 22.34n+.14D Oakmark r + 4 + 3 +29 42.47n+.12D Select r + 3 + 2 +46 33.80n+.10
Oberweis Funds$ 312 mil 800–323–6166
A–Emerg Growth + 7 + 6 +55 28.95n+.02Old Mutual Advisor$ 3.6 bil 888–744–5050AnlyDefEqAm + 2 + 2 .. 13.07 ..D ClipperFocZ + 4 + 2 +26 16.95n+.03E DwShFxdIncZ r 0 0 + 9 9.79n ..B EmerGrowthZ + 8 + 5 –19 15.23n+.07C–Growth Z + 7 + 6 –13 22.81n+.08A HeitREIT Z +15 +14+122 14.46n +.15D+LrgGrConc Z + 6 + 3 –18 17.74n+.07B–Mid Cap Z + 7 + 6 +47 19.46n+.01D SelectGr Z + 5 + 3 –28 24.58n+.10C+TechCommZ + 3 + 1 –51 12.82n+.04
Old Westbury$ 4.8 bil 800–607–2200GlobalSmall + 9 + 9 .. 12.48 +.06
A–Intl + 7 + 7 +27 12.98n +.12D–LargeCapEq b + 4 + 3 + 1 13.14n+.02D Mid Cap Eq b + 9 + 8 +29 17.34n+.07Real Return + 1 + 1 .. 11.09 –.01Olstein$ 1.8 bil 800–799–2113C+Finl Alrt Ad b + 4 + 3 +44 18.09n+.04C+Finl Alrt C + 4 + 3 +38 17.07n+.04
Oppenheimer A$72.7 bil 888–470–0862E AMT Fr Muni + 1 + 2 +27 10.16 +.01E AMT Free NY + 3 + 3 +24 13.06 ..D–Balanced b + 1 + 1 +19 13.68 ..D–CAMuni b + 2 + 2 +31 11.53 ..D Cap Apprec b + 5 + 3 0 44.88 +.13D Cap Income b + 2 + 2 +14 12.07 –.02D–Champ Inc b + 2 + 2 +14 9.39 ..D–Conv Secs b + 3 + 3 +15 13.62 +.03E Core Bond b 0 0 +20 10.17 ..A+DevelopMkt b +11 +11+186 40.15 +.14C Discovery b + 9 + 8 +21 48.15 +.11B–Enterprise b + 7 + 5 –13 15.42 +.07C–Equity + 4 + 3 +13 10.97 +.02A+Glob Opport +12 +11 +72 41.32 +.22A Global b + 7 + 7 +46 71.63 +.30A+Gold&SpMin b +13 +16+236 26.36 ..D–Growth b + 6 + 4 –11 31.62 +.14D–High Yield b + 2 + 3 +11 9.40 ..D Intl Bond b + 4 + 3 +73 5.97 –.01A+Intl Growth b + 9 + 9 +26 23.66 +.03A+Intl Sm Co +14 +15+173 22.90 +.13E Ltd Muni + 1 + 1 +27 15.80 ..E Ltd Trm Gvt b 0 + 1 +11 9.95 ..D+Main Street + 6 + 4 +15 39.22 +.04B–MainSt Opp b + 6 + 5 +55 14.32 +.02A MainStSC b +10 + 9 +87 22.74 +.05B–Mid Cap + 6 + 5 0 19.50 +.05D–NJMuni + 2 + 2 +34 11.97 ..E PAMuni b + 2 + 2 +38 12.83 ..D–Real Asset b – 4 – 2 +43 7.45 –.07A SmlMid Val + 6 + 5+106 35.04 +.11D–Strat Inc b + 2 + 2 +31 4.24 ..E US Govt b 0 0 +16 9.44 –.01C+Value b + 3 + 2 +39 24.05 ..
Oppenheimer B$11.6 bil 888–470–0862D Cap Apprec b + 4 + 3 – 4 41.27n+.11D Cap Incomem + 2 + 1 +11 11.92n–.03D–Champ Incm + 2 + 2 +11 9.38n ..A+DevMktm +10 +11+178 39.79n+.14D+Equity + 4 + 3 + 9 10.51n+.02
A+Glob Opport +12 +11 +67 39.70n+.20A–Globalm + 7 + 7 +41 66.86n+.27D–Growthm + 5 + 4 –14 28.89n+.13D–High Yieldm + 2 + 2 + 8 9.26n+.01D–Intl Bondm + 4 + 3 +67 5.95n–.01A+Intl Growthm + 9 + 9 +22 22.62n+.04A+Intl Sm Com +13 +15+163 22.04n+.12E LtdTrmGvtm 0 + 1 + 8 9.95n ..D Main Street + 5 + 4 +12 38.11n+.04C+MainSt Oppm + 6 + 4 .. 13.81n+.01A–MainStSC b +10 + 8 +80 21.43n+.04C+Mid Cap + 6 + 4 – 4 18.33n+.04E PAMunim + 2 + 2 +35 12.82n ..D–Real Asset m – 4 – 3 +38 7.34n–.07A SmlMid Val + 6 + 5 +97 31.81n+.09D–Strat Inc m + 2 + 2 +28 4.25n ..E US Govt m 0 0 +14 9.43n–.01C Valuem + 3 + 2 +33 23.49n ..
Oppenheimer N$ 2.2 bil 888–470–0862D Cap Apprecm + 5 + 3 .. 44.33n+.13E Cap Presrvm .. .. no quoteA+DevelopMktm +10 +11 .. 39.56n+.14Globalm + 7 + 7 .. 71.07n+.30D Main Street m + 6 + 4 .. 38.74n+.04A MainStSCm +10 + 9 .. 22.35n+.04A SmlMid Val + 6 + 5 .. 34.44n+.10
Oppenheimer Y$ 2.6 bil 888–470–0862D Capital Apprec + 5 + 3 + 1 45.96n+.13E Core Bond 0 0 .. 10.15n–.01A Global + 7 + 7 +47 72.05n+.30D+Main Street + 6 + 4 +16 39.36n+.05D–Real Asset – 4 – 2 .. 7.49n–.07
Oppenhmr C&M$11.5 bil 888–470–0862E AMT Free Cm + 1 + 2 .. 10.12n+.01E CAMuni Cm + 2 + 2 .. 11.51n ..D Cap Income C + 2 + 1 +11 11.88n–.03D–ChmpInc Cm + 2 + 2 +11 9.38n ..D Cp Apprc C b + 4 + 3 – 4 40.91n+.11A+DevlpMkt Cm +10 +11 .. 39.33n+.13A+Glob Opp C +12 +11 +67 39.70n+.20A–Global C b + 7 + 7 +41 67.99n+.28D–High Yield C + 2 + 2 + 8 9.38n+.01D–Intl Bond C + 4 + 3 +67 5.95n–.01A+Intl Gr Cm + 9 + 9 +22 22.63n+.04A+IntlSmCo Cm +13 +15 .. 22.04n+.12E Ltd Muni Cm + 1 + 1 .. 15.75n ..E LtdTmGv Cm 0 + 1 + 8 9.93n ..D Main St C + 5 + 4 +12 38.04n+.04C+MainStOp Cm + 6 + 4 .. 13.87n+.02A–MainStSCCm +10 + 8 +80 21.50n+.05C+Mid Cap b + 6 + 4 – 4 18.33n+.04E PAMuni Cm + 2 + 2 .. 12.81n ..D–RealAsset Cm – 4 – 3 .. 7.30n–.07A SmlMidVal C + 6 + 5 +97 31.78n+.09D–Strat Inc Cm + 2 + 2 +28 4.23n ..C Value Cm + 3 + 2 +34 23.17n ..
Oppenhmr Quest$10.7 bil 888–470–0862D–Bal B + 2 + 1 +11 17.88n+.05D Bal C + 2 + 1 +11 17.89n+.05D Bal Nm + 2 + 1 .. 17.99n+.04D Bal Val A + 2 + 1 +14 18.20 +.04D Bal Y + 2 + 1 .. 18.20n+.05C+Cap Val A b + 6 + 5 +38 28.11 +.03B Intl Val A b + 8 + 8 +32 20.06 +.06D–Opp Val A + 1 + 1 + 3 28.81 –.03D–Opp Val B + 1 + 1 0 27.81n–.02D–Opp Val C b + 1 + 1 0 27.75n–.03C–Value A b + 3 + 2 +13 18.93 ..D+Value Bm + 3 + 2 + 9 17.68n ..
Oppenhmr Roch$16.6 bil 888–470–0862E LtdTrmNY A b + 1 + 1 +19 3.37 ..E LtdTrmNY B b + 1 + 1 +17 3.37n ..E LtdTrmNY Cm + 1 + 1 +16 3.36n ..E Muni A b + 2 + 3 +27 18.45 ..E Muni C b + 2 + 2 +23 18.42n ..E Municipals B + 2 + 2 +23 18.43n ..D NatlMuni A + 2 + 3 +39 12.48 ..D NatlMuni Bm + 2 + 3 .. 12.51n ..D NatlMuni Cm + 2 + 3 .. 12.46n ..
Optimum C$ 640 mil 800–914–0278Fixed Incm 0 0 .. 8.83n–.01Lrg Cap Val m + 5 + 4 .. 11.36n–.01Lrg Cp Growm + 4 + 2 .. 11.41n+.06Optimum Instl$ 1.2 bil 800–914–0278Fixed Inc + 1 + 1 .. 8.84n ..Lrg Cap Val + 5 + 4 .. 11.45n–.01Lrg Cp Grow + 4 + 3 .. 11.71n+.06Osterweis Capital$ 309 mil 866–236–0050C+Osterweis + 4 + 4 +36 27.07n+.04
—P—Q—R—Pacific Cap Inst$ 1.8 bil 800–258–9232E DivrFxdInc 0 0 +18 10.83n–.01
D Growth & Inc + 5 + 3 – 5 14.14n+.02D–Growth Stock + 5 + 3 –18 9.46n+.02B Intl Stock + 8 + 8 +17 11.02n+.04A+Small Cap + 9 + 8+120 18.73n+.02E Tax Fr 0 + 1 +16 10.28n ..C Value + 7 + 6 +17 10.61n+.02
Pacific Cap Ret$ 199 mil 800–258–9232
A+Small Cap A b + 9 + 8 .. 18.49 +.02Parnassus$ 1.4 bil 800–999–3505D–Equity Inc + 5 + 3 +34 25.11n+.03D–Parnassus + 6 + 5 – 3 33.63n+.12
Pax World$ 2.2 bil 800–767–1729D World Bal + 5 + 4 +19 24.75n+.03
Payden Funds$ 2.5 bil 800–572–9336E Core Bond 0 0 +23 10.31n–.01E Glbl FxdInc – 1 0 +12 9.15n–.02E Glbl Sh Bond R + 1 + 1 +17 10.21n ..D–High Income + 2 + 3 +19 8.24 +.01E LtdMaturity + 1 + 1 + 7 9.86n ..E Opport Bond 0 + 1 +18 9.46n–.02E Short Bond + 1 + 1 +12 9.91n ..
Permanent Port$ 509 mil 800–531–5142D Portfolio + 4 + 5 +71 29.98n+.04
Perritt Capital Mgmt$ 596 mil 800–331–8936
A+Perritt Micro + 8 + 7+185 31.90n–.10Phoenix A$ 5.5 bil 800–243–4361C+All Cp Grow + 4 + 2 +10 17.47 –.04D–Balanced + 4 + 3 +13 15.17 ..D–Cap Growth + 2 0 –19 15.80 +.07D+Grow& Inc + 5 + 4 +10 15.75 +.02E High Yield + 2 + 2 + 2 4.95 +.01D–Inc & Grow b + 3 + 2 +14 9.25 ..B–MidCapGrow + 5 + 4 – 3 17.40 +.07E MultSecSht b + 1 + 1 +21 4.72 ..A RealEstSecs +17 +17+156 32.59 +.36B+Sml Cp Grow + 7 + 5 +13 34.81 –.20
Phoenix C$ 564 mil 800–243–4361E MultSecSht b + 1 + 1 .. 4.76n ..
Phoenix Funds$ 896 mil 800–243–4361
B+MidCapVal A b + 6 + 6 +81 21.25 +.09A SmCap Val A b +10 + 8 +53 19.35 +.05
Phoenix T$ 188 mil 800–243–4361MultSecShtm + 1 + 1 .. 4.75n ..PIMCO A$22.7 bil 800–426–0107All Asset b + 1 + 1 .. 12.76 –.02Commod RR b – 6 – 6 .. 13.86 –.04D+EmrgMkt Bd b + 2 + 3 .. 11.30 –.01Float Inc m + 1 + 2 .. 10.40 –.01ForBondUnhgm + 1 + 1 .. 10.0
4 +.03E FrgnBdHedgm – 1 0 +21 10.32 –.02D–High Yield + 2 + 3 +24 9.81 +.01E Low Dration 0 + 1 +12 9.96 –.01E LT US Govt b – 2 – 2 +26 10.69 –.03E Real Return b – 1 – 1 +31 10.97 –.02E Short Term b + 1 + 1 + 8 9.99 ..D StocksPLUS + 5 + 3 + 5 10.40 +.02E Total Return 0 0 +20 10.44 –.01
PIMCO Admin$22.7 bil 800–927–4648Commod RR – 6 – 6 .. 13.88n–.04D–High Yield b + 2 + 3 +24 9.81n+.01E Low Dration 0 + 1 +13 9.96n–.01C+NFJSmlCpValm + 8 + 6 .. 31.24n+.06E Real Return b – 1 – 1 .. 10.97n–.02E Short Term b + 1 + 1 .. 9.99n ..E Total Return 0 0 +21 10.44n–.01
PIMCO B$ 4.6 bil 800–426–0107All Assetm + 1 0 .. 12.68n–.01Commod RR b – 6 – 6 .. 13.74n–.05D–High Yieldm + 2 + 3 +21 9.81n+.01E Low Dration b 0 0 + 9 9.96n–.01E Real Rtrn m – 1 – 1 .. 10.97n–.02E Tot Rtrn m 0 0 +17 10.44n–.01
PIMCO C$10.6 bil 800–426–0107All Assetm + 1 0 .. 12.66n–.02Commod RR b – 6 – 6 .. 13.73 –.04D EmrgMkt Bd b + 2 + 3 .. 11.30n–.01D–High Yield + 2 + 3 +21 9.81n+.01E Low Durm 0 0 +11 9.96n–.01E Real Return b – 1 – 1 +29 10.97n–.02E Short Term b + 1 + 1 .. 9.99n ..E Tot Rtrn m 0 0 +17 10.44n–.01
PIMCO D$ 8.8 bil 800–426–0107All Assetm + 1 + 1 .. 12.77n–.01Commod RR b – 6 – 6 .. 13.87n–.04DevLocalMktm + 3 + 4 .. 10.53 –.01D+EmrgMkt Bd b + 2 + 3 .. 11.30n–.01E FrgnBdHedg b – 1 0 .. 10.32n–.02
D–High Yield b + 2 + 3 .. 9.81n+.01E Low Dur b 0 + 1 .. 9.96n–.01C–OCC Valuem + 4 + 3 .. 16.37n+.07E Real Return b – 1 – 1 .. 10.97n–.02E Short Term b + 1 + 1 .. 9.99n ..E Totl Rtrn b 0 0 .. 10.44n–.01
PIMCO Instl$ 112 bil 800–927–4648D–All Asset + 1 + 1 .. 12.83n–.02AllAsstAuth r 0 0 .. 10.75 –.01D Commod RR – 6 – 6 .. 13.95n–.04DevLocalMkt r + 3 + 4 .. 10.53 –.01Diverse Inc + 1 + 2 .. 11.11 ..C–EmrgMkt Bd + 2 + 3 +98 11.30n–.01Float Inc r + 2 + 2 .. 10.40n–.01ForBondUnhg r + 1 + 1 .. 10.04 +.03E Foreign Bd 0 0 +22 10.32n–.02FundIdxPlTr r + 5 + 4 .. 10.54 ..E Glbl Bd II 0 0 +20 9.70n ..E Global Bond + 1 + 1 +37 9.62n+.02D–High Yield + 2 + 3 +25 9.81n+.01IntlStkPlus r + 6 + 6 .. 12.44 +.01E Low Dur 0 + 1 +14 9.96n–.01E Low Dur 2 0 + 1 +11 9.61n ..E Low Dur 3 b 0 + 1 +14 9.81n–.01E LT US Govt – 2 – 2 +28 10.69n–.03E Mod Duration 0 + 1 +20 10.03n ..E Muni Bond + 1 + 1 .. 10.25n+.01E Real Asset – 2 – 2 .. 11.51n–.03E Real Return – 1 0 +33 10.97n–.02RealEstRR r +15 +13 .. 9.72 +.06E Short Term + 1 + 1 +10 9.99n ..D+StocksPLUS + 5 + 3 + 8 10.65n+.01E Tot Retn III 0 0 +24 9.23n ..E Total Ret II 0 0 +19 9.92n–.01E Totl Rtrn 0 0 +22 10.44n–.01E TotRetMorg r + 1 + 1 .. 10.55n–.02
PioneerN/A 800–225–6292C Independnc b + 6 + 4 +15 13.39n ..
Pioneer A$20.7 bil 800–225–6292E Bond b 0 0 +22 9.09 –.01B CullenValue + 7 + 6 .. 18.47 ..A+EmergeMkts +13 +13+146 28.21 +.09C Eqty Inc b + 7 + 5 +24 30.69 +.06B+EuroSelEqty +11 +11 +26 35.93 +.09Glob Hi Yld b + 3 + 4 .. 12.16 +.01D–Growth b + 4 + 2 –20 12.97 +.04D–High Yield b + 3 + 3 +37 10.97 +.01IbbotModAll m + 4 + 3 .. 11.60 +.02
B+Intl Value + 9 + 8 +30 21.90 +.11C–Mid Cap Gr + 7 + 6 +11 15.95 +.08B Mid Value b + 4 + 3 +59 24.39 +.04D Oak Lrg Gr b + 2 0 .. 13.67 +.07B+Oak Sml Gr b + 7 + 5 .. 26.71 +.02C–Pioneer b + 6 + 4 +11 46.55 +.08A–Sm Cap Val b + 7 + 6 +83 33.85 +.03D–Strat Inc b + 1 + 1 .. 10.32 ..E Tax Fr Inc b + 1 + 1 +18 11.61 ..C–Value b + 4 + 3 +13 18.25 –.02
Pioneer B$ 3.2 bil 800–225–6292C–Eqty Inc + 7 + 5 +21 30.46n+.06D–High Yieldm + 3 + 3 +34 11.02n+.02B–Mid Value + 4 + 3 +51 21.29n+.03D+Pioneer + 5 + 4 + 8 45.51n+.08A–Sm Cap Val + 7 + 6 +75 31.11n+.03E Strat Inc m + 1 + 1 .. 10.17n ..
Pioneer C$ 3.4 bil 800–225–6292CullenValuem + 7 + 6 .. 18.35 ..C–Eqty Inc b + 7 + 5 +21 30.37 +.07Glob Hi Yld b + 3 + 3 .. 12.10 +.01D–High Yieldm + 3 + 3 +34 11.12 +.01B–Mid Value C b + 4 + 3 +51 21.13 +.03D+Pioneer b + 5 + 4 + 8 45.06 +.08A–Sm Cap Val b + 7 + 6 .. 32.62n+.03E Strat Inc m + 1 + 1 .. 10.12 ..
Pioneer Inv$ 1.7 bil 800–225–6292AMTFreeMunI 0 + 1 .. 14.03 ..Growth Opp + 6 + 4 .. 33.80 –.05Pioneer + 6 + 4 .. 46.53 +.08Pioneer Y$ 3.6 bil 800–225–6292Bond 0 0 .. 9.02 –.01D–High Yield + 3 + 3 .. 10.96n+.02A+IntlCoreEq + 8 + 7 +54 15.22n+.06B Mid Value + 5 + 4 .. 25.25n+.03Oak Lrg Gr + 2 0 .. 13.75 +.07C–Pioneer + 6 + 4 +14 46.64n+.08ShortTrmInc 0 + 1 .. 9.74 ..Tax Fr Inc + 1 + 1 .. 11.55 ..Value + 4 + 3 .. 18.36 –.02
A † PolarisGlbl b +10 + 9 .. 17.74n+.07Potomac Funds$ 213 mil 800–851–0511DynHiYldInv b + 1 + 1 .. 18.24n–.07Preferred Group$ 2.8 bil 800–662–4769D Asset Alloc + 4 + 3 +14 13.89n+.01E Fixed Income 0 0 +24 10.56n–.02
A–Intl Value + 9 + 9 +53 18.73n+.12C Large Cap Gr + 1 0 + 2 13.92n+.06B+Mid Cap Gr +10 + 8 .. 12.44n+.06A Small Cap Gr +13 +10 +35 11.17n+.01E ST Govt 0 + 1 +10 9.65n ..D Value + 6 + 4 + 3 16.02n+.01
Price Advisor$ 7.6 bil 800–638–5660D+Blu Chp Gr b + 4 + 2 .. 33.91n+.11C–Equity Inc b + 6 + 5 .. 27.40n+.02C–Growth Stk b + 4 + 3 .. 29.44n+.08B+Mid Cap Gr b + 6 + 4 .. 56.68n+.19B+Mid Cap Val b + 6 + 5 .. 24.61n+.01D+Sci & Tech b + 3 + 1 .. 20.21n+.05A–SmlCapVal b +12 +10 .. 41.08n+.03E Tax Fr Inc b + 1 + 1 .. 9.99n ..C+Value b + 6 + 5 .. 24.61n ..
Price Funds$ 178 bil 800–638–5660D Balanced + 4 + 3 +21 20.47n+.02D+BlueChip Gr + 4 + 2 +10 33.88n+.12E CA Tax Fr Bd + 1 + 1 +18 10.98n ..C–Cap Apprec + 4 + 3 +63 20.93n ..C–Cap Opport + 5 + 3 +15 14.53n+.03E Corp Income 0 0 +25 9.59n–.01D+Dividend Gr + 5 + 4 +18 24.00n+.04C EmergMkt Bd + 3 + 4 +77 13.90n ..A+EmMktsInstl +10 +11 .. 27.50n+.04A+Emrg Eur&Med +13 +14+340 28.53n +.30A+EmrgMkt Stk +11 +11+159 28.38n+.05C–Equity Income + 6 + 5 +30 27.47n+.03D+Equity Index + 5 + 3 + 8 35.26n+.05C–EquityInc R b + 6 + 4 .. 27.37n+.02B+Euro Stk +13 +13 +24 19.33n+.15A–ExtEqMktIx + 7 + 6 +54 15.50n+.05C+Financial Svcs + 6 + 4 +43 22.37n+.08B+Foreign Equity + 8 + 8 +24 18.75n+.14B+Global Stock + 7 + 6 +37 20.73n+.11B Global Tech + 3 + 1 + 3 6.27n+.03E GNMA 0 0 +16 9.40n–.01D Growth & Inc + 4 + 3 + 7 21.53n+.04C–Growth Stock + 4 + 3 +17 29.67n+.09D+GrowthStk R b + 4 + 3 .. 29.26n+.09B Health Sci + 8 + 6 +44 27.09n+.11D–Hi Yld Adv b + 1 + 2 .. 6.92n+.01D–High Yld + 2 + 2 +25 6.93n ..D–High Yld Ins + 1 + 2 .. 10.16n ..E Intl Bond + 2 + 1 +33 9.41n+.04A+Intl Discovery +10 +11 +79 45.68n +.40A–Intl Eq Idx r + 9 + 9 .. 12.91n+.08A Intl Gr&Inc + 9 + 9 +57 15.47n+.09B+Intl Stock + 8 + 8 +23 15.91n+.12A IntlGrIncAv b + 9 + 9 .. 15.47n+.09A+Japan – 3 – 3 +40 11.52n +.16A+Latin Amer +19 +18+216 30.04n–.23C LgCpGrInstl + 2 + 1 .. 14.15n+.08C+LrgCapVal I + 6 + 4 .. 13.57n–.01E MD ST Bd 0 0 + 8 5.12n ..E MD Tax Fr Bd 0 + 1 +18 10.65n ..A+Media&Telcm + 7 + 6 +66 35.81n+.17B+Mid Cap Gr + 6 + 4 +57 57.21n+.19B+Mid Cap Val + 6 + 5 +84 24.73n+.01A–MidCapEqGrI + 6 + 4 +59 27.27n+.09B+MidCapGr R b + 6 + 4 .. 56.34n+.19B MidCapVal R b + 6 + 5 .. 24.45n+.01C–NewAmer Gr + 3 + 2 + 4 32.85n+.10A+NewAsia + 8 + 9 +88 12.79n+.07A+New Era + 7 + 6+103 43.92n–.14A NewHorizons + 9 + 7 +61 34.64n+.12E New Income 0 0 +20 8.89n–.01E NJ Tax Fr Bd 0 + 1 +20 11.68n ..E NY Tax Fr Bd + 1 + 1 +19 11.31n ..D PersonlStrBal + 4 + 3 +34 19.51n+.03C PersonlStrGr + 5 + 4 +38 24.27n+.05D–PersonlStrInc + 3 + 2 +30 15.51n+.02A Real Estate +17 +16+151 22.88n +.25D–Retire Inc + 3 + 3 .. 12.76n+.01Retire 2005 + 4 + 3 .. 11.28n+.01D Retire 2010 + 4 + 3 .. 15.19n+.02Retire 2015 + 5 + 4 .. 11.73n+.02C–Retire 2020 + 5 + 4 .. 16.40n+.03Retire 2025 + 5 + 4 .. 12.08n+.03C+Retire 2030 + 6 + 5 .. 17.44n+.05Retire 2035 + 6 + 5 .. 12.29n+.03C+Retire 2040 + 6 + 5 .. 17.53n+.04D+Sci & Tech + 3 + 1 –26 20.22n+.05A Sm Cap Value +12 +10+127 41.30n+.03B SmCapStk +10 + 8 +71 35.94n+.10B SmCapStkAd b + 9 + 8 .. 35.77n+.10B+SmCapStkIn +10 + 8 +74 15.54n+.04B–Spectrum Gr + 6 + 5 +34 19.37n+.05E Spectrum Inc + 2 + 2 +28 11.90n ..A Spectrum Intl + 9 + 9 +41 12.88n+.10E ST Bond 0 + 1 +12 4.67n ..E Summit Muni + 1 + 1 +23 11.05n ..E SumtMunInt 0 + 1 +17 10.86n ..E Tax Fr Inc + 1 + 1 +19 9.98n ..C TotEqMktIdx + 6 + 4 +17 14.17n+.03E Tx Fr Hi Yld + 1 + 2 +23 11.97n ..E Tx Fr Intm Bd 0 + 1 +15 11.09n ..E Tx Fr Sh Intm 0 + 1 +11 5.33n ..E US Bond Idx r 0 0 .. 10.40n–.02E US Treas LT – 2 – 2 +21 11.54n–.04
E US Trs Intm – 1 – 1 +14 5.25n–.01E VA Tax Fr Bd + 1 + 1 +20 11.62n ..C+Value + 6 + 5 +32 24.76n ..
Principal Funds$23.3 bil 800–521–1502E Bd&Mtg A 0 0 +16 10.64 –.01E Bd&Mtg In 0 0 .. 10.63n–.01E Bd&Mtg Jm 0 0 .. 10.68n–.01DiscLrgInst + 5 + 4 .. 15.34n+.02DivrsIntl J m +11 +11 .. 13.24n+.09E GovHiQBdA 0 0 +12 10.09 –.01A+Intl A +11 +11 +81 13.35 +.09A Intl Gr Ins + 9 + 8 .. 12.35n+.06LgS&P500 J m + 5 + 3 .. 9.21 +.02Life 2040 I + 6 + 5 .. 13.10 +.03Life 2050 I + 6 + 5 .. 12.69 +.03LifeStrIncI + 3 + 3 .. 12.17 +.01D+Lrg Gr A + 4 + 2 – 5 7.65 +.02Lrg Gr Inst + 4 + 3 .. 7.67n+.02D+Lrg Val A b + 7 + 5 +21 12.20 +.01Lrg Val Inst + 7 + 6 .. 12.18n+.01D–LT 2010 In + 4 + 3 .. 12.62n+.02LT 2010 J m + 4 + 3 .. 12.58 +.03D LT 2020 In + 5 + 4 .. 13.01n+.03LT 2020 J m + 5 + 4 .. 12.97n+.03D+LT 2030 Instl + 6 + 5 .. 12.90n+.03D LT 2030 J + 6 + 5 .. 12.88n+.03C MidCpBlendA + 4 + 3 +41 14.13 ..MidCpBlendJ + 4 + 3 .. 13.87 ..Pref Secs I + 1 + 1 .. 10.70 ..PtrIntl Ins + 9 + 8 .. 14.20n+.09D+PtrLgBl I A b + 5 + 3 + 1 9.05 +.02D PtrLgBl Ins + 5 + 3 .. 10.73n+.02PtrLgGr Ins .. .. .. 12.58n+.04D PtrLgGrI In + 2 + 1 .. 8.38n+.04PtrLgGrII I + 3 + 2 .. 8.71 +.04PtrLgValIII .. .. .. 10.71 +.01PtrLVa I In .. .. .. 12.77 ..C PtrLVa Inst + 6 + 5 .. 14.25n+.01PtrMdGr In .. .. .. 10.17n+.05PtrMdGrI In + 6 + 5 .. 12.79 +.02PtrMdVal In + 5 + 4 .. 15.53n+.07PtrMdValI I + 6 + 6 .. 13.55 +.02PtrMGII Ins .. .. .. 12.46n+.04PtrSGIII In .. .. .. 12.91 +.02
A–PtrSmGrI In +12 +10 .. 10.17n+.02PtrSmGrII I +10 + 8 .. 9.78n+.02B PtrSmVa Ins + 8 + 7 .. 17.83n+.07PtrSmVaI In +11 + 9 .. 18.37 +.04PtrSmVaII I +11 + 9 .. 13.32 +.05Real Est I +18 +17 .. 24.64 +.29Real Est J m +18 +17 .. 24.35 +.29SmCpBlend I + 8 + 6 .. 17.16 +.02SmCpBlend Jm +10 + 8 .. 16.67 +.01SmlS&P600 I +10 + 7 .. 18.25 +.04E Tx Ex Bd A b + 1 + 1 +18 11.96 ..
ProFunds Inv$ 3.1 bil 888–776–3637E RisngRateOp .. .. no quoteB+Small Cap +10 + 8 .. 43.10n+.12A Ultra Bull Inv + 9 + 5 –18 62.34n+.15A+Ultra Japan + 1 + 4 .. 65.49n +1.17A+Ultra MidCap +11 + 9 +61 48.87n+.22E Ultra Sh OTC – 4 + 1 –69 14.67n–.10A UltraOTCInv + 3 – 1 –64 25.26n+.19A+UltraSmlCap +21 +16 +58 30.77n+.17
Provident Inv$ 140 mil 800–618–7643B Sm Cap I +10 + 9 +17 19.02n+.08
Prudent Bear Fds$ 758 mil 800–711–1848E Bear b + 2 + 4 +28 5.53n ..E Glob Inc + 3 + 4 .. 11.95n ..
Purisima Funds$ 363 mil 800–841–0199C+Total Return b + 8 + 6 +27 21.75n+.09
Putnam A$67.7 bil 800–225–1581E AmerGovtInc b 0 0 +13 8.83 ..C Asset All Gr b + 6 + 5 +28 12.89 +.03D–Asst All Bal b + 4 + 3 +15 11.57 +.01E AstAlloCns b + 2 + 2 +11 9.46 +.01E CA Tax Ex b 0 + 1 +15 8.19 ..C Capital Appr b + 5 + 4 +15 21.20 +.06B+Capital Opps b +10 + 8 +42 12.40 +.05D Classic Eq x + 5 + 3 + 9x 13.84 ..D Conv Inc&Gr b + 5 + 4 +31 18.30 +.03C–Discovry Gr + 6 + 5 – 7 19.62 +.03E Diversifd Inc b + 1 + 1 +24 9.85 –.01C–Equity Inc b + 6 + 4 +28 17.70 +.01B+Europe Eq +12 +11 +23 25.36 +.12E FL Tax Ex + 1 + 1 +16 9.15 ..Float Inc m + 1 + 2 .. 10.02 ..C+Glob Eqty b + 8 + 7 + 7 9.82 +.05A GlobNatRes b + 9 + 7 +84 30.22 –.18C–Gr & Inc b + 5 + 4 +13 20.67 +.03D–Grge Fd Bos b + 3 + 2 +18 18.41 +.01D–Growth Opp b + 4 + 2 –25 13.86 +.02D–Hi Yld Adv x + 2 + 2 +22x 5.99 –.03D–High Yield x + 2 + 2 +22x 7.95 –.04D Hlth Science b + 3 + 2 + 3 64.59 +.28E Income x 0 0+19x 6.70 –.03B Intl Equity b +10 + 9 +26 28.64 +.19
A–Intl Gr&Inc b + 9 + 8 +44 14.67 +.11A+IntlCapOpps b +11 +11 +53 31.73 +.21B+IntlNewOpp b + 9 + 9 +36 14.84 +.12C Investors b + 4 + 3 + 5 14.17 +.02E Ltd Dur Gov 0 0 +10 5.00 ..E MA Tax Ex b 0 + 1 +18 9.44 ..B Mid Cap Val b + 7 + 6 .. 15.45 +.05C NewOpport b + 6 + 4 – 5 48.37 +.06C+NewValue b + 5 + 4 +37 18.90 +.04E NJ Tax Ex b 0 0 +17 9.19 ..E NY Tax Ex b + 1 + 1 +16 8.65 ..E OH Tax Ex b + 1 + 1 +18 9.06 ..C OTC EmgGr b + 8 + 6 –17 8.56 +.01E PA Tax Ex + 1 + 1 +19 9.11 ..D Research b + 5 + 3 0 15.20 +.01A Sm Cap Val b +10 + 9 +89 18.48 +.06A Sml Cap Gr b + 8 + 6 .. 23.95 –.04E Tax Ex Inc b 0 + 1 +16 8.77 ..E Tax Fr Insur b 0 0 +16 14.85 ..C Tax Smart Eq + 4 + 2 +17 11.39 +.01E Tx Fr Hgh Yld + 1 + 1 +16 12.97 ..E US Govt Inc b 0 0 +15 13.06 –.02B–Util Gr&Inc b + 3 + 3 + 2 11.31 –.03B Vista b + 8 + 6 + 3 11.47 +.01D–Voyager b + 2 0 –11 17.80 +.04
Putnam B$17.4 bil 800–225–1581C Asst All Gr m + 6 + 5 +25 12.68n+.03D–AstAlloBalm + 4 + 3 +12 11.49n+.01E CA Tax Exm 0 + 1 +12 8.18n ..C Cap Apprm + 5 + 3 +11 19.99n+.05B+Capital Opps b + 9 + 8 +37 11.65n+.04D Classic Eqm + 4 + 3 + 7 13.73n+.02D+Discovry Gr + 6 + 4 –10 18.04n+.03E Dvrsfd Incm + 1 + 1 +20 9.78n ..D+Equity Inc m + 5 + 4 +25 17.53n ..B Europe Eq +11 +11 +20 24.53n+.12A Glb NatResm + 8 + 7 +77 28.54n–.17C+Glob Eqtym + 8 + 7 + 4 8.97n+.04D+Gr & Incm + 5 + 3 +10 20.38n+.03D–GrgeFdBosm + 3 + 2 +15 18.23n ..D–Growth Oppm + 3 + 1 –27 13.10n+.02D–High Yield x + 2 + 2 +20x 7.92n–.03D Hlth Sci m + 3 + 2 – 1 58.14n+.25E Income x 0 0+16x 6.66n–.03B–Intl Equity b + 9 + 9 +22 27.60n+.18A–Intl Gr&Incm + 9 + 8 +41 14.43n+.10A+IntlCapOpps +10 +11 +49 31.01n+.20B+IntlNewOppm + 9 + 9 +32 13.87n+.11C–Investorsm + 4 + 3 + 1 13.01n+.01B–Mid Cap Val m + 7 + 5 .. 15.03n+.05C NewOpport m + 6 + 4 – 9 43.31n+.06C+NewValue b + 5 + 4 +34 18.62n+.04C OTC EmgGrm + 8 + 6 –21 7.54n+.01D Researchm + 5 + 3 – 3 14.42n+.02A Sm Cap Val b +10 + 8 +82 17.26n+.05E TxFr HiYldm + 1 + 1 +13 12.99n ..E USGovtIncm 0 0 +12 13.00n–.01B Vistam + 7 + 6 – 1 9.98n+.01D–Voyagerm + 2 0 –14 15.55n+.04
Putnam C$ 1.9 bil 800–225–1581E Dvrsfd Incm + 1 + 1 .. 9.80n ..B–Intl Equity + 9 + 9 +22 28.13n+.18
Putnam M$ 3.5 bil 800–225–1581E Diversifd Inc b + 1 + 1 +22 9.77 ..D–Grge Fd Bos b + 3 + 2 +16 18.23 ..D–Hi Yld Adv x + 2 + 2 +22x 6.00 –.03E Income x 0 0+20x 6.63 –.03C OTC EmgGr b + 8 + 6 –19 7.95 +.01
Putnam Y$ 9.5 bil 800–225–1581D Asset All Bal + 4 + 3 +16 11.59n+.02C+Asset All Gr + 6 + 5 +29 12.99n+.03E Ast All Cons + 2 + 2 +11 9.44n ..A–Capital Opps +10 + 8 .. 12.59n+.05C–Equity Inc + 6 + 4 +30 17.71n+.01D–Grge Fd Bos + 3 + 2 +18 18.45n ..C–Growth & Inc + 5 + 4 +14 20.71n+.03D–High Yld x + 2 + 2 ..x 7.91n–.04E Income x 0 0+20x 6.74n–.04B Intl Equity +10 + 9 +27 28.83n+.19E Intm US Gv 0 0 +12 4.99n ..C Investors + 5 + 3 + 6 14.35n+.02C+NewOpport + 6 + 4 – 4 50.04n+.06B Vista + 8 + 6 + 4 11.94n+.02D–Voyager + 2 0 –10 18.38n+.05
Quaker Funds$ 928 mil 800–220–8888B Strat Gr A + 5 + 4 +40 24.73 –.01
Quant Funds$ 631 mil 800–326–2151
A+EmrgMktsOrd r +13 +13 .. 19.64n+.10A+ForeignVal m +13 +13 .. 19.90n +.18
Rainier Funds$ 3.0 bil 800–248–6314C Core Eq Inst + 6 + 4 .. 28.25n+.06C Core Equity + 6 + 4 +15 28.20n+.06A Sm/Mid Eq +11 + 9 +75 36.77n+.14A Sm/Mid Eq I +11 +10 .. 37.14n+.15
RegionsMorganKeegan$ 2.8 bil 800–433–2829
D–Sel Bal A + 3 + 2 +17 15.83 ..D Sel Grwth A + 4 + 2 + 7 17.60 +.01C–Sel Value A + 4 + 3 +16 17.19 –.02B SelAggrGr A + 5 + 3 +49 18.02 –.02E SelFxdInc A 0 0 +11 10.20 –.01D–SelHiInc A b + 2 + 3 .. 10.24 ..D–SelHiInc I + 2 + 3 .. 10.24n ..E SelIntmBd A b + 1 + 2 .. 9.89 ..
Rice Hall James$ 346 mil 619–239–9005
A Micro Cap I + 7 + 6 +73 20.51n–.01C–SmlMid Cap + 6 + 4 +25 14.90n+.02
RiverSource/AXP A$28.9 bil 800–862–7919E CA Tax Ex + 1 + 1 +17 5.15 ..E Divers Bond 0 0 +14 4.77 –.01A DivrsEqInc + 9 + 8 +58 12.93 –.02A+EmergMkts +12 +13+138 10.64 +.06D Equity Sel + 4 + 2 +29 14.85 +.04B Equity Val b + 9 + 8 +23 12.28 ..C–Fdmtl Val b + 3 + 2 .. 6.12 ..E Glbl Bond + 1 + 1 +28 6.46 ..A–Glob Tech b + 9 + 6 –13 2.28 ..B Global Eq + 7 + 6 +19 7.11 +.04D Growth + 6 + 5 –11 30.52 ..D–High Yield + 2 + 3 +18 2.90 ..Income Opp b + 1 + 2 .. 10.26 +.01B Intl Opp +10 +10 +17 8.93 +.07A IntlAggrGr b +11 +11 .. 8.88 +.05A IntlSelVal b +11 +10 .. 10.17 +.05D Lrg Cap Eq b + 5 + 4 .. 5.57 ..A+Mid Cap Val b + 8 + 7 .. 9.03 ..E MN Tax Ex + 1 + 1 +17 5.26 ..D Mngd Alloc + 6 + 5 +25 10.73 +.02D–Mutual + 4 + 3 + 4 10.23 –.01PrtBldrAgg b + 6 + 5 .. 11.89 +.02PrtBldrMod b + 4 + 4 .. 11.20 +.01PrtModAggr b + 5 + 4 .. 11.52 +.02PrtModCons b + 3 + 2 .. 10.77 ..PrtTotEqty b + 7 + 6 .. 12.26 +.03C Sel Val b + 7 + 6 .. 7.21 ..E Sh US Gov 0 0 + 9 4.72 –.01A–Sml Co Idx +10 + 8 +69 9.09 +.02A–SmlCapAdvt b +10 + 8 +59 7.05 +.02A SmlCapEq b +10 + 8 .. 6.28 +.03B–SmlCapGrow b +11 + 9 .. 5.23 +.01B+SmlCapVal b + 9 + 7 .. 6.71 +.01E Tax Ex Bond 0 + 1 +14 3.84 ..E USGovMort b 0 0 .. 5.01 ..C Value b + 7 + 5 .. 5.45 ..
RiverSource/AXP B$ 8.3 bil 800–862–7919D Div Oppor + 6 + 5 –11 7.82n–.01E Divers Bd 0 0 +12 4.77n–.01A–DvrsEqIncm + 9 + 7 +55 12.92n–.01D Equity Sel + 3 + 2 +24 13.58n+.03B–Equity Val b + 9 + 7 +20 12.28n–.01D+Fdmtl Val m + 3 + 2 .. 5.96n ..D Growthm + 6 + 4 –15 27.89n+.01D–High Yieldm + 2 + 2 +15 2.90n+.01A IntlSelVal m +11 +10 .. 9.88n+.05D Lrg Cap Eqm + 5 + 4 .. 5.47n ..A+Mid Cap Val m + 7 + 6 .. 8.83n ..D Mngd Alloc r + 6 + 5 +22 10.63n+.02PrtBldrModm + 4 + 3 .. 11.15 +.01PrtModAggrm + 5 + 4 .. 11.47 +.02C–Sel Val m + 7 + 6 .. 7.02n+.01E Sh US Gov 0 0 + 7 4.72n–.01A–Sml Co Idxm +10 + 8 +69 8.28n+.03A–SmlCapAdvtm + 9 + 7 +52 6.60n+.01B+SmlCapVal m + 9 + 7 .. 6.50n+.01
RiverSource/AXP Y$ 1.2 bil 800–862–7919E Divers Bond 0 0 +15 4.77n–.01D Eq Select b + 4 + 2 +30 15.05n+.04D Growth + 6 + 5 –10 31.06n+.01D+S&P500 Em + 5 + 3 + 8 5.06n ..
Robeco Funds$ 843 mil
A SmVal2 Ins + 6 + 5+107 23.45n+.08A SmVal2 Invm + 6 + 5+104 23.04n+.08E WPGCoreBd I 0 0 +22 10.55n–.01
Rochdale$ 250 mil 800–245–9888
A Atlasm +13 +13 +66 49.50 +.25Royce Funds$19.0 bil 800–221–4268
A–LowPriceStk r +11 +11 +80 17.28n+.03A MicroCap I +11 +11+104 17.65n ..A+Opport I r +12 +11 +97 13.80n+.01B+PAMutl Cnsl b + 9 + 8 +80 11.15n+.03A–PAMutl Inv r + 9 + 8 +89 11.75n+.04A Premier Inv r + 8 + 7+100 18.20n+.05D+SpecialEq I r + 6 + 4+103 19.77n+.03B–TotlRet I r + 8 + 7 +82 13.53n+.03A+Value Invm +10 + 9 .. 10.59n+.06A+ValuePlsInv +11 +11 .. 13.39n+.01
RS Funds$ 8.2 bil 800–766–3863B Divers Gr b + 6 + 4 + 8 23.66n–.05B+Emerg Grow b + 8 + 6 – 2 35.10n+.05A+Glb Nat Res b + 7 + 7+213 34.82n–.31B Growth + 5 + 4 – 1 16.69n+.03
B+Mid Cap Op b + 9 + 7 +25 14.49n+.03A+Partners + 7 + 7+156 35.30n–.02A Sml Co Gr b + 6 + 4 +38 22.40n+.03A+Value + 3 + 3+126 25.40n–.03
RSI Retire Tr$ 507 mil 800–772–3615D Core Equity + 4 + 2 – 7 92.22n+.15
Rydex C$ 963 mil 800–820–0888E Juno b + 5 + 5 .. 18.25n+.09Juno A + 5 + 5 .. 18.96 +.09Rydex Dynamic$ 1.6 bil 800–820–0888E Tempest 500 b – 8 – 5 –39 36.37n–.06A Titan 500 b + 9 + 5 –20 42.48n+.10A Velocity100 b + 3 – 1 –64 22.65n+.17E Venture 100 b – 4 0 –68 18.62n–.12
Rydex H$ 944 mil 800–820–0888
A+Mekros +16 +12 +57 36.07n+.14B–Sect Rot b + 9 + 7 .. 13.98n+.03
Rydex Investor$ 3.3 bil 800–820–0888E Arktos – 2 + 1 –25 21.99n–.06B–Biotech + 7 + 5 – 9 24.06n+.13A+Energy r + 5 + 3 +83 21.17n–.18A Energy Svcs + 9 + 6 +41 42.97n–.49E Juno + 5 + 5 –27 19.12n+.09B Nova + 7 + 4 – 3 29.31n+.04D+OTC + 2 0 –18 11.25n+.04C+Prec Metals + 8 +10+156 50.02n+.16E Ursa – 4 – 2 –13 7.97n ..
—S—T—U—SA Funds$ 2.2 bilE Fixed Inc 0 0 +14 9.94n–.01A Intl HBtM +11 +11 +67 16.05n+.13A+Intl Sml Co + 9 + 9 .. 20.20n+.12B–US HBtM + 6 + 5 .. 13.07n–.01C–USMkt + 5 + 4 +14 11.80n+.02A–US Small Co +11 + 9 .. 19.61n+.04
Salomon Bros$ 5.2 bil 800–725–6666B–Capital + 5 + 3 +34 31.65n ..B–Capital A b + 5 + 3 +31 30.84 –.01B–Capital Bm + 4 + 3 +26 28.93n ..B–Capital Cm + 4 + 3 +26 29.01 –.01D–Hgh Yd Bd A + 2 + 3 +34 8.42 ..D–Hi Yd Bd B b + 2 + 2 +31 8.46n ..D–Hi Yd Bd C b + 2 + 2 +32 8.50 ..D–Hi Yd Bd Instl + 3 + 3 +40 6.99n ..C Investrs Val A + 6 + 4 +14 21.63 –.02C Investrs Val O + 6 + 5 +14 21.61n–.02C Opportunity + 7 + 7 +24 54.81n+.22A–SmCp Gr Am +12 +10 +33 16.74 +.05
Schroder Funds$ 1.7 bil 800–464–3108Muni Bd Inv + 1 + 1 .. 10.01n+.01NorthAmerEq + 5 + 3 .. 11.90n+.01ShtMunBdInv + 1 + 1 .. 9.92n ..
A–US Opps Inv +11 +10 +73 22.00n+.06Schwab Funds$36.1 bil 800–435–4000E CA LT TxFr Bd + 1 + 1 +20 11.66n ..E CA ShInt TxFr 0 + 1 +10 10.29n ..CATaxFreeSel + 1 + 1 .. 9.96 ..C+Core Equity + 6 + 4 +18 17.37n+.03Div Eq Inv + 7 + 5 .. 13.75n+.01Div Eq Sel + 7 + 5 .. 13.74n+.01
A Health Care + 4 + 2 +57 15.42n ..C–HedgedEqSel r + 4 + 3 .. 15.18n+.02D+InstlS&P500 + 5 + 4 + 9 10.31n+.01A–Intl Idx Sel r + 9 + 8 +32 19.30n+.05B+Intl Index Inv + 9 + 8 +31 19.31n+.05D MktTrack Bal + 4 + 3 +22 16.21n+.01D–MktTrack Cons + 3 + 2 +21 13.95n+.01B–MktTrck All Eq + 7 + 6 +23 12.80n+.02C–MktTrk Growth + 6 + 4 +23 18.12n+.02PremEqtyInv + 6 + 5 .. 12.08n+.01PremEqtySel + 6 + 5 .. 12.09n+.01D+S&P 500 Inv + 5 + 3 + 8 20.19n+.03D+S&P500 Slct + 5 + 4 + 9 20.25n+.03D+S&P500Idx E + 5 + 4 + 8 20.19n+.03E Sh/Int TaxFr b 0 0 +11 10.38n ..B+Sm Cap Inv +10 + 8 +51 25.10n+.07A–Sm Cap Select +10 + 8 +51 25.13n+.07Sm Eq Inv + 8 + 7 .. 17.27n+.04E ST BondMkt 0 + 1 +13 9.91n ..E Tot Bd Mkt 0 0 +16 9.80n–.01C TotStkIdxInv r + 6 + 4 +19 22.52n+.05C TotStkIdxSel r + 6 + 4 +19 22.56n+.04TxFreePlusS 0 + 1 .. 9.96 ..E YieldPlus Inv + 1 + 1 +10 9.66n ..E YieldPlus Slct + 1 + 1 +11 9.66n ..C–1000Idx Inv r + 5 + 3 +12 38.04n+.07C–1000Idx Sel + 5 + 3 +13 38.04n+.07
Schwartz Funds$ 396 mil 248–644–8500B AvMarCathlc b + 9 + 7 .. 16.37 +.02
Scudder Funds A$ 1.0 bil 800–621–1048D Technology + 1 – 1 –23 11.76 +.02

INVESTOR'S BUSINESS DAILY MUTUAL FUND PERFORMANCE MONDAY, MARCH 20, 2006 A1736 Mos 2006 12 Wk 5 Yr NetPerformance % % After Asset NAVRating Fund Chg Chg Tax Rtn Value Chg
36 Mos Fund 2006 12 wk 5 Yr Net NAVPerformance % % After Asset ChgRating Chg Chg Tax% Value
36 Mos 2006 12 Wk 5 Yr NetPerformance % % After Asset NAVRating Fund Chg Chg Tax Rtn Value Chg
36 Mos Fund 2006 12 wk 5 Yr Net NAVPerformance % % After Asset ChgRating Chg Chg Tax% Value
36 Mos 2006 12 Wk 5 Yr NetPerformance % % After Asset NAVRating Fund Chg Chg Tax Rtn Value Chg
36 Mos Fund 2006 12 wk 5 Yr Net NAVPerformance % % After Asset ChgRating Chg Chg Tax% Value
36 Mos 2006 12 Wk 5 Yr NetPerformance % % After Asset NAVRating Fund Chg Chg Tax Rtn Value Chg
36 Mos Fund 2006 12 wk 5 Yr Net NAVPerformance % % After Asset ChgRating Chg Chg Tax% Value
36 Mos 2006 12 Wk 5 Yr NetPerformance % % After Asset NAVRating Fund Chg Chg Tax Rtn Value Chg
36 Mos 2006 12 Wk 5 Yr NetPerformance % % After Asset NAVRating Fund Chg Chg Tax Rtn Value Chg
36 Mos Fund 2006 12 wk 5 Yr Net NAVPerformance % % After Asset ChgRating Chg Chg Tax% Value
36 Mos Fund 2006 12 wk 5 Yr Net NAVPerformance % % After Asset ChgRating Chg Chg Tax% Value
36 Mos Fund 2006 12 wk 5 Yr Net NAVPerformance % % After Asset ChgRating Chg Chg Tax% Value
36 Mos 2006 12 Wk 5 Yr NetPerformance % % After Asset NAVRating Fund Chg Chg Tax Rtn Value Chg
36 Mos Fund 2006 12 wk 5 Yr Net NAVPerformance % % After Asset ChgRating Chg Chg Tax% Value
36 Mos 2006 12 Wk 5 Yr NetPerformance % % After Asset NAVRating Fund Chg Chg Tax Rtn Value Chg
36 Mos Fund 2006 12 wk 5 Yr Net NAVPerformance % % After Asset ChgRating Chg Chg Tax% Value
36 Mos 2006 12 Wk 5 Yr NetPerformance % % After Asset NAVRating Fund Chg Chg Tax Rtn Value Chg
Thedatapresentedherehasbeenobtainedorderived fromsourcesbelievedtobeaccurate,however,Investor'sBusinessDaily, Inc. cannot anddoesnot guarantee theaccuracyof thesesources. This is nota prospectus; no effort with respect to sale or purchase of any securities is intended or implied andshouldnotbeconstruedasanoffer,solicitation, recommendationorratingtobuyorsellanysecurity.Of-ficers,directorsand/orshareholdersof Investor'sBusinessDaily, Inc.and itsaffiliatesmayownsecuri-tiesorbuyorsell securities referred tohere.
Scudder Funds S$ 190 mil 800–621–1048E NY Tax Free 0 + 1 .. 10.89n+.01
Security Funds$ 1.7 bil 800–888–2461E Cap Prsrv A 0 0 +12 9.74 ..D–Equity A + 5 + 3 – 4 6.87 +.02B+MidCapGr A +10 + 9 +29 13.20 –.02A+MidCapVal A + 9 + 8+113 38.84 +.01
SEI Asset Alloc$ 1.2 bil 800–342–5734C–Divr Gl Gr A + 5 + 4 +20 13.67n+.03C+Divr Gl Stk A + 7 + 5 +18 13.12n+.03D–Divr Mod Gr A + 4 + 3 +18 13.40n+.02D Dvr Gl Md GrA + 4 + 3 +22 12.05n+.01
SEI Portfolios$29.3 bil 800–342–5734E CAMuni A 0 + 1 +14 10.16n ..E CoreFxdInst A 0 0 +18 10.26n–.02A+EmrgMkt A b +11 +11+126 16.83n+.08E GNMAA 0 0 +15 9.41n–.01D–High Yld Bond + 2 + 3 +26 8.46n ..B+Intl Equity A + 9 + 8 +29 13.43n+.08E Intl Fxd Inc A – 1 – 1 +25 10.63n–.01C+IntlEmrgMkt A + 4 + 5 +83 11.30n–.01E IntmdMuni A 0 0 +14 10.78n ..C+Larg Cp Val A + 7 + 5 +27 22.56n ..D Lge Cp Gr A + 4 + 2 –11 20.51n+.08D+S&P 500 Idx A + 5 + 3 + 7 38.87n+.05D+S&P 500 Idx E + 5 + 3 + 7 38.99n+.05E Sh Dur Govt A 0 + 1 +10 10.00n ..A–Sm Cp Gr A +12 +10 +24 20.28n+.03A–Sm Cp Val A + 9 + 8 +75 21.25n+.07C–TxMgdLgCp A + 5 + 3 +11 12.58n+.03A–TxMgdSmCp A +10 + 8 +61 13.82n+.04E UltraShBd A + 1 + 1 +10 9.95n ..VolatilityA + 5 + 4 .. 11.71n+.02Selected Funds$10.1 bil 800–243–1575American D + 4 + 2 .. 41.77n+.02C American S b + 4 + 2 +26 41.75n+.02
Seligman Group$ 7.8 bil 800–221–2783C+Capital A m + 6 + 4 +11 22.54 +.08D CmmnStk A + 5 + 4 – 2 12.31 +.02B–Com& Inf Cm +11 + 9 +16 26.10 +.18B Com&Inf Am +11 + 9 +21 30.32 +.21B–Com&Inf B m +11 + 9 +16 26.09n+.18B–Com&Inf Dm +11 + 9 +16 26.08n+.18C Glob Tech A +10 + 9 – 4 15.04 +.11D Growth A + 3 + 1 –17 4.24 +.01D–Hi Yld Bd A b + 2 + 2 –14 3.33 ..B+SmCapVal A b +11 +10 +74 17.50 +.07D–† SenbcRBB b + 5 + 3 +90 16.66 ..
Sentinel Group$ 4.1 bil 800–282–3863D–Bal A b + 3 + 2 +17 17.06 ..C–CmmnStk A b + 5 + 3 +11 31.35 +.02E Govt Sec A b 0 0 +18 10.18 –.01B+Intl Eq A b + 9 + 8 +36 19.84 +.12C+MidCp Gr A b + 7 + 5 +19 16.99 +.06E ShMatGv A b 0 0 + 9 9.04 –.01B Small Co A b + 9 + 7 +70 7.99 +.01B–Small Co Bm + 9 + 7 +62 6.88n+.01B–Small Co C b + 9 + 7 .. 7.61n+.01D–† Sequoia + 3 + 2 +41 159.57n+.19
Sit Funds
$ 1.5 bil 800–332–5580B Mid Cap Grth + 5 + 4 0 13.40n+.05E MN Tax Free + 1 + 1 +17 10.15n ..B Sm Cap Gr + 8 + 6 +12 34.14n+.10E Tax Free 0 + 1 +13 9.75n ..E US Govt 0 0 +13 10.50n–.01A–† Skylne Sp Eq +10 + 9 +88 28.07n–.02
Smith Barn B&P$ 9.3 bil 800–451–2010C+Agg Gr Bm + 4 + 3 +12 100.09n–.05D–Apprec Bm + 4 + 3 + 9 14.67n+.02D+Cap & Inc Bm + 5 + 4 +23 17.69n+.02E CapPresrvB b 0 0 .. 10.93n+.01E CapPrsvIIBm + 2 + 1 .. 11.25n+.01D–Div Strat B b + 6 + 4 –18 15.92n+.01E DivrStrInc Bm 0 0 +15 6.80n–.01C–Fund Val B m + 6 + 4 + 9 14.50n+.03D–High Inc Bm + 2 + 2 + 5 6.81n ..E InvGrdBd Bm – 1 – 1 +22 12.15n–.02D LrgCapGr Bm 0 – 2 + 3 21.62n+.10E MgMun Bm + 1 + 2 +13 15.46n+.01C–Mid Core B b + 7 + 5 +18 21.15n–.01B Sm Cp Val B b + 6 + 5 +81 23.59n+.06
Smith Barney A$24.9 bil 800–451–2010E Adj Inc b + 1 + 1 + 2 9.54 ..B–Aggress Gr b + 5 + 3 +16 112.11 –.04D Apprection b + 4 + 3 +12 15.03 +.02E CAMuni b + 1 + 1 +13 16.36 +.01C–Cap & Inc + 5 + 4 +25 17.83 +.01D–Div&Inc A b + 4 + 3 + 4 13.01 ..E Divr Str Inc b 0 0 +16 6.76 –.01E Divrs LgCpGr + 4 + 3 –12 14.25 +.02D–DivStrategy + 6 + 5 –15 16.92 +.02E FLMuni + 1 + 2 +15 12.97 +.01C Fund Val b + 6 + 5 +13 15.50 +.03E Govt Secs 0 0 +16 9.64 –.01D Gr & Inc b + 4 + 3 + 7 16.56 +.03D–High Incm + 2 + 2 + 7 6.78 ..B Intl AllCpGr b + 8 + 8 + 1 13.77 +.12E Invest Grd Bd – 1 – 1 +24 12.17 –.03D Lg Cap Gr b 0 – 2 + 7 23.03 +.10C Lg Cap Val b + 6 + 5 + 6 17.66 –.01E Mgd Govt b 0 0 +13 12.25 –.01C Mid Core b + 7 + 5 +23 22.57 –.01E MngedMuni b + 1 + 2 +15 15.44 +.01E Muni Hi Inc + 2 + 2 +14 14.66 +.01E Muni Natl Bd + 2 + 2 +15 12.99 +.02E MuniLtdTrm + 1 + 1 +14 6.34 ..E NJMuni b + 1 + 2 +17 12.47 +.01E NYMuni + 1 + 2 +14 13.15 +.02D+S&P 500 Idx b + 5 + 3 + 7 13.27n+.01C+Sm Cap Gr + 8 + 6 + 6 11.74 +.04B+Sm Cp Val b + 6 + 5 +87 24.34 +.07D–Soc Aware b + 3 + 2 0 21.59 ..E US Gvt Sec b 0 0 +15 12.97 –.02
Smith Barney C$ 6.4 bil 800–451–2010E Adj Inc 0 + 1 + 6 9.49n ..C+Agress Grow + 5 + 3 +12 100.82 –.05D–Appreciatn + 4 + 3 + 9 14.69 +.02C–Fundamt Val + 6 + 5 + 9 14.51 +.03D–High Inc L + 2 + 2 + 5 6.81 ..D LrgCapGrow b 0 – 2 + 3 21.61 +.10C–Mid Cp Core + 7 + 5 +18 21.15 –.01E MngedMuni + 1 + 2 +13 15.45 +.01D MultDisAlCp + 4 + 3 – 2 8.98 +.01
E MuniLtdTrm b + 1 + 1 .. 6.35n ..B Sm Cp Val + 6 + 5 +81 23.55 +.06
Smith Barney Y$ 6.9 bil 800–451–2010B–Aggr Grm + 5 + 3 .. 116.63n–.05D Apprection + 4 + 3 .. 15.00n+.02C Fund Val + 6 + 5 .. 15.91n+.04E Inv Grd Bd – 1 – 1 .. 12.17n–.02D Lrg Cap Gr 0 – 2 .. 23.78n+.11E Mgd Govt 0 0 .. 12.25n–.02E Sh Hi Grd Bd 0 0 .. 4.13n ..B Sm Cap Corm +10 + 8 .. 16.19n+.03
Smith Barney 1$ 2.6 bil 800–451–2010D–DivStrategy + 6 + 5 –12 17.34 +.02D Grwth & Inc + 4 + 3 + 8 16.57 +.02
Smith Brn Allo A$ 1.2 bil 800–451–2010D–Balanced b + 2 + 1 +14 12.38 ..D Growth + 3 + 2 + 8 12.85 +.01C Hi Growth + 4 + 2 +15 15.49 +.01
Smith Brn Allo B$ 526 mil 800–451–2010D Growthm + 3 + 1 + 6 12.98n+.01C–Hi Growthm + 3 + 2 +10 14.87n+.01A † Sml Cap Val m + 8 + 6 .. 29.56 +.06C+† Sound Shore + 3 + 2 +37 37.83n+.05
Spectra Funds$ 202 mil 800–711–6141C Spectra N + 6 + 4 + 3 7.82n+.02B–† SpiritAmer b +15 +13+109 15.18 +.08
SSGA Funds$ 6.4 bil 800–647–7327E BdMkt b 0 0 +22 9.79n–.01D+Discplnd Eq + 5 + 4 +12 10.38n+.02A+EmergMkts +13 +13+156 21.24n+.15D–Growth & Inc + 3 + 2 0 20.73n+.04D+IAM + 6 + 4 + 4 9.95n+.02A Intl Stk Sel + 9 + 9 +53 12.04n+.06D+S&P 500 Idx + 5 + 4 + 8 21.52n+.03A–Small Cap +10 + 8 +70 31.94n ..A TuckrmREIT +18 +17+141 19.95n +.24E Yield Plus + 1 + 1 + 7 9.94n ..
State Frm Asc$ 4.9 bil 309–766–2029D–Balanced + 5 + 4 +15 52.98n+.07D Growth + 7 + 6 +16 53.09n+.13E Interim 0 – 1 +10 9.56 ..E Muni Bond 0 0 +13 8.45n ..
State Frm Ret$ 3.0 bilE Bond A – 1 – 1 0 10.29 –.02Equity I + 5 + 4 .. 8.40n ..LifPth2010A b + 3 + 2 .. 12.21 +.02LifPth2020A b + 4 + 3 .. 13.26 +.03LifPth2030A b + 5 + 4 .. 14.02 +.04LifPth2040A b + 6 + 5 .. 14.71 +.05D S&P 500 A + 5 + 3 + 7 9.94 +.02D S&P 500 B + 5 + 3 + 5 9.92n+.01
State Str Res A$ 195 mil 877–773–8637Eq 500 Idx + 5 + 3 .. 10.94n+.01STI Classic$14.1 bil 888–784–3863E Balanced I + 3 + 2 + 4 12.02n+.01D–Cap Appr I + 5 + 3 – 5 12.88n+.04
E Core Bond I 0 0 +16 9.94 –.01E FL TxExBd I 0 + 1 +16 10.91n ..E Hi Yield I + 1 + 2 .. 10.72 ..E InGrTxEx I b 0 + 1 +18 11.44n ..A–Intl Eqty I + 8 + 8 +37 14.39n+.07A–IntlEqIdx I + 9 + 9 +35 15.69n+.10E InvGrdBd I + 1 + 1 +17 10.50n–.01C+Lg Cp Val I + 6 + 4 +23 17.44n+.01C–LgCapValEqI b + 9 + 7 +29 13.99n+.03D–LifeVisGr I + 3 + 3 +22 10.93n+.01E LtdFedMor T + 1 + 1 +13 9.92n ..B–MidCapEq T b + 6 + 5 +38 13.70n+.01B MidValEq I + 8 + 7 .. 13.09n+.04E ShTrmBd I + 2 + 2 + 9 9.74n ..A SmCapGro I +10 + 7 +58 22.98n–.04A SmCapVaEq I +12 +11+123 20.50n+.07E StratInc I + 1 + 1 .. 9.72n ..E UltrShBd I + 1 + 1 .. 9.97n ..E US GvtSec I 0 0 +14 10.26n–.01E VAIntMun I + 1 + 1 +15 10.07n ..
Strategic Ptnrs$ 3.9 bil 800–225–1852C CapitalGr C + 4 + 2 +17 15.94 +.12C CapitalGr M + 4 + 2 +17 15.95n+.11D–Concen Gr B + 5 + 4 –25 11.14n+.04B+Intl Val Z +11 +10 +19 25.06n+.13B Mid Val M + 5 + 4 +55 17.26n+.08D Mod Allc B + 4 + 4 +22 12.15n+.03
Stratton Funds$ 653 mil 800–634–5726
A Growth + 6 + 4 +71 46.90n+.20B–MnthDivREIT +15 +14 +99 39.07n+.27A+Sm Cap Yield +11 + 9+133 48.03n+.16
SunAmer Foc$ 5.4 bil 800–858–8850BalStrat A + 4 + 3 .. 16.62 +.03BalStrat C b + 4 + 3 .. 16.60 +.03EqtyStrat A + 5 + 4 .. 19.35 +.06EqtyStrat B b + 5 + 4 .. 19.15n+.05B Intl A b +10 + 9 .. 20.08 +.08D Lrg Gr I + 1 – 1 + 5 18.07 +.13B+Multi Gr A + 6 + 5 +26 24.40 +.10MultStr A + 5 + 4 .. 18.73 +.06MultStr B b + 5 + 4 .. 18.62n+.06MultStr II b + 5 + 4 .. 18.62 +.05D SS FocLgGrA b + 1 – 1 + 9 19.02 +.14D SS FocLgGrB b + 1 – 1 + 5 18.06n+.13C SS FocMVal C b + 7 + 6 +27 20.74 +.02C SS FocMValA + 8 + 6 +30 21.55 +.02C SS FocMValB b + 8 + 6 +27 20.76n+.02Strat Cm + 5 + 4 .. 19.16 +.06D StySel G&I A b + 3 + 2 +16 17.87 +.09
SunAmer Style$ 1.4 bil 800–858–8850C–FocLrgVal A b + 6 + 5 +19 17.42 –.02B Foc2000ValA b + 7 + 6 +50 18.90 +.09
SunAmerica$ 2.4 bil 800–858–8850E Bal Asst A b + 2 + 1 – 7 14.12 +.01E GNMAA 0 0 +16 11.07 –.02D+Hi Yld A b + 2 + 3 +16 4.58 –.01E SrFloatRt C + 1 + 2 +12 9.44n ..D–StratBond A + 1 + 2 +27 3.55 –.01E US Govt A 0 0 +19 9.25 –.012010HiWatrA b + 2 + 1 .. 10.44 ..2010Water C b + 2 + 1 .. 10.42 ..Synovus Tr
$ 401 milE IntmTrmBd I 0 0 .. 9.62n–.01D–LgCpCorEq I + 5 + 3 .. 11.06n+.01
Tamarack Funds$ 1.2 bil 800–422–2766B Enterprise +10 + 9+119 25.48n+.03A MicroCapVal + 9 + 8+104 21.90n–.02D Value + 5 + 4 + 9 40.50n+.07
Target Funds$ 1.8 bil 800–442–8748B Intl Equity +11 +10 +28 15.49n+.08E Intmd Bond 0 + 1 +15 10.12n ..D+LC Growth + 5 + 3 –13 15.28n+.09B LC Value + 6 + 5 +48 15.98n+.01B–Sm Cp Gr + 7 + 5 + 1 12.10n+.01A SmallCapVal + 9 + 7 +94 20.64n+.05E Tot Ret Bd 0 + 1 +17 10.35n–.01† TCMSmlGro +13 +12 .. 30.53 –.03TCW Galileo Fds$ 5.2 bil 800–386–3829DiversVal I + 6 + 5 .. 14.88 –.03D–Hi Yld Bonds + 2 + 3 +18 6.90n+.01C Slct Eq I – 3 – 5 +10 19.78n+.12E TotRetBond I 0 0 +20 9.38n–.01B Value Opport + 8 + 6 +66 23.72n+.09
TCW Galileo N$ 2.6 bil 800–386–3829C+Div Foc + 5 + 4 .. 12.15n–.03C Select Eq b – 3 – 5 + 8 19.33n+.11E TotlRetBond b 0 0 .. 9.71n–.01B Value Opport b + 8 + 6 .. 23.34n+.09
TD Waterhouse$ 322 mil 800–934–4448D–Dow 30 .. .. no quote
Templeton Instl$ 9.9 bil 800–321–8563
A+EmergMkt b +11 +11+151 20.90n+.11A Foreign Eqty + 8 + 7 +52 23.87n+.04
Third Avenue$15.5 bil 800–443–1021
A+Intl Value r + 7 + 8 .. 22.73n+.07A Real Est Val r +10 +10+138 32.35n+.14B+Small Cap Val + 5 + 4 +90 25.57n–.03A Value + 6 + 5 +76 57.99n+.20
Thompson Plm$ 946 mil 800–999–0887D Growth + 3 + 2 +21 45.82n+.08
Thornburg A$ 7.1 bil 800–847–0200Core Growthm + 7 + 6 .. 16.13 +.01Income Bldr m + 8 + 9 .. 18.95 +.02
A Intl Value b + 9 + 9 +70 25.64 +.12E IntmdMuni 0 + 1 +15 13.25 ..E Ltd Mun Nat b 0 + 1 +13 13.49 ..E Ltd Trm Inc 0 + 1 +16 12.38 ..E NM Int Muni 0 + 1 +14 13.12 ..C Valuem + 6 + 5 +17 35.70 +.16
Thornburg C$ 2.1 bil 800–847–0200Income Bldr b + 8 + 9 .. 18.96n+.02
A Intl Valuem + 9 + 8 .. 24.51n+.12C Valuem + 6 + 5 +13 34.69n+.15
Thornburg I$ 2.3 bil 800–847–0200
A Intl Value + 9 + 9 .. 26.13n+.12E Ltd TrmMun 0 + 1 +13 13.49n ..C+Value + 6 + 5 +19 36.22n+.16
Thrivent Funds A$ 9.0 bil 800–847–4836D–Balanced b + 3 + 2 +11 12.69 +.01E Core Bond 0 0 +16 9.86 –.01D–High Yield + 1 + 2 + 7 5.07 ..D Lrg Cap Gr b + 3 + 1 –21 5.27 +.02D–Lrg Cap Stk + 4 + 2 – 6 27.45 +.05C Lrg Cap Val + 7 + 5 +12 15.74 ..E Ltd Mat Bd 0 + 1 +12 12.56 ..C+Mid Cap Gr + 7 + 6 +18 16.54 +.05B+Mid Cap Stk + 7 + 5 +39 18.22 +.04E Muni Bond + 1 + 1 +19 11.34 ..B PtnrIntlStk + 8 + 8 +14 12.22 +.06A–Sml Cap Stk +10 + 8 +62 18.36 +.04
Thrivent Funds Instl$ 364 mil 800–847–4836D Lrg Cap Stk + 4 + 2 – 4 27.59n+.05
TIAA–CREF Funds$ 2.8 bil 800–223–1200E Bond Plus 0 0 +19 10.06n–.01C–Equity Index + 6 + 4 +13 9.46n+.02D–High Yld Bd + 2 + 2 +20 9.15n+.01A Intl Eqty +10 +10 +40 13.23n+.10D Managed Alloc + 4 + 3 +15 11.83n+.02E Shrt Tm Bd 0 0 +14 10.31n–.01C Social Choice + 5 + 4 +17 10.20n+.02E Tax Ex Bd + 1 + 1 +20 10.71n ..
Tocqueville$ 1.4 bil 800–697–3863
A Goldm +14 +18 .. 46.69n+.08A+Intl Value b + 7 + 7+106 16.35n+.09B+Tocqueville + 7 + 6 +51 24.92n+.04D–† Torray + 5 + 4 +15 41.09n–.12D–† Torray Instl + 5 + 3 .. 117.09n–.41
Touchstone$ 2.2 bil 800–543–0407B Lg Cap Gr A + 4 + 2 +35 23.34 +.03B MidCap Gr A + 8 + 7 +57 23.83 +.06B+MidCap Gr Cm + 8 + 7 .. 21.35n+.05
Tr For Cr Union$ 2.1 bil 800–342–5828E Shrt Duratn + 1 + 1 +12 9.50n ..E UltShDurGov + 1 + 1 + 9 9.42n ..
Transamer Prem$ 1.2 bil 800–892–7587D+Bal Inv + 6 + 4 +31 24.97n+.04B–Equity Inv + 7 + 5 +24 23.49n+.11B+Gr Opps Inv + 6 + 4 +54 23.83n+.07
Transamerica IDEX A$ 3.9 bil 888–233–4339C–AmCenLgVal b + 5 + 3 .. 11.39 ..D–AstAlConsrv b + 4 + 3 .. 11.58 +.02C AstAllocGr b + 7 + 6 .. 13.06 +.03D AstAlMod b + 5 + 4 .. 12.26 +.03D AstAlModGr b + 6 + 5 .. 12.65 +.03C–JanusGrow b 0 – 1 – 4 26.19 +.12PIMCO TIPS b – 1 – 1 .. 10.11 –.02E PIMCO ToRtn b 0 0 .. 10.19 –.02D–TA ConHiYld b + 2 + 3 +16 9.13 ..E TransFlxInc b 0 0 +14 9.34 ..
Transamerica IDEX B$ 2.2 bil 888–233–4339C AstAllocGr b + 7 + 6 .. 12.86n+.04D–AstAlModm + 5 + 4 .. 12.21n+.02D AstAlModGrm + 6 + 5 .. 12.60n+.03C–Janus Grm 0 – 1 – 8 24.05n+.10D–TA Balancedm + 5 + 4 +18 21.66n+.04
Transamerica IDEX C$ 2.8 bil 888–233–4339D–AstAlConsrvm + 4 + 3 .. 11.55n+.01D AstAllModGrm + 6 + 5 .. 12.60n+.03C+AstAllocGrm + 7 + 6 .. 12.86n+.03D–AstAlModm + 5 + 4 .. 12.21n+.02
Transamerica IDEX T$ 229 mil 888–233–4339C Janus Grow 0 – 1 – 2 27.36 +.12
Trendstar Funds$ 287 mil 888–747–4872TrendstarSml r + 9 + 7 .. 13.20n+.03Turner Funds$ 2.1 bil 800–224–6312
A Micro Cap Gr +10 + 8+100 58.52n+.18B+Mid Cap Gr +10 + 8 +18 30.06n+.14A Small Cap Gr +13 +10 +35 28.57n+.04
Tweedy Browne$ 7.8 bil 800–432–4789D American Val + 3 + 2 +15 24.50n ..B+Global Value + 8 + 8 +49 28.50n+.10
UBS Investment Fds$ 8.5 bil 800–794–7753DynAlpha Am + 3 + 3 .. 11.14 +.05DynAlpha C b + 3 + 3 .. 11.09n+.05C+Glob Eq A b + 6 + 5 +25 13.25 +.05C+Glob Eq Y + 6 + 5 +27 13.49n+.06C–GlobAlloc Am + 5 + 4 +46 14.02 +.03D+GlobAlloc B b + 4 + 4 .. 13.79n+.03D+GlobAlloc C b + 4 + 4 .. 13.77n+.04C–GlobAlloc Y + 5 + 4 +47 14.21n+.03B Intl Eq Y + 9 + 8 +24 11.13n+.07D+S&P 500 A b + 5 + 3 + 7 15.19 +.02C–US Alloc A + 3 + 2 + 9 29.88 +.02D+US Alloc C + 3 + 2 + 6 29.31 +.02C+US Lg Eq Y + 5 + 3 +34 19.03n+.03B US SmlGr A b + 9 + 7 +44 15.06 +.03B US SmlGr Y + 9 + 7 +46 15.41n+.03
UBS Pace A$ 1.1 bil 800–647–1568E Glb Fxd Inc b + 1 + 1 +25 11.09 +.02E Govt Fixed b + 1 0 +15 12.86 –.02C Lrg Co Val b + 7 + 5 +29 22.13 +.01
UBS Pace P$ 5.4 bil 800–647–1568E Glb Fxd Inc + 1 + 1 +26 11.09n+.02A–Intl Eqty +10 + 9 +32 18.59 +.11A+IntlEmrgMkt +11 +12+105 19.19 +.05E Intmd Fixed + 1 + 1 + 6 11.37n–.01D Lrg Co Gr + 4 + 2 – 5 17.00n+.07C+Lrg Co Val + 7 + 5 +30 22.14n+.01E Muni Fxd 0 0 +12 12.37n ..E Secs Fxd Inc + 1 0 +16 12.87n–.01C+SmMdCo Gr + 9 + 8 +37 16.34n+.07B SmMdCo Val + 6 + 5 +46 18.64n+.06E Str Fxd Inc 0 0 +22 13.47n–.01
UMB Scout$ 3.2 bil 800–422–2766E Bond 0 0 +13 10.83n–.01B+Small Cap + 9 + 6 +75 17.25n+.02A–Worldwide + 8 + 7 +52 30.39n+.14
Undiscovered Mgrs$ 624 mil 888–242–3514
A+Behav Val Inst + 9 + 7 +89 31.91n+.06B Bhve Gr Inst + 6 + 4 +45 24.61n+.18A–SmlCpGrInst +11 +10 .. 11.40n–.02
US Glob Inv$ 3.4 bil 800–873–8637
A+East Europe b +18 +18+523 46.63n +.79A+Glob Resourc +12 +12+327 16.03n–.02A+WrldMineral +26 +32+470 25.70 +.16
USAA Group$26.6 bil 800–531–8448C–Aggress Grth + 4 + 2 – 6 32.46n+.26D–BalancStrat + 2 + 1 +22 15.44 +.02E CA Bond + 1 + 1 +19 11.14n ..A–Capital Gr + 8 + 8 +28 8.65n+.04D CornerstStr + 4 + 3 +26 26.91n+.03A+EmergingMkt +10 +10+135 17.39n+.09A–ExtnMkt Idx + 7 + 6 .. 12.96n+.04E FL Tax Fr Inc + 1 + 1 +22 10.10n ..C–Frst Start Gr + 1 0 –13 10.71n+.04E GNMA Trust 0 0 +14 9.51n–.01D–Gr & Tax Str + 2 + 2 +11 14.71n+.01C–Growth + 3 + 1 – 7 15.63n+.10C–Growth & Inc + 4 + 3 +13 19.20n+.06D–Hi Yld Opps + 2 + 2 +21 8.71n+.01E Income 0 0 +18 12.12n ..C–IncomeStk + 6 + 5 +14 16.18n+.01B+International +10 +10 +49 25.71n+.08E Intm Trm Bd 0 0 +16 9.96n–.01C–NASDAQ 100 + 2 0 –15 5.24n+.02E NY Tax Ex + 1 + 1 +21 11.98n ..A+PrcsMetals +14 +16+385 24.06n+.06D+S&P 500 + 5 + 3 + 8 19.66n+.03D+S&P 500 Rwrd + 5 + 3 .. 19.66n+.02B–Sci & Tech + 6 + 4 –13 11.19n+.04E Sh Term Bond + 1 + 1 + 4 8.83n ..B–SmlCapStk + 7 + 6 +48 14.57n+.03E Tax Ex Intmd + 1 + 1 +18 13.15n ..E Tax Ex LT 0 + 1 +24 14.03n ..TotalRetStr + 1 + 1 .. 9.97 +.01E Tx Ex Sh Trm 0 + 1 +10 10.61n ..E VA Tax Ex 0 + 1 +20 11.59n ..C Value + 5 + 4 .. 13.86n+.02B–World Gr + 8 + 7 +24 19.22n+.04D+† Utd Assoc + 5 + 4 + 9 9.49n+.02
—V—W—X—Value Line$ 2.4 bil 800–223–0818C–Asset Allocat + 6 + 5 +32 21.95n+.05B–EmergOpps b +11 + 9 +75 31.02n+.13C–Inc & Growth + 5 + 5 +29 8.81n ..D Leveraged Gr + 8 + 5 –10 23.97n+.02B–Special Situat + 9 + 7 +44 27.80n+.07D+Value Line + 8 + 5 – 4 14.16n+.01
Van Eck Funds$ 679 mil 800–221–2220
A+Glb Hrd Ast A + 8 + 7+173 35.86 –.17A Intl Gold A +15 +19+323 14.22 –.01
Van Kamp A$51.2 bil 800–421–5666B Aggressv Gr b + 8 + 6 – 8 16.98 +.03B+Amer Val b + 7 + 6 +55 29.18 +.17E CA InsTxFr b 0 + 1 +18 18.51 +.01C Comstock b + 4 + 3 +22 17.95 –.02E Corp Bond b 0 0 +19 6.55 –.01D Emerging Gr b + 4 + 2 –19 43.28 +.12A+EmrgMkts b +13 +13+147 21.82 +.08D Enterprise b + 4 + 3 – 8 13.78 +.03D Eqty & Inc b + 3 + 2 +31 8.75 +.01D Equity Gr b 0 – 2 0 11.10 –.01C+Glb Franch b + 7 + 7 +74 25.27 –.01C+Glb Val Eq b + 6 + 5 +21 12.88 +.03C+Glbl Eq All b + 7 + 6 +22 16.15 +.06E Govt Secs b – 1 – 1 +13 10.10 –.01C Gr & Inc b + 4 + 2 +32 20.91 +.02D–Harbor b + 5 + 4 + 7 15.08 +.02E Hi YldMuni b + 1 + 2 +25 10.97 ..D–High Yield + 1 + 2 – 1 3.53 ..E Insur Tax Fr b + 1 + 1 +18 18.50 ..B+Mid Cap Gr b + 7 + 6 +31 26.88 +.02E Muni Inc b + 1 + 2 +19 14.69 ..E PA TaxFrInc b + 1 + 1 +18 17.34 +.01D Pace b 0 – 2 + 4 10.53 –.01A+Real Estate b +15 +15+137 27.81 +.32A Small Gr b +12 +10 +25 10.33 +.03B Sml Cap Val + 8 + 7 .. 17.71 –.02E StrMuniInc + 2 + 2 +22 13.35 ..E USMortgage 0 0 +13 13.53 –.01C+Utility b + 3 + 2 + 6 19.29 –.06
Van Kamp B$12.4 bil 800–421–5666B–Aggressv Gr b + 8 + 6 –11 15.57n+.03C Comstockm + 4 + 3 +19 17.96n–.02D Emrg Gr m + 4 + 2 –22 36.83n+.10D–Enterprisem + 4 + 3 –11 12.54n+.04D Eqty & Incm + 3 + 2 +28 8.61n ..C+Glb Franch b + 7 + 7 +68 24.64n–.01C Gr & Incm + 4 + 2 +29 20.73n+.02D–High Yield + 1 + 2 – 3 3.55n ..E HiYldMunim + 1 + 2 +22 10.97n ..B Mid Cap Gr b + 7 + 5 +26 24.57n+.01A Real Estate m +15 +14+132 27.83n +.32D Select Gr r + 3 + 2 –15 5.34n+.01B Sml Cap Val + 8 + 6 .. 16.81n–.02E StrMuniInc + 1 + 2 +19 13.34n ..B–Technologym + 3 + 1 –42 5.03n+.02
Van Kamp C$ 6.4 bil 800–421–5666C Comstock + 4 + 3 +19 17.97n–.02D Emrg Gr m + 4 + 2 –22 37.78n+.11D Eqty & Incm + 3 + 2 +27 8.64n ..C+Glb Franch b + 7 + 7 +68 24.87n–.01C Gr & Incm + 4 + 2 +29 20.77n+.01E HiYldMunim + 1 + 2 +22 10.96n+.01E StrMuniInc + 1 + 2 +19 13.45n ..
Vanguard Admiral$ 238 bilD+Asset Allocat + 5 + 3 .. 59.79n+.08D–Balanced Idx + 3 + 2 +20 20.49n+.01E CA IntmTxEx 0 + 1 .. 10.97n ..E CA LngTxEx + 1 + 1 .. 11.70n ..A Cap Opps + 9 + 8 .. 83.07n+.32A+Energy +10 + 9 .. 115.33n–.80C–Equity Inc + 6 + 5 .. 50.79n+.01A–Euro Stk Idx +11 +11 .. 72.39n+.16A–Explorer + 9 + 8 .. 76.44n+.18A–ExtndMkt Idx x + 8 + 6 +57x36.86n+.08E FL LngTxEx 0 + 1 .. 11.59n ..E GNMA 0 0 +17 10.22n–.01C–Growth & Inc + 4 + 2 .. 54.25n+.08D Growth Idx x + 4 + 2 + 4x28.48n+.01E HiYld Corp + 1 + 2 .. 6.17n ..E HiYldTxEx + 1 + 1 .. 10.80n+.01C Hlth Care + 4 + 3 .. 61.35n+.26E Ins LT Tax Ex + 1 + 1 +19 12.60n ..
E Int Treas – 1 0 +18 10.77n–.01E IntInv Admr 0 0 +20 9.66n–.01A–Intl Growth + 9 + 9 .. 73.13n+.32E Intm Bd Idx – 1 0 .. 10.20n–.02E Intmd Tax Ex 0 + 1 +15 13.29n ..E LgInvGdAdmr – 2 – 1 +32 9.24n–.03E LT Tax Ex + 1 + 1 +19 11.25n+.01E LT Treas – 2 – 2 +26 11.22n–.03E Ltd Tax Ex 0 + 1 +10 10.68n–.01B+Mid Cap Idx + 7 + 6 .. 85.49n+.27C+Morgan Gr + 5 + 3 .. 57.73n+.14E NJ LngTxEx + 1 + 1 .. 11.81n ..E NY LngTxEx 0 + 1 .. 11.25n ..E PA LngTxEx 0 + 1 .. 11.32n ..A–Pac Stk Idx + 4 + 3 .. 77.09n +.75B Primecap r + 7 + 6 .. 72.73n+.28A REIT Idx x +17 +15 ..x98.07n +.31E Sh Tm TxEx 0 + 1 + 8 15.53n ..E Sh Trm Fed 0 + 1 +12 10.23n–.01E ShrtInvAdmr 0 + 1 +13 10.49n ..E ShTrmBdIdx 0 0 .. 9.88n ..A–Small Cap Idx x +10 + 8 +67x31.41n+.08E ST Treas 0 + 1 +12 10.29n ..E Tot Bd Idx 0 0 .. 9.96n–.01C TotStkMktIdx x + 6 + 4 +19x31.57n–.07D+TxMgd G&I r + 5 + 4 .. 58.69n+.09C TxMgdCap r + 5 + 3 .. 62.96n+.13D+US Growth + 2 + 1 .. 47.54n+.17C+Value Idx x + 6 + 5 +16x23.56n–.13E Wellesley Inc + 2 + 2 .. 52.14n–.07D Wellington + 4 + 3 .. 54.46n–.07C+Windsor + 5 + 4 .. 60.96n–.03C+Windsor II + 5 + 4 .. 58.37n+.06D+500 Index x + 5 + 4 + 9x120.35n–.34
Vanguard Funds$ 323 bil 800–851–4999D+Asset Alloc + 5 + 3 +23 26.62n+.03E CA IntmTxEx 0 + 1 +14 10.97n ..E CA LngTxEx + 3 + 4 +20 11.70n ..A–Cap Opport + 9 + 8 +40 35.95n+.14B–Cap Value + 5 + 4 .. 12.23n ..D+Convert Secs + 8 + 7 +32 14.48n+.02C–Dividend Gr + 7 + 5 – 2 13.25n+.01A+Energy +10 + 9+156 61.41n–.42C–Equity Inc + 6 + 5 +20 24.22n ..B+Explorer + 9 + 8 +48 82.09n+.19E FL LngTxEx 0 + 1 +20 11.59n ..A–Global Eq + 8 + 7 +75 20.99n+.10E GNMA 0 0 +17 10.22n–.01C–Growth & Inc + 4 + 2 +14 33.20n+.05C Growth Equity + 6 + 4 – 2 11.06n+.06C Health Care + 4 + 3 +36 145.33n+.62E HiYld Corp + 1 + 2 +15 6.17n ..E HiYldTxEx + 1 + 1 +21 10.80n+.01E Inflation Prot – 1 – 1 +34 12.05n–.03E Insur LT Tx Ex + 1 + 1 +19 12.60n ..E IntInvGdInv 0 0 +20 9.66n–.01A+Intl Explor +12 +13 .. 20.08n+.14A–Intl Growth + 9 + 9 +35 22.98n+.10A Intl Value +11 +10 +60 38.49n+.18E Intmd Tax Ex 0 + 1 +15 13.29n ..E Intmd Treas – 1 0 +17 10.77n–.01D–Life Consv Gr + 3 + 2 +21 15.95n+.01C–Life Growth + 5 + 4 +24 22.14n+.04E Life Income + 2 + 1 +19 13.72n ..D Life Mod Gr + 4 + 3 +24 19.23n+.02E LT Tax Ex + 1 + 1 +19 11.25n+.01E LT Treas – 2 – 2 +26 11.22n–.03E Ltd Tm Tx Ex 0 0 +10 10.68n–.01E LTInvGrdInv – 2 – 2 +32 9.24n–.03E MA Tx Exem 0 + 1 +19 10.16n ..A+Metals&Mine r +14 +15+291 26.55n+.09B MidCapGr A + 9 + 8 +15 19.16n+.07C Morgan Gr + 5 + 3 +16 18.61n+.05E NJ LngTxEx + 1 + 1 +18 11.81n ..E NY LngTxEx 0 + 1 +19 11.25n ..E OH LT Tax Ex + 1 + 1 +19 11.96n ..E PA LngTxEx 0 + 1 +18 11.32n ..B Primecap r + 7 + 6 +30 70.06n+.26PrmcpCorInv + 6 + 5 .. 12.09n+.01
A REIT Idx x +17 +15 +132x22.98n +.07B Select Val r + 3 + 2 +71 19.37n+.03E ST Corp 0 + 1 +13 10.49n ..E ST Federal 0 + 1 +12 10.23n–.01E ST Tax Exempt 0 + 1 + 8 15.53n ..E ST Treas 0 0 +13 10.29n ..D Star + 4 + 3 +30 20.34n+.02A–Strategic Eq + 8 + 6 +77 23.61n+.03TargRetInc + 1 + 1 .. 10.54n–.01TargRet2005 + 2 + 1 .. 11.10n–.01TargRet2015 + 3 + 2 .. 11.79n+.01TargRet2025 + 4 + 3 .. 12.19n+.01TargRet2035 + 5 + 4 .. 12.84n+.01TargRet2045 + 5 + 4 .. 13.26n+.02
A–TxMd Sm Cp r +10 + 8 +81 24.96n+.06D–TxMgd Bal + 3 + 2 +17 19.37n+.02D+TxMgd G&I r + 5 + 3 + 9 28.55n+.04A–TxMgd Intl r + 9 + 8 +38 12.49n+.06C TxMgdCap r + 5 + 3 +12 31.27n+.06D+US Growth + 2 + 1 –18 18.35n+.07C US Value + 5 + 4 +35 14.19n+.01E Wellesley Inc + 2 + 2 +26 21.52n–.03D Wellington + 4 + 3 +30 31.52n–.04C+Windsor + 5 + 4 +31 18.06n–.01C+Windsor II + 5 + 4 +31 32.88n+.04
Vanguard Index$ 213 bil 800–662–7447D–Balanced + 3 + 2 +20 20.48n+.01A–DevlpdMkts + 9 + 8 +37 11.11n+.05A+EmgMktStk +11 +11+146 21.08n+.05A–Euro Stk Idx +11 +11 +34 30.82n+.07A–ExtndMkt x + 8 + 6 +56x36.84n+.09D FTSESocIndx + 4 + 3 + 4 8.60n+.02D Growth x + 4 + 2 + 4x28.48n+.01E Intmd Bond – 1 0 +20 10.20n–.02E LT Bond – 2 – 1 +31 11.51n–.04B+Mid Cap + 7 + 6 +65 18.84n+.06A–Pac Stk Idx + 4 + 3 +43 11.77n +.11A–Small Cap x +10 + 8 +66x31.40n+.08A–Small Cap Gr x +10 + 9 +78x18.13n+.03A–Small Cap Val x +10 + 8 +73x15.98n+.05E ST Bond 0 0 +12 9.88n ..E Tot Bd Mrkt 0 0 +16 9.96n–.01C Tot St Mkt x + 6 + 4 +18x31.57n–.07A Total Intl Stk + 9 + 9 +46 15.55n+.07C+Value x + 6 + 5 +15x23.56n–.12D+500 x + 5 + 3 + 9x120.35n–.32
Vanguard Instl$ 106 bil 800–662–7447D–Balanced Idx + 3 + 2 +20 20.49n+.01A–DevlpdMkts + 9 + 8 +37 11.01n+.05A+EmgMktStk +11 +11+148 21.11n+.04A–Euro Stk Idx +11 +11 +35 30.85n+.07D+Index x + 5 + 4 + 9x119.41n–.33A–Index Ext Mkt x + 8 + 6 +56x36.87n+.08D Index Gr x + 4 + 2 + 5x28.48n ..B+IndexMid Cp + 7 + 6 +66 18.89n+.06D+Index Plus x + 5 + 4 + 9x119.41n–.34A–Index Sm Cp x +10 + 8 +67x31.43n+.09E Index Tot Mkt 0 0 +17 9.96n–.01C+Index Value x + 6 + 5 +16x23.56n–.13InflaProtec – 1 – 1 .. 9.64n–.02
A Pac Stk Idx + 4 + 3 +44 11.79n +.12REIT Idx x +17 +15 ..x15.18n +.05E ShInvGrd I 0 + 1 +13 10.49n ..A–SmCapVal Idx x +10 + 8 +74x16.02n+.05C Tot Stk Idx x + 6 + 4 +19x31.58n–.07C Tot Stk Idx Pls x + 6 + 4 ..x28.42n–.07E Totl Bd Idx 0 0 .. 50.28n–.06C TotStkIdx x + 6 + 4 ..x28.42n–.07C TxMd CpAp r + 5 + 3 +12 31.28n+.06D+TxMd Gr&Inc r + 5 + 4 +10 28.56n+.04A–TxMgd Intl + 9 + 8 .. 12.50n+.06
Vantagepoint$14.0 bil 800–669–7400
A–Aggr Opportun + 8 + 7 +12 12.51n+.01D Asset Alloc + 5 + 3 +13 7.89n+.01C BrdMkt Idx I + 6 + 4 +17 10.93n+.02C BrdMkt Indx II + 6 + 4 +17 10.35n+.02E Cor Bd Idx I 0 0 +17 9.82n–.01E Core Bd Indx II 0 0 +18 9.86n–.01C+Equity Inc + 6 + 5 +34 9.41n–.02D Growth + 4 + 2 0 9.05n+.03D+Growth & Inc + 5 + 3 +16 11.17n+.01A–International + 8 + 7 +29 12.44n+.09D–MdlPtf TradGr + 4 + 3 +14 23.27n+.03C+MP AllEqGr + 6 + 5 .. 24.30 +.07D–MP CnsrvGr + 2 + 2 +14 23.81n+.01D+MP LngTmGr + 5 + 4 +15 23.19n+.04E MP SavOrntd + 2 + 1 +14 24.62n–.01E ShrtTrmBond + 1 + 1 + 9 9.79n ..E US Gov Secs 0 0 +12 10.06n–.01D+500 Stk Indx II + 5 + 3 + 8 9.84n+.01
Victory Funds$ 5.4 bil 800–539–3863D–Balanced A + 3 + 3 +12 13.49 ..E Core Bond A 0 0 +13 9.41 –.01C Divers Stk C b + 5 + 3 .. 17.50n ..C Divers Stk R + 5 + 4 +22 17.60n ..C+DiversStk A + 5 + 4 +24 17.75 ..B–Estblsh Val R b + 7 + 5 +41 29.34n+.03E FundForInc A 0 0 + 8 11.80 ..E FundForInc R 0 0 + 8 11.80n–.01E OHMuniBd A 0 + 1 +14 11.65 ..B+Spec Val A + 8 + 7 +67 16.65 +.04C Value A + 7 + 6 +14 15.56 ..
Waddell&Rd Adv$20.4 bil 800–366–5465D AccumA + 3 + 2 – 3 6.98 –.01C Asset Str A b + 8 + 8 +54 9.82 +.04E Bond A 0 0 +17 6.08 ..D–Contl Inc A + 4 + 3 +15 7.77 +.01D Core Inv A + 7 + 5 + 4 6.56 ..E Glbl Bond A + 1 + 1 +22 3.64 ..E GovSecs A 0 0 +13 5.41 –.01E High Inc A + 2 + 2 +17 7.32 +.01C+Intl Gr A + 8 + 8 +12 8.30 +.06
E Ltd Trm A b 0 0 .. 9.91 ..E Muni Bd A 0 + 1 +14 6.95 ..E Muni Hi Inc A + 1 + 2 +22 5.03 ..B NewCpt A b + 8 + 6 +21 10.95 +.03D+Retire A + 3 + 1 +16 8.09 –.01B Sci & Tech A + 6 + 4 +30 11.77 +.01D+Sel Val A b + 5 + 3 +29 13.04 +.01SelDivInc A b + 6 + 5 .. 14.46 –.02C+Sm Cap A b + 7 + 5 +42 15.95 –.02B–Small Cap Y + 7 + 5 +45 16.37n–.02C–Vanguard A + 3 + 1 +13 9.76 +.05
Wasatch$ 6.0 bil 800–551–1700
B+Core Growth + 8 + 6 +68 43.86n+.05Heritage Gr + 3 + 2 .. 11.72 ..
A+Intl Growth +10 +12 .. 21.88n+.07A Micro Cap + 9 + 8+131 6.93n+.01A Small Cap Val + 9 + 7+102 5.44n ..B SmallCapGr + 6 + 5 +70 39.07n+.03C+Ultra Growth + 6 + 5 +56 25.43n–.06E US Treasury – 3 – 3 +35 14.12n–.06
Wayne Hummer$ 160 mil 800–621–4477D+Growth + 5 + 3 +19 41.34 –.01
Weitz Funds$ 5.4 bil 800–232–4161E Fixed Income 0 0 +14 11.39 ..B Hickory + 4 + 3 +14 33.88n+.01D Partner Val + 2 + 2 +13 23.33n+.01D Value + 2 + 1 +14 36.08n+.01
Wells Fargo Advtg$14.4 bil 800–222–8222
A+AsiaPac Inv + 7 + 9 +94 12.50n +.14D–Balncd Inv + 2 + 1 + 3 20.31n+.01B–CommonStk Z + 7 + 6 +37 23.29n+.03E CorpBondInv 0 0 +11 10.22n–.01B DiscoverInc + 7 + 6 +60 21.98n+.07C–Div Inc Inv + 4 + 3 +12 16.85n ..B EntrprisInv + 8 + 7 +16 29.28n+.08E GovtSecsInv 0 0 +15 10.36 –.01D–Gr&Inc Inv + 2 0 – 4 21.22n+.01C+Growth Inv + 7 + 5 + 1 22.53n+.07D–Hi Inc Inv + 2 + 3 + 2 7.72n ..D LgCpGr Inv + 3 + 1 – 9 25.27n+.08A–MidDisc Inv + 6 + 5 +83 21.67 +.10E MuniBondInv + 1 + 1 +25 9.52n ..B–Opport Inv + 5 + 4 +22 47.21n+.01E ShtTrmBdInv 0 + 1 + 3 8.51n ..A SmlCapVal Z b + 6 + 5+109 31.90n–.04E STMuniBdInv 0 + 1 +13 9.78n ..E UltInc Inv + 1 + 1 + 3 9.13 ..E UltShMuniInv + 1 + 1 + 5 4.77n ..C+Wlthbldr Eq b + 5 + 5 +11 13.30 ..D WlthGrowBal + 5 + 4 +16 12.66 +.01B WlthTactEq b + 6 + 6 +22 15.62 +.02
Wells Fargo Advtg A$ 5.7 bil 800–222–8222D Asset Alloc + 4 + 2 +14 20.75 +.01E CA Tax Free + 1 + 1 +18 11.25 ..B–Endv Select b + 1 0 .. 9.89 ..D+Equity Inc + 4 + 2 + 6 30.59 –.02D+EquityIndex + 5 + 3 + 1 49.88 +.07D–HighYldBond + 2 + 3 .. 10.28 +.01E IntmGovtInc b 0 0 +11 10.66 –.01D–Lg Co Grow + 2 0 –11 52.58 +.29A+MontgEmFoc r +13 +13 .. 32.65 +.24D–Outlook2020 + 4 + 3 +12 14.46 +.02D+Outlook2040 + 6 + 4 +12 17.03 +.04A Sml Cap Val b + 6 + 5 .. 31.59 –.04D+Spec Fincl + 5 + 3 +14 3.97 ..
Wells Fargo Advtg Ad$13.5 bil 800–222–8222D+Aggr Alloc + 5 + 4 +17 15.11n+.04E ConsrvAlloc + 2 + 1 +12 19.26n ..C Divers Eq + 6 + 4 + 9 40.00n+.12A–Divers Sml +10 + 8 +68 15.29n+.03B–Equity + 7 + 6 +18 29.37n+.14C–Equity Inc + 4 + 2 + 7 30.56n–.02D Growth Bal + 5 + 3 +15 30.46n+.06D+Index + 5 + 3 + 9 52.63n+.08E IntmGovtInc 0 0 +12 10.66n ..D–Lg Co Grow + 2 0 –10 50.03n+.27D–ModerateBal + 3 + 2 +13 21.62n+.03E NatlTxFrInc + 1 + 1 +19 10.42n ..D–Outlook2020 + 4 + 3 +14 14.62n+.02E Sh Dur Gov 0 + 1 +11 9.87n ..B+Sm Co Grow +12 +11 +38 33.42n+.07A–SmCapOppor +11 +10 +70 36.58n+.09A Sml Co Val b + 8 + 7 .. 16.22n+.04E Stable Inc + 1 + 1 + 8 10.28n ..E TotRetBd Ad 0 0 +20 12.05n–.01
Wells Fargo Advtg B$ 934 mil 800–222–8222D–Asset Alloc + 4 + 2 +11 12.60n+.01D–Lrg Co Gr + 1 0 –13 47.15n+.25A Sml Cap Val m + 6 + 5 .. 30.10n–.04
Wells Fargo Advtg C$ 299 mil 800–222–8222
A Sml Cap Val b + 6 + 5 .. 30.18n–.04Wells Fargo Advtg D$ 646 mil 800–222–8222C C&B Lrg Val + 5 + 4 +39 9.03n+.02B–C&BMid Val + 9 + 8 .. 21.73n+.16
Wells Fargo Advtg I$ 1.9 bil 800–222–8222C+Growth + 7 + 5 .. 23.43n+.07B–Intl Equity + 9 + 9 +13 15.21n+.11E TotRetBd In 0 0 .. 12.04n–.02E Ult ShMuni + 1 + 1 + 6 4.77n ..
Wells Real Est$ 366 mil 800–448–1010
A–S&P REIT A b +17 +15+119 13.61 +.12WesMark Funds$ 619 mil 800–864–1013E Bond 0 0 +11 9.68 –.01D Growth + 5 + 3 + 1 14.07 +.03
Westcore$ 1.3 bil 800–392–2673D–Flex Income r + 3 + 3 +30 9.91n ..C–Growth + 5 + 3 +14 13.39n+.06C+Midco Growth + 7 + 6 +37 8.38n+.03E Plus Bond + 1 + 1 +23 10.47n ..
Western Asset$13.3 bil 626–844–9400E Core Bond I + 1 + 1 +19 11.17n–.01E CoreBdFiInt b + 1 0 .. 11.17n–.01E CorePlusBdI + 1 0 +23 10.36n–.01D–HighYield I + 3 + 3 .. 10.32n+.01E InflPlsBd I 0 0 .. 10.39n–.02E IntermdBd I + 1 0 +16 10.29n–.01
Westport Funds$ 1.3 bil 888–593–7878C+Sel Cap I + 4 + 3 +47 25.60n+.01C+Sel Cap R + 4 + 3 +45 25.21n+.01
Westwood$ 379 mil 800–422–3554D–BalancedAAA + 4 + 3 +20 12.50n+.01C Equity AAA + 6 + 5 +23 11.93n+.02
William Blair I$ 5.0 bil 800–742–7272EmgMktGrIns r +12 +13 .. 15.84n+.01C–Growth r + 5 + 4 + 8 12.15n ..E Income r 0 0 +13 9.74n–.01InstIntlEq + 8 + 8 .. 12.98n+.05
A InstIntlGr + 9 + 9 .. 19.73n+.08A Intl Growth r + 9 + 9 +67 27.80n+.10IntlEquity r + 8 + 8 .. 13.98n+.05
A+Sm Cp Gr r + 9 + 7+125 26.25n+.02William Blair N$ 3.6 bil 800–742–7272
A Intl Growth + 9 + 9 +65 27.44n+.11Wilmington$ 785 mil 800–336–9970
A–MltMgrIntlI +10 + 9 +28 10.01n+.07Wilshire Funds$ 821 mil 888–200–6796D LgCoGr Inst + 4 + 2 +10 36.25n+.17D LgCoGr Inv b + 4 + 2 + 9 35.72n+.17A+ †WinslwGrnGr r +14 +12 .. 20.04 +.03
WM Group A$ 9.6 bil 800–222–5852D–Balanced b + 4 + 3 +23 14.13 +.03E CAMuni A b + 1 + 1 +19 11.21 ..D–ConserveBal b + 3 + 2 .. 10.93 +.02D+Csrv Growth b + 5 + 4 +22 15.83 +.04B–Equity Inc b + 6 + 5 +53 21.26 +.03E Flex Income b + 2 + 1 +19 11.46 +.01D Gr & Inc b + 4 + 2 + 5 26.22 +.05D Growth b + 2 0 –16 16.81 +.06D High Yield b + 4 + 4 +37 8.59 ..E Income b 0 + 1 +20 9.07 –.01C Strateg Gr b + 5 + 4 +22 17.47 +.06E Tx Ex Bd b + 1 + 1 +18 7.63 +.01B–WCoast Eq + 7 + 5 +49 42.53 +.24
WM Group B$ 5.0 bil 800–222–5852D–Balancedm + 4 + 3 +20 14.09n+.03C+Bd& Stkm + 6 + 5 +48 21.08n+.02E CAMuni B m + 1 + 1 +16 11.21n ..E ConserveBal b + 3 + 2 .. 10.90n+.01D Csrv Growthm + 4 + 3 +19 15.35n+.04E Flex Incomem + 2 + 1 +16 11.43n+.01C Strateg Gr m + 5 + 4 +18 16.63n+.05B–WCoast Eq + 7 + 5 +43 37.87n+.21
WM Group C$ 2.6 bil 800–222–5852D–Balancedm + 4 + 3 .. 14.02n+.03D Csrv Growthm + 4 + 3 .. 15.24n+.04C+Equity Inc m + 6 + 5 .. 20.92n+.02E Flex Incomem + 2 + 1 .. 11.37n ..C–Strateg Gr m + 5 + 4 .. 16.67n+.05
Wright Funds$ 303 mil 800–888–9471
A–Intl Blue Chip + 9 + 8 +42 19.49n+.09
—Y—Z—Yacktman Funds$ 494 mil 800–525–8258D Yacktman b + 5 + 4 +81 15.34n+.02
Corporate News . . . a corporate news updateAdvertisement Advertisement
A D V E R T I S E M E N T
Breakthrough Fuel Cell Technology —READY TO LAUNCH!PowerAir Corp (OTC BB: PWAC) is ready to commercially launch a revolutionary, new Fuel Cell tech-nology for the multi-billion dollar back-up power market. The company’s ZINC AIR FUEL CELL is the world’s first re-fuelable, back-up generator, which can operate indoors, efficiently and emission free. Most importantly, this Fuel Cell technology can compete on price with battery powered back-up and traditional gas/diesel generators. PowerAir Corp is now entering licensing discussions with leading manufacturers which want to market the Zinc Air Fuel Cell generators into the global consumer and business marketplace.
Investors are taking notice!
Newly public, PowerAir Corp (OTC BB: PWAC) is attracting the attention of investors who appreciate it’s enormous market opportunity.
OTC BB Symbol: PWAC Market Price $1.40 52-Week Range: $0.20 - 1.46 Average Daily Volume: 34,500 Shares Outstanding: 43 Million
The Clean Solution for the Global Energy CrisisThe growing epidemic of power failures, brown-outs, and blackouts in major urban centers in New York, California, and South Florida is forc-ing homeowners and businesses to search for safe, and efficient back-up power solutions. Until now, a practical solution just did not exist! That’s because traditional gas-powered generators emit deadly carbon monoxide fumes, are noisy, and inefficient - they simply can’t be used indoors. The safe, practical, answer is PowerAir Corp’s Zinc Air Fuel Cell technology which oper-ates silently, efficiently, and emission free. Un-til now, fuel cells were prohibitively expensive, and unreliable. Now, thanks to a decade of R&D, PowerAirCorp’s Zinc Air Fuel Cell is reliable, efficient - and priced to compete with traditional gas and diesel-powered generators.
Learn more about this exciting opportunity by calling 866-734-7026 or visit www.poweraircorp.com
Ready to Launch into $15 BILLION Marketplace!PowerAir Corp’s man-
agement team (led by former sales and engineer-ing executives from Ballard Power (NASDAQ: BLDP)), is now entering licensing discussions with leading back-up power and generator manu-facturers. Companies like Honda and Caterpil-lar which have massive global distribution and marketing capabilities, would be ideal licensing partners. By licensing the Zinc Air Fuel Cell technology, to these world-class manufacturers, PoweAir Corp. can successfuly leverage their distribution channels, which include national re-tailers like Home Depot, WalMart, and others.
What’s driving this $15 billion opportunity?The power grid in the US is nearing a breaking point. And any hiccup or glitch, can leave millions of homes and business in the dark.This problem gets even more serious in booming economies like China, India, and the emerging world, where 100% reliable power supplies simply don’t exist.
PowerAir Corp’s Zinc Air Fuel Cell is a paradigm-shifting, disruptive technology, which is the result of more than a decade worth of research at the world-renowned Lawrence Liver-more National Laboratory, backed by support from the U.S. Department of Energy and the International Lead Zinc Research Organization.
$3.00
$2.50
$2.00
$1.50
$1.00
$0.50
Dec O6 Feb Mar
Get sponsored, electronic copies ofInvestor’s Business Daily® for use
in your classroom.
Enroll today atwww.investors.com/nie
or call
1-800-831-2525
www.investors.com/nie
Attention Teachers!

A18 MONDAY, MARCH 20, 2006 INVESTORS.COM
A ccording to the Hollywood Reporter, “Crash” director PaulHaggis is in negotiations to direct and produce “Against AllEnemies,” a filmbasedon thebookbyBushcritic and former
counterterrorismofficial RichardClarke, detailing the administra-tion’sallegedmishandlingof terrorist threats.Thenews came just as theMotionPictureAssociation ofAmericareleased its annual theatrical market statistics report showing thatmovie attendancedropped 7.9%worldwide last year, and6% in theU.S., fromtheyearbefore.Hollywood has delighted in recent years in making “message”films suchas “Crash” and“BrokebackMountain,” twoof this year’sfive nominees depicting America as the racist, sexist, homophobicsociety thatHollywoodsees through its tinted limousinewindows.But judging from box office receipts, moviegoers aren’t buyingthatmessageandarecastingvotesof theirownin the formofemptytheater seats.Brandon Gray, writing for the Los Angeles Times’ “The Enve-lope,”pointsout that “Crash”was “the least-attendedwinner ever”and that the other four nominees didn’t faremuch better. Throughthe middle of March, this year’s best picture nominees had com-binedfor$240.4millionat theboxoffice, amere17%of the$1.41bil-lionmadeby thetop fivebox-officeperformers in2005.Such comparisons are inexact, since movies are often released todiffering numbers of theaters over different periods, and kept overor re-released depending on Oscar buzz and results. But the trendin box-office receipts and what Hollywood considers entertain-mentandOscarmaterial is striking.OnBoxofficemojo.com’s listof top2005grossers,bestpicturewin-ner “Crash” (America is racist) was 66th, “Brokeback Mountain”(America is homophobic) was 33rd, “Munich” (Palestinian terror-ists are victims) was 43rd, “Good Night, and Good Luck” (McCar-thyism)was98thand“Capote” (liberal icon)was 119th.It’s worth noting that “The Chronicles of Narnia (the Lion, theWitch, and the Wardrobe),” a film based on Christian writer C.S.
Lewis’ books, grossedmore than all five of the Academy’s best pic-turenomineescombined.While Hollywood’s top five didn’t sell many tickets, they didn’tcostmuch tomake either. Such films can stillmake a profit preach-ing to the liberal choir, andHollywoodcankeepchurning themout.In addition to their overt politicalmessages, four of the five nomi-nees were rated R. As the MPAA observes, movies rated PG andPG-13accounted for85%of last year’s topreleases.Where are the movies about the heroism and sacrifice of our sol-diers in Iraq, who are killed supporting democracy in Iraq whilebuildingschoolsandreopeninghospitals?Instead we get “message” movies like “Syriana,” another Holly-woodparanoid fantasywhere themessage is thatoil companiesandthe CIA are out to kill any moderate pro-democracy Arab whowants tohelphispeople.Right.GeorgeClooney,whowonbest supportingactor in “Syriana,” sayshe’sproud thatHollywood is “out of touch.”And it certainly is.Bestsupportingactresswent toRachelWeisz in “ConstantGardener,” amovie about how drug companies murder people. And best songwent to“It’sHardOutHere foraPimp.”We’re sure it is.We’realso sure that’snotentertainment.
StateOf The Art:The director of this year’s winner forbest picturemay produce and directHollywood’s nextgreat Bush basher as Tinseltown ignores the first rule ofholes:When in one, stop digging.
T hedemagogy booms in the runup to an election inwhichRepublicanshidefromtheirbig-spendingrecordasDem-ocratssearch frantically forhotbuttons.And so both sides create caricatures: Those who hold
that a humane economy calls for tolerance of hard-working non-citizensareaccusedof—shudders!—being in leaguewithbigbusi-ness’s demand for cheap labor. They, in turn, see “nativism” and“bigotry”as thechiefmotivationbehind therestrictionists.PresidentGeorgeW. Bush,who as governor dealtwith immigra-tion issues across Texas, entered the national scene from theformercamp.“Familyvalues,”hesaid, “donot stopat theborder.”Proposing a guest worker plan, much like the old “bracero” pro-gram thatwas shut down in the ’60s, the president angered politi-cians inhis ownparty.They seemigrantworkers as adrain on tax-payers,not tomentionapost-9-11 security threat.So immigration “reform” forced its way to the top of the legisla-tive agenda. Under pressure to enact some kind of package thisyear, congressional leaders duked it out over making Bush’s planorborder securityapriority.Thepresident’splan, incorrectlydubbed“amnesty”by its foes,ap-peared to have lost. So the countrywas bracing for a season of Re-publicans pushing formore border security, while arguing againstsolid, free-market justifications forguestworkers.Thursday, perhaps, they were saved from themselves. Republi-can Sen. JohnMcCain and Democratic Sen. Edward Kennedy re-vivedacompromise thatcouldpass thecommitteenextweek.We’re not sure the planwill work perfectly, especially if already-illegal workers are expected to pay a $2,000 fine before they canget in line for legal status.But it puts the guestworkerplanbackonthetable—therebytakingtheseworkersoutof theshadowsanden-abling candidates to run on border security without using fear ofimmigrantsasapretense forprotectingourselves.Besides, with joblessness at 4.8%, the economic fear engenderedbypeoplefromsouthof theborderwhovacuumhotel roomsorper-formbackbreaking farmwork looksabit silly.Thismonth a joint study by economists at theUniversity of Cali-fornia, Davis, and the University of Bologna, Italy, showed thatover the past 30 years rising immigration led to higher wages forU.S.-bornworkers. Cities that served as migrant magnets did bet-ter than others. Why? Hiring one worker creates wealth withwhich to hire more workers. Against their own Reaganite legacy,on this issuemanyRepublicanshaverelapsed intostaticanalysis.Most immigrants are hardworkers and a dependable part of oureconomy. The compromise bill by McCain and Kennedy, as wesaid, isn’t perfect. But it does address humanitarian concerns, andalso takes a stab at making sure that U.S. taxpayers aren’t encum-bered with soaring education and health care bills for millions ofimmigrants. With 11 million people already here illegally, criticsmight do better to focus on assimilation— turning those nowhereintoAmericanswhospeakour languageand loveourcountry.President Bush understands the universal appeal of such princi-ples. If his party follows him, it will shift America’s new demo-graphics itsway.
A Third Way?Immigration:The upcoming elections promise a fightover an uncomfortable reality:Millions cross our bor-der illegally. Happily, the Senate Judiciary Committeejustmight deny politicians a chance to demagogue it.
Hollywood’s ‘Crash’ Landing
Journalism’s MissionMedia:The news business was grippedmore than usuallast week by stories about itself. Has journalism crosseda Rubicon?Have “newmedia” leapfrogged the “old”?
W ar, said Gen.WilliamTecumseh Sherman, is all hell. Noone likes fighting or killing or dying. But there are timeswhenwar isn’t justanoption,butanecessity.Likenow.
Ifnothingelse, thisanniversaryshouldremindusofourresponsi-bility in the age of terror. We face a civilizational threat from anenemy whose hate is so consuming, so complete, that it’ll stop atnothing to do us harm. If we don’t fight this fight and win, we’llforceourchildren todo it.The threatwon’tmelt away.WhentheU.S. invadedIraqthreeyearsago, itwasn’t,as somesur-mised,acheappoliticalploybyPresidentBush. Itwasabid topushtheterroristsback—toput themonthedefensive.As both PearlHarbor and 9-11 showed, Americans have a specialaversion to being attacked. Since 2001, Bush has done everythinghe could to ensure thatwouldn’t happen again. And so far, despitebombings in London, Madrid and Bali; assassinations in Holland;riots in France; and threats against Denmark, the U.S. has re-mained remarkably free of terrorism. Yes,we live in a state of per-petualhighalert.Butgiven the threat, that’s as it shouldbe.For thosewhoaskwhat’s been gained, other thanour ownsafety,the answer is: Plenty.We havemidwifed free and fair elections inIraq and Afghanistan, which never had them before. We helpedsever Lebanon from the corrupt control of Syria, giving its peoplenewhope.WepersuadedLibya’sMoammarGadhafi to giveuphisown nuclear program, once he saw how seriously we takeWMD.Atsomepoint,wehope topersuadeIran todothesame.This might happen. After 27 years of diplomatic estrangement,Iran last week signaled a willingness to talk with us about how tostabilize Iraq — a willingness that came, conveniently enough,right after theU.S.military’sOperationSwarmer, the largest aerialassault sinceShockandAwe.Some say all this has come at a steep price: A once-great friend-ship with Europe has been strained by our insistence that mightmakes right. Perhaps. That said, our ties to Australia and Japan—two far more strategic allies these days — have never been closer.And our relationshipwith India, the world’s second largest coun-tryandlargestdemocracy, isdownrightwarm.As for Iraq, yes, it struggles — plagued by terror as it tries to re-build. Its parliament met last week for the first time since it waselected inDecember,but itsmemberscan’t agreeonwhowill lead.Iraq’s biggest problem is it’s filled with foreign jihadists who seeit as their last stand. A failure of nerve on our partwon’t justmeanthe lossof Iraq. It’llmeanableakandterror-filled future for theen-tireMideast, indeed for therestof theworldaswell.That’s why we’ll sit out the hand-wringing and finger-pointingon this anniversary. This war is far too important for that. Eitherwe’llwin it orwish forcenturies thatwedid.
A Must-Win War
H eadline:Sacramento-basedMcClatchyNewspapers,amid-sizechain, buys thenation’s second largest,KnightRidder.Deal done,McClatchy announced it would disgorge some
ofKR’sbiggerproperties, includingCalifornia’s venerableSanJoseMercury-NewsandThePhiladelphia Inquirer.Headline:GlobalmogulRupertMurdochtellsagatheringofnews-paper publishers — as if they weren’t angst-ridden about it already— that they ignore the newmedia at their peril. They need to lookwell beyond the printed page, he said, to TV, radio,Web sites, pod-castsandothermeansofdeliveringcontent toyoungerconsumers.Headline: Somethingcalled theProject forExcellence inJournal-ismreportsabaleful “paradox”:Americansmaybeexposedtomoremedia outlets thanever, but those outlets offer less original contentas theycompete for thesamestories.FoxandCNNmayhavediffer-entperspectives, but they’reall over thesamedisasters.Headlines:CBS’ iconic interviewerMikeWallace,afterahalf-cen-tury interrogating the high and mighty, announces his retirement.His colleague, thedisgracednightly anchorDanRather, in anunin-tended farce, lectures aNewJerseyhigh school class onhis rules ofgood journalism.Rumors accelerate thatNBC’smorningmatronofgab,KatieCouric,will soonoccupyhisoracularchair.These are all great business stories, but they aremore: a collectionof tipping points that finally dethrone the establishment media.They put brackets around the past three years of self-discrediting,in which reporters fabricated stories and editors and anchors fell,biddingcitizensandconsumers toenternewandwondrousplaces.Therecent breakdownprovides anotherparadox, oneoverlookedby the Excellence panel. All the recentmedia scandals, it turns out,cameat the endof anera inwhichvast resourcesweremobilized to“professionalize” news gathering. Great journalism schools werefundedto lift the trade towardthehighest social ideals.
Predictably, as journalists concentrated on acquiring journalisticexpertise,and industrypublicationsandconsultantsdevotedthem-selves tonavel gazing, theyoftendistanced themselves fromtheev-eryday concerns of their readers. Seldom did they recognize thatsuchconcernsgrewoutof the fragile stateofbasic freedoms.Aritualnarrativedeveloped:Social tensionsandeconomicdispari-tiesalwaysarose fromanunregulatedzoneof life.Theworld’sprob-lems could always be laid at U.S. foreign policy. Top prizeswent tostories premised on the need for tighter political control or amore“sophisticated”acceptanceofothernations’ statecraft.This set of ideas, though unacknowledged by the craft’s practitio-ners, came to be known as “liberalism.” The philosophyhad a goodrun, fromWilliam Paley’s building of CBS through the Sulzbergerdynasty at The New York Times. It remains in evidence at NBC,ABC and CNN, as well as at the expanded McClatchy empire andthestill-dominantGannett chain.Thenow-decadent philosophy in recent years has been answeredby the spectacular success of talk radio, FoxNewsChannel and theriseof Internetbloggers, allofwhich ingeneralseembetterchampi-ons of individual freedom. As long as people guard their choices,newpathways toreliable informationwillbe found.As newmedia find their places, rigorous fact-finding and editingstandards will have to be applied. The blogosphere turns out to bemore of a source of endless commentary than reportage, which re-quiresmore teamworkandcapital thanbloggerscommand.Still, thisnewuniverseofcommentatorsharksback to thenation’sfounding,whenpartisanpaperswereencouragedasameansofsift-ing truth from the political marketplace. Those who demand theirnews straightmay look further back to when shipping news circu-lars reported thenewestcommodityprices.Price, as the economists always knew, is the most accurate infor-mation available. And tobe reliably accurate, it requires the oxygenof a freemarket, therebymaking confident personal choices possi-ble. Media that understand their free-market origins will thrive.Media thatdonotaremore likely tocollapse.William Allen White, the legendary, Depression-era Kansas edi-tor, understood. “Liberty is the one thing you cannot have,” hewrote, “unlessyouarewilling togive it toothers.”Toomanyof theoldmediahaven’theeded.
ISSUES & INSIGHTS
Popular, Just Not The BestTop-film nominees are no-shows among last year’s top grossers
Source: Motion Picture Association of America
Rank 2005 top 15 grossing films DistributorBox office,in millions Rating
1. “Star Wars: Ep. III Revenge of the Sith” Fox $380.3 PG-132. “Harry Potter and the Goblet of Fire” Warner Bros. 289.2 PG-133. “The Chronicles of Narnia” Buena Vista 288.8 PG4. “War of the Worlds” Paramount 234.3 PG-135. “King Kong” Universal 216.9 PG-136. “Wedding Crashers” New Line 209.2 R7. “Charlie and the Chocolate Factory” Warner Bros. 206.5 PG8. “Batman Begins” Warner Bros. 205.3 PG-139. “Madagascar” DreamWorks 193.2 PG
10. “Mr. and Mrs. Smith” Fox 188.3 PG-1311. “Hitch” Sony 177.8 PG-1312. “The Longest Yard” Paramount 158.1 PG-1313. “Fantastic Four” Fox 118.2 PG-1314. “Chicken Little” Buena Vista 134.8 G15. “Robots” Fox 128.2 PG
WarOnTerror:Anniversaries come and anniversariesgo, and Sunday’s marking the third year of the war inIraq is no different. Before this one passes, we’d like tosay a bit about why our fight is so important.

INVESTOR'S BUSINESS DAILY ISSUES & INSIGHTS MONDAY, MARCH 20, 2006 A19
B O O K S H E L F
L E T T E R S
T O M G R A Y
I sWardChurchill just a fluke?Theshort,sad answer is no— as amply document-ed in a new book, “The Professors: The
101 Most Dangerous Academics in Ameri-ca,” by ex-leftist turned conservative DavidHorowitz.Churchill, the University of Coloradoteacherwho called 9-11 victims “little Eich-manns” and said they got what was comingto them, is far fromtheonlyacademic in thiscountry holding extreme, anti-Americanviews. What’s more, he remains a memberingoodstandingofhisprofession.Despite all the outrage he stirred up, anddespite being unmasked as an unqualifiedcharlatan, Churchill has kept his tenuredpost at amajor tax-fundeduniversity.All hegave up was the chairmanship of an ethnicstudies program. He was succeeded in thatadministrative job, Horowitz notes, by oneofhis “mostpassionatedefenders.”Horowitz also points out that Churchillmade the college speaking rounds for threeyears after he posted his infamous essay onthe Web, and no one seemed to mind untilhewas invited to speak (for $3,500, plus ex-penses) in January 2005 at Hamilton Col-lege inNewYork.The media and public got wind of his up-coming talk, and it was canceled. If theevent had gone ahead, it would have beenChurchill’s 40th campus appearance sincehecamedownpubliclyonthesideofal-Qai-da.HorowitzcorrectlyseesChurchill’spop-ularity as “a chilling indictment of an entiresystem.”
Revered StalinHorowitzandateamofresearchers filloutthat indictment by profiling 101 radicals ofvarious stripes — New Lefties, Old Lefties,anti-Israeli propagandists, black racists andone who’s into leather — on faculties atAmerican colleges and universities. (Thelistdoesnot includeChurchill, buthemeetsitscriteria).Mostare tenured, butonly ahandful couldbesaid tohaveearnedtheirprominentposi-tions through real achievement. For everyNoam Chomsky, who did important workin linguistics until discovering his true call-ing as an anti-American scold four decadesago, a dozen mediocrities went straightfrom grad school to pamphleteering andstill enjoy thestatusof seriousscholars.The book also serves as a Class Notes foralumniof the ’60sLeft aswell asothernoto-riousradicalsor racistsofpastdecades.
We learn that Angela Davis, who was acommunist in good standing right to theend of the Cold War, is now a professor ofthehistoryofconsciousnessat theUniversi-ty of California, Santa Cruz. Leonard Jef-fries, who once called whites “ice people”(not as a compliment) and Jews “a race ofskunks,” is still a tenured professor at CityUniversityofNewYork.Bruce Franklin, an admirer of Stalin whowas kicked out of Stanford (despite his ten-ure) in 1972 for inciting to riot, holds an en-dowedchair inEnglishatRutgers.
Include ChurchillWilliamAyers andBernadineDohrn, hus-band-and-wife leadersof theviolent radicalgroupWeatherUnderground, dodged pris-ononapointof legalprocedureandaresafe-ly perched at academic posts — she as a lawprofessor at Northwestern, he as a distin-guishedprofessorofearlychildhoodeduca-tion and a senior university scholar at theUniversityof Illinois,Chicago.Amiri Baraka, the former LeRoi Jones, isanother Rutgers luminary. Right after 9-11he wrote a poem claiming that Jews weretipped off to the attack (a view consistentwith his past writings). Not long afterwardhewasnamedpoet laureateofNewJersey.Embarrassed by the ensuing controversy,which it somehowdid not foresee, the stateeliminated the laureateship as away of get-ting rid ofBarakawithout firinghim.Buthehas long been on the public payroll as a ten-ured faculty member at New Jersey’s stateuniversity.As for the leather fetishist, she’s GayleRubin, assistant professor of anthropologyand ethnology at the University of Michi-gan. Rubin has criticized the prosecution ofpedophiles as a “savage and underservedwitch hunt” and was namedWoman of theYear by theNational Leather Association, agrouppromotingawiderangeofkinks.There are plenty of other profiles in thisbook that make a strong case for question-ing thesanityof theprofessorsandthe insti-tutions that hired them. But there are hun-dreds of thousands of professors in thiscountry, and101outrageouslybadones (102ifyouaddChurchill)donotnecessarily rep-resent themainstream.Horowitz is well aware of this, and “TheProfessors” attempts to generalize beyondhorror stories. This is where the book leadsto some frustration — not because Horow-itz is wrong, but because most of the factsthat could make his case remain behindcloseddoors.After all, Americans need to know whatthe professors (especially those in the tax-payers’ employ) are teaching, not just whatthey are saying or writing in public venues.The real scandal in higher education is notthat too many professors have radical
views,but that theyforcetheseviewsonstu-dents,mostofwhomaretooyoungandintel-lectually intimidated to talk back. Accord-ing tomany students at the receiving end ofthis indoctrination, these teachers also de-mandpolitical conformityandtauntconser-vativedissenters.Horowitz says it wasn’t always this way.He was well to the left of the faculty whenhe studied at Columbia University in the1950s, andhemadenosecretof that fact.“Even though this was the height of theColdWarandmyprofessorswereanti-com-munist liberals,” hewrites, “they never sin-gledmeout forcommentthewaymanycon-servative students I have encountered aresingledout today.”In other words, the classroom door wasalso treated as a wall meant to separateteaching frompolitics.Times have changed, and Horowitz isn’tthe first to point this out. Thewall hadpret-ty much been torn down in the humanitiesby the time of Roger Kimball’s angry 1990book“TenuredRadicals.”Nowfacultiesarejust sweepingaway therubble.Horowitz describes one such cleanup job,the43-3voteof the facultysenateat theUni-versity of California, Berkeley, in 2003 toscrapRuleAPM0-10of theuniversity’s“Ac-ademicPersonnelManual.”
Not About FactsWritten in 1934 by UC’s president, RobertGordon Sproul, the old rule firmly drew aline against using theprestige of theuniver-sity as a “platform for propaganda” and de-mandedstrict impartiality:“Whereitbecomesnecessary . . . toconsid-er political, social or sectarian movements,they are dissected and examined, nottaught, and the conclusion left, with no tip-pingof the facts, to the logicof the facts.”The new rule, in contrast, leaves it up tothe faculty to determinewhat’s fair and im-partial. In other words, it’s no standard atall.What’s most disturbing about this votewas that it was so clearly a license to indoc-trinate. It indicates that the idea of teachingas a disinterested effort to find and conveythe truth is dead or dying, and that it hasbeen replaced by the notion of teaching as ameans of social change, with truth second-aryatbest.Anotherbook isneeded(maybeseveral) todocument how this new attitude plays outin practice — in the unsupervised, so-farlargely unrecorded realm of the classroomand lecture hall (the good news here is thatstudentsnowseemable to record just aboutanything,anywhere).We might then see that the real threat isnot 101 (or 102) outrageous teachers, but anentire academic culture that has lost itsway.
O N T H E R I G H T
Supporting ImmigrantsRegarding“VisaVersa:WhyDoIllegalsOutnumberH-1Bs?” (Editorial,Thursday):OnceagainIapplaudIBDforbringing thereal immigration issue to light.Forsomereasonall thesepro-immigrationzombieswalkingaroundtellingeveryoneweareanationof immigrants soweshouldhavenobarriers toentry justdon’t get it.Yes,weareanationof immigrants, butmore importantweare (were)anationoflegal, balanced immigration. Itusedtobethat the influxof immigrants representedpeople fromallpartsof theworld fairlyequallyandtheyassimilated into thepopula-tionandAmericanculture fairlywell.Thecrisiswehavenow,however, is thatthrough illegal immigration,wehaveadis-proportionate inflowof immigrants from
onecountry(Mexico)whoare largelyuned-ucatedandunskilledandareabhorrent tointegrate into theAmericanculture—asevidencedby their refusal toeven learntheEnglish language.SomeestimateshaveHispanicsmakingup25%of theU.S.populationby theyear2020.Toomanyof thesepeoplearehere largely toexploitourgeneroussocial servicepro-gramsandsendasmuchmoneyback toMexicoaspossible; theyreallycouldn’t carelessabout thiscountry.This is all at thetaxpayerexpense,ofcourse, somethingpro-immigrantgroups (and theemployersthat like to takeadvantageofcheap labor)don’t seemtomind.Ihavean idea:All thepro-immigrationpeoplecancheckaboxon their taxreturnthisyearvolunteering topayanextra$1,000for theirbeloved illegal immigrants
andwecan finallyendthedebate.JerreMcManus,MadisonHeights,Mich.
Wild SwingGiventheopportunity tocontrast theviewsRepublicansandDemocratshaveofeachother,E.J.Dionnecouldn’tpassup theop-portunity to showcasehisbias in“Blue-StateRichVoteALotLikeBlue-StatePoor”(OnTheLeft,Wednesday).Hefilledhis“RepublicansseeDemocrats”paragraphwithcatchphrasesandquotationmarks,whilehis “Democrats seeRepublicans”counterpartparagraphread likeasimplerevelationof the truth.Doeshethink read-ersare that inattentive?Still,maybethat’swhyyoukeeppublishinghim;he’s thetelegraphed“wild lefthook”attempttocounter thestingingright jab.CharleyWilson, St. Louis
E . J . D I O N N E J R .
Russ Feingold tossed a political gre-nade at President Bush last week, butit fell into the middle of the Senate
Democraticcaucus.ManyDemocraticsena-tors ranaway.The grenade was theWisconsin senator’sproposal tocensure thepresident forviolat-ing the law by ordering electronic surveil-lance on Americans without explicit con-gressional or court authorization. The epi-sode saysmore about Bush’s political frailtythan the first blush accounts have suggest-ed. It alsounderscoredthefrictionsandten-sionsbetweenpassionateDemocraticactiv-istsandtheircautious leaders.The president has lost so much supportand credibility that Republicans were sim-ply grateful that Feingold briefly changedthe political subject from the Dubai portcontroversy, the mess in Iraq and Bush’sanemicpoll ratings.As one of Feingold’s colleagues pointedout, acensureproposal related toanyaspectof thepresident’spoliciesonterrorwouldatoncehaveunleashedanunrelentingGOPat-tack on the sponsor’s patriotism. Now Re-publicans have to content themselves withusing calls for censuring or impeachingBushto rally theirowndispirited troops.At a moment when Democrats have Bushon the run,Feingold’s proposalwasa tad in-convenient, a conversationchangeratamo-ment when Feingold’s colleagues liked thewaytheconversationwasgoing just fine.Consider the disparity between the re-sponsetoFeingold’s initiativeamongDemo-craticsenatorsandthereactionamongDem-ocratic activists. Senators mostly scam-pered away from the cameras last week be-cause they didn’t want to say publicly whatmanyof themsaidprivately.
Won’t Back DownMost were livid that Feingold sprang hiscensure ideaonaSunday talk showwithoutgiving them any notice. Many see Feingoldas more concerned with rallying supportfromtheDemocraticbaseforhis2008presi-dential candidacy than in helping his partyregainCongress this fall.Some Democrats want the party to forgetthe warrantless wiretapping issue becauseengaging it would let Bush claim that he’stougher on terrorists than his partisan ene-mies. Others share Feingold’s frustrationwith the administration’s stonewalling onthe program, but think they need to knowmore before they can effectively challengeBushon the issue.Both groups were furious that Feingoldgrabbed headlines away from those deli-cious stories about Republican divisionsanddefections.But at the grass roots and Net roots, Fein-gold has become a hero — again. They al-ready lovedhim for his courage in opposingthe Patriot Act and his call for a timetablefor troop withdrawals from Iraq. His latestmove only reinforced Feingold’s image forbeing “aDemwith spine,” as the left-liberalWeb site BuzzFlash.com put it in a com-ment representative of the acclaim he wonacross theactivistblogs.In an interview, Feingold was unrepen-tant,arguingthatbeforehemadehispropos-al, “the whole issue of the president violat-ing the lawsof this countrywasbeing sweptunder the rug.Wewere going to sit back asDemocrats and say, ‘This is too hot to han-dle’—well that’soutrageous.”He warned that “the mistakes of 2002 arebeing repeated,” meaning that Democratsshould never again “cower” before Bush onsecurity issues, as somany in the grass rootssawthemdoingbefore the2002elections.
Passion NeededAndit’s asignofFeingold’s viewofsomeofhisDemocratic colleagues that hedefendedhis decision not to let them in on his plan.Had they knownwhat hewasup to, he said,“they would have planned a strategy toblunt this.”Here’s theproblem:Feingoldandtheactiv-istsare right thatDemocratscan’t just takeapass on the wiretapping issue becauseBush’s legal claims are so suspect — even tomany inhis ownparty. The opposition’s jobis to raise alarms over potential abuses ofpresidentialpower.But Democrats, unlike Republicans, haveyet to develop a healthy relationship be-tween activists willing to test and expandconventional limits on political debate andthe politicians who have to calculate whatworks in creating an electoral majority. Fortwo decades, Republicans have used theiridealists, their ideologues and their loud-mouths to push the boundaries of discus-sionto the right.In the best of all worlds, Feingold’s strongstand would redefine what’s “moderate”andmakeclear that thosechallengingthe le-gality of the wiretapping are neither ex-treme nor soft on terror. That would de-mand coordination, trust and, yes, calcula-tion involving the vote-counting politiciansandtheguardiansofprincipleamongtheac-tivists. Republicans have mastered this art.Democratshaven’t.Turning a minority into a majority re-quires passion and discipline. Bringing thetwo together requires effective leadership.Does anybody out there know how to playthisgame?
D R . E L I Z A B E T H W H E L A N
Thepotential for an avian flu pandemicis something we’re constantly askedabout at theAmericanCouncil onSci-
ence and Health. It doesn’t help that head-lines constantly blare about “deadly” out-breaks in Asia and Europe without trou-bling to clarify whether the outbreaks aredeadly tohumansorbirds.Still, unlike so many health scare storieswe analyze, bird flu is not just hype but areal potential threat — the tricky part is de-termininghowbig thatpotential is.Themajoruncertainty iswhether therele-vant bird flu virus, H5N1, which is alreadydevastating flocks in Asia and Europe, willmutate intoa formthathasasimilarlydevas-tating effect on humans. Right now, bird flucan kill humans under rare circumstances,such as when people are in close, frequentcontactwithrawduckblood,orothercondi-tions — highly unusual in developed coun-tries andunusual even in undevelopedones— that increase the odds of transmissionfrombirds tohumans.But to devastate humanpopulations in theway that it has bird populations, H5N1would have to mutate into a form thatspreads easily between and among humansrather than just frombirds to humans. Cur-rently it does not appear to spread fromhuman to human, and several changeswould have to occur in the genetic code ofH5N1for it todoso.In the meantime, though every death istragic, bird flu has taken a relatively smalltoll in human lives. By the end of February,the World Health Organization reported atotal of 173 known cases of human infectionwith H5N1, all among people working inclose contact with infected domesticatedbirds.Of those, 95havedied.
Difficult PreparationsCompared to the daily toll from smoking,car crashes, or countless other killers, thosenumbers are minuscule — but there are afew important reasons that we cannotheaveasighof relief:00Roughly 54% of those humans who havebecomeinfectedwithH5N1havedied,adis-turbingly high fatality rate that may notbode well if the disease begins spreadingrapidlyamonghumans.00The infamous flu pandemic of 1918-19,which killed tens of millions of peoplearound the world, is believed to have origi-nated as a bird flu— a reminder that we areespecially susceptible to diseases that donot normally occur in mammals and towhichwe thereforehave little immunity.00 It is difficult to prepare in advance for apossible bird flu pandemic, because wewon’t know the exact nature of the viruswe’re fighting until the dreaded mutationsoccurred that made it easily transmissiblebetweenhumans.Despite all these reasons for concern, de-fensive measures are being taken: researchinto new antiviral drugs — possibly onesthat target parts of the virus’ genetic codethatareunlikely toalteras itmutates; thede-velopmentof fasterproductionmethods forchurning out a vaccine if a pandemic oc-curs; and the stockpiling ofTamiflu andRe-lenza, existing antivirals that may help re-duce the severity of symptoms for thosewhocatchbirdflu, thoughtheir likelyeffica-cy is a subjectofdebate.
Don’t PanicWhile our best hope is that the fearedmu-tations to H5N1 simply never occur, it iswise to be prepared for the small but realpossibility, given what history teaches usaboutthepotentialmagnitudeofsuchapan-demic. At ACSH,we strongly and frequent-ly advise againstwasting resourcesonmini-mal or purely speculative threats, but this isone case where the consequences might bedevastating enough tomake a heavy invest-mentnowreasonable.Humancases of bird flu arebelieved limit-ed to Southeast Asia, Turkey and Iraq. Inbird populations, though, the disease hasquickly spread to South Korea, Vietnam,Japan, Thailand, Cambodia, Laos, Indone-sia, China, Malaysia, Russia, Kazakhstan,Mongolia, Turkey, Romania, Croatia,Ukraine, Iraq, Nigeria, Azerbaijan, Bulgar-ia,Greece, Italy,Slovenia, Iran,Austria,Ger-many, Egypt, India, France, Hungary, Bos-nia-Herzegovina, Switzerland, Georgia,Niger,SwedenandIsrael.If it reaches theU.S.—andinbirds, at least,it probably will — it is likely to appear firston theWest Coast, coming over among mi-gratorybirds fromAsia toAlaska.Again, its appearance in birds alone, or inveryrarebird-to-humancases, isnot reasontopanicoreventobesurprised. If andwhenmutationsallowinghuman-to-humantrans-missionoccur, itwill still notbeappropriateto panic. But it will be time to face a poten-tially devastating crisis with level-headedresolveandthebestandmost technological-ly advanced public health resourceswe canmuster.
00 Whelan is president of the AmericanCouncilonScienceandHealthandservesasanadviser to theFreeMarketProject.ACSHhas justpublished thereport “AvianInfluenza,or ‘BirdFlu’:WhatYouNeedtoKnow.”
The ProfessorsbyDavidHorowitzRegnery PublishingWashington, D.C. (2006)448 pages, $27.95.
Feingold SpineCould Do WithStiffer Support
Be Concerned,But Don’t PanicOver Bird Flu
It’s Time For Class: Do You KnowWhat Profs Are Telling Your Kids?
O N T H E L E F T
HOLDINGBANNERSsayingfreetradecreatesjobs,thousandsofEcuadoreansmarchedinQuitoFridaytosupporttheFreeTradeAgree-mentwith theU.S. In the past ninemonths, Ecuador’sAndeanneighbors, Peru andColombia, have signed free trade pactswith theU.S.,alongwith its direct economic competitors fromCentral America, whose two-way tradewith theU.S. is seen reaching $3 billion. AP

A20 MONDAY, MARCH 20, 2006 INVESTORS.COM
Stock MktEPS Rel Price Val Revenue Qtr 2/3-yr Qtr Pretax
Rank Company Ticker Rtg ë Str (1 Day Ago) ($Mil) ($Mil) EPS% EPS % Rev % ROE Margin
1 F5 Networks FFIV 98 87 68.07 2789.6 309.5 81 0 47 11.1 28.4Seattle. Sells systems and services to securely manage and optimize Internet traffic.
2 Digital River DRIV 97 80 39.84 1450.9 220.4 40 70 28 18.3 23.6Eden Prairie, Minn. Provides e-commerce outsourcing services.
3 Internet Comm. ICCA 76 97 4.44 84.7 19.5 0 -73.2 44 2.3 1.6Norcross, Ga. Sells network and electronic data interchange services.
4 Radcom RDCM 76 96 4.07 60.8 22.4 0 0 30 -99.7 -55.6Israel-based seller of high-performance networking test and analysis equipment.
5 Akamai Tech. AKAM 68 96 27.19 4281.4 283.1 60 0 44 -27.3 16.7Cambridge, Mass. Helps manage content delivery and other tasks for electronic business.
6 Packeteer PKTR 85 73 12.92 422.9 113 65 71.9 21 14.3 15.3Cupertino, Calif. Handles application traffic management for networks and the Internet.
7 Equinix EQIX 63 83 54.34 1534.6 221.1 0 -80.6 37 -25.1 -41.8Foster City, Calif. Sells network cabinets, power products and other equipment.
8 Q9Networks 5Q 76 66 8.67 174.5 40.8 0 0 37 -35.1 -139.7Toronto. Provides outsourced Internet infrastructure and related managed services.
9 Savvis SVVS 38 93 1.15 226.8 667 0 -17.4 3 52.3 -10.4Town & Country, Mo. Sells network hosting and other services.
10 Imergent IIG 54 67 9.1 105.5 153.1 0 0 1125 71.2 11.8Orem, Utah. Provides e-commerce technology and training to Internet merchants.
B Y D O U G T S U R U O K AINVESTOR'S BUSINESS DAILY
As theworld becomes moredepen-dent on network computing, pro-viders of network solutions arethriving.
Such companies help businessesand other organizations make themost of networks. Their productsare designed to fine-tune systems,letting them handle data morequickly and efficiently.
Some network solution firms arehardware companies that help de-liver Web content for large andsmall businesses. Others are soft-ware and services firms that helpclients manage e-commerce sales.Still others offer software thatlinks together sprawling corpo-rate networks.
“One thing these firms all have incommon is connectivity,” said For-rester Research analyst RobWhiteley. “Right now, all enter-prises are struggling with userswho are becoming more mobileandremote. All this points to need-ing better software and services toconnect backto corporate resourc-es.”
1. Business
For network solution firms, it’sall about helping clients tap thefull power of their networks. Thatoften means developing softwareto better manage sales, data pro-cessing and communications.
That’sno easy task. Software is la-bor-intensive. It consumes morehuman capital per dollar of valueproduced than most other mod-ern industries. It’s also highly com-petitive. These firms develop theirsoftware and services in the faceof fierce rivalries and fast-chang-ing technologies.
Most of the industry’s playersuse a hybrid business modelwhere they both develop softwareand perform some service workfor clients. That lets them createunique technologies that distin-guish them from rivals.
Network solution firms typicallydon’t sell the basic network hard-wareand software. Most business-es acquire those from companieslike Cisco SystemsCSCO or SAPSAP.IBMIBM, Sun MicrosystemsSUNWand OracleORCL also provide vari-ous networking hardware, soft-ware and services.
Network solution firms thencome in and enhance those net-works.
The industry segment includesAkamai TechnologiesAKAM, a Webcontent delivery specialist with$283 million in annual sales, andF5 NetworksFFIV, a network appli-cation provider with yearly sales
of $309 million.Digital RiverDRIV, an e-commerce
software expert with $220 millionin annual revenue, helps compa-nies improve online sales technol-ogy. And EquinixEQIX, which has$221 million in annual sales, offersapplications that connect corpo-rate networks.
“The vast majority of these com-panies are all about optimizing ap-plication infrastructure” for net-works, Whiteley said.
IPassIPAS is another contender.That company, which has annualrevenue of $169 million, providessecure network connections in150 countries.
IPass offers 17,000 broadbandhigh-speed Internet connectionsfor corporate clients worldwide.And it has 15,000 Wi-Fi hot spots— zones where you can go onlinewirelessly.
“It’s a poster child of a companythat solves network problems,”Whiteley said.00 Name Of The Game: Helpingcompanies get a better return ontheir tech investments by makingnetworks faster and more secure— and earning a tidy sum in theprocess.
2. Market
The market is driven by big cor-porate clients, though small andmidsize businesses increasinglyuse network technology as well.
Network solution providers areposting nice revenue growth aslarge companies try to make theirexisting networks better andmore problem-free.
“Our penetration in the Fortune500 has been pretty strong overthe last five years,” said JohnMcAdam, president and CEO ofF5 Networks.
Many big businesses boughtlarge network application packag-esin ’05 from tech playerslike IBMand Siebel, now part of Oracle.Thiswas aftera period of relatively
weak tech spending between 2001and 2004, Whiteley says.
Now these same companies aretapping firms like iPass to upgradetheir networks. “They’re going inand tweaking them,” he said.
In a Forrester study, 59% of 868companies surveyed said “deploy-ing or upgrading a major networkapplication” was the No. 1 item ontheir 2005 IT spending list.
Some customers also want to ex-pand the reach of their networks.
That’s helping bring business toAkamai, which provides a globalserver service for clients. It booststhe ability of customers to deliverWeb content. Akamai has 15,000servers in 1,100 networks in scoresof countries that corporate clientscan use.
“Our market is growing becausethe Internet is growing,” said Aka-mai CEO Paul Sagan.
The fastest-growing segment ofnetwork solutions is security. (Seerelated story on this page.)
Financial services clients likebanks and credit card companiesare investing heavily in applica-tions that protect their networksfrom hackers or insiders that maysteal or damage data. Companiesalso are upgrading networks sotheir financial data conforms withSarbanes-Oxley and other manda-tory federal accounting rules.
These spending priorities willlead to increased sales for compa-nies innetwork computing, White-ley says.
3. Climate
The networking industry is busyconsolidating. Dozens of smallerplayers are being gobbled up bylarger ones.
Some big players like Cisco andIBM are trying to get involved inallaspects ofnetworking technolo-gy in an “under-one-roof” strate-gy. It’s not clear if the tack works.
Smaller network solution firms,meanwhile, are acquiring weaker
rivals where they can.There’s some concern that high-
er energy prices and interest ratescould negatively affect tech spend-ing later this year.
However, analysts say there maybe less impact on network solu-tions. That’s because spending onIT security and regulatory compli-ance issues can’t be put off.
4. Technology
More companies are relying onthe Net to deliver content to thepublic. News, entertainment ande-commercecontent is growing es-pecially fast.
That’s good news for networktechnology providers, since theyhelp deliver such content.
An explosion of new wireless,broadband, satellite and telecomtechnologies also will increase de-mand for networking solutions.
Companies need new applica-tions to deal with Internet phonesystems, Internet video and wire-less networks, says F5 Networks’McAdam.
And telecom companies are mov-ing aggressively into the network-ing space by offering sprawlingwireless networks for business cli-ents. That could create more ancil-lary work for network solutionfirms.
5. Outlook
Spending on network solutionsoftware and services will likelycontinue to rise, boosted by theneed to make networks more se-cure.
The sector also may see a generaluplift if broader IT spending getsstepped up later in 2006.
A March survey on IT spendingby Goldman Sachs found that agrowing number of global compa-nies expect to increase their ITspending by 10% or more in 2006.This would be the highest ITspending boost since early 2002.
F5’s McAdam expects the mar-ket forupgrading andsecuring net-work applications to see top-linerevenue growth of 20% to 25%over the next three years.00 Upside: Companies are spend-ing more on applications thatmake their networks more secure,helping to ramp up sales for net-work solution providers.00 Risks: The networking marketis known for its rapid technologi-cal shifts. Those who fail to keeppace could see existing productsand technology rendered obsolete.
And there’s always the threatthat big providers of networkinggear and software will enter theniches served by network solutionfirms.
Spotlight On SecurityFor Network ManagersNetwork solution firmslook to adapt to newthreats and regulations
Giving Networks A Tune-UpAs computer systems branch out, companies help them run smoothly
B Y D O U G T S U R U O K AINVESTOR'S BUSINESS DAILY
Now that so many companies havenetworks, the challenge is makingthose networks more secure.
Networks are multiplying in the ge-ographies they cover and in the num-ber of workers, applications and de-vices connected to them. Thatmakes security tasks that muchmore complicated — and expensive.
“Securing network applications isa top priority,” said Forrester Re-search analyst Rob Whiteley. “It willbe getting a larger portion of futurecorporate (information technology)budgets.”
The soaring demand for security iscreating big opportunities for net-work solution providers, Whiteleysays. Though many security tasksare handled by dedicated compa-nies, such as SymantecSYMC, networksolution firms see a chance to carveout their own niche. They’re rapidlyadding security features to their soft-ware and hardware.
The network security manage-ment market will rise to $800 mil-lion in 2008, up from $330 million in2005, according to the research firmYankee Group.
Security management involves anumber of tasks. For one, the tech-nology has to shield networksagainst people who want to steal orsabotage data. That includes peopleslipping in from outside the net-work, as well as insiders.
Security technology also has to en-sure that information is handled in away that complies with regulations,such as the federal Sarbanes-Oxleylaw.
For corporate IT departments, se-curity is a major focus. A recent Gold-man Sachs survey of IT managersfound that security, application inte-gration, and compliance and riskmanagement are their top three pri-orities for the next year.
As companies upgrade or expandtheir networks, security needs aretaking precedence. “People are ask-ing, ‘Is this process as secure or moresecure than what I’ve been using?’ ”said Paul Sagan, chief executive ofAkamai TechnologiesAKAM.
Akamai deals with this questionconstantly, Sagan says, since it han-dlesWeb services for clients. Its serv-er networks let Web-linked custom-ers deliver content online.
To alleviate concerns, Akamai rou-tinely improves the security featuresin its network services, Sagan says.
Other network solution firms arebuilding security into their offer-ings. Products once designed just tostreamline networks are helping se-cure them as well.
“We’re joining security and optimi-
zation as part of the same networkoperating system,” said John McAd-am, president and chief executive ofF5 NetworksFFIV, which delivers net-worked software applications.
Hackers aren’t the only fear.Chance glitches can corrupt net-work data and create a bad experi-ence for customers. So businessesare spending more to protect them-selves against network accidents,Whiteley says.
Meanwhile, the need toprotect sen-sitive data under federal accountinglaws is creating more network head-aches, says Ben Nye, a partner withBoston-based venture capital firmBain Capital.
Firms want to ensure that employ-ees haven’t tampered with corpo-rate financial records, he says. “Sar-banes-Oxley is creating enormousdemand for both compliance and se-curity solutions,” Nye said. “Whilenetworks provide applications and
computing power to users, they alsopose a risk to the sensitive internaldata that companies hold. So track-ing the activities of internal and ex-ternal network users is of enormousvalue in policing these concerns.”
Compliance software spendingshould see healthy growth in 2006,according to Goldman Sachs’ IT sur-vey. More customers are automatingcompliance tasks so they can be surethey’re abiding by regulations.
Bain Capital’s Nye expects to seestartup companies profit from thistrend. His company is investing inproviders of network security andcompliance services.
One startup is Network Intelli-gence in Westwood, Mass.
Companiesareworried about insid-ers misusing data, says Jim Melvin,Network Intelligence’s senior vicepresident for marketing. Credit cardfirms and banks are especially wary,he says.
When account information is sto-len, there’s a need for services thattrack the people who’ve accesseddata from inside a network, Melvinsays.
“It’s a huge security risk,” he said.He expects future networks to han-
dle security and all other networkmanagement tasks via one softwarepackage or service.
“There will be a convergence,”Melvin said. “Clients will be able tomonitor what critical network sys-temslike business intelligence, disas-ter recovery planning, security andcompliance are doing at one time.”
I N T E R N E T N E T W O R K S O L U T I O N S
Who’s Who In Internet Network SolutionsStocksranked bya combined EPS and RelativeStrength
INDUSTRY SNAPSHOTS E C U R I T Y
“Sarbanes-Oxley iscreating enormousdemand for bothcompliance and securitysolutions.”BenNye,Bain Capital
Terry Sullo, an Akamai Technologies employee, checks the Internet.The company helps businesses speed up online content. Chicago Tribune
MACROSCOPE
New PrioritiesInformation technology spending continues to rise, but priorities are changing. Companies are focused less on upgrading individual applications and more on upgrading security and complying with regulations, such as Sarbanes-Oxley.Sources: Gartner, Forrester Research
Worldwide IT spending, in trillions IT funding priorities for North American companies
2.0
2.5
$3.0
’07e’06e’05’04Upgrading security
Complying with regulations
Upgrading disaster recovery capabilities
Deploying or upgrading a major application 59%
55%
54%
54% Consolidating IT infrastructure
Upgrading disaster recovery capabilities
Upgrading security
Complying with regulations 67%
57%
54%
51%2005 2006
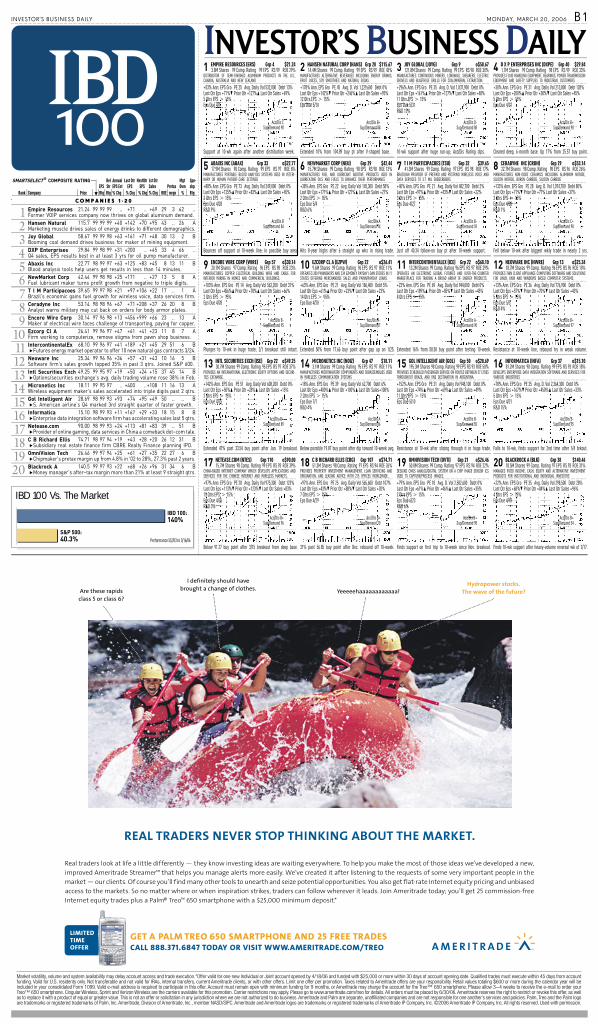
SMARTSELECT® COMPOSITE RATING RelîAnnual Last Qtr NextQtr Lst Qtr Mgtîì Spn-EPS StrëîEPS Est EPS EPS Salesî Pretaxè Ownî shp
6Rank Company Price íî Rtg Rtgî% Chg % Chg % Chg % Chg ROE mrgnè % Rtg.
1 EMPIRE RESOURCES (ERS) Grp 4 $21.243.8M Shares 99 Comp. Rating 99 EPS RS 99 ROE 29%
DISTRIBUTOR OF SEMI-FINISHED ALUMINUM PRODUCTS IN THE U.S.,CANADA, AUSTRALIA AND NEW ZEALAND
+53% Ann. EPS Gro PE 25 Avg. Daily Vol 532,000 Debt 13%Last Qtr Eps +71%6 Prior Qtr +127%5 Last Qtr Sales +69%5 Qtrs EPS) 15%Eps Due 4/1
Acc/Dis CSup/Demand 98
Support at 10-wk again after another distribution week.
5 ABAXIS INC (ABAX) Grp 33 o$22.7717.9M Shares 98 Comp. Rating 99 EPS RS 97 ROE 8%
MANUFACTURES PORTABLE BLOOD ANALYSIS SYSTEMS USED IN VETERI-NARY OR HUMAN PATIENT-CARE SETTINGS
+88% Ann. EPS Gro PE 73 Avg. Daily Vol 249,000 Debt 0%Last Qtr Eps +125%5 Prior Qtr +83%5 Last Qtr Sales +45%2 Qtrs EPS) 15%Eps Due 4/28R&D 9%
Acc/Dis BSup/Demand 84
Bounces off support at 10-week line; in possible buy area.
9 ENCORE WIRE CORP (WIRE) Grp 57 o$30.1420.1M Shares 97 Comp. Rating 96 EPS RS 98 ROE 23%
MANUFACTURES COPPER ELECTRICAL BUILDING WIRE AND CABLE FORINTERIOR WIRING IN HOMES AND COMMERICAL BUILDINGS.
+103% Ann. EPS Gro PE 14 Avg. Daily Vol 562,200 Debt 31%Last Qtr Eps +456%5 Prior Qtr +78%5 Last Qtr Sales +66%2 Qtrs EPS) 15%Eps Due 4/28
Acc/Dis B-Sup/Demand 95
Plunges to 10-wk in huge trade; 2/1 breakout still intact.
13 INTL SECURITIES EXCH (ISE) Grp 22 o$49.2530.7M Shares 99 Comp. Rating 95 EPS RS 97 ROE 37%
PROVIDES AN INTERNATIONAL ELECTRONIC EQUITY OPTIONS AND SECURI-TIES EXCHANGE.
+142% Ann. EPS Gro PE 51 Avg. Daily Vol 608,200 Debt 0%Last Qtr Eps +50%5 Prior Qtr +28%5 Last Qtr Sales +15%2 Qtrs EPS) 15%Eps Due 4/25
Acc/Dis B+Sup/Demand 89
Extended 47% past 33.54 buy point after Jan. 19 breakout.
17 NETEASE.COM (NTES) Grp 110 o$90.0015.7M Shares 98 Comp. Rating 99 EPS RS 93 ROE 39%
CHINA-BASED INTERNET COMPANY WHICH DEVELOPS APPLICATIONS ANDSERVICES FOR THE CHINESE INTERNET AND WIRELESS MARKETS.
+97% Ann. EPS Gro PE 28 Avg. Daily Vol 975,300 Debt 123%Last Qtr Eps +113%6 Prior Qtr +123%6 Last Qtr Sales +83%15 Qtrs EPS) 15%Eps Due 4/26R&D 3%
Acc/Dis B+Sup/Demand 96
Below 91.27 buy point after 3/15 breakout from deep base.
2 HANSEN NATURAL CORP (HANS) Grp 28 $115.6714.4M Shares 99 Comp. Rating 99 EPS RS 99 ROE 43%
MANUFACTURES ALTERNATIVE BEVERAGES INCLUDING ENERGY DRINKS,FRUIT JUICES, SOY SMOOTHIES AND NATURAL SODAS.
+178% Ann. EPS Gro PE 45 Avg. D. Vol 1,229,600 Debt 0%Last Qtr Eps +142%6 Prior Qtr +246%5 Last Qtr Sales +95%12 Qtrs EPS) 15%Eps Due 5/10
Acc/Dis B+Sup/Demand 98
Extended 10% from 104.89 buy pt after V-shaped base.
6 NEWMARKET CORP (NEU) Grp 29 $42.4415.7M Shares 99 Comp. Rating 98 EPS RS 98 ROE 13%
MANUFACTURES FUEL AND LUBRICANT ADDITIVE PRODUCTS USED INLUBRICATING OILS AND FUELS TO ENHANCE THEIR PERFORMANCE
+38% Ann. EPS Gro PE 22 Avg. Daily Vol 145,300 Debt 58%Last Qtr Eps +171%5 Prior Qtr +127%5 Last Qtr Sales +27%2 Qtrs EPS) 15%Eps Due 5/4R&D 6%
Acc/Dis ASup/Demand 74
Hits 8-year highs after 6 straight up wks in rising trade.
10 EZCORP CL A (EZPW) Grp 22 o$26.419.6M Shares 99 Comp. Rating 96 EPS RS 97 ROE 11%
OPERATES 280 PAWNSHOPS AND 234 EZMONEY PAYDAY LOAN STORES IN 11STATES OFFERING MERCHANDISE SALES AND PAWN/PAYDAY LOANS.
+63% Ann. EPS Gro PE 21 Avg. Daily Vol 186,400 Debt 5%Last Qtr Eps +61%5 Prior Qtr +23%6 Last Qtr Sales +23%14 Qtrs EPS) 15%Eps Due 4/20
Acc/Dis A-Sup/Demand 87
Extended 50% from 17.66 buy point after gap up on 1/25.
14 MICRONETICS INC (NOIZ) Grp 47 $18.113.1M Shares 99 Comp. Rating 95 EPS RS 97 ROE 11%
MANUFACTURES MICROWAVE/RF COMPONENTS AND SUBASSEMBLIES USEDIN WIRELESS COMMUNICATION SYSTEMS
+18% Ann. EPS Gro PE 39 Avg. Daily Vol 62,700 Debt 6%Last Qtr Eps +400%5 Prior Qtr +100%5 Last Qtr Sales+108%2 Qtrs EPS) 15%Eps Due 7/1R&D 4%
Acc/Dis ASup/Demand 86
Below possible 19.87 buy point after dip toward 10-week avg.
18 C B RICHARD ELLIS (CBG) Grp 107 o$74.7151.3M Shares 98 Comp. Rating 97 EPS RS 94 ROE 26%
PROVIDES PROPERTY INVESTMENT MANAGEMENT, LOAN SERVICING ANDORIGINATION, AND LEASING ADVICE WITH 215 OFFICES WORLDWIDE.
+97% Ann. EPS Gro PE 25 Avg. Daily Vol 565,600 Debt 107%Last Qtr Eps +43%6 Prior Qtr +88%6 Last Qtr Sales +20%7 Qtrs EPS) 15%Eps Due 4/29
Acc/Dis B+Sup/Demand 70
31% past 56.85 buy point after Dec. rebound off 10-week.
3 JOY GLOBAL (JOYG) Grp 9 o$58.67121.8M Shares 99 Comp. Rating 99 EPS RS 98 ROE 30%
MANUFACTURES CONTINUOUS MINERS, LONGWALL SHEARERS, ELECTRICSHOVELS AND BLASTHOLE DRILLS FOR COAL/MINERAL EXTRACTION.
+296% Ann. EPS Gro PE 35 Avg. D. Vol 1,837,900 Debt 0%Last Qtr Eps +161%5 Prior Qtr +127%6 Last Qtr Sales +48%11 Qtrs EPS) 15%Eps Due 5/31R&D 13%
Acc/Dis D-Sup/Demand 88
10-wk support after huge run-up; Acc/Dis Rating dips.
7 T I M PARTICIPACOES (TSU) Grp 32 $39.6541.3M Shares 99 Comp. Rating 97 EPS RS 98 ROE 17%
BRAZILIAN PROVIDER OF PREPAID AND POSTPAID WIRELESS VOICE ANDDATA SERVICES TO 5.7 MIL SUBSCRIBERS.
+40% Ann. EPS Gro PE 21 Avg. Daily Vol 482,700 Debt 2%Last Qtr Eps +97%5 Prior Qtr +43%6 Last Qtr Sales +22%3 Qtrs EPS) 15%Eps Due 4/27
Acc/Dis B-Sup/Demand 59
Just off 40.34 follow-on buy pt after 10-week support.
11 INTERCONTINENTALEX (ICE) Grp 22 o$68.1013.2M Shares 99 Comp. Rating 96 EPS RS 97 ROE 29%
OPERATES AN ELECTRONIC GLOBAL FUTURES AND OVER-THE-COUNTERMARKETPLACE FOR TRADING A BROAD ARRAY OF ENERGY PRODUCTS.
+23% Ann. EPS Gro PE 69 Avg. Daily Vol 944,000 Debt 0%Last Qtr Eps +189%5 Prior Qtr +85%6 Last Qtr Sales +45%8 Qtrs EPS) 15%
Acc/Dis A-Sup/Demand 90
Extended 16% from 58.50 buy point after testing 10-week.
15 GOL INTELLIGENT AIR (GOL) Grp 50 o$28.69195.3M Shares 98 Comp. Rating 99 EPS RS 93 ROE 50%
PROVIDES SCHEDULED PASSENGER SERVICE ON ROUTES BETWEEN 37 CITIESTHROUGHOUT BRAZIL AND ONE DESTINATION IN ARGENTINA.
+152% Ann. EPS Gro PE 31 Avg. Daily Vol 948,100 Debt 0%Last Qtr Eps +74%5 Prior Qtr +69%5 Last Qtr Sales +49%11 Qtrs EPS) 15%Eps Due 5/10
Acc/Dis B-Sup/Demand 55
Resistance at 10-wk after slicing through it in huge trade.
19 OMNIVISION TECH (OVTI) Grp 21 o$26.4650.0M Shares 99 Comp. Rating 97 EPS RS 94 ROE 22%
DESIGNS CMOS ANALOG/DIGITAL SYSTEM ON A CHIP IMAGE SENSOR ICSUSED TO CAPTURE/PROCESS IMAGES.
+79% Ann. EPS Gro PE 18 Avg. D. Vol 2,582,600 Debt 0%Last Qtr Eps +61%5 Prior Qtr +46%5 Last Qtr Sales +35%2 Qtrs EPS) 15%Eps Due 6/23R&D 6%
Acc/Dis B+Sup/Demand 98
Finds support on first trip to 10-week since Nov. breakout.
4 D X P ENTERPRISES INC (DXPE) Grp 40 $29.841.7M Shares 99 Comp. Rating 98 EPS RS 99 ROE 33%
PROVIDES FLUID HANDLING EQUIPMENT, BEARINGS, POWER TRANSMISSIONEQUIPMENT AND SAFETY SUPPLIES TO INDUSTRIAL CUSTOMERS.
+30% Ann. EPS Gro PE 31 Avg. Daily Vol 213,800 Debt 128%Last Qtr Eps +200%5 Prior Qtr +38%6 Last Qtr Sales +45%5 Qtrs EPS) 15%Eps Due 4/27
Acc/Dis B+Sup/Demand 98
Cleared deep, 6-month base. Up 17% from 25.57 buy point.
8 CERADYNE INC (CRDN) Grp 29 o$53.1422.7M Shares 98 Comp. Rating 98 EPS RS 96 ROE 26%
MANUFACTURES NON-OXIDE CERAMICS INCLUDING ALUMINUM NITRIDE,SILICON NITRIDE, BORON CARBIDE, SILICON CARBIDE
+133% Ann. EPS Gro PE 28 Avg. D. Vol 1,074,700 Debt 80%Last Qtr Eps +71%6 Prior Qtr +77% Last Qtr Sales +37%3 Qtrs EPS) 15%Eps Due 4/28R&D 1%
Acc/Dis C+Sup/Demand 98
Fell below 10-wk after biggest wkly trade in nearly 2 yrs.
12 NEOWARE INC (NWRE) Grp 13 o$25.3418.7M Shares 99 Comp. Rating 96 EPS RS 96 ROE 10%
PROVIDES THIN CLIENT APPLIANCE COMPUTING SOFTWARE AND SOLUTIONSFOR LINUX, UNIX AND WINDOWS BASED COMPUTER SYSTEMS.
+13% Ann. EPS Gro PE 36 Avg. Daily Vol 776,900 Debt 0%Last Qtr Eps +57%6 Prior Qtr +70%6 Last Qtr Sales +43%5 Qtrs EPS) 15%Eps Due 5/3R&D 4%
Acc/Dis B+Sup/Demand 97
Resistance at 10-week line, rebound try in weak volume.
16 INFORMATICA (INFA) Grp 37 o$15.1081.2M Shares 98 Comp. Rating 99 EPS RS 93 ROE 18%
DEVELOPS ENTERPRISE DATA INTEGRATION SOFTWARE AND SERVICES FORVARIOUS INDUSTRIES
+78% Ann. EPS Gro PE 35 Avg. D. Vol 2,364,300 Debt 0%Last Qtr Eps +167%6 Prior Qtr +450%5 Last Qtr Sales +33%5 Qtrs EPS) 15%Eps Due 4/21R&D 15%
Acc/Dis B-Sup/Demand 95
Falls to 10-wk, finds support for 2nd time after 1/4 brkout.
20 BLACKROCK A (BLK) Grp 38 $140.4618.5M Shares 99 Comp. Rating 97 EPS RS 93 ROE 31%
MANAGES FIXED INCOME, CASH, EQUITY AND ALTERNATIVE INVESTMENTPRODUCTS FOR INSTITUTIONAL AND INDIVIDUAL INVESTORS
+22% Ann. EPS Gro PE 35 Avg. Daily Vol 298,500 Debt 28%Last Qtr Eps +68%6 Prior Qtr +84%5 Last Qtr Sales +96%4 Qtrs EPS) 15%Eps Due 4/19
Acc/Dis B+Sup/Demand 54
Finds 10-wk support after heavy-volume reversal wk of 2/17.
IBD 100 Vs. The Market
IBD 100:140%
S&P 500:40.3% Performance 5/2/03 to 3/16/06
C O M P A N I E S 1 - 2 0
1 Empire Resources 21.24 99 99 99 .. +71 .. +69 29 3 62 ..Former VOIP services company now thrives on global aluminum demand.
2 Hansen Natural 115.7 99 99 99 +40 +142 +70 +95 43 .. 26 AMarketing muscle drives sales of energy drinks to different demographics.
3 Joy Global 58.67 99 99 98 +63 +161 +71 +48 30 13 2 BBooming coal demand drives business for maker of mining equipment.
4 DXP Enterprises 29.84 99 98 99 +31 +200 .. +45 33 4 66 ..Q4 sales, EPS results best in at least 3 yrs for oil pump manufacturer.
5 Abaxis Inc 22.77 98 99 97 +63 +125 +83 +45 8 13 11 BBlood analysis tools help users get results in less than 14 minutes.
6 NewMarket Corp 42.44 99 98 98 +25 +171 .. +27 13 5 8 AFuel lubricant maker turns profit growth from negative to triple digits.
7 T I M Participacoes 39.65 99 97 98 +21 +97 +106 +22 17 .. 1 ABrazil's economic gains fuel growth for wireless voice, data services firm.
8 Ceradyne Inc 53.14 98 98 96 +67 +71 +208 +37 26 20 8 BAnalyst warns military may cut back on orders for body armor plates.
9 Encore Wire Corp 30.14 97 96 98 +13 +456 +999 +66 23 .. 13 AMaker of electrical wire faces challenge of transporting, paying for copper.
10 Ezcorp Cl A 26.41 99 96 97 +47 +61 +41 +23 11 8 7 AFirm working to computerize, remove stigma from pawn shop business.
11 IntercontinentalEx 68.10 99 96 97 +41 +189 +21 +45 29 51 6 B7Futures energy market operator to offer 10 new natural gas contracts 3/24.
12 Neoware Inc 25.34 99 96 96 +36 +57 +31 +43 10 16 5 BSoftware firm's sales growth topped 35% in past 3 qtrs. Joined S&P 600.
13 Intl Securities Exch 49.25 99 95 97 +19 +50 +24 +15 37 45 14 B7Options/securities exchange's avg. daily trading volume rose 38% in Feb.
14 Micronetics Inc 18.11 99 95 97 .. +400 ..+108 11 16 13 AWireless equipment maker's sales accelerated into triple digits past 2 qtrs.
15 Gol Intelligent Air 28.69 98 99 93 +93 +74 +95 +49 50 .. .. B7S. American airline's Q4 marked 3rd straight quarter of faster growth.
16 Informatica 15.10 98 99 93 +11 +167 +29 +33 18 15 8 B7Enterprise data integration software firm has accelerating sales last 5 qtrs.
17 Netease.com 90.00 98 99 93 +24 +113 +81 +83 39 .. 51 B7Provider of online gaming, data services in China a comeback dot–com tale.
18 C B Richard Ellis 74.71 98 97 94 +19 +43 +28 +20 26 12 31 B7Subsidiary real estate finance firm CBRE Realty Finance planning IPO.
19 OmniVision Tech 26.46 99 97 94 +25 +61 +27 +35 22 27 6 B7Chipmaker's pretax margin up from 4.8% in '02 to 28%, 27.3% past 2 years.
20 Blackrock A 140.5 99 97 93 +22 +68 +26 +96 31 34 6 B7Money manager's after–tax margin more than 21% at least 9 straight qtrs.
Hydropower stocks. The wave of the future?
I defi nitely should have brought a change of clothes.
REAL TRADERS NEVER STOP THINKING ABOUT THE MARKET.
Yeeeeehaaaaaaaaaaaa!Are these rapids class 5 or class 6?
Real traders look at life a little differently — they know investing ideas are waiting everywhere. To help you make the most of those ideas we’ve developed a new,improved Ameritrade StreamerTM that helps you manage alerts more easily. We’ve created it after listening to the requests of some very important people in the market — our clients. Of course you’ll find many other tools to unearth and seize potential opportunities. You also get flat-rate Internet equity pricing and unbiased access to the markets. So no matter where or when inspiration strikes, traders can follow wherever it leads. Join Ameritrade today; you’ll get 25 commission-free Internet equity trades plus a Palm® TreoTM 650 smartphone with a $25,000 minimum deposit.*
Market volatility, volume and system availability may delay account access and trade execution.*Offer valid for one new Individual or Joint account opened by 4/18/06 and funded with $25,000 or more within 30 days of account opening date. Qualified trades must execute within 45 days from account funding. Valid for U.S. residents only. Not transferable and not valid for IRAs, internal transfers, current Ameritrade clients, or with other offers. Limit one offer per promotion. Taxes related to Ameritrade offers are your responsibility. Retail values totaling $600 or more during the calendar year will be included in your consolidated Form 1099. Valid e-mail address is required to participate in this offer. Account must remain open with minimum funding for 9 months, or Ameritrade may charge the account for the Treo™ 650 smartphone. Please allow 3–4 weeks to receive the e-mail to order your Treo™ 650 smartphone. Cingular Wireless, Sprint and Verizon Wireless are the carriers available for this promotion. Carrier restrictions may apply. Please go to www.ameritrade.com/treo for details. All orders must be placed by 6/30/06. Ameritrade reserves the right to restrict or revoke this offer, as well as to replace it with a product of equal or greater value. This is not an offer or solicitation in any jurisdiction where we are not authorized to do business. Ameritrade and Palm are separate, unaffiliated companies and are not responsible for one another’s services and policies. Palm, Treo and the Palm logo are trademarks or registered trademarks of Palm, Inc. Ameritrade, Division of Ameritrade, Inc., member NASD/SIPC. Ameritrade and Ameritrade logos are trademarks or registered trademarks of Ameritrade IP Company, Inc. ©2006 Ameritrade IP Company, Inc. All rights reserved. Used with permission.
GET A PALM TREO 650 SMARTPHONE AND 25 FREE TRADESCALL 888.371.6847 TODAY OR VISIT WWW.AMERITRADE.COM/TREO
LIMITED TIME OFFER
INVESTOR'S BUSINESS DAILY MONDAY, MARCH 20, 2006 B 1

B2 MONDAY, MARCH 20, 2006 INVESTORS.COM
MicroneticsNOIZboosted its salesandearningssharply in thepasttwoquarters.Earnings leapt 100%and400%assales soared104%and108%.Thatcameafter fourconsecutivequar-tersof flat todownEPSonayear-over-yearbasis andsales rangingfroma17%gain toa6%drop.What’sbehindthe turnabout?InJune ’05, theHudson,N.H.-based firmboughtStealthMicro-wave.Without theacquisition,Micronetics’ 108%sales increase infiscalQ3would’vebeen35%.Themicrocapcompanymakescomponentsandsubassembliesused inbroadbandwireless sys-tems, in-flight Internet,digitalsatellite televisionand themili-tary’s tactical jammingsystems.Customers includecompanies inthedefense, aerospaceandcom-mercial segments.
In fiscalyears2004-05 (ending inMarch),about two-thirdsof salesweredefense-related.The topthreecustomers in fiscal2005ac-countedfor roughly40%ofsales.Pretaxmargin increased threeconsecutiveyears from5.5%infiscal2002ended inMarch to13.3%, then16%and16.8%.AsofDecember, only fivemutualfundsheldMicronetic, but the fourbigholdersare ratedAminusorbetter inperformance.PaulWhitfield
Acquisition Boosts MicroneticsPretax Margin At 16.8%,Up From 5.5% In 2002
Pharmaceutical Product Devel-opmentPPDI has a $245 millionaward tomanage AIDS research inthe U.S., Europe, South Africa,South America and Asia for a divi-sion of the National Institutes ofHealth.TheWilmington,N.C.-based firmis one of the nation’s largest con-tract research organizations. Itmanages and operates clinical testsand other studies for drug makersand health organizations, operat-ing in28countries.Japan-based Falco biosystems, agenetic testing and clinical re-search firm, contractedPPD inDe-cember to do research that couldlead to the development of a diag-nostic test for renal cell carcinoma.PPD’searningsgrowthwent fromflat to 59% to 30% the past threequarters. Sales growth ranged be-tween 20% to 27% over those peri-
ods.The firmexpects to grow first-quarter earnings between 29% and36%, to36 to38cents ashare.Fiscal2006 earnings are expected to in-creasebyat least 17%.The firm claims a backlog of un-filledordersof$1.8billion,a39%in-creaseover last year.Cash flow has increased steadilyfor nine straight years, from 30cents a share in 1997 to $1.49 ashare in 2005. Its debt load is rela-tively light, just 3% of shareholderequity.TrangHo
PPD Is Pharma’s Helping HandManages AIDS ResearchGlobally For NIH Unit
Garmin Eyes Revenue GrowthBiggest Rise Expected InAutomotive And Aviation
B Y P A U L W H I T F I E L DINVESTOR'S BUSINESS DAILY
While finance, health care andothersectorsgrabattentionasmar-ket leaders, small groups of top-performing stocks are showingthey are just as capable of runningwiththemarket’sbig leadership.Recent weeks have been toughfor some leaders, but there arepockets of strength in what mightbe called the second-tier leader-ship .Three areas where small groupsofstocksareshowinglifearerecre-ationalvehicles/mobilehomes, in-surersandregionalbanks.Rising interest rates and highfuel prices might make you thinkstocks in the Building-MobileManufacturing&RecreationalVe-hicles group have no cause to rise.But Drew IndustriesDW, Thor In-dustriesTHO and Cavco IndustriesCVCO are on a roll.Drew is up 24.2% year to date.While the IBD 100 index is upabout 1.9% so far in March, Drewis up 7.9% for the month. The RVand manufactured homes partsmaker recently found support atits 50-day moving average and iswithinasecondarybuyarea.RV and bus maker Thor is up28.5%in2006and9%inMarch.Those two stocks are in a sweetniche right now. Drew and Thorare in the towables part of the RVbusiness, which is growing rapid-ly. Many motor home-relatedstocksaredownfor theyear.Cavco, a manufactured housingplay, is up 19.5% year to date. Inthe first 13 sessions in March, itslipped,but less than1%.The thin-ly traded stock appears tobe form-inga late-stagebaseonbase.Insurers in the IBD 100, such asTower GroupTWGP, EMC Insur-ance GroupEMCI and W.R. BerkleyCorp.BERalso showsome life.Tower is about flat for the year todate — down 8 cents. But, like alion, it leapt 21.2% so far inMarch ,after diving to its 200-day line onheavy volume before recovering
smartly. The October 2004 IPOcouldbe formingabase.EMCis up27.6%year todate andnear two-year highs. It has sloweda bit, but the stock still has an A+Accumulation/Distribution Rat-ing, indicating institutional sup-port. It leads its industry group intermsofTechnical andAttractive-ness Ratings in the IBD StockCheckup at investors.com. Berk-ley isup24.2%in2006.A third group is comprised of re-gional banks — stocks such as Vir-ginia Commerce BancorpVCBI andPremierWestBancorpPRWT.Virginia Commerce is up 22.2%year to date. In March, it moveddown a bit but remains within 3%ofanall-timehigh.PremierWest is up 32.4% year todate. It carries an A+ Accumula-tion/DistributionRating.
Whetheryou’redriving,hikingorsailing,GarminGRMNhasaglobalpositioningsystem-enableddevicethatcanhelpyoufigureoutwhereyouareorhowfaryou’vegone.TheCaymanIslands-basedmakerofnavigationsystems focusesonproducts for theconsumermarket,whichaccounted for78%of2004sales.Theaviationsegmentmadeuptheremaining22%.Garminhasbranchedoutbeyondbasicmapping todevices like theFishfinder,whichhelps locate fishandviewthebottomsurface.Runnersandcyclistswrapthefirm’sForerunneraroundtheirwrist likeawatchto track theirspeed,distance,paceandcaloriesburned.Oneof itsnewestdevices is theStreetPilotc550,anupgradeof thec300series.Newfeatures includeBluetoothwireless technologywith
hands-freecalling, an integratedtraffic receiverandanMP3player.Garminsaid lastmonth itexpectssalesofautomotiveproducts togrowmore than60%thisyear, fol-lowedbyat least a20%increase inaviationsales. It sees 15%orhighergrowth in theoutdoor/fitness seg-mentand10%inmarineproducts.Thefirmhasgrownrevenueandearnings30%ormore thepast threequarters.Analystsexpect53%prof-itgrowth in the firstquarter.NancyGondo
GymboreeGYMBoperatesmore than570 children’s clothing and toy re-tail stores and 13 outlets through-out theU.S.,Canadaandonline.It also sells classic high-end babyclothes suchus$78 floral silkdress-es and $24 “onseys” at 60 Janie andJack stores. In addition, it owns 17Janeville shops, catering towomenin theirmid-30s and older. The SanFrancisco-based firm originallystarted out as Gymboree Play &Music in 1976 and branched intoclothing10years later.Its programs offer developmentalplay,music and arts classes for par-ents and children, fromnewborn toage five.Gymboree reported lastweek thatfourth-quarter operating earningsgrew 211% from the year-ago peri-od to56centsashare.Sales climbed 17% to $206.4 mil-lion, as same-store sales rose 14%
for thequarter.Earnings for the fiscal year endedJan.28 jumped89%andsales 14%.Gymboree also raised its fiscalfirst-quarter earnings guidance to28 cents to 30 cents a share. Thom-son First Call’s consensus is 27cents, a 59%increaseover theyear-earlierperiod.Gymboreeexpects thecurrent fis-cal-year’s earnings to rise by atleast 14%, to $1.16 a share, beforestock-basedcompensation.TrangHo
I N S I D E T H E 1 0 0
Small Groups Of LeadersShowing Their Own Heft
GYMBOREE (GYMB) Grp 14 o$25.6530.1M Shares 98 Comp. Rating 89 EPS RS 94 ROE 8%OPERATES 579 GYMBOREE, 55 JANIE AND JACK CHILDREN'S STORES AND 14JANEVILLE WOMEN'S APPAREL STORES IN THE U.S./CANADA.
-9% Ann. EPS Gro PE 27 Avg. Daily Vol 698,700 Debt 0%Last Qtr Eps +211%5 Prior Qtr +46%5 Last Qtr Sales +17%2 Qtrs EPS) 15%Eps Due 5/18
Acc/Dis ASup/Demand 93
Just past 25.85 buy pt. after pullback to 10-week line.
Weekly Winners & Losers
Weekly % Company Symbol price change
Top 10
DXP Enterprises DXPE 27.1%
HealthExtras HLEX 21.5
Multi-Fineline Electronix MFLX 17.1
Empire Resources ERS 16.7
Eagle Materials EXP 13.4
Gol Intelligent Airlines GOL 12.4
Wesco International WCC 12.3
Dynamic Materials BOOM 10.8
First Cash Financial Svs FCFS 10.4
Micronetics NOIZ 10.4
Bottom 10
Encore Wire WIRE -13.9%
Telemig Celular Part Ads TMB -6.4
GFI Group GFIG -6.3
Edge Petroleum EPEX -6.0
Radvision Ltd RVSN -5.7
Keystone Automotive Inds KEYS -5.1
Celadon Group CLDN -4.8
Ceradyne CRDN -4.1
Las Vegas Sands LVS -3.9
Talx TALX -2.3
Biggest price changes among IBD 100 stocks
MICRONETICS INC (NOIZ) Grp 47 $18.113.1M Shares 99 Comp. Rating 95 EPS RS 97 ROE 11%MANUFACTURES MICROWAVE/RF COMPONENTS AND SUBASSEMBLIES USEDIN WIRELESS COMMUNICATION SYSTEMS
+18% Ann. EPS Gro PE 39 Avg. Daily Vol 62,700 Debt 6%Last Qtr Eps +400%5 Prior Qtr +100%5 Last Qtr Sales+108%2 Qtrs EPS) 15%Eps Due 7/1R&D 4%
Acc/Dis ASup/Demand 86
Below possible 19.87 buy point after dip toward 10-week avg.
PHARMACEUT PDT DEV (PPDI) Grp 81 o$35.5199.0M Shares 94 Comp. Rating 95 EPS RS 83 ROE 19%PROVIDES DRUG DISCOVERY AND DEVELOPMENT SERVICES TO PHARMACEU-TICAL, BIOTECHNOLOGY AND GOVERNMENT ORGANIZATIONS.
+16% Ann. EPS Gro PE 31 Avg. Daily Vol 736,700 Debt 3%Last Qtr Eps +30%6 Prior Qtr +59%5 Last Qtr Sales +20%2 Qtrs EPS) 15%Eps Due 4/19R&D 2%
Acc/Dis C+Sup/Demand 64
Hitting new highs on lower volume.
GARMIN (GRMN) Grp 47 o$77.0975.7M Shares 99 Comp. Rating 96 EPS RS 89 ROE 29%MANUFACTURES HAND-HELD/PORTABLE/FIXED-MOUNT GLOBAL POSITIONINGSYSTEMS FOR THE GENERAL AVIATION AND CONSUMER MARKETS.
+24% Ann. EPS Gro PE 27 Avg. D. Vol 1,273,700 Debt 0%Last Qtr Eps +82%5 Prior Qtr +52%5 Last Qtr Sales +45%4 Qtrs EPS) 15%Eps Due 4/27R&D 7%
Acc/Dis A+Sup/Demand 82
Extended 13% from 68.10 buy point after Feb. 22 breakout.
Gymboree Q4 EPS Beat ViewsKids Chain Expects 2006To Grow By At Least 14%
TAKE HOME hundreds ofdollars worth of investmentadvisories… ABSOLUTELY FREE!
LEARN from among 200 ormore FREE workshops geared togive you profitable newinvestment ideas and in-depthanalysis on every industry.
COMPARE and shop theinvestor’s mega-marketplace:over 200 exhibits featuring topmutual funds, money managers,online services, and advisories.
MEET and greet America’s topinvestment advisors and editors.
ACQUIRE the market insightsof more than 50 world-classadvisors and analysts.
A Perennial Favorite: Bulls vs. BearsTuesday, May 16 11:30 am – 12:15 pm
Enjoy the fireworks as the bullsand the bears square off!Watch the sparks fly as old-timers stake their claims clearlyin the bull or bear pens.
Moderator:Charles GithlerChairmanInterShow
Bulls:Joe BattipagliaCIO, Ryan, Beck & Co., LLC
Louis Navellier, President & CIO, Navellier & Associates
Bears:Peter Schiff, President Euro Pacific Capital, Inc.
Martin Weiss, Chief Editor Safe Money Report
200 Exhibits • 200 Workshops • 20 Panels • 50 Speakers
Attend FREE…Meet and Hear America’s Top Advisors and Money ManagersMay 15-18, 2006 • Bally’s & Paris Resorts
PROFIT Now From 50 Experts…
John BoglePresident, BogleFinancial MarketsResearch Center,and Founder,Vanguard GroupWhat’s Aheadfor Stocks andBonds?
Louis HollandManaging Partner and CIO, HollandCapital ManagementThe NewParadigm forFinancial AssetsIs Over
Kenneth FisherChairman and CEOFisher InvestmentsThe Only ThreeQuestions ThatCount
…For Details on All 50 Experts Visitwww.LasVegasMoneyShow.com
May 15-18, 2006Bally’s & Paris Resorts
For exhibit space and rates,please call 800/822-1134
To register visitwww.LasVegasMoneyShow.comor call 800/970-4355 today
Please mention Priority Code 005832
The Money Show Las Vegasis a unique, one-stop educationalresource for everything relatingto investing, the economy, andyour money. Whether you arean experienced investor or justdeveloping your investment skillsand knowledge, you belong atThe Money Show Las Vegas—you’ll come away smarter. Gainspecific investment strategies frommore than 200 workshops,panels, and generalsessions. The focus of thisyear’s Money Show in Las Vegasis Buy & Hold and Trading.Meet and hear nationallyacclaimed investmentadvisors…all under one roof—FREE OF CHARGE*
*Certain lunches and special eventsrequire admission fees.
Using Investor’s BusinessDaily® and investors.comto Achieve HugePotential ProfitsTuesday, May 16 7:00 pm – 8:30 pm
Learn the basics of Investor’sBusiness Daily’s proven investingsystem that has outperformed themarket year after year. We’ll alsoshow you a series of stockscreening tools you can use toidentify and track potential marketleaders.
In IBD’s FREE seminar,you will learn:
• How to spot the real leaders intheir early emerging stages, and discover companiesthat aren’t on most radarscreens yet
• How to recognize shifts in themarket while there’s still time to act
• How to find the optimal time tomove into stocks within the bestsectors and industry groups
• The most common investingpitfalls that could be holdingyou back
• How to separate the leaders andthe laggards from 8,000 stockchoices, using IBD’s proprietaryratings and web tools
• Simple, but crucial sell rules thathelp you lock in your profits andprevent big losses
Diamond Sponsors Gold Sponsors Media Partner
Real People, Real Success
I LOVE The Big Picture...plus the articles onbuying and selling. You must have a paperlike IBD by your side to keep you motivatedand on the right track.
“
”Want to share your IBD™ Success Story?
E-mail us at [email protected]
www.investors.com
Bob A., IBD™ Subscriber since 1988

INVESTOR'S BUSINESS DAILY MONDAY, MARCH 20, 2006 B 3
SMARTSELECT® COMPOSITE RATING RelîAnnual Last Qtr NextQtr Lst Qtr Mgtîì Spn-EPS StrëîEPS Est EPS EPS Salesî Pretaxè Ownî shp
6Rank Company Price íî Rtg Rtgî% Chg % Chg % Chg % Chg ROE mrgnè % Rtg.
23 USG (USG) Grp 91 o$93.4239.3M Shares 95 Comp. Rating 96 EPS RS 97 ROE 36%
MANUFACTURES AND DISTRIBUTES BUILDING MATERIALS FOR RESIDENTIAL,NONRESIDENTIAL, AND REPAIR AND REMODEL CONSTRUCTION
+66% Ann. EPS Gro PE 8 Avg. D. Vol 1,306,800 Debt 999%Last Qtr Eps +88%5 Prior Qtr +70%5 Last Qtr Sales +14%9 Qtrs EPS) 15%Eps Due 4/26
Acc/Dis C+Sup/Demand 96
Finds support at 10-week line; possible 99.40 buy point.
27 WESCO INTERNATIONAL (WCC) Grp 26 o$63.3032.2M Shares 99 Comp. Rating 94 EPS RS 96 ROE 24%
DISTRIBUTES WIRING DEVICES, CONNECTORS, CIRCUIT BREAKERS, LAMPS,CABLE, CONDUIT, AND MOTOR CONTROL DEVICES.
+77% Ann. EPS Gro PE 26 Avg. Daily Vol 568,500 Debt 109%Last Qtr Eps +132%5 Prior Qtr +47%5 Last Qtr Sales +25%9 Qtrs EPS) 15%Eps Due 4/21
Acc/Dis B+Sup/Demand 83
36% past 46.55 buy pt after gap up on 2nd trip to 10-week.
31 GILEAD SCIENCES (GILD) Grp 19 o$63.31453.0M Shares 99 Comp. Rating 99 EPS RS 88 ROE 32%
DEVELOPS ANTI-INFECTIVE AND ANTI-FUNGAL DRUGS USED TO TREATPATIENTS SUFFERING FROM LIFE-THREATENING DISEASES.
+75% Ann. EPS Gro PE 38 Avg. D. Vol 4,008,500 Debt 8%Last Qtr Eps +116%5 Prior Qtr +52%6 Last Qtr Sales +65%6 Qtrs EPS) 15%Eps Due 4/19R&D 13%
Acc/Dis B-Sup/Demand 74
Holds near 10-wk after recent reversal; poss. 64.07 buy pt.
35 SANDISK (SNDK) Grp 21 o$55.00184.3M Shares 97 Comp. Rating 98 EPS RS 90 ROE 15%
DESIGNS NON-VOLATILE MEMORY USED IN USB STORAGE DRIVES, DIGITALCAMERAS, PDAS, CELL PHONES, AND OTHER DEVICES.
+81% Ann. EPS Gro PE 28 Avg. D. Vol 13,477,200 Debt 0%Last Qtr Eps +58%6 Prior Qtr +90%5 Last Qtr Sales +37%2 Qtrs EPS) 15%Eps Due 4/21R&D 7%
Acc/Dis C+Sup/Demand 99
Stuck below 10-week moving avg for six consecutive weeks.
39 FIRST CASH FINL SVC (FCFS) Grp 22 $19.9322.2M Shares 99 Comp. Rating 94 EPS RS 94 ROE 15%
OPERATES 197 PAWNSHOPS IN TEXAS, MARYLAND, SOUTH CAROLINA,MISSOURI, OKLAHOMA, VIRGINIA, WASHINGTON, D.C., AND MEXICO.
+26% Ann. EPS Gro PE 26 Avg. Daily Vol 377,200 Debt 0%Last Qtr Eps +33%5 Prior Qtr +25%5 Last Qtr Sales +18%18 Qtrs EPS) 15%Eps Due 4/18
Acc/Dis A+Sup/Demand 83
Extended 32% from 15.06 buy point in Jan. 13 breakout.
24 PETMED EXPRESS INC (PETS) Grp 162 o$19.9016.5M Shares 95 Comp. Rating 95 EPS RS 98 ROE 41%
DIRECT MARKETER OF PRESCRIPTION/NON-PRESCRIPTION MEDICATIONSAND NUTRITIONAL SUPPLEMENTS FOR PETS VIA CATALOG/INTERNET.
+45% Ann. EPS Gro PE 42 Avg. Daily Vol 363,900 Debt 0%Last Qtr Eps +38% Prior Qtr +38%6 Last Qtr Sales +25%5 Qtrs EPS) 15%Eps Due 5/16
Acc/Dis B-Sup/Demand 88
25% above 15.92 secondary buy pt after support at 10-wk.
28 HEALTHEXTRAS INC (HLEX) Grp 81 o$36.7230.4M Shares 98 Comp. Rating 93 EPS RS 97 ROE 14%
PROVIDES PHARMACY BENEFIT MANAGEMENT SERVICES TO MANAGEDCAREORGANIZATIONS/SELF-INSURED EMPLOYERS/THIRD PARTY PAYORS
+44% Ann. EPS Gro PE 64 Avg. Daily Vol 337,500 Debt 14%Last Qtr Eps +25% Prior Qtr +25%6 Last Qtr Sales +18%19 Qtrs EPS) 15%Eps Due 4/27
Acc/Dis A-Sup/Demand 74
Surges to all-time high after latest pullback to 10-week.
32 JOS. A. BANK CLOTHIER (JOSB) Grp 14 o$46.2515.1M Shares 99 Comp. Rating 98 EPS RS 91 ROE 24%
OPERATES 263 AND FRANCHISES 10 STORES IN 37 STATES (27 IN TX)OFFERING MEN'S TAILORED AND CASUAL CLOTHING.
+44% Ann. EPS Gro PE 28 Avg. Daily Vol 473,000 Debt 5%Last Qtr Eps +44%6 Prior Qtr +58%5 Last Qtr Sales +28%10 Qtrs EPS) 15%Eps Due 4/4
Acc/Dis BSup/Demand 96
1% past 45.88 buy point after trip to 10-week; recent split.
36 TEAM (TMI) Grp 98 $31.275.6M Shares 96 Comp. Rating 97 EPS RS 93 ROE 13%
PROVIDES INDUSTRIAL REPAIR SERVICES INCLUDING LEAK REPAIR, HOTTAPPING, EMISSIONS CONTROL, FIELD MACHINING
+14% Ann. EPS Gro PE 32 Avg. Daily Vol 75,000 Debt 122%Last Qtr Eps +156%6 Prior Qtr +200%5 Last Qtr Sales +39%4 Qtrs EPS) 15%Eps Due 4/12
Acc/Dis BSup/Demand 76
Finds support on first trip near 10-week since 1/13 breakout.
40 DYNAMIC MATERIALS (BOOM) Grp 6 $35.004.9M Shares 99 Comp. Rating 93 EPS RS 95 ROE 24%
ENGAGED IN HIGH ENERGY METAL WORKING, INCLUDING THE USE OFEXPLOSIVES TO PERFORM METALLURGICAL BONDING, OR "CLADDING."
+56% Ann. EPS Gro PE 41 Avg. Daily Vol 836,500 Debt 14%Last Qtr Eps +40%6 Prior Qtr +136%6 Last Qtr Sales +16%6 Qtrs EPS) 15%Eps Due 5/5
Acc/Dis B+Sup/Demand 99
Back above 10-wk after heavy volume plunge below it on 2/8.
21 COLDWATER CREEK (CWTR) Grp 14 o$26.5754.2M Shares 99 Comp. Rating 97 EPS RS 93 ROE 18%
OPERATES 114 STORES IN THE U.S. OFFERING WOMEN'S CASUAL APPAREL,JEWELRY AND GIFT ITEMS.
+78% Ann. EPS Gro PE 54 Avg. D. Vol 1,521,000 Debt 0%Last Qtr Eps +67%5 Prior Qtr +30%6 Last Qtr Sales +41%9 Qtrs EPS) 15%Eps Due 5/25
Acc/Dis ASup/Demand 90
Gapped out of cup base 3/9. Extended 17% from 22.80 buy pt.
25 CITI TRENDS INC (CTRN) Grp 14 $41.4612.9M Shares 98 Comp. Rating 95 EPS RS 96 ROE 36%
OPERATES 212 VALUE-PRICED RETAIL STORES IN 12 SOUTHEASTERN STATES(44 IN GA AND 32 IN SC).
+37% Ann. EPS Gro PE 37 Avg. Daily Vol 296,700 Debt 6%Last Qtr Eps +22%6 Prior Qtr +800%6 Last Qtr Sales +46%5 Qtrs EPS) 15%Eps Due 6/1
Acc/Dis DSup/Demand 94
Spending 3rd week below 10-wk line after high-volume drop.
29 MULTI FINELINE ELEC (MFLX) Grp 24 o$63.708.3M Shares 99 Comp. Rating 91 EPS RS 99 ROE 22%
MANUFACTURES FLEXIBLE PRINTED CIRCUIT BOARDS AND RELATED COMPO-NENT ASSEMBLIES.
+68% Ann. EPS Gro PE 35 Avg. Daily Vol 384,800 Debt 0%Last Qtr Eps +82%5 Prior Qtr +22%5 Last Qtr Sales +66%2 Qtrs EPS) 15%Eps Due 5/3
Acc/Dis A-Sup/Demand 89
Extended 14% from 55.75 buy pt after 2nd bounce off 10-week.
33 THE PANTRY INC (PTRY) Grp 90 o$58.9822.2M Shares 97 Comp. Rating 98 EPS RS 91 ROE 31%
OPERATES 1,400 CONVENIENCE AND GAS STORES IN 11 SOUTHEASTERNSTATES (442 IN FL, 304 IN NC, AND 235 IN SC)
+108% Ann. EPS Gro PE 16 Avg. D. Vol 382,400 Debt 214%Last Qtr Eps +150%5 Prior Qtr +100%5 Last Qtr Sales +40%8 Qtrs EPS) 15%Eps Due 4/28
Acc/Dis B-Sup/Demand 90
Tight action past 3 weeks after support near 10-week line.
37 SELECT COMFORT (SCSS) Grp 102 o$36.5132.0M Shares 99 Comp. Rating 96 EPS RS 93 ROE 31%
OPERATES 370 STORES IN 45 STATES OFFERING ADJUSTABLE FIRMNESSBEDS AND ACCESSORIES.
+25% Ann. EPS Gro PE 32 Avg. Daily Vol 735,000 Debt 0%Last Qtr Eps +50% Prior Qtr +50%5 Last Qtr Sales +26%4 Qtrs EPS) 15%Eps Due 4/26
Acc/Dis A-Sup/Demand 93
24% above 29.49 buy point after breakaway gap on Feb. 1.
22 GOLDCORP (GG) Grp 7 o$27.95322.1M Shares 99 Comp. Rating 97 EPS RS 93 ROE 16%
ENGAGED IN THE MINING AND EXPLORATION OF GOLD, AND THE PRODUC-TION OF INDUSTRIAL MINERAL PRODUCTS.
+16% Ann. EPS Gro PE 35 Avg. D. Vol 3,897,700 Debt 0%Last Qtr Eps +238%5 Prior Qtr +200%6 Last Qtr Sales+417%4 Qtrs EPS) 15%Eps Due 5/16
Acc/Dis B-Sup/Demand 82
Bounced off 10-week after drop to line in huge volume.
26 BANCOLOMBIA ADR (CIB) Grp 41 $33.71142.7M Shares 98 Comp. Rating 95 EPS RS 95 ROE 30%
COMMERCIAL BANK OPERATING THROUGH 377 BRANCH OFFICES IN 127CITIES AND TOWNS IN COLOMBIA.
+54% Ann. EPS Gro PE 15 Avg. Daily Vol 384,800 Debt 26%Last Qtr Eps +41%5 Prior Qtr +27%6 Last Qtr Sales +58%6 Qtrs EPS) 15%Eps Due 4/12
Acc/Dis CSup/Demand 38
Finds strength after multiple pullbacks to 10-week average.
30 ULTRA PETROLEUM (UPL) Grp 122 o$58.60142.2M Shares 94 Comp. Rating 99 EPS RS 92 ROE 52%
ENGAGED IN OIL/GAS EXPLORATION AND PRODUCTION PRIMARILY IN THEGREEN RIVER BASIN OF WYOMING.
+176% Ann. EPS Gro PE 41 Avg. D. Vol 2,058,900 Debt 38%Last Qtr Eps +100%6 Prior Qtr +124%6 Last Qtr Sales +87%13 Qtrs EPS) 15%Eps Due 4/27
Acc/Dis C+Sup/Demand 85
Below 10-week avg; big-volume down weeks top up weeks.
34 THOMAS & BETTS (TNB) Grp 24 o$51.9660.5M Shares 99 Comp. Rating 98 EPS RS 91 ROE 13%
MANUFACTURES INTERCONNECTS AND ELECTROMECHANICAL COMPONENTSFOR THE INDUSTRIAL, COMMUNICATIONS AND UTILITY INDUSTRIES.
+71% Ann. EPS Gro PE 24 Avg. Daily Vol 422,100 Debt 37%Last Qtr Eps +73%5 Prior Qtr +36%6 Last Qtr Sales +11%10 Qtrs EPS) 15%Eps Due 4/25R&D 1%
Acc/Dis A+Sup/Demand 66
Extended 18% from 43.98 buy point after bouncing off 10-wk.
38 AMER REPROGRAPHCS (ARP) Grp 51 $34.6216.7M Shares 89 Comp. Rating 95 EPS RS 97 ROE 0%
PROVIDES DOCUMENT REPRODUCTION SERVICES MAINLY TO THE ARCHITEC-TURAL, ENGINEERING AND CONSTRUCTION INDUSTRIES.
+37% Ann. EPS Gro PE 41 Avg. Daily Vol 167,500 Debt 999%Last Qtr Eps +111%5 Prior Qtr +44%5 Last Qtr Sales +16%2 Qtrs EPS) 15%Eps Due 5/3
Acc/Dis B-Sup/Demand 48
Extended 4% from 33.31 secondary buy point in short stroke.
Know Your Company!Investigate before you invest. Always check a chart. Is your stock near a properbuy point? Or is the price up over 5% from a sound chart base or buy point andtherefore more risky? Charts within 5% of a possible buy area are shown with abold border. Verify the CAN SLIM vitals — big annual and current earnings andsales increases, high return on equity, better profit margins, sponsorship, marketin a confirmed upturn. Read a company article archived on investors.com. Defineyour risk and price objective.
C O M P A N I E S 2 1 - 4 0
21 Coldwater Creek 26.57 99 97 93 +24 +67 +22 +41 18 .. 42 BWomen's apparel chain's fiscal fourth-quarter earnings beat views by 3 cents.
22 Goldcorp 27.95 99 97 93 +18 +238 +100+417 16 49 .. CGold firm to wrap up Placer asset acquisition in April; will buy Quebec mine.
23 USG 93.42 95 96 97 +14 +88 +45 +14 36 14 2 BBuilding materials firm's margin after–tax rises to double digits in Q3, Q4.
24 PetMed Express Inc 19.90 95 95 98 +44 +38 +20 +25 41 11 10 BOppenheimer initiates coverage with buy for online/catalog pet pharmacy.
25 Citi Trends Inc 41.46 98 95 96 +14 +22 +13 +46 36 7 .. B7Urban–themed clothier's Q4 earnings beat First Call analysts' views.
26 BanColombia ADR 33.71 98 95 95 +10 +41 .. +58 30 .. .. ..Colombia–based bank's revenue rose 58% in the fourth quarter; EPS up 41%.
27 Wesco International 63.30 99 94 96 +34 +132 +92 +25 24 3 32 B7Electric parts maker's profit, sales growth stepped up the past 2 quarters.
28 Healthextras Inc 36.72 98 93 97 +40 +25 +15 +18 14 5 23 B7Multi–employer fund picks firm to provide pharmacy benefit services.
29 Multi Fineline Elec 63.70 99 91 99 +54 +82 +59 +66 22 14 5 B7Shares owned by funds rose from 1.2 mil in Dec. '04 to 2.8 mil at end of '05.
30 Ultra Petroleum 58.60 94 99 92 +23 +100 +70 +87 52 .. 8 CGas E&P firm's Q4 margins grow, sales/profit solid, but stock's had long run.
31 Gilead Sciences 63.31 99 99 88 +24 +116 +50 +65 32 57 3 CWorld Health Organization backs its Tenovofir drug for treatment of AIDS.
32 Jos. A. Bank Clthr 46.25 99 98 91 +39 +44 +40 +28 24 10 12 BMen's clothier's sales grew 20% or more in all but 1 quarter since Sept. '03.
33 The Pantry Inc 58.98 97 98 91 +13 +150 +81 +40 31 2 1 A7Convenience store chain's sales growth rate up sequentially for three qtrs.
34 Thomas & Betts 51.96 99 98 91 +15 +73 +33 +11 13 10 2 BElectrical parts firm's pretax margin at double digits for first time since '97.
35 SanDisk 55.00 97 98 90 +20 +58 +15 +37 15 .. 5 CPacific Crest Securities lifts chipmaker from sector perform to outperform.
36 Team 31.27 96 97 93 +72 +156 +30 +39 13 5 32 AAnalysts expect sales growth to ease to 8% next qtr, weakest since mid–'03.
37 Select Comfort 36.51 99 96 93 +19 +50 +27 +26 31 .. 9 B7Bed maker's lower costs, price hike in December seen boosting margins.
38 Amer Reprogrphcs 34.62 89 95 97 +40 +111 +61 +16 .. 13 62 B7Analysts expect EPS growth of 41% in 2006 for document services provider.
39 First Cash Finl Svc 19.93 99 94 94 +19 +33 +17 +18 15 .. 29 BThree funds with biggest stake in pawnshop firm are rated A+, A and A+.
40 Dynamic Materials 35.00 99 93 95 +30 +40 +86 +16 24 .. 7 AMetalworking firm's EPS growth was 110% in ’05; 30% expected for '06.
Filter the ENTIRE market by:
Find the best stocks fast with interactive stock tables from IBD®
Filter the ENTIRE market for top performers by Volume % Change, EPS and RS Ratings, and more
Access expanded data for EVERY stock in “The IBD 100”, “The New America” and “85-85” indices
Click directly to IBD Stock Checkup®, IBD® Charts, My Stock Lists, and more for every listed stock
Try it FREE for 2 Weeks at
investors.com/TryeTables
Offer available exclusively to current IBD and eIBD™
subscribers.
www.investors.com

B4 MONDAY, MARCH 20, 2006 INVESTORS.COM
SMARTSELECT® COMPOSITE RATING RelîAnnual Last Qtr NextQtr Lst Qtr Mgtîì Spn-EPS StrëîEPS Est EPS EPS Salesî Pretaxè Ownî shp
6Rank Company Price íî Rtg Rtgî% Chg % Chg % Chg % Chg ROE mrgnè % Rtg.
44 BANCO BRADESCO (BBD) Grp 41 $40.64548.5M Shares 98 Comp. Rating 91 EPS RS 97 ROE 32%
BRAZIL'S LARGEST PRIVATE-SECTOR BANK WHICH OFFERS A VARIETY OFPERSONAL AND COMMERCIAL FINANCIAL SERVICES
+50% Ann. EPS Gro PE 17 Avg. D. Vol 1,442,800 Debt 97%Last Qtr Eps +52%6 Prior Qtr +136%6 Last Qtr Sales +56%8 Qtrs EPS) 15%Eps Due 5/9
Acc/Dis C+Sup/Demand 24
Finds support in first trip to 10-week since 1/24 breakout.
48 CELADON GROUP (CLDN) Grp 62 $21.8513.8M Shares 93 Comp. Rating 98 EPS RS 90 ROE 13%
PROVIDES LONG HAUL TRUCKLOAD TRANSPORTATION SERVICES FROM THEU.S. TO/FROM LOCATIONS IN MEXICO AND CANADA.
+52% Ann. EPS Gro PE 20 Avg. Daily Vol 223,700 Debt 4%Last Qtr Eps +72%5 Prior Qtr +67%5 Last Qtr Sales +13%9 Qtrs EPS) 15%Eps Due 4/18
Acc/Dis B-Sup/Demand 87
9% above 20.07 buy point; slips below 10-week average.
52 DREW INDS (DW) Grp 100 $35.0015.7M Shares 97 Comp. Rating 96 EPS RS 90 ROE 24%
MANUFACTURES COMPONENTS FOR RECREATIONAL VEHICLES AND MANU-FACTURED HOMES.
+29% Ann. EPS Gro PE 21 Avg. Daily Vol 123,900 Debt 37%Last Qtr Eps +115%5 Prior Qtr +31%5 Last Qtr Sales +37%2 Qtrs EPS) 15%Eps Due 4/28
Acc/Dis A-Sup/Demand 61
May be forming new base after finding support at 10-wk line.
56 INTERVEST BANCSHARE (IBCA) Grp 164 $33.504.4M Shares 97 Comp. Rating 94 EPS RS 93 ROE 16%
HOLDING CO FOR INTERVEST NATIONAL BANK OPERATING THROUGH 1 NEWYORK BRANCH AND 5 BRANCHES IN PINELLAS COUNTY, FLORIDA.
+17% Ann. EPS Gro PE 14 Avg. Daily Vol 35,500 Debt 110%Last Qtr Eps +54%5 Prior Qtr +30%6 Last Qtr Sales +55%5 Qtrs EPS) 15%Eps Due 4/13
Acc/Dis A-Sup/Demand 53
Extended 22% from last pullback to 10-week; 27.50 buy point.
60 CAVCO INDUSTRIES (CVCO) Grp 100 $45.755.9M Shares 94 Comp. Rating 99 EPS RS 86 ROE 9%
MANUFACTURES SINGLE/MULTI-SECTIONAL MANUFACTURED HOMES SOLDVIA 338 INDEPENDENT/11 COMPANY-OWNED OUTLETS IN 14 STATES.
+51% Ann. EPS Gro PE 22 Avg. Daily Vol 29,200 Debt 0%Last Qtr Eps +53%6 Prior Qtr +73%6 Last Qtr Sales +17%4 Qtrs EPS) 15%Eps Due 4/28
Acc/Dis B+Sup/Demand 53
Forming flat, late-stage base-on-base; thinly traded stock.
64 CHEMED CORP (CHE) Grp 80 o$58.8723.9M Shares 97 Comp. Rating 97 EPS RS 86 ROE 12%
PROVIDES HOSPICE CARE, PLUMBING, SEWER/DRAIN/PIPE CLEANING, ANDHVAC REPAIR AND MAINTENANCE.
+64% Ann. EPS Gro PE 30 Avg. Daily Vol 180,400 Debt 84%Last Qtr Eps +49%6 Prior Qtr +53%5 Last Qtr Sales +16%7 Qtrs EPS) 15%Eps Due 5/3
Acc/Dis B+Sup/Demand 67
Up 2% from 57.44 buy point after pulling back to 10-week.
68 WATSCO INC (WSO) Grp 16 o$70.7522.3M Shares 97 Comp. Rating 95 EPS RS 89 ROE 12%
DISTRIBUTES AIR CONDITIONING, HEATING AND REFRIGERATION EQUIPMENTFOR THE REPLACEMENT AND HOMEBUILDING MARKETS
+32% Ann. EPS Gro PE 28 Avg. Daily Vol 239,000 Debt 12%Last Qtr Eps +117%5 Prior Qtr +49%5 Last Qtr Sales +36%2 Qtrs EPS) 15%Eps Due 4/21
Acc/Dis B-Sup/Demand 74
Support at 10-week line, but higher down than up volume.
72 I H S INC CL A (IHS) Grp 87 $25.1813.4M Shares 95 Comp. Rating 94 EPS RS 90 ROE 12%
PROVIDES TECHNICAL INFORMATION, DECISION SUPPORT TOOLS, ANDRELATED SERVICES
+16% Ann. EPS Gro PE 26 Avg. Daily Vol 162,500 Debt 0%Last Qtr Eps +191%5 Prior Qtr +20%5 Last Qtr Sales +6%2 Qtrs EPS) 15%
Acc/Dis BSup/Demand 46
Back above 10-week line; weekly volume has been light.
76 GENESEE&WYOMING (GWR) Grp 27 $31.8835.1M Shares 98 Comp. Rating 91 EPS RS 92 ROE 13%
HOLDING COMPANY WHOSE UNITS OWN/OPERATE SHORT LINE ANDREGIONAL FREIGHT RAILROADS AND PROVIDE RELATED RAIL SERVICES
+18% Ann. EPS Gro PE 26 Avg. Daily Vol 361,200 Debt 37%Last Qtr Eps +52%5 Prior Qtr +32%5 Last Qtr Sales +29%2 Qtrs EPS) 15%Eps Due 5/2
Acc/Dis B+Sup/Demand 75
5% above 30.41 buy point in Feb. short stroke; split 3/14.
80 AQUANTIVE (AQNT) Grp 58 o$23.8955.8M Shares 95 Comp. Rating 99 EPS RS 84 ROE 15%
PROVIDES ONLINE MEDIA BUYING/PLANNING/AD CAMPAIGN MANAGEMENTAND MARKETING TECHNOLOGY AND SOFTWARE.
+91% Ann. EPS Gro PE 50 Avg. D. Vol 1,406,300 Debt 31%Last Qtr Eps +50%6 Prior Qtr +160%5 Last Qtr Sales +44%2 Qtrs EPS) 15%Eps Due 5/4R&D 1%
Acc/Dis CSup/Demand 93
Plunges below 10-week moving average on heavy volume.
41 EAGLE MATERIALS (EXP) Grp 34 o$59.9724.9M Shares 99 Comp. Rating 93 EPS RS 95 ROE 23%
MANUFACTURES GYPSUM WALLBOARD AND CEMENT PRODUCTS FORRESIDENTIAL, COMMERCIAL AND INFRASTRUCTURE APPLICATIONS.
+40% Ann. EPS Gro PE 23 Avg. D. Vol 1,206,100 Debt 11%Last Qtr Eps +55%5 Prior Qtr +48%6 Last Qtr Sales +41%9 Qtrs EPS) 15%Eps Due 5/4
Acc/Dis B+Sup/Demand 94
Up 3% from 57.67 buy point in flat base; got 10-wk support.
45 SCHICK TECHNOLOGIES (SCHK) Grp 33 $47.4713.8M Shares 99 Comp. Rating 90 EPS RS 98 ROE 28%
DEVELOPS DIGITAL RADIOGRAPHIC IMAGING SYSTEMS AND DEVICES FORTHE DENTAL AND MEDICAL MARKETS.
+9% Ann. EPS Gro PE 53 Avg. Daily Vol 130,400 Debt 0%Last Qtr Eps +32%5 Prior Qtr +21%6 Last Qtr Sales +32%3 Qtrs EPS) 15%
R&D 9%
Acc/Dis A+Sup/Demand 72
Above 10-week since 1/4 rebound after many pullbacks.
49 C B O T HOLDINGS INC (BOT) Grp 22 o$117.0052.3M Shares 99 Comp. Rating 98 EPS RS 88 ROE 19%
OPERATES A DERIVATIVES EXCHANGE FOR FUTURES AND OPTIONS THROUGHBOTH ELECTRONIC TRADING AND OPEN-AUCTION PLATFORMS.
+25% Ann. EPS Gro PE 76 Avg. Daily Vol 270,700 Debt 2%Last Qtr Eps+3300%5 Prior Qtr +65%5 Last Qtr Sales +40%7 Qtrs EPS) 15%
Acc/Dis B+Sup/Demand 57
Possibly building handle of its first base since IPO.
53 G F I GROUP INC (GFIG) Grp 15 o$50.797.2M Shares 97 Comp. Rating 96 EPS RS 90 ROE 56%
INTER-DEALER BROKER PROVIDING BROKERAGE SERVICES AND DATA,ANALYTICS AND DERIVATIVES PRODUCTS TO INSTITUTIONAL CLIENTS.
+54% Ann. EPS Gro PE 29 Avg. Daily Vol 233,700 Debt 110%Last Qtr Eps +88%5 Prior Qtr +30%6 Last Qtr Sales +33%8 Qtrs EPS) 15%Eps Due 5/5
Acc/Dis D+Sup/Demand 73
Finds resistance at 10-week after gapping down below it.
57 CHICAGO MERC XCHNG (CME) Grp 22 o$424.4533.9M Shares 99 Comp. Rating 93 EPS RS 92 ROE 31%
OPERATES A FUTURES EXCHANGE FOR THE TRADING OF FUTURES CON-TRACTS AND OPTIONS ON FUTURES CONTRACTS IN THE U.S.
+45% Ann. EPS Gro PE 48 Avg. Daily Vol 544,700 Debt 0%Last Qtr Eps +33%5 Prior Qtr +29%6 Last Qtr Sales +28%8 Qtrs EPS) 15%Eps Due 4/26
Acc/Dis B-Sup/Demand 89
Extended 7% from 397.00 buy point after flat-base breakout.
61 TOWER GROUP INC (TWGP) Grp 101 o$21.9216.8M Shares 94 Comp. Rating 99 EPS RS 86 ROE 12%
PROVIDES PROPERTY AND CASUALTY INSURANCE PRODUCTS AND SERVICESTO SMALL AND MID-SIZED BUSINESSES AND INDIVIDUALS.
+57% Ann. EPS Gro PE 21 Avg. Daily Vol 266,400 Debt 37%Last Qtr Eps +88%6 Prior Qtr +115%6 Last Qtr Sales+101%10 Qtrs EPS) 15%Eps Due 5/2
Acc/Dis B-Sup/Demand 86
May be forming new base after bounce off 40-week line.
65 EMC INSURANCE (EMCI) Grp 101 $25.455.9M Shares 97 Comp. Rating 96 EPS RS 87 ROE 9%
OFFERS PROPERTY AND CASUALTY INSURANCE PRODUCTS IN THE U.S. ANDWRITES REINSURANCE CONTRACTS WORLDWIDE.
+12% Ann. EPS Gro PE 9 Avg. Daily Vol 29,900 Debt 16%Last Qtr Eps +81%6 Prior Qtr +460%5 Last Qtr Sales +20%3 Qtrs EPS) 15%Eps Due 4/28
Acc/Dis ASup/Demand 33
24% extended from 20.60 buy point after Jan. breakout.
69 PREMIERWEST BANC (PRWT) Grp 104 $18.5412.9M Shares 99 Comp. Rating 95 EPS RS 87 ROE 11%
HOLDING CO FOR PREMIERWEST BANK OPERATING VIA 32 BRANCHES IN 9COUNTIES OF SOUTHERN OR AND NORTHERN CA.
+32% Ann. EPS Gro PE 23 Avg. Daily Vol 25,300 Debt 20%Last Qtr Eps +35%6 Prior Qtr +40%6 Last Qtr Sales +33%6 Qtrs EPS) 15%Eps Due 4/12
Acc/Dis A+Sup/Demand 26
Extended 13% from 16.24 buy point of 7-month saucer base.
73 ATLAS AMERICA INC (ATLS) Grp 122 $47.773.8M Shares 95 Comp. Rating 92 EPS RS 92 ROE 32%
ENGAGED IN THE EXPLORATION AND PRODUCTION OF OIL AND NATURAL GASIN REGIONS OF THE APPALACHIAN BASIN.
+48% Ann. EPS Gro PE 25 Avg. Daily Vol 211,800 Debt 159%Last Qtr Eps +41%5 Prior Qtr +27%6 Last Qtr Sales+119%12 Qtrs EPS) 15%Eps Due 5/4
Acc/Dis B-Sup/Demand 80
Building late-stage base on low volume. 3-for-2 split 3/17.
77 KEYSTONE AUTOMOTIV (KEYS) Grp 60 $43.5415.6M Shares 96 Comp. Rating 90 EPS RS 94 ROE 7%
DISTRIBUTES AFTERMARKET COLLISION REPLACEMENT PARTS FOR CARSAND TRUCKS VIA 129 CENTERS IN 38 STATES/CANADA AND A WEBSITE
0% Ann. EPS Gro PE 38 Avg. Daily Vol 143,600 Debt 0%Last Qtr Eps +76%5 Prior Qtr +20%6 Last Qtr Sales +20%3 Qtrs EPS) 15%Eps Due 6/3
Acc/Dis ASup/Demand 75
24% above 35.06 buy point after latest pullback to 10-week.
43 CANDELA CORP (CLZR) Grp 33 o$19.0121.5M Shares 97 Comp. Rating 92 EPS RS 96 ROE 15%
DEVELOPS ADVANCED AESTHETIC LASER AND LIGHT-BASED SYSTEMS USEDIN COSMETIC AND MEDICAL PROCEDURES
+40% Ann. EPS Gro PE 32 Avg. Daily Vol 410,300 Debt 0%Last Qtr Eps +171%5 Prior Qtr +8%5 Last Qtr Sales +34%1 Qtrs EPS) 15%Eps Due 5/3R&D 5%
Acc/Dis C+Sup/Demand 91
Finds support on second pullback to 10-week moving average.
47 LIFE CELL CORP (LIFC) Grp 19 o$21.4532.3M Shares 98 Comp. Rating 99 EPS RS 87 ROE 15%
DEVELOPS HUMAN ALLOGRAFT TISSUE PRODUCTS VIA TISSUE MATRIXES FORRECONSTRUCTIVE, UROGYNECOLOGIC AND ORTHOPEDIC SURGERY.
+110% Ann. EPS Gro PE 58 Avg. D. Vol 1,004,700 Debt 0%Last Qtr Eps +175%6 Prior Qtr +200%6 Last Qtr Sales +64%8 Qtrs EPS) 15%Eps Due 4/26R&D 11%
Acc/Dis CSup/Demand 96
Back at 10-week after failed breakout from 23.26 buy point.
51 VENTIV HEALTH INC (VTIV) Grp 131 o$31.7025.7M Shares 98 Comp. Rating 98 EPS RS 88 ROE 15%
PROVIDES PRODUCT COMMERCIALIZATION SERVICES FOR PRESCRIPTIONPHARMACEUTICAL AND OTHER LIFE SCIENCE PRODUCTS.
+100% Ann. EPS Gro PE 26 Avg. Daily Vol 387,800 Debt 0%Last Qtr Eps +48%6 Prior Qtr +50%6 Last Qtr Sales +49%4 Qtrs EPS) 15%Eps Due 5/9
Acc/Dis ASup/Demand 86
Extended 13% from 28.05 buy point after 3/9 breakout.
55 THOR INDUSTRIES (THO) Grp 100 o$51.5035.7M Shares 97 Comp. Rating 95 EPS RS 91 ROE 21%
MANUFACTURES RECREATION VEHICLES AND SMALL AND MID-SIZE BUSESIN THE U.S. AND CANADA.
+25% Ann. EPS Gro PE 21 Avg. Daily Vol 370,200 Debt 0%Last Qtr Eps +56%5 Prior Qtr +25%5 Last Qtr Sales +20%2 Qtrs EPS) 15%Eps Due 6/2
Acc/Dis A-Sup/Demand 65
Up 16% from 44.21 buy point after rallying off 10-week line.
59 CAMECO CORP (CCJ) Grp 52 o$35.91346.1M Shares 93 Comp. Rating 99 EPS RS 86 ROE 8%
CANADIAN CO ENGAGED IN THE EXPLORATION, REFINING AND CONVERSIONOF URANIUM IN CANADA AND OTHER COUNTRIES.
+42% Ann. EPS Gro PE 62 Avg. D. Vol 3,002,800 Debt 24%Last Qtr Eps +82%6 Prior Qtr +120%5 Last Qtr Sales +45%2 Qtrs EPS) 15%Eps Due 4/29R&D 3%
Acc/Dis DSup/Demand 74
Falls below 10-week line afer 2nd big reversal in six weeks.
63 WESTERN DIGITAL (WDC) Grp 8 o$19.42214.9M Shares 95 Comp. Rating 97 EPS RS 89 ROE 36%
MANUFACTURES HARD DISK DRIVES FOR COMPUTERS, SERVERS, DIGITALVIDEO RECORDERS AND OTHER CONSUMER ELECTRONICS.
+12% Ann. EPS Gro PE 14 Avg. D. Vol 4,195,600 Debt 5%Last Qtr Eps +88%6 Prior Qtr +120%5 Last Qtr Sales +17%4 Qtrs EPS) 15%Eps Due 4/21R&D 6%
Acc/Dis DSup/Demand 92
Slowly working its way back up after fall below 10-week.
67 MILLER INDUSTRIES INC (MLR) Grp 112 $24.488.9M Shares 95 Comp. Rating 95 EPS RS 91 ROE 33%
MANUFACTURES TOWING AND RECOVERY EQUIPMENT PRODUCTS TO CUS-TOMER DESIGN, CAPACITY AND COST REQUIREMENTS.
+129% Ann. EPS Gro PE 15 Avg. Daily Vol 58,500 Debt 26%Last Qtr Eps +225%5 Prior Qtr +161%5 Last Qtr Sales +38%6 Qtrs EPS) 15%Eps Due 5/10
Acc/Dis B-Sup/Demand 57
Thin stock recovering from pullback to 10-week average.
71 C H ROBINSON WRLD (CHRW) Grp 12 o$45.29157.3M Shares 99 Comp. Rating 94 EPS RS 90 ROE 24%
PROVIDES FREIGHT TRANSPORTATION SERVICES AND LOGISTICS SOLUTIONSTO COMPANIES IN NORTH/SOUTH AMERICA, EUROPE AND ASIA.
+26% Ann. EPS Gro PE 39 Avg. Daily Vol 862,900 Debt 0%Last Qtr Eps +50%5 Prior Qtr +41%6 Last Qtr Sales +33%8 Qtrs EPS) 15%Eps Due 4/26
Acc/Dis B+Sup/Demand 56
Tight action last 3 weeks as stock hovers near 46.36 high.
75 STERLING CONSTRUCTN (STRL) Grp 30 $20.245.2M Shares 95 Comp. Rating 91 EPS RS 94 ROE 20%
PROVIDES HEAVY CONSTRUCTION SPECIALIZING IN MUNICIPAL AND STATECONTRACTS IN TEXAS.
+5% Ann. EPS Gro PE 20 Avg. Daily Vol 68,900 Debt 60%Last Qtr Eps +211%5 Prior Qtr +36% Last Qtr Sales +52%4 Qtrs EPS) 15%Eps Due 3/23
Acc/Dis C+Sup/Demand 73
Correcting for six months. Found support at 200-day average.
79 DRESS BARN (DBRN) Grp 14 o$45.2922.2M Shares 99 Comp. Rating 88 EPS RS 96 ROE 12%
OPERATES 1,272 SPECIALTY STORES OFFERING WOMEN'S REGULAR/ PLUS-SIZED APPAREL AND ACCESSORIES IN 48 STATES (79 IN NY)
+19% Ann. EPS Gro PE 25 Avg. Daily Vol 666,600 Debt 50%Last Qtr Eps +250%5 Prior Qtr +167%5 Last Qtr Sales +55%4 Qtrs EPS) 15%Eps Due 6/1
Acc/Dis BSup/Demand 93
Support at 10-week after pulling back to it; 46.84 buy pt.
IBD 100 Performance Weekly changes in the IBD 100 vs. the S&P 500
IBD 100
MFJ’06
DNOSAJJMAMFJ’05
DNOSAJJMAMFJ’04
DNOSAJJM’03
S&P 500
0
25
50
75
125
150%
100
IBD 100: 133.1%S&P 500: 37.8%Performance: 5/2/03 to 3/10/06
C O M P A N I E S 4 1 - 8 0
42 GILDAN ACTIVEWR INC (GIL) Grp 63 $51.4559.3M Shares 98 Comp. Rating 93 EPS RS 95 ROE 22%
MANUFACTURES IMPRINTED ACTIVEWEAR FOR THE CANADIAN, U.S., EUROPE-AN, AND OTHER INTL WHOLESALE MARKETS.
+29% Ann. EPS Gro PE 31 Avg. Daily Vol 139,300 Debt 12%Last Qtr Eps +93%5 Prior Qtr +27%6 Last Qtr Sales +10%7 Qtrs EPS) 15%Eps Due 5/5
Acc/Dis B+Sup/Demand 34
Near 51.62 buy point after dip near 10-wk; B+ accumulation.
46 OPTIONSXPRESS HLDGS (OXPS) Grp 78 o$28.0422.3M Shares 94 Comp. Rating 99 EPS RS 90 ROE 152%
PROVIDES ONLINE BROKERAGE SERVICES FOR OPTION PRODUCTS TO RETAILAND PROFESSIONAL INVESTORS VIA WWW.OPTIONSXPRESS.COM.
+102% Ann. EPS Gro PE 36 Avg. D. Vol 1,356,600 Debt 0%Last Qtr Eps +67%6 Prior Qtr +122%5 Last Qtr Sales +56%2 Qtrs EPS) 15%Eps Due 4/21
Acc/Dis D-Sup/Demand 93
Second week below 10-week line after high-volume drop.
50 F5 NETWORKS (FFIV) Grp 23 o$69.9339.6M Shares 99 Comp. Rating 98 EPS RS 88 ROE 14%
PROVIDES INTEGRATED SYSTEMS AND SERVICES TO SECURELY MANAGE ANDOPTIMIZE INTERNET TRAFFIC.
+326% Ann. EPS Gro PE 44 Avg. D. Vol 1,110,600 Debt 0%Last Qtr Eps +81%5 Prior Qtr +68%6 Last Qtr Sales +47%14 Qtrs EPS) 15%Eps Due 4/20R&D 11%
Acc/Dis B+Sup/Demand 96
Near new highs after 3rd pullbk to 10-wk after Dec. brkout.
54 GARMIN (GRMN) Grp 47 o$77.0975.7M Shares 99 Comp. Rating 96 EPS RS 89 ROE 29%
MANUFACTURES HAND-HELD/PORTABLE/FIXED-MOUNT GLOBAL POSITIONINGSYSTEMS FOR THE GENERAL AVIATION AND CONSUMER MARKETS.
+24% Ann. EPS Gro PE 27 Avg. D. Vol 1,273,700 Debt 0%Last Qtr Eps +82%5 Prior Qtr +52%5 Last Qtr Sales +45%4 Qtrs EPS) 15%Eps Due 4/27R&D 7%
Acc/Dis A+Sup/Demand 82
Extended 13% from 68.10 buy point after Feb. 22 breakout.
58 MEMC ELEC MATERIAL (WFR) Grp 20 o$36.60138.2M Shares 99 Comp. Rating 87 EPS RS 98 ROE 60%
MANUFACTURES PRIME POLISHED, EPITAXIAL, AND TEST/MONITOR WAFERSUSED IN SEMICONDUCTOR MANUFACTURING.
+160% Ann. EPS Gro PE 30 Avg. D. Vol 3,230,500 Debt 26%Last Qtr Eps +48%5 Prior Qtr -4%6 Last Qtr Sales +18%1 Qtrs EPS) 15%Eps Due 4/28R&D 3%
Acc/Dis A-Sup/Demand 88
Extended 48% above 24.78 buy point after 10-week support.
62 TALX (TALX) Grp 37 o$29.4629.5M Shares 95 Comp. Rating 98 EPS RS 88 ROE 12%
DEVELOPS AUTOMATED EMPLOYMENT, INCOME VERIFICATION, AND UNEM-PLOYMENT SOFTWARE FOR COMPANIES AND GOVERNMENT AGENCIES.
+37% Ann. EPS Gro PE 35 Avg. Daily Vol 515,100 Debt 38%Last Qtr Eps +47%6 Prior Qtr +75%6 Last Qtr Sales +31%6 Qtrs EPS) 15%Eps Due 5/11
Acc/Dis C+Sup/Demand 89
Falls back below 10-week average; volatile after split.
66 EXPRESS SCRIPTS (ESRX) Grp 81 o$90.37142.0M Shares 94 Comp. Rating 95 EPS RS 91 ROE 29%
PROVIDES PHARMACY BENEFIT MANAGEMENT SERVICES TO MANAGED CAREORGANIZATIONS, EMPLOYERS, INSURERS AND ADMINISTRATORS.
+24% Ann. EPS Gro PE 35 Avg. D. Vol 1,693,800 Debt 96%Last Qtr Eps +45%5 Prior Qtr +34%5 Last Qtr Sales +18%20 Qtrs EPS) 15%Eps Due 4/26
Acc/Dis BSup/Demand 82
Gets back above 10-week average, but on light volume.
70 L K Q CORP (LKQX) Grp 69 $21.2338.2M Shares 95 Comp. Rating 94 EPS RS 92 ROE 10%
PROVIDES RECYCLED AUTOMOTIVE REPLACEMENT PARTS TO COLLISION ANDMECHANICAL REPAIR SHOPS
+28% Ann. EPS Gro PE 33 Avg. Daily Vol 457,200 Debt 24%Last Qtr Eps +36%6 Prior Qtr +40%6 Last Qtr Sales +27%5 Qtrs EPS) 15%Eps Due 4/28
Acc/Dis B-Sup/Demand 74
Finding support at 10-week; heavy selling since February.
74 HITTITE MICROWAVE (HITT) Grp 21 $30.769.4M Shares 99 Comp. Rating 92 EPS RS 90 ROE 75%
DESIGNS ANALOG/DIGITAL/MIXED-SIGNAL INTEGRATED CIRCUITS USED INRF, MICROWAVE, AND MILLIMETERWAVE APPLICATIONS.
+74% Ann. EPS Gro PE 43 Avg. Daily Vol 213,500 Debt 2%Last Qtr Eps +64%5 Prior Qtr +31%6 Last Qtr Sales +34%11 Qtrs EPS) 15%
R&D 12%
Acc/Dis A-Sup/Demand 69
5% below 32.35 buy pt; rebound attempt in lower volume.
78 GYMBOREE (GYMB) Grp 14 o$25.6530.1M Shares 98 Comp. Rating 89 EPS RS 94 ROE 8%
OPERATES 579 GYMBOREE, 55 JANIE AND JACK CHILDREN'S STORES AND 14JANEVILLE WOMEN'S APPAREL STORES IN THE U.S./CANADA.
-9% Ann. EPS Gro PE 27 Avg. Daily Vol 698,700 Debt 0%Last Qtr Eps +211%5 Prior Qtr +46%5 Last Qtr Sales +17%2 Qtrs EPS) 15%Eps Due 5/18
Acc/Dis ASup/Demand 93
Just below 25.85 buy point after pullback to 10-week line.
41 Eagle Materials 59.97 99 93 95 +50 +55 +45 +41 23 25 4 BAnalysts project 38% earnings growth in fiscal year ending in March 2007.
42 Gildan Activewr Inc 51.45 98 93 95 +94 +93 .. +10 22 15 1 B7Analysts see activewear firm's sales growth easing to 17% in fiscal 2006.
43 Candela Corp 19.01 97 92 96 +57 +171 +54 +34 15 10 7 AMedical laser maker's sales growth rose past 2 qtrs from 13% to 25% to 34%.
44 Banco Bradesco 40.64 98 91 97 +26 +52 .. +56 32 14 2 DBrazilian bank's 5th qtr of 51%–plus profit growth; increased lending helps.
45 Schick Technolgs 47.47 99 90 98 +31 +32 +11 +32 28 36 15 ..Analysts see 35% EPS growth for imaging firm in fiscal year ended March '07.
46 optionsXpress Hld 28.04 94 99 90 +36 +67 +75 +56 99 .. 64 B7Launched expansion into Singapore that offers trading in U.S. securities.
47 Life Cell Corp 21.45 98 99 87 +24 +175 +29 +64 15 21 3 ABiotech's Q4 sales growth best in at least 13 quarters; EPS met views.
48 Celadon Group 21.85 93 98 90 +48 +72 +50 +13 13 5 9 ATrucking firm's EPS growth rate rose sequentially the past four quarters.
49 C B O T Holdings 117.0 99 98 88 +65 +999 +50 +40 19 29 1 A7Futures exchange operator says it may expand presence in metals futures.
50 F5 Networks 69.93 99 98 88 +43 +81 +61 +47 14 29 1 B7Networking gear maker's ROE grew past 2 yrs from 4% to 13.1% to 14.3%.
51 Ventiv Health Inc 31.70 98 98 88 +16 +48 +19 +49 15 10 7 BProvider of services to drug makers changed name to inVentiv Health 3/14.
52 Drew Inds 35.00 97 96 90 +18 +115 +18 +37 24 8 27 ARV parts firm buys business, certain assets of SteelCo, for $4.5 mil cash.
53 G F I Group Inc 50.79 97 96 90 +27 +88 +38 +33 56 16 74 B7Earnings more than tripled in Q4, beating views by 2 cents; sales up 33%.
54 Garmin 77.09 99 96 89 +13 +82 +53 +45 29 36 24 C7GPS systems maker willing to settle patent dispute w/Dutch rival TomTom.
55 Thor Industries 51.50 97 95 91 +29 +56 +24 +20 21 7 37 BBB&T Capital Markets downgrades rating on RV maker to hold from buy.
56 Intervest Bncshr 33.50 97 94 93 +12 +54 +44 +55 16 30 41 CNew York–based lender's ROE has held at 13.8% or more the past 4 years.
57 Chicago MercXchng 424.5 99 93 92 +25 +33 +26 +28 31 .. 2 C7To let Chinese market trade CME foreign exchange, interest rate products.
58 MEMC Elec Matrl 36.60 99 87 98 +31 +48 +30 +18 60 24 34 CWafer maker will file annual report late; restating 1st 2 qtrs of 2005.
59 Cameco Corp 35.91 93 99 86 +84 +82 +157 +45 8 21 .. CMutual funds owning uranium producer rose to 215 in Q4 from 162 in Q4 '04.
60 Cavco Industries 45.75 94 99 86 +43 +53 0 +17 9 10 7 AAnalysts see manufactured home firm having flat EPS growth in fiscal Q4.
61 Tower Group Inc 21.92 94 99 86 +60 +88 +111+101 12 .. 15 A7Specialty insurer's sales up 100%–plus last 2 qtrs; 3–year growth rate 52%.
62 Talx 29.46 95 98 88 +54 +47 +24 +31 12 19 8 BSoftware maker's sales growth 30%–plus past 5 qtrs, profit growth slows.
63 Western Digital 19.42 95 97 89 +49 +88 +19 +17 36 6 3 BHard disk drive maker reaffirmed 3Q outlook on as–forecast slower demand.
64 Chemed Corp 58.87 97 97 86 +21 +49 +30 +16 12 8 7 BHospice care, plumbing and repair firm beats analyst views 7 straight qtrs.
65 EMC Insurance 25.45 97 96 87 –19 +81 +4 +20 9 12 3 AOne of 2 stocks in Insurance–Prop/Casualty/Title with A+ Acc/Dist Rating.
66 Express Scripts 90.37 94 95 91 +21 +45 +25 +18 29 3 3 CPharmacy benefits manager beat Q4 earnings forecasts by 2 cents a share.
67 Miller Industries 24.48 95 95 91 .. +225 .. +38 33 6 21 ..Custom towing products maker's Q4 EPS more than triple; sales up 38%.
68 Watsco Inc 70.75 97 95 89 +17 +117 +27 +36 12 .. 5 BBeat Thomson First Call consensus estimates by 56% and 14% past 2 qtrs.
69 PremierWest Banc 18.54 99 95 87 +16 +35 +38 +33 11 .. 10 ..DA Davidson cuts bank's rating to underperform from neutral on March 1.
70 L K Q Corp 21.23 95 94 92 +19 +36 +11 +27 10 .. 27 B7Recycled car parts firm beat Q4 views by 2 cents, but guides Q1 lower.
71 C H Robinson Wrld 45.29 99 94 90 +17 +50 +29 +33 24 .. 8 CSurpassed consensus earnings estimates by 5% to 24% past 6 qtrs straight.
72 I H S Inc Cl A 25.18 95 94 90 +1 +191 0 +6 12 16 3 B7Analysts expect flat EPS growth in fiscal Q1, to be released on March 28.
73 Atlas America Inc 47.77 95 92 92 +22 +41 +16+119 32 12 1 A7E&P firm's results missed analysts' estimates the last four quarters.
74 Hittite Microwave 30.76 99 92 90 +18 +64 +33 +34 75 .. 67 B7Elec–Semiconductor Manufacturing ranked in top 16 groups last 9 wks.
75 Sterling Constructn 20.24 95 91 94 +13 +211 –48 +52 20 2 36 AHeavy construction firm posts Q4 results Monday; consensus 23 cents/share.
76 Genesee&Wyoming 31.88 98 91 92 +19 +52 +27 +29 13 14 5 ARail operator's Feb. traffic rose 20.7% in N. America, 5.9% in Australia.
77 Keystone Automotiv 43.54 96 90 94 +62 +76 +100 +20 7 4 3 AProvider of aftermarket car parts sees demand from insurers.
78 Gymboree 25.65 98 89 94 +17 +211 +53 +17 8 7 5 BWedbush Morgan downgrades kids' clothes retailer to buy from strong buy.
79 Dress Barn 45.29 99 88 96 +82 +250 +45 +55 12 5 28 BBuyout of Maurices chain seen driving growth, more leverage w/ vendors.
80 aQuantive 23.89 95 99 84 –10 +50 –33 +44 15 19 17 B7Digital marketer names Wayne Wisehart CFO, prior Western Wireless' CFO.

INVESTOR'S BUSINESS DAILY ADVERTISING FEATURE MONDAY, MARCH 20, 2006 B5
GorillaTrades is a risk-controlled, market-proven, propri-etary system, which generates a menu of stock ideas that
time and time again identifies stock trades with explosive price appreciation potential! Make no mistake, the Gorilla-Trades system
is not about day trading. In fact, the average holding period ofGorillaPicks is between two and four weeks with a goal of 20% to 40%profits from every position recommended. Moreover, each idea present-ed contains only one-half to one-third the risk compared to its poten-tial return. A simple Risk Rating is included with every GorillaPick thatdefines its probable risk.
For the skeptic, this site offers free 30-day access to what may be themost profitable, risk-controlled investment service you’ll ever find.
Since it is quite possible that the stock market could remain ina paralyzing trading range over the next several years, you
need a proven service like GorillaTrades to provide youwith an excellent source of high-probability trading
ideas! If you’re like most of our subscribers, youare probably tired of unrealistic services that
claim to produce only winners and no los-ers. Investors are too intelligent to
believe such ridiculous claims. Mostof these services consistently recom-mend the most volatile stocks,which are unsuitable in certain
market environments. TheGorilla believes in
staying fullydiversified,and pro-
vides riskparameters to
enhance andeducate subscribers in their
trading decisions. As with any system of investing, there will belosses. However, the losses are less than 6% on average, while mostprofits are three, four, five, or even six times this figure! Folks, ifyou take a minute to do the math you will quickly realize just howfast your money could grow!
This is not a service that pulls stocks out of a hat, but rather aprogram that educates its subscribers with valuable information.The Gorilla does not recommend high-flying internet or techstocks that have the same probability of falling as they do rising.The GorillaTrades system not only looks for quick gains, but it rec-ognizes companies that have constructive, long-term technical pat-terns. Burlington Northern, for example, was held for over a yearbefore it finally breached its stop loss level. Because its stop losslevel was continuously raised on a weekly basis, even though itstopped out, it still generated more than a 50% profit! TXU Corp.,a utility company which also offers an attractive dividend, nettedGorillaTrades’ subscribers a whopping 47% profit in just 3months! Urban Outfitters, a retailer, was traded three differenttimes, each time for a profit, while the stop loss level was raised tominimize risk. In fact, the final trade of URBN netted subscribers a42% profit!
How exactly does the Gorilla-Trades system work?GorillaTrades uses its specialized proprietary computer software
program to analyze over 6,000 stocks from the three major marketseach day after the close. Using an intricate formula, it calculates thestrength of 14 different technical indicators and analyzes their poten-tial risk and upside probability parameters. The software programthen projects specific upside price (profit) targets and generates anappropriate stop loss level for every GorillaPick recommended. Thesestocks then have to exceed specific price and volume levels to official-ly enter the Gorilla’s list of stocks that are preparing to explode inprice in one direction (GorillaPicks) or the other (GorillaShorts).This is literally like finding needles in a haystack with a computer-guided magnet! Additionally, the Gorilla raises stop loss levels alongthe way in order to protect his subscribers’ hard-earned profits. TheGorilla “holds your hand” the entire way! This enables you todecrease your research time and improve your portfolio’s return;whether the market goes up, down, or sideways. This takes the hard-est part of investing off your hands. It’s no coincidence that a rapid-ly growing number of subscribers to the GorillaTrades service arestock brokers and professional money managers!
Is it necessary to be available during trading hours to use theGorillaTrades system?
Absolutely not! Within a couple of hours of the markets’ closeeach evening, the Gorilla sends his subscribers a detailed perspec-tive of the market to help them make sense of that day’s activity,and more importantly, gives them insight to help them profit fromwhat some of Wall Street’s top traders are expecting from tomor-row’s market. He then provides specific recommendations for pur-chase at the next morning’s open.
Profit with the ProsAnd, if you’re completely thrilled with your profits, do nothing
and your service will continue at a special introductory rate of only$599.95 for the ENTIRE year (which most subscribers say theymake back in their first trade or two)! However, if you decide thisservice is not for you, simply call us or cancel online at any timewithin the first 30 days, and your credit card will never be charged!GUARANTEED.
So why is GorillaTrades giving you this incredible offer? Becauseonce you try the Gorilla’s service, you’ll be so thrilled with yourprofits you’ll want to continue. To start your free trial today, sim-ply go to www.gorillatrades.com/ibd to register securely online andstart reading today’s market update instantly! Or, call 1-866-222-6639 to speak to one of the Gorilla’s representatives. Due to callvolume, you are strongly encouraged to register securely online.
PROFIT WITH THE PROS
SHORT TERM PROFITS
GorillaTrades is your key to20%-40% short-term profits ona diverse selection of stocks, indifferent sectors, and with dif-ferent risk levels, to keep yourportfolio in balance! Right aresome examples of recent tradesand realized profits.
THE GORILLA ON PROFIT: The personal experience of “The Gorilla” him-self is quite impressive. This master investor behind GorillaTrades maintains anetwork of financial insiders gathered throughout his 25 years in the indus-try. He recognized a phenomenon when he determined that subtle indicatorspreceded explosive individual stock price movements. It was as a result ofthis research that he developed his proprietary formula using 14 differenttechnical indicators, and used the signals generated by his system to turn$250,000 into $5,500,000 in just 18 months!
GORILLATRADES INC.
GorillaTrades...Silly Name, Serious Stock Picks.
Be empowered by the GorillaTrades menu of ideas; fresh stockpicks that have flawlessly passed GorillaTrades’ intricate 14 stepscreening process and analytical scrutiny. New GorillaPicks are pre-sented in the evening Gorilla email and on the subscribers only web-site, along with specific instruction on where to place trading param-eters based on an in- depth technical profile on each stock. EachGorillaPick includes a specific trigger price, confirmation volumelevel, stop loss level, first target, second target, and even trading tipsand a company overview.
GorillaTrades is the market proven investing system that consis-tently produces explosive stock ideas like no other. GorillaTrades pro-vides the complete solution for the modern investor by providingfresh stock picks, precise guidelines about how to trade them, dailyupdates on the current portfolio, a compelling daily market commen-tary, and educational resources to round out the complete investor.
GorillaTrades then continues to actively track these stocks, regular-ly updating stop loss levels and second targets as needed. This guid-ance helps subscribers lock in profits and minimize any losses. Thebeauty of GorillaTrades is that it’s simple, yet highly effective. The sys-tem allows you to invest on a level playing field with professionals,without the research time. There is a good reason why GorillaTradeshas subscribers in 36 different countries, and has become the fastestgrowing, most highly respected investing system in the world – it isbecause GorillaTrades works. Now is the time to take your portfolioto the next level!
LOCK IN PROFITS, MINIMIZE LOSSES
SUBSCRIBERS SUCCESSES
VISIT DURING OPEN HOUSE!Logging in is EASY & FREE until Tuesday morning!
Enjoy all the benefits (including GorillaPicks)NO CREDIT CARD REQUIRED
www.gorillatrades.comusername=openhouse password=special
“As a GorillaTrades sub-scriber since early 2000, I haveseen up markets, and down mar-kets, but have more than paidfor my annual subscription everysingle month! I find it amusingthat my stockbroker now callsme daily, and treats me like a peer. I have learned so much fromthe Gorilla. Thank you for such a wonderful service!” reportsBruce Liebowitz of Farmington Hills, Michigan.
“I have bought and sold mutual funds since about 1986 andhave had decent returns and feel that I understand them prettywell. I never felt that I was knowledgeable or had the time tobecome knowledgeable enough to buy individual stocks. Afterreading numerous books regarding investing, and getting a han-dle on what to look for in a stock, I was left with an empty feel-ing trying to sift through all the stocks to find those few thathad the “right credentials.” I find the GorillaTrades service sovaluable because you have solved the trouble of finding thosestocks. Because of GorillaTrades I feel equipped with the rightstocks to choose from and have made my new adventure intostock trading profitable from the start,” reports BrandonRinehart from Traverse City, Michigan. Brandon has been aGorillaTrades subscriber for almost 2 years.
PROFILE THE GORILLA
Intl. Securities Exch ISE +63.23%
Global Payments GPN +53.22%
Jones Lang LaSalle JLL +52.04%
Gilead Sciences GILD +44.40%
MicroStrategy MSTR +42.15%
NYSE Group NYX +40.76%
Satyam SAY + 40.49%
Oshkosh Truck OSK +37.59%
Assurant AIZ +36.08%
Affiliated Managers AMG +35.36%
Ameritrade AMTD +34.50%
Commercial Metals CMC +33.05%
Intercontinental Exch ICE +30.70%
NII Holdings NIHD +30.32%
Veritas VTS +29.07%
Aluminum China ACH +26.11%
IDEXX Labs IDXX +24.77%
Itron ITRI +23.54%
Morningstar MORN +23.23%
Endesa SA ELE +22.63%
TOP 20 GORILLATRADES PORTFOLIO LEADERS ( A S O F 0 3 / 1 5 / 0 6 )
G O R I L L A T R A D E S C L O S E D S O FA R T H I S Y E A RAllegheny Tech (ATI) 58% profit
Trident Micro (TRID) 49% profit
Broadcom (BRCM) 48% profit
Walter Industries (WLT) 47% profit
USG Corp (USG) 45% profit
GFI Group (GFIG) 41% profit
Terex (TEX) 31% profit
Psychiatric Solutions (PSYS) 29% profit
Pictured above is a graph of the International SecuritiesExchange, which was recommended to GorillaTrades subscriberson 1/10/06. The stop loss level has since been raised to $41.00.
International Securities Exchange (ISE) Trigger: Above $31.50 First Target: $37 Second Target: $47 Stop Loss Level: $26.75Confirmation Volume Area: 460K Risk Rating: 5.
Bruce Liebowitz has been aGorillaTrades subscriber for 5years. His stockbroker now callshim daily.
“As an eighty-year-old sub-scriber, I find your nightly advicenot only profitable these last threeyears - but a boon to keeping theold cranium working. I quit ten-nis at 75 (my partners were fallingby the wayside) and golf two orthree times a week is enough. Myportfolio is not large by normalstandards, but with your guide-lines I have increased it by 50%the last two years. I have takenadvantage of just about all your puppies with large paws. They neverfail to pay for themselves within days if you invest an equal dollaramount in all five," says 3 year subscriber, George Nelson ofBurbank, California.
“I take each and every GorillaPick very seriously and use theirprice/volume guidelines religiously. Many of their GorillaPicks makeyou “Big Money” later rather than immediately! Even when the Gorillais not immediately right, some of their previous picks literally doubleor triple within 9-12 months,” reports Bob Weber of Stockton,California, a subscriber for more than a year.
“In the beginning (I am 73 and never bought or sold stocks) I feltunsure of myself. I too was willing to sell out at the slightest downturn.After time, and your tremendous help, I feel that I have a fairly goodgrasp of how to continue to make winning trades. Yes, there are occa-sional screw-ups, but on the whole, I am in positive territory and get-ting better every day, thanks to you,” says four month subsciber EugeneJ. Dziekan of Boca Raton, Florida.
Eighty-year-old George Nelsonhas increased his portfolio by50% in the last two years.

B6 MONDAY, MARCH 20, 2006 INVESTORS.COM
SMARTSELECT® COMPOSITE RATING RelîAnnual Last Qtr NextQtr Lst Qtr Mgtîì Spn-EPS StrëîEPS Est EPS EPS Salesî Pretaxè Ownî shp
6Rank Company Price íî Rtg Rtgî% Chg % Chg % Chg % Chg ROE mrgnè % Rtg.
81 TURKCELL (TKC) Grp 32 o$18.28207.9M Shares 98 Comp. Rating 99 EPS RS 83 ROE 28%
TURKISH PROVIDER OF PREPAID AND POSTPAID WIRELESS VOICE AND DATASERVICES TO 23.4 MIL SUBSCRIBERS
+133% Ann. EPS Gro PE 15 Avg. Daily Vol 371,400 Debt 13%Last Qtr Eps +74%6 Prior Qtr +120%6 Last Qtr Sales +22%3 Qtrs EPS) 15%Eps Due 5/25
Acc/Dis BSup/Demand 9
Finding support at 10-week moving avg. Gapped down 3/17.
85 VIRGINIA COMM BANK (VCBI) Grp 147 $35.568.5M Shares 96 Comp. Rating 96 EPS RS 87 ROE 19%
HOLDING CO FOR VIRGINIA COMMERCE BANK OPERATING THROUGH 16BRANCHES IN THE NORTHERN VA SUBURBS OF WASHINGTON, DC.
+25% Ann. EPS Gro PE 27 Avg. Daily Vol 42,500 Debt 40%Last Qtr Eps +42%5 Prior Qtr +35%5 Last Qtr Sales +49%4 Qtrs EPS) 15%Eps Due 4/12
Acc/Dis B+Sup/Demand 41
Pulls back to 10-week line; 37.10 potential buy point.
89 BERKLEY WR (BER) Grp 101 o$59.14108.8M Shares 95 Comp. Rating 92 EPS RS 91 ROE 22%
OFFERS SPECIALTY LINES OF INSURANCE INCLUDING EXCESS AND SURPLUSLINES, COMMERCIAL PROPERTY CASUALTY AND REINSURANCE.
+41% Ann. EPS Gro PE 15 Avg. Daily Vol 643,400 Debt 55%Last Qtr Eps +43%5 Prior Qtr +24%6 Last Qtr Sales +14%16 Qtrs EPS) 15%Eps Due 4/26
Acc/Dis BSup/Demand 56
Gaps up after testing 10-wk, then forges all-time highs.
93 SOUTHERN COPPER (PCU) Grp 52 o$83.8936.8M Shares 96 Comp. Rating 91 EPS RS 91 ROE 45%
INTEGRATED PRODUCER OF COPPER THAT OPERATES MINING, SMELTINGAND REFINING FACILITIES IN SOUTHERN PERU.
+162% Ann. EPS Gro PE 9 Avg. D. Vol 1,351,500 Debt 35%Last Qtr Eps +14%6 Prior Qtr +71%5 Last Qtr Sales +14%0 Qtrs EPS) 15%Eps Due 4/21
Acc/Dis D+Sup/Demand 76
3rd pullback to 10-wk after 9-month cup-with-handle.
97 CORE LABS (CLB) Grp 44 $46.3023.5M Shares 97 Comp. Rating 90 EPS RS 91 ROE 23%
DUTCH COMPANY PROVIDING PETROLEUM RESERVOIR DESCRIPTION, PRO-DUCTION ENHANCEMENT AND RESERVOIR MANAGEMENT SERVICES
+91% Ann. EPS Gro PE 27 Avg. Daily Vol 164,400 Debt 40%Last Qtr Eps +62%5 Prior Qtr +60%5 Last Qtr Sales +11%12 Qtrs EPS) 15%Eps Due 4/27
Acc/Dis BSup/Demand 64
Third pullback 10-week average after Nov. 2 breakout.
82 BG GRP (BRG) Grp 115 $61.30688.1M Shares 96 Comp. Rating 97 EPS RS 86 ROE 19%
ENERGY COMPANY ENGAGED IN THE DISCOVERY, EXTRACTION, TRANSMIS-SION, DISTRIBUTION AND SUPPLY OF NATURAL GAS.
+47% Ann. EPS Gro PE 18 Avg. Daily Vol 186,300 Debt 17%Last Qtr Eps +97%5 Prior Qtr +40%6 Last Qtr Sales +54%13 Qtrs EPS) 15%Eps Due 5/9
Acc/Dis B-Sup/Demand 5
Keeps advancing after breakout from late-stage base.
86 NORFOLK SOUTHERN (NSC) Grp 27 o$53.94404.0M Shares 98 Comp. Rating 94 EPS RS 88 ROE 13%
OPERATES, THROUGH NORFOLK SOUTHERN RAILWAY, A 21,200 MILERAILROAD IN 22 STATES, D.C. AND ONTARIO, CANADA.
+40% Ann. EPS Gro PE 19 Avg. D. Vol 2,663,200 Debt 71%Last Qtr Eps +34%5 Prior Qtr +24%6 Last Qtr Sales +16%9 Qtrs EPS) 15%Eps Due 4/27
Acc/Dis BSup/Demand 64
New highs after 3rd pullback to 10-week moving average.
90 SATYAM COMPUTER (SAY) Grp 72 $41.77140.1M Shares 94 Comp. Rating 92 EPS RS 90 ROE 23%
INDIA-BASED PROVIDER OF INFORMATION TECHNOLOGY SERVICES WITH APRESENCE IN 45 COUNTRIES
+37% Ann. EPS Gro PE 33 Avg. Daily Vol 481,900 Debt 1%Last Qtr Eps +57%5 Prior Qtr +50%5 Last Qtr Sales +61%11 Qtrs EPS) 15%Eps Due 4/21
Acc/Dis D-Sup/Demand 42
Found support after pullback to 10-week but on low volume.
94 SCS TRANSPORT (SCST) Grp 62 $29.5113.8M Shares 94 Comp. Rating 91 EPS RS 91 ROE 10%
PROVIDES TRUCKING TRANSPORTATION AND SUPPLY CHAIN SOLUTIONS TOTHE RETAIL, CHEMICAL AND MANUFACTURING INDUSTRIES.
+28% Ann. EPS Gro PE 19 Avg. Daily Vol 171,500 Debt 48%Last Qtr Eps +47%5 Prior Qtr +16%5 Last Qtr Sales +14%2 Qtrs EPS) 15%Eps Due 4/20
Acc/Dis B+Sup/Demand 82
Gaps down on heavy volume after analyst downgrade.
98 E*TRADE FINANCIAL (ET) Grp 78 o$26.33397.0M Shares 98 Comp. Rating 88 EPS RS 94 ROE 15%
PROVIDES ONLINE BROKERAGE AND BANKING SERVICES FOR RETAIL ANDINSTITUTIONAL CLIENTS WORLDWIDE VIA WWW.ETRADE.COM.
+42% Ann. EPS Gro PE 23 Avg. D. Vol 3,480,100 Debt 54%Last Qtr Eps +12%6 Prior Qtr +26%5 Last Qtr Sales +33%0 Qtrs EPS) 15%Eps Due 4/20R&D 3%
Acc/Dis A-Sup/Demand 73
Multiple pullbacks to 10-week line since July breakout.
83 ASV (ASVI) Grp 9 o$30.5417.5M Shares 98 Comp. Rating 97 EPS RS 85 ROE 17%
MANUFACTURES TRACK-DRIVEN ALL-SEASON VEHICLES FOR CONSTRUC-TION, AGRICULTURAL, LANDSCAPING, MILITARY AND OTHER MARKETS.
+118% Ann. EPS Gro PE 31 Avg. Daily Vol 326,400 Debt 1%Last Qtr Eps +44%6 Prior Qtr +71%5 Last Qtr Sales +37%12 Qtrs EPS) 15%Eps Due 4/28
Acc/Dis CSup/Demand 83
Another leading stock that sliced 10-wk heavy volume.
87 OSHKOSH TRUCK (OSK) Grp 112 o$58.4570.7M Shares 96 Comp. Rating 94 EPS RS 88 ROE 22%
MANUFACTURES SPECIALTY COMMERCIAL, FIRE AND EMERGENCY MILITARYTRUCKS AND TRUCK BODIES
+41% Ann. EPS Gro PE 24 Avg. Daily Vol 362,800 Debt 0%Last Qtr Eps +38% Prior Qtr +38%5 Last Qtr Sales +23%5 Qtrs EPS) 15%Eps Due 5/3R&D 1%
Acc/Dis B+Sup/Demand 55
Continues to advance after possible 2/2 exhaustion gap.
91 CATERPILLAR (CAT) Grp 9 o$76.23657.4M Shares 98 Comp. Rating 92 EPS RS 88 ROE 35%
MANUFACTURES CONSTRUCTION, MINING, FORESTRY MACHINERY, ANDENGINES FOR MACHINERY, GENERATION AND OTHER APPLICATIONS.
+54% Ann. EPS Gro PE 19 Avg. D. Vol 4,412,300 Debt 186%Last Qtr Eps +56%5 Prior Qtr +34%6 Last Qtr Sales +13%8 Qtrs EPS) 15%Eps Due 4/20R&D 3%
Acc/Dis B-Sup/Demand 65
18% above 63.25 buy point in high-handle breakout.
95 ITRON INC (ITRI) Grp 96 o$59.1323.7M Shares 97 Comp. Rating 90 EPS RS 92 ROE 18%
MANUFACTURES RESIDENTIAL/COMMERCIAL METERS AND AUTOMATICMETER READING SYSTEMS FOR MONITORING ENERGY AND WATER USAGE.
+12% Ann. EPS Gro PE 32 Avg. Daily Vol 609,800 Debt 50%Last Qtr Eps +48%6 Prior Qtr +53%6 Last Qtr Sales +22%5 Qtrs EPS) 15%Eps Due 4/26R&D 8%
Acc/Dis B+Sup/Demand 95
10% above 54 buy point after gapping out of base 2/15.
99 M W I VETERINARY SPL (MWIV) Grp 43 $34.854.9M Shares 98 Comp. Rating 88 EPS RS 92 ROE 12%
DISTRIBUTES MORE THAN 11,000 ANIMAL HEALTH PRODUCTS TO VETERINARI-ANS THROUGH TEN DISTRIBUTION CENTERS IN THE U.S.
+10% Ann. EPS Gro PE 41 Avg. Daily Vol 29,400 Debt 0%Last Qtr Eps +141%6 Prior Qtr +475%5 Last Qtr Sales +26%5 Qtrs EPS) 15%
Acc/Dis A+Sup/Demand 39
18% above 29.62 buy pt after 2nd 10-wk pullback; thin trade.
84 DIGITAL RIVER INC (DRIV) Grp 23 o$41.2832.4M Shares 99 Comp. Rating 97 EPS RS 83 ROE 18%
PROVIDES E-COMMERCE OUTSOURCING SERVICES TO SOFTWARE PUBLISH-ERS, ONLINE RETAILERS AND ONLINE CHANNEL PARTNERS.
+51% Ann. EPS Gro PE 33 Avg. D. Vol 1,119,100 Debt 0%Last Qtr Eps +40%6 Prior Qtr +76%5 Last Qtr Sales +28%5 Qtrs EPS) 15%Eps Due 4/27R&D 9%
Acc/Dis B+Sup/Demand 96
Forming right side; strong accumulation since December.
88 LIFE TIME FITNESS (LTM) Grp 66 $45.6324.6M Shares 99 Comp. Rating 94 EPS RS 87 ROE 14%
OPERATES 48 MEMBERSHIP-ONLY FITNESS AND FAMILY RECREATIONCENTERS IN NINE STATES UNDER THE LIFE TIME FITNESS BRAND.
+173% Ann. EPS Gro PE 40 Avg. Daily Vol 234,600 Debt 84%Last Qtr Eps +43%5 Prior Qtr +32%5 Last Qtr Sales +26%2 Qtrs EPS) 15%Eps Due 4/28
Acc/Dis A+Sup/Demand 65
3% up from 44.30 buy point after pulling back to 10-week.
92 DRIL QUIP (DRQ) Grp 49 $59.687.1M Shares 96 Comp. Rating 91 EPS RS 92 ROE 6%
MANUFACTURES HIGHLY ENGINEERED OFFSHORE DRILLING AND PRODUC-TION EQUIPMENT FOR USE IN DEEPWATER AND HARSH ENVIRONMENTS.
+42% Ann. EPS Gro PE 34 Avg. Daily Vol 321,700 Debt 13%Last Qtr Eps +186%5 Prior Qtr +184%5 Last Qtr Sales +66%6 Qtrs EPS) 15%Eps Due 4/28R&D 7%
Acc/Dis BSup/Demand 91
Building late-stage sloppy base. Finds support at 10-week.
96 MERIDIAN BIOSCIENCE (VIVO) Grp 111 o$23.7021.1M Shares 96 Comp. Rating 90 EPS RS 92 ROE 21%
MANUFACTURES DIAGNOSTIC TEST KITS FOR RESPIRATORY, GASTROINTESTI-NAL, VIRAL AND PARASITIC INFECTIOUS DISEASES.
+26% Ann. EPS Gro PE 42 Avg. Daily Vol 245,800 Debt 0%Last Qtr Eps +67%5 Prior Qtr +15%6 Last Qtr Sales +32%4 Qtrs EPS) 15%Eps Due 4/21R&D 4%
Acc/Dis B+Sup/Demand 77
Forming new base after hitting all-time high 1/25.
100 TATA MOTORS LTD ADS (TTM) Grp 95 $21.13206.9M Shares 96 Comp. Rating 86 EPS RS 96 ROE 25%
INDIAN MANUFACTURER OF HEAVY/MEDIUM/LIGHT COMMERCIAL VEHICLES,PASSENGER CARS, UTILITY VEHICLES AND ACCESSORIES.
+116% Ann. EPS Gro PE 27 Avg. Daily Vol 599,100 Debt 45%Last Qtr Eps +6%6 Prior Qtr +23%6 Last Qtr Sales +21%0 Qtrs EPS) 15%
R&D 1%
Acc/Dis BSup/Demand 26
Extended 65% from 12.82 buy point after Dec. 13 breakout.
About The Investor’s Business Daily 100The IBD 100, which runs each Monday, is a computer-generated ranking ofleading companies trading in the U.S. Rankings are based on a combination ofeach company’s profit growth; IBD’s Composite Rating, which includes keymeasures such as return on equity, sales growth and profit margins; and relativeprice strength in the past 12 months. Charts of stocks with a highlighted bordermay be near a potential buy point. A company’s inclusion in the list or among thehighlighted charts should not be viewed as a recommendation. Many are newer,smaller and highly volatile companies that require further research due to theirspeculative nature.7 denotes a company that came public within the past 8 years.Supply/Demand Rating compares a stock’s float to its trading volume, from 1 to99. Stocks with the most demand vs. supply are rated 99.
C O M P A N I E S 8 1 - 1 0 0
81 Turkcell 18.28 98 99 83 +30 +74 +182 +22 28 .. 1 B7Increased overall subscriber base by 19% to 28 million as of Dec. 31.
82 BG Grp 61.30 96 97 86 +6 +97 +32 +54 19 40 .. DOil & Gas–International Integrated group is 112th among IBD's 197 groups.
83 ASV 30.54 98 97 85 +19 +44 +20 +37 17 17 12 BSees '06 earnings of $1.14–$1.23 a share vs. consensus of $1.16 a share.
84 Digital River Inc 41.28 99 97 83 +20 +40 +18 +28 18 36 8 B7After–tax profit margins have been above 22.7% for past four quarters.
85 Virginia Comm Bnk 35.56 96 96 87 +23 +42 +31 +49 19 32 35 BFeds drop charges of conspiracy against bank's resigned founding director.
86 Norfolk Southern 53.94 98 94 88 +14 +34 +25 +16 13 20 2 CMerrill's 3/15 industry upgrade, UNP's higher outlook sends rail stocks up.
87 Oshkosh Truck 58.45 96 94 88 +29 +38 +25 +23 22 8 4 BFirm's vehicles getting plenty of action in Iraq; provides parts, maintenance.
88 Life Time Fitness 45.63 99 94 87 +14 +43 +17 +26 14 17 31 B7Earnings growth rate has accelerated for the past three quarters.
89 Berkley WR 59.14 95 92 91 +18 +43 +23 +14 22 15 15 CStifel Nicolaus downgrades from buy to hold rating.
90 Satyam Computer 41.77 94 92 90 +36 +57 +28 +61 23 23 10 B7Goldman Sachs rates "outperform" as one of top technology stocks for ’06.
91 Caterpillar 76.23 98 92 88 +22 +56 +28 +13 35 10 2 DEarnings grew 34% to 56%, sales 13% to 29% over past four quarters.
92 Dril Quip 59.68 96 91 92 +48 +186 +142 +66 6 .. 60 AAnnounced start–up of its first subsea control system in the North Sea.
93 Southern Copper 83.89 96 91 91 0 +14 +42 +14 45 48 1 CFaces new taxes if left–wing candidate elected in Peru's April election.
94 SCS Transport 29.51 94 91 91 +18 +47 +23 +14 10 3 6 ACredit Suisse downgrades from outperform to neutral.
95 Itron Inc 59.13 97 90 92 +14 +48 +50 +22 18 12 5 B9.6% after–tax margin in fourth quarter was best in at least 12 quarters.
96 Meridian Bioscience 23.70 96 90 92 +25 +67 +23 +32 21 21 20 BFDA granted marketing clearance for product that tests for stomach ulcers.
97 Core Labs 46.30 97 90 91 +28 +62 +41 +11 23 13 9 BThomson First Call consensus expects EPS growth of 21% to 45% next 4 qtrs.
98 E`Trade Financial 26.33 98 88 94 +21 +12 +19 +33 15 26 5 COnline broker says February trading volume fell 9% from January.
99 MWI Veterinary Spl 34.85 98 88 92 +71 +141 +200 +26 12 2 54 B7EPS growth expected to taper from 200% to 7% over the next 4 quarters.
100 Tata Motors Ltd 21.13 96 86 96 +41 +6 .. +21 25 10 1 ..Created network w/ Fiat India to sell both brands in 11 cities in India.
Jordan Kotick CMTGlobal Head
Technical Analysis Barclays Bank
SIGNUP
NOWChartered Market Technician (CMT) exams now open for registration
“The SEC decision requiring qualifying exams for fi nancial
analysts has increased the demand for the CMT Charter.”
Professionals Managing Market Risk • Incorporated in 1973
CMTSMJoin us at: www.mta.org
What you don’t know can hurt you.
Diagnose your stocks withIBD Stock Checkup® –included FREE with the daily,digital, or weekly edition ofInvestor’s Business Daily®.
Take a trial or subscribe now on INVESTORS.com or call 800-831-2525.
Barton Biggsmeans business.
An industry legend takes you inside the real world of hedge funds.

INVESTOR'S BUSINESS DAILY GENERAL MARKET & SECTORS MONDAY, MARCH 20, 2006 B7
SmartSelect CompositeRatingcombines all5 IBD SmartSelect Ratings. Of the 5, EPS andRSget themostweight; stocks’%off their highprice also is considered. Ratings range from1-99,with99best.SmartSelectRatings:Earnings Per Share (EPS) Rating com-pares a company’s last two quarters and last3-5years of growthand stabilitywith thatof allother companies. A 90 rating means its earn-ingsoutperformed90%ofall companies’.Relative Price Strength (RS) Rating mea-sures a stock’s relative price change in the last12months vs. all other stocks.Thebest compa-niesrate80ormoreonbothEPSandRS.Industry Group Relative Price StrengthRating compares a stock’s industry price per-formance in the last6months to196 industries.Top industries rateA+, theworst rateE.Sales + ProfitMargins + ROE Rating com-bines recent sales growth, profit margins andreturnonequity intoanAtoEgrade.Accumulation/Distribution Rating uses aprice and volume formula to determine if astock is under accumulation (buying) ordistri-bution (selling) in the last 13 weeks. A signalsheavybuying,E isheavyselling.Vol%Change showshowmuchastock trad-edyesterday vs. its averagedaily volume in thepast 50days. +50=50%more, -50=50%less.Boldfaced stocks are up 1 point ormore or atanewhigh inprice.Underlined stocks are down 1 point or moreoratanewprice low.Boldfaced italicized stockshaveEPSandRSratings of 80 ormore andwere IPOs in the last8years.P-E ratio is shown Mon., Wed., Fri.; Institu-tional Sponsorship Rating (A=best, E=worst)onTue.;%dividendyieldonThu.Codes: r= re-purchased stock in last year; x = ex-dividendorex-rights; k = earnings due within 4 weeks; - =earnings inIBDtoday;o=optionsonstocks.Stocks inblackbarshave topgrowth funda-mentals. The list is selected weekly by a com-puter screenandmaychange frequently.Growth stocks are highly speculative. Do notbuy any black bar highlighted or highly ratedstock without further research. You must al-ways analyze a stock’s daily and weekly chartto see if the stock is in a proper base or near asound buy point and not extended in price toofaraboveacorrectbase.IBD subscribers have free access to charts atwww.investors.com.Also check the General Markets page andTheBigPicture columnonA1 to see if themar-ket indexesare inanuptrend.2006WilliamO’Neil +Co., Inc.All rights reserved.
+13.35%: +13.81% U.S. Defense Index 673.84 + 4.25 +0.64%:+ 6.31% +12.20% Gold Index 83.07 + 0.21 +0.25%+ 8.75% +10.16% Dow Jones Trans 4563.33 +10.23 +0.22%+ 9.59% + 9.47% Amex Composite 1927.83 – 3.89 –0.20%+10.82%:+ 9.22% Russell 2000 746.09 + 2.30 +0.31%:+11.04%:+ 8.87% IBD New America Index 326.27 + 0.76 +0.23%+ 9.80%:+ 8.36% S&P 600 385.03 + 1.00 +0.26%+ 8.03% + 7.03% Value Line Index 2070.66 + 3.58 +0.17%+ 7.16% + 6.48% N.Y.S.E. Finance 8569.52 +32.84 +0.38%+ 6.68% + 5.86% N.Y.S.E. Composite 8271.61 + 9.69 +0.12%+ 6.31% + 5.72% S&P Midcap 400 784.59 + 2.08 +0.27%+ 6.64% + 5.02% New Issues Index 405.17 + 0.57 +0.14%+ 9.10% + 4.94% High–Tech Index 466.61 + 1.02 +0.22%+ 6.89% + 4.67% Bank Index 769.90 + 3.35 +0.44%:+ 5.25% + 3.72% Dow Jones Industrials 11279.65 +26.41 +0.23%+ 4.72% + 3.15% S&P 500 1307.25 + 1.92 +0.15%+ 2.86% + 2.77% Insurance Index 733.74 – 1.95 –0.26%+ 4.59% + 2.40% Nasdaq OTC Comp 2306.48 + 6.92 +0.30%:+ 3.13% + 1.48% Defensive Index 1073.95 + 2.55 +0.24%+ 2.73% – 0.05% Consumer Index 871.68 + 2.36 +0.27%+ 0.14% – 1.90% Medical/Healthcare 4163.21 + 2.08 +0.05%+ 0.74% – 2.32% Dow Jones Utility 408.11 – 1.96 –0.48%– 1.43% – 3.56% Senior Growth Index 585.43 + 1.48 +0.25%
IBD STRIVES TO PROVIDE ACCURATE DATAAND INFORMATION. HOWEVER, THEREMAYBEUNINTENTIONALOMISSIONSORIN-ACCURACIES, IBD DOES NOT GUARANTEETHE ACCURACY, COMPLETENESS, TIMELI-NESS OR FITNESS FOR A PARTICULAR PUR-POSEOFTHEINFORMATIONORDATA.
MarketSector Indexes.................................................................................................
List is sorted by best% gain in last 3months. Boldface sectorsperformedbetter thanNYSEcompositeyesterday.(:on left, top4 indexes since Jan. 1; on right, top4 indexes yesterday.)
Since 3 Month Yesterday’sJan 1 % Change Index Change % Change
Analyzing theprice andvolumechanges in themajor market averages each day is essential tosuccessful investing. They reveal major topsandbottoms in the stockmarket.Moststocksfollowthegeneralmarket’s trend.They tend to rise when the Nasdaq, S&P 500andDowindustrialsmovehigher. They tend tofallwhenthemajor indexestrade lower.Therefore, it’s vital to understand the mar-ket’s direction, as well as secondary indicatorsthat are includedon this page.Youdonotwanttobuy stockswhen theaverages are in a down-trend. You do not want to be in cash or bettingstockswill go down in pricewhen theNasdaq,S&P500andDowindexesare inanuptrend.The Big Picture column on A1 helps you spotmajor market turns and judge the overallhealth of the stock market. Use it in conjunc-tionwith theGeneralMarkets&Sectorspage.
Today’s general market highlights:StocksnotchedmodestgainsFriday, endingaproductiveweekonahighnote.TheNasdaqpickedup0.3%, its fifthupday inthe last six sessions�. The S&P 500 ticked up0.1%�. Volume was heavy across the board,with the day’s quadruple-witching options ex-pirationtheprimaryculprit�.Friday saw a wide array of industry groupsrack up gains.Metals stocks have continued toshowstrength.Leadingproducersof steel, cop-per and other industrial-use metals ran into afew rough patches at various points over thelast year. But leaders from those groups havecontinued to press higher. Titanium producerRTI International MetalsRTI jumped 7% to anall-timehighFriday.Youcanviewtheactionofmetals-related groups and other market nich-esonthe IndustryGroups tableonPageB8.
Go To IBD's Web Site To Learn More About Judging The MarketStudy the collection, Where's The Market Headed?, in the "Investor's Corner Archives."Another valuable resource is the Market Direction category in the "Ask Bill O'Neil Archives.""The Big Picture" is also available to subscribers at investors.com -- at 5 pm Pacific time.
Analyze, Profit FromIBD’s Market Charts
SmartSelect Ratings

B8 MONDAY, MARCH 20, 2006 INDUSTRY GROUPS INVESTORS.COM
Name Symbol Price EPS
Name Symbol Price EPS
Name Symbol Price EPS
Name Symbol Price EPSName Symbol Price EPS Name Price EPSName Symbol Price EPS Name Symbol Price EPS Name Price EPS
Rank 3 No of %Chg DailyThis Last Mo Industry Stocks Since %Wk |Fri|Ago| Name |In Grp | Jan 1| Chg
Rank 3 No of %Chg DailyThis Last Mo Industry Stocks Since %Wk |Fri|Ago| Name |In Grp | Jan 1| Chg
Rank 3 No of %Chg DailyThis Last Mo Industry Stocks Since %Wk |Fri|Ago| Name |In Grp | Jan 1| Chg
Rank 3 No of %Chg DailyThis Last Mo Industry Stocks Since %Wk |Fri|Ago| Name |In Grp | Jan 1| Chg
IBD’s 197 Industry Group RankingsIndustry Groups are ranked 1 through 197 on price performance of all stocks in the industry in the latest 6 months (1& best performance). Top 10 industries in performance yesterday areboldfaced. Worst 10 are underlined. Studies show most top-performing stocks are found in the top quartile of groups and that group action determines at least half of a stock’s performance.
Rank 3 No of %Chg DailyThis Last Mo Industry Stocks Since %Wk |Fri|Ago| Name |In Grp | Jan 1| Chg
New Highs......................................
REAL EST (50)Saul Centers(n) BFS 43.69 62ExtraSpc(n) EXR 16.89 26Wellsfrd(a) WRP 7.65 57Eastgroup(n) EGP 48.35 19AcadiaRlty(n) AKR 24.06 73AshfordH(n) AHT 13.06 76CogdSpen(n) CSA 21.20 73BioMdRlty(n) BMR 29.46 93AmerCamp(n) ACC 27.81 38EssexPpty(n) ESS111.10 10AlexREEqt(n) ARE 97.08 50Equity Inns(n) ENN 16.65 41Wash REIT(n) WRE 35.47 46Taubman Ctr(n) TCO 43.77 32MissWst(a) MSW 11.75 16CmrclNetLs(n) NNN 23.44 31MaguirePr(n) MPG 36.57 18ColumEqTr(n) COE 17.99 18CousinsPty(n) CUZ 33.83 23HomePptys(n) HME 51.98 14BrookfldPr(n) BPO 31.87 81HghwdPrp(n) HIW 34.77 76SLGreenRlty(n) SLG103.09 43CpOffcPty(n) OFC 44.78 23EqLifePrp(n) ELS 51.81 49Tramml Cro(n) TCC 35.19 41SimonProp(n) SPG 88.46 25Liberty Ppty(n) LRY 48.99 59RegencyCtrs(n) REG 68.79 27AmerLndLs(n) ANL 28.54 81DevelprDvs(n) DDR 56.86 47ForestCty A(n) FCEA 45.90 9Rayonier(n) RYN 44.80 92VorndRlty(n) VNO 98.46 19Kimco Rlty(n) KIM 39.58 75EqtyRsd(n) EQR 46.71 37New Pln Excl(n) NXL 26.33 67BostonPpts(n) BXP 96.02 61Hosp Prop Tr(n) HPT 46.34 53FederlRlty(n) FRT 73.49 76UtdDomRlt(n) UDR 28.92 8AMB Ppty(n) AMB 56.53 48Prologis(n) PLD 56.21 56TrizecPr(n) TRZ 26.34 24Camden Pty(n) CPT 68.65 40RecksnAssoc(n) RA 45.82 94HostMariott(n) HMT 21.25 76AvalonBay(n) AVB110.25 63ForestCty B(n) FCEB 45.74 9GrpAerPac(n) PAC 32.85 79 ......................................MEDICAL (49)NymoxPhar NYMX 3.80 16Encision(a) ECI 3.72 13Iridex Corp IRIX 11.49 96Questcor(a) QSC 1.54 49GroupCasaA(n) SAB 21.57 71Antares(a) AIS 1.80 16CortexPhrm(a) COR 4.88 6EDAP TMS EDAP 15.12 32Immucell ICCC 6.74 76
SonusPhrm SNUS 6.34 17XenoPort XNPT 22.50 7Luminex LMNX 14.97 26Akorn(a) AKN 5.20 8EmispTch EMIS 7.02 29GenBiotc GNBT 2.94 13FirstHznPh FHRX 23.45 65Chiron CHIR 45.77 72AdvMagntc(a) AVM 31.55 6KendleInt KNDL 33.82 63HlthExt HLEX 36.72 93†MannKind MNKD 21.08 18ForbsMedi FMTI 2.45 5AlignTech ALGN 9.05 11RockwllMdTc RMTI 6.80 38AcadiaPhm ACAD 16.34 27KeryxBiop KERX 18.38 4MylanLabs(n) MYL 24.92 81MyriadGn MYGN 27.76 29Amylin AMLN 46.42 5RenalCr(n) RCI 47.87 84AdvMOpt(n) EYE 46.75 27Allergan(n) AGN117.48 80PeditrxMed(n) PDX 96.80 89NovoNordsk(n) NVO 63.02 73Idexx Labs IDXX 83.60 87Covance(n) CVD 59.93 93ConorMed CONR 29.13 3Digene DIGE 43.91 63Guidant(n) GDT 77.88 18ManorCare(n) HCR 43.78 71AmsrcBrgn(n) ABC 47.71 82Neogen NEOG 23.10 85Novartis(n) NVS 56.70 62Celgene CELG 42.04 6DaVita(n) DVA 60.02 68Inamed IMDC 92.67 73MedclActn MDCI 24.39 75AltusPh ALTU 25.25 13Alexza ALXA 9.11 3 ......................................BANKS (41)VA Fnl Gp VFGI 40.97 80Cobiz COBZ 20.32 70PremrWBc PRWT 18.54 95†CascadeBcp CACB 27.72 94†CityBank CTBK 42.78 79ShoreBanc SHBI 34.80 78Trustmark TRMK 31.36 52First Source SRCE 28.65 61UMB Finl UMBF 69.82 65BancpInc TBBK 22.18 60PfdBnkLA PFBC 50.29 79HrtgCmrc HTBK 23.97 85SunTrust Bk(n) STI 76.44 57ColumBkg COLB 34.86 91†OceanShor OSHC 12.05 89Bank of NY(n) BK 35.52 50PrvtBcp PVTB 41.10 89BankIrelnd(n) IRE 76.00 61SigntrBk SBNY 33.99 64RegionsFnl(n) RF 36.02 59US Bancrp(n) USB 31.16 67M & T Bank(n) MTB117.19 65VallyBcNJ(n) VLY 25.46 52
SiliconVBk SIVB 51.99 62Zions Bncp ZION 85.04 79SanPaolo(n) IMI 37.89 61Intervst Bncs IBCA 33.50 94†ABN Amro(n) ABN 30.32 73CompsBcs CBSS 51.36 63Wilmgtn Tr(n) WL 44.67 81Barclays(n) BCS 47.58 53EspirSnto(n) ESF 28.65 72BcBilVArg(n) BBV 20.91 85DeutschB(n) DB115.58 83NtlBnksh NKSH 50.30 61BankVA BOVA 8.20 14RepublcFst FRBK 14.79 79SmthBncp SMTB 31.49 81CooprtvBc COOP 24.30 66DesrtCmty DCBK 41.25 89E C B Bancrp ECBE 34.73 80 .....................................INSURANCE (25)EnstarGp ESGR 82.50 47IndepHldg(n) IHC 24.28 33PMA Cp A PMACA 10.07 33JRiverGrp JRVR 26.19 47PresLife PLFE 24.08 40Prudential(n) PUK 23.95 45Aegon NV(n) AEG 18.17 41USI Hldg USIH 15.01 86OHCasualty OCAS 31.77 68SeaBrght SEAB 17.64 96†C N A Surety(n) SUR 17.88 66Scor ADS(n) SCO 2.59 22PhnxCos(n) PNX 15.92 47InfPrCas IPCC 41.77 76AmbacFinl(n) ABK 80.33 68SafeIns SAFT 45.67 99†HCC Insur(n) HCC 33.53 56A X A(n) AXA 35.84 43PMI Group(n) PMI 45.69 64AmerFinlGrp(n) AFG 42.32 94RadianGrp(n) RDN 60.85 61AON(n) AOC 41.19 84ING(n) ING 39.17 74Assurant(n) AIZ 46.39 98RoyalSun(n) RSA 12.29 76 .....................................RETAIL (24)CBRL CBRL 47.00 67TriarcB(n) TRYB 17.17 23WeisMkt(n) WMK 46.03 70SmartFnl(n) SMF 16.67 75CasualMl CMRG 9.94 50TriarcA(n) TRY 18.41 23Ikon Off Sol(n) IKN 13.89 68Costco COST 55.88 79NathnsFms NATH 12.27 62MSC Inds(n) MSM 50.60 88†AaronRnt(n) RNT 26.59 63CKE Restaur(n) CKR 18.07 56Kroger(n) KR 20.74 73Starbucks SBUX 36.61 94†Gaiam A GAIA 15.89 76Office Depot(n) ODP 37.13 91†Wendys(n) WEN 65.26 35CirctCity(n) CC 25.36 49Too Inc(n) TOO 33.02 69S C P Pool POOL 45.83 81J Jill JILL 23.78 31PenneyJC(n) JCP 62.71 98†UtdRetail URGI 18.57 38PetMed PETS 19.90 95†.....................................BUSINESS SVC (22)ComforceGp(a) CFS 3.06 42Bowne&Co(n) BNE 15.98 25WatsnWyat(n) WW 32.12 61Cenveo(n) CVO 15.80 8Lamar Ad LAMR 54.01 69Tyler Tech(n) TYL 10.26 77MPS Gp(n) MPS 15.91 76StandrdPk STAN 24.20 44Acxiom ACXM 26.40 74EMCOR(n) EME 48.78 61Stericycle SRCL 67.21 88AmerSciEn ASEI 89.98 76AlliedWst(n) AW 11.40 44Manpower(n) MAN 56.73 69Lifeline LIFE 47.65 94HewittAs(n) HEW 29.57 36AmerRepro(n) ARP 34.62 95RepubSvc(n) RSG 41.34 64SI Intl SINT 33.87 59Aramark(n) RMK 29.27 53Dun&Brad(n) DNB 75.54 84MultiColor LABL 29.00 82 .....................................
TELECOM (17)CT Comm CTCI 14.08 59SBA Comm SBAC 23.86 37ECI Telecom ECIL 10.51 52LeapWire LEAP 43.89 33Gemplus GEMP 5.92 76TeleMovil(n) TEM 13.25 92Comscope(n) CTV 28.04 71TelkmIndo(n) TLK 29.51 68Anaren ANEN 18.96 76CenturyTel(n) CTL 38.07 69ColtTele COLT 4.83 39NextelPtn NXTP 28.30 64Ericsn ERICY 37.23 52Intrado TRDO 25.91 53Garmin GRMN 77.09 96†Freq Elec(a) FEI 14.19 71Millicom MICC 42.53 11 .....................................FINANCE (15)MoneyGram(n) MGI 29.61 85CaliFstNtl CFNB 13.56 64Advnta B ADVNB 35.11 85Advnta A ADVNA 32.38 85EuronetWW EEFT 37.96 69GldmnSch(n) GS150.36 94†Amvescap(n) AVZ 20.33 34State Street(n) STT 62.77 84FstCshFinl FCFS 19.93 94†Amerco UHAL 99.30 67Schwab SCHW 18.13 76LazardLtd(n) LAZ 44.12 9Nomura(n) NMR 21.61 88†CaptlSrc(n) CSE 25.00 73Ezcorp Cl A EZPW 26.41 96 .....................................BUILDING (15)Quanta(n) PWR 15.16 76Interface IFSIA 13.99 76ComfortSyUS(n) FIX 12.75 93†US Hmsys USHS 8.62 76Vulcan Mat(n) VMC 86.62 82Perini(n) PCR 31.17 19Martin Mari(n) MLM105.55 83†EagleMatl(n) EXP 59.97 93†Weyerhaus(n) WY 73.34 30LaFarge(n) LR 27.57 50US Concrete RMIX 13.78 62EaglMatlB(n) EXPB 59.86 93CRH CRHCY 36.93 63LafargNAm(n) LAF 84.14 57Arcadis NV ARCAF 44.41 90 .....................................LEISURE (14)Ricks Cabrt RICK 5.43 47FortuNet FNET 13.26 61DoverDG(n) DDE 19.68 80DollarThty(n) DTG 44.04 66LifeTmFit(n) LTM 45.63 94†CallwyGolf(n) ELY 16.90 26RedLionH(n) RLH 12.32 32KerznerIntl(n) KZL 70.36 50StarwdHtlR(n) HOT 67.02 68IntCtlHtl(n) IHG 15.83 78StatnCno(n) STN 76.96 87SciGames SGMS 33.85 81Penn Natl PENN 39.70 98†FairmntHtl(n) FHR 44.52 76 .....................................MACHINERY (13)Clarcor(n) CLC 36.00 78PikeElec(n) PEC 21.00 84FrnklnElc FELE 47.65 73LincolnElc LECO 52.96 76BaldorElec(n) BEZ 32.79 69Actuant(n) ATU 60.02 83Flowserve(n) FLS 57.54 5Kennmetl(n) KMT 60.69 64NACCO Inds(n) NC148.90 62Caterpillr(n) CAT 76.23 92†Graco(n) GGG 43.05 77IngersolRand(n) IR 43.02 87ParkerHan(n) PH 82.72 66 .....................................ELECTRONICS (13)Tektronix(n) TEK 36.70 49Technitrol(n) TNL 23.39 85†Radisys RSYS 19.97 28United Inds(n) UIC 55.50 82†Dionex DNEX 59.69 53Danaher(n) DHR 64.51 85Cubic(a) CUB 23.20 30MultFnElc MFLX 63.70 91ThomasBett(n) TNB 51.96 98†L3 Commun(n) LLL 86.95 90DRSTech(n) DRS 56.03 75
Plexus PLXS 37.48 76RockwlAut(n) ROK 72.79 84 .....................................INTERNET (12)NaviSite NAVI 2.16 29IntrNAP(a) IIP 0.86 22E`Trade(n) ET 26.33 88†MnstrWw MNST 50.92 69Bankrate RATE 42.54 80†Equinix EQIX 56.05 63Ariba ARBA 10.76 76WebEx WEBX 32.70 82AkamaiTch AKAM 28.42 68IACInter IACI 30.69 93BEA Systm BEAS 12.24 64Knot KNOT 16.91 40 .....................................COMP SFTWR (12)EonComm EONC 2.44 49Netscout NTCT 7.87 74Lghtbrdge LTBG 10.34 76S P S S SPSS 33.67 70NDS Grp NNDS 52.13 82Jack Henry JKHY 22.87 74CitrixSys CTXS 35.92 80WitnssSys WITS 24.60 69Captaris CAPA 4.50 13Ansys ANSS 50.23 88†Humingbrd HUMC 24.54 32SAP AG(n) SAP 53.38 76 .....................................METALS/STEEL (11)RTI Intl(n) RTI 47.70 76Mueller Inds(n) MLI 34.71 66IL Tool Wrks(n) ITW 97.64 81Gerdau(n) GNA 9.50 20AK Steel(n) AKS 14.08 28CmrclMtls(n) CMC 49.10 82FriedmInd(a) FRD 8.73 73CarpntrTch(n) CRS 92.14 69Nucor(n) NUE 98.64 57OregonSteel(n) OS 48.10 5Ternium(n) TX 26.93 24 .....................................AEROSPACE (11)LMI Aerospc LMIA 18.00 61Orbital Sci(n) ORB 15.73 40GenerlDyns(n) GD130.66 79Boeing(n) BA 77.85 49Servotronics(a) SVT 8.78 43LockheedM(n) LMT 75.95 89NorthrpGru(n) NOC 69.83 62Aviall(n) AVL 39.15 91†RaythnB(n) RTN 45.69 66RockwlCln(n) COL 54.38 79TransDg(n) TDG 25.01 53 .....................................TRANSPORT (9)BritAirwy(n) BAB 61.89 12TNTNV(n) TP 34.21 56CSX(n) CSX 59.46 91†SouthwstAir(n) LUV 17.60 72Union Pacif(n) UNP 91.07 63CtntlAirB(n) CAL 26.55 52Norfolk Sou(n) NSC 53.94 94†AMR(n) AMR 27.00 34ACmclLn ACLI 44.07 63 .....................................MEDIA (6)NTLInc NTLID 29.00 50Amrep(n) AXR 33.62 94Pearson(n) PSO 13.85 60Meredith(n) MDP 56.13 70VivendiU(n) V 33.95 16NewFronMed NOOF 7.83 16 .....................................FOOD/BEV (6)Fomento(n) FMX 91.56 44Corn Prdt(n) CPO 29.72 43HainCelstl HAIN 25.43 51ArcherDanl(n) ADM 35.26 76CmpblSp(n) CPB 32.30 56GpDanone(n) DA 25.73 67 .....................................ENERGY (6)MedisTech MDTL 21.05 27PetroDev PETD 45.37 75HanovrCmpr(n) HC 17.15 44Marathon(n) MRO 76.36 82BG Grp(n) BRG 61.30 97†CopanoEn CPNO 43.86 64 .....................................SVGS & LN (5)Wauwatsa WAUW 13.76 39LegacyBc LEGC 14.95 82TierOne TONE 33.44 96ColonlBnk COBK 12.14 51
MagyarBc MGYR 11.72 75 .....................................CHEMICALS (5)PionrCos PONR 32.75 76CytecInds(n) CYT 57.02 35RockwdH(n) ROC 23.96 76Zoltek ZOLT 19.07 38AEP Industr AEPI 29.04 37 .....................................AUTO&PARTSGroup1Auto(n) GPI 42.89 77Lithia Mtr(n) LAD 33.72 59Autoliv(n) ALV 57.84 61Sonic Auto(n) SAH 27.83 69 .....................................ALCOHOL/TOBBrownForB(n) BFB 81.91 83BritAmTob(a) BTI 51.35 65KirinBr KNBWY 13.56 52BrownForA(n) BFA 83.81 83 .....................................SEMICNDUCTRSActionSm ACTS 9.55 57LexarMd LEXR 9.39 57AXT AXTI 3.42 31 .....................................CONSUMERKimbalIntl KBALB 15.19 18Steelcase(n) SCS 17.80 76Harman Intl(n) HAR114.22 92 .....................................COMP HDWREBrcdeCm BRCD 6.09 20Hypercom(n) HYC 8.45 76NtwrkApl NTAP 35.05 91 .....................................APPARELSteveMdn SHOO 34.94 78Tefron(n) TFR 10.33 54PoloRlphLrn(n) RL 59.84 78 .....................................MININGNoOrion(a) NTO 4.10 76EuroZ(a) EZM 1.68 76 .....................................AGRICULTUREAndersons ANDE 63.81 85†Kubota(n) KUB 51.00 33 .....................................UTILITYPG&E(n) PCG 40.26 43 .....................................OFFICECanon(n) CAJ 64.25 80 .....................................MISCGenTek GETI 20.01 38iShMSCIV(n) EFV 61.87Kaman A KAMN 24.98 60Crane(n) CR 39.92 54Chemed(n) CHE 58.87 97†PwSHard(a) PHW 16.80MyersInds(n) MYE 16.99 64Sec Cap Cp(a) SCC 17.20 97Glatfeltr(n) GLT 17.58 9Agilent(n) A 37.92 76PSAerDef(a) PPA 17.07LeucdNatl(n) LUK 57.75 20Textron(n) TXT 93.39 68NuRealEst(a) JRS 23.15iShREst(n) IYR 74.95StHmbldr(a) XHB 46.14H–IntInf(a) IIH 4.62UPM Kymn(n) UPM 25.44 54iShrsSpain(n) EWP 41.14NeBrRESec(a) NRO 16.00EuroEqFd(n) EEA 10.33Eaton(n) ETN 71.93 83StoraEn(n) SEO 16.31 49iSharCn&St(a) ICF 88.31VangIndl(a) VIS 62.67NorskHydr(n) NHY128.50 75IshGlbHlt(a) IXJ 55.12CapIncStr(n) CII 18.56EuropeFund(n) EF 12.09NBRltyIncm(n) NRI 20.93iShar EMU(a) EZU 87.22INGClRlEst(a) IIA 17.53CohStPrm(n) RPF 23.25iShaR1000V(a) IWD 73.95Sealed Air(n) SEE 58.75 50iShDJTel(n) IYZ 25.75iShrNthrld(n) EWN 22.64EmersnElec(n) EMR 85.67 70Col Muni(n) CMU 5.91VangEuro(a) VGK 58.25IshMSCIEA(a) EFA 64.65
NBDivAdv(a) NDD 21.14IshGlbFnl(a) IXG 79.58H–RegBk(a) RKH148.20BlkVAMuBd(a) BHV 18.35iShare UK(n) EWU 20.47H–Mkt2000(a) MKH 55.49iShrBelgm(n) EWK 21.29iShrInds(n) IYJ 63.00iShrAustria(a) EWO 30.95iShNYCmp(n) NYC 75.89GenlAmInv(n) GAM 37.85iShrSweden(n) EWD 25.60ADRD ADRD 78.50VangREIT(a) VNQ 69.68FstTrVLDv(a) FVD 14.72iShMstLC(n) JKD 69.84NewGermFd(n) GF 12.75iShMSCIG(n) EFG 61.22VangValu(a) VTV 60.77iShrGermny(a) EWG 22.87iShaEur350(n) IEV 89.46iSharSwiss(n) EWL 21.07iShCnsmCyc(n) IYK 54.84NBRlEst(n) NRL 25.57RdxSPGth(a) RPG 34.70PSBldCns(a) PKB 18.22RdxMGth(a) RFG 52.07iShrFrance(n) EWQ 29.03iShNY100(n) NY 68.29iShRs3000(a) IWV 76.00iShMstMC(n) JKG 78.32RdxSCGr(a) RZG 39.64
New Lows.....................................
MEDICAL (9)PainCare(a) 2.01 92MarshlEd 4.91 5Novogen 13.12 3Chad Therap(a) 2.88 36Orthologic 2.30 16Medivatn(a) 3.95 3RehabCare(n) 18.58 18VNUS Med 7.40 22LifepntHos 28.48 63 .....................................MEDIA (9)WorldSpcA 8.89 49CrwnMdia 6.55 3Beasly A 10.54 38Journal Reg(n) 12.11 37LibtyGlbA 18.54 3LibGlobC 17.55 3New Yrk Tm(n) 26.05 29XM Sat 20.74 7LibtyGlbB 19.05 27 .....................................TELECOMWrlssFac 4.03 24TelecmNwZ(n) 27.51 56Audvox A 11.57 8Telstra(n) 13.55 39 .....................................BUSINESS SVCTRM Corp 6.82 6CarlisleHld 5.50 50Cogent 18.27 98
CompetitiveT(a) 3.48 18 ......................................SEMICNDUCTRSSigmaTel 9.90 5Intel 19.54 71EagleTest 15.00 46 ......................................ENERGYTransGasAdr(n) 5.09 29InterOil(a) 14.23 32GPRE 27.50 3 ......................................CONSUMERRowe Co(a) 1.42 8Virco Mfg(a) 5.08 38Libbey Inc(n) 7.95 19 ......................................BANKSFBusnFn 22.00 84Wilber Corp(a) 10.00 29AbglAdms 12.98 28 ......................................AUTO&PARTSBandag(n) 41.00 26HayesLmz 2.17 3Bandag A(n) 34.79 26 ......................................RETAILGTSI 6.40 11Handleman(n) 9.51 17 ......................................MACHINERYVeriTek(a) 3.02 34ThomasE(a) 3.30 50 ......................................FOOD/BEVGoldEntA 2.32 8OmegaPrtn(n) 5.77 8 ......................................
COMP SFTWROptimalGp 14.92 28Symantec 15.53 79 ......................................AGRICULTUREAlico 42.17 41Embrex 10.17 14 ......................................UTILITYRGC Resc 24.40 31 ......................................TRANSPORTABXAir 6.89 53 ......................................SVGS & LNHopfedBcp 15.70 53 ......................................REAL ESTHanovCap(a) 5.10 6 ......................................LEISURESonesta A 24.35 76 ......................................INTERNETExpedia 18.18 55 ......................................INSURANCEMontplr(n) 16.16 10 ......................................COMP HDWREOptibase 3.27 15 ......................................CHEMICALSNL Indus(n) 11.00 42 ......................................MISCTuxis Corp(a) 6.51OwensIllinois(n) 17.25 14StSmcdtr(a) 52.04
GroupsWithHighest%OfStocksMakingNewHighsAerospace/defense 83%
..........................................................................Bldg–cement/concrt/ag 50%
..........................................................................Machinery–tools & re 43%
..........................................................................Insurance–diversified 33%
..........................................................................Metal prds–fasteners 33%
..........................................................................Banks–money center 30%
..........................................................................Comml svcs–printing 29%
..........................................................................Food–flour & grain 29%
..........................................................................Banks–super regional 25%
..........................................................................Elec–military systems 25%
..........................................................................Leisure–hotels & mot 25%
..........................................................................Media–periodicals 25%
..........................................................................Retail/whlsle–office sup 25%
..........................................................................
52–Week Highs & Lows480 New Price Highs63 New Price Lows
..............................................................................NYSE(n)– 265Highs, 14LowsNASDAQ–168Highs,36LowsAMEX(a)–47Highs, 13Lows
Defense Close 673.84+4.25 (+0.64%) Since Jan 1, +13.35%...................................................................................................................
Aeroflex AllintTch Boeing CACI Intl CubicCurtWright GenerlDyns GoodrchCp L3 Commun LockheedMNorthrpGru Precsn Cst RaythnB Teledyne
Russell 2000 Close 746.09+2.3 (+0.31%) Since Jan 1, +10.82%
High Tech Close 466.61+1.02 (+0.22%) Since Jan 1, +9.1%...................................................................................................................
Broadcom CheckPtSf Cisco Dell Inc EMCCorning IBM Intel Microsoft MaximIntNortel Oracle Sun Micr Xilinx
Junior Growth Close 879.91+5.72 (+0.65%) Since Jan 1, +8.69%...................................................................................................................
Biovail CareerEd Coach CitrixSys GarminJacobsEng JosABkCl MobileTele 99Cents NtwrkAplQlogic Rollins Staples Teva Pharm UCBH HldgsVarian Med WholeFds Yahoo Zimmer
Bank Close 769.9+3.35 (+0.44%) Since Jan 1, +6.89%...................................................................................................................
BankofAmer Bank of NY Citigroup FifthThirdBc JPMorgChsMellonFin Northrn Tr PNC Finl SiliconVBk State StreetWachovia Wells Fargo Zions Bncp
N.Y.S.E. Comp Close 8271.61+9.69 (+0.12%) Since Jan 1, +6.68%
Gold Close 83.07+0.21 (+0.25%) Since Jan 1, +6.31%...................................................................................................................
BarrickGld AgnicoEgl ASA AngloAshan GoldFldsGoldcorp Glamis Gold MerdnGold Newmnt Mn
Computer Close 1168.17+5.22 (+0.45%) Since Jan 1, +5.36%...................................................................................................................
Adobe Sys AutoData CAInc CheckPtSf ComputrSciDell Inc EMC HewlettPk IBM IntuitJack Henry Microsoft NtwrkApl Oracle Sun MicrSymantec
Leisure Close 1498.63+14.29 (+0.96%) Since Jan 1, +3.83%...................................................................................................................
BlocbstrA Best Buy Brunswick AnheuserB CheescakeCarnival WaltDsny BrinkrIntl HarleyDav SouthwstAirMarriotInt Mattel MGMMirge Starbucks CBSCorpB
Defensive Close 1073.95+2.55 (+0.24%) Since Jan 1, +3.13%...................................................................................................................
ConagraFd ColgatPlmv CmpblSp DukeEnergy ExelonFPL Grp GenerlMils Heinz H J Coca Cola KrogerAltria Merck PepsiCo Pfizer Procter&GmSara Lee Southern Co Safeway UST WriglyWm
1 1 25 Telecom-FiberOptics 20 +56.0 –1.02 2 164 Textile-Mill/Hsehold 6 +67.8 –1.33 4 2 Steel-Specialty Alloys 10 +33.5 +1.64 6 48 MetalPrds-Distributor 7 +23.0 +1.85 5 29 Steel-Producers 24 +42.2 +1.46 7 22 MetalProc &Fabrica 49 +21.8 +0.47 3 6 MetalOres-Gold/Silver 70 +10.3 +0.38 8 85 Computer-DataStorage 24 +13.9 +0.39 11 8 Machinery-Constr/Mining 10 +28.2 +0.7
10 12 5 Transportation-Equip Mfg 12 +30.5 +0.811 16 65 Food-Flour& Grain 9 +26.7 +0.112 9 19 Transportation-Svcs 10 +21.6 –0.913 14 1 Computer-Manufacturers 15 +12.1 +0.214 19 26 Retail-Clothing/Shoe 61 +9.2 +0.415 10 12 Finance-Investment Bkrs 42 +13.6 +0.316 13 36 Bldg-A/C&Heating P 13 +17.3 –0.417 23 138 Elec-ContractMfg 28 +16.4 –0.118 15 172 Medical-Genetics 38 +14.2 +0.719 20 35 Medical-Biomed/Biotech 267 +13.5 +0.320 17 38 Elec-SemiconductorEquip 61 +12.4 –0.321 18 14 Elec-SemiconductorMfg 148 +11.1 –0.122 21 41 Financial Services-Misc 60 +18.2 +0.423 22 142 Internet-Network Sltns 23 +25.8 +2.324 29 101 Elec-Component/Connectr 30 +17.5 +0.125 24 129 Chemicals-Plastics 16 +15.6 +0.126 26 54 Elec-Parts Distributors 10 +15.3 0.027 25 49 Transportation-Rail 13 +15.1 +0.228 40 79 Beverages-Soft Drinks 18 +18.3 +0.429 30 90 Chemicals-Specialty 58 +13.2 +0.430 37 23 Bldg-HeavyConstruction 20 +17.3 –0.231 28 107 Agricultural Operations 26 +13.6 –0.332 27 20 Telecom-Wireless Svcs 64 +10.1 +0.233 33 3 Medical-Systems/Equip 103 +7.8 +1.034 58 94 Bldg-Cement/Concrt/Ag 18 +34.5 +1.035 38 96 Machinery-Tools &Re 7 +16.3 +0.636 31 62 Comml Svcs-Leasing 17 +15.6 0.037 32 15 ComputerSftwr-Enterprse 137 +9.5 +0.438 41 31 Finance-Investment Mgmt 68 +9.3 –0.139 62 152 Leisure-Gaming/Equip 43 +13.1 +1.9
40 57 75 Machinery-Gen Industrial 44 +16.8 +0.141 36 13 Banks-Foreign 26 +8.9 +0.342 34 76 Medical-Ethical Drugs 77 +8.9 +0.243 51 81 Medical-Whlsle Drg/Suppl 10 +16.4 –0.144 35 11 Oil&Gas-FieldServic 52 +12.4 –0.445 54 39 Comml Svcs-Security/Sfty 55 +9.8 –0.246 76 109 Retail-Consumer Elec 10 +16.7 +0.647 47 53 Telecom-Wireless Equip 67 +13.3 +0.548 53 58 Elec-Misc Products 50 +14.0 +0.349 48 7 Oil&Gas-Machinery/Eq 33 +9.0 –1.250 46 16 Transportation-Airline 32 +0.9 +0.551 63 84 Comml Svcs-Printing 18 +9.1 +1.252 43 9 MetalOres 51 +5.5 +0.653 45 80 Pollution Control-Equip 17 +15.5 +1.054 71 108 Retail-Restaurants 74 +9.7 +0.655 65 77 Retail/Whlsle-Bldg Prds 18 +15.2 +0.756 50 37 Retail/Whlsle-Cmptr/Cell 22 +3.5 +0.257 55 74 Electrical-Equipment 30 +16.5 +0.558 59 103 Comml Svcs-Advertising 30 +6.7 0.059 75 104 Telecom-Equipment 67 +7.9 +0.660 73 140 Retail/Whlsle-Autos/Prts 22 +14.7 0.061 49 52 Finance-Publ Inv Fd-Frgn 85 +10.9 –0.162 44 21 Transportation-Truck 29 +4.8 –1.363 56 57 Apparel-Clothing Mfg 46 +6.7 –0.464 64 50 Bldg-Maintenance &S 9 +17.7 –0.465 42 119 Aerospace/DefenseEqp 52 +14.8 +0.766 67 139 Leisure-Services 39 +7.3 +0.367 88 131 Machinery-Farm 8 +17.6 +1.168 39 43 ComputerSftwr-Desktop 14 +8.0 +0.569 69 128 Auto/Truck-ReplaceParts 8 +16.1 –1.970 72 93 Machinery-Mtl Hdlg/Autmn 17 +14.0 +1.471 78 32 Comml Svcs-Miscellaneous 56 +5.5 +0.772 68 97 Computer-TechServices 78 +9.2 +0.273 111 174 Bldg-Paint&Allied 5 +16.2 –0.174 81 63 Energy-Other 49 +5.8 –0.775 70 105 Transport-AirFreight 11 +6.7 –0.176 79 72 Internet-Isp 23 +13.0 –1.877 105 158 Aerospace/Defense 6 +14.7 +0.778 102 17 Internet-ECommerce 43 –2.2 –0.5
79 52 34 Internet-Software 47 +3.5 –0.880 93 125 Diversified Operations 76 +5.7 –0.481 74 30 Medical/Dental-Services 48 +6.4 –0.282 60 47 Oil&Gas-Intl ExplPr 30 +7.8 –1.783 84 157 Retail-Miscellaneous 18 +9.1 +0.984 85 46 Medical-Nursing Homes 17 +9.0 –1.085 86 95 Banks-Money Center 21 +9.9 0.086 96 144 Finance-Reit 223 +13.5 +0.687 83 67 Comml Svcs-Market Rsrch 22 +7.1 0.088 87 88 Telecom-Services Frgn 60 +6.3 –0.789 91 18 Medical-Generic Drugs 18 –1.4 +0.290 66 73 Retail-Super/MiniMkts 30 +2.8 –0.391 90 61 Bldg-Constr Prds/Misc 38 +12.6 0.092 95 113 Retail/Whlsle-Office Sup 8 +10.9 +0.793 106 160 Retail-Department Stores 13 +14.2 +0.694 109 156 Leisure-Hotels& Mot 17 +3.7 +0.495 82 71 AutoManufacturers 10 +10.5 –0.396 80 115 Elec-Scientific/Msrng 44 +12.5 +0.797 108 117 Containers 24 +6.0 +0.498 104 155 Pollution Control-Svcs 33 +17.3 +0.599 77 86 Mining-Gems 5 +11.3 +0.7
100 61 78 Bldg-Mobile/Mfg& Rv 20 +9.7 +0.3101 92 87 Insurance-Prop/Cas/Titl 112 +3.9 –0.2102 94 175 Retail-Home Furnishings 21 +12.9 +1.3103 89 99 Computer-Networking 44 +9.2 –0.1104 99 82 Banks-West/Southwest 98 +6.7 +0.3105 98 133 Telecom-Services 44 +10.9 +0.4106 119 33 Oil&Gas-Drilling 27 +8.9 –1.3107 130 171 Real Estate Operations 35 +5.8 +0.5108 126 28 Comml Svcs-Staffing 31 +6.4 +0.9109 118 182 Retail-Leisure Products 26 +6.3 –0.1110 100 4 Internet-Content 35 –7.6 +0.4111 116 55 Medical-Products 133 +4.4 +0.5112 103 126 Trucks & Parts-Hvy D 12 +15.6 +0.2113 107 153 Household-ConsumerElec 17 +12.7 +1.3114 115 116 Chemicals-Basic 20 +6.5 –0.1115 117 111 Oil&Gas-Intl Integra 21 +14.4 –0.7116 127 66 Retail-Discount&Vari 6 +7.9 +2.6117 120 132 Utility-WaterSupply 17 +10.8 –0.4118 139 180 Leisure-Photo Equip/Rel 5 +14.3 +1.6
119 125 100 Cosmetics/Personal Care 47 +4.6 –0.3120 97 56 Finance-Consumer/Cml Lns 28 +4.5 –0.2121 113 92 Tobacco 12 +4.1 –0.1122 123 27 Oil&Gas-U SExpl Pro 93 +2.5 –0.6123 114 91 Insurance-Life 31 +6.6 0.0124 166 168 MetalPrds-Fasteners 4 +9.0 0.0125 112 10 ComputerSftwr-Medical 30 +1.9 –0.2126 121 159 Leisure-Movies & Rel 18 +1.2 –0.2127 134 59 Insurance-Diversified 12 +2.2 +0.2128 110 98 Beverages-Alcoholic 29 +5.2 –0.3129 101 69 Computer-Peripheral Eqp 13 +4.4 –0.5130 128 89 Computer-Integrated Syst 25 –1.5 +0.6131 132 137 Comml Svcs-Healthcare 22 +7.1 –0.7132 136 135 Real Estate Development 21 +5.4 +0.1133 122 120 Apparel-Shoes & Rel 17 +5.8 –0.1134 131 64 Medical-Hlth MaintOrg 17 +7.4 –0.1135 133 51 ComputerSftwr-Financial 24 +3.9 +0.3136 168 167 Media-Periodicals 9 +10.0 +1.2137 143 177 Hsehold/Office Furniture 29 +9.8 +0.2138 138 112 Finance-Idx Tracking Fd 240 +6.5 +0.1139 124 42 Insurance-Brokers 15 +1.4 0.0140 137 40 ComputerSftwr-Design 15 +2.3 +0.4141 164 166 Bldg-Hand Tools 9 +4.2 +0.1142 140 163 Elec-Military Systems 16 +10.0 +0.7143 157 118 Transportation-Ship 45 +4.6 +0.1144 158 173 Office-Equip & Autom 7 +0.2 +0.8145 141 162 Paper& Paper Produc 40 +4.2 +0.4146 129 24 Bldg-WoodPrds 18 +6.3 –0.7147 135 102 Banks-Southeast 148 +4.8 0.0148 161 181 Leisure-Toys/Games/Hobby 13 +10.8 +0.9149 155 143 Finance-Savings &Lo 155 +3.9 0.0150 173 70 Oil&Gas-Refining/Mkt 28 +8.6 –0.5151 142 189 Leisure-Products 22 +6.2 –0.1152 156 170 Medical/Dental-Supplies 23 +7.2 +1.6153 147 60 Oil&Gas-Cdn Integrat 5 +11.1 –2.5154 145 165 Retail-MajorDisc Chains 11 +7.1 –0.6155 163 110 Medical-Outpnt/Hm Care 31 –0.6 +0.4156 146 45 Household-Appliances 9 –3.5 –0.6157 153 184 Soap & Clng Preparat 6 +8.7 +0.2158 148 154 Banks-SuperRegional 16 +5.7 +0.5
159 176 190 Retail/Whlsle-Food 15 +9.9 –0.1160 150 148 Food-DairyProducts 7 0.0 –0.1161 144 141 Comml Svcs-Schools 19 +3.1 +0.2162 170 122 Retail-MailOrder&Di 16 +6.4 +0.6163 169 169 Auto/Truck-Original Eqp 30 –7.4 +0.2164 171 134 Banks-Northeast 131 +3.5 +0.3165 160 150 Oil&Gas-Transprt/Pip 43 +9.1 –0.4166 159 44 Oil&Gas-Cdn ExplPro 76 +6.0 –0.5167 154 114 Chemicals-Fertilizers 11 +7.2 –0.5168 149 149 Finance-Mrtg&Rel Svc 21 +0.7 +0.4169 165 121 Utility-ElectricPower 90 +2.4 –0.4170 167 176 Finance-Publ Inv Fd-Eqt 140 +6.8 +0.1171 162 145 Food-Misc Preparation 47 +4.6 –0.1172 179 187 Retail-Drug Stores 7 +11.2 +0.6173 172 106 Comml Svcs-Consulting 24 +3.4 +0.4174 178 124 Media-Books 12 +4.3 –0.5175 175 136 Banks-Midwest 80 +2.4 –0.1176 174 179 Office Supplies Mfg 9 –0.8 0.0177 152 68 ComputerSftwr-Educ/Entr 22 –6.2 –0.3178 187 196 Consumer Products-Misc 20 +9.2 –0.2179 180 186 Finance-Publ Inv Fd-Bond 410 +2.0 0.0180 151 123 Insurance-Acc&Heal 9 +1.7 +0.2181 177 146 Media-Diversified 28 –3.6 –0.7182 181 127 ComputerSftwr-Security 29 –6.5 +1.0183 184 185 FuneralSvcs & Rel 9 +4.8 +0.8184 189 191 Media-Cable/SatelliteTv 31 –3.8 –0.9185 183 83 Oil&Gas-U SIntegrat 5 +5.6 –0.8186 185 178 Utility-Gas Distribution 36 +3.2 +0.3187 191 197 Medical-Drug/Diversified 2 +6.0 +0.5188 182 151 Media-Radio/Tv 39 –7.8 +0.2189 186 161 Food-Meat Products 14 –15.5 +0.1190 196 130 Retail/Whlsle-Jewelry 13 –5.0 +1.3191 188 195 Medical-Hospitals 11 –1.7 –0.2192 190 183 Auto/Truck-Tires &M 6 –5.8 0.0193 193 192 Food-Confectionery 6 –1.5 +1.3194 194 193 Household-Housewares 5 +3.4 –0.1195 197 188 Bldg-Resident/Comml 23 +4.1 +2.7196 192 147 Oil&Gas-U SRoyalty 16 –5.1 –0.8197 195 194 Media-Newspapers 15 –5.7 –2.0
0 0 0 S& P Midcap 400 Ind 0 +6.3 +0.30 0 0 S& P 500 Index 0 +4.7 +0.1
Based on a study of stock market winners,most stocks on the New Highs list tend to gohigher. You can also use our unique NewHighs list to spot new groups assertingmarket leadership. Stocks listed within eachgroup are in order of stocks showing thegreatest % increase in trading volume.Closing price and Earnings Per Share(EPS)Rating are also shown. For more informa-tion, consult IBD’s free education modules atwww.investors.com. Nasdaq stocks over $2only. †See Graphs in NYSE or NASDAQStocks In The News. Boldfaced stocks carryan EPS Rating of 95 or higher.
Dow Indus. Close 11279.7+26.41 (+0.23%) Since Jan 1, +5.25%...................................................................................................................
High +11290.1, Low +11254.1, Off 52 Week High –0.09%, Acc/Dis B...................................................................................................................
30 Dow Stocks, Price Change, Accumulation/Distribution Rating
AA –0.12 D AIG –0.42 B AXP +0.53 B BA +1.12 B C +0.09 BCAT +1.33 B DD –0.07 A DIS –0.04 A GE +0.13 B GM –1.09 BHD +0.15 B HON +0.17 B HPQ +0.3 B IBM +0.43 D INTC –0.11 EJNJ +0.32 C JPM +0.08 B KO +0.1 B MCD +0.04 C MMM –0.1 BMO –0.35 C MRK +0.36 A MSFT +0.23 B PFE +0.34 B PG –0.29 DT –0.11 B UTX +0.57 C VZ –0.11 B WMT +0.33 C XOM –0.59 C
Dow Trans. Close 4563.33+10.23 (+0.22%) Since Jan 1, +8.75%
Dow Utilities Close 408.11–1.96 (–0.48%) Since Jan 1, +0.74%
S & P 400 Close 784.59+2.08 (+0.27%) Since Jan 1, +6.31%
Leading Sectors.....................................................................................................................
Filter the ENTIREstock market by:>
Interactive Stock Tables that let you zero in on the very best stocks with a single click.
www.investors.com/eTablesT R Y I T F R E E F O R 2 W E E K S A T
Offer available exclusively to current IBD and eIBD™ subscribers.
www.investors.com
• • • • • • • • • • • • • • • • • • • • • • • • • • • • • • •
Just
$13.95per month

INVESTOR'S BUSINESS DAILY NYSE MAIN TABLES — Stocks $10 And Above MONDAY, MARCH 20, 2006 B9
SMARTSELECT® COMPOSITE RATINGEARNINGS PER SHARERELATIVE PRICE STRENGTHINDUSTRY GROUP RELATIVE STRENGTHSALES+PROFIT MARGINS+ROEACCUMULATION/DISTRIBUTION
52-wk Stock & Close Vol% Vol PHigh Symbol Price Chg Chg 1000 E666666
SMARTSELECT® COMPOSITE RATINGEARNINGS PER SHARERELATIVE PRICE STRENGTHINDUSTRY GROUP RELATIVE STRENGTHSALES+PROFIT MARGINS+ROEACCUMULATION/DISTRIBUTION
52-wk Stock & Close Vol% Vol PHigh Symbol Price Chg Chg 1000 E666666
SMARTSELECT® COMPOSITE RATINGEARNINGS PER SHARERELATIVE PRICE STRENGTHINDUSTRY GROUP RELATIVE STRENGTHSALES+PROFIT MARGINS+ROEACCUMULATION/DISTRIBUTION
52-wk Stock & Close Vol% Vol PHigh Symbol Price Chg Chg 1000 E666666
SMARTSELECT® COMPOSITE RATINGEARNINGS PER SHARERELATIVE PRICE STRENGTHINDUSTRY GROUP RELATIVE STRENGTHSALES+PROFIT MARGINS+ROEACCUMULATION/DISTRIBUTION
52-wk Stock & Close Vol% Vol PHigh Symbol Price Chg Chg 1000 E666666
SMARTSELECT® COMPOSITE RATINGEARNINGS PER SHARERELATIVE PRICE STRENGTHINDUSTRY GROUP RELATIVE STRENGTHSALES+PROFIT MARGINS+ROEACCUMULATION/DISTRIBUTION
52-wk Stock & Close Vol% Vol PHigh Symbol Price Chg Chg 1000 E666666
SMARTSELECT® COMPOSITE RATINGEARNINGS PER SHARERELATIVE PRICE STRENGTHINDUSTRY GROUP RELATIVE STRENGTHSALES+PROFIT MARGINS+ROEACCUMULATION/DISTRIBUTION
52-wk Stock & Close Vol% Vol PHigh Symbol Price Chg Chg 1000 E666666
NYSE MAIN TABLES Stocks $10 And Above
— A —90 76 92 B C B+ 27.7 AAR AIR 27.00 –.28 +1 529 39 ò91 76 94 B B B 12.6 ABB ABB 12.41 +.09 –47 1.2m 29 o24 65 9 B+ D D–21.9 ABMInds ABM 17.20 +.15 +201 516 15 ò87 73 70 B– A B+ NH ABNAmro r ABN 30.32 +.07 +1 318 13 o16 47 12 D– B E 28.6 AccoBrds ABD 21.97 +.17 –55 118 15 o73 81 67 C+ C B– 57.0 ACE ACE 56.43 –.22 –1 1.2m 18 o30 41 54 D– .. B+ 18.9 AES AES 17.57 –.01 +45 3.4m 24 o47 72 46 D– B C+ 49.6 AFLAC r AFL 46.84 +.24 –12 1.5m 18 o48 44 58 B D B– 21.5 AGCO AG 20.15 +.29 +5 1.5m 13 o44 63 30 E A B 39.3 AGLRes r ATG 35.71 –.01 –18 299 14 o81 28 95 A+ D A– NH AKSteel AKS 14.08 +.65 +48 5.7m 50 o63 76 64 C+ C C+ 21.4 AMNHlt AHS 19.14 +.36 +88 324 26 o74 34 98 B+ E A NH AMR AMR 27.00 +.14 –20 4.2m .. o31 6 99 C .. D+ 126 AOTatneft TNT 109.5 +3.31 +2 110 99 ê66 67 59 C+ C B 28.8 AT&T T 27.00 –.11 +26 21m 15 o61 70 42 A– A D–17.4 AUOpt AUO 14.43 –.07 –30 1.9m 16 o77 41 82 A E A+ 17.3 AVX AVX 16.86 +.01 –37 246 51 o59 43 79 C D A– NH AXA r AXA 35.84 +.41 +7 446 13 o66 67 74 B+ C D 24.8 AZZ AZZ 21.95 +.27 –86 3 18 k89 63 76 C+ A A NH AaronRnt RNT 26.59 +.72 +48 437 22 ê54 65 43 E A B 50.0 AbbotLabs ABT 45.18 +.18 –2 4.9m 18 ò69 92 24 A+ A D–74.1 AberFitc ANF 57.40 +.23 –29 1.8m 15 o76 45 75 B B B+ 33.0 AccentureA ACN 31.51 –.33 –21 2.3m 19 ò19 76 14 C+ .. D–15.9 Accuride ACW 10.52 –.18 +49 231 5 o96 83 74 A– A B+ NH Actuant ATU 60.02 +.84 +128 460 23 k86 66 88 B– D A 41.3 Acuity AYI 40.85 +.32 +86 662 24 k57 64 69 C+ .. B 14.8 AdeccoADR ADO 14.32 +.04 –86 22 19 ê78 77 59 B+ B C+ 26.4 Adesa KAR 25.70 +.17 +64 315 18 o96 76 98 B B A 53.5 Adminstaf ASF 53.20 +.20 +11 387 47 o60 48 50 A B C 17.9 AdvAmCAC AEA 14.27 +.15 +203 615 18 o69 89 45 B+ A D–47.7 AdvAuto AAP 41.54 –.14 –15 866 19 o53 27 67 D+ B A– NH AdvMOpt EYE 46.75 +.51 +29 992 31 o85 71 93 A C C+ 42.7 AdvaMcrDv AMD 33.95 –.13 –4 17m 54 ò74 94 64 D B C 21.3 AdvEngyIn AAV 19.83 –.04 –47 296 15 ê60 36 87 A D D 32.6 Advantest ATE 28.40 +.30 +31 34 39 ê39 54 27 B+ C C 38.3 Advo AD 30.98 +.46 +62 339 21 ê63 41 76 C C A– NH AegonNV AEG 18.17 +.73 +158 984 9 o93 76 67 A+ A B 35.5 Aeropostl ARO 31.13 +.53 +87 1.8m 20 o84 95 72 C– B B– 52.5 Aetna r AET 51.06 –.31 –44 2.0m 22 o
88 80 71 B B B 63.7 AffiltCmpt r ACS 63.08 –.15 +47 2.7m 19 o99 85 89 A– A A 104 AffiltMgrs AMG 103.1 +1.31 +6 634 24 o83 76 62 A D A– 15.4 AgereSys r AGR 14.18 +.23 –6 1.4m 26 o86 76 83 B D A– NH Agilent r A 37.92 +.18 +79 5.0m 46 o64 6 95 A+ B C 28.4 AgnicoEgl AEM 26.27 +1.24 +54 2.4m 62 o78 79 78 D B B– 26.9 Agrium AGU 25.80 –.21 –41 332 12 o75 61 55 A C B+ 66.0 AirPrds r APD 65.74 –.06 +15 1.3m 20 o96 89 88 A C B 39.8 Airgas r ARG 39.17 +.07 –50 282 25 o68 27 92 B+ D B+ 18.3 AirTranHg AAI 17.08 –.24 +67 2.6m 99 o26 15 29 B+ C B 37.9 AlaskaAir ALK 32.38 +.74 +77 1.1m 12 o58 66 58 D+ C B– 40.4 AlbanyIntl AIN 38.44 –.01 +29 367 16 ê81 64 68 A B B– 46.5 Albemarle ALB 43.37 –.24 +75 462 18 o56 72 35 C C B+ 51.7 Alberto r ACV 46.02 +.39 –46 544 19 o43 29 63 B– D B 26.5 Albertsons ABS 25.86 +.10 –33 4.2m 18 o54 46 74 B+ E C+ 51.5 Alcan AL 44.17 +.08 –40 972 19 o76 58 68 B+ D A 14.8 AlcatlAls ALA 14.73 –.05 +67 3.0m 17 o31 21 46 B+ C D 32.2 Alcoa AA 30.11 –.12 +2 5.8m 21 ò50 96 26 C+ A E 148 Alcon ACL 112.2 +.07 –1 936 30 o97 76 94 A+ C A+ 49.8 AlerisInt ARS 45.75 –.59 +26 421 13 o38 17 83 D– D B– 36.5 AlleghnyEn AYE 36.04 –.15 –40 614 38 o99 76 98 A+ A A– 59.0 AllegTech ATI 56.19 +.90 –33 1.7m 16 o96 80 81 A– A B+ NH Allergan AGN 117.5 +.21 +27 1.2m 35 o38 71 29 D– C B– 51.7 Allete ALE 45.59 –.19 +152 244 19 o98 96 75 A A A– 47.2 AlliancDta ADS 46.32 –.28 –14 705 22 o95 71 82 A– A B+ 66.6 AlliBern AB 64.60 –.85 –51 110 21 o67 53 69 D– C A+ 33.6 AllintEngy LNT 33.35 –.02 +9 561 13 o58 76 39 B B D–79.2 AllintTch r ATK 75.76 +.80 –27 223 16 o60 71 75 C– E C 16.6 AllianzAkt AZ 16.53 +.12 +338 1.3m 11 ê71 86 44 A– C C+ 31.1 AlliedCap ALD 29.60 –.40 +46 743 4 o77 57 54 A– B A– 48.1 AlliedIrishBk AIB 46.69 +.26 –11 55 13 ê74 44 86 C+ D A+ NH AlliedWst AW 11.40 +.15 +49 4.1m 24 o27 45 30 C+ D C 63.2 Allstate ALL 54.82 +.36 +30 4.2m 23 o61 40 53 A B B– 68.2 Alltel AT 66.56 +.81 –5 2.2m 19 o78 94 64 D+ A C+ 26.5 AlonUSAEn ALJ 22.02 +.14 +109 270 8 o38 69 13 B B C+ 32.7 AlphaNtRs ANR 20.92 +.02 –41 698 19 o41 35 86 B– E D–33.9 Alpharma ALO 27.27 –.17 +87 1.2m 52 o46 53 38 C B C+ 78.7 Altria MO 73.55 –.35 +39 9.5m 14 o33 43 41 B+ .. B– 24.0 Alumina AWC 20.21 –.85 +265 188 25 ê69 43 94 A+ C E 111 AlumChina ACH 103.8 –1.51 –53 40 99 ê72 68 51 C+ A B NH AmbacFinl r ABK 80.33 –.64 +51 758 12 o95 90 86 B+ C B+ 28.4 AMCOLIntl ACO 26.98 +.07 +2 204 22 o91 68 80 B A B+ 36.0 Amdocs DOX 35.12 +.40 –50 891 22 o
1 11 5 D E E 29.5 AmerAxle AXL 16.23 –.08 –21 859 13 o74 87 59 C B C+ 14.1 AmEqInvLf AEL 13.65 +.13 +10 639 10 o86 79 75 C A B– 156 AmeradHess AHC 143.7 –1.68 –36 1.0m 11 o21 32 23 D– B D+56.8 Ameren AEE 50.83 –.23 –15 635 16 o83 84 92 A .. C 36.9 AmercMvlL AMX 35.41 +.27 –43 2.2m 22 o17 34 24 D– D C+ 40.8 AmerElcPwr AEP 35.50 –.37 +17 1.7m 13 o80 68 55 A B B– 55.0 AmercanExp AXP 54.65 +.53 +14 5.7m 21 o91 94 74 C+ C A NH AmerFinlGrp AFG 42.32 +.17 –3 313 11 o8 39 10 D– D D+28.0 AmerGrtA r AM 21.01 –.03 –21 405 17 ò
69 66 61 C– B B 71.1 AmerIntlGp AIG 68.82 –.42 +200 19m 14 o89 95 97 B+ .. B– NH AmerRepro ARP 34.62 +.02 +26 211 40 ê84 72 87 B– C B– 28.7 AmerRetrmt ACR 25.51 –.28 +74 337 53 ê44 64 20 B B C+ 48.1 AmerStnrd r ASD 41.60 +.80 +21 2.2m 16 o63 55 75 C D B 37.1 AmerStWtr AWR 36.74 +.18 +86 148 27 ê65 42 87 A D C+ 32.7 AmerTower AMT 31.12 +.53 –14 2.5m .. o99 95 83 A A A– 29.7 AmerVngrd AVD 28.87 +.44 +262 96 29 ê66 40 73 C A B 30.8 Americrdt r ACF 30.20 –.05 –49 702 16 o35 57 26 D+ C B 35.0 AmergsPtr APU 29.72 –.28 –24 53 19 ê9 30 6 C– C B– 49.3 Amerigrp AGP 21.13 –.20 –46 307 22 o
74 48 76 A+ C B– 47.3 Ameriprs r AMP 45.90 –.15 +8 1.3m 14 o90 82 83 A– E A NH AmsrcBrgn r ABC 47.71 +.36 –20 1.2m 25 o73 50 91 B– C B– 63.3 AmeronIntl AMN 59.66 –.07 +124 79 15 k67 67 71 C C B– 64.0 AmerUs AMH 62.30 +.60 –26 277 13 o71 80 43 B+ B C+ 45.4 Ametek AME 43.55 +.24 –6 371 21 o82 76 87 A+ C D–21.9 AmpcoPittsb AP 19.06 –.04 –91 4 16 ê95 78 73 A A B+ 52.0 AmphenlA APH 50.71 –.70 +12 540 22 o58 60 48 D A B 28.3 AmSouthBc ASO 28.12 +.22 +39 1.6m 13 o83 34 90 A– B A– NH Amvescap AVZ 20.33 +.42 +50 684 29 ê77 98 63 C A E 110 Anadarko r APC 99.9 –.59 –15 2.3m 9 o44 57 29 A C D 41.5 AnalogDvc ADI 37.23 ... –7 3.1m 27 o18 25 24 C– C B– 30.3 Angelica AGL 20.12 –.47 +99 105 51 k39 18 74 A+ E D+62.2 AngloAshan AU 50.16 –.14 –61 549 .. o32 39 20 C– B B 48.5 AnheuserB BUD 43.32 –.02 –7 2.4m 17 o91 72 77 A C A– 47.5 Anixter AXE 45.10 +.45 +87 476 18 o93 86 83 A+ C B 38.0 AnnTaylor r ANN 37.31 –.02 –24 895 29 o92 95 73 B B B– 55.4 Anteon ANT 54.80 –.02 +78 1.1m 26 o84 84 88 C– C B NH AON AOC 41.19 +.19 –14 1.8m 18 o50 94 22 C A E 78.2 Apache APA 66.07 –.34 –13 3.0m 8 o80 67 69 A– C B– 29.3 AppldBio ABI 27.60 –.16 +54 1.6m 24 o22 26 28 A– E B– 13.4 Aplr–ClrGn CRA 11.38 +.08 +39 635 .. o94 86 84 A+ C B– 44.8 AppliedInds r AIT 44.02 +1.30 +142 420 22 ê7 30 5 D C D–36.8 ApriaHlth r AHG 21.79 –.31 +97 869 12 o
52 59 54 C+ C C+ 57.5 Aptargroup ATR 55.00 +.30 –10 70 19 k61 63 64 C B D+29.8 AquaAmer WTR 27.65 –.02 +12 512 38 o71 54 82 D+ B B 51.1 AracrzCel ARA 48.86 –.31 –30 348 10 k69 53 56 B C A NH Aramark RMK 29.27 +.22 +1 643 18 o21 56 8 B– A E 44.8 Arbitron r ARB 34.40 –.30 +248 1.0m 16 ê73 72 58 A C B 32.9 ArchChem ARJ 30.11 +.55 +33 251 22 ê36 29 67 B C D–88.3 ArchCoal ACI 72.13 –.23 –43 1.1m 83 o93 76 91 A+ D A– NH ArcherDanl ADM 35.26 +.63 +18 5.3m 23 o55 88 48 D+ .. B+ 24.6 ArlingTkr ATB 23.12 +.17 –21 38 12 ê99 94 87 A– A A– 61.7 ArmorHldg r AH 58.01 +.34 –18 506 14 o75 90 53 A D C+ 36.5 ArrowElec ARW 32.24 –.46 +104 1.4m 14 o8 22 16 D D D 20.2 ArvinMrtr ARM 14.92 –.26 +41 1.6m 9 o
81 61 78 B+ C A– 20.4 AsburyAt ABG 20.10 –.20 +76 145 11 ê50 17 66 B C A– 68.1 Ashland r ASH 67.15 –.29 –39 470 12 o12 4 24 C+ D B– 30.1 AspenIns AHL 24.70 +.15 –43 229 .. ê82 98 75 C– C B– NH Assurant r AIZ 46.39 +.16 –29 504 12 o58 55 66 C+ C C+ 27.4 AssurdGty AGO 25.99 –.10 –50 57 10 o56 50 56 D+ B B 30.9 AstoriaFnl r AF 30.43 +.19 +25 593 13 o89 85 62 A– A B– 51.5 AstraZen AZN 50.93 –.25 –19 861 17 o18 25 17 D A D+49.7 AtlasPipln APL 41.11 –.14 –52 32 23 ê26 44 23 E B B– 30.0 AtmosEngy ATO 26.85 +.14 –33 198 14 ê68 38 84 C+ C A– 103 AtwoodOcea ATW 97.36 –.31 +4 378 63 o88 82 54 A– A B+ 97.3 AustNZBk ANZ 94.55 –1.71 +25 30 15 ê59 61 81 D D C+ NH Autoliv r ALV 57.84 +2.03 +78 1.0m 17 o75 70 48 B B B+ 48.1 AutoData ADP 47.16 +.20 +8 2.5m 24 o57 64 46 B+ D B+ 22.9 Autonation AN 21.95 +.07 –13 1.1m 14 o75 67 49 B+ A B 103 Autozone AZO 97.22 –.56 +4 658 13 o52 22 67 B+ B C+ 13.0 Avaya AV 11.90 +.30 –35 2.8m 20 o51 68 43 D– C B+ 62.5 AveryDenn AVY 59.35 –1.10 +137 1.1m 17 o95 91 83 B C A– NH Aviall AVL 39.15 +.40 +14 405 24 o36 32 53 D– D B+ 20.2 Avista AVA 19.85 –.06 +138 620 21 o72 87 48 A D C+ 27.0 Avnet AVT 24.18 –.16 –2 1.3m 15 o29 51 14 C B B– 45.0 AvonPrds AVP 30.13 +.21 +9 2.3m 17 o40 39 50 C+ C C+ 32.2 AXISCap AXS 30.80 –.08 –28 449 90 o92 78 78 A– C A– 39.0 Aztar AZR 38.30 ... +63 964 26 o
— B —64 94 42 C B D 79.4 BASFAG r BF 76.79 –.55 –57 67 10 ê38 58 27 D A D+43.9 BB&T r BBT 40.57 +.23 +18 1.9m 12 ò38 44 32 B– C B– 28.3 BCE BCE 24.74 –.14 +21 311 12 o96 97 86 C A B– NH BGGrp BRG 61.30 +.27 –45 103 18 ê90 88 68 B+ A C+ 39.8 BHPBiliton r BHP 36.39 –.09 –18 2.1m 15 o95 95 66 B+ A B 38.1 BHPBilPLC BBL 34.41 –.19 –2 32 16 ê30 14 23 A C B 16.1 BISYS BSG 14.01 +.04 +29 739 99 o32 48 37 D+ C C 32.9 BJsWhlsl BJ 31.10 +.44 +25 1.0m 16 o74 88 46 A– A D–42.9 BJSvcs BJS 32.80 –.35 –44 3.5m 20 o3 19 1 A– D E 41.5 BKFCaptl BKF 12.70 –.14 +61 144 .. ê
83 77 69 A– C B 23.9 BMCSftwr r BMC 22.19 –.20 +19 1.7m 26 o84 49 85 A C A– 54.7 BOCGrpAds BOX 54.59 –.04 –88 4 22 ê65 92 43 C D B 72.9 BPplc BP 69.53 –.37 –46 1.9m 10 o43 88 25 E A E 80.0 BPPrdhoe BPT 69.09 –.66 –34 96 12 o54 48 38 B– B A– 42.0 BritshTel BT 40.52 –.52 –12 98 11 ê88 88 76 B+ A D+78.3 BakerHughs BHI 67.08 –1.05 –32 2.8m 26 o88 69 81 B+ C A– NH BaldorElec BEZ 32.79 +.55 +129 315 25 k76 75 57 C+ C A– 45.9 Ball BLL 44.33 +.09 –6 616 16 o41 13 76 A– E C+ 16.3 BallyTech BYI 15.09 +.33 +19 498 99 o80 85 76 B– .. A– NH BcBilVArg r BBV 20.91 +.12 –16 225 15 o98 91 97 A– A C+ 43.8 BcBradsco BBD 40.64 +.14 –18 1.2m 17 ê91 65 93 A– B B– 34.5 BancoItau ITU 32.60 –.19 –55 507 15 ê23 7 18 A– B C 22.7 BancLatino BLX 17.94 +.04 –59 30 8 ê80 61 67 A– A C+ 50.0 BancoSnChil SAN 44.35 –.07 –39 70 18 ê87 81 68 B– A B– 14.8 BancSntdr STD 14.76 +.03 –3 325 14 ê98 95 95 A– A C 34.8 BanColombi CIB 33.71 +.21 –64 138 14 k41 47 51 D+ B D+25.2 BancSouth r BXS 24.32 +.07 +312 742 17 o7 26 16 E D D–48.3 Bandag BDG 41.00 +.08 +192 178 16 ê
70 61 38 B– A B+ 47.4 BankofAmer r BAC 46.90 +.14 +31 19m 11 o80 74 57 C+ A B 54.8 BkHawaii r BOH 54.68 +.34 +39 242 16 ê74 68 64 B– A C 61.3 BankMntrl r BMO 56.95 –.49 –21 34 11 ê73 50 66 B– A B NH BankofNY BK 35.52 +.83 +90 6.7m 17 o76 73 63 B– A C+ 42.8 BkNova r BNS 40.79 –.63 +19 56 12 ê31 50 16 D+ B B+ 19.3 BkAtlnA BBX 14.51 +.19 +20 520 12 o68 78 51 B+ C C 52.5 Banta BN 51.15 +1.36 +246 389 17 ê75 53 65 B– B B+ NH Barclays BCS 47.58 +.49 –7 230 12 ê67 83 38 C+ B B– 72.8 BardCR r BCR 69.50 +.71 –35 580 23 o88 93 72 C+ D A 48.4 BarnsNoble BKS 46.10 –1.30 +92 1.2m 20 o89 83 68 A+ C B 40.0 BarnesGrp B 37.92 –.09 +42 198 17 ê86 95 65 B– A C+ 70.3 BarrPharm BRL 61.57 –.76 +73 2.1m 20 o
96 76 90 A+ A– 46.00 RTI Intl Metals o RTI 47.70 +3.06 29 22 1,094 +21595 74 86 B A 31.97 Heico HEI 31.91 +0.69 33 6.3 230 +19597 97 86 B B+ 57.34 Chemed Corp o CHE 58.87 +2.13 30 24 460 +15594 86 84 A+ B– 44.75 Applied Indust Tech AIT 44.02 +1.30 22 27 420 +14290 75 86 A+ C 25.10 SWS Group o SWS 25.05 +0.66 16 16 188 +14196 83 74 A– B+ 59.95 Actuant Corp Cl A ATU 60.02 +0.84 23 26 460 +12899 95 97 A B+ 52.86 Intl Securities Exch o ISE 49.25 +2.15 51 31 1,210 +9980 72 92 C C 49.44 China Life Insurance o LFC 46.53 +0.83 27 662 215 +9899 89 88 A– A+ 63.51 Gardner Denvr GDI 61.58 +0.83 23 25 519 +9899 98 98 A A 43.75 NewMarket Corp NEU 42.44 +0.84 22 16 268 +8498 88 94 B A– 26.06 E`Trade Financial o ET 26.33 +0.64 23 397 5,935 +7199 87 98 A A– 37.77 MEMC Elec Material o WFR 36.60 +0.92 30 138 5,287 +6498 92 88 A+ B– 75.50 Caterpillar o CAT 76.23 +1.33 19 657 6,979 +5899 88 91 B+ A– 50.36 MSC Indstrl Drct MSM 50.60 +1.23 30 46 487 +5596 84 84 A– B+ 29.75 Basic Energy Srvcs o BAS 28.25 +0.65 21 30 452 +5296 82 83 A– B 87.60 Vulcan Materials o VMC 86.62 +1.32 26 99 898 +4787 86 76 A D+ 41.29 Jabil Circuit o JBL 37.99 +0.67 27 175 2,442 +4796 95 72 A– B 67.98 Florida Rock Inds o FRK 59.44 +0.94 25 48 950 +3381 73 97 A– B– 90.00 Unibanco o UBB 85.93 +0.93 33 56 1,057 +3299 96 97 A A– 72.20 IntercontinentalEx o ICE 68.10 +1.31 69 13 1,182 +2599 84 95 A+ A 88.40 Reliance Steel & Alu o RS 86.35 +0.53 14 28 494 +1893 76 91 A+ A– 34.96 Archer Daniels Mid o ADM 35.26 +0.63 24 628 5,319 +18
49 88 Tektronix 36.70 +4.11 B– 3,352,7 +63068 41 Pre-Paid Legal Svcs 39.95 +4.21 B 340,7 +71195 68 World Fuel Services 35.49 +3.24 A– 892,9 +41742 29 Mechel OAO ADS 26.03 +2.17 A+ 1,060,6 +43068 87 Telekom Indo 29.51 +1.96 B– 485,2 +11776 90 RTI Intl Metals 47.70 +3.06 A+ 1,094,4 +21595 62 Genentech 88.14 +5.55 A 9,843,1 +19041 84 Mittal Steel Co NV 37.45 +2.25 A+ 2,900,6 +7674 11 Bausch&Lomb 68.87 +3.81 D+ 4,420,8 +39324 13 Santander BnCp 23.25 +1.26 D+ 52,7 +20878 79 Clarcor 36.00 +1.94 B+ 775,8 +31745 83 Prudential Plc 23.95 +1.25 C– 110,2 +2257 49 P T Indosat T B K 28.92 +1.42 B– 88,2 +58
72 50 Sybron Dental Spc 40.51 +1.98 D+ 699,7 +19792 94 Orix Corp ADS 145.35 +7.09 A 6,1 –61
SMARTSELECT® COMPOSITE RATINGEARNINGS PER SHARERELATIVE PRICE STRENGTHINDUSTRY GROUP RELATIVE STRENGTHSALES+PROFIT MARGINS+ROEACCUMULATION/DISTRIBUTION
52-wk Stock & Close Vol% Vol PHigh Symbol Price Chg Chg 1000 E666666
52 46 B+ Pfizer 26.39 +0.34 A– 31.67 +5.. 71 B– iShares MSCI Japan 13.99 +0.20 C– 20.15 –27
61 38 B+ Bank of America 46.90 +0.14 B– 18.70 +3155 23 B– General Electric 34.51 +0.13 B 40.29 +4155 30 B Citigroup 47.41 +0.09 B– 20.60 +3898 61 D+ Motorola 22.25 +0.09 A– 18.97 –538 31 A Lucent Tech 2.90 –0.01 B+ 32.48 –3830 23 C+ Nortel Ntwrks 2.93 –0.01 B+ 24.38 072 19 D– Time Warner Inc 17.07 –0.04 D– 37.25 +3967 59 B AT&T Inc 27.00 –0.11 C+ 20.69 +2661 6 B– Ford Motor 7.81 –0.12 B– 18.47 –1971 93 C+ Adv Micro Devices 33.95 –0.13 A 17.47 –443 93 A– Qwest Comm 6.94 –0.15 C+ 17.68 +1768 46 D Procter & Gamble 59.10 –0.29 C 17.27 +10787 32 C+ Exxon Mobil 61.05 –0.59 C 25.07 +28
SMARTSELECT® COMPOSITE RATINGEARNINGS PER SHARERELATIVE PRICE STRENGTHINDUSTRY GROUP RELATIVE STRENGTHSALES+PROFIT MARGINS+ROEACCUMULATION/DISTRIBUTION
52-wk Stock & Close Vol% Vol PHigh Symbol Price Chg Chg 1000 E666666
MostActive NYSE StocksEPS Rel Acc Closing Group Vol Vol%Rnk Str Dis Stock Name Price Change Str (mil) Chg
NYSE Stocks On The MoveStocks with high volume vs. 50-day avg., reflecting heavy institutional action. Stocks$20 or more, with at least} point change and avg. volume of 60,000. For stocks upin price, EPS & RS Ratings are 70 or higher and annual earnings estimate 15%+. In-cludes stocks without estimates. Stocks with 80 EPS & 80 RS or better are boldfaced.
.............................................................................................................................................................
15 Most % Up In Price (over $20)EPS Rel Closing Group Vol Vol%Rnk Str Stock Name Price Up Str (100) Chg
SMARTSELECT® COMPOSITERATINGRel Grp Acc 52-Wk Stock Closing Price PE Float Vol Vol%
6 |EPS | Str | Rtg | Dis | High | Stock Name | Symbol | Price | Chg | Ratio | (mil) | (1000s) | Chg
B Y J U A N C A R L O S A R A N C I B I A
INVESTOR'S BUSINESS DAILY
The NYSE composite and S&P 500rose for a sixth straight session onFriday. Volume increased as theS&Pand thecomposite indexedgedup0.1%.Many industrial stocks wereamongtheday’sbestperformers.United IndustrialUIC gapped up,gaining 1.50 to close at 55.50 on tri-ple its average volume. The stockbroke out Feb. 13. The company,whose businesses include defensetraining and test systems, reporteda 69% increase in operating EPS aweek earlier, primarily on strongsales of defense systems and a high-erdemandfor its energyproducts.PikeElectricPEC followedthroughon its breakout earlier in the week
by adding 54 cents to 21 on 3 1/2times itsnormal trading.RTI InternationalMetalsRTI rose3.06 to 47.70 on triple its regularturnover, stretching to an all-timehigh.Thecompanywonamultiyearcontract from Kawasaki Heavy In-dustries for the Boeing 787 pro-gram. On Thursday, RTI reportedfourth-quarter results.ChemedCHE also reached a recordhigh as shares gapped up 2.13 to58.87. The operator of the Roto-Rooter plumbing service and a hos-pice business successfully pulledout of a second trip to its 10-weekmoving average since breaking outin lateOctober.CaterpillarCAT rose 1.33 to an all-time closing high of 76.23 as thestock finished near its intradayhigh. Mark Koznarek, an analyst
with FTNMidwest Securities, saidin a report that “dealers continue toreport strong price realization.”Koznarek raised earnings estimatesby 7 cents a share to $1.08 for thefirst quarter, and2006expectationsto$4.90ashare.Applied Industrial Technolo-giesAITpickedup1.30 to44.02as thestock closed in on a record high.The industrial parts distributorfound support at its 10-week lineafterbreakingout inJanuary.E-Trade FinancialET notched a52-week high. The provider of on-line brokerage and financial servic-es has successfully tested its10-week line several times since itbrokeout lastJuly.On the downside,BrownShoeBWSlost 79 cents to 50.64 on double itsnormal volume. The stock reversedlower for theweek.
99 93 92 A A B– 439 ChiMerc CME 424.4 –3.45 –27 398 48 o99 88 96 A+ A A 152 HallwoodGr HWG 141.9 –2.10 –88 0.7 3 k99 84 89 A+ A B+ 67.0 Greenhill GHL 63.86 –2.09 +24 277 35 ê98 99 97 B– A B 90.0 ApcoArgtina APAGF 82.00 –2.98 +42 2 20 ê95 82 99 B– C A 27.2 AirMethods AIRM 25.29 –1.93 +86 420 21 o92 90 92 C A D+ 95.0 Petrobrs PBR 88.39 –1.99 –35 1.5m 9 o91 91 78 A+ B D 108 UTiWrld UTIW 99.3 –1.88 –2 184 37 k88 91 84 D A B– 98.4 Middleby MIDD 85.82 –1.69 +21 120 21 ê88 82 54 A– A B+ 97.3 AustNZBk ANZ 94.55 –1.71 +25 30 15 ê87 94 47 B A B+ 49.5 J2GlblC r JCOM 42.78 –4.94+347 2.4m 23 o87 87 54 A– B B 89.6 WstpacBk r WBK 87.30 –1.64 –45 5 15 ê86 79 75 C A B– 156 AmeradHess AHC 143.7 –1.68 –36 1.0m 11 o83 56 89 B– A C 59.9 Nexen NXY 54.43 –1.93 –15 461 20 o82 98 48 B B B+ 22.8 ParkOHHld PKOH 18.42 –2.32 +29 45 8 ê81 99 73 D+ A C+ 97.3 Sunoco r SUN 79.61 –1.76 –28 1.9m 10 o81 76 93 D+ A D+ 71.0 GiantIndus GI 62.52 –1.82 –24 261 8 o81 45 89 B– B A– 58.5 AtlantcTel ANK 49.50 –5.15+488 20 18 ê78 98 53 A C C 35.0 StdMicro SMSC 25.55 –2.34+327 1.2m 26 ê78 90 59 D+ A B– 117 ImprlOil IMO 101.5 –1.80 –22 75 13 o76 75 88 D+ A D– 82.2 SuncrErgy SU 74.17 –2.51 –15 2.5m 27 o75 91 90 B– .. C 59.9 TelmgCelu TMB 49.50 –2.85 +98 106 11 ê71 76 56 B A C+ 31.0 ClickCmrc CKCM 20.77 –2.23+139 1.3m 14 o68 59 66 C C A– 232 NatlWstLf NWLIA 229.0 –2.03+380 14 11 ê67 82 36 C B B+ 90.0 CapitlOne COF 81.90 –2.10+149 5.7m 12 o67 60 58 B– B B– 136 NatlAustral NAB 131.8 –1.82 +2 24 16 ê66 23 96 B D A 17.5 EvergrnSlr ESLR 15.35 –1.89+248 11m .. o64 75 93 A .. D+ 24.4 Virophrm VPHM 10.86 –5.38+999 49m 9 o63 85 44 C+ D B 371 Markel MKL 344.0 –2.01 –68 9 24 ê62 52 61 B B B 1860 Seaboard SEB 1549 –8.00 +77 5 7 x57 95 19 B+ C C 32.0 USA Truck USAK 25.17 –2.46+248 431 16 ê55 39 82 B– .. A– 25.2 Emeritus ESC 21.00 –2.79+384 74 .. ê45 37 48 D+ A B 163 SearsHldgs r SHLD 134.9 –3.54+121 4.0m 20 o43 56 65 D+ D B– 28.1 MetaFinl CASH 24.15 –2.10+465 36 .. ê42 34 42 B D B+ 3032 BerkHaB BRKB 2961–14.00+114 28 25 ê37 34 41 B D B– 91200 BerkHaA BRKA 88800 – 400 –33 0.2 25 ê36 65 22 D– B B– 62.6 ConstllEnr CEG 55.88 –1.85+209 3.5m 16 o34 69 78 E .. E 88.8 Perdigao PDA 65.33 –2.36 –67 6 9 ê30 60 21 D– A D– 118 ParkNatl r PRK 105.2 –1.78+373 84 15 ê29 36 31 A– .. A– 18.5 LOUDTech LTEC 13.00 –2.00 –9 1 65 ê23 34 15 C+ D B+ 711 WhtMtIns WTM 571.0 –3.00 –65 7 21 ê22 59 15 D– C C+ 917 Wash Post WPO 744.0–11.04+289 51 22 ê17 15 16 C C B– 70.0 YPFSciedad YPF 53.50 –1.71 –6 3 99 ê14 41 5 C A E 30.1 MergeTech MRGE 15.85 –2.12+310 4.3m .. o10 18 4 B– B D– 66.4 Mills MLS 36.73 –1.96+131 3.3m .. ò7 15 12 B– D D– 75.2 FourSeasn FS 50.84 –1.62 +89 381 52 o6 8 9 C+ E B– 179 FairfxFnl FFH 132.0 –6.88+535 314 .. o5 24 8 E D C 69.3 MediaGenA MEG 47.39 –1.76+375 454 17 k2 3 1 B .. 63.5 GPRE GPRE 27.50 –2.00 +10 22 99 ê
.. 94 B+ .. B– 48.4 MorgSEstEu RNE 44.61 –1.85 +2 62 .. k
.. 57 C– .. B 62.3 StKbwCM KCE 59.57 –2.06 +72 102 99 ê
IBD TIMESAVER TABLECombined summary of key price action for NYSE & Nasdaq highest-rated stocks, a quick andeasy snapshot for busy investors. Stocks up at least 1 point or making new highs, and stocksdown 1 point or making new lows. Sorted by Composite Rating, IBD’s single most useful funda-mental and technical gauge.
STOCK DO’SAND DON’TS
›Do not buy stocks up over 5% from a sound chart base:
$40 CHART BASE
›Do buy in a more proper price area:
$40 CHART BASE
$50
$52BUY AREA
›Or buy the first time the stock retreats to its 10-week moving average line:
›Do cut your losses if stock is 8% below your cost . . .avoids possible greater losses
›Do learn when to take 20% to 100% or greater profits
›Investigate before you invest. Always check a chart and read a company story on investors.com
$40
$50
BUY
10-wk.moving avg.
$65
$50
LATE,RISKIER
BUY
99 99 99 A A B+ 118 HansenNat r HANS 115.7 +2.02 –17 1.0m 44 ê99 99 99 A+ A C 23.9 EmpireRes ERS 21.24 +1.05 –26 391 25 k99 98 91 A C A+ NH ThomasBett TNB 51.96 +.21 +14 483 24 o99 98 88 A A B+ 71.5 F5Netwrks FFIV 69.93 +1.86 –35 724 43 o99 98 88 A A B+ 134 CBOT BOT 117.0 +1.06 –64 97 75 o99 97 83 A A B+ 41.8 DigitalRiver r DRIV 41.28 +1.44 +25 1.4m 32 o99 96 97 A C A– NH EzcorpClA EZPW 26.41 +.50 –32 127 21 o99 96 97 A A A– 72.2 IntcntlEx ICE 68.10 +1.31 +25 1.2m 69 o99 96 89 A– A A+ NH Garmin GRMN 77.09 +.45 –27 931 27 o99 95 97 A A B+ 52.9 IntlSecEx ISE 49.25 +2.15 +99 1.2m 51 o99 94 94 A B A+ NH FstCshFinl FCFS 19.93 +.35 +38 520 25 ê99 94 84 B– B A+ NH RecksnAssoc RA 45.82 +.79 –3 505 24 o99 93 96 A– A B NH EaglMatlB EXPB 59.86 +1.86 –45 88 22 ê99 93 95 A– A B+ NH EagleMatl EXP 59.97 +1.62 +8 1.3m 22 o99 91 99 A A A– NH MultFnElc MFLX 63.70 +.82 +19 457 35 o99 91 78 A+ A A– NH NtwrkApl r NTAP 35.05 +.54 +35 6.2m 46 o99 88 91 B+ A A– NH MSCInds MSM 50.60 +1.23 +55 487 29 k99 85 89 A– A A 104 AffiltMgrs AMG 103.1 +1.31 +6 634 24 o99 80 90 A– A A+ NH CitrixSys CTXS 35.92 +.66 +27 3.1m 30 o99 76 94 A– A A NH AmerSciEn ASEI 89.98 +1.04 +57 449 24 o98 99 97 A– B B 23.3 Abaxis ABAX 22.77 +1.09+131 574 73 o98 98 79 A– A B NH PennNatl PENN 39.70 +1.25 –27 663 25 o98 94 88 A B B NH NorfolkSou r NSC 53.94 +.29 –15 2.3m 18 o98 94 84 B+ A B NH Starbucks r SBUX 36.61 +.43 +42 7.4m 55 o98 94 83 A+ A B– NH GldmnSch r GS 150.4 +2.67 +67 6.6m 10 o98 93 97 B– B A– NH HlthExt HLEX 36.72 +.61+109 706 64 o98 92 88 A+ A B– NH Caterpillr CAT 76.23 +1.33 +58 7.0m 18 o98 91 84 C+ A A+ NH ColumBkg COLB 34.86 +.81+153 174 18 ê98 90 88 A A B 61.9 FstMarbl r FMD 46.40 +1.27 +18 1.1m 15 o98 88 94 B A A– NH E`Trade r ET 26.33 +.64 +71 5.9m 23 o98 84 84 B+ A A NH PikeElec PEC 21.00 +.54+262 757 15 o98 82 91 A+ B B NH CmrclMtls r CMC 49.10 +.70 +26 964 10 ò98 80 98 C+ A A NH Bankrate RATE 42.54 +1.61 +30 324 74 o98 76 91 A– B A NH LincolnElc LECO 52.96 +1.00+153 416 19 ê98 63 96 A+ A B+ 56.9 Zumiez ZUMZ 56.22 +1.92 +31 168 63 ê97 97 86 B B B+ NH Chemed CHE 58.87 +2.13+155 460 30 o97 96 95 A– D B+ NH Iridex Corp IRIX 11.49 +1.44+999 465 71 ê97 94 93 D A A– NH IntervstBncs IBCA 33.50 +.13 +3 36 13 k97 92 73 A A B NH TeleMovil TEM 13.25 +.20+144 19 24 ê97 88 89 A+ B B– NH Nomura NMR 21.61 +.94 –4 455 20 ê97 87 83 A– A B+ NH Idexx Labs IDXX 83.60 +.49 +15 141 34 o97 85 96 A C A– NH Andersons ANDE 63.81 +1.13 +93 85 18 ê97 85 84 A A B NH MoneyGram MGI 29.61 +.42+302 1.4m 22 ê97 83 92 A– B B+ NH MartinMari r MLM 105.6 +1.92 +9 505 26 o97 80 91 A– B A– NH DoverDG r DDE 19.68 +.81+112 89 20 ê97 77 99 A B B+ 36.1 Rambus r RMBS 33.53 +1.78 +2 7.8m 99 ò97 76 88 A+ B A– NH Schwab r SCHW 18.13 +.54 +28 10m 32 o96 97 86 C A B– NH BGGrp BRG 61.30 +.27 –45 103 18 ê96 94 81 C+ A B+ NH CascadeBcp CACB 27.72 +.61+360 171 22 k96 93 80 B– B A– NH BioMdRlty BMR 29.46 +.04+202 597 65 ê
STOCKS UP
Common stocks above $10 for Friday, March 17, 2006
NYSE Stocks Post 6th Straight Rise; Volume Up
STOCKS DOWN
31 76 10 C B D 42.6 BarrettBl BBG 30.43 –.85 –4 333 57 o64 81 32 A+ B D+32.1 BarrickGld ABX 26.63 +.03 –2 5.0m 42 o96 84 84 A– B B+ 29.8 BasicEn BAS 28.25 +.65 +52 452 21 o23 74 11 D+ C E 87.9 BauschLmb BOL 68.87 +3.81 +393 4.4m 20 o49 53 38 C+ B B 41.1 BaxterIntl BAX 38.66 +.40 +8 3.2m 20 o25 24 52 B D E 44.3 Bayer BAY 40.38 +.38 –48 113 15 o95 86 76 A+ A C+ 137 BearStrns r BSC 132.9 –.40 +42 1.7m 11 o76 96 60 E A B 82.1 BeazerHm r BZH 68.01 +.54 –9 1.1m 6 o26 43 11 A– C D+71.0 BeckmnCltr BEC 53.48 +.38 +14 644 17 o76 86 61 D+ A B– 65.8 BectonDck r BDX 64.00 –.07 +3 963 20 o53 34 71 B+ C D+27.7 BeldenCDT r BDC 27.11 +.01 +80 503 23 ê83 60 81 C+ B A– 35.3 BellSouth r BLS 34.40 –.30 +85 17m 17 o7 33 11 E D D–25.0 Belo r BLC 20.07 +.07 +46 553 17 o
71 52 72 C+ B B 34.3 Bemis BMS 32.94 +.36 +7 584 21 o79 78 65 A C C+ 38.2 BenchmrkEl BHE 35.87 –.18 +87 820 19 o66 98 60 B– B E 22.9 BntlyPhar BNT 13.83 +.34 –18 418 28 o95 92 91 C+ B B 60.2 BerkleyWR BER 59.14 –.15 +66 1.1m 14 o37 34 41 B D B–91200 BerkHaA BRKA 88800 – 400 –33 0.2 25 ê42 34 42 B D B+ 3032 BerkHaB BRKB 2961–14.00 +114 28 25 ê85 90 68 C A C+ 80.0 BerryPetA BRY 68.50 –.47 0 237 13 o92 66 85 A– B A– 57.7 BestBuy r BBY 57.00 +.05 –36 2.6m 28 ò29 17 65 D+ E B 14.3 BigLots BLI 14.00 +.55 +135 1.9m 93 o79 44 80 A– A B– 27.3 Biovail BVF 25.35 –.31 –36 612 14 ò78 86 46 D+ A B+ 93.7 BlackDeckr BDK 88.47 –.23 –41 435 12 o22 33 17 B C D+44.6 BlackHills BKH 34.12 –.25 +71 333 16 o99 97 93 A– A B+ 161 BlackrckA BLK 140.5 +.47 –26 220 34 ê28 35 8 A B C+ 30.0 BlockH&R HRB 21.28 –.13 +33 2.9m 12 o38 84 24 D+ .. B+ 18.3 Blount BLT 15.56 +.17 +25 257 10 o36 84 9 B B E 19.7 Bluegreen BXG 13.28 –.10 +126 422 8 o94 80 81 B+ C A+ 16.9 BlueLinx BXC 16.29 –.31 –12 205 11 o5 23 9 D– C D–33.3 Blyth BTH 21.21 +.10 +87 322 11 k
83 87 66 D A B+ 21.7 BdwlkPpl BWP 21.54 +.09 –44 81 14 o69 49 72 B C B+ NH Boeing r BA 77.85 +1.12 +28 4.5m 31 o60 98 35 C A D–19.9 BoisdArc BDE 15.30 –.03 +16 205 20 o42 43 44 C+ D A– 27.4 BordersGp BGP 23.90 –.72 +93 1.0m 14 o54 86 44 D B D 61.8 BorgWarnr BWA 58.71 +.92 +6 505 13 o60 58 60 C– B B– 27.5 BostnBeer SAM 26.91 +.17 +162 102 25 ê25 52 9 C+ B D+31.3 BostonSci BSX 22.62 +.12 –5 10m 12 o12 20 11 D+ E A– 39.8 Bowater BOW 28.61 –.67 +53 1.5m .. o34 25 55 B+ E C+ NH Bowne&Co r BNE 15.98 +.96 +349 593 99 o78 96 23 A– A B 59.3 BoydGmng BYD 46.75 +.07 +2 812 18 o87 33 84 A– A A+ 14.0 BradlyPhar BDY 13.46 –.35 –1 209 89 o59 77 57 D– B C+ 40.5 BradyA r BRC 37.13 +.43 +125 383 20 ê15 13 28 B– C D 45.9 BrasilTel BRP 37.50 –1.04 –60 115 99 ê23 3 55 B– E B 17.4 BrasilTlco BTM 14.92 –.32 –43 46 99 ê16 10 10 C B B 24.3 Braskem BAK 16.35 –.32 –37 194 10 ê
28 35 16 A– B D–40.4 BrigsStrtn r BGG 34.29 –.16 +67 782 13 o9 4 30 B– D D 23.7 BrillChina CBA 15.69 +.59 –21 17 99 ê
85 83 59 B+ B B 43.2 BrinkrIntl r EAT 42.86 +.03 –40 491 18 o54 16 73 A– D A 54.0 Brinks BCO 49.62 –.63 +4 694 66 o49 52 50 C+ B D+20.5 BristolWest BRW 18.76 –.02 +36 168 11 ê27 18 22 A– B C 26.6 BristlMyrs BMY 22.92 +.10 –17 7.5m 16 o35 59 17 A– C D+38.0 Bristowgp BRS 30.30 ... +26 241 13 ê35 12 61 B+ D B– NH BritAirwy BAB 61.89 +1.00 +125 79 10 o23 71 26 E .. C+ 44.3 BritishSkyBr r BSY 37.59 +.43 –61 13 17 ê49 3 88 B– E A 38.0 Brookdale BKD 37.00 –.64 +204 191 .. ê86 80 82 C+ B B– 57.1 BrascanA BAM 55.02 –.69 +36 442 25 o68 96 55 E B C+ 56.4 BrkfldH r BHS 52.46 +.83 +112 342 7 ê68 81 57 C+ C B– NH BrookfldPr BPO 31.87 +1.00 +90 737 46 ê87 85 78 C– A B– 32.9 Brwn&Brwn BRO 31.98 –.16 +28 660 29 o90 83 83 C– B A– NH BrownForB BFB 81.91 +.30 +56 346 28 ê97 87 83 A+ C A– 52.2 BrownShoe r BWS 50.64 –.79 +99 377 15 ê33 66 12 D+ B B 49.8 Brunswick r BC 38.32 +.56 –5 966 11 o40 39 43 A+ D C+ 21.6 BrushEMat BW 17.34 +.04 +95 231 21 ê29 49 25 D A D–50.8 BuckeyePtn BPL 43.50 –.24 +27 109 16 ê84 78 65 A+ B B– 46.4 Buckle r BKE 39.68 +.23 +40 91 15 ê64 88 15 A+ A D 32.5 Buenavntra BVN 24.30 +.21 –50 423 12 ò63 95 43 C+ A E 32.7 BldBear BBW 28.37 +.62 +18 262 20 o29 47 24 A D D 68.0 Bunge BG 53.50 –.22 –49 591 16 o80 51 79 A+ C B 45.4 BurlgtnCt BCF 45.28 ... –35 265 18 k96 81 87 A A B– 82.5 BurlNthSFe r BNI 80.79 +.12 –35 1.5m 20 o96 96 85 C A B 92.3 BurlngtnRs BR 90.43 –.62 –42 2.5m 13 o
— C —85 85 57 B B B+ 68.8 CACIIntl CAI 65.43 +.24 –34 234 22 o69 90 27 A– C B– 29.7 CAInc r CA 27.66 +.16 +23 2.7m 30 o99 98 88 A A B+ 134 CBOT BOT 117.0 +1.06 –64 97 75 o98 97 94 C+ A B+ 76.5 CBREllis CBG 74.71 +.06 –26 417 24 o9 31 15 D– D D+30.4 CBSCorpA r CBSA 24.61 +.40 –36 116 33 o
11 33 15 D– D C+ 30.2 CBSCorpB r CBS 24.62 +.40 –18 4.4m 33 o58 74 55 C+ E B 31.1 CDI CDI 27.89 +.09 +120 240 37 ê27 34 15 B+ B D+43.1 CECEntrtn CEC 32.80 +.15 +29 427 16 ê22 18 55 D C D 19.2 CFInds CF 16.85 +.25 +25 649 13 o44 67 40 D– C B– 50.2 CHEnergy CHG 48.30 ... +293 119 17 ê86 71 73 C A A– 55.2 CITGroup CIT 54.60 –.45 –24 988 12 o87 56 79 B+ C A NH CKERestaur CKR 18.07 +.42 +48 1.3m 20 o16 38 19 D– C D–16.8 CMSEnergy CMS 13.85 –.04 +63 3.1m 9 o21 4 48 C+ E B– 35.3 CNAFinl CNA 32.47 +.03 –33 282 25 o80 66 79 C+ C B+ NH CNASurety SUR 17.88 +.15 +122 125 20 ê65 88 29 B+ B B– 59.8 CNFInc r CNF 50.80 –.59 –16 609 13 o61 24 85 B E A 26.0 CNHGlobal CNH 25.50 –.10 –44 122 27 o92 88 81 B– A C 88.3 CNOOC CEO 80.01 –1.40 –35 119 13 o
73 93 43 C A 26.5 CNXGas CXG 22.39 +.24 –34 291 32 ê85 84 93 D– B B 47.9 CPFLEnrg CPL 44.10 +.29 –55 28 16 ê43 18 52 B+ C A– 19.2 CSKAuto CAO 16.71 +.06 –15 563 24 o32 54 30 D– D B+ 37.7 CSSIndustr CSS 32.90 –1.10 +125 73 14 ê95 91 82 A C B+ NH CSX CSX 59.46 +.43 +20 1.9m 17 o67 63 57 A C C 13.4 CTS r CTS 13.08 +.07 +107 293 20 ê65 85 43 D– B B 31.6 CVS CVS 29.60 ... 0 4.7m 21 o51 59 48 D C B+ 23.1 Cabelas CAB 20.54 –.16 +14 363 18 o14 35 27 E .. B+ 33.9 CablevsnS CVC 26.44 –.05 –47 852 .. o38 20 55 A C D+39.5 Cabot CBT 36.89 +.17 +2 414 24 o89 98 63 C A B 53.5 CabotO&G COG 47.50 –.61 +97 1.1m 16 o31 47 41 E C C+ 43.4 CadburySwp CSG 41.00 –.02 +3 640 20 ê70 80 63 C D B 45.2 CalWtrSvc CWT 43.35 –.20 +239 146 29 ê49 26 73 D+ D A NH CallwyGolf r ELY 16.90 +.17 +89 843 43 o80 76 66 C B B+ 22.4 CallnPet CPE 19.97 +.14 +219 352 15 ê24 16 49 C+ E B– 22.4 Cambrex CBM 20.69 +.32 +111 386 42 o93 99 86 B+ B D 41.1 Cameco CCJ 35.91 –.24 –64 1.1m 61 o53 56 50 D– B B+ NH CmpblSp r CPB 32.30 +.21 –25 794 18 o77 63 66 B– B B+ 74.0 CanImpBk BCM 72.59 –.92 –50 16 10 ê95 82 85 A B B 51.2 CanNtlRwy CNI 45.95 –.91 –31 932 16 o78 68 87 D A C+ 64.4 CndNatRes CNQ 56.25 –1.20 –34 890 19 o
73 39 83 A B C+ 53.0 CanadnPac r CP 50.87 –.31 –35 248 14 o66 91 72 D B E 22.2 Canetic CNE 20.65 +.46 –72 197 34 ê51 80 66 D+ .. C+ NH Canon CAJ 64.25 +1.06 –14 231 16 ê49 94 7 A– B C 32.8 Cantel CMN 16.16 +.16 +102 159 15 o53 12 83 B– .. A+ 20.6 CANTV–Tel VNT 20.21 +.21 –50 234 .. ò67 82 36 C B B+ 90.0 CapitlOne COF 81.90 –2.10 +149 5.7m 12 o
41 14 85 B– E B– 11.1 CapitalSrLvg CSU 10.44 +.08 +25 58 .. k90 73 80 C A B+ NH CaptlSrc CSE 25.00 +.18 –16 1.0m 18 o86 83 82 D– B B+ 45.6 CapitolBcp CBC 44.54 +.17 +125 103 19 ê45 59 26 B+ A D–68.2 CarboCera CRR 54.26 –.44 +58 366 28 ê79 51 72 A– C B+ 75.5 CardnlHlth CAH 74.95 –.31 +34 2.1m 24 o69 90 47 B– B C+ 53.9 CaremrkRX r CMX 49.62 +.33 +6 2.6m 25 o88 85 66 B B A– 80.8 CarlsleCos CSL 79.82 +.19 +84 189 18 ò91 90 75 B+ B B– 36.4 CrCtyCrmx KMX 34.78 +.17 +25 1.1m 26 ò41 66 23 B B E 56.1 Carnival CCL 50.97 +.94 +5 3.3m 18 ò48 69 24 B B D+59.5 CarnPLC CUK 53.94 +.68 –78 16 19 k95 69 90 A+ B B– NH CarpntrTch CRS 92.14 +1.12 +19 429 15 o95 95 81 B+ A C+ 70.5 Carters CRI 68.82 –1.40 –9 260 28 o94 95 70 B B A– 53.8 Cascade CAE 52.49 +.39 +156 102 17 k16 47 22 E C D–22.8 CascdeNtrl CGC 19.61 +.23 +153 109 18 ê97 88 84 A B B+ 29.0 CashAmer r CSH 28.30 –.25 +76 368 19 ê33 46 15 B+ B C+ 27.9 CatalnaMkt r POS 23.45 +.23 +17 608 18 o98 92 88 A+ A B– NH Caterpillr CAT 76.23 +1.33 +58 7.0m 18 o69 84 30 A+ B B– 24.4 CatoCp CTR 21.21 –.17 +191 353 14 ê45 69 23 B C C+ 33.0 CedarFair FUN 28.78 –.07 +13 85 17 ê
T H E R E A L M O S T A C T I V E
Sponsored by:Visit Investors.com to see Stocks on the
Move Updated throughout the day.
Active Trader Services and Wealth-Lab Pro are only available to investors in households that place at least 120 stock, bond, or options trades in a rolling twelve-month period, plus have $25,000 in assets across their eligible Fidelity brokerage accounts.
System availability and response time may be subject to market conditions.
Fidelity Brokerage Services, Member NYSE, SIPC 423889
Find out if you’re as smart as you think you are.
Back-test your trading strategies with Fidelity.
Call or click to learn how to get Wealth-Lab Pro free.
Our exclusive Wealth-Lab Pro® software makes it easy to trade smarter. With both technical and fundamental data, you can design, build, and back-test your big ideas before you invest. Or use one of over a thousand pre-loaded strategies. The best part is, it’s free.
Fidelity Active Trader Services. Power. Price. Service. No compromises.®
1.800.963.2304 | Fidelity.com/backtest

B10 MONDAY, MARCH 20, 2006 NYSE MAIN TABLES — Stocks $10 And Above INVESTORS.COM
SMARTSELECT® COMPOSITE RATINGEARNINGS PER SHARERELATIVE PRICE STRENGTHINDUSTRY GROUP RELATIVE STRENGTHSALES+PROFIT MARGINS+ROEACCUMULATION/DISTRIBUTION
52-wk Stock & Close Vol% Vol PHigh Symbol Price Chg Chg 1000 E666666
Feb. Retail Sales Decline7 The 1.3% drop was worse thanexpected but followed a revised2.9% increase in Jan. on unseason-ably warm weather. Excludingautos, sales fell 0.4% after rising2.6% in Jan. Separately, theIBD/TIPP National Outlook Indexfell 3.5% to 43.5, weighed down bythe president’s declining approvalrating and gloom about theU.S.’ di-rectionandstanding in theworld.
Iraq Deadlocked On Gov’t8 U.S. and Iraqi forces launchedthe biggest air assault in Iraqsince the U.S.-led invasion in ’03.Operation Swarmer, to last severaldays, aims to clear “a suspected in-surgent operating area” northeastof Samarra. Iraq’s new parliamentwassworn inwithparties stilldead-locked over the next government.Vehicles were banned from Bagh-dad’s streets to prevent car bombswhile thecountry fearsacivilwar.
Housing Starts Decrease9Housing starts fell 7.9% in Feb-ruary to an annualized2.23mil-lion units, better than the 2.03 mil-lionexpectedbyanalysts. January’snew construction jumped 15.8% to2.30 million homes on unusuallywarm weather. Building permits,considered a gauge for the home-constructionmarket, fell 3.2%.
Mergers Kicked Off Week10 A flurry of mergers were an-nounced last week. Credit-card issuer Capital One offered$14.6 billion for North Fork Ban-corp and newspaper publisherMc-Clatchy said it’ll buyKnight-Ridderfor$4.5billion.WatsonPharmaceu-ticals bid $1.9 billion for genericdrug maker Andrx, while PinnacleEntertainment offered to pay $1.45billion forAztar, acasinooperator.
SMARTSELECT® COMPOSITE RATINGEARNINGS PER SHARERELATIVE PRICE STRENGTHINDUSTRY GROUP RELATIVE STRENGTHSALES+PROFIT MARGINS+ROEACCUMULATION/DISTRIBUTION
52-wk Stock & Close Vol% Vol PHigh Symbol Price Chg Chg 1000 E666666
SMARTSELECT® COMPOSITE RATINGEARNINGS PER SHARERELATIVE PRICE STRENGTHINDUSTRY GROUP RELATIVE STRENGTHSALES+PROFIT MARGINS+ROEACCUMULATION/DISTRIBUTION
52-wk Stock & Close Vol% Vol PHigh Symbol Price Chg Chg 1000 E666666
SMARTSELECT® COMPOSITE RATINGEARNINGS PER SHARERELATIVE PRICE STRENGTHINDUSTRY GROUP RELATIVE STRENGTHSALES+PROFIT MARGINS+ROEACCUMULATION/DISTRIBUTION
52-wk Stock & Close Vol% Vol PHigh Symbol Price Chg Chg 1000 E666666
72 76 70 C C B 22.0 Celanese CE 21.02 –.67 –45 248 9 o21 17 22 A E B 14.9 Celestica CLS 11.10 +.05 –49 476 19 o86 47 85 A– B B+ 67.2 Cemex CX 65.44 –.19 +13 2.2m 10 o29 45 13 B C B– 22.5 Cendant CD 17.17 +.23 –6 6.9m 13 o60 90 29 C– B B 37.9 Centene CNC 28.46 –.79 +186 1.9m 21 o21 70 19 E D D–15.1 CenterPt CNP 12.51 –.19 +105 3.8m 27 o50 97 25 E A C+ 79.7 Centex r CTX 65.68 +.78 +30 2.7m 6 o49 77 23 C+ A D–39.3 CenPacFnl CPF 35.19 –.07 +276 343 14 ê36 47 47 C+ E B 18.4 CentrlPrkg r CPC 16.04 –.14 +106 189 25 o34 49 46 D– E B+ 22.8 CentralVT r CV 21.20 –.01 +174 98 22 ê70 69 59 C+ C B+ NH CenturyTel r CTL 38.07 +.18 +46 1.4m 14 o54 8 97 B+ E B+ NH Cenveo CVO 15.80 +.16 +112 677 .. o88 78 76 B D A 26.0 Ceridian CEN 25.73 –.13 –33 547 33 o80 61 82 C+ B B– 16.1 ChampnEnt CHB 15.81 +.49 +48 1.3m 29 ê82 86 60 C+ A B– 53.1 CharlsRvLb r CRL 50.30 +.29 +20 475 21 o7 30 16 D .. D 23.4 ChrtrMac CHC 20.60 –.35 +356 473 21 ê
72 75 81 A– C E 29.9 ChckptSys CKP 27.15 +.24 +45 337 25 o97 97 86 B B B+ NH Chemed CHE 58.87 +2.13 +155 460 30 o28 76 5 A D D–17.9 Chemtura CEM 10.84 –.16 0 1.9m 24 o2 8 4 D+ E D–22.9 Chesapeake CSK 14.04 +.41 +7 265 29 o
81 90 62 C A C+ 40.2 ChespkEgy CHK 31.50 –.23 –47 7.1m 12 o44 80 23 C A E 66.0 ChvrnTxco r CVX 57.18 –.56 –7 9.4m 8 o63 86 26 A C B– 33.0 ChicgoB&I CBI 25.09 –.25 –78 304 29 o99 93 92 A A B– 439 ChiMerc CME 424.4 –3.45 –27 398 48 o
96 95 72 A+ A B– 49.4 ChicosFAS CHS 42.35 +.63 –6 2.7m 39 o80 72 92 C C C 49.4 ChinaLfe LFC 46.53 +.83 +98 215 27 o92 87 71 A A C 26.9 ChinaMbl CHL 24.70 +.29 +1 549 14 o31 11 64 B– E B 37.2 ChinaNet CN 34.85 +.26 –42 25 99 o76 64 85 C B B– 64.5 ChinaPet SNP 58.40 +.02 –70 71 10 ò37 46 34 B– C B– 41.1 ChinaTel CHA 36.02 +.23 –24 42 8 o77 59 85 B+ C 56.8 Chipotle CMG 53.86 –1.19 –48 396 68 o
10 40 4 D– B D 31.1 Chiquita CQB 17.27 –.44 +21 695 5 o43 57 46 D B D–30.3 Chittenden CHZ 29.36 +.15 +146 414 16 ê74 80 84 B– .. B 49.1 ChoicHotl r CHH 45.20 +.26 –59 176 35 ê65 64 54 B A D+46.9 Choicepnt r CPS 44.77 +.18 –12 502 25 o95 53 87 A+ B A+ 23.8 ChrisBnk CBK 23.43 +.26 +27 367 30 ò78 84 57 C+ B B– 99 Chubb r CB 98.29 +.09 –8 870 10 o38 37 34 B– B B– 22.3 ChungTel r CHT 19.44 +.09 –26 871 13 o59 59 48 D B A– 39.6 ChurchDwig CHD 37.03 +.01 –11 304 20 o62 39 79 C– C A– 133 CIGNA CI 132.5 +.28 +39 1.3m 16 o66 99 31 C A D 47.8 Cimarex r XEC 40.92 –.70 +12 1.2m 7 o55 68 53 D– B B– 46.0 Cinergy CIN 45.79 +.07 –30 570 17 o72 66 67 A– C C+ 29.2 Circor CIR 28.89 –.11 +268 117 21 ê77 49 89 A– D B+ NH CirctCity CC 25.36 +.14 –5 1.9m 43 ò21 65 12 E E B 14.7 CitadlBrd CDL 11.57 +.24 +74 1.1m 21 o57 55 30 B– A B 49.8 Citigroup C 47.41 +.09 +38 21m 12 o47 76 41 C+ .. B 14.0 CitiznsCom CZN 13.55 +.01 –15 1.8m 22 o70 73 48 C+ A C+ 78.3 CityNatl r CYN 76.50 +.10 +36 247 16 o99 89 88 A+ A A– 36.0 ClairsStr r CLE 35.27 ... –21 602 20 o93 78 79 B+ C A NH Clarcor CLC 36.00 +1.94 +317 776 25 k1 13 4 D– E E 18.1 Clark CLK 10.71 +.01 +173 176 17 ê
22 54 19 D– D B– 33.6 ClearChnl CCU 29.44 –.06 +61 5.6m 25 o78 82 72 B+ E B 23.9 ClearCh CCO 22.43 +.44 +7 239 99 o46 82 25 D– A D 24.4 Cleco CNL 21.53 –.16 +181 867 6 o77 75 66 B+ A D– 110 ClevlndClf CLF 91.27 +2.32 +31 778 9 o54 67 53 D B C+ 66.0 Clorox CLX 62.32 +.44 –9 806 21 o94 98 58 B+ A B+ 37.4 Coach COH 35.55 –.72 +52 3.6m 29 o10 18 14 C+ E B– 14.5 Coachmen COA 11.48 +.28 +289 219 .. ê69 59 35 A A B+ 45.3 CocaCola KO 42.79 +.10 +21 8.2m 19 o59 77 35 A D B– 23.9 CocaColaEn CCE 20.76 +.07 +10 1.4m 16 o89 54 68 A B A+ 31.5 CocaCFmsa KOF 30.85 –.11 +49 209 13 ê98 89 81 A– A B+ 24.9 CohenStrs CNS 23.53 +.45 +120 113 27 ê69 75 48 C B B 58.3 ColgatPlmv CL 56.69 +.04 –4 2.0m 21 o71 62 55 D+ A A– 26.0 ColonlBcgp CNB 25.18 +.10 +17 538 16 o37 52 30 D A D+63.4 Comerica CMA 57.75 +.09 –12 869 11 o98 93 93 A+ D A NH ComfortSyUS FIX 12.75 –.25 +165 583 28 ê65 63 59 D B A– 36.5 CommrcBNJ CBH 35.90 –.11 –7 1.6m 20 ò32 58 13 C+ B C+ 65.5 CommerceGr CGI 52.87 +.04 –18 73 7 ê98 82 91 A+ B B NH CmrclMtls r CMC 49.10 +.70 +26 964 10 ò95 71 93 B+ B A NH Comscope CTV 28.04 +.10 +140 2.1m 27 ê25 45 18 D B C+ 26.1 CmntyBkSy CBU 21.92 +.15 +81 252 12 ê56 90 34 E C B+ 40.7 CommtyHlth r CYH 37.48 –.43 –3 885 18 o84 68 87 C– A B– 45.2 CompBdas ABV 43.60 –.64 –42 351 53 ò79 62 73 C– A A– 39.4 AmBevC ABVC 36.70 –.90 –23 25 45 k67 50 81 C B C+ 21.6 CmpSABESP SBS 19.94 –.06 –9 378 5 k93 94 76 B+ A C+ 51.6 CompVDR RIO 44.92 –.08 –43 2.1m 11 o70 31 95 B– B B 46.0 CompnhBras CBD 45.26 +.46 –51 125 41 k80 70 89 D– A C+ 53.2 CompEngr CIG 46.13 –.77 +20 384 9 ê91 39 92 A+ A B+ 31.9 ComphSidrg SID 30.87 +.45 –48 580 9 ò35 61 36 C– .. B+ 28.5 CompCrvcrs CU 25.70 +.14 –33 29 18 ê32 62 32 C .. B– 26.7 CompssMnl CMP 24.73 –.02 +71 323 15 ê38 47 52 D B C+ 16.7 ComptonP CMZ 13.24 –.49 –55 95 28 k86 78 75 B D A 59.9 ComputrSci CSC 56.90 +.40 –11 1.2m 18 o51 87 21 C A D 34.3 ComstckRes r CRK 28.01 –.33 +10 767 13 o9 42 10 D– D D–27.9 ConagraFd CAG 19.64 +.14 +140 6.9m 15 ò
69 92 40 C A C+ 71.5 ConocPhil r COP 61.36 –.98 –29 7.8m 6 o41 30 71 D– D B+ 25.9 Conseco CNO 25.49 –.01 –67 316 15 o46 41 54 B A D–79.8 ConsolEgy r CNX 65.37 –.44 –62 576 10 o30 57 27 D– C C 49.3 ConsldEdis ED 45.09 –.27 +6 1.1m 15 o59 55 56 B+ C C+ 53.8 ConsldGrph CGX 50.60 –.10 +102 152 19 ê54 86 30 C– B B– 31.6 ConstelA STZ 26.27 –.46 +30 1.5m 17 ò36 65 22 D– B B– 62.6 ConstllEnr CEG 55.88 –1.85 +209 3.5m 16 o
83 52 97 B+ E A– NH CtntlAirB CAL 26.55 +.51 –14 3.0m .. o67 54 69 B D B 18.7 Convergys CVG 17.78 +.01 +18 825 17 o78 82 72 B+ B D 50.6 CooprCmrn CAM 41.42 –.37 –45 1.2m 27 o38 75 13 D+ A C 80.9 CooperCos COO 53.99 +.40 –43 409 16 o80 62 72 B+ C B 85.3 CooperInds CBE 84.74 –.13 –28 426 20 o2 18 11 E E D–21.0 CooperT&R CTB 14.77 +.07 +27 968 .. o
27 86 14 B+ .. E 27.4 CopaHold CPA 22.00 +.20 –60 88 11 ê97 90 91 A– B B 48.1 CoreLabs CLB 46.30 –.30 –18 135 26 ê75 43 79 A+ D A– NH CornPrdt CPO 29.72 +.27 +103 884 24 o97 74 93 A– A B+ 28.3 Corning GLW 26.87 –.64 +4 13m 31 o77 87 32 A– A B 30.4 Corpbanca BCA 27.50 +.01 –93 2 13 k77 91 45 A– D B+ 46.3 CorrecCp CXW 42.60 –.37 +83 388 23 o59 5 92 A+ .. A 15.0 CorusGrp CGA 14.64 –.29 +15 67 8 ê17 29 4 A D B– 26.6 Cott COT 13.51 –.19 –68 148 19 o66 95 41 D A C+ 40.3 Countrywd CFC 36.53 +.79 +25 5.1m 8 o94 93 79 B– B B NH Covance CVD 59.93 +.61 –2 483 30 o50 27 65 B B C+ 18.1 CovantaH CVA 16.99 +.06 +160 1.7m 35 o78 94 58 C– A C+ 61.9 CoventryHt r CVH 56.92 –.23 –47 629 18 o20 63 10 E C C 17.5 CoxRadioA CXR 13.19 +.12 +188 678 17 o79 54 79 B B B+ NH Crane CR 39.92 +.31 +172 714 17 o89 94 73 A– B C 30.8 Credicorp BAP 26.38 –.21 +139 404 11 ê68 33 76 A+ B C 60.5 CrdSuisse CSR 57.00 –.10 –58 157 12 o36 74 19 E A C+ 59.0 CrosTimRoy CRT 43.58 –.62 +43 32 14 k48 39 85 A E E 32.8 CrownCstl CCI 29.10 –.15 –19 969 .. o53 60 55 C+ C C 20.4 CrownHldg r CCK 18.89 –.07 –58 548 59 o78 73 57 C+ A B– 56.4 CullenFrst CFR 55.81 +.19 +1 157 18 o92 98 83 C+ B B– 110 Cummins CMI 107.8 –.26 –33 571 9 o93 85 68 B B A+ 67.4 CurtWright CW 66.55 –.13 +190 264 19 ê60 34 76 A E B+ 18.8 CyprsSemi CY 17.52 –.04 –7 4.0m .. o77 35 79 A B B NH CytecInds CYT 57.02 +.24 +64 672 18 o
— D —79 89 70 D B B 28.3 DCPMidP DPM 27.50 –.05 –79 15 12 o93 89 89 C+ B B+ 39.5 DJOrtho DJO 39.48 +.43 –7 298 30 o40 47 43 D– C B+ 28.3 DPL DPL 27.49 +.03 +2 756 28 o53 97 25 E A C+ 42.8 DRHorton r DHI 34.58 +.63 –18 2.2m 7 o71 75 66 D+ C B+ NH DRSTech DRS 56.03 +.69 –10 660 23 o61 68 60 C– B C 62.3 DSTSys DST 58.57 –.45 –40 520 21 o97 91 74 A+ A B+ 30.2 DSWInc DSW 30.00 +.20 –8 138 29 o20 45 19 D– B D–48.3 DTEEnrgy DTE 42.89 +.17 +3 771 13 o47 36 73 B– E B 60.0 DaimlrChry DCX 56.87 –1.14 +80 867 17 o
89 85 70 B– B B+ NH Danaher DHR 64.51 +.61 +43 1.8m 23 o94 85 78 B+ B B+ 42.9 DardnRest DRI 41.22 +.01 –21 924 21 ò80 68 81 D A B– NH DaVita DVA 60.02 –.25 –44 414 30 o51 58 56 D D B+ 39.8 DeanFds r DF 38.15 +.08 –26 554 19 o77 61 66 B B B+ 79.4 Deere&Co r DE 78.40 +.01 –8 1.7m 13 o36 38 47 D– D A– 11.7 DelMonte DLM 11.21 +.01 +3 909 14 o74 63 68 C B B+ 53.1 DelphiFncl DFG 52.91 +.28 +86 229 14 o52 12 63 A C A– 28.9 DeltaPnLd DLP 28.06 –.14 +22 478 29 ò44 10 79 D+ C B+ 55.5 DeltcTmbr DEL 54.70 –.51 +102 145 46 ê1 30 3 D– .. E 43.2 Deluxe DLX 24.05 +.01 +1 520 7 o
92 87 85 C A B– 30.0 DenbryRes DNR 28.86 +.25 +4 856 19 o84 83 80 B– B C+ NH DeutschB DB 115.6 +1.46 –19 118 12 o29 58 18 B– C D+20.6 DeutschTel DT 17.01 +.02 –58 406 13 o73 97 49 C A D 70.3 DevonErgy DVN 60.50 –.71 –29 2.9m 9 o60 80 63 D D B 24.8 DeVry DV 23.11 –.06 +75 978 48 o78 64 58 C– B A+ 65.7 Diageo DEO 65.34 –.07 –54 305 20 o50 73 23 A– B D+57.7 DiagnstcPr DP 46.53 –.46 +61 283 20 o92 76 89 C+ A B 85.5 DiamondOfs DO 83.06 –.90 –25 2.1m 47 o22 66 7 D+ B E 18.2 DianaShpg DSX 11.75 –.22 –42 199 6 o
85 94 69 C+ B C 40.4 DcksSpt DKS 39.95 +.17 –13 534 22 o21 23 22 C– C B+ 57.8 Diebold r DBD 43.05 +.69 –12 583 22 o52 54 53 B– E A– 28.6 DillrdDept r DDS 26.49 +.06 +22 860 19 o47 76 55 E D B– 16.8 DirecTV r DTV 15.84 +.12 –31 2.4m 68 o47 71 42 B– .. B 22.8 Dist&Svc DYS 20.57 +.07 +102 87 28 ê87 97 59 C B A– 24.4 DolbyLab DLB 20.56 +.01 –53 130 38 o40 69 14 C B B– 22.5 DollarGen DG 18.04 +.50 –6 2.4m 17 ò83 66 79 B D A– NH DollarThty r DTG 44.04 +.55 +106 235 20 o5 42 13 E .. E 51.2 DominonTr DOM 40.10 –.05 –26 29 11 k
13 30 17 D– B E 87.0 DominRes D 73.25 –.60 –3 1.5m 16 o84 79 80 B+ .. A 28.6 Dominos r DPZ 28.12 –.26 +9 476 19 o64 69 46 B+ B C+ 36.0 Donaldson DCI 33.34 +.15 +71 367 23 o47 50 23 B+ B B+ 38.3 DonnellyRR RRD 33.05 +.10 +16 1.2m 14 o4 19 6 D B D 36.4 DoralFin DRL 10.53 –.31 +88 2.2m 99 o
33 14 53 D+ B B– 14.3 DbleHull DHT 13.20 –.04 –52 39 8 ê90 71 73 A– B A– 48.8 Dover DOV 47.99 +.31 –13 816 20 o97 80 91 A– B A– NH DoverDG r DDE 19.68 +.81 +112 89 20 ê56 86 20 C A B– 53.2 DowChem DOW 43.68 –.17 –2 5.0m 9 o35 19 55 E B A– 43.1 DowJones DJ 40.10 –.67 –36 453 40 ò43 64 25 D+ A C 80.8 DownyFinl DSL 65.84 +.27 –50 127 8 o92 70 94 A– D A 30.7 DrReddys RDY 30.42 –.18 –49 153 66 o12 5 13 C B B– 41.3 DrmwksAnm DWA 24.71 –.25 –50 246 24 o42 52 40 B+ C D+28.4 DresserR DRC 24.07 +.05 –49 128 92 o97 96 90 C+ B A– 38.0 DrewIndu DW 35.00 –.10 +68 208 21 ê96 91 92 B+ B B 63.6 DrilQuip DRQ 59.68 –.02 –24 244 33 ê60 70 43 B C B 23.4 Ducommun DCO 21.06 +.03 –70 9 14 ê49 74 43 D– D B 30.6 DukeEnergy r DUK 29.44 +.07 +15 3.8m 17 o91 84 71 B– A B+ NH Dun&Brad DNB 75.54 +.29 –30 243 21 o38 39 20 B C A– 52.8 DuPontNmrs DD 42.57 –.07 +3 5.3m 18 o16 19 23 D– C B– 19.5 DuqLight DQE 17.11 +.04 +87 936 13 ê17 8 32 B+ D D 26.2 Dycom r DY 21.33 +.03 +8 487 22 o
— E —71 82 81 D– .. A 36.9 EDPEnPort EDP 36.61 –.21 –20 25 10 ê87 73 80 A C B 27.5 eFunds EFD 26.48 –.50 +130 498 25 o91 92 46 A+ B A– 14.9 EMC r EMC 14.10 +.08 –30 14m 26 o84 95 63 C A C 86.9 EOGRes EOG 72.56 –.39 –20 3.0m 13 o44 39 51 B C B– 56.2 ESCOTech ESE 49.65 –.10 +7 241 37 o98 88 94 B A A– NH E`Trade r ET 26.33 +.64 +71 5.9m 23 o46 35 73 D– B C 38.5 E.ONAG EON 37.97 –.42 –55 121 14 ê99 93 95 A– A B+ NH EagleMatl EXP 59.97 +1.62 +8 1.3m 22 o99 93 96 A– A B NH EaglMatlB EXPB 59.86 +1.86 –45 88 22 ê32 63 18 E A C+ 34.1 EastrnAmNG NGT 26.75 –.25 –24 15 11 k61 83 26 A B C+ 61.2 EastmnChm EMN 51.70 –.29 +2 886 8 o33 12 61 C D B+ 33.6 EastmKodak EK 29.73 +.46 –12 2.9m 27 o84 83 55 B B B+ NH Eaton r ETN 71.93 +.18 +12 906 13 ò69 73 43 A– A D+30.6 EatonVance r EV 27.01 –.03 +32 848 22 o72 79 68 D B B 40.5 Ecolab ECL 39.29 +.04 +50 1.1m 31 o36 45 40 D– B C+ 49.2 EdisonIntl EIX 43.35 –.25 +40 2.0m 12 o52 47 55 D+ B B 31.9 EDO EDO 30.70 +.32 +94 578 19 o60 55 32 A+ C A– 48.0 EdwardsAG AGE 45.17 +.01 +15 388 16 ò51 80 31 C+ B D 47.3 EdwardLSci EW 42.59 +.29 –30 296 21 o12 17 39 D E C+ 14.2 ElPaso EP 12.32 +.01 –43 3.1m .. o23 71 17 D– C E 22.4 ElPasoElc EE 19.51 –.28 +191 618 19 ê57 38 94 A– E C 16.8 Elan ELN 15.01 +.12 –65 4.0m .. o55 31 80 B E B+ 28.1 ElecData r EDS 27.98 +.31 –6 3.2m 45 o73 71 43 B– B A– 39.0 ElkCorp r ELK 35.69 –.03 +6 174 17 o50 41 47 A D B+ 17.0 Embotlldra AKOB 14.70 –.48 –90 2 26 k34 9 58 B B D 43.0 Embraer ERJ 39.75 –.22 –11 552 23 ò29 60 39 B– .. D+15.3 Embratel EMT 11.30 –.33 –59 61 18 ê84 61 95 B+ E A– NH EMCOR EME 48.78 +.27 +73 594 35 o9 5 22 A– .. D–14.5 EmergMedS EMS 12.50 –.10 –62 19 26 ê
91 70 75 B B A NH EmersnElec EMR 85.67 +.59 –28 1.2m 22 o23 30 32 D– C B 25.0 EmpireDstr EDE 22.69 +.32 +144 238 24 ê49 40 72 D– C B 32.5 EmprsaChle EOC 30.77 –.27 –55 37 44 ê50 28 78 A .. B 39.3 EmpICA ICA 35.64 –.76 –34 23 22 ê57 88 15 C+ A B– 22.7 Emulex ELX 17.98 +.01 –30 1.3m 16 o8 44 12 D .. D 54.7 EnbrEM EEQ 42.81 –.32 +136 72 38 ê
12 35 11 D C D–57.1 EnbrgEngy EEP 43.75 –.11 –6 134 22 o30 61 38 D C E 33.1 Enbridge ENB 30.21 –.91 –32 100 18 ê47 52 59 D A D 59.8 Encana ECA 47.87 –.24 –28 3.2m 14 o55 95 26 C A E 39.5 EncoreAcq EAC 30.49 +.07 +89 744 13 o75 89 86 D– .. A– 33.7 Endesa ELE 33.48 –.02 –71 39 9 o7 18 11 C+ E D 39.7 EndurSpc ENH 31.24 +.55 +43 720 .. o
34 52 29 D– C B 49.3 EnelScieta EN 42.71 +.01 –66 10 20 ê41 93 16 E A D 44.3 Energen EGN 34.10 –.45 –14 286 14 ê35 71 29 D– B D 65.4 Energizer ENR 54.86 –.19 –17 409 14 o27 57 27 D– C C 30.1 EnergyEast EAS 24.98 +.09 –12 562 13 o39 87 13 C A E 33.0 EnergyPrts EPL 22.27 –.04 +6 775 12 o40 82 43 D .. 23.3 EngyTEq ETE 23.12 +.03 –74 183 24 ê66 89 62 D+ .. A– 39.1 EngyTrnsfr ETP 38.87 +.23 –19 121 18 k60 68 70 D A E 56.0 Enerplus ERF 50.30 –.01 –25 352 12 o51 44 71 D– C B+ 12.7 EnersisSA ENI 12.17 –.09 –62 157 99 o27 31 32 B+ C D 15.7 EnerSys ENS 13.59 –.16 +353 331 18 ê81 51 84 A C B– 40.9 Engelhard r EC 39.60 +.08 –63 595 20 o61 69 36 C A B– 60.9 ENISPA E 57.26 –.87 –20 293 10 o64 75 57 D– B B– 20.3 Ennis Forms EBF 19.60 +.42 +278 403 13 ê91 98 67 A– D A– 35.0 EnPro NPO 33.24 –.31 +2 223 15 ê80 82 68 C+ A C+ 56.4 EnscoIntl ESV 47.80 –.57 –23 2.6m 25 o19 61 15 E C D 36.1 EntercomA r ETM 28.90 –.01 +66 601 17 o32 74 29 D– C D–79.2 Entergy ETR 71.64 –.32 –21 934 16 o90 99 70 D B A 40.6 EnterpGP EPE 40.10 –.11 –63 13 62 ê21 38 24 D C C+ 27.7 EnterprsPd EPD 24.58 +.02 –7 669 27 o20 59 10 D B D–26.8 EnterraE ENT 17.50 –.48 +62 383 28 ò5 8 9 B– E D+18.5 EnzoBio ENZ 12.12 –.08 +105 270 .. o
84 77 53 A A B– 39.4 Equifax EFX 38.14 –.01 –23 559 20 o65 78 53 E A B– 41.2 EquitblRs EQT 37.77 +.27 +54 1.2m 18 o36 53 31 C B C 46.5 EsteeLdrA r EL 37.61 +.27 –47 670 19 o42 27 53 B C C 44.3 Esterline ESL 40.40 +.14 +58 241 21 o75 66 72 C+ B C+ 42.8 EthanAlln r ETH 42.09 +.69 +13 571 17 o15 18 33 C+ E C+ 108 EverestRe RE 96.04 –.29 +31 565 .. o23 66 4 D+ B D+21.4 ExcelMar EXM 10.73 –.11 –50 63 4 o11 23 17 C .. 13.7 ExcoRes XCO 12.09 –.01 –73 575 .. ê51 60 53 D– B C 59.9 Exelon EXC 55.90 –.47 –15 2.5m 17 o84 62 83 B– B B+ 21.5 Extndicr EXE 20.50 –.22 –58 14 14 ê63 87 32 C A C+ 66.0 ExxonMbl XOM 61.05 –.59 +28 25m 11 o
— F —59 60 65 C C B– 34.5 FBLFncl FFG 34.33 –.07 +265 114 14 ê62 53 66 C C B– 63.9 FMC r FMC 62.54 –.22 –34 228 14 o95 77 84 B+ C A+ 52.7 FMCTech FTI 49.54 –.64 –19 582 35 o14 27 14 D B C+ 21.0 FNBCorp FNB 16.84 +.11 +196 447 14 ê27 52 20 D– C B– 48.1 FPLGrp FPL 40.62 –.64 +101 4.5m 17 o76 93 65 D– B C+ 30.5 FTICnslt r FCN 28.27 –.16 +40 478 20 o91 86 67 B– A B 42.3 FactsetR FDS 41.00 +.40 +78 399 28 ò51 90 33 C– B D–48.5 FairIsaac FIC 39.94 +1.02 +87 1.3m 21 o26 12 52 A E C+ 20.4 FairchldSm FCS 17.83 +.12 +83 3.4m 99 ò6 8 9 C+ E B– 179 FairfxFnl FFH 132.0 –6.88 +535 314 .. o
87 76 78 B– B B+ NH FairmntHtl r FHR 44.52 –.06 –64 315 21 o35 76 38 C+ .. D+16.8 FairPtCom FRP 14.02 –.19 +118 470 .. o89 55 88 B+ A B+ 35.0 Falconbrg FAL 33.22 –.59 –6 187 13 o56 39 55 C C A+ 31.7 FamilyDllr FDO 26.42 +.67 +27 1.5m 20 ò28 24 43 D C B+ 61.7 FanniMae FNM 53.40 –.03 –26 2.8m 99 o71 81 67 D B B– 32.5 FedAgricC r AGM 28.44 –.10 +154 93 11 ê13 24 30 D .. B– 68.8 FedHmLn FRE 64.25 +.09 –11 2.4m 99 ò75 75 66 B D B 19.0 FederlSgnl FSS 18.31 +.21 +165 709 19 o58 38 54 B– A B 78.0 FederdDept FD 72.23 +.11 –27 1.9m 15 o77 62 67 A– A D+40.2 FedertdInv FII 37.83 –.04 +3 588 20 o91 85 77 B B B+ 116 Fedex FDX 114.9 +.43 +15 1.7m 21 ò14 31 33 D+ E E 22.5 Ferrellgas FGP 21.16 –.09 +93 144 .. ê24 19 43 B E C+ 23.2 Ferro Corp FOE 20.03 –.02 +223 441 40 k47 55 46 C+ B D–41.1 FidNtlFnl r FNF 36.45 +.10 –27 903 6 o68 70 42 A B C 44.6 FidNInfo FIS 40.11 +.36 –37 625 22 o46 67 32 C+ B C+ 25.7 FidlNTtl FNT 22.53 +.03 –6 265 7 ê72 65 49 C A A– 30.1 FinancialFed FIF 28.95 –.27 +93 321 19 ê63 16 80 C+ B A– 13.0 FstAccept FAC 12.52 +.04 +261 203 40 ê51 88 23 C+ B D 49.5 FirstAmer r FAF 40.31 –.17 –7 662 8 o35 96 7 D+ A D–27.8 FstbkPRic FBP 12.97 –.18 +270 1.2m 6 o15 22 30 D C E 14.7 FstCwlFn FCF 13.65 +.12 +302 500 18 ê89 65 62 A B A 48.2 FirstData FDC 47.37 –.37 –4 4.5m 20 ò53 59 38 D+ A B– 44.8 FstHoriz FHN 41.41 +.34 +24 951 12 o98 90 88 A A B 61.9 FstMarbl r FMD 46.40 +1.27 +18 1.1m 15 o48 81 44 C+ .. B– 42.2 FstRepBk FRC 38.09 +.02 +23 188 18 ê6 3 26 D– .. B– 20.1 FstTrFid FFA 18.30 –.45 +22 69 .. x
37 42 53 D– D B 53.4 Firstenergy FE 51.74 –.01 +11 1.3m 17 o79 92 54 D+ A B– 65.3 FirstfedFincl FED 60.16 +.63 –22 351 11 o89 92 60 A– B B 70.7 FisherScnt FSH 69.70 –.05 –36 647 19 o24 36 14 D+ B B 20.6 FlagstBac FBC 15.22 +.19 +81 492 12 o13 35 23 C+ E D–13.7 FleetwdEnt FLE 10.44 –.14 +97 1.4m .. o71 45 77 A C C+ 53.5 FlaEstCst FLA 53.35 +.79 +65 282 31 ê96 95 72 A– A B 68.0 FlordaRRock FRK 59.44 +.94 +33 950 24 o63 90 62 D– C C+ 30.6 FlowrsFds r FLO 27.50 –.11 +83 432 26 o71 5 95 A– D A+ NH Flowserve FLS 57.54 +.55 +115 1.1m 99 ê
94 79 82 A B B 89.0 Fluor FLR 84.29 –.77 –21 999 26 o89 44 89 A B A– NH Fomento FMX 91.56 +.24 +186 972 21 o58 58 30 A+ C B+ 29.6 FootLckr FL 23.92 +.12 –13 787 14 o96 98 77 B A B– 44.3 FdgCCT FDG 42.73 –.15 –37 608 9 o56 9 82 C– C A+ NH ForestCtyA FCEA 45.90 +.93 +49 160 99 k70 50 57 A– B B+ 48.5 ForestLabs r FRX 44.71 –.18 –13 2.1m 21 o51 33 66 C B B– 37.8 ForestOil FST 35.14 –.02 –28 1.1m 12 o50 52 35 B B B– 90.5 FortuneBnds FO 81.95 +.12 –5 638 21 o52 76 68 B D E 47.0 FdtnCoal FCL 36.02 –.30 –25 684 18 o5 7 15 D– D B– 23.0 4KidsEnt KDE 16.17 –.06 +256 344 42 o7 15 12 B– D D–75.2 FourSeasn FS 50.84 –1.62 +89 381 52 o
40 77 8 B– C B– 31.8 FranceTel FTE 22.69 ... –70 103 8 ê94 89 76 A– A C 104 FrankRes BEN 101.5 –.70 +79 1.6m 22 o74 76 70 B+ A E 65.0 FreeprtCGB FCX 53.22 +.49 –5 3.6m 11 o82 80 70 A C C+ 28.5 FreescleA FSL 26.10 –.19 –18 2.0m 19 o83 80 69 A C B– 28.6 FreescleB FSLB 26.27 –.08 +52 2.7m 19 o29 62 16 D B C+ 26.1 FremontGen r FMT 21.83 ... +137 1.0m 4 o84 77 83 D C A 40.2 FresenMd FMS 39.82 –.18 +1 50 24 ê16 69 5 D– D D 32.0 FrshDlMnt r FDP 20.51 ... –29 247 10 o94 76 96 D+ A A– 55.1 FrontierOil r FTO 53.88 –.82 –2 1.2m 11 o9 39 12 D+ .. C 50.6 Frontline FRO 35.81 +.99 –15 668 4 o
94 84 88 B D A+ 43.5 FullerHB FUL 42.03 –.47 +128 485 19 ò30 20 61 C– D B– 25.2 FurnBrnd r FBN 24.60 +.20 –8 707 17 o
— G —65 51 61 A– D B 41.9 GATX GMT 40.14 –.04 +40 685 17 o30 53 27 C– B D–31.9 GallaghrArt AJG 29.06 +.06 –26 446 13 o36 59 34 C .. B+ 64.2 Gallaher GLH 61.59 –.34 –34 22 13 ê41 54 17 A– B C+ 49.0 GabelliAst r GBL 42.10 –.81 +83 84 20 ê84 54 88 A– B B 43.6 GameStpA GME 41.10 +1.00 –2 1.0m 34 ò82 54 86 A– B B– 40.2 GameStB GMEB 37.65 +.96 –48 44 31 ò13 50 9 E B D–80.2 Gannett r GCI 59.04 –1.53 +44 1.7m 11 ò
43 52 19 A+ B C 22.2 Gap GPS 18.22 –.03 –28 4.6m 14 o99 89 88 A– B A+ 63.5 GardnrDen GDI 61.58 +.83 +98 519 22 ê77 55 72 B– B A– 14.6 Gartner IT 14.05 –.17 +84 828 37 o23 4 39 B– E A– 49.0 GaylordEntrt GET 45.33 +.14 +13 376 .. o30 15 43 B E B+ 21.3 GenCorp GY 20.04 +.19 +23 638 .. ò92 95 62 A A C+ 100 Genentech DNA 88.14 +5.55 +190 9.8m 68 ò94 68 96 B+ C A+ 29.0 GenlCable BGC 28.20 +.07 +80 935 27 o84 79 66 B B B NH GenerlDyns GD 130.7 +1.28 +31 1.2m 18 o45 55 23 B B B– 37.3 GenerlElct r GE 34.51 +.13 +41 40m 20 o15 28 9 D+ B B– 50.9 GenerlMrtm r GMR 34.05 +.17 –4 386 10 o36 57 29 D– C B– 52.4 GenerlMils GIS 49.33 +.35 +2 1.6m 16 ò9 18 6 B– D B 37.7 GeneralMtrs GM 21.13 –1.09 +12 15m .. o
73 67 48 A+ A C 42.9 Genesco GCO 38.34 –.20 +117 494 16 o98 91 92 A B B+ 32.1 GenWyo GWR 31.88 +.31 +58 572 26 ê65 62 40 B+ B B+ 46.6 GenuinePart GPC 45.17 ... +7 490 18 o49 48 53 C D B+ 35.4 Genworth r GNW 34.29 +.27 +21 3.1m 13 o28 13 33 A– D B+ 30.9 GeoGroup GGI 25.95 –.37 +145 103 21 ê24 65 11 C C D+51.5 GeorgiaGf GGC 28.51 –.19 –4 532 10 o46 42 82 B E D+12.1 GrbrScnc GRB 10.33 +.09 –25 86 99 ê98 72 96 A+ A B 25.1 Gerdau GGB 24.24 –.25 +25 1.4m 9 o52 95 16 B A E 95.4 GettyIm GYI 75.80 –1.28 +27 1.0m 32 o
81 76 93 D+ A D+71.0 GiantIndus GI 62.52 –1.82 –24 261 8 o
98 93 95 B+ A B+ 53.0 GildanActv GIL 51.45 –.57 +13 157 30 ê86 73 86 A+ B D–32.7 GlamisGold GLG 27.83 –.44 –23 1.2m 99 o40 9 77 D+ E A NH Glatfeltr GLT 17.58 +.29 +90 591 48 ê91 79 55 A– A A 55.0 GlaxoWel GSK 54.40 –.12 –31 906 18 o52 39 64 A .. B 17.9 GlobCash GCA 17.00 +.18 +147 282 37 ê33 81 17 D+ B E 25.5 GlobPtrs GLP 20.25 –.15 –58 9 5 ê98 88 91 A A B+ 53.7 GloblPymts GPN 53.21 +.43 –23 461 39 ò83 71 86 C+ B B– 61.8 GlobalSFe r GSF 58.55 –.38 –33 2.3m 35 o98 99 93 B+ A B– 35.0 GolIntAir GOL 28.69 –.26 –47 503 30 o45 24 90 A+ D E 24.2 GoldFlds GFI 20.01 +.25 –46 1.5m 99 o99 97 93 A+ A B– 29.0 Goldcorp GG 27.95 ... –25 2.9m 34 o80 84 59 D+ A B– 73.4 GoldnWst GDW 72.12 –.54 +27 1.6m 15 o98 94 83 A+ A B– NH GldmnSch r GS 150.4 +2.67 +67 6.6m 10 o62 53 48 B B B 45.8 GoodrchCp GR 43.42 –.17 –42 514 19 o42 23 64 C A D 29.6 GoodrPet GDP 26.10 –.80 +65 404 .. o21 76 10 E C D–19.3 Goodyear GT 13.73 +.08 –27 2.7m 8 o74 76 83 A .. C+ 13.9 Grace WR GRA 12.76 +.40 +63 2.6m 11 o90 77 68 A– A B– NH Graco r GGG 43.05 +.62 +18 369 24 o85 82 66 B+ B C+ 75.7 Grainger GWW 75.07 –.01 –13 437 20 o96 78 91 A C A– 49.5 GraniteCnst GVA 47.75 –.18 +33 483 23 o91 96 76 B+ A D 51.5 GrantPrdco r GRP 41.04 –.14 –11 2.1m 24 o67 47 91 B– E A– 35.2 GreatAtPac GAP 33.70 –.13 –5 391 3 o24 49 17 D– C B– 32.8 GrtPlnsEgy GXP 28.55 +.11 +26 363 13 o43 96 20 C+ C D–30.4 Grtbatch GB 22.34 +.29 +29 360 26 o94 64 90 A+ B B+ 44.4 Greenbrier GBX 41.56 –.09 –61 110 18 k99 84 89 A+ A B+ 67.0 Greenhill GHL 63.86 –2.09 +24 277 35 ê41 55 33 C+ C B 76.9 GreifA GEF 67.55 +1.65 +161 245 20 ê55 58 48 B D B 26.8 Griffon GFF 25.24 +.61 +90 554 17 o95 77 91 B+ C A+ NH Group1Auto r GPI 42.89 +.94 +168 481 13 o71 67 77 D C B+ NH GpDanone DA 25.73 +.01 –40 164 26 o87 97 73 A+ D B– 15.7 GrumaADR GMK 12.67 +.07 –32 15 13 k81 79 78 C+ B NH GrpAerPac PAC 32.85 +.16 –97 57 35 ê39 52 40 C+ C C+ 41.8 GrupoAer ASR 32.95 –.51 –62 72 19 ê36 34 60 D– A D–86.1 GrupTelevis TV 78.16 –.07 –49 356 24 ò80 66 67 A– B C+ 35.0 Gtech GTK 33.80 +.14 –67 671 22 ò57 19 79 A D B+ 20.6 GuangshRy GSH 20.05 +.05 –56 11 99 ê94 73 95 A+ A C 47.3 Guess GES 37.54 +.42 –40 432 27 o38 18 60 C+ C B NH Guidant GDT 77.88 +.62 –11 4.0m 51 o
— H —18 62 12 E C D–58.6 HCA r HCA 46.01 –.22 +34 3.4m 15 o82 56 76 C+ A B+ NH HCCInsur HCC 33.53 +.58 +11 641 19 o87 91 61 A– A D 59.7 HDFCBank HDB 54.42 +.46 –65 75 32 ò67 79 55 C– A D+62.4 HNICorp r HNI 57.95 –.05 +156 324 22 o83 84 52 B– A B 87.1 HSBCHold HBC 86.64 +.95 +2 412 12 o82 72 63 A– C B 53.6 Haemonetic HAE 52.13 –.36 +12 327 29 o94 98 81 A– B B 82.4 Hallibrtn r HAL 70.39 –.51 –38 5.4m 21 o60 44 83 B+ E C NH HanovrCmpr HC 17.15 +.22 +64 2.3m .. o67 44 86 C+ E A 52.8 HanoverIn THG 52.27 –.31 +35 526 53 o94 83 80 A– C A– 67.3 Hanson PLC r HAN 65.73 –1.15 +62 64 13 ê40 53 17 A A D–45.1 HarlandJH JH 36.37 +.04 +45 316 13 ê40 89 16 D+ A D–61.5 HarleyDav r HDI 48.90 –.49 +64 3.5m 14 ò84 92 74 C B C NH Harman Intl HAR 114.2 +2.76 –9 684 30 o37 22 87 A+ E E 18.8 HrmnyGld HMY 14.03 +.04 –37 1.5m .. o80 63 54 A– A B 79.7 HarrhsEnt HET 74.77 +2.15 +46 1.9m 22 o90 91 75 B+ B B– 49.8 Harris HRS 45.83 +.17 +28 941 25 o93 81 82 B C A 83.8 Harsco HSC 82.24 –1.02 –11 205 23 ê61 77 31 B+ B B– 31.5 HarteHanks r HHS 27.17 –.50 +62 462 20 ê57 70 47 C B C+ 89.5 HartfordFncl HIG 82.60 –.56 +19 1.7m 10 o55 84 66 D B E 33.7 HarvestEn HTE 29.90 +.30 +51 471 14 ê40 69 32 D+ C C+ 22.4 Hasbro r HAS 20.90 –.05 –39 714 19 o22 20 48 C+ D D 16.9 HavertyFurn HVT 14.69 +.08 +155 249 21 ê40 56 35 D– C B 28.8 Hawaiian Elc HE 27.21 +.04 +38 310 18 o90 99 60 B A B– 45.8 Headwatrs HW 39.22 –.07 –17 709 15 o29 69 13 E B C 27.0 HlthMgtA r HMA 21.21 +.06 +11 2.0m 14 o44 54 69 C– C D–54.1 HealthNet HNT 49.00 –.01 –38 674 20 o42 84 7 C– A 24.2 HlthSprg HS 17.85 –.15 –83 171 19 ê13 30 21 E D C 26.3 HearstArgl HTV 23.55 +.12 –40 51 26 ê53 79 14 A A D 27.7 HrtldPay HPY 21.83 –.05 +32 243 50 ê95 74 86 B B A 32.0 Heico HEI 31.91 +.69 +195 230 33 ê98 74 91 B B A+ 28.2 HeicoA HEIA 27.11 +.11 –22 50 28 ê44 31 50 D– B A– 38.8 Heinz HJ HNZ 38.32 +.58 +4 2.6m 17 o48 37 49 B– C A– 11.8 HellncTel OTE 10.89 +.05 –30 17 23 ê79 76 81 C+ A D 79.2 HelmrchPay HP 66.56 –.90 –21 670 25 o97 89 91 C A A 35.5 Herbalife HLF 34.57 –.21 +75 500 22 o59 60 40 A C B– 15.0 Hercules HPC 13.15 +.63 +210 2.5m 15 o34 74 12 E B B– 67.4 HersheyCo r HSY 53.86 +1.35 +86 2.1m 23 o49 36 59 D– B A– NH HewittAs HEW 29.57 +.30 +36 564 22 o93 76 84 A+ C B+ 34.5 HewlettPk r HPQ 34.16 +.30 +7 14m 19 o62 76 66 B .. B– 23.2 Hexcel HXL 20.95 +.12 +15 1.4m 28 o50 62 46 C– B C 40.5 HilbRogal HRH 39.00 +.15 +86 357 17 o58 30 53 A– C A– 56.6 Hillenbrand HB 54.89 +.53 +38 362 23 o51 67 43 B– C C+ 26.1 HiltonHotels HLT 23.94 +.40 +13 3.2m 28 o23 5 50 B E B 75.4 Hitachi HIT 69.74 +1.33 –32 41 .. o88 92 85 D+ A C+ 74.2 Holly r HOC 66.85 –.60 +21 459 12 o24 19 24 D A B– 47.0 HollyEngy HEP 38.95 –.95 –32 13 22 ê85 89 46 B+ A B 44.0 HomeDepot r HD 42.90 +.15 +46 13m 15 o87 90 79 E A B 38.2 HomexDvlp HXM 36.49 –.20 –79 105 20 o57 52 61 B– C B– 30.8 HondaMtr r HMC 30.44 +.07 –47 288 13 o71 60 59 B B B+ 43.1 Honeywell r HON 42.76 +.17 +16 4.7m 18 o28 51 28 C+ D D+20.8 HoraceMan HMN 18.51 –.03 +134 448 12 ê34 35 61 D+ E B– 13.3 HorizLns HRZ 12.74 –.09 +192 147 .. ê43 75 43 E B D 36.2 HormelFood HRL 33.18 –.06 +51 441 17 o77 88 59 A– A D–40.7 Hornbeck HOS 33.20 –.71 +25 541 20 o53 43 50 A B C+ 48.0 Hospira HSP 41.67 +.33 +25 1.6m 21 o15 31 14 C B D–71.5 HoustnExpl r THX 50.61 –.64 +3 706 9 o31 84 10 E A D+73.4 Hovnanian HOV 46.90 +1.23 +82 2.0m 6 o18 38 18 D– B D–32.8 HuanengPw HNP 26.72 –.26 –6 86 14 o77 69 76 C– B B 28.9 HubIntl HBG 26.87 –.13 –58 15 18 ê62 58 43 B+ C B+ 54.1 HubbellB r HUBB 49.93 +1.08 +95 378 20 ê95 91 89 B+ B B 46.4 HughSupply HUG 46.36 +.01 –12 1.1m 20 o12 57 17 E .. C+ 41.8 HugotonRyl HGT 31.23 –1.07 +36 150 13 k
70 92 76 C– C D–58.3 Humana HUM 51.71 +1.10 +12 2.1m 24 o13 12 38 C .. B– 26.3 Huntsman HUN 19.94 –.07 –41 1.2m 9 o46 18 87 A .. C+ 25.4 HutchTel HTX 24.37 +.03 –83 23 .. o
— I —4 3 12 C+ E D+14.5 IDT IDTC 11.07 +.08 –15 59 .. o2 3 10 C+ E E 15.2 IDTClB IDT 11.06 +.08 +100 603 .. ê
65 65 54 B+ C B– 53.8 IHOP IHP 49.50 +.11 +28 180 21 ê95 94 90 B– B B 27.4 IHSIncA IHS 25.18 +.06 +15 187 26 ê70 81 40 C– A B+ 28.6 IMSHealth r RX 25.63 +.38 +3 1.9m 18 o79 74 78 C– C B NH ING ING 39.17 +.22 –21 338 11 o20 25 18 C– B C+ 14.2 IRSAInvGlb IRS 11.80 +.01 –78 47 20 ê30 76 17 D– C D 30.3 ITCHoldgs ITC 25.80 –.50 +72 151 24 o82 90 71 D A C+ 64.5 ITTEduc ESI 62.85 +.18 –61 184 26 o80 80 59 B B B 58.0 ITTInds ITT 55.92 +1.18 +50 1.8m 21 o81 66 70 A– A C+ 32.5 ICICIBk IBN 29.32 –.20 +30 1.2m 99 o28 32 55 D– D C+ 33.3 IdahoPwr IDA 32.38 –.25 +74 454 19 o90 80 66 A– B A– 48.7 IDEX Corp IEX 48.36 –.24 –39 116 23 o83 68 86 B– E A+ NH IkonOffSol r IKN 13.89 +.07 +65 1.2m 22 o85 81 59 C B A NH ILToolWrks ITW 97.64 –.26 +55 1.9m 18 o65 84 49 A+ C D–50.9 Imation IMN 43.38 +.11 +33 396 18 o44 26 59 C C B+ 26.2 ImpChemAdr ICI 24.40 +.26 +22 122 12 o68 75 54 C B B 63.5 ImperlTobco r ITY 63.25 +.08 +84 66 15 ê45 8 59 B+ B B 52.2 Inco Ltd N 47.58 +.90 –21 1.8m 14 o3 28 20 E .. E 23.4 IndsBachoco IBA 16.89 +.16 –37 16 5 ê
67 95 35 D+ A C+ 46.3 IndymacBc NDE 40.03 +.22 –16 699 8 o74 34 92 A C B 19.2 Infrasrce IFS 18.69 –.19 +123 382 54 ê85 87 50 A– B B NH IngersolRand IR 43.02 +.39 +1 1.9m 13 o
82 87 62 B+ C B 20.6 IngramMicro IM 19.74 –.01 –39 752 13 o73 23 87 A B B+ 26.1 Innospec r IOP 24.28 –.28 +125 105 7 ê59 79 38 B– B D+23.4 IntrDat IDC 22.38 –.09 –11 80 22 ê59 78 67 B– .. C NH IntCtlHtl IHG 15.83 +.26 –9 39 32 ê99 96 97 A A A– 72.2 IntcntlEx ICE 68.10 +1.31 +25 1.2m 69 o84 90 64 B+ B C+ 26.1 Interline IBI 23.61 +.36 +28 110 21 o49 24 70 A– C B– 38.8 Intermec IN 31.93 –.24 +24 589 49 o22 14 38 D+ E A– 39.2 IntlPaper IP 35.21 –.36 +28 3.3m 32 o34 54 23 A– D C+ 23.8 Interpool IPX 19.54 –.06 +107 68 24 k50 72 35 B C D 91.8 IBM r IBM 83.30 +.43 +8 6.4m 15 ò22 33 23 C C C+ 41.3 Intl Flavors IFF 34.83 +.15 –20 462 17 x82 63 75 A– B B– 37.2 IntlGame IGT 34.98 +.16 –47 1.5m 27 x23 18 25 A C C 56.2 IntlRect IRF 38.98 –.11 +18 1.5m 20 o99 95 97 A A B+ 52.9 IntlSecEx ISE 49.25 +2.15 +99 1.2m 51 o77 56 83 B D B+ 33.8 Intrawest r IDR 32.50 –.35 –1 324 18 ê7 19 6 D+ D C+ 46.5 Invacare IVC 30.60 +.03 +64 287 18 ê
97 72 98 A+ B B+ 52.5 InvTech ITG 50.97 +.62 +7 570 34 o64 78 40 C+ B B 20.2 IowaTele IWA 18.54 +.06 +60 339 12 o80 25 92 A+ B B 106 Ipscoinc IPS 100.3 +.30 –22 320 8 o81 85 71 B C B– 45.1 IronMountn IRM 41.91 +.20 –33 237 49 o5 20 13 D E D 23.3 IrwinFinl IFC 19.76 +.16 +59 212 31 ê
— J —98 85 96 A+ A B 62.5 JLGIndus JLG 58.76 –.44 +67 1.1m 24 o70 51 59 B– B B+ 42.1 JPMorgChs JPM 41.40 +.08 +13 13m 14 o87 86 76 A B D+41.3 JabilCrct JBL 37.99 +.67 +47 2.4m 26 ò74 65 67 B+ C C+ 43.1 JackInBox JBX 42.42 –.07 +22 493 16 o85 76 78 A D B– 31.6 JacksnHew JTX 30.20 –.15 +112 518 20 o96 87 89 A B B+ 88.0 JacobsEng JEC 85.72 +.46 –26 363 30 o75 48 86 A– D B 22.8 JanusCap r JNS 22.18 +.03 –65 722 42 o60 97 28 D– A B 42.3 Jarden JAH 32.91 +.80 –14 1.1m 15 o97 81 86 A+ B B+ 58.5 JeffrsGp JEF 56.21 –.92 –7 374 24 o54 54 64 C C C+ 61.1 JeffrsnPlt JP 59.44 +.13 +103 1.4m 14 o4 19 4 B– D D–29.3 JoAnnStrs JAS 12.50 –.01 –3 294 78 o
38 77 19 E A C+ 70.0 Johnsn&Jhn JNJ 60.34 +.32 +17 11m 17 o69 69 70 D C B+ 76.7 JohnsonCtrl JCI 75.96 +.42 +43 1.4m 17 o49 65 39 B+ C C+ 33.9 JonesApparl JNY 30.96 –.41 +6 1.0m 12 o92 78 92 C+ B B 72.8 JonesLang JLL 72.30 +1.08 +15 350 23 ê75 41 91 A+ .. A– 14.6 JorgEarlM JOR 14.21 +.07 –51 170 8 ê9 22 7 D– C B 17.1 JournlCm JRN 12.26 ... +24 319 14 o
11 37 4 E B C 19.4 JournalReg r JRC 12.11 –.67 +253 954 10 ê
— K —34 57 43 B .. D– 18.4 KFInds KFI 17.30 +.34 +41 259 19 ê47 98 19 E A D+85.5 KBHome KBH 67.23 +.49 –1 2.1m 7 ò70 93 63 C A E 29.4 KCSEnergy KCS 23.53 –.29 +22 752 11 o13 18 24 B– .. C+ 23.1 KT KTC 20.87 ... –27 500 9 o42 63 46 D+ D B– 14.0 KTwoInc KTO 12.10 –.15 +44 566 16 o68 44 68 B– B A– 25.2 KVPharmA KVA 23.46 +.82 +73 805 37 o19 19 30 D+ C B– 23.2 Kadant KAI 19.65 +.29 +221 104 30 ê29 3 48 A C C+ 26.2 KSCitySou r KSU 23.78 –.38 +22 786 99 o97 72 79 A+ B A+ 38.6 Kaydon r KDN 38.10 +.10 +52 343 25 ê6 3 32 D– .. C 28.4 KaynAndsn KYN 25.70 –.07 –11 63 .. ê
72 50 75 B D A 14.7 Keane KEA 14.33 +.12 +62 747 23 o19 7 38 B– D C 16.6 Keithley KEI 15.50 +.02 +201 133 27 ê56 65 38 D– B A– 47.0 Kellogg r K 45.48 +.28 +26 1.8m 19 o61 53 59 B+ E A– 29.3 Kellwood KWD 28.25 –.11 +27 450 16 o81 64 76 A– C B NH Kennmetl KMT 60.69 –.68 +111 571 18 o23 34 28 C– B C+ 35.3 KennethCol KCP 27.47 +.20 +87 295 16 o69 72 61 C A C 111 KerMcGee r KMG 97.37 –.73 –35 1.3m 13 o68 50 58 A– C B NH KerznerIntl KZL 70.36 +.78 +4 138 26 o60 56 59 D A B– 37.7 Keycorp KEY 37.37 +.17 0 1.7m 13 o43 52 53 E C B 41.5 Keyspan KSE 40.85 +.06 –30 1.2m 16 o31 52 20 C B D+67.0 KimbClark KMB 58.99 –.61 +29 2.2m 15 o24 44 23 D B C+ 56.2 KindrME KMP 47.37 –.37 –34 229 29 o66 81 48 D A C+ 103 KinderMorg KMI 93.53 –.66 –11 651 21 o25 79 22 D .. C+ 50.1 KindrMrgn KMR 43.50 –.93 –6 116 99 ê24 44 7 B– C A– 42.1 KindredHl KND 24.60 –.40 –16 834 12 o43 97 7 A– .. B+ 65.0 KineticC KCI 39.07 –.83 –29 449 16 o99 84 93 A– A B+ 20.0 KingPhar KG 19.47 +.06 –34 1.3m 11 o88 82 84 D+ B B+ 64.3 Kirby Corp KEX 63.45 +.45 +122 404 23 o26 40 32 E C B– 69.0 KnightRiddr r KRI 63.50 –.73 +161 2.9m 18 o91 90 65 B+ A B 22.5 KnghtTran KNX 20.54 –.16 +65 847 28 o54 58 70 C– .. A– 22.0 Knoll r KNL 20.74 –.06 –47 175 25 ê76 79 49 B– B B+ 58.9 Kohls KSS 52.99 +.98 –13 3.2m 21 o85 96 61 B C B 34.0 KonPhlps PHG 32.45 –.28 –55 388 9 o87 76 86 A– C B– 80.8 KookminBk KB 76.35 –.02 –62 199 14 ê30 7 68 A .. 19.8 Koppers KOP 17.35 +.25 –69 102 36 ê43 26 83 D– D B 23.1 KoreaElPwr KEP 21.97 –.02 –45 421 13 o63 50 65 C+ B B– 21.1 KornFerry r KFY 20.59 +.44 +112 544 19 o32 51 34 D– C B– 33.1 KraftFdsA KFT 30.26 –.01 –15 1.7m 16 o82 73 64 B– C A NH Kroger KR 20.74 –.01 +43 5.3m 15 o19 16 17 A C C+ 46.1 Kronos KRO 29.75 –1.39 +504 45 21 ê65 33 91 B D B NH Kubota KUB 51.00 +.88 –37 19 13 ê50 37 72 A– E C 91.6 Kyocera KYO 86.15 +2.03 –74 20 49 ê
— L —88 90 67 D+ B A NH L3Commun LLL 86.95 +.42 +5 814 20 o74 84 40 A– A C 26.6 LGPhilips LPL 21.60 +.09 –6 1.1m 29 ò94 76 89 A D A 11.5 LSILogic LSI 11.18 +.20 +9 5.4m 27 o27 24 59 C– E C+ 17.2 LaZBoy LZB 16.43 +.15 –2 502 29 o78 94 58 C+ B C+ 26.5 LaborRdy LRW 23.85 –.46 +93 784 20 o82 78 66 B– B B– 59.1 Laboratory r LH 58.15 +.59 +58 1.2m 20 o87 60 93 A+ D B+ 14.5 LaBranche LAB 14.00 –.14 –31 713 35 o65 69 61 E C A– 34.7 Laclede LG 34.30 –.10 +123 175 14 ê63 50 71 A– .. B+ NH LaFarge LR 27.57 +.19 –5 58 14 ê90 57 89 A– C A– NH LafargNAm r LAF 84.14 +.14 –54 399 19 o81 93 66 A+ E C+ 29.4 Laidlaw LI 26.90 –.62 0 708 27 ò87 92 89 B– A D 32.8 LamsnSsn LMS 22.40 –.83 –3 415 12 ê86 70 62 B+ B B+ 41.0 LANAirADS LFL 39.30 +1.05 –55 30 17 ê72 79 62 C+ C B– 70.1 LandAmer LFG 66.04 +.27 +31 418 6 o42 47 23 A– B B– 54.0 Landauer LDR 46.63 –.73 +179 66 23 ê62 51 63 B+ C B– 32.9 LandrysRst LNY 32.01 +.44 +15 237 16 o95 98 81 A– A C+ 58.0 LasVgSnds LVS 50.50 –.37 –7 2.0m 47 o80 9 94 A+ B A NH LazardLtd r LAZ 44.12 +.77 +20 509 10 o15 72 11 D+ E E 15.4 LeapFrog LF 10.71 ... –3 453 39 o1 18 1 D E E 46.0 Lear LEA 16.23 –.47 +19 3.4m .. o
25 57 7 E B B 45.6 Lee Entrprs LEE 33.22 –.16 +11 196 15 o96 89 80 A+ A B– 140 LeggMason LM 126.9 –.58 +55 1.6m 40 o27 43 27 C– C B– 29.4 LegttPlat LEG 24.78 +.21 –3 738 16 o95 87 82 A+ A C+ 149 LehmnBrHd r LEH 142.8 +.37 +4 2.3m 12 o61 97 27 E A B 68.9 LennarA LEN 60.01 +.11 +4 2.0m 7 ò59 97 29 E A B– 64.0 LennarB LENB 55.54 +.34 –52 36 6 k95 93 81 A+ C B 32.6 LennoxIntl LII 31.47 –.35 +105 569 17 o18 19 30 D– B C 17.9 LenoxGrp LNX 13.20 +.19 –55 17 10 ê73 20 88 B B A NH LeucdNatl LUK 57.75 +.42 +70 532 68 o28 52 12 C+ B C 33.2 Levitt LEV 22.37 –.12 +166 280 7 k10 32 5 C– C D+82.2 LexmarkA LXK 45.84 –.33 +6 1.5m 13 o99 94 87 B A A+ NH LifeTmFit LTM 45.63 –.28 +94 455 40 ê67 62 38 A– B B 61.0 LillyEli LLY 57.09 –.14 –2 3.4m 19 o57 41 53 A+ C C+ 25.5 LimitdBrds LTD 24.23 +.13 –19 1.6m 18 o62 71 59 C C C+ 58.0 LinclnNatl r LNC 55.78 +.01 +25 1.5m 11 o57 51 71 B E B– 26.1 LindsayMfg LNN 25.00 +.99 +173 179 45 k68 59 65 B+ C B NH LithiaMtr LAD 33.72 +.87 +106 224 13 ê65 3 96 B D A+ 19.6 LiveNatn r LYV 18.51 +.01 –41 555 .. o48 56 32 B+ C B 42.8 LizClaibrn r LIZ 38.29 +.39 +31 910 13 o63 39 61 B– B B 40.2 LloydsTSB LYG 39.00 +.40 –22 152 12 ê89 89 73 B C B+ NH LockheedM LMT 75.95 +.10 +19 2.8m 19 o28 6 68 C– D C+ 101 Loews Corp LTR 100.1 +.09 +33 955 19 o51 40 84 C .. B 50.2 LoewsCarGr CG 49.89 –.05 –14 399 13 o74 72 46 B+ A C+ 60.1 LoneStarTch LSS 51.66 –.78 –20 502 7 o57 73 66 D– D B+ 47.1 LongDrugStr r LDG 44.88 +.35 –18 420 25 o55 84 38 D+ B C+ 29.8 LAPac r LPX 26.79 –.30 –46 651 7 o89 94 50 B+ A B 69.7 Lowes r LOW 68.63 +.83 +22 4.6m 19 o34 52 35 D+ B D+46.4 Lubrizol LZ 42.92 +.01 +51 428 15 o76 33 89 B+ D A+ 15.8 Lubys LUB 15.54 –.03 +87 224 33 k76 77 78 B– .. A– 29.1 Luxottica LUX 28.88 +.11 –71 25 31 o8 34 5 C C E 31.9 LyondellChe LYO 20.23 +.20 –48 1.7m 9 o
— M —29 33 42 D– B B– 17.8 M&FWorld MFW 15.37 +.11 +149 89 12 ê71 65 55 D A A NH M&TBank r MTB 117.2 +1.14 +47 392 16 o55 68 35 C+ B C 64.0 MBIA r MBI 60.03 ... +21 1.1m 10 o45 88 16 E A B 89.6 MDCHldgs MDC 66.00 +1.65 +21 1.2m 5 o50 39 69 B– D B– 20.3 MDSInc MDZ 19.11 –.16 –70 24 23 ê65 77 57 B B E 37.1 MDURes MDU 34.31 +.38 +53 494 14 o99 87 98 A A A– 37.8 MEMCElctr WFR 36.60 +.92 +64 5.3m 30 o52 53 49 C+ C B– 72.7 MGICInv r MTG 67.93 +.30 –36 571 10 ò76 84 33 A– A B 46.8 MGMMirge MGM 39.29 +1.05 +38 2.0m 24 o19 37 34 C+ E E 35.0 MIDevl MIM 33.43 –.03 –79 25 99 o48 85 28 E B B+ 61.5 MIHomes MHO 47.65 +2.02 +159 506 6 ê82 76 86 C+ D B NH MPSGp MPS 15.91 +.26 +89 1.3m 30 o99 88 91 B+ A A– NH MSCInds MSM 50.60 +1.23 +55 487 29 k64 53 41 A B B+ 34.4 MacDermid r MRD 30.52 +.57 +184 264 17 ê75 76 69 B .. A 35.2 MacqInfra MIC 34.45 –.12 +32 132 61 o9 23 20 D .. 24.6 MagellM MGG 22.75 –.15 –86 103 94 ê
45 73 22 D A C 35.5 MaglMids MMP 31.35 –.08 –43 99 15 o36 47 51 D C C+ 79.5 MagnaA MGA 75.90 –.76 –42 193 11 ê21 72 3 B+ .. C+ 20.7 Maidenfrm MFB 10.76 +.02 +70 494 12 ê90 68 95 B C B+ 80.3 Manitowc MTW 78.49 –1.01 +18 481 32 o
84 71 62 B– C A+ NH ManorCare r HCR 43.78 +.24 –16 542 21 o78 69 80 C+ D B+ NH Manpower MAN 56.73 +1.19 +45 1.0m 19 o84 62 74 C– A A– 65.4 Manulife MFC 63.96 –.77 –21 261 16 o83 82 84 E A B– NH Marathon r MRO 76.36 –1.17 –12 2.9m 9 o52 51 57 C D A– 18.2 Marcus MCS 17.19 +.45 +27 283 25 k21 69 8 D+ B E 19.1 MarinePrd r MPX 10.70 –.10 +129 129 16 ê39 52 39 C+ C C+ 35.9 MarineMax HZO 30.00 –.06 –4 227 16 o39 50 29 C B 21.0 MarinerE ME 20.05 –.15 –54 807 12 o33 90 11 D+ B D–35.1 Maritrans TUG 22.00 –.24 +2 130 11 ê63 85 44 C+ D B 371 Markel MKL 344.0 –2.01 –68 9 24 ê69 83 45 B– B C+ 70.8 MarriotInt MAR 69.25 +1.19 +1 1.0m 20 o21 26 29 C– C C+ 33.4 Marsh&Mc MMC 30.05 +.01 –23 2.1m 19 o69 76 41 D A A– 47.4 MarshIlsly MI 45.35 +.51 +29 1.0m 15 ò8 49 4 C– E C+ 34.7 MStewartA MSO 16.95 –.15 –15 451 .. o
97 83 92 A– B B+ NH MartinMari r MLM 105.6 +1.92 +9 505 26 o57 74 42 D+ B B+ 22.9 MarvelEnt r MVL 18.77 –.12 –61 271 18 o49 58 35 B– B B– 34.9 Masco r MAS 32.24 +.84 +61 3.9m 14 o18 47 7 B D D 57.0 MasseyEn r MEE 35.83 +.23 –50 1.2m 47 o79 76 88 B+ E B– 13.9 MasTec MTZ 13.40 +.14 –24 374 36 o16 23 13 A+ E D+16.5 Material Sci r MSC 12.00 –.39 –33 22 29 ê66 57 82 B E B 22.6 Matsushita r MC 22.10 +.35 –45 295 73 o35 60 27 D+ C B– 21.6 Mattel r MAT 17.52 +.44 +17 2.8m 14 o97 79 85 B+ A A– 50.2 MavTube r MVK 47.91 +.11 –30 782 11 o13 44 21 D– C E 39.5 Maximus MMS 34.66 +.12 +149 208 18 o
Treasury Yields Retreat2 Soft retail sales and other tameeconomic reports cooled infla-tion fears, which led to a rally inbond prices and a slump in yields.Some on Wall Street think the Fedmight raise rates just oncemore, al-though futures traders still see twoquarter-point hikes by June. The10-year Treasury yield slid 10 basispoints to4.67%lastweek.
Oil Rallies Despite Supplies3 Near-term crude futuresjumped 5% to $62.77 a barrel
last week. Lingering fears over un-rest in Nigeria and the nuclearstandoffwithIranpusheduppricesearly in the week. Oil also ralliedafter a refinery shutdown pushedgasoline to the highest levels sinceOct. Crude stockpiles rose 4.8 milbarrels, the fifth straight weeklybuildand thehighest sinceMay ’99.
Brokers’ Earnings Strong4 ImprovedtradingandM&Aop-erationshelped largebrokerag-es post solid results for their fiscalQ1.BearStearns’EPSrose34%,easi-ly beating estimates. Revenue in-creased19%.CharlesSchwabboost-ed its Q1 forecast. Lehman Bros.also beat estimates as operatingprofit rose 21%. Lehman’s surprisewasn’t as large as that of GoldmanSachs, which blew past views withan84%jumpinearningsper share.
Economy’s Pace Holds Up5 The Philly Fed’s March factoryindex fell 3.1 points to 12.3, indi-cating modest growth. Order gainsrose while price pressures and hir-ingeased.OnWednesday, theFed’sbeige book described the economicexpansion as “moderate or steady”across most of the nation. Hiringpicked up in February and earlyMarch, though wage pressures re-mainedmodest.
Google Awaits Decision6 AU.S. District Court judge saidinTuesday’s hearing he’ll likelymakeGoogle turnover somesearchdata after federal prosecutors saidthe government scaled back theamount of records it originally or-dered. Google argued the informa-tionwouldexposetradesecretsandviolate users’ privacy, although itscompetitors have complied withthegovernment’s request.
I B D ’ S W E E K I N R E V I E W
Weekly Stocks On The MoveStocks with heavy weekly volume vs. their 50-day average weekly volume. Stocks $20 ormore, with at least} point change, and avg. volume of 60,000 and greater. For stocks up inprice, EPS & RS Ratings are 70 or higher and annual earnings estimate 15%+. Includes stockswithout estimates. Stocks with 80 EPS and 80 RS or better are boldfaced.
SMARTSELECT® COMPOSITE RATINGRel Grp Acc 52-Wk Stock Closing WeekPrice PE Float WeekVol WeekVol%
6 | EPS | Str | Rtg | Dis | High | Stock Name | Symbol | Price | Chg | Ratio | (mil) | (1000s) | Chg
Market Hits 5-Year Highs; Leaders Firm
1The S&P 500 climbed to its highest level since May2001 as the benchmark index rose 2% last week. A3.2%sell-off in thePhilly semiconductor indexThursdaytriggeredadistributionday for theNasdaq.Still, the tech-dominated index also finished with a 2% weekly gain.Top-ratedstocksreboundedas theIBD100jumped3.4%.
Retail Sales CoolRetail and food sales
Monthly change
Total sales Ex autos
-1.5
0
1.5
3.0%
FJ ’06DNOS ’05Source: Commerce Dept., Datastream
98 98 88 C– A 33.00 Ventiv Health Inc o VTIV 31.70 +2.60 26 26 5,102 +16397 85 90 A A+ 23.50 Technitrol o TNL 23.39 +1.54 33 38 2,447 +15791 90 75 B+ B– 36.40 Circuit City Carmax o KMX 34.78 +3.66 27 101 11,330 +15499 98 98 A A 43.75 NewMarket Corp NEU 42.44 +3.69 22 16 1,816 +15071 84 87 C+ B– 28.51 The9 Ltd Ads o NCTY 24.99 +3.41 66 9.2 1,911 +13180 70 89 D– C+ 53.21 Comp Energetica CIG 46.13 +1.39 10 99 3,511 +11999 95 97 A B+ 52.86 Intl Securities Exch o ISE 49.25 +0.90 51 31 6,441 +11299 81 98 A+ A+ 25.10 Optelecom–NKF OPTC 24.28 +2.59 30 3.0 627 +10697 76 94 A+ A+ 49.80 Aleris Intl Inc o ARS 45.75 +2.25 14 29 3,155 +8996 76 90 A+ A– 46.00 RTI Intl Metals o RTI 47.70 +6.46 29 22 3,235 +8690 91 75 B+ B– 49.78 Harris o HRS 45.83 +1.94 25 131 6,535 +7899 98 99 A– B+ 30.23 D X P Enterprises Inc DXPE 29.84 +6.36 31 1.7 1,892 +7796 88 87 A– A 46.80 Veritas DGC o VTS 45.25 +1.79 24 35 4,245 +6688 82 84 D+ B+ 64.35 Kirby Corp o KEX 63.45 +3.56 24 22 1,445 +5999 96 97 A A– 72.20 IntercontinentalEx o ICE 68.10 +0.96 69 13 7,413 +5799 85 89 A– A 104.4 Affiliated Mgrs o AMG 103.12 +7.92 24 28 4,621 +5498 99 93 B+ B– 35.05 Gol Intelligent Air o GOL 28.69 +3.17 31 195 7,195 +5295 71 93 B+ A 28.22 Commscope CTV 28.04 +2.37 27 53 6,383 +4899 88 91 B+ A– 50.36 MSC Indstrl Drct MSM 50.60 +6.49 30 46 2,327 +4896 82 83 A– B 87.60 Vulcan Materials o VMC 86.62 + 9.2 26 99 4,466 +4698 99 97 A– B 23.32 Abaxis Inc o ABAX 22.77 +1.88 73 18 1,768 +4299 91 99 A A– 63.24 Multi Fineline Elec o MFLX 63.70 + 9.3 35 8.3 2,719 +4197 82 89 A– A– 52.41 NDS Grp NNDS 52.13 +4.65 33 12 561 +4195 82 99 B– A 27.22 Air Methods Corp o AIRM 25.29 +1.54 22 8.2 1,563 +3999 97 93 A+ A 28.33 Coldwater Creek o CWTR 26.57 +0.64 54 54 10,458 +3897 97 86 B B+ 57.34 Chemed Corp o CHE 58.87 +4.02 30 24 1,248 +3899 90 98 A– A+ 48.93 Schick Technologies SCHK 47.47 +3.47 53 14 887 +3698 85 96 A+ B 62.49 JLG Industries o JLG 58.76 +4.02 25 51 4,499 +3595 74 86 B A 31.97 Heico HEI 31.91 +1.04 33 6.3 512 +3196 76 91 A+ A– 57.00 Trinity Industrs o TRN 54.43 +1.36 28 37 3,204 +3188 91 84 D B– 98.36 Middleby Corp MIDD 85.82 +2.80 21 4.8 647 +3197 72 98 A+ B+ 52.52 Investment Tech o ITG 50.97 +1.47 34 41 3,417 +2997 72 79 A+ A+ 38.62 Kaydon KDN 38.10 +1.05 25 28 1,442 +2896 95 72 A+ B– 49.40 Chicos FAS o CHS 42.35 +3.85 40 177 18,124 +2798 83 94 B+ A 39.12 Daktronics o DAKT 38.96 +1.22 46 15 764 +2690 70 92 A– B+ 34.00 S P S S SPSS 33.67 +0.50 37 16 985 +2589 76 99 A+ B+ 71.71 FreightCar America o RAIL 69.41 +5.78 19 12 1,566 +2592 90 88 C B– 42.65 W & T Offshore Inc o WTI 37.48 +2.36 13 15 2,074 +2598 93 97 B– A– 36.60 Healthextras Inc o HLEX 36.72 +6.51 64 30 2,075 +2386 80 82 C+ B– 57.14 Brascan Cl A o BAM 55.02 +1.56 26 247 1,989 +2386 78 75 B A 59.90 Computer Sciences o CSC 56.90 +1.05 18 183 8,253 +2396 89 80 A+ B– 140.0 Legg Mason Inc o LM 126.94 +1.80 40 116 6,366 +2287 86 76 A D+ 41.29 Jabil Circuit o JBL 37.99 +0.93 27 175 10,175 +2296 93 85 A+ B 34.11 Wabtec WAB 32.59 +1.21 27 44 2,789 +2180 79 74 D+ A– 55.35 Costco Wholesale o COST 55.88 +1.91 26 464 15,794 +21
...and nothing is easier to try.Only TeleChart combines cutting-edge 2-second scans andsorts of the whole stock marketwith crystal-clean data and dailycharting lessons. You’ll quicklylearn how to build lists ofpotential buy and sell candidatesin just minutes per day.
Brand New TeleChart 2005First 30 Days of Service for Free (reg. $29 99)Free Bonus Videos
You can cancel at any time and you will never be asked to return anything.
+ Free Shipping!
No Stock ChartingSoftware is Easier!
Start Monthly Service Now & Get:
Open Seven Days: Mon-Fri 9am-9pm, Sat & Sun 9am-3pm ET. A credit card is required to activate service. INTL shipping $10. ID233
Download TeleChart right now at www.worden.com or call 1-800-776-4940
World’s Favorite Stock Analysis Software

INVESTOR'S BUSINESS DAILY NYSE MAIN TABLES — Stocks $10 And Above MONDAY, MARCH 20, 2006 B11
SMARTSELECT® COMPOSITE RATINGEARNINGS PER SHARERELATIVE PRICE STRENGTHINDUSTRY GROUP RELATIVE STRENGTHSALES+PROFIT MARGINS+ROEACCUMULATION/DISTRIBUTION
52-wk Stock & Close Vol% Vol PHigh Symbol Price Chg Chg 1000 E666666
SMARTSELECT® COMPOSITE RATINGEARNINGS PER SHARERELATIVE PRICE STRENGTHINDUSTRY GROUP RELATIVE STRENGTHSALES+PROFIT MARGINS+ROEACCUMULATION/DISTRIBUTION
52-wk Stock & Close Vol% Vol PHigh Symbol Price Chg Chg 1000 E666666
SMARTSELECT® COMPOSITE RATINGEARNINGS PER SHARERELATIVE PRICE STRENGTHINDUSTRY GROUP RELATIVE STRENGTHSALES+PROFIT MARGINS+ROEACCUMULATION/DISTRIBUTION
52-wk Stock & Close Vol% Vol PHigh Symbol Price Chg Chg 1000 E666666
SMARTSELECT® COMPOSITE RATINGEARNINGS PER SHARERELATIVE PRICE STRENGTHINDUSTRY GROUP RELATIVE STRENGTHSALES+PROFIT MARGINS+ROEACCUMULATION/DISTRIBUTION
52-wk Stock & Close Vol% Vol PHigh Symbol Price Chg Chg 1000 E666666
20 18 32 D C B 20.0 Maytag MYG 16.71 –1.23 +308 4.2m .. o
39 73 21 D– B B 33.2 McAfee MFE 25.83 +1.13 –9 3.2m 21 o11 55 5 E C D–76.0 McClatchy MNI 49.60 –1.55 +206 623 14 k
48 62 48 D– C B 37.8 McCormick MKC 34.37 +.10 –4 536 21 ò54 28 96 A– .. C 53.9 McDermott MDR 50.80 –.45 –57 411 23 o66 58 50 B+ A C 36.8 McDonalds r MCD 35.10 +.04 –10 6.0m 17 o83 82 74 D– A B 59.6 McGrawHill r MHP 58.26 –.79 +7 2.2m 25 o91 90 69 A– C A– 54.9 McKesson r MCK 53.52 –.17 –42 897 20 o18 49 18 C .. C+ 22.2 McmornExp MMR 18.24 –.09 +52 316 .. o15 41 19 D+ E C+ 33.0 Meadwstvc MWV 27.64 +.08 –18 699 30 o37 42 29 A+ B D–37.0 Mechel MTL 26.03 +2.17 +430 1.1m 3 ê75 78 57 B– D A– 59.8 MedcoHlth r MHS 58.77 –.45 –12 1.6m 25 o5 24 8 E D C 69.3 MediaGenA MEG 47.39 –1.76 +375 454 17 k
43 44 25 A– B C 35.5 MedicisPhr MRX 31.87 –.03 +6 1.3m 23 o49 86 19 C+ A D–59.9 Medtronic r MDT 52.66 –.30 +32 5.3m 24 o72 55 61 A– A C 37.2 MellonFin r MEL 35.55 –.25 +26 3.0m 18 o89 86 74 A+ B D+37.4 MenWare MW 35.76 –.01 –37 353 18 x58 58 55 C+ B B– 56.6 Mentor r MNT 46.49 +.08 –12 502 31 o87 60 68 A– B A 36.6 Merck MRK 35.64 +.36 0 8.7m 14 o31 54 25 C+ B E 60.5 MercuryGe MCY 54.97 +.12 –14 150 12 ê71 70 61 C– A B– NH Meredith MDP 56.13 +.55 +19 346 21 ê84 58 84 A+ C B 27.8 MerdnGold MDG 25.71 +.24 –21 736 64 o36 99 8 E A D–96.5 Meritage r MTH 59.02 +2.10 +52 947 6 o98 83 78 A+ A A 79.2 MerrilLyn r MER 77.75 ... +3 5.2m 14 o76 96 70 B+ .. B– 22.4 MesabiTrst MSB 20.04 +.04 –14 51 13 k75 83 56 C C B+ 52.6 MetLife MET 50.71 +.17 +28 2.9m 11 o48 33 91 A– .. D–38.4 Metso MX 36.09 +.02 –51 14 18 ê81 80 67 B– B B+ 64.5 MettlerTole MTD 60.08 –.45 –5 273 20 o56 83 16 B– B B 43.6 MichlsSt r MIK 33.96 –.21 –19 875 18 o35 6 75 A D D+17.1 MicronTech MU 14.77 +.18 –18 9.2m 99 ò56 68 52 B+ C D+24.7 Midas MDS 21.69 +.24 +114 207 35 ê95 95 91 C+ A B– 26.1 MillerIndus MLR 24.48 +.50 –15 50 15 ê89 81 80 C+ B B 73.3 Millipore MIL 73.25 +.45 –40 215 28 o68 86 35 A– B B– 50.2 MineSfAp r MSA 40.69 +.43 +66 418 18 o29 28 25 A D B– 69.5 MineralsTec MTX 58.41 +1.33 +233 383 22 o23 47 45 D– .. 29.0 Mirant MIR 25.97 ... –35 2.3m .. o94 98 84 B– B B– 15.1 MitsuUFJ r MTU 14.44 +.23 –15 1.4m 17 o90 41 84 A+ B A 39.3 MittalStl MT 37.45 +2.25 +76 2.9m 7 o83 84 47 A A C 42.2 MobileTele MBT 37.25 +.70 –48 804 13 ò18 32 11 D C B 38.0 ModineMfg r MOD 29.03 +.24 +65 425 15 ê52 62 36 B– C B– 92.5 MohawkInd MHK 87.43 +.37 –29 327 15 o29 30 31 C– B B 49.8 MolinaHl MOH 32.99 +.47 +98 376 21 o39 36 46 C– C B 80.0 MolCoorsB TAP 69.95 +.60 –20 471 17 o5 12 11 C+ D E 18.5 Monaco MNC 13.04 –.45 +160 678 99 o
97 85 84 A A B NH MoneyGram MGI 29.61 +.42 +302 1.4m 22 ê75 51 79 A C C+ 88.4 Monsanto MON 85.00 –.71 +24 1.8m 39 ò3 10 3 C+ C E 36.4 Montplr MRH 16.16 –.14 –53 453 .. o
97 91 86 B– A B 70.1 Moodys r MCO 69.85 +.79 –5 1.3m 36 o89 82 63 B B A 36.0 MoogA MOGA 34.50 +.50 +83 286 19 ê88 80 56 A+ A B– 62.1 MorgStan MS 60.26 +.32 +48 5.7m 12 ò14 24 17 B+ .. 20.3 MortonsR MRT 16.55 –.09 –64 211 99 ê36 56 36 D B B– 18.0 Mosaic MOS 15.24 –.01 –21 881 25 ò86 98 61 A– B D+25.0 Motorola r MOT 22.25 +.09 –5 19m 19 o73 76 62 B+ C B– 22.8 MovadoGrp MOV 21.05 +.35 +77 174 18 k92 66 77 A+ B B+ NH MuellerInds MLI 34.71 +.46 +79 391 14 o36 76 44 D .. C+ 27.5 MuniMtgEq MMA 26.62 +.12 –20 41 19 k35 85 12 C A E 60.2 Murphy Oil MUR 46.78 –.71 –32 1.2m 11 o82 64 80 C+ D A+ NH MyersInds MYE 16.99 –.04 +128 349 22 ê89 81 80 B– C A– NH MylanLabs MYL 24.92 +.10 +51 2.6m 28 o
— N —50 36 64 C C A– 26.6 NBTY NTY 23.24 +.12 –4 717 19 o93 57 91 A+ C A 59.0 NCIBldg NCS 57.15 ... +32 416 20 o64 67 60 C– C B+ 40.8 NCR NCR 39.46 +.12 –27 945 22 o83 93 73 B+ C C+ 23.4 NIDEC NJ 19.05 +.19 +250 117 30 ê17 42 3 A D C 24.7 NLIndus NL 11.00 –1.18 +262 416 12 k
35 47 63 D– D D 49.5 NRGEnrgy NRG 46.22 +.58 –29 1.3m 49 o74 59 63 B+ A D+46.1 NS Group NSS 42.51 –.28 –10 346 7 o29 57 27 D– C C+ 31.5 NSTAR NST 28.82 –.03 +63 488 15 o30 54 17 A C E 18.8 NTTDoCo r DCM 15.04 +.29 –11 183 15 o58 91 27 C+ A D 82.7 NaborsInds NBR 65.90 –1.52 –23 3.2m 16 o
77 62 84 B D B– NH NACCOInds NC 148.9 +3.05 +59 63 19 ê24 55 24 C D D–22.0 NalcoHldg NLC 17.25 –.02 0 489 35 o56 80 14 A A D+28.4 NamTai NTE 21.70 –.09 –62 90 16 o92 73 93 B+ C A– 29.4 NatcoGpA NTG 26.28 –.49 –48 85 32 ê67 60 58 B– B B– 136 NatlAustral NAB 131.8 –1.82 +2 24 16 ê44 51 38 D B B 40.0 Natl City r NCC 35.76 +.34 –18 1.8m 11 o96 94 75 A+ A C+ 59.6 NatlFinP NFP 55.44 +.43 +3 351 22 ê36 64 43 E C D 36.0 NatlFuelGs r NFG 32.68 +.30 +9 470 17 o71 78 52 D– B A– 54.1 NatlGrid NGG 52.54 –.13 –46 33 12 ê63 87 47 B+ B E 77.6 NatlOilVr NOV 60.01 –.73 –40 1.5m 30 o90 96 63 A B C 30.1 NatlSemi NSM 26.91 –.35 +31 6.7m 23 o60 64 54 C C B 44.9 NtnwdFnlSv NFS 43.49 –.26 –53 127 10 o45 53 15 B A B 69.0 NatRsPt NRP 52.56 +.56 –46 35 15 ê40 53 17 B A D 59.2 NatRPsub NSP 50.75 +.30 –5 17 14 ê5 21 3 D+ C D+29.6 Nautilus NLS 15.07 +.08 –14 1.1m 21 o
39 84 13 D– B B– 28.3 NavigCons NCI 19.59 +.04 +204 1.1m 19 o25 43 11 C+ B C+ 41.7 Navistar NAV 28.60 –.23 –47 442 7 o95 97 66 A A B– 53.7 Navteq NVT 50.29 +.38 –37 514 52 o25 19 57 D+ E B– 34.6 NeenahPpr NP 33.36 +.84 +158 467 68 o83 85 67 C B B– 43.5 Nelnet NNI 42.37 +.19 –53 63 12 o77 82 83 D– C C+ 29.5 NelsonThm TNM 29.20 +.01 +21 137 21 ê35 69 35 C+ .. C+ 33.0 NeuStar NSR 28.77 +.30 –38 551 39 o41 71 27 E B B– 49.3 NewJrsyRes r NJR 44.51 +.27 +89 251 15 ê64 76 61 A E C+ 24.2 NewSkies NSE 22.08 –.02 –9 146 .. ê25 19 7 A+ B B– 24.3 NY&Co NWY 15.35 +.03 –30 377 15 ê43 43 31 D+ B A 19.1 NYCmtyBcp NYB 17.67 –.32 +66 1.8m 13 o11 29 8 E C B 36.7 NewYrkTm NYT 26.05 –.58 +49 1.5m 14 ò
47 75 32 D B C+ 15.1 NewAllinc r NAL 14.55 +.13 +198 1.0m 28 o41 34 57 E C A– 25.9 NewellRub NWL 25.61 +.13 +40 2.1m 20 o35 68 12 C A D 54.5 NewfldExpl NFX 39.09 –.54 +26 2.0m 14 o99 98 98 A C A 43.8 NewMarket r NEU 42.44 +.84 +84 268 21 ê58 74 53 A+ D D–62.7 NewmntMn NEM 49.86 –.14 –16 6.4m 54 o46 83 36 D– C B– 18.2 NewsCorpA NWSA 16.69 –.09 +76 12m 21 o50 81 38 D– C B 18.6 News Corp NWS 17.70 –.11 –12 1.7m 27 o83 56 89 B– A C 59.9 Nexen NXY 54.43 –1.93 –15 461 20 o
25 41 40 E C D–43.1 Nicor GAS 41.92 +.30 +69 784 18 o62 89 30 C– A C 91.5 NikeB r NKE 85.42 –.60 –24 1.4m 16 ò40 14 54 C C A 13.5 99Cents NDN 12.63 +.75 +220 1.9m 54 o25 50 31 B– D E 26.0 NipponT&T NTT 22.62 +.32 –17 252 15 o14 21 14 E C B+ 25.5 Nisource r NI 21.00 ... +55 2.3m 16 o75 81 73 C+ B D 85.0 Noble NE 79.48 –1.00 –29 1.9m 37 o
78 96 43 C A B– 48.8 NobleEngy NBL 41.91 –.19 –13 1.3m 10 o86 63 71 A– B B+ 20.6 Nokia r NOK 20.54 +.07 –43 6.8m 20 o97 88 89 A+ B B– NH Nomura NMR 21.61 +.94 –4 455 20 ê20 55 5 D+ A E 49.8 NordicAm NAT 28.34 –.01 –27 233 9 o92 95 76 B– A B– 42.9 Nordstrom JWN 41.22 +.21 –20 1.5m 20 o98 94 88 A B B NH NorfolkSou r NSC 53.94 +.29 –15 2.3m 18 o86 75 82 B B B– NH NorskHydr NHY 128.5 +4.30 +3 37 13 ê58 54 46 D A B+ 30.0 NoForkBc r NFB 29.10 –.39 +81 7.5m 13 o46 79 32 D– D A– 21.9 NEUtil NU 20.03 –.09 +34 975 22 o56 59 47 D A B 52.4 NorthrnBord NBP 48.45 +.10 –43 73 16 o77 62 76 B D A– NH NorthrpGru r NOC 69.83 +.68 +17 1.9m 18 o15 31 19 E C D+39.6 NWNtrlGas NWN 34.36 +.10 +70 266 16 o19 47 10 C D C+ 48.0 NovaChem NCX 31.02 –1.01 –21 502 15 o
80 62 63 A– A B– NH Novartis NVS 56.70 +.67 –33 903 21 o25 19 27 A+ C C 28.8 Novelis NVL 20.01 +.01 +14 244 99 o73 73 68 A– .. B+ NH NovoNordsk NVO 63.02 +.22 +17 51 21 ê15 38 8 C C D 25.9 NuSkinEntr NUS 17.17 –.43 +124 798 16 o94 57 94 A+ A B NH Nucor r NUE 98.64 +1.77 +6 2.9m 11 o95 85 65 A– A A– 49.0 NuveenInvA JNC 46.25 –.24 –24 450 23 o
— O —48 76 40 D C C+ 30.6 OGEEnergy OGE 29.25 +.16 +42 337 15 o19 3 28 A E A– 31.4 O M Group OMG 21.59 +.33 0 546 22 o33 38 27 D+ B B– 20.4 O M I r OMM 18.40 +.25 –22 677 7 o31 42 26 B+ C C+ 19.6 Oakley r OO 15.09 +.38 +23 562 19 o89 91 70 C A B– 98.0 OccidtlPet OXY 95.08 –.02 –22 2.8m 9 o92 90 74 A– B B– 60.1 Oceanrng OII 55.05 +.04 +40 418 23 o8 18 18 C+ E E 26.9 OdysseyRe ORH 23.13 –.14 +146 251 .. ê
93 91 88 B– C B+ NH OfficeDepot ODP 37.13 +.67 +15 2.5m 25 o22 34 22 B– E B 34.1 BoiseCsd OMX 29.58 +.36 –31 643 99 o92 97 71 A– A C+ 42.2 OilStIntl OIS 33.87 –.78 –18 679 14 o16 48 25 D– C E 23.2 OldNtlBcp ONB 21.31 +.30 +283 623 18 ê63 62 53 C+ C B 22.6 OldRepubIntl ORI 22.26 –.09 +27 971 11 o70 73 50 B B B– 23.8 Olin OLN 21.56 +.13 +104 995 11 o87 88 72 B– B B– 62.5 Omnicare OCR 57.51 –.74 –52 1.1m 23 o52 68 23 B+ B B– 89.0 Omnicom OMC 82.39 –.26 –21 853 18 o46 80 35 E B C 35.9 Oneok r OKE 30.45 ... –34 620 12 o74 40 86 B D A NH OrbitalSci ORB 15.73 –.11 +55 652 34 o76 5 97 A+ B A– NH OregonSteel OS 48.10 +1.18 –14 975 16 o53 31 73 B– C B– 36.4 OrntExHA OEH 35.33 +.45 –33 138 33 ê19 37 18 D+ B C+ 26.2 OrientalFinl OFG 13.71 +.16 +107 175 8 o92 81 96 B B B 43.9 OrmatTech ORA 36.75 –1.26 –36 138 45 ê96 94 88 C+ A B+ 59.0 OshkTruck OSK 58.45 +.34 –33 242 24 o47 44 39 B+ B C+ 48.3 OutbkStk OSI 43.64 +.64 +6 1.5m 21 o27 52 11 D+ B B– 68.2 OverseaShp OSG 49.44 –.06 +27 630 4 o80 72 61 A– C A– 33.6 Owens&Min OMI 32.80 –.22 +207 560 19 o7 14 5 C+ C E 27.5 OwensIllinois OI 17.25 –.24 +103 3.7m 12 o
82 91 59 B+ B B– 57.6 Oxford Inds OXM 50.28 –.67 –12 242 14 ò
— P —69 83 54 D+ A C 32.6 PFFBncp r PFB 32.23 –.22 +191 170 15 ê40 43 53 D– C B NH PG&E r PCG 40.26 –.16 +3 1.8m 17 o44 35 46 A– D B 31.1 PHHCorp PHH 27.61 +.30 +28 539 .. o72 64 67 C+ B B– NH PMI Group r PMI 45.69 +.54 +6 829 11 o75 58 72 D A B+ 71.4 PNCFinl PNC 69.75 +.24 –20 1.3m 14 o19 49 12 D– C D+30.4 PNMRes PNM 24.22 +.02 –16 449 15 o99 90 79 A+ A A– 63.6 POSCO PKX 62.73 +.53 –46 466 4 o43 36 35 C B A– 73.0 PPGIndust r PPG 63.32 –.63 –5 1.0m 13 o41 53 46 D– B C 33.7 PPL PPL 31.26 –.14 –26 1.0m 15 o31 7 49 B– B C+ 32.0 PTIndosat IIT 28.92 +1.42 +58 88 99 ê39 65 29 D B C 35.7 PacEngy PPX 30.64 –.26 –51 31 20 ê15 6 42 D+ D C+ 25.0 PackAmer r PKG 23.00 –.04 +18 651 52 o61 42 64 C+ C B+ 24.2 Pactiv r PTV 24.09 +.01 +142 1.7m 22 o
41 43 50 C+ C C+ 31.5 Pall PLL 29.97 +.62 +205 2.0m 22 o64 76 66 E D A– 25.2 PanAmSat PA 25.05 –.07 –17 250 43 o14 37 9 B– D D 38.7 ParPharm PRX 27.03 –.21 –23 596 75 o78 94 80 C– C B– 25.6 ParTechnlgy PTC 19.76 +.21 –17 67 30 ê74 56 95 D– B B– 11.7 ParaEnCopel ELP 10.85 +.03 –6 305 18 ê96 99 80 A D A– 30.1 ParkElctcm PKE 29.29 –.51 +79 206 22 o87 66 76 A– B B+ NH ParkerHan r PH 82.72 +.40 –6 788 17 o16 18 23 C+ E B 71.0 PartnerreLtd PRE 63.02 –.17 –11 332 .. o86 81 59 B A B– 25.5 Patni PTI 24.65 +.67 +84 154 27 ê32 40 30 A– D C 22.0 Paxar PXR 19.10 +.03 +57 371 18 o60 70 58 A+ D D+25.7 PaylessSho PSS 21.95 –.19 +21 1.2m 18 o91 85 89 B A D+52.5 PeabdyEgry BTU 47.27 +.52 –50 2.5m 29 o48 60 64 D– .. A– NH Pearson PSO 13.85 +.13 +22 181 19 ê89 89 78 D A B+ NH PeditrxMed r PDX 96.80 +.22 +25 261 20 o45 79 36 D A E 25.8 PengrthEgy PGH 22.93 –.08 –45 211 11 o19 24 18 D– B B+ 11.1 PennTrtyAm PTA 8.75 –.28 +136 220 4 k86 91 76 C A D 66.8 PennVA PVA 65.51 +.59 +193 396 19 ê83 96 56 B A D–62.0 PennVARes PVR 57.14 +.19 –40 29 18 ê89 98 76 B– C B NH PenneyJC JCP 62.71 +.20 –29 1.2m 15 o77 86 43 A– B B– 46.5 Pentair PNR 40.60 –.46 +34 793 21 o28 76 16 E C D+45.5 PeoplesEn PGL 37.85 +.29 +105 722 14 o17 20 29 B+ E C+ 18.3 Pep Boys PBY 14.59 –.12 +51 813 .. o29 35 40 D– D B 24.5 PepcoHldg POM 23.65 –.10 +145 1.3m 16 o70 61 47 A C B 30.6 PepsiBttl r PBG 30.41 +.02 –6 717 16 ò65 72 43 A C B– 26.4 PepsiAmer r PAS 24.58 +.01 +39 358 17 ê69 81 46 D– A B+ 60.5 PepsiCo PEP 60.06 +.16 +3 4.1m 22 ò63 19 95 A E B+ NH Perini PCR 31.17 +.90 +41 244 99 ê57 65 53 B– D B– 24.2 Perkinelmr PKI 23.40 –.10 +6 806 22 o32 78 46 E .. C+ 17.2 PermianBsn PBT 16.05 –.01 –52 117 13 ò64 53 54 B C A– 15.6 PerotSysA PER 15.25 +.06 +94 765 17 o89 89 80 D+ A B 51.9 PetroCan PCZ 46.04 –1.46 –39 362 10 o
14 31 18 C D D+16.4 PetroEnr PZE 11.69 –.25 –51 72 7 ê90 88 84 C A D+ 102 Petchina PTR 98.80 –.53 –21 464 12 o92 90 92 C A D+95.0 Petrobrs PBR 88.39 –1.99 –35 1.5m 9 o80 53 94 A– .. A 45.3 PetroGeo PGS 44.62 –.68 –65 15 7 ê65 52 46 A– B B+ 29.2 Pfizer r PFE 26.39 +.34 +5 32m 13 o72 47 81 B+ A D–83.6 PhelpsDodg PD 75.57 +3.06 –13 5.7m 9 o63 37 74 B– B C 36.8 PhilLD PHI 36.10 +.18 –61 96 10 o73 80 59 B+ B D 37.4 PhilpsVnHs PVH 34.45 –.80 +40 486 18 ò58 47 79 C E B+ NH PhnxCos PNX 15.92 +.10 +71 934 15 o29 54 29 E C C+ 25.8 PiedmntNat r PNY 24.03 –.11 +15 194 17 ê16 18 23 C+ E A– 19.4 Pier1 PIR 11.62 +.34 +20 2.4m .. ò98 84 84 B+ A A NH PikeElec PEC 21.00 +.54 +262 757 15 o1 17 2 E C E 40.2 PilgrimsPr PPC 22.16 +.87 –7 1.3m 6 o
72 32 93 A– D B+ 30.5 PinnclEnt PNK 30.42 +.62 +1 792 .. o13 36 15 D– C D–46.7 PinaclWst PNW 40.10 –.14 –7 627 12 o37 94 8 C A E 56.4 PioneerNatrl r PXD 39.38 –.72 +1 1.8m 12 o88 60 91 A+ D A 53.9 PiperJaff PJC 52.76 –.14 +27 251 22 o25 52 20 D+ B E 46.1 PitneyBow PBI 41.36 +.10 +64 1.3m 15 o68 92 54 D B C 48.2 PlainAllAm PAA 45.91 +.11 –48 65 15 o18 54 24 C D E 46.9 PlainsEx r PXP 38.02 –.43 +18 1.3m .. o73 47 54 A– A B+ 39.8 Plantron r PLT 34.61 +.77 +32 700 19 o54 69 22 C+ A B 35.2 PlatUnd PTP 30.10 –.12 +43 604 4 o22 25 40 D– D B+ 15.9 PlayboyB PLA 13.93 +.17 +20 246 24 o13 50 9 C C E 15.5 Playtex Prod PYX 10.09 –.17 +6 757 24 o45 83 17 C A D–60.4 PogoProd PPP 48.12 –.41 0 777 10 o32 70 16 D+ B C+ 73.8 PolarsInds r PII 50.42 +.07 –37 262 15 ò93 78 80 B+ B B+ NH PoloRlphLrn RL 59.84 +1.22 –8 573 19 o47 15 72 B– D B+ 12.4 PortglTel r PT 12.20 +.01 –70 57 32 k56 94 28 D A C+ 115 Potash r POT 86.82 –1.62 –20 742 17 o
38 36 61 D+ D B 41.3 Potlatch PCH 39.77 +.28 +20 500 35 o89 78 65 A A B 57.2 Praxair PX 56.83 +.19 –9 1.3m 22 o50 68 41 B B D–52.8 PrePdLegl r PPD 39.95 +4.21 +711 341 17 o91 79 75 B B B+ 56.8 PrecsnCst PCP 55.75 –.07 –28 679 23 o83 83 51 C+ A B+ 35.1 PrecDril PDS 31.30 –.32 –13 540 11 o20 36 16 C B B– 21.1 PrestgBr PBH 12.41 +.03 +9 256 99 o56 26 51 A C A 17.8 PriceComm PR 17.69 +.43 +690 1.5m 68 o31 33 51 C+ D C 36.9 PrideIntl PDE 29.96 –1.10 +308 7.6m 42 o
47 81 37 D A E 32.9 PrimWst PWI 29.09 +.02 +62 786 11 o27 18 32 A D C+ 15.1 PrimusG PRS 11.98 –.23 –43 99 99 ê72 75 61 C– C B+ 52.0 PrncplFnl r PFG 50.15 +.18 –17 803 16 o89 97 69 C+ D A 53.4 Proassrnce PRA 52.80 –.21 +116 308 20 ê56 68 46 C A D 62.5 Procter&Gm PG 59.10 –.29 +107 17m 21 o40 54 38 D– C B– 46.0 ProgrssEn PGN 45.22 +.17 +17 1.0m 13 o40 50 35 C+ B C 124 Progressiv PGR 106.2 +.27 –25 783 15 ò34 82 3 B– A D–38.0 Proquest PQE 22.03 +.11 –11 277 11 ò71 77 68 C C B– 50.5 PrtcLife PL 49.30 –.11 –5 270 13 o33 60 45 D .. B 12.4 ProvEngy PVX 11.50 +.08 +13 1.2m 19 o38 68 34 D B D–19.2 ProvidFS PFS 18.44 +.08 +139 797 20 o84 97 64 C B B 78.6 Prudentl PRU 76.54 +.17 +35 2.4m 14 o47 45 83 C– .. B– NH Prudential PUK 23.95 +1.25 +225 110 21 ê61 68 55 D– B B+ 72.5 PublicSvEn PEG 67.88 –.42 0 922 18 o14 18 27 D– C C 24.4 PugetEgy PSD 21.40 +.04 0 500 15 o49 94 20 E A C 48.2 PulteHomes r PHM 39.69 +.74 –19 2.2m 7 o
— Q —95 82 74 A+ A B 68.3 Quanex NX 65.08 +1.20 +1 323 9 o91 76 89 A D A– NH Quanta PWR 15.16 +.10 +404 5.3m 60 o2 7 2 B+ E D–24.4 QuebcrWld IQW 9.99 –.22 –8 98 10 ê
74 86 34 B– B B+ 54.8 QuestDiag r DGX 51.86 –.08 +39 1.5m 18 o45 91 27 E A E 89.6 Questar STR 71.61 +.24 +5 731 18 o52 92 19 C A D 52.8 Quickslvr KWK 37.93 –.20 +15 1.7m 35 o47 95 12 B+ A E 17.5 Quiksilver ZQK 13.33 +.14 –17 944 14 o
— R —9 36 3 D+ A E 35.5 R&GFincl RGF 11.58 –.09 +117 397 99 o
18 76 18 D– .. E 67.6 RHDonnell RHD 58.48 –.89 –14 528 40 o76 70 69 C+ C B+ 56.5 RLI r RLI 55.75 +.75 +111 283 15 k81 72 88 A– A D–35.6 RPC RES 20.97 –.45 –26 424 24 o48 56 27 B B B 19.2 RPM OH RPM 18.15 +.25 +63 643 14 ò96 76 90 A+ C A– NH RTIIntl RTI 47.70 +3.06 +215 1.1m 28 o75 61 68 C+ B B+ NH RadianGrp r RDN 60.85 +.35 –7 585 10 o18 21 6 A– B C+ 28.9 RadioShk RSH 18.95 –.05 –39 1.2m 13 o14 34 20 D– C D+47.9 Ralcorp RAH 39.86 +.16 +93 544 19 ê86 99 72 C A D+30.5 RangeRes RRC 25.80 –.30 –37 894 26 o87 74 86 A+ B D 47.2 RaymJames RJF 44.66 +.17 –32 260 21 o71 66 68 B D B NH RaythnB RTN 45.69 +.16 –7 1.4m 20 o15 27 14 C– C C+ 18.0 ReadrDigA r RDA 14.73 +.10 +149 1.1m 16 o16 12 50 D– C E 22.9 ReddyIce FRZ 21.91 +.01 +69 105 .. ê44 43 36 C– B B+ 30.4 ReedElsvNV ENL 28.92 +.53 +409 559 17 ê42 53 33 C– B B– 42.2 ReedElsvr RUK 38.61 +.60 –12 37 17 ê94 87 81 B+ C B+ 41.8 RegalBel RBC 41.00 –.40 +38 293 18 ê41 69 20 C C B 21.5 RegalEntA RGC 18.37 +.01 –69 221 29 o61 59 48 D A B+ NH RegionsFnl RF 36.02 +.12 +63 1.9m 15 o43 62 19 B– B C+ 43.5 Regis r RGS 37.98 +.59 +54 627 17 o6 18 6 D C D 31.2 RehabCare RHB 18.58 –.35 +69 270 16 ê
64 81 44 C C B+ 49.1 ReinsurGrp r RGA 47.53 +.35 –36 130 13 ê99 84 95 A+ B A 88.4 RelianceStl RS 86.35 +.53 +18 494 13 o6 20 12 D– D B– 15.7 RelintEngy RRI 10.19 –.12 –60 1.5m .. o
65 67 68 C B D+45.8 Remington REM 42.10 –.43 –35 507 17 o10 19 18 C+ E D 50.2 RenaissRe RNR 42.60 –.15 –37 269 .. o58 84 52 D B E NH RenalCr RCI 47.87 +.02 +32 534 23 o44 64 30 C B C+ 34.0 RepsolADR REP 28.91 –.23 –23 301 8 o79 64 67 C+ C A– NH RepubSvc r RSG 41.34 +.28 +18 686 23 o91 94 67 C+ A B 43.4 Resmed RMD 40.25 –.34 –50 247 33 o56 47 71 B– E B+ 14.3 RetailVnt RVI 13.84 +.06 +26 284 28 ò73 96 51 A– C D 17.4 RexStores RSC 15.57 –.23 –12 22 5 k46 47 35 A– C C 29.2 Reyn&Reyn REY 28.00 +.32 –5 298 20 o89 64 80 C A A 109 ReynldsAm RAI 108.8 –.01 +20 772 14 o97 98 78 A– B B– 70.3 RinkerADS RIN 69.78 –.32 –71 17 19 ê96 95 79 B+ A B– 212 RioTintoADR RTP 191.8 –1.39 –12 310 13 o
97 89 85 B– A A– 52.3 RitchieBros RBA 50.90 –.26 +67 89 35 ê25 56 19 A– E D–24.9 Robb&Myer RBN 20.91 +.16 +256 159 31 k73 62 72 C+ A C 39.9 RobertHalf RHI 38.37 +.33 –22 700 28 o15 17 33 D+ D C 16.0 RockTennA RKT 13.94 –.02 +82 229 60 ê95 84 81 A– B B+ NH RockwlAut ROK 72.79 +.88 –27 752 25 o91 79 65 B A A– NH RockwlCln r COL 54.38 +.78 –9 1.1m 23 o87 76 75 A D B+ NH RockwdH ROC 23.96 +.01 +22 223 .. o16 6 64 D– D D–44.9 RogrsComB RG 40.65 +.07 –55 75 .. o86 69 81 A D B+ 54.0 Rogers r ROG 52.65 –.27 +86 197 33 o84 91 51 A B B– 52.4 Rohm&Haas ROH 49.73 +.11 –35 552 15 o59 83 32 B+ B D+22.1 Rollins r ROL 19.74 –.01 +164 328 26 ê94 85 79 A– B B– 46.9 RoperInds ROP 46.66 +.26 –23 339 26 o90 88 89 B– C B+ 22.7 Rostelecom ROS 19.07 –.14 –37 112 7 k81 76 76 C+ B B– 45.6 Rowan RDC 41.74 –.76 –28 1.9m 26 o69 76 87 C+ .. C+ NH RoyalSun RSA 12.29 +.14 –46 78 6 ê85 61 80 B– B A– 87.2 RoyalBkCan r RY 85.30 –.82 –20 81 13 o40 65 18 B C C+ 49.5 RoyalCarib RCL 42.45 +.17 –10 1.4m 15 o28 73 27 C .. D– 68.5 RoyalDShA r RDSA 62.24 –.78 +4 1.5m 8 o30 73 27 C .. C+ 72.1 RoyDShlB RDSB 64.87 –.93 –21 174 8 o56 22 74 B– C A– 11.3 RoyalKPN r KPN 11.14 +.04 –68 31 14 k83 48 71 B+ A A– 30.0 RubyTues RI 29.91 +.17 –1 745 20 ò51 48 51 B– D B+ 28.2 Ruddick RDK 24.41 +.06 +163 408 16 ê98 96 78 B+ A B+ 19.5 RushEntB RUSHA 19.16 –.18 +139 353 10 ê22 23 57 D– E A– 22.6 RussBerrie RUS 15.10 +.31 +221 97 .. k13 24 7 B+ D C 21.8 Russell RML 13.98 –.05 +42 390 12 ê86 80 69 A– C B 45.5 Ryder R 45.30 +.66 –2 605 13 o73 42 87 A+ B C 33.2 Ryerson RYI 25.57 +.57 –34 432 7 o60 99 25 E A B 83.3 RylandGrp r RYL 70.53 +1.22 –14 916 7 o
— S —92 76 75 A– A B– NH SAPAG r SAP 53.38 +.39 –58 470 35 o76 90 58 A .. B+ 24.6 SKTelecom SKM 23.41 +.03 –81 200 9 o58 66 49 C B C+ 58.4 SLM SLM 55.60 +.03 –16 1.5m 17 o53 40 66 B E B+ 53.5 SPX r SPW 52.98 –.33 +18 677 30 o90 87 65 B A B+ 38.3 SRAIntl SRX 35.97 +.42 +44 484 32 o90 75 86 A+ C C 25.1 SWSGrp SWS 25.05 +.66 +141 188 16 o38 58 30 E A C+ 52.5 SabnRylt SBR 43.91 –.69 –49 29 13 k57 45 63 B B D+25.7 SabreHoldA TSG 24.95 –.09 +63 1.2m 16 o55 95 82 D– .. D–35.0 SadiaSA SDA 28.94 –1.13 –33 36 7 ê54 29 62 B– C A– 26.5 Safeway SWY 25.54 +.19 –5 2.3m 17 o38 22 68 B– E A– 24.6 SaksInc r SKS 20.23 +.19 +63 3.0m 91 o84 82 95 A– .. B– 43.0 Salesforc CRM 39.15 +.21 –55 867 99 o38 88 20 E A E 51.5 SanJuanRylt SJT 39.81 –.61 –27 207 13 o93 99 50 A– A B+ 48.0 SanofiAvt SNY 45.12 +.08 –9 1.5m 15 o80 61 80 B– D A NH SanPaolo IMI 37.89 +.26 +7 41 17 k
42 84 9 E A B 45.0 SantaFeETr SFF 28.80 –.20 –49 16 7 k39 8 82 D+ E A 15.2 SappiLtd SPP 14.94 –.03 –48 170 99 ê29 48 17 B C C 22.3 SaraLee SLE 18.18 +.13 +8 3.4m 12 o83 90 69 C B B– 43.3 Sasol SSL 36.71 –.10 –48 266 11 ê94 92 90 B A D–43.4 SatyamCpt SAY 41.77 +.11 –27 350 33 ê35 38 39 A– D C+ 23.9 SauerDanf SHS 20.86 –.49 +194 105 27 ê43 78 27 D– B C+ 43.6 Scana SCG 40.66 –.27 +58 561 14 o95 88 64 B+ A A 26.0 Schawk SGK 24.45 +.87 +32 143 19 x88 80 92 A– .. A– 101 Schering SHR 101.0 +1.69 +18 52 25 ê50 76 19 A– C B– 22.5 ScherPlg SGP 18.48 –.10 –38 4.7m 49 o97 89 90 A– A B– 131 Schlumberg SLB 123.3 –.55 –10 6.1m 36 o9 15 18 D+ D C+ 35.2 Schweitzer SWM 24.60 –.06 +180 153 19 ê
65 65 60 D– C A– 42.4 ScottshPwr r SPI 40.87 –.21 +1 135 22 ê61 89 39 C B D 26.0 ScottAL SCT 24.26 –.44 +60 375 8 ê49 58 65 D C C+ 50.5 ScottsMG SMG 46.86 +.43 –23 262 21 o32 57 21 D– B B– 52.9 ScrippsEW SSP 45.90 –.40 +358 2.9m 24 ò4 18 13 D+ E D 20.6 SeaContA SCRA 12.22 –.57 +127 130 .. ò
89 76 65 A– B A– 76.5 SeacorHldg r CKH 75.17 –.77 +96 425 11 ê95 96 85 A+ A E 28.1 Seagate STX 24.73 +.07 –4 7.7m 11 o62 50 61 C+ C B NH SealedAir SEE 58.75 ... –17 264 21 o43 76 43 D+ .. B– 21.5 Seaspan SSW 21.17 +.41 +17 207 51 o46 65 50 E B D 49.5 SempraEn SRE 47.23 –.01 +37 1.3m 11 o9 19 14 D– D C+ 22.2 Sensient SXT 17.59 +.41 +187 569 14 o
88 72 92 B D A– 99 SequaA SQAA 97.20 +.19 +165 65 21 ê79 91 40 A B C+ 21.4 Serono SRA 18.24 –.04 +41 306 18 o53 62 30 B+ C B 14.3 ServiceMast SVM 12.87 +.08 –17 727 21 o49 50 73 E D B 27.7 ShawComB SJR 25.22 –.34 –55 71 37 k73 64 78 A D B– 36.1 ShawGp SGR 30.50 –.02 +12 906 30 ò82 75 51 B+ A B 54.1 SherwinW SHW 48.27 +.63 –50 1.5m 14 o
Black Bar =IBD Top Fundamental stock
99 88 77 A+ B C+ 40.0 p yCompany SYMB 12.34 +1.23 +123 123 45 -o
Composite RatingBold=95or higher
EarningsRatingg
Relative Price Strength Bold=Close Pricewithin 10% of52 week Highg Stock Symboly
ClosePrice Changeg
Vol%Changeg
Vol1000
PE
Industry Group Relative StrengthSales+Profi t Margins+ROE
Accumulation/DistributionUnderline=New Low or down 1 pointBold=New High or up 1 pointBold Ital.=New issue and EPS Rating of 80 or moreand Rel Str of 80 or more
% more than or less than avg. daily vol.
r = companyrebought stock
-= earns. in IBD
k = earnings duex = x-dividend, or
x-right
o = listed options
A+=Best E=Worst
99=Best 1=Worst
Dividends
Stocks Ex-Dividend for March 21, 2006Company AmountCallaway Golf Co .......................................................................... 0.070Capital & Income Str Fd .............................................................. 0.300Chartwell Div & Inc Fund ............................................................ 0.083Cronos Group ................................................................................ 0.070Cutter & Buck Inc ......................................................................... 0.070Dow 30 Prem & Div Inc Fd ........................................................... 0.150Enhanced Equity Yield Fd ............................................................ 0.667Enhanced Government Fund ...................................................... 0.117Federated Prem Inter Mun ........................................................... 0.058Federated Prem Mun Incm ......................................................... 0.073G & K Services Inc ....................................................................... 0.018Gladstone Capital Corp ................................................................ 0.135Gladstone Commercial Cp .......................................................... 0.120Gladstone Investment Cp ........................................................... 0.070Global High Income Dolr .............................................................. 0.114Heartland Express Inc ................................................................. 0.020Holly Corporation ......................................................................... 0.100Insured Muni Income Fund .......................................................... 0.058Investmt Grade Muni Incm ......................................................... 0.063Knight Transportation ................................................................. 0.020L T C Properties Inc ...................................................................... 0.120Lehman Br Fst Tr Inc Opp ............................................................ 0.110Managed Hi Yld Plus Fund .......................................................... 0.048Pioneer Int Shares ...................................................................... 0.130Sempra Energy ............................................................................. 0.300Strategic Global Incm Fd ............................................................. 0.078Synovus Financial Corp ............................................................... 0.195Total System Services .................................................................. 0.060Viad Corp ..................................................................................... 0.040
Record PaymentREGULAR: Period Amt. Date DateAffirmative Insur .................... Q .02 3-21 3-31Albertson's Inc ........................ Q .19 4-12 5-9Arden Realty Inc ..................... Q .505 3-31 4-19Bear StearnsCos ...................... Q .28 4-18 4-28Boston Properties .................... Q .68 3-31 4-28CBRL Group Inc ...................... Q .13 4-14 5-8CVB Financial Cp ................... Q .09 3-29 4-12Carmike Cinemas Inc ............. Q .175 4-4 5-2Center Fncl Cp ........................ Q .04 3-31 4-14Corporate OfficePrps ............... Q .28 3-31 4-14Del Monte Foods Co .............. Q .04 4-20 5-4Delta Fncl Cp .......................... Q .05 3-31 4-14Empire Resour Inc ................. Q .05 3-31 4-18FNB Corp ................................. Q .15 3-30 4-14Golden Telecom ...................... Q .20 3-17 3-31Guaranty FedlBncshrs ............. Q .165 3-30 4-14Horizon Bncp IN ..................... Q .14 4-3 4-17Interpool Inc ........................... Q .08 4-3 4-17Iowa Telecomunicat ................ Q .405 3-31 4-17Merrill MrchntsBshrs .............. Q .17 4-14 4-28Mid-State Bncshrs ................... Q .18 3-31 4-17Monroe Bancorp ...................... Q .12 3-17 3-31Natl Home HlthCare .............. Q .075 4-18 5-5Nicor Inc ................................... Q .465 3-31 5-1Sherritt Intl Cp g ................... Q .025 3-31 4-18Taylor Capital Grp .................. Q .06 3-28 4-7Valor CommunicatGp ............. Q .36 3-31 4-17
MUTUAL FUNDS/ETFs:BlckRock HiIncoShrs ............. M .0205 3-28 4-10Citigroup Pistons ................... M .0702 3-21 3-24Diamond Trust ........................ M .2489 4-21 4-17EvergrnIncoAdv ....................... M .125 4-18 5-1EvergrnIntlBal .......................... M .1458 4-18 5-1EvergrnMgdInco ...................... M .1167 4-18 5-1EvergrnUtils&HiInco ............... M .1667 4-18 5-1Fidelity NasdaqComp ............. Q .14 3-21 3-24ING Glbl EqutyDiv .................. M .156 4-5 4-17Lazard GlblTtlRet .................... M .1042 4-12 4-24Lazard Wrld DivInco ............. M .1167 4-12 4-24MidCap SPDR ........................... Q .3802 3-21 4-28NFJ DivIntPremStrat ............... Q .525 3-27 3-31Nasdaq 100 Trust ................... Q .0291 3-21 4-28NicholasApp Intl&Prm ........... M .5375 3-27 3-31PIMCO CommclMtgSecs ......... M .0937 3-31 4-13PIMCO StratGlblGv ................. M .074 3-31 4-13SPDR ......................................... Q .5194 3-21 4-28Templeton EmergMkts ............ Q .22 3-31 4-17
IRREGULAR:Allianz Aktiengsll z ................... .242 5-3 5-11Aluminum Cp ChinaLtd ............ 2.662 4-7 6-9Bco Bradesco SA z ................... .0148 4-3 5-8Co CervezerasUnids z ............... .6413 4-21 5-5Mitsubishi UFJ Fcl ................... .034 3-30 yNTT DoCoMo Inc ........................ .1704 3-30 y
Nidec Corp z .............................. .0322 3-30 6-30Nissin Co Ltd z ........................ .0852 3-30 yPioneer InterShsrs .................... .13 3-23 3-31Prudentl plc z ........................... .3857 3-24 6-5y - pay date unannounced.z - approx. amount per ADS or ADR.
STOCK:MC Shipping Inc ....................... 5% 4-14 4-28
INCREASED:CN Bancorp Inc ...................... Q .07 3-31 4-14Farmers&Merchants Bcp ....... Q .50 3-17 4-20ILX Resorts Inc ...................... Q .1175 3-31 4-10PanAmSat Hldg Cp ................ Q .4262 3-31 4-13Washington Trust ................... Q .19 3-31 4-14
REDUCED:Fieldstone Investment ........... Q .48 3-31 4-28MortgageIT HldgsInc .............. Q .25 3-31 4-20
INITIAL:Intl Secs Exchange ................ Q .05 3-23 3-31Southern Union Co ................ x .10 3-31 4-14x - Initial cash distribution.
G - payable in Canadian funds; Q - Quarterly;A - Annually; S - Semiannually; M - Monthly;U - Pay undetermined; I - Initial; Y - Year-end.
IBD Forums and related companies are not responsible for the accuracy, errors, or omissions of any information posted on the IBD Forums, including hyperlinks appearing in the IBD Forums, and are not responsible for
any trading or investment decisions based on such information.
Looking for newstock ideas?
Visit
IBD™ Forums at
www.investors.com/idealbb
Share ideas with fellow subscribers on a wide range of topics including...
Individual stocks | Market direction | Chart-reading CAN SLIM™ | Investing tools & strategies... and more!
IBD Forums is a free service available exclusively to IBD™ and eIBD™ subscribers.
89 96 76 A– A E 87.0 Shinhan SHG 81.84 +2.84 –27 32 9 ê13 60 13 D+ .. E 21.8 ShipFin SFL 17.06 +.05 +236 758 6 o59 46 65 B D B 94.2 Siemens SI 92.85 –.23 –31 298 24 o68 76 69 C– C C+ 43.9 SierraHealth r SIE 41.38 –.32 –30 408 22 o21 16 51 D– D B– 15.4 SierraPacif SRP 14.08 +.07 +155 3.2m 22 o90 89 68 B– A B 42.0 SimpsnMf SSD 40.95 –.10 +92 343 20 ê86 61 94 C C A– 60.3 SinopecShng SHI 59.78 –.12 –78 9 11 k46 9 96 B E B 11.9 SixFlags PKS 10.41 –.16 +21 2.4m .. o89 76 89 C– D A+ 22.1 SkechersA SKX 22.07 +.30 –10 321 20 o61 78 51 C+ E B+ 44.1 Skyline SKY 41.69 +.72 +164 56 36 k77 75 80 D D A NH SmartFnl SMF 16.67 +.01 +194 228 17 ê48 62 29 C+ B B– 52.8 SmithNphw SNN 47.73 +.01 +37 85 22 ê97 85 94 A+ D A 51.3 SmithAO AOS 50.54 +.45 –37 219 25 ê79 92 53 B+ A D+45.4 Smith Intl SII 37.14 –.54 –17 2.1m 24 o13 32 19 E C D+32.5 SmithfldF SFD 28.11 +.10 –36 455 11 o28 70 9 D– C B– 51.1 Smucker SJM 40.03 +.03 –17 309 14 o36 47 57 D+ D C+ 40.3 SnapOn SNA 39.25 +.38 +34 456 23 o69 94 69 D C C+ 135 ScQmMra SQM 117.2 –1.51 –17 26 27 ê89 69 78 B+ C A NH SonicAuto SAH 27.83 –.01 +26 482 11 o70 56 66 C+ C B+ 34.8 SonocoPdt SON 33.37 –.08 +43 511 17 ê45 45 78 C E C+ 51.2 Sony SNE 46.79 +.80 –47 628 47 o88 52 90 B– B A 25.2 Sothebys BID 23.84 –.37 +72 939 21 ê26 65 20 E C D+32.4 SouthJersey SJI 28.36 +.30 +185 263 16 ê24 49 25 D– B E 36.5 SouthernCo SO 33.80 –.03 +1 2.4m 15 o96 91 91 B+ A D+91.6 SthnCopp PCU 83.89 +2.38 –20 1.1m 8 o59 98 29 D C B+ 26.3 SouthUnion SUG 24.17 +.03 +279 2.1m 14 o81 72 66 B+ C B NH SouthwstAir r LUV 17.60 +.14 +18 4.4m 26 ò26 31 48 E D B– 29.0 SouthwstGs SWX 28.24 +.24 +180 344 21 ê79 92 82 C A E 44.3 SouthwstEn SWN 31.91 –.04 +7 3.0m 33 o42 60 30 D+ A C+ 24.8 SovergnBc r SOV 22.12 +.17 –20 1.3m 11 o69 65 71 A C D 25.1 Spartech SEH 24.14 –.05 +105 491 21 ê12 25 8 D– B B– 45.0 SpectBrds SPC 22.00 –.16 –37 384 13 o82 93 36 B A B+ 40.3 SpeedwyM r TRK 36.37 +.19 +101 147 15 o77 83 73 C+ D B+ 37.5 SprtAthry TSA 36.68 +.01 –50 375 17 o52 51 43 C+ B B 27.2 Sprint S 25.62 –.29 +1 14m 17 o39 73 11 C+ A C+ 85.3 StJoe r JOE 61.75 +.24 –9 567 41 o62 93 35 C+ A D–54.8 StJudeMed STJ 45.05 +.51 –14 2.2m 29 o92 89 77 C A B 44.7 StMaryLE SM 40.39 –.07 +37 631 17 o26 37 32 C+ C D 47.9 StPaulTrv STA 41.55 –1.41 +196 8.5m 14 o72 71 47 A+ C B 32.4 StageStrs SSI 29.39 +.62 +63 305 15 o85 85 77 C B B 54.8 StancrpF r SFG 54.29 –.13 +39 237 14 o28 57 32 B E C+ 14.2 StdrdMtr r SMP 10.08 –.04 +147 147 99 ê36 86 11 E A C+ 49.7 StandrdPac r SPF 35.17 +1.35 +90 2.2m 5 o23 42 35 D– E B+ 18.4 StandRegstr SR 15.43 –.11 +115 169 99 ê33 22 59 B C D–32.8 Standex Intl SXI 30.94 +.43 +304 89 17 ê51 50 53 D+ B B– 53.1 StanleyWrk SWK 50.87 +.03 –19 605 15 o77 36 89 B C A 22.7 Startek SRT 22.52 +.03 +97 161 23 o64 68 57 B– C C+ NH StarwdHtlR HOT 67.02 +1.01 –7 1.6m 28 o94 84 74 A– A B NH StateStreet STT 62.77 +.34 +42 2.2m 22 o93 87 67 A– A B NH StatnCno STN 76.96 +1.69 –17 529 30 o71 65 78 C B D+27.9 Statoil STO 26.87 –.03 –66 201 12 o57 60 46 B+ C C+ 21.9 SteaknShk SNS 19.45 +.45 +77 283 18 o76 76 76 C– D A– NH Steelcase SCS 17.80 +.05 +42 414 43 ò46 59 25 A– C B– 28.3 Steris r STE 25.19 +.13 +178 819 21 o31 50 25 D B C 23.7 SterlingBcp STL 20.19 –.08 +89 178 16 ê60 6 93 C+ C A 34.5 StwStv SVC 34.47 +.03 –26 482 37 k46 74 48 C+ C E 54.9 StewartInfo STC 47.15 –.63 +24 199 8 ê93 66 86 A+ B B+ 40.3 StifelFin SF 39.56 +.30 +231 91 23 ê57 18 90 B+ D B– 15.5 StillwtrM SWC 14.85 +.27 +2 762 .. o28 17 36 A D B– 19.9 STMicroel STM 17.79 +.46 +78 1.6m 48 o20 39 9 C B C+ 62.5 StoneEgy SGY 42.13 –.57 +31 570 8 o55 49 69 D+ E A NH StoraEn SEO 16.31 +.17 +11 227 46 ê48 60 55 C– C C+ 15.1 StrideRite SRR 14.31 +.14 +106 312 18 ò70 90 35 C+ A B 56.3 Stryker SYK 49.24 +.32 –11 1.4m 28 o16 48 24 D+ .. C+ 37.4 SuburbPrpn SPH 28.10 –.07 –50 67 .. ê69 76 90 D– .. B+ 43.2 SUEZ SZE 41.92 –.47 –39 51 14 ê64 74 71 C .. B+ 44.0 SunLife r SLF 42.70 –.61 –11 134 13 o76 75 88 D+ A D–82.2 SuncrErgy SU 74.17 –2.51 –15 2.5m 27 o81 99 73 D+ A C+ 97.3 Sunoco r SUN 79.61 –1.76 –28 1.9m 10 o65 90 52 D C C+ 43.7 SuncLogtc SXL 42.00 –.15 –53 10 15 ê83 68 81 B– C B+ 38.7 SunriseSr r SRZ 38.10 –.06 +20 481 37 o75 35 95 B A C 46.0 SuntechP STP 35.06 –.43 –78 347 99 o62 57 44 D A A– NH SunTrustBk STI 76.44 +1.16 +166 3.3m 13 o77 58 79 A– A D–27.6 SuperEgry SPN 25.47 –.35 +5 856 28 o4 16 9 D E C 27.9 SuperiorInd SUP 19.51 +.18 +10 391 25 o
28 52 29 B– D D–35.9 Supervalu SVU 32.07 +.12 +31 2.2m 13 o48 97 19 C A E 50.7 SwiftErgy SFY 36.97 –.57 –10 393 9 o22 34 26 B– .. B 39.0 Swisscom SCM 32.58 +.17 +332 159 12 ê55 57 39 A– C B– 24.1 Sybase SY 21.42 –.09 +8 481 16 o60 72 50 D+ B B– 48.0 SybronDntl SYD 40.51 +1.98 +197 700 21 o9 14 14 A– E D–15.4 SymbolTec SBL 10.80 –.22 +20 3.3m 40 o
83 96 53 C+ A B+ 25.9 SymtryMed SMA 22.06 +.06 +48 414 23 o68 46 78 A C C+ 29.2 Syngenta SYT 28.01 –.21 –74 97 18 o20 60 10 A .. D+24.6 Syniverse SVR 14.35 –.13 –21 250 17 o53 35 63 B+ D B 19.3 Synnex SNX 18.82 +.42 –23 80 13 k60 80 27 D+ A B 30.1 Synovus SNV 27.89 +.04 +20 906 16 o30 51 19 D C B+ 38.0 Sysco r SYY 31.54 +.28 +10 3.4m 22 o
— T —39 61 19 D– A B 28.8 TCFFinl r TCB 26.10 –.14 +16 891 13 o37 58 27 D B B 32.4 TDBknorth r BNK 29.87 –.39 –60 383 11 o87 77 77 B– C A 33.6 TDCAS TLD 32.00 +.05 –59 7 16 ê99 97 98 A A B– 40.5 TIMPartic TSU 39.65 –.26 –23 373 20 ê90 68 57 A+ B A+ 25.8 TJXCos TJX 25.53 +.15 +36 3.5m 18 o40 63 40 A .. C+ 25.9 TNSInc TNS 20.54 +.29 +101 534 20 ê79 56 74 B A B– NH TNTNV r TP 34.21 +.67 +87 179 16 ê23 32 19 C+ D B+ 16.1 TRC TRR 11.94 ... –69 17 99 o19 26 34 D D B– 30.0 TRWAuto TRW 24.58 –.59 –24 272 14 o58 85 40 D– A C+ 58.3 TXUCorp TXU 49.54 –.10 +13 4.3m 14 o61 64 68 A– .. C+ 22.5 TALIntl TAL 21.90 –.10 +256 217 20 ê35 55 14 A+ C D 35.3 Talbots r TLB 26.94 +.53 +49 668 15 o74 87 77 D A E 64.8 TalismnEgy r TLM 53.36 –1.36 –27 985 12 o44 84 35 D+ B E 60.0 Target TGT 53.77 +.05 –7 3.6m 19 o96 86 96 B– A B 21.5 TataMotors TTM 21.13 +.28 –4 577 27 ê42 91 13 E A B 30.4 TechOlypc TOA 20.60 +.09 +116 693 5 ò50 27 82 A– .. B 70.2 Technip TKP 67.39 +.13 –25 27 47 ê97 85 90 A D A+ NH Technitrol TNL 23.39 –.02 +289 741 33 o33 65 19 D– B C+ 19.3 TecoEnergy TE 16.64 –.09 +16 977 13 o50 76 59 D+ .. B 35.2 TeekLNG TGP 31.05 –.15 –30 45 9 ê16 27 10 D+ B C 48.2 TeekayShpg r TK 37.42 +.42 +47 743 6 o17 33 29 C– D C+ 62.7 TejonRnch TRC 45.97 +.24 +32 74 99 ê83 49 88 B– C A+ NH Tektronix TEK 36.70 +4.11 +630 3.4m 29 o85 44 86 A B A– 16.8 TelCntrOest TRO 14.18 –.45 –71 125 11 k46 3 97 A .. B 21.1 TeleLstCel TBE 17.94 –.73 –63 8 .. ê64 72 54 B– C C+ 19.8 TelNortLst TNE 17.86 –.16 –27 1.2m 14 o44 24 62 B– D B+ 14.5 TelecmArgt TEO 13.82 +.10 –29 247 5 ê30 3 62 B– .. A 39.1 TelBrasADS TBH 36.13 –.60 –59 50 99 o91 79 75 B– A B 25.5 TeleSaoPau TSP 24.38 –.60 –12 64 11 ê25 25 34 B– D B 32.5 TelItaliaClA TIA 26.32 +.67 –54 12 12 k17 25 17 B– D B– 38.6 TelecmItalia TI 29.32 +.01 –58 37 14 k21 56 6 B– A E 37.7 TelecmNwZ NZT 27.51 –.75 +111 454 10 ê77 81 58 B B B– 39.5 Teledyne TDY 35.45 +.70 +63 380 19 o74 79 57 B D B+ 72.0 Teleflex TFX 68.79 +.10 –19 181 18 o48 64 30 B– A D 52.6 Telefonica TEF 48.06 –.05 –59 135 14 o43 39 58 B– B E 26.1 TelfnMexico TMX 22.63 –.09 –46 1.1m 10 o89 68 87 B– B B+ NH TelkmIndo TLK 29.51 +1.96 +117 485 20 o75 91 90 B– .. C 59.9 TelmgCelu TMB 49.50 –2.85 +98 106 11 ê14 39 6 B– B E 22.0 Telstra TLS 13.55 –.41 +20 319 11 ê78 84 58 B– C B+ 41.7 TelusA r TU 39.91 –.93 –1 74 18 ê26 24 55 D+ D C+ 47.9 TempleInl TIN 44.67 +.63 –14 823 23 o44 87 9 C– A B– 25.0 TemprPdc TPX 13.72 +.56 +13 1.7m 12 o98 80 98 A+ B B+ 186 Tenaris TS 183.0 –1.44 –54 291 16 o67 77 68 A– C E 55.5 Tennant TNC 49.94 +.08 +39 96 19 ê80 98 82 D C C+ 23.3 Tenneco TEN 21.53 –.03 –12 423 14 o24 41 19 D B B– 44.7 TeppcoPtnr TPP 36.90 +.20 –20 122 21 ê16 34 35 B– E E 18.1 Teradyne TER 14.96 +.18 +20 3.9m .. o86 56 90 A+ D B+ 81.7 Terex TEX 74.97 +.62 –10 497 23 o46 24 76 A+ .. NH Ternium TX 26.93 +.03 –51 511 7 ê14 38 15 D B C+ 38.7 TerraNitro TNH 21.80 –.14 –60 23 7 ê71 76 81 D+ A D–74.0 Tesoro TSO 64.88 –.62 –31 1.1m 7 o96 85 95 A– B B 43.2 TetraTech TTI 42.30 –.29 +26 531 39 ê62 26 73 A– C B+ 62.8 TexasInds TXI 60.69 –.02 +15 420 19 ò73 92 32 A B C+ 35.0 TexasInst r TXN 30.19 +.04 –9 14m 22 o88 68 78 B B A– NH Textron r TXT 93.39 +.94 +58 1.3m 24 o87 88 75 B– B B 36.5 ThermoEle TMO 35.90 –.21 –13 702 23 o99 98 91 A C A+ NH ThomasBett TNB 51.96 +.21 +14 483 24 o2 7 5 C .. C+ 28.4 ThmsnMlt TMS 18.28 +.18 –80 20 46 ê
77 77 53 B C A– 39.0 Thomson TOC 37.77 –.33 +72 60 26 o97 95 91 C+ B A– 54.6 ThorInd THO 51.50 ... +150 926 20 o58 79 23 B B B– 87.0 ThreeM r MMM 74.79 –.10 +35 4.0m 17 o85 79 75 A– C B– 59.2 Tidewater TDW 52.30 –.60 –50 868 20 o62 82 54 E B B– 43.8 Tiffany&Co r TIF 39.15 +.05 –15 1.2m 25 ò
52 69 35 C– A C+ 41.0 Timberland r TBL 34.76 –.04 –37 308 14 o24 72 19 D– D D–19.0 TimeWrnr r TWX 17.07 –.04 +39 37m 21 o93 93 63 A+ B B+ 36.6 Timken TKR 32.26 +.14 –29 539 12 o8 3 54 E E E 18.2 TitanIntl TWI 16.90 –.16 +74 180 .. ê
94 55 99 A+ A B– 44.5 TitanmMtl TIE 42.54 –1.10 –9 1.5m 54 o70 76 64 C+ A C+ 49.8 Todco THE 36.62 –.84 –5 2.1m 38 o50 95 9 E A A– 58.7 TollBros TOL 34.95 +.77 –3 3.7m 6 o39 31 63 B .. B 24.1 Tomkins TKS 23.35 –.36 –46 29 13 ê38 22 60 B+ E B 18.8 TommyHlfg TOM 16.43 –.04 –19 885 18 o90 69 79 A+ B B– NH TooInc TOO 33.02 +.20 –19 461 20 o22 40 21 E B C+ 31.8 TootsieRoll TR 27.87 +.54 +125 290 23 ê55 64 48 C C C+ 57.9 Torchmark TMK 57.15 –.17 –19 369 12 o74 85 59 D+ B B 49.0 Toro TTC 47.75 +.03 +4 305 18 o87 76 72 B– A B– 58.1 TorontoDom TD 55.77 –.77 +4 78 12 o58 78 39 C B C+ 139 TotalSA r TOT 130.1 –.65 –37 561 10 o62 83 9 A A B– 25.9 TotalSys TSS 20.07 ... –73 41 20 o69 78 80 B– C E 108 Toyota r TM 108.2 +.27 –34 267 15 o67 41 90 C+ D B+ NH TrammlCro TCC 35.19 +.07 +69 326 31 ê42 63 57 D– D C 23.3 Transalta TAC 20.66 +.08 –34 17 23 ê7 17 19 C+ E E 70.9 TrnsatlHldg TRH 59.19 +.15 –36 17 99 ê
52 75 46 D B C+ 32.4 TransCda TRP 30.33 –.33 –31 82 17 ê77 74 85 C+ C C+ 84.3 Transocn r RIG 80.09 –.12 –38 4.2m 51 o37 16 66 B D B– 18.0 Tredegar TG 15.95 +.08 +132 284 19 ê37 35 57 D– D A– 31.4 TreeHseFd THS 26.49 +.13 –44 90 19 o21 8 26 B– B B 46.0 Trex TWP 28.99 –.45 +3 204 99 o26 78 24 E C D–56.2 TriadHsptl TRI 43.01 +.47 –30 627 14 o46 23 61 B+ C B– NH TriarcA TRY 18.41 +.16 +155 213 .. k55 23 66 B+ C B+ NH TriarcB TRYB 17.17 +.18 +286 591 .. k13 48 9 E C C 40.3 Tribune r TRB 29.36 –1.41 +193 4.9m 14 o96 76 91 A+ C A– 57.0 TrinityIn TRN 54.43 –.27 +46 711 28 o60 69 62 B D C 44.6 TriumphGrp TGI 41.80 +.65 +105 142 23 ê83 76 79 A E B+ 17.0 Tronox TRX 16.69 +.03 +81 547 14 o50 55 37 D+ B A– 46.1 TsakosE r TNP 38.94 +.02 –17 99 6 o7 17 14 E C D–24.7 Tupperwre TUP 20.54 +.08 +63 598 13 o
98 99 83 A A B 19.6 Turkcell TKC 18.28 –.13 –61 145 14 o46 82 38 C+ D D–17.9 21CentIns TW 16.04 +.04 +247 310 15 ê17 23 12 B C C+ 35.2 TycoIntl TYC 26.83 +.29 –33 10m 14 o7 54 5 E E D–19.9 TysonA TSN 13.36 +.20 –4 2.7m 13 o
— U —95 83 77 B– A A– 110 UBS UBS 109.8 +.11 +34 877 14 o17 43 15 E B C+ 30.0 UGI UGI 21.96 +.25 +43 809 13 o72 89 66 D– B C+ 36.9 UICI UCI 36.84 +.01 +79 319 8 o27 62 25 D– D C+ 56.1 UILHldg UIL 48.88 +.38 +452 258 22 ê58 54 77 D+ E B+ NH UPMKymn UPM 25.44 +.61 +22 98 37 ê52 29 64 A C B– 45.5 URS URS 41.66 –.46 +224 963 19 ê74 55 92 B+ .. A– 40.6 USAirway LCC 35.43 +.26 –41 425 .. o64 67 41 D A B+ NH USBancrp USB 31.16 +.07 +55 7.1m 13 o9 13 17 B D D 18.7 USEC USU 11.89 +.10 –8 1.0m 45 o
95 96 97 B– A C+ 99 USG USG 93.42 –.76 –69 411 8 o25 39 29 D+ D B 27.9 USShipg USS 23.59 +.14 –81 4 18 ê30 50 15 C A C 54.9 UST UST 40.64 +.19 +7 1.5m 12 o26 29 60 D+ .. B– 19.4 Ultrapar UGP 17.64 +.25 –44 58 11 ê81 73 97 A– .. B– 90.0 Unibanco UBB 85.93 +.93 +32 1.1m 32 o30 52 21 B C C 45.8 Unifirst UNF 33.35 –.41 +95 87 15 k30 65 35 D– .. B– 72.7 Unilever UN 70.06 –.09 –15 270 17 o31 57 38 D– .. B+ 43.1 Unilever Plc UL 41.88 +.08 –39 145 17 ê80 63 81 A C B– NH UnionPacif UNP 91.07 +1.05 +6 1.6m 26 o54 71 41 C+ A D–72.0 UnionBnCal r UB 69.35 –.30 –43 186 14 o20 47 25 D– D C+ 33.9 Unisource UNS 30.90 –.35 +55 451 24 o84 93 59 C+ A C+ 61.9 Unit Corp UNT 54.42 –1.08 +8 637 11 o89 69 84 B+ C A 45.0 UnitdAuto r UAG 44.74 +.14 –24 292 18 ê96 82 92 D+ A A+ NH UnitedInds UIC 55.50 +1.50 +207 295 20 o82 76 52 B A B+ 80.0 UPSB UPS 78.14 +.14 +29 3.4m 22 o62 7 93 A– E A+ 34.6 UtdRental URI 33.80 –.31 +40 1.3m 99 o77 36 80 A+ C B+ 62.5 USSteel r X 58.93 +1.17 +51 6.4m 8 o72 77 53 B B C+ 59.3 United Tech UTX 58.80 +.57 +38 4.8m 19 o30 18 42 C B B– 25.4 UnitdUtilAds UU 24.90 –.06 –32 56 21 ê62 93 41 C– A D–64.6 Unitedhlth UNH 56.69 +.12 –3 6.4m 22 ò45 55 44 C+ D B– 54.1 Unitrin UTR 49.32 +.17 +19 174 14 ê82 83 67 B+ D B 48.8 UnivCompr UCO 45.70 +.06 +30 420 21 o9 21 8 C C D–49.0 Universal UVV 36.70 +.12 +334 847 11 o
14 39 21 E C C+ 63.7 UnivHlthSvB UHS 48.58 –.01 –51 350 19 o48 88 19 D A C+ 37.7 UnvTchIns r UTI 31.06 –.26 –8 308 23 ê67 79 75 E C B– 35.6 UnivisionA UVN 34.09 +.33 +16 3.5m 40 o22 28 48 D– D B 24.4 UnumProv UNM 21.09 +.23 –30 1.8m 12 o
— V —42 60 23 B+ B C+ 61.6 VFCorp VFC 55.87 +.57 +3 563 12 o62 34 80 B D B+ 38.9 VailResorts MTN 37.91 +.70 +61 634 34 ê32 44 11 B+ B B– 40.8 Valassis VCI 29.40 –.15 +73 676 14 o47 71 21 A– D B 23.8 ValeantPh VRX 18.85 –.49 +8 1.2m 50 o90 96 81 D+ A B– 63.7 ValeroEgy VLO 57.86 –.66 –31 7.7m 8 o24 42 15 D B C+ 64.2 Valero VLI 50.84 –.16 –16 87 17 ê67 52 46 D A A+ NH VallyBcNJ VLY 25.46 +.09 +46 232 17 o82 55 87 A+ D B– 40.3 Valmont VMI 39.42 +.81 +66 177 25 ê37 77 24 C+ .. B 15.3 ValorCom VCG 12.90 +.17 +151 1.1m 23 o89 90 68 B C B+ 27.9 Valspar VAL 27.73 +.09 +21 624 17 o97 90 84 A– A B 61.7 VarianMed r VAR 56.81 +.53 –37 724 36 o33 55 44 C .. B– 20.8 VectorGrp VGR 19.14 +.12 +138 388 23 o37 77 16 E B B– 29.5 Vectren VVC 26.07 +.07 +31 280 14 ê78 92 85 C .. B 55.0 VeoliaEnv VE 54.70 –.34 +21 32 28 ê81 70 95 A .. B– 30.7 VeriFone PAY 29.28 +.46 –31 338 34 o96 88 87 A– C A 46.8 VeritsDGC VTS 45.25 –.14 +71 877 23 o48 39 46 C+ B B 36.3 VerizonCm r VZ 34.41 –.11 –1 14m 13 o10 67 17 D– .. E 43.9 ViacomA VIA 38.97 +.60 –39 123 22 o9 67 17 D– .. E 43.9 ViacomB VIAB 39.00 +.69 –5 3.4m 22 o
63 43 66 B+ D B+ 33.7 Viad VVI 33.60 +.25 +110 173 21 o92 80 77 A– C B+ 30.1 ViasysHlt VAS 29.51 +.26 +30 308 30 o66 30 87 B– B B 19.9 VidSanN VSL 18.62 –.06 +60 151 15 ê85 99 56 A A E 51.0 VimpelComm VIP 42.90 +.72 +5 843 15 ò45 48 48 A E B– 16.6 Vishay VSH 13.62 –.08 –19 1.3m 27 o27 16 50 D– C B NH VivendiU V 33.95 +.50 +5 471 15 o57 74 16 A C A– 28.1 Vodafone r VOD 22.51 –.23 +10 5.8m 12 o78 73 80 C+ D A– 29.0 VoltInfoSci r VOL 27.20 +.88 +100 101 24 ê48 27 71 D+ B B 15.8 Votorntm VCP 15.01 –.18 –22 397 12 o96 82 83 A– B B NH VulcanMat VMC 86.62 +1.32 +47 898 26 o
— W —92 90 88 C A B– 42.6 WTOffshr WTI 37.48 –.82 +26 419 13 o46 74 26 E A B+ 36.0 WCICmts r WCI 28.54 +1.06 +110 1.6m 6 o19 45 19 E C C 34.8 WGLHldgs WGL 30.30 +.25 +112 537 14 ê70 76 40 A– B B 35.2 WMSInds WMS 28.44 +1.06 +18 442 26 o29 59 26 C+ C D 33.3 WPCarey r WPC 26.60 +.10 –28 26 24 ê19 55 14 E B E 60.0 WPSRes WPS 51.70 +.10 –6 184 12 o27 18 11 A– B B– 25.6 WPStew WPL 20.75 +.25 –16 80 18 ê92 82 84 A– A B– 49.0 W–HEnrgy WHQ 38.90 –.46 +21 424 22 o33 30 19 A+ B C 28.0 WabashNtl WNC 20.36 +.42 +22 434 9 o96 93 85 A+ C B 34.1 Wabtec WAB 32.59 –.29 +48 682 26 ê63 60 57 D A B– 57.9 Wachovia WB 57.33 –.04 +106 11m 13 o57 33 56 A– B C+ 23.6 WaddellR WDR 22.53 +.22 +64 1.1m 20 o42 71 23 D+ B C+ 52.4 Wal–Mart WMT 46.69 +.33 –8 12m 17 o46 74 29 D– B B– 49.0 Walgreen WAG 45.32 +.38 +4 3.3m 29 ò47 45 59 D– C A– 29.0 WaltDsny DIS 28.64 –.04 –40 7.9m 23 o83 47 86 B A B+ 69.1 WalterInds WLT 63.46 –1.07 +18 1.1m 18 o80 76 79 B D B+ 22.9 WarnerM WMG 22.00 –.14 –29 191 68 o56 58 44 D+ A B 45.6 WAMutual WM 44.00 +.39 +13 4.8m 11 o85 77 60 C+ B A 39.8 WstCnn WCN 39.06 –.27 +168 1.2m 21 o79 64 68 C+ C A 34.7 WasteMgmt WMI 34.54 –.05 +50 3.7m 22 o58 53 87 D– C B– 28.3 WaterPik PIK 27.61 –.09 +47 113 22 ê76 68 54 B– A B+ 47.8 Waters WAT 44.39 +.19 +40 1.1m 22 o97 95 89 A+ B B– 73.0 Watsco WSO 70.75 –.66 +27 303 28 o12 26 13 B– D E 36.9 WatsonPhar r WPI 29.08 –.42 +7 1.1m 21 o73 61 69 D– A B+ NH WatsnWyat WW 32.12 +.27 +183 441 18 o68 67 57 B– C B+ 37.5 WattsWatr WTS 35.21 –.04 +2 265 20 ê30 21 53 D+ E A– 16.1 WausauPpr WPP 14.26 +.05 +232 658 99 ê96 88 83 B+ B B+ 45.5 WeathIntl r WFT 43.21 –.86 –12 3.2m 30 o44 49 38 D+ B B– 49.5 WbstrFn WBS 48.16 +.15 –2 249 12 o47 76 34 C A E 59.0 WtWatchs WTW 50.10 –.40 –64 236 26 o76 70 66 B– C A– NH WeisMkt WMK 46.03 –.21 +265 112 19 ê81 84 69 C– B B 44.4 Wellcare WCG 42.33 –.34 –11 434 25 o75 91 61 C– B D+80.4 WellPoint WLP 79.62 +.19 +11 3.1m 19 o69 74 46 D A B+ 65.4 WellsFargo r WFC 65.06 +.12 +21 4.9m 14 o74 35 86 B+ C B+ NH Wendys r WEN 65.26 +.36 +13 1.5m 34 o99 94 96 A B B+ 64.2 WescoIntl WCC 63.30 –.10 +20 682 26 o85 76 75 D+ B A 33.4 WstPhrm WST 31.80 +.25 +250 591 22 o26 54 14 D– C B 25.0 WestarEnrgy WR 20.87 –.20 +49 627 13 ê95 89 83 C+ A B 36.8 WstnAllBc WAL 35.32 +.56 +76 64 29 ê95 97 89 A+ B D 24.7 WestDigtl r WDC 19.42 –.04 –30 2.9m 13 o57 74 51 E A B– 52.8 WestrnGas WGR 46.50 –1.22 –17 717 17 o59 99 20 D+ A 19.3 WstrnRef WNR 17.50 +.06 –70 326 5 ê95 94 77 C A A– 37.2 WestlkChm WLK 36.49 +.10 –28 119 10 ê5 41 2 E C E 21.2 WestwdOne WON 11.97 +.23 +71 1.6m 12 o
43 30 53 D+ D A NH Weyerhaus WY 73.34 –.43 –3 1.4m 17 o53 67 64 D C D+91.9 Whirlpool WHR 86.25 –1.29 +153 2.5m 13 o23 34 15 C+ D B+ 711 WhtMtIns WTM 571.0 –3.00 –65 7 21 ê34 59 24 C B D–47.3 WhitingP WLL 40.48 –.03 +2 549 10 o37 63 27 D– B B– 45.2 WilyJhnA JWA 38.29 +.19 +31 130 24 ê36 3 65 A– D B 21.2 Willbros WG 18.46 –.15 –83 64 .. o27 82 25 E B D– 165 WmLynHms WLS 99.00+23.30 +999 1.4m 4 ê17 18 56 E .. B– 21.9 WillmsCoal WTU 19.30 –.08 –49 17 13 k15 47 23 D D D–25.7 Williams WMB 20.89 –.07 +23 6.2m 29 o40 33 69 E D B 34.5 WmsPtrs WPZ 33.35 +.09 +118 58 43 ê66 89 46 C+ A E 45.1 WillmsSon r WSM 42.46 +1.16 +16 1.0m 24 ò24 43 18 C– B D+39.0 WillisGrp WSH 33.65 –.42 +12 1.1m 16 o87 81 72 D A A– NH WilmgtnTr WL 44.67 +.49 –2 233 17 o60 51 87 D D B 28.5 WimmBD WBD 26.31 –.10 +74 49 45 k17 37 11 C+ C D+39.7 Winnebago WGO 28.75 –.22 +224 1.6m 17 o88 87 76 B A D+15.5 Wipro WIT 13.42 –.23 –13 401 44 o35 60 46 D– C E 42.4 WiscsnEgy WEC 40.09 +.04 +5 528 16 o46 73 32 C– B C+ 25.7 WolvrWW r WWW 22.39 +.28 +20 540 17 o92 95 68 A– B B– 37.6 WldFuelSv INT 35.49 +3.24 +417 893 21 o82 73 85 D– C A 17.1 WWF WWE 16.95 +.04 +123 335 22 ê54 41 43 A+ C C+ 21.3 Worthgtn WOR 20.34 +.59 +116 974 12 ò97 86 82 A A B 27.6 WrightExp WXS 26.00 +.21 +47 388 21 o33 57 25 E A C 74.3 WriglyWm WWY 66.86 +.89 –27 593 27 o80 52 64 A– A B+ 50.5 Wyeth WYE 49.80 +.13 +21 5.3m 17 o
— X —11 10 23 C+ E D+76.0 XLCptl XL 67.45 –.47 –30 747 .. o79 97 56 C A D 50.0 XTOEnergy XTO 42.88 –.22 +7 4.3m 13 o19 32 27 D– C D+20.2 XcelEngy XEL 18.50 –.20 +4 1.4m 15 o65 89 43 D+ D A– 15.8 Xerox r XRX 15.24 +.04 +35 6.0m 17 o
— Y —48 75 31 D– A B 34.0 YankCdl YCC 27.43 –.27 +77 699 14 o88 95 56 B A B– 46.3 Yanzhou YZC 40.19 –1.21 +35 44 8 ê64 76 34 B+ B C+ 53.8 YumBrands r YUM 50.45 +.43 +82 2.7m 18 o
— Z —13 41 16 E C D+34.4 Zale ZLC 26.26 +.14 +19 499 13 o89 90 75 C+ A B– 55.3 ZenithNatl ZNT 51.50 –.84 +38 325 13 ê56 92 15 C+ A B– 85.1 Zimmer r ZMH 69.18 +.43 –19 1.2m 22 o

B12 MONDAY, MARCH 20, 2006 NYSE STOCKS IN THE NEWS INVESTORS.COM
Nasdaq Stocks On The MoveStocks with high volume vs. 50-day avg., reflecting heavy institutional action. Stocks $16 or more, with at least}point change and avg. volume of 60,000. For stocks up in price, EPS & RS Ratings are 70 or higher and annualearnings estimate 15%+. Includes stockswithout estimates. Stockswith 80 EPS& 80 RS or better are boldfaced.
71 84 87 B– 28.51 The9Ltd o NCTY 24.99 +1.80 693 +31995 96 85 B– 17.94 SeaBrght SEAB 17.64 +0.84 427 +13896 93 72 A– 40.99 BuffWldWg BWLD 39.43 +1.62 308 +13498 99 97 B 23.32 Abaxis o ABAX 22.77 +1.09 574 +13196 86 88 B 31.26 Intermgntc o IMGC 27.64 +0.99 1,004 +11898 93 97 A– 36.60 HlthExt o HLEX 36.72 +0.61 706 +10972 76 84 D+ 32.90 PionrCos PONR 32.75 +3.05 222 +8680 79 74 A– 55.35 Costco o COST 55.88 +0.88 4,290 +6599 76 94 A 90.37 AmerSciEn o ASEI 89.98 +1.04 449 +5789 76 99 B+ 71.71 FrghtCar o RAIL 69.41 +1.67 389 +5592 77 88 B 54.24 Rofin–Sinar o RSTI 52.79 +0.70 176 +4697 96 90 D+ 61.46 GFIGrp o GFIG 50.79 +0.94 329 +4196 88 79 B 51.18 Qualcomm o QCOM 50.77 +0.90 19,010 +3699 91 78 A– 35.00 NtwrkApl o NTAP 35.05 +0.54 6,186 +3598 80 98 A 41.74 Bankrate o RATE 42.54 +1.61 324 +3097 76 88 A– 17.81 Schwab o SCHW 18.13 +0.54 10,199 +2899 97 83 B+ 41.75 Digital River o DRIV 41.28 +1.44 1,397 +2588 70 88 B+ 41.21 Ansoft ANST 39.45 +1.01 193 +2499 91 99 A– 63.24 MultFnElc o MFLX 63.70 +0.82 457 +19
87 94 47 B+ 49.49 J2GlblC o JCOM 42.78 –4.94 2,398 +347
78 98 53 C 34.97 StdMicro SMSC 25.55 –2.34 1,241 +32798 76 98 A+ 20.49 Vimicro o VIMC 18.00 –1.27 1,093 +30357 95 19 C 32.00 USA Truck USAK 25.17 –2.46 431 +24893 82 79 B 29.04 Mobile Mini o MINI 26.37 –1.14 839 +24160 60 49 A– 25.31 ElizArden o RDEN 22.97 –0.93 792 +20680 49 94 A+ 20.02 Wild Oats o OATS 18.47 –1.49 2,070 +20041 45 67 D– 27.59 Parexel o PRXL 23.61 –0.56 641 +19358 64 38 B– 45.49 Cintas o CTAS 42.17 –1.57 2,344 +19293 85 79 B+ 36.60 Advnta B o ADVNB 35.11 –1.23 224 +19098 98 88 A 33.00 Ventiv o VTIV 31.70 –1.06 1,040 +16897 96 98 B– 36.59 Encore Wire o WIRE 30.14 –1.01 1,440 +15693 98 90 B– 24.99 Celadon Grp CLDN 21.85 –0.83 558 +14971 76 56 C+ 31.04 ClickCmrc o CKCM 20.77 –2.23 1,291 +13993 93 77 B 32.86 SunHydrlcs SNHY 23.79 –1.19 255 +13856 80 42 C 31.34 Synaptics o SYNA 22.94 –1.27 2,563 +13893 96 75 A– 33.99 TierOne TONE 33.44 –0.51 152 +12345 37 48 B 163.5 SearsHldgs o SHLD 134.9 –3.54 3,993 +12157 94 19 C+ 31.25 PRAIntl PRAI 25.59 –0.53 405 +12190 93 55 C 51.77 PortRec o PRAA 45.35 –1.25 412 +10888 69 92 A 27.87 InsitfTch o INSU 26.40 –0.52 470 +10853 15 86 B– 37.00 Argonaut AGII 36.18 –0.52 363 +104
SMARTSELECT®COMPOSITERATINGEPS Rel Acc 52-Wk Stock Closing Vol Vol%
6 Rnk Str Dis High Stock Name Symbol Price Chg (1000s) Chg
SMARTSELECT® COMPOSITE RATINGEARNINGS PER SHARERELATIVE PRICE STRENGTHINDUSTRY GROUP RELATIVE STRENGTHSALES+PROFIT MARGINS+ROEACCUMULATION/DISTRIBUTION
52-wk Stock & Close Vol% Vol PHigh Symbol Price Chg Chg 1000 E666666
SMARTSELECT® COMPOSITE RATINGEARNINGS PER SHARERELATIVE PRICE STRENGTHINDUSTRY GROUP RELATIVE STRENGTHSALES+PROFIT MARGINS+ROEACCUMULATION/DISTRIBUTION
52-wk Stock & Close Vol% Vol PHigh Symbol Price Chg Chg 1000 E666666
SMARTSELECT®COMPOSITERATINGEPS Rel Acc 52-Wk Stock Closing Vol Vol%
6 Rnk Str Dis High Stock Name Symbol Price Chg (1000s) Chg
Common stocks above $10 for Friday, March 17, 2006
SMARTSELECT® COMPOSITE RATINGEARNINGS PER SHARERELATIVE PRICE STRENGTHINDUSTRY GROUP RELATIVE STRENGTHSALES+PROFIT MARGINS+ROEACCUMULATION/DISTRIBUTION
52-wk Stock & Close Vol% Vol PHigh Symbol Price Chg Chg 1000 E666666
15 Most Active NASDAQ StocksEPS Rel Acc Closing Group Vol Vol%Rnk Str Dis Stock Name Price Change Str (mil) Chg
15 Most % Up In PriceEPS Rel Closing Net Grp Vol Vol%Rnk Str Stock Name Price Up Str (100s) Chg
14 5 E Sirius Satellite 4.89 +0.38 E 80.67 +4882 72 A– Cisco 21.62 +0.37 C+ 60.38 –998 79 C+ Apple Computer 64.66 +0.35 A+ 28.09 –2220 89 B+ Brocade Comm 6.09 +0.33 C+ 37.79 +36963 49 B+ Microsoft 27.50 +0.23 B 104.00 +7682 51 A– Oracle 13.60 +0.10 A– 67.78 +3327 98 A– JDS Uniphase 4.05 +0.09 A+ 97.11 +76.. 47 C Nasdaq 100 Trkg Stk 41.45 +0.08 C– 77.47 –16
34 99 A+ Avanex 3.08 +0.07 A+ 28.16 +16579 6 E Symantec Corp 15.53 +0.04 D– 29.37 +8118 63 A– Sun Microsys 4.75 –0.05 A+ 65.73 +1792 8 E Yahoo 30.07 –0.06 C+ 22.79 –1771 5 E Intel 19.54 –0.11 A 100.92 +1235 30 D Applied Materials 17.49 –0.21 A 41.27 +2775 93 D+ Viropharma 10.86 –5.38 A 49.17 +999
98 48 Park Ohio Hldg Cp 18.42 –2.32 B 45,2 +2994 47 J2 Global Comm 42.78 –4.94 B 2,397,6 +34776 56 Click Commerce 20.77 –2.23 B 1,290,6 +13995 19 U S A Truck Inc 25.17 –2.46 B+ 430,5 +24898 53 Standard Microsys 25.55 –2.34 A 1,240,8 +32727 96 Acadia Pharmaceut 16.34 –1.46 A 1,152,3 +7356 65 Meta Financial Grp 24.15 –2.10 D+ 35,6 +46549 94 Wild Oats Markets 18.47 –1.49 B– 2,070,4 +20082 99 Air Methods Corp 25.29 –1.93 B– 419,9 +863 1 GPRE 27.50 –2.00 B 22,1 +10
76 98 Vimicro Intl Corp 18.00 –1.27 A 1,093,1 +30364 60 Columbia Bcp OR 20.57 –1.32 C+ 7,8 +11151 95 G III Apparel Group 16.28 –1.02 B+ 13,0 +1380 42 Synaptics 22.94 –1.27 C– 2,562,6 +13893 77 Sun Hydraulics 23.79 –1.19 A– 254,7 +138
15 Most % Down In PriceEPS Rel Closing Net Grp Vol Vol%Rnk Str Stock Name Price Dwn Str (100s) Chg
CHINA LIFE INSURANCE ADR (LFC) Grp 123 o$46.53662.4M Shares 80 Comp. Rating 72 EPS RS 92 ROE 11%LEADING LIFE INSURANCE COMPANY IN CHINA PROVIDING LIFE ANDANNUITY PRODUCTS, ACCIDENT INSURANCE AND ASSET MANAGEMENT.
... Ann. EPS Gro PE 27 Avg. Daily Vol 108,400 Debt 0%Last Qtr Eps +70%6 Prior Qtr +77%6 Last Qtr Sales +27%6 Qtrs EPS) 15%
Acc/Dis CSup/Demand 4
CATERPILLAR INC (CAT) Grp 9 o$76.23657.4M Shares 98 Comp. Rating 92 EPS RS 88 ROE 36%MANUFACTURES CONSTRUCTION, MINING, FORESTRY MACHINERY, ANDENGINES FOR MACHINERY, GENERATION AND OTHER APPLICATIONS.
+54% Ann. EPS Gro PE 19 Avg. D. Vol 4,412,300 Debt 186%Last Qtr Eps +56%5 Prior Qtr +34%6 Last Qtr Sales +13%8 Qtrs EPS) 15%Eps Due 4/20R&D 3%
Acc/Dis B-Sup/Demand 65
GOLDMAN SACHS GROUP INC (GS) Grp 15 o$150.36424.8M Shares 98 Comp. Rating 94 EPS RS 83 ROE 21%PROVIDES INVESTMENT BANKING, SECURITIES AND INVESTMENT MANAGE-MENT SERVICES WORLDWIDE.
+43% Ann. EPS Gro PE 11 Avg. D. Vol 3,972,700 Debt 357%Last Qtr Eps +84%5 Prior Qtr +42%6 Last Qtr Sales +73%3 Qtrs EPS) 15%Eps Due 6/16R&D 1%
Acc/Dis B-Sup/Demand 76
OFFICE DEPOT INC (ODP) Grp 92 o$37.13289.8M Shares 93 Comp. Rating 91 EPS RS 88 ROE 15%MARKETS OFFICE SUPPLIES/MACHINES VIA 1,047 STORES IN U.S./ CANADA,70 STORES IN EUROPE/JAPAN, CATALOGS, AND THE WEB.
+11% Ann. EPS Gro PE 25 Avg. D. Vol 2,161,100 Debt 21%Last Qtr Eps +54%5 Prior Qtr +25%5 Last Qtr Sales +7%3 Qtrs EPS) 15%Eps Due 4/21
Acc/Dis B+Sup/Demand 68
B G GROUP PLC ADS (BRG) Grp 115 $61.30688.1M Shares 96 Comp. Rating 97 EPS RS 86 ROE 19%ENERGY COMPANY ENGAGED IN THE DISCOVERY, EXTRACTION, TRANSMIS-SION, DISTRIBUTION AND SUPPLY OF NATURAL GAS.
+47% Ann. EPS Gro PE 18 Avg. Daily Vol 186,300 Debt 17%Last Qtr Eps +97%5 Prior Qtr +40%6 Last Qtr Sales +54%13 Qtrs EPS) 15%Eps Due 5/9
Acc/Dis B-Sup/Demand 5
E*TRADE FINANCIAL CORP (ET) Grp 78 o$26.33397.0M Shares 98 Comp. Rating 88 EPS RS 94 ROE 16%PROVIDES ONLINE BROKERAGE AND BANKING SERVICES FOR RETAIL ANDINSTITUTIONAL CLIENTS WORLDWIDE VIA WWW.ETRADE.COM.
+42% Ann. EPS Gro PE 23 Avg. D. Vol 3,480,100 Debt 54%Last Qtr Eps +12%6 Prior Qtr +26%5 Last Qtr Sales +33%0 Qtrs EPS) 15%Eps Due 4/20R&D 3%
Acc/Dis A-Sup/Demand 73
MARTIN MARIETTA MATERLS (MLM) Grp 34 o$105.5544.4M Shares 97 Comp. Rating 83 EPS RS 92 ROE 16%PRODUCES GRANITE, LIMESTONE, GRAVEL AND OTHER AGGREGATES FORINFRASTRUCTURE, COMMERCIAL/RESIDENTIAL CONSTRUCTION MARKETS.
+32% Ann. EPS Gro PE 26 Avg. Daily Vol 463,500 Debt 60%Last Qtr Eps +42%5 Prior Qtr +35%6 Last Qtr Sales +16%4 Qtrs EPS) 15%Eps Due 5/2
Acc/Dis B+Sup/Demand 78
THOMAS & BETTS CORP (TNB) Grp 24 o$51.9660.5M Shares 99 Comp. Rating 98 EPS RS 91 ROE 13%MANUFACTURES INTERCONNECTS AND ELECTROMECHANICAL COMPONENTSFOR THE INDUSTRIAL, COMMUNICATIONS AND UTILITY INDUSTRIES.
+71% Ann. EPS Gro PE 24 Avg. Daily Vol 422,100 Debt 37%Last Qtr Eps +73%5 Prior Qtr +36%6 Last Qtr Sales +11%10 Qtrs EPS) 15%Eps Due 4/25R&D 1%
Acc/Dis A+Sup/Demand 66
Park ElectrochemicalPKE is findingsupport at its 10-weekmoving aver-age for the second time since thestockbrokeoutJan.5.The company makes digital andRF/microwaveprintedcircuitmate-rials andadvancedcompositemate-rials. Its products are used in theelectronics,militaryandwireless in-dustries.After sales struggled for part of2004 and the first half of 2005,Park’srevenuegrew3%intheJune-August ’05 quarter and 14% in thelatest period. Park has the best EPSRating in the Electronics-Compo-nents/Connectors industrygroup.Earnings per share surged 100%and 95% the last two quarters. Af-ter-taxmargintopped14%inthelat-estperiod following11.5%and11.6%marks.China Life InsuranceLFC dippednear its 10-week lineandwenthigh-erafter that.The company also is turning its fi-nancial performance around. Aftera string of single-digit or decliningsales, revenue rose 27% in the latestreportingperiod.Earningsper share rose 70% in thelatestperiod.China Life has the best RS Ratingin the Insurance-Life industrygroup. The group was ranked alowly 124th out of 197 industrygroups in Friday’s IBD. But a fewpeershaveRSRatingsabove80.Juan Carlos Arancibia
Internet, Medical Names Help Nasdaq Advance
NORFOLK SOUTHERN CORP (NSC) Grp 27 o$53.94404.0M Shares 98 Comp. Rating 94 EPS RS 88 ROE 14%OPERATES, THROUGH NORFOLK SOUTHERN RAILWAY, A 21,200 MILERAILROAD IN 22 STATES, D.C. AND ONTARIO, CANADA.
+40% Ann. EPS Gro PE 19 Avg. D. Vol 2,663,200 Debt 71%Last Qtr Eps +34%5 Prior Qtr +24%6 Last Qtr Sales +16%9 Qtrs EPS) 15%Eps Due 4/27
Acc/Dis BSup/Demand 64
PARK ELECTROCHEMICAL (PKE) Grp 24 o$29.2919.1M Shares 96 Comp. Rating 99 EPS RS 80 ROE 7%DESIGNS AND MANUFACTURES ADVANCED ELECTRONIC MATERIALS USED TOFABRICATE MULTILAYER PRINTED CIRCUIT BOARDS,
+149% Ann. EPS Gro PE 23 Avg. Daily Vol 114,800 Debt 0%Last Qtr Eps +95%6 Prior Qtr +100%5 Last Qtr Sales +14%2 Qtrs EPS) 15%Eps Due 4/26
Acc/Dis A-Sup/Demand 60
CHEMED CORPORATION (CHE) Grp 80 o$58.8723.9M Shares 97 Comp. Rating 97 EPS RS 86 ROE 12%PROVIDES HOSPICE CARE, PLUMBING, SEWER/DRAIN/PIPE CLEANING, ANDHVAC REPAIR AND MAINTENANCE.
+64% Ann. EPS Gro PE 30 Avg. Daily Vol 180,400 Debt 84%Last Qtr Eps +49%6 Prior Qtr +53%5 Last Qtr Sales +16%7 Qtrs EPS) 15%Eps Due 5/3
Acc/Dis B+Sup/Demand 67
LIFE TIME FITNESS INC (LTM) Grp 66 $45.6324.6M Shares 99 Comp. Rating 94 EPS RS 87 ROE 15%OPERATES 48 MEMBERSHIP-ONLY FITNESS AND FAMILY RECREATIONCENTERS IN NINE STATES UNDER THE LIFE TIME FITNESS BRAND.
+173% Ann. EPS Gro PE 40 Avg. Daily Vol 234,600 Debt 84%Last Qtr Eps +43%5 Prior Qtr +32%5 Last Qtr Sales +26%2 Qtrs EPS) 15%Eps Due 4/28
Acc/Dis A+Sup/Demand 65
PENNEY J C CO INC (JCP) Grp 93 o$62.71229.9M Shares 89 Comp. Rating 98 EPS RS 76 ROE 13%HOLDING COMPANY OPERATING 1,017 JCPENNY STORES IN 49 STATES ANDPUERTO RICO, AND 62 RENNER DEPARTMENT STORES IN BRAZIL.
+75% Ann. EPS Gro PE 16 Avg. D. Vol 1,746,100 Debt 71%Last Qtr Eps +68%6 Prior Qtr +88%6 Last Qtr Sales +4%10 Qtrs EPS) 15%Eps Due 5/17
Acc/Dis BSup/Demand 69
— A —84 65 78 A+ C B 23.0 AAON AAON 22.08 +.21 +124 69 24 ê14 35 10 B– D C+ 33.3 ACMreArt ACMR 16.47 +.03 –31 247 34 o67 59 85 A .. B 29.1 ADA–ES ADES 23.75 +.59 –68 7 99 ê71 28 75 B+ A A– 27.9 ADCTelcm ADCT 25.28 –.13 –48 726 27 o42 6 81 B– B C+ 34.6 ADE ADEX 30.92 +.06 +133 632 28 o73 37 85 A D B NH AEPIndustr AEPI 29.04 –.21 –61 10 70 ê30 58 31 B+ E D+16.9 AFCEntps AFCE 14.05 –.25 +104 358 .. ê62 47 74 A E B– 19.3 ASMIntl ASMI 18.80 +.31 –40 143 99 o43 6 63 A B C 23.6 ASMHldg ASML 20.26 –.12 –11 2.9m 25 ò98 97 85 A+ A C 35.0 ASV ASVI 30.54 +.29 +10 358 31 o31 47 23 A D D 18.2 ATITechn ATYT 14.40 –.05 –46 2.7m 55 ò65 79 36 A C C+ 34.4 ATMI ATMI 28.34 –.65 +56 735 33 o42 20 85 C D B– 43.6 ATPO&G ATPG 39.57 –.81 +1 316 .. o98 99 97 A– B B 23.3 Abaxis ABAX 22.77 +1.09 +131 574 73 o79 78 71 C+ B C+ 43.1 AberDimnd ABER 40.32 +.41 –47 18 29 ê64 23 97 A E B 22.4 Abgenix ABGX 22.37 ... –14 2.0m .. o32 8 69 C+ E B 11.9 Abiomed ABMD 11.44 +.43 +274 308 .. o72 27 96 A .. A+ NH AcadiaPhm ACAD 16.34 –1.46 +73 1.2m .. o80 97 76 D+ B C+ 15.1 AccessNtl ANCX 11.15 +.05 –67 6 17 ê87 85 81 D A B– 54.9 AccHmLnd LEND 53.05 +.55 +27 1.1m 7 o57 48 47 A B C+ 27.4 AceCashEx r AACE 24.49 +.29 +76 150 13 o62 73 44 A D B– 16.8 Actel r ACTL 14.64 +.01 +62 317 40 o24 39 39 D– C C 18.0 Activision ATVI 14.07 +.27 –31 4.3m 78 o84 74 74 B C B+ NH Acxiom ACXM 26.40 +.13 +75 1.1m 35 o50 72 63 A– .. D 49.7 AdamsResp ARXT 36.39 +1.26 +48 548 26 ê53 54 64 C+ B D 23.4 AdezaBio ADZA 19.10 –.22 +23 172 46 ê80 86 46 B A B– 40.9 AdobeSys ADBE 35.98 +.05 +34 6.1m 31 ò62 4 99 A E A+ 27.8 Adolor ADLR 25.05 –.35 +16 943 .. o86 96 54 B+ A B– 33.5 Adtran ADTN 28.22 +.14 –24 1.0m 21 o14 4 12 A C D+15.8 AdvAnaTch AATI 11.60 –.10 +8 370 99 o52 47 82 A E D 16.8 AdvEngy AEIS 13.43 –.41 0 652 99 o52 13 95 A E B– 15.6 AdvPwrT APTI 14.15 +.13 +69 79 99 ê93 85 79 C A B+ NH AdvntaB ADVNB 35.11 –1.23 +190 224 8 o54 76 73 C– E D+33.2 AdvntSftw r ADVS 28.30 +.22 +55 314 65 o83 87 64 C– A B– 56.4 AdvsrBrd ABCO 54.71 –.13 +25 183 38 ê90 72 86 A– C A– 13.7 Aeroflex r ARXX 12.90 +.04 +38 832 29 o33 62 16 C+ A E 17.7 AffrmInsr AFFM 13.51 +.16 +94 70 8 x22 51 3 A B E 59.7 Affymetrix AFFX 31.34 +.23 –36 1.1m 37 o73 43 76 B B B+ 22.6 AftmktTch ATAC 21.77 –.50 +75 233 14 ê23 59 8 B+ D D+21.3 Agilysys AGYS 14.84 +.46 +58 307 16 o95 82 99 B– C A 27.2 AirMethods AIRM 25.29 –1.93 +86 420 21 o30 51 15 B C B 19.9 AirT AIRT 11.66 ... –79 26 17 ê80 68 97 A .. C+ NH AkamaiTch AKAM 28.42 +1.23 –9 2.3m 54 o69 53 74 C C B+ 53.8 AkzoNobel AKZOY 53.09 –.12 –40 43 14 ê72 76 49 D+ A B+ 70.5 ALNtlBcp ALAB 69.19 –.61 +275 131 17 ê55 58 54 D– A B 25.0 AladdinKno ALDN 20.38 –.01 –63 54 21 o50 46 67 C+ .. A– 12.0 AlskComm ALSK 11.74 +.09 –10 394 .. ê14 37 10 B– C D–17.1 AlbanyMlc AMRI 10.00 +.04 +46 219 19 o48 67 65 E D C+ 17.9 Alderwds AWGI 17.01 +.03 +152 427 16 ê75 55 86 D+ A C+ 33.5 Aldila ALDA 30.06 –.02 +21 59 12 ê27 65 21 D+ C D–56.1 AlexBldwn ALEX 47.03 ... +63 443 17 o58 5 94 A D A– 39.8 AlexionPhr ALXN 36.68 –.48 –51 469 .. ò55 67 46 C+ B D 18.0 Alfa ALFA 16.86 –.01 +358 231 14 ê79 42 95 A D B+ 26.8 Alkermes ALKS 25.16 –.05 –33 1.2m .. o58 97 18 B A D–48.4 AllnceRes ARLP 36.17 +.03 –53 54 12 o31 76 8 B– D C 20.3 AllionHth ALLI 12.95 –.46 +7 267 99 ê59 61 76 D E A– 13.6 AlloyInc ALOY 12.68 +.40 +9 105 .. ò82 76 81 C C B+ 19.8 Allscrpts MDRX 18.98 +.39 –35 683 79 o60 4 95 A .. A+ 17.4 AlnylamPh ALNY 16.79 –.10 –68 126 .. ê78 67 36 A A A– 23.0 Altera ALTR 19.83 +.02 +11 6.3m 26 o74 50 71 A– C B+ 26.4 Altiris ATRS 20.99 +.29 +27 565 42 o50 13 96 A .. NH AltusPh ALTU 25.25 +.40 –62 93 .. ê9 44 11 B .. E 50.0 Amazon AMZN 35.99 –.78 –5 6.7m 48 o
66 50 71 B B C 28.1 AmbasdGp EPAX 24.60 –.09 +150 153 23 ê38 67 28 C+ C D+24.5 AmcorLtd AMCR 21.86 +.14 –59 20 14 ê27 40 35 D– B D 32.9 AmcoreFnl AMFI 30.81 +.37 +278 203 16 k46 86 16 D A C+ 47.7 Amedisys AMED 35.08 +.24 –23 673 18 o89 67 95 A– D B+ NH Amerco UHAL 99.3 –.19 +34 104 20 ê6 18 3 C– C C 26.1 AmerSvcGp r ASGRE 13.16 –.79 +724 539 35 ê
58 49 53 D+ C A+ 11.0 AmBcpNJ r ABNJ 10.86 –.04 –50 26 72 ê59 67 31 A– B C 39.6 AmCapStr ACAS 35.53 –.31 –20 920 9 o74 63 92 D+ .. A+ NH ACmclLn ACLI 44.07 +.77 –39 153 69 o27 76 4 C– B C 23.7 AmerDental ADPI 13.46 –.13 +143 270 12 ê91 73 67 A+ A B 34.0 AmEglOut r AEOS 28.87 –.37 +10 3.1m 14 o83 40 86 C+ A B+ 20.6 AmEcol ECOL 20.19 +.40 +59 280 30 ê86 90 67 C+ A B– 24.4 AmMedSys AMMD 21.67 +.15 +3 617 31 o44 90 3 B– A C+ 58.7 AmPhrm APPX 29.02 –.23 –69 155 23 o72 65 77 C+ C B– 51.1 AmPhysCp r ACAP 49.46 –.62 +41 61 14 ê22 23 19 B+ C C+ 28.6 AmPwCon r APCC 22.41 +.52 +27 1.9m 27 o91 76 95 A+ C 36.2 ARailcar ARII 33.46 –.17 –68 204 37 ê99 76 94 A– A A NH AmerSciEn ASEI 89.98 +1.04 +57 449 24 o41 27 60 B– C B– 39.0 AmWdmk r AMWD 33.08 –.09 +1 121 20 ê72 67 70 C+ C B 26.6 AmWstBcp AWBC 25.92 –.30 +181 77 19 ê75 52 49 B+ A A 24.0 AmerCar r CRMT 21.26 –.64 +69 153 15 ê48 41 69 C+ .. B+ 11.6 Amerisfe AMSF 11.06 +.46 –76 7 30 ê47 62 23 A– B C+ 30.3 AmrstrCno ASCA 23.55 +.98 +77 414 19 o86 94 41 A A B– 86.9 Amgen r AMGN 73.25 –.59 +43 16m 22 o30 65 12 D B C 29.0 AmsurgA AMSG 22.18 +.10 +48 362 18 o56 5 95 A D B NH Amylin AMLN 46.42 +.28 +32 3.0m .. o81 42 96 A .. A+ 16.4 Anadys ANDS 15.52 +.01 +49 295 .. o74 39 85 A– D A 65.5 Analogic ALOG 63.84 +.29 +49 204 58 x92 76 88 A– D A NH Anaren r ANEN 18.96 –.36 +46 154 35 o34 61 36 D+ B E 33.0 AnchrBWI ABCW 30.18 ... +220 171 13 ê97 85 96 A C A– NH Andersons ANDE 63.81 +1.13 +93 85 18 ê41 29 57 A– D C+ 14.3 Andrew ANDW 12.83 –.12 +23 2.0m 27 o55 10 81 B– D A+ 24.3 Andrx ADRX 23.66 –.06 +148 3.8m 45 o71 98 59 C+ B D–30.0 AngioDyn ANGO 24.98 +.24 –21 123 53 k46 6 63 A B C+ 16.8 AngioTchP ANPI 15.73 –.22 –30 530 18 o92 86 80 B+ B B 19.9 AngloAmer AAUK 18.04 –.17 –40 1.0m 14 ê31 26 21 A B B– 17.2 Anika ANIK 11.59 +.02 –45 70 22 ê88 70 88 C– A B+ 41.2 Ansoft ANST 39.45 +1.01 +24 193 33 ê
95 88 84 C– A A– NH Ansys ANSS 50.23 –.44 +6 339 36 o63 63 66 B– D B– 18.6 ApogeeEnt APOG 17.67 +.12 +83 252 24 ò40 95 4 D A C+ 82.5 ApolloGrpA APOL 52.00 +.14 –13 2.2m 19 ò26 64 26 A– .. E 20.7 ApolloInv AINV 17.95 +.10 +999 8.2m 12 ê96 98 79 A+ A C+ 86.4 AppleCmptr AAPL 64.66 +.35 –22 28m 36 ò55 55 30 B+ A B– 28.6 Applebees APPB 24.36 –.18 –42 530 18 o18 34 12 A– E B– 27.9 ApplFilms AFCO 19.71 –.21 +44 330 56 o32 35 30 A C D 21.1 AppldMatl AMAT 17.49 –.21 +27 41m 26 o28 61 33 D+ C D–24.7 AppldSgnl APSG 19.43 –.06 +32 172 26 o95 99 84 B+ A C 29.9 aQuantive AQNT 23.89 –.28 –18 1.2m 49 o85 85 74 C+ C B+ 57.6 ArchCap ACGL 56.54 –.36 +2 202 18 o35 38 51 D+ C B 28.9 ArcticCat ACAT 23.74 +.44 +111 184 17 ê73 28 98 A D A– 20.7 ArenaPhrm ARNA 18.47 –.04 +74 1.6m .. o39 87 15 D+ A E 37.0 ArgonST STST 29.36 +.07 +37 199 26 ê53 15 86 C+ C B– 37.0 Argonaut AGII 36.18 –.52 +104 363 14 ê90 76 93 B D B+ NH Ariba ARBA 10.76 +.20 +14 1.4m 29 o33 22 38 D+ B B+ 16.5 AriesMar RAMS 13.95 –.26 –6 56 19 ê59 66 56 B+ C D 46.4 ARBest ABFS 41.53 +.13 +12 471 11 o92 76 93 B+ C B 14.3 Arris ARRS 13.83 +1.08 +100 3.9m 22 o24 23 30 C+ C B 37.6 ArrowIntl ARRO 31.05 ... +32 179 28 ò31 9 64 A– E D+11.2 ArtesynTc ATSN 10.92 ... +1 940 42 o72 74 78 C+ C C 48.4 Arthrocare ARTC 45.39 +.32 –15 294 48 o37 76 18 A– C D–38.7 AspectMed ASPM 26.95 –.07 –8 188 74 o93 76 97 A– C B+ 13.7 AspenTech AZPN 12.65 +.14 –16 734 99 o94 76 98 A .. A+ 30.0 AsprevaPh ASPV 28.66 –.21 –69 132 45 o60 85 9 A A B– 32.0 AssetAcc AACC 19.65 –.22 –8 255 12 o57 68 43 D– A B– 35.3 AssocBanc r ASBC 34.04 +.15 +58 681 14 o98 92 77 A A A– 35.4 AstaFund ASFI 33.76 –.34 –23 154 14 ê92 76 97 A– A C 26.3 AsteaIntl ATEA 17.22 –.29 –77 19 18 k85 73 80 A+ C B– 39.6 AstecInd ASTE 34.55 +.12 –5 220 29 o79 49 98 A E B+ 11.2 AsystTech ASYT 10.07 –.09 +187 2.6m 99 o14 8 29 A .. C+ 21.8 AthrGnc AGIX 15.60 +.19 +6 909 .. o93 74 98 A D B+ 25.1 AtherosCom ATHR 23.99 +1.35 +4 1.6m 99 o95 92 92 C A B– 49.9 AtlasAmer ATLS 47.77 –.37 –24 160 25 ê8 18 5 B C D–20.1 Audible ADBL 10.19 –.31 –20 526 .. o
90 70 73 B+ B A– 13.3 Audiocodes AUDC 13.13 +.37 +45 498 42 o3 8 8 A– E E 19.0 AudvoxA VOXX 11.57 –.07 +90 219 .. ò
61 87 38 C– A C+ 48.3 Autodesk ADSK 39.31 +.36 –28 2.1m 30 o83 86 55 C– A B+ 60.7 AvatarHldg AVTR 58.63 –.75 +280 95 10 ê31 75 7 C A D–63.4 AvidTech AVID 43.67 –.58 +20 880 18 o65 61 63 C+ C B+ 35.4 Avocent r AVCT 32.51 +.03 +43 688 25 o37 63 9 A– C B 18.9 AxcanPhrm AXCA 13.00 +.22 –36 519 22 o5 12 12 D+ B E 22.8 AxsysTech AXYS 16.25 +.08 –81 14 17 ê
— B —89 64 88 B B B+ NH BEASystm BEAS 12.24 –.01 –13 6.3m 29 o88 76 92 B D B+ 25.1 BEAerosp BEAV 24.66 +.09 +45 891 44 o81 75 69 B+ B B– 27.4 BJSRest BJRI 25.59 +.60 +210 200 69 ê67 61 46 C+ A B+ 49.8 BOKFnl r BOKF 47.46 +.29 +125 72 15 ê87 76 99 A D B– 18.6 BTU Intl BTUI 14.30 +.60 –14 249 24 ê12 76 2 C+ .. D+ 153 Baidu BIDU 49.02 +.70 –28 615 99 ê81 57 93 A+ E B+ 23.0 BakersFt BKRS 20.34 +.36 –67 17 28 k39 49 52 D+ D B– 12.0 BancCorp TBNC 11.81 +.02 +192 102 99 ê86 60 87 D A A NH BancpInc TBBK 22.18 +.36 +254 106 39 ê27 37 28 D B B– 39.8 BcRhodeIs BARI 35.32 +.07 –56 10 17 ê48 67 47 D+ C C+ 12.2 BkMutual BKMU 11.68 ... +202 445 27 ê69 90 45 D+ A C+ 38.7 BankofOzrk OZRK 36.24 +.38 +179 104 19 k71 76 61 D+ C A– 16.2 BankFncl BFIN 15.96 –.04 +538 223 37 ê98 80 98 C+ A A NH Bankrate RATE 42.54 +1.61 +30 324 74 o68 70 49 D+ B A– 28.9 BkUntdFn BKUNA 27.67 +.18 +33 522 16 ê55 44 62 C+ B B– 33.5 Banner BANR 33.00 +.14 +320 90 18 ê71 63 81 C+ B C 29.0 BarrettBusin BBSI 24.89 –.09 –19 54 21 ê34 52 43 C– D C+ 21.2 BassetFurn BSET 19.45 +.19 +289 93 21 k96 68 93 B+ A B+ 41.4 BeaconRfg BECN 40.87 +.56 +12 313 30 o66 60 37 A+ A B 31.0 BebeStrs BEBE 17.92 +.35 –68 340 24 o54 88 14 C+ A C 47.0 BedBath r BBBY 36.81 –.29 –10 3.0m 20 ò60 60 45 A B C 40.2 BelfuseB BELFB 32.92 +.09 +179 78 17 ê89 47 95 B+ C A+ 30.5 Benihana BNHNA 29.95 +.05 –58 22 22 ê74 97 34 D+ A B+ 11.1 BevHilBcp BHBC 10.41 –.09 +232 106 12 k27 66 6 C+ C C 28.9 Big5Sprt BGFV 19.04 –.22 +30 208 12 ê98 72 97 A+ C A+ 14.2 BigDog BDOG 13.10 –.08 –27 25 24 k71 76 60 B– B C 19.3 BioRefLabs BRLI 18.28 –.04 +38 152 30 o51 7 99 A E B+ 23.0 Biocryst BCRX 19.19 –.17 –70 489 .. o94 89 73 A B B+ 50.7 BiognIdec BIIB 49.19 +.09 –14 3.3m 31 o74 33 97 A D B+ 15.3 Biomarin BMRN 14.43 +.51 +292 3.0m .. o54 76 23 C+ A C+ 40.8 Biomet BMET 36.47 +.09 +8 1.7m 22 ò55 85 13 C+ A B 68.9 Biosite BSTE 50.21 –1.45 +53 387 17 o60 70 60 C+ B D+55.4 BlackBox BBOX 46.94 –.43 +59 192 17 o99 88 89 A– A A 20.4 Blackbaud BLKB 19.93 –.05 –11 451 32 ê56 66 69 D– A D–32.5 Blkboard BBBB 27.40 +.23 –25 338 28 o17 73 2 D– A D–52.7 BluCoat BCSI 19.50 –.23 –44 462 20 o35 90 16 B .. C+ 44.4 BlueNile NILE 32.55 –.29 –55 188 45 o74 56 79 B+ D B 30.1 BobEvans r BOBE 29.75 –.16 +51 664 28 ê84 63 95 B– E A+ 33.6 BonTonStrs BONT 32.45 +.34 +30 203 19 ê70 68 87 C+ D B– 13.4 BooksAMil BAMM 12.64 –.26 +123 53 21 k85 83 65 D A A– 31.9 BostPvtFnl BPFH 31.51 +.41 +108 371 18 ê41 62 37 C– B B– 18.6 Bottmline EPAY 13.15 +.35 –21 217 23 o30 94 18 D B E 46.7 BrightHrz BFAM 34.09 +.06 +185 651 26 ê93 52 99 B+ A A– 30.3 Brightpoint r CELL 29.42 –.08 +5 836 38 o91 57 95 A A B– 50.0 Broadcom r BRCM 44.99 +.21 –15 15m 46 o80 36 99 A+ D A– 13.5 Broadwing BWNG 12.70 +.37 +45 3.1m .. o64 76 57 C+ A D+32.0 BroncoDr BRNC 23.68 –.72 –48 130 33 ê54 63 47 D+ B C+ 16.7 BrklneBncp BRKL 15.81 +.26 +221 728 43 ê20 4 28 A E B+ 17.8 BrooksAut BRKS 13.88 –.33 +37 1.3m 51 o97 80 93 A+ C B+ 71.0 Bucyrus BUCY 69.58 –.23 –4 260 31 ò96 93 72 B+ B A– 41.0 BuffWldWg BWLD 39.43 +1.62 +134 308 33 ê86 90 75 B– C B 26.2 BldrFstSc BLDR 22.85 –.14 –5 131 15 o70 97 44 B– A D+49.6 BldgMat BMHC 36.09 +.75 –16 797 8 o80 75 67 A– C B– 43.6 BusinsObj BOBJ 38.54 +.19 –60 288 30 o
— C —81 67 76 B+ C B– NH CBRL CBRL 47.00 +2.70 +708 8.2m 18 o65 80 33 B+ B C 64.2 CDWCorp r CDWC 58.23 +.21 +50 1.4m 17 o99 94 90 A+ B B+ 46.5 CHRobnsn CHRW 45.29 –.17 +28 1.1m 39 o
10 23 16 B .. B– 30.6 CKX CKXE 14.28 +.28 –28 112 .. ê67 80 41 C A B 31.4 CNS CNXS 23.51 +.84 –13 189 21 o49 89 24 D– A C+ 58.5 CRAIntl CRAI 47.22 +.16 +25 181 21 ê74 63 84 A– .. B NH CRH CRHCY 36.93 +1.38 –53 19 16 ê44 95 24 C– .. B+ 15.4 CRMHlds CRMH 12.49 –.04 +33 62 27 ê64 44 62 B B B 24.8 CSGSystm r CSGS 22.63 –.18 +46 695 19 o64 59 73 C+ D B– NH CTComm r CTCI 14.08 +.49 +418 307 18 ê74 66 51 C+ A B 17.6 CVBFncl CVBF 16.92 +.13 +278 467 18 ê14 9 26 A E D+29.8 CVThera CVTX 23.73 –.20 +1 1.3m .. o38 28 56 A D D–38.3 CabotMic CCMP 33.27 +.26 +12 479 25 o70 94 25 A+ B C 19.1 Cache CACH 16.49 –.21 +42 197 19 o69 58 63 C– B A– 18.6 Cadence r CDNS 18.11 +.08 –4 2.2m 22 o14 14 21 A E C+ 22.5 Cadiz CDZI 16.99 –.01 +89 50 .. ê34 38 46 B+ C D–24.4 Cadmus CDMS 18.80 –.10 –51 11 14 ê90 65 83 A– A B 39.4 CalmsAst CLMS 37.35 –.60 +26 278 29 ê65 67 52 B+ B C 34.5 CalPizzaK CPKI 30.67 +.14 –17 213 26 o64 47 79 D+ A 26.1 CalumetSp CLMT 25.50 ... –93 15 25 ê65 76 45 A D B– 15.2 CmbgAntb CATG 13.47 –.23 –72 21 28 ê97 92 96 A– B C+ 20.4 Candela CLZR 19.01 +.61 –5 391 32 o13 14 22 D+ C C+ 36.8 CapitolFed CFFN 32.80 –.10 –9 60 40 o88 97 75 D+ B B 12.9 CardinalFinl CFNL 12.41 –.09 +197 186 28 ê52 14 94 A– E B 14.4 Cardiome CRME 12.69 +.15 –59 133 .. k56 93 34 D A D 41.5 CareerEd r CECO 35.71 +.29 –31 807 15 o6 9 7 C D C+ 37.8 Carmike CKEC 22.70 –.34 +55 207 32 k
35 34 52 C B D+31.6 Carrizo CRZO 23.63 –.60 +4 404 45 ò96 94 81 C+ A B+ NH CascadeBcp CACB 27.72 +.61 +360 171 22 k29 15 29 A C C+ 16.0 CascdMic CSCD 12.88 –.13 +88 139 18 ê38 30 52 C+ D B+ 14.9 CslaWstA CWST 13.78 +.06 +156 250 59 o58 67 51 B– C B– 27.2 CaseyGnStr CASY 23.39 –.41 +52 528 20 ê39 10 90 C D B 28.3 CastleEgy CECX 22.42 –.42 –53 12 99 ê15 11 7 A– C B– 22.3 CatapltCom CATT 14.02 ... –19 97 20 ê75 74 49 C+ A B 39.8 CathayGenl CATY 37.36 +.59 +236 473 18 ê94 99 86 C+ C B+ 48.0 CavcoInd CVCO 45.75 +.02 –30 20 21 ê67 76 64 C+ .. A 15.0 Cbeyond CBEY 13.56 –.73 +2 104 99 ê93 98 90 B+ C B– 25.0 CeladonGrp r CLDN 21.85 –.83 +149 558 20 ê12 66 9 D .. D+20.6 CelebExp BDAY 12.31 –.03 –84 5 27 k80 6 96 A B A NH Celgene CELG 42.04 +.77 –39 2.6m 99 o49 81 22 C+ B D 13.1 CentenBk CBHI 11.90 +.15 +580 775 36 ê78 96 42 C+ A B– 29.0 CntrFin CLFC 24.60 –.39 +163 158 16 ê77 55 85 E B A 71.5 CEurMed CETV 70.00 +1.00 –14 183 63 o39 85 20 C– B D–44.9 CntlErDst CEDC 36.87 –.29 +187 614 23 o73 65 65 B+ C B 55.6 CntlGardn CENT 52.34 –.26 +34 272 21 ê60 12 89 A+ C C 39.1 CenturyAl CENX 36.22 +.22 –51 356 25 o88 60 92 A– B B 82.9 Cephalon CEPH 73.76 –.14 –48 1.5m 26 o98 98 96 A A C+ 63.8 Ceradyne CRDN 53.14 +.48 –8 988 27 o90 87 85 C B B 49.4 Cerner CERN 47.11 +.39 –49 438 42 o91 34 98 A+ B A– 49.4 Chaparral CHAP 48.04 +1.71 +4 257 13 o30 93 6 E A D+26.3 ChrlClvrd CTHR 13.43 +.76 –8 267 43 ê89 79 78 A+ C B+ 22.5 CharRss CHIC 18.65 +.13 –29 407 26 o94 92 80 A+ B B– 14.1 CharmngSh CHRS 13.62 +.14 +39 1.3m 17 o70 91 35 C A B+ 47.0 Chattem r CHTT 39.07 –.65 +74 532 18 ò45 65 33 D– A B– 24.5 CheckPtSf CHKP 21.54 +.12 –31 1.6m 16 o28 33 33 B+ C D–15.9 CheckersDr CHKR 14.64 –.02 +256 496 19 ê96 94 73 A B B+ 55.4 CheckFree CKFR 49.42 +.11 –23 837 29 o79 91 41 B+ A C+ 39.3 Cheescake CAKE 36.65 +.68 +9 698 33 o24 37 23 D– C B– 36.0 ChemclFinl r CHFC 31.90 +.11 +318 198 15 ê81 59 58 B+ A B+ 40.7 Cherokee CHKE 38.81 –.15 +43 73 19 k78 44 60 A+ A B 54.6 ChldrnsPl PLCE 52.01 +.36 –22 535 22 o61 37 96 D B B– 15.1 ChinaAuto CAAS 11.55 –.07 –82 103 57 k96 96 88 A– A C 44.9 ChinaMed CMED 29.65 –.14 –69 263 35 o28 3 99 B– E C+ 21.7 ChinaNRes CHNR 12.30 ... –32 423 99 ê43 76 12 A– A E 19.9 ChinaTcF CNTF 12.10 +.30 +126 1.5m 13 o79 72 61 A C B– NH Chiron CHIR 45.77 +.26 +123 2.0m 35 o66 64 62 C+ C B 12.7 Cholestech CTEC 11.43 +.10 –19 54 24 ê65 78 46 C+ C B 46.0 CinnFnl r CINF 45.35 +.14 +22 403 14 ê58 64 38 B B B– 45.5 Cintas r CTAS 42.17 –1.57 +192 2.3m 22 o92 82 72 C+ A A– 21.7 Cisco CSCO 21.62 +.37 –9 60m 21 o98 95 96 A+ A D 49.3 CitiTrnds CTRN 41.46 +.11 –66 100 37 ê8 37 12 D– C E 32.1 CitznBkMI CBCF 26.70 +.21 +168 343 14 ê
99 80 90 A– A A+ NH CitrixSys CTXS 35.92 +.66 +27 3.1m 30 o63 77 44 D+ A B– 39.2 CityHldg CHCO 36.69 –.12 +264 145 12 ê41 62 67 C D D–55.3 ClayWEgy CWEI 39.88 –1.27 –8 53 99 ê50 38 77 C+ C D 36.6 CleanHrbr CLHB 31.73 +.53 +5 302 22 o71 76 56 B A C+ 31.0 ClickCmrc CKCM 20.77 –2.23 +139 1.3m 14 o16 18 34 D+ C D–11.5 CliftnSvg r CSBK 10.45 +.08 +475 132 74 ê34 12 59 A– D C+ 25.9 ClincData CLDA 21.02 +.16 –74 5 .. ê61 73 58 C+ C C+ 16.1 CNETNtwk CNET 13.65 –.01 +17 1.8m 52 o63 80 33 D+ A B 14.9 CstlFncl CFCP 13.48 +.01 +406 110 15 ê82 70 52 C+ A A NH Cobiz COBZ 20.32 –.18 +546 222 23 ê63 60 83 C D B 15.0 CobraEltr COBR 12.35 –.27 –82 14 22 ê52 98 4 A– A D–33.1 Cogent COGT 18.27 –.21 +72 1.4m 24 o46 87 25 B– C D 33.8 Cognex CGNX 28.41 +.11 +17 377 38 o96 99 71 B A B 59.4 CognizntTc CTSH 57.07 +.32 –32 917 53 o52 54 41 A– B C 44.8 Cognos COGN 37.78 +.33 +30 1.3m 26 ò69 66 48 A– D A+ 40.2 Coherent COHR 33.78 –.05 +59 485 28 o52 75 20 A A D 29.5 Cohu COHU 19.98 +.08 –15 284 14 o73 55 71 B B B– 27.1 Coinstar CSTR 26.01 ... +16 241 26 o99 97 93 A+ A A 28.3 CldwtrCrk CWTR 26.57 –.43 +27 1.9m 54 o15 30 16 A .. D–19.4 ColeyPhm COLY 15.60 ... +4 80 .. ê57 18 97 A– D B– 14.1 Collagenex CGPI 13.53 +.06 +17 122 .. o28 43 13 B B B– 20.0 CllctUnv r CLCT 14.00 +.09 –35 47 29 ê66 71 84 B– .. B– 19.7 ColorKin CLRK 17.96 –.11 +107 217 85 ê98 91 84 C+ A A+ NH ColumBkg COLB 34.86 +.81 +153 174 18 ê76 57 58 B+ B A– 56.4 ColumSpr COLM 53.50 +.18 –37 211 16 o85 76 93 B C D+28.6 ClmbMckn CMCO 26.07 +.68 –30 114 15 ê39 3 86 A .. B 14.5 CombinRx CRXX 10.84 –.14 –88 9 99 ê3 11 14 E D E 34.5 CmcastA r CMCSA 26.90 –.27 +33 14m 65 o5 11 16 E D D+34.2 CmcstSp CMCSK 26.93 –.22 –21 6.0m 65 o
45 65 43 D– A D 53.6 CmrcBcsh CBSH 51.78 +.04 –32 92 16 k30 56 6 D+ B B+ 22.1 CmclCap CCBI 14.42 +.12 +108 837 11 o61 98 20 C+ A C 24.9 ComrclVeh CVGI 18.96 –.54 +18 159 7 ê26 58 12 C+ B E 43.9 CmwlthTel CTCO 32.53 +.27 +73 323 13 o54 63 44 D A C+ 29.9 CmtyBk r CMTY 28.25 +.25 +371 159 16 ê
Materials Firm, InsurerTurning Sales Around
5 86 Global Crossing 20.79 +3.19 C+ 1,480,7 +9997 95 Xenoport Inc 22.50 +2.41 A 232,6 +187
37 96 SBA Comm 23.86 +2.29 A– 3,077,4 +37016 85 Nastch Phrmceutcal 17.41 +1.64 A 1,278,5 +14876 84 Pioneer Companies 32.75 +3.05 C 221,7 +8665 56 LCA Vision 46.02 +3.37 D 1,641,5 +14284 87 The9 Ltd Ads 24.99 +1.80 C+ 693,3 +31928 73 Radisys 19.97 +1.40 A– 510,7 +22564 96 Escala Group Inc 24.77 +1.61 B– 324,1 –438 84 GenTek Inc 20.01 +1.25 B 78,1 +53063 59 Weyco Group 22.31 +1.32 C– 46,9 +69563 96 Kendle Intl 33.82 +1.98 B– 324,9 +11276 18 Orckit Comm 21.82 +1.26 B+ 879,8 +13967 76 CBRL Grp 47.00 +2.70 B+ 8,163,8 +70818 91 Protherics Plc Ads 16.13 +0.92 A 9 –63
B Y C H R I S T I N A W I S EINVESTOR'S BUSINESS DAILY
The Nasdaq finished Friday with a0.3% gain, despite a bumpy after-noon. Volume was above averageandheavier than itwasThursday.Internet and medical names wereamongtheday’s topperformers.The9 LimitedNCTY climbed 1.80 to24.99 as volume swelled to morethan four times its usual level. TheChina-based gaming Web site,which came public at 17 a share inDecember, broke out of a deep baseMarch 6 and dipped before surginghigherThursdayandFriday.BankrateRATE logged its sixthstraight gain in the past seven trad-ing sessions, rising 1.61 to a recordhighof42.54.Thestockhasclimbed9% since finding support at its10-weekmovingaverage.Digital RiverDRIV, which broke out
March 8, added 1.44 to finish at41.28.TheMinnesota-basedcompa-ny handles online transactions, andits platforms allow shoppers todownload software, images, videoandotherdigitalproducts.AbaxisABAX, which makes portableblood analysis systems, rose 1.09 to22.77 on more than two times typi-cal trade. The stock, which brokeoutofacup-with-handlebase in lateJanuary, recently found support atits 10-weekmovigaverage.SeaBright InsuranceSEAB brokeout of a 10-week base, climbing 84cents to 17.64 on double typicaltrade. The workers’ compensationhad its IPOinJanuary2005.Manufactured home builder*Cavco IndustriesCVCO edged up 2cents to 45.75. The stock hasmade astringof tightweeklycloses.On the downside,Mobile MiniMINIfell 1.14 to 26.37 as volume more
than tripled. That left it 9% short ofits Feb. 24 record high. Last monthit broke out of an 11-week base, andFriday’smove left it 2%above its old25.77 buy point. The Arizona-basedcompany provides storage contain-ersandmobileoffices.Encore WireWIRE lost ground forthe second straight day, falling 1.01to30.14onmorethantwotimestypi-cal trade. The stock halted its slidejust above the 50-day moving aver-age. Despite the drop, the stock re-mained 10% above the 27.42 buypoint in itsFeb. 1breakout.Adayafterhittingarecordhigh, in-Ventiv HealthVTIV gave back 1.06 toclose at 31.70 as tradenearly tripled.The stock is up 11% from the 28.05buypoint in itsMarch9breakout.
AVIALL INC (AVL) Grp 65 o$39.1532.0M Shares 95 Comp. Rating 91 EPS RS 83 ROE 15%PROVIDES AVIATION PARTS FROM 220 OEMS TO GOVERNMENT/MILITARY,GENERAL AVIATION AND COMMERCIAL AIRLINE CUSTOMERS.
+22% Ann. EPS Gro PE 24 Avg. Daily Vol 356,200 Debt 47%Last Qtr Eps +43%5 Prior Qtr +37%6 Last Qtr Sales +28%4 Qtrs EPS) 15%Eps Due 4/20
Acc/Dis A-Sup/Demand 79
COMFORT SYSTEMS U S A (FIX) Grp 16 $12.7538.1M Shares 98 Comp. Rating 93 EPS RS 93 ROE 8%PROVIDES HEATING, VENTILATION AND AIR CONDITIONING SERVICES FORTHE COMMERCIAL, INDUSTRIAL AND INSTITUTIONAL MARKETS
+47% Ann. EPS Gro PE 29 Avg. Daily Vol 220,100 Debt 0%Last Qtr Eps +50%6 Prior Qtr +88%5 Last Qtr Sales +18%3 Qtrs EPS) 15%Eps Due 5/4
Acc/Dis ASup/Demand 59
M S C INDUSTRIAL DRCT (MSM) Grp 55 $50.6045.9M Shares 99 Comp. Rating 88 EPS RS 91 ROE 19%DISTRIBUTES MAINTENANCE, REPAIR AND OPERATIONS SUPPLIES VIA 4DISTRIBUTION CENTERS AND 90 BRANCH OFFICES IN 38 STATES.
+44% Ann. EPS Gro PE 30 Avg. Daily Vol 313,600 Debt 0%Last Qtr Eps +27%6 Prior Qtr +28%6 Last Qtr Sales +12%13 Qtrs EPS) 15%Eps Due 4/5
Acc/Dis A-Sup/Demand 54
TECHNITROL INC (TNL) Grp 24 o$23.3937.7M Shares 97 Comp. Rating 85 EPS RS 90 ROE 6%MANUFACTURES PRECISION-ENGINEERED PASSIVE MAGNETICS-BASED ELEC-TRONIC COMPONENTS AND ELECTRICAL CONTACT PRODUCTS
+37% Ann. EPS Gro PE 33 Avg. Daily Vol 190,700 Debt 8%Last Qtr Eps +81%5 Prior Qtr -6%5 Last Qtr Sales +28%1 Qtrs EPS) 15%Eps Due 4/25
Acc/Dis A+Sup/Demand 54
C S X CORP (CSX) Grp 27 o$59.46217.2M Shares 95 Comp. Rating 91 EPS RS 82 ROE 10%OPERATES 21,000-MILE RAIL SYSTEM IN 23 STATES, THE DISTRICT OFCOLUMBIA AND TWO CANADIAN PROVINCES.
+19% Ann. EPS Gro PE 18 Avg. D. Vol 1,597,900 Debt 64%Last Qtr Eps +45%5 Prior Qtr +38%6 Last Qtr Sales +2%5 Qtrs EPS) 15%Eps Due 4/28
Acc/Dis B+Sup/Demand 68
EAGLE MATERIALS INC (EXP) Grp 34 o$59.9724.9M Shares 99 Comp. Rating 93 EPS RS 95 ROE 23%MANUFACTURES GYPSUM WALLBOARD AND CEMENT PRODUCTS FORRESIDENTIAL, COMMERCIAL AND INFRASTRUCTURE APPLICATIONS.
+40% Ann. EPS Gro PE 23 Avg. D. Vol 1,206,100 Debt 11%Last Qtr Eps +55%5 Prior Qtr +48%6 Last Qtr Sales +41%9 Qtrs EPS) 15%Eps Due 5/4
Acc/Dis B+Sup/Demand 94
NOMURA HOLDINGS INC ADR (NMR) Grp 15 $21.611921M Shares 97 Comp. Rating 88 EPS RS 89 ROE 5%LEADING SECURITIES AND INVESTMENT BANKING FIRM IN JAPAN WITHWORLDWIDE OPERATIONS.
+48% Ann. EPS Gro PE 21 Avg. Daily Vol 476,800 Debt 150%Last Qtr Eps +323%6 Prior Qtr+1500%5 Last Qtr Sales +64%2 Qtrs EPS) 15%Eps Due 4/28R&D 2%
Acc/Dis B-Sup/Demand 5
UNITED INDUSTRIAL CORP (UIC) Grp 142 o$55.509.5M Shares 96 Comp. Rating 82 EPS RS 92 ROE 131%MANUFACTURES UNMANNED AERIAL VEHICLES, TRAINING/SIMULATION SYS-TEMS AND AUTOMATED AIRCRAFT TEST/MAINTENANCE EQUIPMENT
+48% Ann. EPS Gro PE 21 Avg. Daily Vol 96,100 Debt 473%Last Qtr Eps +69%5 Prior Qtr +11%5 Last Qtr Sales +72%1 Qtrs EPS) 15%Eps Due 5/9
Acc/Dis A+Sup/Demand 74
.............................................................................................................................................................................................................................................
DAILY STOCK ANALYSIS*For an analysis of CVCO’s IBD chartand Stock Checkup, go to investors.com
T H E R E A L M O S T A C T I V E
“Graphic displays” of stocks over $12 that hit new price highs (names boldfaced) or are near new highs (regular type face) or had greatest % increase in volume on stocks over $15 and up 50¢ or more (name underlined). Stocks that are extended in priceover 15% from a consolidation (or basing) period have been omitted. “How to Read” chart appears on the NYSE every Tuesday. Stocks highlighted are not recommendations and should be researched further before investing.
Sponsored by:
Visit Investors.com to see Stocks on the Move Updated throughout the day.

INVESTOR'S BUSINESS DAILY NASDAQ MAIN TABLES — Stocks $10 And Above MONDAY, MARCH 20, 2006 B13
SMARTSELECT® COMPOSITE RATINGEARNINGS PER SHARERELATIVE PRICE STRENGTHINDUSTRY GROUP RELATIVE STRENGTHSALES+PROFIT MARGINS+ROEACCUMULATION/DISTRIBUTION
52-wk Stock & Close Vol% Vol PHigh Symbol Price Chg Chg 1000 E666666
SMARTSELECT® COMPOSITE RATINGEARNINGS PER SHARERELATIVE PRICE STRENGTHINDUSTRY GROUP RELATIVE STRENGTHSALES+PROFIT MARGINS+ROEACCUMULATION/DISTRIBUTION
52-wk Stock & Close Vol% Vol PHigh Symbol Price Chg Chg 1000 E666666
SMARTSELECT® COMPOSITE RATINGEARNINGS PER SHARERELATIVE PRICE STRENGTHINDUSTRY GROUP RELATIVE STRENGTHSALES+PROFIT MARGINS+ROEACCUMULATION/DISTRIBUTION
52-wk Stock & Close Vol% Vol PHigh Symbol Price Chg Chg 1000 E666666
SMARTSELECT® COMPOSITE RATINGEARNINGS PER SHARERELATIVE PRICE STRENGTHINDUSTRY GROUP RELATIVE STRENGTHSALES+PROFIT MARGINS+ROEACCUMULATION/DISTRIBUTION
52-wk Stock & Close Vol% Vol PHigh Symbol Price Chg Chg 1000 E666666
SMARTSELECT® COMPOSITE RATINGEARNINGS PER SHARERELATIVE PRICE STRENGTHINDUSTRY GROUP RELATIVE STRENGTHSALES+PROFIT MARGINS+ROEACCUMULATION/DISTRIBUTION
52-wk Stock & Close Vol% Vol PHigh Symbol Price Chg Chg 1000 E666666
SMARTSELECT® COMPOSITE RATINGEARNINGS PER SHARERELATIVE PRICE STRENGTHINDUSTRY GROUP RELATIVE STRENGTHSALES+PROFIT MARGINS+ROEACCUMULATION/DISTRIBUTION
52-wk Stock & Close Vol% Vol PHigh Symbol Price Chg Chg 1000 E666666 Black Bar =IBD Top Fundamental stock
99 88 77 A+ B C+ 40.0 p yCompany SYMB 12.34 +1.23 +123 123 45 -o
Composite RatingBold=95or higher
EarningsRatingg
Relative Price Strength Bold=Close Pricewithin 10% of52 week Highg Stock Symboly
ClosePrice Changeg
Vol%Changeg
Vol1000
PE
Industry Group Relative StrengthSales+Profi t Margins+ROE
Accumulation/DistributionUnderline=New Low or down 1 pointBold=New High or up 1 pointBold Ital.=New issue and EPS Rating of 80 or moreand Rel Str of 80 or more
% more than or less than avg. daily vol.
r = companyrebought stock
-= earns. in IBD
k = earnings duex = x-dividend, or
x-right
o = listed options
A+=Best E=Worst
99=Best 1=Worst
34 68 27 D+ B E 35.9 CmntyTrBp CTBI 31.68 –.11 +212 116 13 k70 63 53 D+ A A– NH CompsBcs CBSS 51.36 +.23 –1 522 16 o53 65 52 C B D+46.9 CompuCrd CCRT 37.36 –.38 –20 373 11 o93 93 84 C A B– 47.7 CmptrPr CPSI 46.60 +.21 –35 90 34 ê2 26 5 C+ .. E 21.1 ComsysIT CITP 10.77 +.25 +174 112 13 ê
61 95 16 A– A D+45.6 Comtech CMTL 30.17 +.17 +3 483 17 o46 76 18 B+ C C+ 29.6 Comverse CMVT 24.29 –.03 +66 4.6m 45 ò42 32 90 C+ D D 17.0 Conceptus CPTS 13.75 +.34 –28 155 .. o96 73 91 A– A B+ 17.5 ConcurTch CNQR 16.23 +.46 +55 532 73 o6 27 3 C+ C E 32.6 Conmed r CNMD 18.54 +.07 +10 325 13 o
37 40 24 A– A C+ 29.5 Connetics CNCT 16.80 +.27 +32 665 26 o93 89 86 A– A C+ 45.0 Conns CONN 36.96 –.04 –11 191 23 k41 3 94 C+ .. A– NH ConorMed CONR 29.13 +.36 –2 417 .. o49 47 61 C+ .. A– 15.4 ConsolCom CNSL 14.94 +.04 +4 240 99 ê89 63 87 C B A 28.5 ConsWater CWCO 26.35 –1.06 +41 74 57 ê80 65 63 B A B– 27.2 Copart CPRT 26.86 –.05 –5 381 24 o48 23 74 D C B+ 40.7 CoreMark CORE 39.20 –.22 –76 11 46 ê32 35 45 D C B– 17.4 CornthClg COCO 14.48 +.18 +40 1.4m 25 o92 93 77 B– A C 103 CorpExec EXBD 96.04 –.25 +52 491 52 o65 86 43 D– A C+ 65.5 CorusBkshr CORS 57.91 –.75 +32 332 12 o11 39 10 C+ D E 28.1 CostPlus CPWM 17.47 –.39 +110 1.2m 17 o67 42 65 B– C A 53.0 CostarGrp CSGP 50.11 –.91 +51 198 99 o80 79 74 D+ C A– NH Costco COST 55.88 +.88 +65 4.3m 25 o59 36 60 B B B 17.0 Covansys CVNS 15.93 +.05 +106 253 16 ê26 22 49 B+ D C+ 21.6 CovenantTr r CVTI 14.59 –.26 +192 239 33 ê85 96 92 C A E 31.4 CredoPetr CRED 20.70 –.06 –62 45 36 k91 49 81 A A A 32.8 Cree CREE 31.97 +.46 +2 1.2m 28 ò92 96 65 A A C 14.9 Cresud CRESY 13.88 +.23 –26 103 7 ê22 76 10 C– .. 32.5 Crocs CROX 24.33 –.77 –73 402 47 o27 43 34 C+ E B– 20.3 CrssCtryHlt CCRN 17.67 –.25 +169 298 29 o80 83 91 D C C+ 83.6 CrosstxInc XTXI 79.76 –.29 +18 64 21 ê57 84 37 D B B 45.5 CrosstxLP XTEX 36.71 +.01 –47 28 76 ê54 39 71 A D C+ 30.5 Crucell CRXL 24.79 –.11 +106 353 .. o67 63 52 B A B 36.8 Cryptlgc r CRYP 24.10 –.41 –39 128 18 o96 68 93 B A A– 83.5 Ctripcom CTRP 81.76 +.32 –45 161 48 o80 45 94 A D B+ 25.0 CubistPhr CBST 24.71 +.49 +16 901 .. o4 8 13 E D C+ 14.8 CumulsMdi r CMLS 11.62 +.03 +7 607 89 o
90 97 79 A– B C 44.2 Cutera CUTR 27.48 –.05 –63 129 27 o40 35 39 B+ D B 13.6 CuttrBck CBUK 12.01 +.01 –49 13 21 ê2 3 3 C+ E D 47.8 Cyberonics CYBX 25.26 –.34 +8 632 .. o
37 33 63 B– C D–16.3 CybrOptcs r CYBE 14.74 +.09 –66 11 38 ê73 39 87 A D B+ 50.4 Cymer CYMI 43.85 –.89 +45 1.3m 34 o28 33 17 A– A E 22.8 Cynosure CYNO 18.39 +.34 –62 79 65 ê92 88 71 C+ A B+ 30.8 Cytyc r CYTC 29.56 –.36 +25 933 30 o
— D —81 75 56 A B B– 30.8 DSPGroup DSPG 27.33 –.34 +73 403 27 o56 34 75 C B B– 20.5 DTSInc DTSI 19.41 +.04 +62 182 37 ê99 98 99 A– B B+ 30.2 DXPEnterpr DXPE 29.84 –.15 –6 200 31 ê53 67 45 C+ C B– 42.0 DadeBehr r DADE 37.36 +.14 –29 650 26 o98 83 94 B+ B A 39.1 Daktronics DAKT 38.96 +.12 +52 184 46 o73 67 66 A– D B– 39.8 Datascope DSCP 38.80 –.13 +99 117 23 ê22 19 23 A– A E 34.7 DawsnGeo DWSN 25.94 +.13 –58 45 17 ê27 17 67 B .. C+ 17.5 DayStar DSTI 12.90 –.36 –56 132 .. k28 14 59 A– .. C 24.1 DealerTrk TRAK 21.49 –.14 +121 228 82 ê95 92 81 C– A A– 40.0 DeckrsOut DECK 36.34 –.11 –26 262 14 o51 82 7 A+ B C 42.0 DellInc DELL 29.08 –.37 –20 19m 18 o33 18 73 C B D–24.9 DeltaPetrol DPTR 19.59 –.58 +22 752 .. o34 48 24 C C B+ 20.4 Dendrite DRTE 14.83 +.41 +23 668 21 o63 79 49 D+ C B 58.4 Dentsply XRAY 57.41 +.31 +5 519 21 o8 18 3 A C E 17.1 Deswell DSWL 9.00 –.01 –48 18 11 ê
49 5 88 A– .. A– 20.9 DexCom DXCM 19.28 –.77 –9 139 .. ê21 45 10 D B A– 28.0 DialysisCp DCAI 12.78 +.03 –39 68 60 ê19 33 12 D– A C 23.1 DiamndFds DMND 17.86 –.13 +132 106 99 ê94 63 95 A B B+ NH Digene DIGE 43.91 +.31 –6 305 91 o30 44 28 C+ C B– 15.4 DigiIntl DGII 11.14 –.28 +111 315 21 ò87 95 89 C– C C+ 37.7 DgInsght r DGIN 35.51 +.08 +13 475 40 o99 97 83 A A B+ 41.8 DigitalRiver r DRIV 41.28 +1.44 +25 1.4m 32 o90 83 75 B+ B B– 14.7 Digitas r DTAS 13.92 –.33 +20 1.1m 28 o21 32 20 D+ B C+ 16.7 DimeCmty r DCOM 14.22 –.26 +77 229 13 ê97 81 92 A A B 40.3 Diodes DIOD 37.53 +.28 –21 291 28 o66 53 72 B– B C+ NH Dionex r DNEX 59.69 +.50 +170 259 28 ê34 45 29 C+ B C+ 21.9 DirectGen r DRCT 17.14 +.01 +28 163 9 ê41 47 59 C .. B 16.0 DirectedE DEIX 15.45 +.45 –47 68 29 ê8 4 20 D– C C+ 16.2 DiscHldgA DISCA 14.59 –.10 +4 981 99 o
20 32 18 B– D B– 19.2 DixieGroup DXYN 14.85 –.15 +298 99 19 ê86 72 87 A .. A– 16.9 DollarFin DLLR 16.15 –.41 +109 282 94 ê63 60 62 C B B– 29.0 DollarTree DLTR 27.37 +.23 –38 677 17 o84 91 65 C+ B B 25.7 DonegalA DGICA 24.04 +.36 +281 107 12 ê52 78 34 C A D–30.7 DorchMin DMLP 25.10 +.27 –35 24 13 ê32 5 55 A D B 21.5 DOVPhrma DOVP 17.00 –.05 –40 269 .. o99 88 96 A+ A B 46.7 DressBarn DBRN 45.29 +.86 0 666 24 o37 99 3 D+ A D–21.2 DryShips DRYS 10.51 –.09 –35 297 2 o77 81 65 C+ C B+ 25.5 Duratek DRTK 21.74 –.01 –14 245 17 ê60 76 44 B C C 21.1 Dynamex r DDMX 19.40 –.02 +112 85 20 ê99 93 95 A+ A B+ 38.5 DynamcMtls BOOM 35.00 +.66 –31 575 40 ê42 67 23 B C C+ 18.2 DynmcRsch DRCO 14.97 –.01 –52 15 13 ê
— E —77 32 99 A– .. A+ NH EDAPTMS EDAP 15.12 +1.82 +316 268 .. ê83 76 62 A– B B 12.4 EFJInc EFJI 10.52 –.08 –62 91 17 o98 98 94 A+ D B+ 44.2 EGL r EAGL 43.66 –.15 +75 737 34 o97 96 87 C+ B A 26.0 EMCIns EMCI 25.45 –.10 +109 62 8 ê62 68 51 A– C C+ 19.1 EMSTech ELMG 17.34 –.06 –7 115 20 ê57 83 65 C– C E 23.4 EPIQSys EPIQ 19.71 +.50 +75 220 22 o32 18 73 C+ .. B+ 21.2 ev3Inc EVVV 17.49 +.48 +41 427 .. o3 3 16 D+ .. C+ 17.9 EagleBlk EGLE 13.23 +.03 –57 131 15 o
90 91 52 C+ A A– 38.9 EWBncp EWBC 38.24 +.48 +17 248 19 ò59 98 22 B A E 47.9 eBay EBAY 38.22 –.15 –17 11m 44 o30 74 36 E .. C+ 32.3 Echostar DISH 29.10 ... –7 1.5m 15 o80 76 88 C D B+ 26.3 Eclipsys ECLP 24.03 –.14 +29 889 99 o75 51 87 B B B– 21.8 eCollege ECLG 19.78 +.20 +53 236 43 o79 99 67 C A D–34.6 EdgePetro EPEX 23.48 –.31 –32 386 12 o86 97 80 D B C 42.0 EducMgmt EDMC 41.16 +.11 +25 1.4m 26 o36 24 73 C– E B 19.8 ElbitMed EMITF 19.15 +.15 –94 2 99 k61 17 66 A– B B+ 17.3 ElectrRnt ELRC 15.80 +.04 +228 122 17 k31 5 66 A D D+26.8 ElecSci ESIO 24.72 +.45 +100 366 99 ò20 41 14 D– C B+ 67.5 ElecArts ERTS 52.58 –.43 –6 3.2m 57 o76 78 74 C– C B– 29.4 ElecImag EFII 26.93 +.29 +11 604 29 o60 60 49 C C A– 25.3 ElizArden RDEN 22.97 –.93 +206 792 17 o41 14 57 B D A 14.6 ELong LONG 11.79 –.34 +12 36 .. k21 28 50 C .. C+ 19.3 Emageon EMAG 15.99 –.30 –16 216 .. ê60 70 65 C D B 11.7 WebMD r HLTH 10.30 –.12 –58 1.2m 49 o3 10 8 E E C+ 24.5 EmmisA EMMS 16.57 –.43 +45 663 99 ò
70 95 17 A A C+ 20.2 EncoreCap ECPG 16.48 +.26 +187 364 12 ê97 96 98 B+ A B– 36.6 EncoreWire WIRE 30.14 –1.01 +156 1.4m 14 o97 98 75 A– A B– 34.0 EndoPhrm ENDP 32.75 –.15 –66 626 18 o9 24 3 A– D B– 55.4 Endwave ENWV 12.71 –.48 –23 224 99 o
49 19 92 B C C+ 57.8 EnergyCnv ENER 42.34 –.91 –54 952 .. o67 74 45 A D B 12.0 Entegris ENTG 10.57 +.01 +93 1.9m 70 ò58 86 13 A– A D+16.6 EpicorSftw EPIC 11.80 –.20 +30 705 13 o90 63 85 A D A NH Equinix EQIX 56.05 +1.71 +27 479 .. ê48 50 60 C B C+ 18.5 eResearch r ERES 14.95 +.43 +32 933 49 o60 52 61 A– .. A– NH Ericsn ERICY 37.23 +.68 +8 2.5m 18 o39 47 33 C+ B C+ 55.7 ErieIndty ERIE 52.90 +.04 +13 56 16 ê84 64 96 B– A D+35.0 EscalaGp ESCL 24.77 +1.61 –4 324 17 ê29 13 55 C+ .. A– 14.5 Eschelon ESCH 14.27 +.02 –20 75 .. ê65 76 55 D+ B B+ 25.1 EssexCp KEYW 21.00 +.15 +2 310 55 o17 41 5 D+ B C+ 19.0 EuroBanc r EUBK 11.88 +.04 +31 68 15 ê96 69 88 A B A– NH EuronetWW EEFT 37.96 +1.05 +114 1.1m 52 o52 20 97 B– E B+ 14.3 EuroTrust EURO 13.00 +.14 +8 40 .. ê66 23 96 B D A 17.5 EvergrnSlr ESLR 15.35 –1.89 +248 11m .. o86 47 99 B+ D A+ 19.6 Everlast EVST 18.83 –.15 –54 66 40 ê56 76 30 A D B 16.8 Exar EXAR 13.24 +.02 +42 458 69 o90 78 72 A– C A 30.0 ExcelTech XLTC 29.85 –.01 +68 205 22 ê72 29 92 A E A– 12.2 Exelixis EXEL 11.78 +.28 +39 698 .. o11 55 5 B .. E 27.6 Expedia EXPE 18.18 +.04 +52 4.0m 15 o99 90 89 A+ B A 84.5 Expedtrs EXPD 82.86 –.28 +13 838 47 o94 95 91 B– C B 95.0 ExprsScrpt ESRX 90.37 –.34 –29 1.2m 34 o99 96 97 A C A– NH EzcorpClA EZPW 26.41 +.50 –32 127 21 o
— F —99 98 88 A A B+ 71.5 F5Netwrks FFIV 69.93 +1.86 –35 724 43 o4 10 16 B– E E 26.0 FEI FEIC 19.85 –.47 –1 438 .. o
81 94 56 C+ B C+ 39.8 FPICIns FPIC 36.99 –.40 +93 108 11 ê50 51 58 B+ D C+ 15.0 FmsDaves DAVE 13.02 –.08 –87 8 32 o43 84 26 C– B D 22.5 FargoElec FRGO 17.26 –.09 +37 140 22 ê14 40 2 B– B D+31.2 FaroTech FARO 13.44 +.07 +5 388 23 o98 84 87 B+ A A– 46.7 Fastenal r FAST 46.13 +.37 –6 1.0m 41 ò78 91 67 D+ B C 35.0 FideltyBnk FFFL 33.62 –.11 +122 233 26 ê44 66 23 D A B– 44.7 FifthThirdBc FITB 39.21 +.04 –5 1.9m 14 ò61 83 37 C+ B B 21.2 51Job r JOBS 14.61 +.09 –44 49 56 ê68 79 38 A– D B+ 30.3 FileNet FILE 26.58 +.01 +7 326 27 o47 53 21 A+ B C+ 23.4 FinishLineA FINL 17.16 +.03 –16 474 13 ò44 78 13 B A D 31.1 FirstAdvn FADV 23.00 –.32 +55 105 22 ê55 81 42 D– A D–21.3 FirstBusey BUSE 20.69 +.25 +435 111 15 ê99 94 94 A B A+ NH FstCshFinl FCFS 19.93 +.35 +38 520 25 ê30 33 36 D+ B C+ 26.9 FstChartr FCTR 24.16 +.26 +385 233 16 ê93 92 71 C+ A A– 61.6 FstComBc FCBP 59.01 +.06 +229 311 19 k13 23 13 D+ C C+ 20.3 FstFnlOH FFBC 16.62 –.01 +331 293 19 ê95 65 83 A– A A NH FirstHznPh FHRX 23.45 +.66 +132 1.5m 24 o40 58 51 D– B D 29.2 FirstIndiana r FINB 26.71 –.46 +21 102 18 ê30 48 25 D– C B 29.4 FirstMrcht FRME 25.21 –.23 +155 143 15 ê58 54 46 D– A A– 37.6 FirstMidIL r FMBI 37.03 +.26 +122 514 17 ê64 90 37 D+ A C 15.2 FNiagFnl r FNFG 14.49 +.02 +10 1.3m 16 ê74 77 69 D+ B C+ 25.9 FirstPlace FPFC 25.32 –.19 +452 160 15 ê84 99 59 D+ B B+ 11.0 FstSecGrp FSGI 10.90 +.20 –41 16 23 ê71 61 74 D– B A– NH FirstSource SRCE 28.65 +.27 +262 89 17 ê89 88 71 C+ B B 27.1 FirstStBcp FSNM 25.78 +.66 +288 215 18 ê21 34 16 D– B B– 29.1 Firstmerit r FMER 24.83 ... +100 495 15 o84 82 65 B+ B B– 27.8 Firstservice r FSRV 25.53 –.66 +53 36 21 ê63 80 35 A B D–46.9 Fiserv r FISV 42.39 –.27 –9 1.6m 18 o54 18 78 A D B+ 24.5 FlamelTech FLML 20.93 –.12 –38 125 .. o70 74 52 B+ C B 14.1 Flanders FLDR 11.44 +.18 +95 320 25 ê15 28 9 A E D+14.4 FlextrnInt FLEX 10.15 –.02 –27 4.4m 14 o67 86 33 D+ B A+ 36.4 FLIRSystms r FLIR 27.15 –.19 –37 406 23 o77 53 97 A– E B 14.1 FlowIntl FLOW 12.75 +.17 +16 396 .. ê39 58 28 D+ A C 19.6 FlshngFnl FFIC 17.06 +.04 +112 176 12 ê97 76 99 B+ A B+ 58.0 FocusMed FMCN 55.70 –1.13 –44 386 92 ê95 88 89 A B C+ 42.0 FormFactor FORM 35.41 +.05 +61 1.3m 55 o79 58 79 B– C A– 23.1 ForrstrRes FORR 22.42 +.99 +108 143 32 ê87 87 58 B+ A B 40.9 FrwrdAir r FWRD 36.95 –.65 +52 437 26 ê13 44 9 E B D 26.4 Fossil r FOSL 18.04 +.66 +16 819 17 o91 74 94 A+ D B 20.0 FosterLB FSTR 19.32 –.38 +382 137 37 ê78 76 97 A– .. C+ 53.7 FosterWh FWLT 47.75 +.56 –50 530 37 o78 54 89 C+ C B+ 16.9 FndryNtwk FDRY 16.38 –.25 +134 4.4m 41 o23 76 8 C+ D D 55.2 FoxHollow FOXH 29.82 +.29 –56 301 .. o25 28 24 D+ A C 19.8 FranklnBk FBTX 17.45 +.26 +107 225 13 ê83 73 66 B+ B B– NH FrnklnElc FELE 47.65 +.77 +239 175 23 k
20 68 10 D+ D C+ 20.0 Freds FRED 13.61 +.19 +268 1.5m 18 ò89 76 99 A+ .. B+ 71.7 FrghtCar RAIL 69.41 +1.67 +55 389 18 o86 82 62 C+ A B 33.6 FrontrFn FTBK 32.75 +.09 +381 180 17 ê70 98 41 B+ C B– 14.3 FrozenFood FFEX 11.06 –.79 +93 287 11 k94 49 96 B+ A A 14.0 FuelTech FTEK 13.20 +.03 –19 169 57 ê33 25 54 B E B+ 12.3 FuelClErgy FCEL 10.45 +.04 –29 535 .. o14 26 21 C E C 38.0 FujiPhto FUJIY 32.47 +.17 –28 150 26 ê36 64 30 D A E 18.9 Fulton Fincl r FULT 17.36 +.04 –55 161 15 ò75 58 70 C– B A 12.2 FundTech FNDT 12.05 +.10 –39 33 26 ê
— G —49 53 41 B C B 43.1 G&KSvc GKSR 40.78 +.79 +262 195 21 ê33 68 17 D+ B D 24.5 GBTBanc r GBTB 21.06 –.19 +177 92 21 ê97 96 90 A+ A D+61.5 GFIGrp GFIG 50.79 +.94 +41 329 28 o70 76 96 C A E 50.5 GMXResrcs GMXR 35.27 +.03 –54 193 48 o24 17 38 B D B– 21.3 GSICmmrc GSIC 16.51 +.25 +21 409 99 o46 5 71 A D B 13.5 GSIGroup r GSIG 11.80 –.37 +4 228 51 o54 13 78 A D A– 13.2 GTxInc GTXI 11.65 –.06 –21 90 .. o91 76 96 B– D A– NH GaiamA GAIA 15.89 –.11 +37 67 99 ê26 40 11 A– B C+ 25.5 GamPtrs GPIC 13.15 +.20 –36 20 30 k99 96 89 A– A A+ NH Garmin GRMN 77.09 +.45 –27 931 27 o95 90 82 A+ B B– 35.0 Gehl GEHL 32.13 +.55 +85 195 16 ê98 96 74 A A A– 56.0 GenProbe GPRO 54.95 –.23 +21 459 47 o22 33 11 D+ A D+21.1 GencoShip GSTL 16.93 ... –65 77 6 ê87 81 74 C+ D A+ 11.7 GenComm GNCMA 11.62 +.18 +149 504 30 o54 57 55 B– D B– 48.0 GenesisH GHCI 43.13 +.60 +10 303 17 ê56 80 39 A C D+27.7 GenesMcr GNSS 18.52 –.90 +103 3.4m 24 o88 84 78 B– C B+ 64.0 GenlyteGrp GLYT 61.46 +.03 +258 239 19 ê12 18 35 C+ .. C+ 17.7 Genomic GHDX 11.02 –.33 –35 109 .. ê61 38 84 B E B NH GenTek GETI 20.01 +1.25 +530 78 62 ê32 67 19 D B C 21.0 Gentex GNTX 16.79 –.04 +7 1.1m 23 o44 78 45 D D B– 20.8 GntvaHlth r GTIV 17.28 +.85 +189 718 24 o76 80 44 A A D+77.8 Genzyme GENZ 69.56 +.14 –7 2.1m 30 o74 97 30 C A A 18.0 GeoResourc GEOI 10.57 –.24 –71 88 19 k46 78 31 B C D–30.2 GevityHR r GVHR 22.91 –.10 +49 688 17 o87 64 78 A+ C B 27.6 GibrltrIn ROCK 27.38 +.54 +77 227 15 o99 99 88 A A B– 64.7 GileadSci GILD 63.31 +.42 –11 3.6m 37 o39 76 9 A– C D+32.7 GivenImg GIVN 22.75 +.04 –59 40 81 o83 84 57 C+ A B– 33.5 GlacrBnc GBCI 31.49 +.44 +242 247 19 o58 97 18 A– B D–26.4 GldstnCap GLAD 21.45 ... +125 123 13 ê18 3 43 A– .. D+16.3 GladstInv GAIN 15.11 –.02 +152 147 79 ê32 5 86 C+ E C+ 21.0 GlblCrsg GLBC 20.79 +3.19 +999 1.5m .. o62 71 39 B– A C 38.1 GlobalImg r GISX 35.97 +.01 +144 230 14 o55 14 80 A– C B– 15.2 GloblInds GLBL 13.85 +.09 +90 1.8m 43 o73 50 76 B B A– 15.8 GlblSrcs GSOL 10.56 –.42 –26 27 31 ê70 70 61 D+ B B+ 15.3 Golar GLNG 14.31 +.14 +11 117 27 ê70 66 70 D– A B 18.6 GoldBanc r GLDB 18.41 +.05 +34 429 24 o1 6 4 E C E 23.9 GoldKist GKIS 12.52 +.57 +152 1.5m 5 o
63 68 56 B– B C+ 32.0 GldTlcm GLDN 30.00 +.09 +152 230 14 o64 83 68 C+ .. B– 22.1 GolfGalxy GGXY 21.50 +.84 +130 62 46 ê84 98 69 C+ A D+ 475 Google GOOG 339.8 +1.02 –44 8.5m 58 o24 58 8 B D B 25.9 GrWolfRes WOLF 10.86 +.11 +63 493 .. o53 59 47 C+ B C+ 28.0 GreaterBay r GBBK 27.61 +.48 +159 807 17 o67 72 52 D+ B B 29.9 GrnCntyBcs GCBS 29.15 –.23 +206 71 16 ê45 87 14 C+ B C+ 65.7 GuitarCtrs GTRC 49.12 +.85 +20 644 17 o32 73 15 B+ C E 30.3 GulfIsl GIFI 22.22 –.02 +45 134 21 ê56 76 21 A– A C+ 34.8 GulfMark GMRK 27.01 –.55 +34 225 14 ê55 76 27 C A 16.0 Gulfport GPOR 14.69 –.30 +17 29 34 ê98 89 94 A+ C A 26.3 Gymboree r GYMB 25.65 +.15 +22 855 26 o
— H —76 84 78 A– .. 28.1 HEEqSvcs HEES 27.00 +.76 –85 88 35 ê66 51 81 D– D A NH HainCelstl r HAIN 25.43 +.04 +49 446 26 o88 88 82 D+ A B– 45.4 HanckHldg HBHC 45.21 +.37 +247 214 19 ê72 88 45 C+ A D+20.4 HanmiFn r HAFC 18.67 +.18 +42 388 15 ê99 99 99 A A B+ 118 HansenNat r HANS 115.7 +2.02 –17 1.0m 44 ê52 73 33 D+ A C 40.3 HarborFL HARB 37.44 +.17 +66 230 18 k62 70 68 C+ D C 28.5 Harleysville HGIC 27.62 +.20 +131 109 13 ê36 51 30 D A B– 26.4 HarlNtlPA r HNBC 22.01 –.06 +296 200 15 ê64 76 51 A– D B– 16.1 HarrisHrs TINY 13.49 –.06 +22 269 22 ò77 92 59 C– C B+ 21.8 HealthcrSv HCSG 20.52 +.44 +82 274 30 ê98 93 97 B– B A– NH HlthExt HLEX 36.72 +.61 +109 706 64 o33 53 21 B– B D 48.4 Healthwys HWAY 39.83 –.22 +125 556 44 ò87 83 69 B+ A B– 25.0 HrtlndEx HTLD 22.94 –.44 +93 668 23 ò45 32 54 C+ B B 38.6 HeidrkStrg r HSII 34.97 +.33 +26 225 16 o26 44 17 C B B– 29.8 HelenTroy HELE 19.89 –.35 –37 132 11 o93 96 73 A– A C+ 45.6 HelixEn HELX 35.61 –.97 –12 1.5m 18 o74 86 65 D+ C B 49.2 HenrySchn HSIC 47.26 –.05 +9 416 25 o73 39 88 C+ A C+ 36.7 HercOffsh HERO 32.25 –.40 –8 199 18 ê27 57 22 A– .. C+ 14.4 HercTGC HTGC 11.35 –.15 –77 7 39 ê84 85 67 C+ B B– NH HrtgCmrc HTBK 23.97 +.28 +175 90 20 ê65 70 64 D+ C B 21.7 HerleyInds HRLY 20.00 ... +87 179 23 o95 93 85 B– B A– 32.1 HiTchPhrm HITK 27.21 +.13 –22 171 32 ê88 92 83 C+ B C+ 34.5 HibbettSpt HIBB 32.38 +.04 +60 419 33 o37 5 92 A+ E E 16.6 HighveldStl HSVLY 13.76 +.24 –67 11 99 ê99 92 90 A A A– 32.3 Hittite HITT 30.76 –.05 –41 126 43 ê95 51 98 A– B A 54.8 Hologic HOLX 53.47 +.41 +13 868 84 o17 38 13 C– D B 25.2 HookFrn HOFT 16.75 +.04 +77 105 12 k16 39 10 D B C+ 28.2 HorizHlth HORC 20.18 +.18 +32 128 22 k22 24 8 A+ B C 23.5 HotTopic HOTT 13.77 –.13 +49 1.5m 27 o92 92 86 A+ C C 46.0 HubGroup r HUBG 44.16 +.10 –13 194 27 ê88 87 65 D+ A B+ 13.5 HdsnCity r HCBK 13.26 +.04 –62 1.1m 27 ò19 76 6 C+ E D 28.3 HudsonH HHGP 16.50 +.12 –13 246 82 o48 15 68 A D A– 15.5 HumanGen HGSI 11.51 +.26 –38 2.8m .. o75 91 44 B+ B C+ 25.9 HuntJBTrns JBHT 22.62 –.23 +27 1.9m 16 ò37 55 27 D B B– 25.4 HuntingtnB HBAN 23.80 +.21 +11 1.6m 13 o69 42 89 B A C+ 37.5 Hurco HURC 27.11 –.51 –27 112 12 ê86 75 79 D– A A– 30.5 HuronCon HURN 29.84 –.36 –18 110 21 ê45 46 18 A+ B B+ 43.0 Hutchinsn HTCH 28.14 –.15 –27 408 18 o95 90 70 B+ A B+ 86.5 Hydril HYDL 73.86 –1.53 –7 311 24 o76 87 52 A– B C+ 37.2 HypernSol r HYSL 33.53 –.32 –47 423 21 o
— I —91 93 73 B C B+ NH IACInter r IACI 30.69 –.55 –10 2.0m 22 o30 58 19 A E C+ 30.7 ICOS ICOS 23.33 –.10 –33 648 .. o95 71 98 B C A 25.4 ICT Group ICTG 25.10 +.45 +50 34 34 ê58 77 36 C+ B B 43.1 ICUMed ICUI 34.85 –.27 +6 146 26 o82 76 85 A– C C+ 25.0 IDSystems IDSY 21.20 –.30 +84 222 99 ê8 16 13 C+ D D+18.1 IFlow IFLO 13.36 –.02 +29 413 .. o4 10 8 C+ E D 42.3 IPCHldgs IPCR 28.04 +.29 +325 1.3m .. ê
68 76 87 A– .. C 24.9 i2Tech ITWO 16.14 –.36 –40 182 9 o32 43 10 A B C+ 21.7 IXIA XXIA 13.83 +.75 +102 1.7m 27 o52 64 52 D+ A D–59.3 Iberiabnk IBKC 56.17 –.78 +203 72 17 ê72 68 73 B– C C+ 50.5 IconPLC ICLR 46.81 +.22 –49 15 27 k79 76 95 C– D B– 14.5 IconixBr ICON 12.70 +.11 +11 415 38 o24 13 48 A .. B– 28.3 IdenixPhm IDIX 20.68 +.52 +49 536 .. o97 87 83 A– A B+ NH Idexx Labs IDXX 83.60 +.49 +15 141 34 o72 71 25 A A B+ 21.0 II–VI r IIVI 18.45 +.41 +22 185 21 o81 84 93 A .. C 25.0 IKAN IKAN 20.77 –.15 +999 3.3m 44 ê80 28 98 A D A 26.6 Illumina ILMN 25.35 –.16 +2 559 .. o39 36 63 C .. A– 11.1 Imax Corp IMAX 10.31 +.16 –31 527 30 o20 7 41 A .. C 40.8 Imclone IMCL 35.04 –.22 –18 1.4m 29 o89 97 53 C+ A A– 36.0 Immucor r BLUD 29.30 +.86 +98 728 43 ò51 35 66 B– A B 30.7 ImprlInds IPII 15.48 –.17 –47 21 12 ê76 47 98 A E B 28.7 ImperlSgr IPSU 25.49 –.64 –53 94 99 ê87 73 78 C+ A B NH Inamed IMDC 92.67 +.08 –49 205 43 ò45 47 54 D+ B C 41.1 IndCmtyBk r ICBC 40.71 +.11 –36 570 15 o41 50 46 D B D+31.7 IndepBkMA INDB 30.96 +.53 +999 413 14 k25 64 19 D– B E 30.0 IndtBkMI r IBCP 26.95 +.64 +172 221 13 ê13 9 20 D+ C B– 34.0 Inergy NRGY 27.11 +.01 –34 65 53 ê86 76 71 C+ C A– NH InfPrCas IPCC 41.77 +.73 +71 197 10 ê51 10 73 B B A 18.6 Infocrsng r IFOX 12.14 –.01 +52 238 99 o98 99 93 A– A B– 17.1 Informatca INFA 15.10 +.21 –26 1.7m 35 o17 11 10 C+ B B+ 46.6 InfoSpce r INSP 25.32 –.66 0 771 15 o67 93 18 B A C 83.4 InfosysTech INFY 71.75 –.24 –36 533 38 ò91 90 63 B– B A 13.3 Infousa IUSA 12.34 +.13 +96 447 20 o71 67 72 B– D B 17.5 InglsMkA IMKTA 17.40 +.06 +319 152 14 ê19 29 10 B B C+ 26.1 InnoSltn r ISSC 13.70 +.08 –24 175 19 o48 51 58 B+ D D–22.1 InsightEnt r NSIT 21.03 +.60 +63 581 16 o88 69 92 B+ D A 27.9 InsitfTch INSU 26.40 –.52 +108 470 67 o90 33 99 A+ C A+ 49.9 Insteel r IIIN 45.57 +2.07 +127 550 16 o36 36 39 D– C B+ 23.6 IntegraBk IBNK 22.71 +.29 +417 140 14 ê88 92 63 C+ B A– 41.7 IntgLfSci IART 39.67 +.47 +3 202 30 o91 81 80 B C A 28.8 IntegrlSyst ISYS 27.75 –.08 –9 78 32 ê73 49 66 A C B+ 15.6 IntegDvc IDTI 13.71 –.04 +97 6.4m 39 o35 71 5 A A E 28.8 Intel r INTC 19.54 –.11 +12 101m 13 o56 69 44 C B B– 21.8 InterPrfm IPAR 18.61 –.12 +73 94 24 ê43 43 41 B+ C B– 26.9 InterTel INTL 21.16 –.12 +47 271 20 o66 60 53 D B A 20.0 IntrchgFn IFCJ 19.35 +.09 +399 119 19 ê84 76 90 A– C C+ 27.5 IntrDigtl IDCC 25.30 +.04 +48 1.0m 99 o92 76 95 B– D A+ NH Interface IFSIA 13.99 +.27 +245 1.1m 36 ê61 98 43 C– B D 51.8 Intergraph r INGR 40.93 +.77 +5 475 11 o96 86 88 A– A B 31.3 Intermgntc IMGC 27.64 +.99 +118 1.0m 38 ò48 17 81 A E B 20.9 Intermune ITMN 19.05 +.02 –23 379 .. o76 89 65 D– B B+ 25.4 InterntSty ISSX 24.74 +.54 +37 677 27 o72 69 42 A B A– 15.2 Intersect r INTX 10.69 +.03 –42 83 14 ê86 92 76 A C D 30.8 Intersil r ISIL 25.78 –.38 +107 4.6m 34 o97 94 93 D A A– NH IntervstBncs IBCA 33.50 +.13 +3 36 13 k33 38 22 B B B– 16.6 Intrvideo IVII 10.89 –.02 +40 111 20 ê97 76 97 A+ D A+ 23.4 Intevac Inc IVAC 21.68 +.36 +4 489 28 ê48 63 24 C+ A D+30.5 IntlBcshr r IBOC 28.49 –.26 +129 82 13 ê67 70 36 B A B 60.6 IntlSpeedwy ISCA 50.75 +.08 +18 223 17 ò76 53 93 C+ C B– NH Intrado TRDO 25.91 +.02 –20 331 37 o81 76 53 A– B B+ 22.2 IntraLase ILSE 19.12 +.20 –25 347 63 o78 72 60 C– A B+ 55.9 Intuit r INTU 53.12 –.18 –6 1.7m 24 o88 76 93 A– A D– 139 IntSurg ISRG 104.2 +5.78 +62 2.5m 55 o58 22 85 D+ D A+ 14.5 InvBncp ISBC 13.85 +.10 +166 574 49 ê94 82 70 A A B 51.0 InvFnlSvc IFIN 45.65 +.29 –36 515 19 ò70 78 34 A B B– 88.5 Invitrogen IVGN 72.21 +.17 –2 636 20 o51 22 86 B .. B+ 13.8 Ionatron IOTN 13.05 +.03 +328 2.2m .. o81 58 52 A A B+ 43.5 iPayment IPMT 42.65 +.05 +33 113 23 ê40 75 15 A– B D 28.0 IRISIntl IRIS 16.02 –.26 +10 310 45 o7 27 24 D .. D 37.9 iRobot IRBT 27.16 +.91 –23 223 99 o
75 52 80 A– D A– 31.8 IsleCapri r ISLE 31.16 +.73 +14 366 49 o97 90 92 B– A B+ 62.8 Itron Inc ITRI 59.13 +.98 –28 441 32 o86 93 57 A– A C 18.7 IturanLoc ITRN 15.81 –.48 –49 49 23 ê
— J —72 84 78 D– C B– 35.2 J&JSnack JJSF 33.64 –.70 +195 109 23 ê87 94 47 B A B+ 49.5 J2GlblC r JCOM 42.78 –4.94 +347 2.4m 23 o44 52 33 A– D B+ 17.4 JDASfwr JDAS 14.70 –.25 +23 311 25 o62 31 89 A+ E C NH JJill JILL 23.78 +.01 –22 337 99 o82 74 73 C– B B+ NH Jack Henry r JKHY 22.87 +.28 +48 923 25 o83 69 81 D+ B B+ 26.4 JakksPac JAKK 25.90 –.03 –11 364 11 o3 9 8 B .. D–52.6 JamesRivr JRCC 33.59 –.83 +76 597 .. o
76 47 83 C+ B B NH JRiverGrp JRVR 26.19 +1.20 +348 73 26 ê7 11 6 B+ D D–16.9 Jetblue JBLU 10.27 –.01 –38 3.3m .. o
90 78 95 B+ D B+ 14.9 JewettCmrn JCTCF 14.44 +.57 –20 19 16 k99 98 91 A+ A B 47.2 JosABkCl JOSB 46.25 –.32 –38 292 28 ò99 99 98 A+ A D–59.8 JoyGlbl JOYG 58.67 +.89 +2 1.9m 35 o45 73 10 C+ A B 27.6 JnprNtwk JNPR 19.45 –.11 –37 9.8m 26 o
70 51 62 C+ A A– 22.9 Juptrmed JUPM 17.48 +.49 +24 424 10 o
— K —60 51 47 A– B C+ 26.5 KHDHumbt KHDH 22.66 +.16 –69 8 9 k34 20 35 A B D–55.0 KLATencr KLAC 49.10 +.43 +49 6.6m 23 o54 91 37 D B D 17.0 KNBTBnc KNBT 16.39 +.09 +154 241 21 ê40 73 13 C– A C+ 36.9 KSwiss KSWS 29.19 –.14 +21 373 13 o42 76 36 A– E D–11.6 KVH Indus KVHI 9.98 –.03 –72 30 49 o79 60 89 B D A– NH KamanA KAMN 24.98 +.48 +184 279 45 ê58 83 9 B A B+ 24.9 Kanbay KBAY 16.51 +.08 +30 260 18 ê43 15 64 D+ B B+ 13.8 KearnyFnl r KRNY 13.72 ... +368 165 59 ê42 66 27 C+ E A– 31.2 KellySvcA KELYA 27.88 +.29 +334 420 25 ê87 63 96 B– D A– NH KendleInt KNDL 33.82 +1.98 +112 325 43 o87 76 98 A– .. B+ 29.7 KenexaCp KNXA 28.91 +1.50 +9 162 85 ê29 25 42 C+ C B– 34.0 KenseyNsh KNSY 26.83 +.55 –41 108 33 o47 4 85 A E B+ NH KeryxBiop KERX 18.38 +.38 +58 545 .. o17 24 13 A C E 14.6 Keynote r KEYN 11.00 +.02 +164 222 50 ê96 90 94 B+ D A 46.9 KystnAut KEYS 43.54 –.68 +40 202 37 ê57 47 62 C+ C B+ 13.3 kforce KFRC 11.92 –.10 +23 246 20 ê44 18 78 C– E A NH KimbalIntl KBALB 15.19 +.25 +182 230 33 ê58 52 81 C– .. A– NH KirinBr KNBWY 13.56 +.44 –36 77 28 ê79 31 91 A+ D A– 13.9 KnightTrdg NITE 13.73 +.12 –28 1.4m 29 o2 20 4 D+ .. D–47.5 Knightbrdg VLCCF 24.12 –.01 –33 106 9 o
73 40 97 C+ C B+ NH Knot KNOT 16.91 +.16 –66 54 99 ê98 76 94 A+ A B– 55.0 Komag KOMG 49.92 –.03 –32 911 14 o60 27 77 A B C+ 15.2 KONG KONG 12.28 –.06 –51 206 15 o71 59 44 A– A A– 78.4 KosPhrma KOSP 50.81 +.23 +8 857 19 o24 61 10 C– B E 53.3 Kronos r KRON 38.16 +.82 +8 347 22 o77 76 64 A C B 12.5 KulickSof KLIC 8.81 –.18 +95 3.6m .. o59 76 45 C+ A D 46.9 Kyphon KYPH 35.36 +.41 +74 1.1m 38 o
— L —50 65 56 D A E 56.7 LCAVis r LCAV 46.02 +3.37 +142 1.6m 31 o25 44 17 D– B B– 24.6 LECGCorp XPRT 17.51 –.08 +2 196 18 ê57 86 20 D A B+ 21.7 LHCGroup LHCG 16.03 +.28 +338 116 19 ê95 94 92 B B B– 23.1 LKQCorp LKQX 21.23 –.52 +18 541 32 ê83 61 99 B D B– NH LMIAerospc LMIA 18.00 +.80 +59 163 29 ê32 37 38 B– C C+ 19.9 LSIInd LYTS 15.43 –.15 +63 242 19 ê93 76 94 A+ B C+ 27.6 Ladish LDSH 24.68 –.07 –58 72 25 ê49 71 42 D B D+16.3 LakelndBp LBAI 15.52 –.47 +619 156 16 k87 54 85 A A B 48.6 LamResrch LRCX 42.92 +.02 +1 3.3m 23 ò87 69 77 B+ D A+ NH LamarAd LAMR 54.01 +1.36 +97 1.5m 99 o37 48 35 B C C 46.2 Lancaster LANC 41.61 +.47 +148 281 18 o46 26 80 D– C B+ 22.5 Lance LNCE 22.31 +.54 +22 292 29 ê98 96 77 B+ A A+ 47.4 Landstar LSTR 46.74 –.02 –25 357 23 ò91 59 99 A+ E A+ 21.4 LasrCard LCRD 20.61 +.22 –52 112 .. o51 92 4 A– A D+43.7 Laserscope LSCP 21.01 +.35 –1 387 21 o60 58 63 D B B– 55.0 Laureate LAUR 54.86 +.88 –30 205 33 o97 89 84 A– C A+ 30.3 LaynChrst LAYN 28.51 +.06 +59 124 29 k59 33 84 A .. B NH LeapWire LEAP 43.89 +1.03 +168 882 87 o14 49 14 D E C+ 16.0 LearngTree LTRE 12.28 –.02 +250 98 99 o23 31 18 B– B C+ 21.0 LeCroy LCRY 14.89 –.15 +12 120 12 ê1 3 6 E D E 27.4 LibtyGlbA LBTYA 18.54 –.13 +119 3.7m .. o1 3 5 E D E 26.4 LibGlobC LBTYK 17.55 –.35 +95 2.4m .. o
98 99 87 A A C 25.6 Life Cell LIFC 21.45 +.38 –54 467 57 o11 12 12 C+ B D+18.7 Lifecore Bio LCBM 12.46 +.15 –69 19 23 k98 94 89 A– B B+ NH Lifeline LIFE 47.65 ... +39 291 39 ê13 63 3 E B D–51.5 LifepntHos LPNT 28.48 –.31 –22 966 12 o90 94 85 E B A 27.4 LifetmeBr LCUT 26.31 –.28 +73 143 21 ê60 88 55 D B C+ 18.2 LifewayFd LWAY 11.90 –.10 –66 5 44 k58 20 89 A+ C D 38.0 LihirGold LIHRY 33.79 +.69 +3 120 99 ê17 41 15 D B E 46.0 LincareHld LNCR 38.61 –.69 +62 1.1m 18 o43 60 43 D B C+ 21.0 LincEduSv LINC 16.68 –.32 +40 28 22 ê98 76 91 A– B A NH LincolnElc LECO 52.96 +1.00 +153 416 19 ê44 48 16 A A D+41.7 Linear Tech LLTC 35.21 +.11 +20 4.7m 24 o16 28 19 C D 26.0 LinnEngy LINE 20.62 –.13 –75 86 .. ê35 56 19 C– A C 33.6 LipmnElEn r LPMA 25.11 +.01 –13 83 18 ê67 97 22 B A 13.3 Liquidity LQDT 11.68 –.32 –93 31 64 ê57 17 73 A C B+ 35.5 Littelfuse r LFUS 34.26 –.60 +77 307 46 o88 91 69 A– A C+ 29.0 LoJack LOJN 22.53 –.16 –7 258 23 o14 55 15 E .. B– 19.8 Lodgenet LNET 14.33 –.06 +79 219 .. ê91 74 95 A– C B 12.4 Logility LGTY 10.61 –.37 –88 6 28 ê66 88 47 C– A C 51.4 Logitech r LOGI 39.59 –.01 –54 161 22 o37 24 49 B+ D B 32.0 LoneStarSt STAR 28.41 +.39 +143 376 25 o12 27 13 A– .. D 30.5 LoralSpce LORL 24.61 –.45 –70 8 .. ê86 92 86 B+ C D 68.7 Lufkin Inds LUFK 49.92 –1.27 –13 208 16 o71 26 93 A– E A NH Luminex LMNX 14.97 +.21 +168 354 .. ê
— M —42 56 36 D+ B C+ 44.8 MAFBnc r MAFB 43.32 +.36 +142 269 13 o18 54 14 D– B E 42.7 MBFinl r MBFI 35.24 –.02 +96 221 15 ê14 27 13 D– B D+21.9 MBTFinl r MBTF 16.76 –.58 +502 129 16 k24 58 14 C B E 18.6 MCGCap MCGC 14.24 –.09 +76 652 10 o26 62 17 D– C D+38.8 MGEEngy MGEE 33.51 +.18 +360 153 21 ê20 27 6 A– B C+ 27.7 MGIPhrm MOGN 16.01 –.24 –26 981 42 ò63 28 90 A+ E B+ 19.2 MGPIngr MGPI 14.38 –.44 –85 24 34 o57 19 84 A D B– 23.8 MKSInstr MKSI 22.66 +.04 +48 525 31 o47 63 28 A– D B 17.4 MROSoft MROI 14.66 +.04 +56 202 31 ò49 76 18 A A E 37.2 M–System FLSH 25.67 +.10 –70 427 21 o39 78 8 B B D+38.5 MTCTech MTCT 25.94 –.15 +99 95 19 ê79 64 69 B– B B+ 42.9 MTSSystm MTSC 40.46 +.20 +137 198 22 ê98 88 92 A– B A+ 36.3 MWIVet MWIV 34.85 –.55 +444 160 41 ê52 48 58 D– B B+ 24.2 Macrovisn MVSN 21.46 +.44 +51 833 24 o88 74 86 A– D A– 14.2 MagalSec MAGS 13.24 –.17 –47 38 57 ê74 68 65 C– C A+ 39.9 MaglnHlth MGLN 38.03 –.26 –9 331 15 o67 75 68 D+ B NH MagyarBc MGYR 11.72 +.55 +40 40 34 ê40 44 26 D+ B B+ 29.1 MainStBks MSBK 26.49 +.10 +72 207 18 ê59 79 31 A– B D+24.3 ManhAssc MANH 21.30 +.05 +52 240 24 o58 97 15 C A B 21.1 Mannatech MTEX 13.96 –.28 +29 248 13 o66 18 96 A .. A NH MannKind MNKD 21.08 +.15 +102 776 .. o80 87 59 B B B– 33.0 Mantech MANT 29.76 +.55 +128 347 18 o45 42 39 A– C B– 15.3 MapInfo MAPS 13.23 –.20 +81 209 24 ê48 43 59 B C B– 26.4 Marchex MCHX 21.16 –.27 +24 410 99 o19 4 48 A+ D E 14.6 MktAxess MKTX 11.88 –.05 +136 436 59 ê80 85 40 A– A B– 24.6 MarlinBus MRLN 21.49 –.13 +82 45 15 ê35 42 39 A D B 61.5 MartekBio MATK 33.85 +.49 –16 931 76 o95 76 90 B+ B A 24.8 MartnTrns MRTN 23.56 –.76 +65 190 20 ê46 57 29 D+ B B 34.3 MartinMd MMLP 31.57 +1.23 +85 169 18 ê90 99 70 A A D 73.7 MarvellTc MRVL 54.21 –1.04 +77 10m 39 o56 76 58 B– D C+ 45.0 MatriaH MATR 38.18 ... +14 329 99 o85 75 94 A– E B 11.5 MatrixSvc MTRX 11.00 +.05 –84 39 99 ò91 84 93 C B B– 26.2 Matrixx MTXX 22.85 –.18 –65 89 33 o38 62 36 E A D 41.9 MathwInt MATW 38.09 +.51 +197 254 20 ê44 5 76 A C C+ 13.5 MattsonT MTSN 10.62 –.79 +88 1.8m 40 o26 41 34 C+ E C+ 27.0 MaxReCap MXRE 24.76 –.14 +18 197 99 ê36 45 15 A B D+45.9 MaximInt r MXIM 36.17 +.10 +61 6.9m 23 o77 42 90 A– D A 20.0 MaxwllTch MXWL 17.67 –.41 –53 59 .. o66 64 76 B+ C D–26.7 McCrmSchm MSSR 22.88 –.65 +24 112 29 ê91 77 71 A– A B– 33.3 McGrthRnt MGRC 30.40 +.20 +81 188 18 ê79 76 93 A D D 15.9 MeadowVlly MVCO 14.00 –.23 –52 33 14 ê41 35 28 B– A B 27.2 MeasSpcl MEAS 23.70 –.15 +400 183 28 ê60 4 82 C B A+ 13.1 MedalFin TAXI 12.85 –.17 +44 152 32 o65 35 90 A D B– 16.1 Medarex MEDX 13.92 –.12 +12 1.5m .. o6 9 21 E E B 30.6 Medcath MDTH 20.81 –.45 +88 116 52 ê
85 75 82 D+ B A– NH MedclActn MDCI 24.39 +.32 –56 16 22 ê39 18 45 A D B 24.9 Medicines MDCO 21.45 +.25 +57 1.2m .. o50 8 76 A D B+ 37.6 MedImmne MEDI 36.38 –.50 +45 3.0m 99 o61 27 89 B E A NH MedisTech MDTL 21.05 +.73 +254 636 .. o31 32 53 C– D B 14.0 MentrGrp MENT 11.23 –.09 +9 1.1m 29 o36 77 18 D– A D 48.3 MercBank MBWM 38.25 –.28 +200 77 16 k63 71 53 D A C+ 40.1 MercBkshs MRBK 39.53 +.40 +47 414 17 o11 35 2 C– B D 29.8 MrcryCpt MRCY 16.10 –.16 –3 273 13 o14 41 5 C A E 30.1 MergeTech MRGE 15.85 –2.12 +310 4.3m .. o96 90 92 C+ A B+ 27.7 MerdnBios VIVO 23.70 –.08 +13 278 41 o31 48 28 C+ C C 18.3 MeritMed MMSI 13.65 –.17 +132 283 23 o93 91 87 B+ B C 12.9 MesaAir r MESA 11.15 –.02 –6 656 8 o70 43 71 A+ C B– 29.7 MetalMgmt MTLM 27.75 –.35 +7 328 13 x62 50 68 C B B– 22.2 Methanex r MEOH 20.50 –.29 –27 194 10 ê31 35 27 A C C+ 13.9 Methode METH 10.90 +.04 +175 359 16 o73 65 67 A– B D+24.5 Metrologic MTLG 20.90 +.45 +108 326 29 o62 59 70 A C D–15.4 Micrel r MCRL 13.24 –.39 +43 1.7m 37 o87 78 67 A B B– 38.2 Microchip MCHP 34.61 –.21 +39 2.5m 28 o99 95 97 A– A A 19.8 Micronetics NOIZ 18.11 –.23 +49 94 38 ê64 93 35 C– B B– 55.4 MicrosSys MCRS 44.73 +.70 –14 382 29 o93 89 81 A A D+31.9 Microsemi MSCC 28.28 +.30 +46 1.3m 35 o75 63 49 B A B+ 28.4 Microsoft MSFT 27.50 +.23 +76 104m 22 o92 67 94 A– B B– 109 MicroStr MSTR 106.6 +1.67 +4 401 24 o48 14 87 C+ E A– 12.8 MicrusEnd MEND 11.95 +.75 +182 130 .. ê61 59 52 C+ B B– 31.4 MidStBnc MDST 29.62 ... +383 170 18 ê88 91 84 D A B– 98.4 Middleby MIDD 85.82 –1.69 +21 120 21 ê16 35 25 C D E 23.5 MidsexWtr MSEX 18.65 ... +304 85 26 ê82 79 70 D– B A– 26.6 MidwstBc MBHI 25.46 +.31 +116 139 28 ê75 82 79 C+ D B– 101 Millea MLEA 97.90 +2.69 –37 18 33 ê62 47 62 A D B 11.3 MillPharm MLNM 10.52 +.10 –11 2.8m .. o85 99 51 C– A B+ 33.0 MillerHer r MLHR 31.93 +.43 +44 459 24 ò71 11 97 A D A NH Millicom MICC 42.53 +.52 –63 196 99 o76 76 92 B+ B E 26.2 MitchmInd MIND 16.17 –.48 –74 81 20 ê93 82 79 A– B B 29.0 MobileMini MINI 26.37 –1.14 +241 839 24 o31 33 45 C– C C 16.5 Moldflow MFLO 15.00 +.10 –68 13 30 ê97 86 91 A B A– 34.5 MolclrDvc r MDCC 32.26 +.51 +14 231 31 o79 53 78 A C B+ 33.6 Molex MOLX 33.04 –.35 –15 577 29 o76 53 71 A C B+ 30.0 MolexClA MOLXA 29.48 –.39 –78 62 26 o34 6 79 A .. B 34.6 Momenta MNTA 21.33 –.10 +1 252 .. o98 92 87 A– B B+ 29.3 MonrchCs MCRI 27.93 –.08 +43 176 25 o79 47 86 A A C 19.9 MonPwrSys MPWRE 14.10 –.27 +101 357 99 ê94 79 86 B+ B A– 40.6 MonroMfl MNRO 39.65 –.44 +223 90 26 ê93 69 93 C+ A A– NH MnstrWw r MNST 50.92 +.71 +33 2.1m 54 o10 22 11 B– .. 20.3 MHGC MHGC 17.30 +.10 –66 302 .. ê88 74 90 B– B C+ 43.5 Morngstr MORN 40.93 –.72 –28 68 58 o82 36 97 A+ E A+ 26.2 MothrsWk MWRK 23.89 +.01 –47 15 99 ê99 91 99 A A A– NH MultFnElc MFLX 63.70 +.82 +19 457 35 o59 31 80 A– C C+ 12.9 MultimdG MGAM 12.24 +1.11 +211 1.4m 24 o53 18 99 A E C+ 42.3 Myogen MYOG 36.27 +.92 –29 820 .. o72 29 90 A D A– NH MyriadGn MYGN 27.76 +.12 +32 504 .. o
— N —43 66 30 D B C+ 25.5 NBTBncp r NBTB 23.30 +.16 +397 233 14 ê46 46 59 B C D–15.4 NCIInc NCIT 13.98 –.51 –93 2 22 ê68 48 71 A C B– 24.4 NCOGroup NCOG 22.64 –.54 +92 399 14 o97 82 89 A– B A– NH NDSGrp NNDS 52.13 –.13 +66 132 32 ê
.. 17 A– .. D–16.7 NGPCapRes NGPC 13.60 –.16 +165 171 20 o89 41 90 A A B+ 55.4 NIIHldg NIHD 53.23 –.18 –14 1.1m 45 o19 3 87 C+ E E 26.0 NMTMed NMTI 15.02 +.49 +19 1.3m .. o64 82 47 A+ D D 13.7 NNInc NNBR 12.00 –.92 +378 240 14 ê12 29 6 A D D 16.0 NPSPharma NPSP 9.08 +.28 +51 1.7m .. o50 50 86 E .. B+ NH NTLInc NTLID 29.00 –.15 +122 3.7m 99 o34 63 15 A C D 22.2 NVE NVEC 15.17 –.08 –66 26 45 ê42 18 57 A E B+ 15.7 Nanomtrcs NANO 13.08 –.34 –18 92 99 o95 98 94 A– C C+ 16.0 NapcoSec NSSC 13.85 +.31 –11 115 29 ê78 85 47 C+ A B– 19.6 NaraBcp NARA 17.85 +.39 +23 225 16 o92 45 98 A A B 46.8 Nasdaq NDAQ 43.78 –.48 +30 2.5m 69 o
23 50 21 D C B– 44.1 NashFinch NAFC 29.99 +.62 +83 380 9 o51 16 85 A D B 23.1 Nastech NSTK 17.41 +1.64 +148 1.3m .. o70 76 68 C– B B– 37.4 NatlInstrm NATI 31.99 –.02 –37 211 41 o78 87 53 C+ A C+ 23.6 NatIntst NATL 20.38 +.09 +25 34 13 k74 92 60 B– B D 32.3 NtlMdHlth NMHC 28.53 –.48 –26 34 24 ê41 56 41 D A D+23.2 NatlPennB r NPBC 21.04 –.02 +239 322 16 o12 23 12 C B D–23.9 NaturSun NATRE 16.49 –.20 +122 113 14 ê84 65 95 A– D B– 22.5 NatusMed BABY 20.45 +.24 +1 150 61 o25 32 39 B D D 15.9 Navigant FLYR 12.06 +.20 –2 55 12 ê77 73 80 C+ D B 48.3 NavigGrp NAVG 47.00 ... +107 148 30 ê33 5 67 A E B– 22.3 NektrTh NKTR 19.10 –.02 –25 1.7m .. o99 96 96 A+ B B+ 30.3 Neoware NWRE 25.34 –.17 –63 289 36 o80 86 50 B C A– 12.7 NessTech NSTC 11.35 +.04 +51 275 17 ê87 84 64 A A C+ 33.8 Net1UEPS UEPS 29.98 –.09 –56 102 34 o98 99 93 C+ A B+ 96.0 Netease NTES 90.00 –.88 –33 658 28 o79 60 91 B B D 30.3 Netflix NFLX 26.17 +.70 –10 1.4m 68 o56 93 20 C+ B B– 25.7 Netgear NTGR 18.15 +.15 –10 711 17 o9 8 22 A– E D–14.0 NetIQ NTIQ 11.12 +.34 +66 591 .. o
99 80 97 A A A+ 40.0 NetLogic NETL 35.81 +.81 +5 414 37 ò23 42 18 B– E B 17.2 NetRatgs NTRT 13.29 ... +36 169 .. ê99 91 78 A+ A A– NH NtwrkApl r NTAP 35.05 +.54 +35 6.2m 46 o42 16 79 A D D 16.5 Neurochem NRMX 14.53 –.34 –55 36 .. o68 28 88 A D B+ 73.1 Neurocrine NBIX 70.41 –1.06 +23 800 .. o71 76 97 C+ .. C+ 39.9 NeuroMtrx NURO 36.82 +1.30 –25 127 99 ê55 68 32 D+ C A+ 10.9 NwEngBc NEBS 10.60 –.05 –48 8 44 ê57 13 96 A .. B+ 35.0 NewRvrPhm NRPH 31.96 –.43 –24 183 .. o89 76 81 B– D A+ 20.2 Newport NEWP 18.14 –.16 +27 589 30 o60 64 67 A .. C NH NextelPtn NXTP 28.30 +.03 +34 4.6m 36 o78 56 82 C– B B+ 55.1 NICESys NICE 54.07 +.02 –53 96 32 o73 88 47 C A C 13.3 NicholasFinl NICK 11.73 –.05 –74 9 12 ê77 97 81 B– .. 27.5 NightwkR NHWK 24.56 –.61 –73 150 61 ê58 51 61 B– B C 23.8 NissanMtr r NSANY 23.32 +.16 –56 112 10 ê61 84 58 D C C 18.0 NobleIntl NOBL 16.34 –.02 +49 102 16 ê94 76 82 A– B A 51.9 Nordson r NDSN 48.72 –.09 +111 350 21 ê71 87 42 C+ B B– 21.6 NoPitSys NPSI 20.48 +.38 +529 140 14 ê61 62 55 D A B– 55.0 NorthrnTr NTRS 53.49 +.34 –20 935 20 o8 22 5 A .. D 16.3 NorthfldLab NFLD 9.94 +.29 +73 731 .. ò
60 71 56 D+ C B– 24.4 NrthwstBp NWSB 23.79 +.22 +379 163 21 ê17 24 46 D– .. C 32.9 NorthWst NWEC 31.43 –.27 +199 405 18 ê37 37 39 A+ C C+ 66.5 NovamStl TONS 40.44 +.35 –89 9 11 k96 93 83 A– A B– 37.1 Novatel NGPS 33.02 –.18 –31 113 17 o18 10 23 A D D 30.6 Novellus NVLS 24.58 +.22 +13 4.3m 28 o72 56 54 A– C A– 18.3 NovenPhm NOVN 17.36 +.38 +100 356 33 o1 3 3 A .. E 23.6 Novogen NVGN 13.12 –.35 +315 107 99 ê
39 9 63 A D 13.1 nTelos NTLS 13.00 +.07 –87 59 39 ê88 48 98 B C A 11.2 NuanceCm NUAN 10.21 –.23 0 2.0m 53 o80 51 73 A B B 32.6 Nuco2 NUCO 30.51 –.18 +66 120 33 ê53 71 49 C C C+ 16.5 Nutractcl NUTR 14.85 –.13 +163 58 13 o92 76 99 C A B– 50.0 NutriSys NTRI 41.04 +1.46 –20 1.2m 70 o27 3 76 C+ D D 21.6 NuVasive NUVA 19.63 +.15 –34 236 .. ê66 5 98 A D A 18.7 Nuvelo NUVO 18.01 +.84 +25 1.2m .. o96 81 93 A B B+ 50.7 Nvidia r NVDA 48.77 +.39 +7 5.0m 28 o30 3 69 A– .. B– 15.2 NxStagMd NXTM 12.61 –.39 +172 95 .. ê
— O —43 45 29 A C B+ 18.0 O2Micro r OIIM 11.24 –.79 +196 799 43 o39 17 51 B+ D A 22.9 OCharleys CHUX 18.33 –.05 +28 355 25 ê93 93 76 B+ A C+ 38.3 OReillyAuto ORLY 35.95 +.21 +53 627 25 o43 47 38 A D B+ 50.2 OSIPharmac OSIP 31.98 +.55 –48 895 .. o55 9 85 A– D B+ 23.2 OSISystem OSIS 23.05 +.33 +22 230 .. o88 47 98 B+ C A+ 53.1 OYOGeo OYOG 48.89 –1.39 –82 9 82 ê59 53 65 B– B C 20.6 OdyssyHth ODSY 17.38 +.26 +119 637 21 o67 68 74 C+ C D+ NH OHCasualty OCAS 31.77 +.22 +149 736 11 o90 94 65 B+ B B 29.0 OldDomFrt ODFL 25.92 –.22 +62 447 17 ê62 69 44 D– A B+ 33.6 OldScndBc OSBC 32.40 +.16 +390 118 15 ê54 6 85 A+ C C+ 32.0 OlympcStl ZEUS 27.02 +.03 +19 258 11 o49 35 56 D B A 33.9 OmegaFinl OMEF 32.96 –.08 +436 138 18 ê38 8 74 A– D D+12.8 Omnicell OMCL 11.12 +.54 +23 220 99 o99 97 94 A A B+ 27.8 OmniVisTc OVTI 26.46 –.11 –29 1.8m 17 o67 76 93 C+ D D–12.6 OnAssign ASGN 11.38 +.38 +197 589 .. o46 12 65 A– D A 17.3 OnTrack OTIV 15.20 –.06 –18 121 .. k91 87 82 C– A B+ 14.0 OnlineRes ORCC 13.35 –.30 +469 771 38 ê10 3 21 A E D+36.5 OnyxPhrm ONXX 26.38 +.01 +14 847 .. o57 25 76 C– A B 30.1 OpenSols r OPEN 26.51 +.05 –21 199 31 ê76 84 54 A– C B– 19.0 OpenText r OTEX 16.21 –.16 –65 100 19 o86 76 83 B B B– 23.2 OpnwvSys OPWV 21.10 ... –36 1.5m 41 o77 49 89 A+ D B– 18.2 OplinkC OPLK 17.29 –.41 +67 338 .. ê64 49 70 A– D B 10.7 OpnetTech OPNT 10.20 +.20 –69 16 99 ê99 81 98 A+ A A+ 25.1 OptlcmNKF OPTC 24.28 –.13 +34 82 30 ê5 28 6 C– C E 22.8 OptimalGp r OPMR 14.92 +.55 +140 820 99 o
37 66 33 D B D 15.1 OptionCare OPTN 13.50 +.15 +115 587 20 o94 99 90 B A D–32.4 optnsXprs OXPS 28.04 +.26 –15 1.2m 35 o90 82 51 A– A A– 14.5 Oracle ORCL 13.60 +.10 +33 68m 18 ò78 76 80 C+ C B 14.1 OraSure OSUR 10.59 +.15 –13 579 48 o42 59 32 B– B D+26.4 Orbotech ORBK 23.88 –.45 –46 77 18 o37 76 18 B+ C D–31.2 Orckt ORCT 21.82 +1.26 +139 880 18 ò92 58 94 A B A– 18.4 OriginAg SEED 16.33 +.43 +32 230 54 ê31 47 28 C+ C C+ 48.6 OrthofixIntl OFIX 41.12 –.13 –47 25 18 ê24 48 30 D– C D 31.9 OtterTail OTTR 28.69 –.25 +176 229 16 o1 14 5 E E D–17.5 OutdoorCh OUTD 11.28 –.42 +196 236 99 ê
40 55 54 B+ C D–19.0 OutlookGrp OUTL 11.42 +.27 –81 6 12 k6 10 3 B D C+ 48.6 Overstk OSTK 27.25 –.76 –8 725 .. o
— P —85 53 89 B+ D A+ 24.5 PAMTrans r PTSI 24.09 –.23 +58 57 20 ê56 52 77 C– C D+20.0 PDFSltions PDFS 18.45 –.21 +81 207 40 ê8 18 10 C– D B– 21.4 PDI PDII 11.88 –.09 –52 53 .. o
55 11 88 A D B– 33.3 PDLBio PDLI 32.25 +.51 –3 1.6m .. o39 62 12 B+ B C+ 65.1 PFChangs PFCB 47.96 +.20 +45 713 34 o64 35 88 A E B 13.9 PLXTech PLXT 12.69 +.17 +35 269 99 o94 75 89 A C A– 12.7 PMCSierra PMCS 12.12 +.11 +37 9.8m 60 o57 94 19 B– B C+ 31.3 PRAIntl PRAI 25.59 –.53 +121 405 19 ê96 92 88 A– C B 19.7 PSSWorld PSSI 18.86 –.29 +35 790 29 o94 76 99 A C B 26.3 PWEagle PWEI 24.89 +1.00 –27 410 7 ê65 90 30 C+ A C 76.6 Paccar r PCAR 70.87 +.64 +29 1.1m 10 o94 86 83 A+ C B 33.3 PacerIntl PACR 32.75 –.35 +18 348 21 o35 50 28 C+ B D+39.6 PacificCap PCBC 33.71 –.16 +230 565 15 ê55 6 97 B D A– 20.6 PacEthanl PEIX 19.07 –.07 –34 593 .. o69 88 20 A+ A C 28.6 PacifcSunw r PSUN 23.13 +.05 –9 1.5m 14 o56 56 56 C+ B C+ 15.4 PackDyn PKDY 13.80 +.01 –55 11 14 ê94 85 64 A A A 16.5 Packeteer PKTR 12.23 –.69 +70 875 19 o72 38 95 A– E A 11.8 PainThera PTIE 10.94 +.21 –14 862 .. o64 76 65 C+ D B– 21.7 PalmHrbr PHHM 21.20 ... +61 94 60 ê63 14 88 A+ B C 22.0 palmOne PALM 20.01 +.36 –25 3.2m 29 ò87 98 62 A– A D–41.6 PalomarMed PMTI 33.01 +.86 –45 227 36 o68 22 88 A+ D B+ 25.6 PanAmSlvr PAAS 23.93 +.22 –52 835 99 o97 91 71 B+ A A– 75.1 PaneraBrd PNRA 73.63 –.19 –42 282 44 o97 98 91 B– A B– 62.1 Pantry PTRY 58.98 –.52 –2 376 15 o81 73 86 B+ B D–35.7 PapaJohns r PZZA 31.31 +.01 –39 291 23 o72 71 93 C C D 22.0 ParllPet PLLL 17.72 +.13 +12 539 .. o25 22 36 C– B D+18.3 ParmTch PMTCD 15.61 –.42 +79 1.9m 20 o41 45 67 B– D D–27.6 Parexel PRXL 23.61 –.56 +193 641 38 o82 98 48 B B B+ 22.8 ParkOHHld PKOH 18.42 –2.32 +29 45 8 ê81 98 55 C A C+ 38.5 ParluxFrg PARL 30.54 –.13 –55 188 18 ê54 69 37 D+ A B– 12.8 PrtTrFnl PRTR 11.66 +.03 +136 433 16 ê29 47 22 A– .. B 14.8 PatriotCp PCAP 12.67 –.09 –36 28 70 x36 73 13 D+ B B 53.9 PattrCos PDCO 35.72 +.08 –13 846 25 o49 93 14 C+ A D–38.5 PattrsnUTI PTEN 27.69 –.45 +14 4.1m 16 ò90 84 66 B A B 43.4 Paychex PAYX 40.34 +.24 +60 3.6m 36 ò9 27 21 D E D+17.4 PediaSvc PSAI 13.16 +.11 –61 12 .. ê
57 79 29 B+ B C 37.3 PeetsCof PEET 29.59 –.13 +24 155 39 o98 98 79 A– A B NH PennNatl PENN 39.70 +1.25 –27 663 25 o65 34 85 A E B+ 23.7 PenwstPh PPCO 20.85 +.38 +28 298 .. o81 83 63 D B A 33.8 PeoplesCT PBCT 33.45 +.24 +6 223 37 ê75 85 84 C– .. B+ 27.4 PerSeTech PSTI 25.98 –.40 +42 803 24 o92 66 85 B A B+ 11.3 Perficient PRFT 11.19 –.06 +21 238 34 ê51 71 51 D D B+ 32.3 PerformFod PFGC 31.18 +.06 +34 515 30 o49 41 44 B– B B+ 19.9 Perrigo PRGO 16.10 +.02 +135 965 20 o61 65 44 B+ C B 26.5 PerryEllis PERY 22.16 +.20 +154 79 9 k30 55 9 B– B C 37.8 PETCO PETC 22.31 +1.05 +475 4.3m 16 o95 95 98 D A B– NH PetMed PETS 19.90 +.23 –61 143 42 o66 75 53 C A B– 16.3 Petrohawk HAWK 13.10 ... –8 760 32 o89 75 81 C A B NH PetroDev r PETD 45.37 +.42 +67 233 19 ò75 76 56 B– B B 33.3 Petsmart r PETM 28.56 +.69 +20 1.4m 24 o94 95 83 B– A C+ 36.2 PhrmPdtDv PPDI 35.51 –.26 –9 671 31 o42 75 6 A– C B+ 33.4 Pharmion PHRM 17.71 +.12 +46 677 24 o44 80 7 A– B B+ 32.2 Phazar ANTP 13.61 –.71 –74 132 20 k91 88 75 C+ A B 36.4 PhilConsol PHLY 35.16 –.09 –47 161 16 ê33 47 44 B– E B– 24.7 PhotnDy PHTN 20.35 +.08 –17 260 .. o26 37 16 A C C 27.3 Photronics PLAB 17.29 +.01 –6 762 17 o34 32 56 B D D 36.1 PicoHlds PICO 33.53 –.36 +315 93 27 ê72 76 84 C D D+ NH PionrCos PONR 32.75 +3.05 +86 222 5 ê81 55 85 C B A– 66.2 Pixar PIXR 65.66 –.03 –72 579 52 o82 76 85 A .. B+ 12.5 PixelPlus PXPL 10.69 –.28 –59 42 66 ê74 97 37 C+ A C 30.9 PlacerSier PLSB 27.01 –.25 –46 72 16 ê72 43 97 C– E A+ 16.4 PlanarSys PLNR 15.72 –.09 –66 115 52 o96 76 99 A D A– NH Plexus PLXS 37.48 +.35 –13 769 45 o45 3 86 A– .. A 14.7 PokerTek PTEK 12.00 ... +88 58 .. ê76 40 85 C+ C A+ 21.9 Polycom PLCM 21.34 –.34 +66 2.0m 27 o94 78 79 A– A B– 43.7 Polymdca r PLMD 43.18 +.43 +55 373 27 o17 21 15 B+ D B– 15.7 Pomeroy PMRYE 9.58 –.12 –39 23 9 ê31 60 10 D+ A C 27.7 Popular BPOP 20.51 +.14 –4 523 10 ò52 59 22 A A C+ 33.2 PortlPlyr PLAY 23.28 +.07 –30 1.3m 14 o93 97 82 A+ B D+18.6 PortecRail PRPX 15.36 +1.03 +385 326 24 ê90 93 55 A A C 51.8 PortRec PRAA 45.35 –1.25 +108 412 19 o73 89 56 A C D–28.3 PwrIntgr POWI 24.33 +.38 +59 482 30 o92 76 84 A– C A– 15.8 Pwrwave PWAV 14.62 +.29 +52 3.8m 27 o91 54 99 A– C A– 18.6 Pozen POZN 17.80 –.28 0 350 99 o99 95 87 C+ A A+ NH PremrWBc PRWT 18.54 –.27 +413 130 23 k36 14 75 E B B– 18.5 PrStFarms PORK 17.45 +.02 +3 136 6 ê74 40 86 C B A– NH PresLife PLFE 24.08 +.20 +275 226 14 ê78 51 72 A– B B+ 13.7 Presstek PRST 11.87 +.20 +190 561 59 o90 80 68 A– A C+ 79.8 PrceTRow TROW 77.79 +.19 +12 608 24 o76 92 47 B C B 27.1 priceline PCLN 23.97 +.22 –27 343 17 o88 89 73 D– A B+ NH PrvtBcp PVTB 41.10 +.31 +89 180 26 o84 49 79 C+ B A+ 13.2 ProCentry r PROS 13.04 +.21 –56 10 10 ê42 9 80 A E B– 30.8 Progenics PGNX 27.54 +.44 –36 268 .. o71 85 33 A– B B– 35.8 ProgSftw PRGS 29.91 +.63 +74 440 22 ò69 79 42 C+ A C+ 32.1 ProspBanc PRSP 29.72 +.11 +122 252 16 ê69 44 75 B B C+ 33.4 ProvSvc PRSC 32.32 +1.52 +142 82 32 ê54 52 54 D B B 37.0 PrvdntBk PBKS 36.96 +.50 +135 264 16 ê71 77 52 D+ B B+ 12.9 ProvBncp r PBNY 12.71 +.21 +158 315 25 ê87 96 82 D B B– 34.8 PsycSol PSYS 32.04 –.20 +22 737 36 o
— Q —96 86 75 A B A– 15.6 QiagenNV QGEN 14.81 –.02 –62 127 32 o81 68 70 C+ A B 21.4 Qlogic QLGC 20.03 –.18 –44 2.2m 26 o96 88 79 A– A B 51.2 Qualcomm QCOM 50.77 +.90 +36 19m 39 o68 33 96 B+ .. A 14.0 QltyDistr QLTY 13.82 +.39 –4 45 20 ê75 91 59 C A C+ 91.9 QualtySys QSII 67.71 +.06 –57 168 44 o88 77 64 A– B B+ 16.7 QuestSoft QSFT 16.23 +.15 +27 1.3m 25 o92 96 96 C+ B B 15.9 Quidel QDEL 11.68 –.24 –59 265 35 o19 62 21 C D E 16.9 Quigley QGLY 9.73 +.02 –7 33 42 ê
— R —83 84 85 A+ .. C+ 22.2 RBCBear ROLL 20.62 +.14 +71 131 16 o72 81 58 D+ A B– 41.6 RC2 RCRC 39.42 +.71 +87 216 16 ê21 10 52 C+ .. B– 26.1 RCN RCNI 25.00 –.35 +223 605 .. ê47 25 85 D– C B+ 17.9 RSASec RSAS 17.40 +.11 +49 1.8m 33 o93 74 99 A+ .. A+ 45.3 RackblSys RACK 44.06 +.54 –49 307 63 o71 58 76 C– B B 15.2 RadiantSys r RADS 13.68 –.23 –12 300 33 o47 92 19 D A C+ 39.3 RadThrSvc RTSX 25.21 –.25 –40 207 23 ê49 28 73 A– D C+ NH Radisys RSYS 19.97 +1.40 +225 511 31 o79 99 71 C+ C C+ 21.4 Radvision RVSN 17.33 +.12 –52 203 26 o34 41 42 C+ .. A 25.7 Radware RDWR 20.79 –.24 –43 112 44 o90 59 81 A– A A– 16.3 Radyne RADN 13.39 +.15 –31 152 23 ê97 77 99 A B B+ 36.1 Rambus r RMBS 33.53 +1.78 +2 7.8m 99 ò63 43 61 A+ B C+ 18.7 Randgold GOLD 16.43 –.17 –20 483 26 o85 84 58 B+ B B– 32.9 RareHsp RARE 32.51 +.66 +73 434 20 ê95 92 84 B A B– 36.8 RavenInds RAVN 35.59 +.04 +141 212 26 ê94 71 96 B A B 31.1 RedHat r RHAT 29.31 +.82 –7 3.4m 86 ò36 40 11 B+ A B 62.9 RedRobin RRGB 45.72 +1.12 –45 371 26 o56 27 98 B+ .. B 22.2 Redback RBAK 19.06 +.21 +33 2.6m .. o60 22 99 C+ D A 33.8 Rediff.com REDF 25.04 –.04 –90 151 99 ê23 18 68 D .. 22.2 RegncyE RGNC 21.80 +.39 –67 123 .. ê58 10 98 A E A– 18.0 Regeneron REGN 16.77 –.20 +6 484 .. o84 97 74 C B B– 18.7 Reliv Intl r RELV 12.26 +.13 –66 42 27 ê20 45 18 D– B D 24.2 RensncLrn RLRN 17.33 +.11 +43 60 22 o69 38 96 A– .. B+ 24.0 Renovis RNVS 23.41 –.12 –6 418 .. o45 36 60 C+ C C+ 27.9 RentACtr RCII 23.99 +.67 +143 1.7m 12 o35 9 49 C C A+ 11.5 Rentrak r RENT 10.16 –.09 –72 9 30 ê68 57 57 B+ B B 16.9 RepubAir RJET 15.01 –.10 –34 182 9 ê29 63 19 D– A D–14.1 RepBcp RBNC 12.08 +.02 +128 677 13 k59 27 72 C+ B B+ 18.0 RepCosGrp RUTX 17.75 +.01 +86 44 10 ê78 84 72 B– D B– 19.3 ResCare RSCR 18.13 +.13 +190 272 19 ê82 55 75 A– A B– 90.5 RschInMt RIMM 86.75 +1.00 +29 7.8m 33 ò75 37 69 A– B A– 19.8 ResourcAm REXI 19.02 –.15 +57 145 36 o52 76 42 D– A D 31.5 ResConn RECN 27.37 +.41 +66 740 23 ò64 88 38 C+ B C 43.0 Respironics RESP 36.74 –.32 –58 187 27 o74 97 37 A– C C+ 27.6 Retalix RTLX 25.25 +.82 –49 13 37 ê24 40 17 B– C D+50.0 ReutrsGp RTRSY 40.60 –.07 –42 17 27 o45 69 50 A– .. C+ 20.8 RightNow RNOW 15.21 –.82 +170 1.2m 66 o21 61 12 C– B E 34.0 Rimage RIMG 21.40 +.20 +81 245 19 o83 29 86 A+ B B+ 29.6 RoanokeEl RESC 29.32 +.44 +99 135 7 ê36 79 19 E A B– 25.7 RckyMtCh r RMCF 15.73 –.03 –72 8 27 ê66 82 33 C– A B+ 33.8 RockyShoe RCKY 25.70 –.12 –41 30 11 ê92 77 88 A– B B 54.2 Rofin–Sinar RSTI 52.79 +.70 +46 176 19 o11 19 22 C .. 19.5 RosettaR ROSE 17.67 –.33 –40 95 .. ê70 70 30 A+ A B 31.0 RossStore ROST 27.46 –.35 +29 1.6m 20 o4 26 3 D D D+27.8 Rotech ROHI 14.60 +.16 –76 21 69 ê
85 88 72 A+ A D–41.7 Royal Gold RGLD 29.53 –.02 –46 467 49 o37 9 58 B+ D A– 11.5 RubioRest RUBO 10.20 +.08 –52 9 39 k39 6 56 A D A– 18.1 RudolphTch RTEC 15.91 +.16 +10 417 46 o42 28 94 A .. D–17.9 RuralCellu RCCC 13.44 –.20 –62 40 .. ê79 91 63 B+ .. A– 23.4 RuthChris RUTH 21.84 +.26 –50 141 37 o83 71 62 B+ A B– 57.9 RyanrHldg RYAAY 55.25 +.34 –64 87 23 o29 15 38 B+ E B+ 14.8 RyansRest RYAN 13.18 +.17 +181 714 20 ê
— S —29 53 25 D A E 40.5 S&TBcp r STBA 36.92 +.32 +313 201 16 ê59 37 96 A– .. C NH SBAComm SBAC 23.86 +2.29 +370 3.1m .. o22 11 44 A– E C 12.5 SBSTech SBSE 10.64 –.03 –48 29 96 ê94 81 81 C+ B A NH SCP Pool POOL 45.83 –.03 –20 239 30 o94 91 91 B+ C B+ 31.5 SCSTran r SCST 29.51 –.90 +83 313 18 ê88 83 51 A– A B 42.6 SEI r SEIC 40.62 –.03 +6 366 22 o74 90 58 B– A C+ 45.7 SFBCIntl r SFCC 24.04 +1.14 –7 1.3m 12 o76 59 67 B B B NH SIIntl SINT 33.87 +.74 +12 162 23 ê70 48 86 C+ C B 18.1 SNBBncsh SNBT 17.93 –.03 –90 4 30 ê90 70 92 A– C B+ NH SPSS SPSS 33.67 +.36 +79 282 37 ê61 39 72 A– B D+20.6 SSAGlbTch SSAG 17.09 +.09 +44 100 16 ê63 62 55 D A B NH SiliconVBk SIVB 51.99 +.17 +42 545 21 o56 91 27 C+ C C+ 58.9 SAFECO r SAFC 53.18 +.54 +35 982 10 o17 60 5 D– B D–38.2 SafeNet SFNT 24.76 –.07 –9 533 18 o94 99 79 C+ C B+ NH SafeIns SAFT 45.67 +.18 +41 114 7 ê46 76 16 A C C 38.5 Saifun SFUN 29.31 –.09 –56 42 15 o2 13 4 E D D–21.7 SalemCmA SALM 13.49 +.05 +88 112 26 ê
28 54 9 A– B E 22.8 SalixPh SLXP 15.08 –1.51 +666 4.0m 25 o49 66 33 A+ C D–18.8 SandrsMor SMHG 16.26 +.03 +178 96 29 ê10 82 1 E C E 49.2 SandrsnFm SAFM 21.16 +.95 +156 1.3m 8 o97 98 90 A A C+ 79.8 SanDisk SNDK 55.00 +.10 –50 6.8m 27 o66 56 49 A– C B+ 11.9 SandsRegent SNDS 10.84 –.01 –85 5 20 ê11 35 13 D– D B– 25.0 Sanfilippo JBSS 15.01 +.04 –35 77 38 ê22 47 32 C E C 17.2 SanyoElec SANYY 13.31 +.32 –33 13 .. ê85 80 63 B+ B B 61.6 Scansrce SCSC 60.05 +.38 –5 125 20 o99 90 98 A– A A+ 48.9 SchickTc SCHK 47.47 +.01 –44 73 52 ê85 54 67 A+ B A– 38.2 SchntzrSt SCHN 35.00 +1.28 +95 994 8 ò10 30 14 D– D D+40.0 Scholastic SCHL 30.71 +.26 +79 700 14 ò10 29 8 D D B– 48.9 SchoolSpec SCHS 34.12 +.26 +121 346 25 o86 85 79 A D B– 25.8 SchlmnA r SHLM 24.08 +.06 +53 383 20 ò97 76 88 A+ B A– NH Schwab r SCHW 18.13 +.54 +28 10m 32 o93 81 80 A– B B NH SciGames SGMS 33.85 +.41 –19 539 32 o95 96 85 C+ A B– NH SeaBrght SEAB 17.64 +.84 +138 427 15 ê88 82 78 D+ A B+ 28.0 Seacoast SBCF 27.51 +.10 +265 140 21 x45 37 48 D+ A B 163 SearsHldgs r SHLD 134.9 –3.54 +121 4.0m 20 o66 97 52 D– A C+ 15.3 SecurCmpt SCUR 11.82 –.11 +8 632 21 o99 96 93 C+ A A– 37.7 SelctCmft SCSS 36.51 +.01 –29 520 32 o69 94 55 C+ C D 59.3 SelInsGrp SIGI 55.47 +.02 +73 276 12 o45 4 67 A C B+ 14.0 Semitool SMTL 11.33 –.47 +58 264 59 o39 38 38 A C D 21.1 Semtech SMTC 18.01 ... +72 1.6m 29 o19 28 59 D– E C 22.8 Senomyx SNMX 15.41 –.34 –26 225 .. o41 61 30 A .. B– 63.8 Sepracor r SEPR 54.91 –.63 –19 1.8m .. o38 92 3 C+ A D+23.5 SeraCare SRLSE 11.52 ... –98 2 17 ê72 78 56 C+ B B– 25.7 Serolgicls SERO 23.61 +.14 –27 311 23 o28 82 2 C+ B B– 42.2 ShandaInt r SNDA 13.38 –.26 –56 750 58 o19 8 41 B– E B 17.3 SharprImg SHRP 12.63 –.19 –39 284 .. o72 35 82 A+ D B+ 17.9 ShilohInds SHLO 17.00 +.06 +5 21 13 ê90 52 85 A– A B+ 50.3 ShirePlc SHPGY 48.22 –.27 –26 748 23 o94 84 79 A+ D A– 25.3 ShoeCrnvl SCVL 24.00 +.15 +88 170 17 ê71 95 20 A– A D+30.0 ShuflMstr r SHFL 25.98 +.64 +2 707 31 ò36 8 74 A– E B 14.0 SierraWr SWIR 11.51 +.10 –64 205 .. o63 23 98 B D B+ 14.5 SatyamI SIFY 13.40 +.06 –76 368 .. o80 82 43 A A C 67.1 SigmaAldrc SIAL 64.57 –.07 –18 308 17 o64 34 87 A D B 17.1 SigmaDsgn SIGM 15.24 –.20 –26 375 99 ò6 5 1 A B D–43.6 SigmaTel r SGTL 9.90 –.09 +35 1.7m 7 o
72 64 81 D B B– NH SigntrBk SBNY 33.99 +.49 +64 197 39 ê78 65 79 C+ C B 41.2 SilganHldg SLGN 40.89 +.47 +37 259 16 ê79 76 99 C+ .. B+ 12.5 SilcLtd SILC 10.68 +.03 –89 12 34 ê45 37 28 A A C+ 12.4 SilcnImg SIMG 9.83 +.38 +68 1.8m 20 o95 75 90 A C A 52.8 SilcnLab SLAB 47.81 +.23 –8 1.3m 39 o69 73 45 A A D+17.4 SilicnMot SIMO 12.36 –.36 +3 772 18 ê49 10 87 A+ .. B 19.2 SilverStd SSRI 18.76 –.05 –37 572 99 ò58 63 58 D+ B B– 30.0 SimnsFst SFNC 28.92 +.20 +275 94 15 ê36 44 22 C+ B B+ 33.5 Sina.com SINA 25.58 –.03 –30 905 32 o96 74 97 A A B– 42.5 SiRFTech SIRF 36.53 –1.16 –5 1.4m 55 o33 58 18 D– A B– 29.9 SkyFnlGrp SKYF 26.47 +.01 +22 254 14 ê94 89 80 B+ B B 34.1 Skywest SKYW 28.50 –.32 +7 683 15 o25 18 51 D+ E A– 16.6 SmurfitSt SSCC 13.58 ... –44 1.6m .. o87 82 71 C+ A B 23.7 Sohu.com SOHU 22.89 +.41 –14 892 29 o46 72 16 A– A D–37.0 Somanetics SMTS 20.99 –.26 +50 380 55 ê44 3 93 A– .. B+ 21.1 Somaxon SOMX 16.65 +.40 –54 23 .. ê91 81 51 B+ A A 34.7 Sonic r SONC 33.16 +.67 –1 343 27 ò79 84 58 B A D+22.0 SoncSltn SNIC 17.59 –.19 –21 258 19 o66 49 75 A– D C+ 42.1 SonoSite SONO 39.06 +.25 +41 314 99 o51 36 71 D+ C B– 20.5 SndFdBcp SFFS 20.42 –.02 +5 124 49 ê52 42 47 B A C 13.2 SourcIntlnk SORC 11.82 +.89 +690 3.2m 18 o45 53 52 B D C+ 27.0 Sourcecrp SRCP 24.42 +.08 +39 181 19 k31 50 14 D+ B B– 31.8 SouthFinl TSFG 26.14 +.12 –33 233 14 o55 53 39 C+ B A– 24.3 SWstBcOK OKSB 21.95 –.10 +121 134 13 ê67 70 85 C D C 19.1 SWWater SWWC 16.88 –.72 +85 300 51 ê22 3 43 A E B– 16.2 Spansion SPSN 14.09 –.15 +209 1.9m .. o44 79 32 C+ D C+ 12.6 SpartnMtr SPAR 10.48 +.18 –1 22 16 ê43 20 65 B– D A– 15.5 SpartanSt SPTN 12.81 +.08 +119 266 15 ê59 70 36 A– B C 14.9 Speclink SLNK 12.57 +.05 –3 228 19 o70 54 85 A– C C 13.4 Spectrant SPNC 10.68 +.13 –63 83 99 ê89 92 81 D A B 28.6 SprtGde r SGDE 26.66 +.54 –30 49 19 ê96 76 95 B A A– 35.6 StampsCom STMP 33.99 –.65 –13 335 77 o78 98 53 A C C 35.0 StdMicro SMSC 25.55 –2.34 +327 1.2m 26 ê79 44 86 B C A– NH StandrdPk STAN 24.20 +.42 +76 56 16 ê65 61 60 C– B B 30.9 StanleyFurn r STLY 27.73 –.99 +256 187 15 ê90 87 66 B– B A– 25.4 Staples r SPLS 25.04 +.07 +10 4.5m 22 o98 94 84 B+ A B NH Starbucks r SBUX 36.61 +.43 +42 7.4m 55 o61 75 51 C+ B C 39.9 StatAutoFl STFC 33.43 –.64 +98 155 11 ê5 10 6 D C D+22.0 StateBcp STBC 15.36 –.16 +318 110 .. ê
57 33 50 D+ A A 14.6 StealthGs GASS 13.80 +.30 +64 79 12 ê93 47 91 A+ B A 49.9 SteelDynm STLD 49.56 +1.40 +7 1.1m 11 o36 30 30 A+ C B– 29.9 SteelTech STTX 24.57 –.33 +3 217 13 o20 39 8 A+ C D–26.5 SteinMart SMRT 17.47 –.14 +118 482 15 ê90 66 77 B A A– 46.1 SteinerLeis STNR 42.54 +.40 –53 54 19 ê89 68 84 A– C A– 12.3 Stellent STEL 11.84 –.10 +15 274 39 o59 4 96 A– E A+ 15.8 Stereotxs STXS 13.83 +.46 –10 497 .. o91 88 77 C+ A B– NH Stericycle SRCL 67.21 +1.10 +63 379 32 o82 74 68 C+ B B 18.1 SterlngBanc SBIB 17.72 –.29 +218 1.1m 21 ê95 91 94 A B C+ 28.4 SterlCons STRL 20.24 +.12 –16 58 19 k52 70 34 D A B 23.7 SterlngFPA SLFI 21.27 +.03 +348 172 15 ê71 62 66 D+ A B 29.9 SterlngFnl STSA 29.27 –.14 +181 471 16 ê87 78 93 C– C B+ NH SteveMdn SHOO 34.94 –.93 +19 190 25 o25 71 14 D+ .. B 41.5 StoltNlsn r SNSA 32.81 –.94 –15 33 15 k92 64 88 A– B B+ 14.7 StoltOffsh SOSA 13.81 –.24 –74 146 25 ò32 76 35 E E C+ 24.5 StoneMor STON 21.52 +.19 –66 9 41 k72 83 44 B B B 36.1 Stratasys r SSYS 28.53 +.73 +53 220 28 o62 87 31 D A B 115 StrayrEd STRA 98.85 –.08 –1 192 30 o31 57 18 D B B– 22.6 SunBcpNJ SNBC 19.88 +.01 +137 81 19 k93 93 77 A– A B 32.9 SunHydrlcs r SNHY 23.79 –1.19 +138 255 20 ê74 64 92 B .. B+ 45.1 SunPower SPWR 40.78 –.34 –7 584 .. o26 14 33 B C B 17.2 Sunterra SNRR 14.50 ... +80 236 16 ê63 59 80 A– .. B– 27.4 SuperEssx SPSX 24.33 –.18 +44 221 17 ê93 99 69 A– A C 30.4 SuperWell SWSI 24.89 –.31 +12 69 35 ê85 82 82 A C C 47.6 Supertex SUPX 33.46 +.43 –51 243 41 o22 76 15 C+ E E 29.5 Surewest SURW 24.35 –.25 +271 105 55 ê53 86 17 C+ A C+ 46.9 Surmodics SRDX 36.15 +.49 –30 194 27 o37 65 32 D B D 27.3 SusqueBnc SUSQ 24.79 +.17 +262 462 14 ê67 67 51 B+ C B+ 25.9 SwiftTrns SWFT 22.80 –.73 +60 1.8m 15 o77 54 89 B D B+ 15.4 SykesEnt SYKE 14.34 –.01 +85 412 25 o24 79 6 D– A E 24.4 Symantec r SYMC 15.53 +.04 +81 29m 15 o
39 79 22 D C B– 28.2 Symbion SMBI 22.71 –.36 +53 206 26 ê82 87 37 A B B+ 31.1 Symyx SMMX 27.32 –.02 +7 266 56 o56 80 42 C– B C 31.3 Synaptics SYNA 22.94 –1.27 +138 2.6m 16 o43 36 59 D+ C B– 13.7 SynrgyFnl r SYNF 13.47 –.01 –31 14 33 ê64 97 8 A– A C+ 46.9 SyneronMd ELOS 29.78 +.73 –43 452 18 o73 83 68 C– D A 24.3 Synopsys SNPS 22.11 –.13 –28 975 47 o63 70 37 B A C+ 22.5 Syntel SYNT 18.97 +.21 +11 58 18 ê15 30 13 A D E 14.4 SyprisSol SYPR 9.79 –.32 +113 81 33 ê
— T —20 50 31 D .. C+ 38.5 TCPipelne TCLP 33.81 –.20 –45 19 12 ê96 89 94 B A B– 23.0 TDAmertr AMTD 21.62 +.30 –38 4.3m 26 ò8 5 49 E .. B– 16.4 TELOffshrTr TELOZ 11.90 +.10 –62 7 7 ê
51 38 69 D– B B+ 28.2 THQ THQI 25.58 –.14 +27 1.2m 32 o66 18 92 A D B+ 14.0 TTMTch TTMI 12.73 –.36 +11 473 27 o2 11 4 D– E B 29.6 TakeTwoIS TTWO 15.80 –.44 –67 973 .. o
24 27 22 A– .. B 15.0 TaleoA TLEO 13.13 +.04 +40 61 .. ê95 98 88 A– A C+ 36.8 Talx TALX 29.46 –.73 +15 591 35 o92 55 94 A D A+ 21.0 Tanox TNOX 20.55 –.11 +55 294 .. o7 36 3 B– D D 34.9 TaroPhrm TARO 14.25 +.01 –50 308 24 ò
52 76 12 C+ A B+ 29.0 Tarragon TARR 19.25 –.20 +354 268 5 ê23 32 45 D– B E 43.2 TaylorCp TAYC 38.44 –.38 +129 67 12 ê12 23 19 B+ D E 42.6 TechData r TECD 35.90 –.21 +60 826 17 o95 88 72 A A B– 60.7 Techne TECH 59.72 +.22 –22 179 33 o65 76 26 A– A C 16.7 TechInvt TICC 14.73 –.10 +68 141 12 ê9 9 16 B C E 15.3 TechTeam TEAM 10.59 +.14 –88 9 19 ê5 8 7 A+ E D–41.7 TecmsehA TECUA 21.79 –.16 +247 338 .. ê
25 32 11 B+ B C+ 21.1 Tekelec TKLC 13.35 –.97 +215 3.2m 20 ò28 18 60 B D D+13.3 TeleTech r TTEC 11.76 –.09 +23 333 37 o50 29 76 A E B 22.7 TelikInc TELK 19.88 +.12 –11 739 .. o93 66 94 B+ B B+ 15.3 Tellabs TLAB 14.82 +.03 –53 4.1m 26 o80 62 86 B C B 15.2 Telvent TLVT 14.09 +.02 –60 9 18 ê51 21 84 B+ D C 22.1 Tesco TESOF 18.94 +.22 –28 76 67 ê74 80 37 A A B– 46.0 Tessera TSRA 31.00 –.56 +17 590 31 o62 68 67 C+ E B+ 18.5 TetraTech TTEK 17.96 +.07 +10 559 .. o83 83 68 B– A C+ 45.9 TevaPharm TEVA 42.16 +.28 –12 4.8m 26 o87 95 57 C+ A B– 24.7 TxCapBsh TCBI 23.80 +.07 +61 242 23 ê79 66 54 C+ A A– 32.5 TXRegalBnc TRBS 31.82 –.33 +209 584 17 ê74 69 37 B+ A A– 19.1 TexRdhsA TXRH 15.76 +.09 –27 373 37 ê71 84 87 C+ .. B– 28.5 The9Ltd NCTY 24.99 +1.80 +319 693 65 o48 5 89 A E B– 30.5 Theravnc THRX 28.52 +.40 –66 102 .. o20 3 45 C+ .. B+ 14.0 ThomasPpty TPGI 12.85 –.47 –8 19 99 ê42 28 50 A+ D 23.1 TWeisel TWPG 20.70 –.15 –42 138 .. ê73 81 76 C+ C B– 25.4 Thoratec r THOR 19.90 +.02 +14 1.0m 43 o42 26 63 B C C+ 26.5 ThreeDSys TDSC 22.52 +.13 +46 106 54 ê33 4 90 A .. D–15.7 ThrshldPh THLD 13.60 –.20 –3 343 .. o93 96 75 D+ A A– NH TierOne TONE 33.44 –.51 +123 152 17 ê73 32 99 C+ E A+ 16.1 TimeWrTl TWTC 14.77 –.95 +433 4.1m .. o86 76 96 B+ E B 16.2 TolgrdCm TLGD 16.10 ... –36 65 59 o84 44 92 C+ A B+ 24.0 TOMOnline TOMO 22.24 –.46 +232 1.2m 25 o91 89 72 D+ A A– 19.5 TOPTankrs TOPT 17.44 +.34 +305 2.4m 7 o80 56 75 B– A B 37.3 ToreadrRes TRGL 30.00 +.48 +34 220 60 o94 99 86 C+ A B– 23.4 TowerGrp TWGP 21.92 +.17 –20 213 21 o97 97 82 B+ A B 65.2 TractorSupl TSCO 64.18 +.65 +14 509 30 o95 99 93 B A D 17.8 TradeStat TRAD 14.80 +.12 –42 698 30 o71 58 68 C– B A– 34.4 TrnSysArc TSAI 30.97 –.44 +58 455 28 o37 89 2 C+ A C 56.7 Travlzoo r TZOO 17.72 +.01 –62 83 39 k34 45 23 C+ B B– 55.1 TriGuarty TGIC 45.06 +.31 +160 141 11 ê89 84 73 C+ A B 27.7 TricoBcsh TCBK 27.47 +.47 +352 111 18 ê72 76 75 A– D C 34.1 TricoM TRMA 27.98 +.18 +3 172 .. ê98 76 98 A B B+ 29.7 TridntMcr TRID 27.47 –.06 0 1.8m 76 o93 92 73 A– B B 44.5 TrimblNv TRMB 42.65 –.17 –48 213 29 o63 59 62 A D B– 15.8 Trimeris TRMS 13.55 +.04 +12 289 .. o43 40 70 C– C D 19.7 Trizetto TZIX 16.26 –.27 +13 484 33 o93 75 90 B+ A B– 24.4 TrueRelig TRLG 20.49 –.36 +7 701 22 o18 42 24 A– E E 22.0 TrumpEnt TRMP 16.00 –.06 +88 341 .. ê31 57 21 D+ A D–13.7 TrustcNY TRST 12.32 +.12 +235 603 15 ê62 52 53 D+ A B+ NH Trustmark TRMK 31.36 +.42 +270 463 15 ê32 68 7 C+ B C+ 35.9 TuesMrng TUES 22.01 +.83 +55 816 14 o2 18 3 D D E 20.0 TurboChef OVEN 11.00 +.23 –9 349 .. o
71 76 75 C+ D B 19.8 21Cent TCHC 16.99 +.04 –20 21 10 ê
— U —49 54 63 B+ .. 41.0 UALCorp UAUA 39.20 –.07 –53 1.2m .. o85 70 74 A B B– 22.9 UAPHldgs UAPH 21.42 –.28 +25 279 14 ê53 84 24 C+ A D–21.0 UCBHHldgs UCBH 18.17 +.16 +100 1.2m 18 o49 65 63 D– C D+ NH UMB Finl UMBF 69.82 +.74 +254 137 28 ê21 8 30 A D C+ 39.7 USAMoblty USMO 28.89 +.19 +196 232 .. k55 95 16 C A C 54.1 USANAHlth r USNA 40.53 –.73 –9 178 20 o57 95 19 B+ C C 32.0 USA Truck USAK 25.17 –2.46 +248 431 16 ê91 62 97 A– D A NH USConcrete RMIX 13.78 +.31 –20 379 32 o92 76 96 A– A C 20.0 USGlobal GROW 13.36 –.36 –61 104 33 ê83 86 70 C– A C+ NH USIHldg USIH 15.01 +.19 +156 526 13 ê24 64 23 D B E 20.7 USPhyTh USPH 16.78 –.01 +139 100 22 ê50 66 63 B+ D C 28.6 USXpress XPRSA 17.03 +.07 +117 304 24 ê91 91 78 A+ B D 108 UTiWrld UTIW 99.3 –1.88 –2 184 37 k39 22 34 A– B B 12.9 Ulticom ULCM 10.49 –.23 +72 116 27 k87 76 87 A– E B+ 24.1 UltimtStwr ULTI 23.27 +.09 +19 209 99 o4 31 8 D– E D–18.4 UltrlfBat ULBI 11.41 –.57 +55 274 .. o
65 33 86 A E B+ 24.1 Ultratech UTEK 22.44 –.51 +73 520 .. o81 87 49 C+ A B 29.7 Umpqua UMPQ 27.53 +.25 +66 368 17 ê84 84 66 B+ A B– 41.9 UndArmr UARM 30.07 –.20 –74 260 63 o51 98 29 A– .. C 15.1 UnicaCp UNCA 11.81 +.12 +27 62 22 ê26 39 22 C+ B C+ 18.1 UnionDrll UDRL 13.82 –.28 –52 119 55 ê68 51 72 C+ B B– 23.5 UtdAmIndm INDM 21.54 –.51 +94 122 12 ê51 62 51 D+ A D–38.5 UntBksWV UBSI 38.31 +.58 +318 318 16 o66 77 52 D+ A C+ 30.5 UtdCmBk UCBI 27.86 +.17 +362 246 19 ê58 66 54 D+ C B 13.3 UnitdCmty UCFC 12.40 +.08 +409 201 15 ê10 36 13 C+ E E 47.7 UnitdFire UFCS 34.71 +.22 +70 206 99 ê75 86 62 D C B+ 36.0 UnitdNaturl UNFI 34.10 –.13 +8 567 31 o55 78 24 B A C+ 15.4 UntdOnln UNTD 12.30 –.01 +22 1.0m 11 o82 89 63 C A C+ 30.7 UnitdPnAm UPFC 28.35 –.02 +37 46 19 ê85 38 98 A+ E A+ NH UtdRetail URGI 18.57 +.06 –39 86 42 ê35 32 46 B– C D+53.6 UtdStnr USTR 50.34 +.23 +146 386 17 o61 95 45 E B B– 40.3 UnitdSrgcl USPI 35.04 +.06 +5 497 33 o84 72 56 A A B– 78.7 UtdThrp UTHR 64.13 +.14 +36 705 34 o96 62 92 A+ B A 22.3 UnivStnls USAP 21.48 ... –22 25 10 ê18 56 6 D– B D+25.1 UnivAmFn UHCO 14.80 –.06 +25 518 14 ê40 12 85 A– D D+15.6 UnivDisply PANL 13.02 –.02 +60 370 .. o40 48 41 C C C+ 18.7 UniElec UEIC 17.84 +.19 +387 140 22 ê84 93 82 D+ C B– 64.5 UnivslFrst UFPI 63.10 –.73 +58 190 17 ò87 95 63 B+ A C+ 26.9 UnivTruck UACL 22.50 +.13 +149 62 20 ê66 97 13 A+ A D 33.8 UrbanOutfit URBN 23.80 +.06 –38 2.3m 30 o
— V —88 90 69 B– A C 29.9 VCAAnt WOOF 28.72 +.08 –31 271 30 o34 27 75 C+ .. 12.0 ValeraPh VLRX 11.39 +.03 –83 25 .. ê43 23 75 B+ B E 21.0 ValuClck VCLK 16.42 ... –25 1.6m 37 o41 59 51 D E B 13.5 ValuvisA VVTV 12.80 +.05 +113 676 .. o53 70 37 B– C B 43.2 Varian VARI 39.67 –.22 +102 361 23 o56 76 34 A C C 35.9 VarianSm VSEA 27.36 –.24 +63 2.0m 26 o68 76 78 B– D C+ 22.9 VeecoInst VECO 20.69 +.08 +51 903 44 o88 93 44 A– A B 45.0 VentanaMd VMSI 40.53 +.75 +40 358 51 o98 98 88 C– A A 33.0 Ventiv VTIV 31.70 –1.06 +168 1.0m 25 o51 91 34 D– B C+ 43.2 VerintSys VRNT 35.72 –.38 +14 149 36 ò32 67 17 D– A C 33.4 Verisign VRSN 23.22 +.22 –13 4.9m 22 o71 30 99 A D B+ 44.7 VertxPhar VRTX 40.56 +1.07 +12 2.0m .. o66 87 71 B .. D+ 45.4 Vertrue VTRU 43.02 –.62 +116 105 15 ê68 55 69 A– C C+ 29.2 Viasat VSAT 26.39 –.21 +128 442 26 o86 76 86 A E B+ 20.5 Vicor VICR 19.14 –.01 +50 170 99 k55 76 49 B D B– 18.5 Vignette VIGN 15.46 –.06 +50 547 30 o60 24 89 A– E A– 19.3 ViisageT VISG 17.70 –.05 –53 252 .. o98 76 98 A C A+ 20.5 Vimicro VIMC 18.00 –1.27 +303 1.1m 36 o51 86 17 C+ A D–34.7 VineyrdNtl VNBC 28.61 +.04 +60 72 15 k19 11 45 A E D–12.5 VirageLog VIRL 10.31 –.02 +76 120 .. o96 96 87 D+ A B+ 37.0 VirgCmBk VCBI 35.56 –.42 +131 98 27 k64 75 93 A .. D+24.4 Virophrm VPHM 10.86 –5.38 +999 49m 9 o33 54 34 B– E B+ 24.0 VstaCre VSTA 15.07 +.44 +92 286 .. o85 84 97 B+ .. B 37.8 VistaPrt VPRT 33.25 +.27 –38 100 99 o91 76 96 C C A– 35.5 VtlImgs VTAL 33.02 –.55 –9 192 75 o76 70 76 C+ C B– 53.5 VitalSigns VITL 53.17 +.91 +4 43 24 ê76 80 68 B+ C D+20.9 Vitran VTNC 19.82 +.07 –60 10 14 ê43 13 83 A– .. B+ 15.7 Vocus VOCS 12.98 –.53 –91 4 .. ê89 95 68 B+ A C+ 41.4 Volcom VLCM 33.53 –.17 –8 325 31 ê56 5 79 A B B– 19.5 Volterra VLTR 17.20 –.10 +93 684 78 o54 81 35 C+ C C 49.9 Volvo VOLVY 45.28 +.24 –7 75 10 o
— W —81 78 53 A B B– 33.8 WD40 WDFC 30.96 +.27 +120 146 17 k69 69 54 B+ C B 60.0 WPP WPPGY 59.52 –.02 –5 147 18 o31 27 36 B+ D B 28.2 Warnaco WRNC 24.44 +.54 +78 881 21 o35 48 61 C D D 18.7 WarrenRes WRES 13.99 –.08 +17 435 .. o44 48 41 D+ B B– 25.1 WshFed WFSL 24.20 +.19 +13 294 14 o86 93 68 A C C+ 60.0 WashGInt r WGII 57.99 +.61 +29 424 18 o79 65 71 C+ C A 17.2 WasteHld WWIN 17.00 +.03 +167 47 19 ê54 39 74 D+ C B NH Wauwatsa WAUW 13.76 +.36 +203 121 76 ê97 82 89 B A A– NH WebEx WEBX 32.70 –.20 0 933 28 o62 38 84 C+ C B+ 41.6 WebMD WBMD 35.52 –.85 –9 179 99 o64 94 31 B A E 69.7 Websns r WBSN 57.60 –.40 +50 909 36 o31 73 35 B– .. D–20.8 WebSideSt WSSI 15.99 –.23 +19 530 34 o78 76 86 B .. B+ 13.4 WebsitPro WSPI 12.99 –.03 –38 37 72 ê47 73 32 B+ C D–22.1 WernerEnt WERN 19.46 +.08 +78 1.1m 15 o53 53 46 D+ B B 32.5 Wesbnco r WSBC 31.19 –.23 +254 175 16 ê70 76 46 C+ A B– 28.4 WstCstOR WCBO 27.44 +.11 +383 106 17 ê85 85 63 B A B– 44.1 WestCp WSTC 43.03 +.26 –28 128 20 o6 9 9 C+ D B– 22.8 WstMarn WMAR 13.98 +.22 +18 181 99 o
47 62 35 C+ A E 56.3 WstamBc WABC 53.97 +.79 +188 404 16 o97 89 77 C+ A A+ 43.9 WestSierra WSBA 43.76 +.31 +42 67 19 k62 18 89 A+ B B+ 39.4 WheelPitt WPSC 19.04 +.34 –1 359 .. o69 51 74 D+ A B 36.0 WhtnyHld WTNY 35.91 +.15 –41 154 22 ê39 63 30 B– B D–79.9 WholeFds WFMI 64.11 +1.30 –1 2.1m 61 o91 98 66 A A C+ 19.2 WidrThan WTHN 14.51 –.42 –4 81 18 ê80 49 94 B– D A+ 20.0 WildOats OATS 18.47 –1.49 +200 2.1m 59 o90 76 90 C+ D A+ 24.2 WmsScots WLSC 22.93 +.25 –5 132 88 ê70 72 56 D+ B B+ 17.4 WillowGrB WGBC 16.95 +.06 +12 40 22 ê91 97 74 C+ A C+ 19.8 WilshBncp WIBC 18.23 +.18 +11 133 18 ê26 71 10 C– C C+ 17.7 WindRivr WIND 12.40 –.02 +54 2.5m 42 o67 88 45 D– A B– 59.6 WintrsFnl WTFC 55.14 +.33 +59 250 19 ê92 69 82 A– A B– NH WitnssSys WITS 24.60 +.63 +21 477 36 o67 45 71 A D B+ 16.8 Woodhead WDHD 16.40 –.01 –77 13 23 ê81 48 77 A– C A– 34.0 WodwrdGv WGOV 33.10 +.36 +137 233 20 ê41 74 13 C A C+ 32.4 WrldAcptc r WRLD 24.63 –.46 +100 230 13 o5 49 1 E .. B– 26.0 WorldSpcA WRSP 8.89 –2.63 +903 1.6m .. o
18 44 11 C+ C C+ 28.6 WrightMed WMGI 20.30 +.06 +109 926 28 o68 40 83 A– D B 76.5 Wynn WYNN 71.73 +1.60 –38 744 .. o
— X —1 7 3 E D D–37.3 XMSat XMSR 20.74 +.57 –6 7.9m .. o
36 29 57 B– C B– 16.2 XRite XRIT 12.81 +.57 +230 326 24 ê61 7 95 A .. A NH XenoPort XNPT 22.50 +2.41 +187 233 .. ê49 67 21 A B C+ 30.5 Xilinx r XLNX 26.20 +.36 +10 6.5m 28 o98 86 92 A+ A B 26.7 Xyratex XRTX 25.91 +.07 +5 461 15 k
— Y —48 81 21 B+ B D 62.7 YRCWrldW YRCW 45.27 –.23 –20 845 8 o37 92 8 C+ A E 43.7 Yahoo r YHOO 30.07 –.06 –17 23m 51 o
— Z —53 50 44 C– B B+ 49.4 ZebraTech ZBRA 45.36 +.08 +28 554 29 o88 76 99 A– D B 18.9 ZevexIntl ZVXI 13.25 +.10 –61 33 25 ê87 79 66 C+ A B+ NH ZionsBncp r ZION 85.04 +.90 +7 607 16 o45 51 39 A– E B 28.6 ZollMed ZOLL 26.86 +.64 +19 82 70 ê81 38 97 A D A NH Zoltek ZOLT 19.07 +.96 +20 537 .. o90 73 88 A D A– 22.5 Zoran ZRAN 20.01 +.46 –2 1.0m 34 o98 63 96 A+ A B+ 56.9 Zumiez ZUMZ 56.22 +1.92 +31 168 63 ê83 99 74 B– C D+18.8 Zygo ZIGO 16.20 +.29 –19 189 21 o60 31 83 A E B 25.0 ZymoGen ZGEN 22.41 –.19 –35 398 .. o

B14 MONDAY, MARCH 20, 2006 NASDAQ STOCKS IN THE NEWS INVESTORS.COM
R Acc 52-Wk Closing Vol%%S Dis Hi Stock Symbol Price Chg Chg Yld
SmartSelect® Composite RatingEP R Acc 52-Wk Closingî Vol%
6 S S. Dis Hi Stock Symbol Price Chg Chg
R Acc 52-Wk Closing Vol%%S Dis Hi Stock Symbol Price Chg Chg Yld
R Acc 52-Wk Closing Vol%%S Dis Hi Stock Symbol Price Chg Chg Yld
SmartSelect® Composite RatingEP R Acc 52-Wk Closingî Vol%
6 S S. Dis Hi Stock Symbol Price Chg Chg
SmartSelect® Composite RatingEP R Acc 52-Wk Closingî Vol%
6 S S. Dis Hi Stock Symbol Price Chg Chg
SmartSelect® Composite RatingEP R Acc 52-Wk Closingî Vol%
6 S S. Dis Hi Stock Symbol Price Chg Chg
EP R GrpAcc52-Wk Closing Vol%S S Str Dis Hi Stock Symbol Price Chg Chg
EP R GrpAcc52-Wk Closing Vol%S S Str Dis Hi Stock Symbol Price Chg Chg
EP R GrpAcc52-Wk Closing Vol%S S Str Dis Hi Stock Symbol Price Chg Chg
SmartSelect® Composite RatingEP R Acc 52-Wk Closingî Vol%
6 S S. Dis Hi Stock Symbol Price Chg Chg
R Acc 52-Wk Closing Vol%%S Dis Hi Stock Symbol Price Chg Chg Yld
R Acc 52-Wk Closing Vol%%S Dis Hi Stock Symbol Price Chg Chg Yld
AMEX Stocks On The MoveStocks $12 and higher with at least{ point change and 20,000shares traded for the day. Stocks up with EPS & RelativeStrength 80 or more are boldfaced.
AMERICAN EXCHANGETotal Volume: 71,761,452 Change: #3.8%
50 22 C 30.50 PeapkGlFn PGC 26.98 +0.27 57 +84772 31 C+ 39.90 CamdnNtl CAC 35.75 +1.12 61 +57335 73 B 12.85 GenesEngy GEL 12.23 +0.33 94 +2468 47 B+ 29.99 InvrnsMed IMA 25.85 +0.71 330 +236
45 57 A– 22.00 FrkStPrp FSP 21.48 +0.74 128 +21132 1 E 39.83 InterOil o IOC 14.23 +0.40 481 +14455 29 B+ 43.03 TelData o TDS 39.14 +0.86 458 +128
26 25 C+ 19.89 HungaranTel HTC 15.54 –0.46 45 +80481 49 C 42.58 Ntl Hlthcr NHC 38.41 –1.43 47 +77947 39 D+ 20.98 NatHlthRty NHR 19.83 –0.41 50 +65269 16 B 90.25 ConsTomoka CTO 62.00 –0.90 66 +40539 82 A– 25.24 Emeritus ESC 21.00 –2.79 74 +38460 21 D– 119.0 ParkNatl PRK 105.2 –1.78 84 +373.. 37 B– 15.25 NuvICATF NKX 14.13 –0.27 34 +324
15 Most % Up (Stocks Over $12)
EPS Rel Closing Net Vol Vol%Rnk|Str| Stock Name | Price | Up | (100s) | Chg
76 22 Jed Oil 13.54 +0.91 99,6 +6799 99 EmpireRes 21.24 +1.05 391,4 –2636 86 Contango 13.39 +0.59 21,6 –6928 17 CKXLands 12.01 +0.45 4,3 +7945 57 FrkStPrp 21.48 +0.74 127,8 +21172 31 CamdnNtl 35.75 +1.12 60,6 +57332 1 InterOil 14.23 +0.40 480,7 +14447 93 NovaGold 13.60 +0.38 310,6 –658 47 InvrnsMed 25.85 +0.71 329,7 +236.. 42 NuPADvAd2 14.98 +0.41 8,3 +1446 99 AdvMagntc 31.55 +0.86 316,1 +114
35 73 GenesEngy 12.23 +0.33 93,7 +24695 79 MC Ship 13.58 +0.36 67,8 +2249 99 Metretek 15.44 +0.38 197,8 –2469 97 Bodisen 15.88 +0.38 228,7 –26
15 Most Active StocksEPS Rel Acc Closing Net Vol Vol%Rnk|Str|Dis| Stock Name | Price | Up | (100s) | Chg
.. 42B HoldrsRetl 100.01 +0.58 2.21 –3126 40D+ GlobeTel 2.83 +0.50 5.24 +121.. 62B– iShRs2000 74.09 +0.32 29.63 –10.. 64C+ IshMSCIEA 64.65 +0.26 2.80 –31.. 61B– iShR2000V 73.21 +0.17 2.30 +100.. 58B S&PMdcpDR 142.95 +0.12 2.27 –7
21 94B+ Bema Gold 4.42 +0.07 4.40 –26.. 31D– H–MLSemi 35.55 –0.07 19.79 +2.. 54B– SPDRFincl 33.10 –0.08 7.02 –33.. 47B– DJIDiamnd 112.67 –0.10 5.58 –19
76 15D GreyWolf 6.90 –0.10 4.04 –15.. 49B– S&PDepRec 130.59 –0.44 43.66 –28
92 1E PainCare 2.01 –0.49 3.94 +999.. 58E SPDREnergy 53.65 –0.85 22.94 –8.. 77D H–OilSvc 141.18 –1.58 7.95 –28
EPS Rel Acc 52-Wk Stock Closing Vol Vol%Rnk Str Dis High Stock Name Symbol Price Change (1000s) Change
For Friday, March 17, 2006
– A–B –16 91 B B 14.3 AccessIT AIX 11.89 +.09 +107ê6 99 A A+ N H AdvMagntc AVM 31.55 +.86 +114ê
76 96 A–C+ 18.5 AllisChal ALY 13.08 +.04 –74ê9 88 A+A– 25.9 ApexSilvrMn SIL 22.92 +.12 –67ò
76 93 C C 37.0 ArenaRes ARD 28.91 +.51 +43ô89 91 A–B+ 58.5 BadgerMtr BMI 56.51 –.77 +65ê52 83 D–C+ 28.3 BakerMichl BKR 27.95 +.40 –42ê87 83 A B– 23.9 Balchem BCP 23.86 +.11 +325ê50 40 C+ B– 69.0 BioRad A BIO 59.21 –.79 +118ô69 97 D C 22.0 Bodisen BBC 15.88 +.38 –26ê76 91 B+D– 19.9 Bolt Technol BTJ 11.88 –.12 –82ê65 76 C B+ N H BritAmTob BTI 51.35 –.11 +31ô
– C–D–E –87 53 C B 12.6 CCA Inds CAW 10.88 –.07 –60k76 91 B+C+ 17.4 C E Franklin CFK 13.30 –.57 +6ê9 91 B–A– 13.4 CaracoPh CPD 13.15 ... +42ê
75 92 A+B 30.9 CastleAM CAS 27.06 +.26 +42ê4 56 C D– 43.9 CheniereE LNG 39.42 –.24 +85ô
36 86 C C+ 14.1 Contango MCF 13.39 +.59 –69ê30 80 D+A+ N H Cubic CUB 23.20 +.29 +32ô.. 22 C– .. 24.8 DBCmdty DBC 23.32 –.11 –35ê.. 47 C– B– 113 DJIDiamnd DIA 112.7 –.10 –19ô6 78 A–D– 15.2 DocSecSys DMC 11.73 +.38 –56k
89 78 C+ A– 26.6 EZEM EZEM 19.87 –.47 –60k99 99 A+C 23.9 EmpireRes ERS 21.24+1.05 –26k97 99 D–B+ 13.5 ENGlobal ENG 10.53 –.09 –49ò
– F–G–H –66 57 B+E 14.4 FNXMining FNX 11.21 –.30 –38ê.. 55 C– B– 22.5 FTDJMic FDM 22.36 +.06 –94ô
25 92 B–A+ 11.9 FiveStar FVE 11.34 +.32 0ê76 94 B+A– 29.8 FlotekInd FTK 25.70 –.40 –79ê10 98 A+A– 18.7 GammonLk GRS 16.43 –.35 –29ô35 73 D+B 12.9 GenesEngy GEL 12.23 +.33 +246ê76 75 A–D 26.0 Graham GHM 17.97 +.05 –78ê.. 70 C– B+ 3.0 H–B2BInt BHH 2.90 +.04 –73k.. 60 C– C+ 212 H–Biotech BBH 199.0+4.73 –26ò.. 73 C– B 20.9 H–Brdbd BDH 20.50 +.14 –67ò.. 62 C– C+ 73.5 H–Eur2001 EKH 73.25 +.01 –61ò.. 17 C– C+ 70.9 H–Internt HHH 56.62 –.25 –69ò.. 49 C– D+ 37.9 H–IntArc IAH 37.65 +.01 –95ò.. 70 C– B+ N H H–IntInf IIH 4.62 +.08 +24k.. 45 C– B– N H H–Mkt2000 MKH 55.49 +.07 –44k.. 77 C– D 158 H–OilSvc OIH 141.2–1.58 –28ò.. 40 C– B– 76.5 H–Pharm PPH 73.33 +.37 –44ò.. 52 C– B+ N H H–RegBk RKH 148.2 +.46 –42ò.. 42 C– B 104 HoldrsRetl RTH 100.0 +.58 –31ò.. 31 C– D– 40.6 H–MLSemi SMH 35.55 –.07 +2ò.. 45 C– B 39.5 H–Sftware SWH 37.68 +.12 –60ò
.. 60 C– A 30.3 HoldrsTel TTH 30.06 –.15 –60ò
.. 37 C– B– 124 H–Util UTH 115.0 –.73 –85ò
.. 58 C– B 64.6 H–Wirelss WMH 64.15 +.12 –78ò
– I–J–K–L –90 59 D+B– 117 Imprl Oil IMO 101.5–1.80 –22ô99 99 B+C 23.9 InfoSonic IFO 11.29 –.20 –44ê32 1 D+E 39.8 InterOil IOC 14.23 +.40 +144ò8 47 C+ B+ 30.0 InvrnsMed IMA 25.85 +.71 +236ê.. 72 C– C 57.4 IShrsCmxG IAU 55.20 –.14 –74ê.. 62 C– C+ 101 IshrGSNRs IGE 94.18 –.97 –17ê.. 76 C– C 37.2 IsharGSNtw IGN 36.28 +.02 +6ô.. 40 C– B– 42.8 IsharGSSft IGV 41.19 +.18 –38ô.. 56 C– D+ 68.6 IsharGSSmc IGW 63.28 +.02 –12ô.. 50 C– A 51.0 ISharGSTch IGM 48.79 +.01 +178ô.. 26 C– D+ 113 IshrGS Inv LQD 106.7 +.01 –59ô.. 31 C– B 81.3 IshrLhm1–3 SHY 80.09 –.02 –39ô.. 26 C– D– 97.0 IshrLhm20 TLT 88.85 –.27 –11ô.. 26 C– D– 87.5 IshLhm7–10 IEF 82.40 –.12 –34ô.. 29 C– D+ 104 IShLeAgBd AGG 99.72 –.10 +31ò.. 44 C– B– 20.4 IShrsAustrl EWA 19.75 –.20 –45ê.. 73 C– C+ N H IShrAustria EWO 30.95 +.17 –49ê.. 70 C– D+ 24.1 IShrCanada EWC 23.52 –.33 –69ô.. 64 C– C+ N H IshMSCIEA EFA 64.65 +.26 –31ò.. 77 C– D 101 IShrEmgMkt EEM 98.44 +.69 –58ô.. 65 C– B+ N H IShar EMU EZU 87.22 +.27 –5k.. 70 C– B– N H IShrGermny EWG 22.87 –.02 –62ê.. 81 C– D 39.7 ISharMxco EWW 39.01 +.20 –56ê.. 45 C– D+ 106 IshrPacxJp EPP 104.0 –.56 –53ê.. 84 C– C+ 117 IShrSoAfr EZA 111.4 +.96 –71ê.. 67 C– B+ 85.7 IShaNdqBio IBB 83.52 –.08 –57ò.. 47 C– C 53.1 IShaR1000G IWF 52.91 +.10 –4ò.. 50 C– A 71.6 IShRs1000 IWB 71.27 +.05 +13ò.. 52 C– C N H IShaR1000V IWD 73.95 –.06 –14ò.. 65 C– B– 77.9 IShR2000G IWO 77.46 +.26 –32ò.. 62 C– B– 74.5 IShRs2000 IWM 74.09 +.32 –10ò.. 61 C– B– 73.6 IShR2000V IWN 73.21 +.17 +100ò.. 50 C– B 44.2 IShR3000G IWZ 43.22 +.13 –26ò.. 50 C– C+ N H IShRs3000 IWV 76.00 +.08 –82ò.. 52 C– B– 96.9 IShaR3000V IWW 96.76 +.16 –63ò.. 61 C– B 101 IshrRsMG IWP 100.3 +.26 +105ò.. 59 C– A 94.7 IsharRslMd IWR 94.62 +.41 –62ò.. 58 C– C+ 135 IsharRsMdV IWS 134.7 +.42 –68ò.. 73 C– C+ 123 IshrSPTpx ITF 121.5+1.62 –71ò.. 55 C– C 107 IshGlbEgy IXC 100.7–1.03 –65ò.. 65 C– B– N H IshGlbFnl IXG 79.58 +.23 –41ò.. 52 C– B– N H IshGlbHlt IXJ 55.12 +.37 +2ò.. 52 C– D– 57.4 IshrGlbTlc IXN 55.13 +.08 –32ò.. 40 C– A– 53.1 IShSPGTel IXP 51.97 –.15 +120ò.. 87 C– D– 148 IshrSPLt40 ILF 143.5 –.80 –22ò.. 75 C– A– N H ISharCn&St ICF 88.31+1.07 +9ò
76 22 D D+ 22.1 Jed Oil JDO 13.54 +.91 +67k3 77 B D+ 22.2 KFX Inc KFX 17.75 +.04 +39ô
57 50 A D– 22.0 LaBarge Inc LB 14.56 –.05 +53ê76 80 B–A+ 13.6 Lodgian LGN 13.42 –.08 +214ê
– M–N–O –95 79 D+B– 16.3 MC Ship MCX 13.58 +.36 +22ê49 99 B B– 19.8 Metretek MEK 15.44 +.38 –24ê96 38 E B+ 948 NVR NVR 792.0+9.00 –21ê99 48 B+C+ 40.0 NGSvcs NGS 16.57 –.42 –60ê47 93 A+B+ 14.1 NovaGold NG 13.60 +.38 –65ò91 17 E B 28.5 OrleansHme OHB 19.37 +.09 +104ê
– P–Q–R –70 77 D D– 21.4 Petrofd PTF 20.85 –.07 –31ô76 18 C+ E 23.1 PnrDrlng PDC 14.48 +.01 –11ô.. 63 C– B+ N H PSAerDef PPA 17.07 +.14 +74ô.. 45 C– B– 15.7 PwShDiv PFM 15.65 –.03 +9ô.. 68 C– A– N H PSBldCns PKB 18.22 +.21 –78ô.. 68 C– B 19.4 PwShBio PBE 18.51 –.01 +93ô.. 50 C– C+ 19.7 PSEnEx PXE 17.52 –.16 –80ô.. 43 C– B+ 15.2 PwShFdBev PBJ 15.17 +.04 –73ô.. 57 C– B N H PwSHard PHW 16.80 +.10 +136ô.. 53 C– B+ 17.1 PwShIns PIC 17.02 –.02 +473ô.. 57 C– B 16.3 PwShLeis PEJ 16.26 +.09 –61ô.. 53 C– B+ 16.7 PwShLgGr PWB 16.63 +.07 –14ô.. 57 C– A+ 17.3 PwShLgVal PWV 17.25 –.01 –66ô.. 55 C– B 48.1 PwShDyMkt PWC 47.87 –.08 –25ô.. 27 C– C+ 15.1 PwShMedia PBS 14.51 –.03 –64ô.. 66 C– B+ 18.5 PwShMdGr PWJ 18.46 +.08 –58ô.. 53 C– A– 17.7 PwShMdVal PWP 17.20 ... –24ô.. 64 C– B– 17.7 PwShNetwk PXQ 17.53 +.15 –62ô.. 61 C– C 22.3 PSOilSv PXJ 19.07 –.23 –63ô.. 55 C– B 52.2 PwShDyOtc PWO 51.56 +.11 –22ô.. 61 C– B+ 17.5 PwSPharma PJP 17.47 +.09 –68ô.. 64 C– A– 17.9 PSRetail PMR 17.81 +.01 –22ô.. 70 C– B 20.3 PwShSemi PSI 18.64 –.01 –43ô.. 61 C– B 18.4 PwShSmGr PWT 17.95 –.04 –78ô.. 55 C– B 16.7 PwShSmVal PWY 16.71 +.08 –48ô.. 57 C– B– 18.4 PwShSoft PSJ 17.95 +.07 –74ô.. 53 C– A– 16.4 PwSTelc PTE 16.10 –.04 –64ô.. 50 C– B 16.9 PwsUtils PUI 16.61 –.14 +709ô.. 68 C– B– 16.6 PwrShChna PGJ 15.94 –.07 +12ô.. 50 C– B+ 16.2 PwHiGrDv PHJ 16.11 –.01 –76ô.. 32 C– B– 15.7 PwrShHiYd PEY 15.04 –.06 –27ô.. 55 C– B+ 16.6 PwSIntDv PID 16.41 –.15 –25ô.. 61 C– D– 18.8 PSLNano PXN 17.81 +.02 –70ô.. 45 C– B– 16.9 PwSValL PIV 16.25 ... –37ô.. 66 C– A+ 18.3 PwSWtrRes PHO 17.80 –.06 –34ô.. 79 C– D+ 21.1 PwShWHCln PBW 20.00 –.06 –40ô.. 59 C– B 17.0 PwSZMic PZI 16.59 +.01 –38ô.. 38 C– .. 25.9 PwSZSC PZJ 25.84 +.12 –67ô
92 86 B–A+ 19.1 Psychemed PMD 18.40 +.01 –39ê70 57 A–B 17.5 ReadyMix RMX 14.95 –.15 –73ê5 20 A–B 26.8 RivieraHldg RIV 15.05 +.19 –1ê.. 40 C– D– 96.7 RydRus50 XLG 95.84 –.68 +57ô.. 57 C– C+ 178 RdxSPEqlWt RSP 177.0 –.18 +28ô.. 43 C– .. N H RdxSPGth RPG 34.70 –.02 –75ô.. 45 C– .. 30.3 RdxSPVal RPV 30.31 ... –95ô.. 43 C– .. N H RdxMGth RFG 52.07 +.27 –79ô.. 43 C– .. 31.5 RdxMVal RFV 31.35 –.07 –49ô.. 45 C– .. N H RdxSCGr RZG 39.64 +.44 –99ô.. 43 C– .. 38.8 RdxSCVal RZV 38.52 –.10 –80ô
– S–T –.. 49 C– B– 132 S&PDepRec SPY 130.6 –.44 –28ô.. 58 C– B 144 S&PMdcpDR MDY 143.0 +.12 –7ô.. 37 C– B– 35.0 SPDR Consm XLY 34.02 +.05 +125ò.. 39 C– A– 24.5 SPDRCnStpl XLP 23.96 –.14 –30ò.. 58 C– E 58.3 SPDREnergy XLE 53.65 –.85 –8ò.. 54 C– B– 33.3 SPDRFincl XLF 33.10 –.08 –33ò.. 45 C– B+ 33.1 SPDR HlthC XLV 32.72 –.03 –63ò.. 56 C– A 33.9 SPDR Inds XLI 33.79 +.13 +1ò.. 56 C– C+ 32.6 SPDR Matls XLB 32.19 –.20 –38ò.. 49 C– C+ 22.6 SPDRTech XLK 22.11 +.07 –56ò.. 37 C– D+ 34.1 SPDR Util XLU 32.15 –.32 –49ò.. 45 C– B+ 68.2 StretDJGLT DGT 67.75 –.41 –21ò.. 47 C– B 51.5 StretLCapG ELG 51.10 –.04 –64k.. 50 C– B 74.5 StretCapV ELV 73.92 –.53 –52k.. 64 C– B 90.7 ST–SCapG DSG 90.19 +.06 +999k.. 58 C– B 66.8 StretSCapV DSV 66.46 –.04 –26k.. 50 C– B– 95.0 STTotMkt TMW 94.41 –.13 –52ò.. 43 C– C 59.8 StLgCap ELR 59.29 ... –50ô.. 55 C– A– 55.2 StMdCap EMM 54.96 –.09 –95ô.. 57 C– B 60.6 StMCpGr EMG 60.37 –.21 –97ô.. 55 C– A– 56.5 StMCpVl EMV 56.48 ... +136ô.. 74 C– C+ 79.3 StretkREIT RWR 79.09 +.34 –2k.. 59 C– B– 59.8 StSmCap DSC 59.42 –.40 –82ô.. 45 C– B 54.5 StKbwBk KBE 54.13 –.18 –77ê.. 57 C– B 62.3 StKbwCM KCE 59.57–2.06 +72ê.. 32 C– B– 54.2 StKbwIns KIE 52.60 –.23 +92ê.. 52 C– C 55.6 StretHiT35 MTK 53.48 +.19 +48k.. 53 C– .. 54.4 StBiotech XBI 52.07 –.13 –91ô.. 43 C– A– 56.5 StSpdrDv SDY 56.22 –.16 –54ô.. 43 C– .. N H StHmbldr XHB 46.14 +.82 +26ô.. 40 C– B+ 55.6 SttrkSpdr OOO 53.53 –.29 +113ô.. 27 C– .. 55.8 StSmcdtr XSD 52.04 –.01 –97ô
97 93 C+ B 33.4 Team TMI 31.27 +.43 –31k55 29 A B+ 43.0 TelData TDS 39.14 +.86 +128ô
– UVWXYZ –44 68 A B 59.9 USCell USM 57.45 +.20 +10ô76 12 A–B– 15.7 UTEK UTK 12.27 +.23 –19ê99 92 C C+ 70.0 UltraPt UPL 58.60 –.88 –21ô.. 40 C– B 56.3 VangCnsDs VCR 54.65 +.07 –74ò.. 40 C– B– 58.3 VangCnsSt VDC 58.14 +.05 –24ò.. 76 C– B– 68.3 VangEmMkt VWO 67.17 +.24 –43ê.. 57 C– B– 83.3 VangEner VDE 76.81 –.69 –39ô.. 61 C– B– N H VangEuro VGK 58.25 +.11 –31ô.. 61 C– B+ 97.5 VangrdEMI VXF 97.29 +.23 –24ò.. 57 C– B+ 59.3 VangFinl VFH 59.20 +.10 –44ò.. 48 C– B 55.9 VangGrwth VUG 55.47 +.04 –12ò.. 48 C– C+ 56.5 VangHlCr VHT 56.22 +.16 –32ò.. 61 C– A– N H VangIndl VIS 62.67 +.28 +3ô.. 52 C– C 52.0 VangInfT VGT 50.32 +.11 –66ò.. 50 C– B– 58.3 VangLgCp VV 58.17 +.01 –68ò.. 59 C– D 65.4 VangMatl VAW 65.09 +.15 –57ò.. 61 C– C 69.2 VangMidCp VO 69.13 +.32 –60ò.. 66 C– D+ 63.9 VangPac VPL 62.86 +.55 –41ô.. 70 C– A+ N H VangREIT VNQ 69.68 +.62 –53ô.. 66 C– B– 64.9 VangSmCGr VBK 64.55 +.09 +14ò.. 57 C– B– 66.9 VangSmCpVl VBR 66.80 +.23 –22ò.. 63 C– B– 65.9 VangSmCp VB 65.64 +.22 +57ò.. 61 C– A– 61.6 VangTelSvc VOX 61.40 +.03 –28ô.. 50 C– B 131 VangrdTSMI VTI 130.2 +.10 –28ò.. 37 C– B– 71.1 VangUtil VPU 67.23 –.23 +41ò.. 50 C– B N H VangValu VTV 60.77 –.04 –61ò
28 98 A+A 21.6 WSilver WTZ 19.92 –.23 –52ô18 41 B C+ 31.1 Westmrlnd WLB 24.40 +.12 –22k
Hittite MicrowaveHITT has consis-tently found support at its 10-weekmoving average the past twomonths. It finished Friday 5% shortof therecordhigh itnotchedFeb. 17.The company makes circuits forproducts with radio frequency, mi-crowaveandmillimeter-waveappli-cations. Its products are used incars, broadband systems, cellphones, fiber optics and in the de-fenseandaerospace industries.Hittite’s earnings growth rangedfrom 31% to 64% the past five quar-ters. Its sales growth varied from26%to34%during thesameperiod.At the end of last year, Hittite’sshareholders included 28 mutualfunds. Of these, four carried IBDfund ratings of A- or higher and hadeither taken new positions in thestockduring the reportingperiodoraddedto theirholdings.Charming ShoppesCHRS seems tobe building a base-on-base pattern,and in recent weeks has held aboveits 10-weekmovingaverage.The retail chain specializes inwomen’s plus-sized clothing. It op-erates 2,236 stores under the LaneBryant, Fashion Bug, Fashion BugPlus and Catherines Plus Sizesbrandnames.Its earnings growth acceleratedfrom10%to43%to80%to275%thepast threequarters.Christina Wise
REITs
82 48 79 A+ 55.8 AMB Ppty AMB 56.53 0.88 785 55 62 A- 7.5 ArmHldgs ARMHY 7.10 -0.06 -7783 73 78 B- 24.5 AaronRntA RNTA 24.50 0.50 1891 73 83 A- 23.7 AcadiaRlty AKR 24.06 0.44 22385 57 79 D+ 9.5 ActionSm ACTS 9.55 0.59 49493 71 94 B 4.3 Actuate ACTU 4.10 -0.05 -5194 85 78 A 34.0 Advnta A ADVNA 32.38 -1.40 13478 79 82 B- 24.5 AirFrance AKH 24.02 0.12 -3380 58 55 A- 295.0 Alexanders ALX 283.64 7.14 63884 50 78 A- 97.3 AlexREEqt ARE 97.08 0.68 16889 93 70 A 19.0 AllianceBk ABVA 18.75 -0.01 -8786 45 98 A- 2.4 AlliFibOp AFOP 2.20 0.10 3075 83 40 B 69.5 Altana AAA 59.60 -0.15 14080 43 92 B- 36.0 AmrMovilA AMOV 35.21 -0.24 693 81 74 A+ 28.4 AmerLndLs ANL 28.54 0.14 5582 89 41 B- 13.8 Amer PhysSv AMPH 12.98 0.27 -392 84 80 B 28.3 AmerRvr AMRB 27.80 0.00 -8585 76 88 A 7.1 Amerigon ARGN 6.60 -0.25 28983 77 71 A- 23.5 Ameris ABCB 22.82 0.05 50876 49 91 A- 10.0 AmkorTch AMKR 7.50 -0.14 10688 94 82 B 33.2 Amrep AXR 33.62 0.80 5485 49 98 A 5.6 Angeion ANGN 5.25 -0.10 -6188 74 92 B+ 6.3 answrthnk ANSR 6.13 -0.08 8098 99 97 B 90.0 Apco Argtina APAGF 82.00 -2.98 4277 49 87 B+ 4.3 AppldMicro AMCC 3.92 -0.05 3199 90 96 A+ 45.0 Arcadis NV ARCAF 44.41 -0.33 -5581 52 80 A- 50.1 ArchSmth ASN 49.88 0.43 4092 76 99 A- 3.5 ArtTech ARTG 3.13 -0.03 -2388 76 76 A- 12.8 AshfordH AHT 13.06 0.30 20991 76 91 A- 14.0 Astronics ATRO 13.00 -0.07 -4875 50 66 B+ 10.9 AtlantsPl ATPL 9.35 -0.10 29783 85 78 C+ 83.0 Atrion ATRI 77.06 1.33 -8886 63 85 A 110.3 AvalonBay AVB 110.25 1.39 -2382 34 99 A+ 3.5 Avanex AVNX 3.08 0.07 16591 56 98 A 5.9 Avigen AVGN 5.87 0.18 -6278 76 65 A 8.3 BBVA Bn BFR 8.08 0.03 2583 81 69 B 20.4 B N C Bcp BNCN 19.00 0.00 -9777 43 84 A 56.1 BRE Pprts BRE 55.74 0.21 6779 83 74 D 36.7 BWC Finl BWCF 34.51 0.00 13485 80 47 B 44.4 BcoChile BCH 40.05 -0.80 -5192 61 70 A 74.5 BankIrelnd IRE 76.00 1.85 6978 87 49 C+ 37.3 BkMarin BMRC 36.15 0.10 -2992 85 80 B+ 21.0 BankSC BKSC 20.50 0.00 -7285 99 74 C+ 26.9 BchFstNtl BFNB 25.68 -0.57 15294 67 95 A 30.5 Benihana BNHN 29.69 -0.19 -9496 93 80 A- 29.6 BioMdRlty BMR 29.46 0.04 20278 98 60 C 21.5 BirnrDntl BDMS 17.75 -0.60 20089 76 99 B 8.8 Bitstream BITS 7.77 0.24 -3776 76 81 A- 7.0 Blue Rvr Bnc BRBI 6.64 0.00 13480 46 99 B 9.2 Bookham BKHM 8.14 0.06 -6288 61 88 A 94.3 BostonPpts BXP 96.02 2.52 1693 83 82 A+ 83.9 BrownForA BFA 83.81 0.17 -7375 75 45 A 41.0 C&F Fnl CFFI 40.00 0.00 17186 71 86 A- 8.6 CAE CGT 8.11 -0.11 1589 96 87 D- 15.0 CASMedSys CASM 9.00 -0.04 -7992 99 92 A+ 7.7 CentBusSv CBIZ 7.49 0.10 104
76 73 51 B+ 46.8 CBL&Assoc CBL 43.73 -0.30 4475 82 60 B 22.3 CCFHldgs CCFH 21.10 0.00 -8589 74 87 B 5.0 Chndtcm CHINA 4.29 -0.02 -7184 93 75 C+ 12.6 CalAmp CAMP 9.77 -0.08 -5376 58 88 C 23.7 CAM Comrc CADA 22.28 -0.28 -8391 91 70 B 36.4 CapCpWest CCOW 34.84 -0.16 21981 91 66 B 22.0 CapSoBc CAPB 21.00 0.00 -7082 83 67 A- 15.0 CaroBkH CLBH 13.75 -0.03 -9081 50 93 B- 9.8 CasualMl CMRG 9.94 0.24 18378 42 98 A- 9.6 CecoEnv CECE 9.13 -0.09 1490 93 77 B- 19.3 CtlVlCmBc CVCY 16.25 0.00 -8176 62 67 B+ 5.5 Ceragon CRNT 5.01 -0.01 -3584 79 87 A- 7.4 ChampInds CHMP 5.80 -0.20 -5785 44 98 A- 5.5 Ciena CIEN 5.11 0.02 1783 76 83 B+ 8.8 CirrusLgc CRUS 7.83 -0.07 1576 65 79 A- 29.7 CitizFstB CTZN 28.44 -0.75 12185 99 59 B- 32.0 CcColaHBC CCH 31.40 0.80 11075 49 89 C+ 6.2 Coeur D Alne CDE 5.72 0.08 12576 73 81 A- 21.3 CogdSpen CSA 21.20 0.05 20282 51 74 A- 10.5 Cohesant COHT 9.99 -0.03 -1375 47 77 B+ 51.8 ColonlPty CLP 51.59 0.41 10377 64 60 B+ 23.9 ColmBcOR CBBO 20.57 -1.32 11182 76 88 B- 13.0 Comarco CMRO 12.58 0.11 -8676 94 65 D- 28.8 CwlthBsh CWBS 27.00 0.00 99987 95 56 B- 37.4 CmtyBcp CMBC 36.30 0.30 11477 79 43 B+ 34.8 CmtyBcpNV CBON 31.82 0.36 11192 68 91 A 27.5 CoGnGeo GGY 27.14 -0.37 -7099 90 96 B+ 10.8 ComtchGrp COGO 10.50 -0.19 -2784 76 92 B+ 8.2 CnsmrPrt CPSS 7.74 -0.11 -6586 66 81 A 24.4 CooprtvBc COOP 24.30 0.00 -5781 70 78 A 41.2 Crescent Bk CSNT 39.50 -1.00 -1298 76 91 A 10.2 Cybrsrce CYBS 9.60 0.21 4877 62 69 B- 32.5 Deb Shops DEBS 29.43 -0.56 13786 76 91 A- 3.8 DescSys DSGX 3.56 -0.04 -9384 89 86 A- 41.1 DesrtCmty DCBK 41.25 0.66 -6776 47 77 B+ 56.0 DevelprDvs DDR 56.86 1.08 5484 36 97 B+ 46.3 DiamHill DHIL 42.45 0.45 -5591 80 76 A 34.1 ECB Bancrp ECBE 34.73 0.73 -8981 52 82 A- 9.9 ECI Telecom ECIL 10.51 0.75 23881 64 78 A- 5.5 ECTel ECTX 5.12 0.01 -6694 97 79 D+ 22.5 Ebix EBIX 20.71 0.55 093 84 87 B+ 13.7 ElecClHse ECHO 12.51 0.21 -7282 40 97 A 9.8 Emcore EMKR 9.06 -0.35 7084 86 73 B 27.7 EntFnlSv EFSC 26.03 -0.40 20775 49 98 A- 2.5 EonComm EONC 2.44 0.39 90275 49 77 B 51.2 EqLifePrp ELS 51.81 0.85 7482 72 65 B 28.7 EspirSnto ESF 28.65 0.14 -1378 74 64 A 71.8 EstaDlhaiz DEG 71.20 -0.22 41382 22 95 A+ 8.5 EXFO EXFO 8.23 -0.03 -3692 73 97 A 11.4 ExplorDE TXCO 10.46 0.10 -7483 78 77 A- 22.5 FFDFincl FFDF 21.00 0.15 -7978 80 74 B- 35.4 FNB FNBP 34.39 -0.11 61291 76 78 A+ 72.9 FederlRlty FRT 73.49 0.86 1182 76 86 A 11.4 Fiat S P A FIA 11.35 -0.04 -388 49 99 A 5.3 Finisar FNSR 4.81 -0.12 7582 91 72 C+ 22.3 FCmBcAmer FCFL 20.24 0.00 -68
85 55 91 A+ 20.0 FirstFedFin FFFS 19.75 -0.25 -3388 93 86 C 23.1 FstNBcSC FNSC 19.89 0.00 -5398 98 75 A 91.6 FstRgnlB FRGB 87.00 0.25 16779 90 54 B- 38.0 FirstSthBc FSBK 36.11 0.14 99977 88 63 C 15.8 FstStFnl FSTF 15.42 0.05 -9393 86 81 A- 18.6 FirstBkNW FBNW 18.34 0.09 -8786 78 69 B+ 27.1 FthlIndBc FOOT 26.00 -0.05 -2088 61 95 .. 11.7 FortuNet FNET 13.26 2.21 15282 51 95 A 17.6 G III Apparel GIII 16.28 -1.02 1385 76 94 B 5.9 Gametech GMTC 5.50 -0.13 -3091 20 95 A+ 9.5 Gerdau GNA 9.50 0.10 4979 65 48 A 30.7 GettyRlty GTY 29.78 0.00 22883 70 99 A- 5.6 Gigamedia GIGM 4.91 0.41 -1492 76 93 B+ 4.8 Glenayre GEMS 4.54 0.22 29787 77 57 B- 141.0 GtNorIron GNI 137.17 0.67 4883 94 64 B- 25.3 GreenvFst GVBK 24.99 0.45 -6281 49 83 A+ 33.4 Griffin GRIF 33.43 0.00 17587 71 80 A+ 21.3 GroupCasaA SAB 21.57 0.29 54287 93 65 B 29.3 GuarntyFd GFED 29.30 0.27 -8781 72 60 A+ 34.7 HMN Finl HMNF 34.25 -0.25 -9182 74 85 B- 6.0 HarrisInt HPOL 5.85 0.02 4892 72 82 A- 29.1 HeritagFinl HFWA 28.40 -0.29 -3677 76 73 B- 12.9 HghlndHsp HIH 12.85 0.10 11077 76 72 B+ 34.8 HghwdPrp HIW 34.77 0.22 8678 76 96 D- 7.0 HomeStr HOMS 5.76 -0.05 3587 85 68 B 26.4 HorznFnl HRZB 25.03 -0.40 48282 76 74 A- 21.3 HostMariott HMT 21.25 0.18 -1482 76 88 A+ 8.3 Hypercom HYC 8.45 0.25 32295 71 93 A+ 4.8 I C O Inc ICOC 4.71 0.05 -181 36 94 A+ 51.5 ICOS Vision IVIS 49.00 0.50 -9676 80 63 C+ 9.8 IAMGld IAG 8.20 -0.04 779 76 92 B 7.0 iGate IGTE 6.02 -0.17 18592 97 85 B- 9.0 Ikonics IKNX 7.86 0.00 -9382 76 88 B- 7.0 Immucell ICCC 6.74 0.07 24081 36 95 A 6.8 Indevus IDEV 6.23 -0.05 -6489 73 90 A- 4.0 Indus Intl IINT 3.85 -0.05 -5078 49 82 A- 10.0 InputOut IO 9.14 -0.56 21484 49 95 B 9.7 IntactInt ININ 8.80 -0.13 -6494 76 97 B+ 4.8 IntrntCmA ICCA 4.34 -0.10 2276 93 46 B+ 11.3 IntrtapPly ITP 8.51 -0.17 -7091 94 83 D- 11.7 Intl Assets IAAC 10.39 0.57 -4778 84 74 B- 52.0 IntlPwr IPR 49.20 0.15 -6997 96 95 B+ 10.2 Iridex Corp IRIX 11.49 1.44 99980 71 78 B+ 8.7 Ivillage IVIL 8.37 0.00 -4777 27 98 A- 4.3 JDS Uniph JDSU 4.05 0.09 7677 99 55 C 34.0 JksvlBcFL JAXB 32.77 0.00 4575 98 69 B- 36.4 JHardie JHX 35.53 0.38 -7594 76 81 B+ 8.0 JonesSoda JSDA 7.19 -0.03 -2990 77 82 B+ 43.6 K Tron Intl KTII 43.60 1.59 2578 76 74 B 9.6 Kemet KEM 9.17 0.16 8079 97 68 D+ 5.6 Key Tronic KTCC 4.00 0.03 -3194 75 82 A+ 39.6 Kimco Rlty KIM 39.58 0.58 3785 78 88 A- 18.7 KnapeVogt KNAP 18.43 -0.07 -9984 85 82 D+ 30.9 Koss KOSS 26.65 -0.36 1979 74 91 C 10.7 Kreisler Mfg KRSL 8.85 0.25 -8688 96 60 B 23.9 LTC Ppty Inc LTC 23.39 0.29 9676 76 54 A- 45.2 Lake Finl LKFN 44.88 -0.06 51881 82 60 B+ 20.6 LaklndInd LAKE 19.64 -0.10 1988 72 78 A- 41.9 LaSalleHtl LHO 41.30 -0.23 8382 74 76 A- 8.3 LawsonSft LWSN 7.66 -0.17 5679 57 96 B- 9.6 LexarMd LEXR 9.39 0.55 17176 53 76 A+ 6.5 LexGentcs LEXG 5.34 0.59 30876 59 63 A- 49.0 Liberty Ppty LRY 48.99 0.45 5683 76 90 B- 10.0 Lghtbrdge LTBG 10.34 0.49 108
97 76 96 A- 6.3 LivePrsn LPSN 6.20 0.45 21980 83 60 B+ 19.6 MityEnt MITY 19.00 0.02 -5582 89 56 A- 40.0 MacatBnk MCBC 37.68 -0.68 40675 41 97 B+ 10.2 Maxtor MXO 8.94 -0.01 -4188 99 71 B+ 6.8 Meadwbrk MIG 6.56 -0.12 -1979 70 72 A 9.5 Medtox MTOX 8.75 0.05 -7576 70 86 D+ 18.9 MercerIns MIGP 18.53 0.04 -7693 70 90 A+ 11.8 Merix MERX 10.12 -0.21 -4385 81 69 B 16.7 Mesa Labs MLAB 15.99 0.18 479 81 63 B- 13.8 Met Pro MPR 12.78 -0.13 7081 77 58 B+ 30.8 Metrocorp MCBI 26.97 -0.09 3375 55 81 A- 58.8 Mid Am Apt MAA 58.05 -0.38 16085 99 75 A+ 18.1 MnrchBk MNRK 17.21 -0.79 73585 82 64 B 35.3 MoogB MOGB 34.48 0.41 -8894 74 85 B+ 6.3 Mossimo MOSS 6.19 0.04 -1593 82 78 B- 28.8 MultiColor LABL 29.00 0.56 -9677 59 75 B 6.6 Natl Info EGOV 6.50 0.08 15093 62 85 A- 12.3 NathnsFms NATH 12.27 0.09 6082 89 81 D+ 21.7 Natl Resrch NRCI 20.50 0.00 -1786 85 85 B 23.1 Neogen NEOG 23.10 0.18 -2791 74 91 B+ 7.8 Netscout NTCT 7.87 0.17 23676 77 47 B 54.0 NwCentFinl NEW 44.85 -0.19 5979 67 54 A+ 26.2 New Pln Excl NXL 26.33 0.18 1789 86 61 A 31.5 NorthBay NBAN 30.35 0.37 -9886 46 99 A+ 7.5 Novavax NVAX 7.36 0.06 10589 76 93 B+ 8.7 Numerex NMRX 7.70 -0.01 -5777 64 85 B+ 7.7 OnSmcnd ONNN 6.76 -0.26 1296 95 76 C+ 22.9 OmegaFlx OFLX 18.44 -0.35 25475 66 51 B+ 14.3 OmegaHlth OHI 13.29 -0.09 17895 92 94 D 146.0 Orix IX 145.35 7.09 -6193 95 78 A- 22.3 PABBksh PABK 20.31 -0.79 9375 54 82 B 41.0 PHIvtg PHII 37.93 0.00 -4481 77 50 B+ 17.5 PacfcCntl PCBK 16.85 0.25 29592 81 88 A 8.9 PacIntnet PCNTF 8.60 0.02 -7083 78 75 B- 20.0 PacMercBp PMBC 19.99 0.09 -4278 89 87 A- 25.8 ParkeBc PKBK 25.28 -0.10 -6584 76 98 B+ 9.7 PeerlsSys PRLS 9.00 -0.02 -6278 75 73 B+ 25.0 PeopBNC PEBK 24.74 0.79 2786 57 76 A 63.5 PfeifrVac PV 61.50 0.50 -9282 94 64 C 28.4 PinnclFnPt PNFP 27.75 -0.15 58378 37 87 A- 9.6 Polyone POL 9.25 0.14 6480 87 41 D+ 37.9 Pope Res POPEZ 34.31 0.01 -2675 76 63 B 24.0 Powell Inds POWL 21.55 -0.53 35190 79 74 B 51.0 PfdBnkLA PFBC 50.29 -0.51 25296 95 97 B- 73.0 Primeenergy PNRG 62.85 0.00 -5380 56 82 A- 56.2 Prologis PLD 56.21 0.72 775 83 77 B- 13.5 PrudtlBcp PBIP 13.45 0.15 13885 66 79 B+ 84.6 Public Stor PSA 82.45 -0.45 11078 55 84 B+ 5.4 QckLogic QUIK 5.02 -0.06 781 75 91 A+ 43.2 Quilmes Ind LQU 42.06 -0.75 4385 76 86 B 8.1 RF MicroDv RFMD 7.67 -0.11 1986 76 96 C+ 5.3 Radcom RDCM 4.21 0.14 -1388 92 72 B- 44.8 Rayonier RYN 44.80 0.33 4779 76 84 C+ 9.1 RealNtwk RNWK 8.31 0.03 -2499 94 84 A+ 45.2 RecksnAssoc RA 45.82 0.79 -376 63 63 A- 36.0 Renasant RNST 35.74 0.16 52982 79 69 A- 14.8 RepublcFst FRBK 14.79 0.04 -3475 47 94 B 5.4 Ricks Cabrt RICK 5.43 0.34 47883 85 78 C 28.1 RivrvwBcp RVSB 26.95 -0.04 -9175 38 97 A- 6.7 RockwllMdTc RMTI 6.80 0.26 7398 96 75 A 18.6 RushEntA RUSHB 18.07 -0.13 -5479 76 82 C+ 6.6 SGL Carbon SGG 6.39 0.19 -5789 43 92 A+ 100.5 SLGreenRlty SLG 103.09 2.69 8575 28 89 A+ 6.7 SngmoBio SGMO 5.86 0.01 -44
83 62 76 B- 44.1 Saul Centers BFS 43.69 -0.27 39477 37 97 A+ 1.5 Savvis SVVS 1.35 0.20 19778 76 98 B- 13.0 ScientTch STIZ 7.65 -0.77 2986 49 91 A- 8.6 Segue Sftwr SEGU 8.60 0.05 -9776 96 59 A+ 20.8 Seneca B SENEB 19.94 0.00 -8984 76 98 B 10.8 Sento SNTO 8.01 -0.10 -4890 72 92 A+ 99.2 Sequa B SQAB 97.27 -0.22 -1383 61 90 B 11.0 Shoe Pavilion SHOE 7.75 0.13 -6785 89 62 C+ 26.5 SierraBk BSRR 25.91 -0.24 63978 99 77 C+ 8.0 Slcnware SPIL 6.20 -0.14 5490 41 98 A+ 8.8 Sirenza SMDI 8.14 -0.23 -6381 37 99 A 7.6 SirnaTher RNAI 6.60 -0.11 -1893 55 95 B 9.3 SmithMicro SMSI 9.01 0.01 -4886 81 64 A 31.4 SmthBncp SMTB 31.49 0.29 -5577 74 79 B- 10.3 SmithMtr SMXC 9.37 0.12 -8175 47 85 A- 12.0 Solexa SLXA 9.91 0.26 5386 93 73 A- 15.3 SomerHlls SOMH 14.11 0.03 -7893 99 70 B- 38.5 SwCmBc SWCB 38.21 0.01 -1178 63 70 B+ 55.0 SovranSlfSt SSS 54.40 0.67 35591 87 68 B+ 8.0 SpectCtrl SPEC 7.96 0.01 -276 98 71 B 11.4 Spherion SFN 9.70 -0.09 4575 62 55 B+ 12.6 SpiritFin SFC 12.17 0.04 5685 76 85 B+ 25.0 StratsPpty STRS 23.50 -0.97 1778 83 41 B+ 243.2 StdntLn STU 227.26 4.19 -4487 43 89 A+ 8.4 SunOpta STKL 7.68 -0.13 -2885 70 80 C+ 13.8 Synalloy SYNL 13.10 -0.31 -1383 37 99 B+ 7.8 Synergetc SURG 6.87 -0.09 -5179 99 54 B- 7.8 Systemax SYX 7.04 -0.06 39782 76 96 B- 13.3 TB Woods TBWC 11.50 0.00 -6092 76 85 A- 18.4 T-3 Engy TTES 14.95 0.49 20090 96 82 B 35.5 TangerFact SKT 35.21 0.21 12883 76 90 B 6.4 Taylor Device TAYD 5.05 -0.05 -8688 87 92 D- 8.7 Tech Resrch TRCI 6.60 0.10 -7679 54 94 B+ 10.2 Tefron TFR 10.33 0.25 397 92 73 B 13.1 TeleMovil TEM 13.25 0.20 14481 97 67 A- 49.1 TeleAust TKA 48.76 -0.05 -3976 85 48 B 20.7 TexasUtd TXUI 19.71 -0.04 -9882 57 95 B+ 8.5 The Street TSCM 7.72 -0.33 -6287 76 98 B+ 10.5 ThomasGp TGIS 7.85 0.14 -9288 80 70 A- 27.4 TimbrlndBc TSBK 27.05 0.06 -9380 52 80 C 31.4 Todd Shipyrd TOD 28.10 -0.04 -8276 61 88 B 41.4 Town&Cntry TCT 40.48 -0.02 -4480 53 87 .. 24.7 TransDg TDG 25.01 0.74 -7581 60 94 A- 2.5 Transmeta TMTA 1.64 0.05 -4683 99 57 B+ 29.8 TrnsMontg TLP 26.95 0.10 13687 58 97 A- 9.8 TwtyFrSvn TFSM 9.45 0.33 -3490 76 95 B- 60.0 TwinDisc TWIN 53.49 0.40 -6884 77 79 A- 10.2 Tyler Tech TYL 10.26 0.03 9784 76 92 B+ 8.7 US Hmsys USHS 8.62 0.07 7680 76 70 B 10.2 UbiquiTel UPCS 10.04 0.00 3197 82 89 A- 40.0 UnitdScrty UBFO 40.00 0.00 3782 82 77 B- 17.0 UnityBcp UNTY 15.50 -0.45 -9793 77 84 A 33.5 UtahMedPr UTMD 32.61 -0.88 9090 95 76 B- 52.0 V S E VSEC 41.00 0.10 -8978 56 98 B+ 4.3 VASftwr LNUX 3.58 0.24 -685 87 70 D+ 39.0 VlyBancrp VLLY 37.76 -0.24 -7777 56 62 B 34.7 Ventas VTR 33.99 0.47 -2081 76 93 B 8.7 Versant VSNT 7.25 -0.25 -6482 80 70 B 41.9 VA Fnl Gp VFGI 40.97 -0.85 58979 89 62 D+ 20.0 WshngBk WBCO 18.25 0.25 487 87 54 B 89.6 WstpacBk WBK 87.30 -1.64 -4581 99 92 D- 8.9 WllmVlyVn WVVI 6.55 -0.16 8088 75 73 B 52.1 Wolseley WOS 51.97 0.17 6793 98 89 C 64.4 WooriFin WF 57.24 0.84 -5289 59 95 B+ 7.3 Zones ZONS 6.96 0.05 -65
Top-Ranked Low-Priced StocksIncludes stocks trading less than 20,000 shares.Full list of low-priced and thinly traded stocks atwww.investors.com/editorial/expandedIBD.asp.
“Graphic displays” of stocks over $12 that hit new price highs (names boldfaced) or are near new highs (regular type face) or had greatest % increase in volume on stocks over $15 and up 50¢ or more (name underlined). Stocks that are extended in priceover 15% from a consolidation(or basing) period have been omitted. “How to Read” chart appears on the NASDAQ every Monday. Stocks highlighted are not recommendations and should be researched further before investing.
5 D 12.0 AamesInv AIC 5.50 0.15 554 24.783 A- 23.7 AcadiaRlty AKR 24.06 0.44 223 3.113 B 19.0 AffordRes ARC 10.04 0.01 77 ..51 C+ 33.4 Agree Realty ADC 31.57 0.12 87 ..55 A- 295.0 Alexanders ALX 283.64 7.14 638 ..78 A- 97.3 AlexREEqt ARE 97.08 0.68 168 2.979 A+ 55.8 AMB Ppty AMB 56.53 0.88 7 3.373 A- 28.4 AmerCamp ACC 27.81 0.00 185 ..76 B 26.4 AmerCmtyTr APO 21.90 0.00 -90 1.820 C+ 40.8 AmerHmMtg AHM 29.83 -0.01 62 12.244 A- 7.3 Amerivest AMV 4.53 0.07 -27 ..74 A+ 28.4 AmerLndLs ANL 28.54 0.14 55 3.542 C+ 11.6 AmerRlty ARL 9.80 -0.24 -41 ..11 D+ 17.8 AmFinlRlty AFR 12.04 0.11 25 9.066 B 15.0 AmFstApt APRO 14.70 0.13 -9 6.839 B+ 18.3 AmMtgAcc AMC 15.74 0.00 -21 10.229 B 8.8 AmREIT AMY 7.55 -0.05 -65 ..92 C+ 18.3 AmSpctrm AQQ 16.25 0.25 -85 ..10 C+ 21.2 AnnalyMrt NLY 12.26 0.33 58 3.322 B- 13.0 Anthracite AHR 11.00 -0.02 154 ..11 B- 14.2 Anworth ANH 7.51 -0.09 181 1.175 A 47.5 ApartntInv AIV 47.51 0.30 -32 0.234 A- 31.2 ArborRT ABR 26.75 -0.13 45 10.580 A- 50.1 ArchSmth ASN 49.88 0.43 40 3.562 C+ 48.2 ArdenRlty ARI 45.52 -0.02 -22 4.419 C+ 7.6 Arizona Land AZL 4.51 0.01 57 8.975 A+ 11.9 AsdEstRlty AEC 11.42 0.08 -32 6.076 A- 12.8 AshfordH AHT 13.06 0.30 209 6.152 C+ 25.0 AtlanticRlty ATLRS 22.28 0.00 -96 2.085 A 110.3 AvalonBay AVB 110.25 1.39 -23 2.866 B+ 29.0 BedfordPrp BED 26.95 -0.04 75 1.680 A- 29.6 BioMdRlty BMR 29.46 0.04 202 3.958 B 17.5 BNPResPty BNP 17.00 -0.01 247 6.188 A 94.3 BostonPpts BXP 96.02 2.52 16 2.826 C+ 15.5 BoykinLodg BOY 11.45 0.00 208 ..51 C 33.4 BrandwnRty BDN 31.66 -0.10 81 5.384 A 56.1 BRE Pprts BRE 55.74 0.21 67 3.761 A- 27.4 BRT RealtyTr BRT 27.00 0.00 125 ..
79 B- 68.7 Camden Pty CPT 68.65 1.00 -1 3.811 C 20.6 CapAlli Tr CAA 8.41 0.00 -74 ..32 B- 36.0 Capital Trust CT 32.78 -0.07 448 7.321 B- 18.8 CapstdMtg CMO 6.75 -0.21 52 1.245 C+ 13.5 CaptlLse LSE 11.05 0.45 121 7.280 A 44.9 Carrameri CRE 44.62 0.00 103 4.551 B+ 46.8 CBL&Assoc CBL 43.73 -0.30 44 4.257 A+ 17.4 CedarShp CDR 15.95 0.20 127 5.69 D 31.3 CentraCPr CPV 23.54 0.04 223 7.8
64 C 21.3 CenturyRT CRLTS 19.80 0.00 40 11.766 A 23.2 CmrclNetLs NNN 23.44 0.38 134 5.581 A- 21.3 CogdSpen CSA 21.20 0.05 202 6.677 B+ 51.8 ColonlPty CLP 51.59 0.41 103 5.372 B+ 17.6 ColumEqTr COE 17.99 0.37 126 3.169 B- 33.8 CousinsPty CUZ 33.83 0.28 96 4.488 B+ 44.6 CpOffcPty OFC 44.78 0.52 85 1.856 B- 21.8 CrescntRlE CEI 20.78 -0.13 21 7.222 B- 16.1 DeefldTri DFR 13.41 0.21 59 10.477 B+ 56.0 DevelprDvs DDR 56.86 1.08 54 4.266 B 13.6 DiamRkHos DRH 13.02 0.32 103 5.589 C+ 28.6 DigitlRlt DLR 25.83 -0.42 49 4.165 C+ 38.1 DukeRlty DRE 37.97 0.19 -15 5.021 B 8.2 Dynex Cap DX 6.81 0.16 24 ..53 B 10.5 EagleHsp EHP 9.37 0.58 -58 7.559 B+ 48.2 Eastgroup EGP 48.35 0.62 271 4.11 E 7.0 ECCCap ECR 1.21 -0.06 33 ..
32 A- 20.9 EducRlty EDR 15.58 -0.25 352 7.739 B+ 47.7 EntertmtP EPR 44.55 -0.01 105 6.277 B 51.2 EqLifePrp ELS 51.81 0.85 74 0.678 C+ 46.3 EqtyRsd EQR 46.71 0.76 32 ..82 A- 16.6 Equity Inns ENN 16.65 0.20 161 4.649 A- 24.6 Equity One EQY 24.34 0.24 123 4.962 A 35.8 EquityOfce EOP 34.84 0.39 -2 3.882 B+ 110.0 EssexPpty ESS 111.10 2.57 177 3.069 A+ 16.7 ExtraSpc EXR 16.89 0.24 348 5.478 A+ 72.9 FederlRlty FRT 73.49 0.86 11 3.090 A 22.1 FelCor FCH 21.98 0.05 137 2.717 B- 14.7 Feldman FMP 11.20 -0.30 -79 8.116 C+ 19.5 FieldInv FICC 11.57 0.03 121 18.044 C+ 42.8 First Industrl FR 42.15 0.24 189 6.65 E 28.1 FriedBR FBR 9.54 0.03 -40 8.4
57 A- 22.0 FrkStPrp FSP 21.48 0.74 211 5.870 B+ 30.6 FstPotmc FPO 29.66 -0.28 110 4.273 B 52.3 GenlGrPpty GGP 51.30 -0.06 71 3.248 A 30.7 GettyRlty GTY 29.78 0.00 228 6.172 D- 19.6 Gladstn GOOD 19.29 0.04 6 7.581 C+ 50.7 GlblSignal GSL 49.90 0.04 138 4.256 A- 22.6 GlenbrgRlt GLB 21.10 -0.17 125 5.251 B+ 30.2 GlimchRlty GRT 28.15 0.09 203 6.810 E 17.1 GMHCmmty GCT 12.16 -0.30 187 3.037 C+ 13.8 GovtPptyTr GPT 9.28 0.50 183 6.543 C 27.5 Gramercy GKK 24.35 0.11 163 7.82 D 18.0 HanovCap HCM 5.10 -1.24 1037 11.6
53 D 40.9 HealthCrR HCN 38.12 0.21 -19 6.551 B+ 44.0 HealthRlty HR 38.77 0.09 -6 6.824 B- 12.1 Hersha Hosp HT 9.39 0.03 146 7.767 A- 40.2 HertgPpty HTG 39.99 -0.07 102 3.273 B- 12.9 HghlndHsp HIH 12.85 0.10 110 5.072 B+ 34.8 HghwdPrp HIW 34.77 0.22 86 4.955 B 28.9 HlthCrPpt HCP 28.81 0.30 1 5.916 C 14.9 HMG HMG 10.25 0.00 -67 ..48 B+ 10.1 HomeBanc HMB 8.86 -0.05 148 12.680 A 52.2 HomePptys HME 51.98 0.27 95 4.956 B- 47.4 Hosp Prop Tr HPT 46.34 0.31 15 6.374 A- 21.3 HostMariott HMT 21.25 0.18 -14 2.333 A- 13.3 HRPT Ptys Tr HRP 11.64 0.13 20 7.22 C+ 27.9 ImpacMtg IMH 8.57 0.07 -5 9.3
46 A- 11.7 IncomeOpRe IOT 7.10 0.00 86 ..50 A 17.0 InlandRE IRC 16.56 0.07 230 5.863 D 18.2 Innkpr U S A KPA 16.99 -0.27 129 3.531 B- 10.8 InvtRlEst IRETS 9.43 -0.02 515 6.933 B 45.9 iStarFinl SFI 39.63 -0.01 5 7.819 C+ 19.0 JER Inv JRT 16.35 -0.30 597 8.190 A+ 78.0 Kilroy Rlty KRC 76.65 -0.25 153 2.882 A+ 39.6 Kimco Rlty KIM 39.58 0.58 37 3.337 C+ 16.5 KiteRealty KRG 15.42 0.18 171 4.932 B 25.1 KKRFinl KFN 23.48 0.48 28 6.860 B 23.9 LTC Ppty Inc LTC 23.39 0.29 96 6.278 A- 41.9 LaSalleHtl LHO 41.30 -0.23 83 2.923 C+ 25.3 LexCpPptyTr LXP 21.66 0.51 153 6.763 A- 49.0 Liberty Ppty LRY 48.99 0.45 56 5.073 A 26.3 LongvwFbr LFB 24.84 0.24 113 4.0
13 B- 15.0 Luminent LUM 8.05 0.23 134 1.567 A- 74.7 Macerich MAC 74.34 0.52 71 3.752 C+ 48.4 MackCali Rlt CLI 47.96 0.24 5 5.381 B 36.3 MaguirePr MPG 36.57 0.62 130 4.430 A- 19.5 MaxusRlty MRTI 13.22 0.02 -75 ..38 B- 11.2 MedclProp MPW 10.42 0.17 -4 8.171 B+ 10.5 MerstrHstp MHX 10.31 -0.02 34 ..16 B+ 10.7 MFA Mtg MFA 6.22 -0.04 107 3.237 B 10.7 MHIHosp MDH 9.50 0.10 14 7.281 A- 58.8 Mid Am Apt MAA 58.05 -0.38 160 4.14 D- 66.4 Mills MLS 36.73 -1.96 131 6.8
66 A 13.5 MissWst MSW 11.75 0.15 143 5.428 B 8.9 MonmthCp MONM 5.70 0.00 -65 8.846 B 9.3 MonREIT MNRTA 8.55 0.11 -20 ..2 E 20.2 MortgeIT MHL 9.99 -0.08 22 19.2
39 D+ 21.0 NatHlthRty NHR 19.83 -0.41 652 6.725 C+ 30.9 Natl Hlth Inv NHI 26.62 -0.19 315 7.254 A+ 26.2 New Pln Excl NXL 26.33 0.18 17 4.710 C+ 33.9 Newcstle NCT 24.60 -0.40 234 10.272 B+ 19.2 Newkirk NKT 18.25 -0.50 507 8.814 B 70.3 Novastar NFI 30.82 -0.10 14 18.240 B- 11.7 NStarRlty NRF 10.55 -0.13 160 10.241 B- 26.1 NtnwdHlth NHP 23.46 0.33 115 6.547 B 67.0 NwCentFinl NEW 44.85 -0.19 59 15.62 C+ 11.3 NYMtgTr NTR 4.75 0.20 59 ..
51 B+ 14.3 OmegaHlth OHI 13.29 -0.09 178 6.944 B- 22.7 OneLibertyPr OLP 20.70 0.07 277 6.44 E 16.3 Optium OPX 8.50 0.00 80 5.2
14 C+ 8.8 OrigenFnl ORGN 6.37 0.00 214 ..62 B+ 73.7 PanPacRtl PNP 73.45 0.28 55 3.548 B 50.2 Penn REIT PEI 43.91 -0.01 129 5.229 E 9.9 PittsWVRR PW 9.20 0.00 -35 5.733 C 39.6 Plum Crk Tim PCL 37.46 0.33 -12 4.328 B 16.8 PMC Cmrcl PCC 13.65 -0.10 -27 8.881 A+ 48.0 Post Pptys PPS 47.66 0.10 32 3.815 D 11.2 PresRltyA PDLA 7.89 -0.16 -50 8.16 E 10.3 PresRltyB PDLB 6.51 -0.29 352 9.8
27 B- 53.8 PrkwyProp PKY 44.30 -0.55 95 5.982 A- 56.2 Prologis PLD 56.21 0.72 7 2.876 B 56.7 PSBusPrk PSB 55.47 0.27 124 2.179 B+ 84.6 Public Stor PSA 82.45 -0.45 110 2.422 D+ 31.5 PubStgDSA PSAA 26.42 0.00 -58 ..
37 B- 31.7 RAIT Inv RAS 28.23 -0.02 160 8.651 A 33.0 RamcoGers RPT 30.08 -0.22 179 ..72 B- 44.8 Rayonier RYN 44.80 0.33 47 4.247 A 26.1 RealtyIncm O 24.93 0.30 -24 5.684 A+ 45.2 RecksnAssoc RA 45.82 0.79 -3 3.713 D 66.7 Redwood Tr RWT 43.18 0.23 98 6.573 B 68.6 RegencyCtrs REG 68.79 0.85 55 3.540 A- 12.7 RepPropTr RPB 12.29 -0.06 -43 0.843 14.8 ResceCap RSO 14.38 0.00 -77 ..31 B 11.1 Roberts Rlty RPI 7.95 0.00 -51 ..76 B- 44.1 Saul Centers BFS 43.69 -0.27 394 3.884 A 69.0 Shurgrd Strg SHU 67.37 -0.25 102 3.374 A 87.3 SimonProp SPG 88.46 1.57 61 3.469 B 15.5 Sizeler Prop SIZ 14.74 0.19 191 2.792 A+ 100.5 SLGreenRlty SLG 103.09 2.69 85 1.347 B+ 20.3 SnrHouse SNH 19.06 0.12 79 6.770 B+ 55.0 SovranSlfSt SSS 54.40 0.67 355 4.555 B+ 13.2 SpiritFin SFC 12.17 0.04 56 6.979 B+ 23.3 StratHtls BEE 23.10 0.40 345 4.056 B+ 42.9 Sun Cmnts SUI 36.71 0.21 107 6.924 D- 12.9 SunsetFn SFO 8.66 -0.02 30 1.472 B 30.6 SunstnHtl SHO 29.48 0.08 82 4.158 B 5.3 SuperHosp SPPR 4.96 0.05 118 5.682 B 35.5 TangerFact SKT 35.21 0.21 128 3.784 A- 43.5 Taubman Ctr TCO 43.77 0.57 153 2.823 B- 31.3 ThornbrgM TMA 27.01 0.26 -17 10.188 B 41.4 Town&Cntry TCT 40.48 -0.02 -44 4.279 B+ 26.3 TrizecPr TRZ 26.34 0.15 0 3.021 B- 19.1 Trustreet TSY 15.17 0.09 129 8.745 C+ 22.4 U-Store-It YSI 20.83 -0.13 59 5.665 C+ 40.8 UnivrslHR UHT 37.35 0.60 303 6.040 C+ 17.8 UrstdBdl UBP 17.00 0.12 63 4.856 B 18.9 UrstdBdlA UBA 18.10 0.34 275 5.076 B+ 28.6 UtdDomRlt UDR 28.92 0.57 7 4.127 B 16.7 UtdMblHm UMH 15.40 -0.10 32 6.462 B 34.7 Ventas VTR 33.99 0.47 -20 4.673 A 98.2 VorndRlty VNO 98.46 0.93 44 3.364 A- 35.0 Wash REIT WRE 35.47 0.42 158 4.555 B+ 42.0 WeingrtnR WRI 41.76 0.02 37 4.545 A- 15.8 Windrose WRS 15.10 0.01 3 6.044 A- 12.0 WinstnHtls WXH 11.00 0.03 150 5.570 C 5.8 WinthropR FUR 5.30 -0.04 90 ..
PREMIERWEST BANCORP (PRWT) Grp 104 $18.5412.9M Shares 99 Comp. Rating 95 EPS RS 87 ROE 12%HOLDING CO FOR PREMIERWEST BANK OPERATING VIA 32 BRANCHES IN 9COUNTIES OF SOUTHERN OR AND NORTHERN CA.
+32% Ann. EPS Gro PE 23 Avg. Daily Vol 25,300 Debt 20%Last Qtr Eps +35%6 Prior Qtr +40%6 Last Qtr Sales +33%6 Qtrs EPS) 15%Eps Due 4/12
Acc/Dis A+Sup/Demand 26
CHARMING SHOPPES INC (CHRS) Grp 14 o$13.62117.7M Shares 94 Comp. Rating 92 EPS RS 80 ROE 10%OPERATES 2,221 SPECIALTY STORES IN 48 STATES OFFERING PLUSSIZEWOMEN'S APPAREL UNDER LANE BRYANT AND OTHER BRANDS.
+38% Ann. EPS Gro PE 18 Avg. Daily Vol 928,800 Debt 30%Last Qtr Eps +275%5 Prior Qtr +80%5 Last Qtr Sales +36%3 Qtrs EPS) 15%Eps Due 5/19
Acc/Dis B-Sup/Demand 70
CASCADE BANCORP (CACB) Grp 104 $27.7215.9M Shares 96 Comp. Rating 94 EPS RS 81 ROE 22%HOLDING COMPANY FOR BANK OF THE CASCADES OPERATING THROUGH 21OFFICES SERVING CENTRAL AND SOUTHERN OREGON.
+16% Ann. EPS Gro PE 22 Avg. Daily Vol 37,200 Debt 65%Last Qtr Eps +46%5 Prior Qtr +33%5 Last Qtr Sales +37%5 Qtrs EPS) 15%Eps Due 4/12
Acc/Dis B+Sup/Demand 33
INTERVEST BANCSHARE CL A (IBCA) Grp 164 $33.504.4M Shares 97 Comp. Rating 94 EPS RS 93 ROE 16%HOLDING CO FOR INTERVEST NATIONAL BANK OPERATING THROUGH 1 NEWYORK BRANCH AND 5 BRANCHES IN PINELLAS COUNTY, FLORIDA.
+17% Ann. EPS Gro PE 14 Avg. Daily Vol 35,500 Debt 110%Last Qtr Eps +54%5 Prior Qtr +30%6 Last Qtr Sales +55%5 Qtrs EPS) 15%Eps Due 4/13
Acc/Dis A-Sup/Demand 53
SAFETY INSURANCE GROUP (SAFT) Grp 101 $45.6713.7M Shares 94 Comp. Rating 99 EPS RS 79 ROE 16%OFFERS PERSONAL LINES PROPERTY AND CASUALTY INSURANCE, PRIMARI-LY PRIVATE PASSENGER AUTOMOBILE INSURANCE IN MA.
+72% Ann. EPS Gro PE 8 Avg. Daily Vol 80,500 Debt 7%Last Qtr Eps +101%5 Prior Qtr +96%6 Last Qtr Sales +1%9 Qtrs EPS) 15%Eps Due 5/5
Acc/Dis B+Sup/Demand 57
HITTITE MICROWAVE CORP (HITT) Grp 21 $30.769.4M Shares 99 Comp. Rating 92 EPS RS 90 ROE 76%DESIGNS ANALOG/DIGITAL/MIXED-SIGNAL INTEGRATED CIRCUITS USED INRF, MICROWAVE, AND MILLIMETERWAVE APPLICATIONS.
+74% Ann. EPS Gro PE 43 Avg. Daily Vol 213,500 Debt 2%Last Qtr Eps +64%5 Prior Qtr +31%6 Last Qtr Sales +34%11 Qtrs EPS) 15%
R&D 12%
Acc/Dis A-Sup/Demand 69
COLUMBIA BANKING SYSTEM (COLB) Grp 104 $34.8615.2M Shares 98 Comp. Rating 91 EPS RS 84 ROE 14%HOLDING COMPANY FOR COLUMBIA STATE BANK AND 2 OTHER BANKSOPERATING THROUGH 39 OFFICES IN 5 WESTERN WA COUNTIES.
+23% Ann. EPS Gro PE 19 Avg. Daily Vol 68,600 Debt 52%Last Qtr Eps +32% Prior Qtr +32%5 Last Qtr Sales +24%3 Qtrs EPS) 15%Eps Due 4/27
Acc/Dis A+Sup/Demand 51
PENN NATL GAMING INC (PENN) Grp 39 o$39.7068.4M Shares 98 Comp. Rating 98 EPS RS 79 ROE 25%OPERATES EIGHT GAMING PROPERTIES, TWO HORSE RACETRACKS AND SIXOFF-TRACK WAGERING FACILITIES
+44% Ann. EPS Gro PE 26 Avg. Daily Vol 905,500 Debt 215%Last Qtr Eps +109%5 Prior Qtr +32%5 Last Qtr Sales +90%12 Qtrs EPS) 15%Eps Due 4/26
Acc/Dis BSup/Demand 80
SEABRIGHT INSURANCE HLDG (SEAB) Grp 101 $17.648.5M Shares 95 Comp. Rating 96 EPS RS 85 ROE 14%PROVIDES MULTI-JURISDICTIONAL WORKERS' COMPENSATION INSURANCEIN 43 STATES AND THE DISTRICT OF COLUMBIA.
+64% Ann. EPS Gro PE 16 Avg. Daily Vol 179,500 Debt 21%Last Qtr Eps +81%5 Prior Qtr +67%6 Last Qtr Sales +65%6 Qtrs EPS) 15%Eps Due 4/27
Acc/Dis B-Sup/Demand 81
ANDERSONS INC (ANDE) Grp 31 $63.815.9M Shares 97 Comp. Rating 85 EPS RS 96 ROE 18%DISTRIBUTES GRAINS INCLUDING CORN, SOYBEANS AND WHEAT ANDOPERATES 14 GRAIN ELEVATORS IN THE EASTERN CORN BELT.
+43% Ann. EPS Gro PE 19 Avg. Daily Vol 44,100 Debt 106%Last Qtr Eps +82%5 Prior Qtr ... Last Qtr Sales +4%1 Qtrs EPS) 15%Eps Due 5/4
Acc/Dis A-Sup/Demand 61
FIRST CASH FINANCIAL SVS (FCFS) Grp 22 $19.9322.2M Shares 99 Comp. Rating 94 EPS RS 94 ROE 16%OPERATES 197 PAWNSHOPS IN TEXAS, MARYLAND, SOUTH CAROLINA,MISSOURI, OKLAHOMA, VIRGINIA, WASHINGTON, D.C., AND MEXICO.
+26% Ann. EPS Gro PE 26 Avg. Daily Vol 377,200 Debt 0%Last Qtr Eps +33%5 Prior Qtr +25%5 Last Qtr Sales +18%18 Qtrs EPS) 15%Eps Due 4/18
Acc/Dis A+Sup/Demand 83
PETMED EXPRESS INC (PETS) Grp 162 o$19.9016.5M Shares 95 Comp. Rating 95 EPS RS 98 ROE 42%DIRECT MARKETER OF PRESCRIPTION/NON-PRESCRIPTION MEDICATIONSAND NUTRITIONAL SUPPLEMENTS FOR PETS VIA CATALOG/INTERNET.
+45% Ann. EPS Gro PE 42 Avg. Daily Vol 363,900 Debt 0%Last Qtr Eps +38% Prior Qtr +38%6 Last Qtr Sales +25%5 Qtrs EPS) 15%Eps Due 5/16
Acc/Dis B-Sup/Demand 88
STARBUCKS CORP (SBUX) Grp 54 o$36.61725.2M Shares 98 Comp. Rating 94 EPS RS 84 ROE 22%OPERATES 4,867 COFFEE SHOPS IN THE U.S., 467 SHOPS IN THE U.K., 434SHOPS IN CANADA, AND 232 SHOPS IN OTHER COUNTRIES.
+31% Ann. EPS Gro PE 55 Avg. D. Vol 5,227,200 Debt 0%Last Qtr Eps +29%6 Prior Qtr +33% Last Qtr Sales +22%13 Qtrs EPS) 15%Eps Due 4/27
Acc/Dis BSup/Demand 66
ANSYS INC (ANSS) Grp 140 o$50.2330.9M Shares 95 Comp. Rating 88 EPS RS 84 ROE 23%DESIGNS SIMULATION SOFTWARE FOR DESIGN ANALYSIS AND NEWPRODUCT ASSESSMENT TO A VARIETY OF INDUSTRIES
+30% Ann. EPS Gro PE 36 Avg. Daily Vol 318,900 Debt 0%Last Qtr Eps +17%6 Prior Qtr +40%5 Last Qtr Sales +12%12 Qtrs EPS) 15%Eps Due 5/3R&D 19%
Acc/Dis A-Sup/Demand 78
GARMIN LTD (GRMN) Grp 47 o$77.0975.7M Shares 99 Comp. Rating 96 EPS RS 89 ROE 30%MANUFACTURES HAND-HELD/PORTABLE/FIXED-MOUNT GLOBAL POSITION-ING SYSTEMS FOR THE GENERAL AVIATION AND CONSUMER MARKETS.
+24% Ann. EPS Gro PE 27 Avg. D. Vol 1,273,700 Debt 0%Last Qtr Eps +82%5 Prior Qtr +52%5 Last Qtr Sales +45%4 Qtrs EPS) 15%Eps Due 4/27R&D 7%
Acc/Dis A+Sup/Demand 82
BANKRATE INC (RATE) Grp 110 o$42.549.8M Shares 98 Comp. Rating 80 EPS RS 98 ROE 28%OWNS AND OPERATES BANKRATE.COM, A CONSUMER MARKETPLACEPROVIDING INFORMATION ON OVER 300 FINANCIAL PRODUCTS
+13% Ann. EPS Gro PE 75 Avg. Daily Vol 249,400 Debt 0%Last Qtr Eps +15%5 Prior Qtr +7%5 Last Qtr Sales +49%1 Qtrs EPS) 15%Eps Due 5/3R&D 6%
Acc/Dis ASup/Demand 89
HEALTHEXTRAS INC (HLEX) Grp 81 o$36.7230.4M Shares 98 Comp. Rating 93 EPS RS 97 ROE 15%PROVIDES PHARMACY BENEFIT MANAGEMENT SERVICES TO MANAGEDCAREORGANIZATIONS/SELF-INSURED EMPLOYERS/THIRD PARTY PAYORS
+44% Ann. EPS Gro PE 64 Avg. Daily Vol 337,500 Debt 14%Last Qtr Eps +25% Prior Qtr +25%6 Last Qtr Sales +18%19 Qtrs EPS) 15%Eps Due 4/27
Acc/Dis A-Sup/Demand 74
Hittite Holds Above Its10-Week Moving Avg.
Sponsored by:
Move Updated throughout the day.
Visit Investors.com to see Stocks on the

INVESTOR'S BUSINESS DAILY FUTURES MONDAY, MARCH 20, 2006 B15
Season OpenHigh Low Interest Open High Low Close Chg.
Season OpenHigh Low Interest Open High Low Close Chg.
Season OpenHigh Low Interest Open High Low Close Chg.
Season OpenHigh Low Interest Open High Low Close Chg.
Season OpenHigh Low Interest Open High Low Close Chg.
Season OpenHigh Low Interest Open High Low Close Chg.
Key Commodity Futures
GrainsWHEAT (CBOT) – 5,000 bu minimum– cents per bushel390.50 316.50 May 06 209,644 353.00 359.00 351.00 357.50 +4.75418.25 268.75 Jul 06 83,031 364.50 371.00 363.00 370.00 +5.25410.00 334.50 Sep 06 11,855 375.50 382.00 373.50 380.50 +3.50423.00 326.50 Dec 06 57,077 389.00 396.50 388.00 395.50 +7.50430.50 354.50 Mar 07 5,549 399.00 406.50 399.00 406.50 +8.00431.50 326.50 Jul 07 14,658 407.00 414.00 407.00 413.50 +6.50437.50 345.00 Dec 07 3,096 415.00 422.00 415.00 422.00 +8.00Est. Vol. 53,089 Vol. 52,541 open int 385,642 –5,401CORN (CBOT) – 5,000 bu minimum– cents per bushel276.50 208.75 May 06 468,418 224.75 225.25 220.75 221.50 –3.00302.75 217.25 Jul 06 201,882 235.00 235.50 231.50 232.25 –2.75266.00 226.25 Sep 06 40,993 243.00 244.75 241.00 241.50 –2.75281.75 237.00 Dec 06 247,901 255.50 256.25 252.50 253.25 –2.50271.50 245.25 Mar 07 29,870 263.00 264.50 261.00 261.25 –2.00274.50 249.75 May 07 1,988 267.50 267.50 265.75 266.25 –1.50276.25 244.25 Jul 07 9,724 270.00 270.50 269.00 269.50 –1.00271.00 253.00 Sep 07 1,419 268.75 269.00 268.50 269.00 ...275.75 244.25 Dec 07 37,271 273.00 273.50 272.00 272.50 –0.75284.00 259.00 Jul 08 242 281.25 281.50 281.00 281.50 ...279.50 258.50 Dec 08 9,041 278.00 279.50 277.00 279.00 +0.50Est. Vol. 166,199 Vol. 112,462 open int 1,048,749 –2,876OATS (CBOT) – 5,000 bu minimum– cents per bushel270.50 133.50 May 06 7,703 175.00 175.25 172.00 172.75 –2.50
270.50 133.25 Jul 06 1,072 176.25 176.75 174.50 175.50 –0.25270.50 126.75 Sep 06 177 170.50 170.50 170.50 170.50 –2.50188.25 143.50 Dec 06 2,033 165.25 165.50 162.75 163.00 –2.50Est. Vol. 2,197 Vol. 1,717 open int 11,023 –297SOYBEANS (CBOT) – 5,000 bu minimum– cents per bushel742.00 525.75 May 06 186,027 576.00 579.50 575.00 576.50 +0.25736.00 485.00 Jul 06 84,891 589.00 591.00 587.25 589.00 +0.75707.00 534.00 Aug 06 6,363 595.00 595.00 592.00 593.25 –0.75707.00 534.00 Sep 06 3,871 596.50 599.00 596.00 596.50 +0.50684.00 485.00 Nov 06 63,598 603.75 607.00 603.25 605.25 +0.75650.00 581.00 Jan 07 2,340 610.00 613.50 610.00 612.00 +2.00652.00 587.00 Mar 07 555 616.00 618.00 616.00 617.00 +2.50652.00 543.00 Jul 07 2,060 623.00 625.00 622.50 622.50 +1.00648.00 543.00 Nov 07 2,723 623.00 625.00 622.50 624.00 –1.00Est. Vol. 53,375 Vol. 73,220 open int 352,819 +1,736SOYBEAN MEAL (CBOT) – 100 tons– dollars per ton230.50 109.50 May 06 64,705 173.10 174.50 172.60 173.80 +0.70227.00 158.70 Jul 06 38,876 176.00 177.30 175.30 177.10 +1.00221.50 166.50 Aug 06 10,350 177.80 178.90 177.40 178.50 +0.90216.50 167.00 Sep 06 8,192 179.00 180.00 178.70 179.60 +1.20211.10 158.70 Oct 06 6,697 179.00 180.30 178.70 179.70 +1.10211.10 158.70 Dec 06 18,584 179.90 181.80 179.90 181.60 +1.20203.70 178.50 Jan 07 529 181.70 182.50 181.50 182.40 +1.20204.50 178.50 Mar 07 494 183.70 185.00 183.50 184.30 +0.80204.50 184.00 May 07 24 186.30 186.30 186.30 186.30 +0.80204.50 184.00 Dec 08 na 186.30 186.30 186.30 186.30 +0.80Est. Vol. 21,021 Vol. 27,534 open int 148,451 +153
SOYBEAN OIL (CBOT) – 60,000 lbs– cents per lb26.35 19.61 May 06 117,908 23.43 23.55 23.22 23.24 –0.1926.25 19.61 Jul 06 47,668 23.83 23.94 23.60 23.62 –0.2225.62 20.00 Aug 06 5,407 24.05 24.05 23.75 23.75 –0.2025.60 20.00 Sep 06 4,642 24.22 24.22 23.90 23.90 –0.2225.75 19.61 Oct 06 3,756 24.40 24.40 24.05 24.07 –0.2026.03 19.61 Dec 06 18,759 24.75 24.75 24.40 24.40 –0.2526.05 22.49 Jan 07 803 24.75 24.75 24.55 24.55 –0.2326.20 22.49 Mar 07 231 24.70 24.70 24.70 24.70 –0.2526.50 20.03 Jul 07 199 24.95 24.95 24.95 24.95 –0.3526.75 20.03 Dec 07 1,183 25.55 25.55 25.55 25.55 –0.05Est. Vol. 17,048 Vol. 25,755 open int 200,630 +85WHEAT (KBOT) – 5,000 bu minimum– cents per bushel456.00 344.75 May 06 48,681 421.00 423.00 416.00 421.50 +7.75462.50 342.00 Jul 06 42,777 422.00 426.00 420.00 422.50 +4.75464.50 347.00 Sep 06 8,706 426.00 429.00 424.00 429.00 +8.00470.00 358.00 Dec 06 21,052 433.00 437.00 430.50 437.00 +8.50470.00 375.50 Mar 07 720 438.00 439.00 438.00 439.00 +10.0445.00 380.00 Jul 07 2,536 422.00 428.00 422.00 427.25 +4.25Est. Vol. 11,359 Vol. 17,634 open int 124,961 –2,688ROUGH RICE (CBOT) – 2,000 CWT– dollars per CWT9.010 6.900 May 06 6,300 8.360 8.370 8.230 8.240 –0.139.210 6.900 Jul 06 2,307 8.640 8.640 8.480 8.520 –0.129.180 7.420 Sep 06 718 8.770 8.770 8.650 8.650 –0.139.250 7.870 Nov 06 1,589 8.850 8.850 8.710 8.750 –0.109.370 8.450 Jan 07 411 8.980 8.980 8.950 8.950 –0.06Est. Vol. 1,306 Vol. 550 open int 11,462 –372
MeatsCATTLE (CME) – 40,000 lbs.– cents per lb.95.55 82.35 Apr 06 51,629 83.90 83.90 82.95 83.02 –0.4088.00 77.75 Jun 06 101,830 78.85 78.85 77.75 77.87 –0.6886.75 78.75 Aug 06 34,699 80.35 80.65 79.80 79.90 –0.3289.50 83.00 Oct 06 18,332 84.15 84.37 84.05 84.10 +0.0290.50 85.10 Dec 06 8,176 85.60 86.00 85.60 85.77 +0.2791.40 86.40 Feb 07 3,616 87.00 87.45 86.95 87.35 +0.4789.25 85.50 Apr 07 184 85.75 86.30 85.75 86.20 +0.55Est. Vol. 33,358 Vol. 35,890 open int 218,466 –610FEEDER CATTLE (CME) – 50,000 lbs.– cents per lb.116.10 96.00 Mar 06 3,504 104.75 105.10 104.35 104.47 –0.32115.00 95.50 Apr 06 10,290 105.60 106.15 105.50 105.65 –0.10114.30 96.00 May 06 13,905 106.15 106.75 105.80 106.20 –0.10114.75 100.20 Aug 06 6,863 107.65 108.00 107.40 107.75 –0.02113.90 104.40 Sep 06 866 107.00 107.20 106.75 106.90 +0.05113.00 103.90 Oct 06 927 106.30 106.70 106.25 106.50 +0.30111.75 103.50 Nov 06 285 105.82 106.00 105.60 106.00 +0.30109.25 101.50 Jan 07 44 102.60 102.60 102.60 102.60 +0.10Est. Vol. 5,103 Vol. 8,191 open int 36,684 +2HOGS LEAN (CME) – 40,000 lbs.– cents per lb.70.40 55.00 Apr 06 27,579 58.75 59.40 57.90 59.10 +0.6771.00 57.40 May 06 4,050 65.65 66.10 64.75 66.00 +0.5773.45 59.50 Jun 06 76,481 67.20 67.50 66.10 67.02 +0.3570.55 56.90 Jul 06 16,422 66.50 66.95 65.90 66.57 +0.3767.05 54.90 Aug 06 10,116 65.17 65.65 64.55 65.55 +0.5259.60 49.80 Oct 06 4,173 56.40 56.55 55.97 56.50 +0.3256.75 50.35 Dec 06 2,707 53.80 54.65 53.80 54.52 +0.7558.00 54.35 Feb 07 513 56.80 56.95 56.75 56.95 +0.1258.05 57.05 Apr 07 96 57.05 57.27 57.05 57.27 +0.02Est. Vol. 30,275 Vol. 24,071 open int 142,137 –929PORK BELLIES (CME) – 40,000 lbs.– cents per lb.98.00 72.50 Mar 06 38 82.75 83.20 82.75 83.20 –1.3099.25 73.85 May 06 1,387 84.60 85.00 82.80 84.05 –0.4099.90 75.30 Jul 06 424 83.80 85.60 83.80 85.60 –0.70100.90 75.77 Aug 06 41 82.25 82.25 82.25 82.25 –0.75Est. Vol. 327 Vol. 719 open int 1,902 –108
FoodsCOCOA (NYBT) – 10 metric tons– $ per ton1901.0 1366.0 May 06 50,769 1520.0 1523.0 1490.0 1510.0 –1.001913.0 1390.0 Jul 06 22,021 1539.0 1540.0 1516.0 1531.0 –1.001924.0 1410.0 Sep 06 18,531 1560.0 1560.0 1540.0 1553.0 –2.001932.0 1438.0 Dec 06 12,075 1587.0 1587.0 1581.0 1581.0 –1.001726.0 1465.0 Mar 07 12,153 1608.0 1608.0 1598.0 1606.0 –1.001735.0 1485.0 May 07 3,021 1627.0 1627.0 1627.0 1627.0 ...1769.0 1576.0 Sep 07 4,178 1657.0 1657.0 1657.0 1657.0 –2.001712.0 1606.0 Dec 07 5,236 1682.0 1682.0 1681.0 1681.0 –1.00Est. Vol. 7,262 Vol. 9,696 open int 128,868 –1,104COFFEE C (NYBT) – 37,500 lbs.– cents per lb.148.50 83.30 May 06 60,867 107.00 108.70 105.10 105.25 –1.70148.00 87.10 Jul 06 18,205 109.65 111.10 107.80 107.95 –1.70148.90 90.70 Sep 06 9,569 112.40 113.50 110.20 110.25 –1.70149.15 99.85 Dec 06 5,475 115.10 116.80 113.05 113.05 –1.70143.95 102.70 Mar 07 2,463 119.00 119.00 115.70 115.90 –1.70145.45 104.20 May 07 481 120.25 120.50 116.95 116.95 –2.00136.20 105.30 Jul 07 599 120.85 120.85 117.85 117.85 –2.00139.50 120.00 Dec 07 222 123.50 123.50 121.65 121.65 –2.00Est. Vol. 11,839 Vol. 15,314 open int 98,001 +38ORANGE JUICE (NYBT) – 15,000 lbs.– cents per lb.
140.50 84.45 May 06 24,245 138.60 140.50 138.50 140.15 +1.55137.20 87.50 Jul 06 6,211 135.75 137.20 135.60 137.00 +1.05294.74 93.70 Sep 06 3,419 133.90 133.90 133.25 133.50 +0.65135.00 95.80 Nov 06 1,318 129.50 131.00 129.50 131.00 +0.50135.00 90.00 Jan 07 1,446 130.00 130.00 130.00 130.00 ...135.50 106.00 Mar 07 241 130.25 130.25 130.25 130.25 ...136.00 117.50 May 07 6 130.25 130.25 130.25 130.25 ...136.50 121.00 Jul 07 11 130.25 130.25 130.25 130.25 ...Est. Vol. 2,436 Vol. 2,381 open int 36,897 +534SUGAR 14 (NYBT) – 112,000 lbs.– cents per lb.25.25 20.65 May 06 2,313 23.00 23.20 23.00 23.20 +0.1525.20 20.88 Jul 06 4,346 22.95 23.00 22.95 23.00 +0.0525.08 21.05 Sep 06 3,080 23.00 23.00 23.00 23.00 +0.0123.18 19.45 Nov 06 917 22.10 22.10 22.10 22.10 +0.1023.08 20.00 Jan 07 910 22.25 22.25 22.25 22.25 ...23.05 20.85 Mar 07 869 22.15 22.15 22.15 22.15 ...23.05 20.95 May 07 590 22.38 22.38 22.38 22.38 ...23.10 22.18 Jul 07 30 22.23 22.23 22.23 22.23 ...Est. Vol. 679 Vol. 299 open int 13,055 –974SUGAR–WORLD 11 (NYBT) – 112,000 lbs.– cents per lb.19.65 7.650 May 06 220,002 16.54 16.62 16.41 16.44 –0.1818.71 7.660 Jul 06 94,425 16.17 16.26 16.08 16.13 –0.1418.40 8.120 Oct 06 57,069 16.12 16.19 16.03 16.07 –0.1218.10 8.190 Mar 07 43,027 16.22 16.28 16.13 16.16 –0.1117.75 8.540 May 07 20,775 16.04 16.20 15.95 15.98 –0.1018.07 9.100 Jul 07 15,600 15.60 15.68 15.50 15.66 –0.0616.90 10.87 Oct 07 8,029 15.56 15.56 15.56 15.56 ...Est. Vol. 32,453 Vol. 29,968 open int 458,927 +654
MetalsGOLD (CMX) – 100 troy oz.– dollars per troy oz.579.50 404.50 Apr 06 170,165 555.40 558.60 552.50 555.10 –0.30585.00 303.50 Jun 06 78,537 561.10 563.80 558.00 560.20 –0.30589.00 40.10 Aug 06 8,014 564.90 568.00 564.60 565.20 –0.30592.30 436.50 Oct 06 10,201 574.50 574.50 569.00 570.20 –0.30600.50 321.10 Dec 06 17,308 577.00 578.80 574.00 575.20 –0.30603.30 442.50 Feb 07 9,229 581.60 582.00 580.10 580.10 –0.30608.10 445.40 Apr 07 1,267 585.00 585.30 585.00 585.00 –0.30612.90 342.80 Jun 07 9,227 590.20 590.20 589.90 589.90 –0.30870.40 352.60 Dec 07 10,127 606.00 606.00 604.70 604.70 –0.30658.70 434.90 Dec 08 5,194 634.30 634.30 634.30 634.30 –0.30674.00 459.70 Jun 09 1,865 649.60 649.60 649.60 649.60 –0.30Est. Vol. Vol. 83,464 open int 322,149 +88MINI GOLD (CBOT) – 33.2 troy oz.– dollars per troy oz.579.50 404.40 Apr 06 2,845 555.50 558.60 552.70 554.60 –0.80572.90 540.30 May 06 24 557.20 558.40 556.90 556.90 –1.00583.90 331.40 Jun 06 920 560.50 563.60 558.00 559.60 –0.90587.10 434.10 Aug 06 40 565.30 565.30 565.30 565.30 –0.20598.30 342.90 Dec 06 150 575.20 576.00 574.00 576.00 +0.50Est. Vol. 3,318 Vol. 6,064 open int 4,042 –191PLATINUM (NYM) – 50 troy oz.– dollars per troy oz.1094.0 811.70 Apr 06 5,820 1034.5 1038.0 1029.0 1034.0 +3.401094.3 968.60 Jul 06 1,936 1040.0 1047.2 1040.0 1042.2 +3.601110.0 1015.0 Oct 06 6 1047.2 1047.2 1047.2 1047.2 +3.60Est. Vol. Vol. 1,288 open int 7,762 +62PALLADIUM (NYM) – 100 troy oz– dollars per oz328.00 197.00 Jun 06 13,982 315.90 321.50 315.00 319.75 +4.40330.00 216.75 Dec 06 411 328.00 328.00 325.75 325.75 +4.40Est. Vol. Vol. 845 open int 14,623 +203SILVER (CMX) – 5,000 troy oz.– cents per troy oz.1045.0 568.50 Mar 06 994 1040.0 1045.0 1030.0 1030.6 +2.501046.0 601.70 May 06 81,679 1035.0 1046.0 1030.0 1036.5 +2.301054.0 445.70 Jul 06 16,869 1042.5 1054.0 1039.5 1043.5 +2.101055.0 671.60 Sep 06 5,028 1045.0 1055.0 1045.0 1049.2 +1.601064.0 451.00 Dec 06 14,249 1055.0 1064.0 1052.0 1054.5 +1.101058.0 698.40 Mar 07 3,853 1057.9 1057.9 1057.9 1057.9 +0.701418.9 461.90 Jul 07 1,871 1055.0 1060.9 1055.0 1060.9 –1.601070.0 147.10 Dec 07 2,812 1065.0 1070.0 1063.9 1063.9 –1.601090.0 582.70 Dec 08 778 1090.0 1090.0 1071.0 1071.0 –1.601093.0 695.90 Dec 09 679 1090.0 1090.0 1082.5 1082.5 –1.10Est. Vol. Vol. 22,888 open int 129,883 –723MINI SILVER (CBOT) – 1,000 oz.– cents per oz.1041.6 915.70 Apr 06 71 1030.7 1041.6 1030.7 1032.0 +1.301045.9 601.70 May 06 2,237 1035.3 1045.9 1029.7 1035.1 +0.601052.1 453.90 Jul 06 490 1043.8 1052.1 1040.0 1045.9 +4.201064.5 457.70 Dec 06 485 1052.0 1064.5 1052.0 1057.7 +4.001096.7 696.00 Dec 09 31 1094.0 1094.0 1089.4 1089.4 +5.50Est. Vol. 1,282 Vol. 1,842 open int 3,449 +179HI GRADE COPPER (CMX) – 25,000 lbs.– cents per lb.237.10 95.10 Mar 06 3,162 225.00 237.10 225.00 236.90 +10.3237.00 95.10 Apr 06 3,212 230.80 237.00 230.80 237.00 +9.95236.30 99.25 May 06 62,332 226.50 236.30 226.25 236.00 +9.45234.90 100.25 Jun 06 1,717 225.00 234.90 225.00 234.90 +9.45232.95 98.00 Jul 06 14,554 224.10 232.95 224.10 232.95 +8.95231.50 97.20 Aug 06 598 227.50 231.50 227.50 231.20 +8.80229.70 99.20 Sep 06 4,117 225.00 229.70 225.00 229.60 +8.70228.20 103.50 Oct 06 376 228.20 228.20 227.95 227.95 +8.70226.80 113.10 Nov 06 409 226.60 226.80 226.30 226.30 +8.75224.70 112.60 Dec 06 2,828 218.00 224.70 218.00 224.55 +8.65219.45 115.75 Mar 07 304 218.00 219.45 218.00 219.45 +8.65Est. Vol. Vol. 9,751 open int 94,024 +653
OilsLIGHT SWEET CRUDE (NYM) – 1,000 bbl.– dollars per bbl.71.00 25.05 Apr 06 61,566 63.45 63.70 62.70 62.77 –0.8170.33 25.05 May 06 264,573 65.05 65.30 64.10 64.20 –0.9070.80 23.59 Jun 06 128,290 65.65 66.15 64.95 65.06 –0.9071.10 27.36 Jul 06 40,219 66.37 66.60 65.50 65.60 –0.9170.50 27.31 Aug 06 24,863 66.83 66.85 66.00 66.00 –0.9370.75 27.26 Sep 06 31,583 66.99 67.17 66.32 66.32 –0.9571.20 31.57 Oct 06 27,271 67.32 67.65 66.59 66.59 –0.9670.77 31.42 Nov 06 15,680 67.66 67.66 66.81 66.81 –0.9871.70 17.77 Dec 06 85,344 67.80 68.00 66.90 66.96 –1.0071.00 34.93 Jan 07 19,952 68.00 68.00 67.09 67.09 –1.0170.85 34.78 Feb 07 7,410 67.21 67.21 67.21 67.21 –1.0170.82 34.64 Mar 07 8,286 67.29 67.29 67.29 67.29 –1.0170.78 38.21 Apr 07 7,857 67.34 67.34 67.34 67.34 –1.0171.25 30.71 Jun 07 30,902 68.35 68.35 67.37 67.37 –1.0170.80 18.88 Dec 07 62,484 68.20 68.25 67.13 67.13 –1.0369.05 48.90 Jun 08 10,335 66.74 66.74 66.74 66.74 –1.0568.60 19.56 Dec 08 37,716 66.26 66.26 66.26 66.26 –1.05227.75 21.91 Dec 09 22,479 66.35 66.40 65.43 65.43 –1.0566.85 27.06 Dec 10 33,901 65.30 65.30 64.58 64.58 –1.0566.00 35.73 Dec 11 13,970 64.15 64.15 63.70 63.70 –1.0565.60 52.62 Dec 12 5,878 63.75 63.80 63.15 63.15 –1.05Est. Vol. Vol. 291,087 open int 973,921 –4,581HEATING OIL (NYM) – 42,000 gal, cents per gal211.74 105.87 Apr 06 31,118 181.00 181.60 177.50 178.13 –3.12206.39 103.57 May 06 63,765 181.50 182.25 178.75 179.06 –2.94202.54 102.02 Jun 06 18,475 182.40 183.00 179.75 179.81 –2.79202.14 105.25 Jul 06 15,965 183.55 184.25 181.01 181.01 –2.74203.00 114.40 Aug 06 7,268 185.76 186.75 183.46 183.46 –2.69206.00 127.53 Sep 06 4,658 188.07 188.80 185.81 185.81 –2.64207.00 139.34 Oct 06 2,258 191.00 191.80 188.51 188.51 –2.59213.60 140.64 Nov 06 2,122 193.70 193.70 191.36 191.36 –2.54208.44 156.76 Dec 06 11,096 196.25 196.43 193.81 193.81 –2.49209.54 175.67 Jan 07 7,109 198.25 198.25 195.76 195.76 –2.49209.54 175.35 Feb 07 1,300 198.75 199.00 196.26 196.26 –2.49208.54 173.50 Mar 07 2,406 197.00 197.00 194.66 194.66 –2.49203.00 168.85 Apr 07 2,081 192.80 193.60 190.51 190.51 –2.49196.92 167.61 Jun 07 2,896 185.46 185.46 185.46 185.46 –2.49Est. Vol. Vol. 36,497 open int 172,816 +568UNLEADED GASOLINE (NYM) – 42,000 gal, cents per gal207.84 144.75 Apr 06 34,411 186.40 187.50 183.50 186.01 –1.43208.54 145.73 May 06 61,541 184.00 184.00 180.40 181.59 –1.79208.19 156.00 Jun 06 15,399 182.85 182.85 180.50 181.49 –1.29206.94 159.75 Jul 06 7,701 182.20 182.20 180.70 181.49 –1.19205.14 160.75 Aug 06 6,343 182.75 183.30 182.24 182.24 –1.04201.64 160.35 Sep 06 6,278 183.00 183.00 181.99 181.99 –0.99192.66 153.60 Oct 06 4,306 176.50 176.50 175.59 175.59 –0.99189.66 151.25 Dec 06 2,473 172.84 172.84 172.84 172.84 –0.99Est. Vol. Vol. 60,769 open int 140,554 –272NATURAL GAS (NYM) – 10,000 mm btu's, $ per mm btu11.68 3.175 Apr 06 50,822 7.240 7.310 7.040 7.053 –0.21411.27 3.113 May 06 88,896 7.420 7.450 7.200 7.208 –0.20411.29 3.200 Jun 06 28,526 7.589 7.590 7.354 7.354 –0.19511.30 3.230 Jul 06 21,939 7.731 7.731 7.500 7.500 –0.18911.30 3.260 Aug 06 22,878 7.835 7.840 7.630 7.630 –0.18711.28 3.265 Sep 06 20,585 7.935 7.950 7.720 7.735 –0.18411.39 3.285 Oct 06 41,208 8.084 8.084 7.850 7.880 –0.17411.77 3.438 Nov 06 29,614 9.270 9.280 9.150 9.150 –0.08747.43 3.598 Dec 06 20,067 10.19 10.29 10.19 10.19 –0.04712.60 3.654 Jan 07 45,803 11.03 11.03 10.83 10.88 –0.02712.49 3.554 Feb 07 18,455 10.90 10.95 10.83 10.86 –0.02712.18 3.153 Mar 07 24,331 10.64 10.75 10.62 10.65 –0.0279.755 3.244 Apr 07 16,172 8.870 8.980 8.870 8.900 –0.0279.550 3.234 May 07 16,503 8.680 8.790 8.680 8.710 –0.0279.600 3.274 Jun 07 6,982 8.750 8.900 8.750 8.768 –0.0279.620 3.314 Jul 07 4,940 8.820 8.920 8.820 8.841 –0.0279.690 3.359 Aug 07 4,635 8.905 8.905 8.905 8.905 –0.0279.700 3.359 Sep 07 5,519 8.930 8.930 8.930 8.930 –0.0209.770 3.386 Oct 07 13,558 9.000 9.000 9.000 9.000 –0.02010.36 3.534 Nov 07 5,011 9.730 9.730 9.610 9.610 –0.02052.26 3.684 Dec 07 6,402 10.35 10.35 10.19 10.19 –0.02011.37 3.734 Jan 08 14,279 10.61 10.61 10.61 10.61 –0.02511.20 3.595 Mar 08 12,696 10.45 10.45 10.38 10.38 –0.0259.222 3.432 Apr 08 11,326 8.370 8.370 8.370 8.370 –0.0259.222 3.595 Oct 08 9,129 8.440 8.440 8.440 8.440 –0.01550.85 4.081 Dec 08 7,406 9.595 9.595 9.595 9.595 –0.01510.80 3.686 Jan 09 7,856 10.03 10.03 10.03 10.03 –0.01510.57 3.984 Mar 09 5,319 9.790 9.790 9.790 9.790 –0.0158.732 0.5360 Apr 09 4,675 7.800 7.800 7.800 7.800 –0.0058.352 4.300 Apr 10 5,150 7.265 7.265 7.265 7.265 +0.0159.500 5.190 Dec 10 6,701 8.480 8.480 8.480 8.480 +0.020Est. Vol. Vol. 70,831 open int 637,867 +7,534
Woods And FibersLUMBER (CME) – 110,000 bd. ft.– $ per 1,000 bd. ft.382.80 293.70 May 06 3,018 333.30 335.00 326.30 326.30 –10.0374.50 300.00 Jul 06 545 339.60 339.60 332.30 332.30 –10.0368.30 323.20 Sep 06 191 342.90 345.00 337.90 343.00 –4.90351.00 327.00 Nov 06 32 330.00 330.00 327.00 327.00 –7.90Est. Vol. 788 Vol. 885 open int 3,866 –48COTTON 2 (NYBT) – 50,000 lbs.– cents per lb.66.62 49.10 May 06 89,675 54.55 54.55 54.05 54.06 –0.4362.13 49.75 Jul 06 22,156 55.70 55.70 55.28 55.30 –0.4862.30 50.55 Oct 06 642 57.50 57.50 57.45 57.45 –0.4063.50 51.55 Dec 06 13,661 58.65 58.75 58.40 58.50 –0.3563.75 57.05 Mar 07 1,821 60.00 60.05 60.00 60.05 –0.3263.25 57.20 May 07 106 60.60 60.60 60.60 60.60 –0.3063.20 57.40 Jul 07 1,516 61.20 61.20 61.20 61.20 –0.2263.35 58.10 Oct 07 20 61.55 61.55 61.55 61.55 –0.2063.80 60.05 Dec 07 223 61.80 61.80 61.70 61.70 –0.22Est. Vol. 10,657 Vol. 10,666 open int 129,820 –346
IndexesS&P COMP. INDEX (CME) – 250 x index1321.3 1082.0 Jun 06 643,054 1316.4 1320.5 1314.8 1317.4 +0.601328.8 1116.5 Sep 06 6,136 1328.8 1328.8 1328.0 1328.0 +0.701338.5 1173.0 Dec 06 629 1338.5 ... ... 1338.5 +0.801348.9 1179.5 Mar 07 55 1348.9 ... ... 1348.9 +0.80Est. Vol. 23,839 Vol. 96,268 open int 735,558 –14,130S&P MINI INDEX (CME) – 50 x index1310.2 1179.5 Mar 06 573,037 1303.5 1310.2 1303.5 1310.2 +3.911321.5 1261.3 Jun 06 1,159,314 1316.5 1320.8 1314.8 1317.5+0.751328.0 1307.3 Sep 06 na 1328.0 1328.0 1328.0 1328.0 +20.8Est. Vol. Vol. 1,007,308 open int 1,732,351 –46,230S&P MIDCAP 400 (CME) – 500 x index793.65 678.80 Jun 06 10,960 789.40 792.25 788.50 790.60 +2.80797.65 682.80 Sep 06 na 797.60 797.60 797.60 797.60 +2.80804.60 755.40 Dec 06 na 804.60 804.60 804.60 804.60 +2.80Est. Vol. 100 Vol. 603 open int 14,774 –99DJ INDUSTRIALS (CBOT) – $10 x Dow Jones Industrial Average11370 10303 Jun 06 38,067 11331 11370 11320 11361 +17.011437 10368 Sep 06 43 11435 11437 11425 11437 +17.011512 9752.0 Dec 06 1,675 11512 11512 11512 11512 +17.0Est. Vol. 4,909 Vol. 11,932 open int 62,043 +4,316MINI DOW JONES (CBOT) – $5 x DJIA index11370 10303 Jun 06 62,345 11335 11370 11319 11361 +17.011437 10368 Sep 06 6 11435 11437 11425 11437 +17.0Est. Vol. 71,066 Vol. 110,349 open int 112,419 –3,302NASDAQ 100 INDEX (CME) – $100 x index1789.5 1556.5 Jun 06 56,224 1698.5 1710.0 1695.0 1704.5 +4.501808.0 1678.5 Sep 06 1 1721.5 ... ... 1721.5 +4.50Est. Vol. 5,203 Vol. 24,877 open int 97,705 +4,551MINI NASDAQ 100 INDE (CME) – $20 x index1774.0 1540.0 Mar 06 271,085 1679.5 1686.5 1679.0 1681.2 –0.281793.0 1652.5 Jun 06 211,299 1699.0 1710.5 1695.0 1704.5 +4.501722.0 1721.5 Sep 06 na 1721.5 1721.5 1721.5 1721.5 –0.50Est. Vol. Vol. 371,379 open int 482,384 –10,809RUSSELL 2000 (CME) – 500 x index754.50 629.40 Jun 06 31,346 749.10 752.75 746.60 750.10 +2.10756.10 632.40 Sep 06 34 756.10 756.10 756.10 756.10 +2.10762.10 689.40 Dec 06 2 762.10 762.10 762.10 762.10 +2.10Est. Vol. 540 Vol. 6,442 open int 50,478 +3,490RUSSELL 1000 Mini (NYBT) – $50 x index717.50 646.95 Jun 06 88,274 717.25 717.50 716.60 717.50 +1.00Est. Vol. Vol. 280 open int 93,002 +69NIKKEI 225 AVGS. (CME) – $5 x nsa16750 1135.0 Jun 06 49,352 16205 16240 16195 16240 +150.016725 12750 Sep 06 37 16240 16240 16240 16240 +150.016725 15085 Dec 06 10 16215 16215 16215 16215 +150.0Est. Vol. 330 Vol. 10,114 open int 49,399 +566
FinancialsUS TREASURY BONDS (CBOT) – $100,000 prin– pts & 32ndsof 100 pct118-19 108-24 Mar 06 22,040 111-16 111-16 111-03 111-05 –10117-24 108-24 Jun 06 567,244 111-10 111-15 110-31 111-02 –10117-18 109-11 Sep 06 2,102 111-14 111-29 111-02 111-03 –10115-13 110-13 Dec 06 543 111-16 111-16 111-16 111-16 –11Est. Vol. 223,053 Vol. 502,338 open int 591,930 –26,46510 YEAR TREASURY (CBOT) – $100,000 prin–pts & 32nds & a half 32nd112-30 106-16 Mar 06 47,991 107-25 107-26 107-20 107-21 –045112-03 106-13 Jun 06 1,970,999 107-22 107-25 107-15 107-18–045111-27 106-20 Sep 06 25,233 107-19 107-25 107-19 107-21 –045Est. Vol. 770,990 Vol. 1,446,447 open int 2,044,371 –74,1515 YEAR TREASURY (CBOT) – $100,000 prin–pts & 32nds & a half 32nd109-07 102-19 Mar 06 19,749 105-11 105-11 105-09 105-10 –03108-30 102-19 Jun 06 1,186,244 105-10 105-11 105-06 105-08–03108-30 104-15 Sep 06 3,209 105-09 105-09 105-08 105-08 –025Est. Vol. 347,652 Vol. 799,657 open int 1,209,203 –22,6972YR. TREASURYNOTES (CBOT)–$200,000prin–pts &32nds& aquarter32nd103-31 102-02 Mar 06 17,414 102-08 102-08 102-07 102-08 0.00000103-31 101-28 Jun 06 466,254 102-10 102-10 102-08 102-09 0.00000Est. Vol. 99,489 Vol. 230,493 open int 483,668 +13,273MUNICIPAL NOTES (CBOT) – $1000x index–pts & 32nds106-28 103-09 Mar 06 113 106-00 106-00 106-00 106-00 –02Est. Vol. Vol. 56 open int 113 +5EURODOLLARS (IMM) – $1 million–pts of 100 pct.95.39 94.95 Apr 06 32,495 95.02 95.02 95.00 95.00 –0.0080
95.27 94.88 May 06 10,299 94.95 94.95 94.95 94.95 –0.005097.09 91.91 Jun 06 1,374,056 94.95 94.95 94.92 94.94–0.0196.90 91.88 Sep 06 1,413,585 94.94 94.94 94.89 94.92–0.0296.69 91.81 Dec 06 1,357,305 94.99 94.99 94.94 94.97–0.02596.53 91.86 Mar 07 1,114,046 95.07 95.07 95.02 95.04–0.02596.36 91.82 Jun 07 825,314 95.11 95.11 95.06 95.08 –0.0396.19 91.79 Sep 07 777,183 95.13 95.13 95.08 95.09 –0.03596.04 91.72 Dec 07 550,528 95.13 95.13 95.08 95.08 –0.0496.00 91.75 Mar 08 334,886 95.10 95.11 95.06 95.07 –0.03595.96 91.71 Jun 08 257,923 95.06 95.08 95.04 95.05 –0.0395.94 91.68 Sep 08 235,559 95.03 95.05 95.02 95.02 –0.02595.89 91.61 Dec 08 182,249 94.98 95.00 94.97 94.97 –0.02595.85 91.61 Mar 09 129,799 94.97 94.98 94.94 94.95 –0.02595.83 91.56 Jun 09 117,733 94.94 94.95 94.92 94.93 –0.0295.78 91.53 Sep 09 105,794 94.91 94.92 94.89 94.90 –0.0295.73 91.44 Dec 09 94,465 94.86 94.88 94.85 94.86 –0.02911.57 91.53 Mar 10 73,509 94.85 94.86 94.83 94.84 –0.02904.07 92.00 Jun 10 62,771 94.83 94.84 94.81 94.83 –0.02897.07 92.14 Sep 10 59,261 94.81 94.81 94.79 94.80 –0.02890.07 92.28 Dec 10 43,938 94.78 94.78 94.76 94.77 –0.02883.07 92.30 Mar 11 20,564 94.77 94.77 94.75 94.76 –0.02877.57 92.29 Jun 11 12,099 94.72 94.73 94.72 94.73 –0.02873.07 92.26 Sep 11 14,226 94.70 94.71 94.70 94.71 –0.02867.57 92.35 Dec 11 10,030 94.67 94.68 94.67 94.68 –0.02862.57 92.58 Mar 12 9,134 94.69 94.69 94.67 94.67 –0.02858.07 92.75 Jun 12 5,825 94.64 94.65 94.64 94.65 –0.02855.57 92.73 Sep 12 7,557 94.61 94.63 94.61 94.63 –0.02851.07 92.70 Dec 12 5,917 94.58 94.59 94.58 94.59 –0.02846.07 92.66 Mar 13 2,538 94.58 94.59 94.58 94.59 –0.0295.12 92.64 Jun 13 2,256 94.56 94.56 94.56 94.56 –0.02Est. Vol. 270,676 Vol. 4,038,320 open int 9,251,630 +2,738EUROYEN (IMM) – 100 million Yen– pts. of 100%99.86 98.87 Jun 06 12,392 99.78 99.78 99.78 99.78 –0.0199.83 98.92 Sep 06 5,311 99.60 99.60 99.60 99.60 ...99.77 98.11 Dec 06 7,034 99.40 99.40 99.40 99.40 +0.005099.70 0.5300 Mar 07 2,695 99.20 99.20 99.20 99.20 +0.0199.65 97.92 Jun 07 4,037 99.04 99.05 99.04 99.05 +0.0199.59 98.36 Sep 07 2,001 98.90 98.90 98.89 98.89 +0.005099.52 98.06 Dec 07 464 98.75 98.75 98.75 98.75 –0.005099.36 98.28 Jun 08 252 98.53 98.53 98.53 98.53 +0.02Est. Vol. 1,963 Vol. 1,995 open int 34,240 +319US DOLLAR INDEX (NYBT) – 1000 x index91.69 85.71 Jun 06 26,350 88.69 88.89 88.45 88.53 –0.1391.40 87.15 Sep 06 2,049 88.22 88.22 88.18 88.18 –0.1390.18 86.88 Dec 06 47 88.00 88.00 87.84 87.84 –0.1388.55 87.51 Mar 07 na 87.51 87.51 87.51 87.51 –0.13Est. Vol. 4,580 Vol. 11,660 open int 28,446 +344AUSTRALIAN DOLLAR (IMM) – 100,000 dollars, $ per A $0.7773 0.7204 Jun 06 48,036 0.7370 0.7374 0.7252 0.7257 –0.01060.7715 0.7189 Sep 06 60 0.7366 0.7366 0.7249 0.7249 –0.01060.7611 0.7174 Dec 06 147 0.7311 0.7311 0.7241 0.7241 –0.01060.7488 0.7144 Jun 07 3 0.7306 0.7306 0.7225 0.7225 –0.0106Est. Vol. 2,160 Vol. 31,943 open int 48,247 +688BRITISH POUND (IMM) – 62,500 pounds, $ per pound1.8922 1.7090 Jun 06 75,688 1.7589 1.7598 1.7533 1.7591 –0.00041.8807 1.7161 Sep 06 103 1.7592 1.7616 1.7570 1.7616 –0.00041.8249 1.7191 Dec 06 3 1.7641 1.7641 1.7641 1.7641 –0.00041.8016 1.7221 Mar 07 na 1.7661 1.7661 1.7661 1.7661 –0.0004Est. Vol. 1,723 Vol. 80,755 open int 75,794 +5,095CANADIAN DOLLAR (IMM) – 100,000 dollars, $ per Cdn. dlr0.8879 0.7950 Jun 06 83,026 0.8697 0.8698 0.8631 0.8652 –0.00460.8912 0.7969 Sep 06 2,170 0.8705 0.8705 0.8655 0.8676 –0.00460.8909 0.8096 Dec 06 715 0.8730 0.8730 0.8683 0.8700 –0.00460.8930 0.8503 Mar 07 111 0.8724 0.8724 0.8724 0.8724 –0.00460.8951 0.8640 Jun 07 16 0.8748 0.8748 0.8748 0.8748 –0.0046Est. Vol. 3,872 Vol. 43,282 open int 86,038 –2,120MEXICAN PESO (IMM) – 500,000 pesos, $ per peso0.0951 0.0841 May 06 58 0.0931 0.0931 0.0931 0.0931–0.000450.0950 0.0795 Jun 06 53,734 0.0933 0.0935 0.0926 0.0929–0.000450.0944 0.0802 Sep 06 674 0.0923 0.0923 0.0923 0.0923–0.000450.0935 0.0818 Dec 06 24,542 0.0916 0.0916 0.0916 0.0916–0.000450.0929 0.0838 Mar 07 301 0.0910 0.0910 0.0910 0.0910–0.000450.0920 0.0876 Jun 07 120 0.0901 0.0901 0.0901 0.0901–0.00045Est. Vol. 5,598 Vol. 7,817 open int 79,462 +1,611JAPANESE YEN (IMM) – 12.5 million yen, $ per 100 yen1.0245 0.8468 Jun 06 169,507 0.8660 0.8750 0.8652 0.8739 +0.00731.0128 0.8568 Sep 06 18,962 0.8795 0.8851 0.8795 0.8845 +0.00730.9776 0.8644 Dec 06 126 0.8948 0.8948 0.8948 0.8948 +0.00730.9533 0.8768 Mar 07 2 0.9049 0.9049 0.9049 0.9049 +0.0073Est. Vol. 7,842 Vol. 76,741 open int 188,597 +3,668SWISS FRANC (IMM) – 125,000 francs, $ per franc0.9128 0.7633 Jun 06 86,030 0.7830 0.7841 0.7790 0.7829 –0.00070.9048 0.7712 Sep 06 143 0.7898 0.7898 0.7898 0.7898 –0.00070.8485 0.7777 Dec 06 49 0.7956 0.7956 0.7956 0.7956 –0.00070.8256 0.7840 Mar 07 na 0.8019 0.8019 0.8019 0.8019 –0.0007Est. Vol. 4,651 Vol. 57,783 open int 86,222 –2,059EURO – 125,000 Euros, $ per Euro1.3816 1.1800 Jun 06 150,236 1.2242 1.2278 1.2208 1.2263 +0.00161.3695 1.1895 Sep 06 1,937 1.2305 1.2338 1.2274 1.2327 +0.00151.2839 1.1913 Dec 06 175 1.2358 1.2385 1.2358 1.2385 +0.00151.2580 1.2020 Mar 07 48 1.2441 1.2441 1.2441 1.2441 +0.00141.2637 1.2174 Jun 07 6 1.2496 1.2496 1.2496 1.2496 +0.0012Est. Vol. 10,317 Vol. 193,087 open int 152,402 +15,76830 DAY FEDERAL FUNDS (CBOT) – $5 million– pts. of 100 pct.98.60 95.43 Mar 06 91,515 95.43 95.44 95.43 95.44 ...96.88 95.23 Apr 06 186,200 95.24 95.25 95.23 95.24 ...97.59 95.08 May 06 108,160 95.12 95.13 95.11 95.12 ...96.97 95.02 Jun 06 101,742 95.08 95.09 95.06 95.07 –0.005096.97 94.92 Jul 06 55,925 95.05 95.06 95.02 95.04 –0.0196.97 94.89 Aug 06 19,442 95.03 95.03 95.01 95.02 –0.01596.92 94.86 Sep 06 5,206 95.02 95.02 95.00 95.01 –0.01596.91 94.88 Oct 06 532 95.01 95.01 95.01 95.01 –0.01596.82 94.91 Dec 06 351 95.05 95.08 95.05 95.07 –0.015Est. Vol. 59,355 Vol. 150,170 open int 569,474 +13,057
BY REUTERS
NewYork copper prices rose 4% toa new record on Friday, as moneymanagement funds competed tobuy after prices cleared previousall-timehighs.The benchmarkMay copper con-tract on the New York MercantileExchange’s COMEX division rose9.45 cents to end at $2.36 a lb, peak-ingat$2.3630.Thateclipsedthepre-vious high at $2.3145 a lb that wassetonFeb. 7.The rally accelerated after priceshurdled above $5,000 a ton, thencleared the previous high at $5,100,at the London Metal Exchange,where the benchmark prices formostbasemetals are set.Additional support was seen fromongoing violent protests in Indone-sia to demand the closure of a giantgold mine run by U.S. firm Free-port-McMoranCooper&GoldInc.At the same time, shares of the bigU.S. copper mining companies roseon Friday, a day after Phelps DodgeCorp., the world’s second-largestcopper producer, said it sees pricesstaying at record highs as demand,especially from China and India,keepsgrowing.In London, a 4.6% rally in zinc tonew highs catalyzed the buying incopper. LME zinc has gained over30% this year as investors switched
attention from othermetals to zinc,anunderperformer in2005.COMEXMay silver rose to a new22-year high, ending up 2.3 cents at$10.3650 an ounce. Silver is consid-ered one part precious metal andone part industrial, and can take itscue fromcopper.But buying is mainly pinned onhopes that a new silver-backed ex-change traded fundwill soon be ap-provedbyU.S. regulators.April delivery gold lost 30 cents tosettleat$555.10anounce.At the Chicago Board of Trade,Maywheatwent up 4-3/4 cents to$3.57-1/2 per bushel, in a technicalrebound from the sell-off tosix-week lows on Thursday as rainforecasts promised weekenddrought relief forU.S. Plainswinterwheat.Lower wheat prices have helpedgenerate some export demand forU.S. wheat. Export traders onThursday said U.S. wheat was be-comingmorecompetitiveas futuresprices fall, but most varieties arestill more expensive than French,CanadianorAustralianwheat.NYMEXAprilnaturalgas futuresskidded21.4 cents, or 3%, to close at$7.053 per million British thermalunits. Traders said the cause for thepre-weekend long liquidation wasan 81 cent fall in April crude oil to$62.77 a barrel, and concerns aboutrecordhighinventoriesdespitecool-erU.S.weather forecasts.
For Friday, March 17, 2006
Copper Surges On China Outlook;Oil, Natural Gas Fall On Inventories
FuturesTables & Charts Footnotes:CBOT: Chicago Board of Trade. CME: Chicago Mercantile Exchange.CMX: Comex division of Nymex. IMM: International Monetary Mar-ket at CME. KBOT: Kansas City Board of Trade. NYBT: N.Y. Board ofTrade. NYM: N.Y. Mercantile Exchange.Charts: Daily future prices are displayed with price momentum andvolume. Price momentum equals rate of change of high, low andclose for last 14 days. Change of short-term price direction may beindicatedwhen% F (dark line) crosses% S (thin line).

B16 MONDAY, MARCH 20, 2006 FUTURES & BONDS INVESTORS.COM
Food Fri Thu 03/17 03/16
Flour hard winter KC cwt 11.55 11.55Coffee parana ex–dock NY per lb. 103.85 103.85Coffee medlin ex–dock NY per lb. 116.20 116.20Cocoa beans Ivory Coast $ metric ton 1772 1773Cocoa butter African styl $ met ton 4102 4105Sugar No. 11 cents per lb 17.49 17.58Hogs Sioux Falls 47–50 pct 220–270 lb 38.00 39.50Feeder cattle 500–600 lb Okl av cwt 130.75 130.75Pork bellies 12–14 lb Midwest av cwt n.q. n.q.
GrainsCorn No. 2 yellow Chi processor bid 2.03½ 2.06½Soybeans No. 1 yellow 5.56½ 5.56¼Soybean Meal Cen Ill 48pct protein–ton 173.00 173.00Wheat No. 2 Chi soft 3.27½ 3.32¾Wheat N. 1 dk 14pc–pro Mpls. 4.66¼ 4.62½Wheat No. 1 hard KC. 4.15 4.12Oats No. 2 heavy or Better n.q. n.q.Corn oil crude wet/dry mill Chi. lb. .22½ .22½Soybean oil crude Decatur lb. .23 .23
MetalsAluminum cents per lb LME 113.8 113.8Copper Cathode full plate 232.00 230.00Silver Handy & Harman 10.375 10.240Platinum per troy oz. NY (contract) 1031.00 1033.00Platinum Merc spot per troy oz. 1034.00 1030.60Steel scrap No. 1 heavy gross ton 231.17 231.17
GoldLondon morning fixing 555.50 up 5.80London afternoon fixing 552.75 up 3.05NY Handy & Harman 552.75NY Engelhard 554.34NY Merc. spot month 554.10 off 0.30
Textiles & FibersCotton 1–1–16 in. strict low middling 50.29 50.53
Petroleum – Refined ProductsFuel oil No. 2 NY hbr bg gl fob 1.7826 1.8138Gasoline unl prem RVP NY hbr bg gl fob 1.9526 1.9594Gasoline unl RVP NY hbr bg gl fob 1.8226 1.8369Dubai $ per bbl fob 60.13 61.83North Sea Brent $ per bbl fob 63.41 62.17West Texas Intermed $ per bbl fob 62.78 63.58Light LA Sweet $ per bbl fob 64.78 65.43Alaska No. Slope del. West Coast 60.52 61.33
Raw ProductsNatural Gas Henry Hub, $ per mmbtu 7.18 7.13a–Asked, b–Bid, n–Normal, r–Revised, nq–Not Quoted,n.a.–Not Available.
Spot Prices
Money Rates
Prime Rate ....................................... 7.50Base interest rate charged by majorU.S. commercial banks on loans tocorporations.
Discount Rate:Primary ...................................................... 5.50Secondary ................................................. 6.00Rate charged by Federal ReserveSystem on loans to depository institu-tions
Federal funds market rate:High 4.50 Low 4.50 Last 4.50Rates on overnight loans amongfinancial institutions.
Bankers Acceptances30 days ................................................. 4.7360 days ................................................. 4.8190 days ................................................. 4.88
120 days ................................................. 4.92150 days ................................................. 4.95180 days ................................................. 4.98
Discount rate on business creditsbacked and sold by banks to financetrade.
Commercial Paper (range):Dealers:
30-180 days .................................. 4.57-4.81Corporate Issuers:
30-270 days .................................. 1.97-2.37Discount rate for unsecured notes oftop-credit corporations sold directly orthrough dealers.
Certificates of Deposit:($100,000 minimum)
30 days ................................................ 2.1790 days ................................................ 2.86
180 days ................................................. 3.08Rates paid on new certificates of majorcommercial banks, usually in blocks of$1 million or more.
Broker call loan rate: ................... 6.25Rate charged on short-term loans tobrokerage dealers backed by securities.
Eurodollar rates:(Secondary Market)Overnight ....................................... 4.50-4.561 month ......................................... 4.69-4.813 months ........................................ 4.81-4.946 months ........................................ 4.94-5.061 year ............................................ 5.00-5.13
Rates paid on dollar deposits outsidethe U.S.
London Interbank Offered Rate:3 months ............................................... 4.936 months ............................................... 5.031 year ................................................... 5.12
The average of rates paid on dollardeposits.
Treasury Bill Auction Results:3-months (as of Mar. 13) ................ 4.5106-months (as of Mar. 13) ................ 4.645
12-months (as of Mar. 13) ................. 4.77Average discount rate for Treasury billsin minimum units on $10,000.
BY REUTERS
U.S. Treasury debt succumbed tomild profit-taking onFriday but themarketwas still higher on theweekas investors reassessed the need formore interest-ratehikes.Benchmark 10-year note yieldsstood 0.1 percentage point lower
than they did at Monday’s open asbenign inflation data earlier in theweek suggested the Federal Re-serve need be in no rush to raise in-terest rates.“There has not been significantpush-through of energy price in-creases which has been feared bymany,”saidLynnReaser,chiefecon-
omist at Banc of America CapitalMarket.Still, themarket’s rally led to someretracing on Friday, leaving the10-year note off 6/32 in price for ayield of 4.67%, compared with4.64%onThursday.Friday’sdatawererelatively incon-clusive, with a rise in February in-dustrial production matching fore-casts and an unexpected decline inconsumer sentiment eliciting littlereaction.Two-year notes dipped 1/32 toyield 4.65% from 4.62%, whilefive-year notes ticked down 3/32 toyield4.62%.The 30-year bond fell 11/32 toyield4.72%from4.70%.Traders also reported the sellingof German Bunds overseas spilledover intoTreasuries.Investment banks had startedratcheting up their rate forecastsfor the European Central Bankamid increasing signs of hawkish-ness frompolicyofficials there.Such a tendencywas also having anegative impact on the dollar, withforeign exchange dealers fearingthat the greenback’s long-standinginterest-rate advantage over thoseof its industrialized counterpartswouldbegin to fade.TheU.S. currency fell to its lowestlevel in seven weeks against theeuro, even though Friday’s datawere inconclusive for the inter-est-rateoutlook.Data on U.S. industrial outputshowed cold weather in Februaryboosted overall output 0.7%, in linewith forecasts and up from a down-wardlyrevised0.3%fall inJanuary.TheUniversity ofMichigan’s con-fidence index held steady at 86.7 inmid-March, which was below ana-lysts’median forecastof88.0.
For Friday, March 17, 2006Bonds Summary
Domestic All IssuesFri Thu Fri Thu
Issues traded 25 25 27 27Advances 7 15 8 16Declines 16 8 16 8Unchanged 2 2 3 3Total NY Bond Volume $1,509,000Total Amex Bond Volume $1,395,000
. Muni Corner
Source: Reuters America Investor’s Business Daily
Reuters 10-Year Muni GO Index
Maturity Pre-Refunded Insured AAA AA A BAA 1 Year 2 Year 3 Year 5 Year 7 Year10 Year15 Year20 Year30 Year
3.41 3.44 3.37 3.43 3.50 3.71 -- 3.47 3.49 3.42 3.48 3.57 3.82 4.63 3.51 3.52 3.44 3.51 3.65 3.87 4.62 3.61 3.63 3.54 3.63 3.80 4.11 4.59 3.79 3.80 3.69 3.78 3.99 4.24 -- 3.88 3.99 3.87 3.97 4.16 4.45 4.64 4.06 4.18 4.06 4.16 4.36 4.61 -- 4.21 4.32 4.21 4.31 4.50 4.74 -- 4.39 4.50 4.39 4.49 4.66 4.91 4.69
TreasuryYields
G.O.
Weekly Representative J.J. Kenny Muni-Bond Yields-as of 03/17/06
Treasury Prices Slip, But End Week UpAs Traders See Less Need For Rate Hikes
Looking for the top ETFs?You can find them for FREE in the ETF Center at
investors.com/ETF
Sponsored by:
www.investors.com
Key Financial Futures
Please Ask For Howard Lender
1.800.465.4210 | greenstreet.com | [email protected]
GREENSTREETDISCOUNT CORPORATION
Futures, Options & Single Stock Futures!Professionals, Course Students & Beginners Welcome!
Not An Introductory Rate, No Monthly Fees!Many Trading Platforms Available!
Place Orders Online Or By Telephone 24 Hours A Day!FREE Books, Quotes, Charts & Top Quality Research!
......
190$ FLATPER SIDE
*Volume restrictions apply. This rate applies to all electronically traded miniGlobex, e-CBOT, Eurex, Simex, NQLX and OneChicago products.
There is a substantial risk of loss in trading futures and options.
*
601 W. State St., Suite A, Redlands, California 92373
REDLANDS FUTURESAND OPTIONS
Commodities Brokerage Services
*There is risk of loss in futures and options trading.
WHERE CUSTOMER SERVICE IS STILL IMPORTANT
CALL TODAY FOR MORE INFORMATION
AND FREE STARTERS KIT!
Toll Free 1-888-550-6339or visit us on the web at REDLANDSFUTURES.COM
Quality Service at Discount Rates Low Minimums to Open an Account
On-line Trading
Free 2006 Futures Calendar and Reference Guide
Notice of Redemptionof
7.50% Series B ConvertibleCumulative
Redeemable Preferred Sharesof Beneficial Interest
of
CenterPoint Properties Trust(CUSIP No. 151895 30 7)
CenterPoint Properties Trust (the“Company”) hereby gives notice ofthe redemption of all 1,000,000issued and outstanding shares ofits 7.50% Series B ConvertibleCumulative Redeemable PreferredShares of Beneficial Interest, $0.001par value per share (the “Series BPreferred Shares”). The Series BPreferred Shares will be redeemedeffective April 12, 2006 (the “SeriesB Redemption Date”) by payment,for each Series B Preferred Share,of $50.00, together with all accruedand unpaid dividends to and includ-ing the Series B Redemption Date,without interest. Certificates repre-senting Series B Preferred Sharesshould be tendered to the Com-pany’s transfer agent, Computer-share Trust Company, 250 RoyallStreet, Canton, MA 02021, Attn:Reorg. Department.Dividends on the Series BPreferred Shares to be redeemedwill cease to accrue on the SeriesB Redemption Date.
Dated: March 20, 2006

INVESTOR'S BUSINESS DAILY STOCK OPTIONS MONDAY, MARCH 20, 2006 B17P Strike Last Last LastC Price Vol. Price Vol. Price Vol. Price
P Strike Last Last LastC Price Vol. Price Vol. Price Vol. Price
P Strike Last Last LastC Price Vol. Price Vol. Price Vol. Price
P Strike Last Last LastC Price Vol. Price Vol. Price Vol. Price
P Strike Last Last LastC Price Vol. Price Vol. Price Vol. Price
P Strike Last Last LastC Price Vol. Price Vol. Price Vol. Price
P Strike Last Last LastC Price Vol. Price Vol. Price Vol. Price
Mar Apr
P Strike Last Last LastC Price Vol. Price Vol. Price Vol. Price
P Strike Last Last LastC Price Vol. Price Vol. Price Vol. Price
Mar Apr
P Strike Last Last LastC Price Vol. Price Vol. Price Vol. Price
P Strike Last Last LastC Price Vol. Price Vol. Price Vol. Price
Mar Apr
Mar Apr
P Strike Last Last LastC Price Vol. Price Vol. Price Vol. Price
P Strike Last Last LastC Price Vol. Price Vol. Price Vol. Price
Mar Apr
Mar Apr
P Strike Last Last LastC Price Vol. Price Vol. Price Vol. Price
P Strike Last Last LastC Price Vol. Price Vol. Price Vol. Price
Mar Apr
Mar Apr
P Strike Last Last LastC Price Vol. Price Vol. Price Vol. Price
Mar Apr
Mar Apr
Am BioT Close 728.34 Mayc780 .... .... 25 250 .... ....AM BioT Close 728.34 Mayc800 .... .... 25 1 .... ....DJ Inds Close 112.80 Mayc100 .... .... 47 13 .... ....p105 .... .... 54 010 .... ....p107 .... .... 325 025 514 050p108 .... .... 60 030 .... ....c108 .... .... 2.0k 540 .... ....c110 .... .... 41 360 .... ....p110 .... .... 135 055 4 095p111 .... .... 116 070 60 120c111 .... .... 122 280 300 350p112 .... .... 1.1k 1 47 150c112 .... .... 223 205 10 265p113 .... .... 514 130 11 180c113 .... .... 12k 145 .... ....c114 .... .... .... .... 37 150c116 .... .... 36 030 2.8k 075p116 .... .... 130 320 .... ....p120 .... .... .... .... 500 690GS Idx Close 131.74 Mayp110 .... .... 10 040 100 110p115 .... .... 60 080 .... ....p117 .... .... 31 120 .... ....p120 .... .... 128 155 59 310c120 11 1230 .... .... 661650p122 .... .... 27 215 2 390p125 1 005 72 290 1 480c125 75 740 29 10 .... ....p127 61 005 12 370 2 560c127 26 520 50 920 .... ....p130 1.1k 005 1.0k 490 53 680c130 1.1k 185 1.0k 730 1 990p132 866 075 92 6 .... ....c132 703 010 68 640 .... ....p135 1.3k 3 706 740 3 920c135 92 005 52 490 52 720p137 .... .... .... .... 30 1070c137 .... .... 43 420 .... ....p140 2 840 1341030 .... ....c142 .... .... 32 235 8 470c147 .... .... 556 155 .... ....c150 .... .... 39 110 .... ....c155 .... .... .... .... 50 190c160 .... .... 68 035 4 135JpnIdx Close 173.53 Mayp160 .... .... .... .... 150 120MidCap Close 784.58 Mayp700 .... .... 85 085 9 205p710 .... .... 115 1 5 260p730 .... .... 30 180 2 410MS CYC Close 813.12 Mayc830 .... .... 45 530 .... ....c830 .... .... 45 530 .... ....MSHiTc Close 537.48 Mayp480 .... .... 90 045 .... ....p490 .... .... 90 065 .... ....c580 .... .... 90 045 .... ....c590 .... .... 90 025 .... ....Nasd100 Close 1685.66 Mayp1375 .... .... .... .... 60 135p1400 .... .... 400 040 610 165p1425 .... .... 43 070 61 205p1450 .... .... 224 090 4 260
p1475 .... .... 4.2k 110 1 330p1500 .... .... 517 140 506 430p1525 .... .... 740 175 18 530p1535 .... .... 29k 215 .... ....p1550 .... .... 12k 275 3 770p1560 .... .... 29k 320 .... ....p1575 .... .... 14k 410 931020p1590 .... .... 47 560 .... ....p1600 .... .... 1.6k 620 .... ....c1600 .... .... 65 9430 .... ....c1625 .... .... 61 7960 18840p1625 .... .... 1.6k 1020 31870c1650 .... .... 63 57 .... ....p1650 .... .... 272 1590 12630c1675 .... .... 426 3970 235990p1675 .... .... 507 2350 164 34p1680 .... .... 156 2560 .... ....c1680 .... .... 187 3750 .... ....p1700 .... .... 44 3630 424530c1700 .... .... 738 25 514140c1710 .... .... 168 2180 .... ....c1725 .... .... 493 1570 1272930p1725 .... .... 54 4810 115390p1750 .... .... 35 7120 .... ....c1750 .... .... 541 860 102010c1775 .... .... 134 480 7331460c1800 .... .... 944 220 293 780c1825 .... .... 41k 130 267 5c1850 .... .... 61k 080 101 310c1875 .... .... 2.3k 060 455 2c1900 .... .... 70 040 226 080c1925 .... .... 60 020 .... ....NtGas Close 399.01 Mayp410 .... .... 500 1460 .... ....OilSvc Close 200.11 Mayp202 .... .... 35 850 .... ....c207 .... .... 47 490 .... ....Rus2000 Close 746.09 Mayp570 .... .... .... .... 81 030p600 .... .... .... .... 125 070p700 .... .... 200 350 1 710p710 .... .... 148 470 .... ....c710 .... .... 120 4160 .... ....p720 .... .... 7 6 501140c730 .... .... 186 26 .... ....p730 .... .... 524 880 2351380c740 .... .... 602 1940 62640p740 .... .... 565 12 161750c750 .... .... 1.4k 1380 .... ....p750 .... .... 156 1620 5002320p760 .... .... 29 2080 22670c760 .... .... 117 860 .... ....c790 .... .... .... .... 128 540c820 .... .... 82 020 102 130c830 .... .... 75 020 80 085c840 .... .... .... .... 132 055Russ2000 Close 746.09 Mayp610 .... .... .... .... 50 1p640 .... .... .... .... 166 205p660 .... .... 285 105 34 310p670 .... .... 158 145 295 380p680 .... .... 243 185 1.6k 480p690 .... .... 153 240 .... ....SemiconEu Close 496.37 Mayp487 .... .... 501 1020 .... ....SemiconIdx Close 496.37 May
p435 .... .... 80 070 .... ....p450 .... .... 32 210 11 520p460 .... .... 141 280 .... ....p470 .... .... 184 450 .... ....p480 .... .... 73 650 .... ....p490 .... .... 143 1050 .... ....c490 .... .... 45 1970 .... ....c495 .... .... 29 14 .... ....p495 .... .... 36 1330 .... ....c500 .... .... 82 1470 21850p510 .... .... 70 2150 .... ....c515 .... .... 89 730 11130c520 .... .... 23 630 .... ....c525 .... .... 217 520 .... ....c535 .... .... 825 290 .... ....c540 .... .... 110 175 32 590p540 .... .... 100 4550 .... ....c545 .... .... 64 155 .... ....c550 .... .... 39 145 4 320p560 .... .... 50 6570 .... ....c580 .... .... 32 030 20 125SP100 Close 593.49 Mayp500 .... .... 215 005 .... ....p510 .... .... .... .... 315 050p520 .... .... 294 025 .... ....p525 .... .... 250 035 .... ....p530 .... .... 4.9k 040 .... ....p535 .... .... 50 040 .... ....p540 .... .... 1.0k 050 236 090p545 .... .... 130 060 .... ....p550 12 005 1.4k 065 .... ....p555 .... .... 1.5k 075 .... ....p560 56 005 497 085 20 190c565 201 2850 .... .... .... ....p565 25 005 86 115 .... ....p570 861 005 213 150 16 320p575 809 005 677 195 .... ....p580 1.5k 005 1.1k 275 119 530c580 229 1350 821740 20 21p585 4.4k 005 811 390 .... ....c585 849 870 8321370 .... ....c590 6.2k 340 207 10 1031350p590 15k 005 2.9k 530 18 780c595 12k 005 702 720 .... ....p595 9.4k 170 964 720 .... ....p600 86 660 630 10 331240c600 2.4k 005 2.0k 450 8 750c605 .... .... 410 275 .... ....c610 .... .... 1.6k 150 16 390c620 .... .... 2.2k 045 182 150c630 .... .... 172 020 .... ....c660 .... .... 200 005 .... ....SP100 Eur Close 593.49 Mayp540 .... .... 160 040 .... ....p555 9 005 160 065 .... ....p570 .... .... .... .... 327 3p575 .... .... 36 190 .... ....c580 31 1290 .... .... .... ....p585 50 005 1 340 .... ....c590 396 290 33 960 .... ....p590 25 060 27 530 .... ....p595 8.4k 240 8.7k 720 .... ....c595 9.4k 015 7.4k 670 .... ....c600 400 005 140 440 307 7c605 .... .... 45 275 .... ....c610 .... .... 257 130 27 330
p610 .... .... 79 17 .... ....c615 .... .... 232 070 .... ....c620 .... .... 160 040 1 155SPX500 Close 1307.25 Mayp30 .... .... 4.1k 9 .... ....c30 .... .... 120 2950 .... ....p800 .... .... .... .... 330 005p850 .... .... 100 005 .... ....p950 .... .... 700 010 .... ....p1050 .... .... 280 020 2.1k 050p1100 .... .... 157 040 18 080p1125 .... .... .... .... 2.2k 110p1150 .... .... 13k 070 10 135p1160 .... .... 36 065 .... ....p1165 .... .... 615 080 .... ....p1175 .... .... 198k 105 486 190c1175 .... .... .... .... 50140
p1190 .... .... 300 110 .... ....p1195 .... .... 102k 1 .... ....p1200 .... .... 4.3k 115 15k 280p1205 .... .... 607 135 .... ....p1220 .... .... 64 160 .... ....p1225 .... .... 10k 195 .... ....p1230 .... .... 687 205 .... ....p1235 .... .... 85 240 .... ....p1240 .... .... 2.4k 270 .... ....p1245 .... .... 172 290 .... ....c1250 .... .... 81 64 27240p1250 .... .... 5.8k 320 5.1k 670p1265 .... .... 1.9k 450 .... ....p1270 .... .... 1.0k 5 100 960p1275 .... .... 5.6k 6 6941050c1275 .... .... 44 4230 .... ....p1280 .... .... 376 680 9561170c1280 .... .... 885 3750 134580p1285 .... .... 332 830 101250c1285 .... .... 68 3390 .... ....p1290 .... .... .... .... 400 1370p1295 .... .... 1.2k 1050 .... ....p1300 .... .... 5.1k 1180 3.0k1750c1300 .... .... 11k 2360 1.2k3250p1305 .... .... 777 1410 1 18c1305 .... .... 102 2010 .... ....p1310 .... .... 1.5k 1590 82050c1310 .... .... 13k 17 32450c1320 .... .... 271 12 2001950p1320 .... .... 433 2050 12510p1325 .... .... 14 2260 115 28c1325 .... .... 6.3k 990 7201680c1330 .... .... 162 8 .... ....c1335 .... .... 109 640 .... ....p1335 .... .... 31 30 .... ....p1340 .... .... 30 34 .... ....c1340 .... .... 217 480 .... ....c1345 .... .... 1.8k 390 1 940c1350 .... .... 4.3k 310 586 750p1350 .... .... 40 4120 234150c1355 .... .... 585 220 .... ....c1360 .... .... .... .... 24 590c1365 .... .... 3.5k 150 .... ....c1370 .... .... 2.2k 115 .... ....c1375 .... .... 157k 080 3.0k 260c1400 .... .... 133k 040 36 090c1450 .... .... 600 020 .... ....UtlIdx Close 432.41 Mayp400 .... .... .... .... 50 135
Index OptionsClosing prices may vary due to after hour settlements/trading at time of data transmission.
Mar Apr Mar Apr
Option TotalsTotal Total Call PutCall Put Open Open
Exchange Volume Volume Interest Interest
Comprehensive volume and prices for Friday, March 17, 2006. Investor’sBusiness Daily shows options in a time-saving alphabetical list, withexpiration month in the first column. Closing prices are as of 4 p.m.Eastern and do not reflect after-hours settlements/trading.
AMERICAN 543,687 367,607 70,671,065 54,802,634BOSTON 194,712 140,052 0 0CHICAGO 3,000,000 1,400,000 100,000,000 82,000,000ISEC 1,451,652 916,597 87,895,483 71,390,687NYSE ARCA 318,967 210,423 92,678,059 73,321,524PHILADELPHIA 678,923 373,142 78,964,261 58,330,440TOTALS 6,187,941 3,407,821 430,208,868 339,845,285
3Com Close 5.26 Julc5 2.0k 023 1.6k 048 397 0753M Co Close 74.79 Julc75 2.6k 005 1.2k 150 39 3A E P Close 35.50 Mayc35 634 060 15 109 16 145A Hess Close 143.69 Mayc145 898 005 295 5 16 770p145 904 175 23 560 no trA M D Close 33.95 Julp3250 no tr 620 130 110 270p35 6.0k 095 701 255 36 380c35 4.5k 005 4.5k 185 202 370c3750 no tr 613 110 26 270c40 14 005 1.1k 055 90 195p40 1.0k 6 60 605 3 713A M R Close 27.00 Mayp25 4 005 555 075 1.1k 155c25 3.3k 2 800 295 214 390c30 170 001 345 055 510 115AberFitch Close 57.40 Mayp50 no tr 12 025 632 075c5750 no tr 784 235 no trAbtLab Close 45.18 Mayc45 3.0k 020 632 110 239 155AcadiaPh Close 16.34 Junp1250 no tr 776 065 11 095AccrHme Close 53.05 Junp50 50 015 946 140 109 285Activisn Close 14.07 Mayp1250 no tr 575 010 no trc15 no tr 15 025 850 050ADC Tel Close 25.28 Mayc30 no tr 809 010 no trAdobeS Close 35.98 Julp35 no tr 662 110 6 235c40 no tr 918 035 39 145c4250 no tr 2.5k 015 10 095AEagleO Close 28.87 Mayp30 5 120 1.2k 220 10 230Aeropstl Close 31.13 Julc30 98 160 831 225 38 350Aetna Close 51.06 Julp50 3 005 2.8k 1 10 2c50 504 105 208 235 36 440AffCmpS Close 63.08 Julp60 no tr 1.2k 090 1.2k 230c65 1 010 4.9k 090 1.3k 280AgereSys Close 14.18 Junc1250 960 155 10 170 143 210Agilent Close 37.92 Mayc3750 762 040 280 140 115 2Agnico Close 26.27 Mayc25 573 110 275 210 419 270AK Steel Close 14.08 Junp1250 no tr 818 030 35 080c1250 857 180 671 210 802 250c15 1.2k 010 2.1k 075 630 125Alcatl Close 14.73 Junc15 no tr 2.8k 050 10k 085Alcoa Close 30.11 Julc30 4.7k 010 631 115 5 210AldWaste Close 11.40 Junc10 522 135 12 145 25 170AlexionPh Close 36.68 Mayp35 10 005 530 125 4 210c40 no tr 511 105 30 2Alkerm Close 25.16 Mayp2250 no tr 2.1k 045 no trc25 502 020 168 160 19 225AllegTch Close 56.19 Julc55 1.5k 120 300 390 49 650AlphaNRs Close 20.92 Junc2250 20 005 80 040 502 1Altria Close 73.55 Junp60 no tr 2.0k 025 113 080c65 1.4k 850 342 950 311060p65 9 005 10k 055 2.8k 140c70 1.7k 360 531 520 197 660p70 64 005 15k 125 2.4k 260p75 3.1k 140 5.1k 3 567 450c75 374 005 3.7k 190 12k 340c80 73 005 851 036 1.5k 130Amazon Close 35.99 Julp3250 no tr 585 020 4 110p35 no tr 3.4k 072 54 2p3750 4.9k 150 2.6k 195 5 330c3750 7 005 1.6k 064 47 235c40 no tr 3.2k 015 254 144c4250 no tr 1.3k 005 95 080AmerisBrgn Close 47.71 Mayp45 no tr 550 045 no trAmgen Close 73.25 Julc70 629 285 606 420 113 610p70 2 005 1.4k 090 99 235p75 2.6k 215 1.9k 309 53 457c75 117 005 2.3k 135 244 350p80 5 660 661 750 57 780c80 10 005 2.6k 030 378 160AmHmMtg Close 29.83 Junc30 800 005 171 095 1.0k 170AmIntGp Close 68.82 Mayc65 884 370 1.4k 390 6.2k 450p65 83 005 2.5k 030 2.5k 050p70 1.3k 155 2.1k 2 1.5k 225c70 210 005 6.6k 070 3.1k 130c75 no tr 1.1k 005 135 010AmItlPast Close 5.79 Junp10 615 430 no tr no trAmkorT Close 7.50 Junp750 579 005 48 060 74 1p10 1.2k 250 1.3k 260 no trc10 1 005 172 010 688 035AMovilL Close 35.41 Mayp30 no tr 2.1k 030 340 070c35 782 025 509 180 35 250AmStd Close 41.60 Julp35 no tr 619 010 318 035Amylin Close 46.42 Julp35 no tr 1.8k 020 10 090p40 no tr 1.6k 050 20 205c45 1.4k 140 1.0k 3 120 548c50 10 005 746 080 701 320Anadrk Close 99.91 Mayc100 3.1k 005 136 350 48 530p100 1.2k 015 143 340 9 460p105 519 520 21 6 27 750AndrxCp Close 23.66 Junc20 747 370 no tr 4 390Anteon Close 54.80 Julp50 no tr 611 020 no trAntignics Close 5.91 Junc5 86 095 246 170 528 195c10 no tr 563 045 no trApache Close 66.07 Julc65 405 110 602 295 57 580AppFlms Close 19.71 Julp20 5 035 965 080 no trAppldMat Close 17.49 Julc17 370 035 1.0k 080 123 150p17 200 005 519 040 126 090c18 no tr 2.9k 035 100 1p18 1.1k 070 1.9k 090 81 140c19 25 005 1.7k 010 189 060c20 8 005 121 010 552 037AppleC Close 64.66 Julc55 61 950 6091040 711290p55 no tr 946 050 136 220c60 241 460 1.0k 640 114 940p60 20 004 4.0k 150 295 380p6250 1.3k 005 2.4k 240 154 490c6250 4.8k 2 985 481 887 790p65 13k 048 7.3k 350 358 6c65 14k 005 4.8k 340 305 660p6750 4.1k 295 958 5 62 740c6750 175 005 1.5k 230 113 560p70 1.1k 550 1.1k 675 496 880c70 197 005 4.3k 160 576 453p7250 1.2k 8 999 872 161070c7250 233 005 1.4k 110 84 380c75 31 005 706 070 362 310c80 no tr 1.7k 030 294 195c90 no tr 144 005 610 085ArchDan Close 35.26 Junc30 1.0k 530 182 550 377 610p30 no tr 522 015 671 045c35 4.3k 030 650 135 1.4k 225c40 no tr 65 010 1.0k 055Archiplgo Close 00.00 Julc80 518 540 238 880 281270AriadP Close 6.65 Mayc750 no tr 892 030 133 050Ariba Close 10.76 May
c1250 no tr 1.0k 020 14 040Arris Close 13.83 Mayc1250 599 115 39 169 19 155ASciE Close 89.98 Julc90 656 045 104 620 201090AutoData Close 47.16 Mayc4750 238 005 1.2k 090 37 135AutoZn Close 97.22 Junp100 600 270 114 390 no trAVI BioPh Close 6.34 Junp750 1.0k 115 1.0k 160 no trAvon Close 30.13 Julc30 528 010 74 085 2 185Aztar Close 38.30 Mayc40 no tr 587 050 113 060BankNY Close 35.52 Julp3250 no tr 4.2k 020 2.7k 045c3250 187 280 5.1k 330 6 390p35 300 005 4.1k 065 2.0k 135c35 7.8k 050 10k 140 245 2c3750 no tr 924 035 3.7k 090p3750 no tr 810 225 85 270c40 no tr no tr 2.8k 035BarickG Close 26.63 Julp30 973 320 60 310 65 360BarrPhrm Close 61.57 Mayc60 3 2 157 340 2.1k 440BausLm Close 68.87 Julp65 619 005 251 135 87 255p70 1.2k 120 276 350 90 470c70 1.5k 005 2.3k 230 117 440BE Aero Close 24.66 Julc25 10 005 533 1 5 210BEA Sys Close 12.24 Junc10 807 218 9 235 166 235BearSt Close 132.87 Julp130 5 005 5.8k 2 no trp135 856 210 171 440 14 680c135 1.4k 005 776 230 6 640BeazerHm Close 68.01 Mayp55 no tr 612 020 10 070c70 589 005 178 210 114 340BedBath Close 36.81 Mayc35 590 190 500 245 26 290p3750 154 070 971 155 362 175c3750 22 005 3.3k 1 465 153BenchEl Close 35.87 Julc35 10 085 838 190 2 330BestBuy Close 57.00 Junp50 10 005 1.8k 055 54 105c55 1.9k 189 429 370 42 5p55 27 005 1.7k 165 19 250c60 no tr 1.7k 135 36 245c65 no tr 546 035 no trBestBuy o Close 00.00 Junc5663 917 030 no tr no trBiogenIdc Close 49.19 Julc40 921 930 45 980 no trc45 836 430 63 5 31 640c50 2.9k 005 380 135 39 330BioMarin Close 14.43 Julc1250 102 185 117 220 708 265BiotechT Close 198.96 Julc195 560 330 157 7 2 12p195 2.1k 005 130 250 1.1k 620p200 1.0k 150 12 540 135 880Biovail Close 25.35 Julc25 1.6k 025 140 165 23 290BJ Svc Close 32.80 Julp3250 2.8k 005 47 125 30 230c3250 2.6k 015 120 155 1.3k 3c35 2 005 957 060 538 195BJs Wh Close 31.10 Junc30 148 108 78 178 1.3k 275p35 600 410 no tr no trBk of Am Close 46.90 Mayp1750 669 064 no tr no trc45 857 2 301 220 110 245p45 3 005 1.0k 015 32 030c4750 no tr 1.2k 050 361 080Blckbstr Close 3.39 Julp250 no tr 5.1k 015 no trc5 no tr 32 005 1.4k 025Block Close 21.28 Julp20 25 005 535 045 51 090Boeing Close 77.85 Mayc75 852 290 463 380 331 460p75 no tr 896 069 377 130p80 131 220 695 285 69 350Bois dArc Close 15.30 Julp15 no tr 1.0k 050 no trBostSc Close 22.62 Mayc20 1.0k 270 1.1k 295 52 3p20 no tr 900 010 3 030p2250 3.0k 005 1.5k 065 3.1k 090c2250 7.2k 015 547 090 88 120BoydGam Close 46.75 Junp45 no tr 538 075 423 195BrMySq Close 22.92 Junc2250 7.0k 045 3.1k 065 712 1Broadcm Close 44.99 Mayp40 no tr 1.1k 060 43 125p4250 50 005 1.3k 130 24 207c45 9.0k 005 1.3k 250 418 330p45 8.3k 015 271 234 332 317c4750 87 005 516 142 58 220c50 2 005 586 085 134 170c5250 no tr 1.2k 045 3 085Broadcm o Close 66.39 Mayc4338 628 150 47 330 10 416p4338 745 004 12 160 3 240Broadwing Close 12.70 Mayc750 972 490 no tr 3 510p10 no tr 20 015 9.4k 025c10 2.3k 265 549 295 28 3p1250 108 015 815 085 17 120c1250 2.2k 010 1.0k 115 700 150Brocade Close 6.09 Julc5 683 110 815 115 1.3k 130p6 1.1k 005 688 025 285 040c6 1.6k 010 2.4k 040 925 070c7 no tr 814 010 647 028BurlRs Close 90.43 Mayc90 609 040 618 171 53 250Cablvision Close 26.44 Junc25 1.8k 145 1.8k 195 16 240CACI Close 65.40 Junc65 803 040 no tr 8 430Cameco Close 35.91 Junc3250 905 350 62 410 2 540p35 10 005 1.0k 125 17 240c35 828 105 103 240 55 380c3750 24 003 1.0k 120 51 275CapOne Close 81.90 Junp75 no tr 610 035 286 1p80 no tr 1.1k 130 2.1k 244CareerEd Close 35.71 Julp35 5 005 542 108 5 240c35 803 070 476 180 12 340CaremkRx Close 49.62 Junc45 517 480 30 510 no trc50 1.6k 005 57 120 34 245c55 no tr no tr 550 060Carnvl Close 50.97 Julc45 no tr 509 610 no trc5250 4 005 1.8k 095 15 220c55 no tr 1.0k 025 3 120CasualMle Close 9.94 Junc10 no tr 85 055 578 075Caterp Close 76.23 Mayc7250 2.5k 350 220 440 69 550p75 916 005 394 170 187 265c75 4.1k 105 748 275 2.1k 390c80 no tr 2.2k 070 198 160CBRL Grp Close 47.00 Junc40 1 7 30 790 3.2k 730c45 1.1k 215 1.9k 260 77 360c50 no tr 64 035 1.4k 115p50 190 310 526 340 900 420p55 no tr no tr 545 820Celgene Close 42.04 Julc3750 668 440 129 510 1.5k 750p3750 no tr 1.3k 045 22 245c40 2.5k 190 2.1k 3 1.4k 590p40 20 005 997 095 47 340p4250 6.7k 060 6.5k 190 210 450c4250 121 005 928 150 1.1k 450c45 no tr 1.8k 070 466 330c50 no tr no tr 735 155Cemex Close 65.44 Julc65 818 025 854 250 161 450Cendant Close 17.17 Mayc1750 no tr 1.5k 035 475 060
Centene Close 28.46 Junc30 834 005 5 140 2 266Centex Close 65.68 Julp60 4 005 752 075 83 250c65 887 065 1.9k 320 no trCephln Close 73.76 Mayc80 no tr 611 175 83 290Cerner Close 47.11 Junc45 212 205 610 330 31 460CH Rbins Close 45.29 Mayc50 no tr no tr 590 065Cheesecke Close 36.65 Julc35 620 150 133 205 600 310Cheniere Close 39.42 Junp40 524 055 515 180 no trChesEng Close 31.50 Julc2750 238 4 270 420 506 530c30 2.8k 145 2.3k 220 292 350c3250 no tr 1.4k 080 275 230c35 no tr 753 030 448 135Chevron Close 57.18 Junp55 18 005 336 055 859 130c60 32 005 1.5k 050 1.4k 120ChicBdgIr Close 25.09 Julc25 5.4k 010 4.2k 155 537 280Chicos Close 42.35 Mayc45 no tr 1.8k 075 85 150ChiMerc Close 424.45 Junp420 1.6k 005 no tr no trc420 656 450 no tr 20 30c430 1.8k 005 no tr 52470Chiron Close 45.77 Julp45 3 005 520 075 10 080ChiYuch Close 7.53 Mayc750 3.9k 010 175 045 220 075ChkPoint Close 21.54 Julc2250 no tr 2.5k 039 702 110CienaCp Close 5.11 Julc5 809 015 no tr no trCIGNA Close 132.53 Julp110 no tr no tr 1.0k 085c130 1.1k 235 86 480 106 950Cisco Close 21.62 Julp20 no tr 1.1k 015 336 040c20 5.7k 150 2.7k 170 1.0k 230p2250 350 095 1.4k 115 125 150c2250 no tr 3.6k 025 676 080c25 no tr 50 005 995 025CIT Grp Close 54.60 Julc55 21 005 1.0k 125 5 285Citigrp Close 47.41 Junc4250 656 490 10 5 2 520c45 16k 250 11k 285 374 3p45 1 005 762 020 110 050p4750 3.5k 005 1.8k 080 180 135c4750 1.0k 005 2.0k 090 534 130CitrixSy Close 35.92 Junc30 355 580 17 580 728 630ClevClf Close 91.27 Julc90 727 170 85 580 281040ClickCmrc Close 20.77 Junp2250 591 135 103 240 24 370CntwdFn Close 36.53 Julc35 3.0k 160 1.8k 238 41 360p35 no tr 992 065 153 160c3750 no tr 290 075 890 218CocaCola Close 42.79 Mayc40 101 275 no tr 676 320c4250 3.9k 025 350 095 968 115CoeurM Close 5.72 Junc5 2.3k 075 325 095 214 115c750 no tr no tr 663 025Cognos Close 37.78 Mayc40 no tr 618 090 10 115CogTech Close 57.07 Julc60 no tr 525 085 17 310ColgPl Close 56.69 Mayc55 1.1k 165 137 215 625 255Comcast Close 26.90 Julc2250 4 460 5.1k 470 no trp2250 no tr 4.9k 005 no trComcst sp Close 26.93 Julp2750 1.0k 045 1.0k 085 no trc2750 no tr 1.0k 035 10 135CompSc Close 56.90 Junc55 567 180 43 320 no trComvers Close 24.29 Julc2250 no tr 1.3k 230 no trc25 67 005 4.4k 085 172 150p25 152 070 83 145 842 185ConAgra Close 19.64 Junp20 869 035 568 085 251 095p2250 34 295 4.0k 285 5 320ConEd Close 45.09 Mayc45 28 010 681 075 5 115c50 no tr no tr 657 010ConocPhil Close 61.36 Mayp60 13 005 6.3k 129 241 220c60 880 130 900 280 1.8k 360p65 197 380 859 420 44 490c65 23 005 6.3k 072 718 150ConsolEgy Close 65.37 Julp65 1.1k 005 651 230 178 460c65 334 045 709 290 19 590Corning Close 26.87 Mayc25 1.1k 2 1.6k 250 1.1k 310c30 no tr 1.5k 035 422 080Costco Close 55.88 Julc55 1.3k 1 269 190 19 340p55 50 010 1.0k 070 3 2CovantaH Close 16.99 Junc15 100 185 700 215 no trCP Rlwy Close 50.87 Junc50 504 080 1 190 15 340Crane Close 39.95 Junc40 554 005 522 135 no trCree Close 31.97 Junp30 no tr 775 105 129 155Crucell Close 24.79 Junc25 706 005 229 090 44 195CtlAir B Close 26.55 Junp10 no tr no tr 517 010c2250 3.5k 410 55 440 12 550CVRD Close 44.92 Junp45 2.9k 005 47 185 no trc45 3.2k 005 355 160 no trCymer Close 43.85 Mayc45 103 005 516 175 70 275CypSem Close 17.52 Junc1750 15k 005 1.1k 090 111 155p1750 3.7k 005 1.6k 090 no trc20 no tr 29 020 5.3k 055Danahr Close 64.51 Junc65 240 030 34 122 820 245Dell Inc Close 29.08 Mayc2750 135 160 710 195 47 245p2750 2 005 707 015 534 055c30 38 005 1.9k 045 453 097p30 1.8k 080 1.2k 120 186 165c3250 2 005 144 010 615 031DevonEn Close 60.50 Julp50 no tr 523 010 no trc60 2.6k 050 404 280 31 550c65 2 005 1.8k 090 25 320DiaOff Close 83.06 Junc85 746 005 45 320 12 590DigRiver Close 41.28 Junc40 587 115 123 290 88 470Dillrds Close 26.49 Mayc25 601 145 600 190 no trDiscvLbs Close 7.90 Junc750 1.0k 035 93 120 10 175DJIA Diam Close 112.65 Junc108 17k 460 5 540 47 640p109 no tr 1.1k 040 11 110p110 no tr 1.0k 050 427 145p111 27 005 2.0k 075 33 170c111 249 160 1.3k 285 21 410p112 1.6k 005 4.2k 105 78 202c112 1.3k 070 1.4k 210 120 330c113 1.2k 005 700 150 27 270p113 5.3k 025 2.7k 145 1.6k 240c114 20 005 918 095 34 210p114 2.5k 125 2.0k 190 82 290c115 no tr 730 060 22 160DobsonCm Close 7.63 Junc750 2.8k 020 683 050 608 080DollarGn Close 18.04 Mayc1750 37 035 234 085 691 1Dow Ch Close 43.68 Junc40 5.3k 360 5.1k 370 247 430c45 2 005 337 040 543 115DR Horton Close 34.58 May
c35 2.8k 005 298 140 481 205DressBrn Close 45.29 Junp45 62 005 622 175 2 330DuPont Close 42.56 Julc1250 1.2k 010 no tr no trc4250 no tr 585 1 2.6k 2eBay Close 38.22 Julc750 1.9k 055 no tr no trc1250 20 005 1.1k 045 57 150p3750 no tr 596 130 28 245c3750 no tr 1.3k 205 19 360c40 102 005 3.9k 1 84 240p40 1.3k 185 811 270 62 370p45 50 680 542 7 1 730c45 no tr 2.5k 015 31 1EchoStr Close 29.10 Junc3250 no tr 10 005 600 045EDS Close 27.98 Junc2750 540 050 575 1 50 155EgyConv Close 42.34 Junc45 120 005 740 195 18 410c50 22 005 306 080 600 260EKodak Close 29.73 Julc25 35 470 1.1k 5 10 570c2750 no tr 767 275 no trc30 1.0k 005 1.8k 115 131 240Elan Close 15.01 Julp10 no tr 848 010 10 050c1250 3.0k 250 505 285 141 380p1250 1 005 1.0k 030 17 105p15 4.1k 005 388 1 176 205c15 4.6k 005 4.0k 110 1.7k 220c1750 no tr 1.1k 035 1.8k 125EleArt Close 52.58 Junp50 2 005 1.1k 080 34 185p55 226 265 1.2k 310 91 420c55 10 005 698 095 579 232ElPasoCp Close 12.32 Julc12 803 030 no tr 12 120EMC Close 14.10 Julc14 4.8k 010 1.3k 050 187 104p14 1.1k 005 399 035 20 070c15 no tr 316 015 4.3k 055EnCana Close 47.94 Julp45 1 005 1.9k 080 1.7k 220c45 1.4k 310 893 393 19 580p50 147 195 515 310 35 443c50 20 003 2.7k 125 276 320c55 no tr 1.1k 020 55 155c60 no tr 29 005 515 070EncorWre Close 30.14 Mayp30 203 005 562 180 62 250ENSCO Close 47.80 Junp45 no tr 508 105 no trc50 1 005 320 140 765 285EOG Res Close 72.56 Julp60 no tr 637 030 20 160c70 2.0k 250 299 490 52 840EqOffPT Close 34.84 Julp35 no tr 4 095 1.0k 175eResrch Close 14.95 Junp15 1.1k 010 38 070 31 125EricsnTl Close 37.23 Julc35 144 230 1.2k 255 53 340p3750 no tr 3.8k 135 no trETrade Close 26.33 Julc25 no tr 4.9k 185 230 295EvrgrnSlr Close 15.35 Junp15 1.0k 005 5.2k 085 51 155c15 1.2k 045 1.2k 125 682 210c1750 5 005 1.1k 040 315 105p1750 430 150 1.6k 260 508 330p20 336 510 2.5k 5 6 390ExpScript Close 90.37 Mayp85 no tr 1.5k 110 20 220c90 1.0k 030 117 330 173 5ExtrNetw Close 4.99 Junc5 16 005 1.2k 027 23 040ExxonMob Close 61.05 Julp60 41 005 1.1k 080 576 205c60 2.1k 120 4.0k 220 79 380p6250 131 140 5.5k 2 5 330c6250 no tr 6.4k 090 57 240c65 no tr 255 025 544 145F5 Netw Close 69.93 Julc70 617 015 70 420 no trFalconStr Close 9.05 Mayc750 500 170 no tr 504 180FannieM Close 53.40 Junc50 561 334 115 390 no trc55 4 005 253 085 1.1k 2FdgCdCoal Close 42.73 Junc40 644 270 262 290 307 350c4163 626 105 no tr no trFedEx Close 114.94 Julc115 952 005 560 370 32 670p115 1.3k 005 300 320 2 550c120 no tr 526 160 71 420FHLB Close 64.25 Julc70 no tr 567 010 13 110Finisar Close 4.81 Julc5 no tr 54 040 5.8k 080FishrSci Close 69.70 Junc70 617 005 48 180 11 350Flextrn Close 10.15 Julc10 618 010 244 045 60 097FMCG B Close 53.22 Mayc50 153 360 623 480 46 620FordM Close 7.81 Junp750 no tr 5.1k 020 191 045c750 4.1k 030 534 065 1.4k 085FormFact Close 35.41 Julc45 no tr 1.0k 020 3 125ForstL Close 44.71 Mayp40 no tr 7 043 841 078c45 134 010 1.8k 175 45 225c50 no tr 211 030 2.9k 055Foundry Close 16.38 Junp15 no tr 11 015 559 045FrchldS Close 17.83 Mayp1750 25 015 993 070 52 085Freescale Close 26.10 Junp25 no tr 627 050 39 110FtData Close 47.37 Mayc40 800 775 600 8 no trc45 1.5k 275 248 320 53 360p45 no tr 1.0k 040 20 075c4750 842 005 2.8k 145 81 2Gen El Close 34.51 Junc30 695 450 52 470 140 490c3250 3.2k 2 243 216 878 266p35 2.7k 055 1.4k 075 213 1c35 2.2k 005 4.8k 042 1.9k 085c3750 4 005 no tr 958 015GenDyn Close 130.66 Mayc125 199 560 1.0k 650 10 766c130 302 045 686 3 36 430Genentc Close 88.14 Junp80 1.7k 005 929 073 242 170c80 1.9k 810 1.0k 890 1941056p85 4.6k 005 3.6k 190 483 330c85 16k 290 4.0k 510 879 707c90 3.9k 005 5.5k 245 795 450p90 265 2 249 410 574 560c95 no tr 1.4k 1 323 265c100 no tr 633 033 370 145Genitope Close 8.89 Junp10 491 120 no tr 512 155GenMotrs Close 21.13 Junp20 1.2k 005 4.0k 095 3.5k 210c20 4.9k 120 1.8k 210 3.3k 3c2250 2.7k 005 5.1k 080 588 170p2250 11k 130 3.4k 215 3.1k 330c25 20 005 4.1k 025 1.1k 090p25 615 360 251 4 139 470p2750 485 630 44 610 619 690c2750 13 005 20 010 1.5k 040GenzymGn Close 69.56 Julc65 856 430 21 540 no trGeronCp Close 8.53 Junc10 no tr 831 015 174 040Gilead Close 63.31 Mayc60 2.4k 340 1.0k 470 77 559c65 1 005 1.0k 170 60 266GlobalSFe Close 58.55 Julc55 33 350 543 470 10 680Goldcorp Close 27.95 Julc2750 1.6k 050 919 165 156 310c30 12 005 524 070 127 2GoldFLtd Close 20.01 Julc20 717 005 298 120 180 235p20 546 005 160 115 70 2GoldmnS Close 150.36 Jul
p140 10 005 732 065 30 260c145 1.1k 560 648 770 291160p145 41 005 1.2k 150 68 390GolLinh Close 28.69 Julp25 no tr 3 045 1.0k 145Goodyr Close 13.73 Julp1250 no tr 876 020 186 070Google Close 339.79 Junp270 no tr 615 190 22 510p310 906 005 440 780 1351350c320 1.3k1960 2963180 234020p320 8.5k 005 1.1k1070 1151730c330 6.4k 970 4162550 1313450p330 18k 005 1.1k1430 7192140c340 51k 015 1.0k2020 3392940p340 37k 045 2.7k1880 1082560c350 15k 005 1.3k1560 2042470p350 5.3k1030 1.2k2430 1833170c360 2.5k 003 9161180 902040p360 2.3k2030 2773050 293760p370 6583040 4773750 524360c370 91 005 545 880 67 17p380 7364060 2414520 335030c380 28 005 5.1k 640 5481420c390 5 005 638 470 971150c400 20 005 1.2k 330 215 940c410 no tr 970 240 83 770Grace Close 12.76 Junc10 580 260 189 295 1.1k 350p1250 1.6k 010 140 115 256 190c1250 2.9k 010 1.0k 135 1.8k 235c15 no tr 513 065 2.9k 130Guidant Close 77.88 Julc60 no tr 5.2k1850 no trp60 no tr 1.7k 035 no trp65 no tr 4.2k 065 no trp70 no tr 2.4k 090 no trc70 2.4k 740 202 920 no trc80 no tr 2.0k 1 19 290Halbtn Close 70.39 Julp6750 no tr 1.6k 170 5 370c6750 730 270 829 490 5 760c70 5.1k 055 1.1k 340 75 640p70 3.4k 005 975 265 32 490c7250 60 005 818 230 38 490c75 77 005 610 135 256 4p75 699 460 201 550 10 760
p80 3 960 625 980 5 11HarleyDav Close 48.90 Mayp4750 202 005 781 125 177 170c50 81 004 783 155 247 210p50 1.5k 105 2.1k 235 96 280HarmanIn Close 114.22 Julc115 787 005 324 390 no trHarmonyG Close 14.03 Mayc15 no tr no tr 1.0k 095c1750 no tr no tr 588 035HarrahE Close 74.77 Mayc75 586 005 2.2k 210 349 255HeclaMn Close 5.13 Junc5 2.9k 015 188 050 76 080Heinz Close 38.32 Junp40 678 155 no tr 1 225Hershey Close 53.86 Mayp50 no tr 10 015 598 030c55 6 005 948 075 1.1k 125HewlettPk Close 34.16 Mayc35 10 005 14k 080 7.5k 155p35 94 095 1.6k 150 2.3k 220HomeDp Close 42.90 Mayp4250 no tr 294 065 570 105c4250 4.6k 050 813 130 605 185c45 no tr 534 025 1.0k 065HonwellInt Close 42.76 Junc40 504 285 3 320 62 360c4250 1.9k 027 180 140 56 195HovnanEnt Close 46.90 Mayc45 581 179 114 310 15 390HumGeno Close 11.51 Julp10 no tr 2.1k 035 51 070p1250 7.7k 1 4.6k 135 10 180c1250 11 005 748 040 23 1c15 no tr no tr 631 047Huntsman Close 19.94 Mayp20 639 005 52 060 8 120c20 2.4k 005 2.6k 070 no trI B M Close 83.30 Julc80 804 330 654 430 52 580p80 no tr 527 060 123 145p85 3.9k 162 597 245 44 350c85 no tr 1.1k 108 309 275c90 no tr 905 015 282 1IAC Inter Close 30.69 Julc30 630 070 139 135 45 226
IdenixPh Close 20.68 Julp1750 no tr 780 055 no trImax Cp Close 10.31 Junc10 946 025 94 050 19 095Imclne Close 35.04 Mayc35 5.2k 005 602 165 68 260p35 3.9k 005 93 160 no trc40 10 005 2.0k 030 238 080Inco Close 47.58 Julp40 no tr 1.5k 020 184 080p45 1 005 1.6k 1 33 220c50 2 005 2.6k 135 27 310InfoSpce Close 25.32 Julc25 2.0k 025 327 130 14 255IngersollR Close 43.02 Junp40 no tr 238 020 560 060c4250 627 055 550 140 55 230IntcntlEx Close 68.10 Junp65 570 005 323 320 12 650Intel Close 19.54 Julc15 no tr 82 450 586 470p1750 no tr 2.2k 010 615 040c1750 754 191 3.5k 215 1.2k 255p20 21k 060 18k 095 771 135c20 313 001 12k 045 2.9k 105c2250 no tr 494 005 1.8k 035p2250 265 3 620 3 167 318c2750 no tr 19 005 962 005InterDig Close 25.30 Junc25 1.4k 045 no tr no trInterOil Close 14.23 Junc15 no tr 35 050 1.9k 190IntgDv Close 13.71 Mayc1250 no tr no tr 713 165c15 no tr 10 025 3.7k 050IntRec Close 38.98 Junc45 no tr 520 010 10 085IntSurg Close 00.00 Julp95 no tr 1.6k 190 no trp100 no tr 2.2k 330 no trc100 no tr 1.8k 820 no trp105 no tr 512 520 no trc105 no tr 1.2k 520 no trc110 no tr 1.4k 330 no trc120 no tr 521 105 no trIonatron Close 13.05 Julp1250 728 010 300 060 2.4k 115c1250 918 045 1.6k 095 1.5k 135iPass Close 7.43 Junc750 2.4k 005 1.0k 030 no trIpsco Close 100.30 Junp90 no tr 1 095 1.0k 275c95 1.2k 530 1.2k 790 no trc100 127 025 10 520 1.0k 770c115 no tr no tr 1.0k 205ISE Close 49.25 Julp45 78 020 998 145 4 390c45 518 410 428 560 87 830p50 53 075 509 370 38 580
c50 767 005 1.1k 295 119 6iShDJDv Close 64.03 Junc63 529 110 5 130 432 205iShGSCpB Close 106.67 Junc108 no tr 1.6k 010 30 065iShJapan Close 13.98 Junc14 10 005 584 035 601 065p14 1.2k 005 430 035 1 055p15 1.0k 105 no tr no triShNqBio Close 83.52 Junc80 95 360 54 450 535 590p80 no tr 714 075 24 170iShR2000G Close 77.46 Mayc77 640 065 72 2 25 280iShREst Close 74.95 Junc68 1.7k 660 no tr no trp70 no tr 5 040 562 110p71 no tr no tr 1.0k 125iShRs2000 Close 74.05 Mayp67 no tr 70 020 1.8k 040p68 no tr 78 020 901 055c69 1.0k 530 1.0k 510 no trp70 no tr 4.0k 045 510 085c70 68 430 300 450 2.1k 510c71 8.9k 320 4.3k 360 100 440p71 4.4k 005 6.5k 060 30 108p72 9 005 9.0k 083 3.9k 135c72 426 210 300 295 2.0k 340p73 950 005 5.8k 110 350 155c73 7.6k 120 3.8k 225 2.1k 3c74 32k 025 1.5k 165 162 225p74 30k 005 3.0k 150 1.9k 195p75 684 085 12k 195 no trc75 29 005 516 110 2.4k 180c76 no tr 3.7k 070 73 130c78 no tr 126 020 1.1k 065ITT Ind Close 55.92 Julc55 218 095 567 2 11 350ITW Close 97.64 Junc90 731 770 10 840 4 890c95 1.3k 270 16 387 30 530IvanhoeMn Close 7.91 Junc750 1.6k 055 10 055 30 1j2GlobCm Close 42.78 Junc45 1.6k 005 338 125 44 258p45 2.5k 210 130 320 70 390JackHew Close 30.20 Julc30 1.0k 020 no tr no trJDS Uni Close 4.05 Junc3 1.2k 105 342 110 430 120c4 7.9k 005 2.1k 035 1.7k 050JnprNtw Close 19.45 Julc16 no tr 2.1k 360 67 410p16 no tr 552 010 no trc1750 241 2 5.5k 230 34 290c19 1.9k 050 383 130 20 190p19 no tr 5.0k 077 5 115p20 808 050 296 125 162 170c20 549 005 1.8k 080 568 140c2250 no tr 435 019 505 060
JohnJn Close 60.34 Julp60 131 005 1.0k 080 99 155c60 7.8k 030 2.9k 135 174 245c65 no tr 1.6k 005 1.5k 050JoyGlbl Close 58.67 Julc55 527 330 210 5 107 840JPMorgCh Close 41.40 Junc3750 19k 395 15 410 no trp3750 no tr 2.2k 013 22 030c40 8.2k 135 26k 185 473 230p40 no tr 1.5k 055 423 085c4250 6 005 1.6k 040 259 090c45 no tr 526 005 12 020KB Home Close 67.28 Julc65 301 220 524 430 30 730p65 41 005 1.4k 180 2 370p70 69 270 1.6k 420 11 630c70 5 005 681 165 3 440KerrMc Close 97.37 Julc100 10 015 80 235 808 620KFX Inc Close 17.75 Junc1750 1.5k 015 28 120 no trc20 70 005 830 040 230 105KimbClk Close 58.99 Julc60 no tr 2.2k 055 85 171KindrdHlt Close 00.00 Mayc25 no tr no tr 1.2k 195KinetCncpt Close 39.07 Junc45 no tr no tr 1.1k 150KinrossG Close 9.48 Mayp1250 530 285 no tr no trKLA Tnc Close 49.10 Junp45 no tr 762 045 183 130p50 1.1k 1 376 213 10 320c55 no tr 2.1k 015 118 1p100 765 005 258 101 42 225c100 598 150 201 285 5 340Kohls Close 52.99 Julc50 414 290 990 390 5 560p50 no tr 1.5k 075 100 190c55 no tr 1.4k 110 349 285p55 no tr 2.4k 3 3 440Komag Close 49.92 Junc50 716 010 93 3 75 550Kos Phr Close 50.81 Mayc50 996 090 241 310 4 440Kraft Close 30.26 Junc30 759 030 88 095 64 145Kroger Close 20.74 Julc20 962 075 415 1 345 165c2250 100 005 541 005 3.2k 045KrspKrm Close 8.63 Mayp750 360 005 503 030 no trc750 1.7k 115 450 130 9 155Kulicke Close 8.81 Julc750 no tr 558 155 45 210c10 no tr 681 020 603 080L S I Close 11.18 Julp10 no tr no tr 1.6k 045L–3 Com Close 86.95 Julc80 966 630 11 740 1 940c85 1.0k 195 290 320 992 570Lattice Close 6.07 Junc750 no tr no tr 666 020LearCorp Close 16.23 Junp15 no tr 994 105 171 165LehmBr Close 142.80 Julp145 801 225 204 430 9 690Lennar A Close 60.01 Mayc55 152 520 513 610 18 720c60 5.1k 005 941 275 428 340p60 2.0k 005 391 240 58 285c65 no tr 1.3k 075 181 132LexarMda Close 9.39 Junc750 1.2k 175 124 195 193 220c10 26 005 1.7k 040 607 055Lexmark Close 45.84 Julc50 no tr 580 030 no trLibtyMA Close 7.99 Julp8 no tr 1.5k 010 no trLilly Close 57.09 Julp55 no tr 19 040 1.0k 122Linear Close 35.21 Mayp35 619 005 148 095 54 125Lowes Close 68.63 Julc70 no tr 1.4k 110 320 330c75 no tr 549 010 15 140LucentT Close 2.90 Julc3 no tr 1.1k 010 no trLyondell Close 20.23 Junc20 504 020 92 085 541 155M–SysFD Close 0.05 Julp25 88 005 620 115 no trc30 no tr 672 030 13 130Macrvsn Close 21.46 Julp20 no tr 143 055 934 115p2250 no tr no tr 1.2k 240ManorCare Close 43.78 Mayc40 1.6k 370 no tr 836 420c45 no tr 153 055 836 1Marathon Close 76.36 Julc75 272 160 2.7k 370 30 660c85 no tr 16 045 1.8k 240MarInt Close 69.25 Julc70 11 006 581 131 no trMarshIls Close 45.35 Junc45 618 030 3 1 no trMartek Close 33.85 Junc30 1.7k 370 505 430 25 540MarvellT Close 54.21 Mayp50 no tr 2.0k 120 382 220p5250 1.2k 005 1.9k 205 112 320c5250 1.3k 215 241 430 47 6c55 2.7k 005 1.9k 3 278 442p55 7.9k 055 1.2k 330 287 440p5750 655 3 146 470 136 590c5750 110 003 2.9k 195 749 340c60 6 005 2.1k 125 594 255p60 519 550 237 660 28 720c6250 1 005 5.0k 080 677 190c65 58 005 757 045 305 130c6750 60 005 1.6k 030 378 095Maytag Close 16.71 Julp15 12 010 2.0k 080 462 110c1750 325 005 2.6k 125 457 155MBIA Close 60.03 Mayp65 20 480 1.3k 5 no trMcAfee Close 25.83 Junp25 558 005 no tr 77 155c25 1.6k 070 no tr 251 245McDnlds Close 35.10 Junp3250 no tr 146 020 834 050c3250 609 260 525 290 85 350p35 10k 005 285 075 151 130c35 11k 010 920 095 818 170c3750 6 005 121 015 550 070c4250 no tr no tr 700 010MDC Hldg Close 66.00 Junc70 no tr 531 1 no trMedCo n Close 21.45 Julc25 no tr no tr 701 105MedcoHlt Close 58.77 Julc55 4.4k 390 2.7k 450 no trc60 130 005 3.1k 121 1 350MedImun Close 36.38 Junc35 544 155 53 245 61 350Medtrn Close 52.66 Mayc55 35 005 508 030 240 065MEMC Close 36.60 Julp35 1.3k 005 68 140 no trc40 no tr 2.5k 065 208 240Merck Close 35.64 Julp750 70 205 526 210 44 285c750 100 005 132 035 1.1k 110p3250 no tr 879 025 2 080p35 55 005 738 075 96 155c35 4.7k 065 450 154 148 230Meritage Close 59.02 Junc60 45 010 1.1k 245 78 430MerrLyn Close 77.75 Julp75 no tr 792 075 30 205c80 2 003 531 105 131 290MGM Mir Close 39.29 Junp40 104 090 148 195 842 265c40 7 005 3.6k 115 70 225MicrochpT Close 34.61 Julp35 41 045 621 125 28 240MicronT Close 14.77 Julp14 no tr 1.1k 045 44 080c15 1.0k 005 847 070 119 135p15 2.7k 015 15k 080 63 125p16 3.9k 110 12k 145 no trMicrosft Close 27.50 Julc25 no tr 1.3k 260 325 310
p2750 10k 007 15k 040 491 085c2750 27k 005 11k 048 2.5k 110c30 no tr 6.1k 005 439 020c50 515 245 no tr no trMicroStr Close 106.55 Julc105 565 120 6 520 301080MillsCp Close 36.73 Junp35 9 005 49 105 681 165c40 no tr 67 055 2.2k 140Mirant Close 25.97 Junc25 565 080 45 150 100 230MittalStl Close 37.45 Junc35 743 295 3.7k 275 328 380Mohawk Close 87.43 Mayc85 1.1k 215 no tr no trMonsnto Close 85.00 Julp80 no tr 157 115 4.5k 320c85 637 010 42 310 24 6c100 no tr no tr 2.4k 110MonsterWw Close 50.92 Junp50 29 015 533 125 26 265c50 746 110 1.0k 240 23 420MorgStan Close 60.26 Julc60 4.4k 020 1.1k 160 37 320c65 no tr 658 025 101 110Motorola Close 22.25 Julc20 527 235 227 260 541 310p20 no tr 696 015 168 050p2250 1.0k 020 800 085 61 145c2250 2.4k 005 6.9k 075 10k 160MovieGal Close 2.65 Junc250 2.0k 010 no tr 109 065MStewrt Close 16.95 Junc1750 no tr 1.7k 070 no trMylan Close 24.92 Julc25 20 005 4.6k 080 16 154p25 20 005 574 090 250 170Myogen Close 36.27 Junp35 876 005 361 185 13 4N Semi Close 26.91 Mayc25 771 190 248 235 15 270c30 no tr 1.7k 015 366 045NA Pallad Close 10.56 Junc10 577 065 48 115 17 165NABI Bio Close 4.96 Junc5 2.1k 005 679 035 7.7k 060Nabors Close 65.90 Junp65 1.5k 005 196 220 24 370c65 1.9k 090 383 340 90 540c70 178 005 672 135 180 325c85 no tr 1 005 517 045c90 no tr no tr 510 020Nasd100Tr Close 41.45 Junp38 no tr 10 010 1.0k 030p39 40 005 552 015 200 045c39 2.9k 235 860 270 30 340c40 6.6k 135 2.1k 180 422 249p40 130 005 53k 025 436 070c41 64k 035 32k 106 1.7k 175p41 9.5k 005 54k 060 1.1k 1c42 529 005 20k 055 158 120p42 32k 065 20k 105 1.4k 145c43 3 001 2.3k 020 58 079p43 1.5k 160 4.2k 174 107 2p44 944 265 838 260 215 280Nasdaq Close 43.78 Junc40 968 350 308 480 38 640NashFinch Close 29.99 Mayp30 510 005 no tr no trNastech Close 17.41 Junc15 6.5k 220 52 245 531 360c1750 56 005 6.2k 1 26 2Nautilus Close 15.07 Julc15 no tr 104 095 510 155p1750 no tr 1.8k 285 250 310NCity Close 35.76 Julp3250 no tr 3.1k 020 no trc35 819 080 244 135 36 195c3750 no tr 92 025 1.1k 085NCR Close 39.46 Julp40 4 1 1.5k 185 3 265NektarTh Close 19.10 Mayc25 no tr 20 005 2.2k 020NeoPharm Close 8.44 Julc1250 no tr 3.6k 010 10 075Netease Close 90.00 Junc85 940 5 134 770 no trp90 1.9k 010 290 440 608 720c90 5.2k 005 397 450 9 780Netflix Close 26.17 Junc25 541 1 337 210 53 285p25 2.2k 005 262 110 no trNETgear Close 18.15 Junc20 10 005 1.5k 030 40 080NetwkApp Close 35.05 Junc750 no tr no tr 4.0k 145c35 1.8k 010 719 150 2.7k 260Neurcrine Close 70.41 Mayc70 2.9k 050 31 360 6 580Newell Close 25.61 Junc25 144 075 947 105 24 120NICOR Close 41.92 Julp35 no tr 1 020 574 045NII Hldg Close 53.23 Junc50 456 3 832 420 6 6Nike Close 85.42 Julc85 588 035 568 280 no trp85 53 005 1.0k 212 3 350NobleCorp Close 79.48 Junc80 1.0k 005 no tr 100 630NobleEngy Close 41.91 Mayp45 584 290 695 330 14 4NokiaA Close 20.54 Julc20 1.2k 050 216 075 161 125c2250 no tr 645 005 191 035NokiaCp Close 20.54 Julc1750 no tr 1.8k 3 no trNortelNet Close 2.93 Junp35 1.1k 005 no tr 865 025NovaStr Close 30.82 Junp25 no tr 1 015 2.5k 085c30 1.2k 075 860 165 158 210p35 1.1k 430 13 410 3 620Novavax Close 7.36 Julc5 1.2k 225 1.2k 240 3 270c750 567 020 323 075 no trNovellus Close 24.58 Junp25 510 045 336 115 40 175c25 1 005 1.5k 082 20 140NRG Engy Close 46.22 Junc45 106 095 49 210 2.5k 340c50 no tr 10 030 5.0k 125c55 no tr no tr 2.5k 020NTL Inc o Close 00.00 Junc70 539 180 no tr no trNucor Close 98.64 Julp100 679 120 104 510 3 880NutriSys Close 41.04 Junc40 2.7k 1 no tr 54 550Nuvelo Close 18.01 Julc1750 615 050 511 125 no trNvidiaCp Close 48.77 Junc3250 201590 818 285 no trp4250 2 005 1.2k 025 37 120p45 2 005 2.5k 070 667 185c45 542 370 884 460 49 630p4750 2.0k 005 no tr 1.6k 295c4750 5.4k 115 no tr 203 460p50 765 115 579 280 43 410c50 35 005 3.2k 155 189 320c55 no tr 693 040 179 170c85 no tr 1.0k 075 no trNwCentFn Close 44.85 Mayc40 no tr no tr 2.0k 530c45 no tr no tr 609 205c50 no tr no tr 633 060NwmtMn Close 49.86 Junp4250 no tr 960 020 50 075c45 255 490 627 560 3.0k 680p45 no tr 5.1k 055 150 130p4750 no tr 1.2k 110 76 220c4750 322 220 4.1k 380 159 510p50 11k 005 1.2k 210 214 333c50 12k 005 10k 225 241 370c5250 2 005 9.2k 130 124 265c55 1 005 2.3k 065 2.2k 185p55 514 510 245 560 14 650c5750 60 005 507 030 108 125c60 no tr 1.0k 015 513 090NY CmtyB Close 17.67 Julc1750 787 025 59 045 90 085NYSE Gp Close 86.85 Junc85 no tr 1.0k 570 289 860p90 no tr 840 870 58 12
c90 no tr 778 370 156 710c100 no tr 716 155 74 4NYTimes Close 26.05 Julc25 797 130 800 160 2 230OcciP Close 95.08 Mayp95 1.4k 001 54 310 37 430c95 3.4k 015 75 340 46 510OilSvHT Close 141.18 Julp120 no tr 1.4k 045 25 280p125 2 005 647 090 87 4p130 no tr 4.4k 155 2.0k 530p135 68 005 688 280 7 723p140 2.1k 005 2.0k 450 5 890c140 2.3k 130 386 620 791220p145 1.2k 380 699 720 201188c145 1.7k 005 1.7k 390 60 990c150 no tr 1.0k 225 134 8c160 no tr 588 050 no trc165 no tr 721 030 5 330Omncre Close 57.60 Junc55 523 255 no tr 7 540c60 9 005 1.8k 115 1 270c65 no tr 2.6k 020 1 120OmniVisn Close 26.46 Junc25 1.3k 145 673 215 909 310OnyxPh Close 26.38 Mayp2250 no tr no tr 509 070OpnwvSys Close 21.10 Julc20 2.7k 105 2.1k 167 5 285optXprss Close 28.04 Junc2750 1.6k 040 no tr 40 285Oracle Close 13.60 Junc11 7 260 no tr 737 270c12 1.2k 160 1.3k 175 191 185p13 6 005 1.6k 020 4.2k 035c13 6.8k 060 6.4k 085 1.8k 105c14 1 005 5.0k 025 5.6k 045p14 213 040 1.2k 064 10 070p15 22 145 1.0k 142 152 150OSI Phrm Close 31.98 Julc30 1.9k 2 685 295 1 430OutbkStk Close 43.64 Mayc45 no tr no tr 757 155Overstk Close 27.25 Junp25 no tr 183 105 1.2k 220c25 924 240 155 310 no trp30 1.4k 265 99 4 no trpalmOne Close 20.01 Mayp20 3.3k 005 1.0k 155 357 170c20 12k 005 2.0k 160 1.8k 190c2250 no tr 7.8k 077 2.9k 110c25 no tr 33 035 5.1k 055c2750 no tr 4 015 1.0k 025PanASlv Close 23.93 Julc2250 631 155 104 240 54 372p2250 no tr 516 075 10 185PaneraBrd Close 73.63 Mayc70 1.0k 340 1.1k 470 42 6PatrsEng Close 27.69 Mayc2750 2.5k 015 442 160 259 210p30 1.0k 235 463 290 545 3Paychex Close 40.34 Junc40 3.6k 025 887 150 25 225c4250 no tr 4.1k 050 551 105PDL Bio Close 32.25 Mayc30 1.3k 245 1.0k 270 18 320PeabodyE Close 47.27 Junc4250 3.9k 480 17 560 8 7p4750 1.3k 010 81 230 11 390c4750 1.6k 005 117 240 94 410PepsiCo Close 60.06 Julp60 735 005 415 075 no trc60 4.3k 010 1.2k 110 68 215PETCO Close 22.31 Julc2250 853 005 425 105 10 185Pfizer Close 26.39 Junc20 659 640 20 650 12 650c2250 752 390 128 410 103 420c25 4.7k 140 1.7k 160 376 193p25 no tr 3.6k 015 4.5k 040c2750 no tr 10k 025 3.8k 055PG&E Cp Close 40.26 Junc40 2 040 25 070 542 155Pharmion Close 17.71 Junc1750 2.8k 020 2.1k 105 494 175Phelp Close 75.57 Julc8250 10 005 630 140 10 470Phelps Close 75.57 Julp60 no tr 504 030 27 145p6250 no tr 752 050 103 190c65 251070 6441160 721393p65 10 005 1.6k 070 34 240p6750 22 005 676 105 143 330c70 571 580 2.4k 755 1131070p70 100 005 532 160 66 410c7250 1.8k 320 786 610 91 9p7250 793 005 1.3k 240 112 5c75 9.5k 080 2.2k 430 149 810p75 1.5k 005 1.6k 330 633 640p7750 1.3k 180 324 454 35 750c7750 1.3k 005 3.0k 310 39 630c80 30 005 2.1k 220 676 550PinnclEnt Close 30.42 Junc30 555 030 23 130 5 230PinnW Close 40.10 Julc45 no tr 709 055 no trPixar Close 65.66 Julc65 1.5k 055 1.4k 195 no trPMC Srra Close 12.12 Mayc1250 550 005 4.7k 065 189 090PortlPlay Close 23.28 Mayc2250 199 070 910 2 3 3c25 168 005 1.2k 1 149 155Potash Close 86.82 Junp90 150 3 850 520 no trPrideIntl Close 29.96 Julc30 no tr 679 125 112 260p30 no tr 1.2k 130 452 240c35 no tr 10 010 5.1k 095PrimewEn Close 29.09 Junc25 9 330 1.1k 360 27 390ProctGam Close 59.10 Julp50 no tr no tr 2.9k 020p55 no tr 770 015 3.2k 065c60 28 005 2.0k 065 188 180p60 599 095 831 150 144 235ProgPh Close 27.54 Mayc30 no tr 2 040 527 090PsycSol Close 32.04 Junp30 no tr 1.0k 070 no trPulteHms Close 39.69 Julp35 no tr 1.1k 040 14 136c40 1.7k 005 183 159 500 340p40 669 030 80 173 76 319QkslvRes Close 37.93 Junc40 no tr 1.4k 115 29 275Qlogic Close 20.03 Julc1250 650 750 no tr no trp20 1.8k 005 73 065 10 130c20 3.1k 005 299 075 13 170Qualcom Close 50.77 Julc45 246 580 327 610 543 740c4750 1.5k 317 357 394 93 547p4750 no tr 688 060 41 165p50 1.5k 005 2.5k 125 101 265c50 14k 080 4.7k 215 473 4c5250 no tr 11k 095 271 270c55 no tr 1.3k 030 410 173c5750 no tr 928 015 109 120QwestCom Close 6.94 Julc750 no tr 1.1k 025 335 055RadioShk Close 18.95 Julp20 550 110 169 120 1 170Rambus Close 33.53 Mayp25 no tr 1.5k 045 847 110p30 30 005 1.2k 160 112 275c30 3.6k 350 710 530 196 660p35 831 160 566 4 85 550c35 5.2k 005 3.2k 265 540 430c40 no tr 907 135 312 270Randgold Close 16.43 Junc1750 5 005 17 060 2.3k 105RedbackNt Close 19.06 Junc20 no tr 6 050 1.2k 180RegBkHT Close 148.20 Mayp145 75 010 603 120 5 2c145 1.5k 320 1.0k 410 no trc150 no tr 1.0k 170 no trReliantRs Close 10.19 Mayc750 no tr 1.0k 290 no trp10 no tr 1.0k 025 no trc10 8.5k 025 43 060 no trRenovis Close 23.41 Julc25 no tr no tr 588 155
RetailHT Close 100.01 Julp95 no tr 2.0k 040 1.0k 160p100 789 005 no tr 31 320c100 96 005 1.1k 185 no trc105 no tr no tr 1.0k 195ReynldsAm Close 108.84 Mayc100 782 880 21080 no trc115 no tr 35 115 1.3k 230RF MicD Close 7.67 Mayc750 1.1k 020 4.1k 045 4.6k 065RschMot Close 86.75 Junc70 770 17 151750 181990p75 no tr 752 105 79 270p80 143 005 1.0k 210 347 410c80 1.0k 690 283 910 41 12c85 5.9k 180 964 6 155 9p85 5.1k 005 1.2k 390 1.0k 630c90 10k 005 2.7k 370 170 660p90 2.0k 320 1.6k 640 50 9c95 no tr 733 205 77 460c125 no tr 1.8k 115 no trRyland Close 70.53 Julc70 525 055 221 340 32 650Safewy Close 25.54 Junc25 713 055 108 1 1.5k 170Saks Close 20.23 Mayp1750 no tr no tr 518 035c20 154 025 235 110 666 145SanDisk Close 55.00 Julp50 25 005 573 165 45 430p55 6.5k 015 1.0k 380 110 650c55 10k 005 2.5k 4 55 750p60 1.4k 510 730 680 491 940c60 51 005 2.2k 201 26 530Sanofi Close 45.12 Junp45 1.6k 005 72 105 10 2c45 3.6k 010 151 140 137 210SBA Com Close 23.86 Junp2250 27 005 1.3k 050 no trSchlmb Close 123.25 Mayc120 961 329 240 690 244 9p125 4.6k 160 no tr 37 7c125 2.1k 005 no tr 71 580Schwab Close 18.13 Junc1750 1.8k 065 945 110 405 130c20 no tr 423 015 922 035SciClone Close 3.04 Junc250 660 050 no tr 58 080SeagateTc Close 24.73 Junp2250 no tr 584 060 72 105p25 3.2k 034 4.1k 154 25 215c25 1.3k 005 1.3k 135 171 205c30 no tr 63 025 846 070SearsHldg Close 134.90 Junp120 no tr 825 065 73 275p125 no tr 755 135 64 4c125 1.4k 10 2781130 971490c130 1.6k 480 no tr 64 12p130 1.2k 005 no tr 63 560p135 5.9k 030 no tr 138 790c135 7.7k 005 no tr 173 9p140 509 520 no tr 621060c140 1.8k 005 no tr 101 670SemiHTr Close 35.55 Mayp3250 no tr 456 015 1.0k 035c3250 no tr 702 360 13 390c35 3.8k 055 3.0k 145 328 190p35 8.8k 005 5.1k 075 3.9k 110c3750 21 005 766 040 2.6k 075p3750 4.8k 195 2.6k 220 777 240c40 no tr 116 010 2.4k 025p40 49 440 592 430 67 450Seprcr Close 54.91 Julp50 no tr 55 050 910 210p55 1.0k 005 472 2 388 410c55 1.1k 005 198 225 61 510c60 no tr 724 075 1.2k 290c65 no tr 215 025 904 150SFBC Int Close 24.04 Junc20 1.0k 4 18 410 260 445c2250 1.2k 140 267 210 220 295Shanda Close 13.38 Junp15 747 160 233 185 5 240SherW Close 48.27 Junc45 721 320 218 4 26 480Shire Close 48.22 Julc4250 4.0k 560 no tr no trc4750 642 060 no tr 2.3k 440ShufflMst Close 25.98 Mayp25 20 005 762 065 no trSigmaTel Close 9.90 Junp750 no tr no tr 838 025SimonProp Close 88.46 Julp90 no tr 528 290 no trSina Close 25.58 Junp20 no tr 50 005 1.8k 025c25 1.0k 055 482 130 962 215SiRF Tch Close 36.53 Junp35 123 005 2.8k 170 31 298SiriusSat Close 4.89 Junc4 875 080 573 095 1.7k 105c5 311 005 4.1k 025 1.6k 045p5 1.7k 015 702 035 689 055c6 no tr 517 005 2.3k 020SixFlags Close 10.41 Junp10 no tr 1.3k 035 50 070SmthIn Close 37.14 Julc3750 606 005 51 175 310 310Sohu.cm Close 22.89 Junc1750 530 540 no tr 10 590c2250 1.5k 040 1.2k 135 127 215c25 no tr 601 040 477 120Sonus Close 00.00 Julc5 3.5k 005 858 028 75 065SovrnBcp Close 22.12 Julc25 no tr no tr 830 025SP Engy Close 53.65 Junp49 no tr 1.3k 030 1.0k 085p50 no tr 1.0k 042 7.2k 110p51 8 005 587 065 2 142p52 1 005 5.2k 090 6.1k 170p53 20 005 17k 125 2.4k 210c54 8.9k 005 1.3k 155 1.6k 288p54 14k 030 996 170 7.0k 245p55 325 125 941 220 289 310c55 20 005 5.3k 115 8.0k 230c56 no tr 1.0k 075 445 195c57 1 005 549 045 no trc63 no tr no tr 618 030SP Fncl Close 33.10 Junc33 1.1k 005 36 055 271 1SP Mid Close 142.97 Junp138 no tr 514 095 784 215c142 723 125 no tr no trp143 772 005 no tr no trSPDR Close 130.60 Junp111 no tr 771 005 30 015p112 no tr 4.5k 005 3 020p118 no tr 1.9k 010 12 040p121 no tr 552 016 1 060p124 no tr 759 025 48 090p125 no tr 11k 035 30 110p126 5 005 2.1k 040 25 120p127 10 005 847 055 325 145p128 10 005 1.6k 070 53 175c128 109 260 1.0k 380 39 570p129 92 005 3.3k 095 478 195c129 486 140 2.6k 3 10 490p130 2.9k 001 16k 125 1.4k 235c130 1.5k 055 2.8k 235 1.0k 410c131 9.7k 001 3.6k 171 80 340p131 3.8k 045 3.5k 163 273 270p132 1.8k 135 1.0k 215 173 310c132 no tr 2.0k 115 196 285p133 723 245 874 275 21 370c133 no tr 5.8k 080 no trc137 no tr 1.1k 010 27 085c140 no tr no tr 870 035c145 no tr no tr 624 005SprintNxt Close 00.00 Mayc25 1.4k 060 no tr 158 165Staples Close 25.04 Junc25 727 005 278 065 100 125Starbcks Close 36.61 Julp35 no tr 1.3k 050 119 120c35 1.9k 160 1.5k 210 175 340c3750 100 005 751 070 4.1k 2c40 114 002 1.6k 015 478 110c4250 no tr no tr 1.1k 050StarSci Close 2.68 Junc250 755 015 no tr no trStdPac Close 35.17 Junp35 730 005 30 120 76 230c35 878 015 333 160 30 275c40 no tr 700 010 100 080SthnCopp Close 83.89 Jun
Mar AprMar Apr Mar AprMar Apr

B18 MONDAY, MARCH 20, 2006 STOCK OPTIONS INVESTORS.COM
P Strike Last Last LastC Price Vol. Price Vol. Price Vol. Price
P Strike Last Last LastC Price Vol. Price Vol. Price Vol. Price
P Strike Last Last LastC Price Vol. Price Vol. Price Vol. Price
P Strike Last Last LastC Price Vol. Price Vol. Price Vol. Price
P Strike Last Last LastC Price Vol. Price Vol. Price Vol. Price
P Strike Last Last LastC Price Vol. Price Vol. Price Vol. Price
Mar Apr
Mar Apr
Mar Apr Mar Apr
Mar Apr
Mar Apr
LEAPS
Indexes Total Total Call Put Call Put Open Open
Index Vol. Vol. Interest Interest
SPX500 343,873 395,138 1,521,673 2,341,199Nasd100 111,274 97,440 255,214 299,523SP100 31,496 51,382 148,711 213,807DJ Inds 18,180 3,630 205,857 156,842SP100 Eur 18,944 18,050 49,042 77,066Rus2000 3,131 2,641 78,891 72,845GS Idx 4,246 5,991 74,004 38,661Russ2000 0 3,047 0 50,329SemiconIdx 1,742 1,023 17,617 12,840OilSvc 89 54 4,134 3,680SemiconEu 63 577 1,459 1,279
Total Total Call Put Call Put Open Open
Index Vol. Vol. Interest Interest
NtGas 0 500 0 2,359JpnIdx 32 150 671 560MidCap 3 290 25 794MSHiTc 180 180 257 228UtlIdx 50 51 100 305Am BioT 45 0 381 0Bank Idx 0 10 0 227Oil Idx 20 1 151 4AM BioT 25 0 126 0MS CYC 90 0 0 0DJ Trans 6 0 2 0
Exp. Strike LastDate Price Vol Price
Exp. Strike LastDate Price Vol Price
Exp. Strike LastDate Price Vol Price
Exp. Strike LastDate Price Vol Price
Exp. Strike LastDate Price Vol Price
Exp. Strike LastDate Price Vol Price
Exp. Strike LastDate Price Vol Price
Stock Options Leaders20 Most Active Stock Options
Stock Optn OptnPrice Price Chg. Vol
Nasd100Tr Apr 40 Put 41.45 0.25 – 0.10 53270Google Mar 340 Call 339.79 0.15 – 2.95 51269Google Mar 340 Put 339.79 0.45 – 3.25 37458JPMorgCh Apr 40 Call 41.40 1.85 + 0.10 26450Intel Mar 20 Put 19.54 0.60 + 0.25 21014Intel Apr 20 Put 19.54 0.95 + 0.15 18875Google Mar 330 Put 339.79 0.05 – 0.85 18809Citigrp Mar 45 Call 47.41 2.50 + 0.15 16583SPDR Apr 130 Put 130.60 1.25 – 0.10 16513Genentc Mar 85 Call 88.14 2.90 + 2.80 16232MicronT Apr 15 Put 14.77 0.80 – 0.20 15380Altria Apr 70 Put 73.55 1.25 + 0.05 15096Google Mar 350 Call 339.79 0.05 – 0.40 15027Qualcom Mar 50 Call 50.77 0.80 + 0.55 14720AppleC Mar 65 Call 64.66 0.05 – 0.22 14617HewlettPk Apr 35 Call 34.16 0.80 + 0.15 14330AppleC Mar 65 Put 64.66 0.48 – 0.37 13129Altria Jun 75 Call 73.55 3.40 – 0.10 12971Intel Apr 20 Call 19.54 0.45 – 0.13 12821NwmtMn Mar 50 Call 49.86 0.05 – 0.25 12651
TransDigm Group Inc TDG/NSE 3/15 22.00 21.00 –4.55 25.01 19.10 Aerospace/DefenseEqp CrdtSuisseFrstBosEagle Test Systems Inc EGLT/OTC 3/ 9 16.00 15.50 –3.13 15.00 –3.23 Elec-SemiconductorEquip Bancof AmericaSecuAlexza Pharmaceuticals ALXA/OTC 3/ 8 12.00 8.00 –33.33 9.11 13.87 Medical-Systems/Equip PiperJaffray&CoGrupo Aero del Pac ADS PAC/NSE 2/24 20.00 21.00 5.00 32.85 56.43 RealEstateOperations CrdtSuisseFrstBos
Liquidity Services Inc LQDT/OTC 2/23 11.00 10.00 –9.09 11.68 16.80 Internet-ECommerce Friedman,BillingsMorgans Hotel Group Co MHGC/OTC 2/14 21.00 20.00 –4.76 17.30 –13.50 Leisure-Hotels&Motels MorganStanleyAcorda Therapeutics Inc ACOR/OTC 2/10 13.00 6.00 –53.85 5.85 –2.50 Medical-Biomed/Biotech Bancof AmericaSecuAmCOMP Inc AMCP/OTC 2/10 11.00 9.00 –18.18 8.93 –0.78 Insurance-Prop/Cas/Titl Friedman,Billings
Magellan Midstream Hldgs MGG/NSE 2/10 25.00 24.50 –2.00 22.75 –7.14 Oil&Gas-Transprt/Pipelne CitigroupNightHawk Radiology Hldg NHWK/OTC 2/9 14.00 16.00 14.29 24.56 53.50 Medical/Dental-Services MorganStanleynTelos Holdings Corp NTLS/OTC 2/ 9 17.00 12.00 –29.41 13.00 8.33 Telecom-WirelessSvcs LehmanBrothersMorton's Restaurant Grp MRT/NSE 2/9 16.00 17.00 6.25 16.55 –2.65 Retail-Restaurants WachoviaSecurities
EXCO Resources Inc XCO/NSE 2/ 9 13.00 13.00 0.00 12.09 –7.00 Oil&Gas-USExpl&Prod MorganJPCrocs Inc CROX/OTC 2/ 8 20.00 21.00 5.00 24.33 15.86 Apparel-Shoes&RelMfg PiperJaffray&CoCardica Inc CRDC/OTC 2/ 3 14.00 10.00 –28.57 8.56 –14.40 Medical-Systems/Equip A.G.Edwards&SonsHealthSpring Inc HS/NSE 2/3 18.00 19.50 8.33 17.85 –8.46 Medical-HlthMaintOrg GoldmanSachs&Co
SMART Modular Tech Inc SMOD/OTC 2/3 12.00 9.00 –25.00 8.62 –4.22 Elec-SemiconductorMfg CitigroupEnergy Transfer Eqty LP ETE/NSE 2/ 3 21.00 21.00 0.00 23.12 10.10 Oil&Gas-Transprt/Pipelne UBS InvestmentBankDigital Music Group Inc DMGI/OTC 2/ 2 11.00 9.75 –11.36 9.30 –4.62 Leisure-Services I–BankersSecuritiesThomas Weisel Ptnrs Gp TWPG/OTC 2/2 15.00 15.00 0.00 20.70 38.00 Finance-InvestmentBkrs ThomasWeiselPrtnrs
Valera Pharmaceuticals VLRX/OTC 2/ 2 12.00 9.00 –25.00 11.39 26.56 Medical-Products UBS InvestmentBankIomai Corp IOMI/OTC 2/ 1 9.00 7.00 –22.22 6.32 –9.71 Medical-Biomed/Biotech UBS InvestmentBankS G X Pharmaceuticals SGXP/OTC 2/ 1 7.00 6.00 –14.29 7.34 22.33 Medical-Biomed/Biotech CIBCOppenheimerKoppers Holdings Inc KOP/NSE 2/1 16.00 14.00 –12.50 17.35 23.93 Chemicals-Specialty CrdtSuisseFrstBos
Ternium SA ADR TX/NSE 2/ 1 18.50 20.00 8.11 26.93 34.65 Steel-Producers CitigroupIncrediMail Ltd MAIL/OTC 1/31 8.00 7.50 –6.25 8.30 10.67 ComputerSftwr-Educ/Entr MaximGroupLLCH & E Equipment Svcs Inc HEES/OTC 1/31 17.00 18.00 5.88 27.00 50.00 CommlSvcs-Leasing CrdtSuisseFrstBosRegency Energy Ptnrs LP RGNC/OTC 1/31 21.00 20.00 –4.76 21.80 9.00 Oil&Gas-Transprt/Pipelne UBS InvestmentBank
FortuNet Inc FNET/OTC 1/31 13.00 9.00 –30.77 13.26 47.33 Leisure-Gaming/Equip WRHambrecht&CoCalumet Spclty Pdt Ptnrs CLMT/OTC 1/26 22.50 21.50 –4.44 25.50 18.60 Energy-Other GoldmanSachs&CoAltus Pharmaceuticals ALTU/OTC 1/26 16.00 15.00 –6.25 25.25 68.33 Medical-Biomed/Biotech Merrill LynchChipotle Mexican Grill A CMG/NSE 1/26 20.00 22.00 10.00 53.86 144.82 Retail-Restaurants MorganStanley
Traffic.com Inc TRFC/OTC 1/25 12.50 12.00 –4.00 9.76 –18.67 Media-Radio/Tv WRHambrecht&CoAmerican Railcar Inds ARII/OTC 1/20 18.00 21.00 16.67 33.46 59.33 Transportation-EquipMfg UBS InvestmentBankWestern Refining Inc WNR/NSE 1/19 17.00 17.00 0.00 17.50 2.94 Oil&Gas-Refining/Mktg Bancof AmericaSecuLinn Energy LLC LINE/OTC 1/13 21.00 21.00 0.00 20.62 –1.81 Oil&Gas-USExpl&Prod RBCCapitalMarkets
PixelPlus Co Ltd ADS PXPL/OTC 12/21 14.50 8.00 –44.83 10.69 33.62 Elec-SemiconductorMfg Jefferies&CoC R M Holdings CRMH/OTC 12/21 16.00 13.00 –18.75 12.49 –3.92 Insurance-Brokers SandlerO'Neill&PaDirected Electronics Inc DEIX/OTC 12/16 17.00 16.00 –5.88 15.45 –3.44 Household-ConsumerElec GoldmanSachs&CoSpansion Inc SPSN/OTC 12/16 14.00 12.00 –14.29 14.09 17.42 Elec-SemiconductorMfg Citigroup
Emergency Medical Svcs EMS/NSE 12/16 17.00 14.00 –17.65 12.50 –10.71 CommlSvcs-Security/Sfty Bancof AmericaSecuCopa Holdings SA CPA/NSE 12/15 17.00 20.00 17.65 22.00 10.00 Transportation-Airline MorganStanleySomaxon Pharmaceuticals SOMX/OTC 12/15 12.00 11.00 –8.33 16.65 51.36 Medical-EthicalDrugs MorganStanleyRepublic Property Trust RPB/NSE 12/15 16.00 12.00 –25.00 12.29 2.42 Finance-Reit LehmanBrothers
Suntech Power Hldgs ADS STP/NSE 12/14 13.00 15.00 15.38 35.06 133.73 Energy-Other CrdtSuisseFrstBosDealerTrack Holdings Inc TRAK/OTC 12/13 16.00 17.00 6.25 21.49 26.41 ComputerSftwr-Enterprse LehmanBrothersScopus Video Networks SCOP/OTC 12/13 9.00 7.00 –22.22 5.90 –15.71 Telecom-Equipment ThomasWeiselPrtnrsCapitalSouth Bancorp CAPB/OTC 12/13 20.00 18.75 –6.25 21.00 12.00 Banks-Southeast Sterne,Agee+Leach
Cynosure Inc CYNO/OTC 12/9 14.00 15.00 7.14 18.39 22.60 Medical-Systems/Equip CitigroupBasic Energy Services BAS/NSE 12/9 20.00 20.00 0.00 28.25 41.25 Oil&Gas-FieldServices GoldmanSachs&Co
Company Earnings ReportsIBD’s earnings reports feature stock symbols, industry groups, percent above or belowconsensus estimates, and EPS and Relative Strength Ratings. Earnings growth greaterthan 25%, a key characteristic of winning stocks, is boldfaced. The whole line is bold-faced when EPS growth is more than 25%, EPS Rating more than 85, and earnings arestronger than expected. Arrows indicate acceleration or deceleration in earnings orsales growth comparedwith theprior quarter.Data reportedmaybederived from6-, 9-or 12-month reports. All earnings represent the current quarter. Foreign companies arenot reported.Nonrecurring itemsmaybeexcluded fromearningsper share.Uniquecir-cumstancesaretaken intoaccount formanyindustrygroups.Salesmaynotapply forcer-tain industries.Realestate investment trustsmayreflectEPSor funds fromoperations.
Curr Prior Under Sales RelClosing Qtr Yr’s Qtr EPS /Over Sales % EPS Str
Company Name Symbol Industry Price Erns E.rns %Chg Est % (Mil) Chg Rtg Rtg
Exp. Strike LastDate Price Vol Price
p75 no tr 619 080 40 290
c80 490 380 585 6 346 810
StoneEn Close 42.13 Junc45 no tr 748 080 3 205
StPaulTrv Close 41.55 Julp40 no tr 787 050 112 120
c45 10 010 2.2k 020 77 095
SuncorEng Close 74.17 Junp75 2.1k 060 324 350 84 550
c75 3.2k 005 894 320 131 590
c80 14 005 570 150 63 4SunMicro Close 4.75 Julc4 732 075 82 080 190 095
c5 no tr 2.2k 015 926 035
p5 158 020 522 035 34 055
Sunoco Close 79.61 Mayp80 694 045 24 340 102 490
c80 1.2k 005 110 330 88 460
c85 no tr 611 135 57 280
SuntechPw Close 35.06 Junp35 157 010 885 190 no trSunTrust Close 76.44 Julc75 1.6k 145 2.0k 310 486 440
c80 no tr 10k 090 606 2c85 no tr no tr 504 070
SuperGn Close 5.26 Julp5 no tr 970 015 90 065
SwiftTrn Close 22.80 Julc2250 10 030 530 115 737 230
SwnEngy Close 31.91 Junc30 986 180 86 295 24 420
p30 22 005 1.7k 095 80 210
p3250 856 070 no tr 14 330
p35 79 305 1.2k 380 23 460
p40 18 820 1.0k 820 5 880
SwstAirl Close 17.60 Junc1750 2.5k 020 627 065 455 1p1750 70 005 822 045 no trSymntc Close 15.53 Julc15 377 040 649 080 167 155
c1750 no tr 780 010 1.0k 060
SyneronMd Close 29.78 Junp30 659 035 512 170 10 320
Sysco Close 31.54 Mayc3250 no tr 3 020 1.0k 050
TakeTwo Close 15.80 Junc1750 20 005 1.5k 033 no trTalismEn Close 53.36 Julc55 85 005 1.1k 2 23 470
Target Close 53.77 Julc55 14 005 832 080 3 255
TASER Close 10.00 Junc750 564 250 214 250 161 270
c10 4.4k 005 795 060 192 105
p10 801 005 266 060 43 120
c1250 no tr 854 010 1.2k 040
TD AmriT o Close 21.62 Mayc20 563 165 85 195 93 225
Teekay Close 37.42 Julp40 518 255 10 3 14 380
Tektronix Close 36.70 Julc35 821 1 385 2 72 3Telik Inc Close 19.88 Julp1750 no tr no tr 2.8k 145
p20 no tr 1.0k 1 187 235
TelMexL Close 22.63 Mayp2250 1.1k 005 26 060 no trc2250 2.0k 015 866 070 3 1TempurP Close 13.72 Junp15 821 140 800 165 no trTerdyn Close 14.96 Julp15 2 010 528 070 90 140
c15 34 005 842 075 no trTesoro Close 64.88 Mayc65 565 005 455 275 223 440
Teva Close 42.16 Junc40 1.5k 220 371 280 6 330
p40 5 005 1.0k 050 146 110
TexasInst Close 30.19 Julc30 7.8k 020 1.3k 135 146 235
p30 2.0k 005 4.9k 1 54 170
p3250 4.5k 235 2.5k 260 31 310
c3250 2 005 5.4k 040 187 125
p35 no tr 1.2k 490 19 510
TimeWarn Close 17.07 Julc17 8.7k 002 2.2k 045 319 085
p17 252 005 6.2k 030 168 060
c18 no tr 1.3k 010 418 045
TitanMetl Close 42.54 Junp40 195 005 508 150 86 330
p4250 2.0k 005 no tr 41 440
c4250 1.8k 030 no tr 40 520
c45 118 005 622 185 163 410
TiVo Close 6.59 Mayc750 no tr 1.3k 030 144 050
TollBr Close 34.95 Jun
c35 9.9k 005 1.6k 165 481 3p35 3.2k 010 1.3k 160 73 270
TomOnlin Close 22.24 Junc20 508 185 33 215 36 295
p2250 679 050 217 170 74 235
TOP Tank Close 17.44 Junc1750 115 005 598 080 1.0k 095
Transocn Close 80.09 Mayp75 2 005 1.3k 120 55 220
c80 6.3k 010 211 330 88 508
p80 4.0k 005 294 295 279 410
c85 1 005 531 140 1.0k 285
Tribune Close 29.36 Mayp30 778 055 314 1 5 120
c30 70 005 623 065 273 095
TridMicr Close 00.00 Julp25 no tr 961 080 no trc30 no tr 10 095 1.0k 240
TrueRelig Close 20.49 Julc1750 682 255 152 320 no trc20 899 030 597 170 19 330
TXU Cp Close 49.54 Julp50 248 055 1.6k 180 no trc50 178 005 2.7k 150 21 330
TycoIntl Close 26.83 Julc2750 60 001 570 037 327 105
p2750 58 070 264 105 665 151
UAL Cp Close 39.20 Junp35 no tr 679 080 10 155
UltraPetr Close 58.60 Junc40 6001910 no tr 61940
c55 2.2k 360 305 536 563 770
p55 no tr 1.7k 150 29 320
UndArmr Close 30.07 Julc30 885 005 245 160 18 370
Unisys Close 6.98 Julc750 no tr 10 015 810 050
p750 no tr no tr 850 090
Univision Close 34.09 Junp35 1.2k 085 36 140 no trc35 195 005 5.5k 065 1.0k 140
c40 no tr 15 010 10k 025
UPS B Close 78.14 Julc80 no tr 862 070 254 205
UrbnOut Close 23.80 Junp25 620 120 167 175 19 250
US Bancp Close 31.16 Junc3250 no tr 17 010 1.8k 035
USEC Close 11.89 Julc1250 1.0k 005 188 040 604 125
c15 no tr 40 005 660 050
USG Close 93.42 Mayc95 2.5k 010 132 340 2 590
c100 4 010 369 175 510 380
c110 no tr 570 060 no trUSSteel Close 58.93 Julc55 673 440 544 580 113 860
c60 584 005 1.7k 290 360 570
c65 20 005 1.2k 120 215 350
c75 no tr 1.2k 020 10 115
Utdhlth Close 56.69 Junc55 1.0k 180 439 291 190 4c60 39 005 599 051 387 156
UtdThrp Close 64.13 Mayp65 1.0k 175 1.0k 290 no trValeantPh Close 18.85 Junc1750 2.1k 130 505 285 39 340
p1750 1.9k 005 800 150 no trc20 7.5k 005 1.1k 177 158 223
c2250 471 005 1.0k 1 289 135
c25 no tr 645 050 no trValeroE Close 57.86 Junc4750 5281030 no tr 51190
c50 736 780 727 840 243 970
c5250 560 530 556 650 234 780
p5250 no tr 770 065 79 185
c55 2.6k 295 539 430 397 620
c5750 9.4k 040 1.0k 275 143 460
p5750 5.2k 005 922 220 35 360
c60 50 005 2.5k 158 727 340
c6250 4 005 1.2k 075 132 250
c65 2 005 612 040 288 175
ValueClck Close 16.42 Junp1750 1.2k 105 70 125 16 180
Verisign Close 23.22 Junc2250 917 080 2.8k 130 199 2p2250 6 005 5.8k 050 34 1VeritDGC Close 45.25 Mayc35 5501130 no tr no trc40 15 6 550 690 4 680
c45 2.1k 045 1.0k 280 5 350
VerizonCm Close 34.41 Julp3250 no tr 372 015 754 065
c3250 2.0k 195 383 205 57 245
c35 33 005 2.1k 030 254 095
p35 84 060 849 115 245 175
c3750 no tr 747 005 36 025
c40 no tr no tr 1.2k 010
VertxPh Close 40.56 Julp30 no tr no tr 1.2k 115
p35 no tr 49 045 606 245
p40 1.3k 005 317 185 765 460
c40 2.2k 030 623 250 467 560
c45 55 005 120 060 887 340
p50 3.0k 990 2.9k1010 211130
ViacomB Close 39.00 Junc40 no tr 613 055 no trVimpelC Close 42.90 Julp45 680 230 6 275 734 330
ViroPhrm Close 10.86 Mayp750 no tr no tr 621 035
p10 773 005 no tr 666 110
c10 322 065 no tr 1.0k 210
p1250 3.0k 155 7.7k 245 368 250
c1250 3.8k 005 7.0k 080 1.2k 105
c15 1.7k 005 12k 035 1.7k 060
p15 1.2k 410 2.5k 440 257 450
p1750 1.4k 660 2.3k 660 587 610
c1750 7 005 2.6k 020 3.3k 030
c20 66 005 1.0k 010 2.2k 015
p20 1.8k 910 164 920 130 890
c2250 57 005 766 010 461 010
Vodfne Close 22.51 Julc2250 827 005 222 085 12 140
WA Mutl Close 44.00 Julc4250 1.4k 150 276 205 5 280
c45 no tr 812 060 148 145
Wachovia Close 57.33 Julp5750 614 005 49 120 20 205
c5750 1.9k 015 1.3k 135 67 235
c60 no tr 192 035 839 115
Walgrn Close 45.32 Julc45 1.0k 035 237 130 28 255
WalMart Close 46.69 Junc4250 645 420 278 440 8 480
p45 no tr 473 020 929 065
c45 1.4k 170 2.9k 205 806 275
c4750 159 005 3.6k 045 3.6k 120
p4750 635 074 1.4k 110 562 160
c50 7 005 250 005 1.1k 035
WalterInd Close 63.46 Junc50 no tr no tr 6001480
c65 103 010 764 175 84 410
WDigit Close 19.42 Julp20 1.0k 060 2.0k 130 no trWeathInt Close 43.21 Mayc45 23 005 41 115 599 190
WellPoint Close 79.62 Junc75 1.0k 460 57 550 52 680
p75 no tr 1.1k 050 20 150
WellsFrgo Close 65.06 Julc65 704 015 1.2k 130 47 235
Wendy Close 65.26 Junp60 no tr 136 050 704 145
c60 26 5 142 620 1.2k 740
p65 29 025 1.3k 210 126 310
c65 1.3k 030 2.0k 270 181 410
c70 no tr 1.0k 090 300 180
c75 no tr 516 025 no trWetSeal Close 5.43 Junc5 707 035 10 060 74 090
Whirlp Close 86.25 Junp85 2.7k 005 640 295 30 470
c85 522 105 43 390 no trc90 no tr 508 140 34 340
c95 5 005 761 060 40 180
c100 no tr 1.6k 030 120 090
WhlFd Close 64.11 Mayc65 116 001 1.0k 160 133 285
WillmsCos Close 20.89 Mayc20 858 090 4.4k 140 277 180
c2250 no tr 5 025 799 060
c2750 no tr no tr 607 005
Winnbg Close 28.75 Julp30 370 120 529 175 no trWldFuel Close 35.49 Mayc35 536 040 338 165 20 225
WmsSon Close 42.46 Mayc4250 120 010 504 140 13 175
Worthgtn Close 20.34 Junp20 15 005 18 060 556 110
Wyeth Close 49.80 Julp50 182 005 531 095 6 2c50 305 005 986 1 64 220
WynnRes Close 71.73 Junc65 688 650 35 750 no trp70 602 005 10 260 no trc70 1.1k 135 187 410 30 630
c75 no tr 559 175 27 390
Xerox Close 15.24 Julc15 442 025 320 055 610 110
XM SatRad Close 20.74 Julp20 1.6k 005 1.3k 060 69 150
c20 2.4k 060 860 140 82 250
c2250 36 005 748 035 104 140
p2250 1.0k 182 878 207 72 3XTO Engy Close 42.88 Mayc45 16 005 759 085 589 149
Yahoo Close 30.07 Julp2750 no tr 1.3k 040 no trc2750 244 245 619 3 no trp30 4.8k 005 1.9k 130 201 210
c30 6.4k 005 4.0k 140 348 258
c3250 15 005 3.3k 055 318 155
p3250 1.2k 260 1.0k 295 226 350
c35 no tr 1.4k 020 1.3k 093
YRC Wwde Close 45.27 Julp50 no tr 1.1k 505 5 6
20 Most Active Index OptionsIndex Optn OptnPrice Price Chg. Vol
SPX500 Apr 1175 Put 1307.25 1.05 + 0.25 198077SPX500 Apr 1375 Call 1307.25 0.80 – 0.10 157437SPX500 Apr 1400 Call 1307.25 0.40 .. 133606SPX500 Apr 1195 Put 1307.25 1.00 .. 102161Nasd100 Apr 1850 Call 1685.66 0.80 + 0.05 61093Nasd100 Apr 1825 Call 1685.66 1.30 – 0.05 41512Nasd100 Apr 1560 Put 1685.66 3.20 – 0.50 29793Nasd100 Apr 1535 Put 1685.66 2.15 .. 29260SPX500 May 1200 Put 1307.25 2.80 + 0.30 15577SP100 Mar 590 Put 593.49 0.05 – 0.70 15415Nasd100 Apr 1575 Put 1685.66 4.10 – 0.60 14009SPX500 Apr 1150 Put 1307.25 0.70 + 0.15 13688SPX500 Apr 1310 Call 1307.25 17.00 .. 13399SP100 Mar 595 Call 593.49 0.05 – 0.75 12560Nasd100 Apr 1550 Put 1685.66 2.75 – 0.35 12206SPX500 Apr 1300 Call 1307.25 23.60 + 0.60 11797SPX500 Apr 1225 Put 1307.25 1.95 + 0.05 10875SP100 Eur Mar 595 Call 593.49 0.15 – 1.50 9470SP100 Mar 595 Put 593.49 1.70 – 1.40 9410SP100 Eur Apr 595 Put 593.49 7.20 + 0.20 8708
3Com 5.26cJan07 5 219 105
99 Cents 12.63cJan07 15 2.1k 110
AberFitch 57.40pJan08 60 500 1040
Agilent 37.92cJan07 40 264 320
Agnico 26.27cJan07 20 428 780
AK Steel 14.08cJan07 15 225 2
Allstate 54.82cJan07 50 1.0k 710
Alltel 66.56cJan07 70 215 360
Altria 73.55cJan07 75 258 610
Amazon 35.99pJan08 25 580 180
pJan08 40 500 720
AmbacFn 80.33pJan08 50 222 085
AMCC 3.92cJan07 5 322 050
AMD 33.95cJan07 40 310 4
AmExpr o 54.65pJan08 50 244 170
Amgen 73.25cJan08 75 1.5k 1150
AmIntGp 68.82cJan07 35 413 3460
cJan07 40 258 30cJan07 45 857 2450
pJan07 55 200 070
cJan07 70 611 490
pJan07 70 450 410
pJan07 80 586 1230
cJan08 80 238 450
cJan07 80 203 120
AmkorT 7.50cJan07 750 225 190
AMR 27.00cJan08 25 2.0k 850
cJan07 30 208 390
AmTower 31.16cJan08 25 250 940
Amylin 46.42cJan08 35 238 1730
cJan07 50 225 590
cJan07 60 1.1k 280
cJan08 60 293 630
Anheusr 43.32cJan08 45 223 430
cJan08 50 222 240
ApexSilv 22.92pJan07 20 652 255
ApldMatl 17.49cJan07 1750 260 215
pJan07 1750 215 165
cJan07 2250 214 050
AppleC 64.66pJan07 65 312 880
cJan07 65 393 11ArchDan 35.26
cJan07 35 251 420
pJan07 35 296 275
AvidTch 43.67cJan07 50 200 430
BankAm 46.90pJan07 4750 2.3k 255
cJan07 50 206 112
cJan07 55 1.0k 020
BauschL 68.87cJan08 90 1.0k 410
BellSth 34.40cJan07 30 353 550
Biomet 36.47
pJan07 35 400 235
Blockbstr 3.39pJan07 250 1.5k 045
cJan07 5 1.9k 040
Boeing 77.85pJan07 60 269 085
BostSci 22.62pJan08 2250 299 285
cJan08 2250 792 480
cJan07 25 5.1k 205
BoydGam 46.75cJan07 50 420 490
BP PLC 69.53pJan07 55 200 088
BrcdeCm 6.09cJan08 5 4.4k 215
cJan07 5 1.2k 160
pJan07 5 215 035
cJan08 750 2.6k 1cJan07 750 1.9k 050
cJan07 10 719 016
BrMySq 22.92pJan07 1750 3.1k 030
CapOne 81.90pJan07 95 547 1350
CareerEd 35.71pJan07 25 525 105
Carnival 50.97cJan07 50 475 480
cJan08 50 425 7Caterpillr 76.23pJan08 60 1.0k 330
cJan08 90 252 720
CBRL Grp 47.00cJan07 45 572 5cJan08 50 209 410
Celgene 42.04pJan07 40 255 480
cJan07 40 325 840
cJan07 45 218 570
Cendant 17.17cJan08 2250 362 080
ChespEng 31.50cJan07 35 511 320
Chevron 57.18pJan08 40 400 1
ChkPoint 21.54cJan07 2250 200 215
CienaCp 5.11cJan07 5 741 105
cJan07 750 257 045
pJan07 60 1.6k 5490
Cisco 21.62cJan08 20 274 460
cJan07 20 441 320
pJan07 20 2.6k 090
cJan07 2250 1.6k 175
cJan07 25 346 085
cJan08 25 487 207
cJan07 30 300 020
Citigrp 47.41cJan08 35 205 1320
cJan07 50 1.6k 178
cJan07 55 270 045
CitzCom 13.55cJan07 15 918 030
CmcBNJ 35.90pJan07 25 394 050
CntwdFn 36.53pJan07 2750 215 085
CoeurM 5.72cJan07 750 217 075
Comcast 26.90pJan07 2250 430 065
Comcast sp 26.93cJan08 35 1.3k 145
Comerica 57.75cJan07 60 334 285
CompAsc 27.66pJan07 25 276 095
ConAgra 19.64cJan07 2750 721 010
ConocPhil 61.36cJan07 70 367 310
ContlAir 26.55cJan08 1250 300 1590
pJan07 1250 205 085
Corning 26.87cJan07 25 256 5cJan07 30 263 273
cJan07 40 202 065
CredSys 7.44cJan08 10 251 120
CypSem 17.52pJan07 1750 217 225
cJan07 1750 224 290
Dell Inc 29.08pJan07 2750 526 160
cJan07 30 380 280
Disney 28.64cJan08 20 250 1040
DJIA Dia o 112.70cJan07 12375 523
180
DJIA Diam 112.70pJan07 100 1.0k 135
pJan08 104 360 410
pJan08 105 875 430
DukeEgy 29.44cJan08 35 230 105
Dynegy 4.97cJan07 5 331 080
eBay 38.22pJan07 20 200 025
cJan07 40 532 440
pJan07 40 277 480
pJan07 4250 201 630
EKodak 29.73pJan08 15 250 070
pJan08 25 885 225
cJan08 30 1.6k 480
cJan07 35 2.4k 150
Elan 15.01cJan07 5 263 1040
cJan07 1250 291 5cJan07 1750 230 285
cJan07 35 380 045
cJan08 40 485 125
ElPaso 12.32cJan07 1250 310 165
eResrch 14.95cJan08 20 481 275
ETrade 26.33cJan07 30 249 190
EvrgrSlr 15.35cJan07 15 238 390
Exxon 61.05cJan08 50 802 1530
cJan08 55 905 12pJan07 60 6.5k 370
cJan07 60 7.2k 620
pJan08 65 1.2k 790
cJan07 70 242 210
FordM 7.81cJan07 10 3.3k 045
cJan07 1250 535 020
FPL Gp 40.62pJan07 40 2.5k 225
FstData 47.37cJan07 55 483 145
Gateway 2.42cJan07 250 352 050
GenCorp 20.04cJan07 20 250 190
GenElec 34.51cJan07 25 623 1010
pJan08 35 308 3cJan07 35 702 215
cJan08 35 216 380
cJan07 3750 1.3k 105
cJan07 40 740 050
cJan08 40 290 175
cJan08 45 212 075
Genentch 88.14
cJan07 90 260 1040
cJan07 100 488 640
GenMotr 21.13pJan07 10 6.4k 120
pJan07 15 509 250
pJan07 1750 214 340
pJan07 20 3.9k 450
pJan07 2250 241 570
cJan07 25 379 275
cJan07 30 2.5k 120
GenMotrs 21.13pJan08 10 361 290
pJan08 1250 7.1k 390
pJan08 20 3.7k 7cJan08 25 505 480
pJan08 25 200 950
GileadSci 63.31cJan07 75 267 5cJan07 80 899 380
GoldWFn 72.12pJan07 65 319 3
GreyWolf 6.90cJan08 10 252 075
GtechHld 33.80pJan07 25 400 020
HarleyDav 48.90cJan07 50 278 480
HCA 46.01pJan07 40 1.4k 125
Headwatrs 39.22pJan07 25 1.2k 070
pJan07 30 236 160
pJan07 35 337 290
HomeDp 42.90pJan08 45 1.0k 520
cJan07 45 400 310
cJan08 60 232 130
HuntJB 22.62cJan07 30 213 070
IAC Inter 30.69cJan08 15 283 1710
Intel 19.54cJan08 15 907 6cJan07 1750 708 330
pJan08 1750 1.2k 155
pJan07 1750 483 080
cJan08 1750 202 440
pJan07 20 590 195
cJan07 20 2.4k 190
cJan08 20 686 320
pJan07 2250 627 360
cJan07 2250 1.4k 104
cJan08 2250 199 220
cJan07 25 4.1k 054
pJan07 25 645 560
cJan08 25 939 155
cJan07 2750 1.6k 025
cJan07 30 327 015
cJan08 30 253 070
cJan07 3250 208 010
cJan08 3250 413 045
InterOil 14.23cJan07 25 213 085
IntlPapr 35.21pJan07 30 600 080
iShJapan 13.98cJan07 15 246 080
iShRs2000 74.07pJan07 53 206 045
pJan07 54 780 050
pJan07 5550 500 060
pJan07 72 1.1k 370
pJan07 73 200 450
pJan08 80 260 930
cJan07 84 600 170
JDS Uniph 4.05cJan07 250 442 170
cJan08 250 212 2pJan07 250 381 015
cJan07 5 1.7k 050
pJan07 5 341 135
cJan08 5 755 095
cJan07 750 301 020
JnprNtw 19.45pJan08 20 980 3
JohnJns 60.34pJan07 50 563 060
pJan07 60 1.5k 280
cJan07 60 1.0k 450
KLA Tnc 49.10cJan07 50 229 520
pJan07 50 247 530
Kohls 52.99cJan07 50 437 8
KrspKrm 8.63pJan07 5 973 055
cJan07 750 457 205
pJan07 750 385 145
cJan07 10 579 110
Kulicke 8.81cJan07 10 227 135
LearCp 16.23pJan07 5 2.4k 060
cJan07 15 1.5k 430
pJan07 20 366 630
cJan07 20 350 235
LeggMas 126.94pJan07 130 250 1250
LennarA 60.01pJan07 55 500 460
pJan07 60 311 660
cJan07 60 244 860
LexarMda 9.39cJan08 750 441 3cJan07 750 406 235
cJan07 10 241 105
LibtyMA 7.99pJan07 750 5.2k 025
LillyEli 57.09pJan07 55 204 260
cJan07 60 223 310
LionsGt 9.71cJan07 10 198 140
Lowes 68.63cJan08 80 201 620
Lucent 2.90cJan07 250 220 065
cJan07 5 277 005
cJan08 5 1.8k 020
MarInt 69.25pJan07 65 700 330
pJan07 70 222 510
Masco 32.24cJan07 35 218 155
McAfee 25.83pJan07 20 10k 105
McDnlds 35.10pJan07 3250 1.7k 175
cJan07 35 1.5k 340
cJan08 40 500 320
Medtrnic 52.66pJan07 50 1.3k 190
cJan07 60 238 152
Merck 35.64pJan07 35 245 245
cJan07 35 258 350
Microsft 27.50cJan07 12 357 1570
cJan07 2250 468 6cJan07 2750 1.3k 205
pJan07 27 437 115
pJan08 2750 286 210
cJan07 27 1.0k 235
cJan08 30 2.1k 230
cJan07 30 8.8k 085
pJan08 30 6.9k 330
cJan07 32 233 035
pJan07 3250 238 5Moodys 69.85
cJan07 75 250 430
Morgan 41.40pJan07 30 204 025
MorgStan 60.26cJan07 55 1.0k 840
pJan07 55 1.0k 216
Motorola 22.25pJan07 1750 3.0k 050
cJan07 20 3.0k 410
Nasd100 o 41.45cJan07 5263 200 015
Nasd100Tr 41.45cJan08 25 435 1840
pJan07 33 200 035
cJan07 34 599 9pJan07 38 217 105
pJan07 39 6.8k 130
pJan07 40 10k 155
cJan07 43 7.5k 250
pJan08 45 1.0k 470
cJan08 46 250 350
cJan08 48 1.0k 265
cJan08 49 1.0k 230
cJan08 55 344 085
Netease 90.00cJan07 100 329 1040
NewmntM 49.86pJan08 45 850 5
Nokia 20.54cJan07 20 1.4k 215
NortelNet 2.93cJan07 250 1.5k 080
Novellus 24.58pJan07 20 483 090
NRG Egy 46.22pJan08 25 450 080
pJan08 35 1.5k 235
NthfldLb 9.94pJan07 10 200 350
cJan07 25 450 060
Nvidia 48.77pJan07 100 1.2k 035
OilSvHT 141.18cJan08 145 400 2770
pJan07 155 650 2240
OmniVisn 26.46cJan07 25 209 550
Oracle 13.60cJan07 10 320 410
cJan07 1250 599 210
cJan07 15 1.3k 075
cJan08 15 436 175
OSI Phrm 31.98cJan07 75 398 010
PeabdyEn 47.27pJan08 40 650 570
Pfizer 26.39pJan07 20 680 035
cJan07 2250 281 470
pJan07 25 220 130
cJan07 2750 1.0k 160
cJan07 30 526 075
PhelpDod 75.57pJan07 60 482 370
cJan07 70 505 1410
cJan07 100 550 350
Powrwav 14.62cJan07 15 206 230
ProctGam 59.10cJan08 60 1.7k 650
pJan08 60 1.5k 470
Qualcom 50.77cJan08 35 272 1970
cJan07 50 227 660
cJan07 55 241 420
QuantaSv 15.16pJan08 750 6.0k 035
cJan08 15 4.9k 340
QwestCm 6.94pJan07 5 769 020
cJan07 750 254 080
Rambus 33.53pJan07 25 749 370
cJan07 40 651 7cJan07 50 447 470
cJan07 70 683 235
RedHat 29.31
cJan08 25 1.4k 9SanDisk 55.00
cJan08 130 451 370
Sanmina 4.08cJan07 250 5.0k 185
cJan07 5 5.0k 045
cJan08 5 199 075
SchergPl 18.48cJan07 25 200 020
SeagateT 24.73cJan07 30 1.0k 215
SearsHld 134.90pJan07 105 280 380
cJan07 120 535 2710
cJan08 140 5.0k 2540
cJan07 150 537 1170
cJan07 170 285 570
cJan08 180 10k 1140
cJan07 180 322 410
SemiHTr 35.55pJan07 35 285 235
cJan07 35 257 410
cJan07 40 208 180
cJan07 45 250 070
SimonProp 88.46pJan07 75 258 205
SiriusS 4.89pJan07 250 11k 015
cJan07 250 1.0k 260
cJan07 5 5.4k 1pJan07 5 2.9k 095
cJan07 750 6.9k 035
cJan07 10 389 015
SiriusSat 4.89cJan08 5 555 140
pJan08 5 601 120
cJan08 750 418 080
SixFlags 10.41pJan08 750 1.9k 1
SkywksSol 5.90cJan07 5 420 170
SPDR 130.62pDec07 105 1.4k 170
SprntFON 25.62cJan08 25 287 5cJan07 25 327 330
cJan07 30 2.2k 130
StaarSur 9.10cJan08 1250 300 320
Starbcks 36.61cJan07 40 661 260
StarwdHot 67.02pJan07 60 500 240
cJan07 75 260 285
StationCas 76.96pJan07 60 220 170
StPaulTrav 41.55pJan07 45 485 440
Suncor 74.17cJan07 105 247 310
SunMicro 4.75cJan07 5 239 070
SunTrst 76.50cJan07 80 287 285
SwstAirl 17.60pJan07 1750 382 130
cJan07 20 676 090
Symantec 15.53cJan07 1750 345 145
Target 53.77cJan07 45 245 1160
pJan08 50 405 450
TASER 10.00pJan07 10 266 225
cJan07 1250 482 120
TevaPh 42.16pJan07 40 1.0k 255
Tiffany 39.15pJan07 30 400 075
TimeWarn 17.07pJan07 1250 330 015
cJan07 1750 1.1k 135
TollBros 34.99
cJan07 40 270 340
cJan07 45 673 210
cJan07 4750 500 155
cJan07 55 431 065
Transocn 80.09pJan07 60 2.0k 230
pJan07 65 2.0k 340
TXU Cp 49.54cJan07 60 250 160
TycoIntl 26.83pJan07 25 1.4k 110
cJan07 25 533 350
UltraPet 58.60cJan07 70 216 710
cJan08 90 252 850
UPS 78.14pJan07 70 2.0k 180
cJan07 85 284 240
USG 93.42pJan08 40 750 2
UST 40.64pJan07 35 8.0k 140
UtdhlthGp 56.69cJan07 70 656 170
UTStarcm 5.86pJan08 750 220 265
UTStrcm 5.86cJan07 750 233 070
ValeroEn 57.86cJan07 60 337 774
Verizon 34.41pJan07 35 1.6k 265
cJan07 40 225 045
ViroPhrm 10.86pJan08 750 407 180
pJan07 750 1.2k 110
cJan08 750 211 560
pJan07 10 416 230
cJan08 10 551 440
cJan07 10 224 350
cJan07 1250 237 250
pJan07 1250 547 4pJan08 1250 514 450
cJan07 15 1.6k 185
pJan07 15 201 560
cJan07 1750 640 145
pJan07 20 200 730
cJan07 20 396 145
cJan08 20 544 230
cJan07 2250 219 095
cJan07 25 370 075
cJan08 25 297 155
Visteon 4.47pJan07 5 540 155
Vodafone 22.51cJan07 25 577 115
pJan07 25 1.3k 350
WalMart 46.69pJan07 45 1.3k 180
cJan07 4750 884 330
pJan07 4750 697 280
cJan07 50 1.3k 210
cJan07 5250 696 130
WillmsCos 20.89pJan08 15 547 110
Wyeth 49.80pJan08 50 1.0k 460
cJan08 50 1.0k 720
Xerox 15.24cJan07 15 1.0k 185
XM Sat 20.74cJan07 25 207 195
cJan07 35 343 040
XTO Egy 42.88cJan07 35 382 1060
Yahoo 30.07cJan07 30 555 410
cJan07 35 375 220
cJan07 40 232 110
CALL VOL 160,241CALL INT 27,395,162PUT VOL 107,204PUT INT 22,056,019
Global Traffic Network GNET/OTC 3,400 5.60– 6.50 77.3 Media-Radio/Tv n.a./ 49 Feltl and Co.New York, NY . Australian broadcaster of customized traffic and news reports through 99 radio/12 TV stations in Australia and Canada.
Nextest Systems Corp NEXT/OTC 5,400 14.00– 16.00 270.2 Elec-Semiconductor Equip n.a./ 53 Merrill Lynch.San Jose, CA . Manufactures automated test equipment used during the fabrication of non–volatile memory devices.
Tim Hortons Inc THI/NSE 29,000 18.00– 20.00 3866.1 Retail-Restaurants 17/ 33 Goldman Sachs & Co.Oakville, ON L6K. Franchises and operates 2,597 quick service coffee and bakery restaurants in Canada and 288 in the U.S.
Clayton Holdings Inc CLAY/OTC 6,250 15.00– 17.00 308.4 Financial Services-Misc n.a./ 34 Blair William & Co.Shelton, CT . Provides outsourced services, mortgage–related analytics and consulting to investors in mortgage loans/other securities.
IPOFilings Soon To Be Priced
Symbol/ Shares Estimated Mkt Value P/E Ratios:Company Exchange (000) Price ($Mil) Industry Group Co / Grp Lead Underwriter
Prices Of Recent IPOsHigh % Chg % Chg
Symbol/ Offer Filing Offer From Current FromCompany Exchange Date Price Price Filing Price Offer Industry Group Lead Underwriter
20 Ups
Amer Real Estate Ptr ACP Leisure-Gaming/Equip 44.75 1.01 vs –0.36 +381 .. 554 +204` 18 88Anteon Intl ANT Computer-Tech Services 54.80 r0.52 vs 0.45 +15.6a –5.5 393 +12a 95 73Arena Resources ARD Oil&Gas-U S Expl Pro 28.91 r0.22 vs 0.09 +144a –15 9.4 +215` 76 93Basic Energy Srvcs BAS Oil&Gas-Field Servic 28.25 r0.46 vs 0.09 +411` +31 135 +58` 84 84Cadiz Inc CDZI Agricultural Operations 16.99 –0.46 vs –1.04 .. .. 1.1 +999` 14 21Capital Properties CPI Real Estate Operations 31.25 0.09 vs –0.01 +1000` .. 1.3 0.0 71 84Compx Intl Cl A CIX Hsehold/Office Furniture 16.02 0.16 vs 0.09 +77.8 .. 46.7 +0.2a 13 28Darling International DAR Agricultural Operations 4.51 0.03 vs 0.01 +200 .. 76.9 +7.8 69 79Internet Commrce A ICCA Internet-Network Sltns 4.34 r0.01 vs –0.02 +150a .. 5.0 +44` 76 97Natl Hm Hlth Care NHHC Medical-Outpnt/Hm Care 10.93 0.16 vs 0.14 +14.3 .. 25.7 +6.0a 18 25
New England Rlty NEN Real Estate Operations 75.75 3.28 vs 2.42 +35.5a .. 8.0 +2.2a 75 19Parallel Pete PLLL Oil&Gas-U S Expl Pro 17.72 0.30 vs –0.05 +700` +58 25.1 +106a 71 93Pioneer Companies PONR Chemicals-Basic 32.75 1.12 vs 0.41 +173a .. 131 +14a 76 84Pride International PDE Oil&Gas-Drilling 29.96 0.23 vs 0.08 +188a –21 551 +23a 33 51R F Industries Ltd RFIL Telecom-Wireless Equip 5.93 0.07 vs 0.05 +40.0 .. 3.4 +18` 13 52SCM Microsys SCMM Computer Sftwr-Security 3.49 –0.11 vs –0.28 .. .. 14.4 +7.5a 39 67Valhi Inc VHI Chemicals-Specialty 17.58 r0.13 vs –0.28 +146a .. 350 +5.3` 76 19Value Line Inc VALU Finance-Investment Mgmt 33.51 0.67 vs 0.46 +45.6 .. 21.6 +2.5` 30 11Vector Group VGR Tobacco 19.14 r0.23 vs 0.19 +21.1` .. 136 +6.4` 55 44World Fuel Services INT Oil&Gas-Field Servic 35.49 0.52 vs 0.51 +2.0a +16 2534 +42a 95 68
24 Downs
A B X Air Inc ABXA Transport-Air Freight 6.89 0.16 vs 0.31 –48.4 –41 397 +9.8a 53 12Adventrx Pharma ANX Medical-Biomed/Biotech 4.25 –0.05 vs –0.04 .. .. .... .. 4 96Artesian Res ARTNA Utility-Water Supply 29.71 0.29 vs 0.31 –6.5 –3.3 11.5 +13a 51 36Atlantis Plastics ATPL Chemicals-Plastics 9.35 0.32 vs 0.33 –3.0 .. 116 +27` 50 66Bay View Capital Crp BVC Finance-Consumer/Cml Lns 17.44 –0.90 vs –0.18 .. .. .... .. 13 46BKF Capital Grp BKF Finance-Investment Mgmt 12.70 –0.90 vs 0.23 .. .. 21.7 –47 19 1Bowne & Co BNE Comml Svcs-Printing 15.98r–0.33 vs 0.55 .. .. 163 +5.8a 25 55Epicept Corp EPCT Medical-Biomed/Biotech 3.91r–0.20 vs –0.20 .. .. –0.3 .. 29 1Fed Agric Mtg A AGMA Finance-Mrtg&Rel Svc 18.99 0.57 vs 0.82 –30.5 .. 58.9 +25` 81 44Friendly Ice Cream FRN Retail-Restaurants 9.80r–0.99 vs –0.11 .. .. 124 –12 40 60
Hanover Cptl Mtg Hld HCM Finance-Reit 5.10 0.01 vs 0.33 –97.0 .. 7.9 –7.8 6 2Kronos Worldwide KRO Chemicals-Specialty 29.75 0.18 vs 0.21 –14.3 .. 301 +6.2` 16 17Loud Technologies LTEC Elec-Misc Products 13.00 0.35 vs 0.67 –47.8 .. 56.1 +56a 36 31NB&T Financial NBTF Banks-Midwest 21.10 0.30 vs 0.34 –11.8 .. 10.6 +3.6` 19 19Optical Cable OCCF Telecom-Fiber Optics 5.25 –0.04 vs 0.04 .. .. 9.9 –11 54 21Pokertek Inc PTEK Leisure-Gaming/Equip 12.00 –0.14 vs –0.07 .. .. 0.3 .. 3 86Polyair Inter Pack IncPPK Containers 3.55 –0.30 vs –0.14 .. .. 29.4 –0.2 8 3Price Comm PR Telecom-Wireless Svcs 17.69 0.02 vs 0.11 –81.8 .. 8.5 +1.9` 26 51Telkonet Inc TKO Telecom-Equipment 3.38 –0.11 vs –0.06 .. .. 1.1 +448a 4 4Town & Country Tr TCT Finance-Reit 40.48 –0.15 vs 0.19 .. .. 34.0 +5.2a 61 88
Transmeridian Expl TMY Oil&Gas-Intl Expl Pr 4.98 –0.17 vs –0.01 .. .. 1.4 +62a 4 93Tri Valley Corp TIV Oil&Gas-U S Expl Pro 8.01 –0.23 vs –0.01 .. .. 3.7 +111a 25 7UFP Tech Inc UFPT Containers 3.45 0.08 vs 0.08 0.0 +100 23.2 +27` 20 51Vermont Pure Hldgs VPS Beverages-Soft Drinks 2.04 0.01 vs 0.01 0.0 .. 14.6 +4.7a 24 49
Jan. 1998 – Dec. 2005
S&P 50028.6%
CAN SLIM™
InvestmentWorkshop
Series
. . . . . . . . . . . . . .
It pays
to have a
strategy.
. . . . . . . . . . . . . .
Master the CAN SLIMsystem at a workshop
near you. Visit:
IBDevents.comor call
1-800-583-5975Mon-Fri 5:30am-4:30pm & Sat 7:00am-12:00pm (PT)
American Association of Individual Investors
. . . . . . . . . . . . . .
IBD’sCAN SLIM™
860.3%

INVESTOR'S BUSINESS DAILY MONDAY, MARCH 20, 2006 B 19
B Y K E N H O O V E RINVESTOR'S BUSINESS DAILY
Your mother always told you, “If atfirst you don’t succeed, try, tryagain.” That’s as good advice in thestock market as any other field ofhumanendeavor.Take Gol Linhaus Aereas Intelle-gentes,whichtranslatesasGolIntel-ligent Airlines. You gotta love thatname. The smart managers at thisBrazilianairlinephotocopiedSouth-west Airlines’ business plan for alow-cost, low-fare airline and ap-pliedit toLatinAmerica. Itwasafor-mula for success. The companywasgrowing rapidly when it came pub-lic on the New York Stock Ex-changeJune24,2004.The first sign the stock would be ahit was its first-day performance:Pricedat9, it hit 19.15 before closingat 18.22. Then it moved into themid-30s, where it paused to build a15-week cup-with-handle base. Itbroke out of that baseMay 31, 2005,andfailedthenextday�. Itwasdis-couraging to take a loss on such apromising investment.But first, youhave topreserveyourcapital.Justdon’t giveup.Thestockmightset up again. That occurred in thefall of 2005 soon after a follow-through day in the market signaledanewrally.
Building A RecordBy that time, Gol had a great earn-ings history. In the previous fourquarters, earnings grew 165%, 19%,29% and 66%. Sales were up 63%,48%, 92% and 73%. The five-yeargrowth rate was 192%. The Earn-ings Per Share Rating was 97. TheRelative Strength Rating was 89.The Accumulation/DistributionRating was B-. The 50-day ratio ofup-to-down volume was 1.0. TheIBDCompositeRatingwas98.Mutual funds owned 8% of thefloat.Thereturnonequitywas28%.Gol set up this time in a 10-weekcup-with-handle base that correct-ed 22%. One of the best features ofthe base was that when the stockdropped to its lowpoint, itmanagedto recover most of its loss in thesameday�.That’sasignthatbig in-vestors are supporting the stock atthatprice.Gol broke outNov. 1, 2005, on vol-umethatwas84%aboveaverage�.The breakout was a response to agoodearningsreport.Thestockwasup 22% in the first two weeks, ashow of strength that indicates thepossibilityofabigwinner.Several analyst upgrades along theway boosted the stock. But then thestock got three analyst downgradesin 11 days. Each analyst thought the
company was overvalued, but stillloved it �. This has become com-mon when stocks hit new highs.Theeffect is usually temporary, as itwas in thiscase.It shouldhavebeenencouragingtothe shareholder that on the last twodowngrades, the stockwas knockeddown, butmanaged to nearly recov-erbeforethedaywasover.That indi-cates some big investors saw theweaknessasachancetobuy.
Weak SignThe stock found support at its10-week moving average line, thenmovedtonewhighs.But therewasared flag: Just as the stock hit an all-timehigh, thevolumewasweak�.Three weeks later, the stockplunged through its 10-week lineonthe heaviest volume since the weekof its IPO�. This was dishearten-ing to the investor who believed hehad a huge winner. The Accumula-tion/Distribution Rating fell fromA-toDinamatterofdays.Emerging markets around theworldwere taking ahit, possiblybe-cause of rising U.S. interest rates.But the reason doesn’t matter. Thedropwasa sell signal, and the inves-tormustact.Aseeminglygoodearn-ings report March 10 couldn’t savethestock fromfurtherdecline.Investors will have to wait for Golto tryagain.
B Y J O N A H K E R IINVESTOR'S BUSINESS DAILY
IBD’sCANSLIMinvestingmethodshows that investors should buystocksonbreakoutstomaximizepo-tentialgainsandminimize risk.Not all breakouts should promptyou to buy shares, though. Manybreakouts come with major flaws,making them more likely to fail.Those failed breakouts can some-times turn intobig losses.Toknowwhatmakesa faultybrea-kout, let’s establish how to spot asound one. You want to see a stockform a smooth base, usually lastingseven weeks or more. When a han-dle forms, it should do so in theupperhalf of the base, 5% to 15%offthe stock’s 52-week high. The han-dleshouldedge lower in light trade.The buy point then becomes 10cents above the high of the handlein a cup with handle, or 10 centsabove the middle peak of a double-bottombase.When a stock breaks out, itshouldn’t hesitate. The best break-outs zoom past the buy point. Vol-ume should swell to at least 50%aboveits50-dayaveragelevel. Ideal-
ly you’ll see volume climb to 100%or more above average, especiallyfor smaller-cap stocks. The bullishaction seen on a daily chart shouldbeduplicatedonaweeklychart.A faulty breakout lacks thatstrength. The stock’s price or vol-ume action might be wimpy. Thebreakout could come from toodeepwithin the base. The base itselfcouldbetooshortor lackstrongvol-ume in its right side. The stock’sweekly action could fail to confirmthe apparent strength seen on adailychart.Natural gas exploration and pro-duction firm Southwestern Ener-gySWN had staged a huge run-upcomplete with multiple bases andbreakoutsby the time it setupagainlate last year�. Late-stage break-outs are more likely to fail. That’sdoubly truewhen a stock shows er-raticpriceactionandboutsofdistri-bution,asSouthwesterndid�.The knockout blow came as thestock forged the right side of itsbase, then its breakout. Note howvolumewent limpduring that time,a bearish sign�. Threeweeks laterthe stock plunged 15%, wiping outthebreakout inahurry�.
IBD’S 20 RULES FOR INVESTMENT SUCCESS
1 Consider buying stocks with eachof the last three years’ earnings
up 25%+, return on equity of 17%+and recent earnings and salesaccelerating.
2 Recent quarterly earnings andsales should be up 25% or more.
3 Avoid cheap stocks.Buy stocksselling for $15 to $100 ormore.
4 Learn how to use charts to seesound bases and exact buy
points. Confine buys to these pointsas stocks break out on big volumeincreases.
5 Cut every loss when it’s 8%below your cost.Make no
exceptions so you’ll avoid anypossible huge, damaging losses.Never average down in price.
6 Follow selling rules on when tosell and take profit on theway
up. Review “When to Sell and Takea Profit” in “How toMakeMoney inStocks.”
7 Buy when market indexes are inan uptrend.Reduce investments
and raise cashwhen generalmarketindexes show five days of increasedvolume distribution.
8 Read IBD’s Investor’s Corner andBig Picture columns to learn
how to recognize important topsand bottoms inmarket indexes.
9 Buy stocks with a CompositeRating of 90 or more and a
Relative Price Strength Rating of 85or higher in the IBD SmartSelectCorporate Ratings.
10 Pick companies with manage-ment ownership of stock.
11 Buy mostly in the top six broadindustry sectors in IBD’sNew
Highs List.
12 Select stocks with increasinginstitutional sponsorship in
recent quarters.
13 Current quarterly after-taxprofit margins shouldbe
improving,near theirpeakandamong thebest in the stock’s industry.
14 Don’t buy because of divi-dends or P-E ratios.Read a
story on the company. Buy theNo. 1company in an industry in earningsand sales growth, ROE, profitmargins and product quality.
15 Pick companies with a superiornew product or service.
16 Invest mainly in entrepreneur-ial New America companies.
Pay close attention to thosewith anIPO in the past eight years.
17 Check into companies buyingback 5% to 10% of their stock
and thosewith newmanagement(what is management’sbackground?).
18 Don’t try to bottom guess orbuy on the way down.Never
arguewith themarket. Forget yourpride and ego.
19 Find out if the market current-ly favors big-cap or small-cap
stocks.
20 Do a post-analysis of all yourbuys and sells.Post on charts
where you bought and sold.Evaluate and develop rules tocorrect yourmajormistakes. It’swhat you learn after you think youknowwhat you’re doing that’s vital.That’s how to improve your results.
I N V E S T O R ’ S C O R N E R
INVESTOR EDUCATIONThese rules aren’t based on our personal opinion or those of WallStreet’s experts. IBD built detailed models of all the most successfulstocks every year from 1880 to 2005.We analyzed their common charac-teristics, what factors existed before these very best companies hadhuge advances and how these factors changed when the stocks topped.So these rules represent how themarket actually works.
Gol Intelligently FlewTo Profit On WingsOf Budget Air FaresThe Brazilian airline mimicsSouthwest, rapidly growsin Latin American market
Gol Intelligent Airlines
The base
Subhead
Daily high, low, close
The top
Daily high, low, close
52
03
53
04
1182410361291522842rebmevoNrebotcOrebmetpeStsuguAy ’05luJ
000,02
000,062emuloV
01
51
02
52
03
53
01420172310361281412raMbeFn ’06aJceDvoNOct ’05
000,062000,006emuloV
RS94D-
RS94D-
RS
The run-up
Weekly high, low, close
5.4
6
801215191
2643
6’0 raM ceD peS nuJ5’0raM ceD peS4’0
nuJ
000,002
000,006,1
emuloV
2/1split
2/1split
Ways to Make Money In Stocks...
Take a free trial or subscribe at investors.com/IBDstore or call 800-831-2525.
eIBD™
Daily Digital Edition1 Investor’s Business Daily®
Daily Print EditionIBD™ Monday SpecialWeekly Print Edition
Each includes FREE access to IBD™ Investing Tools on investors.com!
2 3
Perfect for Busy InvestorsStay on top of the market with just one issue a week.
Everything You Need. Every day.Get daily ratings and analysis delivered right to your doorstep.
Anytime, Anywhere AccessGet eIBD online the night before the paper comes out.
Beware Of Faulty Breakouts, Especially After Stocks’ Long Run-Ups
Daily Graphs available atinvestors.com/DGO/IC
Sep’03 Dec Mar ’04 Jun Sep Dec Mar ’05 Jun Sep Dec Mar ’06
Southwestern Energy CoSWN Oil&Gas-U.S. Expl&prod31.90 +2.57
RS83E
2,600,000
6,000,00013,600,000
2.2
2.63.0
3.8
4.5
6789
10
13
15171922
2630343845
5
Volume
W I N N I N G W A Y S
If all 20 fact-based rules are carefully followed (not just the ones youlike), your investment results can materially improve:

B20 MONDAY, MARCH 20, 2006 INVESTORS.COM
They Make Their Living By NOT Letting Anyone Else “In” On This Exclusive Information!It’s part of the reason why the seats on the C.B.O.E.sell for $500,000 EACH! And it’s also why the priceis $1.7 million per seat on the Chicago Board ofTrade!
And here’s what will NEVER CHANGE: A select,powerful few will alwaysprofit from “sure-fire”stock moves—known inadvance. Their accountbalances always keepgrowing because they’reprivy to this inside infor-mation.
It’s like the old saying…
“Wall Street speaks a different language to themasses because it cannotafford to alienate its power-ful backers.”
And they don’t want youto find out . . . But nowthey can’t prevent youfrom finding out!
What Jon shows you isthis: Instead of fightingthis “secret money”…whynot be a little barnacle onthe bottom of their boatwhen the “big players”start putting their smartmoney on the table?!
Then Go Along For TheRide With Them!You are buying the sameoptions the “smartmoney” is buying! Anddon’t forget…this “smartmoney” is buying optionsfor a reason! (A GOODreason…after all, they ARE “insiders”…)
Your trade is the same trade that smarter and clos-er-to-the-action money is making…pretty much
Jon “Doctor J” Najarian, World Famous Trader
E VERY DAY, PRIVILEGED INSIDERS are takingadvantage of a secret—yet legal—rip-off thathappens every day and tells them what,where and when the next big moves will be!
Until now these traders have been reluctant totalk outside their own circles of associates.
But now, an insider with 23 years trading experienceis ready to share this eye-popping secret with you.
And once this insider started talking he committedhimself to reaching out to others who are interested inbecoming highly successful traders!
World-famous Super Trader Jon “Dr. J” Najarianreveals . . .
How To Profit Again and Again . . . TakingLess Risk . . . In All Markets, Up or DownDr. J expects winning trades 75%-85% of the time. . . holding positions 30-90 days…and earningprofits of at least 65%-75% on each win (with afew “inside secret” mega-profits thrown in too!).
Every single year there are literally hundreds andhundreds of compelling situations where stockshave “unusual option activity” happen to them!The “insiders” are making their fortunes.
Until you’ve seen this world famous super trader’s legal inside information. . . his name is Jon “Dr. J” Najarian
WARNING! Trade No Stock
�Former Chicago Bearslinebacker, Jon “Doctor J”Najarian, is considered bymany insiders to be the bestoptions trader of all time. Histrading prowess and perform-ance are legendary. Formerlyon the CBOE Board ofDirectors. . .
�He has spent 23 years asthe market maker for over 90different stocks, trading 30,000-45,000 options per day, andover $150 million in stockseach and every day. If you haveever even considered tradingstocks or options, Jon Najarianis the consummate expert.
�Considered by many insiders to be the bestoptions trader of all time.
�Popular “Money Man”on Fox TV Chicago, whereJon offers money tips andquips with celebrities andnewsmakers.
�Jon’s market observationsare closely followed on hisown daily radio show, aswell as on CNN, FOX,Bloomberg, Reuters, DowJones and CNBC.
�"Dr. J has spentover 23 years as a market maker,trading over 30,000options and over$150 million instocks each andevery day."
assuring you of the right stock move…whichtranslates into a potentially HUGE move in theoptions themselves.
That’s exactly why the smart money goes to theoptions market first…to make these OBSCENE,fast, leveraged profits!
Options give them an almost unfair advantage,and it can happen fast!
And you get the same benefits!
In How I Trade Options—AnInsider’s Guide Jon Najarianreveals how and why volatilityshould be the dominant factorin your trading decisions.
According to Jon, “this is thesingle greatest misunderstand-ing among options traders.This concept alone could be thedifference between your successor failure.”
� THIS IN-DEPTH COURSEINCLUDES LOADS MORE:
� Options Strategies For FindingOptions Winners Under AllConditions
� Two Great Strategies For After ADisaster In Any Stock
� A Great Play Used By SeveralEngineers And Doctors To AmassMulti-Million Dollar Accounts!
� Exactly When To Use EachStrategy—And Why You’ll Use It
� How To Price An Option—The RealWay (If You’ve Ever Even Heard OfBlack-Scholes, You Must See This)
� The Significance Of Major,Extreme Market Moves. . . How ToPlay Them To Your Advantage
� The Questions Jon “Dr. J” Najarian Asks Himself EveryDay—Even After Tripling His Money!
Absolutely Guaranteed For One Full Year�Send for your copy of the How I Trade Options Course for Off-Floor Traders.
Study it... review the video...track the performance of Doctor J’s recommendations and methods. I want you to see for yourself how AMAZINGLYSUCCESSFUL these strategies are! If you’re not totally overwhelmed anddelighted by these techniques, just return the package. I’ll immediatelysend you a prompt and courteous refund. Absolutely No Questions Asked!
Your maximum reward is virtually unlimited once you know the strategies… and your risk virtually nothing…just the time to review this course.
Call Today for Your No-RiskHOW I TRADE OPTIONS COURSE.
Here’s What You’ll Get:� Doctor J’s full presentation taped at an exclusive
$3000 seminar (90 minute recording)� Doctor J’s full-length book How I Trade Options,
considered the Options Trading Bible� Plus Dr. J’s all-new DVD The Inside Options Secret� Special Bonus: CPR Strategy Report
…worth thousands to anyone whoowns stock!
ONE YEARNO RISK
GUARANTEE
PRICE: $95.00Shipping Included
(New York State Residents: Add Sales Tax: $8.19)
Start winning options trading as soon as possible...
CALL 1-800-710-8552 (Toll-Free) FOR THE FASTEST ORDER & DELIVERY!
How I Trade Options—An Insider’s GuideDr. J’s Full Options Trading Program
This is an amazing new course, filled withproven in-the-market techniques for suc-cess in options. You will learn the “singlemost critical concept to determine yoursuccess or failure in the markets” andyou’ll discover:
� A Great Way to Play the Extremes— Euphoria orWhite Knuckle Panic For Others—Controlled-RiskProfits For Us!!
� A Perfect Protection Strategy used by the pros, yetnever even heard of by nearly 99% of traders
� A Specific Strategy to Profit From EarningsAnnouncements with much LESS RISK
� An Amazing “Secret Plan” to Increase Profits withLESS RISK in a BEAR Market
� Plus Much, Much More!!
DOCTOR J: World Famous Trader & Teacher
IMPORTANT NOTICE! Option Trading has large potential rewards, but also large potential risks. You must be aware of the risks and willing to accept them in order to invest in the futures markets. Don’t trade with money you can’t afford tolose. This is neither a solicitation nor an offer to buy/sell commodity interests or listed options. NOTICE: “Hypothetical or simulated performance results have certain inherent limitations. unlike an actual performance record, simulated resultsdo not represent actual trading. Also, since the trades have not actually been executed, the results may have under-or-over compensated for the impact, if any, of certain market factors, such as lack of liquidity. Simulated trading programs ingeneral are also subject to the fact that they are designed with the benefit of hindsight. No representation is being made that any account will or is likely to achieve profits or losses similar to those shown.”
ID 496

GorillaTrades:A risk-controlled, market-proven,proprietary system, which generates amenu of stock ideas that time and timeagain identifies stock trades with explo-sive price appreciation potential!
Make no mistake, the GorillaTrades system is NOTabout day trading. In fact, the average holding period ofGorillaPicks is between two and four weeks with a goal of20% to 40% profits from every position recommended.Moreover, each idea presented contains only one-half toone-third the risk as compared to its potential return. Asimple Risk Rating is included with every GorillaPick thatdefines its probable risk.
FREE 30-day access to what may be THE mostprofitable, risk-controlled investment service you’llever find!
Since it is quite possible that the stock market couldremain in a paralyzing trading range over the next several years, you need a proven service like GorillaTrades to provide you with an excellent source of high-probabilitytrading ideas! If you’re like most of our subscribers, you are
probably tired of unrealistic services that claim to produceonly winners and no losers. Investors are too intelligent tobelieve such ridiculous claims. Most of these services consis-tently recommend the most volatile stocks, which are unsuitable in certain market environments.The Gorilla believes in staying fully diversified, and provides risk parameters to enhance and educate sub-scribers in their trading decisions. As with any system ofinvesting, there will be losses. However, the losses are less
The personal experience of “The Gorilla” himself is quite impressive. This master investor behindGorillaTrades maintains a network of financial insiders gathered throughout his 25 years in theindustry. He recognized a phenomenon when he determined that subtle indicators precededexplosive individual stock price movements. It was as a result of this research that he developedhis proprietary formula using 14 different technical indicators, and used the signals generated byhis system to turn $250,000 into $5,500,000 in just 18 months!
{THE GORILLA On Profit}{PROFILE: THE GORILLA}
profit with the pros www.gorillatrades.com/ibd
A Special Opportunity for Investor’s Business Daily Readers [ FREE for 30 days ]
Discover The Buzz Of The Entire Investment Community!
Below are the unrealized gains of the currentGorillaTrades portfolio leaders (as of 2/2006)
GFI Group GFIG +58.20%Global Payments GPN +50.47%Marvell Tech MRVL +42.23%Jones Lang LaSalle JLL +42.06%Gilead Science GILD +41.27%Psychiatric Solutions PSYS +41.08%Cameco CCJ +40.38%Fluor FLR +39.87%Terex TEX +39.71%Walter Industries WLT +35.79%
P O R T F O L I O L E A D E R S
GorillaTradesINS.2.06 2/3/06 4:09 PM Page 1
spreer
1 of 4

than 6% on average, while most profits are three, four, five,or even six times this figure! Folks, if you take a minute todo the math you will quickly realize just how fast yourmoney could grow!
This is not a service that pulls stocks out of a hat, butrather a system that educates its subscribers with valuableinformation. The Gorilla does not recommend high-flying internet or tech stocks that have the same prob-ability of falling as they do rising. The GorillaTradessystem not only looks for quick gains, but it recognizescompanies that have constructive, long-term technical pat-terns. Burlington Northern, for example, was held forover a year before it finally breached its stop loss level.Because its stop loss level was continuously raised on aweekly basis, even though it stopped out, it still generat-ed more than a 50% profit! TXU Corp., a utility compa-ny which also offers an attractive dividend, nettedGorillaTrades’ subscribers a whopping 47% profit in just3 months! Urban Outfitters, a retailer, was traded threedifferent times, each time for a profit, while the stop losslevel was raised to minimize risk. In fact, the final trade ofURBN netted subscribers a 42% profit!
How exactly does the GorillaTrades system work?
GorillaTrades uses its specialized proprietary computersoftware program to analyze over 6,000 stocks from thethree major markets each day after the close. Using anintricate formula, it calculates the strength of 14 differenttechnical indicators and analyzes their potential risk andupside probability parameters. The software program thenprojects specific upside price (profit) targets and generatesan appropriate stop loss level for every GorillaPick recom-mended. These stocks then have to exceed specific priceand volume levels to officially enter the Gorilla’s list ofstocks that are preparing to explode in price in one direc-tion (GorillaPicks) or the other (GorillaShorts). This is lit-erally like finding needles in a haystack with a computer-guided magnet! Additionally, the Gorilla raises stop losslevels along the way in order to protect his subscribers’hard-earned profits. The Gorilla “holds your hand” theentire way! This enables you to decrease your research
time and improve your portfolio’s return; whether the mar-ket goes up, down, or sideways. This takes the hardest partof investing off your hands. It’s no coincidence that a rap-idly growing number of subscribers to theGorillaTrades service are stock brokers and profession-al money managers!Is it necessary to be available during trading hours to use
the GorillaTrades system?
Absolutely not! Within a couple of hours of the markets’close each evening, the Gorilla sends his subscribers a detailedperspective of the market to help them make sense of thatday’s activity, and more importantly, gives them insight to helpthem profit from what some of Wall Street’s top traders areexpecting from tomorrow’s market. He then provides specificrecommendations for purchase at the next morning’s open.
profit with the pros www.gorillatrades.com/ibd
S H O R T T E R M P R O F I T SGorillaTrades is your key to 20%-40% short-term profits on a diverse selection of stocks,in different sectors, and with different risklevels, to keep your portfolio in balance!Here are some examples of recent tradesclosed so far this year and realized profits:GORILLA TRADES CLOSED SO FAR THIS YEAR!
Allegheny Tech (ATI) 58% profit
Trident Micro (TRID) 49% profit
Broadcom (BRCM) 48% profit
USG Corp (USG) 45% profit
Morningstar (MORN) 25% profit
Teva Pharm (TEVA) 22% profit
Vimpel Comm (VIP) 20% profit
OptionsXpress (OXPS) 19% profit
Pictured at right is a graph of the International SecuritiesExchange (ISE), which was recommended to GorillaTradessubscribers on 1/10/06. The stop loss level has since beenraised to $30.00.
GorillaTradesINS.2.06 2/3/06 4:09 PM Page 2
spreer
2 of 4

subscribers
speak
“Most brokersare faking sin-cerity, fakinge x p e r t i s e . . .sharks looking foreasy prey, tossingdarts at a list of stocks. The Gorilla isthe opposite. You inspire trust. I likethat you’re on my team. You keepfinding new ways to educate me in thebest and safest ways of navigating thejungle. I wasn’t nearly as savvy aninvestor before I found you. I sleepbetter now. Thanks,” Tom Tremont,of Glen Ellyn, Illinois.
No more “sharks” for Tom Tremont, aGorillaTrades subscriber for a little over ayear. Finding GorillaTrades has made him aconfident investor.
Bruce Liebowitz has been a GorillaTradessubscriber for 5 years. His stockbrokernow calls him daily.
“As a GorillaTradessubscriber sinceearly 2000, I haveseen up markets,and down markets,but have more than paid formy annual subscription every singlemonth! I find it amusing that my stock-broker now calls me daily, and treatsme like a peer. I have learned so muchfrom the Gorilla. Thank you for such awonderful service!” reports BruceLiebowitz of Farmington Hills,Michigan.
Be empowered by theGorillaTrades menu of ideas; freshstock picks that have flawlesslypassed GorillaTrades’ intricate 14step screening process and analyti-cal scrutiny. New GorillaPicks arepresented in the evening Gorillaemail and on the subscribers onlywebsite, along with specific instruc-tion on where to place tradingparameters based on an in-depthtechnical profile of each stock.Each GorillaPick includes a specifictrigger price, confirmation volumelevel, stop loss level, first target,second target, and even trading tipsand a company overview.
GorillaTrades is the marketproven investing system that con-sistently produces explosive stockideas like no other. GorillaTradesprovides the complete solution forthe modern investor by providingfresh stock picks, precise guidelines
about how to trade them, dailyupdates on the current portfolio, acompelling daily market commen-tary, and educational resources toround out the complete investor.
GorillaTrades then continues toactively track these stocks, regularly updating stop loss levelsand second targets as needed. Thisguidance helps subscribers lock inprofits and minimize any losses.The beauty of GorillaTrades is thatit’s simple, yet highly effective. Thesystem allows you to invest on alevel playing field with profession-als, without the research time.There is a good reason whyGorillaTrades has subscribers in 36different countries, and has becomethe fastest growing, most highlyrespected investing system in theworld – it is because GorillaTradesworks. Now is the time to takeyour portfolio to the next level!
Each GorillaPick includes a specific trigger price, confirmationvolume level, stop loss level, first target, second target, and even tradingtips and a company overview!
International Securities Exchange (ISE) Trigger: Above $31.50 First Target: $37 Second Target: $47 Stop Loss Level: $26.75 Confirmation Volume Area: 460K Risk Rating: 5.
lock in profits minimize losses
GorillaTradesINS.2.06 2/3/06 4:09 PM Page 3
spreer
3 of 4

And, if you’re completely thrilled with your profits, donothing and your service will continue at a special intro-ductory rate of only $599.95 for the ENTIRE year (whichmost subscribers say they make back in their first trade ortwo)! However, if you decide this service is not for you,simply call us or cancel online at anytime during the 30-day trial period, and your credit card will never becharged! GUARANTEED!
So why is GorillaTrades giving you this incredibleoffer? Because once you try the Gorilla’s service,
you’ll be so thrilled with your profits you’ll want tocontinue. To start your free trial today, simply go
to www.gorillatrades.com/ibd and start read-ing today’s market update instantly! Or, call
1-866-222-6639 to speak to one of theGorilla’s representatives. Due to call vol-
ume, you are strongly encouraged toregister securely online.
While most would expect topay hundreds of dollars per
month for such a service, you willpay nothing for the first 30 days!
profit with the pros www.gorillatrades.com/ibd
notable
quotes
sign up now-
receive
“From the list of closed transactions,
it’s clear that most of his (the Gorilla’s)
picks do go up....He (the Gorilla) may
be into technical voodoo, but he focus-
es much of his buying on real compa-
nies with actual earnings, many of
them listed on the New York Stock
Exchange....Clearly this is no wild-eyed
Nasdaq gunslinger searching for a
busted Internet company that might
rise 500% in the next day and a half.”
“Just Monkeying Around”by Andrew Feinberg
Kiplinger’s Personal Finance
“My experience with GorillaTrades is
outstanding. Since I signed up with the
service in February, I have made
$59,305. I do not play by all of the
Gorilla’s rules, such as stop loss levels,
and I buy in 5,000-share lots only.”
Tom Metcalfe, Monona, WIKiplinger’s Personal Finance
> Daily GorillaPicks
> Daily GorillaShorts
> Daily Market Commentary
> Return-to-Risk Ratio
> Light-Volume Pullback Buys
> Special Situation Picks
> Instant Secure Subscriber Access
> And much more
GorillaTradesINS.2.06 2/3/06 4:09 PM Page 4
spreer
4 of 4