Mapping lateralization of click trains in younger and older populations
Upload
khangminh22Category
view
1download
0
POLITECNICO DI MILANO
SCHOOL OF INDUSTRIAL AND INFORMATION ENGINEERING
Master of Science in Automation and Control Engineering
Fire Detection in Trains Using Image Analysis: A Survey
and a Novel Approach
Supervisor: Prof. Giacomo Boracchi
Graduation Thesis of:
Dilara Cinar
Student ID: 862449
Academic Year 2018-2019

ii

iii
Acknowledgments
To start, I would like to thank my Supervisor, Prof. Giacomo Boracchi, for his great efforts when
I am in need by guiding me and giving me the opportunity to work on this project on which I am
very motivated and curious about.
I would like to thank to Sergio Vicentini, for his guidance and support for this work on this project
within the company K4TECH.
I would like to thank my family, for supporting me during my studies, for their patience and
unconditional love.
October 2018 Dilara Cinar

iv

v
Table of Contents
1. Introduction ............................................................................................................................... 1
1.1. Context............................................................................................................................... 1
1.2. Objectives .......................................................................................................................... 4
1.3. Problem Definition ............................................................................................................ 4
1.4. Contributions ..................................................................................................................... 5
1.5. Summary ............................................................................................................................ 5
2. Literature Review ...................................................................................................................... 1
2.1. Smoke ................................................................................................................................ 1
2.2. Traditional Smoke Detectors ............................................................................................. 3
2.3. Video Fire Detection in Visible/Visual Spectral Range .................................................... 4
2.3.1. Chromatic Analysis .................................................................................................. 10
2.3.2. Motion ...................................................................................................................... 12
2.3.3. Motion and Flicker Analysis in Fourier Domain ..................................................... 15
2.3.4. Color Variations ....................................................................................................... 15
2.3.5. Wavelet Transforms ................................................................................................. 16
2.3.6. Classification ............................................................................................................ 18
2.3.7. Neural Networks ...................................................................................................... 19
2.3.8. Evaluation of Visible Range Video Fire Detection Methods ................................... 22
3. Proposed Detection Approach ................................................................................................ 24
3.1. Frame-Based Detection Algorithms ................................................................................ 24
3.1.1. Wavelet Transform and Analysis ............................................................................. 24
3.1.2. Image Histogram ...................................................................................................... 27
3.1.3. Image Entropy .......................................................................................................... 28
3.1.4. Moving Variance ...................................................................................................... 30
3.2. Region-Based Approach .................................................................................................. 31
3.2.1. Background Subtraction ........................................................................................... 32
3.2.2. Image Filtering and Enhancement ............................................................................ 33
3.2.3. Blob Detection and Analysis .................................................................................... 35

vi
3.2.4. Classification and Training ...................................................................................... 38
3.2.5. Illustration of the Region Based Algorithm ............................................................. 41
4. Experimental Results .............................................................................................................. 47
4.1. Testing Datasets ............................................................................................................... 47
4.2. Performance ..................................................................................................................... 50
5. Conclusions and Further Works .............................................................................................. 53
5.1. Conclusions ..................................................................................................................... 53
5.2. Future Works ................................................................................................................... 54
Bibliography ................................................................................................................................... 55
Appendix ........................................................................................................................................ 63

vii
List of Figures
Figure 1 Italo Train Coach ............................................................................................................... 2
Figure 2 Smoke and Fire in the Train .............................................................................................. 1
Figure 3 Fire Development Curve (Fuel and Ventilation Controlled Regimes) .............................. 2
Figure 4 Ionization Smoke Detector ................................................................................................ 3
Figure 5 Photoelectric Smoke Detector ........................................................................................... 4
Figure 6 Colors of the RGB Model for Smoke .............................................................................. 10
Figure 7 RGB Values of Smoke and Fire ...................................................................................... 11
Figure 8 Train Compartment .......................................................................................................... 13
Figure 9 a Two-Stage Filter Bank .................................................................................................. 18
Figure 10 Training Neural Networks ............................................................................................. 20
Figure 11 Snapshots from Test Sequences with and without Fire, data from [53] ........................ 22
Figure 12 Smoke in the Room........................................................................................................ 25
Figure 13 Wavelet Energies ........................................................................................................... 25
Figure 14 Current - Background Image Wavelet Ratio ................................................................. 26
Figure 15 Histogram of a Frame without Smoke ........................................................................... 28
Figure 16 Histogram of a Frame with Smoke ................................................................................ 28
Figure 17 Entropy Analysis............................................................................................................ 29
Figure 18 Moving Variance Results ............................................................................................... 30
Figure 19 Detection Algorithm ...................................................................................................... 31
Figure 20 Result of the Detection Algorithm ................................................................................. 32
Figure 21 Median Filter .................................................................................................................. 34
Figure 22 Morphological Operations ............................................................................................. 34
Figure 23 Grayscale Labeled Blobs ............................................................................................... 36
Figure 24 Pseudo Colored Labels & Outlines ................................................................................ 36
Figure 25 Extracted Blobs .............................................................................................................. 40
Figure 26 Training Data ................................................................................................................. 47
Figure 27 Test Dataset A ................................................................................................................ 48
Figure 28 Test Dataset B ................................................................................................................ 48
Figure 29 Test Dataset C ................................................................................................................ 49
Figure 30 Test Dataset D ................................................................................................................ 49
Figure 31 Dataset B - Misclassified Blobs ..................................................................................... 50
Figure 32 Dataset C - Misclassified Blobs ..................................................................................... 51
Figure 33 Dataset D - Misclassified Blobs ..................................................................................... 51

viii
List of Tables
Table 1 Literature Review ................................................................................................................ 9
Table 2 Comparison of the Smoke and Flame Detection Methods, data from [53] ...................... 23
Table 3 Gray Color RGB Values ................................................................................................... 27
Table 4 Blob Analysis Results ....................................................................................................... 38

ix

x
Abstract
High tech vehicles continue to develop rapidly and bring the need of high safety control and alarm
technologies with it. Security in travel is primary concern for everyone and currently fire accidents
are most often occurring in railway vehicles. The aim of this work is to make a survey of available
video fire detection methods and develop an innovative way to assess the severity of the situation
to the passengers and the concerned authorities in the early stages of the fire accident in trains.
Traditional point smoke and fire detectors typically detect the certain particles generated by smoke
and fire by ionization or photometry. In the large and complex areas such as train carriers, it may
take long time for smoke particles to reach a detector and they cannot be securely operated in such
electromechanically complex areas. Especially for the high-speed trains, this time delay may cause
large damages. In this work, a smoke detection system based on video cameras is tackled. The
advantage of the proposed system is the ability to be suitable for train environments which is not
the case in the literature. Thus, eliminating the time between the accident occurs and the alarm,
decreases the damage and fatalities. Current fire detection algorithms are mostly based on the
detection of the flames. However, smoke detection is vital for fire alarm systems when large and
complex areas are monitored, because the source of the fire and flames may not always fall into
the camera field of view. On the other hand, smoke of an uncontrolled fire can be observed by a
camera even though the flames are not into the field of view. This approach results in early
detection of fire before it spreads around.
In this study, the possible methods for video smoke detection are investigated and an innovative
method for smoke detection in the trains is proposed. In the proposed setup for the detection system,
the security camera monitoring the train compartment is stable and stationary. In addition to this,
by using the movement of the smoke, the motion detection for the smoke regions is performed and
later, blob detection is applied to identify each moving object in the frame. Following this, smoke
color, spreading features and decrease of high frequency energy of the scene is monitored using
the extracted blobs for each frame of the video. All these clues are used to train a classifier in order
to perform the detection. Following, further solutions are proposed. This work is done within the
K4TECH software company and the solution is customized for the Alstom trains.

xi

xii
Sommario
I veicoli ad alta tecnologia continuano a svilupparsi rapidamente e portano con sé l'esigenza di un
elevato controllo di sicurezza e di tecnologie di allarme. La sicurezza nel viaggio è la
preoccupazione principale per tutti e attualmente gli incidenti d'incendio si verificano più spesso
nei veicoli ferroviari. Lo scopo di questo lavoro è quello di fare un sondaggio su un modo
innovativo per valutare la gravità della situazione per i passeggeri e le autorità interessate nelle
prime fasi dell'incidente.
I rilevatori tradizionali di fumo e fuoco puntano in genere le particelle determinate dal fumo e dal
fuoco mediante ionizzazione o fotometria. Nelle aree grandi e complesse come i convogliatori di
treni, potrebbe essere necessario molto tempo prima che le particelle di fumo raggiungano un
rivelatore e non possono essere azionate in modo sicuro in tali aree elettromeccanicamente
complesse. Soprattutto per i treni ad alta velocità, questo ritardo potrebbe causare gravi danni. In
questo lavoro viene affrontato un sistema di rilevamento del fumo basato su videocamere. Il
vantaggio del sistema proposto è la capacità di essere adatto agli ambienti dei treni che non è il
caso della letteratura. Così, eliminando il tempo tra l'incidente si verifica e l'allarme, diminuisce il
danno e gli incidenti mortali. Gli attuali algoritmi di rivelazione incendi si basano principalmente
sul rilevamento delle fiamme. Tuttavia, il rilevamento dei fumi è di vitale importanza per i sistemi
di allarme antincendio quando vengono monitorate aree grandi e complesse, in quanto la sorgente
del fuoco e delle fiamme potrebbero non sempre cadere nel campo visivo della telecamera. D'altra
parte, il fumo di un fuoco incontrollato può essere osservato da una telecamera anche se le fiamme
non sono nel campo visivo. Questo approccio si traduce in una rapida individuazione del fuoco
prima che si diffonda.
In questo studio vengono investigati i possibili metodi per il rilevamento del fumo video e viene
proposto un metodo innovativo per il rilevamento del fumo nei treni. Nella configurazione proposta
per il sistema di rilevamento, la telecamera di sicurezza che controlla il compartimento del treno è
stabile e stazionaria. Oltre a ciò, utilizzando il movimento del fumo, viene eseguito il rilevamento
del movimento per le aree di fumo e, successivamente, viene applicato il rilevamento del blob per
identificare ciascun oggetto in movimento nel frame. In seguito, il colore del fumo, le
caratteristiche di diffusione e la diminuzione dell'energia ad alta frequenza della scena vengono
monitorati utilizzando i BLOB estratti per ciascun fotogramma del video. Tutti questi indizi sono
utilizzati per addestrare un classificatore al fine di eseguire il rilevamento. Di seguito, vengono
proposte ulteriori soluzioni. Questo lavoro viene svolto all'interno della società di software
K4TECH e la soluzione è personalizzata per i treni Alstom.

xiii

1
Chapter 1
1. Introduction
1.1. Context
Ensuring a safe journey is the highest priority of the high-speed train manufacturers. Lately, fire
accident is most often occurring in trains. When these accidents occur in complex and crowded
areas like railway vehicles, the loss or damage being caused are at higher rates. Even more, the
damage is heavier due to the incapability of the rescue services to reach at the right time because
of erroneous alarms and notifications. All summed up, these deficiencies may cause tremendous
damage, resulting in lost lives in most of the cases. Thus, eliminating the time between when an
accident occurs and when first responders are dispatched to the area decreases the overall damage.
In this study, a possible solution to reduce the safety risks occurring due to fire accidents in high
speed trains is presented. Fire on a high-speed running train is more dangerous than on a stationary
or a slow one, since and the stopping distance is highly related with the speed and the fire may be
easily spread around by winds. There are several definitions for high-speed rail that are in use
worldwide. This study is focused on European lines. Thus, the European Union Directive
96/48/EC, Annex 1defines high-speed rail in terms of the infrastructure, minimum speed limit and
the operating conditions. For the infrastructure, the track must be built specially for high-speed
travel or specially upgraded for high-speed travel. In addition to this, the minimum velocity on
lines specially built for high speed is of 250 km/h, while the vehicle itself must be able to reach at
least 200 km/h to be considered as a “high speed” one. The most important aspect is that the rolling
stock must be designed alongside its infrastructure for complete compatibility and safety.
Nowadays, Italy is Europe’s cutting-edge country when it comes to the high-speed trains. The most
relevant examples are the state-owned Trenitalia’s Frecciarossa, and the privately-owned Italo.
Like many others, Italo’s trains are designed by the global leader Alstom, which is a French
multinational company. Therefore, Italo benefits from their years of engineering expertise in the
rail industry. Italo trains can reach speeds up to 300 km/h, while Frecciarossa may reach up to 350
km/h speed. An example of an Italo train coach is given in the Figure 1. According to the [1], a
train with a top speed of 360 km/h, has approximately 12300 m of breaking distance and therefore,
if a safety critical event occurs in a train and the vehicle must stop, a sudden break of the high-
speed train has a large stopping distance. Early alarm of the safety critical even such as fire, would

2
bring a high advantage of decreasing the risk of accidents or collisions. It is important to underline
that the latest designs bring an increase in the passenger dedicated areas. For instance, in the highest
capacity configuration chosen by the French National Railway Company (SNCF) from Alstom,
trains allow to accommodate up to 740 passengers. The increase in the number of passengers,
comes with a higher safety risk. Considering the above risks, Alstom is in search of a more
intelligent solution. It is the main reason for which the following technical proposal is customized
for Alstom.
Figure 1 Italo Train Coach
As it is underlined, security in travel is the primary concern for the high-speed train companies.
Therefore, in the newly designed trains, all the areas in the compartment are monitored by CCTV
(closed-circuit television) cameras that are constantly monitored by the train managers and
stuff. CCTV cameras are widely used in transportation security applications. However, it is not
possible to assign an employee to track every single camera for unexpected events detection. To
quote New Scientist magazine: “There are too many cameras and too few pairs of eyes to keep
track of them” [2]. Therefore, it is possible to say that there is a real need of computer-based video
analysis for unusual events. For the electromechanical safety of the trains, regulations are clearly
defined. In this project, the study of an innovative safety alarm for the train fires is introduced.
However, even if is a new area of research, it is already giving promising results in respect to the
traditional fire alarm systems. In addition to this, the proposed solution is more economic compared
to the traditional ones since is a system based on the CCTV cameras that are already installed in
3
the trains. It can be surely said that the proposed system also aims to decrease the maintenance
costs on the safety alarm systems of the high-speed trains. The advantage of a video fire detection
is to detect the fire in its early stages and notify the train responsible to watch the area affected and
take the action with minimum delay.
Intelligent video processing techniques for the detection and analysis of fire for railway vehicles
are rare. Having an accurate and quick response fire detection system, plays an important part in
safety analysis and firefighting, and is essential in calculating the risk of growth. Nevertheless,
most of the detectors that are currently in use just ring the bell and are not able to model fire
evolution which is rarely available and difficult to measure. The important weakness of traditional
conventional sensors is that they are distance limited and fail in complex spaces such as railway
vehicles. These sensors require a small proximity to the fire source in order to be able to detect the
smoke. The other important limitation of traditional fire alarms is called as transport delay which
is the time for the smoke particles to reach the detector.
The research in this field has begun mainly with the flame detection. In the recent articles, it is also
possible to see some attempts also for detection of some smoke features. In this work is also focused
in the smoke detection and the reason for this may be explained as follows; smoke spreads very
quickly and in most of the fire cases, especially in the initial state of the fire in a complex
environment, it is not possible to see the flames. Yet, smoke occurs much quicker in the field of
view of the cameras and generally it is the first appearing clue of an uncontrolled fire. Therefore,
smoke can be observed very easily and provides an early indication of the fire [3].
The most of the state-of-the-art detection techniques focuses on the color and shape characteristics
of the smoke and flames and their temporal behavior. But, smoke and flames has quite variable
shape, motion and colors so that most of the video-based fire detection algorithms are still weak
for the manner of accuracy. The strength of using ordinary video in fire detection is the ability to
adapt quicker in railway vehicles which are large, complex and variable areas. Most of the research
in the literature are performed for surveillance of open spaces or large indoor areas. The majority
of the researchers used following methods; color and moving object detection, flicker energy
analysis, spatial difference analysis, dynamic texture and disorder analysis, sub blocking. These
methods are followed by some clean up post processing methods and training models such as
support vector machine and neural networks. Finally, the detection of flames and smoke takes
place. Unfortunately, a specific problem of smoke detection in railway vehicles is not a popularly
tackled topic. Therefore, a survey is presented in this work that aims to fins the most promising
methods for the trains.

4
1.2. Objectives
In this work, main aspects aimed to be achieved are as follows;
• To review traditional fire and smoke detection methods, with a particular focus on the large
literature of video detection systems.
• To implement and test the most promising methods in the literature on video fire detection
systems.
• To design an experimental campaign and assess the performance of the existing methods
in different scenarios and discuss their suitability in the train environment.
• Propose the most appropriate algorithms for the fire detection in high-speed trains.
• To propose further improvements for fire detection systems based on computer vision
techniques.
1.3. Problem Definition
In the railways fire accidents are occurred due to electrical short circuits, wood materials,
flammable materials, derailments, collision, conflicts. The need of intelligent video analysis to
support the train officers for possible safety flaws about fire and early detection to take an action
before it spreads around is the main concern of this work. Even though there are significant amount
of computer vision applications for real time video analysis, there is a deprivation of fire detection
systems in trains. To avoid large scale fire accidents in trains, early and accurate detection is vital.
Since the current detection systems rely on point detectors, the proposed system is an innovative
and more reliable solution for the manner of safety.
The research in this study focuses on both problems and presents several video analysis techniques
that have proven to be useful in fast and accurate detection and localization of smoke. The proposed
techniques are viable alternatives or accompaniments to the existing fire detection techniques and
have proven useful to answer several problems related to the traditional smoke detection methods.
The major reason of the success of video-based fire detection systems is its potential to detect the
fire in the cases when the conventional methods fail. Moreover, overcoming the transport delay
that the traditional detectors suffer of, brings the ability of detection as soon as smoke occurs in the
monitored scene. As a target of video-based fire detection in trains, adapting more accurate
detection on smoke and further intelligence on detection algorithms would be an improvement on
the existing models in the literature.

5
1.4. Contributions
An innovative method for smoke detection for trains is presented in this work. Existing smoke
detection methods for train are based on traditional methods, does not include an intelligent video
analysis. The majority of the existing video fire detection methods analyzes the frames as a whole.
The contribution of this work is to have an image analysis on the suspected areas of the video
frames. Thus, suggested method is searching for a clue on the moving regions in the frame, by
detecting them as a blob and performing the image analysis algorithms on these particular sections.
As can be seen following in the report, this aim of the proposed method is promising to give more
accurate results.
1.5. Summary
This work is divided to five chapters, firstly giving the introduction in the first chapter, with
problem definition and objectives. In Chapter 2, smoke, traditional smoke detectors, literature
review given as background information on video fire detection systems and most used methods
in the literature are studied. The most promising approaches used for the video fire detection
systems are explained deeply in Chapter 3, as formulation and theory and their possible usages in
a train environment. Following, the implementation of the available methods on the videos that
contains smoke and their outcome are discussed. Some additional algorithms are proposed as may
be useful for the video fire detection system for trains as an improvement. Chapter 4 covers the
different results from different source videos with smoke or without, with the aim of having an
observation of the method outcomes. Finally, in Chapter 5, conclusions are given and the summary
of the work with further comments are stated.

1
Chapter 2
2. Literature Review
In this chapter, the background information on general bases of used technologies and system
definitions are introduced. Furthermore, the explanation for the need of such a model is given in
this chapter.
2.1. Smoke
Smoke is a collection of tiny solid, liquid and gas particles, typically emitted from a burning
substance. Although smoke can contain hundreds of different chemicals and fumes, visible smoke
is mostly carbon, tar, oils and ash.
Figure 2 Smoke and Fire in the Train

2
Smoke occurs when there is incomplete combustion (not enough oxygen to burn the fuel
completely). On the contrary, in complete combustion, everything is burned, producing just water
and carbon dioxide. As stated above, smoke is a collection of these tiny unburned particles. Each
particle is too small to see with the naked eye, but when they come together, they can be detected
as smoke.
Smoke is the byproduct of the fuels it is burning. The color of the smoke indicates to firefighters
the type and density of the fuels involved, all of which gives hints as to which can be the evolution
of the fire.
White smoke can often mean material is off-gassing moisture and water vapor, meaning the fire is
just starting to consume material. White smoke can also indicate light and flashy fuels such as grass
or twigs. Thick, black smoke indicates heavy fuels that are not being fully consumed. Sometimes,
black smoke can be an indicator that a manmade material is burning such as tires, vehicles or a
structure. Generally, the darker the smoke, the more volatile the fire is. Grey smoke can indicate
that the fire is slowing down and running out of materials to burn.
Figure 3 Fire Development Curve (Fuel and Ventilation Controlled Regimes)
In the Figure 3, development of a compartment fire is shown within the stages. Fire development
is described as incipient, growth, fully developed and decay. It can be said that this behavior would
be suitable to understand the fore behavior in a train, since it is a closed indoor area. Several things
happen as a compartment fire develops: Heat release rate increases, smoke production increases,
and pressure within the compartment increases proportionally to the absolute temperature. These

3
conditions result in a number of fire behavior indicators that may be visible from the exterior of
the building. As a fire moves from the Incipient to the Growth Stage, an increasing volume of
smoke may be visible from the exterior and the velocity of smoke discharge will likely increase.
It is a reasonably logical conclusion that a smaller volume of smoke and lower velocity of smoke
discharge will be observed in incipient and early growth stage fires and the volume and velocity of
smoke discharge will increase as the fire develops.
2.2. Traditional Smoke Detectors
A smoke detector is a device that senses smoke, typically as an indicator of fire. Commercial
security devices issue a signal to a fire alarm control panel as part of a fire alarm system, while
household smoke detectors, also known as smoke alarms, generally issue a local audible or visual
alarm from the detector itself. A smoke detector is a device that senses smoke, typically as an
indicator of fire.
Smoke detectors are housed in plastic enclosures, typically shaped like a disk about 150 millimeters
in diameter and 25 millimeters thick, but shape and size vary. Smoke can be detected either
optically or by physical process; detectors may use either, or both, methods. Sensitive alarms can
be used to detect the smoke in areas where it is banned. Smoke detectors in large commercial,
industrial, and residential buildings are usually powered by a central fire alarm system, which is
powered by the building power with a battery backup.
Figure 4 Ionization Smoke Detector
4
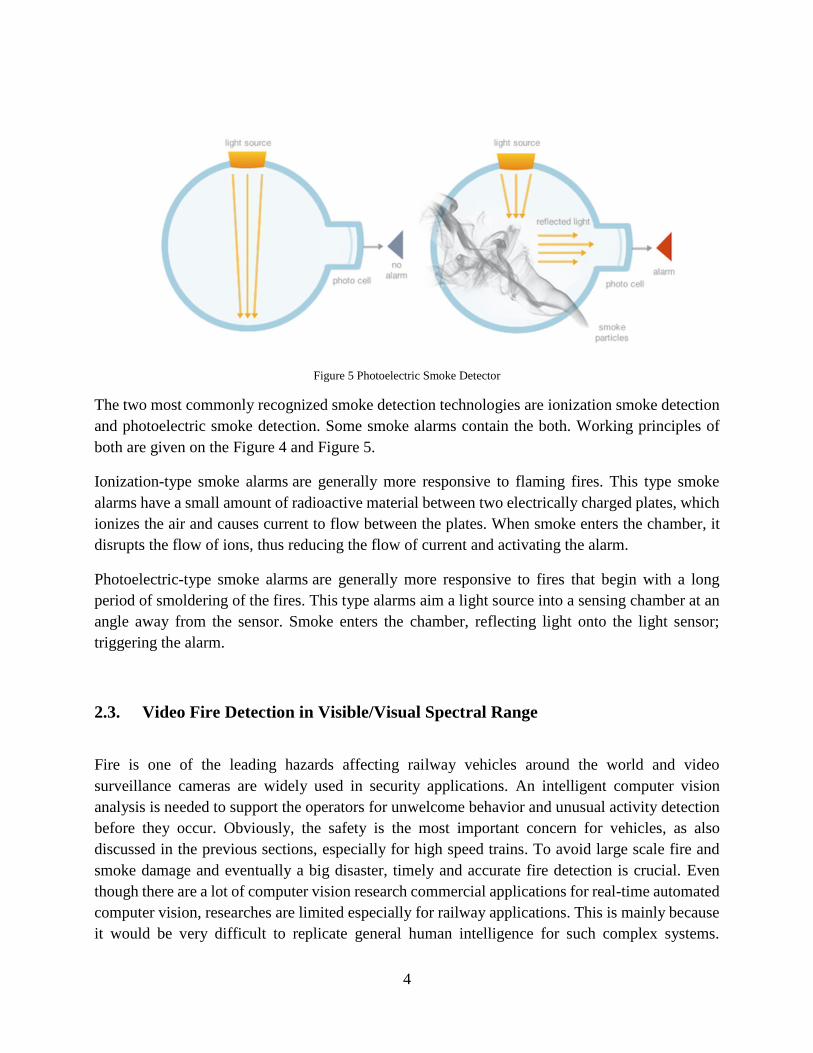
Figure 5 Photoelectric Smoke Detector
The two most commonly recognized smoke detection technologies are ionization smoke detection
and photoelectric smoke detection. Some smoke alarms contain the both. Working principles of
both are given on the Figure 4 and Figure 5.
Ionization-type smoke alarms are generally more responsive to flaming fires. This type smoke
alarms have a small amount of radioactive material between two electrically charged plates, which
ionizes the air and causes current to flow between the plates. When smoke enters the chamber, it
disrupts the flow of ions, thus reducing the flow of current and activating the alarm.
Photoelectric-type smoke alarms are generally more responsive to fires that begin with a long
period of smoldering of the fires. This type alarms aim a light source into a sensing chamber at an
angle away from the sensor. Smoke enters the chamber, reflecting light onto the light sensor;
triggering the alarm.
2.3. Video Fire Detection in Visible/Visual Spectral Range
Fire is one of the leading hazards affecting railway vehicles around the world and video
surveillance cameras are widely used in security applications. An intelligent computer vision
analysis is needed to support the operators for unwelcome behavior and unusual activity detection
before they occur. Obviously, the safety is the most important concern for vehicles, as also
discussed in the previous sections, especially for high speed trains. To avoid large scale fire and
smoke damage and eventually a big disaster, timely and accurate fire detection is crucial. Even
though there are a lot of computer vision research commercial applications for real-time automated
computer vision, researches are limited especially for railway applications. This is mainly because
it would be very difficult to replicate general human intelligence for such complex systems.

5
Moreover, general intelligent video processing techniques for the detection and analysis special to
smoke is relatively limited. Most of the research are based on fire flames or flames and smoke
together. To have the fire detection in an early stage, detection of the initial smoke is a must-have.
The reason for this can be found in the fact that smoke spreads faster and in most cases will occur
much faster in the field of view of the cameras. So, in most of the fire situations, flames are not
visible but there is only smoke on the scene. Thus, it is convenient to say that, with an accurate
smoke detection, the chances for early alarming is high, and losses of resources could be
minimized. Unfortunately, most of the detectors that are currently in use are “point detectors” and
simply issue an alarm as explained in the previous section, Traditional Smoke Detectors. In theory,
they wait for the smoke particles to arrive their sensor, thus, it may be said that, they might have
bigger delay for issuing an alarm than the proposed solution and they do not provide any
information about the fire and smoke circumstances. Therefore, the weak point of the traditional
detection systems is the ability of smoke detection when the smoke arrives to the sensors. In a
complex environment like high speed trains, it is quote dangerous to take the risk of such a delay.
In this section of the report, a review of video fire and smoke detection research is presented. Let
it be known that, recent video fire detection techniques are to be useful to solve several problems
related to the traditional sensors. Conventional point-type thermal and smoke detectors are widely
used nowadays, but as explained before, they are generally limited to basic indoors and are not
applicable in large open spaces with a complex technical infrastructure and safety-critical such as
railway vehicles. They require a small proximity to the fire location. So, the main limitations of
commercially available fire alarm systems can be named as transport delay which is the time for
carbon particles and smoke to reach the “point” detector. Also, on the high-speed trains, the action
should be taken as fast as possible since the safety risks are higher, and the damage is heavier due
to improper reach of service at the right time due to improper communication. This time delay is
causing heavier damage. Thus, eliminating the time between when an accident occurs and when
first responders are dispatched to the scene decreases the damage and risks of death.
Most of the video fire/smoke detection researches are in the early 2000s and articles available in
the literature are about the absence of Artificial Intelligence framework which was first introduced
by Hubert L. Dreyfus in ‘generalized’ Artificial intelligence Dreyfus [4], [5] presents solid
philosophical and scientific arguments on why the search for ‘generalized’ Artificial intelligence
is needed. Afterwards, the specific smoke detection problem in trains is a unique and individual
engineering problem which has its own characteristics like as every other fire and smoke detection
problems. It is possible to develop a model for the smoke and fire behavior in video using various
video and image processing methods. However, it is important to underline that the current systems
are deficient of false alarms because of modeling and training inaccuracies.
Available researches are mainly on the detection and analysis of smoke and flames in consecutive
video images. Having said that most fires start at the blazing phase in which smoke usually appears

6
before flame. And in these cases, smoke is the first visible clue of fire so that it gives an earlier fire
alarm. But compared to flame, the visual characteristics of smoke such as color and grads are less
ambiguous, so that smoke is harder to be differentiated from its disturbances. So, the extraction of
smoke’s visual features is more complicated. In early researches, mainly flame detection was
investigated. There are studies on the smoke detection problem in the more recent articles. As
mentioned before, generally the flames are not visible in the beginning of the fire development but
there is only smoke on the scene. In railway applications, depending on the location of the fire
source, it may not be even possible to observe flames for a long time. The reason for this, trains
have a complex infrastructure. This makes the smoke detection in the trains more crucial.
Over the last years, the number of papers about visual fire detection in the computer vision literature
is growing exponentially [6]. As is, this relatively new subject in vision research is in full progress
and has already gave promising results. However, like most of the computer vision problems, this
subject is not a completely solved problem. Behavior of smoke and flames of an uncontrolled fire
differs depending on the environment with distance and illumination. Furthermore, cameras are not
perfect color and/or spectral measurement devices. They have different sensors and color and
illumination balancing algorithms. They may produce different images and video for the same
scene because of their internal settings and algorithms. In this section, a chronological overview of
the state-of-the-art, often referenced papers on fire/smoke detection methods, is presented in Table
1. For each of these papers it is investigated the underlying algorithms and checked the appropriate
techniques. In the following, the frequently repeated and the most reliable detection techniques and
their use in the listed papers are analyzed and their outcomes are given in the following sections of
the report.

7
Article Colo
r
det
ecti
on
Movin
g
ob
ject
det
ecti
on
Fli
cker
/ en
ergy
(wavel
et)
an
aly
sis
Sp
ati
al
Dif
feren
ce
An
aly
sis
Dyn
am
ic
textu
re/p
att
ern
an
aly
sis
Dis
ord
er
an
aly
sis
Su
b b
lock
ing
Tra
inin
g
(mod
els,
NN
,
SV
M...)
Cle
an
-up
post
pro
cess
ing
Loca
liza
tion
/
an
aly
sis
(flo
w
rate
)
Fla
me
det
ecti
on
Sm
ok
e
det
ecti
on
2002
-2007
Phillips [7],
2002
RGB X X X X X
Gomez-
Rodriguez [8],
2002
X X
X
X
Gomez-
Rodriguez [9],
2003
X X
X
X
Chen
[10],2004
RGB X
X
X X
Liu [11], 2004 HSV
X
X
X
Marbach [12],
2006
X
X
X
Toreyin [13],
2006
RGB X X X
X
Toreyin [14],
2006
YUV X X
X
X
Celik [15],
2007
YCbCr/
RGB
X X
Xu [16], 2007 X X X X X

8
2007 -
2009
Celik [17],
2007
RGB
X
X
X
X
X
Xiong [18],
2007
X X
X
X
Lee [19], 2007 RGB X
X X
X X
Calderara
[20], 2008
RGB X X
X X
X
Piccinini [21],
2008
RGB X X
X
X
Yuan [22],
2008
RGB X
X X
X
Borges [23],
2008
RGB
X
X
Qi [24], 2009 RGB/
HSV
X X
X
X
Yasmin [25],
2009
RGB/
HIS
X
X X
X
X
Gubbi [26],
2009
X X X X
2010 -
2011
Chen [27],
2010
RGB/
HIS
X X X X
Gunay [28],
2010
RGB/
HIS
X X X
X
X
X
Kolesov [29],
2010
X
X
X
X X

9
Ko [30], 2010 RGB X X
X
X
Gonzalez-
Gonzalez [31],
2010
X
X
X
Borges [32],
2010
RGB
X
X
X
X
Van Hamme
[33],2010
HSV
X
X X
X
Celik [34],
2010
CIE
L*a*b*
X
X
X X
X
Yuan [35],
2011
X
X
X
Rossi [36],
2011
YUV/
RGB
X X X X
2012-2
016
Millan [37],
2012
RGB/
YCbCr
X X X X
Suchet [38],
2012
YCbCr X
X
X
X X
Bistrovic [39],
2016
RGB/
YCbCr
X
X
X
Hwang [40],
2016
YUV/
RGB
X X X X X
Table 1 Literature Review

10
2.3.1. Chromatic Analysis
One of the first and main detection technique used in video fire detection systems is the chromatic
analysis so is the color detection and is still used in almost all detection methods. Many of the
color-based approaches in fire/smoke detection systems make use of RGB color space and
sometimes in combination with HSI/HSV saturation [7], [10], [13], [24], [27], [28]. Since almost
all the visible range cameras are having video detection sensors in RGB, spectral content
associated with RGB color space are in common.
Figure 6 Colors of the RGB Model for Smoke
Various combustible materials will generate different colors and quantities of smokes when
burning occurs, which are in form of small particles [41]. In a video frame that contains smoke,
RGB values of the smoke pixels are in grayish color range. And this color range can be classified
into two gray level regions: light-gray and dark-gray, as represented on the Figure 6. In a fire at a
low temperature, light smoke occurs, and the smoke color is white bluish to light gray, while at a
high temperature, dark smoke occurs, and the smoke color varies from gray to black. This can be
explained with the following formula and brings that the intensity of the gray color may vary
between 80 and 220, neither so white nor so black, where 0 represents the black color and 255 the
white.
80 ≤
𝑅 + 𝐺 + 𝐵
3≤ 220
( 1 )
This grayish color of smoke brings the intensities of three 𝑅, 𝐺 and 𝐵 channel values very close to
each other or in other words, approximately the same. Therefore, 𝑅, 𝐺 and 𝐵 values are satisfying
the following rule:
𝑅 ± 𝛼 = 𝐺 ± 𝛼 = 𝐵 ± 𝛼 ( 2 )
In a similar manner, 𝑅𝐺𝐵 channel values of flame pixels are in red-yellow color range indicated
by the rule:
𝑅 > 𝐺 > 𝐵 ( 3 )
If the mentioned rules are satisfied, the pixel is considered as smoke. Explained properties can be
seen in the Figure 7.

11
Figure 7 RGB Values of Smoke and Fire
Among these color models, there is the HIS (hue-intensity-saturation) color model used in the
reviewed articles [24], [25], [28]. This color model can be applied in order to avoid lighting
changes and it is also suitable for providing a people-oriented way of describing the colors, because
the hue and saturation components represent color similarity of how the human eye senses colors
[42]. Smoke pixels detection can be carried out by using saturation channel histogram correlation
analysis [43], the saturation value of the general smoke to be distributed as 0 ≤ 𝑆 ≤ 40.
In YUV and YCbCr color spaces there is a common Y component that determines the brightness
of the color (referred to as luminance or luma). Brightness of the scene is a notable feature for
smoke and fire detection so that these color spaces are also commonly used in many articles, such
as [14], [15], [44]. Smoke motion produces change in the luminance value of a given block in the
consecutive frames. Therefore, for smoke detection, very low chrominance values or a decrease in
this manner and high luminance value of suspicious regions are important clues [13], [45]. The
conditions in YUV color space are as follows:
Condition1: 𝑌 > 𝑇𝑌
Condition 2: |𝑈 − 128| < 𝑇𝑈 𝑎𝑛𝑑 |𝑉 − 128| < 𝑇𝑉
( 4 )
Where 𝑌, 𝑈 and 𝑉 are the luminance and chrominance values of a particular pixel, respectively.
The luminance component 𝑌 takes values in the range [0, 255] in an 8-bit quantized image and the
mean values of chrominance channels, 𝑈 and 𝑉 are increased to 128 so that they also take values
between 0 and 255. The thresholds 𝑇𝑌, 𝑇𝑈 and 𝑇𝑉 are experimentally determined in [36].
More complex systems use rule-based techniques such as Gaussian smoothed color histograms
[7], blending functions [21] and statistically generated color models [46]. It should be underlined
that color information is not enough to be used by itself to detect fire because of the variability in

12
color, density, lighting, and background. However, the color information can be used as a part of
a more sophisticated system.
2.3.2. Motion
Moving object detection in video frames is a subject of research. There are several methods used
in the articles listed in the Table 1 and all these methods try to estimate the background from the
temporal sequence of the frames. Along these methods, there are benefits and limitations. For the
sake of the benefits, it should be underlined that, moving object detection is very handy for
separation of the moving and background areas in a frame. After this separation, the moving areas
would be detected, and this detection makes the recognition, classification and various image
processing algorithms easy to apply on the focused area.
Since smoke and flames have a motion, various moving object detection algorithms are widely
used in smoke and fire detection applications. In the reviewed articles, optical flow analysis [8],
[9], [29] and temporal differencing [19] methods are in use. Independently moving object can be
detected by using optical flow computation methods. However, these methods have
computationally complexity. Besides this, temporal differencing method is very adaptive to the
dynamic environments as well. Unfortunately, in a manner of performance, temporal differencing
generally does a poor job of extracting all relevant feature pixels. Adaptive background subtraction
model [47] may be used for moving object detection as well.
Apart from mentioned methods, the background subtraction methods are commonly in use, such
as in [14], [13], [16], [15], [18], [20], [21], [22], [48], [28], [30], [34]. It also provides the most
complete feature data. However, it is critical to point out that, this method is highly sensitive to
lighting and external circumstances. Additionally, a limitation that affects this method is that it
only works for static cameras or in ‘stepand-stare’ mode for pan-tilt cameras. To overcome this
limitation, a second extension has been developed by Collins at al. [49], to allow background
subtraction from a continuously panning and tilting camera. This Gaussian Mixture Model based
approach model was used in many of the smoke detection studies.
In accordance with this project, the adaptive background subtraction technique proposed by T.
Kanade and R. Collins [47] might be a suitable solution. However, there is a disadvantage of this
adaptive background subtraction method and it may be explained as following [50]. When a
stationary object starts to move, the algorithm detects this movement. Afterwards, they leave
behind “holes” where the newly exposed background imagery differs from the known background
model. While the background model eventually adapts to these “holes”, they generate false alarms
for a short period of time. Thus, it can be concluded that the adaptive background subtraction
technique [47], has handicaps for stationary objects in the scene that start to move. In this point
of the report, it is also convenient to mention about the frame differencing method. Let it be known

13
that the frame differencing is not subject to mentioned ‘holes’ phenomenon, however, it is
generally not an effective method for extracting the entire shape of a moving object.
In this project, the moving pixels and regions in the video are determined by using a background
estimation method developed by Collins et.al. [49]. The method developed by Collins, is a
combination of an adaptive background subtraction technique [47] with a three-frame differencing
algorithm. The method is named hybrid algorithm for detecting moving objects and considers a
video stream from a stationary or stabilized camera. In a train environment, safety cameras are in
stable position, usually placed in the ceiling of the compartment in order to have the maximum
surveillance. An example of camera positioning in the train can be seen on the Figure 8. Therefore,
it is convenient to say that this method is suitable particularly for the train environment.
Figure 8 Train Compartment
Considering the stable video camera, let 𝐼𝑛(𝑥) represent the intensity value at pixel position 𝑥, at
time 𝑡 = 𝑛. The three-frame differencing rule suggests that a pixel is legitimately moving if its
intensity has changed significantly between both the current image and the last frame, and the
current image and the next-to-last frame. That is, a pixel 𝑥 is moving if it satisfies the following
equation ( 5 ).
(|𝐼𝑛(𝑥) − 𝐼𝑛−1(𝑥)| > 𝑇𝑛(𝑥)) 𝑎𝑛𝑑 (|𝐼𝑛(𝑥) − 𝐼𝑛−2(𝑥)| > 𝑇𝑛(𝑥)) ( 5 )

14
Where the 𝑇𝑛(𝑥) is a threshold describing a statistically significant intensity change at pixel
position 𝑥. The main problem with frame differencing is the pixels belonging to an interior of an
object with uniform intensity are not considered as the moving pixels. However, after clustering
the moving pixels into a connected region, interior pixels can be filled in by applying adaptive
background subtraction to extract all the “moving” pixels within the region’s bounding box 𝑅.
𝐵𝑛(𝑥) represents the current background intensity values for pixel 𝑥. Thus, the blob 𝑏𝑛 can be filled
out by taking all the pixels in the region’s bounding box 𝑅, that differs from the background model
𝐵𝑛. 𝑇𝑛(𝑥) considered as the difference threshold. These statistical properties of the pixel intensities
observed from the sequence of images {𝐼𝑘(𝑥)} for 𝑘 < 𝑛 and that is as in the equation ( 6 ).
𝑏𝑛 = {𝑥 ∶ | 𝐼𝑛(𝑥) − 𝐵𝑛(𝑥)| > 𝑇𝑛(𝑥), 𝑥 ∈ 𝑅} ( 6 )
Finally, in this method, a background image 𝐵𝑛+1 at time instant 𝑛 + 1 is recursively estimated
from the image frame 𝐼𝑛 and the background image 𝐵𝑛 of the video. 𝐵0(𝑥) is initially set to the
first image, as 𝐵0(𝑥) = 𝐼0(𝑥) and the 𝐵(𝑥) is updated over time as in the equation ( 7 ).
𝐵𝑛+1(𝑥) = {
𝛼𝐵𝑛(𝑥) + (1 − 𝛼)𝐼𝑛(𝑥), 𝑥 𝑖𝑠 𝑠𝑡𝑎𝑡𝑖𝑜𝑛𝑎𝑟𝑦
𝐵𝑛(𝑥), 𝑥 𝑖𝑠 𝑚𝑜𝑣𝑖𝑛𝑔
( 7 )
where 𝛼 is a time constant parameter that specifies how fast new information replaces previous
observations and it varies between 0 and 1. Having an 𝛼 relatively small results as a more accurate
background subtraction. Implementation of this method and experimental results can be found in
the following section.
For the last word, some of the early articles simply classify the moving objects as fire but this
approach leads to many false alarms, because the moving objects may not be fire or smoke always.
Moving object detection algorithms may be used as a part of the detection system. However, to
determine if the motion is due to smoke or an ordinary moving object, further analysis of moving
regions in video is necessary.

15
2.3.3. Motion and Flicker Analysis in Fourier Domain
Especially when there is too little or too much airflow around the flame, flickering occurs. This
behavior is basically caused by the disturbed air around the fire. Flames heat the air around them
by turning oxygen to carbon dioxide. Both can cause a flame to flicker even when there is no
discernible breeze. Particularly for an uncontrolled fire, flickering occurs persistently. In the
articles listed in Table 1, using the frequency analysis to distinguish the flames from the other
moving objects is proposed. Therefore, the temporal behavior of the flames and smoke can be
analyzed by the flicker detection [51], [18], [12], [14], [48], [28], [30] in video and wavelet domain
signal energy analysis [21], [13], [20], [26], [31], [52]. By the help of these methods, it is possible
to distinguish ordinary objects from fire. It is important to underline that, flame colored pixels
appear and disappear at edges of turbulent flames. The research in [16] and [18] shows
experimentally that the flicker frequency of turbulent flames is not highly affected by the burning
material and the burner and its value is around 10 Hz. According to the article [53], an increase in
Fourier domain energy in 5 to 10 Hz may be accepted an indicator of flames.
However, smoke flicker detection does not seem to be a very reliable technique because of the
following reasons explained. In the early stages of an uncontrolled fire, the combustion process
has great nonlinear instabilities. Therefore, an uncontrolled fire in its early stages exhibits a
transition to chaos [54], [55]. Moreover, it is not possible to observe a single flickering frequency
in an uncontrolled fire for the turbulent flames due to the reason that they can be characterized as
a chaotic wide wand frequency activity. This phenomenon was observed by independent
researchers working on video fire detection and methods were proposed accordingly [14], [48],
[56]. Similarly, for the main scope of this project, for smoke, is not possible to mention about a
specific flicker frequency. However, it is possible to observe a clear time-varying meandering
behavior in uncontrolled fires. Therefore, it can be concluded as follows: smoke flicker detection
is not a very reliable technique, but like the color detection, it can be used as part of a multi-feature
algorithm fusing various vision clues for smoke detection. Temporal Fourier analysis can still be
used to detect flickering flames, but we believe that there is no need to detect specifically 10 Hz.
An increase in Fourier domain energy in 5 to 10 Hz is an indicator of flames. As a result, smoke
boundaries also oscillate with a lower frequency at the early stages of fire [57].
2.3.4. Color Variations
Flame color depends on several factors, the most important typically being black-body radiation
and spectral band emission. There is also a relation between the flame colors and temperature.
Therefore, Flames have varying colors even within a small area. Spatial color difference analysis
focuses on this characteristic. Using the spatial wavelet analysis [14], [28], range filters [24] and
variance/histogram analysis [32], the spatial color variations in pixel values are analyzed to
16
separate ordinary fire-colored objects from flames. Histogram based approach focuses in the
standard deviation of the various color bands. However, green pixel values vary more than red and
blue values. If the standard deviation of the green color band exceeds 𝑡𝜎 = 50 (∼ Borges [32]) in
a typical color video the region is labeled as a candidate region for a flame.
On the other hand, smoke does not show great spatial color variations as flame regions. Therefore,
mentioned methods are not always applicable for smoke regions detection. In general, smoke in
an uncontrolled fire is gray and it reduces the color variation in the background. Therefore, in YUV
color space or YCbCr we expect to have reduction in the dynamic range of chrominance color
components when the smoke occurs in a video frame. In addition, grayish colored moving object
may cause false detections since they have the similar characteristics with smoke.
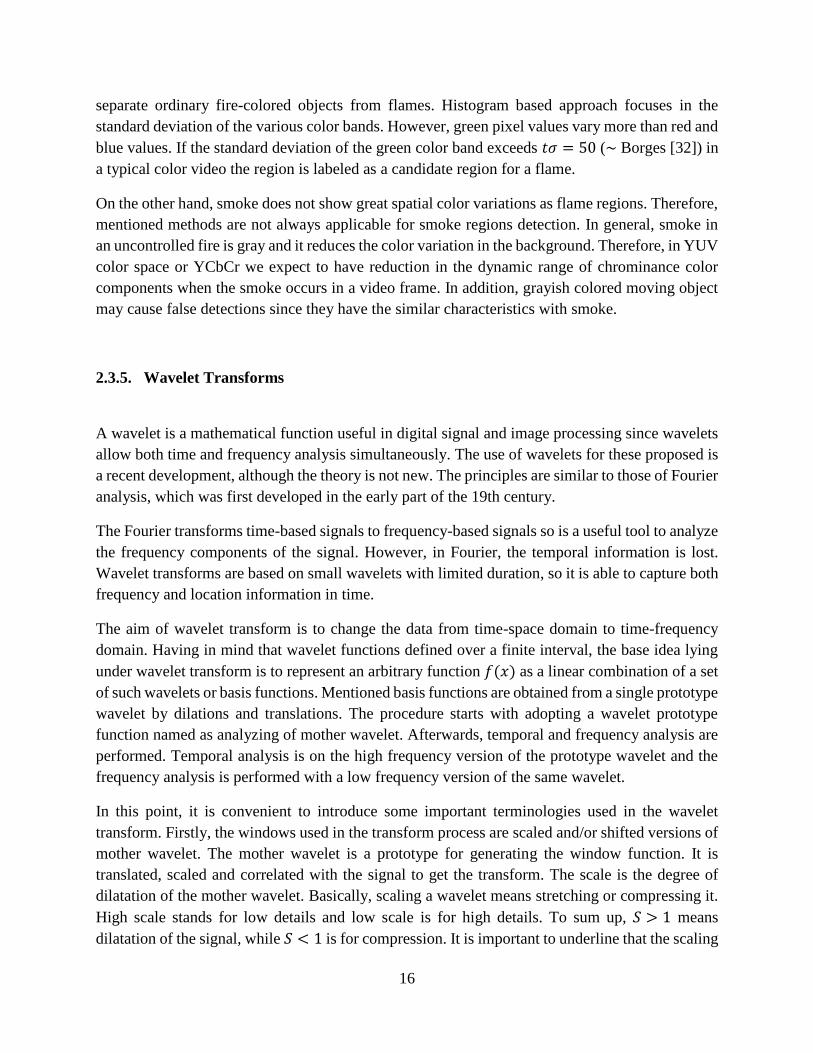
2.3.5. Wavelet Transforms
A wavelet is a mathematical function useful in digital signal and image processing since wavelets
allow both time and frequency analysis simultaneously. The use of wavelets for these proposed is
a recent development, although the theory is not new. The principles are similar to those of Fourier
analysis, which was first developed in the early part of the 19th century.
The Fourier transforms time-based signals to frequency-based signals so is a useful tool to analyze
the frequency components of the signal. However, in Fourier, the temporal information is lost.
Wavelet transforms are based on small wavelets with limited duration, so it is able to capture both
frequency and location information in time.
The aim of wavelet transform is to change the data from time-space domain to time-frequency
domain. Having in mind that wavelet functions defined over a finite interval, the base idea lying
under wavelet transform is to represent an arbitrary function 𝑓(𝑥) as a linear combination of a set
of such wavelets or basis functions. Mentioned basis functions are obtained from a single prototype
wavelet by dilations and translations. The procedure starts with adopting a wavelet prototype
function named as analyzing of mother wavelet. Afterwards, temporal and frequency analysis are
performed. Temporal analysis is on the high frequency version of the prototype wavelet and the
frequency analysis is performed with a low frequency version of the same wavelet.
In this point, it is convenient to introduce some important terminologies used in the wavelet
transform. Firstly, the windows used in the transform process are scaled and/or shifted versions of
mother wavelet. The mother wavelet is a prototype for generating the window function. It is
translated, scaled and correlated with the signal to get the transform. The scale is the degree of
dilatation of the mother wavelet. Basically, scaling a wavelet means stretching or compressing it.
High scale stands for low details and low scale is for high details. To sum up, 𝑆 > 1 means
dilatation of the signal, while 𝑆 < 1 is for compression. It is important to underline that the scaling

17
functions play a crucial role in the wavelet transformations. The concept of scaling functions is
most easily understood using Haar wavelets. The Haar functions are the simplest compactly
supported scaling functions and wavelets. Finally, the translation and shift terms refer to the scaled
wavelet. Principally, shifting a wavelet means introducing a delay.
After giving a brief introduction to the wavelets, it is appropriate to introduce the place and
importance of wavelet transform in smoke detection. Smoke obstructs the texture and edges in the
background of an image. Since the edges and texture contribute to the high frequency information
of the image, energies of wavelet sub images drop due to smoke in an image sequence. Based on
this information proposed by Toreyin et al. [14], it is worthwhile to perform this analysis on the
source video. Following in the report, the decrease in local wavelet energy is under researched.
To begin with the wavelet analysis, introducing equation ( 8 ) represents a composite image
containing high frequency information at a given scale. Performed analysis is fed by a 𝑌𝐶𝑏𝐶𝑟
source image. Thus, the wavelet sub images are computed by using the luminance image 𝑌 as
suggested in the [57]. Letting (𝐾1, 𝐾2) to represent the block size and 𝑒(𝑙1, 𝑙2) to represent the
energy, for each block, the energy is computed as given in the equation ( 9 ). In addition to this, in
the wavelet sub image, 𝑅𝑖 represents a block with the size (𝐾1, 𝐾2).
𝑤𝑛(𝑥, 𝑦) = |𝐿𝐻𝑛(𝑥, 𝑦)|2 + |𝐻𝐿𝑛(𝑥, 𝑦)|2 + |𝐻𝐻𝑛(𝑥, 𝑦)|2 ( 8 )
𝑒(𝑙1, 𝑙2) = ∑ 𝑤𝑛(𝑥 + 𝑙1𝐾1, 𝑦 + 𝑙2𝐾2)
(𝑥,𝑦)∈𝑅𝑖
( 9 )
Wavelet sub images contains the edge information of the original image and they are horizontal,
vertical and diagonal edges of the original image, respectively, 𝐿𝐻, 𝐻𝐿 and 𝐻𝐻. Edges produce
local extrema in the wavelet sub images. Therefore, is smoke occurs on the monitored scene, the
edges become invisible decreasingly and after some time the edges disappear from the frame.
The wavelet domain analysis can be used to analyze the temporal behavior of smoke, as proposed
by Toreyin et al. [14]. This method gives promising results for the smoke detection. When smoke
occurs, the edges in the image are softened gradually. According to the [14], the energy variation
between background and current image can be used as a clue for the smoke detection. Discrete
Wavelet Transform (DWT) is used to detect this energy decrease in the edges of the image. Red
channel values of the pixels are used for DWT. The two-channel sub band decomposition filter
bank is composed of half-band high-pass and low-pass as shown in the Figure 9 and HPF and LPF
represent half-band high-pass and low-pass filters, used for wavelet analysis.
Mentioned filter bank produces four wavelet sub images, called as low–low version of the original
image 𝐶𝑡 and the horizontal, vertical and diagonal high frequency band images 𝐻𝑡, 𝑉𝑡 and 𝐷𝑡. The
high band energy from sub images 𝐻𝑡, 𝑉𝑡 and 𝐷𝑡 is evaluated by dividing the image 𝐼𝑡 in blocks
𝑏𝑘 of arbitrary size and evaluation is based on the formula given on the following equation ( 10 ).

18
𝐸(𝐼𝑡, 𝑏𝑘) = ∑ 𝐻𝑡2
𝑖,𝑗∈𝑏𝑘
(𝑖, 𝑗) + 𝑉𝑡2(𝑖, 𝑗) + 𝐷𝑡
2(𝑖, 𝑗) ( 10 )
Figure 9 a Two-Stage Filter Bank
High-band wavelet images are influenced by the edges of the image rather than the flat areas.
Therefore, smoke detection may be performed by analyzing the decrease in the 𝐸(𝐼𝑡, 𝑏𝑘). In DWT
based video smoke detection, when there is smoke, the ratio between the input frame wavelet
energy and the background wavelet energy decreases and shows a high degree of disorder. Thus,
temporal analysis of the ratio between the current input frame wavelet energy and the background
image wavelet energy is used for performing the smoke detection.
2.3.6. Classification
Classification is a broad range of decision approaches for the identification of images or parts.
Classification approaches contains a database that consist of predefined patterns that are compared
with detected object to classify in to proper category. Image classification refers to the labelling of
images into one of a number of predefined categories, either performed by an analyst (as in
supervised classification) or automatically clustered (i.e. as in unsupervised classification) into
sets of prototype classes, where the analyst merely specifies the number of desired categories.
Image classification is an important and challenging task in smoke detection, since it provides
more promising results for the ambiguous features of smoke. Many classification techniques have
been used for smoke and fire detection. A popular approach for the classification for smoke or
flame blob is the SVM classification, typically with Radial Basis Function kernels. In order to
decrease the number of false alarms, large number of frames of smoke and non-smoke video
sequences need to be used for training SVM classifiers.
The other classification methods listed in the Table 1 are AdaBoost method [22], neural networks
[29], [35], Bayesian classifiers [30], [32], Markov models [28], [33] and rule-based classification
[58].

19
Last but not least, like in all the image processing applications, morphological operations, sub-
blocking and clean-up post processing such as median-filtering are used as the part of the fire
smoke detection systems; [20], [21], [22], [25], [26], [33], [36], [59].
2.3.7. Neural Networks
Machine learning is the practice of using algorithms to analyze and learn from datasets in order to
make an estimation or prediction about new piece of unknown data by learning certain rules from
given data. Using large datasets, machine learning algorithms develop ability to understand how
to perform a task without being explicitly told how to do so. Conventional approaches, on the
contrary, have their focus on manually writing code with a specific set of instructions to
accomplish a particular task, in this case, smoke detection. Neural networks (NN), incorporate
algorithms to analyze data, learn from data, and then make an estimation or
prediction about new data. It is important to remind that the latest advancements in MathWorks’
Neural Network toolbox allow for simple, easy, and fast prototyping of NN based machine
learning methods in MATLAB.
Like all neural networks, convolutional neural networks (CNNs) are made of neurons and
connections that have learnable weights and biases. The only difference between ordinary neural
networks and CNNs is that convolutional network architectures make the explicit assumption that
the inputs are images, which allows us to encode certain properties into the architecture. This
encoding is done through integrating hidden layers that do special transformations on their inputs.
CNN’s also involve other types of hidden layers like Max Pooling, Average Pooling, Batch
Normalization, etc.
The architecture of the network is chosen by the engineer who initially designed the network. But
the layers themselves come with many unknown weights and biases in their connections. The
optimal values of these parameters are determined in the process of training the CNN. Training a
network can be said as solving an optimization problem, which is focused on the weights and
biases in the model. At the beginning, each connection between neurons has an arbitrary weight
assigned to it. During training these weights are constantly updated with the aim of reaching their
optimal values. How the optimization is done depends on the optimization algorithm or optimizer
that the developer chooses to use for the model. The most known optimizer that attempts to set the
model’s weights is called stochastic gradient descent (SGD) and as also proposed in this work,
stochastic gradient descent with momentum (SGDM). Here, the objective is to minimize a given
loss function. The model learns by repeatedly sending the same data into the model, calculating
the loss function, and then update the weights of the model accordingly. A representation of this
logic is given in the Figure 10. A single pass of the data through the model is called an epoch.

20
Figure 10 Training Neural Networks
As indicated before, if we want to use the neural networks, we need to feed the network by images.
As the contribution of this work, the network is not fed by the full-size images. It is proposed to
analyze the images and extract the suspicious regions. Therefore, the detected regions are used to
train the network. Extracted areas are saved in a file as individual images, however, they should
be resized to be in the correct size for the neural network. In addition to this, it is convenient to
introduce here, the term of data augmentation, which is a way of creating new ‘data’ with different
orientations. There are two main benefits of this step, the first being the ability to generate ‘more
data’ from limited data and secondly it prevents over fitting.
Following, a basic NN is designed as a reference to be used for smoke detection. In this step, the
data fed to the network is already preprocessed by the steps explained previously in the report, like
background subtraction and blob detection. Therefore, it is foreseen that a simple neural network,
as given in the following, would be satisfying for this job. In addition to this, labelling can be done
more accurate, not only smoke and nonsmoke indicators but more detailed such as human, luggage
and so on. Following in the report, a NN design is proposed for smoke detection.

21
%Conv Layer 1 conv1FilterSize = [5,5]; conv1FilterNum = 10; conv1 = convolution2dLayer(conv1FilterSize,conv1FilterNum);
%Conv Layer 2 conv2FilterSize = [5,5]; conv2FilterNum = 20; conv2 = convolution2dLayer(conv2FilterSize,conv2FilterNum);
%Conv Layer 3 conv3FilterSize = [5,5]; conv3FilterNum = 30; conv3 = convolution2dLayer(conv3FilterSize,conv3FilterNum);
%Relu Layer ReLU = reluLayer();
%Max Pooling Layer maxpool = maxPooling2dLayer(2,'Stride',2);
Arch2 = [imageInputLayer([48 64 3]); conv1; ReLU; maxpool; % conv2; % ReLU; % maxpool; % conv3; % ReLU; % maxpool; fullyConnectedLayer(2); softmaxLayer(); classificationLayer();];
options = trainingOptions('sgdm',... 'LearnRateSchedule','piecewise',... 'LearnRateDropFactor',0.2,... 'LearnRateDropPeriod',10,... 'MaxEpochs',25);

22
2.3.8. Evaluation of Visible Range Video Fire Detection Methods
In the review paper [53], an evaluation of different visible range fire and smoke detection methods
is presented. Methods are performed on different video clips that contain different fire flames and
smoke from different sources. There are also clips without fire and smoke. Snapshots from test
sequences with and without fire are presented on the Figure 11.
Figure 11 Snapshots from Test Sequences with and without Fire, data from [53]
In the review, among various algorithms, following ones are deeply investigated and performed,
[14], [18], [23], [45], [54]. On an introductory basis, it can be said that, the flame detection methods
by Celik and Borges and the smoke detection methods by Toreyin and Xiong are commonly
referenced methods in the literature and the method of Verstockt is a relatively recent one.
Following Table 2, presents the comparison of the smoke and flame detection methods. The
method proposed by Verstockt [45], named as ‘Method 1’ in the Table 2. Following, a combined
method based on the flame detector by Celik et al. [60] and the smoke detector described in Toreyin
et al. [14], named as ‘Method 2’ in the
Table 2. Finally, the ‘Method 3’ is the combination of the feature-based flame detection method
by Borges et al. [23] and the smoke detection method by Xiong et al. [18].

23
Video
sequence
# o
f fr
am
es # Fire
frames
# Detected fire
frames
# False positive
frames
Detection rate
ground
truth
Method Method Method
1 2 3 1 2 3 1 2 3
Paper fire 1550 956 897 922 874 9 17 22 0.93 0.95 0.89
Car fire 2043 1415 1293 1224 1037 3 8 13 0.91 0.86 0.73
Moving
people
886 0 5 0 28 5 0 28 - - -
Wood fire 592 522 510 489 504 17 9 16 0.94 0.92 0.93
Bunsen
burner
115 98 59 53 32 0 0 0 0.6 0.54 0.34
Moving
car
332 0 0 13 11 0 13 11 - - -
Straw fire 938 721 679 698 673 16 21 12 0.92 0.93 0.92
Smoke/fog
machine
1733 923 834 654 789 9 34 52 0.89 0.67 0.8
Pool fire 2260 1844 1665 1634 1618 0 0 0 0.9 0.89 0.88
Table 2 Comparison of the Smoke and Flame Detection Methods, data from [53]
For performance evaluation, test sequences are captured in different environments under different
conditions as shown in the Table 2 and Figure 11. With the aim of having a fair and objective
evaluation of the different detection methods, the ‘detection rate’ metric [45], [61] is used. The
detection rate is calculated by the ratio of the number of correctly detected frames as fire and the
number of frames with fire in the manually created ground truth frames. It is important to highlight
that, this evaluation method is comparable to the methods used by Toreyin et al. [14] and Celik et
al. [60]. Looking at the detections rates in the Table 2, it is convenient to say that the performances
of various methods are comparable with each other.

24
Chapter 3
3. Proposed Detection Approach
The principal idea is to characterize smoke using efficient features such as motion, color, etc.
Afterwards the detection techniques are discussed for the same. Basically, every single frame in
the video is checked for the presence or absence of smoke. Each step of the proposed algorithm is
explained in detail.
In this section of report, firstly the frame-based fire detection algorithms are implemented in
MATLAB. In this approach, the proposed algorithms are applied in the whole image and outcomes
are observed. Following in the report, contribution of this work to the existing algorithms is
explained. Most of the fire detection algorithms are based on the whole frame analysis. However,
in the proposed approach, region-based detection method is designed.
3.1. Frame-Based Detection Algorithms
The frame-based fire detection algorithms performed in MATLAB and based of several titles: (i)
wavelet analysis is performed to determine high-frequency activity within these moving regions.
After that, image histogram (ii) and entropy (iii) definitions investigated deeply for smoke frames.
After these, an alternative view to the thresholding is proposed, (iv).
3.1.1. Wavelet Transform and Analysis
In the Wavelet Transforms section of the Literature Review title, a brief introductive information
is given to the importance and the usage of the wavelet analysis in the smoke detection problem.
Following that, it is convenient to continue as following. Wavelet analysis has sub-headings such
as continuous wavelet transforms, discrete wavelet transforms, fast wavelet transform. In this part
of the project, discrete wavelet transform is in use, which is a multi-resolution signal
decomposition method obtained by convolving the intensity image with filter banks. Following
the equations ( 8 ) and ( 9 ), suggested methods are implemented on MATLAB. In the Figure 12,
given screenshots are from a video captured in a room when smoke occurs.

25
Figure 12 Smoke in the Room
Considering the edges in the original image correspond to the extremes of the wavelet
transformation of the background image, slow fading of these extremes may be observed when the
scene is subjected to smoke. As can be seen in the Figure 12, smoke brings also less visibility in
the monitored area. Thus, this circumstance may be due to the existence of smoke. It is important
to highlight that in this context; only slow variations are valuable. An instantaneous variance on
the extrema values are not considered because of smoke. These fast changes may be due to an
ordinary moving object that creates a sudden coverage of the edges. Thus, such changes are
ignored.
Figure 13 Wavelet Energies
In the Figure 13, performed wavelet energy analysis is given for the video shown on the Figure
12. The analysis is performed for the all video frames and in the section (a) horizontal, section (b)
vertical and the section (c) the diagonal component is shown. As can be seen on the Figure 13, it
is possible to observe a slow fading of the energies from the moment the smoke comes into scene.

26
Let it be known that, the energy does not drop down to zero but only has a decrease. With the aim
of visibility detection, it is conceivable to set thresholding such as 1 > 𝑇2 > 𝑇1 > 0. By having
𝑇1 > 0 and not 𝑇1 ≥ 0, it is guaranteed to have edges semitransparent and not totally vanished due
to the nature of initial smoke.
To summarize, in general, it is possible to say that if there is a decrease in value of certain 𝑒(𝑙1, 𝑙2),
this means that the texture or edges of the video frame do not have the sharp features as used to
be. Thus, this loss of the high frequency components may be the sign of the smoke in the image
region corresponding to the (𝑙1, 𝑙2)𝑡ℎ block. Under certain conditions, it is possible to set threshold
values for comparison and following an alarm may be given if the energy value 𝑒(𝑙1, 𝑙2) goes
below the defined threshold value.
Figure 14 Current - Background Image Wavelet Ratio
Therefore, the contribution of the edges and details is more significant in high band wavelet images
compared to the plain areas of the image and so it is possible to detect the smoke using the decrease
in the wavelet energy. Since the energy value of a specific block with the size of (𝐾1, 𝐾2), varies
importantly over time in the presence of smoke, the temporal analysis of the ratio between the
current input frame wavelet energy and the background image wavelet energy may be used for the
smoke detection.
The wavelet transforms of the background image, as given on the Figure 14, section (a) is used to
compute the energy values. These values stand for the details in the background image. After this,
the local energy values are computed for the current image that is given on the Figure 14, section
(b) by using its wavelet transform. Having a comparison between these energy values and tracking
this ratio variation, it is possible to obtain a strong hint about smoke detection. The ratio of the
background and the current image wavelet energies is given on the Figure 14, section (c). As can
be seen on the section (c), on the frame numbers between 80 and 200, smoke comes in sight, the
ratio between the input frame wavelet energy and the background wavelet energy decreases and
shows a high degree of disorder. In the rest of the scale, the energy values show a more stable
behavior.

27
This analysis yields good results; however, this approach has two drawbacks. Firstly, in this
algorithm, a stationary camera is in use, but this point is not important for the train environment
as said before, in the trains, the cameras being in fixed position and stable. The second one is that
the algorithm has highly computational complexity despite working in real-time. This point would
be vital for the choosing the adequate hardware.
3.1.2. Image Histogram
Histogram is a graphical representation of a digital image that shows the number of pixels in an
image at each different intensity value found for each color channel. By looking at this graph, it is
possible to investigate the entire tonal distribution. The working principle is very simple. The
image is scanned, and the number of pixels found at each intensity value is used to create the
histogram graph. In a fire situation, as mentioned also in the previous sections, smoke comes in
sight firstly and occupies most of the pixels in the video frame. Thus, it can be said that, the digital
image consists mostly the grayish colored pixels. The average of the RGB values of the pixels
should be in between 80 and 220 as given in the equation ( 1 ). Grayish color range and their RGB
values are given in the Table 3.
RGB (80,80,80) RGB (152,152,152)
RGB (88,88,88) RGB (160,160,160)
RGB (96,96,96) RGB (168,168,168)
RGB (104,104,104) RGB (176,176,176)
RGB (112,112,112) RGB (184,184,184)
RGB (120,120,120) RGB (190,190,190)
RGB (128,128,128) RGB (200,200,200)
RGB (136,136,136) RGB (208,208,208)
RGB (144,144,144) RGB (211,211,211)
Table 3 Gray Color RGB Values
Therefore, the histogram of the frame with smoke will show higher number of grayish pixels with
respect to the frames without smoke. According to this theory, the following experiment is carried
out. In an environment, smoke is generated by a fog machine. The video used to capture two
images, one contains smoke and the other does not. Afterwards, the histogram analysis is carried
out with the aim of determine the smoke colored pixels behavior.

28
Figure 15 Histogram of a Frame without Smoke
Figure 16 Histogram of a Frame with Smoke
In the Figure 15, the frame does not contain any smoke and this image is used to observe the
normal histogram behavior of the scene. As can be seen on the given graphs, for all color bands,
histograms have large range variations. In the Figure 16, the observation is done in the same scene,
when the smoke starts by the fog machine. It is possible to observe a reduction in the color
variations in all color channels and accumulation on the grayish color range on the graphs given
in in the Figure 16.
In a train environment, this method would give promising results as well since in the background
scene there are a lot of details and different colored objects. However, this algorithm is also
essentially color based, and does not exploit other statistical characteristics of potential fire
regions. In addition, temporal variation in image pixel color does not capture the temporal property
of fire and smoke which is more complex and benefits from a region level representation.
3.1.3. Image Entropy
Entropy of the image specifies the uncertainty in the image values. It is used to characterize the
texture of the digital image and it gives the statistical measure of randomness. The entropy 𝐻 of
an image is defined as in the equation ( 11 ).

29
𝐻 = − ∑ 𝑝𝑘 log2(𝑝𝑘)
𝑀−1
𝑘=0
( 11 )
where 𝑀 is the number of gray levels and 𝑝𝑘 is the probability associated with gray level 𝑘. In
case of a uniform, probability distribution, maximum entropy may be reached. If 𝑀 = 2𝑛, then 𝑝𝑘
is constant and it is given by 𝑝𝑘 =1
𝑀= 2−𝑛. Then the maximum entropy can be expressed by the
equation ( 12 ).
𝐻𝑚𝑎𝑥 = − ∑ (1
𝑀) log2 (
1
𝑀) = − log(2−𝑛) = 𝑛
𝑀−1
𝑘=0
( 12 )
In a video frame that is captured in a scene without smoke, the entropy value generally remains
constant and some small variations may occur in case of a moving object. However, in a frame
that contains smoke, the entropy value changes dramatically. When smoke occurs, most of the
pixels in the image would have the close gray levels. The details in the image would be lost and
the image itself becomes almost constant. This may be explained by the help of the minimum
entropy as following. The minimum entropy may be achieved when the image itself is constant,
meaning that all the pixels in the image have the same gray level. Considering the gray level as 𝑘,
𝑝𝑘 = 1 and 𝐻 = − log(1) = 0.
Figure 17 Entropy Analysis
In the Figure 17, the entropy values are calculated for each frame given on the right graph, on the
video shown on the left side of the figure. It is important to specify that processed video is the
same as given in the Figure 12. The graph in the Figure 17, shows the entropy values of the video,
frame by frame. It is clearly seen that, when smoke occurs, the entropy values drop down
expeditiously. This is because the image loses its randomness and becomes more and more
constant when the smoke spreads.

30
3.1.4. Moving Variance
Variance is a measurement of the spread between numbers in a data set. It measures how far each
number in the set is from the mean. In the section of Wavelet Transform and Analysis, it is
proposed to define a threshold by Toreyin et al. [14], to detect the energy variations due to the
smoke in the scene. Variance has many usages in image processing but in this context, it is
proposed to introduce a different perspective than thresholding, regardless the computational load.
It is worthily to introduce this method because thresholding is quite attached to the setups and
spatial variations. Moreover, in real time and practical applications, thresholding would result in
wrong alarms, so that having more reliable methods especially for vehicles like high speed trains
is safety-critical. This method may be seen more adaptive way to detect the wavelet energy
changes.
Proposed wavelet energy variation detection process works with the real-time acquisition of the
energy values and calculating the moving variance over the data series by using an adequate sliding
window. In this point, introducing a MATLAB function 𝑚𝑜𝑣𝑣𝑎𝑟(𝐴, [𝑘𝑏 , 𝑘𝑓]) which returns an
array and computes the variance with a window of length kb + kf + 1. In the given window
length, 𝑘𝑏 elements backward, and 𝑘𝑓 elements forward on the wavelet energy values, as defined
in 𝐴. By placing all the variance values obtained from the wavelet analysis into a vector, the
function 𝑚𝑜𝑣𝑣𝑎𝑟(𝐴, [𝑘𝑏 , 𝑘𝑓]) will operate along the length of the vector.
Figure 18 Moving Variance Results

31
Therefore, the mentioned approach is performed on the video shown in the Figure 12, and the
results can be observed on the Figure 18. In the input video, smoke starts to appear in the scene
after the 120th frame. On the Figure 18, the upper graph shows the energy values obtained by the
help of the wavelet analysis and the graph below, shows the moving variance results of the energy
values. As can be observed on the upper graph and it is also mentioned in the section Wavelet
Transform and Analysis, smoke causes high degree of disorder in the energy wavelet energy.
Therefore, this disorder is detected by the moving variance function as can be seen in the graph in
the Figure 18.
3.2. Region-Based Approach
In this section, the most promising and innovative part of this work is presented. Firstly, suspected
areas are detected in the video frames, after that, smoke clues are searched on these regions. By
computing the most promising smoke clues for each suspicious region, it is possible to train a
classifier by using the parameters obtained from these suspicious regions. The algorithm is given
as following; (i) moving pixels or regions in the current frame of a video are determined, (ii) image
enhancement and filtering methods are performed on the detected moving areas, then blob
detection is performed in the foreground image (iii), feature analysis is carried out on the blobs,
Later, support vector machine (viii) is introduced. The step by step illustration of the implemented
algorithms is given in the report. In the following Figure 19, a representation of the proposed
detection algorithm is shown.
Figure 19 Detection Algorithm

32
3.2.1. Background Subtraction
Motion is one of the most important features of smoke. Therefore, detection of the moving areas
on the image, brings an effective way to distinguish smoke pixels from the background. In this
section of the project, the moving pixels and regions in the video are determined by using a
background estimation method developed by Collins et.al. [49]. As shown in the equation ( 7 ),
the background image is estimated from the current frame and 𝛼 is a time constant parameter that
specifies how fast new information replaces previous observations and it varies between 0 and 1.
Particularly for this project, 𝛼 is defined as 0.05. Having 𝛼 smaller, shows that the contribution of
the recent frames is more while the past frames are becoming more negligible. Thereafter, moving
pixels are determined by subtracting the current image from the background image and
thresholding. MATLAB implementation for this part of algorithm is as following;
alpha = 0.05;
if frame == 1
Background = thisFrame;
else
Background = (1-alpha)*ThisFrame + alpha*Background;
end
differenceImage = ThisFrame - Background
Following Figure 20, shows screenshots of this detection algorithm and the explanation is given
below.
Figure 20 Result of the Detection Algorithm

33
Performing the detection algorithm on a video that contains fire, smoke and a moving person, the
results shown on the Figure 20. In the section (a), original background is shown when there is no
movement on the video frames. Section (b) shows a frame when the smoke occurs, so does the
smoke movement. In the section (c), a frame that contains a moving object (human) and smoke is
shown. After applying the background substraxtion method given in this chapter, results are shown
on the sections (d) and (e). Section (d) shows the detected smoke motion, while the section (e)
showing the detected moving regions of smoke and the moving object.
After this step, it is necessary to analyze these moving regions further to determine if the motion
is due to smoke or an ordinary moving object. The further discussion about this problem is given
on the following chapters.
3.2.2. Image Filtering and Enhancement
After the having the moving object detection by Background Subtraction, it is convenient to
introduce some reference-standard algorithms for image enhancement and filtering. These
methods are used to obtain better results before passing to the next steps. Thus, following methods
are crucial for performing various image processing, analysis such as image enhancement and
noise reduction, visualization, and algorithm development.
• Otsu's algorithm
Otsu's algorithm is used to perform clustering-based image thresholding or, the reduction of a gray
level image to a binary image. This algorithm calculates the optimum threshold level that is used
to convert the intensity image to a binary image. In MATLAB, the ‘graytresh’ function uses Otsu’s
method. In this project work this function is used to create the moving object mask for detection
of smoke.
• Median filter
The median filter is a nonlinear digital filtering technique and often used to remove noise from an
image or signal. It is widely used as it is very effective at removing noise while preserving edges.
Such noise reduction is a typical pre-processing step to improve the results of later processing. In
this project, 2D median filter is used in order to remove the salt and pepper noise on the image
obtained after binarizing the detected moving objects in the video frames.
In the median filter, each pixel is considered in the image and the filter looks at the pixel’s
neighbors to decide whether it is representative of its surroundings or not. Filter uses the median
value of the neighbor pixel values to renew the pixel value. In MATLAB, ‘medfilt2’ function
performs median filtering of the image A in two dimensions.

34
Figure 21 Median Filter
On the video frame shown on the Figure 21, same methods applied for except for the median filter.
In the upper part of the figure, a detection without median filter can be observed while the lower
part of the figure is a snapshot with a 2D median filter applied. As can be seen on the figures,
median filter improves the results.
• Morphology
Morphological image processing is a collection of non-linear operations related to the shape or
morphology of features in an image and its goal is removing imperfections by accounting for the
form and structure of the image. In this project, closing operation is used to fill up the detected
moving object regions.
Figure 22 Morphological Operations
Some examples of the morphological operations in the image processing given on the Figure 22.
Dilation is shown on the section (a) and it lets to grow the image regions. Afterwards on the section
(b) the erosion operation is given, and this is to shrink the image regions. Opening and closing
operations given on the (c) and (d). Respectively, opening is the structured removal of image
region boundary pixels and closing is the structured filling in of image region boundary pixels.

35
3.2.3. Blob Detection and Analysis
As also indicated in the previous sections, most of the existing fire detection algorithms perform
analysis on the whole image. This approach may cause the heavy computational load by bringing
the information into calculation that have no use. In this work, region-based detection algorithm
is proposed and by having moving regions detected, first step of extracting the suspicious regions
from the whole image is realized. After obtaining the moving regions in the video frames, the first
thing to investigate is how to distinguish whether a moving object is smoke or not. To do so, firstly
the different objects in the image should be separated and the evaluation is necessary. In
accordance with this purpose, as also the contribution to the existing methods, performing blob
extraction and analysis is proposed.
In this former process, BLOB stands for Binary Large OBject and refers to a group of connected
pixels in an image that share some common property. The term “Large” indicates that only objects
of a certain size are of interest and that “small” objects are usually considered as noise. As a result,
the large objects are being inspected are clearly distinguished from the background. Thus, it can
be clearly said that, the goal of blob detection is to identify and mark the interested ‘smoke’
regions.
Main advantage of this technique is having the possibility of individual analysis of the interested
regions. Most common limitation of this method is: clear background-foreground relation
requirement. Fortunately, this limitation is overcome by providing a clear input image by means
of the steps previously taken.
To clarify deeply how does this section of the proposed algorithm works, all the methods used
explained step by step in the following. Thanks to MATLAB, computer vision system toolbox, the
BlobAnalysis object computes statistics for connected regions in a binary image. Since the
background subtraction and following enhancement methods are performed, in this point, detected
blobs will be the moving regions in the video frames. By means of blob analysis, every single
moving region will be detected and marked individually. This will allow to make analysis for each
individual blob, to discriminate of the region is smoke or another moving object.
Following function of MATLAB, 𝐻 = 𝑣𝑖𝑠𝑖𝑜𝑛. 𝐵𝑙𝑜𝑏𝐴𝑛𝑎𝑙𝑦𝑠𝑖𝑠(𝑁𝑎𝑚𝑒, 𝑉𝑎𝑙𝑢𝑒), returns a blob
analysis object, 𝐻, with each specified property set to the specified value. In the function,
minimum and maximum blob areas can be chosen, and this adjustment changes the sensitivity of
the blob detection. In case of choosing smaller minimum area, the detection will be more sensitive
for the smaller connected regions. After detection, each blob is labeled for the aim of individual
analysis. Each labeled area is a gray scale valued image where all pixels in the blobs have values
of 0-255. In the Figure 23, section (a) shows the original frame of the video, section (b) is the result
of the background subtraction, so the moving areas in the frame. Finally, the section (c) shows the
gray scale labeled blobs.

36
Figure 23 Grayscale Labeled Blobs
In addition to gray scaled labeling, it is also possible to assign a different color to each blob for
distinction of the blobs more visual. In order to do so, 𝐻𝑆𝑉 color space is used to pseudo random
color the labels. It is also possible to apply the colormap. In the Figure 24, section (a) is the gray
scale labeled blobs, besides this, (b) shows the pseudo colored labelling result. It is important to
underline that the blobs are numbered from top to bottom, then from left to right.
Figure 24 Pseudo Colored Labels & Outlines
Furthermore, 𝑏𝑤𝑏𝑜𝑢𝑛𝑑𝑎𝑟𝑖𝑒𝑠() function in MATLAB returns a cell array, where each cell
contains the row/column coordinates for an object in the image. Afterwards, it is possible to plot
the borders of all the blobs using the coordinates returned by 𝑏𝑤𝑏𝑜𝑢𝑛𝑑𝑎𝑟𝑖𝑒𝑠 function. Performing
this operation, obtained result can be observed on the Figure 24, section (c).
Subsequently, having all these said done, it is essential to perform blob analysis to have a picture
of the smoke features and how they vary over time. In the proposed algorithm, a loop is taken
through all blobs and analysis are performed to capture if a blob contains the features of smoke
that are introduced under the title of Literature Review in this report. According to the researches

37
published in the literature, if a blob belongs to a smoke region, it should be continuous and growing
over time. This is because if a moving region belongs to an object or a person, it is assumed to stop
sometime. Such as the people in the train, if they stand up and start to walk, they must stop and sit
down eventually. Thus, a blob that contains smoke shows an increasing trend in the blob area. The
color distance from gray should decrease over time because of the grayish color of the smoke.
Therefore, following properties are obtained for each blob detected in the video.
𝑡ℎ𝑖𝑠𝐵𝑙𝑜𝑏𝑠𝑃𝑖𝑥𝑒𝑙𝑠 = 𝑏𝑙𝑜𝑏𝑀𝑒𝑎𝑠𝑢𝑟𝑒𝑚𝑒𝑛𝑡𝑠(𝑘). 𝑃𝑖𝑥𝑒𝑙𝐼𝑑𝑥𝐿𝑖𝑠𝑡; % 𝐺𝑒𝑡 𝑙𝑖𝑠𝑡 𝑜𝑓 𝑝𝑖𝑥𝑒𝑙𝑠 𝑖𝑛 𝑐𝑢𝑟𝑟𝑒𝑛𝑡 𝑏𝑙𝑜𝑏.
𝑚𝑒𝑎𝑛𝐺𝐿 = 𝑏𝑙𝑜𝑏𝑀𝑒𝑎𝑠𝑢𝑟𝑒𝑚𝑒𝑛𝑡𝑠(𝑘). 𝑀𝑒𝑎𝑛𝐼𝑛𝑡𝑒𝑛𝑠𝑖𝑡𝑦; % 𝐹𝑖𝑛𝑑 𝑡ℎ𝑒 𝑚𝑒𝑎𝑛 𝑜𝑓 𝑒𝑎𝑐ℎ 𝑏𝑙𝑜𝑏.
𝑏𝑙𝑜𝑏𝐴𝑟𝑒𝑎 = 𝑏𝑙𝑜𝑏𝑀𝑒𝑎𝑠𝑢𝑟𝑒𝑚𝑒𝑛𝑡𝑠(𝑘). 𝐴𝑟𝑒𝑎; %𝐺𝑒𝑡 𝑎𝑟𝑒𝑎.
𝑏𝑙𝑜𝑏𝑃𝑒𝑟𝑖𝑚𝑒𝑡𝑒𝑟 = 𝑏𝑙𝑜𝑏𝑀𝑒𝑎𝑠𝑢𝑟𝑒𝑚𝑒𝑛𝑡𝑠(𝑘). 𝑃𝑒𝑟𝑖𝑚𝑒𝑡𝑒𝑟; %𝐺𝑒𝑡 𝑝𝑒𝑟𝑖𝑚𝑒𝑡𝑒𝑟.
𝑏𝑙𝑜𝑏𝐸𝐶𝐷(𝑘) = 𝑠𝑞𝑟𝑡(4 ∗ 𝑏𝑙𝑜𝑏𝐴𝑟𝑒𝑎/𝑝𝑖); % 𝐶𝑜𝑚𝑝𝑢𝑡𝑒 𝐸𝑞𝑢𝑖𝑣𝑎𝑙𝑒𝑛𝑡 𝐶𝑖𝑟𝑐𝑢𝑙𝑎𝑟 𝐷𝑖𝑎𝑚𝑒𝑡𝑒𝑟.
In addition to these features, a highly promising feature of smoke, wavelet energy, is also computed
for each detected blob and results of this computation are used in the training phase as well as the
other features. Wavelet energy analysis is proposed by Toreyin et al. [14] and it has been cited by
many researches. Therefore, the computation of this feature is not given here, it is worthwhile to
investigate on further thought. Thus, detailed explanations about the wavelet transform is given on
the chapter Wavelet Transform and Analysis.
In the given Table 4, a small portion of the blob analysis results is given. The result is obtained by
analyzing each frame and extracting the moving regions with labelled blobs. Therefore, for each
frame there are one, several or none blobs depending on the events occurring in the scene. It may
be said that observed features are highly depending on the technical and spatial parameters such
as camera, setups, lighting and so on. Thus, it may not be easy to obtain a clear pattern where the
human being can observe quickly and develop an uncomplicated detection method. To summarize,
obtaining an effective feedback from these features requires a detailed analysis on the different
input videos with the same setup. By removing the external effects on the video could result in a
noticeable pattern in the parameter variations. However, this is not realizable when we consider
the dynamic scenes, like train compartments. To conclude, it can be said that these methods can
be used as a part of the system or in case of obtaining a clear pattern. Since this cannot be realized
serenely. For these reasons, obtained feature matrix is proposed to be used to train a classifier
accordingly.

38
Table 4 Blob Analysis Results
3.2.4. Classification and Training
Classification in image processing includes a broad range of decision approaches for the
identification of the images or regions. Basically, all the classification algorithms assume that the
focused image represents one or more features and that each of these features belongs to several
different classes. These classes may be supervised or unsupervised. In machine learning, support
vector machines (SVMs) are an example of supervised learning models. In this context, given a
set of training examples, each marked as belonging to one or other categories, the SVM training
algorithm builds a model that assigns new examples to one of the categories, making it a non-
probabilistic binary linear classifier.

39
The principal idea is to characterize smoke using the features obtained after the blob extraction.
And the detection of the same using a suitable classifier, in this case SVMs. An SVM performs
classification by constructing an N-dimensional hyperplane that optimally separates the data into
two categories. SVM models are closely related to neural networks. On the purpose of preparing
the input, motion detection is performed for any single frame of a video stream and small blobs
are obtained for each moving region. Then, every blob should be checked for presence or absence
of smoke. The algorithm should continue with testing phase.
To give a start to the mentioned process, a number of blobs are obtained for each frame. On the
Figure 25, some examples of extracted blobs are given. For the sake of clarity, for example, frame
number one has blob number one and frame number two has blob number one and number two.
For each frame in the video, all the blobs are detected and extracted as explained, saved in a
different folder to be used later. Each blob is considered as samples and again for each of them
there are the parameters obtained in the previous steps, as explained in the section Blob Detection
and Analysis. In the equation ( 13 ), 𝑋𝑘𝑙 represents the parameters obtained in blob analysis, as
shown in the Table 4. Thus, these parameters are our features that are to be used to train the
classifier. Considering the number of frames that the video has expressed as 𝑓𝑛, in here 𝑓 represents
the frame and subscript 𝑛 represents the frame number. Following, 𝑏𝑚, where the 𝑏 stands for blob
and subscript 𝑚 represents the blob number, associated with that specific frame. In this project
following features are extracted for each blob and used as parameters in the classification input
matrix; mean intensity, blob area, blob perimeter, blob centroid, diameter and wavelet energy of
the blob. As shown in the equation ( 13 ), basically we have a matrix with the size 𝑘𝑥𝑙, 𝑙 used to
describe the number of blobs obtained along the whole video, and this matrix is used as the input.
𝑙 {
𝑓1𝑏1
𝑓2𝑏1
⋮𝑓𝑛𝑏𝑚
[𝑋11 ⋯ 𝑋𝑘1
⋮ ⋱ ⋮ 𝑋1𝑙 ⋯ 𝑋𝑘𝑙
]
𝑘𝑥𝑙
𝑖𝑛𝑝𝑢𝑡
( 13 )
After obtaining this input matrix, labelling should be done for the all blobs extracted from the
video. The blobs that contains smoke labeled as ′smoke’ and the ones does not contain smoke
′nonsmoke’ is used. This step is performed by using the image labeler application available on
MATLAB. This could be done by just using the whole frame and choosing a ROI area and label
them. However, for classification, small size of images that are captured by blob detection are used
to create the label matrix. Therefore, we can use all the parameters that are calculated for each
blob. Afterwards, obtained .mat file is converted to be 1 and -1, 1 represents smoke blobs and -1
is for nonsmoke ones. Moreover, this dataset and labels could be used also in neural networks. So,
the aim of this step is to have the discrimination between the ordinary moving object and smoke.

40
Figure 25 Extracted Blobs
After having the labels as the output vector, this input and output are given into MATLAB, so that
it fits a linear and gives a model. Following code line performs the mentioned process;
𝑆𝑉𝑀𝑀𝑜𝑑𝑒𝑙 = 𝑓𝑖𝑡𝑐𝑠𝑣𝑚(𝐼𝑛𝑝𝑢𝑡, 𝑂𝑢𝑡𝑝𝑢𝑡).
At this point, the SVM model is obtained. After this step, testing is necessary to be done. The aim
of classification is to have an automatic detection system. Therefore, detection of a smoke or
nonsmoke blob is done automatically. 10 percent of the input data may be used to build the test
input matrix. Plus, it is needed to introduce the model obtained. The model decides about the vector
of the label, meaning the output, as given in the following MATLAB code part, named as
labelstest.
𝑙𝑎𝑏𝑒𝑙𝑠𝑡𝑒𝑠𝑡 = 𝑟𝑒𝑑𝑖𝑐𝑡(𝑆𝑉𝑀𝑀𝑜𝑑𝑒𝑙, 𝐼𝑛𝑝𝑢𝑡𝑡𝑒𝑠𝑡);
As explained before, labels are given as [1, −1]. The reason for choosing these numbers is to be
able to calculate the performance easily as shown in the following MATLAB code.
𝑝𝑟𝑜𝑑 = 𝑙𝑎𝑏𝑒𝑙𝑠𝑡𝑒𝑠𝑡.∗ (𝑂𝑢𝑡𝑝𝑢𝑡′);
𝑒𝑟𝑟𝑁𝑢𝑚 = 𝑠𝑖𝑧𝑒(𝑓𝑖𝑛𝑑(𝑝𝑟𝑜𝑑 < 0));
All the blobs examined with the proposed method can give right alarm for most of the time.
However, there exist some false alarm. This may be because of the dependence of the selected
statistical values for training. In case of having non-appropriate values for training, the resulting
accuracy may not be very promising. This issue can be overcome by doing more work on the
training data, using larger input variables for the classification or increasing the number of labels
to have more advanced results.

41
3.2.5. Illustration of the Region Based Algorithm
In this chapter of the report, the code sequence and the outcomes of the mentioned methods in the
Region-Based Approach section are given following the sequence of Figure 19. Methods and
approaches are performed on an ordinary video that includes smoke and the results are shown step
by step.
1. Extract the frame
from video
𝑰𝒏 Frame no:56
2. YCbCr transform,
extract Y channel
𝒀_𝑰𝒏 Frame no:56
𝑰𝑴𝒐𝒗𝒊𝒏𝒈 Frame no:56
3. Background
subtraction with Y
channel

42
4. Image
Enhancement
𝑓56𝑏1
𝑰𝑬𝒏𝒉𝒂𝒏𝒄𝒆𝒅 Frame no:56
5. Blob Detection &
Analysis
𝑓56𝑏2 𝑓56𝑏3 Frame no:56, blob 1, 2 and 3
6. Bob Labelling,
Grayscale
𝑓56𝑏1 𝑓56𝑏2 𝑓56𝑏3

43
7. Pseudo random
color labels
8. Plot blob
boundaries
𝑓56𝑏1 𝑓56𝑏2 𝑓56𝑏3
𝑓56𝑏1 𝑓56𝑏2 𝑓56𝑏3
𝑓56𝑏1
𝑓56𝑏2
𝑓56𝑏3
9. Loop trough all
blobs
Find parameters
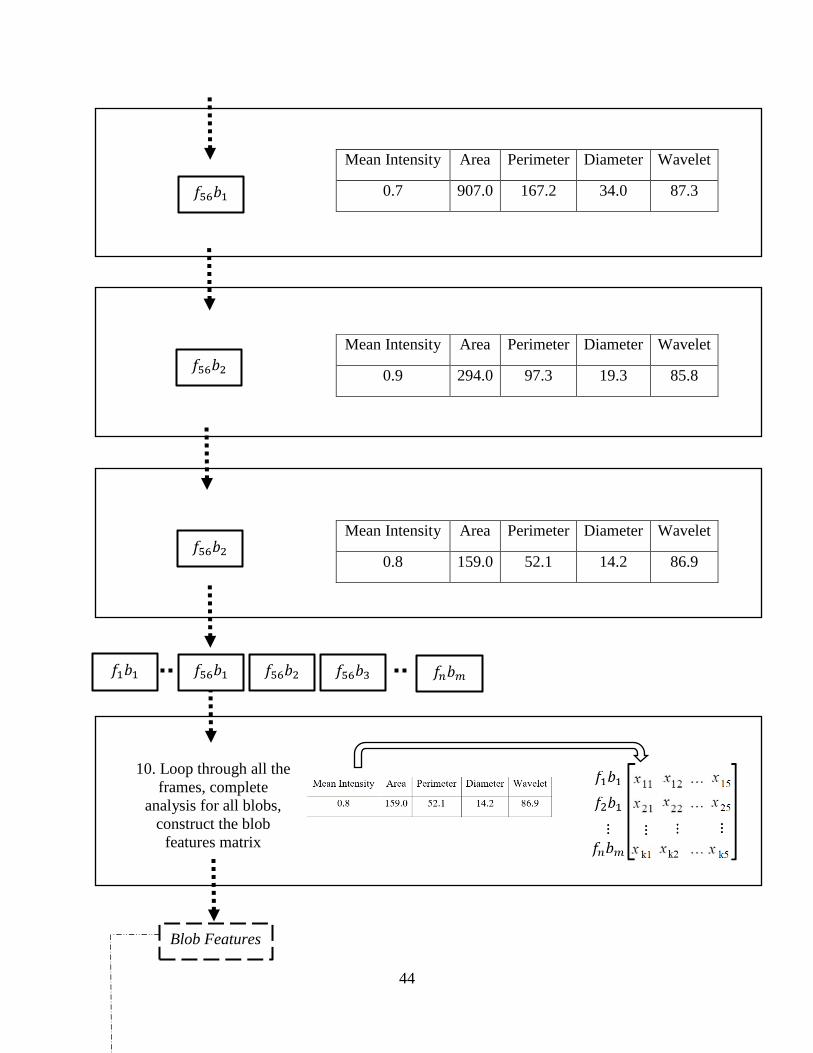
44
Mean Intensity Area Perimeter Diameter Wavelet
0.7 907.0 167.2 34.0 87.3
Mean Intensity Area Perimeter Diameter Wavelet
0.9 294.0 97.3 19.3 85.8
Mean Intensity Area Perimeter Diameter Wavelet
0.8 159.0 52.1 14.2 86.9
𝑓56𝑏1
𝑓56𝑏2
𝑓56𝑏2
𝑓56𝑏3 𝑓56𝑏2
10. Loop through all the
frames, complete
analysis for all blobs,
construct the blob
features matrix
𝑓1𝑏1 𝑓𝑛𝑏𝑚 𝑓56𝑏1
Blob Features

45
Blob Features 🡆 Input
11. Extract all the blobs from the frames
and save in a file with specific names
*Selected input video resulted into 478 blobs
𝑓56𝑏1 𝑓56𝑏2 𝑓56𝑏3
12. Load all the extracted blobs into
MATLAB Image Labeler
Obtain labels for each blob
Labels 🡆 Output
Input
Input matrix is the outcome of the step 10. Size
of the Input matrix 478𝑥5, since 478 blobs are
extracted, and 5 features are analyzed.
Output
Output matrix represents the
outcome of step 12, meaning the
labels of the extracted blobs. 1
represents a smoke blob, -1 is
nonsmoke ones.
Size of the Output matrix is 478𝑥1,
due to the number of blobs.

46
13. Train an SVM classifier by using
input and output .mat files
𝑆𝑉𝑀𝑀𝑜𝑑𝑒𝑙 = 𝑓𝑖𝑡𝑐𝑠𝑣𝑚(𝑖𝑛𝑝𝑢𝑡, 𝑜𝑢𝑡𝑝𝑢𝑡);
14. Create a test input to analyze the
performance of the model, by using a
different video
15. Obtain the features matrix
of the test input to be used as
Test Input
Input_Test
16. Perform the test
and observe the
performance
𝑙𝑎𝑏𝑒𝑙𝑡𝑒𝑠𝑡 = 𝑝𝑟𝑒𝑑𝑖𝑐𝑡(𝑆𝑉𝑀𝑀𝑜𝑑𝑒𝑙, 𝐼𝑛𝑝𝑢𝑡𝑡𝑒𝑠𝑡)
[𝑙𝑎𝑏𝑒𝑙, 𝑠𝑐𝑜𝑟𝑒] = 𝑝𝑟𝑒𝑑𝑖𝑐𝑡(𝑆𝑉𝑀𝑀𝑜𝑑𝑒𝑙, 𝐼𝑛𝑝𝑢𝑡𝑡𝑒𝑠𝑡)

47
Chapter 5
4. Experimental Results
In the previous chapters, the proposed method is explained deeply, and an illustration of the region-
based detection algorithm is given. The sequence is shown on a video, that includes smoke and a
moving person. Therefore, training is done on the blobs that includes smoke and for non-smoke
ones. The screenshots of the training video are given on the Figure 26. It is important to mention
that, training video has 300 frames, and, in these frames, 478 blobs are detected as suspicious, with
or without smoke. By analyzing the important smoke clues within detected blobs, a features matrix
is created. This matrix is used to train an SVM classifier in order to detect the smoke areas
automatically. By using the extracted blob images and MATLAB Image Labelling tool, a label
matrix is created to be used as the output for the SVM training. In this section of the report,
preliminary analysis and the performance of the suggested methods are discussed.
Figure 26 Training Data
4.1. Testing Datasets
In the previous section of the report, the code sequence and the outcomes are shown step by step.
In the step 13, and SVM classifier is introduced and trained. Training is done by using the features
obtained for each blob detected in each frame. In this title, used test datasets are explained. Testing
data is chosen to be 10% of the training data. Since the training data has 478 blobs extracted, first
testing dataset (A) is chosen to produce 47 blobs.
Due to the unavailability of the video from a train environment, following steps are taken to test
the algorithm. 4 different video sequences are used for testing. The first testing video is in the same

48
scene and same setup of training video, but different conditions. For the train coach’s environment,
the algorithm should be trained in different conditions in a train coach. Following this, since the
algorithm supposed to work in the same scene, it is appropriate to test it in the same setup.
Accordingly, since developed algorithm is focused on trains, using the same setup for training and
testing is appropriate. Some screenshots of the testing video are given on the Figure 27 and the
dataset is named after A. Dataset A has 251 frames and in these 251 frames, 47 blobs detected as
suspicious. Smoke clue parameters are extracted from 47 blobs to be fed to SVM model in order
to predict weather they are smoke or not. Let it be known that all the labels from dataset A are
belonging to only one class, smoke.
Figure 27 Test Dataset A
Second dataset is shown in the Figure 28, named after dataset B. Dataset B is from a completely
different scene with respect to the training dataset, includes only smoke, no other moving objects.
It is performed in an empty room. In this case, it is convenient to use more testing data. Thus, this
dataset is also used to extract 97 blobs to be used in testing. Even though the proposed algorithm
is focused on certain smoke types and designed especially for train environment, dataset B is used
to analyze how the proposed algorithm works in general settings.
Figure 28 Test Dataset B

49
The third dataset is named after C and some screenshots of the video is given on the Figure 29.
The video is done in an open space area and includes moving smoke areas. The setup of the video
and the scenes are totally different from the training video. Again, as in the dataset B, given dataset
C is used to test how does the proposed method works in general settings. In this dataset, 140 blobs
are extracted to be used in testing.
Figure 29 Test Dataset C
The fourth dataset is introduced as dataset D and the video is done with a fixed camera in a totally
different scene with respect to the training video, includes only 2 cars as moving object. Colorful
objects are in use to analyze how the algorithm reacts to different scenes. Dataset does not include
any smoke; therefore, all the detected blobs are labelled as nonsmoke. Screenshots of the dataset
D is given in the Figure 30. Again, this dataset is used to analyze the performance of the proposed
algorithm in general settings. 97 blobs are detected to be used in testing.
Figure 30 Test Dataset D

50
4.2. Performance
Dataset A is in the same setup the training video and has only one labels, smoke. As indicated also
before, this test dataset is used to understand how the proposed algorithm works when its trained
and tested for the same environmental conditions. Therefore, this test could give us the idea about
when the algorithm is trained and tested in the train coach scenes. The test by using the dataset A,
gives very promising results. 47 out of 47 blobs are classified correctly.
Dataset B is a video from a completely different scene with respect to the training dataset and
includes only smoke as a moving object. This video is used to test how does the proposed method
works in general settings. Even though the algorithm is not expected to show high performance in
general settings, test results are quite satisfying. 89 blobs out of 97 are detected truly as smoke.
Therefore, the blob-based accuracy for this dataset can be calculated as %91.8. Some of the
misclassified blobs are shown in the following Figure 31.
Figure 31 Dataset B - Misclassified Blobs
It is important to underline that the frames that misclassified blobs belong to, has other blobs which
are classified as smoke. Therefore, it is appropriate to say that, even though some blobs are
misclassified in a frame, there are other blobs which detected as smoke within the same frame.
This results in a better detection performance in the frame-based detection ratio.
Dataset C includes only smoke blobs and it is again a different scene with respect to the training
video. This dataset is used to understand how the trained model works in general settings and how
many false negative classifications are done. Dataset C has 140 blobs detected. The features of the
blobs are analyzed to be used in testing. In the results it is seen that 109 blobs out of 140 are
classified as smoke. The misclassified blobs can be seen on the Figure 32.

51
Figure 32 Dataset C - Misclassified Blobs
It is important to underline that in many of the frames there are several numbers of blobs are
detected. Accordingly, in this dataset, the frames which have false negative misclassified blobs,
have also other blobs are correctly classified. Therefore, it is convenient to say that blob-based
detection ratio is around %77.9 while if the frame-based detection ratio results in higher accuracies.
Dataset D does not include any smoke therefore it is used to analyze how many false positive
classifications may occur in general settings. According to the test results 31 blobs are
misclassified as false positive out of 97 blobs. This results in %68.1 detection accuracy. Some of
the misclassified blobs are given in the Figure 33.
Figure 33 Dataset D - Misclassified Blobs
However, even though the blob-based classification produces false positives, it is important to
underline that, in all the frames where there are misclassified blobs, there are also other blobs are
classified correctly. Hence, it is possible to say that the proposed algorithm gives promising results
in the general settings, for the discrimination of the smoke and non-smoke blobs.
As can be seen from the results, dataset A has very high accuracy where the testing is done in the
same scene with the training. Every smoke detection problem has particular properties depending
on the scene conditions. For the specific problem handled in this work, the algorithm is designed
to be trained in the train coach environment and test in the same environment. Due to the
unavailability of the video from train coaches, the algorithm trained and tested in a video that has

52
the similar conditions with a train coach. On the other hand, due to the absence of the video
sources, testing is performed also with different video scenes. The aim of performing these tests is
to have an idea about how the suggested algorithm works in general settings. The datasets B, C, D
has lower accuracies for blob-based detection, this an expected outcome since their video settings
are different than the video that is used to train the classifier. Hence, it is appropriate to say that
this is due to the lack of training data. Increasing the training set and introducing images from non-
smoke sequences can improve the performance. Nevertheless, blob-based detection has lower
accuracies, frame-based results are very promising. The large part of the frames has correctly
detected blobs besides the false detections.
Unfortunately, a source video from train is not used since it is not available and the video sources
with smoke is quite limited. The whole system can be improved by using more training data and
that more training data are also needed to assess the performance. However, proposed method is
promising to give good results for smoke detection. Once various training and testing videos from
the train setting is available, designed algorithm may be performed for these videos and convincing
results would be obtained.

53
Chapter 6
5. Conclusions and Further Works
5.1. Conclusions
In this study, a survey on the video fire detection systems and a novel method for fire detection in
trains are presented. As explained also in the report, in many of the fire accidents, flames may not
visible in the scene, but smoke becomes visible firstly in the monitored area. Thus, smoke detection
is crucial for early fire detection systems, due to the fact that smoke spreads much faster than
flames. Greatest disadvantage of the traditional sensor’s is that to give an alarm, they must wait
until the smoke particles reach to their sensor. The method proposed in this work does not have
the transport delay that the traditional “point” sensors suffer from. As soon as smoke occurs in one
of the camera views, proposed system can detect fire immediately. It is convenient to say that
image and video processing methods may be applied when the conventional methods are
inadequate or unreliable. It is important to underline that every fire detection problem has its own
properties. Based on this, suggested video-based smoke detection method is focused on train
environment and it has a great potential for fire detection in the train coaches. In addition to that,
this novel method is more economic and requires minimum maintenance with respect to the
available fire detection systems in the railway vehicles.
Uncontrolled fire can be easily detected by human beings by their eyes and the help of vision
systems. However, as it is very well known, it is not very easy to replicate the human intelligence.
As proposed in the last chapter of the report, SVM classification method can give right alarm most
of the time. However, there might exist some false alarms. This simply because the results depend
on the selected training data.
Yet, with today’s technology, it is not possible to have a completely reliable video fire detection
system for railway vehicles. However, the given survey and presented method are helpful tools for
train officers. Even if the goal of this project work is to investigate a fire detection system to be
operated on CCTV equipment without extra apparatus, for the time being, it could also be possible
to use the combination of video fire detection system and point detectors.

54
5.2. Future Works
In the exposed approach, a novel method is presented. As reported in the present work, to train a
classifier with the obtained information solely from the suspicious areas, brings promising results.
In order to represent a real situation and find the most suitable parameters and the learning model,
a video from the train environment is highly needed. However, the absence of this video has
prevented to train the SVM classifier accordingly. Therefore, for future works, it is recommended
to use train and testing videos that are performed in a train coach, with possible scenes that occur
in the train coaches, with and without smoke.
Training data should represent all the possible situations that might occur during monitoring
process. Further research on training will improve the detection performance of the video fire
detection systems while obtaining higher accuracies.
In addition to these, labelling may be done more detailed. With this aim, different moving objects
may be subjected to labelling, such as humans, bags, luggage and so on. After all these points have
been accomplished, the present work method would give more promising and precise results.

55
Bibliography
[1] P. Connor, "High Speed Railway Capacity".
[2] G. Healey, D. Slater, T. Lin, B. Drda and A. D. Goedeke, "A System for Real-Time Fire
Detection".
[3] "Reading the Fire: Smoke and Air Track," Firehouse, 15 Agust 2007. [Online]. Available:
https://www.firehouse.com/operations-training/article/10504806/reading-the-fire-smoke-
and-air-track.
[4] H. Dreyfus, What Computers Can’t Do, MIT Press, 1972.
[5] H. Dreyfus, What Computers still Can’t Do, MIT Press, 1992.
[6] J. Hogan, "Your Every Move Will Be Analyzed," New Scientist, 2006.
[7] W. Phillips Iii, M. Shah and N. da Vitoria Lobo, "Flame recognition in video," Pattern
recognition letters, vol. 23, no. 1-3, pp. 319-327, 2002.
[8] B. A. A. O. F. Gomez-Rodriguez S. Pascual-Pena, Smoke detection using image processing,
in: Proceedings of 4th International Conference on Forest Fire Research & Wildland Fire
Safety, Millpress, 2002, pp. 1-8.
[9] F. Gomez-Rodriguez, B. C. Arrue and A. Ollero, "Smoke monitoring and measurement using
image processing: application to forest fires," 2003.
[10] T.-H. Chen, P.-H. Wu and Y.-C. Chiou, "An early fire-detection method based on image
processing," in Image Processing, 2004. ICIP'04. 2004 International Conference on, 2004.
[11] C.-B. Liu and N. Ahuja, "Vision based fire detection," in Pattern Recognition, 2004. ICPR
2004. Proceedings of the 17th International Conference on, 2004.
[12] G. Marbach, M. Loepfe and T. Brupbacher, "An image processing technique for fire
detection in video images," Fire Safety Journal, vol. 41, no. 4, pp. 285-289, 1 6 2006.
[13] B. U. Toreyin, Y. Dedeoglu and A. E. Cetin, "Contour based smoke detection in video using
wavelets," in European signal processing conference, 2006.

56
[14] B. U. Töreyin, Y. Dedeoğlu, U. Güdükbay and A. E. Çetin, "Computer vision based method
for real-time fire and flame detection," Pattern Recognition Letters, vol. 27, no. 1, pp. 49-
58, 1 1 2006.
[15] T. Celik, H. Demirel, H. Ozkaramanli and M. Uyguroglu, "Fire detection using statistical
color model in video sequences," 2007.
[16] Z. Xu and J. Xu, "Automatic fire smoke detection based on image visual features," in
Computational Intelligence and Security Workshops, 2007. CISW 2007. International
Conference on, 2007.
[17] P.-H. W. Y.-C. C. T.-H. Chen, "An early fire-detection method based on image processing,"
in Proceedings of IEEE International Conference on Image Processing (ICIP), vol. 3,
October 2004, pp. 1707–1710.
[18] Z. Xiong, R. Caballero, H. Wang, A. M. Finn, M. A. Lelic and P.-Y. Peng, "Video-based
smoke detection: possibilities, techniques, and challenges," in IFPA, fire suppression and
detection research and applications technical working conference (SUPDET), Orlando, FL,
2007.
[19] B. Lee and D. Han, "Real-Time Fire Detection Using Camera Sequence Image in Tunnel
Environment," in Advanced Intelligent Computing Theories and Applications. With Aspects
of Theoretical and Methodological Issues, Berlin, Heidelberg, Springer Berlin Heidelberg,
2007, pp. 1209-1220.
[20] S. Calderara, P. Piccinini and R. Cucchiara, "Smoke Detection in Video Surveillance: A
MoG Model in the Wavelet Domain," in Computer Vision Systems, Berlin, Heidelberg,
Springer Berlin Heidelberg, 2008, pp. 119-128.
[21] P. Piccinini, S. Calderara and R. Cucchiara, "Reliable smoke detection in the domains of
image energy and color," in 2008 15th IEEE International Conference on Image Processing,
2008.
[22] F. Yuan, "A fast accumulative motion orientation model based on integral image for video
smoke detection," Pattern Recognition Letters, vol. 29, no. 7, pp. 925-932, 1 5 2008.
[23] P. V. K. M. J. &. I. Borges, "Efficient visual fire detection applied for video retrieval," in
Signal Processing Conference, 2008 16th European (pp. 1-5). IEEE, 2008.
[24] a. J. E. Qi, Xiaojun, "A computer vision-based method for fire detection in color videos,"
International journal of imaging, vol. S09, no. 2, pp. 22-34, 2009.

57
[25] R. Yasmin, "Detection of smoke propagation direction using color video sequences," Int. J.
Soft Comput. 4 , p. 45–48, 2009.
[26] J. Gubbi, S. Marusic and M. Palaniswami, "Smoke detection in video using wavelets and
support vector machines," Fire Safety Journal, vol. 44, no. 8, pp. 1110-1115, 2009.
[27] T.-H. Chen, Y.-H. Yin, S.-F. Huang and Y.-T. Ye, "The Smoke Detection for Early Fire-
Alarming System Base on Video Processing," 2006.
[28] O. Günay, K. Taşdemir, B. Uğur Töreyin and A. E. Çetin, "Fire Detection in Video Using
LMS Based Active Learning," Fire Technology, vol. 46, no. 3, pp. 551-577, 16 7 2010.
[29] I. Kolesov, P. Karasev, A. Tannenbaum and E. Haber, "Fire and smoke detection in video
with optimal mass transport based optical flow and neural networks," in 2010 IEEE
International Conference on Image Processing, 2010.
[30] B. Ko, K.-H. Cheong and J.-Y. Nam, "Early fire detection algorithm based on irregular
patterns of flames and hierarchical Bayesian Networks," Fire Safety Journal, vol. 45, no. 4,
pp. 262-270, 1 6 2010.
[31] R. Gonzalez-Gonzalez, V. Alarcon-Aquino, R. Rosas-Romero, O. Starostenko, J. Rodriguez-
Asomoza and J. M. Ramirez-Cortes, "Wavelet-based smoke detection in outdoor video
sequences," in 2010 53rd IEEE International Midwest Symposium on Circuits and Systems,
2010.
[32] E. I. P.V.K. Borges, "A probabilistic approach for vision-based fire detection in videos,"
IEEE Trans. Circuits Syst. Video Technol., vol. 5, no. 20, p. 721–731, 2010.
[33] P. V. W. P. K. T. D. Van Hamme, "Fire detection in color images," in Proceedings of
Advanced Concepts for Intelligent Vision Systems (ACIVS), 2010.
[34] T. Celik, "Fast and efficient method for fire detection using image processing," ETRI
Journal, vol. 32, no. 6, pp. 881-890, 2010.
[35] F. Yuan, "Video-based smoke detection with histogram sequence of LBP and LBPV
pyramids," Fire safety journal, vol. 46, no. 3, pp. 132-139, 2011.
[36] L. Rossi, M. Akhloufi and Y. Tison, "On the use of stereovision to develop a novel
instrumentation system to extract geometric fire fronts characteristics," Fire Safety Journal,
vol. 46, no. 1-2, pp. 9-20, 1 1 2011.

58
[37] L. Millan-Garcia, G. Sanchez-Perez, M. Nakano, K. Toscano-Medina, H. Perez-Meana and
L. Rojas-Cardenas, "An Early Fire Detection Algorithm Using IP Cameras," Sensors, 2012.
[38] S. Rinsurongkawong, M. Ekpanyapong and M. N. Dailey, "Fire Detection for Early Fire
Alarm Based on Optical Flow Video Processing".
[39] M. Bistrović, J. Ćelić and D. Komorčec, "Computer Vision Application for Early Stage
Smoke Detection on Ships," Pomorski zbornik, vol. 52, no. 1, pp. 63-80, 2016.
[40] U. Hwang and J. Jeong, "COMPUTER VISION BASED SMOKE DETECTION METHOD
BY USING COLOUR AND OBJECT TRACKING," pp. 53-59, 2016.
[41] Thou-Ho Chen, Ping-Hsueh Wu and Yung-Chuen Chiou, "An early fire-detection method
based on image processing," in 2004 International Conference on Image Processing, 2004.
ICIP '04..
[42] R. C. G. a. R. E. Wood, Digital Image Processing, New Jersey: Prentice Hall, 2002.
[43] C.-C. Ho, "Machine vision-based real-time early flame and smoke detection," Measurement
Science and Technology, vol. 20, no. 4, p. 45502, 2009.
[44] S. Rinsurongkawong, M. Ekpanyapong and M. N. Dailey, "Fire detection for early fire alarm
based on optical flow video processing," in Electrical engineering/electronics, computer,
telecommunications and information technology (ecti-con), 2012 9th international
conference on, 2012.
[45] S. Verstockt, "Multi-modal video analysis for early fire detection," Universiteit Gent, 2011.
[46] H. O. H. D. T. Celik, "Fire and smoke detection without sensors: Image processing based
approach," in Proceedings of 15th European Signal Processing Conference (EUSIPCO),
2007.
[47] R. C. A. L. P. B. a. L. W. T. Kanade, "Advances in cooperative multisensor video
surveillance," in DARPA Image Understanding Workshop, 1998.
[48] J. Chen, Y. He and J. Wang, "Multi-feature fusion based fast video flame detection,"
Building and Environment, vol. 45, no. 5, pp. 1113-1122, 1 5 2010.
[49] A. L. T. K. R.T. Collins, "A system for video surveillance and monitoring," in Proceedings
of American Nuclear Society (ANS) Eighth International Topical Meeting on Robotics and
Remote Systems, 1999.

59
[50] J. K. B. B. a. B. M. W. K. Toyama, "Principles and practice of background maintenance," in
Proc. International Conference on Computer Vision, 1999.
[51] X. Qi and J. Ebert, "A Computer Vision-Based Method for Fire Detection in Color Videos".
[52] S. Calderara, P. Piccinini and R. Cucchiara, "Vision based smoke detection system using
image energy and Color Information," Machine Vision and Applications, vol. 22, no. 4, pp.
705-719, 2011.
[53] K. D. B. G. N. G. O. G. Y. H. H. B. U. T. V. A. Enis Çetin, "Video fire detection – Review,"
Digital Signal Processing, vol. 23, p. 1827–1843, 2013.
[54] J. C. G. L. K. S. M. Wendeker, "Chaotic combustion in spark ignition engines," Chaos
Solitons Fractals , vol. 18, p. 803–806, 2003.
[55] A. K. A. P. H. S. G. M. V. Gubernov, "Period doubling and chaotic transient in a model of
chain-branching combustion wave propagation," Proc. R. Soc. Lond. Ser. A Math. Phys. Eng.
Sci. , vol. 466 , no. (2121) (2010) , p. 2747–2769, 2010.
[56] R. W. J. Yang, "A survey on fire detection and application based on video image analysis,"
Video Eng., vol. 8, pp. 92-96, 2006.
[57] B. U. Töreyin, Y. Dedeo\uglu and A. E. Cetin, "Wavelet based real-time smoke detection in
video," in Signal Processing Conference, 2005 13th European, 2005.
[58] B. Merci, Fire Safety Engineering, Fire safety and explosion safety in car.
[59] B. T. U. G. A. Ç. Y. Dedeoglu, " Real-time fire and flame detection in video," in
International Conference on Acoustics Speech and Signal Processing (ICASSP), 2005.
[60] H. D. T. Celik, "Fire detection in video sequences using a generic color model," Fire Saf. J.,
vol. 44 (2) , no. May, p. 147–158, 2008.
[61] A. V. S. V. H. P. L. R. V. d. W. S. Verstockt, "Multi-sensor fire detection by fusing visual
and non-visual flame features," in Proceedings of International Conference on Image and
Signal Processing, 2010.
[62] S. Verstock, Multi-modal Video Analysis for Early Fire Detection, Gent, 2012.
[63] J. R. Martínez-de Dios, L. Merino, F. Caballero and A. Ollero, "Automatic forest-fire
measuring using ground stations and Unmanned Aerial Systems.," Sensors (Basel,
Switzerland), vol. 11, no. 6, pp. 6328-53, 2011.

60
[64] J. Vicente and P. Guillemant, "An image processing technique for automatically detecting
forest fire," International Journal of Thermal Sciences, vol. 41, no. 12, pp. 1113-1120, 2002.
[65] S. Verstockt, P. Lambert, R. V. D. Walle, B. Merci and B. Sette, "State of the art in vision-
based fire and smoke detection," Proceedings of the 14th International Conference on
Automatic Fire Detection, vol. 2, pp. 285-292, 2009.
[66] M. Unser and A. Aldroubi, "A review of wavelets in biomedical applications," Proceedings
of the IEEE, vol. 84, no. 4, pp. 626-638, 1996.
[67] B. U. Toreyin, Y. Dedeoglu and A. E. Cetin, "Flame detection in video using hidden markov
models," in Image Processing, 2005. ICIP 2005. IEEE International Conference on, 2005.
[68] J.-y. Su and Z.-m. Lu, "A Fire-Alarming Method Based on Video Processing Ping-He Huang
TingYing Industry Graduate School , Shenzhen Jeng-Shyang Pan," Signal Processing, 2006.
[69] J. Ojo and J. Oladosu, "Video-based Smoke Detection Algorithms: A Chronological
Survey," Computer Engineering and Intelligent Systems, vol. 5, no. 7, p. 38–50, 2014.
[70] A. Murat Bagci, Y. Yardimci and A. E. Çetin, "Moving object detection using adaptive
subband decomposition and fractional lower-order statistics in video sequences," Signal
Processing, vol. 82, no. 12, pp. 1941-1947, 2002.
[71] J. R. Martinez-de Dios, B. C. Arrue, A. Ollero, L. Merino and F. Gómez-Rodr\'\iguez,
"Computer vision techniques for forest fire perception," Image and vision computing, vol.
26, no. 4, pp. 550-562, 2008.
[72] C.-L. Liu, "A Tutorial of the Wavelet Transform," National Taiwan University, Department
of Electrical Engineering (NTUEE), Taiwan, pp. 1-72, 2010.
[73] D. Krstinić, D. Stipaničev and T. Jakovčević, "Histogram-based smoke segmentation in
forest fire detection system," Information Technology and Control, vol. 38, no. 3, 2009.
[74] B. Ko, "Survey of computer vision–based natural disaster warning systems," Optical
Engineering, vol. 51, no. 7, p. 070901, 2012.
[75] J. Jiang and G. Feng, "The spatial relationship of DCT coefficients between a block and its
sub-blocks," IEEE Transactions on Signal Processing, vol. 50, no. 5, pp. 1160-1169, 2002.
[76] T. Jakovcevic, M. Braovic, D. Stipanicev and D. Krstinic, "Review of wildfire smoke
detection techniques based on visible spectrum video analysis," 2011 7th International

61
Symposium on Image and Signal Processing and Analysis (ISPA), no. September, pp. 480-
484, 2011.
[77] W. B. Horng and J. W. Peng, "A fast image-based fire flame detection method using color
analysis," Tamkang Journal of Science and Engineering, vol. 11, no. 3, pp. 273-285, 2008.
[78] D. Han and B. Lee, "Flame and smoke detection method for early real-time detection of a
tunnel fire," Fire Safety Journal, vol. 44, no. 7, pp. 951-961, 2009.
[79] Y. H. Habiboǧlu, O. Günay and A. E. Çetin, "Covariance matrix-based fire and flame
detection method in video," Machine Vision and Applications, vol. 23, no. 6, pp. 1103-1113,
2012.
[80] N. Fujiwara and K. Terada, "Extraction of a smoke region using fractal coding," IEEE
International Symposium on Communications and Information Technology, vol. 2, pp. 659 -
662, 2004.
[81] Y. Chunyu, F. Jun, W. Jinjun and Z. Yongming, "Video fire smoke detection using motion
and color features," Fire technology, vol. 46, no. 3, pp. 651-663, 2010.
[82] H. J. Catrakis, R. C. Aguirre, J. Ruiz-Plancarte and R. D. Thayne, "Shape complexity of
whole-field three-dimensional space-time fluid interfaces in turbulence," Physics of Fluids,
vol. 14, no. 11, pp. 3891-3898, 2002.
[83] S. Bayoumi, E. AlSobky, M. Almohsin, M. Altwaim, M. Alkaldi and M. Alkahtani, "A real-
time fire detection and notification system based on computer vision," in IT Convergence
and Security (ICITCS), 2013 International Conference on, 2013.
[84] R. Anssari, "Signal Recovery from Wavelet Transform Maxima," IEEE Transactions on
Signal Processing, vol. 42, no. 1, pp. 194-196, 1994.

62

63
Appendix
Final MATLAB Implementation
close all; % Close all figures (except those of imtool.)
imtool close all; % Close all imtool figures.
clear; % Erase all existing variables.
workspace; % Make sure the workspace panel is showing.
% Check that user has the Image Processing Toolbox installed.
versionInfo = ver; % Capture their toolboxes in the variable.
hasIPT = false;
for k = 1:length(versionInfo)
if strcmpi(versionInfo(k).Name, 'Image Processing Toolbox') > 0
hasIPT = true;
end
end
if ~hasIPT
% User does not have the toolbox installed.
message = sprintf('Sorry, but you do not seem to have the Image
Processing Toolbox.\nDo you want to try to continue anyway?');
reply = questdlg(message, 'Toolbox missing', 'Yes', 'No', 'Yes');
if strcmpi(reply, 'No')
% User said No, so exit.
return;
end
end
% Initial settings for visualization
fontSize = 14;
fontSize1 = 9;
frameno=1;
se = strel('disk',10);
Data = zeros (1,5);
% File adress for saving the extracted blobs
blobsFolder = 'C:\Users\dilar\Desktop\blob_dilara\';
% This code part allows the users to choose the input video file from their
PC
strErrorMessage = sprintf('Choose a file :\nYou can choose a file, or
cancel');
response = questdlg(strErrorMessage, 'Choose a file', 'OK - choose a new
movie.', 'Cancel', 'OK - choose a new movie.');
if strcmpi(response, 'OK - choose a new movie.')
[baseFileName, folderName, FilterIndex] = uigetfile('*.avi');
if ~isequal(baseFileName, 0)
movieFullFileName = fullfile(folderName, baseFileName);
else
return;
end

64
else
return;
end
try
videoObject = VideoReader(movieFullFileName)
% Determine how many frames there are.
numberOfFrames = videoObject.NumberOfFrames;
vidHeight = videoObject.Height;
vidWidth = videoObject.Width;
% Print header line in the command window,to show the blob measurements
fprintf(1,'Blob # Mean Intensity Area Perimeter Centroid
Diameter Wavelet\n');
% Enlarge figure to full screen.
figure;
set(gcf, 'units','normalized','outerposition',[0 0 1 1]);
% Loop over all the frames extracted from the video.
for frame = 1 : numberOfFrames
% Extract the frame from the movie structure.
thisFrame = read(videoObject, frame);
% Display the frame, show the number of the frame.
hImage = subplot(2,3,1);
image(thisFrame);
caption = sprintf('Frame %4d of %d.', frame, numberOfFrames);
title(caption, 'FontSize', fontSize);
drawnow; % Force it to refresh the window.
%We need to convert the image to YCbCr and use only the Y channel.
%As suggested in the reviewed articles
% YCbCr converting..
YCBCR = rgb2ycbcr(thisFrame);
% Isolate Y.
Y_ThisFrame = YCBCR(:,:,1);
% *BACKGROUND SUBSTRACTION*
% The differencing
alpha = 0.05;
if frame == 1
% in the first frame background is set to current image
Background =thisFrame ;
else
% Change background slightly at each frame
Background = (1-alpha)* Y_ThisFrame + alpha * Background;
end
% Calculate a difference between this frame and the background.
differenceImage = Y_ThisFrame - Background;
% Convert to gray level for Otsu
grayImage = rgb2gray(differenceImage);
% Get threshold with Otsu method

65
thresholdLevel = graythresh(grayImage);
%Median filter for salt pepper noises.
K = medfilt2(grayImage, [3,3]);
% The binarization
binaryImage = imbinarize( K, thresholdLevel);
% Morphology
binaryImage = bwareaopen(binaryImage, 80);
binaryImage = imfill(binaryImage, 'holes');
closeBW = imclose(binaryImage,se);
% *BLOB ANALYSIS*
% min and max blob area can be adjusted for the sensitivity
BlobAnalysis =
vision.BlobAnalysis('MinimumBlobArea',100,'MaximumBlobArea',50000);
% Perform the blob analysis on the image named "closeBW"
[area,centroid,bbox] = step(BlobAnalysis,closeBW);
% Insert green boxes around the moving blobs
Ishape = insertShape(thisFrame,'rectangle',bbox,'Color',
'green','Linewidth',6);
% Plot green boxes on the detected blobs, over the original frame.
subplot(2,3,3);
imshow(Ishape);
title('Detection');
% Label each blob so we can make measurements of it
labeledImage = bwlabel(closeBW, 8);
% labeledImage is an integer-valued image
% Show the gray scale image.
subplot(2,3,4);
imshow(labeledImage, []);
title('Labeled Image - bwlabel', 'FontSize', fontSize);
% assign each blob a different color to visually show the user the
% distinct blobs.
% pseudo random color labels
coloredLabels = label2rgb (labeledImage, 'hsv', 'k', 'shuffle');
% coloredLabels is an RGB image.
% We could have applied a colormap instead (but only with R2014b and
later)
subplot(2,3,5);
imshow(coloredLabels);
% Make sure image is not artificially stretched because of screen's
aspect ratio.
axis image;
caption = sprintf('Pseudo colored labels - label2rgb\nBlobs are
numbered from top to bottom, then from left to right.');
title(caption, 'FontSize', fontSize1);

66
% Get all the blob properties.
blobMeasurements = regionprops(labeledImage, grayImage, 'all');
numberOfBlobs = size(blobMeasurements, 1);
% bwboundaries() returns a cell array, where each cell contains the
%row/column coordinates for an object in the image.
% Plot the borders of all the blobs on the original grayscale image
%using the coordinates returned by bwboundaries.
subplot(2,3,6);
imshow(grayImage);
title('Outlines, from bwboundaries()', 'FontSize', fontSize);
% Make sure image is not artificially stretched because of screen's
aspect ratio.
axis image;
hold on;
boundaries = bwboundaries(binaryImage);
numberOfBoundaries = size(boundaries, 1);
for k = 1 : numberOfBoundaries
thisBoundary = boundaries{k};
plot(thisBoundary(:,2), thisBoundary(:,1), 'g', 'LineWidth', 1);
end
hold off;
% Used to control size of "blob number" labels put atop the image.
textFontSize = 14;
% Used to align the labels in the centers of the coins.
labelShiftX = -7;
blobECD = zeros(1, numberOfBlobs);
% Loop through all blobs.
for k = 1 : numberOfBlobs
% Get list of pixels in current blob.
thisBlobsPixels = blobMeasurements(k).PixelIdxList;
% Find mean intensity (in original image)
meanGL = mean(grayImage(thisBlobsPixels));
% Mean again, but only for version >= R2008a
meanGL2008a = blobMeasurements(k).MeanIntensity;
% Get area.
blobArea = blobMeasurements(k).Area;
% Get perimeter.
blobPerimeter = blobMeasurements(k).Perimeter;
% Get centroid one at a time
blobCentroid = blobMeasurements(k).Centroid;
% Compute ECD - Equivalent Circular Diameter.
blobECD(k) = sqrt(4 * blobArea / pi);
% Wavelet Analysis
thisblob=thisFrame(thisBlobsPixels);
thisblob3d= cat(3, thisblob, thisblob, thisblob);
Wavelet = rgb2ind(thisblob3d,2);
[c,s]=wavedec2(Wavelet,2,'haar');
[H1,V1,D1] = detcoef2('all',c,s,1);
A1 = appcoef2(c,s,'haar',1);
[Ea,EDetails] = wenergy2(c,s);

67
% Show the values on the Command Window
fprintf(1,'frame%2d, blob%2d %17.1f %11.1f %8.1f %8.1f %8.1f %
8.1f %8.1f\n', frame, k, meanGL, blobArea, blobPerimeter,
blobCentroid, blobECD(k), Ea);
text(blobCentroid(1) + labelShiftX, blobCentroid(2), num2str(k),
'FontSize', textFontSize, 'FontWeight', 'Bold');
% Save the extacted features of blobs for future
% classification uses
save('blobfeatures.mat','frame','k','meanGL','blobArea','blobPeri
meter','Ea');
% Save the extracted blobs for labelling
if ~isempty(bbox)
temp = [meanGL, blobArea, blobPerimeter, blobECD(k), Ea];
Data = [Data; temp];
b_rows = bbox(1,2):bbox(1,2)+bbox(1,4)-1;
b_cols = bbox(1,1):bbox(1,1)+bbox(1,3)-1;
blob = thisFrame(b_rows,b_cols,:);
imwrite(blob,strcat(blobsFolder,'f',num2str(frame),'b',num2str(k)
,'.png'));
end
end
end
catch ME
% for errors
message = sprintf('Error in the code():\n%s', ME.message);
uiwait(warndlg(message));
end

68
Copyright © 2022 FDOKUMEN