fio iswj9 - World Bank Documents and Reports
46
fio iswj9 ERM80 INTERNATIONAL BANK FOR RECONSTRUCTION A1D DEVELOFENMT ECONONI C DEPARTE1NT USE OF EUROPEAN INLAND WATERWAYS: A PRELIMINARY REVIEW Economic Technology Division Prepared by; Mr. Arthur Wubnig May 21, 1948 Public Disclosure Authorized Public Disclosure Authorized Public Disclosure Authorized Public Disclosure Authorized Public Disclosure Authorized Public Disclosure Authorized Public Disclosure Authorized Public Disclosure Authorized
-
Upload
khangminh22 -
Category
Documents
-
view
7 -
download
0
Transcript of fio iswj9 - World Bank Documents and Reports

fio iswj9 ERM80
INTERNATIONAL BANK FOR RECONSTRUCTION A1D DEVELOFENMT
ECONONI C DEPARTE1NT
USE OF EUROPEAN INLAND WATERWAYS: A PRELIMINARY REVIEW
Economic Technology Division
Prepared by; Mr. Arthur Wubnig
May 21, 1948
Pub
lic D
iscl
osur
e A
utho
rized
Pub
lic D
iscl
osur
e A
utho
rized
Pub
lic D
iscl
osur
e A
utho
rized
Pub
lic D
iscl
osur
e A
utho
rized
Pub
lic D
iscl
osur
e A
utho
rized
Pub
lic D
iscl
osur
e A
utho
rized
Pub
lic D
iscl
osur
e A
utho
rized
Pub
lic D
iscl
osur
e A
utho
rized

TABLE OF CONTENTS
PAGE
SUIavIIiY i - iiii
Selected Measures of Current Performance 2
Cargo-Mix of Waterway Traffic 7
Maia Patterns of Existing Traffio 9
Major Conditioning Influences 15
LIST OF APPENDIX TABLES
Table I - Pre-war compered with post-wiar freight traffic onNetherlands inland waterways
Table II - Pre-wer compared with post-war freight traffic onBelgian inland waterways
Table XII- Pre-war compared with post-war cargo loadings onFrench inland waterways
Table IV - Pre-war comnared with post-war freight traffic onBritish Zone inland waterways
Table V - Cargo-mix of freight traffic on Belgion inlandwaterwrays, October 1947
Table VI - Analysis of freight traffic on British Zone inlandwaterways by network and cargo, 1947
Table VII- Use of upper Rhine network as measured by cargo unloadingsat ports in U.S. Zone
Table VIII- Use of 'veser and related canals to move IWT freight outof Bremen, 1946 - 1947
Table IX - Use of Upper Danube network since mid-1947 to moveRuhr coal from Regensburg to Austria

-2-
Table X - Decline of international relative to domestic IWTfreight as measured by cargo to and from Antwerp
Annex A - BIDAC £Ehedule of Rhine transit across Germany betweenCentral Europe and Benelux, February and MvIarch, 1948
Annex B - BIDAC Schedule of suitable freight for Elbe transit fromHamburg to Czechoslovakia, February and March, 1948
Annex C - Pre-wqr freight traffic on Germany's inland waterways
Annex D - Cargo traffic at some major inland ports on Germany'swaterway network, 1937

SWiARY
For European inland transport to operate at top efficiency, full use
must be made of the existing network of rivers, canals, and inland ports,
of the existing fleet of tugs, barges, and motor craft. Ac much heavy freight
as nossible needs to be diverted from rail to water transport to conserve
fuel, equipment, and labor.
Continental Eurone's railroads are seriously over-burdened because they
are now moving, relative to pre-war, equal or heavier freight workloads with
less equipment in '.rorse repair. The inland waterways, in contrast, are
operating below capacity, at least in Western Europe. Here, particularly
on the Rhine and in the LGw Countries, suriplus craft coexist with under-
worked arteries and ports.
IWT traffic is now 40-60 percent below pro-war in "iestern Europe,
probably much lower in Eastern Europe. Piost or all of the drop measures
a. collepse of export, import, and transit freight, dowm, e.g., 75 percent
on the Rhine, 90 percent on the Elbe. Domestic shipments of IWT freight
have shrunk nowhere near as much. Instead, they have revived to pre-war
or not far below (e.g. the Low Countries definitely, perhaps France as well);
to a pace in step with th8t of heavy industrial activity (e.g. western
Germany); or to the limit of transport capacity as cut back by war damages
(e.g. all Eastern Europe).

The European inland waterways are thus experiencing a. dis-inter-
nationalization of traffic. Domestic freight is now P much larger share
of total traffic then before the war, international freight a much smaller
fraction.
The same kind of cargo is currently moving on Europe's rivers and
canals as before the war. They used to function almost entirely as channels
for the cheap, mass haulage of bulk freight, particularly coal, ore, building
materials, grain, sand, fertilizer, iron and steel, timber and petroleum.
They continue to do so on a much-reduced scale. Coal and coke, e.g. comprise
a major or preponderant share of all traffic on the Bizone wraterways, the
Lower Rhine, and the Upper Danube. Potash downstream and petroleum upstream
comprise half the Rhine transit of outside cargo across Germany. Ore,
building materials, heavy chemicals, heavy meta.l, and (now resuming) grain
predominate in Elbe and Danube traffic to and from Czechoslovakia. ;Bulk
cargoes, mainly solid fuel, quarry products, and building materials comprise
95 percent of the freight on Belgian rivers and canals. Coal downstream and
ore upstream are almost the entire content of Oder traffic.
Despite less freight as a whole and a higher ratio of domestic cargo,
Europe's inland waterways Pre serving their entire range of pre-w,-r functions.
The inland fleets which move along them are lifting heavy loads of internal
traffic wherever transport facilities are in reasonably good working order;
e.g., belgium, the Netherlands, France, and Western Germany, In proportion
as intra-European trade revives, they are hauling bulk exports and bulk
imports between neighbor econ6mies; e.g. belgiun-Netherlends, France-Belgium,
Germany-Belelux, C7echoslovakia-Yugoslavia. In proportiQn Ps means of pay-
ment can be devised, they are hauling transit freight to, fro:n, and across
Germany; e.g. on the Rhine via Rotterdam/Antwerp; on the Elbe, via hemburg.
Perhaps two-thirds of the Ruhr's coal exports are now moving IWT; mainly
on the Rhine, but also along the rivers and canals of Northwest Germany.
Pre-war patterns of C?echoslovak traffic are resumlng on the Elbe and the
Danube. The Oder is being reactivated to do even broador work rst. Rolish.
stream that is used to do as a German .streamt.
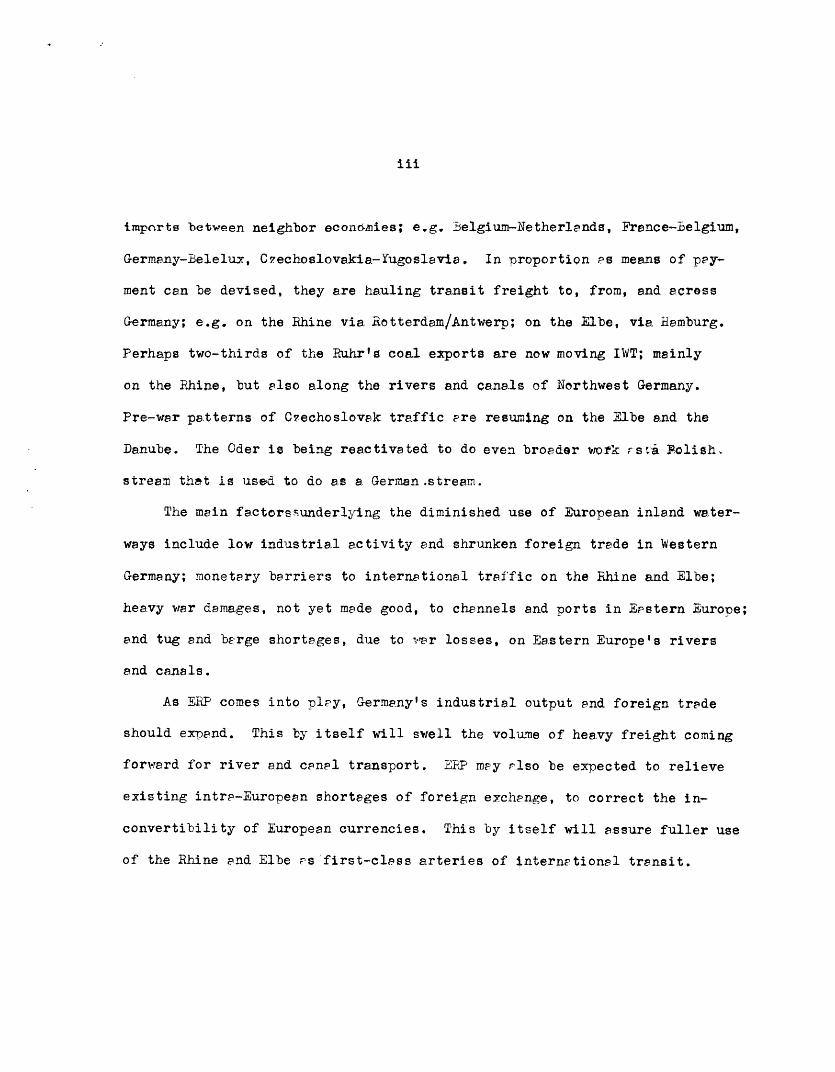
The main factorssunderlying the diminished use of European inland water-
ways include low industrial activity and shrunken foreign trade in Western
Germany; monetary barriers to international traf'fic on the Rhine and lElbe;
heavy war damages, not yet made good, to channels and ports in Eastern Europe;
and tug and berge shortages, due to ,ar losses, on Eastern Europe's rivers
and canals.
As ERP comes into ploy, Germany's industrial output and foreign trade
should exnand. This by itself will swell the volume of heavy freight coming
forw-rard for river and canal transport. vRP mpy rlso be expected to relieve
existing intra-Europeen shorteges of foreign exchange, to correct the in-
convertibility of European currencies. This by itself will assure fuller use
of the Rhine and Elbe Fs first-class arteries of internationel trensit.

Western Europe's tug and barge problem is to bring all her effective
capacity into useful work while modernizing the fleet (e.g. more motor
craft) and improving it (e.g. more special barges) in the process. Eastern
Europe's task is to expand her tug and barge fleet as fast as possible by
lbuilding and repairing craft at home and procuring them abroad (e.g. from
Dutch shipyards).
Western Europels rivers, canals, and inland ports are in fairly good
shape despite some war damages still to be reoa.ired. To render the best
service, however, channels need to be deepened, networks further joined,
locks electrified, port facilities modernized, etc. Eastern Europe, in
contrest, faces a big job of repair and rehabilitetion to bring her inland
waterways back to pre-w..r fitness.
All in all, the outlook is bright for more intensive use of European
inland watr-rways over the next few years. As it eventuates, the EEP effort
will benefit by an ea.sing of the current strain on rail transport.

Use of Euroiean Inland Waterwa e A Preliminary Review
ERP may be seriously impaired unless European inland transport operates
at top efficiency. It cannot do so without full use of the river ead canal
network, the tug and barge fleet. Pre-wer, IWT treffic comprised a big share
of all Inland freight; e.g. 25-30 percent in Germany and France, 40-50 percent
in Belgium-Luxembourg, 75 percent or more in the Netherlands. Today, tags
and barges are hauling much lower ratios which can and should be raised. All
the tulk freight which can needs to be diverted from rail to IWT transport.
This would conserve fuel, equipment, and labor per ton-rile of freight
service. It would concentrate railway motive power, rolling stock, and labor
on the tacks they can perform better and cheaper than other means of transport.
The urgency of shifting LE'uopean heavy traffic fromn over-burdened rail-
roads to underworked rivers and canals is beyond dispute.-/ As reconstruction
got under way, ECITO argued for a greater use of inland waterways. The
Inland Transport Committee, ECE, is advocating it now that EKP is catching
hold. Like views are set forth by the Coal Committee. They are sharcd, also,
by U.S. technicians in ECA, State, and 0WGUS.
It is thus timely to review current performance on Continental Europe's
rivers and cenals as a wholQ. This study sketches the problem in broad
R Ratios measure ton-kilometer performance on inland waterways relative tothat on railroads. Official TKMI data or estimates based on officialtonnage data.
2/ See Transit Traffic on the Lower Rhine through North Sea Forts, ERM-72,pp. 11 - 13.

-2-
outline for want of complete data. It summarizes what can be learned from
documentation on hand. A thorough analysis would require field inquiries
by the iiank in cooperation with ITO.
Selected Measures of Current Performance
Continental Europe's railroads, excenot those of Germany, are currently
operating much more intensively than pre-w,,ar. They a-re carrying an equal or
heavier workload with much less equipment in much worse repai1r. Their
freight traffic has developed as below'.
Table 1. Pre'-war compared with post-war freight onEuropean railroads except thoee of Germany
r million TKMv a month-
Railway system 1937 1946 1947Austria 315 239 366iBelgium 519 391 489Czechoslovakia 885 772 950Friance 2942 3032 3468iHungery 205 114 210Netherlands 188 162 194 eNorway 64 81 91 b/Poland (1864) .cj 2073 2222Roumania. 488 400 n.a..Sweden 314 575 580Nietherlands 1862194 ajTurkey a5189 195.q/
million MT a month - e
lBulgaria (0.5) f/ 0.7 0.7Denmark 0.4 0,7 0.7Finland 1.3 1.2 1.3Italy 4.3 2.4, 3.0Portugal 0.35 0.47 0.44 aSwitzerland. 1.3 1.4 1.5
Through Niov'ember~/Through October£1Pre-pyrr bolundariesdThroug-oh Auguste/Unrelable measure owring to: (i double-count of freight tra-versing twoor more networks within same co-untry; (ii) failure to reflect possiblelengthening or shortening of average haul.
Source: UN, Monthly Bulletin of Statistics, April 1948, Table 50.

-3-
In contrast, inland waterway traffic has dropped far below pre-war.
Clear-cut data exist for Western Europe only. The Benelux, French, and
Bizone networks together are currently carrying about half the pre-rar
freight; those of Eastern Europe, probably much less. Pre-wer cor-res with
1947 performance as below,
Table 2. Selected crude measures of IWT freight onEuropean waterways
Thousand cargo tonsa month 1947 as rough
Network Measure Pre-wer 1947 percent of pre-war
France Loadings only 3750 2330 60Belgium All traffic 3235 1860 a/ 55Netherlands All traffic 7510 3060 b/ 40
British ZoneGermany
Loadings n. a.. 1560Discharges n . . 1050Total n.a. (c) 40
NorthwestGermany Emden traffic 465 145 30Lower andUpper Elbe Hamburg traffic 835 125 15
L/ Through Octoberb/ Through Decemberi/ Non -additive, since loadings partially duplicate discharges.d/ Official estimate; unexplained basis.
Source: Computed from official and quasi-officialdata per Appendix to this study,

-4-
Miost or all of the traffic drop is due to a collapse of international
freight. 'western Europe's inland fleets may well be carrying as much donestic
trade cargo as pre-war; perhaps even more, except in Western Germany. They
are definitely carrying much less e3mort, import and transit freight.
In the Low Countries, beyond doubt, weterway traffic is now below
pre-war only because international traffic has shrunk.
Table 3. Post-war comppred with pre-war IWT trafficon Benelux networks,
- Average performance es rough -percent of pre-war
Traffic by network 1946 1947 B/
BelgiumImport b/ 34 41Export b/ 23 40Transit ]/ 25 31Internatioiial 28 40Domes tic 87 90
Total 49 57
WetherlandsImport 1b/ 18 16Exrort b/ 14 17Transit c/ 28 34International 18 20Domestic 96 94Total 40 41
.a/ For i3elgiup, through October; for the Netherlands, through September.b/ May include somo transit traffic as well.c/ Mlay exclude some transhipments counted as import or export.
Source: (bmputed from official and quasi-official data perAppendix to this study.

-5-
A similar state of affairs may well prevail on the French rivers and
canals. Data for the first half of 1947 suggest that the waterways which
ordinarily bear domestic traffic for the most part are now much closer to
pre-war performance than those which ordinarily bear a big quots of inter-
national freight.
Table 4. Post-war compared with pre-war IWT traffic onFrench networks
- post-war as rough percent of pre-war loadings -
Network by pre-war ratio of January . - June 30 April 1 - June 30international to all traffic 1946 1947 1947Believed to be; high ma/ 47 47 63
medium b/ 49 61 78low A/ 68 69 82
Total 51 g 72
a/ Includes traffic on (1) wraterways of the North, Pas-de-Calais, andSomme; (2) irris-ielgium lines; and (3) the Rhine,
b/ Includes traffic on (1) the Seine; and (2) Feris-Strasbourg line andwaterways of the East,
c/ Includes traffic on waterways of the Center, ilidi, and West,
Source: Computed from official and qua.si-official data. perAppendix to this study.
There is also good reason to infer a better revival of domestic than
international IWT in v'estern Germany. Judging by British Zone data, the
waterways now carry about two-fifths the pre-war freight.Although dmesticcargo
may .,ell have shrunk because of low rates of heavy industrial output, inter-
national cargo has probably shrunk still more in view of a, great drop in
-6-
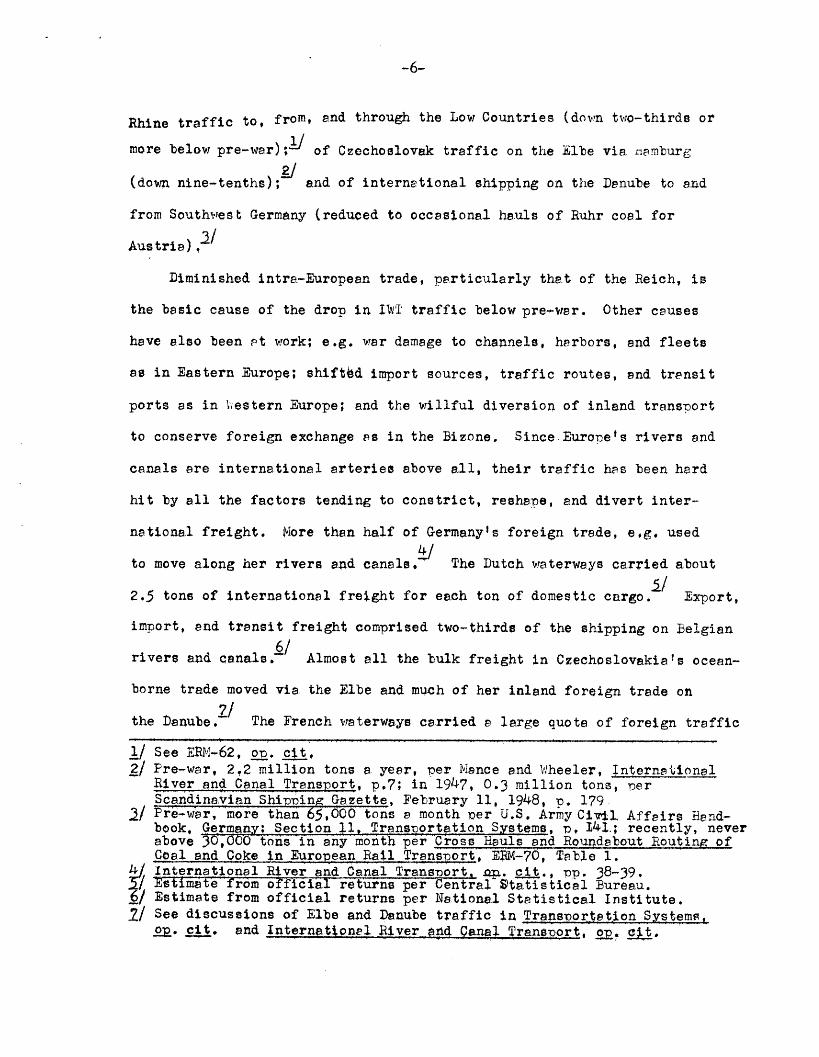
Rhine traffic to, from, and through the Low Countries (down two-thirds or
more below pre-war) of Czechoslovak traffic on the Elbe via 'ramburg
(down nine-tenths); and of international shipping on the Danube to and
from Southwest Germany (reduced to occasional hauls of Ruhr coal for
A1
Diminished intra.-Europeen trade, particularly that of the Reich, is
the basic cause of the drop in IlisI traffic below pre-war. Other causes
have also been Pt work; e.g. war damage to channels, harbors, and fleets
as in Eastern Europe; shiftbd import sources, traffic routes, and transit
ports as in 'Vestern Europe; and the willful diversion of inland transport
to conserve foreign exchange as in the Bizone, Since.Buropets rivers and
canals are international arteries above all, their traffic has been hard
hit by all the factors tending to constrict, reshape, and divert inter-
national freight. More then half of Germany's foreign trade, e.g. used
to move along her rivers and canals. The Dutch waterways carried about
2.5 tons of international freight for each ton of domestic cargo. Export,
import, and transit freight comprised two-thirds of the shipping on I3elgian
rivers and canals. Almost all the bulk freight in Czechoslovakia t s ocean-
borne trade moved via the Elbe and much of her inland foreign trade on
7/the Dlenubej Z The French waterways carried a large quote of foreign traffic
1/ See ERM-62, o, cit.2/ Pre-war, 2,2 million tons a year, per Miance and lWheeler, Internationel
River and Canal Transport, p.7; in 1947, 0.3 million tons, rnerScandinavian Shipning G8zette, February 11, 1948, p, 179.
T/ Pre-war, more than 65,000 tons a month Der U.S. Army Civl. Affairs Hand-book, Germany; Section 11, Transtortation Systems, p, 141.; recently, neverabove 30,000 tons in any month per Cross Heuls and Roundebout Routing ofCoal and Coke in EuroRean,Rail Transrort, EJM-70, Table 1.
4Z International River and Canal Transnort, p. git p. 38-39.Estimate from officia 1returns per Central Statistical Bureau.
6/ Estimate from official returns per National Statistical Institute.%/ See discussions of Elbe and Danube traffic in Transporotation Systems,
ow. cit. and Interngt_ionel River and Canal Transport, 2R, 9tt.

-7-
to and from ocean ports (perticulFrly via the Seine and Rhine) and along
inlend routes to and from neighbor economies (particulrrly the Low Countries
and Germany).
Cargo-14ix of Waterway Traffic
Europe's inland waterways have long served as conduits for the cheap,
mass haulage of heavy freight. They concentrete on such traffic because
their specific advantage - low cost transport - reaches 6 maximum for berge-
loads of low unit-value cargo which need not move high-speed. It will
suffice to consider pre-war German performance.
In the Reich, 25 tons of freight used to move by inland shinping for
each 100 tons by rail. Barge hauls averaged 25 percent longer then rail
hauls. Waterway traffic was 40 percent denser pner route-mile than rail
traffic. About 75 percent of the combined ton-mile work was done by rail-
roads, 25 percent by inland waterways. It was oxplicit, officiel policy to
opertot iland. shipping,t as to -relieve the raillegys-. of;hep.vy freight.
Conl rlone Pomprisef 35eri%ernt of the btrgb-hauled& tonnege; minerailt
17 percent; sand, gravel, etc. 11 percent; griTh; 5 rercet.
1/ See La. Renaissance de la Navigation Interieure, Cohiers Francals d'Information, February 15, 1948, and U.N. Transport and CommunicP&IonMlonthly SummarZ,September - October 1947, pp, 23-26.
2/ Transportation Systems, p. 120.-/ jbi, p. 147.

Table 5. Cargo-mix of inland waterway traffic throughmajor German ports, 1937
Northwest GermenRhine network network Other networs
BerlinDuis- iMann- Gelsen- Hamburg (3raddn- Stettin
Class of Traffic burg heim kirchen Emden (Elbe burg) (COder)
Shipped by PiT 21.4 0.8 3.7 2.8 5.4 1.1 2.5Received by IWT 12.9 4.8 l.9 2.9 v 7.Z 1.4Total, millionmetric tons 34.3 5.6 5.6 5.6 10.0 8.4 3.9
Percent 100 100 100 100 100 100 iCOCereals 1 11 (a) 1 13 4 7Ores 26 3 29 46 3 (a) 11Coal, lignite 53 49 61 46 17 36 38Stone andaggregate 6 8 3 5 14 35 9Fertilizer 2 1 0 (a) 5 (a) 2Wood and products 1 3 2 1 2 2 6Iron, steel andproducts 7 4 4 1 3 2 2All other 5 22 2 1 44 21 26
a/ Some but negligible
Source; Computed from official and qua.si-officialdata per Appendix to this study.
'zestern Europe'e inland fleets are lifting a smaller weight of the
same cargo as pre-war. Coal and coke, e.g., comnrise three-fifths of all
1947 loadings on British Zone waterways, helf of a11- 1947 discheroes
along those of the U.S. Zone, and the entire traffic down the IDanube from
j Pivonthly Statistical Bulletin of the Control Commission-for Guma,(british Element), December 1947, table 91.
2/ Computed from ONGUS monthly rerorts on Transportetion, Nos. 25, 26, and 28.

-9-
Southwest Germany to Austria, Until recently, ore, pyrites, brick, foundry
iron, coal, salt, etc. were the main IVlT freight to and from Czechoslovakia
on the Elbe, Danube, and Oder; since when, grain shipments up the Danube2/
have also resumed. Potash downstream and petroleum upstream comprise
half the Rhine transit between Central Europe and the Low Countries or
through Benelux ports. Solid fuel, quarry products, and building materials
alone make 70 percent of the traffic on Belgian waterways. Solid fuel,
grains, end feed are the major cargo moving internationally by inland shipping
through Rotterdam. Coal downstream and ores upstream are almost all the
freight now moving or soon due to move along the Oder through Szczecin.
Main Patterns of Existing Traffic
Despite a drop in export, import, and transit freight relative to
domestic cargo, Europe's inland waterwrays continue to function as imortant
arteries of international shinping.
Although actual performance may fall short of this ratio, the Coal
Committee, ECE, is scheduling two-thirds of the Ruhrls coal exports to move
/ ibid.gJ Ministry of Foreign Trade, Czechoslovak Economic Bulletin, Februery 19,
1948, p. 10 and February 26, 1948, p. 9; ECE, BIDAC Schedule for down-stream Elbe traffic, February 1947; and most recent notes in Czechoslovakpress.
3! Data for February and March 1948 per MIiAC Schedule.4/ Analysis for January 1 - October 31, 1947 from official returns per
Bulletin de Statistique,November 1947, p. 1346.5] Analysis for January 1 - November 30, 1947 from official returns per
MIaandstatistiek van den In -, Uit-en Doorvoer van Wederlan4, Nov, 1947.6/ National Economic bank, Warsaw, Quarterly Review,December 1947, pp. 3-4.

-10-
IWT, only a third by rail. Roughly 80-85 percent of the international
freight through Dutch ports is brought in or taken out by river craft.
A third of Belgiumls IWT freight comes in or moves out across the French and
Dutch frontiers. Czechoslovak transit cargo comprises 15 percent of all
freight up and dorm the Elbe through Hemburg. In the last fear weeks,
Czechoslovak transit cargo has begun to move on the Oder through Szczecinj
a.s well, thus initiating a broad program for expanded use of that route,
In 1949, if existing plans mature, Poland wi.ll be routing vie the Oder
through Szczecin up to 4.2 million tons of coel enports, 1.2 million tons
of transit ore, and 1.6 million tons of bulk imports.
The Rhine is serving, in reduced measure, all its pre-war trananort
functions. Rhine praft are Carrying much of the internal heavy traffic of
Western Germany; some of France's Ps well. They are moving part of Western
Germany's bulk exoorts to the Iow Countries and Franee, part of her bulk
imports in return. Above all, they are lifting transit freight to, from,
and across Germany.
1/ See, e.g., E/CEC/Coal 5, Rev. 1, Janjgry 31, 1948.2/ Rough estimate from 1947 data on Rotterdam's performonce per retarns of
Dutch foreign trade.2j Rough estimate from official 1947 data. on jelgian inland shipping.4/ Rough estimete from data, in Scandinavian Shipping Gazette, February 11,
1948, p. 179.t/ Recent press notes.6/ Q,uarterly Review, on. cit.

Assuming full realization of the Coal Committee's traffic program,
?25,000 tons of exrort fuel a. month must have been shirnped out of the Rllhr
by Rhine barge in early 1948. Roughly a tenth must have gone upstream to
Alsace and Switzerland, Roughly nine-tenths must have gone dovmstream to
the Low Countries, or, through Benelux ports, to Scandinavia, the Mediterrenean,
and the Iberian Peninsula.
Table 5. Scheduled shipments of Ruhr export coal up or downthe Rhine, first quarter, 1948
- thousand metric tons -
larke t Total -Upstream Downstreamibelgium 335 a/ 0 335Denmark 215 b/ 0 215France and FIN.A. 374 152 222Netherlands 383 -./ 0 383Norway 150 b/ Q 150Greece 105 0 105Italy 415 0 415Portugal 44 0 44Sweden 81 b/ 0 81Switzerland 65 65 0Total 2167 d/ 217 e/ 1950 /
a/ Includes 15,000 tons of bunker fuel.b/ Excludes I.T shiTments via Emden (Denmark,l00,000 tons; Norway, 30,500;
Sweden, 45,500).c/ Includes 50,000 tons of bunker fuel.d/ Compares with 1.1 million tons shipped by rail rilus 0,2 million sent IWT
nlong North German network.i/ Excluding shipments, if any, to Austria via bipsel (only 2,000 tons a
month recently).f/ Of which 1,185,0c0 tons in trFnsit through North Sea ports - i.e,
910,000 via Rotterdair., 275,000 via Antwerr.
Source: Computed from official and quasi-official dataper Appendix to this study.

I

-12-
Judging by LIDAC schedulbs of I!vT transit across Germany, 215,000
tons of non-German cargo a month has recently been moving between benelux
ports and Central Europe. Roughly 30 percent has gone dowrnstream, 70 per-
cent upstream as followrs:
Table 6. Scheduled transit across Germany to, from,and through Benelux po..'ti, February
and March 1943
- thousand metri:;. tons -
To/From Downstream Upstream Total
Strasbourg a/ 90 120 210Basel /j 15 150 165Czechoslovakia c/ 20 30 50U.S. Zone d/ 0 8 8Total 125 308
FOL 0 138 138Potash 80 0 80General cargo 45 170 215
a/ May include some transit via. Strasbourg as well as French exrorts andimports,b/ Maiy include some transit via Basel as well as Swiss exports and imports.£/ Via rail-haul to and from Aschaffenburg.] Only such traffic as requires bIDAC cleerance.
Source: Computed from official and qtuast-officialdata per Appendix to this study,

-13-
Crudely assessed from these incomplete, uncertain data, interneational
Rhine traffic may now be moving at the rate of 10-15 million cargo tons a,
year, or 75 percent below pre-wa.r. It has dropped partly because the
occupation authorities prefer to channel Germanyts foreign trade through
her onm ports. Some review of IWT performance on the ,Veser, Ems, Elbe,
and related canals might thus be in order.
Clear-cut data, unfortunately, are lacking. Such as exist suggest
(1) that the rivers and canals of Northwest Germany may now be carrying
twice or triple the pre-war freight down from the North Sea , but only a
third the pre-war tonnage of ocean-bound cargo. (2) That Hamburg's
Elbe traffic to and from inland rorts of Western Germany may have shrunk
more than her Elbe transit to and from Czechoslovakia, the Soviet Zone,
and Iberlin.
Be this as it may, international traffic on the Elbe has shrunk even
more below pre-war than that on the Rhine. Czechoslovak transit alone is
dowm nine-tenths ; all Elbe freight to, from, and through Hamburg, about
85 percent. Non-CZ cargo is thus only 70 percent lowTer. Some of it,
however, measures Bizone exports and imports which have certainly gone down
more than internal shipments.
1/ See JRM-62, op- cit. and appendix tables to this study,2/ Rough estimate from 1947 performance st BJ3emer, per Ol,¾GUS returns andat Emden per Scandinavian Shipring Gazctte, Februar;- 11, 1948.2/ Rough estimate from 1937 performance per Civil Affairs Handbook and1947 performance per Scandinavian Sh1-pping Gazette, February 11, 1948.

Table 7. Comparison of post-war with pre-war Elbe trafficthrough Hamburg
1947 performance: to, from, or via - Thousand metric tonsWestern Germany 446Mitteland and connecting canals 96Eastern Germany 5)Iberlin 91Czechoslovakia 193Upper Elbe 882Lower Elbe 602Total 1490
1937 performance& in or out
Lordings 5400Discharges 4590Total 9990
Source; 1947 from Scandinavian Shipning Gazette, February 11, 1948, p. 129;1937 from U.S. Army Civil Affairs Handbook on Germany.
Apart from Ruhr coal downstream from Regensburg to Austria, little
or no international freight is now moving on the upper Rezches of the
Danube. That on the Main is limited to small tonnages of Czechoslovak
cargo to and from Aschaffenburg. ;1oth the Danube and the PMain traffic
feed into or out of rail hauls. So does a recent small flow of Ruhr fuel
up the Rhine for rail transit to Austria via B3asel.
j Opinion based on OMGUS periodic reports on Transportation in U.S. Zone../ ibid.~/See, e.g. ±bIDAC schedule of 1Ruhr coal in transit tQ Austria, Arril 1948.

-15-
No clear-cut data. exist on international shipping along the rivers
and canals of ;pastern Europe. Current performance is believed to be far
below pre-war, but in process of recovery. Some metallurgical materials,
building materials, and grain are definitely known to be moving on the
Danube between C7echoclovakia and the downstream economies. It isla uncertain
whether and how far Danube barges may again be hauling international loads
of timber and petroleum. The Oder is on the way to functioning once more
as a conduit of Silesian coal and ScandinavLan orec. A start has been
made, also, to using it as a, transit route to and from Czechoclovakia, thus
partly displaecing the former route via the Elbe. A certain tonnage of
foodstuffs and solid fuel is being hauled West-Rast across Geri-any via
the Mitteland Canal. Some bargeloeds of extort and import freight may
be floating once more on the Vistula.
MaJor Conditioning Influences
A complex set of causes has cut downm the use of Euronean waeterways,
Above all, the following forces Pre operative:
(a) Reduced industria.l output and shrunken foreign trade in Germany
because of war damages, regional cleavage, and disermement
controls.
(b) ivNonetery barriers to international traffic on the Rhine and Elbe
because of foreign exchange shortages and the inconvertibility
of European currencies.
I7/ -zechoslovakid onomic Bulletig, *- cit-2/ q.uarterly Review, o cit.,/ Recent press notes,4/ As indicated, e.g. by recent press renorts concerning the diseute over
traffic control in the Soviet Zone.5/ Quarterly Review, xp. ;it.

-16-
(c) Heavy war damages not yet made good on certain stretches of major
waterways in Central and Eastern Europe.
(d) An acute shortage of tugs and barges, also a, by-product of wer,
on the Elbe, Oder, and Danube,
As Western Germany's industrial outpult increases in response to EBP,
internal traffic on her rivers and canals is bound to exrend. Higher
industrial activity necessarily implies bigger shipments of heavy freight;
e.g. solid fuel, building materials, iron and steel, and chemicals. As
Western Germany's exports and im-ports revive to the stimulus of ERP, her
foreign trade via the Rhine, Weser, Elbe, and connecting canals must also
swell, Heavier outbound cargoes of coa.l, coke, and steel will thus be
passing heavier inbound cargoes of ore, fertilizer, and grain. In short,
the evolution of European waterway traffic over the next few years will
largely reeirond to the im-pact of EKP on 1WJestern Germany.
Neither the Rhine nior the Elbe, however, can function as a first-rate
artery of international traffic unless ERP helps to relieve intra-European
shortages of foreign exchange, helps to make the various European currencies
convertible.
In order to conserve foreign exchange, the occupation authorities are
diverting Western Germany's foreign trade from the Benelux ports to Hamburg,
Bremen, and Emden. Already low because of reduced exports and imports,
transit traffic on the lower Rhine is thus forced lower. It is also kept
back by exchange and clearing flaws which make it herd for Dutch, Belgian,
2/ Analysis which follows based on ERM-62, gp cit.

-17-
French, and Swiss craft to pay for Rhine services on the German stretches.
Both France and Switzerland, e.g. are thereby inhibited from routing a
maximum of export-import traffic along the Rhine via Rotterdam-Antwerp.
International Rhine traffic has also been cut back by the intertlay
of foreign exchange shortages with Hilateral trade agreements and export
allocation controls. Pre-war, e.g,, Ruhr coal used to move up the river
for Swiss import or en routo to Italy and Austria. Today, instead, Silesian
coal moves all-rail across Europe, ocean freighters bring in American coal
to Genoa, and Trieste,
Czechoslovak transit traffic on the Elbe has also been seriously
Impeded by foreign exchange factors, Czechoslovakie is short of tugs
end barges for the job, while Germany has some to spare, Yet until a few
months ago, there was no effective clearing through which Czechoslovakia
could pay for the hire of German craft, Ta early 1948, such a mechenism
was set up at long last. It contemplates the use of enough German craft
to haul 20,000 cargo tons a month upstream. T Is is a third more then the
actual lift by CZ craft alone in 1947, end adds 40.50 percent to their
potential lift a.s recently expanded,
if Analysts which follow based on ERM-70, 9, alt.2/ Analysis based on recent DIPAC meetings and ECE discusslons as well as
recent articles in teehnIcal and official press,

-18-
It is doubtful, howiever, that the Elbe traffic will ever revive to
pre-war d.imensions or beyond. Portly because of foreign exchange factors,
partly for reasons of economic policy, C7echoslovakia. in agreenent with
Polnnd is planning to use the Oder route through Szczecin for much of the
transit freight thst formerly cleared through hemburg. Traffic has already
begun and is expected to exrand considerably; rerhaps by the gradual diversion
of craft nowe operating on the Elbe.
Tugs and barges are seriously short throughout Eastern Europe.
Czechoslovakia has much too few for her Danube and Oder as well as Elbe2/
shifping. Poland and Yugoslavia, have to make good big shortages of harbor_3,
as well as river craft. WVr dameges, repair arrears, and Nazi looting
are the basic causes. They have been partially offset and are due to be
relieved further by the construction of new craft at home (e.g. Czechoslovak
end Polish shioyerds) and abroad (particularly Dutch shipyards); by a
continuing intensive program of repair works; and by the return of displaced
craft in line with the restitution prograrr of the U.S. Army as follows;
1/ Recent prezs notes.2/ See, e.g. M4inistry of F'oreign Trade, Cvechoslovak Economic bulletin,
February 19, 1948, p. 14,31 As evidenced, e.g. by Poland's urgent shinbuilding and ship procurement
program and Yugoslavials ur.gent pressure to get back displaced craft.

-19-
Table 8. Restitution of inland craft via OMGUS throughOctober 31, 1947
Claimed for Approved for ReturnedNetwork and Claimant Retvrn Return to ClaimnntRhine: EBP nationals ./ a15 309 288Weser: ERP nationals,/ 254 175 23Rhine and 'ieser 669 484 361
Danube3ERP nationals c/ 52 39 0Czechoslovak 26 26 26Hungarian 207 207 190Roumanian 21 18 0Yugoslav 177 177. 174
a/ Dutch, French, Belgian, and Swiss,1/ Dutch, Belgian, and French.c/ French, Belgian, Greek, Dutch, and Italian.
Source: 0MGUS, Transrportation Eenort of theMlIiitary Governor,No. 26, p.2 4 , and No. 28, p.11.
For the time being, Western Europe appears to have an adequate fleet,
soon to become more ample, of serviceable tugs and barges. She owes this
to prompt repair and salvage work, the transfer of craft brought in by the
liberating armies, all-out shipbuilding programs, some deliveries by American
and Canadian shipyards, and the return of looted craft from Germany. She
has enough shipbuilding and repair capacity, according to CEEC, to meet all
her replacement and maintenance needs over the life of E?R without importing
new tugs and barges from the outside world,
1/ CEEC, Vol. II. Technical Reports, pp. 329-330.

-20-
The Benelux economies have a good deal more lift capacity and tractive
power afloat than current traffic demands. Despite a much reduced workload,
particularly international freight, the Dutch inland fleet has been brought
back to at least 75 percent of pre-war capacity; the Belgian, to et least
90 percent. Both need to be modernized, however, in the interest of
operating efficiency; ebove all, adding more specialized ships for the
transport of specific cargo, end replacing non-self-propelled barges and2/
lighters by self-propelled motor barges. France, too, appears to have
afloat 75-80 percent of her nre-war fleet measured by nominal capacity,
w.ithout allowing for obsolescence, deferred maintenance, the ratio of canal
to river craft, and availability of special types.
The data on Western Germany's inland fleet are vague and confusing,
They suggest tha.t craft now operating or operational may comprise 50 percent
of pre-war capecity on the Denube; 40 percent on the Rhine; 30 percent on
the Weser; and even less, 1nerhaps, on the Elbe, If this be so, transport
potential has decreased no more, relatively, than actual freight. Since
German tugs and barges used to operate far short of full caoacity, Western
Germany might be deemed to have enough inland ohipping of her own. Yet much
of the capacity now afloat is obsolete or needs to be overhauled, Much is
immobilized from timne to time by the pressure of repair arrears; the loading
of urgent cargo is occasionally delayed by local shorta,ges of traction and
lift.
1/ See notes on Benelux inland shipping, Scandinavien Shitving Gazette,September 3, 1947 and September 17, 1947.
2/ ibid.
3/ See UN Transport and Communicetions Monthly Summary 07. cit. in the lightof La kenalssance dee i-VIRMOH'Interieure. o-. cit.4/ Discussion which folloi-ys based on 0P1vGUS reports for U.S. Zone and British
Element reports for U.K. Zone.

-21-
This is not to argue that Germany's inland fleet ought to be modernized
and expanded at once. It would be wasteful to do so as long as tugs and
barges lie idle at Benelux ports for want of devices to effect intra-Europeanl/
payments, Eventually, perhaps, Germany will have to be re-equipped with a
first-class inland fleet. For the time being, the problem is to put all of
Western Europe's inland shipping to useful work.
To get the best service, however, certain waterways have to be restored
to their pre-war state of fitness, others have to be enlarged, improved, and
modernized. True, those of Western Europe are in much better repair and
form a better articulated network than those of Eastern Europe; considering,
e.g. impaired navigability on the Danube, Oder, and Vistula; inadequate cargo
equipment and harbor craft a1t the Baltic ports, and the long-needed link
between the Oder and Danube. Yet a big job imnrends in Western Europe
as well; e.g. repairing the war damages to the Mittelend Canal which block
its full use to move heavy freight across Germany; repair of war dameges to
certain dams and reservoirs which make it harder to control water levels on
the Rhine, Elbe, Weser, etc; carrying through a $615 million program for the
repair, expansion, and modernization of .belgian rivers end canalo; depeening
the French waterways, electrifying their locks, and improving their port
facilities as now planned; and better articulation of Dutch waterways and
ports with those of zbelgium-Luxembourg in the spirit of the Benelux agreement.
_/ See EIR-62, op. cit,pp. 7-13 and CUEC Technical Reports, on. cit, p. 329,2/ Opinion for Eastern gurope based on recent ECE discussions as well as
recent articles In technical and official press.3] Analysis based on recent BIDAC meetings and ECE discussions as well as
recent articles in technical and officia.l press.

-22-
In any case, European IWT traffic ought to expand steadily from here
on out. The possibilities, the means, and the incentives all exist. ECE
is doing all it can to start the process going. As it develops, the current
strain on European rail transport will tend to ease.

-22-
In a.ny case, European IWT traffic ought to expand steadily from here
on out. The possibilities, the means, and the incentives all exist. ECE
is doing all it can to start the process going. As it develops, the current
strain on European rail transpoort will tend to ea.se.

TABLE I
Prewar compi itraffic on Netherlands inland waterways
(thousand metric tons per month)
1947 S/Class of First Second Third :January 1Traffic 1938 )9A6 rte Qarter 0 arte International
Inland
Arrival 2092. 375 107 415 c/ 485 d./ 335Departure 2252 307 142 475 t/ 525 d/ 380In transit _1Q0 _ o ° / o45 ct 25/Total 5395 977 414 1340 1460 e 1070
NetherlandsInland
Tramp 917 1100 577 1454 1355 1129Liner 500 274 94 280 274 216Private 600 545 216 715 666 532Contract l00 106 48 147 _131 109Total 2117 2024 935 2596 2426 1986
InternationalInland 5395 977 414 1340 1460 1070NetherlandsInland 2117 2 935 2426 1986
TCTAL 7512 3001 1349 3936 3886 3056
a/ Because of seasonal factors, quarterly performance below is not strictlycomparable with annual performance in 1938 or 1946.b/ Performance affected by unusually bad winter freeze.£/ Partly estimated from indirect data..a/ Not a reliable yardstick of January-December performance in view of low waterlevel, retarding traffic in last quarter of 1947.
Source: Computed from Netherlands Central Bureau voor de Statistiek, StatistischBulletin. Jahr;ano 1947, No. 32; Magndschrift, Sept/Oct 1947, pp 716-717; and Maandstatistiek van den In-. Uit-. en Doorvoer, Nov. 1947,pp. 52-55.
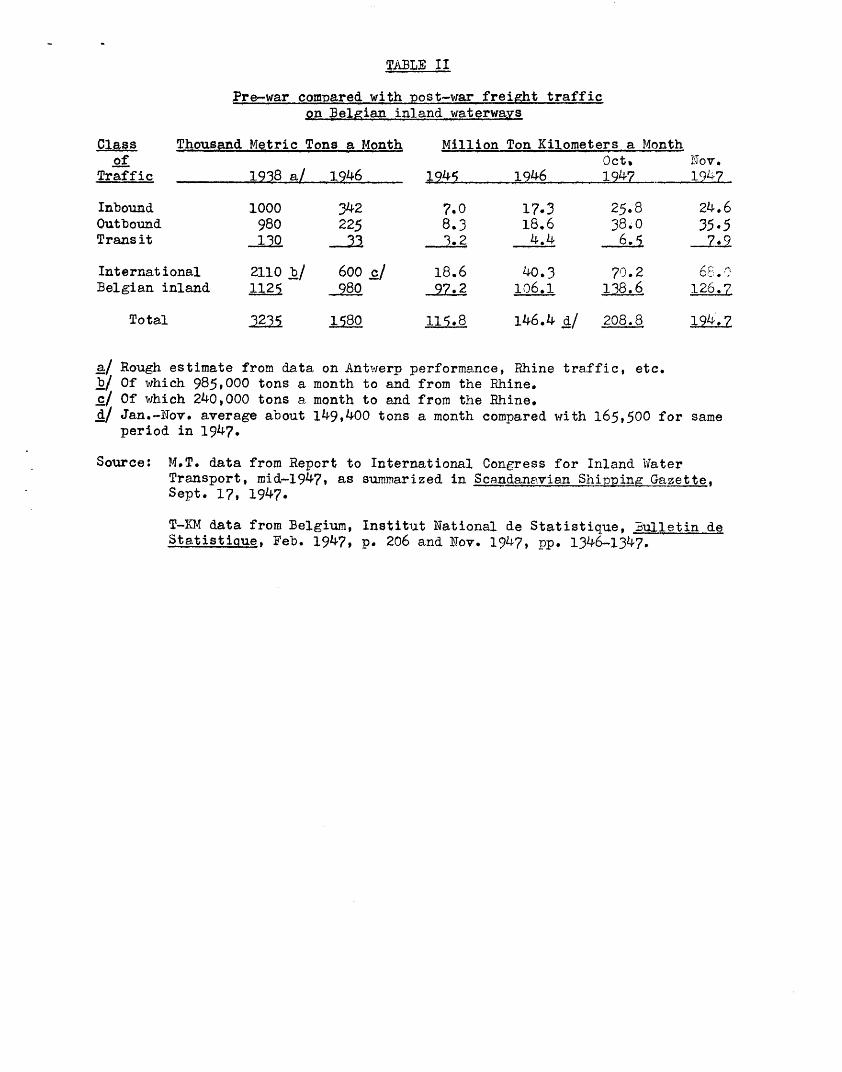
TABILE I I
Pre-war compared with post-war freight trafficon Belgian inland waterwas
Class Thousand Metric Tons a Month Million Ton Kilometers a Monthof Oct. Nov.Traffic 1938 a/ 1946 1945 1946 1947 . 124L
Inbound 1000 342 7.0 17.3 25.8 24.6Outbound 980 225 8.3 18.6 38.0 35.5Transit 130 .. L 4. 6. 72 7.International 2110 b/ 600 c/ 18.6 40.3 70.2 6E.!:,Belgian inland 1125 980 97.2 io6.i 18 126.7
Total 322i 1580 115.8 146.4 d/ 208.8 194.7
a/ Rough estimate from data on Antwerp performance, Rhine traffic, etc.b Of wihich 985,000 tons a month to and from the Rhine.c/ Of which 240,000 tons a month to and from the Rhine.d/ Jan.-Nov. average about 149,400 tons a month compared with 165,500 for sameperiod in 1947.
Source: MoT. data from Report to International Congress for Inland lWaterTransport, mid-1947, as summarized in Scandanavian Shipping Gazette,Sept. 17, 1947.
T-KM data from Belgium, Institut National de Statistique, bulletin deStatistiqiue, Feb. 1947, p. 206 and Nov. 1947, pp. 1346-1347.

TABLE I II
Pre-war compared with post-war cargoloadings on French inland water-
ways
Inland -Thousand Metric Tons in Period-Waterways January 1 - April 1 -Network January 1 - June 30 March 31 June 30
193Q 1946 1947 1946 194 1946 1-24?
North, Pas de 5018 2899 2343 1354 928 1545 1415Calais, Somme
Paris-Belgium 2213 989 1189 407 411 582 778Seine 6122 3783 4262 1648 1860 2135 2402Paris, Strasbourg& East 4482 1406 2185 497 466 909 1719
Rhine 2273 596 944 207 155 389 789Center 1370 802 748 332 284 470 464Midi 1152 800 839 386 352 414 487West 350 340 389 152 150 181 232
22980 a/11615, b/ 12899 c/ 4920 4606 6625 8223
a/ Compares with 12-month aggregate of 45 million tons./ Compares with 12-month aggregate of 25 million tons.
c/ Compares with 12-month aggregate of 25-30 million tons,
Source: France, Ministere de L'Economie Nationale, Bulletin de la StatisticueGenqera1e de la France, Nov.-Dec. 1947, p. 612.

TABLE IV
Pre-war compared with post-war freighttraffic on British Zone inland waterways
Thousand Metric To-ns, in 1947 Ratio of 1947 toMonth or pre-war c/Period Loadings a/ Discharges b/
January 551 280 22%February 39 58 9March 896 350 22April 1849 1142 37May 2014 1364 40June 2150 1496 45Ju:ly 2354 1701 47August 2095 1474 45September 1883 1366 38October 1757 1227 41
Jan.-Oct. 15588 10458 40
a/ Much or most of which also discharged along rivers and canals ofBritish Zone.
b/ Much or most of which also loaded along river and canals of pre-war.c/ Nature of ratio unstated; but presumably reflects non-duplicate count
of loadings and discharges.
Source: Loadings and discharges from Monthly Statistical Bulletin of theControl Commission for Germanv (British Element), December 1947,Table 9.
Ratio to pre-war from Monthly Report of the Control Commissionfor Germany (British .jement), 1947 issue.

TABLE V
Camgo-mix 6-1" freip)~t traffic on 'Belgian inland waterwars,October 1947
Thousand metric tons
Outbound Outbound Inbound Inbound MillionAcross Across Across Acros Ton Kilo-French Dut ch ,Dis- Frenchd/ DJutch-/ meters, all
C;zs of Cargo Loadin sa/ Frontie b/Frontie b/charget!/FrontiFr Frontier freight
Foodstuffs andagriculturalproduce 104 12 12 101 0 22 11.2
Solid fuel 747 147 10 731 0 191 98.6Ore 80 6 9 65 1 1 7.2Iron and steel 36 2 17 24 1 6 4.1Buildingmaterials 223 1 52 205 34 1 26.0
Q.uarry products 262 18 57 394 2 205 31.0Textiles andleather 0 1 5 (e) 1 0.4
Chemicals, fuels,and oils 108 3 26 113 21 12 14.0
Industrial 57 11 8 44 0 5 5.8Miscellaneous 107 2 _2'i 10 1 20 10.7
Total 1728 202 217 1832 60 463 208.8
1946 forcomparison (1390) (98) (238) (1470) (65) (352) (166.8)
Jan-Oct. monthlyaverage1947 1431 136 278 1448 47 384 162.51946 1240 89 175 1351 48 327 148.6
a/ Partly duplicates dischargesb/ Partly from pre-vOctober loadingsc/ Partly duplicates loadingsd/ Partly for post-October dischargese/ -,.Teglig- ible
Source: Belgium, Institut INTational de Statistique, Bulletin de Statistique,1Movember 1947, pp. 1346 - 1347,

TADLE VI
Analysis of freight traffic on British Zone inland waterwaysby network and cargo, i947
Thousand metric tonsJan 1 - Oct. 31, Monthly Average b/'etwork and Cargo Loadings a/ Discharges Loadings a/ Dischirpas
chine 7064 4816 ?06 462Zhine-Herne canal 4479 611 448 61)ther Westphalian water-ways 638 795 64 79
:eser-Mitteland canal 688 1139 69 114rorth coastal area exceptElbe 1517 2006 152 201
.lbe 1166 865 117 863altic coal area 36 226 4.iotal 15588 10458 1559 1046
.hine 7064 4816 706 482,oal 5115 1310 511 13111 other 1949 3506 195 351
Uhine-Herne Canal and other'iestphalian waterways 5117 1406 $12 141,oal 4479 622 448 6211 other 638 784 64 79
'otal 15588 10458 15_2 1046,oal 9594 c/ n.a. 96Q n.a.-11 other 5994 d/ n.a. 599 n.a.
>/ Partly duplicates dischargesTj Partly duplicates loadings_/ Covers only coal loaded at ports on Rhine, Rhine-Herne panal, and other
Westphalian waterways.1/ May include some coal loaded at ports not on Rhine, Rhine-Herne canal, or
other Westphalian waterways.
3ource: Monthly Statistical Bulletin of the Control Commission for Qermany,(British EleMent) December 1947, Table 91

TABLE VII
USE OF UPPER RHI1TE HETWORP AS MEASURED BYCxRGO UiNLOADINGS AT PORTS IN U.S. ZONE
1945-1947
(Thousand Metric Tons a Month)
Coal from Misc. Goods Goods Goods u. S.Down- Cargo for for for IrrystreamvUTJpstreaR/Up & U.S,i irenchf/ Sovietf/ Czech f| Ship-'eriod Source Sourcef Dowm Zone Zone Zo. zoiie Imports ments Tot--I
4t Qt. 6 .j . 4.). .~-- 6.29464th Qtr. 61-011 4.1 - - ---65.2
-2:61st Qtr. 124.1 2.5 35.9 6.7 - _ - - 169.22nd Qtr. 201.2 1.4 123.7 3-3 -- 2,3 13.0 344.93rd Qtr. 278.1 2.9 160.5 31.6 1.5 -- 93.0 7.1 574.74th Q,tr.a/ 220.9 2.8 184.2 11.4 0.3 -- 9.4 14.6 4433.6 -/
9471st Qtr. a/ 77.3 1.9 44,2 '1,4 O*3 0.3 5.8 131,2a/* April 302.1 3.1 254.0 36.8 9.0 20.0 8.1 633.1iay 354.3 2.7 254.4 18.9 10.4 __ 11.4 19.9 672.oJune 361.7 4.4 231.3 32.1 5.3 - 7.2 12.7 654.7July 358.2 5.5 266.8 39.3 3.6 __ 8.9 20.7 703.0August 328.2 6.7 203.1 40.7 6.5 0.7 4.9 14.8 605.5Septemb yi-/249.2 10.5 195.7 47.4 3.8 -- 1.5 12.8 521.0 b/October 136.6 13.8 197.1 32,0 1.7 - 0.8 13.0 395.0 b/
/ Performance affected by unusually bad winter freeze/ Performance affected by unusually lowr water levels./ All, or almost all, from British Zone./ All, or almost all, from U. S. Zone./ Mainly or entirely food from downstream sources/ Mainly or entirely in-transit cargo from downstream sources.
ource: Office of Military Government for Germany (U.S.), Reports of the MilitaryGovernor, No. 25, Statistical Annex, p. 71, No. 26, Transportation, p. 21,and T.o 28, Transportation, p. 10 2

TABLE VIII
Use of lZJeser and related canals to move TUT freight outof B3renen, 19h6 - 19 7
- thousand metric cargo tons per month -
Period_To. U.S. To B.ritish t TPeriod Zone a! Zone Other c/ Total
1946: 2nd q. 6.5 0 0 6.53rd q. 36, 6 12.5 0.1 59.2l4th q. 16e2 17.7 3.0 36.9
1947: 1st q. 5.6 0.2 0 5e8April 33.0 31.5 l.5 66.oI ay 36.7 58.9 0 95.6June 51l.2 78.6 0.2 129.9July 53.9 76.6 0 130.5August 67.6 75Wo 0 142.7Sept. 39.0 101.1 0 14O.lOctober 20.4 100.4 1.1 122.0
a/ Via Kusten canal, Dortmund - &Es canal, and upstream Rhineb/ Via Y.ester and K.itteland canal, etc. as 'Yell as via Kusten canal arid
Dortraund - 1ms canal, etc.c/ mainly or entirely to French Zone, Czechoslovakia, or both.d/ Excluding trans-shipment of cargo, primarily for storage purposes., between
ports in Land Bremen.
Source: Office of -. ilitary Government for Germany (U.S.) Reports of thelitary Governor, No. 25, Statistical PXnex, p. 71, No. 26,
Transportation, p. 22, and No. ?7Transportation, p. 11.

TA3LE IX
Use of Upper Danube network since mid-1947 to move Ruhr coalfrom Repensburg to Austria
Thousand Metric Tons a MonthReceived at Dispatched from
Programmed Regensburg all- Regensburg down ProgramMonth Traffic rail from Ruhr Danube to Austria Realization
July 25-0 25.3 24.3 97%August a/ 75.0 31.5 31.4 42%September a/ 25.0 12.7 12.5 5O%October a/ 25.0 0.2 2,7 lfb
Late 1947 -Early 1948:
Monthly perfor-mance 30.0 100%
Monthly potential 70.0BIDAC Schedule,
April 1948 50.0
.E/ Performance affected by unusually low water level,
Source! July - October 1947 from OMGUS, Transportatign, No. 26, p, 21and No. 28, p. 10.
Late 1947-1948 from ECE data, i.e., ITC, Cross-Haulage of Solid PFel,p.5 and BIDAC 14eetings, Jani 20-21 and March 19-20, 1948

TABLE X
Decline of international relative to domestic UIPTfreight as rmeasured by cargo to and from
Antwerp
- thousand metric tons, Jan.-Sept.
Inbound OutboundClass of Traffic 1938 1946 1947 1938 19L6 1947
International, to ov. from:
Netherlands 762 428 378 562 179 194
France: i.Ieuse a I Escant 117 31 58 62 99 246
Rhine 281 141 195 446 97 379
Germany 2082 457 262 1823 189 262
Svwitzerland 50 11 39 317 240 382
Export, import, &transit 3292 1067 932 3210 803 1463
Belgian, inland 1386 1075 1472 3454 2958 4078
Total 4678 2l142 2404 6664 3761 5541
Source: UN, Transport and Com-unications, Vol. 2, Nos. 11-12, Nov. and Dec. 1947PP. 3re37 (French ext)

Annex A. 33IDAC Schedule of Rhine transit across Germanybetween Central Europe and Benelux, February and I.Iarch, 1948
thousand metric tons -
Dovmstream Traffic
To From Cargo Feb. March Total Routing
Belgium Strasburg Potash 40 40 80 All T'JTGeneralCargo 5 5 10 All IVT
Total 45 45 90
Basel Seneral ro17.5 7.5 15 All I1JT
Total 52.5 52.5 105
Netherlands Czechoslovakia General Rail toCargo 10 10 20 SC fen-burFi themxe
Total 62.5 62.5 125
Upstream Traffic
Strasburg Netherlands POL 25 25 50 All rHT
GeneralCargo 35 35 70 All NTT
Total 60 60 120
Basel Netherlands POL 4o 4o 80 All DTTTGeneralCargo 35 35 70 All PIT
Total 75 75 150
Czechoslovakia Rotterdam, General 15 15 30 rJJT toAmsterdam, ex- Cargo Aschaffen-
overseas burg;thence, rail
U.S.Zone Netherlands POL 4 4 8 All IWT
Total 154 154 308
Source: ECE, 1:iniutes of BIDAC Ileeting, Jan. 20-21, and March 19-20, 1948

Annex B. BIDAC ScheduLe of suitable freightfor Elbe transit from Hamburg to Czechoslovakia, February and
M.arch 194Ld
ilIaxiraum shipping targets contingent onavailability of tugs and barges
- thousand metric tons
Cargo Ex Feb. March Total
Iron ore Norway-Sweden 20 20 40
Pyrites Spain 20 0 20
Copra Unspecified overseas sources 8 0 8
Sulphur U.S.A. 5 0 5
Fish Oil & Canned Fish Norway-Sweden 2.8 2.8 5.6
Ferro-chrome Norway-Sweden 2 0 2
Plywood NIorway-Sweden 0.2 0 0.2
Total, bulk 58 23 81
General Cargo European sources 17.1 8 25
General Cargo Overseas sources 2.5 20.5 23
General Cargo a) Unspecified sources 1 1 2
Total, General Cargo 21 29 50
Total 79b) 5 2b) 131
a) Via Bremen, not Hamburg.
b) Compares with average 1947 lift, Czechoslovak craft only of 15,000 tons amonth; and planned lift, later in 1948, of 50,ooo-6o,ooo tons a month byCzechoslovak plus German craft.
Source: EEC, Minutesof BIDAC Meeting, Jan. 20-21, and MIarch 19-20, 1948

ANNEX C. PRE-V.2J. FREIGHT TRAFFIC ON GEP,ATZTY'S INLMND WATERWAYS
Length of Traffic densityYW.atervrays, 1936 -
million ton kilometers km. thousand tkm.1Jaterway network 1936 1935 _ per route km.
East Prussia 128 115 524 250Oder 2514 1942 1102 2280Miork 1263 1114 905 1400Elbe 3288 2721 1.542 2130Northwest Germany 4237 3498 1596 2650Rhine 14373 13024 1772 8110Danube 127 100 213 600
Total 25930 a2/ 22514 7654 3390 _/
Weight of cargo,million metric tons 116.1 c .
Average length ofhaul, km. 223.4 d/.
a/ About a third the tkm. performance on Germany's railroads.b/ About tvwce the traffic density on Germany's railroads.c! Increased to 133.1 million in 1937 during which German railroads carried
almost 485 million metric tons of freight.dt About a third more than the average haul on Germany's railroads.
Source: U.S.Army Service Forces MSianual, Civil Affairs Handbook, Germany, Section 11;Transportation Systems, pp. 145-147, supplemented by pp. 66L68.

A\ThTh'X D -- CARGO TRAFFIC AT SOiS MAJOR IiMLAND PORTS ON GEVAuY IS. TAT7PW,A[lY ;Y, prik, l19'7 a!
;; ; : :: : ; Coal Stone and: Wood. &e Iron, Steel AllNetwork .; Shipped I Received. Total :: Cereals : Ores Li.Tnite : Agregate : Fertilizer:Prod1,ct;: and Products: Other; (In millions of metric tons) (A:ppDroximate percent of all traffic)
(c) (d)Rhine ;; (43.8) (44.6) ( : Kehl ;; 0.5 1,6 2.1 :: 10 1 59 2 4 9 2 14Karlsruhe ;; 0.3 2.6 2.9 :: 3 1 72 3 1 6 5 10Mannheim ,; 0.8 4.8 5.6 :: 11 3 '49 8 1 3 4 22Ludwigshafen :: 1.7 3-7 5.4 :: 4 11 36 8 4 1 11 26Maina i: 0.7 1.8 2.15 ;: 1 3 38 41 1 5 2 9Neuwied 0.4 0.8 1.1 :: (b) (b) 11 54 0 2 11 21Wlesseling 2.9 0.0 2.9 :: 0 (b) 98 0 0 (b) (b) 1Koeln 1.9 1.6 3.4 :: 6 5 38 2 (b) 4 7 39Leverkusen-Monheim :: 0.3 0.7 1.0 :: (b) 36 9 1 0 3 (b) 51Neuss :: 0.5 0.8 1.2 13 (b) 19 17 (b) 3 5 42Dusseldorf - 0.9 1.9 2.8 :: 10 2 7 28 0 5 10 39Krefeld-Uerdingen :: 0.4 o.6 1.0 :: 16 4 24 3 1 3 2 48Rheinhausen :: 2,5 0.5 3.0 : 0 79 1 1 2 0 12 5Duisburg :: 21.4 12.9 34.3 : 1 26 53 6 2 1 7 5Homberg :: 2.2 0.2 2.4 :: 1 5 88 2 0 1 0 3Wlalsum ;: 1.2 1.6 2,8 0 50 31 2 0 5 9 4Heilbronn o: 0.4 0.9 1-3 :: 6 0 21 15 0 9 9 40Frankfurta/i :: 0°3 2.7 3.0 3 4 50 15 1 (b) 3 24(c) (d)Northwiest Germany :: 22.9) (17.6)
.e.Bremen .. 0.5 2.1 2.6 6 (b) 24 37 9 3 2 19Peine .: 0.5 0.7 1.3 :: 0 41 57 (b) 0 0 2 (b)Dortmund :: 1.4 3.7 5.1 1 55 20 13 (b) 1 7 3Emden :: 2.8 2.9 5.6 :: 1 46 46 5 (b) 1 1 1Herne: Branch Canal : (0.8 (0.1 (0q9 : 0 0 91 8 0 1 0 (b)Rhine-Herne Canal :: (0.8 ((b) (0.8 :: 0 0 99 0 0 1 0 0Hamm o: 0.4 0.5 0.9 5 0 26 3, 0 6 24 6Wanne-Eickel : 2.6 0,2 2.8 :: 1 (b) 93 3 0 2 (b) 2Gelsenkirchen :: 3.7 1.9 5,6 (b) 29 61 3 0 2 4 2Bottrop :: 2.6 0.1 2.6 .: 0 0 94 0 0 2 (b) 4Essen :: 1.8 0.7 2.5 0 21 65 7 0 2 3 2

-2-AkiTEX D -- CARGO TP-AFYIC AT SOii- 7.AJC(R INLAiD POCTS Oil GEi'SA;Y' S
*WATE11'1AY,7T-r7c7:,s',^, 1)2'7 a!
:: : : :: : : Coal Stone and :.1ood -d Iron, Steel - AllNqetwork :: Shinned Received : Total Cereals Ores Li-nite A: hgregate : Fertilizer: Products and Products: Other(In millions of metric tons) (Approximate percent of all traffic)(c) (d)
Elbe ,: (8.q) (8.5) (e : ._ ... _iviagdeburg :: 0,7 1.1 1.3 11 4 38 (b) 1 3 4 40Hamburg 5.'4 4.6 10.0 13 3 17 14 5 2 3 44
Brandenburg : ('3.5) (8.7) (e)Berlin :: 1.1 7.3 8.4 :: 4 (b) 36 35 (b) 2 2 21Niederlehme :: 1.0 0.0 1.0 :: 0 0 2 98 0 0 0 O
(c) (d)Oder :: (7,0) (2.6) e :I'osel e: 3.4 0.5 3.9 : 1 9 84 3 0 () 1 3Stettin :; 2.5 1.4 3.9 7 11 38 9 2 6 2 26
(c) (d)East Prussia :: (0.6) (1.1) : . . .Koenigsberg 0: 0.4 0.5 0.91 4 8 30 28 (b) 7 1 23(c) (d)Danube (0.5) (1.0) :: . . .Regensburg 0.4 0.9 1.3 42 (b) 2 (b) 2 1 7 46
./ Only those ports are shown w,hich processed roughly 1.0 million metric tons or more.b/ Some, but negligible ratio, below 0.5 percent..*/ Shipped from major ports only including some not showm belor.d/ Received at major ports only including some not shown belowf.e/ Would be misleading because of overlap between cargo shiipned and received on same network..
Source: U.S. Army Service Forces Manual, Civil Affairs Handbook.Germany, Section llA: Transportation Systems, Inland Waterways, Table 9. p. 51-52.