Finding Load Profile Primitives by using Independent Component Analysis
14
Finding Load Profile Primitives by using Independent Component Analysis Tadahiro Taniguchi Shiro Yano Haruka Kobayashi * Ritsumeikan University [email protected] Abstract In this paper, we describe our work on finding load profile primitives. Analyzing home electric- ity consumption is an important issue for designing, managing, and analyzing a future smart grid. Load profile data have additive property because of the same property of electric current. It will enable us to decompose observed data into a small number of elemental components, named load profile primitives. We measured several sets of home load profiles and applied independent compo- nent analysis (ICA) to extract load profile primitives. We investigate the possibility of finding load profile primitives by analyzing the measured data set with independent component scores. We eval- uate its performance by comparing with originally observed data, qualitatively. We also adopted ICA to load profiles of one hundred houses measured in Higashiomi city and shows that the method can extract the seasonal changes in load profiles of local grid. 1 Introduction 1.1 Decentralized local smart grid Decentralized electricity networks have recently been attracting attention. People believe a de- centralized electricity network is appropriate to power generators using various renewable energies, e.g., photovoltaic generators (PV) and wind power generators. Many kinds of micro grids have been studied for a long time. Recently, researchers, mainly in Europe, studied Virtual Power Plant (VPP), which is an aggregated electricity resource managed integrally and efficiently [1–3]. How- ever, in such studies, distributed resources tend to be controlled in a centralized way. In contrast, many researchers have started trying to manage distributed electricity resources in a decentralized way [4]. We have proposed and studied a model for a future smart grid named the inter intelligent renew- able energy network (i-Rene) [5,6]. In the i-Rene, most houses are equipped with a PV and a battery. However, electric energy produced by a PV cannot be consumed by the single house. Therefore, the surplus electricity should be put into circulation in the decentralized local power grid by charging and discharging their batteries. For this, each house uses a smart meter (or a power router) with artifcial intelligence, which would be based on a machine learning system, to trade electricity in the networks adaptively and automatically. To circulate surplus electric power efficiently within the smart grid, not only an averaged load profile of the entire network but also individual load profiles must be predicted for each house. Thus, microscopic analysis of load profile data becomes more and more important. * * Currently, she is working for Mitsubishi Electric Corporation. International Journal of Energy, Information and Communications Vol. 4, Issue 2, April, 2013 41
Transcript of Finding Load Profile Primitives by using Independent Component Analysis

Finding Load Profile Primitivesby using Independent Component Analysis
Tadahiro Taniguchi Shiro Yano Haruka Kobayashi∗
Ritsumeikan [email protected]
Abstract
In this paper, we describe our work on finding load profile primitives. Analyzing home electric-ity consumption is an important issue for designing, managing, and analyzing a future smart grid.Load profile data have additive property because of the same property of electric current. It willenable us to decompose observed data into a small number of elemental components, named loadprofile primitives. We measured several sets of home load profiles and applied independent compo-nent analysis (ICA) to extract load profile primitives. We investigate the possibility of finding loadprofile primitives by analyzing the measured data set with independent component scores. We eval-uate its performance by comparing with originally observed data, qualitatively. We also adoptedICA to load profiles of one hundred houses measured in Higashiomi city and shows that the methodcan extract the seasonal changes in load profiles of local grid.
1 Introduction
1.1 Decentralized local smart grid
Decentralized electricity networks have recently been attracting attention. People believe a de-centralized electricity network is appropriate to power generators using various renewable energies,e.g., photovoltaic generators (PV) and wind power generators. Many kinds of micro grids havebeen studied for a long time. Recently, researchers, mainly in Europe, studied Virtual Power Plant(VPP), which is an aggregated electricity resource managed integrally and efficiently [1–3]. How-ever, in such studies, distributed resources tend to be controlled in a centralized way. In contrast,many researchers have started trying to manage distributed electricity resources in a decentralizedway [4].
We have proposed and studied a model for a future smart grid named the inter intelligent renew-able energy network (i-Rene) [5,6]. In the i-Rene, most houses are equipped with a PV and a battery.However, electric energy produced by a PV cannot be consumed by the single house. Therefore, thesurplus electricity should be put into circulation in the decentralized local power grid by chargingand discharging their batteries. For this, each house uses a smart meter (or a power router) withartifcial intelligence, which would be based on a machine learning system, to trade electricity inthe networks adaptively and automatically. To circulate surplus electric power efficiently within thesmart grid, not only an averaged load profile of the entire network but also individual load profilesmust be predicted for each house. Thus, microscopic analysis of load profile data becomes moreand more important.
∗* Currently, she is working for Mitsubishi Electric Corporation.
International Journal of Energy, Information and Communications Vol. 4, Issue 2, April, 2013
41
0
200
400
600
800
1000
1200
1400
0 5 10 15 20 25
Co
nsu
mp
tio
n (
wh
)
Hour
Figure 1. Randomly sampled measuredload profiles
0
50
100
150
200
250
300
350
400
450
500
0 5 10 15 20 25
Ave
rage
d C
on
sum
pti
on
[w
h]
Hour
Figure 2. Averaged power consumptionby a household sector
1.2 Load profile primitives
The averaged load profile of the household sector is often dipicted as shown in Fig. 2. These kindof measured data are widely known1. However, individual load profiles are very different from theaveraged one. Figure 1 shows load profiles randomly sampled from home electric consumptiondata we measured. This shows that daily home electric power consumptions are diverse and noisy.Empirically, a home load profile seems to have a certain kind of consistent pattern, but fluctuatesstochastically depending on the day of the week and schedules of people living in the house. There-fore, it is difficult for us to understand characteristics of individual load profiles from only lookingat measured data for each house.
On the other hand, load profile data have additive property because of the same property ofelectric currents. This additive property, i.e., linear property, will enable us to decompose observedload profiles into a small number of elemental load profiles. We call theseload profile primitives.Decomposition of load profiles has been studied to distinguish elemental pattern representing usageof electric appliances from the profiles in the context of machine learning and data mining [7–9].On the other hand, Yanagida et al. tried to find an underlying structure in annual electric load datausing independent component analysis [10].
In this paper, we measure several sets of home load profile data and try to extract load profileprimitives by applying independent component analysis (ICA). By qualitatively investigating themeasured load profiles and results of ICA, we study the possibility of finding load profile primitivesand using them to predict and/or model individual load profiles.
2 Method for finding load profile primitives
An independent component analysis (ICA) is a statistical technique to extract key low-dimensionalrepresentations from a set of given time series data. There are various algorithms to perform ICA.The fastICA [11,12] is proposed to use for analyzing the target data set in this paper. fastICA is oneof the most popular ICA algorithm having high computational efficiency. ICA tries to decompose
1This figure shows the averaged load profile that was averaged using seven homesf electric consumption data mea-sured in our research during summer 2010.
International Journal of Energy, Information and Communications Vol. 4, Issue 2, April, 2013
42

Figure 3. SHOENE NAVI: an electric power meter [13]
a target signal data by assuming that source signals are independent.
X = SA (1)
XKW = S (2)
A = (KW)+ = ((KW)T(KW))−1(KW)T ≡ B (3)
whereX = {xtk}, S= {stk}, A= {adk} andB= {bdk} are matrices. ICA assumes that the observedsignalX is generated by mixing independent signalsSby using a mixing matrixA. To evaluate in-dependence of signal sources, fastICA uses negentropy representing non-Gaussianity. The abstractprocedure is as follows.
1. Centering and whiteningX by calculatingK using PCA
2. Finding an orthogonal matrixW that maximizes approximate value of negentropy
By estimatingK andW, we can estimate source signalS (Eq. 2). We can also estimate mixingmatrixA via calculating a pseudo-inverse matrix ofKW (Eq. 3). By calculatingA, we can estimateeach independent component score for each piece of the load profile data. Therefore, we alsoestimateA.
In this study, we assumeX contains load profiles.t ∈ {1,· · · ,Tmax} represents an index of timeslot during which electric load is summed up.d is the index of independent components.k is thenumber of samples of load profiles. The fastICA can extract load profile primitives in an unsuper-vised way.
3 Experiment 1: individual homes
3.1 Materials
Electric load profiles of seven houses were measured by using the electric power meter producedby Chugoku Electrical Instruments Co., Ltd. [13] (Fig. 3). This can easily record electric loadprofiles every 15, 30, or 60 minutes. In our experiment, load profile data of the seven houses wererecorded every 30 minutes during July and August 2010.
Six of the seven target houses are occupied by six independent families, and the other is occupiedby two university students. The family structures and other properties are shown in Table 1.
We used the daily individual load profiles as an input dataX. Tmax = 48 andK = 434=7[homes]×72[days]. In this study, we set the number of independent components to five.
International Journal of Energy, Information and Communications Vol. 4, Issue 2, April, 2013
43

Table 1. Target familiesHomeno. Housetype Thenumber of residents family structure
Home1 Apartment1LDK 4 Parents and two infantsHome2 Apartment3DK 3 Parents and an infantHome3 House 2 MarriedcoupleHome4 House 5 Parents and three childrenHome5 House 5 Parents and three childrenHome6 House 4 Parents and two childrenHome7 Apartment1LDK 2 Two students
3.2 Results
3.2.1 Overview
Fig.5 shows the five extracted independent components, i.e., load profile primitives. Fig. 4 showsthe averaged mixing coefficients of independent components for each house. If a coefficient is big,the family living in the home consumes electric power on the basis of a load profile pattern contain-ing the corresponding independent components in large amounts. We consider each independentcomponent (IC) as a load profile primitive.
For example, Home 1 is affected by IC3 negatively. Home 3 is characteristically affected byIC2. Homes 3 and 5 have similar ratios of ICs. These results show that family structure is a poorexplanatory variable to explain load profiles. We also averaged mixing coefficients over days of theweek for each home. In the next subsection, we look at results for all seven homes.
3.2.2 Home 1
Fig. 6 shows that IC1 was relatively active on Wednesday. Fig. 7 shows Home 1’s load profileson Wednesdays. IC1 increases electricity consumption from 9 a.m. to 7 p.m. This tendency can befound in the graphs shown in Fig. 7.
3.2.3 Home 2
Fig. 8 shows that IC1 and IC3 negatively affect Home 2. They are both especially active onFriday. Negative IC1 and IC3 drag down daytime consumption (Fig. 9). Negative IC1 also increasesnighttime consumption. The two ICs mainly characterized load profiles of Home 2.
3.2.4 Home 3
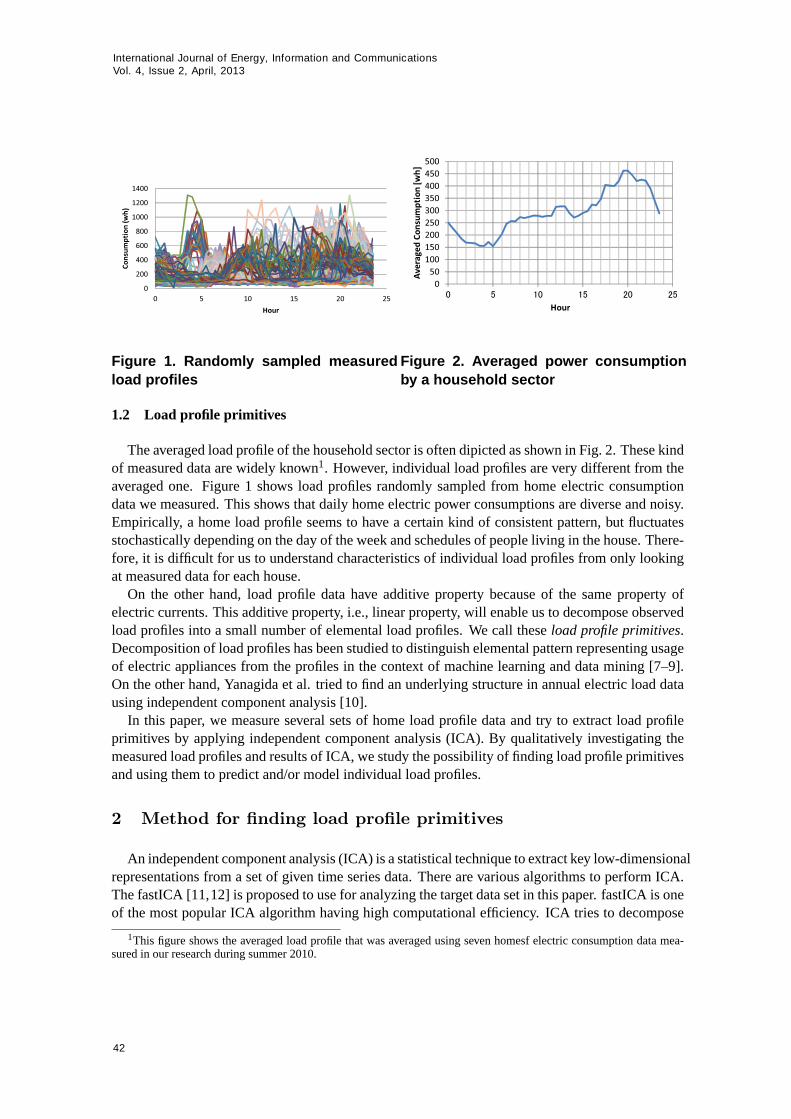
Fig. 10 shows that most ICs negatively affect Home 3’s load profiles. Fig. 11 shows load profilesof Home 3 on Fridays. This family’s load profiles are relatively similar to averaged data in Fig. 2.
3.2.5 Home 4
Fig. 12 shows that IC3 and IC5 negatively affect Home 4’s load profiles. Fig. 11 shows loadprofiles of Home 4 on Saturdays. On Saturday, IC1 increases daytime electricity consumption. Thismeans that people living in Home 4 tend to stay at home on Saturday.
International Journal of Energy, Information and Communications Vol. 4, Issue 2, April, 2013
44

-200
-150
-100
-50
0
50
100
150
H1 H2 H3 H4 H5 H6 H7
IC1
IC2
IC3
IC4
IC5
Figure 4. Averaged mixing coefficients of independent components for each house
-3
-2
-1
0
1
2
3
4
0 5 10 15 20 25
Co
nsu
mp
tio
n (
wh
)
Hour
IC1
IC2
IC3
IC4
IC5
Figure 5. Extracted independent components
3.2.6 Home 5
Fig. 14 shows that the fifth house typically used IC2 positively and IC1 negatively. ComparingFigs. 5 and 14, we found that IC2 clearly represents Home 5’s specific profile from 2 a.m. to 6a.m. (Fig. 15). This family has a contract with an electric power company that allows them to buynighttime electricity cheaply. Therefore, they regularly buy electricity during that period and heatwater automatically. Independent component analysis could extract this feature automatically2.
3.2.7 Home 6
Fig. 16 shows that IC1 gives a relatively larger contribution on Saturday and Sunday. Comparingweekday load profiles and weekend load profiles, we found that growth of consumption at 6 p.m.was very different between weekdays and weekends. We also found that averaged electricity con-sumption during the daytime on weekends was larger than that on weekday. ICA could find suchdifference automatically.
3.2.8 Home 7
Fig. 18 shows no IC had significant soceres. Fig. 19 shows load profiles of Home 7. Two studentsstudying at different universities live in Home 7. They live irregular lifestyles. They come backhome at different times, some days they do not come back home, and wake up late in the morning.From these kind of load profiles, ICA obviously could not find regular load profile primitives.
2However, no meaning of IC2 can be inferred, of course.
International Journal of Energy, Information and Communications Vol. 4, Issue 2, April, 2013
45

-150
-100
-50
0
50
100
150
Mon. Tue. Wed. Thu. Fri. Sat. Sun.
IC1
IC2
IC3
IC4
IC5
Figure 6. Mixing coefficient for days of theweek of home 1
0
200
400
600
800
1000
1200
1400
0 5 10 15 20 25
Co
nsu
mp
tio
n (
wh
)
Hour
2010/7/7
2010/7/14
2010/7/21
2010/7/28
2010/8/4
2010/8/11
2010/8/18
2010/8/25
Figure 7. Load profiles of Home 1 onWednesdays during July and August
-60
-50
-40
-30
-20
-10
0
10
20
30
Mon. Tue. Wed. Thu. Fri. Sat. Sun.
IC1
IC2
IC3
IC4
IC5
Figure 8. Mixing coefficient for days of theweek of home 2
0
50
100
150
200
250
300
350
400
450
500
0 5 10 15 20 25
Co
nsu
mp
tio
n (
wh
)
Hour
2010/7/2
2010/7/9
2010/7/16
2010/7/23
2010/7/30
2010/8/6
2010/8/13
2010/8/20
2010/8/27
Figure 9. Load profiles of Home 2 on Fri-days during July and August
3.3 Discussion
In this experiment, it was shown that the fastICA could extract a small number of independentcomponents which characterize daily electricity consumption of each individual home. Each homehad very different load profiles although the very famous shape of the averaged load profile shownin Fig. 2 is almost consistent all over the nation. ICA also extracted weekly trend in the verycomplicated load profile data as clearly shown in the home 6.
There exists a classical technique extracting low dimensional representation, a principal com-ponent analysis (PCA). PCA also assumes that an input data has an additive property, i.e., linearassumption. However, PCA also assumes Gaussianity to the input data. If the target data has Gaus-sianity, finding axis that has maximal variation in sequence means finding independent components.However, natural consumption data does not have this kind of property. Figure 20 shows the scatterchart of consumption data at different time. This clearly shows that the load profiles do not haveGaussianity. Figure 21 shows the extracted load profile primitives using PCA. For example, PC2,PC4 and PC5 share information about morning peak load of Home 5 in contrast that IC2 clearlyhas the information in ICA (Figure 5).
This experiment showed that mixing scores of independent components of load profiles coulddescribe differences in load profiles among homes and days. However, this experiment did notshow that this technique could extract seasonal trend by finding load profile primitives. In the nextsection, we apply data measured during a longer period and in a wider area, Higashiohmi city,
International Journal of Energy, Information and Communications Vol. 4, Issue 2, April, 2013
46
-120
-100
-80
-60
-40
-20
0
20
40
60
80
Mon. Tue. Wed. Thu. Fri. Sat. Sun.
IC1
IC2
IC3
IC4
IC5
Figure 10. Mixing coefficient for days ofthe week of home 3
0
200
400
600
800
1000
1200
0 5 10 15 20 25
Co
nsu
mp
tio
n (
wh
)
Hour
2010/7/2
2010/7/9
2010/7/16
2010/7/23
2010/7/30
2010/8/6
2010/8/13
2010/8/20
2010/8/27
Figure 11. Load profiles of Home 3 on Fri-days during July and August
-300
-250
-200
-150
-100
-50
0
50
100
150
200
Mon. Tue. Wed. Thu. Fri. Sat. Sun.
IC1
IC2
IC3
IC4
IC5
Figure 12. Mixing coefficient for days ofthe week of home 4
0
200
400
600
800
1000
1200
1400
0 5 10 15 20 25
Co
nsu
mp
tio
n (
wh
)
hour
2010/7/3
2010/7/10
2010/7/17
2010/7/24
2010/7/31
2010/8/7
2010/8/14
2010/8/21
2010/8/28
Figure 13. Load profiles of Home 4 on Sat-urdays during July and August
through natinal project.
4 Experiment 2: Higashiomi city
In the previous section, we treated individual load profiles. Each independent component scorechanged depending on two independent variables, i.e., days and homes. In the next experimentwe treat regionally aggregated load profiles at Higashiomi city in Japan. To reach our final goal,clarifying daily fluctuations of regionally aggregated load profiles as a whole is also an importanttopic. We can make use of the information about the regionally aggregated demand for planningelectric power generation, trading electrisity and demand-side management. We estimate hiddenload profile primitives from the regionally aggregated load profiles.
4.1 Materials
For the last few years, Japanese Ministry of Internal Affairs and Communications has promotedthe project called “green decentralization reforms” which aims to retain sustainable and decentral-ized development throughout the regions of Japan [14]. Higashiomi City (figure 223) participatesin this project and challenges to progress energy independence by developing smart grid technolo-gies [15]. This project aims to investigate the capacity of solar photovoltaic (PV) power generation
3Thefigure is referred from Wikipedia - http://en.wikipedia.org/wiki/Higashi%C5%8Dmi,Shiga
International Journal of Energy, Information and Communications Vol. 4, Issue 2, April, 2013
47

-150
-100
-50
0
50
100
150
200
Mon. Tue. Wed. Thu. Fri. Sat. Sun.
IC1
IC2
IC3
IC4
IC5
Figure 14. Mixing coefficient for days ofthe week of home 5
0
200
400
600
800
1000
1200
1400
0 5 10 15 20 25
Co
nsu
mp
tio
n (
wh
)
Hour
2010/7/12010/7/22010/7/32010/7/42010/7/52010/7/62010/7/72010/7/82010/7/92010/7/102010/7/112010/7/122010/7/132010/7/14Figure 15. Load profiles of Home 5 overtwo weeks
-80
-60
-40
-20
0
20
40
60
Mon. Tue. Wed. Thu. Fri. Sat. Sun.
IC1
IC2
IC3
IC4
IC5
Figure 16. Mixing coefficient for days ofthe week of home 6
0
50
100
150
200
250
300
350
0 5 10 15 20 25
Mon.
Tue.
Wed.
Thu.
Fri.
Sat.
Sun.
Figure 17. Averaged load profiles of Home6 for each day of the week
at Higashiomi City.Electric load profiles of over 200 houses were measured by using an electric power meter “CK-5”
produced by Chugoku Electrical Instruments Co., Ltd. [13, 15] which was also used in the exper-iment 1. In the investigation, load profile data were recorded every 30 minutes during a 6-monthperiod in 2010 (from July 2010 to December 2010). The number of households whose load pro-files can be recorded in sufficient quality for our analysis was 103. More specific experimentalconditions are obtainable in Higashiomi’s Report [15].
We used daily aggregated load profiles as an input dataX. Tmax= 48 andK = 172. In this study,we set the number of independent components to four.
4.2 Results
Fig. 23 shows the four extracted independent components, i.e., load profile primitives. Fig. 24shows the time course of mixing coefficients of independent components for each day. This resultclearly shows that ICA can extract seasonal and daily trends of regionally aggregated load profiles.
As an example, we focus on IC2. We can find the load profile primitive has clear peak around6 a.m. in the morning. This component’s coefficient increases gradually through the measurementperiod. It is easy to be inferred that this peak represents the heater usage in the morning which isdemanded highly in the winter season. In contrast, IC4 decreases clearly and has negative value inthe summer season. Decrease of IC4 corresponds to the increase of electricity demands in afternoonand decrease of it in midnight. This will also represent usage of air-conditioners.
International Journal of Energy, Information and Communications Vol. 4, Issue 2, April, 2013
48

-100
-80
-60
-40
-20
0
20
40
60
80
Mon. Tue. Wed. Thu. Fri. Sat. Sun.
IC1
IC2
IC3
IC4
IC5
Figure 18. Mixing coefficient for days ofthe week of home 7
0
100
200
300
400
500
600
0 5 10 15 20 25
2010/7/1
2010/7/2
2010/7/32010/7/4
2010/7/5
2010/7/62010/7/7
2010/7/82010/7/9
2010/7/10
2010/7/112010/7/12
2010/7/13
2010/7/14
Figure 19. Load profiles of Home 7 for twoweeks
Consumption at 8 a.m.
Co
nsu
mp
tio
n a
t 3
p.m
.
Figure 20. Distribution of consumptiondata at 8 a.m. and 3 p.m.
-0.4
-0.3
-0.2
-0.1
0
0.1
0.2
0.3
0.4
0 5 10 15 20 25
Co
nsu
mp
tio
n (
wh
)
Hour
PC1
PC2
PC3
PC4
PC5
Figure 21. Extracted principal compo-nents
Fig. 25 shows the averaged value of mixing coefficients for each month. This shows that the loadprofile gradually changes according to the season.
As a result, ICA extracted four-dimensional space for representing daily load profiles. Althoughthe extracted IC scores fluctuated day by day, seasonal changes in load profiles were expressed bymixing the four extracted independent components.
5 Conclusion and future works
This is our first work on finding load profile primitives. Analyzing home electricity consumptionpatterns is important for designing, managing, and analyzing a future decentralized local grid thatwill be automatically managed by some artificially intelligent agents. Load profile data have addi-tive property because of the same property of electric current. We applied ICA to electricity con-sumption data measured at seven different datahomes and tried to find load profile primitives. Weobserved the results and investigated the possibility of finding load profile primitives by qualitativeanalyses on the measured home load profiles and extracted primitives. The qualitative investigationgave us some comprehension of the ICA capability for extracting load profile primitives.
In addition, we also adopted tahe method to the load profile data of one hundred houses measuredin Higashiomi city. We showed that the method could extract the seasonal changes in load profiles
International Journal of Energy, Information and Communications Vol. 4, Issue 2, April, 2013
49

Shiga
PrefectureHigashiomi
City
Figure 22. Figure shows the observation site of this study: Higashiomi city in Shigaprefecture, Japan. Green area shows Higashiomi city.
-4
-2
0
2
4
6
8
0.0 6.0 12.0 18.0 24.0
IC1
IC2
IC3
IC4
Figure 23. Extracted independent compo-nents
-200
-150
-100
-50
0
50
100
150
200
250
1-Jul 20-Aug 9-Oct 28-Nov
IC1
IC2
IC3
IC4
Figure 24. Mixing coefficients of indepen-dent components for each day
of local grid.
5.1 Visualization
Our future work is to develop adequate visualization technique by extending this method. As weobserved in this paper, the individual load profiles are very diverse and noisy. Direct visualization ofconsumption data is not effective for consumers to understand their load profiles and change theirdaily consumption. The ICA or other alternative techniques are able to extract such differencesautomatically. Our future work is to develop visualization technique which enables consumers tounderstand the way to change their load profiles and their lifestyle effectively.
5.2 Composition of load profile primitives
Quantitative evaluation about the effectiveness of smart grid concepts is required. Some kindsof such evaluations would be done in a simulation method. Simulating smart grid requires loadprofiles of many families. However, usually such a big number of load profiles is not availablefor researchers. Therefore, generating virtual load profiles is an important topic for simulationstudies of a smart grid. Found load profile primitives can be used for base functions for generatingvirtual load profiles directly. However, ICA has a problem in generating virtual data. Composed
International Journal of Energy, Information and Communications Vol. 4, Issue 2, April, 2013
50

-150
-100
-50
0
50
100
150
IC1
IC2
IC3
IC4
Figure 25. Monthly changes in mixing coefficients of independent components
virtual load profiles could have negative values because ICs take negative values in many cases (seeFig. 5). To avoid this problem, use of non-negative matrix factorizations (NMFs) or non-negativeICA should be considered.
References
[1] D. Pudjianto, C. Ramsay, and G. Strbac, “Virtual power plant and system integration of dis-tributed energy resources,”Renewable power generation, IET, vol. 1, no. 1, pp. 10–16, 2007.
[2] G. Chalkiadakis, V. Robu, R. Kota, A. Rogers, and N. Jennings, “Cooperatives of distributedenergy resources for efficient virtual power plants,” inThe Tenth International Conference onAutonomous Agents and Multiagent Systems (AAMAS-2011), 2011, pp. 787–794.
[3] K. Kok, “Short-term economics of virtual power plants,” inElectricity Distribution-Part 1,2009. CIRED 2009. 20th International Conference and Exhibition on. IET, 2009, pp. 1–4.
[4] H. Vogt, H. Weiss, P. Spiess, and A. Karduck, “Market-based prosumer participation in thesmart grid,” inDigital Ecosystems and Technologies (DEST), 2010 4th IEEE InternationalConference on. IEEE, 2010, pp. 592–597.
[5] “i-rene web site,” HP. [Online]. Available: http://www.i-rene.org/
[6] T. Taniguchi and S. Yano, “Decentralized trading and demand side response in inter-intelligentrenewable energy network,” inThe 6th International Conference on Soft Computing and In-telligent Systems / The 13th International Symposium on Advanced Intelligent Systems, 2012.
[7] Y. Shinohara, “State monitoring of electric appliances by independent component analysis,”CRIEPI Research Report, Tech. Rep. R00022, 2000.
[8] J. Z. Kolter and T. Jaakkola, “Approximate inference in additive factorial hmms with appli-cation to energy disaggregation,” inProceedings of the International Conference on ArtificalIntelligence and Statistics, 2012.
[9] J. Kolter, S. Batra, and A. Ng, “Energy disaggregation via discriminative sparse coding,” inProc. Neural Information Processing Systems, 2010.
International Journal of Energy, Information and Communications Vol. 4, Issue 2, April, 2013
51

[10] Y. Masaomi, I. Atsushi, K. Atsuhiro, U. Nobuo, and Y. Kiyoshi, “Finding underlying structurein electric load data using independent component analysis,”The transactions of the Instituteof Electrical Engineers of Japan. B, A publication of Power and Energy Society, vol. 128,no. 5, pp. 735–741, 2008.
[11] A. Hyvarinen and E. Oja, “A fast fixed-point algorithm for independent component analysis,”Neural computation, vol. 9, no. 7, pp. 1483–1492, 1997.
[12] ——, “Independent component analysis: algorithms and applications,”Neural networks,vol. 13, no. 4-5, pp. 411–430, 2000.
[13] “Chugoku electrical instruments co., ltd.” http://www.chukeiko.co.jp/01product/energy/ck-5/.
[14] “New growth strategy blueprint for revitalizing japan,” Tech. Rep., Jun. 2010.
[15] “Report for green decentralization reforms in higashi-ohmi city,” Tech. Rep., Feb. 2011.
Authors
Tadahiro Taniguchi received the ME and PhD degrees from Kyoto Uni-versity, in 2003 and 2006, respectively. From April 2005 to March 2006, hewas a Japan Society for the Promotion of Science (JSPS) Reserach Fellow(DC2) at the Department of Mechanical Engineering and Science, GraduateSchool of Engineering, Kyoto University. From April 2006 to March 2007,he was a JSPS Reserach Fellow (PD) at the same department. From April2007 to March 2008, he was a JSPS Research Fellow at the Department ofSystems Science, Graduate School of Informatics, Kyoto University. From
April 2008 to March 2010, he was an Assistant Professor at the Department of Human and Com-puter Intelligence, Ritsumeikan University. Since April 2010, he has been an Associate Professorat the same department. He has been engaged in research on machine learning, emergent systemsand semiotics.
Shiro Yano received the ME and PhD degrees from The University ofTokyo, in 2009 and 2012, respectively. From April 2010 to March 2012,he was a Japan Society for the Promotion of Science (JSPS) Reserach Fel-low (DC2) at the Department of Precision Engineering, Graduate School ofEngineering, The University of Tokyo. Since April 2012, he has been anPost-doctoral fellow at the Research Organization of Science and Technol-ogy, Ritsumeikan University. He has been engaged in research on Nonlineardynamical systems, Dynamic game theory and Mobiligence.
International Journal of Energy, Information and Communications Vol. 4, Issue 2, April, 2013
52

Haruka Kobayashi received the BE from Ritsumeikan University, in2011. She was engaged in research on smartgrid.
International Journal of Energy, Information and Communications Vol. 4, Issue 2, April, 2013
53

International Journal of Energy, Information and Communications Vol. 4, Issue 2, April, 2013
54