Excerpts from NCAR Atmospheric Technology No.1, March 1973 - Electra Aircraft Development
Upload
independentCategory
view
1download
0
Financing of internal displacement: excerpts from the Sri Lankan experience
Kopalapillai Amirthalingam Senior Lecturer, Department of Economics, University of Colombo, Sri Lanka, and Rajith W.D. Lakshman Senior Lecturer, Department of Economics, University of Colombo, Sri Lanka
This paper investigates how internally displaced persons (IDPs) in Batticaloa, Sri Lanka, financed their first year of displacement. We conducted extensive fieldwork in August 2007 in numerous welfare centres in Batticaloa that have received persons displaced from the Mutur divisional secretariat (DS) in the Trincomalee district. The sample was selected from the village of Sampur in Mutur DS. The displaced from Sampur are of Tamil origin and our findings reveal certain coping strategies that may be particular to this community, including the selling or mortgaging of gold jewellery to address the effects of displacement. We found that the IDPs in this region rely heavily on jewellery and other forms of savings to ensure their survival. There is also strong evidence to support the critically important coping role played by livelihoods. These coping strategies have enabled the IDP households in the present sample to live marginally above the poverty line.
Keywords: civil conflicts, conflict-induced displacement, coping strategies, cross-sectional data, internally displaced persons, Sri Lanka
IntroductionCivil conflicts, natural disasters and illconceived development work have, for centuries, forcibly displaced persons within their own countries. These people, commonly known as internally displaced persons (IDPs), often remain under the jurisdiction of their own governments. This creates conditions that make it difficult to protect the human rights of IDPs, as the relevant governments are usually directly or indirectly complicit either in their displacement and/or in prolonging the duration of their displacement. Even the international community takes a more cautious stance when intervening to safeguard the human rights of IDPs for fear of breaching sovereignty principles (Muggah, 2000a; Cohen, 2006).1 However, the presentation of the Guiding Principles on Internal Displacement to the United Nations Commission on Human Rights in 1998 and the wide usage of these principles in subsequent years, mostly in African or Latin American countries, are positive signs that an international system for IDPs is in the making. In Asia, though, IDP recognition and rights are still very distant, making this research on the Sri Lankan IDP situation all the more important. The constitutional, cultural, economic, political and social background of the conflict in Sri Lanka has been well documented (see Fernando, 1997; Rogers, Spencer
doi:10.1111/j.03613666.2009.01135.x
Disasters, 2010, 34(2): 402−425. © 2010 The Author(s). Journal compilation © Overseas Development Institute, 2010 Published by Blackwell Publishing, 9600 Garsington Road, Oxford, OX4 2DQ, UK and 350 Main Street, Malden, MA 02148, USA
Financing of internal displacement 403
and Uyangoda, 1998; NavaratnaBandara, 1999; Snodgrass, 1999; DeVotta, 2000; Abeyratne, 2004; Uyangoda, 2005; De Mel, 2007). Some literature makes passing reference to the conflictinduced IDP problem in the country (see Bandara, 1997, 2002; Arunatilake, Jayasuriya and Kelegama, 2001; Bhatt and Mistry, 2006). However, works that focus primarily on the IDP problem in Sri Lanka are rare and a relatively recent phenomena (Brun, 2003; SAHR, 2007; Muggah, 2008). Until the emergence of this new interest, the coverage of displacement in Sri Lanka, especially in local and international media, principally addressed the problem of refugees: persons who flee the country for practically the same reasons as IDPs.2 It is possibly the burgeoning numbers of IDPs that have made it impossible to ignore the IDP problem in Sri Lanka: as of July 2007, there are four to five times as many IDPs in Sri Lanka as there are refugees who have fled the country to India (Muggah, 2008).3
This paper contains an economic analysis of the IDP experience in Sri Lanka. Specifically, it attempts to understand how households finance basic needs during the initial period of conflictinduced displacement (CID). In this paper, we identify certain economic assets and the function of particular goods in shoringup coping strategies to survive the first year of displacement—gold jewellery is a critical variable in this equation. These fit broadly with the literature on losses incurred by displaced persons, which discerns a much wider cluster of losses than mere economic losses. This literature concentrates on refugees, but one can extend the analyses in many cases to a study of losses endured by IDPs. For instance, cultural and social losses relating to access to certain services, common property resources and social capital, inter alia, have been measured (Cernea, 1999). Vital as these ‘noneconomic’ losses are, the mere survival of IDPs is contingent on whether they are able to overcome the economic and financial losses that arise immediately after displacement. This underscores the significance of the present study. This kind of economic analysis, whether short or long term, is largely absent in displacement literature in general. Economists are alleged to have contributed far less to this literature even though their contribution is highly sought after (Cernea, 1995, 2007). Although the concern of Cernea (1995, 2007) is chiefly developmentinduced displacement (DID), to the best of our knowledge, the lack of economic analysis and interpretation also extends to CID. This paper focuses on the experiences of the people of Sampur in the Trincomalee district of Sri Lanka, who after displacement settled in the adjacent district of Batticaloa.4 This group of people, according to our assessment, falls within the definition of an IDP proposed in the Guiding Principles:
For the purposes of these Principles, persons or groups of persons who have been forced or obligated to flee or to leave their homes or places of habitual residence, in particular as a result of or in order to avoid the effects of armed conflict, situations of generalized vio-lence, violations of human rights or natural or human-made disasters, and who have not crossed an internationally recognized State border (Deng, 1999, p. 484).
Kopalapillai Amirthalingam and Rajith W.D. Lakshman404
The displaced in our study clearly voiced their desire to return to their village. Moreover, we could independently establish social, cultural and, more importantly, economic reasons why they would want to go back to Sampur. These ‘pull factors’ are so compelling that these IDPs, we believe, would return voluntarily to Sampur if not for humansecurity concerns. Thus it is clear that these people have been ‘forced or obliged to flee’ as per the IDP definition. The moment that they fled Sampur the households in our sample lost their land, home and other mobile/immobile assets, as well as their livestock. These cataclysmic losses constitute a prima facie dimension of the impoverishment of IDPs (see Cernea, 1997; Muggah, 2000a). This primary and marginally more substantive form of impoverishment sets in long before the IDPs resort to selling their gold jewellery. The separation from such portable/mobile assets imposed on IDPs by their displacement and uprooting, we argue, is a secondary form of impoverishment. This paper concentrates on this secondary form of impoverishment, which follows the primary form of impoverishment at the time of displacement. Here, it is important to note that impoverishment and pauperisation are the essence not only of CID, but also of other forms of forced displacement, including DID. This opens a passage to link the present study to the international body of literature on developmentcaused forced displacement and resettlement (see, for example, McDowell, 1996; Mathur, 2006; Cernea, 2007; Cernea and Mathur, 2008). The main constraint on conducting an economic analysis in conflictaffected regions is availability of data (see Jayatilaka and Muggah, 2004; Närman and Vidanapathirana, 2005; Bohle and Fünfgeld, 2007). For instance, Mutur divisional secretariat (DS) division, which includes the village of Sampur, was not even included in the 2001 census because several villages within it were under the control of the Liberation Tigers of Tamil Eelam (LTTE) at that time (Närman and Vidanapathirana, 2005, p. 14). Hence, to our knowledge, no secondary data is available for the region explored in this study. To perform any kind of economic analysis, therefore, one has to rely on primary data. In this regard, Bohle and Fünfgeld (2007, p. 672) highlight another problem: the ‘need for protecting the security of research participants’. This is because Batticaloa district where we carried out our fieldwork was at that time (August 2007) a highly volatile and a dangerous location. By overcoming these challenges our work has led to a significant and a unique improvement in the quality of data used in relevant literature.5 Four other features make this study unique within the literature on the conflict in Sri Lanka in particular and within the discipline of refugee studies in general:
• First,onlyafewstudiesfocusexclusivelyontheeconomicimpactofCID.Oursis a rare addition to this niche segment of the displacement literature.
• Second,thisworkandtheapproachemployedprovideanelegantmeansofoperationalising some of the ideas proposed in the Guiding Principles.
• Third,mostofthepreviousstudiesontheeconomicimpactofconflictinSriLankahave utilised macroeconomic data while we work with householdlevel microeconomic data (an exception is Ruwanpura, 2006).
Financing of internal displacement 405
• Fourth,ourworkconstitutesthefirstacademicexercisetodocumentthedisplacement of Sampur people.
The paper is organised as follows: the next two sections briefly outline the Sri Lankan experience of internal displacement and enumerate the critical events marking the process of displacement of the people of Sampur. An explanation of the datagathering process used in our study follows these sections. Then we present five case studies of households from the main sample and develop their conclusions by undertaking a crosssectional analysis of the complete sample. The penultimate section elaborates a key finding of our study: the selling and mortgaging of gold jewellery as a strategy to cope with the financial pressure of displacement. The final section contains some concluding remarks.
Internal displacement in Sri LankaSri Lanka has experienced several incidents of ethnic violence since 1956. The worst of these happened in 1983, resulting in the deaths of nearly a 1,000 civilians of Tamil origin. Between 1983 and October 2008 (the time of writing), the ethnic violence escalated into a civil war waged between the government of Sri Lanka and the LTTE. The civil war has mainly taken place in the Eastern and Northern Provinces of Sri Lanka while LTTEorchestrated violence has created havoc in the rest of the country. Tamils followed by Muslims predominantly inhabit the Eastern and Northern Provinces while the Sinhalese have a majority presence in the remainder of the country. This description and similar ones elsewhere highlight the ethnic nature of the Sri Lankan conflict (see NavaratnaBandara, 1999, p. 157; Brun, 2003, p. 380; Närman and Vidanapathirana, 2005, p. 13). However, other studies have explored causes that run beyond ethnic differences (see, for example, Abeyratne, 2004). The violence of 1983 led a large number of Tamils to flee the country as refugees. The flow of refugees bound mainly for Australia, Canada, India, New Zealand and Western Europe, though varying at times, continues unabated as of October 2008. The conflict in Sri Lanka has also produced IDPs, the focus of this paper. The expulsion of nearly 75,000 Muslims from Northern Province (mainly from Jaffna and Mannar districts) by the LTTE in 1990 is generally considered to be the origin of the IDP problem in Sri Lanka. These Muslims remain displaced in Puttalam district to date. IDP numbers in Sri Lanka vary widely, depending on the source of the information and the period for which the estimation is made. The number is also sensitive to the intensity of the conflict (see Van Brabant, 1998). The variation in the reported number of IDPs is underlined by the IDP figure of 371,000 persons put forward by Bhatt and Mistry (2006, p. 56) and that of 208,549 persons reported by the United Nations High Commissioner for Refugees (UNHCR, 2007). The former statistic is for 2005 while the latter is for October 2007. This is strange because, with the renewal of the conflict in 2006, which displaced hundreds of thousands of people, the 2007 figure should be higher than the 2005 figure. Such discrepancies
Kopalapillai Amirthalingam and Rajith W.D. Lakshman406
emphasise the dire need for better and more reliable information on the IDP problem in Sri Lanka. The IDP definition of Deng (1999, p. 484) includes persons displaced by natural disasters. Therefore, one cannot consider the Sri Lankan IDP numbers quoted above to be complete: they do not include those who remain displaced following the 2004 tsunami. The multitudinous government agents involved in tsunami reconstruction work makes it very difficult to collate reliable information on this group of IDPs in Sri Lanka. Due to the outpour of international support and aid, the Sri Lankan government has had ample resources with which to rebuild the country after the tsunami. However, the failure of the PostTsunami Operational Management Structure—involving the government and the LTTE—has meant an absence of a formal mechanism to direct these government resources to the tsunamidisplaced living in LTTEcontrolled areas. On the issue of IDPs, there are allegations that tsunami IDPs were provided with better relief and were resettled or relocated quicker than conflictinduced IDPs.6 Nevertheless, there is still a significant number of tsunami IDPs suffering in welfare centres (UNICEF, 2008, p. 2).7
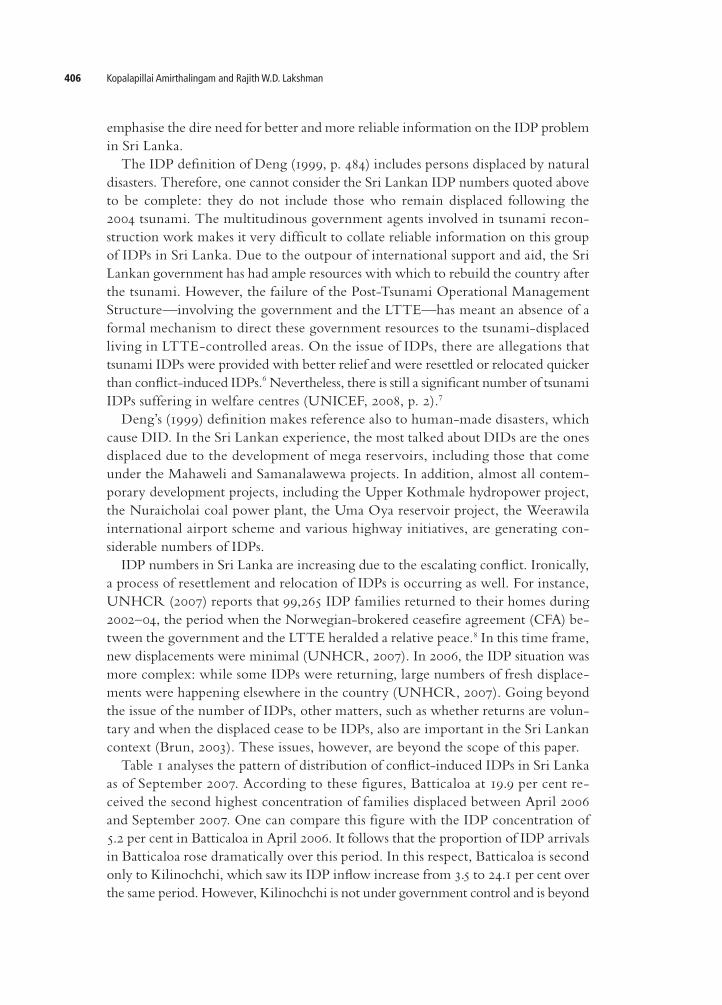
Deng’s (1999) definition makes reference also to humanmade disasters, which cause DID. In the Sri Lankan experience, the most talked about DIDs are the ones displaced due to the development of mega reservoirs, including those that come under the Mahaweli and Samanalawewa projects. In addition, almost all contemporary development projects, including the Upper Kothmale hydropower project, the Nuraicholai coal power plant, the Uma Oya reservoir project, the Weerawila international airport scheme and various highway initiatives, are generating considerable numbers of IDPs. IDP numbers in Sri Lanka are increasing due to the escalating conflict. Ironically, a process of resettlement and relocation of IDPs is occurring as well. For instance, UNHCR (2007) reports that 99,265 IDP families returned to their homes during 2002–04, the period when the Norwegianbrokered ceasefire agreement (CFA) between the government and the LTTE heralded a relative peace.8 In this time frame, new displacements were minimal (UNHCR, 2007). In 2006, the IDP situation was more complex: while some IDPs were returning, large numbers of fresh displacements were happening elsewhere in the country (UNHCR, 2007). Going beyond the issue of the number of IDPs, other matters, such as whether returns are voluntary and when the displaced cease to be IDPs, also are important in the Sri Lankan context (Brun, 2003). These issues, however, are beyond the scope of this paper. Table 1 analyses the pattern of distribution of conflictinduced IDPs in Sri Lanka as of September 2007. According to these figures, Batticaloa at 19.9 per cent received the second highest concentration of families displaced between April 2006 and September 2007. One can compare this figure with the IDP concentration of 5.2 per cent in Batticaloa in April 2006. It follows that the proportion of IDP arrivals in Batticaloa rose dramatically over this period. In this respect, Batticaloa is second only to Kilinochchi, which saw its IDP inflow increase from 3.5 to 24.1 per cent over the same period. However, Kilinochchi is not under government control and is beyond
Financing of internal displacement 407
the reach of researchers without access to this region. In governmentcontrolled areas, Batticaloa attracts the most attention in terms of the pattern of distribution of more recent IDPs. UNHCRcompiled statistics reveal that a large number of the IDPs in Batticaloa in September 2007 originated from the Mutur DS division, the focus of our research (UNHCR, 2007).
Process of displacement in SampurNärman and Vidanapathirana (2005, p. 18) report on the socioeconomic background of Trincomalee district in the Eastern Province of Sri Lanka—hence there is no need to repeat that material here. People from 11 Grama Sevaka (GS) divisions comprising 24 villages in the Mutur DS division in the Trincomalee district were displaced; the GS divisions of Sampur East and Sampur West fall into this group.9 These two GS divisions make up the village of Sampur: our geographic area of interest. The total number of families displaced from the Mutur DS division was 4,081. The total population of the divisions was 15,003 in December 2005 (District Secretariat Trincomalee, 2006). People from the Sampur area were displaced initially in April 2006. Prior to the displacement, this village was under LTTE control in what is called an ‘uncleared area’. In the history of the protracted conflict in Sri Lanka, this was the first instance of displacement among the people of Sampur. The process occurred in five phases (see below), as the people of Sampur were compelled to move further and further away
Table 1 IDP families by district of residence, September 2007
District On 30 April 2006 From April 2006– September 2007
Total as of September 2007
IDP families Percentage IDP families Percentage IDP families Percentage
Jaffna 17,052 22.0 6,786 13.1 23,838 18.4
Mullaitivu 13,658 17.6 9,060 17.5 22,718 17.5
Kilinochchi 2,725 3.5 12,517 24.1 15,242 11.8
Puttalam 14,101 18.2 606 1.2 14,707 11.4
Batticaloa 4,037 5.2 10,319 19.9 14,356 11.1
Vavuniya 9,571 12.3 3,072 5.9 12,643 9.8
Mannar 6,122 7.9 5,834 11.2 11,956 9.2
Other 5,747 7.4 156 0.3 5,903 4.6
Trincomalee 3,768 4.9 1,815 3.5 5,583 4.3
Ampara 815 1.1 1,743 3.4 2,558 2.0
Total 77,596 100 51,908 100 129,504 100
Source: UNHCR (2007).
Kopalapillai Amirthalingam and Rajith W.D. Lakshman408
from their villages when the areas they inhabited became unsafe. At that time, the government had commenced military operations in Eastern Province and the various phases of displacement of the Sampur people roughly correspond with the advancement of government forces. As of September 2008, after the said military operations, all of Eastern Province and parts of Northern Province are under government control. About the time the Sampur people were displaced the situation was much different: there was a strong LTTE presence in the province, particularly in Batticaloa district. However, even during that period, Batticaloa town—the final destination of the majority of Sampur IDPs—was under government control (Bohle and Fünfgeld, 2007, Figure 2). Sampur people were displaced in five phases:
• First,whenSampurcameunderaerialbombardmentandartilleryattackbygovernment forces, the people were displaced to Paddalipuram and surrounding areas. These IDPs were settled in this area for a period of between two and three months, during which they were able to visit their homes. All this time, the IDPs had some hopes that assaults would subside and that they would be allowed to return. However, the artillery attacks and aerial bombardments continued intermittently throughout this period.
• Second,withanextensionintherangeoftheartilleryattacks,theywereforcedtomove to Ilangaithurai Mukaththuvaram and Punnaiyady.
• Third,theyshiftedtoVerukal,whichliesontheBatticaloa–Trincomaleeborder.Again, the shift was due the advancement of ground troops.
• Fourth,peoplemovedtoKathiraveliandthentoVakarai,bothofwhichareinBatticaloa district. By this time, the IDPs had realised the futility of going back to Sampur and had resolved to reach governmentcontrolled Batticaloa town. These places are primarily transit locations thereto.
• Fifth,withfightingescalating,theIDPsmanaged,throughvariousroutes,tocrossover from Vakarai to Batticaloa town.
During these five phases, limited relief items were distributed among the IDPs, predominantly by nongovernmental organisations (NGOs). The disorganised nature of these activities meant that one could not obtain reliable data on volumes and varieties of material dispatched. At Batticaloa, though, the relief operations were more systematic. The IDPs were supplied with shelter, drinking water and common toilet facilities.10 The food aid disseminated by the World Food Programme per person per week included rice (2.5 kilograms), wheat floor (2.5 kilograms), sugar (250 grams), dhal (750 grams) and coconut oil (0.25 litre). Various NGOs also distributed nonfood aid, including buckets, cookers, cooking utensils, hygienic kits and sleeping mats, in an irregular manner. There were some compelling reasons for the people of Sampur to take the road to Batticaloa even though Trincomalee town was practically next door. The main one seems to be the Muslim–Tamil ethnic tension prevailing in Mutur town, the gateway to Trincomalee. The IDPs who arrived in ad hoc groups in Batticaloa were
Financing of internal displacement 409
allocated to various welfare centres in and around Batticaloa. It is important to note that there was no particular order to this process. For instance, Sampur people could be found in various camps along with IDPs from other villages in Mutur DS division. While most of the people displaced in Eastern Province have returned to their respective villages, the people of Sampur and the surrounding villages remain in their camps as of September 2008. When the government declared Sampur and surrounding villages a high security zone (HSZ) in the gazette notification of 30 May 2007, the prospects of resettlement declined further.11 This evidence clearly points to a CID experience. In principle, an HSZ can be removed if security in the area stabilises. If so, there is a chance that the people of Sampur may be resettled at some (distant) future date. However, a plan to establish a coal power plant in Sampur has raised the possibility that the eviction of the people could become permanent.12 Thus this particular displacement experience also bears the marks of a DID experience. Only time will tell whether IDPs from Sampur constitute a case of CID and/or one of DID.13
From Batticaloa some people have subsequently gone to Negombo, on the western coast of Sri Lanka, and to Trincomalee town, in the process adding yet another phase to their displacement. Some people, fewer in number, have gone to south India, changing their status to refugees.14 The majority of Sampur people, however, are still in welfare centres and a few are in rented houses in Batticaloa. Our point of focus is this segment of Sampur IDPs—the ones who have taken refuge in and around Batticaloa and remain there in that position.
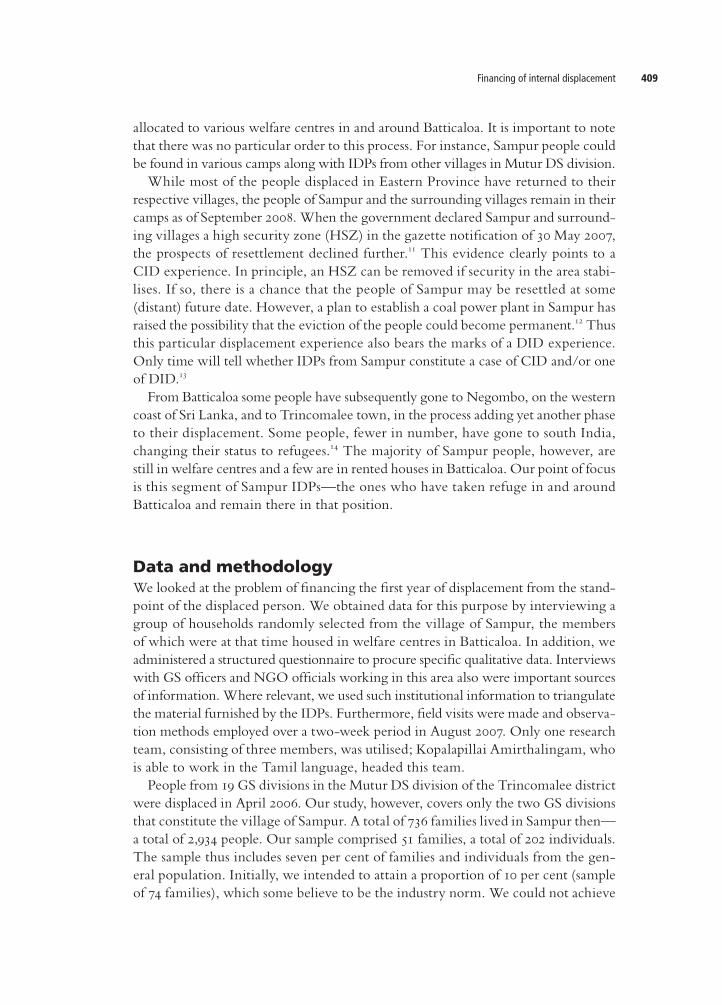
Data and methodologyWe looked at the problem of financing the first year of displacement from the standpoint of the displaced person. We obtained data for this purpose by interviewing a group of households randomly selected from the village of Sampur, the members of which were at that time housed in welfare centres in Batticaloa. In addition, we administered a structured questionnaire to procure specific qualitative data. Interviews with GS officers and NGO officials working in this area also were important sources of information. Where relevant, we used such institutional information to triangulate the material furnished by the IDPs. Furthermore, field visits were made and observation methods employed over a twoweek period in August 2007. Only one research team, consisting of three members, was utilised; Kopalapillai Amirthalingam, who is able to work in the Tamil language, headed this team. People from 19 GS divisions in the Mutur DS division of the Trincomalee district were displaced in April 2006. Our study, however, covers only the two GS divisions that constitute the village of Sampur. A total of 736 families lived in Sampur then—a total of 2,934 people. Our sample comprised 51 families, a total of 202 individuals. The sample thus includes seven per cent of families and individuals from the general population. Initially, we intended to attain a proportion of 10 per cent (sample of 74 families), which some believe to be the industry norm. We could not achieve
Kopalapillai Amirthalingam and Rajith W.D. Lakshman410
this, though, due to security concerns: the activities of the field research team had to be restricted to 10, relatively safe, IDP camps in and around Batticaloa town.15 In the 10 camps, we could locate only 51 households displaced from Sampur. To obtain more data our team would have had to move further from Batticaloa town, but this would have exposed it to unacceptable levels of risk. In other words, the cost of collecting data increased dramatically once the sample size reached 51. The Consortium of Humanitarian Agencies (CHA, 2007) and Bohle and Fünfgeld (2007) outline the fragile security situation in Batticaloa at the time of the datacollection exercise. Henry (1990, p. 126) provides convincing examples where smaller than industry norm samples have achieved credible results. The key, according to Henry, is to have properties of the population represented in the sample. It seems that the economic characteristics, such as livelihood patterns and types and volumes of income, of the sample of 51 households adequately represent the population’s economic characteristics. This is borne out by firsthand accounts of the villagers of Sampur, GS officers and NGO officials. As noted earlier, there was an element of randomness in the way the households were redirected to welfare centres. This ensured that the sample used is essentially a random sample of IDPs from the village of Sampur. This randomness, we feel, was instrumental in the sample having properties similar to the population. We included also some IDP households currently living in and around Batticaloa town but either in rented houses or with relatives. We interviewed all residents except nonSampur households in these locations. Note that the financial situation (as well as other facets of life) of the IDPs is in a state of constant change and that our results are correct as of August 2007.16
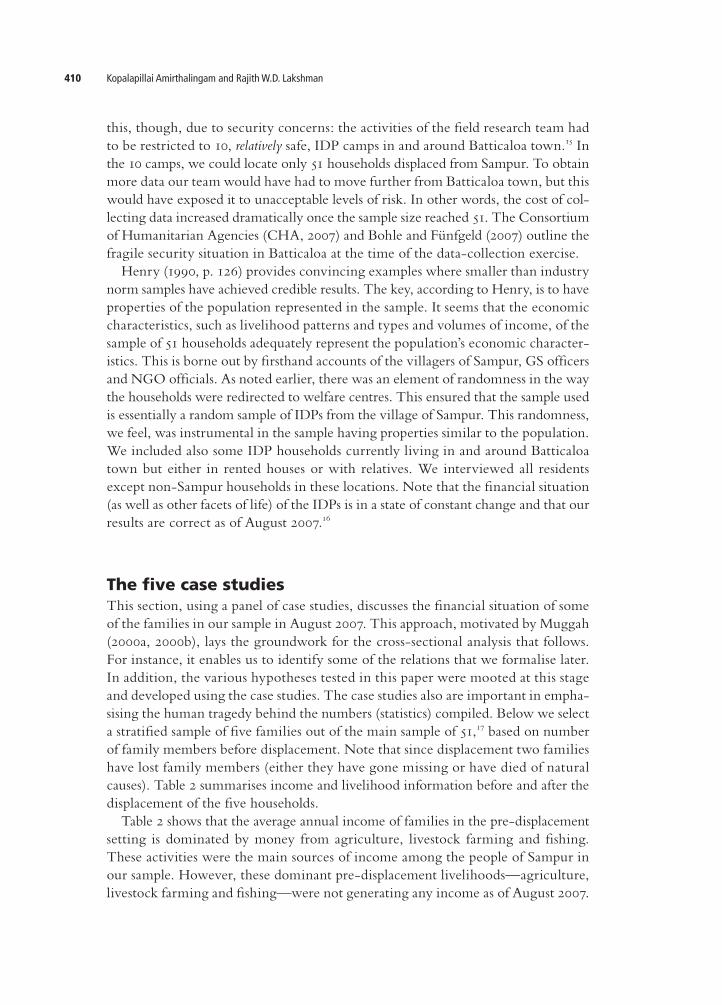
The five case studiesThis section, using a panel of case studies, discusses the financial situation of some of the families in our sample in August 2007. This approach, motivated by Muggah (2000a, 2000b), lays the groundwork for the crosssectional analysis that follows. For instance, it enables us to identify some of the relations that we formalise later. In addition, the various hypotheses tested in this paper were mooted at this stage and developed using the case studies. The case studies also are important in emphasising the human tragedy behind the numbers (statistics) compiled. Below we select a stratified sample of five families out of the main sample of 51,17 based on number of family members before displacement. Note that since displacement two families have lost family members (either they have gone missing or have died of natural causes). Table 2 summarises income and livelihood information before and after the displacement of the five households. Table 2 shows that the average annual income of families in the predisplacement setting is dominated by money from agriculture, livestock farming and fishing. These activities were the main sources of income among the people of Sampur in our sample. However, these dominant predisplacement livelihoods—agriculture, livestock farming and fishing—were not generating any income as of August 2007.
Financing of internal displacement 411
Table 2 Detailed description of annual income and livelihood before and after the
displacement of the selected families*
Family number 12 44 8 4 2
Family members 2 3** 4 5 6**
Family details Husband and wife
Husband,** wife and daughter
Husband, wife and two daughters
Mother, two sons and two daughters
Husband, wife,** three sons and one daughter
Pre-displacement livelihoods
Showing videos, hiring out bullock carts, agriculture and livestock
Labourer, fishing and income from agriculture and from a lime kiln
Agriculture, raising cattle and fishing during the season
Paddy, coconut, dry-land income, chicken, sewing
Paddy, dry-land income, cows, goats, chicken, carpentry
Current livelihood Manual labour None None Sewing, manual labour
Carpentry
Current residence Rented house Savukkadi Camp Navatkeni Camp Relative House Iyankeni Camp
Previous income (1) 859,000 507,950 4,669,500 344,000 1,039,500
Agriculture 235,000 117,000 237,500 140,000 247,500
Livestock 504,000 7,200 4,320,000 48,000 252,000
Fishing – 270,000 100,000 – –
Other 120,000 113,750 12,000 156,000 540,000
Current income (2) 43,500 8,712 21,600 52,416 146,260
Relief 13,500 8,712 21,600 7,416 2,260
Labour 30,000 – – 45,000 144,000
Saved income (3) 100,000 34,200 75,000 52,000 230,000
Cash at displacement 50,000 1,000 0 12,000 60,000
Mortgage 20,000 – 41,000 25,000 110,000
Selling jewellery 0 28,200 0 0 60,000
Debt 5,000 5,000 10,000 15,000 –
Relative help 25,000 – 24,000 – –
(4)=(2)+(3) 143,500 41,912 96,600 92,416 376,260
Poverty line 53,592 53,592 107,184 133,980 133,980
(2)/(1)*100 5% 2% 0.5% 15% 14%
(4)/(1)*100 17% 8% 2% 27% 36%
(2)/(4)*100 30% 21% 22% 57% 39%
(3)/(4)*100 70% 82% 78% 56% 61%
Notes:* Values in Sri Lankan rupees (USD 1 = Rs. 108)** The family has lost a member after displacement. These (2) are the only instances of such losses among the 51 households in our sample.
Kopalapillai Amirthalingam and Rajith W.D. Lakshman412
Comparing predisplacement and current livelihoods in Table 2, one can see how livelihood strategies have shifted. The contribution of predisplacement livelihoods to the postdisplacement income is zero. This is why the ratio (2)/(1) in Table 2 is as low as 0.5–15 per cent. Displacement led to such a drastic reduction in income—including food aid—to make us wonder how people survived the first year. A tentative and obvious answer is that they managed by drastically curtailing their standard of living. We cannot present any quantitative information to back this up but general observations of living conditions in camps, along with common knowledge about village life in Trincomalee, lead us to believe that this is the case. Two distinct sources of income finance the postdisplacement survival of IDPs: current income and predisplacement savings. The distinction is based on whether the source of finance is available for the foreseeable future. For example, the main components of current income among the IDPs in our sample—relief from the government and NGOs and from casual labour—seem to be available for the foreseeable future. Savings, though, are available only for oneoff use. We have included cash at displacement, the sale and mortgage of jewellery, debt and financial help from relatives and friends in this category. Although theoretically, IDPs can appeal to debt and financial help from relatives and friends in the future, we strongly believe that these sources can be less relied on when the financial credibility of the IDPs declines further. Such impoverishment dangers may be categorised as a ‘social disarticulation’ risk (Cernea, 1997, p. 1,575). We link these sources of finance to ‘saved’ financial credibility from life before displacement. There is also an element of ‘social capital’ involved here.18 Therefore, even if these sources are available beyond the first year of displacement, their significance is likely to be very marginal when compared with the first year of displacement. It follows that debt and help from relatives as well as other components in the saved component in Table 2 are more likely to dry up after the first year of displacement. Still, in the first year, the use of savings was indeed a critical coping strategy employed by the IDPs. Savingsbased coping strategies are almost by definition finite and limited in time because savings are not unlimited. This is particularly the case for cash at displacement and for income generated through the sale and mortgaging of jewellery. The five households spent the money that they had at the time of displacement within the first few months, and at the time of the datacollection exercise, they did not have many items of jewellery left. However, total postdisplacement income even with the saved component falls drastically short of predisplacement income as indicated by the sum of (4)/(1) in Table 2 being in the range of between two and 36 per cent. This is a potent indicator of the postdisplacement impoverishment of the IDPs. The use of savings and the curtailed living standards seem to have been critical in allowing IDPs to make ends meet. Table 2 also includes the poverty lines for each of the five families, based on the 2006–07 official poverty line published by the Department of Census and Statistics of Sri Lanka. The official poverty line per person per month for 2006–07 was Rs. 2,233 (USD 21). We used this figure to calculate annual poverty lines based on the number of living members of the five families. Three of the five families were living below
Financing of internal displacement 413
the poverty line; the other two were surviving above it with the help of savings, which will dry up in future, and their ability to find work. This underscores the significance of livelihoods in the survival of these IDPs beyond the first year of displacement. Behind the plight of family number 44 is a particularly shocking finding. After the initial bout of displacement, the head of the family decided to go back to Sampur. He went missing on that day along with the friend who accompanied him and the borrowed motorcycle on which they were travelling. After the husband vanished, the wife had to sell her kodi to pay for the missing motorcycle.19 She is entitled to wear her thali and would want to continue to do so. This is because the assumed death of her husband, as with many others who have gone missing during the war, is not confirmed. There are instances, like in this example, where kodi is cashed in—and replaced with a thinner gold chain or a yellow thread—to address financial difficulties. The predicament of family number 44 shows that while displacement erodes the asset base, liabilities have to be accounted for, placing a colossal burden on families such as this one with no earning capacity. Furthermore, there were households in the sample that had to obtain fresh loans to satisfy their predisplacement liabilities. This too is evidence of the asymmetric impact of displacement on assets and liabilities.
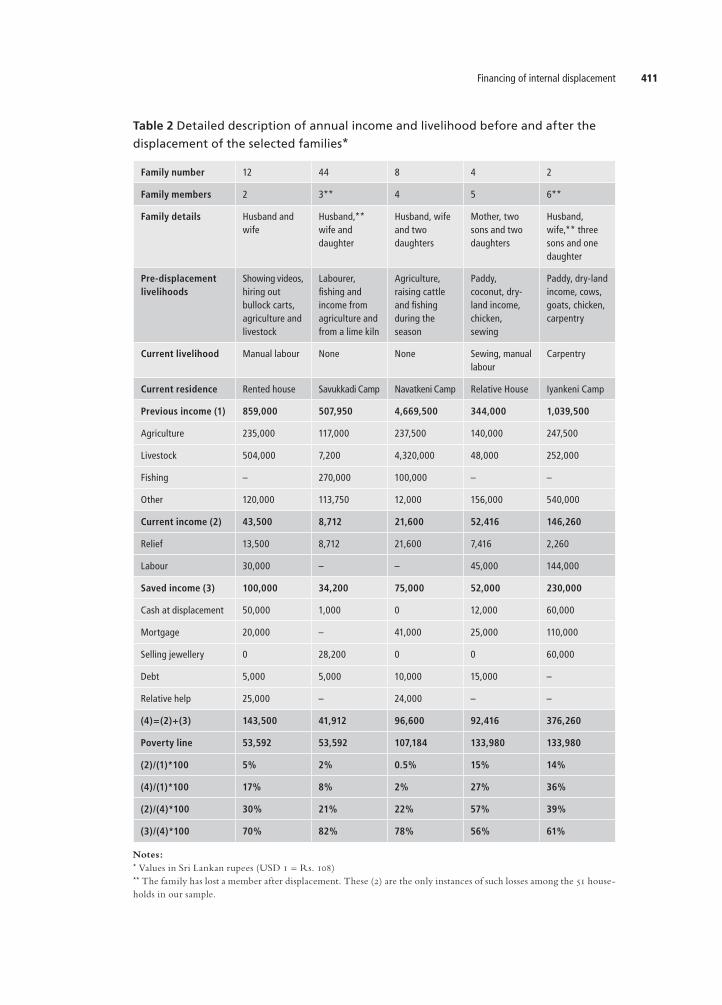
Cross-sectional studyThis section analyses the total sample of 51 households. One can corroborate or refute the assertions made in the casestudies section by using the complete sample. We employed crosssectional data analysis methods for this purpose, and our findings are outlined below. A positive relationship exists between the predisplacement wage and salary income (consisting of income from government employment and from skilled or unskilled labour) and postdisplacement earned income (defined as current income minus government and NGO relief ) during the first year of displacement. Table 3 reports the correlation coefficients useful for measuring this relationship; all are positive and significant at the one per cent level. We note that government workers in our sample, even as IDPs, continued to work for and/or draw a salary from the government.20 Displacement did not significantly affect income for this select group of government servants in our sample, as confirmed by current income data for these IDPs. As the complete sample was used to calculate the correlation coefficients, the effect of the presence of government servants is likely to have influenced positively the results. This bias was removed by filtering out households containing government servants. Correlation values based on the filtered sample were all significant, this time at the five per cent level. It follows that the more income IDPs earned from skilled or unskilled labour in the predisplacement setting the more they will be able to make as IDPs. Of course, it is a small fraction of what they were bringing home earlier; still the positive relationship is unmistakable. This and other unreported correlation coefficients imply that the earned income of IDPs depends heavily on endowments of mobile factors of production, that is, labour.21
Kopalapillai Amirthalingam and Rajith W.D. Lakshman414
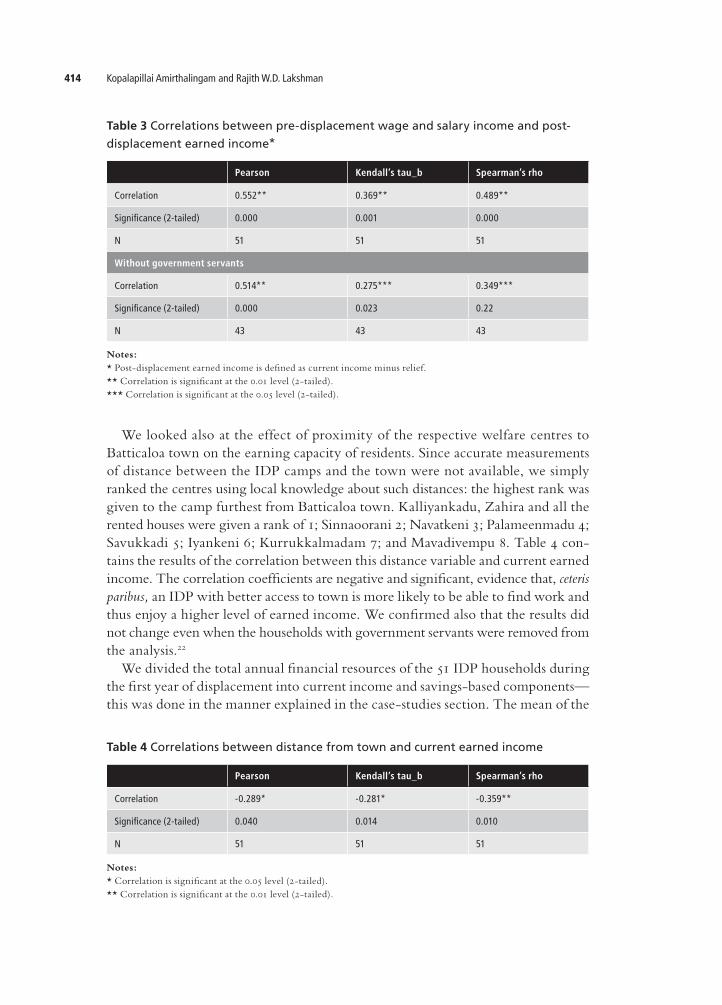
We looked also at the effect of proximity of the respective welfare centres to Batticaloa town on the earning capacity of residents. Since accurate measurements of distance between the IDP camps and the town were not available, we simply ranked the centres using local knowledge about such distances: the highest rank was given to the camp furthest from Batticaloa town. Kalliyankadu, Zahira and all the rented houses were given a rank of 1; Sinnaoorani 2; Navatkeni 3; Palameenmadu 4; Savukkadi 5; Iyankeni 6; Kurrukkalmadam 7; and Mavadivempu 8. Table 4 contains the results of the correlation between this distance variable and current earned income. The correlation coefficients are negative and significant, evidence that, ceteris paribus, an IDP with better access to town is more likely to be able to find work and thus enjoy a higher level of earned income. We confirmed also that the results did not change even when the households with government servants were removed from the analysis.22
We divided the total annual financial resources of the 51 IDP households during the first year of displacement into current income and savingsbased components—this was done in the manner explained in the casestudies section. The mean of the
Table 3 Correlations between pre-displacement wage and salary income and post-
displacement earned income*
Pearson Kendall’s tau_b Spearman’s rho
Correlation 0.552** 0.369** 0.489**
Significance (2-tailed) 0.000 0.001 0.000
N 51 51 51
Without government servants
Correlation 0.514** 0.275*** 0.349***
Significance (2-tailed) 0.000 0.023 0.22
N 43 43 43
Notes:* Postdisplacement earned income is defined as current income minus relief.** Correlation is significant at the 0.01 level (2tailed).*** Correlation is significant at the 0.05 level (2tailed).
Table 4 Correlations between distance from town and current earned income
Pearson Kendall’s tau_b Spearman’s rho
Correlation -0.289* -0.281* -0.359**
Significance (2-tailed) 0.040 0.014 0.010
N 51 51 51
Notes:* Correlation is significant at the 0.05 level (2tailed). ** Correlation is significant at the 0.01 level (2tailed).
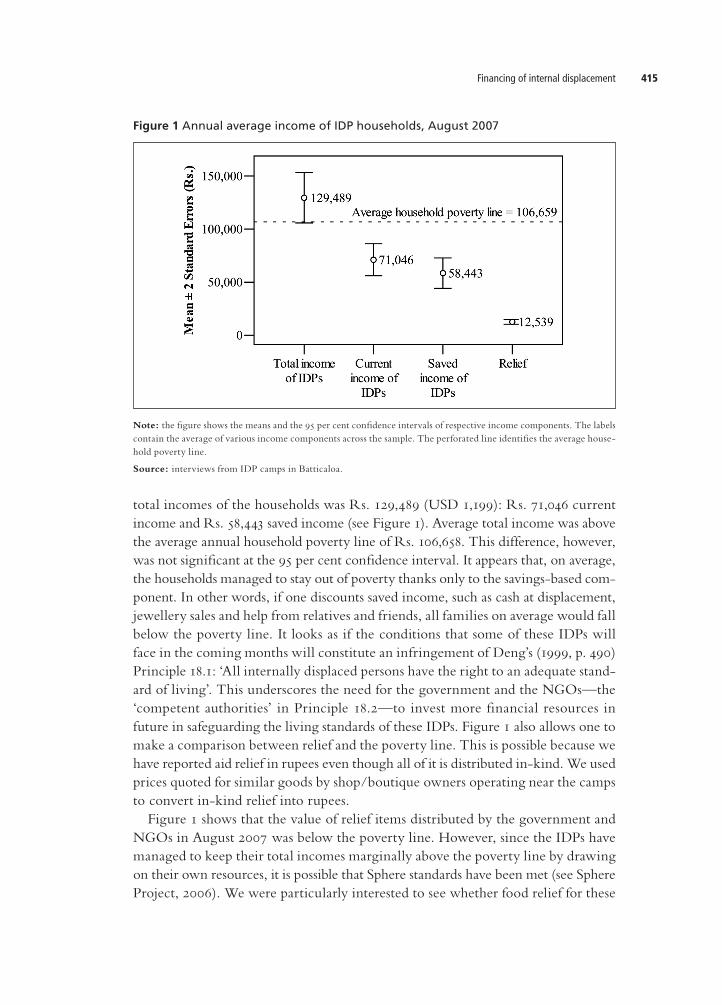
Financing of internal displacement 415
total incomes of the households was Rs. 129,489 (USD 1,199): Rs. 71,046 current income and Rs. 58,443 saved income (see Figure 1). Average total income was above the average annual household poverty line of Rs. 106,658. This difference, however, was not significant at the 95 per cent confidence interval. It appears that, on average, the households managed to stay out of poverty thanks only to the savingsbased component. In other words, if one discounts saved income, such as cash at displacement, jewellery sales and help from relatives and friends, all families on average would fall below the poverty line. It looks as if the conditions that some of these IDPs will face in the coming months will constitute an infringement of Deng’s (1999, p. 490) Principle 18.1: ‘All internally displaced persons have the right to an adequate standard of living’. This underscores the need for the government and the NGOs—the ‘competent authorities’ in Principle 18.2—to invest more financial resources in future in safeguarding the living standards of these IDPs. Figure 1 also allows one to make a comparison between relief and the poverty line. This is possible because we have reported aid relief in rupees even though all of it is distributed inkind. We used prices quoted for similar goods by shop/boutique owners operating near the camps to convert inkind relief into rupees. Figure 1 shows that the value of relief items distributed by the government and NGOs in August 2007 was below the poverty line. However, since the IDPs have managed to keep their total incomes marginally above the poverty line by drawing on their own resources, it is possible that Sphere standards have been met (see Sphere Project, 2006). We were particularly interested to see whether food relief for these
Figure 1 Annual average income of IDP households, August 2007
Note: the figure shows the means and the 95 per cent confidence intervals of respective income components. The labels contain the average of various income components across the sample. The perforated line identifies the average household poverty line.
Source: interviews from IDP camps in Batticaloa.

Kopalapillai Amirthalingam and Rajith W.D. Lakshman416
IDPs was in compliance with ‘food aid planning standard 1’, recommended by the Sphere Project (2006). We used Figure 2 to investigate how this standard fared at the individual level. The graphic plots individual household incomes visàvis the 2006–07 food poverty line for the households.23 It reveals that although the average income of the 51 households is above the poverty line, 13 of 51 households in fact have annual total incomes lower than the food poverty line. This does not mean necessarily that the other 38 are living above the food poverty line—their nonfood expenditure also needs to be taken into account. Thus, we can safely say that Sphere standards are not being achieved for at least 13 of the 51 households in the sample, a figure that is likely to be higher. In addition, the righthandside (RHS) panel illustrates that 31 of the 51 households would slump below the food poverty line if saved incomes were removed. In addition to adequacy, one may question the appropriateness of the food aid delivered to these IDPs. The distributed food consists solely of dry rations such as dhal, rice, sugar and wheat flour. However, the preparation of even the most basic of meals in this part of the world requires other items, such as coconuts, fish, spices and vegetables. Since relief aid does not include these items, the IDPs need to find money to buy them. Livelihoods and savings are useful here. However, the most deprived of IDPs in the sample (elderly, oneparent families, widows) do not have either of these endowments. Therefore, these IDPs have sought to sell some of the relief items to purchase food items not supplied with relief aid. This is a useful coping strategy, making the relief food basket appropriate for the needs of the IDPs. However, the strategy means that perhaps the ‘Food aid planning standard 2’ of the
Figure 2 IDP households’ annual income vis-à-vis the food poverty line (Rs. ’000)
Note: the reference line where household income equals the household food poverty line is shown on the graphs. Households above the reference line are below the food poverty line. The vertical axis is identical in both panels and hence not repeated on the RHS panel.
Source: interviews from IDP camps in Batticaloa.

Financing of internal displacement 417
Sphere Project (2006)—concerning ‘appropriateness and acceptability’—is not being fulfilled by the food aid programme for the Sampur IDPs. Figure 3 further analyses savings and current incomes. One can use it also to identify the more important subcomponents within the two major components of IDP incomes: saved income and current income. For instance, cash at displacement followed by the sale or mortgaging of jewellery are important forms of saved income. At nearly four times the level of relief income, wage earnings clearly stand out as the most important form of current income. It is worth noting here that opportunities to acquire earned income are greater among IDPs located in or closer to the town of Batticaloa.24 One can attribute this to the township being relatively secure compared to rural areas, which gives IDPs more freedom of movement outside camps to search for jobs. In addition, demand for labour is higher in townships than in rural areas. As a result, wages, salaries and selfemployment incomes together constitute 82 per cent of current income—relief makes up only 18 per cent. Although not sufficient to keep them above the poverty line, earned livelihoods provide IDPs with a dependable source of income. This releases the financial pressure on IDPs and offers a respite to the cashstrapped relief agencies. These findings support the literature on the livelihoodbased coping strategies of IDPs (Curtis, 1995; Jacobsen, 2002). Furthermore, they underscore the importance of Deng’s (1999, p. 491) Principle 22.1(b): ‘Internally displaced persons, whether or not they are living in camps shall not be discriminated against as a result of their displacement in the enjoyment of . . . [t]he right to seek freely opportunities for employment and participate in economic activities’.
Figure 3 Analysis of the annual income of the average IDP household
Note: the graph shows the means and the 95 per cent confidence interval using error bars. It separates out the saved (solid error bars) and current (perforated error bars) components of IDP income. Each subcomponent appears in decreasing order of average value within its respective component. The graph labels contain the average of various income components across the sample.
Source: interviews from IDP camps in Batticaloa.
Kopalapillai Amirthalingam and Rajith W.D. Lakshman418
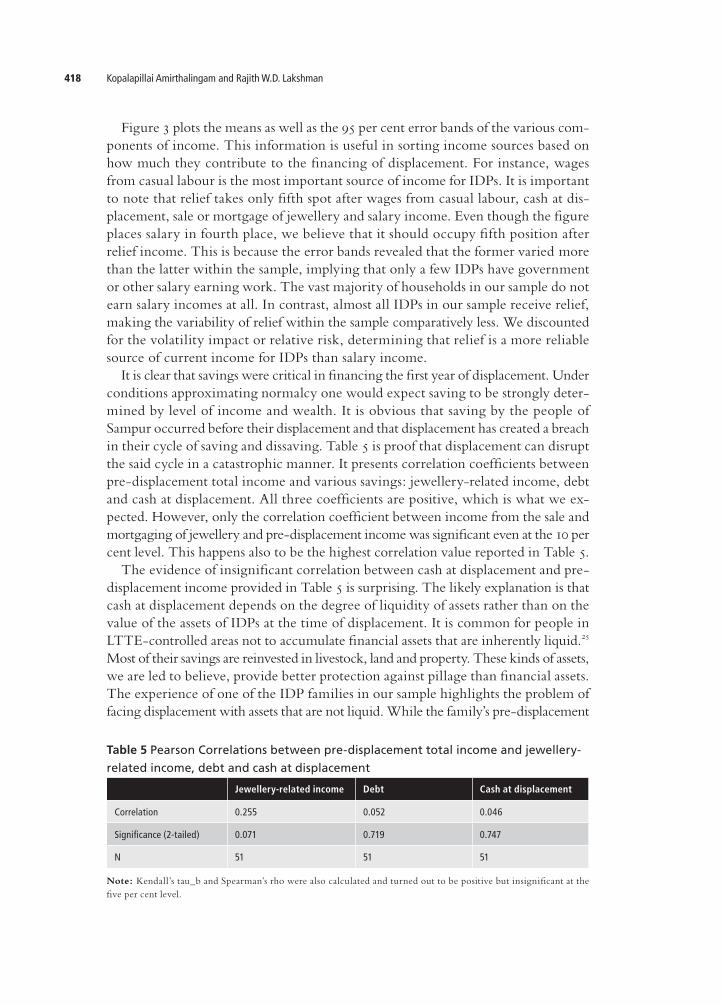
Figure 3 plots the means as well as the 95 per cent error bands of the various components of income. This information is useful in sorting income sources based on how much they contribute to the financing of displacement. For instance, wages from casual labour is the most important source of income for IDPs. It is important to note that relief takes only fifth spot after wages from casual labour, cash at displacement, sale or mortgage of jewellery and salary income. Even though the figure places salary in fourth place, we believe that it should occupy fifth position after relief income. This is because the error bands revealed that the former varied more than the latter within the sample, implying that only a few IDPs have government or other salary earning work. The vast majority of households in our sample do not earn salary incomes at all. In contrast, almost all IDPs in our sample receive relief, making the variability of relief within the sample comparatively less. We discounted for the volatility impact or relative risk, determining that relief is a more reliable source of current income for IDPs than salary income. It is clear that savings were critical in financing the first year of displacement. Under conditions approximating normalcy one would expect saving to be strongly determined by level of income and wealth. It is obvious that saving by the people of Sampur occurred before their displacement and that displacement has created a breach in their cycle of saving and dissaving. Table 5 is proof that displacement can disrupt the said cycle in a catastrophic manner. It presents correlation coefficients between predisplacement total income and various savings: jewelleryrelated income, debt and cash at displacement. All three coefficients are positive, which is what we expected. However, only the correlation coefficient between income from the sale and mortgaging of jewellery and predisplacement income was significant even at the 10 per cent level. This happens also to be the highest correlation value reported in Table 5. The evidence of insignificant correlation between cash at displacement and predisplacement income provided in Table 5 is surprising. The likely explanation is that cash at displacement depends on the degree of liquidity of assets rather than on the value of the assets of IDPs at the time of displacement. It is common for people in LTTEcontrolled areas not to accumulate financial assets that are inherently liquid.25 Most of their savings are reinvested in livestock, land and property. These kinds of assets, we are led to believe, provide better protection against pillage than financial assets. The experience of one of the IDP families in our sample highlights the problem of facing displacement with assets that are not liquid. While the family’s predisplacement
Table 5 Pearson Correlations between pre-displacement total income and jewellery-
related income, debt and cash at displacement
Jewellery-related income Debt Cash at displacement
Correlation 0.255 0.052 0.046
Significance (2-tailed) 0.071 0.719 0.747
N 51 51 51
Note: Kendall’s tau_b and Spearman’s rho were also calculated and turned out to be positive but insignificant at the five per cent level.

Financing of internal displacement 419
income and assets point to a prosperous economic background (the family was possibly in the top quintile in Sampur), it did not have any cash in hand on displacement. This household had just finished celebrating a wedding and had no money in its possession at the time of displacement. The other assets in its possession were of no use in weathering the displacement, as these had to be left behind. In other words, the savings that had gone into building up these assets could not be liquidated and used to survive displacement. The insignificant correlation between predisplacement income and postdisplacement debt in Table 5 is indicative of a breach in the cycle of saving and dissaving and hence of credit worthiness. The asset base mainly determines the latter. The credit worthiness of economic agents speaks of years if not decades of economic activity and resulting asset accumulation. With the separation of IDPs from their assets, their credit worthiness should suffer, too. The insignificance of the relevant correlation coefficient demonstrates the decoupling of past wealth (approximated using predisplacement income) and current debt. The most likely reason for this is displacement. This is evidence that displacement is a shock that can effectively decouple the pre and postdisplacement financial positions of IDPs. An important exception seems to be income from the sale and mortgaging of gold jewellery.
Sale and mortgaging of jewelleryOf our findings, the significant coping role played by the sale and mortgaging of jewellery took us by surprise. It is a common practice in Sri Lanka to sell or mortgage gold jewellery in moments of financial distress. In fact, this phenomenon is documented as prevailing throughout South Asia (Chandavarkar, 1961, p. 142). However, we did not expect to discover that it was such a reliable source of income among IDPs because they evacuated in a hurry. Subsequent enquiries revealed that even during the initial evacuation, the women folk of Sampur would have been wearing customary jewellery. Tamil women wear such culturally important accessories even in their daily life. And even poor people of Tamil origin would possess some gold jewellery for cultural reasons.26 This helps to explain the statistical evidence in the previous section that the sale or mortgaging of jewellery is the only form of saving with a significant relation to wealth before displacement. In addition, people from Sampur had opportunities to visit their village and remove their valuables after their initial displacement. Top of their list of objects to remove would have been the jewellery that they left behind. Even though on average cash at displacement was the most important source of saved finance (see Figure 3), 22 of the 51 households in our sample used more jewellery for consumptive purposes in the first year of displacement than cash at displacement. We have evidence of instances where some IDPs had no cash with them at displacement but possessed some jewellery, a fact that one can readily attribute to the significance of gold jewellery in Tamil culture. We stress that gold jewellery is primarily a cultural asset among Tamils. In fact, all households in the sample rejected
Kopalapillai Amirthalingam and Rajith W.D. Lakshman420
the suggestion that culturally significant gold jewellery was originally purchased as insurance against the negative economic impact of war. This cultural trait ensured that displacement did not completely interrupt the saving–dissaving cycle of the people of Sampur. The jewelleryrelated income levels reported here might in fact be underestimates. The IDPs were desperate for cash when they crossed into governmentcontrolled Valaichchenai, and hence is was at this point that most of them started to sell their jewellery. They could not mortgage their jewellery because of their IDP intransit status: they did not have even a temporary address, which is essential for entering into a contract with a bank. Their only choice was to sell their jewellery to Valaichchenai traders. These transactions took place at rates considerably below the prevailing market price. After arriving in welfare centres in Batticaloa, most of the IDPs switched to mortgaging jewellery via banks. Selling these culturally and socially important items was an option of last resort for the IDPs: they would have likely preferred the chance to redeem their jewellery in better times. Chandavarkar (1961 p. 139) summarises this process:
distress sales of gold are not normally of an appreciable magnitude because the esteem value attached to gold, particularly ornaments, being very high, its outright sale to meet current or capital outlays is only resorted to in exceptional circumstances such as acute depression.
The above scenario confirms the fears expressed in IDP literature that displaced persons are at great risk. Here we outline how assets that are normally extremely liquid become illiquid in the hands of IDPs, further deteriorating their financial position. However, it is not clear whether this lack of liquidity is a realistic representation of the risks associated with the transaction, or whether one can attribute it to displacement. For instance, Chandavarkar (1961, p. 140) notes that ‘[ jewellery] sale usually involves a capital loss in so far as the seller cannot get value for the cost of workmanship’. Similarly, there are reports of cases where the war affected had to dispose of consumer goods far below their market value (Curtis, 1995, p. 70). Only further research can clarify which of these effects dominate the undervalued jewellery transactions of IDPs. Any form of asset stripping not only constitutes an economic loss but also has dire implications for other facets of social life. The sale of jewellery has obvious implications for overall wealth and future collateral. In addition, though, the sale of jewellery, especially of kodi, has a ‘stigmatising effect’. It signals diminished social status and can have repercussions that extend beyond the immediate loss of wealth. This raises the need for a gender analysis of IDP financing. For example, the sale of jewellery affects successive generations. Mothers who sell their jewellery cannot leave it to their daughters, which may have an adverse bearing on marriage, dowries and even the migration prospects of young Tamil women. If jewellery is the saved asset that is easiest to sell, then this presents IDP women with severe consequences that men do not have to face. While extremely important, these social and gender implications do not fall within the scope of this work.

Financing of internal displacement 421
ConclusionIn interviews and in response to questionnaires, IDP communities in Batticaloa, eastern Sri Lanka, regularly highlighted the significance of previous savings in bridging the gap between more regular current income and minimum income required for survival. If not for saved income, the majority of the households in the sample would have drifted below the poverty line within the first year of displacement and acute impoverishment would have manifested itself. Furthermore, the analysis indicates that most of the IDPs will have exhausted their savings inside the second year of displacement. This raises a very pertinent and disturbing question regarding how these people will survive in the months/years to come. For their displacement, contrary to CIDs elsewhere in Sri Lanka, bares signs that it will extend for a few more months if not years. This highlights a lacuna in the literature on financing longerterm CID. This study highlights the fact that the sale and mortgaging of gold jewellery gave a significant boost to savingsbased financial resources. This finding led us to conclude that the significance of gold jewellery in Tamil culture offers a welcome reprieve to IDP finances. The process of exchanging culturally and personally invaluable gold jewellery for amounts less than the market value was a painful yet highly effective coping strategy. It follows that the sale and mortgaging of jewellery possibly may be the only link between the pre and postdisplacement financial positions of IDPs. We contend that the exhaustion of this form of assetbased savings in a context of disease, food insecurity and lack of jobs signifies a second round of impoverishment of IDPs. The paper also hints at the possibility that gold jewellery may become illiquid in the hands of IDPs. Whether this is true and whether the process occurs only in CID situations or among IDPs in general are critical policy questions that could have major implications for operationalising the Guiding Principles. In this regard, the tentative evidence of an asymmetric impact of displacement on assets and liabilities may be of particular significance. The evidence presented here reinforces the importance of livelihood incomes to the daily survival of IDPs from Sampur. Such incomes depend heavily on endowments of mobile factors of production, that is, labour. Consequently, IDPs who lost their endowments of factors of production suffered most due to lower postdisplacement income. In addition, there is evidence that proximity to the town made it easier for IDPs to find paid work. Most of these findings are congruent with those of other studies that have flagged the significance of livelihoods. The converse of the overly significant contribution of livelihoods is the inadequate relief support for daily survival provided by the government and NGOs. However, it is not clear whether this inadequacy is part of a selfselection strategy employed by relief agencies in Batticaloa. Nevertheless, the study reveals that in addition to adequacy, appropriateness and acceptability are important variables in establishing what is sufficient. Thus, in supplying the minimum required amount of aid relief as a selftargeting mechanism, one needs also to appreciate the value of the concept of appropriateness.
Kopalapillai Amirthalingam and Rajith W.D. Lakshman422
AcknowledgementsThe authors are grateful for the useful and detailed comments provided by Micheal Cernea, Neloufer De Mel, W.D. Lakshman, Robert Muggah, Sandy Suardy and the four anonymous peer reviewers. All errors are our own.
CorrespondenceKopalapillai Amirthalingam, Senior Lecturer, Department of Economics, University of Colombo, Sri Lanka. Telephone: +94 11 2582666; fax: +94 11 2502722; email: [email protected]
Endnotes1 This has improved in recent years with the employment of concepts such as ‘responsibility to pro
tect’ in cases of protection of the displaced in Darfur, Sudan.2 See Article 1 of the United Nations Refugees Convention of 1951 for a definition of refugees. Note,
too, that academic literature on Sri Lankan refugees is also rare.3 There are hundreds of thousands more Sri Lankan refugees living in third countries, such as
Australia, Canada, Norway, Switzerland, the United Kingdom and the United States. In addition, see endnote 13.
4 Batticaloa and Trincomalee are adjacent districts in the now ‘liberated’ Eastern Province of Sri Lanka. The country has nine provinces. Northern and Eastern Provinces have been affected most by the ongoing conflict, followed by NorthCentral Province (see Abeyratne and Lakshman, 2005; Brun, 2003, Map 1).
5 We believe that we achieved a proper balance of insider and outsider researchers with Tamil language skills, some firsthand exposure to the displacement experience and regional navigational knowledge (both of Batticaloa and Sampur). This research team thus had a natural capacity to predict likely ethical issues, as well as security risks faced by the research participants (see Goodhand, 2000).
6 Throughout the paper, the word ‘resettlement’ is used to describe return, a common practice in Sri Lanka. ‘Relocation’ describes movement to a place other than one’s home.
7 Official signposts and documents identify these IDP camps as ‘welfare centres’. We observed several welfare activities in these centres: entertainment of children in a ‘happiness hall’, prenursery school, International Committee of the Red Crosssponsored fortnightly medical camps, health meetings, sports events and religious and social functions.
8 The government abrogated the CFA on 16 January 2008.9 GSs are the lowest level (at the village level) of regional administration in Sri Lanka. Several GSs
together comprise a DS division, which is the next highest level of regional administration, followed by the district, made up of several DS divisions. The GS divisions involved in our study were: Chenaiyoor (1), Kadatkaraichchenai (3), Kaddaiparichchan North (2), Kaddaiparichchan South (4), Kooniththeevu (2), Navaradnapuram (2), Pallikudiyiruppu (6), Nalloor (2), Paddalipuram (2), Sampur East (1) and Sampur West (1). The number of villages in each GS division is in parentheses.
10 NGOs provided tents and later temporary shelter in locations allocated by the government. In Kalliyankadu camp, an abandoned government store is being used to house IDPs.
11 The government establishes HSZs to secure strategic areas that are of military and economic significance. Varying degrees of restriction are imposed on the activities of civilians within these zones.
12 See the issues of The Hindu, Daily News and Daily Mirror published on 20 April 2008, 21 April 2008 and 27 March 2008, respectively.
Financing of internal displacement 423
13 An earlier gazette dated 16 October 2006 had declared a wider area within the Trincomalee district a special economic zone (SEZ). The SEZ also includes Sampur and surrounding villages. A map of the SEZ is available at http://www.neweast.lk/oppurtunities.html. It is not clear what kind of role the SEZ will play in the lives of the IDPs.
14 The more accurate term to describe them would be ‘de facto refugees’, since neither India nor Sri Lanka have signed the 1951 Refugee Convention.
15 Iyankeni, Kalliyankadu, Kurrukkalmadam, Mavadivempu, Navatkeni, Palameenmadu, Savukkadi, Sinnaoorani, Valaichchenai and Zahira Camps.
16 At the time of the datacollection exercise, the subjects had been displaced for 16 months. Whenever the data corresponded to the whole 16 months, we interpolated on a straightline basis to calculate the value for a oneyear period. The data were analysed in SPSS 13.0.
17 Our sample contained families with the following numbers of members (frequencies within parentheses) before displacement: 1(2), 2(9), 3(12), 4(6), 5(14), 6(6) and 8(2). Families of sizes 1–8 were removed from the stratified sample due to low frequencies thereof.
18 We take ‘social capital’ to mean connections between individuals and entities that can be economically valuable. Social networks among people who trust and assist one another can be a powerful asset.
19 According to Tamil culture, kodi, a thick gold chain, is used to tie the thali (also spelt taali in north India), a thick gold pendent, around the bride’s neck. The bridegroom gives the thali to the bride at the wedding and it is worn throughout their wedded life. It is taken off only after the death of the husband. Thali can be tied using either a kodi or a thinner gold chain or a yellow thread. Using a kodi signifies that a woman is of wealthy status.
20 Some displaced government servants continue to receive their salaries even though the government cannot make arrangements to utilise their services—teachers are not among these people. For instance, teachers in our sample continue to teach (IDP children) in government schools in Batticaloa.
21 We also calculated two other sets of correlations: 1. Corr. (predisplacement labour income, total IDP income); and 2. Corr. (predisplacement labour income, saved IDP income). The results of these sets of correlation coefficients were: all three correlations were positive (+) but only Pearson was significant; and Pearson was positive (+) and the other two were negative () and all were insignificant at the 10 per cent level.
22 It is likely that government servants would prefer camps nearer to the town because all government offices in Batticaloa are in the town. In addition, they have a higher earned income level among IDPs, which, together with proposed preference to stay nearer to the town, can impose a downward bias on the statistic Corr. (distance to town, earned income).
23 The monthly food poverty line of Rs. 1,527, constructed as per the instructions in DCS (2004), was used for this purpose.
24 The statistically significant relationship between distance to town and current income alludes to the fact that livelihood opportunities are greater closer to the town.
25 Authors’ interviews with people from Sampur, August 2007.26 Of course, the amount of gold used to produce these items would vary depending on wealth status.
Chandavakar (1961, p. 142) notes that ‘the demand for gold in underdeveloped economies is determined largely by variations in the level of incomes’.
ReferencesAbeyratne, S. (2004) ‘Economic roots of political conflict: The case of Sri Lanka’. The World Economy.
27(8). pp. 1295–1314.Abeyratne, S. and R. Lakshman (2005) ‘Impact of the ceasefire agreement on regional economic
growth in Sri Lanka’. 18 July. http://www.peaceinsrilanka.com/peace2005/Insidepage/Archive/Archive2005.asp (accessed on 1 December 2007).
Arunatilake, N., S. Jayasuriya and S. Kelegama (2001) ‘The economic costs of the war in Sri Lanka’. World Development. 29(9). pp. 1481–1500.

Kopalapillai Amirthalingam and Rajith W.D. Lakshman424
Bandara, J.S. (1997) ‘The impact of the civil war on tourism and the regional economy’. South Asia. XX. pp. 269–279.
Bandara, J.S. (2002) ‘Economic cost of Sri Lanka’s ethnic conflict: Comment’. Journal of Contemporary Asia. 32(4). pp. 139–143.
Bhatt, S. and D. Mistry (2006) Cost of Conflict in Sri Lanka. Strategic Foresight Group, Mumbai .Bohle, H.G. and H. Fünfgeld (2007) ‘The political ecology of violence in eastern Sri Lanka’.
Development and Change. 38(4). pp. 665–687.Brun, C. (2003) ‘Local citizens or internally displaced persons? Dilemmas of longterm displacement
in Sri Lanka’. Journal of Refugee Studies. 16(4). pp. 376–397.Cernea, M.M. (1995) ‘Understanding and preventing impoverishment from displacement: Reflections
on the state of knowledge’. The Journal of Refugee Studies. 8(3). pp. 245–264.Cernea, M.M. (1997) ‘The risk and reconstruction model for resettling displaced populations’. World
Development. 25(10). pp. 1569–1587.Cernea, M.M. (1999) ‘Why economic analysis is essential to resettlement: A sociologist’s view’. In
M.M. Cernea (ed.) The Economics of Involuntary Resettlement: Questions and Challenges. World Bank, Washington, DC. pp. 5–49.
Cernea, M.M. (2007) ‘Financing for development: Benefitsharing mechanisms in population resettlement’. Economic and Political Weekly. 24 March. pp. 1033–1046.
Cernea, M.M. and H.M. Mathur (eds.) (2008) Can Compensation Prevent Impoverishment? Reforming Resettlement through Investments and Benefit-Sharing. Oxford University Press, Delhi.
CHA (Consortium of Humanitarian Agencies) (2007) ‘CHA situation report, Eastern Province (Ampara and Batticaloa), July 2007’. http://www.humanitariansrilanka.org/eResources/PDF docs/SituationReports/EPJul2007.pdf (accessed on 4 November 2007).
Chandavarkar, A.G. (1961) ‘The nature and effects of gold hoarding in underdeveloped economies’. Oxford Economic Papers. 13(2). pp. 137–148.
Cohen, R. (2006) ‘Developing an international system for internally displaced persons’. International Studies Perspectives. 7. pp. 87–101.
Curtis, P. (1995) ‘Urban household coping strategies during war: BosniaHercegovina’. Disasters. 19(1). pp. 68–73.
DCS (Department of Census and Statistics) (2004) ‘Official poverty line for Sri Lanka’. http://www.statistics.gov.lk/poverty/OfficialPovertyLineBuletin.pdf (accessed on 11 June 2008).
De Mel, N. (2007) Militarizing Sri Lanka: Popular Culture, Memory and Narrative in the Armed Conflict. Sage Publications, New Delhi.
Deng, F.M. (1999) ‘Guiding Principles on Internal Displacement’. International Migration Review. 33(2). pp. 484–493.
DeVotta, N. (2000) ‘Control democracy, institutional decay, and the quest for Eelam: Explaining ethnic conflict in Sri Lanka’. Pacific Affairs. 73(1). pp. 55–76.
District Secretariat Trincomalee (2006) Statistical Handbook for the Trincomalee District 2006. District Planning Secretariat, Trincomalee.
Fernando, L. (1997) ‘Ethnic conflict and the state in Sri Lanka: A possible solution?’ South Asia: Journal of South Asian Studies. 20(1). pp. 83–96.
Goodhand, J. (2000) ‘Research in conflict zones: Ethics and accountability’. Forced Migration Review. 8. pp. 12–15.
Henry, G.T. (1990) ‘Practical Sampling’. In L. Bickman and D.J. Rog (eds.) Applied Social Research Methods Series. Sage Publication, New Delhi.
Jacobsen, K. (2002) ‘Livelihoods in conflict: The pursuit of livelihoods by refugees and the impact on the human security of host communities’. International Migration. 40(5). pp. 95–123.
Jayatilaka, D. and R. Muggah (2004) ‘Where there is no information: IDP vulnerability assessments in Sri Lanka’s borderlands’. Forced Migration Review. 20. pp. 39–41.
Mathur, H.M. (2006) ‘Managing resettlement in India: Approaches, issues and experiences’. Journal of Refugee Studies. 19(2). pp. 264–267.
Financing of internal displacement 425
McDowell, C. (ed.) (1996) Understanding Impoverishment: The Consequences of Development-Induced Displacement. Berghahn Books, New York, NY.
Muggah, H.C.R. (2000a) ‘Conflictinduced displacement and involuntary resettlement in Colombia: Putting Cernea’s IRLR model to the test’. Disasters. 24(3). pp. 198–216.
Muggah, R. (2000b) ‘Through the developmentalist’s looking glass: Conflictinduced displacement and involuntary resettlement in Colombia’. Journal of Refugee Studies. 13(2). pp. 133–164.
Muggah, R. (2008) Relocation Failures: A Short History of Displacement and Resettlement in Sri Lanka. Zed Books, London.
Närman, A. and U. Vidanapathirana (2005) ‘Transition from prolonged conflict to post conflict development: Locating the case of Trincomalee district of Sri Lanka’. Peace and Democracy in South Asia. 1(1). pp. 13–21.
NavaratnaBandara, A.M. (1999) ‘Ethnic relations and state crafting in postindependent Sri Lanka’. In W.D. Lakshman and C.A. Tisdell (eds.) Facets of Development of Sri Lanka since Independence. Department of Economics, University of Queensland, Brisbane. pp. 157–176.
Rogers, J.D., J. Spencer and J. Uyangoda (1998) ‘Sri Lanka: Political violence and ethnic conflict’. American Psychologist. 53(7). pp. 771–777.
Ruwanpura, K.N. (2006) ‘Conflict and survival: Sinhala femaleheadship in eastern Sri Lanka’. Asian Population Studies. 2(2). pp. 187–200.
SAHR (South Asians for Human Rights) (2007) ‘Report on the state of displaced persons in Sri Lanka’s north and east’. 8 August. http://www.medicointernational.de/en/projects/srilanka/watch/ (accessed on 1 December 2007).
Snodgrass, D.R. (1999) ‘The economic development of Sri Lanka: A tale of missed opportunities’. In R.I. Rotberg (eds.) Creating Peace in Sri Lanka: Civil War and Reconciliation. Brookings Institution Press, Washington, DC. pp. 89–108.
Sphere Project (2006) ‘Sphere Handbook’. http://www.sphereproject.org/content/view/27/84/lang,English/ (accessed on 10 June 2008).
UNHCR (United Nations High Commissioner for Refugees) (2007) ‘Statistical summaries compiled by UNHCR Sri Lanka’. http://www.unhcr.lk/statistics/index.html (accessed on 30 October 2007).
UNICEF (United Nations Children’s Fund) (2008) ‘UNICEF humanitarian action: Sri Lanka in 2008’. http://www.unicef.org/har08/files/har08_SriLanka_countrychapter.pdf (accessed on 23 May 2008).
Uyangoda, J. (2005) Conflict, Conflict Resolution and Peace Building. Department of Political Science and Public Policy, University of Colombo, Colombo.
Van Brabant, K. (1998) ‘Sri Lanka’. In J. Hampton (ed.) Internally Displaced People: A Global Survey. Earthscan, London. pp. 148–153.
Copyright © 2022 FDOKUMEN