FINANCING OF EDUCATION IN INDIA WITH A FOCUS ON ELEMENTARY EDUCATION
102
0LQLVWHULDO/HYHO0HHWLQJ RIWKH 6RXWK$VLD()$)RUXP A Study on FINANCING OF EDUCATION IN INDIA WITH A FOCUS ON ELEMENTARY EDUCATION by JANDHYALA B G TILAK NATIONAL I NSTITUTE OF EDUCATIONAL PLANNING AND ADMINISTRATION 17B Sri Aurobindo Marg, New Delhi 110016, INDIA ,VODPDEDG3$.,67$1 0D\
Transcript of FINANCING OF EDUCATION IN INDIA WITH A FOCUS ON ELEMENTARY EDUCATION

0LQLVWHULDO�/HYHO�0HHWLQJ���RI�WKH��6RXWK�$VLD�()$�)RUXP
A Study on
FINANCING OF EDUCATION IN INDIA WITH A FOCUS ON ELEMENTARY EDUCATION
by
JANDHYALA B G TILAK NATIONAL INSTITUTE OF EDUCATIONAL PLANNING AND ADMINISTRATION
17B Sri Aurobindo Marg, New Delhi 110016, INDIA
,VODPDEDG��3$.,67$1��������0D\�����

SOUTH ASIA EFA FORUM Jandhyala TILAK: Financing of Education in India
2
Draft/ 20 May 2003
South Asia EFA Forum
A Study on
FINANCING OF EDUCATION IN INDIA WITH A FOCUS ON ELEMENTARY EDUCATION
JANDHYALA B G TILAK
NATIONAL INSTITUTE OF EDUCATIONAL PLANNING AND ADMINISTRATION 17B Sri Aurobindo Marg, New Delhi 110016
INDIA
May 2003

SOUTH ASIA EFA FORUM Jandhyala TILAK: Financing of Education in India
3
Contents
1. Why Invest in Elementary Education? 2. Size and Structure of Elementary Education 3. Trends in Expenditure on Education in India
• Sources of Funds for Education • Government Expenditure on Education • Allocation of Resources
� Inter-sectoral Allocation of Resources � Share of Education in GNP � The Education Budget � Plan and Non-Plan Expenditure � Education in Five Year Plans � Intra-Sectoral Allocation of Resources � Plan and Non-Plan Expenditure on Elementary Education
• Inter-Functional Allocation of Resource • Public Expenditure on Elementary Education per Student • Union State Relations in Financing Education • Expenditure on the Central Government Schemes in Elementary Education
4. Resource Requirements for Universalisation of Elementary Education 5. Mobilisation of Resources of Elementary Education
• Decentralisation and Mobilisation of Community Resources • Foreign Aid for Education
6. Concluding Observations
References
Tables

SOUTH ASIA EFA FORUM Jandhyala TILAK: Financing of Education in India
4
FINANCING OF EDUCATION IN INDIA WITH A FOCUS ON ELEMENTARY EDUCATION
JANDHYALA B G TILAK National Institute of Educational Planning and Administration
17B Sri Aurobindo Marg, New Delhi 110016 E-mail: [email protected]
The deleterious consequences of non-investment or inadequate investment in education are indeed serious. National Policy on Education (1986)
1. WHY INVEST IN ELEMENTARY EDUCATION ?
The Post-War Plan of Educational Development Plan of India (CABE, 1944)
recommended a speedy introduction of a system of universal, compulsory and free education
for all boys and girls between the ages 6 and 14. Following this, the Directive Principle of
the Constitution of independent India (Article 45) stated in 1950:
the State shall endeavor to provide, within a period of ten years from the
commencement of this Constitution, for free and compulsory education for
all children until they complete the age of fourteen years.
Thus long before the formulation of the UNESCO resolutions and the emergence of
interest by international agencies like the World Bank, UNICEF, UNDP etc., which finally
culminated in the EFA programme in the Jomtien Conference in 1990 and later in Dakar in
2000, the Government of India had recognised the importance of elementary education. The
National Policy on Education 1968, the Draft National Policy on Education 1978, and the
National Policy on Education 1986 have laid special emphasis on the fulfillment of the
Constitutional Directive of universalisation of elementary education. The National Policy on
Education 1968, the first national policy on education in the independent India, has
emphatically stated, "strenuous efforts should be made for the early fulfillment of the
Directive Principle under Article 45 of the Constitution seeking to provide free and
compulsory education for all children up to the age of 14." The National Policy on Education

SOUTH ASIA EFA FORUM Jandhyala TILAK: Financing of Education in India
5
1986 (revised 1992) also reiterated the resolve that "by 1995, all children will be provided
free and compulsory education up to 14 years of age" (Government of India, 1986, p. 12).
More over both resolved to increase the public funding of education to at least six per cent of
national income, so that education, elementary education in particular, does not suffer from
paucity of financial resources. Five Year Plans repeatedly promised to take the nation
towards achieving this goal. Elementary education is given a high priority in national
development strategies and it is regarded as an important component of minimum needs
programme in the Five Year Plans and it was also included in the ’National Programme of
Minimum Needs’ in the Five Year Plans, and this inclusion has significant implications for
allocation of resources. This was expected to ensure favourable treatment in the allocation of
resources, and to protect it from reallocation of approved outlays away from elementary
education. Education is also made an important component of the ’national human
development initiative’ in the union budget 1999-2000 (see Tilak, 1999a). Very recently the
86th amendment to the national Constitution has been made to make elementary education a
fundamental right and to provide it free and compulsorily to all children of the age group 6-
14, to be followed by a Central legislation to operationalise the fundamental right. A major
programme called Sarva Shiksha Abhiyan has also been launched as a holistic convergent
approach to achieve universalisation of elementary education by 2010.
By resolving to provide elementary education ’free’ to all, the Constitution and the
Government of India have implicitly recognised the ’public good’ nature of elementary
education. Elementary education is, in fact, recognised by many as a ’pure public good’, as
the benefits from elementary education are immense; they are not confined to the individuals
who go to the school; and the rest of the society also benefits considerably. In fact, the
neighbourhood or externality benefits of elementary education are believed to outweigh the
direct private benefits. Besides, it is a ’social merit want’. In such cases, public financing out
of general tax revenues is regarded to be superior to any method of financing, according to
which the recipients, viz., the students pay even partially for the same.
The Constitutional Directive in India received further boost with increasing research
evidence that establishes that the contribution of elementary education to development -- in all
socioeconomic development spheres -- is very significant. Education, particularly elementary
education, is regarded as a very valuable unique investment, serving as a major effective

SOUTH ASIA EFA FORUM Jandhyala TILAK: Financing of Education in India
6
instrument of various facets of development. First, it has its own intrinsic value, enhancing
the human capabilities to enjoy life, inculcating better habits and approaches to life, and
thereby enhancing the quality of life. For the same reason, elementary education is regarded
in many countries, as in India, as a fundamental right, and literacy and enrolment ratios in
school education have become an integral part of measurement of quality of life, well-being
of the people (Dasgupta, 1990) and human development (UNDP, 1991). Secondly, as a
valuable component of human capital, it is an important instrument of economic development
at personal level, as it enhances the productivity of the labour force in the labour market, and
thereby increases the earnings. Labour force with primary education more than double their
earnings compared to illiterates, and compared to mere literacy, primary education enhances
individual earnings by 20 per cent (Tilak, 1987a). The economic returns to primary education
are estimated to be not only positive and high, but also that they are higher than alternative
rates of return on the one hand, and higher than returns to secondary and higher education on
the other. Not only monetary returns, the additional effects of primary education on labour
productivity are found to be very significant. It changes the habits of the people, makes
people ready for change and to adopt new methods of farm practices and production (Raza
and Ramachandran, 1990). As Jamison and Lau (1982) concluded, four years of primary
education results in 7.4-8.7 per cent increase in agricultural productivity. On national
economic front, primary education is found to contribute to miracles in transforming nations
from poor undeveloped societies to rapidly developing or industrialising tigers (World Bank,
1993).
Education is also found to contribute significantly towards improvement of health
(Cochrane et al., 1980). The effects are more significant in case of education of women.
Further, primary education contributes to reduction in fertility rates, indirectly by increasing
the rates of participation of women in labour force and increasing the minimum age at
marriage and directly through adoption of better approaches to family planning and
development (e.g., see Nair, 1981), thereby reducing population growth. Primary education is
also found to improve significantly the rates of child survival and life expectancy.
Elementary education also helps in socialisation of the young children and in their
effective functioning in the modern societies (Inkeles and Smith, 1974). It contributes
significantly to transformation of traditional societies into modern ones. It also helps in

SOUTH ASIA EFA FORUM Jandhyala TILAK: Financing of Education in India
7
formation of national culture. It helps people in their effective participation in socio political
and economic spheres of development of the societies. In short, education is a major
instrument of social change. As the Education Commission in India (1966, p. 8) noted, "if
this ’change on a grand scale’ is to be achieved without violent revolution (and even for that it
would be necessary), there is one instrument, and one instrument only, that can be used:
EDUCATION."
Effective elementary education also contributes to evening out some of the ills of the
society, such as child labour and exploitation of children, and even phenomena like child
marriage and correspondingly early teen-age pregnancies. Elementary education is also
considered rightly as a basic need fulfillment of which helps in fulfilling other basic needs.
Effective provision of elementary education might reduce the level of public expenditure
required on other basic needs. It might even obviate the need for spending on certain other
basic needs (Tilak, 1989b; Panchamukhi et al., 1995; Minhas, 1992). Lastly, it improves not
only efficiency of the system through increased labour productivity, and personal and social
development, but it is also found to be an effective instrument of reduction of poverty,
upward social and occupational mobility, empowerment of people, redistribution of resources
and thereby of improvement of equity in the system, besides itself reducing educational
inequalities. As Carnoy (1992, p. 35) argued, education is a more effective instrument than
several direct measures of income redistribution. In fact, elementary education is one of the
few sectors where equity-efficiency trade-offs do not seem to exist. It is both an equitable and
at the same time an efficient investment for development.
Thus the significant effects of elementary education on reduction in poverty and on
improvement in income distribution, improvement in health and nutritional status of the
population, its negative relationship with fertility and population growth, and positive
association with adoption of family planning methods and its positive relationship with
general social, political and economic development and overall quality of life are well
recognised (see Lockheed et al., 1991; Tilak, 1989a, 1994a; Carnoy, 1992; Psacharopoulos
and Woodhall, 1985; Drèze and Sen, 1995).
Universal elementary education is, thus, one of the greatest values enshrined in the
Constitution of India and in several declarations of the UNESCO and other United Nations
organisations. In short, universal access to education can reduce class and social status

SOUTH ASIA EFA FORUM Jandhyala TILAK: Financing of Education in India
8
barriers to individual advancement; it can help to equalise earned incomes by educating
people and leading to mobility of people from out of historically low paid jobs to historically
higher paid positions; it can help people to be better decision makers in many aspects of their
lives (e.g., health and consumer expenditure), and thus help to equalise individual
maximisation of life chances; it can lead to greater participation in the political process, and
thus to wider distribution of power; it can lead to greater tolerance for and consideration of
one’s fellow persons, and thus to more voluntary concern for their welfare; and it can lead to
greater emphasis on the rights to and the availability of free choice for all individuals (Rawls,
1971, p. 83).
All these factors stress the need for provision of basic education free to all. Hence it
should be applauded that Government of India, like several other developed and developing
countries, had decided to fully finance elementary education, and provide it free to all.
But even after five decades of development planning, and four decades after the
deadline stipulated by the Constitution, and despite several strategies adopted, programmes
and schemes launched, this goal is still elusive. As the Tenth Five Year Plan noted,
“despite significant improvement ... the achievement is short of target.” It has been
strongly felt by many that elementary education suffered in India, due to, apart from
several factors, insufficient allocation of financial resources. At the same time, it be noted
that while finances are an important constraint, they are however not the only constraint, but
one among many. In other words, financial resources provide a necessary, but not a
sufficient condition in achieving universal elementary education.
2 SIZE AND STRUCTURE OF ELEMENTARY EDUCATION
Elementary education in India refers to eight years of schooling (Grade I to Grade
VIII) for the children of the age group 6-14. It comprises of primary education of five
years (Grades I to V for the children of the age group 6-11) and upper primary education of
three years (Grades VI to VIII for the children of the age group 11-14). (Table 1) The
Constitutional Directive refers to universalisation of elementary education. Primary
education is also compulsory in many states in India, and efforts are being made to make
elementary education a fundamental right in the Constitution.

SOUTH ASIA EFA FORUM Jandhyala TILAK: Financing of Education in India
9
There has been phenomenal growth in enrolments in elementary education after
independence. As per the latest statistics, there are nearly 640 thousand primary schools
and another 200 thousand upper primary schools in the country in 2000-01. Elementary
education is also offered in secondary and higher secondary schools in several states.
About 11.4 crore children are enrolled in primary level and another 4.3 crore in upper
primary level of education. According to official statistics, while the gross enrolment ratio in
primary education was 96 per cent, the corresponding ratio in upper primary education was
only 59 per cent in 2000-01. The net enrolment ratios could be much lower. It was
estimated to be 75 per cent in primary education in 1997-98. While the growth in enrolments
over the period has been impressive, still about four crore children, who should be in school,
are estimated to be out of school in 200-01, as per the estimated reported in the Economic
Survey 2002-03 (p.223). Further, 40 per cent of the children enrolled in Class I drop out
before reaching Grade V. The dropout rate in elementary education as a whole is as high as
54 per cent. Along with increase in number of pupils, number of teachers also increased
during the period, but not at the same rate of growth of enrolments. As a result, the pupil-
teacher ratios have ‘worsened,’ as the government of India (Economic Survey 2002-03, p.225)
observed. The pupil teacher ratio was one teacher for 23 children in primary schools in 1950-
51, which has increased to 1 teacher for 43 children in 2000-01; during the same period, the
increase was from 1:20 to 1:38 at upper primary level. A few important details on the size of
elementary education are given in Table 2.
3. TRENDS IN EXPENDITURE ON EDUCATION IN INDIA
Sources of Funds for Education in India
Education is financed in India, like in many developing countries by the government
and non-governmental sources.
• Government
o Union (central) government
o state (provincial) governments, and
o local bodies (district and below district level bodies such as
block and village level political/administrative bodies), and by
• Non-governmental sources

SOUTH ASIA EFA FORUM Jandhyala TILAK: Financing of Education in India
10
o student fees, and
o voluntary contributions from the community.
The union government spends considerable amounts on education on its own, and also
devolves resources to the states to spend on education. Resources flow from the central
government to states through the Planning Commission (plan grants) and Finance
Commission (non-plan assistance), in addition to discretionary grants.1 States also spend
education directly and also devolve resources to local bodies for spending on education.
Recent amendments to the Constitution provide elaborate mechanisms of strengthening local
bodies and for devolution of resources from state governments to local bodies.
In relative terms, the contribution of non-governmental sources has declined steeply
in India over the years. Student fee is still an important source of funds for secondary and
higher education. But elementary education is mostly financed by the government – central,
state and local bodies, though students also pay a small amount of fees in primary and upper
primary schools. No recent data are available on the contribution of various sources listed
above to financing education in India. Some details are, however available on family
expenditures on education. According to household surveys, students and their parents,
incur considerable levels of expenditure on a variety of items related to elementary
education, such as on purchase of textbooks and stationery, uniforms, transport etc.
Figure 1 Government and Household Expenditure on Elementary Education,
1995-96
Government Expenditure
66%
Household Expenditure
34%
1 See Tilak (1989c) for an elaborate discussion on the mechanism of transfer of resources from the centre to the states.

SOUTH ASIA EFA FORUM Jandhyala TILAK: Financing of Education in India
11
As shown in Table 3, household expenditures on elementary education are sizeable.
On average, households spent Rs. 500 per student per annum on elementary education, while
government spent about Rs. 915 (in 1995-96). Rough estimates indicate that household
expenditures amount to one-third and government expenditure the remaining two-thirds of
the total –government and household – expenditure on elementary education. (Figure 1)
Government Expenditure on Education
In absolute terms, the increase in expenditure on education at national level during
the post independence period is very impressive: the educational expenditure increased by
about 900 times from Rs. 55 crores in 1947 to Rs. 62 thousand crores in 1998-99, the latest
year for which such data are available. According to the budget estimates, it would be of the
order of Rs. 78 thousand crores in 2000-01. But this impressive growth is belittled by
(a) rapid growth in population,
(b) phenomenal increase in student numbers, and above all,
(c) escalation in prices,
As a result of growth in population, while the total expenditure on education increased more
than 500 times, in per capita terms the increase between 1950-51 to 1998-99 had been by
about 200 times only. In contrast, the expenditure per pupil increased only by 92 times
during the same period, from Rs. 36 to Rs. 2640. These figures are at current prices and the
impressive picture remains no more so impressive, if they are converted into constant prices.
After adjusting these figures with the help of national income deflators, it can be noted that
the real rates of growth2 in total, per capita and per pupil expenditure on education are very
small, as shown in Table 4. For instance, as compared to a rate of growth of 13.7 per cent in
current prices, the total expenditure on education increased at a rate of growth of 6.4 per cent
only in real prices during the five decades (1950-51 to 1998-99). The real rate of growth of
per capita expenditure on education was about four per cent; and in per pupil terms the real
growth was less than one-third of the growth in current prices. On the whole, the real rate of
growth of total expenditure on education during the last five decades is marginally higher
2 The rate of growth is estimated by fitting the equation: Y = a bt, where Y is the variable of which the rate of growth is estimated, t the time period, and a and b are intercept and regression coefficient to be estimated, b being defined as 1 + (r/100), r being the annual rate of growth.

SOUTH ASIA EFA FORUM Jandhyala TILAK: Financing of Education in India
12
than growth in national economic indicators, proving Wagner’s (1890) law in education too,
that public expenditure increases at a faster rate than national income.
The decadal trends in growth in public expenditure on education in India are indeed
important to note. Looking at the real rates of growth, one notices that the 1950s was a
period of rapid growth in total expenditure on education; and the 1960s was also a very
favourable period for education, as in many developing and developed countries of the
world. The global disenchantment with education, partly attributable to growing educated
unemployment on the empirical scene, and the emergence of screening and credentialism
theses on the role of education on the theoretical front, caused a great setback for the growth
of expenditure on education during the 1970s in the third world. India has had also a similar
experience. The 1980s marked the revival of faith in education. ’Human resource
development’ became a favorite slogan by the mid-1980s, and education was regarded as an
important component of human (resource) development. Expenditure on education
increased during the 1980s at a reasonably high rate of growth, particularly compared to the
preceding decade. However, the rate of growth -- both in total and per capita -- have not
reached the levels of the 1950s. The rate of growth could not be sustained in the 1990s, may
be because of the effect of economic reform policies introduced in India at the beginning of
the 1990s (see Tilak, 1996). It would be interesting to interpret these trends in the
framework of public finance, particularly as a phenomenon of "displacement effect"
(Peacock and Wiseman, 1961), according to which, public expenditure on social sectors like
education get displaced due to economic problems created by wars and other crises, and
more importantly, public expenditure levels do not go back to the former (pre-war) levels
even several years after the economic crisis (see also Tilak, 1998).
Allocation of Resources
There are four important aspects relating to allocation of resources to education:
(a) allocation of resources to education vis-a-vis other sectors, which can be referred
to as inter-sectoral allocation of resources,
(b) intra-sectoral allocation of resources within education, i.e., allocation to different
levels of education,

SOUTH ASIA EFA FORUM Jandhyala TILAK: Financing of Education in India
13
(c) inter-functional allocation of resources referring to allocation of resources to
different activities such as teaching, administrative, welfare activities, etc.
(d) Yet another important dimension of allocation of resources to education, that is
important in a federal system like India is allocation of resources by the union
government to the states and by the state governments to local bodies.
These aspects are briefly discussed in the following pages, surveying the existing scanty
literature, and with the help of some important indicators using the recent data available. At
the outset it may be noted that despite recognising the contribution of education to economic
growth and development, the pattern of allocation of resources to education in India is still
far from satisfactory.
Inter-Sectoral Allocation of Resources
First, what is the priority given to education in the national development framework?
This question is generally answered in terms of a few select indicators such as the share of
education in GNP, share of education in the government expenditure, share of education in
the five year plan outlays, etc., some of which are discussed below.
Share of Education in GNP
Share of education in gross national product is the most standard indicator of national
efforts on the development of education in a given society. This reflects the relative priority
being accorded to education in the national economy. This indicator is also found to be
superior to several other indicators.3 On the recommendation of the Education Commission
(1966), the Government of India (1968) quantitatively fixed a target of investing six per cent
of national income in education from the public exchequer by 1986. A glance at the figures
on expenditure on education as a proportion of GNP given in Table 5 shows that over the
years it has increased remarkably.
At the inception of planning (1950-51) India was spending 1.2 per cent of GNP, and
by 1998-99, it increased to about four per cent, even though the growth is not smooth, as can
be noted from Figure 2. This is indeed a remarkable increase.
3 See Coombs (1985), and Tilak (1986).

SOUTH ASIA EFA FORUM Jandhyala TILAK: Financing of Education in India
14
Figure 2Expenditure on Education as % GNP
1.0
1.5
2.0
2.5
3.0
3.5
4.0
4.5
5.0
1950
-51
1955
-56
1960
-61
1965
-66
1970
-71
1975
-76
1980
-81
1985
-86
1990
-91
1995
-96
2000
-01
BE
However, it needs to be underlined that the level of spending as a proportion of GNP
accomplished so far, is less than
(a) the requirements of the education system to provide reasonable levels of quality
education to all the students enrolled presently,
(b) the requirements of the system to provide universal elementary education of eight
years for every child of the age-group 6-14, and consequent growth in secondary and
higher education, as universalisation of elementary education in a comprehensive
sense, includes universal provision of resources, universal enrolment, and universal
retention (see Tilak and Varghese, 1990),
(c) the recommendations of the Education Commission (1966), the resolve made in the
National Policy on Education 1968, reiterated in the National Policy on Education
1986 (Government of India, 1986), and the revised Policy (1992) to invest six per
cent of GNP in education,4 and
(d) the proportion of GNP invested in education in many other developing, leave alone
developed, countries of the world, including Africa. It should be noted that it would
be a stupendous task to reach a level of six per cent of GNP before the end of the
4 It may be however noted that the Education Commission’s recommendation assumed higher economic growth rate than actually realised in the country, in which case, the requirement of education would be more than six per cent.

SOUTH ASIA EFA FORUM Jandhyala TILAK: Financing of Education in India
15
tenth Five year plan, i.e., by 2007, as promised by the Government recently, from the
current level of about four per cent.
According to the Human Development Report 2001, India ranks 104th with respect to
share of public expenditure on education in GNP, among the 143 counties on which such
data are available.5 In comparison a large number of countries spend more than six per cent,
some more than eight per cent and a few more than ten per cent. Some of the countries,
which spend more than four per cent of GNP on education, include countries, which are
economically poorer than India. India had set a long time ago a target of six per cent of
GNP to be spent on education. This target still eludes, and may continue to elude in the near
future.6 The need to raise this proportion considerably needs no over emphasis.7 Almost all
-- from laymen to experts -- plead for the same, though there are no detailed estimates on
what should be the desirable and feasible proportion of GNP.8
The Education Budget
Perhaps a more important gauge of what is actually happening is revealed by the
priority given to education in the government budget. This is also preferred to the earlier
one, as governments have more direct control on government budgets than on GNP.
Unfortunately there is no ’education budget’ per se in India. To arrive at an education budget
5 According to the Human Development Report, India was devoting 3.2 per cent of her GNP to education (1995-97). 6 According to an earlier analysis (Tilak, 1990b), among the countries of the world on which such data are available, India ranked very poorly, almost at the bottom, with respect to this indicator of national efforts on education, and amongst the countries with a population of 100 millions or more, India figured at the bottom except Bangladesh.
7 In stead of pursuing this goal vigorously, attempts are being made to redefine the target, and play with not so confusing terminology, in violation of the spirit and letter of the recommendations made by the national commissions on education, and approved by the Government of India, to show that the target has already been achieved (e.g., see Kolhatkar (1988). See Tilak (1990b) for a comment on Kolhatkar’s approach and analysis. See also Tilak (1999a).
8 Norm based estimates (based on cost functions and enrolment projections), by Tilak (1994b) suggested that it should be about 8 per cent by 2000 AD. Rao (1992) compared the cost of education in India with developed countries like Singapore, and estimated that about a quarter of our GNP needs to be allocated to education. Seth (1985) felt that provision of appropriate education might require about ten per cent of GNP.

SOUTH ASIA EFA FORUM Jandhyala TILAK: Financing of Education in India
16
of the country as a whole, one has to look at the education components in the union budget,
and more importantly in the budgets of all the states and union territories. Then only one can
present a complete idea of the education budget in the country. We do not have such an
"integrated budget presentation" in our country.9 The union budget fails to provide any
significant idea, as its contribution is relatively very small compared to the state budgets for
education.
Budgetary resources flow into education from the Departments of Education, and
also form other Departments/Ministries, both at the central and state level. While the share
of the Department of Education is substantial, other departments also contribute significant
amounts to the education budget. For example, at the central government level, in addition
to the Department of Education, more than 35 Ministries/Departments are found to be
spending on education, important ones among them being Department of Women and Child
Development, and Ministry of Social Justice and Empowerment (Table 6). There may be
several other Ministries/Departments spending on education, details on which are not
available. Over the years, the later increased in relative proportion from 8.5 per cent in
1971-72 to 17 per cent of the total education budget by the end of the decade of the 1990s
(Table 7).
Further, in the budget framework, resources flow from government in two forms -- in
the revenue account of the budget and in the capital account. While in the revenue budget
the share of education sector is reasonably large, in the capital budget the share of education
is infinitesimally small, the net result being pushing down the share of education in the total
budget. But most researchers, planners and general official documents (e.g., Selected
Educational Statistics) confine to revenue budget only and give the impression that larger
allocations are being made for education in the budgets. For instance, it is generally argued
that about a quarter of the budget goes for education in India. This is true with respect to
only revenue accounts of state budgets. If central and state budgets are considered and both
revenue and capital accounts are taken into consideration, as shown in Figure 3, the total
9 In this context, the Analysis of the Budgeted Expenditure on Education (Department of Education, Ministry of Human Resource Development) is a very valuable document, though it is published with a gap of 3-4 years. However, it does not give other details like the revenue incomes of the education sector that are found in the general budgets, which facilitate estimation of budgetary subsidies, etc. This also dose not provide details on expenditure on education incurred by other departments by levels of education.

SOUTH ASIA EFA FORUM Jandhyala TILAK: Financing of Education in India
17
budget resources available for education forms 11 per cent only during the last five years
(Table 8).
Figure 3
Education Budget
Further, we also notice that while in the central budget the share of education sector
was 3.5 per cent (4.5 per cent in revenue budget, and nil in the capital budget), it was a little
less than one-fifth of the budgets of the states and union territories (23 per cent in the
revenue budgets and 1.2 per cent in capital budgets) in 1998-99. It may also be noted that
even though the share of education in the (revenue) budget oscillated frequently, over the
years, on the whole, in the central budget it has increased from 1.6 per cent in 1967-68 to
nearly four per cent by the end of the 1990s, and in the state budget, it has been around 20
per cent (Table 9). The total on the whole, seems to be stabilising around ten per cent –
declining from 14 percent in the early 1980s to 11 percent by the end of the century (Figure
4).
In both central and states' budgets revenue expenditure on education is substantial,
and the capital expenditure forms a very small magnitude. But the budgetary terminology
Revenue Account
States/Union Territories
Union/Central
Revenue Account
Capital Account
Capital Account
The National Budget

SOUTH ASIA EFA FORUM Jandhyala TILAK: Financing of Education in India
18
referring to ‘revenue’ and ‘capital’ accounts is not in conformity with the standard
terminology in Economics.
Figure 4Expenditure on Education as %of Total Government Expenditure
0
5
10
15
20
25
30
1967
-68
1970
-71
1973
-74
1976
-77
1979
-80
1982
-83
1985
-86R
1988
-89e
st
1991
-92
1994
-95
1997
-98
2000
-01B
State/Uts Union All-India
For example, even expenditure on capital items like construction of buildings could be
incurred out of revenue expenditure. Hence it is widely held that this classification does not
seem to be serving any meaningful purpose (e.g., Rangarajan, 2001).
With respect to international comparisons, India fares very poorly in comparison
with not only advanced countries, but also even some of the poor countries of the globe.
Out of the total government (central and state) expenditure, India was spending 11.6 per
cent on education (1995-97), compared to more than 15 per cent in many advanced
countries. The corresponding figure was above 20 per cent in several rich and poor, and
small and big countries, such as Singapore, Poland, Costa Rica, Estonia, UAE, Lithuania,
Mexico, Macedonia, Venezuela, Thailand, Saudi Arabia, Kyrgyzstan, Uzbekistan,
Namibia, Morocco, Botswana, Togo, Yemen, Cote d’Ivoire, Senegal, Gambia, Guinea, and
Rwanda.
In terms of these two indicators, viz., share of education in GNP and share of
education in total government expenditure, India was faring better during the 1980s. But

SOUTH ASIA EFA FORUM Jandhyala TILAK: Financing of Education in India
19
after the economic reform policies were introduced in the beginning of the 1990s, public
finances for education were subject to severe squeezes. The relative priorities were also
affected, and the shift has been away from education sector. Generally it is suggested by the
UNDP and other international organisations that about 20 per cent of the government budget,
and 5-6 per cent of GNP should be allocated to education in the developing countries.
Plan and Non-Plan Expenditure
The total government expenditure on education consists of plan and non-plan
expenditures. Plan expenditures are meant for meeting development needs, while non-plan
expenditures meet the maintenance expenditure. The later is referred to as committed
expenditure. As the system grows, non-plan expenditure becomes more important in size.
Plan expenditure on education is relatively very small in size; and a large proportion of the
expenditure on education is non-plan is nature. In fact, non-plan expenditures form the
major chunk of expenditures on education. Nearly 85 per cent of the expenditure on
education in 1990-91 was of non-plan category and only 15 per cent was accounted by plan
expenditure. However, in the following years, plan expenditures grew faster, and as a result,
currently plan expenditures form a little more than twenty per cent of the total (Table 10). It
may be emphasised that since non-plan expenditure is only for maintenance, the smaller plan
expenditure, the small is the scope for setting new directions of development and to
introduce innovations and reforms.
First, the plan expenditures.
Education in Five-Year Plans
Five Year Plans are an important instrument of development strategy adopted by the
independent India. And hence, it is important to examine the priority given to education in
the Five Year Plans. Expenditure on education in the five-year plans has shown a rapid rise
since the inception of the first five-year plan. The absolute expenditures/outlays for
education multiplied by more than 350 times between the First five-year plan to the ninth
Five Year Plan. The first plan invested Rs. 153 crores on education. The expenditure rose to
Rs. 7.7 thousand crores in the seventh five-year plan. The expenditure during the eighth
five-year plan was more than doubled further to reach a level of Rs. 27 thousand crores,

SOUTH ASIA EFA FORUM Jandhyala TILAK: Financing of Education in India
20
which again nearly doubled in the ninth plan. Thus, it seems that increasingly larger
resources are being allocated to education (Table 11).
Figure 5Expenditure on Education in Five Year Plans
(Rs in Crores in 1993-94 Prices)
0
10000
20000
30000
40000
I II III IV V VI VII VIII IX
Five Year Plans
But when we look at the figures in real prices,10 expenditure on education declined from the
third five-year plan onwards up to the fifth five-year plan (see also Figure 5). The
expenditure on education in real prices in the fourth five-year plan was less than four-fifths
of the expenditure in the third plan and the expenditure in the fifth plan was about
three-fourths of the expenditure in the fourth plan. It is only in the sixth plan this trend was
reversed and the expenditure in the sixth plan was about double the expenditure in the fifth
plan11 and is slightly above the expenditure in the third plan in real terms; and the
expenditure in the seventh plan was about 1.8 times the expenditure in the sixth plan.
The relative importance given to education in the five year plans has declined
gradually over the years, from 7.9 per cent in the first five year plan, to 2.7 per cent in the
10 The expenditure in the Five Year Plans is spread over five years. Conversion of the actual expenditure into real expenditure in a Plan is made with the help of national income deflators (derived from GNP in current prices and GNP at 1993-94 prices corresponding to the period of each Five Year Plan. See also Tilak (1987).
11 As the fifth plan period was truncated, the actual expenditure was much less than the original outlay.

SOUTH ASIA EFA FORUM Jandhyala TILAK: Financing of Education in India
21
sixth five year plan. It is only during the seventh five-year plan, and later in the eighth and
the ninth five-year plans this declining trend was reversed12 (Figure 6).
Figure 6 Share of Education in Five Year Plans (%)
7.9
5.8
6.9
5.2
3.32.7
3.6
4.5
6.2
0
2
4
6
8
I II III IV V VI VII VIII IX
Five Year Plans
The eighth five year plan allocation was quite high, 4.5 per cent; but it was still much less
than the proportion allocated in the first five year plan, for that matter it is less than the
allocations made in the first four five year plans. The expenditure in the ninth Five-year plan
is likely to be much higher, as the available estimates reveal, and tentative estimates put this
figure around 6.2 per cent.
Not only has the relative importance given to education in the plan expenditure
gradually declined until the sixth five year plan, but also the relative share of education in
any five year plan, including the seventh, the eighth and the ninth five year plans, has been
the lowest, despite the hymns sung in praise of education in every plan document. The
closest figure is three per cent allocated to health in the seventh and the eighth five-year
plans. Several major sectors received much higher than the allocation made to the education
sector, as can be noted from Table 12.
12 The declining share of education in the total plan outlays/expenditure is a phenomenon common to several states also. E.g., in Andhra Pradesh the trends were most erratic, and in Uttar Pradesh and Bihar a somewhat consistent declining trend in the relative priority accorded to education in the Five Year Plans can be noted. See Tilak (1991). See also Tilak (1995a).

SOUTH ASIA EFA FORUM Jandhyala TILAK: Financing of Education in India
22
One can note that there are three important phases in the allocation of resources to
education in the five year plans. During the first three five year plan periods, the allocation
to education as a proportion of total five-year plan expenditure had been more than five per
cent. Even though it declined in the second plan, the decline was immediately checked in
the third plan. The second phase, consisting of the fourth, fifth and the sixth five-year plans,
was characterised by a consistent decline in the relative share of education. The seventh, the
eighth and the ninth five year plans form the third phase when efforts are made to check the
declining trend and to substantially increase the allocation to education. This phase refers to
the post-1986 Policy period and the positive effect of the Policy could be noted. Still the
allocation made in the ninth plan is much lower than the allocation made in the very first
five-year plan. All this may lead one to conclude that the five decades have been a period of
under investment in education (Tilak, 1997).
Intra-Sectoral Allocation of Resources
What has been the pattern of allocation of resources to different levels of education?
An analysis of intra-sectoral allocation of resources in education in India during the
plan period shows a lopsided emphasis on not only elementary education, but also on other
layers of education. A clear-cut shift in the priorities is quite obvious from the figures in
Table 13. In the first five year plan, 56 per cent of the total plan resources to education were
allocated to elementary education, 13 per cent to secondary, nine per cent to university
education and 13 per cent to technical education. The relative importance given to
elementary education declined to 35 per cent in the second plan, to 34 per cent in the third
plan, and gradually to 30 per cent in the sixth plan. It is only again during the seventh, the
eighth and the ninth plans significant efforts were made to increase the allocation
substantially, though the allocations made in the eighth plan and the ninth plan were still less
than the corresponding one in the first plan in percentage terms. The share of other levels,
excepting technical education, experienced a significant increase until the sixth plan, though
the increase was not smooth. In the first plan only 13 per cent of the total educational
expenditure was meant for secondary education and by second plan it increased to 19 per
cent where as that for university level increased from less than one-tenth to nearly one-fifth
in the second plan, to about one-fourth in the fourth and fifth plans, reduced to about

SOUTH ASIA EFA FORUM Jandhyala TILAK: Financing of Education in India
23
one-fifth in the sixth five year plan, and it was drastically reduced to seven per cent in the
eighth plan. Elementary education was given a boost in the seventh plan. This boost seems
to have been possible with severe cuts in plan resources for secondary and higher education
(Figure 7).
Figure 7Intra-Sectoral Allocation of Resources in Education in Five
Year Plans
0%
20%
40%
60%
80%
100%
I II III IV V VI VII VIII IX
Five Year Plans
Elementary Adult Secondary Higher Technical Others
Even with respect to utilisation of plan allocations in five-year plans, the sub-sector
of elementary education fared better in the recent plans periods, as can be noted from Table
14. Though mostly, more than 90 per cent of the allocations were utilised, except in the fifth
five-year plan, in the seventh and the eighth pans the expenditure was much higher than the
plan allocations (Figure 8). During the seventh plan, as many programmes conceived in the
National Policy on Education 1986 were launched after the initial allocations were made, it
was understandable that the actual expenditure exceeded the original plan allocation. But
this continued in the eighth five-year plan as well. This may cast doubt on the efficiency of
criteria used, if any, in making the allocations in the five-year plans in general, and in the
eighth five-year plan in particular.
The plan period can be divided into four phases depending on the pattern of
allocation of resources to elementary education, viz., phase I: 1951-56 (the first five year
plan period), phase II: 1956-69 (the period covering the second and the third five year plans,

SOUTH ASIA EFA FORUM Jandhyala TILAK: Financing of Education in India
24
and the annual plans), phase III: the post-1968 Policy period up to 1980, or simply 1969-
1986, and phase IV: the post-1986 (Policy) period.
Figure 8% of Utilisation of Five Year Plan Outlays on
Elementary Education
91102 96 93
77
98
144135
98
0
50
100
150
I II III IV V VI VII VIII IX
Five Year Plans
Phase I witnessed a substantial part, nearly three-fifths, of the total plan educational
resources, being allotted to elementary education, i.e., high priority was given to elementary
education and a low priority to higher and technical education. The period favorable to
elementary education ended with the end of the first five-year plan. Phase II, specifically the
second five year plan marked the beginning of a drastic decline of resources allocated to
elementary education and a doubling or trebling of resources allocated for higher education.
It may also be noted that the overall developmental priorities also changed with the
beginning of the second five-year plan. Relative emphasis shifted from agricultural sector in
favor of industrial sector. Industrial development requires manpower, and higher education
was looked upon for the supply of manpower. Accordingly, expenditure on higher education
was increased considerably. It reached a proportion of 24 per cent by 1967-68, while the
corresponding figures for elementary education showed a decline from 56 per cent in first
plan to 17 per cent in 1966-67. Phase III, i.e., period after 1969 showed a slight reversal of
these trends. The proportion of elementary education showed an increasing trend and that of
university and technical education showed a gradual decline. This may be attributable partly
to the Education Commission’s (1966) concerns, and the National Policy on Education 1968
that laid emphasis on elementary education on the one hand, and partly due, on the other

SOUTH ASIA EFA FORUM Jandhyala TILAK: Financing of Education in India
25
hand, to the growth of educated unemployment, the mismatches in the labor market, and the
resultant social unrest. 1986 marks the beginning of the renewed emphasis on elementary
education, with the formulation of the National Policy on Education (1986), and with the
’operation blackboard’ and similar other programmes launched by the union and state
governments. The allocation to elementary education was stepped up significantly during
the seventh five-year plan, and the eighth five-year plan continued to lay the same emphasis
on elementary education. In the ninth plan also elementary education was given a high
priority. Besides the National Policy on Education 1986, international environment,
particularly the Jomtien conference in 1990, and the Dakar conference in 2001 on Education
for All (EFA), and the beginning of the flow of external assistance for primary education,
also have been responsible for the increase in priority for elementary education.
56
35 3430
3530
34
42
51
0
10
20
30
40
50
60
I II III IV V VI VII VIII IX
Five Year Plans
Figure 9Share of Elementary Education in Total Expenditure on
Education in Five Year Plans (%)
However, it is to be noted that though the third phase showed marginal
improvements so far as elementary education is concerned, it has yet to go a long way to
reach the proportion that it obtained in the first plan. While universalisation of elementary
education has been becoming an increasingly tougher and tougher task, causing repeated
postponement of the goal, the relative priority given to elementary education in the total
educational expenditures has gradually declined over the successive five-year plans. It was
only during the fist five year plan that elementary education was allocated a sizeable
proportion of the total educational outlay: it was 56 per cent. During the subsequent plans
this proportion has been dwindling between 30 and 35 per cent, except in the seventh plan

SOUTH ASIA EFA FORUM Jandhyala TILAK: Financing of Education in India
26
and later13 (Figure 9). On the whole, it seems plausible to argue that had the priority given to
elementary education in the first five year plan continued, universalisation of elementary
education would not have been so elusive as it is today, if not already accomplished.
Five-year plan allocations to secondary education do not show any noticeable
pattern. The resources allocated to secondary education showed that after an initial jump
from 13 per cent to 19 per cent between the first and the second five year plans it got
relatively stabilised and remained around that proportion until the sixth five year plan. In the
six plan, for the first time, the allocation was increased to 25 per cent; but this level could not
be maintained; it gradually declined to 16 per cent in the eight five year plan. It is feared that
the proportion might decline further in the ninth five-year plan.
During the first phase, i.e., during the first Five Year plan, higher education was not
given a high priority. But probably realising the importance of higher education soon, in the
second five-year plan the allocation to higher education was doubled from nine per cent to
18 per cent of the total education outlay. But certainly it is during the third phase, i.e., during
the post-Kothari Commission period, higher education received a better treatment, with more
than 20 per cent of the total outlay allocated to education being given to higher education.
But the fourth phase was the worst period for higher education. The relative share of higher
education touched an all-time low level of seven per cent in the eighth five-year plan. The
economic reform polices introduced in the beginning of the 1990s contributed to inflicting
steep cuts on allocations to higher education and also effected drastic changes in the
perceptions on public financing of higher education. As a result, today few hope that even
during the tenth five-year plan higher education would be allocated any better share of the
total education outlay.
Plan and Non-Plan Expenditure on Elementary Education
All this may present only a partial picture because non-plan expenditure is also
equally important. Plan expenditures are meant for meeting development needs, non-plan
expenditures meet the maintenance expenditure. The later is referred to as committed
expenditure. Plan expenditure on education, including in case of elementary education, is
13 Originally consistent with the declining trends, only 29 per cent was allocated in the seventh Plan for elementary education.

SOUTH ASIA EFA FORUM Jandhyala TILAK: Financing of Education in India
27
relatively very small, compared to non-plan expenditure on education. In fact, non-plan
expenditures form the major chunk of expenditures on education. A large proportion of the
expenditure on elementary education (and also education as a whole) is non-plan is nature,
and presently only 20 per cent is of the plan category (Figure 10). Since 1980-81, this
proportion has increased from 5.9 per cent to ten per cent in 1990-91 and then jumped to 20
per cent in the recent years (Table 15). It may be emphasised that since non-plan
expenditure is only for maintenance, the smaller plan expenditure, the small is the scope for
setting new directions of development and to introduce reforms.
Figure 10Plan and Non-Plan Expenditure on Elementary Education
(per cent Distribution)
0
20
40
60
80
100
1980
-81
1981
-82
1982
-83
1983
-84
1984
-85
1985
-86
1986
-87
1987
-88
1988
-89
1989
-90
1990
-91
1991
-92
1992
-93
1993
-94
1994
-95
1995
-96
1996
-97
1997
-98
1998
-99
1999
-200
0R
2000
-01B
Plan Non-Plan
Though plan expenditures are relatively small, the increase in plan expenditure is very
important as plan expenditures allow increase in development activities, including
construction of school buildings, recruitment of new teachers and launching of new
development programmes. The significant increase in the relative share of plan expenditure
on elementary education in the 1990s could be due to (a) the massive operation blackboard
programme that involved provision of additional classrooms, additional teachers in single
teacher schools, and provision of a huge basket of teaching learning material, that is expected
to have significant effects on quality of education, (b) provision of incentives, particularly

SOUTH ASIA EFA FORUM Jandhyala TILAK: Financing of Education in India
28
noon meals to school children, and (c) flow of external aid to education, in the form of DPEP
and other projects.
In all, expenditure on elementary education increased significantly in current prices.
During the 1990s alone, the public expenditure on elementary education increased by 2.4
times from Rs. 8 thousand crores in 1990-91 to Rs. 31.5 thousand crores by 2000-01
(budgeted). However, in real prices the growth has not been so impressive. Nevertheless it
was nearly doubled during this period, as can be noted in Figure 11.
Figure 11Index of Real Growth in Expenditure on Elementary
Education (1990-91=100)
75
100
125
150
175
200
1990-91 1992-93 1994-95 1996-97 1998-99 2000-01B
Figure 12Share of Expediture on Elementary Education in GNP (%)
1.0
1.2
1.4
1.6
1.8
2.0
1985-86 1990-91 1995-96 2000-01B

SOUTH ASIA EFA FORUM Jandhyala TILAK: Financing of Education in India
29
But the trends in the relative share of elementary education -- total, plan plus
non-plan expenditure – in GNP are also of the same kind, as described above. Though total
expenditure on elementary education has increased rapidly, the share of elementary
education in GNP has decreased marginally from 1.6 per cent in 1989-90 to 1.4 percent in
1994-95; this slowly increased to 1.6 per cent by 1998-99 (Figure 12). This is the change
during the post 1986 Policy decade, though it is generally felt that high priority is being
given to elementary education after the 1986 Policy. If the differences between
revenue/budget estimates and actual expenditures turn out to be negligible, this proportion
could increase further in the following years (Table 16).
It is intriguing to note that the relative priority given to elementary education in the
total expenditure on education has not changed significantly over the years. The share
elementary schools in the total 'direct/recurring' expenditure on education, plan and non-plan
combined together, remained more or less stagnant, ranging between 40 per cent and 50 per
cent and might get stabilised around 50 per cent (Table 17). The got has been trying to
ensure that at least 50 per cent of the total resources devoted to education are allocated to
elementary education.
Inter-Functional Allocation of Resources
An important question is: what are the items on which the expenditure is incurred? It
is a well-known fact that non-recurring expenditure forms a very small proportion of total
expenditure on elementary education. Expenditure on buildings, libraries, equipment,
furniture, etc., formed a very small proportion, 2.1 per cent, of total expenditure on
elementary education in 1992-93. That many primary schools are run in open space, kachha
buildings, inadequate rooms, etc., is a clear reflection of the same. Expenditure on fixed
capital such as buildings, however, increases with increase in levels of education. On the
whole, formation of fixed capital in this human capital industry, such as in the form of
buildings takes place at a very slow pace.14 The slow pace may be justified, as the capital
needs of the education sector might decline with fewer and fewer new schools being needed
and opened, as there exist already schools in almost every habitation. But it should be noted
14 For example, the annual real rate of growth of non-recurring expenditure at upper primary level between 1976-77 and 1987-88 is 1.85 per cent, compared to 5.6 per cent in recurring expenditure.

SOUTH ASIA EFA FORUM Jandhyala TILAK: Financing of Education in India
30
that the backlog in terms of buildings is still high. This is clearly understandable as very
often not only schools, but also colleges and even universities are found with no basic
infrastructure facilities like buildings, furniture and equipment. Thus the present pattern of
spending does not contribute much to physical capital formation.
Of the total recurring expenditure on elementary education, teachers’ salaries amount
to more than 90 per cent, and expenditure on the salaries of the non-teaching staff form the
next largest proportion, about three per cent. All other items, including teaching learning
material like apparatus, chemicals, books, libraries, and others like financial incentives,
games, sports etc., receive negligible amounts. Teachers’ salaries increase as a proportion of
the total recurring expenditure, as one goes down the educational ladder.
Available data for the 1990s allow another brief look at inter-functional classification
of expenditure on elementary education, classified in a different form (Table 18). The pattern
in the 1990s does not show any systematic trends and any significant changes in priorities.
This may be partly due to the nature of data available. The available data do not provide a
detailed break-up. Trends in the proportion of expenditure on government schools to toal
expenditure on elementary education show a zig-zag pattern -- the relative proportion
experiencing frequent ups and downs; grants in aid to local body schools remained more or
less constant, and grants-in-aid to private schools also experienced a somewhat zig-zag
pattern. Most, if not all of the aid to government, local body and private schools is for the
salaries of teachers and others. So about 90 per cent of the total expenditure on elementary
education could be treated as expenditure on salaries. Quite interestingly, the relative priority
accorded to teacher training declined steeply in the recent years from about seven per cent in
1993-94 to less than or around half percent in the recent years. The share of quality
enhancing inputs like textbooks, is small, and continues to be very small, accounting for less
than 0.3 per cent in 2000-01. The proportion allocated to financial incentives in the form of
scholarships has also been small, and it marginally declined further to an insignificant level of
0.1 per cent. This pattern of financing needs to be examined in contrast to research evidence
available, though on other countries, that demonstrates significant effects of investment in
non-salary items such as text books, and other teaching-learning material on the quality and
overall efficiency of education systems in developing countries. On the whole, there is not

SOUTH ASIA EFA FORUM Jandhyala TILAK: Financing of Education in India
31
any significant change in the inter-functional allocation of resources to elementary education
during the 1990s.
Public Expenditure on Elementary Education per Student
The time trends in expenditure on education per student, that is indicative of some
aspects of quality of education in terms of physical and human infrastructure facilities
available to students on average, are indeed disturbing. In the four decades after the
inception of planning, i.e., from 1950-51 to 1990-91 expenditure per pupil on primary
education increased at a very modest rate of growth of 2.1 per cent in real prices; and middle
level education at a rate of growth of less than one per cent, even though the trends in current
prices are somewhat impressive. There are significant decadal variations. During the decade
of the 1970s, the real expenditure per student on primary education increased fast, but during
the same period, the expenditure per student in middle level registered a negative rate of
growth. Middle level education received a favourable treatment only in the 1980s. Teacher
salaries, and pupil teacher ratios explain the variations in the expenditure per student in
several states. Even during the 1990s, the growth in per student expenditure has not been
smooth (Table 19). In real prices, it has gradually declined during the first half the decade of
the 1990s: between 19990-91 and 1993-94, it declined by 14 per cent between 1990-91 and
1994-95. (Figure 13).
Figure 13Index of Growth in Real Expenditure per Student in
Elementary Education (1990-91= 100)
75
100
125
150
175
1990-91 1992-93 1994-95 1996-97 1998-99 2000-01

SOUTH ASIA EFA FORUM Jandhyala TILAK: Financing of Education in India
32
Since there were no economies of scale, or any significant change in technology of
classroom practices, the decline must have adversely affected the quality considerably.
There was an increase in the later years only and as a result, on the whole, it registered an
increase by about 50 per cent between 19990-91 and 2000-01.
Union-State Relations in Financing Education
Another important aspect in the context of allocation of resources in India refers to
allocation of resources by the union government to the states. In the federal framework, the
mechanism of sharing financial responsibilities between the centre and the states is a very
important issue. We may briefly examine the center-state shares in financing education.
There is very little research available on centre-state relations in financing education in India.
The limited research available is largely concentrated on non-financial aspects (e.g., Rao,
1972; Baker, 1976; Pinto, 1984; Rai, 1990).
As per the Constitution, education was a ‘state’ subject. However, after the 42nd
amendment to the Constitution (1976), education has become a concurrent subject, i.e., the
central and the state governments both take responsibility for education. Earlier it was a
state subject. Even then, state governments meet a large part of the expenditure on
education.
The trends in the relative shares of the union government and the states in plan and
non-plan expenditure on education during the five-year plans are given in Table 20. During
the first three five year plan periods the share of the central government in the total plan
outlay for education has been of the order of a quarter of the total. During the fourth plan
period this figure increased to 31 per cent. In the fifth plan the share of the central
government continued to be the same. After education was brought into 'concurrent' list
from the 'state list' through the 42nd Constitutional amendment, it was expected that the
share of the central government in educational outlays would considerably increase. But the
relative share in the sixth five year plan15 allocations belied such expectations: the share of
the union government in the plan outlays declined steeply during the sixth five year plan to
15 Incidentally the sixth plan was the first five-year plan of the Congress government after the Constitutional amendment.

SOUTH ASIA EFA FORUM Jandhyala TILAK: Financing of Education in India
33
22 per cent. This was the least of all the five-year plans.16 The earlier criticism that there
was only physical (or non-financial) concurrence in education and that there was no real
financial concurrence continued to hold good (Tilak, 1989c). The seventh plan attempted at
correcting this anomaly, and for the first time the union government funded the education
bill to the extent of 40 per cent, which marginally declined in the eighth five-year plan, but
increased significantly to 50 per cent in the ninth five year plan. This was also necessitated
by the National Policy on Education 1986 that promised to ensure meaningful relationship
between the union government and the states.
The pattern of distribution of non-plan expenditure between the center and the states
is also not altogether different. In fact, the share of the state government is not only very
high, it has also increased from 86 per cent in the second five year plan period to 96 per cent
in the fourth five year plan, pushing down the role of the central government to a bare four
per cent of the total non-plan expenditure. The share of the states was 95 per cent in the
eighth five-year plan. Maintenance, and corresponding needed improvement of the system, it
appears, is not a matter of concern of the union government.
The share of the union government in the total, plan plus non-plan, expenditure, had
been around one-fifth during the first three five year plans. From the fourth five-year plan
onwards, i.e., during the post-Education Commission period, the contribution of the central
government has been less than ten per cent, the remaining being the states’ contribution. It
has marginally increased during the later period, but it is around ten per cent only.
The union government finances quite a few important programmes/schemes called
centrally sponsored schemes in education. These schemes number about twenty and the
expenditure on them in 1996-97 was of the order of Rs. 917 crores (Table 21).
Further, the union government’s increased involvement with elementary and
secondary education is clearly noticeable from the seventh five-year plan onwards in the
allocation of plan resources (Table 22). After the 1986 National Policy on Education, and
more particularly the Conference on Education for All at Jomtien (1990), and the EFA
Summit in Delhi (1993), the union government began taking more serious interest in
elementary education. This is reflected in the eighth and the ninth plan shares between the
16 In fact, the share originally proposed in the sixth plan was much less than the corresponding proportion of the fifth plan as well.

SOUTH ASIA EFA FORUM Jandhyala TILAK: Financing of Education in India
34
union and the state governments. During the same period, a significant decline in the share
of union government in higher education is also noticeable. While the increased level of
concern of the union government for elementary education is somewhat justified, it may
nevertheless be noted that the Constitution has required the union government to take more
responsibility for higher education and less role in case of school education. Thus the recent
trends are not really consistent with the Constitutional provisions, relating to List I, List II
and List III of activities of the states and the union.17 However, if the total, plan and non-
plan, expenditure on education is considered, on the whole, the role of the union is minimum
with respect to primary and middle levels of education, as union government rarely finances
any significant proportion of expenditure on school education.
Tilak (1989c) has shown that the union government’s pattern of allocation of
resources to the states either through the Planning Commission or through the Finance
Commission has not been taking into account the educational needs or economic capabilities
of the states. It was found that in either case the allocations were highly random and ad hoc
in nature, defeating the very purpose of central intervention in financing education. The
allocations have not been found promoting equity or efficiency.
The ninth Finance Commission has made some important modifications in the
methodology of estimating the states’ requirements. By fitting cost functions in education on
selected variables like enrolment ratios, and student-teacher ratio, the requirements of the
states on various levels of education have been projected in a ’normative’ way, which formed
the basis for the recommendations of the Finance Commission. Yet the final ’normative
expenditure’ on education during the period 1991-95 as recommended by the Finance
Commission were found to be poorly correlated to the level of educational development
(measured in terms of literacy), economic development (SDP per capita) or economic
backwardness (as measured by the Finance Commission).18
An important objective of central government intervention in educational finances is,
after all, inter-state equality in educational efforts, indicated by expenditure on education per
17 See Tilak (1989c) for more details.
18 The simple coefficients of correlation of the recommended expenditure on education per capita with literacy, SDP per capita and economic backwardness estimated for the 14 major states for which the allocations have been made, are respectively: 0.1405, 0.2428, and 0.1835.

SOUTH ASIA EFA FORUM Jandhyala TILAK: Financing of Education in India
35
capita or per pupil. The center has to distribute the resources out of the collective pool,
essentially keeping in view of the interests of the backward states, so that we move towards
overall equality in education development. This is, after all, a basic principle of financing in
a federal framework. Detailed research is needed on the principles and practice of financing
education in the federal system of India, including issues relating to the roles of the union
and the state governments, the Finance Commission, the Planning Commission, etc., in
promoting equitable and efficient educational development.
Expenditure on the Central Government Schemes in Elementary Education
As noted earlier, the union government began taking more serious interest in
elementary education since 1986. As a result, there is a considerable increase in the share of
the central government in plan expenditure on elementary education. As already noted, the
central government spends considerable amounts on a variety of schemes, called Centrally
Sponsored Schemes. Of the several schemes, three are very important, in terms of size of
the expenditures. They are: operation blackboard, non-formal education and teacher
education. Together, these three account for 57 per cent of the total expenditure on
centrally sponsored schemes in education. The operation blackboard scheme makes a
provision of at least two classrooms in each primary school with facilities of toilets for
boys and girls, providing of an additional teacher to single teacher primary schools and
prevision of essential teaching learning equipment, including furniture for teachers. The
scheme launched in 1987, is being extended to upper primary level of education. The non-
formal education programme which is in operation since 1979-80, focuses on children of
the age-group 6-14 who have been out of the formal schooling system. The central scheme
primarily covers educationally backward states and assistance is given not only to state
governments, but also to voluntary agencies. Special emphasis is laid on girls, working
children and those belonging to socially backward sections of the society. The scheme is
being revised and is called the scheme of Alternative and Innovative Education. The
scheme of teacher education includes assistance for setting up of district institutes of
education and training and similar other institutions, which primarily provide training
teachers.

SOUTH ASIA EFA FORUM Jandhyala TILAK: Financing of Education in India
36
Trends in the expenditures on these three schemes are given in Table 24. There has
been a very rapid increase in the expenditure on all the three schemes during the 1990s.
But among the three, the operation blackboard scheme is the most sizeable one.
Expenditure on non-formal education and teacher education of course increased by several
times during the ten years (Figure 14). In addition, the central government launched a
national scheme of midday meals to the children, called the National Programme of
Nutritional Support to Primary Education in 1995. The programme is designed to give a
boost to the universalisation of primary education by improving enrolment retention and
the nutritional conditions of the children in primary classes. The support of the Central
government under this scheme includes provision of food grains, free of cost to children.
Details on the progress of the scheme are given in Table 24.
With respect to all the centrally sponsored schemes and more importantly in case of
the four schemes describe above, one notices very wide annual fluctuations, which cannot
be meaningfully explained. For example, while the number of children covered under the
midday meals scheme is increasing consistently over the years, the allocation pattern has
been quite erratic – Rs. 1600 crores in 1998-99 and Rs. 1030 crores in 2001-02 (in current
prices). The fluctuations are not so wide with respect to other schemes, but we do find
significant fluctuations, particularly in real prices.
Figure 14Index of Real Growth in Expenditure on Selected Centrally
Sponsored Schemes
0
100
200
300
400
500
600
1990
-91
1991
-92
1992
-93
1993
-94
1994
-95
1995
-96
1196
-97
1197
-98
1998
-99
1999
-200
0
2000
-01
2001
-02
Operation Blackboard Non-formal education Teacher education

SOUTH ASIA EFA FORUM Jandhyala TILAK: Financing of Education in India
37
On the whole, the share of central government in total plan plus non plan
expenditure on elementary education is very small, though it has increased from less than 3
per cent in 1990-91 to about ten per cent by the end of the decade (Figure 15).
Figure 15
State and Centre Shares in Budget Expenditure on Elementary Education (%)
0
25
50
75
100
1990
-91
1991
-92
1992
-93
1993
-94
1994
-95
1995
-96
1996
-97
1997
-98
1998
-99
1999
-200
0R
2000
-01B
State Centre
Since central government does not finance no-plan expenditures, which are substantial, the
relative share of the central government in total plan plus non-plan expenditure cannot be
very high. Further, it is clear that not only in relative proportions, but also in terms of rate
of growth, the central government expenditure on elementary education has been of a
higher order. It has increased substantially over the years. Between 1990-91 and 2000-01,
it has increased by seven times in real prices, in contrast to a 1.7 times increase in state
government expenditures (Table 25). The budgetary position of many states does not
allow rapid increase in the state government expenditure on elementary education.
It is important to note that the under the Sarva Shiksha Abhiyan it was proposed to
increase the share of the central government in plan amounts for elementary education
substantially, though the states always meet a major part of the educational budget, both in
absolute and relative terms. In fact, the pattern of funding under SSA makes a major point
of departure for the past practice, wherein all committed expenditure on ongoing activities
such as teachers’ salaries, for instance under the operation blackboard programme, had to be
met by the state governments. Under the SSA a long-term sharing arrangement was

SOUTH ASIA EFA FORUM Jandhyala TILAK: Financing of Education in India
38
proposed, according to which, the centre was to meet 85 per cent and state government the
remaining 15 per cent of expenditure on such items during the ninth five year plan. The
sharing responsibilities would change to 75 per cent by the centre and 25 per cent by the
states during the tenth five ear plan and there after it has to be equally shared by the centre
and the states. This is a significant change in the sharing of financial responsibilities
between the centre and the states with respect to elementary education. Probably for the
first time, in any sector a commitment has been made by the central government to fund a
programme across plan periods. Given the system of centre-state financing any sector, this
seems to be not a small modification, but an important one with immense implications in
terms of sustainable financing of universal elementary education, as well as in the context of
enforcing the fundamental right to education.
4. RESOURCE REQUIREMENTS FOR UNIVERSALISATION OF ELEMENTARY EDUCATION
Fulfillment of the goals with respect to universal elementary education within a time
schedule requires huge financial and other resources. There are a few studies conducted at
international levels on the magnitude of financial resources additionally required for universal
primary education in India. Three such studies are reported in UNESCO (2002). Their
estimates given in Table 26 vary between US$ 1500 million and US$ 3800 million. The
parameters and assumptions used in the three studies are different. All these three studies
confined to primary education. The key parameter of the UNESCO and the UNICEF studies
was 100 per cent net enrolment ratio; World Bank used 100 per cent completion rate; all of
them used unit costs while estimating the resource requirements; but UNESCO expected a cut
in teacher salaries to 70 per cent level of the 1997. UNICEF and the World Bank also
assumed a teacher pupil ratio of 1:40, while UNESCO assumed a ten per cent improvement in
the same.
While the international studies have their own use and significance, it is important that
detailed studies are conducted at national level. They could be more useful for sound
planning of universal elementary education at the national and sub-national levels. Quite a
few studies (e.g., Tilak, 1985, Tilak and Varghese, 1990; Tilak, 1994b; Ramachandran, et al.,
1997) were conducted in India, that provide estimates of requirement of resources for
universal elementary education. Some of these studies were very dated and used much more

SOUTH ASIA EFA FORUM Jandhyala TILAK: Financing of Education in India
39
dated database and parametres. A more recent and a very detailed study was conducted by a
Group of Experts, constituted by the Government of India (1999) specifically for this task.
On the basis of the recommendation of the high-powered Saikia Committee
(Government of India, 1997), which made, considering number of non-enrolled children and
unit cost per student, a rough estimate of the financial requirements for elementary education
to be about Rs. 40 thousand crores for a five year period, a Group of Experts was constituted
to made detailed estimates of the requirement of financial resources for making elementary
education a fundamental right in the Constitution. Based on a detailed estimation of costs of
each item/programme, and considering the present number of children who were out of
schools, and the likely growth in relevant age group child population, the Group of Experts
has estimated that universalisation of elementary education requires additionally Rs. 136.9
thousand crores during the next ten years (Table 27). Further, Table 28 gives an idea of the
year-wise additional investment of resources. The needed investments progressively increase
from about Rs. 100 crores in the first year to Rs. 29 thousand crores by the end of the decade.
According to the Committee’s estimates, this would provide for a reasonably good pupil
teacher ratio of 1:30, improved physical access to schools, provision of instructional material,
other necessary incentives, and on the whole a tolerable minimum level of quality of
education, etc., to every child in India, by the end of the first decade of the 21st century. As
can be noted from Table 27, the estimates thus provide for quantitative expansion,
improvement in quality and improvement in equity in the system.19
While the total figure of Rs. 140 thousand crores may seem to be awesome, certainly
being much higher than the Rs. 40 thousand crores for a five year period, estimated by the
Saikia Committee, it has to be noted that additionally it means only Rs. 14 thousand crores a
year on average, or additionally 0.7 per cent of GDP (if the GDP grows at a modest rate of
growth of five per cent per annum). This should be easily possible.
The Expert Group also felt that if the government is serious about allocation of six
per cent of GDP to education, the task becomes easier: six per cent of GDP would not only
provide the needed resources for universalisation of elementary education, but it would also
allow provision of additional resources for growth of secondary and higher education.
19 See Table A.1 in the Appendix that describes n details the norms adopted in estimation of the resource requirements by the Expert Group.

SOUTH ASIA EFA FORUM Jandhyala TILAK: Financing of Education in India
40
Further, the Group showed that increasing of total allocation to education to reach six per cent
of GDP is not at all difficult, given (a) the growth of the economy which is likely to grow at a
rate of growth of above five per cent, and (b) the likely increase of tax/GDP ratio and the non-
tax-revenue/GDP ratio during the next ten years. The Group also had attempted to clear two
absurd propositions that are in circulation: (a) that we cannot have universalisation of
elementary education, because it is too costly; and (b) that the only way to have it to divert
funds to it from higher education. It concluded that finding resources to finance
universalisation of elementary education is an urgent task as well as, contrary to popular fears,
is an entirely achievable task.
The Working Group on Elementary and Adult Education, constituted in the context of
the tenth five year plan (2002-07) by the Government of India (2001) has marginally revised
the estimates. Confining mainly to the plan period, i.e., 2002 to 2007, it was estimated that
elementary education would require additionally Rs. 55-60 thousand crores, depending upon
alternative scenarios regarding growth in enrolments.
To expedite the progress on universal elementary education, the Government of India
has launched a nation wide programme of universal elementary education called Sarva
Shiksha Abhiyan (SSA). SSA aims at enrolling all children of the age group 6-14 in schools
by 2003; all children in the age group 6-14 complete at least five years of primary education
by 2007; and all children in the same group complete eight years of schooling by 2010. The
programme lays special focus on quality and equity in schooling. It was estimated, under the
new programme, that universal elementary education would require additionally Rs. 98
thousand crores, as against the estimate of the Expert Group which was Rs. 137 thousand
crores. The revised estimate of Rs. 99 thousand crores comes close to the estimate of Rs.
98 thousand crores proposed in the financial memorandum attached to the Constitutional
amendment to make elementary education a fundamental right. The causes of the
differences between these two elaborate estimates lie in the assumptions and norms used.20
Besides, there are also certain items under SSA, which have not been considered in the
Expert Group report such as pre-project activity and management cost; and in turn there
are several items that the Expert Group considered, but were not taken into consideration
under SSA.
20 See Table A.2 in Appendix for details.

SOUTH ASIA EFA FORUM Jandhyala TILAK: Financing of Education in India
41
To conclude, as per the estimates of the MHRD, universal elementary education
would additionally requite about Rs. 98 thousand crores, nearly Rs. 10 crores per annum. The
estimates made by the MHRD under SSA also provide details for the tenth five-year plan
period separately. It was estimated that elementary education would require Rs. 52.3
thousand crores during the tenth plan period (2002-07). This financial responsibility has to be
shared between the centre and the sates. The National Plan of Action for EFA has estimated
the distribution of financial responsibilities for elementary education during the tenth plan as
follows (Table 29).
As noted, SSA has kept some of the important items like midday meals scheme out of
the SSA while calculating the resources needed. But this is recognised as an important
scheme for universalisation of elementary education. Estimates are made separately for this
scheme. It was estimated that the midday meals scheme would require Rs. 17.6 thousand
crores – Rs. 16.6 thousand crore in the central government account and Rs. 11 thousand
crores to be met by the state governments.
In addition to midday meals scheme, and SSA, estimates were also made of financial
resources required for various under programmes under EFA. They are given in Table 30.
The National Plan of Action also provides estimates on the gap in the finances. Of the
total central government share of Rs. 39.8 thousand crores for the tenth plan period, only Rs.
21.3 thousand crores has been provided in the plan, leaving a gap of Rs. 18.5 thousand crores
which needs to be bridged with funds to be generated from external sources and from
domestic government and non-governmental sources. The National Plan has not estimated the
resource gap in the state sector, which could also be sizeable, requiring serious efforts of
mobilisation of resources.
What are the efforts that are being initiated to mobilise the needed additional
resources?
5. MOBILISATION OF RESOURCES FOR ELEMENTARY EDUCATION
In the process of review of the National Policy on Education 1986, the Government
of India (1990) for the first time referred in detail to some of the methods that are nowadays
being discussed to generate additional resources for education. These methods largely refer
to higher education sector. Prominent ones among the several measures that are discussed
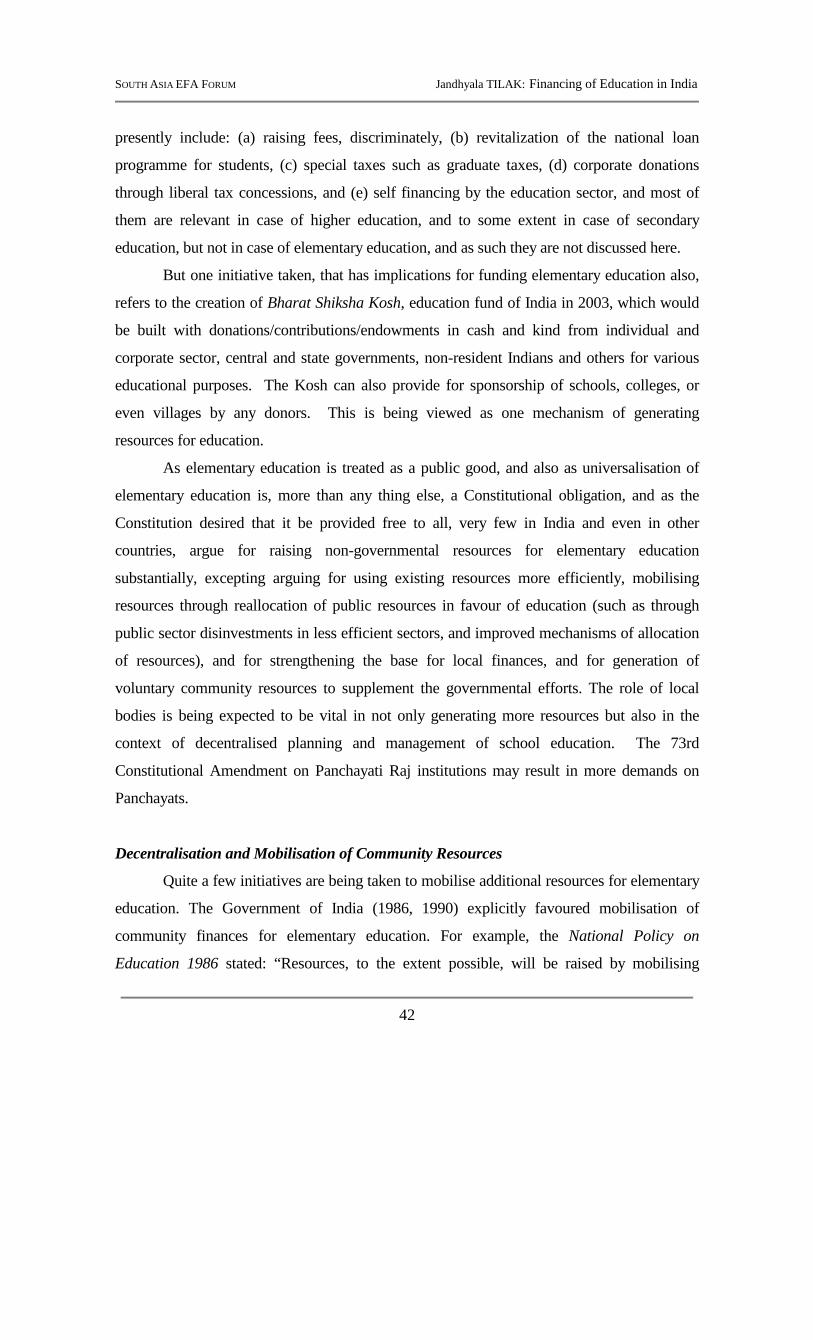
SOUTH ASIA EFA FORUM Jandhyala TILAK: Financing of Education in India
42
presently include: (a) raising fees, discriminately, (b) revitalization of the national loan
programme for students, (c) special taxes such as graduate taxes, (d) corporate donations
through liberal tax concessions, and (e) self financing by the education sector, and most of
them are relevant in case of higher education, and to some extent in case of secondary
education, but not in case of elementary education, and as such they are not discussed here.
But one initiative taken, that has implications for funding elementary education also,
refers to the creation of Bharat Shiksha Kosh, education fund of India in 2003, which would
be built with donations/contributions/endowments in cash and kind from individual and
corporate sector, central and state governments, non-resident Indians and others for various
educational purposes. The Kosh can also provide for sponsorship of schools, colleges, or
even villages by any donors. This is being viewed as one mechanism of generating
resources for education.
As elementary education is treated as a public good, and also as universalisation of
elementary education is, more than any thing else, a Constitutional obligation, and as the
Constitution desired that it be provided free to all, very few in India and even in other
countries, argue for raising non-governmental resources for elementary education
substantially, excepting arguing for using existing resources more efficiently, mobilising
resources through reallocation of public resources in favour of education (such as through
public sector disinvestments in less efficient sectors, and improved mechanisms of allocation
of resources), and for strengthening the base for local finances, and for generation of
voluntary community resources to supplement the governmental efforts. The role of local
bodies is being expected to be vital in not only generating more resources but also in the
context of decentralised planning and management of school education. The 73rd
Constitutional Amendment on Panchayati Raj institutions may result in more demands on
Panchayats.
Decentralisation and Mobilisation of Community Resources
Quite a few initiatives are being taken to mobilise additional resources for elementary
education. The Government of India (1986, 1990) explicitly favoured mobilisation of
community finances for elementary education. For example, the National Policy on
Education 1986 stated: “Resources, to the extent possible, will be raised by mobilising
SOUTH ASIA EFA FORUM Jandhyala TILAK: Financing of Education in India
43
donations, asking the beneficiary communities to maintain school buildings and supplies of
some consumables, raising fees at the higher levels of education, and effecting some savings
by the efficient use of facilities...” (Government of India, 1986, p. 28). In contrast to the
earlier stand that the State shall provide resources for universalisation of elementary
education, now, even for elementary education, is stated that non-governmental resources
would be required. The Government of India (1986, p. 28) stated: “the Government and the
community in general will find funds for such programmes as: universalisation of
elementary education; liquidation of illiteracy ..” It is being increasingly realised that the
government has to accord a high priority for universalisation of elementary education. At
the same time, it is now being realised that the government's capability in funding education
has reached a saturation point relatively, suggesting the need for a search for community
resources for education.
An important development of the 1990s refers to significant efforts of the
government to decentralise educational planning and administration and involvement of the
community at various levels in planning, administration, financing, monitoring and
supervision of the working of the school system. Following the Constitutional amendment in
favour of Panchayati Raj institutions, and also the launching of externally aided projects in
primary education, village education committees, school development committees and similar
committees at various levels are set up with the involvement of the local community. With
the participation of these committees, efforts are also being made to mobilise physical and
financial resources for the village communities to finance elementary education. For
example, the School Reform Act in Andhra Pradesh provides for establishment of
Committees for people's participation in educational activities at various levels -- a school
committee, a Panchayat Education Committee, Mandal Education Committee, Municipal
Education Committee, District Education Committee, and for monitoring the activities
relating to education two boards one at district level called District Education Board and
another state level called State Advisory Board for School Education. These committees at
various levels are expected to be composed of parents, community leaders and teachers, with
a fair representation of women. The Committees are vested with several powers including
resource generation. Thus a significant move has been made on the part of the government to
decentralise the administration of school education in the state. Such experiments are not

SOUTH ASIA EFA FORUM Jandhyala TILAK: Financing of Education in India
44
however getting spread all over the country evenly. But many states realise the importance of
community contributions to elementary education. Though data are not available in any
systematic form, it is realised that sizeable resources –- monetary and non-monetary a re
being generated from community. Village level communities are getting increasingly
enthusiastic involved in the school improvement programmes.
While the formal private school sector’s contribution to financing education is limited,
as discussed in the following section, it is important to note that quite a few non-governmental
organisations have begun taking serious interest in elementary education –formal and non-
formal. Though quantitative evidence are not available, mention may be made of a few
important initiatives.
According to the latest available statistics, there are more than 772 NGOs or
voluntary organisations working on various aspects of education in India.21 These are the
organisations that received grant-in-aid from the Ministry of Human Resource
Development, Government of India in 1997-98. A large number of them, more than 550,
work in the area of non-formal education, and 61 in the area of adult education. The others
operate in various other areas of education. There may be several other NGOs or voluntary
organisations working, but not receiving any aid from the government.22 On the whole,
there is a large number, and a wide variety of NGOs operating in India. It is just
impossible even to list all the NGOs working in India in this area. It is also difficult to
judge how effective they have been. There has been very little systematic analysis of the
contribution of the NGOs by the NGOs themselves or by others, except for some case
studies.23 Some of the important initiatives made by NGOs refer to Pratham, MV
Foundation etc. Some noteworthy initiatives have also been taken by foundations and
trusts such as Azimji Prejmji Foundation, ICICI Social Initiatives, CII-UNDP initiatives
etc., which mark a welcome change on the contribution of NGOs to the field of education.
21 Annual Report 1998-99, Department of Education, Ministry of Human Resource Development, Government of India, New Delhi, 1999. 22 Additionally there is a list of 300 organisations in the Annul Report from whom audited accounts are awaited. Some names in this list do not necessarily figure in the list of organisations that received the aid in 1997-98. 23 See Tilak (2000) for a brief discussion on the role and contribution of NGOs to education in India.

SOUTH ASIA EFA FORUM Jandhyala TILAK: Financing of Education in India
45
Quite a few NGOs also contributed to the success of a few specific projects like the
Shiksha Karmi in Rajasthan.
One important issue often raised in the context of financing education relates to
private schools and the public policy towards private schools, with an implicit assumption
that private schools meet a sizeable share in financing education in the society. In the
present period, characterised by global wave of privatization, it is being increasingly felt that
private schools are an effective answer to the problems of depleting public budgets. The role
of private sector in educational development in India is totally different from that of the
private sector in this mixed economy in general. Private education or private schools
necessarily mean a privately managed system, and not necessarily a privately funded system
of education. Thus, private schools are of two kinds: private aided schools, and pure private
or unaided private schools. The aided private schools do not provide any significant
financial relief to the government, as more than 95 per cent of the recurring expenditure, and
some times some part of capital expenditure of these schools are met by the government.
Private institutions have to survive for a few years, 3-5 years, before they could qualify for
government aid, some times even retrospectively.24 Both during the initial and later periods,
they might make profits by under paying teachers and other staff, charging various types of
non-tuition fees, and through other questionable practices. Thus private sector not only does
not necessarily reduce public financial burden, but also enriches itself at government and
social expense.
That the private aided schools depend on public subsidies for most of their
expenditures is an undisputable fact. Private aided sector rarely generates any substantial
resources on its own, but relies extensively on governmental grants. By taking away dis-
proportionately (in relation to number of schools) large amounts from the limited public
budgets, private sector also contributes to pauperization of government schools, and
misallocation of public resources, in addition to causing severe inequitable distribution of
government expenditure on education.
24 In fact, it may not be appropriate to refer to such schools as ’private’ schools.

SOUTH ASIA EFA FORUM Jandhyala TILAK: Financing of Education in India
46
The unaided primary schools25 do provide some financial relief, but at huge social
and economic cost. They might accentuate dualism, elitism, and class inequalities. Tilak
(1994b) has analyzed the various characteristics of private versus public schools in India, and
has found that the private schools cater to the needs of the rich only, their quality of
education is not necessarily superior to the state run schools, they do not have any equity
oriented programmes in the schools, etc. It has been earlier found that the effects of private
schools on income distribution in the society are so severe, that they even outweigh the
positive effects of the vast public (government) school system, and thereby the net effect
being significantly negative.
Foreign Aid for Education
Among the several sources of financing education in India, foreign aid has not been
significant during the last four decades. But foreign aid is one important source of finances
for education in several developing countries. Its importance gets enhanced in developing
countries like India where public budgets for education become very tight with the structural
adjustment policies adopted. But it is, however, too much to expect that foreign aid will
solve the financial problem in education substantially in a vast country like India, when it
could not do significantly even in small countries of Africa, Latin America and Asia. As
Verspoor (1993, pp. 103-04) noted, “international aid has not been able to change the course
of events. International meetings have set goals and redefined priorities on a regular basis.
Over the past 25 years, a well-established education aid community has developed, with a
busy meeting schedule, several newsletters, professional networkers, and aid watchers. It
includes also an international education research community with several respectable
journals. But the action has rarely been at part with the rhetoric. In fact, it can be argued
that external aid to education has been peripheral to the course of educational development”
(emphasis added).
In the trends on foreign aid for education, a clear shift can be noted, the priority
shifting from higher education in the 1960s to secondary education (diversification of
secondary education in particular) in the 1970s and up to mid-1980s, and to primary
25 In fact, they are not completely ‘unaided’ private schools, as they receive land and other resources at highly subsidised prices, besides concessions in taxes – direct and indirect.

SOUTH ASIA EFA FORUM Jandhyala TILAK: Financing of Education in India
47
education since the late 1980s. Relatively more aid began to flow to primary education. The
global Education for All campaign is also partly responsible for the increased emphasis on
foreign aid for primary education.
In India the need for external assistance for education in general, and primary
education in particular was not felt for a long time. Foreign aid was felt necessary only in
case of foreign exchange-intensive, capital intensive, and foreign expertise needed sectors
only. Education in India in general, and primary education in particular, does not belong to
either of these categories. The donors also felt the same. But the 1990s is a decade that
marks a new phase of developments in education in general, and primary education in
particular, in case of foreign aid. Preceded by a serious economic crisis, the Government
of India adopted in 1990 structural adjustment policies, which had inflicted serious cuts in
budgetary resources for education in general, including elementary education in particular.
Consequently, a social safety net programme was launched to protect vulnerable but
important sectors like primary education and basic health care from the adverse effects of
stabilisation and structural adjustment policies. Thus began the international assistance for
primary education in India, which has been the most significant development in education
in independent India, as external assistance was not sought even for other levels of
education for a long time by the government of India during the fifty years of
independence. In fact, quite a few international aid organisations were very eager to enter
into the primary education scene in India from the mid-1980s onwards. However, the
Government of India felt no need of external assistance for primary education. The foreign
exchange crisis in 1989 followed by the adoption of structural adjustment policies, which
were regarded as ’a necessary evil’ changed the whole situation and thereby the approach of
the government. For the first time, primary education sector was rather reluctantly opened
to the enthusiastic external aid organisations on a large scale.26 Starting with the World
Bank assistance for primary education in ten districts in Uttar Pradesh and that of UNICEF
in Bihar, a plethora of international -- both multi-lateral and bi-lateral -- aid organisations
26 There were a couple of minor projects in operation earlier. They include non-formal education projects in a few selected villages financed by United Nations Children’s Fund (UNICEF) and primary education projects in selected schools in Andhra Pradesh funded by the Overseas Development Administration (ODA).

SOUTH ASIA EFA FORUM Jandhyala TILAK: Financing of Education in India
48
are currently in operation in India working for the improvement of primary education
system. Some important organisations are: World Bank, European Community, UNICEF,
United Nations Development Programme (UNDP), ODA of England, and Swedish
International Development Agency (SIDA). Thus the external aid to education in India is
both bilateral flowing from countries, and multi-lateral flowing from international -- UN
and other -- organizations. The later is however more significant than the bilateral aid.
Table 31 gives the available details on the extent of their financial contributions to the
primary education system in the country. External aid has growth from Rs. 37 crores in
1993-94 to Rs. 1200 crores in 2001-02, i.e., by 32 times in less than a decade. (Figure 16)
Figure 16 Growth in Foreign Aid for Elementary Education in India
(Rs crores)
37122
228 219
610 597729
948
1210
0
500
1000
1500
1993-94 1994-95 1995-96 1996-97 1997-98 1998-99 1999-00 2000-01 2001-02B
In order to ensure better coordination from the point of view of the government of
India and governments of various states (provinces) in India on the one hand, and the host
of international aid organisations on the other, the government of India has launched a
programme of District Primary Education Programme (DPEP), as a broad overall umbrella
of international aid programmes in primary education in the country. Quite a few other
programmes assisted by external agencies that were in existence before the formation of
the DPEP are also brought under this common umbrella. A couple of projects however,
remained separately.27 Now of course, almost every project is to be converged into the
SSA.
27 The exceptions are: Shiksha Karmi project and the Lok Jumbish project in Rajasthan, both funded by Swedish International Development Agency and the Mahila Samakhya project financed by the Dutch government.

SOUTH ASIA EFA FORUM Jandhyala TILAK: Financing of Education in India
49
District Primary Education Programme
Starting with 42 districts in seven states in phase I of the DPEP in 1994, the
programme has been expanded to cover as many as 273 districts in 18 states by 2002-03.
The programme provides additional inputs over and above the resources provided by the
state governments for elementary education. According to the programme, the external
agency contributes 85 per cent of the project costs that flow through the central
government to the concerned state, and the remaining 15 per cent was to be met by the
state governments themselves. At present the external assistance under the programme is
of the order of Rs. 6938 crores – Rs. 5137 credit from IDA and Rs. 1801 crore grant from
the European Commission, DFID, UNICEF and Government of Netherlands.28 IDA credit
accounts for the bulk of the project, covering 211 districts in 16 states. The grant flows to
DPEP in various states. The shares of various international agencies are given in Table 32.
A grant of Rs. 623 crores from the European Commission is available for 17 districts in
Madhya Pradesh and nine districts in Chhattishgarh. Elementary education in eight
districts of Gujarat is funded out of the Netherlands grant of Rs. 215 crores. The grant
from DFID, UK of Rs. 927 crores is meant for five districts of Andhra Pradesh and ten
districts of West Bengal, and eight districts in Orissa. UNICEF’ s assistance of Rs. 36
crores flows to DPEP in Bihar and Jarkhand.
In addition to DPEP, there are a few externally aided projects on primary or
elementary education in India. Some of them are as follows:
GOI-UN Programme: Janashala: In a collaborative effort, five UN agencies, viz.,
UNDP, UNICEF, UNESCO, ILO and UNFPA, pooled their resources to jointly support a
community based primary education programme in 139 blocks and ten cities in 30 districts
of nine states in India. The total project outlay was Rs. 103 crores (US$ 20 million).
Shiksha Karmi Project: This project of recruitment local youth as teachers was
imitated in Rajasthan in 1987 with the support of SIDA. It went through different phases
with different arrangements for sharing of the costs between the external agency and the
local government. During the first phase (1987-94) the project costed Rs. 21.12 crores,
which shared by SIDA and government of Rajasthan on a 90:10 basis; during the second
phase (1994-98) the proejcst costs of Rs. 72.21 crores was shared on a 50:50 basis. During
28 Annual Report 2002-03, p. 65.

SOUTH ASIA EFA FORUM Jandhyala TILAK: Financing of Education in India
50
the third phase (1999-2003) an outlay of Rs. 240 crores was to be shared by the
Government of Rajasthan and DFID on a 50:50 basis.
Mahila Samakhy: Started in 1989 with Dutch assistance aims at empowering
women through education. The project is supported now under DPEP in several states.
Lok Jumbish: This is yet another project started in Rajasthan in 1992 with a focus
on decentralisation and involvement of community in school planning, with the support of
SIDA, and during the third phase, DFID has provided assistance to the project. The
project provides financial and non-financial resources to schools.
Given the situation in some other countries where a multitude of external agencies
work on primary education uncoordinated, and even contributing to confusion, if not
chaos, with conflicting policies, procedures, approaches and plans of action, the formation
of the overall umbrella of DPEP by the government of India earlier and now as proposed
under SSA, could be seen as an important step in a positive direction that facilitated better
coordination among the three partners, viz., the government of India, the governments of
the states, and the funding agencies, avoided duplication and ensured some kind of
coherence and consistency in the overall programme. From the point of view of planning
and management, this is indeed an important step, though it also worked as a catalytic
force contributing to some weaknesses of the whole programme, as we discuss a little later.
Of all, the most important consequence of DPEP is relaxation of resource
constraints in planning education. Educational planning under austerity (or under
conditions of severe resource constraints) has had been the characteristic feature of
planning education in India for a long time, as in many developing countries. Perhaps for
the first time, the districts in India were told that each district participating in the DPEP
would be given about Rs. 40 crores for a seven-year project period under DPEP. While
Rs.35-40 crores is a substantial additional amount for a district, Rs.5-6 crores per annum is
not really that high compared to the present level of public spending of about Rs. 50 crores
on average per district in India, as per current estimates. The DPEP provided important
needed inputs.
As already noted, the total aid amounted to Rs. 1200 crores in 2001-02. In relative
terms, it amounted to less than ten per cent of the central government plan expenditure on
elementary education in India in 1993-94, which rose to a level of nearly one-third by

SOUTH ASIA EFA FORUM Jandhyala TILAK: Financing of Education in India
51
2001-02. In 2001-02, it also formed about one-fifth of the total central government plan
expenditure on education. These are indeed high proportions.29 The high proportions
also warn the danger of substituting central government assistance by external aid. We
have already noted that the growth in absolute terms has been phenomenal. All this may
raise questions of donor dependency and increasing debt burden, part from questions on
sustainability of the foreign aided projects after the aid ceases to flow.
However, at the national level, the size of the aid does not seem to be alarmingly
big. The aid amount of Rs. 1200 crores, may be compared to the current level of total
expenditure on education in the country which is about Rs. 65 thousand crores. Thus the
aid hardly forms two per cent of the total government spending on education. Even as a
proportion of total government expenditure on elementary education, which is about Rs. 32
thousand crores in the country (2000-01), the aid forms only 3.8 per cent. (Figure 17)
Figure 17Foreign Aid to Elementary Education as % of Central
Government Plan Expenditure on Education (%)
0
5
10
15
20
25
30
35
1993-94 1995-96 1997-98 1999-00 2001-02B
% of Elementary % of Total Education
Thus, in another sense, despite geographical expansion of the programme as noted earlier,
it still cannot be regarded as a massive large scale programme of improvement of primary
education all over India, as the funds constitute less than three per cent of the total
expenditure of the government on elementary education. It seems thus that relative to the
large education budget in India, the foreign aid seems to be insignificant in quantum.
29 As aid flows through central government as a part of central government assistance to states for elementary education, the rapid growth in central government expenditure on elementary education is also described by some as ‘borrowed growth’ (Tilak, 1999a).

SOUTH ASIA EFA FORUM Jandhyala TILAK: Financing of Education in India
52
The effect of aid on education in India is yet to be seen. But high expectations are
being created on the contribution of foreign aid for primary education, particularly with the
launching of the social safety net programmes with the help of the assistance from the World
Bank, that are being initiated to reduce the adverse effects of structural adjustment policies
that are being adopted.30 There are very few studies on the role of foreign aid for education
in India. Until now, it has not received the attention of the researchers, as education sector
did not attract foreign aid on a large scale. But now we may not afford to ignore it any more.
In the context of international aid to EFA, the Fast Track Initiative (FTI) launched by
the World Bank and the G8 countries, promises a new funding mechanism to finance basic
education in developing countries. It promises an increased and better-coordinated aid, with
an emphasis on urgent action. However, there is a danger that the FTI would evaluate the
performance of developing countries based on a new set of policy and financing norms,
relating to Millennium Development Goals (MDG), which are different from the EFA goals
and norms. Universal primary education is just one of the eight Millennium Development
Goals.31 Millennium Development Goals also do not refer to the other components of EFA.
As already feared by some, exclusive focus on the Millennium Development Goals may
result in overlooking of other EFA goals, both by the developing counties and by
international community. There are several valid concerns already expressed on the FTI
(UNESCO, 2002, p. 176). It is important that any initiative such as FTI provides for built-in
flexibility to meet country specific requirements and policies. Besides any dilution of the
EFA goals at this stage may lead to avoidable undesirable compromises both within national
education planning and international cooperation for education.
6. CONCLUDING OBSERVATIONS
Education systems like all modern organisations run on money. It is widely felt
that essentially constrained by resources, many educational plans and reforms either failed
30 See Tilak (1992 and 1998) for a discussion on the adverse effects of adjustment on education, and the need for social safety net programmes.
31 The Millennium Development Goals are: eradication of extreme poverty and hunger, achievement of universal primary education, promotion of gender equality and empowerment of women, reduction in child mortality, improvement in maternal health, combating HIV/AIDS, malaria and other diseases, ensuring of environmental sustainability and development of a global partnership for development by 2015.

SOUTH ASIA EFA FORUM Jandhyala TILAK: Financing of Education in India
53
or did not take off in several developing countries including in India. The Constitutional
Directive of universalisation of elementary education in India, which was to be achieved
four decades ago still eludes. Though huge amounts of investment are made in education
in the post-independence period, they are not adequate to meet the modest targets of
providing quality education to the children.
Despite official recognition of education as an investment, and as a ’crucial
investment for national survival’ by the Government of India, the pattern of allocation of
resources to education is far from satisfactory, judged in terms of adequacy, efficiency and
equity. The priority accorded to education in the Five Year Plans, total government budget
expenditures and in GNP need to be improved. The priority accorded to education in the
Five Year Plans, government budget expenditures and in GNP needs to be improved. The
patterns of intra-sectoral allocation as well as inter-functional allocation of resources need
to be improved. There are signs of improvement in intra-sectoral allocation of resources in
favour of elementary education. While allocations to elementary education have been
raised, they seem to be at the cost allocations to secondary and higher education The
allocation of resources from the Centre to the states and the overall union-state relations in
financing education do not seem to be promoting equitable and efficient educational
development. With respect to financing of school education, specifically elementary
education, is concerned, there are no magic solutions. Government has to finance
’generously’ education. Efforts to augment non-government resources may be restricted to
higher education. Additional resources that can be generated from the community for
financing school education may be viewed as supplementary resources. While external aid
comes hand to provide critical inputs, after all, it does not flow forever. Hence reliance on
external aid has to carefully monitored with a view to gradually reduce it.
The beginning of the 1990s is marked by a few significant developments in the
socioeconomic spheres of the developing countries of the world. The World Conference on
Education for All (Jomtien Conference) held in Jomtien, Thailand, in March 1990 has made a
few significant contributions in the form of (a) recognition of importance of education for
development and (b) correspondingly a revival of commitment of the governments, the
internal organisations an the societies as large to education in general and to primary

SOUTH ASIA EFA FORUM Jandhyala TILAK: Financing of Education in India
54
education in particular. In a sense, governments became more serious with the goals of
Education for All.
The rationale for financing of education is clear. Both economic theory and
empirical evidence on returns to investment in education and distribution benefits of
investment in education necessitate financing of education. The recognition of the
investment nature and the public good characteristic of education are expected to influence
the policies and pattern of financing education positively and significantly. The role of the
government is found to be justifiably crucial in funding education in India.
Parallel to this, unfortunately the 1990s also marked a beginning of serious economic
problems in most developing countries, necessitating adoption of stabilisation and structural
adjustment reform policies. The economic reform policies had a serious adverse effect on
public expenditures in general, including education in particular. Public budgets for
education, including for elementary education, began to suffer seriously. The social safety net
programmes and corresponding flow of foreign aid to primary education mitigated the
adverse effects of economic reform policies on primary education, but only to a certain extent.
As a result, today we find mixed trends in public financing of education in many developing
countries in the 1990s. In the last few years, central government allocations to elementary
education have been increased. But a substantial part of the increase in the outlay for
elementary education is accounted by external aid, leading many to warn that the growth in
public expenditure on elementary education is largely "borrowed growth."
The need to enhance the levels of funding elementary education is obvious. It is
estimated that realisation of the long cherished goal of universalisation of elementary
education requires additionally Rs. 137 thousand crores in the next ten years -- about Rs. 14
thousand a year, or on average about 0.7 per cent of national income per annum. This does
not seem to be an un-achievable task, nor is it un-affordable. At the end it may, however, be
noted that finances are only a necessary condition, but not a sufficient condition for achieving
universal elementary education in India.
The issue of mobilising additional resources for education is also briefly discussed
here. First, it is concluded that as far as school education, specifically elementary
education a ’pure public’ good and a ’merit’ good, is concerned, there are no magic
solutions. Government has to finance ’generously’ education. Efforts to augment non-

SOUTH ASIA EFA FORUM Jandhyala TILAK: Financing of Education in India
55
government resources may be restricted to higher education. Additional resources that can
be generated from the community for financing school education may be viewed as
supplementary resources and the government should own complete responsibility of
funding. There are a few developments taking place in funding school education. Two
important developments have been reviewed: privatization, and international aid. Both
have their own limitations. The former accentuates socioeconomic inequalities in the
society, besides leading to enrichment of the private sector and the pauperization of the
government schools, and the latter cannot be an effective solution, even if associated
anomalies can be eliminated. A strong political commitment to finance liberally the
education sector from domestic resources seems to be the only alternative.
To underscore, before conclusion, it may be noted that the five fundamental
characteristic features of education, viz., education as a public good, as a merit good, as a
basic need, as a human (or fundamental) right and as an investment – social and individual,
all necessitate a very special treatment of education in resource allocation. They also
emphasise the need for liberal financing by the State, without reliance on private sector.
Secondly, the need for a perspective plan for education in the country is obvious.
Absence of a long-term plan in education is perhaps one of the main sources of ills of the
system. Attempts to prepare national plans of action in education are noteworthy; but they
need to consider short, medium and long term dimensions, and more over look beyond
EFA. Detailed financial plans also have to be an integral part of such plans.
The government has been promising to allocate at least six per cent of GNP to
education. While there is no sanctity about the six per cent, it is important to realise that it
is the bare minimum that the government has to allocate to education.
When several sectors of the education system still suffer from inadequacies of
several kinds of resources, the need for stepping up the share of education in plan outlays
is obvious. Plan resources are required to finance improvement in quantity, quality, equity
and diversity in elementary education.
Out of the total government budget, there is need for increasingly larger share to be
devoted to education. Tentatively one may aim at providing at least 25 per cent of the
revenue budget to education immediately, but it may be raised to 30 per cent soon. With
respect to devolution of resources by the Centre to state governments and by the state

SOUTH ASIA EFA FORUM Jandhyala TILAK: Financing of Education in India
56
governments to local bodies for education, the goal should be to promote regional equity in
education development.
It is important to note that all levels of education suffer from inadequacy of funds.
Hence all levels of education need to be provided more resources. Putting one sector of
education against another in the allocation of resources will be counter-productive. While
universal elementary education is important, as it provides the foundation for development,
it is also important that sustainable rapid development requires secondary and higher
education. Moreover, accomplishment of goals with respect to universal elementary
education would result in steep increase in demand for secondary and higher education.
Improvement in the quality of education also requires specific investments in
quality related inputs in education. Presently scanty amounts are allocated to such items.
This is true in case of every level of education. As some advocate, about ten per cent of
the budget at each level of education may be devoted to specific inputs that have direct
relation to quality. This proportion has to be reached not by reducing salary/wage bill in
the total, but increasing allocations to the specific items.
Similarly, sizeable investments have to be made to promote equity in the system.
This is critically important when economic reform policies cause severe hardships to the
weaker sections. Provision of free education, provision of textbooks, uniforms and noon
meals to all and financial incentives to economically weaker sections etc., help a lot in
improving equity in the system. Sizeable resources need to be allocated for such items.
A minimum level of resources for education per pupil at each level of education
should be defined, and in no region and time, actual expenditure per pupil could be
allowed to fall below this minimum levels. Expenditure on education per pupil in real
terms in a given year should not normally be less than the corresponding expenditure in the
preceding year, unless there is a significant change in educational technology.
Above all, it should be recognised that education is a long-term investment that
contributes to socioeconomic development quite significantly, besides being an end in
itself in human development. No nation goes bankrupt by investing in education of her
people.

SOUTH ASIA EFA FORUM Jandhyala TILAK: Financing of Education in India
57
REFERENCES
Baker, M.A. (1976) Union and the States in Education. New Delhi: Shabd Sanchar.
Bashir, Sajitha (2000) Government Expenditure on Elementary Education in the Nineties. New Delhi: European Commission.
CABE: Central Advisory Board of Education (1944) Post-War Educational Development in India (Report of the Central Advisory Board of Education) [Sargent Report]. Delhi: Manager of Publications.
Carnoy, M. (1992) The Case for Investing in Basic Education. New York: UNICEF.
Cochrane, S.H. (1986) The Effects of Education on Fertility and Mortality. EDT26. Washington DC: World Bank.
Coombs, P.H. (1985) The World Crisis in Education: The View from the Eighties. New York: Oxford University Press.
Dasgupta, Partha (1990) Well-Being in Poor Countries, Economic and Political Weekly 25 (31) (4 August): 1713-20.
Drèze, Jean and Amartya Sen (1995) Basic Education as a Political Issue, Journal of Educational Planning and Administration 9 (1) (January): 1-26.
Education Commission (1966) Education and National Development: Report of the Education Commission. New Delhi: Government of India [Reprint: NCERT, 1971].
EFA Summit (1993) Delhi Declaration. Education for All Summit of Nine High Population Countries. New Delhi.
Government of India (1968) National Policy on Education 1968. New Delhi: Ministry of Education.
Government of India (1978) Draft National Policy on Education 1978. New Delhi: Ministry of Education.
Government of India (1985) The Challenge of Education: A Policy Perspective. New Delhi: Ministry of Education.
Government of India (1986) National Policy on Education 1986. New Delhi: Ministry of Human Resource Development.
Government of India (1990) Towards an Enlightened and Human Society: NPE 1986: A Review, Report of the Committee for Review of National Policy on Education 1986 [Chairman: Acharya Ramamurti]. Faridabad: Government of India Press.
Government of India (1997) Report of the Committee of State Education Ministers on Implications of the Proposal to Make Elementary Education a Fundamental Right. New Delhi: Government of India. [Chairman: Muhi Ram Saikia]
Government of India (1999) Expert Group Report on Financial Requirement for Making Elementary Education a Fundamental Right. New Delhi: Government of India [Chairman: Tapas Majumdar].
Inkeles, A. and D. Smith (1974) Becoming Modern. Cambridge, Mass.: Harvard University Press.
Jamison, D.T. and Lawrence J. Lau (1982) Farmer Education and Farm Efficiency. Baltimore: Johns Hopkins University Press.
Kolhatkar, M.R. (1988) Education Expenditure in India in Relation to National Income (1980-88): Trends and Implications, Journal of Education and Social Change 2 (2): 104-127.

SOUTH ASIA EFA FORUM Jandhyala TILAK: Financing of Education in India
58
Lockheed, M., A. Verspoor, and Associates (1991) Improving Primary Education in Developing Countries. World Bank Publication. New York: Oxford.
Minhas, B.S. (1992) Educational Deprivation and its Role as a Spoiler of Access to Better Life in India, in The Quality of Life (eds.: Amlan Datta and M.M. Agarwal). Shimla: Indian Institute of Advanced Study/ Delhi: B.R. Publishing Co., pp. 81-98.
Ministry of Finance (various years; latest 2002-03) Economic Survey. New Delhi: Government of India, Department of Economic Affairs.
MHRD: Ministry of Human Resource Development (1993) Education for All: The Indian Scene.New Delhi: Government of India, Department of Education.
MHRD (various years; latest year: 1998-99 to 200-01) Analysis of Budgeted Expenditure on Education in India. New Delhi: Government of India, Department of Education.
MHRD (various years: latest 2002-03) Annual Report. New Delhi: Government of India, Department of Education.
MHRD (various years; latest: 1992-93) Education in India. New Delhi: Government of India, Department of Education.
MHRD (various years; latest: 2000-01) Selected Educational Statistics. New Delhi: Government of India, Department of Education.
MHRD (2003) National Plan of Action: EFA. New Delhi: Government of India, Department of Education (unpublished)
Nair, P.R.G. (1981) Primary Education, Population Growth and Socio-Economic Change. New Delhi: Allied.
NSSO (1998) Attending an Educational Institution in India: Its Level, Nature and Cost (NSS 52nd Round 1996-97) [Report no. 439]. New Delhi: Government of India.
Panchamukhi, V.R., G.A. Tadas and S.K. Mohanty (1995) Social Development and Economic Development: How are They Related? RIS Discussion Paper. New Delhi: Research and Information System for the Non-Aligned and Other Developing Countries (mimeo).
Peacock, A.T., and J. Wiseman (1961) The Growth of Public Expenditure in the UK. London: Oxford.
Pinto, Marino (1984) Federalism and Higher Education: The Indian Experience. Delhi: Orient Longman
Planning Commission (various years) Annual Plan. New Delhi: Government of India.
Planning Commission (various years) Analysis of the Annual Plan: Education Sector. New Delhi: Government of India.
Planning Commission (various years) Five Year Plan. New Delhi: Government of India. [latest: Draft Tenth Five Year Plan]
Planning Commission (2002) National Human Development Report 2001. New Delhi: Government of India.
Planning Commission (2000) Mid Term Appraisal of Ninth Five Year Plan (1997-2002). New Delhi: Government of India.
Psacharopoulos, G. and M. Woodhall (1985) Education and Development: An Analysis of Investment Choices. New York: Oxford University Press for the World Bank.
Rai, N. (1990) Centre-State Relations in the Field of Education in India. Delhi: Atma Ram & Sons.

SOUTH ASIA EFA FORUM Jandhyala TILAK: Financing of Education in India
59
Ramachandran, V.K.; V. Rawal and M Swaminathan (1997) Investment Gaps in Primary Education, Economic and Political Weekly 32 (1-2_ (4-11 January): 39-45.
Rangarajan, C. (2001) Fiscal Restructuring, Keynote Address, Conference on ‘India: Fiscal Policies to Accelerate Economic Growth.’ New Delhi: National Institute of Public Finance and Policy/Department for International Development (UK)/World Bank (21-22 May) (mimeo)
Rao, V.K.R.V. (1972) Centre-State Relations in Education. In: The Union and the States (eds.: S.N. Jain et al.). New Delhi: National, pp. 197-86.
Rao, V.V. Bhanoji (1992) A Note on Financing Education: Towards a Strategy for the 1980s and Beyond, Journal of Educational Planning and Administration 6 (1) January: 73-78.
Rawls, John (1971) A Theory of Justice. Cambridge, Mass.: Harvard University Press.
Raza, M. and H. Ramachandran (1990) Schooling and Rural Transformation. New Delhi: Concept for National Institute of Educational Planning and Administration.
Seth, S.C. (1985) India: The Next 7000 Days. New Delhi: Wiley Eastern.
Sipahimalani, Vandana (2000) India: Financing of Elementary Education in India in the 1990s. Report No.2 New Delhi: World Bank.
Tilak, J.B.G. (1983) On allocating Plan Resources for Education in India. Margin. 16 (1) (October): 93-102.
Tilak, J.B.G. (1985) A Note on Resources for Education in India. National Seminar on Financing of Education. Madras: Madras Institute of Development Studies (mimeo)
Tilak, J.B.G. (1986) Political Economy of Investment in Education in South Asia: A Reply. International Journal of Educational Development 6 (3): 209-14.
Tilak, J.B.G. (1987) Educational Finances in India. Journal of Educational Planning and Administration. 1 (3 and 4) July-October 1987, pp. 132-99.
Tilak, J.B.G. (1987a) Economics of Inequality in Education. New Delhi: Sage Publications, for Institute of Economic Growth, Delhi.
Tilak, J.B.G. (1988a) Costs of Education in India. International Journal of Educational Development.8 (1): 25-42.
Tilak, J.B.G. (1989a) Education and its Relation to Economic Growth, Poverty and Income Distribution. Discussion Paper no.46. Washington D.C.: World Bank.
Tilak, J.B.G. (1989b) Education and Basic Needs, in Human Resource Development for Rural Development (eds.: M K Rao and P P Sharma). Bombay: Himalaya, pp. 47-67.
Tilak, J.B.G. (1989c) Center-State Relations in Financing Education in India. Comparative Educational Review. 33 (4) (November): 450-80.
Tilak, J.B.G. (1990a) The Political Economy of Education in India. Special Studies No.24, Comparative Education Center, State University of New York at Buffalo (in collaboration with the University of Virginia).
Tilak, J.B.G. (1990b) Expenditure on Education in India, Journal of Education and Social Change 4 (2) (July-September): 62-69.
Tilak, J.B.G. (1991) Financing Education in India: A Review of Trends, Problems and Prospects.New Delhi Office: World Bank Resident Mission. (unpublished)
Tilak, J.B.G. (1992) Education and Structural Adjustment. Prospects 22 (4) no. 84: 407-22.

SOUTH ASIA EFA FORUM Jandhyala TILAK: Financing of Education in India
60
Tilak, J.B.G. (1993) External and Internal Resource Mobilisation for Education for All. Discussion Paper. New Delhi: Education for All Summit of Nine High Population Countries.
Tilak, J.B.G. (1994a) Education for Development in Asia. New Delhi: Sage.
Tilak, J.B.G. (1994b) Resource Requirements of Education in India: Implications for the Tenth Finance Commission. (Report prepared for the Government of India). New Delhi: National Institute of Educational Planning and Administration.
Tilak, J.B.G. (1995) Costs and Financing of Education in India: A Review of Issues, Trends, and Problems. Discussion Paper 5. Studies on Human Development in India. UNDP Research Project on Strategies and Financing of Human Development. Thiruvananthapuram: Centre for Development Studies.
Tilak, J.B.G. (1996) Higher Education Under Structural Adjustment, Journal of Indian School of Political Economy 8 (2) (April-June): 266-93.
Tilak, J.B.G. (1997) Five Decades of Under Investment in Education in India, Economic and Political Weekly 32 (36) (6-12 September): 2239-41
Tilak, J.B.G. (1998) Effects of Adjustment on Education: A Review of Asian Experience, in Education, Development and Underdevelopment (eds.: S Shukla and R Kaul), New Delhi: Sage, pp. 99-137.
Tilak, J.B.G. (1999a) National Human Development Initiative: Education in the Union Budget, Economic and Political Weekly 34 (10-11) (6 March): 614-20.
Tilak, J.B.G. (1999b) Development Assistance to Primary Education in India: Transformation of Enthusiastic Donors and Reluctant Recipients, in Changing International Aid to Education: global Patterns and National Contexts, (eds: Kenneth King and Lene Buchert), UNESCO in cooperation with NORRAG, pp. 307-17.
Tilak, J.B.G. (2000) Education Poverty in India NIEPA Occasional Paper No. 29, New Delhi: NIEPA..
Tilak, J.B.G. (2001) Financing Elementary Education in India. Bangkok: Unesco PROAP. (unpublished).
Tilak, J.B.G. (2002) Financing Elementary Education in India, in R. Govinda (ed.) India Education Report. New Delhi: Oxford for NIEPA, pp. 267-94.
Tilak, J.B.G. (2003) Public Expenditure on Education in India, in Financing Education in India (ed. Jandhyala Tilak), New Delhi: Ravi Books for NIEPA (in press).
Tilak, J.B.G., and N.V. Varghese (1990) Resources for Education for All, Journal of Education and Social Change 4 (4) (January-March): 24-59.
Tilak, J.B.G. and N.V. Varghese (1992) A Note on Financing Elementary Education in the Eighth Five Year Plan, Journal of Education and Social Change 6 (3) (October-December 1992): 69-80
United Nations (1948) Declaration of Human Rights. New York.
United Nations (1979) Convention of the Rights of the Child. New York.
UNDP (1991) Human Development Report. New York.
UNESCO (2002) Education for All: Is the World on Track? Paris.
Verspoor, Adriaan (1993) More than Business-As-Usual: Reflections on the New Modalities of Education Aid, International Journal of Educational Development 13 (2): 103-12.
Wagner, Adolph (1890) Finanzweissenchaft. Leipzig: Winter Verlag. [Third Edition].

SOUTH ASIA EFA FORUM Jandhyala TILAK: Financing of Education in India
61
WCEFA: World Conference on Education for All, Jomtien (1990) World Declaration on Education for All. New York.
World Bank (1986) Financing Education in Developing Countries: An Exploration of Policy Options.Washington D.C.
World Bank (1993) East Asian Miracle. New York: Oxford.
World Bank (1995) Priorities and Strategies for Education: A World Bank Review. Washington D.C.

SOUTH ASIA EFA FORUM Jandhyala TILAK: Financing of Education in India
62
Table 1 Structure of Elementary Education in India
Level Grades Age-Group
Primary Education I to V 6-11 Upper Primary Education VI to VIII 11-14
Elementary Education I to VIII 6-14

SOUTH ASIA EFA FORUM Jandhyala TILAK: Financing of Education in India
63
Table 2
Size and Growth of Elementary Education in India
Primary Upper Primary Elementary Schools (thousands) 1950-51 209.7 13.6 221.3 2000-01 638.7 206.3 845.0
Enrolment (millions) 1950-51 19.2 3.1 22.3 2000-01 113.8 42.8 156.6
% of Girls in Enrolment 1950-51 28.1 16.1 2000-01 43.7 40.9
Gross Enrolment Ratio (%) 1950-51 42.6 12.7 32.1 2000-01 95.7 58.6 81.6
Net Enrolment Ratio (%) Primary (1997-98) 71
Dropout Rates 1960-61 64.9 .. 78.3 2000-01 40 .. 53.7
Teachers (thousands) 1950-51 538 86 624 2000-01 1896 1326 3222
% of Female Teachers 1950-51 20 3 2000-01 55 62
Pupil-Teacher Ratio 1950-51 24 20 .. 2000-01 43 38 ..
Source: Selected Educational Statistics, 2000-01; Economic Survey 2002-03; and Tenth Five Year Plan 2002-2007) [for net enrolment ratio]
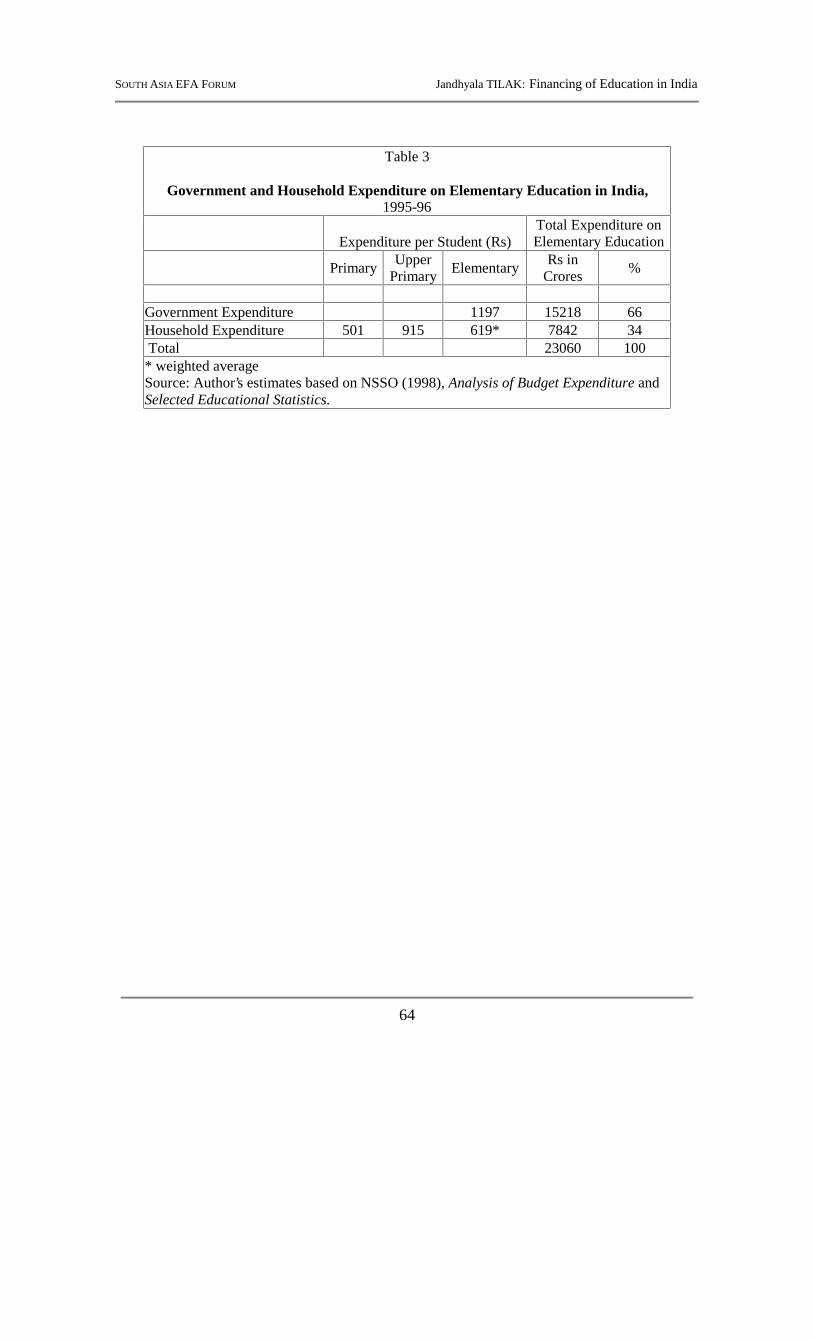
SOUTH ASIA EFA FORUM Jandhyala TILAK: Financing of Education in India
64
Table 3
Government and Household Expenditure on Elementary Education in India, 1995-96
Expenditure per Student (Rs) Total Expenditure on Elementary Education
PrimaryUpper
PrimaryElementary
Rs in Crores
%
Government Expenditure 1197 15218 66 Household Expenditure 501 915 619* 7842 34 Total 23060 100
* weighted average Source: Author’s estimates based on NSSO (1998), Analysis of Budget Expenditure and Selected Educational Statistics.

SOUTH ASIA EFA FORUM Jandhyala TILAK: Financing of Education in India
65
Table 4
Public Expenditure on Education in India
Year Total
(Rs. in crores)
Per Capita (Rs.)
Per Pupil (Rs.)
Total (Rs. in crores)
Per Capita (Rs.)
Per Pupil
(Rs.)
AT CURRENT PRICES AT CONSTANT (1993-94) PRICES
1950-51 114.4 3.2 35.6 1683.8 46.6 524.0
1951-52 124.6 3.4 38.3 1778.7 48.5 546.8
1952-53 137.6 3.8 40.3 2047.4 56.5 599.6
1953-54 147.7 3.9 40.9 2140.5 56.5 592.7
1954-55 165.0 4.3 41.8 2654.7 69.2 672.5
1955-56 189.6 4.8 42.7 3077.4 77.9 693.1
1956-57 206.3 5.1 44.3 2964.7 73.3 636.7
1957-58 240.7 5.9 48.0 3341.0 81.9 666.3
1958-59 266.2 6.4 49.1 3555.2 85.5 655.8
1959-60 300.4 7.0 51.1 3902.1 90.9 663.8
1960-61 344.4 7.8 53.7 4376.4 99.6 682.4
1961-62 388.9 8.9 54.1 4828.4 110.5 671.7
1962-63 441.7 9.7 57.3 5234.2 114.9 679.0
1963-64 484.1 10.4 60.0 5272.3 113.3 653.5
1964-65 534.5 11.3 62.6 5357.4 113.3 627.4
1965-66 622.0 12.8 70.0 5734.9 118.0 645.4
1966-67 697.9 14.1 99.6 5720.9 115.6 816.5
1967-68 811.3 15.7 111.7 6110.8 118.3 841.3
1968-69 898.4 17.3 120.2 6585.3 126.8 881.1
1969-70 1010.4 19.1 132.0 7171.5 135.6 936.9
1970-71 1118.3 20.4 141.7 7837.9 143.0 993.1
1971-72 1237.5 23.2 157.9 8226.2 154.2 1049.6
1972-73 1373.8 24.3 159.8 8272.8 146.3 962.3
1973-74 1590.5 25.0 .. 8184.2 128.6 !
1974-75 1807.3 30.5 200.6 8006.7 135.1 888.7
1975-76 2104.7 34.7 230.1 9572.4 157.8 1046.5
1976-77 2304.2 37.9 231.1 9868.1 162.3 989.7
1977-78 2602.0 41.0 284.4 10488.7 165.3 1146.4
1978-79 2853.1 44.1 278.0 11288.4 174.5 1099.9
1979-80 3157.3 47.9 290.7 10843.9 164.5 998.4

SOUTH ASIA EFA FORUM Jandhyala TILAK: Financing of Education in India
66
1980-81 3640.6 53.3 319.7 11211.9 164.1 984.6
1981-82 4685.8 67.5 426.7 13098.6 188.7 1192.8
1982-83 4912.2 69.3 424.0 12697.9 179.1 1096.0
1983-84 5523.8 76.4 446.2 13113.1 181.4 1059.2
1984-85 6353.8 86.1 491.1 14046.9 190.3 1085.7
1985-86 7456.9 98.9 564.6 15359.3 203.7 1162.9
1986-87 8450.3 109.6 604.1 16262.2 210.9 1162.6
1987-88 10430.2 132.5 723.4 18352.9 233.1 1272.9
1988-89 12408.7 154.5 824.7 20146.4 250.8 1339.0
1989-90 15044.2 183.5 960.4 22555.0 275.1 1439.9
1990-91 17193.7 203.9 1071.6 23350.4 276.9 1455.3
1991-92 18757.6 218.9 1144.7 22390.3 261.3 1366.4
1992-93 20953.0 237.2 1206.8 23005.3 260.4 1325.0
1993-94 23413.1 262.4 1308.0 23413.1 262.4 1308.0
1994-95 27232.2 295.4 1548.9 24847.5 269.5 1413.3
1995-96 31516.6 339.6 1710.8 26377.0 284.2 1431.8
1996-97 36371.6 382.9 1937.7 28358.0 298.5 1510.8
1997-98 48954.9 507.6 2639.5 35757.8 370.8 1927.9
1998-99 62019.5 631.1 3262.2 41937.5 426.8 2205.9
1999-00R 77545.8 774.6 3990.5 50661.6 506.1 2607.0
2000-01B 78236.5 761.8 3957.1 49208.7 479.2 2488.9
Growth Rates (%)
1950s 11.49 9.30 3.78 5.58 3.51 -1.72
1960s 12.77 10.26 11.97 4.78 2.44 4.03
1970s 12.64 10.30 8.98 4.37 2.20 0.98
1980s 16.21 13.84 11.68 7.47 5.28 3.28
1990s 18.24 16.01 15.91 8.99 6.94 6.84
1950-51/98-99 13.63 11.20 9.75 6.41 4.13 2.78
Note: 1984-85 onwards government expenditure only Rates of growth are estimated on the basis of semi-log regression equation (see the text) In this and all tables, R: revised estimate; B: budget estimate Source: up to 1983-84, based on Education in India, (various years) After 1983-84, based on Analysis of Budgeted Expenditure on Education and Selected Educational Statistics.

SOUTH ASIA EFA FORUM Jandhyala TILAK: Financing of Education in India
67
Table 5
Share of Education in GNP (%) % % %
1950-51 1.2 1970-71 2.7 1990-91 3.4 1951-52 1.2 1971-72 2.8 1991-92 3.2 1952-53 1.4 1972-73 2.8 1992-93 3.2 1953-54 1.4 1973-74 2.6 1993-94 3.0 1954-55 1.6 1974-75 2.5 1994-95 3.0 1955-56 1.8 1975-76 2.8 1995-96 3.0 1956-57 1.7 1976-77 2.8 1996-97 3.0 1957-58 1.9 1977-78 2.8 1997-98 3.6 1958-59 1.9 1978-79 2.9 1998-99 3.9 1959-60 2.0 1979-80 2.9 1999-00R 4.5 1960-61 2.1 1980-81 2.8 2000-01B 4.2 1961-62 2.3 1981-82 3.1 1962-63 2.4 1982-83 2.9 1963-64 2.3 1983-84 2.8 1964-65 2.2 1984-85 2.9 1965-66 2.4 1985-86 3.0 1966-67 2.4 1986-87 3.1 1967-68 2.4 1987-88 3.3 1968-69 2.5 1988-89 3.3 1969-70 2.6 1989-90 3.5
Note: 1984-85 onwards government expenditure only R: revised estimate; B: budget estimate Source: upto 1983-84, based on Education in India, (various years) After 1983-84, based on Analysis of Budgeted Expenditure on Education and Selected Educational Statistics. GNP: New Series, Economic Survey 2001-02 and 2002-03

SOUTH ASIA EFA FORUM Jandhyala TILAK: Financing of Education in India
68
Table 6
Spending on Education by Various Ministries/Departments (Central Government), 1998-99
Rs Crores %
Women & child Development 1176.7 12.16
Health and Family Welfare 610.9 6.31
Culture 292.7 3.02
Agriculture 273.9 2.83
Youth Affairs & Sports 193.5 2.00
Social Justice & Empowerment 183.0 1.89
Labour 115.4 1.19
Tribal Affairs 89.0 0.92
Railways 71.2 0.74
Defense 55.8 0.58
Telecommunications 54.5 0.56
Textiles 27.7 0.29
Home Affairs 25.4 0.26
Finance 25.4 0.26
Personnel & Public Grievances 24.9 0.26
Environment and Forests 20.5 0.21
Information and Broadcasting 16.0 0.17
Rural Development 15.9 0.16
Small Scale Industries 15.7 0.16
Tourism 14.0 0.15
Chemicals & Petrochemicals 13.0 0.13
Atomic Energy 11.9 0.12
Posts 8.2 0.09
Power 7.5 0.08
Urban Affairs & Employment 6.6 0.07
Food& Consumer Affairs 6.0 0.06
Surface Transport 4.7 0.05
Urban Development 4.3 0.04
Space 3.9 0.04
Science & Technology 3.5 0.04
Statistics & Programme Implementation 1.4 0.01
Civil Aviation 1.3 0.01
External Affairs 1.1 0.01
Water Resources 0.8 0.01
Coal & Mines 0.5 0.01

SOUTH ASIA EFA FORUM Jandhyala TILAK: Financing of Education in India
69
Ocean Development 0.2 0.00
Non-Conventional Energy 0.1 0.00
Total (‘Other’ Ministries/Departments) 3352.2 34.65
Department of Education 6323.3 65.35
Grand Total 9675.6 100Source: Analysis of Budgeted Expenditure on Education (2001).

SOUTH ASIA EFA FORUM Jandhyala TILAK: Financing of Education in India
70
Table 7
Expenditure on Education by Education and other Departments in India (Rs in crores)
Education Dept Other Depts Total Year Amount (%) Amount. (%) Amount (%)
1971-72 922.5 91.5 85.3 8.5 1007.8 100
1972-73 1041.2 88.7 132.9 11.3 1174.1 100
1973-74 1196.1 89.7 137.5 10.3 1333.7 100
1974-75 1439.1 87.7 200.9 12.3 1640.0 100
1975-76 1683.0 88.0 229.1 12.0 1912.1 100
1976-77 1843.2 86.2 294.4 13.8 2137.6 100
1977-78 2104.3 85.1 369.8 14.9 2474.1 100
1978-79 2353.7 84.2 443.1 15.8 2796.8 100
1979-80 2660.2 84.8 478.4 15.2 3138.7 100
1980-81 .. ..
1981-82 3790.1 85.4 498.7 11.2 4435.9 100
1982-83 4761.8 83.0 719.1 12.5 5736.3 100
1983-84 5473.9 82.8 790.1 12.0 6610.9 100
1984-85 6423.2 83.9 953.8 12.5 7657.2 100
1985-86 7681.7 83.4 1230.7 13.4 9211.9 100
1986-87 8310.6 82.8 1126.9 11.2 10041 100
1987-88 .. ..
1988-89 .. ..
1989-90 15044.2 83.8 2905.9 16.2 17950.1 100
1990-91 17193.7 83.9 3297.5 16.1 20491.2 100
1991-92 18757.6 83.8 3636.1 16.2 22393.7 100
1992-93 20953.6 83.7 4076.7 16.3 25030.3 100
1993-94 23413.1 82.8 4866.6 17.2 28279.7 100
1994-95 27232.1 83.5 5374.1 16.5 32606.2 100
1995-96 31516.6 82.6 6661.5 17.4 38178.1 100
1996-97 36371.6 82.9 7524.9 17.1 43896.5 100
1997-98 41512.1 84.8 7442.8 15.2 48954.9 100
1998-99 51665.9 83.3 10353.7 16.7 62019.6 100
1999-00R 65130.7 84.0 12415.1 16.0 77545.8 100
2000-01B 65284.6 83.4 12951.9 16.6 78236.5 100
Note: R: Revised estimates; B; Budget estimates; Others: Actuals Source: Analysis of Budgeted Expenditure on Education (various years)

SOUTH ASIA EFA FORUM Jandhyala TILAK: Financing of Education in India
71
Table 8
Budget Expenditure on Education in India (Education and other Departments) 1995-96 1996-97 1997-98 1998-99 1999-00R 2000-01B
Rs. incrores
% inTotal
Budget
Rs. incrores
% inTotal
Budget
Rs. incrores
% inTotal
Budget
Rs. inCrores
% inTotal
Budget
Rs. incrores
% inTotal
Budget
Rs. inCrores
% inTotal
Budget
Centre
Revenue 5550.5 4.0 6314.3 4.0 7122 3.9 9675.6 4.45 11144.8 4.4 12816.3 4.6
Capital 0 . 0 0 0 . 0.96 0 0.98 0 0 0
Loans & Advances 0.5 . 0.5 . 0.01 . 0 0 0 . 0 0
Total 5551 3.1 6314.8 3.1 7122.01 2.99 9676.56 3.5 11145.78 3.7 12816.3 3.8
States & Union Territories
Revenue 32627.6 22.3 37582.2 22.1 41430.1 21.98 51903.4 23.4 65911.5 24 65031.3 22.2
Capital 379.1 2.0 313.2 1.3 384.24 1.66 431.9 1.2 484.6 1.2 386.9 0.8
Loans & Advances 211 2.6 6.0 0.1 18.54 0.17 7.7 0.07 3.94 0.03 1.04 0.01
Total 33217.7 19.2 37901.3 18.5 41832.92 18.4 52343 18.3 66400.04 20.2 65419.24 18.5
Total
Revenue 38178.1 13.4 43896.5 13.3 48552.1 13.1 61579 13.8 77056.3 14.6 77847.6 13.6
Capital 379.1 1.04 313.2 0.8 384.24 0.9 432.86 0.5 485.58 0.6 386.9 0.4
Loans & Advances 211.5 0.6 6.0 0 18.55 0.04 7.7 0 3.94 0 1.04 0.01
Total 38768.7 10.9 37901.3 10.8 48954.93 10.9 62019.56 11.1 77545.82 10.9 78235.54 11.3
Source: Analysis of Budgeted Expenditure on Education, Ministry of Human Resource Development, New Delhi.

SOUTH ASIA EFA FORUM Jandhyala TILAK: Financing of Education in India
72
Table 9
Percentage of Expenditure on Education to Total Budget
Year
State* Govt.
Union Govt.
All- India
Year
State* Govt.
Union Govt.
All- India
1967-68 19.8 1.6 11.9 1984-85 23.3 2.7 13.1
1968-69 20.2 2.0 12.5 1985-86R 24.0 2.8 13.4
1969-70 20.5 2.3 13.0 1986-87B 23.8 3.0 13.4
1970-71 21.4 2.8 14.1 1987-88 .. .. ..
1971-72 20.3 2.5 13.4 1988-89 .. .. ..
1972-73 19.8 2.4 12.6 1989-90 25.4 3.5 14.2
1973-74 20.6 2.0 13.0 1990-91 24.7 3.3 14.0
1974-75 23.2 2.1 14.1 1991-92 22.6 3.0 13.1
1975-76 22.9 2.0 13.7 1992-93 22.7 3.1 13.2
1976-77 22.7 2.3 13.8 1993-94 22.4 3.3 12.9
1977-78 21.4 2.1 12.7 1994-95 22.2 3.1 13.0
1978-79 21.8 2.2 13.1 1995-96 22.4 4.0 13.4
1979-80 21.6 2.0 13.1 1996-97 22.1 4.0 13.3
1980-81 20.9 2.0 12.8 1997-98 18.8 2.9 10.6
1981-82 20.8 1.9 12.5 1998-99 19.5 3.5 11.3
1982-83 21.3 1.3 10.8 1999-00R 20.2 3.7 12.3
1983-84 20.8 1.5 11.4 2000-01B 18.5 3.8 11.3
Note: * includes union territories Source: Analysis of Budgeted Expenditure on Education (various years)

SOUTH ASIA EFA FORUM Jandhyala TILAK: Financing of Education in India
73
Table 10
Plan and Non-Plan Expenditure on Education (Revenue Account) (Rs crores)
Plan Non-Plan Total Plan Non-Plan Total Plan Non-Plan
in Current Prices in 1993-94 Prices % Distribution
1970-71 118.6 852.2 970.8 831.2 5972.9 6804.1 12.2 87.8
1980-81 460.2 3545.1 4005.3 1417.3 10917.8 12335.1 11.5 88.5
1990-91 3247.9 17243.3 20491.2 4410.9 23417.8 27828.7 15.9 84.1
1991-92 3746.9 18846.9 22593.8 4472.5 22496.9 26969.4 16.6 83.4
1992-93 4009.0 21021.3 25030.3 4401.7 23080.3 27481.9 16.0 84.0
1993-94 5181.1 23098.6 28279.7 5181.1 23098.6 28279.7 18.3 81.7
1994-95 6538.7 26067.6 32606.2 5966.1 23784.9 29751.0 20.1 79.9
1995-96 8383.1 29795.0 38178.1 7016.0 24936.1 31952.2 22.0 78.0
1996-97 10305.4 33591.1 43896.5 8034.8 26190.1 34224.9 23.5 76.5
1997-98 10387.6 38164.6 48552.2 7587.3 27876.3 35463.6 21.4 78.6
1998-99 13280.3 48298.6 61578.9 8980.1 32659.5 41639.6 21.6 78.4
1999-00R 15763.5 61292.8 77056.3 10298.5 40043.3 50341.8 20.5 79.5
2000-01B 17578.9 60268.7 77847.6 11056.7 37907.4 48964.1 22.6 77.4
Source: Analysis of Budgeted Expenditure on Education (various years)

SOUTH ASIA EFA FORUM Jandhyala TILAK: Financing of Education in India
74
Table 11
Expenditure on Education in the Five Year Plans (Rs. in crores)
Five Year Plan Period
In Current Prices
In 1993-94 Prices*
Real Increase
(%)
% of Total Plan
ExpenditureFirst Five Year Plan (1951-56) 153 2325 .. 7.86 Second Five Year Plan (1956-61) 273 2966 27.57 5.83 Third Five Year Plan (1961-66) 589 6408 116.05 6.87 Fourth Five Year Plan (1966-74) 786 5018 -21.69 5.17 Fifth Five Year Plan (1974-79) 912 3876 -22.76 3.27 Sixth Five Year Plan (1980-85) 2619 6833 76.29 2.70 Seventh Five Year Plan (1985-90) 8540 15144 121.63 3.55 Eighth Five Year Plan (1992-97) 27458 25410 67.79 4.50 Ninth Five Year Plan (1997-2002) 52173 34215 34.65 6.23
Note: * based on national income deflators. Source: Five Year Plan(s), Annual Plan(s), Economic Survey(s); Annual Financial Statistics of Education Sector, 1997-98, New Delhi.

SOUTH ASIA EFA FORUM Jandhyala TILAK: Financing of Education in India
75
Table 12
Sectoral Outlays in Five Year Plans in India (per cent) FirstPlan
SecondPlan
ThirdPlan
AnnualPlans+
FourthPlan
FifthPlan
SixthPlan
SeventhPlan
AnnualPlans++
EighthPlan
NinthPlan*
Agriculture & Allied 14.8 11.8 12.7 16.7 14.7 12.3 13.7 14.3 13.9 14.7 13.6 Irrigation & Fl0od Control 22.0 9.3 7.8 7.1 8.6 9.8 10.0 7.5 6.1 7.5 6.5 Power/ Energy 7.7 9.5 14.6 18.3 18.6 18.8 28.3 28.4 28.9 26.6 25.9 Industry & Minerals 4.9 24.1 22.9 24.7 19.7 24.3 15.8 13.5 12.8 10.8 7.6 Transport & Communications 26.4 27.0 24.6 18.4 19.5 17.4 16.1 17.4 19.7 18.7 20.4
Social Sectors 24.1 18.3 17.4 14.7 18.9 17.3 16.2 15.8 15.6 18.2 21.3 of which Education 7.9 5.8 6.9 4.6 4.9 3.3 2.7 3.5 3.5 4.5 6.2Health 5.0 4.9 2.9 3.2 3.9 3.2 3.1 3.0 2.9 3.2 ..
Total 100 100 100 100 100 100 100 100 100 100 100Rs. in 100 million 196 467 858 663 1578 3943 10965 22292 12737 43410 85920Note: + 1965-66 to 1967-68; ++ 1990-91 and 1991-92; * outlay Source: Five Year Plans and other documents of the Planning Commission, Government of India.

SOUTH ASIA EFA FORUM Jandhyala TILAK: Financing of Education in India
76
Table 13
Intra-Sectoral Allocation of Plan Expenditure in Education in the Five Year Plans in India
(Rs. in crores)
Five Year Plan
Eley* Adult Secy HigherTech-nical
GrandTotal
% of TotalPlan
Outlay85 5 20 14 20 153 7.86First
(56) (3) (13) (9) (13) (100)95 4 51 48 49 273 3.83Second
(35) (1) (19) (18) (18) (100)201 2 103 87 125 589 6.87Third (34) (0.3) (18) (15) (21) (100)
75 .. 53 77 81 322 4.86Annual Plans**(24) (16) (24) (25) (100)239 6 140 195 106 786 5.04Fourth (30) (1) (18) (25) (13) (100)317 33 156 205 107 912 3.27Fifth (35) (4) (17) (22) (12) (100)883 156 736 530 324 2943 2.70Sixth (30) (3) (25) (18) (11) (100)
2849 470 1829 1201 1083 8500 3.50Seventh (34) (6) (22) (14) (12) (100)
1734 376 1079 595 848 5318 4.20Annual Plans (33) (7) (20) (11) (16) (100)
8936 1808 3498 1516 2786 21217 4.90Eighth (42) (8) (16) (7) (13) (100)
27363 1102 9526 4350 4778 53524 6.20Ninth Plan (51) (2) (18) (8) (9) (100)
Note: * Includes pre-school education; .. Negligible; E: Estimates by the Planning Commission Totals may not add up, as Totals include expenditure on other programmes such as art & culture, youth services etc. ** 1965-66 to 1967-68 (three years); Source: Five Year Plan(s), Annual Plans(s), Analysis of Annual Plan, Education Sector (various years), Economic Survey, and the Report of the NDC Committee on Literacy, Planning Commission, New Delhi.

SOUTH ASIA EFA FORUM Jandhyala TILAK: Financing of Education in India
77
Table 14
Utilisation of Five Year Plan Outlays (% of Expenditure to the outlay)
Five Year Plan Elementary Secy Adult HigherTotal Gen Tech TotalFirst 91.40 90.91 100.00 93.33 91.10 86.96 90.53Second 102.15 104.08 80.00 102.13 99.55 96.08 98.56Third 96.17 117.05 33.33 106.10 112.01 88.03 105.18Fourth 93.36 118.64 75.00 23.99 97.66 100.00 95.62Fifth 77.32 62.40 127.78 70.21 71.15 68.59 70.97Sixth 98.34 186.68 121.88 110.49 113.60 114.39 103.76Seventh 143.99 273.80 111.11 283.33 136.54 158.86 133.79Eighth 135.03 165.49 73.44 155.74 136.17 90.38 129.41Ninth 97.98 98.51 78.77 98.60 99.26 98.14 99.00Source: Five Year Plans and Analysis of Budgeted Expenditure on Education

SOUTH ASIA EFA FORUM Jandhyala TILAK: Financing of Education in India
78
Table 15
Plan and Non-Plan Expenditure on Elementary Education
(per cent) Plan
Non-Plan
Total
Total Rs
in TenMillions
1980-81 5.9 94.1 100 1537.31981-82 6.2 93.8 100 1660.71982-83 7.3 92.7 100 2172.11983-84 8.8 91.2 100 2475.31984-85 9.2 90.8 100 2854.91985-86 7.7 92.3 100 3448.31986-87 8.9 91.1 100 3881.71987-88 11.8 88.2 100 4856.71988-89 12.9 87.1 100 5539.81989-90 14.0 86.0 100 6888.31990-91 10.1 89.9 100 7955.51991-92 11.1 88.9 100 8684.31992-93 11.2 88.8 100 9477.31993-94 12.2 87.8 100 10821.81994-95 14.1 85.9 100 12638.91995-96 18.0 82.0 100 15217.81996-97 19.6 80.4 100 17850.51997-98 20.7 78.9 100 20391.51998-99 20.3 79.7 100 25114.71999-2000R 19.7 80.3 100 31087.12000-01B 22.7 77.3 100 31522.0
Note: R: Revised estimate; B; Budget estimate Source: Analysis of Budgeted Expenditure on Education (various years)

SOUTH ASIA EFA FORUM Jandhyala TILAK: Financing of Education in India
79
Table 16
Trends in Expenditure on Elementary Education in India In current
PricesIn 1993-94
PricesYear
(Rs in 10 Millions)
Share of Elementary
Expenditure in GNP
(per cent) 1950-51 463 6815 0.37 1955-56 694 11264 0.67 1960-61 1259 18733 0.78 1965-66 2023 18652 0.80 1970-71 4074 28554 0.97 1975-76 7873 35807 1.04 1980-81 13921 42872 1.07 1983-84 22016 52264 1.11 1984-85 28550 67776 1.44 1985-86 34483 71026 1.39 1986-87 38817 74702 1.40 1987-88 48567 85458 1.55 1988-89 55398 89943 1.48 1989-90 68883 103273 1.59 1990-91 79555 108042 1.58 1991-92 86843 103661 1.50 1992-93 94773 104056 1.43 1993-94 108218 108218 1.41 1994-95 126389 115321 1.40 1995-96 152177 127361 1.44 1996-97 178505 139176 1.45 1997-98 203915 148944 1.48 1998-99 251147 169825 1.59 1999-2000R 310871 202353 1.78 2000-01B 315220 196772 1.66
Source: Based on Education in India and Analysis of Budget Expenditure on Education. New Delhi: MHRD

SOUTH ASIA EFA FORUM Jandhyala TILAK: Financing of Education in India
80
Table 17
Trends in Intra-sectoral Allocation of Total Expenditure on Education in India (Rs in 10 Lakhs)
Direct/Recurring Expenditure on
Year Elementary
SchoolsSecy.
SchoolsHigher
Education Total
Indirect/ Rec. Expr.
GrandTotal
1950-51 463 231 184 921 232 1153
(%) 48 25 20 100
1955-56 694 376 293 1148 449 1897
(%) 48 26 20 100
1960-61 1259 689 585 2573 870 3444
(%) 42 27 22 100
1965-66 2023 1504 1241 4673 1192 5853
(%) 39 32 27 100
1970-71 4074 2700 2709 9611 1572 11183
(%) 43 28 28 100
1975-76 7873 4636 5410 17925 3122 21047
(%) 44 25 30 100
1980-81 13921 10102 10014 34425 1981 36406
(%) 41 29 29 100
1983-84 22016 14414 15068 52699 2539 55238
(%) 42 27 29 100
1984-85 28550 20200 14788 - - 63538
(%) 45 32 23 100
1985-86 34483 22939 17148 - - 74570
(%) 46 31 26 100
1986-87 38817 26011 22675 - - 87516
(%) 44 30 23 100
1987-88 48567 32196 23539 - - 104302
(%) 47 31 23 100
1988-89 55398 39780 28909 - - 124087
(%) 44 32 24 100
1989-90 68883 47215 22099 - - 150442
(%) 46 31 15 100
1990-91 79555 55311 23118 - - 171936
(%) 46 32 13 100
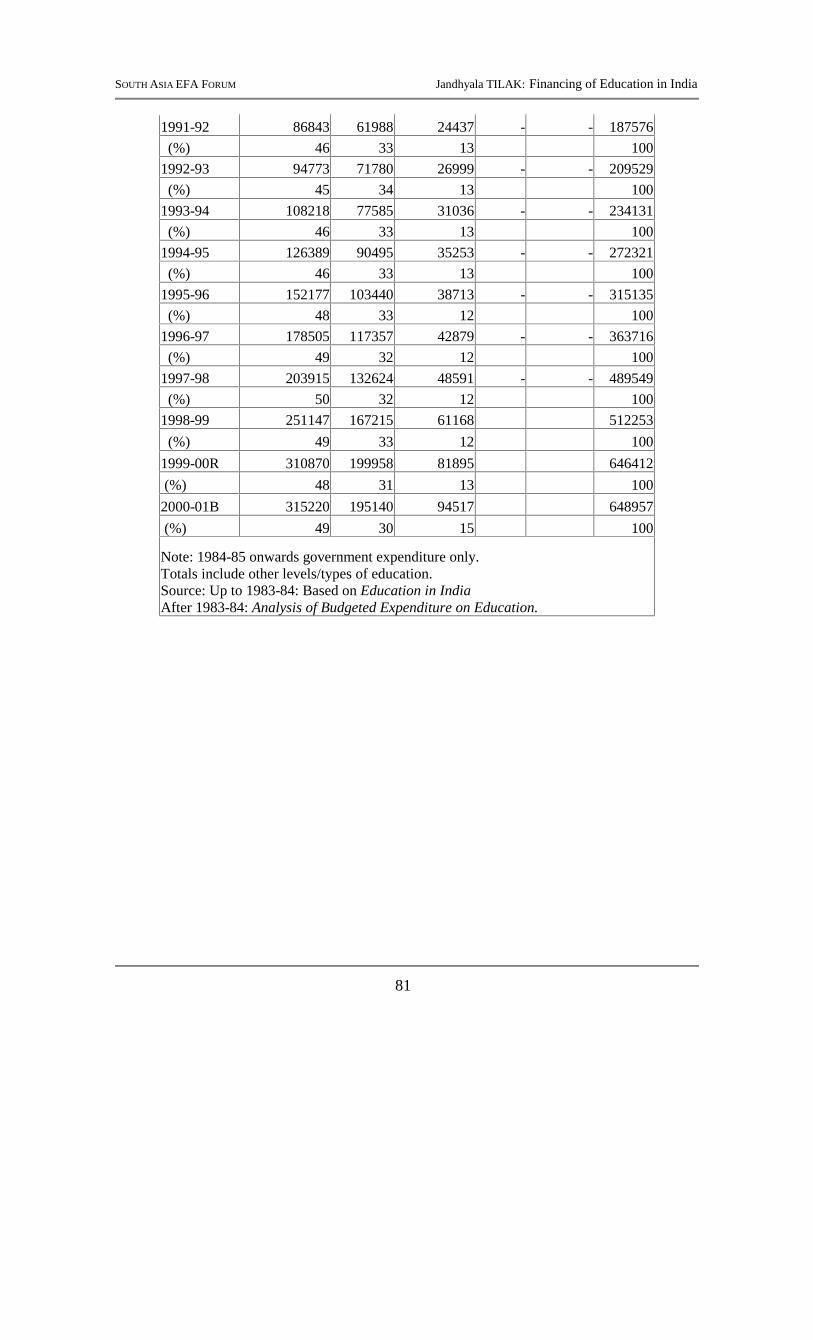
SOUTH ASIA EFA FORUM Jandhyala TILAK: Financing of Education in India
81
1991-92 86843 61988 24437 - - 187576
(%) 46 33 13 100
1992-93 94773 71780 26999 - - 209529
(%) 45 34 13 100
1993-94 108218 77585 31036 - - 234131
(%) 46 33 13 100
1994-95 126389 90495 35253 - - 272321
(%) 46 33 13 100
1995-96 152177 103440 38713 - - 315135
(%) 48 33 12 100
1996-97 178505 117357 42879 - - 363716
(%) 49 32 12 100
1997-98 203915 132624 48591 - - 489549
(%) 50 32 12 100
1998-99 251147 167215 61168 512253
(%) 49 33 12 100
1999-00R 310870 199958 81895 646412
(%) 48 31 13 100
2000-01B 315220 195140 94517 648957
(%) 49 30 15 100
Note: 1984-85 onwards government expenditure only. Totals include other levels/types of education. Source: Up to 1983-84: Based on Education in India After 1983-84: Analysis of Budgeted Expenditure on Education.

SOUTH ASIA EFA FORUM Jandhyala TILAK: Financing of Education in India
82
Table 18
Inter Functional Allocation of Public Expenditure on Elementary Education in India*
Year 1989-90 1990-91 1992-92 1992-93 1993-94 1994-95 1995-96 1996-97 1997-98 1998-99 1999-2000R 2000-01B
Direction Inspection & Admn., 2.4 2.4 2.6 2.9 2.7 2.5 2.2 2.5 2.6 2.9 3.1 3.2
Assistance to Govt schools 36.0 37.5 27.1 50.1 36.7 42.9 39.5 38.6 46.1 45.9 44.0 46.1
Assistance to Private schools 27.4 25.9 26.4 17.4 16.3 19.1 21.6 22.6 20.0 23.0 18.8 20.1
Assistance to Local Body Schools 21.2 22.7 23.0 24.0 23.1 23.3 23.2 24.1 24.3 22.4 27.3 24.0
Teacher Training 7.2 6.5 7.1 1.2 7.7 7.2 7.0 7.2 0.5 0.6 0.5 0.5
Non Formal education 0.4 0.5 9.7 0.6 8.6 0.4 1.0 0.8 0.5 0.4 0.5 0.6
Scholarships 0.4 0.4 0.2 0.1 0.2 0.3 0.2 0.2 0.1 0.1
Textbooks 0.2 0.5 0.4 0.4 0.5 0.5 0.6 0.4 0.4 0.3
Other 5.4 4.5 3.5 3.0 4.4 4.2 4.8 3.3 4.3 4.4 5.3 5.1
Total 100 100 100 100 100 100 100 100 100 100 100 100
* includes expenditure by states and union territories only. Source: Analysis of Budget Expenditure on Education.

SOUTH ASIA EFA FORUM Jandhyala TILAK: Financing of Education in India
83
Table 19
Per Student Budget Expenditure on
Elementary Education (Rs.)
Year In Current
PricesIn 1993-94
Prices
1990-91 722.1 980.67
1991-92 760.1 907.31
1992-93 764.4 839.27
1993-94 850.7 850.70
1994-95 1017.5 928.40
1995-96 1197.4 1002.13
1996-97 1404.5 1095.05
1997-98 1631.3 1191.54
1998-99 1969.8 1331.98
1999-2000R 2360.4 1536.44
2000-01B 2409.9 1504.35
Source: Based on Analysis of Budget Expenditure on Education and Selected Educational Statistics.

SOUTH ASIA EFA FORUM Jandhyala TILAK: Financing of Education in India
84
Table 20
Expenditure on Education in Central and State Sectors (Rs in crores)
Period Union Government State Government Total
Rs. % Rs. % Rs. %
Plan Expenditure First Five Year Plan 40 26 113 74 153 100
Second Five Year Plan 68 25 205 75 273 100
Third Five Year Plan 153 26 436 74 589 100
Fourth Five Year Plan 241 31 545 69 786 100
Fifth Five Year Plan 283 30 647 70 930 100
Sixth Five Year Plan 657 22 2288 79 2945 100
Seventh Five Year Plan 3009 40 4597 60 7605 100
Eighth Five Year Plan 8178 39 13039 62 21217 100
Ninth Five Year Plan 26655 50 26870 50 53525 100
Non-Plan Expenditure Second Five Year Plan 80.8 14 496.2 86 577 100
Third Five Year Plan 169.0 16 887.0 84 1056 100
Fourth Five Year Plan 192.8 4 4627.2 96 4820 100
Fifth Five Year Plan 480.5 6 7528.5 94 8009 100
Sixth Five Year Plan 1406.0 6 22028.0 94 23434 100
Seventh Five Year Plan 2449.3 5 43707.8 95 46157 100
Eighth Five Year Plan 73855.5 6 126188 95 133574 100
Total Expenditure First Five Year Plan 39.8 26.0 113.2 74.0 153 100
Second Five Year Plan 149.0 17.5 701.0 82.5 850 100
Third Five Year Plan 322.1 19.6 1322.9 80.4 1645 100
Fourth Five Year Plan 464.4 8.2 5178.6 91.8 5643 100
Fifth Five Year Plan 891.7 9.6 8402.3 90.4 9294 100
Sixth Five Year Plan 2063.0 7.8 24316.0 92.2 26379 100
Seventh Five Year Plan 5457.9 10.2 48304.5 89.8 53762 100
Eighth Five Year Plan 15563.5 10.1 139227 89.9 1547905 100
Source: Five Year Plans and Analysis of Budgeted Expenditure in Education

SOUTH ASIA EFA FORUM Jandhyala TILAK: Financing of Education in India
85
Table 21
Centrally Sponsored Sachems in Education in India
1995-96 1996-97 1998-99 (Rs. In lakhs)
Operation Blackboard 26793 29117 22783Non formal Education 15341 15820 16000Teacher Education 7830 7931DPEP --- 17942 54975Vocational Education 6755 5129 656Lok Jumbish --- 2220 3750Science Education 2317 1447E.T 418 1016Environment education 4 106IEDC 670 580CLASS 2199 2054YOGA 10 12 39RFLP 28 33PL&CE 934 1771SAS 1100 1159Appt. of Hindi translator 410 440Development of Sanskrit 61 145 586National Scholarship 67 43 483Scheme for talented children 42 24TLC/PLC 9870 4761
Total 74848 91748Source: Annual Financial Statistics of the Education Sector, and Analysis of Budget Expenditure on Education. New Delhi: MHRD

SOUTH ASIA EFA FORUM Jandhyala TILAK: Financing of Education in India
86
Tale 22
Centre-State Shares in Financing Education, by Levels (Plan Expenditure) (per cent)
Level Fourth Five Year Plan (1969-74)
Sixth Five Year Plan (1980-85)
Seventh Five Year Plan (1985-90)
Eighth Five Year Plan
(1992-97)+
Ninth Five Year Plan
1997-2002 Centre State* Centre State* Centre State* Centre State* Centre State*
-
Elementary 2.4 97.6 6.4 93.6 23.1 76.9 32.2 67.8 59.8 41.2Secondary 0.3 99.7 4.2 95.8 81.5 18.5 30.9 60.6 .. ..Higher 56.7 43.3 41.3 58.7 54.9 45.1 24.5 70.5 .. ..Total General**
29.3 70.7 18.3 81.6 35 65 39.4 60.6 50.1 49.9
Technical 53.4 46.6 44.3 55.7 56.4 43.6 29.5 61.5 49.6 50.4
Grand Total 32.9 67.1 22.3 77.7 40 60 38.5 61.5 44.9 50.2
Note: + Outlay * States and Union Territories; .. not available ** includes all other levels of General Education; Source: Five Year Plan(s), Annual Plan(s), and Analysis of Annual Plan: Education Sector(various years). Planning Commission.

SOUTH ASIA EFA FORUM Jandhyala TILAK: Financing of Education in India
87
Table 23
Expenditure on Centrally Sponsored Schemes in Elementary Education (Rs crores)
Operation Blackboard
Non-FormalEducation
Teacher Education
Operation Blackboard
Non-FormalEducation
Teacher Education
in current prices in 1994-94 prices
1990-91 150.09 34.92 19.74 203.83 47.42 26.81
1991-92 175.63 40.02 44.29 209.64 47.77 52.87
1992-93 154.91 45.17 82.93 170.08 49.59 91.05
1993-94 178.70 86.26 68.02 178.70 86.26 68.02
1994-95 214.70 106.37 63.23 195.90 97.06 57.69
1995-96 267.93 153.41 78.30 224.24 128.39 65.53
1996-97 291.77 158.20 179.42 227.49 123.34 139.89
1997-98 275.62 182.59 89.50 201.32 133.37 65.37
1998-99 227.83 160.00 158.34 154.06 108.19 107.07
1999-2000 311.73 153.72 149.86 202.91 100.06 97.55
2000-01 438.12 157.02 192.37 273.49 98.02 120.08
2001-02 520.00 400.00 220.00 314.06 241.58 132.87Source: Bashir (2000); and Working Group Report on Elementary and Adult Education: Tenth Five Year Plan

SOUTH ASIA EFA FORUM Jandhyala TILAK: Financing of Education in India
88
Table 24
The Scheme of Mid-Day Meals in Schools
ExpenditureRs crores
No. of children covered(Crores)
1995-96 441.2 3.341996-97 800.0 5.571997-98 1070.4 9.101998-99 1600.2 9.751999-2000 1500.0 9.902000-01 1300.0 10.542001-02 1030.3 10.352002-03* 952.4 10.26* up to September 2002 Source: Annual Report 2002-03. New Delhi: MHRD

SOUTH ASIA EFA FORUM Jandhyala TILAK: Financing of Education in India
89
Table 25
State and Centre Budget Expenditure on Elementary Education Year State Centre Total State Centre Total State Centre Total
Rs crores (in current prices)
Rs crores (in 1994-94 prices)
Per cent Shares
1990-91 7729.7 225.8 7955.5 10497.6 306.7 10804.2 97.2 2.8 100
1991-92 8401.4 282.9 8684.3 10028.5 337.7 10366.1 96.7 3.3 100
1992-93 9161.1 316.3 9477.3 10058.4 347.3 10405.6 96.7 3.3 100
1993-94 10432.1 389.7 10821.8 10432.1 389.7 10821.8 96.4 3.6 100
1994-95 12090.8 548.2 12638.9 11032.0 500.2 11532.1 95.7 4.3 100
1995-96 14014.9 1202.9 15217.8 11729.4 1006.7 12736.1 92.1 7.9 100
1996-97 16288.8 1561.7 17850.5 12699.9 1217.6 13917.6 91.3 8.7 100
1997-98 18155.1 2236.4 20391.5 13260.9 1633.5 14894.4 89.0 11.0 100
1998-99 22363.1 2751.6 25114.7 15121.9 1860.6 16982.5 89.0 11.0 100
1999-2000R 28282.3 2854.2 31087.1 18409.6 1857.9 20235.3 91.0 9.0 100
2000-01B 27911.2 3610.8 31522.0 17423.2 2254.0 19677.2 88.5 11.5 100
Source: Analysis of Budget Expenditure on Education (various years)

SOUTH ASIA EFA FORUM Jandhyala TILAK: Financing of Education in India
90
Table 26
Average Annual Additional Cost of Universal
Primary Education in India by 2015 Million US$
UNICEF study 1474.01 UNESCO Study 1164.72 World Bank study 3832.70
Source: UNESCO (2002).

SOUTH ASIA EFA FORUM Jandhyala TILAK: Financing of Education in India
91
Table 27
Additional Requirement of Resources for Universal Elementary Education (Rs in tem million)
PrimaryUpper
Primary ElementaryItem Access and retention: Non recurring costsA1 Construction of schools with community supervision 188.71 136.68 325.39A2 Provision of school equipments by decentralized procurement 1.78 10.30 12.08A3 Establishment of new DIET’s and up gradation of existing DIET’s 280.02 280.02A4 Establishment of cluster centres 1.13 0.55 1.68A5 Establishment of block resource centres 3.81 143.69 147.50Access and retention: Recurring costsA6 Teachers salaries 135.03 94.47 229.50A7 Teachers support material and aids 2.06 1.74 3.80A8 Maintenance and repair of school infra structure with community support 2.26 1.86 4.12A9 Provision for sustainable replacement/repair/maintenance of school equipment 2.26 1.85 4.11A10 salaries of DIET staff 11.22 11.22A11 Salaries of block level institutions 0.94 0.94Access and retention: Special needs-Non recurring costs B1 Integrated education for disables children 14.22 8.94 23.16Access and retention: Special needs-Recurring costs B2 Teachers for disables children 4.52 2.22 6.74Access and retention: Incentives-Recurrent costs 0.00C1 Free uniforms 14.88 9.31 24.19C2 Mid-day meals 11.83 7.45 19.28C3 Scholarships 14.78 9.31 24.09C4 Teaching and learning equipment for students 9.46 11.17 20.63Curriculum and text books: Non recurrent cost 0.00D1 curriculum and text book improvement 0.05 0.05Curriculum and text books: Recurrent cost D2 Teacher Training 2.89 1.74 4.63D3 Teachers’ Support and aids 0.75 0.75D4 Community based monitoring supervision and research 0.95 0.95D5 Advocacy environment building and mobilisation 0.95 0.95D6 Classroom observations by resource persons 1.35 0.67 2.02
Source: Expert Group Report on Financial Requirements for making Elementary Education a Fundamental Right (Tapas Majumdar Committee), MHRD, 1999.

SOUTH ASIA EFA FORUM Jandhyala TILAK: Financing of Education in India
92
Table 28
Additional Expenditure Required for Universalisation of Elementary Education in India (Rs in thousand crores)
Recurring
Non- Recurring
Total
Total as % of GDP
1998-1999 0.1 0 0.1 0.007 1999-2000 1.5 2.0 3.5 0.24 2000-2001 4.0 3.0 7.0 0.46 2001-2002 6.0 4.0 10.0 0.62 2002-2003 8.5 4.0 12.5 0.73 2003-2004 10.0 4.0 14.0 0.78 2004-2005 13.0 4.0 17.0 0.90 2005-2006 16.0 4.0 20.0 1.01 2006-2007 20.0 4.0 24.0 1.16 2007-2008 27.3 1.6 28.8 1.32 Total 106.4 30.6 136.9 0.72* Note: * average. Source: Based on MHRD (1999).

SOUTH ASIA EFA FORUM Jandhyala TILAK: Financing of Education in India
93
Table 29
Requirement of Funds for Elementary Education and the Centre-State
Shares in the Tenth Five Year Plan (2002-07) (Rs in thousand crores)
Programme Total Norms of Sharing
Centre State
SSA 46.13 75:25 34.60 11.53
DPEP 5.65 85:15 4.80 0.85
Lok Jumbish 0.30 5:1 0.25 0.05
Shiksha Karmi 0.18 50:50 0.09 0.09
GOI-UN Janshala 0.02 100:00 0.02 0.00
Total 52.28 39.76 12.52
Source: National Plan of Action: EFA.

SOUTH ASIA EFA FORUM Jandhyala TILAK: Financing of Education in India
94
Table 30
Requirement of Funds for EFA (Rs in thousand crores) Total Centre State
Early Child Care and Education
ICDS 10.39World Bank Assisted ICDS Projects 1.29
Training 0.46
Balika Samridhi Yojana 0.10
Total 12.25 12.25 0.00
Elementary Education 52.28 39.76 12.52
Midday Meal 17.60 6.60 11.00
Girls’ Education
Free Education 1.50 1.13 0.38
Mahila Samakhya 0.25 0.25 0.00
KGSV 1.20 1.20 0.00
Total 2.95 2.58 0.38
Teacher Education 0.95 0.95 0.00
Youth & Adolescent Education 1.75 1.10 0.65
Adult Education 6.34 6.34 0.00
Grand Total 94.12 69.57 24.55
Source: National Plan of Action: EFA.

SOUTH ASIA EFA FORUM Jandhyala TILAK: Financing of Education in India
95
Table 31
Foreign Aid for Elementary Education in India (Rs crores) 1993-94 1994-95 1995-96 1996-97 1997-98 1998-99 1999-00 2000-01 2001-02B
Shiksha Karmi 5.00 5.00 8.00 9.00 13.85 5.20 19.28 24.46 30.00
Mahila Samakhya 6.71 3.68 4.08 4.64 3.73 5.00 6.00 8.73 11.00
Bihar Education Project 16.00 10.00 .. .. .. .. .. .. ..
Lok Jumbish 6.26 9.30 15.00 22.20 32.66 37.50 20.98 56.10 59.00
DPEP 3.50 94.00 201.14 183.16 559.58 549.75 682.80 858.29 1100.00
GOI-UN Prog 0.00 10.00
Total 37.47 121.98 228.22 219.00 609.82 597.45 729.06 947.58 1210.00
As a % of Central Government Budget
Total Elementary Education (Plan) 9.60 22.29 19.00 14.00 27.30 21.73 25.56 30.40 31.84
Total Education (Plan) 3.08 7.38 10.40 8.77 18.65 14.97 16.63 17.39 20.44
Total Elementary* 388.80 547.15 1201.80 1560.59 2234.94 2749.82 2851.97 3117.38 3800.00
Total Education* 1217.37 1653.87 2193.41 2496.75 3269.50 3990.60 4384.96 5449.00 5920.00
* Central Budget plan account only (Dept of Education) Source: Analysis of Budgeted Expenditure on Education, Working Group Report on Elementary and Adult Education: Tenth Five Year Plan 2002-2007; and Annual Report 2002-03.

Table 32
Credit and Grants for DPEP
Rs crores
No of Districts
No of States
States
Credit IDA 5138 211 16
Assam, Andhra Pradesh, Kerala, Karnataka, Haryana, Maharashtra, Madhya Pradesh, Chhattisgarh, Tamil Nadu, Himachal Pradesh, Orissa, Uttar Pradesh, Uttaranchal, Bihar, Jharkhand and Rajasthan
European Commission 623 26 2 Madhya Pradesh and Chhattisgarh Netherlands 215 8 1 Gujarat DFID, UK 927 23 3 Andhra Pradesh, West Bengal and Orissa UNICEF 36 2 Bihar, Jharkhand
Grant
Total 1801 57 10
Total 6938 273 18
Assam, Andhra Pradesh, Bihar Gujarat, Kerala, Karnataka, Haryana, Maharashtra, Madhya Pradesh, Chhattisgarh, Tamil Nadu, Himachal Pradesh, Orissa, Uttar Pradesh, Uttaranchal, Bihar, Jharkhand and Rajasthan
Source: Annual Report 2002-03.

SOUTH ASIA EFA FORUM Jandhyala TILAK: Financing of Education in India
------------------------------------------------------------------------------------------------------------- 97
Appendix
Table A.1
Norms and Assumptions made by the Expert Committee in the Estimation of Requirement of Additional Resources for Universal Elementary Education
Expenditure Head Norm Cost And Investments
I. Access And Retention: Non Recurrent Costs Al Construction of schools with community supervision
Provision of a class room for every 30 children at Primary stage plus at least two rooms in the newly established 1.76 primary schools irrespective of numbers. Provision of a classroom for every 30 children at upper primary stage, at least three rooms in every newly established upper primary school on a norm of one upper primary school for every two primary schools and a Head master’s Room.
Rs.75,000/- per classroom. This would provide savings for facilities like drinking water, toilets, playground if implemented with community support. It could even be used for renovation of existing school infrastructure where necessary. Current investment under Ministry of Rural Areas & Employment, DPEP and other sources are likely to provide nearly Rs. 4000 crores.
A2 Provision of school equipments by decentralised procurement.
Provision of school equipments by decentralised procurement as per operation Blackboard norms for all newly established primary and upper primary schools (Existing schools have been covered/would be covered under ongoing OB scheme)
@ Rs. 10,000/- for new primary schools@ 50,000- for new upper primary schools.
A3 Establishment of new DIETs and up-gradation of existing DIETs
• Up-gradation of 50% of existing DIETs
• New DIETs in uncovered districts
• Rs. 1.5 crore for the establishment of a new DIET
• Rs. 50 lakhs for up-gradation of DIETs
A4 Establishment of Cluster/centres
• One lead school out of every 10 schools
Rs. 15,000 cluster
A5 Establishment of Block Resource Centres Centres
• One per Block • Rs. 7 lakhs

SOUTH ASIA EFA FORUM Jandhyala TILAK: Financing of Education in India
------------------------------------------------------------------------------------------------------------- 98
2. Access And Retention and Recurrent Costs A6 Teachers’ salaries
Provision of primary school teachers at the rate of 1:30 children and provision of 2 primary school teachers in all new primary schools irrespective of number of children. Provision of one teacher in upper primary school for every 30 children and at least three teachers in all newly established upper primary schools.
After revision of State Pay scales after the fifth Central Pay Commission, salaries of primary school teachers have been taken as Rs. 5000 per month and of upper primary school teachers at Rs. 6000/- per month). At upper primary level Provision under. QBB, DPEP, State Plans to provide nearly Rs, 1000 crores annually
A7 Teachers Support materials and Aids
* For all primary and upper primary school teachers.
@ Rs. 500 per primary school teacher per year and @ Rs. 700 per upper primary school teacher.
A8 Maintenance and Repair of School Infrastructure with Community Support
Creation of maintenance fund for all primary and upper primacy schools to be operated with community support
per year for every primary school and @ Rs. 5000 per year for every upper primary school. for support under DPEP.Adjustments for support under DPEP
A9 Provision for Sustainable replacement/repair, maintenance of school equipment
Provision for sustainable replacement/repair maintenance of school equipment provided under OB to primary and upper primary schools.
@ Rs. 3000 per year for every primary school and @ Rs. 5000/- per year for every upper primary school.
A 10 – Salaries of DIET staff
As per staff and salary norms of DIETs
Rs. 40 lakhs per annum
4.11 Salaries of Block level institutions
One coordinator, one desk, and one grade-iv employee
Rs. 14500 per month
Il Access And Retention: Special Needs On Recurrent Costs Bl Integrated Education for Disabled Children
* Aids for disabled children as per Govt. norm and assuming a 4% incidence of disability among children
Rs. 3000/ - per student
II. Access And Retention: Special Needs Recurrent Costs B2 Teachers disabled children for
Normal, salary plus additional honorarium for qualified teachers.
Additional honorarium and special recruited teachers – salary under Teacher Salary Head. Additional honorarium @ Rs. 6000/- per year over and above salary

SOUTH ASIA EFA FORUM Jandhyala TILAK: Financing of Education in India
------------------------------------------------------------------------------------------------------------- 99
III. Access And Retention: Incentives (Recurrent Costs) C1 Free Uniforms Two uniforms per year per
student for children from facilities below poverty line (50% of total)
Rs. 250/- per student States are currently providing total up to approx. Rs. 200 crores annually
C2 Mid-day Meals @ 3 kilograms of wheat/rice per student for 10 months to all children below poverty line (50% of total)
Rs. 200 per student Central Government provides nearly 1200 crores
C3-Scholarship Per year per student to be provided to all children from Below poverty line families (50% or total enrolled children)
Rs. 250/- per student States are currently providing approximately Rs. 250 crores
C4 Teacher Learning Equipments for Students
Per student per year t be provided to all students
@ Rs. 80 for primary schools @ Rs 150 for upper primary students
Non Recurring Costs D1 Curriculum and Textbook development
Lump sum provision Rs. 15 lakhs per state
IV Quality: Recurring Costs D2 Teacher Training Every year currently nearly Rs.
62 cores annually is available for in-service training
Rs. 70 per teacher for 10 days per year
D3 Teacher Support and Aids
Monthly meetings at cluster level
@ Rs. 10,000 per year per cluster
D4 Community Based monitoring supervision and research
Per district per year Rs. 20 lakhs per district
D5 – Advocacy environment building and mobilization
Per district per year Rs. 20 lakhs per district
D6 – Classroom observations by Resource Persons
6 visits to each primary and upper primary school in a year
Rs. 300/- per visit per person (to cover cost of travel, stationery, honorarium

SOUTH ASIA EFA FORUM Jandhyala TILAK: Financing of Education in India
------------------------------------------------------------------------------------------------------------- 100
Appendix A.2
Expert Group Estimates versus MHRD Estimates under SSA
The main reasons for differences between the estimates of the Expert Group and the estimates of the MHRD made under SSA are as follows:32
(i)While the Expert Group has considered a pupil teacher ratio (PTR) of 30:1, it has been modified to 40:1 under SSA.
(ii)SSA envisages opening of less expensive schools under the Education Guarantee Scheme, while the Expert Group assumed that good formal schools have to be provided everywhere, and that there would be no place for less expensive schools of the EGS type.
(iii)Similarly, the Expert Group considered the actual average salary of formal school teachers -- Rs. 5000 per month for primary and Rs. 6000 per month for upper primary teachers. On the other hand, SSA, assumed an average salary of Rs. 3000 per month, as it considered .the appointment of para-teachers.
(iv)Certain important items such as mid-day meals, uniforms, scholarships and DIETS (District Institutes of Education and Training) have been taken into account by the Expert Group in making the estimates, which were not considered under SSA.
(v)SSA also expected that around 15 per cent of 6-14 age-group child population would be enrolled in private schools. To that extent that requirement of funds would reduce. The Expert Group recognised this phenomenon of enrolment in private schools, but did not find the need to make any adjustment for this.
(vi)Under the integrated education development (IED) scheme, meant for disabled children, the Expert Group assumed a cost norm of Rs. 3000 per child per year, but SSA allowed for only Rs. 1200 per child per year.
(vii)SSA has projected the total requirement of classrooms at 1.1 million, while the Expert Group has projected it to be 4.3 million. In money terms, the estimate of the Expert Group was Rs. 32.2 thousand crores which was revised downwards by the MHRD to Rs. 26.3 thousand crores. After making adjustments for other programmes, under SSA the total additional cost was estimated to be Rs. 11.4 thousand crores of which, Rs. 6.4 thousand crores was expected to come from other schemes, and only Rs. 5 thousand crores was expected to be provided under SSA head.
(viii) SSA estimated the requirement of teacher as 11.5 lakh teachers, while the Expert Group figure was 35.6 lakh teachers. This, along with lesser salary, has led the MHRD to a projection of requirements under teachers’ salaries as Rs. 4140 crores per annum under SSA (by the tenth year), against Rs. 18000 crores per annum in the tenth year under Expert Group.
32 Some of these details are provided by the Department of Education, MHRD in a personal communication.

SOUTH ASIA EFA FORUM Jandhyala TILAK: Financing of Education in India
------------------------------------------------------------------------------------------------------------- 101
(ix)Because of higher PTR under SSA and opening of EGS centers, other requirements also fall below the estimates of the Expert Group.
(x)For the items not included in SSA, the implications in financial terms are as follows:
a. Mid-day meals (additionally Rs. 700 crores annually by the tenth year. b. Free uniforms (additionally Rs. 2200 crores annually by the tenth year. c. Scholarship (additionally Rs. 2150 crores annually by the tenth year. d. DIETS (additionally Rs. 280 crores non-recurring and recurring Rs. 11
crores annually by the tenth year). 2. Disabled children under Expert Group provided for @ Rs. 3000/- per year,
while under SSA they are provided at Rs. 1200/- per year, with the balance being expected from other programmes under existence. The additional requirement on this would be non-recurring Rs. 2311 crores and recurring Rs. 400 crores annually in the tenth year.
To briefly summarise some of the main differences,
SSA Expert Group
Pupil Teacher Ratio 1:40 1:30
Average salary of teachers per month
Rs. 3000 Rs. 5000 primary
Rs. 6000 upper primary
Enrolment in private schools 15 per cent Nil
Integrated Education Development: cost per child
Rs. 1200 Rs. 3000
a) Grant per school Rs. 2000 Rs. 3000 primary
Rs. 5000 upper primary
b) Grant per teacher Rs. 500 Rs. 500 primary
Rs. 700 upper primary
(a) + (b) Total Rs. 395 crores Rs. 670 cores
c) Teacher Learning equipment: Total
Rs. 402 crores Rs. 1029 crores
Tilak/South Asia EFA Forum Financing Education/May 2003

SOUTH ASIA EFA FORUM Jandhyala TILAK: Financing of Education in India
------------------------------------------------------------------------------------------------------------- 102
About the Author
Professor Jandhyala B G Tilak is Senior Fellow and Head of the Educational Finance Unit at the National Institute of Educational Planning and Administration, New Delhi. Doctorate from the Delhi School of Economics, Professor Tilak had taught in the University of Virginia, Indian Institute of Education and the University of Delhi, and as a Visiting Professor in Economics at the Sri Sathya Sai Institute of Higher Learning (Prashanti Nilayam), and in the Hiroshima University (Japan). An economist of education, Dr Tilak was also on the staff of the World Bank, Washington D.C. In addition to several monographs prepared for the Unesco, the IIEP, the World Bank, the UNDP, etc., Dr Tilak’s publications include Education for Development in Asia (Sage, 1994), Economics of Inequality in Education (Sage, 1987), Educational Planning at Grassroots (Ashish, 1991), Educational Finances in South Asia (UNCRD, 1988), Education and Regional Development, edited (Yatan, 1986), India’s Socio-Economic Database, jointly edited (Tulika, 2001) and several research papers published in professional journals of high repute in the areas of economics, development studies and education. Professor Tilak, a contributor to the International Encyclopedia of Education (Pergamon, 1994), Encyclopedia of American Educational Research (1992), and Encyclopedia of Education (Macmillan, 2002) is also the Editor of the Journal of Educational Planning and Administration, and is associated (as a member of the editorial board) with Journal of Quantitative Economics, Higher Education Policy (Pergamon), International Journal of Educational Policy Research and Practice (Florida, USA), Compare: Journal of Comparative Education (England), Manpower Journal (India), Perspectives in Indian Education (Vadodara), Asian and African Journal of Economics and Econometrics (Pondicherry), Educational Review (Birmingham, UK), Peabody Journal of Education (USA) etc. . Prof Tilak also served as a Consultant for the World Bank, Asian Development Bank, UNESCO, UNDP, Swiss Development Corporation and several other organisations. He is also a member of several official committees on education of the Government of India.