Financing and Managing Health Expenditure: Evaluation of Aging and Capitation Criteria in the...
27
UNIVERSITA’ DEGLI STUDI DI BERGAMO DIPARTIMENTO DI INGEGNERIA GESTIONALE E DELL’INFORMAZIONE ° QUADERNI DEL DIPARTIMENTO † Department of Management and Information Technology Working Paper Series “Economics and Management” n. 4/EM – 2005 Financing and Managing Health Expenditure: Evaluation of Aging and Capitation Criteria in the Italian Healthcare System by Paolo Malighetti, Stefano Paleari and Renato Redondi ° Viale Marconi. 5, I – 24044 Dalmine (BG), ITALY, Tel. +39-035-2052339; Fax. +39-035-562779 † Il Dipartimento ottempera agli obblighi previsti dall’art. 1 del D.L.L. 31.8.1945, n. 660 e successive modificazioni.
Transcript of Financing and Managing Health Expenditure: Evaluation of Aging and Capitation Criteria in the...
UNIVERSITA’ DEGLI STUDI DI BERGAMO DIPARTIMENTO DI INGEGNERIA GESTIONALE E DELL’INFORMAZIONE°
QUADERNI DEL DIPARTIMENTO†
Department of Management and Information Technology
Working Paper
Series “Economics and Management”
n. 4/EM – 2005
Financing and Managing Health Expenditure: Evaluation of Aging and Capitation Criteria in the Italian Healthcare System
by
Paolo Malighetti, Stefano Paleari and Renato Redondi
° Viale Marconi. 5, I – 24044 Dalmine (BG), ITALY, Tel. +39-035-2052339; Fax. +39-035-562779 † Il Dipartimento ottempera agli obblighi previsti dall’art. 1 del D.L.L. 31.8.1945, n. 660 e successive modificazioni.

COMITATO DI REDAZIONE§ Series Economics and Management (EM): Stefano Paleari, Andrea Salanti Series Information Technology (IT): Stefano Paraboschi Series Mathematics and Statistics (MS): Luca Brandolini, Sandro Fassò § L’accesso alle Series è approvato dal Comitato di Redazione. I Working Papers ed i Technical Reports della Collana dei Quaderni del Dipartimento di Ingegneria Gestionale e dell’Informazione costituiscono un servizio atto a fornire la tempestiva divulgazione dei risultati di dell’attività di ricerca, siano essi in forma provvisoria o definitiva.
FINANCING AND MANAGING HEALTH EXPENDITURE: EVALUATION OF AGING
AND CAPITATION CRITERIA IN THE ITALIAN HEALTHCARE SYSTEM
Working Paper
Research area: Economics & Management (Serie EM)
Authors: Stefano Paleari, Renato Redondi, Paolo Malighetti
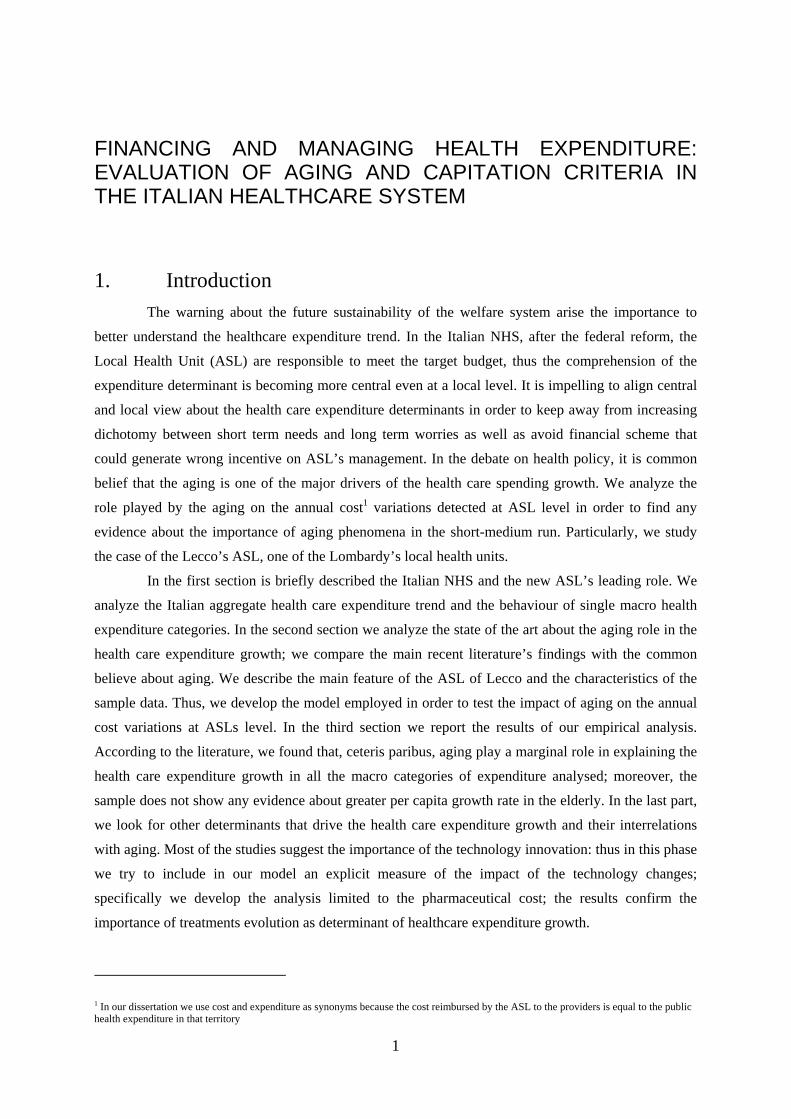
Abstract
The object of this work is to isolate and to evaluate the role played by aging in the annual
cost variation. The aim is to strength the congruence between central health policy concern and the
understanding of the annual cost variation at Local Health Unit level. The sample regards
pharmaceutical, hospital and outpatient cost in the ASL of Lecco: a Lombardy’s Local Health Unit
which covers about three hundred thousand citizens. The period analysed is 2001-2004. We found that
in our case study the impact, ceteris paribus, of the aging on the total expenditure growth has been
relative according to recent literature findings. Further, the study does not show any evidence
suggesting different growth rate between elderly and the rest of the population, supporting the thesis
that short and medium term dynamics are driven mainly by other patterns. Indeed, the role of the
product innovation, analysed in regard of the pharmaceutical expense, has been found to have an
annual impact three times greater than the aging effect.
Keywords: Healthcare expenditure, ASL, Aging. JEL: I18
For correspondence:
Paolo Malighetti, Università di Bergamo - Viale Marconi, 5 - I - 24044 Dalmine
Ph. +39- 035 2052360 - Fax. +39 035 562779
E-mail: [email protected]

1
FINANCING AND MANAGING HEALTH EXPENDITURE: EVALUATION OF AGING AND CAPITATION CRITERIA IN THE ITALIAN HEALTHCARE SYSTEM
1. Introduction The warning about the future sustainability of the welfare system arise the importance to
better understand the healthcare expenditure trend. In the Italian NHS, after the federal reform, the
Local Health Unit (ASL) are responsible to meet the target budget, thus the comprehension of the
expenditure determinant is becoming more central even at a local level. It is impelling to align central
and local view about the health care expenditure determinants in order to keep away from increasing
dichotomy between short term needs and long term worries as well as avoid financial scheme that
could generate wrong incentive on ASL’s management. In the debate on health policy, it is common
belief that the aging is one of the major drivers of the health care spending growth. We analyze the
role played by the aging on the annual cost1 variations detected at ASL level in order to find any
evidence about the importance of aging phenomena in the short-medium run. Particularly, we study
the case of the Lecco’s ASL, one of the Lombardy’s local health units.
In the first section is briefly described the Italian NHS and the new ASL’s leading role. We
analyze the Italian aggregate health care expenditure trend and the behaviour of single macro health
expenditure categories. In the second section we analyze the state of the art about the aging role in the
health care expenditure growth; we compare the main recent literature’s findings with the common
believe about aging. We describe the main feature of the ASL of Lecco and the characteristics of the
sample data. Thus, we develop the model employed in order to test the impact of aging on the annual
cost variations at ASLs level. In the third section we report the results of our empirical analysis.
According to the literature, we found that, ceteris paribus, aging play a marginal role in explaining the
health care expenditure growth in all the macro categories of expenditure analysed; moreover, the
sample does not show any evidence about greater per capita growth rate in the elderly. In the last part,
we look for other determinants that drive the health care expenditure growth and their interrelations
with aging. Most of the studies suggest the importance of the technology innovation: thus in this phase
we try to include in our model an explicit measure of the impact of the technology changes;
specifically we develop the analysis limited to the pharmaceutical cost; the results confirm the
importance of treatments evolution as determinant of healthcare expenditure growth.
1 In our dissertation we use cost and expenditure as synonyms because the cost reimbursed by the ASL to the providers is equal to the public health expenditure in that territory
2
2. Italian NHS
2.1. ASLs’ role
Since the 1992 reform, Regions have been in charge on planning and financing the public health care
with broad independence inside the general State mandatory; for example Mapelli (2000) shows
differences framework among Regional Health System: Lombardy (one of the most important Italian
Region) has chosen, law n°31 11/07/1997, to split management and provider activity: public hospital,
tipically run by ASL, became an independent and separate firms. In other word Lombardy has chosen
the stronger form of separation between buyer and provider in order to promote efficiency and
competition among provider. Indeed, inside this new framework ASLs role have changed toward a
more managerial role of the Health care system. Besides, decentralization makes ASLs aware about
the target budget increasing their economic responsibilities. More specifically, in the Lombardy health
system2, Regional health fund is shared out among ASL using capitation criteria. With the so
established amount of financing, ASLs have to cover all the costs for the health of the citizens:
physician, hospital and pharmaceutical cost, prevention. Thus, ASL have to manage the annual cost
variation and they are, in first instance, the financial responsible; so it is important to develop a better
understanding of the underlining dynamics even at local level. New incentive system has been
introduced in order to strength the ASL responsibilities, for example ASL management are evaluated
on the base of the target met. In this context, to highlight the role of the external phenomena like aging
is important to set the right parameters evaluating ASL performance.
2.2. Macro healthcare expenditure trends
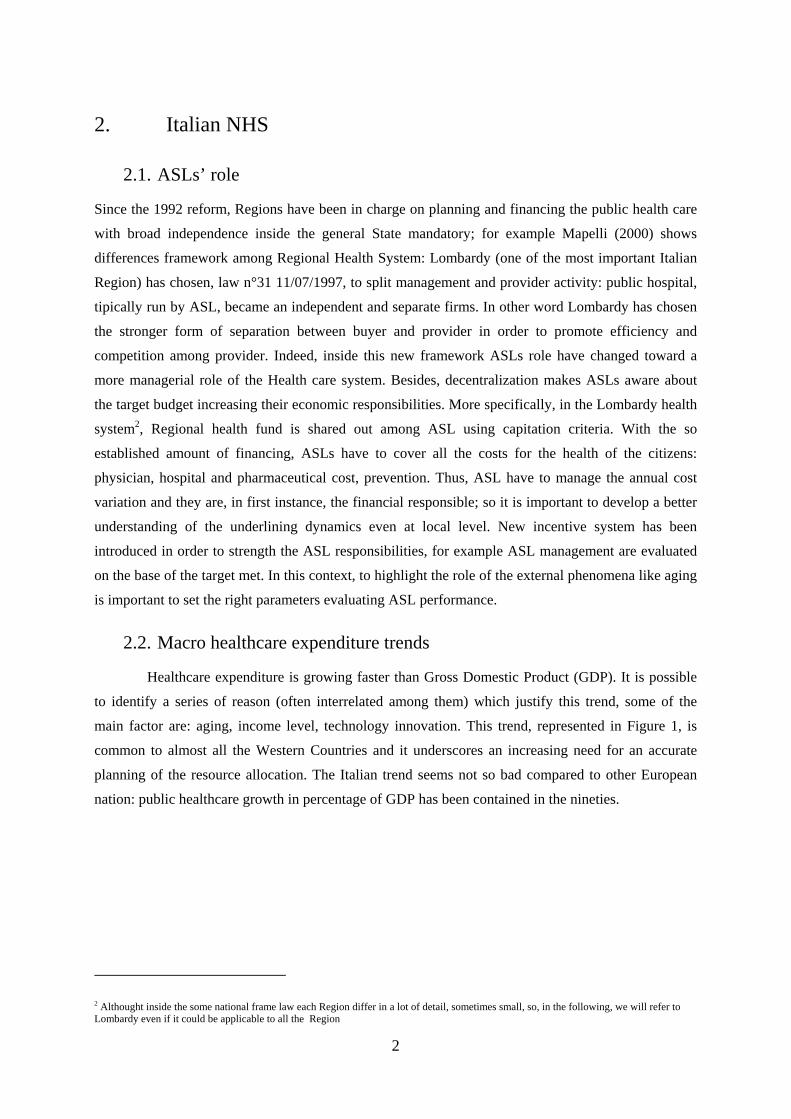
Healthcare expenditure is growing faster than Gross Domestic Product (GDP). It is possible
to identify a series of reason (often interrelated among them) which justify this trend, some of the
main factor are: aging, income level, technology innovation. This trend, represented in Figure 1, is
common to almost all the Western Countries and it underscores an increasing need for an accurate
planning of the resource allocation. The Italian trend seems not so bad compared to other European
nation: public healthcare growth in percentage of GDP has been contained in the nineties.
2 Althought inside the some national frame law each Region differ in a lot of detail, sometimes small, so, in the following, we will refer to Lombardy even if it could be applicable to all the Region
3
% Public health care expenditure on GDP
4
5
6
7
8
9
1990 1991 1992 1993 1994 1995 1996 1997 1998 1999 2000 2001 2002years
% on GDP
Italy
Germany
France
Spain
UK
Figure 1 – Public healthcare expenditure trend as a percentage of GDP in some of the main European
Countries.
Sourse: OECD data 2004
At the same time we should highlight three aspects:
In the last three years healthcare expense, as share of GDP, has grown as fast as it has
declined in the mid nineties suggesting that healthcare expense is not strictly under control
and cost containing policy has not brought structural variation
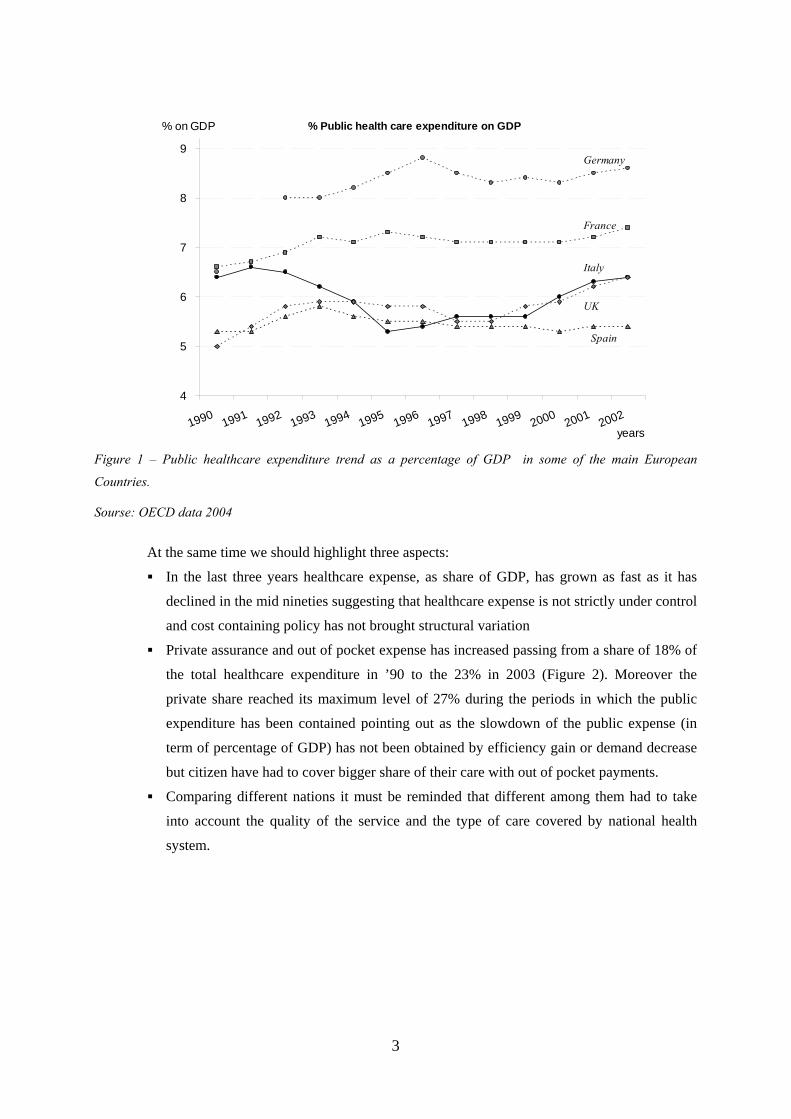
Private assurance and out of pocket expense has increased passing from a share of 18% of
the total healthcare expenditure in ’90 to the 23% in 2003 (Figure 2). Moreover the
private share reached its maximum level of 27% during the periods in which the public
expenditure has been contained pointing out as the slowdown of the public expense (in
term of percentage of GDP) has not been obtained by efficiency gain or demand decrease
but citizen have had to cover bigger share of their care with out of pocket payments.
Comparing different nations it must be reminded that different among them had to take
into account the quality of the service and the type of care covered by national health
system.
4
share of private healthcare expenditure
15% 17% 19% 21% 23% 25% 27% 29%
19901991
19921993
19941995
19961997
19981999
20002001
20022003
Figure 2 –Private healthcare expenditure (private assurance plus out of pocket) as percentage of the overall
healthcare expenditure in Italy.
Source: Saniteia’s elaboration on ISTAT and National accounting data (SEC 95).
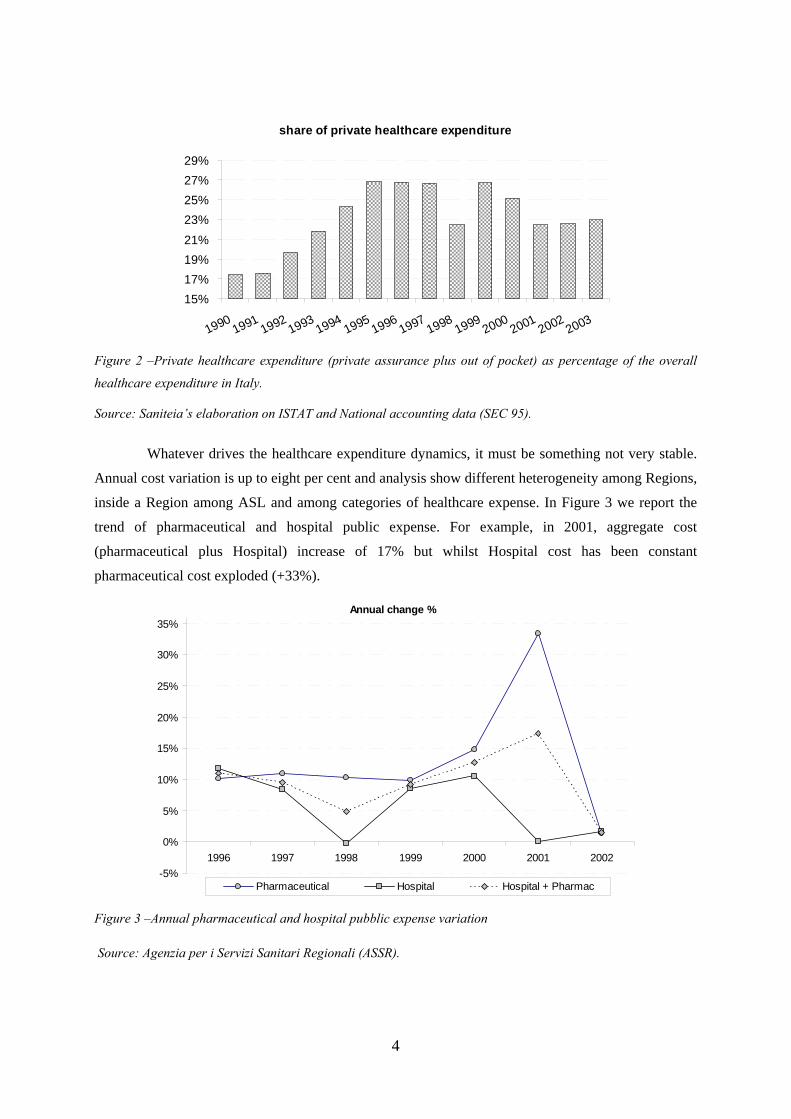
Whatever drives the healthcare expenditure dynamics, it must be something not very stable.
Annual cost variation is up to eight per cent and analysis show different heterogeneity among Regions,
inside a Region among ASL and among categories of healthcare expense. In Figure 3 we report the
trend of pharmaceutical and hospital public expense. For example, in 2001, aggregate cost
(pharmaceutical plus Hospital) increase of 17% but whilst Hospital cost has been constant
pharmaceutical cost exploded (+33%).
Annual change %
-5%
0%
5%
10%
15%
20%
25%
30%
35%
1996 1997 1998 1999 2000 2001 2002
Pharmaceutical Hospital Hospital + Pharmac
Figure 3 –Annual pharmaceutical and hospital pubblic expense variation
Source: Agenzia per i Servizi Sanitari Regionali (ASSR).
5
Opposite in 1996 and 1999 both trends, hospital and pharmaceutical, were the same. Similar
heterogeneity can be reported comparing ASL; if we look at Lombardy in the first nine months of
2004 some ASLs have been reported a pharmaceutical cost growth around 6%, others up to 13%. On
the light of so widespread variation it appears crucial to individuate the role of the main healthcare
expenditure determinants in order to:
Complete successfully the decentralization process. Without a greater agreement on the
effect of each determinant on healthcare cost variation it is not possible to decrease the
dichotomy between ASLs and Region, and between Regions and Central Government.
Draw adequate financial scheme. One of the aim of the decentralization process is to
increase commitment and efficiency adding more effort on the financial responsibility of
the single ASL. As a consequence, Regions (particularly Lombardy) use capitation
formula to establish the amount of funds due to each ASL; without a settlement with
health care expenditure determinants used criteria may not grant sufficient financial
support to some ASL, of course it becomes difficult to distinguish between inefficiency
and natural demand growth.
Increase ASLs’ cost control capacity. With the new and stronger financial responsibility
ASLs’ management need to understand, to justify and to control healthcare expenditure
variation which are often very different if compared with which ones reported by other
ASLs. They can not explain such differences; neither employ structural remedies without
a better understand of healthcare determinants.
Particularly we investigate on the role of aging.
3. Aging and healthcare expenditure trend
3.1. Literature review
The analysis of the healthcare determinants is an interest topic for academics and policy
maker. The relationship between healthcare expenditure and its determinants is a complex task
partially still unresolved and there are a lot of interconnection among determinants that increase
misspecification and endogeneity problems using econometric models. In the literature review by
Mahal and Barman (2001) bas been summarised the main problem and result evaluating aging impact
on healthcare expenditure; for example they point out how it is not easy to establish if it is the greater
health care expense that increase life expectancy or it is the increased life expectancy that is raising
health care expenditure. Similar question can be raised analysing the role of technological
development. So, even if it is identifiable a relationship, it needs to be analysed what is the cause and
what is the effect.
The role of the demographical structure changes, usually identified as aging, is particularly
debated because it is widely believed that the aging of population is a major driver of the annual

6
growth in the demand for health care spending, which is increasing at a fast pace of GDP in all most
Western countries, and this trend can be worsened by the progressive going toward oldness of the
baby-boom generation.
There is a general agreement on the presence of different intensity of the health cost during
the life (Newhouse 1992, Fuchs 1998, 1999 Richardson and Robertson 1999, Chernichovskya and
Markowitz 2004): the elderly consume significantly more resources than the young. Fuchs estimates
an average consumption by people over 85 three times the average spending of age 65-74. Similar
results has been found in our analysis (Figure 5). Despite of the natural conjecture coming out from
this figure is that aging is a crucial determinant of the healthcare expenditure trends, all of the previous
studies do not arrive to this conclusion. Opposite, they found that the share of healthcare expenditure
growth strictly imputable to aging is only a marginal quote and does not justify an increasing
incidence on GDP therefore suggesting that changes of citizens’ habits and technological
developments could be the major drivers. Apparently this result has not been taken in by policy maker
and politicians3 who seem to be still concerned particularly about aging effect. Previous studies
analyze different NHS, some of the more relevant are based on USA and Australia data, further the
databases are different not only because they are related to different reality but even because they look
at different healthcare cost groups and patients group: for example most of the studies on USA data
analyze samples from Medicare or Medicaid which cover only a part of the population. However the
overall results have been substantially similar among studies. In this paper we analyze the role of
aging in the Italian case: our work analyzes the public healthcare expenses which represent about 73%
of the total healthcare expense. Compared with other studies we test the effect of aging at local level
basing our analysis on a detailed database that cover all the citizens living within the ASL territory:
we aim to analyze the role of aging using simple operating model that can be employed by ASLs in
the analysis of the annual cost variation.
3.2. ASL of Lecco and the sample data
The sample data is the database of the ASL of Lecco. It covers the access to hospital cares,
pharmaceutical and diagnostic/ambulatory cares by all the citizens living in the territory of the ASL of
Lecco during the periods 2001-2003. The sample is composed by the track record of the single access,
recorded by all the suppliers that provide cares on behalf of the ASL; and it contains information
about the patient (age, gender, ID code) and about the care provided (diagnosis, cost, data, quantity in
the case of drugs, DRG groups in the case of hospital care). The sample is geographically limited4
which can raise doubt about the extendibility of the results; opposite, in our view, it offers the chance
to analyze an homogeneous area in term of administrative boundary, epidemiological and climatic
3 Some worry is externalised by Reinhardt (2003) in regard to the debate on USA public healthcare cover plans.

7
events, so all this effects are eventually more easy to find and it is less likely that they affect the results
of our analysis (because they affect homogeneously the overall sample). The database covers all the
citizens, so the information about healthcare expenses at each the age level is more accurate; it is also
possible to analyze trend related to single health cost categories. The number of records registered is
around 3 millions a year. The population of the territory analysed was 312.594 in 2001 and risen to
318.119 in 2003. In Figure 4 is reported the demographic structure of the population of the ASL of
Lecco in 2001 and in 2003; it is easy recognizable the shift toward older ages and the actual position
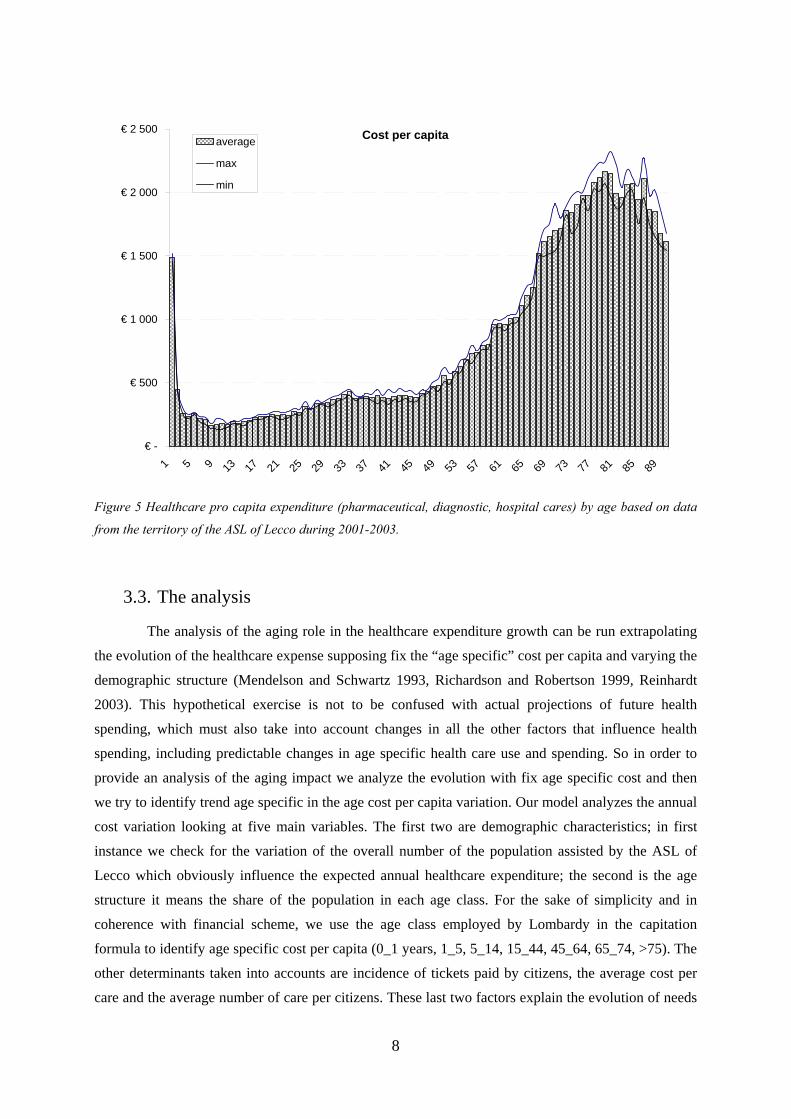
of the baby-boom peak. The per capita cost figure by age (Figure 5) confirms that elderly face greater
cost, more than 1500€ on average for hospital pharmaceutical and diagnostic cares compared to less
than 500€ for citizens between 5 and 45 years old. This figure suggests the importance of aging in the
health expenditure growth and it confirms the importance to understand the evolution of the
phenomena.
Population by age
0
1.000
2.000
3.000
4.000
5.000
6.000
0 5 10 15 20 25 30 35 40 45 50 55 60 65 70 75 80 85 90 95
age2001 2003
Figure 4 Evolution of the demographic structure during the years 2001-2003 in the territory of the ASL of
Lecco.
4 The t ASL of Lecco cover an area of about 814 km^2
8
spesa pro capite
€ -
€ 500
€ 1 000
€ 1 500
€ 2 000
€ 2 500
1 5 9 13 17 21 25 29 33 37 41 45 49 53 57 61 65 69 73 77 81 85 89
average
max
min
Figure 5 Healthcare pro capita expenditure (pharmaceutical, diagnostic, hospital cares) by age based on data
from the territory of the ASL of Lecco during 2001-2003.
3.3. The analysis
The analysis of the aging role in the healthcare expenditure growth can be run extrapolating
the evolution of the healthcare expense supposing fix the “age specific” cost per capita and varying the
demographic structure (Mendelson and Schwartz 1993, Richardson and Robertson 1999, Reinhardt
2003). This hypothetical exercise is not to be confused with actual projections of future health
spending, which must also take into account changes in all the other factors that influence health
spending, including predictable changes in age specific health care use and spending. So in order to
provide an analysis of the aging impact we analyze the evolution with fix age specific cost and then
we try to identify trend age specific in the age cost per capita variation. Our model analyzes the annual
cost variation looking at five main variables. The first two are demographic characteristics; in first
instance we check for the variation of the overall number of the population assisted by the ASL of
Lecco which obviously influence the expected annual healthcare expenditure; the second is the age
structure it means the share of the population in each age class. For the sake of simplicity and in
coherence with financial scheme, we use the age class employed by Lombardy in the capitation
formula to identify age specific cost per capita (0_1 years, 1_5, 5_14, 15_44, 45_64, 65_74, >75). The
other determinants taken into accounts are incidence of tickets paid by citizens, the average cost per
care and the average number of care per citizens. These last two factors explain the evolution of needs
Cost per capita
9
and habits of citizens including care developments, standard of life, epidemiologic condition. Using
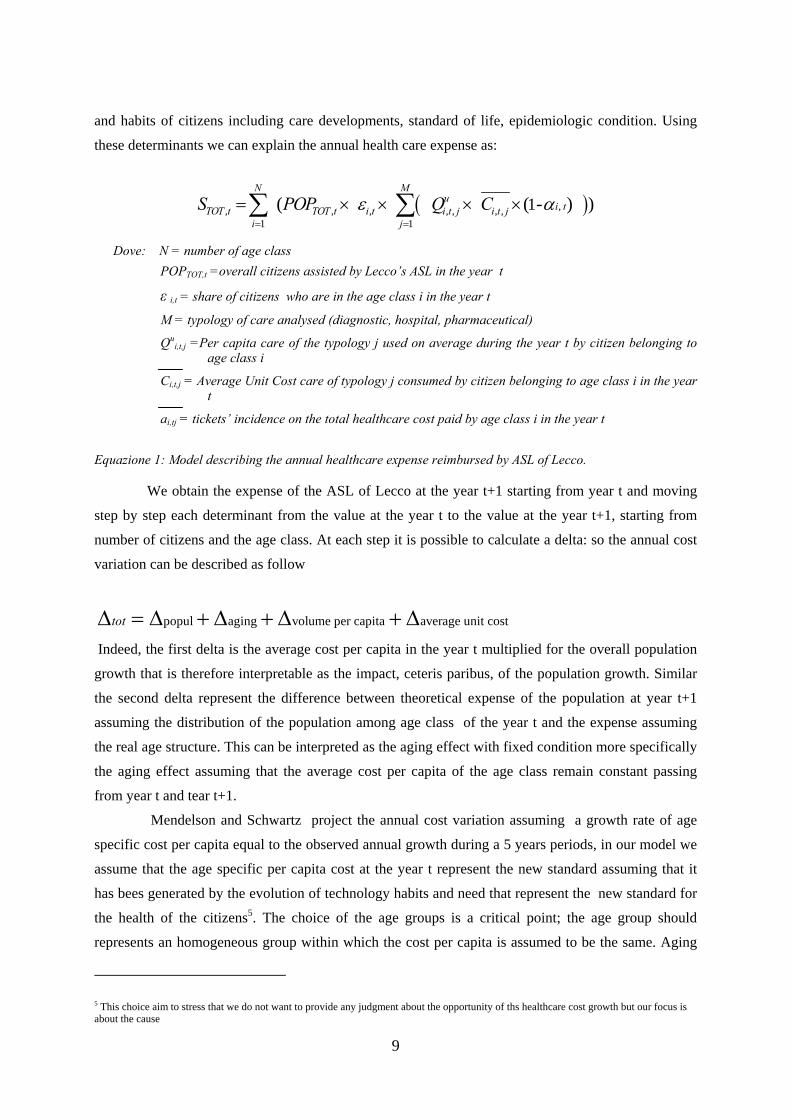
these determinants we can explain the annual health care expense as:
( ),, , , , , , ,1 1
1( ( - ) )N M
ui tTOT t TOT t i t i t j i t j
i j
S POP Q Cε α= =
= × × × ×∑ ∑
Dove: N = number of age class POPTOT,t =overall citizens assisted by Lecco’s ASL in the year t
ε i,t = share of citizens who are in the age class i in the year t
M = typology of care analysed (diagnostic, hospital, pharmaceutical)
Qui,t,j =Per capita care of the typology j used on average during the year t by citizen belonging to
age class i
Ci,t,j = Average Unit Cost care of typology j consumed by citizen belonging to age class i in the year t
ai,tj = tickets’ incidence on the total healthcare cost paid by age class i in the year t Equazione 1: Model describing the annual healthcare expense reimbursed by ASL of Lecco.
We obtain the expense of the ASL of Lecco at the year t+1 starting from year t and moving
step by step each determinant from the value at the year t to the value at the year t+1, starting from
number of citizens and the age class. At each step it is possible to calculate a delta: so the annual cost
variation can be described as follow
popul aging volume per capita average unit costtotΔ = Δ + Δ + Δ + Δ
Indeed, the first delta is the average cost per capita in the year t multiplied for the overall population
growth that is therefore interpretable as the impact, ceteris paribus, of the population growth. Similar
the second delta represent the difference between theoretical expense of the population at year t+1
assuming the distribution of the population among age class of the year t and the expense assuming
the real age structure. This can be interpreted as the aging effect with fixed condition more specifically
the aging effect assuming that the average cost per capita of the age class remain constant passing
from year t and tear t+1.
Mendelson and Schwartz project the annual cost variation assuming a growth rate of age
specific cost per capita equal to the observed annual growth during a 5 years periods, in our model we
assume that the age specific per capita cost at the year t represent the new standard assuming that it
has bees generated by the evolution of technology habits and need that represent the new standard for
the health of the citizens5. The choice of the age groups is a critical point; the age group should
represents an homogeneous group within which the cost per capita is assumed to be the same. Aging
5 This choice aim to stress that we do not want to provide any judgment about the opportunity of ths healthcare cost growth but our focus is about the cause
10
study at a macro levels consider the age group by over 65 (Fuchs 1996, Shaesmani 2004) or standard
age group employed in the NHS analysis6 .
In our model we use the same age group employed by the Lombardy authority so the results
can be direct used in an evaluation of the financing criteria. The second critical point is the output
units: because of strong heterogeneity we measure separately the volume of pharmaceutical, hospital
and diagnostic care provided and then we aggregate them. Unit level of output chosen for
pharmaceutical care is the number of prescription, whilst for hospital and diagnostic care we employ
respectively the number of hospitalize and number of prescription.
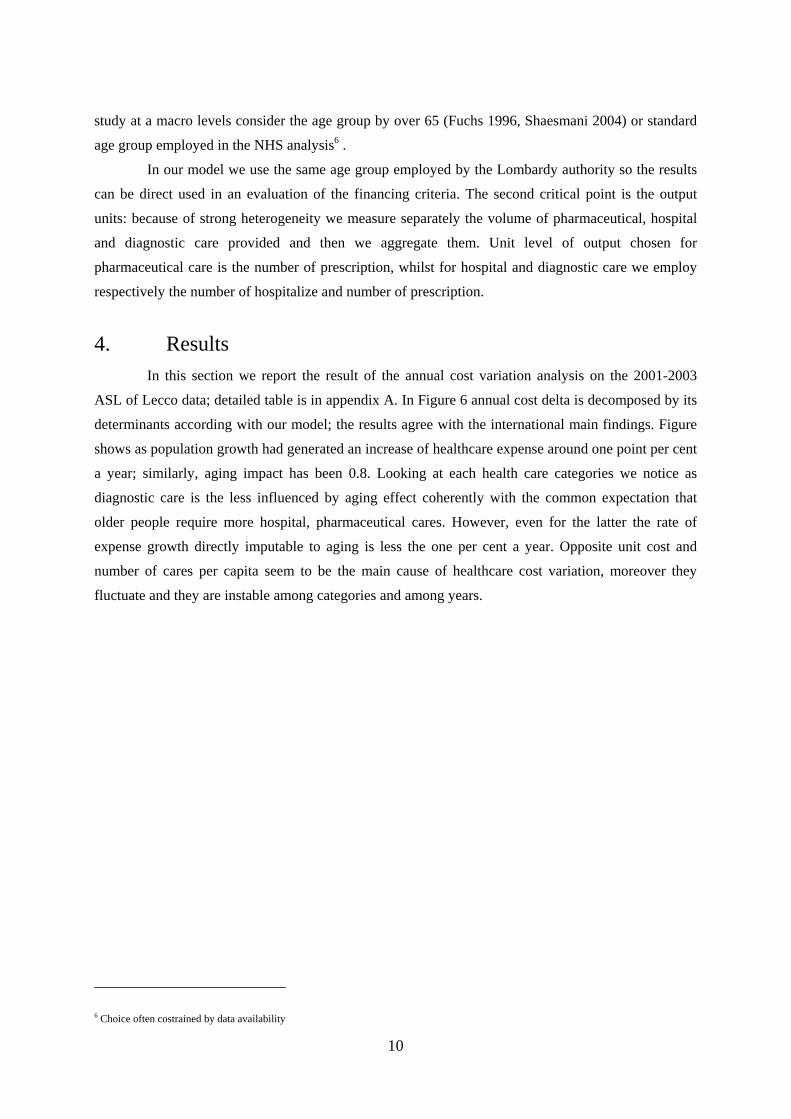
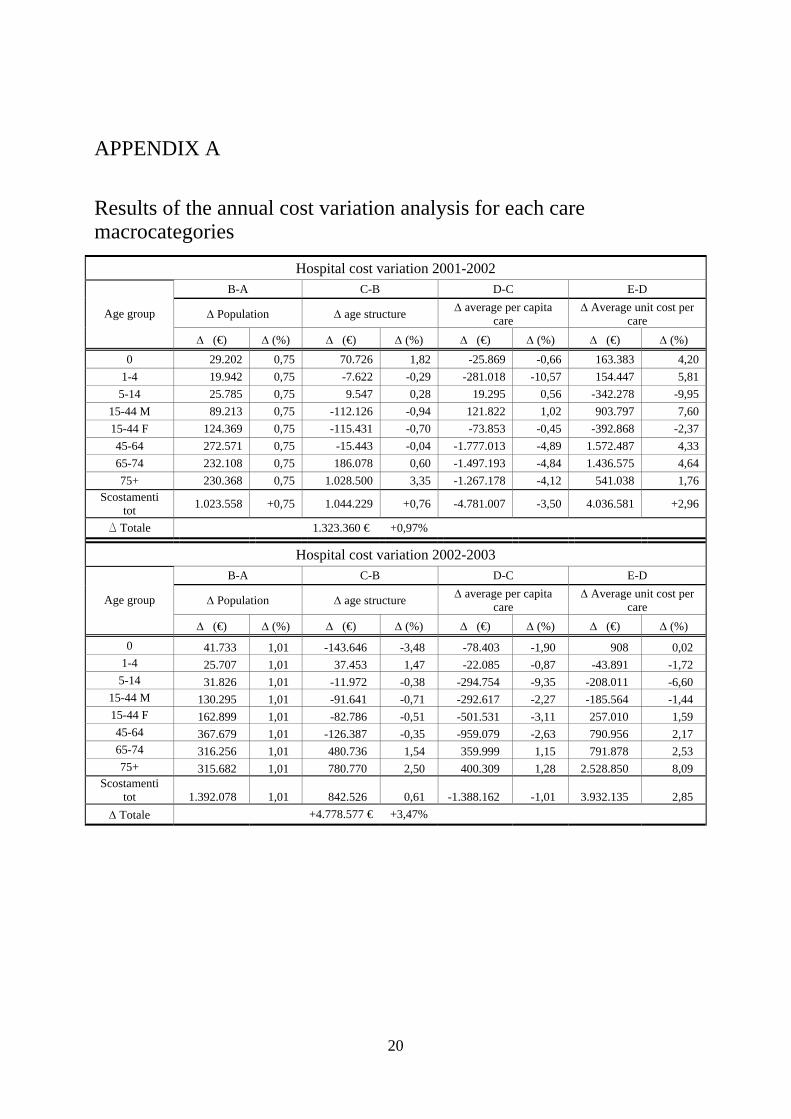
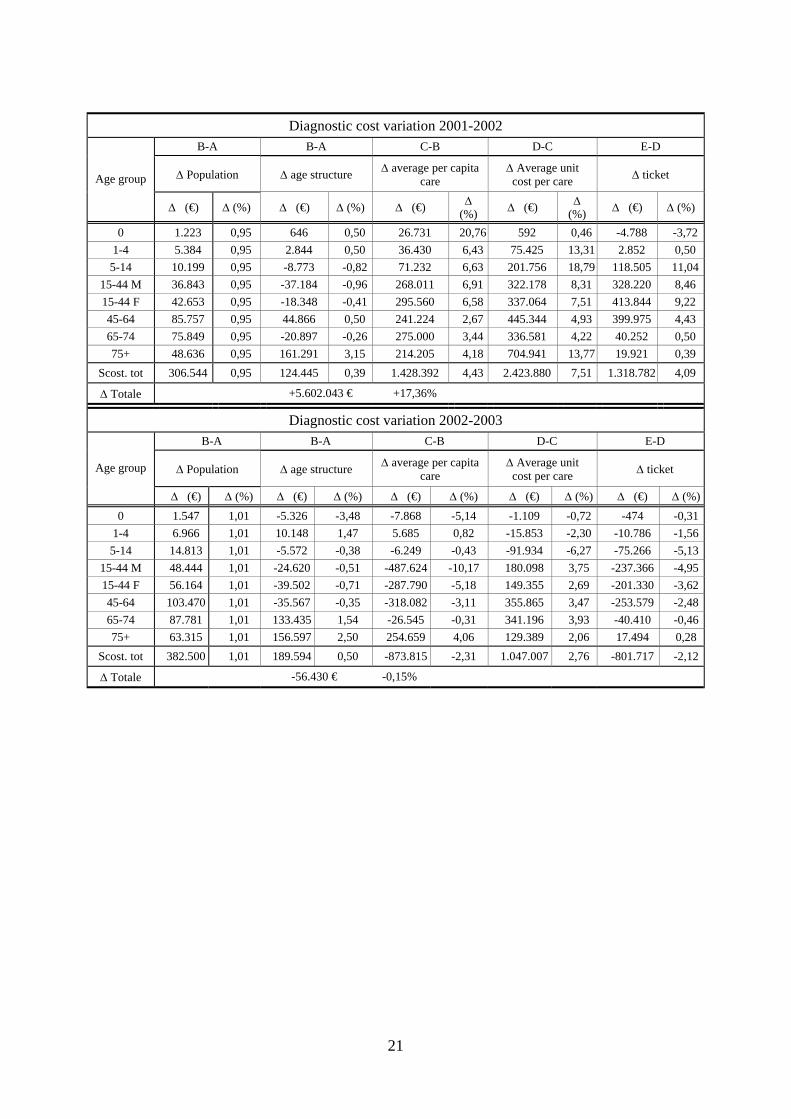
4. Results In this section we report the result of the annual cost variation analysis on the 2001-2003
ASL of Lecco data; detailed table is in appendix A. In Figure 6 annual cost delta is decomposed by its
determinants according with our model; the results agree with the international main findings. Figure
shows as population growth had generated an increase of healthcare expense around one point per cent
a year; similarly, aging impact has been 0.8. Looking at each health care categories we notice as
diagnostic care is the less influenced by aging effect coherently with the common expectation that
older people require more hospital, pharmaceutical cares. However, even for the latter the rate of
expense growth directly imputable to aging is less the one per cent a year. Opposite unit cost and
number of cares per capita seem to be the main cause of healthcare cost variation, moreover they
fluctuate and they are instable among categories and among years.
6 Choice often costrained by data availability
11
Analysis of the overall ASL cost variation 2001-02 vs 2002-03
0.45%
2.92%
1.60%
0.72%
0.75%
6.45%
-2.59%
2.41%
0.64%
1.01%
-1.67%
-3.14%
-4.0% -2.0% 0.0% 2.0% 4.0% 6.0% 8.0%
impact of delta ticket
impact of delta price
impact of average percapita care variation
impact of aging
impact of populationgrowth
Overal cost growth
2001-02 2002-03
Figure 6 Impact of aging and the main determinants tested on overall healthcare expense variation in the
healthcare unit of Lecco during 2001-2003.
Once we had tested that aging effect at constant condition play a marginal role in explaining
annual health care cost variation, we next check if there are any evidences that show different rate of
average per capita expenditure among age groups. Indeed if it is recognizable a systematic greater rate
of growth of the per capita expenditure in older age group compared to others age group the ceteris
paribus condition is a distorting hypothesis and the impact measured is underestimated. For example
Culter highlight as in the USA the healthcare per capita expenditure among over 65 and under one
year old increased disproportionately from 1963 to 1985 ( Cutler and Meara 1999) whilst thereafter
this trend has changed(Meara et al 2004).Our data do not provide any evidence about different growth
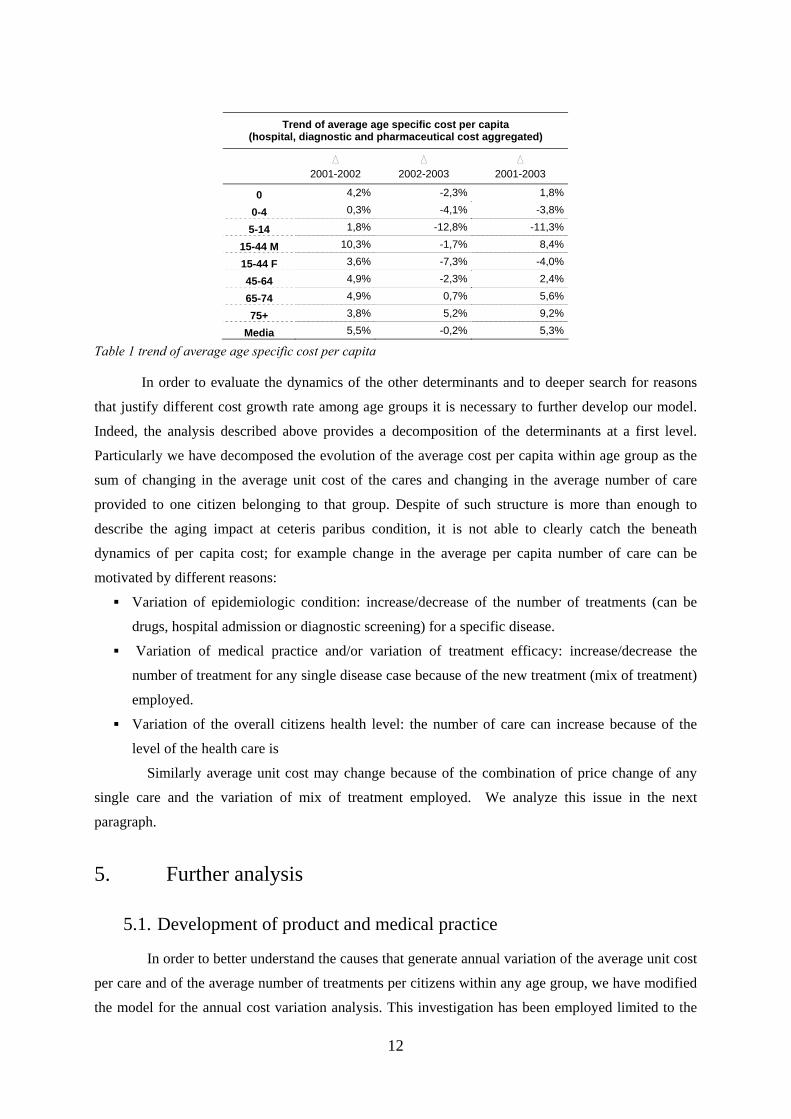
rate of the age specific cost per capita; we detect an overall growth of the cost per capita of over 75
greater compared to the other age group (+9.2%) but this is not true if we analyze 2001-2002 (see
Table 1), the time series is very short and is not enough to establish with a reasonable grade of
confidence if the are different rate of growth, however there are not strong sign that suggest it.
Moreover the literature underscores (Evans 2001, Richardson 1999) that there are no emerging reason
, clinical or epidemiological, that justify a priori greater rate of growth of average cost per capita for
elderly age groups.
12
Trend of average age specific cost per capita (hospital, diagnostic and pharmaceutical cost aggregated)
D 2001-2002
D
2002-2003 D
2001-2003
0 4,2% -2,3% 1,8%
0-4 0,3% -4,1% -3,8%
5-14 1,8% -12,8% -11,3%
15-44 M 10,3% -1,7% 8,4%
15-44 F 3,6% -7,3% -4,0%
45-64 4,9% -2,3% 2,4%
65-74 4,9% 0,7% 5,6%
75+ 3,8% 5,2% 9,2%
Media 5,5% -0,2% 5,3%
Table 1 trend of average age specific cost per capita
In order to evaluate the dynamics of the other determinants and to deeper search for reasons
that justify different cost growth rate among age groups it is necessary to further develop our model.
Indeed, the analysis described above provides a decomposition of the determinants at a first level.
Particularly we have decomposed the evolution of the average cost per capita within age group as the
sum of changing in the average unit cost of the cares and changing in the average number of care
provided to one citizen belonging to that group. Despite of such structure is more than enough to
describe the aging impact at ceteris paribus condition, it is not able to clearly catch the beneath
dynamics of per capita cost; for example change in the average per capita number of care can be
motivated by different reasons:
Variation of epidemiologic condition: increase/decrease of the number of treatments (can be
drugs, hospital admission or diagnostic screening) for a specific disease.
Variation of medical practice and/or variation of treatment efficacy: increase/decrease the
number of treatment for any single disease case because of the new treatment (mix of treatment)
employed.
Variation of the overall citizens health level: the number of care can increase because of the
level of the health care is
Similarly average unit cost may change because of the combination of price change of any
single care and the variation of mix of treatment employed. We analyze this issue in the next
paragraph.
5. Further analysis
5.1. Development of product and medical practice
In order to better understand the causes that generate annual variation of the average unit cost
per care and of the average number of treatments per citizens within any age group, we have modified
the model for the annual cost variation analysis. This investigation has been employed limited to the
13
pharmaceutical cost, in order to introduce a second level of analysis with further variables and
measures that can describe more accurately the dynamics beneath volume and unit cost trend. In first
instance we have changed the unit of measure of the output from the number of prescription to the
number of drug package7. At the second level of analysis we want to separate the variation of the unit
cost due to increase of price from which one caused by a variation of drugs mix consumed. Moreover
we want to establish if the variation of the mix has been caused by a change of the epidemiological
need or by different medical practice as the introduction of new drugs. The crucial point is find out a
criteria to distinguish change of epidemiological need to change of medical practice; we use the ATC
categories to group drugs and then assuming that drugs in the same ATC group is employed to care
the same disease. The ATC code classifies drugs based on organs on which they work, their chemical
and medical properties. We consider cost variation due to change of the share of drugs belonging to an
ATC groups as a modification of the epidemiological needs whilst we consider cost variation due to
change in the mix of drugs consumed within the same ATC group as a proxi of treatments
development. What we call treatments developments is the sum of product development (new drugs)
and more broad medical practice evolution. It is not a simple task to define at which level drugs can be
consider “substitutes” making right our assumption that “within groups changes in the mix are due to
evolution of products and practice” and not due to different disease. This is of course never possible
completely, even if we assume to be able to distinguish a drug group that is used only for a very
specific disease, a physician can opt for one of this drugs instead of another one because of the patient
show specific collaterals need (for example the patient show some allergy)
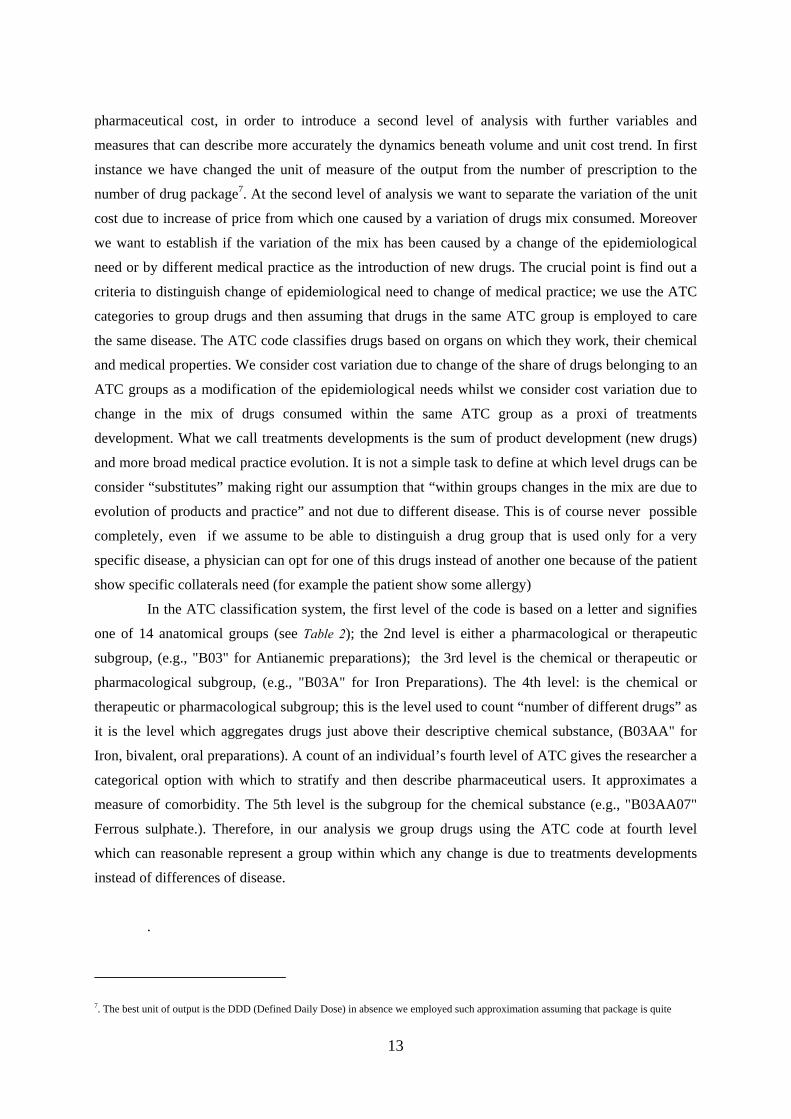
In the ATC classification system, the first level of the code is based on a letter and signifies
one of 14 anatomical groups (see Table 2); the 2nd level is either a pharmacological or therapeutic
subgroup, (e.g., "B03" for Antianemic preparations); the 3rd level is the chemical or therapeutic or
pharmacological subgroup, (e.g., "B03A" for Iron Preparations). The 4th level: is the chemical or
therapeutic or pharmacological subgroup; this is the level used to count “number of different drugs” as
it is the level which aggregates drugs just above their descriptive chemical substance, (B03AA" for
Iron, bivalent, oral preparations). A count of an individual’s fourth level of ATC gives the researcher a
categorical option with which to stratify and then describe pharmaceutical users. It approximates a
measure of comorbidity. The 5th level is the subgroup for the chemical substance (e.g., "B03AA07"
Ferrous sulphate.). Therefore, in our analysis we group drugs using the ATC code at fourth level
which can reasonable represent a group within which any change is due to treatments developments
instead of differences of disease.
.
7. The best unit of output is the DDD (Defined Daily Dose) in absence we employed such approximation assuming that package is quite
14
ATC categories description ATC categories at first level
Alimentary tract and metabolism A Blood and blood forming organs B Cardiovascular system C Dermatologicals D Genito urinary system and sex hormones G Systemic hormonal preparations, excl. Sex hormones and insulins H
Antiinfectives for systemic use J Antineoplastic and immunomodulating agents L Musculo-skeletal system M Nervous system N Antiparasitic products, insecticides and repellents P Respiratory system R Sensory organs S Various V
Table 2 ATC group at first level : the 14 anatomical categories
The annual cost variation can be describing as follow: th in the x group
, , ,, , ,1 1 1
( )n drugsN n ATC
ix t ixy t xy tTOT t TOT t i ti x y
S POP C K K p°°
= = =
= ⋅ ⋅ ⋅ ⋅∑ ∑ ∑
In which Ci,t is the average per capita number of drugs consumed by citizen of the age class i
in the year t, Kix,t is the percentage (in term of number) of drugs consumed belonging to ATC group x,
pxy,t are the unit price of the drugs y and a xy,t the percentage of the drug y on the total drugs
consumed belonging to the same ATC group of the drug y
For example, the annual cost variation due to “treatments development” related to the age
group 45_64 year old is calculated as follow:
, 0245 64 ,03 45 64 ,021 1
45 64 45 64 ,03 45 64 ,03
45 64 ,03 45 64 ,031 1
years anni
anni years
n ATCgroup n drugs in ATC x
xy x xyx y
02-03 years n ATC group n drugs in ATC x
years x yers xyx y
K pS POP C
K
α
α
° °
− −= =
− − − ° °
− −= =
⎛ ⎞⋅ ⋅ −⎜ ⎟
⎝ ⎠Δ = ⋅ ⋅⋅ ⋅
∑ ∑
∑ ∑ , 02xy
subscript 45-64years= age groupsubscript 02 or 03 = yearsC= average n° of drugs consumed per capita K=share of a specific ATC on the overll number of drug consumed by the age
p
⎡ ⎤⎢ ⎥⎢ ⎥⎢ ⎥⎛ ⎞⎢ ⎥⎜ ⎟⎢ ⎥⎝ ⎠⎣ ⎦
groupα=share of the drugs y within their ATC group p=price calibrate for using on a standard periods.
15
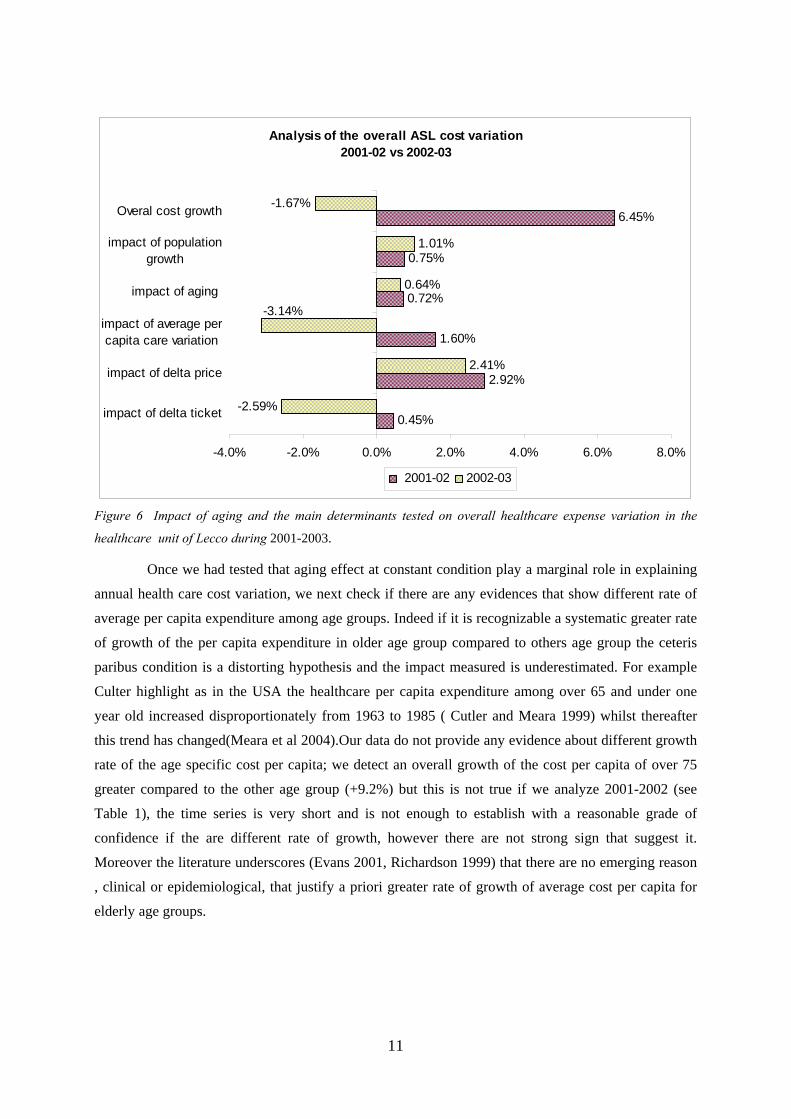
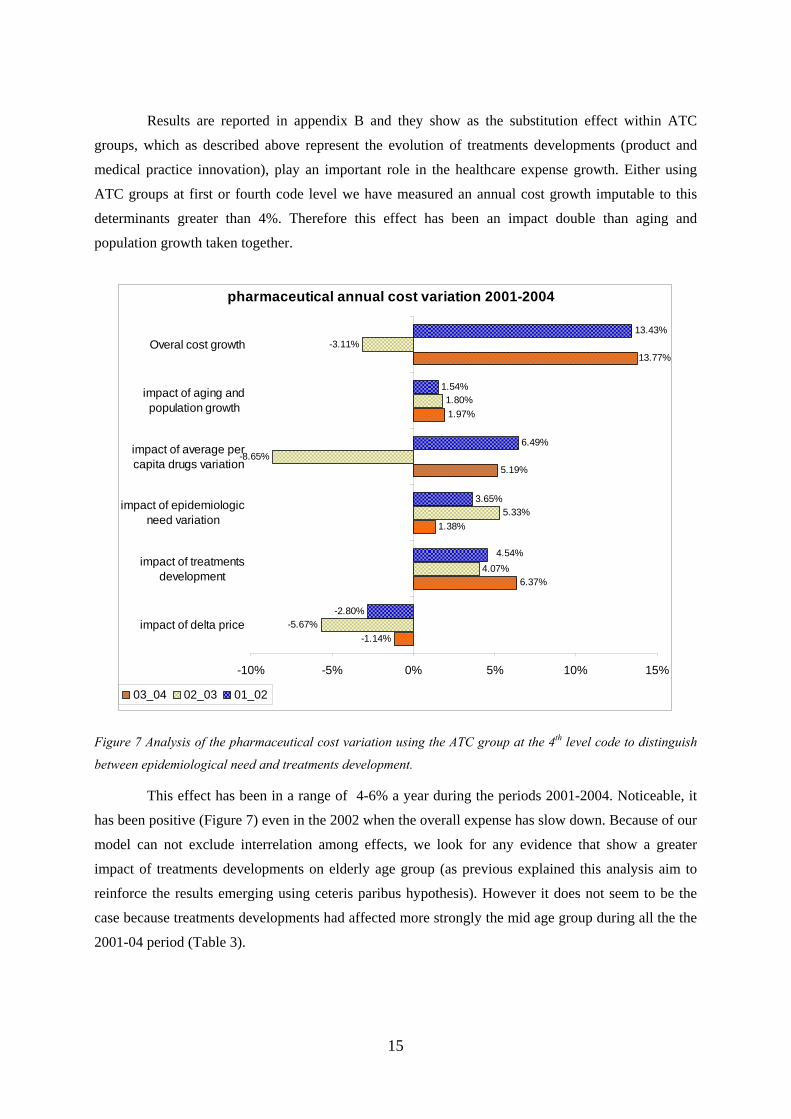
Results are reported in appendix B and they show as the substitution effect within ATC
groups, which as described above represent the evolution of treatments developments (product and
medical practice innovation), play an important role in the healthcare expense growth. Either using
ATC groups at first or fourth code level we have measured an annual cost growth imputable to this
determinants greater than 4%. Therefore this effect has been an impact double than aging and
population growth taken together.
pharmaceutical annual cost variation 2001-2004
-1.14%
6.37%
1.38%
5.19%
1.97%
13.77%
-5.67%
4.07%
5.33%
-8.65%
1.80%
-3.11%
-2.80%
3.65%
6.49%
1.54%
13.43%
4.54%
-10% -5% 0% 5% 10% 15%
impact of delta price
impact of treatmentsdevelopment
impact of epidemiologicneed variation
impact of average percapita drugs variation
impact of aging andpopulation growth
Overal cost growth
03_04 02_03 01_02
Figure 7 Analysis of the pharmaceutical cost variation using the ATC group at the 4th level code to distinguish
between epidemiological need and treatments development.
This effect has been in a range of 4-6% a year during the periods 2001-2004. Noticeable, it
has been positive (Figure 7) even in the 2002 when the overall expense has slow down. Because of our
model can not exclude interrelation among effects, we look for any evidence that show a greater
impact of treatments developments on elderly age group (as previous explained this analysis aim to
reinforce the results emerging using ceteris paribus hypothesis). However it does not seem to be the
case because treatments developments had affected more strongly the mid age group during all the the
2001-04 period (Table 3).

16
Impact of treatments development ATC code at fourth level
Age group 2001-2002 2002-2003 2003-2004
(first 6 month)
<1 3,82% -3,36% -0,11% 1-4 1,93% -0,27% -1,21% 5-14 2,80% 0,56% -0,27% 15-44 M 5,15% 3,68% 7,22% 15-44 F 5,40% 6,18% 11,14% 45-64 4,94% 4,56% 7,73% 65-74 4,23% 4,09% 6,22% >75 4,11% 3,39% 4,09% Totale 4,54% 4,07% 6,37%
Table 3 Specific impact of treatments development on each age group.
5.2. Average number of care per capita
The last part of our model that can be interrelated to aging effect is the variation of the
average number of care per capita. Deepening has been run limited to pharmaceutical cost, as for the
previous parameter we analyze the age specific trend of the average number of care per capita. The
average number can be decomposed as the percentage of citizen that have access to pharmaceutical
care during the year multiplied for the average number of drugs of people that have effectively
accessed (Table 4)
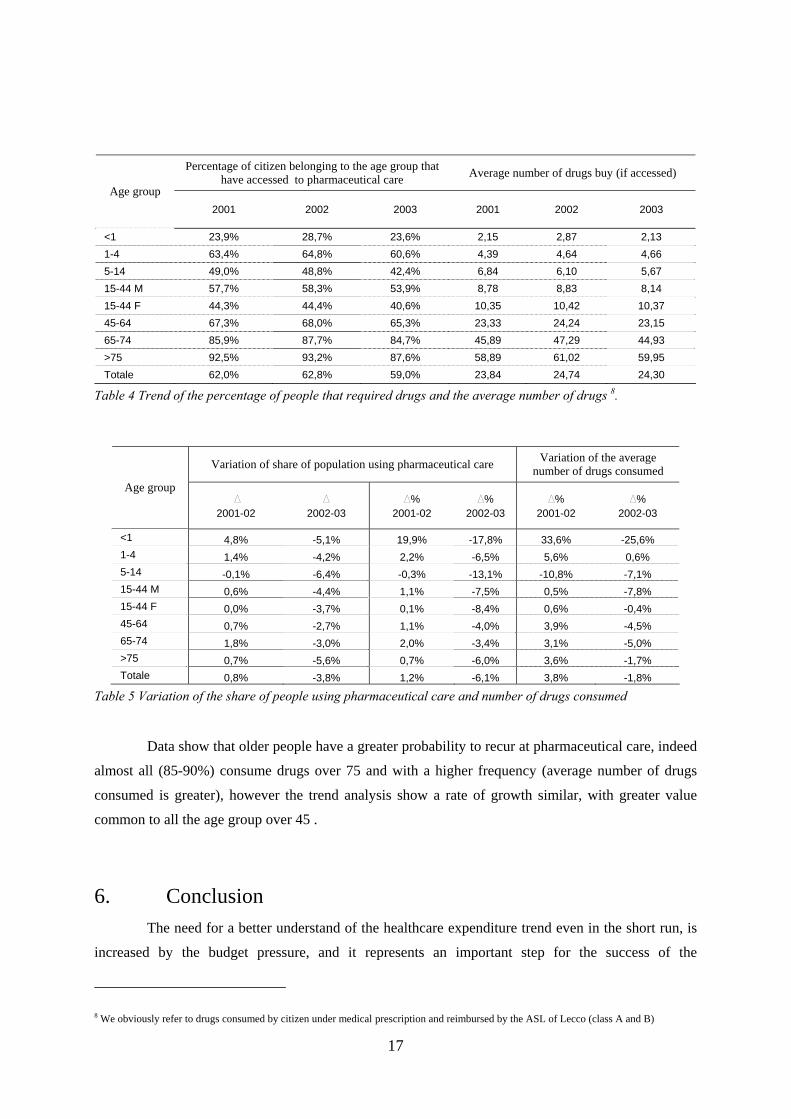
17
Percentage of citizen belonging to the age group that
have accessed to pharmaceutical care Average number of drugs buy (if accessed) Age group
2001 2002 2003 2001 2002 2003
<1 23,9% 28,7% 23,6% 2,15 2,87 2,13 1-4 63,4% 64,8% 60,6% 4,39 4,64 4,66 5-14 49,0% 48,8% 42,4% 6,84 6,10 5,67 15-44 M 57,7% 58,3% 53,9% 8,78 8,83 8,14 15-44 F 44,3% 44,4% 40,6% 10,35 10,42 10,37 45-64 67,3% 68,0% 65,3% 23,33 24,24 23,15 65-74 85,9% 87,7% 84,7% 45,89 47,29 44,93 >75 92,5% 93,2% 87,6% 58,89 61,02 59,95 Totale 62,0% 62,8% 59,0% 23,84 24,74 24,30
Table 4 Trend of the percentage of people that required drugs and the average number of drugs 8.
Variation of share of population using pharmaceutical care Variation of the average number of drugs consumed
Age group D
2001-02 D
2002-03 D%
2001-02 D%
2002-03 D%
2001-02 D%
2002-03
<1 4,8% -5,1% 19,9% -17,8% 33,6% -25,6% 1-4 1,4% -4,2% 2,2% -6,5% 5,6% 0,6% 5-14 -0,1% -6,4% -0,3% -13,1% -10,8% -7,1% 15-44 M 0,6% -4,4% 1,1% -7,5% 0,5% -7,8% 15-44 F 0,0% -3,7% 0,1% -8,4% 0,6% -0,4% 45-64 0,7% -2,7% 1,1% -4,0% 3,9% -4,5% 65-74 1,8% -3,0% 2,0% -3,4% 3,1% -5,0% >75 0,7% -5,6% 0,7% -6,0% 3,6% -1,7% Totale 0,8% -3,8% 1,2% -6,1% 3,8% -1,8%
Table 5 Variation of the share of people using pharmaceutical care and number of drugs consumed
Data show that older people have a greater probability to recur at pharmaceutical care, indeed
almost all (85-90%) consume drugs over 75 and with a higher frequency (average number of drugs
consumed is greater), however the trend analysis show a rate of growth similar, with greater value
common to all the age group over 45 .
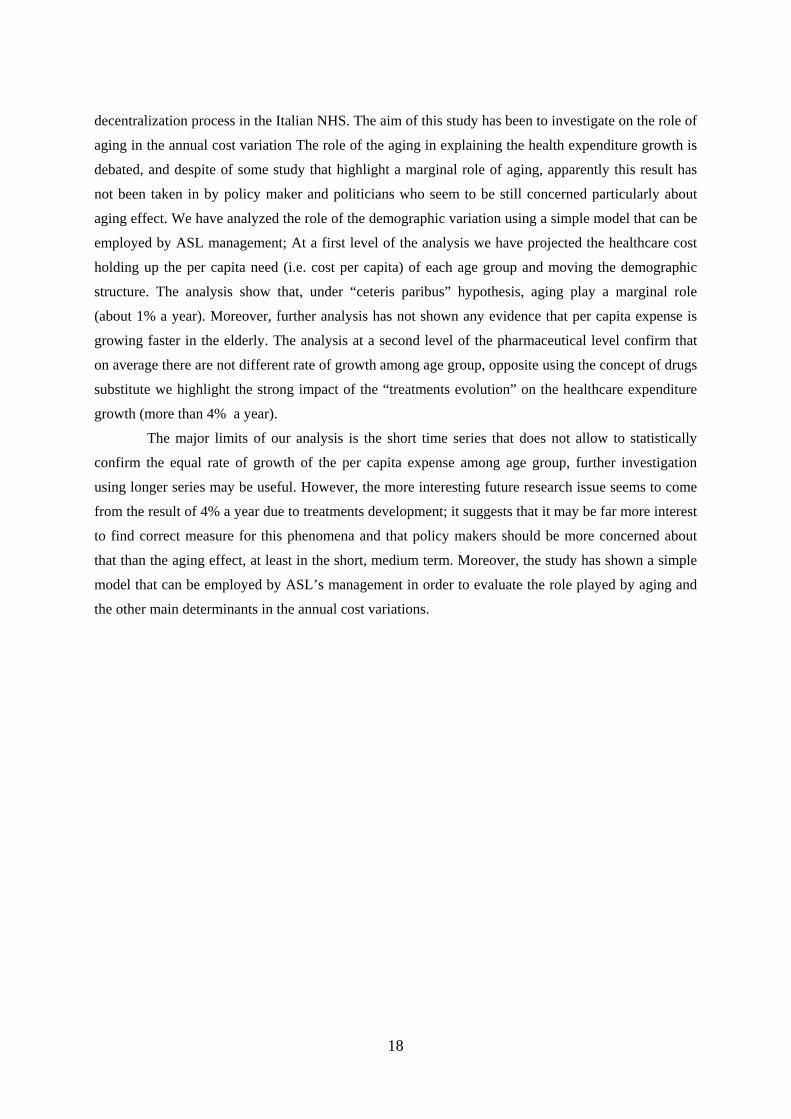
6. Conclusion The need for a better understand of the healthcare expenditure trend even in the short run, is
increased by the budget pressure, and it represents an important step for the success of the
8 We obviously refer to drugs consumed by citizen under medical prescription and reimbursed by the ASL of Lecco (class A and B)
18
decentralization process in the Italian NHS. The aim of this study has been to investigate on the role of
aging in the annual cost variation The role of the aging in explaining the health expenditure growth is
debated, and despite of some study that highlight a marginal role of aging, apparently this result has
not been taken in by policy maker and politicians who seem to be still concerned particularly about
aging effect. We have analyzed the role of the demographic variation using a simple model that can be
employed by ASL management; At a first level of the analysis we have projected the healthcare cost
holding up the per capita need (i.e. cost per capita) of each age group and moving the demographic
structure. The analysis show that, under “ceteris paribus” hypothesis, aging play a marginal role
(about 1% a year). Moreover, further analysis has not shown any evidence that per capita expense is
growing faster in the elderly. The analysis at a second level of the pharmaceutical level confirm that
on average there are not different rate of growth among age group, opposite using the concept of drugs
substitute we highlight the strong impact of the “treatments evolution” on the healthcare expenditure
growth (more than 4% a year).
The major limits of our analysis is the short time series that does not allow to statistically
confirm the equal rate of growth of the per capita expense among age group, further investigation
using longer series may be useful. However, the more interesting future research issue seems to come
from the result of 4% a year due to treatments development; it suggests that it may be far more interest
to find correct measure for this phenomena and that policy makers should be more concerned about
that than the aging effect, at least in the short, medium term. Moreover, the study has shown a simple
model that can be employed by ASL’s management in order to evaluate the role played by aging and
the other main determinants in the annual cost variations.
19
References
[1] Mahal A., Barman P., 2001; “Health Expenditures and the Elderly: a survey of issues in forecasting, methods used, and relevance for developing countries”, Research Paper No. 01.23, The global burden of disease 2000 in aging populations, Harvard Burden of Disease Unit, Cambridge, MA, December 2001.
[2] Mapelli V. 2000; "Tre riforme sanitarie e ventuno modelli regionali" in Bernardi: “La finanza pubblica italiana. Rapporto 2000.” Il Mulino, Bologna.
[3] Newhouse, J.P., 1992. “Medical care costs: how much welfare loss?” Journal of Economic Perspectives 6, 3–21.
[4] Fuchs V. 1998; “Health care for the elderly: How much? Who will pay for it?” Working Paper #6755. Cambridge, MA: National Bureau of Economic Research.
[5] Fuchs V. 1998; “Provide, Provide: The Economics Of Aging” WIP, Cambridge, MA: National Bureau of Economic Research.Scitovsky A. 1988; “Medical care in the last twelve months of life: The relation between age, functional status, and medical care expenditures.” Milbank Memorial Fund Quarterly; 66(4):640-60.
[6] Richardson J., Robertson I. 1999; “Ageing and the cost of health services.” Policy implications of the Ageing of Australia's Population Conference.
[7] Chernichovskya D. Markowitz., 2004,“Aging and aggregate costs of medical care: conceptual and policy issues.” Health Economics, 13: 543–562.
[8] Schulz E., Liidl R., König H. 2003; “The impact of ageing on hospital care and long-term care: the example of Germany; health policy; article in press.
[9] Cutler D.M., Meara E. 1999; "The Concentration of Medical Spending: An Update," NBER Working Paper no. 7229 (Cambridge, Mass.: NBER, August,).
[10] Meara et al. 2004; “Trends In Medical Spending By Age, 1963–2000” Health Affairs; 23: 176-183
[11] Boccuti Moon M. 2003; "Comparing Medicare and Private Insurers: Growth Rates in Spending over Three Decades." Health Affairs; Mar/Apr: 230-237
[12] Evans et al. 2001; "Apocalypse No: Population Aging and the Future of the Health Care System" First author, with K. McGtail, S. Morgan, M.L. Barer, and C. Hertzman) Canadian Journal on Aging; 20, supplement 1: 160-191.
[13] Getzen T.E. 2000; “Health care is an individual necessity and a national luxury: applying multilevel decision models to the analysis of health care expenditures” Journal of Health Economics; 19:259–270.
[14] Reinhardt U.E. 2003; “Does the aging of the population really drive the demand for health care?” Health Affairs; 22: 27-39.
[15] Seshamania M., Grayb A. 2004; “Ageing and health-care expenditure: the red herring argument revisited.” Health Economics; 13: 303–314.
20
APPENDIX A
Results of the annual cost variation analysis for each care macrocategories
Hospital cost variation 2001-2002 B-A C-B D-C E-D
Δ Population Δ age structure Δ average per capita care
Δ Average unit cost per care Age group
Δ (€) Δ (%) Δ (€) Δ (%) Δ (€) Δ (%) Δ (€) Δ (%) 0 29.202 0,75 70.726 1,82 -25.869 -0,66 163.383 4,20
1-4 19.942 0,75 -7.622 -0,29 -281.018 -10,57 154.447 5,81 5-14 25.785 0,75 9.547 0,28 19.295 0,56 -342.278 -9,95
15-44 M 89.213 0,75 -112.126 -0,94 121.822 1,02 903.797 7,60 15-44 F 124.369 0,75 -115.431 -0,70 -73.853 -0,45 -392.868 -2,37 45-64 272.571 0,75 -15.443 -0,04 -1.777.013 -4,89 1.572.487 4,33 65-74 232.108 0,75 186.078 0,60 -1.497.193 -4,84 1.436.575 4,64 75+ 230.368 0,75 1.028.500 3,35 -1.267.178 -4,12 541.038 1,76
Scostamenti tot 1.023.558 +0,75 1.044.229 +0,76 -4.781.007 -3,50 4.036.581 +2,96
D Totale 1.323.360 € +0,97%
Hospital cost variation 2002-2003 B-A C-B D-C E-D
Δ Population Δ age structure Δ average per capita care
Δ Average unit cost per care Age group
Δ (€) Δ (%) Δ (€) Δ (%) Δ (€) Δ (%) Δ (€) Δ (%) 0 41.733 1,01 -143.646 -3,48 -78.403 -1,90 908 0,02
1-4 25.707 1,01 37.453 1,47 -22.085 -0,87 -43.891 -1,72 5-14 31.826 1,01 -11.972 -0,38 -294.754 -9,35 -208.011 -6,60
15-44 M 130.295 1,01 -91.641 -0,71 -292.617 -2,27 -185.564 -1,44 15-44 F 162.899 1,01 -82.786 -0,51 -501.531 -3,11 257.010 1,59 45-64 367.679 1,01 -126.387 -0,35 -959.079 -2,63 790.956 2,17 65-74 316.256 1,01 480.736 1,54 359.999 1,15 791.878 2,53 75+ 315.682 1,01 780.770 2,50 400.309 1,28 2.528.850 8,09
Scostamenti tot 1.392.078 1,01 842.526 0,61 -1.388.162 -1,01 3.932.135 2,85
Δ Totale +4.778.577 € +3,47%
21
Diagnostic cost variation 2001-2002 B-A B-A C-B D-C E-D
Δ Population Δ age structure Δ average per capita care
Δ Average unit cost per care Δ ticket Age group
Δ (€) Δ (%) Δ (€) Δ (%) Δ (€) Δ (%) Δ (€) Δ
(%) Δ (€) Δ (%)
0 1.223 0,95 646 0,50 26.731 20,76 592 0,46 -4.788 -3,721-4 5.384 0,95 2.844 0,50 36.430 6,43 75.425 13,31 2.852 0,50 5-14 10.199 0,95 -8.773 -0,82 71.232 6,63 201.756 18,79 118.505 11,04
15-44 M 36.843 0,95 -37.184 -0,96 268.011 6,91 322.178 8,31 328.220 8,46 15-44 F 42.653 0,95 -18.348 -0,41 295.560 6,58 337.064 7,51 413.844 9,22 45-64 85.757 0,95 44.866 0,50 241.224 2,67 445.344 4,93 399.975 4,43 65-74 75.849 0,95 -20.897 -0,26 275.000 3,44 336.581 4,22 40.252 0,50 75+ 48.636 0,95 161.291 3,15 214.205 4,18 704.941 13,77 19.921 0,39
Scost. tot 306.544 0,95 124.445 0,39 1.428.392 4,43 2.423.880 7,51 1.318.782 4,09
Δ Totale +5.602.043 € +17,36%
Diagnostic cost variation 2002-2003 B-A B-A C-B D-C E-D
Δ Population Δ age structure Δ average per capita care
Δ Average unit cost per care Δ ticket Age group
Δ (€) Δ (%) Δ (€) Δ (%) Δ (€) Δ (%) Δ (€) Δ (%) Δ (€) Δ (%)0 1.547 1,01 -5.326 -3,48 -7.868 -5,14 -1.109 -0,72 -474 -0,31
1-4 6.966 1,01 10.148 1,47 5.685 0,82 -15.853 -2,30 -10.786 -1,565-14 14.813 1,01 -5.572 -0,38 -6.249 -0,43 -91.934 -6,27 -75.266 -5,13
15-44 M 48.444 1,01 -24.620 -0,51 -487.624 -10,17 180.098 3,75 -237.366 -4,9515-44 F 56.164 1,01 -39.502 -0,71 -287.790 -5,18 149.355 2,69 -201.330 -3,6245-64 103.470 1,01 -35.567 -0,35 -318.082 -3,11 355.865 3,47 -253.579 -2,4865-74 87.781 1,01 133.435 1,54 -26.545 -0,31 341.196 3,93 -40.410 -0,4675+ 63.315 1,01 156.597 2,50 254.659 4,06 129.389 2,06 17.494 0,28
Scost. tot 382.500 1,01 189.594 0,50 -873.815 -2,31 1.047.007 2,76 -801.717 -2,12
Δ Totale -56.430 € -0,15%
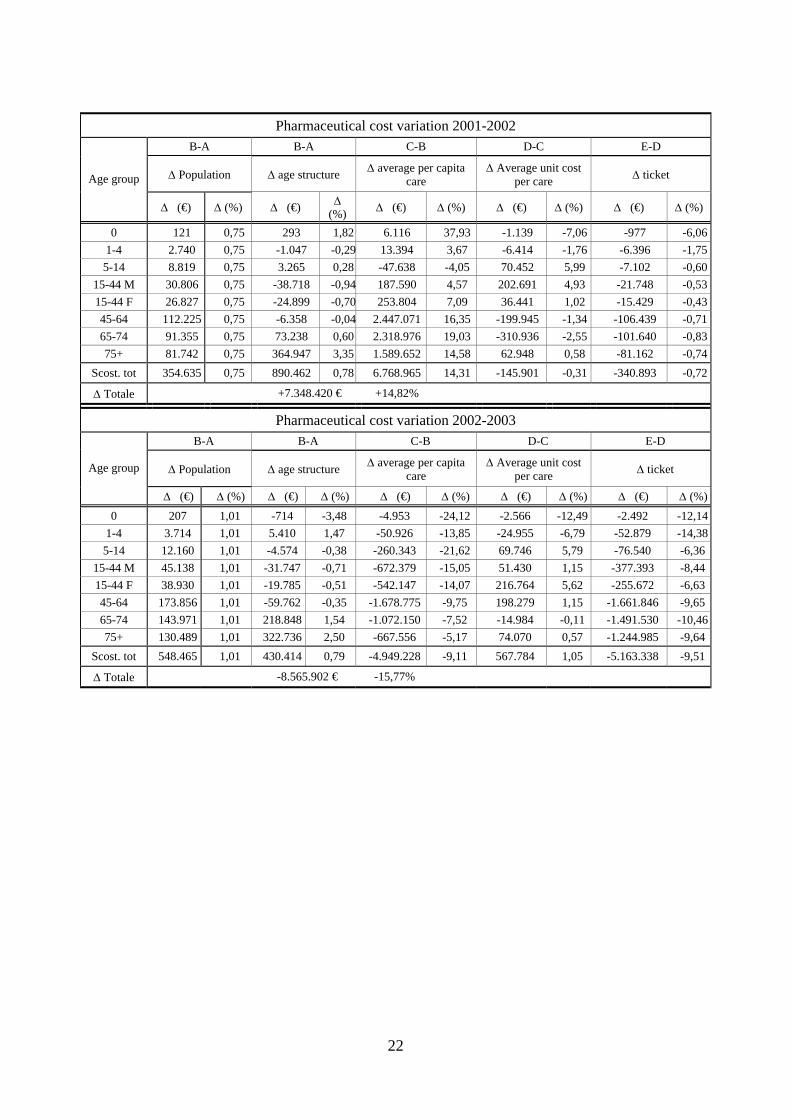
22
Pharmaceutical cost variation 2001-2002 B-A B-A C-B D-C E-D
Δ Population Δ age structure Δ average per capita care
Δ Average unit cost per care Δ ticket Age group
Δ (€) Δ (%) Δ (€) Δ (%) Δ (€) Δ (%) Δ (€) Δ (%) Δ (€) Δ (%)
0 121 0,75 293 1,82 6.116 37,93 -1.139 -7,06 -977 -6,061-4 2.740 0,75 -1.047 -0,29 13.394 3,67 -6.414 -1,76 -6.396 -1,755-14 8.819 0,75 3.265 0,28 -47.638 -4,05 70.452 5,99 -7.102 -0,60
15-44 M 30.806 0,75 -38.718 -0,94 187.590 4,57 202.691 4,93 -21.748 -0,5315-44 F 26.827 0,75 -24.899 -0,70 253.804 7,09 36.441 1,02 -15.429 -0,4345-64 112.225 0,75 -6.358 -0,04 2.447.071 16,35 -199.945 -1,34 -106.439 -0,7165-74 91.355 0,75 73.238 0,60 2.318.976 19,03 -310.936 -2,55 -101.640 -0,8375+ 81.742 0,75 364.947 3,35 1.589.652 14,58 62.948 0,58 -81.162 -0,74
Scost. tot 354.635 0,75 890.462 0,78 6.768.965 14,31 -145.901 -0,31 -340.893 -0,72
Δ Totale +7.348.420 € +14,82%
Pharmaceutical cost variation 2002-2003 B-A B-A C-B D-C E-D
Δ Population Δ age structure Δ average per capita care
Δ Average unit cost per care Δ ticket Age group
Δ (€) Δ (%) Δ (€) Δ (%) Δ (€) Δ (%) Δ (€) Δ (%) Δ (€) Δ (%)0 207 1,01 -714 -3,48 -4.953 -24,12 -2.566 -12,49 -2.492 -12,14
1-4 3.714 1,01 5.410 1,47 -50.926 -13,85 -24.955 -6,79 -52.879 -14,385-14 12.160 1,01 -4.574 -0,38 -260.343 -21,62 69.746 5,79 -76.540 -6,36
15-44 M 45.138 1,01 -31.747 -0,71 -672.379 -15,05 51.430 1,15 -377.393 -8,4415-44 F 38.930 1,01 -19.785 -0,51 -542.147 -14,07 216.764 5,62 -255.672 -6,6345-64 173.856 1,01 -59.762 -0,35 -1.678.775 -9,75 198.279 1,15 -1.661.846 -9,6565-74 143.971 1,01 218.848 1,54 -1.072.150 -7,52 -14.984 -0,11 -1.491.530 -10,4675+ 130.489 1,01 322.736 2,50 -667.556 -5,17 74.070 0,57 -1.244.985 -9,64
Scost. tot 548.465 1,01 430.414 0,79 -4.949.228 -9,11 567.784 1,05 -5.163.338 -9,51
Δ Totale -8.565.902 € -15,77%
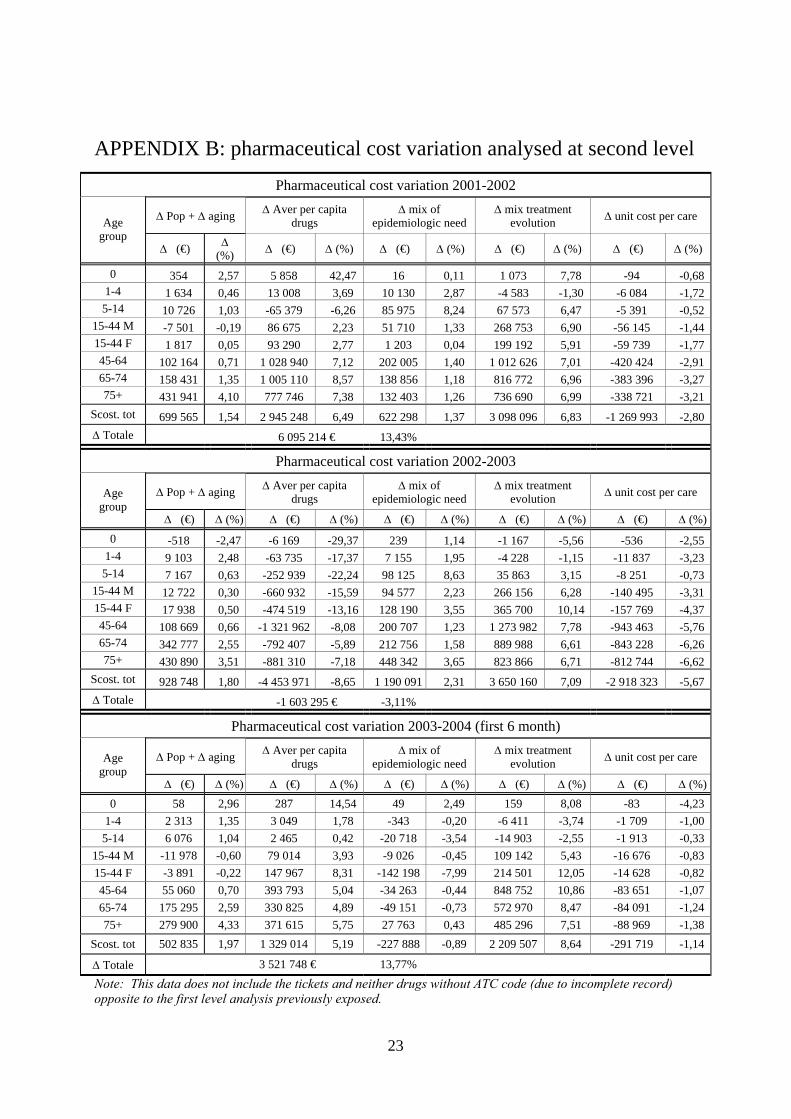
23
APPENDIX B: pharmaceutical cost variation analysed at second level Pharmaceutical cost variation 2001-2002
Δ Pop + Δ aging Δ Aver per capita drugs
Δ mix of epidemiologic need
Δ mix treatment evolution Δ unit cost per care Age
group Δ (€) Δ
(%) Δ (€) Δ (%) Δ (€) Δ (%) Δ (€) Δ (%) Δ (€) Δ (%)
0 354 2,57 5 858 42,47 16 0,11 1 073 7,78 -94 -0,68 1-4 1 634 0,46 13 008 3,69 10 130 2,87 -4 583 -1,30 -6 084 -1,72 5-14 10 726 1,03 -65 379 -6,26 85 975 8,24 67 573 6,47 -5 391 -0,52
15-44 M -7 501 -0,19 86 675 2,23 51 710 1,33 268 753 6,90 -56 145 -1,44 15-44 F 1 817 0,05 93 290 2,77 1 203 0,04 199 192 5,91 -59 739 -1,77 45-64 102 164 0,71 1 028 940 7,12 202 005 1,40 1 012 626 7,01 -420 424 -2,91 65-74 158 431 1,35 1 005 110 8,57 138 856 1,18 816 772 6,96 -383 396 -3,27 75+ 431 941 4,10 777 746 7,38 132 403 1,26 736 690 6,99 -338 721 -3,21
Scost. tot 699 565 1,54 2 945 248 6,49 622 298 1,37 3 098 096 6,83 -1 269 993 -2,80 Δ Totale 6 095 214 € 13,43%
Pharmaceutical cost variation 2002-2003
Δ Pop + Δ aging Δ Aver per capita drugs
Δ mix of epidemiologic need
Δ mix treatment evolution Δ unit cost per care Age
group Δ (€) Δ (%) Δ (€) Δ (%) Δ (€) Δ (%) Δ (€) Δ (%) Δ (€) Δ (%)
0 -518 -2,47 -6 169 -29,37 239 1,14 -1 167 -5,56 -536 -2,55 1-4 9 103 2,48 -63 735 -17,37 7 155 1,95 -4 228 -1,15 -11 837 -3,23 5-14 7 167 0,63 -252 939 -22,24 98 125 8,63 35 863 3,15 -8 251 -0,73
15-44 M 12 722 0,30 -660 932 -15,59 94 577 2,23 266 156 6,28 -140 495 -3,31 15-44 F 17 938 0,50 -474 519 -13,16 128 190 3,55 365 700 10,14 -157 769 -4,37 45-64 108 669 0,66 -1 321 962 -8,08 200 707 1,23 1 273 982 7,78 -943 463 -5,76 65-74 342 777 2,55 -792 407 -5,89 212 756 1,58 889 988 6,61 -843 228 -6,26 75+ 430 890 3,51 -881 310 -7,18 448 342 3,65 823 866 6,71 -812 744 -6,62
Scost. tot 928 748 1,80 -4 453 971 -8,65 1 190 091 2,31 3 650 160 7,09 -2 918 323 -5,67 Δ Totale -1 603 295 € -3,11%
Pharmaceutical cost variation 2003-2004 (first 6 month)
Δ Pop + Δ aging Δ Aver per capita drugs
Δ mix of epidemiologic need
Δ mix treatment evolution Δ unit cost per care Age
group Δ (€) Δ (%) Δ (€) Δ (%) Δ (€) Δ (%) Δ (€) Δ (%) Δ (€) Δ (%)
0 58 2,96 287 14,54 49 2,49 159 8,08 -83 -4,23 1-4 2 313 1,35 3 049 1,78 -343 -0,20 -6 411 -3,74 -1 709 -1,00 5-14 6 076 1,04 2 465 0,42 -20 718 -3,54 -14 903 -2,55 -1 913 -0,33
15-44 M -11 978 -0,60 79 014 3,93 -9 026 -0,45 109 142 5,43 -16 676 -0,83 15-44 F -3 891 -0,22 147 967 8,31 -142 198 -7,99 214 501 12,05 -14 628 -0,82 45-64 55 060 0,70 393 793 5,04 -34 263 -0,44 848 752 10,86 -83 651 -1,07 65-74 175 295 2,59 330 825 4,89 -49 151 -0,73 572 970 8,47 -84 091 -1,24 75+ 279 900 4,33 371 615 5,75 27 763 0,43 485 296 7,51 -88 969 -1,38
Scost. tot 502 835 1,97 1 329 014 5,19 -227 888 -0,89 2 209 507 8,64 -291 719 -1,14
Δ Totale 3 521 748 € 13,77%
Note: This data does not include the tickets and neither drugs without ATC code (due to incomplete record) opposite to the first level analysis previously exposed.