Film and Digital Media Industry Los Angeles County Perspective
206
Film and Digital Media Industry Los Angeles County Perspective
-
Upload
khangminh22 -
Category
Documents
-
view
1 -
download
0
Transcript of Film and Digital Media Industry Los Angeles County Perspective

Film and Digital Media Industry Los Angeles County Perspective

Project Advisors
project team
Founded in 2007, Beacon Economics, an LLC and
certified Small Business Enterprise (SBE) with the
state of California, is an independent research and
consulting firm dedicated to delivering accurate,
insightful, and objectively-based economic
analysis. Leveraging unique proprietary models,
vast databases, and sophisticated data processing,
the company specializes in services like industry
analysis, economic policy analysis, economic
impact analysis, and real estate market analysis.
Beacon Economics equips its clients with both the
data and the analysis required to understand the
significance of on-the-ground realities and to make
informed business and policy decisions.
Christopher Thornberg, PhDFounding Partner
Adam J. FowlerDirector of Research
Alysa HannonClient and Product Development Manager
Taner Osman, PhDSenior Research Associate
Dustin SchraderResearch Manager
Hoyu ChongSenior Research Associate
Justin NiakamalSenior Research Associate
Peter BreslinResearch Associate
Jordan GialiResearch Associate
Mazen Bou ZeineddineResearch Intern
Robert Kleinhenz, PhDExecutive Director of Economic Research
Film and Digital Media IndustryLos Angeles County PerspectivePrepared by Beacon Economics

Special Thanks to
Commissioned by
Doug Baron and Gary Smith, Economic Development Division, Chief Executive Office, County of Los Angeles; Amy Lemisch,
California Film Commission; Ed Duffy, Teamsters Local 399; Kevin James and Eva Bitar, City of Los Angeles; Sarah Walsh,
Motion Picture Association of America (MPAA); Paul Audley, FilmL.A.; Philip Sokoloski, FilmL.A.; Donna Washington,
FilmL.A.; Michael DeLorenzo, Santa Clarita Studios; Stosh Mintek, Ghetto Film School; Juan Camacho, 21st Century Fox;
Elnie Vannatim, 21st Century Fox; Sabrina Dridje, Telly Awards and formerly Made in NY Media Center.
AcknowledgementsCounty of Los Angeles, Chief Executive Office
The contents of this report are based on information derived from carefully selected sources we believe are reasonable. We do not guarantee its accuracy or completeness, and nothing in this document shall be construed to be a representation of such a guarantee.
Los Angeles County is one of the nation’s largest counties, totaling 4,084 square miles, and is its most populous with nearly 10 million residents, who account for approximately 27 percent of California’s population. As a subdivision of the state, the County is charged with providing numerous services that affect the lives of all residents, including law enforcement, tax collection, public health protection, public social services, elections, and flood control.

Film and television production has long been at the core of the L.A. regional economy, and Beacon Economics was tasked with examining the industry implications of disruptions accompanying the rise of digital distribution and emerging online platforms.
Key goals of the Los Angeles County Chief Executive Office in commissioning this report include identifying priority issues for the Film and Digital Media industry and recommending specific action items for the County of Los Angeles’ consideration in enhancing the industry’s regional competitiveness as it evolves and in facilitating its inclusive growth in L.A. County.
PREFACEThe Los Angeles County Chief
Executive Office engaged Beacon
Economics to undertake an analysis
of the Film and Digital Media industry
with a focus on Los Angeles County
and strategies for inclusive growth.

Table of Contents
Executive Summary
Introduction
Industry Analysis
Inclusionary Growth
Growth Landscape
Intervention Framework & Recommendations
Appendix
1
13
27
85
109
135
157

The blurring of traditional industry lines presents
a challenge to researchers attempting to define
and measure the reach and scope of such a
dynamic and large sector of the economy. Official
government economic statistics are useful in
classifying and measuring data with regard to
current and legacy industries, but they are often
misleading amid rapid, cross-sectoral industry
disruption. This report draws from a number of
data sources to define the Film and Digital Media
industry in L.A. County and to offer a conceptual
roadmap for supporting its future economic growth
and talent development. This report posits that the
perceived fragmentation of the market for services
and products generated by the Film and Digital
Media industry may ultimately be representative
of a broader shift toward greater integration and
interconnectedness and importantly, an opportunity
for L.A. County.
executive summary
As global content consumption increases, due in part to seamless access to video content across a diversifying menu of devices – mobile, laptop, television – the arbitrary lines between television, film, publishing, and advertising have becoming increasingly blurred.
1 FDMI | Los Angeles County Perspective

Film Sector (comprised of 3 sectors)
Digital Media (comprised of 4 sectors)
Film and Digital Media Industry Cluster (comprised of 30 sectors)
Icons
• Film • Artists and Agents• Sound Production and
Recording
• Advertising Agencies• Agents and Managers for Artists,
Athletes, Entertainers and Other Public Figures
• Commercial Photography• Graphic Design Services• Independent Artists, Writers, and
Performers• Libraries and Archives• Marketing Research and Public Opinion
Polling• Media Buying Agencies• Media Representatives• Photography Studios, Portrait• Cable and Other Subscription
Programming• Internet Publishing and Broadcasting• Internet Publishing and Broadcasting and
Web Search Portals• News Syndicates
• Television Broadcasting• Web Search Portal• Motion Picture and Video Distribution• Motion Picture and Video Production• Music Publishers• Other Motion Picture and Video
Industries• Teleproduction and Other Postproduction
Services• Other Sound Recording Industries• Sound Recording Studios• All Other Publishers• Book Publishers• Newspaper Publishers• Periodical Publishers• Software Publishers• Custom Computer Programming Services• Data Processing, Hosting, and Related
Services
• Publishers• Broadcasting • Professional Services &
Business Operations • Emerging Digital Media*
*Emerging Digital Media specifically refers to three subsectors: Data Processing, Hosting, and Related Services; Internet Publishing and Broadcasting and Web Search Portals; and, Custom Computer Programming Services.
Source: Beacon Economics
2FDMI | Los Angeles County Perspective

FILM AND DIGITAL MEDIA Cluster definition Figure 1.1
SOUND PRODUCTION AND RECORDING
Music Publishers
Other Sound Recording Industries
Sound Recording Studios
ARTISTS AND AGENTS
Agents and Managers for Artists, Athletes, Entertainers, and Other Public Figures
Independent Artists, Writers, and Performers
Motion Picture and Video Production
Motion Picture and Video Distribution
Teleproduction and Other Postproduction Services
Other Motion Picture and Video Industries
FILM
Example Firms Per
Sector
Source: Beacon Economics
• Amazon Studios• Netflix• Deluxe Entertainment• Disney Enterprises• Warner Bros.• Universal Studios• Sony Pictures Entertainment
• International Creative Management, Inc. (ICM)
• Creative Artists Agency (CAA)• William Morris Endeavor
Entertainment (WME)• The Young Turks• Bento Box Entertainment
• Universal Music Group• Warner Bros. Records• Sony Interactive Entertainment• Stupid Buddy Studios
3 FDMI | Los Angeles County Perspective
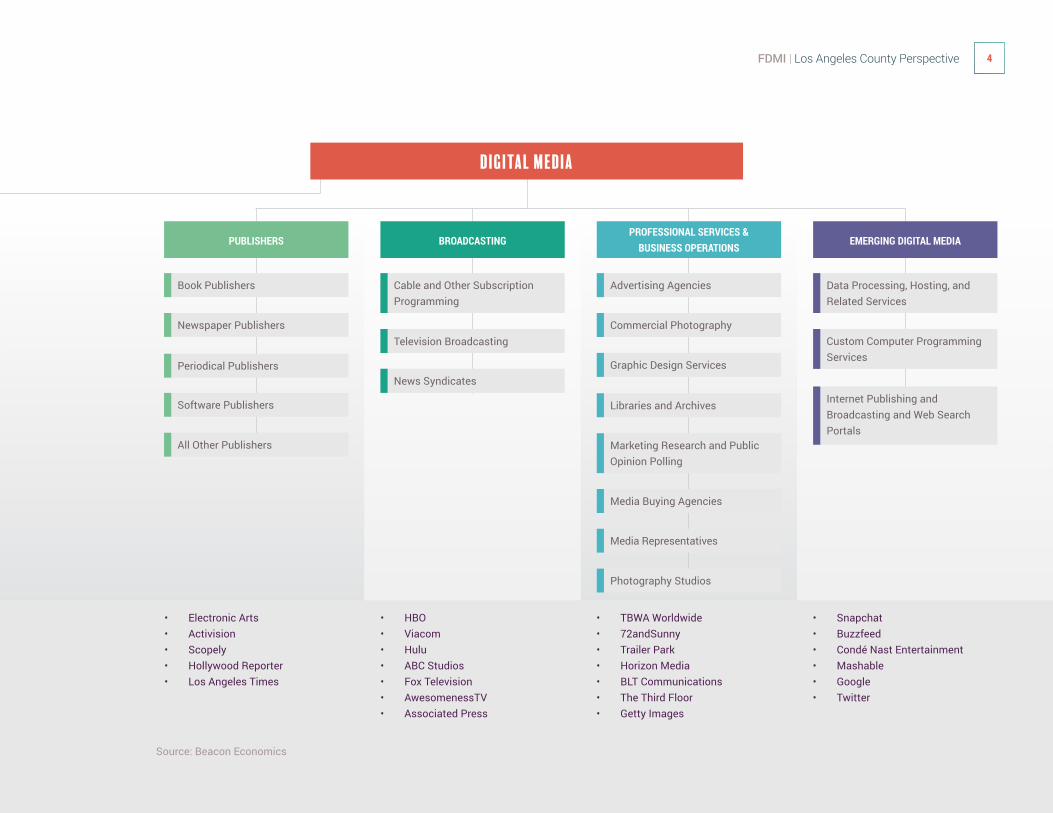
Digital media
PUBLISHERS
Book Publishers
Newspaper Publishers
Periodical Publishers
Software Publishers
All Other Publishers
PROFESSIONAL SERVICES & BUSINESS OPERATIONS
Advertising Agencies
Commercial Photography
Graphic Design Services
Media Buying Agencies
Photography Studios
Media Representatives
Libraries and Archives
Marketing Research and Public Opinion Polling
EMERGING DIGITAL MEDIA
Data Processing, Hosting, and Related Services
Custom Computer Programming Services
Internet Publishing and Broadcasting and Web Search Portals
BROADCASTING
Cable and Other Subscription Programming
Television Broadcasting
News Syndicates
Source: Beacon Economics
• Electronic Arts• Activision• Scopely• Hollywood Reporter• Los Angeles Times
• TBWA Worldwide• 72andSunny• Trailer Park• Horizon Media• BLT Communications• The Third Floor• Getty Images
• HBO• Viacom• Hulu• ABC Studios• Fox Television• AwesomenessTV• Associated Press
• Snapchat• Buzzfeed• Condé Nast Entertainment• Mashable• Google• Twitter
4FDMI | Los Angeles County Perspective

Film and digital media encompass a wide variety of industries. As film and digital media continue to co-evolve, embracing new and innovative activities, film and digital media become increasingly more co-mingled. Beacon Economics distinguishes between traditional sectors of the economy that predate the digital age, though they are certainly enhanced or broadened by it, and those industries that have recently emerged as a result of the digital age and whose core functions pivot around the generation and distribution of digital content.
Beacon Economics aggregated thirty-two (32) relevant industries at the 6-digit North American Industry Classification System level into seven (7) unique sectors: Film, Publishers, Broadcasting, Professional Services and Business Operations, Emerging Digital Media, Artists and Agents and Sound Production and Recording in order to create a taxonomy of convergent creative sectors.
The seven (7) sectors capture the collection of industries that have a locally configured value chain of relationships among firms and suppliers of inputs and support services. That chain consists of production and post-production firms, broadcasters, distributors, digital platforms, and specialized service providers such as production facilities, guilds, unions, agencies, and a specialized labor pool.
For purposes of this report a sector refers to one of the following: Film, Publishers, Broadcasting, Professional Services and Business Operations, Emerging Digital Media, Artists and Agents and Sound Production and Recording as defined above.
Nationally, the Film and Emerging Digital
Media sectors are the only sectors of the
industry to have grown over the period
between 2001 and 2016.
Within the Film and Digital Media industry,
the Emerging Digital Media sector pays the
highest wages nationally, roughly $124,700
per worker.
Film and Digital Media Industry cluster
SECTOR
Label Description Example of Usage
Taxonomy
Source: Beacon Economics
5 FDMI | Los Angeles County Perspective

JOBS
The Film sector is the largest component of the cluster in L.A.
County employing 164,100 people – 46% of the nation’s film sector
employment. Following Film is Emerging Digital Media with 36,200
employees, and Professional Services employing 29,000. The
Broadcasting sector employs 18,600 people and Publishers and
Sound Production round out the cluster with 15,600 and 1,700
respectively. The Film and Digital Media industry accounts for 6.1% of
jobs in Los Angeles County.
The Los Angeles County Film and Digital Media industry includes 265,000 jobs that produce or facilitate digital video production – accounting for around 9% of United States’ Film and Digital Media employment.
6FDMI | Los Angeles County Perspective

Industry Wages GROWTH
In the Film sector, the average wage is $98,800 in Los Angeles
County compared to $90,800 nationwide. The average wage
in the Publishing ($147,800), Broadcasting ($141,500), and
Emerging Digital Media ($123,200) sectors all eclipsed the
average wage found in Film. Across each industry sector
the average wage in Los Angeles County beat the national
average except for Emerging Digital Media where wages were
on par with the national average of $124,700.
The industry grew from 215,800 jobs to 265,200, an increase
of 23%. In comparison, employment in the industry grew
by 12% in New York and 15% nationally. The Film Sector
accounted for the majority of job gains adding 34,300 jobs
followed by the Emerging Digital Media Sector with 7,700
jobs. Beacon Economics believes growth will continue
through 2020 with the Film and Digital Media industry adding
16,500 additional jobs. Beacon Economics estimates 7,000
new jobs will be in the Film Sector and 3,800 in Emerging
Digital Media
The average wage in the Film and Digital Media industry in Los Angeles County is $117,000. The industry has a +95% wage premium compared to the average wage economy-wide ($59,900) in the County.
From 2011 to 2016 Los Angeles County Film and Digital Media industry added 49,500 jobs, growing faster than the national rate of growth for the industry.
7 FDMI | Los Angeles County Perspective

$158.3 BILLION IN ECONOMIC OUTPUT
$97.1 BILLION DIRECT OUTPUT
$29.5 BILLION INDIRECT OUTPUT
$31.7 BILLION INDUCED OUTPUT
Economic Impact
Of the 640,500 total jobs, 265,000 are workers directly employed in the Film and Digital
Media industry and 375,500 jobs are indirectly generated by the industry. In total, the
direct employment and jobs created through multiplier effects comprise 17% of Los
Angeles County’s total workforce.
The Los Angeles County Film and Digital media cluster generates 640,500 jobs, $58.8 billion in income for labor, and $158.3 billion in annual output.
8FDMI | Los Angeles County Perspective

Industry Occupations
Of those jobs in Arts & Entertainment, the largest categories
include Producers and Directors (20%), Designers (14%),
Editors (7%) and Writers (7%). From 2006 to 2016 occupations
in Arts and Entertainment saw job growth of 37.8%. Producers
and Directors accounted for 8.5% of the growth, followed by
Actors and Designers with almost 5% growth each.
In Los Angeles County, 40% of jobs in the Film and Digital Media Industry are in Arts & Entertainment.
The Film and Digital Media Industry has begun employing more highly skilled individuals in the Computational and Mathematical occupations, which increased from 7.7% of the workforce in 2006 to 11.5% in 2016 and is now the fastest growing occupation in the Industry.
9 FDMI | Los Angeles County Perspective

Industry Workforce Demographics
Non-Hispanic Whites compose a slight majority
(56.8%) in Film and Digital Media, however,
employment growth among racial minorities have
all outpaced that of non-Hispanic Whites from 2006
to 2016. In Los Angeles County, the employment
ratio by gender remains virtually unchanged from
2006 to 2016 – for every 100 male workers in Film
and Digital Media, there are 60 female workers.
This is consistently lower than that of New York
City’s metro area, which has hovered between 70 to
75 female workers per 100 male workers. Average
wages have risen faster for female professionals
than their male counterparts, however in 2016
female workers still only earned about 80 cents per
1 dollar earned by male professionals in Film and
Digital Media Industry in Los Angeles County.
The Film and Digital Media Industry workforce is
becoming increasingly educated. Those with a
bachelor’s degree or above had the lion’s share of
employment gains between 2006 and 2016. The
number of workers with less than a high school
level of education fell by 36% and those with only a
high school diploma fell by 5%.
Los Angeles County has been making progress toward diversifying the workforce in the Film and Digital Media Industry.
The Film and Digital Media Industry is more diverse than 10 years ago.
Arts and Entertainment occupations in Los Angeles County, which include producers, directors, editors, and writers, have less wage inequality than 10 years ago.
Average wages in the Industry have risen faster for women over the last 10 years, but women still only earn 80 cents for every $1 male counterparts earn.
10FDMI | Los Angeles County Perspective

OPPORTUNITIES FOR L.A. COUNTY
TO SUPPORT INDUSTRY GROWTH
1.Resource and Prioritize Existing Efforts
In order for those mandates to be actionable and perceived as legitimate by the industry, they
must be prioritized and thus resourced by County leadership. The Office of the CEO and the
County’s Film Liaison must have the necessary capacity to convert on goals that have been
publicly formulated in good faith with stakeholder input through efforts like this report.
While more efficient infrastructure is put in place around fees and enforcement, increased staff
capacity is needed to address constituent concerns, troubleshoot challenges as they arise, and
follow through with solutions. Given the vast and diverse coverage of the County’s jurisdiction,
the capacity required to implement and respond to issues like special conditions on permitting
for particular communities is unique in the County’s case and significant. The County cannot
strategically engage and partner with industry stakeholders in responding to the more crucial,
adaptive challenges of the day without competently addressing the clearly solvable problems.
The County has already put in motion efforts that help to provide a top-down mandate, strengthen the County’s enforcement mechanism, and increase industry access to County personnel and properties. Motions regarding these topics were put forward in May 2016 by Supervisors Knabe and Kuehl, in January 2017 by Supervisor Ridley-Thomas, and in May 2017 by Supervisors Keuhl and Hahn.
11 FDMI | Los Angeles County Perspective

UTILIZE County Levers & Assets: Industry Growth
Stakeholders encouraged the County to consider actively developing soundstage
space or expediting through the regulatory and approval process the development of
such spaces. The strategic development of brick and mortar spaces can play an important role in anchoring certain parts of the industry
in specific geographies and in otherwise excluded communities.
Develop Soundstage Space or Facilitate its
Development Stakeholders expressed interest in easier
and more open access to County assets for filming, presenting an opportunity for national
and global brand building for Los Angeles County, a valuable benefit for which other
jurisdictions actively pay.
Open County Assets to Filming
Reduction of use fees at the County level not intended for cost recovery would not only
incentivize more filming in the County, but it would help to level and make more consistent the playing field between the County and the
City of Los Angeles.
Remove Use Fees (where possible)
12FDMI | Los Angeles County Perspective

2. Focus on L.A. COUNTY’S Core Competency: Talent Development
Currently, the permitting process is the core focal point of the region’s
engagement with the Film sector and the Film and Digital Media industry.
Widening both the purview of that engagement and those it includes will help
competitively position L.A. County, as the firms in the industry’s supply chain
reorder themselves and the format of film evolves. As the industry breaks out of
its historically vertical silos into a lateral, multi-dimensional configuration, so
too can the County’s approach to the industry and the talent that powers it.
L.A. County has a clear workforce advantage; the talent of the Film sector and in many cases the creative capital of the U.S. congregate here.
13 FDMI | Los Angeles County Perspective

UTILIZE County Levers & Assets: TALENT DEVELOPMENT
Focusing on identifying the needs of up-and-coming talent and small, innovative companies
contributing to the industry’s disruption may help to keep the frontlines of industry innovation
in L.A. County. As this report indicates the challenges of smaller, emerging companies and
their leaders are different from those of large legacy behemoths.
Support Talent and Smaller, Innovative Companies
As the occupational analysis demonstrated, computer-mathematical skills are on the
rise among the industry’s workers reflecting broader trends in the economy. Also, a
creative skillset is increasingly touted by education practitioners as a core competency
of well-adjusted, adaptive 21st century workers capable of problem-solving in an ever-changing, technology-driven market.
Government intervention strategies like the establishment of STEAM (Science, technology,
engineering, arts, and math) Centers in New York City target this intersection of computer-mathematical and creative skills. Los Angeles
County not only has applicable workforce dynamics for developing a STEAM-oriented, inter-disciplinary skillset among its workers, but it also has the industry base to translate
that skillset into market opportunity.
Create Inter-Disciplinary Career Pathways
The industry is slowly becoming more diverse, however knowledge of its opportunity landscape remains limited. Community-based
awareness campaigns were put forward as a successful way of not only democratizing
knowledge of the industry’s opportunities but also normalizing for communities pursuit of
them as a feasible career option.
Build on Industry’s Growing Diversity
14FDMI | Los Angeles County Perspective

15 FDMI | Los Angeles County Perspective
INTRODUCTIONThe Shifting
Media Landscape
15 FDMI | Los Angeles County Perspective

16FDMI | Los Angeles County Perspective
For example, more than half of U.S. residents now prefer to forfeit large movie screens and wait for films to be available on home release.1 Movie theater attendance in the U.S. and Canada declined 5.9% in 2017 to 1.24 billion, marking the lowest attendance since 1995.2 Domestic box office revenues edged down 2.3% in 2017 from 2016’s record $11.4
billion.3 Increases in average ticket prices have blunted top line revenues from the drop off in attendance, but the recent shifts in consumer behavior may indicate a longer-term downward trend for movie going and perhaps for other traditional ways of consuming media as well.
The Film and Digital Media industry is experiencing meaningful disruption as a broader convergence across the whole economy blurs the boundaries of the industry’s subsectors. Changing consumer behavior and rapid technological advances in video content delivery have resulted in a shifting media landscape.
Preferred movie watching location in the U.S. 2018Figure 2.1
Source: YouGov; The Economist. United States; February 25 - 27, 2018; 1,497 respondents; 18 years and older; Analysis by Beacon Economics
60%
50%
40%
20%
30%
10%
0%IN A MOVIE THEATER
AT HOME NEITHER BOTH EQUALLY NOT SURE
11%
1 YouGov. (n.d.). Do you prefer to see movies in a movie theater or wait for them to come out on home release?. In Statista - The Statistics Portal. Retrieved from: https://www.statista.com/statistics/264399/preferred-place-of-movie-consumption-in-the-us/.
2 National Association of Theater Owners. (n.d.) “Annual U.S./Canada Admissions.” Retrieved from: http://www.natoonline.org/data/admissions/
16FDMI | Los Angeles County Perspective

As consumers move from traditional linear
viewing, of television and other types of media, to
on-demand and mobile viewing, the advertising
ecosystem has had to move beyond its legacy
marketing models and innovatively reimagine itself.
Up and down the industry food chain, revenue
models have been necessarily transformed in
response to brands demanding a more dynamic
relationship with their audiences, commensurate
with the dynamism of the media they consume.
This same transformation motivated by changing
consumer behavior has taken place across legacy
and emerging sectors of the media landscape,
affecting traditional publishers like Conde Naste
and new digital players like Facebook, Apple, and
Snapchat. Old silos are falling rapidly as new
partnerships are announced quarterly, and a great
convergence is crystalizing around how media
firms, across sectors previously thought to be
unrelated, engage with their audiences in the digital
age. Video content production is increasingly at the
center of that mass metamorphosis.
NEW BEDFELLOWSTable 2.1
Network Series
Snapchat3
Condé Nast Entertainment True crime series, “True Crime/Uncovered.”
A&E Networks4 Relationship crisis show “Second Chance” entering second season.
TBS “Team Coco's Comedy Club,” with Conan O'Brien featuring stand-up routines.
Facebook5
Vox Media
BuzzFeed
Group Nine Media
Twitter6
NBCUniversal Live and original programming from NBC, NBC News, MSNBC, Telemundo, TODAY and E! News.
Hearst Magazines Digital Media
Buzzfeed News
Viacom Digital Studios Shows from Comedy Central, BET, MTV News and MTV News International.
NASA and Vice News
Ellen Digital Studios
3 Patel, Sahil. (2018, Feb 22). Snapchat is enlisting more publishers to make video shows. Retrieved from: https://digiday.com/media/snapchat-is-enlisting-more-publishers-to-make-video-shows/
4 Flynn, Kerry. (2018, Feb 14). Snapchat’s dating show ‘Second Chance’ returns for season 2. Retrieved from: https://mashable.com/2018/02/14/snapchat-second-chance-dating-show-reality-second-season/#ypwqaACo.iqW
Source: Beacon Economics
17 FDMI | Los Angeles County Perspective

5 Toonkel, Jessica. (2017, May 24). Exclusive Facebook signs BuzzFeed, Vox, others for original video shows -sources. Retrieved from: https://www.reuters.com/article/us-facebook-tv-idUSKBN18K2U0
6 Swant, Marty. (2018, April 30). Twitter is Debuting 30 New Shows Focused on Activism, Entertainment and Sports. Retrieved from: http://www.adweek.com/digital/twitter-is-debuting-30-new-shows-focused-on-activism-entertainment-and-sports/
18FDMI | Los Angeles County Perspective

There is no lack of industry reporting or analysis
highlighting the increasingly fragmented nature of
Consumer-to-Business and Business-to-Business
markets for services and products generated by the
Film and Digital Media industry. This report takes
a more discerning view, namely that the disruption
observed in the industry is a broader move toward
integration and interconnectedness. The ability to
seamlessly access video content across devices–
mobile, laptop, television–blurs the arbitrary lines
between television, film, publishing, and advertising.
On the other hand, the technology and the mechanics
of producing top quality video content are not
changing as quickly or significantly, and the demand
for quality video content continues to increase.
In 2017 alone there was a combined total of 38,284
shoot days (across project type) filmed on location
in Los Angeles County. Total project filming in the
County grew by 23.9% between 2012 and 2017.
Compared to 2012, feature film on-location shooting
has fallen 8.2%, while TV projects have increased by
31.5%. Between 2012 and 2017, web-based TV has
increased by 55.4%, the second highest growth after
TV dramas, and commercial filming is up 18%.
This report endeavors to redefine the legacy film
industry in the context of digital media disruption
as the Film and Digital Media industry, parsing the
vast world of digital media through the lens of film. It
can be easy for industry analysts and policymakers
Opportunity In Disruption
for Los Angeles County
19 FDMI | Los Angeles County Perspective

Sources: FilmL.A.; Anaysis by Beacon Economics
40,000
35,000
30,000
25,000
15,000
0
5,000
10,000
20,000
2011 2012 2013 2014 2015 2016 2017
Features Television (Aggregate) Commercials Other
Shoot Days Total by Filming Type Los Angeles CountyFigure 2.7
to get lost amid alarmist rhetoric about industry
fragmentation, mutating supply chains, changing
consumer behavior, and technological innovation,
all moving at seemingly neck-breaking speed. This
report where relevant will dig into these discrete
elements as they relate to the broader and more
stable industry picture for L.A. County. Fortunately
for L.A. County, the shapeshifting of the media
landscape has translated directly into opportunity
pertinent to its fundamental core competencies.
As the media, film, television, publishing, and
advertising landscape transitions from a historically
one-dimensional clean set of vertical relationships
to a multi-dimensional convergence of access,
medium, format, and intention, the video content
that powers it and the way it is made have by
comparison remained stable. Ultimately, that is great
news for L.A. County’s unchallenged foothold in
video content production. With these opportunities
in mind, this report defines the Film and Digital
Media industry amid rapid innovation, evaluates its
potential for growth and inclusivity in L.A. County,
and assesses the role the County can play to
facilitate both.
20FDMI | Los Angeles County Perspective

Sources: FilmL.A.; Anaysis by Beacon Economics
7,000
8,000
6,000
5,000
4,000
2,000
-1,000
0
1,000
3,000
Features Commercials Other TotalTelevision (Aggregate)
5-Year Growth (2012 vs. 2017) in Shoot Days
Los Angeles CountyFigure 2.8
-350
+3,648
845
3,232 7,375
21 FDMI | Los Angeles County Perspective

Sources: FilmL.A.; Anaysis by Beacon Economics
15,000
9,000
0
3,000
6,000
12,000
2011 2012 2013 2014 2015 2016 2017
TV ComediesTV Dramas TV Pilots TV Reality Web Based TV
Total Annual Shoot Days for Television Los Angeles CountyFigure 2.9
22FDMI | Los Angeles County Perspective

INDUSTRY ANALYSIS
OF the Film & Digital Media Industry
in L.A. County
23 FDMI | Los Angeles County Perspective

In its broadest form, it includes a range of diverse activities and industries woven together in the digital age, which has spawned new industries and transformed many traditional ones. The Internet Revolution produced new digital media companies created to exclusively distribute digital content, such as Facebook and Google, which have become some of the largest multinational corporations in the world. It also reshaped legacy media industries such as television broadcasting and newspaper publishing.
The Film sector is a classic example of an industry fundamentally transformed by the digital age. In 2004, there were more than 9,000 Blockbuster Video stores in the U.S.7 Today, there are fewer than 10 Blockbusters nationwide–one in Bend, Oregon and six in Alaska–as viewers increasingly consume entertainment content through their smart TVs, smart phones, and other connected devices.8 Film is also now digitally distributed to households by companies like Netflix, Hulu, and Amazon, which have quickly grown beyond their role as distributers of content and have become creators of content. This same dynamic is playing out in other industries, such as publishing, sound recording, and broadcasting.
A distinction can be drawn, therefore, between traditional sectors of the economy that predate the digital age, though certainly enhanced or broadened by it, and industries that have recently emerged as a result of the digital age and whose core functions pivot around the generation and distribution of digital content.
Figure 3.1 defines the Film and Digital Media industry across various subsectors of the economy. Traditional media sectors include Film, which covers all activities related to the creation, production, and distribution of motion pictures and TV programming; Publishers, which covers a range of traditional publishing activities, such as the publication of newspapers and books, as well as more recent extensions of the industry, such as software publishing; Sound Production and Recording, which includes primarily music production and sound recording; Broadcasting, which covers companies engaged in traditional forms of content distribution like television and cable networks; and Professional Services, which covers a range of services that are key inputs to film and digital media content creation, including graphic designers, photography, and market research. The final category, Emerging Digital Media, covers the elements of media that produce or distribute digital content exclusively, such as Facebook, Google, and Snapchat.
Film and Digital Media
clusterIn the simplest terms,
“digital media” refers to content and information
encoded in an electronic, computer-readable format.
7 Clifford, S. “Other Retailers Find Ex-Blockbuster Stores Just Right. The New York Times. April 8, 2011. Accessed April 27, 2018. Retrieved at: https://www.nytimes.com/2011/04/09/business/09blockbuster.html
8 Krazit, T. “Blockbuster’s last stand: Inside one of the iconic video rental chain’s final U.S. stores.” GeekWire. March 31, 2018. Accessed April 27, 2018. Retrieved at: https://www.geekwire.com/2018/blockbusters-last-stand-inside-one-iconic-video-rental-chains-final-u-s-stores/
24FDMI | Los Angeles County Perspective

FILM AND DIGITAL MEDIA Cluster definition Figure 3.1
SOUND PRODUCTION AND RECORDING
Music Publishers
Other Sound Recording Industries
Sound Recording Studios
ARTISTS AND AGENTS
Agents and Managers for Artists, Athletes, Entertainers, and Other Public Figures
Independent Artists, Writers, and Performers
Motion Picture and Video Production
Motion Picture and Video Distribution
Teleproduction and Other Postproduction Services
Other Motion Picture and Video Industries
FILM
Example Firms Per
Sector
• Amazon Studios• Netflix• Deluxe Entertainment• Disney Enterprises• Warner Bros.• Universal Studios• Sony Pictures Entertainment
• International Creative Management, Inc. (ICM)
• Creative Artists Agency (CAA)• William Morris Endeavor
Entertainment (WME)• The Young Turks• Bento Box Entertainment
• Universal Music Group• Warner Bros. Records• Sony Interactive Entertainment• Stupid Buddy Studios
Source: Beacon Economics
25 FDMI | Los Angeles County Perspective

Digital media
PUBLISHERS
Book Publishers
Newspaper Publishers
Periodical Publishers
Software Publishers
All Other Publishers
PROFESSIONAL SERVICES & BUSINESS OPERATIONS
Advertising Agencies
Commercial Photography
Graphic Design Services
Media Buying Agencies
Photography Studios
Media Representatives
Libraries and Archives
Marketing Research and Public Opinion Polling
EMERGING DIGITAL MEDIA
Data Processing, Hosting, and Related Services
Custom Computer Programming Services
Internet Publishing and Broadcasting and Web Search Portals
BROADCASTING
Cable and Other Subscription Programming
Television Broadcasting
News Syndicates
• TBWA Worldwide• 72andSunny• Trailer Park• Horizon Media• BLT Communications• The Third Floor• Getty Images
• Electronic Arts• Activision• Scopely• Hollywood Reporter• Los Angeles Times
• HBO• Viacom• Hulu• ABC Studios• Fox Television• AwesomenessTV• Associated Press
• Snapchat• Buzzfeed• Condé Nast Entertainment• Mashable• Google• Twitter
Source: Beacon Economics
26FDMI | Los Angeles County Perspective

Despite the ubiquity of digital media companies and products, they make a relatively modest contribution to total employment in the U.S. economy. At the national level, the Film and Digital Media industry accounts for only 2% of all jobs, a share that has remained largely constant since the turn of the century.
Yet recent employment gains in the Film and Digital Media industry have been outpacing employment growth in the national economy, leading policymakers and industry analysts to label the industry a “growth sector.” Since 2011, the industry has added more than 400,000 jobs nationally, which represents a 15% growth rate. By contrast, the total number of jobs in the U.S. economy grew by 9% over that same period.
In the U.S., the growth of the Film and Digital Media industry has varied by region. Between 2011 and 2016, the industry grew by 23% in Los Angeles County, faster than the national rate of growth for the industry. Furthermore, the Film and Digital Media industry in L.A. County has been growing faster than the rest of the County’s economy, where employment has grown only by 12% over that same period.
The industry grew even faster in the metropolitan areas of San Francisco and San Jose, where it grew by 81% and 53% respectively. San Francisco and San Jose benefited tremendously from the recent boom in the Emerging Digital Media sector of the Film and Digital Media industry, as these two regions are disproportionately specialized in this sector, particularly their tech-enabled elements. This point will be further discussed on subsequent pages.
Industry PROFILE
The Film and Digital Media Industry
27 FDMI | Los Angeles County Perspective

Source: Quarterly Census of Employment and Wages; Analysis by Beacon Economics
Film and Digital Media Industry Employment by RegionTable 3.1
2011 Employment 2016 Employment Total Change 2011-2016
Percentage Change 2011-2016
San Francisco 81,200 147,300 66,100 81%
San Jose 70,500 107,700 37,200 53%
Atlanta 58,600 73,800 15,200 26%
Los Angeles County 215,800 265,200 49,500 23%
Orange County 27,800 33,600 5,900 21%
New York City 339,600 380,500 40,900 12%
National 2,699,200 3,111,500 412,300 15%
28FDMI | Los Angeles County Perspective

Compared to other regions
with a strong presence in
Film and Digital Media, only
New York City has more jobs
than Los Angeles County
in the industry. Yet the Film
and Digital Media industry
comprises a larger share
of the total economy in L.A.
County than it does in New
York City: it accounts for
6.1% of jobs in L.A. County
compared to 3.2% of jobs
in New York City. Together,
L.A. County and New York
City account for 21% of the
nation’s Film and Digital Media
industry employment. Source: Quarterly Census of Employment and Wage; Analysis by Beacon Economics
Film and Digital Media Industry Share of Employment by RegionFigure 3.2
Film as Share of Total Employment Digital Media as Share of Total Employment
8% 7% 6% 5% 4% 2%3% 1% 0%
Atlanta
Los Angeles County
New York City
Orange County
San Francisco
San Jose
2.6%
2.6%
1.9%
3.7%
7.0%
2.6% 2.5%
0.1%
0.5%
0.1%
0.2%
0.1%
2001
29 FDMI | Los Angeles County Perspective

30FDMI | Los Angeles County Perspective
Source: Quarterly Census of Employment and Wage; Analysis by Beacon Economics
Film as Share of Total Employment Digital Media as Share of Total Employment
2% 4% 6% 8% 10% 12%0%
Atlanta
Los Angeles County
New York City
Orange County
San Francisco
San Jose
0.3%
0.5%
0.1%
0.2%
0.0%
2.7%
2.1%
6.2%
10.2%
3.8%
2.7%
2.3%
2016
30FDMI | Los Angeles County Perspective

While growth has varied by region, it still has
been largely concentrated. Just five regions have
accounted for over 50% of the nation’s employment
growth in the Film and Digital Media industry since
2011, with Los Angeles County accounting for 12%
of that growth.
Beyond sheer employment numbers, Film and Digital
Media sectors are an important source of higher-
paying jobs. On average, the sector pays nearly
double the wages of other sectors in the economy.
This is the case both nationally and by region.
Film and Digital Media wages in Los Angeles County
are higher than the national average for the industry
but lower than the industry’s wages in New York
City, San Francisco, and San Jose. This is due
to differences in the nature of the industry from
one region to another. As mentioned earlier, San
Francisco and San Jose are highly specialized in the
higher-paying segments of the industry, namely the
heavily tech-focused Emerging Digital Media sector.
31 FDMI | Los Angeles County Perspective

Source: Quarterly Census of Employment and Wages; Analysis by Beacon Economics
Film and Digital Media Wages in 2016Table 3.2
Economy-wide Film and Digital Media Film and Digital Media Wage Premium
Atlanta $56,900 $104,900 +84%
Los Angeles County $59,900 $117,000 +95%
New York City $67,200 $124,900 +86%
Orange County $59,800 $104,800 +75%
San Francisco $85,200 $157,600 +85%
San Jose $118,100 $205,200 +74%
National $53,600 $102,200 +91%
Employment Growth in Film and Digital Media Industry, 2011-2016Figure 3.3
Source: Quarterly Census of Employment and Wage; Analysis by Beacon Economics
100%
75%
50%
25%
0%
Atlanta Los Angeles County
New York City Orange County
San Francisco
San Jose Rest of U.S. National
4%
12%
10% 1%
16%9%
48% 100%
32FDMI | Los Angeles County Perspective

2001 2006
Film and Digital Media Industry: A Sub-Sectoral Analysis
Since 2001, employment growth has varied across the different sectors that
make up the Film and Digital Media industry. Nationally, the Film and Emerging
Digital Media sectors are the only sectors of the industry to have grown over
the period between 2001 and 2016. These two sectors have grown at almost
identical rates, although the Emerging Digital Media sector has been growing
at a faster rate since 2011. Contrastingly, significant employment losses
have occurred in other sectors of the industry. The Publishing, Broadcasting,
and Sound Recording sectors have experienced the steepest declines and, in
some instances, the core functions of these sectors have been fundamentally
transformed by the digital revolution.
Source: Quarterly Census of Employment and Wages; Analysis by Beacon Economics
Employment Growth by sector, 2001 – 2016, U.S.Figure 3.4
2011 20160.4
0.2
0.6
0.8
1.0
1.2
1.4
1.6
Film Sound Production and Recording Publishers Broadcasting Professional Services & Business Operations Emerging Digital Media
33 FDMI | Los Angeles County Perspective

Source: Quarterly Census of Employment and Wages; Analysis by Beacon Economics
Source: Quarterly Census of Employment and Wages; Analysis by Beacon Economics
Employment Change by sector – NationalTable 3.3
Employment Change by sector – Los Angeles CountyTable 3.4
In 2016, the Emerging Digital Media sector made up the largest share of Film and Digital Media employment nationally, accounting for around 44% of total employment in the industry. This share has increased since 2011, when the Emerging Digital Media sector compromised only 38% of the nation’s employment in the industry. Representing 11% of the industry’s national employment in 2016, the Film sector accounts for the fourth highest number of jobs within the Film and Digital Media industry.
Nationally, the Emerging Digital Media sector has accounted for 83% of Film and Digital Media industry employment growth since 2011, with around 345,000 jobs added. Employment in the Film sector also grew by about 22% over that same period. Publishers and Broadcasters have been losing employment since 2011, which reflects longer-term trends as traditional activities in these sectors have been replaced by digital activities.
2011 2016Change from 2011 to 2016Employment Share of Film & Digital
Media Employment Employment Share of Film & Digital Media Employment
Film 291,300 10.8% 356,700 11.5% 356,700
Sound Production 11,900 0.4% 11,100 0.4% 11,100
Publishers 703,400 26.1% 699,400 22.5% 699,400
Broadcasting 204,700 7.6% 199,300 6.4% 199,300
Professional Services 471,200 17.5% 483,500 15.5% 483,500
Emerging Digital Media 1,016,700 37.7% 1,361,600 43.8% 1,361,600
Film & Digital Media Total 2,699,200 3,111,500 412,300
2011 2016Change from 2011 to 2016Employment Share of Film & Digital
Media Employment Employment Share of Film & Digital Media Employment
Film 129,800 48.9% 164,100 61.9% 34,300
Sound Production 2,100 0.8% 1,700 0.6% -400
Publishers 12,700 4.8% 15,600 5.9% 2,900
Broadcasting 15,300 5.8% 18,600 7.0% 3,300
Professional Services 27,500 10.4% 29,000 10.9% 1,500
Emerging Digital Media 28,500 10.7% 36,200 13.7% 7,700
Film & Digital Media Total 215,800 265,200 49,400
34 FDMI | Los Angeles County Perspective
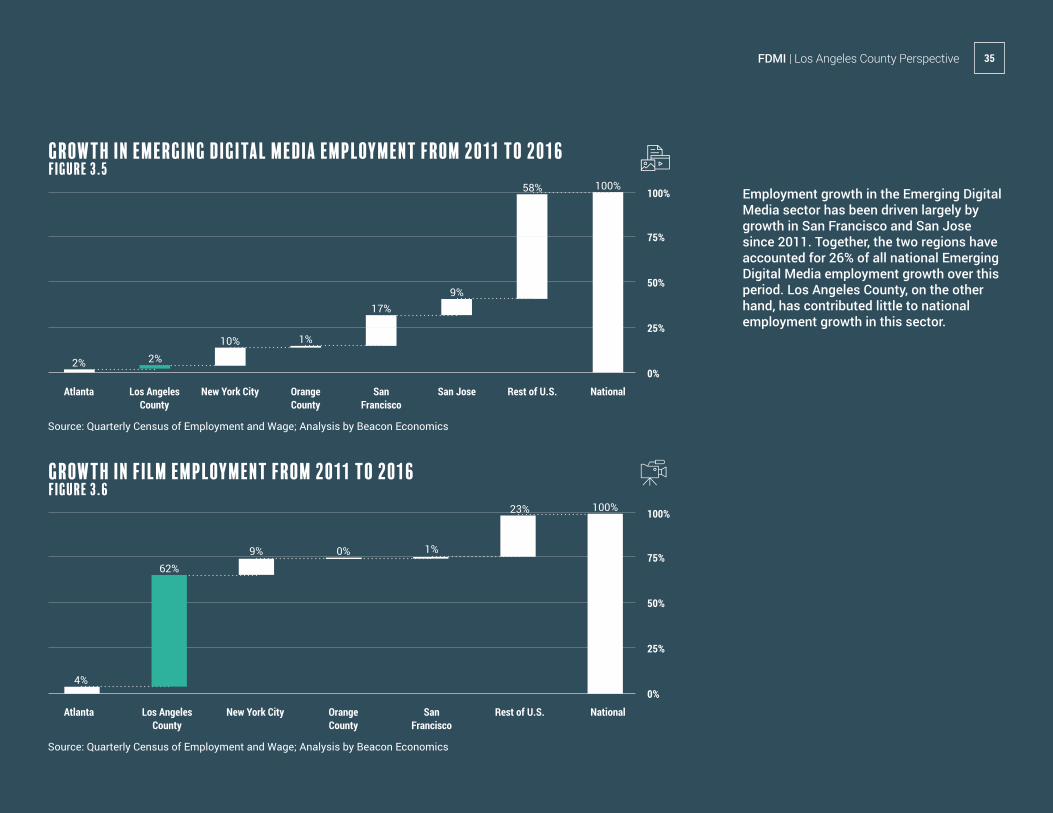
Employment growth in the Emerging Digital Media sector has been driven largely by growth in San Francisco and San Jose since 2011. Together, the two regions have accounted for 26% of all national Emerging Digital Media employment growth over this period. Los Angeles County, on the other hand, has contributed little to national employment growth in this sector.
Growth in Emerging Digital Media Employment from 2011 to 2016Figure 3.5
Source: Quarterly Census of Employment and Wage; Analysis by Beacon Economics
100%
75%
50%
25%
0%
Atlanta Los Angeles County
New York City Orange County
San Francisco
San Jose Rest of U.S. National
2% 2%10% 1%
17%9%
58% 100%
Growth in Film Employment from 2011 to 2016Figure 3.6
Source: Quarterly Census of Employment and Wage; Analysis by Beacon Economics
100%
75%
50%
25%
0%
Atlanta Los Angeles County
New York City Orange County
San Francisco
Rest of U.S. National
4%
62%9% 0% 1%
23% 100%
35FDMI | Los Angeles County Perspective

$220,000
$180,000
$140,000
$100,000
$80,000
$120,000
$160,000
$200,000
$60,000Film Artists and
AgentsSound Production Publishers Broadcasting Professional
ServicesEmerging Digital
Media
Wages by sector, 2016Figure 3.7
Source: Quarterly Census of Employment and Wage; Analysis by Beacon Economics
Sub-sector Average Wage (National) Sub-sector Average Wage (Los Angeles County)
Film and Digital Media Average Wage (National) Film and Digital Media Average Wage (Los Angeles County)
Within the Film and Digital Media industry, the Emerging Digital Media sector pays the highest wages nationally, roughly $124,700 per worker. By comparison, the average worker in the Emerging Digital Media sector in L.A. County earns $123,100–less than Artists and Agents ($208,900), workers in the Publishing sectors ($147,800), and workers in the Broadcasting sectors ($141,500).
36 FDMI | Los Angeles County Perspective

Source: Quarterly Census of Employment and Wages; Analysis by Beacon Economics
Regional share of Film and Digital Media Employment, 2016 Table 3.5
Film and Digital Media Employment Share Of Total
Atlanta 73,800 3.0%
Los Angeles County 265,200 6.1%
New York City 380,500 3.2%
Orange County 33,600 2.2%
San Francisco 147,300 6.3%
San Jose 107,700 10.3%
In Los Angeles County, the Film and
Digital Media industry accounts for a
much larger share of total employment
than is the case nationally. In 2016,
Film and Digital Media companies
directly accounted for around 6.1% of
all jobs in the County, compared to 2%
for the nation.
In 2011, Los Angeles County accounted for about 8% of the nation’s Film and Digital Media industry employment; by 2016, the County’s share of the national industry had grown to 9%. In line with precedent, the County’s growing strength in the industry at large can be attributed to the performance of its Film sector.
Given its strength in Film, the profile of L.A. County’s overall Film and Digital Media industry is vastly different from that of the national industry. Film accounts for 61% of the County’s Film and Digital Media industry, while it accounts for only 11% of the nation’s Film and Digital Media industry.
Film and Digital Media in
Los Angeles County’s Broader Economy
37FDMI | Los Angeles County Perspective

The Emerging Digital Media
sector accounts for a far lower
share of the County’s Film
and Digital Media industry:
13.5% compared to 44% at the
national level. The County has
accounted for only 2% of the
nation’s employment growth
in the Emerging Digital Media
sector since 2011. By contrast
and as mentioned, the County has
accounted for 62% of the nation’s
employment growth in the Film
sector since 2011.
With regard to Film, Los Angeles
County accounts for 46% of the
nation’s sector. This position has
strengthened since 2011, when
Los Angeles County accounted
for 40% of employment in the Film
sector nationally.
Share of employment across Industry Sectors, 2016Figure 3.8
Film
Film
Soun
d Pr
oduc
tion
Soun
d Pr
oduc
tion
Publ
ishe
rs Publ
ishe
rs
Broa
dcas
ting
Broa
dcas
ting
Prof
essi
onal
Ser
vice
s
Prof
essi
onal
Ser
vice
s
Emer
ging
Dig
ital M
edia
Emer
ging
Dig
ital M
edia
Source: Quarterly Census of Employment and Wages; Analysis by Beacon Economics
80%
60%
40%
20%
0%62% 1% 7%6% 11% 14% 11% 6%0% 22% 16% 44%
Los Angeles County National
38 FDMI | Los Angeles County Perspective

Share of Film by Region, 2016Figure 3.9
Source: Quarterly Census of Employment and Wages; Analysis by Beacon Economics
Los Angeles County
46%
New York 17%
San Francisco
1%
Atlanta2%
Elsewhere in the U.S.
34%
In summary, the County’s Film and Digital Media industry is dominated by the Film sector. Los Angeles County has increased its strength in the Film sector relative to the rest of the nation.
Further, the Film sector has enjoyed an
upward growth trajectory almost identical
to that of the Emerging Digital Media sector,
with the latter picking up more quickly since
2011. While there is no obvious causal
relationship from the data between the
two, there is a working assumption among
industry analysts and industry stakeholders
that the growth in the Emerging Digital
Media sector has acted as an input to
growth in the Film sector, as many of the
digital media platforms and ecosystem
actors are increasingly participating in the
production of video content.
39FDMI | Los Angeles County Perspective

The Film and Digital Media industry has experienced impressive employment growth in the last ten years in Los Angeles County. From 2006 to 2016, employment increased 32%, substantially more than in all other industries combined (21%) in the County.9 The increase is more than the 14% growth in New York City Metro’s Film and Digital Media industry. Figure 3.10 provides the industry employment trend by occupation.
Occupational OverviewTrends in the Fastest Growing and Highest Paid Occupations
Employment in Film and Digital Media by Occupation - Los Angeles CountyFigure 3.10
9 Employment by industry and occupation can be calculated only by using U.S. Census Bureau’s Public Use Microdata Sample (ACS PUMS). Incidentally, these employment estimates are higher than the estimates from the Bureau of Labor Statistics’ Quarterly Census of Employment and Wages (QCEW) because the QCEW excludes several types of workers whereas the ACS PUMS does not. Specifically, the QCEW employment
Source: Public Use Microdata Sample, American Community Survey, U.S. Census Bureau; Analysis by Beacon Economics
2006
2008
2010
2012
2014
2016
120,000
60,000
0
180,000
240,000
360,000
420,000 Transportation
Life/Physical/Social Science
Sales
Protective Service
Production
Personal Care and Service
Office/Administrative
Management
Legal
Install./Maint./Repair
Food Prep./Serving
Education
Construction and Extraction
Computer/Mathematical
Cleaning/Grounds Keeping
Business/Financial
Arts/Entertainment
Architecture/Engineering
40 FDMI | Los Angeles County Perspective

Employment growth in Film and Digital Media Industry by OccupationLos Angeles County, 2006 to 2016Figure 3.11
Computer and Mathematical Occupations as Share of Employment in Film and Digital Media – Los Angeles CountyFigure 3.12
Source: Public Use Microdata Sample, American Community Survey, U.S. Census Bureau; Analysis by Beacon Economics
Source: Public Use Microdata Sample, American Community Survey, U.S. Census Bureau; Analysis by Beacon Economics
140%
14%
80%
8%
100%
10%
120%
12%
40%
4%
60%
6%
20%
2%
0%
0%
2006 2016
Arts, Design, Entertainment, Sports, and Media (hereinafter Arts/Entertainment) is by far the most common occupational category in L.A. County in 2016, employing 40% of workers in the Film and Digital Media industry, followed by Management (16%) and Computer/Mathematical Occupations (11%). An increasing share of people employed in the Film and Digital Media industry work in these three broad occupations, and percentage growth rates of the largest occupations have outpaced other occupations (Figure 3.11). Overall, the top five occupations (listed in Figure 3.11) accounted for more than 80% of total employment in the Film and Digital Media industry.
Another notable trend is the employment by the Film and Digital Media industry of more highly skilled individuals in the Computational/Mathematical occupation, which increased from 7.7% in 2006 to 11.5% in 2016 (Figure 3.12). Much of the increase can be attributed to the booming Computer Systems Design and Related Services sector. Overall and unsurprisingly, the Emerging Digital Media sector accounted for most of the increases in Computer and Mathematical occupational demands. Notably however, demand for Computer/Mathematical professionals also rose in the Motion Picture and Video sector, with employment increasing by 12% from 2011 and by 16% from 2006. Figure 3.13 shows the trend for Computer/Mathematical occupations by industry.The Computational/Mathematical
Office/Administrative
Other Occupations
Management
Computer/Mathematical
Business/Financial
Arts/Entertainment
+38%
+49%+98%
+40%
+8%
+5%
2006 2007 2008 2009 2010 2011 2012 2013 2014 2015 2016
Occ
upat
ion
Gro
wth
(Ind
exed
to
2006
Tot
al E
mpl
oym
ent)
data excludes proprietors, the unincorporated self-employed, unpaid family members, and certain farm and domestic workers. The employment count also excludes workers who earned no wages during the entire applicable pay period because of work stoppages, temporary layoffs, illness, or unpaid vacations. Given the prevalence of self-employment and freelance work within creative industries such as Film & Digital Media, one can expect that the QCEW employment figures are underreported.
41 FDMI | Los Angeles County Perspective

10 The Herfindahl-Hirschman Index (HHI) measures market concentration and is calculated as the sum of the squares of the market share of each firm competing in a market. The resulting HHI ranges from 0 (where there is an infinite number of firms with identical market power) to 10,000 (where one firm has all the market share). Here, the HHI is implemented as a way to quantifiably measure the occupation concentration within a region. Given that Los Angeles has a large film industry–and therefore serves as a hotbed for professionals in the Arts/Entertainment occupations–it is therefore
occupation is the fastest growing occupation group, followed by Legal (+83%), Architecture/Engineering (+62%), and Business/Financial (+49%). The County saw only a few occupations decline in the industry’s employment over the last 10 years. With the exception of Science (-38%), the declining occupations are manual labor-intensive: Cleaning/Grounds Keeping (-30%), Installation/Maintenance/Repair (-20%), and Production (-29%).
The “Other Occupations” category includes a few fringe occupations, each of which makes up 1% or less Film and Digital Media workers: Cleaning/Grounds Keeping, Community/Social Service, Construction, Farming/Fishing/Forestry, Food Preparation, Healthcare Practitioners, Healthcare Support, Legal, Protective Service, and Science.
The large size of L.A. County’s film sector means that a higher concentration of the workforce is clustered in fewer occupations compared with other metros that also have sizable Film and Digital Media workforces. Most notable is that in 2016 40% of the Film and Digital Media workforce in Los Angeles County were professionals in Arts/Entertainment occupations. In contrast, the shares of the Film and Digital Media workforce employed in Arts/Entertainment occupations were 30% in New York City Metro and 23% in Orange County. Beacon Economics has calculated the Herfindahl-
Computer and Mathematical Occupations Breakdown Los Angeles CountyFigure 3.13
Source: Public Use Microdata Sample, American Community Survey, U.S. Census Bureau; Analysis by Beacon Economics
50,000
20,000
30,000
40,000
10,000
0Other Film & Digital Media Industries
Motion Picture & Video Industries
Computer Systems Design & Related Services
Internet Publishing & Broadcasting & Web Search Portals
Data Processing, Hosting, & Related Services
20072006 2008 2009 2010 2011 2012 2013 2014 2015 2016Em
ploy
men
t
42FDMI | Los Angeles County Perspective

Herfindahl-Hirschman Index of Occupations in Film and Digital Media, Los Angeles County vs New York City Metro and Orange County, 2008 to 2016Figure 3.14
Source: Public Use Microdata Sample, American Community Survey, U.S. Census Bureau; Analysis by Beacon Economics
2,300
1,700
1,900
2,100
1,500
1,300
NYC Metro Orange County Los Angeles County Bay Area
2008 2009 2010 2011 2012 2013 2014 2015 2016
Her
finda
hl-H
irsc
hman
Inde
x(3
Yea
r M
ovin
g A
vera
ge)
Hirschman Index10 (HHI) for Los Angeles County, adjacent Orange County, and the New York City Metro Area. Figure 3.14 shows that Los Angeles County has a significantly higher HHI every year than Orange County and New York City Metro.
The average (mean) wages11 across all occupations in the Film and Digital Media industry also increased at a similar pace, a 32% gain between 2006 and 2016. Wage gains across occupations varied significantly, however, and gains in the five largest occupations by workforce size have all trailed behind the 32%, which is illustrated in Figure 3.15.
Occupations stagnating or declining in employment, such as Sales and Cleaning/Grounds Keeping, posted the highest average wage increases. The top five largest occupations have all posted wage gains less than the average wage gain of all occupations in the Film and Digital Media industry. The fastest growing occupations—Computer/Mathematical, Legal, and Architecture/Engineering—require highly specialized skill sets, underscoring the importance of the County’s investment in higher education or equivalent programs.
expected that Los Angeles has a higher HHI than either New York City metro area or Orange County. In fact, Los Angeles County actually has a lower HHI than New York City metro area or Orange County if excluding the Arts/Entertainment occupation group.
43 FDMI | Los Angeles County Perspective

11 Unless otherwise specified throughout this section, average wage refers to the mean wage rather than the median wage.
Source: Quarterly Census of Employment and Wage; Analysis by Beacon Economics
Average Wage and Employment Percent Change, 2006 to 2016, Film and Digital Media Industry in Los Angeles CountyFigure 3.15
Employment Average Wage
-40% -20% 0% 20% 40% 60% 100%80%-60%
Protective Service
Transportation
Personal Care
Business/Financial
Install./Maint./Repair
Food Prep./Serving
Management
Arts/Entertainment
Construction
Production
Office/Administrative
Computer/Mathematical
Education
Science
Legal
Architecture/Engineering
Cleaning/Grounds Keeping
Sales
44FDMI | Los Angeles County Perspective

Source: Public Use Microdata Sample, American Community Survey, U.S. Census Bureau; Analysis by Beacon Economics
Arts, Design, Entertainment, Sports, and Media Occupations ListTable 3.6
SOC Code Occupation Description Occupation Shorthand
27-1010 Artists and Related Workers Artists and Related
27-1020 Designers Designers
27-2011 Actors Actors
27-2012 Producers and Directors Producers and Directors
27-2020 Athletes, Coaches, Umpires, and Related Workers Athletes, Coaches, and Umpires
27-2030 Dancers and Choreographers Dancers and Choreographers
27-2040 Musicians, Singers, and Related Workers Musicians and Singers
27-2099Entertainers and Performers, Sports and Related Workers, All Other
Entertainers and Performers
27-3010 Announcers Announcers
27-3020 News Analysts, Reporters and Correspondents News Analysts and Reporters
27-3031 Public Relations Specialists PR Specialists
27-3041 Editors Editors
27-3042 Technical Writers Technical Writers
27-3043 Writers and Authors12 Writers and Authors
27-3090 Miscellaneous Media and Communication Workers Media and Comm Workers
27-4021 Photographers Photographers
27-4030Television, Video, and Motion Picture Camera Operators and Editors
Camera Operators and Editors
27-40XXBroadcast and Sound Engineering Technicians and Radio Operators, and Media and Communication Equipment Workers, All Other
Engineering Techs and Operators
12 Includes copy writers, poets, lyricists, and creative writers.
Arts, Design, Entertainment, Sports, and Media Occupations
Drill DownThe high concentration of Arts/Entertainment
professionals in the Film and Digital Media industry in L.A. County warrants a more in-depth analysis. The
following is a detailed list of what is meant by Arts/Entertainment.
45 FDMI | Los Angeles County Perspective

In 2016, Producers and Directors (20%)
was the largest occupational category
within Arts/Entertainment in L.A.
County, followed by Designers (14%),
Artists and Related Workers (10%), and
Writers and Authors (9%). The frontstage
performing occupations—Actors (Standard
Occupational Classification [SOC] Code:
7-2011) and Musicians, Singers, and
Related Workers (SOC Code: 27-2040)—
accounted for 6% respectively of total Arts/
Entertainment occupations in the Film and
Digital Media industry.
Source: Public Use Microdata Sample, American Community Survey, U.S. Census Bureau; Analysis by Beacon Economics
Arts/Entertainment Occupations Detailed BreakdownLos Angeles County, 2016Figure 3.16
Technical Writers
Editors7%
Other Arts & Entertainment
26%
Producers and Directors
20%
Musicians, Singers,
and Related Workers
7%
Designers14%
Actors7%
Artists and Related Workers
10%Writers and
Authors9%
Announcers
Entertainers and Performers, Sports
and Related Workers, All OtherMiscellaneous Media and
Communication WorkersPublic Relations SpecialistsNews Analysts, Reporters
and Correspondents
Broadcast
and Sound Engineerin
g
Technici
ans and Radio O
perators,
and Med
ia and Communicatio
n
Equipment W
orkersTe
levi
sion
, Vid
eo, a
nd
Mot
ion
Pict
ure
Cam
era
Oper
ator
s an
d Ed
itors
Phot
ogra
pher
s
46FDMI | Los Angeles County Perspective
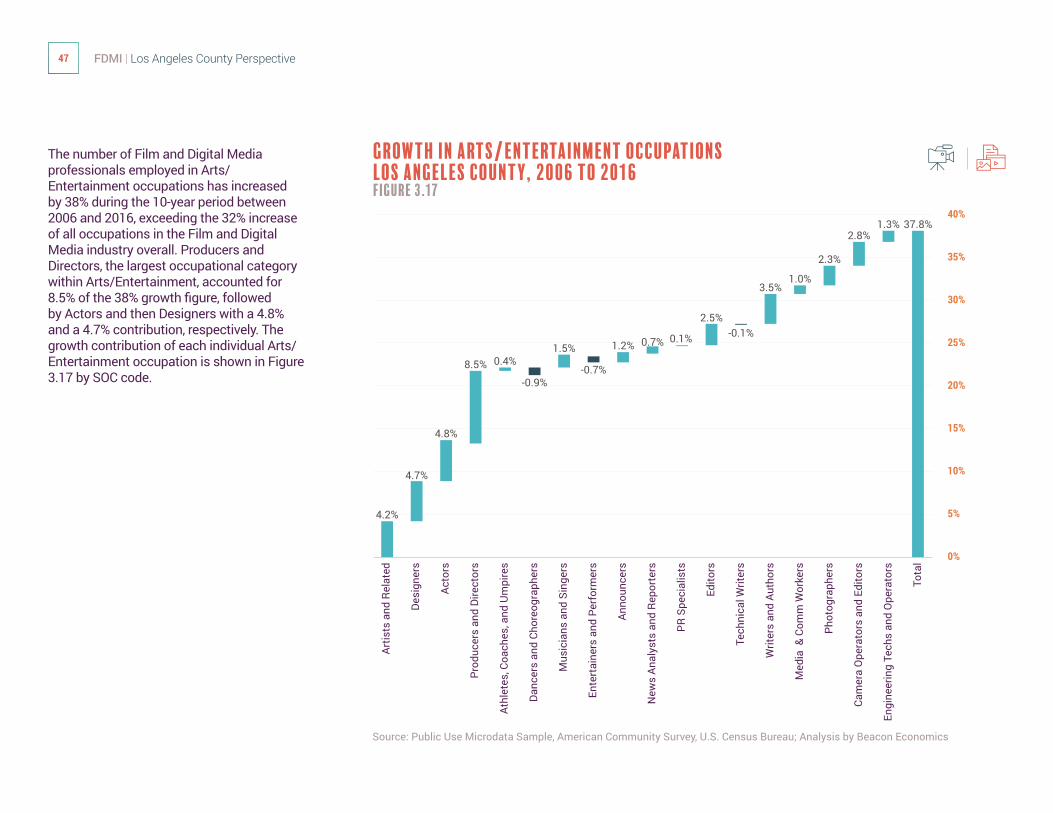
Growth in Arts/Entertainment Occupations Los Angeles County, 2006 to 2016Figure 3.17
Source: Public Use Microdata Sample, American Community Survey, U.S. Census Bureau; Analysis by Beacon Economics
The number of Film and Digital Media professionals employed in Arts/Entertainment occupations has increased by 38% during the 10-year period between 2006 and 2016, exceeding the 32% increase of all occupations in the Film and Digital Media industry overall. Producers and Directors, the largest occupational category within Arts/Entertainment, accounted for 8.5% of the 38% growth figure, followed by Actors and then Designers with a 4.8% and a 4.7% contribution, respectively. The growth contribution of each individual Arts/Entertainment occupation is shown in Figure 3.17 by SOC code.
40%
20%
25%
30%
35%
10%
15%
5%
0%
Artis
ts a
nd R
elat
ed
Desi
gner
s
Acto
rs
Prod
ucer
s an
d Di
rect
ors
Athl
etes
, Coa
ches
, and
Um
pire
s
Danc
ers
and
Chor
eogr
aphe
rs
Mus
icia
ns a
nd S
inge
rs
Ente
rtai
ners
and
Per
form
ers
Anno
unce
rs
New
s An
alys
ts a
nd R
epor
ters
PR S
peci
alis
ts
Edito
rs
Tech
nica
l Writ
ers
Writ
ers
and
Auth
ors
Med
ia &
Com
m W
orke
rs
Phot
ogra
pher
s
Cam
era
Ope
rato
rs a
nd E
dito
rs
Engi
neer
ing
Tech
s an
d O
pera
tors
Tota
l
4.2%
4.7%
4.8%
8.5% 0.4%1.5%
-0.7%
-0.1%1.2% 0.7% 0.1%
2.5%
3.5%1.0%
2.3%
2.8%1.3% 37.8%
-0.9%
47 FDMI | Los Angeles County Perspective

180%
100%
120%
140%
160%
60%
80%
40%
20%
Wages in Arts/Entertainment occupations varied considerably. The three categories with the highest average wages in 2016 were Producers and Directors (+51% above average wage of all occupations in Arts/Entertainment), Editors (+27%), and Public Relations Specialists (+16%). Frontstage performers have some of the lowest average wages relative to all occupations’ average wage: Actors (-27%), Dancers and Choreographers (-67%), and Musicians, Singers, and Related Workers (-47%). Figure 3.18 illustrates average wages by occupation in 2006 and in 2016 with respect to total average wage for Arts/Entertainment.
Figure 3.18 shows that Television, Video, and Motion Picture Camera Operators and Editors (-15%) experienced the largest decline in average nominal wages.13 Writers and Authors (-5%) and News Analysts, Reporters and Correspondents (-2%) professionals have also seen notable slumps in their wages.14 On the other hand, Athletes, Coaches, Umpires, and Related Workers (+116%), Actors (+64%), Announcers (+61%), and Miscellaneous Media and Communication Workers (+56%) posted the highest jumps in real average wages. However, all of these occupations pay significantly less than the total Arts/Entertainment average wage. These observations indicate that perhaps the average wage of each occupation in Arts/Entertainment is becoming more equalized. Based on the employment and average wage estimates, Beacon Economics has derived the Lorenz Curve for 2006 and 2016.22
Relative Wages of Arts/Entertainment Occupations in Film and Digital Media, Los Angeles County, 2016 vs. 2006Figure 3.18
Source: Public Use Microdata Sample, American Community Survey, U.S. Census Bureau; Analysis by Beacon Economics
2006 2016
Artis
ts a
nd R
elat
ed
Desi
gner
s
Acto
rs
Prod
ucer
s an
d Di
rect
ors
Athl
etes
, Coa
ches
, and
Um
pire
s
Danc
ers
and
Chor
eogr
aphe
rs
Mus
icia
ns a
nd S
inge
rs
Ente
rtai
ners
and
Per
form
ers
Anno
unce
rs
New
s An
alys
ts a
nd R
epor
ters
PR S
peci
alis
ts
Edito
rs
Tech
nica
l Writ
ers
Writ
ers
and
Auth
ors
Med
ia &
Com
m W
orke
rs
Phot
ogra
pher
s
Cam
era
Ope
rato
rs a
nd E
dito
rs
Engi
neer
ing
Tech
s an
d O
pera
tors
13 These wage figures are not inflation-adjusted. Adjusting for inflation (based on all items in Los Angeles-Riverside-Orange County, CA, all urban consumers—series CUURA421SA0, CUUSA421SA0), the real average wage decreases are 38% for Technical Writers and 28% for Motion Picture Camera Operators and Editors.14 These are equivalent to a 20% and 18% decrease, respectively, in real average wage.
48FDMI | Los Angeles County Perspective

49 FDMI | Los Angeles County Perspective
As Figure 3.19 illustrates, the average wage distribution by occupation is closer to equal in 2016 than in 2006. For example, the bottom 26% of workers earned 16% of the cumulative wage in 2016, which is a 3% improvement over the 13% cumulative wage they earned in 2006. Nevertheless, the average wage figures do not paint a complete picture of wage differences.
Lorenz Curve of Arts/Entertainment Workers in Film and Digital Media, Los Angeles County, 2006 vs. 2016Figure 3.19
Source: Public Use Microdata Sample, American Community Survey, U.S. Census Bureau; Analysis by Beacon Economics
100%
40%
50%
60%
70%
80%
90%
20%
30%
10%
0%
100%40% 50% 60% 70% 80% 90%20% 30%10%0%
Cum
ulat
ive
Per
cent
of
Inco
me
of S
ubse
t
Cumulative Percent of Workforce Population of Subset
2006 2016 Equality (Gini = 0)
Arts and Entertainment occupations in Los
Angeles County, which include producers,
directors, editors, writers have less wage inequality
than 10 years ago.
49 FDMI | Los Angeles County Perspective

50FDMI | Los Angeles County Perspective
Occupation by Specific Sector in Film and Digital Media Industry
The Internet Publishing and Broadcasting and Web Search Portals sector has the most diverse occupations, followed by the Advertising, Public Relations, and Related Services sector and Broadcasting (except Internet). Although the Film and Digital Media industry employs a diverse set of occupations, the subset of individual sectors encompassing it each employ a few niche occupational groups. In every year between 2006 and 2016, Specialized Design Services is by far the most specialized sector, with roughly 70% of its professionals employed in Arts/Entertainment occupations. Roughly half of the workforce in the Motion Picture and Video sector was employed in 2016 in Arts/Entertainment occupations, in which Producers and Directors, Artists and Related Workers, Editors, and Camera Operators alone accounted for about three-fourths of those Arts/Entertainment occupations. A breakdown of the occupations in the Motion Picture and Video sector is illustrated in Figure 3.20.
Occupation Breakdown of Motion Picture and Video SectorLos Angeles County, 2016Figure 3.20
Source: Quarterly Census of Employment and Wage; Analysis by Beacon Economics
Arts/Entertainment
50.5%Occupations not in Arts/Entertainment
Editors
Produ
cers
and D
irect
ors
Television, Video, and Motion Picture Camera Operators and Editors
Artists and Related WorkersOther Arts/Ent.
Other Occupations
24.1%
Office / Administrative
12.1%
Management13.3%
49.5%
19.3%
5.6%
5.6%
6.5%
13.6%
50FDMI | Los Angeles County Perspective

In 2016, Arts/Entertainment was a top-three occupation for all Film and Digital Media sectors except the Data Processing, Hosting, and Related Services sector, the Libraries and Archives sector, and the Computer Systems Design and Related Services sector, in which Arts/Entertainment occupations made up between 2% to 4% of total employment for each. Management and Office/Administrative occupations were also common in the Film and Digital Media industry. Management was a top-three occupation in 2016 for all sectors except the Newspaper Publishers sector and the Libraries and Archives sector. Finally, Emerging Digital Media sectors tend to have a relatively high concentration of Computer/Mathematical occupations: Data Processing, Hosting, and Related Services (61%), Internet Publishing and Broadcasting and Web Search Portals (22%), and Computer Systems Design and Related Services (52%).
51 FDMI | Los Angeles County Perspective

The U.S. Census American Community Survey Public Use Microdata Samples (PUMS) provide rich and unique data that enable more in-depth analysis of the characteristics of the Film and Digital Media sectors than is otherwise possible with the Quarterly Census of Employment and Wages. The PUMS data do not provide the NAICS codes at the granular six-digit level, however, so some of the more granular sectors are aggregated according to the parameters set by PUMS.
The County has a diverse workforce
in the Film and Digital Media industry,
whether assessed by race, educational
attainment, age, gender, or income.
Demographic Profile of Industry Workforce
52FDMI | Los Angeles County Perspective

Source: Quarterly Census of Employment and Wages; Analysis by Beacon Economics
PUMS NAICS Code ListTable 3.7
NAICS Broad Industry Detailed Industry
51111 Publishers Newspaper Publishers
5111Z Publishers Periodical, Book, and Directory Publishers
5112 Publishers Software Publishers
5121 Film Motion Picture and Video Industries
5122 Sound Producing and Recording Sound Recording Industries
515 Broadcasting Broadcasting, Except Internet
5182 Emerging Digital Media Data Processing, Hosting, and Related Services
51912 Professional Services and Business Operations Libraries and Archives
51913 Emerging Digital Media Internet Publishing and Broadcasting and Web Search Portals
5191ZM Professional Services and Business Operations Other Information Services
5414 Professional Services and Business Operations Specialized Design Services
5415 Emerging Digital Media Computer Systems Design and Related Services
5418 Professional Services and Business Operations Advertising, Public Relations, and Related Services
5419Z Professional Services and Business Operations Other Professional, Scientific, and Technical Services
711 Artists and Agents Performing Arts, Spectator Sports, and Related Industries
53 FDMI | Los Angeles County Perspective

Race
The Film and Digital Media industry as a
whole is becoming more diverse than it
was 10 years ago. Specifically, employment
growth in Film and Digital Media sectors
among Asians (+61%), Hispanics (+37%),
Blacks (+26%), and Other Racial Groups
(+74%) has outpaced growth of Non-
Hispanic Whites (+24%) from 2006 to 2016.
Growth in Film and Digital Media Industry Employment by RaceLos Angeles CountyFigure 3.21
Source: Public Use Microdata Sample, American Community Survey, U.S. Census Bureau; Analysis by Beacon Economics
220
130
160
190
100
70200820072006 2009 2010 2011 2012 2013 2014 2015 2016
Gro
wth
in E
mpl
oym
ent
(Ind
exed
to
2006
Val
ues)
Film and Digital Media Industry Employment by RaceLos Angeles County, 2006 vs 2016Figure 3.22
Source: Public Use Microdata Sample, American Community Survey, U.S. Census Bureau; Analysis by Beacon Economics
80%
60%
40%
20%
0%HISPANIC
(ALL RACES)ASIAN BLACK WHITE OTHER
12% 15% 11%14%
18% 19%
3% 3%6% 6%
61% 57%
2006 2016
Hispanics Other TotalAsian Black White
54FDMI | Los Angeles County Perspective

10-Year Percent Growth of Employment in Film and Digital Media Sectors by Region and Race, 2006-2016Figure 3.23
In the Motion Picture and Video sector, Hispanics represented 15% of individuals employed in this sector in Los Angeles County in 2016, up 1.4% from 2006. Similarly, Blacks made up of 7% of this sector in 2016, up 0.8% from 2006. The percentage of workers in this sector who are of Asian descent held steady at 9%.
For the first time in 2016, Hispanics made up one-fifth of those employed in the Performing Arts, Spectator Sports, and Related Sectors in Los Angeles County, up 4.7% from 2006. In contrast, non-Hispanic Whites made up 62.5% of all workers in the sector, down 5.3% from 2006.
Source: Public Use Microdata Sample, American Community Survey, U.S. Census Bureau; Analysis by Beacon Economics
new york metro area
los angeles county
3.5%
3.5%
7.6%
4.7%
1.7%
1.9%
0.6%
14.6%
7.2%
60%
50%
40%
30%
20%
10%
0%
orange county
Hispanics
Other
Asian
Black
White
3.5%
10.4%
0.8%
3.5%
32.6%
55 FDMI | Los Angeles County Perspective

Source: Public Use Microdata Sample, American Community Survey, U.S. Census Bureau ; Analysis by Beacon Economics
50%
40%
30%
10%
20%
0%
Hispanics Asian Black White Other Total
9%4%
4%
26%4% 47%
Motion Picture and Video Sector
Workforce Gain by Race in Selected Film and
Digital Media Sectors Los Angeles County, 2006-2016
Figure 3.24
Source: Public Use Microdata Sample, American Community Survey, U.S. Census Bureau; Analysis by Beacon Economics
35%
28%
21%
7%
14%
0%
Hispanics Asian Black White Other Total
7%
8%2%
15%2% 32%
Film & Digital Media Industry
56 FDMI | Los Angeles County Perspective

Source: Public Use Microdata Sample, American Community Survey, U.S. Census Bureau; Analysis by Beacon Economics
Source: Public Use Microdata Sample, American Community Survey, U.S. Census Bureau; Analysis by Beacon Economics
35%
18%
28%
12%
15%
21%
9%
7%
3%
14%
6%
0%
0%
Hispanics
Hispanics
Asian
Asian
Black
Black
White
White
Other
Other
Total
Total
5%
8%
12%
1%
1%
1%
12%
26%
1% 31%
1% 16%
In 2016, the Motion Picture and Video sector was the most popular sector employment category for all races except for Asians, whose most popular employment category was Computer Systems Design and Related Services. Of all Asian workers in the Film and Digital Media industry in 2016, 17.1% were employed in the Motion Picture and Video sector, much lower than the 29.7% average across all races. Similarly, only 6.6% of all Asian workers in the Film and Digital Media industry were employed in the Performing Arts, Spectator Sports, and Related Sectors compared to Hispanics (18.7%), Blacks (21.9%), non-Hispanic Whites (18.9%), and other races (19.2%) in 2016. Overall, despite respectable growth in these front-end, audience-facing industries, Asians accounted for a small fraction of workforce gains: 4% of the 47% gain in Motion Picture and Video and 1% of the 16% gain in Performing Arts, Spectator Sports, and Related. Between 2006 and 2016, all other Film and Digital Media sectors excluding the aforementioned two sectoral groups grew by 31%, and Asians alone accounted for 12% of that 31% growth figure.
Performing Arts, Spectator Sports, And Related Sectors
Other Film & Digital Media Sectors
57FDMI | Los Angeles County Perspective

Educational Attainment
The workforce is becoming increasingly
educated. Those with bachelor’s or higher
degrees enjoyed most of the employment
gains. Compared to 2006, the number
of workers with bachelor’s degrees
increased 60% and those with graduate or
professional degrees increased 47%.
There were fewer people with no post-
secondary education working in the Film
and Digital Media sectors in 2016 than
in 2006. Compared to 2006, the number
of workers with less than a high school
education fell 36% and the number with
only a high school diploma fell 5%.
Individuals with bachelor’s degrees made
up slightly more than half of the industry’s
workforce in 201623, followed by those with
some college or associate’s degrees (24%).
Source: Public Use Microdata Sample, American Community Survey, U.S. Census Bureau; Analysis by Beacon Economics
80%
0%
20%
40%
60%
-20%
-40%Less Than High
SchoolHigh School
GraduateSome College Bachelor’s
DegreeGrad./Prof.
Degree
23 This represents a nine-percentage point increase compared to 2006’s 42%.
In Film/Digital Media Industries Not In Film/Digital Media Industries
10-Year Percent Change of Workforce in Film and Digital Media Industry by Educational AttainmentLos Angeles County, 2006-2016Figure 3.25
58 FDMI | Los Angeles County Perspective

Workforce Gain by Educational Attainment in Selected Film and
Digital Media SectorsLos Angeles County, 2006-2016
Figure 3.26
Motion Picture and Video Sector
Source: Public Use Microdata Sample, American Community Survey, U.S. Census Bureau; Analysis by Beacon Economics
Source: Public Use Microdata Sample, American Community Survey, U.S. Census Bureau; Analysis by Beacon Economics
50%
40%
30%
10%
20%
0%Less Than
High SchoolHigh School
GraduateSome College Bachelor’s
DegreeGrad./Prof.
DegreeTotal
0.2% 0.3%
8.3%
30.3%
8.1% 47.2%
Film & Digital Media Industry35%
30%
20%
0%
5%
15%
25%
10%
-5%Less Than
High SchoolHigh School
GraduateSome College Bachelor’s
DegreeGrad./Prof.
DegreeTotal
-1.8%-0.7%
3.6%
25.2%
6.1% 32.4%
59FDMI | Los Angeles County Perspective

Motion Picture and Video is the most popular sector for individuals across all educational attainment levels.
Those with less than a high school diploma make up just 2% of the Film and Digital Media workforce, down from 5% in 2006. Individuals with lower educational attainment levels are more likely to work in Performing Arts, Spectator Sports, and Related Sectors, and those with at least a bachelor’s degree are more likely to be employed in Computer Systems Design and Related Services.
Performing Arts, Spectator Sports, And Related Sectors
Other Film & Digital Media Sectors
Source: Public Use Microdata Sample, American Community Survey, U.S. Census Bureau; Analysis by Beacon Economics
Source: Public Use Microdata Sample, American Community Survey, U.S. Census Bureau; Analysis by Beacon Economics
18%
35%
15%
30%
9%
20%
-3%
0%
0%
5%
6%
15%
12%
25%
3%
10%
-6%
-5%
Less Than High School
Less Than High School
High School Graduate
High School Graduate
Some College
Some College
Bachelor’s Degree
Bachelor’s Degree
Grad./Prof. Degree
Grad./Prof. Degree
Total
Total
-2.3%-0.7% +1.1%
27.1%
5.8% 31.0%
-3.1%
-1.9%+3.9%
13.2%
4.1% 16.2%
60 FDMI | Los Angeles County Perspective

Age
There was an increase in employment in all age groups from 2006 to
2016. The 26- to 35-year-old (+51%) and over-55 groups (+49%) were
the fastest growing. However, the industry is not attracting young
talents (ages 25 and under) as fast as people from other age groups.
Individuals ages 26 to 35 make up the largest age group, representing
a little more than one-third of all workers employed in the Film and
Digital Media industry. Individuals 25 and younger made up 11% of
the Film and Digital Media workforce in 2016, down from 13% in 2006.
After the Motion Picture and Video sector, which is the largest sector
for all age groups, Performing Arts, Spectator Sports, and Related is
the next largest sector for those 25 and younger and for those 46 and
older. Computer Systems and Design and Related is the next largest
sector for people 26 to 45 years old.
Newspaper Publishers, a declining sector, employs a disproportionate
number of older workers. Young workers make up the majority of the
workforce in Advertising, Public Relations, And Related Services.
61FDMI | Los Angeles County Perspective
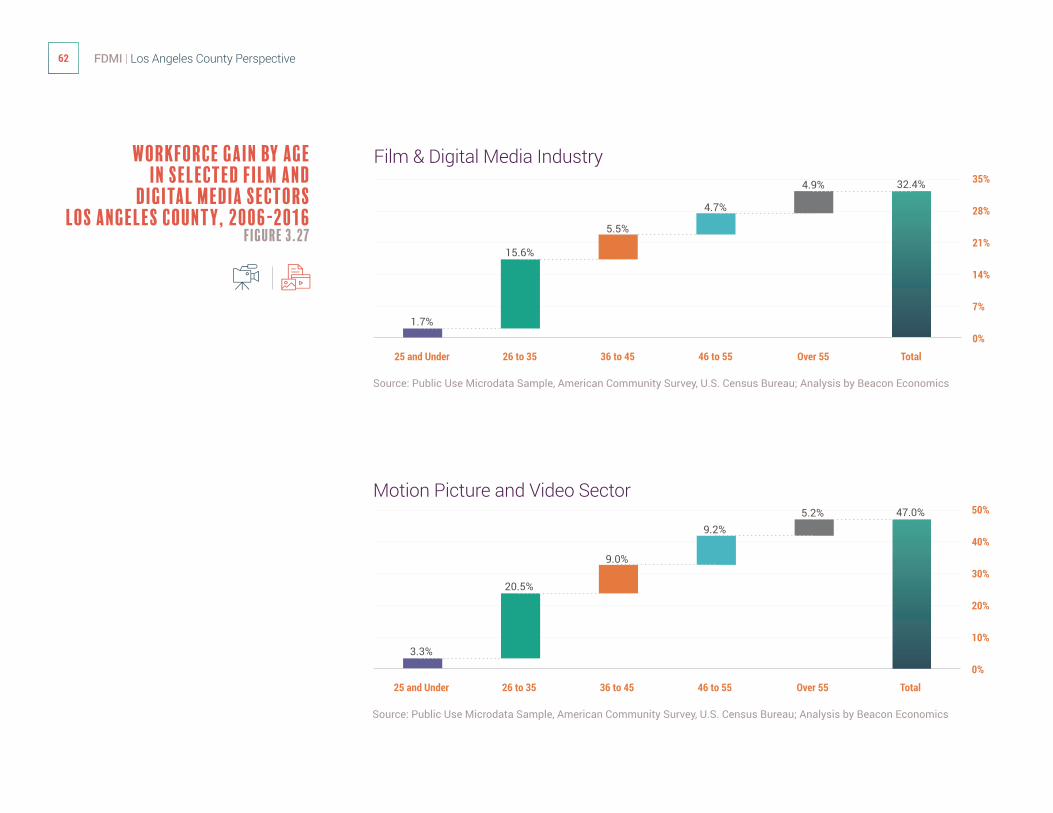
Source: Public Use Microdata Sample, American Community Survey, U.S. Census Bureau; Analysis by Beacon Economics
50%
40%
30%
10%
20%
0%
25 and Under 26 to 35 36 to 45 46 to 55 Over 55 Total
Motion Picture and Video Sector
Workforce Gain by Age in Selected Film and
Digital Media SectorsLos Angeles County, 2006-2016
Figure 3.27
Source: Public Use Microdata Sample, American Community Survey, U.S. Census Bureau; Analysis by Beacon Economics
35%
28%
21%
7%
14%
0%
25 and Under 26 to 35 36 to 45 46 to 55 Over 55 Total
Film & Digital Media Industry
1.7%
4.9% 32.4%
5.5%
15.6%
4.7%
3.3%
20.5%
9.0%
9.2%5.2% 47.0%
62 FDMI | Los Angeles County Perspective

Source: Public Use Microdata Sample, American Community Survey, U.S. Census Bureau; Analysis by Beacon Economics
Source: Public Use Microdata Sample, American Community Survey, U.S. Census Bureau; Analysis by Beacon Economics
35%
18%
28%
12%
15%
21%
9%
7%
3%
14%
6%
0%
0%
25 and Under
25 and Under
26 to 35
26 to 35
36 to 45
36 to 45
46 to 55
46 to 55
Over 55
Over 55
Total
Total
Performing Arts, Spectator Sports, And Related Sectors
Other Film & Digital Media Sectors
3.1%
0.8%
5.9% 31.0%
5.2%
16.1%
2.0%
7.7%1.5%
.9%
2.1% 16.2%
63FDMI | Los Angeles County Perspective

Gender
In Los Angeles County, employment by gender remained little changed from 2006 to 2016: for every 100 male workers in the Film and Digital Media industry, there were 60 female workers. Female employment relative to male employment in the industry in L.A. County has remained consistently lower than in the industry in New York City’s Metro Area, where it hovered between 70 and 75 female workers per 100 male workers over the last 10 years.
Of male professionals in the Film and Media industry, 32% were employed in Motion Picture and Video; 18% were employed in Performing Arts, Spectator Sports, and Related; and 16% were employed in Computer Systems Design and Related Services in 2016 in Los Angeles County. About 25% of female Film and Digital Media professionals were employed in Motion Picture and Video. A comparable percentage (17%) were employed in Performing Arts, Spectator Sports, and Related, and 12% were employed in Computer Systems Design and Related Services in 2016 in the County. Female professionals were more likely to be employed in Specialized Design Services and Advertising, Public Relations, and Related Services industries than their male counterparts.
Female Employment as Percent of Male Employment in Film and Digital Media Industry, Los Angeles CountyFigure 3.28
Source: Public Use Microdata Sample, American Community Survey, U.S. Census Bureau; Analysis by Beacon Economics
80%
50%
55%
60%
65%
70%
75%
45%
40%200820072006 2009 2010 2011 2012 2013 2014 2015 2016
Los Angeles County New York City Metro
64 FDMI | Los Angeles County Perspective

Average Wage and Percent of Total Employment by Gender, Film and Digital Media INDUSTRY vs. Motion Picture and Video Sector, Los Angeles County, 2006-2016Figure 3.29
Source: Public Use Microdata Sample, American Community Survey, U.S. Census Bureau; Analysis by Beacon Economics
$90,000
$80,000
$70,000
$60,000
$50,000
$40,000
$30,000
$20,000
$10,000
0%
Female Male
Average wages have risen faster for female professionals than for their male counterparts, but in 2016 female workers still earned only about 80 cents per $1 earned by male professionals in the Film and Digital Media industry in L.A. County. However, female professionals earned as much if not more on average than their male counterparts in Sound Recording, Libraries and Archives, and Other Information Services. Unfortunately, female professionals are also relatively underrepresented in these sectors except for Libraries and Archives compared to male professionals.
Finally, compared to the total Film and Digital Media industry employment, females are comparatively underrepresented in Motion Picture and Video. Although they made up 38% of all employment in the Film and Digital Media industry in the County in 2016, they accounted for only 33% of all employees in the Motion Picture and Video sector. Encouragingly, the gender pay gap is smaller in the Motion Picture and Video sector than that of the entire Film and Digital Media industry.
Film & Digital Media Industry
0% 20% 40% 60% 80% 100%
Aver
age
(mea
n) w
age
Percent of Total Employment in Film & Digital Media
Women earn 80
cents for every $1
male counterparts
earn.
65FDMI | Los Angeles County Perspective

Source: Public Use Microdata Sample, American Community Survey, U.S. Census Bureau; Analysis by Beacon Economics
$90,000
$80,000
$70,000
$60,000
$50,000
$40,000
$30,000
$20,000
$10,000
0%
Female Male
Motion Picture and Video Sector
0% 20% 40% 60% 80% 100%
Aver
age
(mea
n) w
age
Percent of Total Employment in Motion Picture and Video
66 FDMI | Los Angeles County Perspective

Income
There has been an increase in
employment in the Film and
Digital Media industry across
all household income levels;
however, as with educational
attainment, households in the
higher income echelons had the
most employment growth in the
industry.
Compared to 2006, workers
from households earning more
than $150,000 annually more
than doubled, and those from
households earning less than
$20,000 a year decreased by 3%.
Motion Picture and Video is the
largest sector for workers from
all household income levels
except households earning
less than $20,000 per year; for
these workers, Performing Arts,
Spectator Sports, and Related,
which tend to provide lower
paying jobs, is the largest. The
higher the household income
level, the larger the share is of
Film and Digital Media workers
employed in the Motion Picture
and Video sector.
More than one-sixth of Film
and Digital Media workers from
households earning at least
$75,000 a year are employed in
the Computer Systems Design
and Related Services sector, a
relatively well-compensated field,
compared to a less than 12%
representation in the sector of
workers from households earning
less than $40,000, as Figure 3.33
illustrates.
67FDMI | Los Angeles County Perspective

50%
40%
30%
10%
20%
0%
Under $20,000
$20,000 to $39,999
$40,000 to $74,999
$75,000 to $149,999
Over $150,000
Total
Motion Picture and Video Sector
Workforce Gain by household Income in Selected
Film & Digital Media SectorsLos Angeles County, 2006-2016
Figure 3.30
Source: Public Use Microdata Sample, American Community Survey, U.S. Census Bureau; Analysis by Beacon Economics
35%
30%
25%
5%
20%
15%
10%
0%
-5%
-10%
Under $20,000
$20,000 to $39,999
$40,000 to $74,999
$75,000 to $149,999
Over $150,000
Total
Film & Digital Media Industry
7.6%3.7%
9.7%
17.7%
8.4% 47.2%
-4.9%
-0.9%
+7.4%
19.8%
9.6% 31.0%
Source: Public Use Microdata Sample, American Community Survey, U.S. Census Bureau; Analysis by Beacon Economics
68 FDMI | Los Angeles County Perspective

Source: Public Use Microdata Sample, American Community Survey, U.S. Census Bureau; Analysis by Beacon Economics
Source: Public Use Microdata Sample, American Community Survey, U.S. Census Bureau; Analysis by Beacon Economics
35%
18%
28%
12%
15%
21%
9%
7%
3%
14%
6%
0%
0%
Under $20,000
Under $20,000
$20,000 to $39,999
$20,000 to $39,999
$40,000 to $74,999
$40,000 to $74,999
$75,000 to $149,999
$75,000 to $149,999
Over $150,000
Over $150,000
Total
Total
Performing Arts, Spectator Sports, And Related Sectors
Other Film & Digital Media Sectors
4.9%
3.0%1.6%
5.2%1.4% 16.2%
0.4% 1.1%
6.9%
16.4%
7.7% 32.4%
69FDMI | Los Angeles County Perspective

Direct effects result from the additional output of goods or services from the target industry or the industry under observation. Then, there is a chain of indirect effects on all the industries whose outputs are used by the industry under observation. These are the impacts generated by a business’ supply chain. Third, there are induced effects that arise when employment increases and household spending patterns are expanded. These impacts follow from the additional income that is earned in the course of producing this output, both by employees in the target industry and in those supplying it.
Economic Impact of
the Industry
While the Film and Digital Media industry directly accounts for 6.1% of all employment in Los Angeles County, this figure does not capture the significance of its contribution to the region’s broader economic health and vitality.
Source: Quarterly Census of Employment and Wages; Analysis by Beacon Economics
Economic Impact Summary–Film and Digital Media Industrylos angeles County, 2016Table 3.8
Impact Type Employment Labor Income ($ Billions)
Output ($ Billions)
Direct Effect 265,000 35.2 97.1
Indirect Effect 163,900 12.4 29.5
Induced Effect 211,600 11.2 31.7
Total 640,500 58.8 158.3
70 FDMI | Los Angeles County Perspective

Source: Beacon Economics
direct effect: $203.4B
indirect effect: $62.0B
induced effect: $62.8B
value added: $111.1B
LABOR INCOME: $58.8B
output: $158.3B
$158.3 BILLIONIN ECONOMIC OUTPUT
640,500JOBS
$58.8 BILLIONIN LABOR INCOME
In total, the Film and Digital Media industry in 2016 generated:
Economic Impact Summary, L.A. County, 2016Figure 3.31Source: Beacon Economics
71FDMI | Los Angeles County Perspective

Direct Output: 97.2
Indirect Output: 29.6
Induced Output: 31.64
Film: 62.9
Sound Production and Recording: 1.5
Broadcasting: 17.3
PUBLISHING: 2.9
Professional Services and Business Operations: 9.2
Emerging Digital Media: 12.4
Artists and Agents: 6.8
All Other Industries: 43.60
Hospitals: 1.65
Economic Output by Selected Sectors, L.A. County, 2016 (Billions of Dollars)Figure 3.32Source: Beacon Economics
Output
In 2016, the Film and Digital Media industry generated a total of $158.3 billion in economic output countywide, of which $61.2 billion represented economic activity generated down the supply chain through secondary effects – such as when Film and Digital Media companies and workers transact with other sectors of the economy. Of that $61.2 billion, $29.5 billion represented indirect economic output—spending by businesses down the supply chain—and $31.7 billion represented induced economic output—spending by workers down the supply chain.
Some sectors in particular benefit tremendously from the Film and Digital Media industry as a result of their business relationships with it. For instance, the industry generated $4.5 billion in economic output in Real Estate. Real Estate is a major beneficiary of the Film and Digital Media industry not only because of the property investments that studios and other industry businesses hold, but also because of the indirect investments made by industry workers in new homes across the County. As in many other industries, hospitals are also major beneficiaries of the Film and Digital Media industry in L.A. County, as workers earning income spend some of that income on health services.
72 FDMI | Los Angeles County Perspective

Direct Employment: 268.7
Indirect Employment: 163.9
Induced Employment: 211.4
Film: 152.9
PUBLISHING: 19.1
Emerging Digital Media: 39.6
Broadcasting: 23.5
Professional Services and Business Operations: 44.9
Sound Production and Recording: 1.9
Artists and Agents: 57.3
Employment Services: 21.0
All Other Industries: 241.3
Real Estate: 16.2
Full-service Restaurants: 14.9
Limited-Service Restaurants: 11.4
Employment
In 2016, the Film and Digital Media industry supported 640,500 jobs across Los Angeles County. In addition to the 265,000 workers directly employed in the industry, another 375,500 workers were supported through indirect and induced economic impact. For example, Employment Services is a major beneficiary in terms of employment of Film and Digital Media businesses in Los Angeles County, with a total of 20,928 jobs in Employment Services supported by the industry solely through secondary effects. Particularly in television and motion picture production, staffing firms play a fundamental role in finding the workers needed to fill vacancies, and these firms consequently require substantial staffing of their own. The dollars that Film and Digital Media businesses spend in the local economy lead to significant hiring at businesses across many other sectors of the Los Angeles County economy as well. The Film and Digital Media industry supports a total of 16,277 jobs in Real Estate and 14,870 jobs in Full-Service Restaurants, as the dollars that businesses generate and workers earn in the industry are spent on residential and commercial properties and on dining out.
Employment Impact by Selected Sectors, L.A. County, 2016 (Thousands of Jobs)Figure 3.33Source: Beacon Economics
73FDMI | Los Angeles County Perspective

Direct Labor Income: $35.3
Indirect Labor Income: $12.3
Induced Labor Income: $11.3
Film: $16.5
Sound Production and Recording: $0.1
Broadcasting: $12.5
PUBLISHING: $1.1
Professional Services and Business Operations: $3.9
Emerging Digital Media: $4.5
Artists and Agents: $3.6
All Other Industries: $16.1
Wholesale Trade: $0.6
Earnings by Selected Sectors, L.A. County, 2016 (Billions of Dollars)Figure 3.34
Earnings
In 2016, the Film and Digital Media industry generated a total of $58.8 billion in labor income in Los Angeles County. Of this total, $35.2 billion represented earnings in jobs directly connected to the industry, while $12.4 billion represented earnings generated through indirect economic impacts and $11.2 billion represented earnings generated through induced economic impacts.
A total of $16.5 billion in earnings went to workers in Motion Picture and Video Production, including $15.2 billion in direct payments to workers in that sector. The Radio and Television Broadcasting sector contributed $12.2 billion in wages to Los Angeles County workers, $10.6 billion directly and $1.6 billion through secondary effects. Other Film and Digital Media sectors like Advertising ($2.7 billion), Computer Programming Services ($2.0 billion), and Internet Publishing ($1.8 billion) were major contributors to workers’ wages in L.A. County, but Film and Digital Media businesses also generated hundreds of millions of dollars in wages through secondary effects in other major Los Angeles County sectors not commonly associated with the industry. For instance, the industry generated $486.7 million in labor income for workers in Wholesale Trade, as well as $447.3 million in labor income for workers in Accounting and $441.2 million in labor income for workers in Legal Services. The Film and Digital Media industry clearly serves as a crucial wage generator and job supplier for sectors across the L.A. County economy.
Source: Beacon Economics
74 FDMI | Los Angeles County Perspective
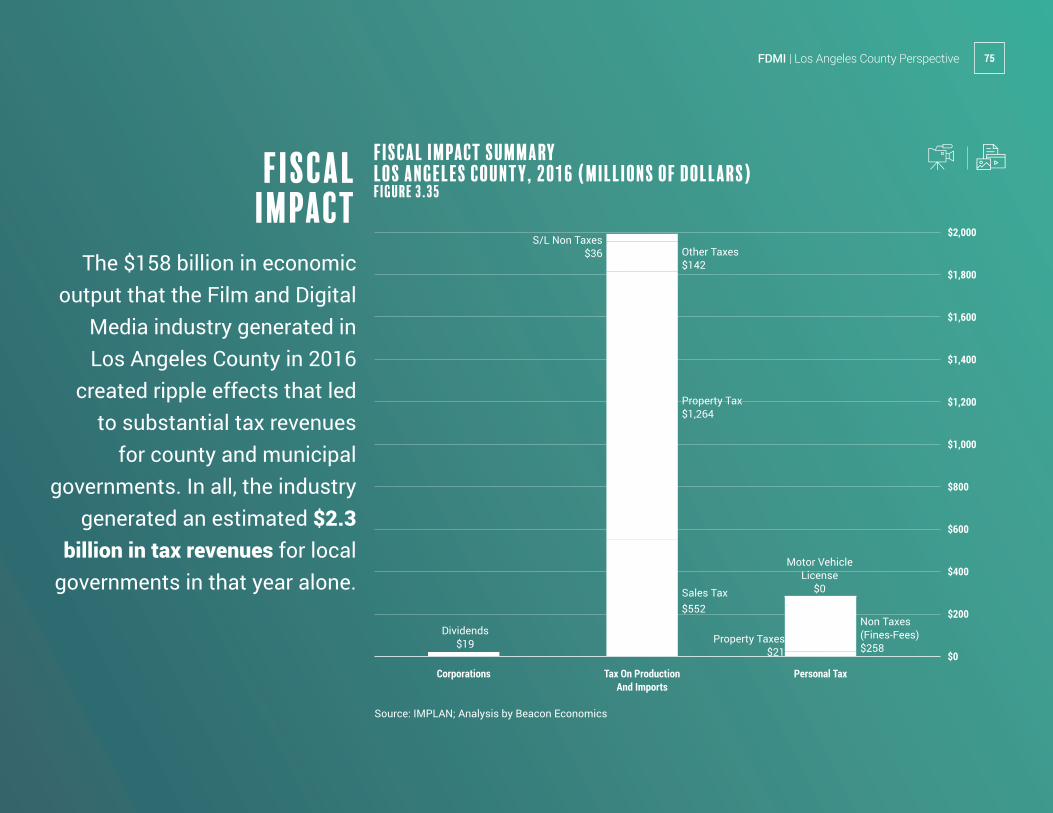
fiscal impact
The $158 billion in economic output that the Film and Digital
Media industry generated in Los Angeles County in 2016
created ripple effects that led to substantial tax revenues
for county and municipal governments. In all, the industry
generated an estimated $2.3 billion in tax revenues for local
governments in that year alone.
$2,000
$1,600
$1,400
$1,200
$800
$400
$200
$600
$1,000
$1,800
$0Corporations Tax On Production
And ImportsPersonal Tax
Fiscal Impact SummaryLos Angeles County, 2016 (Millions of Dollars)Figure 3.35
Source: IMPLAN; Analysis by Beacon Economics
Dividends$19
Motor Vehicle License
$0Sales Tax$552
Non Taxes (Fines-Fees) $258
Property Tax$1,264
Other Taxes $142
S/L Non Taxes $36
Property Taxes$21
75FDMI | Los Angeles County Perspective

The Film sector will account for the largest share of that growth,
adding around 7,000 jobs by 2020. The balance of the employment
growth in the Film and Digital Media industry will come from Emerging
Digital Media, which will add around 3,800 jobs; Broadcasting, which
will add around 3,700 jobs, and Professional Services, which will
add around 2,000 jobs to the County’s economy. In the Publishing
and Sound and Recording sectors of the economy, employment is
expected to remain constant over the next three years.
Over the next three yearsBeacon projects that around 16,500 Film and Digital Media jobs will be added to Los Angeles County’s economy, an increase of around 6.3%.
76 FDMI | Los Angeles County Perspective

77FDMI | Los Angeles County Perspective

78 FDMI | Los Angeles County Perspective
Inclusionary Growth
Workforce and Talent Development Landscape for the Film & Digital Media Industry in L.A. County
78 FDMI | Los Angeles County Perspective
79FDMI | Los Angeles County Perspective
Industry stakeholders from major studios and industry unions
highlighted their different roles around increasing diversity in the
industry, discussing “above the line” and “below the line” opportunities
over which they have influence.
The phrases “above the line” and “below the line” are common Film
sector terms inherited from accounting and, more specifically, the
top sheets used by film production companies to determine budget
for a project. For clarity, “above the line” jobs generally refer to those
occupations most publicly associated with the Motion Picture
sector, like actors, directors, and producers who necessarily travel to
production locations and whose wages are typically fixed on a project.
“Below the line” jobs include those behind-the-scenes but equally
critical occupations like art designers, grips, make-up artists, special
effects technicians, and electricians.15
The major studios direct their inclusion and diversity efforts primarily at “above the line” opportunities through capacity building programs like writers’ room workshops, first-time director workshops, mentorship programs, and grant making. For example, Warner Bros. hosts an Emerging Film Directors Workshop, HBO runs HBOAccess Writing and Directing Fellowships, and 21st Century Fox funds the Fox Writers Lab. The studio heavyweights fund similar external programming as well. Sponsored by Sony, HBO, Laika, and AmazonStudios, Project Involve is a free nine-month program offering up-and-coming film professionals from underrepresented communities the opportunity to produce films with free or heavily subsidized resources and to gain “the industry access necessary to succeed as a working artist.”16 The program is administered by Film Independent, which also produces the Spirit Awards and the Los Angeles Film Festival.
Programs like Project Involve are aimed at addressing the dire statistics that define minority representation within a historically homogenous and insular industry. A report published by the University of Southern California looked at inequality in 900 popular films from 2007-2016 and, in short, the industry lived up to its reputation, getting dismal marks for diversity across gender, race/ethnicity, disability, and LGBTQ status. For example, the study found that only 12% of the 700 films had gender-balanced casts and only 5.6% of directors over the sample were Black.17
The Film and Digital Media industry’s current approach to workforce development is largely embedded in its structure, with different ecosystem actors facing different challenges and equipped with different levers around inclusivity.
15 National Endowment for the Arts, National Governors Association Center for Best Practices (2008). Promoting Film and Media to Enhance State Economic Development. July 15, 2008. Retrieved April 17 2018. Retrieved from: https://www.nga.org/files/live/sites/NGA/files/pdf/0807PROMOTINGFILMMEDIA.PDF
16 Film Independent (2017). Project Involve. Retrieved April 19 2018. Retrieved from: https://www.filmindependent.org/programs/project-involve/
Who’s Doing What
79FDMI | Los Angeles County Perspective

17 USC Annenberg, School for Communication and Journalism, Media, Diversity, and Social Change Initiative (2017). Inequality in 900 Popular Films: Examining Portrayals of Gender, Race/Ethnicity, LGBT & Disability from 2007 to 2016. July 2017. Retrieved April 20, 2018. Retrieved from: https://annenberg.usc.edu/sites/default/files/Dr_Stacy_L_Smith-Inequality_in_900_Popular_Films.pdf 18 Local 399 (2018). January 2018 News Reel. January 2018. Retrieved April 11, 2018. Retrieved from: https://www.ht399.org/january-2018-newsreel-now-available-online/
With statistics like those and hashtags-turned-movements like #OscarsSoWhite and #TimesUp, the corporate titans of the Film sector are keenly aware of the industry’s lack of diversity and thus funding both in-house and external programming to make a good faith effort to address it. While these programs endeavor to connect underrepresented communities to industry decision-makers and many have produced headline-making success stories, the strong networks of current industry professionals, persistent bad assumptions about what audiences desire, and a general lack of awareness of the industry’s interworkings on the part of the general public all act as inputs to a slow pace of change.
Efforts around greater inclusion in “below the line” jobs have been more the purview of the industry’s below-the-line unions, which are criticized for many of the same failings as the big studios when it comes to diversity. As an industry stakeholder remarked, “For many years most of the union workforce came from cousins, and uncles, and referrals, you came from the business so you went into the business.” Thus, not unlike getting an on-screen part, getting on a union roster has not been a straightforward career step for interested individuals not already well-networked in the Film
sector. In parallel with the efforts of the big studios, below-the-line unions and union coalitions have established apprenticeship programs, community college partnerships, and awareness campaigns to recruit more diverse and inclusive union rosters, especially with production high and their current workforce hovering around full employment. For example, Local 399 has a Veterans Program18 to place retired military service men and women on productions, and Hollywood CPR, West Los Angeles College, and the IATSE Union have brokered a curricular partnership for career pathways in the Film sector. Together, they developed a two-year apprentice-style program including training in stagecraft, grip, set lighting, costuming, set painting, camera, sound, and editing.19
Still, some of the most lauded efforts to increase representation in the industry come from community-based organizations like Ghetto Film School (GFS). Founded in 2000 in New York City, GFS now has a Los Angeles-based program funded in large part by 21st Century Fox, serving students from over 50 neighborhoods across L.A. County.20 Over the course of 30 months and 1,000 hours, students in the GFS Fellows Program receive college-level training from leading filmmakers and industry professionals. Some of the core
components of the GFS approach include local community-based partnership, rigorous high-quality study, subsidized or free transit, obligatory and paid internships, broader community engagement, and thoughtful curation of opportunities in order to set their alumni up for long-term success.
GFS’ L.A. Executive Director, Stosh Mintek, emphasized the reach of GFS’ programming in Los Angeles County as a marker of success and reflective of a break with local, conventional wisdom around community-based programming. Prior to founding an L.A.-based program, GFS leadership conducted a feasibility study in Los Angeles County and were repeatedly told by industry and community-based stakeholders that the program’s location would determine its beneficiaries given a general lack of mobility in the County, particularly for young people coming from lower-income households. While the GFS Director underlined the difference in access to the industry’s relevant spaces enjoyed by GFS students in New York City compared with that of his students in Los Angeles County, he and his team have remained successfully committed to reaching communities across L.A. County, not just those in the immediate vicinity of the program’s physical home in McArthur Park.
80 FDMI | Los Angeles County Perspective

“Right away what we realized was that geography was going to dictate everything, in L.A. County particularly. It is just so big and so spread out and one of the big barriers that’s facing a teenager whom we are trying to find [for our program] is simply that there is just not the infrastructure yet of public transit to allow him or her to move around in the way that a New York City kid can. A kid living in the Bronx can hop on the 6 train and 20 minutes later she’s in Astor Place checking out a cool art show going on at NYU. For a kid in L.A., that’s three buses and two hours to do the same thing. But we also didn’t buy into the conventional wisdom in L.A. about whom we could and could not serve. We believed that if we built something special and worked to remove some of the barriers, we could get kids from all over L.A. County.”–GFS Stakeholder
81FDMI | Los Angeles County Perspective

82 FDMI | Los Angeles County Perspective
While GFS has managed to reach students from
a wide array of communities across L.A. County,
physical access to brick and mortar spaces
connected to the industry is an important lever to
consider, as opportunity interacts with the physical
landscape of the County, disproportionately
impacting communities of color.
GFS also has an entire staff function to support alumni programming and facilitate the education-to-industry transition of its graduates. Given the public criticism of the industry and a broadening of its audiences, the traditional corporate players are actively seeking to employ young diverse talent like GFS graduates. However, GFS leadership reiterated the importance of curating opportunities. In an industry where job descriptions can be unclear, personal impressions can be impactful, and culture has been historically defined by a homogenous group of people, it requires time and investment by all parties to successfully and sustainably increase diversity and inclusivity.
Programs like Project Involve and GFS target different demographics, but both are designed to increase and systemize greater access through the lowering of barriers to entry, whether they be brute costs or network connectivity in a traditionally very insular industry. Social media and virality have also had democratizing effects on access, catapulting individuals otherwise out of the industry’s human network into a virtual seat at the decision-making table.
“While people may be aware of the need for inclusiveness in the industry, there isn’t always a corresponding understanding of what that journey looks like because the people who are in this industry have usually been on that path for a really long time, often they are children of the industry themselves. Their families have worked in it. They are able to get advice from Uncle Ralph on how to get their first apprenticeship or internship. That kind of structure, if you want to build it, is not an overnight solution and it also can’t be coming from a fear-based or punitive lens where you’re punishing folks who are in the industry now. You have to play the long game.” –industry stakeholder
19 Hollywood CPR. Hollywood CPR and West Los Angeles College Motion Picture and Television Production Crafts Program Information. Retrieved April 11, 2018. Retrieved from: http://www.hollywoodcpr.org/training/WLAC%20and%20Hollywood%20CPR%20Film%20TV%20Crafts%20%20Production%20Information.pdf
20 Ghetto Film School. Retrieved April 17, 2018. Retrieved from: www.ghettofilm.org
Challenge 1: access
82 FDMI | Los Angeles County Perspective

83FDMI | Los Angeles County Perspective
Digital media have helped provide filmmakers opportunities to create movies that otherwise would’ve been difficult, if not impossible, to
fund through traditional industry channels. One example is David F. Sandberg, who is now known for directing Lights Out. The inspiration
for his film came from a three-minute short that Sandberg made with his wife for an online horror movie contest.21 The short went viral
after social media platforms like Reddit started sharing the video. It caught the attention of Hollywood producer Lawrence Grey, who
then encouraged New Line to fund it as a feature film. The movie was a massive commercial success, earning $150 million on a $5
million budget and jumpstarting Sandberg’s career. Sandberg went on to make other successful movies like Annabelle: Creation, and he’s
currently directing Shazam!, a film for the DC Extended Universe.
Another director catapulted into Hollywood’s inner circle as a result of digital media exposure was Jon Watts, who uploaded a fake
trailer for a movie called Clown, made in the style of classic horror movies such as Hostel. The trailer generated buzz and online viewers
associated it with Eli Roth, one of the leading producers and directors of Hollywood’s horror genre. After watching the trailer and being
impressed by it, Eli himself recommended that Dimension Films turn it into a feature film.22 Watts, now a director of multimillion-dollar
budgeted films, has been chosen to direct the highly anticipated Spider-Man: Homecoming.
David Sandberg
Jon Watts
Social Media’s Democratizing Effect on Industry Access: Profiles in Virality
21 Berkshire, G. (2017). 10 Directors to Watch: David F. Dansberg Scores Horror Knockout with “Lights Out.” Variety.com. January 3, 2017. Retrieved on March 28, 2018. Retrieved from: http://variety.com/2017/film/features/10-directors-to-watch-david-f-sandberg-lights-out-1201951439/
22 Abramovitch, S. (2016). Why Eli Roth Made “Spider-Man” Director Jon Watts’ Fake Horror Trailer Into A Feature Film. HollywoodReporter.com. May 30, 2016. Retrieved on March 29, 2018. Retrieved from: https://www.hollywoodreporter.com/rambling-reporter/why-eli-roth-made-spider-897094
83FDMI | Los Angeles County Perspective

84 FDMI | Los Angeles County Perspective
Fede Álvarez is one of the lucky filmmakers to get noticed through social media channels.
After uploading his short science fiction film Ataque de Panico! to YouTube on a budget
of $300, he caught the attention of Sam Raimi, who signed him on to develop projects
through his production company Ghost House Pictures. This led to the release of Evil Dead,
which on a budget of $17 million, made almost $98 million.23
It isn’t just directors getting attention in the virtual realm that then leads to traditional
industry opportunity. In some cases, the virtual realm is directly offering opportunity
competitive with the industry. YouTube has been fertile ground for notoriety as well as
revenue for online personalities, with some of them becoming just as popular as A-list
movie stars. The data indicate that this more intimate mode of celebrity is appealing to
younger age groups who are generally accustomed to greater access to their politicians,
corporations, and cultural icons through platforms like Instagram, Twitter, and Facebook.
In fact, in a survey by Defy Media, 62% of Americans aged 13-24 said they consume digital
content because it “makes them feel good about themselves”, as opposed to the 40% who
responded the same way for television. YouTube is connecting performers to their fans
more easily and more intimately, and traditional industry actors want in on the action.
Jake Paul, known for starting out in Vine, became a YouTube vlogger where his popularity
caught the attention of Disney, who briefly gave him his own TV show.24 25
Fede Álvarez
Jake Paul
23 Scott, J. (2009). YouTube Success Lands Filmmaker A Real Hollywood Directing Gig. TubularInsights.com. December 1, 2009. Retrieved on March 29, 2018. Retrieved from: http://tubularinsights.com/youtube-success-lands-filmmaker-real-hollywood-directing-gig/
24 Pittman, T (2015). How YouTubers Beacame A New Breed Of Celebrity That Hollywood Starts Can’t Touch. HuffingtonPost.com. March 4, 2015. Retrieved on March 27, 2018. Retrieved from: https://www.huffingtonpost.com/2015/03/04/teens-prefer-youtubers-over-celebrities_n_6801792.html
Access to the industry and its decision-making networks remains a significant challenge, but there are clearly both active efforts and broader technological changes at play lowering the barriers to entry in a historically closed-door industry.
In addition to Access, stakeholders highlighted a short list of other challenges hindering inclusivity and diversity in the industry, challenges important to address as the Film sector continues to grow in L.A. County. Those challenges include: (2) Awareness; (3) Transparency; and (4) Capital.
84 FDMI | Los Angeles County Perspective

85FDMI | Los Angeles County Perspective
25 Baron, Z. (2017). The New Rules for Making It In Hollywood. GQ.com. July 24, 2017. Retrieved on March 27, 2018. Retrieved from: https://www.gq.com/story/new-rules-for-making-it-in-hollywood 26 Bureau of Labor Statistics, Occupational Outlook Handbook. 2017.
27 FilmL.A. (2018). FilmL.A. Celebrates 26 years of the Pan African Film & Arts Festival. March 14, 2018. Retrieved on April 10, 2018. Retrieved from: https://www.FilmL.A..com/filml-a-celebrates-26-years-of-the-pan-african-film-arts-festival/
Challenge 2: Awareness “People don’t understand what folks in this industry actually do, that’s one of the biggest problems. There are good-paying, middle class jobs in this industry and nobody knows about them.” –industry stakeholder
In reflecting on some of the largest occupations
of the industry represented in L.A. County and
highlighted in the Industry Analysis Chapter,
Graphic Designers had a median pay of $48,700
per year in 2017, Film and Video Editors and
Camera Operators made $58,210, Writers and
Authors $61,820, Multimedia Artists and Animators
$70,530, Producers and Directors $71,620, and Art
Directors $92,500.26 But a lack of awareness of
these opportunities and other middle-class jobs in
the industry was reiterated as an obstacle faced
by organizations like GFS and unions as they look
to ramp up recruitment, especially in communities
historically excluded from the industry.
Community-based arts organizations discussed battling the misperception of the Film sector as only a place for the rich and famous in its engagement with funders like foundations and with local communities across L.A. County. Another industry stakeholder offered the example of a panel held at the Pan African Film Festival in 2018, sponsored by FilmL.A. and Local 399, during which location managers offered commentary on their general responsibilities and were met with both enthusiasm and a host of questions from audience members.27 The stakeholder said, “The scene indicated both a keen interest in knowing more and an obvious lack of awareness about these kinds of opportunities among a demographic you don’t see represented widely in the industry.” A lack of awareness regarding what the industry’s opportunities entail does not just plague the lesser known, “below the line” jobs. In discussing the industry ignorance of graduates from some of the best film schools in the U.S., an industry
stakeholder remarked, “Even from top educational programs like NYU Tisch, graduates say they want to be directors or writers but have no idea what that means. And there are now programs that take those students before graduation and bring them to L.A. to basically introduce them to people on the ground and see what the business looks like, how things get done. Maybe they actually want to be a Director of Cinematography. And I think more programs like that are exactly what we need across the board. It saves time and is such a huge win for everyone.”
The shroud that hangs about the industry and about its internal mechanics is both a challenge for the industry’s workforce development efforts and an opportunity for the County of L.A. That the industry and its insiders are here in L.A. County and interested to get the word out about industry opportunities should be considered a tool in the toolbox of the County’s policymakers.
85FDMI | Los Angeles County Perspective

Challenge 3: Transparency In addition to awareness about the range
and nature of opportunities available in the
Film sector, transparency regarding their
requirements and associated career pathways
was cited as a significant challenge. As one
industry stakeholder remarked,
“Career paths in the creative industry are
nonlinear. They are not the kind of career
paths where you decide you want to be a
lawyer and there’s a clear track laid out for you
from law school moving forward. Often in the
creative industries, the best move is a lateral
move and through your network.”
While industry infrastructure for talent development in the Film sector may not even preferably be as structured as that of the legal or medical sectors, some guidance in how young talent may move up the industry food chain earning higher wages consistently and over time is essential for making the industry more inclusive and contributes to industry efficiency overall. Facilitating the creation of stable career pathways is a longstanding concern within the industry and its unions in particular. As one industry stakeholder explained,
“We don’t want to create part-time jobs, we want to create careers. People in this industry need to be guided along because they need to move from project to project. We don’t want to throw new people into it, particularly with less industry know-how, and then not have that follow through which is crucial.”
Particularly given the non-linear nature of career trajectories in the Film and Digital Media sectors, direct interventions to guide young talent can be catalytic. Community-based arts organizations and industry representatives alike underlined the vital role internships play in the industry’s effective assimilation of young talent, especially those unequipped with personal networks in the space. Yet, industry stakeholders indicated that internships are often met with mixed feelings, not all positive, and inconsistent expectations. One industry stakeholder noted that “a spate of
historical lawsuits has forced some companies to pull back from this essential experience which they had been previously providing to young people.” Recognizing the unique utility of internships in grooming the industry’s talent pipeline - specifically its underrepresented segments - industry stakeholders from all sides indicated interest in collectively crafting a clearer, institutionalized framework for internships, that works for all parties and satisfies concerns raised in more recent years.
Partnership across silos will be an important part of ensuring any intervention to increase the industry’s diversity is successful over the long run. Even with greater access and awareness as well as more transparent structure for navigating a successful career, the experience of diverse, young talent in the industry will inevitably suffer from unique vulnerabilities. A recent study by GFS looking at the attitudes and opinions of their graduates, found that on average a young person of color working in her first job in a creative company tends to stay in that job too long relative to her peers and compared with the industry’s average career trajectories.28 Both open dialogue among the ecosystem’s actors--including studios, community-based organizations, and policymakers--and a collective examination of available data can together equip the industry to address current and evolving challenges faced by diverse talent in L.A. County’s Film and Digital Media industry.
28 Industry stakeholder confidential insight. 29 SCVnews.com. Supes Create First LA County Arts Department. May 16, 2018. Retrieved on: May 16, 2018. Retrieved from: https://scvnews.com/2018/05/16/supes-create-first-la-county-arts-department/
30 SCVnews.com. Supes Create First LA County Arts Department. May 16, 2018. Retrieved on: May 16, 2018. Retrieved from: https://scvnews.com/2018/05/16/supes-create-first-la-county-arts-department/31 Ibid
86 FDMI | Los Angeles County Perspective
Challenge 4: CAPITAL Where the market has failed to include certain groups of people,
insertions of capital can and have made up at least some of the
difference. In comparing the funding landscapes of New York
City and Los Angeles County, one stakeholder noted,
“If you’re looking from a programmatic perspective, all you
really need to do is compare the New York City budget for its
Department of Cultural Affairs to the corresponding budget in
L.A. City. New York City is the largest arts funder in the U.S.;
in the L.A. region, it’s just not the same; you have to knock a
couple of zeros off. That’s certainly an impediment to growth,
especially for community-based arts organizations trying to
scale. Receiving a six-figure grant from a government source
before you are able to attract the kind of private support you
need to sustain operations can be the reason you survive.”
And as the Film and Digital Media industry continues to globalize, the even bigger budgets of Los Angeles County’s European counterparts loom large, the National Center for Cinematography in France and the British Film Institute in the U.K. chief among them. One industry stakeholder with professional experience in both U.S. and European markets remarked, “We’re spoiled in Europe, it is such a different industry in terms of public funding.”
A noteworthy development in L.A. County in terms of industry-specific, government infrastructure was a recent vote by the L.A. County Board of Supervisors to create the first Los Angeles County Arts Department.29 Board Chair Sheila Kuehl said, “It makes sense that we establish a County department to support arts and culture. With this motion, we will provide the capacity for a robust department that can strengthen the arts and expand our commitment to cultural equity and inclusion.”30 Additionally, the new County department will retain the L.A. County Arts Commission, a robust “full-service local arts agency” with an existing and wide-ranging portfolio of arts programming, including K-12 educational programs.31 While L.A. County may not be structured to compete dollar-for-dollar with the arts budgets of markets like New York City, L.A. County policymakers may consider leveraging public funds to direct capital where it is most catalytic, scaling successful models for driving outcomes which the market is not otherwise producing. With such a large bank of investment precedent nationally and internationally, L.A. County may explore in partnership with its community-based organizations which specific, well-evidenced investments would be most helpful in the L.A. market. L.A. County may also leverage its convening power to generate funding, connecting the voiced interest of private industry to diversify its ranks with those community-based organizations on the ground translating that aspiration into reality.
87FDMI | Los Angeles County Perspective

As one industry stakeholder concisely summarized,
“The talent is here. So, then all the other creative
people come here—for its professionals, for its
collaborative, creative culture, for its reputation as
the top market—in order to make it. In L.A. we have
the workforce advantage.” In a general context of
abounding talent opportunity, there are industry-
specific and market-based trends incentivizing
the diversification of the industry’s talent pool,
independent of broader policy goals around inclusion.
In its annual Hollywood Diversity Report for 2018,
UCLA confirmed its previous finding around
audience preferences in the U.S.: America’s
increasingly diverse audiences prefer diverse
film and television content.32 Two data points to
support that working conclusion included minority
representation in ticket sales and the success
at the box office of films with casts that were
from 21% to 30% minorities. Firstly, minorities
accounted for the majority of ticket sales for five
of the top 10 films in 2016.33 Minorities are an
important audience and increasingly representative
not only of the U.S. generally but of U.S. movie-
goers. Secondly, films with 21% to 30% minority
casts had the highest median global box office
receipts and highest median return on investment,
whereas films with the most racially and ethnically
homogenous casts were the poorest performers.34
Opportunity: International markets and more diverse audiences While there are key challenges to the industry’s development of talent broadly and specifically as it applies to intentionally inclusive efforts, there are also key opportunities around both. For one, as this report communicates clearly, L.A. County is the nation’s leading hub of creative professionals; the industry’s icons, its young talent, and many of the industry’s best-in-class educational institutions, or talent feeders, are here.
32 UCLA College, Social Sciences (2018). Hollywood Diversity Report 2018: Five Years of Progress and Missed Opportunities. February 27, 2018. Retrieved on March 26, 2018. Retrieved from: https://socialsciences.ucla.edu/wp-content/uploads/2018/02/UCLA-Hollywood-Diversity-Report-2018-2-27-18.pdf
33 Ibid34 Ibid
88 FDMI | Los Angeles County Perspective

Aside from more diverse demand in the U.S., Hollywood is increasingly after an international market, given its size and purchasing power as well as its increasingly easy access to licensed U.S. content, made possible by the rise of digital platforms. With regard to sheer size, China for example is projected to outstrip North America in box office revenues and number of movie-goers by 2020, according to a Deloitte report, “China’s Film Industry – A New Era.”35
One industry stakeholder commented, “Because of this digital era that we are now in and because of the Amazons and Netflixes of the world, there’s a huge demand and need for the U.S. market to better understand their international audiences. Amazon has recently hired people specifically to explore how to license content and produce work with international appeal outside of the U.S. Many markets around the world have historically spent their time figuring out how to crack the U.S. market and now, especially with all these platforms, the reverse is true. Understanding the international landscape and having an international or diverse team has become increasingly important when work can be viewed easily all over the world.”
Both of these trends mean the Los Angeles County-based Film and Digital Media industry will require the insight and creative voice of diverse talent to be competitive globally. And as the convergence of media in Film and Digital Media continues to blur lines between television, film, and advertisement, creative
voice is that much more loudly showcased. The GFS Director reiterated the centrality of that focus in their programming and the importance of translating their students’ diverse voices into clear and leveragable assets in the creative market. He said:
“We’ll look to someone like Spike Jonze, an accomplished filmmaker who also happens to curate all the shows on Viceland and who just made a four-minute commercial for an Apple product with a hit music video that went viral overnight. Spike is someone who has never really boxed himself in as being one kind of creative maker; instead, he looks at the various platforms as each their own sort of challenge. And when we invite him to speak with our students, the message he touts is really focused on identifying your own creative voice and bringing that to whatever the assignment might be. The key thing is to be in tune with your own style and identify that early.”
For students from diverse backgrounds whose voices go generally underrepresented on the broader industry landscape, diversity can be a competitive advantage in an increasingly global market, amplified by a mutating menu of media options.
35 Deloitte Global (2017). China’s Film Industry – A New Era. Deloitte.com. Retrieved on April 5, 2018. Retrieved from: file:///Users/alysasloanhannon/Downloads/deloitte-cn-tmt-china-film-industry-en-161223.pdf
89FDMI | Los Angeles County Perspective

36 NYCEDC Press Release (2017). NYCEDC Celebrates the Opening of TechShop Brooklyn – 20,500 SF Advanced Manufacturing Center at the Brooklyn Army Terminal. Nycedc.com. October 19, 2017. Retrieved on May 1, 2018. Retrieved from: https://www.nycedc.com/press-release/nycedc-celebrates-opening-techshop-brooklyn-20500-sf-advanced-manufacturing-center
37 Center for an Urban Future (2015). Creative New York. June 2015. Retrieved on May 2, 2018. Retrieved from: https://nycfuture.org/pdf/Creative-New-York-2015.pdf
Targeting underserved workersIn examining diversity and inclusion efforts for any industry, it
is customary and prudent to explore opportunities specifically
for underserved workers, those populations that generally
suffer systematically from lower employment rates and that
have indicators of career-limiting circumstances. The Los
Angeles County Board of Supervisors adopted in 2016 a
Countywide Local and Targeted Worker Hire Policy that defines
workers with barriers to employment as those having one or
more of the following attributes: (1) has a documented annual
income at or below 100% of the Federal Poverty Level; (2) no
high school diploma or GED; (3) a history of involvement with
the criminal justice system; (4) protracted unemployment; (5)
is a current recipient of government cash or food assistance
benefits; (6) is homeless or has been homeless within the
last year; (7) is a custodial single parent; (8) is a former foster
youth; or (9) is a veteran, or is the eligible spouse of a veteran.
Broadly speaking, the most pervasive challenges faced by vulnerable communities like those listed often have to do with more traditional services provided and interventions implemented by government, including the provision of equitable infrastructure, adequate housing supply, quality education, and a well-funded safety net. Funding and guidance for creative arts programming across L.A. County public schools is a good example of an intervention that is likely to impact vulnerable populations. In reflecting on L.A. County’s leading industry advantage around workforce and the County’s demographic diversity, an intervention targeting the creative-tech skillset of K-12 populations may be an optimal investment. STEAM (Science, Technology, Engineering, Arts, and Math) Centers have opened up across places like New York City, funded by City government agencies like the New York City Economic Development Corporation. They equip young people to pair creative competencies with STEAM skills in an increasingly quantitatively driven job market and in sectors on the rise like those in the Film and Digital Media industry.36 While sound, these types of investments are long-term investments and demand a long-horizon perspective of the investor, government or otherwise.
Though macro and perceivably removed from industry dynamics, the broader role of government is not to be understated in terms of its effect on industry growth. Housing is a great example. In a recent study entitled “Creative New York” published by the Center for an Urban Future, the L.A. region was held up as more affordable than New York City and thus more attractive to artists. The report found that “Portland, Austin, Nashville, Detroit, L.A. and many others are attracting young creative professionals. Their biggest advantage over New York is obvious: low rent.” the L.A. region was differentiated from that mix with its powerful, competitive industry hub and housing costs lower than Manhattan’s by about 114%. “L.A. is very hot and up and coming, said Emma McClendon assistant curator of costume at The Museum at FIT. ‘It’s attracting more creative individuals than New York is. Friends from London said they’d never move to New York, only L.A. because it’s more affordable.”37 As rents and cost of living continue to rise in the L.A. region, L.A. County policymakers can expect young artists and creative professionals migrating from London and New York City to L.A. County to continue on down the list of up and coming and more affordable cities in search of affordable rents and lifestyles.
Policy Context
90 FDMI | Los Angeles County Perspective

As it applies to educational attainment level (without a high school diploma or GED), labor market data can help drive policymakers’ understanding of the industry’s opportunity landscape. Overall and unsurprisingly, the Film and Digital Media workforce is becoming increasingly educated, reflecting broader trends. In 2016, 65% of all employed in the Film and Digital Media industry in L.A. County had a bachelor’s degree or above, up from 59% in 2011. While it is not surprising that sectors within the industry that are highly specialized, such as Software Publishers, reflect unusually high educational attainment levels (81% have at least a bachelor’s degree), even the “least educated sector” of the industry, the Libraries and Archives sector, has a workforce where 46% of its L.A. County workers have a bachelor’s degree or above.
With regard to the industry’s largest occupational group in L.A. County in 2016, Arts/Entertainment, 66% of professionals had at least a bachelor’s degree, representing an educational attainment profile very similar to that of the overall industry.
Further, the Arts/Entertainment educational profile has not changed much since 2011, when 64% had a bachelor’s degree or above. Management, the second largest occupation within the industry in L.A. County, has even higher educational attainment levels, with 56% of workers having a bachelor’s degree and 21% having a graduate or professional degree. Computer and Mathematical, the industry’s third largest occupation in L.A. County, has a similarly high educational attainment level, with 76% of the occupation’s professionals in the County armed with at least a bachelor’s degree and just 3% having a high school diploma or below.
While employment opportunities seem limited at first glance for individuals without a bachelor’s degree, the Film and Digital Media industry does employ over 141,000 individuals in L.A. County who do not have a bachelor’s degree. Of these 141,000 professionals, slightly above half (72,000) were employed in Motion Picture and Video or Performing Arts and Spectator Sports industries–core Film-related sectors—in 2016. And within the Arts/Entertainment occupational
group, of the 55,000 L.A. County workers with only an associate’s degree or below, 67% (or 37,000 individuals) are also employed in the two aforementioned Film-related sectors.
Within Arts/Entertainment occupations, performance-related occupations except for Actors tend to have lower educational barriers. For example, 50% of Musicians and Singers in L.A. County have no bachelor’s degree and 20% have only a high school diploma or below; 29% of Announcers have either less than a high school or a high school level of education. While only 8% of Actors have no post-secondary education, 38% have only some college or an associate’s degree.
Of the largest occupations in the Arts/Entertainment occupational group, 32% of designers in L.A. County’s Film and Digital Media industry at large are without a bachelor’s degree. Furthermore, specifically within the Motion Picture and Video sector, almost 4 out of 10 designers have no bachelor’s degree (but do have some sort of post-secondary education). Similarly, 41% of
Of the vulnerable populations mentioned previously, veterans, individuals who’ve interacted with the criminal justice system, and at-risk youth including youth in
foster care are some of the most commonly targeted for industry programming. As mentioned, Local 399 runs a program targeting veterans for industry positions
like location managers. In 2017, Vice launched a program in partnership with the Center for Employment Opportunities to offer a six-month paid apprenticeship
program for people with criminal records.38 And CalArts, one of the best schools for animation in the country, administers a Community Arts Partnership initiative
providing art and technology education to high-need youth in L.A. County.39 These kinds of programs help to bridge the gap in access to opportunity broadly and to
industry opportunity specifically by targeting designated populations and in many cases tailoring programming to their unique circumstances. For these groups and
other underserved populations, the challenges enumerated previously are that much greater and intervention to overcome them that much more needed.
38 Vice Staff (2016). We’re Launching an Apprentice Program for Formerly Incarcerated People. Vice.com. December 8, 2016. Retrieved on May 1, 2018. Retrieved from: https://www.vice.com/en_us/article/3db588/vice-ex-con-apprentice-program
39 Nobil, T. (2017). CalArts’ CAP Trains the Next Generation of Filmmakers and Animators in Underserved L.A. Communities. Variety.com. December 8, 2017. Retrieved on May 2, 2018. Retrieved from: http://variety.com/2017/film/news/calarts-cap-trains-the-next-generation-of-filmmakers-and-animators-in-underserved-la-communities-1202620933/
91FDMI | Los Angeles County Perspective

Artists and Related workers in the industry have no bachelor’s degree, however, just 3% have only a high school diploma or below. As for Producers and Directors, 25% have no bachelor’s degree in the Motion Picture and Video sector, and that figure is the same for the Film and Digital Media industry at large.
Film and Digital Media professionals without a bachelor’s degree or above are employed in a variety of occupations in the industry. However, some post-secondary education is still typically required for entry – as only 11% of the industry’s workers have only a high school diploma or below.
While the general trends at play in the broader economy apply to the Film and Digital Media industry, namely that a bachelor’s degree is an increasingly common, competitive credential, digital media may present opportunities for young talent without formal instruction. One stakeholder commented,
“As the barrier to entry in the industry has dropped, the perceived need for official training in film seems to have dropped as well. But that doesn’t necessarily mean that formal instruction isn’t a clear advantage for people who have it. But there seem to be fewer impediments, with this new generation and an era of digital media, young people are really comfortable with cameras and even video editing software just as a function of being a teenager and fooling around. That might be another part of this digital puzzle.”
92 FDMI | Los Angeles County Perspective

93FDMI | Los Angeles County Perspective

Tax incentives: the nitty gritty
“We’re obviously aware of Georgia, we’re obviously aware of New York, we’re obviously aware of Vancouver and the United Kingdom. We recognize that there’s competition. But we have a major advantage: The entertainment industry talent pool is here.
I’ve got a friend who has a show that shoots in Georgia so they could take advantage of the tax credit. He had a sound mixer who was in a car accident, and it took him three days to find a sound mixer to replace the one he lost. If you’re in L.A. you could’ve had one in three hours. So we know that’s an advantage but also know that their tax credit is larger than ours. We compete in other ways. And the best way we can compete is through our talent pool, by having the best talent. ” –industry stakeholder
94 FDMI | Los Angeles County Perspective

Setting the Employment Record StraightNarrowing the focus to just individuals employed in the Film
sector shows that between 2011 and 2016, employment in
Atlanta grew by about 4,000 (or 241%) compared to 27,100
(or just 24%) for Los Angeles County. However, during the
same period, Atlanta’s total employment grew by 317,500 jobs
while L.A. County’s increased by 461,600 jobs. In other words,
relative to total employment growth, Film sector employment
growth in Atlanta accounted for just 1.3%, a paltry share
compared to L.A. County’s 5.9% share.
In reflecting on stakeholder insights regarding tax incentives and their relationship to talent, it is worth revisiting figures put forward in the Industry Analysis section of this report. It was noted that employment in Atlanta in Film and Digital Media grew from 58,600 in 2011 to 73,800 in 2016 (+15,200) 26% growth compared to 23% growth in L.A. County.
95FDMI | Los Angeles County Perspective

Georgia’s recent surge in the Film Sector–whether measured in terms
of employment, shoot days, or number of films shot–is noteworthy.
However, this growth, which hinges on a generous tax credit program,
may be transitory, as similar growth in other markets has been in
the past. Furthermore, Georgia lacks a robust process for evaluating
the value of its program or the economic benefits and costs of its
incentives to date.41 Contrastingly, California’s Legislative Analyst’s
Office is required to evaluate its equivalent program effective by
2019.42 Specifically, in California, an audit of all in-state production
activities must be performed before tax incentives are awarded.43
Georgia’s film incentive program is a transferable tax credit of 20%
of investments of at least $500,000 (plus an additional 10% if the
production includes Georgia’s promotional logo in credits); whereas,
California offers a nontransferable tax credit of 20% or 25%. A
transferable tax scheme is one that is refundable, allowing production
companies to sell the tax credits in excess of their tax liability to others.
The generous terms of the incentive, coupled with an insufficient
evaluation process of the program’s overall benefit to Georgia’s
taxpayers, imply a vulnerability to tax incentive abuse in Georgia, with the
most notorious incident by Warner Bros. on the film Sully.44
“Georgia has the most robust incentive program [in the country]. They incentivize anything that walks across the street.” 40 –industry stakeholder
40 71 Bertagnoli, Lisa. (2017, July 17). “Why doesn’t Illinois rank higher in film production.” Retrieved from: http://www.chicagobusiness.com/article/20170715/ISSUE01/170719897/why-doesnt-illinois-rank-higher-in-film-production
96 FDMI | Los Angeles County Perspective

Finally, in addition to a lack of program oversight, it appears Georgia’s purported economic impacts stemming from film tax incentives may very well be overstated. Generally, states adopt tax incentive programs tailored to a variety of industries under the assumption that these incentives create jobs and provide other economic benefits, even if such schemes may have poor returns for government.45 Currently, 31 states (plus Washington, D.C.; Puerto Rico; and U.S. Virgin Islands) provide tax incentives for film, down from 44 states in 2009. The Georgia Department of Economic Development claims that the film industry in Georgia generated an economic impact of $9.5 billion in Fiscal Year 2017 based on direct spending of $2.7 billion. In other words, every dollar of spending resulted in about $3.5 of economic impact. This 3.5 multiplier is abnormally high. By comparison, in an earlier section of this report, Beacon Economics estimates an economic impact multiplier of $1.63 for every dollar spent by the Film and Digital Media industry in Los Angeles County. While the multiplier effect for any one industry can vary depending on many factors, including time-specific and geography-specific factors, the differences are rather minimal. Indeed, it appears the accurate multiplier for Georgia should be about $1.83, according to Bruce Seaman, an economics professor of Georgia State
University.46 Georgia’s economic impact from the film industry is consistently and significantly overstated as “the state economic development department has multiplied direct spending by $3.57 to estimate impact for at least 30 years.”47
Driving the competition of state film incentive programs is the historical nature of the feature film business. In the past, the business of producers and the broader Film sector by extension was entirely a project-by-project undertaking. Each piece of intellectual property was taken from concept through development, then from development through financing, and finally from financing to production. To the extent that there was a long-term business strategy for the producer, it was driven by the availability of project financing and the role of state tax incentives to minimize that cost for funders. As the space for digital video content production gets noisier and noisier with media and funders growing ever more diverse and with shorter-form content in many cases supplanting the old feature film formats, the old equation for film funding is made less relevant and its future viability is thrown into question.
41 Huh, K., Chapman, J., Pearson, C., Goodman, J., Maynard, M., Wakefield, A., Burgoyne, M., Griffin, J., Hamman, J., and Pagels, J. (2017). How States are Improving Tax Incentives for Jobs and Growth. The Pew Charitable Trusts. Published May 2017. Accessed May 12, 2018. Retrieved at: http://www.pewtrusts.org/~/media/assets/2017/05/edti_how_states_are_improving_tax_incentives_for_jobs_and_growth.pdf
42 Ibid.43 National Conference of State Legislatures (2018). State Film Production Incentives & Programs. Published January 30, 2018. Accessed May 12, 2018. Retrieved at: http://www.ncsl.org/Portals/1/Documents/fiscal/2018StateFilmIncentivePrograms_20189.pdf
97FDMI | Los Angeles County Perspective

`
From Projects to Ecosystem: Creative Meets Tech
The unmatched quality of film production in the Los Angeles market stands on its own merits, yet in this period of disruption, riding the wave of past success is not enough to ensure a strong Film and Digital Media industry in L.A. County into the future.
As there is now, there will always be another state racing
to offer a more generous tax incentive program, minimizing
costs for big, traditional projects funded and powered by
the old industry equation. However, the national and global
Film and Digital Media industry is moving and evolving at a
rapid pace, diversifying far beyond the parameters of the old
industry equation. Los Angeles County would be wise to focus
on championing its broad-based creative sector and its best-
in-class creative talent base to feed the needs of a shifting
Film and Digital Media landscape.
44 Maddaus, G. (2018). “Warner Bros. Faces Tax Fraud Investigation for ‘Sully’ Airplane Costs.” Variety. April 25, 2018. Accessed on May 12, 2018. Retrieved at: http://variety.com/2018/biz/news/warner-bros-tax-fraud-sully-1202757739/
45 Thom, M. (2016). Lights, Camera, but No Action? Tax and Economic Development Lessons From State Motion Picture Incentive Programs. The American Review of Public Administration, Vol. 48 issue 1, pp 33-51. Retrieved from: http://journals.sagepub.com/doi/abs/10.1177/0275074016651958
98 FDMI | Los Angeles County Perspective

`
46 Hunt, A. (2015). “Claim overstates film industry’s impact on Georgia economy.” PolitiFact Georgia. August 7, 2015. Accessed May 12, 2018. Available at: http://www.politifact.com/georgia/statements/2015/aug/07/georgia-department-economic-development/film-industrys-impact-georgia-economy-overstated/
47 Ibid.
99FDMI | Los Angeles County Perspective

Film and television production has been a great
success story for Los Angeles County economically
as well as culturally, and the County has a global
reputation for its Film and Digital Media industry
and the creative people working in it. In Los
Angeles County, 40% of the occupations in the
Film and Digital Media Industry are in Arts and
Entertainment compared to only 30% in New
York City. Additionally, Arts and Entertainment
occupations in the Film and Digital Media industry
have seen a 38% increase over the last decade
in Los Angeles County. In 2016, 53% of Arts and
Entertainment occupations were composed of
Producers and Directors (20%), Designers (14%),
Artists (10%) and Writers (9%).
As technology has disrupted the sector and
forced commercial models to change, there is a
growing demand for individuals at the juncture of
creative and technology. This trend is evident in the
emerging growth of Computer and Mathematical
occupations across the Film and Digital Media
industry in Los Angeles County. The Computer and
Mathematical occupation employment share grew
from 7.7% in 2006 to 11% in 2016 (+3.3%), but more
impressively, growth of these occupations in the
Motion Picture and Video sector grew 16% across
the same period.
The future of the Emerging Digital Media sector
in Los Angeles County presents an opportunity
to support creative companies that may have
historically operated in the traditional production
model by promoting joint ventures and alliances
across sectors. Tech fluency is no longer a
sideline activity for content production, and
100 FDMI | Los Angeles County Perspective

policies that silo tech separately from creative
are outdated. Recent examples of innovation in
navigating the new digital media landscape include
The Sundance Institute’s Creative Distribution
Initiative, which focuses on helping independent
storytellers navigate the changing business
models of digital distribution, marketing, and
audience engagement.47 Similarly, Snapchat
recently announced it was launching an accelerator
program, Yellow, that will fund a class of “up-and-
coming creatives” in pushing the boundaries of
mobile storytelling. The program will provide seed
funding, workspace in Venice, and mentorship
in conjunction with Snapchat’s media partners.
Creativity is broadly defined for the program
participants: “from filmmakers to editors to
producers to writers to influencers and creators.48”
Los Angeles County has strong competency
in creative skillsets and, as the demand for
digital video content continues to come from an
increasingly diverse mix of firms, the County must
not be constrained by outdated models of thinking.
The lens must be widened to capture a broader
creative sector including film, television, music,
and digital media. County goals should reflect
questions like, “Would one of the young diverse
candidates in Snapchat’s accelerator program be
able to interact with the local levers of government
in a way that pushed her to succeed and
encouraged a continued sprit of entrepreneurship?”
The competition to attract production activity
means that the County must employ a broad and
diverse strategy for retaining and attracting digital
video content creation.
47 Sundance Institute. (2018). Retrieved from: http://www.sundance.org/programs/creative-distribution-initiative#/
48 Jarvey, N. (2018). Snapchat Launches Accelerator for Mobile-First Media Companies. Retrieved from: https://www.hollywoodreporter.com/news/snapchat-launches-accelerator-mobile-first-media-companies-1114331
101FDMI | Los Angeles County Perspective

Growth landscape
for the Film & Digital Media Industry
in L.A. County
102 FDMI | Los Angeles County Perspective

It also identified Emerging Digital Media as the largest component and along with
Film, the fastest growing sectors of the industry nationally. This chapter will analyze
the geography of these sectors within Los Angeles County and identify the region’s
competitive advantage in the Film and Digital Media industry.
Cluster analysis
The Industry Analysis: The Industry Analysis Chapter identified the Film sector as the most dominant component of Los Angeles County’s Film and Digital Media industry.
103FDMI | Los Angeles County Perspective
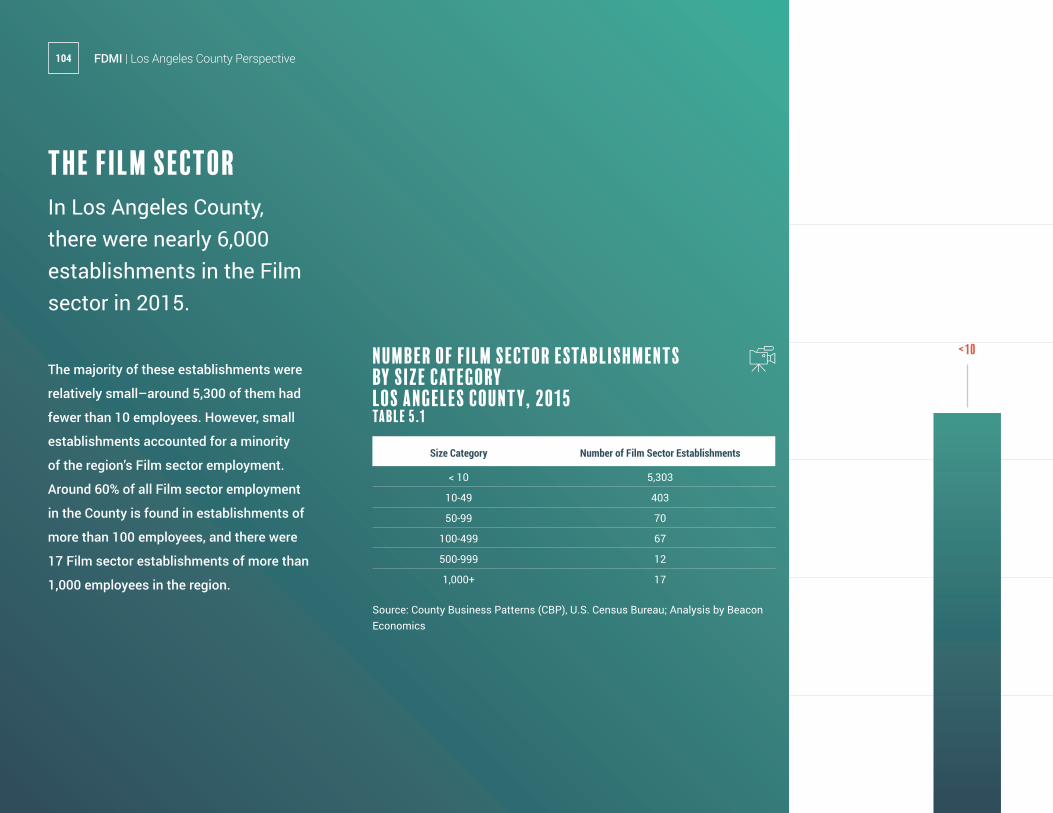
The Film Sector
The majority of these establishments were
relatively small–around 5,300 of them had
fewer than 10 employees. However, small
establishments accounted for a minority
of the region’s Film sector employment.
Around 60% of all Film sector employment
in the County is found in establishments of
more than 100 employees, and there were
17 Film sector establishments of more than
1,000 employees in the region.
In Los Angeles County, there were nearly 6,000 establishments in the Film sector in 2015.
Source: County Business Patterns (CBP), U.S. Census Bureau; Analysis by Beacon Economics
Number of Film Sector Establishments by Size category Los Angeles County, 2015 Table 5.1
Size Category Number of Film Sector Establishments
< 10 5,303
10-49 403
50-99 70
100-499 67
500-999 12
1,000+ 17
<10
104 FDMI | Los Angeles County Perspective

25,000
20,000
15,000
10,000
5,000
0
10-49
50-99
100-499
1,000+
500-999
Film Sector Employment by Establishment SizeLOS ANGELES COUNTY, 2015FIGURE 5.1
Source: County Business Patterns (CBP), U.S. Census Bureau; Analysis by Beacon Economics
105FDMI | Los Angeles County Perspective

Los Angeles County
LA Film Industry Report
These maps display the location of Film
sector establishments throughout Los
Angeles County. Figure 5.2 shows the
location of small and large establishments.
Larger green dots depict areas where there
is a large concentration of the sector’s
small establishments. The heaviest
concentration of small establishment
activity is found northwest of downtown
Los Angeles, in the western areas of Los
Angeles County and in the San Fernando
Valley. With the exception of smaller
pockets of activity in the San Gabriel Valley,
there is very little Film sector activity in the
eastern parts of Los Angeles County.
The blue dots depict the location of Film
sector establishments with 10 employees
or more. The pattern of activity is very
similar to the geography of activity
for smaller establishments. Again, the
dominant hubs of activity are found in the
western half of the County.
51 or More Establishments
11 - 25 Establishments11 - 25 Establishments
26 - 50 Establishments26 - 50 Establishments
1 - 10 Establishments1 - 10 Establishments
LARGE ESTABLISHMENTS IN FILM INDUSTRIES with at least 10 employees
SMALL ESTABLISHMENTS IN FILM INDUSTRIES with FEWER THAN 10 employees
Source: County Business Patterns (CBP), U.S. Census Bureau; Analysis bBeacon Economics
Film Sector Employment by Establishment Size2015FIGURE 5.2
106 FDMI | Los Angeles County Perspective

Los Angeles County
LA Film Industry Report
The Emerging Digital Media Sector
In the Emerging Digital Media sector, small
establishments again make up the majority
of the sector’s total establishments in Los
Angeles County. Together, establishments of
fewer than 10 employees account for over 80%
of the sector’s total establishments.
In contrast to the Film sector, larger
establishments account for a smaller share
of Emerging Digital Media employment in the
County. Establishments with more than 100
employees only account for around 43% of the
sector’s total employment.
In Los Angeles County, there were just over 3,000 Emerging Digital Media establishments in 2015.
Number of Emerging Digital Media Sector Establishments by Size Category, LOS ANGELES COUNTY, 2015TABLE 5.2
Size Category Number of Emerging Digital Media Sector Establishments
<10 2,563
10-49 454
50-99 76
100-499 61
500-999 5
1,000+ 1
Source: County Business Patterns (CBP), U.S. Census Bureau; Analysis by Beacon Economics
107FDMI | Los Angeles County Perspective

Los Angeles County
LA Film Industry Report
Los Angeles County
LA Film Industry Report
<10
16,000
12,000
8,000
5,000
0
10-49
50-99
100-499
1000+
500-999
NUMBER OF EMERGING DIGITAL MEDIA SECTOR ESTABLISHMENTSBY SIZE CATEGORY, Los Angeles county, 2015FIGURE 5.3Source: County Business Patterns (CBP), U.S. Census Bureau; Analysis by Beacon Economics
Figure 5.4 depicts the location of small and larger establishments, but for the Emerging Digital Media
sector. Compared to the distribution of the Film sector, there is a greater presence of the Emerging Digital
Media sector in the eastern parts of the County, but Emerging Digital Media firms are again much more
likely to be found west of downtown Los Angeles. The location of this sector is particularly pronounced in
the coastal communities, especially around Santa Monica.
108 FDMI | Los Angeles County Perspective

Los Angeles County
LA Film Industry Report
Los Angeles County
LA Film Industry Report
Source: County Business Patterns (CBP), U.S. Census Bureau; Analysis by Beacon Economics
26 or More Establishments
11 - 25 Establishments
1 - 10 Establishments
LARGE ESTABLISHMENTS IN EMERGING digital media with at least 10 employees
26 or More Establishments
11 - 25 Establishments
1 - 10 Establishments
SMALL ESTABLISHMENTS IN EMERGING digital media with FEWER THAN 10 employees
Growing cluster of small Emerging Digital Media firms in East Los Angeles
CountyDigital Media Sector Employment by Establishment SizeLOS ANGELES COUNTY, 2015 FIGURE 5.4
109FDMI | Los Angeles County Perspective

Despite accounting for only 3% of the
nation’s total employment across all
industries, the County accounts for a
remarkable 46% of the nation’s Film sector
employment. And despite significant
upheaval in the industry over the last
decade–from changes in how content is
primarily distributed to the emergence of
new content creators in the space–Los
Angeles County’s national and global
strength in the sector has been growing,
not declining. To take this one step further,
the emergence of Digital Media has helped
to strengthen, not weaken, Los Angeles
County’s position in the Film sector.
Los Angeles County’s Competitive Advantage In the Film and Digital Media industry, Los Angeles County’s core strength lies in its role as the national leader of the Film sector.
110 FDMI | Los Angeles County Perspective

How can we account for Los Angeles County’s
continued strength in the Film sector as significant
aspects of the sector have changed? As Emerging
Digital Media firms have ventured into the Film
sector generally via the vector of video content
production, they have tended to locate the Film
sector components of their businesses in Los
Angeles County. Two of the most telling examples
of this trend include Amazon Studios and YouTube
Space, which are both in Los Angeles County.
Amazon and Alphabet did not place these functions
of their enterprises in Los Angeles County because
it provided a cheaper alternative to Seattle and the
San Francisco Bay Area respectively. Rather, they
located these functions in Los Angeles County
because it provided each of these companies with
the best opportunity to succeed in the Film sector
given the unique ecosystem of the sector’s inputs
competitively available in Los Angeles County as
they are nowhere else.
Los Angeles County offers each of these
companies access to a unique ecosystem of
Film sector assets, what are known formally as
agglomeration economies. Los Angeles County’s
Film sector strength lies in three primary areas.
The first is found in its specialized labor force. Up
and down the sector’s food chain, Los Angeles
County provides an unparalleled advantage in
workforce compared to other regions. For example,
Los Angeles County is home to 49% of the nation’s
make-up artists, 39% of the nation’s film and video
editors, 23% of the nation’s camera operators, and
23% of the nation’s actors.
Such a density of Film sector talent provides great
advantages to Film sector firms in Los Angeles
County. A firm in the region can ramp up employment
quickly as needed and recruit workers for short-term
projects without engaging in lengthy nationwide
employment searches. The talent they require from
one project to another is at their doorstep. This
dynamic places Film sector firms outside of Los
Angeles County at a competitive disadvantage.
Los Angeles County’s second strength in the
sector is found in specialized Film sector
“infrastructure.” The presence of the Film sector
in Los Angeles County has led to the growth of
a range of industries that provide specialized
services to the sector such as talent agencies,
law firms specializing in entertainment-related
law, caterers, and studios. For example, 38% of the
nation’s agents and business managers are in Los
Angeles County. Again, the density of specialized
services in Los Angeles County provides Film
sector firms here with significant advantages
unavailable in other regions. From one project to
the next, a Film production company, for example,
is able to pull together a patchwork of different
industries required to operationalize a shoot, which
is facilitated by the proximity and the established
network of these different players within the
County.
Finally, despite great advances in communication
technologies and low costs of communication,
face-to-face contact remains a critical component
of business operations and industry efficiency, not
to mention of the creative ideation process which
lies at the foundation of the sector’s products and
services. The concentration of the Film sector in
111FDMI | Los Angeles County Perspective

Los Angeles County creates great advantages in the form of networking effects.
Consider the labor market. The majority of all recruitment in the U.S. still occurs through word of mouth, rather than
through formal recruitment processes. To find work, an aspiring actress or cameraman would be at a disadvantage
if they lived in a location other than Los Angeles County. By living elsewhere, they would not learn of employment
opportunities provided by local network effects. These networking effects would equally apply to directors seeking
producers and financers, lawyers seeking entertainment-related clients, and agents seeking talent. Most Film sector
firms and workers not located in Los Angeles County find themselves at a competitive disadvantage to their Los
Angeles County-based peers.
These are only a few examples of the ecosystem inputs disproportionately and most competitively available in the
Los Angeles County-based Film sector which have helped sustain the endurance of the Film sector in Los Angeles
County over time, and which are expected to help Los Angeles County retain its dominance in the Film sector for
decades to follow. While the various ecosystem actors of the Film sector expectedly gain benefits from locating in
close proximity to one another, those proximity benefits become self-reinforcing over time as firms not within Los
Angeles County’s ecosystem are placed at a competitive disadvantage. And as more Film sector players move to the
region, this further reinforces Los Angeles County’s strength.
112 FDMI | Los Angeles County Perspective

“The changes in the industry have meant much more content is being demanded on a multitude of platforms and much more production is happening. And that has also meant that demand for us who
work on the streets in Los Angeles County is just growing in leaps and bounds.”
– Industry Stakeholder
Both the qualitative and quantitative data indicate
one trend consistently and clearly: Video content
production and accordingly the Film sector is on-
net growing in Los Angeles County. FilmL.A.’s Q1
On-Location Production Stats report indicate an
overall increase of 2.4% in on-location filming and
there are brighter spots still in the Q1 numbers with
feature film production and commercial production
up 11.7% and 10% respectively since 2017.49
Similarly, Los Angeles County’s sound stage
occupancy rates remain at a record high hovering
around 95% in the Greater Los Angeles Area.50
The growth observed in Los Angeles County’s
video content production pipeline is attributed by
industry stakeholders to primarily two different
inputs: California’s tax credit program and digital
media disruption.
Regarding the first input, this report has offered
context and insight on both the general efficacy of
industry tax credits and the specific landscape of
competitive film tax credits offered by other states
against which California’s stack. Regarding the
second input, while the broader question of digital
media disruption and its impacts is addressed
in more depth in other parts of this report, it is
important to note here that the growth resulting
from developments in digital media broadly
speaking is not to the exclusionary benefit of
newer, smaller production firms entering the fray.
Directly to the point of the stakeholder comment
above, changing consumer behavior and the
proliferation of streaming opportunities via a
multitude of platforms have created significant
growth for traditional entities too, situated within
the traditional industry ecosystem. In some
cases, the industry’s most traditional corporate
players have taken on new roles to participate in
that growth, and the digital platforms themselves
49 FilmL.A., Inc. “Q1 2018 On Location Feature Production Stats.” FilmL.A., Inc., 18 Apr. 2018. Retrieved April 25, 2018. Retrieved from: www.FilmL.A..com/on-location-feature-production-rises-in-first-quarter-of-2018/.
50 FilmL.A., Inc. “Sound Stage Production Report” FilmL.A., Inc., Nov. 2017. Retrieved April 1, 2018. Retrieved from: https://www.FilmL.A..com/wp-content/uploads/2017/11/sound-stage-study-v3-WEB.pdf.
113FDMI | Los Angeles County Perspective

are acting like traditional funders and
producers of high-cost, high-impact
video content. Ultimately, this general
growth trend means that up and down
the food chain of the Film sector there
is a general perception that the digital
media disruption process has created a
net positive opportunity for non-traditional
and traditional actors alike, from the “Big
Eight” studios and well-positioned industry
unions to platforms-turned-original-content-
producers and freelancing YouTubers.
Given these dynamics, here is a summary of
challenges still considered highly relevant
and many amplified by digital media market
entrants. These challenges reflect traditional
bottlenecks to growth for the Film and
Digital Media industry in L.A. County.
Industry Stakeholder Feedback on Key Challenges
The permitting process is the most direct
touchpoint between the Film and Digital Media
industry and the public sector in the County
of Los Angeles and is the most significant
regulatory process specific to the industry.
Stakeholders identified the challenges they face
in navigating that process, and those challenges
are synthesized here in five categories.
Solutions, existing or recommended, to some
of the challenges are discussed as part of the
intervention landscape in the final chapter of this
report; however, where practices or interventions
implemented particularly by the City of Los
Angeles were highlighted by stakeholders as
a useful counterpoint to challenges faced at
the County level, they are briefly discussed.
A fuller description of how L.A. City and L.A.
County practices respectively compare with best
practices is included in the final chapter.
Industry stakeholders elaborated primarily on two traditional challenges: (1) the permitting process for on-location filming; and (2) sound stage space in the Greater Los Angeles Area.
permitting
51 Lauder, Thomas Suh. “Groups Back Effort to Standardize on-Location Filming Policies.” Los Angeles Times, Los Angeles Times, 13 July 2012. Retrieved April 4, 2018. Retrieved from: articles.latimes.com/2012/jul/13/entertainment/la-et-ct-effort-to-standardize-streamline-process-for-onlocation-filming-gets-endorsement-20120713.
114 FDMI | Los Angeles County Perspective

Specifically, tasked departments are often
perceived to be under-resourced to address
the volume, scope, and urgent nature of
requests made by industry stakeholders. Time
lags regarding urgent issues or unanticipated,
urgent troubleshooting at the beginning of
a new shoot–inevitably associated with
on-location filming given its multi-variable
nature–were noted to be of particular
concern for industry stakeholders, given
the exorbitantly high costs of delays on-set.
While the issue of efficiency is legitimate
and there are recommendations outlined in
later chapters which the County may choose
to implement to organize, streamline, and
prioritize industry requests more efficiently,
it is useful to keep in mind that this is a
frequent criticism made by private industry
of the public sector at regulatory junctures.
Further, while the City of Los Angeles and its
infrastructure for interacting with the Film
sector will be a useful point of comparison for
certain County challenges, the City was also
criticized for being less efficient than industry
needs demand.
As a note, it is understood that the
California Film Commission’s Model Film
Ordinance–updated in 2006 and then
again revised in 2012 with resounding
support from a variety of public and private
stakeholders including the Southern
California Association of Governments–in
theory addresses many of the challenges
described here.51 There are indeed existing
and good efforts to improve the permitting
process in the Greater Los Angeles region
and to shape it to be more predictable
and uniform for the industry. The Model
Film Ordinance and the role FilmL.A. as
the largest permitting organization in the
state has played in reforming it are chief
among them. The list here is intended to
summarize and capture ongoing challenges
faced by industry stakeholders specifically
at the County level and in the context of
the County’s interest in supporting the
industry’s growth.
Generally, both the size and purview of government departments
and teams tasked with fulfilling permitting requests were said to be
misaligned with the industry’s needs, pace, and size.
115FDMI | Los Angeles County Perspective
efficiency
115FDMI | Los Angeles County Perspective
“There are some truths to the idea that the City is more efficient than the County and some untruths. It’s not just the County; there are problems now at the City level where staffing cuts and a lack of staffing make it difficult for the permitting process to go as speedily as the industry would like.” – Industry Stakeholder
116 FDMI | Los Angeles County Perspective

Setting the issue of expense aside, the
restrictions on use of County properties alone
were highlighted as a barrier to working with
the County and perceived as a disincentive
to using County assets. In some cases, these
restrictions translated as an incoherent
matrix of fees associated with particular
sites. At these County sites, the dominant
pain point was not necessarily high costs but
the cumbersome nature of the site for filming
including, but not limited to, a perceived
incoherent application of fees. Examples
cited include the division of Grand park for
fee administration by quadrant, inaccessible
beaches, and the perception of double and
triple counting in crossing County roads for
filming. The accessibility of filming locations
has increasingly become relevant to the
competition for on-location film production
as international locations once perceived
as logistically impossible have been made
accessible and, in some cases, even easy by
remote communication technologies.
ACCESSStakeholders repeatedly raised the issue of access, both to County
personnel and to County properties.
117FDMI | Los Angeles County Perspective

Relevant County departmental personnel are also generally perceived as
inaccessible, with communication lines and points of contact unclear and
personnel changes noted as a perennial challenge. As a point of contrast,
the City of Los Angeles offers within the Department of Public Works what
it refers to as a “concierge service” for issues around filming, whereby
concerns flagged by industry clients as urgent are addressed in real time
by departmental senior staff which in turn liaise with every other relevant
City department. Additionally, individual staff members at the Department
of Public Works have been identified specifically for the film community as
an accessible port of entry to City government bureaucracy for the solving
of urgent problems collaboratively and quickly. While the City’s approach to
systematized access is inevitably imperfect, the County’s identification of
“fixers” and the County’s explicit empowerment of those individuals within its
governing structure has proven more difficult.
“And you get passed around and around until you realize you have to figure out who has the authority on the issue at hand or who has the film industry as their issue purview if you want to solve your problem in a time-sensitive manner.” – Industry Stakeholder
118 FDMI | Los Angeles County Perspective

Further, given the lack of clarity, when conflicts do arise, filming productions
have been subject to political whims in a de facto system where the highest
authority of assumed last resort, the relevant County Supervisor, is often--
particularly for County residents--the first engaged. Industry stakeholders
noted instances where they had no viable alternative for navigating conflict
with residents on legally permitted shoots other than to rely on whomever
they might know in County government for help. Experiences like these have
characterized the system for many industry stakeholders as nepotistic and
the permitting process as immaterial to on-the-ground realities.
Jurisdictional Clarity The decision-making structure of the County can also be a source of unpredictability and cost for industry
stakeholders. Even where it has been made clear which governmental departments are invoked by a particular
permitting request, industry stakeholders have been left unsure if a particular body is the legitimate and effective
authority in the invoked geography, capable of enforcing the permissions it sanctions.
“Part of the problem is this borderline between the Supervisor districts and the way the County operates almost like five cities, with their departments divided along those lines responding to different people along those lines and not really having a centralized administration for the industry to work with.” –industry stakeholder
119FDMI | Los Angeles County Perspective

Transparency and Consistency of Fees While use of County assets is generally and significantly more expensive than
other jurisdictions, including the City of Los Angeles, a lack of transparency
and consistency around County fees was instead the focus of industry
feedback, and a resulting lack of trust was reiterated.
“Fee increases are communicated by City and County departments but because there’s little to no coordination when those fees are announced, there just seems to be an ever-present drip of fee increases. The industry has pushed back on a couple of proposed increases in the past and managed to get them moderated, which leads naturally to the question if these are supposed to be cost recovery-based, how could the industry ever be successful at getting leniency on a particular fee? If there were coordination on the County’s part to look seriously at incentivizing film, they would rigorously scrutinize the fee structure, which is currently handled at the department level, but there doesn’t seem to be coordination at the County level.” –industry stakeholder
120 FDMI | Los Angeles County Perspective

Industry stakeholders requested more
coordination and communication around fees,
including a clear articulation of what services
different fees cover and advance notice,
organized at the County level, of when those
fees were expected to increase. Stakeholder
feedback indicated that multiple L.A. County
departments have raised fees without notice or
a clear relationship to a particular service that
contradicts the Model Film Ordinance set forth by
the California Film Commission, to which FilmL.A.
adheres and which it helped revise in 2012.
There is significant literature on best practices for
effective, efficient regulation by government. For
example, the 2017 U.S. Chamber of Commerce
report “The Bridge to Cooperation: Good
Regulatory Design” highlights principles like
centrality of coordination, formal authority for
oversight, regulatory credibility, and regulatory
consistency as key components of good
regulatory design.52 In a related report published
by the Organization for Economic Cooperation and
Development (OECD) titled “Strategy and Policies
for Better Regulation,” an OECD interlocutor was
quoted as saying, “If you want to avoid cynicism,
be consistent.53” Both the principles and quote
cited pertain directly to the Film and Digital Media
industry’s challenges around fees and regulation
in L.A. County. More than the brute cost of fees
associated with regulation, regulatory consistency
and regulatory credibility grounded in a well-
designed regulatory process were top priorities
articulated by Film and Digital Media industry
stakeholders.
52 https://www.uschamber.com/sites/default/files/good_regulatory_design_paper_-_4-24-2017_-_final.pdf53 http://www.oecd.org/gov/regulatory-policy/44912041.pdf
121FDMI | Los Angeles County Perspective

122 FDMI | Los Angeles County Perspective
approachRelated to the topics of both trust and costs, the County’s broader historical approach to the Film and Digital Media
industry has been characterized loudly as “cost recovery,” in both practice and spirit.
“The truth is, we don’t have a problem with paying general fees. I mean, not with regard to a particular property use fee that’s just so expensive above what other jurisdictions charge; we just simply wouldn’t choose to use it. But, in general even then, if it’s a reasonable use fee, we don’t have a problem. Our production will pay it. It’s never a question of whether we will pay or not, or whether we want it for free. It just has to be reasonable in terms of what other areas charge. With regard to service fees: Typically, if there is an increase in service fees, our folks are also usually supportive when those fees are for cost recovery purposes. So, if the City or the County needs to increase a fee because they need more personnel to be able to handle the volume of permits going through their offices, our folks will say, “Okay. That’s make sense.” But, often times when the County just sets the rate and they say this is what it is, and there’s no discussion with the industry, there’s no conversation about why, I think that’s when our production folks say, “Wait, what’s going on here? Why did this go up by $100 in two weeks and nobody notified us until we went to pay it?” That’s when our folks start to look at working with the County generally differently.” –industry stakeholder
122 FDMI | Los Angeles County Perspective
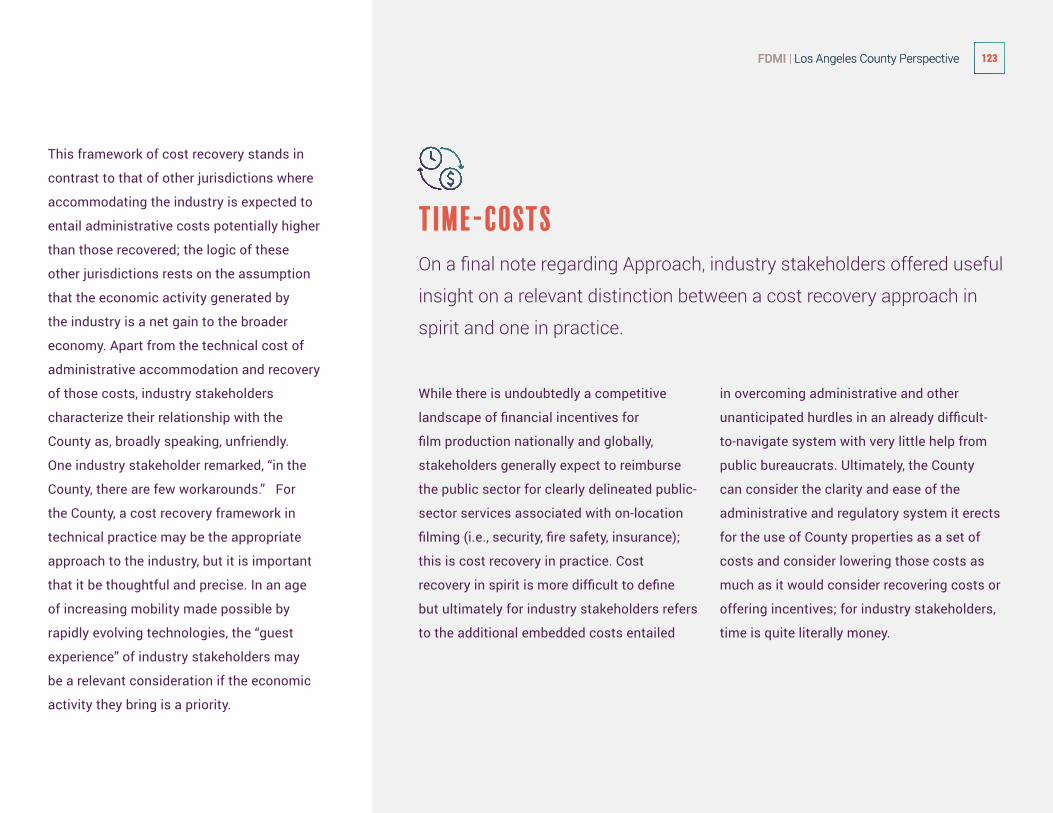
123FDMI | Los Angeles County Perspective
This framework of cost recovery stands in
contrast to that of other jurisdictions where
accommodating the industry is expected to
entail administrative costs potentially higher
than those recovered; the logic of these
other jurisdictions rests on the assumption
that the economic activity generated by
the industry is a net gain to the broader
economy. Apart from the technical cost of
administrative accommodation and recovery
of those costs, industry stakeholders
characterize their relationship with the
County as, broadly speaking, unfriendly.
One industry stakeholder remarked, “in the
County, there are few workarounds.” For
the County, a cost recovery framework in
technical practice may be the appropriate
approach to the industry, but it is important
that it be thoughtful and precise. In an age
of increasing mobility made possible by
rapidly evolving technologies, the “guest
experience” of industry stakeholders may
be a relevant consideration if the economic
activity they bring is a priority.
While there is undoubtedly a competitive
landscape of financial incentives for
film production nationally and globally,
stakeholders generally expect to reimburse
the public sector for clearly delineated public-
sector services associated with on-location
filming (i.e., security, fire safety, insurance);
this is cost recovery in practice. Cost
recovery in spirit is more difficult to define
but ultimately for industry stakeholders refers
to the additional embedded costs entailed
in overcoming administrative and other
unanticipated hurdles in an already difficult-
to-navigate system with very little help from
public bureaucrats. Ultimately, the County
can consider the clarity and ease of the
administrative and regulatory system it erects
for the use of County properties as a set of
costs and consider lowering those costs as
much as it would consider recovering costs or
offering incentives; for industry stakeholders,
time is quite literally money.
On a final note regarding Approach, industry stakeholders offered useful
insight on a relevant distinction between a cost recovery approach in
spirit and one in practice.
Time-costs
123FDMI | Los Angeles County Perspective

The first set of challenges pertains to those new digital media firms that have
recently entered the market but are creating traditional content with big budgets
and often high-impact footprints in the communities they enter. Distribution
technology platforms like Netflix and Hulu are good examples of these players,
and they have expanded well beyond acting as a point of distribution to making
their own original content which in most respects looks much like the activity
of big traditional studios. Because their activity is traditional, so too are their
challenges, which have just been itemized. As a representative of FilmL.A.
summarized well, “Although they may be digital media companies, they
resemble a high-dollar production going into a community and that looks like
a traditional media production format. In order to capture a share of that new
activity Los Angeles needs to continue to do the things it’s been trying to do with
traditional filmmakers for years: Lower the barriers to entry on the permitting
process; streamline requirements across jurisdictions; ensure there are as few
impediments as possible to local filming because those jurisdictions outside
of L.A. competing for this activity are rolling out the red carpet.” Further, the
entrance of new digital players driving up traditional production activity has had
amplifying effects on the associated traditional challenges, placing strains on a
regulatory system and industry infrastructure already struggling with capacity
concerns. Conveniently, these players do have the funds to navigate the
traditional permitting process and even cover rising costs due to the increase in
volume of activity.
Evolving Challenges As mentioned, the digital media wave has meant both an uptick in more mobile, lower-impact, non-traditional content and an uptick in traditional, high-impact content. This bifurcation of content type and their respective production formats has correlated with a proliferation of new talent in both arenas with different sets of challenges as they pertain to the traditional system in place for regulation and permitting. As far as the County or the public sector more generally is concerned, each set of challenges demand separate treatment and a coherent conceptual framework in which to understand them.
54 Box Office Mojo reports the Lights Out had a production budget of $4.9 million with a domestic lifetime gross of $67.2 million and a worldwide lifetime gross of $148.8 million as of April 22, 2018. Retrieved from: http://www.boxofficemojo.com/movies/?id=newline0116.htm
55 Ng, David. “L.A. lowering filming permit costs for digital productions.” Los Angeles Times, Los Angeles Times, 09 July 2017. Retrieved April 13, 2018. Retrieved from:http://www.latimes.com/business/hollywood/la-fi-ct-digital-production-permits-20170609-story.html
124 FDMI | Los Angeles County Perspective

The second set of challenges pertains to those smaller digital media companies that tend to have smaller budgets and lower-impact footprints in the communities where they film. They represent significant opportunity both in terms of an outsized profit margin and the potential participation of more diverse communities without historical access to the industry. In discussing this group of digital media actors, one industry stakeholder noted that the film Lights Out was quoted to have made $67M on a $5M dollar budget in addition to featuring a young, first-time director.54 Furthermore, smaller production companies currently off the regulatory radar anecdotally prefer to be legally in the system, as many of their growth trajectories include acquisition by major industry players that will not look fondly upon a history of violation. However, as it stands, these smaller companies simply can’t afford the basic requirements of the formal permitting process (i.e., insurance).
The City of Los Angeles in partnership with FilmL.A. has launched a pilot program called the Digital Makers Initiative, which targets this very group of digital media companies and aims to solve for their challenges directly, particularly with regard to affordability of fees.5 This initiative will be further referenced in the final chapter along with other public-sector interventions aimed at capturing the growth presented by digital media disruption and solving for the new challenges arising from it.
As with any evolving trend, taxonomy has been a challenge for policymakers seeking to understand the new types of firms participating in video content production. Directly to that point, a representative from FilmL.A. noted the difficulty they have had in their own efforts to monitor and report out on filming in L.A. County and its new evolving set of actors: “We have had a separate category for what we were calling web-based production for three years. We are now having to redefine that as low-impact filming based on the size and scale of the activity.” In further elaborating, the analyst explained that the imprecise category “web-based” failed to capture over time the types of firms FilmL.A. had originally set out to monitor: smaller, low-budget, low-impact media outfits. Firms producing video content are now being categorized by the types of content they produce and their production format as opposed to the nature of the production company itself. This technical clarification in naming conventions represents an important and broader insight: who is producing original video content is changing much more rapidly than how video content is being produced.
The production of video content itself is indeed changing, evolving, and further “digitizing” but the industry’s traditional production format is alive and well and the digital media disruption process is in fact one of the key inputs to its growth and that’s great news for Los Angeles County’s historically strong Film sector.
125FDMI | Los Angeles County Perspective

126 FDMI | Los Angeles County Perspective
OPPORTUNITY: Sound Stage Space
Both this report and stakeholder feedback
corroborated a consistent sound stage
occupancy rate of around 95%.56 For its
report, FilmL.A. also identified hundreds of
noncertified production facilities offering
nearly an additional one million square
feet of dedicated production space. These
facilities usually come in the form of empty
warehouses or buildings that house floors
of permanent standing sets for generic
locations like hospitals and courtrooms.
FilmL.A.’s biannual report on shoot days at certified sound stages provides insight on 232 of the 334 (70%) certified sound stages in the Greater L.A. region, or 3,332,000 of the 4,730,000 total square feet of sound stage space there.
In terms of market size, the Greater Los Angeles region not only outstrips its top five competitors in sound stage space, its 5.7 million square feet offers about as much dedicated space as Georgia, New York, Ontario, Louisiana, and British Columbia combined which together total around 6 million square feet of space.57 Moreover, the Greater L.A. region’s sound stage space continues to increase with three of the major studios, including NBCUniversal, Paramount, and Warner Bros., undertaking in some cases historical expansion efforts to either create new stages or maximize square footage. For example, NBCUniversal is building for the first time in 50 years new sound stages on its lot, adding since 2016 188,000 square feet of production space with state-of-the-art amenities including New York City-esque facades for on-site exterior filming. Additionally, Line 204 Studios has a major Sun Valley complex under way (240,000 square feet) and a number of the digital media players like Amazon and Apple are taking on original content creation at a scale that is demanding traditional sound stage infrastructure. Amazon, for example, moved from its Santa Monica location to Culver City Studios lot currently undergoing a modernization effort to add over 400,000 square feet of new production space.
While construction is ongoing, Los Angeles County’s Film and Digital Media industry is and has been facing a sound stage shortage, and the industry continues to grow faster than the County’s infrastructure is able to accommodate it. The market gap around space was highlighted by industry stakeholders as the door through which the state of Georgia entered the film production scene in a significant way in recent years. The state is now home to nearly 60 stages, with Pinewood Studios Atlanta, the largest movie studio complex outside of California, boasting as of 2017 361,000 square feet of space and 18 stages. Built in 2014, Pinewood Studios Atlanta has been hailed the “unofficial home in Georgia” to Marvel Studios, and a number of other large studios have cropped up in Georgia including Tyler Perry Studios, whose presence predates the more recent Georgia rush. While activity is certainly on the rise in Georgia, the Peach state has in total only a little over 1 million square feet
56 FilmL.A., Inc. “Sound Stage Production Report” FilmL.A., Inc., Nov. 2017. Retrieved April 1, 2018. Retrieved from: https://www.FilmL.A..com/wp-content/uploads/2017/11/sound-stage-study-v3-WEB.pdf.57 Ibid.
126 FDMI | Los Angeles County Perspective

127FDMI | Los Angeles County Perspective
compared to the Greater L.A. region’s 5.7 million, an important datapoint to keep in mind amid hyperbolic rhetoric around Los Angeles County’s competitors in Film. Industry stakeholders underlined the importance of sound stage space as a still key piece of infrastructure for the industry, even as it evolves. They indicated that any public-sector action to help expedite the construction of these spaces would be catalytic for growth and essential for keeping that growth in L.A. County, particularly for feature-film production more vulnerable to poaching.
Sample Pain points provided by Industry Stakeholders and Associated Challenge Areas
“This was all before more recent developments at the County to improve relations with the industry. But our experience had to do with a known area of filming activity and we had gotten all the necessary permits etc. We ended up having to file all these extra forms and pay a lot of extra money-hire an arborist, get an environmental report. And we obliged because again, we already spent a million dollars. Had we not relinquished and said yes to all those things immediately, it would’ve thrown our production schedule completely off. And so, we went out of our way to do anything and everything requested. But, again, with our folks saying, “We are never doing this again” and with colleagues in peer firms taking note and saying, “We heard about what happened to you guys.”
Example “War Story”
Perception of double and triple counting in crossing County roads for filming
inaccessible beaches
the division of Grand park for fee administration by quadrant
127FDMI | Los Angeles County Perspective

Intervention FRAMEWORK
and RecommendATIONS
128 FDMI | Los Angeles County Perspective

129FDMI | Los Angeles County Perspective

Key Insights to Keep in mind
Government’s Unique Lever
Land use, access to transit, and housing are all fundamentally policy issues, and policy is
the exclusive purview of government, its unique lever. The County of Los Angeles and the
cities it comprises along with its State government should consider any action to increase
the quality of life in California, particularly affordability, a direct investment in the growth
of its industries. Especially as the County explores supporting the Film and Digital Media
industry as a generator of diverse opportunities, notably middle-income jobs, the cost of
living in Los Angeles County will come sharply and immediately into focus, with housing
costs at the top of the list. Middle-income jobs can produce middle-income households
insofar as middle-income wages translate into middle-income lifestyles, after the bills
have been paid. Against the backdrop of California’s rising and unmitigated housing
costs and stagnate housing supply, the conversation around the intentional generation of
“middle-income jobs” is at risk of being rendered effectively moot.
The government’s most fundamental role in supporting the sustainable growth of the Film and Digital Media industry–and any industry–lies first and foremost in its core competencies and functions.
130 FDMI | Los Angeles County Perspective

Setting the Rules of the Game
Practical solutions for the Film and Digital Media industry across the Greater L.A. region may very well lie outside
of legislative changes to the “rules,” shared rules between L.A. City and L.A. County or otherwise; however, as it
applies solely to the jurisdictions of L.A. County, it is important for County policymakers to understand that clear and
consistent rules are better than lenient rules applied inconsistently.
Another important note worth reiterating regarding government intervention and reflective of stakeholder insight highlighted earlier, is government’s unique and vital role in setting the rules of the game. Government’s setting consistent and transparent rules is more important to industry’s ability to plan for growth than its setting of favorable or lenient rules. As one industry stakeholder noted:
“You need to be consistent. Why can’t L.A. City adopt L.A. County rules or the other way around, just so the Film industry knows it’s the same. Why, if you shoot in San Fernando as opposed to Santa Clarita, only a mile apart, are the rules so different? Why should it cost the production entity or the studio vendor an additional $22k to shoot in L.A. County? I’ve had producers not be clear on the differences and promise to never shoot again in L.A. County. That being said, we are still growing but it sure would be a lot easier if one municipality would copy the other. And I don’t care either way honestly. Just level the playing field.”
131FDMI | Los Angeles County Perspective

With these general insights in mind, this chapter
summarizes stakeholder feedback regarding best practices1
puts forward an intervention framework2
presents challenges, opportunities, and recommendations for the Film and Digital Media industry in L.A. County3
offers a landscape of intervention strategies4
132 FDMI | Los Angeles County Perspective

A Summary of Best Practices
While challenges, big and small, were outlined by stakeholders, representatives of industry across the board praised the County’s evolving position toward Film and Digital Media. One stakeholder remarked,
“The County has taken really great first steps. You have a new attitude at the County toward filming that we’ve all noticed and that is positive for the industry. And I think the County has an opportunity now that probably didn’t exist before, with the coming together of industry dynamics at high tide and political developments as well as supportive leadership. They are–and we are–really headed in the right direction, I think.”
As the national hub for the Film sector, the Greater Los Angeles region has employed an array of industry-specific best practices in support of the Film and Digital Media industry. Based on stakeholder insight and broader analysis, what follows is a summary of those practices employed by the City and County of Los Angeles respectively.
–industry stakeholder
133FDMI | Los Angeles County Perspective

134 FDMI | Los Angeles County Perspective
The context for film policy and regulatory process at the City level is driven by Mayor Eric Garcetti’s Executive Directive No. 6, which has been given credit for helping to improve the City’s relationship with the industry in recent years.57 Issued in March of 2015, the Directive enshrines as mandate a few broad guidelines for the City’s engagement with the Film sector. It mandates the public designation of industry-specific liaisons at each City department; it requires those liaisons be present at quarterly Film Task Force meetings; and it reiterates mandatory cooperation with FilmL.A. as the City’s permitting body. Importantly, it also lays out a clear set of expectations around the administration of fees: that they be simple, predictable, consistent, timely, incremental, and minimal. The Directive also requires that policy or regulatory changes be submitted to the Mayor’s Office at least 45 working days before changes can be approved. Finally, it lays out two additional asks for the City’s Economic and Workforce Development Department, including the provision of an annual training around filming to all relevant City staff and the development of a comprehensive list of City-owned properties that can reasonably accommodate production shoots. While Mayor Garcetti did also establish the City’s first Entertainment Industry and Production Office, the directive itself is not overwhelming in its length or innovative approach. However, the top-down mandate from the highest political office has been held up as an effective tool in communicating the priority of the industry in the City of Los Angeles and empowering public-sector workers to act on it.
Since 2016, the County has taken significant strides in a very similar direction. In May 2016, Supervisors Don Knabe and Sheila Kuehl put forward a motion directing the County’s Chief Executive Office to review the County’s practices around filming and align them to the greatest extent possible with that of California’s Model Filming Ordinance. That motion also included a directive around outreach to the 88 cities within L.A. County, requesting their consideration of and alignment with the California Model Filming Ordinance to the greatest extent possible.
In January 2017, Supervisor Mark Ridley-Thomas put forward another motion focused on filming and specifically with regard to Fire District Filming Fees. The motion requested the CEO’s office to conduct a comprehensive and comparative analysis of fees and consider their impact on filming in Los Angeles County.
Finally, On May 2, 2017, Supervisors Sheila Keuhl and Janice Hahn sponsored the County’s most comprehensive motion on filming and film policy to date, directing the County to: (1) examine the County’s Film Liaison and recommend strategies for strengthening the role; (2) review and recommend reductions to filming fees; and (3) review and recommend amendments to the County’s enforcement code to ensure the necessary enforcement authority.
Top Down MandateAt the City Level At the County Level
57 City of Los Angeles. Eric Garcetti, Mayor, Executive Directive No. 6. March 4, 2015. Retrieved on April 30, 2018. Retrieved from: https://www.lamayor.org/sites/g/files/wph446/f/page/file/ED6Film.pdf?1426620059
134 FDMI | Los Angeles County Perspective

135FDMI | Los Angeles County Perspective
The City of L.A.’s provision of concierge-like services was highlighted, as was its chief liaison’s relatively successful role as a one-stop shop through which to troubleshoot challenges involving other City departments with the implied backing of the Mayor’s office. The City’s quarterly as opposed to the County’s biannual meeting schedule of the Task Force was preferred, and there was broad interest in having the meetings provide a more communicative and accountable forum such that items raised in one meeting would be addressed in the subsequent meeting. With regard to fees, stakeholders highlighted the attraction of the City’s waiver of use fees for City properties, which was extended in December 2014 for an additional five years through June 2019.58 While the focus of stakeholder feedback was not with regard to brute costs in the form of fees at the County level, the County is undeniably more expensive than other jurisdictions, notably the City, and the waiver of use fees at the City level does lower the comparative bottom line for shoots.
While both the City and the County of Los Angeles have taken legislative action around filming to optimize the regulatory environment for the L.A.-based industry, the legislative directive or motion itself is not the substance of a top-down mandate although it is a necessary foundation. To note, both Mayor Garcetti’s Executive Directive No. 6 and Supervisors Keuhl and Hahn’s May 2017 Motion were reflective of best practices already enshrined in the statewide California Model Filming Ordinance years prior. The substance or power of a top-down mandate lies in the political will it directs and the resultant empowerment public sector workers feel to act accordingly. Given its more complex structure, the County faces greater challenges in directing its political will and mandates down the bureaucratic chain of command. As one stakeholder commented:
“There’s a political will that has to be present in order for departments to respond effectively. And where in the City of L.A. there’s been a couple of mayors who have made it clear to their general managers and then downhill from them that film is a priority, in the County, it’s been harder. With five Supervisors, there’s no one person in that same kind of role. So, similar efforts have been championed in the County through the powers of the CEO office. And the County also has Task Force meetings and it has already identified key people, it’s really a question of whether they feel either pressured or empowered to do the work necessary to support filming and to make things move smoothly in the County for the industry, amid many other competing priorities.”
OPEN ACCESSAt both the City and County levels, industry-specific
liaisons have been appointed for issues related to
film in an effort to streamline the public sector’s
interaction with the industry’s key stakeholders
and facilitate its engagement of them.
58 City News Service. “L.A. Waives Filming Fees on City Land to Keep Movies, TV Shows Local.” December 2, 2014. Retrieved on April 30, 2018. Retrieved from: https://www.kcet.org/agenda/la-waives-filming-fees-on-city-land-to-keep-movies-tv-shows-local
135FDMI | Los Angeles County Perspective

Resultantly, there’s confusion about what departments are responsible for what issues, who in particular in any one department is capable of making accountable decisions, and to whom decision-makers answer. Ultimately, accountable decision-making is the paramount challenge as it applies to jurisdictional clarity at the County level, especially since FilmL.A. does administer on behalf of the County the technical permitting process as it does for the City, though it doesn’t collect fees on behalf of all County departments. While clarifying and simplifying the system of County decision-making and authority as it applies to filming would be useful, the key structural difference between the City and the County underlined by stakeholders was the enforcement mechanism.
““The City of Los Angeles has implemented an enforcement mechanism for permits. There was a change to the L.A. municipal code that
set it up as a misdemeanor offense to film without a permit or to interrupt or interfere with a duly permitted filming activity. There was also a unit created at the LAPD that was designed and tasked with the process of film permit enforcement. And this “toothiness” in the City’s film policy helped in a couple of different ways. One, it lowered the ability of residents or business owners to be disruptive to filming in an attempt to extort payment from production companies for inconvenience. There have been cases and they are legendary in the industry - blaring music from a boombox, blowing leaves so that sound can’t be captured - and now there have been enforcement actions by LAPD if those things occur. And the same goes the other way around; film companies caught without a permit are at risk of having their equipment confiscated and the shoot shut down and sometimes equipment is rented so it’s a very big risk for a filmmaker. And that together gives residents and
filmmakers assurance that the film permitting process actually means something. At the City, the LAPD is the issuing authority and the enforcement authority. The County does not have the same kind of enforcement mechanism in place.” – Industry Stakeholder
Notably, per the aforementioned May 2017 Motion put forward by Supervisors Kuehl and Hahn and its amendment put forward by Supervisor Kathryn Barger, the County is currently in the process of revising the County Code to strengthen its enforcement mechanism for addressing violations of the film permitting process by property owners and production companies alike. This effort should streamline and improve the County’s ability to enforce the film permitting process and help to make the decisions made through it both accountable and legitimate.
Issuing Authority as Enforcement Authority Given the different organizational structures of the County and City, the complexity at the top of the County’s
structure, with five County supervisors as opposed to one mayor, flows down the respective power channels and
jurisdictional authorities.
136 FDMI | Los Angeles County Perspective

Recommended Interventions more broadly are interventions
the County may consider that are directly sourced through
engagement with communities of stakeholders the County
may wish to serve and are based on their voiced pain-points
or requests. The other categories of intervention reflected
in the intervention landscape are: Scalable Interventions,
relevant solutions already being implemented on the ground
with success, and Borrowed Interventions, solutions that
have been piloted elsewhere in this industry or another
industry experiencing similar challenges by agents or actors
with similar levers to those of the County.
The design of any one intervention will likely involve
consideration of questions related to all three categories:
Intervention Framework The recommendations put forward by industry stakeholders are one category of intervention, recommended interventions, included in the intervention landscape chart at the end of this chapter; they are interventions that have been suggested by County constituents and industry representatives through this report’s insight and data collection process.
Whose problem are you solving and what specific challenge are you targeting?
Recommended Interventions
Is any local entity already addressing this challenge effectively and if so, what are
the working conclusions about its solution at scale?
Scalable Interventions
Is there relevant precedent nationally or internationally whose lessons learned
may help inform the design and implementation of a local solution?
Borrowed Interventions
137FDMI | Los Angeles County Perspective

While a government actor may have many constituencies in the way it conceives
of its guiding mission and work, it is important that the intervening body clearly
articulate whom it seeks to serve through the design of a specific intervention. Any one
challenge may involve a number of constituencies, and solving the challenge for one
constituency may not solve it adequately for another. Whom the County seeks to serve
may dovetail intimately with how the County will serve them and under the banner of
what data-driven goal. Indeed, defining an intervention’s served constituency and its
primary goal may be inextricably intertwined, depending on the policy context. The
process of determining exactly how to intervene is expounded upon in the discussion
that follows; however, with regard to top level goal-setting, clearly indicating for whom
an intervention is designed and implemented is key to a foundation for measurable
success. It often costs more to solve the same challenges for different constituencies,
which implies tradeoffs that should be clearly stated from an intervention’s conception.
Constituency – Whom do you seek to serve?INTERVENTION FRAMEWORK:
CONSIDERATIONSIn identifying precisely the goal of any intervention the County
may choose to implement, the County may consider the following items as part of its
intervention framework:
138 FDMI | Los Angeles County Perspective

In the case of government intervention in particular, consideration
of an agency’s deployable levers maximizes the return on a potential
investment. When an intervening body understands the universe
of what it can potentially do, the universe of what it may consider
doing to address any one challenge of an identified constituency
is considerably narrowed. This exercise in many cases may not be
necessary, but if an agency or institution is exploring intervention
for the first time, an examination of the tools in its proverbial
toolbox streamlines the intervention design process. By doing so,
the intervener may productively eliminate those challenges and
solutions it is not well-positioned to address or implement and
maximize exploration of those that it is.
Related to an examination of levers, articulated consensus on an
intervening actor’s unique value can help maximize the efficiency
of the intervention design process. For example, in a public sector
context, a particular agency’s unique purview or primary lens may
be informed by that of its peer agencies and how they are expected
to work together. An intervening body’s additionality can be likened
to what outcomes or results would not be generated “if not but for”
the intervener.60 Articulating an intervening body’s additionality
early in the intervention design process also prevents conflicting
interpretations of the agency’s unique purview among the design
team members.
Levers additionality
60 Gillenwater, M. “What is Additionality? Part 2: A framework for more precise definitions and standardized approaches.” GHG Management Institute, December 2012. Retrieved on April 30, 2018. Retrieved from: http://ghginstitute.org/wp-content/uploads/2015/04/AdditionalityPaper_Part-2ver3FINAL.pdf
139FDMI | Los Angeles County Perspective

intervention framework: toolbox for succesful intervention design
61 W.K. Kellogg Foundation. “Logic Model Development Guide: Using Logic Models to Bring Together Planning, Evaluation, and Action.” W.K. Kellogg Foundation, Jan. 2004. Retrieved on April 30, 2018. Retrieved from file:///Users/alysasloanhannon/Downloads/LogicModel%20(3).pdf.62 Kellogg Logic Model
Armed with a broad goal, a specific constituency, and a sound
assessment of its own levers and unique purview, the County may
use logic modeling tools to design the “how” of an intervention. As
defined by the W.K. Kellogg Foundation’s Logic Model Development
Guide, a logic model “is the theory and assumptions underlying a
program. A program’s logic model links outcomes (both short- and
long-term) with program activities and processes and the theoretical
assumptions and principles of the program. Basically, a logic model
presents and shares your understanding of the relationships among
the resources you have to operate your program, the activities you
plan, and the changes or results you hope to achieve.”61
Logic models break down inputs, outputs, and outcomes in order
to demonstrate an “outcomes pathway” or the interlinking series
of relationships that encapsulate a theory of how and why change
is predicted to happen. A theory of change articulates why an
intervening body believes certain outcomes are likely to result from
its designed intervention.
Logic Modeling Theory of Change
140 FDMI | Los Angeles County Perspective

resources / inputs1 ACTIVITES2 OUTPUTS3 OUTCOMES4 IMPACT5
Your Planned Work Your Intended Results
63 Globerman, S. “The Entertainment Industries, Government Policies, and Canada’s National Identity.” Fraser Institute, March 2014. Retrieved on May 1, 2018. Retrieved from: https://www.fraserinstitute.org/sites/default/files/entertainment-industries-government-policies-and-canadas-national-identity_0.pdf
64 Globerman, S. “The Entertainment Industries, Government Policies, and Canada’s National Identity.” Fraser Institute, March 2014. Retrieved on May 1, 2018. Retrieved from: https://www.fraserinstitute.org/sites/default/files/entertainment-industries-government-policies-and-canadas-national-identity_0.pdf
Logic Model62
Figure 6.1
With a well-defined logic model powered by
a clear theory of change, precise metrics for
success can be identified with benchmarks
indicating progress toward those goals.
Economic data indicators can be useful
tools for both defining success in empirical
terms and evaluating whether success has
been achieved.
In the context of most industries, government actors in addition to identifying what intervention they
believe may be effective and why, must grapple with questions around market interference and its
appropriateness on behalf of an industry. In a report published by the Fraser Institute entitled “The
Entertainment Industries, Government Policies, and Canada’s National Identity,” the direct and indirect
support of the entertainment industries by government and the logic that justifies such support, including
its economic evidence is rigorously evaluated.63 The report concludes,
“…Proponents of government intervention are obliged to make a credible argument that the free market
will fail in some fundamental way to produce the socially efficient (or desirable) industry rate of output.
Proponents of government intervention into the entertainment industry rarely address the issue of market
failure directly; however, the arguments they have articulated for government intervention can be put into
the context of market failure.”64
According to this framework, addressing market failures like potentially a lack of diversity, an outcome
the market is not producing on its own, may justify intervention by a government actor where expediting
or facilitating growth on its own may not.
Metrics for Success Government’s Justification for Intervention
141FDMI | Los Angeles County Perspective

This chart summarizes the Industry’s challenges and opportunities highlighted throughout this report. Based on these challenges and opportunities and informed by broader stakeholder insight, a short list of highlighted recommendations for the County of Los Angeles follows.
Challenges and Opportunities for Industry Growth and Talent Development Figure 6.2
GROWTH
Regulatory Process: Efficiency
Regulatory Process: Access (to property/people)
Regulatory Process: Jurisdictional Clarity
Regulatory Process: Transparency and Consistency of Fees
Regulatory Process: Approach
Process: High cost to smaller, digital media firms
Sound stage space shortage
Production surge
Use of County property for filming
Growing cluster of small Emerging Digital Media companies in East L.A.
Challenges, Opportunities, & Recommendations
opportunity
challenge
Source: Beacon Economics
142 FDMI | Los Angeles County Perspective

talent
Access: To decision-makers and networks
Awareness: Of the types and nature of opportunities available in the industry
Transparency: Of the requirements and associated career pathways of opportunities
Capital: LA County’s funding landscape compared with other markets particularly for programmatic intervention
International markets: Industry exploring international markets increasingly
Diversifying domestic markets: Industry catering to an increasingly diverse domestic market
L.A. County’s concentration of creative talent
L.A. County’s growing ecosystem of Emerging Digital Media companies
Increasing trend of computer-mathematical skillsets in the Film and Digital Media industry
Increasing trend of income equality in the industry relative to 10 years ago
Increasing diversity in industry workforce
Relatively smaller wage gap for women in Film and Digital Media industry
Source: Beacon Economics
143FDMI | Los Angeles County Perspective

Broad Recommendations
informed by Stakeholder
Insight
Resource and Prioritize Existing Efforts: Industry GrowthThe Office of the CEO and the County’s Film Liaison must have the necessary capacity
to convert on goals that have been publicly formulated in good faith with stakeholder
input through efforts like this report. While more efficient infrastructure is put in place
around fees and enforcement, brute human capacity is needed to address constituent
concerns, troubleshoot challenges as they arise, and follow through with solutions.
Given the vast and diverse coverage of the County’s jurisdiction, the capacity required
to implement and respond to issues like special conditions on permitting for particular
communities is unique in the County’s case and significant.
Additionally, in order to heed the full breadth of recommendations from this report
and broaden the purview of the County’s engagement beyond permitting, there must
be capacity in place to respond to the simpler, technical challenges that have been
long identified. The County cannot strategically engage and partner with industry
stakeholders in responding to the more crucial, adaptive challenges of the day without
competently addressing the clearly solvable problems.
The County has already put in motion efforts including the directives mentioned earlier that help to provide a top-down mandate, strengthen the County’s enforcement mechanism, and increase industry access to County personnel and properties. In order for those mandates to be actionable and perceived as legitimate by the industry, they must be prioritized and thus resourced by County leadership.
Recommendation Highlights
144 FDMI | Los Angeles County Perspective

UTILIZE L.A. County’S Levers & Assets: Industry GrowthBuilding on these efforts, the County of Los Angeles should continue identifying ways of leveraging its assets and levers to support the growth of the Film and Digital Media Industry. Some of those strategies may include:
Stakeholders encouraged the County to consider actively developing soundstage space or expediting through the regulatory and approval process the development of such spaces. The strategic development of brick and mortar spaces can play an important role in anchoring certain parts of the industry in specific geographies and in otherwise excluded communities.
Stakeholders expressed interest in easier and more open access to County assets for filming which simultaneously presents an opportunity for national and global brand building for Los Angeles County, a valuable benefit for which other jurisdictions actively pay.
Efforts by the City and the County to centrally and accessibly warehouse filming location information for industry stakeholders are underway and can be productively coordinated and perhaps even combined, removing arbitrary barriers to entry and to information in the Greater Los Angeles region.
Develop Soundstage
Space or Facilitate its
Development
Open County Assets
to Filming
Combine City and County
Location Databases
Reduction of use fees at the County level not intended for cost recovery would not only incentivize more filming in the County but it would help to level and make more consistent the playing field between the County and the City of Los Angeles.
Remove Use Fees (where possible)
145FDMI | Los Angeles County Perspective

Focus on L.A. COUNTY’S Core Competency: Talent Development
The Film and Digital Media industry is undergoing a
transformation by which the demand for creative digital video
content is multiplying and mutating. However, the creative
minds, talent, and workers producing that good, which has not
dramatically changed as its distribution channel and format
have, are in the Greater L.A. region. The County can do more
to put its talent pool at the center of its conversation around
policy and intervention. Currently, the permitting process is
the core focal point of the region’s engagement with the Film
sector and the Film and Digital Media industry. Widening both
the purview of that engagement and those it includes may help
competitively position L.A. County, as the firms in the industry’s
supply chain reorder themselves and the format of film evolves.
As the industry breaks out of its historically vertical silos into a
lateral, multi-dimensional configuration, so too can the County’s
approach to the industry and the talent that powers it.
L.A. County has a clear workforce advantage; the talent of the Film sector and in many cases the creative capital of the U.S. congregate here.
Focusing on identifying the needs of up-and-coming talent and small, innovative companies contributing to the industry’s disruption may help to keep the frontlines of industry innovation in Los Angeles County. As this report indicates the challenges of smaller, emerging companies and their leaders are different from those of large legacy behemoths. For example, the challenge faced by smaller digital media companies around preclusively expensive permitting costs is being addressed by the City of Los Angeles through its Digital Makers Initiative.
As the occupational analysis demonstrated, computer-mathematical skills are on the rise among the industry’s workers reflecting broader trends in the economy. Also, more broadly, a creative skillset is increasingly touted by education practitioners as a core competency of well-adjusted, adaptive 21st century workers capable of problem-solving in an ever-changing, technology-driven market. Government intervention strategies like the establishment of STEAM (Science, technology, engineering, arts, and math) Centers in New York City target this intersection of computer-mathematical and creative skills. Los Angeles County not only has useful workforce dynamics for developing a STEAM-oriented, inter-disciplinary skillset among its workers but it also has the industry base to translate that skillset into market opportunity. Strategies that target the intersection of computer-mathematical skills and creative skills are both regionally relevant and globally competitive.
As the data indicates, the industry is slowly becoming more diverse, however knowledge of its opportunity landscape remains limited. Community-based awareness campaigns were put forward as a successful way of not only democratizing knowledge of the industry’s opportunities but also normalizing for communities pursuit of them as a feasible career option.
Support Talent and Smaller, Innovative Companies
Create Inter-Disciplinary Career Pathways
Build on Industry’s Growing Diversity
146 FDMI | Los Angeles County Perspective

Global Innovation: Preparing for What’s Next
Similarly, the Greater L.A. region is perceived as an international, not just
a national, hub for film and creative talent. Identifying ways of creating
bidirectional exchange between the international community and L.A. County’s
industry can help increase its competitiveness, not only providing exposure to
the frontlines of disruption but also increasingly molding L.A. County into the
source of industry innovation. Because L.A. County’s Film and Digital Media
industry is dominated by its strong, legacy Film sector, this traditional industry
tactic of international outreach and exchange may help connect the dots
between the legacy and emerging segments of the industry in L.A. County and
by extension across the globe.
L.A. County policymakers may consider (1) Providing L.A. County-based firms
with access to international markets and facilitating the testing and iterating
of their international market strategies and partnerships; (2) Creating forums
for exchange in Los Angeles County, among creatives from around the world,
making L.A. County a place creative individuals can come for access not
only to the L.A. County-based industry but also to the global industry and the
diversity of people and cultures it comprises; (3) Exposing the industry in L.A.
County, its legacy and evolving segments, to innovations in film and media
around the world and the proliferation of applications of digital video content
to other sectors, i.e. retail, museums, etc.
Increasingly, disruptions and changes in the industry’s consumer markets and in its production process are driven by a global, not a national, set of variables.
147FDMI | Los Angeles County Perspective

Intervention Landscape with LeversFigure 6.3
Space L1 - Open up County Properties for filmingL1 - Use County properties as hub for filming L2 - Remove use fees L4 - City and County database of locationsL1 - County as a portal to filming in the State
L4 - FutureWorks: Place-based hub for Advanced Manufacturing in NYC
L2 - Top-down Mandate, i.e. Directive No. 6 L2 - Industry “Czar” appointments Regulatory Process: Access
Regulatory Process: ClarityL2 - Enforcement mechanism (permitting authority is enforcement authority)
Regulatory Process: High Costs L2 - Remove use fees L4 - Digital Makers Initiative (*exploring low-cost insurance models in other markets to bring down cost of permitting)L4 - FilmL.A. subsidy for Student filmmakers
GOAL: GROWTH
Lever 1 Convening
Lever 2 Regulatory
Lever 3 Capital
Lever 4 Capacity BuildingL1 L2 L3 L4
Using government platform to convene stakeholders across sectors, silos, and interest groups in pursuit of shared goals.
Adjusting the regulatory or policy framework relevant to a particular industry
Directing investment of capital to stimulate private capital
Building the capacity of a particular group of individuals or firms
Source: Beacon Economics
148 FDMI | Los Angeles County Perspective

goal: talent development
L1 & L4 - Hollywood CPR curricular partnerships with West Los Angeles College
L1 - Community-oriented awareness campaigns re. industry opportunity
Awareness
L1 & L4 - Industry-wide infrastructure and standards for internships and apprenticeships66
L1 & L4 - Industry-approved credentialing program67Transparency
L3 & L4 - Evolve Entertainment Fund68 L3 - BFI Film Fund; Creative BC Amplify69Capital
Access L4 - Ghetto Film School; Project Involve L4 - Made in NY Media Fellowships for diversity in the industry.65
L4 - IN2NYC70International Markets
opportunity challenge Recommended scale up borrowed
65 http://nymediacenter.com/category/call-for-entries/66 http://www.bfi.org.uk/sites/bfi.org.uk/files/downloads/future-film-skills-an-action-plan-2017.pdf67 http://www.bfi.org.uk/sites/bfi.org.uk/files/downloads/future-film-skills-an-action-plan-2017.pdf
68 http://www.lamayor.org/mayor-garcetti-launches-evolve-entertainment-fund-boost-diversity-entertainment-industry69 http://www.creativebc.com/programs/amplify-bc70 http://www.in2.nyc/
Source: Beacon Economics
149FDMI | Los Angeles County Perspective

APPENDIX
150 FDMI | Los Angeles County Perspective

151FDMI | Los Angeles County Perspective

Film and Digital Media encompass a wide variety of industries. As Film and Digital Media
continue to co-evolve, embracing new and innovative activities, Film and Digital Media
become increasingly co-mingled. Beacon Economics distinguishes between traditional
industries of the economy that predate the digital age, though they are certainly enhanced
or broadened by it, and industries that have recently emerged as a result of the digital age
and whose core functions pivot around the generation and distribution of digital content.
Overall, Beacon Economics aggregated relevant industries at the National Industry level
(6-digit North American Industry Classification System level) into three broad categories:
Film, Digital Media, and Film and Digital Media hybrid.
The three broad categories are further divided into seven sectors: Film, Publishers (Digital
Media), Broadcasting (Digital Media), Professional Services and Business Operations
(Digital Media), Emerging Digital Media (Digital Media), Artists and Agents (Film and Digital
Media hybrid), and Sound Production and Recording (Film and Digital Media hybrid).
Beacon Economics used the Quarterly Census of Employment and Wages (QCEW) published by the Bureau of Labor Statistics to conduct the industry profile analysis. The QCEW publishes a quarterly count of employment and wages reported by employers covering more than 95% of U.S. jobs, available at the county, MSA, state and national levels by industry.
Beacon Economics used the American Community Survey (ACS) Public Use Microdata Samples (PUMS) published by the Census Bureau to conduct the industry profile analysis. The ACS PUMS files are a set of untabulated records about individual people or housing units. The Census Bureau produces the PUMS files so that data users can create custom tables. Employment by industry and occupation can be calculated only by using ACS PUMS. Incidentally, these employment estimates
Film & Digital Media Cluster Definition
Notes on MethodologyIndustry Profile
Occupational Profile and Demographics Profile
152 FDMI | Los Angeles County Perspective

To conduct an analysis of the economic impact of the Los Angeles County Film and Digital Media industry, Beacon used data from the U.S. Census Quarterly Census of Employment & Wages (QCEW) for 2016 on jobs and earnings in the sectors that Beacon determined constitute the industry. Beacon input those jobs and earnings by sector (the direct impact) into the IMPLAN economic impact model to estimate direct economic output generated by the Film and Digital Media industry in Los Angeles, as well as the induced and indirect impacts of the industry countywide. An example of indirect economic activity would be a studio purchasing construction supplies for a soundstage from local suppliers. The additional income that is earned by employees in the industry and down the supply chain also causes additional economic activity in Los Angeles County—known as induced demand, as these employees spend money earned in connection to the Film and Digital Media industry on goods and services in the local economy. The sum of the direct, indirect, and induced impacts represents the total economic impact of the Film and Digital Media industry in Los Angeles County.
To determine the outlook of Film and Digital Media, Beacon Economics forecasted the growth of its component industries over the next few years through 2020. This forecast for the County of Los Angeles used standard time-series econometric techniques based on historical correlations and forecasts of economic trends. Beacon Economics’ method of forecasting takes a layered approach: National policy changes and external shocks are built into a U.S. model with a variety of economic indicators: GDP, production, demographics, interest rates, government spending, taxes, savings, income growth, and real estate. Beacon then crafts a California model that incorporates macro trends at the national level with statewide trends in employment/labor markets, demographics, real estate, and business activity.
Taking into account these state and national factors, Beacon creates a regional model for Los Angeles County using macro trends to generate a local forecast that delivers a broad outlook for the region, which were then in turn used as exogenous inputs to forecast industry employment using autoregressive distributed lag models.
To determine where the Film and Digital Media industries are clustered in Los Angeles County, Beacon Economics used the zipcode level County Business Patterns (CBP) data published by the Census Bureau. The CBP is an annual series that provides subnational economic data by industry. This series includes the number of establishments, employment during the week of March 12, first quarter payroll, and annual payroll. Beacon Economics used the CBP data to derive the concentration of establishments by size and estimate the number of employees at the zipcode level.
Economic Impact
Forecast
Industry clusters
are higher than the estimates from the Bureau of Labor Statistics’ Quarterly Census of Employment and Wages (QCEW) because the QCEW excludes several types of workers whereas the ACS PUMS does not. Specifically, the QCEW employment data excludes proprietors, the unincorporated self-employed, unpaid family members, and certain farm and domestic workers. The employment count also excludes workers who earned no wages during the entire applicable pay period because of work stoppages, temporary layoffs, illness, or unpaid vacations. Given the prevalence of self-employment and freelance work within creative industries such as Film & Digital Media, one can expect that the QCEW employment figures are underreported.
153FDMI | Los Angeles County Perspective

Continued from
Introduction
154 FDMI | Los Angeles County Perspective

155FDMI | Los Angeles County Perspective

156 FDMI | Los Angeles County Perspective

157FDMI | Los Angeles County Perspective
the Existential Question of Digital Media Consumers are becoming increasingly agnostic about how they access digital video content. The nature of the device attached to the screen is becoming less important than the platform powering content on the screen. While the industry’s enterprise firms are reeling and racing to adapt and restructure, the creative professionals who power the industry are enjoying a boon of production activity. L.A. County, the nation’s largest hub of workers in the Film sector, is struggling to keep pace with the demand for digital video content, as it comes in from an increasingly diverse mix of firms.
Traditional media players are not just creating add-
ons for the emerging digital world, they are fully
integrating video content across all dimensions to
embrace it. Firms that used to be disparate players
in the media production value chain–production
companies, distribution platforms, advertising
agencies, and brand representatives—are now all
sitting together at the same table. As one industry
stakeholder remarked, “The dividing line between a
brand and a story is blurring, and we’ll only continue
to see brands bleeding into narratives.” For anyone
who has ever impatiently waited to click the “skip
ad” button on YouTube, it’s intuitive as to why such
a traditional interruptive model for advertising is
posited for major disruption. Why should marketers
interrupt video content when they can be the content?
A Shifting Media Landscape
157FDMI | Los Angeles County Perspective

71 Anderson, C. (1994) Hollywood TV: The Studio System in the Fifties (Texas Film Studies Series). University of Texas Press. 72 VideoInk. (2018). Inside Apple’s Mission to Take on TV. Retrieved from: https://www.thevideoink.com/2018/03/14/inside-apples-mission-take-tv/
73 Koblin, J. (2018). Apple Goes to Hollywood. Will Its Story Have a Happy Ending? Retrieved from: https://www.nytimes.com/2018/03/25/business/media/apple-hollywood-streaming.html
158 FDMI | Los Angeles County Perspective

From the 1920s through the 1940s the Hollywood
studio system dominated the industry’s productive
structure, with a vertically integrated pipeline of
production, distribution, and exhibition of feature
film content. In 1948 the U.S. Supreme Court forced
the major studios to divest from their theater
holdings, and the landscape continued to mutate,
as broadcast network television found its way
into homes across the country. It did not take long
for the major studios to move beyond skepticism
and embrace the new television medium and
its potential revenue opportunities, which were
increasingly apparent. In fact, TV became such a
lucrative revenue stream for the major studios that
Warner Bros. did not release a single motion picture
in January of 1959 as the studio focused its time
and effort on TV programming.71
Fast-forward to 2018 and different but familiar
mutations of medium and role swaps are occurring
across the media landscape. Now, the focus is less
on the distribution medium which has converged
onto universal mobile screens of varying size and
more on a new cast of digital actors supplanting
the previous century’s major content creators.
New Tech, New Threats?The transformation of the entire entertainment ecosystem from the advertisement dollars on up is not without precedent. Disruption, historically and naturally, has been perceived by industry stakeholders with unease and hostility, yet it has been a constant on the industry landscape since the high-water mark of the studio system.
74 Spangler, Todd. (2018, May 21). Netflix Widens Lead as Having ‘Best Original Programming,’ Beating HBO, Amazon, Hulu, Showtime on Survey. Retrieved from: http://variety.com/2018/digital/news/netflix-best-original-programming-hbo-amazon-hulu-showtime-survey-1202817673/
75 Spangler, Todd. (2018). Netflix Content Chief Says 85% of New Spending is on Originals. Retrieved from: http://variety.com/2018/digital/news/netflix-original-spending-85-percent-1202809623/
159FDMI | Los Angeles County Perspective

The New Digital Cast
$8 billion content spending with 85% on original programming in 2018.
Expecting roughly 1,000 originals on the streaming service by the close of 2018 74
including 80 feature length films.75
Up to $1 billion
Over 30 shows, with 7 of them in production currently.
$5 billion estimated in 2018
Focusing on original programming and sports rights.78
Greater than $1 billion in 2018
12 programs (dates, releases not yet confirmed)73
72
76 Spangler, T. (2017). Hulu to Spend $2.5 Billion on Content in 2017. Retrieved from: http://variety.com/2017/digital/news/hulu-2017-content-spending-2-5-billion-1202558912/ 77 Hulu’s four parent companies.78 Wepin, A. (2018). Amazon Expected to Spend $5 Billion on Video Content This Year. Retrieved
from: https://www.mediapost.com/publications/article/315055/amazon-expected-to-spend-5-billion-on-video-conte.html79 Koblin, J. (2018). Apple Goes to Hollywood. Will Its Story Have a Happy Ending? Retrieved from: https://www.nytimes.com/2018/03/25/business/media/apple-hollywood-streaming.html
Apple is one of the more recent crossover tech companies to enter Hollywood and is spending more than $1 billion dollars to leave a mark. Apple’s entry into the
market has not been an immediate success, but its competitors fear it may still become a dominant player, given its investment power and the value of the Apple
brand worldwide. The tech giant released its first series in 2017, a reality show called Planet of the Apps, soon after labeled a dud.79 However, Apple has used its
financial power to hire some of the most talented and sought after writers, directors, and actors of the industry including Steven Spielberg, Damien Chazelle, M
Night Shyamalan, and Jennifer Aniston among others, hoping one will provide a breakthrough into the market.
$2.5 billion budget for content in 2017 76
Deals with 21st Century Fox, Disney, NBCUniversal, Time Warner (for Turner’s networks),77 CBS, A&E Networks, and Scripps Networks Interactive.
Estimated Planned Spending on Digital Video Content
Source: Beacon Economics
160 FDMI | Los Angeles County Perspective

80 Koblin, J. (2018). 487 Original Programs Aired in 2017. Bet You Didn’t Watch Them All. Retrieved from: https://www.nytimes.com/2018/01/05/business/media/487-original-programs-aired-in-2017.html 81 Bui, H. (2018). Netflix is Set to Release a Total of 700 Original Movies and TV Shows this Year
Alone. Retrieved from: http://www.slashfilm.com/netflix-originals-700-in-2018/ 82 Spangler, T. (2018). Netflix Widens Lead as Having ‘Best Original Programming,’ Beating HBO, Amazon, Hulu, Showtime on Survey. Retrieved from: http://variety.com/2018/digital/news/netflix-best-original-programming-hbo-amazon-hulu-showtime-survey-1202817673/
Netflix is no amateur in the original video content
production space. Not only has it attracted millions
of subscribers over the years, but it is now a
genuine competitor in Hollywood for the most
successful movies and shows, as evidenced by
its nominations for Academy and Emmy awards
in recent years. Armed with a subscription-based
funding model friendly to scale, Netflix is putting
forward larger and larger budgets to flood the
market with as much material as it can. Back in
2013, Netflix premiered 24 original programs.
In 2017, that number jumped up to 117.80 And
in 2018, Netflix subscribers can expect to
have a whopping 700 programs from which to
choose.81 The perception of the quality of Netflix
programming continues to outrank that of other
subscription video peers ranking number one in
‘Best Original Programing’ in 2018 ahead of HBO
(second), Amazon Prime Video (third), Hulu (fourth),
Showtime (fifth), and Starz (sixth).82
Facebook has also recently entered the online
streaming market through the release of Facebook
Watch, where it’s developing its own content.
With up to 25 shows launched—and seven more
to be released soon—Facebook has spent up to
$1 billion trying to acquire its share of the digital
video content market.83 Analysts at Morgan
Stanley were surprised in January 2018 by the
“early Watch traction.84” Morgan Stanley found that
40% of Facebook users in the U.S. view video on
Watch every week and 24% of Facebook users view
Watch videos each day. For users in the 16 to 24
demographic daily viewing on Watch jumped to 40%.
161FDMI | Los Angeles County Perspective

Apple’s Welcome Home85
Directed by Spike Jonze and featuring FKA twigs as well as music
by Anderson .Paak, Welcome Home and its production process are
emblematic of the matrix of change that has the Film sector spinning.
At odds with the cast of A-listers behind and in front of the camera
and its unusual length, the video is firstly a commercial pitching
Apple’s HomePod speaker curated by Apple Music and powered by
Siri. Yet, reflecting the increasingly blurry line between advertisement
and film, the product itself isn’t what made this four minute video go
viral across the internet and the creative virtual universe. In fact, it
made such a splash that a mini-documentary directed by Danilo Parra
was made about it, giving audiences a behind-the-scenes look at how
the film was made and the challenges the production team faced.
One of the major takeaways discussed by industry commentators
was the limited use of CGI, as Jonze preferred to have most of the
set pieces which artfully created the illusion of a shapeshifting
apartment physically built. The set itself also expanded on hydraulics
allowing Jonze to shoot the video in real time. While technology is
rapidly enabling CGI and visual effects artists to do more on smaller
budgets, many of the Film sector’s acrobatics in the visual arts still
require teams of people and large physical sets, which are in many
cases still the cheaper alternative.
83 Etherington, D. (2017). Facebook plans to spend up to $1B on original shows in 2018. Retrieved from: https://techcrunch.com/2017/09/08/facebook-plans-to-spend-up-to-1b-on-original-shows-in-2018/ 84 Drier, T. (2018). Facebook Watch Platform Shows Strong Early Usage: Morgan Stanley. Retrieved
from: http://www.onlinevideo.net/2018/01/facebook-watch-platform-morgan-stanley/85 Nudd, T. (2018). This Look Inside Spike Jonze’s Apple Ad Is as Fascinating as the Film Itself. AdWeek.com. March 22, 2018. Retrieved on March 23, 2018. Retrieved from:https://www.adweek.com/creativity/this-look-inside-spike-jonzes-apple-ad-is-as-fascinating-as-the-film-itself/
UNEXPECTED PARTNERSHIPS THAT
ARE CHALLENGING THE NORM
162 FDMI | Los Angeles County Perspective

Netflix + Vox86 SnapChat True Crime Series87
The announcement of a partnership between Netflix and Vox in the form of a
new series entitled “Explained” had many pundits excited. The pairing of the
two digital media giants, though fittingly from different media worlds, invoked
broader questions about what not only video content but also streaming
platforms of video content mean for news media. As Joshua Benton of
Nieman Lab put it, “What is the post-cable future of news in video form?”
Vox isn’t the most unlikely news media entity to make the leap to video and
streaming, as they already host an active YouTube channel and champion a
clear differentiated video product line in Vox Videos which are clearly distinct
from Vox Stories. Nevertheless, Vox on Netflix is a significant move and Vox
in Netflix form is different than its previous iterations. For one, the videos
are 16-18 minutes in length, more than double the length of Vox Videos and
reflective of a Netflix sweet spot evidenced by the platform’s set of 15-minute
comedy specials which debuted earlier in 2018. This development presents
interesting questions about the future of news and more specifically local
news historically subsidized by the distribution technology of 21st century
broadcast television. As Benton artfully posits, “The real revolution in video
news will be when someone, someday, figures out a way to make timely, high-
quality, democratically useful news work, natively on a streaming platform.
We haven’t figured out how to do that yet. The one thing we know is that that
particular revolution won’t be televised.”
In its latest move for social media dominance, Snapchat launched
True Crime/Uncovered, a six-part true crime video series you can
watch on the app. To further complicate the significance of the move
it’s being funded by Condé Naste Entertainment video team. The
series was the work of SnapChat’s head of original content, Sean
Mills who was hired in 2015 and launched 40 non-scripted series
on SnapChat in 2017 alone including Fright Club and NailTheLook.
True crime/Uncovered is hosted by actress Samantha Miller and runs
about 5 minutes an episode. While there’s been skepticism around
the genre selection, Mills said, “This is a year where we’ll play with a
lot of new genres. We’re still experimenting.88” Whether or not True
Crime takes off, it’s clear platforms like Snapchat are a burgeoning
universe for brands and more traditional media corporates, as players
like National Geographic successfully jump into the fray. Notably,
National Geographic in 2017 hired Jonathan Hunt from Vox Media as
SVP of audience development and digital strategy.89
86 Benton, J. (2018). Vox’s new Netflix series is really good, but it doesn’t get us any closer to figuring out what news on streaming platforms looks like. NiemanLab.org. May 23, 2018. Retrieved on May 3, 2018. Retrieved from: http://www.niemanlab.org/2018/05/voxs-new-netflix-series-is-really-good-but-it-doesnt-get-us-any-closer-to-figuring-out-what-news-on-streaming-platforms-looks-like/
87 Barsanti, S. (2018). Snapchat to condense real murders into digestible videos for new true-crime series. March 12, 2018. Retrieved from: https://www.avclub.com/snapchat-to-condense-real-murders-into-digestible-video-1823706328
163FDMI | Los Angeles County Perspective

88 White, P. (2018). Snapchat Moves Into True Crime Genre with Original Series – INTV. March 12, 2018. Retrieved from: http://deadline.com/2018/03/snapchat-moves-into-true-crime-genre-with-original-series-intv-1202335830/
89 Johnson, L. (2017). What National Geographic Did to Earn 3 Million Snapchat Discover Subscribers in Just 3 Months. October 5, 2017. Retrieved from: https://www.adweek.com/digital/what-national-geographic-did-to-earn-3-million-snapchat-discover-subscribers-in-just-3-months/
The increase in demand for video streaming has led to a notable decline in traditional cable subscriptions and to a decrease in the number of viewers of live TV. Down-trending metrics like cable subscriptions and households tuning in to watch live primetime network television, however, provide a misleading picture for overall media consumption trends. Globally, time spent with media90 continues to push up.
In North America, the average individual daily media consumption has gone from 578 minutes in 2010 to 620 in 2018.91 As the number of hours in a day remains fixed, the increase in consumption has been enabled by a rapid transformation of technology infrastructure and technology devices as well as the businesses that serve them, most notably the emergence of digital platforms. The expanding landscape of competitors has pushed both traditional broadcasters and digital platforms to increase investment in original digital video content.
From 2010 to 2017, the number of original scripted television series in the U.S. increased from 210 to 487 (131.9%).92 Of those series, about half were web-hosted, with 217 hosted on cable and 117 on online services.94 Increasing the production of original content by leaps and bounds, Netflix and Amazon and other similar streaming services are evolving from hosting video content to creating it. Netflix alone is planning to spend between $7 billion and $8 billion95 to release 700 original television shows worldwide this year.96
Netflix Surpasses Major Cable Providers iN SUBSCRIBERS in the U.SFigure 7.1
Q1 2012
23.41
52.60
Q1 2013
29.17
51.04
Q1 2014
35.67
50.42
0
10m
20m
30m
40m
50m
60m
Q1 2015
41.40
49.22
Q1 2016
46.97
49.11
Q1 2017
48.61
50.85
Cable
Netflix
Source: Netflix, Leichtman Research Group; Analysis by Beacon Economics
164 FDMI | Los Angeles County Perspective

Time Spent in minutes per day on Digital vs Traditional Media
in the U.S. in 2018 FIGURE 7.2
Source: eMarketer; MediaPost; Analysis by Beacon Economics
500
400
300
200
200
200
200
90 National Association of Theater Owners. (n.d.) “Annual U.S./Canada Box Office Grosses.” Retrieved from: http://www.natoonline.org/data/boxoffice/91 Includes newspapers, magazines, TV, radio, cinema, outdoor, internet.
92 Molla, Rani. (2017, May 30). “People consumed more media than ever last year — but growth is slowing.” Retrieved from: https://www.recode.net/2017/5/30/15712660/media-consumption-zenith-mobile-internet-tv
Tim
e in
Min
utes
TraditionalDigital
2011
214
250
288
309
328
343353
369
382
392402
427
448453
2012 2013 2014 2015 2016 2017
165 FDMI | Los Angeles County Perspective

93 Variety. (n.d.). Number of original scripted TV series in the United States from 2009 to 2017. In Statista - The Statistics Portal. Retrieved from https://www.statista.com/statistics/444870/scripted-primetime-tv-series-number-usa/
94 Otterson, J. (2018, January 05). 487 Scripted Series Aired in 2017, FX Chief John Landgraf Says. Retrieved from http://variety.com/2018/tv/news/2017-scripted-tv-series-fx-john-landgraf-1202653856/
Source: Zenith; 2017-2019 are estimates; Analysis by Beacon Economics
640
600
520
400
440
480
560
Min
utes
Dai
ly
North AmericaGlobal
2010 2011 2012 2013 2014 2015 2016 2017 2018 2019
Average individual daily media consumption in minutes
FIGURE 7.3
579
411
570
421
597f
415
598
425
595
434
604
444
602
456
612
456
620
459
633
463
166FDMI | Los Angeles County Perspective

Estimated spending on non-sports video programming by
selected companies in 2017FIGURE 7.4
Source: MoffettNathanson via Recode; Analysis by Beacon Economics *Includes original and acquired/licensed programming
Estimated spending on non-sports video programming by select companies in 2017*
Traditional TV/MediaStreaming
20
NBC Universal
FOX
TimeWarner
Disney
Netflix
Viacom
Amazon
CBS
Hulu
Discovery Channel
Apple
4 6 8 10 12
$10.2b
$8.0b
$8.0b
$7.8b
$6.3b
$5.4b
$4.5b
$4.2b
$2.5b
$2.2b
$1.0b
$1.0b
95 NFLX - Q3 2017 Netflix Inc Earnings Call. (2017, October 16). Retrieved from https://ir.netflix.com/static-files/49c690f3-8b70-4c49-824a-bcc488e6bc7d
96 Spangler, T. (2018, April 12). Netflix Eyeing Total of About 700 Original Series in 2018. Retrieved from http://variety.com/2018/digital/news/netflix-700-original-series-2018-1202711940/
167 FDMI | Los Angeles County Perspective

Number of original scripted TV series in the US from 2009 to
2017, by service providerFIGURE 7.5
Sources: Varies sources; Nielsen; Wikipedia; Variety; FX Networks Research; Analysis by Beacon Economics
600
500
300
0
100
200
400
Num
ber
of S
crip
ted
Ser
ies
2010 2011 2012 2013 2014 2015 2016 2017 2018 2019
Online Services Basic Cable Broadcast Pay Cable
168FDMI | Los Angeles County Perspective

97 PwC. (2018). Retrieved from: https://www.pwc.com/us/en/industry/tmt/assets/pwc-deals-day-media-and-telecom-q1-2018.pdf
98 Statistic Brain Research Institute. (n.d.). Number of cable TV subscribers in the United States from 2010 to 2016 (in millions). Retrieved from: https://www.statista.com/statistics/680645/number-of-cable-subscribers-usa/
From 2010 to 2016, the number of cable
subscribers in the United States fell by 22.8%98,
and in 2017 Netflix for the first time claimed
more U.S. subscribers than the top six cable
companies combined.99 In 2017 more than half of
U.S. households subscribed to a video streaming
service, a 450% surge from 2009, and an average
subscriber paid for three services.100 Such
aggressive shifts in market power and influence
have caused traditional media titans to invest in
digital media to compete in the digital world. Some
recent notable acquisitions have been Disney
acquiring a controlling stake in Hulu in 2017 and
Dreamworks acquiring AwesomenessTV for $117
million in 2014.101
New CapitalPwC recently reported that deal activity in U.S. Media and Telecommunications showed no sign of slowing down in the first quarter of 2018. Deal volume reached a two-year high with 244 deals, a 33% increase over fourth quarter 2017.97 The recent trend in large media deals strongly focused on gaining access to original content and other intellectual property. Traditional media players including telecom have been making large investments in content and exclusive rights to intellectual property as competition – from both traditional Hollywood players and from Silicon Valley-based newcomers – remains intense in an everchanging landscape.
169 FDMI | Los Angeles County Perspective

99 Morris, I. (2017, June 13). Netflix Is Now Bigger Than Cable TV. Retrieved from: https://www.forbes.com/sites/ianmorris/2017/06/13/netflix-is-now-bigger-than-cable-tv/#35f905e2158b
100 Deloitte. (2018). Digital media trends survey. Retrieved from https://www2.deloitte.com/content/dam/insights/us/articles/4479_Digital-media-trends/4479_Digital_media trends_Exec Sum_vFINAL.pdf101 Pitchbook, LLC. (2018). Retrieved from: http://www.pitchbook.com/
NEW DIGITALMEDIA PLAYER
Traditional Media Player participating
in Deal(s)
Vice Media
BuzzFeed
Vox Media
Funny or Die
Twenty-First Century Fox
A&E Networks
The Walt Disney Company
NBC Universal
Hearst Communications
NBC Universal
Comcast Ventures
AMC Networks
HBO
Turner Broadcasting
Source: Pitchbook, LLC; Analysis by Beacon Economics
Source: Pitchbook, LLC; Analysis by Beacon Economics
12
10
6
0
2
4
8
2013 2014 2015 2016 2017
Comcast
STX
A&E
Sony
LionsGate
TimeWarner
Paramount
Twentieth Century
Relativity
VENTURE CAPITAL DEAL COUNT IN LOS ANGELES COUNTY BY MAJOR FILM/TV STUDIOSFigure 7.6
170FDMI | Los Angeles County Perspective

Continued from
Industry Analysis
171 FDMI | Los Angeles County Perspective

172FDMI | Los Angeles County Perspective

Source: Public Use Microdata Sample, American Community Survey, U.S. Census Bureau; Analysis by Beacon Economics
Detailed Employment by Sector by RaceLos Angeles County, 2016Figure 7.7
Newspaper Publishers
Periodical, Book, And Directory Publishers
Software PublishersSound Recording Industries
Data Processing, Hosting, And Related Services
Libraries And ArchivesInternet P
ublishing And Broadcasting
And Web Search Porta
ls
Other Inform
ation Services
6%
8%
19%
12%
Motion Picture And Video Industries
Perfo
rmin
g Ar
ts,
Spec
tato
r Spo
rts,
And
Rela
ted
Indu
strie
s
24%
Others11%
8%
12%
Broa
dcas
ting,
Exce
pt In
tern
et
Motion Picture And Video In
dustries
Computer Systems Design And Related Services
Advertising, Public Relations,
And Related Services
Computer
Systems Design
And Related
Services
Detailed Employment
by Industry Among
Hispanics
173 FDMI | Los Angeles County Perspective

Source: Public Use Microdata Sample, American Community Survey, U.S. Census Bureau; Analysis by Beacon Economics
Detailed Employment by Sector by RaceLos Angeles County, 2016Figure 7.8
Newspaper Publishers
Periodical, Book, And Directory PublishersSoftware PublishersSound Recording Industries
Data Processing, Hosting, And Related Services
Libraries And Archives
Internet Publishing And Broadcastin
g
And Web Search Porta
ls
Other Inform
ation Servi
ces
6%
6%6%
12%
Motion Picture And Video Industries
Broadcasting, Except Internet
Perfo
rmin
g Ar
ts,
Spec
tato
r Spo
rts,
And
Relate
d
Indu
strie
sCom
pute
r Sys
tem
s
Desi
gn A
nd R
elat
ed
Serv
ices
Others11%
12% 12%
12%
Mot
ion
Pict
ure
And
Vide
o In
dust
ries
Computer Systems Design And Related Services
Advertising, Public Relations,
And Related Services
Detailed Employment
by Industry Among
Asians
174FDMI | Los Angeles County Perspective

Detailed Employment by Sector by RaceLos Angeles County, 2016Figure7.9
Newspaper Publishers
Periodical, Book, And Directory Publishers
Software PublishersSound Recording Industries
Data Processing, Hosting, And Related Services
Libraries And ArchivesInternet P
ublishing And Broadcasting
And Web Search Porta
ls
Other Inform
ation Services
3%
7%
22%
8%
Motion Picture And Video Industries
Perfo
rmin
g Ar
ts,
Spec
tato
r Spo
rts,
And
Rela
ted
Indu
strie
s
34%
Others9%
4%
13%
Broa
dcas
ting,
Exce
pt In
tern
et
Motion Picture And Video In
dustries
Computer Systems Design And Related Services
Advertising, Public Relations,
And Related Services
Computer
Systems Design
And Related
Services
Detailed Employment
by Industry Among
Blacks
Source: Public Use Microdata Sample, American Community Survey, U.S. Census Bureau; Analysis by Beacon Economics
175 FDMI | Los Angeles County Perspective

Detailed Employment by Sector by RaceLos Angeles County, 2016Figure 7.10
Newspaper Publishers
Periodical, Book, And Directory PublishersSoftware PublishersSound Recording Industries
Data Processing, Hosting, And Related Services
Libraries And ArchivesInternet Publishing And Broadcasting
And Web Search Portals
Other Inform
ation Services
19%4%
9%
11%
Motion Picture And Video Industries
Perfo
rmin
g Ar
ts,
Spec
tato
r Spo
rts,
And
Rela
ted
Indu
strie
s
Others10%
9%
4%
34%
Motion Picture And
Video Industries
Broadcasting, E
xcept
Internet
Computer Systems Design And Related Services
Advertising, Public Relations,
And Related Services
Computer System
s Design
And Related Services
Detailed Employment
by Industry Among
Non-Hispanic Whites
Source: Public Use Microdata Sample, American Community Survey, U.S. Census Bureau; Analysis by Beacon Economics
176FDMI | Los Angeles County Perspective

Detailed Employment by Sector by RaceLos Angeles County, 2016FigurE 7.11
Newspaper PublishersPeriodical, Book, And Directory PublishersSoftware PublishersLibraries And Archives
Internet Publishing And Broadcasting
And Web Search PortalsOther In
formation Services
3%
10%
19%
12%
Motion Picture And
Video Industries
Perfo
rmin
g Ar
ts,
Spec
tato
r Spo
rts,
And
Rela
ted
Indu
strie
s
Others11%
7%
36%
4%
Broadcasting,
Except Internet
Motion Picture And Video Industries
Computer Systems Design And Related Services
Advertising, Public Relations,
And Related Services
Computer
Systems Design
And Related
Services
Detailed Employment
by Industry Among
Other Races
Source: Public Use Microdata Sample, American Community Survey, U.S. Census Bureau; Analysis by Beacon Economics
177 FDMI | Los Angeles County Perspective

Detailed Employment by Sector by Educational AttainmentLos Angeles County, 2016Figure 7.12
Newspaper Publishers
Periodical, Book, And Directory Publishers
Libraries And ArchivesInternet P
ublishing And Broadcasting
And Web Search Portals
9%
5%
22%
3%M
otion Picture And Video Industries
Perfo
rmin
g Ar
ts,
Spec
tato
r Spo
rts,
And
Rela
ted
Indu
strie
s32%
Others10%
8%
11%
Broad
casti
ng,
Excep
t Int
ernet
Motion Picture And Video Industries
Computer Systems Design And Related Services
Advertising, Public Relations,
And Related Services
Computer
Systems Design
And Related
Services
Detailed Employment by
Industry Among Individuals
with Less than High School
Educational Attainment
Source: Public Use Microdata Sample, American Community Survey, U.S. Census Bureau; Analysis by Beacon Economics
178FDMI | Los Angeles County Perspective

Detailed Employment by Sector by Educational AttainmentLos Angeles County, 2016Figure 7.13
Newspaper Publishers
Periodical, Book, And Directory Publishers
Software Publishers
Sound Recording Industries
Data Processing, Hosting, And Related Services
Libraries And Archives
22%6%
5%
8%Motion Picture And Video Industries
Perfo
rmin
g Ar
ts,
Spec
tato
r Spo
rts,
And
Rela
ted
Indu
strie
s
Others9%
5%
16% 29%
Motion Picture And Video Industries
Broadcasting, Except
Internet
Computer Systems Design And Related Services
Computer System
s Design
And Related Services
Advertising, Public Relations,
And Related Services
Detailed Employment by
Industry Among Individuals
with Only a
High School Diploma
Source: Public Use Microdata Sample, American Community Survey, U.S. Census Bureau; Analysis by Beacon Economics
179 FDMI | Los Angeles County Perspective

Detailed Employment by Sector by Educational AttainmentLos Angeles County, 2016Figure 7.14
Newspaper Publishers
Periodical, Book, And Directory PublishersSoftware PublishersSound Recording IndustriesData Processing, Hosting, And Related Services
Libraries And ArchivesInternet P
ublishing And Broadcasting
And Web Search Portals
Other Inform
ation Services
4%
6%
21%
13%Motion Picture And Video Industries
Perf
orm
ing
Arts
, Sp
ecta
tor S
port
s,
And
Rela
ted
Indu
strie
s34%
Others11%
6%
9%
Broad
cast
ing,
Exce
pt In
tern
et
Motion Picture And Video Industries
Computer Systems Design And Related Services
Advertising, Public Relations,
And Related Services
Computer
Systems Design
And Related
Services
Detailed Employment by
Industry Among Individuals
with Some College
Source: Public Use Microdata Sample, American Community Survey, U.S. Census Bureau; Analysis by Beacon Economics
180FDMI | Los Angeles County Perspective

Detailed Employment by Sector by Educational AttainmentLos Angeles County, 2016Figure 7.15
Newspaper PublishersPeriodical, Book, And Directory PublishersSoftware PublishersSound Recording Industries
Data Processing, Hosting, And Related Services
Libraries And ArchivesInternet Publishing And Broadcasting
And Web Search Portals
Other Information Services
14%
4%
12%
16%
Motion Picture And Video Industries
Perfo
rmin
g Ar
ts, S
pect
ator
Spo
rts,
And
Rela
ted
Indu
strie
s
Others9%
9%
6%
30%
Motion Picture And
Video Industries
Broad
cast
ing, E
xcep
t In
tern
et
Computer Systems Design And Related Services
Advertising, Public Relations,
And Related Services
Computer System
s Design And Related
Services
Detailed Employment by
Industry Among Individuals
with a Bachelor’s Degree
Source: Public Use Microdata Sample, American Community Survey, U.S. Census Bureau; Analysis by Beacon Economics
181 FDMI | Los Angeles County Perspective

Detailed Employment by Sector by Educational AttainmentLos Angeles County, 2016Figure 7.16
3%
10%
19%
12%
Motion Picture And
Video Industries
Perf
orm
ing
Arts
, Sp
ecta
tor S
port
s,
And
Rela
ted
Indu
strie
s
Others11%
7%
36%4%
Broa
dcas
ting,
Exce
pt In
tern
et
Motion Pict
ure And Video
Industr
ies
Computer Systems Design And Related Services
Advertising, Public Relations,
And Related Services
Computer
Systems Design
And Related
Services
Detailed Employment by
Industry Among Individuals
with Graduate or
Professional Degrees
Newspaper Publishers
Periodical, Book, And Directory PublishersSoftware PublishersSound Recording Industries
Data Processing, Hosting, And Related Services
Libraries And Archives
Internet Publis
hing And Broadcasting
And Web Search Porta
ls
Other
Info
rmat
ion S
ervic
es
Source: Public Use Microdata Sample, American Community Survey, U.S. Census Bureau; Analysis by Beacon Economics
182FDMI | Los Angeles County Perspective
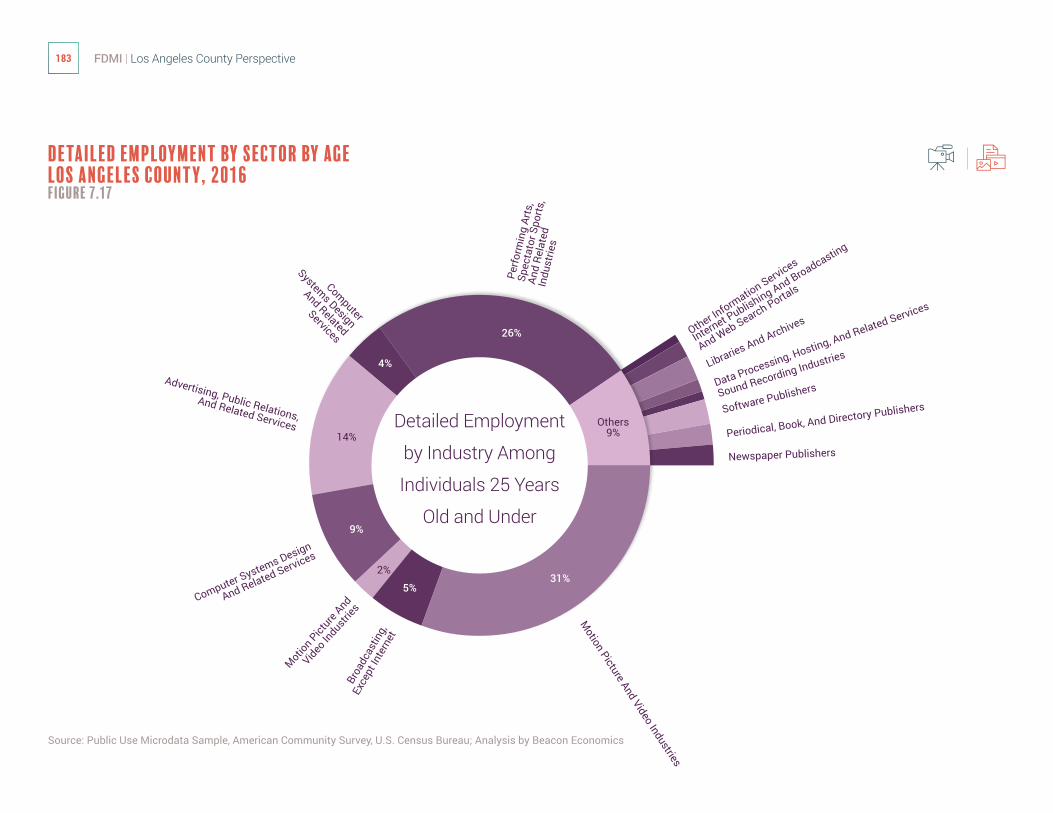
Detailed Employment by Sector by AgeLos Angeles County, 2016Figure 7.17
Newspaper Publishers
Periodical, Book, And Directory PublishersSoftware PublishersSound Recording Industries
Data Processing, Hosting, And Related Services
Libraries And ArchivesInternet Publishing And Broadcasting
And Web Search Portals
Other Inform
ation Services
4%
14%Others
9%
26%
Motion Picture And Video Industries
Perf
orm
ing
Arts
, Sp
ecta
tor S
port
s,
And
Rela
ted
Indu
strie
s
2%31%
5%
9%
Broa
dcas
ting,
Exce
pt In
tern
et
Motion Pict
ure And
Video In
dustries
Computer Systems Design
And Related Services
Advertising, Public Relations, And Related Services
Computer
Systems Design
And Related
Services
Detailed Employment
by Industry Among
Individuals 25 Years
Old and Under
Source: Public Use Microdata Sample, American Community Survey, U.S. Census Bureau; Analysis by Beacon Economics
183 FDMI | Los Angeles County Perspective

Detailed Employment by Sector by AgeLos Angeles County, 2016Figure 7.18
Newspaper PublishersPeriodical, Book, And Directory PublishersSoftware Publishers
Sound Recording IndustriesData Processing, Hosting, And Related Services
Libraries And ArchivesInternet Publishing And Broadcasting
And Web Search Portals
Other Inform
ation Services
15%4%
10%
18%M
otion Picture And Video Industries
Perfo
rmin
g Ar
ts, S
pect
ator
Spor
ts, A
nd R
elat
ed In
dust
ries
Others10%
6%
8%
29%
Motion Picture And
Video Industries
Broa
dcas
ting,
Exc
ept
Inte
rnet
Computer Systems Design And Related Services
Advertising, Public Relations,
And Related Services
Computer System
s Design
And Related Services
Detailed Employment
by Industry
Among Individuals
Ages 26 to 35
Source: Public Use Microdata Sample, American Community Survey, U.S. Census Bureau; Analysis by Beacon Economics
184FDMI | Los Angeles County Perspective

Detailed Employment by Sector by AgeLos Angeles County, 2016Figure 7.19
Newspaper PublishersPeriodical, Book, And Directory PublishersSoftware PublishersSound Recording Industries
Data Processing, Hosting, And Related Services
Libraries And ArchivesInternet Publishing And Broadcasting
And Web Search Portals
Other Inform
ation Services
5%
8%15%
16%
Motion Picture And Video Industries
Perfo
rmin
g Ar
ts, S
pect
ator
Spor
ts, A
nd R
elat
ed In
dust
ries
31%
Others10%
5%
10%
Broad
cast
ing,
Exce
pt In
tern
etMotion Picture And Video Industries
Computer Systems Design And Related Services
Advertising, Public Relations,
And Related Services
Computer System
s Design
And Related Services
Detailed Employment
by Industry
Among Individuals
Ages 36 to 45
Source: Public Use Microdata Sample, American Community Survey, U.S. Census Bureau; Analysis by Beacon Economics
185 FDMI | Los Angeles County Perspective

Detailed Employment by Sector by AgeLos Angeles County, 2016Figure 7.20
Newspaper Publishers
Periodical, Book, And Directory Publishers
Software PublishersSound Recording Industries
Data Processing, Hosting, And Related Services
Libraries And Archives
Internet Publishing And Broadcasting
And Web Search Portals
Other Inform
ation Services
18%4%4%
12%
Motion Picture And Video Industries
Perfo
rmin
g Ar
ts, S
pect
ator
Spor
ts, A
nd R
elat
ed In
dust
ries
Others10%
13%
7%
32%
Motion Picture And Video Industries
Broadcasting, Except
Internet
Computer Systems Design
And Related Services
Advertising, Public Relations,
And Related ServicesCom
puter Systems Design
And Related Services
Detailed Employment
by Industry
Among Individuals
Ages 46 to 55
Source: Public Use Microdata Sample, American Community Survey, U.S. Census Bureau; Analysis by Beacon Economics
186FDMI | Los Angeles County Perspective

Detailed Employment by Sector by AgeLos Angeles County, 2016Figure 7.21
3%
10%
19%
12%
Motion Picture And
Video Industries
Perf
orm
ing
Arts
, Sp
ecta
tor S
port
s,
And
Rela
ted
Indu
strie
s
Others11%
7%
36%4%
Broa
dcas
ting,
Exce
pt In
tern
et
Motion Picture And Video Industries
Computer Systems Design And Related Services
Advertising, Public Relations,
And Related Services
Computer
Systems Design
And Related
Services
Detailed Employment
by Industry
Among Individuals
Ages 55 and Older
Newspaper Publishers
Periodical, Book, And Directory Publishers
Software PublishersSound Recording Industries
Data Processing, Hosting, And Related Services
Libraries And Archives
Internet Publishing And Broadcastin
g
And Web Search Porta
ls
Other Inform
ation Services
Source: Public Use Microdata Sample, American Community Survey, U.S. Census Bureau; Analysis by Beacon Economics
187 FDMI | Los Angeles County Perspective

Detailed Employment by Sector by household IncomeLos Angeles County, 2016Figure 7.22
Newspaper Publishers
Periodical, Book, And Directory Publishers
Software Publishers
Sound Recording Industries
Data Processing, Hosting, And Related Services
Libraries And Archives
Internet
Publishing A
nd Bro
adca
sting
And Web
Search
Portals
Other
Info
rmat
ion S
ervic
es
5%
7%
Others 14%
28%
Motion Picture And Video Industries
6%
24%
5%
11%
Broa
dcas
ting,
Ex
cept
Inte
rnet
Mot
ion
Pict
ure
And
Vide
o In
dust
riesComputer Systems Design
And Related Services
Advertising, Public Relations, And Related Services
Computer Systems Design
And Related Services
Performing Arts,
Spectator Sports, And
Related Industries
Detailed Employment
by Industry Among
Individuals with HH
Income Under $20,000
Source: Public Use Microdata Sample, American Community Survey, U.S. Census Bureau; Analysis by Beacon Economics
188FDMI | Los Angeles County Perspective

Detailed Employment by Sector by household IncomeLos Angeles County, 2016Figure 7.23
Newspaper Publishers
Periodical, Book, And Directory PublishersSoftware Publishers
Sound Recording Industries
Data Processing, Hosting, And Related Services
Libraries And ArchivesInternet Publishing And Broadcasting
And Web Search Portals
Other Inform
ation Services
20%4%
9%
12%M
otion Picture And Video Industries
Perfo
rmin
g Ar
ts, S
pect
ator
Spor
ts, A
nd R
elat
ed In
dust
ries
Others9%
10%
10%
26%
Motion Picture And
Video Industries
Broa
dcas
ting,
Exc
ept
Inte
rnetComputer Systems Design And Related Services
Advertising, Public Relations,
And Related Services
Computer System
s Design
And Related Services
Detailed Employment
by Industry Among
Individuals with HH
Income Between
$20,000 and $39,999
Source: Public Use Microdata Sample, American Community Survey, U.S. Census Bureau; Analysis by Beacon Economics
189 FDMI | Los Angeles County Perspective
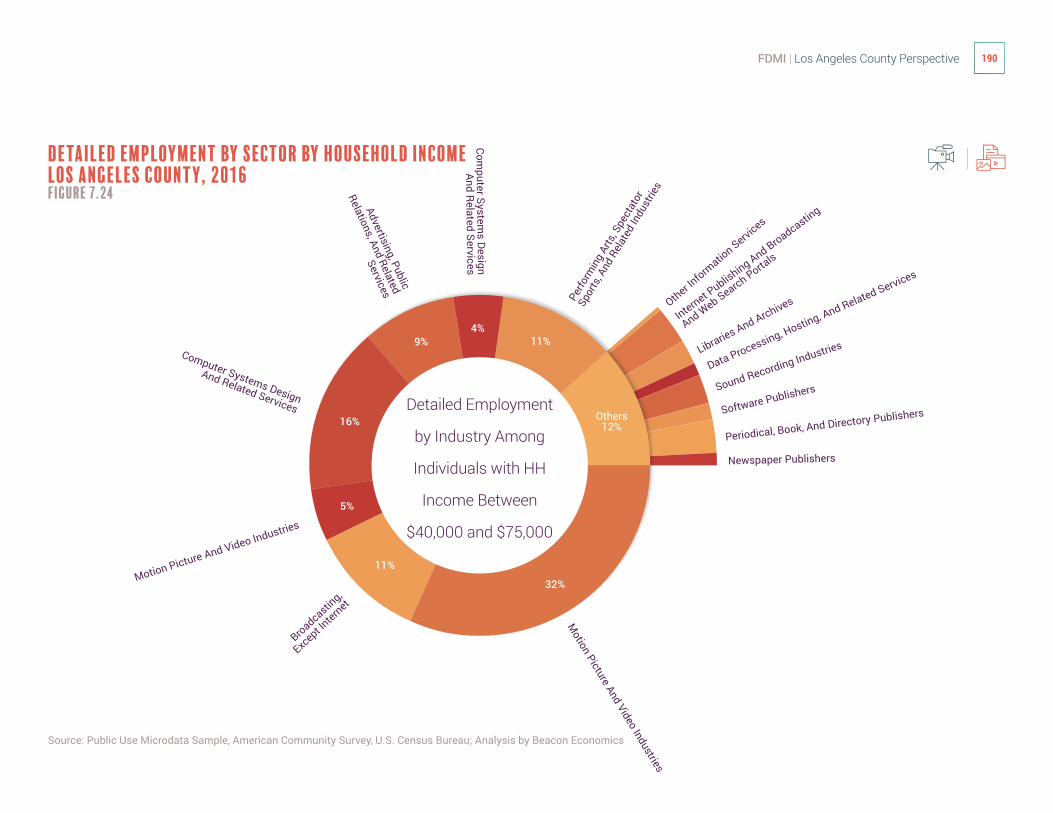
Detailed Employment by Sector by household IncomeLos Angeles County, 2016Figure 7.24
Newspaper Publishers
Periodical, Book, And Directory PublishersSoftware PublishersSound Recording Industries
Data Processing, Hosting, And Related Services
Libraries And ArchivesInternet P
ublishing And Broadcasting
And Web Search Porta
ls
Other Inform
ation Services
4%9% 11%
16%
Motion Picture And Video Industries
Perfo
rmin
g Ar
ts, S
pect
ator
Spor
ts, A
nd R
elate
d In
dust
ries
32%
Others12%
5%
11%
Broadcasting,
Except In
ternet
Motion Picture And Video Industries
Computer Systems Design
And Related Services
Advertising, Public
Relations, And Related
Services
Computer System
s Design And Related Services
Detailed Employment
by Industry Among
Individuals with HH
Income Between
$40,000 and $75,000
Source: Public Use Microdata Sample, American Community Survey, U.S. Census Bureau; Analysis by Beacon Economics
190FDMI | Los Angeles County Perspective

Detailed Employment by Sector by household IncomeLos Angeles County, 2016Figure 7.25
Newspaper PublishersPeriodical, Book, And Directory Publishers
Software PublishersSound Recording Industries
Data Processing, Hosting, And Related Services
Libraries And Archives
Internet Publishing And Broadcasting
And Web Search Portals
Other Information Services
9%
3%12%
19%
Motion Picture And Video Industries
Perfo
rming
Arts
, Spe
ctat
or
Sports
, And
Rela
ted I
ndus
tries
Com
pute
r Sys
tem
s De
sign
And
Rela
ted
Serv
ices
Others9%
11%
5%
32%
Motion Picture And
Video Industries
Broadcasting, E
xcept
Internet
Computer Systems Design
And Related Services
Advertising, Public Relations, And
Related Services
Detailed Employment
by Industry Among
Individuals with HH
Income Between
$75,000 and $149,999
Source: Public Use Microdata Sample, American Community Survey, U.S. Census Bureau; Analysis by Beacon Economics
191 FDMI | Los Angeles County Perspective

Detailed Employment by Sector by household IncomeLos Angeles County, 2016Figure 7.26
3%9%
9%
17%
Motion Picture And
Video Industries
Com
pute
r Sys
tem
s De
sign
And
Rela
ted
Serv
ices
Perfo
rmin
g Ar
ts, S
pect
ator
Spo
rts,
And
Rela
ted
Indu
strie
s
Others11%
14%
35%
2%
Broadcasting,
Except Internet
Motion Picture And Video Industries
Computer Systems Design
And Related Services
Advertising, Public
Relations, And Related Services
Detailed Employment by
Industry Among Individuals
with HH Income Over
$150,000
Newspaper PublishersPeriodical, Book, And Directory PublishersSoftware Publishers
Sound Recording Industries
Data Processing, Hosting, And Related Services
Internet Publishing And Broadcasting
And Web Search Portals
Source: Public Use Microdata Sample, American Community Survey, U.S. Census Bureau; Analysis by Beacon Economics
192FDMI | Los Angeles County Perspective

Continued from
Intervention Framework and Recommendations
193 FDMI | Los Angeles County Perspective

194FDMI | Los Angeles County Perspective

An organization’s logic model in many cases is its
strategy or plan for action and it is powered by a
theory of change. The exercise of logic modeling
forces intervention design teams to rigorously
articulate and clarify an intervention’s theory of
change, as defined by Paul Brest in his seminal
article “The Power of Theories of Change,” the
empirical basis underlying any intervention.102
The philanthropic community has led the way,
piloting data-driven tools for measuring the
success of interventions and testing with data
collected the theories of change that underpin
them.103 Originally funded by the Rockefeller
Foundation, B Lab has developed a data platform
called B Analytics that helps investors, supply
chain managers, and governments measure and
improve their impact, as defined by them. As an
investor in outcomes, intervening government
actors can leverage tools like B Analytics to
answer questions like whom, demographically,
an intervention is serving and what kinds of
measurable outcomes it’s driving.104 In 2015, The
New York City Economic Development Corporation
launched a program in partnership with B Lab
called Best for NYC, designed around the use of the
B Analytics platform.105
As reflected in Brest’s article, logic models and
theories of change have mostly been developed for
use by nonprofit and philanthropic communities
in assessing their programmatic portfolios and
investments. Government agencies similar to their
LOGIC MODELINGArmed with a broad goal, a specific constituency, and a sound assessment of its own levers and unique purview, the County may use logic modeling tools to design the “how” of an intervention.
102 http://1rqxbs47ujl4rdy6q3nzf554.wpengine.netdna-cdn.com/wp-content/uploads/2016/07/The-Power-Of-Theories-Of-Change.pdf
103 http://www.bcorporation.net/what-are-b-corps/the-non-profit-behind-b-corps/our-history105 http://b-analytics.net/content/b-analytics-measure-what-matters105 https://www.nycedc.com/blog-entry/compete-be-best-nyc
195 FDMI | Los Angeles County Perspective

106 W.K. Kellogg Foundation. “Logic Model Development Guide: Using Logic Models to Bring Together Planning, Evaluation, and Action.” W.K. Kellogg Foundation, Jan. 2004. Retrieved on April 30, 2018. Retrieved from file:///Users/alysasloanhannon/Downloads/LogicModel%20(3).pdf.
107 Globerman, S. “The Entertainment Industries, Government Policies, and Canada’s National Identity.” Fraser Institute, March 2014. Retrieved on May 1, 2018. Retrieved from: https://www.fraserinstitute.org/sites/default/files/entertainment-industries-government-policies-and-canadas-national-identity_0.pdf
philanthropic and nongovernmental counterparts
may intervene or invest in order to generate certain
outcomes; in certain domains and less in others
government actors in the U.S. are comfortable or
uncomfortable respectively with the language of
intervention and the role of intervener. For example,
government actors typically consider and plan
for producing outcomes via intervention in the
healthcare industry which is often categorized
as quasi-privatized. In a report published by
the Fraser Institute entitled The Entertainment
Industries, Government Policies, and Canada’s
National Identity, the direct and indirect support
of the entertainment industries by government
intervention and the logic that justifies such
support including its economic evidence is
rigorously evaluated.107
While the report’s justification of the “socially
efficient or desirable industry rate of output” may
not translate usefully to L.A. County’s decision-
making landscape for the Film and Digital Media
industry, the broader framework of addressing
“market failures” may. This framework may also
usefully align with a time-bound government role,
where a government actor intervenes to correct
for a market failure, provides the market a proof of
concept or significantly subsidizes a perceived risk,
and then exits without the implication of subsidy in
perpetuity.
resources / inputs1 ACTIVITES2 OUTPUTS3 OUTCOMES4 IMPACT5
Your Planned Work Your Intended Results
Logic Model106
Figure 7
196FDMI | Los Angeles County Perspective

A Look at Three Governments Intervening in Film and Digital MediaMany of the interventions discussed are public-private partnerships. Public-private partnership enjoys support in the economic development space as a successful approach to government intervention, allowing the public sector to help drive the correction of a market failure and leveraging the private sector’s expertise and funding.108
197 FDMI | Los Angeles County Perspective

Creative BC is an organization sponsored by the Canadian provincial government of British Columbia
and established to provide professional expertise and business support to strengthen BC’s motion
picture, interactive digital, music, and publishing sectors. The program’s website claims that Creative
BC’s “programs, services, and investments act as a catalyst to help these sectors realize their economic
and creative potential and to contribute to the future prosperity of our province.”
Creative BC has three types of programs: (1) Industry Initiatives including Amplify BC Portfolio directed
at the music industry; (2) Project and Market Development Programs; and (3) Skills Development
Programs. More specific examples of the types of interventions within each include:
• Industry Initiatives, Amplify BC Portfolio: $7.5M Music Fund to support people working in BC’s diverse music industry. It targets four program areas : career development for BC artists, support for live music events in BC, support for BC’s music companies, and the development of its provincial music industry.
• Market Development Programs, Passport to Markets Program: This program provides travel support to BC resident film, TV, and new media producers and sales agents to attend international markets and conferences. The fund is intended to assist producers exploring co-production partnerships and developing relationships with broadcasters, distributors and financiers.
• Skills Development Programs, CMPA-BC Story Department Internship: Creative BC and the Canadian Media Producers Association (CMPA)—BC Producers Branch provides funding for the skills development of professionals committed to careers in writing for dramatic television.
British Columbia, Creative BC
108 https://insights.som.yale.edu/insights/are-public-private-partnerships-the-best-way-to-provide-government-services
198FDMI | Los Angeles County Perspective

New York City, NYCEDCThree interventions piloted by NYCEDC around Creative Tech include:
• NYC Media Lab: Launched in partnership with NYU-Poly and Columbia University, Media Lab connects digital media and technology companies with New York City’s universities to drive innovation, entrepreneurship, and talent development. Media Lab “tackles big questions facing the media industry today, with the goal of generating research, knowledge transfer, talent development, R&D, and new business models.” Media Lab funds prototyping projects that foster collaboration across a range of disciplines core to the future of media and runs The Combine, an early stage accelerator for emerging media and technology startups.
• Made in NY Media Center: A 20,000 square foot facility funded through partnership with the Independent Feature Project, the Media Center is a collaborative workspace and community designed to support and connect the next generation of media and tech entrepreneurs, innovators, and artists with industry resources, events, mentorship, and educational opportunities.
• AR/VR Lab: In February 2017, NYCEDC released an RFP for a Virtual Reality and Augmented Reality Lab. The lab “will support growing VR/AR companies and entrepreneurs and convene cross-sector stakeholders to position New York City as the global leader in the emerging VR/AR industry. Representing $6 million in public and private funding, the lab will be the first publicly-funded VR/AR space in the country and will provide shared access to tools and technologies and strengthen the local talent pipeline.
• IN2NYC (*Industry-agnostic, internationally focused): IN2NYC brings international entrepreneurs to schools across New York City’s five boroughs to build businesses, develop innovation ecosystems, and train the next generation of entrepreneurs. Entrepreneurs will have the opportunity to build their businesses in CUNY co-working spaces alongside other innovators while using their areas of expertise to contribute to campus life through activities such as participation in academic research and mentorship of student entrepreneurs.
Through its Industry Initiatives department,
The New York City Economic Development
Corporation administers a number of industry-
oriented programs intended to generate good
jobs in New York City. The department has a
Creative and Applied Tech team which hosts a
number of programs related to the sectors of
the Film and Digital Media industry. Because
NYCEDC manages certain real estate functions
on behalf of New York City, many of its
interventions involve the leveraging of real estate
and brick and mortar spaces.
199 FDMI | Los Angeles County Perspective

U.K., British Film Institute (BFI)
• Film Export Fund: This fund offers support to drive export opportunities for British films abroad. It is a springboard for British film exports, designed to help British films make sales abroad when they’re selected for important international festivals, alleviating costs around a film’s publicity and marketing and technical as well as logistical costs.
• Audiovisual Policy Engagement: BFI takes a leading role in shaping policy and advocacy on not only IP protection and international free trade agreements but also co-production agreements, sustainability, and access to finance.
• Documentary Funding: BFI partners with Doc Society to fund and support progressive and creative documentary filmmaking across the whole of the UK. This program provides funding for UK documentary films, along with a dedicated support program for new and emerging filmmakers as part of BFI NETWORK.
• BFI Vision Awards: The BFI Vision Awards focus on supporting a new generation of diverse, ambitious film producers around the UK to help support its mission of discovering and developing emerging filmmaking voices, providing funding to build up and strengthen their development slates.
Founded in 1933, BFI is a charity governed by the Royal Charter. BFI
awards lottery funding to film production, distribution, education,
audience development, and market intelligence and research.
200FDMI | Los Angeles County Perspective