FILE C PY - World Bank Documents & Reports
117
Document of The World Bank FILE C PY FOR OFFICIAL USE ONLY Report No. 2745b-IN IND]IA SECOND SINGRAULI THERMALPOWfER PROJECT STAFF APPRAISAL REPORT April 25, 1980 Regional Projects Department South Asia Projects This document has a restricted distribution and may be used by recipients niry in mne pertormance of their official duties. Its contents may not otherwise be disclosed without World Bank authorization. Public Disclosure Authorized Public Disclosure Authorized Public Disclosure Authorized Public Disclosure Authorized
-
Upload
khangminh22 -
Category
Documents
-
view
2 -
download
0
Transcript of FILE C PY - World Bank Documents & Reports

Document of
The World Bank FILE C PY
FOR OFFICIAL USE ONLY
Report No. 2745b-IN
IND]IA
SECOND SINGRAULI THERMAL POWfER PROJECT
STAFF APPRAISAL REPORT
April 25, 1980
Regional Projects DepartmentSouth Asia Projects
This document has a restricted distribution and may be used by recipients niry in mne pertormance oftheir official duties. Its contents may not otherwise be disclosed without World Bank authorization.
Pub
lic D
iscl
osur
e A
utho
rized
Pub
lic D
iscl
osur
e A
utho
rized
Pub
lic D
iscl
osur
e A
utho
rized
Pub
lic D
iscl
osur
e A
utho
rized

CURRENCY EQUIVALENTS
Currency Unit = Rupee (Rs)Rs 1 Paise 100
US$1 = Rs 8.4 1/Rs 1 = US$0.1190 1/Rs 1 million = US$119,047.62 1/
MEASURES AND EQUIVALENTS
1 Kilometer (km) 1,000 meters (m) = 0.6214 miles (mi)1 Meter (m) = 39.37 inches (in)1 Cubic meter (m3) = 1.31 cubic yard (cu yd) = 35.35 cubic feet (ft)l1ectare (ha) 10,000 m2 = 2.471 acres (ac)l'Rilogram (kg) 2.2046 pounds (lb)1 Ton 1 metric ton = 2,200 lbs1 Kilocalorie (kcal) = 3.968 British thermal unit (Btu)1 Kilovolt (kV) = 1,000 volts (V)1 Kilovolt-ampere (kVA) = 1,000 volt-amperes (VA)1 Megawatt (MW) = 1,000 kilowatts (kW) = 1 million watts1 Gigawatt hour (GWh) = 1,000,000 kilowatt hours
ABBREVIATIONS AND ACRONYMS
APS - Annual Power Survey
BHEL - Bharat Heavy Electricals LimitedCANDU - Canadian Deuterium Uranium (Natural Uranium, Heavy
Water Reactor)CEA - Central Electricity AuthorityCWPC - Central Water and Power CommissionDESU - Delhi Electricity Supply UndertakingGOI - Government of IndiaGDP - Gross Domestic Product
HPSEB - Himachal Pradesh State Electricity BoardHSEB - Haryana State Electricity BoardHVDC - High Voltage Direct CurrentJKSEB - Jammu & Kashmir State Electricity BoardKfW - Kreditanstalt fuer WiederaufbauNHPC - National Hydro Power CorporationNTPC - National Thermal Power CorporationPERT - Programme Evaluation and Review TechniquePSEB - Punjab State Electricity BoardRAPS - Rajasthan Atomic Power StationREC - Rural Electrification Corporation LimitedREB - Regional Electricity BoardRSEB - Rajasthan State Electricity BoardSEB - State Electricity BoardTDO - Thermal Design OrganizationUNDP - United Nations Development ProgramUPSEB - Uttar Pradesh State Electricity Board
NTPC's FISCAL YEAR (FY)
April 1 - March 31
1/ Since September 25, 1975, the Rupee has been officially valued relativeto a basket of currencies. As these currencies are floating, the US$/Rsexchange rate is subject to change. Conversions in this report havebeen made at US$1 to Rs 8.4.

FOR OFFICIAL USE ONLYINDIA
SECOND SINGRAULI THERMAL POWER PROJECT
STAFF APPRAISAL REPORT
Table of Contents
Page No.
I. THE POWER SECTOR ....................................... 1Background ............................................. 1Energy Resources ...................................... 1Past Bank Group Involvement in the Sector .... .......... 2Sector Institutions .................................... 3Existing Facilities - All India ........................ 5Power Supply/Demand Balance - All India .... ............ 6Future Development - All India ......................... 7Regional Demand and Supply - Northern Region .... ....... 8Future Integrated System Operation ..................... 9Bank Group's Strategy in the Sector ........ ............ 9
II. THE BENEFICIARY - NATIONAL THERMAL POWER CORPORATIONLIMITED ................................................ 13Legal Status and Authorities ........................... 13Organization and Management ............................ 14Training ............................................... 15Sale of Power from the Project .......................... 16Accounting Organization and Systems .................... 17Audit .................................................. 17
III. THE PROGRAM AND THE PROJECT ............................ 17The Program ............................................ 17The Project ......... ...... 18Estimated Cost ......................................... 18Project Financing ................... 19Engineering and Construction ........................... 19Procurement .......... .................................. 20Disbursements .......................................... 21Ecological Aspects ..................................... 21Project Risks ............ ... 22
IV. FINANCIAL ANALYSIS ..................................... 23Introduction ........... ... 23Future Earnings ........................................ 23Taxation ............ ................................... 24
This report is based on information provided by CEA, Department of Power inthe Ministry of Energy, NTPC and SEBs during an appraisal carried out byMessrs. B.C. Lynch, V. Antonescu, K.G. Jechoutek and A_E. Bailey (consultant)during May/June 1979.
This document hu a restricted distribution and may be used by recipients only in the performanceof their omcial duties. Its contents may not otherwise be disclosed without World Bank authorization.

- ii -
Table of Contents (continuation)
Page No.
Financing Plan FY1977-FY1987 ................................. 24Internal Cash Generation .--------------------.-.------ 26Future Finances ............................................ 26Borrowing Powers ................---------------- 28NTPC's Bulk Tariff .......................................... 28Regional Tariffs .------------------------------------------ 28Commercial Arrangements for Sale of NTPC Power .29Tariff Level and Marginal Cost .............................. 29
V. JUSTIFICATION . 30Project Definition .......................... 30Comparison of Alternative .30Benefits .................................................... 31
VI. AGREEMENTS REACHED AND RECOMMENDATION .33
ANNEXES
1. All India-Sales and Energy Data for 1969/70, 1974/75,1975/76, 1976/77, 1977/78 and 1978/79 .................... 34
2. Regional Demand and Supply; Energy Exchanges Among VariousSystems 1978/79; Schedule of Yearly Additions to ThermalGenerating Capacity; Comparative Demand Forecasts for UttarPradesh and Rajasthan - Northern Region .35
3. Sales and Energy Data for 1974/75 - 1978/79 - Northern Region 454. Power Supply Position 1976/77-1983/84 - Northern Region ..... 505. Tentative Demand Forecasts 1984/85 to 1988/89 - Northern
Region .516. Yearwise Capacity and Energy Allocation from the Singrauli
Development .527. Planned Investment in the Power Sector 1978/79 to 1982/83
- Northern Region .538. Suggested Terms of Reference for a Study to Prepare a
Least-Cost Power Development Program .549. Financial Position of the State Electricity Boards .5910. Terms of Reference of the Rajadhyaksha Committee on Power 6211. Organization Chart of NTPC .6412. Organization Charts of NTPC's Finance and Accounting
Organization .6713. Description of the Singrauli Development .6914. Project Cost Estimates .7215. Estimated Construction Schedule .7416. Estimated Schedule of Disbursements .7717. NTPC - Income Statements FY1979 through FY1991 .7818. NTPC - Source and Application of Funds FY1977 through FY1991. 80

- iii -
ANNEXES (continuation)
Page No.
19. NTPC - Condensed Balance Sheets FY1977 through FY1991 ....... 8220. Assumptions on Financial Projections ........................ 8321. Annual Rates of Return in Real Terms ........................ 8722. NTPC's Bulk Tariff (Northern Region) and Bulk Exchange
Tariffs in Northern Region ................................ 8823. Regional Marginal Cost Analysis of NTPC Operations .... ...... 9024. Definition and Cost of Alternative to the Project .... ....... 9625. Additional Transmission and Distribution Cost .... ........... 9726. Shadow Pricing of Costs and Benefits ........................ 9827. Structure of Operation and Maintenance Costs .... ............ 10028. Economic Benefits ........................................... 10129. Economic Costs - Second Singrauli Project and Alternative ... 10330. Economic Justification: Results ............................ 10531. Documents Available in the Project File ..................... 107
MAPS
IBRD - 14739RIBRD - 14517


INDIA
SECOND SINGRAULI THERMAL POWER PROJECT
I. THE POWER SECTOR
Background
1.01 Economic growth and improvement of the standard of living in Indiadepend critically on the development of the power sector. In the presentstage of economic development, the demand for power grows roughly twice asfast as the economy. Because the power industry is relatively capital inten-sive, its share in total fixed asset formation is increasing rapidly; thepower sector, which has made great strides in the last two decades, is todaythe largest economic sector in the country in terms of investments. The sheersize and increasing complexity of India's power sector, as well as economicconsiderations, necessitate an approach to system planning which, to a muchlarger extent than in the past, should concentrate on nationwide power devel-opment and aim at making use of economies of scale through construction oflarger, more efficient power stations and interconnected high voltage trans-mission systems.
1.02 The strategy of the Government of India (GOI) is to intensifycentralized planning of generation and'high voltage transmission with a viewto ultimately centralize control through a national grid with the operationof generating plant on a merit order basis. To this end, GOI establishedin 1975 two power generating companies, the National Thermal Power Corpora-tion (NTPC) and the National Hydro Power Corporation (NHPC) to construct andoperate large thermal and hydro power stations and associated transmission.Consultants have been engaged to assist the Central Electricity Authority(CEA) in undertaking a 400 kV system study to determine the configuration andparameters of the future interconnected national power system. GOI alsodecided to proceed with the construction of four large thermal power stationsof 1,100 MW to 2,100 MW capacity to be built in two stages, located on coalfields and supplying bulk power to the States via an interconnected 400 kVtransmission system. The construction of three such developments, the 2,000MW Singrauli, the 2,100 MW Korba and the 2,100 MW Ramagundam projects, hasbeen started with IDA/Bank financial assistance. This comprises 600 MW ofgenerating plant and transmission for each project (Credits 685-IN Singrauli,793-IN Korba, 874-IN and Loan 1648-IN Ramagundam). The second stage ofSingrauli, comprising two additional 200 MW units and two 500 MW units withassociated transmission facilities, is the subject of this report. An IDAcredit of US$300 million is proposed.
Energy Resources
1.03 India's main commercial energy resources are coal, oil, naturalgas and hydro power. There are also resources of nuclear fuels, principallyuranium and thorium, and India's power program includes the construction offurther "CANDU" type heavy water reactors using domestically produced natural

- 2 -
uranium as fuel. Two nuclear power stations have been constructed to dateand a third is under construction. Some geothermal energy sites have alsobeen identified, but the potential appears to be limited.
1.04 Coal is by far the most extensive indigenous fossil fuel; reservesare estimated at 83 billion tons of which some 21 billion tons have beenproven. Additionally, total reserves of lignite at the Neyveli field inTamil Nadu are estimated at around 2 billion tons. If low quality coal, e.g.,coal with high ash and moisture content, is excluded, the estimate of commer-cially usable coal and lignite is reduced to approximately 24 billion tonswhich, on a forecast countrywide usage, would be adequate for some 50 yearsunder current assumptions of economic growth.
1.05 By comparison with coal, proven reserves of oil are small. However,oil and gas exploration programs are still going on. Exploration and drill-ing activities to date have already proven an estimated 230 million tons onshore, and recent off-shore discoveries west of Bombay in the Arabian Sea haveled to delineation of fields with proven recoverable reserves of about 250million tons of crude oil and 30 billion cubic meters of natural gas. Otherreserves of natural gas, which are found in India both alone and in associa-tion with crude oil, are estimated at over 100 billion cubic meters.
1.06 The potential of hydroelectric power resources is estimated at70,000 MW of which some 11,000 MW has already been developed. A further4,700 MW is scheduled for commissioning by FY1984 (see Table 1.2) and some23,000 MW is currently under investigation or scheduled for investigation.Some 70% of the total potential is in the Northern and Northeastern regions.Additional emphasis on hydro power investments is planned.
1.07 Oil and natural gas have important alternative uses and it is un-likely that they will be a significant factor in the generation of electricpower. The Government intends, therefore, to base the development of generat-ing facilities for the foreseeable future on coal or lignite burning thermalstations and hydroelectric power stations and to gradually develop a smallnuclear program.
Past Bank Group Involvement in the Sector
1.08 The Bank has made nine loans to India for power projects amountingto US$334.5 million and IDA twelve credits totalling US$1,171 million. Ofthis amount US$870.5 million involves financing of generating plant; US$23million the purchase of construction equipment for the Beas hydroelectricproject; US$380 million the provision of high voltage transmission; and US$232million the purchase of rural electrification equipment. Nine loans andcredits for generating plant, the Beas project (Credit 89-IN) and the firstthree transmission projects (Loan 416-IN Credits 242-IN and 377-IN) have beencompleted. The Fourth Transmission Project (Credit 604-IN) is nearing comple-tion, and the whole credit amount of US$150 million has been committed. TheThird Trombay Thermal Power Project (Loan 1549-IN) was approved in April 1978.The Ramagundam Thermal Power Project (Credit 874-IN and Loan 1648-IN) and the

-3-
Second Rural Electrification Project (Credit 911-IN), are still in the preli-minary implementation stage and no disbursements have yet been made. Commit-ments to April 30, 1980 totalled some US$500 million on the four thermal powerplant projects (Singrauli, Korba, Ramagundam and Trombay) and US$150 millionon the two Rural Electrification Projects (Credits 572-IN and 911-IN).
1.09 The Singrauli, Korba and Trombay projects are on schedule. TheRamagundam Project, the Fourth Power Transmission Project and the First RuralElectrification Project are proceeding satisfactorily notwithstanding initialdelays in implementation and the substantial delay in preparation of specifi-cations and review of tenders for the more sophisticated load dispatch equip-ment in the case of the transmission project.
Sector Institutions
1.10 The principal agencies in the industry are: (i) the State Elec-tricity Boards (SEBs); (ii) the Atomic Energy Commission; (iii) the CentralElectricity Authority (CEA); (iv) Regional Electricity Boards; (v) the twoCentral Power Corporations (NTPC and NHPC); and (vi) the Rural ElectrificationCorporation Ltd (REC).
1.11 The SEBs are constituted by the State Governments under the provi-sions of the Electricity (Supply) Act, 1948, to promote the coordinateddevelopment of the generation, supply and distribution of electricity withintheir respective States in the most efficient and economical manner, and forthe control and regulation of other supply undertakings which are privatelicensees. These comprise municipal utilities such as Bombay Suburban Elec-tric Supply Undertaking, and private utilities, the largest of which are theTata Electric Companies, (Bombay), the Calcutta Electric Supply Company, andthe Ahmedabad Electric Supply Company. At the present time, the States effec-tively own or control well over 90% of electricity supply facilities. Whilethe SEBs are corporate entities in their own right and enjoy some autonomyin the management of their day-to-day operations, they are under the controlof their State Governments in such matters as policy, capital investment,tariff changes, borrowings, pay scales and personnel policies.
1.12 The CEA was formally created in 1950 with responsibility for devel-oping a national policy for power development and coordinating the activitiesof the various planning agencies involved in electricity supply. At thattime, it came under the Power Wing of the Central Water and Power Commission(CWPC). As a result of administrative changes introduced in October 1974,responsibility for power was transferred to the Ministry of Energy, which wascreated at that time to bring together ministerial responsibility for coal andpower. This involved the transfer of the Power Wing of the former CWPC to theCEA, which now comes under the Department of Power of the Ministry of Energyand is responsible for developing a sound national policy for the electricitysupply industry. The Department of Atomic Energy, which is directly responsi-ble to the Prime Minister, deals with nuclear power generation.
1.13 CEA's powers were enlarged through amendments to the generalprovisions of the Electricity (Supply) Act, 1948, which were enacted on

-4-
November 30, 1976. In addition to its general responsibilities for national
power policies, it is now responsible for the formulation and coordination
of plans for power development, optimization of investments in the power
sector for the whole country, development of interconnected system operation,
training of personnel and research and development. It includes specialist
engineering organizations which provide comprehensive project engineering
services to the electricity supply industry. The Thermal Department also
takes responsibility for monitoring the performance and maintenance records
of thermal power stations and for organizing the training of power stationpersonnel. The Economic and Commercial Department accumulates data on
economic, finance and accounting aspects of the power industry in India,
both at Center and State levels, with particular reference to the operations
of the SEBs. The emerging role of CEA in financial affairs is evidenced by
the conveying of statutory authority 1/ on it to formulate, in conjunction
with GOI, policy for the accounting treatment of depreciation of fixed assetsin the power sector in India. CEA is also playing a leading role in advising
State Governments on the measures to be taken to implement the amendments
to the financial provisions of the Electricity (Supply) Act, 1948, and isalso providing information to the various working panels of the RajadhyakshaCommittee (para 1.42). A recent major achievement for the CEA was the adop-
tion by the SEBs of a uniform system of commercial accounting, devised by it
over a period of time. This system, which applies to all SEB accounts fromApril 1979, brings uniformity to the procedures relating to the maintenanceof accounts, and, for the first time, enables direct inter-Board comparisonof financial results.
1.14 The SEBs and the other licensed electricity undertakings are
required to submit their investment proposals to the CEA for technical and
economic appraisal and to the Energy Division of the Planning Commission forinclusion in the Five Year Plan. The Planning Commission is responsible for
the allocation of Plan funds among the States and among sectors. Planning
of generation, transmission, and distribution development has traditionallybeen undertaken by each SEB for its own State rather than on a regional or
national basis. However, with the rapid growth of the power sector and with
the resultant increasing complexity of operation, GOI sees the necessity for
an integrated national approach to sector development.
1.15 Four Regional Electricity Boards (REBs), for the Northern, Southern,Eastern and Western regions, were established between 1964 and 1966 by common
resolution of the State and Central Governments, to help develop integratedpower systems in their respective regions, and thus prepare for the transition
from separate power systems at State level to regional systems and finally to
an interconnected national grid. The chairmanship of each REB is assumed inrotation by the Chairmen,of the SEBs within the region and they are staffed by
engineers seconded from their constituent SEBs. The general functions of theREBs are to plan integrated operation of the power systems in the region for
the maximum benefit of the region as a whole, coordinate overhaul and mainten-
ance programs, determine generation schedules to be followed and the power
1/ Amendment of Section 68 of the Electricity (Supply) Act, 1948.

-5-
available for transfer between States and determine a suitable tariff structurefor the transfer of power within the region. At present, the Boards functionmainly in an advisory role in relation to the SEBs.
1.16 NTPC and NHPC are at present not intended to take a leading rolein the generation and sale of power in the States. At the present time, theconstruction of four large central thermal power stations has been started asmentioned in paragraph 1.02. All of these developments are being constructedand will be operated by NTPC. NHPC will construct and operate large hydro-electric projects. A transmission wing has also been established in NHPC todesign and construct the 220 kV and 400 kV overhead transmission associatedwith hydro-projects, and any other transmission work which it might be commis-sioned to undertake. In most States, the SEB will continue for some time tobe the largest power undertaking.
1.17 REC was incorporated in July 1969 under the Indian Companies Act,1965, as a company wholly owned by GOI, under the general supervision of thethen Ministry of Irrigation and Power (now under the Ministry of Energy).REC's chief objective is to finance rural electrification schemes throughoutthe country, acting as a financial intermediary with technical expertise,and administering funds received primarily from GOI. It is REC's functionto ensure efficient allocation of these funds by establishing policies,procedures, and criteria for the formulation, approval and implementationof such schemes. In doing so, REC is directed to adopt a "project approach,"coordinating electrification with other inputs in rural development in orderto achieve increased agricultural production and overall economic development.
Existing Facilities - All India
1.18 The total installed generating capacity in the whole of India asof March 31, 1979 was just under 29,000 MW, including about 2,225 MW of non-utility capacity, mostly thermal, which is owned by major industrial consumersto meet their own needs. The generating capacity is shown in Table 1.1 below:
Table 1.1: INSTALLED GENERATING CAPACITY AS OF MARCH 31, 1979(MW)
Region Conventional Thermal Nuclear Hydro Total
Northern 3,773 220 3,718 7,711Western 5,204 420 1,770 7,394Southern 2,193 - 4,303 6,496Eastern 3,854 - 895 4,749North-eastern 188 - 146 334Andaman and NicobarLakshadweep 6 - - 6
Non-utility Capacity 2,225 - - 2,225
Total 17,443 640 10,832 28,915
Source: CEA.

- 6 -
1.19 Transmission is at 132 kV and 220 kV and, generally, load centersare interconnected by 132 kV and 33 kV subtransmission lines. Distributionvoltages are 11 kV and 415/240 V. The supply, in general, is reliable, butpower shortages, especially during the summer months, necessitate shutdownsand brownouts. System losses have been reduced in recent years but they arestill high accounting for about 20% of units sent out. This subject is underexamination by the "Rajadhyaksha Committee" (see para 1.42).
Power Supply/Demand Balance - All India
1.20 India's installed power generating capacity increased at an annualrate of 10.3% during the 1950s and 1960s while gross electricity generationgrew at just under 12% during this 20 year-period due to a better utilizationof the generating capacity. Although local and intermittent shortages didoccur during this period, system failures did not present a major problem.However, by the early 1970s, the supply situation had grown more serious andpotential unconstrained demand consistently outpaced supply in a number ofstates. This situation was due to several factors such as: failure to imple-ment projects in accordance with planned schedules; inadequate transmissiondevelopment; operating and maintenance problems leading to a low plant avail-ability factor of around 72%; inadequate budget allocation and the absence ofmonsoon rains, particularly during the early 1970s, leading to lower hydrooutput.
1.21 The shortage situation was most serious in 1974/75 and 1977/78 andis again extremely serious now, particularly in the Eastern Region. Theestimated deficit of energy throughout India in 1974/75 was about 11,000 GWh(14.1%); this fell to 8,600 GWh (10.3%) in 1975/76 and to 5,100 GWh (5.8%) in1976/77, but increased to 15,800 GWh (15.5%) in 1977/78. Data for 1978/79indicate that the deficit was of the order of 10%.
1.22 Power shortages, particularly in the industrial sector, have affectedthe output of the country and the cost in terms of industrial production fore-gone has been substantial (generally, energy restrictions fall on industry andthere is relatively little loss to the economy on account of power shortages ineither the residential or agricultural sectors). Lost value-added due to lostindustrial production because of power restrictions, could well be in theneighborhood of 3% of GDP. 1/
1.23 The growth of the power sector during the last 10 years and thepattern of consumption during this period is shown in Annex 1. Sales to agri-culture and irrigation have increased substantially during the 1970s, mainlybecause of the rural development programs. Industrial demand as a proportionof the total demand has declined, and there has been a small but steady increasein domestic demand. It is expected that this pattern of demand will continuewith a gradual improvement in the annual load factor.
1/ See: India, Economic Issues in the Power Sector, 1979 (World Bank ReportNo. 2335-IN, paragraph 68).

-7-.
Future Development - All India
1.24 The countrywide peak demand in 1977/78 was 15,520 MW; accordingto CEA's estimates, unconstrained demand was expected to increase to about20,300 MW by 1979/80, 18,600 MW of which are being met by available capacity.Installed capacity by 1979/80 was expected to reach about 31,900 MW of which29,700 MW would be utility plant with the balance of 2,200 MW non-utility.
1.25 The development program provides for an expansion of generatingcapacity during the five-year period 1979/80-1983/84, including the nuclearpower plants which are scheduled to come into operation during that period,by about 19,000 MW, so that the total planned installed capacity would beabout 45,000 MW by 1983/84. The additional capacity scheduled for commis-sioning during this period is shown in more detail in Table 1.2. Furthermore,the construction of some 15,000 km of 400 kV transmission lines is plannedto enable full integration of the regional systems and the evacuation of theoutput from the proposed large thermal power stations.
Table 1.2: SCHEDULE OF PLANNED ADDITIONS TO CAPACITY DURINGTHE PERIOD 1979/80-1983/84 /a
ConventionalThermal Nuclear Hydro Total
------------------- (MW) --------------------
Northern 2,900 455 1,300 4,655Western 5,270 - 521 5,791
Southern 2,100 470 2,310 4,880Eastern 2,710 - 305 3,015North-eastern 298 - 261 559
Total 13,278 925 4,697 18,900
/a Excludes non-utility capacity.
Source: CEA.
1.26 Table 1.3 shows the planned annual installed capacity aggregatingabout 45,600 MW in 1983/84, the available capacity, the peak load and theforecast of energy requirements and availability (not taking into accountdiversity). The data referring to the peak load and energy requirement in1978/79 show the demand constrained by supply. The estimated unsuppressedpower and energy demand would have been about 10% higher (see para 1.21).The forecasts of peak load and energy requirements are based upon continuousmonitoring of development trends during the preparation of the annual electricpower surveys of India. If the program of generation development can beachieved on time, the present shortage of energy would be eliminated from1982/83 on, but there would still be a capacity deficit through the five-yearperiod due to a low availability factor of generating plants. The peak avail-ability in India under present operating conditions, is around 60% of installedcapacity. This availability factor is expected to improve gradually as aresult of the development of system interconnection and the improvement ofmaintenance practices.

- 8 -
Table 1.3: INSTALLED CAPACITY, PEAK AVAILABILITY, PEAK LOAD,ENERGY AVAILABILITY, AND ENERGY REQUIREMENT
ALL-INDIA 1978/79-1983/84
1978/79 1979/80 1980/81 1981/82 1982/83 1983/84
Installed Capacity (MW) /a 26,741 29,734 33,009 35,585 40,804 45,590
Peak Availability (MW) 16,268 18,566 20,968 22,171 25,443 28,822
Peak AvailabilityFactor (%) 61 62 64 62 /c 62 /c 63
Peak Load (MW) 16,268 /b 20,348 22,443 24,717 27,334 30,068
Surplus (Deficit) (MW) - (1,782) (1,475) (2,546) (1,891) (1,246)
Energy Availability (GWh) 97,376 103,549 117,855 131,496 151,036 171,949
Energy Requirement (GWh) 97,376 /b 112,700 124,408 137,089 150,819 166,298
Surplus/(Deficit) (GWh) - (9,151) (6,553) (5,593) 217 5,651
Ia Excludes non-utility capacity.lb Demand constrained by supply.Ic Reduction in availability factor due to commissioning of hydro plant.
Source: CEA.
1.27 Table 1.3 also indicates that both peak load and energy requirement
are estimated to grow at an average annual rate of around 10% during the five
year period 1978/79-1983/84. The forecast capacity deficit decreases from
around 10% of the system load in 1979/80 to 4% in 1983/84 and the energy
availability exceeds energy demand by some 3% in 1983/84. These are varia-
tions which are less than the accuracy of any of the forecast data inputs, butthey demonstrate that, if anything, a case could be made for sanctioning morecapacity than presently planned for commissioning during the five-year periodending 1983/84, particularly since All-India data mask shortages in specificregions, which may develop due to insufficient interconnection.
Regional Demand and Supply - Northern Region
1.28 The major authorities supplying the Northern region are the UttarPradesh State Electricity Board (UPSEB), the Punjab State Electricity Board(PSEB), the Haryana State Electricity Board (HSEB), the Delhi ElectricitySupply Undertaking (DESU), the Rajasthan State Electricity Board (RSEB), theJammu and Kashmir State Electricity Board (JKSEB), and the Himachal PradeshState Electricity Board (HPSEB). NTPC operates the Government-owned 510 MWthermal station at Badarpur. Each of these authorities owns either totallyor partly generating facilities and (with the exception of NTPC) supplieselectricity to final consumers. Interchanges of temporary power surplus arecommon.
1.29 The Bhakra/Beas hydroelectric generating complex is jointly owned bythe SEBs of Punjab, Haryana, and Rajasthan. These SEBs draw energy from thi6facility in accordance with their ownership shares. In addition, energy issupplied on a contractual basis to "common pool consumers" such as part ofHimachal Pradesh, the Nangal Fertilizer Factory, Chandigarh, and Jammu andKashmir. The largest intra-regional transfers are recorded between the

- 9 -
Bhakra/Beas complex and its owners and bulk consumers, the second largesttransfer occurs from the Badarpur thermal power station to DESU. Annex 2describes the regional demand and supply situation in quantitative detail.49% of installed regional capacity is thermal, 48% hydro, and the remaindernuclear. This hides significant differences between States: only UPSEB,DESU and the Central Sector are not heavily dependent on hydro generatingfacilities. Installed capacity has been growing at a rate of about 13% p.a.in recent years--firm available capacity, however, only at 9% p.a., reflect-ing a falling availability percentage. Availability is expected to improveby 1983/84, by which time an additional 4,655 MW are expected to have beenadded to the existing capacity, most of it thermal and nuclear.
1.30 The region is less industrially oriented than the Indian average--only 52% of consumption is attributable to industry, compared to a nationalaverage of 66%. Agriculture, with its greatest burden on the supply system,is significantly more important than on an All-India basis. Energy consump-tion has been growing at an average annual rate of 14.5%, with fluctuationsdepending on hydro availability. Some reduction in technical losses has beenachieved (Annex 3).
1.31 Peak unconstrained capacity demand is expected to exceed availablecapacity for the foreseeable future: the anticipated shortfall will begrowing steadily to reach more than 1,100 MW in 1983/84. It is likely thatpersistent shortages will continue well beyond 1984 (Annexes 4 and 5). In1983/84, the capacity of the proposed project's first stage will be the equiv-alent of 7% of regional capacity. At the time of commissioning of the lastunit, the proposed project will represent about 3% of potential unconstrainedregional capacity demand (Annex 6). The shift of responsibility for powergeneration from SEBs to NTPC is reflected in the lower anticipated percentageof the SEBs' investment programs devoted to generating facilities (Annex 7).All supply authorities in the region had to impose restrictions on demandin 1978/79. Restrictions are widespread in Uttar Pradesh, imposing largecuts on capacity demand and energy consumption (Annex 2), mostly borne byindustry. Rotation of supply to rural areas is common, as is ad hoc loadshedding.
Future Integrated System Operation
1.32 With the increasing size of the power sector in India and its far-reaching impact on the country's economy, annual surveys and Five-Year Plansat the State level have become insufficient as a basis for power developmentplanning. The larger size of power plants, their consequent longer construc-tion period--on average six to eight years for thermal plants and eight toten years for hydro plants--as well as their gradual interconnection requirea long-range perspective for investment decisions on a regional and nationallevel.
1.33 Recognizing the need for coordinated power development throughoutthe country, provision was made in Credit 604-IN to help finance the costof consultants to study the technical, financial and economic aspects of along-term national plan for the sector. Such a plan should include, interalia, detailed demand forecasts, investigation of power generation schemes

- 10 -
to meet load growth requirements for a 15-20 year period (indicating costs andsequencing of investments to optimize resources), development of primary gridconfigurations, including the 400 kV system study which CEA has started butwhich has come to a temporary standstill mainly due to lack of overall plan-ning, coordination of power plans with plans for other sectors (determiningresource requirements), and recommendations on responsibilities and neededoperational policies at the State, regional and national levels (Annex 8).Such a study is an essential prerequisite for formulating sound policies forfuture development of the sector, and the Government has indicated its inten-tion to complete such a study by April 1982.
1.34 The operation of regional systems, which will be integrated in thefuture in a national grid, requires large numbers of personnel who would haveto be trained in the use of sophisticated load dispatch equipment and inter-connected systems operation. A UNDP project designed to assist CEA in devel-oping programs for training staff to operate the future load dispatch centerscame to a halt in 1977, primarily because of personnel problems, and lack ofcounterpart staff. GOI's plans to revise this project, in consultation withUNDP, were discussed during negotiations. These plans would form part of awider program for strengthening systems operation and training. The Associa-tion would be kept informed about the development of such program.
Bank Group's Strategy in the Sector
1.35 The Bank Group's strategy in its involvement in the Indian power
sector, has been one of co-operation with GOI in seeking solutions to themany difficult and politically sensitive problems which have confronted theIndian electricity supply industry since Independence. The sensitivity ofCenter-State relations, because of concurrent jurisdiction over the electri-city supply industry, has dictated that a policy of persuasion rather thanone of explicit leverage would produce better results.
1.36 The Bank Group's main objectives in the sector are:
(a) assistance in accelerating the installation of gene-rating capacity and promoting measures to improvethe operation and maintenance of existing plant 1/in order to gradually eliminate the prevailing powershortages in the country;
(b) assistance in introducing long-range system plan-ning on a nationwide basis which would assure imple-mentation of a least-cost power development program;
(c) promotion of appropriate measures with respect toimproving the sector organization and training; and
1/ This subject is dealt with in the terms of reference of both thesuggested Least-cost Power Development Study (Annex 8, para. 3) andthe Rajadhyaksha Committee (see para 1.42 and Annex 10).

- 11 -
(d) strengthening of the finances of the institutions involvedin the sector, particularly of the State Electricity Boards(SEBs), through setting of rate-of-return targets or levelsof self-financing and advising in designing of appropriatetariff systems.
1.37 Progress towards achieving the above goals has been hindered byconstitutional factors. Under the Electricity (Supply) Act 1948, power supplyis a concurrent subject. This means that the responsibility for supplyingelectricity is shared between the Central Government and the State Governments,requiring full agreement between the Center and the States for the implement-ation of most actions. The States operate, and develop, through their Elec-tricity Boards, most of the power facilities. The consequence of this arrange-ment in many instances has been a parochial approach where a national or atleast regional approach would have been more beneficial. On the other hand,it is debatable whether Central initiative could have been taken much furtherin the time available. The radical proposal which would have enabled powersystem generation and bulk supply to be exclusively a Central responsibility,would have meant a considerable upheaval and would have have raised fundamentalpolitical and constitutional issues going well beyond efficiency considerations.
1.38 Given these difficulties, results achieved so far have been encourag-ing. They are the following:
(a) with the establishment of the Regional Electricity Boards(REBs, para 1.15) and later of NTPC and NHPC, the firstimportant steps towards an improved organizational struc-ture of the power sector have been made. GOI intends togradually strengthen the authority of the REBs and toincrease their role of coordinating the SEBs in mattersof power development and operations;
(b) CEA was reorganized and had its powers enlarged throughthe amendment in 1976 of the Electricity (Supply) Act1948 (paras 1.12 and 1.13);
(c) a recent amendment of the financial provisions of theElectricity (Supply) Act 1948 requires that tariffs beset at levels sufficient to enable the SEBs to financefrom internal sources a reasonable proportion of theirinvestment programs;
(d) recently, SEBs in the Northern Region and the DelhiElectricity Supply Undertaking (DESU), have developedand partially implemented plans designed to restore thecovenanted rate of return of 9-1/2% (Credit 604-IN).These plans consist of tariff increases, rationalizationof manpower requirements and other cost effective measures;
(e) with a view to the reassessment of tariff policies,the majority of the SEBs have recently completed

- 12 -
tariff studies based on marginal cost pricing principles.The Bank Group's review of these studies recommended thestandardization of certain assumptions so as to producea uniform methodology for general application by all SEBs.To assist in this standardization process, CEA is establish-ing a specialist department to interact with the SEBs andto keep the Bank Group advised of future developments; and
(f) NTPC's generation/transmission construction program (paras3.01 and 3.02), which is in the process of staged implemen-tation with Bank Group assistance, will make an importantcontribution to the gradual elimination of the presentdeficit in the country's power balance. The proposedproject would help to continue this program.
1.39 There are two major remaining areas which have been the cause of con-
cern to the Bank Group and also have been the subject of continuing dialoguewith GOI. They are:
(a) the weakness of nationwide long-range planning for powerdevelopment; and
(b) the weak financial position of a number of SEBs which,for instance, have not always been able to achieve thecovenanted rate of return of 9-1/2%.
1.40 In the continued effort of the Bank Group in dealing with the long-range problems of the power sector in India, it was decided to concentrateon the above two areas. During appraisal and negotiations, discussions wereheld with CEA, NTPC and NHPC on the content of a long-range power developmentstudy designed to prepare a least-cost power development program, CEA's capa-bility to undertake such study with its own staff, and the possible need forconsultants' support (para 1.33). Agreements were reached during negotiationson the preparation of a least-cost development program based on the terms ofreference suggested by the Association.
1.41 From a commercial point of view, the financial performance ofseveral SEBs, the sole customers of NTPC, has been marginal (for detailedexplanation see Annex 9) and even in years when 9-1/2% rates of return wereachieved, a number of SEBs were not able to meet their debt service require-ments. 1/ There are several reasons for this unsatisfactory performance,
1/ However, in all States except one, excise taxes or duties are leviedon electricity sales. Including such taxes as a benefit to the States/SEBs increases the returns by up to 5 percentage points. Furthermore,a recently enacted GOI tax on kWh generated is also equivalent to areturn of about 2-3 percentage points. The total return in economicterms is therefore substantially higher than the commercial return to
the SEBs.

- 13 -
such as insufficient generating capacity which does not permit utilization ofthe market potential to the fullest extent, less than efficient operating of
existing plant, lack of monsoon rains in the Eastern Region leading to severeload shedding and blackouts, railroad and coal mine strikes resulting in insuf-ficient coal supply, and low tariff levels. In the Northern Region (supplyarea of the Singrauli station), the SEBs and the DESU have taken steps toredress the shortcomings (para 1.38d). The GOI representatives indicatedduring negotiations that these organizations were currently operating atlevels which are expected to achieve rates of return of at least 9.5%, netof taxes.
1.42 Indian authorities have recognized that with the rapidly expandingpower sector in the coontry, all aspects of the sector have to be reviewedand that satisfactory solutions have to be found for the various sector prob-lems. Consequently, GOI has established a high-level committee in November1978, known as the "Rajadhyaksha Committee", so called after the name of itsChairman. This committee, whose terms of reference are attached as Annex 10,has been assigned the task to examine and make recommendations for improve-ments of the following aspects of the power sector:
(a) power planning;
(b) project formulation and implementation;
(c) operation and maintenance;
(d) organization and management;
(e) finance, financial management and tariffs;
(f) rural electrification; and
(g) research and development.
Draft reports by the seven expert panels assembled for this purpose have beencompleted and are under review by the committee. The committee is expected tosubmit its findings to GOI during 1980. The Bank Group will continue to takean active interest in the committee's progress, and it is recognized that theBank Group may have to modify its approach to the problems of the Indian powersector in case the committee recommends approaches different from the presentBank Group approach, but equally acceptable. For example, one of the majorconcerns would be that consumers contribute more towards the cost of powersupply facilities through allowing their SEBs to generate internally a reason-able proportion of their capital investments.
II. THE BENEFICIARY - NATIONAL THERMAL POWER CORPORATION LIMITED
Legal Status and Authorities
2.01 NTPC, the beneficiary of the proposed credit was established in1975 under the Companies Act, 1956. The Electricity (Supply) Act, 1948, has

- 14 -
been amended to give the Corporation statutory recognition. NTPC is a companywholly owned by GOI under the general supervision of the Ministry of Energy.Its initial authorized share capital of Rs 1,250 million (US$149 million) wasincreased in May 1979 to Rs 3,000 (US$357 million). The Corporation has aBoard of Directors consisting of not less than four and not more than fifteen,some of whom are part-time.
2.02 The Companies Act, 1956, confers broad powers on NTPC to carry outits work. However, the tariffs to be applied, as well as, any changes in suchtariffs, its investment plans and annual capital budgets, have to be approvedby the Government. NTPC is also subject to periodic examination by theCommittee on Public Undertakings--a body established by GOI to monitor theperformance of public sector enterprises.
2.03 The main objectives for which the Corporation has been establishedare:
(i) to design, construct, and operate large central thermalpower stations and projects; and
(ii) to transmit and sell the power generated.
NTPC will initially own and operate the associated 400 kV transmission systemover which power will be distributed and sold in bulk to State ElectricityBoards. Later this system will be part of the 400 kV interconnected regionalsystem which will be integrated into the national grid.
2.04 NTPC's present program provides for the construction of four thermalpower stations, (Singrauli, Korba, Ramagundam and Farakka). It is also possi-ble that NTPC might ultimately take over the 510 MW Badarpur station nearDelhi (ultimate planned capacity 720 MW). Presently NTPC is in charge of theoperation of Badarpur on a management fee basis.
Organization and Management
2.05 NTPC's organization which at present is necessarily constructionoriented is shown in Annex 11, page 1. The complete range of managementsystems for all disciplines now under formulation are shown in Annex 11,pages 2 and 3. These are based on the philosophies explained in the NTPCpublication "Framework for Project Management" which was discussed with NTPCduring negotiations for the Ramagundam project and further reviewed by themission during appraisal. The organization is adequate.
2.06 NTPC has adopted a two-tier organizational structure: one at thecentral/corporate level and the other for the projects. In addition to theaccepted corporate level, activities such as the development and formulationof policies, and other services relevant to the projects, have been centralized;these are Technical Services, Contract and Procurement Services, QualityAssurance and Expediting and Project Management Services. Other departmentsat the central level are Corporate Planning and Marketing, Corporate Finance,Personnel and Administration.

- 15 -
2.07 The second tier, which embraces project activities, consists of aproject organization for each of the four power plants under construction.Each project organization is headed by a General Manager who is entrustedwith total responsibility for implementation of all aspects of the project'sconstruction program.
2.08 Good progress has been made in building up the organization since1975 when NTPC was established. The Chairman and Managing Director wasappointed in early 1976 and the number of staff appointed by February 29,1980, was 2,658 comprising 523 executives, 131 executives in training and2,006 non-executives. NTPC has also taken over the majority of the employeesof the Badarpur Project and Power Station (see para 2.04).
2.09 Present indications are that NTPC is developing along sound lines.It has a Chairman and Managing Director who is a competent administrator withan established reputation in the formation and development of large industrialundertakings. He has taken a great personal interest in developing a compre-hensive project management system as well as designing the organization andprocedures, while building up an establishment of highly motivated engineersand staff. Remarkable progress has been made in all activities in the fouryears since his appointement and providing this impetus can be maintained withno deterioration in management, NTPC should, with the assistance of consultants,be capable of handling the present large development program. Site organiza-tions are effectively functioning at the Singrauli, Korba and Ramagundam proj-ects. The centralized functions which, in addition to the corporate person-nel, are planning and finance, and provide the engineering, contracting andproject management input. They are organized to meet the project requirementsand to ensure an effective coordination of the projects under construction.
Training
2.10 NTPC is a young organization which is growing rapidly to meet thedemands of its large construction program. The next phase of expansion willinvolve the need to recruit and train operating staff. When all currentdevelopments have been completed and commissioned, NTPC's establishment willhave grown from a present 2,658 to a figure in the neighborhood of 10,000.The importance, therefore, of implementing training programs for the variousexpertises required during the construction and operational phases cannotbe too highly stressed.
2.11 Fortunately, NTPC has placed special importance on this aspect ofits organization, and training programs are being developed by the Corpora-tion which will, in due course, be backed by a training school equipped witha simulator, financed from funds of Credit 793-IN, and other modern facilitiesfor instructing and training the operating staff.
2.12 NTPC's training programs are presently concentrated on pre-operational spheres of activity such as Planning, Design, Construction andManagement. Some of the current major activities are:

- 16 -
(a) Professional engineering training for Executive Trainees(Engineering).
(b) Professional engineering training for Supervisory Trainees(Engineering).
(c) Management development programs.
(d) Seminars and lectures on selected topics.
(e) Familiarization courses for both accounting and managerialstaff on the accounting systems and procedures being imple-mented by NTPC's consultants.
Recruitment of young executive trainees is mainly from engineering graduatesbelonging to mechanical, electrical and civil disciplines on appointment,who are inducted into a one-year training program. The first group of youngexecutive trainees was recruited in February 1977, the second in December1977 and the third by mid-1978 comprising 35, 45 and 84 members respectively.The third group comprising 100 trainees was recruited during 1978 and joinedthe professional engineering training course which started on November 15,1978. The fourth group comprising 131 trainees was recruited in 1979 and thetraining was started on November 25, 1979. The training programs have beenwell designed to provide exposure to power stations under construction andoperation, equipment manufacturing plants, engineering descriptions and projectmanagement services. For these purposes, assistance is taken from a largefaculty of experienced engineers and managers selected from all over thecountry.
2.13 With the first 200 MW generating unit scheduled to commence commer-cial operation in FY1982, NTPC has finalized comprehensive plans for trainingoperational staff, particularly the non-supervisory staff, in the varioustechnical and non-technical trades, to provide foremen to the first two unitsat Singrauli. The manpower for these is being drawn from experienced staffas well as from fresh recruitment. Recruitment of manpower has commenced andkey personnel such as the station superintendent, are already in position.
2.14 On-the-job training has high priority. The methodology includesclassroom lectures, participation in group exercises and discussions sup-ported by direct reading, audio-visual presentations and plant visits.Overall training plans and arrangements at this time are satisfactory.
Sale of Power from the Project
2.15 GOI proposes to allocate 85Z of Singrauli's power to the SEBs ofUttar Pradesh, Punjab, Haryana, Rajasthan and the DESU, the remaining 15%being sold in accordance with priorities to be determined by CEA to Stateswith the greatest need. The Association has received undertakings from therespective SEBs and DESU confirming that they would take power in accordancewith agreed allocations, in aggregate not less than 85% of the output ofpower from the project.

- 17 7
Accounting Organization and Systems
2.16 NTPC and its management consultants report good progress in theplanning of NTPC's finance and accounting organization (Annex 12) and in thedesign and implementation of accounting systems and procedures. The designof systems for both the construction and operational phases of NTPC's activ-ities has been completed. Implementation of systems for the constructionphase is either complete or at an advanced stage both at the corporate centerat headquarters, and also at the sites, while the consultants' proposals forthe operational phase are at an advanced stage of discussion with management.To familiarize staff with the systems and procedures, training courses arebeing conducted by the consultants in conjunction with staff members fromNTPC's corporate cente'r.
2.17 Current problems being faced by NTPC and its consultants in build-ing up the accounting organization are: difficulties in obtaining adequatelyqualified staff; retaining staff at project sites, and the introduction oftighter controls in the management of materials on sites. This latter prob-lem will be resolved by the introduction of the systems for inventory controlwhich have been planned by management. These would include continuous stockchecking and the use of more sophisticated weighing and measuring facilities.The personnel problems are likely to be more difficult to resolve.
Audit
2.18 The audit of NTPC's accounts and records is undertaken by a profes-sional auditor appointed by the Company Law Audit Board, on the recommendationof the Comptroller and Auditor General of India. The auditor is normally amember of the Indian Institute of Chartered Accountants, and his audit reporton NTPC's financial statements is subject to comment by the Auditor General.The current auditor Messrs. V. K. Mehta and Company, Chartered Accountants,Delhi, has audited NTPC's accounts since its incorporation on November 7,1975, and their audit reports have expressed satisfaction at the state of thecompany's affairs during this period. It should be borne in mind that NTPC'sactivities will cover only project construction until FY1982 when power willbe sold for the first time. NTPC has already undertaken, in connection withprevious credits and loan, to submit to the Association/Bank audited financialstatements within seven months of the end of the fiscal year to which theyrelate, together with a certified report by the auditor, and a review of theaccounts by the Director of Commercial Audits. This has been restated inconnection with the proposed credit.
III. THE PROGRAM AND THE PROJECT
The Program
3.01 NTPC's present development program comprising the four centralthermal power stations Singrauli, Korba, Ramagundam and Farakka, with asso-ciated 400 kV transmission, is part of India's power development programwhich is described in paragraphs 1.24 through 1.27. The four power plants,

- 18 -
totalling 7,300 MW, have been located on coal fields, since it is more econo-
mical to transport electricity than coal to the load centers.
3.02 The first stages of the four central power stations consisting in
each case of 3 x 200 MW generating units and associated transmission are under
construction. The commissioning of the power plant units is scheduled between
February 1982 (first 200 MW unit at Singrauli) and July 1989 (last 500 MW
unit at Ramagundam).
The Project
3.03 The project represents the second stage of the Singrauli develop-
ment comprising two additional 200 MW units and two 500 MW units with asso-
ciated transmission totalling about 2,000 km of 400 kV lines. This extensionwould bring the power plant to its final installed capacity of 2,000 MW.
3.04 The Singrauli development which is described in detail in Annex 13
is being constructed on the fringe of the Rihand Reservoir close to the Sin-
grauli coal field deposit at Kota in the Mirzapur district of Uttar Pradesh(see attached maps).
Estimated Cost
3.05 The estimated cost of the project, excluding interest during con-
struction and duties and taxes, is about Rs 7,175 million (US$854 million).On the assumption that most of the contracts will be won by Indian suppliers,
the direct and indirect foreign currency costs are estimated at about Rs 1,199million (US$238 million) and the local currency costs at Rs 5,176 million
(US$616 million). The estimated costs of the principal features of the proj-ect are shown in Table 3.1 below, and in more detail in Annex 14.
Table 3.1: ESTIMATED COSTS
Local Foreign Total Local Foreign Total------Rs million ------ --------US$---------
Preliminary Works 2.7 - 2.7 0.3 - 0.3
Civil Works 449.3 7.7 457.0 53.5 0.9 54.4Electrical and MechanicalPlant 1,761.3 1,289.4 3,050.7 209.6 153.6 363.2
Coal Handling & Transportation 112.6 7.4 120.0 13.4 0.9 14.3Transmission (400 kV) 1,032.4 129.9 1,162.3 122.9 15.5 138.4
Sub-Total 3,358.3 1,434.4 4,792.7 399.7 170.9 570.6
Physical Contingencies 190.2 72.2 262.4 22.6 8.5 31.1Price Contingencies 1,217.9 467.3 1,685.2 145.0 55.7 200.7
Total 4,766.4 1,973.9 6,740.3 567.3 235.1 802.4
Engineering & Administration 409.2 25.2 434.4 48.7 3.0 51.7Project Cost (before Duties
& Taxes) 5,175.6 1,999.1 7,174.7 616.0 238.1 854.1
Duties & Taxes 505.9 - 505.9 60.2 - 60.2
Total Project Cost 5,681.5 1,999.1 7,680.6 676.2 238.1 914.3
Interest during Construction 528.4 - 528.4 62.9 - 62.9Total Financing Required 6,209.9 1,999.1 8,209.0 739.1 238.1 977.2

- 19 -
3.06 The estimates for the main items of equipment are based on thequotations received during 1977, 1978 and 1979 for similar types of plant andequipment for the first stage of the Singrauli and Korba developments, in thecase of the 200 MW units, and for the Trombay Project, in the case of the 500MW units. Prices were escalated to 1979 levels. Transmission costs areequally based on estimates received for the 400 kV transmission associatedwith the first stage of the Singrauli development and on the costs of 400 kVconstruction at various locations in India. Physical contingencies of 10% oncivil works, and of 5% on plant and transmission costs have been allowed toprovide for unforeseeable factors. In assessing price contingencies, it hasbeen assumed that fixed price contracts and contracts with ceilings on priceinflation for turbogenerators and boilers, as in the case of NTPC's three otherpower plants under construction, will also be obtainable in the case of theSecond Singrauli Project. Costs for equipment and erection have been escalatedat 6% for 1979, 10% for 1980, 7% for the years 1981-1983 and 5% for the yearsafter 1983. These assumptions have resulted in price contingencies of 24% forcivil works, 36% for supply and erection of electrical and mechanical equipment,32% for supply and erection of coal handling and transportation equipment, and31% for supply of materials and erection of the transmission system.
Project Financing
3.07 The proposed credit of US$300 million representing about 35% of thecost of the project (excluding duties and taxes and interest during construc-tion), should be applied to the CIF and/or ex-factory costs of plant andequipment, excluding the 2 x 500 MW turbogenerators and associated equipment.The latter would be financed by Kredit fuer Wiederaufbau (KfW) from Germanywhich has been requested by GOI, and in principle has agreed, to extend aloan of about US$100 million equivalent to support the proposed project infinancing the 500 MW turbo-generator units. Civil works, plant erection costs,inland transportation costs, interest during construction, duties and taxesand any other costs not financed from the credit and KfW, aggregating aboutUS$694 million, would be financed by GOI in the form of loan and equitycapital. Retroactive financing of up to US$15 million, to allow NTPC toexercise its option for a repeat order for the two 200 MW turbogenerators andboilers, is proposed.
Engineering and Construction
3.08 As in the case of the first stage, the second stage of the Singraulidevelopment comprises a number of major works which must be carefully coordi-nated to ensure efficient progress. The power plant is expected to be com-pleted by February 1987. The project construction schedule is shown in Annex 15.Much of the detailed power station engineering and design work carried out forthe first stage is applicable to the second stage. Under previous credits andloan granted for NTPC's program, consultants were appointed for the 200 MWunits to: (i) review NTPC's basic engineering and design; (ii) assist in themore sophisticated areas of design; and (iii) provide a back up review ofspecifications for generating units, boilers, transformers and other specifi-cations, as required by NTPC and the Association. NTPC has acquired adequateexperience in the area of design and engineering of 200 MW units, especially

- 20 -
from the first stage of the Singrauli power plant, and therefore there is no
need to appoint consultants for the engineering of the 200 MW units. As for
the 500 MW sets which are being installed for the first time in India, GOI and
NTPC have agreed during negotiations as a condition of effectiveness of the
proposed credit, to engage consultants acceptable to the Association to assist
in the design, the preparation of specifications and bidding documents and theevaluation of bids for the 2 x 500 MW part of the project.
3.09 NTPC, under its competent chairman, has developed a comprehensive
project management system, including program coordination and supervision of
construction of the power stations. However, in view of the magnitude of its
construction program, NTPC has agreed to conclude, as a condition of credit
effectiveness, all contractual arrangements for the employment of consultantsto review its project management and information systems and their initialimplementation.
3.10 Under the first Singrauli Project, GOI agreed to take the necessarysteps to make available adequate coal supplies for the 600 MW stage of thepower plant by the time the first generating unit shall have been commissioned.These measures should be extended under the proposed project for the finalinstalled capacity of the power plant. Agreements to this effect were reached
during negotiations.
Procurement
3.11 Procurement of all equipment to be financed from the proposed credit,
with the exception of the 200 MW units including turbogenerators and boilers,would be on the basis of international competitive bidding in accordance with
the Association's guidelines. For the procurement of the 200 MW turbo-generator
sets and boilers, the Association has agreed, in view of the expected cost and
time savings, that NTPC should exercise the option under the contract for thefirst Singrauli project, which was awarded after international competitivebidding. Documents for individual contracts above US$1,500,000 equivalentwould be subject to prior review by the Association. Bidding documents forsuch equipment, including tender analyses and recommendations for award ofcontracts, would be prepared by NTPC with the assistance of its consultants,
and approved by the Association. To facilitate contract coordination, theinvitation to tender for major plant contracts would be on a supply, deliverand erect basis. This could include civil works in certain cases where these
cannot be disassociated from the plant contract--i.e., coal handling, substa-
tion structures, transmission lines, but such civil works would not be financedfrom the proposed credit. Local manufacturers would be expected to bid forall categories of equipment. A domestic preference of 15% or the import duty,
whichever is less, would be applied in bid comparison for equipment contracts.
To prevent administrative procurement delays, in case the lowest evaluated
bidder is a foreign manufacturer, GOI agreed during negotiations that it wouldgrant import permissions for such items without further review by any agency
of the Government. There are competent local contracting firms in India and
also manufacturing facilities covering most of the equipment for the project.All goods not financed from the proposed credit (and from the KfW loan) willbe subject to local procurement procedures, which are satisfactory.

- 21 -
Disbursements
3.12 Disbursements from the proposed credit would be made against 100%of the cost of consultants retained for the 500 MW units (see para 3.08) andto review NTPC's project management systems (see para 3.09), and against thecost of the equipment to be financed from the proposed credit on the followingbasis:
(a) 100% of the ex-factory cost of equipment procured inIndia after international competitive bidding; and
(b) 100% of the foreign cost of equipment procured fromabroad.
Any balance of the credit not used after commitments have been made for allitems covered by the list of goods, could be used to purchase other electricaland mechanical equipment for the project, after obtaining the Association'sagreement. Retroactive financing of up to US$15 million is proposed for ex-penditures after August 1, 1979, made to allow NTPC to exercise its optionfor a repeat order for the two 200 MW turbogenerators and boilers (para 3.11).The estimated disbursement schedule is given in Annex 16.
Ecological Aspects
3.13 The ecological and environmental aspects of the project were dis-cussed during appraisal. GOI confirmed that the Singrauli development hadreceived the approval of the Indian National Committee on Environmental Plan-ning and NTPC agreed to comply with all environmental quality standardsprescribed by this committee in the design, construction and operation ofthe project.
3.14 As in the case of the first stage of the Singrauli development, theprincipal environmental problems with the proposed project are: (a) location,(b) stack emissions, (c) heat dissipation, and (d) ash disposal. These areoutlined below:
(a) Location. The proposed Singrauli power station is a pithead station and is situated far from any urban area.Accordingly, there are no problems other than the need toensure the health and environment of the operating staffwho will be housed in a residential area to be constructedsome 4 or 5 km from the power station.
(b) Stack Emissions. Electrostatic precipitators will be in-stalled and the stack will be of such a height that emittedparticulate matter will be spread over a sufficiently widearea to reduce the density of pollutants to an acceptablelevel. The sulphur content of the coal is in the range of0.3% to 0.6% which is low and does not present a pollutionproblem.
(c) Heat Dissipation. The cooling pond is designed to ensurethat its average temperature increase will not exceed 3%with the station under full operation. This would haveno adverse effect on fisheries.

- 22 -
(d) Ash Disposal. The ash will be pumped as a slurry, througha 5 km pipeline, to an ash dump area which has been reclaimedfrom the Rihand Reservoir. The area will be enclosed by abund, and together with a reserve area, will be adequate tocontain the ash output for the life of the power station.
3.15 With regard to the safety and occupational health of employees,safety regulations for power stations, to which all operating personnel mustconform, will be strictly enforced. As far as noise levels are concernedthe turbine hall of a modern steam turbine power station, which is the noisi-est area of the plant, has a sound pressure level of less than 90 decibelswhich is well below the maximum acceptable threshold for the normal 8 hour/day
shift worker.
Project Risks
3.16 The project represents one phase of an overall development programwhich comprises 7,300 MW of generating plant and some 7,000 km of 400 kVtransmission. It is part of a tightly designed program with plant and trans-mission coming in at phased intervals throughout the period 1982 through 1988.Maintaining this program on schedule requires careful coordination and expertsupervision at all levels. The principal risk is the possibility of slippagewhich could give rise to delayed commissioning of plant and loss of revenues.With a program of construction of this magnitude, there is no guarantee thatsome delays will not occur, but these will be kept to a minimum through care-ful coordination and supervision during construction and careful attention,when placing contracts, to the capability of manufacturers to meet the deliveryschedules.
3.17 Other risk areas are in engineering design, cost overruns and prob-lems of commissioning and operation during the early operational stage withresultant loss of revenues. There is also the risk of damage due to fire,explosion, etc., but this is covered by insurance provided by the respectivecontractors during the construction stage and by GOI through its self-insurancepolicy after commissioning.
3.18 These risks have been carefully assessed and the following safe-guards taken:
(a) NTPC is being assisted by consultants and sub-consultants, and this should minimize problemsdue to error at the engineering and design stage;
(b) Plant and equipment cost are based on similar workscurrently in progress in India; provision has beenmade for cost escalation and there should be littlerisk of any substantial cost overrun;
(c) a number of 200 MW generating units will have beenin operation for some years before the project iscommissioned, thus, providing experience and trainedmanpower for the project.

- 23 -
IV. FINANCIAL ANALYSIS
Introduction
4.01 Financial forecasts of NTPC's annual operations through FY91 arepresented in Annexes 17 through 19. The forecasts are based on a capitalinvestment program (Annex 18, page 2) which envisages the construction of fourlarge thermal power stations with a combined capacity of 7,300 MW, togetherwith almost 7,000 circuit kilometers of 400 KV transmission lines at a latestestimated cost of Rs 48 billion (US$5,714 million equivalent). The powerstations and transmission lines will be commissioned on a phased basis duringthe period February 1982 to July 1989.
4.02 Concurrently with this construction program, NTPC is responsible forthe operation and development of the Badarpur power station in Delhi. Thisinvolves directing operations of the 510 MW thermal generating plant (initial300 MW plus 210 MW extension constructed and commissioned by NTPC), and forconstruction of a further 210 MW extension already sanctioned and due forcommissioning in September 1981.
Future Earnings
4.03 NTPC will become operational in February 1982 when its first 200 MWgenerating unit at Singrauli is expected to be commissioned. Additional gene-rating capacity scheduled for commercial operation during the succeeding sevenyear period, is set out in Annex 20, page 1, paragraph 2(a). NTPC's projectedearnings are based on the assumption that NTPC would supply bulk power at 400 kVto State Electricity Boards at a tariff level which would enable it to earn areasonable return on its investment. This was defined in connection withprevious credits and loan as being a tariff level sufficient to produce arate of return of not less than 9.5% on the book value of the average netfixed assets in service in FY1989 1/, and applied from the time of commis-sioning of the first generating unit in Singrauli in 1981/82 2/.
4.04 Several changes were necessary in, a number of assumptions underlyingNTPC's financial projections, because of: slippage in the commissioning datesof operating plant, release of GOI funds as equity capital in the earlieryears, followed by loan capital in later years and cost revisions in theoverall investment program. The effects of these changes are to:
1/ The first fiscal year in which all generating units at Singrauli wereprojected to operate at 5,500 hours a year.
2/ There are no requirements within India either statutorily or for commer-cial accounting purposes, to note fixed asset and depreciation data atcurrent price levels. The equivalent in real terms of a 9.5% rate ofreturn on an historic rate base in FY1989 is about 7.5%.

- 24 -
(a) increase the bulk selling price by 12% over the levelestimated at the Ramagunda appraisal, bringing it tojust over 29 paise/kWh;
(b) eliminate losses during the initial years of operation; and
(c) reduce by some 5% the overall cost of the investment program.
4.05 The income statement (Annex 17) shows the projected earnings per-formance for FY1982 through FY1991. Mainly because of a substantially reducedinterest charge, resulting from the revised financing arrangement referred toat paragraph 4.04, NTPC will become profitable in its first year of commercialoperation, FY1982. Earnings will rise rapidly thereafter, following the rapidcommissioning of plant from FY1984 through FY1989, and will reach the stipu-lated rate of return of 9.5% in FY1989, rising to 11.4% by FY1991. Internalresources will generously cover debt service requirements in the initial yearsFY1982-FY1986 and adequately thereafter.
4.06 The regulation of NTPC's annual earnings is a function imposed onGOI by the amendment to Section 75A of the Electricity (Supply) Act, 1948.Under the amendment, GOI is required to specify the quantum of annual surpluswhich should be earned so as to provide from internal resources a reasonablecontribution to capital investment, and to pay dividends on the equity capital.Under present assumptions, NTPC's internal resources would not be adequate tomeet these commitments until FY1988. During negotiations, GOI confirmed thatwhile NTPC's surplus would be regulated from the time NTPC became revenue earn-ing (FY1982) the appropriate amount of surplus would depend, in part, uponNTPC's future investment program at that time. It was thus premature to spe-cify a surplus at this stage. However, the 9.5% rate of return would beretained as a minimum requirement in FY1989 and thereafter.
4.07 As in earlier credits and loan, it has been restated for this pro-posed credit that NTPC would achieve in FY1989 and maintain thereafter arate of return not less than 9.5% on net fixed assets in operation, and toset tariffs from the time the first generating unit at Singrauli is commis-sioned, at levels not lower than estimated to achieve the required 9.5% rateof return in FY1989.
Taxation
4.08 NTPC is liable for income tax under the Indian Income Tax Acts.Because of the large capital expenditure program between FY1979 and FY1988liability to tax will not arise in the foreseeable future and a tax equaliza-tion reserve is not necessary.
Financing Plan FY1977-FY1987
4.09 The following table sets out the financing plan for the eleven-yearperiod FY1977 through FY1987 (the year during which the project is scheduledfor completion):

- 25 -
Table 4.1
Total TotalRs Million US$ Million x
Source of FundsInternal Cash Generation 6,426 765 14Less: Debt Service (3,083) (367) (7)
Deferred Charges (11) (1) -Working Capital Increase (579) (69) (1)
Net Internal Cash Generation 2,753 328 6Capital Raised:GOI Equity 21,959 2,614 48GOI Loans 13,413 1,611 29IDA Credits/IBRD Loan onlent /a 7,680 900 17Total 43,052 5,125 94
Total Sources 45,805 5,453 100
To Finance:Investment Program 45,805 5,453 100(incl. interest duringconstruction)
/a Includes the following:
Singrauli (Credit 685-IN) 1,290 150 3Korba (Credit 793-IN) 1,720 200 4Ramagundam (Credit 874-IN) 1,720 200 4Ramagundam (Loan 1648-IN) 430 50 1Second Singrauli ProposedCredit 2,520 300 5
7,680 900 17
4.10 The financing plan provides for the construction of the ongoingFirst Singrauli, Korba, and Ramagundam Projects, the proposed Second SingrauliProject, and the tentative Farakka Project together with the balance of thegeneration and transmission construction program, during the project construc-tion period. GOI is expected to request additional financial assistance forthe balance of the program. The cost of the proposed Second Singrauli Projectrepresents almost 18% of construction expenditure in the financing plan. GOIwould provide the capital required by NTPC in the form of debt and equity ina ratio not exceeding 1:1.
4.11 The proposed IDA credit of US$300 million would be relent to NTPCin accordance with an acceptable onlending agreement, as a condition ofeffectiveness of the credit. As in previous operations, the terms of theon-lending agreement would provide for final maturity in 20 years, includinga grace period of 5 years, and repayment of principal in equal semiannualinstallments, with interest payable on outstanding loans at 10.25% per annum.This is the rate of interest at which GOI currently lends to industrial andcommercial undertakings in the public sector, and compares with about 16%

- 26 -
charged by domestic lending institutions for similar types of lending. Theforeign exchange risk would be borne by the Government. GOI has invited KfWto assist in the financing Df th- Project It is likely that the latter willfinance the 2 .. 500 MW turbogenerators and associated equipment to the extentof approximately US$100 million. Assurances were obtained during negotiationsthat GOI will provide the balance of the capital needed to complete the projecton terms satisfactory to the Association.
4.12 IDA financing of the proposed Second Singrauli Project, US$300million, together with Bank Group financing of the first stage developmentof each of the Singrauli, Korba and Ramagundam stations, US$600 million, inaggregate US$900 million, represents some 40% of the total costs involved,excluding duties, taxes, and interest charged to construction.
Internal Cash Generation
4.13 The Source and Application of Funds Statement presented in Annex18 shows the rapid buildup of internally generated funds from the time NTPCbecomes revenue earning in February 1982. An unusually high debt servicecoverage of 9 times and 6 times in FYs1982 and 1983, respectively, is causedby the mainly equity financing in those years. Financing by means of loancapital in succ,eding years reduces the coverage ratio to a more balancedlevel reaching 1.7 times in FY1987, when the total Singrauli development wouldbe commissioned.
4.14 The level of internal cash generated is determined by the assump-tions made in the financial projections (Annex 20). Surplus funds arisein FY1988 and accelerate rapidly thereafter. It is reasonable to assumethat having reached a sat-isfactory level of financial viability, NTPC wouldbe expected to commence paying dividends on its equity share capital. Thisis a decision which will have to be made by GOI in due course, and will beinfluenced by decisions on whether or not to expand the activities of NTPCbeyond the current investment program. A decision could also be made to payoff GOI loans in advance of their maturity, thereby saving interest andimproving NTPC's profitability.
Future Finances
4.15 Forecast condensed balance sheets through FY1991 are presented inAnnex 19. The balance sheets reflect the build-up of the construction pro-gram, the commencement of commercial operations in February 1982, and thefinancing of NTPC's capital requirements by GOI through a combination of longterm borrowing and equity capital, so as not to exceed a debt/equity ratio of1:1, with equity being released initially followed by loan capital later.Table 4.2 below shows NTPC's projected financial position at three significantpoints in its development:
(a) at March 31, 1982 - end of year when NTPC becomes revenueearning;
(b) at March 31, 1987 - end of year following commissioning ofthe proposed Second Singrauli Project; and

- 27 -
(c) at March 31, 1991 - end of year in which the SingrauliStation (2,000 MW) would be operating 5,500 hours a year.
Table 4.2
As at March 31 FY1982 FY1987 FY1991--------Rs Million--------
Fixed Assets at Cost 2,453 29,530 48,275Less: Depreciation 1 1,866 6,748
Net Fixed Assets in Service 2,452 27,664 41,527Work-in-Progress 11,589 16,275 -
Total Net Fixed Assets 14,041 43,939 41,527
Short Term Deposits - - 5,207Working Capital 27 579 1,129Deferred Expenses 11 - -
Total Net Assets 14,079 44,518 47,863
Financed by:Equity Capital 13,812 21,959 21,959Retained Earnings 7 1,866 9,862
Total Equity 13,819 23,825 31,821
Long Term Debt 260 20,693 16,042
Total Capitalization 14,079 44,518 47,863
Debt/Equity Ratio 2/98 46/54 34/66
4.16 The above table shows that by March 31, 1982, just after the pointat which NTPC becomes revenue earning, total capitalization would be aboutRs 14,000 million (US$1,667 million), with a debt/equity ratio of 2/98.Five years later - end of FY1987, after the Second Singrauli Project wouldbe commissioned - total capitalization would have more than tripled to aboutRs 45,000 million (US$5,357 million) with a debt/equity ratio of 46/54. Over60% of the construction program will have been completed at this time. ByMarch 31, 1991, when the balance of the construction program would be completedand Singrauli station operating at 5,500 hours per year, capitalization wouldbe about Rs 48,000 million (US$5,714 million) with an improvement in the debt/equity ratio to 34/66. The improvement in the debt/equity ratio between FY1987and FY1991 reflects the assumed cessation of expansion and its associatedfinancing, combined with significant increases in the level of retained earn-ings, caused by improved profit volume. NTPC's authorized share capital wouldbe raised progressively during the period FY1981 through FY1987 (Annex 19) toreach a figure of about Rs 22,000 million (US$2,620 million). It is currentlyRs 3,000 million (US$357 million).

- 28 -
4.17 The level of working capital in NTPC's balance sheet assumes thatits customers (SEBs) would have credit terms of 30 days. Monthly billings
for energy sold would be running at the rate of almost US$3 million in FY1983,US$47 million in FY1987 and US$116 million in FY1991. Accordingly, delay in
payment of accounts by SEBs would adversely affect NTPC finances. This isnot regarded by NTPC as a serious problem because, under existing circumstancesin India, credit terms of less than 30 days for interstate transfers are com-
mon. In addition, penalties for late payment of accounts would be imposed.Further reference to this subject will be made during dialogue with GOI and
NTPC on the bulk tariff issue (para 4.19).
Borrowing Powers
4.18 The Companies Act 1956 (Section 293.1(d)) restricts borrowing byNTPC to within a sum equal to the aggregate of the paid up share capital andthe "free reserves" (i.e., those not set apart for a specific purpose) exceptwith the consent of the corporation in general meeting. During negotiationsNTPC agreed to inform the Association beforehand of any proposal to alter ormodify existing limitations on the borrowing powers of its Board of Directors.
NTPC's Bulk Tariff
4.19 This is a matter which was first discussed during the appraisal andnegotiation of the First Singrauli Project (Credit 685-iN). Since the first200 MW unit was not scheduled to come into commercial operation until earlycalendar year 1982, this matter has awaited the formulation by GOI and NTPCof the strategy for the sale of power from the central thermal power stations.The dialogue was resumed at negotiations of the Ramagundam Project (Credit874-IN and Loan 1648-IN) and continued during appraisal of the Second SingrauliProject. Subjects discussed included the regionalization of the bulk tariff;the form of contract with SEBs and REBs, covering operating practices, finan-cial requirements, arrangements for settlement of disputes; and the structureof proposed tariff. These matters are discussed in more detail in the follow-ing paragraphs.
Regional Tariffs
4.20 There appears to be a valid case for regionalizing NTPC's bulk tariffto better reflect the nature of the individual NTPC thermal power stations asintegral parts of regional power systems, at least until a national power
grid is established. This could be achieved in a manner compatible withNTPC's tariff covenant with the Association (para 4.07). If the total capitalbase at FY1989 was broken down over each of the four stations and operatingcosts and revenues for the various years similarly allocated, a bulk tariff
for each station in each region would emerge. This exurJis was undertakenduring appraisal and produced the following approximate bulk tariffs:

- 29 -
Paise/kWh 1/
Singrauli (Northern Region) 23Korba (Western Region) 31Ramagundam (Southern Region) 34Farakka (Eastern Region) 32Average (All Regions) 29
A comparison of the Singrauli bulk tariff with bulk exchange tariffs in theNorthern Region is contained in Annex 22.
Commercial Arrangements for Sale of NTPC Power
4.21 NTPC has prepared a draft contract for the sale of its power to itscustomers in the Northern Region (mostly SEBs). The draft explains the mannerin which power (including NTPC's) would be distributed to individual customersin the region through the Regional Load of Dispatch Centers, the commercialand financial arrangements for the sale of NTPC's power, and the arrangementsfor the settlement of disputes. During negotations, GOI confirmed that NTPC'sdraft contract was being examined in the context of a proposal to study thefeasibility of a common agency selling power from all central projects in aregion to SEBs at a common rate, so as to optimize operation of regionalsystems. The feasibility and the several technical, operational, commercialand institutional aspects of this proposal needed examination. Once a viewhad been taken on the concept of a pooled tariff for central generation in aregion, NTPC's commercial arrangements for the sale of its power would befinalized. It was recognized that this would need to be some months beforethe start of commercial operation of the first NTPC unit which was scheduledfor February 1982. Continuing dialogue would be maintained with the Associa-tion on this subject.
Tariff Level and Marginal Cost
4.22 At the present time, while no output will be sold by NTPC for sev-eral years to come, it is irrelevant to talk of marginal cost-based tariffsat 1979 levels. NTPC is not an existing expanding system, but has to betreated as the beginning of such a supply system. By definition, practicallyall costs of the system known in 1979 are future, marginal costs of supplyingincremental demand. In order to arrive at marginal costs in future years whenpower is actually sold, assumptions about the future expansion and operationof the system, and about inflation expectations have to be made (Annex 23,pages 1 through 5).
1/ While interest during construction has been calculated on a "totalcompany" basis, some inequities may emerge in allocating of the interestto individual stations, due to the fact that loans as distinct fromequity finance may have been allocated to specific plants, on a "firstin-first out" basis, whereas it might be more equitable to allocateinterest on an "average cost of capital basis". The figures above wouldrequire some adjustment if this were the assumption. Nevertheless theyare useful for purposes of illustration.

- 30 -
4.23 Assuming that capacity expansion investment will continue for the
foreseeable future in line with growing demand, and that, ultimately, NTPC
will be operating at the limit of its capacity, the estimates of marginal-cost-
based tariffs for 1984/85, the first year of operation of all four stationsrange from 35 to 37 paise/kWh (USJ4.1-4.4) as a one-part tariff, and Rs 935-1,022/kW/year (US$111-122) plus 9.3-11.2 paise/kWh (WScl.1-1.3) as a two-part
tariff 1/ (Annex 23, page 6). The discrepancy between these figures and the
financially justified tariff levels (para 4.20) is, of course, attributable
to the fact that present financial projections are based on investment
tapering off in the later years, while the marginal cost concept assumes
that additional investment will be necessary to accommodate any incremental
demand.
4.24 Notwithstanding the limitations of the marginal cost approach, it
will be necessary to consider it as an input into tariff construction in later
years, when marginal cost will start exceeding the financial tariff that is
planned to remain fixed in absolute terms throughout the projection period.
Any intention to expand NTPC operations after the late 1980's or an integra-
tion of NTPC capacity into a future national generating authority will have
to take into account the need to provide for future investment and to post
proper price signals to SEBs and consumers. By the mid-1980's, the time will
have arrived to adjust the bulk tariff upwards in line with marginal cost.
This will be particularly relevant for the Singrauli station (Northern Region),
where the projected financial tariff level would be as low as 23 paise/kwh
compared to a marginal-cost based tariff of 35 paise.
V. JUSTIFICATION
Project Definition
5.01 The proposed project 2/ is justified as the least-cost solutionavailable to meet part of forecast demand in the Northern Region within a
limited time frame.
Comparison of Alternatives
5.02 Given the existing and forecast power shortages in the Northernregion, the need for additional capacity in the shortest possible time is
urgent (para 1.31). This short-term capacity of the required size can only
be provided by thermal plant with a sufficiently short gestation period.Possible new hydro sites require extensive engineering studies, and those
hydro projects that could yield available capacity within a reasonable time
1/ Total capital cost recovered in fixed charge.
2/ For purposes of justification, the project is defined as the expansion by1,400 MW of the first 600 MW stage of the Singrauli thermal power station.

- 31 -
are designed to meet another part of future demand as part of the concurrentSEB investment plan. The justification of the complete 2,000 MW developmentat the time of appraisal of the first stage, was based on the fact that anyready hydro potential was already included to be developed in parallel withSingrauli. The nuclear alternative was excluded because of the long gestationperiod.
5.03 In continuation of the approach used in the analysis of realisticalternatives at the time of first stage appraisal, the only solution thatcould yield available energy at the same time as the incremental 1,400 MW ofSingrauli would be a combination of new smaller coal-fired plant and expan-sion of existing stations, undertaken by the regional SEBs individually.The theoretically most attractive solution to provide equivalent thermalcapacity quickly is the expansion of existing sites. Two obstacles to thisare evident in the Northern Region: (a) the expansion potential of existingstations is limited, or allocated to be developed concurrently with Singrauli;(b) the Singrauli expansion cost of about Rs 3.3 million/MW (in 1979 marketprices) (US$0.39 million) is lower than the average cost of installingscattered new capacity in the region, amounting to about Rs 3.7 million/MW(US$0.44 million).
5.04 The alternative consisting of smaller stations would encompass threenew sites (a pithead site in Uttar Pradesh near the Singrauli site, and twosites in Punjab and Haryana), and two expansions of existing stations (Kotain Rajasthan, and Badarpur for Delhi), with an aggregate capacity equal tothat of the proposed project. With the exception of the Uttar Pradesh site,all locations would require transport of coal. The largest station (630 MW)would supply Uttar Pradesh; the remaining stations range from 110 MW to 220 MW(Annex 24).
5.05 As the transmission cost included in the proposed project cost isdesigned to serve not only for the evacuation of Singrauli power, but alsofor other energy flows in the region, an allowance for some additional trans-mission investment has been made in the cost of the alternative solution.This includes not only the transmission necessary for the evacuation ofpower from the Uttar Pradesh pithead station, but also the "regional" element(Annex 25).
5.06 The costs of both the project and its alternative have been phasedto provide capacity and energy in the same pattern (Annex 29). All costs areexpressed in economic terms, i.e. in CIF/FOB prices where available and ad-justed by the appropriate conversion factors to border prices where necessary.Unskilled labor has been shadow priced at 75% of the market wage, skilledlabor at full market wage. The economic cost of coal has been derived fromproduction cost expressed in border prices (Annexes 26 and 27).
5.07 The present value of the cost stream of the project is lower thanthat of the alternative at any discount rate. The project, therefore, consti-tutes the least cost solution for satisfying the future 1,400 MW portion ofdemand in the Northern Region gradually from 1985 onwards. Annex 30 showsthe present values of the cost streams of the project and of the alternativeassuming opportunity cost of capital of 10% as the discount rate, with as a

- 32 -
sensitivity test a discount rate of 13%. The results show the advantage ofthe project over its alternative (Rs 1,075 million (US$128 million) at 10%discount rate, and Rs 792 million (US$94 million) at 13% discount rate). Thecost differentials in the base case increases slightly if the cc;t of capitalgoods is increased, and decreases slightly if this cost decreases. The costadvantage of the project rises with higher fuel cost.
Benefits
5.08 Quantification of economic benefits arising from the implementationof an expansion of generating plant integrated into an existing and growingsystem is not easily established. A two-stage approximation approach hasbeen adopted for the proposed project: (a) average retail tariffs in theregion have been assumed to represent a proxy for the minimum observed will-ingness of consumers to pay for power; and (b) in order to quantify any addi-tional consumer surplus beyond this minimum, the cost incurred by industryin maintaining and operating standby generating sets has been assumed torepresent a proxy for industrial consumers' willingness to pay for continuouspower supply (Annex 28).
5.09 Corresponding to the definition of benefits as willingness to payat the retail level, additional costs of transmission and distribution invest-ment as well as for operation and maintenance have been allocated to projectcost in line with the general regional incremental investment pattern. Thisadditional cost is net of the transmission element already included in theproject cost. The incremental amount of energy sold has been adjusted toaccount for system losses typical for the region (Annex 25).
5.10 The weighted average of tariff revenue at retail level in theNorthern Region has been established at 26.4 paise/kWh in 1979 prices, andconverted to border prices for purposes of the comparison with economiccost. The industrial tariff revenue is replaced by the observed averagewillingness to pay for continuous power supply. 1/ The minimum economicinternal rate of return is about 13%, rising to 16% if outages are morefrequent and standby sets utilized more (Annex 30).
5.12 The internal economic rate of return is likely to be considerablyhigher than the minimum quantifiable estimate of 13%, if the derived consumers'and producers' surplus of industrial, agricultural and commercial output madepossible by the alleviation of shortages is taken into account and if indirectbenefits accruing to the Indian economy would be fully considered. Benefitsaccruing to domestic consumers are understated by the use of the tariff asbenefit. The conclusion that can be drawn from the exercise using retailtariffs only, is that regional tariffs charged final consumers are slightlyinadequate to recover the incremental cost of the project.
1/ The average cost of grid supply together with the operation of dieselstandby generating sets during power outages has been established asabout 37 paisa/kWh as opposed to the weighted average regional industrialtariff of 25 paisa/kWh (22 paisa in economic terms), given typicalutilization rates of standby sets (Annex 28).

- 33 -
VI. AGREEMENTS REACHED AND RECOMMENDATION
6.01 During negotiations, the following issues were raised with GOI andsatisfactory agreement or assurances were obtained with regard to:
(a) preparation of a study for a long-term development plan(para 1.33);
(b) continuation of the 400 kV study (para 1.33);
(c) revival of the UNDP project to assist CEA in establishinga systems operation organization and developing and imple-menting programs for training staff (para 1.34);
(d) status of action programs of Northern Region SEBs and DESUto achieve rates of return of at least 9-1/2% on historicassets (para 1.41);
(e) provision of adequate coal supplies (para 3.10);
(f) import permission without Government review (para 3.11);
(g) provision of the balance of capital to complete the project,together with any additional funds which might be needed dueto cost overruns or other unforeseeable factors (para 4.11);and
(h) bulk tariffs (para 4.21).
6.02 During negotiations the following issues were raised with GOI andNTPC and satisfactory agreement or assurances were obtained with regard to:
(a) audit (para 2.18);
(b) appointment of consultants for the 500 MW units (para 3.08);
(c) appointment of consultants to review NPTC's project manage-ment systems (para 3.09);
(d) tariffs (para 4.07);
(e) the conclusion of an onlending arrangement between GOI andNTPC (para 4.11); and
(f) borrowing (para 4.18).
6.03 Subject to the foregoing assurances, the project forms a suitablebasis for a credit of US$300 million.

INDIA
SECOND SINGRAULI THERMAL POWER PROJECT
All-India-Sales and Energy Data for 1969/7 1, 1974/75, 1975/76, 1976177, 1977i70 and 1978/79
1969/70 1974/75 1975/76 1976/77 1977/78 1978/79
(Estimated
Installed Capacity (excl.non-utility plant (MW) 14,102 18,317 20,117 21,814 23,770 26,743
Electricity Generated (MW) 57,988 70,191 79,231 88,333 91,206 97,376
Electricity sold GW4 41,061 52,682 60,246 66,608 68,693 78,32
Electricity Generation per capita kWh 96.2 119.2 132.5 147.2 146.7 156.4
Electricity Consumption per capita kWh 76.0 89.9 100.3 111.0 110.9 118.7
Proportion of Sales (%)
Agricultural and Irrigation 9.2 14.5 14.5 14.4 14.5 15.1
Railway Traction 3.5 2.9 3.1 3.3 3.5 3.2
Industry 69.1 62.1 62.4 62.5 61.6 61.8
Commerce and Government 6.5 8.5 7.3 7.3 7.3 7.0
Dkues tic 8.ti 8.5 9.7 9.5 10.0 10.2
Other (Public Lighting, Waterworks etc.) 3.1 3.5 3.2 3.0 3.0 2.7
Average Annual Growth of Sales (%) 9.9 5.3 14.5 10.5 3.2 14.0
Losses as percentage of kWh sent out 16.8 20.5 19.4 19.7 19.6 19.9

.-- 35-
ANNEX 2Page 1 of 10 pages
INDIA
SECOND SINGRAULI THERMAL POWER PROJECT
Regional Demand and Supply (Northern Region)
1. Of all energy flows in the region, about 45% (including Bhakra/Beasshare distribution) are accounted for by inter-authority transfers. Similarly,about one-third of total capacity demand at peak is made available as inter-authority exchange (Annex 10).
2. Estimated total energy consumption in the region 1978/79 was20,062 GWh (at final consumer level); estimated maximum regional coincidentpeak demand during the same fiscal year was 4,796 MW. This represents alarge increase of 20% (3,347 GWh) in terms of energy, and an increase by 8%(356 MW) in terms of capacity over the previous year. The large jump inenergy sales can be explained by an exceptionally high availability level ofhydro capacity following a good monsoon, while 1977/78 had actually experienceda decrease in energy sales. The importance of the hydro element in the fluc-tuations can be observed in the fact that States heavily dependent on hydrogeneration (Punjab, Haryana, Jammu and Kashmir) have recorded energy saleincreases of up to 25%, while Uttar Pradesh with its predominantly thermalcapacity shows an increase of about 10%.
3. In March 1979, 49% of installed regional capacity consisted ofthermal plant, 3% of nuclear and 48% of hydro. The high dependence on hydrocapacity makes the region vulnerable to fluctuations in water levels, butalso provides it with desirable peaking capacity for future, shortage-freeyears. The degree of reliance on hydro varies within the region (ProjectFile Working Papers):
Share of hydro in theinstalled capacity (%) a/
Central SectorDelhi -Himachal Pradesh 98Haryana 67Jammu & Kashmir 83Punjab 70Rajasthan 60Uttar Pradesh 35
a/ Including shares of common hydro complex.

-36 -ANNEX 2Page 2 of 10 pages
4. Diversity within the Region is not very pronounced, the diversity
factor ranging from unity to 1.048 (Project File Working Papers)). By far,
the largest supplying authority is UPSEB, accounting for 40% of total
installed capacity, followed by Punjab with about 20% (including its hydro
share). In terms of firm available capacity at the peak, Uttar Pradesh also
provides 40%, while Punjab's share is about 18%. UPSEB's share of potential
unconstrained peak demand would be even slightly higher at 41% of the esti-
mated regional total. In 1978/79, the net imports of energy from outside
the region were negligible, mainly confined to minor local exchanges with
Madhya Pradesh and Bihar. In effect, therefore, the region operates as a
self-contained system.
5. The pattern of electricity consumption in the region shows a pre-
dominance of industry, but to a much lesser extent than the All-India average:
industry accounts for 52% of consumption, against a national average of about
62%. Agriculture, on the other hand, occupies a large share of consumption in
the region (26% as against a national average of about 15%, (Annex 3)). The
region, therefore, is subject to the disadvantages of high agricultural demand,
such as pronounced peaks in the daily load curve, low load factor, and high
system losses in distribution. Punjab, Rajasthan, and Uttar Pradesh are
States with a relatively high degree of industrial consumption, while the
other States show a more even split between industry and agriculture. Over
the period 1974-79, the pattern of consumption has remained approximately
constant, and no major changes in the composition of consumption are expected.
6. During recent years, installed capacity in the region has been
increasing at a rate of about 13% per year to reach 7,769 MW in March 1979.
Firm available capacity, however, has been increasing only at a rate of about
9% per year, falling to 62% of installed capacity from 73% in 1973/74. DESU
is the only supply authority in the region whose plant availability factor
has not deteriorated severely since 1976: rapidly rising installed capacity
is not reflected in similarly increasing ability to meet peak demand. An
increase in availability approaching 70% is expected for future years after
present difficulties with forced outages are overcome.
7. In terms of energy, consumption has been growing at approximately
14.5% per year for the five years up to 1978/79, with growth rates of up to
25% for years with good hydro availability. Growth of sales over time has
been uniform throughout the region. Energy available to be sent out, however,
has been growing only at a rate of about 13% during the same period: some
progress in reducing the high system losses is evident.
Future Development
8. By 1983/84, an additional 4,820 MW (plus 62%) are expected to have
been added to regional capacity installed in March 1979. 3,059 MW (63%) of
this increase will be accounted for by UPSEB and the Central Sector (mainly
NTPC) together. Presently available plans indicate a further increase of
about 3,000 MW between 1984 and 1988, and new capacity amounting to 665 MW
already sanctioned to come on stream after 1988. About 25% of total new

- 37 -
ANNEX 2Page 3 of 10 pages
capacity to be commissioned between 1980 and 1988 is attributable to theSingrauli development. About 70% of new capacity to be available by 1983/84will be thermal and nuclear thus shifting the regional balance somewhat awayfrom excessive dependence on hydro capacity. This trend is expected to con-tinue until 1988: new capacity in the region will be 75% thermal. Annex 2,pages 7-10 indicates the planned investment program at its latest status inJune 1979.
9. The basis for this capacity extension plan is the demand forecast-ing conducted in the form of the periodical comprehensive power surveys("Annual Power Surveys") by the CEA, and amended by deliberations of thePlanning Commission, SEBs, and National Development Council. At the time ofpublication of the tenth APS in 1977, it was envisaged that about 5,530 MWof an unconstrained potential peak load demand of almost 6,000 MW in 1978/79would be met. Actual estimated peak availability in that year, however, wasonly about 4,800 MW. All demand forecasts have now been scaled down by thePlanning Commission's Working Group: unconstrained potential peak loaddemand in 1983/84 is now estimated to be about 9,130 MW (a reduction by 10%from the tenth APS estimate), 8,320 MW of which are expected to be met byavailable plant. The anticipated capacity shortfall will be growing steadilyover the five years to reach more than 800 MW in 1983/84.
10. A possible variation in the forecast capacity and energy require-ment is introduced by consideration of future new industrial consumers andfuture agricultural demand. Differences of opinion on the extent of demandattributable to new high-voltage industries exist between the Planning Commis-sion, the APS, and the SEBs. Macro-economic considerations of the PlanningCommission have led to a reduction of the bulk provision for industries likelyto be licensed in the future. On the other hand, the SEBs' micro-economicforecasts are consistently higher than either the APS or the Planning Commis-sion estimates. Annex 2 page 10 illustrates the range of recent forecasts fortwo States in the Northern region (Uttar Pradesh and Rajasthan): the estimatefor potential unconstrained peak demand in 1983/84 ranges from 3,997 MW to4,957 MW for Uttar Pradesh, and from 1,186 MW to 1,600 MW for Rajasthan. Inthe years beyond 1984, the range increases. Correspondingly, the forecasts ofannual energy demand are spread over a wide range. The significance of thedisparity becomes clear in its effect on future shortages: the Working Group'sestimate for Rajasthan,, for example, forecasts a slight capacity surplus from1980/81 onwards; RSEB's estimates would result in continuing capacity short-falls. This is reflected in the tentative RSEB projections of new availablecapacity, which exceed the CEA's by about 260 MW until 1983/84.
11. Neither forecast can be based on recent data, all of which areconstrained by shortages. For planning purposes, the latest estimates of thePlanning Commission's Working Group, which are also the lowest so far, arebeing used (Annex 4). Further tentative projections of demand by the CEA,which are not universally accepted as of now, indicate a growth of potentialpeak load demand in the Region by about 11% per year, to reach about 15,350 MWby 1988/89. Similarly, the potential energy requirement is expected to growat a similar rate to about 80,000 GWh (Annex 5). Firmer forecasts will beavailable after the ongoing eleventh APS is finalized early in 1980.

- 38 -
ANNEX 2Page 4 of 10 pages
12. Resource constraints and slippage in implementation of projectsare expected to reduce the target of additional capacity installation:preliminary estimates envisage a figure of total capacity installed by1982/83 which is about 7% lower than anticipated by the Working Group.It is likely, therefore, that persistent shortages at peak times are goingto be more pronounced, and will continue well beyond 1984, even under thelowest assumption of demand growth.
13. The investment expenditure in the region necessary to reach thephysical targets for 1982/83 is estimated to be about Rs 43,935 million(US$230 million) for the fiscal years 1979/80 to 1982/83. The bulk (60%)of this expenditure will be allocated to Uttar Pradesh (including the NTPCSingrauli development), the State with the largest anticipated peak loadshortfall. About 60% will be attributable to generation, the remainder totransmission, distribution and rural electrification. Except for UPSEB,most States in the region will devote smaller percentages of their investmentto generation, reflecting the shifting of some of the responsibility forgeneration development from the States to NTPC (Annex 7).
Shortages and Restrictions
14. During 1978/79, only Punjab and some of the smaller supply areaswere relatively free of shortages. All other supply authorities had toimpose restrictions on unconstrained demand to avoid large-scale breakdownsat peak. In addition, the regional dependence on hydro generation leads tothe need to impose a maximum on the monthly energy consumption. UPSEB iscontinuing to impose the following major restrictions on its consumers:
(i) non-continuous industries do not get supply at the fourhours of evening peak;
(ii) many continuous industries suffer a 50% cut in capacityavailability and energy consumption; if they have atleast 50% captive capacity, the cut is 100%;
(iii) rural feeder lines are interrupted for 3 hours, 3 daysper week; and
(iv) commercial establishments business hours are limited to9 a.m. to 8 p.m.
It is notable that domestic and rural consumers are guaranteed almost con-tinuous supply, while industry is bearing the brunt of the shortages.
15. The other supply authorities resort to less drastic restrictionsof their industrial consumers' demand. The usual restrictions are the non-supply to industry during the evening peak (about 6 to 10 p.m.), and anoverall cut in monthly energy allocation by 5-10%. Rotation of supply toindividual rural feeders during the day is also widespread. In additionto these planned restrictions, ad hoc load shedding becomes necessary inthe case of local plant or distribution breakdowns.

- 39 -
ANNEX 2Page 5 of 10 pages
The Project in the Regional Context
16. As Singrauli capacity gradually comes on stream between 1981/82and 1986/87, shares of this capacity will be allocated to individual supplyauthorities. Fifteen percent of total capacity will remain unallocated tosatisfactory demand where needed on an ad hoc basis. UPSEB will be receiving50% of allocated capacity. Annex 6 illustrates the planned build-up of allo-cations of capacity and energy in the region. At the time of fully availableSingrauli capacity, the complete project (including the first 600 MW stage)will represent about 15% of regional potential unrestricted demand. In1983/84, the latest year for which accepted regional capacity forecasts areavailable, Singrauli capacity will be the equivalent of 8% of total regionalcapacity. If a high firm availability of the project is assumed, its shareof capacity actually available at peak rises to about 10-12%.
17. In terms of energy supplied to the Northern region grid from theproject, the Singrauli share of forecast unconstrained energy requirementwill be about 13% in 1988/89. In 1983/84, its share in the consumptionactually met is anticipated to be 5-6%.

INDIA
SECOND SINGRAULI THERMAL POWER PROJECT
Northern Region 1/Energy Exchanges Among Various Systems-
1978-79
(million Kwh)From
To Bhakra Dehar Pong BadarpurHydro Hydro Hydro Thermal RSEB DESU UPSEB PSEB HSEB HPSEB JKSEB Total
Delhi - - - 562.7 36.4 1,462.0 17.6 53.1 175.3 - - 2,307.1
Punjab 2,420.9 922.0 259.9 - 10.4 - - 967.0 30.5 70.9 9.8 4,691.4
Rajasthan 987.1 384.2 610.4 59.0 346.7 - - 63.5 - - - 2,450.9
U.P. - - - 48.0 29.4 - 11,058.6 86.3 - 33.5 - 11,255.8 .
Haryana 1,754.5 614.7 173.2 16.40 - 286.2 - 38.2 140.4 - - 3,023.6
Chandigarh 191.2 - - - - 14.5 3.5 - 0.3 209.5
J&K 125.9 - - - - - - 23.5 3.1 - 467.7 620.2
Himachal 154.9 6.7 - - 54.1 - 215.7
Pradesh
Nagal 935.0 -- - - - - - - - 935.0
Fertilizer
Beas/Sutlej 39.8 - - - - - - - - 39.8
Link
Salal - 13.1 - - - - - - - 13.1
Siul - - - 16.1 - - - - - - - 16.1
Transfer 161.7 80.7 40.5 - - - - - - - - 282.9
Losses
TOTAL 6,771.0 2,008.3 1,084.0 715.3 422.9 1,748.2 11,076.2 1,246.1 352.8 158.5 477.8 26,061.1 X
. .~~~~~~~~~~~~~~~~N 0
1/ Including supply from own capacity in own State. o
Source: CEA x

INDIA
SECOND SINGRAULI THERMAL POWER PROJECT
Northern RegionSchedule of Yearly Additions to Thermal
Generating Capacity
CAPACITY 1979-80 - 1987-88 (All figures in MW)
State Projects Installed Additions to Installed Capacity 1984/85-Capacity 1979-80 1980-81 1981-82 1982-83 1983-84 Total 1987/88
Haryana Panipat, Stages I, 5x110 110 - - 220 - 330 220II, IIIFaridabad, Unit 3 lx60 60 - - - - 60
Sub-Total 170 - - 220 - 390
Rajasthan RAPP, Unit 2(nuclear) 1x220 220 - - - - 220Kota 2x110 - 110 110 - - 220
Sub-Total 220 110 110 - - 440
Uttar Obra Extn. 3x200 200 400 - - - 600Pradesh Paricha 2xllO - - - 220 - 220
Anpara 3x210 - - - 210 420 630Narora (nuclear) 2x235 - - - - 235 235 235
4x110 - - - - - - 440Sub-Total 200 400 - 430 655 1685
Central Badarpur Extn. lx210 - - 210 - - 210Unit 5Singrauli 5x20 0 _ _ 200 400 - 600 1,400
Sub-Total +2x500 _ 410 400 - 810
GRAND TOTAL 590 510 520 1050 655 3325 2,295 |-.4
0
Source: HECO, CEA0)

Northern RegionSchedule of Yearly Additions to Hydro
Generating Capacity
1979-80 1987-88 (All figures in MW)
State Project Type* Installed Additions to Installed Capacity 1984/85-Capacity 1979-80 1980-81 1981-82 1982-83 1983-84 Total 1987/88
Himachal Bassi Extn. R lx15 15 - - - - 15Pradesh Andhra R 3x5 - - - 5 10 15
Binwa R 2x3 - - - 6 - 6Rongtong R 4x0.5 - - - 2 - 2Bhabar 3x40 - - - - - 120
Sub-Total 15 - - 13 10 38 1
Jammu & Lower Jhelum, R lx35 35 - - - - 35Kashmir Unit 3
Punjab Shannan Extension R lx5O - 50 - - - 50Anandpur Sahib ROR 4x33.5 - 33.5 100.5 - - 134Mukerian ROR 6x15+6x - - - 15 69 84 123
Sub-Total 19.5 35 83.5 100.5 15 69 303
Rajasthan Mahi I R lx25+1x45 - - 25 45 - 70Mahi II R lx25+1x45 - - - 25 45 70
Sub-Total - - 25 70 45 140
Uttar 1/ Yamuna II(Khodri) R 4x30 - - 90 30 - 120Pradesh - Maneri Bhali I R 3x30 - - 90 - - 90
Garhwal Rishi- RO1, 4x36 36 108 - - - 144kesh (Chilla) C mVishnu Prayag 3x65.5 - - - - - 196.5
Sub-Total 36 0 30

Northern RegionSchedule of Yearly Additions to Hydro
Generating Capacity
1979-80 1987-88 (All figures in MW)
State Projects Type* Installed Additions to Installed Capacity 1984/85-Capacity 1979-80 1980-81 1981-82 1982-83 1983-84 Total 1987/88
Central Baira Siul R 3x60 60 - 120 - - 180Sector Salal 3x115 - - - - - - 345
Common Dehar Extn. R 2x165 - - - 165 165 330Projects Pong Extn. RIC 2x60 - - - 120 - 120
Sub-Total - - - 285 165 450
GRAND TOTAL 146 191.5 425.5 413 289 1465 784.5
* RIC Reservoir stations with Irrigation Control
R Reservoir stations without Irrigation Control
ROR Run of the River Stations
1/ After 1988: Tehri Hydro: 600 MW, Vishnu Prayag Hydro: 65.5 MW
0Source: HECO, CEA
CD
CQ

-44 ANNEX 2Page 10 of 10 pages
INDIA
SECOND SINGRAULI THERMAL POWER PROJECT
Comparative. Demand Forecasts forUttar Pradesh and Rajasthan
.Uttar Pradesh Rajasthan10th APS (77) PCWG (79) UPSEB (79) 10th APS (77) PCWG (79) RSEB (79)
Peak Load (MW)
1979/80 2,859 2,421 3,234 864 747 961
1980/81 3,190 2,738 3,577 973 841 1,079
1981/82 3,639 3,090 4,003 1,115 943 1,223
1982/83 4,042 3,568 4,498 1,253 1,061 1,425
1983/84 4,457 3,997 4,957 1,409 1,186 1,600
1988/89 7,474 6,940 8,500 2,416 2,038 n.a.
1995/96 14,745 n.a. 17,746 4,770 n.a. n.a.
2000/01 n.a. n.a. 29,400 n.a. n.a. n.a.
Energy Require-ment (GWl;)
1979/80 14,935 12,682 17,127 4,6300 4,000 4,760
1980/81 16,605 14,293 18,854 5,221 4,488 5,392
1981/82 18,950 16,080 21,112 5,955 5,031 6,214
1982/83 20,963 18,059 23,459 6,695 5,624 7,370
1983/84 23,082 20,310 25,781 7,503 6,300 8,414
1988/89 38,890 36,113 43,427 12,930 10,906 n.a.
1995/96 77,500 n.a. 89,084 25,700 n.a. n.a.
2000/01 n.a. n.a. 146,715 n.a. n.a. n.a.
S>ource: APS, GOI estimates, UPSEB, RSEB
n.a. pnot available
*Note: APS - Annual Power SurveyPCWG - Planning Commission Working Group

INDIA
SECOND SINGRAULI THERMAL POWER PROJECT
Northern RegionSales & Energy Data for 1974-75 - 1978-79
Delhi
1974-75 1975-76 1976-77 1977-78 1978-79(Provi- (est.)sional)
Electricity Sold (GWh) 1,420 1,447 1,608 1,707 1,925
Proportion of Sales (%):
Agriculture & Irrigation 0.4 0.4 0.3 0.3 0.5
Railway Traction 0.0 0.0 0.0 0.0 0.0
Industry 33.6 34.0 35.1 36.6 37.4
Commercial & Government 21.7 23.0 22.9 21.8 21.8
Public Lighting 5.4 2.6 2.8 2.9 2.9
Domestic 31.0 32.4 32.0 31.7 30.6
Public Waterworks, Drainage etc. 7.9 7.6 6.9 6.7 6.8
Average Annual Growth of Sales (%) 6.1 1.9 11.1 6.2 12.8
Losses as % of the units sent out 9.8 16.3 15.6 NA NA
mlb
Source: Commercial Directorate, CEA. w
OQ0)

Northern RegionSales & Energy Data 1974-75 - 1978-79
Haryana
1974-75 1975-76 1976-77 1977-78 1978-79(Provi- (est.)sional)
Electricity Sold (GWh) 1,239 1,602 1,866 1,892 2,333
Proportion of Sales:
Agriculture & Irrigation 42.6 37.1 38.6 35.4 38.6
Railway Traction 0.0 0.0 0.0 0.0 0.0
Industry 42.0 48.5 47.0 49.0 47.1
Commercial & Government 6.2 5.5 5.5 5.8 4.9
Public Lighting 0.4 0.4 0.4 0.4 0.3
Domestic 7.4 7.4 7.4 8.3 7.9
Public Waterworks, Drainage etc. 1.4 1.1 1.1 1.1 1.2
Average Annual Growth of Sales (%) -11.6 29.3 16.5 1.4 23.3
Losses as % of the units sent out 24.4 23.2 21.5 NA NA
Source: Commercial Directorate, CEA.
(D M
r'o 0F-h
Ln
oq;b
0q

Northern RegionSales & Energy Data 1974-75 - 1978-79
Punjab
1974-75 1975-76 1976-77 1977-78 1978-79(Provi- (est.)sional)
Electricity Sold (GWh) 2,219 3,380 3,585 3,434 4,180
Proportion of Sales (%):Agriculture & Irrigation 31.4 26.5 27.1 31.9 31.1
Railway Traction 0.0 0.0 0.0 0.0 0.0
Industry 53.8 60.6 59.4 51.9 53.8
Commercial & Government 5.5 5.0 5.2 6.1 5.34s-
Public Lighting 0.3 0.3 0.3 0.3 0.3
Domestic 8.9 7.4 7.8 9.6 9.1
Public Waterworks, Drainage etc. 0.1 0.2 0.2 0.2 0.4
Average Annual Growth of Sales (%) -20.0 52.3 6.1 - 4.2 21.7
Losses as % of the units sent out 19.1 15.1 17.5 NA NA
Source: Commercial Directorate, CEA.
o
sn
a,OQfb02

Northern RegionSales & Energy Data 1974-75 - 1978-79
Rajasthan
1974-75 1975-76 1976-77 1977-78 1978-79(Provi- (est.)sional)
Electricity Sold (GWh) 1,560 1,821 2,107 2,255 2,700
Proportion of Sales (%):
Agriculture & Irrigation 22.2 19.4 20.4 19.3 22.2
Railway Traction 0.0 0.0 0.0 0.0
Industry 56.4 60.0 58.8 59.4 63.0
Commercial & Government 8.2 8.2 8.8 8.3 4.8
Public Lighting 0.8 0.8 0.7 0.8 0
Domestic 6.9 6.6 6.4 7.1 6.7
Public Waterworks, Drainage etc. 5.5 5.0 4.9 5.1 2.6
Average Annual Growth of Sales (%) 17.5 16.7 15.7 7.0 19.7
Losses as % of the units sent out 30.6 25.8 24.5 NA NA
Source: Commercial Directorate, CEA.
oq z:O L
o L)
rD

Northern RegionSales & Energy Data 1974-75 - 1978-79
Uttar Pradesh
1974-75 1975-76 1976-77 1977-78 1978-79(Provi- (est.)sional)
Electricity Sold (GWh) 4,682 5,925 7,072 6,760 8,147
Proportion of Sales (%):
Agriculture & Irrigation 26.3 28.7 26.2 30.4 28.2
Railway Traction 3.9 3.7 3.7 4.5 4.3
Industry 54.2 47.1 56.5 51.0 54.0
Commercial & Government 4.0 8.2 2.2 2.1 1.1
Public Lighting 0.6 0.6 0.5 0.5 0.4
Domestic 9.3 9.8 9.5 10.1. 9.8
Public Waterworks, Drainage etc. 1.7 1.9 1.4 1.4 2.2
Average Annual Growth of Sales (%) 12.8 26.5 19.4 - 4.4 20.5
Losses as % of the units sent out 26.4 22.0 24.0 NA NA
Source: Commercial Directorate, CEA.
LJi
09I-tAn
GQw

-50- ANNEX 4
INDIA
SECOND SINGRAULI THERMAL POWER PROJECT
Northern Region
Power Supply Position 1976-77 - 1983-84
1976-77 1977-78 1978-79 1979-80
Installed capacity (MW) 5,629 6,654 7,769 8,505
Peak availability (MW) 4,288 4,440 4,796 5,479
Peak Load (MW) 4,288 4,440 4,796 5,868
Surplus/Deficit (MW) - - - (-)389
Energy availability (.UWh) 23,317 22,539 26,190 30,681
Energy requirement (CWh) 23,317 22,539 26,190 30,065
Surplus/Deficit (GWh) - - - 616
1980-81 1981-82 1982-83 1983-84
Installed capacity (MW) 9,207 10,168 11,645 12,589
Peak availability (MW) 6,085 6,850 7,593 8,318
Peak Load (MW) 6,538 7,294 8,205 9,130
Surplus/Deficit (MW) (-)453 (-)444 (-)612 (-)812
Energy availability (OWh) 35,009 39,195 44,213 48,453
Energy requirement (GWh) 33,578 37,451 41,700 46,500
Surplus/Deficit (GWh) 1,431 1,744 2,513 1,953
Source: GOI
* demand constrained by supply.

- 51 -ANNEX 5
INDIA
SECOND SINGRAULI THERMAL POWER PROJECT
Northern RegionTentative Demand Forecasts
1984-85 to 1988-89
1984-85 1985-86 1986-87 1987-88 1988-89
Peak Load (MW)
Haryana 1,352 1,509 1,682 1,878 2,090
Himachal Pradesh 171 195 222 253 288
Janmu & Kashmir 329 376 430 490 557
Punjab 1,591 1,724 1,864 2,017 2,176
Rajasthan 1,322 1,475 1,646 1,832 2,038
Uttar Pradesh 4,409 4,943 5,537 6,207 6,940
Chandigarh 77 84 92 101 110
Delhi 805 863 966 1,055 1,150
TOTAL 10,056 11,189 12,439 13,833 15,349
Energy (GWh)
Haryana 6,479 7,244 8,091 9,030 10,068
Himachal Pradesh 878 1,000 1,137 1,291 1,464
Jammu & Kashmir 1,618 1,853 2,117 2,415 2,752
Punjab 8,642 9,351 10,108 10,917 11,779
Rajasthan 7,043 7,867 8,780 9,790 10,906
Uttar Pradesh 22,828 25,636 28,764 32,244 36,113
Chandigarh 375 412 452 494 540
Delhi 3,951 4,330 4,737 5,175 5,641
TOTAL 51,814 57,693 -64,186 71,356 79,263
Source: Provisional GOI estimates

INDIA
SECOND SINGRAULI THERMAL POWER PROJECT
Yearwise Capacity and Energy Allocation from the Singrauli Development
1981-82 1982-83 1983-84 1984-85 1985-86 1986-87 1987-88 1988-89 1989-90 1990-91
I. Capacity (MW)
Delhi 8 24 58 58 104 150 - -
Punjab 12 36 84 84 142 200 - - - -
Haryana 12 36 84 84 142 200 - - - -
Rajasthan 18 54 124 124 212 300 - - - -
U.P. 50 150 350 350 600 850 - - - -
Unallocated 100 300 300 300 300 300 - - - -
NORTHERN 200 600 1,000 1,000 1,500 2,000 - - - -
REGION
II. Energy (GWh)
Delhi 3 39 119 224 385 587 714 791 821 825
Punjab 5 58 176 327 541 800 960 1,056 1,095 1,100
Haryana 5 58 176 327 541 800 960 1,056 1,095 1,100
Rajasthan 7 87 262 484 803 1,196 1,437 1,534 1,643 1,%50
U.P. 21 242 734 1,363 2,270 3,383 4,070 4,488 4,654 4,675
Unallocated 42 484 1,050 1,474 1,650 1,650 1,650 1,650 1,650 1,650z
NORTHERN 83 968 2,517 4,199 6,190 8,416 9,791 10,625 10,958 11,000REGION
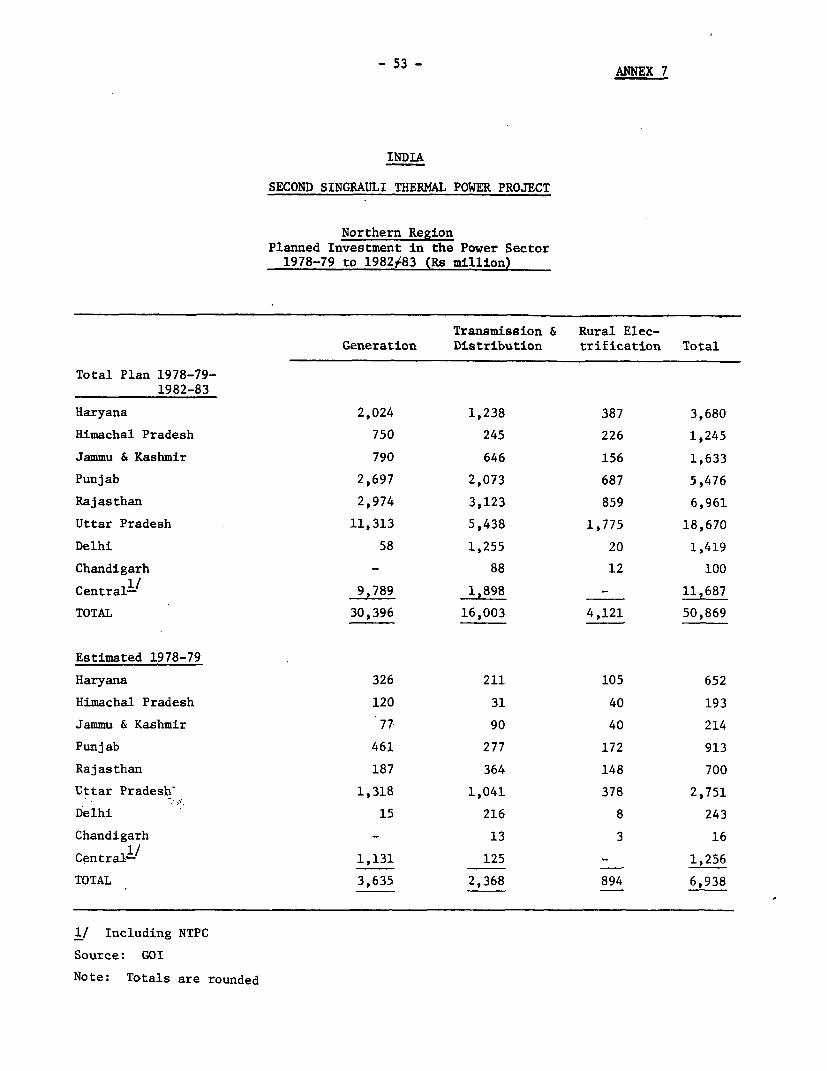
-53- ANNEX 7
INDIA
SECOND SINGRAULI THERMAL POWER PROJECT
Northern RegionPlanned Investment in the Power Sector1978-79 to 1982f83 (Rs million)
Transmission & Rural Elec-Generation Distribution trification Total
Total Plan 1978-79-1982-83
Haryana 2,024 1,238 387 3,680
Himachal Pradesh 750 245 226 1,245
Jammu & Kashmir 790 646 156 1,633
Punjab 2,697 2,073 687 5,476
Rajasthan 2,974 3,123 859 6,961
Uttar Pradesh 11,313 5,438 1,775 18,670
Delhi 58 1,255 20 1,419
Chandigarh - 88 12 100
Centrall/ 9,789 1,898 - 11,687
TOTAL 30,396 16,003 4,121 50,869
Estimated 1978-79
Haryana 326 211 105 652
Himachal Pradesh 120 31 40 193
Jammu & Kashmir 77 90 40 214
Punjab 461 277 172 913
Rajasthan 187 364 148 700
Uttar Pradesh 1,318 1,041 378 2,751
Delhi 15 216 8 243
Chandigarh - 13 3 16
Central/ 1,131 125 - 1,256
TOTAL 3,635 2,368 894 6,938
1/ Including NTPC
Source: GOI
Note: Totals are rounded

- 54 - ANNEX 8
Page 1 of 5 pages
INDIA
SECOND SINGRAULI THERMAL POWER PROJECT
Suggested Terms of Reference for a Study to Preparea Least-Cost Power Development Program
Introduction
1. With the rapid growth of the power sector, the increasing size ofpower plants and the resultant complexity of operation, it has become neces-sary to extend the perspective of power development both geographically andwith regard to the considered period, in order to avoid possible unjustifiedinvestments in the future and the occurrence of chronic gaps between demandand supply.
2. These Terms of Reference outline the scope of a study to be under-taken by the Central Electricity Authority (CEA) (with possible technicaladvisory services if consicdered necessary), aimed at preparing a least-costpower development strategy for the country for the next twenty years, initi-ally for the period 1980-2000. The study should be updated periodically(say, every two years) to reflect the current trends in the country's economicdevelopment. It would thus become a basis for investment decisions for eachfive year plan and within the context of a long-range least-cost nationalprogram. The study should include, inter alia, detailed demand forecasts.investigations of power generation schemes to meet load growth requirementsefficiently, development o:. primary grid configurations, coordination of thepower sector with plans for other sectors, resources requirements, and recom-mendations on responsibilities and operational policies at the state, regionaland national levels.
Existing Facilities
3. The study should review the existing power facilities in the countryand those under construction, by state and region, including a general descrip-tion of the supply stations, power and energy capabilities, equipment types,transmission line voltages and configuration, power system characteristicssuch as load flow, short circuit and stability considerations, and facilityretirement schedules. A survey should be made of the present capacities ofthe generating, transmission and distribution systems in each state/region,as a basis of determining future system expansion requirements. This shouldinclude a critical analysis of the availability and capacity utilization ofthermal power plants in the public sector with possible targets for improvingthe situation, and necessary measures to reach these targets. The types andsizes of generating capacities in the private sector should be included sothat data are available on the overall power sector.

- 55 -
ANNEX 8Page 2 of 5 pages
Existing Power Market
4. The historic power market should be reviewed by state/region,covering at least ten years, i.e., 1970-80, divided into the various consumercategories with special emphasis on large industrial loads. System energylosses should be reviewed by state/region, and losses should be broken downin those attributable to station auxiliaries, transmission losses, distri-bution losses, unpaid electricity, etc. The pattern and trend of monthlypeak (kW) and energy (kWh) demands should be studied and any unsatisfieddemand, peak and/or energy, should be estimated.
Load Forecast
5. Load forecasts should be made, building on the framework of the"Annual Power Surveys" for the period 1980-2000, including, if necessary,monthly forecasts in regions where hydro energy availability in criticalwater years may influence the development program. Appropriate methodologyshould be used, including extrapolation of statistical data, regressionmodeling using the relationship between electricity consumption and appro-priate independent variables such as gross domestic product, analysis ofurbanization and electrification trends, projected population growth, satu-ration of present market, consideration of the sales impact of expectedfuture tariffs, review of trends in reduction of losses and unpaid consump-tion, and a survey of expected major industrial consumers and other economicdevelopment plans with consideration of possible delays in implementationschedules. The forecast for each state/region should be developed on anenergy basis, thereafter determining peak demand based on the expected evolu-tion of the system load factor. To allow for data uncertainties, a range offorecasts should be developed (i.e., "high," "low," "most likely") and thebasis of each and its probability should be explained.
6. The regional load forecasts should be combined into a nationalforecast with appropriate consideration of any possible diversities betweenregions.
Energy Resources
7. The country's known energy resources--coal, oil, gas, hydro, nuclearfuels should be reviewed giving all available data including location, sizeof field and reserves, available energy and capacity in the case of hydrosites, ownership, present production, national market, future productionschedules, refinery plans, economic costs, etc. An assessment should bemade of the alternative uses of these resources, e.g., in the case of naturalgas, use as feedstock for fertilizer or petrochemical production.
Least-Cost Regional Programs
8. Taking account of possible interconnections between states andregions (see para 14), all practicable alternatives should be consideredin the preparation of regional least-cost development programs, comprisingthe most beneficial combination of thermal, hydro and nuclear power plants.

- 56 -ANNEX 8Page 3 of 5 pages
9. The capital costs should be based on present (1979 or 1980) prices,excluding taxes, duties or interest during construction (which should beshown separately) without escalation. The capital costs should be separatedinto civil works, electromechanical works, engineering, administration (forowners's costs associated with project execution) and physical contingencies.All costs should be expressed in CIF/FOB prices or their equivalent. Capitalcost estimates should be prepared for the hydro sources that are known fromthe results of the available studies and for thermal alternatives from recentfeasibility studies.
10. Recurrent operation and maintenance costs (except fuel) should alsobe based on present prices, without allowance for future inflation. The fuelrequirements of the alternatives considered should be valued at their oppor-tunity cost, e.g., coal at its incremental cost of production; crude oil. atimport or possible export price; residual fuel oil at the import price (orexport price, if to be supplied from local refineries), and natural gas at itseconomic value if not used for electricity production.
I1. Other shadow prices should be used wherever appropriate in costingthe alternatives (e.g., for valuing unskilled labor).
12. least-cost development programs should be prepared for each regionbased on a common reliability standard say, a capacity reserve from a lossof load probability analysis (LOLP) using the discounted cash flow method tocompare alternative programs for the period 1980-2000. The comparison ofthe alternative programs should include all relevant transmission costs wherethese may change with alternative programs.
13. The discounted cash flow comparison should be based on a 10%opportunity cost of capital with sensitivity testing in the range of 8 to 13%.Sinking fund residual values, if any, of the capital costs at the end of thediscount period should be deducted. Changes in plant scheduling and possiblechanges in plant mixes through adoption of the "high" or "low" load forecastsshould be expected. Sensitivity testing should also be conducted for changes,over the range of possible values, in capital costs, and operating and main-tenance costs.
Regional Interconnections
14. It is expected that within the 1980-2000 study period, interconnec-tion of most, if not all, of the state/regional systems may become feasible.The regional programs should, therefore, be restudied assuming various inter-connections to consider the benefit obtained through reduction of generatingcapacity reserves, complementary operation of hydro and thermal sources,increased energy capability if some hydraulic diversity exists, more rapidabsorption of major new sources, increased availability and utilization ofexisting capacities, etc. For this purpose the relative merits of differenttransmission voltages should be compared to determine the most economicchoice of the next voltage level, including DC back to back ties, given theexpected long-term development of the national power system.

- 57 -
ANNEX 8Page 4 of 5 pages
Organization of the Power Sector
15. The study should examine the present organization of the PowerSector, with the State Electricity Boards as principal agencies and therecently created national corporations, NTPC and NHPC, which are responsiblefor the construction and operation of large power plants. Recommendationsshould be made with regard to the long-term measures to be taken by theGovernment in the organization of the sector to reflect the structuralchanges in the power systems, from state level to region level and finallyto an interconnected national grid.
Constraints
16. Of major consideration in the study would be the financing ofgrowth in the electricity industry. The rate at which electricity consump-tion has been growing relative to GNP is much higher in India than is typicalin other countries, being about 2:1 as against 1:1 respectively. The abilityto mobilize resources to finance continued growth at this level is likely tobe a restricting factor to the development of the physical program. Anotherfactor which in the past has curtailed physical achievements is inflation.The study would need to review financial planning methodology currently usedby GOI in investment planning to recognize the existence of inflation. (Con-sidering the relatively long gestation periods of generation projects, resourceswhich have been earmarked for the physical program have to be diverted tofinance inflation of earlier projects unless additional resources can bemobilized.
17. Other points of reference would be:
(a) Sources of resource mobilization. There is need to increasethe internal resources generated by the SEBs so as to relievethe burden of financing of the power sector from generalrevenue sources.
(b) Need for efficiency in operations of SEBs--improved organi-zational structure and management, and more efficient useof existing plants.
Study Results
18. The study results should show the least-cost national program,region by region, and combination of regions where interconnection isrecommended within the period 1980-2000, based on a rational discount rateand the "most likely" load forecast. A full explanation of the impact ofthe various sensitivity tests should be given, including related recommenda-tions in cases where substantial savings or increases in reliability couldbe made by small changes in the base assumptions.
19. The schedule of projects and their costs comprising the least-costprogram for the period 1980-2000, together with the year-by-year investments(at least until 1995), should be shown for each region and combined into a
- 58 -
ANNEX 8Page 5 of 5 pages
national total (including estimates for the private sector), with appropriateregional investments for transmission and distribution, to provide the overallpower sector investment requirements.
20. The study results should include proposals for the organization ofthe Power Sector, the phases of its implementation and for increasing of
sector efficiency.
21. The results should be compared to the investment program presentlyplanned or under construction for the initial part of the study period. The"ideal" schedule of projects as resulting from the study should be reviewedin the light of projects under implementation that might not be fully con-sistent with the study results. Similarly, "second-best" scenarios shouldbe prepared taking into account the resource constraints.

- 59 -ANNEX 9Page 1 of 2 pages
INDIA
SECOND SINGRAULI THERMAL POWER PROJECT
Financial Position of the State Electricity Boards
1. The problems associated with the SEBs' financial position have beenthe subject of continuing dialogue with GOI. Under previous transmissionCredits/Loan, the beneficiary SEBs undertook to achieve and maintain rates ofreturn of 9-1/2% (on a rate base stated at actual cost), in some cases on agraduated basis, in order to take account of particular circumtances. (SeeAttachment 1). In all cases the 9-1/2% rate was to be achieved by FY1979.Results have been moderately successful, with a wide variation in performanceas between SEBs. By FY1977, seven out of the sixteen major SEBs achievedtheir target rates of return, with a further two SEBs reaching their targetsin FY1978 with the help of rural electrification subsidies from their StateGovernments under the conditions of eligibility for the second rural electri-fication project (Credit 911-IN). Uttar Pradesh SEB is expected to reach9-1/2% in FY1979 mainly due to State Government rural electrification subsi-dization commencing in that year, again under eligibility criteria of Credit911-IN. The other six SEBs, while not reaching the stipulated return, showedimproving trends up through FY1977. However, the results generally deterio-rated during FYs1978 and 1979 to leave seven out of the sixteen major SEBsin a position of default on their rate of return undertakings with theAssociation. This group included two Northern Region SEBs, Haryana andRajasthan, and the DESU (recipients of Singrauli power).
2. The main reason for the poor financial performance of some of theSEBs was that tariffs have not kept pace with increases in operating coststhus not ensuring that a healthy ratio between operating income and capitalbase is maintained during periods of expansion. Other factors which haveadversely affected financial performance were: low availability of plant andof power imports from neighboring state systems, and increased cost of theseimports because of a higher proportion of expensive thermal power where pre-viously cheaper hydro power was available. It can be justifiably argued thatthe situation faced by some SEBs did not constitute "normal circumatances"and that the achievement of covenanted rates of return could not be realistic-ally expected.
3. During appraisal, financial plans for the restoration of rates ofreturn to at least 9-1/2% were discussed with the SEBs and the DESU of theNorthern Region and found acceptable. These plans either have been imple-mented or are under implementation and consist of: tariff increases rangingfrom 10-14%, rationalization of manpower requirements, improving generatingefficiency, reduction in line losses, improved billing and collection proce-dures, and introduction of other cost reduction measures. In the case ofHaryana, plans include the commencement of subsidization of rural electrifi-cation losses by the State Government.

-60 - ANNEX 9
Page 2 of 2 pages
4. The financial provisions of the Electricity (Supply) Act, 1948,have been recently amended to put the operations of the SEBs on a more com-mercial basis by enabling them to generate internally a reasonahie (consideredby CEA to be 20-25%) contribution to their capital investments. Under theAmendments (Section 59 (1)), the State Governments are now required to specifythe level of annual surplus which should be earned by their SEBs to enablethem to comply with the amended legislation. The manner in which this willbe achieved is a subject which has been under evaluation by both the StateGovernments in conjunction with their SEBs, and by the finance panel of theRajadhyaksha Committee. Complex issues are involved which will require"tailoring" by each State Government to meet the particular circumtances ofits SEB, while at the same time giving due consideration to State resourcesand impact on consumers. CEA has issued guidelines to the State Governmentsand the SEBs explaining these issues and pointing out the measures that needto be taken by each of them and the options which are available.
5. The guidelines emphasize the following aspects:
(i) special steps to increase sales volume;
(ii) economies in both operating costs and capitalexpenditure;
(iii) more efficient asset utilization;
(iv) timely commissioning of new projects;
(v) reduction in line losses;
(vi) improved financial management;
(vii) tariff revisions to reflect cost of supply;
(viii) capital structure adjustemnts - SEBs may now receivefunds from the State Government in the form of sharecapital, and State Government loans may now be con-verted into share capital;
(ix) disposal of arrears of State Government loaninterest; and
(x) basis for charging depreciation of fixed assets.
6. Because of the far reaching consequences of the above measures, the
State Governments and their SEBs are awaiting the findings of the RajadhyakshaCommittee before implementing financial policies to give effect to the finan-cial amendments of the Electricity (Supply) Act 1948.

INDIA
Second Singrau i Thermnal Power Project
Rates of Return !:/of SEBs FY 1976 - FY 1980
FY 1976 | F1977 FY 1978 FY 1979 FY 1980
(Actual) (Actual) (ActuAl) (Estimated) (Ehxpectation)
Return to Return inc. Return to Return incl. Return to Return incl. Return to Return incl. Return to Return incl.
SEBs SEB State Dutiea SEB State Duties SEB State Duties SEB State Duties SEB State Duties
. % q .% % % %
Andhra Pradesh 7.7 7.7 9.0 9.0 9.5 9.5 9.5 9.5 t 9.5 9.5
AsawA 6.4 7.4 12.3 13.5 10.4F 11.5F 2.0 3.4 "'A NA
Bihar 7.0 8.5 8.1 9.5 8.0 9.4 1.8 2.6 I.b 2.b
Gujarat 7.9 11.0 9.7 13.9 9.5 13.5 I 9.5 13.5 9.5 13.3
Haryana 7.2 11.4 6.4 10,9 6.6 10.6 10. OA 14.4A 9.5 13.5
Maharashtra 10.0 11.5 13.0 14. 5 15.3 16.8 14.2A 15,7A 9. 5 11.0
Punjab 7.4 10.1 8.2 11, 9. 5 11.9 9.5A 11,9A 9 . 11.6
Rajasthan 8.7 9.9 9.2 10,5 '7.9 9.0 i 8.6 9.6 9.5 10.5
Uttar Pradesh 4.6 5.4 5.8 6.6 o.s 1.6 9.5 10.1 9.5 10.1
West Bengal 6,o 8.0 9.5 11.1 9.8 11.0 9.5 11.1 7 0 8.5
Delhi ESU (14.7) (9.6) 7.6 12.9 7.6 14.7 8.6 18.5 S.5 15.4
Kerala 5.9 8.1 8.5 10.5 8.0 9.9 7.5 9.5 8.7 10.7
Madhya Pradesh 12.8 15.4 13.1 15.3 14.7 16.7 11.2 13.2 9.5 11.5
Karnataka 10.0 14.9 15.8 20.7 8.3F 12.6F 7.1 11.0 NA NA
Orissa 5.8 9.1 6.3 9.9 4.8 9.1 4.9 9.9 4.9 9.7
Tamil Nadu 9.7 10.4 9.5 10.3 9.5 10.3 9.5 10.2 9.5 10.2
INDEX
F = ForecastA = Actual :L
NA = Not Available 8
I/ Target rate of return in general is 95,%. When this was established in 1964. it was also conceived that an averape eZr is txY or duty eao;val.nt +o a .+,-r of 1 5 1 would *b- H
applied, making the total expected return 11%. Effective March 1978, GGI has levied am additional excise tax of 2 paise/kWh of generation which is not included ebore. TS
would add an estimated 2-3 percentage points to tbe returns noted.

- 62 -
ANNEX 10Page 1 of 2 pages
INDIA
SECOND SINGRAULI THERMAL POWER PROJECT
Ministry of Energy (Department of Power)No. 31 (33)/78-US. V
New Delhi, November 27, 1978
Terms of Reference of the "Rajadhjaksha Committee" on Power
Power Planning
1. Evaluate the methodology adopted for the present power survey anddemand forecast being made by the Central Electricity Authority; examine theintroduction of concepts of energy management in the power industry; critic-ally examine the thermal-hydel-nuclear mix for power development in thenational regional contexts and the time frame in which such plans are made;examine other aspects of power planning including institutional changesinterstate linkages in power, the role of central generation and RegionalElectricity Boards; and the problems of funding the massive investments inthe power sector; study the need for and policy regarding captive powergeneration.
Project Formulation and Implementation
2. Review the approach by the State and Central organizations informulating projects examine the procedures and evaluation criteria adoptedby the CEA for approving them; examine the need and scope for standardizationof project design especially in thermal and transmission projects; examinethe procedures/agencies fcr implementation of major projects with a view toreducing/eliminating the delays and cost overruns; identify the more commonconstraints in execution; and propose measures to remove them, includingtraining in project implementation and monitoring systems, and availabilityof power equipment for generation, transmission and distribution; also studythe institutional/organizational framework in this regard.
Operation and Maintenance
3. Review the operational efficiency (including outages, renovationschemes and maintenance standards of present equipment) of power stationsand the state grids, and suggest ways and means of improvement; suggestmethods for the optimum utilization of present installed capacity includingthe flattening of the load curve by restructuring demand patterns, incentives,etc., identify shortcomings in the training institutions/programs beingprovided for power plant operators and evolve appropriate systems of trainingnorms for operations and maintenance personnel.

- 63 -
ANNEX 10Page 2 of 2 pages
Organization and Management
4. Study the organization of State Electricity Boards afid other Centralbodies in the Power Sector (including Central Undertakings) and suggest waysand means for increasing their effectiveness/efficiency; also examine theneed for creation of new organizations to fill specific gaps; examine theexisting legislation with regard to the adequacy of its provision for theproper organization of the State Electricity Boards; evaluate the recruitmentand selection procedures of these organizations training schemes and alsothe extent of professionalization achieved so far; evolve guidelines for theappropriate relationship between Electricity Boards and the State/centralbodies.
Finance, Financial Management and Tariffs
5. Study in depth the financial working of Electricity Boards andother generation and distribution organizations; study the existing legisla-tive framework to make the Boards financially viable and make recommendationsin this regard; examine ways and means of funding needs of the power sectorboth at State and Central levels and suggest changes required in this regard;examine procedures for capitalization of interest charges during constructionand principles regarding the depreciation of assets, cost accounting methodsand related issues; study the tariff structure in the various States, includ-ing matters relating the concession given to certain classes of consumers;examine the desirability for adopting of marginal cost pricing in India inthe light of experience in other countries; study the problems encounteredin interstate sales of power, and suggest institutional and other changes.
Rural Electrification
6. Evaluate the progress achieved so far by the rural electrificationprograms in meeting its stated social and economic objectives and identifythe constraints in timely project implementation and efficient operation andmanning norms; study the organizations concerned with rural electrification,i.e., Electricity Boards, Rural Electrification Corporation, etc., the finan-cial working of the organizations involved in rural electrification and sug-gest ways and means of augmenting the resources available for the purpose;evolve criteria for distribution of funds to various States for rural elec-trification programs keeping in view regional imbalances; examine patterns/procedures for financing capital outlays to rural power consumers and theirproblems of maintenance of power equipment; study the implications of subsi-dizing extensive rural electrification, especially its implications for thetariff policies to be adopted by the Boards; examine alternative energysystems for motive power in rural areas and suggest policy guidelines.
Research and Development in Power Sector
7. Evaluate the present state of R&D in the power industry, makerecommendations for the systematic development of R&D work with a view toimprove planning techniques, system/station efficiencies and reliability.

INDIASECOND SINGRAULI THERMAL POWER PROJECT
NATIONAL THERMAL POWER CORPORATION LIMITEDOrganization Chart
CHAIRMAN&
MANAGINGDIRECTOR
MANAGEMENT COMMITTEE|
PROJECT REVIEW TEAMS
PLANNINGFINANCE | PERSONNEI
MARKTIN SECFRETARY ' & TRAIN ING |c
TECHNICALSERVICES CONTRACTDIVISION
QUALITY
CONTRACTS ASSURANCE &EXPEDITING
OQ zp]~~~~~~~~~~~~~~~~~ m
BADARPUR SINGRAULI KORBA RAMAGUNDAM FARAKKA I TRANSMISSION
00
THERMAL POVVER THERMAL THERMAL THERMAL THERMAL |SYSTEMS
STATION/PROJECT POWER PROJECT POWER PROJECT POVVER PROJECT POWER PROJECT |DIVISINW
World Bank - 20639 CD

INDIASECOND SINGRAULI THERMAL POWER PROJECT
NATIONAL THERMAL POWER CORPORATION LIMITEDProject Organization
GENERAL
MANAGER
PLANNING & SYSTEMS
QUALITY SURVEILLANCE
MATERIALSCCIVIL FINANCE & EQUIPMENT PERSONNEL I,
MANAGEMENT CONSTRUCTION ACCOUNTS ERECTION & ADMIN.
E | _ ~~~~~~~~~~~~~~FIELD ENGINEERING
1 CONTROL& COALNSTRUMENTA HANDLING & 0 P
TION TRANSPORT -6 w

INDIASECOND SINGRAULI THERMAL POWER PROJECT
NATIONAL THERMAL POWER CORPORATION LIMITEDTechnical Services Division
GENERALMANAGER
(ENGINEERING)
OPERATION PLANT AND CIVIL AND
SERVICES EQUIPMENT SYSTEMSENGINEERING ENGINEERING
PROJECT ENG
MGMT. CO-ORDS.SERVICES
OPERATiON MECHANICAL NT A ELECTRICAL TRANSMISSION CIVIL SYSTEMS CONSTRUCTION
SERVICES DESIGN TRMN DESIGN COORDINATION DESIGN ENGINEERING SERVICES
World Bank -20641 °

SECOND SINGRtAULI TH ERMAL POWER PROJECT
MATIONAL THERMAL POWER CORPORATION LIMITEDORGANIZATION CHART 197 9
S t ~~~~~~~~~~~~~~~~~~~~~~~~~~~~~~Cop -- SO C.ff t , .
00
0 [e1 x not(D
0
C( C ns >~~~~~~~~~~~~~~~~~~~~~~~~~~~~~~~~~~~-
9 AO swnFor Atsountb 0P+r ~ ~ ~ ~ ~ ~ ~ ~ ~
@ N0t A PO$Pt on | TOTt 7t 1 0 |_~~~~~~0

INDIASECOND SINGRAULI TH ER MAL POWER PROJECT
NATIONAL THERMAL POWER CORPORATION LIMITEDORGANIZATION CHART 1979-80
Foioo. ,nd A-o.bnt D.P.t4 - Sinornuli Th-rm--I Pow.r Stttion Sit.
l i~~~~~~~~~~~~~~~~~~~~~~~~~~~~~~~~~~~~~~~~~~~~~~~~~~~~~~~~~~~o
0,00000 FLdrceMnlg 00 0000 0 0 0000000|
-1-Accl Sen nr AxconaRant | AL 600 0|, 0 ,0000000000 Ooroouo,looo 00,000, Sl0ns>9PaDhess 1wo 1
A55100 0., Oo ooo one gIIereent 4of nz1r Ac<¢ 1-\rrs<os Atcounesox 5va1- 1-t F anh A Depararrz or
I-, Z'11- ,"o . 0 0 0" 0 0
ooooo 000 ~~~~~~~~~~~~~~~~~~~~~~~~~~~~~~~~~~~~~~~~~~~~~oo 0.,~~~~~~~~~~~~~~~oeey 04

- 69 -
ANNEX 13Page 1 of 3 pages
INDIA
SECOND SINGRAULI THERMAL POWER PROJECT
Description of the Singrauli Development
1. The Singrauli development is the first of a series of large thermalpower stations, planned by the Government of India, to feed into a 400 kVinterconnected transmission system and supply bulk power to the State Elec-tricity Boards (SEBs). The Singrauli 2,000 MW power station is being installedon the fringe of the Rihand Reservoir adjacent to the extensive Singrauli coalfields at Shaktinagar in the Mirzapur District of Uttar Pradesh.
2. The plant will consist of 5 x 200 MW and 2 x 500 MW generating unitswith boiler plant, ancillary electrical and mechanical equipment and associated400 kV transmission. First Singrauli Project (Credit 685-IN) consisted ofthe 3 x 200 MW first stage installation. The Second Singrauli Project willconsist of the second stage installation of 2 x 200 MW units and 2 x 500 MWunits.
3. The 200 MW turbines are three cylinders, tandem compound 3,000 rpm,double flow exhaust type reheat units, operating at 130 kg/cm with a steamtemperature of 535 C. The generators will be of the hydrogen cooled type,and will each be rated at 235,000 kVA. The boilers are natural circulation,pulverized fuel fired, balanced draft type using the direct firing system.Each boiler will have a continuous evapoiation rating of 700 t/h with asuperheater outlet pressure of 138 kg/cm and temperature of 535 C. Each200 MW generating unit will be connected to a 250 MVA transformer and willfeed power into the 400 kV system.
4. The 500 MW turbines will be three cyclinders reheat condensing typehaving one HP cyclinder, one double flow IP cyclinder and one double flow LPcyclinder with initial steam parameters of 168 kg/cm and 538 C/538 C. Thegenerators will be water and hydrogen cooled type with each rated at 588 MVA.The boiler will be a controlled circulation, pulverized fuel fired, balanceddraft type, using the direct firing system. It will have a continuous eva- 2poratiog rating of 1,700 t/h with a superheater outlet pressure of 178 kg/cmand 540 C. It is proposed that each generating unit will have four singlephase 200 MVA, 21/400 kV transformers and will feed power into the 400 kVsystem.
5. The salient features of the development are shown below:

- 70 -ANNEX 13
Page 2 of 3 pages
POWER STATION
Capacity - 2,000 MW (5 x 200 MW + 2 x 500 MW).
Fuel - Coal from the Singrauli coal fields located within
6 km of the project. Consumption of the 2,000 MW
power station at 5,500 hours operation per year is
6.49 million t/year. The calorific value of the
coal averages 4,000 kcal/kg, it has an ash content
of 30-40% and a moisture content of 10-12% at 60%
relative humidity and 400C.
Transport Unit train continuous system with continuous bottom
of Coal - discharging wagons.
Cooling The cooling water system for the Singrauli power
System - station envisages the use of the Rihand reservoiras cooling pond. The cooling water requirement for
ultimate capacity of 2,000 MW would be drawn fr om
this reservoir. Out of the total drawal of 84m(3,000 ft)/sec most of the water would be returned
to the reservoir, the consumptive water requirements
for boiler make up and township being comparatively
small. A pumphouse is being constructed on the
bank of the reservoir with an approach channel
extending to the minimum drawdown level 254 m
(830 ft). This will be expanded to meet the second
stage requirements. From the pumphouse, the water
will be pumped to the power house through the intake
duct. The hot water will be taken from the power
house via a discharge duct to a number of points
on the shore of the reservoir on the opposite
side of the power house.
Ash Ash is pumped as a slurry through a pipe to the
Disposal - ash disposal area of about 800 ha (2,000 acres),
situated some 5 km from the power station. The
area is reclaimed from the Rihand Reservoir and
is contained within an earth bund 12 km long.
Land - A total area of approximately 1,200 ha (3,000acres) including about 160 ha (390 acres) for
power station, switchyard, coal storage, etc.,
and 240 ha (600 acres) for the residential colony
is being acquired. About 16 ha (40 acres) is
required for main approach road and ash slurry
line and the balance is largely unusable area.

- 71 -
ANNEX 13Page 3 of 3 pages
TRANSMISSION
400 kV First (Singrauli-Obra 60 circuit kmlines Singrauli (required - Project (Singrauli-Kanpur 455 " "
(Singruali-Lucknow 470 " I
(Lucknow-Moradabad 330 "
Second (Moradabad-Muradnagar: 150 " "
Singrauli (Project (Muradnagar-Panipat : 95 "
((Singrauli-Kanpur : 455 " "((Kanpur-Jaipur : 475 "
Also associated switchgear, telemetry and meter-ing equipment, land, buildings and other miscel-laneous works.

- 72 -
ANNEX 14Page 1 of 2 pages
INDIA
SECOND SINGRAULI THERMAL POWER PROJECT
Project (2 x 200 + 2 x 500 MW) Cost Estimates
Rupee Million US$ MillionLocal Foreign Total Local Foreign Total
1. Preliminary WorksRoad and Railway 2.7 - 2.7 0.3 - 0.3
2. Civil WorksBuildings, Foundation, etc. 377.1 7.7 384.8 44.9 0.9 45.8Residential and others 72.2 - 72.2 8.6 - 8.6
Sub-total 449.3 7.7 457.0 53.5 0.9 54.4Physical Contingencies 44.9 0.8 45.7 5.3 0.1 5.4Price Contingencies 118.8 2.0 120.8 14.1 0.3 14.4
Total 613.0 10.5 623.5 72.9 1.3 74.2
3. Electrical & Mechanical PlantTurbogenerators, Boilersand Associated Equipment 1,444.9 1,226.8 2,671.7 172.0 146.1 318.1
Electrical Equipment 285.9 52.6 338.5 34.0 6.3 40.3Miscellaneous Tools & Plant 30.5 10.0 40.5 3.6 1.2 4.8
Sub-total 1,761.3 1,289.4 3,050.7 221.7 153.6 363.2Physical Contingencies 88.1 64.5 152.6 10.5 7.7 18.2Price Contingencies 725.7 421.3 1,147.0 86.4 50.2 136.6
Total 2,575.1 1,775.2 4,350.3 306.5 211.5 518.0
4. Coal Handling & TransportationWagons 4.4 1.6 6.0 0.5 0.2 0.7Locomotives 4.3 1.1 5.4 0.5 0.1 0.6Coal Handling Equipment 103.9 4.7 108.5 12.4 0.6 13.0
Sub-total 112.6 7.4 115.9 12.9 0.8 13.7Physical Contingencies 5.6 0.4 6.0 0.7 0.1 0.8Price Contingencies 36.8 2.4 39.2 4.4 0.3 4.7
Total 155.0 10.2 165.2 18.5 1.3 19.8

- 73 -ANNEX 14Page 2 of 2 pages
Rupee Million US$ MillionLocal Foreign Total Local Foreign Total
5. Transmission (400 kV) 216.9 27.2 244.1 25.8 3.2 29.0Singrauli-Lucknow (470 km) 187.3 23.5 210.8 22.3 2.7 22.5Lucknow-Moradabad (330 km) 88.8 11.4 100.2 10.6 1.4 10.5Moradabad-Muradnagar (150 km) 62.0 8.1 70.1 7.4 1.0 6.9Muradnagar-Panipat (95 km) 216.9 27.2 244.1 25.8 3.2 30.9Singrauli-Kanpur (455 km) 260.5 32.5 293.0 31.0 4.0 32.5
Subtotal 1,032.4 129.9 1,162.3 122.9 15.5 138.4Physical Contingencies 51.6 6.5 58.1 6.1 0.6 6.7Price Contingencies 336.6 41.6 378.2 40.1 4.9 45.0
Total 1,420.6 178.0 1,598.6 169.1 21.0 190.1
6. Engineering & Administration 409.2 25.2 434.4 48.7 3.0 51.7Total Project Cost
(before duties & taxes) 5,175.6 1,999.1 7,174.7 616.0 238.1 854.1Duties & Taxes 505.9 - 505.9 60.2 - 60.2Total Project Cost 5,681.5 1,999.1 7,680.6 676.2 238.1 914.3Interest during Construction 528.4 - 528.4 62.9 - 62.9Total Financing Required 6,209.9 1,999.1 8,209.0 739.1 238.1 977.2
Notes: Physical Contingencies: 10% on civil works.5% on plant and transmission costs.
Price Contingencies: 6% for 1979, 10% for 1980, 7% for the years1981-1983 and 5% for the years after 1983 forequipment and erection costs.

SEASND SIGRUSMA0!YRM POWER PIMIJET00TBTMADM CONSTRUC~TTLN SCHJE
___ ___ __ ___ __ ___ __ ___ _ ___ __ ___ ___ __ ___ __ ___ __ ___ _ ___197__ __ ___ __8 __ ___ _981___1__ __238 198398
8 A Kl J J3 A S 0 5 5 J F 8 A M 0 J A S 0 A 0 J3 F M A S J J A 5 0 N D J3 F fl A S J C A $ I S C F S A F i S A S 0 FI A
$00088000 035S5035300 ESm icr-UN-9Wr. SRDSEO TOD TzrN - ---
SOC XVi SVIZO? YARD _____________O____MAN._& EL. __C_ON TSTIN
P0W08 A CO 0TD 0 ARL ISEES -or mw MANF. ADEL. MXETION (PFART) ERT - - --- -TI
300FF.)A020. 13A0 FURM301 8 AUX. SYRA S0 S TT N
L.T. TRAN'S. LT. 5W.0EA0 AlO ______/___________ ____C_______
_ _ _ _ _ _ _ _ _ - -r~~~~~~~~~~~~~~~~~~~~~~~~~~~~-- ----
CO';TRCl, & REUY PANELS LEAD FI 8 MN? DE. NS Nm.-- S-- - - - - - -.) T.-D- - - -ATO- .- -0 81. -3 S F.05
OIDLE ONSTIMMENTATIONOERTSOFAOMS
TURNS 0GENE3ATOR MrF rODEMN. k DEL. BEET'DON A o-4..BI
I 008058 ~~CRDN SAIN TEST
SORSCT01. SOA EASA 83580103 F AnSTfC_A_TT _ MET ION&~8 FAL CtTD BALANCE STRUCt.woSE,556 SN A CLAMDIMS
T MSRIT, AOL I PASTAL
FUUN-7-~ ~~~--- LSENS
50818 ~~~~~~~~~~~~SEES wN&RE 52NSTRCTT0O 0-AC0O
PRW,&Vgr. ACF. A, DIL~. 05OM51ENSAMT DSL. (CONTD.) ERE0TION OE0 80Y5. TC3 00DrER V-INF T108 A RAEMIT 0FLIET SE "
MADE. A SE. EEOI ~~~~~~~~~~~~~~~~~~~~~~~~~~~~~~~~~ PESM -- RSD ATION OF PROPOSAL
LEAD SEES. ~~~~ ~~~0M 83EUl.A,RMSR MANF. & DEL.R I I MAFADER- CONS 7R A0555 SELIEE
FUEL. OIL SY0000F& SPER 'TI B DLN.ORD MEANT. & DEL. -U I
C.W. SYSTEM-PUMP & ACCA2. R MANE. A, DEL. 0
SPMS. B &O, 50 CB~~~~~~~~~~~~~~~~~m00303880, SSSS
LkDS ENSI S. D. 0850EAS. tDETI-N -…
TORBINE OTL FSSOICATSION PLANT
FORD ?0D3'00N0 MASF.A . EETLEAOSPESO M NY. IIV…C
AIR CONDITIONINGS A PTIFLATONO __________I ________________ AN_____ EL.
SPEE. I 0 5 WLD.WOSS MARY.&DE.NUCTN TEIN
SON. LISOTINS A DMMUTNIGATION SP________ _MS._________
TOWSHIP~ ~ ~~~ES ISSESASI ~~--

A7JEx 17Page 2 2f 3 p-^s
T - - - -.-- -
Li0
I I -
*411~~~~~~ 0
A

I N D I ASEOND SING8AULI THRMAL POWER PRDJECT
ESTIMATED CONSTRUCTION SCHREDULTIBNSI4TSSIOBi LIMNBSr
1975 1980 1981 1982 1983 15184
J F M A M J J A s o N D J F M A M J J A s o N D J F M A M J J A s o N D J F M A H J J A s o N D J F M A M J J A s o N Di J F M A M J J A s o NT D
STUBS 4 TR4PLATRS LBALANCR OF
25% SUPPLY -- > | STUBS 4\THMPLATRS
SDUPPLY * TESTING & START UP POWER
\ 9_SUPPLY OF SIIWRY .... F S,fl AULI - LUCKNOW TESTING & START UP POWER
\T WER PARTS ARTS LUCKNOW - MORADABAD
TOWER ERIETION MORADABAD - MURADRAGARh -- r-~~ | TOWRR b t bc BALANCR STUB \0 \ | 6ANPUR -JAIPUR | SaCRAULI -KAKAPURN- JAIPU
STRINGING P / SPEC SPOTTI G SETTINO
VERTFNG & FINALISATION IEI tRINARY , 20% STUB
TERDERRING --- / SURVR / SETTING
R ORMMANDATION / PTC \______________T______CT_>__AWARD OF CONTRACT AAX
APPROVAL SURVE (PARII STRINGING
& PR FILINIG
RALANCTOR RC______
INSPRCTION tSTING OAPPROVAL OF FARTH
MANUFACTURE & RREPT OF RE O ' _
FARTH WIRs 14o% MTOALANCE XARTH
COBIN WITORNE0 q A > . INSPECTION TBSTING
r1ART WIRE APPROVAL OF CONrco
"Ri. SPT -APPROVA OF SPE FROM I D A-_ MAdFACTURE h REI.° RNCPT. OF-
TENDR -__/ OF CONUCTOR BALANCE CONLUCTO
RECOMM DSATIr _AaADF WTSRACT -- -- -
MANUFACTURE & REPT. & APPROVAL INSULATO
OF INSULATORS 4o5 REPT. OF%
-- - - R~~ALANC R
INSULATORS INSULATORS
h &-,eo^o_ INSP.SCT ON
HARDWARE PRE. OF SPUS. _- _ TESTING & APPROVA>-O HAREWARg
APPROVAL OF SPECS -- TEDERrING
FRIM IDA NREOMMENIADTION RRCPT. OF BALANA
AWARD OF OINTRAC HARDWARE NSPCTION TYPE TESTS OF
MANUFACTUTRA h REPT. 0 - . ACCESSORIES OTHER Tr I
HARAER 40% SPACB h DAMPERS
MANUFACTURE & RNCPT. I RBFPT OF BALANCE ACC SORIES
OF AccEssoRIBs 45% I INSPECTION TESTING & LPPROVAL OF
EA RTrRE _ SPACERS & DAMPBRS
ACCESSORIES PREP. I SPEC APPROVL OF SPFC E1 IDA -
TNDXb G _ _ R____ // NF h RE& PT OF
RECOEK RATION -- _ _-/ - SE OF SPACERS BALANCE SPACHR3
AWARD CONTRACT __h RS 405 h D BRS

- 77 -
ANNEX 16
INDIA
SECOND SINGRAULI THERMAL POWER PROJECT
Estimated Schedule of Disbursements
DisbursementsIDA Fiscal Year Cumulative US$and Half-Year million Equivalent % Undisbursed
1980December 31, 1979June 30, 1980 -
1981December 31, 1980 20 93
June 30, 1981 50 83
1982December 31, 1981 75 75June 30, 1982 140 53
1983December 31, 1982 180 40June 30, 1983 220 27
1984December 31, 1983 250 17June 30, 1984 265 12
1985December 31, 1984 275 8
June 30, 1985 280 7
1986December 31, 1985 285 5June 30, 1986 290 3
1987December 31, 1985 295 2June 30, 1986 300 0

INDIA
SECOND SINGRAULI THERMAL POWER PROJECT
National Thermal Power Corporation Limited
Income Statement Covering Operations - FY1982 thrpugh FY19'1 (Forecast)
(in millions of rupees except where otherwise stated)
Year to March 31 1982 1983 1584 1985 1986 1987 1988 1989 1990 1991
Total Sales of Energy (CGWh) 73.0 969.0 3,258.0 6,683.0 10,349.0 14,380.0 19,340.0 25,304.o 30,446.0 33,618.0Average Revenue - Bulk Supply
- Paise per kWh 29.08 29.08 25.08 29.08 2°.08 29.08 29.08 29.08 29.08 29.08- Fuel Surcharge (paise per kWh sold) - 0.350 0.712 1.116 1.397 1.773 2.179 2.615 3.197 3.750- Central Excise (paise per kWh sentout) 2.0 2.0 2.0 2.0 2.0 2.0 2.0 2.0 2.0 2.0
Operating Revenue:Sales - Bulk Supply 21.2 281.8 959.0 1,543.4 3,00o.4 IJ,181.7 5,62h.1 7,358.4 8,853.7 9,776.1Sales - Fuel Surcharge - 3-4 23.5 74.6 144.6 259.0 421.4 661.7 973.5 1,260.9Central Excise 1.5 19.9 67.6 137.1 212.3 295.0 356.7 519.1 624.6 689.8
Total Operating Revenue 22.7 305.1 1,050.1 2,155.1 3,366.3 4,731.7 6,442.2 8,535.2 10,451.8 11,726.8
Opea.ting enses:Generation - Singrauli - Fuel 4.2 49.0 127.5 212.8 271.3 375.5 406.1 508.9 541.5 552.4
- Fuel Surcharge - 3.4 18.5 47.9 77.7 125.0 169.8 236.5 305.4 354.4- 0 & M 6.o 64.0 93.0 107.0 117.0 175.0 219.0 219.0 219.0 219.0- Depreciation - 63.0 99.0 132.0 132.0 223.0 305.0 305.0 305.0 305.0
Korba - Fuel - 8.1 71.9 141.8 194.9 252.2 355.1 497.5 624.1 695.3- Fuel Surcharge - - 5.° 20.6 3Q.4 66.2 115.6 194.9 287.9 371.6- 0 & M - 14.0 70.0 84.O 84.0 111.0 167.0 232.0 268.o 26 80- Depreciation - - 68.o 105.0 105.0 105.0 189.0 278.o 391.0 391.0
Ramagundam - Fuel - - 7.1 87.4 189.6 266.4 381.4 542.1 752.9 908.1- Fuel Surcharge - - - 6.1 23.4 47.9 102.8 163.0 279.9 399.9- 0 & M - - 8.0 66.o 90.0 90.0 132.0 185.o 248.0 264.0- Depreciation - - - 62.0 112.0 112.0 112.0 199.0 280.0 383.8
Farakka - Fuel - - - 11.5 81.6 155.1 210.2 312.1 363. 396.8- Fuel Surcharge - - - - 4.1 15.9 33.2 67.3 100.3 135.0- 0 & M - - 19.0 80.0 97.0 97.0 167.0 167.0 167.0- Depreciation - - - - 72.0 119.0 119.0 228.0 228.0 228.0
Transsuission - 0 & M 1.9 2.9 8.5 17.5 25.2 28.7 31.5 32.1 32.1 32.1- Depreciation 1.2 10.6 26.9 65.2 111.0 142.0 153.4 160.8 160.8 160.8
Central &cise @ 2 Paise/kWh of RiergySent Out 1.5 19.9 67.6 137.1 212.3 295.0 396.7 519.1 624.6 689.8
Total Operating Expenses 14.8 234.9 671.0 1,322.9 2,022.5 2,801.9 3,6S5.8 5,047.3 6,178.9 6,921.2
Operating Income (before interest) 7.9 70.2 379.1 832.2 1,340.8 1,025.8 2,746.4 3,491.9 4,272.9 4,805.6
Less: Interest on Loans 13.0 132.0 501.0 1,101.0 1,718.0 2,067.0 2,210.0 2,162.0 2,072.0 1,851.0Deduct: Interest Capitalized 12.0 108.0 327.0 630.0 894.o 878.0 663.0 249.0 62.0
Net Interest Chargeable to Operations 1 24 174 471 824 1,189 1,547 1,913 2,010 1,851
Profit 6.9 46.2 205.1 361.2 516.8 740.8 1,159.4 1,578.9 2,262.9 2,954.6
Write off Deferred E&penses - 6.0 5.0 - - - - - -
Earnings 6.9 40.2 200.1 361,.2 516.8 740.8 1,199.4 1,578.9 2,262.9 2,954.6
Average Rate Base - 4,405.0 9,188.0 14,7I5iO 19,997.0 25,124.0 30,058.0 36,753.0 42,024.0 42,261.0ate of Returm (Operating Income beforeInterest as % of Average Rate Base) - 1.6 4.1 5.7 6.7 7.7 9.1 9.5 10.2 11.4
Operating Ratio (Operating Expenses as %of Operating Revenue) 65.1 77.0 63.9 61.4 60.1 59.2 57.4 59.1 59.1 59.0
Source: NTPC March 1980

INDIA
SECOND SINGRAULI THERMAL POWER PROJECT
National Thermal Power Corporation Limited
Statement Sowing Capacity of Plant, Generation and Sales of Ebergy
Year to March 31 1982 1983 198L 1985 1,86 1987 1988 1989 1990 . 1991 1992 1993 1994
Capacity - Singrauli MW 200 600 1,000 1,000 1,500 2,000 2,000 2,000 2,000 2,000 2,000 2,000 2,000- Korba MW - 200 600 600 600 1,100 1,600 2,100 2,100 2,100 2,100 2,100 2,100- Ramagundam KW - - 200 600 600 600 1,100 1,600 2,100 2,100 2,100 2,100 2,100
- Farakka XW - - - 200 600 600 600 1,100 1,100 1,100 1,100 1,100 1,100
Total MW 200 800 1,800 2,400 3,300 4,300 5,300 6,800 7,300 7,300 7,300 7,300 7,300
Generation - Singrauli GWh 83 967 2,516 4,199 5,357 7,083 8,959 10,125 10,791 11,000 11,000 11,000 11,000- Korba GW - 125 1,117 2,200 3,025 3,925 5,550 7,800 9,800 10,925 11,425 11,550 11,550
- Ranagundam GWh - 83 967 2,099 2,949 4,238 6,050 8,425 10,175 11,113 11,488 11,550
- Farakka GWh - - 167 1,184 2,250 3,050 4,550 5,300 5,800 6,050 6,050 6,o50
Total GWh 83 1,092 3,716 7,533 11,665 16,207 21,797 28,525 34,316 37,900 39,588 40,088 40,150
Station Use - Singrauli GWh 8 87 226 378 482 637 806 911 971 990 990 990 990
- Korba GWh - 11 100 198 272 353 500 702 882 983 1,028 1,040 1,040
- Ramagundam GWh - - 8 87 189 266 381 545 758 916 1,000 1,034 1,040
- Farakka GWh _ _ _ 15 107 203 275 410 477 522 545 545 545
Total GWh 8 98 334 678 1,050 1,459 1,962 2,568 3,088 3,411 3,563 3,609 3,615
Ehergy Sent Out - Singrauli GWh 75 880 2,290 3,821 4,875 6,446 8,153 9,214 9,820 10,010 10,010 10,010 10,010
- Korba GWh - 114 1,017 2,002 2,753 3,572 5,050 7,094 8,918 9,942 10,397 10,510 10,510
- Ramagundam GWh - - 75 880 1,910 2,683 3,857 5,505 7,667 9,259 10,113 10,454 10,510
- Farakka GWh - - - 152 1,077 2,047 2,775 4,140 4,823 5,278 5,505 5,505 5,505
Total GWh 75 994 3,382 6,855 10,615 14,748 19,835 25,953 31,228 34,489 36,025 36,479 36,535
Transmission - Singrauli GWh 2 22 57 96 122 161 204 230 246 253 250 255 250
Losses - Korba GSh - 3 25 50 69 89 126 177 223 251 259 262 262
- Ramagundam GWh - - 2 22 48 67 96 138 192 234 253 261 262
- Farakka GWh - - - 4 27 51 69 104 121 133 138 138 138
Total GWh 2 25 84 172 266 368 495 649 782 871 900 911 912
Energy Sales - Singrauli GWn 73 858 2,233 3,725 4,753 6,285 7,949 8,984 9,574 9,757 5,760 9,760 9,760- Korba GWh - 111 992 1,952 2,684 3,483 4,924 6,917 8,695 9,691 10,138 10,248 10,248- Ramagundan Gh - - 73 858 1,862 2,616 3,761 5,367 7,475 5,025 9,860 10,193 10,248
- Farakka (Oh - - - 148 1,050 1,996 2,706 4,036 4,702 5,145 5,367 5,367 5,367 a
Total GWh 73 969 3,298 6,683 10,349 14,380 19,340 25,304 30,446 33,618 35.125 35,568 35,623
Station use as % of generation 9 9 9 9 9 9 9 9 9 9 9 9 9Transmission losses as % of generation 2.3 2.3 2.3 2.3 2.3 2.3 2.3 2.3 2.3 2.3 2.3 2.3 2.3
Source: NTPC March 1980

INDIA
SECOND SINGRAULI THERMAL POWER PROJECT
National Themnal Power Corporation Limited
Source and Application of Pands for Ff1977 hrough Ff1979 (Actual) and for FY1980 through FY1991 (Forecast)
kin millions o rupees
____A C T U A L-----____ _____________--__---__---------------------------- F O R E C A S T ------------- I---------------------------------------
Year to March 31 1977 1978 1979 1980 1981 1982 1983 1984 1985 1986 1987 1988 1989 1990 1991
Source of FundsInternal Cash Generation
Operating Income (before Interest) - - - - - 7.9 70.2 379.1 832.2 1,340.8 1,929.8 2,746.4 3,491.9 4,272.9 1,805.6
Depreciation _ _ _ _ _ 1.2 73.6 193.9 364.2 532.0 701.0 878.4 1,170.8 1.364.8 1,467.8
Total -9.1 143.8 573.0 1,196.4 1,872.8 2,630.8 3,62L.8 4,662.7 5,637.7 6,273.4
LoansOOI Loans - - - - - 260.0 2,108.0 5,198.0 6,492.8 4,512.5 2,521.2 1,028.2 - - -
touitYGOI Subscriptions 34.3 224.3 702.4 1,622.0 3,227.0 8,002.0 5,675.6 2,471.4 _ - _
Total Sources 34.3 224.3 702.4 1,622.0 3,227.0 8,271.1 7,927.4 8,242.4 7,689.2 6.385.3 5,152.0 4,653.o 4,662.7 5,637.7 7,273.4
Aoolication of FondsCapital Expenditure (including interest
during construction) 7.1 225.1 658.6 1,622.0 3,227.0 8,262.0 7,815.0 7,962.0 7,095.0 5,434.0 3,427.0 1,591.0 657.0 222.2 -
Debt Service:Interest Chargeable to Revenue - - - - - 1.0 21.0 171.0 171.0 821.0 1,189.0 1,517.0 1,913.0 2,010.0 1,851.0
Amortization of Loans _- - - - -_00.0 858.o 1,598.0 1.611.0 1.611.0
Total - - - 1.0 24.0 174.0 471.0 824.0 1,589.0 2,405.o 3,511.0 3,621.0 3,.62.0
Preliminary Deferred Expenses 2.2 1.3 2.0 2.0 2.5 1.0 - - - - - - - -
Short Term Deposits - - - - - 500.0 286.1 1,664.6 2,756.3
Working Capital Increase/(Decrease) 25.0 (2.1) 1.8 (2.0) (2.5) 7.1 58.8 106.4 123.2 127.3 136.0 157.0 206.6 125.9 55.1
Total Applications 34.3 224.3 702.1 1,622.0 3,227.0 8,271.1 7,927.1 8,242.4 7,689.2 6,385.3 5,152.0 4,653.0 4,662.7 5,637.7 6,273.1
Debt Service Coverage - - - - - 9.1 6.0 3.3 2.5 2.3 1.7 1.5 1.3 1.6 1.8
Source: NTPC March 1980

INDIA
SECOND SINGRAULI THERMAL POWER PROJECT
National Thenmal Power Corporation Limited
Investment Program Covering F11977 through FY1990(in millions of rupees)
_______A C T U A L------- ________________ST______---------------------F O R E C A S T--------------------------------------------- TOTALYear to March 31 1577 1978 1079 1080 1981 1982 1983 1984 1985 1986 1987 1988 1989 1990 1977-1990
Power Stations
Singrauli 7 197 296 714 1,271 2,2S7 1,955 1,575 752 496 280 - - - 9,840Korba - 19 281 301 802 2,468 1,915 2,224 1,873 1,3D9 751 414 223 - 12,576Ramagundam - 50 363 427 1,677 1,418 1,515 2,108 1,807 1,547 839 434 213 12,326Farakka - - 4 94 400 977 1,216 1,079 1,120 1,284 848 338 - - 7,360
Total Power Stations 7 212 631 1,472 2,900 7,419 6,504 6,393 5,853 4,896 3,354 1,591 657 213 42,102
TransmissionsAssociated with:
Singrauli - 13 73 115 119 282 476 532 416 123 - - - - 2,149Korba - - - 31 139 265 372 313 290 113 - - - - 1,523Ramagundam - - - 3 73 235 341 494 366 227 73 - - - 1,812Farakka - - - 1 - 61 152 230 170 75 - - - - 689
Total Transmission - 13 73 150 331 843 1,341 1,569 1,242 538 73 - - - 6,173
Total Construction Program 7 225 704 1,622 3,231 8,262 7,845 7,962 7,095 5,434 3,427 1,591 657 213 48,275
Source: NTPC March 1980
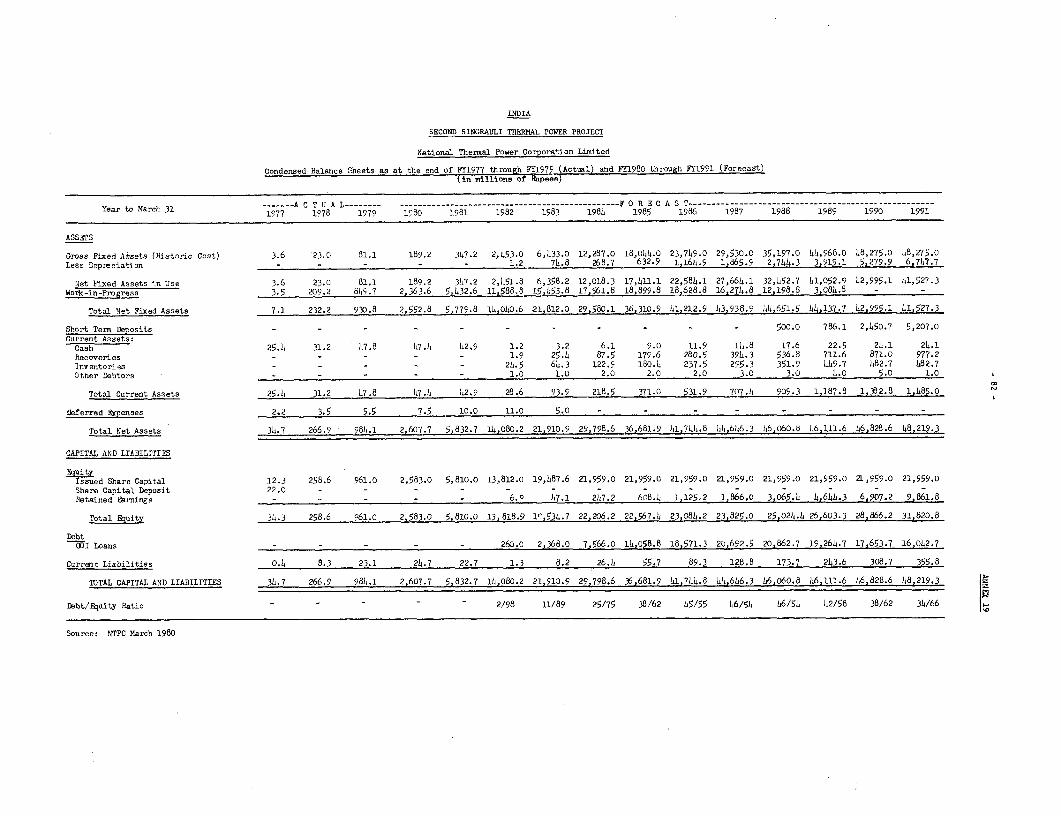
INDIA
SECOND SINGRAULI THERMAL POWER PROJECT
National Thermal Power Corporation Limited
Condensed Balance Sheets as at the end of FY1977 through FP1979 (Actmul) and FY1980 through FY1991 (Forecast)(in millions of Rupees)
oMac -_---A C T U A L…OEA---ST- ------------------ _--------------------------F O R E C A S T_--------_-----_- -_______________- ___________Year to March 31 1977 1978 1979 1980 1981 1982 1983 1984 1985 1986 1987 1988 1989 1990 1991
ASSETS
Gross Fixed Assets (Historic Cost) 3.6 23.0 81.1 189.2 347.2 2,453.0 6,433.0 12,287.0 18,044.0 23,749.0 29,530.0 35,197.0 44,968.0 48,275.0 48,275.0
Less Depreciation - - - - - 1.2 74.8 268.7 632-9 1,164.9 1,865.9 2,744.3 3,915.1 5,279.9 6,747.7
Net Fixed Assets in Use 3.6 23.0 81.1 189.2 3147.2 2,451.8 6,358.2 12,018.3 17,411.1 22,584.1 27,664.1 32,452.7 41,052.9 42,995.1 4l1,527.3
Work-in-Progress 3.5 209.2 849.7 2,363.6 5,432.6 11,588.8 15,153.8 17,561.8 18,899.8 18,628.8 16,274.8 12,198.8 3,084.8 - -
Total Net Fixed Assets 7.1 232.2 930.8 2,552.8 5,779.8 14,040.6 21,812.0 29,580.1 36,310.9 41,212.9 43,938.9 44,651.5 44,137.7 42,995.1 41,527.3
Short Tenm Deposits - - - - - - - . - - - 500-0 786.1 2,450.7 5,207.0
Current Assets:Cash 25.1 31.2 47.8 17.1 42.9 1.2 3.2 6.1 9.0 11.9 14.8 17.6 22.5 24.1 24.1Recoveries - - - - 1.9 25.4 87.5 179.6 280.5 394.3 536.8 711.6 871.0 977.2
Inventories _ _ _ _ _ 24.5 64.3 122.9 180.4 237.5 255.3 351.9 449.7 482.7 482.7Other Debtors - - - - - 1.0 1.0 2.0 2.0 2.0 3.0 3.0 4.0 5.0 1.0
Total Current Assets 25.1 31.2 47.8 147..4 42.9 28.6 93.5 218.5 371.0 531.9 707.4 909.3 1,187.8 1,382.8 1,185.0
Deferred Ecpenses 2,2 3.5 5.5 7.5 10.0 11.0 5.0 - - - - - - - -
Total Net Assets 34.7 266.9 984.1 2,607.7 5,832.7 14,080.2 21,910.9 29,798.6 36,681.9 41,744.8 4b,646.3 46.060.8 46,111.6 46,828.6 48,219.3
CAPITAL AND LIABILITIES
EquityIssued Share Capital 12.3 258.6 961.0 2,583.0 5,810.0 13,812.0 19,487.6 21,959.0 21,959.0 21,959.0 21,959.0 21,959.0 21,959.0 21,959.0 21,959.0Share Capital Deposit 22.0 - - - - - - - - - -
Retained Earnings - - - - 6.9 1.7.1 217.2 608.1 1,125.2 1,866.0 3,o65.4 4,644.3 6,907.2 9,861.8
Total Equity 34.3 258.6 961.0 2,583.0 5,810.0 13, 818.9 l1,531..7 22,206.2 22,567.4. 23,084.2 23,825.0 25,024.4 26,603.3 28,866.2 3i,820.8
DebtI Loans - 260.0 2,368.0 7,566.0 14,058.8 18,571.3 20,692.5 20,862.7 19.264.7 17,653.7 16,042.7
Current Liabilities 0.4 8.3 23.1 21.7 22.7 1.3 8.2 26.1 55.7 89.3 128.8 173.7 243.6 308.7 355.8
TOTAL CAPITAL AND LIABILITIES 31.7 266.9 981.1 2,607.7 5,832.7 14,080.2 21,510.9 29,798.6 36,681.9 41.744.8 414,646.3 46.060.8 146.111.6 46,828.6 _48,219.3
Debt/Equity Ratio - - - 2/98 11/89 25/75 38/62 45/55 46/54 46/54 42/58 38/62 34/66
Source: NTPC March 1980

- 83 -
ANNEX 20Page 1 of 4 pages
INDIA
SECOND SINGRAULI THERMAL POWER PROJECT
National Thermal Power Corporation Limited
Assumptions on Financial Projections
1. The financial statements in this report project NTPC's financialoperations for the period FY79 through FY91. They comprise income statements,with a supporting statement showing the capacity of plant, energy generatedand sold (Annex 17), sources and applications of funds, with supportinginvestment program (Annex 18) and condensed balance sheets as at March 31each year (Annex 19).
2. The following assumptions are made:
(a) Schedule of Commissioning Operating Plant
Units Singrauli Korba Ramagundam Farakka
200 MW- Unit 1 February 1, 1982 January 1, 1983 February 1, 1983 December 1, 1984200 MW- Unit 2 August 1, 1982 July 1, 1983 August 1, 1984 June 1, 1985200 MW- Unit 3 February 1, 1983 January 1, 1984 February 1, 1985 December 1, 1985200 MW- Unit 4 August 1, 1983 -
200 MW- Unit 5 February 1, 1984 -
500 MW- Unit 1 February 1, 1986 October 1, 1986 July 1, 1987 April 1, 1988500 MW- Unit 2 February 1, 1987 October 1, 1987 July 1, 1988 -500 MW- Unit 3 - October 1, 1988 July 1, 1989
(b) Energy Output
200 MW Units - First year - 2,500 hrs. operation- Second year - 4,000 hrs. operation- Third year - 5,500 hrs. operation
500 MW Units - First year - 2,500 hrs. operation- Second year - 4,000 hrs. operation- Third year - 5,000 hrs. operation- Fourth year - 5,500 hrs. operation

- 84 -
ANNEX 20Page 2 of 4 pages
(c) Fuel Cost Escalation
Singrauli - based on 0.600 kg/kWh and 0.589 kg/kWhfor 200 and 500 MW respectively andRs 55/ton in FY77 5% per annum
Korba - based on 0.685 kg/kWh and 0.673 kg/kWhfor 200 and 500 MW respectively andRs 41/ton in FY78 5% per annum
Ramagundam - based on 0.588 kg/kWh and 0.548 kg/kWhfor 200 and 500 MW respectively andRs 75.34/ton in FY78 5% per annum
Farakka - based on 0.666 kg/kWh and 0.655 kg/kWhfor 200 and 500 MW respectively andRs 39/ton in FY78 5% per annum
An additional 5% cost is added for the fuel oil needed for starting and lowload operation plus tax of Rs 5 per ton.
(d) Calorific Value of Coal
Singrauli - 4,000 Kcal/kgKorba - 3,500 Kcal/kg
Ramagundam - 4,300 Kcal/kgFarakka - 3,600 Kcal/kg
(e) O&M Expenses
Power Station - 2.5% on original cost of 200 MW plant- 2.0% on original cost of 500 MW plant
Transmission - 1/2% of original cost
(f) Depreciation
Power Station - 3.1% of original costTransmission - 2.6% of original cost
NOTE: Section XVII(8) of the 6th Schedule of the Electricity(Supply) Act 1948, provides for depreciation "from thebeginning of the year of account next following that inwhich the particular asset became available for use inthe business". Under the recently enacted financial amend-ments to the Act, depreciation is in future to be chargedin accordance with the directions to be issued by GOI.GOI has issued a notification covering the FY79 whichmakes no chanige in the 1948 Act provisions. Notificationscovering future years will be issued in due course.

-85- ANNEX 20Page 3 of 4 pages
(g) Tariffs
NTPC has an obligation to achieve a rate of return of not lessthan 9-1/2% on the forecast average net fixed assets in serviceby FY1989, and from the commencement of its commercial operationsin FY1982 to set tariffs at levels not lower than those requiredto achieve a 9-1/2% rate of return on the forecast data forFY1989. On this basis, and bearing in mind the time it takesfor the generating plant to reach an operating level of 5,500hours a year, the average price of 27.22 paise/kWh calculatedon the FY1989 estimates, is assumed as the average price for allsales from February 1982.
(h) Fuel
Fuel costs are based on the prices per ton shown in paragraph2(c) and escalated at 5% per annum until FY1982. Thereafter afuel clause is assumed in the bulk supply contract, to permitadjustment to meet any further variation in fuel costs. Theeffect of any fuel price variation is shown separately in theforecast expenses and recovered by means of a fuel surcharge.
(i) Rate Base
Construction costs are based on 1978 prices escalated at 6%per annum except where orders have been placed when escalationat 6% per annum is applied from award date. Turbine generatorsand boilers are subject to the following maximum price escala-tion from the date of order:
Singrauli 200 MW units - 25%Korba, Ramagundam and Farakka 200 MW units - 20%All 500 MW units - 15% Generators
- 20% Boilers
Physical contingencies have been assumed as follows:Civil Works - 10%Plant & Equipment - 5%
The average rate base is half the sum of the net fixed assetsin service at the beginning and end of the year.
(j) Capital Requirements
(a) The proposed Credit would be relent by the GOI to NTPCfor a period of 20 years from the date of withdrawalof the first installment including a 5 year initialgrace period, and repayable in equal semiannual install-ments of principal, together with interest at the rateof 10-1/4% per annum on unpaid balances.

- 86 -ANNEX 20Page 4 of 4 pages
(ii) Other capital requirements would be advanced by GOI in theform of debt and fully paid up equity capital, providedthat the unpaid debt at the end of each year would notexceed the sum of the issued share capital and the "free"reserves, that is to say those which are not requiredfor specific purposes.
(iii) GOI loans (including the onlending of both the proposedCredit and also previously approved Credits and Loan) areassumed to finance either defined projects or individualgenerating units and transmission lines included in NTPC'sinvestment program. Interest on the loans up to the dateof commissioning of each unit of plant would be chargedto construction, and subsequent interest accruals wouldbe charged to revenue. Repayment of principal is assumedin 30 semiannual installments commencing on the firstanniversary following the end of the five year graceperiod.
(k) Working Capital
Variations in working capital represent the differences betweenthe sums of the inidividual items making up current assets lesscurrent liabilities at the beginning and at the end of the year.
(1) Balance Sheets (Annex 19)
Current Assets
(i) Receivables are assumed at a level equivalent to one-twelfth of the revenue for the year; and
(ii) Inventories are assumed at 1% of gross assets at theend of the year.
Current Liabilities
Current liabilities are assumed at a level of one month'sfuel cost, plus 4% of the annual operating and maintenanceexpenses.

- 87 -
ANNEX 21
INDIA
SECOND SINGRAULI THERMAL POWER PROJECT
National Thermal Power Corporation Limited
Annual Rates of Return in Real Terms
Rate of Return on Rate of Return onYear to March 31 Historic Rate Base Revalued Rate Base Assuming
1982 0.6% 0.5%1983 1.6% 1.3%1984 4.1% 3.6%1985 5.7% 4.9%1986 6.7% 5.7%1987 7.7% 6.3%1988 9.1% 7.3%1989 9.5% 7.5%1990 10.2% 7.7%1991 11.4% 8.1%
1/ The following inflation rates have been used:
FY1981 10%FYs 1982, 1983 and 1984 7%FY1985 forward 5%

- 88--ANNEX 22Page 1 of 2 pages
INDIA
SECOND SINGRAULI THERMAL POWER PROJECT
NTPC's Bulk Tariff (Northern Region) and Bulk Exchange Tariffsin Northern Region
1. The proposed regional financial bulk tariff of about 23 paise/kWh forsupply from Singrauli to the Northern Region needs to be seen in the generalcontext of "bulk" tariffs and costs prevailing in the region. Tariffs chargedbetween supply authorities for energy exchanges in 1978/79 were as follows:
Paise/kWh
UPSEB purchase from NTPC (Badarpur) 23UPSEB purchase from Himachal Pradesh 18UPSEB net exchange with MPSEB 16-17HSEB purchase from NTPC (Badarpur) 22HSEB purchase from Punjab 22RSEB purchase from RAPS (nuclear) 13-22
2. These exchange tariffs at voltages similar to those of the proposedSingrauli sale points, have only a general relationship with costs of genera-tion, in that the relatively lower price of energy obtained from HPSEB isattributable to the lower cost at hydro stations in Himachal Pradesh comparedto Badarpur. In theory, an elaborate system of guidelines exists in theNorthern Region, defining the method of calculating cost-related tariffs forsuch instances as short-term supply, banking transactions, night valleysupply, spinning reserve, emergency assistance, and inadvertent exchanges.In practice, the exchange tariff levels are arrived at after reaching a com-promise on opposing views. This is illustrated in the case of Rajasthan,where the cost-related 19-22 paise/kWh that were to be charged by the nuclearsupply authority were held at 13 paise because no agreement could be reachedwith RSEB.
3. It should be borne in mind that the present range of exchange tariffs,if regularly adjusted for general inflation, could reach 19-27 paise/kWh by1982, when the first Singrauli energy would be supplied and a level of 27-38paise/kWh by the late 1980s. At that time the Singrauli tariff is stillprojected to be at 23 paise, thus possibly falling behind the general regionalexchange tariff level.
4. The cost of energy supply by SEBs at high voltage levels in theRegion can be estimated by using the following samples of average financial 1/costs:
1/ Financial cost is defined as the SEB's accounting cost.

- 89 -
ANNEX 22Page 2 of 2 pages
Paise/kWh (1979) /a
HPSEB 26HSEB 12RSEB 10
21
/a Includes purchased energy cost. Source: SEBs.
5. Again assuming adjustment for inflation, the average regional SEBcost of supply at voltage levels comparable to NTPC's will be 25 paise/kWh in1982, and will rise to about 36 paise/kWh by 1989. While NTPC power is likelyto be about equally costly in 1982 as the regional average generating cost, itwill have a competitive advantage by 1989, if the Singrauli tariff will remainfixed. For SEBs such as Haryana or Rajasthan, however (or any SEB relying onhydro power to a large extent), NTPC power will represent a costly purchaseon average. UPSEB and DESU will benefit most from NTPC's present intentionswith respect to tariff levels. On a marginal basis, incremental energy obtainedfrom NTPC is likely to be the least-cost source of power in the region in thelong run.

- 90 -
ANNEX 23Page 1 of 6 paaes
INDIA
SECOND SINGRAULI THERMAL POWER PROJECT
Regional Marginal Cost Analysis of NTPC Operations
1. The following assumptions are necessary to make marginal costanalysis for NTPC a relevant exercise that can enter as input into tariffconsiderations:
(a) Each station is reviewed as an independent system sellingpower in bulk to the Region concerned;
(b) Whether there will be additional investment by NTPC in eachRegion or not beyond the presently planned program, NTPC ateach of its regional stations will ultimately operate at itscapacity limit: this implies that any incremental demandwill have to be satisfied by further investment, and justi-fies the inclusion of representative marginal capacity costin the tariff;
(c) All sales of energy will be at the level of 400 kV;
(d) There will be no seasonal and only minor daily variation inNTPC's load demand: all stations will be operated as baseload for the participating SEBs, thus eliminating any peaksin NTPC operations; and
(e) For each station, the program of commissioning of units andannual hours of operation is taken as planned by NTPC.
2. The method used for the computation of an approximation of long-runmarginal cost is the concept of Average Incremental Cost (AIC), smoothing outany fluctuations by averaging over the entire known investment program. Theresults are expressed in terms of both (a) a uniform energy charge per Region,incorporating both marginal capacity and energy costs; and (b) a two-parttariff consisting of a capacity charge and an energy charge, recoveringmarginal capacity and energy costs, respectively.
3. The basic computation is performed in terms of constant 1979 costs.In order to arrive at marginal cost in future years when energy will be soldto SEBs, it is assumed (in the absence of a longer-term investment plan) thatany investment necessary to satisfy incremental demand beyond NTPC capacityat the time will have the same pattern as the investment envisaged for thelate 1970's and 1980's. For this purpose, marginal cost for future years isarrived at by updating the 1979 marginal cost by projected inflation rates offrom 10% p.a. declining to 5% p.a. in 1984. All marginal costs are expressedin constant market prices of the year in question, and discounted at 10% p,a.
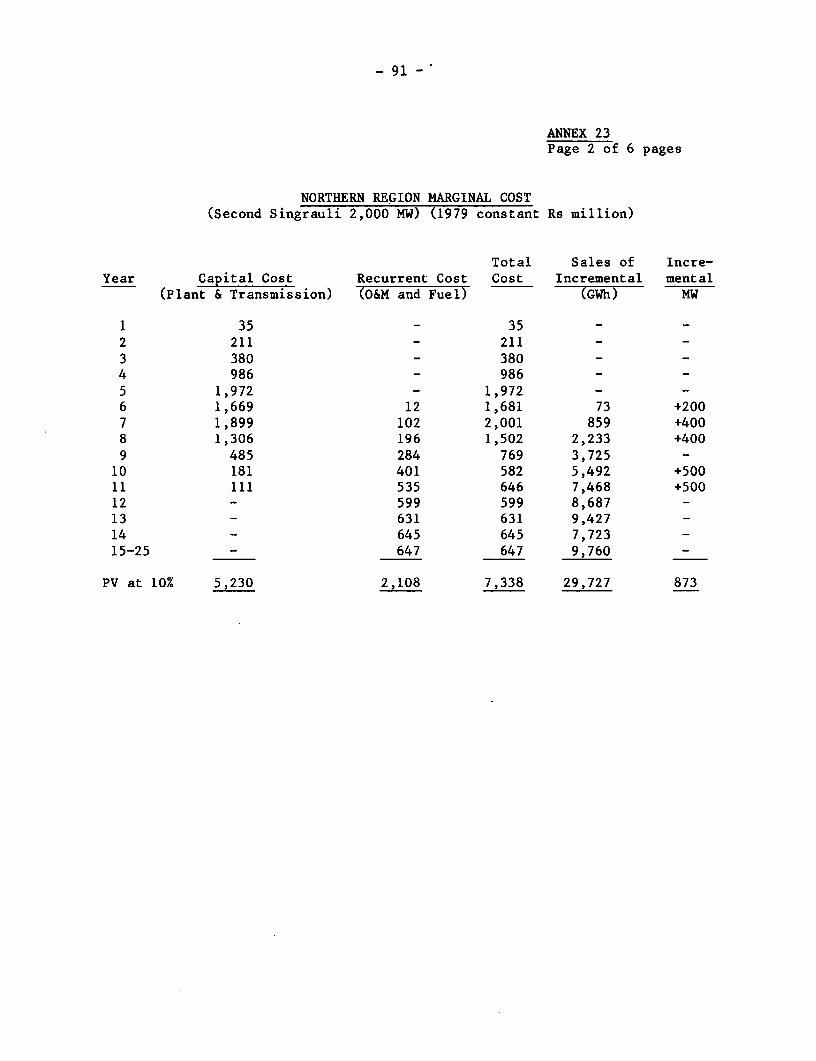
- 91 -
ANNEX 23Page 2 of 6 pages
NORTHERN REGION MARGINAL COST(Second Singrauli 2,000 MW) (1979 constant Rs million)
Total Sales of Incre-Year Capital Cost Recurrent Cost Cost Incremental mental
(Plant & Transmission) (O&M and Fuel) (GWh) MW
1 35 - 35 - -2 211 - 211 - -3 380 - 380 - -4 986 - 986 - -5 1,972 - 1,972 - -6 1,669 12 1,681 73 +2007 1,899 102 2,001 859 +4008 1,306 196 1,502 2,233 +4009 485 284 769 3,725 -10 181 401 582 5,492 +50011 111 535 646 7,468 +50012 599 599 8,687 -13 631 631 9,427 -14 645 645 7,723 -15-25 - 647 647 9,760 -
PV at 10% 5,230 2,108 7,338 29,727 873

- 92 -
ANNEX 23Page 3 of 6 pages
EASTERN REGION MARGINAL COST(Farakka 1,100 MW) (1979 constant Rs million)
Total Sales of Incre-Year Capital Cost Recurrent Cost Cost Incremental mental
(Plant & Transmission) (O&M and Fuel) (GWh) MW
1 8 - 8 - -
2 66 - 66 - -3 801 - 801 - -4 1,056 - 1,056 - -5 1,361 - 1,361 - -6 1,172 - 1,172 - -7 587 85 672 665 +4008 229 150 379 1,730 +2009 113 264 377 3,638 +50010 - 301 301 4,702 -11 317 317 5,14612-25 - 325 325 5,367 -
PV at 10% 3,347 1,188 4,535 18,455 511
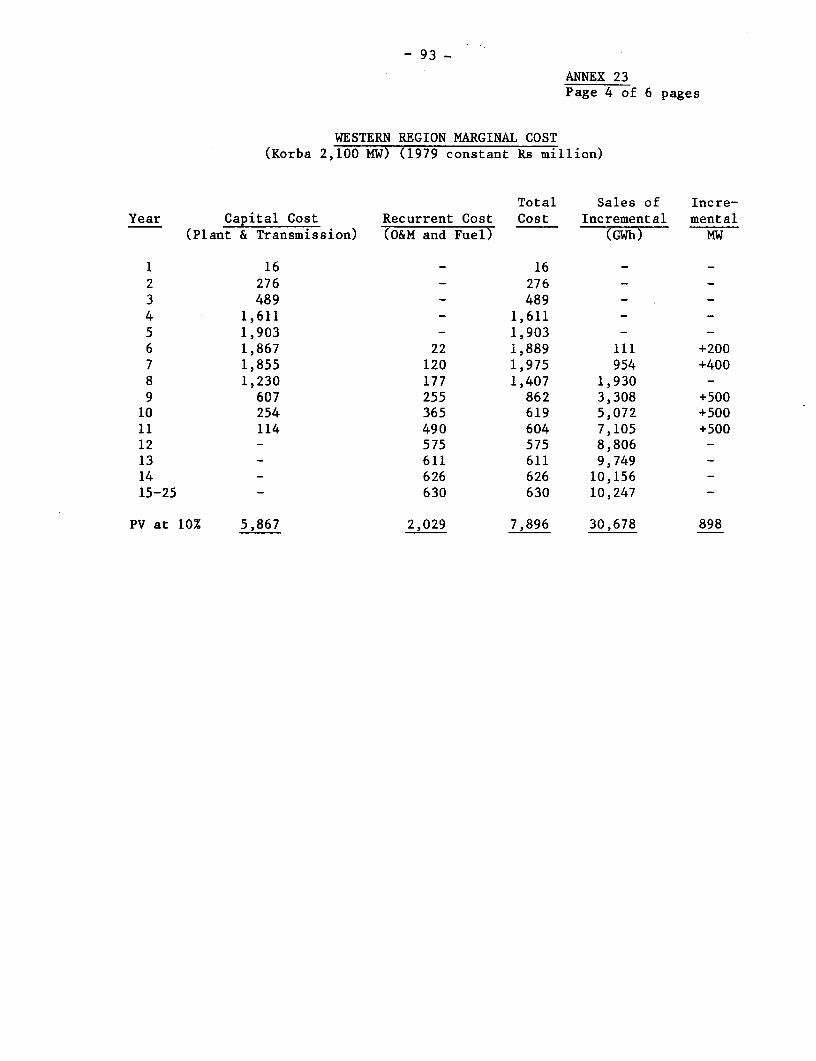
- 93 -
ANNEX 23Page 4 of 6 pages
WESTERN REGION MARGINAL COST(Korba 2,100 MW) (1979 constant Rs million)
Total Sales of Incre-Year Capital Cost Recurrent Cost Cost Incremental mental
(Plant & Transmission) (O&M and Fuel) (GWh) MW
1 16 - 16 -2 276 - 276 -3 489 - 489 -4 1,611 - 1,611 -5 1,903 - 1,903 - -6 1,867 22 1,889 111 +2007 1,855 120 1,975 954 +4008 1,230 177 1,407 1,930 -9 607 255 862 3,308 +50010 254 365 619 5,072 +50011 114 490 604 7,105 +50012 - 575 575 8,806 -13 - 611 611 9,749 -14 - 626 626 10,156 -15-25 - 630 630 10,247 -
PV at 10% 5,867 2,029 7,896 30,678 898

- 94 -
ANNEX 23Page 5 of 6 pages
SOUTHERN REGION MARGINAL COST(Ramagundam 2,100 MW) (1979 constant Rs million)
Total Sales of Incre-Year Capital Cost Recurrent Cost Cost Incremental mental
(Plant & Transmission) (O&M and Fuel) (GWh) MW
1 45 - 45 - -2 457 - 457 - -3 1,075 - 1,075 - -4 1,772 - 1,772 - -5 1,696 - 1,696 - -6 1,774 37 1,811 222 +2007 1,513 147 1,660 1,242 +4008 881 239 1,120 2,794 +5009 350 390 740 4,736 +50010 167 542 709 6,754 +50011 99 582 781 8,363 -12 - 745 745 9,478 -13 776 776 10,081 -14-25 - 785 785 10,247 -
PV at 10% 5,926 2,626 8,522 33,076 956

- 95 -
ANNEX 23Page 6 of 6 pages
SUMMARY: MARGINAL COST - BASED TARIFFS
North: East: West South:Singrauli Farakka Korba Ramagundam
Marginal Cost 1979
1. One-part tariff: paise/kWh 24.7 24.6 25.7 25.92. Two-part tariff: Rs/kW/year 661 722 720 683
plus paise/kWh 7.1 6.4 6.6 7.9
Marginal Cost in First Yearof Energy Sales /a /b
1. One-part tariff: paise/kWh 29.1 34.8 32.4 34.92. Two-part tariff: Rs/kW/year 778 1,022 907 920
plus paise/kWh 8.4 9.1 8.3 10.7
Marginal Cost 1984/85 /b
1. One-part tariff: paise/kWh 35.0 34.8 36.4 36.72. Two-part tariff: Rs/kW/year 935 1,022 1,019 966
plus paise/kWh 10.1 9.1 9.3 11.2
/a Singrauli 1981/82, Farakka 1984/85, Korba 1982/83, Ramagundam 1983/84.
/b Inflation 10% p.a. 1980/81, 7% p.a. 1981/82-1983/84, 5% p.a. beyond1983/84.

- 96 -
ANNEX 24
INDIA
SECOND SINGRAULI THERMAL POWER PROJECT
Definition and Cost of Alternative to the Project
Cost (Rs million in constant 1979 market prices)Other Civil Total
Location Capacity Boiler & TG Equipment Works Other Cost
Uttar Pradesh 630 MW 1,303 773 423 184 2,683(pithead site) (3x210 MW)
Rajasthan 210 MW 434 213 73 70 790(1x210 MW)
Delhi 210 MW 434 193 62 64 753(1x210 MW)
Punjab 220 MW 500 228 107 66 901(2x1IO MW)
Haryana 110 MW 250 114 53 33 450
AssociatedTransmissionSystem /a - - - - 573
Total 1,400 MW 2,921 1,521 718 417 6,150
/a This includes (a) 515 km of 400 kV lines for the pithead station inUttar Pradesh; and (b) certain incremental investmenton transmission lines for other stations. The linesincluded in (b) would form part of the integratedsystem.
Source: NTPC

- 97 -
ANNEX 25
INDIA
SECOND SINGRAULI THERMAL POWER PROJECT
Additional Transmission and Distribution Cost
1. The Draft Plan 1978-83 (Annex 9) provides for about 60% of theregional expenditure to be allocated to generation, the rest to transmission,distribution and rural electrification (i.e. rural distribution). Non-generation expenditure, therefore, accounts for about 67% of generationexpenditure.
2. The cost of the project already includes a transmission elementwhich accounts for about one third of the generating plant component. Thedifference between this and the regional average is, therefore, allocated tothe project to enable a comparison with tariff revenue at retail level: anadditional investment necessary to serve final consumers.
3. Operating and maintenance expenditure on the additional transmis-sion and distribution facilities is assumed to be 2% of the cumulative valueof the assets installed.
4. The split by cost components of the additional investment isassumed to be similar to that of the original transmission component includedin the project, and is expressed in identical economic terms.
5. The amount of energy sold to final consumers is arrived at byreducing the kWh sent out from the project after auxiliary use by the averageregional system losses:
Share of RegionalState Consumption (%) System Losses (%)
Haryana 12 21.5Himachal Pradesh 1 25.9Jammu & Kashmir 2 23.8Punjab 21 17.5Rajasthan 13 24.5Uttar Pradesh 41 24.0Delhi 10 15.6
Weighted average 21.6
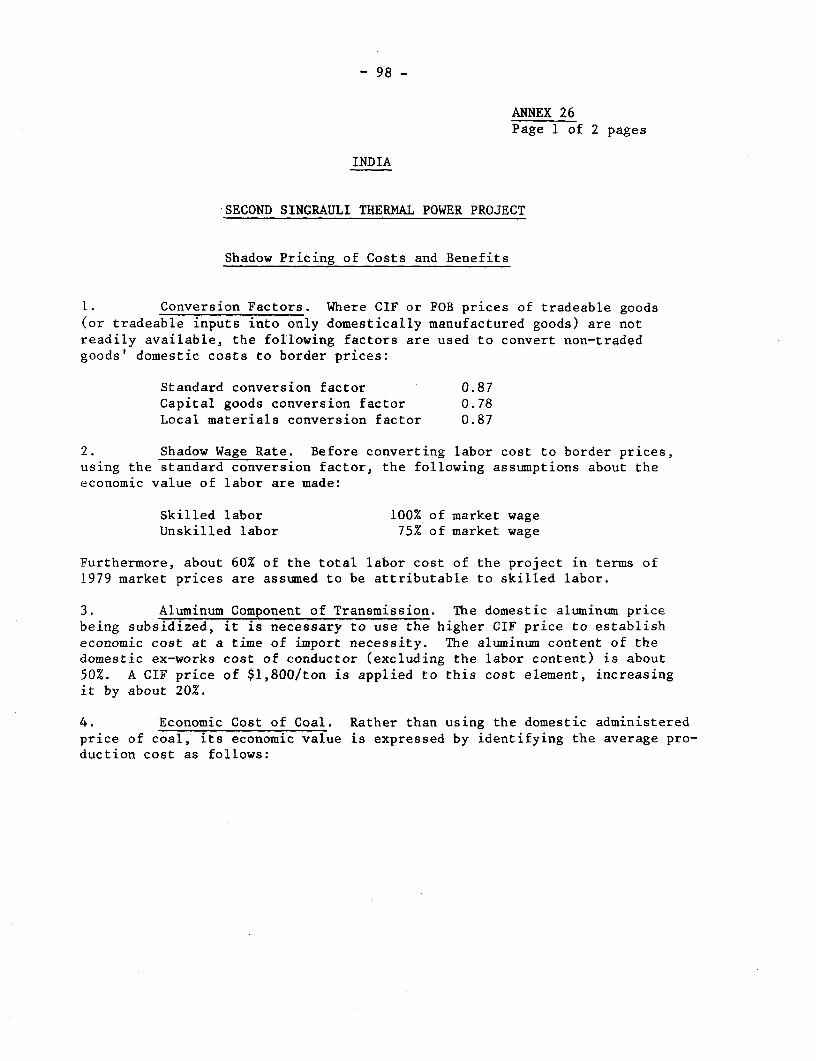
- 98 -
ANNEX 26Page 1 of 2 pages
INDIA
SECOND SINGRAULI THERMAL POWER PROJECT
Shadow Pricing of Costs and Benefits
1. Conversion Factors. Where CIF or FOB prices of tradeable goods(or tradeable inputs into only domestically manufactured goods) are notreadily available, the following factors are used to convert non-tradedgoods' domestic costs to border prices:
Standard conversion factor 0.87Capital goods conversion factor 0.78Local materials conversion factor 0.87
2. Shadow Wage Rate. Before converting labor cost to border prices,using the standard conversion factor, the following assumptions about theeconomic value of labor are made:
Skilled labor 100% of market wageUnskilled labor 75% of market wage
Furthermore, about 60% of the total labor cost of the project in terms of1979 market prices are assumed to be attributable to skilled labor.
3. Aluminum Component of Transmission. The domestic aluminum pricebeing subsidized, it is necessary to use the higher CIF price to establisheconomic cost at a time of import necessity. The aluminum content of thedomestic ex-works cost of conductor (excluding the labor content) is about50%. A CIF price of $1,800/ton is applied to this cost element, increasingit by about 20%.
4. Economic Cost of Coal. Rather than using the domestic administeredprice of coal, its economic value is expressed by identifying the average pro-duction cost as follows:

- 99 -
ANNEX 26Page 2 of 2 pages
Rupees per tonneCost. Items (1979 market prices)
Coal India Private Collieries
Labor 50.27 48.91Stores 9.70 15.70Power 4.28 2.14Transportation 2.12 1.48Capital goodsannuity 13.31 15.16
Other 7.63 2.68Conservation andsafety 1.33 0.12
Total 88.64 86.19
5. Labor cost is assumed to consist of 50% skilled and 50% unskilledlabor; stores to consist of capital goods and local materials; capital goodscosts are converted to border prices at the capital goods conversion factor,other expenditure at the standard conversion factor. The economic cost ofcoal amounts to Rs 68-70/t. An average of Rs 69/t is used.
6. For the alternative to the project, the following cost of coal isassumed, reflecting transport from the closest location:
Financial Cost of which EconomicStations (Rs/t) Freight (Rs/t) Cost (Rs/t)
Uttar Pradesh 69 - 69Rajasthan 151 90 147Delhi 168 107 162Punjab & Haryana 153 92 149
7. Opportunity Cost of Capital. A range between 10 and 13% is assumedto reflect the rate of return on public investment in the economy.
8. Benefits. The alternative use of expenditure for tariff paymentsand maintaining standby generating sets is assumed to be expenditure on abasket of tradeable goods. Consequently, the standard conversion factoris used to convert these benefit proxies to border prices.

- 100 -
ANNEX 27
INDIA
SECOND SINGRAULI THERMAL POWER PROJECT
Structure of Operation & Maintenance Costsin Z of total O&M cost in 1979 constant market prices
Domestic Costex-works
(excluding labor) Labor Total
1. Spares 29.05 9.45 38.502. DM Plant Chemicals 6.50 1.20 7.703. Consumables, Lube Oil,
Chemicals etc. 9.30 2.20 11.504. Direct Labor - 40.00 40.005. Other 2.30 - 2.30
Total 47.15 52.85 100.00
Source: NTPC
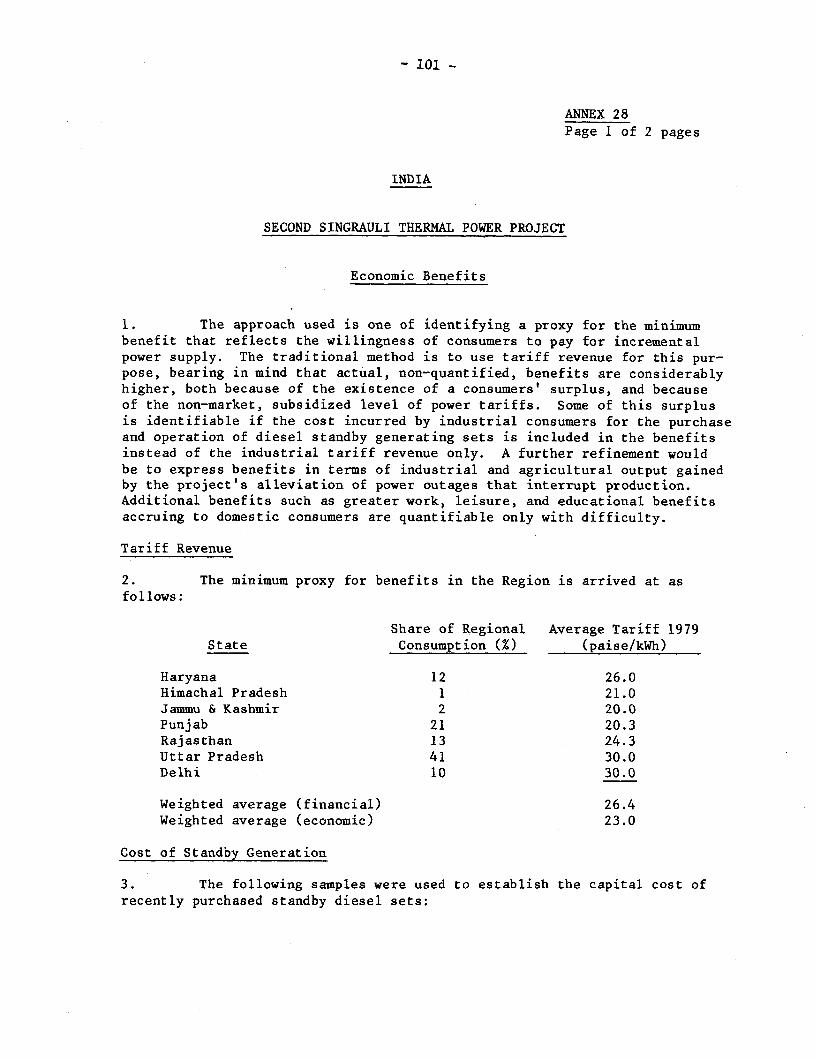
- 101 -
ANNEX 28Page 1 of 2 pages
INDIA
SECOND SINGRAULI THERMAL POWER PROJECT
Economic Benefits
1. The approach used is one of identifying a proxy for the minimumbenefit that reflects the willingness of consumers to pay for incrementalpower supply. The traditional method is to use tariff revenue for this pur-pose, bearing in mind that actual, non-quantified, benefits are considerablyhigher, both because of the existence of a consumers' surplus, and becauseof the non-market, subsidized level of power tariffs. Some of this surplusis identifiable if the cost incurred by industrial consumers for the purchaseand operation of diesel standby generating sets is included in the benefitsinstead of the industrial tariff revenue only. A further refinement wouldbe to express benefits in terms of industrial and agricultural output gainedby the project's alleviation of power outages that interrupt production.Additional benefits such as greater work, leisure, and educational benefitsaccruing to domestic consumers are quantifiable only with difficulty.
Tariff Revenue
2. The minimum proxy for benefits in the Region is arrived at asfollows:
Share of Regional Average Tariff 1979State Consumption (%) (paise/kWh)
Haryana 12 26.0Himachal Pradesh 1 21.0Jammu & Kashmir 2 20.0Punjab 21 20.3Rajasthan 13 24.3Uttar Pradesh 41 30.0Delhi 10 30.0
Weighted average (financial) 26.4Weighted average (economic) 23.0
Cost of Standby Generation
3. The following samples were used to establish the capital cost ofrecently purchased standby diesel sets:

- 102 -
ANNEX 28Page 2 of 2 pages
Unit Size (kW) Cost of Set (Rs 1978) Rs/kW
244 284,000 2,869200 600,000 3,000315 1,000,000 3,174244 700,000 2,869
Assuming an average 1979 purchase price of about Rs 3,000/kW, plus 10%installation charges, the total cost of Rs 3,300/kW can be expressed per kWhas follows, assuming that an industrial consuemr satisfies his demand by usingown generation:
Life of set: 15 yearsAverage utilization: 4,400 hours/year(50% load factor)
Annual charge at 13% discount rate : Rs 510/kW/yearor Rs 0.12/kWh
Annual O&M cost @ Rs 180/kW/year : Rs 0.04/kWhAnnual fuel and lubricant cost at
0.25 l/kWh @ Rs 1.50/1 : Rs 0.38/kWhTotal cost (financial) : Rs 0.54/kWhTotal cost (border prices) about : Rs 0.52/kWh
4. The economic cost of Rs 0.52/kWh (at the assumed load factor) rep-resents the observed maximum willingness to pay for continuous power supply.Combined with the average industrial tariff in the region of 25 paise/kWh(Haryana: 29, Punjab: 22, Rajasthan: 24, Uttar Pradesh: 25) and its economicequivalent of 22 paise/kWh, the resulting average benefit proxy for industrialconsumers is 37 paise/kWh in economic terms. 1/ It can be confidently assumedthat this represents the demonstrated willingness to pay.
1/ Assuming a sloping demand curve for industrial energy inputs. A mixbetween grid supply and own generation can be imagined between the twoextremes, resulting in decreasing average valuation of the kWh unit withdecreasing utilization of the standby set: a movement along the demandcurve. In aggregate terms, the average willingness to pay is assumed tobe halfway between cost of own generation and the tariff.

INDIA
SECOND SINGRAULI THERMAL POWER PROJECT
Economic Cost: Second Singrauli Project (Rs million)
1990-91-Item 1979-80 1980-81 1981-82 1982-83 1983-84 1984-85 1985-86 1986-87 1987-88 1988-89 1989-90 1003-04
Plant Capital goods- CIF 94 322 470 651 470 193 92 56 - - - -- dom. 18 63 92 127 92 38 18 11 - - - -
Other goods, freight, 14 49 72 100 72 30 14 9 - - - -ins.
Labor 29 99 145 201 145 59 28 17 - - - -Trans.Capital goods- CIF 2 29 77 120 79 23 - - _
- dom. 5 56 151 234 155 45 - - - - - -
Other goods, freight, 0.3 4 10 16 10 3 - - - - - -ins.
Labor 1.6 20 54 84 56 16 - - - - - -O&M Spares, freight, - - - - 6 12 27 47 50 50 50 50
ins.
Labor - - - - 6 14 30 52 55 55 55 55Fuel - - - - 19 59 133 236 299 337 353 355
Additional trR4Xnlpission + 8.9 109 .292 454 300 87 - - - - -distribution invsstment
Additional transmission + - - - - 23 25 25 25 25 25 25 25distribution O&M .
Benefit:
Incremental kWh sold: retail - - - - 365 945 2,295 3,970 4,880 5,425 5,605 5,605 1 (MkWh)
m ¢Tariff revenue @26.4 p/kWh - - - - 96 250 606 1,042 1,288 1,432 1,480 1,480(Rs mn.)
0o
Economic cost of tariff - - - - 84 218 527 912 1,121 1,246 1,288 1,288 trevenue at 0.87 SCF 0
a
Economic benefit (non- - - - - 99 257 622 1,077 1,324 1,472 1,521 1,521industrial tariffrevenue plus industrialwillingness to pay for power)

Economic Cost: Alternative to Second Singrauli Proiect (Rs million)
Item 1979-80 1980-81 1981-82 1982-83 1983-84 1984-85 1985-86 1986-87 1987-88 1988-89 1989-90 2003-04
Plant Capital goods- CIF 163 222 564 762 703 469 157 43 - - - -
-dom. 31 42 108 146 135 90 30 8 - - - -
Other goods, freight, 24 33 84 113 105 70 23 6 - - - -
ins.
Labor 53 71 182 245 226 151 51 14 - - - -
Trans.Capital goods- CIF 4 17 27 44 26 21 16 - - - - -
- dom. 6 27 44 71 42 34 26 - - - - -
Other goods, freight, 0.5 2 4 6 4 3 2 - - - - -
ins.
Labor 3 12 19 30 18 15 11 - - - - -
0&M Spares, freight, - - - - 31 44 53 56 57 57 57 57
ins.
Labor 34 48 58 61 62 662 62 62
Fuel UP - - - - 19 72 116 146 151 1151 151 151
Rajasthan ) 0 S
Delhi ) - - - - - - 57 180 287 343 363 363
Pun4ab & Haryana)
Total Fuel - - - - 19 72 173 326 438 494 514 514 m
V~.._

- 105 -
ANNEX 30Page 1 of 2 pages
INDIA
SECOND SINGRAULI THERMAL POWER PROJECT
Economic Justification: Results
1. Least-Cost Analysis
Present Value of Cost StreamsDiscount Rate (Rs million)
(%M Project Alternative(Singrauli 1,400 MW) (5 stations in
5 states)
Base case 10 5,563 6,63813 4,615 5,407
Cost of capital goods upby 10% 10 5,825 6,913
13 4,852 5,653
Cost of capital goods downby 10% 10 5,302 6,364
13 4,379 5,160
Cost of labor up by IOZ 10 5,655 6,74613 4,693 5,515
Cost of fuel down by 10% 10 5,411 6,42113 4,510 5,331
Cost of alternative downby 10% 10 5,563 5,974
13 4,615 4,866

- 106 -
ANNEX 30Page 2 of 2 pages
2. Benefits and Internal Rates of Return for the Project
Minimum InternalRate of Return (%)
Tariff Revenue as Proxyfor Minimum Benefit
Base case 7.4Cost of capital goods up by 10% 6.8Cost of capital goods down by 10% 8.0Cost of labor up by 10% 7.2Cost of fuel down by 10% 7.8Tariff revenue up by 10% 9.0
b. Willingness to Pay as Proxyfor Minimum Benefit
Base Case 13.2Benefits up by 10% /a 15.9Costs up by 10% 11.2
/a This can be attributable to one or more of.the following:
(i) increased frequency of outages and use of standby capacity,(ii) decreased losses in distribution and higher kWh sales,(iii) higher valuation by the consumer of the unit of energy.

- 107-
ANNEX 31
INDIA
SECOND SINGRAULI THERMAL POWER PROJECT
National Thermal Power Corporation Limited
Documents Available in the Project File
A. General Reports and Studies Related to the Sector
A.1 Tenth Annual Electric Power Survey of India.A.2 Report on Power System Planning Studies - Phase I 1979-1984
System.A.3 Report of Working Group on Power Development 1979/80 to
1983/84.A.4 Uniform Heads of Accounts for State Electricity Boards.A.5 Forms for Compilation of Annual Accounts of State Electricity
Boards, approved by the Comptroller and Auditor General ofIndia on November 28, 1978.
B. Selected Reports and Working Papers Relating to the Project
B.1 Second Singrauli Project Feasibility Report.B.2 Updated Cost Estimates for NTPC's Development Program;
Operating Plant Commissioning Schedule.B.3 A Conceptual Plan for Development of an Integrated MGR System
of Coal Transportation to a Chain of Super Thermal PowerStations in Singrauli Area: Rail India Technical and EconomicServices Ltd.
B.4 Short Note on Development Program in Singrauli Coalfield.B.5 Draft Report on Project Monitoring System: A.F. Ferguson
& Co., Delhi, Management Consultants.B.6 Dr. R.K. Pachouri - Discussion Paper on Approval to Power
Pricing by NTPC.B.7 Economic Costs of Project and Alternative.B.8 Power Supply Position 1976/77-1983/84 of SEBs in Northern Region.B.9 Regional Diversity in Peak Demand - September 1978 to April 1979 -
Northern Region.B.10 Schedule of Installed Capacity of Existing Thermal Stations
at end of March 1979 - Northern Region.B.l1 Miscellaneous Appraisal Data.


-5" -- ,AF'-'>HAN STAN REM REP OF' y''~~~~~~~~~~~~~~~~~~~ LV~~~~~"T..P~Ih
J-k,,~ ~ ~ ~ ~ ~ ~ ~ ~ ~~~ ~~~~~~~~~~~~~~~~~~~~~~ S,,P,T' ~ A\ N
H . ~~~~~~ .1 I 'N'v A~~~~~~~~~~~~
5AG >~)S
Ash ':-'-' C LI I N A i~~~~~~~~~~~~~~~~~~~~~~~~~~~~~~~~~~~~~~~~~~~ V t > ~ ~ ~ ~ ~ ~ 4
5' ALIjyQ SeTH Vt)~~~~~~~~~~~~~~~~~~~~~~~~~~~~~~~~~~~~~~~~~~~~~~~~~~~~~~~~~~~~I
At v--- As--d
~-A ASLo%~ ~ l~ ALSATNO' " ,Jl -hr-H7>> >A~~~~~~.NDL
Ss~ ~ ~ ~ ~~SCNDSNGAL
AL-MI, ~ ~ ~ ~ ~ ~ ~ ~ ~ ~ ~ ~ ERA OERSA~
AT2 25'RTP'~L T \ kVTrI&A NSH 45. AINE
Cx~~~~~~~~~~~~~~~~~~~~~~~~~~~~~~~~~~~~~~~Mk PK~lllI"F A R'A"'~~~~~~~~~~~~~~~~~~~~~~~~~~~~~~~~~~~~~ l C" P,b-C -T,LM W'rAALL
5, 'A. -AE ,~~~~~~~~~~~~~~~~~~~~sp> B l~ E OU aA IE -J
"N '>'>'' -,7~~~~~~ (s,,sA' '-st_~~~~~~~>5-,,-., tA',,
4, 4 c [At? S,,s*<MT,M,S-STATMBOUNARIE
(C 54 A -~~~~~\T ", -ENr NA BONDAIEN r4~~~~~~~~~~~~~~~~~~~~~~~~~~~~~~~~~~~~~~'p ~ ~ ~ ~ ~ ~ ~ ~ ~ ~ ~ o
B> %d LN U5? ssV ~,rz / ' 551555E
- 55555 kkLs ~~~~A/LANKIso,,,, \ -> -,~~~~~~~~~~~~~~~~~~~~~~~~~~~~~~~~~~~~~~~~~~~~?


IBRD 1451782 30' \ 82'45 /torsen . er8300o' NOVEMBER 1979IN 1/ D I A j C1tts C/rp,4
Second Singrouli Thermal Power Project (/i Ob (JhnItio
PROJECT SITE LAYOUT I Il JunctionI \ /f f Obra Dam
I Projected power plant facilities JProposed 400 kv transmission lines (Project)Planned 400 kv transmission line
- - Proposed railroods (Project) /F _ Proposed cool mines / Magardua JunctionV7- Tfl Future coal mining areasL Power plant facilities under construction(Singrouli Project I) /
Water discharge pipe under construction (Singrauli Project I)400 kV transmission lines under construction (600 MW stage, IDAcredit685 IN)400 kV transmission line under construction by SEB
- Railroad under construction (600 MW stage)B8g:>; Ash disposal areaE-'Z Existing coal mines
Raliroads
* Railroad stops Sunhera* Thermal power station Rani TatRoads i
=_-.vzrSO Rivers- Dams o Villages Mirc
- *- State boundaries
UT TAR PRADESH l
>\ ~~~~~M A D H Y A PR AD E SH t /1 7 55'
* /;
p0,+,3 .... ) F6g2X=e C H I N A A'Co"-n;5 r f 5 i 0 \ S t B p
PAKISTN ' / AB0aZt d 5 -" noieri dorge
~~~~~~~~ p5-, ~ ~ ~ ~ ~ ~ ~ ~ ~ ~ ~ ~ ~ ~ ~ ~ ~ ~ ~ ~ ~ ~ IA~O psf1
K I N D I A1I' -A I.> H I N A
f .5 lJ 2A 04200- KILOMEETRS 0 2 4 6 E 10 12 14 16 24'00
'rc29t d \ fiY o ndzbi7 \<MILES 0 2 4 6 _ 0Se,? 0 < X \ l attherende of lherepnrmtswelCh t/StStaChed fhe d d mn*tfonsUset/addthe~~dtflrsdsr ~ sh ,pss S sosc .1isansu, rh dhOrrsOs sdddh h
> / JSS St?bosirdr es ord\ o usr,hitat8ntld7hbd,^lso, histntnlrv vnsNte
I,LA> -- curdornCier AS A 45 I tS3-00