FILE COPY - World Bank Documents & Reports
217
FILE COPY DOCUMENT OF INTERNATIONAL BANK FOR RECONSTRUCTION AND DEVELOPMENT INTERNATIONAL DEVELOPMENT ASSOCIATION Not For Public Use Report No. 156-IN ECONOMIC SITUATIONAND PROSPECTS OF INDIA May 8, 1973 Asia Region South Asia Department This report was prepared for official use only by the Bank Group. It may not be published, quoted or cited without Bank Group authorization. The Bank Group does not accept responsibility for the accuracy or completeness of the report. Public Disclosure Authorized Public Disclosure Authorized Public Disclosure Authorized Public Disclosure Authorized
-
Upload
khangminh22 -
Category
Documents
-
view
1 -
download
0
Transcript of FILE COPY - World Bank Documents & Reports
FILE COPYDOCUMENT OF INTERNATIONAL BANK FOR RECONSTRUCTION AND DEVELOPMENT
INTERNATIONAL DEVELOPMENT ASSOCIATION
Not For Public Use
Report No. 156-IN
ECONOMIC SITUATION AND PROSPECTS
OF
INDIA
May 8, 1973
Asia RegionSouth Asia Department
This report was prepared for official use only by the Bank Group. It may not be published, quotedor cited without Bank Group authorization. The Bank Group does not accept responsibility for theaccuracy or completeness of the report.
Pub
lic D
iscl
osur
e A
utho
rized
Pub
lic D
iscl
osur
e A
utho
rized
Pub
lic D
iscl
osur
e A
utho
rized
Pub
lic D
iscl
osur
e A
utho
rized

CURRENCY AND OTHER EQUIVALENTS
Currency
Prior to mid-December 1971 US $ 1.00 = Rs 7.50Rs 1.00 = US $ 0.1333
Mid-December 1971 toend June 1972 US $ 1.00 = Rs 7.27927
Rs 1.OO = US $ 0.1374
After end-June 1972 floating rate
Spot rate(March 31, 1973) approx. US $ 1.00 - Rs 7.59
approx, Rns 100 - US $ 0,13
For all projections in this report the exchange rateuS $ 1.00 = Rs 7.50 has been used, unless specified otherwise.
Weights
Unless otherwise specified all weight measures are metric.
Years
The Indian fiscal year runs from April 1 through March 31l
This report was prepared in the Office of the ResidentRepresentative of the World Bank in India by William M. Gilmartin,Bilsel H. Alisbah, Timothy King, Wolf Ladejinsky, Timothy P.Lankester, Peter E. Naylor, Norman E. Reynolds, N. S. Segal,Armand Van Nimmen, Sunanda Sengupta and Y. Satyanarayanan(Statistical Analyst).


ECONOMIf, SITTATION XAN) ̀ RCSPECTS CF' INDIA
Table of Contents
BASIC DATA .................. ..*. .
MAP .................................... ... ......... ...
SUFi4AP2fA.ND CONCLUSIONS ....................... . . ..............
1. INTRODUCTION
Historical Perspective ..................... ...... . 1Recent Developments .................... , .. ............ 7
2. 1T4?UATION 14
The Current Situation .,..... 17New Directions? . ... ................. C
3. UNEINPLODIP1NT AND POVERTY 21
'. AGRICULTURAL PRODUCTION
Growth Rate of total Agricultural Output. 2Foodgrains - 1. 1Theat ................. e ............... 27Foodgrains - 2. Rice 8.....2Foodgrains - 3. Other Toodgrains ., 30Foodgrains - 4. Total Seasonal and Regional Trends 31Non-Foodgrains Crops ...... ............ 32Livestock. . .. 3The Production Record in relation to Requirements . 34Implications of past trends for future growth ... 36
5. THE RURAI, SC'ENE
The Drought . .............. 40Illusory Drought Consequences . . .42Green Revolution's Gainers and Losers ..... O.......... 43Agricultural Prospects. .. 45New Land Ceiling Round 0............ ..Rural Programs .. . ............. .............. 52
G. INDUSTRY
HIistorical Perspective ........ .0* ...... 63Current Situation and Short Term Prospects ............. 67Longer Term Prospects .... .................... 69
7. STEEL, POWIER AND FERTILIZER: A BPLEF REVIEW 76
Table of Contents (continued) Page No.
u. DONIESTIC FINANCE
Domestic Resource Mobilization .............. .. .... 86Overall Budgetary Situation ............................... 90The Center ............ .......... O.!.......... 91State Finances ............. a. ...... , .... 96Plan Outlay ............. 98hioney and Prices ...... ............. 100
9. THE APPROAUCT TO TIIE FIFTH PLAN
Summary . .... . ......................... 102Faster Development . ................. 105n.edistribution . ................. ..... 106r ,omrjestic Financing ................ ......... 106'el.f Relia.ce.. ..... * g 109
10. EXPORTS
The Overall Record . . . ............ 112Direction of Exports .................... 0... . ... 1l11The Comxposition of Exports .................. . I .. 114Tr'aditional .. Exports . . . ....... ,. 115T.on-Traditional Ex.orts ................. . . . 117T..e I. ..ure . . . 124
11. YSTI;:ArTTD ACTD I.EQUIREJ1IET FOR 1 973/7)4
7lecent Trends in te Balance of Payments ..... ............ 125TIndia 1 s Trade and Aid el.atfionshin3 with East European
rountries ....... ........ 128Foreign Exchange Reserves . ..............................131External assistance .................. . . 1327lalance of Payments Projection and Aid Recor^mendation
for 1 973/714 ... 1............ ........ 135
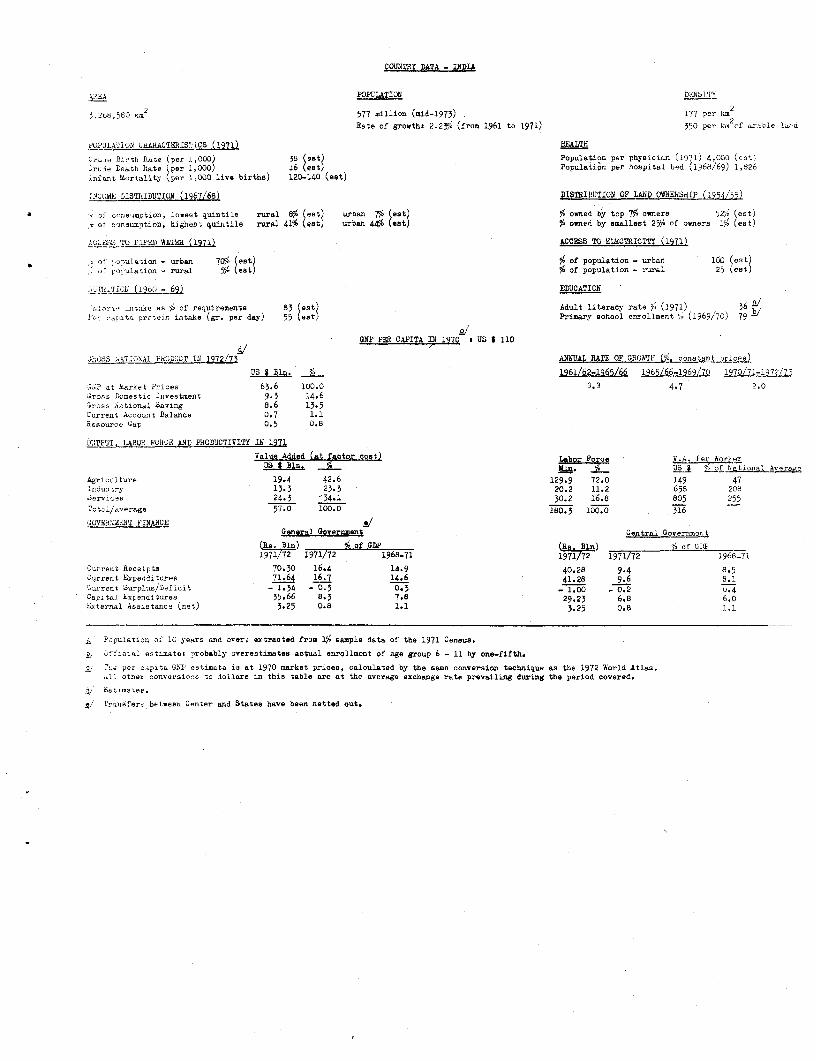
COUNTRY DATA - INDIA
]POPULATION DRl'.'TY
3 '68, 580 ,,2 577 million (mid-1973) 177 per kmRate of growths 2.2Yp% (from 1961 to 1971) 350 per km of arable 1nd
r UPLAT103 26ARACTRILS, CS (H)EALT
Brs ir ith reRe (per 1,000) 38 (eat) Population per phyatcian (1971) 4,000 (ast
1.rLie Death Rate per 1,000) 16 (eat) Populationr per hospital bed (1968/69) 1,826infant biortality per 1,000 live births) 120-140 (eat)
INCui& DlSTlibVTIOP (1967/68) DISTRIMJTION OF LAND OWNERSHIP (1954/55)
- of oonsumption, lowest quintile rural 8% (eat) urban 7e (eat) % owned by top 7% owners 12('6 (estjtol cnsumption, highest quintile rural 41% (est) urban 44% (eat) 56 owned by smallest 25%A of owners 19) (est)
A,;C-I 'O PIPED WATER (1971) CCESS TO ELECTRICITY (1971)
, of ;p,.laaion - urban 7VI6 (est) 56 of population - urban 100 (est).f rorulation - rural 556 (eat) 56 of population - rural 25 (eat)
.Ti.TOl; (i9 - 69) EDUCATION
-t. s 1o of requireoienta 83 (est) Adult literacy rate 74 (1971) 36Ir ,aitta protelr intake (gr. per day) 55 (est) Primary school enrollment 7/. (1969/70) 79
2/'GN? PEN CAPITA IN 1970 t US 4 110
hROSS N6TIONAL P0XO16T IN 1972/73 ANNIUAL RATE OF GROWTL (p/J constant prices)
US I Bln. % 1961/62-1965/66 1965/66-1969/70 1970/71-197?/75
11 at Lerket Irices 63.6 100.0 3.3 4.7 2.0Iro,s Domestic Investment 9.3 14.6^.ross ointional Saving 8.6 13.5Carrent Account Balance 0.7 1.1Resource Gap 0.5 0.8
OUTPUJT. LABOR FUH0E AND PRODUCTIVITY IN 1971
Value Added (at fastor oost) Labor Force V.A. Per WorkerUS t Bln. nc ____ L Rf National Averoe
kgrijul ture 19.4 42.6 129.9 72.0 149 47lndoi ry 13.3 23.5 20.2 11.2 658 208aervises 24.3 34.1 30.2 16.8 805 255Totl/.,erage 57-0 100-0 IO.3 100.0 316
.0VEW4IAriiT FINANCE 1/General GOvernment Central Governmen t
(Re. Bin) S of GDP (R ) B of GAL1971/72 1971/72 1968-71 1971/72 1971/72 1968_71
lurreat Receipts 70.30 16.4 14.9 40.28 9.4 8.5Current Expenditurse 71.64 16.7 14.6 41.28 9.6 8.1Corrent Surplucs/Deficit - 1.34 - -3 0.3 -_ 1.00 - 0.2 0.4lapotal iEx~enditnres 35.66 8.3 7.8 29.23 6.8 6.0Bxternal Ass:.otanoe (net) 3.25 0.8 1.1 3.25 0.8 1.1
M Population of 10 years and over; extracted from 156 sample data of the 1971 Census.
t*ffcial estimatet probably overestimates aotual enrollment of age group 6 - 11 by one-fifth.
c 2,s per CipltB GN2P estimate is at 1970 market prioces, caloulated by the same conversion technique as the 1972 World Atlas.Ai other conversiorns o dollars in this table are at the average exchange rate prevailing during the period covered.
E. Estimates.
c,' Prsofers between Center and States have been netted out.

C0OIISRY DATA - 31DIA
.O*bY 1h1*;lT AN3 P1UC8S 1965/66 1969/70 l 1 1971/72 October 1971 October 1972
( Billion Rs outstanding at end of period)
:o-OTy and quasi 2looey 61.4 93.3 105.6 122.3 113.7 130.4oank Credit to Publio Seotor 40.8 52.4 56.9 69.0 64.0 77.5Bank Credit to Private Sector 28.1 48.3 56.7 64.4 59-9 64.3
(Percentages or Index liumbers)
1965/66 1296 1970/71 1971/72 February 1972 February 1973
i,oney and .uasi Money as 31 of GPP 24.2 24 .3 24.8 26.5Yholebale Price Index (1961/62-100) 137.5 175.7 180.6 192.2 191.2 217.2
lh,uui percentage changee in?
ifolse61e Price Index 12.4 6.4 2.8 6.4 13.6oank Credit to Public Sector 12.9 1.5 8.6 21.3Snk Credit to Private Sector la.8 15.1 17.4 13.6
b i-jACa 0. PAYX1aTS
1969/70 1970/71 1971/72 DRCHANDISR EXPORTS (AVERAGE 1969/70-1971/72)(Million US S) US $ min. i
dicport of Goode 1,884 1,950 2,106 Jute Manufactures 291 15l-orts of GoodS ,109 2,179 2,436 Tea 188 9Trade Balance - 225 - 229 - 330 Cotton Textilee 161 8§sr 'net) 13 - 7 n.a. Iron Ore 139 7Ltouacur G4s - 212 - 236 n.a. Engineering Goods 136 7
Interest Payments (net) - 192 - 214 n.a. Others 1,968 1Cther Factor Payments (net) - 15 - 20 n.a. Total 1,9B0 100Set Transfers 79 83 n.a.
Galance on Current Account - 340 - 387 n.a. EXTERNAL MT. March 31. 1971OS $ bdn.
Official Aid (incl. grants) Repayeable in foreign currenoy 7,771Disbursementc 1,188 1,096 1,089 Repayable through export ofAmortization - 357 - 387 goods 782
birect Foreign Inveatment ) - 288 - 558 n.e. Total Outstanding 8,553Other Capital (net) )All Other Items ) DET BERjYIOB RATIO FOR 1971/72 30.6 percent
lncr.ase in Reserves 203-/ - 237-/ 39Gross Reserves (end year) 1,095 1, 052 1,277let Reserves (end year) 912 1,052 1,277 IBRD/IDA LENDING. March 31 1973 (UsS 1f4e S
hAT PE OF MC{APGR
Prior to mid-December 1971 a US 6 1.00 - Re. 7.5 IIRD IDARs, 1.00 - US 5 0.133333 Outstandirg and Disbursed 541 2,105
id-December 1971 to US 3 1.00 ' Ra. 7.27927 Undisbursed 66 755end June 1972 Rs. 1.00- lS 0.137376 Outstanding incl. Indisbursed 607 2,860
A-tor end June 1972 3 Floating Rate
Spot Rate (March 31, 1975) A app-rox, US $ 1,00 - RE. 7.59approx. Rs. 1.00 - US *0.13
, Allooations of SR' a and valuation changes reaulting solely from changes in exchange rates and the gold parity of the US dollar are treatedhere as exogenous to the balanoe of payments.
2/ 1530lization snd interest payments as a percentage of merohandise exports,

IBRD 10483
70 j soS;_Ms ,.S,,,a ra° 9O. May 1973
AFGHANISTAN u fit " ._' N'I rifl' /e!.r os ,ff I N D I A
JAMMU and KASHMIR
3 -~~~~~~sriaer grState and Union Territory Capitals
Si' - <~ >* National Capital
H S /1/MACHAL t.4 0 Other Cities
_t st .-' g PRADESH > State ond UnionTerritory Boundaries
.5 -.-.i-- _-- International Boundcries
PAKISTAN l c aandieerh
PUNJAB
YA/E/Af { \-| ~~~~~T I B E T._ ../ 1 Sl,DfZ~~~HI Zv
/A 'ANA EW DELHI p A BES
J -< ,3 u T rA P . NEPAL B HU 7 TAN
f B PRA DfESH .r. itCkIKKIM,P BHUTANDESHRAJA STHAN I4cknoc K 7.v
;aipur 0,Goreikhp.r ~\ 1 / X ~~~~~~ ~ ~~~Karpur Patnl({ 5t. s g > v
(( t*\ . .MG A Z A oi Y mp 01e
BIHAR hANGLADESH X /3 AgartaIX~
, -gGUJARAT D g u < BENGAL. : ~~~~~~M A D) H Y A P R A DEfS H />CiU8 9.% VIF
BURMA
t M~~A/IAA HBJA t>W-
$~~ ~~~~~ ~ ~~~~~~~~~~~ n g ofl\ J ( D~~~~~~Hyderabad ;Benga/
5 c/ )~A NDHRA rArab/an P PRADESH (4
Balngao @
\t ~~~~~~~~~~~~~~~~~~~~~~~ t),0. \ ) J~~~~~A MI Z NAODU
ffERA/At~ ~ ~ ~ ~ ~ ~~~~~1 Kp q 0 O 400 500 MILES
0 g > °cb > ~~~~~~~~0 O)l C 200 3070 400 5 60 7q) EqOO 0 KILOMETERS
Triwndru
7 ~ ~ ' 9 7De erzlunssS zON /11¢xnri doalolj iSRI L.AN,YAii ol,~~iio,jcqingrceleor -/rzr by i1tO I
1jDgii ¢'.dd 15t%/ lerk \ it jf.P

I

SULkARY AND CONCLUSIONS
i. The focus of this report is on the progress of India's developmenteffort during the 1y60s as a prelude to a discussion of next year's FifthFive Year Plan (1974/79). The record is a mixed one. In statistical termsand in relation to the immense needs of the world's second largest populationthe record is disappointing. It is nevertheless impressive not only for thevery considerable achievements but also when judged against India's inherentdevelopment difficulties and frequent disruptions caused by conflicts withneighboring countries and confrontations with nature.
ii. This year's poor agricultural harvest has provided a reminderof the ever-growing pressure of population on land and capital resourcesand the prospects of any great improvement in this regard are not bright.ACter several years of rising expenditure and declining performance therewas in some respects an improvement in family planning acceptance during1)71/72 and under the influence of a program of mass sterilization campsthis has continued in 1972/73. The ability to sustain this improvement mayhowever be hampered by the 1973/74 budget for family planning which has beencult sharply as part of the budget effort to curb inflation. In any case,there is considerable disagreement among experts as to the demographic effectof the program. Some feel that until the prospects for child survival toadulthood improve, it will be difficult to reduce family size. Nevertheless,the achievements of the family planning program are substantial and sincethere are no feasible alternatives as a way of tackling India's major longterm problem, the case for strengthening and expanding the program remainsstrong.
iii. Though it is not quite clear from the available statisticswhether the proportion of the population living below a very austere povertyline increased during the 1960s, there are reasons to believe that it did;in any case it is certain that the absolute number grew and may include40-50 percent of the population. Most of this is in the rural areas. Whilethere is substantial rural unemployment, low productivity of available em-ployment and partial employment is the principal cause of rural poverty.Urban poverty and underemployment and the employment problems of the recentlyeducated, which are compounded by both an excessive rate of growth in educa-tional enrolments at upper levels and a very slow increase in employment inthe private organized sectors, remain serious.
iv. In 1972/73, as often before, the weather has played havoc withIndia's agriculture. Foodgrain production has declined from a high of 108million tons in 1970/71 to at most 100 million tons; stocks of 9 milliontons which were accumulated during favorable years have been nearly depletedand orders were placed for about 2 million tons of imports in 1972/73. Thedrought however should not obscure the fact that domestic production is nowable to satisfy foodgrain demand during normal years. This has been made

- ii -
possible primarily by the breakthrough in wheat production which dominatesand explains most of the important agricultural trends of the latter 1960sincluding the productivity gains in foodgrain production and part of thesubstantial slowdown of the rate of growth of other crops because of shiftsto wheat. lt has also contributed to the increasing importance of the rabicrop and the considerably faster rise of agricultural production and in-comes in northern India as compared with the rest of the country.
v. One of the main challenges for the 1970s will be to improve thelot of the growing numbers of rural poor. This can best be achieved whereirrigation is possible by spreading the technology of the wheat revolutionto small as well as larger farmers and to other crops and regions. In ricea modest beginning has been made particularly in the eastern region. Inrain-fed areas a start has yet to be made and will probably require furthertechnological advances as well as institutional and infrastructure improve-mients. The prospects for helping the rural poor through land reform do notappear promising despite a new round of land ceiling legislation. The pre-occupation with the size of holdings and with a one shot redistribution havelead once again to the neglect of the broader and more lasting aspects ofagrarian reform. The rights and interests of the multitudes who can neverhope to ow. land are still poorly defined and Lnadequately defended. Theattempts to tackle the problem of extreme rural poverty through speciallydesigned rural works programs are certainly timely. There are however agreat many unanswered questions surrounding the existing schemes concerningdevelopment potentials of particular areas and the extent to which therural population are able and prepared to accept the work offered, and thebest way of organizing assistance schemles especially in the absence ofworthwhile district planning and of institutional channels oriented towardsthe problemins of the rural poor.
vi. In Indian industry the structure has changed dramatically since1956 when production was concentrated in light manufactures and consumergoods industries; today value added by capital and intermediate goods eachaccounts for nearly a third of total value added. The structural changehas also been accompanied by the substantial reduction of the dependence onimports. Partly as a consequence, however, the record of growth since 1965has been di-sappointing. Inadequate supplies of raw materials in some casesand in ot'121r cases insufficient demand have held back industrial growth.Contributing factors have been measures designed to curb the activities ofthe larger houses, and insufficient public savings for which the poorfinancial performance of some of the larger public sector industries is atleast partly responsible. Licensing procedures and price controls havealso hampered industrial growth.
vii. Some of the serious problems of the last few years have beencaused by large shortfalls in the domestic production of a number of keyindusLries. Steel, electric power and fertilizers have been among the:LnMcbtstrles whose procuoction arnc general performance have been leastsatiac ctorJ, While there were differences in circumstances among theseaU-ee infdutstries and within each industry from one producing unit to another,

- iii -
a review of their record since about 19966 showis a number of vital, conmonfactors underlying their difficulties. First, the industries were all ina state of rapid expansion thro-ughout the period; and although this waslargely justified from the point of view of domestic derand, the continuingemphasis on expansion meant that insufficient attention was paid to con-solidation of initial operating experience, to preventive maintenance andto the development of a strong and balanced institutional structure in eachsector. Second, prices were controlled at levels which were not attractiveto new investment and which, in some cases, meant that existing operationscould not maintain an adequate rate of reinvestment for modernization andsimilar purposes and still be profitable. Third, the construction programswere adversely affected by delays in licensing and procurem-.ent, Dy rawmaterial shortages and so on. Fourth, there were serious labor problemsespecially in some parts of the country where political conditions weredisturbed.
vi-ii. The 7 percent growth of industrial production in 1972 has beenmade possible largely by the recoveries of textile and steel productionthough the growth is more broadlyg based. Tne prospects for sustaining t}lisrate of growth in the immediate future however are not encouraging in viewof the possible after-effects of the current drought and the serious powershortages which have emerged in recent years, and indeed there are indica-tions that industrial production has started to level off towards the endof 1972. In the longer term, however, it should be possible to restoreindustry as the leading growth sector of the economy. This of course cannotbe! taken for granted and will require action on a large number of fronts.Some of the key requirements will be: (i) policies and procedures whichwill boost exports; (ii) procedures which will reconcile India's aims ofgr-eater social and economic quality with the need for increased privatesector investment in new capacity and for modernization; (iii) furtherimprovem,ents in the efficiency of public sector enterprises; (iv) largerava i lability of foreign exchange for raw materials and components, includingthose required by the historically neglected small scale sector, in orderto utilize existing capacities more fully and to make up for shortfalls inthe production of key industrial and agricultural requirements. There issome progress on all these fronts but whether it will prove adequate remainstc be seen.
ix. One of the reasons for India's disappointing economic performanceduring the 1960s is undoubtedly the fact that the level of domestic savingshas hardly increased. The main explanation for this phenomenon is providedby fiscal developments. On the revenue side, India's revenue efforts havebeen outstanding and the country's overall tax revenues expressed as a per-centage of national income have increased by about 50 percent since 1)60.This has included increased direct taxation but has been largely on accountof Central excise duties and Sta-te sales taxes. Agricultural taxation hasremained minimal and its incidence may have declined. This rapid expansionin tax revenue, however, has been outpaced by the increase in current outlays,so that budget savings have in effect gone down in the period. Partly thisspurt in current outlays has been caused by extraneous elements, such aswars and droughts. Nevertheless, in relation to India's development needs
- iv -
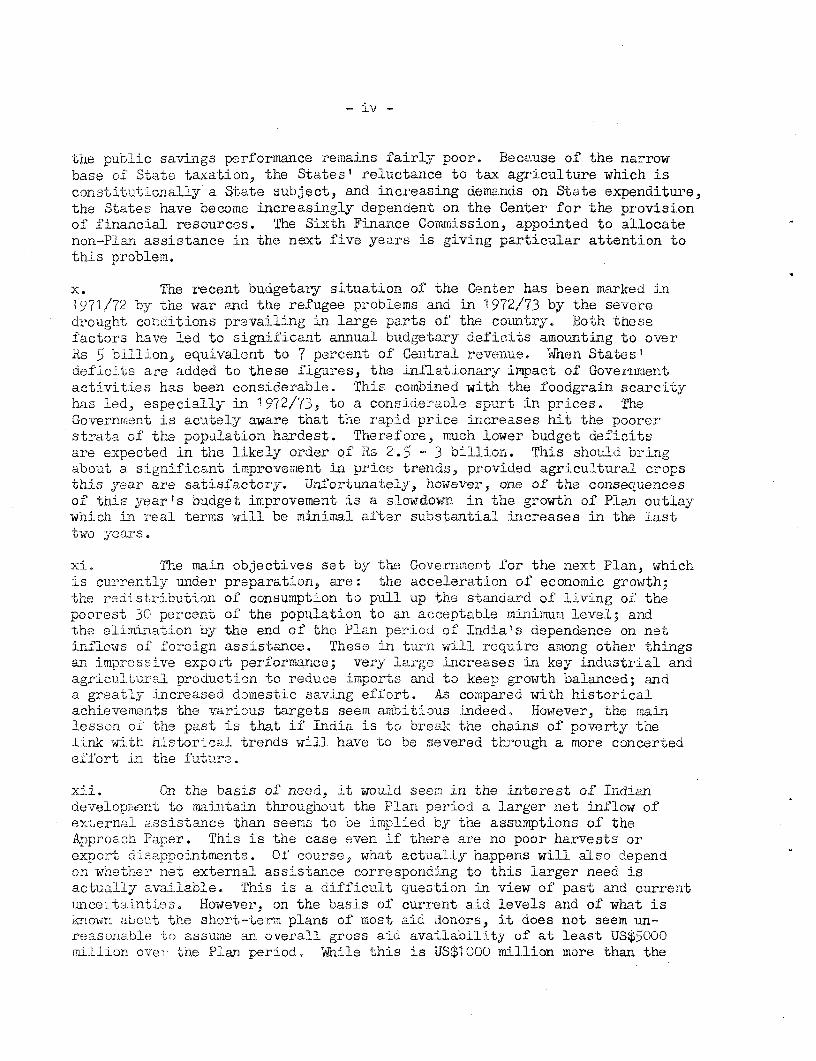
the pu'blic savings performance remains fairly poor. Because of the narrowbase of State taxation, the States' reluctance to tax agriculture which isconstitutionally a State subject, and increasing demands on State expenditure,the States have become increasingly dependent on the Center for the provisionof financial resources. The Sixth Finance Cormission, appointed to allocatenon-Plan assistance in the next five years is giving particular attention tothis problem.
x. The recent budgetary situation of the Center has been marked in1971/72 by the war and the refugee problems and in 1972/73 by the severedrought conditions prevailing in large parts of the country. Both thesefactors have led to sigLificant annual budgetary deficits amounting to overRs 5 billion, equivalent to 7 percent of Central revenue. When Statestdeficits are added to these figures, the inflationary impact of Governmentactivities has been considerable. This combined with the foodgrain scarcityhas led, especially in 1972/73, to a considerable spurt in prices. TheGovernm.ent is acutely aware that the rapid price increases hit the poorerstrata of the population hardest. Therefore, much lower buidget deficitsare expected in the likely order of Rs 2.5 3 billion. This should bringabout a signif icant improvement in price trends, provided agricultural cropsthis year are satisfactory. Unfortunately, however, one of the consequencesof this year's budget improvement is a slowdown in the growth of Plan outlaywhich in real terms will be minimal after substantial increases in the lasttwo yeaLrs,
xi. The main objectives set by t1he Government for the next Plan, whichas currently under preparation, are: the acceleration of economic growth;the redistribution of consumption to pull up the sTandard of living of thepoorest 30 percent of the population to an acceptable minirnu.i level; andthe elimination by the end of the Plan period of India's dependence on netinflows of foreign assistance. These in turn will require among other thingsan impressive expoit performance; very large increases in key industrial andagricultural production to reduce imports and to keep growth balanced; anda greatly increased domestic saving effort. As compared with historicalachievements the -various targets seem ambitious indeed. However, the mairlesson of the past is that if India is to break the chains of poverty thelink with historical trends will have to be severed through a more concertede'fort in the future.
x.i. On the basis of need, it would seemJ in the interest of Indiandevelopzient to maintain throughout the Plan period a larger net inflow ofexternal assistance than seems to be implied by the assumptions of theApproach Paper. This is the case even if there are no poor harvests orexport disappointments. Of course, what actually happens will also dependon whether net external assistance corresponding to this larger need isactually available. This is a difficult question in view of' past and currentuncertaintnes. However, on the basis of current aid levels and of what isknnoiv about the short-term plans of most aid donors, it does not seem un-reasonable to assume an overall gross aid availability of at least US$5000million ovel the Plan period. While thlis is US$1000 million more than the

-v -
assessment in the Approach Paper, in relation to India's needs it is by nomeans an excessive figure, and in fact would realise a net transfer of onlyabout US$1500 million over the five year period.
xiii. The fifth Plan aim to increase exports by 7 percent a year wouldbe a major improvement over the 3 percent annual growth during the Sixties.The latter was much poorer than that achieved by most other developingcountries andi the export objective of the next Plan would be of irmmensebenefit in strengthening the econory and its capability for development.
* I.n this connection it is encouraging that export earnings in the last twoyears have increased substantially by about 8 percent in 1971/72 and anestimated i0 percent in 1)72/73. Unf:ortunately, India's non-traditionalexports and particularly engineering goods on which the hopes for thefuture are based and which have provided the main boost since the Wic-1Sixties,have not contributed to this recent acceleration. The pick up in domesticdemand for these goods, the serious shortage of steel and possibly decliningprofitability have all contributed to this phenomenon. Achievement of thetarget of 7 percent anmual growth in export earnings is likely to depend ongreater attention from policy rmakers ancd administrators in the provision ofincentives and other conditions conciucive to exports including ensuredpriority in the allocation of resources.
x-iv. As indicated, 1973/74 wiJl undoubtedly be a better year for theIndian economy in spite of obstacles like the power shortages, provided thereis a satisfactory monsoon. Nevertheless, the balance of payrnents can beexpected, as usual, to keep a check-rein on economic activity consideringInidia's mounting import needs of such critical items as petroleum, fertilizerand other chemicals, steel and non-ferrous metals, etc, as well as componentsand equipment for industrial and power expansion beyond domestic productioncapacities. We have assessed this year's minimum import requirements for themaintenance of current trends in the economy at about US$2540 million orUS$260 million more than the likely 1972/73 import level. This is wgithallowance for no more grain imports than the remainder from 1972/73 ordersdespite the depletion of stock after last year's poor harvest. Consideringthis stock depletion, it would seem inadvisable to draw on reserves for non-fcod imports in the event that adverse harvests might again require foodpurchases abroad.
xv. Hence, the possibility of larger non-food impolts will depend onthe export outlook and the level of foreign aid. Some increase in exportsis to be expected although not by as much as this year. Therefore the largerimport needs will depend on somewhat higher aid availabilities than last year.Taking account of the commodity aid pipeline and probable disbursement ratesfrom new aid commitments, the level of comirtrments required this year for non-.project aid may be estimated at US$700 million. This would allow for only amodest increase in the low non-project pipeline level. In addition we estimatethe need for new project aid commitments at about US$500 million. This takesaccount, on the one hand, of India's aim for a large expansion of the projectinvestment level in connection with Flfth Plan production targets and, on theother hand,, the linitations at present of projects which are likely to beprepared and ready for consideration this year and of uncertainties about

- vi -
Government policy in easing the import licensing of project equipment,On balance, US$500 million ofne project commitment may be a reasonableobjective for this year considering current project preparation effortsand the expectation that new project commitments by the Bank Group duringthe Indian fiscal year 1973/74 would be substantially more than the US$200million committed in 1972/73. Even if the proposed level of new non-projectand project commitments were to materialize, the net assistance of Consortiumcountries (excluding Bank Group) in 1973/74 would be only of the order ofUS$200 million.

CHAPTER I
1ThTODUCTION
Historical Perspective
1.1 Indiats record of economic developrnent during the 1960's andearly 1970's (the period of the Third and Fourth Five Year Plans) is asvaried as is the wide variety of life and environment in this vast,heavily populated and poorly endowed country. In such a context, averagesand generalizations are apt to be misleading. Yet there is, nevertheless,a broad impression of rather slow economic progress -- too slow -- andof large numbers of very poor Indians for whom the last fifteen years havebrought little improvement. The theme of this report is the course ofIndian economic development since about 1960, the achievements and short-comings of economic activity in this period, and some of the hobbles onthe pace of development with which the econorTr has had to contend. Infollowing this theme the report does not attempt to discuss all the importantsectors of the econonm or all of the influences which have tended to shapeIndia's development. Last year's economic report did provide a comprehensivecoverage of the main economic and social sectors including analysis of theircuirrent problem-;is. For this reason and also while awaiting the Fifth FiveYear Plan for review and comment in next year's economic report, it was felta(lvisable this time to review India's recent econoric past, and in so doingselect for comment only those facets of the econorr which have been criticalin liriting economic betterment for most Indians. In being selective, ourfocus has some glaring omissions like education and some other social servicesor transport or mining or certain important industries or others. This re-f'ects either our judgement about relative importance in influencing Indiandevelopment or a lack of anything substantial to add to last year's report.
1, - Whatever disappointrmients there may be in India's developmentrecord, they should not obscure the fact that there have been impressiveachievements. Indeed, the progress of some large regions of the country hasbeen satisfactory by any world standard. In the Punjab, Haryana and WesternUttar Pradesh, a region of about 50 million population which has been theheartland of the "green revolution", annual growth in output since 1965 hasbeen about 6 percent per year. (In Haryana alone about 12 percent during1965/66 - 1969/70.) Substantial progress as measured by economic growth hasalso been characteristic of other large parts of India including Mysore, Delhiand major sections of Maharashtra, and Tamil Nadu. These regional recordsare obviously not cited to minimize the significance of slow growth for thecountry as a whole; in fact as part of the national average they make it allthe more evident that the below-average parts of the country have been sluggishindeed. The better performing regions are worth noting however, not only fortheir own development, but to indicate capabilities for more rapid Indiandeveloprment given a reasonably satisfactory chance.

-2-
1.3 It is not only in selected regions that there has been substantialadvancement. The infrastructure of economic and social services has alsobeen greatly expanded since the beginning of the Sixties along with theimportant advances in agricultural technology and more rndern structure ofindustry.
1.4 Just a few examples: Since the beginning of the Sixties,foodgrain production has increased by 30 percent, the irrigated area hasalmost doubled and fertilizer consumption has gone up more than 10 times.Power capacity is about 3½2 times greater. There is half again as muchsurfaced roads, about the same increase in railway freight, the number ofcommercial vehicles has considerably rsore than doubled, and port and shippingcapacity is greater by two to three times. In industry, the changing structureof the latter Fifties toward the manufacture of heavy capital goods, basicmetals and more sophisticated equipment continued, especially during thefirst half of the Sixties. By 1971 it is estinated that capital and inter-rmediate goods made up about 65 percent of industrial value added as com-pared with less than 50 percent in 1957. As a result the industrial sector(including mining, construction and electric power) increased from 19 to22 percent of the net national product between 1960 and 1970 while the shareof agriculture fell from 52 to 46 percent. Despite the substantial growthof the economyn, India now produces a far larger proportion of capitalgoods requirements as reflected in the impressive fact that capital goodsimports a-re now less in absolute value than they were in 1960.
1 X5 Some of the most substantial achievements have been in the socialserxice fields with primary education enrolment nearly doubling since 1960, andimticlo.e, secondary and university enrolment increasing proportionately by far more.Sinilarly there has been a large expansion in health services which have aboutdoubled since 1960 as measured by numbers of hospital beds, primary health centers,medical college enrolment and nuribers of doctors and nurses. Nevertheless,health facilities still remain grossly inadequzate to needs.
1.6 This record of advancement in the last decade or so is the moreimpressive, considering the difficulties of the environment, limitations onthe availability of domestic resources, the substantial decline of netforeign assistance, as well as the serious international crises that pun-ctuated the Sixties and early Seventies . The prolonged and severe droughtof 1 065 and 1966 was one of the worst in history. And in three years ofthe period 1962,1965 and 1971, India was at war. Perhaps, most persistentand intractable of all in dissipating the flow of potential human improve-ment from development has been India's annual increase in population. Atabout 2.25 percent a year this has thinned per capita benefits of developmentto about 1 percent on the average for the country at large; for the backwardregions -_-uhich are not backward in human fertility -- the incrementalper capita fare from development is much less if anything. In the face ofthese many economic, political and demographic difficulties, a high placeamong all of India's achievements must be given to the continuing preserva-tion, w-thout qualification or challenge, of free, democratic and tolerantpolit4ical and social institutions.

-3-
1.7 Yet with all these achievements of recent times -- the break-t hrough in agriculture, the creation in industry of a modern complexstructure, the advance of education and other social services, and theadherence to liberal political institutions -- the record of economicprogress remains disappointing when judged in relation to potentialitiesand especially to the depths of Indian poverty. Among the poor, as com-pared with 1960, those still living below an austerely drawn minimumacceptable consumption level are probably larger in number now, and perhapsthey are also a larger part of the population. Any improvement for thislarge segment of the population has been small at best, and for largenumbers of the very poorest conditions may have grown worse.
1.8 Actually this record of limited economic improvement is wellbelow the sights set for the economy by the Indian planners. Since 1 61/62when the Third Five Year Plan began, growth targets were over 5 percent ayear during the Third Plan period (1961/62 - 1965/66) and 5.5 percent duringthe Fourth Plan period ending this year (1969/70 - 1973/74). The plannersalso expected that growth in these amounts would be accompanied by signi-ficant inroads into low-end poverty and unemploymrent. The frustrations ofplanning, with actual growth at only about 3 percent a year, is obvious.
1.9 It is not only in relation to India's enormous needs and to theanticipations of the economic planners that the development record hasbeen disappointing. It is also disappointing in comparison with much of therest of the developing world. India t s growth in national product during theSixties was veyy low among developing countries. In addition there was asubstantial shortfall below planned objectives, which was not because plannedobjectives were unusually high.
1.10 Looking back on these frustrated development ambitions, thismray be a gooci time at the end of the Fourth Plan and just before theFifth to seek reasons for India's slow development.
1.11 There is of course the fundamental handicap of a poor naturalendowment for such a large and rapidly growing population. Improvement ofthe environment relative to population is difficult indeed in a countrywhere fuel and mineral resources are far below needs, where rainfall ispoorly distributed and unreliable while water resource development is slowand complicated, and where transport in such a large and diverse countryis a demanding and heavy burden. Agricultural difficulties, becuase ofthe poor and uncertain environment, are well kmown. In combination with over-crowding, these difficulties condemn most farming to low output per personand per acre.
1,12 It is the overwhelming dominance in the lives of most Indiansof this poor, slow-moving and unreliable agriculture which should be perhapsthe starting point for considering why Indian development has not beenfaster.
1.13 In starting with agriculture, it is important to emphasize thatthis is no way to belittle or minimize the significance of the changes in

-4a-
agricultural technology that have been taking place in the last severalyears (the "green revolution"). Where this has taken place its remarkableeffect on production and modernization has opened a window on new horizonsfor agricultural development. But it still is a small window in theexpanse of Indian agriculture. The impact of the new technology has sofar been confined to wheat and millets, and to a few favorably located.rice growing areas. Thus far it has been a revolution in the technologyof irrigated land rather than rain-fed cultivation. Its big and growingimport has therefore been in the off-monsoon (rabi) season. The area asyet affected is about 15 million hectares out of a total cropped area ofabout 160 million hectares and a foodgrains area of almost 125 millionhectares. This obviously still leaves most of Indian agriculture and aneven larger part of the agricultural population untouched by technologicalchange. Regionally, Punjab, Haryana and Western Uttar Pradesh have beeneffected in a major way but for the rest of India regions of such changehave been very few, small and scattered.
1.14 As for its effect on trends in agricultural production, thebenefit from the expanded output fromw the "green revolution" has been tosustain an agricultural growth trend since the mid-Sixties which wouldotherwise have fallen. The rise in agricultural trends, including food-grirns, was no greater during the latter Sixties when the new agriculturaltechnology was spreading than it was during the Fifties. The reason forthis was that opening of new agricultural land, which had earlier been animportant growth factor, came nearly to a halt in the latter Sixties. Thusthe surge in wheat production in recent times offset a slowdown elsewhere.BLt regionally the slow own was a hard reality for those who were not partof the wheat expansioni.
1 .15 Thus even allowing for the "green revolution", agriculture inthe large has been a pretty slow growing part of the Indian econoV., Itis doubtful that a higher priority and a greater agricultural emphasis inofficial policies and programs would have pushed agriculture ahead verymuch laster in the Sixties. Even with hindsight it is not easy to see howany realistic potentials of importance were missed, considering the resistantand -ddependable environment, rural congestion, the disappearance of newland development opportunities, ancl above all the technological inhibitionsuntil the latter Sixties when the high yielding varieties came along. Itwould have been helpful if the development of rural institutions, e.g. thecooperatives and the extension services, had been a little more lively anduseful. Nevertheless there have been effective efforts for institutional,infrastructure and other improvements in agriculture such as the expansionand diversification of agricultural credit, the very large increase in publicas well as private groundwater facilities, some improvement in the distri-b-ution ol farm inputs like fertilizer, and above all the drive, organizationand imagination that went into the research, development and spread of the
21 For a more extended discussion of agricultural trends of the last decadesee Chapter II. See also Dharm Narain, "Growth and Imbalances in Indian1i'griculture", Journal of the Indian Society of Agricultural Statistics,Vol. XXIV, No 1, June 1972,

new high yielding technology.
1.16 Despite these welcome improvements, the limited progress inmost of Indian agriculture has had serious implications not only for economicgrowth but for rural welfare. It could hardly have been otherwise with70 percent of the population producing only half, and more recently less,of the national output. An overall increase in rural productivity wouldseem a pre-condition of sustained rural improvement. Agrarian reformcould helD if it were real agrarian reform, but this has not com-e of' inany substantial way. Other redistributi-ve measures and improvement ofrural social services would also help although these for India are tooexpensive to sustain on a rising course unless accompanied by real andsignificant gains in productivity. Arnd for such gains, the technologicalconstraints prescribe either adequate and effectively controlled water,or a major transformation of farming from a subsistence to a marketorientation, or both. Such agricultural changes on a scale of nationalsignificance within the available technology would have required muchmore than was available of water, water control, extensive marketinginfrastructure, and institutional mechanisms for planning and performringso complex a transforTmation. Without these, and with all the materialtechnological and institutional inhibitions, it is hardly surprising thatagriculture has been such a slow mover in the Indian economy, and thatthe economy in turn has had difficulty in reaching an acceptable momentumwith agriculture accounting for so much of the national output.
1.1 7 ?hus with the agriculturaL engine of development turning slowlyand unevenly it was a reasonable strategy to rely on the faster gearedindustrial engine to pull up the average pace of development. With theagricultural half of the economy on a 3 percent growth trend, the rest ofthe econony would have had to advance by about 8 percent a year for anovrerall annual growth rate of 5 or o percent. And this would imply alead frormi the industrial sector at something like 9 or 10 percent a year.Obviously, this pace could not be sustained if dependent mainly on anindustrial orientation toward the mass consumes market as constituted.This market is mainly agricultural and slow-groiwing and has only limitedlinks to rmanufacturing, mainly through food processing and textiles.Linkages between this market and heavy industr-y are even more tenuous.And so the strategy of rapid industrialization had to face in otherdirections -- toward the buildl-up of a heavy industrial base oriented to-ward import substitution and to the denand for capital equipment generatedby the rapid industrialization process itself -- "making machines to makemachines" as the strategy was sometimes described. Since it depended primarilyon the investment market rather than the consumption market, the process re-quired a substantial increase in investment resources, which -were to begenerated through increased budgetary saving, through saving generatedfrom earnings within the industrialization process itself and throughforeign saving supplied from external assistance. It might also haveleaned considerably on the export market but this possibility waslargely neglected.
-6-
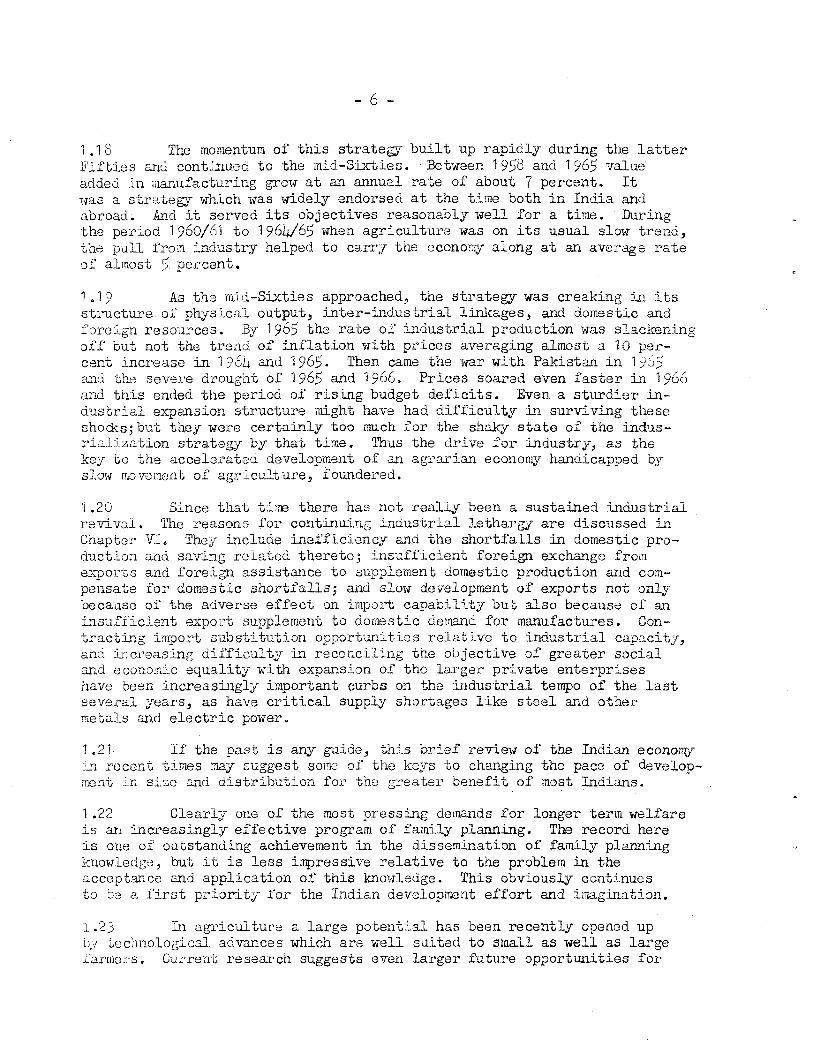
1 .18 Qi The momentum of this strategy built up rapidly during the latterFifties and continued to the mid-Sixties. Between 1958 and 1965 valueadded in ,oanufacturing grew at an annual rate of about 7 percent. Itwas a strategy which was widely endorsed at the time both in India andabroad. And it served its objectives reasonably well for a time. Duringthe period 1960/61 to 1964/65 when agriculture was on its usual slow trend,the pull from- industry helped to carry the econozy along at an average rateof almost 5 percent.
1.19 As the mid-Sixties approached, the strategy was creaking in itsstructure of phys-cal output, inter-industrial lincages, and domestic andforeign resources. By 1965 the rate of industrial production was slackeningoff but not the trend of inflation with prices averaging almost a 10 per-cent increase in 1?64 and 1965. Then came the war with Pakistan in 1/$65an(d the seve-e drought of 1965 and 1966. Prices soared even faster in 19660and this ended the period of rising budget deficits. Even a sturdier in-dustrial expansion structure mnight have had difficulty in surviving thieseshodks;but they were certainly too much for the shaky state of the ind-us-rialization strategy by that time. Thus the drive for industry, as thekey to the accelerated develop-ment of an agrarian econotmv handicapped byslow moveiment of agriculture, foundered.
1.20 Since that ti-ne there has not really been a sustained industrialrevival. The reasons for continuing industrial lethargy are discussed inChapter VI. They include inefficiency and the shortfalls in domestic pro-duction and saving related thereto; insufficient foreign exchange fromexports and foreign assistance to supplement domestic production and com-pensate for domestic shortfalls; and slow development of exports not onlybecause of the adverse effect on import capability but also because of aninsufficient export supplement to domiestic demand for manufactures. Con-tracting inport subst-tution opportun ies relati ve to industrial capacity,and increasing difficulty in reconciling the obiective of greater socialand economic equality with expansion of the laxger private enterpriseshiave been increasingly important curbs on the industrial tempo of the lastseveral years, as have critical supply shortages like steel and othermetals and electric power.
1.21 If the past is any guide, this brief review of the Indian econoiyin recent times may suggest some of the keys to changing the pace of develop-ment in sise and distribution for the greater benefit of most Indians.
1.22 Clearly one of the most pressing demands for longer term welfareis an increasingly effective program of family planning. The record herels one of outstanding achievement in the dissemination of family planningknowledge, but it is less iapressive relative to the problem in theacceptance and application of this knowledge. This obviously continuesto be a first priority for the Indian develop,ment effort and inagination.
1 .23 In agriculture a large potential has been recently opened upb, tec.hnological advances which are well suited to small as well as largefarmlers, Currentu research suggests even larger future opportunities for

-7-
widespread participation in higher crop and livestock productivity bymeans of extended irrigation and other infrastructure and institutionaliraprove-ments. But this will still leave vast numbers of Indians in ruraldestitution unless the productivity of rain-fed crops and animal husbandrycan also be raised. Here the imperatives of technical, physical andinstitutional change are even more difficult and challenging than in thefurther spread of irrigation technology. But the rewards for achievementin this crucial part of Indiats struggle against poverty will be highindeed.
1.24 Along these two main lines of rural development emphasis, thereis every reason as subsequently discussed, to expect a better record ofproduction and distribution in agriculture during the next ten years thanin the last. Yet, even then agriculture is hardly likely to be the pacesetter if a more acceptabls size and pattern of development is to emergein the Seventies. Tne potentialities for the pace setter role are onlylikely to exist in a more lively industrial sector. For this there appearsstill the need to surmount the obstacles which have contributed to in-dustrial lethargy and which may be worth listing again: industrial in-efficiency, insufficient resource generation, poor export performance,shortages of materials -- imported and domestic -- and of infrastructureservices, contracting incentives for import substitution, and curbs onprivate industrial expansion attributable to cumbersome policy administra-tion and restraint on larger industrial establishments as the chosenmeans in this field for pursuing social objectives of grea-ter equality.
Recent Developments
1.25 The mass refugee influx and the war with Pakistan in 1971 andthe adverse turn of weather especially in 1972 have imposed severe strainson the Indian economy during the last two years. The recent reflection ofthese strains has been severe food shortages in large parts of Central andWestern India and an upswing in the general price level, particularly infood. Considering the difficulties, the fact that economic dislocationswere not more serious is a considerable tribute to the effective mobilizationof financial, material and human resources for support of the refugees andthe war, and to the accumulation in recent years of large food stocks totide over harvest failures like that of last year. And while the broadeconomic picture of 1 072 was not very bright, it did contain some brightspots including an improved industrial situation and a sharp rise in exports,mostly in some of the traditional commodities. A steady increase in realoutlays on development was also maintained through these difficult times.Because of the difficulties, however, the recent course of the Indian economyhas remained on the slow and uneven trend of the last ten or fifteen years.National output rose oy not more than 2 percent on average during 1971/72and 1972/73 and probably by less. This obviously allowed for no per capitagains and the very large numnber of Indians living in the drought areas orwhose incomes have lagged behind inflation are worse off today than theywere two years ago.
1 .26 The adverse effects of weather are reflected in the decline inthe kharif foodgrain crop from the bumper level of 69 million tons in 1970to 62 million in 1971 and down to around 52-54 million in 1972. Part of

this fall has probably been offset by the record rabi crop which has justbeen harvested. This has been partly the result of favorable rainfall inthe past winter and spring, and partly the result of a "crash" effort toboost the rabi crop which could have been even more effective but for in-sufficient fertilizer and power to operate tubewells and pumps. On balance,for the 1972/73 crop year as a whole production statistics will probably showno more than 100 million tons and possibly a little less, compared with 108million in 1970/71 and 105 million in 1971/72. The deprivation in thedrought-affected areas has been severe -- in drinking water as well asfood for both huian beings and livestock. It has been reflected in intensehuman suffering, migration and crowding into cities from the countryside,and heavy losses of cattle. The situation has been bad enough but it mighthave been even worse but for the grain stocks, which were drawn down fromabout '9 million tons to working levels of 2 or 3 million tons at the endof March, and by imports which had totalled 680,000 tons by the end of March1972 out of 1.65 million tons on order. With these additions to the supplyIndia may get along in 1973/74 without further critical difficulty providedthe 1973 monsoon is satisfactory and the distribution of wheat and rice flowswell through the newly nationalized channels.i/
1.27 Along with foodgrains, other crop production was also off in1)72/73 -- only marginally in tne case of cotton, jute and mesta but quiteseriously in the case of oilseeds. There was a slight rise in sugarcaneproduction. By and large there has been little recent evidence of spreading
1/ The Government has decided that the wholesale trade in wheat and rlceis to be taken over by government agencies this year. Accordingly StateGovernmen-ts have abolished private wholesale trade in wheat from the startof the current wlheat marketing season (from April 1I73). This is to befollowed by nationalization of the wholesale trade in rice in the latterpart of this year. As a supporting measure interstate movements of wheaton private account have been banned and this presumably will be followedby similar measures for rice. Government agencies will stand ready topurchase all the wheat and rice offered for sale by farmers to theseagencies at fixed procurement prices. No attempt is to be made to procurethe total marketable surpluses through levies or compulsory purchase.The private retail trade is not to be touched and farmers may makce salesd!irectly to licensed retailers.
The stated purpose of this nationalization of the wholesale trade is toreduce distribution margins and speculative seasonal price fluctuations,as well as to control an increasing volume of grain in the interest ofL;ul1d.ni up buffe- stocks and otherwise improving the distribution system.
Intended government procurement of wheat this season for official distri-bution through the nationalized channels is 7.5 million tons (or about 25percent of the expected production) compared with about 5 million tonslast year. It was still too early in the season at the timne of writing(rmiid-April) to judge the effectiveness of the newly nationalized system andits influence on flows of wheat through official and non-official channelsand on price patterns in the grain markets. The prospects for a favorablewheat harvest should make the difficult nationalization task somewhat easier.

-9-
dymamism or a new breakthrough in agriculture. The "green revolution" issuill going strong in reglons conducive thereto which means the regions andfarms with controlled irrigation and which have not been otherwise seriouslyhandicapped by fertlizer and power shortages. It is these regions whichare steadily boosting the i-mportance of the non-monsoon (rabi) crop comoaredto the monsoon crop. But indications of an early and significant upwarddeparture from the slow long term agricultural trend have not been evidentin the last two years.
1 .28 As so often happens, the direction of Indian industry was againcontrariwise to that of agriculture in 1972. A considerable range of i-ndus-trial production emnerged from the industrial doldrums prevail-ing since 1969to push up the industrial index by about 7 percent. This was twice theaverage annual gain in industrial production in 1970 and 1971. The indexleaves out a large share of industrial activity carried on in small scaleplants, but indications are that these also were considerably more busy in1 972.
1 .29 The industrial upswing appears to have been fairly broadly based,although particular pockets of industry were of special importance inboosting production. The textile industry -- cotton and jute -- ran alrmost10 percent above the low levels of 1)71 during most of 1972, and thisindustry accounts for more than a quarter of the industrial productionindex. It had been cramped in 171 by insufficient raw materials, butthis was not the case last year, thanks to the excellent harvests of cottonand jute in 1971/72. Favorable foreign markets for jute goods in theabsence of full production in Bangladesh, and government operation ofailing cotton mills previously closed all helped to raise textile produc-tion. In addition to textiles, other major branches of industry whichshared in the upswing were chemicals, electricity, transport equipment,machinery, mining and metals, non-metallic mineral products. The onlyimportant branches of industry which failed to expand production in 1972were food manufacturing and metal products.
1.30 There were several factors which helped last year to dispelthe previously prevailing industrial lethargy. More raw materials wasone factor, not only in raw cotton and jute but in metal and fuels as well.Steel, though still below demand, was in larger supply than in 1971. Domesticcoal production was also larger. Some further reduction in labor disputes,continuing after the considerable improvement in labor relations in 1971contributed to industrial advancement.
1.31 There were also bu-oyant influences from the demand side. Im-portant in this respect were substantial increases in development spendingby the Government in the last two years. Central budget outlays on directinvestment increased by 18 percent a year in both 1970/71 and in 1971/72,while total plan expenditure for the public sector (including Central andState Governments, public undertakings and financial institutions) may havegone up by 19 and 20 percent respectively in the same two years. These in-creases were not only a direct stimulus to manufacturing but also spurredindustrial expansion in indirect ways including some expansion of activity

- 10 -
in the private sector. Capital raised by private companies in 1972 wasabove that of the previous two years, and capacity utilization in a widerange of private industries was considerably improved, including most linesof chemicals, electrical goods, machinery (other than machine tools),rubber goods and metal products.
1.32 On the other hand, for a variety of reasons including supplyand operational constraints and demand deficiencies, large portions ofcapacity were still unutilized in many parts of the industrial sector,especially in engineering industries, in metals, fertilizer, and a varietyof electrical and metal manufactures. The amount of licensing of new andexpanded capacity was not indicative of any particularly buoyant outlookby private industry. Rather, even the short'er term outlook was clouded byuncertainties toward the end of the year including increasingly seriousshortages of industrial power and doubts about the ability of the Governmentto sustain the upward course of developnent spending.
1.33 P1eanwhile the development of exports as a supplementary marketfor Indian manufactures has continued to be disappointing. Manufacturesthat contributed to export expansion in 1972 were all in traditional lineslike jute and cotton textiles and leather goods. Exports of engineeringgoods, on which hopes have been pinned for improvement in Indian exportperformaance, actually fell. And this again reflected on export policiesand promotion measures which see.n unable to cope with the relative attrac-tions of the domestic market as opposed to export markets.
1 .34 By and large, industrial production in 1972 was encouragingindeed by comparison with the sluggish behavior in 1970 and 1971. But itwas still lacking in prornise of the drive necessary from the side of in-dus-try to bolster export growth and a sustained and satisfactory developmentoi the Indian economy.
1.39 It is hardly surprising that the international crises of 1971and the agricultural setback of 1972 have been accompanied by financialdifficulties -- both internal and external -- which are persisting into1973. Government expenditures in 1971/72 (Central and State) ran far overthe budget estimates, and were nearly Rs 107 billion or 20 percent morethan in the pre8rious year. Heroic revenue efforts and other means of non-inflationary financing covered most of the increases but there was stillheavy inflationary financing of Central and State deficits by the ReserveDuak of over Rs o billion (about 10 percent of the money supply.
1.36 Financing problems, stemming from the war and aggravated by the1972 crop failures of last year continued into 1972/73. In addition to somne
contmnuation of refugee and Bangladesh aid expenditures, the past year hasaiso brought large emergency outlays for drough-t relief and for the crashmeasures to boost the rabi harvest. Development spending, including pro-grams for the poorer rural population, was also considerably expanded inIthe last two years as previously noted. Again, there were large offsettingMnirovements in revenues in 1972/73 which, with some further additional
taxataon and a full year of the wartimes revenue measures taken in 1971,
- 11 -
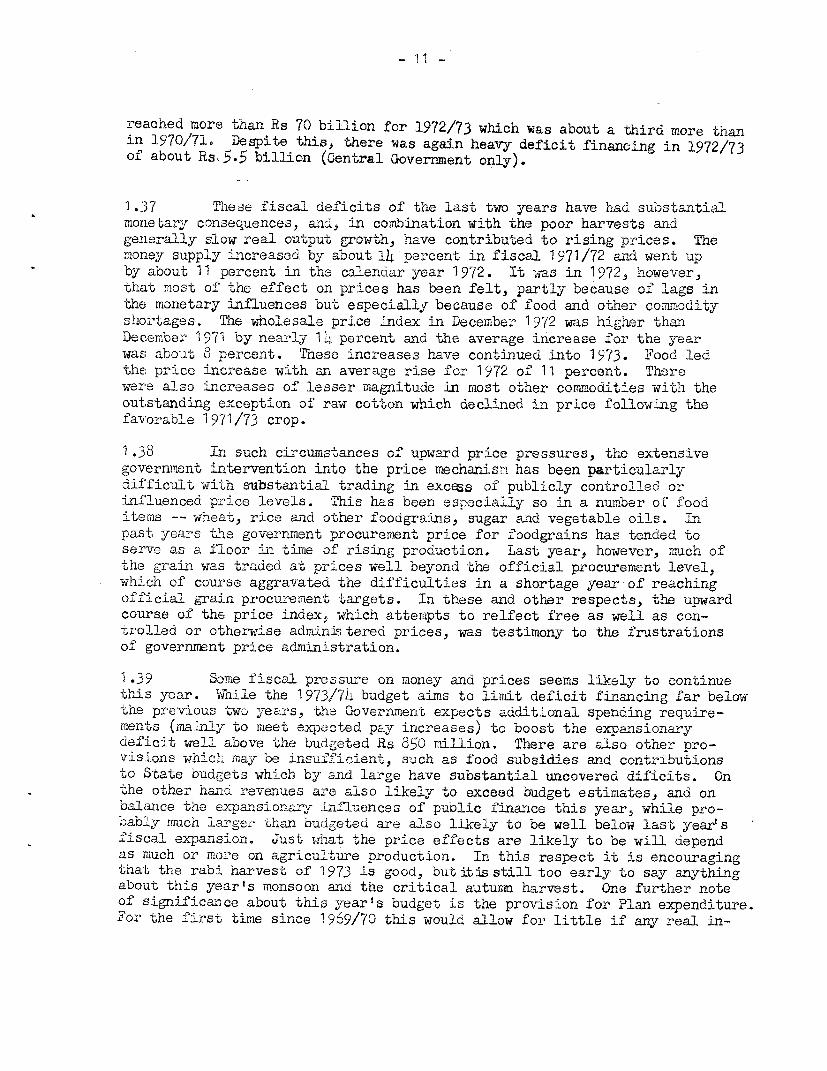
reached more than Rs 70 billion for 1972/73 which was about a third more thanin 1970/71. Despite this, there was again heavy deficit financing in 1972/73of about Rs 5.5 billion (Central Government only).
1.37 These fiscal deficits of the last two years have had substantialmonetary consequences, and, in combination with the poor harvests andgensrally slow real output growth, have contributed to rising prices. Themoney supply increased by about 14perceriL in fiscal 1971/72 and went upby about 11 percent in the calendar year 1972. It was in 1972, however,that most of the effect on prices has been felt, partly because of lags inthe monetary influences but especially because of food and other commodityshortages. The wholesale price index in December 1972 was higher thanDecember 1571 by nearly 14 percent and the average increase for the yearwas about 8 percent. Tnese increases have continued into 1973. Food ledthe price increase with an average rise for 1972 of 11 percent. Therewiere also increases of lesser magnitude in most other commodities with theoutstanding exception of raw cotton which declined in price following thefavorable 1971/73 crop.
1 .38 In such circumstances of upward price pressures, the extensivegovernment intervention into the price mechanism has been particularlydifficult with substantial trading in excess of publicly controlled orinfluenced price levels. Tnis has been especially so in a number of fooditems -- wheat, rice and other foodgrains, sugar and vegetable oils. Lnpast years the government procurement price for foodgrains has tended toserve as a floor in time of rising production. Last year, however, much ofthe grain was traded at prices well beyond the official procurement level,which of course aggravated the difficulties in a shortage year of reachingofficial grain procurement targets. In these and other respects, the upwardcours.e of the price index, which attem,pts to relfect free as well as con-t,rolled or othexrvise administered prices, was testimony to the frustrationsof goverrnment price administration.
1.39 Some fiscal pressure on money and prices seems likely to continuethis year. While the 1973/74 budget aims to limit deficit financing far belowthe previous two years, the GovernLment expects additional spending require-ments (mainly to meet expected pay increases) to boost the expansionarydeficit well above the budgeted Rs 850 million. There are also other pro-visions which .may be insuLficient, such as food subsidies and contributionsuo State budgets which by and large have substantial uncoverea dificits. Onthe other hand revenues are also likely to exceed budget estimates, and onbalance the expansionary influences of public finance this year, while pro-bably much larger than bud5eted are also likely to be well below last year' sfiscal expansion. Just what the price effects are likely to be will dependas much or more on agriculture production. In this respect it is encouragingthat the rabi harvest of 1973 is good, but itis still too early to say anythingabout this year's monsoon and the critical autumn harvest. One further noteof significance about this year's budget is the provision for Plan expenditure.For the first time since 1969/70 this would allow for little if any real in-

- 12 -
crease if budgeted intentions are adhered to. Once again it is India'schronically difficult choice to forego badly needed development outlays inan effort to curb the price instability which bears so heavily on poorerparts of the population.
1.40 The tight resource situation of the last two years, describedabove, had only limited relief from external developments. By far the mostfavorable aspect of recent external transactions was the substantial increasein Indian exports by 8 percent in 1971/72 and about 9 percent in 972/73.This was a rmlarked improvement from the 3h-4 percent growth rate of the pre-vious two years, even though the impact on India's purchasing power has beenmore limited due to rising import prices. In addition, there was specialinternational help in 1971 in support of the refugees in an amo-unt of aboutUS$230 million.
I .LjI Yet despite the improvement in exports, the broad balance of pay-men-ts situation has continued to be difficult. Increasing pressures onIndian import capability have stemmed from the contracting margin betweendeclining foreign assistance on the one hand and rising external debt serviceon -the other. At the same time there have been added recent import require-ments arising from shortfalls in domestic production, especially i grain,steel and fertilizer, which has meant tightening of import policy on otheritems.
1.42 For these and other reasons India has been losing foreign exchangereserves in the last,year for the first time since 1964. The drop in re-serves in 1972/73 amounted to US$46 million of which US$13 million was arepayment to Bangladesh and US$33 million was due to other balance of paymentsnet deficits.
1 .43 A continuing tight exchange situation and possibly further lossesof reserves are in prospect for the near future. This is on the assumptionof no substantial reversa'l of adverse trends in foreign aid and debt servicerequirements. There will contiuue to be large Lmport requirements -- muchof it available only at higher prices than in 1972 -- of steel, fertilizer,and petroleum as well as other current supplies. Further grain imports mayalso be needed, certainly if the 1973 monsoon is again unsatisfactory, andpossibly in any case if the decision is taken to start rebuilding the stocksof foodgrains depleted by last year's drought. There is also great uncer-tainty about sustaining last year's export expansion. Satisfaction aboutthe expansion was necessarily qualified by the fact that gains were almostentirely in traditional exports for reasons which are not necessarily likelyto be sustained. On the other hand newer exports in lines of manufacturelike the engineering industries, which are India's best hope for continuingexport strength, failled to contribute to the expansion. Part of the reasonhas been shortage of essential raw materials like steel. But there are otherreasons including the difficulties of world market competition, which in theabsence of adequate incentives and other export promotion measures, appearto give potential exporters an understandably strong preference for the pro-tected domestic market over the harsh exposures of foreign markets.

- 13 -
1.44 Broadly then 1972 was a mixed experience for the Indian economy.Agriculture was in one of its off years, and this, in combination with themonetary expansion left behing from the Pakistan war, gave prices one oftheir largest boosts in recent times. In this financial atmosphere budgetingfor 1973/7h was a difficult exercise which limited the scope for continuingincreases in Plan expenditures. It was also a mixed year for internationalaccounts with a welcome increase in traditional exports but disappointingforeign sales of non-traditional manufactures. Manufacturing for the domesticmarket did have some considerable revival, mainly in textiles but also in anumber of other lines of production. This did not, however, have promise ofanry great or sustained dynamism. On balance then 1972 was somewhat below butstill in the pattern of India's longer run trend of slow and uneven econormiicgrowth. Handicapped by sluggish and irregular agricultural development andwithout adequate thrust from the industrial side, the economy continued tofall short of adequate and socially acceptable patterns of development.
l
- 14 -
CHAPTER II
POFULATION
2.01 It should scarcely need stressing that population growth is one ofthe most important contributors to India's major economic and social problemsin the long run, probably the most important of all. This year the ghost ofI4althus has returned for one of its periodic visitations. Indeed, it isapparent that this ghost has never really departed, when one looks at region-ally disaggregated data on agricultural output, examines the statistics onmalnutrition and the obvious contribution it makes to infant and childmortality, or realizes that for at least the first eight years of the 1960snot merely the numbers but probably also the proportion of those livingbelow a most austerely-defined poverty line actually increased, and nowcomprise roughly half the population. 1/ Of course, population growth isnot the sole cause of India's poverty -- this year in the drought-hit areasmany of the very largest farms were as barren as the smallest plots, andlandowTners were as destitute as the landless -- but the two are intertwined.Incomes were so low, less because of an absence of employment opportunitiesthan because of their low productivity, and this reflects the remorselesspressure of population upon cultivable land and capital resources.
2.02 This pressure is going to continue to increase for the foreseablefuture. Which side of the billion mark the pop.lation will be at the end of
1/ It is possible to debate endlessly how to resolve the statistical problemsin using the National Sample Survey data (the orny source available on theconsuamption of the poor) -- what subsistence level to take, what price indexto use, etc. This does affect bot.h magnitudes and trends, but not theappalling nature of the problem, and the debate is bound to be inconclusive.The most disturbirg estimate is.also one of the most careful and convincing;"using NSS data on persons in different expenditure groups, the percentageof rural people below this alternative minimum level (Rs 14 per head monthlyin 1600/61) went up from somewhat less than 38 percent in 1960/61 to about53t percent in 1968/69". Pranab K. 1Bardhan, "On the Incidence of Poverty inRural Tndia of the Sixties", Economic and Political Weekly2 Annual Number,173 p i-254. This i r1)3,pp 211 5-. . hs level is base-d on an estimate of a nutritionallya. -iillU diet olus the same small nroportion of total expendit-re on non--food items that the bottom f-ifty percent of the rural population spent in1 C,0/61; it worked out at Rs 14 in 11 60/61 and Rs 28 in 1968/69. Theau-thor notes that there may be unreported consLmption of food and fueliterts - h-unted, fished, collected, or gleaned -- and that the imputed-alle of the consumption of home produced items may be under-estimated.
availa-bilt-y of cheaper local foodgrains might also affect the costoi a 1 mnirnLo diet. These adJus`ments would affect the proportion of thepopulation below any partic'llar level, but not the startling trend. Thewidely quoted estimate by V.I. Dandekar and Nilakerntha Rath was that in1967/68 nearly 40 percent of rural population and half the urban populationweere 1viin g below a povertyr line defined in terms of an adequate calorieint-a're plus rinimal non-food expenditure; see Poverty in India (IndiankIchool of Political Economy, 1971). On these estimates the rural poor,excent for the poorest, were marginally better off than in 1960/61, but the'7-ba; ooor substantially worse off.

- 15 -
this century is a matter for conjecture. It depends on the rate at whichfertility drops in an unprecedented situation; in the extreme, if it failedto drop at all, but mortality declined at a plausible rate, the populationwould reach the formidable figure of 1 ,230 million by 2 000.
2.03 The problem has been acknowledged for a great many years and therehas been an official family planning program since 1951 -- for longer thananywhere else. Only since the mid-1960s has it amounted to anything signi-ficant, either by way of total expenditure or in numerical measures offamily planning acceptance. A separate Department of Family Pla-nning wasestablished i-n 1966. In terms of acceptance, the program at that timeenjoyed a brief flowering; in 1965/66 and in 1966/67 the number of IUDinsertions was over 800,000 and 900,000 respectively; while sterilizationswent from 477,000 in 1965 to 1.8 million in 1967/68. Expenditure alsoroserapidly; from Rs 22 million in 1963/64 and Rs 65 million in 1964/65, itrose to Rs 265 million in 1967/68 and Rs 305 million in 1968/69. It hascorLtinued to rise ever since, as a huge network of health centers and sub-centres have been established through rural and urban areas alike, employingmarLy thousands of doctors, and paramedical staff and others involved insupplying both services and extension education. Very considerable propa-garnda efforts through mass media have also been made. But in spite ofthis increased expenditure the program seemed to be on a downward slide innumbers of acceptors, except of condoms, at least until 1971/72.
2.C4j 1971/72 was a somewhat more promising year. Dramatic gains wereachieved in the sterilization program with a 64 percent rise over i970/71,reversing a steady fall since 1967/68 and achieving the best year ever.Modest gains (1.5 percent) occurred in the I-TD program for the second yearrunning, though still leaving the program only a little over half its1966/67 level. Conventional contraceptive distribution, mainly condoms,continued to show encouraging growth, with a 14 percent increase. Theperiod April-November ,972, however, showed only a L.5 percent increase insterlizations over the corresponding period in 1971 and IUD insertions andconventional contraceptive distribution fell by 16 percent and 11 percentrespectively. The latter may in part reflect a shlortage of condoms. Bythe end of the financial year the sterilization performance is expected tobe much better in relation to 1971/72 than the April-November figures suggest.
2.05 The rise in sterilization in 1971/72 was undoubtedly the result ofa number of district-wide vasectomy camps, in which the whole of the admini-stration of a district participated, and which, for the most part, offeredmuch larger firnancial incentives to participants than the regular program. 1/In Gujarat these were held in all districts and the regular sterilizationprogram suffered. In Kerala, a very iwidely publicized single camp drew manyparticipants from outside the district and there was a similar drop. Elsewhere
1/ In 1971/72 there were wide difference between the levels of incentivesoffered by vasectomy camps in different states. The regular program paidan acceptor of a vasectomy Rs 10-16, except in Tamil Nadu where it wasRs 30. In the camps the total value of the payment to the acceptor wasin some states Rs 80-100, though some were significantly lower. In 1972/73the Central paymrents to states for camp acceptors was standardized atRs 100 of which not more than Rs 60 was to be paid to the acceptor himself.

- 16 -
the regular sterilization program roughly maintained its 1970/71 level. In1972/73, the camps were continued on a larger scale, covering over half thedistricts of India, though with some changes in organization. The principalchange has been to insist that the newly vasectomized remain at the camp forseveral days -- in principle a week, in practice more usually two days -- inorder to prevent infections from leading to deaths, as happened in UttarPradesh last year. At the time of writing, the 1972/73 camp results have notbeen issued but individually they are reported to be less good than last year's.However, by mid-February 1973 over 1.5 m.illion had been sterilized at the camps.
2.06 The camps have been a major factor in leading to increased expenlitureon the nrogram. This is expected to amount to nearly Rs 750 million, up fromELs 590 million in 1971/72 and about Rs 110 million above the initial budgetoutlay. The old situation in which the program was unable to spend its entirebudget has vanished with a vengeance. Rising costs and only modest progresshave regrettably led to an apparent cutback in financial support for theprogram -- only Rs 550 million have been budgeted for 1973/74. This meansthat total Plan expenditure for the Fourth Plan will be well below the ori-ginally proposed outlay of Rs 3,150 million. Unfortunately the easiestprogram to cut wxill be the vasectomy camps even though these are perhapsthe most promising of recent innovations, if no substitute for the regularprogram. It might be possible, however, to get equivalent results by thesame organizational pattern without such large incentives. In any case,having a different pattern of incentives for the camps for the regular programhas no justification -- if these are thought worthwhile for camps they mustequally be so for the regular program.
2.07 This year's Economic Report does not repeat the analysis of theproblens of the regular family planning program, which have been treated atsomne length in our two previous Reports. There would appear to be fewchang-es in these. It might be useful to no-te, however, that the programand its problems received a very thorough discussion in the ThirteenthReport of the Estimates Conmittee (1971/72) of the Lok Sabha, published inApril 1 972.
2.08 We argued last year, but it is worthwhile repeating, that the down-ward trend in acceptance from 1967/68 through 1970/71 could not be taken asa sign that diminishing returns to expenditure were firmly established.There is some evidence that inter-state variation in program acceptance issignificantly determined by family planning inputs, though environmentalfactors are also important. 1/ This argues strongly that the prograna shouldbe carried on to the fullest extent possible. It is at present the onl ysignif-icant weapon a' the disposal of the government in its desperate need toslow the iate of population growtlh, and i-t must, at this stage, be given theben fit of ar,y doubt.
1/ See S.Y. Agarwala, "A Study of Factors Explaining Variability in FamilyPlanning Performance in Different States of India", and O.P. Vig "AnAppL cation of Path Analysis to Study Variation in Acceptance of theKir±ly `-Imnnino- Progranme in India 1 966-71 " in All-India Seminar onTF aMily -L-anninn Problems in India (ebruar 20-22 1972): A ReportP on- r, Bombay International Institute for Population Studies, 1972).
- 17 -
The Current Situation
2.09 It must also be admitted that there is room for doubt. In October1972, the Office of the Registrar General hosted a week-long Seminar tocelebrate the remarkable fact that India has had an .unbroken series ofdecennial population censuses for a whole century. To the Seminar camenot only most of those concerned with population research within the countrybut also many of the most distinguished scholars in the field, both Indianand foreign, who are resident abroad. The discussions revealed a veryremarkable lack of consensus among leading researchers on the interpretationof the current situation, on the prospects for reducing the rate of populat-ongrowth, and especially on the role of the family planning program in bring-ing about such a reduction. At one extreme, one of America's best-1naowvrfamily planning specialists argued that, historically, once a country'sbirth rates had fallen below 40, it tended to drop rapidlyJ, though it mLi-htlevel off about 30. " ... it can ratiler firmly be declared that India haspassed this take-off point and is in self-powered flight towards its derao-graphic goals." 1/ While acImowledging that with a birth rate in the reglonof 36-38, this decline had been smaller than was originally hoped for inthe family planning target of 32 by the end of the Fourth Plan and also tha'tit might be due at least as much to general modernization as to the familyprogram, the optimists could point to some solid prograrm achievements --widespread awareness and approval of family planning, the setting up of ahuge organization, the success of vasectomy camps and the growth of condomuse. In addition, with small but increasing pill use, the recent libera-lization of abortion laws, the decline in mortality, the improvement inliteracy and other indicators of modernization and the fact that in a fewstates the birth rate was already apparently in the lower 30's were allcited as reasons for optimism.
2.10 On the other hand, it could be pointed out that though there islittle doubt that the birth rate has fallen from its level at the beginningof the 1960s the magnitude of the fall is uncertain. Good vital registra-tion has always been lacking; the birth rate estimate of 41.7 for the period1951-61, estimated from census,data, is itself not above challenge. TheNational Samaple Survey showed much lower figures for 1959/60, but these aregenerally thought to be an underestimate. The Sample Registration Scheme(SPS) has functioned widely only since 1968. It provides now the principalevidence that the birth rate is indeed below 40. Even the SRS cannot, however,be considered totally satisfactory; inevitably there are sampling fluctuationsand there are also some improbable results. Rural Bihar, for example, withone of India's poorest family planning performances, has apparently a bir-thrate below 35; mural Gujarat, wSrhich has above-average faniy planning results,has a birth rate above 40.
1/ Donald J. Bogue, Moderators Statement for Session XIV, Family Plarnning,Indian Census Centenary Seminar, October 23-29, 1972.

- 18 -
2o11 Granted, however, that there has been some fall in the birth rate,there is still scope for very wide divergence about its interpretations. Inthe first place, there has been a fall in the proportion of the populationwho are women aged 15-44; this itself would account for a one to two pointdrop in the birth rate, without fertility changes. The SRS, however, sup-ports the idea of a fertility decline -- in contrast to a general feritlityra-e (births per thousand women 15-49) of 195 estimated by the Census Actuaryfor the 1950s, estimates based on the rural SRS put it at 174 for 1969. Ifurban areas were included, it would doubtless be lower.
2.12 The extent to which the decline in fertility can be credited to thefamily planning program is unknowable, though it is one on which strong viewsare frequently expressed. There are those who argue that no faiaily planninuprogram in any country has ever been shown beyond a shadow of doubt to havecaused a reduction in fertility -- those programs with apparently the great-est impact have been in situations where fertility was already falling beforethe program started. Of course, nobody can say with confidence what thefertility of acceptors under a program would have been in its absence. Therealso seems to be almost no correlation between the birth rates in differentstates as recorded under the SRS and the estimates made by the Department ofFamily Planning, on the basis of acceptance figures, of the proportion ofcouples practicing family planning there. The data do not, however, permita ver-y exact comparison and this statement should not be read as the con-demnation of the family planning program that it may at first glance appear.Indeed, in the case of some states the Department's figures may seem to beevidence of the inaccuracy of the SRL as much as the other way round. FurtherinMestigation of the relatiornship might be well worthwhile. If the absenceof correlation persists, this may still not reflect adversely on the program1tself -- rmerely on the rather mechani al way that service statistics areused to grind ou1t estimates of "births averted! and "couples protected". Inthe light of the prima facie case against the Department's statisticalpractices, however, it might be seemly if it were to desist from some of itsoolder statements -- especially those which appear to link its estima-es of`Tbirths averted" (which, among demogi-aphers, is a most dubious and contro-
4versLal concept) to the apparent fall in the birth rate. The fact that theDeprt`ment's estimate of births averted in 1971/72, 2.5 million, is remarkablyconsi-tent with the fact that the bilth rate is perhaps 4 points lower thanit was ten years earlier -- equivalent to about 2.2 million births per year --
should bDe treated as no more than a coincidence.
New Directions?
2.13 If there is no general agreement among experts as to the degree ofachievement of India's demographic goals or to the prospects ahead if policiesremain unchanged, there is still less of a consensus about the way in which-olicles should move in order to have greater impact. The past two yearshave seen two potentially important innovations, but at the moment neitherloocs as though it is in the near future likely to provide the degree ofacceleration in fertility decline which would be needed if the program'scurrent target of a birth rate of 25 in 1980, or the more important longertern objective of fertility at merely replacement levels, were to seem inany wala7 feasible.

- 19 -
2.1 ~ The first of these innovations, the vasectomy camps, have indeedmade a marked impact on the prograr, but, as noted, this progran is 'ikelyt;o be severely curtailed. The second, the liberalized abortion law, Cameinto force in April 1972, though it still has not been implemented byseveral states. Officially it is regarded primarily as a health neasurerather than as a family planning one but, of course, it may have considerabledemographic implications in the long run. Inevitably it has got off theground only very slowly; about 22,000 abortions had been performed by earlJy1973.
.i Cne of the most controversial features o' the vasectomy carps ha-beer, the liberal use of financial incentives. Previously, the amounts paidto the recipient of a vasectomy could reasonably be described as fairl-ygenerous compensation for the loss of up to a week's work following thecnDeranicn and out-of-pocket expenses. In the camps the total sum ;n cashwas frequently much larger and often there were gifts in kind, bringing thetotal value of the incentive to a figure that could approximate a month sincome. There were those who felt that this was an affront to the dignityof man, and others who felt that the incentives provided for corruption,coercion and fraud were too great to 'ustify the scheme. On the otherhand, the bnefit to India undoubtedly ,ustified the cost. The extent towhich the camps' success has depended on the size of the incentiitve, and theextent to which it has resulted from the pattern of organization and ofrecruitment of acceptors is, however, far from clear. In 1971/72 some ofthe camps where the increase in incentives from the regular level was muchless than elsewhere achieved as good results as some where the increase wasover 500 percent.
2. 1- It can be argued that even if the principle of siubstantial firancialincentives is accepted, cash payments for sterilization and its motivationare perhaps not the best type of incentive. For example, the cost is borneby society in anticipation of benefits from fertility reduction. Alternativeschemes which would defer benefits until an individual family size was provento have been small have been suggested, and one of these -- a "no-bir-thbonus" scheme is being tried out on tea estates in South India. Pay,,mentsare made to a savings scheme; payments is made to mothers with fewer thanfive children (abortions being treated as a live birth) at age 45, with sub-stantial amounts being forfeited if there is a third and fourth child.Initially the scheme was started with its administration costs financed byITSAID though with the bonuses paid by management, on 3 estates only. TheGovernment is now financing it on a much larger scale. Unfortunately theeconomies of the tea estates are very different from the rest of rural India.In addition the design of the experiment will make it difficult to assesswhat has been the result of the bonuses themselves, and what the result ofthe S7eater medical and propaganda efforts made on estates which have thescheme.
2l.17 Positive incentives to encourage small families are not the onlypossible ones. Disincentives, in the form of withdrawal of various formsof social assistance, to parents with large families, can also be practiced.In 1967 the Maharashtra Government announced that certain government schemesfor loan and subsidies, housing allotments, and scholarships would be with-drawn where families were larger than three children after August 1968, butit is not known how far this policy has actually been applied. The Uttar

- 20 -
Pradesh Government's similar disincentive proposals for civil servants do notappear to be in operation. By contrast, the land ceiling legislation continuesto favor large families.
2.18 A scheme like the no-birth bonus scheme is designed to affect thesize of family that parents desire on the assumption that an important motivefor wanting large families is support in old age. The bonus at age 45 isdesigned to offer an alternative source of such support. Another school ofthought would put less emphasis on trying to alter the parents' desired com-pleted family size and more on the fact that under present conditions of highchild and infant mortality, parents can only have a reasonably high probabilityof a completed adult family of a particular size by having significantly morebirths than this. Individually parents insure themselves against loss of achild; collectively, society overcompensates for child loss. In conseq.uenceit is widely argued that a fall in mortality is a necessary precursor of afertility fall. Tnis is not only plausible, but has historical backing; inmany countries, mortality fall has preceded fertility fall with some time-lag. On the other hand, demographic history also provides some counter-exam,ples and the case is not conclusive. An interesting experiment designedto test this hypothesis in Indian conditions is underway at Narangwal in thePunjab, and in a project in Uttar Pradesh and Mysore, which is to be financedwith an IDA credit ard a Swedish International Development Agency grant, thiswill also be tested. While infant and child mortality decline is obviouslydesirable in its own right, the possible link with fertility offers an addedreason for applauding the considerable expansion of the nutrition programs,described in last year's report, -which has continued in 1972/73 and is expectedto continue through the Fifth Plan. At present some 3 million pre-school andsome 12 million school age children are being fed daily; by the end of theFifth Plan it is hoped this will reacla 9 and 15 million respectively.

- 21 -
CHAPTER III
UNEMPLOYMENT AND POVERTY
3.1 As noted in the section on population growth, there is room fordebate as to whether the economic condition of the poorer half of India'spopulation in the 1960s was very grave and getting worse, or very graveand slightly improving. Its gravity, however, is not in question. Whilethe long-term implications of the two views may appear quite different,the rate of improvement or deterioration, whichever it may be, is not sosharp as either to soften this picture or to compel a radical change inpolicy in the near future.
3.2 Unemployment and poverty are often treated together. This makessome sense, in that unemployment and underemployment obviously contributeto poverty. But they are far from being a necessary cause of it. For exaomplea man who worked every day of the year for the wage of Rs 3, which is fairlytypical of the wages to be earned on the Crash Scheme for Rural Employment(CSRE), would, if his wife and children do not work and he has a family ofaverage size, fall into the category of families whose incomes are insuffi-cient to buy a nutritionally adequate diet for every member plus a verys 'all amount of other purchases. (It should be noted that the CSRE doesnot normally supply year-round employment for any individual. Moreover itgenerally pays less than peak season agricultural wages. But it is still afairly small scheme, aiming to employ the equivalent of 1000 persons in eachdistrict for 10 months of the year.) The root cause of poverty is that theemployment that is obtained by very many people in the rural sector, whetheron their own farm or on somebody else's, or in towns in the unorganised servicesor labour, is of such low productivity as to yield only a miserable income.Indeed it can be regarded as no more than a subsistence income, though thisconcept is a rather fuzzy one -- there is a substantial difference in calorierequirements for different levels of effort, and a somewhat lower level ofwages might provide an adequate income to sustain an agricultural labourer,while a higher one would not suffice for an earthworker. 1/
3.3 The 1972 Economic Report reviewed the available statistical data onopen unemployment. Most of this showed that open unemployment, both urbanand rural, appeared to be very low. In agriculture, real wages have verypossibly fallen in recent years (with considerable regional variation).Under the pressure of a growing labour force with no other source of support,the labour market supply price of individuals is very low indeed and somesort of remunerative occupation, however little productive, is usually obtained.
1/ A recent study by G.B. Rodgers "Effects of Public Works on Rural Poverty"Economic and Political WeeklZ Annual Number 1973, pp 255-268, makes thepoint that earthworRing requires perhaps l1uu calories per day more thannormal agricultural labour, and shows that in some small case studies inBihar the main reasons given for a refusal to do earthwork were health,fitness, and the hardness of earthwork, rather than a need for no moreemployment.

- 22 -
The data available last year were, however, old. The National SampleSurvey stopped its rural labour force surveys in 1960/61, though some datawere available from a more limited number of households upto 1967/68. The25th round of the NSS (1970/71), however, made a special study of employ-ment and income among landless agricultural labourers (about 26 percent of thetotal labour force or 1971 census definition) and the lowest 10 percent ofhouseholds having some cultivated land (cultivation comprised 4s3 percent ofthe labour force in the 1971 census). Some of this material in a preliminairyversion has already been made available for research purposes 1/. Unlikeearlier rounds of the NSS enquiries were made abouit mandays in the labourforce, and in employment and in unemployment, rather than manwseks. Inaddition, data are available only by state for the majority but not for allof the states -- the results cannot be readily aggregated and there is agood deal of inter-state variation. So on grounds both of coverage andconcept these cannot be compared with earlier data to estimate a trend inunemployment. The incidence of unemployment of male small cultivators var-ied-- om 0.7 percent in Punjab to 24.9 percent in Kerala, though the second highestfigure (for T.amil 1.'adu) was 9.5 percent. There was an equivalent variationfor women. For "non-cultivating wage earners" tile figure went from 1.1 percentin Orissa to 23.0 percent in Kerala, with the second higlest again beingTamil Nadu irLth 14.5 percent, and again with a similar degree of femalevariation.
3.4 The concept of underemployment is not, of course, a new one,and certain data can be used to support the view that it is widespread.Averaging NSS data from the 17th, 19th and 21st rounds Raj Krishna foundthat 17.7 percent of the labour force were unemployed or worked less than 28
hours a week, and that 9.0 percent were either unemployed or worked lessthani 23 hours a week and were available for additional work. 2/ There hasalso been for years and years a still smouldering debate on the extent andmeaning of "surplus labour" in Indian Agriculture. 3/ Although some hiredlabour is employed, even by small farms, and although there is littleevidence of much unemployment during peak agricultural seasons, it isprobably true that in practice, some labour could be removed from some farmswithout reduction of output (prov-ided that those remaining on the farms wereviiling to work harder). The practical significance of this finding isprobably not great. It does support, however, the implication of the NSSfindings -- that the provision of work schemes that would provide standby
1/ Pravin and Leela Visaria "Employment Planning for the Weaker Sectionsin Rural India", Economic and Political Weekly Annual Number 1973,pp 269-276.
2/ Raj Krishna "Unemployment in India", Economic and Political Weekly,'ilarch 3, 1973, pp 475-L84.
3/ ror a recent salvo see Ashok Rudra "Direct Estimation of Surplus Labourin Agric.lture", Economic and Political Weekly Annual Number 1973,pp 27726I0.
- 23 -
employment ought to attract a good deal of labour. The preliminary Statedata from the 25th Round of the NSS showed that the proportion of smallcultivator households, with at least one person available for regularfLull-time wage employment, ranged from just under 30 percent to just 70percent, and of non-cultivating rural households similarly placed it wentfrom 38 percent to 73 percent. A considerable number of these expresseda willingness to send family members outside their village, especially ifa job could be guaranteed.
3.5 It should be noted, however, that a hypothetical willingness toaccept available work is not a reliable indication of how many people willturn up for a particular scheme if started. For a short period before theneed to supply relief for the current drought swamped all other public worksprograms, the Government of Maharashtra experimented with an EmploymentGuarantee Scheme. When a survey was made, some 5 percent of the ruralpopulation registered for jobs, but the large majority of these rejected thejobs when actually available or gave them up either because they found thewage rate low or the location of the jobs inconvenient. 1/ During the pastyear the Government of India has initiated a Pilot Intensive Rural Employ-ment Project in 15 blocks for an initial 3 year period. The works herewill be based on thorough survey of the numbers and characteristics ofthose in the age group 15-59 who declare themselves as available for work,and an attempt will then be made to supply all of them with work by thethird year of the project.
3.6 Public works schemes have their critics. Ideally they shouldcreate durable assets. This requires that suitable projects be identifiedand designed, and taken up in appropriate order of priority. This in turnrequires proper district-level planning, which is at present completelyinadequate. There may also be a conflict between the ideal of asset creationat a reasonable pace (work in progress is itself a form of capital, and aconstruction project that drags on for a great many years is in effect amore capital intensive affair than it appears at first sight) and the idealof having standby local employment opportunities which do not have a costin terms of agricultural output foregone. Another problem concerns admini-stration -- if there is any competition for jobs, the possibility forcorruption exists -- and indeed a leakage of funds from any very decentralised,irregular and loosely budgeted project is hard to prevent. In addition, thelimitations on the ability of works projects to relieve poverty have to beacimowledged -- they require additional food consumption, they may berestricted in importance during the monsoon when frequently most needed, andwhere excess labour prevails and slack season wages in the village aredetermined by the subsistence requirements of landless labourers, additionalenployment available by works programs may be offset by a fall in the agri-cultural wage. 2/
1/ Visaria, op.cit., p. 269
2/ Rodgers, p .cit., pp 263-268

- 24 -
3.7 Inspite of these limitations, the heavy emphasis to be placed onrural work schemes during the Fifth Plan seems wholly correct. On thepoverty front, an alternative systemk of income redistribution through doleswould raise most of the difficulties of works schemes, without any possi-bility of creating permanent social assets. While obviously a fast rate ofagricultural development that would keep labour scarce for most of the yearwould be preferable if it were feasible, the magrntude of the problem issuch that it is sadly far from being realistic. Over the decade 1970-i980the labour force, on the 1971 census definitions and participation rates,is expected to grow from 177 million to 226 million, with at least 70 percentin rural areas 1/; only a very deliberate and large scale attempt to steerinvestment into labour-intensive ways of providing employment can ha;ve any hopeof alleviating poverty among the rural Door.
3.3 Although the numbers of the rural poor and underemployed dwarf allother aspects of this matter, their urban counterparts are also very numerousand not significantly better off. The 1961 census suggested that open urbanunem,ployn_t rates were somewhat higher than rural; NSS surveys at about thesame time showed the opposite; neither showed the percentage to be high, andthere is no recent information. The rate of growth of employment in the"organized sector" (public sector Dias larger private firms) remains lessthan 3 percent -- and this has been generated almost entirely in the publicsector. Particularly affected by -2iSs slow growth have been, as we notedlast year, the relatively educated, thoujh the data on this are indadecuate.A smectacular rise in thre applicants registered for jobs wvith employmentexchanges, vrho are relat.vely highly eciucated, has taken place in recentyea--s. This continued in 1972, with a rise of one thlrd percent in thefirst vl .nronths of the year, but it is not T-noiE hol, far these applicantsalready hav.e jobs or are registered with mlore than one exchange. Their:arrnbers now exceed one-third of those employed in the org-nized sector.A great deal of attention is apparently being paid to this problem and anumoer of schemes, involving such things as employment on government surveys,the training of graduates to become e-rtrepreneurs, for the self-employedcredit etc., have beenl st-arted. But, as noted by the Approach Paper to the5'i 'th Plan, the problem cannot be solvei by operating only on the demandside -- rather radical changes are needced iI the pattern and priorities cfeducation. 1hile this has been long and widely recognized, and discussedextensively in our two previous Reports, there has been no sign that thisrcecognition is about to be translated into practical policy, or that thep-ressures -that have generated the rapid increase of enrolments at the upperlevels of education are about to be resisted.
1/ As noted last year, the 1971 census used a mutch more restrictive definition of the iabour force than did the 1961 census -- and the openly unemriployedwere not included, Using rather similar growth rates but a larger base,ratier more dramatic figures for the projected rise in the Indian labourfo,rce are sometimes used.

- 25 -
CHAPTER IV
AGRICULTURAL PRODUCTION
Growth Rate of total Agricultural Output
4.1 The new high yielding varieties of cereals with all that theyinvolve in the way of a new farming technology, with an increased emphasisoII scientific farming methods and a much greater use of purchased inputs,have wwrought a remarkable qualitative change in the past six or seven yearsin Indian agriculture and in the attitudes of the Indian farmer towards pro-duction for the market. This is discussed in more detail in Chapter V. Thischange, however, has not led to any change in the overall growth rate of totalagricultural output; indeed, the 3.0 percent per annum growth rate in the ten-year period ending 1971/72 was actually lower than the 3.2 percent grow2th ratein the previous ten-year period ending 1961/62. It is only when one looks atthe sources of growth that the impact of the new technology is apparento
4.2 During the decade up to 1961/62 over half of the increase in cropproduction came from an increase in the cropped area; yields were grownLgat only 1.2 percent per annum0 By the early sixties it was clear that theperiod of rapid expansion of crop area was over and the main emphasis ofpolicy shifted to raising productivity 0 This shift had very little success,hcoever, until the new varieties wele introduced; and it was only from 1967/68onwards that the yield growth rate began to 3spond to the new agriculturalpolicy. Nevertheless, the result was that the yield growth rate in the decadeending 1971/72 was almost double that in the previous decadea Without thisthe agricultural growth rate would probably be nearer 2 percent per annumi thanits present 3 percent,
Foodgrains and Other Crops: Growth Rate of AreaProductivity and Production 0 (percent per annuumi)/
Area Productivity ProductionFoodgrains
1952/53 to 1961/62 1.3 1.3 2.61962/63 to 1971/72 007 2.8 3.6
Other Crops
1952/53 to 1961/62 2.8 1.0 4-31962/63 to 1971/72 0.2 1.0 1.8
All CropS
1952/53 to 1961/62 1.5 1.2 3.21962/63 to 1971/72 o.6 2.2 3.0
1/ Based on revised series of index numbers (triennium ending 1961/62=100)issued by Directorate of Economics and Statistics, Ministry of Agriculture,December 19729 See Appendix Table 704

- 26 -
4.3 These overall growth rate figures conceal substantial differencesbet-ween foodgrains and nan-foodgrai-n crops. A1hile in both groups the con-tributioin of an increase in the cultivated area to total growth hasslackened, the slackening has been much more marked in the case of the non-foodgrain area, which was earlier growing more rapidly. This seems largelyto reflect the change in the emphasis of price policy from non-foodgrainsto foodgrains that took place in the middle of the sixties. The moresignificant differerre, however, is in productivity changes; in the case offoodgrains, as a result of the new cereal varieties, productivity increaseshave more than made up for the slackening of area grawth; while in the caseof non-foodgrains, for which there were no new high yielding varieties, therate of productivity increase has not changed and total production growthis thus down by the full extent of the decrease in the area growth rate.The comparative figures for the two groups are shown above. The real impactis the change in the yield growth rate for foodgrains from 1.3 percent to2.8 percent between the two decades.
4.4 These comiparative figures for different ten year periods over-simplify the complex changes which have occurred during this period.Because of large variations in the monsoon fro-m year to year and the con-sequent large annual changes in production, growth rates are very sensitiveto the time period chosen for any comparison. If different periods had beencompared, different rates would have resulted. In particular, if onecalculates growth rates which straddle the mid-fifties to the mid-sixties,=ch lower rates appear. Partly this is the result of weather; but partlyit also reflects the deeper -anderlying changes that were occurring; thegeneral slowing doawn of growth rates resulting from the slackening in thegrowth rate of area unaccompanied by any increase in the growth rate ofyield which was only reversed, and then only in the case of foodgrains, bythe onset of the green revolution from 1967/68 onwards. The trends are moreapparent in the accompanying graphs of Figure 1, which show the absolutechanges that were occurng in area, yields, and production based on indexnunbers, but smoothed out by means of itve year moving averages in order toeliminate short-term fluctuations. These bring out clearly how the growthin area slackened from the early sixties and how this was reversed at the endof the decade in the case of foodgrains but not in the case of non-foodgrains:indeed, the graph of area shows clearly how foodgrains have grown at theexpense of non-foodgrins in recent years. In the case of yields the muchmore rapid growth of foodgrains in the past few years is clearly apparentalthough the yield graph brings out also an unexpected increase in non-foodgraingrowth after a period of stagnation in the first part of the sixties.

Figure 1
FIVE YEAR MOVING AVERAGESAREA, YIELD, PRODUCTION
FOODGRAINS AND NON-FOODGRAINS
120 _
AREA NON-FOODGRAINSAREA
110 - _ _ ___________ l
sst0 s__M FOO DG RA INS
100 0111 _ __ __ ___ __ __
1:20
YIELD
1'10 _ _ _ _
NON-FOODGRAINS
0o _ ss1q'0 _ I .-
t st** FOODG RAINS
L_____ ,,____ _____I ______ __________
_ _ _ _ = _ _ _ _ _ I _ __ _
130 [j 1 rPRODUCTION
120 - ____'__
NON-FOODGRAINS
113 -- - -_ _ _ __ _ _ _ _ __ _ _ _ _ _ _
1001- ____________# 1
FOODGRAINS
-( X ,1 R . [ ___
1952/3 1954/5 1956/7 1958/9 1960/1 1962/3 1964/5 1966/7 1968/9
MID POINT OF 5 YEAR MOVING AVERAGE
World Bank - 7669

I

- 27 -
4.5 Within the foodgrain and non-foodgrain groups also there aremajor differences in the growth rates of different crops, both in therelative contribution of area and productivity to total production gainsas weIl as in the rates of change in different parts of the country. Theseare examined in suDsequent paragraphs for the main crops. In the case offoodgrains a more detailed examination of regional growth rates has alsobeen made. For the sake of ease of comprehension the country has been splitinto four Regions: (1) the dry north, covering roughly the western Indo-Gangetic plain, (2) the drought prone west covering the northern Deccan andthe desert areas, (3) the high rainfall east including the eastern Gangeticplain, (4) the southern Deccan and Peninsular Indil. In the discussion ofindividual foodgrains these are referred to as Northern Region, SouthernRegion, etc.
Foodgrains: 1 . Wheat
4.6 The growth of wheat production, which is always quoted as themajor success story of the High Yielding Varieties Program (HYVP) in India,has indeed been remarkable. Over a ten-year period, which includes fiveyears before the new varieties were grown on any appreciable scale, produc-tion grew at over 12 percent per year. Approximately one-third of thisincrease was the result of additional area under wheat (much of it withdrawnfrom the competing rabi pulses) and two-thirds the result of higher produc-tivity. During the first 2-3 years following on the introduction of thenew high yielding varieties the bulk of production growth came from theNorthern Region, especially Punjab, Haryana and Western U.P. This Regioncontains almost half the total area under wheat and 65 percent of the areaander high yielding varieties. During the last three years, however, theImpetus in this Region has slackened: the rate of growth in the area underwheat has tended to slow down and wheat yields have been virtually staticsince 1969/70. This is partly the result of a stabilization of the areaunder high yielding varieties at around 70 percent of the wheat area, amore important cause, however, appears to be the greater susceptibility ofthe originally introduced high yielding varieties to new strains of rust,insufficient availability and use of pure seeds of newly released varietiesand soil nutrient, particularly micro-nutrient, deficiencies resulting fromheavy cropping of the new varieties. in the current year this has beenmade worse by fertilizer scarcity and power shortages.
4.7 During the last three years tuhe growth rate of total wheat pro-duction has only been maintained because the new varieties have been found tobe well-adapted for cultivation in non-traditional wheat areas. Theirphoto-insensitivity, which enables them to give reasonable yields even when
1/ The definition of each Region is given in a footnote to Appendix Table 7.5.For reasons of data availability it has been necessary to define theseRegions to conform to state boundaries although true regional boundariesin most cases would more appropriately lie within states. These region-wise growth rates are also not strictly comparable with those shown inparagraphs 4.1 and 4.3 since the latter are based on value weighted indexnumbers which are also adjusted for changes in statistical reporting methodsand areas, while the regionwise figures are based on unadjusted figures ofproduction volume. The difference, however, is slight.

- 28 -
sowTn late in the season, has led to a rapid increase in wheat production(over 30 percent per annum in the past five years) in the Easterm GangeticPlain. Their comparative superiority over the old varieties even underrainfed conditions has also led to a rather rapid growth in production(almost 11 percent per annum in the past five years) in the Western Region.Ilow long this rate of growth can be sustained in either Region is difficultto predict; it seems to be the outcome of the increasing development ofgroundwater by tubewells. While the scope for this is immense in theEastern Gangetic Plain it is somewhat limited in the Western Region.
Foodgrains: 2. Rice
4.8 The major disappointment of the HYVP has been the lowz growth ofrice production. Compared with the period 1°952/53 to 1964I65 when riceproduction grew at the compound rate of 3.2 percent per year, in the tenyear period ending 1971/72 the growth rate fell to under 2.0 percent peryear. This fall was entirely due to the same decrease in area growth thataffected all crops in this period; the rate of change of productivityremained the same in both periods.
4.9 The nef varieties, however, only began to be grown on anyappreciable scale in the second half of this ten year period, and theiradoption was much slaver than in tne case of wheat. By 1971/72, when 40percent of the total wheat area was sown to the new wheat varieties, only19 percent of the rice area was sown to the new rice varieties. Thisslower rate of adoption was partJy due to the fact that the initiallyintroduced varieties mostly proved unsuitable and had to be changed, partlydue to the inherently more demanding ervironmental requirement of even thermore adaptable new rice varieties like IR.-8; it is almost impossible to use thehigh fertilizer rates which the new varieties require under the rainfedconditions that characterize so much of Indian rice cultivation in themonsoon season; the new varieties require a control over the depth offlooding that is impossible to proNride under present day irrigation systems;their yield superiority over local varieties during the monsoon season isoften marginal and may well not cover the additional costs and risk asso-ciated with their cultivation, particularly their greater susceptibility topests and diseases. Only in the last 2-3 years have newer varieties, thatdo not suffer so many of the drawbacks of the earlier introduced varieties,been released for general cultivation. These too have only spread slowlythough this tine largely for organizational and institutional rather thIanagronomic reasons; particularly reasons related to difficulties associatedwith adoption of complex new practices by small subsistence rice farmers.A more rapid spread can be expected over the next few years but even so thetotal growth rate is unlikely to approach that now being experienced in thecase of wheat; a growth rate around h percent per annum is the more likelyprospect once the institutional and orgai7,ational bottlenecks have beeneased.
4.10 Within this overall picture of slaw growth there are very markcedregional and seasonal differences. The so-called "sumt er" rice crop, whichis grovam in the dry, sunny winter montns of January to April/fMay, ideal

- 29 -
growing conditions for the new varieties provided adequate irrigation wateris available, has been grwing very rapidly indeed, at 7.5 percent per yearover the past five year This growth is mainly concentrated in theEastern Region. This high rate of gro-rth has as yet had little impact ontotal rice output, since the sumer rice crop even by 1971/72 accounted forless than 8 percent of the total rice crop. Ndajor efforts are now being-made to increase the area under sumier rice, particularly through theexpansion of minor irrigation (both of surface and underground water) inthe Eastern Gangetic Plain. Given that summer rice yields are double thoseof rice gro.'m in other seasons, the share of summer rice in the total canbe expected to rise very rapidly in the next few years.
4.11 The rest of the rice crop is gronm under varying types of monsoonconditions. The more extreme these are the slower has been the rate ofadoption of the new varieties and the less the total growth of production,the Eastern Region for instance has only 9 percent of its total rice cropunder the new varieties and virtually all of this is "summer" rice. Duringthe last five years total monsoon rice production in this Region has declined.At the other extreme the Southern Region has almost 47 percent of its monsoonrice crop under the new varieties and total production has grown at almost4 percent per year in the past five years; and this figure conceals largedifferences within the Region. Those parts of the Region that rely on thesouthwest monsoon have developed slowly; indeed in Andhra Pradesh rice Dro-duction has declined since 196 4/ 6 5. Those parts that rely on the northwest(November -- January) monsoon on the other hand have developed fast; in TamilNadu where 76 percent of the rice area is nowi under HYVP's production hasgrown at around 5 percent per year over the past five years. The NorthernRegion, however, has recorded the fastest growth rate. Here most of the ricecrop is grown under controlled irrigation conditions2/ (except in EasternUl.P. -- if this could be excluded the Northern Region growth rate would beeven higher). Although only 23 percent of the crop is in the new varieties,production in the past five years has groim at 7.4 percent per year, two-thirds of this being the result of increased productivity.
1/ The ten year production growth figure of 19 percent in Table 7.6 ismisleading as production in 1962/63 to 1964/65 was very low; the veryhigh regional growth rates similarly need to be treated with caution,particularly that for the Northern Region.
2/ The relationship between production growth and irrigation in the case ofrice seems highly variable. Andhra Pradesh for instance has a higherproportion of its rice crop under irrigation than either Punjab orHaryana, or even than Tamil Nadu. What is important is the degree ofcontrol exercised by the individual farmer over irrigation applications;in Andhra Pradesh this is almost nil. Improved water control, as emphasizedelsewhere, is basic to expanded rice production in such areas.
- 30 -
4.12 It would appear, therefore, from this regional analysis,particularly over the last five years, that rice production may be startingto respond to the potential offered by the new varieties. Excluding theEastern Region, production even of monsoon rice has been growing at nearly5 percent per year for the past five years; and 90 percent of this is theresult of productivity gains.
Foodgrains: 3. Other Foodgrains
4.13 This heading covers a heterogeneous group of cereals and pulses.Three of the cereals, maize, bajra (pearl millet) and jowar (sorghum)formed part of the HYfVP, and their separate varying experience are worthrecording individually. The rest of the cereals and pulses can be coveredmore brief.y. The "T other kharif cereals" group is virtually stagnant inarea, productivity, and hence also production; siilarly for "kharif pulses"altlough here there has been a slight productivity gain. In both cases thegrmwth rate in the five years ending 1971/72 is slightly higher thaLn the tenyear growth rate but this is largely attributable to the more favorablemonsoons of the 1966/67 - 1971/72 period. The picture for barley (a rabicereal) and the rabi pulses is rather different. The competition fromwheat is cutting into the area devoted to alternative rabi crops and bothshow a declining area trend; but at least partly as a result of this theproductivity on the remaining area is increasing, and increasing more thansufficiently to compensate for the loss of area so that there is a smalloverall production ilerease.
4.14 Of the three HYVP cereals only bajra has shown any significantchanges in production trends. The ten year productivity growth rate at 4.2percent per year is the next highest after wheat of all foodgrains; and inthe last five years, at 8.7 percent per year, has actually exceeded that forwheat though most of this is the effect of the exceptionally good 1970/71monsoon. In the period 1952/53 to 1964/65 the bajra productivity growthrate was only 1.6 percent per year. The new varieties have evidently had amarked impact in the case of this particular crop.
4.15 This situation is in marked contrast to both maize and jowar. Inneither case have the high yielding varieties proved at all popular. Farmershave failed to adopt the full range of improved practices needed to realizetheir full potential; as a result on 9 percent of the maize area and 5 per-cent of the jowar area is sown to them. The rate of productivity change isinsignificant (0.4 percent per annum) and indeed lower than in the 1952/53to 1964/65 period. Yaize production has sho-wnm some increase (3.7 percent-Der -nun, over the last 10 years) but only as a result of a larger area; thej owar area and production both show a declining trend, though this is largelythe resulLt of a series of bad monsoons in Maharashtra since 1969/700
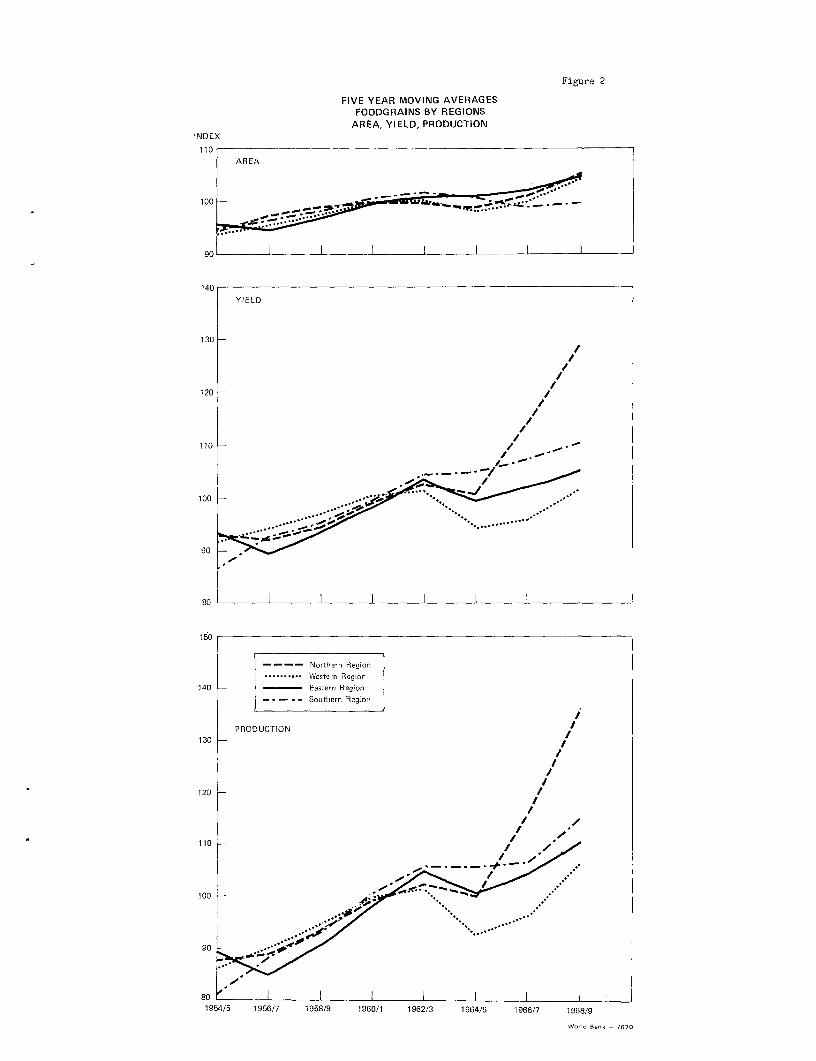
Figure 2
FIVE YEAR MOVING AVERAGESFOODGRAINS BY REGIONS
AREA, YIELD, PRODUCTiONINDEX
110AREA
100 __-_-
90
140
YIELD
130 -
120 /
110 , _
100 -
90
150r
- - - - Northern Regior.Western Region
140 - Eastern Region
- - - - Southern Region
PRODUCTION130 /
//
120 //
// .
110i
1954/5 1956/7 1958/9 1960/1 1962/3 1964/5 1966/7 1968/9
World eBak - 7670

I I

31 -
FoodErains: 4, Total Seeasonal and_ L:!i 1l Trends
4.16 One of the most interesting feult,Ures of the growrth rates given inTable 7.6 is the remrkable contrast in the perfo=m-nce of the rabi crops a.sa whtole compared with kharif crops as a whole. fIn the ten year period underreview rabi crop production gre-. at 7 nerqen1t per year while kharif pro-duction grew at only 2 percent per year, _t The comparison of these twonumbers brings out better thLn alo ost ary other figures the impact of thegreen revolution in its widest sense; not only the spread of the new seedsbut of all the other associated inputs that go vi-th them. The green revolu-tion has had virtually no i-pact upon kcharif production, except for thelimited growth in rice already mentioned, e.ll its impact has been upon rabicultivation. This is not a matter oG` a larger area under improved varieties,for the total rabi area has growm at only 1.25 percent per year in the pasttoi years, but of a general upward move. rent in yields of almost all rabicrops (except rabi j owar), whether imriproved seed varieties exist for them ornot, not just of wheat. These other crops also appear to have benefitedfrom higher fertilizer use, the develonpent of tubewell irrigation and thegeneral spread of more scientific farsrliThg where eavironmenLtal conditionsare more stable. This difference in gs-o-iLh rates has meant that the propor-tion of total foodgrains comiLng from rabi crops has increased steadilyduring the decade, from 31.8 percent in 1962/63 (a fairly typical figurealso for the mid-1950's) to 40.B percent in 19971/72 and this proportion isstill rising.
4.17' This trend has wider implicatiions for the national foodgrain pro-duction strategy since rabi production is inherently more stable than kharifproduction because it is largely insulated from the vagaries of the monsoon.A rising proportion of output being produced under more stable conditionsimplies a greater stability in total production, a trend whose importanceneeds no emphasis in a year like the present, Indeed, this analysis throwsuseful light on one of the big questions cf the present year: is the greenrevolution slackening off? The answer clearly is no, the green revolutionlhas not yet had any significant impact uponAdharif growth: the impact uponspecific crops like bajra is so small in relation to annual variability thatit does not influence the overall growth. This year's kharif productiondrop is not a reflection of any slackening of the green revolution, merelyof the unpredictable variability of the monsoons The green revolution is arabi revolution and on present indications likely 1972/73 rabi production(thanks to an intensive production campaign admittedly) will be on trend.
4.18 The Regional distribution of total foodgrain growth, as might beexpected, has been very unequal, although if one examines it at the statelevel and even more so at the district level a much greater degree ofinequality emerges, with some districts showirng a very fast rate of grawthand others, even in the wheat belt, showing a secular decline. The Northern
1/ Because of large year to year fluctuations the khkarif grrwth rate is notstatistically significant from zero.

- 32 -
Region, correctly regarded as the main gainer from the green revolution,has grown fastest (6.8 percent per annum); the combined result of a highproportion (66 percent in 1971/72) of production caming from rabi cropsand also a high rate of kharif production growthŽii' Western and EasternR,egions both ocme almost equal second with a growth of 2.8-2.9 percent peryear. This growth arises from different sources in each case. In theW,,'estern Region it is kharif production that has grown more rapidly (2.5percent per a±num as against 0.9 percent in the Eastern Regian) though bothareas are subject to very wide monsoon-induced fluctuations from year toyear; wLile in the FELstern Region it is rabi production, as a result of both;rea arld prodcction gains, that has grown much more rapidly (12.6 percent
per alunum as against 3.2 percent). The Eastern Region in fact has a higherrL.te of growtfh of rabi production than any other Region but as the rabi cropfolmed such a smaUl proportion of total production at the start of the
eri.od (1 h petcent) this rapid growth has no-t resulted in a very rapidtotal growth. The lowest rate of gro-wli (1 e9 percent per annum) has beenexperienced in the Southern Region. TiLs Region has the lowest proportioncf rabi. crop (15 percent) and though rabi production has bemn growin.g atover 4 .3 percent per annum -this has had little influence on the total growthrate wkhhich is domiated by rice, and the growth rate of rice production,as already mwtioned, has been slow. However, if one takes growtU rate overthe Ilast five years separately a different picture emerges; rice productionin the Sou-thern Region has begun to grow rapidly in this period giving ita faster growth rate than either the Western or Eastern Regions. While itis dangerous to rely too much on gro, ;-Lates over this short period it saybe indicative of an emerging change. Thi-s would be even clearer if one wereto take out Andhra Pradesh, as this state h.as not yet experienced any:DrL.;vervener.t in rice production and were to tike oxn.ny iWsore, Tamil iadu, andXef la as the Southern Region, since rice production is growing quite Cast
Joo in all these three states.
i!. A 1 9 In Figure 2-, an atLempt has beesn mde to bring aett the differentcow1' ccŽ'periEmflle of each Region over the past twenty years The figu.re
o- thv atht, yield, and produceLion troend( in each Fiegion since 1952/53.'?. h1. , tLhe reeait siLarp upward _wing in yields and production in the
;-. s, .Iue4n .tans out quite clt,arly- Also, clearly apparent is the much-r linstiabi.y of both area iad y-ields In the Eastern and Western
t. eCT rtIpared .'ith eiVier of the ot'er bi'o Regions, a basic consequencea--.-r J-reato;x v' -endence up ui ti&.% .:outhwo'-.3:; t ok1SOOal
!I ! i- -fiOtrail Crop
'i .7 As mentioned earlier, the growth rate of non-foodgrain crops as ajir,ujc ic signi.ficantly below that ior .Woodgrains and it was lower in then..di. 1)62/63 to 17'0,/O/71 tlaan in the -revious ten year period largely
L.-:-;e of a f.ll -i the rate of aru:. inerease without any compensatingŽ..nc rcc i !roductivity.
T Northern Region is the only Region with a statistically significantton year growth r te in total khlar:if production.

- 33 -
4.21 Non-foodgrain crops account for one-third by value of total cropaotput. The major crops involved, their share of total non-foodgrainoutput by value and their rates of growth of output over the ten yearperiod 1962/63 to 1971/72 are given below:
Non-Foodgrain Crops: Growth Rates 1962/63 to 1971/72
Crop Value Share of total Annual percent groAh ratenon-foodgrain output Area Productivity Production
Oilseeds 3365 0.1 1.5 2.0Sugarcane 22.8 1.0 1.4 2.3Cotton 9.6 -o.6 1.0 06Tea 8.4 1.2 1.2 2.4Jute 3.9 -1.7 0.2 -1.5
Total 100.0 0.2 1.0 1.8
4.22 These growth rate figures bring out well the general stagnationthat is afflicting most non-foodgrain crop production. With one or twoexceptions (notably rubber) non-foodgrain crop output has grown at sub-stantially lower rates than in the previous decade. Moreover, these ratesare well below the rates of growth in demand and, indeed, mrny are belotxthe population growth rate and allowJ nothing to spare f'or rising per capitaconsumption levels.
4.23 Besides showing very low rates of growth, many non-foodgraincrops are subject to very large year to year fluctuations in output. Thisis a function of the low proportion growni under irrigation and the fact thatthe majority of them are kharif crops and thus dependent on the monsoon.This is not true o' sugarcane, nearly 80 percenat of which is irrigated, butthis has its own cyclical fluctuations although frequently changing marketingpolicies have helped to exaggerate these. Given the absence of an organizedprice support system for most crops these weather indaced production fluc-tuations lead to large price fluctuations with their own consequent dis-incentive effects on production growth.
4.24 The basic cause of the low productivity growth, however, is theabsence of improved crop varieties or new cultivation technologies com-parable to those introduced in foodgrains. Only in the case of cotton dosome recently introduced new varieties provide hope of significant futureproductivity gains though even here there are doubts of how widespread thesegains will be. In the case of oilseeds a way out is being sought throughthe introduction of new types of oil-bearing crops, principally soybeanand sunflower, rather than through the improvement of existing ones.

However, there are some developments which hold out hope of future pro-ductiviLty growth in oilseeds, in particular, the increasing cultivation ofgroundnuts in the Southern Region under irrigated conditions,, wth sub-stantially higher yields than elsewhere in India. The productivity ofrape and mustard seed, interestingly enough a rabi crop, has also beengrowing fast over the past few years.
Livestock
4. 2 5, In coiparison iith crop production the data on livestock productionare very scanty. The only set of consistent data is that contained in thenational accounts estimates. On the basis of these, livestock account forno less than 16 percent by gross value of total agricultural output.Livestock output, however, appears to be growing substantially more slowlythan crop output, at the rate of only 1.0 percent per annum for the period1960/61 to 1969/70. This is less than half tne growth rate of population sothat per capita availability of livestock products must be declining at arate in excess of 1 percent per annum. The livestock statistics are suchthat it is not possible to make any further analysis either on a productor regional basis as to where or why this growth rate was so slow.
The Productian Record in Relation to ReEi=rements
4E26 Throughout the w.rhole period since Independence India has nevercuite been able to accelerate the growzth rate of foodgrain production abovethe grcwth rate in foodgrain demand sufficiently, and for long enough toeliri_ ate the conparatively margina1 dependence upon imports. However,from the end of the drought years of the mid-sixties, as the momentumn offoodgrain production increased, this dependence declined until at the startof 1 972 the Government felt able to disoense -with all concessional foodgrainimports. The fact that it was necessary to resume inports, this time oncomaercial terms, before the year was over, therefore, raises the questionw4heth-ier the decision to dispense withl concessional imports was premature, beingbased on too optimistic an assessment of production trends, or whether the11972/73 experience was exceptional.
)4.27 T)he preceding analysis of production data provides a reasonablebackgroinrid against which to try to ansa-er this. The facts as they now appearare tiesee The rate of increase foodgra-in desiend during the sixties wasabout 2.8 to 2.9 percent per year,- The rate of increase in foodgrain pro-duction was something in excess of 3.0 percent per year; how; much in excessis a matter 'Lor argument: one &btains d-ifferent g-owt7h rates ranging from2.6 to 3.7 percent per annum depending upon which particular group of yearsone uses for the calculation. As alrea.dy stressed this wide variation ingro-vft,h estimaites only arises from the very violent fluctuations which are
1/ Population increase accounted for 2.3 percent per year demand increase,while increased per capita consumption was equivalent to about 0.6 percentper year (based on average elasticity of demand for foodgrains of 0.5)andan actual increase of per capita incomes of 1 .2 percent per annum.

35-
experienced in the production or kharif foodgrains, which can be as much as20 percent from year to year. IzJhat the previous analysis brings out andwhat does not seem to be widely appreciated is that increases in rLb.i cropproduction alone almost cover the total growth in foodgrain deman - Ifone then adds in the statistical 2 percent per annum growth in kharif pro-duction one ends up wJith a total foodgrain grotrth corafortably in excess ofdemand gr3wth. Unfortunately, only the rabi growth is reliable; likelyfluicuuations in kharif production are so great that they may more thancancel out any growsth in rabi production (as has happened five times in thepast eleven years) or they may add their weight to the growth in rabi andpush total growth up by 8 percent in a single year. This is what happenedin 1970/71 and it appears to have been taken as an indication of a faster un-turn in the underlying growth rate than appears justified by subsequentevents. At the same time, the do,'mturn in 10972/73 was rather exceptional.Although the Government had built up a substantial buffer stock as a cons,>-que:,ce of the bad 1972/73 monsoon follow,ying a year of relatively poor pro-duction in 1971/72, it proved inadequate and imports therefore again becamenecessary.
4.28 WShile the growth of total foodgrain production can thus in a sensebe said to have outpaced the growth in demand during the past decade, thedifferential grofth between different foodgrains was leading to severe demandimbalances between cereals. At the one extreme was wheat, production ofwhich increased at the rate of 12 percent per year. At the other extreme wasjowar, production of which declined over the decade. Although the elasticityof demand for wheat is much higher than for cereals as a whole the totalgrowth rate of demand for wheat cannot have exceeded 3.5 percent per annum.Tt was possible to sustain a production growth of this magnitude only becausepart of the demand had earlier been supplied from imports, because there wasa strong demand from Government to use wheat as a buffer stock and becauseconsumers were substituting wheat for other cereals, whose production waslagging. During the decade the production of rice, jowar, the minor kh1arifcereals like ragi, barley, and pulses all grew more slowly than populationand their per capita availability thus declined. The most important of thesew,as rice which had accounted for over 40 percent of all foodgrain production.
4.29 Production of all the major non-foodgrain crops also grew much moreslowly than demand during the decade. For most of them the income elasticityof demand is in the range 1-1.5 so that, with per capita income growing atjust over 1 percent and population by 2.3 percent per annum, demand growthwould be 3.5-4.0 percent per annum; yet the fastest growLng of any of themajor crops was sugar and that only grew at 2.3 percent per annum. Thefailure of these crops to grow has many severe side effects; on the one hand,it raises the cost of essential components of urban and rural diets therebytending to raise wage rates; on the other hand, it raises the cost of supplies
1/ Rabi production accounts for 40 percent of total foodgrain production3 inthe ten years ending 1971/72 rabi production grew at 7 percent per annum.Calculated over total foodgrains this is equivalent to 2.8 percent perannum, against 2.8-2.9 percent demrand increase.

3t
of raw materials to major national industries such as cotton and jute andlowers the rate of industrial growth; and yet again it lowers the growth ofexport earnings by cutting into the exportable margins of such major con-tributors as jute and tea.
Imaplications of Past Trends for Future Growth
4.30 Since agricultural production accounts for over 40 percent of NDPa high agricultural growth rate would help greatly in the attainment ofnational growth targets. As indicated earlier, a major reason for thefailure of the economy to grow more ra.pidly in the past decade has been thelagging growth rates in the agricultural sector., For the Fifth Plan agrowth target of 4.7 percent per annum is proposed for the agriculturalsectory ranging from 4 percent for foodgrains to 4.9 percent for non-foodgrainsand 5.8 percent for livestockM How far do these seem possible of attainmentin the light of the preceding analysis of crop production growth in thepast ten years?
14.31 IIn the first place the rates would represent a sharp upward junpover rates recently experienced, less so in the case of foodgrains which wouldonly have to move from 3.6 to 4.0 percent, but very considerable in the caseof ncn-foodgrains which would need to more than double, from 1.8 percent to4.9 percent.
14.32 In the second place there is little prospect of obtaining any partof this increased growth rate frcm an upward jump in the growth oL croppedarea. As already meationed, the rate of increase in the net sown area isnow- very small (about 0.4 percent per year); similarly, increases in theintensity of land use have also been small. Between 1960/61 and 1969/70 thedouble cropped area increased by 580,000 ha per year, representing an increaseof mnly 0,3 percent per year in cropped area. About 1400,000 ha per year ofthis is thus the result of additional double cropping on irrigated land. Thegross irrigated area is nowi rising more rapidly (apparently at as much as 2.0million hectares per year) and a further acceleration is planned in the Fifth FiveYear Plan which should result in some acceleration in the double cropped areato perhaps 1.2 million hectares per year equivalent to 0.7 percent on thegross cropped area. Area growth from both sources should, therefore, riseto about 1.0-1.1 percent per year during the next 5-10 years. This wouldleave 3.6-3.7 percent of the 4.7 percent growth in production in the FifthPlan to come from productivity growth.
1/ These are the "lvalue of output" growth rates used in the "Approach tothe Fifth Plan" and are consistent with the growth rates used elsewherein this chapter. The'value added" growth rates are lower, e.g. 4percent for total crop output, compared with 4.7 percent on the basisof gross output value.

37
4 .33 How the growth in area would be divided between foodgrains andother crops also has a critical bearing uon t,he prospects of attainingtheir respective growth rates. The Fifth Plan targets represent a reversalof recent growth trends with nonfoodgrains having to grow faster than food-grains. A prerequisite to such a reversal of positions would be a relativelyfaster growth of non-foodgrain than foodgrain area. Earlier evidence presentedgrowth that, while in the fifties non-foodgrain crops were the major gainersfrom area growth, in the sixties this position was reversed and foodgrain areagrew faster than non-foodgrains. Indeed there is reason to believe that atleast part of the foodgrain area growth in the past decade was achieved bytaking land away from nor-foodgrain crops. I/ There are, however, signs thatthis may have stopped; for instance in the five years ending 1972172 in factthe non-foodgrain area index grewf faster than that for foodgrains. In addition,a larger proportion of irrigation dev'elopment in future will be from privatetubewells where there is a somle-What greater tendency to grow cash crops. 2/Assuming that future increases in tie cropped area were allocated, in the ratio40:60S, foodgrains to non-foodgrains the area growth rate of the respectivegroups would be about 05 percent per annum for foodgrains and something over2 percent per annum for non-foodgrains. On the other hand it would seem thabappropriate changes in public policy couild be used to bring about an evenbigger shift in land allocations in favor of non-foodgrains, even to the ex-tent of cutting the growth in foodgrain area to zero* This would raise thearea growth rate of non-foodgra-iilis to near 4 percent per annum. This could bebrought about either through changes in pricing policy, which would appear tohave been a major causative factor in the changes in relative area growth ratesin the fifties and sixties, and by zoning arrangements or appropriate waterrelease policies in surface irrigation projects which prevented uneconomic useof water on high water using crops like rice or sugarcane and encouraged theproduction of cotton or oilseeds. In many irrigatim projects such regulatorypowers exist but the will to enforce them has been lacking.
4h34, Looking at the present rate of productivity growth for non-foodgrainsof 1.0 percent per annum and comparing it with the 4.9 percent needed to reachFifth Plan targets, it is apparent that policy changes that will attract landinto non-foodgrain crops will be needed to meet the target. Aside from somenew cotton varieties the new technology and varieties needed to bring abouta sharp upward swing in the productivity growth rate of non-foodgrains asa whole is just not in sight. Even when the effects of a number of specialarea development programs for non-foodgrain crops are added in and the spreadof the new oilseed crops allowed for, it does not seem likely that one canattain a productivity growth rate of more than 2 percent per annum; even thiswould be a major achievement0 Thus 2.9 percent of growth would still need tocome from increased crop area.
1/ For further evidence on this point and also for a numrber of other pointsdiscussed in this section see Dhanm Narain, "Growth and Imbalances inIndian Agriculture., Journal of the Indian Society of AgriculturalStatistics. Vol. XXIV, No. 1,June 1972,
2/ An analysis of eight recent IDA project reports for groundwater develop-ment covering 8 states and 500,000 ha of additional crop land shows thepredicted distribution of new crops is 40:60, foodgrains to non-foodgrainso
- 38 -
4.35 By contrast the attainment of a 4 percent foodgrain growth targetseems within grasp. During the past decade yield growth has averaged 3 percentso that even without any additional area the target could be met by a one-thirdincrease in the yield growth rate. There is no doubt that the technology toachieve a 4 percent yield grow-th now exists although to maintain a balancebetweeni different foodgrains would require a number of changes on the presentpattern. In the first place wheat production has been growing substantiallyfaster than demand, and it is a matter for argument how long this can continue.Qn the one hand are those who argae that a growth rate much in excess of 5-6percent per annum cannot be sustained indefinitely since this is the rate ofdemand increase and also that any increase in excess of this rate is at thecost of other foodgrains. On the other hand,ane cian equally well argue thattotal foodgrain output has risen faster through the diversion of land frcnr4 yielding palses to high yielding wheat than it would otherwse have done,
aTnd that a high rate of wheat production growth in excess of erand growith islhe cn certain and stable way to build up the buffer stockIs that are necessary
to prow-ide against the type of drought situation that has occurred i:L the current'year, It is clear that the present is no tine to attempt del- e-rat,f4.Iy to reducethe growth rate of wheat production. The previous analysis indr\Wtwes that thepa t hirzh mates will anyway not be sustained and that a level o f '& percentrer annur, is more Ii .kely over the next few years. Ever this, however, isessentially dependent on the availability of increasing volu-Mez of fertilizersamd Sof adequate power to run tubewells. The shortage of b;t2 in the current
7-nust have had a substantial if as yet undet:e rr&ne ei ect on wheat pro-cLu-tion and if thz; cortinues in sn bsecu e.r G yeas the grmoth rte of heat'11~r,3:;1t'~vnt'. w13. def.:Ciat.ely decilbas even f7urthler.
U i'' IfTf the g,rowth -Tate of wheat production is deeclIxdlig then the ratewsr-1-ce cnrd aotler food.grain production groc3.ith. zaxut be a. cetelratevd tc ta
5Ure ea. te tot-a" foodgrain product-ion growiS,th,, Theb e are sigs A thiLSzZt'..Ing in r.ceand given sufficient ad r.disctrat-ive baclkng -L4ere seems
K'hy i',+i<t peont gcrc th rate 'ror rice& shiDuld not be attedned. Theg.a; . at presentIIJ is te aatRe.e Region. "'This Regicn. pos-sesses
' >ntapped girrhd4ater res.u.rces -',rhich 'ould be ased Kvvn adequateLtg, r:'? o, mcwS of' major prog.am to increase se r>e that would
.T ' -?assina ta fe ifficcl-y cc ic r if rice yeldsaaT, h J_ ;?^ I. T~~;Lo ? :Ts _:at-e r o^ul.d of c4-fiarae esalaIy well be used
. ouDet ;t -1 -t is not ye-L clear wh' h i,5s more likely.) Such11,~ W Jm at should be n-a e cthe mai poic pc -
X>v'.rii'<t' J+t nct ,F,ijrSt,Ve,.rs rea27>;>45ise3>n g prlopart?o;n of total fooid-, IAs ci aue f r-wn r jhe rab seahnL a sd thuLs decreasing the dependence
cr n'stable, kha if Production.
'X,,37 Ihe more rapid exploration arnd exploitation of groundwater resourcesS 3.earJ. em.erges Fai.z b thids analysis of the .soource of foodgrain growth andfr eTr, the ealt2Z-er una-lysis of the sources of 2o-nal-foodgrain growth., as a keyfacit,cir the achi,; e.t.ent of the Fifth Pln. targets. The major unused ground-wat,er resource exists in the Gangetic Plain; in most of remaining parts oftIte COU L'-Y7 groundw;,Bater resources are relatively meager, and much nearer totUre limts of full deveLopment. A major concentration of effort on the GangeticP.aimm iS thus indicated for the Fifth Plan. Shortage of power is likely to re-
alun ar important constraint on this development for some years to cameo

- 3,0
438 As far as other foodgrains are concerned the currently availablenew varieties, except for bajra, have failed to have any major lasting impactso far. Major improvements must therefore wait orn two things, the adoptionby farmers of the complete package of practices necessary to bring out thefull potential of the new varieties and the development of a suitable dry-land farming technology. Research to find such a technology started 2-3years ago and already results are available that show major yield improve-ments are possible even in low rainfall areas. This research is also begin-ning to indicate that existing traditional cropping patterns may also not bethe most suitable for these areas and that major cropping pattern changes(especially from foodgrains to oilseeds) should be introducedO It will,however, be a number of years before tested, reliable, area-specific recom-mendations can be given to farmers on a big enough scale to affect totalproduction trends. This research in its turn is likely to make farmers morewilling to adopt the full HYVPpackage with the new varietiese
4h.39 No mention has so far been made of fodder crop production; indeedno figures of any kind are available on the extent of the sown area used forfodder. It is probably small since most livestock exist on crop residues 0Fawever, the Fifth Plan growth target for livestock and fishezies of 5.8percent, involving as it does an almost sixfold increase over the presentlivestock production growth rate must presuppose the beginning of some kindof mixed farming system and the diversion of coarse cereals to foodgrains.It seems unlikely, however, during the next few years that this will be ona large enough scale to affect the growth rate of other crops in any dis-cernible way. A sixfold increase in the production growth rate also seemsoptimistic.
4.40 In suamiary the prospects for achieving the production growths requiredby the Fifth Plan targets do not seem out of reach. In the case of foodgrainsthe major determining factor will be the rate of adoption of the new ricevarieties and the impact these have on yields; recent policy changes thatshould help to bring this about have been taken in the past two years thoughit is as yet too early to assess if these are adequate. Given an upward shiftin rice productivity, however, foodgrain production should keep pace withdemand growth. This does not mean that a bad monsoon might not make foodgrainimports necessary yet again in the next Plan period. This is a matter of chance.On the average,however, India is now self-sufficient in foodgrainso In the case ofnon-foodgrains ,the attainment of targets appears to depend mainly on the Govern-ment's ability to bring about a more rapid area increase in these crops. Thepolicy changes necessary to do this have yet to be adopted; there is a real-istic awareness in Government of the need for changes to bring such shifts topass though what exactly they should be has not yet been worked out. Further-more since many of them will have to be implemented at the state level, wherethe level of awareness of national problems is lower, one cannot be altogetheroptimistic whether such area shifts will occur, If they do not occur the presentstate of imbalance in agricultural growth will continue.

- 40 -
CHAPTER V
THE RURAL SCO
The Drought
5.1 In the annals of Indian agriculture the year 1972/73 will be remem-bered primarily for its crop failure and for the new round of land ceilings,the latest in a series of efforts to deal with the most difficult issues ofagrarian reform. But overall, where 70 percent of the people depend for theirliving on farming, it is the decline of the kharif crop by nine to ten milliontons which looms largest in assessing the agricultural scene. The principalsufferers are obviously the farmers of the stricken areas, but the repercussionsare much wider. The nearly 20 percent increase in foodgrain prices betweenJanuary 1972 and January 1973 has had a depressing effect on the economy ingeneral, and more immediately on the consumers, particularly the overwhelmingmajority of the poor. In a country where 40-50 percent of the people livebelow an austerely defined poverty line, and where 50-60 percent of the familybudget is devoted to food, the deleterious consequences of the drought neednot be labored. This apart, the drought has given rise to much unsubstan-tiated speculation about the inadequate potential of the agricultural economyof the country and, more especially, about the "tfailure"l of the green revolu-tion. All that can be said here by way of a preface is that while the tragedyof the afflicted is real beyond doubt, taking the long view the gloom emanatingfrom the drought on these two accounts is not warranted. The fact is that theIndian agricultural economy has not been stagnating and there is reason tobelieve that it will make further strides in the future. These, then, arethe main themes of this year's account of the agricultural scene. Other -issues, notably rural poverty and rural credit, are omitted. In these regards,and unless the the increased volume of credit be considered the touchstone ofperformance -- no significant improvements worth reporting have taken placein the course of the year, and last year's detailed examination of these prob-lems should suffice for the time being.
5.2 Only a year ago, in conditions well below those of the record cropalready attained, India still seemed on the threshold of food self-sufficiency.Judging by the rising trend of grain production -- an overall increase of 19million tons between 1964/65 and 1970/71 -- there was reason to believe thatthe country was beginning to emerge from food shortages and food imports.The officially pronounced policy in early 1972 of no concessional food importsand the flight of unofficial fancy that the country might even export grainin the near future, were part of the picture suggesting that India was turningthe corner. The only variable omitted in all these anticipations was the be-havior of the monsoon. This year, after three favorable ones and two onlymoderately so, it has played truant in many parts of the country, bringing inits wake severe food shortages, sharply mounting food prices throughout thecountry, and grave privations.
5.3 The statistical and interpretative picture of agricultural produc-tion in India is presented in Chapter IV, but by way of summary of the impactof the drought it suffices to say that this year's drought was one of theworst in recent memory, the monsoon rains having failed over a large part of
- 41 -
the country. The precise number of people affected is difficult to estimate,but conservatively speaking tens of millions of people have been subjectedto very inadequate food rations. To this must be added shortage of drinkingwater and shortage of fodder, which in turn consigned a large number of thecattle population to the slaughter houses or death from starvation. Thecalamity was not as country-wide as some observers claim, but it made itsdeepest inroads in the States of Maharashtra, Rajasthan, Andhra Pradesh,Gujarat, large pockets of Mysore, Madhya Pradesh and segments of Uttar?radesh. In the first mentioned State alone, an estimated 20 million, outof a rural population of 35 million suffered from the drought, and will remem-ber it for years to come.
',.4 Space does not permit even a fleeting description of the intensehardships borne by the stricken rural communities, and yet the 1972 droughtdid not develop into the classical famine with its accompanying horrors ofmnass mortality. This is explained by a number of factors, the principal onebeing the nine million tons of buffer stocks. They made the difference betweenstarvation and survival, even if in the midst of privation. Next in order ofiLmportance were the massive relief works generating employment. Once they arecreated in sufficient numbers and people employed, wages are paid and someform of food rations are provided by the buffer stock, the worst of starvationis averted, although debilitating malnutrition persists. This is India's casein 1972. Apart from the traumatic experience of farmers barely keeping bodyand soul together tending relief works instead of planting and harvesting crops,the material loss of failed crops and general pauperization of the drought-affected communities is enormous, and the farm income of some of the Stateswill have been cut by half, more or less. The Government of India has by nowincurred expenditures in one form or another to the extent of Rs 4.4 billion,a burden it can ill-afford. The burden would have been much greater but forthe very stringent control over the purse strings. This is exclusive ofemergency food imports which are likely to absorb some US$200 million. Andthere is yet another cost -- the sharp depletion of the original reserve stocksbefore the procurement of the new rabi crop commences in May 1973. In thelight of the Government take over of the wholesale trade of wheat and rice,the size of the rabi crop, that of the 1973/74 crop, the volume procured andthe quality of distribution will be crucial. The successful test will comeif as a result of the trade take over the Government of India manages to pro-cure 8 million tons of wheat as against 5 million tons a year ago. But asof the moment, India is likely to wind up its agricultural year ending inJune with a total estimated foodgrain crop of close to 100 million tons anda reserve stock of about h million tons including imports -- instead of 9million tons in the preceding year. For a country like India with its un-predictable climate vicissitudes and rising demands due to population growth,this is not a satisfactory position, unless both the winter and summer cropsof 1973 are good indeed. In that event, the current food gloom will havedissipated.
5.5 It is not far-fetched to hope that the latter might come to pass,and the 1972 visitation may be just another familiar passing phase typicalof Indian agriculture. The cycle of four-five reasonably good monsoon yearsand one peor one will probably be in for a renewal, and 1973/74 may demonstrateonce again India's unquestionable agricultural potential. But the sufferingand degradations of millions reduced to meager relief work wages and meager
- 42 -
food rations cannot be entirely attributed to nature's caprice. Such actsof God are an old Indian story, but their pernicious effects might have beentempered through timely preventive measures rather than through shock treat-ment after the event. As it is, the record shows that large sums are spenton drought relief without creating a significant residual to minimize theill-effects of the next drought. Mindful of this experience and the direneed to augment production, the Government of Ihdia is not banking now onlyon a good monsoon. As an emergency measure it is providing the state govern-ments with Rs 1.5 billion to create additional minor irrigation facilities onsome four million hectares of land. In addition, Rs 1 billion of short-terminput loans have been earmarked for this emergency. In this manner it isanticipated that some of the lost ground in crop production will be retrievedin 1973 while at the same time additional assets of a permanent nature willbe created, thereby reducing the proneness of some of the affected areas tosimilar situations in the future. Much of this work is underway, but onlytime will tell the effectiveness of these measures induced by the drought.
J2lusory Drought Consequences
5.6 In the midst of rampant pessimism generated by the drought, two ofits by-products are the tendency to minimize the past achievements of thecountry's agricultural economy and, along with it, to treat the green revolu-tion as if it were a non-event. Neither position is valid. Precisely because1972 was a "Year of Trouble", a brief look at the past record on both scoresis in order. The fact that the overwhelming majority of the rural populationstill live in abject poverty should not be taken to mean that what has beenaccomplished is in any sense insignificant. Even in conditions of traditionalagriculture, between 1949/50 and 196h/65 the grain output of India increasedfrom 55 to 89 million tons. That half of it was a result of expanded acreageand half resulting from higher productivity does not invalidate the achieve-ment. Clearly, what stands out is that the rural economy was not one ofstagnation even long before the advent of the new technology. The more sowith its advent, though admittedly productivity has a long-long way to gobefore agriculture ceases to be a gamble on monsoons.
5.7 The subject of the green revolution has been repeatedly discussedin this space on previous occasions, but in the midst of decrying the effec-tiveness of the new agricultural strategy a few indicators may be usefullycited once again. The outstanding one is that in 1970/71 India attaineda record crop of 108 million tons; while wheat made the principal contri-bution, the new practices were making themselves felt in higher rice yieldsas well. Since this resulted from a combination of good climatic conditionsand modern technology, a better measure of the contribution of the technologyis the veritable revolution in the utilization of inputs. Fertilizer con-sumption (N+P+K20) increased from 306,000 metric tons in 1961 to 2,260,000tons in 1970/71; during the same period the number of electric and dieselpumpsets increased from 421,000 to over 2.4L million; the number of tube-wells from 19,000 to 480,000 and tractors from 31,000 to 117,000, and thearea under improved varieties from 1.9 million to 15.4 million hectares.They helped to raise output beyond what could have been achieved even infavorable climatic conditions, lifting up the trough of total grain produc-tion by approximately 20 million tons even in a poor year like 1972. To theextent that the green revolution makes for stability via irrigation and for
- 43 -
higher yields via its other techniques, its role is indispensable in anyattempt to modernize Indian agriculture. One should remember also that,as already indicated, the process of modernization has spread to otherwalks of life, and in at least a few regions the green revolution hasgrown into something bigger -- a more complete rural revolution.
5.8 Much of this has tended to be forgotten in the traumatic eventsof 1972, and it is not surprising that the voices of the detractors of thegreen revolution swelled into a chorus. At this juncture it is importantto note not what the new technology failed to do, but what it did accom-plish in a brief span of time. To begin with and very importantly, thereis the lion's share of the 9 million tons of buffer stocks which came fromthe authentic green revolution areas. Without this contribution India wouldhave reaped starvation on an unprecedented scale. The procurement campaignof the summer crop now underway has fallen far short of the target. On theother hand, Punjab and Haryana, the two States where the new technology madeits deepest penetration, are the best performers accounting for nearly 50percent of what has been procured. Significantly enough, they did it mostlyin rice, which country-wide is in short supply this year. This is worthstressing because it points to a major and useful shift in the croppingpattern of these States, primarily due to the new farm practices. Punjaband Haryana have also had to contend with their climatic problems and powershortages but their investments in irrigation and in other modern practiceshave sustained them rather well in an unfavorable season. All this is inrelation to the immediate food crisis situation, and these facts of lifeand other contributions noted earlier cannot be overlooked. Moreover, thedenigration of the new technology on the ground that it is uneven, selective,income-disparity-prone, etc. has nothing to do with the modern practices assuch. The new techniques as techniques cannot be held responsible for avariety of imbalances such as poor credit, minimal extension service, in-adequate farm labor wages, or for the fact that generally speaking economicnecessity and social justice do not often ride in tandem. These are essen-tially man-made issues of long standing. More to the point is that in thecourse of a very few years the new technology has become agriculture's turn-ing point for what has already been achieved and for what it may attain inthe future.
Green Revolution's Gainers and Losers
5.9 Assuming, therefore, that there is a technological breakthrough incertain areas of Indian agriculture, the question may be raised as to howbeneficial this has proved to be so far to the big farmers, small farmers,tenants and farm laborers. Numbers cannot be assigned either to the sizeof these groups or to gains or losses in income terms. Nevertheless, withinthe areas affected by farm innovations their respective positions can be as-certained if only in general terms. The point of departure of an assessmentof this kind is the admittedly existing dualism in Indian agriculture: a smallpart of it -- 10-15 or more percent -- that is irrigated, prospering and pro-gressive and the remainder that is dry, poor and stagnant, or what one writer calls"two rural India's" 1/. Both of them are conditioned by geography, nature
1/ Ashok Thapar. "The Challenge to India". Times of India, August 15, 1972.

- 44
of land ownership, size of holdings, costly investments imposed by the newtechnology, and much else already touched upon in a preceding paragraph.The predominance of " t dry farming" explains why vast parts of the countryhave not been touched by the green revolution. In that sea of farmsteadsunequal income distribution is not nearly as burning an issue as in thesmaller areas with assured irrigation potential where big farmers withowned or borrowed capital have taken advantage of the combination of tube-wells, improved seed, fertilizer and tractors. In the process they struckit rich beyond their expectations, and the rich became richer. And notonly have the rich benefited. In States like Punjab and Haryana numeroussmall farmers, though by no means most of them, with owned holdings of5 acres and more of good land have also benefited from the adoption of newpractices. This said, there is no doubt that the gaibs of the gFeen revolu-tion are distributed differently with different categories of farmers puttingthe small entrepreneurs at a disadvantage.
5.1iO In the very same hub of rural transformation the meek and the humbleamong the farm owners, mostly holders of five acres and less, have been moreor less bNy-passed. In thebry the new technology is "neutral to scale 1 , whichmeans that it can be applied to art size of farm, and yields are only a function,of in:uts. In practice this does not often happen, the constraint being mainlylack of resources. For all the expansion of cooperative credit in recent years,its distrioution has always been weighted in favor of the wel-l-to-do ratherthan the weaker sections of the farm coIbmmunity, Summing up the gainers orlosers among all the farmt 6wx6iS3rs in areais wheree the new practieos predominate,the situation is about like this't (a) fore or less all ininovators have enjoyedconsiderable gains in real ineome; (b) withbin the innovating groups propor-tionately larger gains have accrued to the bigger tarmers with larger ladand ot.her resources; (c) the income disparities have greatly widened betwteent,e innovator and non-innovatbrs; (d) even in the backward agricaltural, Stateswi¢ith islands of improbved technology farmers have substantially b6tefited and(e) unequal access to credit is bhe principal reasons why in typical regionsof agrioultural modernization so many srmalll farmers have fallen by the wayside.
5.11 As to whethe'r in the decide-dly innovative 4reas the landless farmlabo-rers are gainers or l-osoes, the picture at tbi$s Stageof t,olot is
i,LLted 1i. their:: favor, 3ven Sif only slightly. The hew type of agriculturei ½ri-intensive, employing more labor over a lodger period of time in
Ine occductJC_on of a longer output. While th-e cost of living has risen sharply,so have iwages, labor gaining some ground. But the technology is also poten-tially labor-displacing, notably with the introduction of the co-rbine.-thresher.With no mechanization policy to avert an unfavor'able impact on rural-employmentin regions discussed here, in the yeais ahead the trend will shift frowm time-saving to labor-saving devices, and the number of displaced laborers can onlyincrease. This movement may slacken its pace from time-to-time, *as is thesituation rlght now, but possibly sooner than later events might well beginto catch up with Nehruts lament against farm mechanization as a threat to thewelfare of the landless farm hands. Assuming that as of now farm labor hasnot suffered from the impact of the green revolution, the outlook however isfor an overcrowded, competitive low wage farm market regardless of the scopeof the new technology.

- 45 -
5.-L2 Whether farm labor gained some, stood still, or, as others contend,lost some ground, the very important saving grace is the indirect multipliereffects on employment attributed to agricultural modernization. The newdemand for a wide range of goods and services had created new opportunitiesfor goods and services ranging from small-scale engineering industries andon through expanded activities among blacksmiths, carpenters, masons, brick-makers, leather workers, untensil-makers, transporters, wholesalers, retailersand many others. This is the shock-wave impact of increased production andprosperity it generates. That many of the beneficiaries are non-farmersonly speak in favor of the broader implications of the green revolution.In any assessment, therefore, whether farm labor has gained or lost underthe aegis of the new technology these ne-wly-created employment opportunitiesmust be taken into consideration.
5.13 If there is any segment of the rural population which has clearlylost out in the innovative process it is the tenants or sharecroppers. Thisis particularly true in areas where agricultural transformation is a potentforce. There, land values have risen sharply and so have rentals from 50percent to as high as 70 percent of the crop. Besides, unrestricted landcontrol has never been more prized, and security of tenure and other rightsin land a tenant might claim have been perceptibly weakened. The ownerswould like to get rid of tenants and resume the land for self-cultivation,making use of the plentiful supply of hired labor combined with a new arrayof modern equipment. The old practice, if not always successful, wherebytenants are reduced to sharecroppers and eventually to landless workers,is being accelerated as more of the bigger owners shift to the new tech-nology. If anything, they are trying to lease-in or buy more land to insurethe fullest utilization of tractors, pumpsets, power threshers, reapers, etc.The tenants, therefore, are the losers of the transformation from traditionalto modern agriculture.
Agricultural Prospects
5.14 In the mid-60's the authors of "rFamine 1975!''1/ argued that Indiais doomed to starvation. Her agricultural policies being allegedly whatthey were, from the standpoint of food sufficiency she was past redemption.So much so, the authors contended that "If other more deserving countriesare to be 'saved' (through food aid imports), India must be 'sacrificed'. 2/This dire prediction was followed by the introduction of the new package offarm practices and their well-known attendant consequences. If in 1972,however, the optimism of recent years has given way to concern once again,the explanation lies in the time-lag to capitalize on scientific advances ina number of important foodgrain and cash grops and in the drought, or in theobviously great impact which climatic conditions still have on the produc-tivity of unirrigated semi-arid areas which in better years contribute over40 percent of the country's food supply. While all this does not minimizethe progress made thus far, the eminent scientist Dr. D. M. Swaminathan,calls attention to the fact that "it would be self-deception to believe thata scientific breakthrough will automatically (emphasis added) result in
1/ William and Paul Paddock, Famine 1975!, Weidenfeld and Nicolson, London 1968.
2/ Op. Cit. p. 218.

- )4/
a production revolution and that a production revolution in agricaulturewill simultaneously result in a prosperity advance.I"l/ In his view, itwould take concerted efforts in many directions (scientific, socio-economic,educational and "hard" political decisions) to bring that about. Meantime,and in the light of the tasks ahead, the promising lessons of recent ex-perience are the watering-down of the mVths about the Indian peasant's>inertia and fatalism on the one hand, and that of technological stagnationon the other.
5.15 The size of the task of feeding the rapidly growing population ofIndia is indeed immense considering the Fifth Five Year Plan targets and thoseto follow. Whether they can be met or not, the targets for 1973/74 and1978/79 are 115 million and 140 million tons respectively. Looking fartherahead, the rela-tionship between population growth and food needs tells itsown target stories, varying with the estimates presented below. The 1971census revealed a population of 5h8 million, 80 percent of it living inrural areas. By 1981 total population is estimated to reach 657 million,703 by 1985 and 86' million by the year 2000. These estimates are con-servative in the sense that the annual rates of growth are assumed to be1.55 and 1.30 percent respectively, during 1981-1991 and 1991-2000. Sincethis kind of impact of family planning programs is conjectural at best, bythe year 2000 India may have to feed a population of 900 million to onebillion. As against this, there are numbers of foodgrain requirement pro-jections based on a variety of assumptions. According to the PlanningCommission, by 1981 India would need 168 mil'ion tons of cereals and 19million tons of pulses. The est 1 mates of the National Council of AppliedEconomic Resear'ch (NCAER) are lower by 30 million tons. Finally, thereis the Working Group on Demand and Supply projections of the National Com-mission on Agriculture with an estimate of 228 million tons of grain andpulses by AD 2000. Regardless of the acts of commission and omission inall t+he estimates, clearly agriculture has a long "'?iay to go to meet require-ments of such dimensions. Additionally, milk and meat production and thefish catch must be sharply raised.
5.16 The foodgrain and cash crop expectations are based on a totalcropped area of 16L million hectares, or a sown area of 139 million hectares,
-,,d cropping intensity of 1'8 peroent. the real hope lies in the irrigatedac-'age As oW recent date, the net and gross irrigated areas were 30 and
77ion he'ares, resnectively, OUt of tehe net irligated area, 12, 4,and mi7lion hectares were irrigated by canals, tanks, wlells and tube-
we1 s, and cther methods, respectively. TEhe possible irrigated area isestimated by the Irrigation Commission at 82 million hectares, but the moreimmediate prospect is a total of h9 inllion hectares if all the projectsnow in various stages of execution are completed. The increased wateravailability presupposes vastly improved water management, soil researchand conditions, and successful genetic manipulations of yield potentialsof various crops.
1/ Dr. M. S. Swaminathan, Director-General of Agricultural Resear-ch,in "Population and Food Supply". YOJANA, January 26, 1973.

- 47 -
5-17 Despite the formidable enterprise that lies ahead, Dr. Swaminathanis optimistic about meeting the food needs of India. He is aware of thestill prevailing low yields in grain production (except wheat), animalhusbandry, and fisheries; he is equally aware of the gap between what hasbeen accomplished in the major crops in the experimental stations and inthe field. Nevertheless, he concludes that "The targets are not frightening,considering the irrigated area we have and scope which exists for moistureconservation and integrated land-use planning." 1/ He does not discount theever-present technical scientific problems, but with regard to India's prob-lem of problems, the dry land problem,i the encouraging signs lie in thepreliminary work of the All India-coordinated Dry Land Farming ResearchProject, the small-scale but successful Indo-Canadian dry farming projectat Hayatnagar, near Hyderabad, the Central Arid Research Institute at Jodhpur,Rajasthan, concerned with management of desert soils, and perhaps above allthe newly created International Crop Research Institute for the Semi-AridTropics (ICRISAT) at Hyderabad. The thrust of all these is but one effect-vewater-harvesting and moisture conservation among small and marginal farmers,most of them subject to well-known handicaps apart from being "dry". Partof the effort is the development of new cropping strategies and the exploita-tion of "the resilience which tropical and subtropical agriculture . . .offers with regard to crop substitution." 2/ A11 this entails a generationof work, but Dr. Swaminathan's conclusion is that as far as scientific appli-cation is concerned, it "offers cheer and hope for striking a favorablebalance between population growth and food supply at least till the end ofthis century, by which time we can expect a greater stability in populationexpansion." 3/
5.18 In trying to assess this optimistic picture, willy-nilly one mustoscillate between favorable and unfavorable factors, hoping of course thatthe former will prevail. The following pages are an attempt to do just that.To deal with the negative side first, the outlined potential is viewed againstthe elements which tend to hinder and slow down the implementation of adesirable scheme. The optimistic anticipations have been predicated on appro-priate policies and their implementation at all political, economic, andorganizational levels, and most particularly district level, where the fateof any rural undertaking is decided. Past experience cannot exclude the well-known "implementation gap" even if the purpose and general design of a parti-cular measure might have left little to be wished for. A number of agricul-tural endeavors like credit distribution, agrarian reforms, small farmerdevelopment agencies, drought-prone areas, etc. point, among otlher things,to this problem. It cannot be eliminated overnight, and hence the caveatabout executing with dispatch the multifarious and admittedly difficult task-.that lie between anticipation and realization. The hindrance to implementa-tion is particularly pronounced at the village level where the aim is notonly increasing production, but all-round development as well, and where theneed for people's active participation in decision-making are indispensable.The record on this score is particularly poor, though with many exceptionsto the contrary. The village panchayats, or developmental bodies, havingbecome largely political entities controlled by the well-to-do whether foreconomic or soical-caste reasons, have tended to minimize the developmental
1/ Ibid.2/ Ibid.3/ Ibid.

- 48 -
and other needs of the weaker sections, beginning with production and downthrough education, health, nutrition, family planning, water supply, roads,electrification, and the like. The success, therefore, of a good manyprograms depends upon the revitalization of the panchayats in the sensethat responsibility for carrying out local programs involves initiative andaction at the grass roots level. The latter cannot be effected by-fiat,for in good measure their success depends on the elimination of culturalbarriers replete with emotional and psychological snags. A close observerof the rural scene can see welcome signs of change, but they are not suffi-ciently widespread to overcome these barriers, and their persistence alonemay well inhibit implementation even in the presence of such reliable criteriaas physical inp-nts and much else to go with them.
5.l9 Yet, there is another side to the picture on the face of which 'theoutlook need not be as agonizing as it can be made out to be. The renovativepolicies and actions to maximize productivity and employment in agricultureand in activities allied to it are not lacking. They have been diafTerentlycatalogued by different people, and the critical important elem;ents are these:(a) widening the range of economic activities to which the new and upc6mingtechniques are applicable; (b) development of rural industries and agrIculture-allied activities such as livestock breeding, dairying, and forestry; (el) im-proving the infrastructure facilities for credit, extension, tenurnial con-ditions, and marketing, and (d) underlying most of this more effective andquicker exploitation of the country's water resources. As an aid to thisthere is the favorable position of the Fifth Plan vis-a-vis agricuilture.The latter is assured top priorifty with an outlay of Rs '70 billion, oar doublethat of the Fourth Elan. TLhe promise of supplementary special funds shouldworlc to the same end. As to the emphasis on particular sectors of thie a-'i-cultural econony, the "Approach to the Fifth five Year Plan 1974-79" notes thatwhile the strategr which fathered the green revol-ation "will continue tor-ceive a-,tention 1 . . "it will be necessary to place stress on agricul-tural f7' ogramns in rainfed and other less promising areas." Uoe7' l thoughthis mw- be, general propositions of this sort and generous funding do notal-ways make for elffective programs, and only performance will tell the story.There are, houever, a number ofi otYher factors ,favoring higher productivityand greater rr e.7l em-oloyment.
5.20 Science ma,y eventually wTell play tIhe role ascribed to it. What isoftern i the experimental station is not always withIn the grasp of the farmer,but the technical innovations are now m ore closely related to the ultimatebeneficia;iies vhan they were l ot many years back. Thle new technology reflectsit. The times when the peasantry had to be persuaded to shift to a higherproductivity plateau have, for the greater part, changed. The lesson derivedfrom the green revoluti7on, that better farming stands for better living, isknown among the "outsiders'" as well. ihis year's drought experience cannotbut lead to greater appreciation that vulnerable farm areas must be madeless so. The measures to modernize the rural economy are not novel; inone way or another most of them, though with gaping holes, are either dealtwith or are under active consideration. The country is not lacking incapable, ambitious and energetic bureaucrats who may yet find the organ-izational keys to open many a door. And once again with a stress on greaterproductivity only, if the additional 15-20 million irrigated hectares whichare expected to enter the picture upon the completion of projects already

undertaken are indeed there, the volume of output is bound to increasesignificantly. This is not to speak of an expected general rise inproduction from a rural econonr in general acquiring muscle. None ofthis implies meeting all the targets or the dogma of self-sufficiency.The latter in particular need not be treated as sacrosanct so long asagriculture and the national economy as a whole are buoyant. 1/ Last butnot least, with the notable exception of agrarian reforms where slogans setthe tone, most of the other objectives noted above are conceptually realistic;if they fail of successful resolution it will be only because science, admin-istrative-organizational arrangements, and policies to unleash rural energiesfall below the mark. This cannot be excluded, but the time is fast approach-ing when failure will be inadmissible. Tne reasons are twofold. The future,like the past and present, holds out hardly any promise that the country'sindustrial and commercial develepment can absorb significant numbers of thevillage poor. Only within agriculture with heightened productivity, greateremployment, and improved tenurial relations will one have to look for signsof rural betterment. 2/ Failure, therefore, can be contemplated only at therisk of worse things to come; in that event, all or most of the favorableassumptions recited thus far would be writ in water.
5.21 Summing up, in an India which is changing, however slowly, it can-not be assumed that the debilitating elements are there to stay forevermoreregardless of the level where they make themselves felt. Given the emergenceof countervailing factors on top of all that already exists and stands forprogressive agriculture, it is not inconceivable that India may feed itsgrowing numbers, to be sure not always without the aid of imports, whilemaking at the same time some dent in the mass poverty prevailing in therural sector. Some of the cited favorable conditions may seem to the readertoo intangible, more like an act of faith than well-supported evidence. Thisis conceded, but to one familiar with the Indian rural scene, especially withits compelling needs and aspirations which simply cannot be denied muchlonger, the economist's facts and figures must also make room for a measureof faith in a timely intervention of benevolent political, economic, andsocial forces. The immensity of the task of feeding India's rapidly risingpopulation and ameliorating the conditions of the poor may indeed seem for-bidding in a country with so complex and variegated an agricultural economrand rural society, but who is there to say that the prospect is not feasibleif the will is there?
1/ In connection with higher production, we assume that it would not takeall the farmers to achieve the objective, and that social justice andequitable income distribution may not necessarily be one of its outcomes.This matter has been treated in preceding economic reports.
2/ "tAt the present pace of industrialization, any mass-scale transfer of thelabor force from agriculture to non-agricultural sectors is ruled out.The growing labor force in agriculture has to be provided with fulleremployment within agriculture. A redistributive land reform derives itsbasic rationale from this consideration."'
Source: Approach to the Fifth Plan, 1974/79, p. 5

50
5.22 A good deal of the observations recounted thus far lie in thefuture, and are admittedly speculative. Less so is the case of two im-portant issues, which are now as in the recent past much in the limelight.One of them is the new land ceiling round on the institutional side, andthe other is the old and familiar Small Farmers' Development Agency andother allied schemes dealing with the rehabilitation of one of the poorersections of the farm community.
New Land Ceiling Round
5.23 Not every subject dealt with in last year's annual agricultural,review is repeated, but the new land ceiling round is one of the two thatcannot be ignored. Until early 1972, ceilings on landownership for redis-tribution among the landless was a dead issue because all legislative enact-ments in the past decade or more were failures. But ever since: the- CongressParty's victories in 1971 and 1972, coupled with the promises of land -to theneedy, the ceiling issue has been coming to a head once again. After monthsof the bitterest political controversy in the history of Indian agrarlan.reform, the battle was stilled on July 22, 1972, when national guidelinesof a new ceiling program were ushered in. In brief, the main provisionsare these: (a) an owner can retain a maximum of 18 acres of doubla-cropped.perennially irrigated land, or 27 acres of single-cropped land, or 54 acresof all other types of land; (b) the ceiling applies to the family as a unitof five rather than as in the past to individual holders; (c) "major"children (over 18 years) are treated as separate units and each one of themis entitled to hold land not exceeding the governing ceiling for a familyof five; (d) Janiuary 24, 1971, is the effective date for the purpose ofceiling implementation; finally, (e) compensation for the surplus land kobe distributed "should be fixed (by the States) well below the market valueof the property so that it is wiithin the paying capacity of the ne*.> allottees". . . 8Ynd in a manner that it will be no f4nanoial burden on the Centrall andState GovernFents.?t
5.24 ..o date, most Statea have enacted new ceiling legislation, but itis highly quest ionable if they will be or can be implemented in a way thatwould result in a large pool of surplus land earmarked for distribution.An examination of the neW% package of guidelines outlined above and theabsence of an administrative organization 'to implement the provisions leadto this conclusion. On the face of it: the guiidelines for the new ceilinground are better than what had preceded them for the following reasons:drastic curtailment of permissible land retention; acceptance of the familyunit as a base for land allocation; curtailment of illegal land transactionsby advancing retrospective effect of the ceiling application, and the lowprice of land to the would-be recipients. For all this and for other con-siderations unstated, the effort appears to be on the plus side. But thereis another, less promising, side to the story, and a few examples will suffice.
5.25 The retrospective date of January 24, 1971, is not a serious deter-rent to the curtailment of illegal land transaction. In practice, the landillegally transferred cannot be recovered. The effectiveness of family asa unit has been gravely eroded by splitting the family unit into two parts,
both of which are entitled -to separate ceiling retentions, and the netresult will be a decline in the land availability. Compensation for theacquired land might, in effect, border on confiscation, and as economic menthe owners with surplus land can be expected to behave accordingly, or resistthe implementation of the ceiling reform in every possible way. They are greatpractitioners of the art as evidenced by the failure of all previous ceilingenactments. The most basic provision of the new legislation deals with "peren-nially irrigated land or irrigated land capable of growing two crops."r Thecontrolling word is "perennial"t which means water all the year round, or atleast ten months of the year. It implies a sufficiency of water for two crops,and this is not common even in the best irrigated State of Punjab. It willtake some proving that each irrigated acre isperennially irrigated, a featvery difficult to perform. But even if the enumerated handicaps did not exist,implementation would be very difficult, if not impossible because of the absenceof an organizational structure and an administrative set-up. This was raised oyway of a question at the very highest leviel of Government, but there is so farno evidence of any answer to meet it. Pie chances are that as in the past thebrunt of the effort will continue to rest with the Revenue Departments. Theirprimary responsibility is to collect revenue rather than attending to very com-plex reform chores. More difficult is the situation at local administrativelevels where the reform must be enforced if it is to be enforced at all. Apartfrom political and caste considerations which motivate the local officials intheir essentially anti-reform attitudes, there is the additional and well-knowndrawback once again noted on the highest level of Government, namely, that manrStates do not have the basic land records and the collateral infonmationnecessary for the implementation of an effective land ceiling policy. This ex-plains the anachonism that while State after State continues to enact newceiling laws hardly any of them has taken the trouble of putting their recordsin order and finding out how much surplus land there might be available fordistribution.
5.26 Much else could be added to the list of problems standing in the wayof well formulated laws and enforcement. For the moment, let it be noted thatthe new ceiling round will be judged not by the level at which ceilings arefixed but by how much or little land they will generate for redistribution.The range of permissible retention currently prescribed is at least half ofthat of the former ceiling limits. The presumption is that it should yielda much greater surplus than the actual distribution of a million-plus acresof poor land as against a variously estimated anticipation ranging between 37to 40 million acres. This assumption, however, has little validity, for thelessons of the past experience amply demonstrate that such estimates and ful-filment are worlds apart. There are occasional State news items with ratherlow surplus land expectations. This is neither surprising nor encouraging.If these straws in the wind are indicative of a trend, and leaving out of con-sideration waste land vested in the States, the surplus is not likely to bemany times more than that secured under the past ceiling enactments. Moreover,in most instances, the land that finds itself into the hands of future benefi-ciaries will be relatively poor, marginal land.
5.27 None of the above inveighs against a celing program. Any meaningfulreform without it is a misnomer while its presence should be one of the mainguarantees of the success of an agrarian reform in its broadest sense. Thedifficulty with the new ceiling round is the agonizing negativism impingingupon it. Similarly when the ceiling idea assumes proportions of a cure-all

- 52 -
without the requisite underpinnings in sight. In these circumstances, anexaggerated priority id attached to the land ceiling in the absence of equalconcern about such fundamentals as the absence of the recorded rights oftenants, the largely absent security tenure, high rentals, very questionablepractice of land resumption for "personal cultivation," sharecropping ana itsinvidious effects, exploitative farm-labor wages in most instances, ana anumber of other items adversely affecting the weaker rural sections. Allthose are vital matters, are are part of a minimum agrarian reform, whichshould be part and parcel of a ceiling program. The separation of the twoas if they are not interrelated does not auger well for either one, and cer-tainly not for the unfinished business relating to the issues just -raised.The prospect is for di,-,inishing the ranks of tenants and sharecroppers andadding to the ranks of agricultural laborers, a condition to be avoided atall costs.
Rural /rogrars1/
5.28 The main objectives of these programs are to create -epnloyment andincrease opportunities for the poorer sections and to add to -the productonpotential of the economically weaker farmers. The programs haTve been in opera-tion nearly two years and some more than that, but their assessment is not alltlhat might be desired. The latest available official monthly report for SFDAand MFAL for Jaruary, 1973, gives amounts spent, number of people identified,number of beneficiaries, credit issued, tubewells and cther wells dug, pump-sets and so on. With variations, they all show thati the programs have notstood still. Taking a few examples at random, in AndIra Pradesh the utiliza-tion of funds since inception against funds released i s above 50 percent; inBihar 60-70; in Gujarat around 90; the same for Kerala, and in Madhya Pradeshclose to 50 percent. Speaking more specifically of the SIFDA, as oQ' the end of
=anuary, 1973, the 46 agencies received Rs 110 mi;llicn o:f whi`ch they haduI-lized -PIs 1210 million; in addution, they received short and medium-termloans froxY the cooperatives amount to Rs 220 rilllion, and Rs 15 million fromthe cornmerc ial banks. The beneficiaries compared with the number of identified,),'a -lcipants is a more mixed bag. In two -projects o' Andhbra Pradesh the per-centage iS 11 and ,6; in Bihar f40 antd '26; in three Gujarat projects it is 17,O a;nd < in - eranK 10 and 9, a-nd in Xadbya Pradesh 23 and 13.
Whiat emerges from all these figures is that a number of' small farmershave benefited from a neT well, a pq;mpset, a head of cattle, other inputsacquired through credit extension, and here and there they benefited throughthe improvement in cultural practices. At the same time, these figures arelargely devoid of interDretation and do not tell nearly enough what lies behindthem. The data on t!beneficiariesll and why in a number of instances so relative-ly few benefited are a case in point. Many factors enter here, including thefacts -that field work gained momentum onaly in 1971/72. Apart from this, one
1/ SFDA (Small Farmers Development Agency); MFAL (Marginal Farmers and Agri-oultural Laborers); CSRE (Crash Scheme for Rural Enployment), and DPAP(Drought Prone Areas Programs).

-53 -
of the surmises is that what 'viable" small farmers can do with short-termand medium credit, non-viable, marginal, non credit-worthy farmers cannot do.Even if they secure a measure of credit, and used it for productive purposes,the additional benefits accruing to themt1preby are so small that in absoluteterms they continue to remain below the -subsistence level. Moreover, if andwhen they do get cash loans, it is not easy for them to sacrifice immediateconsumption needs for the sake of future productive purposes. The given datado not touch on this, and nor do they reveal much of the process and problemsof these programs. It is regrettable that at this writing there is no analyticalprogramwide study that would permit firm judgments about the true state of thesetwo types (SFDA and MFAL) of rural programs. One must turn to other, non-statistical, but authoritative evidence, which shows why at this stage of dev-elopment some are making progress, others are not faring any too well, and stillothers (drought-prone programs) are in need of '"restructuring" or a new strategy.
5.30. A national seminar on SFDA and MFAL held in Delhi in April of 1972,contains a large array of recommendations on how to improve their operationsadministratively, financially and technically. They are too lengthy even fora summary, except that they point to almost every conceivable problem. It isuseful to turn to the more recent assessments made by the Approach to the FifthPlan, 1974-79, and Dr. B.S. Minhas (Member, Planning Commission). Accordingto the "Approach" :
"By and large, these programmes (referring to all ruralprogrammes) were conceived in isolation and theiroperations were locationally dispersed. In the FifthPlan, it sill be necessary not only to accelerate thepace of implementation of these programmes but also tomake distinct operational improvements. The experiencewith these programmes has shown that, if an impact is tobe made, the development programmes in general and thespecial programmes in particular will have to be inte-grated. In these areas, an effort towards integratedarea development will be a necessary condition for im-proving the economy of small and marginal farmers andagricultural laborers. Such integrated rural develop-ment programmes will vary in terms of different landand water resource situations and will have to betailored to suit the local conditions."l/
5.31 From Dr. Minhas' detailed assessment,2/ it appears that the SFDAis fully underway, and that "On a very rough estimate about a fifth to afourth of the identified participants (particularly among small farmers)would have benefited from one program or the other by the end of the FourthPlan." The progress might have been speedier but for a number of problems.In addition to the credit difficulties already mentioned, particularly inbackward areas, in many instances State Governments failed to provide addi-tional funds as originally anticipated. Because of these constraints, aprogram's utilization of allocated funds does not mean that financing is
1/ Approach to the Fifth Five Year Plan 1974-79.
2/ B.S. Minhas. "Rural Development for Weaker Sections: Experience andLessons." Commerce, October 14, 1972.

- 54 -
sufficiently ample to meet on-going needs. There is too much uniformity infashioning a program; the variation between districts let alone betweenStates is very great and for this reason alone "there cannot be one uniformmodel for the country as a whole". The extension service is not performingwell. This is not surprising. Its record of performance has never been ofhigh quality and more so when dealing with small and marginal farmers, withproblems more complicated than those of medium and big farmers. Dr. Minhasrightly concludes that "experience in the field shows that it is difficult toprepare any worthwhile program of improvement in small scattered holdings"1,and he concludes that "In order to improve the lot of small and marginalfarmers, some sort of cooperative management technology seems essential."This in turn implies not only pooling together of material resources outalso consolidation of fragmented holdings and resolution of tenurial issuesmuch talked about but left undone. These are part of the imiediate corrective.measures, but if the programs are to be viewed as permanent institutions inthe attack on low-end poverty of rural India, the success, according to Minhas,would depend upon the answers to a number of questions. Summarized, they areas follows: (a) the state of the rural econorm as a whole in a decade or morefrom now; (b) the consequences of the newly proposed agrarian reforms (if im-plemented) on small and/or "non-viable farmers"; (c) effects of leasing-inand leasing-out of land on the same groups of farmers; (d) time-span of com-pleting consolidation of holdings; (e) administrative and institutional re-arrangements for integrated development at district or village levels; (f)biological advances in semi-arid cropping areas and livestock husbandry, andfinally (g) "How much off-farm work is likely to be available for the non-viable farmers and agricultural labor during the next 5-10 years?" All theseare relevant to the Fifth Elan and other Plans to follow in order to rehabili-tate the poorest groupe of the farm community.
5.32 The SFDA and the MFAL have their rough sailing as one might haveexpected, but their problems can be deal.t with and their futirre progress isnot in qiaestion. The DPAP (Drought Frone Area Program) on the other handpresents formidable problems. A goodly number of these progU-ris are in asomewhat .larnorphous" state and in need oL thorough recastingi It was in-evitable that the monsoon failure of 1972 would play havoc with a number ofthem in the drought-stricken areas, but the basic difficulties which besetther extend beyond the drought visitations. Thus, in the words of Minhas,
"In most cases . . . the master plans (prepared by Stategovernmen.ts) turned out to be no more than a series ofschemes pieced together without any central strategyIt is becoming increasingly clear that the droughtproblem can be tackled only on a long-term basis andthe current effort will not even touch the fringe. Itis also clear that the specific long-term anti-droughtprograms needed for different districts would not emergeout of any overall state plar.s but have to be preparedat the district level."
5.33 The quoted observation does not imply that the DPAP stood still sinceits inception. Not unlike all other rural programs, within a period of two anda half years it spent Is 480 million out of a total four year allocation ofRs 1,000 million. According to official sources, this program expected to

- 55 -
benefit about 500,000 hectares through new or improved irrigation; 500,000hectares from soil conservation; 170,000 hectares from afforestation, and14,000 kilometers of road are expected to be constructed or regraded. Nodata are available on other ingredients of the DPAP, namely, pasture develop-ment, drinking water facili-ties and groundwater surveys. However, thiscategory claimed only 2 percent of the total expenditures. Worthy of note,too, is that the new irrigation facilities are estimated to add less than2 percent of what is already available, The cost per irrigated hectare(as in all other projects) varies widely, from less than RS 500 in somedistricts to as high as Rs 7,500 in others. During the period under con-sideration, all DPAP projects generated approximately 94 million mandays ofemployment. There is a difference, of course, between what is expected tobe accomplished and the work actually accomplished. The candidly admittedreason for this is that "The information on physical performance of theprogram is quite vague in most of the cases. In the . . . progress reports(from the districts) the physical achieverments have not been clearly indicated,and in most cases only various stages of works have been reported. This hasto a great extent reduced the utility of these data for any analytical study."
5.34 Other pertinent observations are omitted here for the sake ofbrevity, but looking at the DPAP as a whole concerned officials are of theview that it calls for a new approach, one of the principal reasons beingthat these programs laid too much stress on creating employment and on build-ing roads rather than stressing above all anti-drought facilities. Moreover,the administrative-organizational-technical arrangements have been such thatm,lany district programs are poorly designed; that the sine qua non of the DPAPis a detailed analysis of the water resources to determine the type of irri-gation facilities to be created or added and how best to exploit them, andthis has not often been the case; that there is a growing gap between themoney spent and work attained; that the pattern of the programs is frequentlychanged with no benefit to ultimate results; that information on employmentleaves so much to be desired "that a suitable income and employment policycannot be framed"; that above all the preparatory survey of a district'sresource endowment has not been well analyzed in the light of the tasks under-taken, and this is particularly true in explaining why in many districts irri-gation work has lagged far behind and that implementation of other projectsis retarded. Not the least among the cited impediments is the lack of a tech-nology which, when coupled with the other elements of a well-prepared program,would serve as the most significant factor in stabilizing production andincome in drought prone areas.
5.35 In the light of all this, which speaks for rational utilization andallocation of resources, the administrators of DPAP at the Center are stronglyof the opinion that a new strategy must be evolved in order to eliminate allthe snags which came to the surface in the course of implementation whileadding wherever possible the beneficial effects of any up-coming new dry landtechnology. The more so if it is recalled that the basic problem of thedrought areas is low production and unstable income. The main objective oft:he DPAP, therefore, is to find a solution to recurring droughts which wouldinsure increased production per acre of land and per unit of water. On ashort-term basis, this program would provide employment opportunities insuch areas and, at the same time, create permanent assets for generatingfuture employment and income. In practice, the effort generated employment

- 56 -
but the performance and goals did not quite match. While the reasons whyhave been spelled out in the preceding paragraph, it is instructive to sum-up the problem the DPAP has been facing in the words of the following state-ment:
"The State Governments were required to send masterplans of each district indicating the strategy ofdevelopment. The experience, however, has been thatnone of the State Governments spelt out clearly thestrategy within which this programme was to operate.Moreover, considering that the initial emphasis wason labour intensiveness, all schemes within the programmewere designed to provide employment without a definedapproach to solve the drought problem within a long-termperspective. Due to the urgency of the situation, theState Governments were asked to go ahead with the schemes,generally followqing the basic priorities of the prograrime,even before any strategy of development could be evlvedva" V
5.36 As regards the CSHE (Crash Scheme for Rural ihployment), it may berecalled that its objective (during the three year period ending March 31,1974) is to provide productive jobs for 1,000 persons in each district ofthe country for at least 250 days per year at an annual cost of Rs 1.25million. In the light of the available surplus labor fOrce tinis was judgeda modest but yet another attempt to ;ad-1 to usefuI assets while providingbadly needed employment. The StatiSti. picture is far from complete, butin 1971/72 about Rs 320 nillion were spent for work performed during anes timated 80 million mandays. During this timse t+he following assets werecreated: 5L,oo000 hec-tares u nd'en minor irrigation projects; 5,000 hecta±Esreclaimed; 6,000 hectares afforested; 9,000 hectares under soil conserva-tion, 37$000 heota ,es under drainage and anti-water.'ogging schemes, and27,000 ki-LometerS: c' roads built.2/ These figures indicate uset.aI empi oY-ment, but as in thAe Inst,anrCe O er rua::, -1ral pr o g ra-s there Fs no o f ficialcritical e :lv'tEzn of 'the t i-e i,ty of the performance itself. wages earned,sks115, antit&Udes, Or,A SiO1or> tra'n4ng, mobi1itv of labor' 'in search of cityerimploy'met , ra--. Iorniger or shorter poeriods:5 of time, the properut7izaltion 0o furds e it r -nit r *-lvo fanilies in greatest need, ortype of work pre.1.1erence. Ln Um9 hre is little offiScial information aboutthe lessons o4 thg e
5017 Pore reCently, however, some of the CSRE problems bave been privatelyhighlighted, directly and inVdirect-ly and not merely in the form of statisticalbarebones. The resultS could be better. 'The revealing feature of the CSREof Satara District 3/ is considerable de1laeys in carrying oUt a project,
1/ Draft Paper on the ApproacIl to the Drought Prone Areas Program in theFifth Five Year Plan.
2/ Professor Sher Singh, Minister of State for Food. The Economic Times,February 26, 1973.
3/ A.P. Apte. The Grash Schbee for Rural Employment: An evaluation of theProgramr in Satara Distri4ct in Maharashtra State. Prepared by the Agro-Economic Research Unit of the UokhaIe_Institute of Politics and Economics.

- 57 -
one of the principal reasons being that the unemployed or underemployed donot flock to the projects in anything like the numbers anticipated. Abudanceof labor and reluctance of many to respond to something approaehing regularemployment flies in the face of a commonly accepted canon, but this phenomenonshows up not only the case of Satara. In separate studies, but all touchingon the subject, Drs. M. Dantwala,!/ Raj Krishna?./ and G.B. Rodgersl/ arriveat the same conclusion.
5.38 In Satara work attendance at a daily wage of Rs 3 is way below themaster roll of unemployed. A 70-90 percent attendance is a rarity, and sois perhaps the cited case of only 20 percent of workers attending all-theworking days; what is evidently fairly common is that 50 percent of workersshow up during half of the working days. The wide attendance girations,particularly with a male bias towards limited attendance, has raised theproblem of an adequate labor supply to keep the projects going. The conclu-sion is that "Judging by the experience in Satara district it appears thatthe Scheme has failed to achieve this objective as a large proportion ofworkers do not seek continuous employment in the CSRE." The Study also con-cludes that "It was impossible to find out the reasons for lack of continuityin attendance on the part of the laborers.'f Some explanations are offered thatexplain at least in part the contradiction between offering jobs to manywho need them and yet shy away from them. In modern parlance one of thereasons might be attributed to "male chauvinism". Since the CSRE tries orlargely adheres to a uniform wage scale for male and female.Alike, male workersmay resent this equalization. Perhaps as a corollary of this, and for a numberof other reasons subsequently suggested, male unemployed prefer to search forwork in neighbouring towns and cities and show up on the projects "only when
1/ Dr. M.L. Dantwala. "Approaches to Growth and Employment, Economic andPolitical Weekly, December 16, 1972, p. 2463. The pertinent part readsas follows:
"More important for the purpose of designing rural employ-ment programmes is the phenomenon -- as revealed by thedata from the 25th NSS Round -- of unwillingness or inabilityof a large number of rural households to spare a single memberof the familty to take up regular full time employment andtheir low rating of the possibility of supplementing their in-comes through ancillary agricultural or non-agricultural activi-ties. It is quite possible that apparent unwillingness of thepoor households to take up alternative, better paid full timejobs is due to lack of confidence in such proposals or pro-grammes, and the unwillingness to risk even the scanty secu-rity which their current occupation/activity provides. A lackof motivation for achievement may be suggested as a cause, buta better explanation may be a feeling of diffidence about theunknown."
2/ Raj Krishna. "Unemployment in India". Economic and Political Weekly,March 3, 1973.
3/ G.B. Rodgers. "Effects of Public Works on Rural Poverty" -- Some caseStudies from the Kosi Area in Bihar. Economic and Political Weekly.Annual Number, 1973.

- 58 -
they had no attractive alternate occupations". But even this doesn'talways hold despite the failure to find alternative jobs, and despite thefact that the majority of the labor groups discussed here are eitherlandless or small or marginal farmers with incomes of Rs 1,000 or lessper family per year.
5.39 We shall return to the "mystery" t in a moment, but in the GSRE ofSatara female workers predominate; their output is low and this is one ofthe reasons for delayed completion of projects. But there are many othercauses which contribute to the same end. They are: (a) administrativedelays in project designing; (b) shortage of supervisory work staff;(c) projects claiming some land still under crops, or reluctance of thefarmers to part with any land to mount a project, since no compensationis provided for such inconvenience; (d) unwillingness to report to workwhere distance is judged a factor; (e) failure of a road project to meetwith the particular wishes of a village community; (f) shortage of eauip-ment and other required materials; and (g) shortage of drinking water.
5.40 Reverting to the problem of limited attendance it appears thatSatara is not an exception induced by local circumstances. Dr. Raj Krishnalsalready referrud-to article on "Unemployed in India" provides additionalevidence from a sample survey in Rajasthan. There, too, being poor andwillingness to mitigate it through additional labor doesn't always go hand-in-hand. Basing himself oi a snmple of 487 male workers in four Rajasthanvillages, he comes to the following conclusion:
"The poor (33 percert) are clearl'.r more numerous thanthe idle (28 percent); and the idle more numerousthan the willing (Lb. percent). Since all the poorare not idls and all the idle are not poor, thosewho are idle us well as poor are fewer (12 percent)than the idle or the poor. Less than a fifth of thepoor and less t1han a third of the idle are willIngto work more And those whno are idle and poor andwilling are onrlT albout 5 percent of the total maleworking force in tnese villages
WTe cannot juidge whether .,c i. evidence is valid, particularly in relation towider areas in Rajasth'an, but, Raj Krishna is of the view that better "workguarantee and public works" programs would "increase the number of willing(to work), especially if the opportunities match the kind of labor that theidle and the poor can offer." As of the moment, however, if his findingsare accepted at their face value the conclusion that may be drawn is thatbeing poor and unemployed or underemployed does not automatically make oneable or willing to snatch at any offered job.
1/ Ibid. Raj Krishna, p. 476. Workers gainfully occupied less than 36 hoursa week are defined as "idle", those with incomes of less than Rs 60 amonth as "poor"l, and those willing to work more in prevailing conuitionsas "willing".
_ 59 _
5.41 The Kosi experience gained from public works activities points tothe same problem. In one form or another earthwork, including land lt=velling,is the main source of employment, and so it id in most crash programs of ruralemployment. The author is careful not to draw broad generalizations. Never-theless, and though the evidence maylyeem one-sided in the extreme, one isfaced with statements such as these:-
"In villages selected near project sites, there was verylittle reaction to the presence nearby of the projects.No village laborer interviewed had worked on any of theprojects . . . Among the village laborers we find that,in most cases, more than half are not prepared to doearthwork at all, and very few are prepared to do itother than at the last resort.'
Recognizing that "attitudes are not immutable", and that "questions onattitudes are notoriously unreliable", the study draws this conclusion:
"However, it is clear that there are groups of laborerswho are unlikely to supply labor to earthwork under anyconditions ... Of course, we cannot generalize fromthe case studies; but the repeated incidence of aver-sion to earthwork in all villages-- which were selectedfor proximity to earthwork sites and in the village toproject-- makes it very unlikely that this is a purelylocal phenomenon."
There were significant exceptions to "unwillingness" for work of this type,but "For the other case studies, village labor supply to earthwork of anykind was small, and often negligible."
5.42 No attempt is made here to exaggerate the treatment of job offerswith neglect or reluctance, but the recurrence of the theme cannot beneglected. If this phenomenon is observable beyond the areas touched upondeopite the unouestioned availability of surplus labor, it can have seriousbearing on reducing poverty through suitable employment. The causes ofthis phenomenon appear to be: aversion to certain types of work; reluctanceto depart from traditional modes of activity; caste prejudices in somereported instances on the ground that non-strictly agricultural work degrades;inadequate wage scales and failure of timely payments; unauthorized exactionsostensible job benefits; uncertainty about job continuity; poor healthand poor nutrition mitigating against hard labor; conflicting timing,distance to reach the work, and farm skills not suited to a variety of crashwork programs. Some of those can be organizationally eliminated while otherscall for retraining, admittedly a time-consuming process. Taken together,they can be dealt with by more judicious dovetailing of projects with thelabor force. Furthermore, whatever the current indications of "unwillingness",in a rural society with demands for goods and services rising as in India'scase, it is reasonable to accept the proposition that factors which tend toincrease the unemployment participation rate operate more strongly thanfactors which reduce it.
1/ All quotations from G.B. Rodger's study. Footnote 3/ paragraph 5.37.

- 60 -
5.43 To keep the record straight it should be pointed out that officialcircles directly involved with the CSRE operations deny the existence of the"unwillingness" 1 issue. Their reports from the field reportedly reveal noindication of this sort; on the contrary, given greater resources thenurmber of employed would rise accordingly. Nevertheless, CSRE is not withoutother problems as well, such as "xa tendency t.o spread the benefits thinlythroughout the district and that unless a more concentrated effort is made inat least some selected areas, the impact of the scheme (CSRE) will not becomeclear and it would be difficult to draw useful lessons for the evaluation ofa comprehensive program." 1/ Hence the decision in late 1972 to set up aPilot Intensive -Rural Employment Ptoject (PIREP) in 15 selected blocks.Though "unwillingness"! is not mentioned in the programmatic statement leadingto PIREP, some of the functions 1mply its existence and ways to eliminate it.
5.44 PIREP is a three year program designed to offer employment in 15selected blocks to all withirn the age group of 15 to 59 years :For a periodranging between 15 to 40 weeks, and at places of work as cloc,e to the villagesas possible. It aims to 'lstucy in depth the problems underlying tine full(italics added) utilization of rural manual laborf. Furthermore, D iRP
takes into account and tries to coordinate the suppl:y of labor fo x vary,ringperiods with the demand for labor arising from different types oI Nork andprovide work on that basis, whil7e OSRE speaks of no such coorfination orspecific linkage." This is another w,iay of saying that work should be matchedwith the type of la:bor available and seasonallity, both. F explainingthe reluctance of some of the labor force t.o take any job flfered at a giventime. One of the 7_econdia-.ieBns; of the r. hem bearing on -lhe above-mentionedpoint is a survey of each o r o.der to flind out +the. -,"umber of peopleavailable for empninmen'r- tne diffe nt perid -5 < ohwic h v o i-r need , -ploymtnt "and the kind ol job 'or .-hicr they w b s'l't le" O nce agz-.n,here is another attemrapt to eliminate one o,7 t.'-e a can»"s tha t leaa toT"reluctance". As -15o -.he Tat,, -ff ,:,ages they cans L, tae o,- high a than p-;yatlingloc-l wa2r-,s £, J , -: .o output, coosdera-tion being -lver ' e o' t- es el'e amodest o'ne, trhe tot,.a e'.r.S\- ur-,Lng FtakL s t and se od yea,r anmountingto only Hs 1.5 T-ii d Rs 'E i-13-ior r-e. P reenooeed" 7
to mo-ve toward-s, the tJar,et ba,'- cmias+2Oy0 3m. p . T sno rr`s approach isunderstandabi'lef ±, Dh g o ' an e a'n-t nat).uro, ,he th - n purpose
of which -s ts eLi T-Ln ae aC)13!7 -'.-he pr oblefis vlhLoh cIropped Up duringCSRKE o1paer-atJioons o ' °"s r'eia&ne hiere and there to acceptenLloyent. ; 's3 -- .- to publi-c wcrks programLt. general, of fh e- li.'n -s "usU- ta o-'Q`her fG.-ocmi O" Lhe sarme. Of1 the formerthere will be a great deal more under the FiTf'th 'L an, and the lessons learnedfrom the ?IRE? operations cou_d be usefully appliea to CSFE and the generalityof public works as iell.
5.45 Summing up, it would have been sLrpfrising if in the third yearpioneering programs of this kind wi.ere pe-fŽ3rming as well as they might have,
1/ Pilot Intensive HurL2 Employment Pro;ect p.1.

- 61 -
and that corrective measures were not called for. But the tendency amongcertain observers to write them all off as failures have no validity whatever;it merely underscores the lack of appreciation of all the trials and errorsthat uplift of the rural poor inevitably entails. The programs are operatingwith various degrees of attainments, and the problems they have generatedare quite natural, if undesirable and unfortseeable, in the conditions withinwhich they are taking root. It is encouraging that in the "Approach" generalassessment and the more specific ones by Minhas, the Satara evaluation andthe DPAP forthright examination of its problems, no attempt is made to condone,overlook or minimize the shortcomings revelead in the course of theirimplementation. Therein lies the likelihood of remedial measures, if not atthe tail end of the Fourth Plan then in the course of the Fifth Plan.. Wlilerecognizing the difficulties, let it- be noted that they are not only the end-results of limited resources and of spreading them thinly, poor preparationof projects, execution, or of some unemployed preferring to stay unemployed.These are problems that can be overcome. Surely equally serious is that theclients of these programs enjoy little or no economic and social status inthe village. Such constraints give rise to special political, legal, techni-cal and administrative problems which could not have been sorted out in theon-rush of trying to translate the programs into practice.
5.46 None of this is an argument against any rural programs but one fortrying harder, 'lot to have ventured was to admit defeat, and the Governmentof India has elected to ven ure in a big way. Under the Fifth Plan alloca-tions for "minimVnum needs" 1/ in the rural sector and for a great variety ofpublic works programs in the same sector are variously estimated at Rs 60to 70 billion, or to 10 to 12 percent of all Plan allocations. It is all partof the objective to "remove poverty". The practice and theory may not quitematch, for the organizational aspects of spending such vast sums of moneyand of formulating projects creating productive assets and to raise employ-ment will present prodigious difficulties. Nevertheless, the approach tomassive employment assistance has finally become more a reality than everbefore. Not many years ago this was not even dimly perceived. In 1968,Dr. V. M. Dandekar, in "Problems of Small Farmers",..2/ ended on a note ofdespair. Said he:
"Admittedly they are hungry. But they must wait for thepromised bread which will come at the end of the nthfive-year plan of overall economic development -- wheren is an eternal unknown. The only difference the five-year plans of economic development have made to thesepeople is that, while earlier they used to count insingle years, now they are asked to count in five-yearperiods."
1/ Approach to the Fifth Five Year Plan 1974-79, pp. 9 - 11.
2/ Dr. V. M. Dandekar. Report of the Seminor on Problems of Small Farmers,Seminar Series - VII, Indian Society of Agricultural Economics, Bombay,1968, p. XVI.
`2
- 62 -
5.47 Dr. Dandekar was right for his time about the small farmers orrural unemployed or underemployed in general, but events have overtakenhis cmncern in the very few recent years, at least in part, and particularlyand hopefully about the years immediately ahead. All this points to theCentral Government's involvement with social and ecaaomic justice issuesin rural areas. In the ultimate, the real meaning of these issues is two-fold: more jobs and better farming among the weakest sections of the village.Considering the size and growth of the rural working population, noteverybody will get a job and nor will every cultivating farmer become viable.-But the main point is not the final solutions of this sort; India is not ina position to perform this miracle in years to come. What is immediatelycrucial is amelioration of conditions, and this is what the Fifth Planaims to achieve. It is appropriate, therefore, to conclude on this note 0All job-creating efforts as well as rural development programs are bounds tobe beset with numerous impediments, but these are no excuse for avoidingsuch goals. They do represent areas of promise aimed at the right thingsby attempting rural relhabilitation among the poor and poorest of rural India.
- 63 -
CHAPTEd _V
INDU3TRaY
Historical Perspective
6.01 Objectives: As the guardians of a t'ederal parliamentary democracy
of over 560 million people, the majority of whom are extremely poor and yetincreasingly aware of their rights, Lndian policy makers are subject to alarge variety of pulls and pressures which understandably result in thesimultaneous pursuit of numerous and not always consistent objectives. Aprimary industrial objective of post-independence India has been to trans-form through rapid growth the small and unsophisticated industrial sectorin which the production of relatively simple consumer goods predominatedinto a broad industrial base capable of producing a wide range of capitaland intermediate as well as consumer goods. From the beginning it has beenaccepted that to bring about such a transformation, the Government would haveto bear sole responsibility for investments in certain key sectors and assumethe lead in others, while at the same time guiding private investment indesired directions through controls and other policies.
6.02 Import substitution has been a second predominant objective pur-sued vigorously since the mid-1950's. It is an obvious and, particularlyin the early stages of industrialization, easy strategy to pursue and giventhe praminent place of "self reliance" in Indian thinking probably it wouldhave been adopted in any case. Nevertheless, it gained considerablemomentum from a severe foreign exchange crisis in 1958 which was partlyattributable to the acceleration of industrial investment both in thepublic and private sectors. Once adopted it has developed a momentum ofi-2,s own -- thanks to the growing influence of Indian capital and India'salways precarious foreign exchange situation. It also has offered onemeans of ensuring the fuller utilization of domestic capacities which havebeen established without too much regard to production costs. Export pro-motion is also an often mentioned objective, though in actual practice ithas never been accorded anywhere near the same priority as import substitution.
6.03 In addition, there have been a number of socio-economic objectives.Possibly the two most important have been the desire to avoid undue concen-tration of wealth and its corollary of wishing to encourage the growth ofsmall/medium entrepreneurs. The concern with concentration of wealth,though ever present, appears to have gained momentum in recent years asreflected in the increasing restrictiveness of licensing policy towardsthe larger houses, the passage of the Mbnopolies and Restrictive TradePractices Act (MRHTP) in 1970 and certain measures designed to provide theterm lending institutions with a voice in the management of private enter-prises. Other socio-economic objectives include the industrial developmentof backward areas, the encouragement of employment, the desire to check un-duly high profits and to control the prices of essential commodities.
- 64 -
6.0k The pursuit of these objectives has resulted in quite complicatedrules and regulations and the establishment of a sizeable bureaucracy toimplement them. As a consequence, much of the time of public and privatesector industrialists is spent in trying to operate within the system,while that of policy makers and the bureaucracy is spent in trying to trans-late the objectives into specific policies and rules and regulations,adminiastering these and trying to plug any loopholes with additional rulesand regulations.
6.05 Structure: The strategy of the Government has been exceedinglysuccessful in bringing about a major structural change in industry withina relatively short time. Whereas in 1951 over two-thirds of value added in
rmau't c-ure -was in consumer goods, presently it is only slightly more than athird with capital and intermediate goods each accounting for nearly a third.l a con3equence, India today is capable of producing an extremely wide rangeof L'M"ustrial products. This structural change has been brought about pri-7ar- l. y bsy influencing and controlling the investment decisions of the privatesector -hich still accounts for 85 percent of value added in manufacturingwiln about 35 percent being attributable to medium and large-scale privateinzustry and the balance of 50 percent to small-scale private industry (i.e.all in dustrial units with investment in plant and equipment of not moretha.n R ?7000G0 or Rs 1 million if they are ancillaries).
rport Substitution: The strategy of import substitution has alsoben exrtaremely successful in reduciLng the dependence on imports of the manu-la_cturing sector. Despite the growth of GNP and increasLg import prices,
present level of imports is only marginally higher thenan that in 1961 and-scars•derabiy less than imports during the 1961-65 period. Even more striking
s cnaevement ian regard to imports of capital goods. Today 90 percent ofl3 aie -Saintenance imports inJluding food -ith only the balance of 10
COZ!t,^ -tIg of complete machinery and eq`ipment. There are striking.^ l5<sst: O n field after field. For example, prior to 1952, con7ercial
ion irn India was based entirely on the asse .blT of inlortedco re.y 'd irect imports cons4C.itvue on ly 8 to 10 per-cent of the ex-
a .rUo,- pr:e im tractors, domestic assembly started in 1963/64 and todayof t' 1p0he ex-fact ory pr-ce oonsist s of diLrect imports.
-'71' 9 ioducton and Investmenxt: While the strategies of structuralsutrt Sbsitution have been successful, partly as a consequence
t sa o: growth is much mere uneven. Broadly speaking, since 1950t,nere has been only one period of uninterrupted axd rapid growth. This isthAe sever year period from 1958 to 1965 during which a confident privatesecto- greatly accelerated its investments in response to the clarificationof ardutt r a! policy (the Lndustrial Policy Resolution of 1956) and to the
SUp of public investment in industry during the Second Plan fromabs-aut oie-tIa--wentieth of Plan outlay dur-ng the previous period (1950-56) toabouf d. quarter. Further boosted by fairly liberal Ucensing policies and thevaila'ility of sizable foreign aid, industrial production in the large and'ealum-scale sector during this period grew at an average annual compound,at,e of more than 10 percent. The period since 1965 has been one of dis-appo...f,n- growth if not downright stagnation, with industrial production

- 65 -
growing at an annual average compound rate of slightly more than 3 percent.Undoubtedly, this is partly a reflection of other difficulties during thisperiod including severe droughts (1965/67 and 1c,72/73) and three wars (withChina in 1962 and with Pakistan in 1965 and 1971) the last of which wasaccompanied by a refugee problem of unprecedented proportions. These eventshave disrupted orderly development and also reduced the availability ofresources for public and private investments in industry. Furthermore,there has been a significant decline in the level of net foreign assistance.The slowdown of industrial growth, however, is also traceable to the economicpolicies pursued. The very success achieved in import substitution hasreduced the scope for achieving rapid industrial growth by concentratingon producing primarily for the dornestic market. In addition, the increasingpreoccupation with restricting the larger industrial houses has undoubtedlydarmpened their investments despite the greater availability of resources andknow-how in this sector, without touching off an offsetting investmient spreeby the rest of private industry including the small-scale sector for which128 fields of activity are exclusively reserved. Finally, the productionrecord of public sector industry has not always been commensurate with thevoLume of resources absorbed by it.
6.08 Throughout this period of stagnation, it has been quite customaryto have side by side capacity which could not be utilized for want of materialsand components and capacity which could not be utilized for want of demand.This will undoubtedly iremain the case, so long as ability to export is notmore fully developed; foreign exchange continues to be a dominant constraintcausing imports to be administratively controlled; and shortages of savingscontinue to limit the demand for capital goods. Droughts are fairly commonphenomena in India and strikes even more so. Both affect the aggregatelevel and the structure of demand as well as the availability of domesticallyproduced capital and intermediate goods. Nor is the situation helped much bythe scarcity of foreign exchange and frequent delays in authorizing imports tooffset domestic shortages. On the other hand,idle capacity is seldom trans-lated into exports due to a complex set of factors including high inputcosts, poor design and product quality, inadequate marketing effort andfailure to meet delivery schedules.
6.09 Efficiency: Measures of industrial efficiency are hard to come byand can be misleading in the Indian context. One problem is the paucity ofdata; for example, aggregate data are not available about production, costsand profits in the small-scale sector which accounts for about half of valueadded in industry. Measurements based on profitability can be particularlymisleading since some prices are controlled while others are not and becauseprofit maximization is not a primary objective of public sector enterprises.These caveats notwithstanding, it is possible to offer some generalizations

- 66 -
on the basis of work done to date.1/ One is that there has been littleimprovement in efficiency over time. As pointed out in last year'sReport the annual surveys carried out by the Reserve Bank indicate that"the efficiency of a number of medium and large scale industries in theprivate sector has been either stagnating or declining in the last tenyears ... For these industries as a whole the productivity of capital asmeasured by the ratio of value added to productive capital employed hasdeclined by aoout 8 percent during 1960/61 - 1969/70."
6.10 However, in a number of important branches the productivity ofIndian industry can withstand international comparisons. Electrical equip-ment, telephone equipmient, railway wagons, commercial vehicles and aluminiumare some of the products which India produces at prices which comnpare favor-ably with imports on a c.i.f. basis. Industries which compare poorly withimports and exhibit declining productivity trends include cotton textiles,basic chemicals, heavy machinery and paper. Even more striking than differencesbetween branches of industry are differences in efficiency among firms in-te same branch. In truck manufacturing, for example, two of the six firmsin India have ex-factory prices which are lower than the c.i.f. price ofconparable imports -- without even making adjustments for the high costsof certain indigenous inputs -- while the rest have ex-factory prices whichare considerably higher than import prices. Partly as a consequence, in 1972,the most efficient producer was operating at about 104 percent of installedcapacity while the least efficient at about 8 percent. Similar divergencesin efficiency betwieen different firms are encountered in many other fields.This is an interesting phenomenon which illustrates that in India it isquite possible to become an efficient producer, even of sophisticated equip-merit, despite the plethora of controls, regulations and price irrationalitieswthich often cause outside observers to conclude that Indian industry is beingchoked and is forever condemned to inefficiency. This of course does notobviate the cost to the economy of keeping the inefficient producers inbusiness thaiks to a protected market in which efficiency is not always adecisiv-e consideration for granting industrial licenses for capacity ex-Dansion. Nor does it suggest that excessive reliance on administrativecontrols does not have a negative impact on the volume and quality of in-daustrial investment.
62t11 A final generalization with respect to industrial efficiency isthat, on the whole, in the private sector large firms are more efficient
j See, for example, the following Bank/IDA reports:
i. India: A Review of Trends in Manufacturing Industry, April 1, 1970No SA-9a, Volume 1, pp 53-59;
ii. Economic Situation and Prospects of India, May 10, 1972, No SA-32a,Volume 1, pp 125-127;
iii, Small-Scale Industry in India, May 22, 1972, No SA-33a, Volune 1,pp 50-66;
iv. Appraisal of Eighth Industrial Imports Project in India - IntensiveSurvey of Commercial Vehicle and Tractor Sectors, May 1973
.7 -
than medium ones; and this is reflected in their relative profitabilities(Appendix Table 8.7). It is difficult Lo know whether this is primarilyattributable to economies of scale or just to the fact that the largerfirms are better managed and more able to comprehend and operate withinthe sTstem of adrinistrative controls. It is even harder to make anygeneralizations about the small-scale sector silce little is know aboutit and since differences between firms and the quality, of their manage-ments, etc. are much greater than in the rest of industry. What littleevidence there is does not suggest that thhis is an inefficient sectorh;however, this subject could withstand considerable additional research.
Current S-tuation and Short-TerLL PrI22ects
6.12 Against the backdrop of a declining rate of industrial growth- 3.1 percent in 1970 and 209 percent i-n 1971 -- preliminary indicationsbased on data for the first 9 rmonths of 1972 are encouraging and suggesta growth of about 7 percent during 1972 largely made possible by produc-tion gains recorded in the first half of the year. The disappointing per-formance of 1970 and 1971 was due to a combination of factors: inadequatesupplies of inputs, the beginnings of power shortages, sluggish demand and,in a few areas, capac ty7 constraints. In both years the output of steelwas below its 196 level and this, unmatched by adequate imports of steel,had a pervasi-.e effect on other industries. Likewise, in 1971, cottontextile producition declined sharply on account of raw cotton shortages;and a poor sugarcane crop resulted in a drop in sugar refining. Sincesteel, cotton textiles and sugar refining account for almost a third of the-production index, their negative growth goes far to explain the decline in
the all-industries growth rate during 1970 and 1971.
6.13 During these two years inadequate demand continuled to holdback in particular the capital goods sector, reflecting the sluggishnessof both private and public investment. Railroad equipmnent and textilemachinery were especially depressed due to low orders, wvhile in 1971 theelectrical equipment industry was affected by a slowdtown. in the powerprogram. On the other hand, in a few industries output was held back bycapacity constraints: caustic soda, paper and cement are some principalexamples. And in others, notably fertilizers andi some of the largepublic sector engineering industries, capacities wgere not fully utilizedbecause of poor plant operations, power shortages and irnadequate availabilityof steel.
6.14 The growt>h of industrial output in 1)72 by about 7 percent isparticularly welcome as it is made possible by improvred performnance in alarge number of industries. Because of their weight in the industrialproduction index the revival of textile and steel production is especiallynoteworthy. Textiles benefitted from an excellent cotton crop and largerexport orders for both cotton and jute textiles; and steel output, while
j See, for example, Volumes I and II of IDA report on Small-Scale Industryin India, May 22 1972, No SA-33a.

- 68 -
still far from satisfactory in relation to capacities, at least recoveredto about its 1969 level. With imports also running at high levels, totalsteel availabilities improved considerably. Partly reflecting this butalso what appears to have been some pick-up in investment, capital goodsoutput has improved considerably: figures for the first six months of1972 show an 11 percent growth over the same period of 1971. Orders forrailroad equipment have at last been stepped up and the engineering industryas a whole has been more buoyant. Relatively stable industrial relationswere also a factor in the improved production record of 1972. Whereas in1970 a total of 20.6 million man-days were lost on account of industrialdisputes, in 1971 16,5 million man-days were lost and the estimate for 1972is about 15 million.
6.15 Despite the improved industrial performance in 1972 there is noroom for complacency since in the next year or tifo India faces seriousobstacles to continued industrial growth. T'he most serious araong these isthe current drought and its impact on agricultural production and incomes.This will affect industrial production in a number of direct and indirectways. It will. certainly reduce the availability of domestic inputs foragriculture-based industries. The reduction of rural purchasing power isalso likely to affect the denand for certain durable consumer goods and inview of India s self-sufficie-ncy in this category, the impact wil,L fall ondomestic produAction rather than or imports. The c-u:rent inllflationarysituation which is also attributable to the drought an. the, resulting foodscarcities, do not augar wrell fo the imrmediate futire. Rising priceswill inevvitably cause increased confrontations between emp >oyers andemployees and threateri the trend towards impro inF indi-ustrial relations,tising ?rices will also squeeze profits in those ind-ustrlies the products
of whicil are subject to price coitrols, with the result. that further i,n-vestments .in these fields. will b.e discouraged iules.<s the Taqriff Goonrissionis qu-ick in resp-onding to ch¾,,ed circumstances. FJ7 exam.e the cementindustry which has aQt been granted any price Aincreases since oril 1969,claims that, since tkie n -the per ton capital. c.0,ost f' a new cement unit hasancreased. from reS 200 to .Ts 500 due to wag'e increases an-d ri.sing inputcosts. J.ina-l1lY , the curroent ag-ric'cultural situation might a,ffect theavailabil.ity of foreLgn exchange for industrial. maLntenance imports; notonly because food imports reduce the .foreeign exchraunge available for otherpurposes but also b-cause, wle underst,a,?,nda,bly,-ul.< an:y- drought in Indiagives rise to fears o.f a ccnsecutive jroughbt an causes the authorities.to become mere cautious than- usual. in licensing imports.
6.16 Another immediate obstacle to industrial growth is the currentpowier crisis. The rate of growth of electricity generation has fallenshort of plan projections and more inmportantly, it is also short of demand.This situation has been further aggravated b.y low water levels in mostnorthern hydro-reservoirs as a conseeQuence of the monsoon failure in 1 972,by excessive construction times and technical problems in some new thermalunits, by shortages of coal and by maintenance problems and transmissionlosses around the country. As a conisequence, power cuts have been intro-duced in most industrial states starting in October 1972; and by February1973, power cuts ranging from about 10 to 75 percent were in effect in the
- 69 -
following states: Maharashtra, Gujarat, Punjab, Haryana, Andhra Pradesh,West Bengal, Bihar, Uttar Pradesh, Mysore and Tamil Nadu. While a goodmonsoon would provide some relief by mid-1973, power shortages in certainregions are likely to persist beyond then (see Chapter VII).
6.17 In view of these obstacles, it is difficult to be optimisticabout the possibility of sustaining during the next few years the 7 percentrate of industrial growth achieved in 1972. A further cause for scepticismis that cotton and jute textile production, which provided much of theimpetus for industrial growth in 1972, is unlikely to sustain the samerate of growth. In 1971/72 the cotton crop recovered dramatically froman unusually bad year in 1970/71. Even though it has not been affected bythe current drought, cotton production cannot be expected to grow at thesame rate. In jute again, both 1971 and 1972 were unusually good years,largely due to increased Indian exports caused by developments inBangladesh.
Longer Term Prospects
6.18 While in the next year or two there are some real obstacles torapid industrial growth, beyond that prospects can be more encouraginggiven India's sizeable and diversified industrial base, a potentially largeinternal market, an increasingly experienced and still relatively cheaplabor force, and the emergence of a new breed of professional businessmanagers in both the public and private sectors. In recognition of India'slonger term potential in the Approach to the Fifth Plan it is planned thatindustrial production should grow at an annual rate of 8.3 percent. Whilethe potential for longer term growth is there, whether it is exploitedwill depend on the policy framework and on the quality of economic manage-ment. To be more specific, success in the long run will depend on whether:(i) industry can become more export-oriented than in the past; (ii) theprivate sector, which accounts for about 85 percent of value added inindustry, can be induced to accelerate its investments in new schemes aswell as for modernization; (iii) the availability of imported raw materials,components and spares can be increased in order to permit fuller utilizationof existing capacities; (iv) the efficiency of industry -- particularly ofthe large public sector undertakings -- can be improved; and (v) the powershortage can be resolved. If the prospects of bringing about these changesare evaluated in the light of recent trends, a rather mixed picture emerges,though there are some encouraging signs.
6.19 Export Orientation: Exports and export prospects are discussedin Chapter X. What is relevant here is that rapid industrial growth inthe future will be difficult to achieve in the absence of more dynamic ex-port growth. There is still scope for import substitution in steel,fertilizers, petro-chemicals and a number of organic and inorganic chemicals.There are also such possibilities as the replacement of certain importednon-ferrous metals by plastics, of wood pulp by cotton linter pulp and ofimported long staple cotton by synthetic fibre. Finally, the requirementsfor goods and services of a rapidly growing population also provide addi-

- 70 -
tional scope for import substitution. Nevertheless, import substitutionin many obvious and some not so obvious fields has already been accomplishedor is well in hand. This is reflected in the composition of India's im-ports which include almost no manufactured consumer goods and a relativelysmall amount of capital equipment and machinery. The clear implication isthat, in the absence of dynamic export and investment growth, India's in-dustrial growth will be constrained increasingly by the growth of therest of the economy, and as discussed elsewhere in this report the pacethat the rest of the economy can set is likely to be rather slow.
6.20 In Chapter X it is pointed out that in the future, exports willhave to receive greater attention from policy makers and administrators.In the case of exports of manufactures, in addition to attention, moreirnagination and a greater willingness to experiment are also required. Forexample,the administrative control of imports is often quoted by indus-trialists as one of the major obstacles to exports. It is argued thatoften export orders are held up because a relatively insignificant item.which is domestically produced is either of poor quality or becomesunavailable due to a strike or failure to produce up to estimated capacity.Since the practice is to ban imports as soon as domestic capacity is established,the potential exporter has to take his case to the import licensing authorities,and eren if they see his view-point, it all takes time. Of course, import con-trols are so deeply ingrained that to expect major changes overnight would beunrealistic. Nevertheless, some marginal liberalisation such as allowing manu-facturers to import a small- propolution of their imrport requirements (bothcapital and intermediate goods) without prior licensing and without regard tothe list of banned items would be an imaginative way of dealing with thenegative effect of import controls on export performance. Another means ofminimizing the negati-e effects of controls is offered by the possibili-ty ofsetting up industrial zones which would not; be sub ject to import restrictionsand which exDort all their products. The Goverr,ent has anuroved this approachand t-he first such zone, specialising in electr ;OnIic products, is to be establishedin tie vicinity o' BomLbay airport.
6.21 Haintenance lmports: Tte negative effect on production of rawmaterial shortages has already been observed. To the extent that they arecaused by foreign exchange constraints, these shortages once again under-scr-e the im4portance o- export policy-,; and of foreign assistance in the form£ maintenance iports, uhile foreign exchange ILmitations affect raw
material availabilities for all types of industry-, the problem is more acutefor the small-scale sector. By its very nature, the raw material require-ments of this sector are much harder to assess than for the rest of industry.As a consequence the inTort requirements of small entrepreneurs have tendedto be neglected. In recognition of this problem and in view of the socialand economic importance of this sector, the Governnent has increased theavailability of foreign exchange to this sector. Nevertheless, the require-ments are still far from being met.
6.22 Private Sector Investment: On paper, both in the Third andFourth Five Year Plans, the private sector has been expected to carry outslightly less than half the industrial investment contemplated. The
- 71 -
Approach to the Fifth Plan makes much the same assumption and in fact en-visages a proportionate increase in the draft on private savings for publicsector investment. Nevertheless, at least until now the volume of privatemanufacturing investment has been larger than public sector investment.This is not surprising in view of the fact that the private sector stillaccounts for about 85 percent of value added in industry. Furthermore,public sector investment has been consistently below expectations at leastpartly because contrary to expectations the surpluses generated by publicsector enterprises have been minimal. It also needs to be recognizedthat in the short and medium term there are limits to the rate at whichpublic sector industry can expand. It is not only a question of findingthe financial resources but, perhaps more importantly, of developing thecapacity to implement and manage. Hence,the level of private investmenthas been and will continue to be an important determinant of industrialgrowth.
0.23 Unfortunately in recent years the discernible trends in privatesector investment have been discouraging. The rates of gross fixed assetforrnation appear to have declined in large and mediurm scale industry between1966/67 and 1970/71 (Appendix Table 8.6). It is also discouraging that bothletters of intent and industrial licenses issued during 1972 have been fewerthan in 1971 though these figures are not very reliable indicators of futureinvestments. The performance of private investment is all the more dis-appointing to the Government since it cannot be explained in terms of declin-ing profitability. For the 1501 large and medium public limited companiessurveyed by the Reserve Bank profits after tax expressed as a percentage of networth have increased from 7 percent in 1968/69 to 10 percent in 1970/71. Thereis, however, some indication that profits have declined during 1971/72. Pro-fits after tax as a percentage of net worth have declined to 10.8 percent ascompared with 12 percent in 1970/71 in the revised Reserve Bank sample of 346large public limited companies. These averages, however, can be misleadingsince they disguise major differences in profitability among branches ofindustry. For example, in 1971/72 for the 37 large public limited companiesproducing cotton textiles profits after tax as a percentage of net worth de-clined from 7.2 percent to 2.3 percent whereas for the 57 large firms pro-ducing chemicals they increased from 16.8 percent to 17.3 percent. Theadvance announcement in May 1971 that the development rebate would not beapplicable to investments made after May 31, 1974, was also expected toboost investments in the interim but does not appear to have had the desiredeffect. To avoid the possibility of having new investment decisions delayedby uncertainty about what, if anything, happens after the development rebate,in the 1973/74 Budget the Government has announced that in 1974 an accelerateddepreciation allowance would be introduced. It has also been stated that,unlike the development rebate, the new system would apply only to selectedindustries. The fact that the industries are not specified appears somewhatinconsistent with the objective of dispelling uncertainty.
6.24 It is tempting to conclude that in recent years the private sectorhas been more responsive to measures creating uncertainty about its future andparticularly the role of the larger houses, than to other forms of incentives.One action contributing to uncertainty has been the enactment in 1971 of the
- 72 -
25th Amendment to the Constitution which empowers the Government to nation-alize by legislation private enterprises and to determine the level ofcompensation without recourse to the courts. The fact that this articlehas been followed by the takeover of the Indian Iron and Steel Company(IISCo), and of first coking and then non-coking coal mines, of "sick"textile mills and of the Indian Copper Company has also contributed to un-certainty, despite the fact that with the exception of Indian Copper, theother takeovers were prompted by serious financial difficulties and de-clining production. Needless to say, the various nationalizations andthe increasing official preoccupation with remittances is also unlikelyto encourage private foreign investment, despite assurances that suchinvestment is welcome on a selective basis (i.e. if it is in an exportindustry or entails the provision of know-how). The 1970 Guidelines re-quiring term lending institutions in loans exceeding Rs 5 million to setterms and conditions for (at their option) subsequently converting partof their loans into equity have also cauised some uncertainty. But atleast taus far they do not appear to have affected recourse to the financialinstitutions which in 1971/72 increased their loans sanctioned by 38 per-cent and their underwriting and direct subscription to shares and deben-tures by 26 percent (Appendix Table 6.5).
6.25 It is too early to determine the axtent to which the Monopoliesand Restrictive Trade Practices Act of 1970 is havirng a restrictive effecton private sector investment. Thus far 853 undertakings have been registeredunder the Act as having interconnected assets in excess of Rs 200 millionand/or being dominant in the production or distribution of goods and services.The total assets of these undertakings amount to about half of private sectorassets in the medium and large-scale sector (or an estimated 15 to 20 percentof total valuae added in industry as a whole -- public and private). Ah ofthe and u' iebruary 1973, a total of 331 applications for expansion ofcpacity or new undertakings have been received from registered firms. In88 of these cases it has been decided that no clearance under the Act isrequired. and 30 applications have been withdrawn. Of the balance, 88 havebeen approved, only 5 have been rejected and another 120 are at variousstages of consdieration. Of the total cases considered and ulder consider-ation only 28 have been referred to tVle iHonopolies Commission establishedunder the Act, and the balance have been processed by the Government withoutreie"renCe Q'o the Commissioni. Judged on the basis of the cases already de-cided, consideration under the Act appears to take an average of about sixmonths. This time, however, is not entirely additive, since to some extentthe application for an industrial licence and clearance under the Act areprocessed simultaneously. Most of the applications approved under the Acthave been approved subject to certain conditions designed to dilute thecontrol of existing managements and/or to place an export obligation onthe firms. It remains to be seen whether these conditions will deter theundertakings involved from going ahead with their investments.
6.26 An additional problem faced by licensing authorities and potentialiinvestors is the pre-emption of some capacity by those who are not utilizingtheir licenses. This is particularly applicable to state industrial andagro-industrIal corporations. There are a large number of outstanding licenses
- 73 -
for the production of such goods as scooters, tractors, caustic soda, etc.Many of these schemes are not being implemented for want of know-how and/orfinancing. The existence of these outstanding licenses, however, makeslicensing authorities and such bodies as the M;onopolies Commission uneasyabout approving further licenses for fear of creating excess capacity andhurting the smaller investors. There is also the possibility that theexistence of these licenses may inhibit some iovestors from going ahead.There are some indications that the M�linistry of Industrial Development isthinking of tackling this problem by a more selective review of licenseapplications in order to separate real investors from those who are merelypre-empting capacity. While in theory this may have some appeal, in viewof the length of time that licensing now takes, any attempt that mightresult in an exhaustive examination of applications is clearly undesirable.A better approach would be to license free y but to require revalidationat certain intervals, with revalidation being denied unless some realprogress is demonstrated (e.g. obtaining of loan from term financing in-stitutions).
6.27 Two recent events suggest that the Government is concerned aboutthe level of private investments and is trying to cope with it. The firstis the industrial policy announcement of February 2, 1973. Coming at atime of increasing uncertainty about industrial policy and the future roleof the private sector, the announced reaffirmation of the principles of the1956 Industrial Policy Resolution -- which first spelled out the respectiveroles of the public and private sectors -- has struck a reassuring note andjudging by public pronouncements appears to have been warmly welcomed bythe private sector.
6.28 One of the most positive features of the new announcement is anappendix describing those areas in which larger houses will be permitted toinvest. Some of these are so broadly defined (e.g. industrial machinery,machine tools) that they could be interpreted to include most anythingimaginable with the exception of consumer goods. The new announcement also,without going into too much detail, appears to give official blessing tothe joint sector approach -- i.e. investments which are jointly financedby private entrepreneurs and state or central governments. Policy makersconsider the joint sector approach to be one of the more promising meansof tapping for industrial development the expertise and capital of the largerhouses.
6029 Another aspect of the new announcement is the adoption of abroader definition of "larger houses" for purposes of applying the in-dustrial licensing restrictions spelled out in the licensing policy of1970 (i.e. restricting the investments of the larger houses to the coreand heavy investment sectors, not allowing for automatic expansions ofcapacity even if little or no foreign exchange is required). Whereas the1970 policy had defined larger houses as those with interconnected assetsof more than Rs 350 million, the February 1973 announcement adopts thecriterion of Rs 200 million, which is consistent with that adopted inthe Monopolistic and Restrictive Trade Practices Act of 1X.70. Even this

- 74 -
feature of the new announcement, however, in practice could have a bene-ficial effect on investment, because of the direct link established withthe I4FTP Act for licensing purposes. This is because the firms registeredunder the Act are far fewer in number than those listed as larger housesin the 1969 Report of the Industrial Licensing Policy Inquiry Committeewhich until now had been the point of reference in applying the restrictivefeatures of the 1970 policy.
6.30 In the final analysis, as much else in India, the real impact ofthe announcement will be determined not by the words used -- which as isoften the case are open to a variety of interpretations -- but by themanner in which the new policy will be implemented. To the extent that thelicense applications of all -- including the larger houses -- are positivelyand expeditiously handled there is bound to be some acceleration of invest-ment. In this context it is encouraging that the Minister of IndustrialDevelopment is on record as having promised a major streamlining of licensingprocedures in the near future.
6.31 A second indication of the Government's desire to reassure theprivate sector is provided by the 1973/74 budget. The Governunetit has had toresort to new measures designed to raise Rs 250 million of Central Revenues(see Chapter VIII). Some of the new measures will undoubtedly affect in-dustrial costs (e.g. increased customs and excise duties on raw materialsand components). However, it is striking that tne considerable revenuemeasures proposed do not include aN! major attempt to increase corporateincore taxation. Another illustration of the Government's desire to en-courage investment is the already mentioned advance annoiuncement concerningthe accelerated depreciation allowance (paragraph 6.214). Potentially evenmore importart is the introduction in the 1073/74 Budget of an allowancefor new i-ndustrial investments in back"ard areas. This should have a signi-ficant eafect on the profitability of such investments Under the systementrepreneurs investing in these areas will be permitted, over a ten yearperiod, to deduct 20 percent of tiLeir profits in computing their taxableprof-+s. A present 163 of India's districts -- about half of_ the total --a-- T classified as industrially backward and there is continuing politicalop-essura to expand th-e list.
.2 Efficiency of Public Sector nus : Tne efficient operationct- public sector inc^stry is increasiraly impoortant because t'his sector ab-sorbs a growing. proportion of total investment and because its products arekey inputs which therefore affect tie cost structure of industry. Theefficient operation of public enter.r-k ses has always been a popular topic inIndia particularly during periods «Ian preparation. In retrospect,however, these discussions have nob :.I.ys been followed by actions andresults. This time, however, there are indications that the subject isbeing taken more seriously than before. The establishment in February 1973of a separate Ministry of Heavy Industry, with jurisdiction over most publicsector manufacturing enterprises, reflects official recognition of the factthat this sector requires continuing and comprehensive attention at thepolicy making level. Also encouraging is a high level task force in thePlaxTing Commission which has been reviewing since 1972 the operations of

-75-
major public sector enterprises with a view to identifying bottlenecks andworking out detailed action programs for the fuller use of existing capacity.There is a willingness to experiment with different forms of organization inorder to free the day to day management of public sector industry frombureaucratic and political interference. The recent establishment of asteel holding company -- Steel Authority of India Ltd -- is a major example
of this approach. It is likely to be followed in other fields includingfertilizers. There is also an increasing willingness to use professionalmanagers in public sector industry and encouraging results are beginning toflow from the units headed by such men. Finally, there is a trend towardsa more thorough evaluation of public sector investments and this is re-flected in the establishment during 1972 of a Project Appraisal Divis ionin the Planning Commission which is to help prepare, review and evaluatemajor public sector investments. Unfortunately, insofar as the preparationof the Fifth Plan is concerned, this unit may have only a limited impact.The preparation of the Fifth Plan is now in full swing and sectoral productionand investment decisions are being taken not against a shelf of project feasi-bility reports but on the basis of hurried macro-estimates put together byoverworked task forces. If past experience is any guide, these decisionsonce taken will become politically binding and limit the maneurverabilityand potential usefulness of the newly established unit. Nevertheless, theactivities of the new unit, if kept up and supplemented by similar units inthe operating ministries, could in the longer term lead to a significantimprovement in plan preparation and implementation.
6.33 Conclusion: The record of industrial growth since 1965 hasbeen disappointing. The prospects for the immediate future are also notencouraging. During the Fifth Plan period, however, it should be possibleto restore industry as the leading growth sector of the economy. This ofcourse cannot be taken for granted and will require action on a large numberof fronts. At the risk of oversimplifying, some of the key requirementswill be: (i) to formulate policies and procedures which will boost exports:(ii) to overcome inhibitions about the private sector and particularly thelarger houses and to devise policies and procedures which will encouragethe acceleration of private sector investment in new capacity and for moder-nization: (iii) to sustain the trend of improving efficiency in publicsector enterprises; (iv) to increase the availability of foreign exchangefor raw materials and components, particularly for the historically neglectedsmall-scale sector, in order to utilize existing capacities more fully, and(v) to make up for shortfalls in the production of key inputs which affectindustrial as well as agricultural production. The experience with threesuch inputs -- steel, power and fertilizer -- is the subject matter of thefollowing chapter.
- 76 -
CHAPTER VII
STEEL, POWER, AND FERTILIZER: A BRIEF REVIEW
7.1 Over the last several years India has experienced substantialshortfalls in the production of a number of key industrial commodities. Insome instances, such as steel and fertilizer, these shortfalls have in partbeen made up through imports, at considerable cost to the balance of pay-ments; in others, covering effectively non-tradeable items like electricity,no relief through imports has been possible. Overall, therefore, seriousshortages have emerged which have both retarded and distorted India's economicgrowth. The successful operation of these "shortage" industries will beessential to the sustained and balanced growth envisaged for the Fifth Planand beyond. In this chapter, therefore, we examine the situation from about1960 onwards of three of the most important of these industries -- steel,power, and fertilizer. This is a brief and general review and certainlydoes not purport to be exhaustive.
7.2 In the early 1960's the steel industry.1/ appeared well set forefficient production and continued expansion. The three plants (Bhilai,Durgapur and Rourkela) of the public sector corporation Hindustaan SteelLimited (HSL) had recently been completed and after the inevitable teethingtroubles, particularly at Rourkela and Durgapur, by 1964 were all operatingat around 100 percent of their nominal capacity. In the private sector,the expansion and modernization program at Tata Iron and Steel Campany(TISCO) had also been completed by 1960, and both TISCO and the other mainprivate producer Indian Iron and Steel Company (II5CO) were also running athigh output levels.
7.3 In the nid 1960's HSL undertook an expansion program at each of itsnlants which w as completed by about 1 969. But from about 1966 until 1 970average capacity uti.lization at the HSL plants declined to around 60 percentand tshereafter remained stagnant at that level until 1972. The decline wasmost marked at 3urgapur iwlhere capacity utilization fell to almost 40 percentby 1970 and showed little sign of improvement. The decline was somewhat lessserious at Rour-kela, where the utilization factor remained above 55 percentexcept in 1971/72 Trrhen it was 45 percent due to an accident arising from alac; of preventive maintenance The fall in perf ormance at Bhilai was theleast serio w iLth ,he t Ltilizat,ion factor generally being around 75 - 80percent fron 1966 onwards. All in all, although between 1964/65 and 1971/72ISL capacity in terms of ingot steel increased some 90 percent (from 3.1
million to 5.9 million tons 2/, output increased only about 12 percent
V This account is confined to the mild steel industry and consequently thereas no reference to the alloy steel plant at Durgapur. Also, for lack ofspacc it deals with only the main steel producing units.
2/ At present, total effective capacity is some 10 - 15 percent below therated figures of 5.9 million tons because of a lack of balance amongthe different process umits in each plant. Capacity could be restoredto the rated level through additional investment. The capacity utiliza-tion ligures given here are based on rated capacity.

- 77
7.7 Low p;rices thus played an important part in bringing about the,Torsening financial and production performance of the entire steel industry.In the case of 1ISL, however, a variety of additional interrelated factorswere operative Twhich were undoubtedly the more important factors underlyingits poor overall performance. First, as a result of soae difficultiesexperienced in the foreign collaboration arrangements, particularly atDurgapur and RZourkela, IISL did not derive the full benefits of foreigntechnology and management experience at the early and critical stages ofits corporate development. This also led to the premature though under-standable desire on the governmentts part to reduce reliance on foreigntechnical assistance. Second, with the advantage of hindsight it can beseen that the mid-1960's expansion program was undertaken too early in theplants' development and at too rapid a pace. As a result, there was in-sufficient opportunity for the consolidation of the initial experiencegained by the operating personnel, and the attention of management wasdistracted from the immediate as well as longer range problems of productionand maintenance. There was no concerted effort to improve plant operationsand to overcome the many technical problems associated with raw materialsupplies and equipment, so that technical productivity remained at levelswhich were low by international standards for new plants. Third, therewas excessive centralization within HSL itself, which tended to erode theinitiative and responsibility of the personnel directly engaged in managingand operating the individual plants. Finally, no concerted attempt wasmade until quite recently to formulate a progressive and active, rather thanpassive, labor policy. This became a critical factor because of the dis-turbed political situation which prevailed from the mid-1960's onwards innorth-east India where the Rourkela (northern Orissa) and Durgapur (WestBengal) mills were located and which led directly to extremely difficultindustrial relations. Output at these plants, especially Durgapur, wasseriously curtailed by labor unrest, and serious thermal and mechanicaldamage was caused to the operating equipment as a result of sudden un-controlled stoppages. It is noteworthy that the third HSL plant at Bhilai,which was subject to the same labor.. policies as the other two but whichwas located in Iadhya Pradesh, was affected by only brief and intermittentlabor problems. The IISCO mill, which is situated at Burnpur in WestBengal and which followed fairly traditional labor policies applied, washit by strikes and all manner of disruptive tactics, with the same negativeconsequences as at Durgapur and Rourkela. The TISCO plant, at Jamshedpurin Bihar, where comprehensive and forward-looking labor policies werepursued, has not had any stoppages on account of labor trouble for somefifteen years.
7.8 In sum, therefore, the overall performance of the steel industr-yover the last decade has been disappointing, especially taking into accountthe successful record of the early 1960's. To a certain extent this wasdue to managerial and technical inefficiencies and to lack;- of experiencewithin the industry itself. But it will be apparent from the above that toa greater degree the unsatisfactory state of affairs was directly and in-directly the result of factors beyond the control of the industry: theeconomic recession of the mid-late 1960's, the pricing policy, the somew-hatpremature and undue emphasis on expansion rather than consolidation at thepublic sector units, seriously disturbed labor conditions related in largemeasure to the political situation in West Bengal, and so on. The industryhas now acquired a considerable body of experience at all levels of its
- 78 -
(from 3.1 to 3.5 million tons ingot steel).
7.4 The production of IISCO over the same period followed a rathersimilar pattern to that of HSL, with capacity utilization declining fromabout 100 percent in 1963/64 to about 60 percent in 1971/72. Only TISCOkept up a consistently high production record throughout the period, al-though even in its plant a variety of technical problems developed whichfrom 1 968 onwards brought the level of capacity utilization down to 815percent.
7.5: The financial record of the industry was also rather poor, andappeared to be worsening rather than improving over time. Except for1964/65 the three IISL steel plants ran at a loss in the period under review,and by the end of 1971/72 the accumulated losses amounted to about Rs 1,800million. IISCO's profitability declined throughout the period, with dividendsin the later years being financed primarily out of reserves, and in 1971/72a loss was incurred 1/. Only TISCO maintained a reasonable level of profits,although for a brief period in the mid-1960's it had to draw on reserves inorder to provide a satisfactory dividend.
7.6 Tn the mid-late 1960's the poor financial record of the industrywas in part due to the economic recession at that time and the cut back inthe development program. More generally low capacity utilization wasobv-LousILy a factor, especially in the case of the IISCO and IISL plants.Of greater significance, however, was the pricing policy for the wholeindustry set by the Governnent. Throughout the period under reviewal-though roughly in line with world price;, the average level of steel priceswas set considerably below the real costs of Droduction; moreover, therelative costs of different products were only tradequatel-y reflected inthe product-structure of prices. The effect of this p ricing policy wasmanifold. First, in combination witht complex and varying systems of controlsnu steel distribui-on, the low prIces paid to producers permitted theaccruaal o. high proflts to middlemen and tradees operating outside controlledar _kes. Second, even wi-th the demand for steel being relatively inelastictner.: Ls no doubt that at these low prices demand in the controlled marketshas been inflated and hasthereby exacerbated thle general shortage of steel
tha has prevailed _n recent years. Third, and most important, the pricing:"..>' Bse-vrerely areduced the profitability of the industrzy and limited its
abi'ity to invest in the modernization of its plant. This was most seriouse rase of TISCO Wrhose mianagexent was seeking to cut costs, replaceol eJ-ipmen-, effect technical improvements, and so on, but was continually
InaTpered by a weak cash flow position. it was also a factor for TISCO, butthere the situation was aggravated by serious manage' ment problems. And eveniM the case of HSL, for which financial resources were generally not alimitation, it is likely that the low o prices had an inhibiting effect oner -fo-'m.ance br the pricing policy was such that it was impossible for them
to earn a reasonable return even had they maintained a igh level ofcapacity utilization, and so the policy offered then little incentive toincrlease output as well as technical efficiency.
1/ oor this and other reasons the Government took over management of thefompany wirth effect from July 1 972.
- 79 -
operations, and provided the above or other external factors do not continue tohamper it, there is no reason to doubt its ability to resolve the problerns atthe existing plants and to implement successfully the current and proposedexpansion program. Already in recent months the Bhilai plant has been opera-ting at utilization factors of arounid 90 percent and there have also beensome encouraging signs that the production bottlenecks, particularly atRourkela and to a lesser degree at Durgapur, are being overcome.
7.9 In relation to present capacity the expansion program now underconsideration for the Fifth Plan and immediately following years is anambitious one. The final decisions have yet to be taken, but at thisstage investment outlays during the Fifth Plan are expected to be of theorder of US$5000 million, or approximately five times the correspondingexpenditure in t-e Fourth Plan. In physical terms, total capacity is expectedto increase from the present figure of 8.9 million ingot tons to around20 million ingot tons by 1978/79. At least 4 million tons and possiblyas much as 7 million tons of this additional capacity will be provided bythe Bokaro project which is to be commissioned in stages starting in mid-1974-The balance will come from expansion of some or all of the existing/plants, forall of which feasibility studies are in hand. The outlays required to cleminatethe current bottlenecks on the full utilization of existing capacit:- at theseplants will also form part of the investment program. Finally,two new plantsare under construction in South India wihich are scheduled for production inthe early years of the Sixth Plan.
7.10. As already noted, given the technical and managerial competence thatnow exists within the industry, its successful operation will depend on theresolution of the "external" factors referred to earlier. The Governmenthas recently set up the Steel Authority of India Limited (SAIL) as a publicsector holding company with inter alia full technical and commercialresponsibility for the HSL steel mills. It is likely that in due courseHSL will be gradually phased out as a separate corporate entity. The basicideas underlying SAIL are to have a commercially oriented organization atthe head of the public sector steel plants, with a maximum devolution ofresponsibility to the individual plants and a minimum interference in normaloperational matters by both Parliament and the M1,inistry. Whether or notSAIL will prove effective, and whether the Government will take the otherdecisions -- such as on steel prices or as will permit the full utilizationof the outstanding managerial capability of TISCO -- fundamental to theoverall health of the industry, can only remain to be seen.
7.11 In terms of both installed generating capacity and energy production,the electricity supply industry grew at an average annual rate of aroLund 11percent between 1960 and 1972. This was approximately th-ie same rate of growthas occurred in both peak demand for power and in the demand for energy. Out-standing progress was made with the program of rural electrification: overthe decade of the 1960's the number of villages in which electricity wasavailable increased at a rate of 14 percent per arnum, and the number ofirrigation purmpsets electrified, whichi became the main thrust of the prograrmafter the mid-1960's, at about 24 percent a year. Despite these considerableachievements, and to some degree also because of them, in recent years thecountry has been increasingly beset with local shortages of Dower, interruptions

- 8o -
of supply, and poor voltage conditions. In some parts, notably the northernelectricity region where there was extremely rapid growth in rural electri-fication, these difficulties were partly due to demand growing considerablyfaster than originally estimated. In some instances, such as after thefailure of the monsoon in both the north and south in 1 972, the supply cap-ability was severely reduced through limitations on hydro-electric power(wh' ich now accounts for nearly half of installed capacity). Overall, however,the difficulties were the reflection of a number of financial, technical, andinstitutional problems that had been accumulating for many years.
7.12 First, once the basic grid systems had been established within eachState, which in most cases was by the early mid-1960's there was a persistentbias in favor of investment in generation rather than in interstate transmissionat the bulk supply level, and consequently there was a high degree of -nder-utilization of generating equipment. This reflected the desire of each Stateto be self-sufficient in electricity supply and to retain f-ill control overthe planning and operation of its own system. Even though from the early1960's the Center increasingly emphasized the substantial bene-fits that wouldaccrue from the regional integration of the State supply systens, progresswas slow both in the establishment of regional boards equipped with theappropriate powers and in the construction of inter-State tie-lines ofadequate capacity. This situation has slowly been changing in recent yearsas a result of a greater direct Central involvement in supra-State generatingand transmission schemes and, more important, also of the gradual recognitionby the States, prompted by the continued recurrence of local power shortages,of 1he mutual benefits of power exchanges. in -the last few years powertransfers between surplus and deficit States have gradukally been becomingaccecued practice and steps have been taken to achieve coordinated regionaland nationa'l power development.
7,13 Second, notwithstanding the above point, in sore areas such as partsr o hwes' and southern India where demand was grwing fast and 'the pro-
-X-isiorl o_ lr 1i-tension distribution facilitiec was being emphasized, insuffi-cient a ttention was paid to the forecasting of demand and to sec-uring anadeqLate energy supcly capability. As a res-ult, in these areas peak demand¢in terms o'f 1169) and overall energy demand (in terms of kWh) began to runahead of the sUPpply capability.
.14 hlrd, considerable problems were experienced in the plning andri - tLeme lation of power projects and in mairntaining an adequate pipeline of
we--rrepared projects for fut-are investment. To some extent the problems-n pl a:3Lng and ruzning the industry were inevitable in a still relatively
inexperienced industry that was gfrowing fast from a small base. However,they were also the result of the constant shortage of raw materials, byGoverumen.t policy to allow procurement of heavy electrical equipment only fromdomestic suppliers, by the delay in procurement from the indigenous heavyelectrical manufacturing industry which froml the late 1960's was becomingan mc-eas½g' important supplier, and by various other factors beyond thecontrol of the electricity supply authorities. As a result of all thesedifficulties, there were drastic slippages in construction schedules andafter the mid-1960's there was even a decline in the annual rate of insta-llation of new capacity. There was also a lack of mordination in planninguh'ich meant, for Instance, that coal supplies were unreliable as well as ofpoor qual Ity so that considerable damage was caused to the power station
- 81 -
boilers, or that after completion power plant remained unconnected for sometime with the transmission system. Furthermore, within the power industryitself, routine maintenance was neglected and operating practices wereinefficient, with the result that there was a high rate of breakdown ofequipment. There was also occasional resort to investment in relativelyshort-gestation and high cost thermal projects even in areas with abundantand cheap hydro resources. And finally progress in the installation ofmeters for bulk consumers and in raising the efficiency of the transmissionsystem remained slow, so that there were high losses.
7.15 Fourth, with the advantage of hindsight it seems that the risksof power shortage inherent in running a system highly dependent on hydro-electric power wereunderestinated. This problem was aggravated by the longbuilding times and high rate of forced shutdown for repair of thermal plant,as well as the unreliability of coal and lignite supplies.
7.16 Fifth, there was a costly commitment by the Centre to investment innuclear energy for commercial purposes. There was no doubt that the longrun aims of the atomic power program remained valid and that investment ina number of nuclear stations was an essential part of the development ofthe nuclear industry. However, there was unrealistic allowance for theamount and reliability of supply from these nuclear plants, which insubstantial part were for R&D and "learning"t purposes. As has generallybeen the experience elsewhere in the world, the nuclear stations havesuffered excessive delays in construction, and the one plant alreadycommissioned has proved far less reliable and to have a much lower avail-ability factor than anticipated. Moreover, the nuclear stations havepre-empted a high proportion of the Centre's resources allocated to poweroutside of their assistance to the States.
7,17 Sixth, it was necessarily a slow and difficult task to strengthenthe financial situation of the individual electricity supply authoritiesin a systematic and uniform fashion, especially when their finances wereplaced under considerable strain by the rural electrification program. Inthe early 1960's the Centre began stressing the need for a greater financialdiscipline and internal generation of investment resources on the part ofthe State Electricity Boards and consequently for an increase in the averagelevel of the tariff and for a rationalization of its structure. But it wasonly in the late 1960's that progress in this regard became apparent and afew years later that the financial returns of at least some of the StateBoards started approaching satisfactory levels.
7.18 Finally, the status of electricity as a "concurrent" subject in theUnion Constitution (i.e. a subject for which both the Centre and the Stateshad responsibility) was a continuing obstacle to the rational organization ofthe sector and exacerbated a number of the difficulties described above.Althought Central assistance for power constituted the bulk of total invest-ment in power as well as around 30 - 40 percent of total Central Plan assis-tance to the States, it appears that there was insufficient collaborationbetween the Centre and the States, as well as among States as already noted,in undertaking a concerted planning effort to deal with the problems of theentire sector.

- 82 -
7.19 Given the above circumstances it is not surprising that with thewidespread failure of the 1972 monsoon, power cuts have had to be imposedin many parts of the country. Of even greater concerr, however, is thequestion of how long the power shortage will continue to be a problem. Itis more than a problem of hydroelectric capacity being restored to its fuLlcapability by re-mular and adequate rains. Additional capacity and betteruse of existing facilities are necessary, and to these ends the authoritiesare now mounting a massi-ve effort to prevent future shortages. Neverthelessthe lead time for in-tallation of new capacity is necessarily long and atight situation between power supply and demand seems likely to persist forsome time. Early achievement of a comfortable supply situation is hamperedby the lack of effective long range planning in the past and. the consequentdearth of fully prepared projects ready for implementation; by the constraintson rapid expansion of coal production and transport; by the fact that forplnanbg purposes the present genera-tlion of nuclear power stations cannot berelied upon for sustained commercial operation at high load factors asoriginally intended; and by the general shortage of financial resources, andespecially foriegn exchange if, as currently seems likely, it will benecessary to impDort a considerable amount of equipment for the investmentprogram. Furthermore, the size of the task confronting the plar-sers isenormLous. Current demand estimates indicate that the electricity supplyindustrry will need approximately to double its capacity by the end of thepresent decade. The power outlook is thus one of tight supply, even withoptimristic assumptions about the availability orf hydroelectricity and therate of installation of new eaaipment.
7G20 Until the late 1950's the Indian fertilizer industa remained sm.alland undeveloped. However, the Third Plan recognized that future gains ilgr icultural production would have to be based essentially on increasing the£rcd ,ti'.rity of the land and accordingly proposed a substantial expansion oft+e domezt:.. fertilizer industry. In the mid-1960'E the foodgrain crisisand Jhe adoption of the new agricultural strategy further emphasized the need- .fe- ilizers, anad the Fourt-h Plan made provision for large additions to
'7Iocluct-ion capacity.
7¢2 s a result, the growth of the industry has been spectacular: inof' nutrient tons per anni.E for .nstance, bet-wveen 1960/61 and 1970/71
'e :r~tsalled capacity of nitrogenous fertilizers increased from abouttens to I,51c,000 tons and production from around 110,000 tons
8 'OjD0-Ot3 tons Generally speaking, however, the performance of theindustry fell short of the Plan targets, in -terns of both the rate oflnstallation of new plant and the production from plant in operation. Forexanuole, the target for nitrogenous fertilizer production in 1965/66 was1 million nutrient tons wvnhich was considerably higher than the actualachieverment five years later, and the overall degree of capacity utilizationras remained around 55 - 70 percent.
7.22 In broad terms, two factors appear to have underlain the slowprogress made in the construction of new plant. First, some difficultywas experienced in bringing to fruition a number of projects in the privatesector. Differences between the Government and the projects' promoters,
- 83 -
both national and foreign, arose on a variety of matters such as fertilizerpricing and marketing and the choice and source of feedstock and plantequipment, which led in some cases to delays of several years in the deci-sions to proceed with projects and in others to the withdrawal of projectproposals. The question of the Government's pricing policy as well as therelated issue of the choice of feedstock have remained difficult and tosome extent unresolved issues to the present day. Wqhile the domestic pricesof nitrogenous fertilizer have generally been above world prices, they havebeen set too low to earn sufficient profits to attract private investment,especially in the context of the other difficulties noted above. This hasbeen one of the main reasons why the private sector has not come forwardwith new projects to the extent the Government had initially expected.T.fhile the Government has recoginzed this problem, it has not found iteasy -to make the necessary adjustments to the pricing policy. On oneside, there have been powerful arguments to keep fertilizer prices tothe farmer as low as possible; on another side, the recent increases in theprices of petroleun products have left little room for reducing input prices-to the industry; and finally, there were strong budgetary reasons for notlowering customs duties and other taxes or for giving other fiscal concessions.Irreconcilable as these conflicting pressures may have been, it was, andremains, a serious problem for tle industry that ea effective mechanism forsetting a compromise pricing policy and for continually reviewing it in thelight of changing economic and financial conditions has not been developed.The low profitability of new investment in fertilizers and the continuinguncertainty about the Government's intentions on prices and feedstock havewithout doubt unnecessaily held back the growth of the industry.
7.23 The second reason for slow progress was that there were excessivedelays -- frequently as long as 3 years -- in the implementation of newprojects, especially in the public sector in which the bulk of investmentprogram was being undertaken. Some of the causes were the familiar onesof raw material shortages, difficulties in obtaining import licenses, delaysin local procurement, etc., and were out of the control of the projectauthorities. In several instances the project sites were relatively in-accessible and the site conditions difficult. In other cases late changeswere made in the project's design. Difficulties were also experienced inthe technical and managerial organization of the large number of new andcomplex projects. These problems were probably the most acutely felt bythe Fertiliser Corporation of India (FCI) which was responsible for almostthe whole of the public sector investment program. Largely because of thesmaller participation of the private sector than originally anticipated,FCI had been called upon to undertake an extremely ambitious investmentprogram. In 1972, for instance, when it had only five plants in operation,it also had nine new schemes under construction, accounting for almost 60percent of total nitrogenous fertilizer capacity then being constructed.Moreover, all of the latter were of a scale and technical sophistication forgreater than FCI's operating plants, and three were based on the relativelyunproved technology of using coal as hydrocarbon feedstock. Unfortunately,the major expansion was embarked upon at a time when FCI wias experiencingconsiderable difficulties in the operation of its existing plants. Further-more, CI had not had the opportunity to develop a sufficiently experiencedand balanced organizational structure, and insufficient attention was paidto strengthening its structure to meet the demands imposed by the expansion.The institutional organization of the fertilizer industry remains one ofthe most important issues determining its future viability.

- 84 -
7.24 As already noted, the overall production record of the fertilizerindustry was unsatisfactory4 At the same time, it would be wrong tosuppose that the performance of all the producing units was uniformly poor.As is invariably the case in India, there were wide variations amongstthe ifferent units. In fact, if one excludes those plants with specialproblems outside the control of the fertilizer industry, the productionrecord of the .zemaining plants would have been quite reasonable. To takethe case of a recent year, for instance, in 1972/73 the ov'erall capacityutilization of nitrogenous fertilizer plants was approadmately 70 percent.But the figure would be aroiud 85 percent if allowance were made for the'problenr" plants -- notably Nangal, wlhere output was seriously curtailedby power shortages; ITeyveli, where lignite supplies were inadequate ando poor quality and there were seriouis difficulties in Lhe gasificationunit; THourkelaj where a deficiency in the desigm. of the coke ovens at thesteel plant meant that the supply of coke oven gas feedstock to thefertilizer unit was only about 40 percent of the design figure; Sindri,whichl TAwas old and obsolete and in need of rehabilitation and modernization;andi so on. Moreover, included in the figure of 85 percent would be plants,such as 2iadras Fertilizers, which had only recently been cormmissioned andwere still beitg run in; a nunmber of other plants adversely affected by thepow0er shortage; and one or -two other plants which from the time of theircor'issioning had proved to be deficient in certain aspects of their designand -whfich required considerable investment in "debottlenecking" and balancingfacilitiLes in order to achieve full productionat their rated capa'city. Inthle -vears before 1972/73 the "problem"f plants form.ed a. greater proportion oftotal caDacity and the new and more efficient plants were either not yet orstill in the process of being run in, so the overall picture was correspond-ingly further distorted.
7.25 In addition to the above specific difficulties, there were a numiberof other factors which generally affected all the plants. Some -- the,ihortages of raw materials and imported- spare parts, the political factorsleading ~to labo. problems -- were beyond the abi.ity of the industry toremedy. Others -- neglect of routine maintenance, improper use of instru-men tation, to tone extent the unsAtisfactory industrial relations -- wereessentially the responssibility of management.
7.26 In the circumstances described above of long delays in constructionand. of low capacity utilizatlion, it was imevitable that the industry as awh1ol.e was notl in a strong financial position. In 1972, for instance, onlytwo plants ea.Zmed reasonable profits. The posi.tion was of course greatlyaggravated by the xlicy of setting prices t-he minimum necessary to ensuresatisfactory returns to producers.
7.27 The fertilizer industry is at present still in the process ofcarrying out the expansion and debottlenecking program embarked upon inear ier years. TIhese measures will somewhat more than double capacityover tJhe next; several years. Nevertheless, estimates of fertilizer demandshow a need for further investment in new schemes. The exact size of thenew investment program in fertilizer in the Fifth Plan is still underdiscz-ission.

- 85 -
7.28 Irrespective of the precise target finally selected, however, bu-tall the more important the larger -the program, it will be essential for theGovernment to resolve the problems that have for so long adversely affectedthe viability of the industry -- pricing and feedstock policy, the role ofand incentives for private participation in the investment program, andinstitutional arrangements to ensure that FCI would not be overburdenedwith t1he brunt of the expansion program in addition to its existing responsi-bilities.

- 86 -
CHAPTEA VIII
DOIMESTIC FZIANCE
A. Domestic Resource Mobilization
8.1 When it comes to assessing India's future growth prospects and tomeasuring its success in achieving self-sufficiency, few indicators are asimportant as the evolution of domestic savings. Yet, on this :score theFourth Plan Mid-Term Appraisal paper had sounded a very gloomy note indeed2!However, more recent data published by the Reserve Bank show that the overallsavings performance in the period 1967/68 to 1971/72 may not have been as pooras indicated in the earlier estimates. In fact, as illustrated in the tablebelow, the more recent figures show that since 1967/68 India's net domestic
SAVINGS AND INVESTMENT:1(as percent of NDP)
Domestic Savings Foreign Savings InvestmentPublic Private Total
1960/61 1.7 8.0 9.7 3.5 13.21961/62 2.3 6.9 9.2 2.4 11.61962/63 2.5 6.8 9.3 2.8 12.11963/64 2.9 7,7 10,6 2.4 13.01964/65 2.4 7.0 9.4 2.6 12.21965/66 2.9 7.8 10.7 2.6 13.31966/67 1.6 6.3 7.9 3.2 11.11967/68 1.0 6.4 7.4 2.8 10.21i968/169 1.8 64 8.2 1.3 9.519;69/70 1.9 6.6 8.5 0.7 9.21970/71 2.0 7,5 9.5 1.1 10.61 971/712 1.5 8.5 10,0 1.5 11.5
af These are the most recent estimates available. Some of the figures areopen to doubt. In particular, for instance, the figures show an increasingCraft on Loreign savings in 197Q/71 and 1971/72, which does not seem con-sistent with other data on external assistance.
Source: Reserve iYarn of India (See Appendix Table 2.3)
1/ As noted in our last economic report (paras 8.1 to 8.7) the Mid-TermAppraisal estimated that TIdia's net domestic savings ratio in the period1968/69 to 1971/72 had declined from 8.4 to 8.2 percent of NDP. Not onlywas this performance disappointing with regard to the Fourth Plan targetwhich had postulated an increase in the domestic savings ratio from 8.0 to11.9 percent, it was altogether a level of savings mobilization which, giventhe decline in net foreign aid, could not in the long run ensure a satisfactoryrate of overaU growth. In fact, the marginal savings rate implied in theseestimrates for the last three years was between 7 and 8 percent. This wouldhave been lower than the marginal savings rate recorded in any three-yearperiod in either the fifties or the sixties. Only in years of severe droughthas the marginal rate of savings fallen below 7 percent.
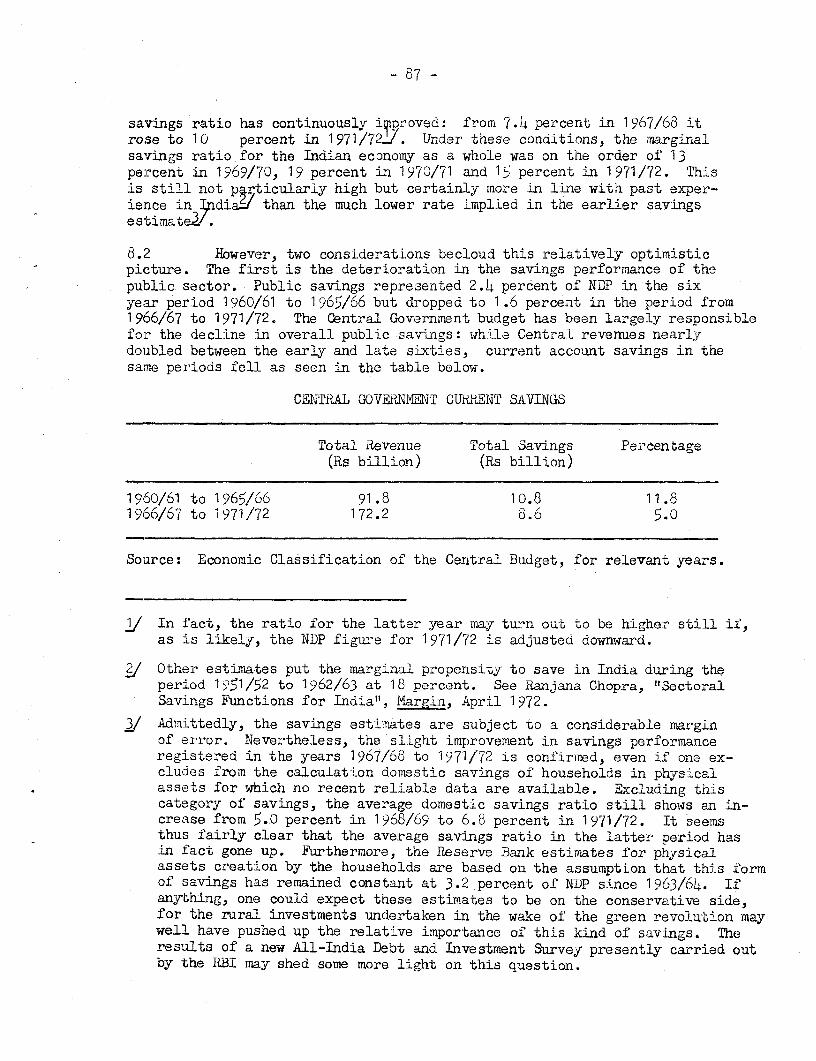
- 87 -
savings ratio has continuously improved: from 7.4 percent in 1967/68 itrose to 10 percent in 19 71/72J/. Under these conaitions, the marginalsavings ratio for the Indian economy as a whole was on thae order of 13percent in 1969/70, 19 percent in 1970/71 and 15 percent in 1971/72. Thisis still not py.rticular1y high but certainly more in line with past exper-ience in IndiaJ than the much lower rate implied in the earlier savingsestimate3/.
8.2 However, two considerations becloud this relatively optimisticpicture. The first is the deterioration in the savings performance of thepublic sector. Public savings represented 2.4 percent of NDP in the sixyear period 1960/61 to 1965/66 but dropped to 1.6 percent in the period from1966/67 to 1971/72. The Central Government budget has been largely responsiblefor the decline in overall public savings: while Central revenues nearlydoubled between the early and late sixties, current account savings in thesame periods fell as seen in the table below.
CENTRAL GOVERMNtENT CUFiENT SAVINGS
Total Revenue Total Savings Percentage(Rs billion) (Rs billion)
1960/61 to 1965/66 91.8 10.8 11.81966/67 to 1971/72 172.2 8.6 5.0
Source: Economic Classification of the Central Budget, for relevant years.
j In fact, the ratio for the latter year mnay turn out to be higher still if,as is likely, the NDP figure for 1971/72 is adjusted downward.
j Other estimates put the marginal propensity to save in India during theperiod 11051/52 to 1962/63 at 18 percent. See Ranjana Chopra, "EectoralSavings Functions for India", Margin, April 1972.
j Admittedly, the savings estimates are subject to a considerable marginof error. Nevertheless, the slight improvement in savings performanceregistered in the years 1967/68 to 15971/72 is confirmed, even if one ex-cludes from the calculation domestic savings of households in physicalassets for which no recent reliable data are available. Excluding thiscategory of savings, the average domestic savings ratio still sho-ws an in-crease from 5.0 percent in 1968/69 to 6.8 percent in 1971/72. It seemsthus fairly clear that the average savings ratio in the latter period hasin fact gone up. Furthermore, the Reserve Bank estimates for physicalassets creation by the households are based on the assumption that this formof savings has remained constant at 3.2 percent of NDP since 1963/64. Ifanytthing, one could expect these estimates to be on the conservative side,for the rural investments undertaken in the wake of the green revolution maywell have pushed up the relative importance of this kind of savings. Theresults of a new All-India Debt and Investment Survey presently carried outby the RBI may shed some more light on this question.

- 88 -
Estimates for the State Governments for the years 1968/69 to 1971/72 in-dicate that savings -rom these sources have remained virtually constant,despite a yearly increase of about 12 percent in revenue receipts.
8.3 Savings of public enterprises have been negligible. Total savingsfrom this source were only Rs 0.43 billion in 1971/72. That any savings areregistered at all is, in fact, largely due to the financial institutions,which were able to show large profits, of which Rs 0.65 billion from theReserve Bank alone. A sample of two thirds(105) of the non-departmentalenterprises, representing net assets worth Rs 28.5 billion shows that re-tained earnings were negative and that the enterprises had dissaved to theextent of Rs 0.25 billion in both 1969/70 and 1970/71. Clearly, at thislevel of aggregation no easy generalizations are possible. A number ofpublic sector enterprises have shown considerable profits, while those whichare making losses are often at quite different stages in their development.Others still, have clearly a promotional function and cannot be expected tomake profIits in their early years of operation. Nevertheless, it is generallyrecogni-zed that with im-provement in management and utilizatiorn of capacityand with improved pricing policies, public sector enterprises could con-tri,bute much more to domestic savings.
8.4 Although the overall domestic savings ratio has recovered fromits low level in 1967/68, it still is only about at the level reached in theearlier years of the decade. The i.nprovement since 1967/68 was from a yearin whrich the savings were low indeed. In that year, because of the continuedimpact of t-wo years of drought on private consumption needs and on Governmentrevenue, both the py Plic and private savings ratios reached their.lowestpoint in the decade- . Look-ing at the decade as a whole, it appears that aclearly noticeable increase in household savings was entirely absorbed byan equally significant fall in public and private corporate savings. Con-sequently3 th,,average net domestic savings ratio is still in the neighborhoodof 1 rpercentAS, a level which would be clea l,y insufficient to reach thegroTth envisaged for the next five year plan_.
t/ SaB ogsunly totaled 7.4 percent of NDP, whereas the ratio continuouslyexceeds 9 percent during the first six years of the decade and had gone
nigr as 10.6 percent in 1963/64 and 10.7 percent in 1965/66.
Jg Pribably around 14 percent on a gross basis.
j The question as to whether India's savings performance is low comparedto the savings record registered in countries with similar levels ofincome is a very interesting one, but difficult to answer. Neverthelesssome recent work undertaken in the Bank and relating average savingsratios to a numnber of variables, including level of income, growth rate,etc., indicates that Indiafs performance would be about "normal". Itsgross savings rate for the period 1960/65 was slightly above "normal",its net savings rate slightly below "normal".

- *59 -
'5 .5 The one hopeful feature in the savings record of the deca-ie isan. improvement in the rate of household savings especially frorn 1 )6-/5(onwards when the increase has been steady and impressive: financial house-hold savings, which reached 3.0 percent of NBP in that year, rose to 4.6i. 1 9bj 1/72. Undoubtedly, tnis phenomenon has been of recent origin ana thedrou,,ght of 1572/73 may again have had a negative impact on rural savings.Bu.-' nonetheless, there are indications that in recent years both theaverage and the marginal propensity to save of rural households have goneup L/. Credit for this goes partly to regional increases in agricultuwralincomes and more generally to the rise in banking facilities, especiallyin. the rural areas. After the nationalization of 14 commercial banks inJuly 1 ,.6f/' the number of commercial bank branches in the country increasedby nearly 80 percent in 31- years. This has lowered the population perbank from 65,000 before nationalization to 37,000 at the end of 1°72.
HOLJSEhOLJI) XFINANCIAL SAVINGS (GROsS)(Ks billion)
1968/69 1 56/7C 1970/71 1 7 /72
Cur-ency/ 2.6 3.2 3.4 4.0Deposits 5.2 5.9 &.9 11.'Provident Zunds 2.7 3.5 3.9 4.2Other 3.3 3.5 4.1 4.5
TOTALL 13.8S 16.1 20.3 24.3
Source: Reserve Bank of India
Between 16'83/69 and 1971/72 household bank deposits rose from. Rs j.2 toits 11.6 billion. Of course, to a certain extent this reflects both a mneresubstitution of deposit money for currency in circulation and also an in-crease in the general price level. Nevertheless, the increase in bankdeposits also reflects an increase in real savings.
Similarly, small savings in other f'ormas have also increasectrapidl;r in recent years. From Rs 1.0 billion in 19601/1 the annual netincrease in such savings has gone up to Rs 1.5 billion in 1965/66 anci Rs 2.0billion in 1971/72.
j' A recent study undertaken oy the XCA&L indicated that between 1 y)62 and156o7 the average propensity to save of rural households, went up from5 to 6.9 percent, while their marginal propensity to save may have risenfrom 15 to 34 percent. Savings behaviour of urban households remain-idfairly unchanged. See Household Income, Saving and Consumer Expenditure,NCAER, December 1972.

- 90 -
:e-ail Budgetar- Situation
K?.7 Looking at the budgetary situation oI' the Center andt Statei corbined during the laset decade, one of the outstanding features is a sharpincrease in the tax burden. State and Center tax revenue combined, whichrenresented 10.2 percent of national income in 1j60/61, rose to 14.7 percen'tin 1, 71/72. While this ratio still re 'Lns rather low, it is not unje-asonao±i)allowance is made for adverse factorsl% affectin, India's taxable capacj. -.
t.C The secon, feature to standc out is that the increase ifn txyield Lhas been primarily shouldered by the twro taxes which alreoa lo iiunlargest at the outseL of the decade, nam,ely, excise duties for tit", Co btenand sales tax for thin States. In fact, tlhese t-wo taxes alone accolantec>. i.cRs 23.7 billion, oI ,' percent of the u )s L 7o bi!Llion increase in taxrevenue real ized during the period. On the other hand, total revenue fromthe t,hvee udin.octr taxes -- personal incom,ae tax, corporutiori ta aria'land revenue tax -- onl- increased fro,n As 3.7 cillLon in 1193)0/61 to ILs 1.3bi.llion .n 1,-71/72. Consequently, the Indian tax system has beco-me even
orte oiase;-l towar.i indirect taxation thani ten years ago, and the yiel fromthe vhree aboveme.-int,ioned direct taxes has dropped from 28 to 1 i percent ototal tw, revenue. 'Thi-Ls tread continues to be noticeable in the neow txproposals included in the 1973/7i4 Central Budget. Of the total expect;ed
ie(l of Rs 2.92 billion deraved from these measures, only .Ks u.ib ,,blion,0O i l :cen-, resu3- from direct taxation (see para 5.?L). This hcv n sl;an;tjovardls indi,rect taxes has the definite adinantage that it permits thu pInai.-:;ZoItcnn of luxury ccmnsuraption and, po-siJ. iy, the stimulation of savin,:c.'urtheinore, in a situation in which admJUirn::ra1ion of taxes is
cut and theor are many exesti ng or o o Lent al loon'ol_s, i.t is probata..o rel-y on in rect rather -than cimi-e t taxes.
J. The thiinr featuie of Ind-Jin taxation in the sixties is thei il.:;.-.-,l.e contribu-L io of taxation of a ricu]ture to overall t,ax raxonue.
The cnl c' d-.rect ag:cult,ural t,x.es presentl14- l e v ied are a land reverLe tax.*.. vh sl-rciron yes arni- c:esses, anri an agrLcultural ncomie tax, al viec. Lrr
2 >.l.; ott-. s. 'tal. on t c,^-'tter they only- yielced ~is 1 .1 billion i-n 1'-z/o.'-''.y'.i 'or -n I ;'( /I-l. As a percert ci national rnco're iroi aJri-rLa tua.e ohe.a a-; inc .dernce drotpped fro 1 , I i2 ercen; in 1 4- .- pe !cent, ein
'X,7 . rrh~e &Ln J-3ora on this rel:at. uve declie en tar; 4 a-lc is tr,at.;-.::r :ai-.es have. d and 'arn re,laino nctan e, and w.re in any case
t Lc a uO increises nn a'- i.cuitu.rl rrrociuotavit, . A Comuittec a' enter2'- -the (velnramenrJt nas recently stud-i.d the cluestion and has recom-Nmended,
E., -,. the low per capita incoml-e, theo smallness of the foreign trade sector,the sLl size o:; the industrial sector relative to the totaw econon.rj,
I.c. Yor a review of such studies on taxable capacity, and the intro-tut.-Lon OT a new approach for comparinr; inter-country tax effort, see
L. in'o . "A Reo;oresentative Tax Syste.m AppJroach to ideasuring Tax Ef :ortI1 D-D-c -7npi-ng Coun-tries", IP& 3taff Payerr;. larch L1972.

among other things, that the land revenue tax be replaced by an agri cUit oiallaoao:rw tax. This tax would be levied on the imputed value of tne crop arid,woooo. aurtler2-ore, have a progressive scale. Total net additional yiei hasbeen estimated at is l. billion. However, the arouCht conditions oL thJisyeaor have delay-ed the in.troduction of the new- tax, although anotber recomi-mi.endation by the Comcmittee on the clubbing together of agricultural and non-agricultural income has been followed up in the 1 973/7L7 Central budget proposals(see para L.2i4).
.1t FnThe fourth and probably most striking aspect of the overcall bud--etary- situation is that, despite the buoyancy in tax revenue and the in-crease' burden of taxation, current outlays have outpace(d total revenue, sotr-t ouiget savings have practically reimained unchanged, if not in Iact de-cd-ined (see para 8.2). This is not to say that the taxes shoulc not havcceen raised or that current outlays could easily have been kept below
present levels. The tr uth of the matter is that the country has hadI toshoulder the financial burden of a nuiber of wars, of ref-ugee probleins antof drought relief. But it is equally true that in the past, taxation h-a.been an insufficient instrument for raising the country's overall savings.If tax revenue will ccntinue to expand ati a similar rate in the futore,greater restraint will have to be exercised in the expansion of ordinarycurrent outlav. Othe:'iwise the savings record will remrtain poor.
;.l1 A fifth, ano L unal, f eature oi the past is the rapidly incre-asingl_.nnnc2al interciepencence of Center acnd States. As will be showm below, the
expansion of' the States' ovun revenue h_s 'been insufficient to keep pace withthe increase in State expenclitures and has had to be compensated by anincreasiingly iXMportant ilow ol' transf'ers irom the Center. This is worrisoi:iebecause, while it is a reflection of the federal structuie of the countryanci the constitutional allocation ofL' taxing povers as between the Cernter endtihe States, it is also a reflection of the Suates unwillingJsess to increasetheir taxation. Furtherrmore, no satisfactory answer has oeen found yet tothe question as to which criteria should guide the distribution of the Centraltransfers to the States. These criteria have perforce to be based on a pol-itically7 acceptable formula and there is no scientifically objective rule toformulate them. But it appears that so fax they have not sufficiently re-warded nerformance or thrift, and that, consequently-, the Center has had toprovide financial resources, regardless of the nature of the expenditureincurred or of the additional tax effort undertaken by the States themselves.1Furthermore, the continued, somewhat arti.'icial distinction between Plan andnon-Plan assistance, makes it difficult to look at Center-State relations asa whole, and to rationalize the overall criteria for allocation of Centralassistance.
C. The Center
8.12 An overview of the public finances o0 the Central Government inthe last decade shows that in the period froml 1960/61 to 1971/72 the greatesttax buoyancy Ihas been in excise duties, the revenue of which increased 'oyneaily 16 percent a year, as compared to 14 percent for the total tax re-ceipts. Consequently-, the share of excises in tax receipts has risen from

- 92 -
h6 percent at the beginning of the decade to 55 percent at the end.
8.13 Whereas the Center's total revenue increased annually by slightlyover 15 percent in the decade, current expenditure on the Center's ownaccount increased by slightly less than 15 percent, leaving an increasingsurplus on revenue account. However, two reservations have to be added tothis observation. First the Center's increase in non-development currentexpendituresY/ was rnuch faster (17 percent a year) than its expansion ofdevelopmental current outlays (7 percent a year), although the lattercertainly have a more direct link than the former with the improvement ingrowth and welfare. Secondly, the Center's financial situatlon cannot beloolked at in isolation, but must be analyzed in conjunction with thefinances of the States. As will be seen below, partly because of a ve-yrapid expansion in non-development outlays by the States, the latter'sfinancial dependence on the Center has become much more pronounced. Aftertaking into account the increasing transfer of resources from -the Centerto the States, either in the form of a share in tax receipts or as outrightgrant assistance, the current surplus generated by the Center has in factdecreased. Wihereas this surplus totaled Rs 10.7 billion in the period1960/61 to 1965/66, it did not exceed Rs 6.0 billion in the period 1966/67to 1971/72.
CEN4TnAL GOVE±r1'MNT ±iAiANCE6(r?s billion)
1960/61 to 1965/66 1966/67 to 1y71/72
.evenue receipts 99.2 183.1tevenue expenditure - 88,5 - 177.1
zzlzes 10.7 0.Capital expenditure 82.4 130.3
Ga-1jslo7 132,3Capital receipts 63.o 116.2iDe'i 8.1 16.1
Source: Explanatory i'iemoranida to the Budget for the relevant years.
8.1 6 Despite this decline in current surplus, the Central Government hasmaintained a reasonably rapid pace oI spending on capital account. Nearlyone hal- of such spending is capital outlay of the Central Government proper,as well as loans to public enterprises. The remaining hal consists of loansto State Governments. In total, these expenditures amounted to Hs 82.4 billionin the period 1960/61 to 1965/66, and to Rs 138.3 billion in the period1966/67 to 1971/72. Compared to the available surplus on revenue account,th-s shows a large and increasing need for capital receipts.
9' Cons-sting largely of expenditures on general administration, as opposedto expenditures on such services as education, public health, etc.
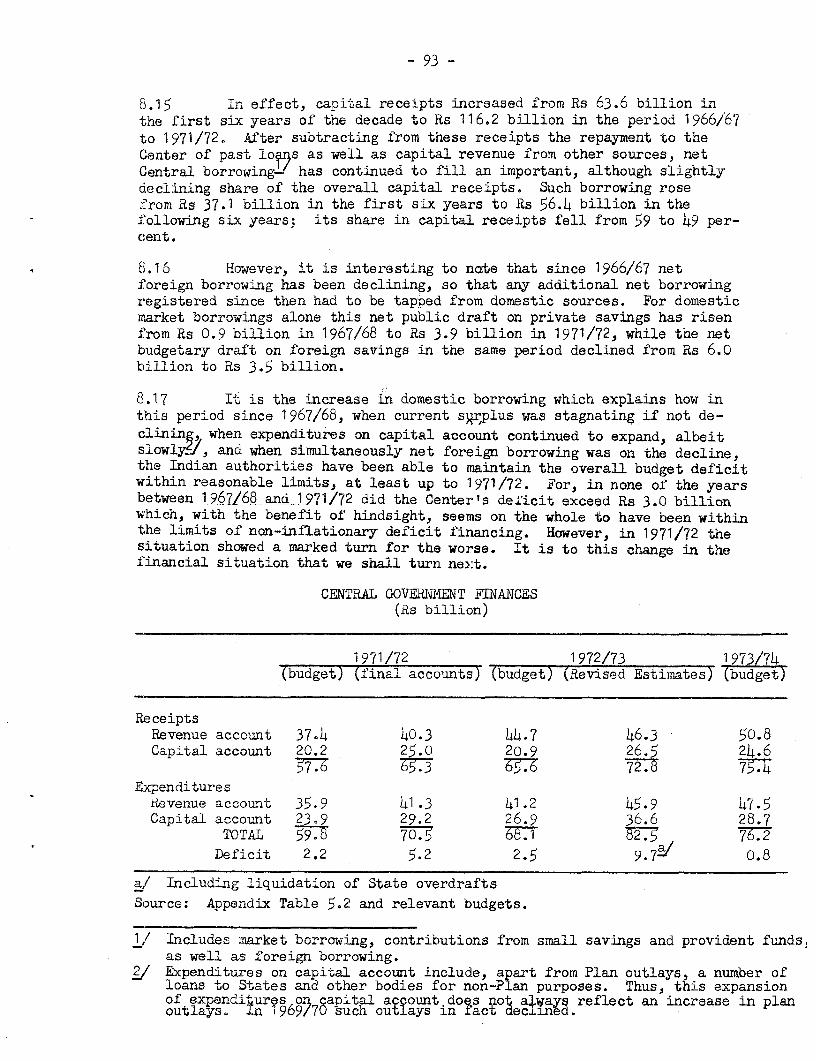
- 93 -
8.15 Tn effect, capital receipts increased from Rs 63.6 billion inthe first six years of tne decade to Rs 116.2 billion in the period 1966/67to 1971/72. After subtracting from these receipts the repayment to theCenter of past lopV~ s as well as capital revenue from other sources, netCentral borrowing- has continued to fill an important, although slightlydeclining share of the overall capital receipts. Such borrowing rosefrom Rs 37.1 billion in the first six years to Rs 56.4 billion in thefollowing six years; its share in capital receipts fell from 59 to 49 per-c:ent.
8.16 However, it is interesting to nate that since 1966/67 netforeign borrowing has been declining, so that any additional net borrowingregistered since then had to be tapped from domestic sources. For domesticmarket borrowings alone this net public draft on private savings has risenfrom Rs 0.9 billion in 1967/68 to Rs 3.9 billion in 1971/72, while the netbudgetary draft on foreign savings in the same period declined from Rs 6.0billion to Rs 3.5 billion.
8.17 It is the increase in domestic borrowing which explains how inthis period since 1967/68, when current sFr,plus was stagnating if not de-clinin, when expenditures on capital account continued to expand, albeitslowly,j, and when simultaneously net foreign borrowing was on the decline,the Indian authorities have been able to maintain the overall budget deficitwithin reasonable limits, at least up to 1971/72. For, in none of the yearsbetween 1967/68 and 1-971/72 did the Center's deficit excepd Rs 3.0 billionwhich, with the benefit of hindsight, seems on the whole to have been withinthe limits of non-inflationary deficit financing. However, in 1971/72 thesituation showed a marked turn for the worse. It is to this change in thefinancial situation that we shall turn next.
CEN'TLAIJ GOVEINMMENT FINIANCES(Rs billion)
1971/72 1972/73 1973/74(budget) (final accounts) (budget) (Revised Estimates) (budget)
ReceiptsRevenue account 37.4 40.3 44.7 46.3 50.8Capital account 20.2 25.o 20.9 26.5 24.6
57.6 65.3 65.7 72.8 75.4Expenditures
Revenue account 35.9 41.3 41.2 45.9 47.5Capital account 23.9 29.2 26.9 36.6 28.7
TOTAL 59.8 70.5 76 .2Deficit 2.2 5.2 2.5 9.72/ 0.8
a/ Including liquidation of State overdraftsSource: Appendix Table 5.2 and relevant budgets.
1/ Includes market borrowTing, contributions from small savings and provident funds,as well- as foreign borrowing.
i/ Expenditures on capital account include, apart from Plan outlays a number ofloans to States and other bodies for non-Plan purposes. Thus, tAis expansionof expenditur$s on,apital account do es not ciwayQ reflect an increase in planoutlays. 969/70 such outlays in Tact declined.

- 94 -
8.18 Total expenditures in 1971/72 rose to Rs 70.5 billion, exceedingthe budget forecast by 18 percent (see above). Excess spending was registeredon both current; and capital account; mainly because of military requirements,refugee assistance, and relief to Bangladesh; and also for additional invest-ment and for increased lending to State Governments. The Government had re-acted early to the situation with additional taxation and by boosting marketborrowing which was greatly facilitated by the highly liquid position of thecommercial baxnks. Inspite of these efforts, the combined deficit financingof the Central and State Governments reached the all time record in 1971/72of Rs 7.1 billion.L/.
8.19 Unfortunately the circumstances prevailing in 1972/73 were againexceptionally difficult. Last year started with high hopes for a return tomore normal finances. Several rounds of additional taxation had raisedfinancial resources in 1971/72 by about Rs 2.5 billion, but had been es-timated to yield Rs 5.0 billion on a full year basis. New taxation measuresin 1972/73 were expected to yield another Rs 1.3 billion. These two factorscombined with the normal tax revenue buoyancy have in fact resulted in anunusually large revenue increase of Rs 6.0 billion, according to the revisedbudget estimate.
8.20 Meanwhile, however, there were adverse developments on the expen-diture side. Fi'rst there was a severe drought in large parts of the country.Measures to provide drought relief and to boost the rabi crop, have addedlRs 3.35 billion to the budget. These budget increases include Rs 1.50billion for an emergency agricultural production program, Rs 1.45 billionas financial assistance for natural -calamities and Rs 0.40 billion asfinancial resources for the purchase of fertilizers and pesticides. All ofthis increased assistance will be given to the State Governments, mostly ona loan basis.
8.21 The second disturbing factor in the overall financial situationof 1972/73 was the rapid expansion of State overdrafts with the Reserve Bankof India (RBI). Such overdrafts over and above the authorized ways and meansadvances are not a new phenomenon, but towards the end of 1971/72 and in thefirst month of 1972/73, they took inordinate proportions. State unauthorizedoverdrafts which totalled Rs 0.9 billion at the end of March 1970, had risento Rs 5.0 billion by the end of March 1972 and to iRs 6.4 billion by the endof April 1972. At that point the Government put an end to this facility.The States concerned repaid Rs 2.2 billion of the overdrafts while the re-maining Rs 4.2 billion were converted into a debt to the Center. These twofactors -- the drought relief measures and the State overdrafts -- togetherwith additional defense outlays of Rs 1.9 billion and additional Centralassistance to States of Rs 2.1 billion, both on plan and non-plan account,represent a total increase in expected expenditures of Rs 11.5 billion. Thisaccounts for most of the ERs 14.4 billion or 15 percent increase between theoriginal budget and the revised estimate for 1972/73.
j As measured by the net increase in the Goverrnent's indebtedness to theABI.
- 95 -
8.22 Fortunately, during this second year of rapid expansion in bud-getary outlays, banks continued to be very liquid, thereby permitting theCentral Government (and the States) to tap considerable resources from themarket. Instead of the gross market borrowing target of Rs 5.1 billion,actual gross borrowing by the Center in 1972/73 totalled Rs 7.8 billion,providing an additional amount of Rs 2.7 billion to the exchequer. Never-theless, inspite of this unforseen addition to budgetary resources, andinspite of the considerable -ncrease in current revenue, the authorities-now estimate the overall deficit at Rs 9.7 billion, or Rs $.5 billion ifabstraction is made of the liquidation of State overdrafts!/. Comparedto the original budget figure of Rs 2.5 billion, this is indeed, a very pro-nounced deterioration.
8.23 With this deteriorating financial background and in the faceof accelerating price increases (see para 8.37), the 1973/74 budget attemptsto reduce the inflationary impact of budget finance and remains, therefore,rather austere. This austerity manifests itself primarily in a stabiliza-tion of defense expenditures at the level of 1972/73 and in constrainedCentral plan outlays. The latter outlays are expected to rise by 7.7 percent,as compared to 23 percent in 1972/73 budget.
8.2)4 New taxation expected to yield Rs 2.5 billion in the currentyearTM, consists primnarily of additional import duties with an expectedyield of Rs 1.56 billion and increased excise levies, with a probable yieldof Rs 0.80 billion. The budget also inclu5gs one of the recommendations ofthe recent report on agricultural taxation 2 1 , the so-called "partial inte-gration" of agricultural and non-agricultural income. This means that theagricultural income, although still tax-exempt, will be added to the non-agricultural income in determining the bracket of taxation rate applicableto the non-agricultural income. This will thuis raise the income tax yiel:don non-agricultural income. Additional Central revenue from this and afew other changes in direct tax legislation-' is estimated at Rs 0.14 billion.
2/ This liquidation of State past overdrafts with the RBI is a mere booktransaction without monetary significance.
TM Or Rs 2.9 billion if the States' share in Central taxation is included.
Report of the Committee on Taxation of Agricultural Wealth and Income,paras 4.1 to 4.7. The report, however, recommended that the additionalrevenue derived from this measure be distributed to the States of originof the agricultural income. It also included a number of other re-commendations, among which the introduction of an agricultural holdingstax, to be levied by the States.
k/ Including the plugging of some of the loopholes surrounding the taxationof the Hindu Undivided Farnily.
- 96 -
8.25 On the basis of these additional measures the original deficitwas estimated at Rs 0.8 billion. However, with the introduction of post-budgetary pay increases, costing Rs 1.5 billion, the overall deficit ofthe Central Government is now set at Rs 2.3 billion, or less than half oflast year's deficit. In fact, the deficit may well run somewhat higher.For, although revenue estimates appear conservative, larger than budgetedrevenues mmay De exceeded by larger outlays for Central assistance to theStates and for food subsidies. The outcome seems likely to be a deficitbetween Rs 2e5 and Rs 3.0 billion which would be a large fiscal improvementand a major contribution to the anti-inflationary effort of the Government.
D. State Finances
8.26 Increasing dependence of the State Governments on the Centerover the pasti decade is well known. Probably less well known is that thishas occurred despite a relatively fast expansion of State tax revenue. Asillustrated in Appendix Table 5.1, between 1960/61 and 1971/72 State taxrevenue has grown at an only slightly lower rate (12.4 percent a year)than Central tax revenue (14.2 percent a year). And since 1965/66 Statetax revenue has, in fact, expanded more rapidly than Central tax yield(12.1 percent a year for the States as against 10.9 percent for the Center)2! .
8.27 Horever, because of a slow growth in non-tax receipts andbecause of the relatively rapid expansion of both current and capitaloutlays, the overall deficit of the States, disregarding all transfers toand from the Center, has risen relatively to their total outlays. In 1971/72this deficit represented 41 percent of State outlays -- as compared to 34percent in 1960/61. In absolute terms the size of the deficit has increasedduring the same period from Rs 5.0 billion to Rs 22.1 billion. Even afterincluding the States' share in Central taxation in State revenue, and debtservicing to the Center in State expenditure, the overall State deficitwould still have increased from Rs 5.1 billion in 1960/61 to Rs 21.9 billionin 1971/72, were it not for a significant increase in grant assistance.
8.28 The balancing of State accounts has thus clearly required in-creasing net transfers from Center to States. As shown in the tablebelow, these net transfers have risen during the last decade from Rs 4.6billion in 1960/61 to Rs 29.2 billion in 1972/73.
j The fact that State tax revenue has been more buoyant than wasgenerally assumed is also pointed out in the Economic Survey 1972/73.See also James Cutt, Taxation and Economic Development in India,Praeger, 1969, p.33.

- 97 -
CENTER TRANSMERS TO STATES(Rs billion)
States' share Grants Loans Gross Interest Principal Netfrom taxes transfer repayment transfer
1960/61 1.65 1.22 3.46 6.33 - 0.58 - 1.14 4.611965/66 2.76 3.30 8.16 14.22 - 1.52 - 2.85 9.851969/70 6.21 5.31 10.29 21.81 - 2.81 - 6.08 12.921970/71 7.55 5.66 10.05 23.26 - 2.59 - 6.34 14.331971/72 9.44 8.91 12.09 30.44 - 2.96 - 8.50 18.981972/73 (RE) 10.66 9.85 19.42 39.93 - 3.45 - 7.25 29.231973/74 (RE) 11.36 8.85 13.42 33.63 - 3.85 - 8.50 21.28
Source: Appendix Table 5.1 and 1973/74 budget.
The average terms of these Central transfers have irnproved over time, withthe share of loans in the gross transfer declining from 55 percent in 1960/61bo 40 percent in 1971/72. Nevertheless, because of the considerable increasein the volume of yearly lending from the Center to the States, the latter'sdebts outstanding towards the Center has been expanding rapidly, with a con-comitant increase in debt service. State debt to the Center has risen fromRs 20.1 billion at the end of March 1972, i.e. an annual rate of 11.8 percent.JEt can be estimated to reach Rs 84.2 billion at the end of March 1974.
8.29 Service on this debt, including principal repayment and interest,absorbed 50 percent of new gross lending in 1960/61 and will equal 92 percentof gross lending this year. Net transfer of loan funds this year will beonly Rs 1.1 billion and tax sharing together with grant assistance willpractically have become the only vehicles for net transfer of resources.
8.30 This present structure of State debt requires even larger loansand grants from the Center to the States if an increase in the net transferof funds is to be realized. However, because a great deal of loan fundsare already at present channelled to the States for the defrayment of re-current outlays or for the financing of social infrastructure projectswhose direct return to the econonr is not commensurate with t-he terms oflending, such a step-up in lending to the States does not seem advisable.To find an answer to this problem the Sixth Finance Commission, which wasset up in June 1972 to determine the principles regarding non-plan financialassistance in the five-year period 1974/75 to 1978/79, has been explicitlyrequested to review the States' debt position, and to make recommendationson possible changes in the terms of repayment of Central assistance to theStates.
8.31 Looking once again at the overall picture of State finances, itappears that the growth in net transfers from the Center to the States, in-

- 98 -
cluding both grant aid and loans, although very impressive, has not beenenough tc bridge the gap beuween StatesI own reven-ue and expenditures and,as a resuit t'he remaining deficit has gone uap. This remaining deficit canonly be financed through the withdrawal of cash balances, through normalways and means advances from the RBIE, or through overdrafts. In fact, inthe last few years, recou-se to the former two means of finance having beenexhausted, R31 overdrafts by the States had become the main instrument offinancing their deficit. However, because only the Center is legallyentitled to cneate money supply these outst-anding overdrafts had to betaken over every year by the Center. And, because in the last couple ofyears the advances given by the Center to clear the outstanding overdraftswere not an "additiona- 1" assistance but came in deduction of the "normal"1
streams of assistanceq , the same outstanding overdraft -- usually in-creased by additional deficits -- reappeared at the end of the followingyear. As already mentioned before, these cumulati7Ve overdrafvs had grownto Rs 6.4 billion at the end of April 1972. At t3hat point, "additional"assistance was g,iven by the Center to clear the situation off the books.
8.32 It is hard to imagine that t,he decislon to discontinue thesystem of State overdrafts -with t1he RBI as of :a3 1972, 5 ill by i tself'so_ve the problem. Clearly, if yearly outstanding overdrafts by the Stateshave been increasing in the last few years, this means that the States notonly were unable to clear their previous deficits, but kept in fact livingbeyond available means. WThat is neded is restrictive action where'oy theoverall expansion of expenditure rermains in line with the overall expansionof receipts and whereby the overall deficit of Center and States togethercan be kept within reasonable limits. To ensure that this restrictive actionon expenditur-e levels will in effect take place, without undue darmage to theresources available for investment and growth, is clearly the main task offinancial poliicy makers in the next few years. In a climate of rising pricesthis will not be an easy one.
E. Plan Outlay
8.33 As mentioned earller, one of the consequences of the Government'sdesire to malntain deficit financing in 1973/74 within reasonable limits,is a significant deceleration in the growth of Plan outlay. Whereas in1972/73 the Central budgetary provision for plan financing was 23 percenthigher than in the previous year, the present budget limits the expansionof such outlayj to 7.7 percent. This expansion is stIll considerably largerthan the budgeted growth. of 35 perocenu n total revenue expenditure, butit certainly aoes reflect an attempt orn the part of the authorities toproceed with caution. In fact, except for the power sector, all other sec-tors see their budgetary outlay for ongoing schemes slightly reduced below
I/ It is true that this "tnormal" stream of Central assistance to the Statesincluded for the Fourth Plan period total special accommodation of Rs 8.5billion. This special accommodation was supposed to fill the States' gapon non-pHlan account; but, in effect, it turned out to be insufficient.

- 99 -
the level of 1972/73, so that the increase in total outlay is entirely as-cribable to the introduction in this year's annual plan of a Rs 1.0 billionprogram to emiploy the educated unemployed and of a Rs 1.5 billion provisionfor advance action on the Fifth Plan. Central assistance to State Plans,on the other hand, is stepped up a bit, and expected to increase by 10percent, as against a 7 percent increase in the previous year. However,the amount of this central assistance (Rs 9.2 billion) is less than halfthe amount of the budgetary allocation for the Central Plan (Rs 19.2 billion)and, on the whole, therefore, the Central budget allocation for planfinancing shows a substantially smaller expansion than last year.
8.34 This declaration in the growth 9o plan outlay is also noticeablein total plan outlay for Center and States!/. The showdown is particularlypronounced in the Center plan which is expected to increase from Rs 23,1billion in 1972/73 to Rs 24.4 billion in 1973/74, i.e. by 6 percent. Thiscompares to an increase of 36 percent in the previous year. Because theState Plans are budgeted to increase at the same rate as last year, namely15 percent, the deceleration of overall plan outlay is not as pronouncedas for the Center alone. Total plan outlay is now targeted to rise fromRs 39.7 billion in 1972/73 to Rs 43.6 billion in 1973/74. This representsan increase of 10 percent, as compared to an increase of 26 percent in theprevious year.
8.35 Total public sector plan outlay during the period of the FourthPlan can now be estimated at about Rs 163 billion, as compared to the -is 159billion envisaged in the original Fourth Plan document and maintained in theMid-Term Appraisal Paper. It may be recalled, however, that, contrary tothe Fourth Plan estimate -- which was expressed in 1968/69 prices -- theMid-Term Appraisal estimate was expressed in current prices for the firsttwo years of the Plan and in April/July 1971 prices for the remaining threeyears. Although in financial terms the two estimates were equal, in fact,they implied a scaling down in real terms of about 10 percent (from Rs 159billion to Rs 144 billion). Because rapidly rising prices have prevailedsince the middle of 1972, the likely increase in the plan outlay during thelast two years of the Fourth Plan period (from -as 77.5 billion in the Mid-Term Appraisal to the present estimate of Rs 83.4 billion) may be more thanentirely off-set by the decrease in purchasing power. Assuming that theGovernment will succeed in keeping price rises during the last year of thePLan to 5 percent, the volume of the new estimate for plan outlay would,when expressed in 1968/69 prices, amount to something like Rs 138 billion.This would mean that, despite an increase in financial terms during thelast two years, the shortfall of Fourth Plan outlay may have increasedsince the time of the !'id-Term Appraisal from 10 to 13 percent.
j4 Total plan outlay for both Center and States includes, apart fromthe budgetary provisions proper, a number of extra-budgetary resources,such as loans from financial institutions, market borrowings, contri-butions of non-departmental enterprises,etc.

_ 100 -
FOURTH PLAN PUBLIC SECTOR OUTLAY(Rs billion)
Mid-Term Appraisal Present EstimatesMiixed a/ 1968/9 Current 1968/6~
prices_/ priceS prices priceS2/
1969/70 21.99 21.20 21.82 21.031970/71 27.93 25.51 26,42 24.131971/72 31.58 28.19 31,58 27.731972/73 - 1'73/74 77-48 69.36 83.37 65.21
158,98 144.06 163.19 138.10
q/ i.e. current prices for the first two years, and April/July 1971prices for the remaining three yeaLrs.
g/ Own estimates
F. Money and Prices
8.36 The history of price developments in the last decade can basicallybe grouped into three periods. The first period runs from the beginningOf the sixties until 1965/66: it is characterized by an average yearly priceincrease of about 7 percent. This period is followed by a three-year inter-lude in which prices first soared under the contuinued pressure of two con-secutive droughts and a devaluation, then -- when the after-effects of thesetwo phenomena were overcome -- underwent a slight downward movement. Thethird period covers the years 1969/70 to 1971/72; it shows a moderate butsteady increase in prices of about 4.5 percent a year.
8.37 Since then, however, a new and untoward upward movement in priceshas set in. This movement is a cause of serious concern to the authoritiesand has beern very much in the forefront of political debate d-uring the pastyear. The price increase did not, however, come unexpectedly. In fact,for many observers the puzzling question ls not that it occurred, but why itdid not occur sooner. inaeed in 1971/72, with a money supply expanding ata growth rate at least 2 percent above "normal" and with an increase in realoutput at least 2 percent below "normal", one might have expected prices tobe pushed upwgrards. However, it was not until the middle of 1972 that thedelayed effects of the increase in money supply, combined with speculativemovements related to the drought, led to a sudden upsurge in prices. In thethree months period f"rom MIay to August 1972 the wholesale price index roseoy 7.4 percent. Price increases in these months were particularly sharpfor foodstuffs, tbhe index of which rose by nearly 12 percent. In the lastmonths of the year prices stuabilized somewhat, but contrary to other years,
- 101 -
the seasonal decline did not take place. At year t s end the December indexwas 13.7 percent higher than the one of the previouS ear. In the firsttwo months of 1973, the increase continued unabatedJ. 1
8.38 That the cause for this recent price movement has to be found inthe combined effect of money surplus and scarcity, seems to be substantiatedby the figures. These figures shaw that the increase in prices was partic-ularly sharp for certain categories of foodstuffs which are in especiallyshort supply. Compared to the overall price increase of 13.7 percent in thecourse of calendar year 1972, the prices of foodgrains and groundnut oilincreased by 17.2 and 37.8 percent, respectively. In the same period theprice of sugar increased by as much as 54.6 percent. However, the priceof all commodities excluding foodstuffs still increased by 8.9 percent inthe year 1972, which indicates that an inflationary trend is present overand above the scarcity-induced rise in foodstuffs prices. The cause of thisresidual inflationary trend is to be found in the above-mentioned increasein money supply and, more particularly in the past high levels of deficitfinancing which were at the root of the money supply expansion, as well asthe upward push generally of labor and agricultural raw material costsattributable to agricultural shortages.
8.39 The Government is particularly pre-occupied by the social impli-cations of the price rise, for it leaves no doubt that the poorer sections ofthe population are the ones which are most badly hit by the soaring pricesof essential commodities. The Government has, therefore, taken a number ofsteps to steady the supply of foodstuffs through the public distributionsystem, but until overall availability of food is increased through a suc-cessful rabi crop or through imports, the pressure on foodstuffs priceswill persist.
1/ At the equivalent of a yearly rate of more than 16 percent.

_ 102 -
CFAPTEPR 1X
THE APPROACH TO THE FIFTH PLAN
9.1 Nexi; year India begins the fifth of its Five Year Plans for economicdevelopment. The schedule of Plan preparation is for a draft to be readyfor government consideration late this year and for implementation beginningin April 1974. Meanwhile the broad objectives amd the financial and physicalmagnitudes have been set out generally by the Planning Commission in what iscalled the Approach to the Fifth Plan, 1974-1979. This emphasizes the objec-tives of better living conditions for the poor, greater economic self-suffi-ciency, and faster economic growth -- " a war on. poverty, dependence andstagnation" as the Approach Paper puts it.
9.2 As explained in the Approach Paper, the current strategy and planningas far as economic expansion is concerned is along lines which are not verydifferent from previous plans. The expansion target is set at 5.5 percent,about the same as in the Fourth Plan. The component contributions to thisare annual growth rates of about 4 percent in agriculture, 8 percent inm.ining and manufacturing, 10 percent in electric-ity, 8 percent in constructionand about 5.5 percent each in transport and services.1_/ Export expansionaims are set at 7 percent a year.
9.3 The total Plan expenditure for the five years is projected at aboutRs. 512 billion of which about Rs. 59 billion is for current developmentoutlays and Rs. 453 billion for public and private gross investnent. Theinvestment is divided between public and private in proportions of about65 and 35 percent respectively. All this is in constant 1971/72 prices.The total of Ps. 512 billion is nominally more than twice the provision forthe Fourth Plan, but aith adjustment for price irncreases and other require-ments for comparability between the two plans, the increase in real ter-mswould probably be about 80 percent. Provision for the public sector atRs. 356 billion is also about two-thirds larger in real terms than thepublic sector provisions of the Fourth Plan. For Plan financing, relianceis almost entirely on domestic resources requiring a large increase insaving rates from a projected level of 13 percent of GNP in 1973/74 to16.6 percent in 1978/79. This implies a marginal rate of sa-ving of about28 percent. Most of this is expected to come from the public sector witha rise in the rate of Central and State budgetary saving from 14 to morethan 21 percent while only a modest increase is expected in householdsaving rates. These saving targets are recognized as ambitious; they aresimilar to those which were set but not reached in tDhe Fourth Plan. Theywould require, as the Approach paper emphasizes, a high degree of fiscaldiscipline and rigorous restraint on non-essential consumption. The
1/ These are approximate targets for additional value added. The targetsfor increases in the gross value of output are 4.7 percent for agriculture,8.3 percent for mining and manufactuiring, 10.6 percent for electricity,8.1 percent for construction, and 6.3 percent each for transport andservices.

- 103 -
approach strongly apposes inflationary financing as seriously jeopardizingother objectives to be sought during the Plan period.
As indicated, the Approach Paper proposes balanced development amongthe- different major sectors with nearly similar proportions of total publicinvestment assigned to agriculture, mining and manufacturing, transport andcommunications, social services, and electricity. Of these public invest-ments, the social services and electricity have somewhat larger shares thanin the Fourth Plan, transport and communication a little smaller, and agri-culture and mining and manufacturing about the same (about 20 percent inagriculture and about 22 in manufacturing and mining together).
9.5 In most of these aspects of economic expansion and the means thereto,the indications of the Approach Paper are that the Fifth Plan will not bevery different from the Fourth. There is somewhat greater emphasis placedon the public sector relative to the private in the Fifth Plan (about 70percent of Plan expenditure including current as well as investment outlays,in the public sector in the FifQh, compared with about 64 percent in theFourth). However, the greatest differences from the Fourth Plan are in theapproach to poverty and unemployment, and to the place of foreign assistancein the resoaurce and foreign exchange requirements of the Plan.
9.6 Of course, concern with poverty and unemployment is hardly new toIndian planning. Wdhat is new, according to the promise of the ApproachPaper, is a specific delineation in the Fifth Plan of the low-end poverty(and unemployment) problem and a strategy for ensuring a substantial shareof development benefits for the poor -- a more than proportionate share. Asexplained in the Approach Paper on the subject of poverty, the innovation ofthe Fifth Plan is to be the integration of specific measures of redistribu-tion into the strategy for development. "This", according to the ApproachPaper, "requires planning not only for a high growth rate but also for aparticular composition of growth which favours the weaker sections ofsociety. The desired composition of the growth process can be obtainedby following a policy of massive employment generation which will sustainand will be sustained by much greater availability of goods and servicesof mass consumption".
a.7 More specifically, the Approach Paper skmetches a redistributivepolicy for the Fifth Plan which would raise the average real consumptionlevel of the poorest 30 percent of the population by about 60 percent.Such an increase would be necessary to bring this poorest segment of thepopulation up to a very austerely defined minimum consumption level amount-ing in 1971/72 prices to about Rs. 37 percent capita per month.
9.8 This would be an impressive improvement, but only by presentpitifully poor comparisons. Yet even this improvement would be beyondthe capacities of a 5.5 percent annual rate of economic expansion, accordingto Planning Commission econometric exercises, unless accompanied by stringentcurbs on consumption among the upper income levels in the interest of expandedlower income consumption. The approach calculations indicate that theredistributive objectives in favor of the poor would involve an absolutereduction in the consumption of the highest 30 percent of income receivers

over the period of the Plan by about 5 percent. It should be appreciatedthat the average income of this upper income growth is only around Rs. 450per family per month. Explanation of the means to this redistributionobjective are only broadly indicated and are left, presumably, for eluci-dation in the Plan itself. The process contemplated appears to involvefiscal and saving measures in the upper income levels and a correspondingreorientation of production in the direction of mass consumption commoditiesand away from :uxury goods.
9.9 The other Fifth Plan innovation, indicated in the Approach, is notso much departure from the Fourth Plan but rather a further extension of theobjective of the Fourth Plan period toward decreasing dependence on foreignassistance. 7Whereas the reduction in net foreign assistance by half was bothaim and fact in the Fourth Plan period, the Approach Paper says that the`fth Plan aim will be to eliminate net foreign assistance entirely by
1978/79. This "zero net aid" objective means a level of gross foreignassistance (meaning presumably official concessional assistance) which wouldbe no larger than transfers of principal and interest due on total foreigndebt by 1978/79. This objective would not preclude continuing privatecapital inflows.
9.10 None of these assumptions has been quantified in the Approach Paperand hence the balance of payments magnitudes associated with the redistributiveand import substitution objectives are not now available pending clarificationpresumably in the Fifth Plan. The Approach does indicate, however, that afterallowance for the effect of these influences on the balance of payments itwould be possible for India to manage with gross aid for the five-year periodof US$h000 million, of which about US$3150 would correspond to debt service(principle and interest) due during the period. The remainder would be fornet infiows of aid in excess of debt service on both capital (about US$530million) and current (about US$320 million) accounts presumably prior to thelast year of the Plan period.
9.11 These then in broad terms are the current lines of thinkring aboutthe direction which India is seeking to follow in the next five years ofdevelopment. The direction is along a course similarly marked out in previousplanning, but there is an important difference. The attack on mass povertyhas been shfted from its place as an incidental concomitant of the growftheffort to the prime objective of the effort. At the same time there isrecognition -n the Approach that effort to improve the poor and expand theeconomy are lnseparable. "The problem (of poverty)", it says, "cannot beovercome within the forseeable future by efforts in one direction only ...
Growth and reduction in inequality are both indispensable to a successfulattach on mass poverty."
9.12 In commenting on current planning as reflected in the Approach Paper,it is of course recognized that these reflections are only very generallyset forth in the Paper, and that the specifics of means toward the approachobjectives (which seem individually unexceptionable) still await formulationin the Fifth Plan itself. Comments at this stage can be therefore onlytentative. .-ith this caveat, some comments follow on plans for speeding upthe pace ol Indian development, for improving the conditions of India'sdestitute, for mobilizing domestic resources, and for reaching the "zeronet aid" objective by 1978/79.

- 1C5 -
-aster Development
9.13 The approach to an acceleration of development appears well orientedtoward the potentialities and practical possibilities in agriculture but thisis less clear in the case of industry.
9.1h In agriculture, there is first the realistic recognition that ruralpoverty and unemployment (or underemployment) are twin symptoms of the basicmalady which is low productivity and stagnation. Improvement is along thetwo lines of intensified pursuit of the further potentialities of the "greenrevolution", and an advance against the formidable difficulties of raisingproductivity and living conditions in those large parts of India dependenton the less promising technologies of rain-fed cultivation. The proposedeffort and emphasis in these directions seems well chosen for improvementof agriculture as a whole and for the poorer part of the rural community.But the difficulties remain formidable and the period of the Fifth Plan seemsunlikely to be sufficient time for the fundamental improvements in rain-fedcultivation which appear necessary. This has implications for the distributiveobjectives of the Approach, subsequently discussed.
9.15 Whereas lines of rural improvement reflected in the Approach Paperappear promising, those for more satisfactory growth and distribution in therest of the economy are disappointing. In fact for the economy as a whole,with all its growth and distributive difficulties, the approach seems muchmore an exercise in establishing the internal consistency of all the manymaterial, financial and distributive parameters of Plan objectives, than anindication of the course by which the objectives might be reached or pursued.Of course detailed explanations are presurnably deferred for the Plan itself,ra-ther than the Approach. But some indication of how the economy is to bemoved from the disappointing development paths of the past to the hopefuldistributive and growth paths of the coming five years would seem a reasonableexpectation. There is some such indication about agricultural production anddistribution as mentioned, but for little else. If the record of accomplish-ment in relation to targets of Fifth Plan magnitude had been better, theinterest in means as well as ends might be less. But considering the diffi-culties of the past, some diagnosis of past development and distributive short-comings and prescription (even in broad terms) for improvement in the futuremi£ht be expected, even in an Approach Paper. Perhaps the greatest disappoint-ment in the approach, given the record of recent times, is the very limitedconsideration of problems of industrial acceleration. How the inefficiencies,inadequate uses of capacity, delays in project completion, lack of inter-industrial coordination, and other aspects of industrial lethargy and short-fall will be tackled is a question which is not even raised. Perhaps mostcrucial to a more lively industrial sector are improvements in technical andr-anagement efficiencies in both public and private industries and revivalof private industrial initiatives. The latter seems increasingly to hingeon finding a solution to the problem of reconciling social equality objectives'along the positive lines of socially regulated private industrial expansionrather than along the negative lines of socially imposed private stagnation.Wdhether in the pursuit of social equality there is really substantial cost inthe form of private industrial production foregone, whether the cost is worththe social benefits realized, and whether the cost might be reduced without

- 106 -
sacrifice of benefits are issues which would seem to merit some attentionin the Approach to the Plan.
9.16 Tne Approach does recognize the importance of one chronic difficultyof the industrial sector which is the promotion of non-traditional exports.It is encouraging that attention is to be given in the Plan not oily toadequate export capacity and related regulation of growth in domestic demand,but also to "a system of taxes and incentives which ensures an adequate rateof return on exports". "Adequate" presumably means enough to make exportingattractive vis a vis domestic sales, and in international competition.
Redistribution
9.17 A unique contr-bution of the F-ifth Plan according to the Approachwill be a specific and quantitative formulation of a strategy for distribu-tion as well as production which, as indicated, would bring the lowest incomegroups of Indians, up to minimum corsumption standards. This has been widelydiscussed in India since the appearanee of the Approach. There appears tobe a fairly wide consensus of commendation for the focus on the objectiveof improving conditions of the poorest 30 percent, and of skepticism aboutthe practicabilities of thi-e formulation proposed for accomplishing theobjective.
9.18 Noted earlier are the difficulties of raising the productivity ofthe lower 30 percent in agriculture, where most of them are located, withinthe next five ;years. Shortfalls here would mean. by definition that thecommodity requirements for the con-smption improvemenrt of the lower 30 percentwould have to come from elsewihere in the economy and would have to be sub-sidized in some form. The additional production of low income consumer goodselsewhere in the economy would not seem of a magnitude to be unmanageableexcept in poor harvest years. But the financial burdens of subsidizing suchdistribution would appear to become increasingly formidable unless the con-sumption spending of the upper 30 percent were really to be absolutelycurtailed and the corresponding income made available for transfer to thelower 30 percent by means of taxation, sving or otherwise. For this incomegroup, the implication is for a marginal saving rate, directly or indirectly,of more than 100 percent.
19.9 The political and practical realities of this are not very clear.Comments on this formulation have noted that the upper 30 percent includesthose with incomes going down to about Rs. 300 a nonth for a family. Hencemost of the draft on upper incomes, if it were to come off at all, wouldprobably have to fall on the highest income decile. How this might bebrought about is explicitly left for later explanation.
Domestic Financing
9.20 'lhe domestic financial parameters of the Fifth Plan, as indicatedin the Alpproach Paper, are still difficult to assess. The financing require-ments amount in real terms to about 80 percent more than in the Fourth. Plan.Yet when domestic resource requirements are weighed against actual performanceduring the Fourth Plan period the -task of financing the Fifth Plan looksdifficult indeed. But this is not the only criterion by which to judge theproblem. Weighed against financial potentialities within the changed policy

- 107 -
and growth premises oil the Fifth Plan, the domestic financing requirementswould seem manageable if the policy and growth premises are feasible.
9.21 Broadly, the ratio of gross saving to GNP is expected to rise, asnoted, from about 13 percent next year to 16.6 percent in 1978/79. This wouldrepresent a marginal saving rate of about 28 percent. The marginaltarget may not need to be quite as high because the starting point of nextyear's saving rate may turn out to be somewhat underestimated. In any case,these saving objectives are still high, and they look particularly difficultbecause so much of the additional saving is expected from Center and Statebudgets, whereas much less is expected from an increase in private saving,and very little from foreign saving. The marginal saving rate for Centerand States according to the Approach is targeted at 35 percent which is twicethe average for the Center in the latter half of the Sixties and compares withrecent marginal saving rates of the Center of 19 percent in 1970/71, 15 percentin 1971/72 and probably less in 1972/73. The kind of budget surpluses whichsuch saving implies looks difficult indeed unless accompanied by ratherfundamental changes in the pattern of public financing.
9.22 The burden of public sector Plan financing to be covered by Centerand State revenues during the Fifth Plan period is estimated at Rs 141 billionor about 40 percent of the total, according to the Approach Paper. Thiscompares with only about 28 percent of the total during the Fourth Plan1/.The Fifth Plan will also depend on surpluses from public enterprises for a muchlarger share of public Plan expenditures -- 16 percent as compared with about8 percent in the Fourth Plan period. The reasons for this increased relativereliance on public revenues and enterprise surpluses are the greatly reducedshares allowed for net external assistance (about 4 percent of public Planoutlays in the Fifth Plan compared with about 16 percent in the Fourth) and asharp reduction in the allowance for deficit financing from about 7.5 percentof the ta,l in the Fourth Plan to about 5 percent in the Fifth. The shareof financing from a variety of miscellaneous sources is also much less for reasonswhich are not explained.
9.23 A comparison of Plan financing in the public sector for the FifthPlan, as reflected in the Approach Paper, ard for the Fourth Plan as estimatedin the mid-term appraisal of 1971 is as follows:
1/ The Fourth Plan public sector financing estimates are set forth in themid-term appraisal of Plan progress by the Planning Commission in 1971.

- 108 -
PLAN INANCE(Rs billion)
Fourth Plan Fifth Plan
Amount Percent Amount Percent
Current account surplus 8.02 5 75.22 22Contribution from public enterprise 11.71 8 56.18 16Additional resource mobilization 37.28 23 66.15 19Market borrowing 19.75 12 51.57 15Small savings (net) 10.00 6 18.00 5Miscellaneous receipts (net) 34.79 22 49.57 14Deficit financing 12.03 8 18.56 5External assistance (grosa dis-
bursements lelss amortization) 25.,40. 16 12,95 4
TOTAL 158.98 100 348.20 100
,.24, It is this increased relative dependence of Fifth Plan financingon budget and public enterprise. contributions that appears to be the mostdifficult aspect of the financing plan,, judging by; the past. It may be lessdifficult, however, if, agriculture were to be effecitively taxed and if pro-posed limitations on. consumption in the upper income levels were actuallyto be realized, thereby making resources available through the budget andother saving channels for~ Plan financing.
9.25 Additional agricultural taxation could contribute substantially,especially to additional, resource mobilization by the States which is ex-pected to doublea from Rs., 11 billion in the Fourth Plan to about Rs 25 billionin the Fifth. Recommendations oaf a. recent Committee on Taxation ofAgricultural Wealth and Income (the Raj Committee), if fully adopted,would add an- estimated Rs 3 billion a year to revenues or, after allowancefor some growth in the agricultural taxation base, about Rs 16 or 17 billionover a five year period. This would still leave a long way to go toward thetargets of State Plan financing from the. present low position, but it wouldbe a major step along the way. Without something like this level of agri-cultural taxation it is difficult to see the States reachiag their Planfinancing requirementss.
9.26 Ax for the Plan financing implications of redistribution, theApproach Paper is again. not very clear. Very roughly the magnitudes involvedmight reach as high as Rs 100 billion over the Plan period if the redistri-butive objectives were to be fully successful. But this, as indicated, seems

- 109 -
uncertain. In any case it is not evident from the Approach Paper whetherany allowance has been made for this redistributive effect in the estimatedfinancing contributions from budget and private saving resources.
9.27 In addition to these conditional judgments about the financialframework of the Fifth Plan, perhaps the most important condition forreaching the financing objectives is the acceleration of economic activity.In the framework of a dynamic economy, financing in Fifth Plan magnitudesseems a much more approachable objective than past patterns would suggest.
Self-Reliance
9.28 One of the prime targets of the next five years, as earlier in-dicated, is greater self-reliance, defined as the elimination of net con-cessional external assistance by 1978/79. This as noted would mean thatgross external aid would presumably be no more in the final year of the Planperiod than principal and interest payments on external debt.
9.29 According to the Approach Paper this would be a conditional ob-jective, depending on the three assumptions previously explained: Exportgrowth of 7 percent a year; the redistribution of consumption; and theachievement of basic industrial production targets and related import sub-stitution. These are obviously ambitious objectives which can hardly betaken for granted., Self-reliance thus seems from the Approach Paper to bea provisional goal, deemed to be feasible if other goals are to be reached.Because many of these other goals are likely to be difficult and uncertain,one can only reserve judgment about the realism of the self-reliance for-mulations. The means to reach self-reliance and other Fifth Plan ends areexplicitly deferred at thls stage by the planners to later consideration.They say in the Approach Paper that "a coherent policy frame in terms ofmajor instruments of policy which can translate the required growth ratesinto observed magnitudes will need to be developed." "All this", they con-clude, "should be facilitated by the assurance provided by the model thatit is possible to achieve a closer harmonization between the principalobjectives of the Plan of removing poverty and attaining self-reliance thanis commonly assumed". In the light of past shortcomings and prospectivedifficulties in translating required growth rates into actual performance,the basis for this assurance is hardly self-evident.
9.30 In any case, self-reliance is an understandable goal and also alaudable one if really reasible without serious sacrifice of India's ex-pansion and distribution objectives. Judgment on this score must await thedetails of Planning Commission analysis, especially concerning the physicaloutput and import-saving targets and the interrelations and time dimensionsof the paths toward these targets, as well as the export assumptions andthe trade implications of redistribution.
9.31 Pending such details and clarification one can only express someskepticism about self-reliance as consistent with other objectives withinthe time span of the next five years.

- ~110 -
9.32 In looking over the past there is no question that foreign ex-change limitations have been among the most critical constraints on fasterdevelopment of the econoay, especially in restraining industry from thepace-setting role required for accelerated growth. Furthermore the con-straining effects of insufficient foreign exchange appear as likely to beoperative in the next five years as in the past. Granted the Fifth Planassumptions of grain self-sufficiency and export growth, there is stillample room for reservations about the realism of the non-food importsaving expectations. The Plan strategy involves very substantially in-creased rates of expansion in industries like metals and machinery,electrical equipment, petroleum and petro-chemical products, and transportequipment. Growth rates in these fields are set generally between 9 to 12percent and in some cases more. Escalation of import coefficients for theexpansion of those industries at these rates is likely to be substantial,and difficult to reconcile with the tight import implications of the Plan.Beyond this, there are other aspects of import demand which have beencritical in the past and which do not appear to have been adequately allowedfor in the Approach Paper. These are import needs due to delays and short-falls in production, both in relation to targets and also during the yearsalong the way toward the targets. Obviously, such shortfalls are boundto retard an integrated program of industrial expansion unless compensatedby imports. The methodology of the Approach Paper seems to make no allowancefor this kind of import need. Thus there is reason for questioning whetherone of the most crucial foreign exchange needs, that to allow for the flex-ibility and adjustment required because of almost certain shortfalls, delaysand imbalances, has been adequately taken into account.
9.33 In the light of the above considerations, the implied magnitudesfor imports seem likely to be inadequate for maintaining thne target expansionof the industrial sector, particularly the heavier industries, and henceof the economy. The fact is that there is no recent experience of sustainedindustrial expansion by which to judge import requirements at higher growthrates. One year spurts are not very significant in the absence of informationabout inventory adjustment. And taking a longer period, industrial growth inrecent years has been slow enough to allow import substitution to take care ofmuch of the import demand which might otherwise develop. Nevertheless, aftera sharp fall in 1969/70 imports since have been going up at an annual averagerate of about 6.5 percent despite the slow pace of the economy. The rise inimports would have had to be much greater had there been more rapid and sus-tained industrial expansion. Indeed, the absence of larger imports of metalsand particularly steel has been one of the limitations on industrial activity.
9.34 It is interesting that only recently in another connection, thePlanning Commission in its mid-term review of the Fourth Plan, was of theopinion that acceleration of the economy during 1971/72 - 1973/74 at ratesonly a little higher than those of the Fifth Plan (a 10 percent rate ofindustrial expansion compared with 8 in the Fifth Plan) would requireadditional imports, amounting to an average annual rate of increase oftotal imports of 18 percent during the three years. This may be comparedwith the implied Fifth Plan import trend in the Planning Commission's more

- 111 -
recent Approach Paper of at most 7 percent. Undoubtedly a sustained annualincrease in imports during the Fifth Plan need not be as high as 18 percentbut the 7 percent certainly appears much too low for maintaining the tar-geted growth of the economy and of industry if account is taken of the verylarge project requirements for the early years of the Plan as well as ofneeds arising from production delays and targets unfulfilled. Some savingin imports would undoubtedly result from the redistributive objectives ofthe Plan if they were realized, but that such saving would be on the scaleimplied in the Approach Paper would seem to warrant further substantiation.
9.35 On the basis of need, it would seem in the interest of Indiandevelopment to maintain throughout the Plan period a larger net inflow ofexternal assistance than seems to be implied by the assumptions of theApproach Paper. This is the case even if there are no poor harvests or ex-port disappointments. Of course, what actually happens will also dependon whether net external assistance corresponding to this larger need isactually available. This is a difficult question in view of past and currentuncertainties. However, on the basis of current aid levels and of what isknown about the short-term plans of most aid donors, it does not seem un-reasonable to assume an overall gross aid availability of at least US$5000million over the Plan period. While this is US$1000 million more than theassessment in the Approach Paper, in relation to India's needs, it is by nomeans an excessive figure, and in fact would realize a net transfer of onlyabout US$1500 million over the five year period.
9.36 It would be unfortunate for Indian development if external aidin at least this magnitude were not to continue to be forthcoming. Itwould be equally unfortunate and even more difficult to understand, if Indiawith such vast numbers of destitute were to reject foreign aid, availableunder reasonable conditions, at the cost of slower development than necessary.

- 112 -
CHEAPTB X
EXPORTS
10.1 Indials economic growth has been seriously cons-rained over thelast decade and a half by shortages of foreign exchange, which have heldimports below desired levels and have been partly responsible for theexistence of a highly restrictive import control system. A larger capitalinflow -- more in line with most other developing countries on a per capitabasis -- could have, of course, eased the import bottleneck. But in anycase, the growth of exports has been disappointing. Moreover, the growth ofindustrial production has not received much support from manufacturingexports. In this section we examine the export record.
The Overall Record
10.2 Except for a brief spurt durimng the Korean war boom, India'-sexports in the 1950's were stagnant. An upward trend only becomes dis-cernible around 1960/61, though initially this was partly statisticalbecause of the inclusion of exports from Goa starting in 1961/62. Between1960/61 and 1971/72 exports grew from US$1,386 million to US$2,106 million,or at an average annual compound rate of 3e9 percent. By comparison, worldexports grew at an average rate (between 1960 and 1971) of 9.4 percent,while exports of LDC's, excluding the oil exporters, increased by 6.9 per-cent per annum. In constant prices, India's exports increased at anaverage rate of 3.8 percent per annum, compared with an average of 5.8percent per annum for L 5C's, again excluding the oil exporters. India hasthus lagged far behind other LDC's; and her share of world ports hasfallen from 1.1 percent to 0.6 percent over the same periodX.
10.3 The Sixties were marked by three distinct phases. First, therewas a period of expansion up until 196 4j/ 6 5. Secondly, there were threeyears, 1965/66 to 1967/68, of substantial export contraction. Finally, therewas a resumption of export growth in 1968/69. The Fourth Plan, starting in1969/70, adopted a:target growth rat2 for export.s of 7 percent per annum invalue terms. In 1969/70 and 1970/71-I, the actual growth by value was lessthan 4 percent in each year, while the average rise in volume was under 2percent. In 1971/72, the growth rate about doubled to 8 percent, althoughthis was entirely due to the strong revival of jute textile exports onaccouit of the disruption of exports from Bangladesh.
1/ International Trade, 1972, GATT, Table 2; and IMF Annual Report, 1972,Table 3.
g/ The official statistics substantially overstate the level of exports in1970/71 because of a change in the method of recording in that year. Weestimate actual exports to have been US$1,950 million -- about 5 percentless than the nominal total of US$2,047. One may assume that the nominalfigures for each expor item are also about 5 percent too high. Allreferences in this report are to the adjusted figures.

- 113 -
10.4 For 1972/73, provisional figures for the nine months endingDecember 1972 show total exports at Rs 13.95 billion, 22 percent higher inrupee terms than for the first nine months of 1971/72. However, in dollarterms the increment was less -- at 1,8 percent -- because of the depreciationof the rupee in the course of 19721(. Furthermore, the total includes pro-bably about Rs 650 million in exports to Bangladesh which are being financedmostly through Indian assistance. Excluding these, the dollar increment wasabout 13 percent (about US$1,715 million compared with US$1,520 million inApril - De mber 1971). For the full year, again excluding all exports toBangladeshW, we estimate exports at US$2,290 million. The latter figuretakes into account the probability that export performance in the finalquarter of 1972/73 has weakened. Assuming it is correct, this representsa 10 percent increase as compared with 1971/72. This is indeed a welcomeimprovement, but it should not provide grounds for complacency. For a gooddea;L of it was due to exceptionally favorable market conditions for severalimportant items (leather, oilcakes and marine products) and the continuationof heavy sales of jute goods as the Bangladesh industry took time to recover.
I/ From June 1966 to December 1971, the exchange rate was fixed at Rs 7.5to the US dollar. As a result of the exchange rate changes in December1971, the rupee was revalued against the dollar by 3.04 percent; butagainst all the other major currencies it was depreciated. The rupeewas thereafter linked with sterling, and when sterling began to floatdown in June 1972 the rupee depreciated with it. The rupee/dollar ratefor the rest of 1972/73 was between Rs 7.7 and Rs 8.1 to the dollaruntil the dollar devaluation in February 1973. The rupee, still linkedwith sterling, then appreciated against the dollar once again, but notby the full amount of the devaluation. In mid-March the rate stood atabout Rs 7.6 to the dollar. Weighting the changed relationship of therupee to other currencies by the relative importance of India's exportsto the countries in question, we have calculated that the rupee waseffectively depreciated over the complete period December 1971 toMarch 1973 by about 13 percent. However, this calculation ignores thefact that India's competitiveness vis-a-vis other LDC exporters such asPakistan and Korea declined, because their currencies depreciated sig-nificantly more than India's.
g/ Total exports to Bangladesh in 1972/73 are likely to be of the order ofRs 1,500 million. Indian assistance, which according to revised estimatesin the 1972/73 budget will have totalled Rs 1,415 million, accounts fornearly all of it. However, possibly not more than Rs 1,000 million willbe recorded in the export figures because the customs authorities havenot been able to keep track of all shipments. Exports to Bangladesh in1971/72 were excluded altogether from the commodity-wise export figures,but a figure of Rs 380 million has been added to the total in officialstatements (e.g. Economic Survey, 1972/73, p. 163) to cover them. Thefigures for 1971/72 in this Report exclude this addition on account ofBangladesh.

- 114 -
The disappointing feature of 1972/73 has been the sluggishness of engineer-ing and other non-traditional exports.
Direction of Exports
10.5 The direction of exports changed considerably over the pastdecade or so, as the following table indicates:
DESTINATION OF EXPORTS(percent)
1960/61 1965/66 1971/72
W. Europe 36.3 27.3 20.8E. Europe (including USSR) 7.5 19.4 21.9USA 15.5 18.3 16.8Japan 5.3 7.1 11.6Others 35-.4 27.9 28.9
100.0 100.0 100.0
Source: Appendix Table 3.2
The relative share of Western Europe declined very substantially, and evenin absolute terms there was a small reduction. This reflected entirely thedeclining importance of exports to India's largest traditional customer, theUK. The USA's share remained about the same, while Japan's more than doubled.The most striking increase was in the share of the Eastern European countries.Most of it took place in the early 1960's, when increasing purchases by thesecountries were an important factor in total export gtowth. Eastern Europe'sshare continued to increase in the late 1960's, but at a much reduced pace.Although full figures are not available, it seems that much of the 1972/73export growth is accounted for by larger purchases by Eastern Europe.
The Composition of Exports
10.6 The composition of exports can be conveniently thought of as com-prising two main groups: traditional items which are mainly agro-based andinclude cotton and jute textiles; and non-traditional items, which are mainlymanufactured goods, but also include primary products such as fish and ironore, exports of Which are of recent origin.

- 115 -
10.7 Most o1 the increase in total exports in the early part of the1960's was accounted for by traditional items, principally jute manu-factures. In percentage terms the non-traditional group grew very fast,partly reflecting the greater priority given to exports in the Third Planthan previously. But their impact on total exports was still relativelysmall. Then in the middle and late 1960's traditional items registered asubstantial decline. Meanwhile, non-traditional items continued to growrapidly, more than offsetting the decline in the traditional group.Finally, the last two years have seen a reversal -- stagnation in non-traditional exports, but a revival of the traditional group.
Traditional Exports
10.8 The performance of the main traditional exports is summarizedin the following table:
PRINCIPAL TRADITIONAL EXPORTS(US$ million)
1960/61 - 1964/65 - 1968/69 - 1971/72 1972/731961/62 1965/66 1969/70 (estimate)
Jute manufactures 295 369k 284 356 310Cotton piecegoods 111 11g 93 103 130Tea 258 251 187 210 210Leather 53 58 102 122 195Oilcakes 33 78 61 54 85Tobacco 32 46 45 61 80Cashew kernels 40 59 79 82 90Spices 36 42 39 48 50Coffee 17 28 25 30 32
TOTAL 875 1,050 915 1,066 1,167
Source: Appendix Table 3e1
10.9 Traditional exports might have done better than they did,especially in the late 1960's. A first indication is that India's share inworld exports of all of the above items, with the exception of leather andcoffee, declined during the 1960's. Inadequate export availabilities, un-competitive prices, and insufficient effort to "trade-up" or improve qualityso as to secure better unit values, generally characterized the situation.Hindsight suggests that the Government contributed to this by levying heavyexport duties after the 1966 devaluation on all of the items except cottonpiecegoods and cashews, thus to a large extent obviating the devaluation --

- 116 -
when greater profitability from exporting and/or more competitive priceswere required. Moreover, in contrast to so many import substitutingactivities, very little priority was given to production programs. Evenin the case of tea, where -world prices were falling, India should not havebeen willing to lose her market share, given the premium on foreign exchange.in general, it would have paid the Government to have devoted more resourcesto traditional exports by way of export duties foregone and more activeassistance generally. This having been said, more atterntion is now beinggiven to this group than in the 1960's, but much more still needs to bedone.
10.10 The three most important items (jute goods, tea and cotton piece-goods) performed worst of all in the face of generally unfavorable externalfactors. Exports of jute manufactures declined continuously from 1967/68to 1970/71. They faced exceptional difficulties on account of growingcompetition from the erstwhile East Pakistan and from synthetics. indiadid "trade-up", moving increasingly from sacking to hessian, and then tocarpet-backing. It is doubtful whether lower prices would have stemmedthe competition from Pakistan; but they would certainly have reduced thelarge inroads made by synthetics. This might not have resulted in higherexport values, but it would have made the futuie of jute mudh rore securethan it is today. Lower priced raw jute, resulting from a more vigorousjute program, and a more lenient fiscal policy would have helped. As men-tioned earlier, there was a sharp recovery in 1971/72, which continued into1972/73, caused by events in Bangladesh.
10.11 Tea exports stagnated in volume terms because production increasedonly just fast enough to satisfy domestic demand. With prices falling, ex-port values declined. Output could have risen faster had there been adequateinvestment; but given the existence of heavy excise duties, and export dutiesuntil 1970, the industry's low profitability did not justify or permit it.Uncertainties about the role of foreign-owrned plantations also contributedto the industryts problems.
10.12 In cotton piecegoods, export markets did not expand much owing tothe worldwide switch-over to blended fabrics. in addition, because of highcost raw cotton and very low productivity combined with rising wages, India'scompetitive position declined. In the last few years, India was unable evento fill her duty-free quota in the UK. Moreover, India has not moved intothe much more buoyant trade in blended fabrics because man-made fibres werenot available at reasonable prices. In 1972/73 several factors cornbined tomake for a large export increase; the world market for cotton fabrics wasitself more buoyant, resulting in higher prices; there were very largesales to the USSR, which under a special agreement had supplied the rawcotton; and following threats of compulsion from the Government, the industryimposed on itself a system of compulsory exports.
10.13 Leather exports increased rapidly in the late 1960's, but nearlyall in semi-finished form. The excellent opportunities for exporting highervalue finished leather and leather goods were not exploited. Lack ofspecialized equipment and quality finishing materials, as well as lack of

- 117 -
technical know-how, were largely responsible. In 1972/73 overseas demandhas been very strong, resulting in a very large export increase mainly invalue terms; but exports were still overwhelmingly semi-finished leather.The Government has recently announced restrictions on exports of semi-finished leather, which in future will be "canalized" through the StateTrading Corporation; and has declared its intention to help the industryshift over to finished leather and leather goods.
10.14 Exports of oilcakes have fluctuated largely as a residual off-take from a highly unreliable groundnut crop. Hardly anything was done byGovernment agencies to raise groundnut output, or to increase the crushingof this and other oilseeds. In 1972/73 exports have soared in value termsbecause of the sudden shortage of animal feeds in world markets. Intobacco likewise, production programs were neglected and quality remainedpoor. Though exports increased, particularly in the last two years withheavy purchases by USSR, the excellent market for flue-cured tobacco wasnot taken sufficient advantage of, especially when Rhodesia went out ofthe market.
10.15 The export performance of cashew kernels looks impressive; butin terms of net earnings it was less so, because the export increase wasbased entirely on larger imports on unprocessed nuts. Local productionof cashewnuts did not progress owing to inadequate prices and the absenceof a concerted production program.
,0.16 As regards spices, both production and exports of the two mainones, pepper and cardamon, were more or less stagnant. In both, India'spreponderant world market share declined, and in pepper India was increas-ingly priced out of Western markets. The growth of exports in value termswas due to a healthy expansion of minor spices, and higher prices forcardamon. As for coffee, production did increase, as did exports; andgiven the market limitations, exports could hardly have done any better.However, all of the increase and more was to East Europe as exports to freeforeign exchange markets dropped by about 50 percent.
Non-traditional Exports
10.17 The record of the principal non-traditional items is shown inthe following table:

- 118 -
PRINCIPAL NON-TRADITIONAL EXPORTS(US$ million)
1960/61- 1964/65- 1968/o9- 1970/71 1971/72 1972/731961/62 1965/66 1969/70 (adjusted) (estimates)
Engineenggoods-I 16 33 105 147 142 145
Iron and steely 17 14 101 101 51 40Chemicals and
allied products 7 16 26 37 37 35Clothing 2 11 24 38 47 63Gems n.s, 29 59 53 69 90Fish 9 14 36 40 56 80Iron Ore 55 83 122 148 141 140
TOTAL 106 200 473 562 543 593
%/ The Ministry of Commerce has recently broadened the category of "engineeringgoods" to include several items previously included under "iron and steel".The latter has been correspondingly narrowed. In this report we are usingthe old classification.
Source: Appendix Table 3.1
Although starting from a low base, these exports as a group registered anincrease of over 20 percent per annum throughout the 1960's. The itemshaving the largest absolute increases were engineering goods, iron ore andiron and steel. In the last two years, the first two of these have stagnatedwhile the third has declined by half. Chemicals have also fallen off some-what. While the remaining items continued to increase, expansion in the groupas a whole has been halted. In the following paragraphs, we will try toexplain this changed situation. First, we discuss the primary products andthen the manufactured items.
10.18 Iron ore exports increased from 10 million tons in 1961/62to about 20 million tons in 1970/71, and probably 21 million tons in 1972/73.The major market is Japan, though as a proportion of Japan's iron ore importsindia's share has declined. There have been sizeable additions to exportearnings from the expansion, but judged against the performance of othercountries India's record has not been particularly impressive. The main con-straint has been poor internal transportation and inadequate port facilities.India has been slaw to improve them, several port projects in particularhaving been inordinately delayed. The stagnation of exports in the last

- 119 -
two years cannot really be attributed to the Japanese steel recession2l,since in view of the infrastructural bottleneck larger export supplieswould not have been available. However, the sharp increase in freightrates has reduced earnings on the residual exports to Europe.
1029 arine product exports (mainly shrimps) have grown spectacularlysince the mid-1960's, helped by devaluation and rising unit values. Mostof the large increase in 1972/73 is due to higher prices. Growth could havebeen faster still if off-shore fishing had developed as originally planned.Because of restrictions on imports, trawlers have been slow to be introduced.
10,20 Exports of gems -- mainly cut and polished diamonds -- onlystarted in the 1960's. The rough diamonds have to be imported, but evenso net export earnings have becorne quite large (about US$35 million in1972/73). Here is a rare example -- the other main one being that of cashews-- of a flexible import policy combined with India's cheap labor being suc-cessfully used to further exports. It is an example that ought to be followedin the case of other labor intensive export products. The experience of gems,and in particular the special scheme under which rough diamonds are imported,shows that it is possible to organize the import of raw materials for con-version into exports, without their being diverted on an unduly large scaleto domestic usage.
10.21 A prime candidate for a more flexible import policy is clothingexports. India has barely participated in the fast growing internationaltrade in clothing. Exports were only US$24 million in 1971/72, comparedwith US$1.6 billion (in 1971) for the three major LDC exporters, Hong Kong,Korea and Taiwan. The key problem is the very high cost of blended fabric;imports are no-t allowed. Consequently, India's exports have been confinedmainly to cotton garments, which have only about a quarter of the inter-national clothing trade and have grown relatively slowly. Even in cottongarments, India has been at a disadvantage because of higher cost cottonfabrics. India has been virtually excluded from the high volume marketsin the West, and has had to concentrate instead on modish items. Thisrequires first-class marketing, which on the whole has been limited. Never-theless, exports have increased, with a doubling in the last two years. Thelargest buyer has been the USSR. But there has also been considerableexpansion into Western markets, particularly in Scandinavia; the "mod"market is growing rapidly and Indian manufacturers are becoming more sen-sitive to its changing requirements.
10.22 Iron and steel became an important export in the late 1960's,because of the recession in the engineering industries which created somesurpluses. in the last two or three years, the situation has reversed assubstantial shortages emerged; and consequently exports have fallen. There
j India's iron ore exports to Japan actually increased from 16.9 milliontons in 1970/71 to 17,3 million tons in 1971/72, and probably 18 milliontons in 1972/73.

- 120 -
continues to be a surplus of pig iron and certain flat products, whichexplains why exports (about US$40 million in 1972/73) are still fairlylarge.
10.23 Exports of chemicals and engineering goods increased by over4 and 6 times respectively during the 1960's. At the beginnming the expansionwas primarily the result of the various export subsidy schemes built up inthe early 1960's. The 1966 devaluation, and new export incentive schemeswhich followed shortly afterwards, probably raised the profitability fromexporting on the majority of items. However, in the case of engineering goodsthe major push to exports in the mid-Sixties came from the recession, whichespecially affected the engineering industry and forced many firms to lookfor sales abroad for the first time. Exports increased from US$31 millionin 1966/67 to about US$147 million in 1970/71. Major items to emerge werecommercial vehicles, industrial machinery, steel pipes and tubes, electricwires and cables, bicycles, iron and steel castings, machine tools, handtools and small tools, and electrical equipment.
10.24 Unfortunately, the impressive record of the 1960's has not beenmaintained, as both chemical and engineering exports have either stagnatedor marginally fallen in the last two years. In chemicals, the reason is,essentially lack of productive capacity, combined with profitability fromexporting which is by all accounts considerably lower than from sellingdomestically. The level of exports is partly being maintained because ofcompulsory exports for pharmaceuticals. The position of engineering good.sis more complex.
10.25 Despite the rapid advance up to 1970/71, engineering exportsremained a marginal activity for most firms. In 1970/71, exports representedonly about 5 percent of the engineering sector's output; but this in itselfwas no cause for concern. Considering the low base at which exports stoodin the mid-Sixties and the difficulties of exporting for the first time, itwould have been surprising if the proportion reached had been higher thanthis. The marginality of exports was more in relation to their profitability.Exporting was conaidered worth doing only because, at the margin, profitscould be made; profits on domestic sales were considerably higher. Thepackage of export incentives in 1970/71 may have been worth 25 - 30 percentof f.o.b. value for engineering exports on average; but nonetheless, therupee realization from exporting, because of high domestic prices and heavydiscounts necessary for competing in new markets, was generally well below.that from selling in India, There were subsidiary reasons for exporting:a good export record could obtain preferred treat-ment in normal (Actual User)import licensing and in industrial licensing; exporting provided opportunities.for foreign travel and exposure to new ideas for product development; and itprovided some insurance against a sudden drop in domestic demand. In addition10 industries within the sector were obliged to export 5 percent of theiroutput. Since 1970, several things appear to have happened.
10.26 First, there has been a pick-up in the domestic demand for en-gineering goods, which may have had an adverse effect on exports in viewof their marginality as noted above. This would only apply as a single ex-
- 121 -
planation to _firms producing at or near full capacity. Most firms in thesector are operating at well below full, capacity. However, it is oftenthe few firms which are operating at full capacity which have the bestexport capability. TELC0, the truck manufacturer, is a good example. Forsuch firms, higher domestic demand and slowness to expand capacity -- forwhich the industrial licensing policies have been largely responsible --have contributed to the sluggishness of exports.
10.27 Second, there has been a serious shortage of steel. In 1971/72,there was an acute shortage in most branches of the engineering industry.In 1972/73, the gap between supply and demand has probably been a good dealless, but shortages have continued to be felt. Many firms may as a resulthave been operating at lower capacity than they might otherwise have been.In theory, exporting units are supposed to receive their full requirements,but in practice they do not. Given that exports are largely done at themargin, it is they that have suffered rather than domestic sales. Firmsare especially reluctant to take on new export orders when steel availabili-ties are in doubt.
10.28 Third, our impression from discussions with exporters -- thoughthis needs to be verified by detailed studies -- is that export profitabilityhas declined, so that exporting even at the margin appears less attractivethan it did. This is essentially because of the steep rise in domestic steelprices -- by about 25 percent on average since 1970. Much of this is due toincreased excise duty, which is refundable to the exporter in the dutydrawTback; but the latter operates in an unreliable and dilatory marmer,such that many exporters ignore it in calculating their returns. The greaterdependence on imported steel, because of purchases from expensive sources andtariffs, also raised costs. There has been no appreciable increase in exportincentives. The depreciation of the rupee, particularly in the last 6 months,may have improved matters -- though the attendant currency uncertainty has
al3o been a depressant.
10.29 FoLrth, there may have been a "threshold" effect. Firms whichexport fox- reasons other than profitability (preferred import licensing,foreign travel, etc.) reach a certain level of exports, and see no reason togo further. Almost by definition, this effect has operated in the case ofcompulsory exports, since the percentages have not been increased. Finally,there have been specific problems such as the dislocation in 1971 of tradewith Egypt, which had been the largest single market for engineering products;and :Latterly the power shortages.
10.30 Engineering exports cover a wide variety of items; and the situationls by no means all gloomy. An outstanding example of continuing growth isexports of small tools and hand tools, which have increased from US$6 millionin 1970/71 to US$8 million in 1971/72, and probably US$11 million in 1972/73;17 percent of the industry5s output now goes to export, and export realizationsare good, and compare reasonably with realizations from domestic sales. More-over, the contraction of low value-added items, such as steel pipes and tubes,has been no bad thing -- given the shortages of steel.

- 122 -
10.31 However5 the overall position of engineering goods, and thenewer manufactured exports in general, does warrant serious considerationin terms of the suitability of existing policies. Even if other exportsreceive more attention than in the past, the performance of this group willprimarily determine the course of exports as a whole in coming years. Clearlyin the past, the import substitution policies and the highly protective im-port control system., have both been heavily biased against exports. Much ofthis anti-export bias is irreversible in the sense that production cannotnormally be discontinued because it is high cost. What are the best policyinstruments for overcoming this bias and how should they be used? And towhat extent can the policies which have led to this bias be modified forthe future?
10.32 On the second question, we have argued in earlier reports thatthere is room for a more discriminating approach to import substitution.The greater attention which is now been given to project evaluation in thePlanning Commission augurs -well in this context. We have also argued thatsome element of foreign comDetition would be highly desirable so as to forcefirms to keep costs and profits within limits and improve their productquality; and that for this to be achieved a move from the present systemof banning imports outright once domestic production comes up, towards asystem where tariffs regulate imports, is required. At the very least, theimport control system needs to be further relaxed for the specific benefitof eaorters, so that they have greater flexibility in regard to their in-putsJ .
10.33 Thie instruments that are currently used to counter the anti-export bias of other poliaies are principally three: cash assistance, importreplenishment entitlements (REPs) and export obligations. The first twohave been in existence since 1966, when they replaced the ea-rlier incentiveschemes. They are available for most non-traditional manufactured exportproducts, and for each product separate rates are specified. Cash assistanceis paid at various rates up to a maximum of 30 percent of f.o.b.; the weightedaverage rate for engineering goods was 14.5 perzent in 1970/71, and forchemical and allied products 13,7 percent. The basis on which the selec-tion of different cash assistance rates is based is not very clear, Inorder to encourage items which have a long-run comparative advantage, theselection of rates should be such as selectively to adjust for any shortrun allocative distortions in the economy, while taking into account themarket prospects of the product in question. It is possible that the currentdifferential rates may do just this; but from what we know of the selectionmethod, which seems to concentrate on costs to the firm as compared with ex-port prices, it would be pure chance if they did. Consequently, the differ-ential rates as they stand may just as often reinforce as cormpensate forallocative distortions in the econormy.
10.34 REPs are special import licenses issued against exports. Theyare supposed to cover in value terms the import component in the various export
9] See IBR.D Economic Report, 1971, paras 5e24 to 5.38. Also EighthIndustrial Imports Credit, Presidentts Report.
- 123 -
items. They are valuable because they permit imports of certain specifiedinputs not allowed under the Actual User import policy; they can be usedfor imports from any source; they are additional to Actual User licenses;and they enjoy limited transferability.
10.35 Both schemes are aimed at making it possible for firms to ex-port by, in the first case, "compensating" for high costs in the economy,domestic fiscal policies and tariff barriers abroad; and in the secondcase, by providing some imputs at international prices. They are not in-tended to make exporting as profitabl ? as domestic sales. And in practice,taken together with the duty drawback.] and other minor export incentives,they generally do not do so. This is partly due to delays in administeringthe schemes, particularly the duty drawback. The result is that exporting,as mentioned earlier, is mostly a marginal activity; and in the last twoyears, exporting even at the margin appears to have become less profitable.
10.36 The Government at present appears to rule out the possibility ofoffering additional incentives to mrake exporting more competitive withselling domestically. Instead, it is placing increasing emphasis on thepolicy of export obligation. Compulsion was first applied in 1968/69 whennine industries became obliged to export 5 percent of their output, failingwhich they were liable to cuts in import licenses. By 1972/73 the list ofindustries had grown to twelve -- ten in engineering and 1o in chemicals.For 1973/74, five non-priority industries have been added&', and it is theGovernment's intention to expand the list further. Since 1970, exportobligations have also been imposed through the industrial licensing system.Foreign firms and firms connected with the larger houses, which wish toexpand outside the core and heavy investment sectors, have to export aminimum of 60 percent of the additional production within 3 years (and 75percent if they wish to expand in areas reserved for the small scale sector);"dominant" undertakings wishing to expand in their own lines of production aresubject to the same 60 percent; and in general, any firm in return for aninclustrial license may be required to export a certain percentage of addi-tional production. Although many firms have refrained from seeking, or havewithdrawn their applications for, industrial licenses rather than acceptthem, a growing number of expansions are under way which involve exportobligations.
10.37 If one accepts the rationale for restricting the larger housesetc., the main criticism of export obligations is that they encouragedumping: sub-standard products are exported which earn the country a badreputation, or foreign buyers pay lower prices than they would otherwise.Studies are required to determine how important this might be in practice.If it is not important, the export obligation policy could be economicallyrational if properly operated -- in the sense that firms are forced to
2/ Drawback of customs and excise duty is available on final inputs.
g/ Radio receivers, cosmetics and toiletries, playing cards, spectacleframes, and vacuum flasks.

_ 124 -
operate more in line with national interests than the distorted set ofmarket indicators would otherwise lead them to, without adding to overallprofits (which are by and large adequate). However, its effectivenessseems likelr to be limited unless it is part of a broader export promotionpolicy which includes the carrot of greater monetary reward for exportingas cormpared with selling domestically, along with the stick of compulsoryexport quotas.
The Future
10.38 The "Approach to the Fifth Plan" assumes a 7 percent per annumgrowth of exports in the Fifth Plan. This ought to be achievable with theright policies and programs. In this section we have not tried to spellout precisely what these should be, but rather to focus on the problems ofthe past. One general point is clear, however: namely that exporting willneed to receive greater attention from policy makers and administrators,and probably greater priority in the allocation of available resources.
10.39 As for 1973/74, we expect a lower growth in exports than in1972/73. There will be continued further inroads from Bangladesh in exportsof jute manufactures; the prospect for engineering exports is not veryencouraging because order books are currently low; and the market for, andthe supply of, oilcakes (which was an important growth item irn 1972/73),are likely to be a good deal less favorable. There will be off-setting in-creases. Coffee exports, for example, are likely to be substantially up, andthere should be continued increases from items such as gems, fish and leather(provided "canalization" works smoothly and restrietions on semi-finishedleather are not imposed too quickly). Cotton textile exports may quitelikely show a further improvement because of the current market buoyancy.Altogether, we estimate total exports (excluding Bangladesh) at US$2,400million, which represents a 5 percent increase over our estimate for 1972/73.

- 125 -
CrAPPER XI
ESTIMATED AID REUIRFEINT KUR 1973/74
Recent Trends in the Balance of Payments
11.1 The balance of payments for recent years is summarized in thefollowing table. Exports already having been covered in Chapter X, theother components are examined in the paragraphs which follow. The pro-jections are discussed in the final section.
TABLE 1(US$ million)
1969/70 1970/71 1971/72 1972/73 1973/74Actual Actual Actual Current Projection
Estimate A B
Exports 1,884 1,9q50 2,106 2,290 2,400 2,400Imports 2,109 2,179 2,436 2,280 2,44hQ 2,540Oof which:foodstuffs 392 337 256 150 190 190other 1 717 1,842 2,180 2,130 2,250 2,350
Trade balance - 229 - 330 + 10 - 4-140Debt service - 550 - 600 - 615 - 681 - 720 -720IX transactions - 154 - 185 - 19 __ __ __Other capital andinvisibles_/ - 56 - 227 - 269 - 258 - 200 - 200
Overall deficit 985 1 241 1,233 929 960 1 060Gross aid -To 1,096 1,319 " 7 -9 1,902/0Use of reserves
(- = increase) - 203 + 145 - 86 + 33 -- --
a Includes errom and omissions.g,/ Includes US$230 million of refugee assistance.ci Assuming same level and composition of aid commitments as in 1972/73.j Based on our estimate of the economy's minimum import need.
Source: Appendix Table 3.7
11.2 Imports in recent years have been well below the levels of the mid-Sixties, even at current prices. Between 1964/65 and 1967/68 total importsaveraged over US$2,800 million, whereas from 1969/70 to 1972/73 they averagedless than US$2,300 million. Most of the difference is accounted for by
- 126 -
nIa1Jj.efr imports of foodistuffs, but irports other than foodstuffs have beenslignt.Ly lower as well. Where foodstuffs are concerned, the reduceddependence on foreign supplies have been all to the good. As regardsother imports, it has largely been a matter of holding them back withinthe limitations of inadequate foreign exchange availabilities, althoughat times, as in 1968/69 and 1969/70, import licensing may have put con-siderable emphasis on reserve accumulation, because of growing foreignaid uncertainties.
11.3 In 1971/72 imports increased by 12 percent compared with 1970/71.Imports of foodstuffs, at US$256 million 2 !, were US$81 million lower thanin 1970/71, and over half were relief supplies for the Bangladesh refugees.Maintenance imports, which in the last few years have made up about three-quarters of the non-food import bill, increased by US$358 million, or 24percent. The main increases were in steel, imports of which were 1.4 milliontons -- double the previous year's figure; POL, to a large extent onaccount of higher prices; and components and spares. There were smallerincreases in fertilizers and raw cotton imports. Imports of complete mach-inery and equipment at US$259 million, were just about-the same as in theprevious three years.
11.4 The latest customs figures for 1972/73 show total imports forthe first three quarters at Rs 12.31 billion, which, calculated on a monthby month basis at the appropriate exchange rate, works out at only US$1,608million, 12 percent lower than for the same period of 1971/72. Commodity-wise data for the months up to August indicate substantlally lower importsin value terms of foodstuffs, cotto.n, fertilizers, non-ferrous metals, andseveral smaller items. Imports of machinery and equipment (including com-ponents and spares) were slightly up, while steel and POL were about thesame as in the corresponding months of 1971/72.
11.5 Imports in the final quarter of 1972/73 are likely to have pickedup very considerably. As a result of the poor kharif crop, the Governmentdecided to purchase 2 million tons of foodgrains. By the beginning of April,actual orders placed amounted to 1.65 million tons, of which 680,000 tonshad arrived at a c.i.f. cost of about US$75 million. In addition, oils andfats imports, which were unusually low in the early part of the year, haveincreased considerably following the poor groundnut crop. Fertilizer ship-ments have also picked up substantially. The outcome for 1972/73 as a wholemay be a total import level of about US$2,280 million, with non-food importsat US$2,130 million, slightly lower than in 1971/72.
11.6 The coincidence of lower non-food imports with a somewhat improvedindustrial performance is less strange than it may seem. A good part of thehigher industrial output has come from the cotton textile industry, which has
1/ Consistirng of US$176 million for foodgrains and US$80 million for dairyproducts, vegetable oils and oilseeds.

- 127 -
managed with lower cotton imports because of the large stock carry-over fromthe 1971 bumper crop. Total steel availabilities have risen because ofhigher production (which itself has been an Lmportant element in the betterindustrial picture) and imports at about the same level as in 1971/72.Furthermore, in general the relatively high import levels of 1971/72 wouldhave had soimie lagged effect on production in 1972/73. On the other hand,there have continued to be raw material shortages in many industries, butfor which production could have been higher. In the last few months, thepower shortage may have taken over in many areas as the critical constrainton output -- such that larger imports would not have helped. In agriculture,there has been a serious shortage of fertilizers. Fertilizer imports havebeen well up on 1971/72, but the bulk of shipments have been in the latterpart of the year. Earlier in the year larger imports were just not availablefor purchase in the international market.
11.7 The low level of non-food imports in the early part of 1972/73 1/may seem surprising in the light of the import licensing figures for 1971/72,(Imports normally reflect licensing with a o-9 months lag.) Import licensingof the principal categories was 13 percent higher than in 1970/71, with noslowing down in the latter half of the year. However, the licensing figuresdo include most of the US$88 million of licenses which became unuseablefollowing the suspension of US assistance in December 1971: these were notall reallocated against other funds) and even where they were it took severalmonths; and those reallocated may have been counted twice. Licensing datafor the first 9 months of 1972/73 indicate a 5 percent decrease as comparedwith 1971/72; but the Government believes the figures are incomplete, sincerecommendations for license issuance (which are usually just about the same)are slightly up. Nonetheless, it seems clear that, as compared with thelacrease in licensing in the previous two years, licensing has not beenallowed to increase very much further.
11.8 The de cl,ine in imports combined with the estimated 9 percent in-crease in exportsg has brought trade approximately into balance in 1972/73,compared with a trade deficit of US$330 million in 1971/72. Despite a con-siderable increase in debt service payments, the overall deficit has fallenby rather more, owing to the apparent fall in the net out-go on "other capitaland invisiblesr?. It has been financed by US$896 million in aid disbursementsand US$33 million in draw-down of reserves.
11,9 While debt service paymnents now constitute the largest part ofthe overall deficit, in each of the last three years the item "other capitaland invisibles" has contributed US$250 - 350 million of it. In our presenta-tion, this is the residual item, and therefore includes errors and omissions.
j/ See Economic Survey, 1972/73. Table XI.
g/ As in ChaDter X, we exclude all exports to Bangladesh, since, beingfinanced mostly by Indian assistance in the form of grants, they donot earn India any claim on foreign resources.

- 128 -
Since our trade figures are on a shipment basis, it also includes paymentsleads and lags. It is some comment on the statistical system that both weand thie Government are obliged, in our current estimates, to derive such aliarg .e.TLe itetn as a residual. The Reserve Bank's balance of paymentsestimates are currently available only up to December 1971; they are alsoless complete and less revealing than they should be. They contain, forexample, no identifiable information on rupee area transactions, eventhough India's rupee trade now accounts for about one-quarter of totaltrade.
11.10 The Reserve Bank figures, which are on a payments basis, showa trade deficit for 1970/71 US$195 million higher than in our table -- pre-sumably because of payments leads and lags-. This would explain a largepart of the out-go under "other capital and invisibles" in our table for1970/71. Offsetting this somewhat, the items not specified in our tablebut shown by the Reserve Bank -- namely factor and non-factor servicesother than debt service, transfer payments, and long-term private capital-- all lumped together showed a small surplus of US$38 million. However,we also know that India had a payments surplus with Eastern Europe(including USSR) in 1970/71: since surpluses with these countries are re-flected in the "rupee balances" rather than the foreign exchange reserves,it would also show up as "minus" under "other capital and invisibles" (seeparagraphs 11.13 - 11.18). If imports have been under-recorded, they wouldalso show up as a "minus" under this head.
11.11 The even larger out-go under this residual item for 1971/72 and1972/73 may be explained by the same factors, although it would be sur-prising if payments leads and lags operated in the same direction in threesuccessive years. On the basis of trade and aid data, India again had alarge payments surplus with Eastern Europe in 1971/72, and the same againseems likely in 1972/73.
11.12 Wihile these are some of the reasons for the large outflow under"other capital and invisibles" in the past, they do not much help Us orthe Government in forecasting the future. Since it has become of late sucha relatively large component of the overall deficit, special efforts areneeded to improve the balance of payments data base, so that more timelyand accurate statistics become available, covering not only trade but alsoinvisibles and capital account items.
India's Trade and Aid Relationship with East European Countries
11.13 Throughout the 1960's India's trade with East European countriesincluding the USSR expanded much more rapidly than her trade with the restof the world with the result that in 1971/72, 22 percent of exports and 11percent of imports were to and from East Europe as compared with 7.5 and 4
i/ Possibly also our downward adjustment of the official export figure istoo small -- see Chapter X, para 10.3 footnote 2.
- 129 -
percent respectively in 1960/61-/. India's transactions with these countriesare conducted within the framework of annual agreements. Over time, theseaim at balancing payments, on account of non-aid imports and debt service,with receipts, on account of exports. When full balance is not achieved inany one period, this is reflected in movements in the trading partners; rupeebalances with the Reserve Bank of India. When India's overall transactionswith a particular trading partner are in surplus these balances decrease;when Indiats transactions are in deficit, the balances increase. Aid financedimports involve no immediate payment and do not, therefore, affect the rupeebalances in the year of the irnport transaction.
11.14 Because of the magnitude of India's trade and aid relationship withthese countries, it is important to assess its overall impact on India's balanceof payments. Four interrelat-ed questions suggest themselves in this connection:
i. Does the relationship put a pressure on India's foreign exchangereserves?
ii. How do the prices of exports to and imports from East Europecompare with the prices of similar commodities Ln India's tradewith other countries?
iii. Is the composition of India's trade with these countries suchthat the magnitude of exports which could earn free foreignexchange elsewhere is at least equal to the magnitude of essentialraw materials and capital goods for which India would have tospend free foreign exchange in any case?
iv. Does the overall relationship provide India with a net inflowof resources to assist her development effort?
11i15 The aid and trade relationship with East Europe certainly does notplace any direct pressure on India's foreign exchange reserves. If there areany payments deficits, these are reflected in the first instance by increasesof the non-convertible rupee balances held by these countries in the ReserveBank. These balances are ultimately worked off only in the form of increasedexports of goods and servicea.
2/ Over the same period there was a large increase in Eastern Europeantrade with the rest of the world. The growth in India's trade withEastern Europe is roughly in line with the trends in trade betweenEastern Europe and the rest of the world, though with some differencesin tiinLg. Thus, starting from a very low base India's exports grewrapidly in the early 1960's (an approximately three-fold increase be-tween 1960 and 1965), bUt thereafter slowed down considerably and in-creased by only about 33 percent between 1965 and 1970. In contrast,total international exports to Eastern Europe grew rather more steadilywith a slower growth than India's in the first half of the decade (anincrease of around 45 percent between 1960 and 1965) but a faster growthin the latter half (an increase of approximately 50 percent between1965 and 1')70).

- 130 -
11.16 Whether there is any indirect effect on India's foreign exchangereserves depends on the composition and the terms of trade. Insofar as theterms of trade are concerned the available information indicates that pricesof Indian exports to East Europe on the whole are higher than the averageprices received in other markets. In regards to imports it is harder tomake any generalizations since homogenous commodities which can be easilycompared account for a small proportion of total imports. However, to theextent that comparisons can be made, prices appear comparable to the averageprices of imports from elsewhere. Insofar as the composition of this tradeis concerned, at present traditional exports constitute about 65 percent oftotal exports as compared with about 50 percent in 1967/68. On the otherhand, with the exception of an undetermined amount of strategic imports, allof India's inports from East Europe consist of essential raw materials andcapital goods. Equally important is the fact that India has been ablecontinually to expand the list of items which can be imported from thesecountries. Historically there have been some problems in affecting theimports agreed upon. To the extent that this was caused by individualIndian importerst lack of familiarity with East European products and pro-cedures the increasing canalization of India's trade through public sectortrading corporations has been helpful.
11.17 Insofar as the resource position is concerned, on the basis ofstatistics on aid disbursements, debt service, and changes in the rupeebalances held by East European countries, over the three years 1970/71 -1972/73, debt service exceeded aid receipts by a cumulative total of US$187million equivalent. In addition, the East European countries taken as agroup also drew down their previously accumulated rupee balances by US$45million equivalent over the same period, resulting in an overal+fpetresource transfer from India of about US$232 million equivalent_/. Theterms 2 9 f aid are also relatively unfavorable as measured in grant elementterms- .
11.18 The net negative aid situation has existed in spite of a largepipeline of comnitted East European aid -- about US$530 million at present.
j This is inconsistent with the available trade statistics which show alarger net transfer from India during the same period -- about US$470million. While a fully satisfactory explanation for this discrepancyis not available, inaccuracies of trade statistics, considerable under-recording of imports -- possibly of strategic equipment, the exclusionof the services of East European experts and other usual "errors andomissions" are undoubtedly part of the explanation.
/ For example, Soviet credits hatve generally carried a 21 percent interestrate and have been repayable over a period of 12 years starting one yearafter the completion of deliveries of equipment. The grant element forthe Bokaro credit, for example, is about 35 percent, compared to theConsortium average for all loans and grants during the 1960ts of around70 perceet.
- 131 -
The reason for this anomaly is slow disbursement despite the size of thepipeline. Disbursements have fallen from US$104 million in 1968/69 to onlyUS$24 million in 1971/72 and an estimated US$39 million in the past year.This reflects delays in earmarking the aid to specific projects as well asprolonged delays in project implementation in the field of heavy industryr,especially the Bokaro steel plant for which a large part of the present aidis committed. As a result of recent Indi-Soviet discussions, the expectationis for a large increase in aid-financed imports for Fifth Plan projects in-cluding expansion of the steel industry and other heavy industry projects.Thus, the Government expects that India's recent negative net aid positionwith the USSR and other East European countries will be reversed during theF.fth Plan period.
Foreign Exchange Reserves
11.19 As compared with the very low levels prevailing through most ofthe Sixties, India's reserve position strengthened very considerably inthe first three years of the Fourth Plan. Overall reserves (including India'sIMF gold tranche) were US$1,277 million at the end of 1971/72, up from US$769dfallion at the beginning of 1969/70 -- an increase of US$508 million.
11.20 In 1969/70 and 1970/71 India completed her repayments to theInternational Monetary Fund against the use of Eund credit, which at thestart of 1969/70 stood at US$340 million. Adding this, her net reserveposition improved by US$848 million over the three years 1969/70-1971/72.Of this total increment, US$408 million was generated by the balance of pay-ment itself (mostly in 1969/70); US$335 million was due to SDR allocations;US$17.5 million to use of previously non-monetary gold; US$13 million toforeign exchange held on behalf of Bangladesh; and US$66 million to theef.fect of exchange rate changes2/.
11.21 At the end of March 1973, overall reserves stood at US$1.,231in(dicating a fall of US$46 million since the beginning of 1972/73. Repay-ment to Bangladesh of the US$13 million held by India accounted for partof the fall; the balance of US$33 million was due to the net deficit inother balance of payments transactionsj/.
1/ US$3 million of the increment is unexplained.
EThese figu=es are at the post-Smithsonian exchange rates. Taking intoaccount the dollar devaluation of February 1973, the decline in reservesduring 1972/73 would have been more than recovered -- because of therevaluation of assets other than dollars. On the other hand, it maybe noted that India's sterling assets have continued to be valued atthe rate of US$2.60571 = b1 established in December 1971. Since theactual dollar-sterling rate has been consideribly less than this sinceJune 1972, in this respect there has been an element of over-valuationof Indials reserves.

- 132 -
11.22 India's reserves are just over 40 percent of estimated importsand debt service payments in 1972/73. Despite the decline during 1972/73,the position appears adequate. However, any complacency has to be temperedby the fact that "secondary reserves" in the form of foodgrain stocks havefallen during the year by a1bout 5 million tons, which at current internationalprices is the equivalent of about US$550 million.
External assistance
11.23 Latest data on gross and net aid are given in the following table.The country-by-country breakdown of these data for 1971/72 and 1972/73 aregiven -in Appendix Table 3.10.
TABLE 2GROSS AND NET AID TRANS.PERS
(UTS$ million)
1964/65- 1c969/70 1970/71 '1971/72 1972/731967/68 EstimateAverage
Gross aid disbursements 1,561 1,188 1,096 1,089&' 896of which:Project aid (567) (314) (321) (352) (399)Non-project aid (in-cluding debt relief) (472) (585) (573) (579) (484)Non-food PL1480 (38) (44) (25) (23) __Food aid (484) (245) (177) (135) (13)
Less: debt service 345 C50 600 615 681
Net aid transfer 1,216 638 496 474 215
a/ Excluding refugee assistance.
11.24 Gross aid disbursements increased rapidly in the early 1960's.Between 1964j/65 and 1967/68 they more or less levelled off at an annualaverage of US$1,561 million. Since 1967/68 there has been a year-by-yeardecline -- to an estimated low of US$896 million in 1972/73. Comparing theaverage for 1964/65 - 1967/68 with estimates for 1972/73, 70 percent of thedecline was accounted for by the reduction in food aid. Food aid in 1972/73was a mere US$13 million compared with US$538 million at its peak in 1966/67.In recent years non-project assistance has been the largest component in thetotal, whereas in the earlier period project aid predominated.
11.25 Debt service has been mounting yearly, and consequently the nettransfer of aid has fallen by much more than gross disbursements. From

- 133
an average of US$1,216 million in 1964/65 - 1967/68, the net transfer de-clined to an estimated US$215 million in 1y72/73. The decline in the nettransfer has been rather less in the case of Consortium assistance -- froman average of US$1,146 million to US$294 million in 1972/73. Net assistancefrom non-Consortiium countries has fallen from an average of US$78 millionin 1964/65 - 1967/68 to a negative amolnt in each of the last three years,as previously indicated.
11 .26 Aggregate data on new project and non-project commitments and onthe pipeline in 1971/72 and 1972/73 are given in the following table. Sup-porting countirwise information is sho-mn in Appendix Table 3.9. The figuresfor 1973/71 are based on o-r recommerbndations in the next section.
TABL- 3(US'a Xitllion)
1571/72 1972/73 1973/74Actual Estimate Recommended
Total new commitments 1,084 889 1,200
Project assL inC
Opening pipeline 1,399 X,76 / 1 , 7 5 0vNew commitments 694 341 500Disbursements 352 399 400Closing pipeline 1,741 1,712 1,850
Non-project assistance
Opening pipeline 577 41 6J 50 New commitments 390 548 700Disbursements 579 497-' 660Closing pipeline 388 467 540
1/ Opening pipeline adjusted to take into account exchange rate changesduring preceding year.
&/ Includes US$13 million of food aid.
Source: Appendix Table 3.9
11.27 New commaitrments in 1972/73 totalled US$889 million or about thesame as disbursements. The commitments were composed of US$548 million of

-134k -
non-project aid (including US$13 million for food) and US$341 million ofproject aid. In aggregate, they were nearly US$200 million lower thanin 1971/72 entirely on account of a sharp fall in project commitments.
11.28 Project commitments in 1972/73 were only about half the levelof 1971/72. This was to a large extent the result of lower commitments byIDA and IBRD, which only reflects timning differences: taking the Bank'sfiscal year (July to June), Bank Group project commitments will be higherthis year than last. There were no new commitments from non-Consortiumcountries. The rate of utilization improved somewhat -- from 17 percentof total availabilities in 1971/72 to 19 percent in 1972/73. At the startof 1973/74, after adjusting for the latest currency realignments the totalproject pipeline stood at about US$1,750 million, including US$532 millionfrom non-Consortium countries.
11.29 New non-project commitments were a good deal higher compared with1971/72; but were well below the minimum level of US$700 millioi which werecommended in last year's report. Non-project commitments included debtrelief to an amount of approximately US$160 million, which was provrided bymembers of the,gonsortium following multilateral discussions dLuilqr thecourse of 197221. In addition, Italy made her contributioux for twvo yearsunder the earlier Guindey debt exercise.
11.30 The opening pipeline for non-project aid i_n i)``2/73 shown aboveis in a sense overstated, since it, include5 t ie 'J,$6b3 oIillion of US assistancewhich was suspended in Decerb,e-i9 71. Taking this into accowut, the rate ofutilization of non-project assistance was, by the standards of earlie-r years,satisfactory. In the past few years, disbursement and other procedu.reas havebecome more flexible in a number of bilateral aid programs. This has madepossible the faster disbursement achieved. At the same tine, se erai donorswould have liked their assistance to have been utilized faster, and it isnow partly up to the Goverrnent tc aDllow faster- utiLIzatio'i -y taking fulladvantage of the extia flex-ibility that >s now av-ailable, -Ar'ne, non-projectpipeline at the end of 1972/73 stooci at about U0$5C00 m- aJ after adjust-ment for the latest currency realini,gients, TJ384 `)ilIL1,. igher than at thestart of the year.
2/ At the time of writing, the USA hadr not yet sagrneci an agreementcovering its debt relief contributionA. Bwt debt relief in the amountrecorded in the Record of Understand nz lias been efiecteud Japanagreed to provide US$43 million in deot relief, but because of theitime schedule of debt service paymenLs wras only able to make US$38million available in 1972/73; the balarnce will be provided in 1973/74.The total of US$160 million is made of US$146 million under the Coombsagreement plus approximately US$14 million from Italy in respect ofobligations incurred under the '2ruirndey exercise.
P/ This includes the US$88 miliion of US non-project assistance, whosesuspension has now been lifted.

- 135 -
Balance of Payments Projection and Aid Recommendation for 1 973/74
11.31 In earlier reports, we have been able to forecast exports with afair degree of accuracy. Our import forecasts, however, have tended to besubstantially on the high side. The reason for tuhis is that we have madeour projection largely on the basis of the import level we considered was-equired -- with the qualification that this would come about only if adequateaid were made available and there were adequate licensing of imports, bothof which were essential for a revival of industrial production. In practiceaid availabilities have fallen well short of requirements, and the Governmenthas by and large adjusted for this in its import licensing. As a result,imports have turned out lower than projected.
11.32 In this Report we make two projections, which are shown as A and13 in Table 2. The first shows what would be the probable level of importsif new aid commitments were the same as in 1972/73. The second is basedon our estimate of the economy's minimum import need for sustaining currentlevels of economic activity.
I11.33 As indicated in Chapter X, we expect a 5 percent growth rate for
exports -- considerably lower than in 1972/73. Debt service pay-ments areestimated at US$720 million, taking into account the latest currency re-alignments. "Other capital and invisibles" are forecast by the Governmentas a net out-go of US$176 million. Since there has previously been a ten-dency to under-estimate this item, we have increased it to US$200 million.
11.34 The Government is not at present contemplating any drawdown ofreserves. We consider this to be correct in view of the fact that foodgrainstocks have been virtually eliminated, and current plaVs are only to import1.3 million tons of grain in 1973/74 to replenish themJL'. In other words,the present level of reserves is required as a stand-by in the event ofanother bad or even moderate monsoon, in which case they would be needed,possibly in very substantial amounts, for foodgrain imports. In Table 1,imports of foodstuffs in 1973/74 are shown as US$190 million; this coma-prises US$140 million for presently planned foodgrain imports, and US$50million which will probably have to be spent on other foodstuffs, principallyedible oils.
11.35 In regard to external assistance, we first make the assumptionthat new commitments would be the same as in 1972/73 -- namely approximatelyUS$550 million of non-project assistance (including US$160 million of debtrelief and US.340 million of project assistance. This is not to say thatthey should not be higher, but simply to illustrate the import implicationsof new aid in this amount. Let us also assume the same rate of disburse-ment out of new commitments and out of the opening pipeline as in 1 972/73Y.
1/ This is the balance of the 2 million tons of grain which the Governrmentdecided to import a few months ago, see para 11.5.
j The disbursement rate out of the pipeline has been adjusted upwards totake into account the fact that most of the US non-project pipeline wasblocked in 1972/73.
- 136 -
Total disbursements would then be US$960 million. This is higher than in1972/73 both because of the higher opening non-project pipeline and becauseof the unblocking of the US pipeline.
11,36 Taking this as an illustrative assumption on gross aid disburse-ments together with our estimate for the other items, we arrive at totalimports for 1973/74 at US$2,440 million; and subtracting the US$190 millionset aside for imports of foodstuffs, at UTS32,250 million foIr non-food im-ports. Total imnports would of course be higher than indicated irrespectiveof aid availabilities, if larger food imports are required and are financedout of reserves.
11.37 The figure indicated on this basis for non-food imports is US$120million higher than our estimate for 1972/73. The level of import licensingis likely to be more than sufficient to support an increase of this magnitude.As mentioned earlier the:level of import licensing in 1972/73 is not entirelyclear], but there has probably been a small increase; and this seems likelyto be continued into 1973/74. The import policy for 1973/74 is somewhat moreliberal than that for 1972/73; in particular, thirteen industries:have beenadded to the list of "priority industries", which receive import licenses moreor less automatically on the basis of consumption. From the standDoint of theadequacy of import licensing, larger new aid commitments thai we have so farassumed -- to the extent they were fast disbursing -- could be translatedinto additional imports, provided the Government receives an earlier enoughindication of them.
11.38 The import level implied by the assumption that new aid would beavailable only in the same quantity and composition as in 1972/73 appearsto be substantially less than the economy badly needs. And this is ignoringadditional food imports if any, which we are assuming would have to befinanced out of reserves. To start with, it is about US$700 million lessthan the estimate of import requirements for 1073/74 given in the FourthPlan Mid-Term Appraisal, which we broadly endorsed in last year's report.However, economic growth in 1972/73 has been less than envisaged in theAppraisal; and the same seems likely in 1973/741. Consequ.ently, the poten-tial demand for imports is probably less than originally envisaged. On theother hand, import prices are now higher in dollar terms (by at least 5 per-cent) than w'hen the Appraisal was written simply on account of exchange ratechanges; and unrelated to these, prices of steel, non-ferrous metals andPOL will be higher in 1973/74 than they were in 1972/73. As a result, thelevel of non-food imports that we have shown in projection A is probablybarely higher in real terms than our estimate for 1972/73.
11.39 There are no major import items which can be reduced. (It isworth recalling that India imports no consumer goods except foodstuffs,books, and a few other essential items smuch as drugs). There are many itemswhich, for the health of the economy, need to be increased. Although certain
1/ This is the relevant licensing peri,.d for most imports in the first halfof 1973/74.
- 137 -
industries suffer from inadequate demand or inadequate capacity -- and atthe moment too there is the problem of power shortage -- an important con-straint on industrial production continues to be lack of raw materials andcomponents. Thus, higher imports of steel (even assuming some further im-provement in domestic steel production), non-ferrous metals and chemicals,as well as components and spares, are needed. In addition, larger importsof machinery are required because of the urgent need for power equipmentto tackle the power crisis. Fertilizer imports will also have to be in-creased to avoid the shortages of 1972/73. Finally, there is bound to bea sizeable increase in imports of petroleum products in value terms simplyto maintain the 1972/73 volume, and some volume increase will be necessary.Altogether, we believe that the economy's minimuma import needs will be rmUchhigher than would be possible at last year's aid level. Our rough assessmentof the need is at Least US$100 million higher than indicated in projectionA., Projection B therefore shows total imports at US$2,540 million and non-food imports at US$2,350 million.
11.40 We recommend that the Consortium should try to make the importlevel shown in projection B possible, by providing larger new aid commit-ments as compared with 1972/73. As indicated in Table 1 at the beginningof this Chapter, the achievement of this import level would imply aid dis-bursements of US$1,060 million, US$100 million higher than if new aidcommitments were the same as in 1972/73. To achieve this means essentiallya higher level of non-project aid, since only about 5 percent of new pro-ject aid on average disburses in the year in which it is committed. Toachieve the required disbursement level, we estimate that US$700 millionin new non-project assistance, including debt relief of US$178 million inaccordance with Dr.14. C. Coombs' proposals for the two years 1972/73 and1973/74, is needed J . To reach the same disbursement level in the absenceof any debt relief, non-project commitments would probably have to be atleast US$900 million. If commitments were US$700 million, including US$178million of debt relief, the non-project pipeline at the end of 1973/74 wouldprobably 'pe about US$540 million, US$40 million hlgher than at the startof the year. As compared with the very low pipeline at the start of 1972/73,this should provide a firmer base for stepping up imports in 1974/75.
11.41 As mentioned earlier, procedures relating to non-project assistancehave become more flexible. There have also been in the last year or two somemovement in the direction of untying. The larger amount of debt relief in1 972/73 as compared with earlier years has by definition increased the untiedportion of non-project aLd; and at least one donor is now makirng all its non-project aid untied. Untying and flexibility of procedures results in lower-cost imports and makes the task of managing a tight foreign exchange budget
1/ A Bank staff working paper will be issued shortly on the case for debtrelief in 1973/74 within the framework of the Coombs proposals. Dr.Coombs' proposals provided for debt relief of US$165 million; thefigure of, US$178 million given above takes into account the February1973 dollar devaluation and general currency realignments.

- 138 -
that much easier. It is to be hoped that donors will find it possible tomake further progress along these lines.
11.42 With its slower disbursement, project aid has to be viewed in alonger perspective. The Government appears to be looking for a substantialincrease in project assistance, both from Consortium and non-Consortiumcountries, at the beginning of the Fifth Plan. The steel, fertilizer, petro-chemical, non-ferrous metals, power, and other sectors have, been mentioned inparticular as needing assistance. For projects to be completed in the earlypart of the Fifth Plar., commitment of fuunds for Lomte of th.-ses projects willbe necessary in 1973/74.
11.43 New project commitments well in excess of the US$341 million for1972/73 can be accommodated by the econony. As against the current low de-pendence on capital goods imports, the intention is to ste;p up the importsof equipment in the Fifth Plan. But the inclusion of local cost financingwill continue to be important. We would propose at an indicative target for1973/74 new project commitments by the Consortium of US$500 rmillion, whichis higher than in 1972y73 but should be possible given the larger commitmentexpected from Bank/IDA. -
11.44 The level of new aid commitmEnts which we are rec'nnmending isthus US$1,200 million, composed of US$700 million in non-Droject aid in-cluding debt relief, and US$500 million of project aid. Mucn of the higherlevel of project commitments as compared with 1972/73 can be expected fromthe Bank Group. Most of the recommended increase (by about US$150 million)in non-project commitments, however, would have to come from other donors.The target for larger non-project assistance would seem to be reasonablein the light of donors' expanding aid programs, the latest currency re-alignments which have increased the value of many donors' assistance indollar terms, and the possibility of renewed assistance from the USA.
jl This is because a number of the Bank Group's 1972/73 operations havefallen into the Indian FY 1973/74 (i.e. are being signed in the periodApril 1 - June 30, 1973).

STA'TiSTICAL AP.PENDIX
Table of Contents
_Table No.
Human Resources
1.1 Population
.L.2 Rural and Urban Composition of Population
L.3 Performance of Family Planning Program in India
1.4 Workers According to Sex and Activity
1.5 Employment in the Organized Sector - by Industry
National Accouints
2.1 Gross National Product, Net National Product andDistribution of Net National Product - by Industry Origin
2.2 Net Domestic Savings
2.3 Net Savings and Investment Ratios
Foreign Trade and Balance of Payments
3.1 Exports (Quantity and Value)
3.2 Destination of Exports
3.3 Principal Imports
3.4 Origin of Imports
3.5 Import Summary
3.6 Terms of Trade
3.7 Balance of Payments Summary
3.8 India's Gold and Foreign Exchange Reserves

-2-
Table No.
3..9 (a & b) Project and Non Project Aid Pipeline 1971/72 and 1972/73
3..10 (a & b) Gross and Net Aid Flows 1971/72 and 1972/73 -
External Debt
4.1 Debt Service Payments cf External Public and Private Debt
Public Finance
5.1 Consolidated Finances of Center and State Governments
5.2 Central Government Finances
5.3 Economic Classification of the Central Government Finances
5.4 Tax Revenue - Center and States
5.5 Current Expenditures - Center and States
5.6 Total Plan Outlay - by Sectors
5.7 Financing of Public Sector Plan Outlay - Main Items
5.8 Financing of Public Sector Plan Outlay - Detail of i4ain Items
5.9 Central Government - Balance from Current Revenues at 1968/69Rates of Taxation
5.10 State Governments - Balance from Current Revenues at 1968/69Rates of Taxation
Money, Credit and Prices
6.1 Factors Affecting Money Supply
6.2 Advance Outstanding to Priority Sectors by Scheduled CommercialBanks
6.3 Food Procurement Advances by Scheduled Commercial Banks
6.4 Savings and Time Deposits and Small Savings
-3-
Table No.
6e5 Assistance by Term-Lending Institutions to the Industrial Sector
6.,6 Selected Interest and Earning Rates
6.7 Index Numbers of Wholesale Prices
Agriculture
7.1 Production of Principal Crops
7.2 Public Distribution of Foodgrains
7,3 Availability of Cereals and Pulses
7,4 All India Index Numbers of Foodgrains, Non-foodgrainsand Cash Crops.
7.5 Region-wise Distribution of Foodgrains - Area & Production
7.6 All India and Region-wise - Area, Yield and ProductionGrowth Rates of Foodgrains
Industry
8,1 Structural Change in Manufacturing Industry
8.2 Index Numbers of Industrial Production
8,3 Production in Selected Industries
8,4 Investment in Public Sector Industry
6.5 Capital Employed, Gross Profit and Net Profit in PublicSector Enterprises
8,.6 Gross and Net Fixed Assets in the Corporate Sector
8,.7 Profitability Ratios of Public Limited Companies - by Industry

I
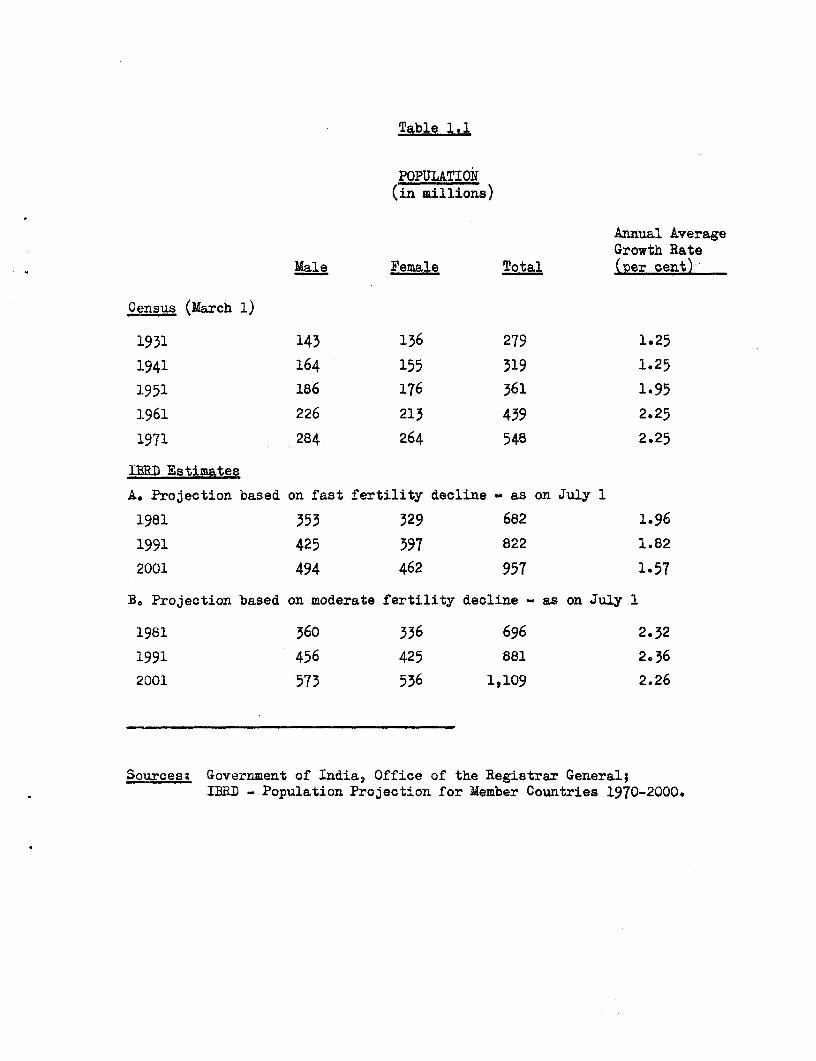
Table 1.1
POPULAPTION(in millions)
Annual AverageGrowth Rate
Male Female Total (per cent)
Census (March 1)
1931 143 136 279 1.25
1941 164 155 319 1.25
1.951 186 176 361 1.95
1961 226 215 439 2.25
1971 284 264 548 2.25
IBRD Estimates
A. Projection based on fast fertility decline - as on July 1
1981 353 329 682 1.96
1991 425 397 822 1.82
2001 494 462 957 1.57
B. Projection based on moderate fertility decline - as on July 1
1981 360 336 696 2.32
1991 456 425 881 2e36
2001 573 536 1,109 2.26
Sources: Government of India, Office of the Registrar General;IBRD - Population Projection for Member Countries 1970-2000.

Table 1.2
RURAL AND URBAN COMPOSITION OF POPULATION
Pereentage of urbanPopulation, 1971 population to total(in 000's) population
Total Rural Urban 1961 1971
ALT, INDIA 547s950 438,856 109,094 18.0 19.0
STATES
Andhra Pradesh 43,503 35,100 8,400 17.4 19.3
Assam 14,957 13,630 1,327 7.4 8.8
Bihar 56,353 50,719 5,6S34 8.4 9.9
Gujarat 26,697 19,200 7,507 25.8 28.1
Haryana 10,037 8,264 1,773 17.2 17.6
HIimachal Pradesh 3,460 3,219 242 6.3 6.9
Jammu & Kashmir 4,617 3,758 858 16.7 18.5
Kerala 21,347 17,881 3,466 15.1 16.2
Madhya Pradesh 41,654 34,:869 6,785 14.3 16.2
Manipur 1,073 931 141 8.7 13.1
Maharashtra 50,412 34,701 15,711 28.2 31.0
Meghalaya 1,012 865 147 12.5 14.5
Mysore 29,299 22,177 7,122 22.3 24.3
Nagaland 516 465 51 5.2 9.8
Orissa 21,945 20,099 1,845 6.3 8.4
Punjab 13,551 10,335 3,216 23.1 23.7
Rajasthan 25,766 21,222 4,544 16.3 17.6
Tamil Nadu 41,199 28,734 12,464 26.7 30.0
Tripura 1,556 1,394 162 9.0 10.4
Uttar Pradesh 88,341 75,953 12,369 12.9 14.0
West Bengal 44,312 33,345 10,928 24.5 24.0
UNION TERRITORIESAND OTHER AREAS 6,341 1,993 4,349 63.0 68.0
Source: Census of India. Paper I of 1971, Final Population Totals.

Table 1.3
PERFORMAN~CE OF FAMILY PLANNING PROGRAMA IN lINDIA 1.956 - 1971172(in numbers)
1996 1960 1963/64 1964/6S 1965/66 1966/67 19671685 L6869 19691I0 170171 19I1/72
Sterij:.A#tior 7,153 64,338 170,246 v 269,565 A 670,823 - 887,368 1,839,811 1,664,817 1,422,118 1,319,589 2,161,472
Tubeotomy 4,758 26,742 55,625 A 68,394 / 94,214 _ 101,990 191,659 281,764 366,258 449,892 552,902
Vasectomy 2,395 37,596 114,621 a 201,171 576,609 / 785,378 1,648,152 1,383,053 1,055,860 869,697 1,608,570
IUCD Insertions 812,713 909,726 668,979 478,731 458,726 471,039 478,313
Conventional Contraceptive Users 297,613 438,903 582,141 464,605 475,236 960,896 1,515,329 1,954,683 2,234,462
Distribution (in '000 numbers)
Nirodh 8,332 14,412 23,811 16,438 24,489 59,209 98,778 142,923 173,558
of which& Commercial Outlets 30,018 52,706 66,550
Diaphragms S 108 121 206 77 30 33 23 14 18
Jelly Crea2/' 299 298 393 420 348 387 465 447 345
Foam Tablet.-. 6,131 9,777 6,668 9,912 5,065 4,793 4,724 3,105 2,234
* Provisional
j/ Refers to calendar years 1963 and 1964.
./ Covers calendar year 1965 and period January - Maroh of 1966,
2/ All these items were distributed free of charge.
Source: Ministry of Health and Family Planning, Program Information 1971/72,

Table 1.4
WORKERS ACCORDING TO SEX AND ACTIVITY(in million numbers)
1961 1971As % of As S ofTotal Total
Male Female Total Workers Mal Female Total Workers
Total Workers 129.11 9 188.57 ) 149.07 31.30 180.37 (100)
Cultivators 66.41 33.11 99.53 (53) 68.91 9.27 78.18 (43)
Agr. Labourers 17.32 14.20 31.52 (17) 31.70 15.79 47.49 (26)
Otner AlliedAgr. Activities 4.03) 1.20 ) 5.22) (3) 3-51 0.78 4.29 (2.4)
Mining and Quarrying ) ) ) 0.80 0.12 0.92 (0.5)
Household Industry 7.37 4.67 12.03 (6) 5.02 1.33 6.35 (4)
Manufacturing (otherthan household) 7.19 0.79 7.98 (4) 9.85 0.87 10.72 (6)
Construction 1.62 0.24 2.06 (1) 2.01 0.20 2.22 (1)
Trade & Commerce 6.83 0.82 7.65 (4) 9.48 0.56 10-04 (6)
Transport & Communications 2.95 0.07 3e02 (2) 4.26 0.15 4.40 (2)
Other Services 15.20 4.37 19.57 (10) 13.54 2.23 15.77 (9)
Notes The data for the two Census:es are not oomparable on account of changes. in thedefinition of a 'worker' in the 1971. In 1961, asy; participation in economic activityby an individual led to his inclusion in:the Census. In 1971, persons h-ave been categorisedas workers.on the basis of their main activity; Data on secondary work have been presen-tedseparately. The changed definition therefore explains the;fall in absolute number of workersin the recent Census.:
Sources: Census, of India 1961 - General Economic Tables,. Vol. I Part-II BCFinal Population Totals 1971, Paper 3'of 1972.

Table loS
EMPLOYMENT IN THE ORGANIZED SECTOR BY INDUSTRY(in thousand numbers)
Annual Averagegrowth 1961-70(excl. private
19614 _ 1 6_ _ 68 l_ establishments
oi 10-24 workers)Public Private Total Public Private Toal Public Prjvt Total Public Private Total per cnt
Plantations,Forestry etc. 180 670 850 203 900 1,103 246 850 1,096 283 810 1,093 2.6
Mining andquarrying 129 550 679 157 500 657 174 430 604 255 350 605 - 1,5
Manufacturing 369 3,020 3,389 581 3,420 4,001 731 3,710 4,441 870 3,970 4,840 3.0
Construction 602 240 842 715 170 885 756 150 906 915 170 1,085 1l1
Public Utilities 224 40 264 264 40 304 346 50 396 458 5v 508 6.o
Trade & Commerce 94 160 254 133 200 333 177 350 527 374 300 674 7.9
Transport andCommunications 1,725 80 1,805 1,937 110 2,047 2,137 100 2,237 2,249 80 2,329 2.6
Services 3,427 280 4,007 4,464 430 4,894 5,236 880 6,116 5,785 1,050 6,815 4.8
TOTAL 7.050 &.0M0 12.090 k" 5.780 14.234 9.802 6.520 16,X22 11,189 650 170jL 2 5 iA
v As of 31 March each year.
E Establishments of 25 workers and over. Reporting is compulsory.
£/ Includes employment in establishments of 10 workers and over. Reporting for this category (10-24 workers)is on a voluntary basis, and the extent of coverage is not known.
Sources: Ministry of Labor, Director General of Employment and Traing.Ministry of Finance - Economio Survey 1972/73.

I
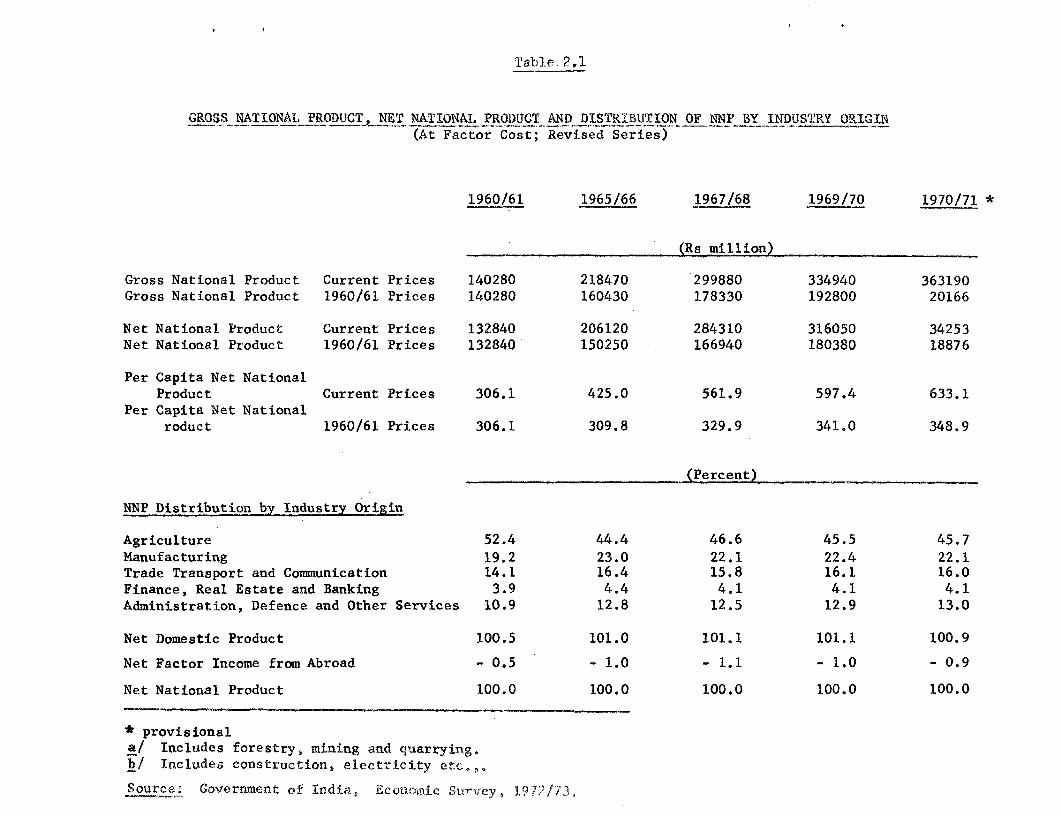
Table 2.1
GROSS NATIONAL PRODUCT, NET NATIONAL PRODUCT AND DISTRIBUTION OF NNP BY INDUSTRY ORIGIN(At Factor Cost; Revised Series)
1960/61 1965/66 1967/68 1969/70 1970/71 *
(Rs million)
Gross National Product Current Prices 140280 218470 299880 334940 363190Gross National Product 1960/61 Prices 140280 160430 178330 192800 20166
Net National Product Current Prices 132840 206120 284310 316050 34253Net National Product 1960/61 Prices 132840 150250 166940 180380 18876
Per Capita Net NationalProduct Current Prices 306.1 425.0 561.9 597.4 633.1
Per Capita Net Nationalroduct 1960/61 Prices 306.1 309.8 329.9 341.0 348.9
(Percent)
NNP Distribution by Industry Origin
Agriculture 52.4 44.4 46.6 45.5 45.7Manufacturing 19.2 23.0 22.1 22.4 22.1Trade Transport and Communication 14.1 16.4 15.8 16.1 16.0Finance, Real Estate and Banking 3.9 4.4 4.1 4.1 4.1Administration, Defence and Other Services 10.9 12.8 12.5 12.9 13.0
Net Domestic Product 100.5 101.0 101.1 101.1 100.9
Net Factor Income from Abroad - 0.5 - 1.0 - 1.1 - 1.0 - 0.9
Net National Product 100.0 100.0 100.0 100.0 100.0
* provisionala/ Includes forestry, mining and quarrying.b/ Includes construction, electricity etc.,.
Source: Government of Irndia, Economiic Survey, 1972/72.

Table 2.2
NET DON,ESTIC SAVINGS(Rs billions)
PrivatePublic Corporate Household SavingsSector Sector Financial Physical Total Domestic
Year Savings Savings Assets Assets Savings
Second Plan
1960/61 2.38 1.07 4.38 5.90 13.73
Third Plan
ig61/62 3.48 1.09 5.03 4.46 14.06
1962/63 4.11 1.34 4.92 4.91 15.28
1963/64 5.38 1.43 6.98 6.01. 19.80
1964/65 5.37 0.92 7.47 7.04 20.80
1965/66 6.60 0.89 9.62 7.32 24.43
Annual Plans
1966/67 4.13 1.03 7.24 8.42 20.82
1967/68 3.10 0.49 9.21 9.9b 22.74
1968/69 5.60 0.60 9.50 10.11 25.81
Fourth Plan
1969/70 6.55 1.20 10.65 11X02 29.42
1970/71 7.42 1.95 14.55 12.11 36.03
1971/72 6.20 2.15 19.70 13.20 41.25
Source: Reserve Bank of India.

Table 2.3
NET SAVINGS AND INVESTMENT RATIOS(as per oent of NDP at market prices 4
Household Savings TotalPublic Sector Private Corporate Financial Physical, Domestic Foreign
Year Savings SectoL_ Rin&q__ Assets Assets Sin Savings Inyestment
Second Plan
1960/61 1.7 0.8 3.1 4.1 9.7 3.5 13.2Third Plan
1961/62 2.3 07 3.3 2.9 9.2 2.4 11.61962/63 2.5 08 3.0 3.0 9.3 2.8 12.11963/64 2.9 0.9 3.7 3c2 lO6 2,4 13e01964/65 2.4 04 3e4 3,2 9.4 2.8 12.21965/66 2.9 0.4 4.2 3.2 10,7 2.6 13.3
Annual Plans
1966/67 1.6 0.4 2.7 3.2 7e9 3.2 11.11967/68 1.0 0.2 3.0 3.2 7.4 2.8 10.21968/69 1.8 0.2 3e0 3.2 8.2 1.3 9,5
Fourth Plan
1969/70 1.9 03 3.1 3.2 8,5 0°7 9.21970/71 2.0 0.5 3.8 3.2 9.5 1.1 10.61971/72 1.5 0.5 4.8 3.2 10.0 1.5 11.5
A/ Figures for NDP at market prices have been taken from the Mid-Term Appraisal.
k/ From the year 1963/64 onward, a constant ratio has been assumed for household savings in physical assets,
Sources Reserve Bank of Indiae

I
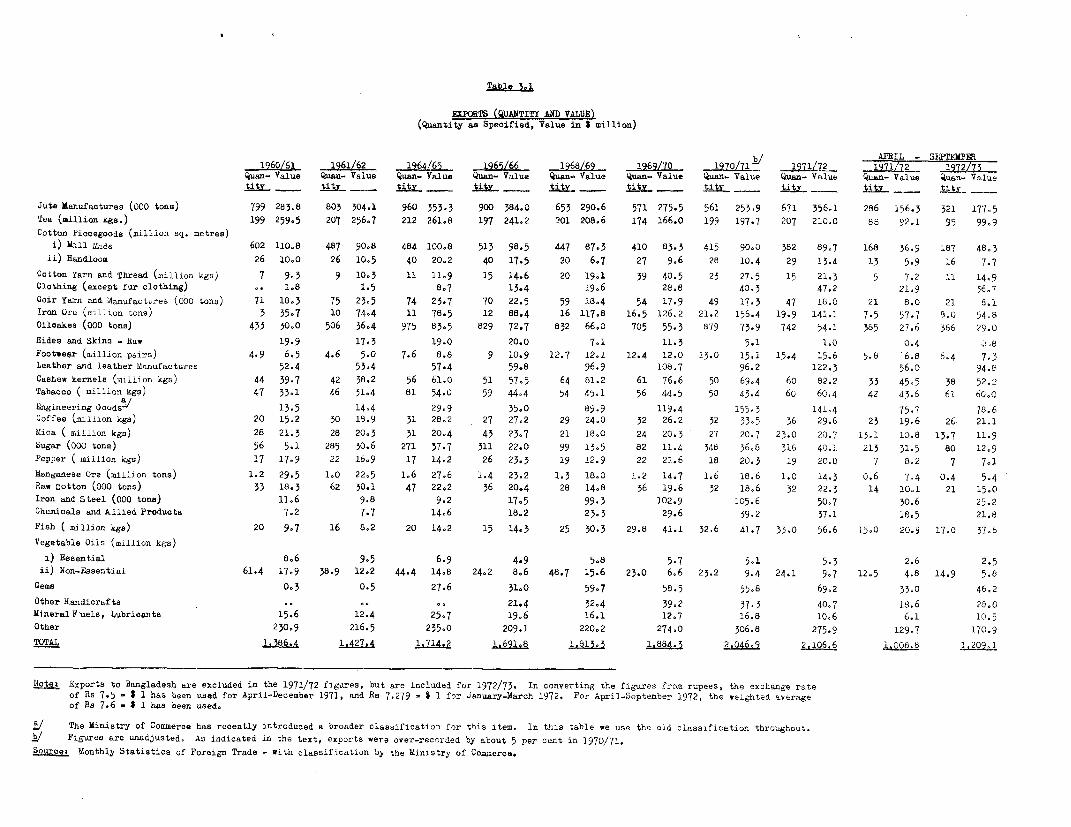
Table 3.1
ELPORTS (QUAJTITY AND VALUE)(Quantity as Specified, Value in S million)
1960/61 1961/62 1964/65 1965/66 1268L69 _ 1969/70 7 /7 2A _1971/72I_ 1971/72 EPE
;iuan- Value Quan- Value Quan- Value Quan- Value Quin- Value quaan- Value Quan- Value Quan- Value Quan- Value Quen- Valuetity _ tititv __ tity _ _ _ tity tity - t tti.t-y _ _ Stz__
Jute Manufactures (000 tons) 799 28358 803 304.1 960 353.3 900 384.0 653 290.6 571 275-5 561 253,9 671 356,1 286 156.3 321 177,5
Tea (million kga.) 199 259.5 207 256.7 212 261.8 197 241.2 201 208,6 174 166.0 199 197.7 207 210.0 88 92.1 95 99,9
Cotton Eiocegoods (million sq. metres)i) kill Made 602 110.8 487 90.8 484 100.8 513 98.5 447 87.3 410 83-3 415 90.0 382 89.7 168 36.9 187 48,3
ii) Handloom 26 lo0O 26 10.5 40 20,2 40 17.5 20 6.7 27 9,6 28 10.4 29 13.4 13 5,9 16 7c7
Cotton Yarn and Thread (million kgs) 7 9r3 9 10,3 11 11.9 15 14.6 20 19,1 39 40.5 23 27,5 15 21.3 5 7.2 11 14,9Clothing (except fur clothing) ,. 1.8 1.5 8.7 13.4 19.6 28.8 40,3 47.2 21.9 36,7
Coir Yarn and Manufactures (OOO tons) 71 18.3 75 23-5 74 23.7 70 22.5 59 18-4 54 17.9 49 17.3 47 18.0 21 8,0 21 8,1
Iron Ore (million tons) 3 3557 10 74,4 11 7805 12 88.4 16 117,8 16.5 126.2 21.2 156.4 19.9 141.1 7.5 57.7 8,0 54,8
Oiloakea (000 tons) 435 50.0 506 36,4 975 8355 829 72-7 832 66.0 705 55,3 879 73-9 742 54-1 385 27.6 366 29.0
Hides and Skins - haw 19.9 17.3 19.0 20,0 7.1 11,3 5.1 1,0 0.4
Footwear (million pairs) 4-9 6.5 4.6 5.0 7.6 8.8 9 10.9 12.7 12,1 12.4 12,0 1350 15,1 15-4 15.6 5.8 6.8 6,4 7.3Leather and leather Manufactures 52-4 5354 57.4 59,8 96.9 108,7 96,2 122.3 56,0 94e8Cashew kernels (million kgs) 44 39.7 42 38,2 56 61.0 51 57,5 64 81.2 61 76.6 50 69,4 60 82.2 33 45.5 38 52.2
Tabacco ( million kgs) 47 33.1 46 31.4 81 54.0 59 44.4 54 45.1 56 44.5 50 43.4 60 60,4 42 43.6 61 60.0
Engineering Ooodse" 13.5 14.4 29.9 3550 89.9 119.4 155.3 141,4 75-7 78.6Coffee (million kgs) 20 15,2 30 18.9 31 28,2 27 27.2 29 24.0 32 26.2 32 33°5 36 29,6 23 19.6 26 21.1
Mica ( million kgs) 28 21,3 28 20,3 31 20.4 43 2357 21 18,0 24 20.3 27 20.7 25.0 20.7 13.1 10.8 13.7 11,9
Sugar (OOO tone) 56 5.1 285 30.6 271 57-7 311 22.0 99 13-5 82 11.4 348 36.8 316 40.1 213 31-5 80 12.9
Pepper ( million kgs) 17 17.9 22 16.9 17 14,2 26 2353 19 12.9 22 21.6 18 20.3 19 20,0 7 8.2 7 7.1
Mangenese Ore (million tons) 1.2 29.5 1.0 22,5 1.6 27.6 1,4 23.2 1.3 18.0 1.2 14.7 1,6 18.6 1.0 14.3 o.6 7-4 0.4 5.4Raw Cotton (OOO tons) 33 18,3 62 30.1 47 22,2 36 20,4 28 14,8 36 19.6 32 18,6 32 22.3 14 10.1 21 15,0
Iron and Steel (000 tons) 11.6 9.8 9.2 17.5 99.3 102.9 105,6 50.7 30.6 25.2
Chemicals and Allied Products 7.2 7-7 14,6 18.2 2353 29.6 39.2 37.1 18.5 21.8
Fish ( million kgs) 20 9.7 16 8,2 20 14.2 15 14.3 25 30.3 29.8 41.1 32.6 41.7 33.0 56.6 15,0 20.9 17.0 37,6
Vegetable Oils (million kgs)
i) Essential 8,6 9-5 6.9 4.9 5.8 5-7 5-1 5-3 2,6 2.5ii) Non-_asential 61.4 17,9 38.9 12,2 44.4 14,8 24,2 8,6 48.7 15.6 23.0 6.6 23.2 9.4 24.1 9.7 12.5 4.8 14.9 5.8
Gems 0.3 0.5 27.6 31,0 59,7 58.5 55.8 69.2 33°0 46.2
Other aandicrafts *- °° D 21.4 32,4 39.2 37-3 40,7 18.6 28.0kineralFuels, Lubricants 15.6 12.4 25-7 19,6 16.1 12,7 16.8 10,6 6.1 10.5
Other 230,9 216.5 235.0 209.1 220,2 274,0 306.8 275-9 129.7 170.9
TOTAL 1.386.4 1.427.4 1,714.2 1.691.8 1.813,3 1.884.5 2.046,9 2106.6 1,OQ8.8 82 2
Note, Exports to Bangladesh are excluded in the 1971/72 figures, but are included for 1972/73. In converting the figures from rupees, the exchange rateof Rs 7.5 - $ 1 has been uaed for April-December 1971, and Rs 7,279 5 6 1 for January-March 1972. For April-September 1972, the weighted averageof Rs 7.6 - S 1 has been used.
t/ The Ministry of Commerce has recently introduced a broader classification for this item. In this table we use the old classification throughout.
~/ Figuree are unadjusted, As indicated in the text, exports were over-recorded by about 5 per cent in 1970/71.
Sourcez Monthly Statistics of Foreign Trade - with classification by the ministry of Commerce,
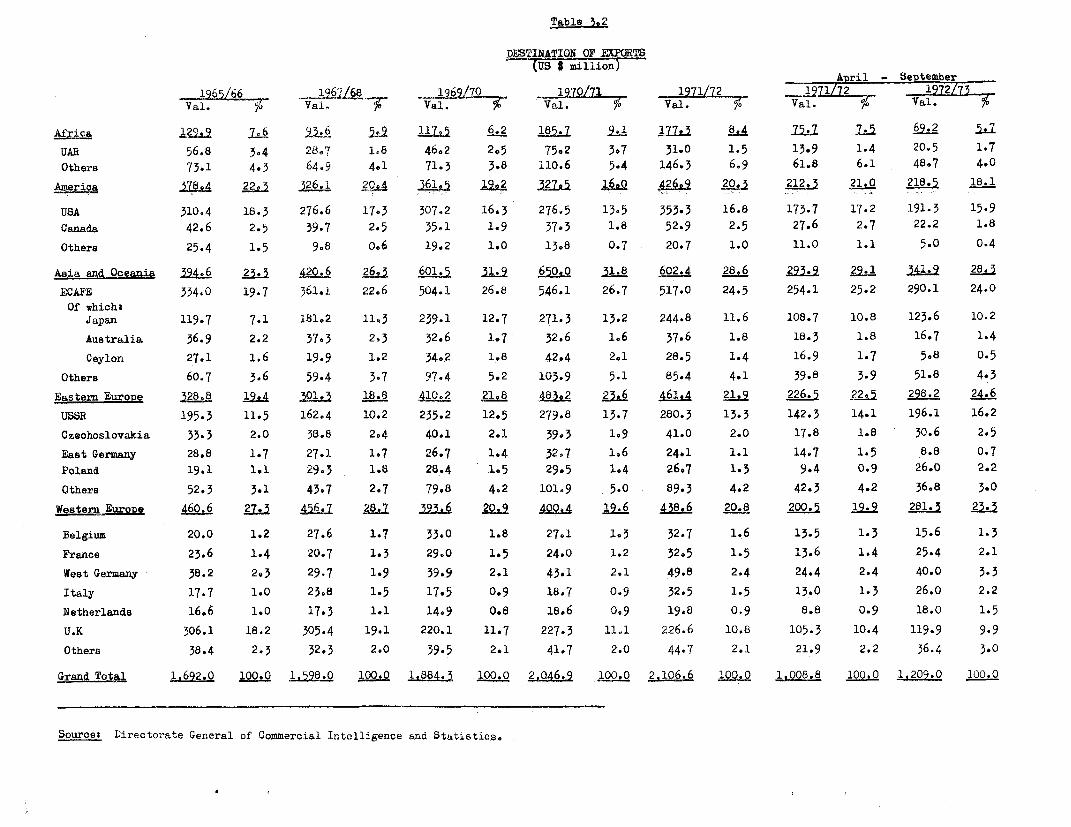
Table 302
DESTINATION OF EXPORTS(US ilin
k7ril_ -_ September_ri 19712L /719
Val. 66i ; Va Val. % Val. Val. Val.,.
ALfra 2i-C a 5 6 6117, 6.2 185 9.1 7 69.2UAR 56,8 3,4 2807 1.8 46.2 2,5 75.2 307 31.0 1.5 13.9 1.4 20,5 1.7Others 73.1 4,3 64-9 4.1 71-3 3.8 110.6 5.4 146.3 6.9 61.8 6.1 48.7 4.0
America e j4 L J 2g6.1 gQ4A 19. 2 3gji 16,0 426,22 9 ?i 212.3 21.0 218.5 18.1
USA 310.4 18.3 276.6 1703 307.2 16.3 276.5 13.5 353.3 16.8 173.7 17.2 191.3 15.9Canada 42.6 2.5 39-7 2.5 35.1 1.9 37.3 1.8 52.9 2.5 27.6 2.7 22.2 1.8Others 25.4 1-5 9.8 0,6 19.2 1.0 13,8 0.7 20.7 1.0 11.0 1.1 5.0 0.4
Asia and Oceania 594_6 235. A20.6 2 L 60Lo. 519 650.0 31s8 02. A 28,6 293.9 29.1 419 28.3ECAFE 334.0 19.7 361.1 22.6 504.1 26.8 546.1 26.7 517.0 24-5 254-1 25.2 290.1 24.0
Of which&Japan 119,7 7.1 181.2 11.3 239.1 12.7 271.3 13.2 244.8 11.6 108.7 10.8 123.6 10.2Australia 36.9 2.2 37°3 2.3 32.6 1.7 32.6 1,6 37.6 1.8 18.3 1.8 16.7 1.4Ceylon 27.1 1.6 19.9 1.2 34.2 1.8 42.4 201 28.5 1.4 16.9 1.7 5.8 0.5
Others 60.7 3.6 59.4 3-7 97.4 5.2 103.9 5.1 85,4 4.1 39.8 3.9 51.8 4.3Eastern Europe 5 la& iit4 L8 18s8 A1Q02 21,8 Aa82 23.6 461.4 L-2 226.5 22_5 298.2 24.6
USSR 195.3 11.5 162.4 10.2 235.2 12.5 279.8 13.7 280.3 13.3 142.3 14.1 196.1 16.2Czechoslovakia 33.3 2.0 38.8 204 40.1 2.1 39v3 1.9 41.0 2.0 17.8 1.8 30.6 2.5East Germany 28.8 1.7 27.1 1,7 26.7 1.4 32.7 1,6 24,1 1.1 14,7 1.5 8.8 0.7Poland 19.1 1.1 29.3 1.8 28.4 1.5 29e5 1.4 26.7 1.3 9.4 0.9 26.0 2.2Others 52.3 3.1 43.7 2.7 79.8 4.2 101.9 5.0 89.3 4.2 42.3 4.2 36.8 3.0
Western EuroDe 460.6 kW AL .6 28.7 33Li 6 2i2 A400, 19.6 438.6 20.8 200.5 19.9 281.3 23.3
Belgium 20.0 1.2 27.6 1.7 33,0 1.8 27-1 1.3 32.7 1.6 13.5 1.3 15,6 1.3France 23.6 1.4 20.7 1.3 29.0 1.5 24.0 1.2 32.5 1.5 13.6 1.4 25-4 2.1West Germany 38.2 2*3 29.7 1.9 39.9 2.1 43.1 2,1 49.8 2.4 24.4 2.4 40.0 3.3Italy 17.7 1.0 23.8 1.5 17.5 0.9 18,7 0.9 32.5 1.5 13.0 1.3 26.0 2.2Netherlands 16.6 1.0 17.3 1.1 14,9 0.8 18.6 0,9 19,8 0.9 8.8 0.9 18.0 1.5U.K 306.1 18.2 305-4 19.1 220.1 11.7 227,3 11.1 226.6 10.8 105.3 10.4 119.9 9.9Others 38.4 2.3 32.3 2.0 39.5 2.1 41*7 2.0 44,7 2.1 21.9 2.2 36.4 3.0
Grand otal 1,692.0 100.0 1598.0 100.0 188,884. 100.0 2.046,9 100.0 -2.1066 100-.0 1.08.8 100.0 1.209.0 100.0
Source: Directorate General of Commercial Intelligence and Statistics,

Table 3. 3
PRINCIPAL IMPORTS(US $ million)
April-AugustItems 1960/61 1968/69 1969/70 1970/71 1971/72 1971 1972
Cereal and Cereal1Ireparations 380.9 448.8 348.0 284.0 176.1 57.8 16.3
iAoa-ElectricalMachinery & Parts 427.2 487.8 373.9 343.7 360.0 157.6 156.4
Zlectrical Machineryand Parts 120.1 109.0 85.7 93.7 137.2 49.4 62.7
Transport Equipmentand Parts 152.1 88.5 68.3 88.7 113,4 45.6 37.6
Iron and Steel 257.3 114.9 108.7 196.0 319.6 127.4 125.0
Non-Ferrous Metals 99.3 118.7 99.3 159.2 136.7 68.5 59.6
Petroleum Oil andLubricants 145.4 177.6 183.9 181.2 261.1 107.8 103.6
Drugs and Medicines 22.0 23.3 24.3 32.4 35.7 17.2 11.1
Dyeing, Tanning andColouring Materials 27.1 11.9 9.4 12.3 11.0 4.5 5.2
Cashew Nuts(unprocessed) 20.1 41.8 36.8 39.2 37.5 12.6 18.5
Raw Cotton 171.7 120.2 110.4 131.2 152.3 88.9 71.1
Paper, Paper Board andManufaoctures ' 25.5 24.4 31.6 33.5 47.1 15.0 11.5
Fertilizer and FertilizerMaterials 31.2 264.1 143.2 133.2 152.8 51.9 44.9
Chemical Elements andCompounds 81.6 70.2 62.2 71.4 86.1 38.9 29.2
Animal and VegetableOils and Fats 9.6 25.7 39.5 51.3 62.7 31.2 10.5
Other 421.3 417.9 384.3 327.2 347.1 145.7 157.6
TOTAL IMPORTS 2393.3 2544.8 2109.5 2178.9 2436.4 1020.0 920.8
Source: Monthly Statistics of Foreign Trade, Directorate General ofCommercial Intelligence and Statistics, Calcutta.

ORIGIN OF IMPORTS(US $ million)
1965/66 196768 1969/70 197OZ71 1971/72 A=i - AURBt
Val.. al. Val. T V . Val. Va. Val
Africa 1122 A,0 5.6 A1d 188.6 2 226.4 10o4 193.3 788. 8.7 114.l l4
UAR 41.9 1.4 35-9 1.3 28.9 1.4 5351 2.5 44.7 1.8 34.2 3.4 24.5 2,7
Other 75°3 2.5 89,7 3.4 159.7 7,5 73,3 8.0 148,6 6.1 54-4 5.3 89.8 9.8
AwcricS 1,194.9 ~±4 1.188.Q 44.4 737.6 Q5±~ 781.3~A 2.7 296 M 30,1 140. 15.a2
USA 1,123.7 38c0 1,035.5 38-7 623.0 29.5 603.9 27,7 560.0 23.8 261,2 25.6 106.8 11,6
Canada 64.1 2.2 131.0 4.9 99.8 4.7 156.3 7.2 151.7 6.2 43.0 4.2 30.5 3.3
Other 7.1 0.2 21.5 0.8 14.8 0.7 21.1 10 9.0 0.4 3.0 0.3 3.0 0.3
Asia and Or i A2b,2 16, A 16. 2 18 8 400.2 2 0 238 2
ECAFE 460.7 15.6 385.2 14.4 347.5 16.5 352,5 16.3 485.8 19.9 204.2 20,0 201.9 21,9
Of whichs
Japan 166.6 5.6 144.6 5.4 89.9 4.2 111.2 5,1 21703 8.9 87.9 8.6 77.6 8.4
Australia 50.8 1.1 86.6 3.2 41.7 2,0 48.8 2.3 39.5 1.6 20.3 2.0 a 20.1 2.2
Ceylon 8.4 0,3 4.4 0.2 3.8 0.2 3.9 0.2 1.9 0.1 0.1 n.s. 0.2 nese
Other 33.3 1.1 52.9 2,0 49-4 2,3 47,7 2,2 84,3 3.5 30*6 3.0 36.9 4.0
Eastern EuroDe *.0 11.1 296.3 11.1 2 111.6 12.1
USSR 174.7 5-9 148.3 5.5 228.4 1008 141,5 6.5 109.8 4.5 50.2 4.9 51.3 5.6
Czechoslovakia 44°4 1,5 36,5 1,4 30.7 1.5 26.9 104 13.7 0.6 4-9 0-5 8.7 0.9
East Germany 27.3 0,9 28,8 1.1 32.6 105 24,8 1,1 2702 1.1 12,3 1.2 12,2 1.3
Poland 28.7 1.0 31.7 1.2 31.4 1.5 37-4 1.7 66,6 2.7 33,5 3.3 21.5 2.3
Other 53.9 1,8 51.0 1.9 55.2 2,6 72,9 3.4 53.9 242 22,9 2.2 17.9 1.9
W22ster6 28r De 6208. 19,3 214 6 26.1 7
Belgium 24.2 0.8 23.7 0.9 109 0,5 15.3 0.7 46.2 1.9 16.6 1,6 21.9 2.4
France 37.0 1.3 45e9 1.7 31.6 1.5 28.4 1,3 48,5 2.0 22.5 2,2 19.0 2.1
West Germany 288.0 9.7 191.9 7.2 112,6 503 143,3 6.6 166.6 6.8 65,7 6.4 85,2 9.3
Italy 41.7 1.4 45.7 1,7 53.1 2,5 3805 108 32,9 1,3 14,8 1.5 13.3 1.4
Netherlands 41.4 1.4 34,2 1.3 21.0 1.0 25.5 1.2 41.2 1,7 15,9 1.6 18.2 2,0
UK 315.2 10.7 217.1 8.1 136e8 6.5 169,0 7,8 291.6 12.0 110,0 10.8 1.32.1 14.3
Other 74.2 2.5 70,3 2.6 42,0 2,0 4701 292 45,4 1.9 20.2 2,0 22.9 2.5
Grand Total 9 1000 2.676,8 100,0 4Q9 , 100,0 2. 1 0 _ 42-- 100 tQ_O.O 100,0 9__/ 100.0
'Not significant. Includes Y 8-Omillion of exports under reference,S/ Includes Y 3.0 million of exports under reference.
Sources Directorate General of Commercial Intelligence and Statistics.

Table 3.5
IMPORT SUMMARY(US $ million)
1968/69 1969/70 1970/71 1971172
Foodgrains 449 348 284 176
Maintenance Imports 1612 1328 1512 1870of which:
Steel 115 109 196 320Non-Ferrous Metals 119 99 159 137Fertilizers and Fertilizer Raw
Materials 264 157 133 153
P.O.L. 178 183 181 261
cotton 120 110 132 152
Chemical Elements and Compounds 70 62 71 86
Components and Spares 434 287 284 368
Complete Machinery and Equipment 265 252 260 259
Other 218 181 123 131
TOTAL IMPORTS 2545 2109 2179 2436
Note: Figures for 1971/72 are provisional.
Source: Ministry of Coumerce, Government of India.

Table 3.6
TERMS OF TRADE
(Base 1958-100)a/
Exports Imports Terms of TradeVolume Unit value Tolume Unit value
index index index index
1960/61 100 110 128 96 115
1961/62 105 109 121 98 111
1962/63 112 106 131 94 115
1963/64 126 105 135 97 108
1964/65 182 107 146 99 108
1965/66 124 113 154 104 109bE /
1966/67- 119 169 140 150 115
1967/68 122 169 166 156 124
1968/69 142 166 151 141 118
1969/70 143 , 171 128 140 122
1970/71 153 173 127 147 118
1971/72 151 180 139 149 121
a/ Export unit value index divided by import unit value index.
b/ Covers only the 10 months following devaluation - June to April.
c/ Unadjusted for over-recording of exports in 1970/71.
Source: Directorate General of Comnercial Intelligence and Statistics, Calcutta4

Table 3.7
BALANCE OF PAYXENTS SJMMIRY(US $ million)
1964/65 1965/66 1966/67 1967/68 1968/69 1962/70 193JL71 191/2 1 2tEs timaA7
1. 1Erts 1,714 1,692 1,542 1,598 1,810 1,884 1,950 2,106 / 2,290 a1)
2. Inyorts 2,833 2,958 2,771 2,677 2,545 2,109 2,179 2,436 2,280
(a) Foodstuffs v (638) (725) (920) (739) (487) (392) (337) (256) (150)
(b) Other imports (2,195) (2,233) (1,851) (1,938) (2,058) (1t717) (1,842) (2,180) (2,130)
3. Trade Ba_lanc - 1 1L229 -109- 225 -29 + 10
4. Debt Service I - 255 - 315 - 365 - 444 - 500 - 550 - 600 - 615 -681
5. Gold and Credit Transactionswith IF - 62 130 33 - 78 - 154 - 185 - 19 -
6. Other Capital and Invisibler9/ - 260 3 - 35 - 27 105 - 56 - 227 - 269 - 258
7. Finni (8 + 9 + 11) 1.614 1.516 1.499 1,517 1.208 985 L,241 1,233 922
8. Refugee Assistance - - 230
9. Gross Aid Disbursements 1.516 1.617 1.511 1.52 1.259 1.188 1.096 1.089 896
a. Project Aid 696 678 507 385 410 314 321 352 399
b. Non-Project Aid (includingdebt relief) 349 416 431 690 550 585 573 579 484
o. Food Aid 451 481 538 466 287 245 177 135 13
d. Non-food PL 480 20 42 35 57 12 44 25 23 -
10. Net Aid Disbureements(- 9-4) 1,261 1,302 1,146 1,154 759 638 496 474 215
11. Use of Reserves (t - decrease) + 118 - 101 - 12 - 81 -51 - 203 + 145 86 + 33
v/ Comprises foodgraino, other cereals and cereal preparations, milk, edible oils and oilseeds.
v/ Includes both payments of interest and amortizatisn of prinoipal, before debt relief.S Includes errors and omissions. Also includes movement into reserves of previously non-monetary gold and also changes in value of certain
reserves following Smithsonian agreement on currency realignments.Excludes exports to Bangladesh.
i SDR holdings are not included in reserves. Consequently, allocation of SDR's compensated by increased Indian holdings of SDR's do notappear in the table. Any differences between these two magnitudes are shovn in line 5 (gold and credit transactions with IMF). Forexample, in a year when India is a net user of part of its SDR allocation for payments, this is included as a positive element in line 5.Conversely, in a year when India is designated to accept SDR's in payments, and has a net increase in its holdings of SDR's in excess ofthe year's allocation, this shows up as a negative element in line 5.
Source: Trade figures are obtained from Customs data; debt service and aid figures from the Ministry of Finance. This presentation of thebalance of payments is consistent with that used in our last report, but differs frc-c the balance of payments prepared by theReserve Bank, which in a slightly modified form is used in the Economic Survey, 1972/73.
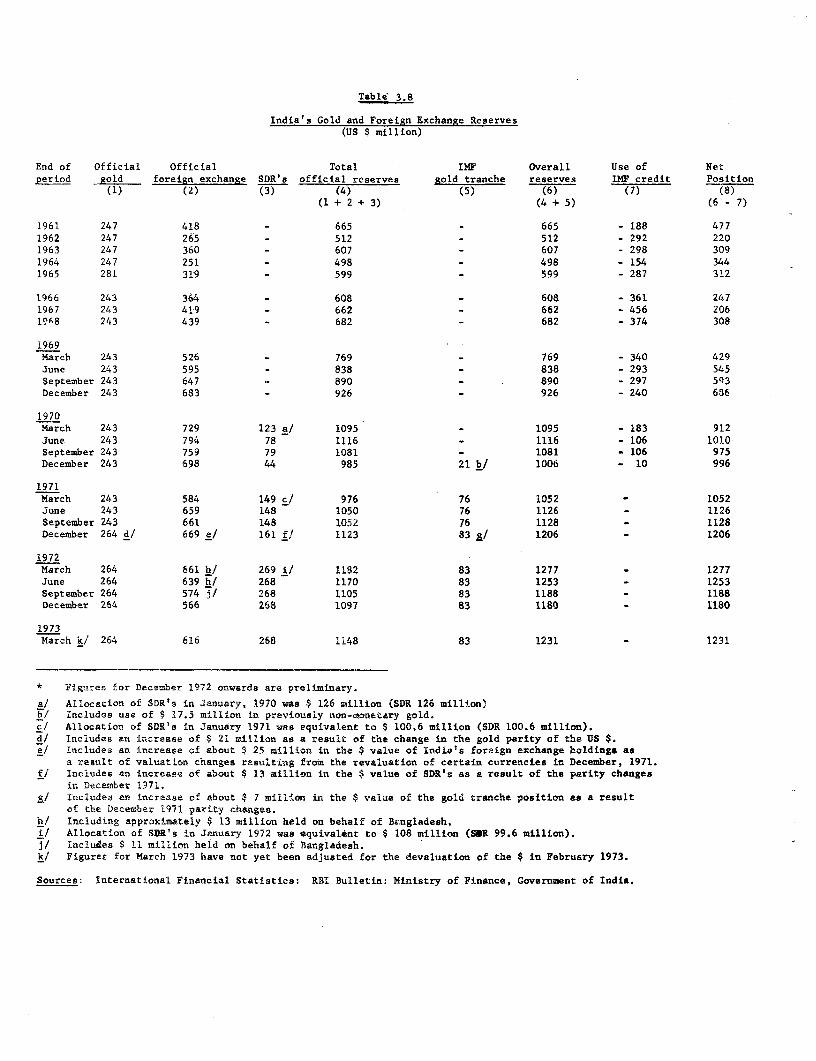
Table 3.8
India's Gold and Foreign Exchange Reserves(US $ million)
End of Official Official Total IMF Overall Use of Netperiod gold foreign exchange SDR's official reserves gold tranche reserves IMF credit Position
(1) (2) (3) (4) (5) (6) (7) (8)(1+ 2 + 3) (4 + 5) (6 - 7)
1961 247 418 - 665 - 665 - 188 4771962 247 265 - 512 - 512 - 292 2201963 247 360 - 607 - 607 - 298 3091964 247 251 - 498 - 498 - 154 3441965 281 319 - 599 - 599 - 287 312
1966 243 364 - 608 - 608 - 361 2471967 243 419 - 662 - 662 - 456 20619A8 243 439 - 682 - 682 - 374 308
1969March 243 526 - 769 - 769 - 340 429June 243 595 - 838 - 838 - 293 545September 243 647 890 - 890 - 297 593December 243 683 - 926 - 926 - 240 636
1970March 243 729 123 a/ 1095 - 1095 - 183 912June 243 794 78 1116 - 1116 - 106 1010September 243 759 79 1081 - 1081 - 106 975December 243 698 44 985 21 b/ 1006 - 10 996
1971March 243 584 149 c/ 976 76 1052 _ 1052June 243 659 148 1050 76 1126 - 1126September 243 661 148 1052 76 1128 - 1128December 264 d/ 669 e/ 161 f/ 1123 83 £1 1206 - 1206
1972March 264 661 h/ 269 i/ 1182 83 1277 - 1277June 264 639 hi 268 1170 83 1253 - 1253September 264 574 7/ 268 1105 83 1188 - 1188December 264 566 268 1097 83 1180 - 1180
1973March k/ 264 616 268 1148 83 1231 - 1231
* Figures for December 1972 onwards are preliminary.
a/ Allocation of SDR's in january, 1970 was $ 126 million (SDR 126 million)b/ Includes use of $ 17.5 million in previously non-monetary gold.c/ Allocation of SDR'c in January 1971 was equivalent to $ 100.6 million (SDR 100.6 million).dj Includes an increase of $ 21 million as a result of the change in the gold parity of the US $.e! Includes an increase of about $ 25 million in the $ value of Indiat s foreign exchange holdinga as
a result of valuation changes resulting from the revaluation of certain currencies in December, 1971.fl Includes en increase of about $ 13 million in the $ value of SDR's as a result of the parity changes
ir. December 1971.S/ Includes an increase of about $ 7 million in the $ value of the gold tranche position as a result
of the December 1971 parity changes.h/ Including approximately $ 13 million held on behalf of Bingladesh.iJ Allocation of SDR's in January 1972 was equivalent to $ 108 million (SDR 99.6 million).1/ Includes $ 11 million held on behalf of Bangladesh.k/ Figures for March 1973 have not yet been adjusted for the devaluation of the $ in February 1973.
Sources: International Financial Statistics: RBI Bulletin: Ministry of Finance, Government of India.
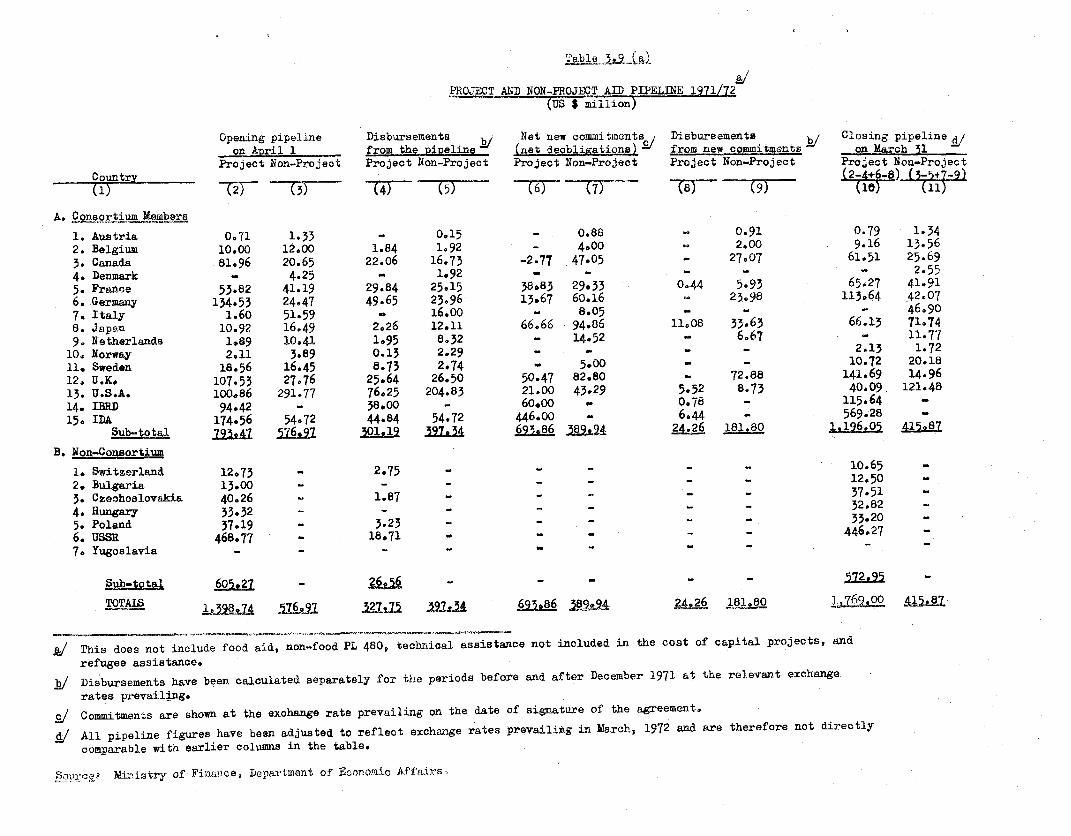
Table 3_&Lj
PROJECT AND NON-PROJECT AID PIPELINE 1971/72(US $ million)
Opening pipeline Disbursements Net new commitments Disbursements Closing pipeline d/on April 1 from the pipeline (net deobli ationl from new commitmnts on March 1
Project Non-Project Project Non-Project Project Non-Project Project Non-Project Project Non-ProjectCountry- (2) -4 6 7 8 24+)6-a) (3-5+)7-9)
A. Consortium Members
1. Austria 071 1-33 - 015 - 0.88 _ 0.91 0.79 1.342. Belgium 10.00 12,00 1.84 1l92 - 4.00 2.00 9.16 13.563. Canada 81.96 20.65 22.06 16.73 -2-77 47.05 27n07 61.51 25.694, Denmark - 4.25 - 1.92 - - - - - 2.555. Franee 53.82 41.19 29.84 25e15 36.83 29.33 0044 5.93 65.27 41e916. Germany 134.53 24.47 49.65 23096 13,67 60.16 23,98 113,64 42.077. Italy 1.60 51.59 - 16.00 - 8.05 _ - - 46,908. Japan 10.92 16.49 2,26 12*11 66.66 94.86 11.08 33,63 66.13 71.749. Netherlands 1,89 10,41 1,95 8,32 - 14.52 - 6.67 - 11.7710. Norway 2ll 3.89 0.13 2.29 - - - - 2.13 1.7211. Sweden 18.56 16.45 8.73 2.74 - 5.00 - - 10.72 20.1812. U.K. 107.53 27,76 25.64 26*50 50.47 82,80 - 72.88 141.69 14.9613. U.S.A. 100,86 291.77 76.25 204.83 21.00 43.29 5.52 8.73 40.09. 121.4814. IBRD 94.42 - 38000 - 60.00 - 078 115.64 -15. IDA 174.56 54,72 44.84 54.72 446.oo - 6.44 - 569.28 -
Sub-totag ?95t47 *19.j04 24.26 181.80 1 6196.05 415,87B. Non-Consortium
1. Switzerland 12.73 - 2.75 _- - 10.65 -
2. Bulgaria 13.00 - - - - - - - 12.50 -
3. Czeohoslovakia 40,26 - 1.87 - - - - - 37.51 _4. Hungary 33.32 - - _ - - _ - 32.82 -
5. Poland 37-19 323 - 33.206. USS 468.77 - 18.71 - - 446277. Yugoslavia - - - - - - - -
§ at 60527 -S26956 -
TOTALS 1,1WsA 5l6.l 2 5 .19Jj4 69I386 339,9A gb.26 11,80 00 45.8
' This does not include food aid, non-food PL 480, technical assistance not included in the cost of capital projects, andrefugee assistanceo
b/ Disbursements have been calculated separately for the periods before and after December 1971 at the relevant exchange,rates prevailing.
£1 Commitments are shown at the exchange rate prevailing on the date of signature of the agreement.
d/ All pipeline figures have been adjusted to reflect exchange rates prevaili*g in March, 1972 and are therefore not directlycomparable with earlier columns in the table.
Sopr;lqF Ministry of Finaflce, Department of Economic Affair-

Table jv9 >9.
PROJECT AND NCN-PROJECT AID PIPELINE 1972
Opening pipeline Disbursements p Net new commitments p Disbursements p Closing pipeline pon4prill1 from the ipelte Lnet of deoi ons) from now commitments __En MachcL
Project Non-Project Project Non-Project Project Non-Project Project Non-Project Project Non-ProjectCountryv 4~
A. Consortium Members
1 Austria 0.79 1.34 - 0O11 2.90 - 2.40 0,79 1.732. Belgium 9.16 13.56 0.10 1.77 - 5,00 - 1.67 9,06 15,123. Canada 61.51 25.69 36.20 12.12 15.31 75.41 - 42.76 40.62 46.224. Denmark - 2.55 - 1.49 - 5.84 - 0.64 6.265. France 65.27 41,91 24,11 20.49 33.43 19,16 - 6.50 74.59 34e086. Germany 113.64 42.07 25,21 39.96 15.53 71-43 1.14 47,72 102o82 25.,827. Italy - 46.90 - 2,40 _ 13.94 - 13.94 - 44.508. Japen 66,13 71.74 13,05 31.67 9.74 71-43 1.17 41.7J. 61.65 69-799. Netherlands 11.77 - 9-42 - 21.00 - 2.73 - 20a62
10. Norway 2.13 1.72 - 0.10 - _- - 2.13 1.6211. Sweden 10.72 20.18 - 4.70 14.13 49,97 - 1.58 24.85 63.8712, U.K. 141.69 14.96 45.73 14.90 41.60 107.90 5.12 100.02 132.44 7.9413. U.A.A. 40.09 121.48 28.03 22.10 12.35 29.12 - 29.12 24.41 99.3814. TIBD 115.64 - 40o96 _ - - - - 74.68 -
15. IDA 569.28 - 121.48 - 199.00 75.00 15,52 45.00 631.28 30.00
Sub-toial 1,196.05 415.87 334,87 161.23 341.09 548.10 ML922 3 1,179.32 466.95
B. Non-Consortium
1. Switzerland 10.65 _ 2.18 - _ _ 8.47 -
2. Bulgaria 12.50 - 2.00 10.50 -
3. Czechoslovakia 37.51 - 7.96 . -_ _ 29.55 -
4. Hungary 32.82 - 0.04 - - - - - 32.78 -
5. Poland 33.20 - 1.63 - - - - - 31-57 -
6. USSR 446.27 - 27.00 p - - - 419,27 -
7. Yugoslavia - - - - - -
Sub5totA. _ 40.81 - 5 - _ _ 532.14 -
TOTALS 1,769,00 415.87 375.68 161.23 341.09 548,10 2295 335.79 466.95
v Including government to government food aid, which in terms of both commitments and disbursements amounted to $ 13 million (all fromCanada). Food aid under PL 480 Title II and under the World Food Program is not included. Technical assistance not provided in the
cost of capital projects is also excluded,
b/ Commitme. ts and disbursements have been calculated at the par values and central rates which came into effect after the December 1971currency re-alignments. Canadian assistance has been converted at the rate of US S 0.9944 8 1 Canadian. For assistance from EastEurope conversion rates have not been altered from previous years. In so far as spot rates have diverged from central rates or parvaluem, individual donors' assistance is over-stated or under-stated as the case may be.
& End-year pipeline figures do not take into account the US $ devaluation of February 1973 and other latest currency developments.Taking these into account, the total project pipeline would have been about s 1,750 million and the non-project pipeline about S 500 million.
Sources Ministry of Finance, Department of Economic Affairs,

Table 3.10 (a)
GROSS AND NET AID FLOWS : 1271/72(iR 31llion US dollars)
Project Non. Food aidaid dis. Project and non- Debtburse- aid dis- !/ food Service Net aidments bursements PL 480 ToJE,1 Payments transfer
A. Consortium members
1 Austria 1.06 - 106 3.22 2*162. Belgium 1.84 3.92 _ 5.76 3.39 2.373, Canada 22.06 43.80 37.33 103.19 9.05 94.144, Denmark _1.92_ 1.92 0.72 1l205. France 30.28 31.08 - 61.36 22e58 38.786. Germany 49.65 47.94 97.59 90.93 6.667. Italy - 16.00 _ 16000 30.97 14.978. Japan 13.34 45.74 59,08 79.86 - 20,789. Netherlands 1.95 14099 16e94 6.48 1046
!O. Norway 0.13 2.29 2e42 0,20 2.2211, Sweden 8.73 2.74 11.47 2.09 9,3812, U.K. 25.64 99.38 1.92 126094 54,70 72.2413. U.S.A. 81.77 213.56 116.48 411.81 118.25 29305614. IBRE 38e78 - - 38e78 80055 - 41.7715. IDA 51.28 54072 - 106,00 9035 96,65
Sub..total 325.45 1 155,71 1.060.32 3 5122547098
B. Non-Consortiu
. Bulgaria -006 _ 0.062. Czechoslovakia 1.87 - 1IV87 12.27 -10-40
3- liungarY ~ ~ ~ ~ - -0,44 - 0.443. Hungary - B4 ~ O44. Poland 3.23 - 3.23 5.13 - 1.905. USSR 18-71 -l 18.71 54.92 -36.216, Yugoslavia _ _ _ - 10.41 -10.41
S. Switzerland 2.75 - - 2.7 e 5,81 3*068. Others - - 2.33 2.33 13938 -11.05
Sub-total 26.56 - 20 28089 102.42 -75.
TOTAL 352.01 579.14 118.06 1089.21 614.76
_/ Including debt relief.
b/ Net resource transfer would in a number of cases be higher if technicalassistanoe or PL 480 TitleIlswere included.
Soirces Ministry of Finance, Department of Economic Affairs.
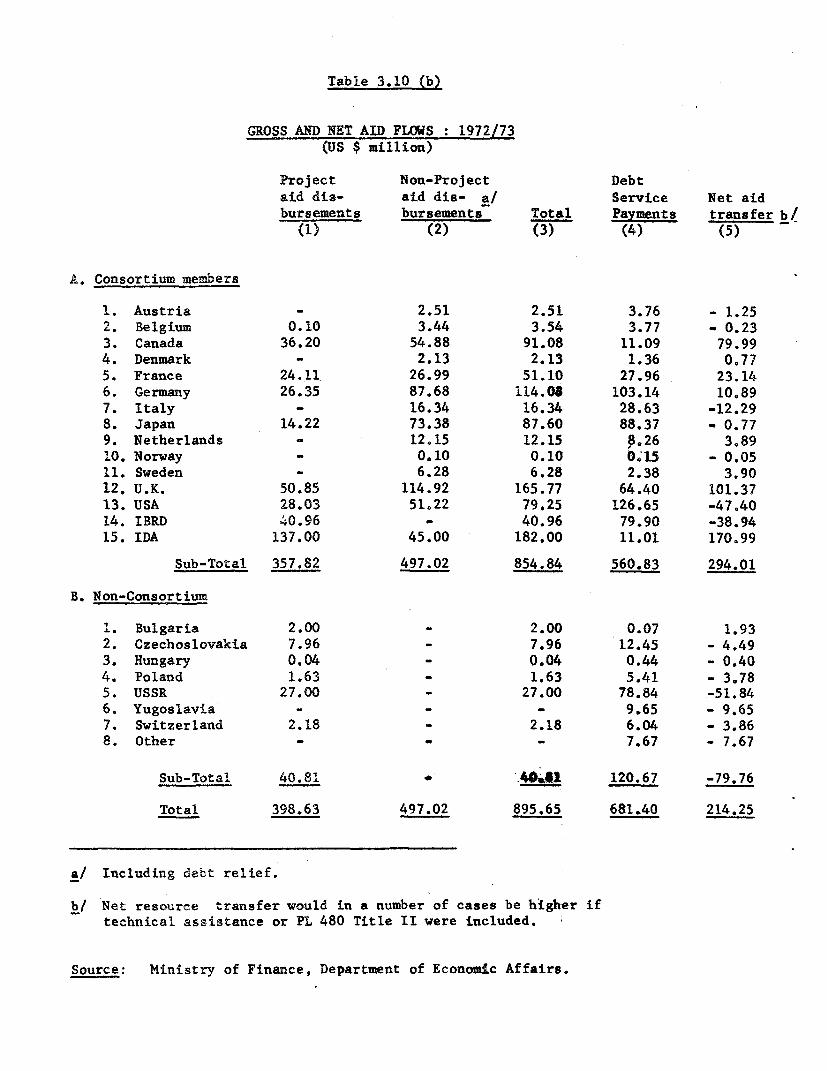
Table 3.10 (b)
GROSS AND NET AID FLOWS : 1972/73(US $ million)
Project Non-Project Debtaid dis- aid dis- a/ Service Net aidbursements bursements Total Payments transfer b/
(1) (2) (3) (4) (5)
A. Consortium members
1. Austria - 2.51 2.51 3.76 - 1.25
2. Belgium 0.10 3.44 3.54 3.77 - 0.23
3. Canada 36.20 54.88 91.08 11.09 79.994. Denmark - 2.13 2.13 1.36 0.77
5. France 24.11 26.99 51.10 27.96 23.14
6. Germany 26.35 87.68 114.03 103.14 100897. Italy - 16.34 16.34 28.63 -12.29
8. Japan 14.22 73.38 87.60 88.37 - 0.779. Netherlands - 12.15 12.15 P.26 3,89
10. Norway - 0.10 0.10 0.15 - 0.05
11. Sweden - 6.28 6.28 2.38 3.90
12. U.K. 50.85 114.92 165.77 64.40 101.3713. USA 28.03 51.22 79.25 126.65 -47.40
14. IBRD 40.96 - 40.96 79.90 -38.94
15. IDA 137.00 45.00 182.00 11.01 170.99
Sub-Total 357.82 497.02 854.84 560.83 294.01
B. Non-Consortium
1. Bulgaria 2.00 - 2.00 0.07 1.932. Czechoslovakia 7.96 _ 7.96 12.45 - 4.49
3. Hungary 0.04 - 0.04 0.44 - 0.404. Poland 1.63 - 1.63 5.41 - 3.78
5. USSR 27.00 - 27.00 78.84 -51.846. Yugoslavia - - - 9.65 - 9.65
7. Switzerland 2.18 - 2.18 6.04 - 3.868. Other - - 7.67 - 7.67
Sub-Total 40.81 - 40*I 120.67 -79.76
Total 398.63 497.02 895.65 681.40 214.25
a/ Including debt relief.
b| Net resource transfer would in a number of cases be higher iftechnical assistance or PL 480 Title II were included.
Source: Ministry of Finance, Department of Economic Affairs.
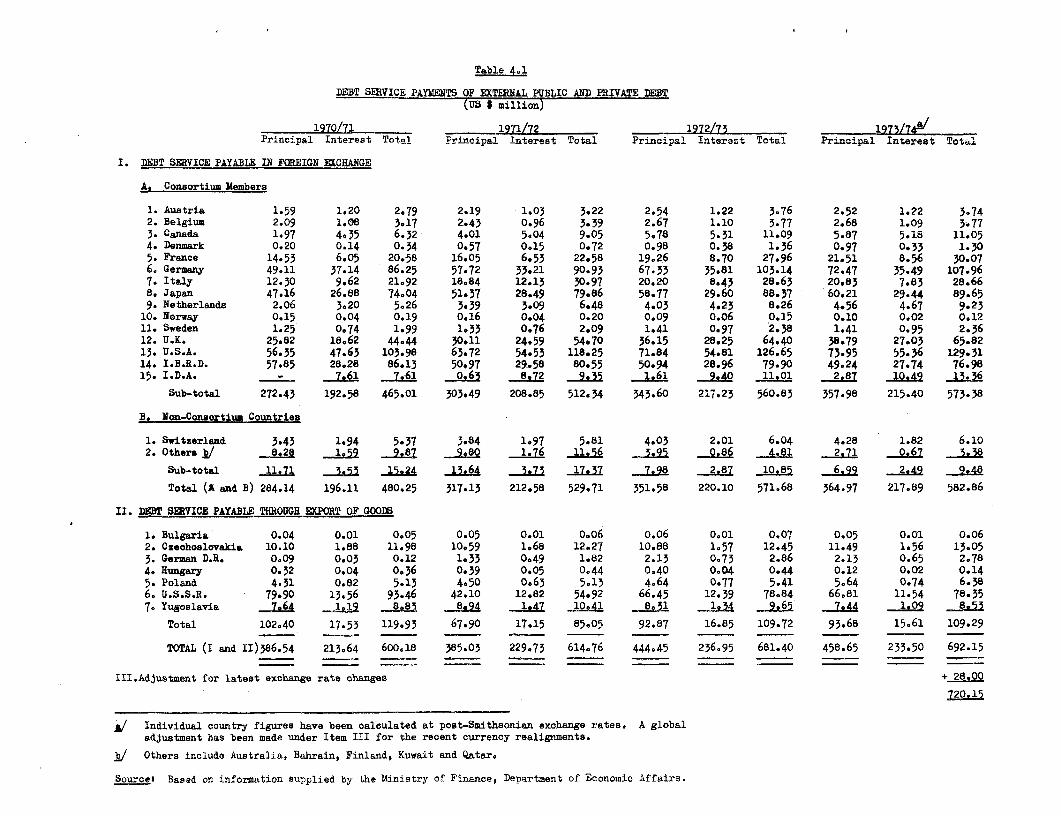
Table 4,1
DEBT SERVICE PAYUEUTS OF EXTEknAL PUBLIC AND PRIVATE DEBT(US $ million)
1970/71 1971/72 1972/73 1973/74i/Principal Interest Total Prilcipal Interest Total Principal Interest Total Principal Interest Total
I. DEBT SERVICE PAYABLE IN FOREIGN EXCHANGE
A. Conaortium Members
1. Austria 1-59 1.20 2.79 2.19 1.03 3.22 2.54 1.22 3.76 2.52 1.22 3.742. Belgium 2.09 1.08 3e17 2.43 0.96 3.39 2.67 1.10 3.77 2.68 1.09 3.773. Canada 1.97 4.35 6.32 4.01 5.04 9.05 5.78 5.31 11.09 5.87 5.18 11.054. Denmark 0.20 0.14 0.34 0.57 0,15 0.72 0.98 0.38 1.36 0.97 0.33 1.305. France 14.53 6.05 20.58 16.05 6.53 22.58 19.26 8.70 27.96 21.51 8.56 30.076e Germany 49.11 37.14 86.25 57.72 33,21 90.93 67.33 35.81 103.14 72.47 35.49 107.967. Italy 12.30 9.62 21.92 18.84 12.13 30.97 20.20 8-43 28.63 20.83 7.83 28.668. Japan 47.16 26.88 74-04 51,37 28.49 79.86 58.77 29.60 88.37 60.21 29.44 89.659. Netherlands 2.06 3.20 5.26 3e39 3.09 6.48 4.03 4.23 8.26 4*56 4.67 9.2310. Norway 0.15 0.04 0.19 0.16 0,04 0.20 0.09 0.06 0.15 0.10 0.02 0.1211. Sweden 1.25 0.74 1.99 1*33 0.76 2.09 1.41 0.97 2.38 1.41 0.95 2.3612. U.K. 25*82 18,62 44.44 30*11 24.59 54*70 36.15 28.25 64.40 38.79 27.03 65.8213. U.S.A. 56.35 47.63 103.98 63.72 54.53 118,25 71.84 54.81 126.65 73.95 55.36 129.3114. I.B.R.D. 57o85 28.28 86.13 50.97 29.58 80.55 50.94 28.96 79.90 49.24 27.74 76.9815. I.D.A. _ 7.61 7.,61 0.63 8*72 9*55 1061 __&tLQ 11.01 2.87 10.49 _1iL6
Sub-total 272.43 192.58 465.01 303*49 208.85 512.34 343.60 217,23 560.83 357.98 215.40 573.38
B, Non-Consortium Countriea
1. Switzerland 3.43 1.94 5.37 3.84 1.97 5.81 403 2.01 6.04 4.28 1.82 6.102. Othersa/ 8.28 1959 9J87 9.80 1.76 11.56 3095 0.86 4.81 2.71 0.67 L
3.8
Sub-total 11.71 353 15.24 13.64 3*73 17.37 7L98 2.87 10.85 6.99 2,49 9*48
Total (A and B) 284.14 196.11 480.25 317.13 212.58 529.71 351.58 220.10 571.68 364-97 217.89 582.86
II. DEBT SERVICE PAYABLE THROUGH EXPORT OF GOODS
1. Bulgaria 0.04 0.01 0,05 0.05 0.01 00o6 o.06 0.01 0.07 0.05 0.01 0.06
2. Czeohoslovakia 10.10 1.88 11.98 10.59 1.68 12,27 10.88 1.57 12.45 11.49 1.56 13.05
3. German D.R. 0.09 0.03 0.12 1.33 0,49 1.82 2.13 0.73 2.86 2.13 0.65 2.78
4. Hungary 0.32 0.04 0,36 0,39 0.05 0.44 0.40 0,04 0.44 0,12 0.02 0.14
5. Poland 4.31 0.82 5.13 4,50 0.63 5,13 4.64 0,77 5.41 5.64 0.74 6.38
6. U.S.S.R. 79.90 13,56 93.46 42.10 12.82 54.92 66.45 12.39 78.84 66n81 11.54 78.357G Yugoslavia 26.1 -=AU gxQA "e4 10.41 8_51 _ 4 __261 7e44 1.09 __sLU
Total 102.40 17.53 119,93 67.90 17.15 85005 92.87 16.85 109.72 93.68 15.61 109.29
TOTAL (I and II)386.54 213,64 600,18 385.03 229,73 614.76 444,45 236.95 681.40 458,65 233.50 692.15
III.Adjustment for latest exchange rate ohanges + 28.00
720.15
A Individual courntry figures have been calculated at post-Smithsonian exchange rates. A globaladjustment has been made under Item III for the recent currency realignments.
b/ Others include Australia, Bahrain, Finland, Kuwait and Qatar.
Source3 Based on information supplied by the Ministry of Finance, Department of Economic Affairs.

I I

Tabla 5,1
CONSOLIDATED FINANCES OF CENTER AND STATE GOVERNMENTS Rsbilllons) AT
Revised Average AnnualEstimate Budget Growth (C)
1960/61 1965/66 1969/70 1970/71 1971172 1972/73 1960161 - 1971/72
A. TAX REVENUE 13.55 29.03 41.82 47.34 55.17 62.88 13.6Canter 8.95 20.61 28.22 32.06 38.46 43.61 14.2States 4.60 8.42 13.60 15.28 16.71 19.27 12.4
B. NON.TAX REVENUE 3.54 7.87 12.05 12.52 15.13 15.15 14.1Center n.89 3.84 5.45 5.83 7.73 7.23 21.7States 2.65 4.03 6.60 6.69 7.40 7.92 9.8
C. TOTAL REVENUE 17.09 36.90 53.87 59.86 70.30 78.03 13.7Canter 9.84 21.45 33.67 37.89 46.19 50.84 15.1States 7.25 12.45 20.20 21,97 24.11 27.19 11.5
D. NON-DJ1VELOPMENT CURRET EXPENDITURE 8.28 20.73 32.08 34.41 43.39 42.90 16.3Center 4.68 14.36 20.17 21.54 26.95 27.06 17.3States 3.60 6.37 11.91 12.87 16.44 15.84 14.8
E. DEVELOpMENT CURRENT EXPENDITURE 8.06 13.38 21.05 24.00 28.25 31.23 12.1Center 2.36 2.35 3.54 4.10 4.82 5.60 6.7States 5.70 11.03 17.51 19.90 23.43 25.63 13.7
F. TOTAL CURRENT EXPENDITURE 16,34 34.11 53.13 58.41 71.64 74.13 14.4Center 7.04 16.71 23.71 25.64 31.77 32.66 14.7Sitates 9,30 17.40 29.42 32.77 39.87 41.47 14.2
G. CURRENT SURPLUS (C - F) 0.75 2. 79 0.74 1.45 -1.34 3.90 -Center 2.80 7.74 9.96 12.25 14.42 18.18 16.1States -2.05 -4.95 -9.22 -10.80 -15.76 -14.28 20.1
H. CAPITAL RECEIPTS 12.66 19.13 27.88 26.11 30.90 27.40 8.4Center 10.42 14.20 20.32 19.16 23.18 18.77 7.5States 2.42 4.93 7.56 6.95 7.72 8.63 11.1
I. TOTAL FINANCING AVAIWLE (C + H) 13.41 21.92 29.62 27.56 29.56 31.30 7.5Center 13.22 21.94 30.28 31.41 37.60 36.95 10.0States 0.19 -0.02 -1.66 -3.85 -9.04 -5.65 -
J. CAPITAL OUTLAY 7.23 12.66 11.58 14.99 18.10 15.91 8.7Center 4.05 7.76 6.49 9.41 10.94 8.22 9.5States 3.18 4.90 5.09 5.58 7.16 7.69 7.7
K. DEBT PAYMENTS 1.48 2.64 7.08 5.81 6.39 6.84 14.2Center 1.27 2.35 5.72 4.78 5.30 5.52 13.9States 0.21 0.29 1.36 1.03 1.09 1.32 16.2
L. LOANS AND ADVANCES 3.31 9.15 8.60 10.39 11.17 11.18 11.7Center 1.51 3.95 4.29 5.48 5.36 6.65 12.2States 1.80 5.20 4.31 4.91 5.81 4.53 11.2
M. TOTAL CAPITAL DISBURSEMENTS (J + K + L) 12.02 24.45 27.26 31.19 35.66 33.93 10.4Center 6.83 14.06 16.50 19,67 21.60 20.39 11.0States 5.19 10.39 10.76 11.52 14.06 13.54 9.5
N. OVERALL DEFICIT (I - M) 1.39 -2.53 1.36 -3.63 -6.10 -2.63 -Surplus of Center 6.39 7.88 13.78 11.74 16.00 16.56 8.7Deficit of States -5.00 -10.41 -12.42 -15.37 -22.10 -19.19 14.5
0. NET CENTER TO STATES 4.61 9.85 12.92 14.33 19.71 19.31 14.1States share fromi Taxes 1.65 2.76 6.21 7.55 9.45 10.53 17.2Grants to States 1.22 3.30 5.31 5.66 8.70 8.06 19.6Loans to States 3.46 8.16 10.29 10.05 13.16 12.02 12.9Loan Repayments by States C-) -1.14 -2.85 -6.08 -6.34 -8.13 -7.85 19.6Interest Payments by States (-) -0.58 -1.52 -2.81 -2.59 -3.47 -3.45 17.7
CENTER SURPLUS LESS TRANSFERS 1.78 -1.97 0.86 -2.59 -3.71 -2.75 -STATES DEFICIT PLUS TRANSFERS -0.39 -0.56 0.50 -1.04 -2.39 -0.11 17.9
OVERALL DEFICIT- 1.39 -2.53 1.36 -3.63 -6.10 -2.63 -
a/ This table has been prepared by netting out five kinds of transfers between Center and State Governments. These are taxshares, grants and loans made by the Center to the States and repayment and interest of loans paid by the States to theCenter. The figures given for these transfers in the Center and State Budgets are not the same and in each case one setof figures has been used and the other's account adlusted accordingly. Interest payments to the Center and the States'share of Central Taxes have been those from the Central Budget while the other figures have been taken from State Budgets.The five types of transfers are shown ssparately under item 0.
b/ The overall deficit, as presented in this table, ignores certain adjustments and net remittances and is therefore notcomparable to the deficit appearing in Table
Source: Reserve Bank of India, Reports on Currency end Finance.
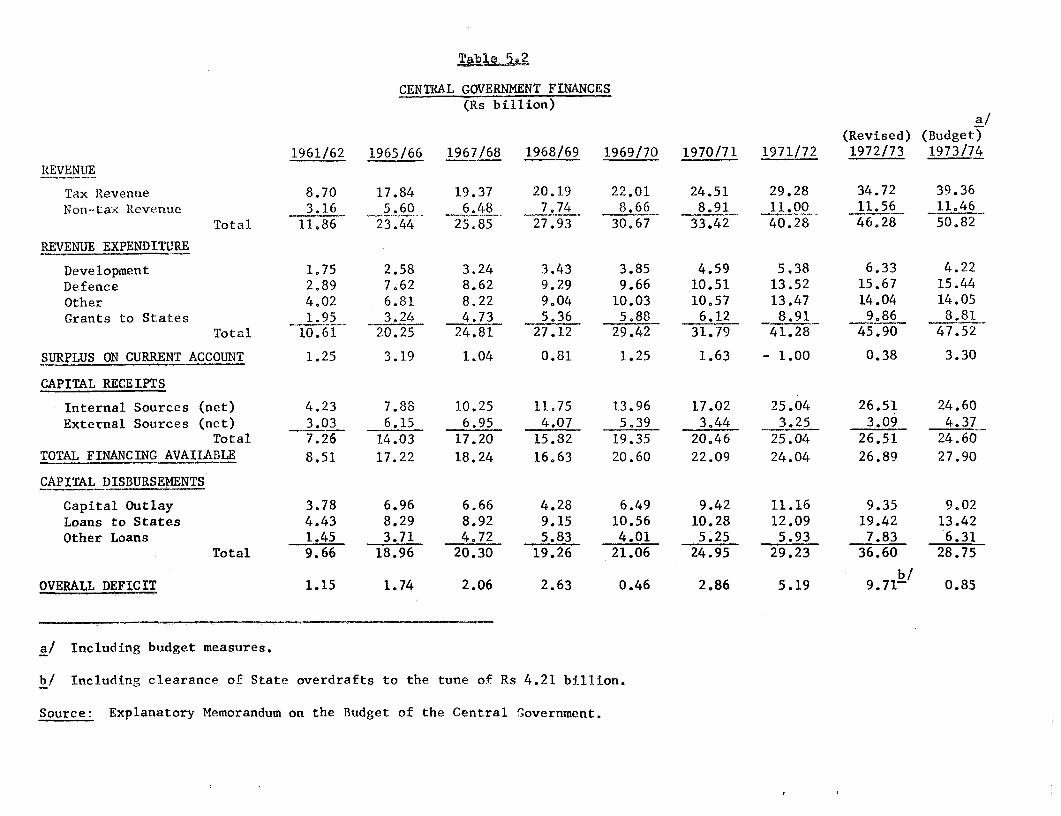
CENTRAL GOVERNMENT FINANCES(Rs billion)
a!(Revised) (Budget)
1961/62 1965/66 1967/68 1968/69 1969/70 1970/71 1971/72 1972/73 1973/74REVENUE
Tax Revenue 8.70 17.84 19.37 20.19 22.01 24.51 29.28 34.72 39.36Non-tax Revenue 3.16 5.60 6.48 7,74 8.66 8.91 11.00 11.56 11.46
Total 11,86 23.44 25.85 27.93 30.67 33.42 40.28 46.28 50.82
REVENUE EXPENDITURE
Development 1.75 2.58 3.24 3.43 3.85 4.59 5.38 6.33 4.22Defence 2.89 7.62 8.62 9.29 9.66 10.51 13.52 15.67 15.44Other 4.02 6.81 8.22. 9.04 10.03 10.57 13.47 14.04 14.05Grants to States 1.95 3,24 4.73 5.36 5.88 6.12 8.91 9.86 8.81
Total 10.61 20.25 24.81 27.12 29.42 31.79 41.28 45.90 47.52
SURPLUS ON CURRENT ACCOUNT 1.25 3.19 1.04 0.81 1.25 1.63 - 1.00 0.38 3.30
CAPITAL RECEIPTS
Internal Sources (net) 4.23 7.88 10.25 11.75 13.96 17.02 25.04 26.51 24.60External Sources (net) 3.03 6.15 6.95 4.07 5.39 3,44 3.25 3.09 4.37
Total 7.26 14.03 17.20 15.82 19.35 20.46 25.04 26.51 24.60
TOTAL FINANCING AVAILABLE 8.51 17.22 18.24 16,63 20.60 22.09 24.04 26.89 27.90
CAPITAL DISBURSEMENTS
Capital Outlay 3.78 6.96 6.66 4.28 6.49 9.42 11.16 9.35 9,02Loans to States 4.43 8.29 8.92 9.15 10.56 10.28 12.09 19.42 13.42Other Loans 1.45 3.71 4.72 5.83 4.01 5.25 5.93 7.83 6.31
Total 9.66 18.96 20.30 19.26 21.06 24.95 29.23 36.60 28.75
OVERALL DEFICIT 1.15 1.74 2.06 2.63 0.46 2.86 5.19 9.71- 0.85
a/ Including budget measures.
b/ Including clearance of State overdrafts to the tune of Rs 4.21 billion.
Source: Explanatory Memorandum on the Budget of the Central Oovernment.
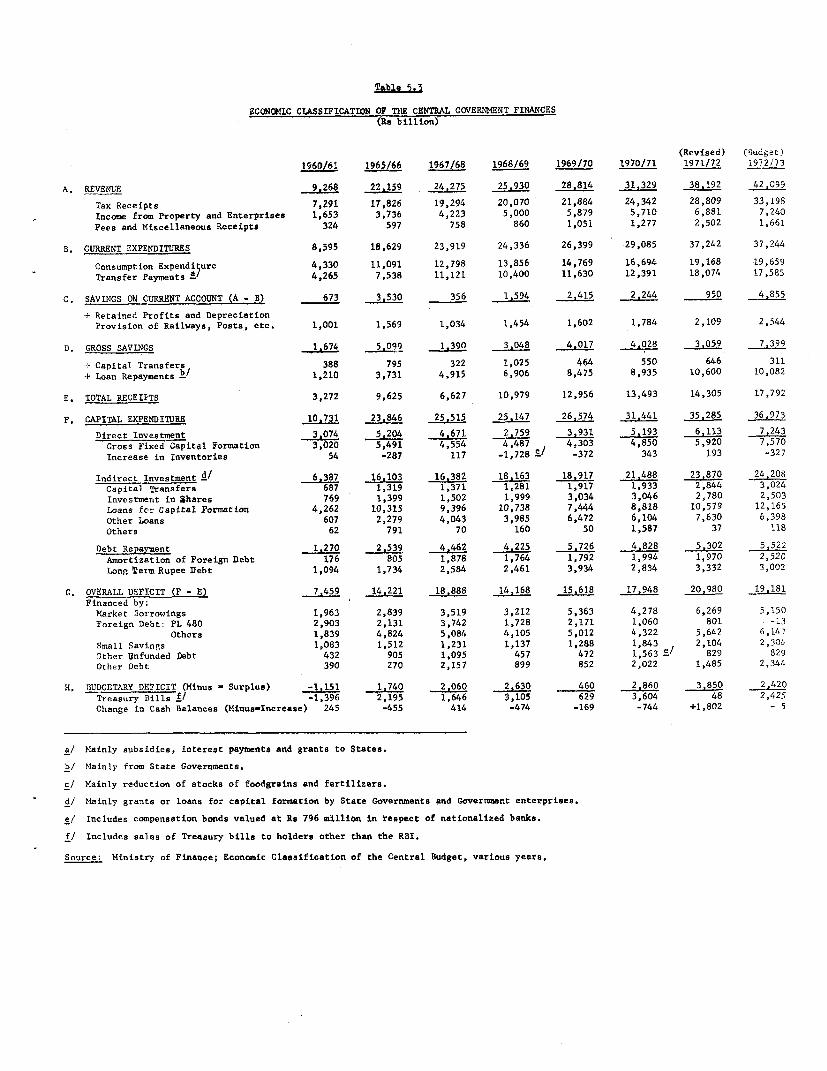
Table 5.3
ECONOMIC CLASSIFICATION OF TZE CENTRAL GOVERNMENT FINANCES(RI, billion)
(Revised) (Budget)1960/61 1965/66 1967/68 1968/69 1969/70 1970/71 1971/72 1972i73
A. REVENUE 9.268 22.159 24.275 25,930 28,814 31,329 38,192 42,099
Tax Receipts 7,291 17,826 19,294 20,070 21,884 24,342 28,809 33,198Income from Property and Enterprises 1,653 3,736 4,223 5,000 5,879 5,710 6,881 7,240Fees and Miscellaneous Receipts 324 597 758 860 1,051 1,277 2,502 1,661
B. CURRENT EXPENDITURES 8,595 18,629 23,919 24,336 26,399 29,085 37,242 37,244
Consumption Expendi5ure 4,330 11,091 12,798 13,856 14,769 16,694 19,168 19,659Transfer Payments a 4,265 7,538 11,121 10,400 11,630 12,391 18,074 17,585
C. SAVINGS ON CLURRENT ACCOUNT (A - B) 673 3,530 356 1,594 2,415 2,244 950 4,855
+ Retained Profits and DepreciationProvision of Railways, Posts, etc. 1,001 1,569 1,034 1,454 1,602 1,784 2,109 2,544
D. GROSS SAVINGS 1.674 5*099 1.390 3.048 4.017 4,028 3,059 _,99
Capital Transfers 388 795 322 1,025 464 550 646 311+ Loan Repayments b/ 1,210 3,731 4,915 6,906 8,475 8,935 10,600 10,082
E. TOTAL RECEIPTS 3,272 9,625 6,627 10,979 12,956 13,493 14,305 17,792
F. CAPITAL EXPENDITURE 10.731 23.846 25,515 25,147 26,574 31,441 35,285 36,973
Direct Investment 3,074 5 204 4 671 2,759 3,931 5,193 6,113 7,243Gross Fixed Capital Formation 3,020 5,491 4,554 4 487 4,303 4,850 5,920 7,570Increase in Inventories 54 -287 117 -1:728 cl -372 343 193 -327
Indirect Investment d/ 6,387 16,103 16,382 18.163 18.917 21,488 23870 _24 208Capital Transfers 687 1,319 1,371 1,281 1,917 1,933 2,844 3,024Investment in Shares 769 1,399 1,502 1,999 3,034 3,046 2,780 2,503Loans for Capital Formation 4,262 10,315 9,396 10,738 7,444 8,818 10,579 12,165Other Loans 607 2,279 4,043 3,985 6,472 6,104 7,630 6,398Others 62 791 70 160 50 1,587 37 118
Debt Repayment 1,270 2.539 4,462 4,225 5.726 4,828 5,302 5,522Amortization of Foreign Debt 176 805 1,878 1,764 1,792 1,994 1,970 2,520Long Term Rupee Debt 1,094 1,734 2,584 2,461 3,934 2,834 3,332 3,002
G. OVERALL DEFICIT (F - E) 7.459 14,221 18,888 14,168 15.618 17,948 20,980 19.181Financed by:
Market Borrowings 1,963 2,839 3,519 3,212 5,363 4,278 6,269 5,150Foreign Debt: PL 480 2,903 2,131 3,742 1,728 2,171 1,060 801 - -13
Others 1,839 4,824 5,084 4,105 5,012 4,322 5,642 6,147Small Savings 1,083 1,512 1,231 1,137 1,288 1,843 2,104 2,304Other Unfunded Debt 432 905 1,095 457 472 1,563 e/ 829 829Other Debt 390 270 2,157 899 852 2,022 1,485 2,344
H, BUDGETARY DEFICIT (Minus - Surplus) -1.151 1.740 2,060 2,630 460 2,860 3,850 2420Treasury Bills t/ -1,396 2, 19.5 1,646 3,105 629 3,604 48 2,425Change in Cash Balances (Minus-Increase) 245 -455 414 -474 -169 -744 +1,802 - 5
a/ Mainly subsidies, interest payments and grants to States.
b/ Mainly from State Governments.
c/ Mainly reduction of stocks of foodgrains and fertilizers.
d/ Mainly grants or loans for capital formation by State Governments and Government enterprises.
e/ Includes compensation bonds valued at Re 796 million in respect of nationalized banks.
f/ Includes sales of Treasury bills to holders other than the RBI.
Source: Ministry of Finance; Economic Claosification of the Central Budget, various years.
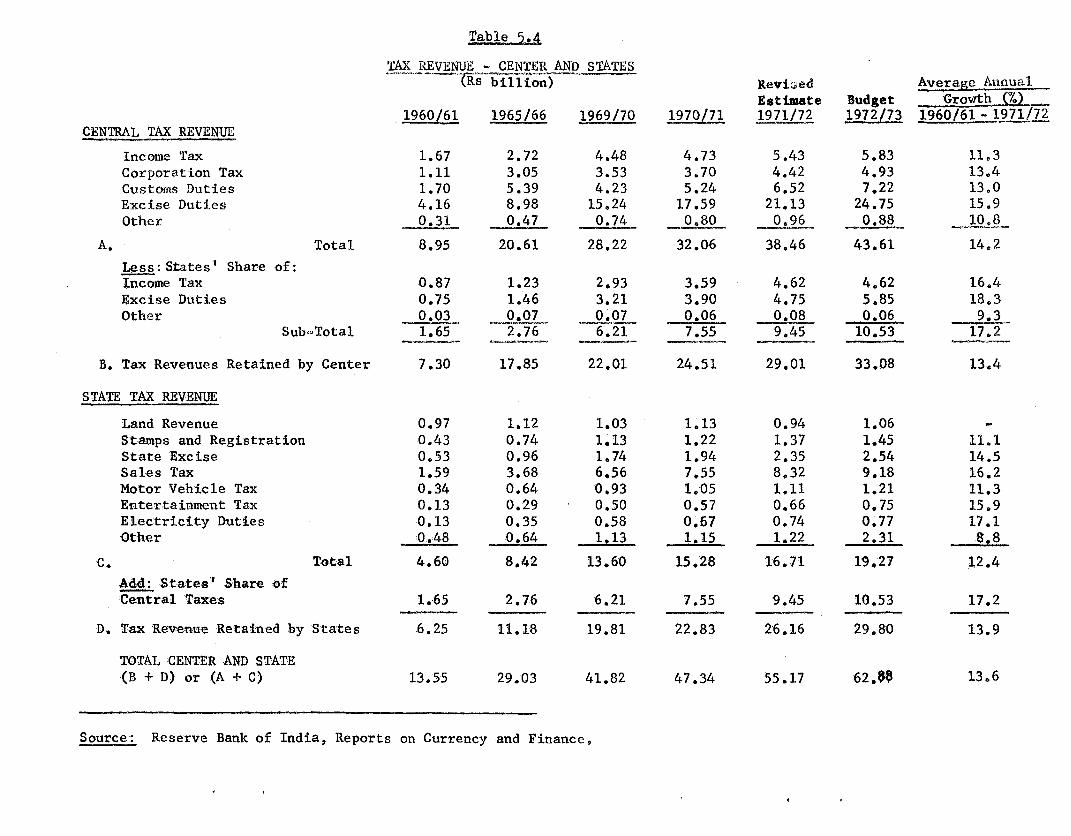
Tabjle 5,
TAX REVENUE - CENJ'ER AND SIATES
( ~aR.s billion) Revised Average Annual
Estimate Budget Growth (7.)
1960/61 1965/66 1969/70 1970/71 1971/72 1972/73 1960/61 -1971/72
CENTRAL TAX REVENUE
Income Tax 1.67 2.72 4.48 4.73 5.43 5.83 11.3
Corporation Tax 1.11 3.05 3.53 3.70 4.42 4.93 13.4
Customs Duties 1.70 5.39 4.23 5.24 6.52 7.22 13,0
Excise Duties 4.16 8.98 15.24 17.59 21.13 24.75 15,9
Other 0.31 0.47 0.74 _ 0.80 0.96 0.88 10.8
A. Total 8,95 20.61 28.22 32.06 38.46 43.61 14e2
Less:States' Share of:Income Tax 0.87 1.23 2.93 3.59 4.62 4.62 16,4
Excise Duties 0.75 1.46 3.21 3.90 4.75 5.85 18.3
Other 0.03 0.07 0.07 0.06 0.08 0.06 9.3
Sub-Total 1.65 2.76 6.21 7.55 9.45 10.53 17.2
B. Tax Revenues Retained by Center 7.30 17.85 22.01 24.51 29.01 33.08 13.4
STATE TAX REVENUE
Land Revenue 0.97 1.12 1.03 1013 0.94 1.06 -
Stamps and Registration 0.43 0.74 1.13 1.22 1.37 1.45 11.1
State Excise 0.53 0.96 1.74 1.94 2.35 2.54 14.5
Sales Tax 1.59 3.68 6.56 7.55 8,32 9.18 16.2
Motor Vehicle Tax 0.34 0.64 0.93 1,05 1.11 1.21 11.3
Entertainment Tax 0.13 0.29 0.50 0.57 0.66 0.75 15.9
Electricity Duties 0.13 0.35 0.58 0,67 0.74 0.77 17.1
Other 0.48 0.64 1.13 1.15 1.22 2,31 8.8
C. Total 4.60 8.42 13.60 15.28 16.71 19.27 12.4
Add: States' Share ofCe-ntral Taxes 1.65 2.76 6.21 7.55 9.45 10.53 17.2
D. Tax Revenue Retained by States 6.25 11.18 19.81 22.83 26.16 29.80 13.9
TOTAL CENTER AND STATE(B + D) or *(A + C) 13.55 29.03 41.82 47.34 55.17 62.0$ 13,6
Source: Reserve Bank of India, Reports on Currency and Finance.

Table 5.5
CURRENT EXPENDITURES - CENTER AND STATES(in Rs billion)
Revised Average Annuala/ Estimate Budget Growth (%)
1960/61 1965/66 1969/70 1970/71 1970/71 1972173 1960/61 - 1971/72
Central Government
A. Development 2.36 2.35 3.54 4.10 4.82 5.60 6.7
B. Non-Developmenta. Tax Collection 0.22 0.30 0.42 0.48 0,53 0.50 8,3b. Civil Administration 0.59 0.95 1.75 2.02 2.55 2.68 14.2c. Defense 2.48 7.62 9.66 10.51 12.48 12.18 15,8d. Debt Service 0.77 3.71 5.65 6.06 6.84 7.30 21.9e. Other 0.62 1.78 2.69 2,47 4.55 4.32 19.9
Sub-Total 4.68 14,36 20.17 21.54 26.95 27.06 17 3
C. Grants to State.- 1.22 3.30 5.31 5,66 8.70 8.06 19.6(A + B + C) "'otal 8,26 20301 29,02 31.30 40Q47 40.72 15.5
State Governments
D Develo.menta. Education 1.95 3.73 6b.80 7.83 8.95 9.78 14.9b. Public Realth 0.81 1.49 ,'74 2.99 3.62 4.05 14.6c. Agriculture 0.66 1.56 2,11 2.27 2,76 3.09 13.9d. Rural and Comunity
Development 0.52 0.86 0.71 0,83 1.14 1.37 7.4e. Civil Works 0.67 1,35 1,90 2.17 2.59 2.52 13.1f. Industry 0,22 0.29 0,33 0,34 0.39 0.44 5.3g. Other 0 87 1,75 2.92 3,47 3,98 4.38 14.8
Sub-Total 5.70 11.03 17.51 19g90 23.43 25.63 13.7
E. Non-Developmenta. Tax Collection 0.66 0.81 1.30 1.48 1,69 1.85 8.9b. Civil Administration 1.67 2.73 4,11 4.55 5.00 5.17 10.5c. Famine 0 22 0.17 1,59 1.06 1.65 0.67 20.0d. Debt Service 0.26' 1.17 2,68 3.19 3,39 4.16 26.4e, Other 0.78 1.49 2,23 2.59 4.71 3.99 17.8
Sub-Total 3.59 6.37 11.91 12.87 16.44 15.84 14.8
F. Interest Payments to d/Center 0.58 1.52 2.81 2.59 3.47 3,45 17.7
Total 4.17 7.89 14.72 15.46 19.91 19.29 15.3
G. Total States (D + E + F) 9,87 18.92 32.23 35.36 43.34 44.92 14.4
H. Total Center and States(Net)(A + B + D + E) 16.33 34.11 53.13 58.41 71.64 74.13 14.4
4 Figures for 1960/61 were prepared on a basis slightly different from other years. However,the differences are generally small.
b/ Figures for grants to States were taken from data provided by the States and are not identicalwith those of the Center. The "other" category is a residual.
c/ Figures are not strictly comparable.d/ Figures for interest payments to the Center are taken from the Center's data and are not the
same as those provided by the States. The "other" category is again a residual.
Source: Reserve Bank of India, Reports on Currency and Finance.

TOAL PLAN OUTIAY - BY SECTORS(Ho billion)
Fourth Plan Fourth Plan
96g7Actuals 1970 stiated i971L2 Target 19727 Taret 197/7 ge latest estimates) (oriarina estimates)
Amount 3 Amount % Amount c Amount s Amount 5 Amount M4 Aount G
Agriculture & Allied Sectors 3.26 14n9 5,05 19.1 5.54 17.6 7.82 19.7 7.76 17.8 29-43 18.0 27.28 17.2
Irrigation & Mood Control 1.95 8.9 2.13 8.1 2.32 7.3 2.60 6.6 2.94 6.7 11.94 7-3 10.87 6.8
Power 4,73 21.7 5.25 19.9 5.29 16.8 6.03 15.2 6.87 15.8 28.16 17-3 24-48 15.4
Industry and Minerals 4.29 19,7 4.53 17.1 6.09 19.3 7.31 18.4 7-52 17.2 29.73 18.2 33,38 21.0
Tillage & Small Lndustries 0.37 1.7 0-43 1.6 0.46 1.5 0.63 1.6 0.60 1.4 2.49 1.5 2.93 1.8
Transport and Comunications 4.08 18.7 4-97 18.8 6.32 20.0 7.28 18.3 7-00 16.0 29.66 18.2 32.37 20.4
Education 0.87 4.0 1.16 4,4 1.58 5,0 1.94 4-9 2.18 5.0 7.74 4.8 8.23 5.2
Scientific Research 0.14 o.6 0.17 0.6 0.27 0,9 0.42 1.1 0-33 0.8 1.34 0.8 1.40 0.9
Health 0.40 1.8 0.50 1.9 0.74 293 0.87 2.2 0,91 2.1 3-43 2.1 4.35 2.7
Pamily Planning 0.37 1,7 0-47 1.8 0.61 1.9 o.63 1.6 0.55 1.3 2.63 1.6 3-15 2.0
Water Supply and Sanitation 0.47 2.1 0.68 2.6 0.84 2.7 1.02 2.6 1.23 2.8 4.23 2.6 4.06 2.5
Housing, Urban end RegionalDevelopment 0.33 1.5 0-39 1.5 0-54 1.7 0.62 1.6 0.63 1.4 2.51 1.5 2.37 1.5
Welfare of Backwrd Classes 0.22 1.0 0.26 1.0 0.30 1.0 0.42 1.1 0.41 0.9 1.60 1.0 1.42 0.9
Social Welfare -/ 0.04 0.2 0-05 0.2 0.17 0-5 1.54 3.9 1.52 3-5 3-31 2.0 0.41 0-3
Labour Welfare and CraftsmenTraining 0.04 0.2 0-04 0.2 0.07 0.2 0.08 0.2 0.14 0.3 0.37 0.2 0.40 0.2
Other Wrograma 0.2B 1.3 0.33 1.2 0.43 1.4 0.51 1.3 0.56 1.3 2.11 1.3 1.92 1.2
Crash Soheme for EducatedUnemployed 1.00 2.3 1.00 0.6
Advance Lotion for the FifthPlan 1.50 3.4 1.50 0.9
Amu _21.82 Q0 ,0 2 6.42 Q 31.58 2AU I" A_16 4 100.0 163j20 159.02 100.0
,/ Including special welfare scheees.
Sourest Government of India, Planning Commission and Amnual Plan Docuiiients 1972/73 and 1973/74.

Table 5.7
FINANCING OF PUBLIC SECTOR PLAN OUTLAYS - MAIN ITEMS(Rs. billion)-
Annual Pnnu19 Pa Plan 1971/72 Annul Plan 1972 Annua Plan 1973/74 Fourth Plan Fourth Plan(Act-ls) (Latest Eat t at Estimates) (Estate sties) (Latest Estimates) (Original Estimates)
Center #t#tes Total Center States Total -Center SJate Total Center States Total Center States Total Center States Total Center States Total
Revenue Surplus 3.97 -0.48 3.49 5.07 0.79 5.86 4.03 2.51 6.54 11.45 4.71 16.16 13.75 3.48 17.23 38.27 11.01 49.28 37.25 11.46 48.71
Surpluses of PublicSector Enterprises 1.61 1.00 2.61 1.54 0.87 2.41 2.04 0.63 2.67 3.04 0.81 3.85 2.22 0.78 3.00 10.45 4.09 14.54 16.99 5.32 22.31
Internal Borrowing 4.88 4.69 9.57 6.82 3.72 10.54 9.26 3.54 12.80 10.19 3.98 14.17 12.53 5.55 18.08 43.68 21.48 65.16 39.08 14.28 53.36
Deficit FinanoingThrough N.et Credit 0.89 -0.31 0.58 2.31 1.34 3.65 3-83 - 3.83 2.42 -0.67 1.75 0.85 - 0.85 10,30 0.36 10.66 8.50 - 8.50
Total ilomestic Resources 11.39 4.90 16.2S,~ § 122A6 19.16 6.68 25.84 27.10 8.83 35.93 92m,U 9.81 3 1026 70 5A 5.64 101.32 31.06 132.88
External A.ssistance(Net of Repayments) 5.74 - 5.74 5.47 - 5.47 5.74 - 5.74 3.80 - 3.80 4.48 - 4.48 25.23 - 25.23 26.14 - 26.14Total Resources(to be) Mobilised 1l| s2 Aj22 Z21. 21.21 6.72 j1 24dQ 6.68 31.58 8*! j2 8 9.81 5 127.93 : 164.87 127.96 51.06 15902&
Assistance for State Plans -6.06 6.o6 - -6.28 6.28 - -7.20k/ 7.20 t _ -7-19 7.19 -8.55 8.55 - -35.28 35.28 - -35.00 35.00 -
Total Resources for Plan 11.03 10.96 14-21 l 13, 21.121' I 13.88 31.58 23.71 160.2 S 25,28 1.6 48 72.22 1 l A 159.0a
A For details, see Table 5.8 See also footnotes to Table 5.8
/ Includes assistanoe for Himachal Pradesh, whioh became a State in January, 1971. The estimates for 1972/73 and 1973/74 also includeassistance for Menipur and Tripura which have also become States.
c/ Total outlays are now placed at Rs. 21.82 billion; no detailed adjustment is available for the financing items.
A/ Total outlays are now anticipated to be Rs. 26,42 billion; no detailed adjustment is available for the financing items.
SQurcegu Fourth Five Year Plan 1969-74; Annual Plans 1969/70, 1970/71, 1972/73 and 1973/74.The Fourth Plan Mid-Term Appraisal.

Table 5. 8
FIRANICING OF PUBLIC SEC T0R,AEN OUTLAYS - =ETAILS OF M4AIN ITEMB(Re billion)
Annual Planl~L~ A 1nual Plan 1970/71 i lPlar 1971/2 navXl191a l 3 Annual Plan 197 /74 Fourth Plan Fourth Plan
(Actua1ls) ~ Latest Estimates) (Latest Estimates) (BEtimates) (Estimates) (Latest lEstimateu) (Original Estimates)
Center States Total Center States Total Center States Total Center States Total Center States Total Center States Tota, Center States Total
Le_veu SurBalance froa Current Revenuev at
1968/69 Rates of Taxationm' 2.58 -1.00 1.58 1.98 -0.41 1.57 -1.41 0.80 .0.61 2.15 1.66 3.81 1.01 -0.46 0.55 6.31 0.59 6.90 16.25 0.46 16.73
Additional Resource R.obilisationMeasures F/
1969/70 measures 1.29 0.52 1,81 1.41 0.87 2.28 1.50 0.94 2.44 1.60 1.01 2.61 1.70 1.09 2.79 7.50 4.43 11.93 7.25 4.14 11.39
1970/71 measures 0.10 - 0.10 1.68 0.33 2.01 .-1.97 0.48 2.45 2.10 0.52 2.62 2.26 0.58 2.84 8.11 1.91 10.02
1971/72 measures 1.97 0.29 2.26 4.10 0.64 4.74 4.33 0.67 5.00 10.40 1.60 12.00 13.75) 6.84) 20.59)
1972/73 measures 1.50 0.88 2.38 1.52 1.13 2.65 3.02 2.01 5.03
1973/74 measures 2,93 0.47 3.40 2.93 0.47 3.40 )
Total 1L9I -0.48 1.49 5.07 0.79 5.86 4.03 2.51 §.5A 11.45 A4U 16.6 .l7D *.48 17.23 38,27 11.01 49.28 1d ILL6 48.71L
Railways 0.27 - 0.27 _0.19 - -0.19 -0.35 - -0.35 -0.41 - -0.41 -1.11 - .1.11 -1.79 - -1.79 2.65 - 2.65
Poets and Telegraphs 0.40 - 0.40 0.36 - o.36 0.42 - 0.42 0.56 - 0.56 0.93 - 0.93 2.67 - 2.67 2.25 - 2.25
IDC, ARC, RBC, DVC,Central Power Generating Units 0.17 - 0.17 0.33 - 0.33 0.55 - 0.55 0.76 - 0.76 0.34 - 0.34 2.15 - 2.15 2.59 - 2.59
Others L 0.75 0.94 1.69 0.70 0.74 1.44 0.92 0.53 1.45 1.38 0.67 2.05 1.26 0.53 1.79 5.01 3.41 8.42 7.85 4.95 12.80
Retained Profite Reserve Bank 0.02 0.06 0.08 0.34 0.13 0.47 0.50 o.lo 0.60 0.75 0.14 0.89 0.80 0.25 1.05 2.41 0.68 3.09 1.65 0.37 2.02
Total 1.61 1 OC 2.61 1.54 0.87 2.41 2.04 0.63 26 1O 0.81 1. 0 2.22 3 0078045 AOJ 1 16.99 14, 223
lMarket Borrowing (net) 1.28 0.83 2.11 1.86 0.99 2.85 1.88 1.01 2.89 2.15 1.09 3.24 3.26 1.48 4.74 10.43 5.40 15.83 9.00 5.15 14,.15
Borrowing by Food Corporation - - - 1.16 - i.16 0.19 - 0.19 0.95 - 0.95 1.00 - 1.00 3.30 - 3.30 1-55 - 1.55
Borrowing by Other FinancialInstitutioms 0.22 - 0.22 0.14 - 0.14 0-39 - 0.39 0.37 - 0.37 0-59 - 0.59 1.71 - 1.71 2-50 - 2.50
Small Savings 0.54 0.75 1.29 0.89 1.02 1.91 0.53 1.29 1.82 0.80 1.50 2.30 0.85 2.40 3.25 3.61 6.96 10.57 2.74 4.95 7.69
Annuity and Compulsory Deposits,Price and Gold Bonds -0.34 - -0.34 -0.18 - -0.18 -0.18 . -0.18 -0.16 - -0.16 -0.18 - _0.18 -1.04 - -1.04 -1.04 - -1.04
State Provident Funds 0.80 0.76 1.56 0.83 0.61 1.44 0.88 o.66 1.54 0.99 0.68 1.67 1,15 0.88 2.03 4.65 3.59 8.24 3-43 3.17 6.60
Loans from LIC and StateEnterprises Market Borrowings - 1.26 1.26 - 1-33 1-33 - 1.53 1.53 - 1.89 1.89 - 2.21 2.21 - 8.22 8.22 - 5.06 5.06
Miscellaneous Capital Receipts (net) 2.38 1.09 3.47 2.12 -0.23 1.89 5.57 -0.95 4.62 5.09 -1.18 3.91 5.86 -1.42 4.44 21.02 -2.69 18.33 20.90 -4.05 16.85
Total 4 a8 Aa6 2zU /U Ij71 2 IlO.S 9.26 5.S4
1 10.19 .9_8 14-1 12.53 S.SS 18.08 4l.68 21.48 65.16 59.08 14.28 S6
llxternal AessistanCe (net)
Other than PL 480 3.56 - 3.56 4.25 - 4.25 4.28 _ 4.28 3-84 - 3.84 4.16 - 4.16 20.09 - 20.09 22-34 - 22.34
PL 480 2.18 - 2.18 1.22 - 1.22 1.46 - 1.46 -0.04 - -0.04 0.32 - 0.32 5.14 - 5-14 3.80 - 3.80
Tota - "E - S .7 - S.74 .310 - .3-0 4 A8-4 - A4.8 1 - 26.14 - 26.14
A/ Amounts for the States are inclusive of their share of additional taxation by the Center since 1969/70.
,/ Additional measures of the Center are net of the share of States.
Q/ Exclusive of revenue from rate increases during the Plan period, which is included under Additional resource mobilisation measures.
AV Amounts for the States represent Reserve Bank loans to State Governments for participation in the share capital of oooperatives.
Sourcess Fourth Five Year Plan 1969-74; Annual Plans 1969/70, 1970/71, 1972/73 and 1973/74.The Fourth Plan Mid-Term Appraisal.

Table 5-9
CEYNRAL GOVERNMT - BALANCE FROM CUEBfT REVENUESAT 1968/69 RATES OF TAXATION
(Rs billion)
1969/70 1970/71 1971/72 1972/73 1973/74 Fourth PlanActuals Latest Latest Annual Plan Annual Plan Latest
Estimates Estimates E Estimates Estimates
I. Revenue Receipta at 1968/69 R.ites OfTaxation
1. Income Tax and Corporation Tax 7.88 8.07 8.60 9.70 10.97 45.222. Union Dxcise Duty 14.13 15.52 16.93 18.98 20.17 85.733. Customs 3.89 4.30 4.18 4.56 5.15 22.084, Other Taxes and D.uties 0.74 0.81 0.97 1.80 1.24 5.565. Non-tJax Revenue 8.62 8.95 9.78 10.31 11.28 48.94
Total 1 - 5 M.26 7 40.46 48.81 207.53
6. Deducts States' Share 5-93 6.83 7.96 8.53 9.25 38.507. Revenue leceintS of the Center
at 1968/69 R3ate of uA0tion ,0.82 525 6.82 59.6 169.03
II. Current Non-Plan Expenditure
1. Administrative Services 2.16 2.49 2.98 3.25 3.42 14.302. Debt Service 5.65 6.04 6.48 7.30 8.35 33.823. Defence, including Capital Outlay 11.01 11.91 12.80 14.09 16.00 65.814. Capital Oatlay on Border Roads 0.35 0.41 0.44 0-44 0.32 1.965, Currency and Kint 0.26 0.27 0.28 0.22 0.21 1.246. Export Subsidy 0.42 0.50 o.60 0-59 0.67 2.787. Food Subsidy 0.31 0.18 0.30 1.00 1.30 3.098. Non-Plan Development 2.52 2.92 3.25 3.23 3.75 15.679. Bangladesh Rtefugees (net of aid from
foreign sources) and rants toBangladesh - - 1.90 0.38 0.25 2-53
10. Grants to States (non-Plan)
a) Crash Program for Rural Employment - - 0.50 v/ 0.50b Programs for Educated Unemployed - - 0.25 i 0.25o Others 2.59 2.64 2.82 2.47 2.53 13.05
Total 10 2i2 o2" IA2 2.47 2.S 13.80
11. Grants to Union Territories(non-Plan) 0.49 0.51 0.34 0.10 0.15 1.59
12. Miscellaneous 1.61 1-54 1.52 2.15 2.16 8.9813. Deducto Writeback of Food Losses,
Capital Grants to States, IndusWater Treaty Payments and Re-habilitation Expenditure(includedunder above 4.tems) -0.62 -0.57 -0.55 -0.55 -0.56 -2.85
Total II 26.75 28.84 mA.91 J4.61 8.LS 162.72III. Balance from Current Revenues
(I - II) 1.98 -41 6.31
Notet Expenditure on revision of emoluments of Government employees since the start of theFourth Plan period is distributed over different items of expenditure.
A/ Includes yield of Rs. 0.7 billion in 1972/73 sad spillover yield of Rs. 0.02 billionin 1973/74 from special levies for relief of evaouees from Bangladesh.
b/ Included under Plan.
Source: Information supplied by the Planning Commission.

Table 5.10
STATE GOVERNIONTS - BALAN CE FROM CURRE&T REVEUESAT 1968/69 RATES OF TAXATION
(Rs billion)
1969/70 1970/71 1971/72 1972/73 1973/74 - Fourth'PlanActuals Latest Latest Annual Plan Annual Plan Latest
Estimates Estimates Estimates Estimates Estimates
I. Revenue Receicts_
1. Share of Central Taxes 6.22 7.55 9.16 9-72 11.22 43.87
2. State Taxes at 1968/69Rates of Taxation 13.39 14.58 15.75 17.07 18.36 79.15
3. Non-Tax RIevenue 5.37 5.50 6.68 6.28 6.03 29.86
4. Grants from Center 2.59 2.64 3.57 2.46 2.80 14.06
Total 1 27.S7 30.27 3Z 166.94
II. Revenue Expenditure
1. Non-Develonment
a) Debt Service 5.49 5.80 6.41 6.55 7.79 32.04
b ) Other Iion_D.eveloDment
i) Tax C.ollection Charges 0.88 0.96 1.04 1.10 1.23 5.21
ii) General A.dministration 1.10 1.20 1.24 1.29 1.38 6.21iii) Police 2.11 2.33 2.46 2.59 2.86 12.35iv) Famine Relief 1-57 1.03 0.93 0.23 0.79 4.55v) Others 2.86 3.34 4.04 3.56 4.00 17.80
Total (b) 8.52 8.86 9.7 8.77 10.26 46.12
2, Non-Plan Development 14.01 15.45 17.20 17.30 19.49 83,45
3. Revision of Dearness Allowanceand P,ay Soales, etc. not includedunder above items - - 0-45 0.73 0.82 2.00
4. Others 0.55 0-57 0.59 0.52 0.51 2.74
Total II 28.57 30.68 J4.16 58 81 166.35
III. Balance from-carrent Revenues at1968/69 Rates of State Taxes (I _ II) -0.41 0.80.59
v Inclusive cf States' share in additional taxation by the Center since 1969/70.
ources Government of India, Planning Commission.

Table 6.1
FACTORS AFFECTING MONEY SUPPLY(Rs billion)
December1965/6.6 1968/69 1969/70 1970/71 1971/72 1972
a/Money Supply 45.29 57.79 63.87 71.38 81.11 85.70
Of which:
Currency 30.34 36.82 40.10 43.81 48.09 49.57
Deposits 14.95 20.97 23.76 27.57 33.02 36.13
Percentage Variation 11.00 8.00 10.50 11.70 13.60 11.00
Annual Variation b/ +4.49 44.29 +6.07 +7.51 +9.73 +8.49
Of which:
Net Bank Credit toGovernment Sector +4.67 44.43 +0.29 +5.10 +11.83 +12.42
Net Bank Credit toCommercial Sector +1.00 +0.92 +2.91 +3.90 - 0.30 - 4.06
Net Foreign ExchangeAssets of Banks -0.24 +1.65 - +2.50 -0.28 + 0.54 - 0.72
Other -0.94 -2.71 c/ +0.37 -1.21 -2.33 + 0.86
a/ As of last Friday of March each year.
b/ Change over preceding 12 months.
c/ Both these items include Rs 670 million on account of revaluation of gold reserves.
Sources: Reserve Bank of India, Report on Currency and Finance 1971/72, and various issues of the
Monthly Bulletin.

Table 6.2
ADVANCES OUTSTANDING TO PRIORITY SECTORS BY SCHEDULED COMMECIAL BAIN1(Rs. million)
June 1969 June 1970 June 1971 March 19212%0 to -% to %4 to % to
Amount total Amount total Amount total Amount Jal
All Schedul4 Co_mr_i_a Baks_
Agriculture 1,884 5.2 3,418 8.1 3,825 8.6 3,930 7.5of whichaDirect Finance to Farmers (536) (1.5) (1,840) (4.4) (2,364) (5-0) (2,583) 5.0
SmalleScale Industries 2,856 7.9 4,141 9.8 5,002 10.5 5,755 11.0Road Transport Operators 82 0.2 306 0.7 480 1.0 596 1.1Exports 2,634 7.3 3,205 7.6 3,825 8.0 4,268 8.2
Public Sector Banks
Agriculture 1,623 5.3 3,016 8.3 3,410 8.1 3,430 7.8of whichsDirect Finance to Farmers (402) (1i3) (1,604) (4.3) 2,064 (4.9) 2,229 (5.1)
Small-Scale Industries 2,511 8.3 3,696 10.4 4,423 10.8 5,105 11.7Road Transport Operators 55 0.2 244 007 399 1.0 494 1.1Exports 1,947 6.5 2,501 7.1 3,999 7.4 3,327 7.6
Publi2 Sector Banks/
Retail Trade and Small Business 192 0.6 649 1.8 720 1.8 787 1.8Professional and Self-employed 6
persons 3 n.sek 67 0e2 86 0.2 113 0-3Education 5 nos, 21 0.1 37 0.1 29 0.1
Total Advanaes
All Scheduled Commercial Banks 35,988 100.0 42,127 100,0 47,629 100.0 52,092 100.0Public Sector Banks 30,170 100.0 35,776 100l 0 40,799 100.0 43,772 100.0
&/ Data for these seotors are available in respect of Public Sector Banks only.N Not significant.
§Souce: Reserve Bank of India.
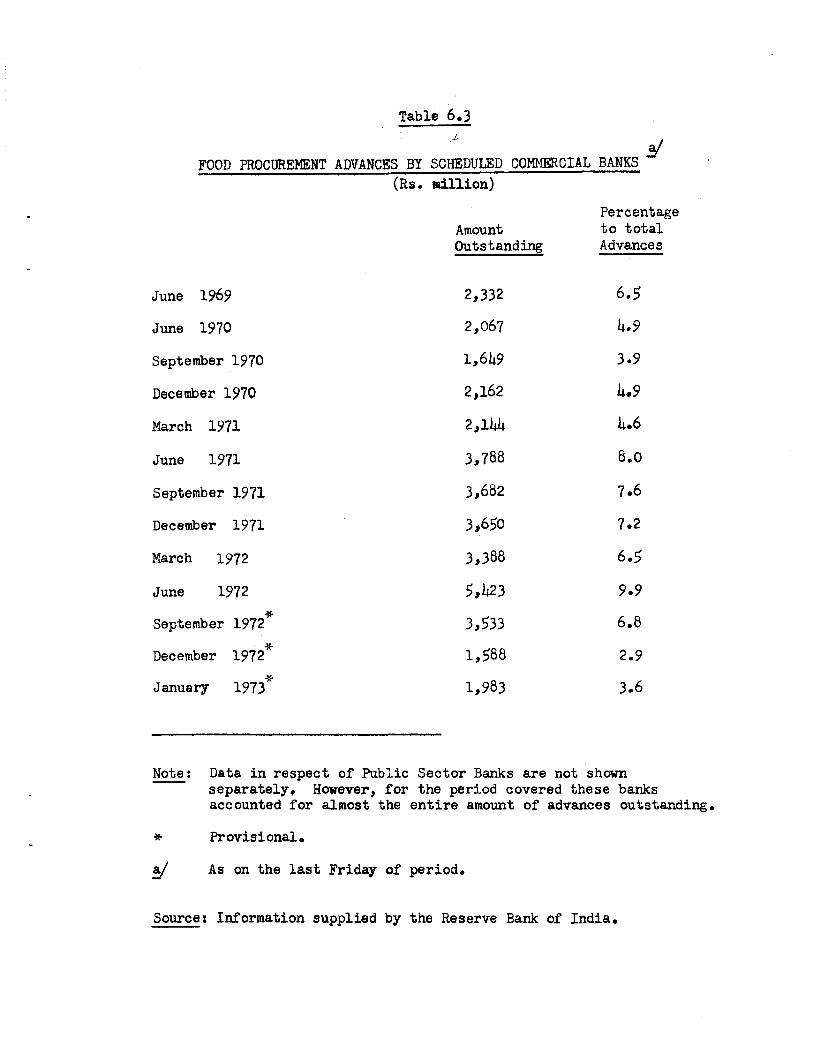
Table 6.3
# ~~~~~~a/
FOOD PROCURENENT ADVANCES BY SCHEDULED COMMERCIAL BANKS(Rs. million)
PercentageAmount to totalOutstanding Advances
June 1969 2,332 6.5
June 1970 2,067 4.9
September 1970 1,649 3.9
December 1970 2,162 4.9
March 1971 2,144 4.6
June 1971 3,788 8.0
September 1971 3,682 7.6
December 1971 3,650 7.2
March 1972 3,388 6.5
June 1972 5,423 9.9
September 1972 3,533 6.8
December 1972* 1,588 2.9
January 1973 1,983 3.6
Note: Data in respect of Public Sector Banks are not shownseparately. However, for the period covered these banksaccounted for almost the entire amount of advances outstanding.
* Provisional.
a/ As on the last Friday of period.
Source: Information supplied by the Reserve Bank of India.
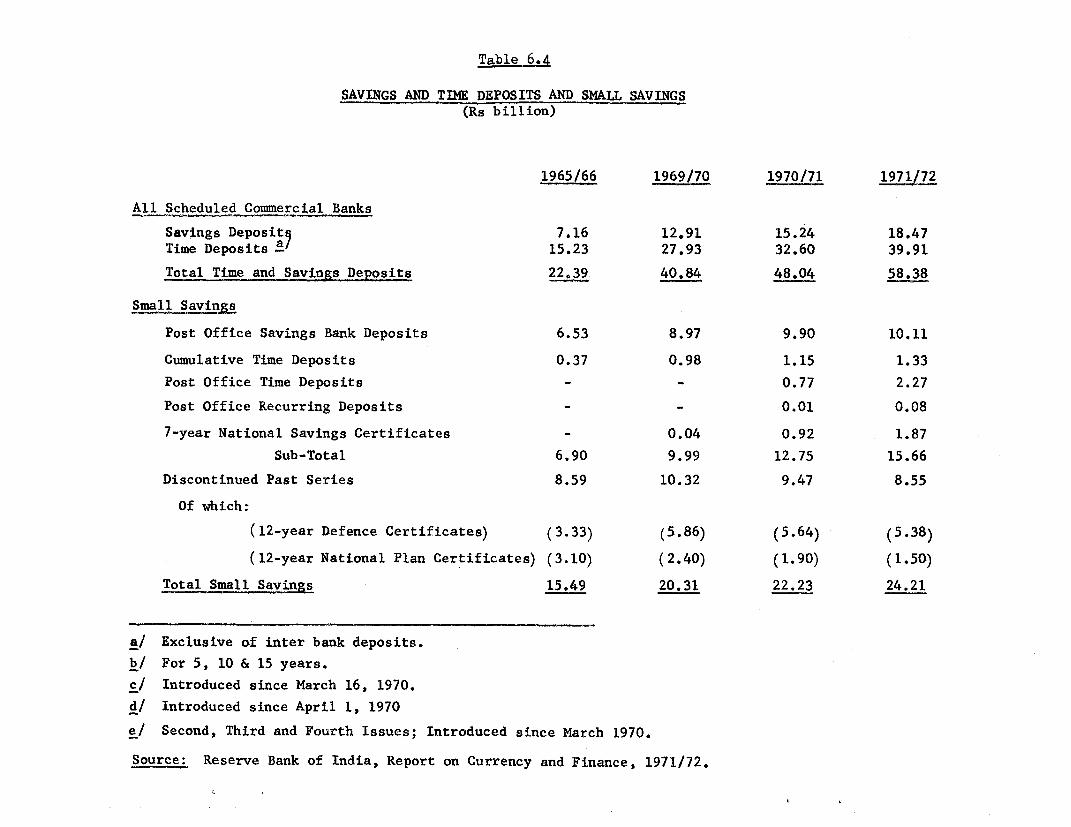
Table 6.4
SAVINGS AND TIME DEPOSITS AND SMALL SAVINGS(Rs billion)
1965/66 1969/70 1970/71 1971/72
All Scheduled Commercial Banks
Savings Deposits 7.16 12.91 15.24 18.47
Time Deposits a/ 15.23 27.93 32.60 39.91
Total Time and Savings Deposits 22.39 40.84 48.04 58.38
SmallS Svngs
Post Office Savings Bank Deposits 6.53 8.97 9.90 10,11
Cumulative Time Deposits 0.37 0.98 1.15 1.33
Post Office Time Deposits - - 0.77 2.27
Post Office Recurring Deposits - 0.01 0.08
7-year National Savings Certificates - 0.04 0.92 1.87
Sub-Total 6.90 9.99 12.75 15.66
Discontinued Past Series 8.59 10.32 9.47 8.55
Of which:
(12-year Defence Certificates) (3.33) (5.86) (5.64) (5.38)
(12-year National Plan Certificates) (3.10) (2.40) (1.90) (1.50)
Total Smallavins 15.49 20.31 22.23 24.21
a/ Exclusive of inter bank deposits.
b/ For 5, 10 & 15 years.
c/ Introduced since March 16, 1970.
d/ Introduced since April 1, 1970
e/ Second, Third and Fourth Issues; Introduced since March 1970.
Source: Reserve Bank of India, Report on Currency and Finance, 1971/72.

Table 6.5
ASSISTANCE BY TERM-LEDING INSTITUTIONS TO THE INDUSTRIAL SECTOR(Rs millions)
1960/61 1963/64 1965/66 1976 1986 1969/70 1970/71 1971/72 Ar 1972/73beSanc- Dis- Sanxe- Dis- Sanc- Dis- Sanc- Dis- Sanc- Die-. Sanc- Die- Sanc- Dis- SanC- Die- Sane- Dis-tioned bursed tioned bursed tioned bursed tioned bursed tioned bursed tione bureed tioned bursed tioned bursed tioned bursed
IDBI ~~~~~~~~~563 325 266 390 461 274 469 433 769 511 1,297 774 655 344
IFCI 275 74 421 171 401.2/ 230 190 221 196 177 172 164 285 165 298 195 248 109ICICI 117 31 249 108 239 223 97 158 295 114 179 161 384 258 345 285 219 167
'RCI1b 66 1 1SFCs 92 48 179 125 234 161 188 155 193 179 329 220 490 331 634 390 .
SIDOs 3 3 10 11 19 20 204 77 171 95 171 112Sub-Total AM 1.U M 44 I42 ~ f ~ ~ 114 ~ .5 1.60 2.81.1 1767
UTI d/ LI H LIC .. .. / .. A/ .~ 153 18 29 108 33 39 26 17 45 25 141 9 .
Total 154 3 84j**4Q4 jZL _2P 780& 1.043 1.197 803 1s.72 1,072~ 2.144 1.385 2.92_1.776
Underwriting and-Direct Subscription to Shares and Debentures
iDHI 105 28 9 26 26 9 62 18 37 47 129 .14 30 20IFCI 19 11 46 20 58 41 10 18 31 17 14 10 38 9 23 8 35 14ICICI 17 16 18 8 57 30 55 45 75 49 49 37 54 31 52 18 33 20INCISPC s 19 19 12 8 3 5 5 3 6 4 7 6 .
SIDOs 14 11 33 18 25 15 55 40 22 16 4.8 12Sub-Total .1 27 4 28 Z 129 119 119 160 2~ 185 108 107~ 25 2
UTI dl A A / 22 18 83 95 103 103 99 81 107 51 150 16 42 48LIC .. A/ .. A/ &~ 96 79 103 108 144 116 110 101 133 54 90 44
Total ,_6 27 64 28 371 226 305 318 407 314 394 290 397 212 499 118
Tota AssistanceIDBI 668 353 275 416 486 282 531 451 806 558 1,426 788 685 3641101 294 85 467 191 4592/ 271 200 239 227 195 186 175 323 174 321 203 283 123ICICI 134 47 267 116 296 253 152 203 370 162 228 198 439 289 397 303 252 187IRCI 66 11SFCs 92 48 179 125 253 180 200 163 196 184 334 223 496 335 641 396SIDC$ 17 14 43 29 44 35 259 116 193 111 219 124Sub-Total 920 180 .2 iLo107 7 j,950 - .3 .6 1.467 3.o70 1.8_2_
UTI 22 i8 83 95 103 103 99 81 107 51 150 16 42 4LIC Ali ../ ../ ./ 249 97 132 216 177 155 1,136 118 178 81 231 53
!rand Total _520 18Q_ .2412 =1....42 i§_1 145 1 2TI~2~&* ata rfer t fiscl yeas(April - March) ; differences in totals are due to rounding. Figures o 917 are provisional
i/ Includes direot loans, refinance to banks and rediecounts; exclusive of refinance to SFCs to avoid double counting.2/ Including disbursements on account of guarantees.2/ Foreign currency loans converted at post devaluation value.1/ Data not compiled for these years. The total assistance figure for each of the years 1960/61 and 1963/64 includes loans and underwriting by the LIC,
j2oaEcea Reserve Bank of India, Reports on Currency and FinLance.

Table 6,6
SELECTED INTEREST AND EARNING RATESS(in per cent)
1966 1967 1968 1969 1970 1971ar-
Ba9 rate 6 6 5 5 5 6
Deposit rates b/ a/Post Office Savings 4 4 3.5 3.5 3.5 4Fixed deposits for 1 year or
less than 2 years with cllarge banks 6 6 5.5 5.5 5.5 6
Rates on bank advancesMinium based on Interbank d/
Agreement e8 ! 8 7 7 7.5Rate of Scheduled Banks 8-9 84-94 84-94 84-94 81-11 9-11i
LonS Term Lending Rates ftRupee loans of IDB1, IFCI and &/
ICICI 8 8 8 8 8.5 8.5
Central Government secur'ities3 per cent 1986 or later -/ 5.57 5.45 4.99 5.00 5.00 5.00
3.75 per cent 1974 4.94 4.94 4.22 4.21 4.26 4.44i/
4 per cent 1980 5610 4.92 4.38 4.38 4.55 4.97
rivate se itis
Debenturestedemptioa yield 7.97 8.37 7.96 7.98 8.11 8.70
Running yield 6.85 6.87 7.16 7.26 7.31 7.40
Preference shares 9.38 9.85 9.95 9.79 9.72 10.09
Variable dividend securities 7.71 8.22 6.81 5.75 5.53 6.49
al Since March 1968.
b/ Free of income taxi
c/ The highest rate for deposits ever 5 years is now 7.25 per cent.Previously it was 6o75 per cent,
d/ The Interbank Agreement on Advance Rates was withdrawn in April 1970.
ef Data based on Surveys of the Reserve Bank. The rise in 1967 is due to a change inclassification rather than to a change in rates. No data have been publishedafter April 1968. The rates for the later years are those most coonly charged.
f_ Norsal lending r&e 2. In case of default, a penalty rate of 0.5 per cent normallyapplies.
jiX Fr Octobesr 1970,
/ JFlat yield.
_. Bedemption yield.
j Fercentages are for fiscal year beginning in the year stated and express grossyields.
Source: Informatioa supplied by the Reserve Bank of India.

Table 6.7
INDEX NUMBERS OF WHOLESALE PRICES(Base 1961-62 - 100)
Machinery Manufacturers
Food Articles Liquor Fuel,Power Industrial and Interme- All
(Cereals) and Light and Raw Transport diate Finished Coummod i
Total Foodgrains Rice Wheat Pulses Tobacco Lubricants Materials Chemicals Equipment Total Products Products ties
Weight = 41.3 14.8 6.7 3.2 2.7 2.5 6.1 12.1 0.7 7.9 29.4 5.7 23.7 100.0
Average of months1965/66 145 154 137 149 191 133 124 133 126 118 118 125 117 131.6
1968/69 197 201 196 204 210 193 147 157 169 133 134 145 132 165.4
1969/70 197 208 196 215 239 195 155 180 184 136 144 160 140 171.6
1970/71 204 207 201 209 240 185 162 197 188 148 155 179 149 161.1
1971/72 210 215 204 208 272 195 172 191 197 159 167 197 160 188.4
1972/73 239 248 231 222 312 233 180 203 200 168 177 213 168 207.3
Average of weeks1972
January 210 221 199 219 295 202 175 191 200 162 171 204 163 190.0
February 213 222 201 218 292 203 175 186 198 162 172 205 165 191.2
March 216 223 204 218 286 204 176 182 199 163 173 207 165 192.2
April 216 222 211 207 279 217 178 176 199 165 173 205 166 192.3
May 219 224 217 203 282 218 178 174 200 166 173 204 166 193.2
June 228 234 222 207 272 216 177 182 201 166 174 204 166 197.9
July 236 243 232 212 285 223 179 189 199 167 174 204 166 202.5
August 245 252 242 218 300 236 179 193 199 167 175 210 167 207.5
September 245 253 245 216 302 241 179 195 199 168 175 210 167 207.8
October 247 255 243 218 312 239 180 203 199 168 176 210 168 210.1
November 244 253 234 221 329 239 181 211 202 169 177 214 168 209.9
December 244 252 225 232 331 239 181 213 202 170 178 217 169 211.4
1973January 246 256 223 245 344 241 182 223 202 170 179 219 170 213.0
February 251 261 236 249 345 242 182 233 202 170 181 222 171 217.2
March 253 266 243 232 360 245 185 238 204 171 184 228 173 219.7
Sources: Reserve Bank of India, Report on Currency and Finance 1971/72; various issues of the Monthly Bulletin;
and the Office of the Economic Adviser - Ministry of Industrial Development.


Table 7.1
PRODUCTION OF PRINCIPAL CROPS
Unit
M. Metric Tons 1949/50 1955/56 1960/61 1965/66 1967/68 1969/70 1970/71 1971/72
FOODGRAINS 60.81 69.38 82.21 72.35 95.05 99.50 108.42 104.66
a) Cereals 50.74 57.65 69.45 62.40 82.95 87.81 96.60 93.60Rice t 25.16 28.73 34.64 30.59 37.61 40.43 42.23 42.73Wheat 6.75 8.87 11.00 10.39 16.54 20.09 23.83 26.48Jowar 6.76 6.73 9.81 7.58 10.05 9.72 8.10 7.75Bajra 3.20 3.46 3.29 3.75 5.19 5,33 8.03 5.36Maize n 2.80 7.26 6.63 4.82 6.27 5.67 6.92 6.25
Others " 5.87 2.60 4.08 5.27 7.30 6.57 7.19 5.03
b) Pulses " 10.07 11.73 12.75 9.95 12.10- 11.69 11.82 11.06
Grams 3.90 5.41 6.25 4.22 5.97 5.55 5.20 5.11
NON FOODGRAINS
a) Oil Seeds 5.09 6.84 6.87 6.40 8.30 7.73 9.26 8.28of which:
Groundnuts n 3.31 3.71 4.70 4.26 5.73 5.13 6.11 5.71Rapeseed & " 0.81 o.86 1.35 1.30 1.57 1.56 1.98 1.45Mustard
b) Sugarcane b/ 'I 6.20 7.43 11.40 12.77 9.79 13.78 12.98 11.73(in tons of gur)
c) Cotton (in million bales) 2.59 3.99 5.24 4.58 5.45 5.26 4.50 6.53d) Jute & Mesta 3.97 5.65 5.26 5.78 7.59 6.79 6.20 6.84
Note:- Production relates to production in agricultural year ̂ July/June:Figures upto 1964/65 are adjusted estimates of productio'i (with 1965/66 fully revisedestimates as base) 1967/68 figures are particularly revised estimates. Data for otheryears are provisional and subject to revision.
a/ Includes groundnuts, rapeseeds, mustards, linseed etc.b/ Adjusted on basis of 1961/62 Fully Revised Data
Bale - 180 Kgs.Source: Government of India, Ministry of Agriculture, Directorate of Economics & Statistics.

Table 7e2
PUBLIC-DISTRIBUTION OF FOODGRAINS(000 metric t,ns)
19i2_66 1967 19691_ _....2
0vei,Ye Stook 1,016 2t079 1,815 1,695 3,893 4,387 5,340 7,885
Rice 453 542 417 665 1,182 1,724 1,834 2,313Wheat 556 1,414 1,033 760 2,126 2,329 3,130 5,034
Procurement 4,031 4,009 4,462 6,805 6,381 6,714 8,860 7,695
Rice 2,951 3,100 2,785 3,373 3,581 3,043 3,461 2,586Wheat 375 219 779 2,373 2,417 3,183 5,088 5,025
IMgvrts 7,462 10,358 8,672 5,694 3,872 3,631 2,054 446
Rice 783 787 453 446 487 206 240 131Wheat 6,583 7,7b4 6,348 4,766 3,090 3,425 1,814 315
Issues 10,080 14,085 13,166 10,221 9,385 8,841 7,826 10,503Rice 3,645 4,131 3,010 3,287 3,405 3,050 3,235 3,614Wheat 6,100 8,142 7,366 5,755 5,195 5,347 4,455 6,637
C1oinG Et_ck 2,079 1,815 1,695 3,893 4,387 5,340 7,885 3,389Rioe 542 417 665 1,182 1,724 1,834 2,313 1,343Wheat 1,414 1,033 760 2,126 2,329 3,130 5,034 1,895
Notes By definition Opening Stock + Procurement + Imports - Issues + Closing Stock. In practice the right handside of the equation is invariably smaller than the left, due to stocks in transit and stock losses; butthe size of this discrepancy at nearly 700,000 tons in 1972 is large enough to cast doubts on the reliabilityof some of the figures.
vl Individual position for the two main cereals, rice and wheat has been shown, the balance in total foodgrainbeing accounted for by other foodgrains.
vl In addition 909.000 tonnes (102,000 of rice and 805,000 of wheat and 2,000 of other grains) were exportedto Bangladesh out of the total stocks.
Source: "Food Statistics", Directorate of Economics and Statistics & Ministry of Agriculture, New Delhi.

Tablo 7,3
AVAILAILITY 01 GEIALS AND PULSES
Cerealm Pulses(Hillio.n (Million Net Availabilitymntric tons metric tons Per Person Per DaY
With.drnwals (In grams)Calendar Produc- NFt (-) from Net Net
Year 14on I &;t.Stocks Availsbility Availability Cereals Pulses Tota
1954¢ 53.55 0.33 ( O,0 54.18 9.76 387.7 69.8 157..
1956 50.14!t 2.3 (-)0.60 52.43 10.2 5 360.6 70.5 4-0,
1958 4t91.46 3.22 (-)C.?7 5?.95 8.87 350.2 58.7 14o8.
1960 56.89 5.13 (+)3.hc 60.62 10.38 382.8 65.5 448.3
19061 60.77 3* ? (-)O.17 64.43 11.16 398e7 69.1 1467.
1962 62.27 3j64 (-)03d6 66.27 10.32 1402.0 62.6 46h.
1963 60.18 4.55 (-)0.02 64.75 10.10 384.4 60o0 Lih.
1964 61.76 6.26 (-)1.24 69.26 8.82 401.4 51.1 1V2.
1965 67.31 7A45 (+)l.06 73.70 10.86 418.9 61.7 L43o.
1966 54.60 10.34 (+)o.114 64.80 8.70 360.3 48.4 14o8.
1967 * 57.65 8.67 (-)o.23 66.60 7.30 362.3 39.7 402.
1968 * 72.58 5.69 (+)2.13% 76.14 10.59 404.0 56.21 1460.
1969 * 73.15 3.85 (+)o.36 76.64 9.12 398.9 47.3 4;46,
1970 76.83 3.58 (+)1.122 79.29 10.20 403.3 51.9 4155.
1971 84.53 2.21 (-)2.57 84.17 10.33 419.1 51.4 4?7o.
1972 81.90 0.50 (+)40oo 78.40 9.67 381.2 47.0 L428
* Provisional
Notes: 1. Net product-on ht% heen taken as 87.5% of the gross production, 12.5%being provided for feed, seed requirements and wastage.
2. rigtu'es in respect of change in stocks with traders and producers overa year aro not kncw71 The estimates of net availability given abovechoilr'd not thernfGce be tpken to be strictly equivalent to consumption.
3. Net Availnb:117ty - Not Product-ion + Net Imports + Change in GovernmentSto lsk.
Sources: Totall a&ailrbilityr statistics - Ministry of Finance,Economic Survey.Avalaability p9r capita derived from mid-year population statisticsadJusted to 1971 Populatjim census Drovided bv Office of the ReRistrar

Table LA
ALL-INDIA INDEX NUMBFY OF FOODGRAINSNON-FOODGRAINS AND ALL CROPS - 1949-50 TO 1971-72
(Bases Triennium ending 1961-62 - 100)
Index of AYea unde croDs Index o(Agri al Prgductio , Index of Yield
Years Food&rains Non-foodgrains All Crops Foodarains Non-foodgrains ASl CroDa Foodgrains Non-foodgrains All. rops
1949-50 85,0 69.6 82.1 74.9 68.1 72.8 87.0 97.9 89.81950-51 83.2 77.2 82*0 67.4 72.2 68,9 79-1 93.5 83.21951-52 83.3 84.5 83-5 68.2 75.0 70.3 81.1 89.9 83-71952-53 87.8 80,9 86e5 75°4 71.1 74.1 86.9 89.1 87.5
1953.54 93.7 80.7 91.3 89.0 72.0 83.9 96.9 96,4 96.81954-55 92.9 88,7 92.2 85.7 82.6 84.8 9400 99.7 95.61955-56 95.2 91o0 94.4 85.6 81.6 84.4 91.4 93,4 91.91956-57 95.7 93.6 95.2 89.5 89.6 89.5 95.0 97.9 95.1
1957-58 94.2 94.2 94.2 81.7 88.3 83e7 87.0 94.7 89.41958-59 98.7 95e1 98.0 97,0 95e6 96.6 99e2 103.6 100,51959-60 100.0 97,3 99°4 95,2 92-7 94.3 95.4 96.2 95-71960-61 99.4 98,4 99,2 102.1 103.8 102.7 102.8 104.2 103.3
1961-62 100.6 104.3 101.4 102.7 103.5 103.0 101.8 99.6 101.01962-63 101.6 104.9 102.3 99.4 105.4 101.4 96.3 102.3 98.51963-64 101.1 105.4 102o1 101.7 108.2 103.9 99.3 103,3 100.81964-65 101.7 108.8 108.3 112.0 120.9 115.0 108,5 107.5 108.1
1965-66 99.1 107.2 100.9 89.9 107.1 95-8 89.6 96.2 92,21966-67 99.3 105.6 100.7 91.9 103.7 95.9 91,7 97-4 93-81967-68 104.6 106,5 105.0 117.1 115.6 116.6 113,5 108.1 111,51968-69 103e7 101.7 103.3 115.7 113.2 114-8 109.1 105.0 107.61969-70 106.4 105.6 106.2 123.5 120.5 122,5 116.3 106.5 112,7
1970-71 107.0 108e4 107.3 133,9 127,0 131.5 122.0 111.2 118.11971-72 105,2 109o1 106.0 130.9 126.0 129.2 120.3 111.5 117.1
Notessl) Indices from 1966-67 to 1971-72 are subject to revision,2) Original indices for the years 1949-50 to 1958-59 with base 1949-50 - 100
shifted to the base for the Triennium ending 1961-62 - 100
Sources Ministry of Agriculture, Directorate of Economics & Statistics,
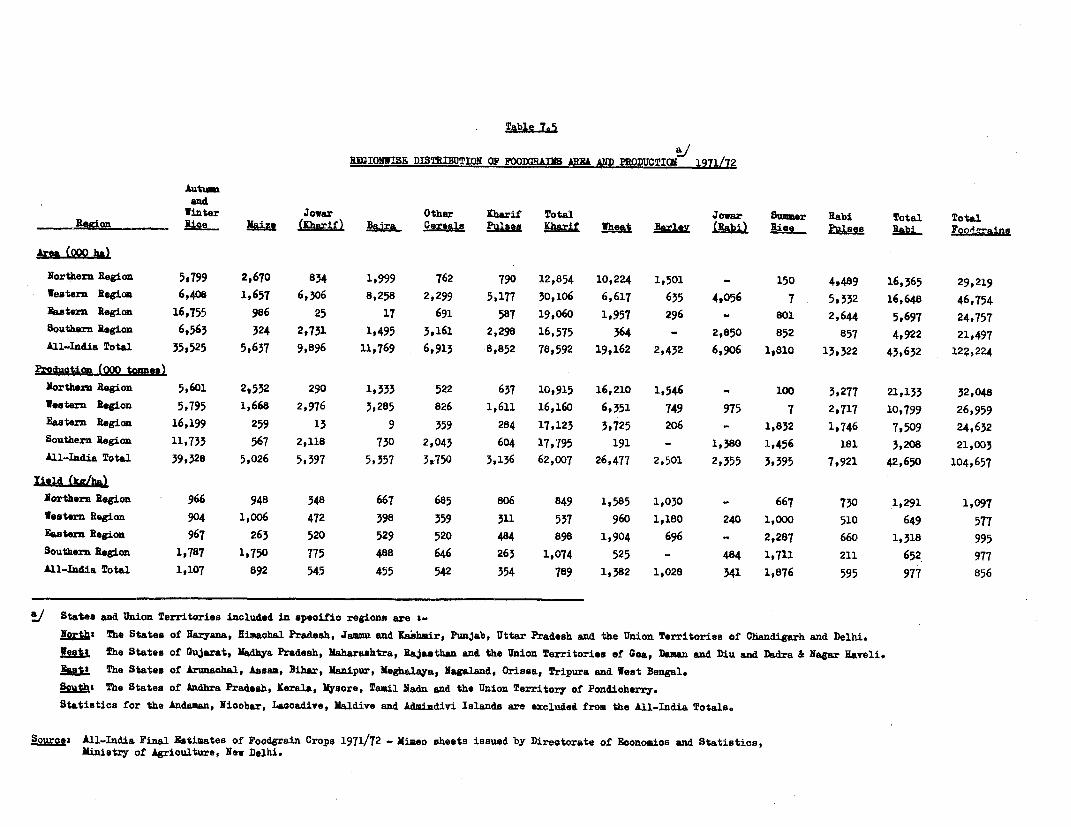
Table 70S5
aJRiGIONWISE DISTRIBUTION OF FOODGRAINS ARM AND PRODUCTION 1971/72
Autumnand
winter Jowar Other [harif Total Jowar Sumer Rabi Total TotalRegion - he Nize (Kharifh Baira, Cergsla Pblsea lhharif Wheat Ba2la (Rabi) Rise Pulses RAL. Foodmraine
Area (000 ha)
Northern Region 5,799 2,670 834 1,999 762 790 12,854 10,224 1,501 - 150 49489 16,365 29,219
Western Region 6,408 1,657 6,306 8,258 2,299 5,177 30,106 6,617 635 4,056 7 5,332 16,648 46,754
as"tern Region 16,755 986 25 17 691 587 19,060 1,957 296 - 801 2,644 5,697 24,757
Southern Region 6,563 324 2,731 1,495 3,161 2,298 16,575 364 - 2,850 852 857 4,922 21,497
All-India Total 35,525 5,637 9,896 11,769 6,913 8,852 78,592 19,162 2,432 6,906 1,810 13,322 43,632 122,224
Production (000 toxn.e)
Northern Region 5,601 2,532 290 1,333 522 637 10,915 16,210 1*546 - 100 3,277 21,133 32,048
Weatern Region 5,795 1,668 2,976 3,285 826 1,611 16,160 6,351 749 975 7 2s,717 10,799 26,959
Eastern Region 16,199 259 13 9 359 284 17,123 3,725 206 - 1,832 1,746 7,509 24,632
Southern Region 11*733 567 2,118 730 2,043 604 17,795 191 - 1,380 1,456 181 3,208 21,003
All-India Total 39,328 5,026 5,397 5,357 3,750 3,136 62,007 26,477 2,501 2,355 3,395 7,921 42,650 104,657
rield ( i ha)
Northern Region 966 948 348 667 685 806 849 1,585 1,030 - 667 730 1,291 1,097
Western Region 904 1,006 472 398 359 311 537 960 1,180 240 1,000 510 649 577
Eastern Region 967 263 520 529 520 484 898 1,904 696 _ 2,287 660 1,318 995
Southern Region 1,787 1,750 775 488 646 263 1,074 525 - 484 1,711 211 652 977
All-India Total 1,107 892 545 455 542 354 789 1,382 1,028 341 1,876 595 977 856
a/ States and Union Territories included in speoifio regions are -
QgLtA The States of Raryana, Himaohal Pradesh, Jammu and Ksehnir, Punjab, Uttar Pradesh and the Union Territories of Chandigarh and Delhi.
!M3s. The States of Gujarat, Madhya Pradesh, Mshnraahtra, Rajasthan and the Union Territories of Goa, Deamn and Diu and Dadra & Negar Haveli.
EkaP The States of Arunachal, Assam, Bihar, Manipur, Meghalaya, Nagaland, Orissa, Tripura and West Bengal.
8e1t&$ The States of Andhra Pradesh, Kerala, Mysore, Tamil Nadu and the Union Territory of Pondioherry.
Statistics for the AnAdann, Nicobar, Laccadive, Maldive and Adnindivi Islands are excluded from the All-India Totals.
Source2 All-India Final Estimates of Foodgrain Crops 1971/72 - Mimeo sheets issued by Directorate of Economios and Statistics,Ministry of Agrioulture, New Delhi.

Table 7.6
ALL IhDIA AND REGIONWISE AREA. YIEILD AND PRODUCTION GROWTH RATES OF FOODGRAINS PER CENT PER ANNUM
TEN YEAR GROWTH BATES 1962/63 To 1971/72
Autumnand
Winter Jowar Other Kharif Total Jowar Sumer Rabi Total TctalRi c e Rice (Rharif) Bajra Ce_reals Pules ( Rabi h Rice Pulses Rabi Lains
Area ChsnZe
North 1.21 4-00 - 3-75 1.54 - 0.18 - 1-53 1.07 5,52 - 1.64 - 57.86 - 3.92 1.45 1.28
West 0.32 2.18 - 0.06 1.42 1.36 1.38 0.88 5098 1.39 - 0.06 2.09 0.24 1.47 1.03
East 0.46 2-59 7-17 - 4.35 4.21 - 3,05 0.56 12-53 - 3.82 - 29.42 - 3-10 2.27 0.91
South _ 1.10 5,34 1.16 0.06 - 1.74 0.68 -0O98B 0.96 - - 0.59 8-57 0.98 1.05 - 0.53
Total 0.23 3.25 - 0.70 1.24 - 0.07 0.20 0.42 4.42 - 1.24 - 0.27 15.20 - 1.99 1.25 0.70
Produotlivityv ChAMIR
North 3.18 1.74 - 1.17 5.49 2.29 2.84 3-13 7.44 3.29 - - 0.45 3.19 7.00 5.49
West 3.03 - 1.12 -0.88 4.66 0.88 0.53 1,60 0.34 2-58_ -6.50 - 0-30 2.53 1.68 1-70
East 0.52 - 6.41 - 1.59 0-44 o.67 0.55 0-30 12.06 2-95 - 11.45 2.71 10.08 2.03
South 2.90 8-44 2.83 0.70 0.17 1.71 2.44 6.82 - 1.07 1.43 0,36 3.23 2.42
Total 1.71 0-43 0.36 4.20 0,31 0.81 1.60 7-37 3-31 - 2.77 3.32 2-42 5.72 3.01
Production ChM.
North 4-43 5.81** 4-87 7.11 2.11 1,27 4.23- 13.36 1.60 - 57.20 - 0.85 8.55 6.84
West 3.36 1.03 - 0.94 6.15 2.25 1,92 2.50 635* 4.00 - 6-55 - 5.04 2.77 3.17 2.75
East 0.98 - 3-99 5-47 - 3.93 4.90 - 2.52 0o86 26.10 _- 098 - 44.24 - 0.47 12,58 2-95
South 1-77 14.22 1.64 0.76 1-57 1,02 1,44 7.85 - 0.48 10.12 1.35 4-33 1.88
Total 1.95 3069 -0.35 5o50 0.24 1.01 2.02 12.12 2.02 - 3-04 19.02 0.38 7.04 3-73
Significant at the 5 % level.
* Signifioant at the 1 % level.
/ Production growth rates are calculated on a basis of production volume not production value as in the growth rates based on the index numbers of Table 7,4.These rates tend to be higher than those based on index numbers as the latter are based on "adjud'ted estimates" of agricultural produotion that take account
of changes in statistical coverage and methods of yield estimation. These are not available on a statevise basis. The following data have been used incompiling the growth rates of Table 7.5 - 1962/63 to 1965/66 Fully Revised Estimates; 1966/69 and 1967/68 Partially Revised Estimates ; 1968/69 to1971/72 Final Estimates.
Source: "Estimates of Area and Production of Principal Crops in India" Various issues, Directorate of Economic and Statistios, Ministry of Agriculture, New Delhi,

Table 8.1
STRUCTURAL CHANGE IN MiANUFACTURING INDUSTRY(Percentage of Value Added)
a/ b/ Annual Rate of Growth in Value Added (%)1951 1956 1956 1959 1965 1968 19717 1951-1956 1959-65 1965-71
Consumer Goods 67.6 64.4 52.8 48.3 37.7 36.8 33.5 1.4 8.7 2.0
Intermediate Goods 15.2 17.0 19.8 25.2 24.7 29.2 31.5 9.1 12.8 8.3
Capital Goods 17.2 18.6 27.4 26.5 37.6 34.0 35.0 12.3 20.0 2.8
Total Manufacturing 100.0 100.0 100.0 100.0 100.0 100.0 100.0 5.1 13.2 4.1
a/ Based on provisional data.
b/ Estimated from the index of industri.al production.
Sources: Census of Manufacturing Industries for 1951, 1956 and 1958.Annual Survey of Industries for the years 1959, 1965 and 1966.
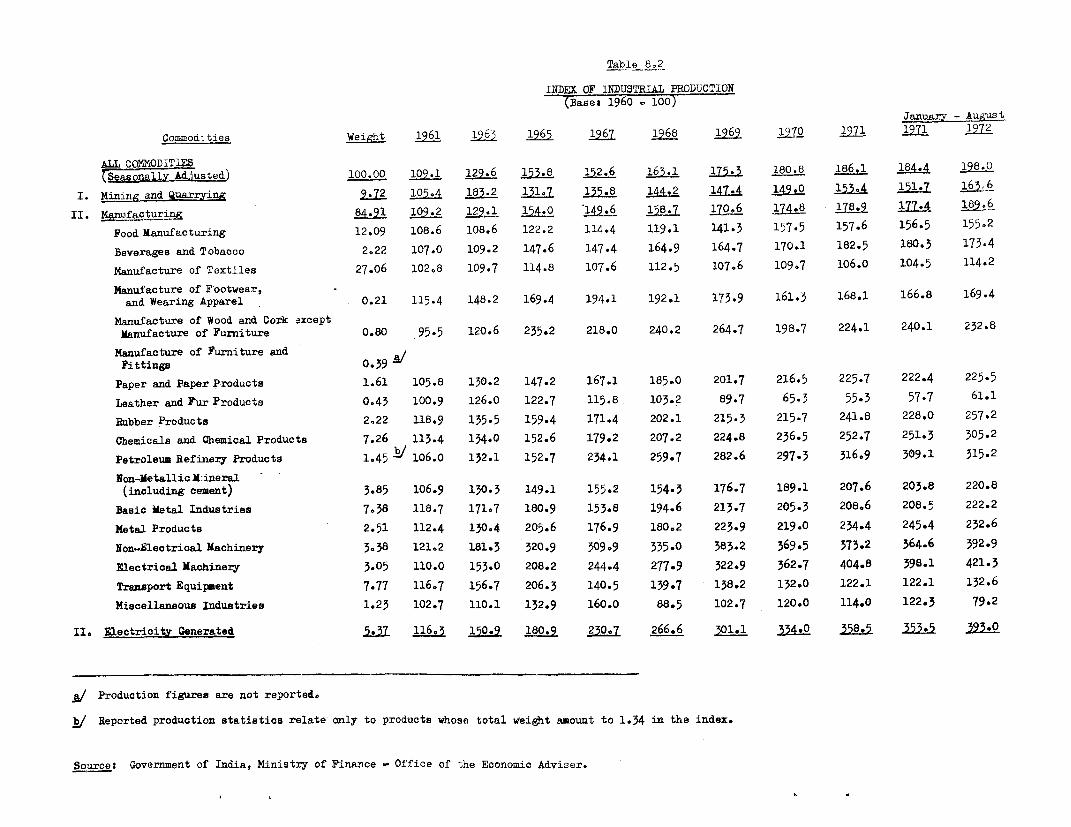
Table 8,2
INDEX OF INDUSTRIAL PRODUCTION(Bases 1960 = 100)
January - ASCommodities Weight 1961 1963 1965 1967 1968 1969 197 1971 1971 1972
ALL CCOMODITIES(8easonal1a Adiusted) 100.00 109.1 129.6 153.8 152.6 163.1 15. 180.8 186.1 184.4 198.0
I. Mining and uarrsYing 9.72 105.4 183.2 131.7 135.8 144.2 7.4 149.0 15304 151.7 16
II. Manufact3 _ KA 84.91 109.2 129.1 1 0 46 1 178.9 1196Food Manufacturing 12.09 108.6 108.6 122.2 114.4 119.1 141.3 157-5 157.6 156.5 155.2
Beverages and Tobacco 2.22 107.0 109.2 147.6 147-4 164.9 164.7 170.1 182.5 180.3 173-4
Manufacture of Textiles 27.06 102.8 109.7 114.8 107.6 112-5 107.6 109.7 106.0 104.5 114.2
Manufacture of Footwear,and Wearing Apparel 0.21 115-4 148.2 169.4 194.1 192.1 173-9 161.3 168.1 166.8 169.4
Manufacture of Wood and Cork 3xceptManufacture of Furniture 0.80 95-5 120.6 235.2 218.0 240.2 264.7 198.7 224.1 240.1 232.8
Manufacture of Furniture andFittings 0.39
Paper and Paper Products 1.61 105.8 130.2 147.2 167.1 185.0 201.7 216.5 225-7 222.4 225.5
Leather and Pur Products 0.43 100.9 126.0 122.7 115.8 103.2 89.7 65-3 55.3 57-7 61.1Rhbber Products 2.22 118.9 135.5 159-4 171,4 202.1 215-3 215-7 241.8 228.0 257,2
Chemicals and Chemical Products 7.26 113.4 134.0 152.6 179.2 207.2 224.8 236.5 252.7 251.3 305.2
Petroleum Refinery Products 1.45 106.0 132.1 152-7 234.1 259-7 282.6 297-3 316.9 309.1 315.2Non-Metallic X-ineral -
(including cement) 3,85 106.9 130*3 149.1 155.2 154-3 176.7 189.1 207.6 203.8 220.8Basic Metal Industries 7,38 118.7 171.7 180.9 153.8 194.6 213-7 205.3 208.6 208.5 222.2Metal Products 2.51 112.4 130.4 205.6 176.9 180.2 223.9 219.0 234-4 245.4 232.6Non-Electrioal Machinery 3,38 121.2 181.3 320.9 309.9 335.0 383.2 369-5 373.2 364.6 392.9
Electrical Machinery 3.05 110.0 153.0 208.2 244.4 277-9 322.9 362.7 404-8 398.1 421.3
Transport Equipment 7.77 116.7 156.7 206.3 140-5 139-7 138.2 132.0 122.1 122.1 132.6
Miscellaneous Industries 1.23 102.7 110.1 132.9 160.0 88-5 102.7 120.0 114.0 122.3 79.2
II. Electricity Generated I5.3 116.3 150.9 180.9 230.7 266.6 301.1 334-0 358.5 35355 393.0
v Production figures are not reported.
y/ Reported production statistics relate only to products whose total weight amount to 1.34 in the index.
Source: Government of India, Ministry of Finance - Office of the Economic Adviser.

Table 8.3
PRODUCTIQN OF SELECTED ISDRUSTRIEScontinued
Jan - June
Unit 1950/51 1955/56 1960/61 1962/63 1965/66 1967/68 1269/70 1970/71 1971/N iL 1972
CEHY1CAL AND ALLID INDUSTRIES
Nitrogenous Fertilizers (N) '000 tonnes 9 80 98 178 308 367 716 830 952 417 536
Phosphatic Fertilizers(P 2 05) '000 tonnes 9 12 52 61 145 191 222 229 276 126 150
Sulphuric Acid '000 tonnee 101 167 368 485 702 858 1197 1155 975 545 524
Soda Ash '000 tonnee 45 82 152 236 348 371 427 449 489 234 246
Caustic Soda '000 tonnea 12 36 101 130 233 278 354 364 385 181 197
Paper & Paper Board '000 tonnes 116 1io 350 401 580 660 723 755 803 360 401
Rubber Tyres and Tubes
i) Automobile Tyrea Million numbers .. 0.90 1.44 1.76 2.43 2.47 3.62 3.79 4.33 1.92 2.15
ii Automobile Tabes Million numbers .. 0080 1.35 1.77 2.40 2.77 2.90 3.45 4.24 1.67 2.16
iii Bicycle Tyres Million numbers .. 5.80 11.15 12.43 20.34 22.79 21.32 19.70 22.36 7.75 11.28
iv Bicycle T%bes Yillion numbers .. 5.69 13.27 12.07 20.75 18.63 16.79 13.81 14.35 4.60 7.36
Cement Million tonnes 2.7 4.67 8.0 8,85 11.1 11.5 13.8 14.4 15.0 7.5 7.9
Refraotories 1000 tonmes 237 293 567 679 730 749 685 743 808 385 400
Refined Petroleum Broducts Million tonnes 0.2 3.4 5.8 6.9 11.9 13.8 16.6 17.0 18.6 8.8 9.0
TEXTILE INLUSTRIrS
Jute Textiles '000 tonnes 837 1071 1097 1202 1117 1156 944 958 1129 529 580
Cotton Yarn Million kgs. 534 744 801 857 902 926 962 929 902 428 472
Cotton Cloth Million metres 4215 6260 6738 7004 7303 7511 7753 7596 7547 3589 3951
i) Mill Sector Million metres 3401 4665 4649 4498 4202 4258 4192 4055 4039 1939 2095
ii) Decentralised Sector Million metres 814 1595 2089 2506 3101 3253 3561 3541 3508 1650 1856
Rayon Yarn ' 000 tonnes 2.1 13.5 43.8 62 80.6 92.2 98.8 1001. 102.3 54.2 54.8
Art Silk Fabrics Million metres 287 / 331 / 544 61T 862 917 863 947 968 235 233
Woollen Manufactures
i) Yarn Million kgs. 8.7 98 13.0 .. 16.9 16.8 18.8 19.7 .. 9-7
ii) Fabrics Million metres 6.1 68 8,4 .. 9.5 9.2 12.2 14.3 .. 6.5
FOOD ISDUYTRIES
Sugar, §/'000 tonnes 1134 1890 3029 2152 2147 2248 4261 3740 3110 2756 2178
Tea Million kgB. 277 308 322 343 369 387 401 421 429 133 142
Coffee '000 tonnes 21.0 29.0 54.1 49.0 71.0 72.6 64.6 71.8 95.6 69.2 55.7
VanDapati '000 tonnes 170 280 340 366 366 423 477 558 594 297 300
EIECTRICITY GEtEaATAD Billion kwh 5.3 8.8 16.9 22.1 36-4 39.4 51-4 55.8 59.8 28.9 31.4
&L Includes viscose yarn, staple fibre and acetate yarn.
Relates to calendar year.
. The annual figures relate to the sugar season which was November to October upto 1966/67 and October to September thereafter.
l Relates to public utilities only.
Sources Government of India, Ministry of Industrial Development.
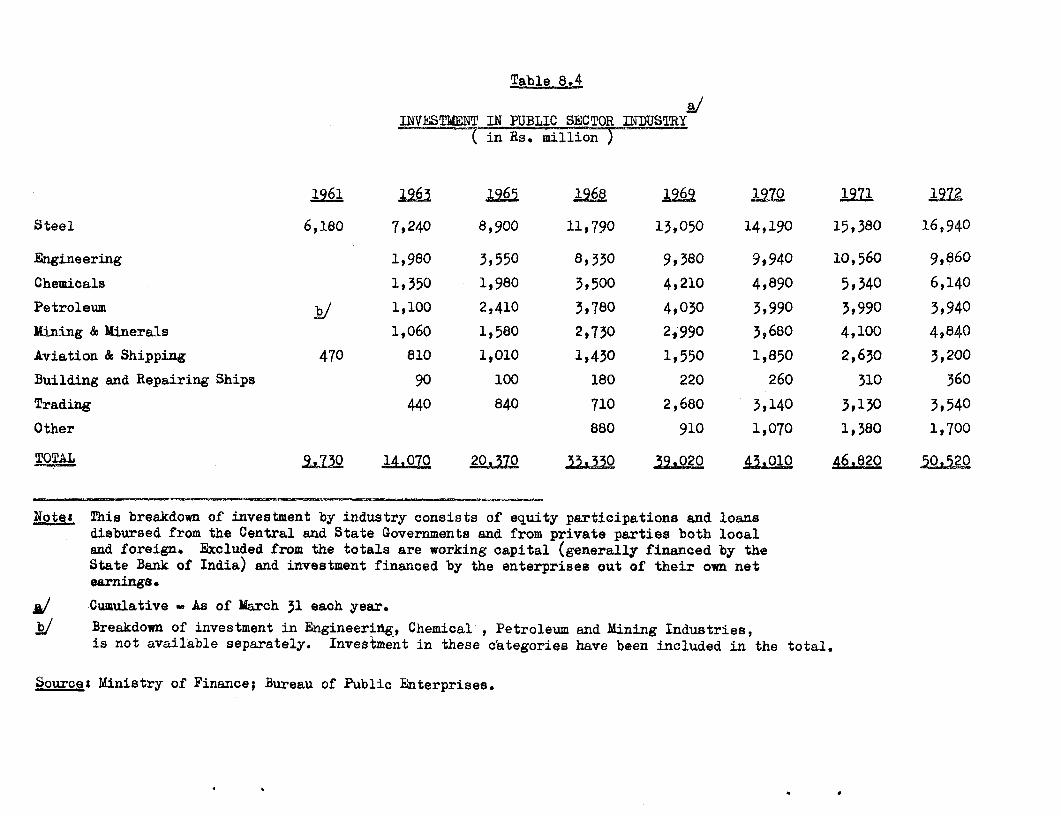
Table 8.4
a/INVESTMENT IN PUBLIC SECTOR INDUSTRY
( in Rs. million )
1961 1263 1965 ;1268 1926 22 1971
Steel 6,180 7,240 8,900 11,790 13,050 14,190 15,380 16,940
Engineering 1,980 3,550 8,330 9,380 9,940 10,560 9,860
Chemicals 1,350 1,980 3,500 4,210 4,890 5,340 6,140
Petroleum ib 1,100 2,410 3,780 4,030 3,990 3,990 3,940
Mining & Minerals 1,060 1,580 2,730 2,990 3,680 4,100 4,840
Aviation & Shipping 470 810 1,010 1,430 1,550 1,850 2,630 3,200
Building and Repairing Ships 90 100 180 220 260 310 360
Trading 440 840 710 2,680 3,140 3,130 3,540
Other 880 910 1,070 1,380 1,700
TOTAL ILMO 14i.07 20,30 .0o2-0 A43.0 L.0 46.820 52j.S20
Notes This breakdown of investment by industry consists of equity participations and loansdisbursed from the Central and State Governments and from private parties both localand foreign. Excluded from the totals are working capital (generally financed by theState Bank of India) and investment finanoed by the enterprises out of their own netearnings.
v,' Cumulative -. As of March 31 each year.Breakdown of investment in Engineering, Chemical , Petroleum and Mining Industries,is not available separately. Investment in these categories have been included in the total.
Sg: Ministry of Finance; Bureau of Public Enterprises.

Table 8.5
CAPITAL DLPIOza. GROSS MROIT 15
D 1TROIOFSELECTID PUBLIC0 SCTOR EN.RS~1966/67 - 1971/72( -9i"., illion)
1966/67 1968/69 1970/71 1971/72
STECEL 6 ENGINEEROING
Hjindustan Stool 6,932 18 0.3 -197 8,589 "119 - 1.4 -394 8,559 228 2.7 - 47 8,273 -200 -2.4 -456
Heoavy FngineeringGorporation , -49 . 61 1,449 - 89 - 6.4 -141 1,674 - 83 -5.0 -183 1,652 - 71 -4.3 -149
11induatan Machine Tools 0 22 7.1 14 372 3 0.6 a 421 16 3.9 .. 455 33 7.3 11
inoiag &. Allied MachinerySCorporation 270 -44 -16.3 - 64 270 -40 ..14.8 -.64 262 -23 .8.6 .36
Indian Telephone InLdustries. 147 29 19.7 13 173 38 21.9 15 212 43 20.5 18 296 66 22.2 32
Hindustan Aeronautios 263 23 8.7 14 949 52 5.5 22 1,662 83 5.0 47 1,665 86 5.1 48
Bharat Ea.rth hiovers 66 4 6.0 1 136 25 18.4 12 282 51 18.2 29 373 52 13.9 26
Bharat Electronics 115 27 23.5 13 169 47 27.8 24 241 57 23.8 26 313 72 23.1 30
Bharat Heavy Hileotricals .. 48 .. - 57 357 16 4.5 -34 1,386 68 4.9 7 1,666 96 5.7 31
Heavy Electricals 532 -30 -5.6 - 52 657 -22 - 3,4 -59 639 - 4 - 0.6 -50 728 39 5.4 - 14
C4EIalck
Fertilizers & Chemicals 91 10 10.9 4 264 10 3.8 3 248 - 10 - 4.0 -21 307 -15 ..4.9 - 28
TravancoreF'ertilizer Corporation 795 13 1.6 -12 879 66 7.5 40 1,735 52 3.0 17 1,591 49 3.1 19
of IndiaHindustan Pr,,olofilms 107 -15 -14.0 -21 107 - 18 -16.8 -29 112 15 -13,0 - 27
Indian Druga &Pharmaceut.,cals 43 - 4 -9.3 -6 385 ..64 -16.7 -91 506 - 42 - 8.3 -79 530 -7 - 1.4 - 47
MfINING & M8RI
Natiornal Coal Development 779 8 1.0 -2 1,369 37 2.7 15 1,747 16 1.0o 9 1,737 -25 - 1.4 - 58
CorporationNeyveli Ligni,;e Corporation 1,104 -49 -4.4 - 79 1,340 19 1.4 -24 1,44T - 52 - 3.6 -111 1,385 -66 - 4.8 -133
National kineral Develop-aenxt Corporation 86 3 3.5 - 3 240 -T -2.9 -18 324 -19 -5.5 - 26 353 -24 -6.8 - 32
Hindustan Ciao Limited .. 4 0 109 4 3.7 1 135 -6 -4.4 - 12 186 4 2.0 - 3
PETiiJUM
Oil &. Natural GasCommissiono. 122 .. 112 1,557 153 9.8 137 2,068 119 5.7 94 2,207 148 6.7 122
Indian Oil Corporation 1,100 114 10.4 77 1,526 238 15.6 194 1,70 251 14.8 203 1,744 594 22.6 300Cochin Refinaeries 268 46 17.2 35 258 33 12.9 25 233 25 10.6 17
TRA-DING
State Trading Corporation 179 42 23.4 20 377 113 29.9 25 496 67 13.5 5 208 146 70.2 47
Mineralsa & Metals TradingCorporation 185 82 44,3 35 165 -6 - 3.6 - 7 168 88 52.3 20 210 155 73.8 45
Food Corporation of India . 47 .. 10 1,408 143 10.2 5 4,639 231 4.9 4 6,359 393 6.2 6
THAD%,iPTAITC0NMioghdalaonee 24 2 8.3 2 102 6 5.9 3 96 4 4.2 1 147 3 2.1
Air lrd:,a 400 56 14.0 38 536 56 10.5 22 975 54 5.5 39 1,288 18 1.4 -20
Indian Airlincs 276 -23 -8.3 -35 437 37 8.5 16 684 - 17 -2.5 -47 671 -9 .1.4 - 51
Shipping corporationof India 417 57 13,7 45 573 65 11.3 50 1,1.75 115 9.8 87 -1,237 111 9.0 81
TOTAL (for above concerns) 1384 AIQ .1,.5 _-a 2A~.76 33 .k858~ Idan 3j 1 8 1,3 . -239
Ngt.e, The total investment of these companies aooount for over 80 per cent of all investaent In the public sector industrial end
aoommsroire.l undertakings of Central end State governmients.
I/ Capital employed is fixed assets lees depresiation, plus working capital, not inLcluding items under construotion or expansion.Capital employed is as at the beginning of the year.
* ~~~/ Groas profit represents ezcess of income over expendliture after depreciation but before tax enid interest on loan.
lNet profit represents Gross profit zeinua initerest and tax. It is not adjusetd to non operating end prior period receiptsand expenses.
Gross profit as per cent of capital employed.
Souroe, Annual Reports of the Bureau of Public Enterprises, Ministry of Finance.
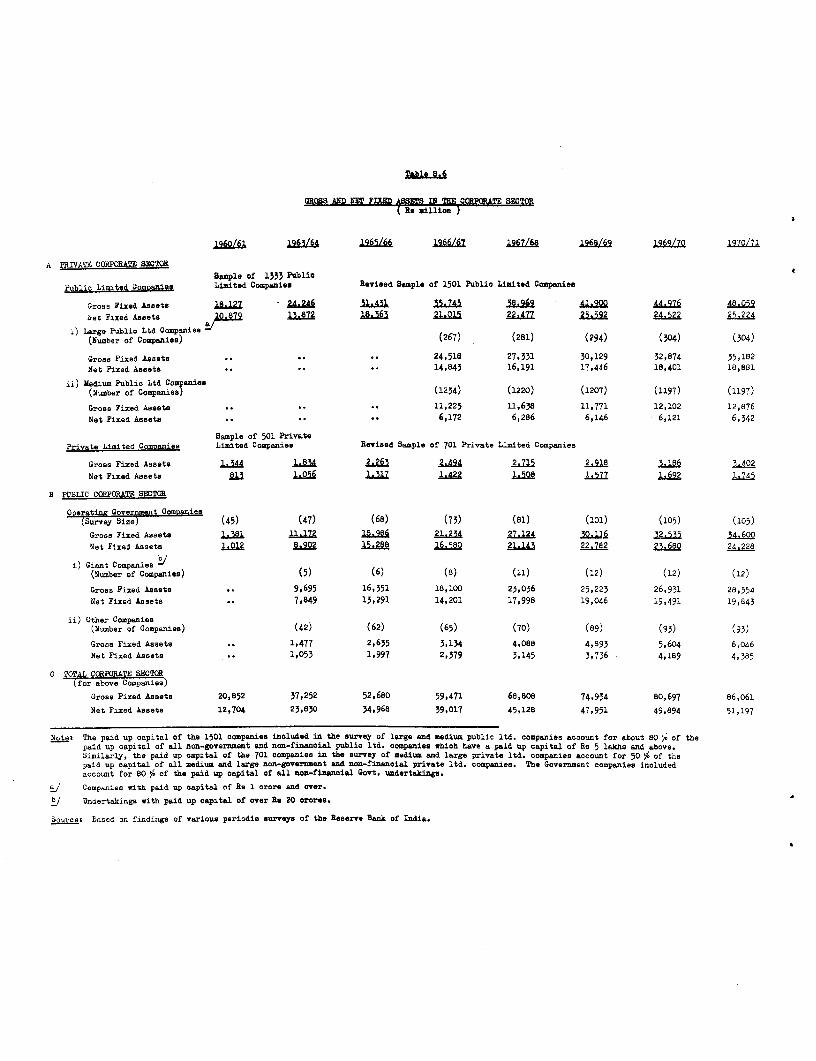
Table 8.6
GROSS AND NET FUIX fR P IN ORPOR SECTORRg illion ORORT
1960/61 196/6 1 961/66 1966/67 1°67/68 1968/69 1969/70 1970/71
A PRIVATE CORPORATE SECTOR
Sample of 1333 Pitblio
Public Limited Companies Limited Compenies Revised Sample of 1501 Publio Limited Companies
Gross Fixed Assets 1..127 242&6i .1 $ 3743 396q 41.00 44 976 482059
Net Fixed Assets 1Z,872 163 21.01i 22 477 2'i.82 24 S22 29.224
i) Large Publio Ltd Companies(Number of Companies) (267) (281) (294) (304) (304)
Gross Fixed Assets .. .. 24,518 27,331 30,129 32,874 35,182
Net Fixed Assets .. .. 14,843 16,191 17,446 18,401 18,881
ii) Medium Public Ltd Companies(Number of Companies) (1234) (1220) (1207) (1197) (1197)
Gross Fixed Assets .. 11,225 11,638 11,771 12,102 12,876
Net Fixed Assets .. 6,172 6,286 6,146 6,121 6,342
Sample of 501 PrivatePrivate Limited Companies Limited Companies Revised Sample of 701 Private Limited Companies
Gross Fixed Assets 1." 1.8'4 2.263 a"4447 2.918 3.186 3,.402
Net Fixed Mseets j1 1 OS 1,U7 1,422 1S08 1.577 1.692 1.75
B PCBLIC CORPORATE SECTOR
Oceratins Government Comosnies(Survey Bize) (45) (47) (68) (73) (81) (101) (105) (105)
Gross Fixed Assets 1.581 11.172 18.986 21.234 27.124 Z0 6 f2,535 34.600
Net Fixed Assets 102L 2 15.2S8 16 5Q0 21.143 22.782 23.680 24.228
i) Giant Companies /(Number of Companies) (5) (6) (8) (11) (12) (12) (12)
Gross Fixed Assets .. 9,695 16,351 18,100 23,036 25,223 26,931 28,554
Net Fixed Assets 7,849 13,291 14,201 17,998 19,046 19,491 19,843
ii) Other Companies(Number of Companies) (42) (62) (65) (70) (89) (93) (93)
Gross Fixed Assets .. 1,477 2,635 3,134 4,088 4,893 5,604 6,046
Net.Fixed Assets .. 1,053 1,997 2,379 3,145 3,736 4,189 4,385
C TOTAL CORPORATE SECTOR(for above Companies)
Gross Fixed Assets 20,852 37,252 52,680 59,471 68,808 74,934 80,697 86,061
Net Fixed Assets 12,704 23,830 34,968 39,017 45,128 47,951 49,894 51,197
Note: The paid up capital of the 1501 companies included in the survey of large and medium public ltd. companies account for about 80 Gp of the
paid up capital of all non-government and non-finanoial public ltd. companies which have a paid up capital of Rs 5 lakhs and above.Similarly, the paid up capital of the 701 companies in the survey of medium and large private ltd. companies account for 50 S4 of thepaid up capital of all medium and large non-government and non-finanoial private ltd. companies. The Government companies includedaccount for 80 % of the paid up capital of all an-fiancial Govt. undertakings.
aj Companies with paid up capital of Rs 1 crore and over.
U Ondertakings with paid up capital of over Rs 20 crores.
bources Based on findings of various periodic eurveys of the Reserve Bank of India.
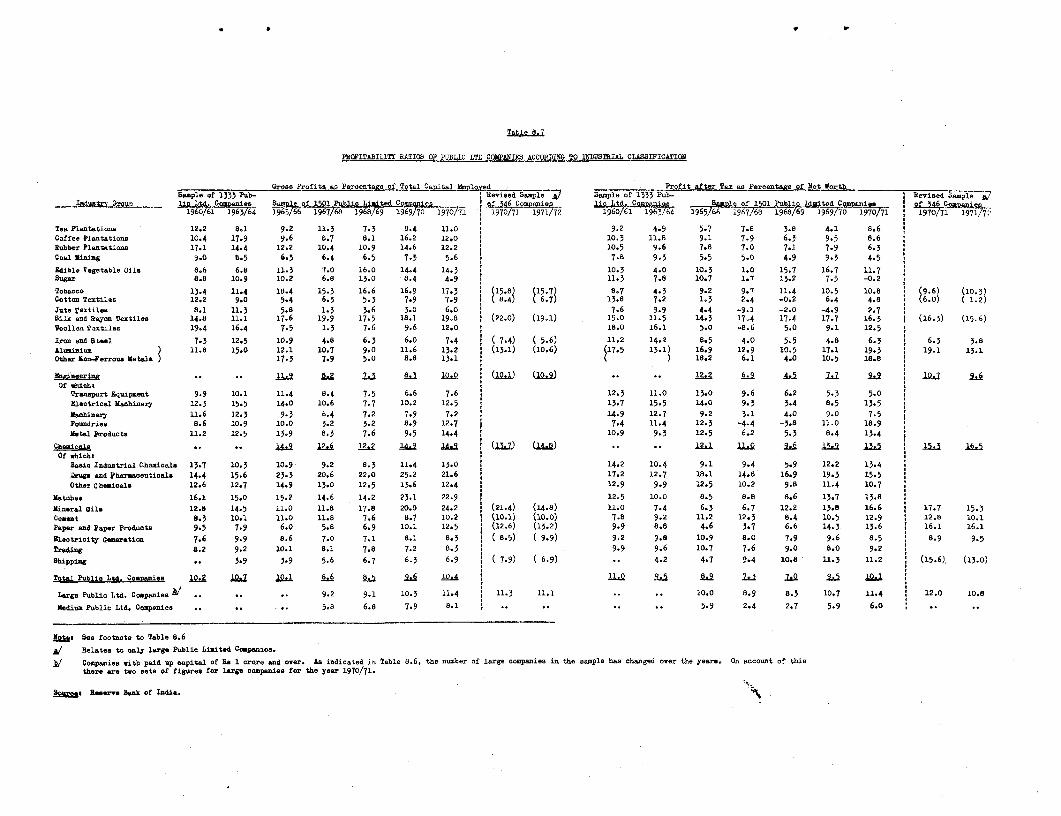
Table 8.7
PROFITABIL1TT PJTIOS OF PUBLIC LTD COIPANII89 ACCORDING TO MlWOSTITIA. CLASSIPICATION
G.rose Profits go Percentage of Total CaDital Etclored Profit after Tax ab Pereentage of Net WorthSanple of 1333 Pub- IRevieed Sample A/ Sampla of 1333 Pub- ' eBised Sapl A7
L pnr Gr,oup _ lie Lt,Co le 6 C iL Ltd. Coof lic Limited COCo aie 3 6e Public Limiited Com. 5 12L3. e196C/61 1963/64 1965/66 1967/68 1968/69 1969/0 1970/71 1970/7l 1971/72 1960/61 1963/64 1965/66 167/68 1968/69 1969/70 1970/71 1970,71 1971/72
Tea Plantations 12.2 8.1 9.2 11.3 7.3 8.4 11.0 9.2 4.9 5.7 7.8 3.8 4.1 8.6Coffee Plantations 10.4 17.9 9.6 8.7 8.1 16.2 12.0 10.3 11.8 9.1 7.9 6.3 9.5 8.6Rubber Planrtiot s 17.1 14-4 12.2 10.4 10.9 14.6 12.2 10.5 9.6 7.8 7.0 7.1 7.9 6.3Coal Rliniag 9.0 8.5 6.3 6.4 6.5 7.5 5.6 7.8 9.3 5.5 5.0 4.9 935 4.5
Edible Vegetable Oils 8.6 6.8 11.3 7.0 16.0 14.4 14.3 10.3 4.0 10.3 1.0 15.7 16.7 11.7Sugar 8.8 10.9 10.2 6.8 13.0 8.4 4.9 11.3 7.8 10.7 1.7 13.2 7.5 -0.2
Tobaeco 13.4 11.4 18.4 15.3 16.6 16.9 17.3 (15.8) 15.7) 8.7 4.3 9.2 9.7 11.4 10.5 10.8 (9.6)Cottor Textiles 12.2 9.0 5.4 6.3 5.3 7.9 7.9 8(.4 7 13.8 7.2 1.3 2.4 -0.2 6.4 4.8 6 ( 1-2Jute Textiles 8.1 11.3 5.8 1.3 3.6 3.0 6.0 7.6 9.9 4.4 -9.1 -2.0 -4.9 2.7Silk and Rayon Textiles 14.8 11.1 17.6 19.9 17.5 18.1 19.8 (22.0) (19.1) 15.0 11.5 14.3 17.4 17.4 17.7 16.3 (16,3) (15.6)Woollen Toxtiles 19.4 16.4 7-5 1.3 7.6 9.6 12.0 18.0 16.1 5.0 -8.6 5.0 9.1 12.5
Iron and Steel 7.3 12.5 10.9 4.8 6.3 6.o 7.4 j 7.4) ( 5.6) 11.2 14.2 8.5 4.0 5,5 4.8 6-3 6.3 3.8Al.-ivi= ) 11.8 15.0 12.1 10.7 9.0 11.6 13.2 (13.1) (10.6) (17.5 13.1) 16.9 12.9 10.5 17.1 19.3 19.1 13.1Other aon.-Ferrous Metals ) 17.3 7.9 5.0 8.8 13.1 ( ) 18.2 6.1 4.0 10.5 18.8
ndFing .. .. ~~~~~~~~~~~11.9 8. u l.! t(10.1) (19.2) ... 12.2 6.9 All. qo ' X; .Of nhicht
Transport Equipment 9.9 10.1 11.4 8.4 7.5 6.6 7.6 1 12.3 11.0 13.0 9.6 6.2 5.3 5.0Electrical llachinery 12.3 15.5 14.0 10.6 7.7 10.2 12.5 13,7 15.5 14.0 9.3 3.4 8.5 13.5Meahinery 11.6 12.3 9.3 6.4 7.2 7.9 7.2 14.9 12.7 9.2 3.1 4.0 9.0 7.5Foendries 8.6 10.9 10.0 3.2 3.2 8.9 12.7 7.4 11.4 12.3 '4'4 -3.8 11.0 18.9
setal Products 11.2 12.5 13.9 8.3 7.6 9.5 14.4 10.9 9-3 12.5 6.2 5.3 8.4 13.4
Cheical .. .. }2 A 12.2 .A (2l3) (1§) .. .. i2. 11.0 t6 i1a 1n; i, l'idOf whicht
aiac Industrial Chaeioals 13.7 10.3 10.9 9.2 8.3 11.4 13.0 14.2 10.4 9.1 9.4 5.9 12.2 13.4,rugs and lharmaoeuticals 14.4 15.6 23.3 20.6 22.0 25.2 21.6 17.2 12.7 18.1 14.8 16.9 19.3 15.5Other Chmicala 12.6 12.7 14.9 13.0 12.5 13.6 12.4 12.9 9.9 12.5 10.2 9.8 11.4 10.7
Matohee 16.1 15.0 15.2 14.6 14.2 23.1 22.9 12.5 10.0 8,5 8.8 8.6 13.7 13.8
Mineral Oil 12.8 14.5 11.0 11.8 17.8 20.0 24.2 1 (21.4) (14.8) 11.0 7.4 6.3 6.7 12.2 13.8 16.6 1 17.7 15.3Cement 8.3 10.1 11.0 11.8 7.6 8.7 10.2 (10.1) (10.0) 7.8 9.2 11.2 12.3 8.4 10.5 12.9 12.8 10.1Paper and Paper Products 9.5 7.9 6.o 5.8 6.9 10.1 12.5 (12.6) (13.2) 9.9 8.8 4.6 3.7 6.6 14.3 13.6 16.1 16.1
Electricity Generation 7.6 9.9 8.6 7-0 7.1 8.1 8.3 i 8.5) ( 9.9) 9.2 9.8 10.9 8.0 7.9 9.6 8.5 8.9 9.5Trading 8.2 9.2 10.1 8.1 7.8 7.2 8.3 . 9.9 9.6 10.7 7.6 9.0 8.0 9.2
Shipping *- 3-9 3.9 5.6 6.7 6.3 6.9 5 ( 7.9) ( 6.9) .. 4.2 4.7 9.4 10.8 11.3 11.2 1 (15.6). (13.0)
Total Public Ltd, Coacaniee 10.2 a 8.6 §i 1 11.0 § QQ2 2a12 7.0 2.L5 1.1 i
Large Publio Ltd. Companies .. .. *. 9.2 9.1 10.3 11.4 11.3 11.1 .. .. 10.0 8.9 8.3 10.7 11.4 12.0 10.8
Medium Public Ltd. Compenies .. .. - * 5.8 6.8 7.9 8.1 5.. .. .. . 5.9 2.4 2.7 5.9 6.o
llgt See footnote to Table 8.6
A Relates to only large Public Limited Companies.
/ Companies with paid up capitWa of Rs 1 crore and over. As indicated in Table 8.6, the number of large companies in the sample hue changed over the year. On account of thicthere are two sets of figures for large companies for the year 1970/71.
So-rces Reserve bank of India.


![Page 1 (C :' ]\ HYDRAULICS BRANCH OFFICIAL FILE COPY Bur..u ...](https://static.fdokumen.com/doc/165x107/6317b04371e3f2062906e3cf/page-1-c-hydraulics-branch-official-file-copy-buru-.jpg)