Influence of naringin on ferric iron induced oxidative damage in vitro
Vol. 7(11), pp. 215-224, December, 2013
DOI: 10.5897/AJBR2013.0692
ISSN 1996-0778 ©2013 AcademicJournals
http://www.academicjournals.org/AJBR
African Journal of Biochemistry Research
Full Length Research Paper
Ferric reducing antioxidant power and total phenols in Cordia africana fruit
Tewolde-Berhan Sarah1,2*, Remberg Siv Fagertun2, Abegaz Kebede3, Narvhus Judith2,
Abay Fetien1 and Wicklund Trude2
1Department of Land Resources and Environmental Protection/Department of Crop and Horticultural Sciences, Mekelle
University, P.O. Box 231, Mekelle, Ethiopia. 2Department of Chemistry, Biotechnology and Food Science/Department of Plant and Environmental Sciences,
University of Life Sciences, P.O. Box 5003, NO-1432 Aas, Norway. 3School of Human Nutrition, Food Science and Technology, Hawassa University, P.O. Box 5, Hawassa, Ethiopia.
Accepted 4 December, 2013
Antioxidants are beneficial compounds found in a lot of foods. Cordia africana (Lam.) is a small fruit eaten all over Tigray and other parts of Ethiopia. The fruit was tested for its antioxidant content using the ferric reducing antioxidant power (FRAP) assay and total phenols (TP) measured with Folin Ciocalteu`s reagent, across four different agroecological zones and three land use classes in Tigray. The average FRAP value on dry weight basis was 30.8 ± 1.45 mg Trolox equivalent 100 g
-1 fruit, and the
average TP value on dry weight basis 2317.0 ± 104.0 mg gallic acid equivalent 100 g-1
fruit. Both FRAPand TP values were found to be significantly (p < 0.05) different across the agroecology with the lower altitude agroecology giving the highest value and the dry mid altitude agroecology giving the least value. The difference in land use showed no effect on the FRAP value; however the TP values were significantly (p < 0.01) different across the different land use. The highest value of TP was found in the wild and the lowest was found in the backyard land uses. C. africana is a fruit with good quantities of TP, and small amounts of antioxidants measured with FRAP. Both FRAP and TP values showed variation across agroecology, while only the TP content vary across land use. The fruit was also found to have 9.07 mg 100 g
-1 fruit, which makes it a good source of the vitamin to meet part of the daily
requirement. As antioxidants and vitamin C are highly beneficial to general health, the consumption of this fruit should thus be recommended and promoted.
Key words: Cordia africana fruit, ferric reducing antioxidant power, total phenol, agroecology, land use.
INTRODUCTION
The benefits of antioxidants have been studied and discussed by many scientists in food science, medical science and general health areas (Baumann, 2009; Cadenas and Packer, 2002; Packer et al., 2000; Sen et al., 2000; Tardif and Bourassa, 2006). These show the
multi-disciplinary nature of the studies and the multiple use and application of antioxidants. When it comes to Cordia, several species have been investigated for their antioxidant properties of the fruits, roots, barks and leaves. For example the leaves of Cordia wallichii and
*Corresponding author. E-mail: [email protected]. Tel: +47 41396795. Fax: +47 64965901.
Abbreviations: ANOVA, Analysis of variance; FRAP, ferric reducing antioxidant power; TP, total phenol measured with Folin Ciocalteu`s reagent; m.a.s.l., meters above sea level; DW, dry weight basis; TE, trolox (6-hydroxy-2,5,7,8-tetramethylchroman-2-carboxylic acid) equivalent; GAE, gallic acid equivalent.

216 Afr. J. Biochem. Res.
Figure 1. Map of selected woredas in Tigray, Ethiopia, East Africa, showing their relative location and altitude (Generated on DIVA-GIS software). Altitude: Irob; Lalay maychew; Astbi womberta; Hintalo wejerat; Raya Azebo; Alaje.
Cordia verbenacea were looked into by two different studies (Makari et al., 2008; Michielin et al., 2011).
The antioxidant content of fruits vary due to cultivar (genetic variance, provenance) (Cordenunsi et al., 2002; Howard et al., 2003; Kotíková et al., 2011; Wicklund et al., 2005), ripening stages (Gull et al., 2012; Kotíková et al., 2011; Vendramini and Trugo, 2000), various climate conditions such as season and production location (Howard et al., 2003; Iqbal and Bhanger, 2006), temperature(Howard et al., 2003; Wang and Zheng, 2001), altitude and ultraviolet radiation (Bhattacharya and Sen-Mandi, 2011) in addition to overall environmental conditions (Oh et al., 2009; Wang, 2006; Yuri et al., 2009).
Cordia africana is a fruit found wide spread in the Middle East, West, East, and Southern Africa. It is known by the name Sudan teak, East African Cordia, large-leafed Cordia, and Sebastian fruit (ICRAF, 2008). In Tigray, C. africana fruit is eaten by the local community during its fruiting season of April to June. It is collected and eaten by shepherds and children when found in the wild, and collected, and eaten or sold by women and children when grown in farms or backyards. Generally, the fruit is eaten fresh, however traditionally the fruit is also dried and kept for use during off season. The objective of this study was to determine the antioxidant levels of C. africana within
the context of the typical Tigrian diet when consumed fresh.
MATERIALS AND METHODS
C. africana fruit sampling strategy
In Tigray, it is found that C. africana grows in the wild (natural forests, community afforestation sites, church forests), farm lands, grazing lands and people’s backyards (home gardens) within the altitude range of 1500 to 2950 m.a.s.l. Thus, the present experimental design took into account the different agroecological and land use patterns. In two studies, the diversity of C. africana was observed by looking at genetic markers (Derero et al., 2011), seed physical characteristics and germination time (Loha et al., 2006; Loha et al., 2009). The results of these studies found that the populations of C. africana investigated had more genetic diversity within the populations rather than between populations. Thus, the present experimental design took into account both inter- and intra- population diversities, looking at variations across the different populations at the different agroecology and land uses.
The existing study areas where C. africana grows were divided into four agroecological zones. A woreda (second smallest level administrative body in Ethiopia) was randomly selected from each of the agroecological zone so as to represent the agroecological area. Figure 1 shows an altitudinal map of Tigray Regional State showing the three different agroecological zones based on altitude. Estimated rainfall data were added to this map in order to
Altitude
Irob
Lalay maychew
Astbi womberta
Hintalo wejerat
Raya Azebo
Alaje

determine the selection of the four woredas. The four randomly selected woredas were: Irob (Weyna dega, midland) which is mid altitude 1500-2300 m.a.s.l., moist with mean annual rainfall ranging from 316 to 823 ml year
-1; Laelay Maychew (Weyna dega) mid
altitude 1500-2300 m.a.s.l., dry mean annual rainfall ranging from 639 to 673 ml year
-1; Atsbi Womberta (Dega, highland) higher
altitude 2300- 3200 m.a.s.l., moist mean annual rainfall ranging from 577 to 608 ml year
-1; and Raya Azebo (Kolla, lowland) lower
altitude 500-1500 m.a.s.l., dry mean annual rainfall ranging from 633 to 770 ml year
-1. These agroecological classifications follow the
standard set for Ethiopia by the Soil Conservation Research Programme (Hurni, 1986). However, no adequate number of trees could be found in the three land use categories in Irob and Atsbi Womberta. As a result, Hintalo Wajerat (Weyna dega) mid altitude 1500-2300 m.a.s.l., moist mean annual rainfall ranging from 516 to 716 mL year
-1 and Alaje woredas (Dega) higher altitude 2300- 3200
m.a.s.l., moist mean annual rainfall ranging from 624 to 839 mL year
-1 were selected as substitutes. Within the selected woredas, a
village was purposively selected where C. africana could be found growing in the wild, farm lands and backyards in consultation with the woreda level forestry experts. Ten trees were selected randomly from each site of the wild, farm and grazing land and backyards. From each tree, 250 to 450 g mature fruits were collected, labelled, and placed in a cooler (which had an average of 4°C) for transport. The transport from Laelay Maychew and Raya Azebo took 24 h from collection to placement in the laboratory, and that of Alaje and Hintalo Wajerat arrived in the laboratory 5 h after collection. On the same day of arrival, the size, colour and weight of 10 representative fruits from each tree was measured. Two representative fruits were taken in triplicate for the moisture level and ash content determination. The whole fruit and fruit stones were also separated out and ashed for ash content determination. The reminder of the fruit was placed in a refrigerator (4°C) until processed. Within two to three days (stored at 4°C), fruits from each tree were homogenized. For homogenization, initially the fruit cap was removed; then the fruit skin was removed. Following this, the sticky flesh was dissolved into a specified amount of water (50-150 mL depending on number of fruits collected and fruit flesh size) and by blending it with an egg whisk. When the stone and flesh are separated, the skin is placed into the dissolved fruit flesh and blended into a homogenized fruit pulp paste.
Analytical methods
The size, colour, weight, moisture and ash were determined on individual fruits, while TP, FRAP, and vitamin C values were determined from the homogenized samples. As the homogenisation process involved dilution, TP, FRAP and vitamin C values were calculated back to discount the dilution. The principles followed in the analytical measurements were the following:
1. Antioxidants: 3 g of the homogenate was extracted in 30 mL ofmethanol and the antioxidant levels were determined by ferric reducing activity power (FRAP), and total phenols (TP) using Folin Ciocalteu’s reagent. For both analysis, the Konelab 30i outline and method was followed (Volden et al., 2008; Zargar et al., 2011). 2. Size: the size was measured on both diagonal and verticaldirections of the fruit (Bertin et al., 2009). This was done using a micro-calliper. 3. Colour: the colour was initially measured using a colour chartfrom the Natural Colour Systems (Hård and Sivik, 1981). The Natural Colour Systems colours were then converted to the CIE L*a*b* colour (Osorio and Vorobyev, 1996; Özkan et al., 2003) reading using a Minolta colour meter. 4. Weight: the weight of a selected representative 10 fruits wasmeasured in grams using a portable digital balance with a
Tewolde-Berhan et al. 217
sensitivity of 0.001 g (Ercisli and Orhan, 2007). 5. For vitamin C measurement 2,6-dichloroindophenol titrimetricmethod using oxalic acid as extractant was used, AOAC 967.21 was used (Hernández et al., 2006) . 6. Ash: As separating the flesh and the stone without dilution wasdifficult, ashing was done on the whole fruit and on the separated out stones. The overall procedure followed the AOAC 940.26 standard (Horwitz and Latimer, 2005).
The overall experimental setup gave a nested or hierarchical design of the four weredas, with three land uses and ten replicas. Each laboratory analysis was measured with three parallels. The results were aggregated per tree. To test for land use (inter population), variances and agroecological (intra population) variances, the fully nested ANOVA was used (Minitab 16.1, USA). The FRAP and TP means where tested for grouping and ranking using Tukey’s tests. Further investigation was done using a Principal Component Analysis (PCA, Unsrambler 10X, USA and PAST (Hammer et al., 2001)), to test the relationship between the FRAP and TP laodings and agroecology. Another set of PCA was applied to test the relationship between FRAP and TP across agroecology and land use. This relationship was further explored by making a correlation matix (Minitab 16.1, USA).
RESULTS AND DISCUSSION
Fruit physical and chemical properties
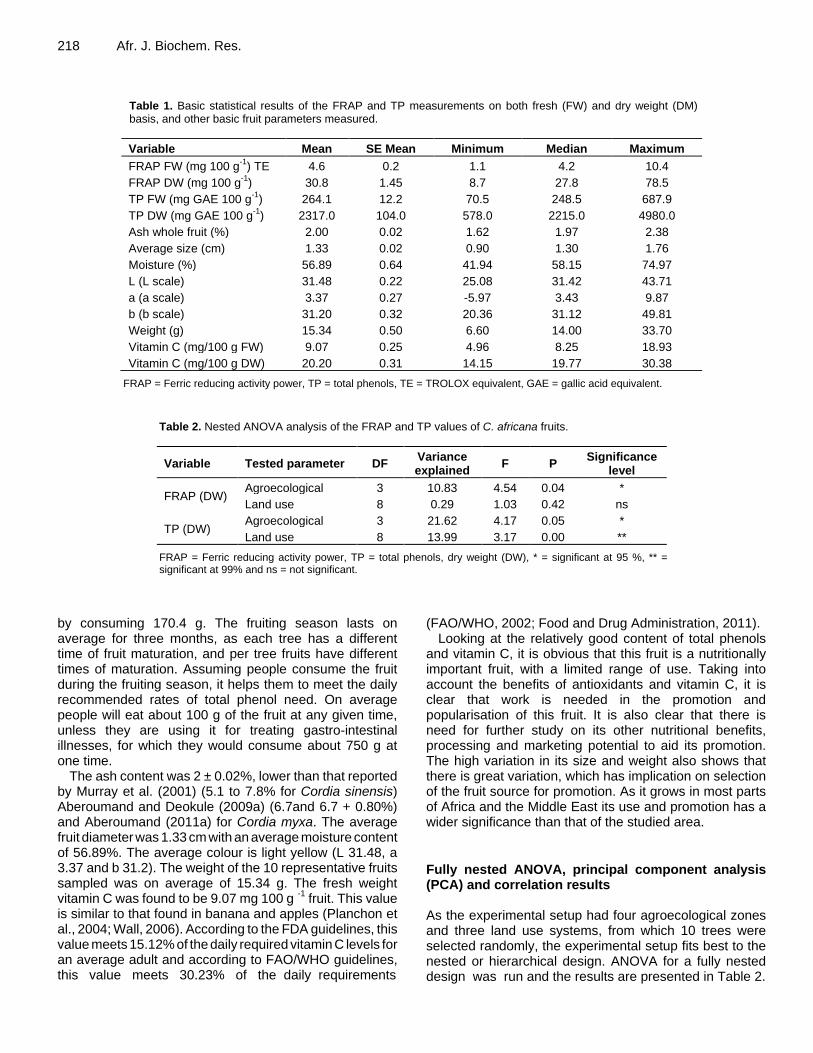
The mean, standard error, minimum, median and maximum values of the FRAP and TP, both on fresh fruit (FW) anddry weight (DW) basis, are presented in Table 1.
The antioxidant levels in Table 1 show the measured values. There is a difference between the fresh and dry weight FRAP and TP values because the fresh fruit contained a lot of moisture with a mean of 56.89%. The FRAP average is comparable to that found from the bark extract in a similar species Cordia dichotoma bark, with 22.8 mg mL
-1 TE on a dry weight basis (Ganjare et al.,
2011). The average total phenol values (DW) are at least 5.7 times higher than fruit extract found in a similar species, Cordia myxa, with a variation found in the literature of 373.9-400 mg 100 g
-1 GAE (Aberoumand and
Deokule, 2009b; Aberoumand, 2011b; Souri et al., 2008). TP values in fresh fruits are comparable with that found in Cordia exaltata fruit with 190 mg 100 g
-1 on a FW basis
(Silva et al., 2007). To date, there is no daily requirement set for the consumption of antioxidants and total phenols. The American average daily intake of total phenols has been set to 450 mg GAE (Chun et al., 2005), and the Mexican average daily intake of antioxidants is 170.2 -240.2 mg trolox equivalents day
-1, which is stated to be
similar to 222-1004 mg GAE per day as found in Spanish Mediterranean diets, which is used as a reference for European countries (Hervert-Hernández et al., 2011). Taking these figures as bench marks, on the one hand, these antioxidant levels are too low for daily intake levels to be reached as 5222 g would be needed to reach the American recommended values. On the other hand, the total phenol content is high enough to meet the American and Mexican/Spanish Mediterranean daily intake levels
218 Afr. J. Biochem. Res.
Table 1. Basic statistical results of the FRAP and TP measurements on both fresh (FW) and dry weight (DM) basis, and other basic fruit parameters measured.
Variable Mean SE Mean Minimum Median Maximum
FRAP FW (mg 100 g-1
) TE 4.6 0.2 1.1 4.2 10.4
FRAP DW (mg 100 g-1
) 30.8 1.45 8.7 27.8 78.5
TP FW (mg GAE 100 g-1
) 264.1 12.2 70.5 248.5 687.9
TP DW (mg GAE 100 g-1
) 2317.0 104.0 578.0 2215.0 4980.0
Ash whole fruit (%) 2.00 0.02 1.62 1.97 2.38
Average size (cm) 1.33 0.02 0.90 1.30 1.76
Moisture (%) 56.89 0.64 41.94 58.15 74.97
L (L scale) 31.48 0.22 25.08 31.42 43.71
a (a scale) 3.37 0.27 -5.97 3.43 9.87
b (b scale) 31.20 0.32 20.36 31.12 49.81
Weight (g) 15.34 0.50 6.60 14.00 33.70
Vitamin C (mg/100 g FW) 9.07 0.25 4.96 8.25 18.93
Vitamin C (mg/100 g DW) 20.20 0.31 14.15 19.77 30.38
FRAP = Ferric reducing activity power, TP = total phenols, TE = TROLOX equivalent, GAE = gallic acid equivalent.
Table 2. Nested ANOVA analysis of the FRAP and TP values of C. africana fruits.
Variable Tested parameter DF Variance explained
F P Significance
level
FRAP (DW) Agroecological 3 10.83 4.54 0.04 *
Land use 8 0.29 1.03 0.42 ns
TP (DW) Agroecological 3 21.62 4.17 0.05 *
Land use 8 13.99 3.17 0.00 **
FRAP = Ferric reducing activity power, TP = total phenols, dry weight (DW), * = significant at 95 %, ** = significant at 99% and ns = not significant.
by consuming 170.4 g. The fruiting season lasts on average for three months, as each tree has a different time of fruit maturation, and per tree fruits have different times of maturation. Assuming people consume the fruit during the fruiting season, it helps them to meet the daily recommended rates of total phenol need. On average people will eat about 100 g of the fruit at any given time, unless they are using it for treating gastro-intestinalillnesses, for which they would consume about 750 g at one time.
The ash content was 2 ± 0.02%, lower than that reported by Murray et al. (2001) (5.1 to 7.8% for Cordia sinensis) Aberoumand and Deokule (2009a) (6.7and 6.7 + 0.80%) and Aberoumand (2011a) for Cordia myxa. The average fruit diameter was 1.33 cm with an average moisture content of 56.89%. The average colour is light yellow (L 31.48, a 3.37 and b 31.2). The weight of the 10 representative fruits sampled was on average of 15.34 g. The fresh weight vitamin C was found to be 9.07 mg 100 g
-1 fruit. This value
is similar to that found in banana and apples (Planchon et al., 2004; Wall, 2006). According to the FDA guidelines, this value meets 15.12% of the daily required vitamin C levels for an average adult and according to FAO/WHO guidelines, this value meets 30.23% of the daily requirements
(FAO/WHO, 2002; Food and Drug Administration, 2011). Looking at the relatively good content of total phenols
and vitamin C, it is obvious that this fruit is a nutritionally important fruit, with a limited range of use. Taking into account the benefits of antioxidants and vitamin C, it is clear that work is needed in the promotion and popularisation of this fruit. It is also clear that there is need for further study on its other nutritional benefits, processing and marketing potential to aid its promotion. The high variation in its size and weight also shows that there is great variation, which has implication on selection of the fruit source for promotion. As it grows in most parts of Africa and the Middle East its use and promotion has a wider significance than that of the studied area.
Fully nested ANOVA, principal component analysis (PCA) and correlation results
As the experimental setup had four agroecological zones and three land use systems, from which 10 trees were selected randomly, the experimental setup fits best to the nested or hierarchical design. ANOVA for a fully nested design was run and the results are presented in Table 2.
Tewolde-Berhan et al. 219
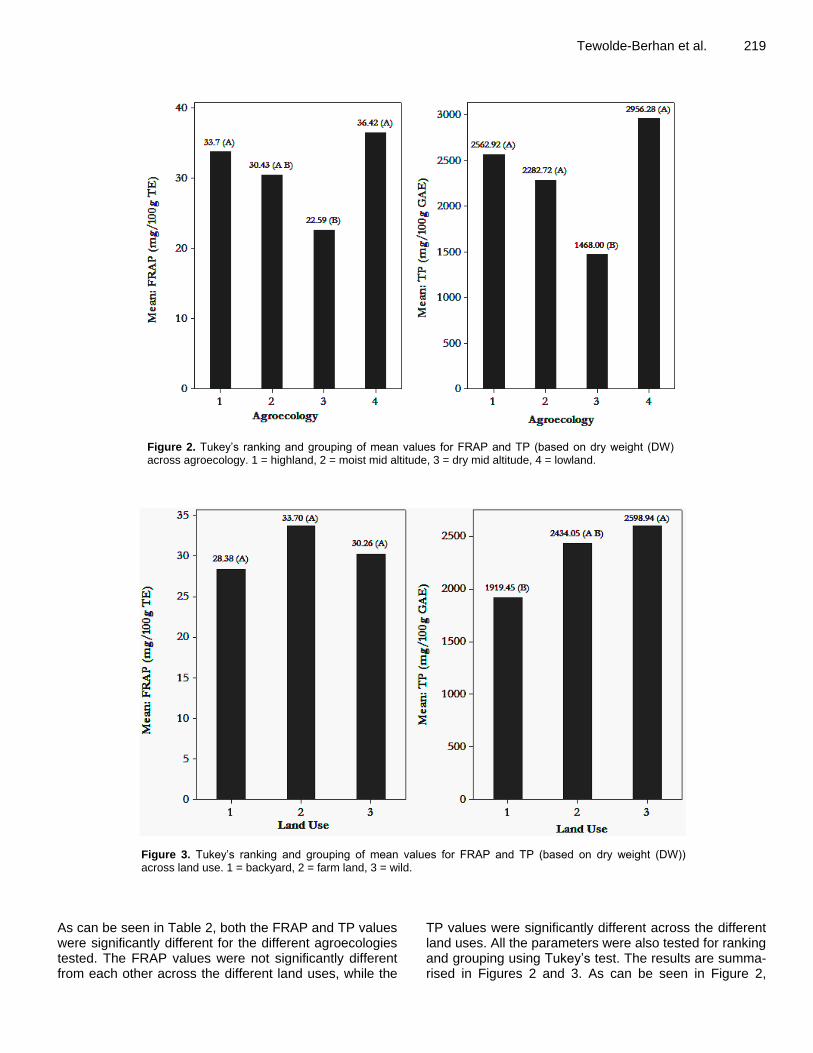
Figure 2. Tukey’s ranking and grouping of mean values for FRAP and TP (based on dry weight (DW) across agroecology. 1 = highland, 2 = moist mid altitude, 3 = dry mid altitude, 4 = lowland.
Figure 3. Tukey’s ranking and grouping of mean values for FRAP and TP (based on dry weight (DW)) across land use. 1 = backyard, 2 = farm land, 3 = wild.
As can be seen in Table 2, both the FRAP and TP values were significantly different for the different agroecologies tested. The FRAP values were not significantly different from each other across the different land uses, while the
TP values were significantly different across the different land uses. All the parameters were also tested for ranking and grouping using Tukey’s test. The results are summa-rised in Figures 2 and 3. As can be seen in Figure 2,
220 Afr. J. Biochem. Res.
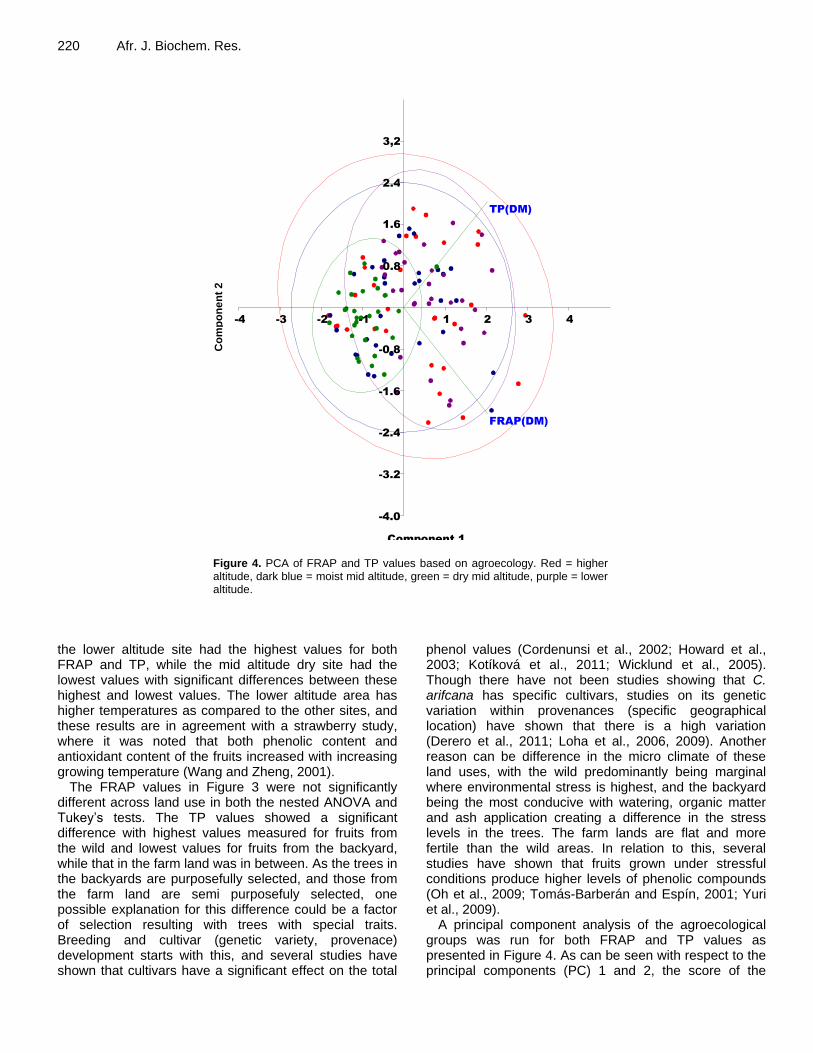
Figure 4. PCA of FRAP and TP values based on agroecology. Red = higher altitude, dark blue = moist mid altitude, green = dry mid altitude, purple = lower altitude.
the lower altitude site had the highest values for both FRAP and TP, while the mid altitude dry site had the lowest values with significant differences between these highest and lowest values. The lower altitude area has higher temperatures as compared to the other sites, and these results are in agreement with a strawberry study, where it was noted that both phenolic content and antioxidant content of the fruits increased with increasing growing temperature (Wang and Zheng, 2001).
The FRAP values in Figure 3 were not significantly different across land use in both the nested ANOVA and Tukey’s tests. The TP values showed a significant difference with highest values measured for fruits from the wild and lowest values for fruits from the backyard, while that in the farm land was in between. As the trees in the backyards are purposefully selected, and those from the farm land are semi purposefuly selected, one possible explanation for this difference could be a factor of selection resulting with trees with special traits. Breeding and cultivar (genetic variety, provenace) development starts with this, and several studies have shown that cultivars have a significant effect on the total
phenol values (Cordenunsi et al., 2002; Howard et al., 2003; Kotíková et al., 2011; Wicklund et al., 2005). Though there have not been studies showing that C. arifcana has specific cultivars, studies on its genetic variation within provenances (specific geographical location) have shown that there is a high variation (Derero et al., 2011; Loha et al., 2006, 2009). Another reason can be difference in the micro climate of these land uses, with the wild predominantly being marginal where environmental stress is highest, and the backyard being the most conducive with watering, organic matter and ash application creating a difference in the stress levels in the trees. The farm lands are flat and more fertile than the wild areas. In relation to this, several studies have shown that fruits grown under stressful conditions produce higher levels of phenolic compounds (Oh et al., 2009; Tomás-Barberán and Espín, 2001; Yuri et al., 2009).
A principal component analysis of the agroecological groups was run for both FRAP and TP values as presented in Figure 4. As can be seen with respect to the principal components (PC) 1 and 2, the score of the
FRAP(DM)
TP(DM)
-4 -3 -2 -1 1 2 3 4
Component 1
-4.0
-3.2
-2.4
-1.6
-0.8
0.8
1.6
2.4
3,2
Co
mp
on
en
t 2
Tewolde-Berhan et al. 221
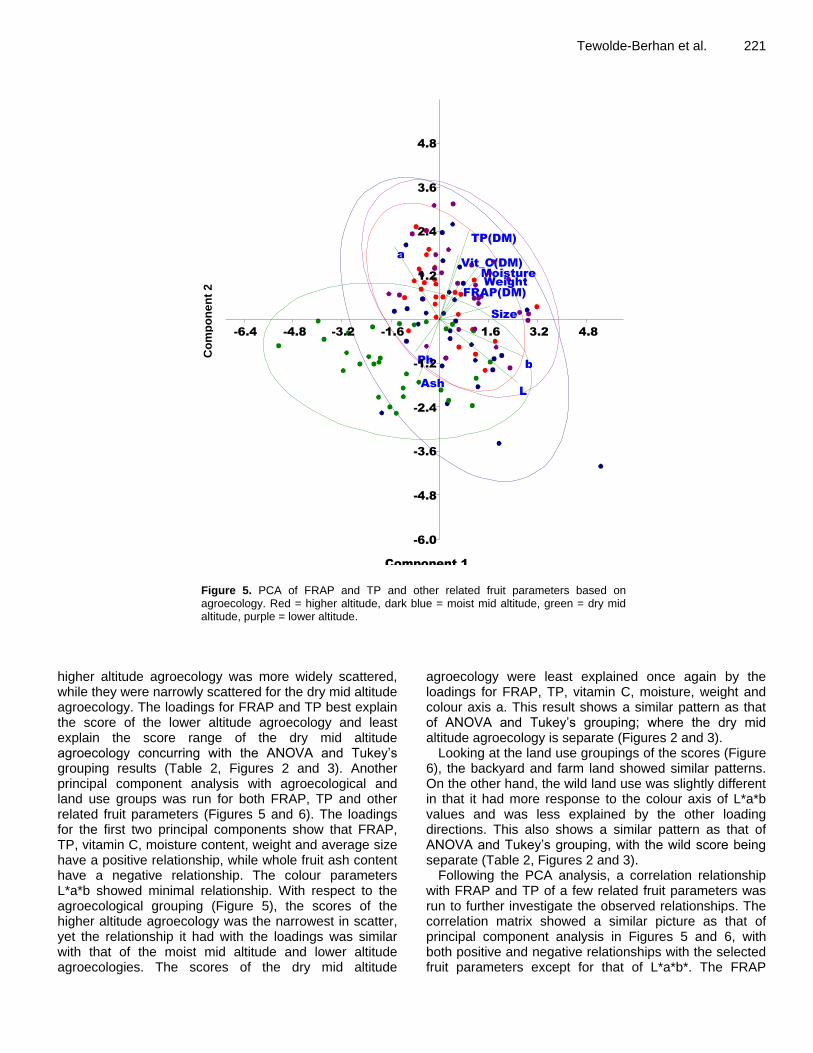
Figure 5. PCA of FRAP and TP and other related fruit parameters based on agroecology. Red = higher altitude, dark blue = moist mid altitude, green = dry mid altitude, purple = lower altitude.
higher altitude agroecology was more widely scattered, while they were narrowly scattered for the dry mid altitude agroecology. The loadings for FRAP and TP best explain the score of the lower altitude agroecology and least explain the score range of the dry mid altitude agroecology concurring with the ANOVA and Tukey’s grouping results (Table 2, Figures 2 and 3). Another principal component analysis with agroecological and land use groups was run for both FRAP, TP and other related fruit parameters (Figures 5 and 6). The loadings for the first two principal components show that FRAP, TP, vitamin C, moisture content, weight and average size have a positive relationship, while whole fruit ash content have a negative relationship. The colour parameters L*a*b showed minimal relationship. With respect to the agroecological grouping (Figure 5), the scores of the higher altitude agroecology was the narrowest in scatter, yet the relationship it had with the loadings was similar with that of the moist mid altitude and lower altitude agroecologies. The scores of the dry mid altitude
agroecology were least explained once again by the loadings for FRAP, TP, vitamin C, moisture, weight and colour axis a. This result shows a similar pattern as that of ANOVA and Tukey’s grouping; where the dry mid altitude agroecology is separate (Figures 2 and 3).
Looking at the land use groupings of the scores (Figure 6), the backyard and farm land showed similar patterns. On the other hand, the wild land use was slightly different in that it had more response to the colour axis of L*a*b values and was less explained by the other loading directions. This also shows a similar pattern as that of ANOVA and Tukey’s grouping, with the wild score being separate (Table 2, Figures 2 and 3).
Following the PCA analysis, a correlation relationship with FRAP and TP of a few related fruit parameters was run to further investigate the observed relationships. The correlation matrix showed a similar picture as that of principal component analysis in Figures 5 and 6, with both positive and negative relationships with the selected fruit parameters except for that of L*a*b*. The FRAP
FRAP(DM)
TP(DM)
Size
Moisture
L
a
b
Weight
Vit_C(DM)
Ph
Ash
-6.4 -4.8 -3.2 -1.6 1.6 3.2 4.8
Component 1
-6.0
-4.8
-3.6
-2.4
-1.2
1.2
2.4
3.6
4.8
Co
mp
on
en
t 2

222 Afr. J. Biochem. Res.
Figure 6. PCA of FRAP, TP and other related fruit parameters based on land use. Red = backyard, dark blue = farm land, purple = wild.
values were only correlated significantly with total phenol and fruit moisture levels, while the TP values are significantly correlated with the moisture, weight, vitamin C and fruit ash content. However, it needs to be noted that though there was a significant relationship considering the p values, the Pearson’s correlation coefficient was very low. The correlation relationship of TP with fruit ash content was negative as indicated by the PCA in Figures 5 and 6. The positive relationships could be explained as vitamin C is an antioxidant and the weight and moisture content are indicators of better fruit growth. The negative relationship can be explained by the fact that phenols are acidic, and acidic compounds have lower pH. With respect to the relationship with the fruit ash content, the highest content of total phenols was found in the wild which are marginal lands. The soil fertility in these areas is lower, and previous studies have shown that soil fertility and mineral contents are related (Havlin et al., 2009; Lucas et al., 1942).
These results have implications for the use and promotion of this fruit. Currently, the fruits is consumed locally and sold in local markets (Demel and Abeje,
2005). Currently, in most parts of Ethiopia and Tigray there are massive afforestation efforts underway, that if managed properly have a great potential to contribute to improved food security, poverty alleviation and environmental rehabilitation (Egziabher, 2006; Fentahun and Hager, 2009; Gebrehiwot and Headquarters, 2004; Mengistu et al., 2005; Tewolde-Berhan et al., 2000; Yami et al., 2006). This study has shown that the fruit is useful and beneficial for health, and the TP values were highest in the wild. The promotion and wider use of the fruit can be achieved through its incorporation in the existing enclosure, communal forestry, and hillside distribution efforts. In addition to this, efforts need to be put in place to promote and market the fruit.
Conclusion
Cordia africana is a fruit with good quantities of TP-total phenol antioxidants. The antioxidant content tested with the FRAP, was not high. Both FRAP and TP values showed variation across agroecology, and only the
FRAP(DM)
TP(DM)
Size
Moisture
L
a
b
Weight
Vit_C(DM)
Ph
Ash
-6.0 -4.8 -3.6 -2.4 -1.2 1.2 2.4 3.6 4.8
Component 1
-6.0
-4.8
-3.6
-2.4
-1.2
1.2
2.4
3.6
4.8
C
o m p o n e n t
2
Co
mp
on
en
t 2

phenolic content with variation across land use. The phenolic content is also strongly related to the FRAP, moisture content, weight, vitamin C and fruit ash contents.
The significance of these results is in its implication for use. These fruits are consumed by the local community and are sold in local markets. As these antioxidants and vitamin C tested are known to have beneficial effects towards health, the continued consumption of these fruits in Tigray is highly recommended. As the fruit is known to grow in most parts of Africa and the Middle East, its use needs to made known and the fruit needs to be promoted. Further study on its overall nutritional value, processing potential and marketability will help in the promotion of the fruit. As the size and weight was also found to have great variability, care needs to be taken to select appropriate seed sources for promotion. With the growing afforestation efforts in the region, this species should be given focus as its TP values where the highest in the wild, which represents the afforestation sites. Understanding their use will help in the up scaling of their use and marketing.
ACKNOWLEDGEMENTS
The authors would like to thank NUFU (The Norwegian Programme for Development, Research and Education), Mekelle University, University of Life Science, and Sokoine University for the collaborative project that made this study possible. We would also like to thank the laboratory staff of the Mekelle University and the University of Life Science.
REFERENCES
Aberoumand A (2011a). Studies on nutritional and functional properties of some plant foods. World J. Sci. Technol. 1(3):26-30.
Aberoumand A (2011b). Survey on some food plants as sources of antioxidants. Innov. Rom. Food Biotechnol. 8: 22-25.
Aberoumand A, Deokule SS (2009a). Determination of elements profile of some wild edible plants. Food Anal. Methods 2(2):116-119.
Aberoumand A, Deokule SS (2009b). Studies on Nutritional Values of Some Wild Edible Plants from Iran and India. Pakistan J. Nutr. 8(1):26-31.
Baumann L (2009). Cosmetic Dermatology: Principles and practices. Second Edition ed. New York. 366 p.
Bertin N, Causse M, Brunel B, Tricon D, Génard M (2009). Identification of growth processes involved in QTLs for tomato fruit size and composition. J. Exp. Bot. 60(1):237-248.
Bhattacharya S, Sen-Mandi S (2011). Variation in antioxidant and aroma compounds at different altitude: A study on tea (Camellia sinensis L. Kuntze) clones of Darjeeling and Assam, India. Afr. J. Biochem. Res. 5(5):148-159.
Cadenas E, Packer L (2002). Handbook of antioxidants. Second edition revised and expanded ed. New York: Marcel Dekker Inc. 602 p.
Chun OK, Kim DO, Smith N, Schroeder D, Han JT, Lee CY (2005). Daily consumption of phenolics and total antioxidant capacity from fruit and vegetables in the American diet. J. Sci. Food Agric. 85 (10):1715-1724.
Cordenunsi BR, Oliveira do Nascimento JR, Genovese MI, Lajolo FM (2002). Influence of cultivar on quality parameters and chemical composition of strawberry fruits grown in Brazil. J. Agric. Food Chem.
Tewolde-Berhan et al. 223
50(9):2581-2586. Demel Teketay, Abeje Eshete (2005). Status of indigenous fruits in
Ethiopia. In IPGRI-SAFORGEN (ed.). Review and appraisal on the status of indigenous fruits in Eastern Africa: AFREA/FORNESSA.
Derero A, Gailing O, Finkeldey R (2011). Maintenance of genetic diversity in Cordia africana Lam., a declining forest tree species in Ethiopia. Tree Genetics Genomes 7(1):1-9.
Egziabher TBG (2006). The role of forest rehabilitation for poverty alleviation in drylands. J. Drylands 1 (1): 3-7.
Ercisli S, Orhan E (2007). Chemical composition of white (Morus alba), red (Morus rubra) and black (Morus nigra) mulberry fruits. Food Chem. 103(4):1380-1384.
FAO/WHO (2002). Human Vitamin and Mineral Requirements. In FAO/WHO (ed.). Training materials for agricultural planning. FAO Rome: FAO. pp. 1-286.
Fentahun M, Hager H (2009). Exploiting locally available resources for food and nutritional security enhancement: wild fruits diversity, potential and state of exploitation in the Amhara region of Ethiopia. Food Sec. 1(2):207-219.
Food and Drug Administration (2011). Guidance for Industry: A Food Labeling Guide. (14. Appendix F: Calculate the Percent Daily Value for the Appropriate Nutrients) Silver Spring, US: U.S. Food and Drug Administration. Available at: http://www.fda.gov/Food/GuidanceComplianceRegulatoryInformation/GuidanceDocuments/FoodLabelingNutrition/FoodLabelingGuide/ucm064928.htm (accessed on 05/23/2011).
Ganjare AB, Nirmal SA, Rub RA, Patil AN, Pattan SR (2011). Use of Cordia dichotoma bark in the treatment of ulcerative colitis. Pharm. Biol. 49(8):850-855.
Gebrehiwot K, Headquarters NK (2004). Dryland agro-forestry strategy for Ethiopia. Mekelle, Tigray, Ethiopia. pp. 1-20.
Gull J, Sultana B, Anwar F, Naseer R, Ashraf M, Ashrafuzzaman M (2012). Variation in antioxidant attributes at three ripening stages of guava (Psidium guajava L.) Fruit from different geographical regions of Pakistan. Molecules 17(3):3165-3180.
Hammer Ø, Harper DAT, Ryan PD (2001). PAST: Paleontological statistics software package for education and data analysis. Palaeontol. Electronica. 4(1):1-9.
Hård A, Sivik L (1981). NCS-Natural Color System: A Swedish Standard for Coloer Notation. Color. Res. Appl. 6(3):129-138.
Havlin JL, Tisdale SL, Nelson WL, Beaton JD (2009). Soil fertility and fertilizers: an introduction to nutrient management. New Delhi: PHI Learning. 528 p.
Hernández Y, Lobo MG, González M (2006). Determination of vitamin C in tropical fruits: A comparative evaluation of methods. Food Chem. 96(4):654-664.
Hervert-Hernández D, García OP, Rosado JL, Goñi I (2011). The contribution of fruits and vegetables to dietary intake of polyphenols and antioxidant capacity in a Mexican rural diet: Importance of fruit and vegetable variety. Food Res. Int. 44 (5):1182-1189.
Horwitz W, Latimer GW (2005). Official methods of analysis of AOAC International. Gaithersburg, Md.: AOAC International. No 37.1.18, method 940.26.
Howard LR, Clark JR, Brownmiller C (2003). Antioxidant capacity and phenolic content in blueberries as affected by genotype and growing season. J Sci. Food Agric. 83(12):1238-1247.
Hurni H (1986). Guidelines for development agents on soil conservation in Ethiopia. [Addis Ababa], Ethiopia: Ministry of Agriculture, Natural Resources Conservation and Development Main Dept., Community Forests and Soil Conservation Development Dept. Ethiopia. 100 p.
ICRAF (2008). Cordia africana. A tree species reference and selection guide World Agroforesrty Centre database. Nairobi: ICRAF. Available at: http://www.worldagroforestry.org/treedb2/AFTPDFS/Cordia_africana.pdf (accessed: 4/10//2008).
Iqbal S, Bhanger MI (2006). Effect of season and production location on antioxidant activity of Moringa oleifera leaves grown in Pakistan. J. Food Compost. Anal. 19(6-7):544-551.
Kotíková Z, Lachman J, Hejtmánková A, Hejtmánková K (2011). Determination of antioxidant activity and antioxidant content in tomato varieties and evaluation of mutual interactions between antioxidants. LWT - Food Sci. Technol. 44 (8):1703-1710.

224 Afr. J. Biochem. Res.
Lucas RE, Scarseth GD, Sieling DH (1942:468). Soil fertility level as it influences plant nutrient composition and consumption. Lafayette, Ind.: Purdue University Agricultural Experiment Station. p. 43.
Loha A, Tigabu M, Fries A (2009). Genetic variation among and within populations of Cordia africana in seed size and germination responses to constant temperatures. Euphytica 165(1):189-196.
Loha A, Tigabu M, Teketay D, Lundkvist K, Fries A (2006). Provenance Variation in seed morphometric traits, germination, and seedling growth of Cordia africana Lam. New For. 32(1):71-86.
Ind.: Purdue University Agricultural Experiment Station. 43 p. Makari HK, Haraprasad N, Ravikumar PH (2008). In vitro antioxidant
activity of the hexane and methanolic extracts of Cordia wallichii and Celastrus paniculata. Internet J. Aesthet. Anti-aging Med. 1(1).
Mengistu T, Teketay D, Hulten H, Yemshaw Y (2005). The role of enclosures in the recovery of woody vegetation in degraded dryland hillsides of central and Northern Ethiopia. J. Arid Environ. 60(2):259-281.
Michielin EMZ, de Lemos Wiese LP, Ferreira EA, Pedrosa RC, Ferreira
SRS (2011). Radical-scavenging activity of extracts from Cordia verbenacea DC obtained by different methods. J Supercrit. Fluids 56(1):89-96.
Murray SS, Schoeninger MJ, Bunn HT, Pickering TR, Marlett JA (2001).
Nutritional composition of some wild plant foods and honey used by
Hadza foragers of Tanzania. J. Food Compost. Anal. 14 (1):3-13. Oh MM, Trick HN, Rajashekar CB (2009). Secondary metabolism and
antioxidants are involved in environmental adaptation and stress tolerance in lettuce. J. Plant Physiol. 166(2):180-191.
Osorio D, Vorobyev M (1996). Colour vision as an adaptation to
frugivory in primates. Proceedings of the Royal Society of London.
Series B: Biol. Sci. 263(1370):593-599. Özkan M, Kirca A, Cemeroğlu B (2003). Effect of moisture content on
CIE color values in dried apricots. Eur. Food Res. Technol. 216(3):217-219.
Packer L, Rösen P, Tritschler HJ, King GL, Azzi A (2000). Antioxidants
in diabetes managment. New York: Marcel Dekker Inc. 376 p. Planchon V, Lateur M, Dupont P, Lognay G (2004). Ascorbic acid level
of Belgian apple genetic resources. Sci. Hortic. 100(1-4):1-61. Sen CK, Packer L, Hänninen O (2000). Handbook of Oxidants and Anti-
oxidants in Exercise. Amsterdam: Elsevier. 1220 p. Silva EM, Souza JNS, Rogez H, Rees JF, Larondelle Y (2007).
Antioxidant activities and polyphenolic contents of fifteen selected plant species from the Amazonian region. Food Chem.101(3):1012-1018.
Souri E, Amin G, Farsam H, Barazandeh Tehrani M (2008). Screening of antioxidant activity and phenolic content of 24 medicinal plant extracts. DARU J. Pharm. Sci. 16(2):83-87.
Tardif JC, Bourassa MG. (2006). Antioxidants and Cardiovascular Disease. Second edition ed. New York: Springer. p. 494.
Tewolde-Berhan S, Mitlöhner R, Muys B, Haile M (2000). Comparison of Flora development of area enclosures and ‘undisturbed’forest in Tigray, Ethiopia. Deutscher Tropentag 2002: Challenges to Organic Farming and Sustainable Land Use in the Tropics and Subtropics, October 9 - 11, 2002, University of Kassel, Witzenhausen: 8 p.
Tomás-Barberán FA, Espín JC (2001). Phenolic compounds and related enzymes as determinants of quality in fruits and vegetables. J. Sci. Food Agric. 81(9):853-876.
Vendramini AL, Trugo LC (2000). Chemical composition of acerola fruit (Malpighia punicifolia L.) at three stages of maturity. Food Chem. 71(2):195-198.
Volden J, Borge GIA, Bengtsson GB, Hansen M, Thygesen IE, Wicklund T (2008). Effect of thermal treatment on glucosinolates and antioxidant-related parameters in red cabbage (Brassica oleracea L. ssp. capitata f. rubra). Food Chem. 109(3):595-605.
Wall MM (2006). Ascorbic acid, vitamin A, and mineral composition of banana (Musa sp.) and papaya (Carica papaya) cultivars grown in Hawaii. J. Food Compost. Anal. 19(5):434-445.
Wang SY (2006). Effect of pre-harvest conditions on antioxidant capacity in fruits. Acta Hort. (ISHS) 712:299-306.
Wang SY, Zheng W (2001). Effect of plant growth temperature on antioxidant capacity in strawberry. J. Agric. Food Chem. 49 (10):4977-4982.
Wicklund T, Rosenfeld HJ, Martinsen BK, Sundfør MW, Lea P, Bruun T, Blomhoff R, Haffner K (2005). Antioxidant capacity and colour of strawberry jam as influenced by cultivar and storage conditions. LWT - Food Sci. Technol. 38(4):387-391.
Yami M, Gebrehiwot K, Moe S, Mekuria W (2006). Impact of area enclosures on density, diversity and population structure of woody species: the case of May Ba’ati-Douga Tembien, Tigray, Ethiopia. Ethiop. J. Nat. Resour. 8(1):99-121.
Yuri JA, Neira A, Quilodran A, Motomura Y, Palomo I (2009). Antioxidant activity and total phenolics concentration in apple peel and flesh is determined by cultivar and agroclimatic growing regions in Chile. International J. Food Agric. Environ. 7(3-4):513-517.
Zargar M, Azizah AH, Roheeyati AM, Fatimah B, Jahanshiri F, Pak-Dek MS (2011). Bioactive compounds and antioxidant activity of different extracts from Vitex negundo leaf. J. Med. Plants Res. 5(12):2525-2532.
Copyright © 2022 FDOKUMEN