Effect of fungal colonization on mechanical performance of cork
Upload
independentCategory
view
7download
0
The environmental behaviour of polychlorinated phenols and its relevance
to cork forest ecosystems: a review
Iain McLellan,a Mariana Carvalho,b Cristina Silva Pereira,b Andrew Hursthouse,*a
Calum Morrison,aPaul Tatner,
aIsabel Martins,
bM. Vitoria San Romao
cand
Maria Leitaob
Received 30th January 2007, Accepted 8th June 2007
First published as an Advance Article on the web 6th July 2007
DOI: 10.1039/b701436h
Pentachlorophenol (PCP) has been used as a herbicide, biocide and preservative worldwide since
the 1930s and as a result, extensive and prolonged contamination exists. The environmental
impact increases when its many degradation products are taken into consideration. A number of
chloroanisols and their related chlorophenols have been found in cork slabs collected from
Portuguese oak tree forests before stopper manufacturing, and contamination by PCP and
polychlorinated anisole (PCA) has been detected in Canadian forests. It is suggested that the use
of polychlorinated phenols, in particular PCP, is thought to be a cause of the cork taint problem
in wine, a major socio-economic impact not only for industry but on sensitive and highly
biodiverse ecosystems. It also highlights particular issues relating to the regional regulation of
potentially toxic chemicals and global economics world wide. To fully understand the impact of
contamination sources, the mechanisms responsible for the fate and transport of PCP and its
degradation products and assessment of their environmental behaviour is required. This review
looks at the current state of knowledge of soil sorption, fate and bioavailability and identifies the
challenges of degradation product identification and the contradictory evidence from field and
laboratory observations. The need for a systematic evaluation of PCP contamination in relation
to cork forest ecosystems and transfer of PCP between trophic levels is emphasised by
discrepancies in bioaccumulation and toxicity. This is essential to enable long term management
of not only transboundary contaminants, but also the sustainable management of socially and
economically important forest ecosystems.
Introduction
The unique physical properties attributed to cork have en-
couraged its use for sealing bottles, especially for high-quality
wines. The frequent occurrence of sensorial alterations in
spoiled wines identified as ‘‘cork taint’’ is still a major concern,
representing a significant source of economic losses world-
wide. This off-flavour, described as mouldy/musty, is com-
monly related to the chloroanisole family of compounds,
especially 2,4,6-trichloroanisole (TCA) and, to a lesser extent,
2,3,4,6-tetrachloroanisole (TeCA) and pentachloroanisole
(PCA). The mechanisms leading to the appearance of TCA
in wines are difficult to isolate mainly because there are several
potential dispersed sources of contamination, which could
include the transport and the conservation of either the corks
or the bottled wines. In either case, it can be assumed that the
direct precursors of chloroanisoles are chlorophenols, 2,4,6-
trichlorophenol (TCP), 2,3,4,6-tetrachlorophenol (TeCP) and
pentachlorophenol (PCP), which are converted into less toxic
compounds through O-methylation reactions mediated by
different microbial species. During the last decade the cork
industry introduced rigorous quality control in their processes,
and have replaced all manufacturing steps with a high risk of
contamination by cork taint with safer ones (e.g. selective
removal of defective cork slabs and removal of chlorination as
a water treatment process). Most chlorophenolic products
have been banned from use in cellars or during the manufac-
ture of cork stoppers.
The environmental impact increases when its many degra-
dation products are taken into consideration, with chloroani-
soles and related chlorophenols found in cork slabs collected
from Portuguese oak tree forests before stopper manufacture,
and contamination by PCP and PCA detected in Canadian
forests.
The cork oak (Quercus suber) forest, therefore, may repre-
sent a critical scenario for PCP contamination of the food
chain. Cork slabs contaminated with polychlorinated phenols,
either by direct use or from transboundary contamination
where PCP use is still authorised as a pesticide, are likely to be
a major cause of the cork taint problem in wine. The focus of
this review is to establish the environmental context for forest
contamination and the state of knowledge of the role of major
environmental variables.
a School of Engineering and Science, University of Paisley, Paisley,UK, PA1 2BE. E-mail: [email protected]; Fax:+44-141-848-3204; Tel: +44-141-848-3213
b IBET/ITQB–UNL, Instituto de Biologia Experimental eTecnologica/Instituto de Tecnologia Quımica eBiologica–Universidade Nova de Lisboa, Oeiras, Portugal.
c EVN, Estacao Vitivinıcola Nacional, Dois Portos, Portugal.
This journal is �c The Royal Society of Chemistry 2007 J. Environ. Monit., 2007, 9, 1055–1063 | 1055
CRITICAL REVIEW www.rsc.org/jem | Journal of Environmental Monitoring

PCP and its derivatives sodium pentachlorophenate
(NaPCP) and pentachlorophenyl laurate (PCPL) have been
used worldwide as herbicides, biocides, pesticides and wood
preservatives since the 1930s. This extensive use has resulted in
the contamination of soils, sediments and waters. Within the
European Union (EU), the Marketing and Use Directive (76/
769/EEC) and its Ninth Amendment (91/173/EEC) intro-
duced restrictions on PCP’s use and at present only profes-
sional and industrial use is permitted but under strict
conditions. Most EU countries have introduced legislation
which prohibits the use of PCP. Production of PCP has ceased
within the EU with the remaining countries who use PCP to
any great extent (France, Spain, Portugal and the United
Kingdom) relying on imports from the United States (US).1
Production in the US has decreased from 45 million lbs
(E20.4 million kg) in 1983 to approximately 11 million lbs
(E5 million kg).2,3 Emissions within the UK fell from 538
tonnes to 437 tonnes between 1990 and 2002.4
Cork stoppers are produced from the bark of the cork oak
Quercus suber, an evergreen oak tree found in Portugal, Spain,
France, and Italy, with smaller forests in Tunisia, Morocco
and Algeria. Spain and Portugal are the world’s largest cork
producers.5 Cork is a lightweight material with good thermal
insulating properties and is also elastic, compressible and
impermeable to gases or liquids6,7 making it the most suitable
material for the manufacture of products which rely on its
high compressibility, such as wine stoppers.8 Although cork is
the primary resource of Quercus suber forests, they are also
used for grazing animals, crop growing and honey production,
with estimates that close to 10% of the Tunisian population
rely on the cork oak forests for subsistence. Cork forests
ecosystems have also been identified as areas rich in biodiver-
sity9,10 and are home to the Iberian Lynx (Lynx paradinus) and
the Iberian Eagle (Aquila adalberti) two of Europe’s most
endangered species.
The cork taint phenomena is an earthy, mouldy flavour/
aroma that affects 1–5% of bottled wine,11 with economic
losses estimated to be in the order of US $10 billion annually
and is predominately associated with chloroanisoles.12,13
Chloroanisoles are produced within cork via fungal methyla-
tion of the corresponding chlorophenol. 2,4,6-Trichlorophe-
nol, a PCP transformation product, has been found in trace
quantities within wine.14 It is known that the long lifespan of
Quercus suber, 160–200 years, allows for the accumulation of
polycyclic aromatic hydrocarbons, organochlorine pesticides
and other persistent organic pollutants within the bark due to
the contaminant’s high lipophilicity.15 An examination of used
and unused cork stoppers indicated substantial differences in
relative abundance of several classes of organochlorine pesti-
cides, which are probably due to differences in the pesticide
usage practices of the various regions in which the oak trees
were grown.15 In other work it was indicated that globally the
average amounts of organochlorine pesticides detected in cork
were consistent with values found in foods, which suggests
that cork is produced to a suitable hygienic quality.5 Both
studies strongly suggest that cork contamination with organo-
chlorine pesticides happens in an early stage of cork stopper
production. Apparently the presence of PCP in the forest is a
possible explanation of chloroanisole appearance in bottled
wine.13 PCP is often, if not always, associated with cork taint,
but PCP contamination of cork may be related to indirect
sources of contamination, for example PCP dispersed from
nearby located agro-activities or industrial units.
Previous reviews have focused on the transformation of
PCP within the environment16,17 and many studies have
shown that a majority of ecosystems are contaminated by
PCP, however no research has been carried out in cork forests.
This problem is particularly relevant to north Africa because
other organochlorine contaminants have already been found
in this region.18–20 Bioavailability, bioaccumulation and toxi-
city studies have focused on single species, e.g. earthworms,21
but as yet there does not appear to be any significant inves-
tigation of PCP bioaccumulation and transfer between various
trophic levels.
Degradation products
PCP can degrade into as many as 30 different products
depending on the experimental and environmental conditions.
The main degradation products are tetrachloro-, trichloro-,
and dichlorophenols (TeCP, TCP, DCP),22 tetrachlorocate-
chols (TeCC), tetrachloro-, trichloro-, and dichlorohydroqui-
nones (TeCHQ, TCHQ, DCHQ),23 pentachloroanisole
(PCA)22 and hexachlorobenzene (HCB);24 polychlorinated
diphenylethers and polychlorinated dibenzo-p-dioxins are
minor products.25 Degradation of PCP follows first order
kinetics with rate constants of 0.16 min�1 (at pH 3) and 0.26
min�1 (pH 9) in water26 and 1.3–14.4 min�1 (pH 3.9–7.2) in
soils.22 The rate of degradation decreases with decreasing
chlorination; the half-lives (t12) of PCP, 2,4,6-TCP, 2,4-DCP
and 4-MCP in water treated with UV irradiation are 132 min,
198 min, 342 min and 3240 min, respectively,27 possibly as a
result of the structural properties of chlorophenols.28 In river,
ground and estuarine water samples the t12of PCP was found
to be 100 min (ground and estuarine water, pH 7.4 and 8.1,
respectively) and 115 min in river water (pH 7.8).28 This would
suggest that the presence of particulate matter in environmen-
tal samples, or the type/intensity of irradiation affects degra-
dation rates.
Although the lower chlorinated phenols will always be
produced through reductive dechlorination (PCP - TeCP
- TCP-DCP), there is confusion as to the products formed
and in the order they are formed. The C–Cl bond energies
have been calculated as 88.8 kcal mol�1 for ortho-positions,
87.7 kcal mol�1 for meta-positions and 87.1 kcal mol�1 for the
para-position, suggesting that the para-chlorine is the easiest
to dissociate;29 this study did not detect chlorophenols that
had been dechlorinated in the ortho-position. However, this is
contradicted by other studies that detected 2,3,4,5-TeCP (de-
chlorinated in the ortho-position).22,25 These studies investi-
gated PCP in water using mercury lamps as UV sources,
however the time samples were exposed to irradiation was
different; it is possible that differences in results were caused by
this. Reductive dechlorination from PCP occurs in soils under
anaerobic conditions with transformation rates highly corre-
lated to soil carbon, nitrogen and phosphorous content.22
Whilst most of the soils studied in this study produced
products dechlorinated in the ortho-and para-positions, one
1056 | J. Environ. Monit., 2007, 9, 1055–1063 This journal is �c The Royal Society of Chemistry 2007
soil (which had the lowest total C content and highest pH) also
produced chlorophenols dechlorinated in the meta-position,
e.g. PCP - 2,3,4,6-TeCP - 2,3,6-TCP.
Chlorocatechols and chlorohydroquinones are photo-oxi-
dation products formed via dechlorination and the addition of
OH radicals. TeCC is formed via the dechlorination and
addition of OH to the ortho-positions; TeCHQ is formed by
dechlorination and addition at the para-position. TeCC is
formed more quickly than TeCHQ suggesting that the ortho-
chlorines are the easiest to dissociate, again contradictory to
the calculated bond energies. These reactions are also pH
dependent; at pH 4 similar quantities of TeCC and TeCHQ
are produced, however at pH 7 levels of TeCC are greater than
TeCHQ26. HCB has been detected as a degradation product
of PCP in water25 and in an organic solvent;24 although OH
bonds are fragile, C–Cl bonds are more easily dissociated. The
pathway is thought to be the dechlorination of PCP to TeCP,
the free Cl atom then attaches to a PCP molecule which has
lost its OH group.24 It is possible that high levels of HCB
(481 000 ppb) and low levels of PCP (135 ppb) are due to the
fast degradation of PCP.30
It is clear that under carefully controlled laboratory condi-
tions PCP is easily degraded and removed from samples,
however its persistence in the environment would suggest that
sorption to soils, sediments and dissolved and particulate
organic matter in waters decreases degradation rates. The
apparent lack of agreement in the literature as to the products
that are formed, and how they are formed, highlights the
difficulty in analysing chlorophenols in environmental
samples.
Soil and sediments
The manufacture and use of chlorophenolic compounds has
resulted in the contamination of soils31 and sediments32 with
PCP and lower-chlorinated phenols. The sorption of organic
contaminants to soils and sediments can be related to the
interaction between the contaminants and soil constituents,33
such as substrate pH, organic matter content and clay content.
Although sorption of chlorophenols is continuous, there is
some confusion as to whether it is adsorbed in a smooth
fashion34 or is truly biphasic i.e. an initial rapid sorption phase
followed by a more prolonged slower phase.35 However, both
studies agree that the majority of PCP is adsorbed rapidly,
possibly as a result of (i) PCP entering macro-and mesopores
within soils before entering the micropores, which are more
difficult to enter or (ii) less available sites being available.35
The mobility and fate of PCP can be predicted if both
sorption and desorption characteristics are known; these can
be described by different isotherms. A number of models have
been used, such as the Radke–Prausnitz model,36 and the
triple-layer model,37 however the most commonly used are
the Langmuir model and the Freundlich model.38,39 Using
isotherm results obtained in the laboratory to help our under-
standing of field soil sorption characteristics should be done
with caution as (i) results are only valid under the same
conditions as the original experiment,37 (ii) the field sites
may be geochemically too complex to achieve correct sorption
values using these relatively simple models38 and (iii) the
Langmuir model has been found to underestimate the amount
of PCP adsorbed at concentrations greater than 100 ppm,
whilst the Freundlich model overestimated the amount ad-
sorbed at the same concentration.36
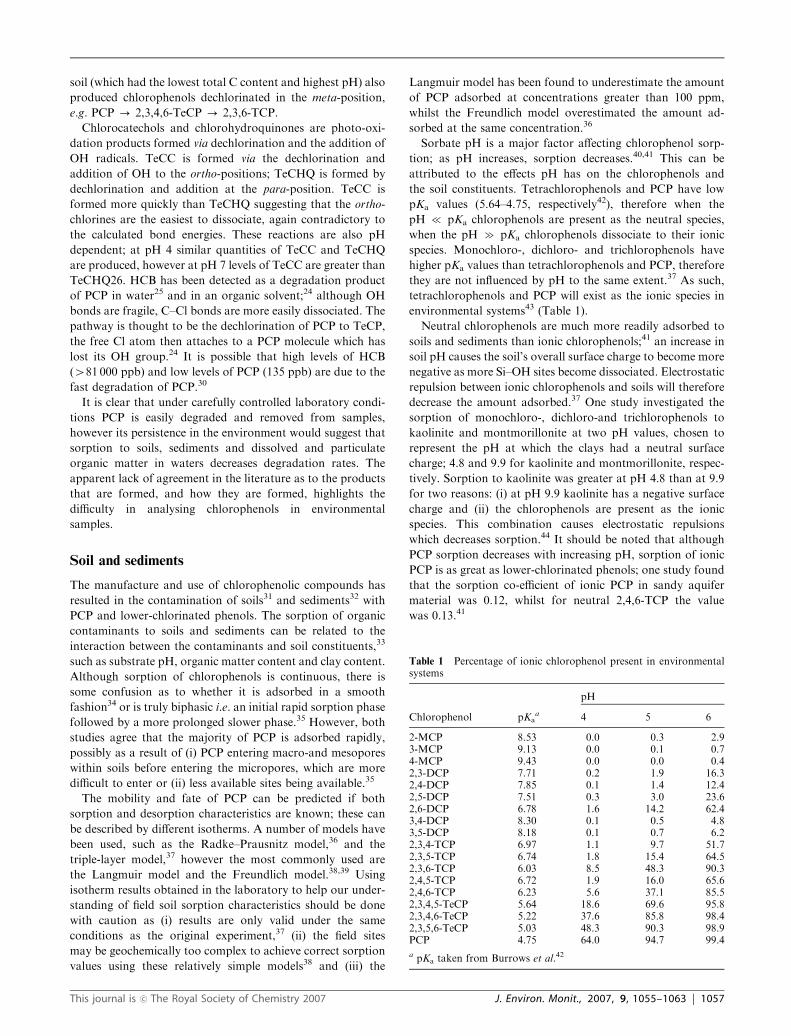
Sorbate pH is a major factor affecting chlorophenol sorp-
tion; as pH increases, sorption decreases.40,41 This can be
attributed to the effects pH has on the chlorophenols and
the soil constituents. Tetrachlorophenols and PCP have low
pKa values (5.64–4.75, respectively42), therefore when the
pH { pKa chlorophenols are present as the neutral species,
when the pH c pKa chlorophenols dissociate to their ionic
species. Monochloro-, dichloro- and trichlorophenols have
higher pKa values than tetrachlorophenols and PCP, therefore
they are not influenced by pH to the same extent.37 As such,
tetrachlorophenols and PCP will exist as the ionic species in
environmental systems43 (Table 1).
Neutral chlorophenols are much more readily adsorbed to
soils and sediments than ionic chlorophenols;41 an increase in
soil pH causes the soil’s overall surface charge to become more
negative as more Si–OH sites become dissociated. Electrostatic
repulsion between ionic chlorophenols and soils will therefore
decrease the amount adsorbed.37 One study investigated the
sorption of monochloro-, dichloro-and trichlorophenols to
kaolinite and montmorillonite at two pH values, chosen to
represent the pH at which the clays had a neutral surface
charge; 4.8 and 9.9 for kaolinite and montmorillonite, respec-
tively. Sorption to kaolinite was greater at pH 4.8 than at 9.9
for two reasons: (i) at pH 9.9 kaolinite has a negative surface
charge and (ii) the chlorophenols are present as the ionic
species. This combination causes electrostatic repulsions
which decreases sorption.44 It should be noted that although
PCP sorption decreases with increasing pH, sorption of ionic
PCP is as great as lower-chlorinated phenols; one study found
that the sorption co-efficient of ionic PCP in sandy aquifer
material was 0.12, whilst for neutral 2,4,6-TCP the value
was 0.13.41
Table 1 Percentage of ionic chlorophenol present in environmentalsystems
pH
Chlorophenol pKaa 4 5 6
2-MCP 8.53 0.0 0.3 2.93-MCP 9.13 0.0 0.1 0.74-MCP 9.43 0.0 0.0 0.42,3-DCP 7.71 0.2 1.9 16.32,4-DCP 7.85 0.1 1.4 12.42,5-DCP 7.51 0.3 3.0 23.62,6-DCP 6.78 1.6 14.2 62.43,4-DCP 8.30 0.1 0.5 4.83,5-DCP 8.18 0.1 0.7 6.22,3,4-TCP 6.97 1.1 9.7 51.72,3,5-TCP 6.74 1.8 15.4 64.52,3,6-TCP 6.03 8.5 48.3 90.32,4,5-TCP 6.72 1.9 16.0 65.62,4,6-TCP 6.23 5.6 37.1 85.52,3,4,5-TeCP 5.64 18.6 69.6 95.82,3,4,6-TeCP 5.22 37.6 85.8 98.42,3,5,6-TeCP 5.03 48.3 90.3 98.9PCP 4.75 64.0 94.7 99.4
a pKa taken from Burrows et al.42
This journal is �c The Royal Society of Chemistry 2007 J. Environ. Monit., 2007, 9, 1055–1063 | 1057

Sheet silicates have been found to be more important
sorbents for polar organic herbicides than soil organic matter;
soils with a high clay content and a low organic carbon
content have greater sorption capacities than soils with low
clay content and low organic content.45 Depending on the
‘sheet’ configuration, clays can be classified as 1 : 1 or 2 : 1
clays; 1 : 1 clays, such as kaolinite, are the simplest and consist
of one alumina and one silica sheet. 2 : 1 clays, such as
bentonite and montmorillonite, have a sheet silicate sand-
wiched between two alumina sheets—this configuration allows
the clays to expand in the presence of polar organic molecules
and water.46 Sorption to kaolinite is therefore lower than to
bentonite, with Kf (Freundlich co-efficient) values of 23.68 and
73.22, respectively, due to the increase in surface area as
bentonite expands.47
Sorption to 2 : 1 clays is dependent on the cation present
within the interlayer spacing—Ca2+ containing montmorillo-
nite (Ca-montmorillonite) is known to adsorb less PCP than
K-montmorillonite; Kf values of 34.19 (at pH 8.37) and 193.69
(pH 8.35), respectively.48 As the pH values in this study are
similar the effects of pH can be excluded, however the ex-
planation for why this might be the case remains unclear;
organic contaminants are known to form intercalates in the
interlayer spacing,49 however the formation of chlorophenol-
intercalates in montmorillonite clays has not been detected.
Chlorophenols have a calculated diameter of 8–10 A50 and
montmorillonite clays have an interlayer spacing of 9.6–15.5
A,46 it would therefore seem probable that chlorophenol-
intercalates would form. However, X-ray diffraction (XRD)
analysis of Ca-montmorillonite (with or without the presence
of PCP) found that there was little difference in the interlayer
spacing; suggesting that intercalates do not form, perhaps as a
result of competition with water molecules for available sites.51
K-montmorillonite has an interlayer spacing of approximately
12 A (smaller than Ca-montmorillonite) which is optimal for
the sorption of organic pollutants, as competition with water
molecules is avoided.48,52 Clearly, as no chlorophenol-inter-
calates have been found in montmorillonite clays when other
organic pollutants have, it suggests some other process is
involved and further investigation is required. Model clays
were used to detail sorption characteristics in the literature,
however environmental samples are known to adsorb signifi-
cantly greater amounts of chlorophenols as clays in soils are
weathered, and therefore have a greater sorption capacity47
and may also be associated with other soil constituents.45
The effect of organic matter on sorption of chlorophenols is
unclear; organic matter has been found to (i) not affect the
sorption of chlorophenols,53 (ii) decrease the amount bound to
substrate,54 or (iii) aid the sorption of chlorophenols.40 When
organic matter content was varied, 2.4–11.9 mg l�1, at a
constant pH it was found that an increase in humic material
present did not cause a significant increase in the amount of
2,4,6-TCP and PCP adsorbed.53 Increasing the amount of
humic material has been found to decease the amount of
PCP bound to sediments and increased the amount of un-
bound PCP in water.54 An increase in the sorption of 2,4,6-
TCP, 2,3,4,6-TeCP and PCP has been reported as the organic
matter increased.40 The pH of the sorbents differed (4.8,53
6.554 and 5.7–8.340), therefore it is possible that pH affected
the results; however, the latter study found that for all pH
values sorption was greater in soils with high organic matter
content. Another study has found that sorption was greater in
sandy soils with high organic matter content and low pH than
in sandy soils with low organic matter and low pH;55 this
would suggest that organic matter is an important factor
affecting chlorophenol sorption regardless of pH.
The organic carbon (OC) content of sediments is known to
bind 1.5 times more PCP than dissolved humic matter.54 The
investigation of sediments has found that there is a correlation
between OC content and organic pollutants;20 it has also been
reported that soils which contain higher quantities of OC
adsorb greater amounts of organic contaminants than soils
with little or no OC.56 However, this may be too simplistic; a
recent study worked under the assumption that the organic
matter fraction of the soil is solely responsible for the sorption
of organic contaminants. This assumption had to be made to
determine the effects of OC on sorption but it should be
remembered that other studies have shown that other soil
constituents affect sorption; it has also been reported in the
literature that certain organic pollutants associate with miner-
alogy and not organic content.57
Chlorophenol sorption to soils is thought to be caused by a
combination of hydrophobic and electrostatic interactions,
although hydrophobic interactions are thought to be stronger
as sorption decreases with increasing pH and a corresponding
increase in the percentage of ionised species present.58 Recent
investigations of 3,4-DCP, 3,4,5-TCP, 2,3,4,5-TeCP and PCP
sorption to soils rich in organic matter (organic carbon con-
tent: 10.8–43.6%) found that the relationship between the
organic matter distribution co-efficient (KOC) and the octa-
nol–water partition co-efficient (KOW) suggests that hydro-
phobic bonding is the dominant sorption mechanism.
Likewise, by measuring chlorophenol sorption as a function
of temperature and calculating the free energy changes (DG1)for both neutral and ionised PCP, it was found that hydro-
phobic bonding is the dominant process for neutral PCP; a
more specific bonding process was found to exist for ionised
PCP,39 possibly via ligand exchange.37
How much contaminant desorbed from the sorbent is
determined by a number of factors (pH, clay type), however
it is largely determined by the quantity adsorbed in the first
place and the length of exposure time. Desorption can be
considered to be biphasic; an initial quick release of contami-
nants is followed by a slower phase.47 Desorption of contami-
nants from soils and sediments produces a variety of results,
ranging from complete desorption to complete irreversibility,
i.e. contaminants remain bound to the sorbent; complete
desorption occurs when the adsorption co-efficient is low.59
Increases in the length of time sorbents are exposed to con-
taminants increases the time it takes to achieve desorption. It
has been found that if sorption time increases from 2 to 21
days, the amount desorbed after 2 days decreases from 95% to
68% (for neutral PCP) and 85% to 49% (for ionised PCP); an
increase in the desorption time (to 8 days) increased the
desorption figure for neutral PCP to 94% whilst only 50%
of PCP was desorbed after this period.39 It can be seen that
although it is difficult for ionised chlorophenols to adsorb to
sorbents,41 they are also more resistant to desorption. Clay
1058 | J. Environ. Monit., 2007, 9, 1055–1063 This journal is �c The Royal Society of Chemistry 2007
type is also a factor controlling desorption; an investigation of
two artificial soils, one containing kaolinite and the other
containing bentonite, found that desorption was greater in
the kaolinite soil.47 Although pH, clay type, clay content and
organic matter content all affect chlorophenol sorption and
desorption, the interactions between these constituents are
often in conflict.
Aquatic environment
Aquatic environments are sensitive to chlorophenols and
although levels are decreasing primarily due to decreasing
use as new chemicals are introduced to replace them and
through the introduction of national legislation banning
PCP use,60 they are still being detected worldwide. 2-MCP,
2,4-DCP, 2,4,6-TCP and PCP have been detected in Portu-
guese61 and Japanese62 river waters and a Chinese study found
2,4-DCP, 2,6-DCP, 2,4,6-TCP, 2,3,4,6-TeCP and PCP at ppb
in tap water.63
Contamination of waters is caused by the use of chlorophe-
nolic wood preservatives, and the manufacture and agricultur-
al use of PCP, which subsequently degrades into various
products. A New Zealand study investigating organochlorine
contamination of river and lake water found that one river,
which received run-off from a sawmill that had used chloro-
phenol products over 3 decades, had PCP levels of 3.62 ppb.
Other rivers, which were remote from the contamination
source, contained levels of 0.01–0.02 ppb,64 which would
suggest atmospheric or possible ground water transport to
remote locations. Organochlorines found in the Arctic
environment come from distant global sources via long-range
atmospheric and oceanic transport from lower latitudes,65 e.g.
chlorophenols, produced by microbial degradation of PCP,
appear in sediments dated as 1940, shortly after the introduc-
tion of PCP. Some metabolic by-products of chlorophenols
are still being identified in sediment cores, suggesting that fresh
applications of legal and illegal chlorinated pesticides are
adding to Arctic contamination. In China, an investigation
of river and pond sediments found that PCP levels were higher
in pond sediments than river sediments (37.5 ppb and
5.45 ppb, respectively); this study also found that highly
industrialised areas had lower PCP values than less industria-
lised areas (2.20 ppb and 37.5 ppb, respectively) which would
suggest agricultural sources of contamination.66 Ponds are
closed systems and, unlike rivers, contaminants cannot be
removed easily, and therefore levels increase; PCP within river
waters has been found to be removed through outflow and
biodegradation.67
One method of determining if a contaminant poses a
risk to the environment is to calculate the ratio of the predicted
environmental concentration (PEC) to predicted no-effect
concentration (PNEC); if the value is 41 then a pollutant
can be considered to pose a risk. The PCP–PEC value for
marine and river water in the North Sea region has
been reported as 0.07 mg l�1 in the period 1983–1997. The
calculated PEC : PNEC ratio for waters and sediments in this
region were found to be o1,68 therefore no risk can be
considered. However, there are two locations where the
PEC : PNEC ratio of sediments was found to be 41—north-
ern France and the Netherlands. Industry in northern France
is reported to use approximately 10 times less NaPCP than
southern France, however the PEC : PNEC ratio for northern
France was 1.36, and for southern France it was 0.041.
The waters of northern France contain more particulate
matter than southern France and it is thought that reduced
rates of photodegradation in northern waters is responsible for
the high PEC : PNEC ratio.1 Although a national ban on the
use of PCP exists in the Netherlands the PEC : PNEC ratio of
sediments was larger than 1; this is thought to be partly due to
historic use (chlorophenols are lipophilic and are strongly
bound to sediments69) and partly due to rivers that travel
through countries where PCP is still in use and is subsequently
transported downstream, e.g. the River Meuse which
originates in France and reaches the North Sea in the
Netherlands.
Bioaccumulation and toxicity
Bioaccumulation and bioavailability are closely linked; bioa-
vailability can be defined as the portion of chemical that has
not been adsorbed to soil and is available for interactions with
soil biota.70 Soils and sediments with a high organic matter
content have lower bioavailable fractions than those with a
low organic matter content.69,71 Competitive sorption between
humic acids and chlorinated organic contaminants is sug-
gested to be able to increase the mobility and bioavailable
fraction of contaminants and may explain differences between
sorption and desorption isotherms.72 It is possible to correlate
sorption and desorption isotherms with the bioaccumulation
of various chlorophenols; the greatest bioaccumulation occur-
ring if there are differences between the sorption and deso-
rption isotherm.73 Neutral chlorophenols are bound to soils
more easily than ionised chlorophenols and are also more
mobile due to the ease of desorption, therefore bioaccumula-
tion increases at low pH values.74,75
Chlorophenols are bioaccumulative in humans, and aqua-
tic76 and terrestrial77 organisms. A 1998 environmental survey
in Germany found the mean PCP concentration in human
urine was 1.0 ppb, which was down from 2.7 ppb in 1992. 4-
MCP was found at the highest concentrations in all samples
(n = 692) with a mean concentration of 4.9 ppb, partly as a
result of it being a metabolite of chlorobenzene, which is used
as a herbicide.78 Analysis of sawmill workers in Taiwan found
urine levels of 0.08 ppb, 0.13 ppb, 1.56 ppb and 0.6 ppb for
PCP, 2,3,4-TCP, 2,4-DCP and 2-MCP, respectively.79 Breast
milk sampled from first time mothers in China contained an
average of 2.15 ppb66 PCP and levels of 1.27 ppb have been
detected in the urine samples of American pre-school chil-
dren.80 The use of PCP and chlorophenols has been prohibited
in Germany and Taiwan since 1989 and in China since 1987;
the detection of PCP and its transformation products many
years after this highlights their persistence in the environment.
Repeated human exposure via dermal exposure, inhalation
and ingestion, is known to cause headaches, drowsiness and
numbness of the limbs.81
Contaminants can be accumulated without being toxic;
toxicity of chlorophenols is dependent on the degree of
chlorination, position of the chlorine atoms, species and pH.
This journal is �c The Royal Society of Chemistry 2007 J. Environ. Monit., 2007, 9, 1055–1063 | 1059
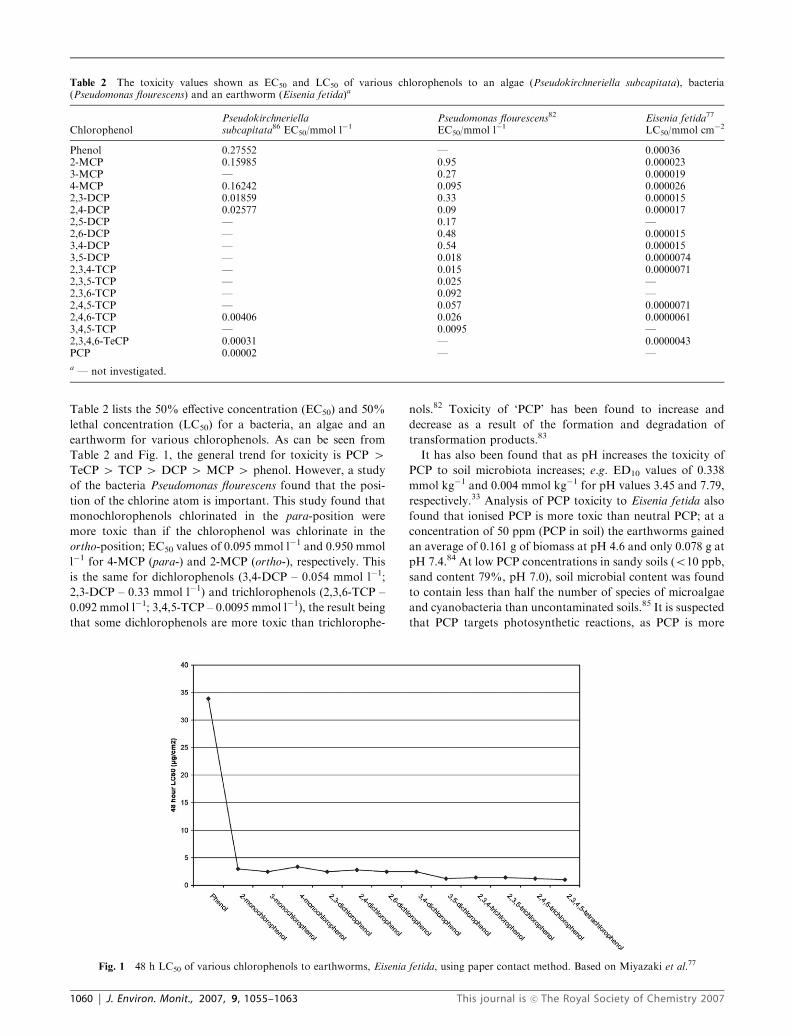
Table 2 lists the 50% effective concentration (EC50) and 50%
lethal concentration (LC50) for a bacteria, an algae and an
earthworm for various chlorophenols. As can be seen from
Table 2 and Fig. 1, the general trend for toxicity is PCP 4TeCP 4 TCP 4 DCP 4 MCP 4 phenol. However, a study
of the bacteria Pseudomonas flourescens found that the posi-
tion of the chlorine atom is important. This study found that
monochlorophenols chlorinated in the para-position were
more toxic than if the chlorophenol was chlorinate in the
ortho-position; EC50 values of 0.095 mmol l�1 and 0.950 mmol
l�1 for 4-MCP (para-) and 2-MCP (ortho-), respectively. This
is the same for dichlorophenols (3,4-DCP – 0.054 mmol l�1;
2,3-DCP – 0.33 mmol l�1) and trichlorophenols (2,3,6-TCP –
0.092 mmol l�1; 3,4,5-TCP – 0.0095 mmol l�1), the result being
that some dichlorophenols are more toxic than trichlorophe-
nols.82 Toxicity of ‘PCP’ has been found to increase and
decrease as a result of the formation and degradation of
transformation products.83
It has also been found that as pH increases the toxicity of
PCP to soil microbiota increases; e.g. ED10 values of 0.338
mmol kg�1 and 0.004 mmol kg�1 for pH values 3.45 and 7.79,
respectively.33 Analysis of PCP toxicity to Eisenia fetida also
found that ionised PCP is more toxic than neutral PCP; at a
concentration of 50 ppm (PCP in soil) the earthworms gained
an average of 0.161 g of biomass at pH 4.6 and only 0.078 g at
pH 7.4.84 At low PCP concentrations in sandy soils (o10 ppb,
sand content 79%, pH 7.0), soil microbial content was found
to contain less than half the number of species of microalgae
and cyanobacteria than uncontaminated soils.85 It is suspected
that PCP targets photosynthetic reactions, as PCP is more
Table 2 The toxicity values shown as EC50 and LC50 of various chlorophenols to an algae (Pseudokirchneriella subcapitata), bacteria(Pseudomonas flourescens) and an earthworm (Eisenia fetida)a
ChlorophenolPseudokirchneriellasubcapitata86 EC50/mmol l�1
Pseudomonas flourescens82
EC50/mmol l�1Eisenia fetida77
LC50/mmol cm�2
Phenol 0.27552 — 0.000362-MCP 0.15985 0.95 0.0000233-MCP — 0.27 0.0000194-MCP 0.16242 0.095 0.0000262,3-DCP 0.01859 0.33 0.0000152,4-DCP 0.02577 0.09 0.0000172,5-DCP — 0.17 —2,6-DCP — 0.48 0.0000153,4-DCP — 0.54 0.0000153,5-DCP — 0.018 0.00000742,3,4-TCP — 0.015 0.00000712,3,5-TCP — 0.025 —2,3,6-TCP — 0.092 —2,4,5-TCP — 0.057 0.00000712,4,6-TCP 0.00406 0.026 0.00000613,4,5-TCP — 0.0095 —2,3,4,6-TeCP 0.00031 — 0.0000043PCP 0.00002 — —
a — not investigated.
Fig. 1 48 h LC50 of various chlorophenols to earthworms, Eisenia fetida, using paper contact method. Based on Miyazaki et al.77
1060 | J. Environ. Monit., 2007, 9, 1055–1063 This journal is �c The Royal Society of Chemistry 2007

than three times toxic to dissolved oxygen production than to
microbial growth.86
Bioremediation
The degradation of PCP and the formation of less toxic
transformation products by filamentous fungi has been the
focus of bioremediation efforts. The ligninolytic enzymes of
white-rot fungi have broad substrate specificity and have been
implicated in the transformation and mineralization of orga-
nopollutants with structural similarities to lignin.87 White-rot
fungi occur naturally on wood88 and the most commonly
investigated species are Phanerochaete chrysosporium and
Trametes versicolor because they can degrade PCP, mainly
through reductive dechlorination reactions that presumably
lead to its complete mineralisation to CO2.89 PCP degradation
in some cases may result in the production of pentachloro-
anisole (PCA),88,90,91 which is seen as a detoxifying step, as
PCA is less toxic than PCP.92 PCP co-polymerization with
low-molecular weight aromatic compounds produced during
decay of lignin would reduce PCP bioavailability. This was
suggested after the observation of in vitro polymerization of
PCP to ferulic acid by enzymes produced by P. chryso-
sporium.90 PCP transformation in soils after inoculation with
P. chrysosporium has lead to a decrease of the PCP level, but
apparently not in the overall toxicity, suggesting that the
formation of toxic transformation products occur during
PCP bioremediation.83
PCP degradation is not an exclusive feature of white-rot
fungi, soft rot species are frequently found in organochlorine
pesticide contaminated soils93 and some species, for example
filamentous fungi ascomycetes isolated from cork slabs,94,95
have also shown the ability to degrade some chlorinated
phenols.13,96,97 Chrysonilia sitophila was observed to degrade
2,4,6-trichlorophenol and did not lead to significant produc-
tion of the corresponding anisole.96 This fungal species was
reported to express lignin peroxidase activity.98 The potential
of cork colonising species for PCP bioremediation is only now
being explored. The ability of these species to grow in a cork
based media, which is enriched in lignin and suberin phenolic-
polymers,99 may suggest active PCP bioremediation. Addi-
tionally, soft rot fungi ascomycetes ensure efficient degrada-
tion of lignin enriched composites in soil, where high moisture
and reduced oxygen conditions prohibit the activity of other
fungi.100 Some common ascomycetes genera e.g. Trichoderma,
Aspergillus and Penicillium, are capable of mineralizing syn-
thetic lignins to CO2; moreover, the transformation is not
limited to methoxyls, but also includes propanoid groups and
even aromatic rings.89
Conclusions
Current and historical use of PCP is an environmental con-
cern. Transportation of man-made chemicals, via air or water,
results in extensive contamination of all ecosystems. Through
direct use of chlorophenols as biocides, preservatives and
pesticides, in industry and agriculture has led to contamina-
tion of soils, sediments, waters and through wine production,
has resulted in exposure of higher levels of the food chain.
Despite the number of environmentally relevant studies of
PCP and its degradation products, there is a significant degree
of uncertainty in environmental behaviour, associated bio-
availability and accumulation. The complexity of degradation
pathways provides a challenge for chemical analysis and many
of the conclusions regarding fate/transport are obscured by
incomplete understanding of these pathways. The comparison
of laboratory and field behaviour produces often conflicting
conclusions regarding the role of organic matter and pH and
the influence of the properties of solids such as the clay
minerals. This has a knock on effect in describing the dynamics
of sorption–desorption to solid phases and their role in models
for dispersion prediction. Forests are commonly perceived as
non-polluted ecosystems and have been neglected in terms of
wider environmental management. However, whilst the trans-
fer of PCP related contamination has been indirectly identified
and external factors are a probable cause, the levels and
variation of PCP and its degradation products in cork forest
ecosystems have yet to be systematically investigated and it is
clear that without a detailed mechanistic understanding, the
variation in environmental variables will introduce an un-
acceptable uncertainty to our model of fate and risk. This is
especially true in northern African forests where other orga-
nochlorine contaminants have been identified and the import-
ing of cork from this source into the EU potentially short
circuits regulatory restrictions. In line with evolving regulatory
approaches globally to manage potential transboundary pol-
lution issues, this review highlights the need for a ‘multi-
purpose’ monitoring strategy, linking urban, rural and global
sites to systematically examine chlorophenol contamination
within cork forests and the transfer between trophic levels. A
case study which identifies a strong link between scientific
understanding and policy implementation.
Acknowledgements
The authors would like to thank the University of Paisley for
granting a PhD studentship to I.S.M. This research was
partly funded by NATO, Science for Peace, Project
ESP.MD.SFPP981674.
References
1 J. Muir and G. Eduljee, Sci. Total Environ., 1999, 236, 41–56.2 USEPA, Ground Water & Drinking Water: Pentachlorophenol, 28February 2006, retrieved 26 September 2006, from http://-www.epa.gov/safewater/dwh/c-soc/pentachl.html.
3 USEPA, Pesticides: Pentachlorophenol and its use as a woodpreservative, 2 May 2006, retrieved 26 September 2006, fromhttp://www.epa.gov/opp00001/factsheets/chemicals/pentachloro-phenol_main.htm.
4 C. J. Dore, J. W. L. Goodwin, J. D. Watterson, T. P. Murrells, N.R. Passant, M. M. Hobson, K. E. Haigh, S. L. Baggott, S. T. Pye,P. J. Coleman and K. R. King,UK emissions of air pollutants 1970to 2001, National Atmospheric Emissions Inventory, 2003.
5 V. Mazzoleni, L. Dallagiovanna, M. Trevisan and M. Nicelli,Chemosphere, 2005, 58, 1547–1552.
6 M. H. Lopes, A. S. Barros, C. Pascoal Neto, D. Rutledge, I.Delgadillo and A. M. Gil, Biopolymers, 2001, 62, 268–277.
7 J. F. Mano, J. Mater. Sci., 2002, 37, 257–263.8 M. E. Rosa, J. Osoria, V. Green and M. A. Fortes, Mater. Sci.Forum, 2004, 455–456, 235–238.
This journal is �c The Royal Society of Chemistry 2007 J. Environ. Monit., 2007, 9, 1055–1063 | 1061

9 WWF, Cork screwed? Environmental and economic impacts of thecork stoppers market, WWF Mediterranean Programme Office,2006, http://assets.panda.org/downloads/cork_rev12_print.pdf.
10 T. Maranon, R. Ajbilou, F. Ojeda and J. Arroyo, Forest Ecol.Manag., 1999, 115, 147–156.
11 A. Zalacain, G. L. Alonso, C. Lorenzo, M. Iniguez and M. R.Salinas, J. Chromatogr., A, 2004, 1033, 173–178.
12 A. Martınez-Urunuela, J. M. Gonzalez-Saiz and C. Pizarro, J.Chromatogr., A, 2005, 1089, 31–38.
13 C. Silva Pereira, J. J. Figueiredo Marques and M. V. San Romao,Crit. Rev. Microbiol., 2000, 26, 147–162.
14 G. J. Soleas, J. Yan, T. Seaver and D. M. Goldberg, J. Agric.Food Chem., 2002, 50, 1032–1039.
15 B. Strandberg and R. A. Hites, Chemosphere, 2001, 44, 729–735.16 M. Czaplicka, Sci. Total Environ., 2004, 322, 21–39.17 M. Czaplicka, J. Hazard. Mater., 2006, 134, 45–59.18 A. O. Barakat, M. Kim, Y. Qian and T. L. Wade, Mar. Pollut.
Bull., 2002, 44, 1421–1434.19 A. Derouiche, Y. G. Sanda and M. R. Driss, Bull. Environ.
Contam. Toxicol., 2004, 73, 810–817.20 B. Pavoni, D. Berto, M. Rigoni and M. Salizzato, Mar. Environ.
Res., 2000, 49, 177–196.21 D. G. Fitzgerald, R. P. Lanno, U. Klee, A. Farwell and D. G.
Dixon, Soil Biol. Biochem., 1997, 29, 685–688.22 E. M. D’Angelo and K. R. Reddy, Soil Sci. Soc. Am. J., 2000, 64,
933–943.23 Y. I. Skurlatov, L. S. Ernestova, E. V. Vichutinskaya, D. P.
Samsonov, I. V. Semenova, I. Y. Rod’ko, V. O. Shvidky, R. I.Pervinina and T. J. Kemp, J. Photochem. Photobiol., A, 1997, 107,207–213.
24 P. Piccinini, P. Pichat and C. Guillard, J. Photochem. Photobiol.,A, 1998, 119, 137–142.
25 J. Hong, D. G. Kim, C. Cheong, S. Y. Jung, M. R. Yoo, K. J.Kim, T. K. Kim and Y. C. Park, Anal. Sci., 2000, 16, 621–626.
26 J. F. Benitez, J. L. Acero, F. J. Real and J. Garcıa, Chemosphere,2003, 51, 651–662.
27 T. Essam, H. Zilouei, M. A. Amin, O. El Tayeb, B. Mattiassonand B. Guieysse, Chemosphere, 2006, 63, 277–284.
28 M. Castillo, R. Domingues, M. F. Alpendurada and D. Barcelo,Anal. Chim. Acta, 1997, 353, 133–142.
29 J. Suegara, B. D. Lee, M. P. Espino, S. Nakai and M. Hosomi,Chemosphere, 2005, 61, 341–346.
30 N. R. do Nascimento, S. M. C. Nicola, M. O. O. Rezende, T. A.Oliveira and G. Oberg, Geoderma, 2004, 121, 221–232.
31 M. R. Lee, Y. C. Yeh, W. S. Hsiang and B. H. Hwang, J.Chromatogr., A, 1998, 806, 317–324.
32 M. Lyytikainen, A. Sormunen, S. Peraniemi and J. V. K. Kuk-konen, Chemosphere, 2001, 44, 341–350.
33 G. Welp and G. W. Brummer, Ecotoxicol. Environ. Safe., 1999,43, 83–90.
34 J. P. DiVincenzo and D. L. Sparks, Environ. Sci. Technol., 1997,31, 977–983.
35 M. C. Diez, M. L. Mora and S. Videla, Water Res., 1999, 33,125–130.
36 A. H. Mollah and C. W. Robinson, Water Res., 1996, 30,2901–2906.
37 M. Cea, J. C. Seaman, A. A. Jara, M. L. Mora and M. C. Diez, J.Colloid Interface Sci., 2005, 292, 171–178.
38 A. Davis, J. Campbell, C. Gilbert, M. V. Ruby, M. Bennett and S.Tobin, Ground Water, 1994, 32, 248–257.
39 J. P. DiVincenzo and D. L. Sparks, Arch. Environ. Contam.Toxicol., 2001, 40, 445–480.
40 S. Fingler, V. Drevenkar and Z. Frobe, Arch. Environ. Contam.Toxicol., 2004, 48, 32–39.
41 F. Amiri, M. M. Rahman, H. Bornick and E. Worch, ActaHydrochim. Hydrobiol., 2004, 32, 214–224.
42 H. D. Burrows, L. S. Ernestova, T. J. Kemp, Y. I. Skurlatov, A.P. Purmal and A. N. Yermakov, Prog. React. Kinet., 1998, 23,145–207.
43 K. Schellenberg, C. Leuenberger and R. P. Schwarzenbach,Environ. Sci. Technol., 1984, 18, 652–657.
44 S. Polati, S. Angioi, V. Gianotti, F. Gosetti and M. C. Gennaro,J. Environ. Sci. Health, Part B, 2006, 41, 333–344.
45 L. Cox, M. C. Hermosın, R. Celis and J. Cornejo, Water Res.,1997, 31, 1309–1316.
46 R. E. Grim, Clay mineralogy, McGraw-Hill Book Company, Inc.,London, 1953.
47 X. Pu and T. J. Cutright, Chemosphere, 2006, 64, 972–983.48 Y. He, J. Xu, H. Wang, Q. Zhang and A. Muhammad, Chemo-
sphere, 2006, 65, 497–505.49 J. E. D. Davies and N. Jabeen, J. Inclusion Phenom. Macrocylic
Chem., 2002, 43, 329–336.50 M. W. Jung, K. H. Ahn, Y. Lee, K. P. Kim, J. S. Rhee, J. T. Park
and K. J. Paeng, Microchem. J., 2001, 70, 123–131.51 B. Xing, W. B. McGill and M. J. Dudas, Chemosphere, 1993, 26,
1311–1324.52 S. A. Boyd, G. Sheng, B. J. Teppen and C. T. Johnston, Environ.
Sci. Technol., 2001, 35, 4227–4234.53 F. Amiri, H. Bornick and E. Worch, Water Res., 2005, 39,
933–941.54 N. Paaso, J. Peuravuori, T. Lehtonen and K. Pihlaja, Environ.
Int., 2002, 28, 173–183.55 A. Boivin, R. Cherrier and M. Schiavon, Chemosphere, 2005, 61,
668–676.56 Z. Khan and Y. Anjaneyulu, Environ. Geol., 2005, 48, 1–5.57 P. J. Edgar, A. S. Hursthouse, J. E. Matthews, I. M. Davies and
S. Hillier, J. Environ. Monit., 2006, 8, 887–896.58 S.-C. Tam, S. A. Johnson and A. Graham, Water, Air, Soil
Pollut., 1999, 115, 337–346.59 C. Fall, J. Chaouki and C. Chavarie, Water Environ. Res., 2000,
72, 162–169.60 M. L. Davı and F. Gnudi, Water Res., 1999, 33, 3213–3219.61 D. de Almeida Azevedo, S. Lacorte, T. Vinhas, P. Viana and D.
Barcelo, J. Chromatogr., A, 2000, 879, 13–26.62 M. Kawaguchi, Y. Ishii, N. Sakui, N. Okanouchi, R. Ito, K. Saito
and H. Nakazawa, Anal. Chim. Acta, 2005, 533, 57–65.63 M. Jin, X. Chen and B. Pan, J. Liq. Chromatogr. Relat. Technol.,
2006, 29, 1369–1380.64 J. S. Gifford, S. J. Buckland, M. C. Judd, P. N. McFarlane and S.
M. Anderson, Chemosphere, 1996, 32, 2097–2113.65 Y. F. Li and R. W. Macdonald, Sci. Total Environ., 2005, 342,
87–106.66 H. C. Hong, H. Y. Zhou, T. G. Luan and C. Y. Lan, Environ. Int.,
2005, 31, 643–649.67 J. Chi and G. L. Huang, J. Environ. Sci. Health, Part A, 2002, 37,
113–125.68 Eurochlor, Euro Chlor Risk Assessment for the Marine Environ-
ment OSPARCOM Region – North Sea: Pentachlorophenol1999.
69 A. Nikkila, A. Halme and J. V. K. Kukkonen, Chemosphere,2003, 51, 35–46.
70 R. Lanno, J. Wells, J. Conder, K. Bradham and N. Basta,Ecotoxicol. Environ. Safe., 2004, 57, 39–47.
71 J. Salminen and J. Haimi, J. Appl. Ecol., 1997, 34, 101–110.72 B. Xing and J. J. Pignatello, Environ. Sci. Technol., 1998, 32,
614–619.73 M. A. M. Lawrence, N. A. Davies, P. A. Edwards, M. G. Taylor
and K. Simkiss, Chemosphere, 2000, 41, 1091–1100.74 C. A. M. van Gestel and W. C. Ma, Ecotoxicol. Environ. Safe.,
1988, 15, 289–297.75 X. Y. Hu, B. Wen, X. Q. Shan and S. Z. Zhang, J. Environ. Sci.
Health, Part A, 2005, 40, 1905–1916.76 K. A. Maenpaa, O. P. Penttinen and J. V. K. Kukkonen, Aquat.
Toxicol., 2004, 68, 75–85.77 A. Miyazaki, T. Amano, H. Saito and Y. Nakano, Chemosphere,
2002, 47, 65–69.78 K. Becker, C. Schulz, S. Kaus, M. Seiwert and B. Seifert, Int. J.
Hyg. Environ. Health, 2003, 206, 15–24.79 M. R. Lee, Y. C. Yeh, W. S. Hsiang and C. C. Chen, J.
Chromatogr., B: Biomed. Appl., 1998, 707, 91–97.80 N. K. Wilson, J. C. Chuang, M. K. Morgan, R. A. Lordo and L.
S. Sheldon, Environ. Res., 2007, 103, 9–20.81 R. J. Fielder, Toxicity review: Pentachlorophenol, HMSO, Lon-
don, 1982.82 E. M. Boyd, K. Killham and A. A. Meharg, Chemosphere, 2001,
43, 157–166.83 R. McGrath and I. Singleton, Soil Biol. Biochem., 2000, 32,
1311–1314.84 M. K. Banks and A. P. Schwab, J. Environ. Sci. Health, Part A,
2006, 41, 117–128.
1062 | J. Environ. Monit., 2007, 9, 1055–1063 This journal is �c The Royal Society of Chemistry 2007

85 M. Megharaj, I. Singleton and N. C. McClure, Bull. Environ.Contam. Toxicol., 1998, 61, 108–115.
86 C. Y. Chen and J. H. Lin, Chemosphere, 2006, 62, 503–509.87 S. B. Pointing, Appl. Microbiol. Biotechnol., 2001, 57, 20–33.88 M. Walter, L. Boul, R. Chong and C. Ford, J. Environ. Manage.,
2004, 71, 361–369.89 M. L. Rabinovich, A. V. Bolobova and L. G. Vasil’chenko, Appl.
Biochem. Microbiol., 2004, 40, 5–23.90 C. Ruttiman-Johnson and R. T. Lamar, Soil Biol. Biochem., 1997,
29, 1143–1148.91 R. T. Lamar and D. M. Dietrich, Appl. Environ. Microbiol., 1990,
56, 3093–3100.92 N. Chung and S. D. Aust, J. Hazard. Mater., 1995, 41,
177–183.93 O. Bordjiba, R. Steiman, M. Kadri, A. Semadi and P. Guiraud, J.
Environ. Qual., 2001, 30, 418–426.
94 P. Danesh, F. M. Valez Caldas, J. J. Figueiredo Marques and M.V. San Romao, J. Appl. Microbiol., 1997, 82, 689–694.
95 A. C. Oliveira, C. M. Peres, J. M. Correia Pires, C. Silva Pereira,S. Vitorino, J. J. Figueiredo Marques, M. T. Barreto Crespo andM. V. San Romao, Microbiol. Res., 2003, 158, 117–124.
96 C. Silva Pereira, A. Pires, M. J. Valle, L. Vilas Boas, J. J.Figueiredo Marques and M. V. San Romao, J. Ind. Microbiol.Biotechnol., 2000, 24, 256–261.
97 M. L. Alvarez-Rodrıguez, L. Lopez-Ocana, J. M. Lopez-Coro-nado, E. Rodrıguez, M. J. Martınez, G. Larriba and J. J. R.Coque, Appl. Environ. Microbiol., 2002, 68, 5860–5869.
98 J. Rodriguez, Appl. Biochem. Biotechnol., 1997, 62, 233–242.99 C. Silva Pereira, G. A. M. Soares, A. C. Oliveira, M. E. Rosa, H.
Pereira, N. Moreno and M. V. San Romao, Int. Biodeterior.Biodegrad., 2006, 57, 244–250.
100 Y. S. Kim and A. P. Singh, IAWAJ, 2000, 21, 135–155.
This journal is �c The Royal Society of Chemistry 2007 J. Environ. Monit., 2007, 9, 1055–1063 | 1063
Copyright © 2022 FDOKUMEN