Fenton-like oxidation of Orange II solutions using heterogeneous catalysts based on saponite clay
13
Fenton-like oxidation of Orange II solutions using heterogeneous catalysts based on saponite clay J. Herney Ramirez a , Carlos A. Costa a , Luis M. Madeira a, * , G. Mata b , Miguel A. Vicente b , M.L. Rojas-Cervantes c , A.J. Lo ´pez-Peinado c , R.M. Martı ´n-Aranda c a LEPAE, Departamento de Engenharia Quı ´mica, Faculdade de Engenharia da Universidade do Porto, Rua Dr. Roberto Frias, 4200-465 Porto, Portugal b Departamento de Quı ´mica Inorga ´nica, Universidad de Salamanca, Plaza de la Merced, S/N E-37008 Salamanca, Spain c Departamento de Quı ´mica Inorga ´nica y Quı ´mica Te ´cnica, Facultad de Ciencias, UNED, Paseo Senda del Rey 9, E-28040 Madrid, Spain Received 29 May 2006; received in revised form 31 July 2006; accepted 24 August 2006 Available online 25 September 2006 Abstract In this work, the degradation and mineralization of Orange II solutions (0.1 mM) using catalysts based on pillared saponite impregnated with several iron salts is reported. Oxidation is carried out in a batch reactor, in presence of various hydrogen peroxide concentrations, and in a wide range of temperature and pH values. Twelve samples are prepared, with three iron loads (7.5, 13.0 and 17.0 wt.%) and four iron salts as precursors, namely Fe(II) acetate, Fe(II) oxalate, Fe(II) acetylacetonate and Fe(III) acetylacetonate. The samples are characterized using X-ray diffraction, thermal analysis, infrared spectroscopy, energy dispersive spectroscopy and adsorption of nitrogen at 77 K. The catalytic results show that these solids present good properties for the degradation and mineralization of Orange II solutions, allowing to reach, in the best conditions and after 4 h of oxidation, 99% of dye degradation with 91% of total organic carbon (TOC) reduction (at 70 8C), using only ca. 90 mg of clay catalyst per litre of solution. Nevertheless, 96% of dye removal with 82% of mineralization are also reached at 30 8C. Besides, the amount of iron released into the final solution is lower than 1 ppm, in the worst of the cases, and 0.09 ppm in the best case. # 2006 Elsevier B.V. All rights reserved. Keywords: Orange II; Fenton’s reagent; Oxidation; Clay-Fe catalysts; Heterogeneous catalysis 1. Introduction Chemical process industries, such as oil refineries, petrochemical units, dye and dye intermediate manufacturing industries, textile units, among others, are typical industries that dump toxic organic compounds to the nearer water courses, thus making the water polluted [1]. To overcome this, the use of advanced oxidation processes (AOPs) has been widely proposed, as they operate at temperature near ambient and atmospheric pressure. These processes involve the generation of highly reactive radicals (specially hydroxyl radicals) in enough quantity to effect water purification [2], and their use is justified by the low organic content of the wastewaters to be treated, besides the low reaction temperatures, thus requiring the presence of very active oxidation agents. In particular, the oxidation using Fenton’s reagent (a powerful source of oxidative HO radicals generated from H 2 O 2 in the presence of added Fe 2+ ions [3]) has proved to be a promising and attractive treatment method for the effective destruction of a large number of hazardous and organic pollutants [4–8]. The generated HO radicals are highly oxidative, non-selective, and able to decompose many organic compounds, including dyes [9]. However, it should be pointed out that the homogeneous Fenton process has a significant disadvantage. Homogeneously catalyzed reactions need up to 50–80 ppm of Fe ions in solution, which is well above the European Union directives that allow only 2 ppm of Fe ions in treated water to dump directly into the environment [10]. In addition, the removal/ www.elsevier.com/locate/apcatb Applied Catalysis B: Environmental 71 (2007) 44–56 * Corresponding author. Tel.: +351 22 5081519; fax: +351 22 5081449. E-mail address: [email protected] (L.M. Madeira). 0926-3373/$ – see front matter # 2006 Elsevier B.V. All rights reserved. doi:10.1016/j.apcatb.2006.08.012
-
Upload
independent -
Category
Documents
-
view
4 -
download
0
Transcript of Fenton-like oxidation of Orange II solutions using heterogeneous catalysts based on saponite clay
www.elsevier.com/locate/apcatb
Applied Catalysis B: Environmental 71 (2007) 44–56
Fenton-like oxidation of Orange II solutions using heterogeneous
catalysts based on saponite clay
J. Herney Ramirez a, Carlos A. Costa a, Luis M. Madeira a,*,G. Mata b, Miguel A. Vicente b, M.L. Rojas-Cervantes c,
A.J. Lopez-Peinado c, R.M. Martın-Aranda c
a LEPAE, Departamento de Engenharia Quımica, Faculdade de Engenharia da
Universidade do Porto, Rua Dr. Roberto Frias, 4200-465 Porto, Portugalb Departamento de Quımica Inorganica, Universidad de Salamanca,
Plaza de la Merced, S/N E-37008 Salamanca, Spainc Departamento de Quımica Inorganica y Quımica Tecnica, Facultad de Ciencias,
UNED, Paseo Senda del Rey 9, E-28040 Madrid, Spain
Received 29 May 2006; received in revised form 31 July 2006; accepted 24 August 2006
Available online 25 September 2006
Abstract
In this work, the degradation and mineralization of Orange II solutions (0.1 mM) using catalysts based on pillared saponite impregnated with
several iron salts is reported. Oxidation is carried out in a batch reactor, in presence of various hydrogen peroxide concentrations, and in a wide
range of temperature and pH values. Twelve samples are prepared, with three iron loads (7.5, 13.0 and 17.0 wt.%) and four iron salts as precursors,
namely Fe(II) acetate, Fe(II) oxalate, Fe(II) acetylacetonate and Fe(III) acetylacetonate. The samples are characterized using X-ray diffraction,
thermal analysis, infrared spectroscopy, energy dispersive spectroscopy and adsorption of nitrogen at 77 K. The catalytic results show that these
solids present good properties for the degradation and mineralization of Orange II solutions, allowing to reach, in the best conditions and after 4 h
of oxidation, 99% of dye degradation with 91% of total organic carbon (TOC) reduction (at 70 8C), using only ca. 90 mg of clay catalyst per litre of
solution. Nevertheless, 96% of dye removal with 82% of mineralization are also reached at 30 8C. Besides, the amount of iron released into the final
solution is lower than 1 ppm, in the worst of the cases, and 0.09 ppm in the best case.
# 2006 Elsevier B.V. All rights reserved.
Keywords: Orange II; Fenton’s reagent; Oxidation; Clay-Fe catalysts; Heterogeneous catalysis
1. Introduction
Chemical process industries, such as oil refineries,
petrochemical units, dye and dye intermediate manufacturing
industries, textile units, among others, are typical industries that
dump toxic organic compounds to the nearer water courses,
thus making the water polluted [1]. To overcome this, the use of
advanced oxidation processes (AOPs) has been widely
proposed, as they operate at temperature near ambient and
atmospheric pressure. These processes involve the generation
of highly reactive radicals (specially hydroxyl radicals) in
enough quantity to effect water purification [2], and their use is
* Corresponding author. Tel.: +351 22 5081519; fax: +351 22 5081449.
E-mail address: [email protected] (L.M. Madeira).
0926-3373/$ – see front matter # 2006 Elsevier B.V. All rights reserved.
doi:10.1016/j.apcatb.2006.08.012
justified by the low organic content of the wastewaters to be
treated, besides the low reaction temperatures, thus requiring
the presence of very active oxidation agents. In particular, the
oxidation using Fenton’s reagent (a powerful source of
oxidative HO� radicals generated from H2O2 in the presence
of added Fe2+ ions [3]) has proved to be a promising and
attractive treatment method for the effective destruction of a
large number of hazardous and organic pollutants [4–8]. The
generated HO� radicals are highly oxidative, non-selective, and
able to decompose many organic compounds, including dyes
[9]. However, it should be pointed out that the homogeneous
Fenton process has a significant disadvantage. Homogeneously
catalyzed reactions need up to 50–80 ppm of Fe ions in
solution, which is well above the European Union directives
that allow only 2 ppm of Fe ions in treated water to dump
directly into the environment [10]. In addition, the removal/

J.H. Ramirez et al. / Applied Catalysis B: Environmental 71 (2007) 44–56 45
treatment of the sludge-containing Fe ions at the end of the
wastewater treatment is expensive and needs large amount of
chemicals and manpower.
To overcome the disadvantages of the homogeneous Fenton
process, and also considering the possibility of recovering the
catalyst, some attempts have been made to develop hetero-
geneous catalysts, prepared by incorporating Fe ions or Fe
oxides into porous supports [11–14]. Other transition metal
complexes supported on several surfaces such as metal oxides,
resins and mixed (Al-Cu) pillared clays have also been used as
potentially active catalysts for the decomposition of H2O2 and
for the oxidative degradation of organics [15]. Among the
porous solids used as supports for the iron phases, it is worth
mentioning the use of silica, alumina, silica-alumina and
cation-exchanged resins, which have been used in the
degradation and mineralization of dyes [11]. More complex
systems have been prepared by modifying a polyacrylonitrile
(PAN) fibre by treatment with a mixture of hydrazine and
hydroxylamine to introduce chelating functional groups onto
the fibre surface. These functional groups are used to coordinate
the transition metal cations Fe3+, Co2+, Ni2+ and Cu2+ to the
fibre to act as the active catalytic sites for decomposition of the
hydrogen peroxide [12]. Using an alternative strategy, other
catalytic systems have been prepared by co-intercalation of two
natural smectites (Wyoming SWy-1 and Tunisia-Gafsa VI) with
Fe-Al polycations, obtained by polymerisation of a mixture of
FeCl3 and chlorhydrol [13]. Tachiev et al. [14] have reported
other catalysts, in which Fe(II) and Fe(III) cations are
complexed by the ligands DTPA, EDTA, EGTA and NTA.
The use of zeolites [16] and carbons [17] to support iron
catalysts is also worth mentioning.
The mechanism of H2O2 decomposition on homogeneous
Fenton’s oxidation is not well established, where several
oxidising agents have been suggested to be involved in the
oxidation reactions, in addition to the HO� radicals. For the
heterogeneous systems this is still less clear, being a matter of
controversy. Some authors suggest an initial step of fast
adsorption of the H2O2 molecule on (BBFe(III)) sites [17] and
others the adsorption of the organics [18]. Nevertheless, the
involvement of the following steps has been suggested in most
of the works found in the literature, which correspond to Fe3+
reduction with generation of less oxidative HO2� radicals,
followed by Fe3+ regeneration with formation of the hydroxyl
radicals:
X� Fe3þ þ H2O2!X� Fe2þ þ HO2� þ Hþ (1)
X� Fe2þ þ H2O2!X� Fe3þ þ OH� þ HO� (2)
where X represents the surface of the catalyst. However, it must
be remarked that the radicals can also be generated in the
surface of the solid so they are actually ‘‘caged’’ in the solid
structure, subsequently reacting with the adsorbed reagent(s)
without radicals generation. Obviously, besides the indicated
steps many other radical reactions occur, including those
involving the reaction intermediates.
Among the above-mentioned catalyst supports, pillared
clays (PILCs in short) is one of the families of microporous
solids developed by Molecular Engineering that have been more
studied in recent years, because of their particular properties and
structures (with tunable pore size), as well as the abundance
and low cost of natural clay minerals. Besides, they lead to active
and stable solids in aqueous media, usually being very stable
against leaching [19]. The PILCs synthesis procedure can be
divided into three main steps: (i) preparation of polyoxocations
by careful hydrolysis of certain multivalent cations, which under
appropriate conditions give rise to cationic polymeric species,
(ii) ionic exchange of the original charge-compensating cations
of swellable smectite clays by the polyoxocations before
synthesized, this exchange giving rise to the so called
‘‘intercalated clays’’ and (iii) stabilisation of the intercalated
clays by calcination at relatively high temperatures, which
transform the metastable polyoxocations into ‘‘pillars’’, stable
metallic clusters, close to oxi-hydroxidic phases, which maintain
the layers of the clays separated to a long distance [20], thus able
to accommodate large molecules susceptible to undergo
chemical transformations. These solids are called ‘‘pillared
clays’’, showing a bidimensional microporous network of
molecular dimensions, with the pillars occupying the interlayer
space defined by the clay layers. The number and size of the
pillars in the interlayer region are responsible for the pore
parameters of the pillared clay structure [21].
Recently, Feng and co-workers [18,22] synthesized clay-
based Fe nanocomposites by the so-called pillaring technique
and used them as heterogeneous catalysts for the photo-Fenton
discoloration and mineralization of azo-dyes. Their results
clearly indicate that the solids are promising photo catalysts,
but the use of light increases the costs of the overall process as
compared to dark Fenton oxidation. However, in their
conditions the oxidation is much faster, which is also important
to be taken into account in economical analysis.
In this work, we have prepared several heterogeneous
catalysts based on Al-pillared saponite impregnated with iron
salts. Saponite is a smectite clay characterized by a high
negative charge, generated by a high degree of Si–Al
substitution in the tetrahedral sheet, and by a high occupancy
of the octahedral layer, mainly by Mg. The high occupancy in
the octahedral sheet, together with a certain degree of
substitution by trivalent cations, makes the negative charge
in this sheet to be very low, sometimes close to zero, and even
slowly positive. Thus, the negative charge of the clay is strongly
concentrated in the tetrahedral sheet, which differentiates
saponite from the most known and used smectite material,
montmorillonite, in which the charge is mainly located in the
octahedral sheet. The other important characteristic of the
saponite has already been mentioned, the highly magnesic
composition of its octahedral layer [23]. The amount and location
of the clay charge gives saponite a particular interest from the
catalytic point of view, because of the direct relation between it
and the acidity of the clay. In the preparation of pillared solids, the
charge has a great importance regulating the facility for
intercalation, the cross-linking between the clay layers and the
pillars, and the thermal stability, remarkably higher than for
pillared montmorillonites [24]. Besides, saponite is a clay
mineral abundant and cheap in the Iberian Peninsula.
J.H. Ramirez et al. / Applied Catalysis B: Environmental 71 (2007) 44–5646
Thus, a saponite has been intercalated with Al polycations,
and the pillared solid obtained after calcination at 500 8C has
been used as support for the impregnation with iron. Four iron
salts have been used as precursors and three loads of iron have
been prepared. The obtained heterogeneous catalysts have been
used in the Fenton-like oxidation of the non-biodegradable azo-
dye Orange II (abbreviated ‘‘OII’’ from here) in water solution,
using a batch reactor. The choice of OII as model pollutant lies
in the fact that it is a typical dye which is widely used in textile,
pulp and paper industries. The effectiveness of these catalysts in
the oxidation of the dye, as well as the influence of the variables
of the synthesis and of the reaction conditions on the catalytic
activity are discussed.
2. Materials and methods
2.1. Preparation of the catalysts
Saponite from Yunclillos (Toledo, Spain) was kindly
supplied by TOLSA (Madrid, Spain). The fraction with
particle size smaller than 2 mm, obtained by dispersion in
water and controlled decantation of the natural clay, was used
for intercalation/pillaring experiment. Its chemical composi-
tion, expressed in wt.% of oxides and referred to water-free
solid, is the following: SiO2, 62.20; MgO, 29.45; Al2O3, 5.21;
Fe2O3, 1.46; TiO2, 0.30; Na2O, 0.54; K2O, 0.30; CaO, 0.53
(analytical method described below, Section 2.2). It is a well-
ordered smectite with basal spacing of 14.4 A, BET specific
surface area of 152 m2/g and cation exchange capacity (CEC)
of 0.9 meq/g.
Saponite was intercalated with [Al13O4(OH)24(H2O)12]7+
polycations (in short, Al13), by using a standard procedure
[25,26]. First, the Al13 solution to be intercalated was obtained
by careful hydrolysis of an Al3+ solution, derived from
AlCl3�6H2O (Panreac, purissimum), with 1 M NaOH (Panreac,
purissimum), using a ratio OH�/Al3+ of 2.2, stirring vigorously
to avoid local increases of pH that may lead to the precipitation
of aluminium hydroxide, and aging 24 h (a final pH of 4.1).
After that, the solution was added to the saponite, employing an
Al/clay ratio of 5 mmol/g clay. In order to favor intercalation,
the clay had been swollen by preparing an aqueous suspension
12 h before the addition of the intercalating solution. The new
suspension was stirred for 24 h, and then washed by
centrifugation and dialysis until absence of chloride (evaluated
by the Ag+ test). The solid obtained was dried at 70 8C for 16 h,
and then heated to 500 8C at a heating rate of 1 8C/min under air
atmosphere and maintained at this temperature for 4 h. The
solid obtained, designated as Al13-500, was used as support for
the preparation of the supported catalysts.
Impregnation of the support was carried out by means of the
incipient wet impregnation method, by using four Fe-salts as
precursors, namely Fe(II) acetate, Fe(II) oxalate, Fe(II)
acetylacetonate and Fe(III) acetylacetonate. For each precursor,
the amounts needed for obtaining 7.5, 13.0 and 17.0 wt.% of
iron in the final catalysts were dissolved in the minimum
amount of the appropriate solvent, water for the acetate and the
oxalate, and acetone for both acetylacetonates. The first two
salts were very soluble and a single impregnation step was
needed, while five cycles were needed for both acetylaceto-
nates, because of their low solubility. After completing the
impregnation, the solids were calcined at 500 8C following the
calcination procedure described for Al13-500, thus obtaining
the final catalysts. These catalysts are designated by a
precursor-amount notation, for example, Fe(II) acetate 7.5
designates the solid prepared using Fe(II) acetate as precursor
and containing 7.5 wt.% of Fe in the final catalyst.
2.2. Characterization of the catalysts
Elemental chemical analyses were performed to determine
the composition of the original clay and the exact amount of
iron in the final catalysts, by using scanning electronic
microscopy (SEM-JEOL-JSM6301-F) with an Oxford INCA/
ENERGY-350 microanalysis system. The samples were
covered with carbon by vaporization.
Powder X-ray diffraction patterns (XRD) of the solids were
recorded in the 2u range of 2–658 by a Siemens D-500
diffractometer at 40 kV and 30 mA using filtered Cu Ka
radiation (l = 1.5418 A).
FT-Infrared spectra were recorded in the 4000–350 cm�1
region with a Perkin-Elmer 1730 FT-IR spectrometer, using a
He–Ne laser source (l = 632.8 nm), in KBr pellet (1 mg sample
with 300 mg KBr) and 15 scan per minute to improve the
signal-to-noise ratio.
BET specific surface areas were determined by adsorption of
nitrogen at 77 K, by using a Micromeritics Gemini apparatus
and measuring five adsorption points between 0.01 and 0.2 of
relative pressure. The samples were previously outgassed by
treatment at 110 8C for 2 h, under flow of nitrogen.
Simultaneous thermal gravimetric (TG) and differential
scanning calorimetric (DSC) analyses of samples were carried
out using a TA-SDT Q600 Instrument. Samples of about 40 mg
were heated in air (flow-rate = 100 mL/min) from room
temperature up to 900 8C, with a heating rate of 10 8C/min.
2.3. Catalytic activity
Chemical oxidation of Orange II (Fluka p.a.) was carried out
using 1 L of a 0.1 mM solution, in a jacketed glass batch reactor
under continuous stirring (by means of a FALC F30ST
magnetic stirrer—230 rpm), and with a permanent control of
the temperature by a Huber (Polystat CC1 unit) thermostatic
bath. After stabilisation of both temperature and pH, the powder
catalyst was added and the beginning of the reaction (t = 0) was
considered when H2O2 (30%, w/w, from Merck) was added.
Absorbance, temperature and pH were permanently measured
by means of a Philips PU8625 UV–vis spectrophotometer, a
thermocouple and a pH EDT Instruments RE 357 TX electrode,
respectively. Prior to the absorbance measurements, a calibra-
tion curve was obtained that showed a good linear relationship
between the absorbance at 486 nm (characteristic wavelength
of the Orange II molecule) and the concentration up to 0.1 mM.
For the on-line determination of the absorbance at l = 486 nm a
flow-through cell was used, recirculation being obtained by a

J.H. Ramirez et al. / Applied Catalysis B: Environmental 71 (2007) 44–56 47
Fig. 1. XRD diffractograms of the support and catalysts with 7.5 wt.% of iron
calcined at 500 8C.
peristaltic Watson–Marlow 5055 pump, using a flow-rate of
100 mL/min. It is worth of mentioning that due to the low mass of
catalyst used, 91.5 mg, with an average volumetric diameter of
3.342 mm – determined in a Coulter Counter particle size
analyser, ref.: LS230 – no interference in the absorbance data was
noticed. In the runs where a significant concentration of clay was
used (1 g/L), samples taken along time were filtered before
measurement of absorbance. Acquisition of data was carried out
by means of a home-built interface using Labview 5.0 software,
from National Instruments, with a frequency of 1/3 Hz (although
in the OII concentration figures much less data are displayed, for
a better visualization). Each run lasted for 4 h. All the
experiments were repeated at least twice (the average relative
error along the runs was of 11%, while at the end of the oxidation,
t = 4 h, conversion values differed only, on average, 2%).
Complete discoloration of OII does not mean that it has been
completely oxidized into CO2 and H2O, as reaction inter-
mediates can be formed during oxidation. Therefore, it is
important to evaluate the mineralization of organic dyes. So, in
all cases, total organic carbon (TOC) was measured using a
Shimadzu 5000A spectrophotometer, model TOC-5000 CE,
equipped with an automatic sample injector. TOC was
calculated as the difference between the total carbon (TC)
and inorganic carbon (IC) in the liquid sample. Reported TOC
values represent the average of at least two measurements.
After taking the sample and before measuring TOC, reaction
was stopped by adding excess Na2SO3 (which quickly
consumes remaining H2O2), followed by centrifugation and
filtration for separation of the catalyst from the liquid phase.
The total Fe in the solution was determined using a
UNICAM 939/959 atomic absorption spectrophotometer.
3. Results and discussion
3.1. Characterization of the catalysts
Intercalation/pillaring experiment, as indicated above, was
carried out under standard conditions and proceeded success-
fully. The solid intercalated with Al13 polycations and then
calcined at 500 8C, used as support for further experiments,
shows the typical features of Al-PILCs. It has a layered
structure with a basal spacing of 18.2 A (Fig. 1) and a BET
specific surface area of 240 m2/g. Its thermal analysis curves
(not shown) and FT-IR spectrum (vide infra) also show the
typical behaviour of Al-PILCs.
The impregnated solids also maintain the layered structure,
but with a remarkable loss of ordering if compared to the
support. These catalysts, once calcined at 500 8C, show a weak
diffraction peak, between 16.8 and 17.3 A (2u = 5–78), due to
0 0 1 reflection (Fig. 1). However, as can be observed in these
diffractograms, although the long-range ordering in the c-axis is
low, it is not negligible, and all solids show a certain degree of
layered-structure ordering. At the same time, the impregnation-
drying process, mainly in the solids treated with acetylaceto-
nate solutions, for which various impregnation cycles are
needed, and the further calcination at 500 8C, produce a certain
collapse and delamination of the structure. Reflections
independent of c-axis ordering do not show any variation with
respect to the support, indicating that the impregnation does not
affect the individual layers, but only their stacking.
On the other hand, it may be underlined that no peaks due to
iron phases are observed in the diffractograms, even for
samples with 17.0 wt.% of iron (not shown in the figure).
Considering the preparation method used and the results
obtained from other techniques, it may be reasonably expected
that phases of composition close to Fe2O3 be formed after
calcination of the impregnated solids at 500 8C, by the removal
of the organic moieties of the precursors and oxidation, if
needed, of iron. However, no peaks of oxides or oxi-hydroxides
are found in the diffractograms, although the amounts of iron
used in the impregnations are relatively high. So, it may be
proposed that iron is in form of a very disperse phase on the
surface of the support (very small crystallite size, thus not
detected by XRD). The presence of such well dispersed phase
on the catalyst surface, particularly Fe(III) oxide, was
confirmed by XPS (data not shown).
FT-IR spectra of the support and of various impregnated
solids, both dried and calcined, are shown in Fig. 2. The FT-IR
spectrum of the support shows, as indicated before, the
characteristic bands of Al-PILCs. Thus, in the high wave
number region, the spectrum is dominated by the stretching
vibrations of the hydroxyl groups bonded to metallic cations
and to water molecules. Bending of water molecules also
produces an important effect close to 1630 cm�1, while the
bands characteristic of the tetrahedral layer of the clay
dominate the region of low wave numbers, the band at
1007 cm�1, assigned to Si–O–Si bonds, being the most intense
of the spectrum, and the bands due to M–O bonds in the
octahedral layer (mainly Mg–O and Fe–O, because of the
chemical nature of saponite) appearing at lower wave numbers.
Spectra of solids impregnated and dried show, in all cases,
the bands due to the support and bands assigned to the
precursors. The first bands do not display important variations
with respect to those of the support (they only show small
differences in the intensity). This is an expectable observation,

J.H. Ramirez et al. / Applied Catalysis B: Environmental 71 (2007) 44–5648
Fig. 2. FT-IR spectra of the support and impregnated solids, before and after
calcination: (A) Fe(II) oxalate 17.0 and (B) Fe(II) acetylacetonate 17.0.
because of the low influence of the impregnation on the
structural bonds of the clay, where only surface hydroxyl
groups may be affected, giving rise to interfacial coordination
bonds with Fe2+ and Fe3+ cations of the precursors. On the other
Table 1
Characterization data and catalytic behaviour of the catalysts
Sample Fe contenta (wt.%) BET surface
Fe(II) acetate 7.5 8.12 170
Fe(II) acetate 13.0 13.85 192
Fe(II) acetate 17.0 16.50 141
Fe(II) oxalate 7.5 7.87 160
Fe(II) oxalate 13.0 13.81 151
Fe(II) oxalate 17.0 17.29 141
Fe(II) ac. acetonate 7.5 8.02 155
Fe(II) ac. acetonate 13.0 13.89 162
Fe(II) ac. acetonate 17.0 17.03 137
Fe(III) ac. acetonate 7.5 7.54 154
Fe(III) ac. acetonate 13.0 14.02 136
Fe(III) ac. acetonate 17.0 17.56 128
a The Fe content was determined over the catalysts calcined at 500 8C and keptb treaction = 4 h, T = 30 8C, pH 3.0, ðCH2O2
Þo¼ 6 mM.
c Amount (wt.%) of iron lost into the solution after reaction as refereed to the t
hand, the bands due to the precursors are strongly intense, as
can be expected because precursors containing organic
moieties have been employed. The characteristic bonds of
each precursor are observed in each case, with vibrations of C–
H bonds, carboxylate or carbonyl groups, etc. All these bands
disappear completely when the impregnated solids are calcined
at 500 8C, meaning that organic moieties are completely
removed at this temperature, by transformation of the precursor
molecules into iron oxide-like phases. However, no peak due to
Fe oxides neither oxy-hydroxides are observed in the spectra.
The contents of Fe (determined by elemental analyses)
present in the final catalysts are shown in Table 1, together with
the BET specific surface areas. Slight variations (<8.3%) are
noticed between the expected and the determined iron content
of the samples, which is due to the high hydration degree of the
solids at the stages of the preparation procedure, thus making
difficult to obtain the targeted iron contents. The values of
specific surface areas are comprised between 128 and 192 m2/g,
which represents a percentage of 53–80% of the value of the
support. These values are relatively high considering the
subsequent steps of the preparation of the catalysts, including
impregnation, drying and calcination at 500 8C. It has been
reported that the impregnation of clay supports with precursors
containing organic moieties causes a strong decrease in surface
area, by blocking of the interlayer porosity by such organic
groups, sometimes the impregnated solids only showing the
external surface area of the support. However, the further
calcination of the impregnated solids produces, if the
temperature is high enough to remove all the organic moieties,
the recuperation of the access to the internal porosity of the
support [20]. Sometimes, these successive processes cause a
strong deleterious effect in the surface properties of the solids,
although this is not the case for the solids prepared in this work.
It may be noticed that part of this surface area may be due to the
particles of iron incorporated, considering that they form phases
of composition close to iron oxide phase and that they are very
dispersed on the support surface.
The thermogravimetric analyses curves of the impregnated
samples are displayed in Fig. 3. Several weight losses can be
observed. The removal of adsorbed water and physisorbed
area (m2/g) TOC removalb (%) Iron leachedb,c (wt.%)
66.7 7.5
68.3 8.0
70.9 4.0
70.3 2.6
72.8 4.2
81.6 1.4
62.1 2.6
68.0 0.9
68.9 0.6
53.2 2.2
63.8 1.2
69.5 2.2
in closed polyurethane flasks.
otal Fe initially present in the catalyst.
J.H. Ramirez et al. / Applied Catalysis B: Environmental 71 (2007) 44–56 49
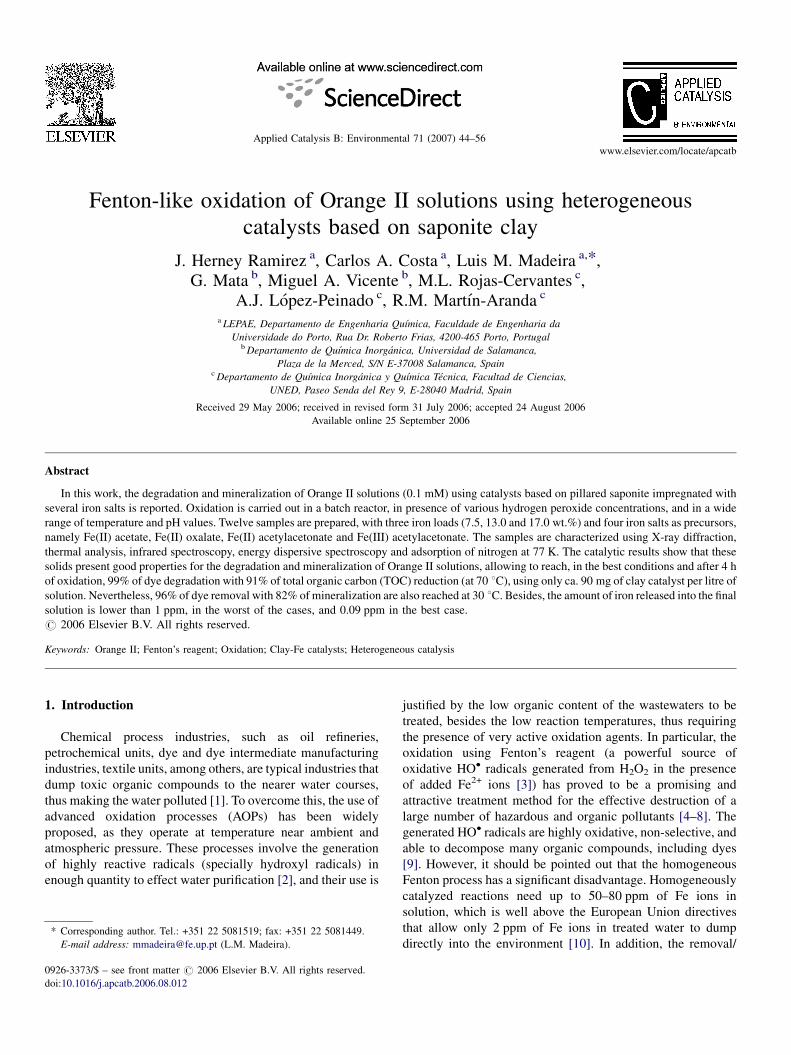
Fig. 3. Thermogravimetric analysis of different dried samples: (A) Fe(II) acetate, (B) Fe(II) oxalate, (C) Fe(II) acetylacetonate and (D) Fe(III) acetylacetonate.
solvent occurs until ca. 150 8C. This is associated with a weight
loss of around 7–8 wt.% for samples containing acetate and
lower (3 wt.%) for those prepared with oxalate and acetyla-
cetonates. The decomposition of the organic precursors occurs
in the 150–325 8C range for Fe(II) acetate and Fe(II)
acetylacetonate samples and in a wider range (150–425 8C)
for the rest of samples. In addition, when using oxalate and
acetylacetonate as precursors, the complexity of the salts,
which are decomposed in several successive steps, determines
the presence of more steps of weight loss in the corresponding
TG curves of these samples than in those of the acetate samples.
The values of total weight loss of the samples prepared in this
work are comprised between 19.5 wt.% for Fe 7.5 acetate and
47 wt.% for Fe 17.0 oxalate, the values depending on the nature
of the precursor used and the load of the same. The final weight
loss observed in all cases in the 415–825 8C range is due to the
dehydroxilation of the clay. For all samples, it is clear that the
temperature of calcination guarantees the removal of the
organic fragments and the obtaining of iron-like phases.
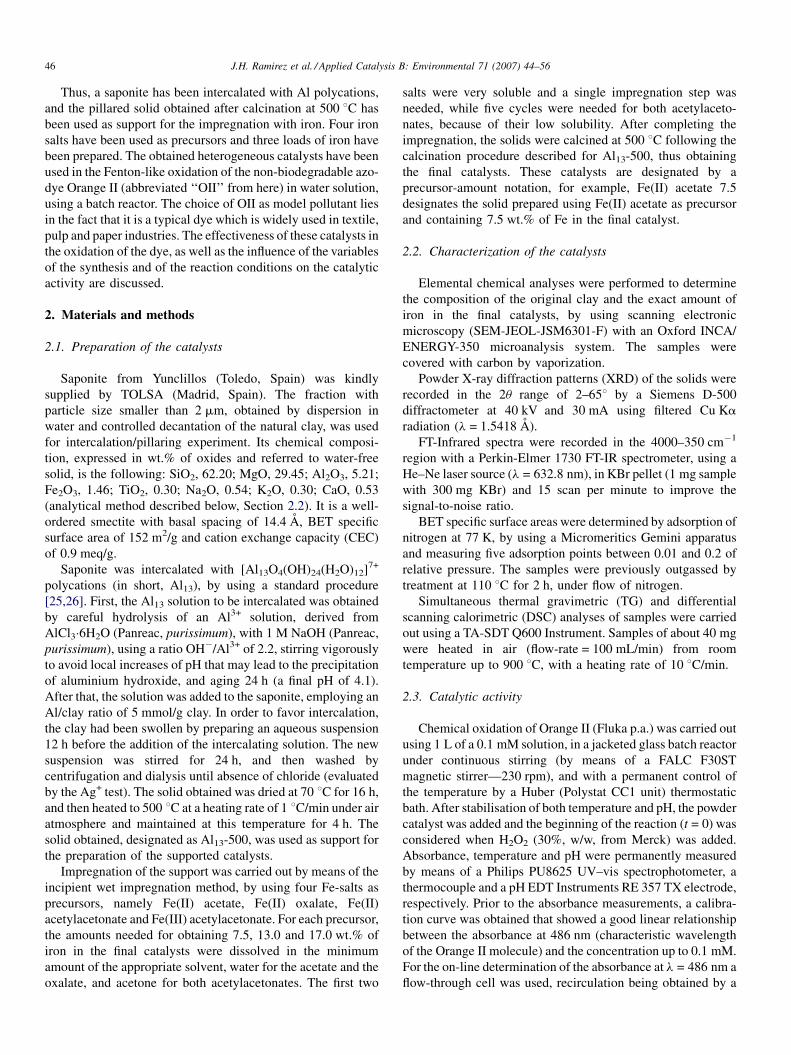
The DSC curves for the samples containing 13 wt.% of Fe
are shown in Fig. 4. An endothermic peak is observed in the 30–
150 8C for the sample containing acetate (Fig. 4A), as
consequence of the highest weight loss of adsorbed water
and solvent detected in the TG curve of this sample, with
respect to those prepared with other precursors. The DSC peak
corresponding to the decomposition of the most part of the
organic material is centred at around 315 8C for acetate, 275 8Cfor Fe(II) acetylacetonate and 350 8C for oxalate and Fe(III)
acetylacetonate. For these last three samples, other exothermic
peaks of lower intensity can be observed in the 150–275 8Cwith associated weight losses in their corresponding TG curves.
The removal of the last hydroxyl groups in the clay is observed
as a clear weight loss close to 800 8C, associated to an
endothermal effect, and once this dehydroxilation is completed,
it is followed by an exothermal effect corresponding to the
phase transformation from saponite to enstatite, not associated
with any weight loss in the TG curves. No peaks that could be
associated to transformation of iron phases are observed.
3.2. Catalytic behaviour
3.2.1. Effect of the precursor nature and iron load on the
degradation of OII solution
As above-mentioned, catalytic experiments were performed
using a 0.1 mM solution of OII, which is in the range of azo
dyes concentrations usually found in industrial waste streams
[27]. Although the natural clay has already some iron (ca.
1 wt.%), no degradation of the OII solution was noticed when
using it as catalyst under the typical conditions adopted in this
work (ðCH2O2Þ
o¼ 6 mM, T = 30 8C, pH 3, wclay = 91.5 mg/L,
t = 4 h), which may be related to the inaccessibility of such
iron, located in the octahedral positions of the clay structure.
Besides, dye removal by adsorption (blank run in the same
conditions but without hydrogen peroxide) was not detectable,
what is due to the remarkably low concentrations of clay used in
our work. The use of wclay = 1 g/L, an amount commonly found
in the literature, provided about 36% removal by adsorption
after 4 h (but no equilibration was yet reached).
J.H. Ramirez et al. / Applied Catalysis B: Environmental 71 (2007) 44–5650
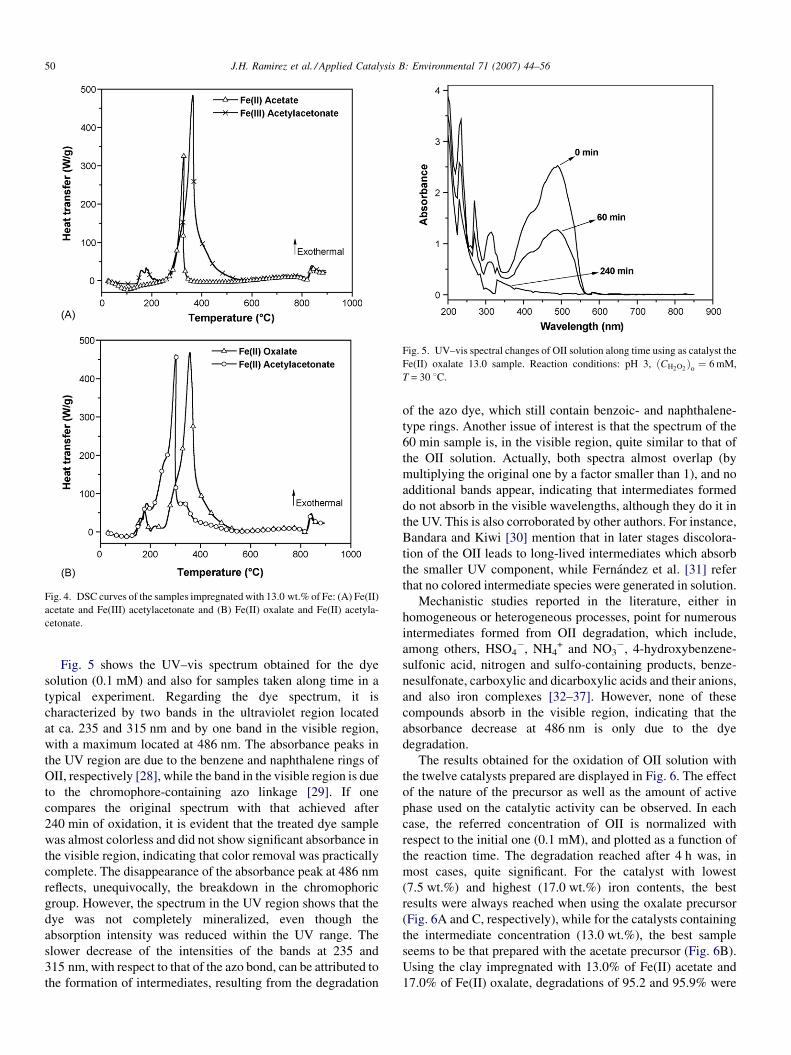
Fig. 4. DSC curves of the samples impregnated with 13.0 wt.% of Fe: (A) Fe(II)
acetate and Fe(III) acetylacetonate and (B) Fe(II) oxalate and Fe(II) acetyla-
cetonate.
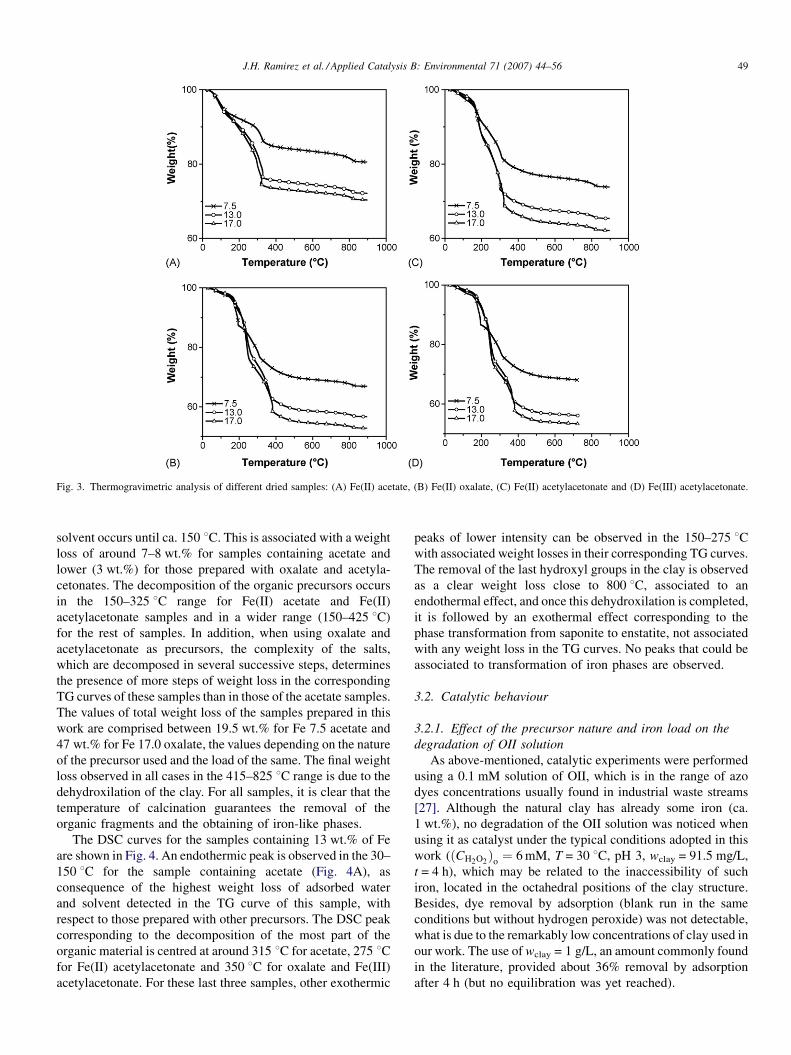
Fig. 5. UV–vis spectral changes of OII solution along time using as catalyst the
Fe(II) oxalate 13.0 sample. Reaction conditions: pH 3, ðCH2O2Þ
o¼ 6 mM,
T = 30 8C.
Fig. 5 shows the UV–vis spectrum obtained for the dye
solution (0.1 mM) and also for samples taken along time in a
typical experiment. Regarding the dye spectrum, it is
characterized by two bands in the ultraviolet region located
at ca. 235 and 315 nm and by one band in the visible region,
with a maximum located at 486 nm. The absorbance peaks in
the UV region are due to the benzene and naphthalene rings of
OII, respectively [28], while the band in the visible region is due
to the chromophore-containing azo linkage [29]. If one
compares the original spectrum with that achieved after
240 min of oxidation, it is evident that the treated dye sample
was almost colorless and did not show significant absorbance in
the visible region, indicating that color removal was practically
complete. The disappearance of the absorbance peak at 486 nm
reflects, unequivocally, the breakdown in the chromophoric
group. However, the spectrum in the UV region shows that the
dye was not completely mineralized, even though the
absorption intensity was reduced within the UV range. The
slower decrease of the intensities of the bands at 235 and
315 nm, with respect to that of the azo bond, can be attributed to
the formation of intermediates, resulting from the degradation
of the azo dye, which still contain benzoic- and naphthalene-
type rings. Another issue of interest is that the spectrum of the
60 min sample is, in the visible region, quite similar to that of
the OII solution. Actually, both spectra almost overlap (by
multiplying the original one by a factor smaller than 1), and no
additional bands appear, indicating that intermediates formed
do not absorb in the visible wavelengths, although they do it in
the UV. This is also corroborated by other authors. For instance,
Bandara and Kiwi [30] mention that in later stages discolora-
tion of the OII leads to long-lived intermediates which absorb
the smaller UV component, while Fernandez et al. [31] refer
that no colored intermediate species were generated in solution.
Mechanistic studies reported in the literature, either in
homogeneous or heterogeneous processes, point for numerous
intermediates formed from OII degradation, which include,
among others, HSO4�, NH4
+ and NO3�, 4-hydroxybenzene-
sulfonic acid, nitrogen and sulfo-containing products, benze-
nesulfonate, carboxylic and dicarboxylic acids and their anions,
and also iron complexes [32–37]. However, none of these
compounds absorb in the visible region, indicating that the
absorbance decrease at 486 nm is only due to the dye
degradation.
The results obtained for the oxidation of OII solution with
the twelve catalysts prepared are displayed in Fig. 6. The effect
of the nature of the precursor as well as the amount of active
phase used on the catalytic activity can be observed. In each
case, the referred concentration of OII is normalized with
respect to the initial one (0.1 mM), and plotted as a function of
the reaction time. The degradation reached after 4 h was, in
most cases, quite significant. For the catalyst with lowest
(7.5 wt.%) and highest (17.0 wt.%) iron contents, the best
results were always reached when using the oxalate precursor
(Fig. 6A and C, respectively), while for the catalysts containing
the intermediate concentration (13.0 wt.%), the best sample
seems to be that prepared with the acetate precursor (Fig. 6B).
Using the clay impregnated with 13.0% of Fe(II) acetate and
17.0% of Fe(II) oxalate, degradations of 95.2 and 95.9% were

J.H. Ramirez et al. / Applied Catalysis B: Environmental 71 (2007) 44–56 51
Fig. 6. Effect of the precursor nature on the degradation of the OII solution for different iron loads: (A) 7.5 wt.%, (B) 13.0 wt.% and (C) 17.0 wt.%. pH 3,
ðCH2O2Þ
o¼ 6 mM, T = 30 8C.
obtained after 4 h, respectively. In contrast, the precursor that
gave rise to the less active catalyst was the Fe(II)
acetylacetonate with 13.0% of Fe, which produced an
efficiency of only 66.4%.
It is noteworthy that for samples with ca. 7.5, 13.0 or
17.0 wt.% of Fe, Fig. 6A–C, respectively, there is no apparent
relationship between the reaction rate for each set of catalysts
and the effective amount of iron in the samples. This means that
the slight differences in the amount of iron between different
samples, which ranges between 7.54 and 8.12, between 13.81
and 14.02 and between 16.50 and 17.56 wt.% of Fe,
respectively, for each one of the iron contents targeted (see
Table 1), are not responsible for the differences recorded. On
the other hand, the sample that exhibits higher reaction rate in
Fig. 6B (Fe(II) acetate) is the one that looses more iron
(Table 1), suggesting that the homogeneous process contribu-
tion could be of importance. However, for the samples with 7.5
or 17.0% of Fe (Fig. 6A and C, respectively) such relationship
is not observed. Therefore, not only the homogeneous, but also
the heterogeneous catalytic process, seems to have an important
role in the degradation reaction.
It can also be observed in Fig. 6 that the influence of the iron
concentration on the degradation of Orange II is not equal for
all the precursors, but, in general, the final performances are not
too different (with a few exceptions). The reason behind this
fact is not yet clear, and a deeper insight regarding the
mechanisms occurring in the system is required. Nevertheless,
Table 1 shows clearly that TOC elimination, at the end of the
runs, increases, for each precursor, with the iron load. This
increment in the mineralization with the iron concentration
occurs because when the amount of active phase increases,
more radicals are produced for the oxidation reaction (Eqs. (1)
and (2)).
To use a heterogeneous catalytic system in industrial practice,
it is important to evaluate the loss of catalyst from the support.
This was done by measuring the iron concentration in the
solution along time (samples were taken every hour, although in
Table 1 only data after 4 h of reaction time are shown). Some
important results must be stressed. First, in almost all cases the
iron leaching is considerably low (<1 mg/L, thus being below
the EU directives (<2 mg/L)). Secondly, catalysts that exhibit
higher iron leaching values are those prepared with the acetate
precursor, independently of the iron load. Finally, the 17.0 wt.%
samples are those that loose a smaller percentage of iron (except
Fe(III) acetylacetonate). This is particularly interesting from the
practical point of view due to the possibility of using these last
catalysts for a longer operation time (slower deactivation). In this
concern, it is especially remarkable the Fe(II) oxalate 17.0
catalyst, which shows a very good behaviour in terms of
mineralization (81.6% of TOC reduction) and discoloration
(95.9% of OII removal), and its performance seems to be mainly
due to the heterogeneous Fenton-like process.
The importance of the heterogeneously catalyzed reaction is
also put in evidence when one compares the performance of the
catalysts prepared with precursors of Fe(II) versus Fe(III).
While OII degradation is much more significant for the Fe(III)
J.H. Ramirez et al. / Applied Catalysis B: Environmental 71 (2007) 44–5652
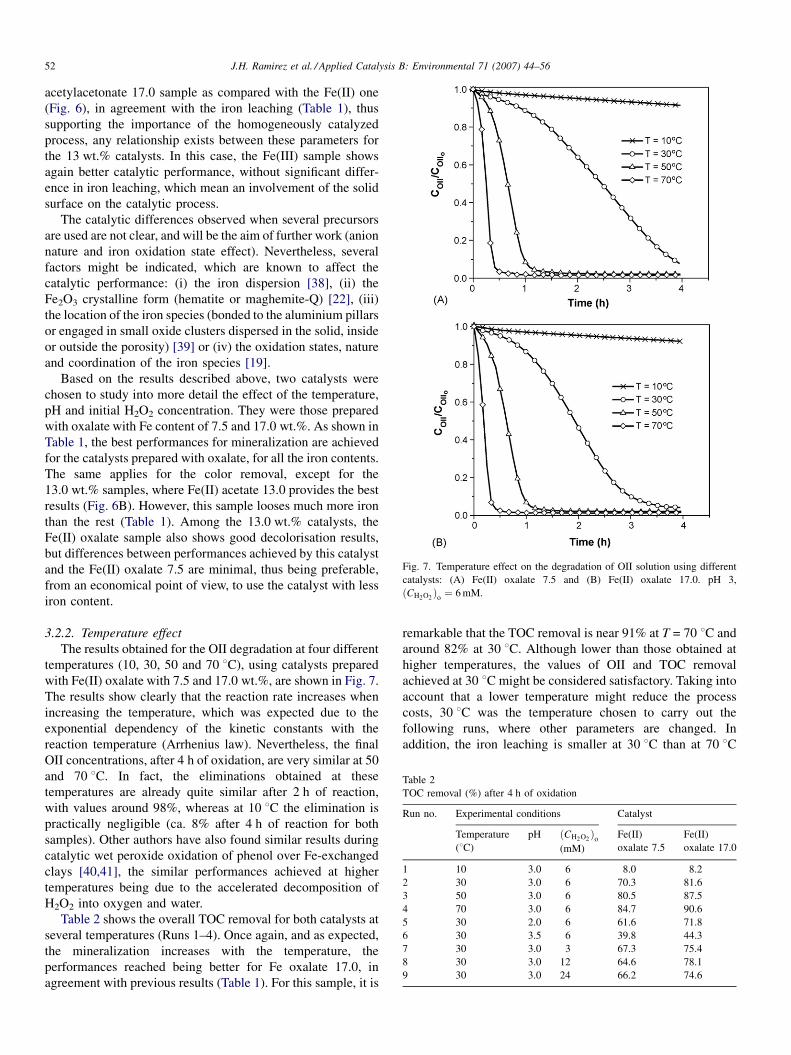
Fig. 7. Temperature effect on the degradation of OII solution using different
catalysts: (A) Fe(II) oxalate 7.5 and (B) Fe(II) oxalate 17.0. pH 3,
ðCH2O2Þ
o¼ 6 mM.
Table 2
TOC removal (%) after 4 h of oxidation
Run no. Experimental conditions Catalyst
Temperature
(8C)
pH ðCH2O2Þ
o
(mM)
Fe(II)
oxalate 7.5
Fe(II)
oxalate 17.0
1 10 3.0 6 8.0 8.2
2 30 3.0 6 70.3 81.6
3 50 3.0 6 80.5 87.5
4 70 3.0 6 84.7 90.6
5 30 2.0 6 61.6 71.8
6 30 3.5 6 39.8 44.3
7 30 3.0 3 67.3 75.4
8 30 3.0 12 64.6 78.1
9 30 3.0 24 66.2 74.6
acetylacetonate 17.0 sample as compared with the Fe(II) one
(Fig. 6), in agreement with the iron leaching (Table 1), thus
supporting the importance of the homogeneously catalyzed
process, any relationship exists between these parameters for
the 13 wt.% catalysts. In this case, the Fe(III) sample shows
again better catalytic performance, without significant differ-
ence in iron leaching, which mean an involvement of the solid
surface on the catalytic process.
The catalytic differences observed when several precursors
are used are not clear, and will be the aim of further work (anion
nature and iron oxidation state effect). Nevertheless, several
factors might be indicated, which are known to affect the
catalytic performance: (i) the iron dispersion [38], (ii) the
Fe2O3 crystalline form (hematite or maghemite-Q) [22], (iii)
the location of the iron species (bonded to the aluminium pillars
or engaged in small oxide clusters dispersed in the solid, inside
or outside the porosity) [39] or (iv) the oxidation states, nature
and coordination of the iron species [19].
Based on the results described above, two catalysts were
chosen to study into more detail the effect of the temperature,
pH and initial H2O2 concentration. They were those prepared
with oxalate with Fe content of 7.5 and 17.0 wt.%. As shown in
Table 1, the best performances for mineralization are achieved
for the catalysts prepared with oxalate, for all the iron contents.
The same applies for the color removal, except for the
13.0 wt.% samples, where Fe(II) acetate 13.0 provides the best
results (Fig. 6B). However, this sample looses much more iron
than the rest (Table 1). Among the 13.0 wt.% catalysts, the
Fe(II) oxalate sample also shows good decolorisation results,
but differences between performances achieved by this catalyst
and the Fe(II) oxalate 7.5 are minimal, thus being preferable,
from an economical point of view, to use the catalyst with less
iron content.
3.2.2. Temperature effect
The results obtained for the OII degradation at four different
temperatures (10, 30, 50 and 70 8C), using catalysts prepared
with Fe(II) oxalate with 7.5 and 17.0 wt.%, are shown in Fig. 7.
The results show clearly that the reaction rate increases when
increasing the temperature, which was expected due to the
exponential dependency of the kinetic constants with the
reaction temperature (Arrhenius law). Nevertheless, the final
OII concentrations, after 4 h of oxidation, are very similar at 50
and 70 8C. In fact, the eliminations obtained at these
temperatures are already quite similar after 2 h of reaction,
with values around 98%, whereas at 10 8C the elimination is
practically negligible (ca. 8% after 4 h of reaction for both
samples). Other authors have also found similar results during
catalytic wet peroxide oxidation of phenol over Fe-exchanged
clays [40,41], the similar performances achieved at higher
temperatures being due to the accelerated decomposition of
H2O2 into oxygen and water.
Table 2 shows the overall TOC removal for both catalysts at
several temperatures (Runs 1–4). Once again, and as expected,
the mineralization increases with the temperature, the
performances reached being better for Fe oxalate 17.0, in
agreement with previous results (Table 1). For this sample, it is
remarkable that the TOC removal is near 91% at T = 70 8C and
around 82% at 30 8C. Although lower than those obtained at
higher temperatures, the values of OII and TOC removal
achieved at 30 8C might be considered satisfactory. Taking into
account that a lower temperature might reduce the process
costs, 30 8C was the temperature chosen to carry out the
following runs, where other parameters are changed. In
addition, the iron leaching is smaller at 30 8C than at 70 8C
J.H. Ramirez et al. / Applied Catalysis B: Environmental 71 (2007) 44–56 53
and is not very significant after 4 h (<0.25 mg/L, thus being
below the value of the EU directives), although we have not
experimentally observed any clear relationship between the
loss of catalyst from the support and the reaction temperature.
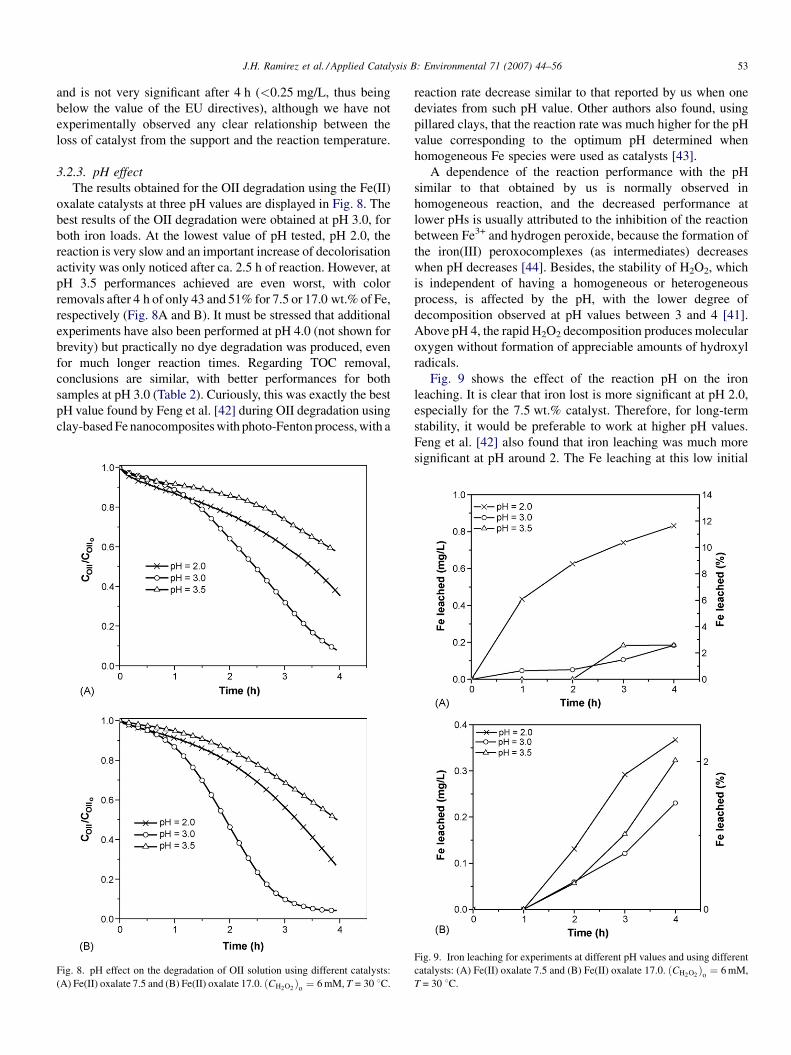
3.2.3. pH effect
The results obtained for the OII degradation using the Fe(II)
oxalate catalysts at three pH values are displayed in Fig. 8. The
best results of the OII degradation were obtained at pH 3.0, for
both iron loads. At the lowest value of pH tested, pH 2.0, the
reaction is very slow and an important increase of decolorisation
activity was only noticed after ca. 2.5 h of reaction. However, at
pH 3.5 performances achieved are even worst, with color
removals after 4 h of only 43 and 51% for 7.5 or 17.0 wt.% of Fe,
respectively (Fig. 8A and B). It must be stressed that additional
experiments have also been performed at pH 4.0 (not shown for
brevity) but practically no dye degradation was produced, even
for much longer reaction times. Regarding TOC removal,
conclusions are similar, with better performances for both
samples at pH 3.0 (Table 2). Curiously, this was exactly the best
pH value found by Feng et al. [42] during OII degradation using
clay-based Fe nanocomposites with photo-Fenton process, with a
Fig. 8. pH effect on the degradation of OII solution using different catalysts:
(A) Fe(II) oxalate 7.5 and (B) Fe(II) oxalate 17.0. ðCH2O2Þ
o¼ 6 mM, T = 30 8C.
reaction rate decrease similar to that reported by us when one
deviates from such pH value. Other authors also found, using
pillared clays, that the reaction rate was much higher for the pH
value corresponding to the optimum pH determined when
homogeneous Fe species were used as catalysts [43].
A dependence of the reaction performance with the pH
similar to that obtained by us is normally observed in
homogeneous reaction, and the decreased performance at
lower pHs is usually attributed to the inhibition of the reaction
between Fe3+ and hydrogen peroxide, because the formation of
the iron(III) peroxocomplexes (as intermediates) decreases
when pH decreases [44]. Besides, the stability of H2O2, which
is independent of having a homogeneous or heterogeneous
process, is affected by the pH, with the lower degree of
decomposition observed at pH values between 3 and 4 [41].
Above pH 4, the rapid H2O2 decomposition produces molecular
oxygen without formation of appreciable amounts of hydroxyl
radicals.
Fig. 9 shows the effect of the reaction pH on the iron
leaching. It is clear that iron lost is more significant at pH 2.0,
especially for the 7.5 wt.% catalyst. Therefore, for long-term
stability, it would be preferable to work at higher pH values.
Feng et al. [42] also found that iron leaching was much more
significant at pH around 2. The Fe leaching at this low initial
Fig. 9. Iron leaching for experiments at different pH values and using different
catalysts: (A) Fe(II) oxalate 7.5 and (B) Fe(II) oxalate 17.0. ðCH2O2Þ
o¼ 6 mM,
T = 30 8C.
J.H. Ramirez et al. / Applied Catalysis B: Environmental 71 (2007) 44–5654
solution pH can be attributed to the dissolution of iron oxide at
very acidic conditions.
At pH 2.0, the amount of iron leached into solution is much
higher for the Fe oxalate 7.5 than for the Fe oxalate 17.0
(Fig. 9A versus B), although the catalytic performance of the
first catalyst is not better (Fig. 8A versus B and Table 2), thus
supporting the importance of the heterogeneous catalytic
process. Finally, it is noteworthy that in the pH range studied
(2.0–3.5) the sample with more iron (17.0 wt.%) shows almost
always lower percentages of iron lost (Figs. 9A and B), and thus
can be in practice used for more operation cycles.
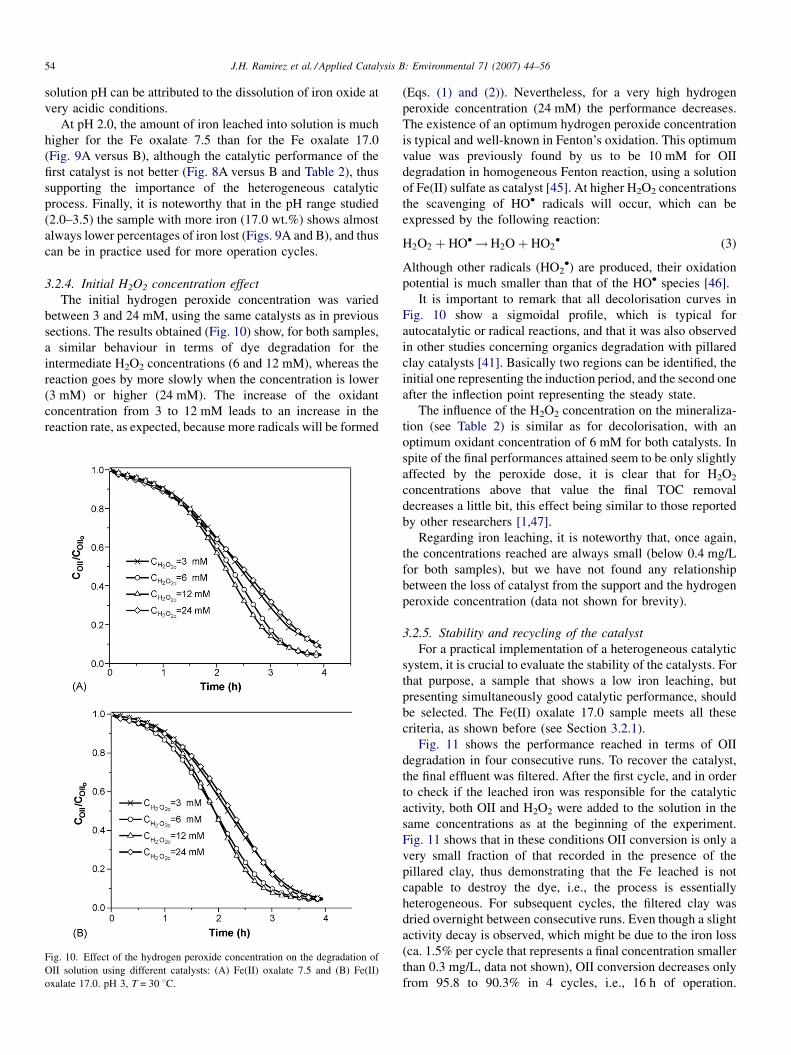
3.2.4. Initial H2O2 concentration effect
The initial hydrogen peroxide concentration was varied
between 3 and 24 mM, using the same catalysts as in previous
sections. The results obtained (Fig. 10) show, for both samples,
a similar behaviour in terms of dye degradation for the
intermediate H2O2 concentrations (6 and 12 mM), whereas the
reaction goes by more slowly when the concentration is lower
(3 mM) or higher (24 mM). The increase of the oxidant
concentration from 3 to 12 mM leads to an increase in the
reaction rate, as expected, because more radicals will be formed
Fig. 10. Effect of the hydrogen peroxide concentration on the degradation of
OII solution using different catalysts: (A) Fe(II) oxalate 7.5 and (B) Fe(II)
oxalate 17.0. pH 3, T = 30 8C.
(Eqs. (1) and (2)). Nevertheless, for a very high hydrogen
peroxide concentration (24 mM) the performance decreases.
The existence of an optimum hydrogen peroxide concentration
is typical and well-known in Fenton’s oxidation. This optimum
value was previously found by us to be 10 mM for OII
degradation in homogeneous Fenton reaction, using a solution
of Fe(II) sulfate as catalyst [45]. At higher H2O2 concentrations
the scavenging of HO� radicals will occur, which can be
expressed by the following reaction:
H2O2 þ HO� !H2Oþ HO2� (3)
Although other radicals (HO2�) are produced, their oxidation
potential is much smaller than that of the HO� species [46].
It is important to remark that all decolorisation curves in
Fig. 10 show a sigmoidal profile, which is typical for
autocatalytic or radical reactions, and that it was also observed
in other studies concerning organics degradation with pillared
clay catalysts [41]. Basically two regions can be identified, the
initial one representing the induction period, and the second one
after the inflection point representing the steady state.
The influence of the H2O2 concentration on the mineraliza-
tion (see Table 2) is similar as for decolorisation, with an
optimum oxidant concentration of 6 mM for both catalysts. In
spite of the final performances attained seem to be only slightly
affected by the peroxide dose, it is clear that for H2O2
concentrations above that value the final TOC removal
decreases a little bit, this effect being similar to those reported
by other researchers [1,47].
Regarding iron leaching, it is noteworthy that, once again,
the concentrations reached are always small (below 0.4 mg/L
for both samples), but we have not found any relationship
between the loss of catalyst from the support and the hydrogen
peroxide concentration (data not shown for brevity).
3.2.5. Stability and recycling of the catalyst
For a practical implementation of a heterogeneous catalytic
system, it is crucial to evaluate the stability of the catalysts. For
that purpose, a sample that shows a low iron leaching, but
presenting simultaneously good catalytic performance, should
be selected. The Fe(II) oxalate 17.0 sample meets all these
criteria, as shown before (see Section 3.2.1).
Fig. 11 shows the performance reached in terms of OII
degradation in four consecutive runs. To recover the catalyst,
the final effluent was filtered. After the first cycle, and in order
to check if the leached iron was responsible for the catalytic
activity, both OII and H2O2 were added to the solution in the
same concentrations as at the beginning of the experiment.
Fig. 11 shows that in these conditions OII conversion is only a
very small fraction of that recorded in the presence of the
pillared clay, thus demonstrating that the Fe leached is not
capable to destroy the dye, i.e., the process is essentially
heterogeneous. For subsequent cycles, the filtered clay was
dried overnight between consecutive runs. Even though a slight
activity decay is observed, which might be due to the iron loss
(ca. 1.5% per cycle that represents a final concentration smaller
than 0.3 mg/L, data not shown), OII conversion decreases only
from 95.8 to 90.3% in 4 cycles, i.e., 16 h of operation.

J.H. Ramirez et al. / Applied Catalysis B: Environmental 71 (2007) 44–56 55
Fig. 11. Effect of consecutive experiments with the Fe(II) oxalate 17.0 catalyst
on the degradation of OII solution. pH 3, T = 30 8C, ðCH2O2Þ
o¼ 6 mM.
Regarding TOC reduction, in the 4 cycles, final values were:
81.6, 81.4, 78.5 and 77.1%. In practice, this small deactivation
could be compensated, if required, by adapting the reaction
conditions (for instance slightly increasing the temperature
along time). Other authors reported similar results, but they
attributed the loss of activity to poisoning of the active catalytic
sites due to adsorbed organic species [40]. However, this could
be avoided by submitting the catalyst to an intermediate
calcination step, thus restoring its catalytic activity [48].
Nevertheless, catalyst deactivation may occur due to a diversity
of factors, as pointed by Guo and Al-Dahhan [49], including
reduction of the catalyst specific surface area, poisoning of the
catalytic agents by compounds formed during oxidation,
surface deposition and strong adsorption of a polymeric carbon
layer or even the dissolution of some metal oxides from
catalysts into the hot acidic reaction medium. This issue will be
the aim of future works.
4. Conclusions
� Twelve supported Fe-saponite catalysts have been prepared,
by means of the incipient wet impregnation method, using a
pillared clay support and four salts of Fe precursors at
different Fe loads. The characterization of the catalysts shows
that the decomposition of the precursors gives rise to solids
that present laminar structure, with active phases of Fe highly
dispersed on the support, and high specific surfaces (in most
of the cases with values comprised between 130 and 170 m2/
g), characteristics that make them potentially good catalysts
for oxidation in the Fenton-like process.
� A
ll the catalysts revealed to be quite active in the Fenton-likeoxidation of Orange II, because clay concentrations used are
much below than those usually found in the literature
(typically around 1 g/L).
� T
he effects of the nature of the catalyst’s precursor, hydrogenperoxide concentration, temperature and pH of the reaction
medium were analysed in the present work. The obtained
results show a high degradation of OII and of the
intermediary oxidised compounds. At optimal conditions,
99% discoloration and 91% of mineralization were reached
(after 4 h of reaction), using the catalyst prepared from Fe(II)
oxalate with 17.0 wt.% of Fe and in the following reaction
conditions: T = 70 8C, pH 3.0 and ðCH2O2Þ
o¼ 6 mM.
However, good performances with high selectivities to
CO2 and H2O were also reached at significantly lower
temperatures (30 8C).
� A
ll the catalysts exhibit not only good catalytic activity butalso a reasonable small iron leaching (below the EU
directives values), indicating that the active phases are
strongly fixed to the support (possibly iron strongly bonded to
the aluminium pillars or engaged in small oxide clusters
dispersed in the solid, inside or outside the porosity). This
characteristic makes possible the Fe-saponite catalysts to
have long-term stability, without generating iron hydroxide
sludges.
� I
t was shown that the nature of the salt and the content of ironused to prepare the catalyst have a significant effect on the
process performance, the Fe(II) oxalate 17.0 being the most
promising one. Consecutive reaction cycles carried out with
this sample showed a minor deactivation, which is possibly
due to some iron leaching, thus evidencing the possibility of
being used in continuous processes.
Acknowledgements
J.H. Ramirez wishes to express his gratitude to FCT for the
PhD grant (ref.: SFRH/BD/24435/2005). The authors also
acknowledge the financial support from CRUP, Portugal
(Programa de Accoes Integradas Luso-Espanholas, ref. E-31/
06) and the Spanish Ministerio de Educacion y Ciencia
(Programa de Acciones Integradas Hispano-Portuguesas, ref.
HP 2005-0097).
References
[1] D. Kabita, M. Subrata, B. Sekhar, C. Basab, J. Hazard. Mater. B84 (2001)
57–71.
[2] W.H. Glaze, J.W. Kang, D.H. Chapin, Ozone. Sci. Eng. 9 (1987) 335–352.
[3] C. Walling, Acc. Chem. Res. 8 (1975) 125–131.
[4] V. Kavitha, K. Palanivelu, Water Res. 39 (2005) 3062–3072.
[5] R. Oliveira, M.F. Almeida, L. Santos, L.M. Madeira, Ind. Eng. Chem. Res.
45 (2006) 1266–1276.
[6] J.J. Pignatello, Y. Sun, J. Agric. Food Chem. 41 (1993) 1139–1142.
[7] D.L. Sedlak, W.A. Andren, Environ. Sci. Technol. 25 (1991) 777–782.
[8] X. Xiang-Rong, Z. Zhen-Ye, L. Xiao-Yan, G. Ji-Dong, Chemosphere 55
(2004) 73–79.
[9] K. Swaminathan, S. Sandhya, A.C. Sophia, K. Pachhade, Y.V. Subrah-
manyam, Chemosphere 50 (2003) 619–625.
[10] S. Sabhi, J. Kiwi, Water Res. 35 (2001) 1994–2002.
[11] A.H. Gemeay, I.A. Mansour, R.G. El-Sharkawy, A.B. Zaki, J. Mol. Catal.
A: Chem. 193 (2003) 109–120.
[12] V.V. Ishtchenko, K.D. Huddersman, R.F. Vitkovskaya, Appl. Catal. A:
Gen. 242 (2003) 123–137.
[13] S. Letaief, B. Casal, P. Aranda, M.A. Martın-Luengo, E. Ruiz-Hitzky,
Appl. Clay Sci. 22 (2003) 263–277.
[14] G. Tachiev, J.A. Roth, A.R. Bowers, Inc. Int. J. Chem. Kinet. 32 (2000)
24–35.
[15] J.G. Carriazo, E. Guelou, J. Barrault, J.M. Tatibouet, S. Moreno, Appl.
Clay Sci. 22 (2003) 303–308.

J.H. Ramirez et al. / Applied Catalysis B: Environmental 71 (2007) 44–5656
[16] M. Neamtu, C. Zaharia, C. Catrinescu, A. Yediler, M. Macoveanu, A.
Kettrup, Appl. Catal. B: Environ. 48 (2004) 287–294.
[17] T.L.P. Dantas, V.P. Mendonca, H.J. Jose, A.E. Rodrigues, R.F.P.M.
Moreira, Chem. Eng. J. 118 (2006) 77–82.
[18] J. Feng, X. Hu, P.L. Yue, H.Y. Zhu, G.Q. Lu, Chem. Eng. Sci. 58 (2003)
679–685.
[19] C. Catrinescu, M. Neamtu, J. Miehe-Brendle, M.G. Garcia, A. Kettrup, in:
M.A. Vicente, M. Suarez, V. Rives, M.J. Sanchez (Eds.), Materiales
Arcillosos: de la Geologia a las Nuevas Aplicaciones, Salamanca, 2006,
pp. 87–98.
[20] C. Belver, M.A. Banares-Munoz, M.A. Vicente, Appl. Catal. B: Environ.
50 (2004) 101–112.
[21] A. Gil, L.M. Gandia, M.A. Vicente, Catal. Rev. Sci. Eng. 42 (2000) 145–
212.
[22] O.S.N. Sum, J. Feng, X. Hu, P.L. Yue, Chem. Eng. Sci. 59 (2004) 5269–
5275.
[23] G.W. Brindley, G. Brown, in: G.W. Brindley, G. Brown (Eds.), Crystal
Structures of Clay Minerals and their X-ray Identification, Mineralogical
Society, London, 1980.
[24] J.F. Lambert, G. Poncelet, Top. Catal. 4 (1997) 43–56.
[25] J.Y. Bottero, J.M. Cases, F. Fiessinger, J.E. Poirier, J. Phys. Chem. 84
(1980) 2933–2939.
[26] N. Lahav, V. Shani, J. Shabtai, Clays Clay Miner. 26 (1978) 107–115.
[27] S.A. Ong, E. Toorisaka, M. Hirata, T. Hano, Sep. Purif. Technol. 42 (2005)
297–302.
[28] W. Feng, D. Nansheng, H. Helin, Chemosphere 41 (2000) 1233–1238.
[29] C. Bauer, P. Jacques, A. Kalt, J. Photochem. Photobiol. A: Chem. 140
(2001) 87–92.
[30] J. Bandara, J. Kiwi, New J. Chem. 23 (1999) 717–724.
[31] J. Fernandez, J. Kiwi, C. Lizama, J. Freer, J. Baeza, H.D. Mansilla, J.
Photochem, Photobiol. A: Chem. 151 (2002) 213–219.
[32] J. Bandara, C. Morrison, J. Kiwi, C. Pulgarin, P. Peringer, J. Photochem.
Photobiol. A: Chem. 99 (1996) 57–66.
[33] V. Nadtochenko, J. Kiwi, J. Chem. Soc. Faraday Trans. 93 (1997) 2373–
2378.
[34] S. Nam, V. Renganathan, P.G. Tratnyek, Chemosphere 45 (2001) 59–65.
[35] S. Liakou, M. Kornaros, G. Lyberatos, Water Sci. Technol. 36 (1997) 155–
163.
[36] T. Yuranova, O. Enea, E. Mielczarski, J. Mielczarski, P. Albers, J. Kiwi,
Appl. Catal. B: Environ. 49 (2004) 39–50.
[37] M. Stylidi, D.I. Kondarides, X.E. Verykios, Appl. Catal. B: Environ. 40
(2003) 271–286.
[38] J. Carriazo, E. Guelou, J. Barrault, J.M. Tatibouet, R. Molina, S. Moreno,
Water Res. 39 (2005) 3891–3899.
[39] J. Barrault, M. Abdellaoui, C. Bouchoule, A. Majeste, J.M. Tatibouet, A.
Louloudi, N. Papayannakos, N.H. Gangas, Appl. Catal. B: Environ. 27
(2000) 225–230.
[40] C. Catrinescu, C. Teodosiu, M. Macoveanu, J. Miehe-Brendle, R.L. Dred,
Water Res. 37 (2003) 1154–1160.
[41] J. Guo, M. Al-Dahhan, Ind. Eng. Chem. Res. 42 (2003) 2450–2460.
[42] J. Feng, X. Hu, P.L. Yue, Water Res. 40 (2006) 641–646.
[43] J. Barrault, J.M. Tatibouet, N. Papayannakos, C.R. Acad. Sci. Paris, Serie
IIc, Chimie: Chem. 3 (2000) 777–783.
[44] J.J. Pignatello, Environ. Sci. Technol. 26 (1992) 944–951.
[45] J.H. Ramırez, C.A. Costa, L.M. Madeira, Catal. Today 107–108 (2005)
68–76.
[46] R.J. Bigda, Chem. Eng. Prog. 91 (1995) 62–66.
[47] A.M.F.M. Guedes, L.M.P. Madeira, R.A.R. Boaventura, C.A.V. Costa,
Water Res. 37 (2003) 3061–3069.
[48] G. Centi, S. Perathoner, T. Torre, M.G. Verduna, Catal. Today 55 (2000)
61–69.
[49] J. Guo, M. Al-Dahhan, Appl. Catal. A: Gen. 299 (2006) 175–184.