Female brown bears in Sør-Varanger, Norway: localities and mother-cub relationships analyzed by...
25
Female brown bear with cubs in Sør-Varanger. Photo: Steinar Wikan. Bioforsk Report Vol. 9 No. 167 2014 Female brown bears in Sør-Varanger, Norway: localities and mother-cub relationships analyzed by genetic methods Alexander Kopatz 1 , Rune J. Andreassen 2 , Hans Geir Eiken 1 , Siv Grete Aarnes 1 , Camilla Tobiassen 1 , Rolf Randa 3 , Steinar Wikan 3 , Snorre B. Hagen 1 1 Bioforsk – Norwegian Institute for Agricultural and Environmental Research, Svanvik, Norway 2 Faculty of Health Sciences, Oslo and Akershus University College, Oslo, Norway 3 Norwegian State Nature Inspectorate, Kirkenes, Norway www.bioforsk.no/svanhovd
-
Upload
independent -
Category
Documents
-
view
0 -
download
0
Transcript of Female brown bears in Sør-Varanger, Norway: localities and mother-cub relationships analyzed by...

Kopatz et al. Bioforsk Report Vol. 9 No. 167 2014
1
Female brown bear with cubs in Sør-Varanger. Photo: Steinar Wikan.
Bioforsk Report
Vol. 9 No. 167 2014
Female brown bears in Sør-Varanger, Norway: localities and mother-cub relationships analyzed by genetic methods Alexander Kopatz1, Rune J. Andreassen2, Hans Geir Eiken1, Siv Grete Aarnes1,
Camilla Tobiassen1, Rolf Randa3, Steinar Wikan3, Snorre B. Hagen1
1
Bioforsk – Norwegian Institute for Agricultural and Environmental Research, Svanvik, Norway 2
Faculty of Health Sciences, Oslo and Akershus University College, Oslo, Norway 3
Norwegian State Nature Inspectorate, Kirkenes, Norway
www.bioforsk.no/svanhovd

Kopatz et al. Bioforsk Report Vol. 9 No. 167 2014
2
Main Office Frederik A. Dahls vei 20, N-1432 Ås Tel.: +47 40 60 41 00 Fax: +47 63 00 92 10 [email protected]
Bioforsk Soil and Environment Svanhovd N-9925 Svanvik Tel.: +47 464 13 600 Fax: +47 78 99 56 00 [email protected]
Title: Female brown bears in Sør-Varanger, Norway: localities and mother-cub relationships analyzed by genetic methods
Authors: Alexander Kopatz1, Rune J. Andreassen2, Hans Geir Eiken1, Siv Grete Aarnes1, Camilla
Tobiassen1, Rolf Randa3, Steinar Wikan3, Snorre B. Hagen1 1 Bioforsk – Norwegian Institute for Agricultural and Environmental Research, Svanvik, Norway 2 Faculty of Health Sciences, Oslo and Akershus University College, Oslo, Norway 3 Norwegian State Nature Inspectorate, Kirkenes, Norway
Date: Availability: Project No.: Archive No.:
10.12.2014 Open 8831 Archive no.
Report No.: ISBN-13 no.: Number of pages: Number of appendices:
9 (167) 2014 978-82-17-01363-1 25 10
Employer: Contact person:
Fylkesmannen i Finnmark (Norway), Alexander Kopatz
Keywords: Brunbjørn; brown bear; Ursus arctos; DNA profiler; DNA profile; slektskap; pedigree; kinship; likelihood ratio; non-invasive sampling; ikke forstyrende innsamling; Sør-Varanger; Pasvikdalen, Pasvik Valley; Norge; Norway
Field of work: Population monitoring; bestandsovervåkning; molecular ecology; molekylær økologi; wildlife management; viltforvaltning
Abstract: Knowledge on the number of female brown bears, especially reproducing females, is
important for the wildlife management. One of the largest and densest populations of brown bears in
Norway is located in Sør-Varanger, Finnmark, Northern Norway. Observations of females with cubs are
reported regularly in the region. Information on the relatedness among individuals is often unknown as
well as specifics on the number of reproductions and relatedness among females within this
population. We have utilized genetic data originating from feces and hair samples collected in Sør-
Varanger in the years 2004-2014 to investigate female brown bear localities. In the same period,
personnel from the Norwegian State Nature Inspectorate (SNO) have observed 9 female brown bears
with potential female cubs (a priori probability of 0.5). Sampling areas of those female brown bears
and their potential offspring showed substantial geographical vicinity suggesting overlapping home
ranges. We then calculated the likelihood ratios for these relationships using the forensic software
Familias for 18-mother-female cub relationships. For 10 of 18 such relationships, the genetic
relationship between mother and female cub were confirmed as their observation in the field was
suggestive of. Of the initially observed 9 female bears, 6 have produced 10 female cubs, which here
could be confirmed by genetic methods. The remaining 3 females were not excluded to be mothers to
their potential cubs, but these relationships cannot be confirmed without additional DNA analyses.
Another family relationship could also be confirmed between two observed female bears, but the type
of relationship could not be determined.

Kopatz et al. Bioforsk Report Vol. 9 No. 167 2014
3

Kopatz et al. Bioforsk Report Vol. 9 No. 167 2014
4
Table of Contents
Table of Contents ..................................................................................................... 4
Abstract ................................................................................................................. 5
1. Introduction ........................................................................................................ 6
2. Materials and methods ............................................................................................ 7
3. Results and discussion ............................................................................................ 8
4. Conclusive remarks ............................................................................................... 12
Acknowledgements .................................................................................................. 13
References ............................................................................................................ 14
Appendix 1. Female FI4 and potential offspring FI7 and FI86 . .............................................. 16
Appendix 2. Female FI19 and potential offspring FI40 and FI54 ............................................ 17
Appendix 3. Female FI40 and potential offspring FI72 and FI135 .......................................... 18
Appendix 4. Female FI42 and potential offspring FI77 and FI147 .......................................... 19
Appendix 5. Female FI43/MO3 and potential offspring FI39/LL4, FI109, FI110, FI111 and FI160 ..... 20
Appendix 6. Female FI63/MO4 and potential offspring FI129 ............................................... 21
Appendix 7. Female FI97 and potential offspring FI139 ...................................................... 22
Appendix 8. Female FI98/MO17 and potential offspring FI116 and FI117 ................................. 23
Appendix 9. Females FI14, FI82, FI89/LL29, FI102, FI119, FI121, FI144, FI149, and FI150 ............. 24
Appendix 10. Females FI38/MO18, FI74, FI95, FI148/LL8, FI157 and FI167 ............................... 25

Kopatz et al. Bioforsk Report Vol. 9 No. 167 2014
5
Abstract
Knowledge on the number of female brown bears, especially reproducing females, is
important for the wildlife management. One of the largest and densest populations of brown
bears in Norway is located in Sør-Varanger, Finnmark, Northern Norway. Observations of
females with cubs are reported regularly in the region. Information on the relatedness among
individuals is often unknown as well as specifics on the number of reproductions and
relatedness among females within this population. We have utilized genetic data originating
from feces and hair samples collected in Sør-Varanger in the years 2004-2014 to investigate
female brown bear localities. In the same period, personnel from the Norwegian State Nature
Inspectorate (SNO) have observed 9 female brown bears with potential female cubs (a priori
probability of 0.5). Sampling areas of those female brown bears and their potential offspring
showed substantial geographical vicinity suggesting overlapping home ranges. We then
calculated the likelihood ratios for these relationships using the forensic software Familias for
18-mother-female cub relationships. For 10 of 18 such relationships, the genetic relationship
between mother and female cub were confirmed as their observation in the field was
suggestive of. Of the initially observed 9 female bears, 6 have produced 10 female cubs,
which here could be confirmed by genetic methods. The remaining 3 females were not
excluded to be mothers to their potential cubs, but these relationships cannot be confirmed
without additional DNA analyses. Another family relationship could also be confirmed
between two observed female bears, but the type of relationship could not be determined.

Kopatz et al. Bioforsk Report Vol. 9 No. 167 2014
6
1. Introduction
Although the brown bear (Ursus arctos) has been characterized as a solitary animal, kin-
related spatial structure has been described in brown bears (Proctor et al. 2004; Støen et al.
2005): especially related female brown bears, which tend to be philopatric, often have
overlapping home ranges. Male brown bears leave their natal area and disperse to further
distances, probably to avoid inbreeding (McLellan and Hovey 2001). The number of females,
in particular the ones reproducing, is important for the viability of a population, since a
skewed sex ratio may have large influence on e.g. genetic drift and may lead to a loss in
genetic variation. Also, the number of successful reproduction of bears in an area has become
of high interest to the wildlife management nowadays, as a specific, maximum number of
reproductions might be the goal to be achieved, e.g. to keep a population stable in size.
Sør-Varanger, including the Pasvik Valley, in Northern Norway houses one of the largest and
densest brown bear populations in Norway (Schregel et al. 2012). Observations of females
with cubs are reported regularly from the region (Wartiainen et al. 2009); however, little is
known about the reproduction of this population in the far north of Europe. Since 2004, non-
invasive genetic sampling (feces and hairs) has been conducted in Sør-Varanger (see e.g.
Wartiainen et al. 2009; Kopatz et al. 2011 and 2012a). Methods of noninvasive genetic
sampling to monitor and investigate brown bears or other rare and elusive mammals have
become favored by wildlife researchers and managers during the last decade. Biological
samples are collected and used for identification of animals with the help of the DNA
contained in the sample (Taberlet et al. 1997; Waits and Paetkau 2005; Schwartz et al. 2006).
Feces and hairs are the most common sources for DNA in brown bear monitoring and research
and are widely in use (see e.g. Woods et al. 1999; Mowat and Strobeck 2000; Romain-Bondi et
al. 2004; Kendall 1999; Bellemain et al. 2005; Thompson 2004; Waits & Paetkau 2005; Kendall
et al. 2005, 2008a, 2008b, 2009; De Barba et al. 2010; Schregel et al. 2012).
A previous study investigated the sampling areas and pedigree of brown bears in Sør-Varanger
from 2004 to 2008 (Wartiainen et al. 2009). At least 6 litters from 5 family groups were
reported. At that time, three potential breeding females were known. Starting from 2004,
biological samples from brown bears in Pasvik have been collected regularly. Since 2006 non-
invasive genetic monitoring is implemented in the national monitoring scheme of brown bears
in Norway (see e.g. Aarnes et al. 2013). Here, we use those samples and genotypes to
investigate female brown bear localities and areas of abundance based on the locations the
samples were collected as well as the kinship among individual female bears based on direct
observations from the field by experienced personnel from the Norwegian State Nature
Inspectorate (SNO).

Kopatz et al. Bioforsk Report Vol. 9 No. 167 2014
7
2. Materials and methods
Study area
The study area encompasses the municipality of Sør-Varanger in Finnmark, Northern Norway.
The terrestrial area covers 3481.5 km². The area consists of arctic and boreal ecosystems in a
mosaic of peat land and forest with Scots pine (Pinus silvestris) and downy birch (Betula
pubescens).
Sampling and data analyses
We used the data from samples collected noninvasively from 2004 to 2014 by opportunistic
field sampling of feces and hairs (Wartiainen et al. 2008; Tobiassen et al. 2012) and
systematic sampling with the help of hair traps in the area (Smith et al. 2007; Kopatz et al.
2011). Genetic analyses, PCR, fragment analysis and individual identification were not part of
this study and have been described by Kopatz et al. (2012b) and Andreassen et al. (2012).
Most samples were genotyped with 8 genetic markers (STRs). Being part of other research
projects, a selection has also been previously genotyped with 12 microsatellite markers (see
e.g. Schregel et al. 2012; Kopatz et al. 2014). Further, some individuals have been genotyped
with 15 STRs.
Personnel of the Norwegian State Nature Inspectorate (SNO) records regularly brown bear
females with cubs by observation. Such observations can be characterized as strong indication
of relatedness of the bears observed, since unrelated brown bears tend to roam separately
and solitary (Dahle and Swenson 2003; Dahle et al. 2006; Støen et al. 2006). Further, family
members, especially related female brown bears are known to show overlapping home ranges
(Støen et al. 2006; Zedrosser et al. 2007). In order to reveal geographical overlap and
intersecting residency of female bears, we plotted all sampling locations of each individual
female on a map.
Individual bear genotypes were analyzed based on ecological indications for family
relationship: pedigree analyses were only performed for individuals, which have been
observed and identified previously by the Norwegian State Nature Inspectorate (SNO) in the
field together, suggesting family relationship. We used the latest version of the program
Familias 3.1.6 (Egeland and Mostad 2000; Kling et al. 2014) to calculate likelihood ratios (LR)
for genetic relationship. The LR shows which pedigree is more likely than others. Based on
the field data, the a priori probability of being related/being not related is 0.5. This means a
LR of 20 from the genetic analysis corresponds to a probability of 95% for relatedness. A value
for LR above 20 would be considered as significant support (95% probability for relatedness)
from DNA data for the pedigree in question while a LR value above 100 would be a very strong
support (99% probability of relatedness). The Familias software is widely in use worldwide by
human forensic laboratories and has been applied to numerous cases e.g. resolving family
relations, individual identification after disasters etc. Calculating family relationships
requires allele frequency data of the population in question and we deduced this information
from the overall data we have recorded from the bear population in Sør-Varanger, genotyped
with 12 STRs (Kopatz et al. 2012b). Based on our previous study we used a kinship correction
(FST) of θ=0.09 (Andreassen et al. 2012).
Kopatz et al. Bioforsk Report Vol. 9 No. 167 2014
8
3. Results and discussion
A total of 47 individual genotypes from brown bears sampled in Sør-Varanger (2004-2014)
have been extracted from our genetic database (data not shown). Field observations by the
Norwegian State Nature Inspectorate (SNO) indicated motherhood for 9 female brown bears
with 18 potential female cubs (Tab. 1). For those females and their potential female
offspring, feces and hair has been collected throughout the past. Potential family groups have
been plotted on a map with the following female bears as potential mothers: FI4 (Appendix
1), FI8, FI19 (Appendix 2), FI40 (Appendix 3), FI42 (Appendix 4), FI43/MO3 (Appendix 5),
FI63/MO4 (Appendix 6), FI97 (Appendix 7) and FI98 (Appendix 8). Females without known
reproduction were plotted together (Appendix 9 and 10). Overall, females and potential
offspring showed close proximity of their sample locations and substantial overlap of their
sampling area. Although we have not calculated home ranges, the data suggests overlapping
territory of most of the females with their potential offspring, as it is expected from previous
studies (Støen et al. 2005 and 2006; Zedrosser et al. 2007). The data also suggests that
females, which may be unrelated or distantly related, share territories and probably have
overlapping home ranges, especially in the southern part of the research area, namely the
Pasvik Valley, as it has been reported earlier (see Appendices 1-10; Wartiainen et al. 2009).
We calculated the LRs for 18-mother-female cub relationships and 10 of those relationships
confirmed the genetic relationships between mother and the potential female cub (with a
LR>20; Tab. 2) as their observation in the field was suggestive of. FI42 and FI77 showed the
highest LR=113.9 for their relationship and suggest 99% probability for relatedness. LR results
for FI4-FI86, FI40-FI72, FI40-FI135, FI42-FI147, FI43/MO3-FI160, FI98/MO17-FI116 and
FI98/MO17-FI117 showed 95% probability of relatedness. Mother-cub relations of FI19-FI40 and
FI43/MO3-FI39/LL4 were just below the threshold of LR=20 (95% probability of relatedness).
The bears FI149 and FI150 have been observed together in the field, suggesting family
relationship. However, information from the field could not determine which individual is the
mother and which one the cub. Genetic relatedness was supported by the results for of the
pedigree calculation using 8 STRs: LR=50.8, suggesting significant probability of relatedness.
The results suggests, that at least 6 female brown bears had female offspring during the last
ten years in Sør-Varanger: mothers FI4, FI19, FI40, FI42, FI43/MO3 and FI98/MO17 and 10
female cubs showed significant likelihood with their potential mother using the genetic
method (LR>20; Tab. 2). Reproduction for FI4, FI8, FI19 and FI40 was reported in the previous
study, investigating the relatedness of bears from Sør-Varanger from 2004 to 2008 (Wartiainen
et al. 2009). New individuals with female litter were FI42, FI43/MO3 and FI98/MO17. In
addition, most probably there has been one more reproduction within family FI149/FI150.
Observations in the field are independent from the genetic analysis and therefore represent a
strong likelihood of relatedness (a priori likelihood of 0.5). While for a part of such
observations we found genetic indication, other relationships could not be confirmed with
genetic methods, although field observations suggested such a relationship. One reason could
be the number of genetic markers, STRs, used. While 8 STRs are sufficient for a feasible
identification of individual brown bears, that number seems too low for revealing genetic
relatedness among individuals in some cases. In human forensics 17 STRs are applied to
scrutinize genetic relationships among humans, e.g. for parentage cases or after disasters.
Here, we tested the use of data acquired during wildlife monitoring and including individuals
genotyped with more than 8 STRs. Our results suggest that the panel of genetic markers used
should be increased.

Kopatz et al. Bioforsk Report Vol. 9 No. 167 2014
9
Tab. 1: Genetic registration of female brown bears in Sør-Varanger, Norway, based on collected feces
and hair as well as their potential female offspring based on field observations by the Norwegian State
Nature Inspectorate (SNO).
ID mother Year of registrations
(DNA) ID of potential female
offspring
FI4 2004, 2005, 2007, 2008, 2009
FI7, FI86
FI8 2004 FI10
FI19 2004, 2005, 2006, 2008, 2009, 2011, 2013, 2014
FI40, FI54
FI40 2005, 2006, 2007, 2008, 2009, 2011, 2012
FI72, FI135
FI42 2005, 2008, 2009, 2012, 2013
FI77, FI147
FI43/MO3 2005, 2007, 2008, 2009, 2010, 2011, 2012, 2013
FI39/LL4, FI109, FI110, FI111, FI160
FI63/MO4 2005 (Russia), 2007, 2008, 2009, 2010, 2011, 2012, 2013
FI129
FI97 2009, 2010, 2011, 2012, 2013
FI139
FI98/MO17 2010, 2011, 2012, 2013 FI116, FI117
Kopatz et al. Bioforsk Report Vol. 9 No. 167 2014
10
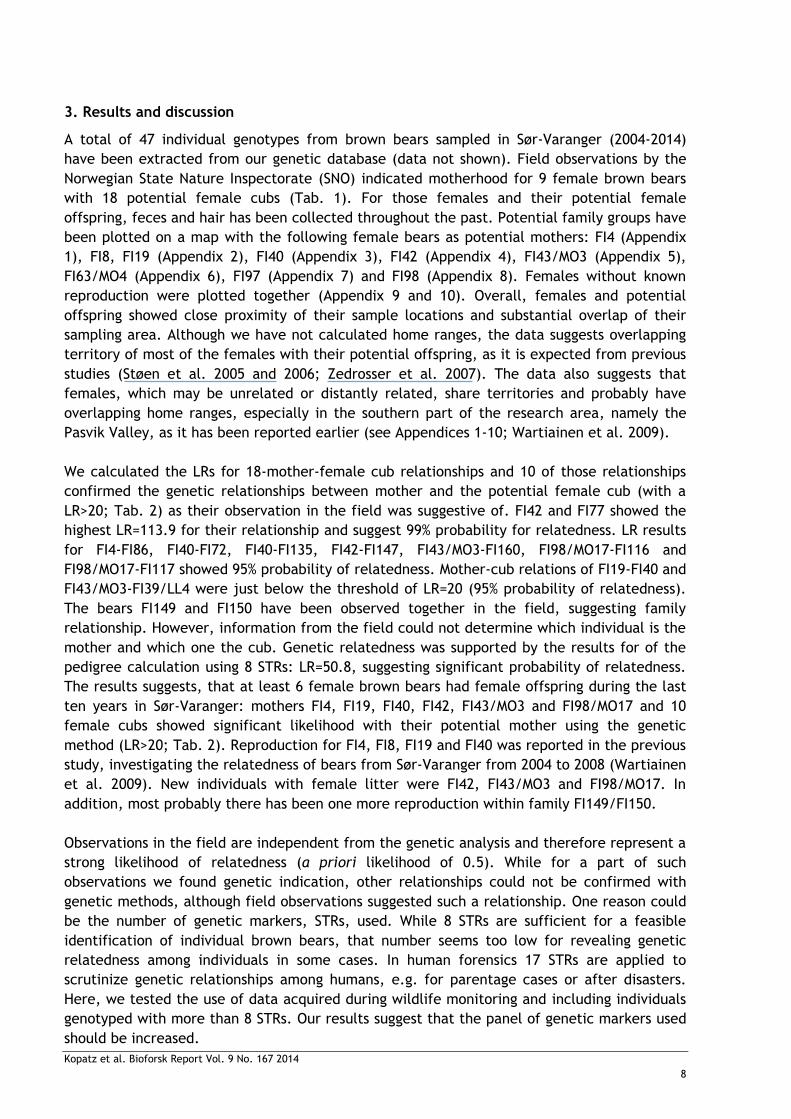
Tab. 2: Analyses of the genetic relationship (mother-cub and family) with the program Familias 3.1.6.
The table shows female brown bears in Sør-Varanger, Norway, and their potential female offspring
based on field observations. Table includes the ID of the female bear and potential offspring, first year
of DNA registration (NO=Norway, RU=Russia), LR=likelihood ratio, STRs=number of STRs as well as
notes.
ID mother ID of potential female offspring
Year of first registration (DNA)
LR STRs Notes
FI4 2004 (NO) 15
FI86 2008 (NO) 51.0 15
FI7 2004 (NO) 14.0 15 Dead 2009
Family 17105.8
FI8 2004 (NO) 6
FI10 2004 (NO) 7.3 12 Dead 2005
FI19 2004 (NO) 15
FI40 2005 (NO) 19.6* 15
FI54 2006 (NO) 7.0 15 Dead 2008
Family 48.6*
FI40 2005 (NO) 15
FI72 2007 (NO) 25.0 15 Dead 2010
FI135 2012 (NO) 21.1 8
Family 1288.3
FI42 2005 (NO) 12
FI77 2008 (NO) 113.9 12
FI147 2012 (NO) 30.4 12
Family 11435.3
FI43/MO3 2005 (RU) 12
FI160 2013 (NO) 83.3 8
FI39/LL4 2005 (NO/FI) 19.9 12 Dead 2005
FI109 2010 (NO) 10.3 8
FI110 2010 (NO) 3.1 8
FI111 2010 (NO) 1.4 8
Family 1891189.9
FI63/MO4 2005 (RU) 12
FI129 2011 (NO) 15.7 8
FI97 2009 (RU) 8
FI139 2012 (NO) 7.5 8
FI98/MO17 2010 (NO) 8
FI116 2011 (NO) 23.5 8
FI117 2011 (NO) 22.5 8
Family 869.7
* Calculation based on 12 STRs

Kopatz et al. Bioforsk Report Vol. 9 No. 167 2014
11
Besides increasing the number of genetic markers (STRs) for future studies we suggest
including male bears to calculate full family pedigrees. The application of next generation
sequencing techniques, i.e. SNPs, may be also be considered to analyze the genetic
relationship among the brown bears in Sør-Varanger.
Individual identification of brown bears has become more and more important for wildlife
management as well as in research. Nowadays, an effective management bases its decisions
and actions on a feasible and correct identification of an animal and the genetic
identification may determine the destiny of an individual bear. Therefore highest standards
applied in human and animal forensic should be applied (see Linacre et al. 2011).
Fig. 1: Female brown bear with cub it Pasvik, Sør-Varanger, Norway. Photo: Steinar Wikan.

Kopatz et al. Bioforsk Report Vol. 9 No. 167 2014
12
4. Conclusive remarks
We investigated the sampling locations of female brown bears in Sør-Varanger, Norway,
registered by DNA from 2004 to 2014. In a second step, we used individual genotypes of
bears, which had strong indication of being related based on observations in the field and
calculated the pedigree. The results of this study can be summed up as follows:
Sampling areas of female brown bears and their potential offspring showed substantial
geographical vicinity suggesting overlapping home ranges.
Observations in the field indicated relatedness of 9 female brown bears and 18 female
cubs.
Of those 9 female bears, 6 have reproduced 10 female cubs, which could be confirmed
by genetic methods; including females FI4, FI19, FI40, FI42, FI43/MO3 and FI98/MO17.
The remaining 3 of the 9 females were not excluded to be mothers to their potential
cubs, but these relationships could not be confirmed. The results suggest that the
panel of genetic markers used should be increased.
Another family relationship could be confirmed between female bears FI149 and FI150.
However, which bear is mother and which may be the cub remains unknown at this
point.
Low likelihood ratios for relatedness may have been caused by the number of genetic
markers used for some individuals. Therefore we suggest increasing the number of
STRs for a more feasible analysis of pedigrees.
Brown bear management and research is based on individuals. Therefore, high quality
standards have to be applied in the handling of the samples and laboratory analyses,
but also further, in the post-processing and analysis of the genetic data. The pedigree
analyses were performed with Familias, a program widely used in human forensics.

Kopatz et al. Bioforsk Report Vol. 9 No. 167 2014
13
Acknowledgements
We thank Daniel Kling for helpful advice in the application of the program Familias.
The project was funded by the Finnmark County Governor’s Office, Environmental
Department.

Kopatz et al. Bioforsk Report Vol. 9 No. 167 2014
14
References
Aarnes, S.G., Tobiassen, C., Brøseth, H., Spachmo, B., Bakke, B.B., Hagen S.B., Eiken, H.G. (2013) Populasjonsovervåking av brunbjørn 2009-2012: DNA analyse av prøver innsamla i Norge i 2012. Bioforsk Rapport Vol. 8, No. 47: 1-61.
Andreassen, R., Schregel, J., Kopatz, A., Tobiassen, C., Knappskog, P.M., Hagen, S.B., Kleven, O., Schneider, M., Kojola, I., Aspi, J., Rykov, A., Tirronen, K., Danilov, P. & Eiken, H.G. (2012) A forensic DNA profiling system for Northern European brown bears (Ursus arctos). Forensic Science International: Genetics 6: 798-809.
Bellemain E., Swenson J.E., Tallmon O., Brunberg S., Taberlet, P. (2005) Estimating population size of elusive animals with DNA from hunter-collected feces: Four methods for brown bears. Conservation Biology 19: 150-161.
Dahle, B., Swenson, J.E. (2003) Home ranges in adult Scandinavian brown bears (Ursus arctos): effect of mass, sex, reproductive category, population density and habitat type. Journal of Zoology 260: 329-335.
Dahle, B., Støen, O.G., Swenson, J.E. (2006) Factors influencing home-range size in subadult brown bears. Journal of Mammalogy 87: 859-865.
De Barba, M., Waits, L.P., Genovesi, P., Randi, E., Chirichella, R. and Ermanno C. (2010a) Comparing opportunistic and systematic sampling methods for non-invasive genetic monitoring of a small translocated brown bear population. Journal of Applied Ecology 47:172-181.
Egeland, T., Mostad, P.F. (2000) Beyond traditional paternity and identification cases. Selecting the most probable pedigree. Forensic Science International 110(4): 47-59.
Kendall, K.C. (1999) Sampling grizzlies with noninvasive techniques. In: Selleck, J. Natural resource year in review: 1998. Lakewood, CO: National Park Service. p. 20-22.
Kendall, K.C. (2005) Northern Divide Grizzly Bear Project, Northern Rocky Mountain Science Center Webpage: http://www.nrmsc.usgs.gov/research/NCDEbeardna.htm.
Kendall, K.C., Stetz, J.B., Roon, D.A., Waits, L.P., Boulanger, J.B., Paetkau, D. (2008a) Grizzly Bear Density in Glacier National Park, Montana. Journal of Wildlife Management 72: 1693–1705.
Kendall, K C., Stetz, J. B., Boulanger, J.B., Macleod, A., Paetkau, D., White, G.C. (2008b) Demography and genetic structure of a recovering grizzly bear population. Journal of Wildlife Management 73: 3-17.
Kling, D., Tillmar, A.O., Egeland, T. (2014) Familias 3 – Extensions and new functionality. Forensic Science International: Genetics 13: 121-127.
Kopatz, A., Eiken, H.G., Aspholm, P.E., Tobiassen, C., Bakken, B.B., Schregel, J., Ollila, T., Makarova, O., Polikarpova, N., Chizhov, V., Hagen, S.B. (2011) Monitoring of the Pasvik-Inari-Pechenga brown bear population in 2007 and 2011 using hair-trapping. Bioforsk Report Vol. 6, No. 148: 1-27.
Kopatz, A., Eiken, H.G., Aspholm, P.E., Hagen, S.B. (2012a) Hair trapping versus field sampling of feces and hair – a comparison of two strategies to collect brown bear samples in 2007 and 2011 at the Pasvik Valley, Norway. Bioforsk Report Vol.7, No. 128: 1-23.
Kopatz, A., Eiken, H.G., Hagen, S.B., Ruokonen, M., Esparza-Salas, R., Schregel, J., Kojola, I., Smith, M.E., Wartiainen, I., Aspholm, P.E., Wikan, S., Rykov, A., Makarova, O., Polikarpova, N., Tirronen, K.F., Danilov, P.I., Aspi, J. (2012b) Connectivity and population subdivision at the fringe of a large brown bear (Ursus arctos) population in North Western Europe. Conservation Genetics 13(3): 681-692.
Kopatz A, Eiken HG, Aspi J, Kojola I, Tobiassen C, Tirronen KF, Danilov PI, Hagen SB (2014) Admixture and gene flow from Russia in the recovering Northern European brown bear (Ursus arctos). PLoS ONE 9(5): e97558.

Kopatz et al. Bioforsk Report Vol. 9 No. 167 2014
15
Linacre A., Gusmão, Hecht W. et al. (2011) ISFG: Recommendations regarding the use of non-human (animal) DNA in forensic genetic investigations. Forensic Science International - Genetics 5: 501-505.
Mowat G., Strobeck, C. (2000) Estimating population size of grizzly bears using hair capture, DNA profiling, and mark–recapture analysis. Journal of Wildlife Management 64: 183–193.
Proctor, M.F., McLellan, B.N., Strobeck, C., Barclay, R.M.R. (2004) Gender specific dispersal distances for grizzly bears analysis revealed by genetic analysis. Canadian Journal of Zoology 82: 1108-1118.
Romain-Bondi, K. A., Wielgus, R.B., Waits, L.P., Kasworm, W.F., Austin, M., Wakkinen, W. (2004) Density and population size estimates for North Cascade grizzly bears using DNA hair-sampling techniques. Biological Conservation 117: 417-428.
Schregel, J., Kopatz, A., Hagen, S.B., Brøseth, H., Smith, M.E., Wikan, S., Wartiainen, I., Aspholm, P.E., Aspi, J., Swenson, J.E., Makarova, O., Polikarpova, N., Schneider, M., Knappskog, P.M., Ruokonen, M., Kojola, I., Tirronen, K.F., Danilov, P.I., Eiken, H.G. (2012) Limited gene flow among brown bear populations in far Northern Europe? Genetic analysis of the east–west border population in the Pasvik Valley. Molecular Ecology, 21: 3474–3488.
Schwartz, M.K., Luikart, G., Waples, R.S. (2006) Genetic monitoring as promising tool for conservation and management. Trends in Ecology and Evolution 22: 25-33.
Smith, M.E., Ollila, L., Bjervamoen, S.G., Eiken, H.G., Aspholm, P.E., Kopatz, A., Aspi, J., Kyykkä, T., Ollila, T., Sulkava, P., Makarova, O., Polikarpova, N., Kojola,I. (2007) Monitoring of the Pasvik Pasvik-Inari brown bear population using hair snares. Final report of the project “Development of the monitoring and research of brown bear population in North Calotte area. 1-9.
Støen, O.G., Bellemain, E., Sæbø, S., Swenson, J.E. (2005) Kin-related spatial structure in brown bears Ursus arctos. Behavioral Ecology and Sociobiology 59: 191-197.
Støen O.-G., A. Zedrosser, S. Sæbø, Swenson, J.E. (2006) Inversely density-dependent natal dispersal in brown bears Ursus arctos. Oecologia 148:356-364
Taberlet, P., Camerra, J.J, Griffin, S., Uhres, E., Hanotte, O., Waits, L.P., Dubois-Paganon, C., Burke, T., Bouvet J. (1997) Noninvasive genetic tracking of the endangered Pyrenean brown bear population. Molecular Ecology 6: 869-876.
Thompson W. L., editor. (2004) “Sampling Rare or Elusive Species.” Island Press, Washington D.C. 429 pages.
Tobiassen, C., Brøseth, H., Banken Bakke, B., Aarnes, S.G., Hagen, S.B., Eiken, H.G. (2012) Populasjonsovervåking av brunbjørn 2009-2012: DNA analyse av prøver samlet i Norge i 2011. Bioforsk Rapport 7 (57): 1-58.
Waits, L., Paetkau, D. (2005) Noninvasive genetic sampling tools for wildlife biologists: A review of applications and recommendations for accurate data collection. Journal of Wildlife Management 69: 1419–1433.
Wartiainen, I., Tobiassen, C., Bjervamoen, S.G., Smith, M.E., Wikan, S., Eiken, H.G. (2008) DNA analyse av sporprøver fra brunbjørn, Øst-Finnmark 2007. Bioforsk Rapport 3 (127): 1-28.
Wartiainen, I., Andreassen, R.J., Tobiassen, C., Aarnes, S.G., Randa, R., Turtumøygard, S., Wikan, S., Eiken, H.G. (2009). Binneområder i Sør-Varanger: Undersøkelse av områdebruk og identifisering av mulige avkom ved feltobservasjoner og DNA-analyse. Bioforsk Rapport Vol. 4, No. 189: 1-21.
Woods J. G., Paetkau D., Lewis D., McLellan B.N., Proctor, M., Strobeck C. (1999) Genetic tagging of free-ranging black and brown bears. Wildlife Society Bulletin 27: 616–627.
Zedrosser A, Støen O -G, Sæbø S, Swenson J E (2007): Should I stay or should I go? Natal dispersal in the brown bear. In: Animal Behaviour, 74 pp. 369-376.

Kopatz et al. Bioforsk Report Vol. 9 No. 167 2014
16
Appendix 1. Localities of samples found and identified for FI4 (red squares; 2004-2009) and potential female offspring FI7 (blue circles; 2005-2009) and FI86 (yellow circles; 2008).
Kopatz et al. Bioforsk Report Vol. 9 No. 167 2014
17
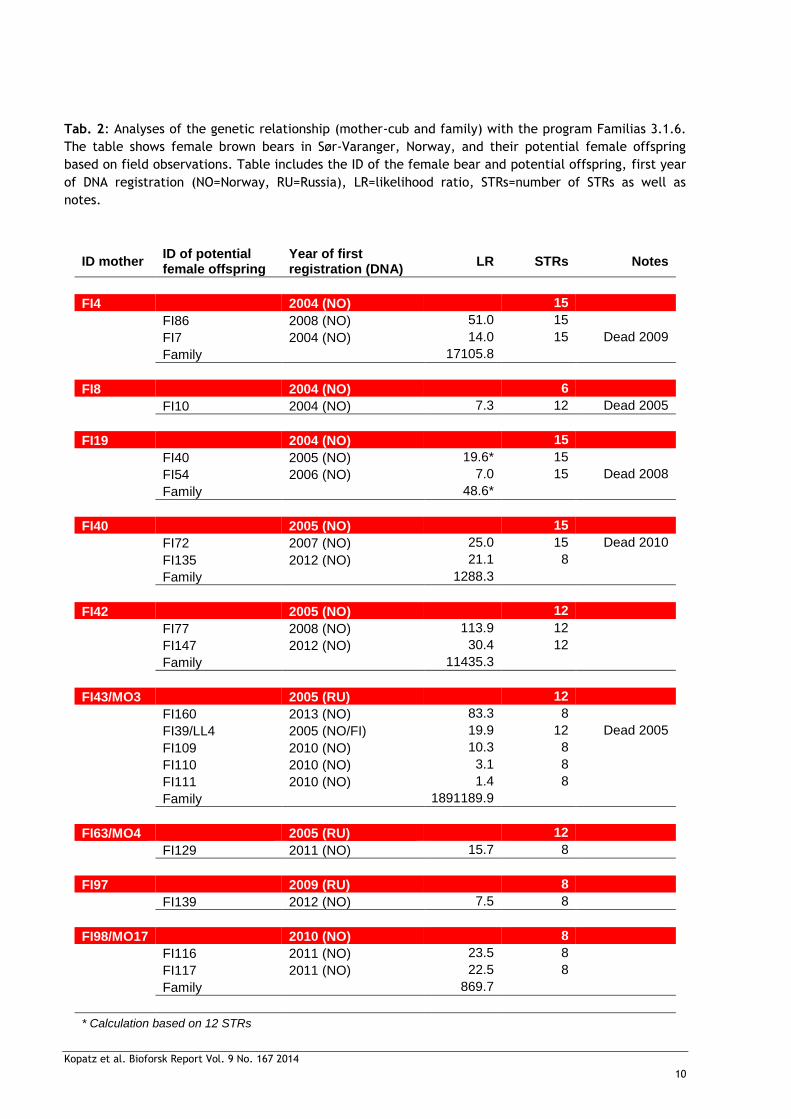
Appendix 2. Localities of samples found and identified for FI19 (red squares; 2005-2014) and potential female offspring FI40 (yellow circles; 2005-2012) and FI54 (blue circles; 2006-2008).

Kopatz et al. Bioforsk Report Vol. 9 No. 167 2014
18
Appendix 3. Localities of samples found and identified for FI40 (red squares; 2005-2012) and potential female offspring FI72 (yellow circles; 2007-2010) and FI135 (blue circles; 2012-2014).

Kopatz et al. Bioforsk Report Vol. 9 No. 167 2014
19
Appendix 4. Localities of samples found and identified for FI42 (red squares; 2009-2013) and potential female offspring FI77 (yellow circles; 2008-2013) and FI147 (blue circles; 2012-2013).

Kopatz et al. Bioforsk Report Vol. 9 No. 167 2014
20
Appendix 5. Localities of samples found and identified for FI43/MO3 (red squares; 2005-2012) and potential female offspring FI39/LL4 (blue circles; 2005), FI109 (green circles; 2010-2011), FI110 (magenta circles; 2010-2012), FI111 (light blue circles; 2010-2013) and FI160 (yellow circles; 2013).

Kopatz et al. Bioforsk Report Vol. 9 No. 167 2014
21
Appendix 6. Localities of samples found and identified for FI63/MO4 (red squares; 2007-2013) and potential female offspring FI129 (yellow circles; 2011).

Kopatz et al. Bioforsk Report Vol. 9 No. 167 2014
22
Appendix 7. Localities of samples found and identified for FI97 (red squares; 2009-2013) and potential female offspring FI139 (yellow circles; 2012-2013).

Kopatz et al. Bioforsk Report Vol. 9 No. 167 2014
23
Appendix 8. Localities of samples found and identified for FI98/MO17 (red squares; 2010-2013) and potential female offspring FI116 (yellow circles; 2011-2012) and FI117 (blue circles; 2011).

Kopatz et al. Bioforsk Report Vol. 9 No. 167 2014
24
Appendix 9. Localities of samples found and identified for females FI14 (blue circles; 2008-2011), FI82 (cyan circle; 2008), FI89/LL29 (green circles; 2009), FI102 (yellow circles; 2010-2013), FI119 (dark blue; 2011-2012), FI121 (dark green; 2012), FI144 (brown; 2012), FI149 (magenta circles; 2013) and FI150 (red circles; 2013).

Kopatz et al. Bioforsk Report Vol. 9 No. 167 2014
25
Appendix 10. Localities of samples found and identified for females FI38/MO18 (light blue circles; 2005), FI74 (green circles; 2008-2013), FI95 (yellow circles; 2009-2010), FI148/LL8 (purple circle; 2012), FI157 (magenta circle; 2013) and FI167 (red circles; 2014).