Feed preference in pigs: Effect of cereal sources at different inclusion rates
32
D. Solà-Oriol, E. Roura and D. Torrallardona Feed preference in pigs: Effect of cereal sources at different inclusion rates published online Oct 24, 2008; J Anim Sci http://jas.fass.org the World Wide Web at: The online version of this article, along with updated information and services, is located on www.asas.org by on May 10, 2011. jas.fass.org Downloaded from
-
Upload
independent -
Category
Documents
-
view
0 -
download
0
Transcript of Feed preference in pigs: Effect of cereal sources at different inclusion rates

D. Solà-Oriol, E. Roura and D. Torrallardona
Feed preference in pigs: Effect of cereal sources at different inclusion rates
published online Oct 24, 2008; J Anim Sci
http://jas.fass.orgthe World Wide Web at:
The online version of this article, along with updated information and services, is located on
www.asas.org
by on May 10, 2011. jas.fass.orgDownloaded from

1
Running head: Cereal preference in pigs 1
2
Feed preference in pigs: Effect of cereal sources at different inclusion rates1 3
4
D. Solà-Oriol,* E. Roura,† and D. Torrallardona*
2 5
6
*Animal Nutrition, Institut de Recerca i Tecnologia Agroalimentàries (IRTA), E-43120 7
Constantí, Tarragona, Spain; and †R & D Feed Additives, Lucta SA, E-08170 Montornés del 8
Vallès, Barcelona, Spain 9
10
1This study was supported by the project “Quantitative evaluation of the palatability of
feed and feed ingredients in swine,” Lucta SA, Montornés del Vallès, Barcelona, Spain. The
authors wish to thank the technical support received from IRTA’s laboratory and farm staff.
2Corresponding author: [email protected]
Page 1 of 30 Journal of Animal Science
Published Online First on October 24, 2008 as doi:10.2527/jas.2008-0949 by on May 10, 2011. jas.fass.orgDownloaded from

2
ABSTRACT: The palatability of different cereals was studied in 2 two-way choice (preference) 11
experiments using pigs of 56 d of age and 17 kg BW. In Exp. 1, the effect of 24 cereals vs. a 12
common reference diet containing white rice on feed preference in pigs was studied. Pigs were 13
offered a free choice between the reference diet and a diet with the cereal under study for 4 d. 14
Barley, corn (2 sources), wheat, cassava meal, biscuit meal, rye, sorghum, and one source of oats 15
were tested at inclusion rates of 300 and 600 g·kg-1
. Short grain rice (whole, brown, or extruded 16
white), long-grain white rice (raw and cooked), extruded barley, extruded corn, extruded wheat, 17
oats (2 sources), thick rolled oats, cooked oats, and naked oats (raw, extruded, or micronized) 18
were tested at inclusion rates of 150, 300, and 600 g·kg-1
. Relative preference of cereals (% of 19
total feed intake) was affected by type of cereal and by rate of inclusion. The diets containing 20
extruded rice (150 g·kg-1
), extruded naked oats (150, 300, and 600 g·kg-1
), or naked oats (150 and 21
300 g·kg-1
) were preferred (P < 0.05) by pigs to the reference diet. However, the reference diet 22
was preferred (P < 0.05) by pigs to the diets containing 150, 300, and 600 g·kg-1
of cooked long-23
grain rice, oats, or cooked oats, 300 and 600 g·kg-1
of extruded wheat, wheat, corn, sorghum, or 24
unhulled short-grain rice, and 600 g·kg-1
of thick rolled oats, extruded corn, rye, extruded barley, 25
micronized naked oats, barley, cassava, or biscuit meal. Extrusion improved (P < 0.05) 26
preference values for corn and naked oats by pigs, but had no effect on barley, rice, or wheat. In 27
Exp. 2, the pig's preferences for oats and barley were studied using mash and pelleted diets. Diet 28
form did not affect preference in oats diets. However, for barley, greater preference values were 29
obtained when measured in pelleted form compared with mash form. Additionally, direct 2-way 30
choices were also performed between oats and barley diets and between diets presented in mash 31
and pelleted forms. Pigs preferred barley to oats, and preferred diets presented in pelleted to 32
those presented in mash form. In conclusion, cereal type, inclusion rate, and diet form affected 33
Page 2 of 30Journal of Animal Science
by on May 10, 2011. jas.fass.orgDownloaded from

3
feed preference in pigs. Using cereals with greater preference values may contribute to the 34
formulation of more palatable feeds, which enhance feed intake of piglets at critical stages such 35
as weaning time. 36
37
Key words: cereal, palatability, pigs, preference, two-way choice. 38
39
INTRODUCTION 40
Piglets at weaning have difficulty in initiating dry feed consumption. They are removed 41
from the sow and offered dry feed and plain water, which, along with other stress factors (Lalles 42
et al., 2007), results in what has been referred to as post-weaning anorexia. As a consequence, 43
the integrity of the gastrointestinal tract may be compromised (Pluske et al., 1997). Thus, 44
ensuring a fast initiation of feeding immediately after weaning is essential to maintain gut 45
function and piglet growth. Animal taste and smell have evolved to associate beneficial (or 46
nutritious) compounds and detrimental (or toxic) compounds with pleasant and unpleasant 47
sensations, respectively (Goff and Klee, 2006). This may result in innate preferences or aversions 48
for different feeds regardless of previous experiences or post-ingestive mechanisms. Therefore, 49
the newly-weaned pig mostly depends on its oro-nasal sensing systems to evaluate feed, and the 50
most palatable feed ingredients should be used at this stage (Forbes, 1995). 51
Cereals constitute the main energy source in piglet diets and are chosen on the basis of 52
their nutrient composition, ignoring possible differences in palatability. The quantification of pig 53
preferences for different cereals should enable the formulation of highly palatable diets that 54
improve feed intake at weaning. This study aims to quantify the palatability of different cereals 55
with the use of 2-way choice preference tests as proposed by Solà-Oriol (2008). The impact on 56
Page 3 of 30 Journal of Animal Science
by on May 10, 2011. jas.fass.orgDownloaded from

4
feed preference of other factors that have been shown to affect feed intake, such as cereal 57
extrusion and feed pelleting (Medel et al., 1999), has also been studied. 58
59
MATERIALS AND METHODS 60
Animals and Housing 61
All the experiments were conducted at Animal Nutrition Unit, Institut de Recerca i 62
Tecnologia Agroalimentàries (IRTA). The experimental procedures with animals described in 63
this study were approved by IRTA’s Ethical Committee on Animal Experimentation. 64
A total of 912 pigs (Landrace × Pietrain) from 9 production batches in IRTA’s sow herd 65
were used to perform 9 groups of 2-way choice tests. Pigs (456 boars and 456 gilts) initiated the 66
tests at 56-d of age (4 wk post-weaning) with an average BW of 16.8 ± 4.2 kg. The results of our 67
previous study (Sola-Oriol, 2008) indicated that feed preferences did not differ between piglets at 68
weaning and 4 wk after weaning. Therefore, the results of the present study using 56-d-old pigs 69
should be applicable to newly-weaned pigs. Eight of the pig groups were used in Exp. 1 and the 70
last group was used to conduct Exp. 2. For each group of pigs, there were 36 pens, containing 2 71
to 3 pigs each, in 2 weaning rooms (24 and 12 pens, respectively) with automatic, forced 72
ventilation and completely-slatted floors. Each pen was provided with 2 feeders with 2 feeding 73
spaces placed beside each other and an equidistant independent water supply at the opposite 74
wall. Within a pen, the 2 diets compared were offered in the 2 feeders according to a two-way 75
choice protocol. 76
Experimental Design 77
In Exp. 1, each of the 8 pig groups was used to conduct a total of 12 two-way choice 78
comparisons during 3 consecutive 4-d experimental periods (4 comparisons per period). All the 79
Page 4 of 30Journal of Animal Science
by on May 10, 2011. jas.fass.orgDownloaded from
5
2-way choice comparisons were conducted using the same reference diet containing 600 g·kg-1
of 80
white broken rice as the only source of cereal. In each experimental period, 1 of the 2-way 81
comparisons consisted of a “reference diet vs. reference diet” comparison which was used as the 82
control. The remaining 3 two-way comparisons were used to test 3 different cereals. In the first 83
experimental period, the 3 cereals were tested at 300 g·kg-1
for the first 3 groups of pigs and at 84
150 g·kg-1
for the last 5 groups of pigs. In the second period, the inclusion rate of the cereals was 85
increased to 600 and 300 g·kg-1
for the first 3 and last 5 groups of pigs, respectively. Finally, in 86
the third period, the cereals alone (at 1,000 g·kg-1
) were tested against rice on its own for the first 87
3 groups and at 600 g·kg-1
for the last 5 groups of pigs. The same cereal was evaluated during the 88
3 periods for each of the 36 pens in each group of animals, and only the inclusion rate was 89
increased with time. Therefore in Exp. 1, a total of 24 different cereal ingredients were compared 90
to the reference diet with white broken rice. Nine replications for each comparison were 91
obtained. All the diets were presented in mash form. 92
The position of the feeders was not changed during the experiment, and the reference diet 93
was always kept in the same position during the 3 periods. This prevented an adaptation period 94
that would have been necessary to respond to the changes in feeder position and shortened the 95
duration of the measurements. Although it could be argued that this approach would not correct 96
for possible effects of feeder position on preference, a control “reference vs. reference” two-way 97
comparison was included in every group of animals to detect such possible effects. For all the 98
animals, it was confirmed that the pre-starter and starter diets that they had been offered before 99
the start of the trial did not contain rice (reference cereal) or any of the cereals to be tested in 100
each particular group. 101
Page 5 of 30 Journal of Animal Science
by on May 10, 2011. jas.fass.orgDownloaded from

6
The last group of animals (36 pens) was used to conduct Exp. 2, which was divided into 2 102
parts (Exp. 2A and Exp. 2B). In Exp. 2A, 24 pens were used to test barley and oats vs. the 103
reference diet, essentially as described for Exp. 1. Twelve pens were used to compare diets 104
presented in mash form, while the other 12 were used to compare diets presented in pelleted 105
form. Both cereals were tested at the inclusion rates of 200, 400, and 600 g·kg-1
in 3 consecutive 106
4-d periods. Six replications for each comparison were obtained. Exp. 2B was conducted with 107
the last 12 pens. In the first 4-d period, the control comparison “reference diet vs. reference diet” 108
was made with both, mash and pelleted diets (6 pens each). In the second 4-d period, the animals 109
that had been offered pelleted diets during the first period were offered a direct 2-way choice 110
between pelleted diets containing 600 g·kg-1
barley and 600 g·kg-1
oats. The animals that had 111
been offered mash diets were offered the same 2-way choice between barley and oats diets, but 112
presented as mash. Finally, in the third 4-d period, each group of 6 pens was divided into 2 113
groups of 3 pens. One was offered the choice between mash and pelleted barley diets (at 600 114
g·kg-1
), and the other was offered the choice between mash and pelleted oats diets (at 600 g·kg-1
). 115
Six replications for each comparison were obtained, 3 of which had previous experience with 116
pelleted and 3 with previous experience with mash diets. 117
Diets and Feeding 118
A basal diet (Table 1) was formulated to meet or exceed the nutrient requirements for 119
swine (NRC, 1998). All of the cereal ingredients were ground with the same hammer mill using 120
a 3-mm screen. Different cereals were evaluated in diets prepared by replacing the corresponding 121
amount of broken rice from the reference diet with the cereal of interest. To avoid possible 122
interferences on feed palatability caused by ingredients other than the cereals, energy, protein, or 123
AA composition were not corrected. The addition of fat or free AA themselves may affect 124
Page 6 of 30Journal of Animal Science
by on May 10, 2011. jas.fass.orgDownloaded from

7
palatability (Mori et al., 1991a,b; Tabuchi et al., 1991; Mizushige et al., 2007). It was decided 125
not to correct for nutrient composition because it would not have been possible to assess the 126
palatability of the cereals per se, if fat or AA were added to the feed. 127
A short-grain variety of rice obtained from the sieving of polished white rice was taken as 128
the cereal of reference in all the tests. Short grain rice was tested as un-hulled rice (whole 129
unpolished rice), as brown rice (unpolished rice with only the husk of the grain removed), and as 130
extruded white rice (at 150°C, 70 atmosphere pressure, and screw speed of 100 rpm). A long-131
grain variety of rice was also tested as long-grain white rice (broken and small size grains 132
obtained from the sieving of polished white rice) and as cooked long-grain white rice (by thermal 133
steaming in a hydrothermal reactor). Barley was used in raw form (without processing) and as 134
extruded barley (at 145ºC; 70 atmosphere pressure, and 75 rpm). Raw (2 sources) and extruded 135
(at 130ºC, 51 atmosphere pressure, and 75 rpm) corn were tested. Raw (unprocessed) and 136
extruded (at 135ºC, 71 atmosphere pressure, and 75 rpm) wheat were also used. Cassava meal 137
was obtained by grinding cassava roots pelleted at 70ºC. Biscuit meal was obtained by grinding 138
byproducts from the bakery industry such as bread, biscuits, breakfast cereals, cakes, crisps, and 139
snacks that are no longer suitable for human consumption. Rye and sorghum were also tested as 140
raw whole grains. Oats was tested as the raw grain (3 sources) without removing the hull, thick 141
rolled oats (the grain was de-hulled, steamed at 120ºC for 45 min, and then flattened by steel 142
rollers into flakes), and cooked oats (thermal steaming in a hydrothermal reactor at 100ºC for 45 143
min). Finally naked oats, a variety of oats with no outer husk, was also tested raw, extruded (at 144
150ºC, 39 atmosphere pressure, and 10 rpm), and micronized (grinding of grains to particles that 145
are only a few microns in diameter). 146
Page 7 of 30 Journal of Animal Science
by on May 10, 2011. jas.fass.orgDownloaded from

8
The different cereal ingredients tested were analyzed according to AOAC (2000) for DM 147
(method 925.09), ash (method 923.03), crude fiber (method 962.09), ether extract (method 148
920.39), and CP (method 968.06). The results of the analysis are shown in Table 2. 149
In Exp. 1, raw barley, corn (sources 1 and 2), wheat, cassava, biscuit meal, rye, sorghum, 150
and oats (source 1) were tested at inclusion rates of 300 and 600 g·kg-1
against the reference diet 151
and also as pure ingredients (1,000 g·kg-1
) against pure short-grain white rice. Whole rice, brown 152
rice, long-grain white rice, extruded white rice, cooked white rice, extruded barley, extruded 153
corn, extruded wheat, oats (sources 2 and 3), thick rolled oats, cooked oats, naked oats, extruded 154
naked oats, and micronized naked oats were tested at inclusion rates of 150, 300, and 600 g·kg-1
155
against the reference diet. 156
Measurements and Calculations 157
In each pen, feed disappearance from the 2 feeders was measured between d 0 to 4, 4 to 158
8, and 8 to 12. Preference was measured as intake of the test diet expressed as % of total feed 159
intake. The following mathematical equation was used: 160
( ) ( )100
intakediet Referenceintakediet Test
intakediet TestPreference% ×
+= 161
Statistical Analysis 162
Exp. 1. Preference values were compared (between cereals by inclusion rate or between 163
inclusion rates by cereral) by ANOVA using the GLM procedure (SAS Inst. Inc., Cary NC). The 164
mathematical model used was: Yi = µ + αi + εi, where Yi is the preference value for the 165
observations of cereal ingredient (or inclusion rate) i, µ is the general mean of all observations, 166
αi is the effect of the feed cereal source (or of inclusion rate), and ει is the unexplained random 167
error. Means from the ANOVA models were compared using the Tukey's Studentized Range 168
Page 8 of 30Journal of Animal Science
by on May 10, 2011. jas.fass.orgDownloaded from

9
(HSD) Test. Additionally, the preference for each cereal at each inclusion rate was compared to 169
the neutral value of 50% using a Student’s t test. 170
The preferences for diets containing either 300 or 600 g·kg-1
extruded barley, corn, naked 171
oats, white rice, or wheat was also compared to that of the corresponding diets with raw cereal 172
using a Student’s t test. The alpha level used for the determination of significance for all the 173
analysis was 0.05. 174
Exp. 2. Preference values for barley and oats at each inclusion rate (200, 400, and 600 175
g·kg-1
) were analyzed with ANOVA using the GLM procedure of SAS by considering the main 176
effects of diet form, cereal type and their interaction. The mathematical model used was Yij = µ + 177
αi + βj + (αβ)ij + εij, where Yij is the percentage of preference for the observations of diet form i 178
and cereal j, µ is the general mean of all observations, αi is the effect of the diet form (mash or 179
pelleted), βj is the cereal effect (barley or oats), (αβ)ij is the interaction between diet form and 180
cereal, and εij is the unexplained random error. 181
Additionally, Student t-tests were performed to compare: (1) the preference for each 182
cereal at each inclusion rate and each diet form with the neutral value of 50%, (2) ADFI of 183
barley and oats based diets offered as 2-way choice either in mash or pelleted form, and (3) 184
ADFI between mash and pelleted diets offered as 2-way choice according to cereal composition 185
(barley or oats) and previous diet form experience of the pigs (mash or pelleted). 186
187
RESULTS 188
Exp. 1 189
The preference values obtained in the first 3 groups of animals using pure cereals were 190
erratic (i.e., not always agreeing well with those obtained at lower inclusion rates). Taking this 191
Page 9 of 30 Journal of Animal Science
by on May 10, 2011. jas.fass.orgDownloaded from

10
into account and the fact that cereals are always included in a balanced diet under practical 192
conditions, in groups 4 to 8, cereals were not tested in pure form, and, instead, the inclusion rate 193
of 150 g·kg-1
was evaluated. The percentage preference measured for the double reference 194
control did not differ from 50% (overall mean = 50.4; SE = 1.22) in any of the 8 groups of pigs 195
(P-values ranging from 0.29 to 0.94), indicating that the observed preference values may be 196
attributed to dietary changes in cereal ingredients. 197
Preference values for the different cereal ingredients studied relative to the common 198
reference diet are shown in Table 3. Differences among cereals were observed at each of the 199
inclusion rates tested (P < 0.05). Among the cereals tested at inclusion rates of 150 g·kg-1
, the 200
highest preference values were observed for extruded rice, extruded naked oats, and naked oats, 201
and having a preference value greater than 50% indicated that they were preferred to the 202
reference diet (P < 0.05). However, the preference values observed for extruded barley, brown 203
rice, extruded corn, thick rolled oats, extruded wheat, micronized naked oats, long-grain white 204
rice, and unhulled short-grain rice were not different from the reference diet. Finally, the lowest 205
preference values (lower than 50%) were observed for cooked white long-grain rice, oats 206
(sources 2 and 3), and cooked oats (P < 0.05). 207
When included at 300 g·kg-1
, preference values greater than 50% were only observed for 208
raw and extruded naked oats. However, preference values lower than 50% (indicative of 209
preference for the reference diet) were observed for wheat, extruded wheat, cooked long-grain 210
rice, corn (source 1), sorghum, oats (sources 1 to 3), unhulled short-grain rice, and cooked oats 211
(P < 0.05). 212
At the greatest inclusion rate of 600 g·kg-1
, a greater preference value than the neutral 213
value of 50% was only observed for extruded naked oats (P < 0.05). The preference values for 214
Page 10 of 30Journal of Animal Science
by on May 10, 2011. jas.fass.orgDownloaded from
11
extruded rice, brown rice, long-grain white rice, and naked oats were not different from 50%; 215
whereas, thick rolled oats, extruded corn, rye, cooked long-grain rice, extruded barley, 216
micronized naked oats, extruded wheat, barley, cassava, wheat, biscuit meal, corn (sources 1 and 217
2), sorghum, unhulled rice, oats (sources 1 to 3), and cooked oats had preference values below 218
50% (P < 0.05). When the cereals were tested as pure ingredients (1,000 g·kg-1
) using pure white 219
short-grain rice as a reference, the preference values for cassava and barley were greater than 220
50% (P < 0.05), whereas corn (source 1), oats (source 1), and sorghum were lower than 50% (P 221
< 0.05). 222
The effect of the inclusion rate (P < 0.05) was observed regardless of the cereal 223
ingredients. When pure ingredient results were discarded, cereal preference decreased as the rate 224
of inclusion increased, with the exception of extruded naked oats where a greater preference 225
value was observed at the inclusion rate of 300 g·kg-1
than at 150 g·kg-1
(P < 0.05). As mentioned 226
before, the preference values for the pure cereals did not always agree with those obtained at 227
lower inclusion rates. Although preference generally decreased with increasing inclusion rates, 228
greater preference values were obtained with barley, corn (source 2), cassava, biscuit meal, and 229
oats (source 1) at 1,000 g·kg-1
than those cereals included at 600 g·kg-1
(P < 0.05). However, it 230
must be taken into account that pure cereals were compared to pure rice instead of the reference 231
diet, which may explain these observations. 232
The effect of extrusion on the preference of different cereals is shown in Figure 1. 233
Extrusion improved the preference value for corn (P = 0.06 and P < 0.05 at 300 and 600 g·kg-1
, 234
respectively) and naked oats (P < 0.05), but had no effect on barley, rice, or wheat. 235
Exp. 2 236
Page 11 of 30 Journal of Animal Science
by on May 10, 2011. jas.fass.orgDownloaded from

12
The preferences for the double reference control in mash and pelleted form (Exp. 2B, first 237
period) were 44.62 (SE, 3.93) and 46.65% (SE, 4.58%) respectively, which were not different 238
from 50% (P = 0.293 and 0.645, respectively). Preference values for barley and oats by diet form 239
(mash or pellet; Exp. 2A) are presented in Table 4. Greater preference values were observed for 240
barley than for oats at all inclusion rates (P < 0.01), confirming the findings of Exp. 1. A 241
tendency (P < 0.10) for greater preference values was observed in pelleted diets for the inclusion 242
rates of 200 and 400 g·kg-1
. At these inclusion rates, interactions between diet form and cereal 243
type were observed (P = 0.10 and P < 0.05, respectively), indicating that the preference 244
improved when measured in pelleted form for barley but not for oats. 245
Comparisons between barley and oats (Exp. 2B, second period) and mash and pelleted 246
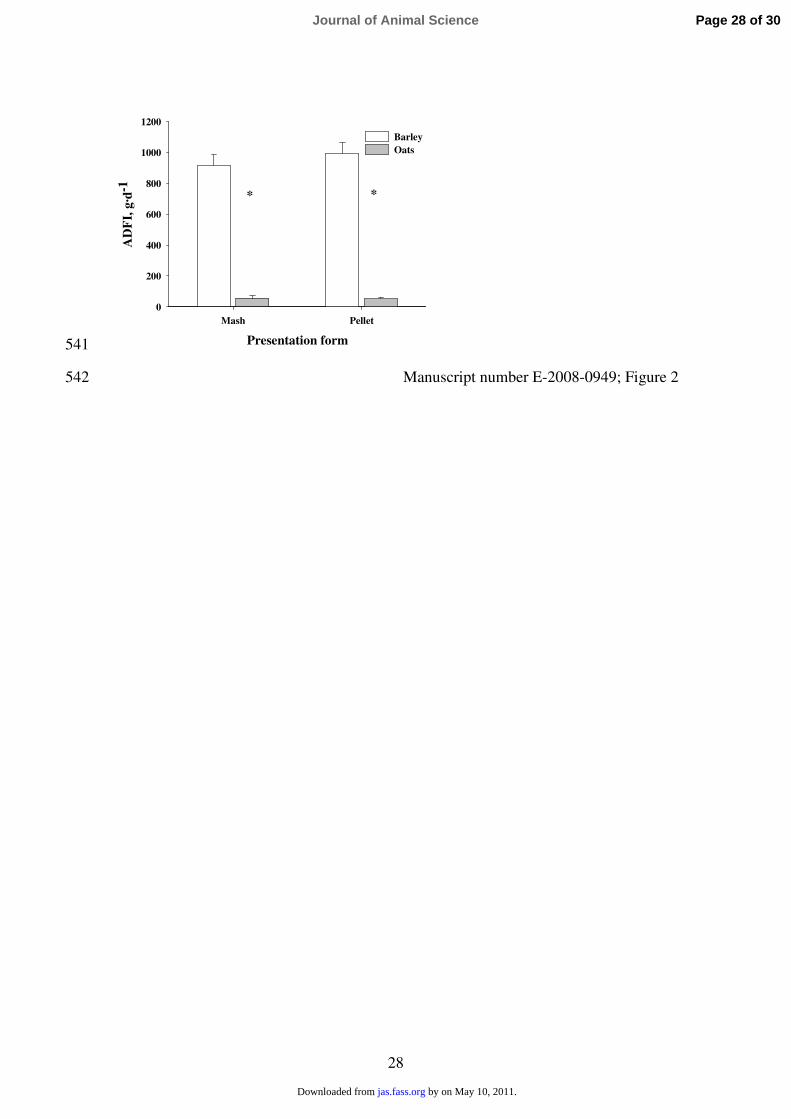
diets (Exp. 2B, third period) are presented in Figures 2 and 3, respectively. Average daily feed 247
intake was greater for barley than for oat-based diets in either mash or pellet form (P < 0.05). 248
Also, intake was greater for pelleted diets than for diets in mash form in both barley and oats (P 249
< 0.05), regardless of previous experience with either mash or pelleted diets. 250
251
DISCUSSION 252
Piglets at weaning have difficulties in initiating dry feed intake. They spend considerable 253
time engaged in exploratory behavior to gather information on the new environment (Gardner et 254
al., 2001), but also spend a lot of time fighting with the new penmates until the new social 255
hierarchy is established (Bruininx et al., 2001). In addition, piglets also seem to have some 256
difficulty in identifying and accepting the new supplies of feed and water. It has been reported 257
that it takes up to 3 wk for piglets to reestablish pre-weaning levels of energy intake, and, 258
meanwhile, their gut integrity can be compromised (Pluske et al., 1997). If a continuous supply 259
Page 12 of 30Journal of Animal Science
by on May 10, 2011. jas.fass.orgDownloaded from

13
of nutrients is maintained after weaning, the detrimental changes in gut structure and function 260
after weaning can be prevented (Kelly et al., 1991; Pluske et al., 1996a,b). Therefore, ensuring a 261
fast initiation of feeding immediately after weaning is essential to maintain gut function and 262
ensure good piglet growth. 263
Cereals are the main source of energy in piglet diets, and they may play an important role 264
in the palatability of feed and its recognition by the weaned piglet. The measurement of 2-way 265
choice preferences against a common reference diet has been proposed as a way of quantifying 266
feed palatability (Solà-Oriol, 2008). The results of our previous study indicated that feed 267
preferences did not differ between newly weaned piglets and pigs at 4 wk post-weaning, 268
provided that the animals from either age group did not have previous experience with any of the 269
2 ingredients tested. Although we used pigs at 4 wk post-weaning, previous experience with the 270
cereals tested was avoided, and therefore, the preference values observed could be applicable to 271
newly weaned pigs. 272
Our results showed a high palatability for cereals not commonly used in piglet feeding 273
such as white rice and naked oats; whereas, a widely used cereal like corn had relatively poor 274
preference values. This is in agreement with the work of Mateos et al. (2006) who showed 275
greater feed intake and weight gain for rice-based diets than for corn-based diets. 276
We observed that pigs have a particularly low preference for oats. This is probably due to 277
its high fiber content, as husk removal (in thick rolled oats) clearly improved the preference. This 278
may also explain the pig's decreased preference for the un-hulled short-grain rice compared to 279
polished white rice. 280
Cereals with relatively high fiber content may increase the bulkiness of the diet and affect 281
intake as a result of the physical capacity of the gastrointestinal tract (Kyriazakis and Emmans, 282
Page 13 of 30 Journal of Animal Science
by on May 10, 2011. jas.fass.orgDownloaded from

14
1995; Whittemore et al., 2001). Mateos et al. (2006) observed that oat hulls reduced feed intake 283
when added to corn-based diets, but had the opposite effect when added to rice-based diets, 284
indicating that fiber only affects palatability above certain rates of inclusion. 285
However, crude fiber content cannot explain the differences observed between other 286
cereal sources. Many plant volatile compounds are produced in plant tissues at specific 287
developmental stages. Although hundreds of volatiles are synthesized at different stages of cereal 288
grain development, only a small subset helps animals recognize the appropriate feeds and avoid 289
poor or dangerous feeds (Goff and Klee, 2006). Studies of flavor preferences and aversions 290
indicate that flavor perception may be linked to the nutritional value associated with the 291
perceived feeds (Gilbertson et al., 1997; Myers et al., 2005). Some of the preference values 292
observed in our study may be explained by the sensory evaluation of the feed, as each cereal 293
ingredient is characterized by a particular volatile profile that can be distinguished by the 294
olfactory system of mammals (Grosch and Schieberle, 1997; Zhou et al., 1999; Sides et al., 2001; 295
Schuh and Schieberle, 2005). 296
Innate preferences may be due to the evolution of taste sensory receptors to recognize 297
specific nutrients or toxic constituents (Mueller et al., 2005). Nutritive characteristics are usually 298
associated with receptors of pleasant tastes: sweet receptors with carbohydrate energy sources, 299
umami with AA, and salty with mineral sources. In contrast, the stimulation of sour and bitter 300
receptors is unpleasant and warns the animal against deteriorated feed or toxic compounds, 301
respectively. This is a potentially important factor when evaluating feed preferences in naive 302
weanling pigs. 303
Some plant volatiles or their precursors may also have antimicrobial or health-promoting 304
activities (Villalba and Provenza, 2005; Goff and Klee, 2006), and as a result, animals may also 305
Page 14 of 30Journal of Animal Science
by on May 10, 2011. jas.fass.orgDownloaded from

15
have developed a preference for them. For example, it is well accepted that grazing herbivores 306
are able to self-medicate by selecting plants with medicinal properties (Villalba and Provenza, 307
2007). 308
It is possible that the high preference values observed in our work for white rice could be 309
related to its health promoting properties. Pluske et al. (2002, 2007) observed that a diet based on 310
white rice improved the resistance of piglets to an E. coli infection, and proposed the use of this 311
cereal as a means of controlling piglets post-weaning diarrhea. Similarly, Mateos et al. (2001) 312
indicated an improved growth in piglets fed cooked rice, but they attributed their results to a 313
greater digestibility and decreased content of non-starch polysaccharides. 314
Feed intake and preference may be regulated by post-ingestive factors as well as sensorial 315
perception. The nutrient composition of the diet has been reported to affect feed intake 316
(Kyriazakis and Emmans, 1995; Whittemore et al., 2001) probably via feedback signals from the 317
gastrointestinal tract that respond to quality and quantity of ingested nutrients. In our studies, the 318
different cereals replaced the white rice from the reference diet on a weight basis without 319
adjusting the nutritional value. Correcting for energy and AA composition was not made as this 320
may affect feed palatability by itself. Fat (Mizushige et al., 2007) and free AA (Mori et al., 321
1991a,b; Tabuchi et al., 1991) have been shown to have an effect on palatability. In addition, 322
under our experimental conditions (Solà-Oriol, 2008), the preference responses are evident as 323
early as the first day of testing, and do not change for at least 10 to 12 d. This indicates a 324
sensorial rather than a post-ingestive (nutritional) response. Nevertheless, feed preference 325
responses to nutritional composition seem to require a period of adaptation longer than the 4 d 326
used in our experiments (Black et al., 1986). Kyriazakis et al. (1991) also reported that although 327
pigs are able to make appropriate choices between diets differing in protein composition to meet 328
Page 15 of 30 Journal of Animal Science
by on May 10, 2011. jas.fass.orgDownloaded from

16
their nutritional needs, they can only do so if they had previous experience with the feeds being 329
offered and had been able to learn about their nutritional consequences. In the current study, pigs 330
did not have previous experience with any of the diets under evaluation, further refuting a 331
possible nutritionally driven choice response. 332
It could be hypothesized that the improved preference observed with extrusion cooking of 333
corn and naked oats was due to an improvement in the availability of their starch and faster 334
glucose release (Medel et al., 1999; Piao et al., 1999) that resulted in an improved palatability. 335
The improvement of feed intake and performance of piglets due to the extrusion of maize 336
supports this hypothesis (Hongtrakul et al., 1998). However, Medel et al. (1999) observed that 337
extrusion of corn improved weight gain of piglets without affecting feed intake, which indicates 338
an effect on nutrient digestibility rather than palatability. Similarly, in our study, the 339
micronization of naked oats had a rather negative effect on preference, despite an expected 340
improvement in nutrient digestibility (Huang et al., 1998). Therefore, there seems to be no clear 341
relationship between nutrient availability and feed preference. Differences in oro-sensorial 342
perception cannot be discarded as it is well known that heat treatments can cause a dramatic 343
change in the profile of volatiles released. 344
Our study on cereal preference was performed using diets in mash form. Considering the 345
fact that diets are often presented as pellets in practice, we performed a 2-way choice to test 346
whether diet form could have an impact on the preference values in oats and barley based diets. 347
While no effect of diet form on the measurement of preference was observed for oats, the 348
preference values for barley were increased in pelleted diets. It seems that pelleting affected 349
palatability of barley in a different way compared with white rice. Therefore, possible 350
interactions between cereal type and technological processing of feed must be considered. 351
Page 16 of 30Journal of Animal Science
by on May 10, 2011. jas.fass.orgDownloaded from

17
Due to the impossibility of testing all cereals against each other, they were compared to 352
the same reference diet containing rice. It could be assumed for a given pair of cereals that the 353
observed relative preferences (vs. rice in the reference diet) would be indicative of which of the 2 354
cereals would be preferred in a direct comparison against each other. In this way, in Exp. 1, it 355
can be expected that barley should be preferred to oats because the preference value for barley 356
was 23% at 600 g·kg-1
; whereas, the preference value for oats ranged between 3 and 8%. The 357
greater intake observed in Exp. 2 for the barley compared with the oat-based diets when offered 358
in a direct 2-way choice supports this approach. 359
The greater preferences observed for pellet over mash feed form for both barley- and oat-360
based diets are in good agreement with the results of Skoch et al. (1983). They observed that 361
when pigs were offered a free choice between corn-based pelleted and mash diets, pigs preferred 362
pelleted diets (85.5 vs. 14.5%, respectively). 363
The nutritional value of feedstuffs is the main criteria for feed formulation, and some 364
aspects such as palatability are often ignored. Our work showed marked differences in pig 365
preference for different cereals. This information may allow nutritionists to choose cereals with a 366
high preference by the piglets, which may contribute to more efficient feed formulation at critical 367
stages such as immediately after weaning. 368
369
LITERATURE CITED 370
AOAC. 2000. Official Methods of Analysis. Assoc. Off. Anal. Chem., Washington, DC. 371
372
Black, J. L., R. G. Campbell, H. Williams, K. J. James, and G. T. Davies. 1986. Simulation of 373
energy and amino acid utilization in the pig. Res. Dev. Agric. 3:121-146. 374
375
Bruininx, E. M. A. M., C. M. C. van der Peet-Schwering, J. W. Schrama, P. F. G. Vereijken, P. 376
C. Vesseur, H. Everts, L. A. den Hartog, and A. C. Beynen. 2001. Individually measured 377
feed intake characteristics and growth performance of group-housed weanling pigs: 378
Page 17 of 30 Journal of Animal Science
by on May 10, 2011. jas.fass.orgDownloaded from

18
Effects of sex, initial body weight, and body weight distribution within groups. J. Anim. 379
Sci. 79:301-308. 380
381
Forbes, J. M. 1995. Voluntary Food Intake and Diet Selection in Farm Animals. CAB 382
International, Wallingford, UK. 383
384
Gardner, J. M., C. F. M. de Lange, and T. M. Widowski. 2001. Belly-nosing in early-weaned 385
piglets is not influenced by diet quality or the presence of milk in the diet. J. Anim. Sci. 386
79:73-80. 387
388
Gilbertson, T. A., D. T. Fontenot, L. D. Liu, H. Zhang, and W. T. Monroe. 1997. Fatty acid 389
modulation of K+ channels in taste receptor cells: Gustatory cues for dietary fat. Am. J. 390
Physiol. Cell Physiol. 41:C1203-C1210. 391
392
Goff, S. A., and H. J. Klee. 2006. Plant volatile compounds: Sensory cues for health and 393
nutritional value? Science 311:815-819. 394
395
Grosch, W., and P. Schieberle. 1997. Flavour of cereal products - a review. Cereal Chem. 74:91-396
97. 397
398
Hongtrakul, K., R. D. Goodband, K. C. Behnke, J. L. Nelssen, M. D. Tokach, J. R. Bergström, 399
W. B. Jr. Nessmith, and I. H. Kim. 1998. The effects of extrusion processing of 400
carbohydrate sources on weanling pig performance. J. Anim. Sci. 76:3034-3042. 401
402
Huang, S. X., W. C. Sauer, M. Pickard, S. Li, and R. T. Hardin. 1998. Effect of micronization on 403
energy, starch and amino acid digestibility in hulls barley for young pigs. Can. J. Anim. 404
Sci. 78:81-87. 405
406
Kelly, D., J. A. Smyth, and K. J. McCracken. 1991. Digestive development of the early-weaned 407
pig. 1. Effect of continuous nutrient supply on the development of the digestive-tract and 408
on changes in digestive enzyme-activity during the 1st week post-weaning. Br. J. Nutr. 409
65:169-180. 410
411
Kyriazakis, I., G. C. Emmans, and C. T. Whittemore. 1991. The ability of pigs to control their 412
protein intake when fed in three different ways. Physiol. Behav. 50:1197-1203. 413
414
Kyriazakis, I. and G. C. Emmans. 1995. The voluntary feed intake of pigs given feeds based on 415
wheat bran, dried citrus pulp and grass meal, in relation to measurements of feed bulk. 416
Br. J. Nutr. 73:191-207. 417
418
Lalles, J. P., P. Bosi, H. Smidt, and C. R. Stokes. 2007. Nutritional management of gut health in 419
pigs around weaning. Proc. Nutr. Soc. 66:240-268. 420
421
Mateos, G. G. et al. 2001. Influence of type of cereal and level of fiber on performance of early-422
weaned piglets. J. Anim. Sci. 79 (Suppl. 1):106-107. (Abstr.) 423
424
Page 18 of 30Journal of Animal Science
by on May 10, 2011. jas.fass.orgDownloaded from

19
Mateos, G. G., F. Martin, M. A. Latorre, B. Vicente, and R. Lazaro. 2006. Inclusion of oat hulls 425
in diets for young pigs based on cooked maize or cooked rice. Anim. Sci. 82:57-63. 426
427
Medel, P., S. Salado, J. C. de Blas, and G. G. Mateos. 1999. Processed cereals in diets for early-428
weaned piglets. Anim. Feed Sci. Tech. 82:145-156. 429
430
Mizushige, T., K. Inoue, and T. Fushiki. 2007. Why is fat so tasty? Chemical reception of fatty 431
acid on the tongue. J. Nutr. Sci. Vitaminol. 53:1-4. 432
433
Mori, M., T. Kawada, T. Ono, and K. Torii. 1991a. Taste preference and protein nutrition and l-434
amino-acid homeostasis in male sprague-dawley rats. Physiol. Behav. 49:987-995. 435
436
Mori, M., T. Kawada, and K. Torii. 1991b. Appetite and taste preference in growing rats given 437
various levels of protein nutrition. Brain Res. Bull. 27:417-422. 438
439
Mueller, K. L., M. A. Hoon, I. Erlenbach, J. Chandrashekar, C.S. Zuker, and N. J. Ryba. 2005. 440
The receptors and coding logic for bitter taste. Nature 434:225-229. 441
442
Myers, K. P., J. Ferris, and A. Sclafani. 2005. Flavour preferences conditioned by postingestive 443
effects of nutrients in preweanling rats. Physiol. Behav. 84:407-419. 444
445
NRC. 1998. Nutrient Requirements of Swine. 10th rev. ed. Natl. Acad. Press, Washington, DC. 446
447
Piao, X. S., B. J. Chae, J. H. Kim, J. Jin, W. T. Cho, and I. K. Han. 1999. Effects of extrusion 448
condition of barley on the growth and nutrient utilization in growing pigs. Asian-Aust. J. 449
Anim. Sci. 12:783-787. 450
451
Pluske, J. R., D. J. Hampson, and I. H. Williams. 1997. Factors influencing the structure and 452
function of the small intestine in the weaned pig: a review. Livest. Prod. Sci. 51:215-236. 453
454
Pluske, J. R., L. Montagne, F. S. Cavaney, B. P. Mullan, D. W. Pethick, and D. J. Hampson. 455
2007. Feeding different types of cooked white rice to piglets after weaning influences 456
starch digestion, digesta and fermentation characteristics and the faecal shedding of beta-457
haemolytic Escherichia coli. Br. J. Nutr. 97:298-306. 458
459
Pluske, J. R., D. W. Pethick, D. E. Hopwood, and D. J. Hampson. 2002. Nutritional influences 460
on some major enteric bacterial diseases of pigs. Nutr. Res. Rev. 15:333-371. 461
462
Pluske, J. R., I. H. Williams, and F. X. Aherne. 1996a. Maintenance of villous height and crypt 463
depth in piglets by providing continuous nutrition after weaning. Anim. Sci. 62:131-144. 464
465
Pluske, J. R., I. H. Williams, and F. X. Aherne. 1996b. Villous height and crypt depth in piglets 466
in response to increases in the intake of cows' milk after weaning. Anim. Sci. 62:145-158. 467
468
Schuh, C., and P. Schieberle. 2005. Characterization of (E,E,Z)-2,4,6-nonatrienal as a character 469
impact aroma compound of oat flakes. J. Agric. Food Chem. 53:8699-8705. 470
Page 19 of 30 Journal of Animal Science
by on May 10, 2011. jas.fass.orgDownloaded from

20
471
Sides, A., K. Robards, S. Helliwell, and M. An. 2001. Changes in the volatile profile of oats 472
induced by processing. J. Agric. Food Chem. 49:2125-2130. 473
474
Skoch, E. R., S. F. Biner, C. W. Deyoe, G. L. Allee, and K. C. Behnke. 1983. Effects of pelleting 475
conditions on performance of pigs fed a corn-soybean meal diet. J. Anim. Sci. 57:922-476
928. 477
478
Solà-Oriol, D. 2008. Quantitative evaluation of the palatability of feed ingredients in swine. PhD 479
Diss. Universitat Autònoma de Barcelona, Bellaterra, Spain. 480
481
Tabuchi, E., T. Ono, H. Nishijo, and K. Torii. 1991. Amino-acid and NaCl appetite, and Lha 482
neuron responses of lysine-deficient rat. Physiol. Behav. 49:951-964. 483
484
Villalba, J. J., and F. D. Provenza. 2005. Foraging in chemically diverse environments: Energy, 485
protein, and alternative foods influence ingestion of plant secondary metabolites by 486
lambs. J. Chem. Ecol. 31:123-138. 487
488
Villalba, J. J., and F. D. Provenza. 2007. Self-medication and homeostatic behaviour in 489
herbivores: learning about the benefits of nature’s pharmacy. Animal 1:1360-1370. 490
491
Whittemore, E. C., G. C. Emmans, B. J. Tolkamp, and I. Kyriazakis. 2001. Tests of two theories 492
of food intake using growing pigs - 2. The effect of a period of reduced growth rate on 493
the subsequent intake of foods of differing bulk content. Anim. Sci. 72:361-373. 494
495
Zhou, M. X., K. Robards, M. Glennie-Holmes, and S. Helliwell. 1999. Analysis of volatile 496
compounds and their contribution to flavor in cereals. J. Agric. Food Chem. 47:3941-497
3953. 498
Page 20 of 30Journal of Animal Science
by on May 10, 2011. jas.fass.orgDownloaded from

21
Table 1. Composition of the basal reference diet, as-fed basis 499
Item Content
Ingredients, g·kg-1
White broken rice 600
Soybean meal, 56% CP1 200
Wheat bran 130
Sunflower oil 30.0
DL-Methionine 1.7
L-Lysine-HCl 4.2
L-Threonine 1.6
L-Tryptophan 0.01
Calcium carbonate 10.1
Dicalcium phosphate 15.0
Salt 3.4
Vitamin and mineral complex2 4.0
Estimated nutrient composition
CP, g·kg-1
179.0
Crude fiber, g·kg-1
19.9
Fat, g·kg-1
43.4
Ash, g·kg-1
52.8
Energy, MJ ME·kg-1
14.1
Calcium, g·kg-1
8.0
Inorganic P, g·kg-1
3.7
Chloride, g·kg-1
3.1
Sodium, g·kg-1
1.5
Methionine, g·kg-1
4.5
Met + Cys, g·kg-1
7.4
Lysine, g·kg-1
12.5
Tryptophan, g·kg-1
2.3
Threonine, g·kg-1
8.1 1HP-300 (Hamlet Protein, Horsens, Denmark). 500
2Provided the following per kg of diet: vitamin A, 10,000 IU; vitamin D3, 2,000 IU; vitamin E, 15 mg; 501
vitamin B1, 1.3 mg; vitamin B2, 3.5 mg; vitamin B12, 0.025 mg; vitamin B6, 1.5 mg; vitamin K3, 2 mg; D-calcium 502
pantothenate, 10 mg; nicotinic acid, 15 mg; biotin, 0.1 mg; folic acid, 0.6 mg; Fe, 80 mg as iron sulfate; Cu, 6 mg as 503
copper sulfate pentahydrate; Co, 0.75 mg as cobalt sulfate; Zn, 150 mg as zinc oxide; Mn, 60 mg as manganese 504
sulfate; I, 0.75 mg as potassium iodate; Se, 0.10 mg as sodium selenite; and ethoxyquin, 150 mg. 505
506
Page 21 of 30 Journal of Animal Science
by on May 10, 2011. jas.fass.orgDownloaded from

22
Table 2. Analyzed nutrient content of the cereal feed ingredients, g·kg-1
507
Cereal Description DM Ash
Crude
fiber Fat CP
Reference White raw short-grain rice 861 5 3 6 71
Rice (short-grain) Unhulled raw 875 37 82 23 66
Brown raw 867 15 8 26 76
White extruded 889 9 2 3 72
Rice (long-grain) White raw 877 9 4 12 89
White cooked 877 15 6 13 74
Barley Raw 909 26 46 18 119
Extruded 897 21 38 20 100
Corn Raw (source 1) 887 13 13 39 82
Raw (source 2) 875 12 15 41 73
Extruded 890 16 14 28 96
Wheat Raw 898 16 28 15 131
Extruded 885 17 17 15 114
Cassava Pellets 880 69 59 7 24
Biscuit meal Bakery byproduct 905 62 13 86 95
Rye Raw 889 16 19 15 97
Sorghum Raw 867 15 12 29 77
Oats Raw (source 1) 895 20 126 52 102
Raw (source 2) 872 26 85 27 97
Raw (source 3) 900 19 91 38 119
Thick rolled (source 2) 889 18 10 53 125
Cooked (source 3) 900 28 92 59 118
Naked oats Raw 878 16 19 67 137
Extruded 898 17 12 79 112
Micronized 907 18 22 77 133
508
Page 22 of 30Journal of Animal Science
by on May 10, 2011. jas.fass.orgDownloaded from

23
Table 3. Preference (% of total feed intake) of different cereal based diets offered in a two-way 509
choice with a common reference diet (Exp. 1)1 510
Inclusion rate, g·kg-1
Cereal Description 150 300
600
1,0002
Rice (short grain) Unhulled raw 37.2defg
18.0efg
*
10.8fgh
*
ND3
Brown raw 56.6abcd
58.8bc
45.6bcd
ND
White extruded 72.0a*
59.5
abc 52.3
b ND
Rice (long-grain) White raw 41.0defg
42.2bcdef
43.5bcd
ND
White cooked 32.8efgh
*
32.6cdefg
*
27.9bcdefg
*
ND
Barley Raw ND
46.6bcde
22.8defgh
*
65.1ab
*
Extruded 64.8abc
56.9bcd
25.8cdefgh
*
ND
Corn Raw (source 1) ND
29.2cdefg
*
11.3fgh
*
32.3bc
*
Raw (source 2) ND
31.4cdefg
8.4gh
*
65.2ab
Extruded 51.1abcde
47.9bcde
33.6bcdef
*
ND
Wheat Raw ND
39.2bcdefg
*
21.7defgh
*
40.6abc
Extruded 47.5bcde
36.3bcdefg
* 23.5defgh
*
ND
Cassava Pellets ND
30.3cdefg
21.8efgh
*
68.6a*
Biscuit meal Bakery by product ND
30.9cdefg
18.4fghi
*
52.2abc
Rye Raw ND
44.5bcde
29.1bcdefg
*
49.1abc
Sorghum Raw ND
26.6defg
*
11.2fgh
*
23.3c*
Oats Raw (source 1) ND
18.1efg
*
3.0h*
30.9
c*
Raw (source 2) 23.1fgh
*
9.9g*
6.6
gh*
ND
Raw (source 3) 11.4h*
10.3
g*
8.3
gh*
ND
Thick rolled (source 2) 50.5abcde
44.9bcde
34.2bcdef
*
ND
Cooked (source 3) 18.5gh
*
12.1fg
*
6.9gh
*
ND
Naked oats Raw 66.6abc
*
65.8ab
*
42.2bcde
ND
Extruded 69.8ab
*
90.1a*
81.8
a*
ND
Micronized 45.6cdef
38.8bcdefg
25.0defgh
*
ND
Pooled SE 4.92 6.09 4.79 7.46
a-iValues in the same column with different letters are different (P < 0.05); n = 9. 511
*Values with this symbol are different from the neutral value of 50% (P < 0.05). A value 512
of 50% indicates that the diet under study and the reference diet are equally preferred. 513 1Cereal based diets were prepared by replacing variable amounts of short-grain raw white 514
rice from the reference diet. 515 22-way choice of pure cereals was performed using pure short-grain raw white rice as 516
reference. 517 3ND: Not determined. 518
Page 23 of 30 Journal of Animal Science
by on May 10, 2011. jas.fass.orgDownloaded from

24
Table 4. Preference (% of total feed intake) of barley and oats based diets offered in a two-way choice with a common reference diet using diets 519
presented in mash or pelleted form (Exp. 2A)1 520
521
Diet form
Mash
Pellet P-values
Inclusion,
g·kg-1
Barley Oats Barley Oats
Pooled
SD Cereal Form Cereal × form
200 60.2b
33.9c 88.2
a*
36.6
c* 18.32 < 0.001 0.054 0.106
400 43.1b
28.8b* 80.8
a* 23.2
b* 22.24 < 0.001 0.092 0.027
600 34.9ab
15.9b*
53.4
a 9.3
b* 21.46 0.002 0.501 0.167
522 a-c
Values in the same row with different letters are different (P < 0.05). 523
*Values with this symbol are different from 50% (P < 0.05). A value of 50% indicates that the diet under study and the reference diet are 524
equally preferred. 525 1Diets were prepared by replacing the corresponding amount of short-grain raw white rice from the reference diet by barley or oats. 526
Means: n = 6. 527
528
529
Page 24 of 30Journal of Animal Science
by on May 10, 2011.
jas.fass.orgD
ownloaded from

25
Figure 1. Percentage of preference of the raw vs. extruded for different cereals tested 530
included at 300 (A) and 600 g·kg-1
(B; Exp. 1). Differences in preference between diets 531
with raw and extruded cereal: *P < 0.05 and †P < 0.10. Values are means (n = 9) with 532
SE represented by vertical bars. 533
534
Page 25 of 30 Journal of Animal Science
by on May 10, 2011. jas.fass.orgDownloaded from

26
300 g·kg-1
Cereal
Barley Corn Naked oats White rice Wheat
% o
f P
refe
ren
ce
0
20
40
60
80
100
Raw
Extruded
*
†
600 g·kg-1
Cereal
Barley Corn Naked oats White rice Wheat
% o
f P
refe
ren
ce
0
20
40
60
80
100
Raw
Extruded
*
*
A
B
535 Manuscript number E-2008-0949; Figure 1 536
Page 26 of 30Journal of Animal Science
by on May 10, 2011. jas.fass.orgDownloaded from

27
Figure 2. Individual ADFI of barley and oats based diets (600 g·kg-1
) offered in 537
a two-way choice; presented either in mash or pellet form (Exp. 2B, 2nd
period)). 538
Differences between barley and oats diets: *P < 0.05. Values are means (n = 6) with SE 539
represented by vertical bars. 540
Page 27 of 30 Journal of Animal Science
by on May 10, 2011. jas.fass.orgDownloaded from
28
Presentation form
Mash Pellet
AD
FI,
g·d
-1
0
200
400
600
800
1000
1200
Barley
Oats
* *
541
Manuscript number E-2008-0949; Figure 2 542
Page 28 of 30Journal of Animal Science
by on May 10, 2011. jas.fass.orgDownloaded from

29
Figure 3. Individual ADFI of mash and pelleted diets offered in a two-way 543
choice according to previous experience with either mash or pelleted diets. Diets 544
contained 600 g·kg-1
of either barley (A) or oats (B; Exp. 2B, 3rd
period). Differences 545
between mash and pelleted diets: *P < 0.05. Values are means (n = 3) with SE 546
represented by vertical bars. 547
Page 29 of 30 Journal of Animal Science
by on May 10, 2011. jas.fass.orgDownloaded from

30
Barley diets
Previous experience
Mash Pellet
AD
FI,
g·d
-1
0
200
400
600
800
1000
1200
1400
1600
Mash
Pellet
* *
Oats diets
Previous experience
Mash Pellet
AD
FI,
g·d
-1
0
200
400
600
800
1000
1200
1400
Mash
Pellet
* *
A
B
548
Manuscript number E-2008-0949; Figure 3 549
550
Page 30 of 30Journal of Animal Science
by on May 10, 2011. jas.fass.orgDownloaded from

Citations http://jas.fass.org#otherarticles
This article has been cited by 1 HighWire-hosted articles:
by on May 10, 2011. jas.fass.orgDownloaded from