
Feature extraction using discrete cosine transform for face recognition
11
This article appeared in a journal published by Elsevier. The attached copy is furnished to the author for internal non-commercial research and education use, including for instruction at the authors institution and sharing with colleagues. Other uses, including reproduction and distribution, or selling or licensing copies, or posting to personal, institutional or third party websites are prohibited. In most cases authors are permitted to post their version of the article (e.g. in Word or Tex form) to their personal website or institutional repository. Authors requiring further information regarding Elsevier’s archiving and manuscript policies are encouraged to visit: http://www.elsevier.com/copyright
Transcript of Feature extraction using discrete cosine transform for face recognition

This article appeared in a journal published by Elsevier. The attachedcopy is furnished to the author for internal non-commercial researchand education use, including for instruction at the authors institution
and sharing with colleagues.
Other uses, including reproduction and distribution, or selling orlicensing copies, or posting to personal, institutional or third party
websites are prohibited.
In most cases authors are permitted to post their version of thearticle (e.g. in Word or Tex form) to their personal website orinstitutional repository. Authors requiring further information
regarding Elsevier’s archiving and manuscript policies areencouraged to visit:
http://www.elsevier.com/copyright

Author's personal copy
Feature extraction using discrete cosine transform and discrimination poweranalysis with a face recognition technology
Saeed Dabbaghchian a,�, Masoumeh P. Ghaemmaghami b, Ali Aghagolzadeh a
a Faculty of Electrical and Computer Engineering, University of Tabriz, Tabriz, Iranb Faculty of Electrical Engineering, Islamic Azad University, Science & Research Branch, Tehran, Iran
a r t i c l e i n f o
Article history:
Received 10 June 2009
Received in revised form
27 September 2009
Accepted 1 November 2009
Keywords:
Discrimination power analysis (DPA)
Discrete cosine transform (DCT)
Coefficient selection (CS)
Face recognition
Pattern recognition
a b s t r a c t
Discrete cosine transform (DCT) is a powerful transform to extract proper features for face recognition.
After applying DCT to the entire face images, some of the coefficients are selected to construct feature
vectors. Most of the conventional approaches select coefficients in a zigzag manner or by zonal
masking. In some cases, the low-frequency coefficients are discarded in order to compensate
illumination variations. Since the discrimination power of all the coefficients is not the same and
some of them are discriminant than others, so we can achieve a higher true recognition rate by using
discriminant coefficients (DCs) as feature vectors. Discrimination power analysis (DPA) is a statistical
analysis based on the DCT coefficients properties and discrimination concept. It searches for the
coefficients which have more power to discriminate different classes better than others. The proposed
approach, against the conventional approaches, is data-dependent and is able to find DCs on each
database. The simulations results of the various coefficient selection (CS) approaches on ORL and Yale
databases confirm the success of the proposed approach. The DPA-based approaches achieve the
performance of PCA/LDA or better with less complexity. The proposed method can be implemented for
any feature selection problem as well as DCT coefficients. Also, a new modification of PCA and LDA is
proposed namely, DPA–PCA and DPA–LDA. In these modifications DCs which are selected by DPA are
used as the input of these transforms. Simulation results of DPA–PCA and DPA–LDA on the ORL and Yale
database verify the improvement of the results by using these new modifications.
& 2009 Elsevier Ltd. All rights reserved.
1. Introduction
Researches in the field of face recognition have become anattractive subject in the recent years. Activities in this field comefrom its applications in different areas such as security andsurveillance, commercial and law enforcement. Ability forimplementation in real time has intensified the attention to thisfield. Although research in the field of face recognition is activeover 30 years and considerable successes in face recognitionsystems have been achieved, still there are some unsolvedproblems in it. Illumination variation, rotation and facial expres-sion are the basic existing challenges in this area.
A wide variety of approaches have been developed byresearchers for face recognition problem (see [1,2] for a survey).From one point of view, these various approaches are categorizedinto two general groups, namely feature-based and holisticapproach. In feature-based approaches, shapes and geometricalrelationships of the individual facial features including eyes,
mouth and nose are analyzed. But in holistic approaches, the faceimages are analyzed as two-dimensional holistic patterns.Feature-based approaches are more robust against rotation, scaleand illumination variations, but their success depends on thefacial feature detection. Due to difficulties in facial featuredetection, holistic approaches are considered much morefrequently than feature-based approaches [1].
Extracting proper features is crucial for satisfactory design ofany pattern classifier system. In this way, two types of discretetransforms, statistical and deterministic, have been widely usedfor feature extraction and data redundancy reduction. The basisvectors of the statistical transforms depend on the statisticalspecification of the database and different basis vectors arepossible for different databases. Deterministic transforms haveinvariant basis vectors which are independent of the database.Although statistical transforms have a great ability to removecorrelation between data, they have high computational complex-ity. Also computation of the basis vectors for each given databaseis needed.
Among statistical approaches, principal component analysis(PCA) and linear discriminant analysis (LDA) are two powerfulstatistical tools for feature extraction and data representation.
ARTICLE IN PRESS
Contents lists available at ScienceDirect
journal homepage: www.elsevier.com/locate/pr
Pattern Recognition
0031-3203/$ - see front matter & 2009 Elsevier Ltd. All rights reserved.
doi:10.1016/j.patcog.2009.11.001
� Corresponding author. Tel.: +98 9353611842.
E-mail address: [email protected] (S. Dabbaghchian).
Pattern Recognition 43 (2010) 1431–1440

Author's personal copyARTICLE IN PRESS
Kirby and Sirovich [3] were the first to employ Karhunen–Loevetransform (KLT) to represent facial images. Then Turk and Pentland[4]developed a PCA based approach namely ‘‘Eigenface’’. PCAextracts features that are most efficient for representation, whichmay not be very useful for classification. Etemad and Chelappa [5],Belhumeur et al. [6] and Zhao et al. [7] then proposed the LDA‘‘Fisherface’’ method to extract features that are most efficient forclassification. Because of some limitations of the PCA and LDA, avariety of modifications have been proposed by authors. For moredetails see [8–16].
Proportional advantages of deterministic transforms makethem an interesting class of feature extraction approaches.Discrete Fourier transform (DFT) [17], wavelet transform[18–20] and discrete cosine transform (DCT) [21–28] are theimportant approaches of this class. Some special properties of DCTmake it a powerful transform in image processing applications,including face recognition. DCT is very close to the KLT and has astrong ability for data decorrelation [26]. There are fast algorithmsfor DCT realization, which is not the case for KLT.
Combination of statistical and deterministic transformsconstructs a third type of feature extraction approaches withboth advantages. In this type, DCT reduces the dimension ofdata to avoid singularity and decreases the computationalcost of PCA and LDA. Chen et al. [29] showed that using thePCA or the LDA in the DCT domain yields the same results asthe one obtained from the spatial domain. Various combina-tions of the DCT, PCA and LDA have been surveyed byPnevmatikakis and Polymenakos [30]. Ramasubramanian andVenkatesh [22] used a combination of the DCT, PCA and thecharacteristics of the human visual system for encoding andrecognition of faces.
After applying the DCT to an image, some coefficients areselected and others are discarded in data dimension reduction.The selection of the DCT coefficients is an important part of thefeature extraction process. In most of the approaches whichutilize the DCT, not enough attention was given to coefficientsselection (CS). The coefficients are usually selected with conven-tional methods such as zigzag or zonal masking. These conven-tional approaches are not necessarily efficient in all theapplications and for all the databases. Discrimination poweranalysis (DPA) is a novel approach which selects features (DCTcoefficients) with respect to their discrimination power. DPAutilizes statistical analysing of a database, associates each DCTcoefficient discrimination to a number, and generates a CS mask.Our proposed feature extraction approach is database dependentand is able to find the best discriminant coefficients for eachdatabase.
The rest of the paper is organized as follows: Section 2 isdevoted to the feature extraction approach. The whole procedureof our approach is depicted in Section 3. Experimental results anddiscussion are presented in Section 4, and finally Section 5includes conclusion.
2. Feature extraction
In this section, various DCT feature extraction approachesare considered and a new efficient approach is proposed. DCTfeature extraction consists of two stages. In the first stage, theDCT is applied to the entire image to obtain the DCT coefficients,and then some of the coefficients are selected to constructfeature vectors in the second stage. Dimension of theDCT coefficient matrix is the same as the input image. In factthe DCT, by itself, does not decrease data dimension; so itcompresses most signal information in a small percent ofcoefficients.
2.1. DCT and coefficients selection
For an M�N image, where each image corresponds to a 2Dmatrix, DCT coefficients are calculated as follows:
Fðu; vÞ ¼1ffiffiffiffiffiffiffiffiMNp aðuÞaðvÞ
XM�1
x ¼ 0
XN�1
y ¼ 0
f ðx; yÞ � cosð2xþ1Þup
2M
� �
� cosð2yþ1Þvp
2N
� �u¼ 0;1; . . . ;M; v¼ 0;1; . . . ;N ð1Þ
where aðoÞ is defined by:
aðoÞ ¼1ffiffiffi2p o¼ 0
1 otherwise
8<: ð2Þ
f ðx; yÞ is the image intensity function and Fðu; vÞ is a 2D matrix ofDCT coefficients. Block-based implementation and the entireimage are the two implementations of the DCT. Entire image DCThas been used in this paper. The DCT is applied to the entire imageto obtain the frequency coefficient matrix of the same dimension.Fig. 1a and b shows a typical face image and its DCT coefficientsimage.
In general, the DCT coefficients are divided into three bands(sets), namely low frequencies, middle frequencies and highfrequencies. Fig. 1c visualizes these bands. Low frequencies arecorrelated with the illumination conditions and high frequenciesrepresent noise and small variations (details). Middle frequenciescoefficients contain useful information and construct the basicstructure of the image. From the above discussion, it seems thatthe middle frequencies coefficients are more suitable candidatesin face recognition.
Although coefficients selection, the second stage of thefeature extraction, is an important part of the feature extractionprocess and strongly influences the recognition accuracy, but ithas received only scant attention. Pan et al. [28] proposed toselect the coefficients which minimize the reconstruction error.But this is a good criterion in case of compression notrecognition. Jing and Zhang [21] proposed an approach to finddiscriminant bands (a group of coefficients) in the transformedspace. Their approach searches the discriminant coefficients inthe transformed space group by group. In this case, it is possibleto lose a discriminant coefficient placing beside the non-discriminant coefficients in a group [35]. Er et al. [27] proposedto discard DC or three low-frequency coefficients in order tocompensate illumination variations. Jiang and Feng [31]showed that removal of DC element enables the reconstructedfacial image to be robust to lighting changes and removal ofhigh-frequency DCT coefficients to be robust to scaling varia-tions. Choi et al. [32] proposed using energy probability togenerate a frequency mask but without attention to class
Low Middle High
Fig. 1. (a) A typical face image; (b) its DCT transformed image and (c) typical
division of the DCT coefficients into low, middle and high frequencies.
S. Dabbaghchian, M.P. Ghaemmaghami / Pattern Recognition 43 (2010) 1431–14401432

Author's personal copyARTICLE IN PRESS
information. Sanderson and Paliwal [33] used the polynomialcoefficients derived from the 2D–DCT coefficients obtainedfrom the spatially neighboring blocks.
2.2. Basis of data-dependent approach
By paying attention to the points stated in the abovediscussion, conventional CS approaches select the fixed elementsof the DCT coefficients matrix. We call these conventional CSapproaches deterministic. Zigzag, zonal masking and theirmodifications are the examples of the deterministic approaches.Two popular deterministic approaches are shown in Fig. 2.Although the deterministic approaches are simple, they are notnecessarily efficient for all the databases. Using a DCT coefficientin a feature vector, which improves the true recognition rate in adatabase, may deteriorate results in another database. We claimthat an adaptive CS method will improve the accurate recognitionrate. In this way, we propose another group of CS approachesnamely, data-dependent approaches. The main idea behind thedata-dependent approaches is that all of the DCT coefficients donot have the same ability to discriminate various classes. In otherwords, some coefficients, namely discriminant coefficients,separate classes better than others. These discriminantcoefficients are dependent on database specifications. Our aim isto find these discriminant coefficients of a database. We propose astatistical approach to solve this problem. Our approachstatistically analyzes all images of a database to associate eachDCT coefficient with a number related to its discrimination power(DP). We name this analysis discrimination power analysis (DPA).Experimental results show that DPA as a data-dependentapproach improves the accurate recognition rate in exchange fora little increase in computations. But what are the characteristicsof a discriminant coefficient? A discriminant coefficient has smallvariation within a class, and also large variation between theclasses. It is described completely in the following subsection. Theidea of data-dependent approach and DPA can be implementedfor any feature selection problem as well as DCT coefficients.
DPA is different from other similar approaches such as PCA andLDA, etc., which utilize between- and within- class variances.These approaches are trying to obtain a transform whichmaximizes the discrimination of the features in the transformeddomain, while DPA searches for the best discriminant features inthe original domain. Also combination of DPA and premaskingmakes it robust against the limited number of the trainingsamples. DPA has no singularity problem which is commonamong LDA-based methods. DPA can be used as a stand-alonefeature reduction algorithm or combined with other approaches.DPA–PCA and DPA–LDA are two new modifications of the baselinePCA/LDA which combines with DPA.
2.3. Discrimination power analysis
DP of a coefficient depends on two attributes: large variationbetween the classes and small variation within the classes (and itmeans large discrimination power). Thus in one possible way, theDP can be estimated by the division of the between- class varianceto the within- class variance. In this way, it is expected that onecan estimate large values for discriminant coefficients. Eq. (3)represents the DCT coefficients matrix for an image size of M�N
X ¼
x11 x12 . . . x1N
x21 x22 . . . x2N
^ ^ ^ ^
xM1 xM2 . . . xMN
266664
377775
M�N
ð3Þ
Having C classes and S training images for each class, totally C� S
training images are present. DP of each coefficientxij(xijði¼ 1;2; . . . ;M; j¼ 1;2; . . . ;NÞ) can be estimated as follows:
1. Construct the train set matrix, Aij, by choosing the DCTcoefficients of the positions i and j for all classes and alltraining images:
Aij ¼
xijð1;1Þ xijð1;2Þ � � � xijð1;CÞ
xijð2;1Þ xijð2;2Þ � � � xijð2;CÞ
^ ^ ^ ^
xijðS;1Þ xijðS;2Þ � � � xijðS;CÞ
266664
377775
S�C
ð4Þ
2. Calculate the mean value of each class:
Mcij ¼
1
S
XS
s ¼ 1
Aijðs; cÞ; c¼ 1;2; . . . ;C ð5Þ
3. Calculate variance of each class:
Vcij ¼
XS
s ¼ 1
ðAijðs; cÞ �McijÞ
2; c¼ 1;2; . . . ;C ð6Þ
4. Average the variance of all the classes:
VWij ¼
1
C
XC
c ¼ 1
Vcij ð7Þ
5. Calculate the mean of the all training samples
Mij ¼1
S� C
XC
c ¼ 1
XS
s ¼ 1
Aijðs; cÞ ð8Þ
6. Calculate the variance of all the training samples:
VBij ¼
XC
c ¼ 1
XS
s ¼ 1
ðAijðs; cÞ �MijÞ2
ð9Þ
7. Estimate the DP for location (i,j):
Dði; jÞ ¼VB
ij
VWij
; 1r irM; 1r jrN ð10Þ
The high value of DP means high discrimination ability of thecorresponding coefficient. In other words, it is expected to gainthe maximum recognition rate by using the coefficient that hasthe maximum discrimination power. Fig. 3a and b shows the DPvalues for Yale and ORL databases. Their values are normalizedbetween zero and one. As expected, high-frequency coefficientshave small power of discrimination. The middle frequencycoefficients have approximately large power of discrimination.Also discrimination power of low-frequency coefficients variesbased on the database. The low-frequency coefficients have largediscrimination power on the ORL database, but small values onthe Yale database. Illumination variations of the facial images are
1 0
Fig. 2. Scheme of the DCT coefficients selection with deterministic approaches,
(a) zigzag and (b) zonal masking.
S. Dabbaghchian, M.P. Ghaemmaghami / Pattern Recognition 43 (2010) 1431–1440 1433

Author's personal copyARTICLE IN PRESS
the reasons for this difference. Illumination conditions varyextensively on the Yale database, while there is no change onthe ORL database. Fig. 3c and d shows the location of the fiftylarge value of DP. Whereas DPA is a statistical approach, thenumber of training images influences the DP values. The numberof training images affects the DP values of the low-frequencycoefficients more than other coefficients.
2.4. Premasking
Because DPA is a statistical analysis, the number of trainingsamples influence its validation. Ideally, when enough number ofsamples for each class is available, DPA is an optimum CSapproach. But when a limited number of the training samples isavailable, it degrades. Suppose that a training set of a databasedoes not have any illumination variations. Therein, a largeDP is calculated for the DC coefficient. So it is a discriminantcoefficient. Any illumination variation in the test set may lead toincorrect recognition. A large number of training samples whichcontains various conditions of the face images increases the DPAvalidity [34].
As considered in the previous section, the DCT domain isdivided into three bands. Middle frequencies are suitablecandidates for the correct recognition among these bands. Ourexperiments show that large DP may be calculated on highfrequencies, especially with small size of training set, but it is notreasonable because of the noisy nature of these coefficients. Thesame phenomenon happens for the low frequencies, except thatlarge DP will be reasonable if there is no illumination variation. Byattention to our experiments and properties of the three bands,our proposed method limits the search area of the discriminantcoefficients to avoid reaching an unreasonable results, which is a
consequence of the small number of the training samples.Furthermore, limitation of the search area decreases thecomputational cost, and it is sufficient to analyse the DP for thecoefficients inside the area. A premask (pm), like the one shown inFig. 3e, limits the search area of the discriminant coefficients. Thecoefficients outside the mask are not used for recognition. LargeDP values outside the premask most probably result from thesmall number of the training samples [35]. Suitable size andshape of the premask depends on the database specifications.Size of the premask is determined by the number of coefficientswhich is desired for selection. Very small size premask losesthe discriminant coefficients, and very large premask has nosignificant effect and increases the computational complexity. Asan experimental rule, the number of coefficients inside thepremask must be 1.5–2 times greater than the number ofcoefficients which is desired for selection. High frequenciesalways masked, but masking of low frequencies depends on theillumination variation of the database. The notation
rs re cs ce� �
is used to describe a premask position andlength. In this notation rs and re are the start and end row ofthe premask, respectively. Also cs and ce denote the start and endcolumns of the premask.
2.5. Connection with PCA and LDA
Principal component analysis (PCA) and linear discriminantanalysis (LDA) are two powerful tools for feature extraction anddata representation. They have been successfully used inhuman face recognition. Kirby and Sirovich [3] employedKarhunen–Loeve transform to represent facial images. Their workimmediately led to the PCA Eigenface technique [4]. LDA extractsfeatures that are most efficient for discrimination, while PCA
horizental frequency index
verti
cal f
requ
ency
inde
x
10 20 30 40 50 60 70 80
10
20
30
40
50
600.1
0.2
0.3
0.4
0.5
0.6
0.7
0.8
0.9
horizental frequency index
verti
cal f
requ
ency
inde
x
10 20 30 40
10
20
30
40
500.1
0.2
0.3
0.4
0.5
0.6
0.7
0.8
0.9
10 20 30 40
10
20
30
40
50
20 40 60 80
10
20
30
40
50
605 10 15 20
5
10
15
20
10
5 10 15 20
5
10
15
20
rs
re
cecs
Fig. 3. (a,b) DPA values for all of the frequency indexes on the Yale and ORL database; (c,d) the location of fifty largest DPA values on the Yale and ORL database and
(e) premasking of the DCT coefficients.
S. Dabbaghchian, M.P. Ghaemmaghami / Pattern Recognition 43 (2010) 1431–14401434
Author's personal copyARTICLE IN PRESS
extracts features that are most efficient for representation, whichmay not be very useful at all from a classification standpoint [12].Etemad and Chalappa [5], Belhumeur et al. [6] and Zhao et al. [7]then proposed the LDA Fisherface method to extract features thathave the best discrimination ability. Eigenface and Fisherfacemethods have by now become common performance benchmarksin the field. However, there is a serious limitation of FLD, which isthat the total number of the features available from FLD is limitedto c�1, where c is the number of classes.
However, PCA and LDA have a common disadvantage whenworking on images. In face recognition for example, each datum isan image matrix. To perform PCA or LDA, the two-dimensional(2-D) image matrices must be previously transformed intoone-dimensional (1-D) vectors. The resulting vector space isusually of a very high dimensionality: An image of 256�256resolutions then becomes a 65,536-dimensional vector. The highdimensionality makes PCA and LDA difficult to implement. On theone hand, PCA and LDA both involve eigenvalue decomposition,which is extremely time consuming for high dimensional vectors.On the other hand, if the dimensionality exceeds the number ofdata points, LDA becomes a singularity problem and cannot besolved directly. To avoid the implementation difficulties of PCAand LDA, it is necessary to decrease data dimensions with apreprocessing step. For this purpose, PCA and LDA can beimplemented in the DCT domain. In this way, data dimension isreduced by selecting some of the coefficients with a zigzagmanner. Also, it is a good idea to use DPA as a preprocessing stepbefore PCA and LDA, finding discriminant coefficients and datadimensions reduction. We call these modifications of PCA andLDA in the DCT domain as DPA–PCA and DPA–LDA, respectively.PCA and LDA transfer data from original space to feature spaceagainst DPA, which finds discriminant coefficients in the originalspace.
3. The whole procedure
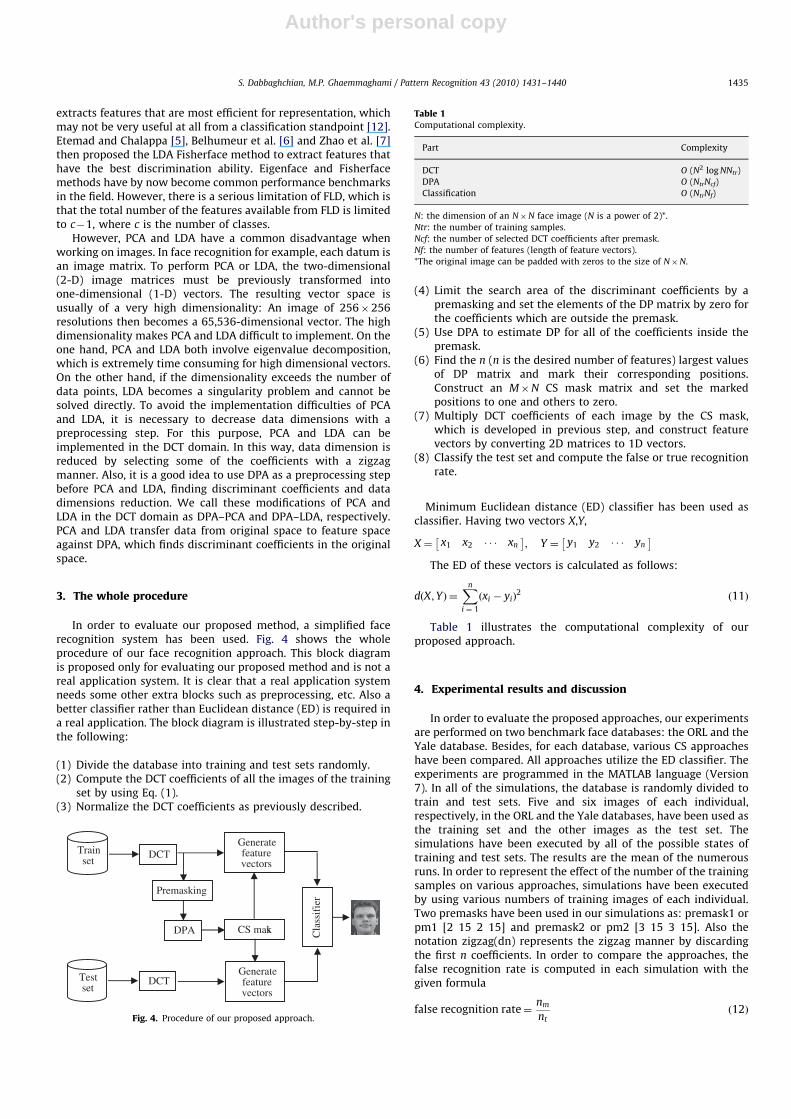
In order to evaluate our proposed method, a simplified facerecognition system has been used. Fig. 4 shows the wholeprocedure of our face recognition approach. This block diagramis proposed only for evaluating our proposed method and is not areal application system. It is clear that a real application systemneeds some other extra blocks such as preprocessing, etc. Also abetter classifier rather than Euclidean distance (ED) is required ina real application. The block diagram is illustrated step-by-step inthe following:
(1) Divide the database into training and test sets randomly.(2) Compute the DCT coefficients of all the images of the training
set by using Eq. (1).(3) Normalize the DCT coefficients as previously described.
(4) Limit the search area of the discriminant coefficients by apremasking and set the elements of the DP matrix by zero forthe coefficients which are outside the premask.
(5) Use DPA to estimate DP for all of the coefficients inside thepremask.
(6) Find the n (n is the desired number of features) largest valuesof DP matrix and mark their corresponding positions.Construct an M�N CS mask matrix and set the markedpositions to one and others to zero.
(7) Multiply DCT coefficients of each image by the CS mask,which is developed in previous step, and construct featurevectors by converting 2D matrices to 1D vectors.
(8) Classify the test set and compute the false or true recognitionrate.
Minimum Euclidean distance (ED) classifier has been used asclassifier. Having two vectors X,Y,
X ¼ x1 x2 � � � xn� �
; Y ¼ y1 y2 � � � yn� �
The ED of these vectors is calculated as follows:
dðX;YÞ ¼Xn
i ¼ 1
ðxi � yiÞ2
ð11Þ
Table 1 illustrates the computational complexity of ourproposed approach.
4. Experimental results and discussion
In order to evaluate the proposed approaches, our experimentsare performed on two benchmark face databases: the ORL and theYale database. Besides, for each database, various CS approacheshave been compared. All approaches utilize the ED classifier. Theexperiments are programmed in the MATLAB language (Version7). In all of the simulations, the database is randomly divided totrain and test sets. Five and six images of each individual,respectively, in the ORL and the Yale databases, have been used asthe training set and the other images as the test set. Thesimulations have been executed by all of the possible states oftraining and test sets. The results are the mean of the numerousruns. In order to represent the effect of the number of the trainingsamples on various approaches, simulations have been executedby using various numbers of training images of each individual.Two premasks have been used in our simulations as: premask1 orpm1 [2 15 2 15] and premask2 or pm2 [3 15 3 15]. Also thenotation zigzag(dn) represents the zigzag manner by discardingthe first n coefficients. In order to compare the approaches, thefalse recognition rate is computed in each simulation with thegiven formula
false recognition rate¼nm
ntð12Þ
Train set
Test set
DPA
DCT
CS mask
Generate feature vectors
Cla
ssif
ier
DCTGenerate feature vectors
Premasking
Fig. 4. Procedure of our proposed approach.
Table 1Computational complexity.
Part Complexity
DCT O (N2 log NNtr)
DPA O (NtrNcf)
Classification O (NtrNf)
N: the dimension of an N�N face image (N is a power of 2)*.
Ntr: the number of training samples.
Ncf: the number of selected DCT coefficients after premask.
Nf: the number of features (length of feature vectors).
*The original image can be padded with zeros to the size of N�N.
S. Dabbaghchian, M.P. Ghaemmaghami / Pattern Recognition 43 (2010) 1431–1440 1435

Author's personal copyARTICLE IN PRESS
where nm is the number of misclassified images and nt is thenumber of the test set images.
4.1. Experiments with the Yale face database
The Yale face database (http://cvc.yale.eduTail) containsimages with major variations, including changes in illuminationconditions, subjects wearing eyeglasses and different facialexpressions. This database involves 165 frontal facial images,with 11 images of 15 individuals. The size of each image is243�320 with 256 gray levels. Fig. 5 shows 11 sample images ofone individual of this database. Each image is scaled down to thesize of 60�80 pixels. Reconstructed images by using fiftycoefficients with zigzag and DPA are presented in Figs. 5b and c,respectively.
4.1.1. Comparison of various CS approaches
This experiment compares the performance of two groups ofCS approaches: conventional and data dependent. Fig. 6a showsthe false recognition rate in terms of the number of features(coefficients), comparing six different approaches. From theconventional approaches zigzag CS approach is very popular,but there is no theoretical background in which it is suitable forrecognition. As shown in Fig. 6a, it generates poor results on theYale database. Discarding the first or the first three coefficients of
zigzag feature vectors improves the recognition rate on the Yaledatabase. CS by using DPA decreases the false recognition ratesignificantly, but it is slightly larger than the zigzag(d3).Premasking the search area of DPA decreases the computationalcost and reaches the minimum false recognition rate.
4.1.2. Number of training images
The number of the training images has an important effect onthe performance of each pattern recognition system. The overallperformance of all the approaches deteriorates by decreasingthe number of training images and vice versa. But some of theapproaches are more sensitive than others. Fig. 6b shows the falserecognition rate in terms of the number of the training images forfour different approaches. DPA is the most sensitive to thenumber of training images, among the four approaches. The falserecognition rate decreases from 0.29 to 0.12. Limiting the searcharea of DPA reduces its sensitivity. The preference of pm2+DPAover DPA becomes more distinctive when the number of trainingimages is decreased. Also it is observable that by using sufficientnumber of training images, DPA and pm2+DPA significantlyimprove the performance over zigzag and zigzag(d3). Twenty-fivecoefficients have been used in this simulation. We repeated thesimulation with different number of coefficients and similarresults were achieved.
Fig. 5. Demo images from the Yale database; (a) original images; (b) reconstructed images by zigzag and (c) reconstructed images by DPA.
20 40 60 80 100 120 1400.08
0.1
0.12
0.14
0.16
0.18
0.2
0.22
0.24
0.26
number of features
mea
n of
fals
e re
cogn
ition
rate
zigzagzigzag(d1)zigzag(d3)DPApm1+DPApm2+DPA
2 4 6 8 100.12
0.14
0.16
0.18
0.2
0.22
0.24
0.26
0.28
0.3
number of training images
mea
n of
fals
e re
cogn
ition
rate
zigzagzigzag(d3)DPApm2+DPA
Fig. 6. Mean of false recognition rate with different CS approaches on the Yale database in terms of (a) number of features and (b) number of training images.
S. Dabbaghchian, M.P. Ghaemmaghami / Pattern Recognition 43 (2010) 1431–14401436

Author's personal copyARTICLE IN PRESS
4.1.3. Combining with PCA and LDA
As previously mentioned, DPA+PCA and DPA+LDA are the newmodifications of conventional PCA and LDA approaches. In thesenew modifications, DPA selects discriminant coefficients andprovides the input vectors for PCA and LDA. Fig. 7a compares thebaseline PCA and some modifications in the DCT domain. Theseapproaches have a difference on the CS section and using DPAdecreases the false recognition rate. Among the PCA withconventional CS approaches, zigzag (d3) reaches the minimumfalse recognition rate, but pm2+DPA reaches a smaller error withless computations. Fig. 7b presents a similar comparison onLDA-based approaches. DPA+LDA significantly decreases the falserecognition rate, but limiting the search area has a smallreduction of error rate. The horizontal axis of Fig. 7b is thedimension of the input vectors to LDA.
4.1.4. Summary of the results
As shown in Fig. 6a and Fig. 7a, b, the difference of falserecognition rate between various approaches is a functionof feature numbers. So the improvements of proposed approachesvary depending on the number of coefficients. Table 2summarizes the minimum, maximum and mean improvementof the proposed approaches with other approaches on theYale database. Among the CS approaches, pm2+DPA hasbeen compared with other approaches. As an example,pm2+DPA leads, in improvement, to 0.2% at minimum and2.66% at maximum and 1.12% at average improvement incomparison with zigzag(d3). Also pm2+DPA+PCA andpm2+DPA+LDA lead to 1% and 3.35% at average in comparisonwith zigzag(d3)+PCA and zigzag(d3)+LDA, respectively. DPA-
based approaches achieve the performance of PCA/LDA or betterwith less complexity.
4.2. Experiments with the ORL face database
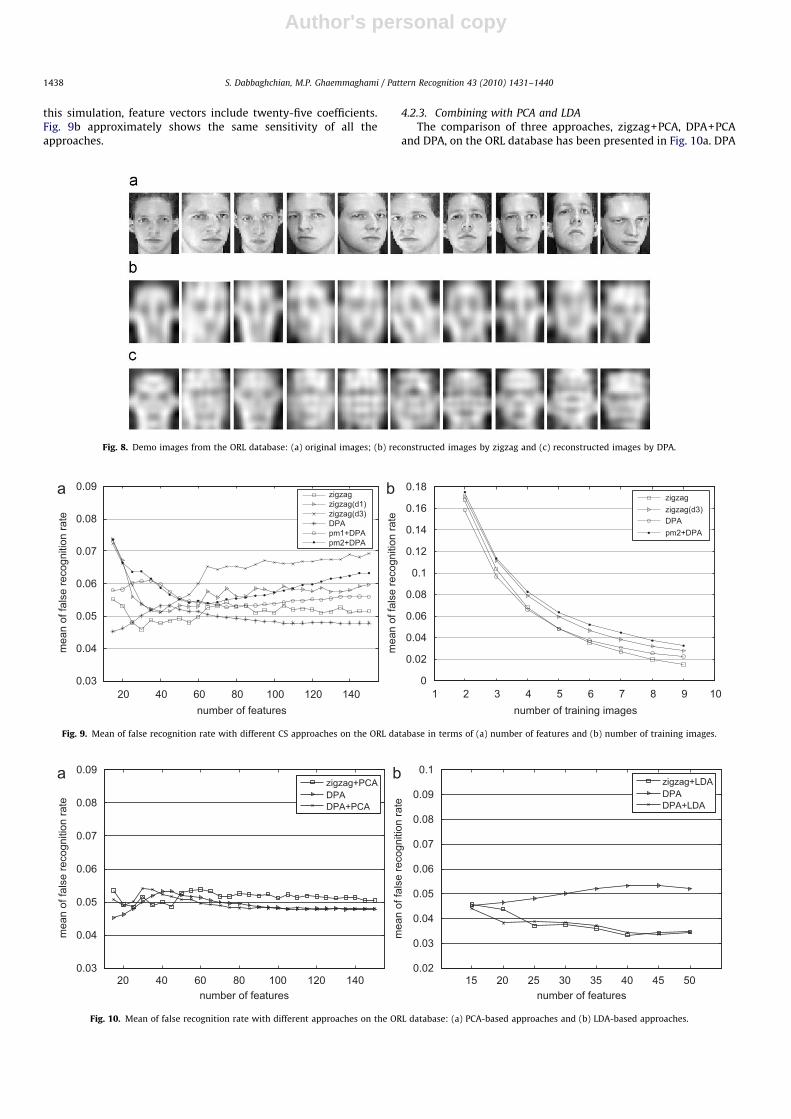
The ORL database (http://www.cam-orl.co.uk) contains 400facial images (40 images of 10 individuals) captured betweenApril 1992 and April 1994. The size of each image is 92�112pixels with 256 gray levels. The images of each individual vary inexpressions, details, poses and scales. Fig. 8a shows 10 sampleimages of one individual. Each image is scaled down to the size of46�56 pixels. Reconstructed images by using fifty coefficientswith zigzag and DPA are presented in Fig. 8b and c, respectively.
4.2.1. Comparison of various CS approaches
Fig. 9a shows the false recognition rate in terms of the numberof features (coefficients), using six different approaches on theORL database. Whereas there is no illumination variation onthe ORL database, three low-frequency coefficients have largediscrimination, and discarding these coefficients increasesthe false recognition rate. DPA confirms this result as the largeDP value is computed for these low-frequency coefficients(see Fig. 3). Because of the same reason limiting the search areaof DPA increases the false recognition rate. Coefficients selectionby using DPA reaches better performance than other approacheson the ORL database, particularly when the number of features issmall.
4.2.2. Number of training images
The effect of the number of training images for the fourapproaches on the ORL database is illustrated in Fig. 9b. In
20 40 60 80 100 120 1400.08
0.1
0.12
0.14
0.16
0.18
0.2
0.22
0.24
number of features
mea
n of
fals
e re
cogn
ition
rate
zigzag+PCAzigzag(d3)+PCADPA+PCApm2+DPApm2+DPA+PCA
15 20 25 30 35 40 45 500.12
0.14
0.16
0.18
0.2
0.22
0.24
number of features
mea
n of
fals
e re
cogn
ition
rate
zigzag+LDAzigzag(d3)+LDADPA+LDApm2+DPApm2+DPA+LDA
Fig. 7. Mean of false recognition rate with different approaches on the Yale database: (a) PCA-based approaches and (b) LDA-based approaches.
Table 2Improvement of our approaches on Yale database(%).
pm2+DPA pm2+DPA+PCA pm2+DPA+LDA
Method Min Max Mean Method Min Max Mean Method Min Max Mean
Zigzag 1.29 10.3 8.32 Zigzag+PCA 0.73 10.3 8.51 Zigzag+LDA 3.08 7.9 4.93Zigzag(d1) 5.26 9.08 6.72 Zigzag(d1)+PCA 3.19 7.51 6.48 Zigzag(d1)+LDA 2.44 9.34 4.92Zigzag(d3) 0.2 2.66 1.12 Zigzag(d3)+PCA �0.34 2.85 1 Zigzag(d3)+LDA 1.27 7.67 3.35DPA 1.52 3.97 2.99 DPA+PCA 1.52 4.07 3.18 DPA+LDA 0.43 1.24 0.75pm1+DPA 1.57 3.26 2.2 pm1+DPA+PCA 1.55 6.12 2.9 pm1+DPA+LDA 0.5 1.23 0.71Zigzag(d3)+PCA �1.84 1.73 0.25 pm2+DPA �0.38 1.99 0.74 pm2+DPA �3.75 5.62 1.38Zigzag(d3)+LDA �0.99 5.02 2.17 pm2+DPA+PCA 0 0 0 pm2+DPA+LDA 0 0 0
S. Dabbaghchian, M.P. Ghaemmaghami / Pattern Recognition 43 (2010) 1431–1440 1437
Author's personal copyARTICLE IN PRESS
this simulation, feature vectors include twenty-five coefficients.Fig. 9b approximately shows the same sensitivity of all theapproaches.
4.2.3. Combining with PCA and LDA
The comparison of three approaches, zigzag+PCA, DPA+PCAand DPA, on the ORL database has been presented in Fig. 10a. DPA
Fig. 8. Demo images from the ORL database: (a) original images; (b) reconstructed images by zigzag and (c) reconstructed images by DPA.
20 40 60 80 100 120 1400.03
0.04
0.05
0.06
0.07
0.08
0.09
number of features
mea
n of
fals
e re
cogn
ition
rate
zigzagzigzag(d1)zigzag(d3)DPApm1+DPApm2+DPA
1 2 3 4 5 6 7 8 9 100
0.02
0.04
0.06
0.08
0.1
0.12
0.14
0.16
0.18
number of training images
mea
n of
fals
e re
cogn
ition
rate
zigzagzigzag(d3)DPApm2+DPA
Fig. 9. Mean of false recognition rate with different CS approaches on the ORL database in terms of (a) number of features and (b) number of training images.
20 40 60 80 100 120 1400.03
0.04
0.05
0.06
0.07
0.08
0.09
number of features
mea
n of
fals
e re
cogn
ition
rate
zigzag+PCADPADPA+PCA
15 20 25 30 35 40 45 500.02
0.03
0.04
0.05
0.06
0.07
0.08
0.09
0.1
number of features
mea
n of
fals
e re
cogn
ition
rate
zigzag+LDADPADPA+LDA
Fig. 10. Mean of false recognition rate with different approaches on the ORL database: (a) PCA-based approaches and (b) LDA-based approaches.
S. Dabbaghchian, M.P. Ghaemmaghami / Pattern Recognition 43 (2010) 1431–14401438
Author's personal copyARTICLE IN PRESS
and DPA+PCA are approximately similar and slightly better thanzigzag+PCA. Fig. 10b shows the same comparison for zigzag+LDA,DPA+LDA and DPA approaches. DPA+LDA and zigzag+LDAproduce similar results, but DPA slightly decreases theperformance.
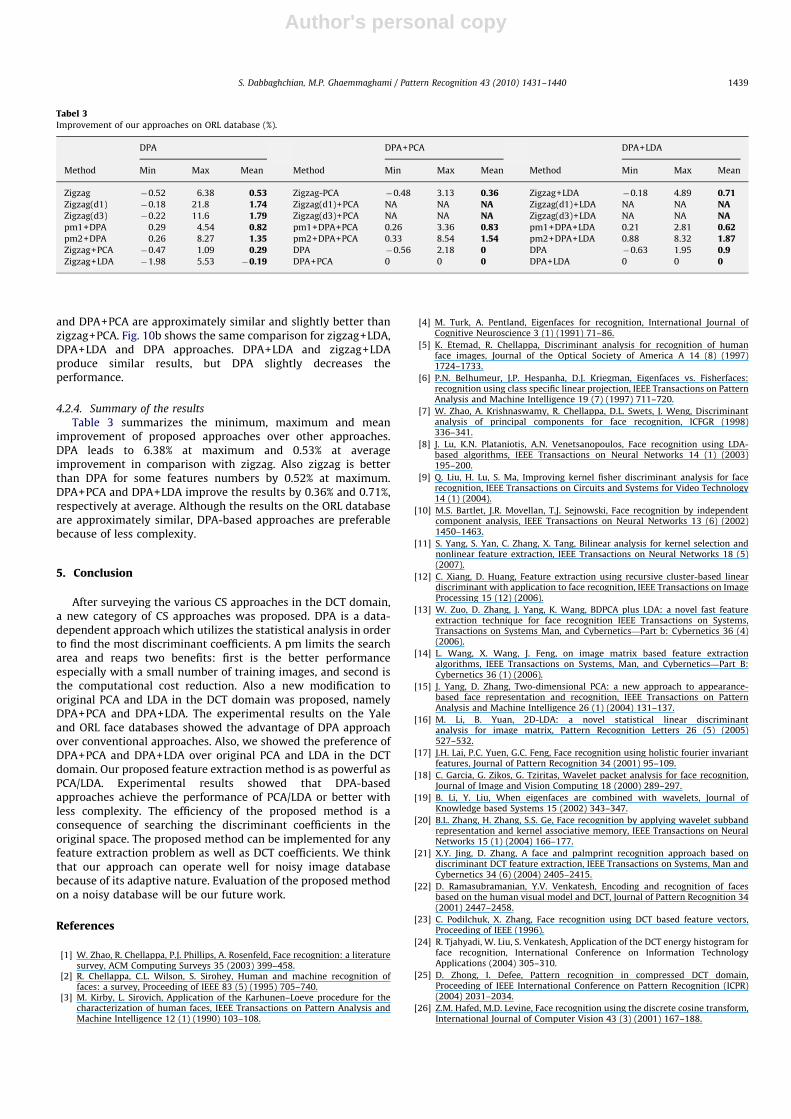
4.2.4. Summary of the results
Table 3 summarizes the minimum, maximum and meanimprovement of proposed approaches over other approaches.DPA leads to 6.38% at maximum and 0.53% at averageimprovement in comparison with zigzag. Also zigzag is betterthan DPA for some features numbers by 0.52% at maximum.DPA+PCA and DPA+LDA improve the results by 0.36% and 0.71%,respectively at average. Although the results on the ORL databaseare approximately similar, DPA-based approaches are preferablebecause of less complexity.
5. Conclusion
After surveying the various CS approaches in the DCT domain,a new category of CS approaches was proposed. DPA is a data-dependent approach which utilizes the statistical analysis in orderto find the most discriminant coefficients. A pm limits the searcharea and reaps two benefits: first is the better performanceespecially with a small number of training images, and second isthe computational cost reduction. Also a new modification tooriginal PCA and LDA in the DCT domain was proposed, namelyDPA+PCA and DPA+LDA. The experimental results on the Yaleand ORL face databases showed the advantage of DPA approachover conventional approaches. Also, we showed the preference ofDPA+PCA and DPA+LDA over original PCA and LDA in the DCTdomain. Our proposed feature extraction method is as powerful asPCA/LDA. Experimental results showed that DPA-basedapproaches achieve the performance of PCA/LDA or better withless complexity. The efficiency of the proposed method is aconsequence of searching the discriminant coefficients in theoriginal space. The proposed method can be implemented for anyfeature extraction problem as well as DCT coefficients. We thinkthat our approach can operate well for noisy image databasebecause of its adaptive nature. Evaluation of the proposed methodon a noisy database will be our future work.
References
[1] W. Zhao, R. Chellappa, P.J. Phillips, A. Rosenfeld, Face recognition: a literaturesurvey, ACM Computing Surveys 35 (2003) 399–458.
[2] R. Chellappa, C.L. Wilson, S. Sirohey, Human and machine recognition offaces: a survey, Proceeding of IEEE 83 (5) (1995) 705–740.
[3] M. Kirby, L. Sirovich, Application of the Karhunen–Loeve procedure for thecharacterization of human faces, IEEE Transactions on Pattern Analysis andMachine Intelligence 12 (1) (1990) 103–108.
[4] M. Turk, A. Pentland, Eigenfaces for recognition, International Journal ofCognitive Neuroscience 3 (1) (1991) 71–86.
[5] K. Etemad, R. Chellappa, Discriminant analysis for recognition of humanface images, Journal of the Optical Society of America A 14 (8) (1997)1724–1733.
[6] P.N. Belhumeur, J.P. Hespanha, D.J. Kriegman, Eigenfaces vs. Fisherfaces:recognition using class specific linear projection, IEEE Transactions on PatternAnalysis and Machine Intelligence 19 (7) (1997) 711–720.
[7] W. Zhao, A. Krishnaswamy, R. Chellappa, D.L. Swets, J. Weng, Discriminantanalysis of principal components for face recognition, ICFGR (1998)336–341.
[8] J. Lu, K.N. Plataniotis, A.N. Venetsanopoulos, Face recognition using LDA-based algorithms, IEEE Transactions on Neural Networks 14 (1) (2003)195–200.
[9] Q. Liu, H. Lu, S. Ma, Improving kernel fisher discriminant analysis for facerecognition, IEEE Transactions on Circuits and Systems for Video Technology14 (1) (2004).
[10] M.S. Bartlet, J.R. Movellan, T.J. Sejnowski, Face recognition by independentcomponent analysis, IEEE Transactions on Neural Networks 13 (6) (2002)1450–1463.
[11] S. Yang, S. Yan, C. Zhang, X. Tang, Bilinear analysis for kernel selection andnonlinear feature extraction, IEEE Transactions on Neural Networks 18 (5)(2007).
[12] C. Xiang, D. Huang, Feature extraction using recursive cluster-based lineardiscriminant with application to face recognition, IEEE Transactions on ImageProcessing 15 (12) (2006).
[13] W. Zuo, D. Zhang, J. Yang, K. Wang, BDPCA plus LDA: a novel fast featureextraction technique for face recognition IEEE Transactions on Systems,Transactions on Systems Man, and Cybernetics—Part b: Cybernetics 36 (4)(2006).
[14] L. Wang, X. Wang, J. Feng, on image matrix based feature extractionalgorithms, IEEE Transactions on Systems, Man, and Cybernetics—Part B:Cybernetics 36 (1) (2006).
[15] J. Yang, D. Zhang, Two-dimensional PCA: a new approach to appearance-based face representation and recognition, IEEE Transactions on PatternAnalysis and Machine Intelligence 26 (1) (2004) 131–137.
[16] M. Li, B. Yuan, 2D-LDA: a novel statistical linear discriminantanalysis for image matrix, Pattern Recognition Letters 26 (5) (2005)527–532.
[17] J.H. Lai, P.C. Yuen, G.C. Feng, Face recognition using holistic fourier invariantfeatures, Journal of Pattern Recognition 34 (2001) 95–109.
[18] C. Garcia, G. Zikos, G. Tziritas, Wavelet packet analysis for face recognition,Journal of Image and Vision Computing 18 (2000) 289–297.
[19] B. Li, Y. Liu, When eigenfaces are combined with wavelets, Journal ofKnowledge based Systems 15 (2002) 343–347.
[20] B.L. Zhang, H. Zhang, S.S. Ge, Face recognition by applying wavelet subbandrepresentation and kernel associative memory, IEEE Transactions on NeuralNetworks 15 (1) (2004) 166–177.
[21] X.Y. Jing, D. Zhang, A face and palmprint recognition approach based ondiscriminant DCT feature extraction, IEEE Transactions on Systems, Man andCybernetics 34 (6) (2004) 2405–2415.
[22] D. Ramasubramanian, Y.V. Venkatesh, Encoding and recognition of facesbased on the human visual model and DCT, Journal of Pattern Recognition 34(2001) 2447–2458.
[23] C. Podilchuk, X. Zhang, Face recognition using DCT based feature vectors,Proceeding of IEEE (1996).
[24] R. Tjahyadi, W. Liu, S. Venkatesh, Application of the DCT energy histogram forface recognition, International Conference on Information TechnologyApplications (2004) 305–310.
[25] D. Zhong, I. Defee, Pattern recognition in compressed DCT domain,Proceeding of IEEE International Conference on Pattern Recognition (ICPR)(2004) 2031–2034.
[26] Z.M. Hafed, M.D. Levine, Face recognition using the discrete cosine transform,International Journal of Computer Vision 43 (3) (2001) 167–188.
Tabel 3Improvement of our approaches on ORL database (%).
DPA DPA+PCA DPA+LDA
Method Min Max Mean Method Min Max Mean Method Min Max Mean
Zigzag �0.52 6.38 0.53 Zigzag-PCA �0.48 3.13 0.36 Zigzag+LDA �0.18 4.89 0.71Zigzag(d1) �0.18 21.8 1.74 Zigzag(d1)+PCA NA NA NA Zigzag(d1)+LDA NA NA NAZigzag(d3) �0.22 11.6 1.79 Zigzag(d3)+PCA NA NA NA Zigzag(d3)+LDA NA NA NApm1+DPA 0.29 4.54 0.82 pm1+DPA+PCA 0.26 3.36 0.83 pm1+DPA+LDA 0.21 2.81 0.62pm2+DPA 0.26 8.27 1.35 pm2+DPA+PCA 0.33 8.54 1.54 pm2+DPA+LDA 0.88 8.32 1.87Zigzag+PCA �0.47 1.09 0.29 DPA �0.56 2.18 0 DPA �0.63 1.95 0.9Zigzag+LDA �1.98 5.53 �0.19 DPA+PCA 0 0 0 DPA+LDA 0 0 0
S. Dabbaghchian, M.P. Ghaemmaghami / Pattern Recognition 43 (2010) 1431–1440 1439

Author's personal copyARTICLE IN PRESS
[27] M.J. Er, W. Chen, S. Wu., High speed face recognition based on discrete cosinetransform and RBF neural networks, IEEE Transactions on Neural Networks16 (3) (2005) 679–691.
[28] Z. Pan, A.G. Rust, H. Bolouri, Image redundancy reduction for neuralnetwork classification using discrete cosine transforms, Proceeding ofInternational Joint Conference on Neural Networks (Como, Italy) 3 (2000)149–154.
[29] W. Chen, M.J. Er, S. Wu, PCA and LDA in DCT domain, Pattern RecognitionLetters 26 (2005) 2474–2482.
[30] A. Pnevmatikakis, L. Polymenakos, Comparison of eigenface-based facturevectors under different impairments, International Conference on PatternRecognition (ICPR) 1 (2004) 296–299.
[31] J. Jiang, G. Feng, Robustness analysis on facial image description in DCTdomain, Electronics Letters 43 (24) (2007).
[32] J. Choi, Y.S. Chung, K.H. Kim, J.H. Yoo, IEEE 2006. Face recognition usingenergy probability in DCT domain.
[33] C. Sanderson, K.K. Paliwal, Features for robust face-based identity verifica-tion, Journal of Signal Processing 83 (2003) 931–940.
[34] S. Dabbaghchian, A. Aghagolzadeh, M.S. Moin, Feature extractionusing discrete cosine transform for face recognition, in: Inter-national Symposium on Signal Processing and its Applications(ISSPA), 2007.
[35] S. Dabbaghchian, A. Aghagolzadeh, M.S. Moin, Reducing the effects of smallsample size in DCT domain for face recognition, in: International Symposiumon Telecommunication (IST), 2008.
About the Author—SAEED DABBAGHCHIAN received his B.S. degree from Urmia University, Urmia, Iran, in 2003, and his M.S. from the University of Tabriz, Tabriz, Iran, in2005, both in electrical engineering. His current research interests include feature extraction, pattern recognition and speech recognition.
About the Author—MASOUMEH P. GHAEMMAGHAMI received his B.S. degree from Urmia University, Urmia, Iran, in 2005, and his M.S. from the Science and ResearchBranch of Islamic Azad University, Tehran, Iran, in 2009, both in electrical engineering. Her research interests have been focused on the pattern recognition and robustspeech recognition.
About the Author—ALI AGHAGOLZADEH received his B.S. degree from Tabriz University, Tabriz, Iran, in 1985, and his M.S. from Illinois Institute of Technology, USA, in1988, and Ph.D. from Purdue University, USA, in 1991, all in electrical engineering. He is a Professor of Faculty of Electrical and Computer Engineering in Tabriz University,Tabriz, Iran. His research interests have been focused on image processing and computer vision, image and video coding and transmission.
S. Dabbaghchian, M.P. Ghaemmaghami / Pattern Recognition 43 (2010) 1431–14401440