Feasibility study of Pridneprovskaya Thermal Power Plant ...
267
NEDO —IC-00ER01 020005064 Feasibility Study of Pridneprovskaya Thermal Power Plant Reconstruction Project IVIarch, 2001 New Energy and Industrial Technology Development Organization (NEDO) usted by: Chubu Electric Power Co., Inc. -9
-
Upload
khangminh22 -
Category
Documents
-
view
1 -
download
0
Transcript of Feasibility study of Pridneprovskaya Thermal Power Plant ...
NEDO —IC-00ER01
020005064
Feasibility Study of
Pridneprovskaya Thermal Power Plant
Reconstruction Project
IVIarch, 2001
New Energy and Industrial Technology Development Organization (NEDO)
usted by: Chubu Electric Power Co., Inc.
-9
Feasibility Study of Pridneprovskaya Thermal Power Plant Reconstruction Project
Entrusted by : Chubu Electric Power Co., Inc.
Prepared on : March, 2001
Study purpose
This project has been framed to apply Scrap & Build project of 300MW Electric
power plan, to the Pridneprovskaya Thermal Power Plant owned by the JST
Dneproenergo in the UKRAINE,. This project is aimed at improving the efficiency
of aged facilities of the plant; enhancing its environment-friendliness; and reducing
the emission of greenhouse gases.
NEDO-IC —00ER01
Feasibility Study of
Pridneprovskaya Thermal Power Plant
Reconstruction Project
March, 2001
New Energy and Industrial Technology Development Organization (NEDO)
Entrusted by: Chubu Electric Power Co., Inc.
PrefaceThis Report is a result of the survey of the Feasibility Study of Pridneprovskaya
Thermal Power Plant Reconstruction Project, which Chubu Electric Power Co., Inc.
received consignment of New Energy Development and Industrial Technology
Organization (NEDO) to conduct this study.
In December 1997, the Third Conference of the Parties to the United Nations
Framework Convention on Climate Change (COP3) was held in Kyoto. At the
conference, the "Kyoto Protocol" was adopted in order to prevent global warming
caused by greenhouse gases including carbon dioxide. It commits developed
countries to reduce their average emissions of greenhouse gases by at least 5% "in the
period 2008 - 15" from the 1990 level. Japan set its target of reduction at 6%.
The Kyoto Protocol also provides measures to give flexibility in attaining the goals:
"Joint Implementation (JI)" and "Clean Development Mechanism (CDM)." In JI,
greenhouse gas reductions are shared among developed countries through
implementation of specific international projects. CDM is implemented through
cooperation between developed and developing countries. Japan intends to utilize
these programs positively to achieve its goal.
This feasibility study is a basic study for leading the "Reconstruction Project of
Pridneprovskaya TPP" to joint implementation.
"Reconstruction Project of Pridneprovskaya TPP" is the project that realize the
renewal of a superannuated unit, environmental protection, energy conservation, and
reduction of greenhouse gas by scrapping and building a 300MW unit in the
Pridneprovskaya Thermal Power Plant owned by J ST Dneproenergo.
Chubu Electric Power Co., Inc. conducted site surveys of the Pridneprovskaya Thermal
Power Plant, had meetings at the Ministry of Fuel and Energy, and considered the
results. These results were compiled in this report of Feasibility Study of
Pridneprovskaya Thermal Power Plant Reconstruction Project.
March 2001
Chubu Electric Power Co., Inc.
List of the Participants in the Survey
Corporate Planning International Affair Group Akihisa MizunoDepartment
Keiichi Yoneyama
Hideo Iwata
Hirotaka Watanabe
Hisashi Kishi
Power SystemOperations Department
Planning Group Junichi Takahasi
Thermal Power Department Planning Group Tetsuya Watabe
Construction Group Takashi Sato
Shunichiro Ide
Katsuo Sakurai
Tadashi Kawamoto
Yoshitaka Okuno
Eisuke Adachi
Civil Engineering And Thermal Power Youichi MomoseArchitectural Department Civil Engineering
and Architectural Group Hiroshi Kouyama
Hironori Kamiya
Kenji Kikuchi
Tomoyuki Amano
Osamu Inada
Minoru Ishida
Junji Nakajima
Contents
Summary
Chapter.1 Basic Subjects of Project
1. Circumstances in Ukraine................................................................................................1-1
1.1 Political, economic, and social conditions ............................................................. 1-1
1.1.1 Nature ....................................................................................................................1-1
1.1.2 Population, ethnic groups, religions ............................................................... 1-3
1.1.3 Administrative sections......................................................................................1-5
1.1.4 Politics....................................................................................................................1-5
1.1.5 Economy..................................................................................................................1-14
1.2 Energy circumstances ................................................................................................1-28
1.2.1 Energy resources ..................................................................................................1-28
1.2.2 Energy demand/supply........................ *.............................................................1-30
1.2.3 Present electric power industry situation * *................................................. 1-31
1.2.4 Electric power demand/supply trends............................................................. 1-33
1.2.5 Present conditions of power generation facilities............ *..........*.............. 1-36
1.2.6 Electricity rates system......................................................................................1-41
1.2.7 Electricity rates collection system................................................................... 1-43
1.2.8 Environmental problems....................................................................................1-44
1.3 Need for joint execution of project............................................................................1-45
2. Need for introduction of energy-saving technology to the subject industry......... 1-47
3. Significance, needs, and effects of concerned project, and propagation of results in
same type of industry........................................................................................................1-49
Contents 1
Chapter.2 Implementation of the Project Scheme
1. Project scheme...................................................*.............................................................. 2-1
1.1 Overview of the object region for implementing the project.............................2-1
1.1.1 Economic/social situation............................................................................. .. 2-1
1.1.2 Environmental issues **••*••.................... *...................... ............................ .. 2-4
1.2 Details of the project...............................*................................................ *................ 2-4
1.2.1 Objective of this project .................. .................................................................. 2-4
1.2.2 Selection of the unit to be abolished............................................................... 2-5
1.2.3 Location of the newly installed unit........ *.....................................................2-5
1.3 Targeted greenhouse gas.............................................*..................*........................ 2-5
2. Outline of the implementation site................................................................................2-6
2.1 Degree of interest at the implementation site...................................*................ 2-6
2.2 Situation with respect to the relevant equipment at the implementation site
2-8
2.2.1 Outline of Pridneprovskaya TPP..................................................................... 2-8
2.2.2 Equipment specifications of Pridneprovskaya TPP................ *.................. 2-8
2.2.3 Operating situation of Pridneprovskaya TPP * * *.................... ....................2-10
2.3 Project implementation capability of the implementation site.........................2-12
2.3.1 Technological capability.............................. 2-12
2.3.2 Management support.....................*.......................................................... - 2-15
2.3.3 Business management, management policy....................................... 2-16
2.3.4 Finance defrayal capability *.............................................................................2-17
2.3.5 Capability to acquiring human resources .......................................................2-18
2.3.6 Implementation framework...........................................*.......................... * * * * 2-18
2.4 Details of the project at the implementation site and specifications after
modification to relevant equipment *............ .............................................................2-19
2.4.1 Outline of newly combined cycle power generating plant ............ 2-19
2.4.2 Environmental measures ............................................... 2-32
2.4.3 Main equipment of the plant and equipment specifications...................... 2-33
2.4.4 Layout scheme................................................................... .............................. * • 2-44
2.4.5 Building scheme *.................................. 2-58
2.4.6 Utility supply conditions for the newly installed plant.................................2-62
2.4.7 Details of modification of existing equipment............ *................... 2-63
Contents 2

2.4.8 Procurement of labor and materials / equipment and transportation route
•...................... ..... ........................................................................................................................................................................................................................................................................................................................... • • • 2-66
2.4.9 Construction method and process *................................. 2-67
2.4.10 Operation of newly installed plant ........ *.....................................................2-75
2.5 Division of responsibilities for provision of funds, facility/equipment, and service
in implementing the proposed project * *........ *......................*................................ 2-81
2.5.1 Decision of project implementation................................................................... 2-81
2.5.2 Financing................................................................................................................. 2-82
2.6 Preconditions and problems related to implementation of the proposed project
2-83
2.7 Project implementation schedule............................................................................... 2-84
3. Concrete financial planning............................................................................................. 2-86
3.1 Financial plan for project implementation * *................................................. * * * 2-86
3.1.1 Expenses required.....................................*......................................*................ 2-86
3.1.2 Financing method.......................................... 2-87
3.2 Prospect of financing............ *..........*...................................................................... 2-87
3.2.1 The Japanese side action plan * *........ *.................................................. * * * * 2-87
3.2.2 The Ukrainian side action plan.......... *..........................*..........*.............. * * 2-88
4. Matters related to Joint Implementation and other conditions........ *.................. 2-88
4.1 Matters to be coordinated with the Ukrainian side for project implementation:
Establishment of project implementation condition and division of duties, taking
into consideration the actual situation of the site where the project will be
implemented...............................................................................*..................*..............2-88
4.2 Possibility of accepting this project as a Joint Implementation scheme........ 2-89
Contents 3
Chapter.3 The Project Effect
1. Energy conservation effect ..............................................................................................3-1
1.1 Technical basis for producing energy conservation effect.................................3-1
1.2 Base line for calculating energy conservation effect * *....................................... 3-2
1.2.1 Setting the base line.....................................................*.................................... 3-2
1.2.2 Specifications of the base line and calculation results ...............................3-4
1.3 Concrete values, period and cumulative values of energy conservation effect
3-6
1.3.1 Considering the project case..............................................................................3-6
1.3.2 Specifications of the project case and calculation results...........................3-7
1.3.3 Calculation results of energy conservation effect...........................................3-11
1.4 Confirming energy consumption effect....................................................................3-13
2. Effects of reducing greenhouse effect gases...................... *........................................ 3-13
2.1 Technical basis for reducing greenhouse effect gases-----*................................ 3-13
2.2 Base line for calculating reduction in greenhouse effect gases.........................3-14
2.2.1 Setting base line...................................*...............................................................3-14
2.2.2 Specifications of the base line and calculation results ...............................3-15
2.3 Concrete and cumulative values and period of reduction in greenhouse effect
gases.................................................................................................................................. 3-18
2.3.1 Considering the project case..............................................................................3-18
2.3.2 Specifications of the project case and calculation results...........................3-19
2.3.3 Calculation results of reduction in greenhouse effect gases .....................3-22
2.4 Confirming reduction in greenhouse effect gases ............................................... 3-23
3. Influence on productivity.................................................................................................. 3-24
Contents 4
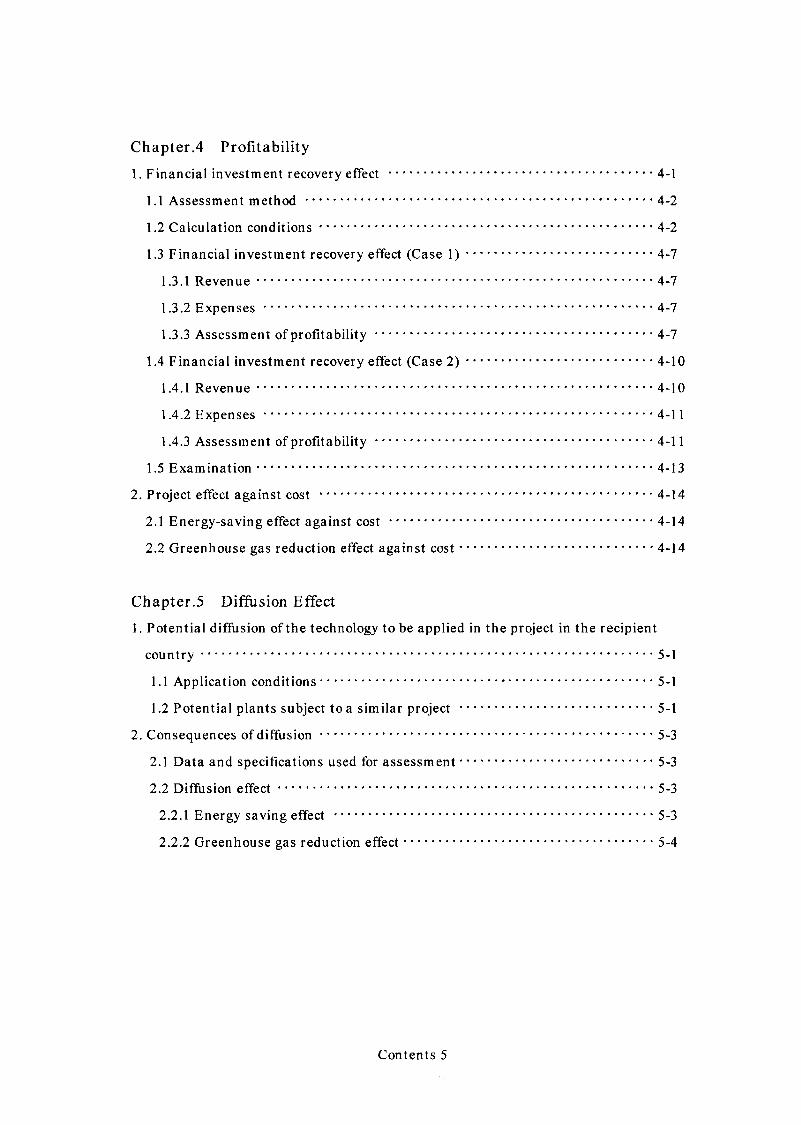
Chapter .4 Profitability
1. Financial investment recovery effect ...............................*..........................*.............. 4-1
1.1 Assessment method ........................ *......................*..................*............................ 4-2
1.2 Calculation conditions........................ *..........*..........................*............................ 4-2
1.3 Financial investment recovery effect (Case 1)-----*.............................................4-7
1.3.1 Revenue..................................................................................................................4-7
1.3.2 Expenses ****......................................................................................................... 4-7
1.3.3 Assessment of profitability................................................................................. 4-7
1.4 Financial investment recovery effect (Case 2)........................................................ 4-10
1.4.1 Revenue................................................................................................................... 4-10
1.4.2 Expenses ...............................................................................................................4-11
1.4.3 Assessment of profitability.........................*..............*.................................... 4-11
1.5 Examination...................................... * * *..............................*.............................. * * * 4-13
2. Project effect against cost • *.........................................*.................................................4-14
2.1 Energy-saving effect against cost .......................................*.......................... * 4-14
2.2 Greenhouse gas reduction effect against cost.............. *..............*...................... 4-14
Chapter.5 Diffusion Effect
1. Potential diffusion of the technology to be applied in the project in the recipient
country.................................................................................................................................. 5-1
1.1 Application conditions................................................................................................5-1
1.2 Potential plants subject to a similar project ....................................................... 5-1
2. Consequences of diffusion................................................................................................5-3
2.1 Data and specifications used for assessment.........................................................5-3
2.2 Diffusion effect-----*..................*..............................*..............*..........*.............. * * 5-3
2.2.1 Energy saving effect .......... *...........................................................................**5-3
2.2.2 Greenhouse gas reduction effect.........................*.................................. .. 5.4
Contents 5
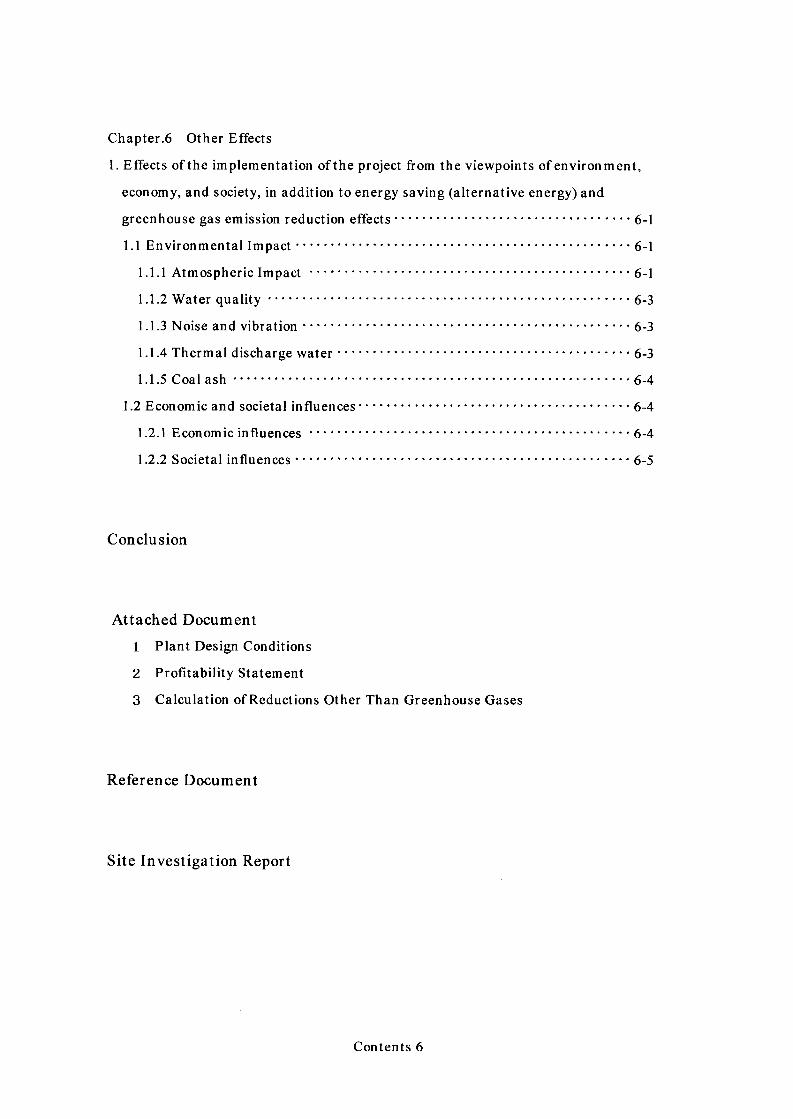
Chapter.6 Other Effects
1. Effects of the implementation of the project from the viewpoints of environment,
economy, and society, in addition to energy saving (alternative energy) and
greenhouse gas emission reduction effects........ *.........................................................6-1
1.1 Environmental Impact....................................................................... 6-1
1.1.1 Atmospheric Impact ............................................................................................. 6-1
1.1.2 Water quality......................................................................................................... 6-3
1.1.3 Noise and vibration............................................................................................... 6-3
1.1.4 Thermal discharge water..................................................................................... 6-3
1.1.5 Coal ash................................................................................................................... 6-4
1.2 Economic and societal influences............................................................................... 6-4
1.2.1 Economic influences.........................*......................*........................................ 6-4
1.2.2 Societal influences................................................................................................. 6-5
Conclusion
Attached Document
1 Plant Design Conditions
2 Profitability Statement
3 Calculation of Reductions Other Than Greenhouse Gases
Reference Document
Site Investigation Report
Contents 6

Summary
Summary
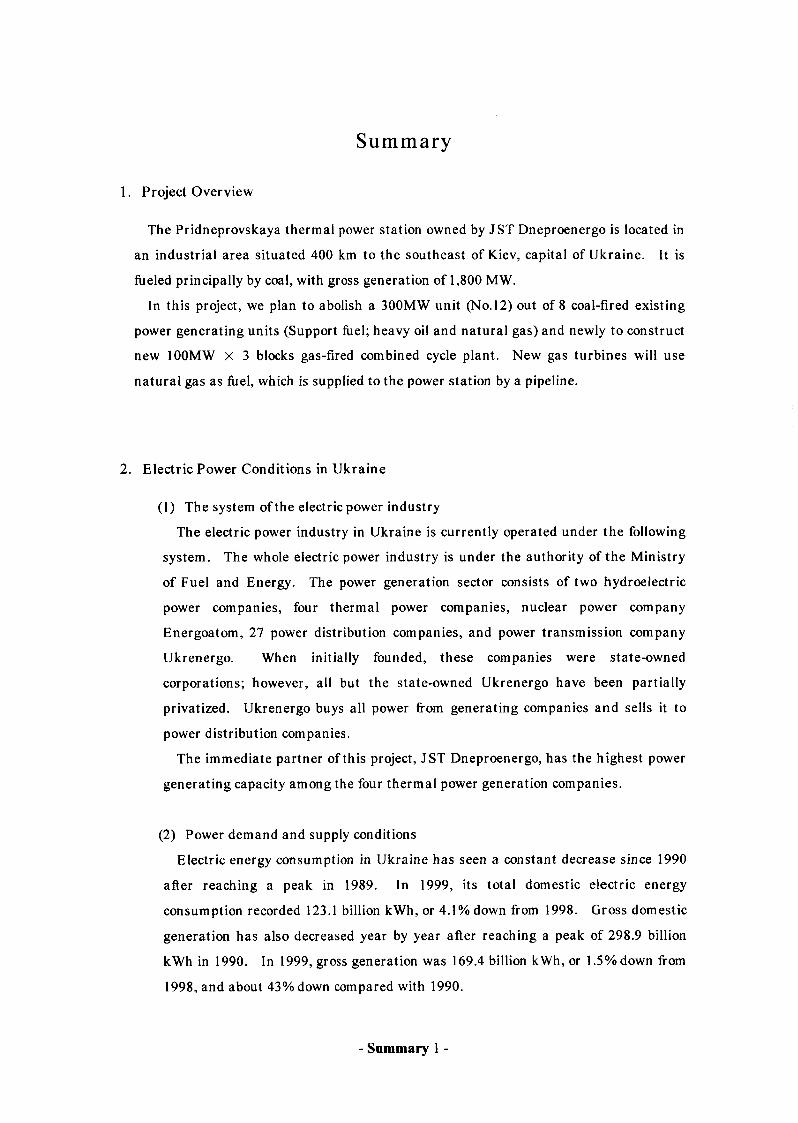
1. Project Overview
The Pridneprovskaya thermal power station owned by JST Dneproenergo is located in
an industrial area situated 400 km to the southeast of Kiev, capital of Ukraine. It is
fueled principally by coal, with gross generation of 1,800 MW.
In this project, we plan to abolish a 300MW unit (No.12) out of 8 coal-fired existing
power generating units (Support fuel; heavy oil and natural gas) and newly to construct
new 100MW X 3 blocks gas-fired combined cycle plant. New gas turbines will use
natural gas as fuel, which is supplied to the power station by a pipeline.
2. Electric Power Conditions in Ukraine
(1) The system of the electric power industry
The electric power industry in Ukraine is currently operated under the following
system. The whole electric power industry is under the authority of the Ministry
of Fuel and Energy. The power generation sector consists of two hydroelectric
power companies, four thermal power companies, nuclear power company
Energoatom, 27 power distribution companies, and power transmission company
Ukrenergo. When initially founded, these companies were state-owned
corporations; however, all but the state-owned Ukrenergo have been partially
privatized. Ukrenergo buys all power from generating companies and sells it to
power distribution companies.
The immediate partner of this project, JST Dneproenergo, has the highest power
generating capacity among the four thermal power generation companies.
(2) Power demand and supply conditions
Electric energy consumption in Ukraine has seen a constant decrease since 1990
after reaching a peak in 1989. In 1999, its total domestic electric energy
consumption recorded 123.1 billion kWh, or 4.1% down from 1998. Gross domestic
generation has also decreased year by year after reaching a peak of 298.9 billion
kWh in 1990. In 1999, gross generation was 169.4 billion kWh, or 1.5% down from
1998, and about 43% down compared with 1990.
- Summary 1 -
According to prediction of Ukraine Ministry of Fuel and Energy, the total
generated energy will be changed to an increase in 2000 and afterwards, and is
expected to increase slightly by 1 - 2% compared with the former year.
No large-scale development of power resources was conducted in the 1990s.
Total installed generating capacity has also decreased year by year. Generating
facilities in Ukraine have become considerably outdated due to shortage in funds
necessary for modernization. Eighty percent of thermal power stations are
regarded as in need of rehabilitation or rebuilding. The capacity ratios of thermal
power stations have also decreased, as funds for purchasing fuel have also become
short. Total installed generating capacity in Ukraine was 53.9 million kWh, as of
1999, which had not changed since 1997. However, actual available generating
capacity is deemed to be about 60% of the aforementioned capacity.
Although at present there is no restrictive condition regarding the supply and
demand of power, it is highly probable that serious power shortages will occur in
the near future as the aged generating facilities are expected to fail eventually,
albeit gradually.
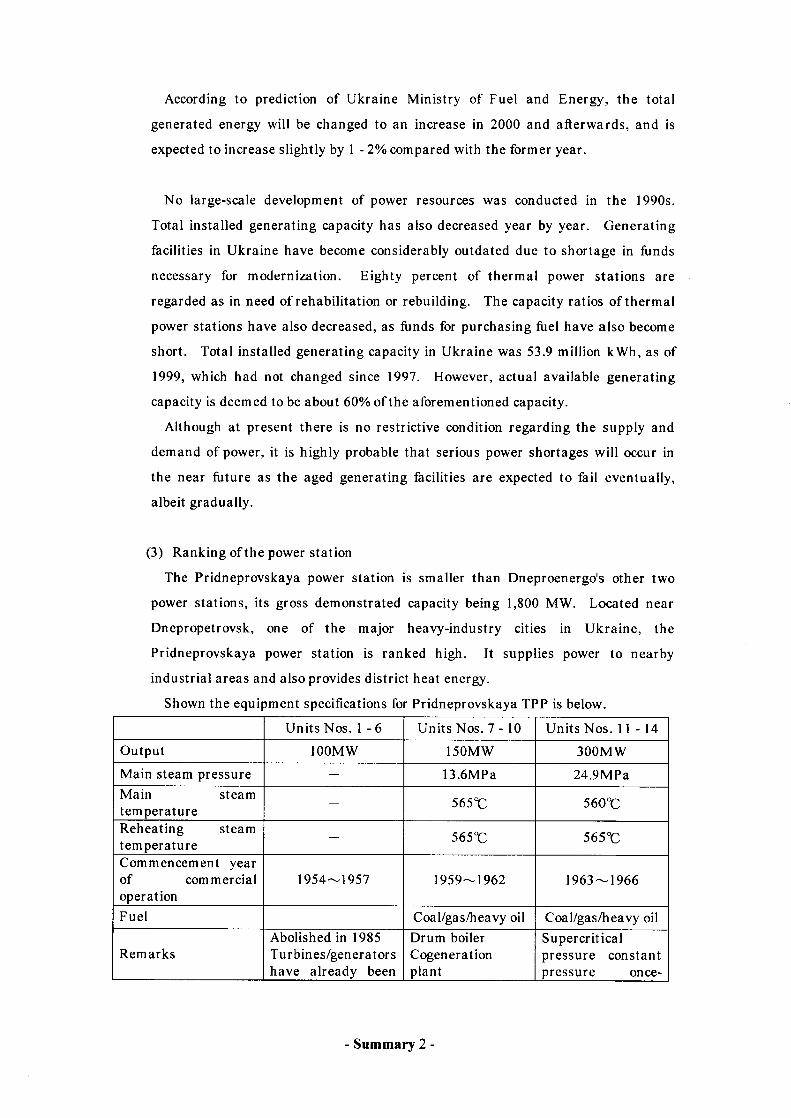
(3) Ranking of the power station
The Pridneprovskaya power station is smaller than Dneproenergo's other two
power stations, its gross demonstrated capacity being 1,800 MW. Located near
Dnepropetrovsk, one of the major heavy-industry cities in Ukraine, the
Pridneprovskaya power station is ranked high. It supplies power to nearby
industrial areas and also provides district heat energy.
Shown the equipment specifications for Pridneprovskaya TPP is below.
Units Nos. 1 - 6 Units Nos. 7-10 Units Nos. 11-14Output 100MW 150MW 300MWMain steam pressure — 13.6MPa 24.9MPaMain steamtemperature — 565%: 560%:
Reheating steamtemperature — 565%: 565%:
Commencement year of commercialoperation
1954—1957 1959—1962 1963 — 1966
Fuel Coal/gas/heavy oil Coal/gas/heavy oil
RemarksAbolished in 1985 Turbines/generators have already been
Drum boilerCogenerationplant
Supercritical pressure constant pressure once-
- Summary 2 -
removedThe boilers are in the process of being removed.(5 out of 12 units have beenremoved.)
through boiler
3. Details of the Project
3.1 The Unit to Be Decommissioned
The unit to be decommissioned is Unit No.12 (300MW), generation of which has long
been suspended. Below is general information on Unit No.12.• Output 300MW• Fuel Coal, Natural gas, Heavy oil• Commencement of operation 1964• Operating time 221,579 hours
Because the operation time has exceeded the administration value, the unit cannot
be operated unless the remaining life assessment is performed. However, the
diagnosis itself cannot be implemented due to lack of finance.
3.2 Outline of the New Unit
The new unit features natural gas-fired combined-cycle generating facilities
incorporating the latest technology. It consists of three blocks of 100-MW combined-
cycle generating facilities. This unit configuration offers the following advantages.
0 In Ukraine where the basic electric energy source is from nuclear plants, thermal
power plants should be capable of performing demand and supply adjustments.
Whereas combined-cycle generating facilities can be started and stopped with
ease in a short time, the drawback is a substantial decrease in thermal efficiency
when partially loaded.
The multi-shaft configuration is intended to cover this shortcoming. By
changing the number of operating blocks according to changes in demand, it
becomes possible to maintain the output of operating blocks and ensure constant
high-efficiency operation.
- Summary 3 -
(2) This unit configuration is suitable for step-by-step development accommodating
changes in power demand and supply, and keeping pace with the progress of fund
procurement.
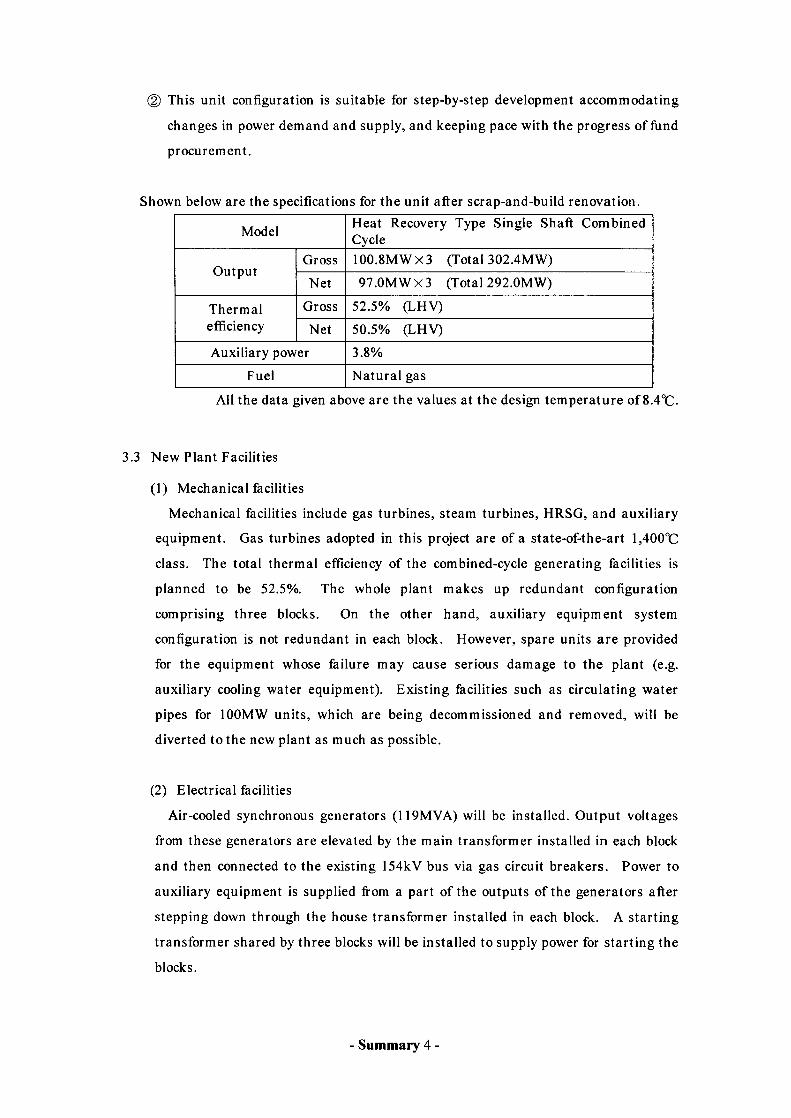
Shown below are the specifications for the unit after scrap-and-build renovation.
Model Heat Recovery Type Single Shaft Combined Cycle
OutputGross 100.8MWX3 (Total 302.4MW)
Net 97.0MWX3 (Total 292.0MW)
Thermalefficiency
Gross 52.5% (LHV)
Net 50.5% (LHV)
Auxiliary power 3.8%
Fuel Natural gas
All the data given above are the values at the design temperature of 8.4°C.
3.3 New Plant Facilities
(1) Mechanical facilities
Mechanical facilities include gas turbines, steam turbines, HRSG, and auxiliary
equipment. Gas turbines adopted in this project are of a state-of-the-art 1,400°C
class. The total thermal efficiency of the combined-cycle generating facilities is
planned to be 52.5%. The whole plant makes up redundant configuration
comprising three blocks. On the other hand, auxiliary equipment system
configuration is not redundant in each block. However, spare units are provided
for the equipment whose failure may cause serious damage to the plant (e.g.
auxiliary cooling water equipment). Existing facilities such as circulating water
pipes for 100MW units, which are being decommissioned and removed, will be
diverted to the new plant as much as possible.
(2) Electrical facilities
Air-cooled synchronous generators (119MVA) will be installed. Output voltages
from these generators are elevated by the main transformer installed in each block
and then connected to the existing 154kV bus via gas circuit breakers. Power to
auxiliary equipment is supplied from a part of the outputs of the generators after
stepping down through the house transformer installed in each block. A starting
transformer shared by three blocks will be installed to supply power for starting the
blocks.
- Summary 4 -
3.4 Modification of Existing Facilities
(1) Removal of the existing building for abolished 100MW units
The existing building for abolished 100MW units will be removed to provide a
space for installing the new plant. The 100MW units (Nos.l - 6) were abolished in
1985. Turbines and generators have already been removed. Existing facilities
will be removed only within the area required for the construction of the new plant.
About two-thirds (corresponding to 4 units) in the longitudinal direction of the
building and two smokestacks will be removed.
(2) Relocation of utility-related facilities
Utility facilities and pipes being used now will be relocated along with the
aforementioned removal.
3.5 Civil Engineering Facilities
Three turbine/HRSG buildings will be built to hold three blocks of the new 100MW
generating facilities. Each block will be installed in a turbine/HRSG building. A
building holding the central control room will be built between the office building and
the new 100-MW buildings. In addition, a utility pump building will be built to hold
the aforementioned relocated utility facilities.
3.6 Operation of the New Plant
(1) Operation characteristics
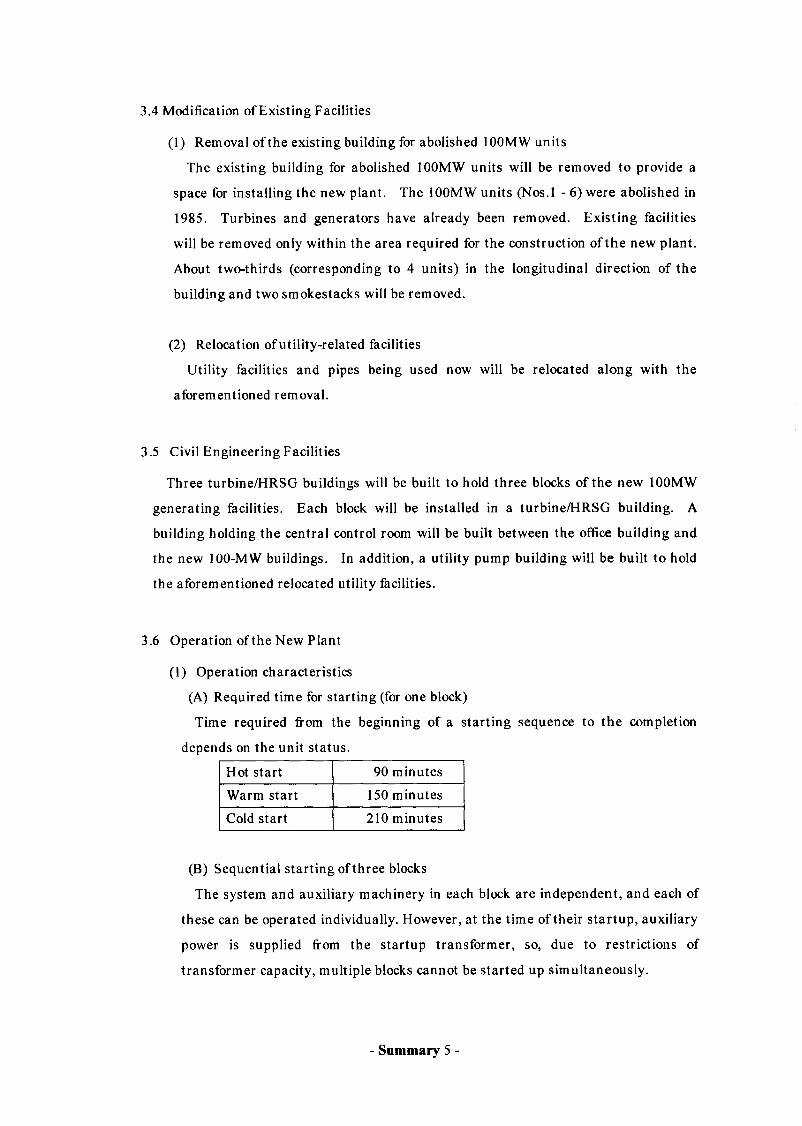
(A) Required time for starting (for one block)
Time required from the beginning of a starting sequence to the completion
depends on the unit status.
Hot start 90 minutes
Warm start 150 minutes
Cold start 210 minutes
(B) Sequential starting of three blocks
The system and auxiliary machinery in each block are independent, and each of
these can be operated individually. However, at the time of their startup, auxiliary
power is supplied from the startup transformer, so, due to restrictions of
transformer capacity, multiple blocks cannot be started up simultaneously.
- Summary 5 -
After the first gas turbine has been started up, the startup of the next gas
turbine can be done after an interval of about 20 minutes, which is after the
synchronization and the switchover of auxiliary power of the first block has been
completed. Therefore, the time needed to start up all blocks will be the
previously-mentioned time needed for startup of 1 block, plus approximately an
additional 40 minutes.
(C) Minimum operating load- 60% (60 MW/block)
(D) Load change ratio- 5%/min (5 MW/min • block)
3.7 Environmental Protection Measures
(l) Air pollution
O Smoke and dust / sulfur oxides
The new unit generates no smoke or dust, as it uses clean natural gas as fuel.
Moreover, the amount of sulfur contained in the fuel is very low, meaning that
sulfur oxide discharge can be considered insignificant, requiring no specific
measures.
O Nitrogen oxides
Use of low-NOx combustors is planned for new gas turbines. The concentration
of emitted NOx is controlled to a low value of 38.5 ppm (wet gas). Based on this
value, we assessed the concentration on the ground in the surrounding area with
three blocks in operation, assuming that the smokestack is 45 m high. The result
was below the maximum permissible concentration established by the Ukrainian
ministry of welfare at 0.085 mg/m3 (0.043 ppm).
In order to meet the Ukrainian standard, "a smokestack height shall be made
15m and over higher than the top of a neighboring building", the smokestack
height is finally changed to 75m (the height of the existing 300MW boiler, 60m,
plus 15m). However, there is no problem because the landing concentration
becomes lower.
O Carbon monoxide
The new unit bums natural gas in combustors with extremely high combustion
efficiency. It generates little CO, and therefore no specific measures against
- Summary 6 -
(2) Water pollution
<0> Thermal discharge water
In a combined cycle, the output ratio of steam turbines that require cooling
water is one-third of the overall output. Accordingly, the amount of cooling water
will be less than that required under current conditions. The temperature
difference occurring at the condenser of the existing unit is 8°C under normal
conditions (the limit is 12°C). In contrast, it is planned to be 7°C in the new unit.
Therefore, neither the amount nor the temperature of hot wastewater will increase
from the current conditions.
<0 Wastewater
The new unit, which incorporates combined-cycle generating facilities and uses
natural gas as fuel, generates little wastewater under normal conditions. The
amount of wastewater discharge is considered to be less than that discharged from
the existing generating facilities that mainly burn coal. Incidentally, wastewater
is planned to be directed to the existing wastewater treatment equipment.
(3) Noise and Vibration
In the new unit, main units of gas turbines will be contained in an enclosure to
suppress noise to 90 dB (A) at locations 1 m away from the unit. Furthermore, the
whole generating facilities, including HRSG, are housed in the building.
Environmental impacts at the boundaries of the premises are considered to be
minimum.
- Summary 7 -
3.8 Cost of the Project
The required cost for the project is: ¥ 30,107 million
Of this amount, ¥ 27,132 million is the construction cost required for new generating
facilities and civil engineering work. Since the installed generating capacity is 302.4
MW, the construction cost will be ¥90,000/kW. The scope of the quoted cost covers
relocation of utility facilities carried out as part of the construction of the new plant,
removal of the existing buildings, and construction of new buildings.
4. Effects of the Project
4.1 Base Lines of Fuel Consumption and CO2 Emissions
We setting the base line for calculating energy conservation effect and the reduction
in greenhouse gases, it is not realistic to assess only Unit No.12, which we plan to
abolish. Four 150MW units (Nos.7 to 10) are used preferentially as district heating
power plants, and after completion of the project, they will continue to play the same
role as the present. Accordingly, it is not necessary to assess these 150MW units.
As a result, operation performance of the four 300MW units (Nos. 11 to 14) of
generating facilities recorded in 1999 is used to set the base line.
4.2 Project Case
It is assumed that the three blocks of the new 100MW generating facilities plus the
existing three 300MW units of generating facilities would generate the same level of
power as the base line. The utilization factor planned for the new plant is 70%
assuming that priority is given to continuous operation during the heavy-duty seasons
of winter and summer and that DSS operation is carried out in spring and fall to
accommodate peaks. However, generating output shortages on the base line occur
only by the new plant. To supply the shortages, the three coal-fired units (Nos.l 1, 13,
and 14) remaining after the project are operated. The calculation period is assumed to
be 40 years, which is generally applicable to new generating facilities.
- Summary 8 -
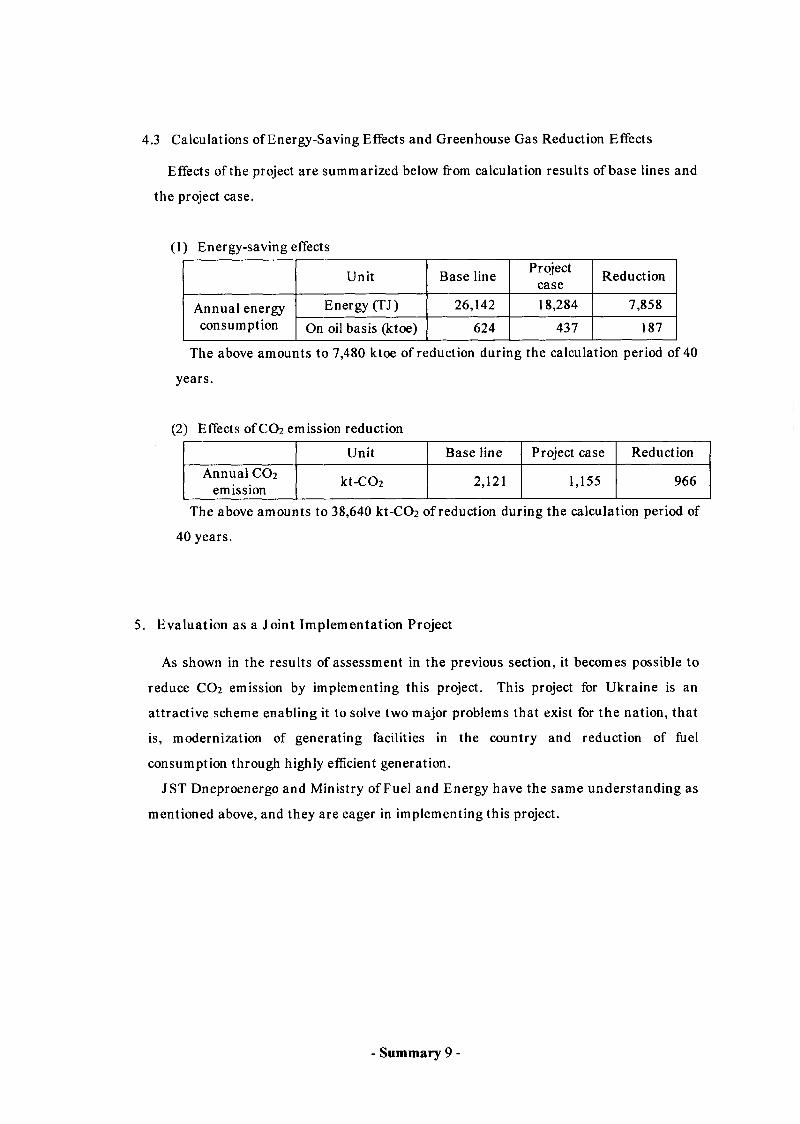
4.3 Calculations of Energy-Saving Effects and Greenhouse Gas Reduction Effects
Effects of the project are summarized below from calculation results of base lines and
the project case.
(1) Energy-saving effects
Unit Base line Projectcase Reduction
Annual energy consumption
Energy (TJ) 26,142 18,284 7,858
On oil basis (ktoe) 624 437 187
The above amounts to 7,480 ktoe of reduction during the calculation period of 40
years.
(2) Effects of CO2 emission reduction
Unit Base line Project case ReductionAnnual CO2
emission kt-C02 2,121 1,155 966
The above amounts to 38,640 kt-CO] of reduction during the calculation period of
40 years.
5. Evaluation as a Joint Implementation Project
As shown in the results of assessment in the previous section, it becomes possible to
reduce CO2 emission by implementing this project. This project for Ukraine is an
attractive scheme enabling it to solve two major problems that exist for the nation, that
is, modernization of generating facilities in the country and reduction of fuel
consumption through highly efficient generation.
JST Dneproenergo and Ministry of Fuel and Energy have the same understanding as
mentioned above, and they are eager in implementing this project.
- Summary 9 -
6. Profitability
6.1 Description of Evaluation
Case 1: [Revenues = Sales of electricity]
Case 1 is the most realistic. In the evaluation of profitability, all revenues from the
sales of electricity generated by the new plant are regarded as the revenues brought
about by the project. As it is intended to evaluate the profitability of the new plant
alone, tradable polluting rights on greenhouse gas (CO2) are not considered.
Case 2: [Revenues = Revenues from trading 1/2 of reduced CO2 emission + Revenues
from sales of electricity]
Case 2 assumes joint implementation and that Ukraine draws revenues from trading
polluting rights for reduced CO2 emission. Profitability is evaluated assuming that
revenues of the project comprise this revenue plus revenue from sales of electricity
generated by the new plant.
- Summary 10 -
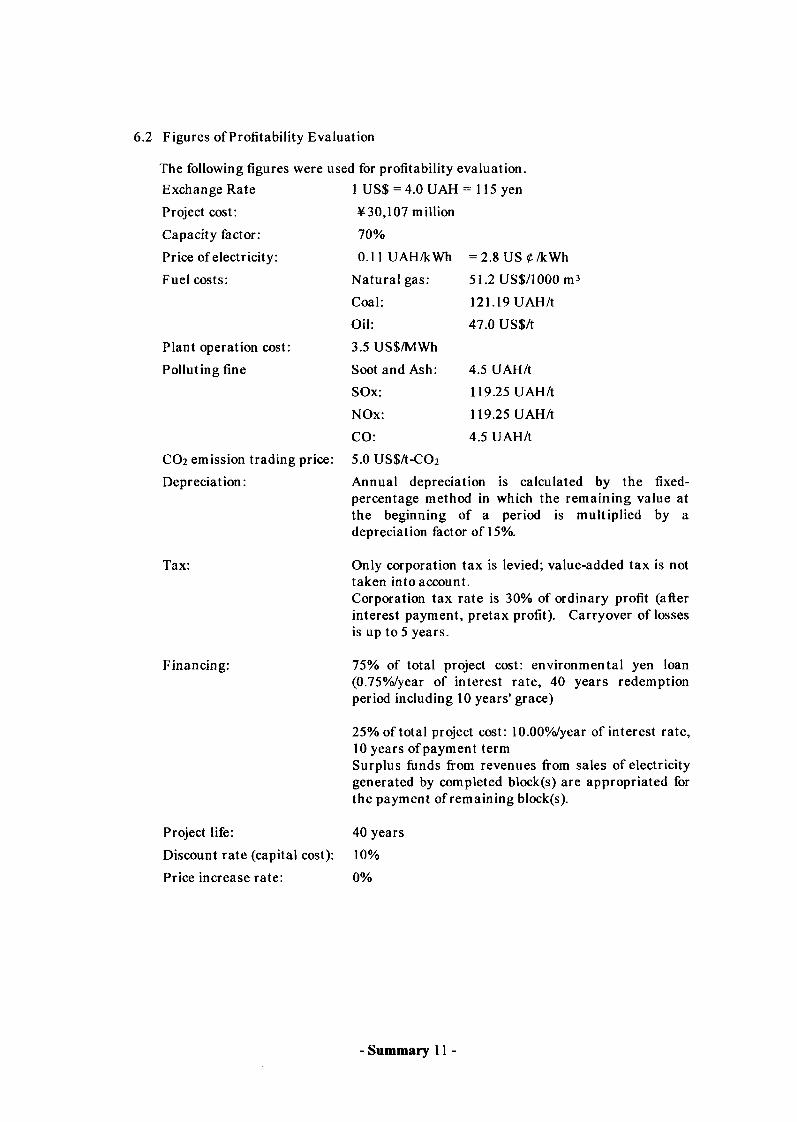
6.2 Figures of Profitability Evaluation
The following figures were used for profitability evaluation Exchange Rate 1 US$ = 4.0 UAH = 115 yenProject cost:
Capacity factor:Price of electricity:Fuel costs:
¥30,107 million70%0.11 UAH/kWh = 2.8 US 0 /kWh
Natural gas: 51.2 US$/1000 m3Coal: 121.19 UAH/tOil: 47.0 US$/t
Plant operation cost: Polluting fine
3.5 USS/MWhSoot and Ash: 4.5 UAH/tSOx: 119.25 UAH/tNOx: 119.25 UAH/tCO: 4.5 UAH/t
CO2 emission trading price: Depreciation:
5.0 US$/t-C02Annual depreciation is calculated by the fixed- percentage method in which the remaining value at the beginning of a period is multiplied by a depreciation factor of 15%.
Tax: Only corporation tax is levied; value-added tax is not taken into account.Corporation tax rate is 30% of ordinary profit (after interest payment, pretax profit). Carryover of losses is up to 5 years.
Financing: 75% of total project cost: environmental yen loan (0.75%/year of interest rate, 40 years redemption period including 10 years' grace)
25% of total project cost: 10.00%/year of interest rate, 10 years of payment termSurplus funds from revenues from sales of electricity generated by completed block(s) are appropriated for the payment of remaining block(s).
Project life:Discount rate (capital cost):Price increase rate:
40 years10%0%
- Summary 11 -
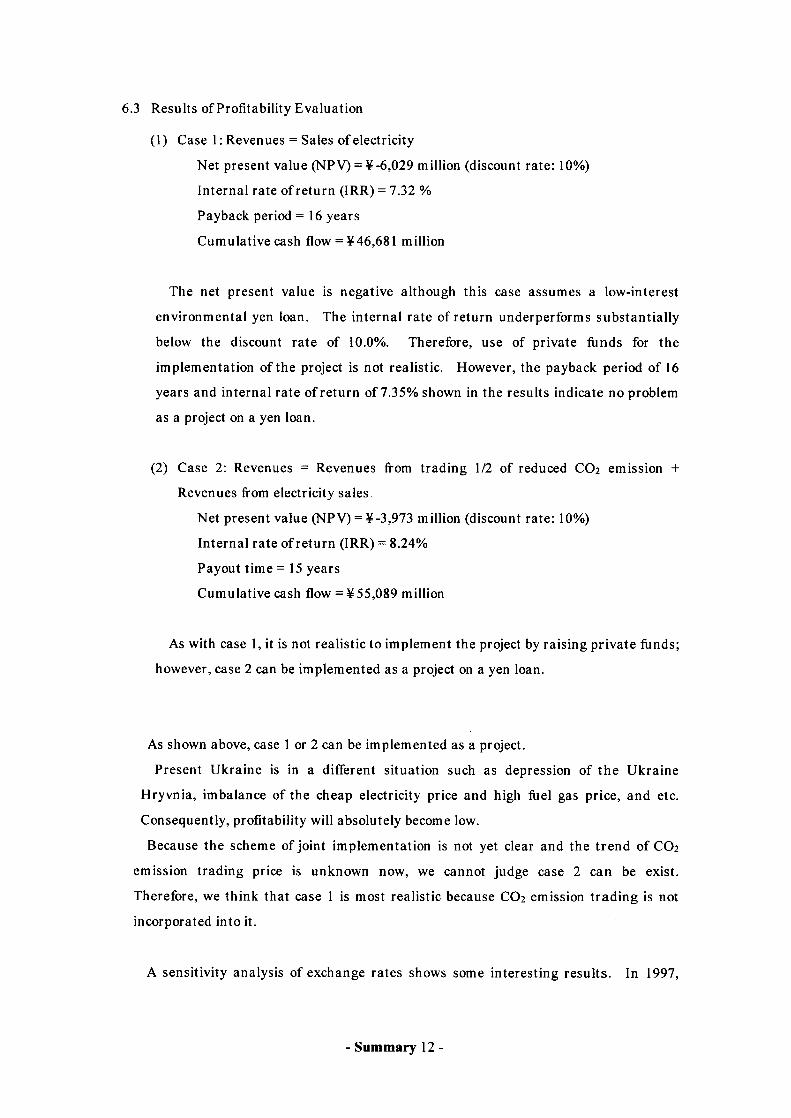
6.3 Results of Profitability Evaluation
(1) Case 1: Revenues = Sales of electricity
Net present value (NPV) = ¥-6,029 million (discount rate: 10%)
Internal rate of return (IRR) = 7.32 %
Payback period = 16 years
Cumulative cash flow = ¥46,681 million
The net present value is negative although this case assumes a low-interest
environmental yen loan. The internal rate of return underperforms substantially
below the discount rate of 10.0%. Therefore, use of private funds for the
implementation of the project is not realistic. However, the payback period of 16
years and internal rate of return of 7.35% shown in the results indicate no problem
as a project on a yen loan.
(2) Case 2: Revenues = Revenues from trading 1/2 of reduced CO2 emission +
Revenues from electricity sales
Net present value (NPV) = ¥-3,973 million (discount rate: 10%)
Internal rate of return (IRR) = 8.24%
Payout time = 15 years
Cumulative cash flow = ¥55,089 million
As with case 1, it is not realistic to implement the project by raising private funds;
however, case 2 can be implemented as a project on a yen loan.
As shown above, case 1 or 2 can be implemented as a project.
Present Ukraine is in a different situation such as depression of the Ukraine
Hryvnia, imbalance of the cheap electricity price and high fuel gas price, and etc.
Consequently, profitability will absolutely become low.
Because the scheme of joint implementation is not yet clear and the trend of CO2
emission trading price is unknown now, we cannot judge case 2 can be exist.
Therefore, we think that case 1 is most realistic because CO2 emission trading is not
incorporated into it.
A sensitivity analysis of exchange rates shows some interesting results. In 1997,
- Summary 12 -
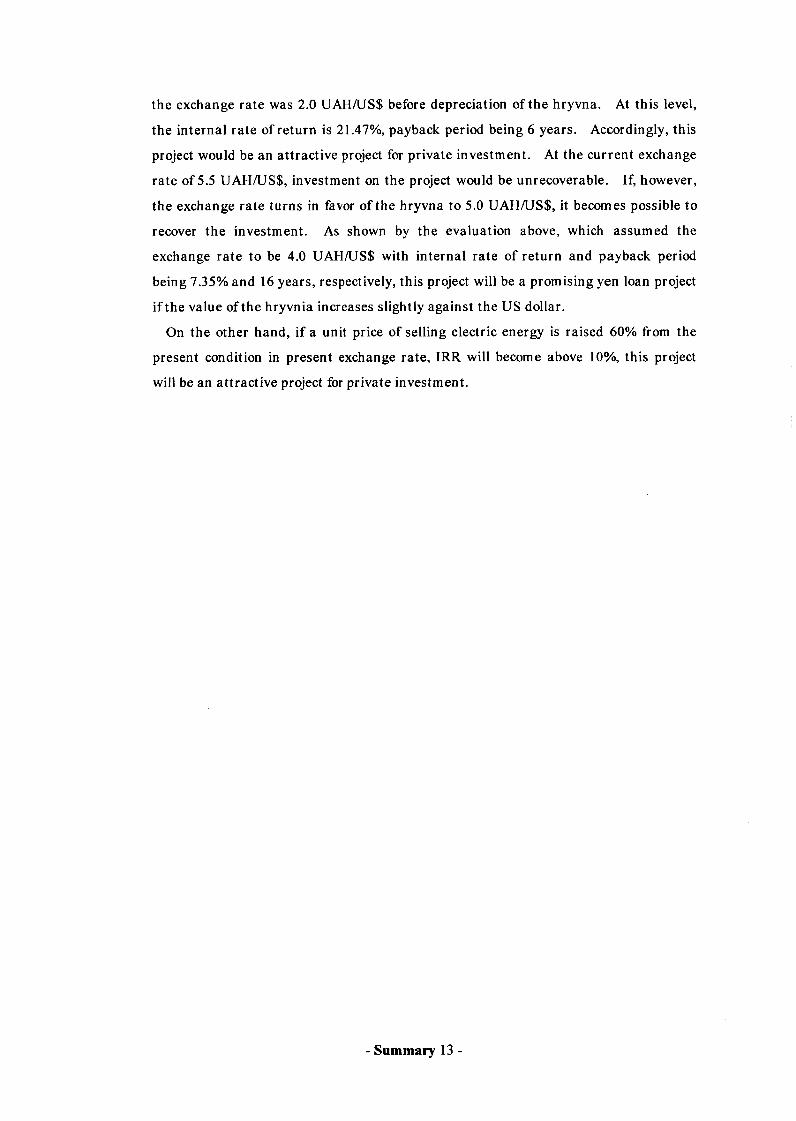
the exchange rate was 2.0 UAH/US$ before depreciation of the hryvna. At this level,
the internal rate of return is 21.47%, payback period being 6 years. Accordingly, this
project would be an attractive project for private investment. At the current exchange
rate of 5.5 UAH/US$, investment on the project would be unrecoverable. If, however,
the exchange rate turns in favor of the hryvna to 5.0 UAH/US$, it becomes possible to
recover the investment. As shown by the evaluation above, which assumed the
exchange rate to be 4.0 UAH/US$ with internal rate of return and payback period
being 7.35% and 16 years, respectively, this project will be a promising yen loan project
if the value of the hryvnia increases slightly against the US dollar.
On the other hand, if a unit price of selling electric energy is raised 60% from the
present condition in present exchange rate, IRR will become above 10%, this project
will be an attractive project for private investment.
- Summary 13 -
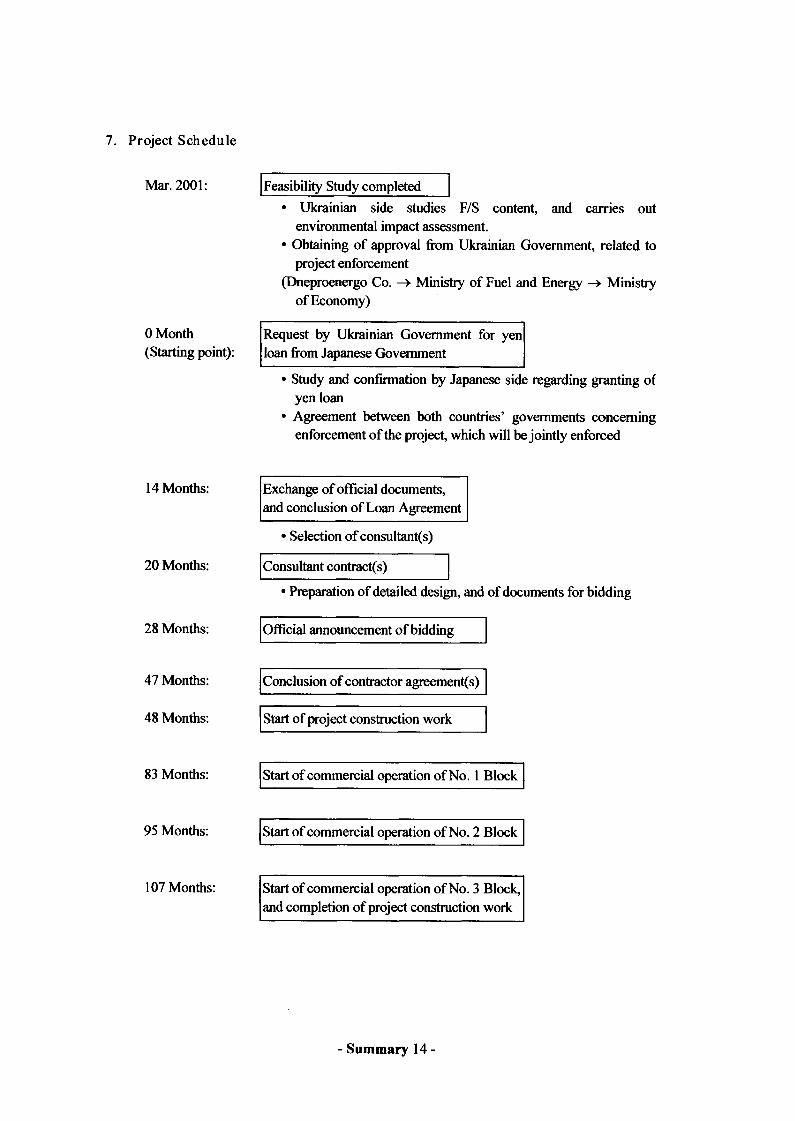
7. Project Schedule
Mar. 2001:
0 Month (Starting point):
14 Months:
20 Months:
28 Months:
47 Months:
48 Months:
83 Months:
95 Months:
107 Months:
Feasibility Study completed• Ukrainian side studies F/S content, and carries out
environmental impact assessment.• Obtaining of approval from Ukrainian Government, related to
project enforcement(Dneproenergo Co. -» Ministry of Fuel and Energy —» Ministry
of Economy)
Request by Ukrainian Government for yen loan from Japanese Government
• Study and confirmation by Japanese side regarding granting of yen loan
• Agreement between both countries’ governments concerning enforcement of the project, which will be jointly enforced
Exchange of official documents, and conclusion of Loan Agreement
• Selection of consultants)
Consultant contracts)
• Preparation of detailed design, and of documents for bidding
Official announcement of bidding
Conclusion of contractor agreements)
Start of project construction work
Start of commercial operation of No. 1 Block
Start of commercial operation of No. 2 Block
Start of commercial operation of No. 3 Block, and completion of project construction work
- Summary 14 -
8. Conclusion
This project is intended to improve generating efficiency through maximum use of the
existing facilities and premises of the power station, thereby reducing CO2 emissions.
The result of the feasibility study shows that CO2 reduction achieved by the project would
be 966 kt/year, the total amount of reduction reaching approximately 39 million tons
during the 40 years of calculation period. Moreover, it will be possible to reduce other air
pollutants, coal ash, and the like by several tens of percent.
At present, it is the most realistic that evaluation of profitability, first of all, estimates
the profitability of a project simple substance, without taking into consideration an
economic repercussion effect and C02 emission rights trading.
Consequently, the capital introduction by the finance of the low interest which cannot
necessarily say that it is high but secures enterprise nature is required for the rate of
return of this project. Therefore, introduction of private sector capital is not expectable.
However, when a yen loan is assumed as a finance of low interest, since it is certain to
be realized as an enterprise satisfactory in payment of a debt, this project contributed to
discharge curtailment of greenhouse gas and an air pollution substance is expected
application of an environmental special yen loan.
The result of our feasibility study on the facility plan shows that infrastructure such as
installation space and supply of fuel are in proper condition. Moreover, there are no
technical difficulties involved in the feasibility of facility building. However, as the
exhaust heat recovery combined-cycle system incorporates the latest technology and no
other such system exists in Ukraine, it appears necessary to include a scheme for giving O
& M technical guidance to Ukrainian engineers when the project is implemented. A
possible way to realize this scheme is to provide on-the-job training in a similar plant in
Japan or to send engineers from Japan to give guidance on-site. As we have experience in
operating many combined-cycle systems, we are able to provide technical assistance in a
scheme like this.
Both Dneproenergo, our direct partner in this project, and those on the site concerned
with this project are willing to realize this project, as their power facilities have become old
with decreasing efficiency and capacity factor and they are worried about shortage of
supply capability in the near future. Also, through the feasibility study, we feel that
positive assistance can be gained from the Ministry of Fuel and Energy (MOFE), which is
the supervisory agency for Dneproenergo.
- Summary 15 -

We intend to promote this project continuously, working with Ukrainian government
agencies concerned and aiming to develop concrete actions, such as making a request for a
yen loan, to raise funds for the project. With profitability taken into consideration, a
special yen loan at a low rate of interest is necessary for this project. This necessitates
activities aimed at obtaining the understanding of Japanese government agencies
concerned.
In promoting this project in the future, several things will need to be kept in mind. The
project should not transfer Japanese techniques and experience in a unilateral manner.
Requests and actual conditions on the Ukrainian side and changes in future circumstances
shall be thoroughly taken into account. Furthermore, achievement of maximum and
continued effects from the project should be borne in mind.
- Summary 16 -

Chapter ! Basic Subjects of Project

[Summary]
This chapter introduces the state of energy affairs, general
circumstances such as geography, climate, politics and the
economy, and explains the electric power situation in Ukraine.
In addition, the need for introduction of energy-saving
technology and the significance of this project will be elucidated.

1.1.2 Population, ethnic groups, religions
The population of Ukraine is 49.81 million (as of July 1999): Ukrainians, 73%
(the same Slavic ethnic group as Russians); Russians, 22%; Jews, 0.9%;
Belorussians, 0.9%; Moldavians, 0.6%. Small numbers of people from adjacent
East European countries, such as Bulgarians (0.5%), Poles (0.4%),
Hungarians(0.3%), Romanians (0.3%) and Greeks (0.2%) also live there.
Ukrainians are in the majority in almost all oblasts, although, Russians are the
majority (64%) of the population in “the Self-Governing Republic of Crimea.”
Percentages of Russians are also high in eastern and southern oblasts, while in
contrast, the percentages of Ukrainians are higher in western oblasts.
About 2,620,000 people live in Kiev, the capital of Ukraine. The populations of
other major cities are: Kharkiv, 1,520,000; Dnepropetrovsk, 1,120,000; Donetsk,
1,070,000; Odessa, 1,030,000 and LViv, 790,000. Male population is smaller than
female population; the male/female ratio is 47:53.
Ukrainian, which, like Russian, is an Eastern Slavic language, is stipulated by
the Ukrainian constitution as the official language, but Russian, which was the
official language in the USSR era, is still in wide general use.
Ukraine became a Christian nation (Ukrainian Orthodox Church) after the Kiev
dukedom adopted the Eastern Orthodox Church form of Christianity (Greek
Orthodox) in the middle of the 10th Century. However, because Ukraine was
under the control of Poland in medieval times, Roman Catholicism also spread
throughout the country. The Uniate sect (also called “Eastern Uniate,”
“Ukrainian Catholic,” or “Greek Catholic”) was formed in the 16th Century, by a
union of the Eastern and Western Churches. In the Imperial Russian era, this
sect was not authorized and was suppressed, but in 1889 there was a movement
demanding that the ban be lifted, and the Uniate was legalized in December 1889.
- 1-3 -

Outline of history
The country’s name, Ukraine, originates from a word combining “U” which means
“the surrounding area” and “Krai” which means “frontier” and “national boundary.”
Russians believe that the Kiev Dukedom, formed around the 9th Century, is the
origin of Russian history, and feel strongly that Ukraine is truly the core of Russia.9th - 12thCentury:
In the latter half of the 8th Century, a group of merchants called “Rus” set up a base in Kiev, in the mid-stream area of the Dnepr river, and the “Kiev Russie” (Kiev Dukedom) was formed. After 988, when the Greek Orthodox Church was introduced, Kiev became a flourishing political, economic and cultural center.
Mid-13thCentury:
Kiev was destroyed by the Mongol invasion (in 1240), and the center of Russie was moved to Moscow.
14th Century: Most of Ukraine became controlled by the “Great Dukedom of Lithuania.”
1569: Ukraine became Polish territory by the union of the “Lithuanian Great Dukedom” with Poland.
17th Century: Kiev was rebuilt by Ukrainian Cossacks.
1648: All-out war between Ukraine Cossacks and Poland1654: Ukraine asked the czar of Moscovy to protect Ukraine from
Poland. Ukraine eventually became part of the Russian Empire.
Second half of 18th Century:
As a result of the Russia-Poland War, the area on the “right” bank of the Dneiper river became Polish territory, and the area along its “left” bank, and Kiev, became Russian territory.
Later, Ukraine became completely absorbed into Russia under Ekaterina II, and Ukrainian Cossack society became extinct.
1919: Ukraine became a Soviet republic.
December 1922: Ukraine became one of the founding members of the United Soviet Socialist Republic.
World War II: At one time, while the greater part of the nation was occupied by German forces, there was a movement for independence, but USSR forces eventually “liberated” Ukraine again, and Ukraine did not achieve independence.
Following World War II, the USSR seized the “Gartia” region (including LViv) from Poland, the North Bukovia region (Chernovtsy, etc.), the South Bessarabia region (Western Odessa) from Romania, and the Ruthenia region (Uzhgorod, Mukachevo, etc.) from Czechoslovakia, and incorporated these regions into Ukrainian territory.
1945:Although a constituent republic of the USSR, Ukraine
participated in the United Nations as one of its original founding member nations.
July 1990: Sovereignty of the republic was declared.
August, 1991: Ukraine declared independence, and “Ukraine” was determined as the name of the country.
- 1-4 -
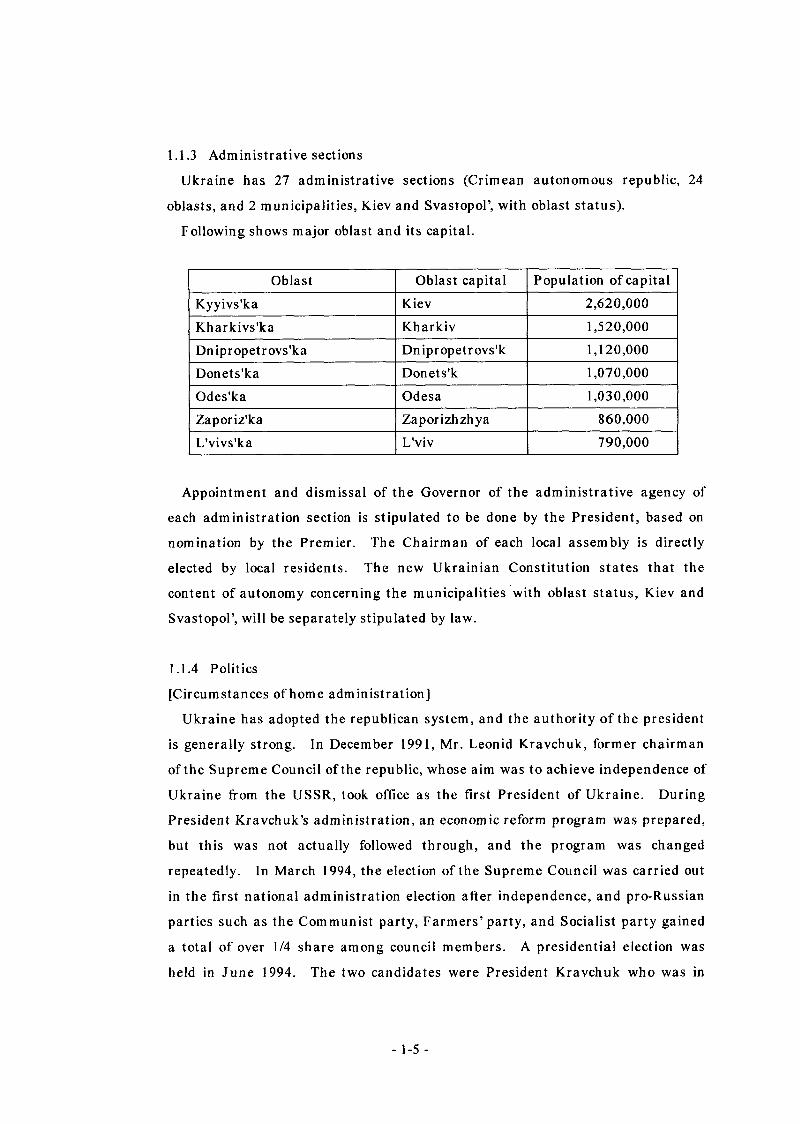
1.1.3 Administrative sections
Ukraine has 27 administrative sections (Crimean autonomous republic, 24
oblasts, and 2 municipalities, Kiev and Svastopol’, with oblast status).
Following shows major oblast and its capital.
Oblast Oblast capital Population of capital
Kyyivs'ka Kiev 2,620,000
Kharkivs'ka Kharkiv 1,520,000
Dnipropetrovs'ka Dnipropetrovs'k 1,120,000
Donets'ka Donets'k 1,070,000
Odes'ka Odesa 1,030,000
Zaporiz'ka Zaporizhzhya 860,000
L'vivs'ka L'viv 790,000
Appointment and dismissal of the Governor of the administrative agency of
each administration section is stipulated to be done by the President, based on
nomination by the Premier. The Chairman of each local assembly is directly
elected by local residents. The new Ukrainian Constitution states that the
content of autonomy concerning the municipalities with oblast status, Kiev and
Svastopol’, will be separately stipulated by law.
1.1.4 Politics
[Circumstances of home administration]
Ukraine has adopted the republican system, and the authority of the president
is generally strong. In December 1991, Mr. Leonid Kravchuk, former chairman
of the Supreme Council of the republic, whose aim was to achieve independence of
Ukraine from the USSR, took office as the first President of Ukraine. During
President Kravchuk’s administration, an economic reform program was prepared,
but this was not actually followed through, and the program was changed
repeatedly. In March 1994, the election of the Supreme Council was carried out
in the first national administration election after independence, and pro-Russian
parties such as the Communist party, Farmers’ party, and Socialist party gained
a total of over 1/4 share among council members. A presidential election was
held in June 1994. The two candidates were President Kravchuk who was in
- 1-5 -

favor of cordial relations with Europe and America, who strongly favored
“Ukraine for the Ukrainians,” and whose constituency was in the western regions,
and Mr. Leonid Kuchma, the former Premier, who called for closer economic
integration with Russia, and was supported by the military and industrial
complex in the eastern regions where there were deep economic ties with Russia.
In the final vote, Kuchma obtained 52% of total votes and became the second
President.
Since Kuchma was inaugurated as President, there have been continuous
confrontations between the President, who wants increased presidential authority
in order to carry out economic reformation efficiently, and the Parliament’s
mainly conservative forces.
President Kuchma issued a presidential order for a national referendum to
authorize the President and Parliament to deliberate the draft plan for the new
Constitution, and tension between the President and the Parliament increased.
But demand for a compromise between the President and the Parliament grew,
and President and the Chairman of the supreme council signed a “Constitution
agreement” that includes stipulations such as “the new constitution must be
enacted within 1 year” and “the President can appoint or dismiss Cabinet
Ministers without consent of Parliament.”
Heated arguments developed in the deliberation of the new Ukrainian
Constitution, concerning partition of the authorities of the President, the
Parliament, and the government, selection of a bicameral or monocameral system
for Parliament, and the position of Crimea, etc. A considerable amount of time
was spent on determining procedures and deciding such questions as whether the
new Constitution should be adopted by Parliament or by a national vote. The
new Constitution was finally adopted by the Supreme Council on June 28, 1996,
and enforced as of that date.
Separation of the three powers, administrative, legislative and judiciary, is
clearly stated in the newly-adopted Constitution. The next election for the
Supreme Council was scheduled for March 1998, and the next presidential
election was scheduled for October 1999.
After President Kuchma took office, he determined economic reform to be his
first task, and started to develop a full-scale market economy with IMF guidance,
implementing radical price liberation and curtailing subsidies, etc.
However, economic reform was delayed due to strong opposition by Communist
and Socialist forces in Parliament, and many tasks still remain to be carried out.
- 1 -6 -

Recently, slight progress has been evident in some aspects, such as the passage of
a law concerning the transfer of state-owned enterprises to private enterprises,
and passage of a part of the bill for reformation of the taxation system, but the
gap between the President and the Communist and Socialist forces in Parliament
is still great.
The Communist party won 123 seats, 27% of total seats in the Parliament (450)
in the parliamentary election in March in the 1998 fiscal year.
The total number of seats won by the 3 left-wing parties (Communist party,
Socialist farmers’party, progressive Socialists’ party) was 171, 38% of the total.
As a result, resistance by the Parliament against the President, who was
attempting to achieve economic reformation, was intensified.
In the presidential election held in October 1999, the incumbent, President
Kuchma, was in the lead with 36% of the votes but did not have a majority;
however, after the final runoff vote between Kuchma and Mr. Simonenko, the
Communist party leader, who was in second place with 22% of the votes,
President Kuchma was reelected. President Kuchma submitted a presidential
order concerning reformation of government organization. The purpose of this
order was to drastically re-arrange and unite the original 89 ministries and
agencies, reducing them to only 35; in other words, this reformation cut central
government offices by about 40%. Table 1.1-1 shows current members of the
Ukrainian Cabinet as of January 2001.
- 1-7 -
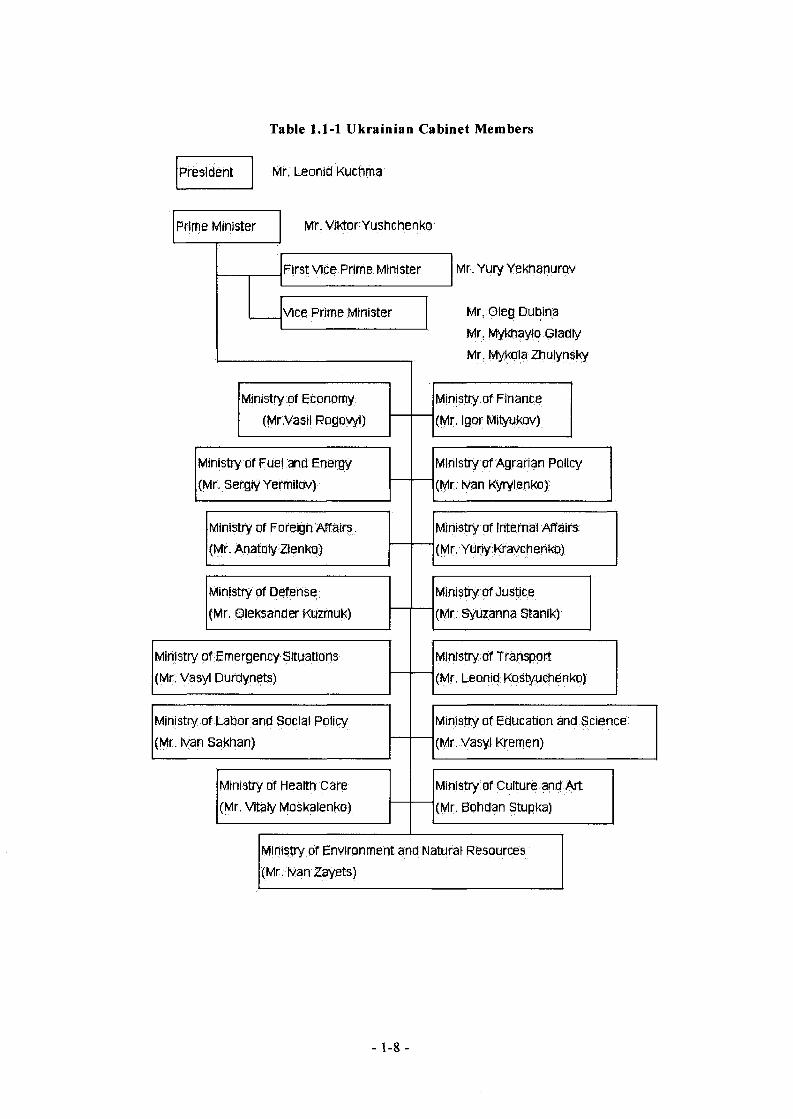
Table 1.1-1 Ukrainian Cabinet Members
Mr. Leonid Kuchma
Mr. Viktor Yushchenko
Mr.Yury Yekhanurov
Mr; Oleg Dubina
Mr. Mykhaylo Gladly
Mr Mykola Zhulynsky
President
Prime Minister
Vice Prime Minister
First Vice Prime Minister
Ministry of Finance
(Mr. Igor Mityukov)
Ministry of Economy
(Mr .Vasil Rogovyi)
Ministry of Justice
(Mr. Syuzanna Stanik)
Ministry of Health Care
(Mr, Vitaly Moskalenko)
Ministry of Agrarian I
(Mr. Ivan Kyrylenko)
Ministry of Culture and Art
(Mr. Bohdan Stupka)
Ministry of Foreign Affairs
(Mr. Anatoly Zlenko)
Ministry of Transport
(Mr. Leonid Kostyuchenko)
Ministry of Defense
(Mr, Oleksander Kuzmuk)
Ministry of Internal Affairs
(Mr. Yuny Kravchenko)
Ministry of Fuel and Energy
(Mr. Sergiy Yermilov)
Ministry of Education and Science
(Mr. Vasyl Kremen)
Ministry of Labor and Social
(Mr. Ivan Sakhan)
Ministry of Emergency Situations
(Mr. Vasyl Durdynets)
Ministry of Environment and Natural Resources
(Mr. Ivan Zayets)
- 1-8 -
[President]
The President of Ukraine represents the nation as the head of state, as
stipulated in the Constitution, and is obliged to protect sovereignty and the
Constitution. The president is elected by national election, for a 5-year term of
office.
The president can be re-elected and can serve a maximum of 2 terms. The
President appoints the Premier and other cabinet members, although approval by
the Supreme Council is needed for appointment of the premier. The President
also appoints other cabinet members, based on the advice of the Premier.
However, approval by Parliament is not needed for dismissal of the Cabinet
members including the Premier, which can be done by presidential decision alone.
The President’s authority extends mainly to the appointment and dismissal of
cabinet members; from the constitutional viewpoint, the Cabinet council holds the
actual authority for administrative execution.
[Cabinet council (Cabinet)]
The Cabinet council is considered the highest execution organ in Ukraine. The
President appoints the Premier, who heads the Cabinet council, after obtaining
the approval of parliament. The Cabinet council is constituted of the Premier, 1
First Deputy Premier, 3 Deputy Premiers, and the head minister of each ministry.
When the President is replaced by a new President, the Cabinet council resigns
en masse.
[Ukrainian supreme council]
The legislative organ is the Verkhovna Rada (Ukrainian Supreme Council) set
up as a monocameral system, with 450 seats. The term of service for each
member is 4 years. According to the Ukrainian Constitution, Ukrainians aged
18 or older have the right to vote, and Ukrainians aged 25 or older are eligible for
election. Council members are elected by equal, direct, ordinary, and secret
election.
The system adopted in the present Election Law jointly uses a single-member
constituency system and a proportional representation system, and with members
occupying half of the 450 seats elected from single-member electoral districts, and
the other half elected from proportional representation districts (nationwide
constituency).
- 1-9 -
[Crimean (Krymskii) problem]
The Crimean (Krymskii) peninsula was “presented” by Russia to Ukraine in
1954, and even now, Russians comprise over 60% of the population of the
Crimean peninsula. After the collapse of the USSR, the Crimea adopted a
constitution asserting its independence from Ukraine, and elected its own
President, becoming more oriented toward autonomy and independence, but the
Ukrainian government revoked the Crimean constitution and abolished its
presidency in March 1995. Crimea could not obtain support from Russia which
was then occupied with the Chechen (Chechnya) problem, and it was also unable
to gain the support of international society for its territorial integrity, so its
separation and independence movement was greatly deflated. The Crimean
problem also had aspects of a problem involving Russia, and in May 1993, the
Ukrainian government protested against Russian Lower House passage of a bill
making reversion of the Crimean peninsula to Ukraine illegal, and Ukraine
presented this case to the United Nations Security Council. However, the
Russian government now considers the Crimean problem to be a Ukrainian
domestic problem, and both nations are carrying out moderate measures.
The autonomy of the autonomous republic of Crimea is expressly stipulated in
the new Ukrainian Constitution. At present, a Crimean Constitution which
stipulates that Crimea is an autonomous republic within Ukraine is being
deliberated, although approval from Ukraine’s Verkhovna Rada is needed for the
enactment of the Crimean Constitution.
[Diplomacy]
Former President Krachuk, who had maintained some distance from Russia,
was replaced as president of Ukraine by President Kuchma who is pro-Russian,
but contrary to initial expectations, Ukraine did not move rapidly toward Russia,
making efforts instead to strengthen its relationships with various nations in
Europe, with America, and with international organs such as IMF, World Bank,
FBRD, etc.; the Ukrainian government adopted a pro-Europe & pro-America line.
Improvement of the relationship between Ukraine and Russia has, however, been
progressing since the bilateral friendship treaty was concluded in May 1997; for
example, the principle of abolishing discriminatory handling tariffs on both
countries’ products was hammered out in unofficial talks between the presidents
of the two nations.
- 1-10 -

[Relationships between Ukraine and Russia and other CIS nations]
In May 1997 Ukraine and Russia signed the “Treaty concerning friendship,
cooperation and partnership.” Through the conclusion of this treaty, a legal
foundation for the relationship between the two nations, which had not existed
since the collapse of the USSR, was created, and the principle of strengthening
the relationship between the two nations in political and economic aspects, by
respecting existing national boundaries, was clarified.
Ratification of the treaty by the parliaments of both nations is still expected to
take quite a long time, but, through this treaty, the two countries have finally
agreed concerning the questions of the reversion of the Crimean peninsula and
the division of the Black Sea fleet, which had been pending between Russia and
Ukraine for a long time.
Previously, the two nations had been struggling to find ways to improve their
relationship. In particular, they agreed in a top-level conference in January
1996 to strengthen their relationship by concluding a bilateral treaty without
waiting for final approval of the question of the Black Sea fleet.
Later, however, the Russian side which considered that final settlement of the
problems of the right to possession of the Crimean peninsula and division of the
Black Sea fleet, both long-pending matters, had top priority, stated that the
bilateral friendship treaty could not be ratified until these problems were
officially settled, and Russia retreated by postponing President Yeltsin’s visit to
Ukraine.
Eventually, in view of NATO’s eastward expansion, Russia was in a pressing
situation and felt it must improve its relationship with Ukraine, so the Russian
side made drastic concessions and signed the treaty in May 1997.
Through this treaty, consent was reached concerning the question of possession
of the Crimean peninsula, one of the focal points of the treaty, confirming the
Crimean peninsula as Ukrainian territory and, concerning the question of
division of the Black Sea fleet, agreeing that Russia would “lease to use” the
Sevastopol’ base.
The Ukrainian side succeeded in obtaining advantageous conditions from
Russia in this agreement. Ukraine will receive a payment of about US$100
million every year for 20 years from Russia for leasing the Sevastopol’ base, and
will receive compensation of about US$520 million in exchange for Russia’s
ownership of 80% of the fleet.
Concerning the problems of division of credit and obligations remaining from
-1-11-
the time of the USSR, in December 1994 Ukraine accepted the so-called “Zero
option” by which Russia took over Ukraine’s entire amount of foreign obligations
and assets under the condition of deferment of Ukraine’s obligation to Russia to
make payments for energy.
The IMF actually acted as an intermediary, and in March 1995 the deferment
of Ukraine’s energy obligation to Russia was carried out with the condition that
the Ukrainian obligation to pay US$2.5 billion (US$1.1 billion to the Russian
government, and US$ 1.4 billion to “Gas Prom”) will be deferred for 12 years.
However, after the deferral of these obligations, Ukraine again fell behind in
the payment of its obligations concerning petroleum and gas imported from
Russia, and new unpaid obligations began to accumulate. There was also the
problem of unpaid obligations for gas imported from Turkmenistan, so energy
obligations become another Ukrainian problem. In addition, Russia was actually
feeling uncomfortable about the sudden approach of the USA to Ukraine around
that time, and there was a high possibility that this could develop into a political
problem.
Ukraine has been concerned about CIS becoming a supranational organization,
and so is carrying out bilateral military cooperation and economic cooperation
individually with each of the CIS nations including Russia.
[Relationships with nations in Europe and America]
By signing the START I Lisbon Protocol in May 1992, Ukraine agreed to
become a non-nuclear power by transferring strategic nuclear weapons out of its
own country. Later, in January 1994, Ukraine signed a triangular joint
declaration with the USA and Russia.
Through this, Ukraine maintained its financial and technological aid from the
USA, and received free granting of nuclear fuel for nuclear power generation for 5
years. Also, in December 1994, Ukraine joined the Nuclear Nonproliferation
Treaty (NRT).
Concerning the abolition of nuclear warheads based on START I, nuclear
warheads in the Ukraine were transferred to Russia and disposed of under the
above-mentioned triangular joint declaration. Based on this, President Kuchma
declared the complete removal of nuclear warheads from Ukraine in June 1996.
- 1-12 -
In its relationship with the North Atlantic Treaty Organization (NATO),
Ukraine agreed to the “Partnership For Peace” (PFP) document framework in
February 1994. Following this, in July 1997, Ukraine signed the
“NATO/Ukraine Charter” which stipulates mutually cooperative relationships
including the establishment of a joint committee and carrying out of mutual visits,
achieving a strengthening of its relationship regarding military cooperation.
Leading opinions at present, however, say that there will be no demand for
Ukraine to join NATO, because of apprehension about the worsening of its
relationship with Russia, and because strong opposition by Russian residents can
be expected.
Ukraine signed a “Friendship treaty” with the European Union in July 1994,
and in November 1995, it joined the Council of Europe (CE). Ukraine is also
continuing its efforts to join WTO in order to expand its foreign trade with EU
nations.
There are about 1 million Ukrainian immigrants in the USA, which has
strengthened its diplomatic relations with Ukraine. Actually, among the USA’s
foreign aid, aid for Ukraine is the third largest amount, exceeded only by aid for
Israel and Egypt. (Of the total US$3 billion amount of foreign investment in
Ukraine since it became independent, the USA has provided the largest portion,
US$570 million.)
The most important problem for Ukraine, which has foreign exchange reserves
of only about US$1.25 billion, is its external debt of about US$3.1 billion, which
needs to be repaid during the fiscal year of 2000. In particular, repayments for
approximately US$ 1 billion are concentrated in the first quarter term of the
fiscal year of 2000; this includes about US$780 million related to Eurobonds, due
to be repaid in March 2000.
But IMF must avoid economic breakdown of Ukraine, and is expected to use
every possible measure to prevent any defaults.
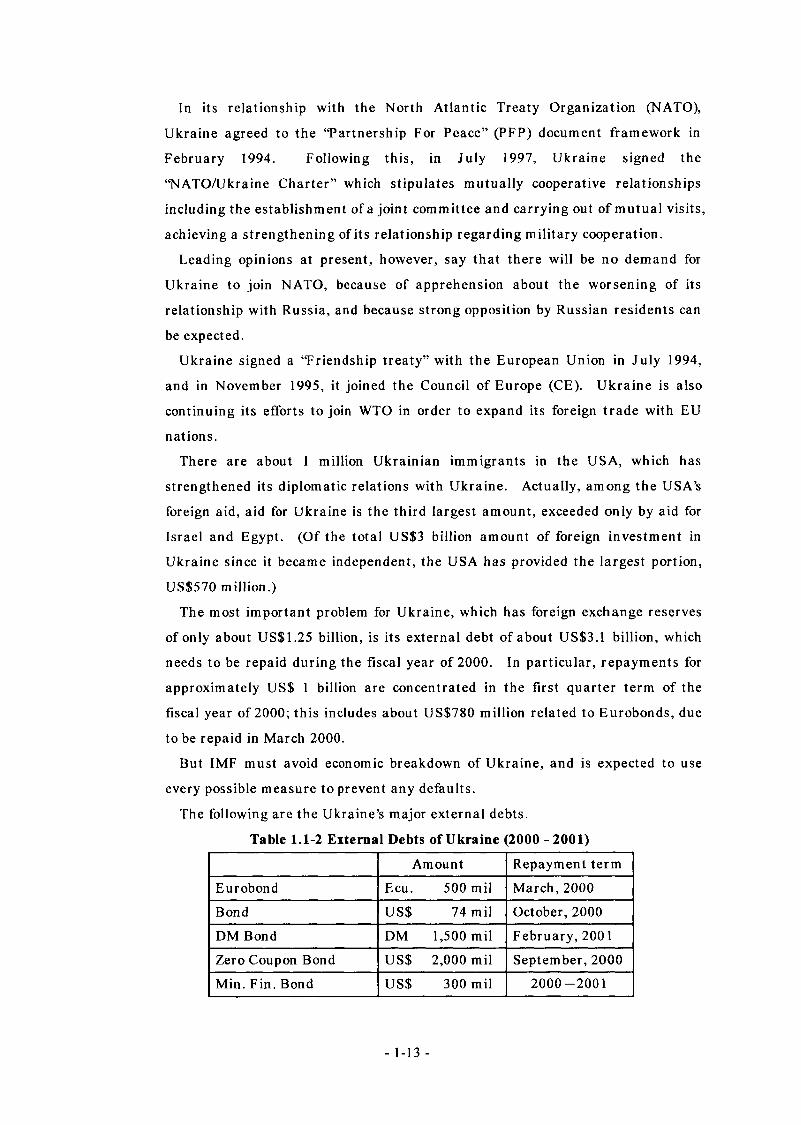
The following are the Ukraine’s major external debts.
Table 1.1-2 External Debts of Ukraine (2000 - 2001)
Amount Repayment term
Eurobond Ecu. 500 mil March, 2000
Bond US$ 74 mil October, 2000
DM Bond DM 1,500 mil February, 2001
Zero Coupon Bond US$ 2,000 mil September, 2000
Min. Fin. Bond us$ 300 mil 2000-2001
- 1-13 -
[Others]
Ukraine has already concluded “friendship and good neighbor” treaties with
Hungary, Poland and Slovakia, and has good relationships with them. Ukraine
had been in dispute with Romania about a territorial problem, but made a
“friendship and good neighbor” treaty with Romania, and settled their national
border. Ukraine hopes to join the WTO while also strengthening its
relationships with nations in Central and Eastern Europe.
1.1.5 Economy
(1) Domestic economic trends
When the USSR broke up at the end of 1991, Ukraine was considered to have
the highest feasibility for future development of all the republic nations that
had constituted the former USSR. The rehabilitation of Ukraine’s economy
began with organization into the form of the national economy of an
independent nation, first by the improvement of its central bank and banking
system, then the issuing and management of currency, the establishment of
financial affairs, and establishment of systems for taxes, tariffs and foreign
trade. But the Ukrainian economy has lagged behind expectations, for the
following reasons.
• Except for coal, Ukraine is dependent on imports of energy resources from
Russia and other CIS nations, and energy export prices increased when
Ukraine became independent.
• The production system in Ukraine was deeply integrated with the system
for division of work formerly used in the USSR; therefore, there are
shortages of know-how in every area of government and private industry.
Also, agriculture has become sluggish due to sharp rises of prices for
agricultural equipment and machines.
• Drastic delay of conversion from military-controlled industry to private
industry
- 1-14 -
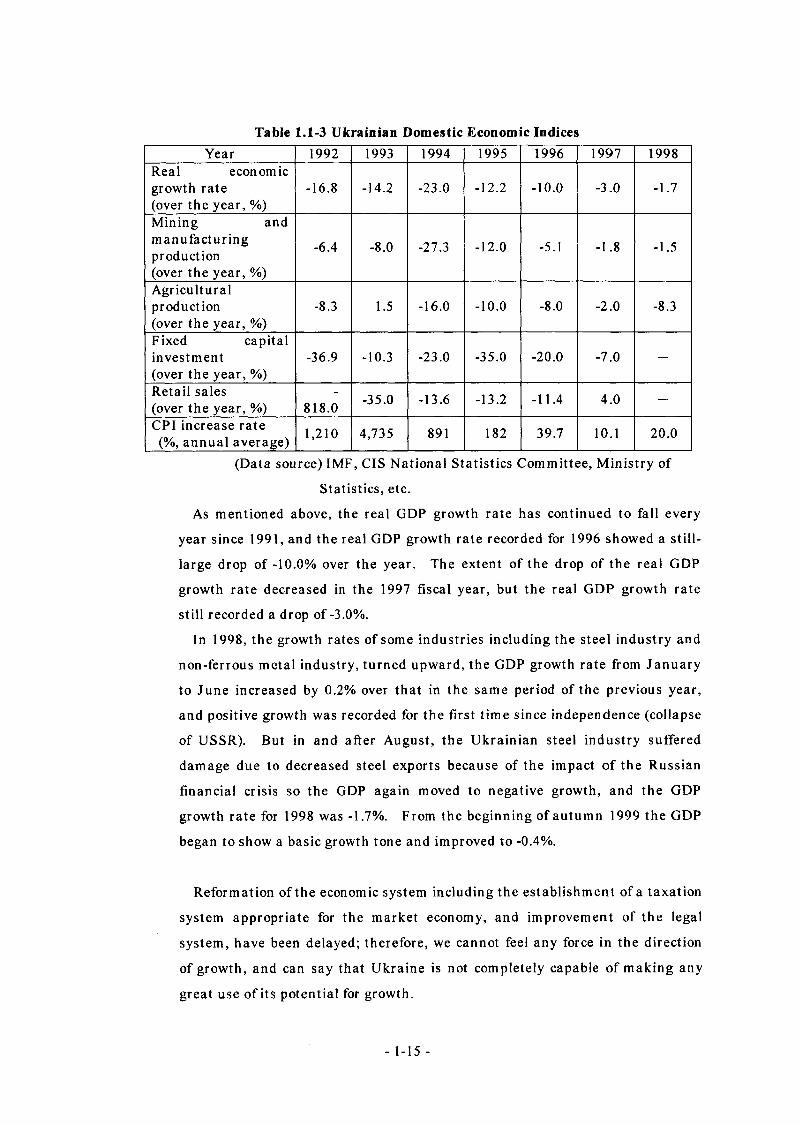
Table 1.1-3 Ukrainian Domestic Economic IndicesYear 1992 1993 1994 1995 1996 1997 1998
Real economicgrowth rate (over the year, %)
-16.8 -14.2 -23.0 -12.2 -10.0 -3.0 -1.7
Mining andmanufacturingproduction(over the year, %)
-6.4 -8.0 -27.3 -12.0 -5.1 -1.8 -1.5
Agriculturalproduction(over the year, %)
-8.3 1.5 -16.0 -10.0 -8.0 -2.0 -8.3
Fixed capitalinvestment(over the year, %)
-36.9 -10.3 -23.0 -35.0 -20.0 -7.0 —
Retail sales (over the year, %) 818.0 -35.0 -13.6 -13.2 -11.4 4.0 —
CPI increase rate (%, annual average) 1,210 4,735 891 182 39.7 10.1 20.0
(Data source) IMF, CIS National Statistics Committee, Ministry of
Statistics, etc.
As mentioned above, the real GDP growth rate has continued to fall every
year since 1991, and the real GDP growth rate recorded for 1996 showed a still-
large drop of -10.0% over the year. The extent of the drop of the real GDP
growth rate decreased in the 1997 fiscal year, but the real GDP growth rate
still recorded a drop of -3.0%.
In 1998, the growth rates of some industries including the steel industry and
non-ferrous metal industry, turned upward, the GDP growth rate from January
to June increased by 0.2% over that in the same period of the previous year,
and positive growth was recorded for the first time since independence (collapse
of USSR). But in and after August, the Ukrainian steel industry suffered
damage due to decreased steel exports because of the impact of the Russian
financial crisis so the GDP again moved to negative growth, and the GDP
growth rate for 1998 was -1.7%. From the beginning of autumn 1999 the GDP
began to show a basic growth tone and improved to -0.4%.
Reformation of the economic system including the establishment of a taxation
system appropriate for the market economy, and improvement of the legal
system, have been delayed; therefore, we cannot feel any force in the direction
of growth, and can say that Ukraine is not completely capable of making any
great use of its potential for growth.
- 1-15 -
According to the EBRD estimation, 49% of the Ukrainian economy is
considered a “shadow economy,” and its real GDP is far greater than that
shown by statistics; also, in the past 2 years, the GDP is considered to have
been almost stable.
Generally speaking, the registration rate for small and medium industries is
low in Ukraine, and some foreign trade is not reported. There are many cases
of the accounts for such foreign trade being settled between bank accounts in
countries outside Ukraine; therefore, in many cases, business results are
undervalued.
(2) Commodity prices & employment
(A) Commodity prices
CPI increase rates compared with the previous year’s were 1,210% in 1992,
and 4,735% in 1993. When the 1990 CPI is considered as the standard, that
of 1993 exceeds it by 120,000 times, indicating hyperinflation. However,
since October 1994, Ukraine has been carrying out austerity measures
according to IMF guidelines; as a result, the CPI increase rate over the year
was 891% in 1994, 182% in 1995, 39.7% in 1996, and 10.1% in 1997, becoming
quite settled. This is the result of the development of a full-scale market
economy, including liberalization of prices and the curtailing of subsidies,
which Ukraine has started with IMF guidance.
But the subsidence of inflation was the result of total demand being severely
suppressed, and fund shortages occurred throughout the Ukrainian economy,
causing problems such as various unpaid debts to become more serious.
Price freeze measures were taken when the new currency, the “UAH,” was
introduced in September 1996, but basically, price liberalization has been
encouraged, and the majority of price controls were abolished in October 1994.
Due to the impact of the financial breakdown in Russia in August 1998, the
value of the UAH fell, and the inflation rate in 1998 increased to 20%. It was
19.2% in 1999.
(B) Employment
According to official statistics, the number of unemployed persons as of the
end of September 1997 was 577,703, and the unemployment rate was only
2.1%. But this is considered to be a reflection of the low level of
unemployment allowances, and of delays in their payment, so there is little
incentive for the registration of unemployed persons. Actually, there are
- 1-16 -
many “hidden unemployed persons” who have been laid off for long periods of
time, or who have shortened their work hours, in order to avoid official
dismissal, so the actual unemployment rate after including them is assumed
to be quite different from the official statistics figure.
According to an announcement by the Ministry of Labor, the number of
unemployed persons as of the end of 1996 had increased to 3,500,000, and the
unemployment rate was estimated to be about 12%. However, the
unemployment rate at the beginning of the 1999 fiscal year was 4.3%, so the
unemployment rate trend has improved.
(3) Industrial structure
(A) Distinctive features of industrial structure
Ukraine “has been fortunate in its possession of fertile national land since
the time of USSR”(sic), and has long been called the “granary of Europe.”
Typical large-scale mechanized agriculture is carried out, and winter wheat,
corn, and rye, etc., are produced. Ukraine was the top grain-producing nation
in the former USSR.
Industry was developed in the Dnepr region in eastern Ukraine, utilizing
the abundant local coal, and after World War II, chemical industries and
heavy industry, mainly the steel industry, were developed utilizing local
underground resources.
As mentioned above, Ukraine can be roughly divided into a western
agricultural area and an eastern industrial area. The Ukrainian government
has now hammered out a drastic plan to admit the participation of foreign
capital to the private operation of large enterprises including the electric
power industry, the communication industry, and the agricultural
infrastructure.
But restructuring of enterprises is not being carried out, and many
enterprises still have huge numbers of excess personnel; therefore, foreign
capital is not approaching Ukrainian enterprises, and the development of
private industry has not yet advanced.
(B) Mining and manufacturing industry
30% of the exports from Ukraine are iron and steel products, and since the
time of Imperial Russia, Dombasle in eastern Ukraine has been the site of a
munitions industry with high technical power, as well as other industries,
- 1-17 -
making great use of the Donetsk coal mine and iron ore from Krivoi Rog.
This complex was extensively developed with the assumption of a supply of
cheap energy from the USSR, therefore, because Ukraine has not been able to
obtain sufficiently cheap energy from Russia since independence, the
operation rates of heavy industries such as the metals industry, machine
industry, petroleum refining industry and munitions industry have declined to
an extreme degree, and at present industrial production has fallen to less than
50% of its 1990 level.
Concerning its energy supply, Ukraine is almost self-sufficient in coal, but
its self-supply rates of petroleum and natural gas are very low, and it has been
depending on imports of petroleum from Russia and natural gas from Russia
and Turkmenistan. Considering Ukraine’s future energy supply, its self
supply rate for coal is high, but restructuring of the industry has not advanced,
so coal production is extremely inefficient and coal cannot become an
important energy supply source.
Ukraine is highly dependent on imports of both petroleum and natural gas
from Russia, but on the other hand it has such problems as differing opinions
concerning the subject of pipeline fees.
For the purpose of ensuring stable procurement, Ukraine has made an
import contract with Azerbaijan concerning petroleum imports, and one with
Uzbekistan concerning natural gas imports.
Ukraine is also attempting to organize imports of petroleum from Middle
Eastern and Near Eastern nations such as Iran. It is also drilling for natural
gas in the Sea of Azov off the Crimean peninsula; this is expected to contribute
to the gas supply for the Crimean region.
(C) Agriculture
In keeping with its history as “the granary of Europe,” agriculture in
Ukraine, which has a such large fertile loam region, accounts for a large share
of the economy (13.4% of the GDP composition ratio in 1996). Also, 22% of all
workers in Ukraine are agricultural workers.
But unfavorable conditions for agricultural production have been continuing
recently. Agricultural production in 1994 recorded a drastic negative growth
rate, 16% less than that in the previous year; in 1995, it showed a negative
growth rate of -10%; and in 1996 growth was still negative at -8%. The rate
of negative growth decelerated slightly in 1997 but was still recorded at -2%.
The amount of minus growth worsened in the 1998 fiscal year, to -8.3%.
- 1-18 -
EIU estimation was that the amount of negative growth in 1999 would be -
1.0%.
As the above shows, agriculture, originally supposed to be one of the pillars
supporting the Ukrainian economy, has been continuously inactive. In the
days of the USSR, Ukraine imported agricultural machinery, fuel, and
chemical fertilizers at cheap prices from other CIS nations, mainly Russia, but
since the USSR collapsed, import prices for these items have been sharply
increasing at rates greater than the increase rate for the prices of agricultural
products. This can be mentioned as one reason for agricultural inactivity.
Also, as of the middle of 1997, about 95% of all farm land still belonged to
collective farms (kolkhoz) and state-operated farms, so that development of
private operation of agriculture has been delayed; the maintenance of this
inefficient system is another cause of agricultural inactivity.
(4) Financial affairs
When it was part of the USSR, Ukraine’s financial affairs had a structure in
which any financial deficit was compensated for by transferring the deficit to
the USSR government. Therefore, after the USSR collapsed and the transfer
of deficits to the USSR government was abolished, the budget deficit structure
was exposed.
Since 1992, Ukrainian government introduced a new taxation system
including VAT and commodity taxes, etc., and has been simultaneously making
efforts to curtail annual expenditures including those for subsidies and social
services, but no remarkable improvement has yet been seen.
The budget deficit in 1996 was 4.6% of GDP, apparently showing the
effectiveness of the retrenchment budget, but actually, under conditions in
which the government is unable to collect sufficient tax revenues and there are
annual revenue shortages, the financial situation has recovered from its worst
situation only through the suppression of annual expenditures by lowering the
level of social services. Due to this, the problem of unpaid (delayed payment
of) pensions and wages has become more serious.
Essential problems such as reformation of the taxation system, restructuring
of state-operated enterprises, and reduction of the scale of administrative
organs, have still not been solved, and the deficit rate (GDP ratio 6.7%) again
worsened in 1997. As a result, wage and pension obligations have
accumulated, becoming a serious problem obstructing economic reformation in
- 1-19 -
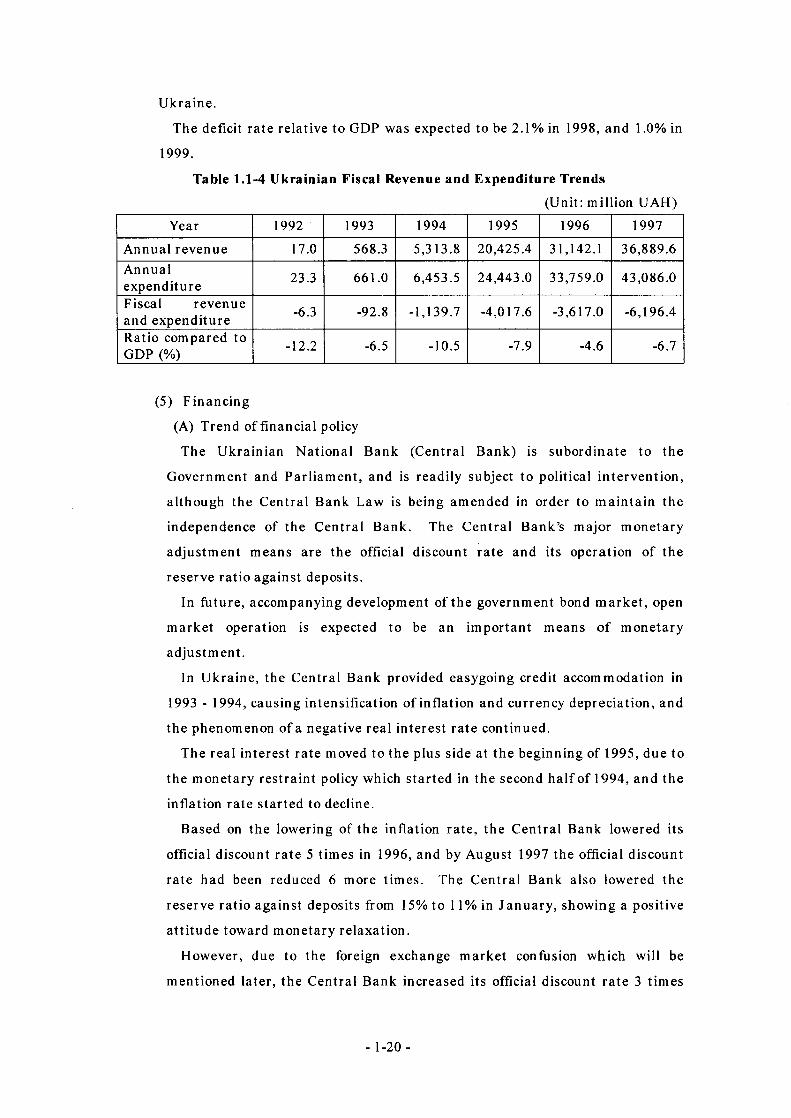
Ukraine.
The deficit rate relative to GDP was expected to be 2.1% in 1998, and 1.0% in
1999.
Table 1.1-4 Ukrainian Fiscal Revenue and Expenditure Trends
(Unit: million UAH)
Year 1992 1993 1994 1995 1996 1997
Annual revenue 17.0 568.3 5,313.8 20,425.4 31,142.1 36,889.6Annualexpenditure 23.3 661.0 6,453.5 24,443.0 33,759.0 43,086.0
Fiscal revenueand expenditure -6.3 -92.8 -1,139.7 -4,017.6 -3,617.0 -6,196.4
Ratio compared to GDP (%) -12.2 -6.5 -10.5 -7.9 -4.6 -6.7
(5) Financing
(A) Trend of financial policy
The Ukrainian National Bank (Central Bank) is subordinate to the
Government and Parliament, and is readily subject to political intervention,
although the Central Bank Law is being amended in order to maintain the
independence of the Central Bank. The Central Bank’s major monetary
adjustment means are the official discount rate and its operation of the
reserve ratio against deposits.
In future, accompanying development of the government bond market, open
market operation is expected to be an important means of monetary
adjustment.
In Ukraine, the Central Bank provided easygoing credit accommodation in
1993 - 1994, causing intensification of inflation and currency depreciation, and
the phenomenon of a negative real interest rate continued.
The real interest rate moved to the plus side at the beginning of 1995, due to
the monetary restraint policy which started in the second half of 1994, and the
inflation rate started to decline.
Based on the lowering of the inflation rate, the Central Bank lowered its
official discount rate 5 times in 1996, and by August 1997 the official discount
rate had been reduced 6 more times. The Central Bank also lowered the
reserve ratio against deposits from 15% to 11% in January, showing a positive
attitude toward monetary relaxation.
However, due to the foreign exchange market confusion which will be
mentioned later, the Central Bank increased its official discount rate 3 times
- 1-20 -
in November alone, and simultaneously increased its reserve ratio against
deposits from 11% to 15%, and the Ukrainian government was obliged to
change its financial policy to one of monetary restraint.
(B) Foreign exchange trends
In January 1992 Ukraine introduced a “coupon” system to compensate for
the shortage of rubles. The coupons were replaced by the legal currency
called “karbovanet” as a provisional measure until introduction of the official
currency in November 1992, when Ukraine officially broke away from the
Russian ruble zone.
The value of the “karbovanet” against the US dollar fell continuously from
the time of its introduction. In 1993, in order to stabilize foreign exchange
rates, the Central Bank carried out the policy of forcibly exchanging 50% of
enterprises’ foreign currency income for “karbovanets,” Further, in August
1995, circulation of foreign currency in Ukraine was prohibited, and payment
using the nation’s own currency became obligatory for domestic business
transactions. Also, in October, 1994, multiple foreign exchange rates had
been unified in the market foreign exchange rates to be determined in the
inter-Ukrainian bank foreign exchange market.
Introduction of the official currency, the “hryvnia (UAH)” a goal set since
economic reformation started, was earlier postponed due to economic
confusion, but after inflation was suppressed, introduction of the UAH was
finally achieved in September 1996.
When the UAH was introduced, the UAH: US funds exchange rate was fixed
at US$1.00 = 1.76 UAH, but a floating exchange system went into effect on
October 7, 1996. Ukraine officially introduced a currency fluctuation margin
in order to stabilize foreign exchange rates. (The fluctuation margin until the
end of 1997 was set at US$ = 1.7 - 1.9 UAH, and in the first half term of 1998
it was set at US$ = 1.75 - 1.95 UAH.)
However, because the IMF postponed the execution of standby credit, and
because there was also worldwide confusion in newly-risen markets, selling of
short-term government bonds by non-residents accelerated in October 1997,
and UAH-selling pressure increased. The Central Bank was obliged to
change its policy to one of monetary restraint, and in November it reduced the
official discount rate 3 times in order to slow currency depreciation.
The influence of de facto downward devaluation of the Russian currency, the
- 1-21 -

ruble, was one of the factors precipitating the Russian financial crisis in
August 1998; this was followed by a severe decline of currency value which
spread to Ukraine, and on August 18, 1998 the Ukrainian Central Bank
reduced the currency exchange rate for the UAH and US dollar, from 1 US
dollar = 2.14356 UAH, to 1 US dollar = 2.1805 UAH.
Devaluation of the UAH continued after this, and at the end of 1998 the
exchange rate was 1 US dollar = 3.4270 UAH. The exchange rate at the end of
1999 was 1 US dollar = 5.50 UAH, and as of the end of February, 2000 it is 1
US dollar = 5.59 UAH.
(6) International balance of payments
(A) Trade balance trend
Ukrainian foreign trade was increasing nicely from 1995, but the trade
balance in 1997 showed only sluggish growth; the amount of exports was
US$15.4 billion and the amount of imports was US$19.6 billion, so the balance
showed a deficit of US$4.2 billion. This was because the majority of
Ukrainian exports previously went to Russia, but exports (sugar and vodka,
etc.) for Russia had decreased drastically, due to Russia’s discriminatory
handling of Ukrainian products, to which it applied tariffs and added-value
taxes.
On the other hand, due to the strong tendency of producers and consumers
to favor high-quality imported products from Western nations, imports
basically continued to increase, so the trade deficit is expected to become even
larger. The total amount of exports and imports in the 1998 fiscal year was
US$30 billion (14.3% less than in the previous year). Exports were US$13.7
billion (an 11.0% decrease from the previous year) and imports were US$16.3
billion (a 17% decrease from the previous year) so the trade balance showed a
surplus of US$2.6 billion. It is also noteworthy that foreign trade with
Russia dropped to 23% of total exports and 48.1% of total imports.
Major export products are iron, steel, machinery, transport vehicles, mineral
resources, chemical products, farm products and other agricultural products.
Major imports are energy resources including petroleum and natural gas, and
products related to agriculture, etc.
- 1-22 -
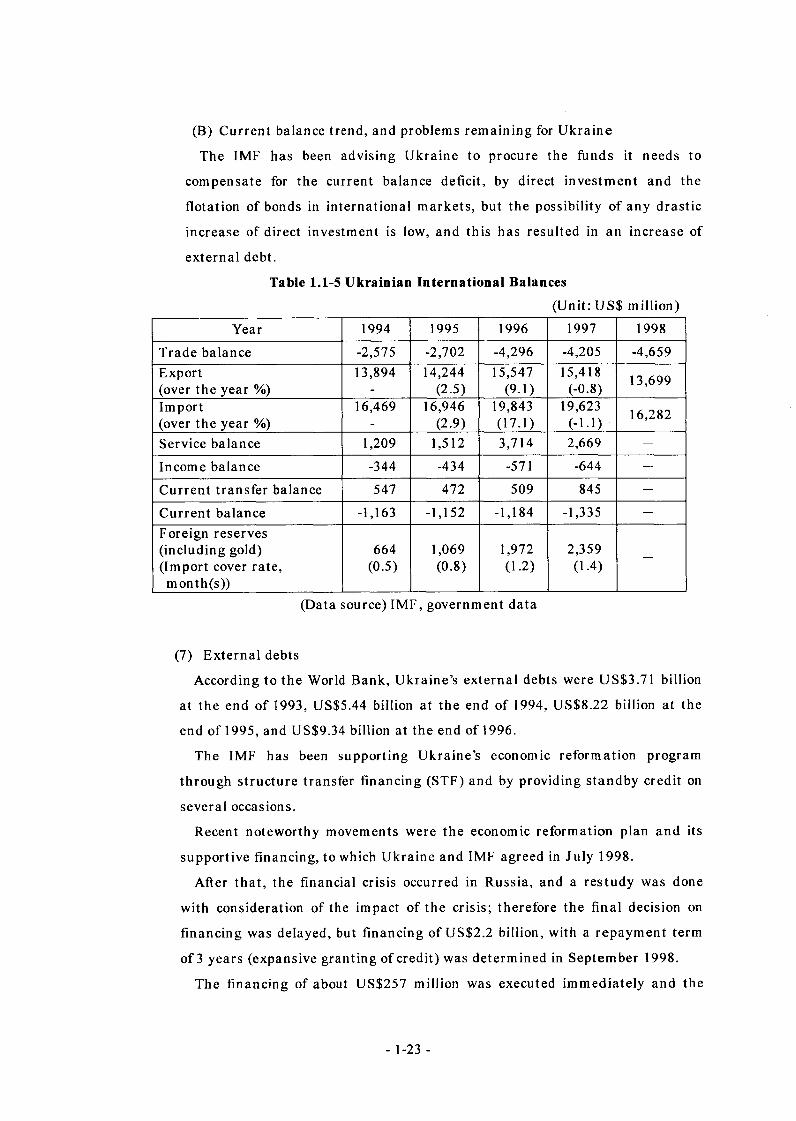
(B) Current balance trend, and problems remaining for Ukraine
The IMF has been advising Ukraine to procure the funds it needs to
compensate for the current balance deficit, by direct investment and the
flotation of bonds in international markets, but the possibility of any drastic
increase of direct investment is low, and this has resulted in an increase of
external debt.
Table 1.1-5 Ukrainian International Balances
(Unit: US$ million)
Year 1994 1995 1996 1997 1998
Trade balance -2,575 -2,702 -4,296 -4,205 -4,659Export(over the year %)
13,894 14,244(2.5)
15,547(9.1)
15,418(-0.8) 13,699
Import(over the year %)
16,469 16,946(2.9)
19,843(17.1)
19,623(-1.1) 16,282
Service balance 1,209 1,512 3,714 2,669 —
Income balance -344 -434 -571 -644 —
Current transfer balance 547 472 509 845 —
Current balance -1,163 -1,152 -1,184 -1,335 —Foreign reserves (including gold)(Import cover rate, month(s))
664(0.5)
1,069(0.8)
1,972(1.2)
2,359(1.4) —
(Data source) IMF, government data
(7) External debts
According to the World Bank, Ukraine’s external debts were US$3.71 billion
at the end of 1993, US$5.44 billion at the end of 1994, US$8.22 billion at the
end of 1995, and US$9.34 billion at the end of 1996.
The IMF has been supporting Ukraine’s economic reformation program
through structure transfer financing (STF) and by providing standby credit on
several occasions.
Recent noteworthy movements were the economic reformation plan and its
supportive financing, to which Ukraine and IMF agreed in July 1998.
After that, the financial crisis occurred in Russia, and a restudy was done
with consideration of the impact of the crisis; therefore the final decision on
financing was delayed, but financing of US$2.2 billion, with a repayment term
of 3 years (expansive granting of credit) was determined in September 1998.
The financing of about US$257 million was executed immediately and the
- 1-23 -
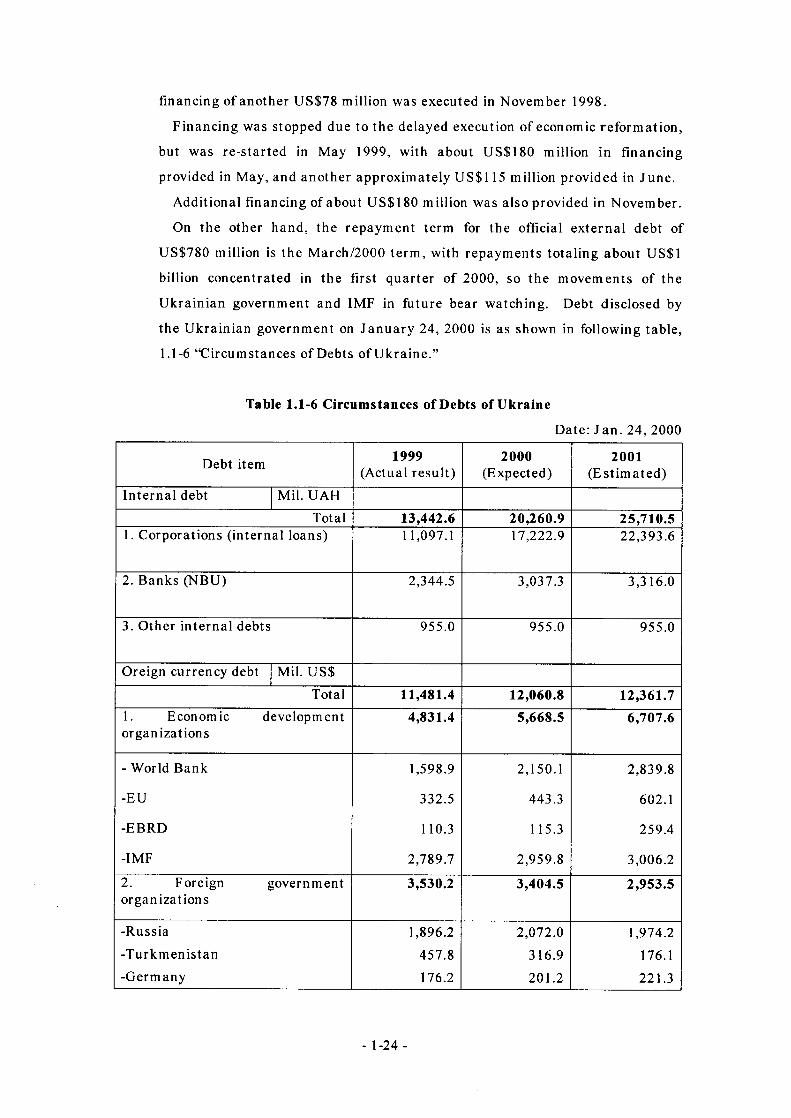
financing of another US$78 million was executed in November 1998.
Financing was stopped due to the delayed execution of economic reformation,
but was re-started in May 1999, with about US$180 million in financing
provided in May, and another approximately US$115 million provided in June.
Additional financing of about US$180 million was also provided in November.
On the other hand, the repayment term for the official external debt of
US$780 million is the March/2000 term, with repayments totaling about US$1
billion concentrated in the first quarter of 2000, so the movements of the
Ukrainian government and IMF in future bear watching. Debt disclosed by
the Ukrainian government on January 24, 2000 is as shown in following table,
1.1-6 “Circumstances of Debts of Ukraine.”
Table 1.1-6 Circumstances of Debts of Ukraine
Date: Jan. 24, 2000
Debt item 1999(Actual result)
2000(Expected)
2001(Estimated)
Internal debt Mil. UAHTotal 13,442.6 20,260.9 25,710.5
1. Corporations (internal loans) 11,097.1 17,222.9 22,393.6
2. Banks (NBU) 2,344.5 3,037.3 3,316.0
3. Other internal debts 955.0 955.0 955.0
Oreign currency debt Mil. US$Total 11,481.4 12,060.8 12,361.7
1. Economic developmentorganizations
4,831.4 5,668.5 6,707.6
- World Bank
-EU
-EBRD
-IMF
1,598.9
332.5
110.3
2,789.7
2,150.1
443.3
115.3
2,959.8
2,839.8
602.1
259.4
3,006.2
2. Foreign governmentorganizations
3,530.2 3,404.5 2,953.5
-Russia-Turkmenistan-Germany
1,896.2
457.8176.2
2,072.0316.9201.2
1,974.2
176.1221.3
- 1-24 -
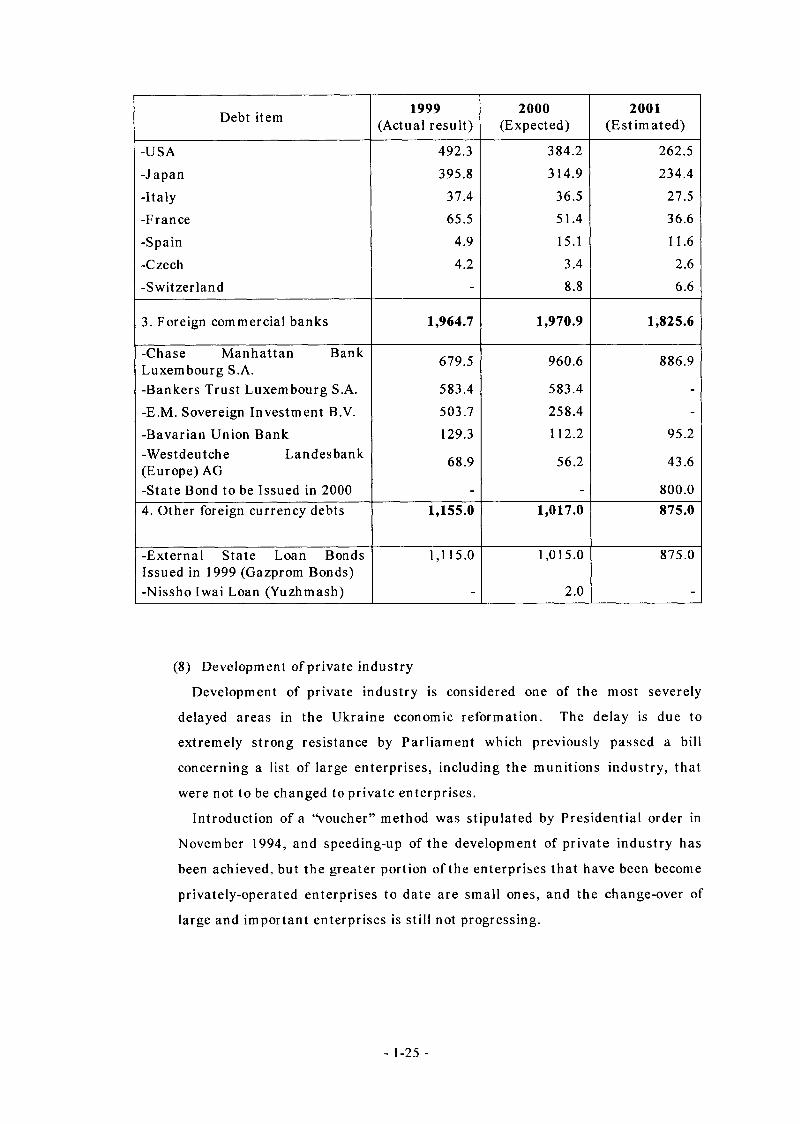
Debt item 1999 2000 2001(Actual result) (Expected) (Estimated)
-USA 492.3 384.2 262.5
-Japan 395.8 314.9 234.4
-Italy 37.4 36.5 27.5
-France 65.5 51.4 36.6
-Spain 4.9 15.1 11.6
-Czech 4.2 3.4 2.6
-Switzerland - 8.8 6.6
3. Foreign commercial banks 1,964.7 1,970.9 1,825.6
-Chase Manhattan BankLuxembourg S.A. 679.5 960.6 886.9
-Bankers Trust Luxembourg S.A. 583.4 583.4 --E.M. Sovereign Investment B.V. 503.7 258.4 --Bavarian Union Bank 129.3 112.2 95.2-Westdeutche Landesbank(Europe) AG 68.9 56.2 43.6
-State Bond to be Issued in 2000 - - 800.04. Other foreign currency debts 1,155.0 1,017.0 875.0
-External State Loan Bonds 1,115.0 1,015.0 875.0Issued in 1999 (Gazprom Bonds) -Nissho Iwai Loan (Yuzhmash) - 2.0 -
(8) Development of private industry
Development of private industry is considered one of the most severely
delayed areas in the Ukraine economic reformation. The delay is due to
extremely strong resistance by Parliament which previously passed a bill
concerning a list of large enterprises, including the munitions industry, that
were not to be changed to private enterprises.
Introduction of a “voucher” method was stipulated by Presidential order in
November 1994, and speeding-up of the development of private industry has
been achieved, but the greater portion of the enterprises that have been become
privately-operated enterprises to date are small ones, and the change-over of
large and important enterprises is still not progressing.
- 1-25 -
According to the EBRD report, the speed of development of private industry
in Ukraine is quite slow compared to that in other nations in Eastern Europe
and in former USSR nations, in which state-operated enterprises are being
transformed into private enterprises; as of mid-1996 the share of annual
production provided by private enterprises in the Ukrainian GDP was only 40%.
In May 1997, President Kuchma issued a new Presidential Order in order to
accelerate the development of private industry and clarified the principles for
development of private industry in the strategic fields (energy, transportation,
and communication) not previously included in the subject of the development
of private industry, so future advances in the development of private industry
are expected.
Development of private operation in the agricultural field is one important
pillar of economic reformation in Ukraine, although there is great resistance,
mainly by the agricultural lobby, and opinions about this do not coincide even
within the government; therefore private operation is even more delayed in
agriculture than in the development of other private enterprises.
(9) Direct investment trend
Overseas direct investment in Ukraine is tending to increase annually,
although it showed only a sluggish rise in 1997. The amount of investment to
Ukraine in 1997 was about US$759,200,000, and the cumulative amount of
investment accepted was about US$2.3 billion.
However, overseas direct investment rose by US$420 million (an increase of
103% over the same period in the previous year) in the first half term of the
1998 fiscal year, and the amount of direct investment reached US$2.5 billion as
of July 1, 1998. The leading investing nation is the USA, and over 200 US
enterprises including Cargill (sunflower oil refining), John Deere (assembling of
combines), Coca-Cola, Philip Morris, and McDonald’s, etc., have advanced into
Ukraine.
One large investment determined in 1997, the project for establishment of
joint venture company between the Daewoo group of Korea and AvtoZAZ Co.,
the state-operated automobile manufacturer in Ukraine, is worth mentioning.
The total investment by the Daewoo group is said to be US$1.3 billion (plan
basis).
- 1-26 -
Investors are strongly dissatisfied, making the following complaints.
The taxation system changes too easily, and tax rates are high.
Enterprise registration procedures are rough and unsatisfactory.
Government officials demand bribes.
There are many other things that need to be improved.
(10) Relationship with Japan
The Government of Japan recognized the independence of Ukraine in
December 1991. After that, Japan established diplomatic relations with
Ukraine in January 1992, and opened a Japanese embassy in Ukraine in
January 1993.
In March 1995, when President Kuchma visited Japan, Japan agreed to
provide financial support, and The Export-Import Bank of Japan provided
US$200 million in financing to support economic reform in Ukraine.
Exports from Ukraine to Japan in the 1998 fiscal year totaled ¥9.49 billion
and were mainly steel, non-ferrous metals, and foodstuffs, while on the other
hand, imports into Ukraine from Japan, mainly machinery and automobiles,
totaled ¥9.6 billion. Total direct investment by Japan in Ukraine until March
1997 was about ¥ 187 million.
- 1-27 -
1.2 Energy circumstances
1.2.1 Energy resources
(1) Coal
Ukraine is blessed with abundant coal resources, and its coal production in
1990 was 25% of total coal production in the USSR.
A large percentage of coal is used as the raw material for coke for iron
foundries. The Dnetsk coal mine in the eastern Ukraine is the largest coal
production site in Ukraine, and even now, about 68% of all Ukrainian coal
production comes from this mine.
Annual coal production in 1997 was 71 million tons, which was below the
production goal of 90 million tons a year, and only 76 coal mines out of 270 sites
could expect a profit. Modernization of production facilities is essential in
order to increase coal production.
(2) Petroleum
Petroleum production in Ukraine peaked at 15,500,000 tons in 1972, after
which oil production continuously dropped; at present, almost all oil fields are
completely depleted, and Ukraine is dependent on oil imported from Russia.
Another oil shortage cause is that surveying and boring activities have not
been done in Ukraine due to financial difficulties.
(3) Natural gas
It will be started in the 1950s, after greeting a peak by 69 billion m3 in 1975,
decrease in production continues, and it depends for production of natural gas
from Russia (75% of the amount of import), Turkmenistan (15%), and
Uzbekistan (10%) on import now, and it provides the need of a thermal-power-
station plant
Every country was previously supplying gas to Ukraine at cheap rates, but
they have gradually raised their gas prices to higher than the international
market price. Therefore, payment of the gas charge have become difficult.
Ukraine's debt as of 2000 to be paid to Russia is about US$3 billion and that
to be paid to Turkmenistan is about US$300 million.
- 1-28 -
Ukraine haters toll payment for the pipeline that passes Ukraine from Russia
for gas charge with Russia, however, there is a problem with the excessive
quantity of gas drawn out by Ukraine as a toll payment for pipeline.
Therefore plans to change the route of the pipeline for Europe often come up.
At present, political agreement is got from both countries to a debt problem,
and supply is received succeedingly.
This problem is an economical problem purely, the management of a power
generation firm improves by improvement in the electricity-rate recovery
mentioned later etc., and if a gas charge can be paid, it will be solved.
(4) Nuclear power generation fuel
At present there are nuclear power generation plants in 4 places in Ukraine,
with 13 reactors being operated. These plants generate 12,000 MW of
electrical energy, which is 48% of total power generation facility capacity, but
the entire power generation fuel cycle is dependent on imports from Russia, and
imported nuclear fuel plays a major role in compensating for the shortage of
energy resources in Ukraine.
Furthermore, in future, Ukraine will be obliged to promote power generation
using nuclear fuel because this is cheaper than fossil fuel.
Ukraine has uranium mines in 2 areas, and the ores obtained from these
mines are processed in refining plants in Ukraine. The fuel cycle is presently
dependent on Russia, and in particular, the negotiations with Russia
concerning the processing of spent fuel are not going smoothly, and have
become a problem; therefore Ukraine has been negotiating with the USA about
a plan to construct a spent fuel storage facility in Ukraine, and the USA is
considering providing the research expenses.
- 1-29 -
1.2.2 Energy demand/supply
(1) Energy policy
The national ‘Petroleum and gas in Ukraine until 2010” plan, prepared in
1994 as the country’s energy policy, stated that increased production of
7,500,000 tons per year of petroleum and 35.5 billion m3 per year of gas, would
be possible, although increasing the production of oil and gas is difficult under
present circumstances, in which the nation’s finances are close to a breakdown.
In the rehabilitation plan, Ukraine expects aid from Western bloc nations,
but circumstances from the viewpoint of the laws and policies of Ukraine itself
are not appropriate for these nations to provide financing to Ukraine.
In order to solve the energy problem in Ukraine, it is urgently important to
start fuel resource surveying and development using financial aid received from
other countries in order to increase the energy self-supply rate, which is 50 -
60% at present.
Two major tasks are to improve the production structure, which currently
uses antiquated industrial facilities and power generation facilities with poor
efficiency, in use since the time of the USSR, and to improve the industrial
structure which wastes huge amounts of energy due to heat loss from
superannuated heat-supply facilities.
Efficiency is considered to be 4 - 5 times worse than that of advanced nations,
and according to trial calculations by a research institute in Ukraine, saving
970 kWh a year of electric power is said to be possible.
- 1-30 -

1.2.3 Present electric power industry situation
In 1992, after Ukraine became independent, Mineenergo (Ministry of Electric
Power and Electrification of Ukraine) formerly a subordinate organization of the
Ministry of electric power and electrification of the USSR, became the
organization with general control of electric business and heat supply in Ukraine.
Under the supervision of Mineenergo, 8 corporate bodies called Energo (electric
power and electrification production unions) were organized for individual areas
in Ukraine, and each Energo has taken charge of the processes from power
generation to supply of electric power in each district of jurisdiction.
In order to rebuild the electricity business in the aspects of technology and
economy, the Ukrainian government decided to start to reorganize the electric
business according to the English model. The principles for unbundling of the
electricity business and the establishment of a competition-based wholesale
electric power market were stipulated by Presidential order in 1994. Based on
these principles, a concrete movement started in 1995 - 1996, after technological
support was received from specialists from the Western bloc. At present,
electricity business is operated according to the following system.
In the power generation category, 2 hydroelectric power generation companies
and 4 thermal power generation companies were established. Table 1.1-7 shows
the scale of each thermal power generation company.
Table 1.1-7 List of Thermal Power Generation Companies
Powergenerationcompany
Powergeneration
capacityMW
Actual power generation
results (1999)
mil. kWh
Employees Average age of facility
Fuelcomposition
ratio
Coal:Gas:Oil
Dnieproenergo 8,160 18,591 10,000 28 65:30:05
Donbassenergo 7,710 20,513 15,000 30 80:15:05
Centrenergo 7,550 17 872 6,500 27 81:10:10
Zahidenergo 4,700 10,966 8,000 31 80:10:10
Each hydraulic and thermal power generation company was designated as a
state-owned corporation. (Some of these have now become private corporations.)
Nuclear power generation plants are owned and operated by Energoatom, the
nuclear power generation company newly established at the end of 1996.
-1-31-
In the category of distribution of electrical energy, a total of 27 Oblenergi
(electric energy distribution companies) were established, one for each
administrative section, and all of these companies were designated as state-
owned corporations. (Some of these have now become private corporations.)
Each distribution company owns and operates the distribution network in its area,
as well as relatively small-scale power generation facilities. Many of these are
steam supply and power generation plants. Each distribution company is
obligated to supply electric power at regulated charges to all users who wish to
receive electricity supply.
In the category of power transmission, the state-owned company, Ukrenergo,
owns and operates a power transmission system and central electric power supply
command station. Ukrenergo does system operations including electric power
supply control and the providing of supplementary services, and also carries out
the business of settlement of accounts accompanying electric power transactions
between market participants.
Ukrenergo purchases all electric power from power generation business
operators and sells electric power to each distribution company based on the
market regulations stipulated in the electric power market participants’
agreement. The price of electric power purchased from thermal power
generation plants is determined on the basis of bidding for each hour in the
electric power market. On the other hand, hydroelectric power and nuclear
power are purchased on a contract basis.
The independent regulatory organ for supervision of such electric power
transactions, the National Electric Regulation Committee (NERC), was
established in 1995. This committee issues licenses to electric power business
operators, and supervises them. These licenses regulate the methods for
calculating the rental fees for transmission cables and the retail charges for
distribution companies.
At present, however, payment arrears and barter transactions with users are
constantly occurring throughout the entire economy in Ukraine, so the above-
mentioned electric power transaction system does not actually function without
problems. In spite of the establishment of the independent organ, NERC, there
has been very little change in the Ukrainian government’s/Mineenergo’s strong
influence on electric power business operation; therefore, the government can
easily carry out political intervention in the market, and transactions do not
actually conform to market regulations.
- 1-32 -
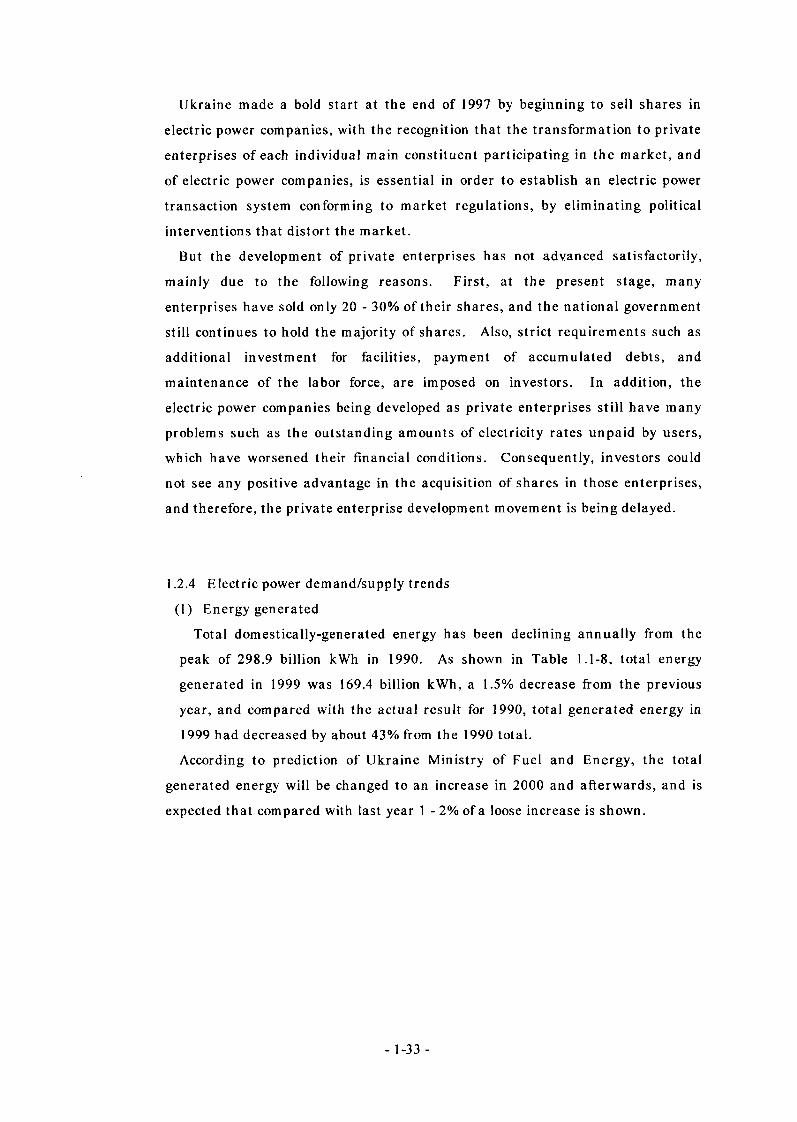
Ukraine made a bold start at the end of 1997 by beginning to sell shares in
electric power companies, with the recognition that the transformation to private
enterprises of each individual main constituent participating in the market, and
of electric power companies, is essential in order to establish an electric power
transaction system conforming to market regulations, by eliminating political
interventions that distort the market.
But the development of private enterprises has not advanced satisfactorily,
mainly due to the following reasons. First, at the present stage, many
enterprises have sold only 20 - 30% of their shares, and the national government
still continues to hold the majority of shares. Also, strict requirements such as
additional investment for facilities, payment of accumulated debts, and
maintenance of the labor force, are imposed on investors. In addition, the
electric power companies being developed as private enterprises still have many
problems such as the outstanding amounts of electricity rates unpaid by users,
which have worsened their financial conditions. Consequently, investors could
not see any positive advantage in the acquisition of shares in those enterprises,
and therefore, the private enterprise development movement is being delayed.
1.2.4 Electric power demand/supply trends
(1) Energy generated
Total domestically-generated energy has been declining annually from the
peak of 298.9 billion kWh in 1990. As shown in Table 1.1-8, total energy
generated in 1999 was 169.4 billion kWh, a 1.5% decrease from the previous
year, and compared with the actual result for 1990, total generated energy in
1999 had decreased by about 43% from the 1990 total.
According to prediction of Ukraine Ministry of Fuel and Energy, the total
generated energy will be changed to an increase in 2000 and afterwards, and is
expected that compared with last year 1 - 2% of a loose increase is shown.
- 1-33 -
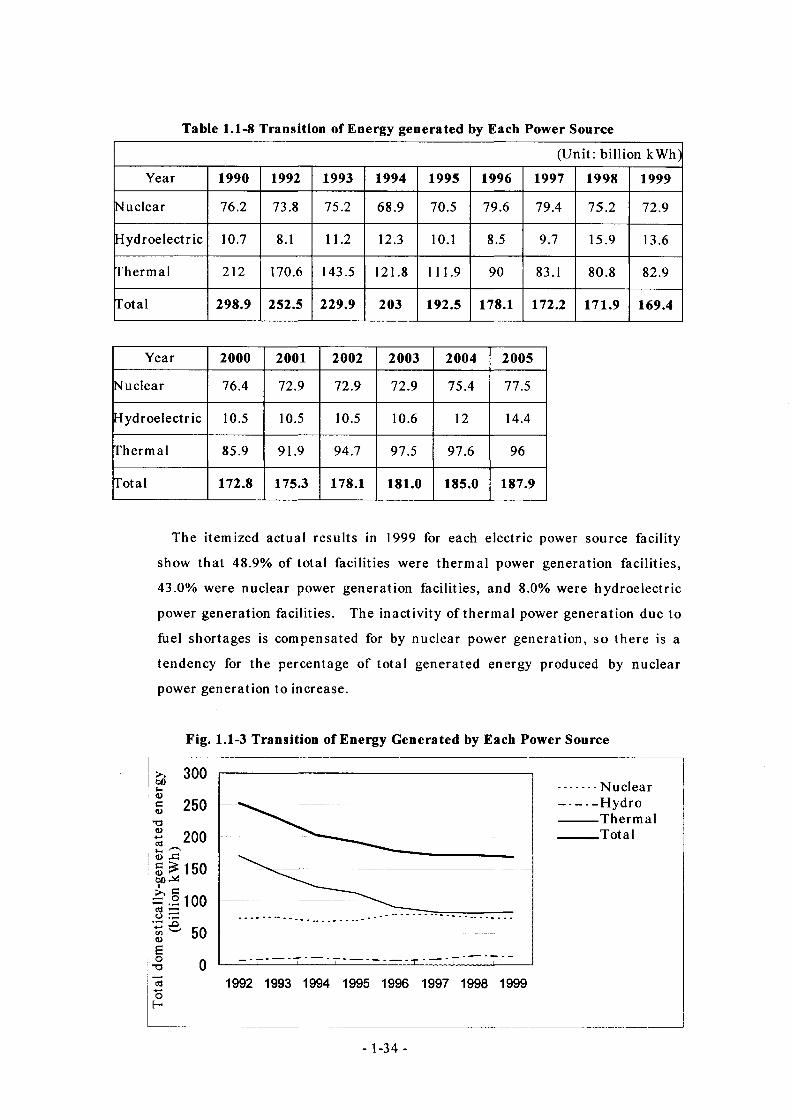
Table 1.1-8 Transition of Energy generated by Each Power Source
(Unit: billion kWh)
Year 1990 1992 1993 1994 1995 1996 1997 1998 1999
Nuclear 76.2 73.8 75.2 68.9 70.5 79.6 79.4 75.2 72.9
Hydroelectric 10.7 8.1 11.2 12.3 10.1 8.5 9.7 15.9 13.6
Thermal 212 170.6 143.5 121.8 111.9 90 83.1 80.8 82.9
Total 298.9 252.5 229.9 203 192.5 178.1 172.2 171.9 169.4
Year 2000 2001 2002 2003 2004 2005
Nuclear 76.4 72.9 72.9 72.9 75.4 77.5
Hydroelectric 10.5 10.5 10.5 10.6 12 14.4
Thermal 85.9 91.9 94.7 97.5 97.6 96
Total 172.8 175.3 178.1 181.0 185.0 187.9
The itemized actual results in 1999 for each electric power source facility
show that 48.9% of total facilities were thermal power generation facilities,
43.0% were nuclear power generation facilities, and 8.0% were hydroelectric
power generation facilities. The inactivity of thermal power generation due to
fuel shortages is compensated for by nuclear power generation, so there is a
tendency for the percentage of total generated energy produced by nuclear
power generation to increase.
Fig. 1.1-3 Transition of Energy Generated by Each Power Source
>> 300
.2 100
* 1992 1993 1994 1995 1996 1997 1998 1999oH
.......... Nuclear— - — - — H ydro-------- Thermal______Total
- 1-34 -
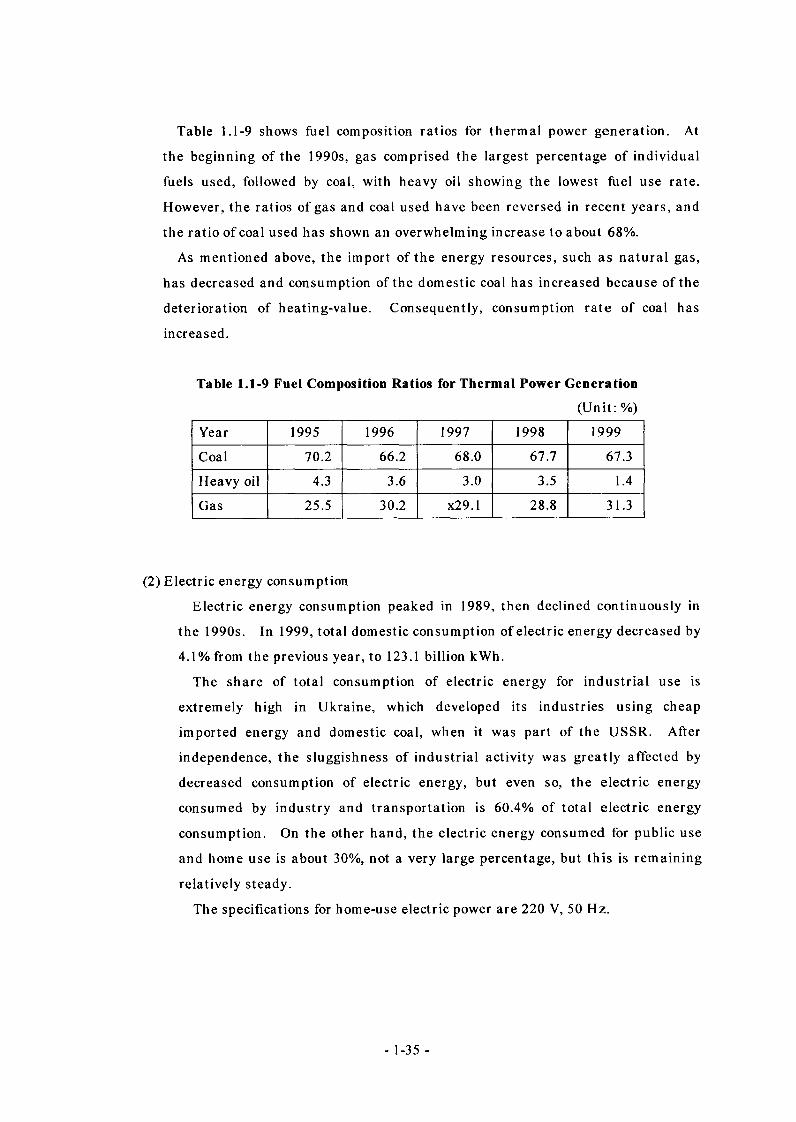
Table 1.1-9 shows fuel composition ratios for thermal power generation. At
the beginning of the 1990s, gas comprised the largest percentage of individual
fuels used, followed by coal, with heavy oil showing the lowest fuel use rate.
However, the ratios of gas and coal used have been reversed in recent years, and
the ratio of coal used has shown an overwhelming increase to about 68%.
As mentioned above, the import of the energy resources, such as natural gas,
has decreased and consumption of the domestic coal has increased because of the
deterioration of heating-value. Consequently, consumption rate of coal has
increased.
Table 1.1-9 Fuel Composition Ratios for Thermal Power Generation
(U n it: %)
Year 1995 1996 1997 1998 1999
Coal 70.2 66.2 68.0 67.7 67.3
Heavy oil 4.3 3.6 3.0 3.5 1.4
Gas 25.5 30.2 x29.1 28.8 31.3
(2) Electric energy consumption
Electric energy consumption peaked in 1989, then declined continuously in
the 1990s. In 1999, total domestic consumption of electric energy decreased by
4.1% from the previous year, to 123.1 billion kWh.
The share of total consumption of electric energy for industrial use is
extremely high in Ukraine, which developed its industries using cheap
imported energy and domestic coal, when it was part of the USSR. After
independence, the sluggishness of industrial activity was greatly affected by
decreased consumption of electric energy, but even so, the electric energy
consumed by industry and transportation is 60.4% of total electric energy
consumption. On the other hand, the electric energy consumed for public use
and home use is about 30%, not a very large percentage, but this is remaining
relatively steady.
The specifications for home-use electric power are 220 V, 50 Hz.
- 1-35 -
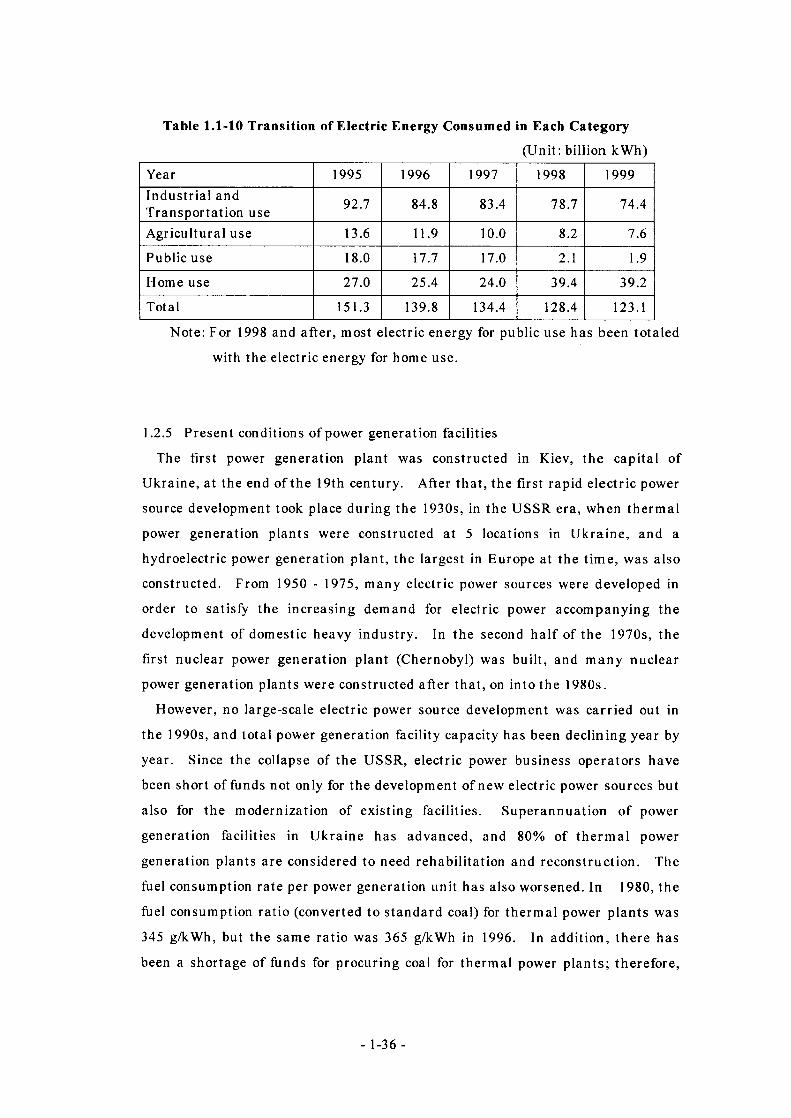
Table 1.1-10 Transition of Electric Energy Consumed in Each Category(Unit: billion kWh)
Year 1995 1996 1997 1998 1999Industrial and Transportation use 92.7 84.8 83.4 78.7 74.4
Agricultural use 13.6 11.9 10.0 8.2 7.6
Public use 18.0 17.7 17.0 2.1 1.9
Home use 27.0 25.4 24.0 39.4 39.2
Total 151.3 139.8 134.4 128.4 123.1
Note: For 1998 and after, most electric energy for public use has been totaled
with the electric energy for home use.
1.2.5 Present conditions of power generation facilities
The first power generation plant was constructed in Kiev, the capital of
Ukraine, at the end of the 19th century. After that, the first rapid electric power
source development took place during the 1930s, in the USSR era, when thermal
power generation plants were constructed at 5 locations in Ukraine, and a
hydroelectric power generation plant, the largest in Europe at the time, was also
constructed. From 1950 - 1975, many electric power sources were developed in
order to satisfy the increasing demand for electric power accompanying the
development of domestic heavy industry. In the second half of the 1970s, the
first nuclear power generation plant (Chernobyl) was built, and many nuclear
power generation plants were constructed after that, on into the 1980s.
However, no large-scale electric power source development was carried out in
the 1990s, and total power generation facility capacity has been declining year by
year. Since the collapse of the USSR, electric power business operators have
been short of funds not only for the development of new electric power sources but
also for the modernization of existing facilities. Superannuation of power
generation facilities in Ukraine has advanced, and 80% of thermal power
generation plants are considered to need rehabilitation and reconstruction. The
fuel consumption rate per power generation unit has also worsened. In 1980, the
fuel consumption ratio (converted to standard coal) for thermal power plants was
345 g/kWh, but the same ratio was 365 g/kWh in 1996. In addition, there has
been a shortage of funds for procuring coal for thermal power plants; therefore,
- 1-36 -
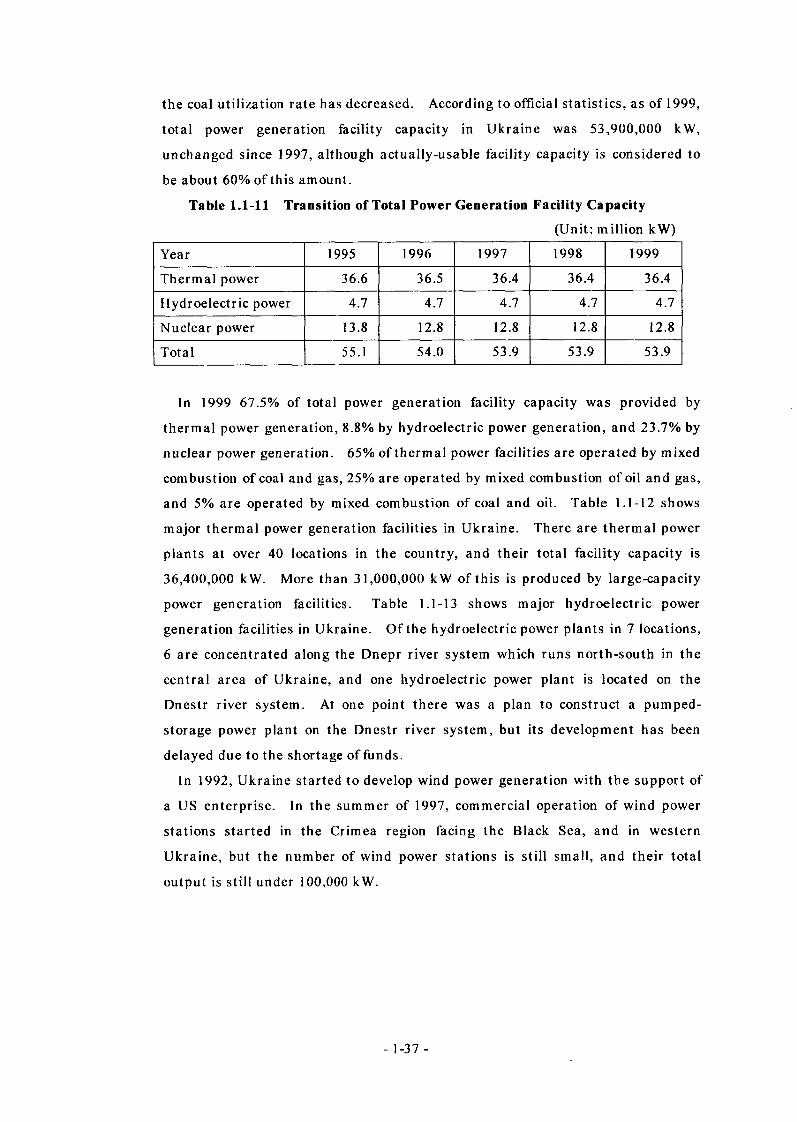
the coal utilization rate has decreased. According to official statistics, as of 1999,
total power generation facility capacity in Ukraine was 53,900,000 kW,
unchanged since 1997, although actually-usable facility capacity is considered to
be about 60% of this amount.
Table 1.1-11 Transition of Total Power Generation Facility Capacity
(Unit: million kW)
Year 1995 1996 1997 1998 1999
Thermal power 36.6 36.5 36.4 36.4 36.4
Hydroelectric power 4.7 4.7 4.7 4.7 4.7
Nuclear power 13.8 12.8 12.8 12.8 12.8
Total 55.1 54.0 53.9 53.9 53.9
In 1999 67.5% of total power generation facility capacity was provided by
thermal power generation, 8.8% by hydroelectric power generation, and 23.7% by
nuclear power generation. 65% of thermal power facilities are operated by mixed
combustion of coal and gas, 25% are operated by mixed combustion of oil and gas,
and 5% are operated by mixed combustion of coal and oil. Table 1.1-12 shows
major thermal power generation facilities in Ukraine. There are thermal power
plants at over 40 locations in the country, and their total facility capacity is
36,400,000 kW. More than 31,000,000 kW of this is produced by large-capacity
power generation facilities. Table 1.1-13 shows major hydroelectric power
generation facilities in Ukraine. Of the hydroelectric power plants in 7 locations,
6 are concentrated along the Dnepr river system which runs north-south in the
central area of Ukraine, and one hydroelectric power plant is located on the
Dnestr river system. At one point there was a plan to construct a pumped-
storage power plant on the Dnestr river system, but its development has been
delayed due to the shortage of funds.
In 1992, Ukraine started to develop wind power generation with the support of
a US enterprise. In the summer of 1997, commercial operation of wind power
stations started in the Crimea region facing the Black Sea, and in western
Ukraine, but the number of wind power stations is still small, and their total
output is still under 100,000 kW.
- 1-37 -
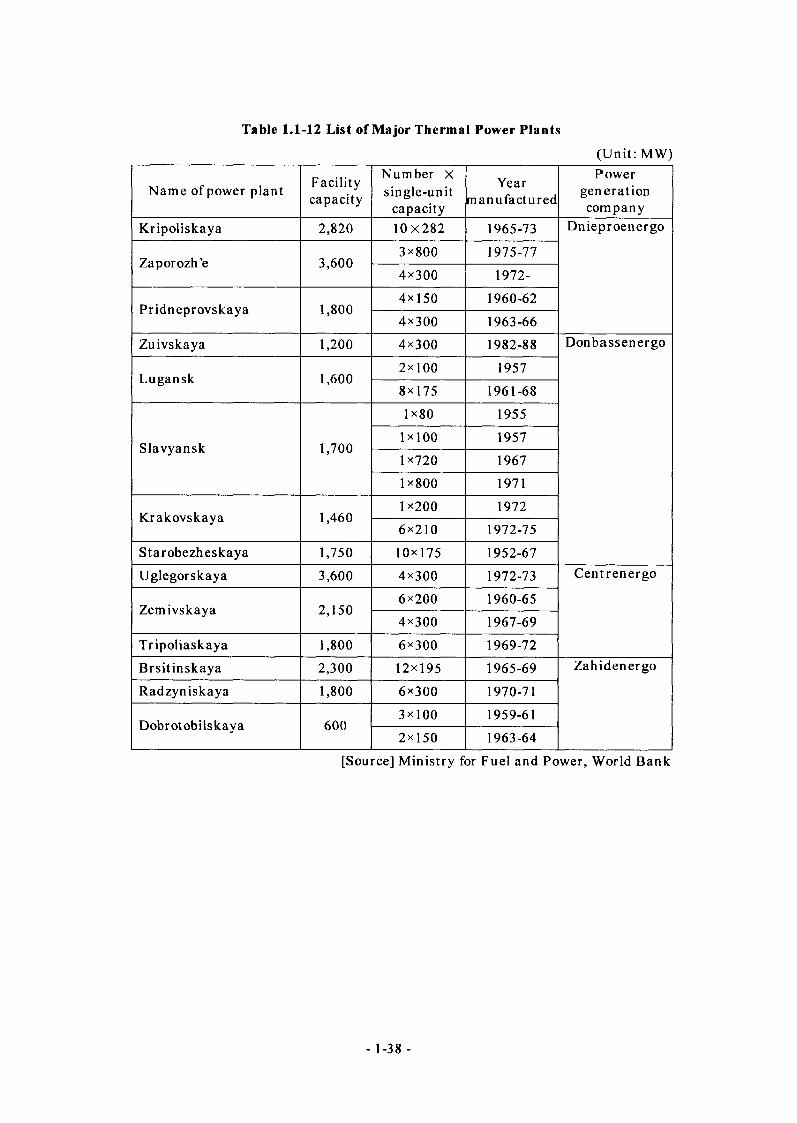
Table 1.1-12 List of Major Thermal Power Plants(Unit: MW)
Name of power plant Facilitycapacity
Number X single-unit
capacity
Yearmanufactured
Powergenerationcompany
Kripoliskaya 2,820 10X282 1965-73 Dnieproenergo
Zaporozhye 3,6003x800 1975-77
4x300 1972-
Pridneprovskaya 1,8004x150 1960-62
4x300 1963-66Zuivskaya 1,200 4x300 1982-88 Donbassenergo
Lugansk 1,6002x100 19578x175 1961-681x80 1955
Slavyansk 1,7001x100 19571x720 19671x800 1971
Krakovskaya 1,4601x200 19726x210 1972-75
Starobezheskaya 1,750 10x175 1952-67Uglegorskaya 3,600 4x300 1972-73 Centrenergo
Zemivskaya 2,1506x200 1960-654x300 1967-69
Tripoliaskaya 1,800 6x300 1969-72Brsitinskaya 2,300 12x195 1965-69 Zahidenergo
Radzyniskaya 1,800 6x300 1970-71
Dobrotobilskaya 6003x100 1959-61
2x150 1963-64[Source] Ministry for Fuel and Power, World Bank
- 1-38 -
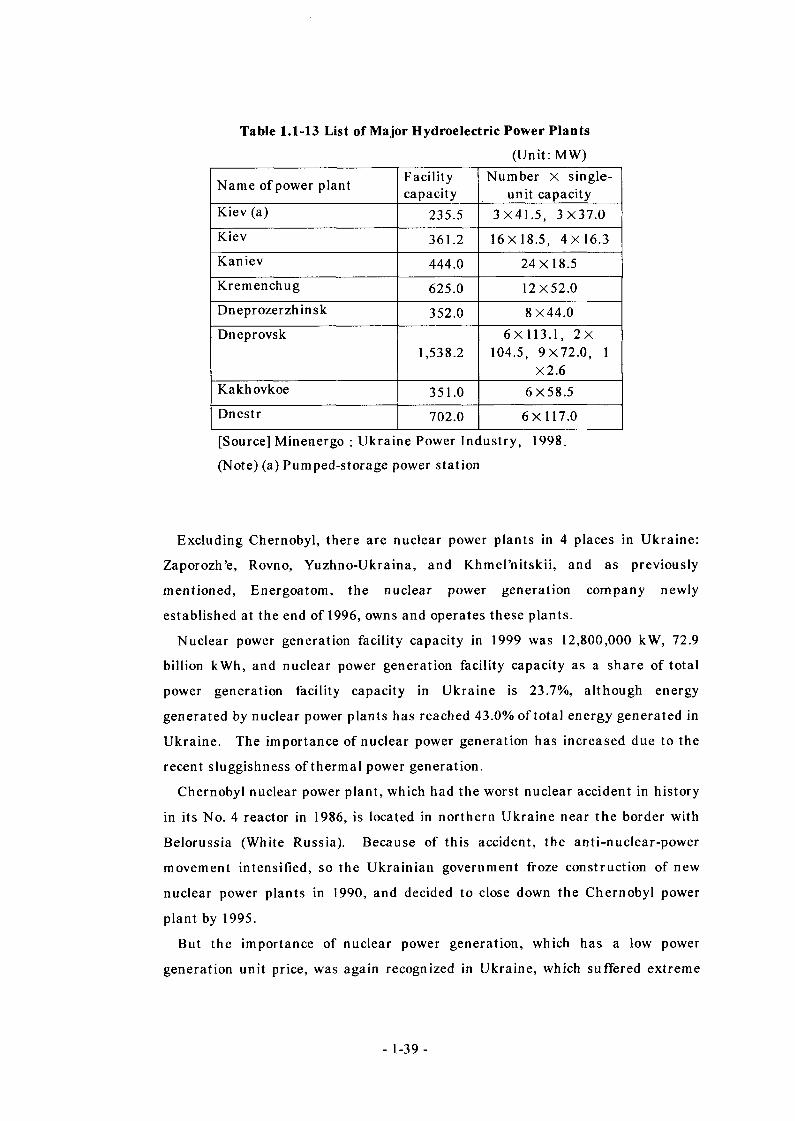
Table 1.1-13 List of Major Hydroelectric Power Plants(Unit: MW)
Name of power plant F acility capacity
Number X singleunit capacity
Kiev (a) 235.5 3X41.5, 3X37.0Kiev 361.2 16X18.5, 4X16.3Kaniev 444.0 24X18.5Kremenchug 625.0 12X52.0Dneprozerzhinsk 352.0 8X44.0Dneprovsk
1,538.26X113.1, 2 X
104.5, 9X72.0, 1 X2.6
Kakhovkoe 351.0 6X58.5Dnestr 702.0 6X117.0
[Source] Minenergo : Ukraine Power Industry, 1998.
(Note) (a) Pumped-storage power station
Excluding Chernobyl, there are nuclear power plants in 4 places in Ukraine:
Zaporozhye, Rovno, Yuzhno-Ukraina, and Khmel’nitskii, and as previously
mentioned, Energoatom, the nuclear power generation company newly
established at the end of 1996, owns and operates these plants.
Nuclear power generation facility capacity in 1999 was 12,800,000 kW, 72.9
billion kWh, and nuclear power generation facility capacity as a share of total
power generation facility capacity in Ukraine is 23.7%, although energy
generated by nuclear power plants has reached 43.0% of total energy generated in
Ukraine. The importance of nuclear power generation has increased due to the
recent sluggishness of thermal power generation.
Chernobyl nuclear power plant, which had the worst nuclear accident in history
in its No. 4 reactor in 1986, is located in northern Ukraine near the border with
Belorussia (White Russia). Because of this accident, the anti-nuclear-power
movement intensified, so the Ukrainian government froze construction of new
nuclear power plants in 1990, and decided to close down the Chernobyl power
plant by 1995.
But the importance of nuclear power generation, which has a low power
generation unit price, was again recognized in Ukraine, which suffered extreme
- 1-39 -
energy shortages after independence. Due to this, the freeze on new nuclear
power plant construction was lifted in 1993, and it was decided to postpone the
closing of the Chernobyl plant. At present, 5 nuclear reactor units are being
constructed, but, due to the worsening of Ukraine’s financial situation, this
construction work is not progressing well.
In December 1995, Ukraine and the G7 nations agreed to the closing of the
Chernobyl plant, and both sides signed a memorandum incorporating shutdown
of the Chernobyl plant by 2000, alienation of US$498 million by the Western Bloc,
and financial support of US$1.89 billion. The main constituent of this financing
is applied to the plan (K2R4 plan) to complete the Fumerinitsky No. 2 reactor and
Rovno No. 4 reactor, now under construction.
The Fumerinitsky and Rovno nuclear power plants are both in the western
Ukraine. The Ukrainian government had suspended their construction in 1990
at the stage in which 70 - 80% of construction processes were already completed.
In 1997, however, opinions doubting the economy and safety of the K2R4 plan
arose not only from the Western Bloc, but also in Ukraine and from NGOs in
eastern European nations.
Based on this, the EBRD (European Bank for Rehabilitation and Development)
was obliged to re-investigate the appropriateness of the K2R4 plan, and financing
for the plan was drastically delayed.
As a result of the Ukrainian government’s repeated demands that EBRD and
the Western Bloc finance the K2R4 plan, and its statement that shutdown of the
Chernobyl No. 3 reactor by 2000 would not be possible if financing for the K2R4
plan could not be obtained, America decided, as a result of the Kuchma-Clinton
talks in June 2000, to provide US$80 million as support funds for closing the
Chernobyl nuclear plant. After the talks, Ukraine announced the deadline of
December 15, 2000, for permanent closure of Chernobyl.
In September, at a top-level conference with EU, Ukraine succeeded in
obtaining the promise of financing for the K2R4 plan through EBRD and EU’s
Utram fund.
Through these movements, the No. 3 reactor of Chernobyl nuclear power plant,
the only one still operating, was shut down on December 15, 2000, and the plant
was completely closed, in the 15th year since the accident.
- 1-40 -
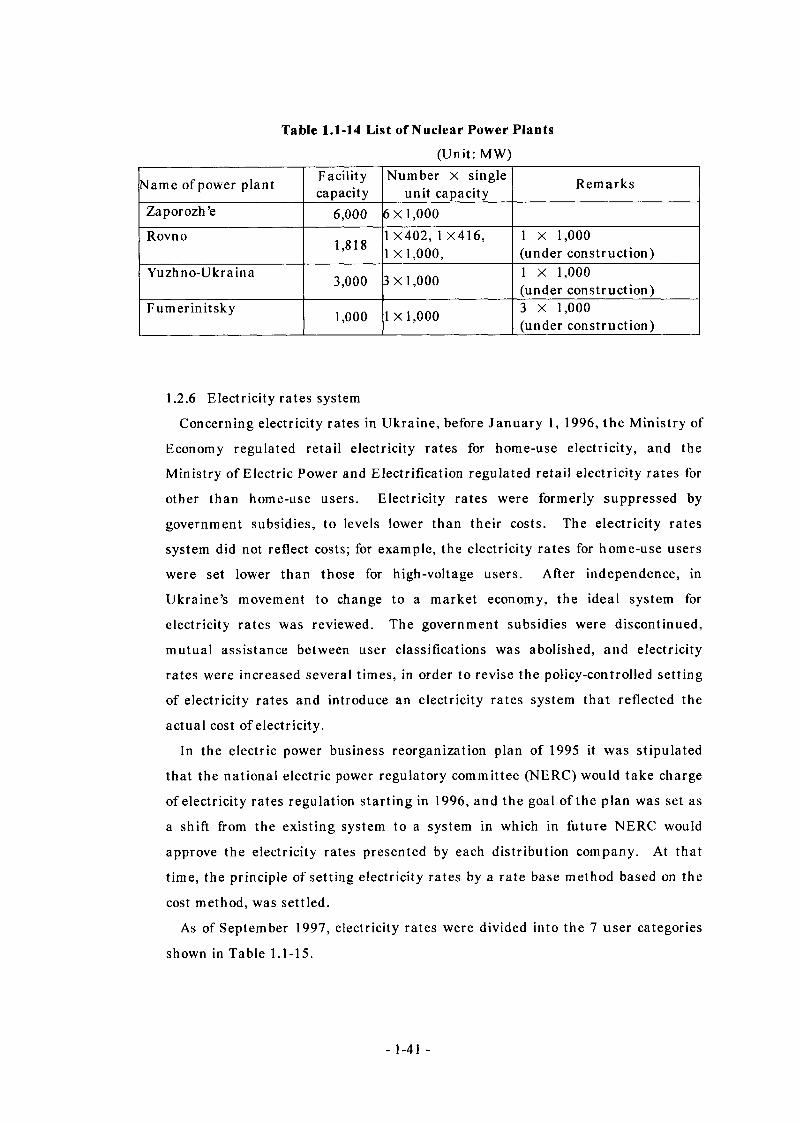
Table 1.1-14 List of Nuclear Power Plants(Unit: MW)
Name of power plant Facilitycapacity
Number X single unit capacity Remarks
Zaporozh’e 6,000 6X1,000Rovno 1,818
1 X402, 1 X416,1 XI,000,
1 X 1,000 (under construction)
Yuzhno-Ukraina 3,000 3X1,000 1 X 1,000 (under construction)
Fumerinitsky 1,000 1 X 1,000 3 X 1,000 (under construction)
1.2.6 Electricity rates system
Concerning electricity rates in Ukraine, before January 1, 1996, the Ministry of
Economy regulated retail electricity rates for home-use electricity, and the
Ministry of Electric Power and Electrification regulated retail electricity rates for
other than home-use users. Electricity rates were formerly suppressed by
government subsidies, to levels lower than their costs. The electricity rates
system did not reflect costs; for example, the electricity rates for home-use users
were set lower than those for high-voltage users. After independence, in
Ukraine’s movement to change to a market economy, the ideal system for
electricity rates was reviewed. The government subsidies were discontinued,
mutual assistance between user classifications was abolished, and electricity
rates were increased several times, in order to revise the policy-controlled setting
of electricity rates and introduce an electricity rates system that reflected the
actual cost of electricity.
In the electric power business reorganization plan of 1995 it was stipulated
that the national electric power regulatory committee (NERC) would take charge
of electricity rates regulation starting in 1996, and the goal of the plan was set as
a shift from the existing system to a system in which in future NERC would
approve the electricity rates presented by each distribution company. At that
time, the principle of setting electricity rates by a rate base method based on the
cost method, was settled.
As of September 1997, electricity rates were divided into the 7 user categories
shown in Table 1.1-15.
- 1-41 -
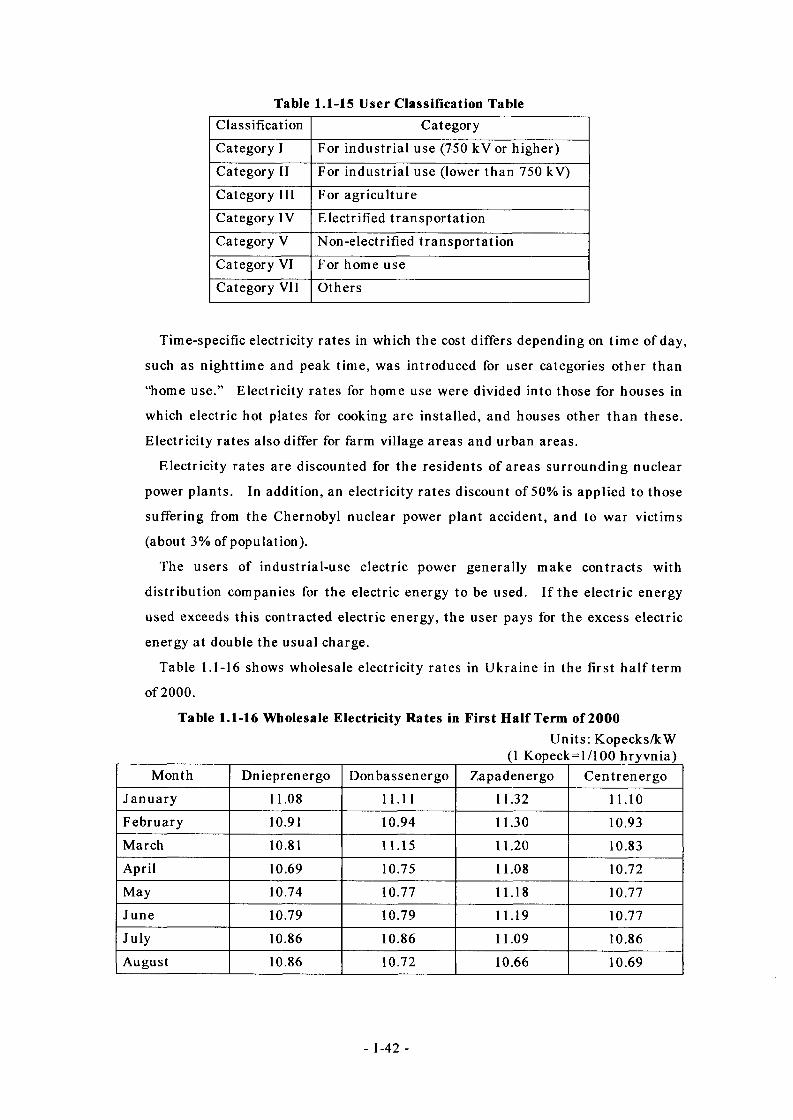
Table 1.1-15 User Classification Table
Classification Category
Category I For industrial use (750 kV or higher)
Category II For industrial use (lower than 750 kV)
Category III For agriculture
Category IV Electrified transportation
Category V Non-electrified transportation
Category VI For home use
Category VII Others
Time-specific electricity rates in which the cost differs depending on time of day,
such as nighttime and peak time, was introduced for user categories other than
“home use.” Electricity rates for home use were divided into those for houses in
which electric hot plates for cooking are installed, and houses other than these.
Electricity rates also differ for farm village areas and urban areas.
Electricity rates are discounted for the residents of areas surrounding nuclear
power plants. In addition, an electricity rates discount of 50% is applied to those
suffering from the Chernobyl nuclear power plant accident, and to war victims
(about 3% of population).
The users of industrial-use electric power generally make contracts with
distribution companies for the electric energy to be used. If the electric energy
used exceeds this contracted electric energy, the user pays for the excess electric
energy at double the usual charge.
Table 1.1-16 shows wholesale electricity rates in Ukraine in the first half term
of2000.
Table 1.1-16 Wholesale Electricity Rates in First Half Term of 2000
Units: Kopecks/kW_______________________________________________ (1 Kopeck=l/100 hryvnia)
Month Dnieprenergo Donbassenergo Zapadenergo CentrenergoJanuary 11.08 11.11 11.32 11.10February 10.91 10.94 11.30 10.93March 10.81 11.15 11.20 10.83April 10.69 10.75 11.08 10.72
May 10.74 10.77 11.18 10.77June 10.79 10.79 11.19 10.77July 10.86 10.86 11.09 10.86
August 10.86 10.72 10.66 10.69
- 1-42 -
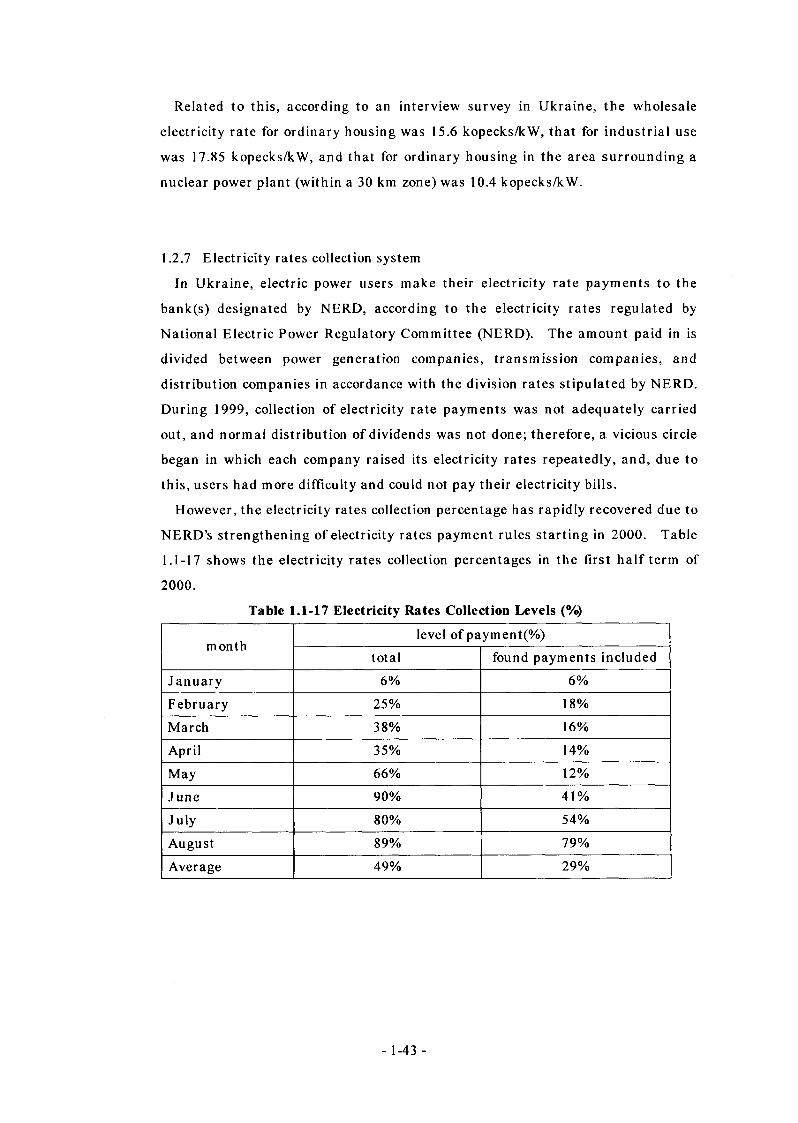
Related to this, according to an interview survey in Ukraine, the wholesale
electricity rate for ordinary housing was 15.6 kopecks/kW, that for industrial use
was 17.85 kopecks/kW, and that for ordinary housing in the area surrounding a
nuclear power plant (within a 30 km zone) was 10.4 kopecks/kW.
1.2.7 Electricity rates collection system
In Ukraine, electric power users make their electricity rate payments to the
bank(s) designated by NERD, according to the electricity rates regulated by
National Electric Power Regulatory Committee (NERD). The amount paid in is
divided between power generation companies, transmission companies, and
distribution companies in accordance with the division rates stipulated by NERD.
During 1999, collection of electricity rate payments was not adequately carried
out, and normal distribution of dividends was not done; therefore, a vicious circle
began in which each company raised its electricity rates repeatedly, and, due to
this, users had more difficulty and could not pay their electricity bills.
However, the electricity rates collection percentage has rapidly recovered due to
NERD’s strengthening of electricity rates payment rules starting in 2000. Table
1.1-17 shows the electricity rates collection percentages in the first half term of
2000.
Table 1.1-17 Electricity Rates Collection Levels (%)
monthlevel of payment(%)
total found payments included
January 6% 6%
February 25% 18%
March 38% 16%
April 35% 14%
May 66% 12%
June 90% 41%
July 80% 54%
August 89% 79%
Average 49% 29%
- 1-43 -
1.2.8 Environmental problems
(1) Environmental policies and standards
The following shows the laws and standards in Ukraine related to
environmental protection1. Environmental Protection Law2. Water Quality Standards3. Air Pollution Control Law4. Standards for procedures for approval for special utilization of natural
resources5. Standards for procedures for approval for special utilization of precious
natural resources6. Environmental Surveillance Standards7. Environmental Inspection Law8. National Environmental Inspection Standards9. Air Pollution Control Method Standards10. Standards for setting of physically and biologically toxic air pollution impact
levels11. Standards for methods of monitoring the impact of air pollution from power
generation plants and boiler facilities12. Public water area protection standards13. Law concerning waste14. Standards for environmental pollutant disposal charges and transactions
concerning disposal fundsThe “Ministry of Environment and Natural Resources” is the organ concerned
with environmental protection, and the State Ecological Inspection Agency is
the environmental inspection organ.
(2) Air pollution control
Ukraine has abundant coal deposits, and has been encouraging the use of
this coal in thermal power plants.
The impact on the surrounding areas of dust from fly ash and clinkers
accompanying the combustion of coal has been reduced by installing
electrostatic precipitators. But facilities for NOx and SOx control measures
have not yet been installed, and those pollutants have been treated by
expanding their diffusion range by increasing chimney heights and increasing
emission rate speed, etc. (But) strict standards are applied for (most) toxic
substances measured in the air.
Table 1.1-18 shows the allowable values for toxic substances in air.
- 1-44 -
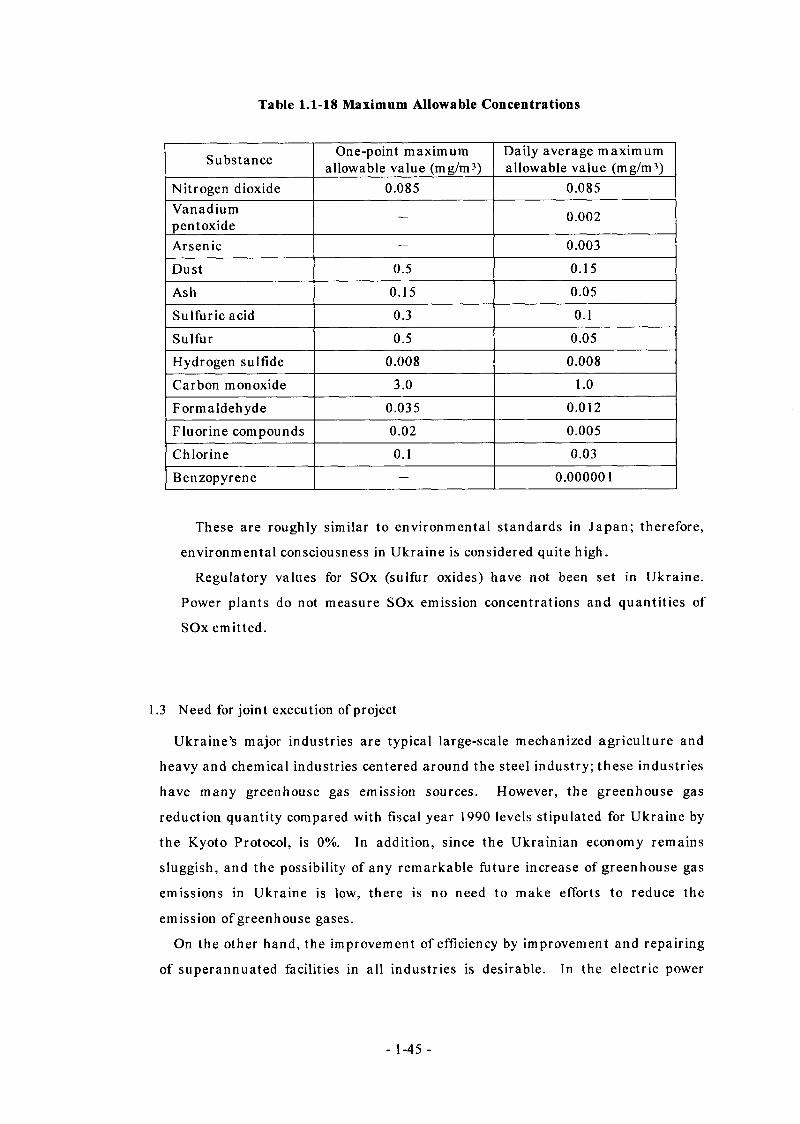
Table 1.1-18 Maximum Allowable Concentrations
Substance One-point maximum allowable value (mg/m3)
Daily average maximum allowable value (mg/m3)
Nitrogen dioxide 0.085 0.085Vanadiumpentoxide
— 0.002
Arsenic - 0.003
Dust 0.5 0.15
Ash 0.15 0.05
Sulfuric acid 0.3 0.1
Sulfur 0.5 0.05
Hydrogen sulfide 0.008 0.008
Carbon monoxide 3.0 1.0
Formaldehyde 0.035 0.012
Fluorine compounds 0.02 0.005
Chlorine 0.1 0.03
Benzopyrene — 0.000001
These are roughly similar to environmental standards in Japan; therefore,
environmental consciousness in Ukraine is considered quite high.
Regulatory values for SOx (sulfur oxides) have not been set in Ukraine.
Power plants do not measure SOx emission concentrations and quantities of
SOx emitted.
1.3 Need for joint execution of project
Ukraine’s major industries are typical large-scale mechanized agriculture and
heavy and chemical industries centered around the steel industry; these industries
have many greenhouse gas emission sources. However, the greenhouse gas
reduction quantity compared with fiscal year 1990 levels stipulated for Ukraine by
the Kyoto Protocol, is 0%. In addition, since the Ukrainian economy remains
sluggish, and the possibility of any remarkable future increase of greenhouse gas
emissions in Ukraine is low, there is no need to make efforts to reduce the
emission of greenhouse gases.
On the other hand, the improvement of efficiency by improvement and repairing
of superannuated facilities in all industries is desirable. In the electric power
- 1-45 -
industry in particular, domestic and international condemnation of nuclear power
generation has been intense since the Chernobyl No. 4 reactor accident, future
prospects for the previously-mentioned K2R4 plan are unclear, and construction of
new nuclear power plants is completely stagnant.
Also, both the construction of new thermal power plants and the rehabilitation
of existing facilities are difficult to achieve due to financial problems, and power
generation is inevitably continuing with the use of low-efficiency power generation
facilities; the resulting increased fuel expenditure and decline of energy generated,
cause further worsening of financial conditions and a vicious circle of problems for
the management of power generation companies.
Ukraine is blessed with abundant coal resources, but for most of the oil and
natural gas it uses, it depends on imports; its self-supply rate for crude oil is 33.6%,
and for natural gas, 22.3%.
These oil and natural gas imports have created enormous debts, causing great
difficulty for Ukrainian finances; reducing the quantity of fuel imported from
outside Ukraine is essential to improve the country’s financial condition.
In other words, Ukraine needs to reduce fuel consumption while maintaining its
present power generation capacity; this is directly related to reduction of
greenhouse gas emissions.
In addition, there is a possibility of serious electric power shortages due to
operation shutdowns of superannuated thermal power plants, which could occur
one after another in the near future. Repair and improvement of superannuated
power generation facilities are urgent tasks for Ukraine which has a pressing need
to avoid such a state of emergency in any way possible.
Under such circumstances, the Ukrainian government has great hopes for the
modernization and improvement of its power generation facilities by joint
implementation of a CO2 reduction project, and is strongly motivated to carry out
such a project.
- 1-46 -
2. . Need for introduction of energy-saving technology to the subject industry
The electric power sector in Ukraine is suffering from such problems as the delay
of new electric power source development, declining total power generation facility
capacity due to superannuation of facilities, worsening of fuel consumption rates,
and declining utilization rates due to the shortage of funds for procurement of fuel.
These have caused a decline of energy generated and an increase of fuel
consumption, creating a vicious circle for electric power sector management.
Under such circumstances, introduction of energy-saving technology to the
electric power sector is essential.
The improvement of efficiency by introduction of energy-saving technology to the
electric power sector actually involves various tasks involving both software and
hardware. The following are examples.
(A) Reduction of transmission and distribution losses
The actual transmission and distribution loss total in Ukraine was 7.3% in
1990; this increased to 17.6% in 1999.
We can assume transmission and distribution losses in major Western
countries to be at the 8% level but in Ukraine these figures are higher. (The
average transmission loss rate for Chubu Electric Power Co., Inc. was 4.89%
in the fiscal year 1999.) Reduction of transmission and distribution losses is
one area in which energy-saving technology can be introduced.
Technical loss due to superannuation of facilities causes transmission and
distribution losses in Ukraine, but non-technical losses, such as theft of
electric power from the trolleys used for public transportation, are also large
and cannot be resolved simply by the introduction of technology.
- 1-47 -
(B) Improvement of power generation efficiency
The thermal efficiency of thermal power generation in Ukraine is generally
around 20 - 30%, very low values compared to the thermal efficiency level of
approximately 40% for electric power companies in Japan.
The following factors can be considered to be the causes of low thermal
efficiency in Ukraine.
• Superannuation of facilities due to shortage of rehabilitation funds
• Worsened properties of fuel
• Ukraine has selected nuclear power generation as its electric power
source base, and uses thermal power plants to cope with peak load.
The vicious circle of shortage of funds, shortage of electric power, and shortage of
technical power, is the generally the background in such cases. For improvement,
the introduction of a wide range of technology is needed, not only to increase
efficiency, but also to save energy at the daily business level. Introduction of such
energy-saving technology is expected to have not just a simple energy-saving effect,
but also to result in reduction of fuel costs through improved thermal efficiency, and
in increases of energy generated by improving the reliability of facilities; in other
words, improving profitability as well as the ability to supply power. When a
positive loop such as this has been created, it can be expected to connect to the
improvement of performance for the entire electric power sector.
As stated in “1.1.2, Energy Conditions,” Ukraine is blessed with abundant coal
resources, but depends on imports for most of the oil and natural gas it uses; in
1997 its self-supply rate for crude oil was 33,6%, and that for natural gas was 22.3%.
These imports of oil and natural gas have created enormous debts which have
handicapped Ukrainian finances; therefore, reduction of the quantity of fuel
imported is essential for improvement of Ukraine’s financial condition.
Under such circumstances, Ukraine is carrying out programs to increase its own
production of gas and petroleum, and the National “Petroleum and gas in Ukraine
until 2010” Program has set as its goal the meeting of at least 50% of the demand
for oil and gas in Ukraine by domestic production, within approximately 10 years.
The Ministry of Fuel and Energy of Ukraine basically encourages the use of
domestic coal in newly-built or rebuilt power plants, while the previously-mentioned
National Program is aimed at meeting 50% of oil and gas demand by domestic
production. Development of the gas-combined cycle is permitted in the case of this
- 1-48 -
project, however, because power generation plants are presently obliged to use low-
grade coal, and this power plant is located in a suburb of a large city,
Dnipropetrovs’k, where stable supplies of gas and heavy oil can be expected.
At present, power generation facilities in Ukraine are operating at very low
thermal efficiency due to superannuation of facilities and the delay of technological
development by the economic problems that have prevailed since the USSR broke
up; however, the development of the combined cycle in the execution of this project
can drastically decrease fuel consumption by increasing power generation thermal
efficiency (30.43% -+ 52.5%), by the installation of 3 new 100MW combined-cycle
gas turbine units, as replacements for the existing 300 MW steam power generator
to be removed and disposed of, simultaneously achieving drastic reduction of carbon
dioxide emission quantity by changing the fuel used from coal to natural gas.
Also, since the Chernobyl nuclear power plant accident, the electric power
industry in Ukraine has been in circumstances in which they cannot construct any
new nuclear power plants, so the Ukrainian electric power industry must construct
high-efficiency combined-cycle power plants in order to make efficient use of its
limited domestic resources.
3. Significance, needs, and effects of concerned project, and propagation of results in
same type of industry
(1) Significance of project execution
The Pridniprovslcaya power plant is located in Dnipropetrovsk city in
southeastern Ukraine, where the steel industry, one of the country’s key
industries, is concentrated, as the key power plant supplying electric power and
heat to local residents and to manufacturing plants.
The Ukrainian government strongly desires execution of the concerned
project not only from the viewpoint of its environmental improvement effects,
but also to achieve a stable supply of energy, and J ST Dniproenergo is
preparing its acceptance system under the guidance of the Ministry of Fuel and
Energy of Ukraine.
The efficacy of execution of the project is considered to be like the
administration of nutrients (for healthy growth), different from fund aid to
Ukraine which is more like an (emergency) intravenous drip infusion treatment
for the worsened economy. The execution of this project will involve many
- 1-49 -

technologies and the exchange of many human resources, and the project is
highly significant from the viewpoint of friendly relations between Japan and
Ukraine.
Also, the execution of this project, which is the goal of this feasibility study
survey, has great significance as a basis for obtaining cooperation from the
Ukrainian side when carrying out future adjustments, contracts, joint
implementation of future projects, and CO2 emission rights transactions.
(2) Need for and effects of project execution
Execution of the concerned project will play an important role as a measure
for providing a stable supply of electric power and contributing to industrial
reformation and to the development of the local economy.
Electric power source development has been sluggish in Ukraine, and its
electric power industry has continued to use superannuated facilities with
performance that is remarkably degraded due to the continuous operation of
these facilities for many years, worsening the efficiency of power plant
operation. Such circumstances not only cause increased fuel consumption, but
are also connected to worsening of the financial condition of power generation
companies.
The existing power generation facilities in Ukraine today were mostly
constructed in the 1960s and 1970s, as was the Pridniprovskaya power plant,
and many facilities have low thermal efficiency and poor operation efficiency.
Under the circumstances in which Ukraine is shifting to a free economy
accompanying its economic reformation, power generation companies urgently
need to improve their power generation efficiency, and to upgrade their power
generation facilities to those with good operation efficiency using the newest
technology.
Also, because Ukraine has many neighboring nations, the achievement of
environmental control and safety using the newest facilities, is not only
expected within the Ukraine, but is also urgently anticipated by these many
adjacent nations.
The Pridniprovskaya power plant was constructed in the 1960s, and 34 years
have already passed since its 300 MW facility, the subject of this project, was
built; its efficiency and its utilization rate have both declined. Except for
electric power shortages in some localities, Ukraine’s overall electric power
supply has had no major problems to date, but if the problem of superannuated
- 1-50 -

facilities is ignored, power supply shortages will occur in future as power
demand increases.
In this situation, this project’s plan to install a combined-cycle power
generation facility utilizing an idle location on the same power plant site, and
to remove an existing power generation facility, can maintain output in a
drastically short period of time compared with the development of a new
electric power source; therefore, the need for this project is great.
(A) The fuel consumption reduction effect of executing this project, and its
impact on the Ukrainian economy, will be very large.
(B) Ukraine is presently carrying out economic reformation to shift to a free
economy, and by execution of the concerned project the power generation
company can expect the effect of increased management efficiency, enabling
it to maintain profit from the operation of the power plant by improvement of
plant efficiency through use of the newest facilities.
(C) Since this is the key power plant in southeastern Ukraine, stable
supplies of electric power and heat from the concerned power plant are most
important for social and economic development; therefore, early actualization
of the concerned project is considered necessary.
(D) Execution of this project will increase the efficiency of existing power
generation facilities, which had dropped due to their superannuation, and
very great energy-saving can be expected from it.
- 1-51 -

Chapter.2 Implementation of the Project
Scheme

[Summary]
This chapter provides a description of the specific details of
the project.
This is a scrap-and-build project to abolish Pridneprovskaya
TPP Unit No. 12 (output: 300 MW) and newly build a combined
cycle power plant (output: 100 MW X 3).
We looked into the current state of equipment, and examined
system configuration/equipment specifications/layout
scheme/construction process while taking into consideration the
needs of Ukraine. As a result, we see a bright outlook for
materialization of this project without a technical hitch.
The total amount of finance needed for this project (including
modification of existing equipment/new construction of power
generating facilities) is estimated at 30,107 million yen.
Although in this project, the implementation site has
attracted a high public interest, we believe it is necessary to
reinforce the capacity to carry out the project in terms of
operating techniques.
1. Project scheme
1.1 Overview of the object region for implementing the project
1.1.1 Economic/social situation
(1) Overview of the object area for implementing the project
The object area for implementing the project is a catchment area along the
Dnieper River in the southeastern part of Ukraine. This is Dnepropetrovsk
Province with the total area of 31,900 km2 (5.3% of the whole land of Ukraine).
The population of the province is 3.70 million (7.5% of Ukraine as a whole).
Apart from the urban area, the terrain is flat, consisting of steppe and
woodland.
Dnepropetrovsk Province is located at almost the center of eastern Ukraine.
Heavy industries have developed from old times based on the water
transportation utilizing the Dnieper River. Today,
mining/steel/chemical/mechanical industries are thriving. There are 15 types
of industry/587 corporate entities, accounting for 15.6% of industrial output of
Ukraine as a whole.
The land is fertile and suitable for agriculture. Farmland accounts for 73.4%
of the total area of the province (2,299.3 ha). Wheat/sunflower
seeds/beets/vegetables are produced, and the revenue from agriculture
accounts for as much as 14% of the total production of the province.
In addition to water transportation, other transportation infrastructure is
also in place. Included are three airports including two international airports.
The total extension of the railway track and that of the motorway is 49.5 km
per 1,000 km2 (national average: 37.0 km) and 283 km per 1,000 km2 (national
average: 269 km), respectively, both of which surpass the national average of
Ukraine.
The City of Dnepropetrovsk, the capital of the province, has a population of
1.12 million, and is located about 400 km southeast of the national capital of
Kiev. It is a city of heavy industries located almost at the center of the
province. Although detailed information is not available, it seems that
armament-related factories also exist. In addition, it was the center of
aerospace-related industries in the era of the former Soviet Union. For these
reasons, access by foreigners was restricted up until several years ago.
- 2-1 -
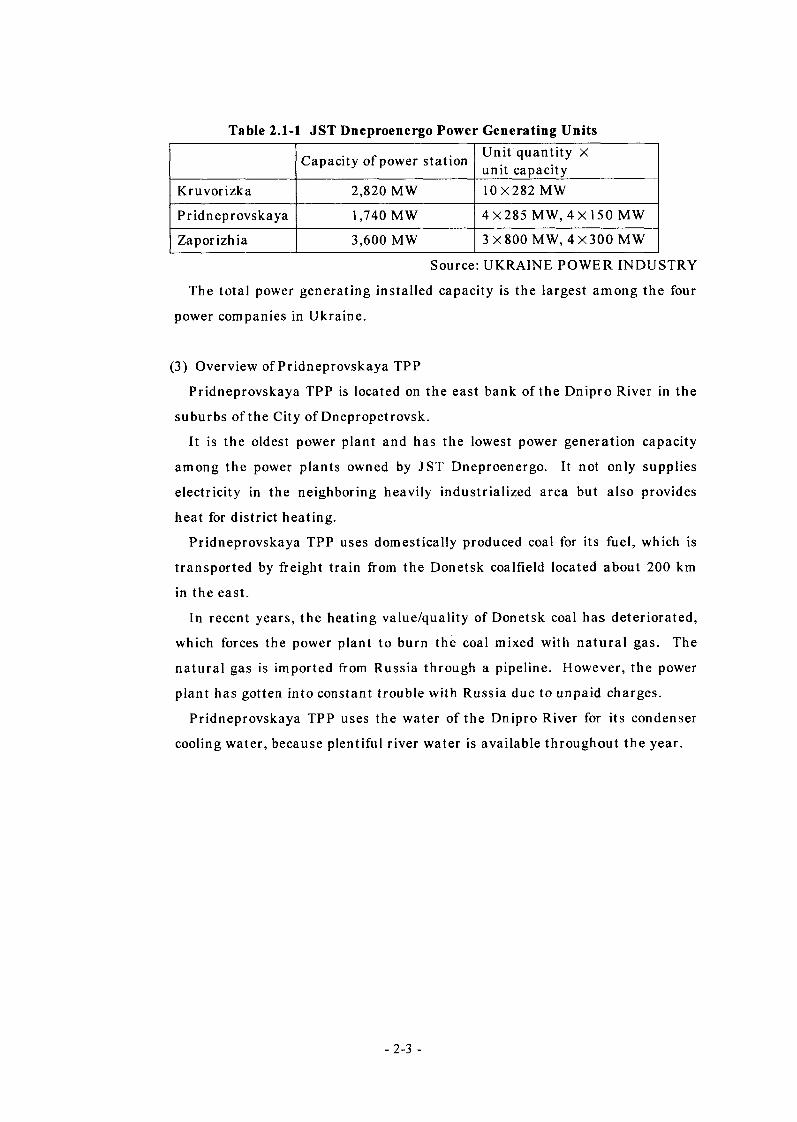
Table 2.1-1 JST Dneproenergo Power Generating Units
Capacity of power station Unit quantity X unit capacity
Kruvorizka 2,820 MW 10X282 MW
Pridneprovskaya 1,740 MW 4X285 MW, 4X150 MW
Zaporizhia 3,600 MW 3 X800 MW, 4X300 MW
Source: UKRAINE POWER INDUSTRY
The total power generating installed capacity is the largest among the four
power companies in Ukraine.
(3) Overview of Pridneprovskaya TPP
Pridneprovskaya TPP is located on the east bank of the Dnipro River in the
suburbs of the City of Dnepropetrovsk.
It is the oldest power plant and has the lowest power generation capacity
among the power plants owned by JST Dneproenergo. It not only supplies
electricity in the neighboring heavily industrialized area but also provides
heat for district heating.
Pridneprovskaya TPP uses domestically produced coal for its fuel, which is
transported by freight train from the Donetsk coalfield located about 200 km
in the east.
In recent years, the heating value/quality of Donetsk coal has deteriorated,
which forces the power plant to burn the coal mixed with natural gas. The
natural gas is imported from Russia through a pipeline. However, the power
plant has gotten into constant trouble with Russia due to unpaid charges.
Pridneprovskaya TPP uses the water of the Dnipro River for its condenser
cooling water, because plentiful river water is available throughout the year.
-2-3 -
1.1.2 Environmental issues
Ukraine used to be rich and abundant in high-quality coal resources. On the
other hand, it was not endowed with gas and petroleum resources, most of which
were imported from other countries. For this reason, a number of coal-fired
thermal power plants were established against a backdrop of abundant coal
resources. In recent years, however, most of the coal resources are not adequate
in quality, though rich in reserves. As a result, the coal produces excessive NOx
and SOx when combusted.
Pridneprovskaya TPP, which is the subject of modification this time, is
equipped with an electric precipitator, but not with equipment for removing NOx
and SOx. The northwester blowing at an annual occurrence rate of 95% or more
forces most of these substances emitted from the power plant to come down on
the central part of Dnepropetrovsk city street.
In addition, internationally active environmental protection groups reside in
the vicinity of the power plant, keeping a watch on the exhaust gas from the
power plant all the time.
Due to the tight domestic economy, it is necessary to give priority to utilizing
domestic resources as much as possible. It is more desirable, however, to add
equipment for environmental measures or utilize natural gas, which is a clean
fuel, in an effort to reduce adverse effects on the surrounding area caused by use
of low quality coal.
1.2 Details of the project
1.2.1 Objective of this project
The objective of this project is to abolish one of the four 300 MW units that
have become deteriorated with lowered efficiency and utilization factors at
Pridneprovskaya TPP, owned by JST Dneproenergo, and newly install a
highly efficient and highly reliable combined cycle power generating unit of
the same size.
This project is aimed at ensuring power resources over the years to come by
renovating equipment, and at the same time, at attaining energy saving and
reduction in CO2 (a global warming gas) emissions by improving thermal
efficiency and converting fuel from coal to natural gas.
- 2-4 -
1.2.2 Selection of the unit to be abolished
As a result of examination of their needs, of the four 300 MW units, we will
demolish Unit No.12, which is shut down at present.
1.2.3 Location of the newly installed unit
The already abolished 100 MW unit area will be utilized as the location for
the newly installed unit, not the area of Unit No.12 to be demolished. Because
a structure still exists in the abolished 100 MW area, the structure will be
removed, and the site of a demolished building will be utilized. Thus, Unit
No.12 will be simply abolished, and we will not take into consideration the
removal of the unit in this project.
1.3 Targeted greenhouse gas
This project aims at abolishing one of the existing four coal/gas/heavy oil-fueled
300 MW units of Pridneprovskaya TPP that have become superannuated and
whose efficiency and utilization factor have declined, and at providing a highly
efficient and highly reliable combined cycle power generating unit of the same
size.
Thus, fuel consumption will be cut by the improvement in thermal efficiency,
and carbon dioxide emissions will be cut in proportion to the fuel consumption.
At the same time, this project also makes it possible to cut the carbon dioxide
emissions further by converting fuel use from coal to natural gas.
Accordingly, the greenhouse gas targeted in this project is carbon dioxide.
-2-5 -
2. Outline of the implementation site
2.1 Degree of interest at the implementation site
The Ukrainian side is very much interested in this project. Through this study,
we were able to obtain full support from JST Dneproenergo as well as
Pridneprovskaya TPP.
At present, Ukraine has the following problems:
(1) Since independence from the former Soviet Union, stagnation of the
Ukrainian economy has resulted in domestic industry becoming sluggish.
Owing to uncollected electricity bills, operation finance for the power
generating plant is running short. At the present time, there is no
tightening of supply and demand of electric power. However, under the
current situation, it is difficult to determine maintenance costs, not to
mention costs for development of a new power source or
modernization/modification of the existing plant. For these reasons,
shortage of power generation capability is a matter of concern in the near
future.
(2) The energy situation in Ukraine is severe. Ukraine is suffering from a
decline in the heating value of domestically produced coal and suspension
of supply of natural gas produced in Russia due to default in the payment
of charges.
(3) In recent years, there has been growing interest in environmental
protection in Ukraine. It is also required to take measures against air
pollution in the City of Dnepropetrovsk.
Under these circumstances, this project is considered to be the means to save
valuable natural gas and achieve maximum power generation. Expectation on
the Ukrainian side is higher than expected.
Pridneprovskaya TPP being under the control of JST Dneproenergo is required
not only to supply electric power and heat in a stable manner. In the midst of
economic reform, Pridneprovskaya TPP is also, due to necessity, under pressure
to modify power plant equipment and to improve efficiency, which appears to be
peculiar to power companies. Thus, the degree of interest in the power
generation plant modification project scheme is very high, though from a different
- 2-6 -
viewpoint from the objective of greenhouse gas reduction that Japan tries to
achieve.
JST Dneproenergo is fully aware of the needs to modify Pridneprovskaya TPP.
However, under the current economic situation in Ukraine, there are problems in
financing the modification. We feel their interest and need for finance to be
granted in implementing this project.
The power generation of Ukraine is based on the nuclear power generation
plant. The thermal power generation plant requires response to the peak load.
On the other hand, Pridneprovskaya TPP Units Nos. 11-14 are 300 MW once-
through units, and time required for start-up/shutdown is excessive. Thus, they
are not capable of coping with the peak load. A combined cycle power generating
unit whose time for start-up/shutdown is particularly short is exactly what JST
Dneproenergo needs.
We felt a high degree of interest in this project plan and high expectation for its
implementation. We felt this not only in carrying out this F/S study but also
through the cooperation process, including the study of the local power plant,
which occurred at the power company and the power plant. In addition it
included their response at the meetings, materials on the existing power plant,
and the submission of operation data.
Thanks to this, we were given almost free access to the facilities in the power
plant. We were also able to proceed with collection of internal documents (e.g.
necessary drawings/data) and study hearings without a hitch.
In addition, lively Q & A sessions were held at the project plan presentation
and an exchange of views conducted on the site with the executives of JST
Dneproenergo. Thus, we were able to make this study a productive one.
Generally speaking, the Ukrainian side (including executives of JST
Dneproenergo) is very positive about this project. We thus believe that we will be
able to get positive support. We also feel that we will be able to get positive
support from the Ministry of Fuel and Energy (MOFE) (the upper organization).
-2-7 -
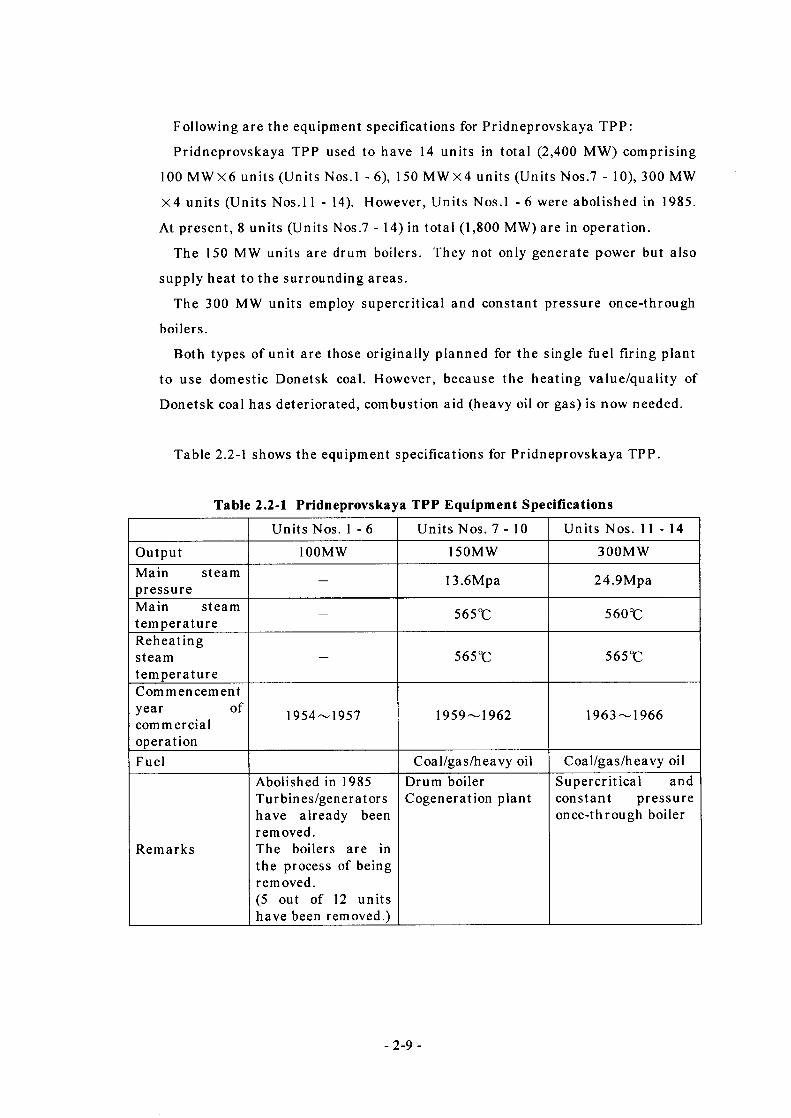
Following are the equipment specifications for Pridneprovskaya TPP:
Pridneprovskaya TPP used to have 14 units in total (2,400 MW) comprising
100 MWX6 units (Units Nos. 1 - 6), 150 MWX4 units (Units Nos.7 - 10), 300 MW
X4 units (Units Nos.l 1 - 14). However, Units Nos.l - 6 were abolished in 1985.
At present, 8 units (Units Nos.7 - 14) in total (1,800 MW) are in operation.
The 150 MW units are drum boilers. They not only generate power but also
supply heat to the surrounding areas.
The 300 MW units employ supercritical and constant pressure once-through
boilers.
Both types of unit are those originally planned for the single fuel firing plant
to use domestic Donetsk coal. However, because the heating value/quality of
Donetsk coal has deteriorated, combustion aid (heavy oil or gas) is now needed.
Table 2.2-1 shows the equipment specifications for Pridneprovskaya TPP.
Table 2.2-1 Pridneprovskaya TPP Equipment Specifications
Units Nos. 1 - 6 Units Nos. 7-10 Units Nos. 11-14
Output 100MW 150MW 300MWMain steampressure
— 13.6Mpa 24.9Mpa
Main steamtemperature — 565%: 560°C
Reheatingsteamtemperature
— 565°C 565%:
Commencement year ofcommercial operation
1954—1957 1959—1962 1963~1966
Fuel Coal/gas/heavy oil Coal/gas/heavy oil
Remarks
Abolished in 1985 Turbines/generators have already been removed.The boilers are in the process of being removed.(5 out of 12 units have been removed.)
Drum boiler Cogeneration plant
Supercritical andconstant pressureonce-through boiler
- 2-9 -
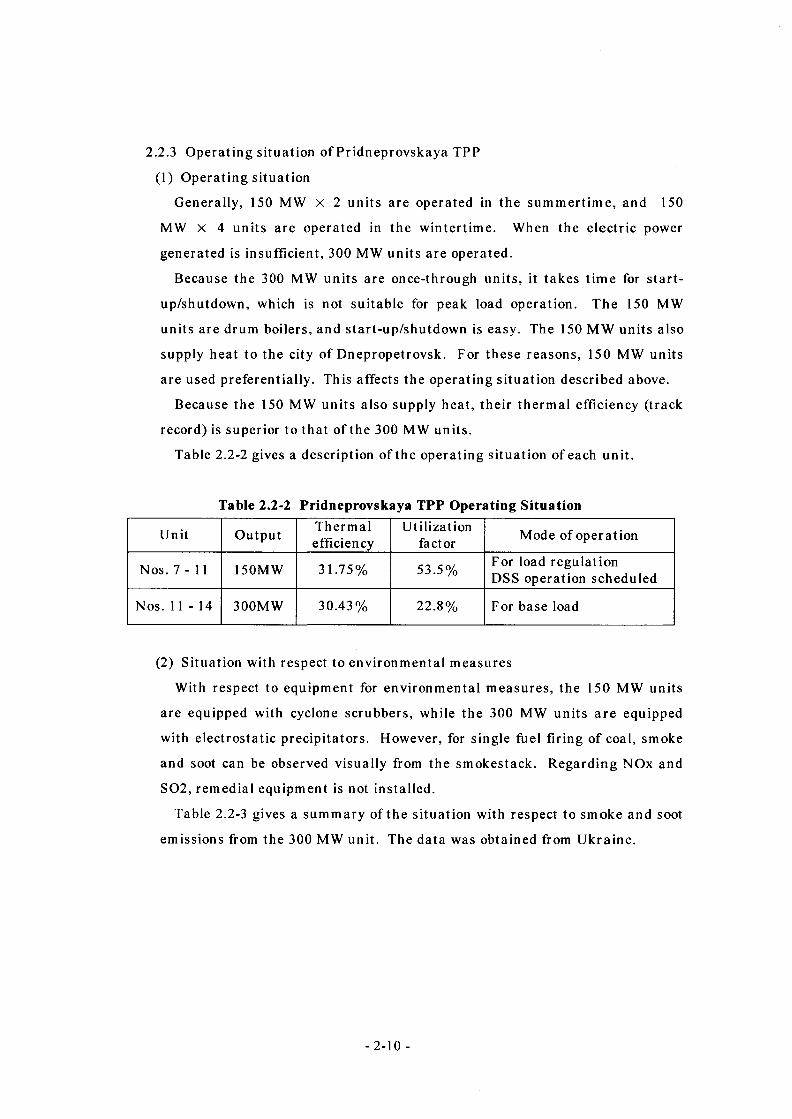
2.2.3 Operating situation of Pridneprovskaya TPP
(1) Operating situation
Generally, 150 MW X 2 units are operated in the summertime, and 150
MW X 4 units are operated in the wintertime. When the electric power
generated is insufficient, 300 MW units are operated.
Because the 300 MW units are once-through units, it takes time for start
up/shutdown, which is not suitable for peak load operation. The 150 MW
units are drum boilers, and start-up/shutdown is easy. The 150 MW units also
supply heat to the city of Dnepropetrovsk. For these reasons, 150 MW units
are used preferentially. This affects the operating situation described above.
Because the 150 MW units also supply heat, their thermal efficiency (track
record) is superior to that of the 300 MW units.
Table 2.2-2 gives a description of the operating situation of each unit.
Table 2.2-2 Pridneprovskaya TPP Operating Situation
Unit Output Thermalefficiency
Utilizationfactor Mode of operation
Nos. 7 - 11 150MW 31.75% 53.5% For load regulationDSS operation scheduled
Nos. 11-14 300MW 30.43% 22.8% For base load
(2) Situation with respect to environmental measures
With respect to equipment for environmental measures, the 150 MW units
are equipped with cyclone scrubbers, while the 300 MW units are equipped
with electrostatic precipitators. However, for single fuel firing of coal, smoke
and soot can be observed visually from the smokestack. Regarding NOx and
S02, remedial equipment is not installed.
Table 2.2-3 gives a summary of the situation with respect to smoke and soot
emissions from the 300 MW unit. The data was obtained from Ukraine.
-2-10 -
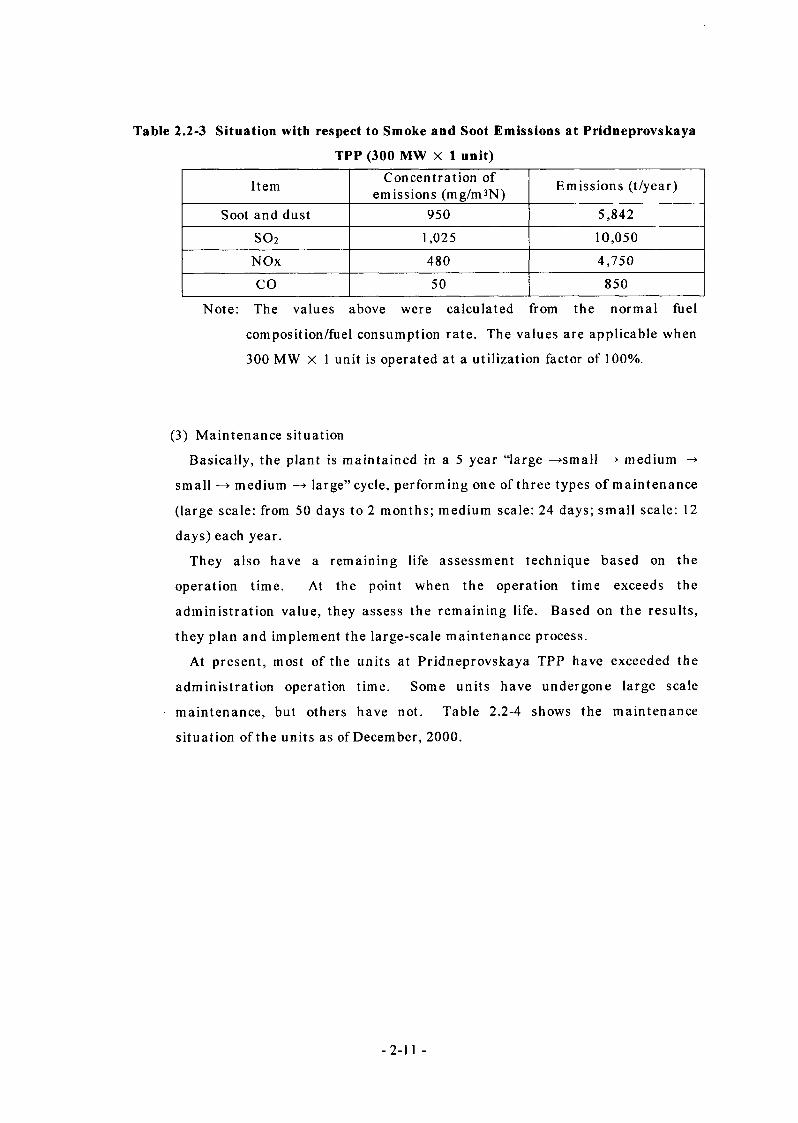
TPP (300 MW X 1 unit)
Table 2.2-3 Situation with respect to Smoke and Soot Emissions at Pridneprovskaya
Item Concentration of emissions (mg/m3N) Emissions (t/year)
Soot and dust 950 5,842
S02 1,025 10,050
NOx 480 4,750
CO 50 850
Note: The values above were calculated from the normal fuel
composition/fuel consumption rate. The values are applicable when
300 MW X 1 unit is operated at a utilization factor of 100%.
(3) Maintenance situation
Basically, the plant is maintained in a 5 year “large —>small —» medium —»
small —> medium —> large” cycle, performing one of three types of maintenance
(large scale: from 50 days to 2 months; medium scale: 24 days; small scale: 12
days) each year.
They also have a remaining life assessment technique based on the
operation time. At the point when the operation time exceeds the
administration value, they assess the remaining life. Based on the results,
they plan and implement the large-scale maintenance process.
At present, most of the units at Pridneprovskaya TPP have exceeded the
administration operation time. Some units have undergone large scale
maintenance, but others have not. Table 2.2-4 shows the maintenance
situation of the units as of December, 2000.
-2-11 -
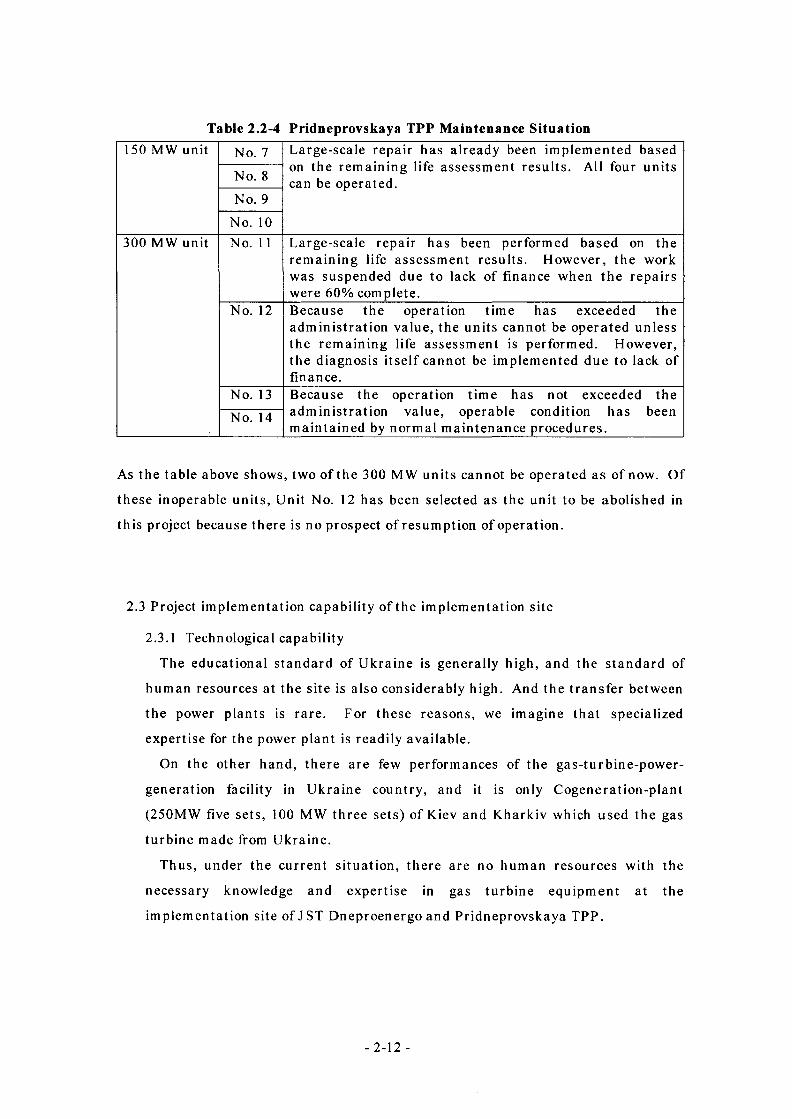
Table 2.2-4 Pridneprovskaya TPP Maintenance Situation150 MW unit No. 7 Large-scale repair has already been implemented based
on the remaining life assessment results. All four units can be operated.No. 8
No. 9
No. 10300 MW unit No. 11 Large-scale repair has been performed based on the
remaining life assessment results. However, the work was suspended due to lack of finance when the repairs were 60% complete.
No. 12 Because the operation time has exceeded the administration value, the units cannot be operated unless the remaining life assessment is performed. However, the diagnosis itself cannot be implemented due to lack of finance.
No. 13 Because the operation time has not exceeded the administration value, operable condition has been maintained by normal maintenance procedures.
No. 14
As the table above shows, two of the 300 MW units cannot be operated as of now. Of
these inoperable units, Unit No. 12 has been selected as the unit to be abolished in
this project because there is no prospect of resumption of operation.
2.3 Project implementation capability of the implementation site
2.3.1 Technological capability
The educational standard of Ukraine is generally high, and the standard of
human resources at the site is also considerably high. And the transfer between
the power plants is rare. For these reasons, we imagine that specialized
expertise for the power plant is readily available.
On the other hand, there are few performances of the gas-turbine-power-
generation facility in Ukraine country, and it is only Cogeneration-plant
(250MW five sets, 100 MW three sets) of Kiev and Kharkiv which used the gas
turbine made from Ukraine.
Thus, under the current situation, there are no human resources with the
necessary knowledge and expertise in gas turbine equipment at the
implementation site of JST Dneproenergo and Pridneprovskaya TPP.
-2-12 -
(1) Plant planning/design
Due to the lack of human resources with a full knowledge of combined cycle
plants, we believe it is difficult for the implementation site alone to
plan/design the project.
However, it is common in Ukraine to employ consultants such as the
Donbasenergo Thermoelectricity Design Research Institute in planning/design,
even for power generation plant modification.
It is also possible in this project to proceed with planning/design of the plant
without problems, by selecting consultants with extensive knowledge/expertise
of combined cycle plants.
(2) Construction administration
In the 1990’s, new power sources were not developed in Ukraine. In 1994,
JST Dneproenergo was established in a reform of the electric power sector.
However, there is no track record of construction administration by J ST
Dneproenergo as the main constituent.
In the track record of modification for life extension of the existing plant,
consultants have played the central part in overall administration, while the
Reconstruction Section of the power plant has been responsible for
quality/process and safety management at the site.
For this reason, we believe that the site can play the central part in
promoting the work with no problems, by selecting appropriate consultants for
this project with the cooperation of contractors/plant manufacturers.
(3) Operating technology
Unlike electric power companies in Japan, a companywide training scheme
(including simulator training) has not been implemented. However, a
moderate training scheme has been put in place, such as having training
equipment for the operating personnel at the power plant. Thus, the
proficiency of the operating personnel has been adequately maintained.
When we studied the central control room, the leader of the operation team
answered our questions explicitly. While we were in the room, operating
personnel quickly responded to the transmitted alarms. We got the
impression that they are prompt and efficient.
We thus believe that the current operating technology is adequate. However,
because they do not have knowledge of the combined cycle power generating
plant, it is necessary to provide operation training together with the
-2-13 -
implementation of this project.
(4) Maintenance technology
They have well-developed comprehensive maintenance procedures ranging
from maintenance techniques to cope with daily problems, to periodical
inspection, analyzing the equipment status, remaining life assessment,
deterioration renovation, preventive maintenance, and historical data
management. This is evidenced by the fact that they operate the
approximately 40 year old Unit No. 7 (150 MW), even though it started
commercial operation in 1959.
The executives of the power plant who received us answered most of our
questions on the spot in the local study. This also testifies to the high
standard of human assets.
They also have their own repair plant in the power plant, and can manage
some equipment repair on-site. Thus, their specialized technology is excellent.
As described above, they do not have knowledge of combined cycle power
generating plant, in particular of gas turbines. However, if we provide
knowledge necessary for maintenance of combined cycle power generating
plant by giving training to the maintenance personnel together with the
implementation of this project, we expect that they will be able to operate the
plant for a long period of time.
-2-14 -
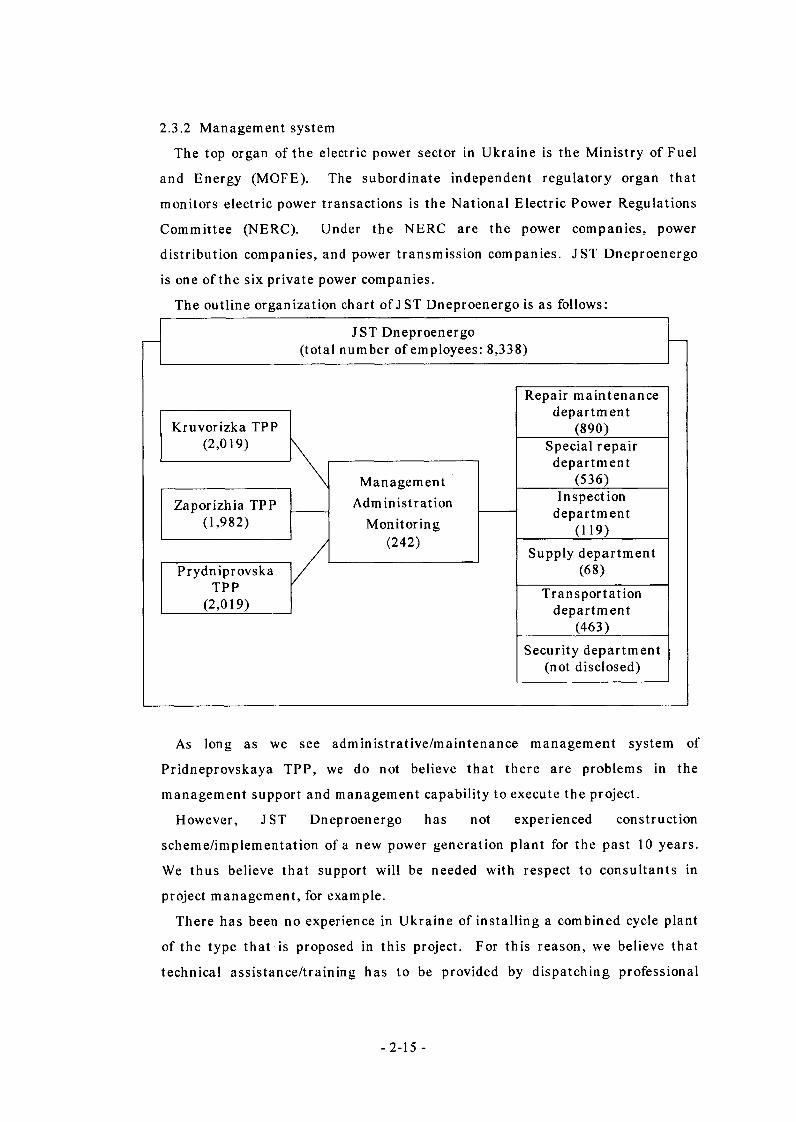
2.3.2 Management system
The top organ of the electric power sector in Ukraine is the Ministry of Fuel
and Energy (MOPE). The subordinate independent regulatory organ that
monitors electric power transactions is the National Electric Power Regulations
Committee (NERC). Under the NERC are the power companies, power
distribution companies, and power transmission companies. JST Dneproenergo
is one of the six private power companies.
The outline organization chart of J ST Dneproenergo is as follows:
PrydniprovskaTPP
Zaporizhia TPP
Kruvorizka TPP
ManagementAdministration
Monitoring(242)
JST Dneproenergo (total number of employees: 8,338)
Security department (not disclosed)
Repair maintenance department
(890)
Supply department (68)
Transportationdepartment
(463)
Special repair department
(536)Inspection
department(119)
As long as we see administrative/maintenance management system of
Pridneprovskaya TPP, we do not believe that there are problems in the
management support and management capability to execute the project.
However, JST Dneproenergo has not experienced construction
scheme/implementation of a new power generation plant for the past 10 years.
We thus believe that support will be needed with respect to consultants in
project management, for example.
There has been no experience in Ukraine of installing a combined cycle plant
of the type that is proposed in this project. For this reason, we believe that
technical assistance/training has to be provided by dispatching professional
-2-15 -
engineers for the planning, design, and site administration, and experienced
personnel for the test run.
2.3.3 Business management, management policy
At present, default in payment by customers and barter transactions are
commonplace in the Ukrainian economy as a whole. Thus, the framework of
electric power transactions is marred by problems. Although the National
Electric Power Regulations Committee (NERC) was established in 1995 as an
independent regulatory organ, the government/Ministry of Fuel and Energy
have strong influence over management of electric utilities. This allows easy
political intervention in the market by the government. Thus, under the current
situation, transactions are not conducted in accordance with the market
regulations.
Privatization is indispensable to the elimination of political intervention that
distorts the market, and to establishing a framework for electric power
transactions in accordance with the market regulations. Based on this
understanding, Ukraine launched the sale of stocks of electric power companies
at the end of 1997.
As of now, most of the companies have sold only 20% - 30% of their stocks.
Most of the stocks are still owned by the national government. The same is true
of J ST Dneproenergo. 75% of the stocks are owned by the national government,
while the remaining 25% are owned by the employees of the power company
(union). Thus, under the present situation, we cannot say that the company is
virtually privatized.
Privatization is not progressing because severe conditions are imposed on
these companies (e.g. additional equipment investment, payment of cumulative
debts to the investors, maintenance of labor force). In addition, electric power
companies that were subject to privatization have many problems such as
default in payments by customers. Thus, under the current situation, these
problems aggravate the financial position.
However, from January, 2000, rules to collect electricity bills have been
enforced against customers. While recovery of charges was 6% as of January
2000, it rose to 89% as of August. The GNP growth rate recorded the 5% mark
at the end of 2000, far exceeding the original projection of 2%. For these reasons,
it is expected that the Ukrainian economy will recover and the management
conditions of JST Dneproenergo will improve in the future. We believe that
- 2-16 -

these developments will be favorable for implementation of this project.
2.3.4 Finance defrayal capability
Although JST Dneproenergo is a private enterprise, most of the stocks are
owned by the Ukrainian government. In addition, charges for electricity and
heat supply are determined by the Ukrainian government. Thus, the right of
management is virtually held by the Ukrainian government. For this reason, it
is believed that the Ukrainian government will defray the actual project costs.
However, the Ukrainian government, dependent on Russia for most of its
industrial activities, is in serious economic difficulties after its independence
from the Soviet Union. Later, due to cooperative recovery with Russia and
cooperation with Europe, the domestic economy showed signs of recovery.
However, strongly affected by Russia’s financial crisis in 1998, the economic
situation is still in serious condition because of concerns over the recurrence of
inflation caused by sharp declines in its currency, the Hyrvna. This has also
caused delays in the loan repayment schedule from other governments/organs.
Thus, at present, the granting of additional finance from other countries has
been shut down.
However, in January, 2001, the IMF announced its approval to grant
additional finance. Thus, we expect that granting of additional finance will be
resumed from other countries in the future. We believe that a low-interest soft
loan with a long payback period is desirable as an appropriate source of finance
for this project under the circumstances.
When this project is implemented, emissions of carbon dioxide are expected to
be reduced. Thus, we believe that application of Japan’s special yen loan for the
environment is optimal. However, the special yen loan for the environment is
granted only for 75% of the total cost of the project. For this reason, we need to
examine the financing method for the remaining 25% of the finance.
We believe it is difficult for the Ukrainian government, which is not in good
economic condition, to cover 25% of the project finance by itself. We thus need to
think about financial assistance from overseas for the remaining 25% of the
finance.
At present, the shutdown of the Chernobyl nuclear power plant has triggered
a growing demand for shutdown of the Soviet Union type nuclear power plants
in European countries and around the world. We believe that finance assistance
can be elicited under the pretext of ensuring a power source to augment the
-2-17 -
domestic electric power generation capacity, which is strained due to the
shutdown of the nuclear power plant.
In any event, we believe that the practical source of finance and defrayal of
finance will be left to the negotiations that will be held when this project is
implemented.
2.3.5 Capability to acquiring human resources
Because JST Dneproenergo and Pridneprovskaya TPP have a number of
engineers, we believe that there are no problems in acquiring the personnel
needed for this project.
However, there has not been any experience in Ukraine of installing the kind
of combined cycle generator proposed in this project. For this reason, we believe
that the professional engineers have to be dispatched in planning, design, and
site administration, and technical assistance/training have to be provided by
experienced personnel during the test run.
2.3.6 Implementation framework
The possible basic framework will be that JST Dneproenergo is mainly
responsible for implementation, and consultants are arranged under JST
Dneproenergo to undertake substantial duties.
There has been no experience in Ukraine, not to mention in JST Dneproenergo,
of installing and operating a combined cycle power generating plant. For this
reason, we believe it necessary to select consultants with extensive
experience/knowledge.
-2-18 -
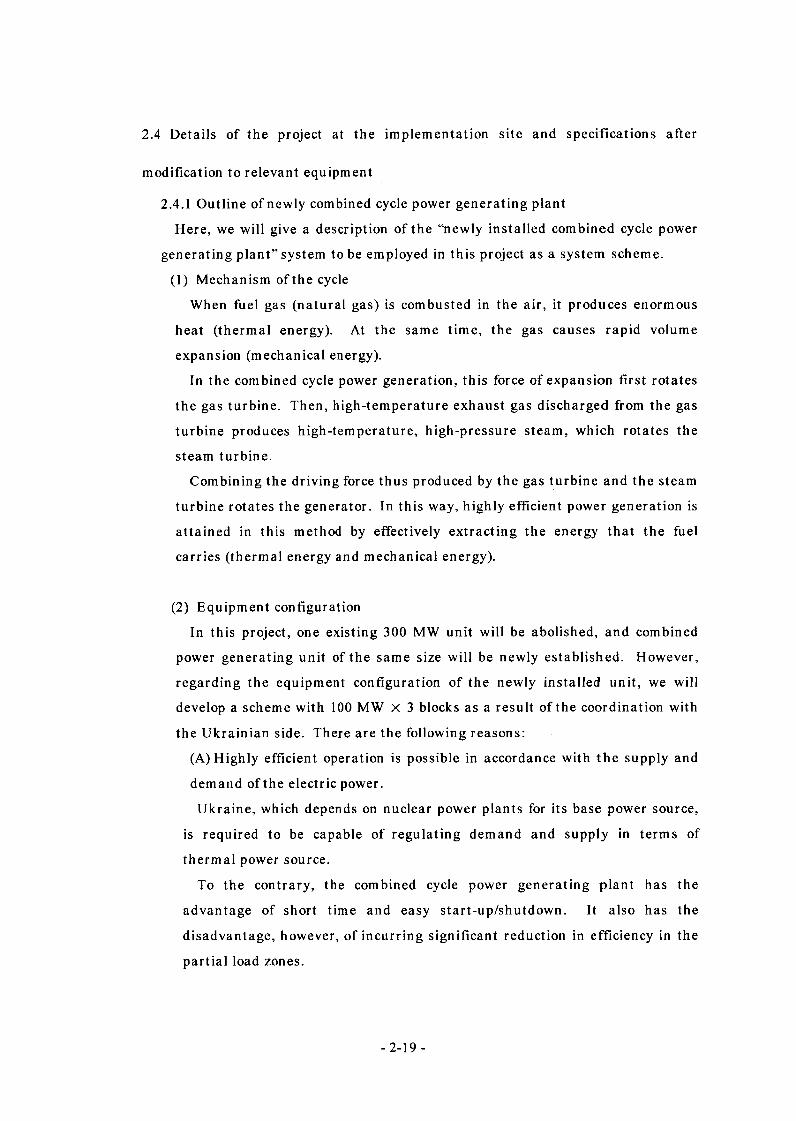
2.4 Details of the project at the implementation site and specifications after
modification to relevant equipment
2.4.1 Outline of newly combined cycle power generating plant
Here, we will give a description of the “newly installed combined cycle power
generating plant” system to be employed in this project as a system scheme.
(1) Mechanism of the cycle
When fuel gas (natural gas) is combusted in the air, it produces enormous
heat (thermal energy). At the same time, the gas causes rapid volume
expansion (mechanical energy).
In the combined cycle power generation, this force of expansion first rotates
the gas turbine. Then, high-temperature exhaust gas discharged from the gas
turbine produces high-temperature, high-pressure steam, which rotates the
steam turbine.
Combining the driving force thus produced by the gas turbine and the steam
turbine rotates the generator. In this way, highly efficient power generation is
attained in this method by effectively extracting the energy that the fuel
carries (thermal energy and mechanical energy).
(2) Equipment configuration
In this project, one existing 300 MW unit will be abolished, and combined
power generating unit of the same size will be newly established. However,
regarding the equipment configuration of the newly installed unit, we will
develop a scheme with 100 MW X 3 blocks as a result of the coordination with
the Ukrainian side. There are the following reasons:
(A) Highly efficient operation is possible in accordance with the supply and
demand of the electric power.
Ukraine, which depends on nuclear power plants for its base power source,
is required to be capable of regulating demand and supply in terms of
thermal power source.
To the contrary, the combined cycle power generating plant has the
advantage of short time and easy start-up/shutdown. It also has the
disadvantage, however, of incurring significant reduction in efficiency in the
partial load zones.
-2-19 -
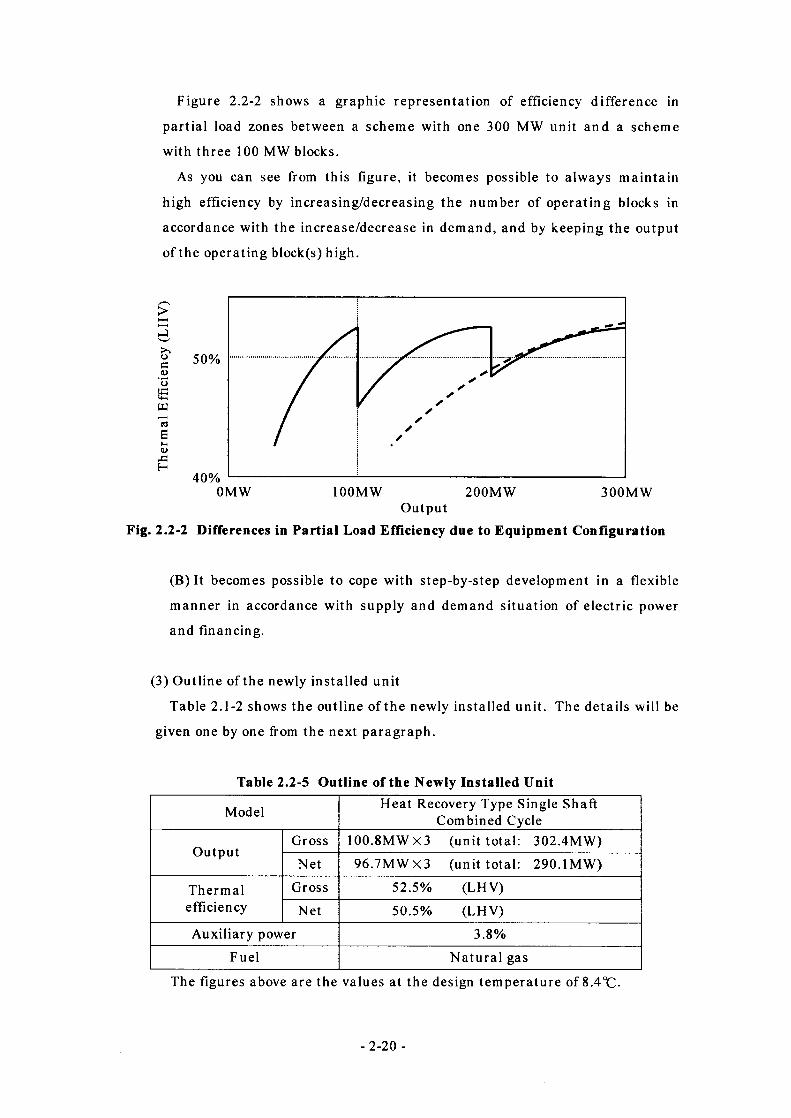
Figure 2.2-2 shows a graphic representation of efficiency difference in
partial load zones between a scheme with one 300 MW unit and a scheme
with three 100 MW blocks.
As you can see from this figure, it becomes possible to always maintain
high efficiency by increasing/decreasing the number of operating blocks in
accordance with the increase/decrease in demand, and by keeping the output
of the operating block(s) high.
OMW 100MW 200MW 300MWOutput
Fig. 2.2-2 Differences in Partial Load Efficiency due to Equipment Configuration
(B) It becomes possible to cope with step-by-step development in a flexible
manner in accordance with supply and demand situation of electric power
and financing.
(3) Outline of the newly installed unit
Table 2.1-2 shows the outline of the newly installed unit. The details will be
given one by one from the next paragraph.
Table 2.2-5 Outline of the Newly Installed Unit
Model Heat Recovery Type Single Shaft Combined Cycle
OutputGross 100.8MWX3 (unit total: 302.4MW)
Net 96.7MWX3 (unit total: 290.1MW)
Thermalefficiency
Gross 52.5% (LHV)
Net 50.5% (LHV)
Auxiliary power 3.8%
Fuel Natural gas
The figures above are the values at the design temperature of 8.4°C.
- 2-20 -
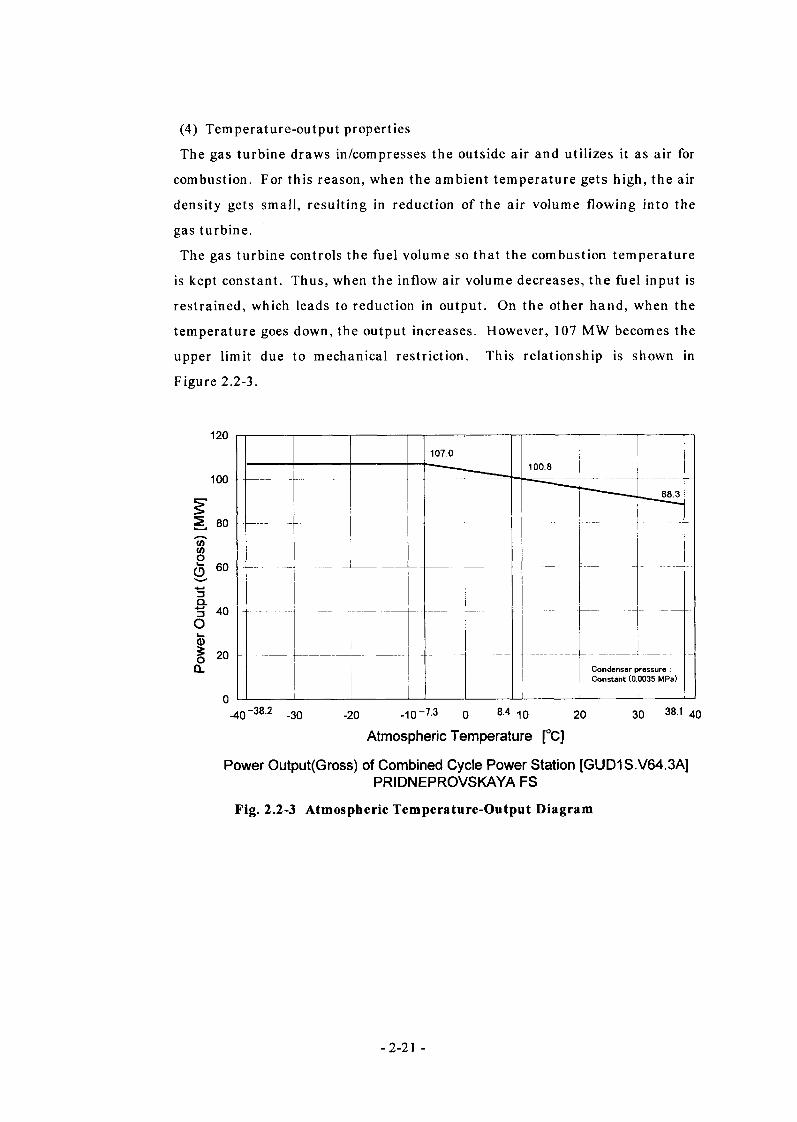
(4) Temperature-output properties
The gas turbine draws in/compresses the outside air and utilizes it as air for
combustion. For this reason, when the ambient temperature gets high, the air
density gets small, resulting in reduction of the air volume flowing into the
gas turbine.
The gas turbine controls the fuel volume so that the combustion temperature
is kept constant. Thus, when the inflow air volume decreases, the fuel input is
restrained, which leads to reduction in output. On the other hand, when the
temperature goes down, the output increases. However, 107 MW becomes the
upper limit due to mechanical restriction. This relationship is shown in
Figure 2.2-3.
107.0100.8
Condenser pressure : Constant (0.0035 MPa)
-38.2 38.1 40-10 ~7-3 0 &4 10Atmospheric Temperature [°C]
Power Output(Gross) of Combined Cycle Power Station [GUD1S.V64.3A]PRIDNEPROVSKAYA FS
Fig. 2.2-3 Atmospheric Temperature-Output Diagram
-2-21 -
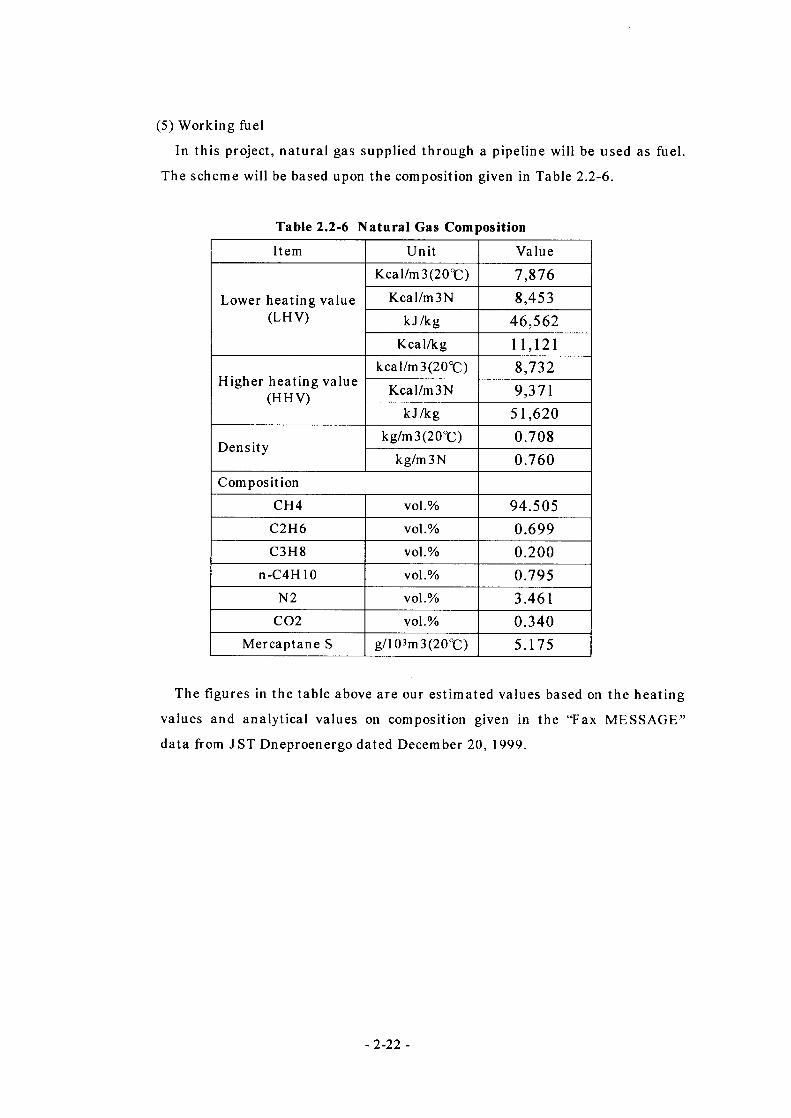
(5) Working fuel
In this project, natural gas supplied through a pipeline will be used as fuel.
The scheme will be based upon the composition given in Table 2.2-6.
Table 2.2-6 Natural Gas Composition
Item Unit Value
Lower heating value (LHV)
Kcal/m3(20°C) 7,876Kcal/m3N 8,453
kJ/kg 46,562Kcal/kg 11,121
Higher heating value (HHV)
kcal/m3(20°C) 8,732Kcal/m3N 9,371
kJ/kg 51,620
Densitykg/m3(20°C) 0.708
kg/m3N 0.760Composition
CH4 vol.% 94.505C2H6 vol.% 0.699C3H8 vol.% 0.200
n-C4H 10 vol.% 0.795N2 vol.% 3.461
CQ2 vol.% 0.340Mercaptane S g/103m3(20°C) 5.175
The figures in the table above are our estimated values based on the heating
values and analytical values on composition given in the “Fax MESSAGE”
data from J ST Dneproenergo dated December 20, 1999.
- 2-22 -
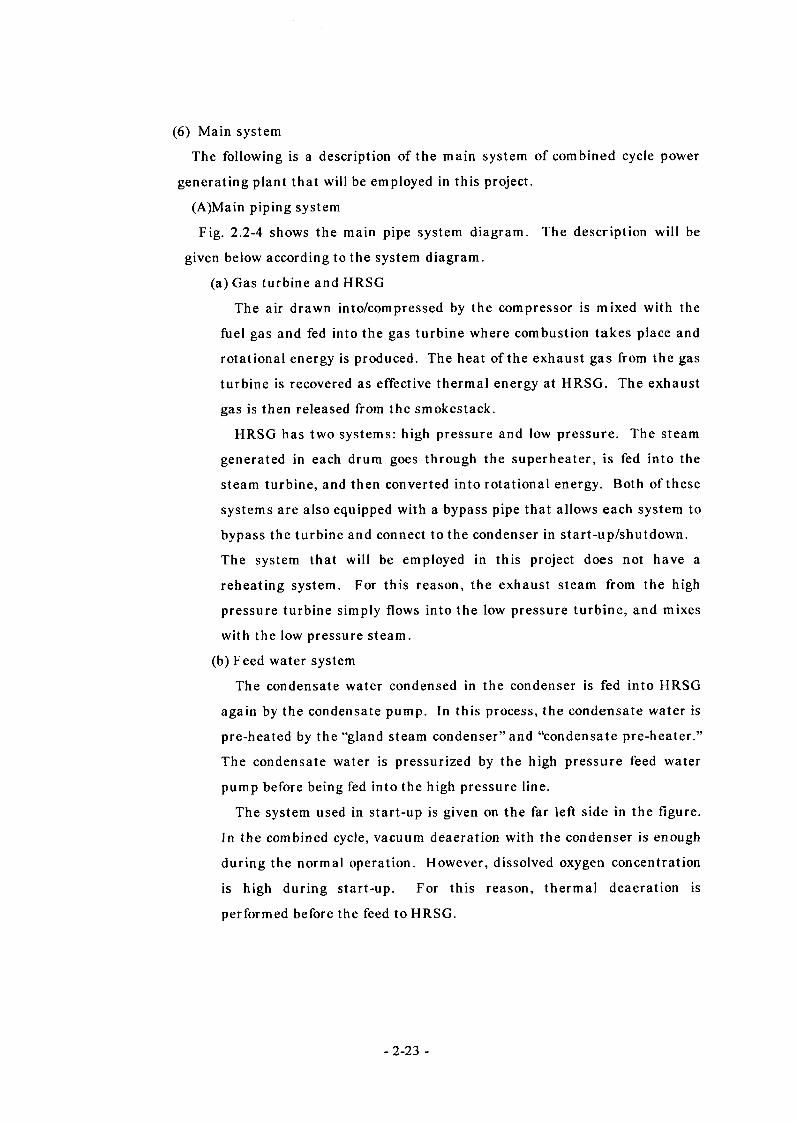
(6) Main system
The following is a description of the main system of combined cycle power
generating plant that will be employed in this project.
(A)Main piping system
Fig. 2.2-4 shows the main pipe system diagram. The description will be
given below according to the system diagram.
(a) Gas turbine and HRSG
The air drawn into/compressed by the compressor is mixed with the
fuel gas and fed into the gas turbine where combustion takes place and
rotational energy is produced. The heat of the exhaust gas from the gas
turbine is recovered as effective thermal energy at HRSG. The exhaust
gas is then released from the smokestack.
HRSG has two systems: high pressure and low pressure. The steam
generated in each drum goes through the superheater, is fed into the
steam turbine, and then converted into rotational energy. Both of these
systems are also equipped with a bypass pipe that allows each system to
bypass the turbine and connect to the condenser in start-up/shutdown.
The system that will be employed in this project does not have a
reheating system. For this reason, the exhaust steam from the high
pressure turbine simply flows into the low pressure turbine, and mixes
with the low pressure steam.
(b) Feed water system
The condensate water condensed in the condenser is fed into HRSG
again by the condensate pump. In this process, the condensate water is
pre-heated by the “gland steam condenser” and “condensate pre-heater.”
The condensate water is pressurized by the high pressure feed water
pump before being fed into the high pressure line.
The system used in start-up is given on the far left side in the figure.
In the combined cycle, vacuum deaeration with the condenser is enough
during the normal operation. However, dissolved oxygen concentration
is high during start-up. For this reason, thermal deaeration is
performed before the feed to HRSG.
- 2-23 -

(B) Condenser and auxiliary cooling water system
Fig. 2.2-5 shows the condenser and auxiliary cooling water system diagram.
The description will be given below according to the system diagram.
(a) Condenser cooling water system
The cooling water is taken in from the existing main pipe using the
intake for the former 100 MW unit located near the newly installed unit.
In this scheme, the waste water is also returned to the existing culvert.
Like the existing unit, the condenser will be equipped with a ball
cleaning unit.
(b) Auxiliary cooling water system
This system is used for the auxiliary cooling water cooler branching
off from the feed piping of the condenser cooling water. This system
consists of a booster pump and a cooler, and cools the auxiliary cooling
water that circulates between the auxiliary cooling water pump and
auxiliary equipment.
The booster pump has a spare unit, achieving the configuration of
100% X 2 units. This is because the bearing of the main engine may be
damaged by the time when the rotation of the main engine stops
completely, even if the plant is shut down immediately due to failure of
this pump.
The cooler is also configured with 100% X 2 units by taking into
consideration the cleaning of clogging and dirt during the operation of
the plant.
(C) Fuel feed system
Fig. 2.2-6 shows the fuel system diagram.
This figure gives the system diagram for all the three blocks.
The system branching off from the existing gas main pipe to each block
consists of a compressor for pressurization up to the pressure needed for the
gas turbine (2.6 MPa); a control valve for controlling the flow rate and
pressure; and a gate valve and filters associated with these units.
- 2-24 -
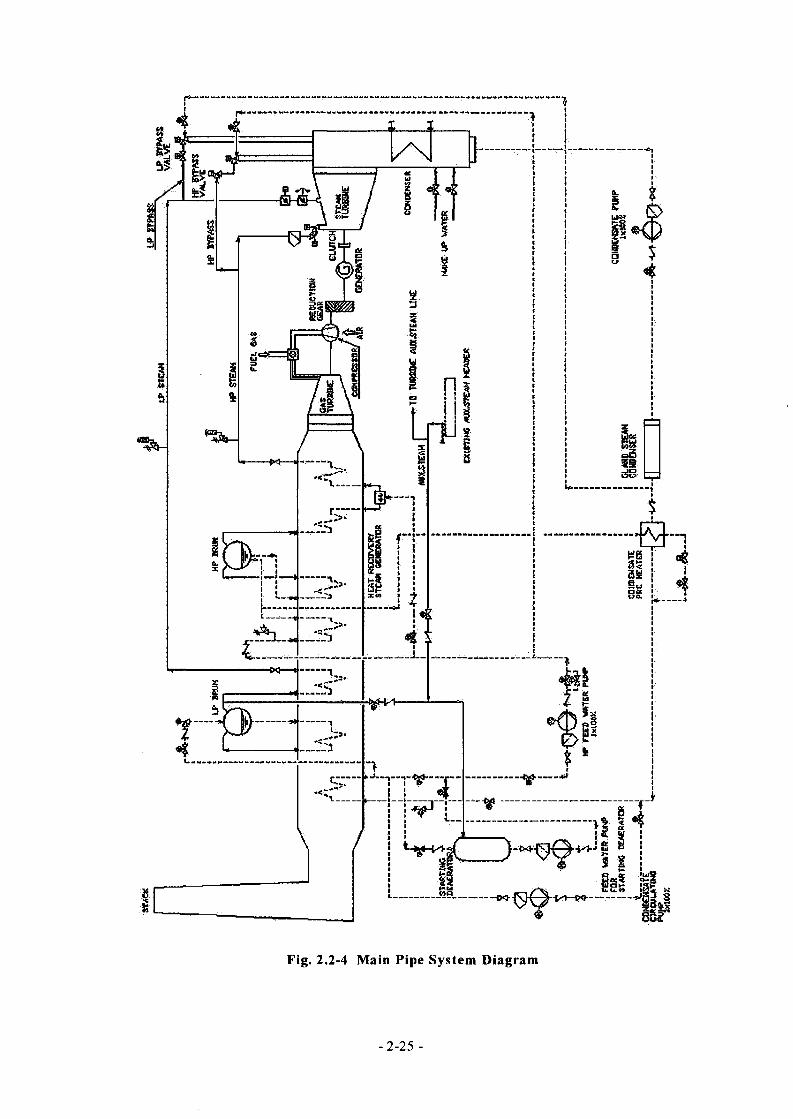
Fig. 2.2-4 Main Pipe System Diagram
2-25
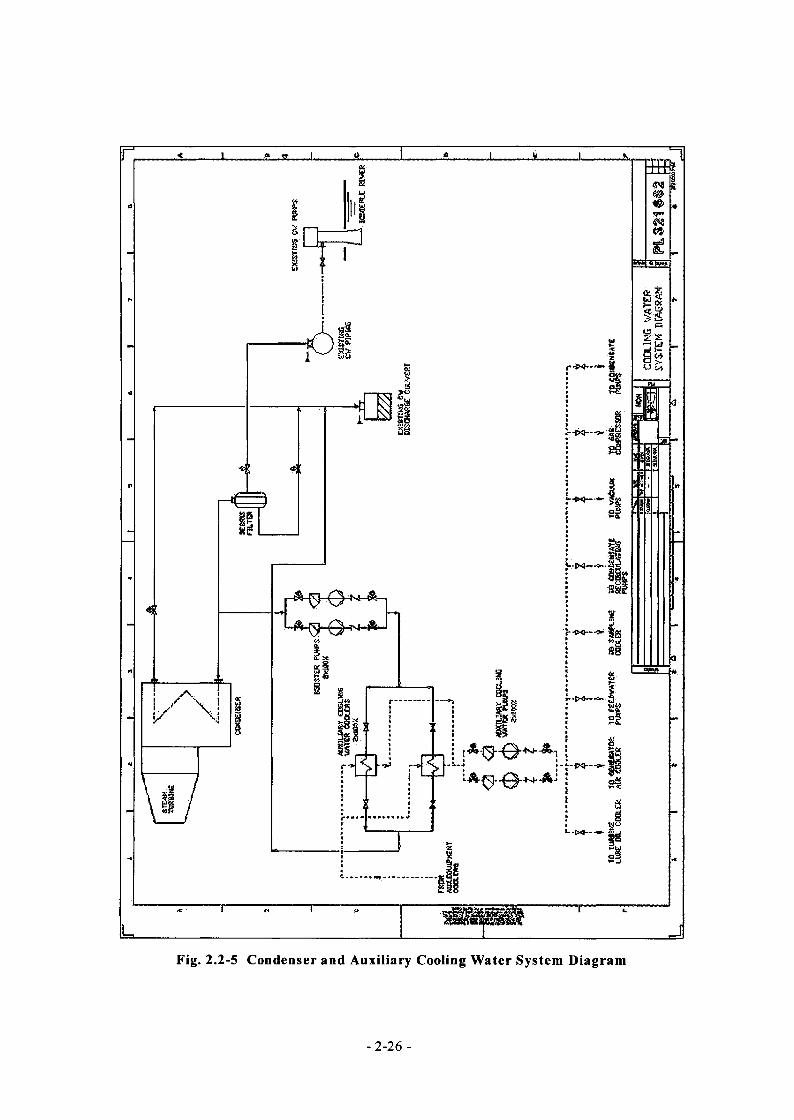
Fig. 2.2-5 Condenser and Auxiliary Cooling Water System Diagram
- 2-26 -
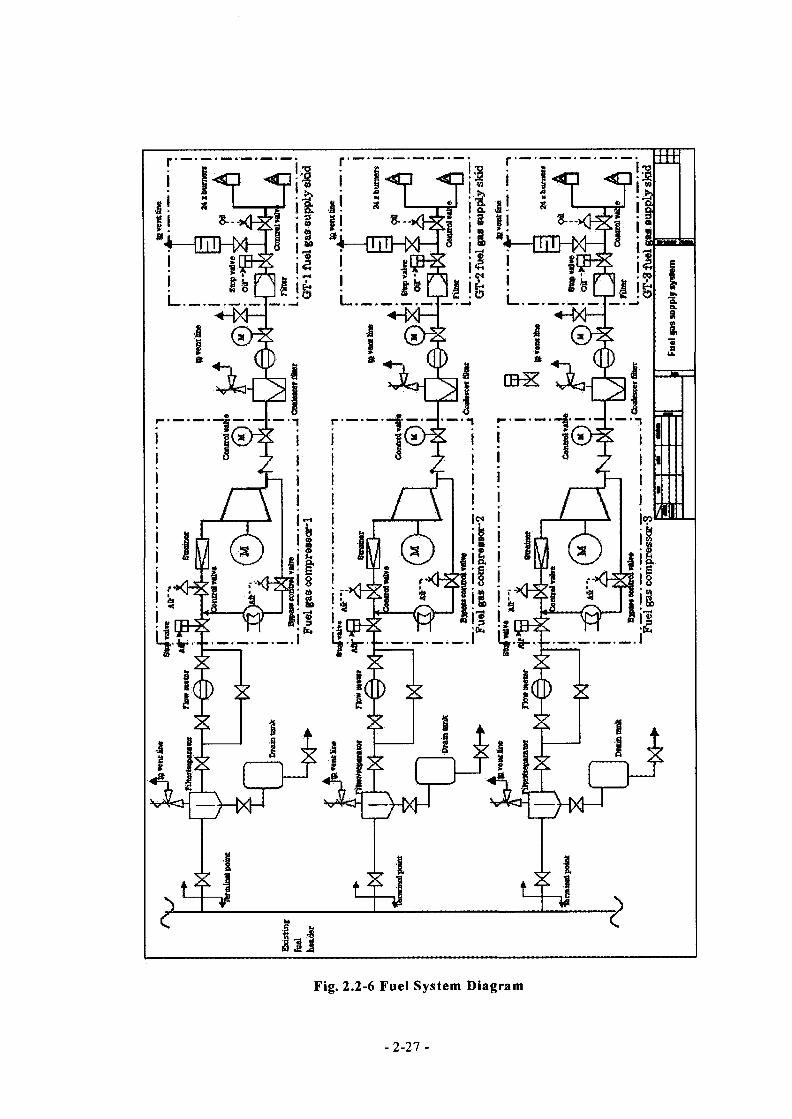
Fig. 2.2-6 Fuel System Diagram
- 2-27 -
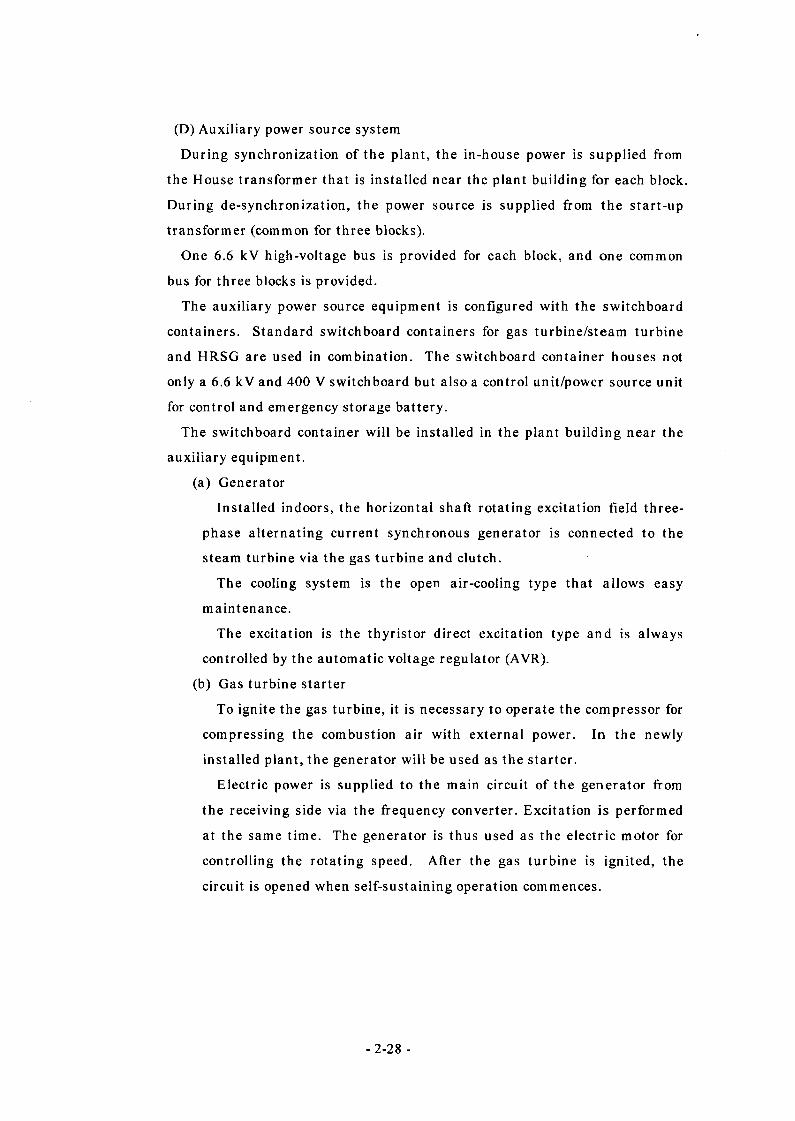
(D) Auxiliary power source system
During synchronization of the plant, the in-house power is supplied from
the House transformer that is installed near the plant building for each block.
During de-synchronization, the power source is supplied from the start-up
transformer (common for three blocks).
One 6.6 kV high-voltage bus is provided for each block, and one common
bus for three blocks is provided.
The auxiliary power source equipment is configured with the switchboard
containers. Standard switchboard containers for gas turbine/steam turbine
and HRSG are used in combination. The switchboard container houses not
only a 6.6 kV and 400 V switchboard but also a control unit/power source unit
for control and emergency storage battery.
The switchboard container will be installed in the plant building near the
auxiliary equipment.
(a) Generator
Installed indoors, the horizontal shaft rotating excitation field three-
phase alternating current synchronous generator is connected to the
steam turbine via the gas turbine and clutch.
The cooling system is the open air-cooling type that allows easy
maintenance.
The excitation is the thyristor direct excitation type and is always
controlled by the automatic voltage regulator (AVR).
(b) Gas turbine starter
To ignite the gas turbine, it is necessary to operate the compressor for
compressing the combustion air with external power. In the newly
installed plant, the generator will be used as the starter.
Electric power is supplied to the main circuit of the generator from
the receiving side via the frequency converter. Excitation is performed
at the same time. The generator is thus used as the electric motor for
controlling the rotating speed. After the gas turbine is ignited, the
circuit is opened when self-sustaining operation commences.
- 2-28 -
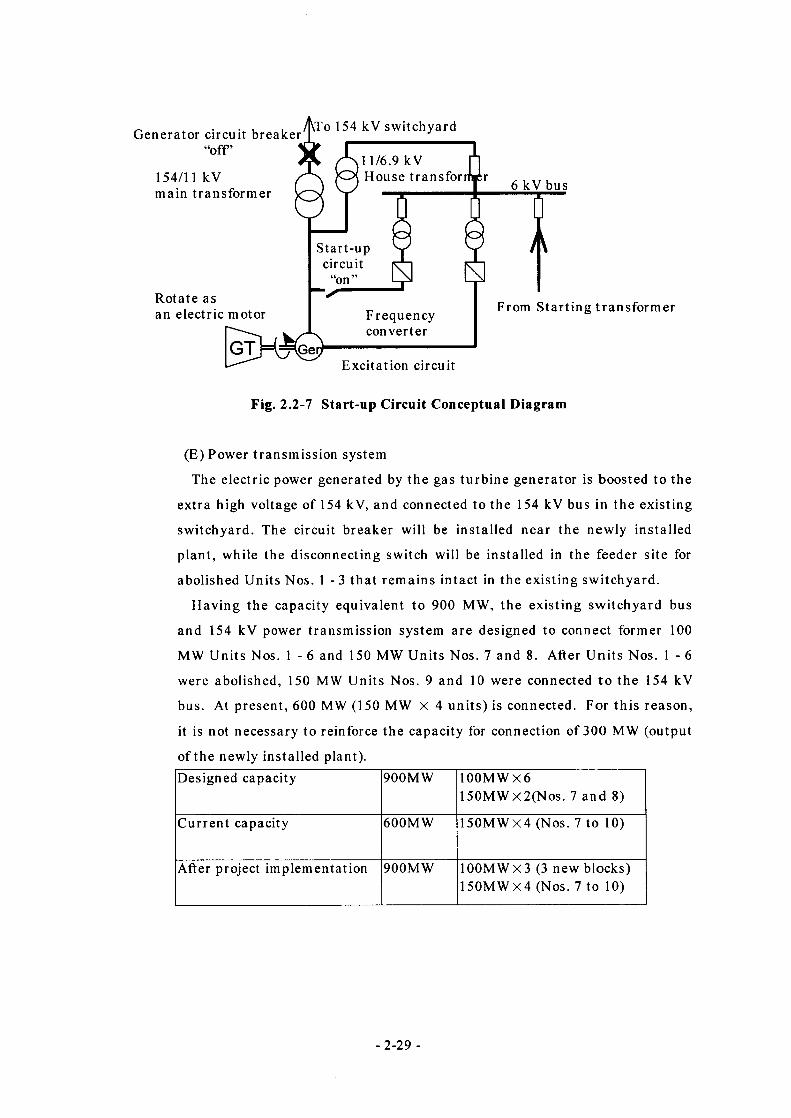
ATo 154 kV switchyardGenerator circuit breaker
11/6.9 kV House transfer154/11 kV
main transformer 6 kV bus
Start-upcircuit
Rotate as an electric motor From Starting transformerFrequency
converter
Excitation circuit
Fig. 2.2-7 Start-up Circuit Conceptual Diagram
(E) Power transmission system
The electric power generated by the gas turbine generator is boosted to the
extra high voltage of 154 kV, and connected to the 154 kV bus in the existing
switchyard. The circuit breaker will be installed near the newly installed
plant, while the disconnecting switch will be installed in the feeder site for
abolished Units Nos. 1 - 3 that remains intact in the existing switchyard.
Having the capacity equivalent to 900 MW, the existing switchyard bus
and 154 kV power transmission system are designed to connect former 100
MW Units Nos. 1 - 6 and 150 MW Units Nos. 7 and 8. After Units Nos. 1 - 6
were abolished, 150 MW Units Nos. 9 and 10 were connected to the 154 kV
bus. At present, 600 MW (150 MW X 4 units) is connected. For this reason,
it is not necessary to reinforce the capacity for connection of 300 MW (output
of the newly installed plant).Designed capacity 900MW 100MWX6
150MWx2(Nos. 7 and 8)
Current capacity 600MW 150MWX4 (Nos. 7 to 10)
After project implementation 900MW 100MWX3 (3 new blocks) 150MWX4 (Nos. 7 to 10)
- 2-29 -
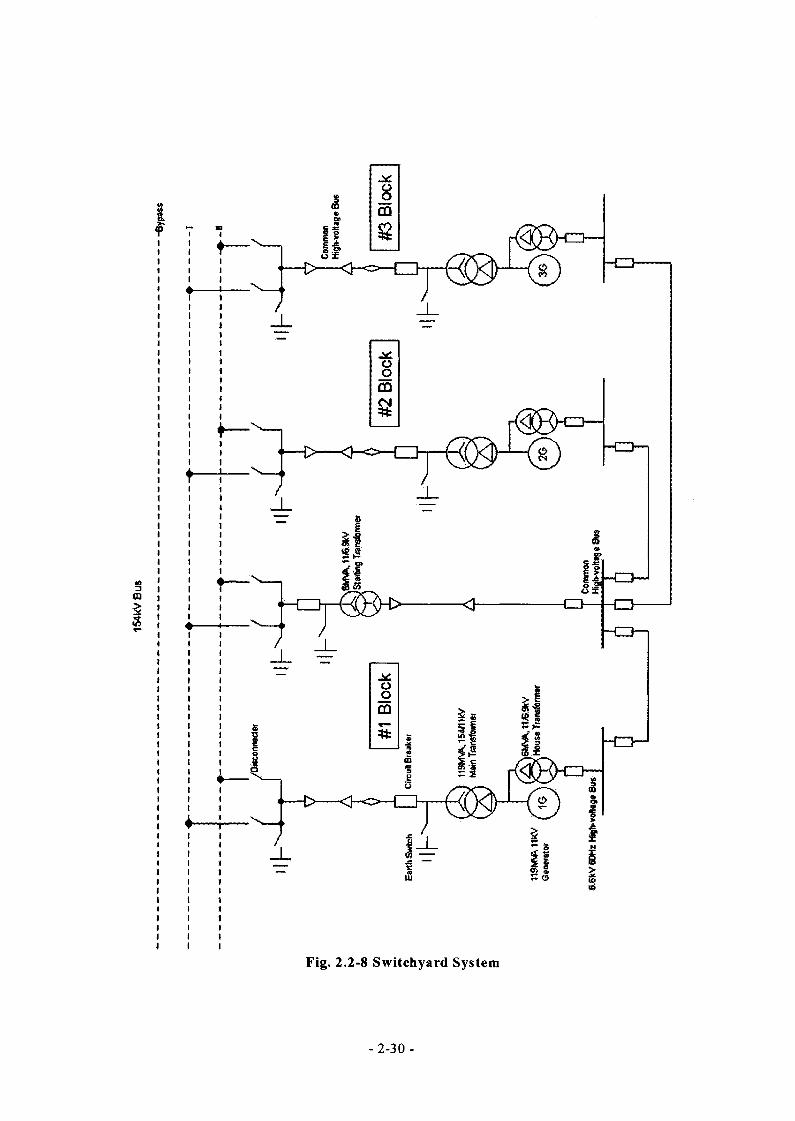
l54k
V B
us
n----D>—<}-o—CD
Fig. 2.2-8 Switchyard System
-2-30 -
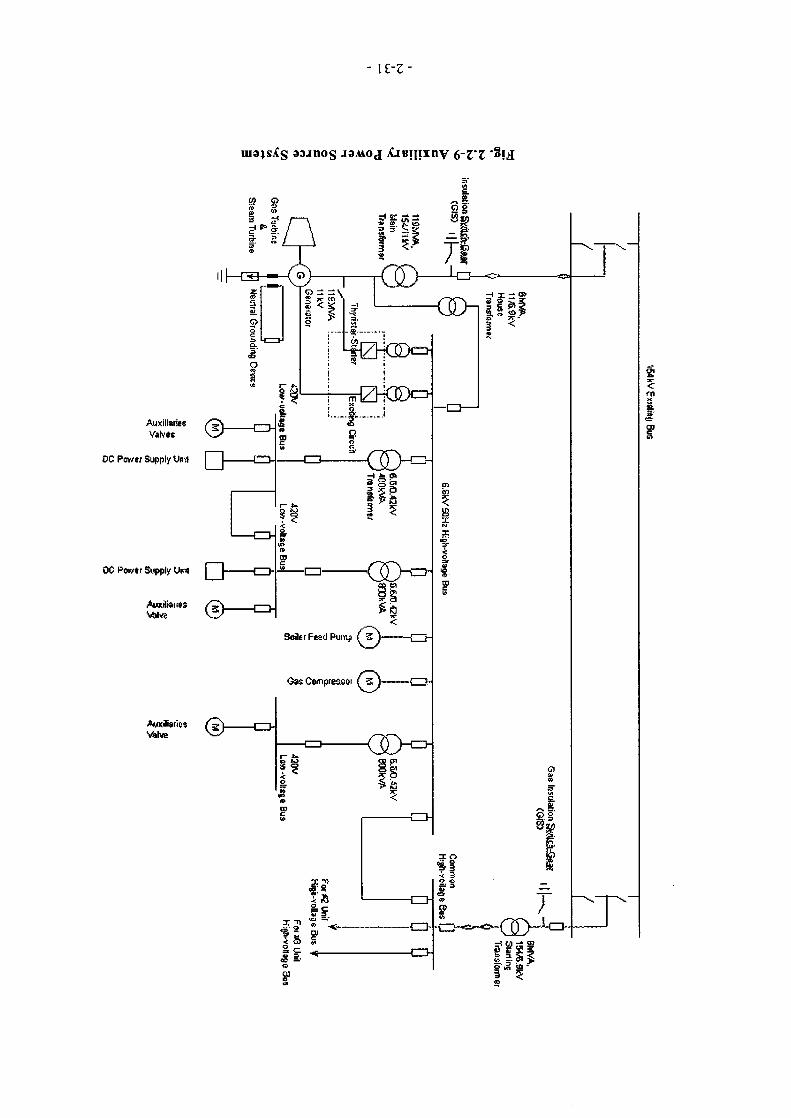
\£-Z-
uia;sXs ao-inos jauoj Xjeifixny *Si£
AuxiliariesVakes
DC Pav/Ei Supply Un .1
00 Povztr Supply Untl
;ng I
?u2|
$«3
/yifr
St
2.4.2 Environmental measures
(1) Related to atmosphere
(A) Soot and dust/S02
The new unit generates no smoke or dust, as it uses clean natural gas as
fuel. Moreover, the amount of sulfur contained in the fuel is very low,
meaning that sulfur oxide discharge can be considered insignificant,
requiring no specific measures.
(B) NOx
This project is designed to employ combined cycle power generating unit
equipped with a low NOx burner. The NOx emissions after
implementation of the project are cut by about 61% from the current level.
We assessed the concentration on the ground in the surrounding area,
assuming that the smokestack is 45m high. The result was below the
maximum permissible concentration established by the Ukrainian
Ministry of Welfare. In this evaluation result, the result exceeding a
present ground concentration a little is brought. However, it is below a
permission ground concentration and NOx discharge is cut down 50% or
more. And in order to meet the Ukrainian standard, "smokestack height
shall be 15m and over higher than the top of a neighboring building," the
smokestack height is changed to 75m (the height of the existing 300MW
boiler, 60m, plus 15m.) So, there is no problem.
(C) CO
In this project, clean natural gas will be used as the fuel. At the same
time, a burner is employed whose combustion efficiency is extremely high.
For these reasons, generation of CO is extremely low.
Thus, there is no need to take special measures.
(2) Related to thermal effluent
Pridneprovskaya TPP is located on the bank of the Dnieper River. The
cooling water for power generation (condenser cooling water) is taken in from
the Dnieper River, and discharged into the Dnieper River as thermal effluent.
In this project, one conventional unit (existing 300 MW) will be abolished.
In its place, a combined cycle power generating unit will be employed with
high efficiency and less workload on the steam turbine per the generated
electric power amount. For these reasons, the volume of cooling water for
-2-32 -
power generation is less than the amount currently required. In the existing
unit, the temperature difference at the condenser is 8°C (limiting value: 12°C)
under normal conditions. In this case, the difference is planned to be 7°C for
the newly installed unit. Thus, neither the thermal effluent volume nor the
temperature will ever increase from the current level. In this way,
environmental measures are not needed for the thermal effluent.
(3) Waste water from the plant
The objective of this project is to abolish one existing coal-fired 300 MW unit
and set up a combined cycle power generating unit of the same capacity fueled
by natural gas. For this reason, the volume of the waste water will be
decreased. Thus, environmental measures are not needed.
(4) Noise/vibration
Regarding the combined cycle power generating installation that is to be
newly installed under this project, the main unit of the gas turbine will be
packed in an enclosure, which makes it possible to control the noise at 90
dB(A) 1 m on the equipment side. The impact on the border of the lot is also
small because the entire power generating facilities is housed in a building.
2.4.3 Main equipment of the plant and equipment specifications
(1) Outline of the plant Plant model
Gross output Net output Auxiliary power ratio Designed ambient temperature Maximum ambient temperature Minimum ambient temperature Designed atmospheric humidity Working fuel
Gross efficiencyNet efficiencyExhaust gas parameters
Heat Recovery Type,Single Shaft Combined Cycle100.8 MW/block97.0 MW/block3.8 %
8.4 °C38.1 °C -38.2 T RH 74 %Natural gas (See 1.2.1 (3) for details) Lower Heat Value(LHV):7,876 kcal/m3(46,562 kJ/kg)52.5 % (LH V Base)50.5% (LH V Base)See Table 2.2-7
-2-33 -
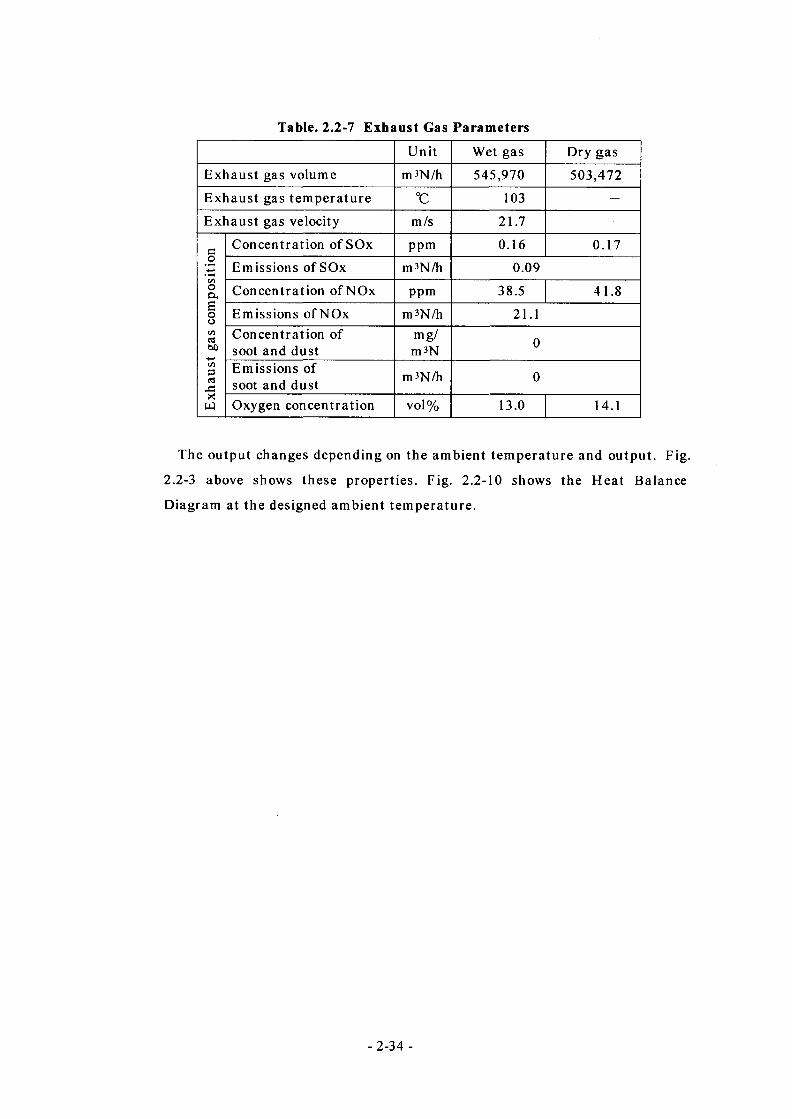
Table. 2.2-7 Exhaust Gas Parameters
Unit Wet gas Dry gas
Exhaust gas volume m3N/h 545,970 503,472
Exhaust gas temperature °C 103 —
Exhaust gas velocity m/s 21.7 —
c Concentration ofSOx ppm 0.16 0.17o
Emissions of SOx m3N/h 0.09ocx Concentration of NOx ppm 38.5 41.8
! Emissions of NOx m3N/h 21.1
cdbO
Concentration of soot and dust
mg/m3N 0
C/5
3cd
*5
Emissions of soot and dust m3N/h 0
XOxygen concentration vol% 13.0 14.1
The output changes depending on the ambient temperature and output. Fig.
2.2-3 above shows these properties. Fig. 2.2-10 shows the Heat Balance
Diagram at the designed ambient temperature.
-2-34 -
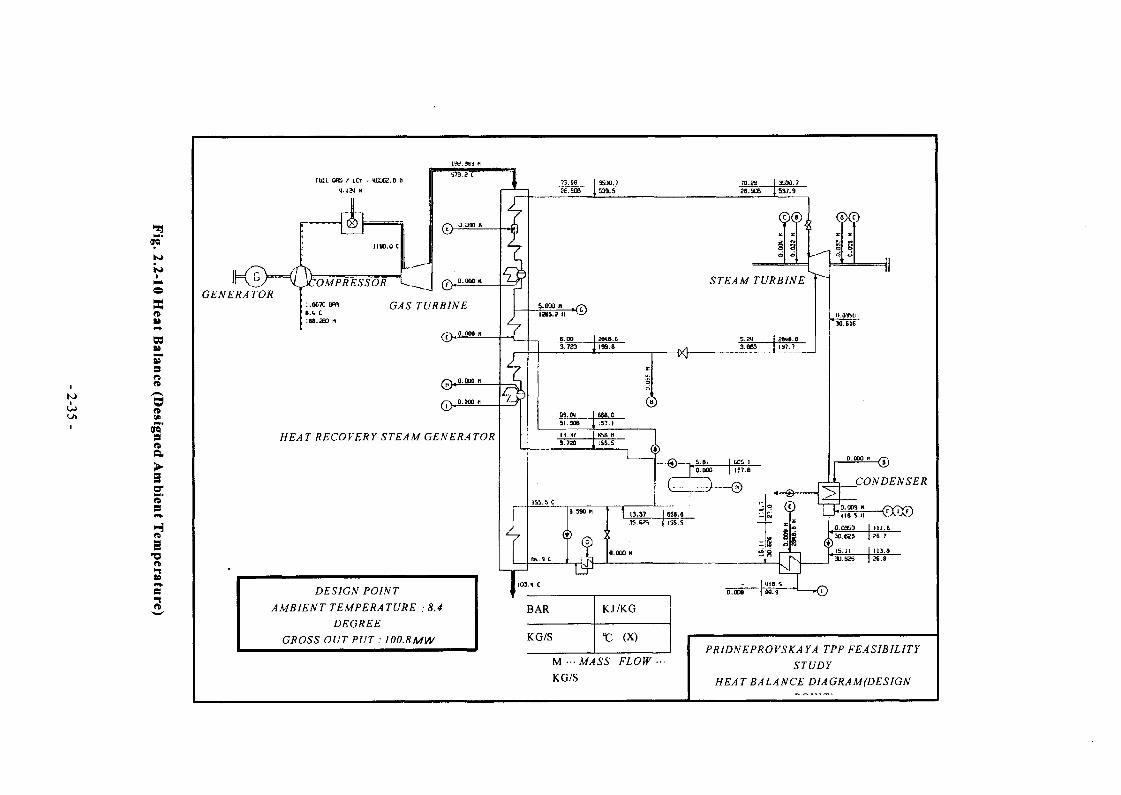
Fig. 2.2-10 Heat Balance (D
esigned Am
bient Temperature)
STEAM TURBINE•OMPRESSORGENERA TOR
GAS TURBINE
HE A T RECOVERY STEAM GENERA TOR
CONDENSER
DESIGN POINTAMBIENT TEMPERATURE 8.4
DEGREEGROSS OUT PUT : 100.8MW
KJ/KG
t (X)KG/SPRIDNEPROVSKAYA TPP FEASIBILITY
STUDYHEAT BALANCE DIAGRAM (DESIGN
M ... MASS FLOW KG/S
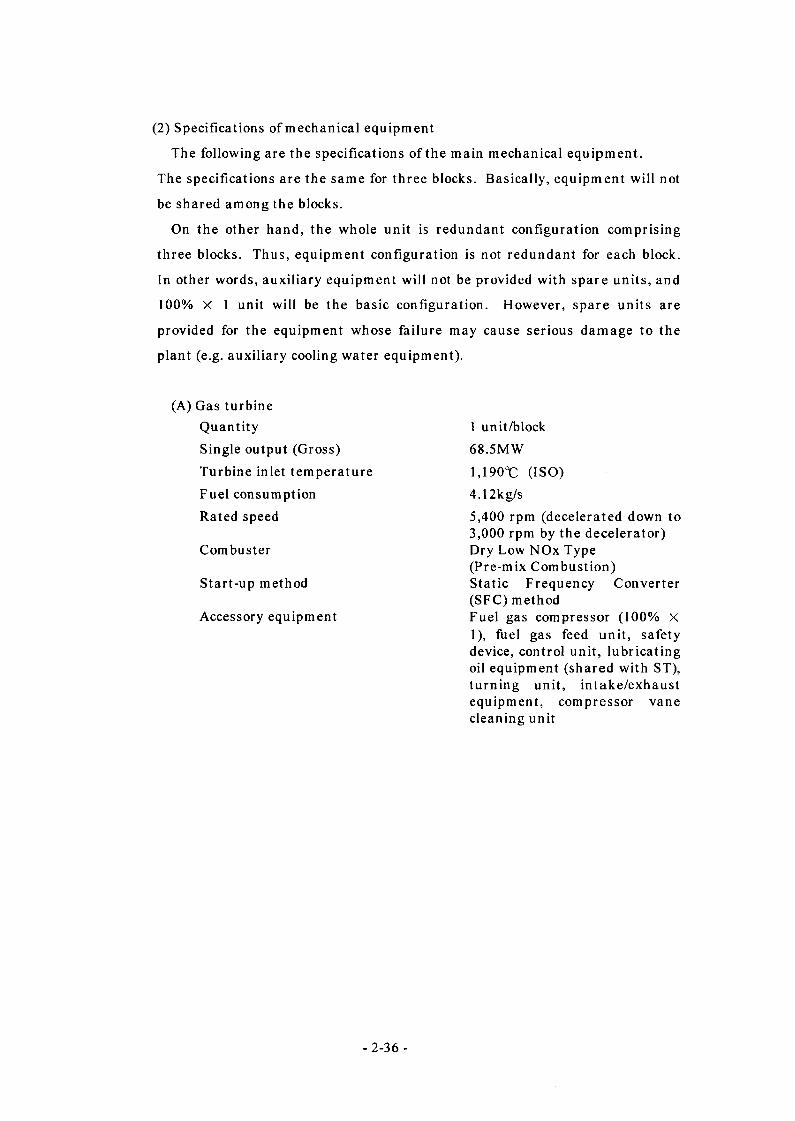
(2) Specifications of mechanical equipment
The following are the specifications of the main mechanical equipment.
The specifications are the same for three blocks. Basically, equipment will not
be shared among the blocks.
On the other hand, the whole unit is redundant configuration comprising
three blocks. Thus, equipment configuration is not redundant for each block.
In other words, auxiliary equipment will not be provided with spare units, and
100% X 1 unit will be the basic configuration. However, spare units are
provided for the equipment whose failure may cause serious damage to the
plant (e.g. auxiliary cooling water equipment).
(A) Gas turbine QuantitySingle output (Gross) Turbine inlet temperature Fuel consumption Rated speed
Combuster
Start-up method
Accessory equipment
1 unit/block 68.5MW
1,190°C (ISO)4.12kg/s5,400 rpm (decelerated down to 3,000 rpm by the decelerator) Dry Low NOx Type (Pre-mix Combustion)Static Frequency Converter (SFC) methodFuel gas compressor (100% X 1), fuel gas feed unit, safety device, control unit, lubricating oil equipment (shared with ST), turning unit, intake/exhaust equipment, compressor vane cleaning unit
- 2-36 -
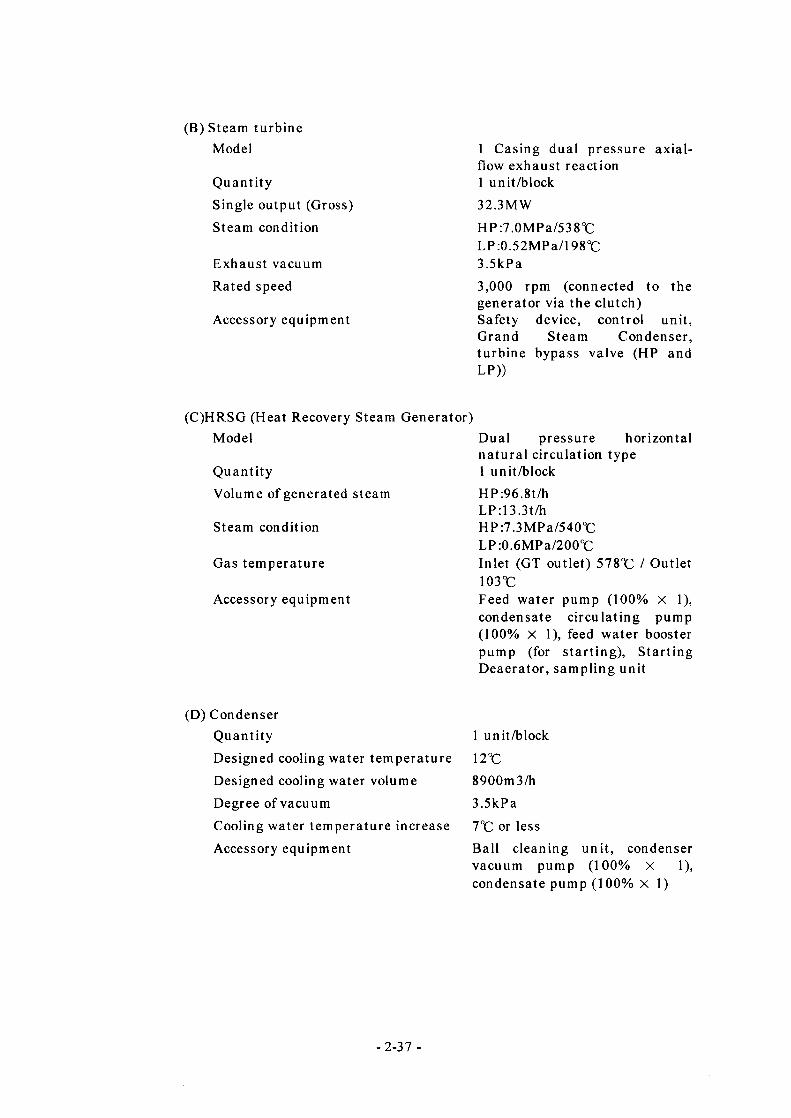
(B) Steam turbine Model
QuantitySingle output (Gross) Steam condition
Exhaust vacuum
1 Casing dual pressure axial- flow exhaust reaction 1 unit/block32.3MW
HP:7.0MPa/538°CLP:0.52MPa/198°C3.5kPa
Rated speed
Accessory equipment
3,000 rpm (connected to the generator via the clutch)Safety device, control unit, Grand Steam Condenser, turbine bypass valve (HP and LP))
(C)HRSG (Heat Recovery Steam Generator)Model
QuantityVolume of generated steam
Steam condition
Gas temperature
Accessory equipment
(D) Condenser QuantityDesigned cooling water temperature Designed cooling water volume Degree of vacuumCooling water temperature increase Accessory equipment
Dual pressure horizontal natural circulation type 1 unit/blockHP:96.8t/hLP:13.3t/hHP:7.3MPa/540°CLP:0.6MPa/200°CInlet (GT outlet) 578°C / Outlet103°CFeed water pump (100% X 1), condensate circulating pump (100% X 1), feed water booster pump (for starting), Starting Deaerator, sampling unit
1 unit/block
12°C8900m3/h 3.5kPa
7°C or lessBall cleaning unit, condenser vacuum pump (100% X 1), condensate pump (100% X 1)
- 2-37 -
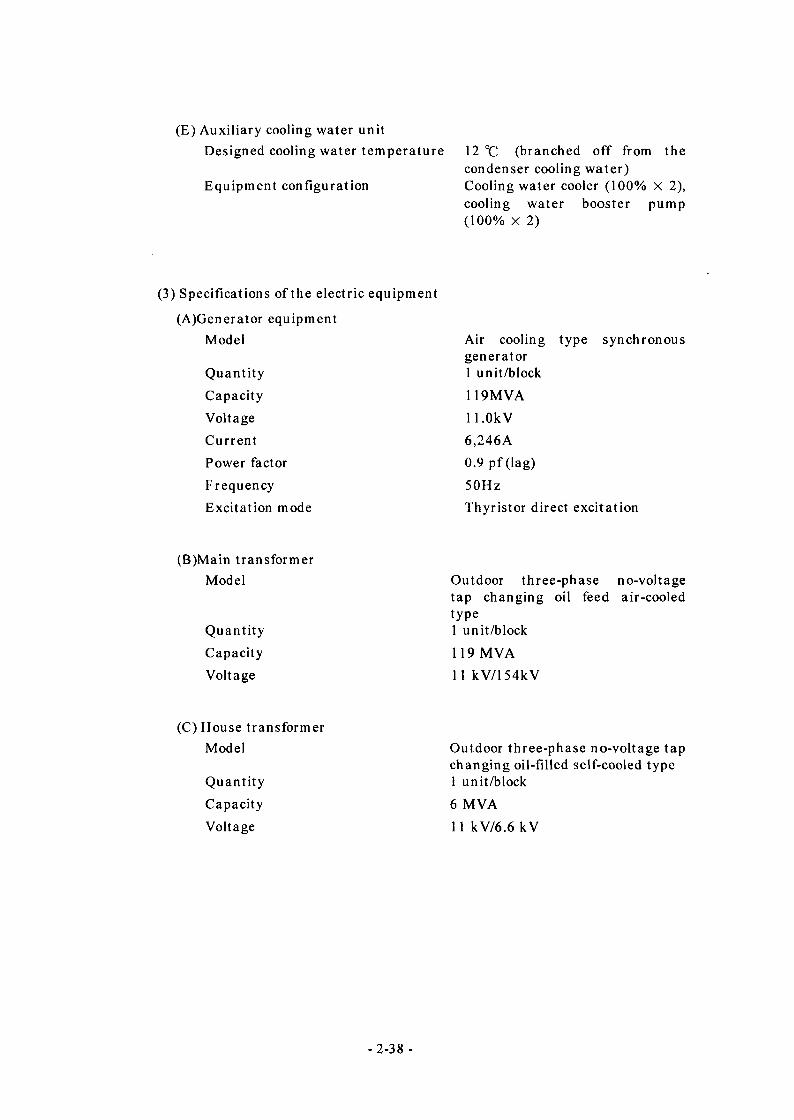
(E) Auxiliary cooling water unitDesigned cooling water temperature 12 °C (branched off from the
condenser cooling water)Equipment configuration Cooling water cooler (100% X 2),
cooling water booster pump (100% X 2)
(3) Specifications of the electric equipment
(A)Generator equipmentModel Air cooling type synchronous
QuantityCapacityVoltageCurrent
generator1 unit/block
119MVAll.OkV6,246A
Power factor 0.9 pf (lag)FrequencyExcitation mode
50HzThyristor direct excitation
(B)Main transformerModel Outdoor three-phase no-voltage
tap changing oil feed air-cooled
QuantityCapacityVoltage
typeI unit/block
119 MVAII kV/154kV
(C) House transformerModel Outdoor three-phase no-voltage tap
changing oil-filled self-cooled typeQuantityCapacityVoltage
I unit/block6 MVAII kV/6.6 kV
- 2-3 8 -
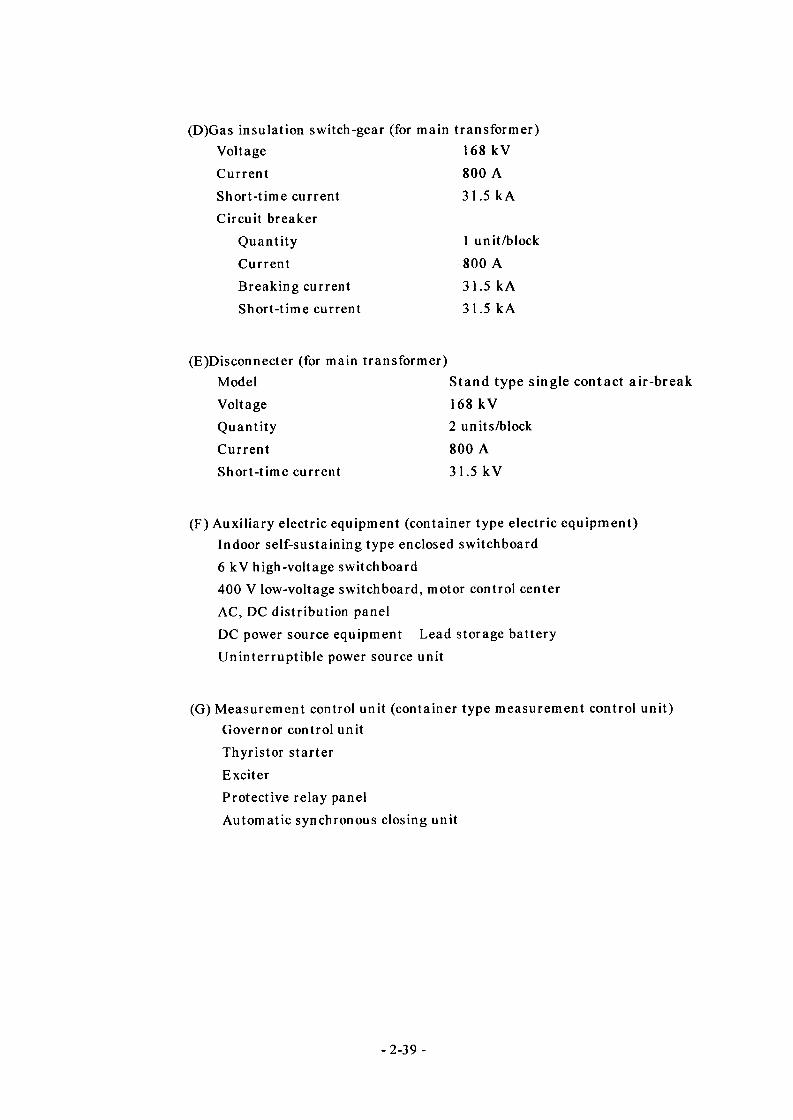
(D)Gas insulation switch-gear (for main transformer)Voltage 168 kVCurrent 800 AShort-time current 31.5 kACircuit breaker
Quantity 1 unit/block
Current 800 ABreaking current 31.5 kAShort-time current 31.5 kA
(E)Disconnecter (for main transformer) Model Voltage Quantity CurrentShort-time current
Stand type single contact air-break 168 kV 2 units/block
800 A 31.5 kV
(F) Auxiliary electric equipment (container type electric equipment) Indoor self-sustaining type enclosed switchboard 6 kV high-voltage switchboard400 V low-voltage switchboard, motor control center AC, DC distribution panelDC power source equipment Lead storage battery Uninterruptible power source unit
(G) Measurement control unit (container type measurement control unit) Governor control unit Thyristor starter ExciterProtective relay panel Automatic synchronous closing unit
- 2-39 -
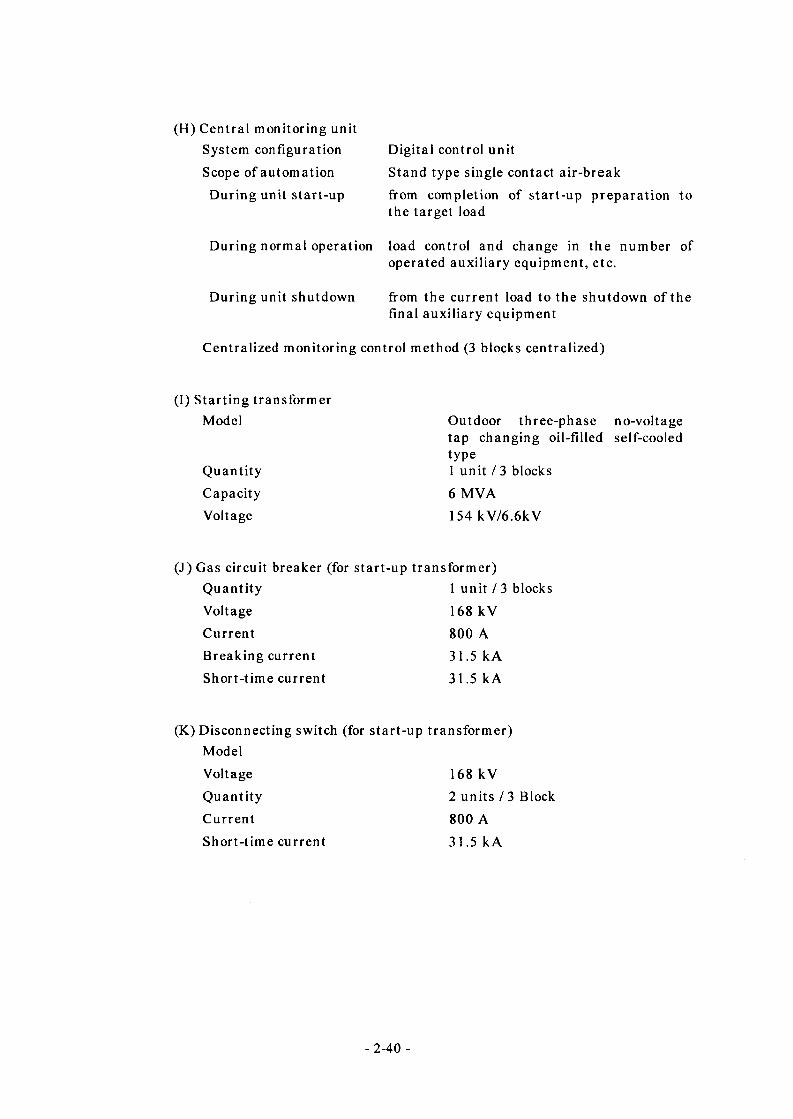
(H) Central monitoring unit System configurationScope of automation During unit start-up
Digital control unitStand type single contact air-breakfrom completion of start-up preparation to the target load
During normal operation load control and change in the number of operated auxiliary equipment, etc.
During unit shutdown from the current load to the shutdown of the final auxiliary equipment
Centralized monitoring control method (3 blocks centralized)
(I) Starting transformerModel Outdoor three-phase no-voltage
tap changing oil-filled self-cooled
QuantityCapacityVoltage
type1 unit / 3 blocks6 MVA154 kV/6.6kV
(J) Gas circuit breaker (for start-up transformer)Quantity 1 unit / 3 blocksVoltageCurrent
168 kV800 A
Breaking currentShort-time current
31.5 kA31.5 kA
(K) Disconnecting switch (for start-up transformer) ModelVoltageQuantityCurrent
168 kV2 units / 3 Block800 A
Short-time current 31.5 kA
- 2-40 -
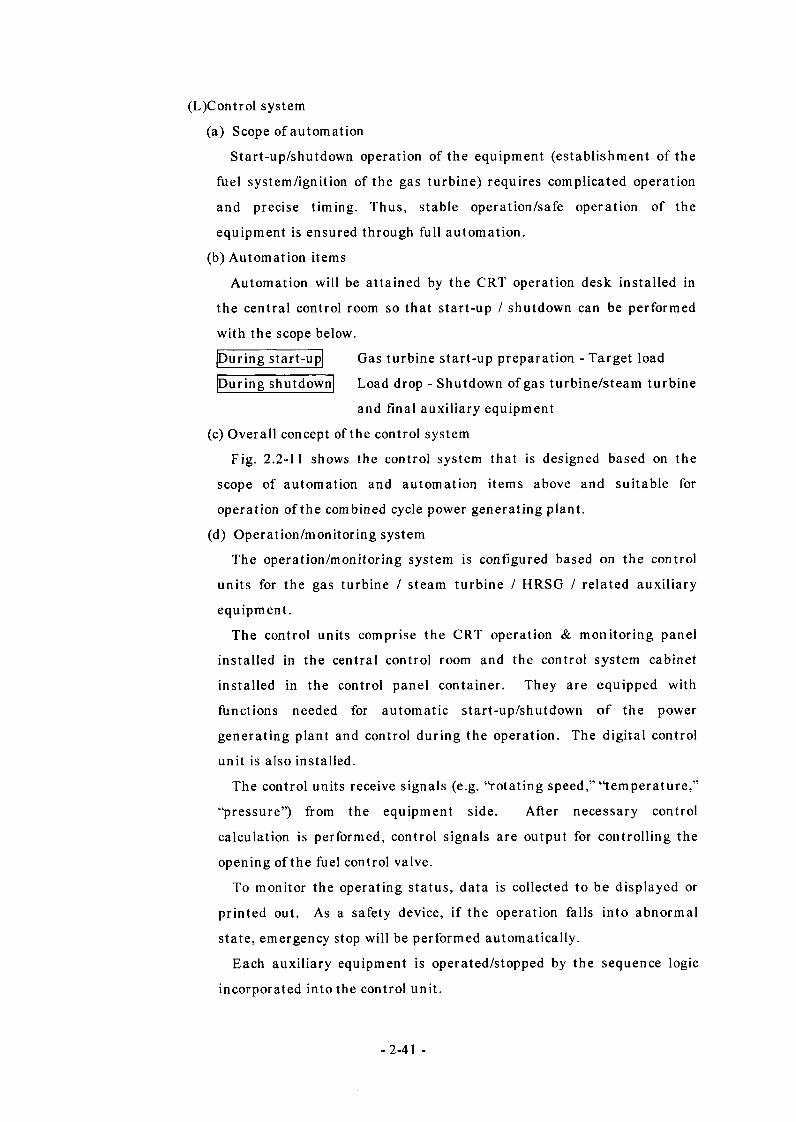
(L)Control system
(a) Scope of automation
Start-up/shutdown operation of the equipment (establishment of the
fuel system/ignition of the gas turbine) requires complicated operation
and precise timing. Thus, stable operation/safe operation of the
equipment is ensured through full automation.
(b) Automation items
Automation will be attained by the CRT operation desk installed in
the central control room so that start-up / shutdown can be performed
with the scope below.
Gas turbine start-up preparation - Target load
Load drop - Shutdown of gas turbine/steam turbine
and final auxiliary equipment
(c) Overall concept of the control system
Fig. 2.2-11 shows the control system that is designed based on the
scope of automation and automation items above and suitable for
operation of the combined cycle power generating plant.
(d) Operation/monitoring system
The operation/monitoring system is configured based on the control
units for the gas turbine / steam turbine / HRSG / related auxiliary
equipment.
The control units comprise the CRT operation & monitoring panel
installed in the central control room and the control system cabinet
installed in the control panel container. They are equipped with
functions needed for automatic start-up/shutdown of the power
generating plant and control during the operation. The digital control
unit is also installed.
The control units receive signals (e.g. “rotating speed,” “temperature,”
“pressure”) from the equipment side. After necessary control
calculation is performed, control signals are output for controlling the
opening of the fuel control valve.
To monitor the operating status, data is collected to be displayed or
printed out. As a safety device, if the operation falls into abnormal
state, emergency stop will be performed automatically.
Each auxiliary equipment is operated/stopped by the sequence logic
incorporated into the control unit.
During start-up
During shutdown
-2-41 -
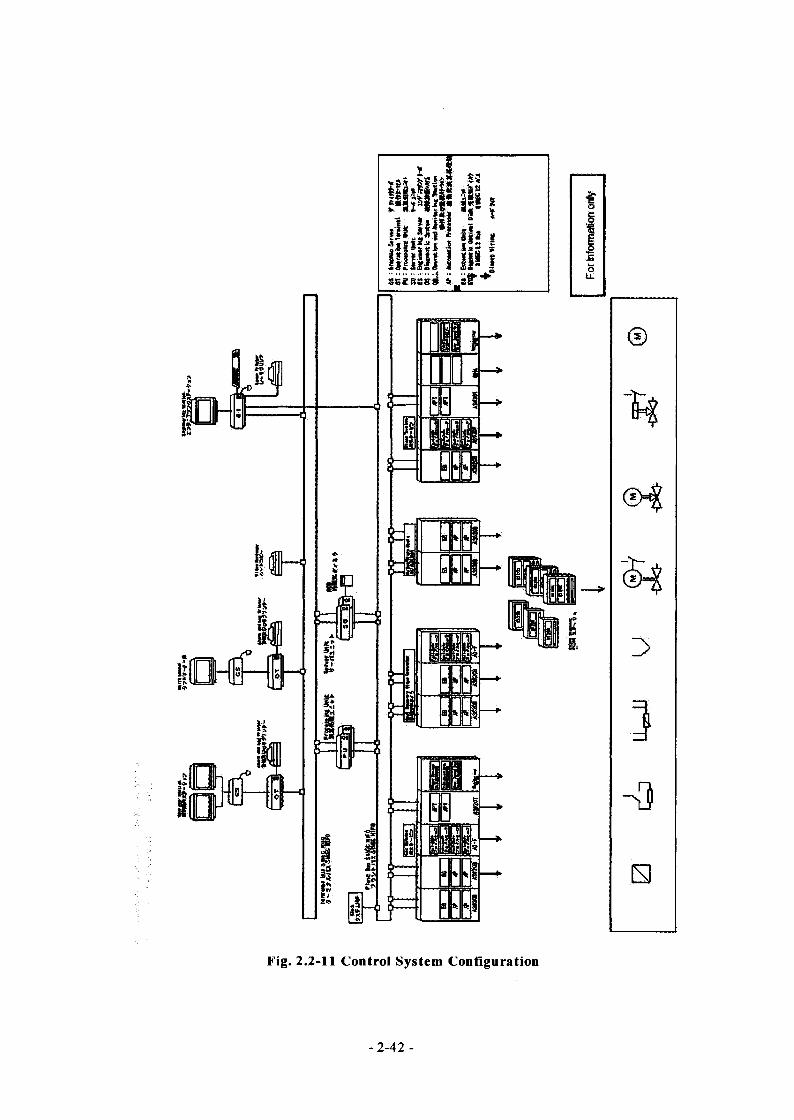
£ i jr
Fig. 2.2-11 Control System Configuration
- 2-42 -
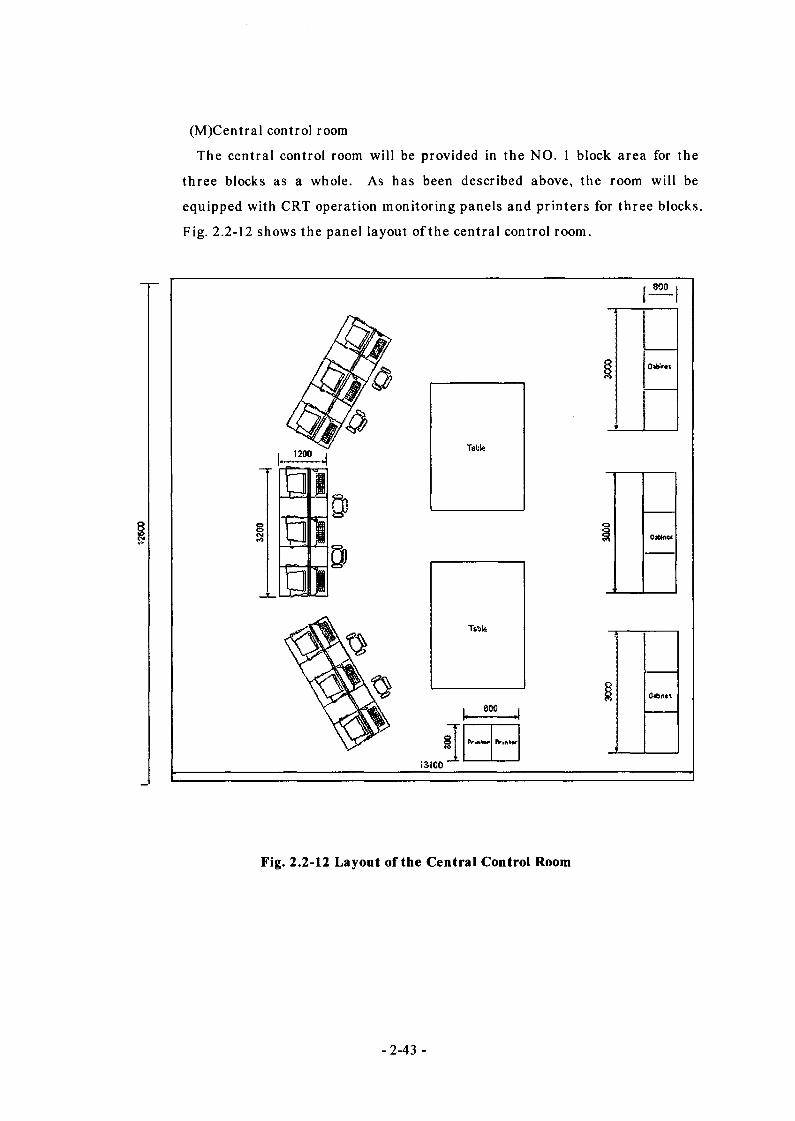
(M)Central control room
The central control room will be provided in the NO. 1 block area for the
three blocks as a whole. As has been described above, the room will be
equipped with CRT operation monitoring panels and printers for three blocks.
Fig. 2.2-12 shows the panel layout of the central control room.
Fig. 2.2-12 Layout of the Central Control Room
- 2-43 -
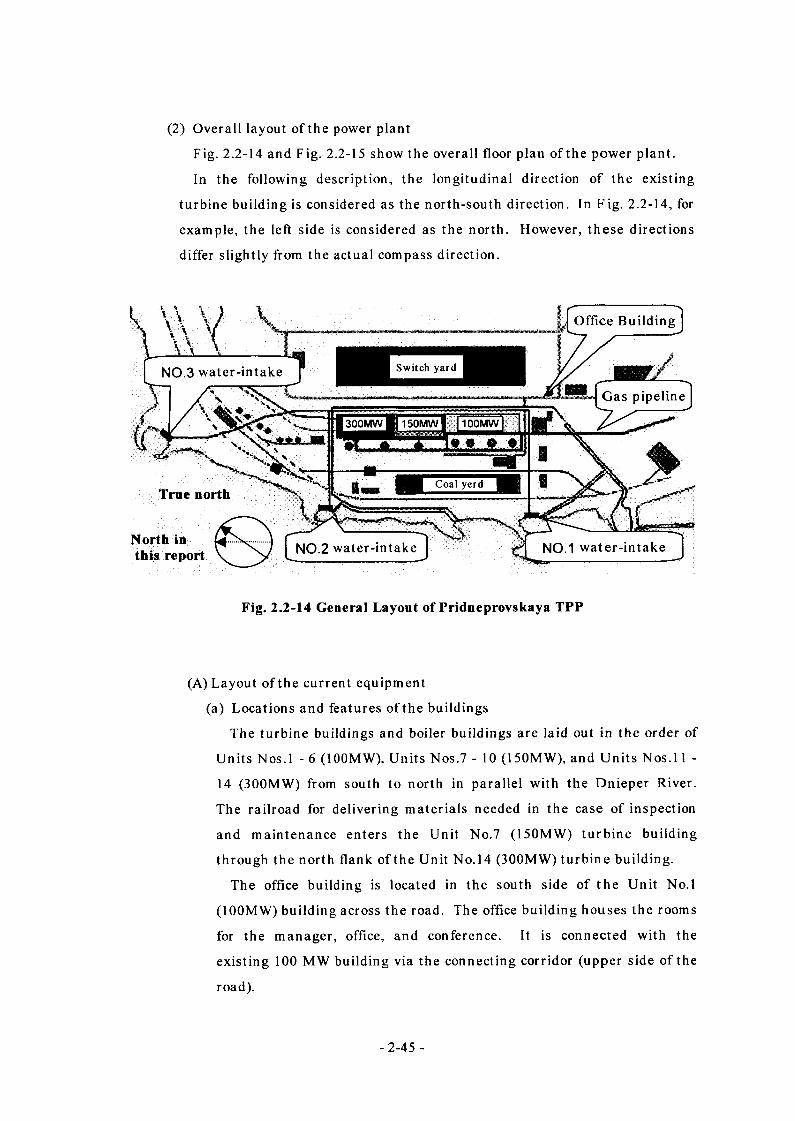
(2) Overall layout of the power plant
Fig. 2.2-14 and Fig. 2.2-15 show the overall floor plan of the power plant.
In the following description, the longitudinal direction of the existing
turbine building is considered as the north-south direction. In Fig. 2.2-14, for
example, the left side is considered as the north. However, these directions
differ slightly from the actual compass direction.
Fig. 2.2-14 General Layout of Pridneprovskaya TPP
(A) Layout of the current equipment
(a) Locations and features of the buildings
The turbine buildings and boiler buildings are laid out in the order of
Units Nos.l - 6 (100MW), Units Nos.7 - 10 (150MW), and Units Nos.l 1 -
14 (300MW) from south to north in parallel with the Dnieper River.
The railroad for delivering materials needed in the case of inspection
and maintenance enters the Unit No.7 (150MW) turbine building
through the north flank of the Unit No. 14 (300MW) turbine building.
The office building is located in the south side of the Unit No.l
(100MW) building across the road. The office building houses the rooms
for the manager, office, and conference. It is connected with the
existing 100 MW building via the connecting corridor (upper side of the
road).
- 2-45 -
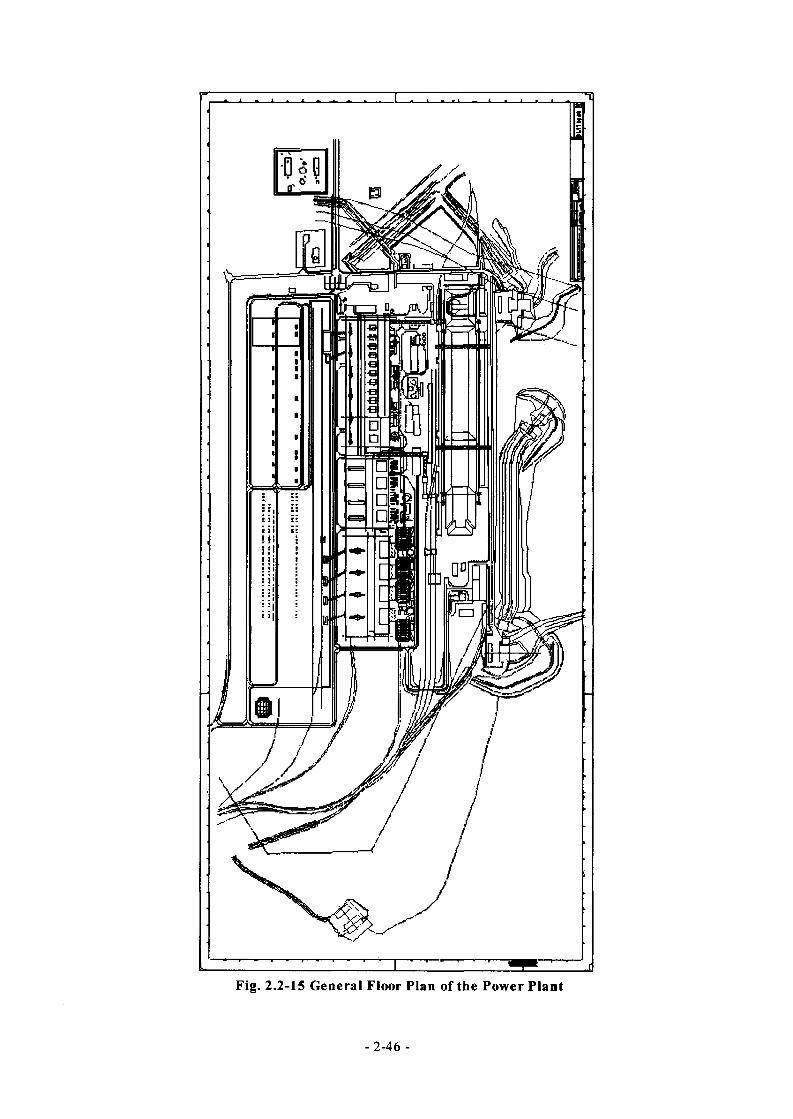
Fig. 2.2-15 General Floor Plan of the Power Plant
- 2-46 -
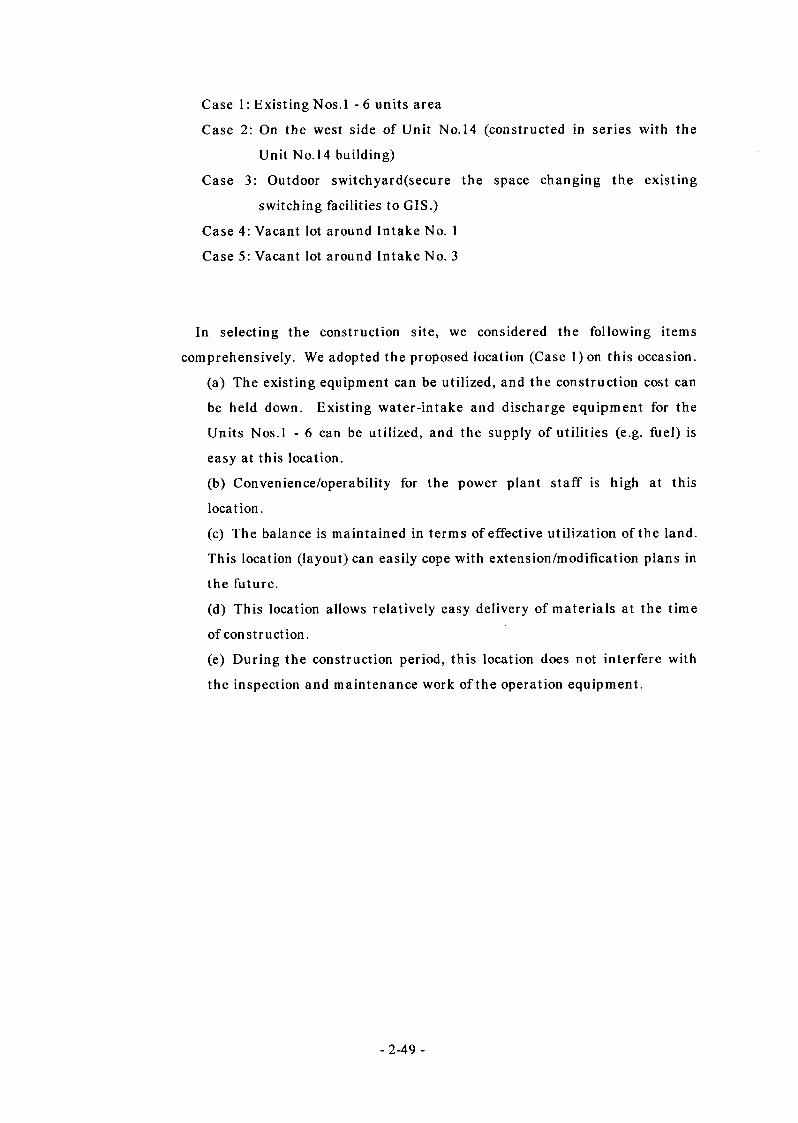
Case 1: Existing Nos.l - 6 units area
Case 2: On the west side of Unit No.14 (constructed in series with the
Unit No.14 building)
Case 3: Outdoor switchyard(secure the space changing the existing
switching facilities to GIS.)
Case 4: Vacant lot around Intake No. 1
Case 5: Vacant lot around Intake No. 3
In selecting the construction site, we considered the following items
comprehensively. We adopted the proposed location (Case 1) on this occasion.
(a) The existing equipment can be utilized, and the construction cost can
be held down. Existing water-intake and discharge equipment for the
Units Nos.l - 6 can be utilized, and the supply of utilities (e.g. fuel) is
easy at this location.
(b) Convenience/operability for the power plant staff is high at this
location.
(c) The balance is maintained in terms of effective utilization of the land.
This location (layout) can easily cope with extension/modification plans in
the future.
(d) This location allows relatively easy delivery of materials at the time
of construction.
(e) During the construction period, this location does not interfere with
the inspection and maintenance work of the operation equipment.
- 2-49 -
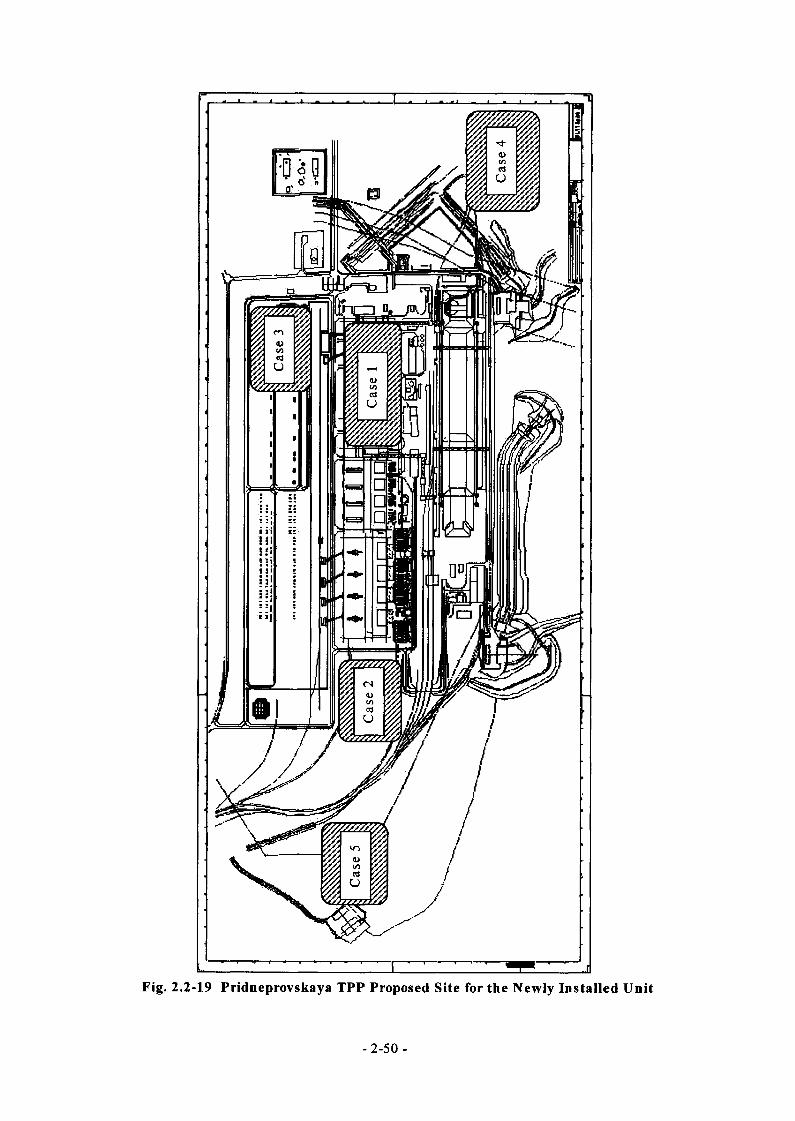
Fig. 2.2-19 Pridneprovskaya TPP Proposed Site for the Newly Installed Unit
- 2-50 -
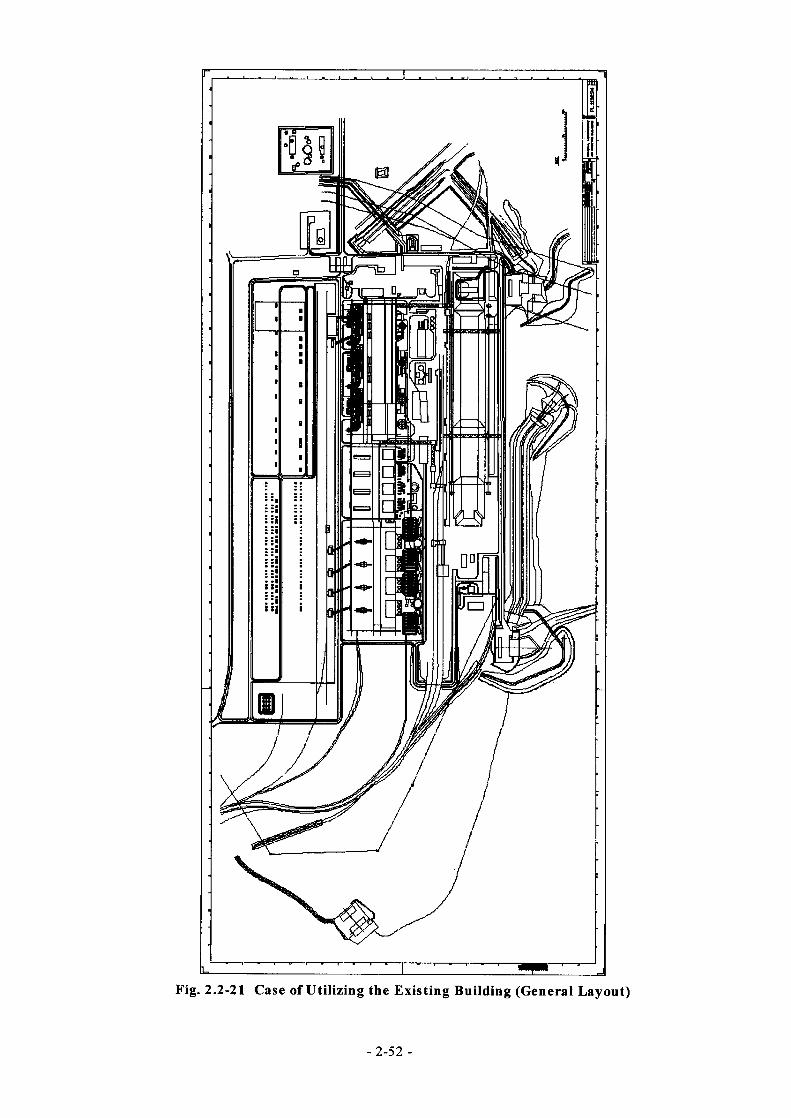
-2-52 -
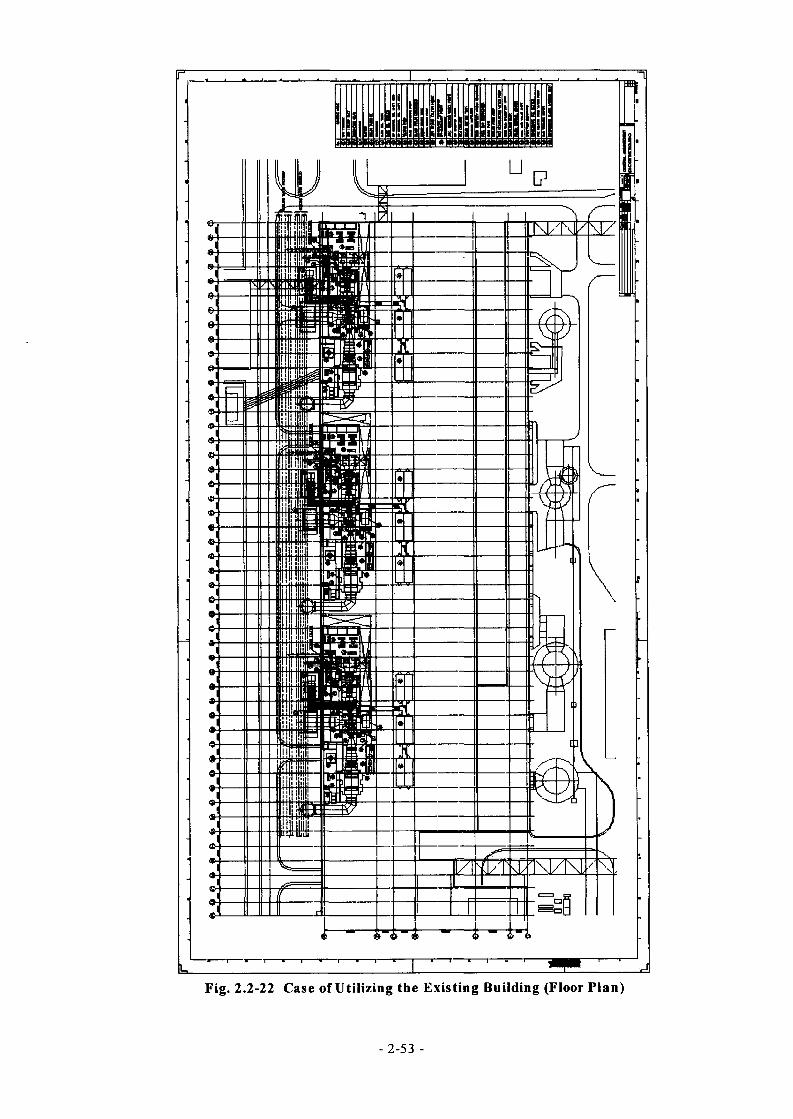
Fig. 2.2-22 Case of Utilizing the Existing Building (Floor Plan)
-2-53 -
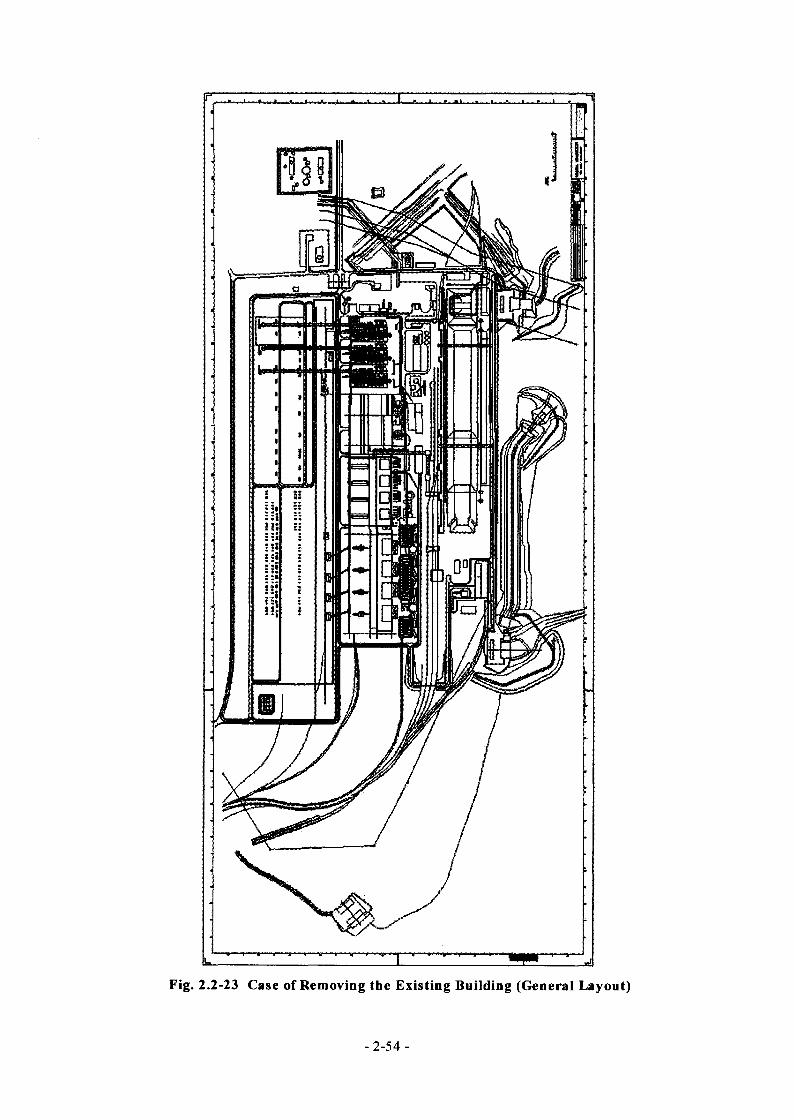
Fig. 2.2-23 Case of Removing the Existing Building (General Layout)
- 2-54 -
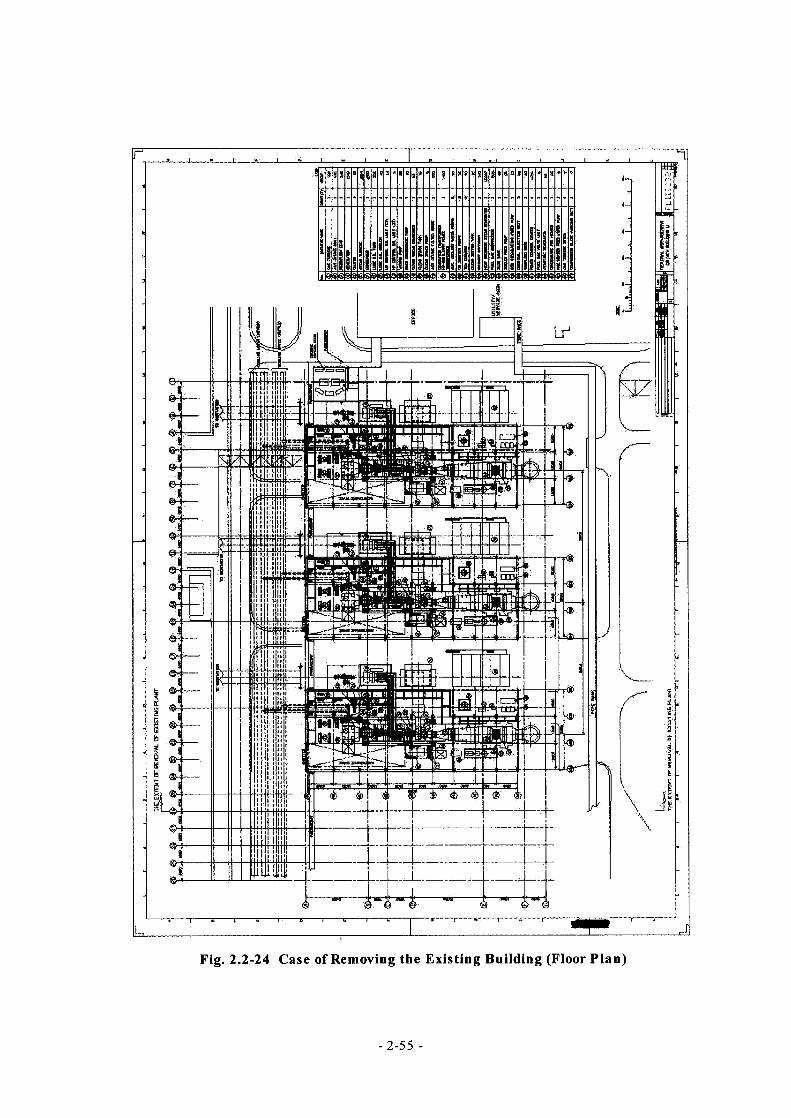
Fig. 2.2-24 Case of Removing the Existing Building (Floor Plan)
-2-55 -
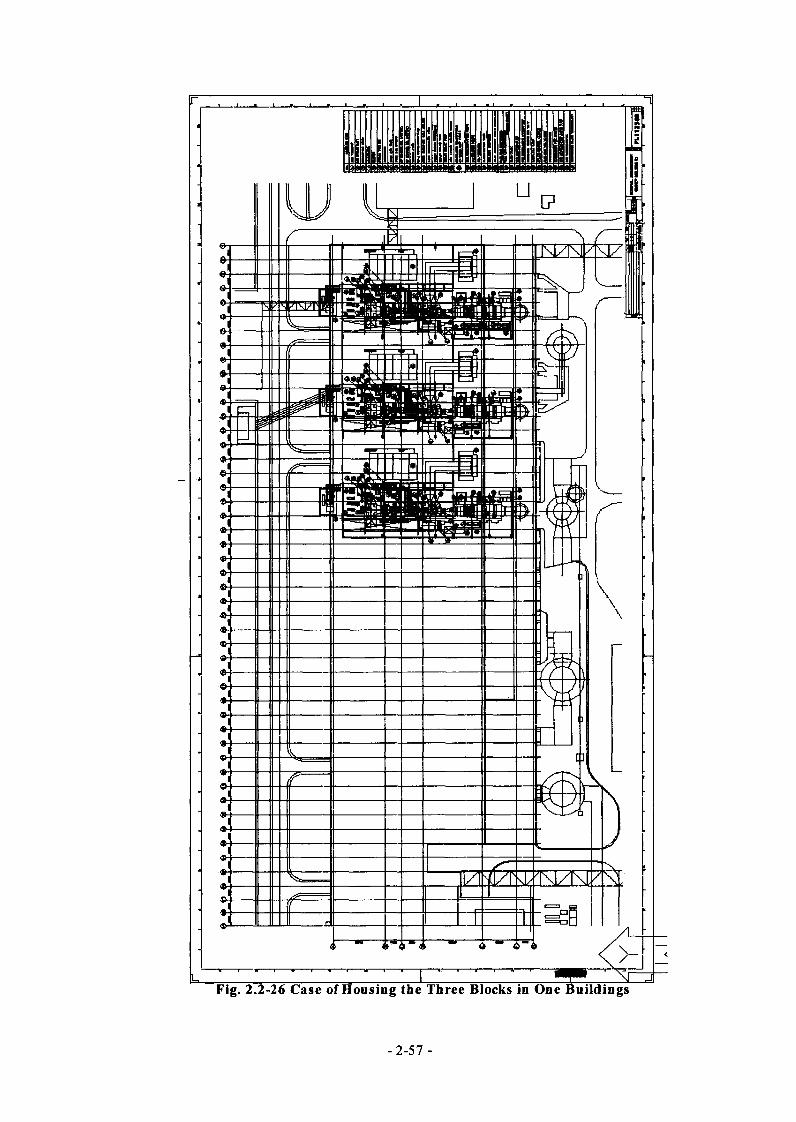
Fig. 2.2-26 Case of Housing the Three Blocks in One Buildings
-2-57 -
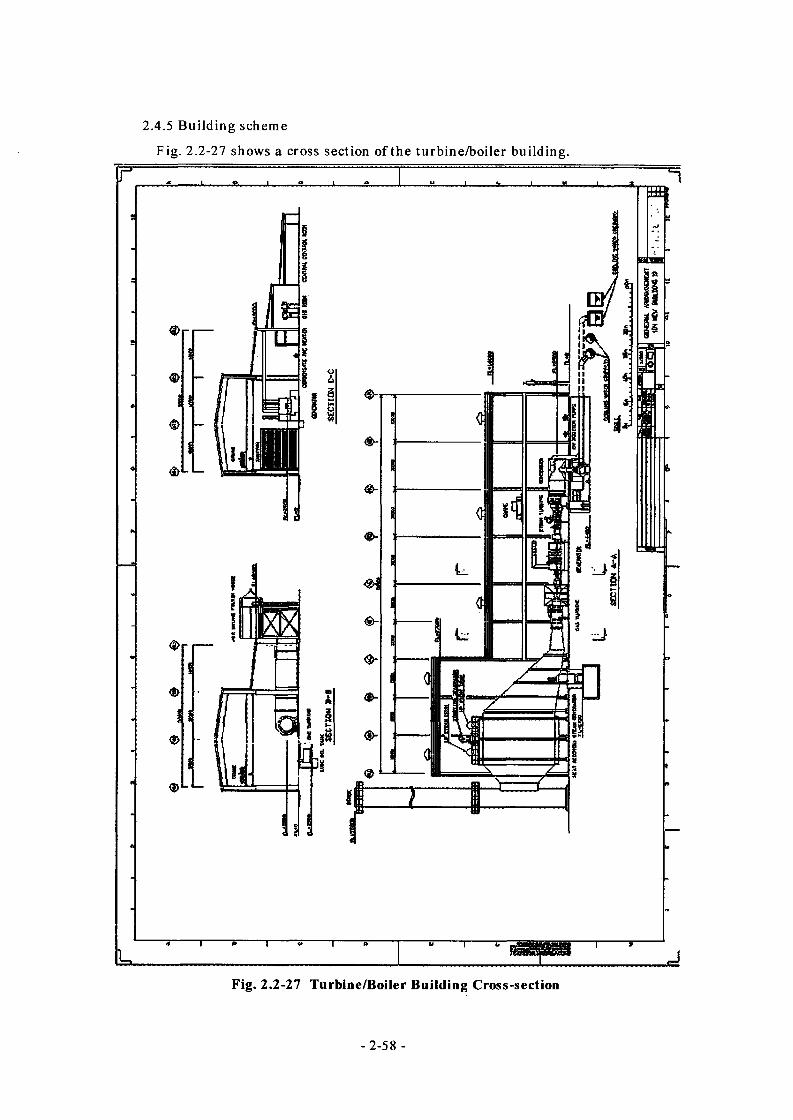
2.4.5 Building scheme
Fig. 2.2-27 shows a cross section of the turbine/boiler building.
<a>L
#1
e-
<t
<t
iv
'
Fig. 2.2-27 Turbine/Boiler Building Cross-section
- 2-58 -
(1) Basic policy
We devised the building scheme based on the results of the survey on
natural conditions in the outskirts of the City of Dnepropetrovsk, technical
conditions such as building materials/methods of construction, and
Pridneprovskaya TPP.
(2) Structural design
The mathematical expectation of an earthquake occurring in the City of
Dnepropetrovsk is extremely low. The city is not included in the subject areas
that require aseismatic design stipulated in SNIPII-7-81 “Construction of
Seismic Area.” For this reason, we will not take into consideration any
seismic force in structural design. (SNIP is the construction standard used in
the former Soviet Union.)
We will take into account the wind load of 0.038 tf/m2 and the snow load of
0.05 tf/m2 as stipulated in SNIP2.01.07-85 “Loads and Effects.” When the
shape factor of the building is taken into consideration, the designed load will
be 0.046 tf/m2 for the wind load and 0.050 tf/m2 for the snow load.
Spread foundation will be employed for the foundations of structures. The
soil freezing depth is GL-1.5 m. For this reason, we will employ GL-2 m as the
standard value for the bottom end level.
The structural type of the shed is steel-frame construction only. Reinforced
concrete construction is not advantageous in terms of the cost, because the
mold forms are expensive. In addition, construction work takes time. For
these reasons, reinforced concrete construction will not be employed except for
the foundations of the buildings.
(3) Equipment scheme
The central control room building will be equipped with the heating
equipment that utilizes warm water from the existing plant in an effort to
improve the operability/convenience for the operating personnel during winter.
In the summer, a separate air conditioner dedicated for cooling will be
provided.
At the turbine/HRSG building, ventilation because of buoyancy will be via
the ventilator installed on the rooftop. However, the amount of ventilation
will be restricted in the winter season. For this reason, the ventilator will be
equipped with a manual switching device. Regarding freeze proofing, heat
insulation will be provided to the piping.
-2-59 -

(4) Specifications of the newly installed building
(A) Turbine/HRSG buildingStructure: One-storied steel-frame constructionBuilding area: Maximum height:External wall:
2,460 m228 mWeatherproof folded plate
F oundations: Independent footing foundations (Bottom end GL-3 m)
Floor: Earth floor.Other notes: Natural lighting through the side multiple windows.
Ventilator provided on the rooftop.Crane: Turbine building 70 t hanging
Boiler building 15 t hanging.Large shutter: Delivery of materials and equipment in the case of
inspection/maintenanceAnnexed building: GIS housing building (one-storied steel-frame
construction).Power control center (Intense cold specifications container house)
(B) Central control room buildingStructure: One-storied steel-frame constructionBuilding area: Maximum height:External wall:
232 m2
4.5 mWeatherproof folded plate (with heat insulating material)
Foundations: Continuous footing (bottom end GL-2 m)Floor: Concrete slab placed on the heat insulating material.
The load will be transmitted to the continuous
Living space:footing.Control room, rest room for operators, bathroom, and shower room.Double sash and pair-glass will be used for weather protection.
- 2-60 -

(C) Utility pump buildingStructure: One-storied steel-frame construction
Building area: Maximum height:External wall:
220 m24.5 mWeatherproof folded plate (with heat insulating material)
Foundations: Continuous footing (bottom end GL-2 m)Floor: Earth floor.
The load will be transmitted to the continuous footing.
(D) PassagewayStructure: One-storied steel-frame constructionMaximum height:External wall:
3.0 mWeatherproof folded plate (with heat insulating material)
F oundations: Independent footing foundation (bottom end GL-2 m)Floor: Earth floor.
(E)F oundationsStructure: Reinforced concrete constructionForm: mat foundation (bottom end GL-2 m)
-2-61 -
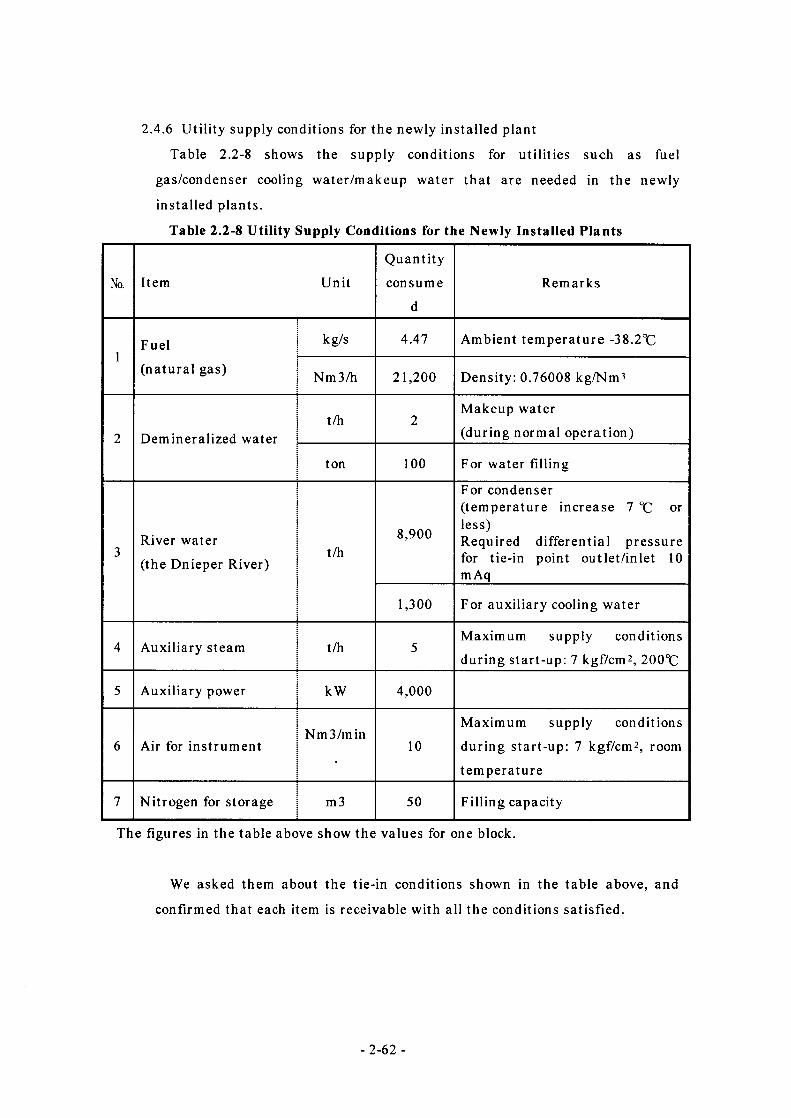
2.4.6 Utility supply conditions for the newly installed plant
Table 2.2-8 shows the supply conditions for utilities such as fuel
gas/condenser cooling water/makeup water that are needed in the newly
installed plants.
Table 2.2-8 Utility Supply Conditions for the Newly Installed Plants
No. Item Unit
Quantity
consume
d
Remarks
1Fuel
(natural gas)
kg/s 4.47 Ambient temperature -38.2°C
Nm3/h 21,200 Density: 0.76008 kg/Nm3
2 Demineralized watert/h 2
Makeup water
(during normal operation)
ton 100 For water filling
3River water
(the Dnieper River)t/h
8,900
For condenser(temperature increase 7 °C or less)Required differential pressure for tie-in point outlet/inlet 10 mAq
1,300 For auxiliary cooling water
4 Auxiliary steam t/h 5Maximum supply conditions
during start-up: 7 kgf/cm2, 200°C
5 Auxiliary power kW 4,000
6 Air for instrumentNm3/min
10
Maximum supply conditions
during start-up: 7 kgf/cm2, room
temperature
7 Nitrogen for storage m3 50 Filling capacity
The figures in the table above show the values for one block.
We asked them about the tie-in conditions shown in the table above, and
confirmed that each item is receivable with all the conditions satisfied.
- 2-62 -
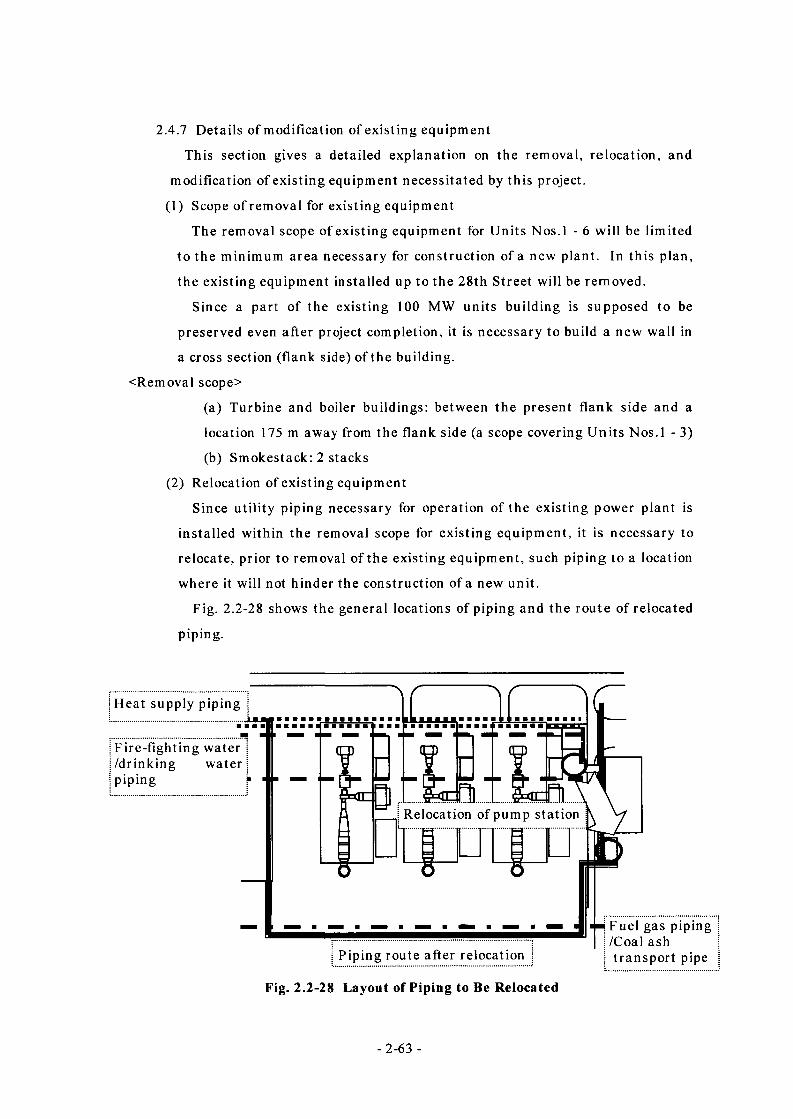
2.4.7 Details of modification of existing equipment
This section gives a detailed explanation on the removal, relocation, and
modification of existing equipment necessitated by this project.
(1) Scope of removal for existing equipment
The removal scope of existing equipment for Units Nos.l - 6 will be limited
to the minimum area necessary for construction of a new plant. In this plan,
the existing equipment installed up to the 28th Street will be removed.
Since a part of the existing 100 MW units building is supposed to be
preserved even after project completion, it is necessary to build a new wall in
a cross section (flank side) of the building.
<Removal scope>
(a) Turbine and boiler buildings: between the present flank side and a
location 175 m away from the flank side (a scope covering Units Nos.l - 3)
(b) Smokestack: 2 stacks
(2) Relocation of existing equipment
Since utility piping necessary for operation of the existing power plant is
installed within the removal scope for existing equipment, it is necessary to
relocate, prior to removal of the existing equipment, such piping to a location
where it will not hinder the construction of a new unit.
Fig. 2.2-28 shows the general locations of piping and the route of relocated
piping.
Heat supply piping
Fire-fighting water /drinking water piping
Relocation of pump station
Fuel gas piping /Coal ash transport pipePiping route after relocation
Fig. 2.2-28 Layout of Piping to Be Relocated
-2-63 -

Details of equipment that should be relocated are given below.
(a) Fuel gas piping
Fuel gas piping starts from a fuel gas flow meter room, goes through
the west side of the office building and the vicinity of the smokestacks
for Units Nos.l - 6, and to Units Nos.7 - 14.
Prior to the removal of the existing buildings, a new piping rack will
be installed to create a detour to avoid the construction area. The
piping will then be relocated.
Since fuel gas piping consists of two systems, construction works can
be carried out without affecting the operation of the existing unit by
relocating one system at one time.
(b) Coal ash transport pipe
Coal ash transport pipe is installed in the same piping rack as the
fuel gas piping. Therefore, it is necessary to relocate coal ash pipe prior
to the removal of the existing buildings, as in the case for fuel gas
piping.
Similarly, since coal ash piping also consists of two systems,
construction works can be carried out without affecting the operation of
the existing unit.
(c) Fire-fighting water pump/drinking water pump station
A pump station is installed in the south end inside the existing 100
MW unit building.
Prior to the removal of the existing building, a utility pump building
is installed in the western side of an office building, and the pump
station is relocated in this room.
(d) Fire-fighting water/drinking water piping
Fire-fighting water and drinking water piping for the buildings of the
entire existing power plant is laid along the inner side of the external
walls of the 100 MW unit building, as if encompassing it.
Prior to the removal of the existing building, the piping will be
relocated onto the same piping rack as fuel gas piping.
(e) Heat supply piping
Heat supply piping for the office building and surrounding buildings,
which is from Unit No.7, is laid along the outer and inner sides of the
east-side external walls of Units Nos.l - 6 building.
- 2-64 -
2.4.8 Procurement of labor and materials / equipment and transportation route
(1) Procurement of labor
For implementation of construction works, an organization consisting of an
engineer from the owner side, a consultant from Japan or other foreign
country, and a local construction company may be established.
If the owner-side engineer is selected from the employees working in
Pridneprovskaya TPP, a chief engineer or sub-chief engineer will be suitable
for the job. Since such a position is supposed to be assigned to a worker who
has engaged in all types of jobs, including mechanical, electrical, and civil
engineering and construction works, a chief engineer or sub-chief engineer is
considered to have sufficient competence to administer and manage the entire
construction work.
In Dnepropetrovsk City, there are a number of construction companies,
some of which engaged in construction of existing power plants. A
construction company in Kiev has recently constructed a thermal power plant.
An interview survey of construction companies in Dnepropetrovsk City
found that it is possible to procure most of the necessary mechanics,
electricians, and civil engineering and construction workers from the city or
the area adjacent to the power plant.
(2) Procurement of materials and machinery
As a center of steel and other manufacturing industries in Ukraine,
Dnepropetrovsk Province is conveniently located for the procurement of
materials and machinery.
According to the results of the interview survey of local construction
companies, it is possible to procure most of the materials subject to local
procurement for mechanical and electric equipment works—namely, piping
and electric cables. Since only ordinary materials will be used for civil
engineering and construction works, all such materials can be procured within
Ukraine.
As for construction machinery, although some construction companies have
limited types of such machinery, basic heavy machines are available partly
through a leasing company. Regarding special heavy machines, however,
further investigation is required.
(3) Procurement of equipment / facilities
The purpose of the project is to construct a power plant with high power
- 2-66 -
generating efficiency. In light of this, it is necessary to adopt high-quality
equipment produced under strict quality control for the main power
generating equipment that will significantly affect power generating efficiency,
such as a gas turbine and generator. Such equipment should ideally be
procured from foreign manufacturers who have extensive experience of
undertaking construction works in regions with low winter temperatures.
(4) Transportation route
Large equipment (such as gas turbine and generator) will be shipped by
water from a manufacturing country to the coast of the Black Sea, and after
unloading, transported by rail to the power plant.
Water-borne transport from the Black Sea to Dnepropetrovsk City is not
feasible, since there is a dam on the way and there is no large-scale unloading
facility in the city. At the time of construction of the existing Pridneprovskaya
TPP, the materials, including those procured locally , were transported 50% by
rail, 30% by truck, and 20% by water or air.
transportation limitation>Truck transportation : Height limit: 4.5 m (50 t maximum)
It is necessary to obtain permission to use respective roads.Permission is not required for vehicles of 36 t or less.
Rail transportation : Height limit: 4.8 to 5 m above rail surfaceLoad limit for a general freight car: 60 t Transportation of heavier loads is allowed, if a special freight car is used.
2.4.9 Construction method and process
(1) Construction method
(A) Removal of existing 100 MW unit
Prior to the construction of new units, the structures (including the
foundation) of the existing 100 MW unit will be removed.
Under this project, the removal scope covers up to the 28th Street (around
the former Unit No. 4), as an area where three new units can be constructed.
The structures outside the scope will remain as they are, and walls will be
built for them.
- 2-67 -
The removal scope of existing foundations will be limited to an area where
such structures would not hinder the construction of new units. The
remaining foundations will remain as they are.
Prior to the removal of the existing unit, utility equipment for the entire
power plant (fuel gas piping, fire-fighting water piping, general service water
piping, drinking water piping, heat supply piping, etc.) will be relocated.
(B) Construction of three 100 MW unit blocks
After removal of the existing 100 MW unit, three blocks of new 100 MW
units will be constructed.
The construction period of each block is assumed to be one year, taking into
consideration the arrangement of construction machinery and the availability
of construction workers.
Details of the construction process and the conceptual diagram of the
construction method are provided later.
(C) Delivery road
Heavy equipment will be transported by rail on to the premises of the
power plant. After transferring to a trailer, the freight will be transported to
the construction area.
As a transportation route on the premises, the main road between the power
plant turbine building and outdoor switchyard will be used. Gas turbine,
steam turbine, and accessory equipment will be installed through the hatch of
a newly constructed building using the overhead traveling crane of the
building. Heavy equipment related to HRSG will be transported on the
delivery road to the HRSG area, and installed using a mobile crane. A
generator stator, which cannot be lifted using a overhead traveling crane, will
be installed using rollers.
The largest equipment both in size and weight in this project is the
generator stator, which has a height of approximately 4 m (when the
generator stator is loaded on a low body trailer) and weighs approximately 90
tons.
At such a height, there will be no clearance against overhead lines running
between Units Nos.7 - 10 and the outdoor switchyard. To cope with the weight,
protective measures will be required for condenser cooling water pipes,
discharge culvert, and other underground facilities.
These matters will be studied further in the stage of detailed design after
finalization of the proposed project.
-2-68 -
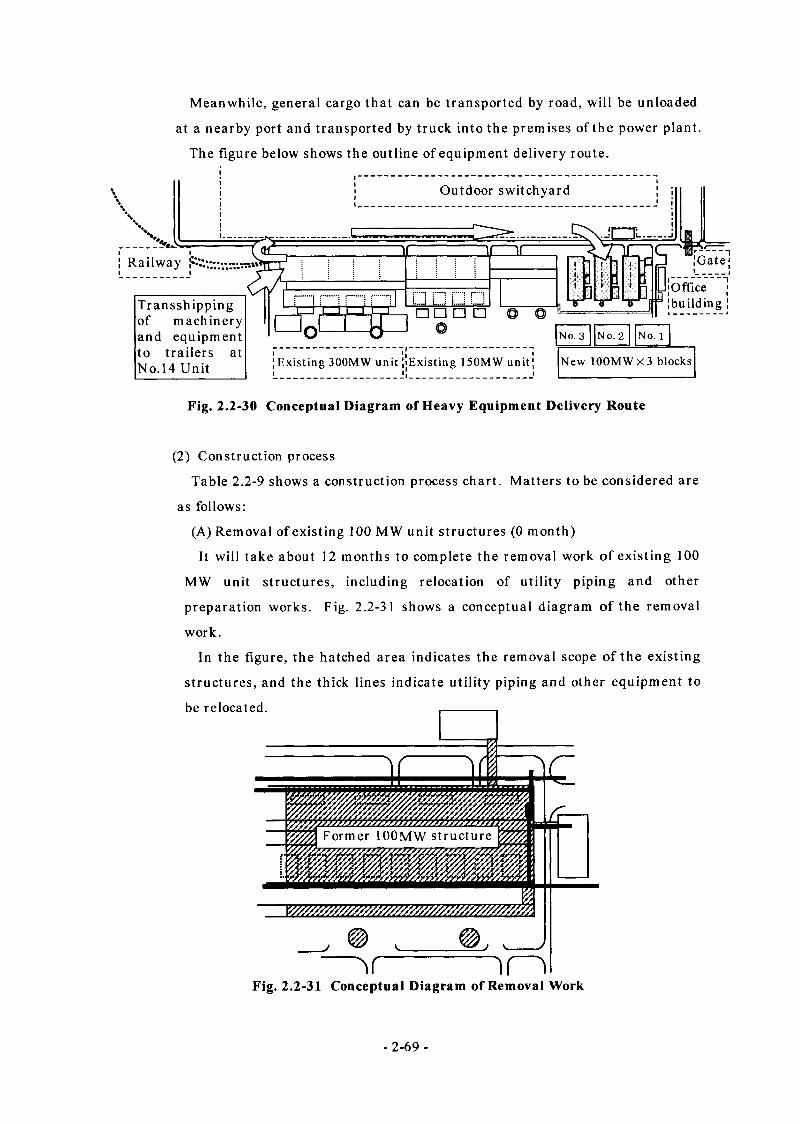
Meanwhile, general cargo that can be transported by road, will be unloaded
at a nearby port and transported by truck into the premises of the power plant.
The figure below shows the outline of equipment delivery route.
Outdoor switchyard
Gate;Railway
[Office[buildingTransshipping
of machinery and equipment to trailers at No. 14 Unit
□ □ □ □
New 100MWX3 blocksExisting 300MW unit ['Existing 150MW unit
Fig. 2.2-30 Conceptual Diagram of Heavy Equipment Delivery Route
(2) Construction process
Table 2.2-9 shows a construction process chart. Matters to be considered are
as follows:
(A) Removal of existing 100 MW unit structures (0 month)
It will take about 12 months to complete the removal work of existing 100
MW unit structures, including relocation of utility piping and other
preparation works. Fig. 2.2-31 shows a conceptual diagram of the removal
work.
In the figure, the hatched area indicates the removal scope of the existing
structures, and the thick lines indicate utility piping and other equipment to
be relocated. ------------,
"N---------------------- \r~s\Fig. 2.2-31 Conceptual Diagram of Removal Work
- 2-69 -
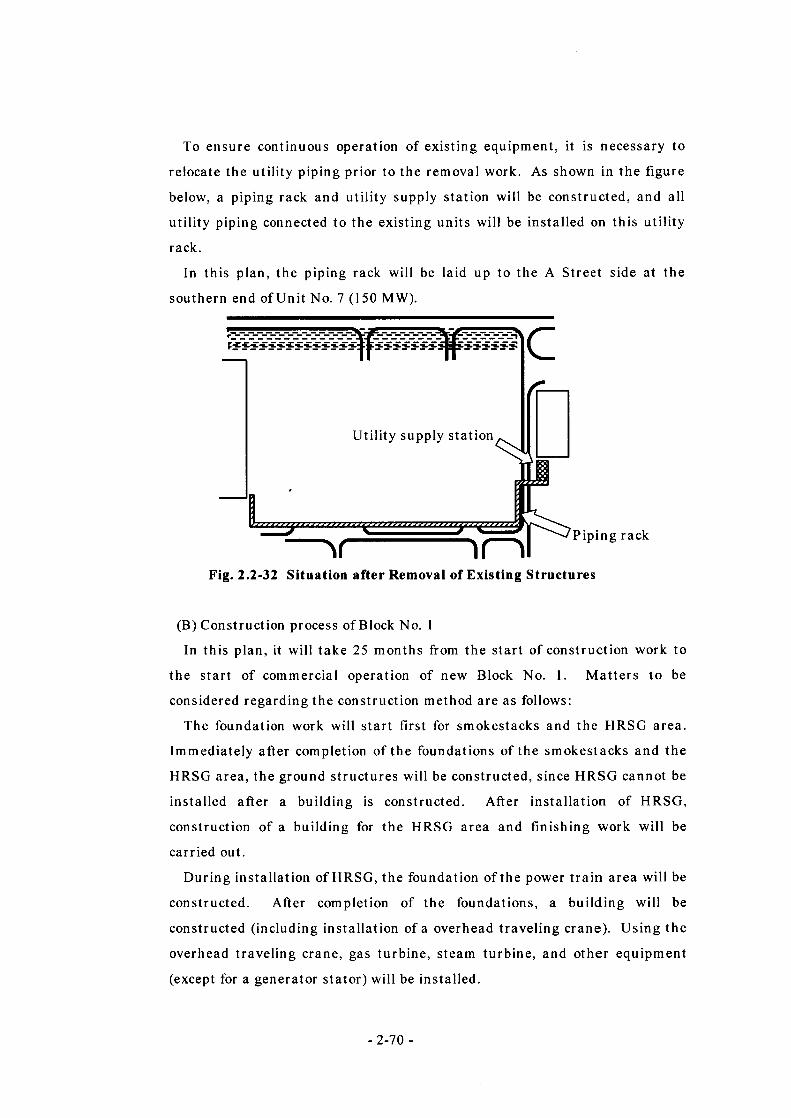
To ensure continuous operation of existing equipment, it is necessary to
relocate the utility piping prior to the removal work. As shown in the figure
below, a piping rack and utility supply station will be constructed, and all
utility piping connected to the existing units will be installed on this utility
rack.
In this plan, the piping rack will be laid up to the A Street side at the
southern end of Unit No. 7 (150 MW).
Utility supply station
Piping rack
Fig. 2.2-32 Situation after Removal of Existing Structures
(B) Construction process of Block No. 1
In this plan, it will take 25 months from the start of construction work to
the start of commercial operation of new Block No. 1. Matters to be
considered regarding the construction method are as follows:
The foundation work will start first for smokestacks and the HRSG area.
Immediately after completion of the foundations of the smokestacks and the
HRSG area, the ground structures will be constructed, since HRSG cannot be
installed after a building is constructed. After installation of HRSG,
construction of a building for the HRSG area and finishing work will be
carried out.
During installation of HRSG, the foundation of the power train area will be
constructed. After completion of the foundations, a building will be
constructed (including installation of a overhead traveling crane). Using the
overhead traveling crane, gas turbine, steam turbine, and other equipment
(except for a generator stator) will be installed.
- 2-70 -
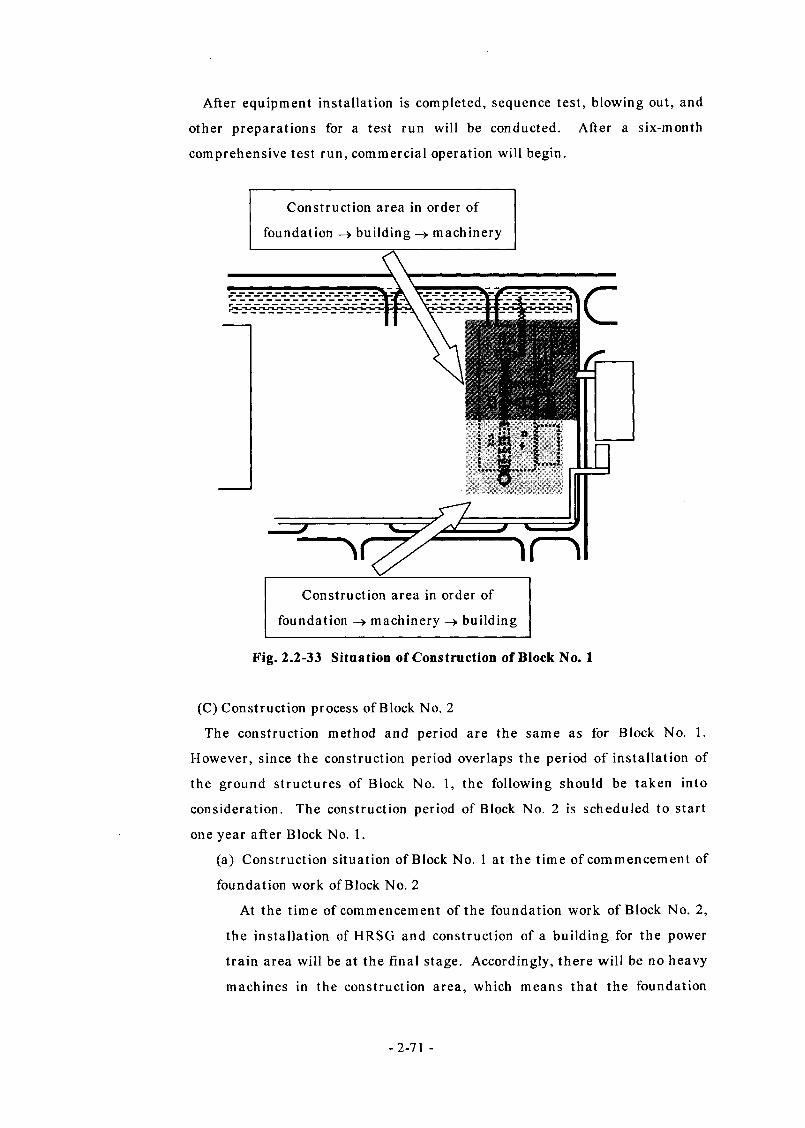
After equipment installation is completed, sequence test, blowing out, and
other preparations for a test run will be conducted. After a six-month
comprehensive test run, commercial operation will begin.
Construction area in order of
foundation -> building —» machinery
Construction area in order of
foundation -> machinery -> building
Fig. 2.2-33 Situation of Construction of Block No. 1
(C) Construction process of Block No. 2
The construction method and period are the same as for Block No. 1.
However, since the construction period overlaps the period of installation of
the ground structures of Block No. 1, the following should be taken into
consideration. The construction period of Block No. 2 is scheduled to start
one year after Block No. 1.
(a) Construction situation of Block No. 1 at the time of commencement of
foundation work of Block No. 2
At the time of commencement of the foundation work of Block No. 2,
the installation of HRSG and construction of a building for the power
train area will be at the final stage. Accordingly, there will be no heavy
machines in the construction area, which means that the foundation
-2-71 -
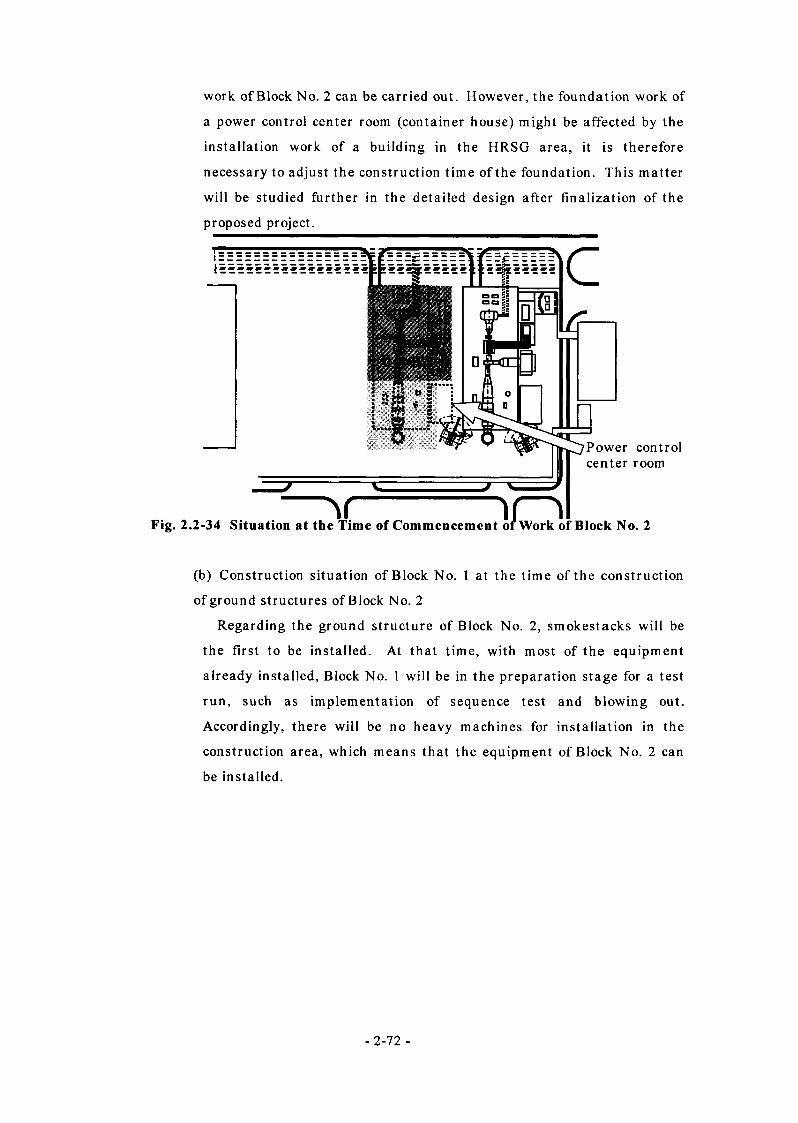
work of Block No. 2 can be carried out. However, the foundation work of
a power control center room (container house) might be affected by the
installation work of a building in the HRSG area, it is therefore
necessary to adjust the construction time of the foundation. This matter
will be studied further in the detailed design after finalization of the
proposed project.
(b) Construction situation of Block No. 1 at the time of the construction
of ground structures of Block No. 2
Regarding the ground structure of Block No. 2, smokestacks will be
the first to be installed. At that time, with most of the equipment
already installed, Block No. 1 will be in the preparation stage for a test
run, such as implementation of sequence test and blowing out.
Accordingly, there will be no heavy machines for installation in the
construction area, which means that the equipment of Block No. 2 can
be installed.
- 2-72 -
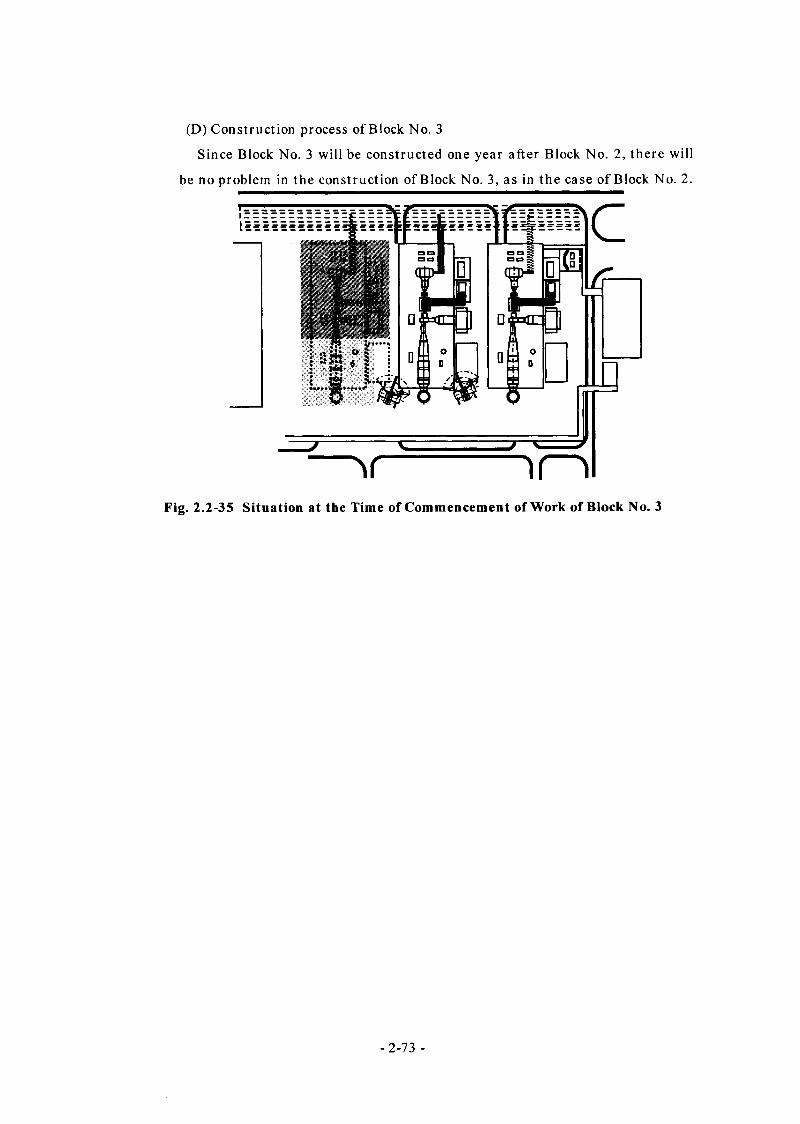
(D) Construction process of Block No. 3
Since Block No. 3 will be constructed one year after Block No. 2, there will
be no problem in the construction of Block No. 3, as in the case of Block No. 2.
Fig. 2.2-35 Situation at the Time of Commencement of Work of Block No. 3
- 2-73 -
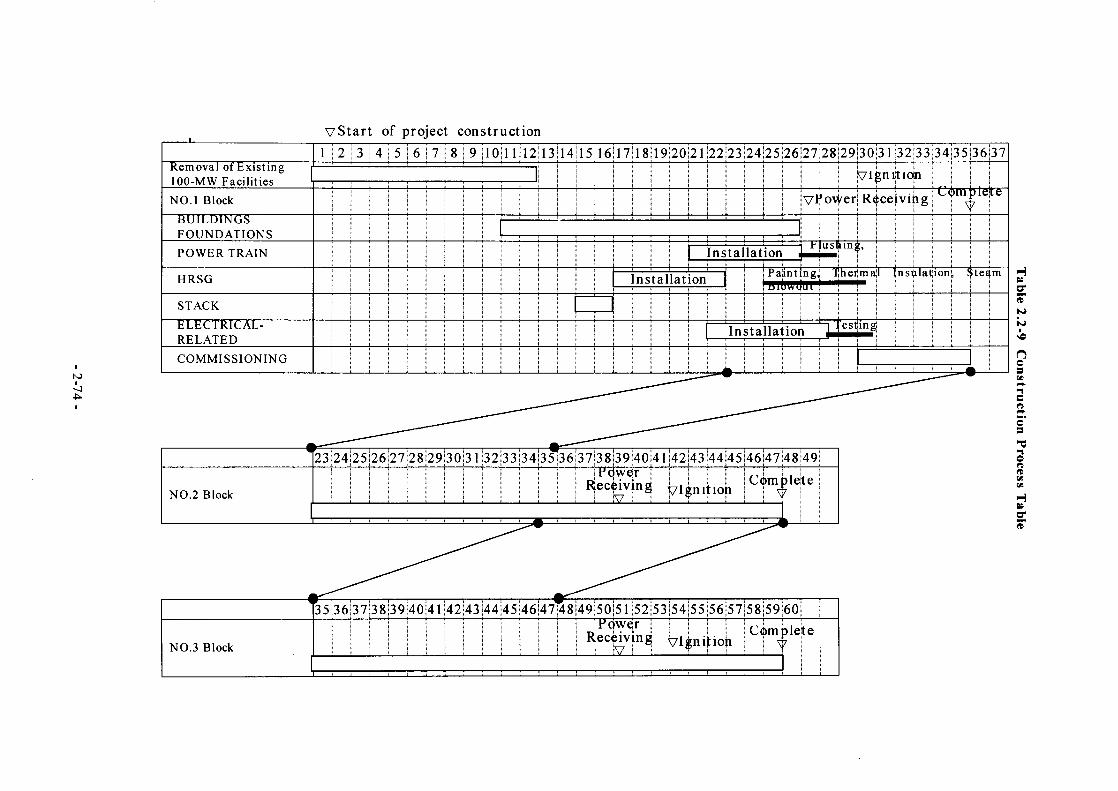
- 2-74 -
VStart of project construction1 2|3l4|5|6|7|8|9|l0|ll|l2 13 14 15 16 17 18 19 20 21 22 23 24 25 26 27 28 29 30 31 32 33 34 35 36 37
Removal of Existing100-MW Facilities Vlj tion
NO.l Block vi 'ovrer :ce ivi igmrpie
7re-
BUILDINGSFOUNDATIONSPOWER TRAIN
Plus!unjg.Instal lation i
HRSG int ngj T hei ma 1 nst ilat ionInstallation r a >ica m141 UWU Ul
STACKELECTRICAL-RELATED
'esi ingInstallation L
COMMISSIONING1—
------------------------------- <23 24 25 26 27 28 29 30 31 32 33 34 35 36 37 38 39 40 41 42 43 44 45 46|47|48 49
NO.2 Block RPceci
we;ivV
ring plgni tio l
C<|)m()le te
: i—:—,—,—,—,--- ,---- ,--- ,--- .--- .——;--- '—'—'—'—'—:—'—'—:—
------------------------------------------------------------------135 36 37'38 39 40 41 42 43 44 45 46 47148 49 50 51 52 53 54 55 56 57 V
loo 59 60
NO.3 BlockR
Pceci
we;iv
ring ■ 7lj ;ni tio i
C( >m )le7
te
—T' ' ; i ! i i =
Table 2.2-9 Construction Process Table
2.4.10 . Operation of newly installed plant
(1) Start-up/shutdown methods
(A)Start-up procedure
The outline of the plant start-up procedure is as follows:
® Before plant start-up
Establish lubricating oil system. Receive electricity for auxiliary power
source from a starting transformer. The turbine is in turning operation.
(D Start-up preparation
Establish control oil system. Start-up fuel gas compressor, and keep it
idling on stand-by.
(3) HRSG purging
Start up gas turbine using an electric motor (generator) for start-up,
and conduct HRSG purging for 10 minutes at a gas turbine velocity of
approximately 1,000 r.p.m.
(D Gas turbine ignition/speed up
After purging, ignite the gas turbine and increase the speed to a rated
speed. When the designated speed is achieved, shut off electric power
supply and excitation to the electric motor (generator) for start up.
(5) Generator parallel-in
When the operation condition of the gas turbine becomes stable, resume
excitation to the generator to establish generator voltage. After the rated
voltage is achieved, synchronize and parallel in the system. After
paralleling in, switch over the power source of the auxiliary power system
from the starting transformer to the house transformer.
(6) Steam turbine speed up
At the initial stage of start-up, steam generated in HRSG is sent into a
condenser, bypassing the steam turbine, by a turbine bypass valve. When
steam conditions are satisfactory, start up and speed up the steam turbine.
During this period, the steam turbine is disconnected from the gas turbine
and generator by a clutch.
(7) Clutch engagement
When the steam turbine speed reaches the rated speed, let in the steam
turbine clutch.
(8) Completion of start-up
Start-up is complete, when the output of gas and steam turbines
- 2-75 -
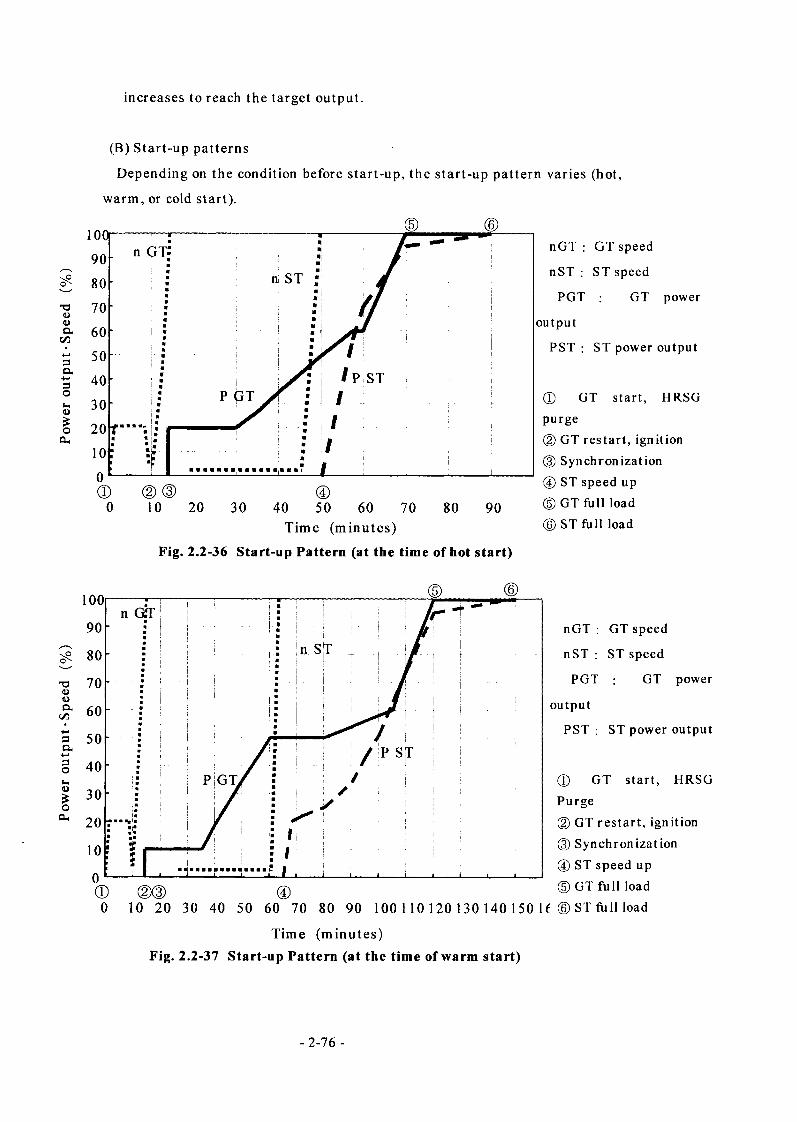
Pow
er ou
tput
-Spe
ed (%)
Po
wer
outp
ut-S
peed
(%)increases to reach the target output.
(B) Start-up patterns
Depending on the condition before start-up, the start-up pattern varies (hot,
warm, or cold start).
Time (minutes)
Fig. 2.2-36 Start-up Pattern (at the time of hot start)
ST full load
(Do
nGT : GT speed
nST : ST speed
PGT : GT power
output
PST : ST power output
(D GT start, HRSG Purge(2) GT restart, ignition(3) Synchronization (D ST speed up(5) GT full load
10 20 30 40 50 60 70 80 90 100 110 120 130 140 150 If © ST full load
Time (minutes)Fig. 2.2-37 Start-up Pattern (at the time of warm start)
- 2-76 -
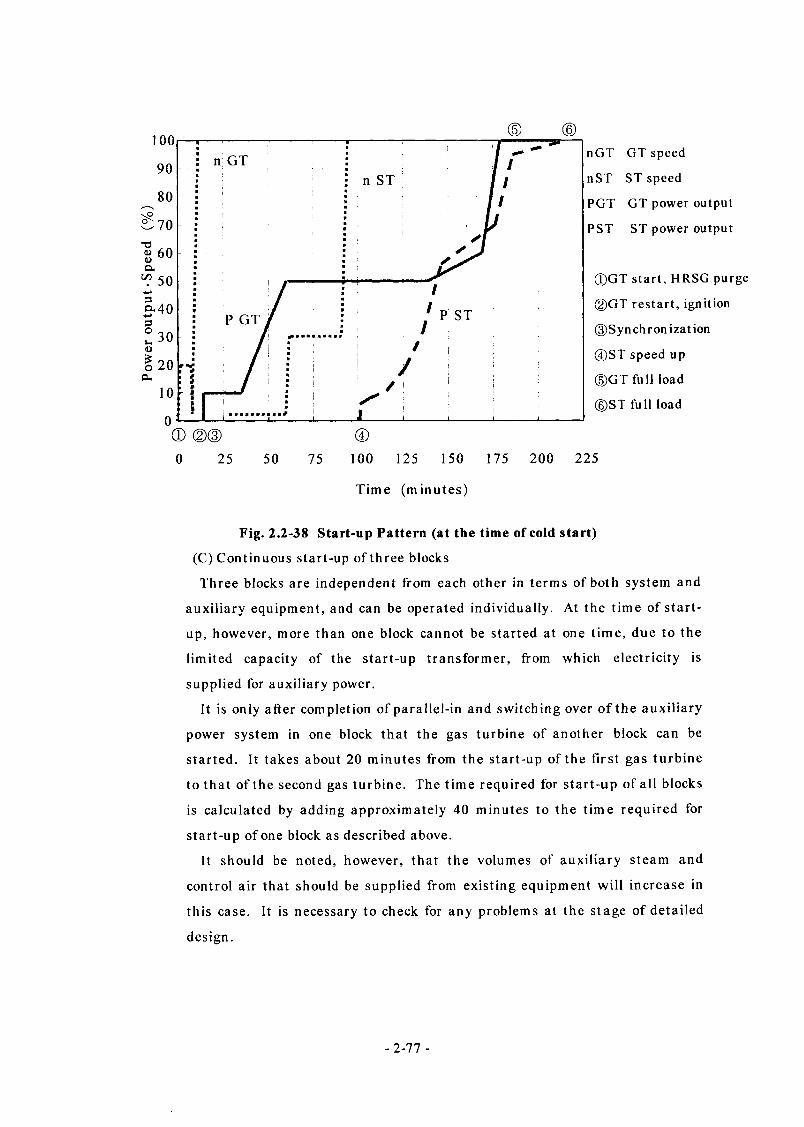
(5) ®nGT GT speed
nST ST speed
PGT GT power output
PST ST power output
©GT start, HRSG purge
©GT restart, ignition
©Synchronization
©ST speed up
©GT full load
©ST full load
® <D© ©0 25 50 75 100 125 150 175 200 225
Time (minutes)
Fig. 2.2-38 Start-up Pattern (at the time of cold start)
(C) Continuous start-up of three blocks
Three blocks are independent from each other in terms of both system and
auxiliary equipment, and can be operated individually. At the time of start
up, however, more than one block cannot be started at one time, due to the
limited capacity of the start-up transformer, from which electricity is
supplied for auxiliary power.
It is only after completion of parallel-in and switching over of the auxiliary
power system in one block that the gas turbine of another block can be
started. It takes about 20 minutes from the start-up of the first gas turbine
to that of the second gas turbine. The time required for start-up of all blocks
is calculated by adding approximately 40 minutes to the time required for
start-up of one block as described above.
It should be noted, however, that the volumes of auxiliary steam and
control air that should be supplied from existing equipment will increase in
this case. It is necessary to check for any problems at the stage of detailed
design.
n GTn ST
P GT
- 2-77 -
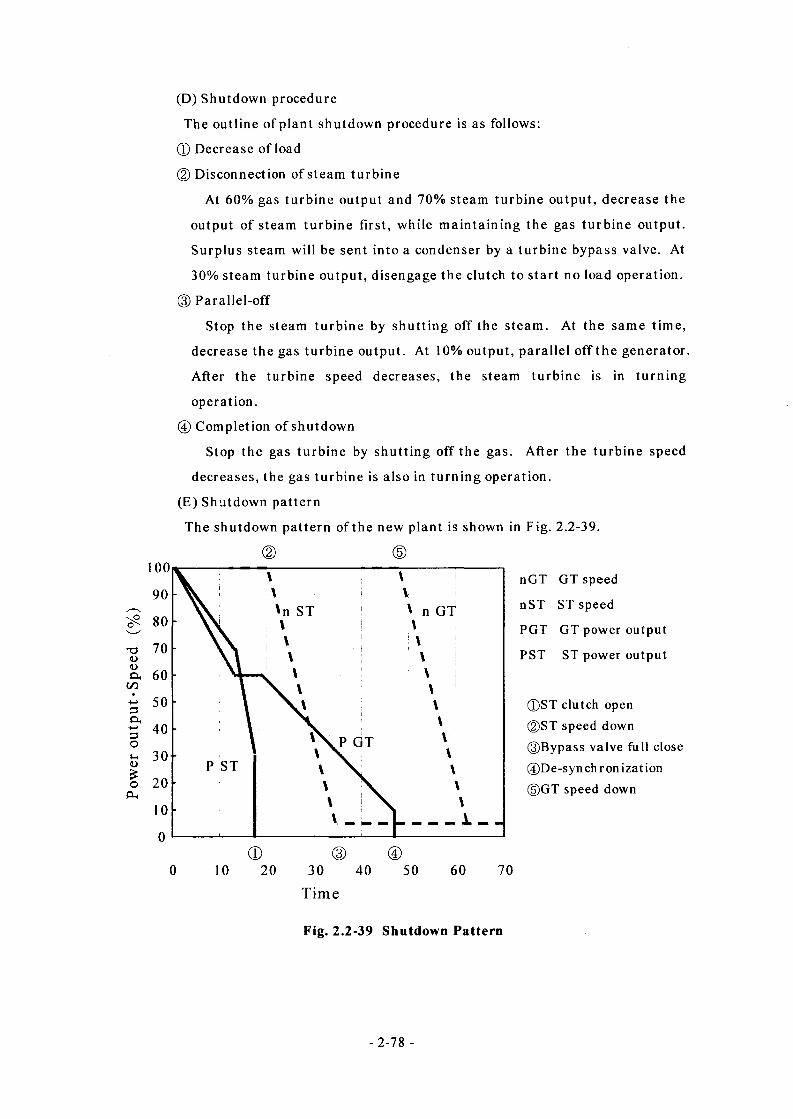
(D) Shutdown procedure
The outline of plant shutdown procedure is as follows:
0 Decrease of load
0 Disconnection of steam turbine
At 60% gas turbine output and 70% steam turbine output, decrease the
output of steam turbine first, while maintaining the gas turbine output.
Surplus steam will be sent into a condenser by a turbine bypass valve. At
30% steam turbine output, disengage the clutch to start no load operation.
(3) Parallel-off
Stop the steam turbine by shutting off the steam. At the same time,
decrease the gas turbine output. At 10% output, parallel off the generator.
After the turbine speed decreases, the steam turbine is in turning
operation.
0 Completion of shutdown
Stop the gas turbine by shutting off the gas. After the turbine speed
decreases, the gas turbine is also in turning operation.
(E) Shutdown pattern
The shutdown pattern of the new plant is shown in Fig. 2.2-39.
\ n GT
t3 70 -
ts 50 -
P GT*-i 30 -
P STo 20 ■
nGT GT speed
nST ST speed
PGT GT power output
PST ST power output
0ST clutch open ©ST speed down ©Bypass valve full close ®De-synchronization ©GT speed down
Time
Fig. 2.2-39 Shutdown Pattern
(2) Personnel scheme
(A) Operation personnel
Since a newly installed plant is primarily free from site operation, and
adopts one-man operation through digital control unit/CRT operation, the
minimum operation personnel required consists of one shift leader, one
operator, and one patroller. By adding one worker as a standby, four
personnel comprise one shift. In total, 16 workers are necessary for three
shifts.
(B) Maintenance personnel
Maintenance work is divided into four sections: gas turbine, HRSG,
electrical equipment, and instrumentation equipment. One worker will take
charge of the maintenance of each section per one block. Four maintenance
heads will be assigned for supervision of their respective sections. In
addition, a worker responsible for civil engineering and construction for three
blocks will be necessary.
(C) Planning personnel
Since the new plant will be a power generating plant with properties
significantly different from those of the existing Unit No. 12, it is necessary
to introduce planning personnel for performance control and other jobs.
Therefore, the number of personnel required for a new plant can be
summarized as follows:Operationpersonnel
Maintenancepersonnel
Planningpersonnel Total
At commencement ofcommercial operation of Block No. 1
16 9 2 27
At commencement ofcommercial operation of Block No. 2
16 13 2 31
At commencement ofcommercial operation of Block No. 3
16 17 2 35
(3) Operation pattern
Since a new plant will consist of three 100 MW blocks, the most efficient
operation of the plant can be achieved by coordinating the shutdown and
restart of each block depending on output.
- 2-79 -
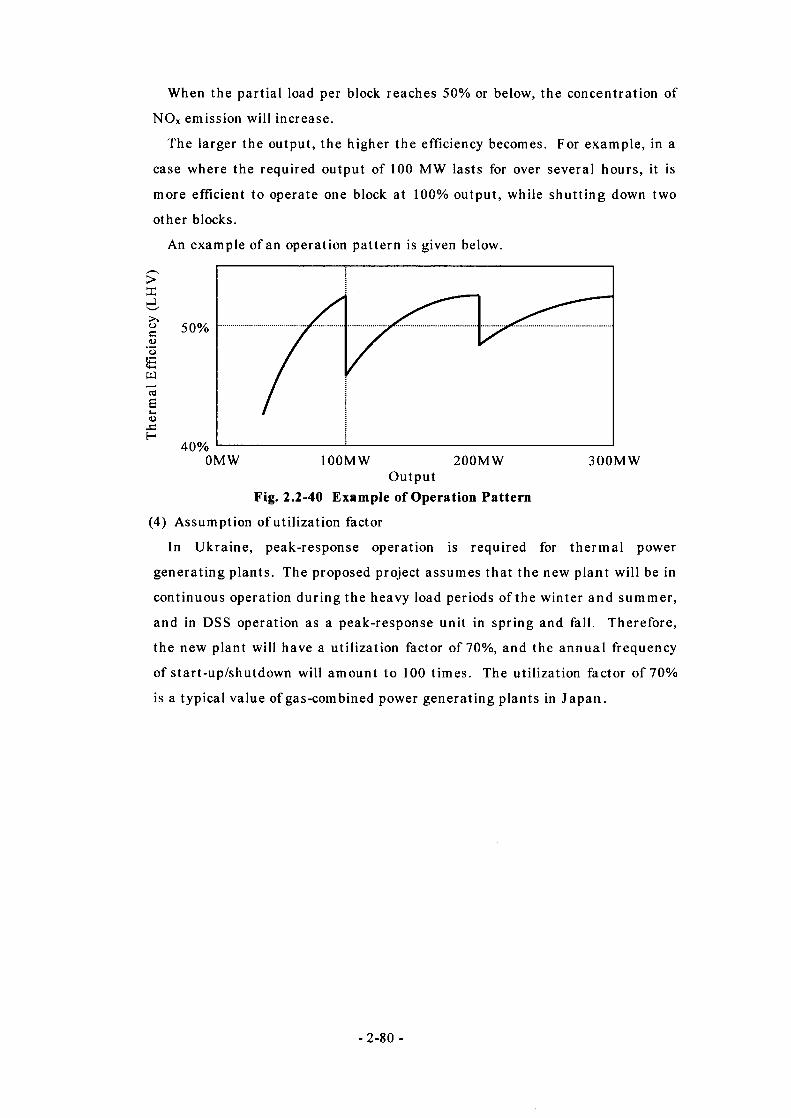
Ther
mal
Effi
cien
cy (L
HV
)
When the partial load per block reaches 50% or below, the concentration of
NOx emission will increase.
The larger the output, the higher the efficiency becomes. For example, in a
case where the required output of 100 MW lasts for over several hours, it is
more efficient to operate one block at 100% output, while shutting down two
other blocks.
An example of an operation pattern is given below.
0MW 100MW 200MW 300MWOutput
Fig. 2.2-40 Example of Operation Pattern
(4) Assumption of utilization factor
In Ukraine, peak-response operation is required for thermal power
generating plants. The proposed project assumes that the new plant will be in
continuous operation during the heavy load periods of the winter and summer,
and in DSS operation as a peak-response unit in spring and fall. Therefore,
the new plant will have a utilization factor of 70%, and the annual frequency
of start-up/shutdown will amount to 100 times. The utilization factor of 70%
is a typical value of gas-combined power generating plants in J apan.
- 2-80 -
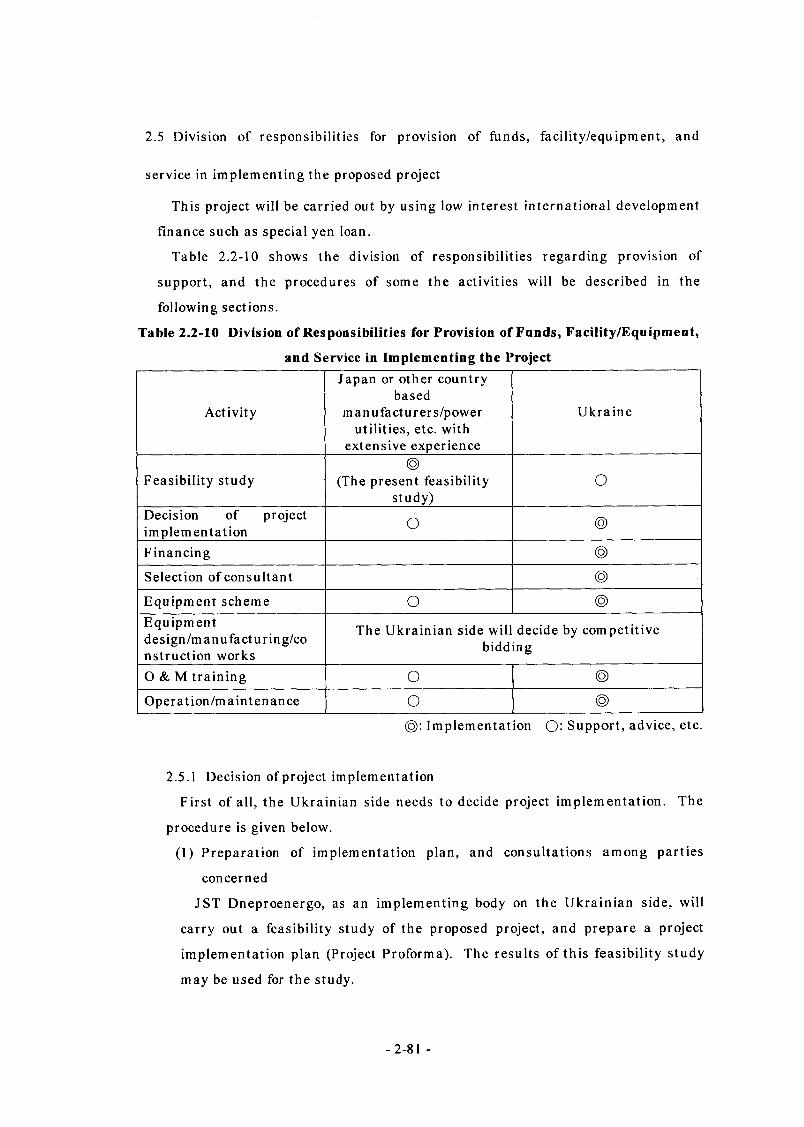
2.5 Division of responsibilities for provision of funds, facility/equipment, and
service in implementing the proposed project
This project will be carried out by using low interest international development
finance such as special yen loan.
Table 2.2-10 shows the division of responsibilities regarding provision of
support, and the procedures of some the activities will be described in the
following sections.
Table 2.2-10 Division of Responsibilities for Provision of Funds, Facility/Equipment,
and Service in Implementing the Project
Activity
Japan or other country based
manufacturers/power utilities, etc. with
extensive experience
Ukraine
Feasibility study©
(The present feasibility study)
O
Decision of projectimplementation O ©
Financing ©
Selection of consultant ©
Equipment scheme O ©Equipmentdesign/manufacturing/co nstruction works
The Ukrainian side will decide by competitive bidding
O & M training O ©
Operation/maintenance o ©
Implementation O' Support, advice, etc.
2.5.1 Decision of project implementation
First of all, the Ukrainian side needs to decide project implementation. The
procedure is given below.
(1) Preparation of implementation plan, and consultations among parties
concerned
JST Dneproenergo, as an implementing body on the Ukrainian side, will
carry out a feasibility study of the proposed project, and prepare a project
implementation plan (Project Proforma). The results of this feasibility study
may be used for the study.
-2-81 -

For our part, we will contact the parties related to project implementation
on the Ukrainian side toward implementation of this project.
(2) Approval by the Cabinet, the Ukrainian government
The Project Proforma prepared by JST Dneproenergo will be examined at
the Ukrainian Cabinet council meetings. If the plan is approved, the
Ukrainian government will officially decide the implementation of the project.
2.5.2 Financing
This project is not only to energy saving and C02 curtailment, but that it can
contribute to preparation of the power infrastructure of Ukraine country, and
Ukraine offers it about project capital.
However, if an example is taken in economic conditions etc., its own country
capital cannot be expected but it is thought that a project can be promoted by
the ability using extraordinarily low interest yen loan international development
finance.
We want to perform the following support so that this project will realize by
the application of a yen loan.
(1) We intend to obtain the understanding of the Ukrainian side, such as JST
Dneproenergo, Ukraine government, especially the organization concerned
about planning the power-source development of this project, and raise its
priority among power-source development.
(2) We intend to appeal to the Ukrainian side related organization to
understand the scheme, the superiority, the significance, and its
effectiveness of joint implementation, and to lead to positive actions.
(3) After being made a request for a yen loan for this project, we intend to
appeal and support to the Japanese side related organization to understand
and accept the request.
Japan Bank for International Cooperation (JBIC)'s opinion about a yen loan
donation to Ukraine is as follows.
Although there is no experience in allocating a yen loan to Ukraine,
JBIC want to expand the yen loan to Ukraine after allocating about 10
billion yen loan for the most important project at first and judging the
payment state.
The yen loan to Ukraine will be allocated once a few years.
- 2-82 -

Considering the circumstances mentioned above, this project is thought to be
difficult to become the first yen loan project in Ukraine.
However, this project is certainly important subject in Ukraine and meets one
of the requirements for realizing a yen loan.
2.6 Preconditions and problems related to implementation of the proposed project
According to the equipment scheme assumed in this feasibility study,
installation space, fuel supply, and other conditions in terms of infrastructure are
secured satisfactorily. There will be no problem in the feasibility of equipment
development.
The following preconditions should be met before determining elements other
than technical requirements, such as funds, contract method, standards and other
detailed equipment specifications for implementation of the project.
(1) In light of the present economic condition, it is difficult for Ukraine to
finance the project on its own. Therefore, financing by a special
environmental yen loan or equivalent is a precondition for project
implementation.
(2) Concrete trading scheme of reduced greenhouse effect gas emissions, such
as Joint Implementation, are established and agreed on by the Conference
of the Parties to the United Nations Framework Convention on Climate
Change.
(3) The importance of this project heightens in Ukraine, and an approval is
obtained from the related ministries and agencies of the Ukrainian
government.
Given that a combined cycle system is a state-of-the-art technology that is
unprecedented in Ukraine, it is necessary to introduce an O & M technical
assistance scheme for Ukrainian engineers in implementing the project.
The scheme may include real machine training in a similar plant in Japan as
well as on-site training by engineers sent from Japan. With extensive experience
and proven track record of this system in our power plants, we will be pleased to
offer technical cooperation in such schemes.
Ukraine has a relatively loosely-binding environmental assessment system:
After completion of a feasibility study on installation of a new power source,
- 2-83 -
necessary data is submitted to the local government and related organizations,
and the data is reviewed one month before commencement of construction work
for the submission of revised data.
However, in light of the situation that a new power source has not been
developed since the 1990s, and that environmental issues are rapidly attracting
attention in Ukraine, it is highly likely that the present environmental
assessment system will be replaced by a more strict and time-consuming
assessment system as in Western industrialized countries.
2.7 Project implementation schedule
The power generating plant of Pridneprovskaya TPP are superannuated due to
over 30 years of operation. It has been an urgent task to construct a new plant.
Taking into consideration that modification of existing equipment would require
too long a construction period, and that existing equipment is extensively
deteriorated due to aging, we designed a project in which a new combined cycle
power generating plant will be installed and existing power generating plant will
be removed (actually, abolished).
Assuming the project is to be implemented, a schedule for the shortest possible
time span (as concerned at present) is given below.
- 2-84 -
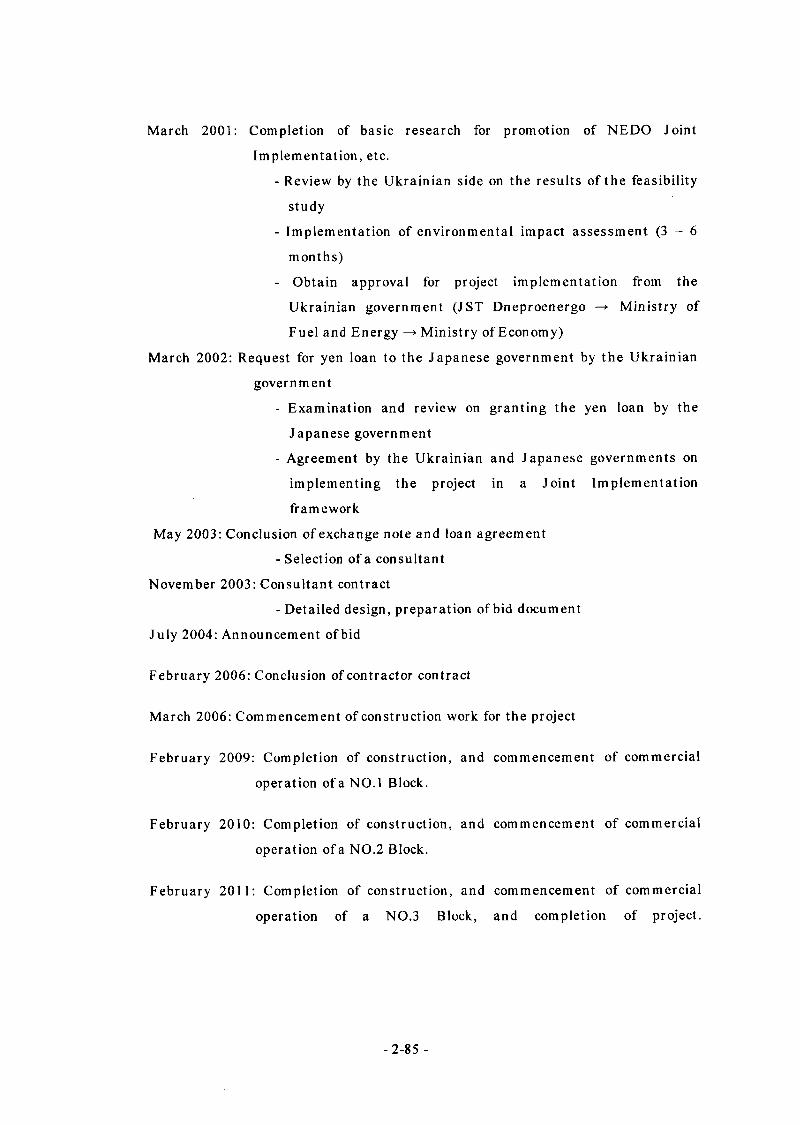
March 2001: Completion of basic research for promotion of NEDO Joint
Implementation, etc.
- Review by the Ukrainian side on the results of the feasibility
study
- Implementation of environmental impact assessment (3-6
months)
- Obtain approval for project implementation from the
Ukrainian government (JST Dneproenergo —» Ministry of
Fuel and Energy —» Ministry of Economy)
March 2002: Request for yen loan to the Japanese government by the Ukrainian
government
- Examination and review on granting the yen loan by the
Japanese government
- Agreement by the Ukrainian and Japanese governments on
implementing the project in a Joint Implementation
framework
May 2003: Conclusion of exchange note and loan agreement
- Selection of a consultant
November 2003: Consultant contract
- Detailed design, preparation of bid document
July 2004: Announcement of bid
February 2006: Conclusion of contractor contract
March 2006: Commencement of construction work for the project
February 2009: Completion of construction, and commencement of commercial
operation of a NO.l Block.
February 2010: Completion of construction, and commencement of commercial
operation of a NO.2 Block.
February 2011: Completion of construction, and commencement of commercial
operation of a NO.3 Block, and completion of project.
- 2-85 -
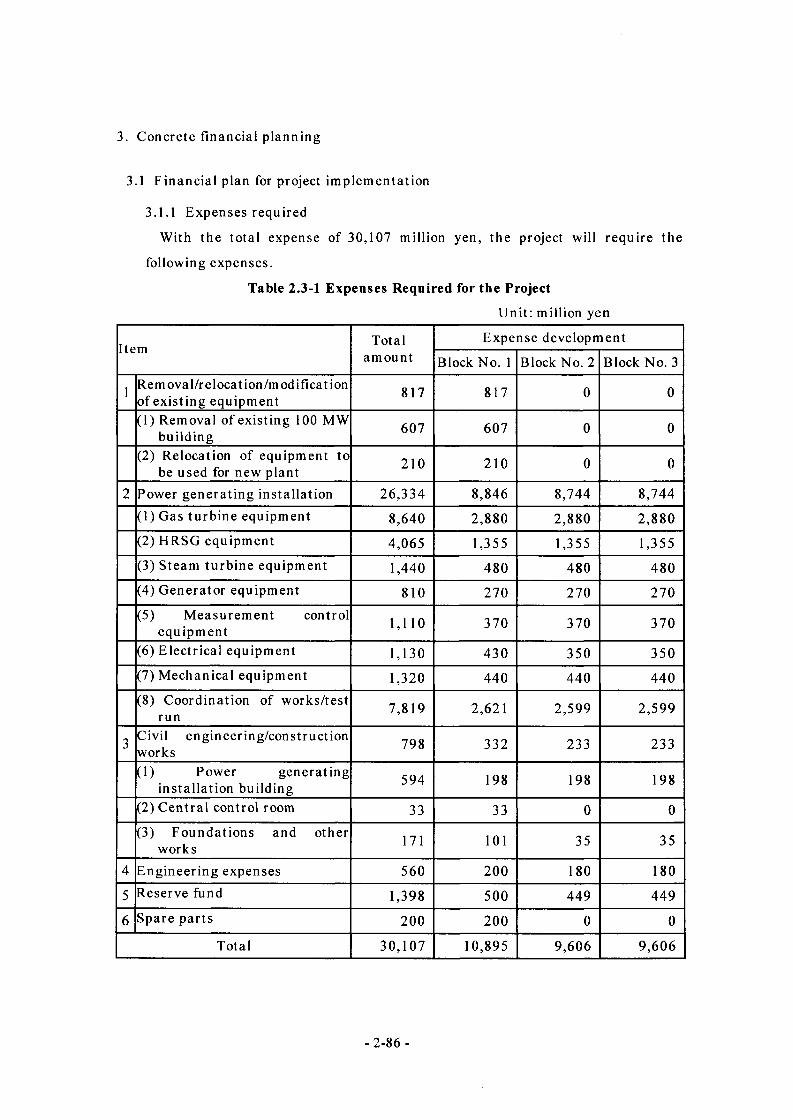
3. Concrete financial planning
3.1 Financial plan for project implementation
3.1.1 Expenses required
With the total expense of 30,107 million yen, the project will require the
following expenses.
Table 2.3-1 Expenses Required for the Project
Unit: million yen
Item Totalamount
Expense development
Block No. 1 Block No. 2 Block No. 3
1 Rem oval/relocation/m edification of existing equipment 817 817 0 0
(1) Removal of existing 100 MW building 607 607 0 0
(2) Relocation of equipment to be used for new plant 210 210 0 0
2 Power generating installation 26,334 8,846 8,744 8,744(1) Gas turbine equipment 8,640 2,880 2,880 2,880(2) HRSG equipment 4,065 1,355 1,355 1,355(3) Steam turbine equipment 1,440 480 480 480(4) Generator equipment 810 270 270 270(5) Measurement control
equipment 1,110 370 370 370
(6) Electrical equipment 1,130 430 350 350(7) Mechanical equipment 1,320 440 440 440(8) Coordination of works/test
run 7,819 2,621 2,599 2,599
3 Civil engineering/construction works 798 332 233 233
(1) Power generatinginstallation building 594 198 198 198
(2) Central control room 33 33 0 0(3) Foundations and other
works 171 101 35 35
4 Engineering expenses 560 200 180 180
5 Reserve fund 1,398 500 449 449
6 Spare parts 200 200 0 0
Total 30,107 10,895 9,606 9,606
- 2-86 -
Of the above total expense, 27,132 million yen will be used for construction of
a new power generating facility and civil engineering/construction works. For
an installed generating capacity of 302.4 MW, the construction cost per kW
amounts to 90 thousand yen/kW.
The above values were calculated based on an exchange rate of 1 US$ = 4.0
UAH = 115 yen.
In addition, value added tax (VAT) and import duty are not included, since
special exemption can be expected for the project as a national project.
3.1.2 Financing method
Under the leadership of President Kuchma, the Ukrainian government has
held a series of meetings with the IMF and is carrying out administrative and
financial reforms for reconstruction of the economy. As a financial reform, the
government decided to keep expenditure at less than revenue in the budget for
this fiscal year and onward. In addition, to ensure stable tax revenue, efforts
are being made to simplify the present tax system, which is unrealistic and
complicated. Under such circumstances, it is considered impossible for Ukraine
to finance the project on its own terms.
Given that this project is aimed at greenhouse effect gas reduction, and that
the Ukrainian economy is in the stage of reconstruction, and that it will be in a
few years time when the implementation of this project is scheduled, the most
realistic financing method is an environmental special yen loan.
Project cost
(1) 75%: Environmental special yen loan
(2) 25%: The Ukrainian side’s own funds
Depending on the results of COP-7, greenhouse effect gas emissions trading
can be one source of finance, as the primary goal of this feasibility study is
reduction of such emissions.
3.2 Prospect of financing
3.2.1 The Japanese side action plan
Upon completion of the present basic research, we will report the results to the
Ukrainian side, and reconfirm their needs and conditions. If it is confirmed that
an environmental special yen loan will satisfy such needs and conditions, we will
- 2-87 -
recommend the Ukrainian side to request for an environmental special yen loan
as a financing method.
We will give advice on the system, conditions, and request procedure of an
environmental special yen loan to the Ukrainian side to help smooth
implementation of the request procedure.
3.2.2 The Ukrainian side action plan
Since this feasibility study is conducted on the assumption that the proposed
project is aimed at reduction of greenhouse effect gas emissions, the Ukrainian
side is primarily relying on financing to be a low-interest environmental special
yen loan granted by Japan.
If the Ukrainian side reaches the conclusion that the project is feasible after
reviewing the content of a report on the basic research, J ST Dneproenergo will
prepare a request for an environmental special yen loan and submit it to the
Ministry of Fuel and Energy, an authority supervising the company.
If the Ministry of Fuel and Energy approves the content of the request for an
environmental special yen loan for this project, the request will be submitted to
the Japanese Embassy in Ukraine via the Ministry of Economy, which is
responsible for foreign economic cooperation.
4. Matters related to Joint Implementation and other conditions
4.1 Matters to be coordinated with the Ukrainian side for project implementation:
Establishment of project implementation condition and division of duties, taking
into consideration the actual situation of the site where the project will be
implemented
To promote this project as a Joint Implementation project, the conditions and
matters to be coordinated with the Ukrainian side are given below. However, a
scheme for Joint Implementation has yet to be established within the
international community. In light of the present situation, we have to admit that
such conditions and matters will be largely affected by the results of COP-7.
- 2-88 -
(1) Arrangement for an organization coordinating the project and a project
implementation system, to facilitate Joint Implementation by Ukraine and
J apan
(2) Arrangement of allocation between the Ukrainian and Japanese sides of
reduced CO2 emissions (CO2 credit) to be achieved by the project
implementation
4.2 Possibility of accepting this project as a Joint Implementation scheme
As mentioned previously regarding the power plant’s interest in this project,
J ST Dneproenergo and Pridneprovskaya TPP are not just required to supply
electric power and heat to the Dnepropetrovsk area in a stable manner. In the
midst of economic reform, they are also, out of necessity, under pressure to modify
the power plant equipment and to improve efficiency partly due to the power
company’s pursuit of its own economic efficiency.
Under the present business condition of J ST Dneproenergo, however, it is
difficult to modify the superannuated power plant with its own funds. The
electric utility strongly wishes to implement the project under a Joint
Implementation scheme. If such a scheme is adopted, it is highly likely that the
Ukrainian side will accept trading of all or part of greenhouse effect gas emission
reductions achieved by the implementation of the proposed project.
- 2-89 -

Chapter.3 The Project Effect
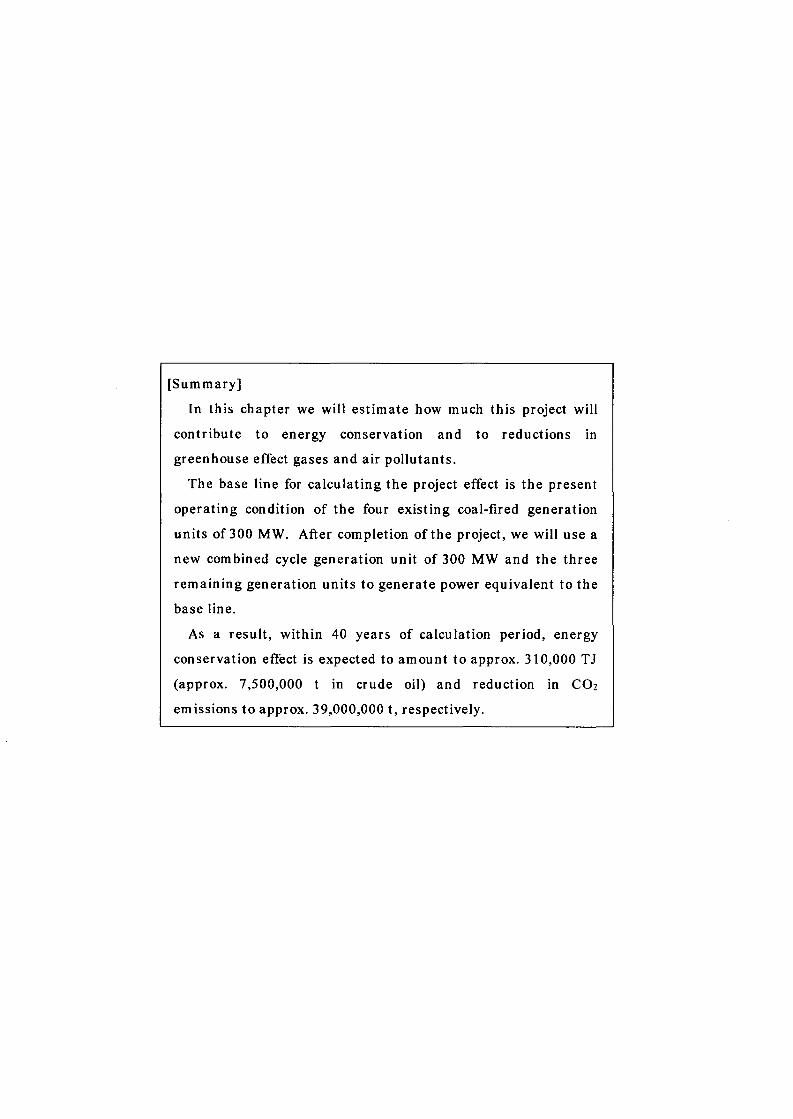
[Summary]
In this chapter we will estimate how much this project will
contribute to energy conservation and to reductions in
greenhouse effect gases and air pollutants.
The base line for calculating the project effect is the present
operating condition of the four existing coal-fired generation
units of 300 MW. After completion of the project, we will use a
new combined cycle generation unit of 300 MW and the three
remaining generation units to generate power equivalent to the
base line.
As a result, within 40 years of calculation period, energy
conservation effect is expected to amount to approx. 310,000 TJ
(approx. 7,500,000 t in crude oil) and reduction in CO2
emissions to approx. 39,000,000 t, respectively.
1. Energy conservation effect
1.1 Technical basis for producing energy conservation effect
In this project, we will scrap one of the existing coal-fired units of 300 MW in
the Pridneprovskaya Thermal Power Plant, and newly construct a combined cycle
unit using gas (100 MW X 3 blocks).
The combined cycle unit is a highly efficient system, combining the gas turbine
generation unit and the boiler/steam turbine generation unit. Adoption of this
system enables substantial improvement in thermal efficiency and energy
conservation.
In the gas turbine generation unit, combustion gas energy directly drives the
turbine generator to generate power. The advantage of the system is that its
simple and small-scale system configuration provides large output and that
start/stop operations are possible in a short time; the disadvantage is that high
thermal efficiency is not expected in a single system. As temperature of the gas
exhausted from the gas turbine is generally high (400 to 600°G), thermal energy
of the gas is exhausted as surplus heat quantity.
In the boiler/steam turbine generation unit, on the other hand, the boiler heats
water to generate steam. Steam energy thus generated drives the turbine
generator to generate power. This is the most widespread type of thermal power
generation system.
The combined cycle generation (cogeneration) unit uses gas exhausted from the
gas turbine as heat source for the boiler. By appropriately combining the gas
turbine and the steam turbine, thermal energy of the gas exhausted from the gas
turbine is reduced to approx. 100°C for efficient use and steam is generated in the
boiler without fuel.
Since 1980 such combined cycle units have been rapidly proliferating with the
progress of turbine technology, that is, high temperature and large scale of the
turbines. As a result, internationally, the technology thus progressed is the main
current of thermal power generation using gas. While thermal efficiency of the
conventional boiler/steam turbine system even in the most up-to-date plant is
45% at best, that of the combined cycle system has already exceeded 50%; 60% is
expected in future.
-3-1 -
Thermal efficiency of the old coal-fired unit to be scrapped is 35% at best. On
the other hand, in this project adopting the combined cycle generation unit with
the newest 1,400°C class gas turbine, thermal efficiency of 52.5% is expected at
rated output.
Such improvement of thermal efficiency enables reduction in fuel consumption,
that is, energy conservation.
1.2 Base line for calculating energy conservation effect
1.2.1 Setting the base line
(1) Units to be assessed
At present, the system of the Pridneprovskaya Thermal Power Plant
consists of four coal-fired units of 150 MW and heat supply (Units Nos.7 - 10)
and four coal-fired units of 300 MW (Units Nos.11 - 14) exclusively for power
generation.
With respect to the present operation condition, 1999’s actual results show
that the average utilization factor of the 150 MW units Nos.7 - 10 is
comparatively high, 53.5%, and that of the 300 MW units Nos.11 - 14, as low
as 22.9%.
The reason the utilization factor of the 150 MW units is high is; that they
have functions to supply heat or energy as important as electric power; that
they can be started/stopped in a shorter time than 300 MW units; and that one
cycle of rehabilitation has been completed to maintain the system in
comparatively favorable conditions. On the contrary, the 300 MW units
exclusively for power generation are inferior in utilization. Since unit No. 9 of
them is under rehabilitation, utilization factor is low. Unit No. 12 has not been
operated for a long time.
In this project, we plan to scrap one unit (No. 12) under long-term stoppage
out of 300 MW units and newly to construct a combined cycle generation unit
with the equal output. When setting the baseline for calculating energy
conservation effect, it is not realistic to assess only this unit under long-term
stoppage.
After completion of the project, the 150 MW units that are playing roles of
supplying heat locally as mentioned above will be continuously used,
-3-2 -
separately from the unit to be newly-constructed exclusively for power
generation. Accordingly, it is not appropriate to assess these 150 MW units.
As a result, when calculating energy conservation effect, all of the already-
constructed 300 MW units NO.l 1 ~14 are to be assessed.
(2) Utilizing units to be assessed on the base line
About 40 years have passed since the 150 MW units Nos.7 - 10 in the
Pridneprovskaya Thermal Power Plant started operation. During these years,
comparatively large-scale rehabilitation such as replacement of turbine
generators was carried out to prolong their working lives for consecutive
operation.
The 300 MW units Nos.l 1 - 14 to be assessed have become old as they have
been operating for about 35 years. Unit No. 11, which started operation first,
is under rehabilitation. Unit No. 12, under long-term stoppage is waiting for
funds required for rehabilitation.
Decrease in electric power demand in Ukraine that was caused by economic
disorder after the ruin of the USSR has come to the end of the first stage.
According to a long-range supply-demand outlook by the fuel energy
department, after 2000, demand is expected to increase slightly by 1 to 2%
compared with the former year. The ratio of thermal power generation to
entire power generation is expected to maintain the present 40%.
By using the closed Chernobyl nuclear power plant as security to raise
money, construction of a new nuclear power plant is being planned. It is not
clear, however, that any thermal power plant will be newly constructed on a
large scale.
As a result, it is considered that the present thermal power plants in
Ukraine will hold the same positions in the middle- and long-term periods.
Accordingly, it is considered that the thermal power plants will be
rehabilitated to prolong the lives for continued operation without such scrap
and build as in this project.
In conclusion, as the base line for calculating energy conservation effect in
this project, the 300MW units Nos.l 1 - 14 for assessment are to be operated
while maintaining the present utilization factor.
- 3-3 -
1.2.2 Specifications of the base line and calculation results
As specifications of the base line, we use the 1999 actual operation results of
the units for assessment that were obtained from Dneproenergo Power Company.
The data are shown in Table 3.1-1 below.
Table 3.1-1 1999 Actual Operation Results of the Units for Assessment
Item Unit Actual results
Unit — Nos. 11, 12, 13, 14Annual gross generating
output MWh 2,406,107
Annual fuel consumption
Total ton as CF(X) 891,986
Coal ton as CF 608,752
Petroleum ton as CF 5,609Naturalgas ton as CF 277,625
CF: Abbreviation of ‘Conditional Fuel,’ virtual fuel of 7,000 kcal/kg
used as the control base in Ukraine
By using the specifications in Table 3.1-1, the operation results of these units
are calculated as follows:• Utilization factor• Average gross thermal efficiency• Average gross heat rate
22.9 %33.1 %
10,865 kJ/kWh
The fuel consumption is given as the value already converted to the virtual fuel
of 7,000 kcal/kg. Therefore, the annual energy consumption of the units for
assessment can be simply obtained as shown below.
The annual energy consumption
= Total annual energy consumption (ton as CF) X 103 X 7000(kcal/kg) X
4.1868(kJ/kcal)XlO-9
= 26,142 TJ/Year
In comparing the base line and the project case, generating output is assumed
to be constant before and after the project. It is not the gross generating output
but the net generating output that should be constant.
Although actual results of the net generating output are not shown, they can
be obtained as follows by using the auxiliary power ratio of the 300 MW units,
7.0%
- 3-4 -
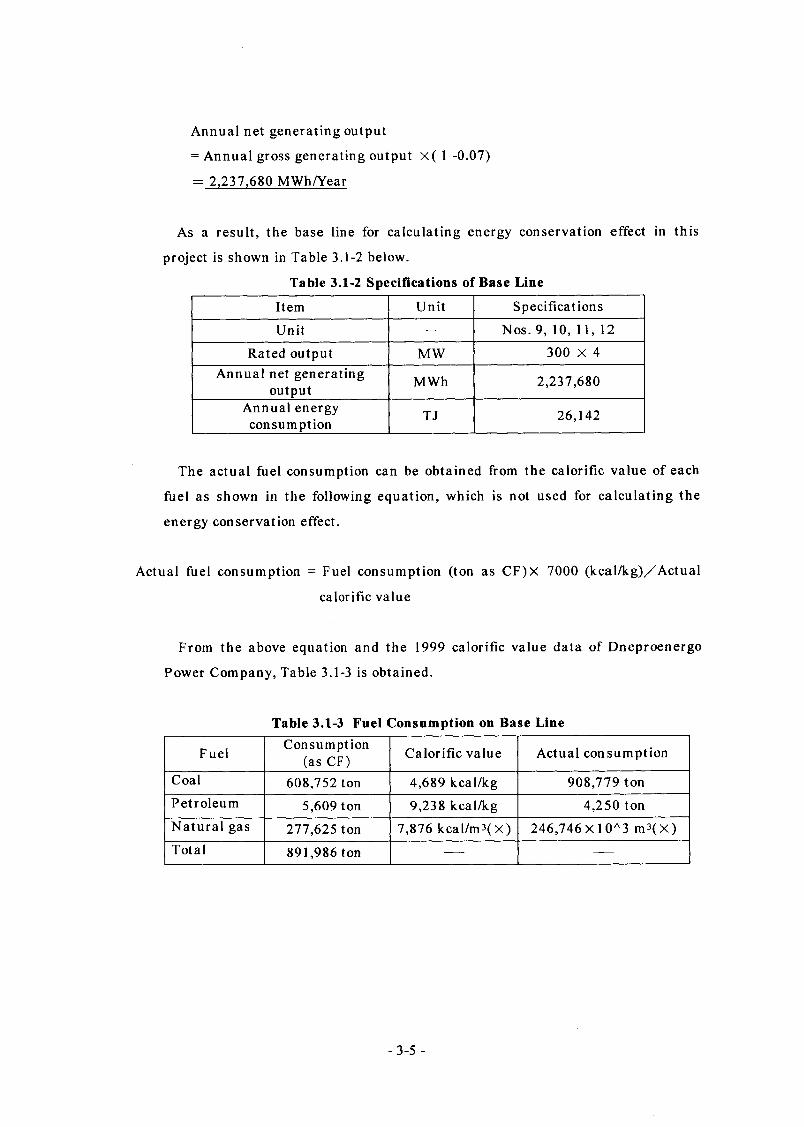
Annual net generating output
= Annual gross generating output X( 1 -0.07)
= 2,237,680 MWh/Year
As a result, the base line for calculating energy conservation effect in this
project is shown in Table 3.1-2 below.
Table 3.1-2 Specifications of Base Line
Item Unit Specifications
Unit — Nos. 9, 10, 11, 12
Rated output MW 300 X 4Annual net generating
output MWh 2,237,680
Annual energy consumption TJ 26,142
The actual fuel consumption can be obtained from the calorific value of each
fuel as shown in the following equation, which is not used for calculating the
energy conservation effect.
Actual fuel consumption = Fuel consumption (ton as CF)X 7000 (kcal/kg)/Actual
calorific value
From the above equation and the 1999 calorific value data of Dneproenergo
Power Company, Table 3.1-3 is obtained.
Table 3.1-3 Fuel Consumption on Base Line
FuelConsumption
(as CF) Calorific value Actual consumption
Coal 608,752 ton 4,689 kcal/kg 908,779 tonPetroleum 5,609 ton 9,238 kcal/kg 4,250 tonNatural gas 277,625 ton 7,876 kcal/m3(X) 246,746 X 10A3 m3(X)Total 891,986 ton — —
- 3-5 -
1.3 Concrete values, period and cumulative values of energy conservation effect
1.3.1 Considering the project case
(1) Handling the new unit
In this project we plan to scrap Unit No. 12 (under long-term stoppage) out
of the four 300 MW coal-fired units and instead to newly construct a combined
cycle generation unit using natural gas (100 MW X 3) with equal output.
This new unit will form a highly efficient plant with the newest technology.
As a matter of course, it is assumed that operation of this unit shall be prior to
that of the existing units.
Nuclear power generation in Ukraine, which occupies a little more than 40%
of the total generating output, is the base power source. Thermal and
hydroelectric power generation is regarded as middle and peak power source
to meet power demand increase or decrease. On the other hand, the
superannuated coal-fired plants, which are inferior in utilization, cannot fully
meet the demand. This is a problem to be solved, and one of the causes of low
utilization factor in 300 MW units.
The combined cycle generation unit to be newly constructed is superior in
utilization because of its high efficiency and a short time and easy start/stop
operation. We expect that this unit will be operated, taking priority over
existing thermal generation units, and that this will be often started and
stopped according to decreased demand on holidays and at nights.
Such operation is the same as that of combined cycle generation units in
Chubu Electric Power Co., Ltd., n which nuclear power and coal-fired power
are used as base load. Such utilization is also seen in Chubu Electric Power
Co., Ltd. Therefore, based on the actual results in this company, utilization
factors of the new combined cycle generation unit are set as follows.
• Calendar day utilization factor = 70 %
Annual generating output (MWh) Generating capacity (MW)x24hours x365days
• Generating time utilization factor = 90 %
Annual generating output (MWh)Generating capacity (MW)X Annual generating time (hours)
- 3-6 -
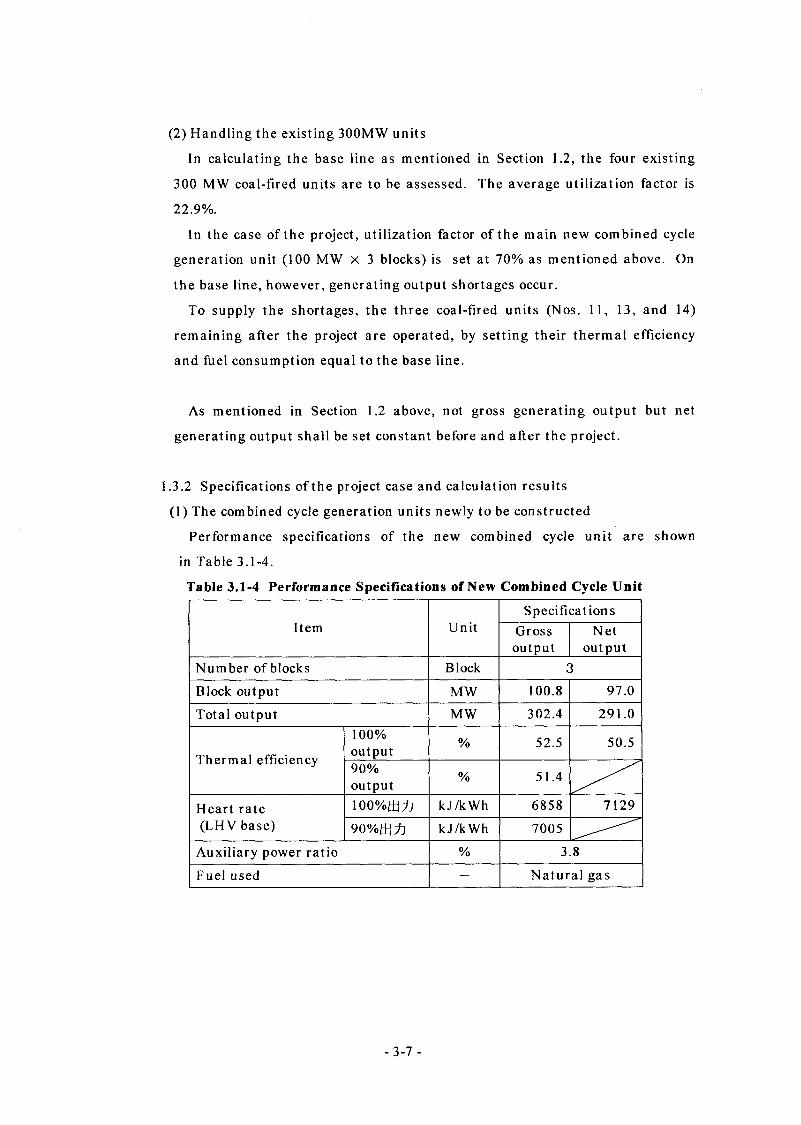
(2) Handling the existing 300MW units
In calculating the base line as mentioned in Section 1.2, the four existing
300 MW coal-fired units are to be assessed. The average utilization factor is
22.9%.
In the case of the project, utilization factor of the main new combined cycle
generation unit (100 MW X 3 blocks) is set at 70% as mentioned above. On
the base line, however, generating output shortages occur.
To supply the shortages, the three coal-fired units (Nos. 11, 13, and 14)
remaining after the project are operated, by setting their thermal efficiency
and fuel consumption equal to the base line.
As mentioned in Section 1.2 above, not gross generating output but net
generating output shall be set constant before and after the project.
1.3.2 Specifications of the project case and calculation results
(1) The combined cycle generation units newly to be constructed
Performance specifications of the new combined cycle unit are shown
in Table 3.1-4.
Table 3.1-4 Performance Specifications of New Combined Cycle Unit
Item UnitSpecifications
Grossoutput
Netoutput
Number of blocks Block 3Block output MW 100.8 97.0
Total output MW 302.4 291.0
Thermal efficiency
100%output % 52.5 50.5
90%output % 51.4
Heart rate (LHV base)
ioo %mt) kJ/kWh 6858 7129
90 kJ/kWh 7005
Auxiliary power ratio % 3.8
Fuel used — Natural gas
-3-7-
By using net output in Table 3.1-4 and calendar time utilization factor, 70%,
set in Section 1.3.1 above, annual gross generating output of the new
combined cycle unit is obtained as follows:
Annual gross generating output of the new combined cycle unit
= 302.4(MW) x24houres X 365days X70%
= 1,854,317 MWh/Year
By multiplying the annual gross generating output by the annual gross heat
rate, the annual energy consumption of the new combined cycle unit is
obtained.
As specified in Section 1.3.1 above, generating time utilization factor, or the
average output during operation is 90%. Therefore, for the average thermal
efficiency/heat rate, specifications at 90% output are used, as follows.
Annual energy consumption of the new combined cycle unit
=Annual gross generating output X Gross heat rate (at 90% output)
= 1,854,317 (MWh)X 103 x 7005 (kJ/kWh)X 10-9
= 12,989 TJ/Year
Fuel (all natural gas) consumption in the new combined cycle unit is
obtained as follows:
Annual natural gas consumption
= Annual energy con sum pt ion/Nat ural gas calorific value
_ 12,989(11/Year) 9
7,876(kcal/m3) x 4.1868(kJ/kcal)
— 393,902 X 10A3 m3/Year (at latm,20°C) ( = 443,196 ton as CF/Year )
Annual net generating output is obtained as follows:
Annual net generating output of the new unit
= 291.0 (MW)X 24 hours X 365 days X 0.7
= 1,784,412 MWh/Year
-3-8 -
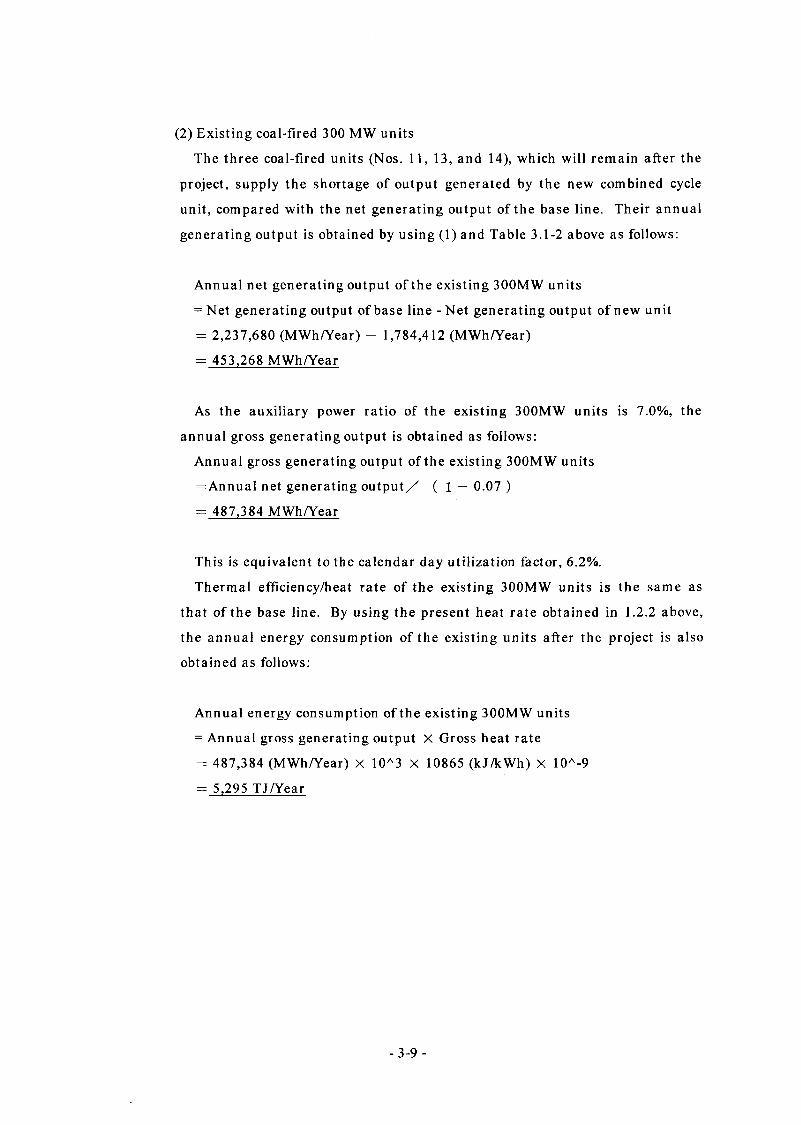
(2) Existing coal-fired 300 MW units
The three coal-fired units (Nos. 11, 13, and 14), which will remain after the
project, supply the shortage of output generated by the new combined cycle
unit, compared with the net generating output of the base line. Their annual
generating output is obtained by using (1) and Table 3.1-2 above as follows:
Annual net generating output of the existing 300MW units
= Net generating output of base line - Net generating output of new unit
= 2,237,680 (MWh/Year) - 1,784,412 (MWh/Year)
= 453,268 MWh/Year
As the auxiliary power ratio of the existing 300MW units is 7.0%, the
annual gross generating output is obtained as follows:
Annual gross generating output of the existing 300MW units
=Annual net generating output/ ( 1 — 0.07 )
= 487,384 MWh/Year
This is equivalent to the calendar day utilization factor, 6.2%.
Thermal efficiency/heat rate of the existing 300MW units is the same as
that of the base line. By using the present heat rate obtained in 1.2.2 above,
the annual energy consumption of the existing units after the project is also
obtained as follows:
Annual energy consumption of the existing 300MW units
= Annual gross generating output X Gross heat rate
= 487,384 (MWh/Year) X 10A3 X 10865 (kJ/kWh) X 10A-9
= 5,295 TJ/Year
-3-9 -
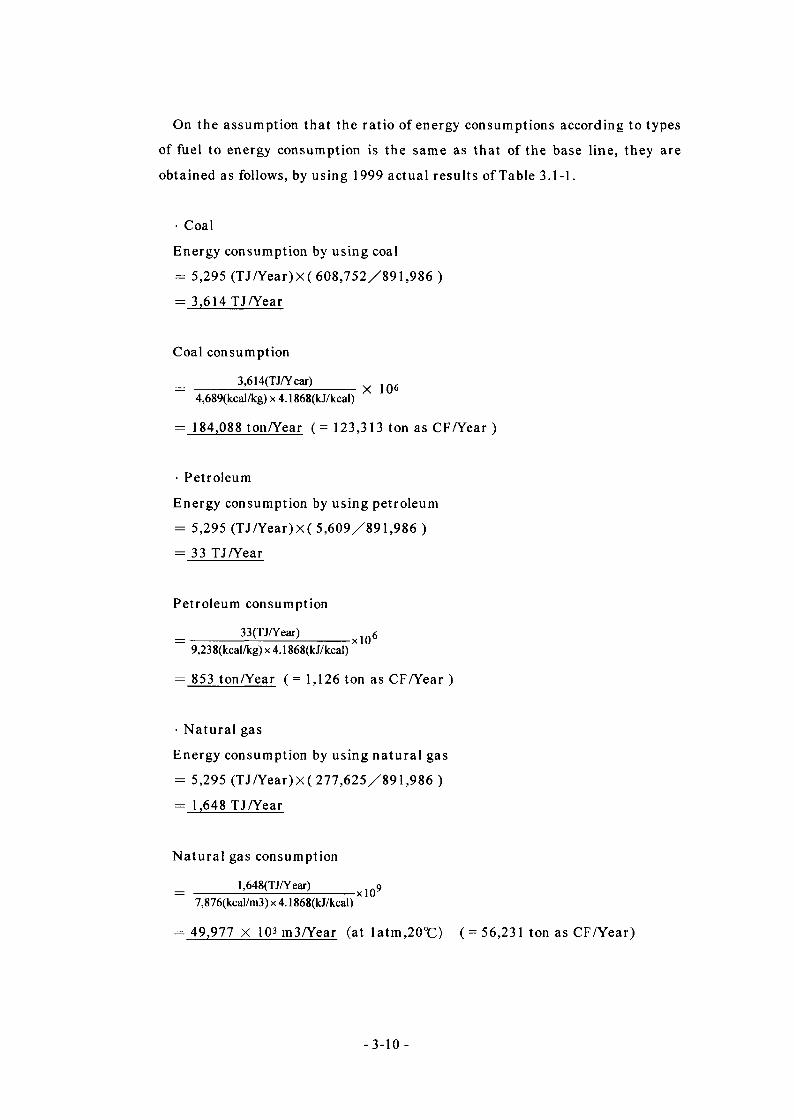
On the assumption that the ratio of energy consumptions according to types
of fuel to energy consumption is the same as that of the base line, they are
obtained as follows, by using 1999 actual results of Table 3.1-1.
• Coal
Energy consumption by using coal
= 5,295 (TJ/Year)X( 608,752/891,986 )
= 3,614 TJ/Year
Coal consumption
3,614(TJ/Y ear)4,689(kcal/kg) x 4.1868(kJ/kcal)
X 106
— 184,088 ton/Year (= 123,313 ton as CF/Year )
• Petroleum
Energy consumption by using petroleum
= 5,295 (TJ/Year)X( 5,609/891,986 )
= 33 TJ/Year
Petroleum consumption
= 3 3 (TJ/Year) 1q69,238(kcal/kg) x 4.1868(kJ/kcal)
= 853 ton/Year ( = 1,126 ton as CF/Year )
• Natural gas
Energy consumption by using natural gas
= 5,295 (TJ/Year)X( 277,625/891,986 )
= 1,648 TJ/Year
Natural gas consumption
_ ______ 1,648(TJ/Year)_______ xl()97,876(kcal/m3) x 4.1868(kJ/kcal)
= 49,977 X 103 m3/Year (at latm,20°C) ( = 56,231 ton as CF/Year)
- 3-10 -
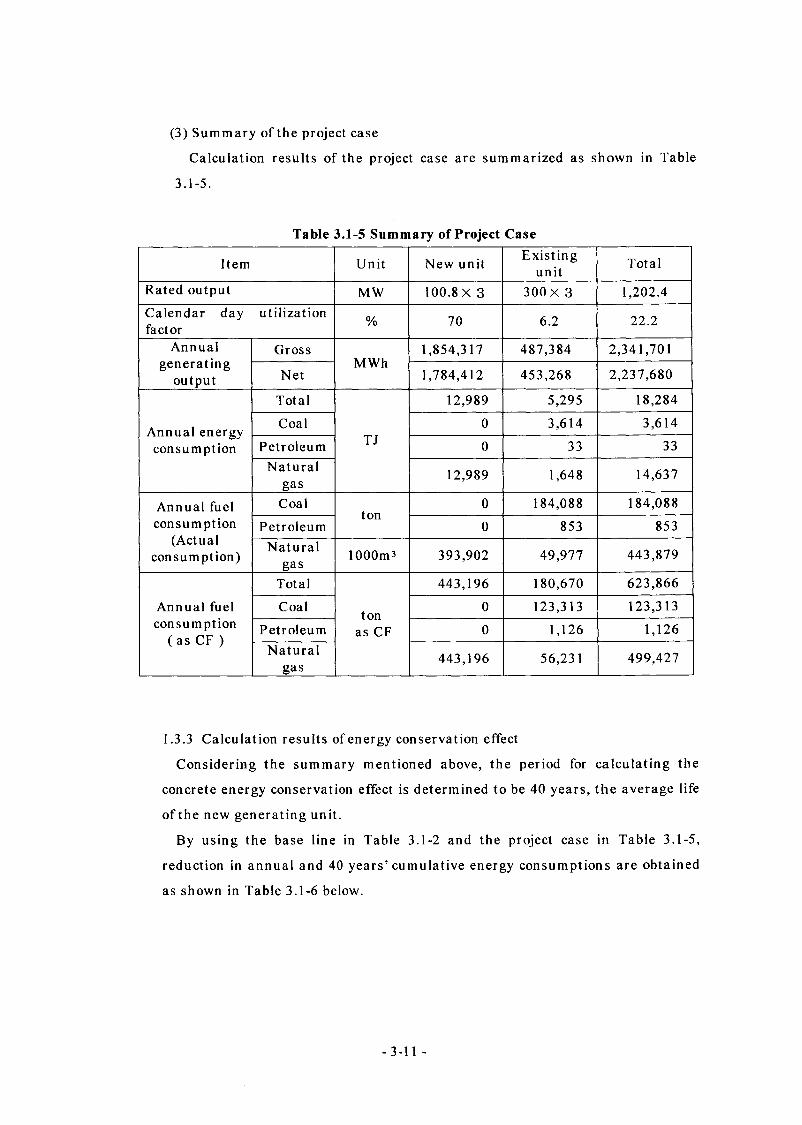
(3) Summary of the project case
Calculation results of the project case are summarized as shown in Table
3.1-5.
Table 3.1-5 Summary of Project Case
Item Unit New unit Existingunit Total
Rated output MW 100.8 X 3 300 X 3 1,202.4Calendar day utilization factor % 70 6.2 22.2
Annualgenerating
output
GrossMWh
1,854,317 487,384 2,341,701
Net 1,784,412 453,268 2,237,680
Annual energy consumption
Total
TJ
12,989 5,295 18,284
Coal 0 3,614 3,614
Petroleum 0 33 33Natural
gas 12,989 1,648 14,637
Annual fuel consumption
(Actual consumption)
Coalton
0 184,088 184,088
Petroleum 0 853 853Natural
gas 1000m3 393,902 49,977 443,879
Annual fuel consumption
(as CF )
Total
tonas CF
443,196 180,670 623,866
Coal 0 123,313 123,313
Petroleum 0 1,126 1,126Natural
gas 443,196 56,231 499,427
1.3.3 Calculation results of energy conservation effect
Considering the summary mentioned above, the period for calculating the
concrete energy conservation effect is determined to be 40 years, the average life
of the new generating unit.
By using the base line in Table 3.1-2 and the project case in Table 3.1-5,
reduction in annual and 40 years’cumulative energy consumptions are obtained
as shown in Table 3.1-6 below.
-3-11 -
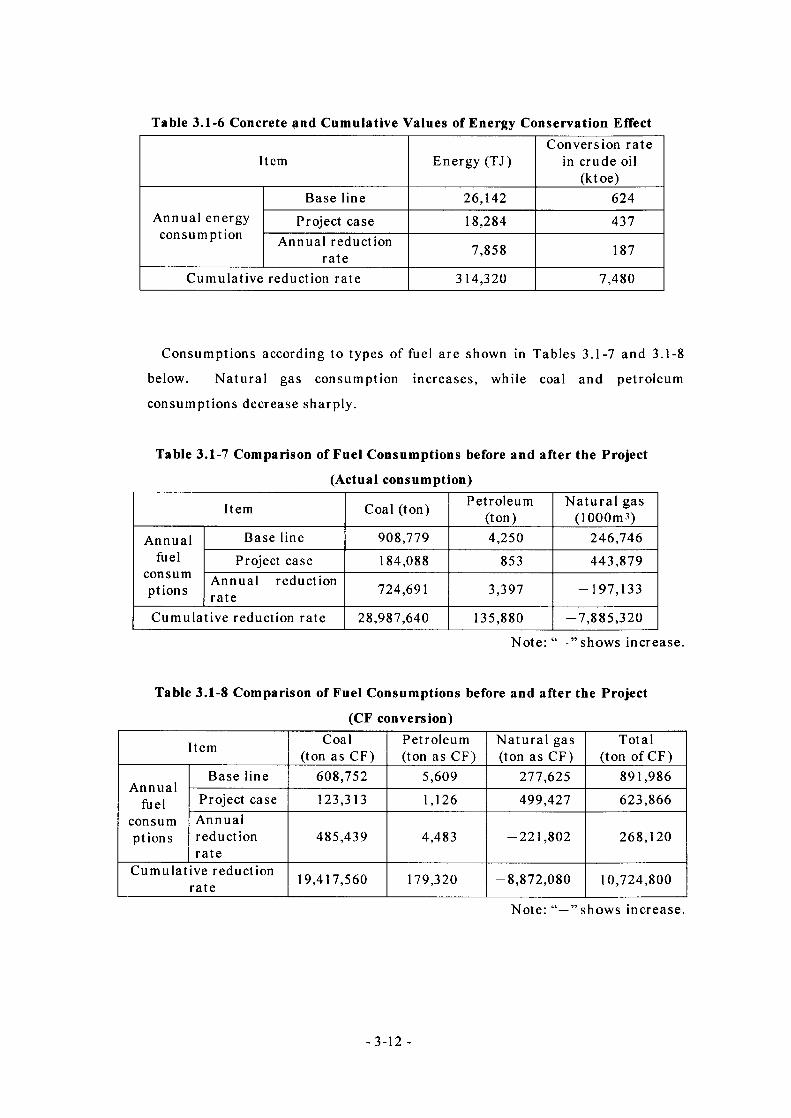
Table 3.1-6 Concrete and Cumulative Values of Energy Conservation Effect
Item Energy (TJ)Conversion rate
in crude oil (ktoe)
Annual energy consumption
Base line 26,142 624
Project case 18,284 437Annual reduction
rate 7,858 187
Cumulative reduction rate 314,320 7,480
Consumptions according to types of fuel are shown in Tables 3.1-7 and 3.1-8
below. Natural gas consumption increases, while coal and petroleum
consumptions decrease sharply.
Table 3.1-7 Comparison of Fuel Consumptions before and after the Project
(Actual consumption)
Item Coal (ton) Petroleum(ton)
Natural gas (1000m3)
Annualfuel
consumptions
Base line 908,779 4,250 246,746Project case 184,088 853 443,879
Annual reductionrate 724,691 3,397 -197,133
Cumulative reduction rate 28,987,640 135,880 -7,885,320
Note: “—’’shows increase.
Table 3.1-8 Comparison of Fuel Consumptions before and after the Project
(CF conversion)
Item Coal(ton as CF)
Petroleum (ton as CF)
Natural gas (ton as CF)
Total(ton of CF)
Annualfuel
consumptions
Base line 608,752 5,609 277,625 891,986Project case 123,313 1,126 499,427 623,866Annualreductionrate
485,439 4,483 -221,802 268,120
Cumulative reductionrate 19,417,560 179,320 -8,872,080 10,724,800
Note: “—’’shows increase.
-3-12 -
1.4 Confirming energy consumption effect
In this project, we plan to scrap the existing 300 MW generating unit and newly
to construct the combined cycle generating unit (100 MW X 3 blocks).
The project enables improvement in thermal efficiency of the thermal power
plant. By comparing thermal efficiencies of the plant before and after the project,
energy conservation effect can be confirmed concretely.
Accordingly, for obtaining thermal efficiency of the thermal power plant, it is
indispensable to measure fuel gas consumption and gross/net generating output
of the new combined cycle generating unit. Therefore the new combined cycle
unit shall be equipped with a fuel meter and a wattmeter.
In the project case for assessing energy conservation effect, it is assumed that
the new generating units with high thermal efficiency will be operated at
utilization factor of 70% prior to the existing 300MW units. Owing to the
shortage of generating output before improvement, the three existing coal-fired
generating units (Nos. 11, 13, and 14) remaining after the project will be operated
to supply the shortage.
By comparing the ratio of fuel consumption to the equal generating output of
these three existing coal-fired units and the new combined cycle generating unit,
energy conservation effect can be appropriately assessed.
2. Effects of reducing greenhouse effect gases
2.1 Technical basis for reducing greenhouse effect gases
In this project, we will scrap one of the existing coal-fired units of 300 MW in
Pridneprovskaya Thermal Power Plant , and newly to construct a combined cycle
generation unit using gas (100 MW X 3 blocks).
The combined cycle unit is the highly efficient generating system combining the
gas turbine generating unit and the boiler/steam turbine generating unit.
Adoption of the system enables thermal efficiency and energy conservation to
greatly improve compared with the existing units, thus reducing fuel
consumption. This system enables reduction of CO2 to be generated and emitted
by fuel combustion.
-3-13 -
Here we will omit features of each generating system and the principle of
combined cycle generation, since we mentioned them in “1.1 Technical basis for
producing energy conservation effect” in this chapter. Thermal efficiency of the
superannuated coal-fired generating unit to be scrapped is 35% at best. On the
other hand, that of the new combined cycle unit using l,400°C-class gas turbine is
expected to be 52.5% at rated output.
Thus improvement of thermal efficiency enables reduction in fuel consumption
or CO2 emissions.
The main fuel for the generating unit to be scrapped is coal. In this project,
however, we will use only natural gas for the combined cycle unit to be newly
constructed. While the present utilization factor of the unit to be scrapped is as
low as 20%, the new unit with high efficiency and favorable utilization is expected
to have high operation rate of approx. 70%. After carrying out the project, such
high operation rate will be effective in controlling operations of the existing coal-
fired units (Nos. 11,13 and 14) other than that to be scrapped.
If natural gas mainly consisting of methane (CH4) including hydrogen is used,
CO2 emissions original unit per energy unit is approx. 3/5 compared with the case
using coal mainly consisting of carbon. As explained above, if fuel for the units is
changed from coal to natural gas, and coal consumption is reduced by using
existing thermal power with the help of high performance of the new natural gas
fueled unit, CO2 emissions will be reduced.
This project will bring both reduction in fuel consumption owing to
improvement in thermal efficiency and fuel conversion from coal into natural gas.
Such multiplier effect enables drastic reduction in CO2 emissions.
2.2 Base line for calculating reduction in greenhouse effect gases
2.2.1 Setting base line
(1) Units to be assessed
At present, Pridneprovskaya Thermal Power Plant consists of four coal-fired
units Nos.7 - 10 (150 MW and heat supply) and other four coal-fired units
Nos.11 - 14 (300 MW) exclusively for power generation. In this project, we
plan to scrap the No.12 out of the four 300 MW units, which has been under
long-term stoppage, and newly to construct a combined cycle unit with equal
-3-14-
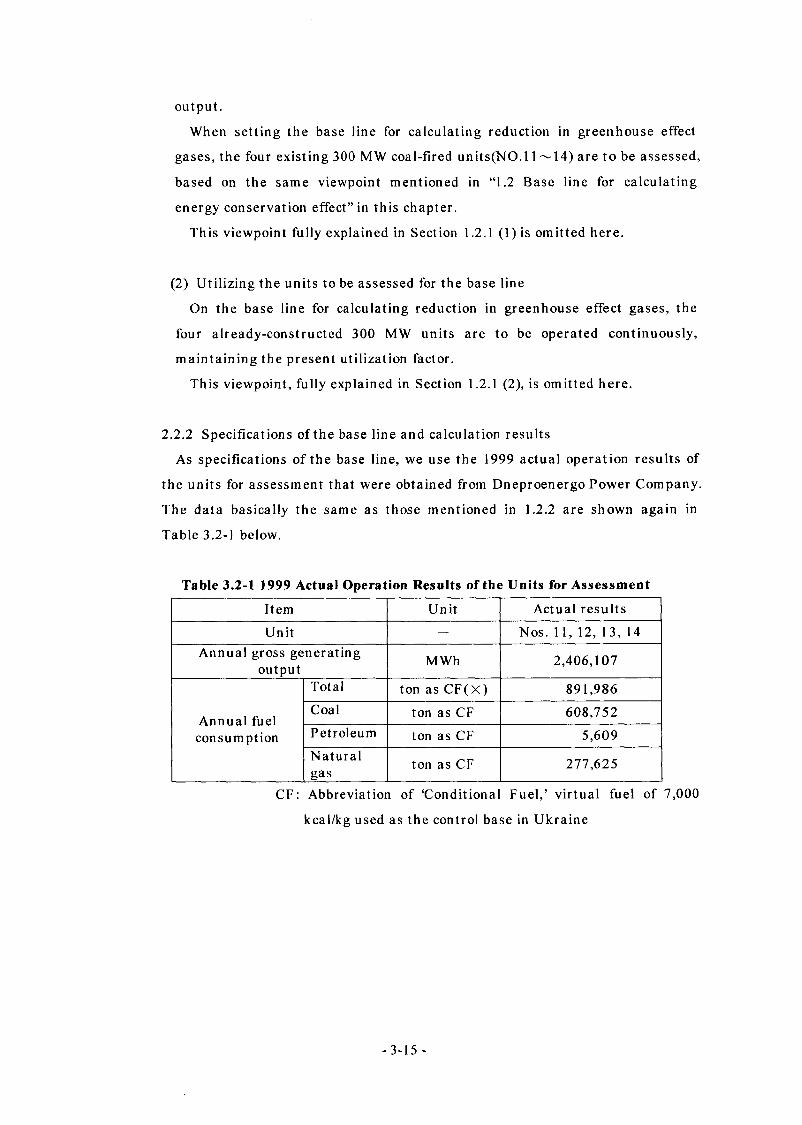
output.
When setting the base line for calculating reduction in greenhouse effect
gases, the four existing 300 MW coal-fired units(N0.11 ~14) are to be assessed,
based on the same viewpoint mentioned in “1.2 Base line for calculating
energy conservation effect” in this chapter.
This viewpoint fully explained in Section 1.2.1 (1) is omitted here.
(2) Utilizing the units to be assessed for the base line
On the base line for calculating reduction in greenhouse effect gases, the
four already-constructed 300 MW units are to be operated continuously,
maintaining the present utilization factor.
This viewpoint, fully explained in Section 1.2.1 (2), is omitted here.
2.2.2 Specifications of the base line and calculation results
As specifications of the base line, we use the 1999 actual operation results of
the units for assessment that were obtained from Dneproenergo Power Company.
The data basically the same as those mentioned in 1.2.2 are shown again in
Table 3.2-1 below.
Table 3.2-1 1999 Actual Operation Results of the Units for Assessment
Item Unit Actual results
Unit — Nos. 11, 12, 13, 14Annual gross generating
output MWh 2,406,107
Annual fuel consumption
Total ton as CF(X) 891,986Coal ton as CF 608,752Petroleum ton as CF 5,609Naturalgas ton as CF 277,625
CF: Abbreviation of ‘Conditional Fuel,’ virtual fuel of 7,000
kcal/kg used as the control base in Ukraine
-3-15 -
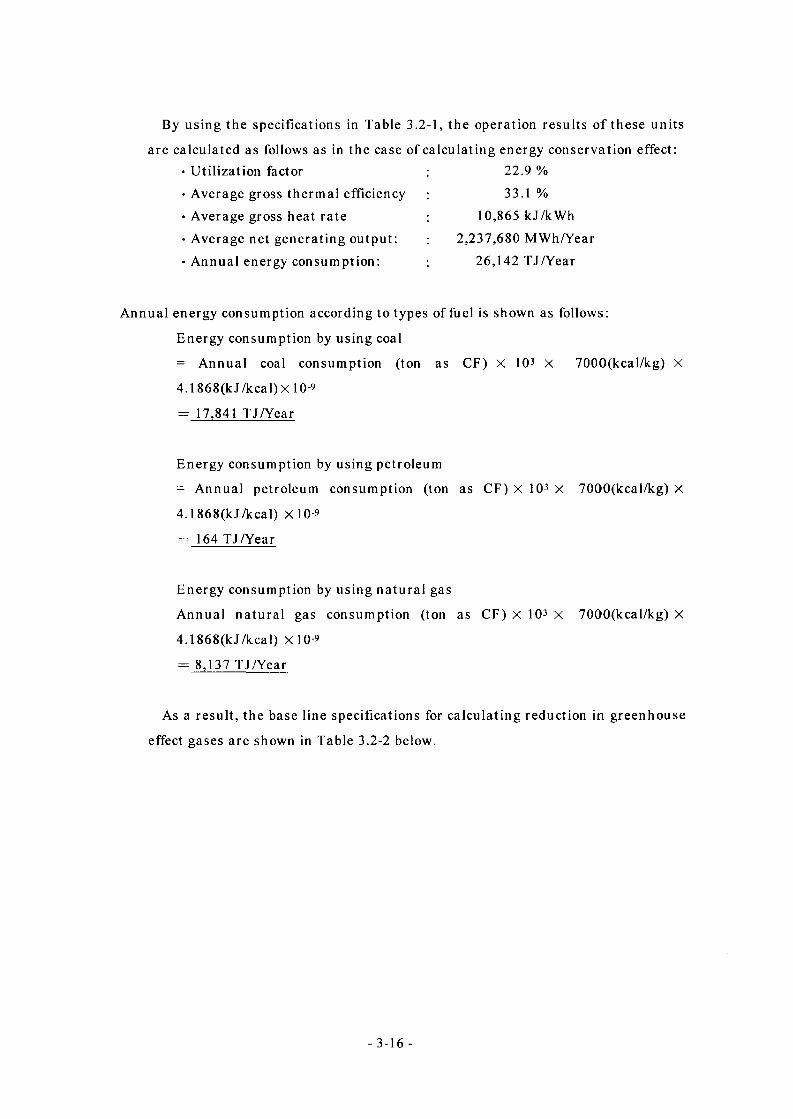
By using the specifications in Table 3.2-1, the operation results of these units
are calculated as follows as in the case of calculating energy conservation effect:22.9 %33.1 %
10,865 kJ/kWh 2,237,680 MWh/Year
26,142 TJ/Year
• Utilization factor• Average gross thermal efficiency• Average gross heat rate• Average net generating output:• Annual energy consumption:
Annual energy consumption according to types of fuel is shown as follows:
Energy consumption by using coal
= Annual coal consumption (ton as CF) X 103 X 7000(kcal/kg) X
4.1868(kJ/kcal)X 10-9
= 17,841 TJ/Year
Energy consumption by using petroleum
= Annual petroleum consumption (ton as CF) X 103 X 7000(kcal/kg) X
4.1868(kJ/kcal) Xl(M
= 164 TJ/Year
Energy consumption by using natural gas
Annual natural gas consumption (ton as CF) X 103 X 7000(kcal/kg) X
4.1868(kJ/kcal) XlO-9
= 8,137 TJ/Year
As a result, the base line specifications for calculating reduction in greenhouse
effect gases are shown in Table 3.2-2 below.
-3-16 -
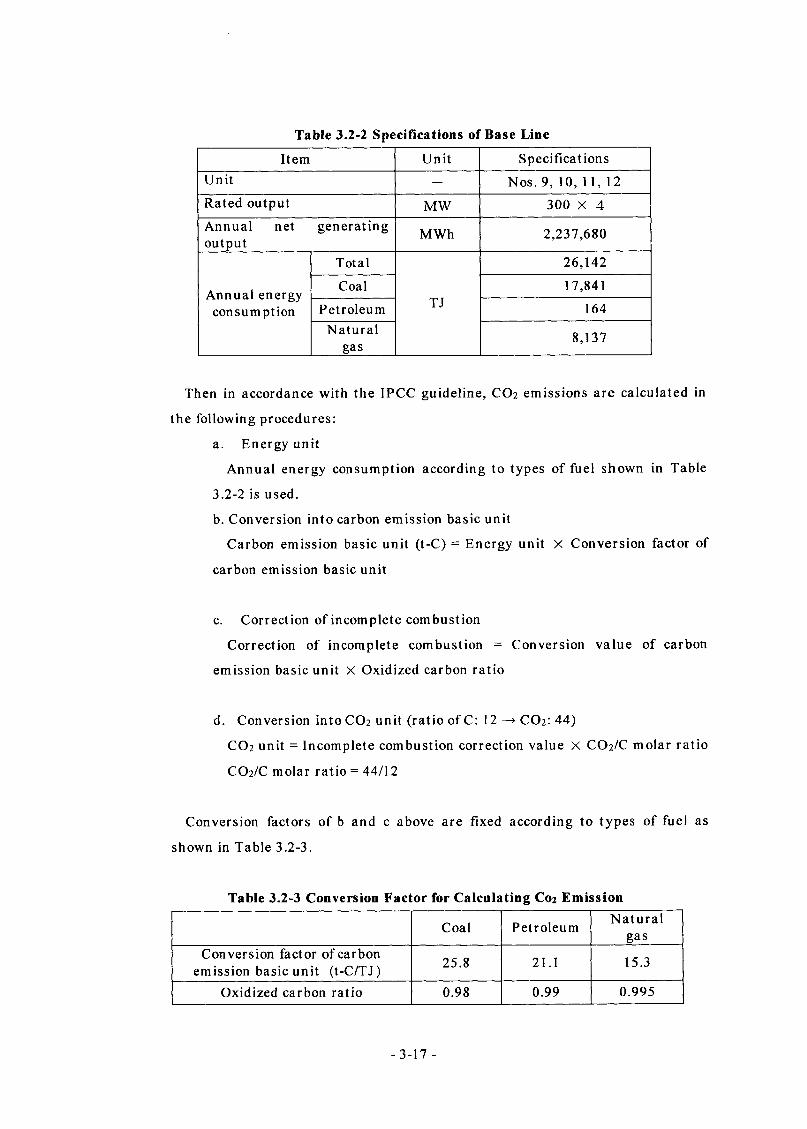
Table 3.2-2 Specifications of Base Line
Item Unit SpecificationsUnit — Nos. 9, 10, 11, 12Rated output MW 300 X 4Annual net generating output MWh 2,237,680
Annual energy consumption
Total
TJ
26,142
Coal 17,841
Petroleum 164Natural
gas 8,137
Then in accordance with the IPCC guideline, CO2 emissions are calculated in
the following procedures:
a. Energy unit
Annual energy consumption according to types of fuel shown in Table
3.2-2 is used.
b. Conversion into carbon emission basic unit
Carbon emission basic unit (t-C) = Energy unit X Conversion factor of
carbon emission basic unit
c. Correction of incomplete combustion
Correction of incomplete combustion = Conversion value of carbon
emission basic unit X Oxidized carbon ratio
d. Conversion into CO2 unit (ratio of C: 12 —» CO2: 44)
CO2 unit = Incomplete combustion correction value X CO2/C molar ratio
CO2/C molar ratio = 44/12
Conversion factors of b and c above are fixed according to types of fuel as
shown in Table 3.2-3.
Table 3.2-3 Conversion Factor for Calculating C02 Emission
Coal Petroleum Naturalgas
Conversion factor of carbon emission basic unit (t-C/TJ) 25.8 21.1 15.3
Oxidized carbon ratio 0.98 0.99 0.995
-3-17 -
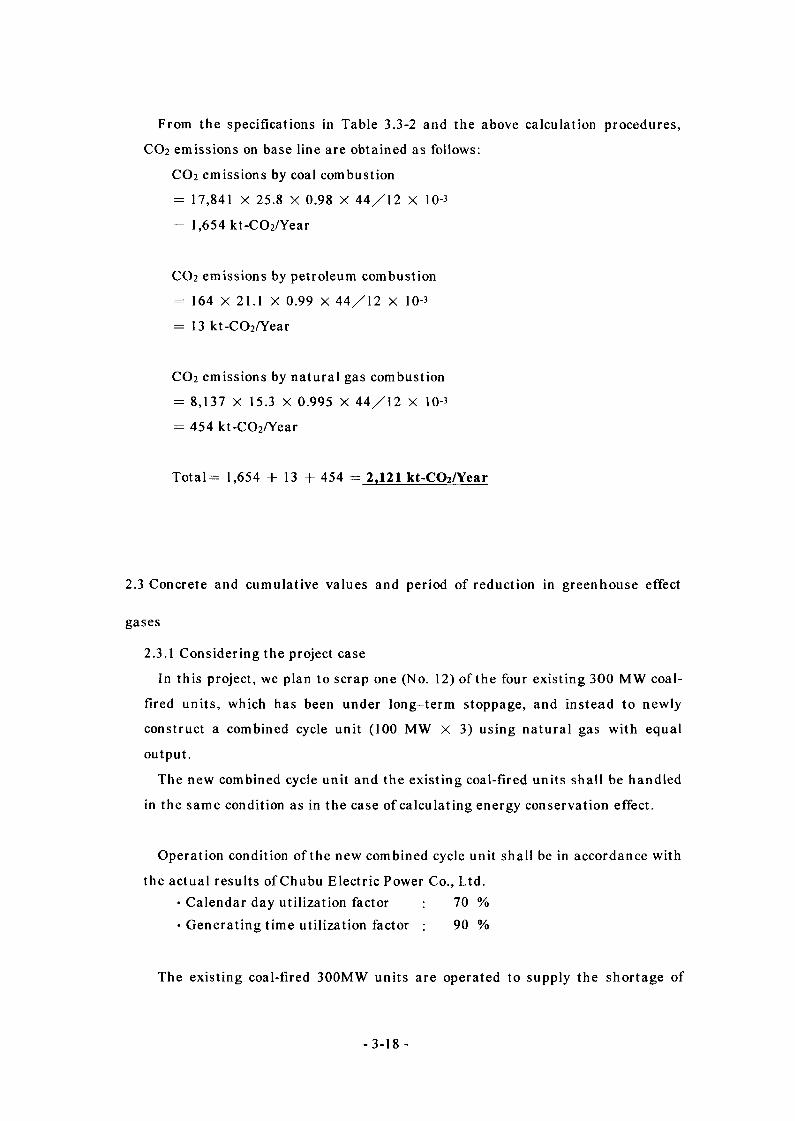
From the specifications in Table 3.3-2 and the above calculation procedures,
CO2 emissions on base line are obtained as follows:
CO2 emissions by coal combustion
= 17,841 X 25.8 X 0.98 X 44/12 X 10-3
= 1,654 kt-C02/Year
CO2 emissions by petroleum combustion
= 164 X 21.1 X 0.99 X 44/12 X 10-3
= 13 kt-CCh/Year
CO2 emissions by natural gas combustion
= 8,137 X 15.3 X 0.995 X 44/12 X 10-3
= 454 kt-CC>2/Year
Totals 1,654 + 13 + 454 = 2,121 kt-CQ2/Year
2.3 Concrete and cumulative values and period of reduction in greenhouse effect
gases
2.3.1 Considering the project case
In this project, we plan to scrap one (No. 12) of the four existing 300 MW coal-
fired units, which has been under long-term stoppage, and instead to newly
construct a combined cycle unit (100 MW X 3) using natural gas with equal
output.
The new combined cycle unit and the existing coal-fired units shall be handled
in the same condition as in the case of calculating energy conservation effect.
Operation condition of the new combined cycle unit shall be in accordance with
the actual results of Chubu Electric Power Co., Ltd.• Calendar day utilization factor 70 %• Generating time utilization factor 90 %
The existing coal-fired 300MW units are operated to supply the shortage of
- 3-18 -
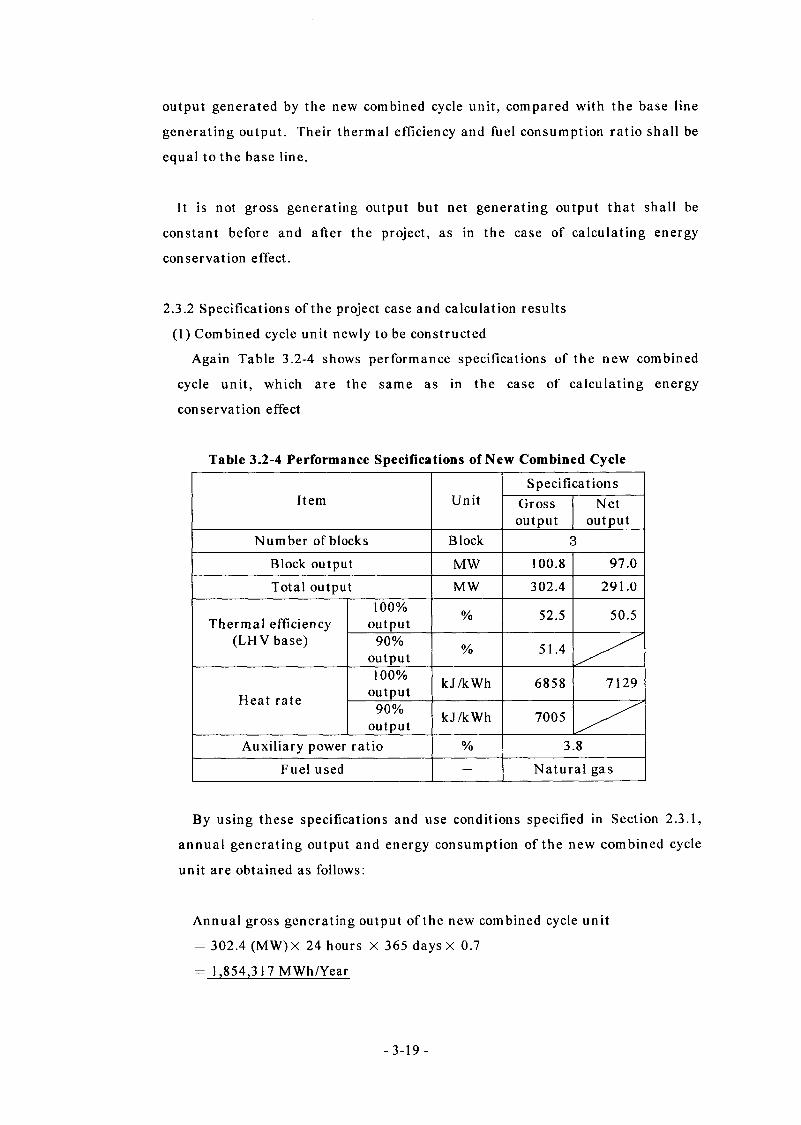
output generated by the new combined cycle unit, compared with the base line
generating output. Their thermal efficiency and fuel consumption ratio shall be
equal to the base line.
It is not gross generating output but net generating output that shall be
constant before and after the project, as in the case of calculating energy
conservation effect.
2.3.2 Specifications of the project case and calculation results
(1) Combined cycle unit newly to be constructed
Again Table 3.2-4 shows performance specifications of the new combined
cycle unit, which are the same as in the case of calculating energy
conservation effect
Table 3.2-4 Performance Specifications of New Combined Cycle
Item UnitSpecifications
Grossoutput
Netoutput
Number of blocks Block 3Block output MW 100.8 97.0
Total output MW 302.4 291.0
Thermal efficiency (LHV base)
100% output % 52.5 50.5
90%output % 51.4
Heat rate
100% output kJ/kWh 6858 7129
90%output kJ/kWh 7005
Auxiliary power ratio % 3.8
Fuel used — Natural gas
By using these specifications and use conditions specified in Section 2.3.1,
annual generating output and energy consumption of the new combined cycle
unit are obtained as follows:
Annual gross generating output of the new combined cycle unit
= 302.4 (MW)X 24 hours X 365 days X 0.7
= 1,854,317 MWh/Year
-3-19-
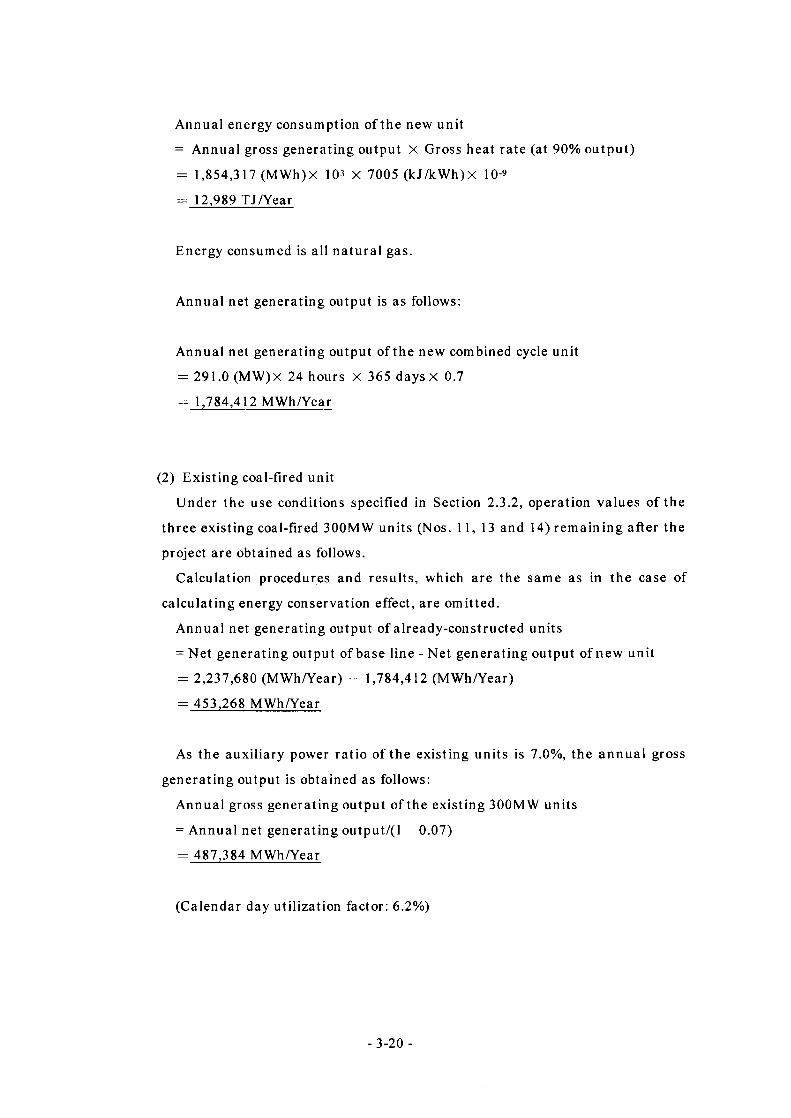
Annual energy consumption of the new unit
= Annual gross generating output X Gross heat rate (at 90% output)
= 1,854,317 (MWh)X 103 X 7005 (kJ/kWh)X 10-9
= 12,989 TJ/Year
Energy consumed is all natural gas.
Annual net generating output is as follows:
Annual net generating output of the new combined cycle unit
= 291.0 (MW)X 24 hours X 365 days X 0.7
= 1,784,412 MWh/Year
(2) Existing coal-fired unit
Under the use conditions specified in Section 2.3.2, operation values of the
three existing coal-fired 300MW units (Nos. 11, 13 and 14) remaining after the
project are obtained as follows.
Calculation procedures and results, which are the same as in the case of
calculating energy conservation effect, are omitted.
Annual net generating output of already-constructed units
= Net generating output of base line - Net generating output of new unit
= 2,237,680 (MWh/Year) - 1,784,412 (MWh/Year)
= 453,268 MWh/Year
As the auxiliary power ratio of the existing units is 7.0%, the annual gross
generating output is obtained as follows:
Annual gross generating output of the existing 300MW units
= Annual net generating output/(l - 0.07)
= 487,384 MWh/Year
(Calendar day utilization factor: 6.2%)
- 3-20 -
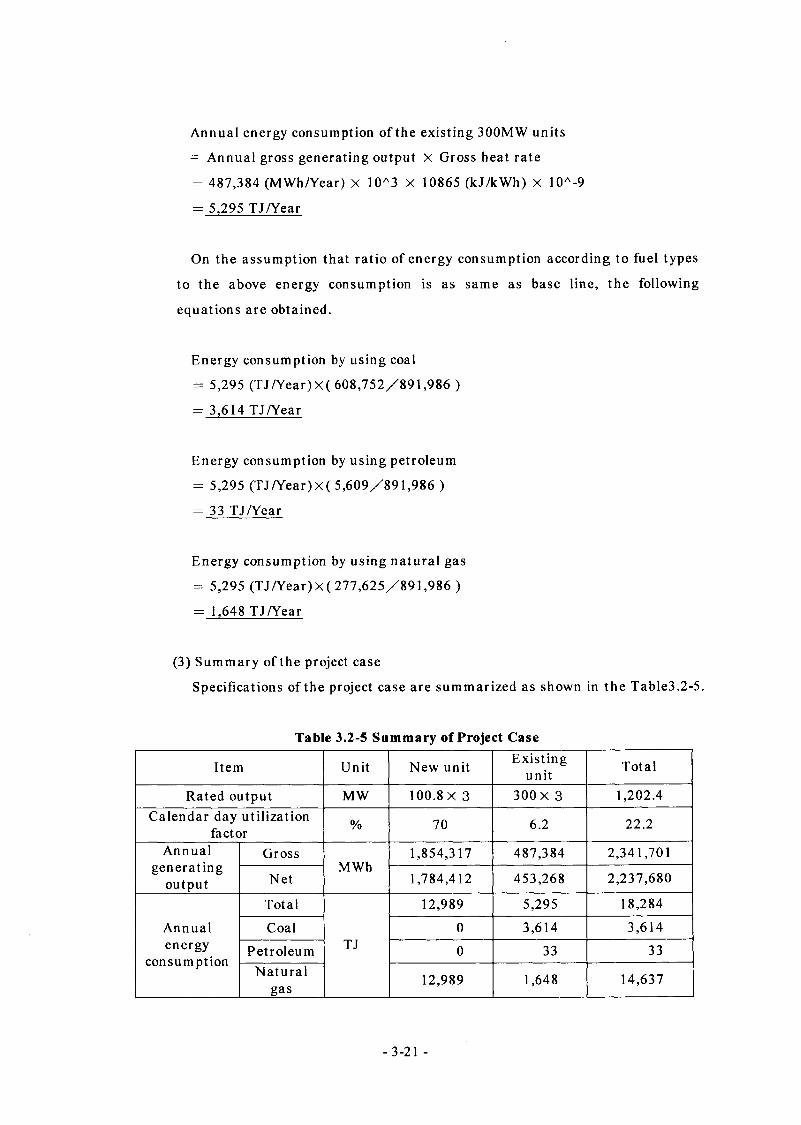
Annual energy consumption of the existing 300MW units
= Annual gross generating output X Gross heat rate
= 487,384 (MWh/Year) x 10A3 X 10865 (kJ/kWh) X 10A-9
= 5,295 TJ/Year
On the assumption that ratio of energy consumption according to fuel types
to the above energy consumption is as same as base line, the following
equations are obtained.
Energy consumption by using coal
= 5,295 (TJ/Year)X( 608,752/891,986 )
= 3,614 TJ/Year
Energy consumption by using petroleum
= 5,295 (TJ/Year)X( 5,609/891,986 )
= 33 TJ/Year
Energy consumption by using natural gas
= 5,295 (TJ/Year)X( 277,625/891,986 )
= 1,648 TJ/Year
(3) Summary of the project case
Specifications of the project case are summarized as shown in the Table3.2-5.
Table 3.2-5 Summary of Project Case
Item Unit New unit Existingunit Total
Rated output MW 100.8 X 3 300 X 3 1,202.4Calendar day utilization
factor % 70 6.2 22.2
Annualgenerating
output
GrossMWh
1,854,317 487,384 2,341,701
Net 1,784,412 453,268 2,237,680
Annualenergy
consumption
Total
TJ
12,989 5,295 18,284
Coal 0 3,614 3,614
Petroleum 0 33 33Natural
gas 12,989 1,648 14,637
-3-21 -
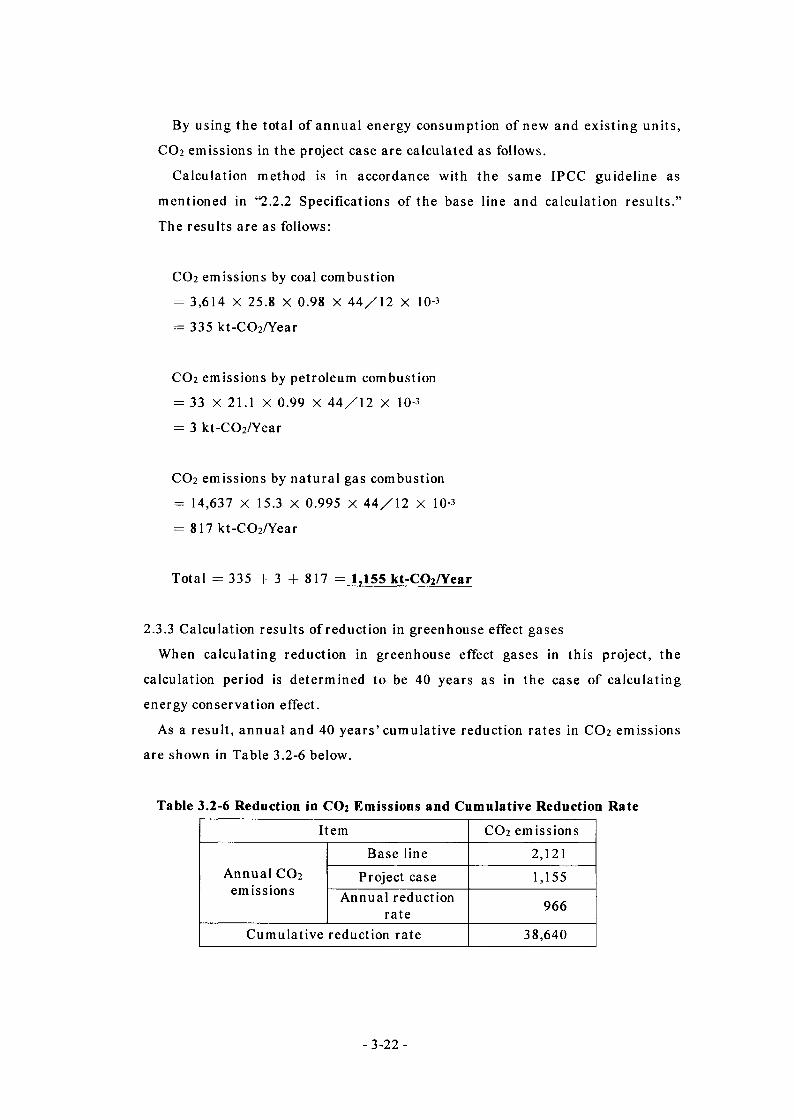
By using the total of annual energy consumption of new and existing units,
CO2 emissions in the project case are calculated as follows.
Calculation method is in accordance with the same IPCC guideline as
mentioned in “2.2.2 Specifications of the base line and calculation results.”
The results are as follows:
CO2 emissions by coal combustion
= 3,614 X 25.8 X 0.98 X 44/12 X 10-3
= 335 kt-CCh/Year
CO2 emissions by petroleum combustion
= 33 X 21.1 X 0.99 X 44/12 X 10-3
= 3 kt-CCh/Year
CO2 emissions by natural gas combustion
= 14,637 X 15.3 X 0.995 X 44/12 X 10-3
= 817 kt-CG2/Year
Total = 335 + 3 + 817 = 1,155 kt-CQ2/Year
2.3.3 Calculation results of reduction in greenhouse effect gases
When calculating reduction in greenhouse effect gases in this project, the
calculation period is determined to be 40 years as in the case of calculating
energy conservation effect.
As a result, annual and 40 years’cumulative reduction rates in CO2 emissions
are shown in Table 3.2-6 below.
Table 3.2-6 Reduction in CO2 Emissions and Cumulative Reduction Rate
Item CO2 emissions
Annual CO2 emissions
Base line 2,121
Project case 1,155Annual reduction
rate 966
Cumulative reduction rate 38,640
-3-22 -
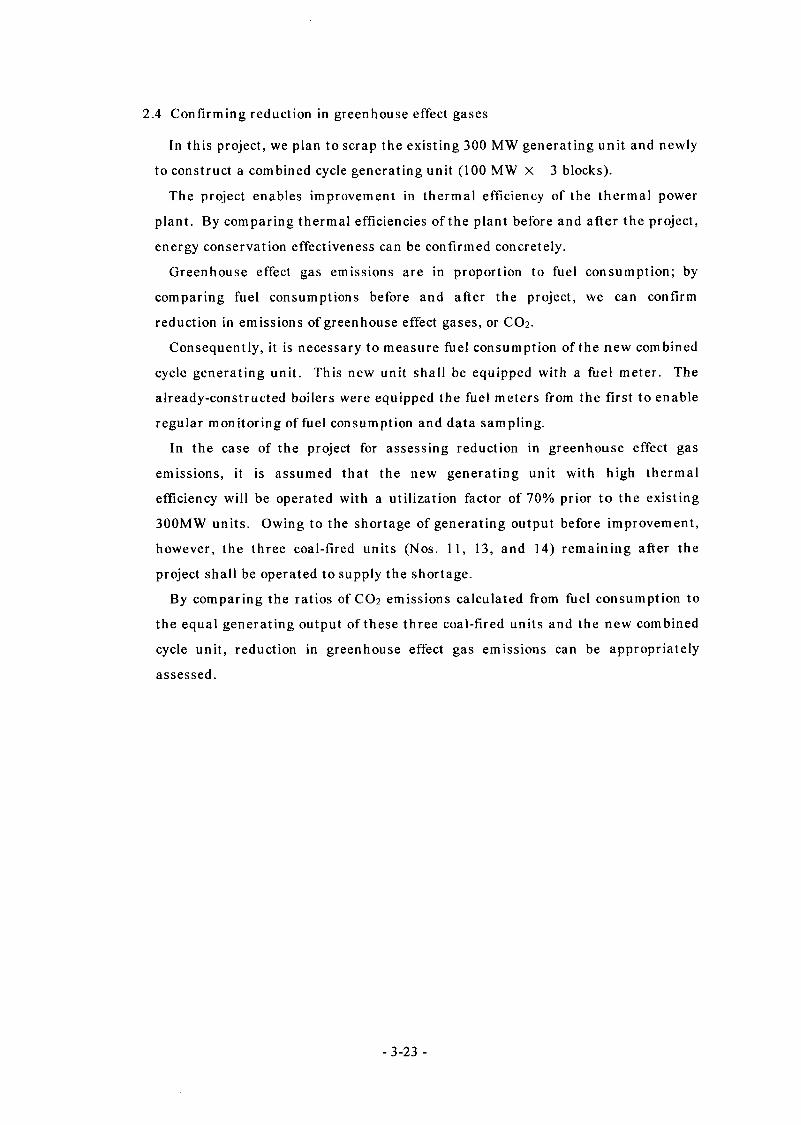
2.4 Confirming reduction in greenhouse effect gases
In this project, we plan to scrap the existing 300 MW generating unit and newly
to construct a combined cycle generating unit (100 MW X 3 blocks).
The project enables improvement in thermal efficiency of the thermal power
plant. By comparing thermal efficiencies of the plant before and after the project,
energy conservation effectiveness can be confirmed concretely.
Greenhouse effect gas emissions are in proportion to fuel consumption; by
comparing fuel consumptions before and after the project, we can confirm
reduction in emissions of greenhouse effect gases, or CO2.
Consequently, it is necessary to measure fuel consumption of the new combined
cycle generating unit. This new unit shall be equipped with a fuel meter. The
already-constructed boilers were equipped the fuel meters from the first to enable
regular monitoring of fuel consumption and data sampling.
In the case of the project for assessing reduction in greenhouse effect gas
emissions, it is assumed that the new generating unit with high thermal
efficiency will be operated with a utilization factor of 70% prior to the existing
300MW units. Owing to the shortage of generating output before improvement,
however, the three coal-fired units (Nos. 11, 13, and 14) remaining after the
project shall be operated to supply the shortage.
By comparing the ratios of CO2 emissions calculated from fuel consumption to
the equal generating output of these three coal-fired units and the new combined
cycle unit, reduction in greenhouse effect gas emissions can be appropriately
assessed.
- 3-23 -
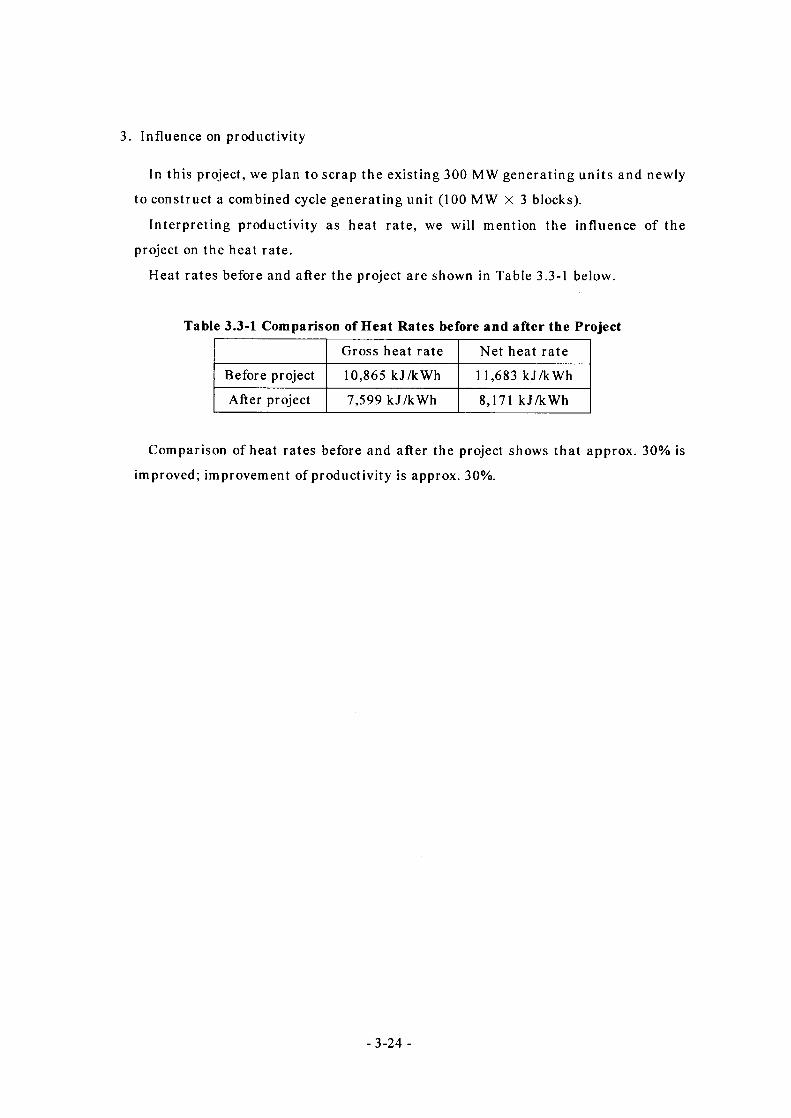
3. Influence on productivity
In this project, we plan to scrap the existing 300 MW generating units and newly
to construct a combined cycle generating unit (100 MW X 3 blocks).
Interpreting productivity as heat rate, we will mention the influence of the
project on the heat rate.
Heat rates before and after the project are shown in Table 3.3-1 below.
Table 3.3-1 Comparison of Heat Rates before and after the Project
Gross heat rate Net heat rate
Before project 10,865 kJ/kWh 11,683 kJ/kWh
After project 7,599 kJ/kWh 8,171 kJ/kWh
Comparison of heat rates before and after the project shows that approx. 30% is
improved; improvement of productivity is approx. 30%.
- 3-24 -

Chapter.4 Profitability
[Summary]This chapter deals with the profitability of this project.Analyses were conducted based on two assumptions- a case
considered to be the most down-to-earth in light of the present electric power conditions of Ukraine (Case l)l and a case where future implementation of greenhouse gas (CO2) emission trading is taken into consideration in assessment of the profitability (Case 2). These cases assume that the project is funded by an environmental yen loan (with a repayment period of 40 years including 10 years' grace, and with an interest rate of 0.75%).
As a result, in the [Case 1], internal rate of return (IRR) becomes 7.32% and payback period becomes 16 years. Therefore, introduction of private sector capital is not expectable. However, from the viewpoint of a yen loan project, payment of a debt is no problem and there is no doubt about feasibility of this project as a business.
Moreover, in the [Case 2] in which revenue from CO2 emission trading is taken into consideration, IRR becomes 8.24% and payback period becomes 15 years.
1. Financial investment recovery effect
In this section, the calculation/assessment of financial investment recovery effect as a business is conducted on the following two cases, based on the plans of the project described in the previous chapters*
[Case 1 (Revenue = Revenue from sales of electricity)In this case, an assessment is made on the profitability of a new plant alone. So,
all the revenue from the sales of electricity generated at a newly constructed plant is considered to be the project revenue. And the economic ripple effects of the new plant on other factors are not taken into consideration. Accordingly, the case does not assume greenhouse gas (CO2) emission trading.
[Case 2 (Revenue = Revenue from trading of 1/2 of reduced CO2 emission + Revenue from sales of electricity)]
In this case, under a joint implementation scheme, the Ukraine side gains revenue from emissions trading for 1/2 of reduced CO2 emission. This revenue plus revenue from sales of electricity are considered as the project revenue in assessment of the profitability.
41-
1.1 Assessment method
After preparation of an income statement and cash flow chart, the net present value (NPV), the internal rate of return (IRR), and the payback period are calculated, and used as the indicators in the assessment of the profitability of the investment project.
[Net present value (NPV)]
NPV =Rt
M (1 + 0'-/
R: Free cash flow i- Discount rate (Capital cost)t' Term (cash flow of the investment occurring in “n”
years)I- Amount of investment
[Internal rate of return (IRR)]R: Free cash flow r* Internal rate of returnt- Term (cash flow of the investment occurring in “n”
years)I- Amount of investment
The internal rate of return (IRR) is the "r" that meets the above equation, which means the discount rate that makes the NPV equal to zero. In other words, the IRR is the value that what percent interest the return yielded by the investment to the project is equivalent to.
[Payback period]Payback period is the period in which the accumulation of the initial
investment amount and subsequent cash flow in and out becomes equal to zero.
'=1 Rt
E'O + r)'
1.2 Calculation conditions
For assessment, the following calculation conditions were adopted.[Assessment currency]
Due to its moderate fluctuations, the US dollar was adopted.Fig. 4.11 shows changes in the exchange rate between Ukraine Hryvnia (UAH)
and US dollar (US$). Since the rate fluctuated sharply between 1997 and 2001,
-4-2-
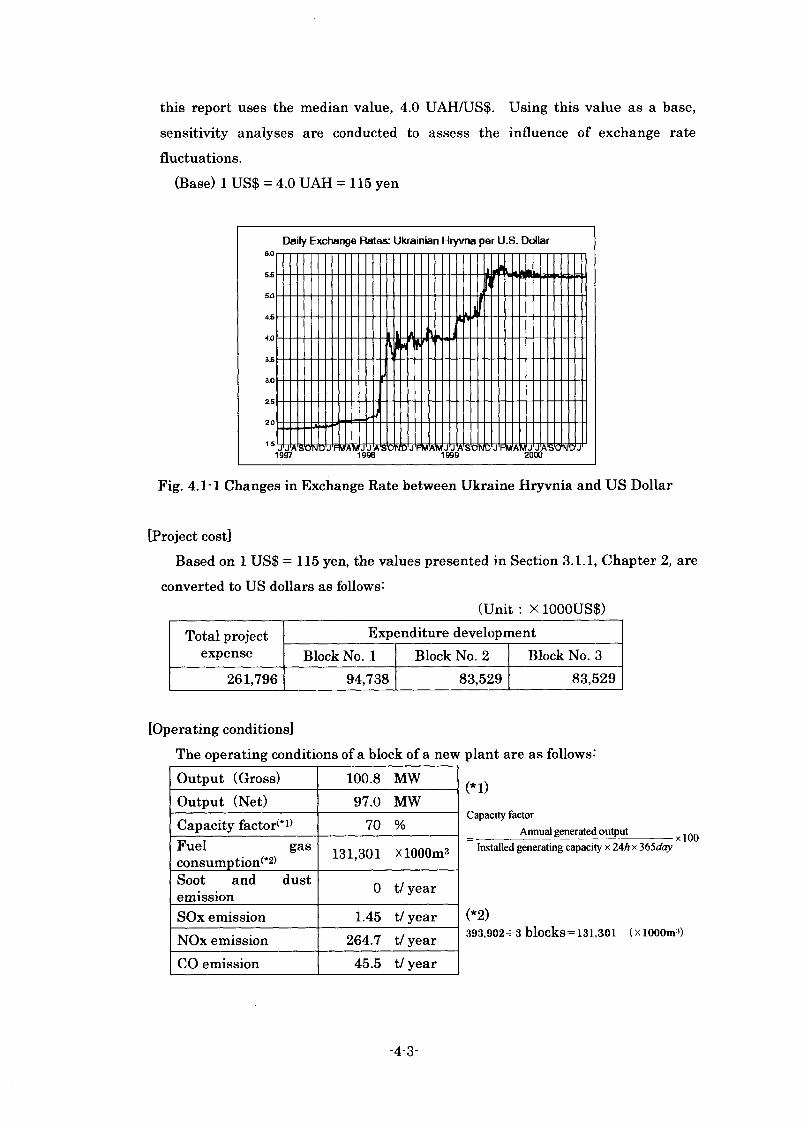
this report uses the median value, 4.0 UAH/US$. Using this value as a base, sensitivity analyses are conducted to assess the influence of exchange rate fluctuations.
(Base) 1 US$ = 4.0 UAH = 115 yen
Daily Exchange Rates: Ukrainian Hryvna per U.S. Dollar6.0
6.5
5.0
4.5
40
3.5
30
2.5
2.0
1.5
1997 1998 1999 2000
Fig. 4.1-1 Changes in Exchange Rate between Ukraine Hryvnia and US Dollar
j AsWkid j Fwawj j asoWd j fwaWj j asWmd j fmaWj j aso'nWj
[Project cost]Based on 1 US$ =115 yen, the values presented in Section 3.1.1, Chapter 2, are
converted to US dollars as follows:(Unit : X 1000US$)
Total project expense
Expenditure developmentBlock No. 1 Block No. 2 Block No. 3
261,796 94,738 83,529 83,529
[Operating conditions]The operating conditions of a block of a new plant are as follows:
(*1)
Capacity factorAnnual generated output
Installed generating capacity x 24h x 365day
(*2)393,902-r3 blocks= 131,301 (X 1000m0
Output (Gross) 100.8 MWOutput (Net) 97.0 MWCapacity factor(M) 70 %Fuel gasconsumption^) 131,301 X 1000m3
Soot and dustemission 0 t/ year
SOx emission 1.45 t/ yearNOx emission 264.7 t/ yearCO emission 45.5 t/ year
-43-
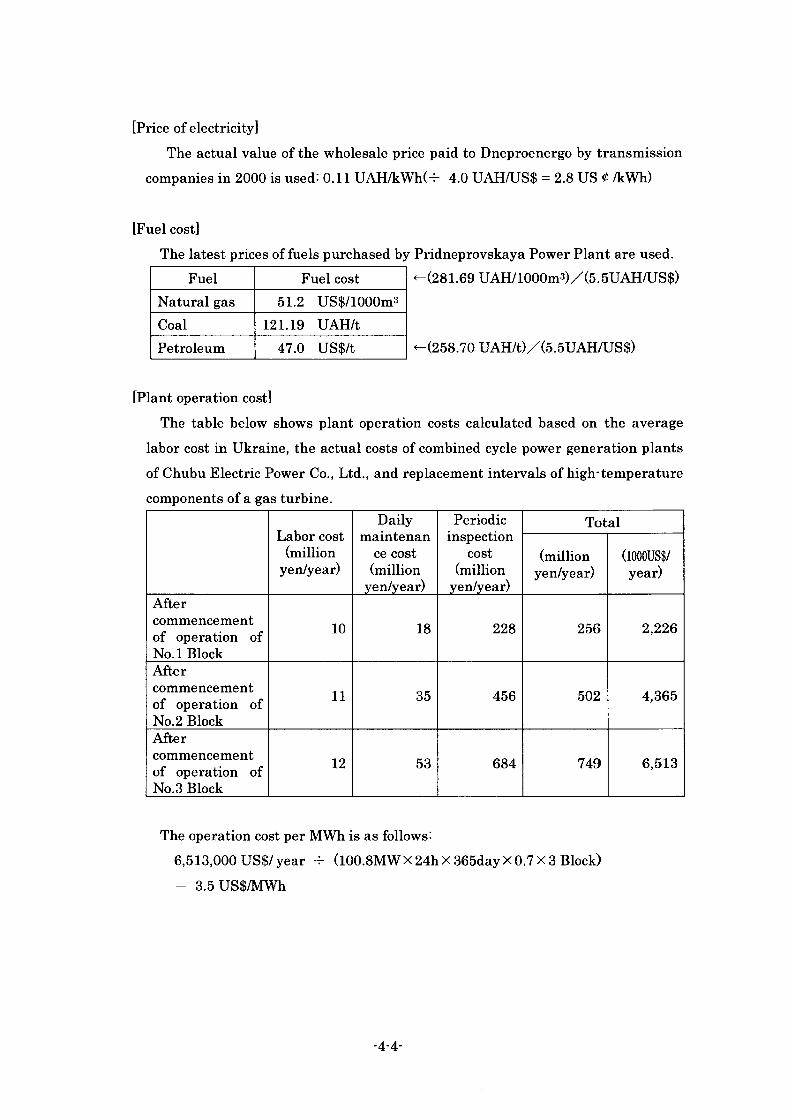
[Price of electricity]The actual value of the wholesale price paid to Dneproenergo by transmission
companies in 2000 is used- 0.11 UAH/kWh(-r- 4.0 UAH/US$ = 2.8 US < /kWh)
[Fuel cost]The latest prices of fuels purchased by Pridneprovskaya Power Plant are used.
(281.69 UAH/1000m3)/(5.5UAH/US$)
(258.70 UAH/t)/(5.5UAH/US$)
Fuel Fuel costNatural gas 51.2 US$/1000m3Coal 121.19 UAH/tPetroleum 47.0 US$/t
[Plant operation cost]The table below shows plant operation costs calculated based on the average
labor cost in Ukraine, the actual costs of combined cycle power generation plants of Chubu Electric Power Co., Ltd., and replacement intervals of high-temperaturecomponents of a gas turbine.
Labor cost (million
yen/year)
Dailymaintenan
ce cost (million
yen/year)
Periodicinspection
cost(million
yen/year)
Total
(millionyen/year)
(1000US$/year)
Aftercommencement of operation of No.l Block
10 18 228 256 2,226
Aftercommencement of operation of No.2 Block
11 35 456 502 4,365
Aftercommencement of operation of No.3 Block
12 53 684 749 6,513
The operation cost per MWh is as follows- 6,513,000 US$/ year 4- (100.8MWX 24h X 365day X 0.7 X 3 Block) = 3.5 US$/MWh
-4-4-
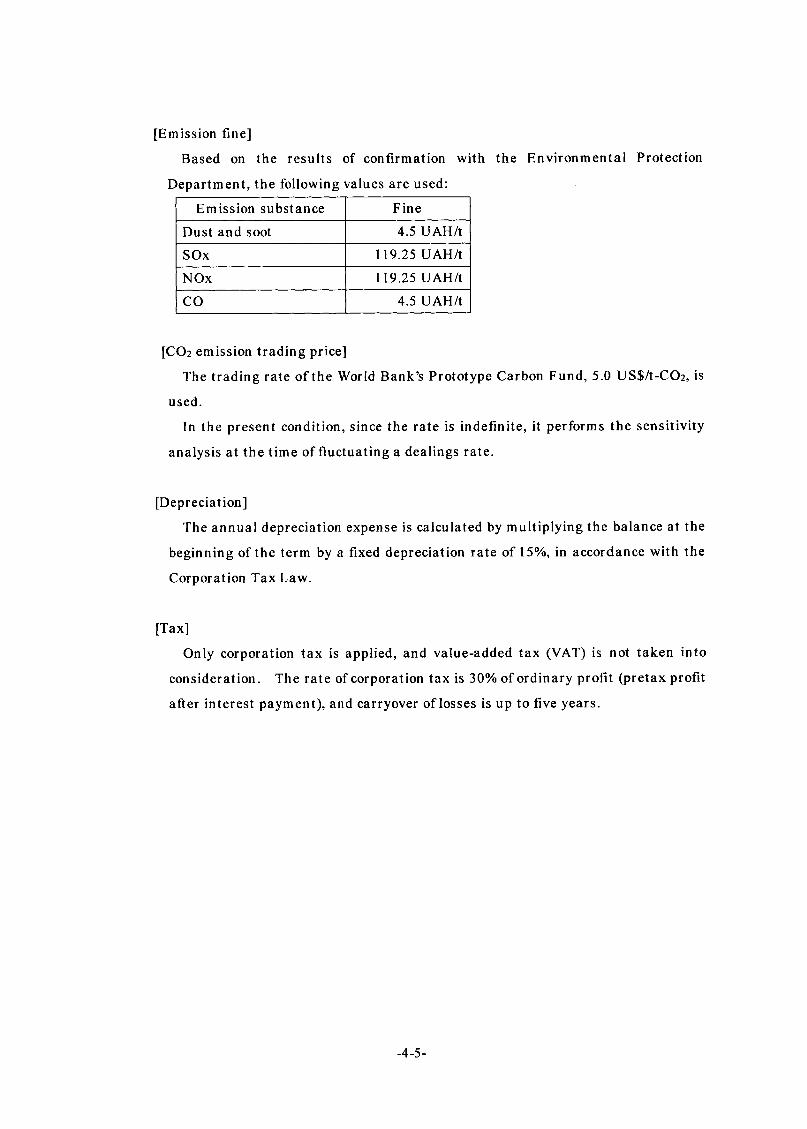
[Emission fine]
Based on the results of confirmation with the Environmental Protection
Department, the following values are used:
Emission substance Fine
Dust and soot 4.5 UAH/t
SOx 119.25 UAH/t
NOx 119.25 UAH/t
CO 4.5 UAH/t
[CO2 emission trading price]
The trading rate of the World Bank’s Prototype Carbon Fund, 5.0 USS/t-CO], is
used.
In the present condition, since the rate is indefinite, it performs the sensitivity
analysis at the time of fluctuating a dealings rate.
[Depreciation]
The annual depreciation expense is calculated by multiplying the balance at the
beginning of the term by a fixed depreciation rate of 15%, in accordance with the
Corporation Tax Law.
[Tax]
Only corporation tax is applied, and value-added tax (VAT) is not taken into
consideration. The rate of corporation tax is 30% of ordinary profit (pretax profit
after interest payment), and carryover of losses is up to five years.
-4-5-
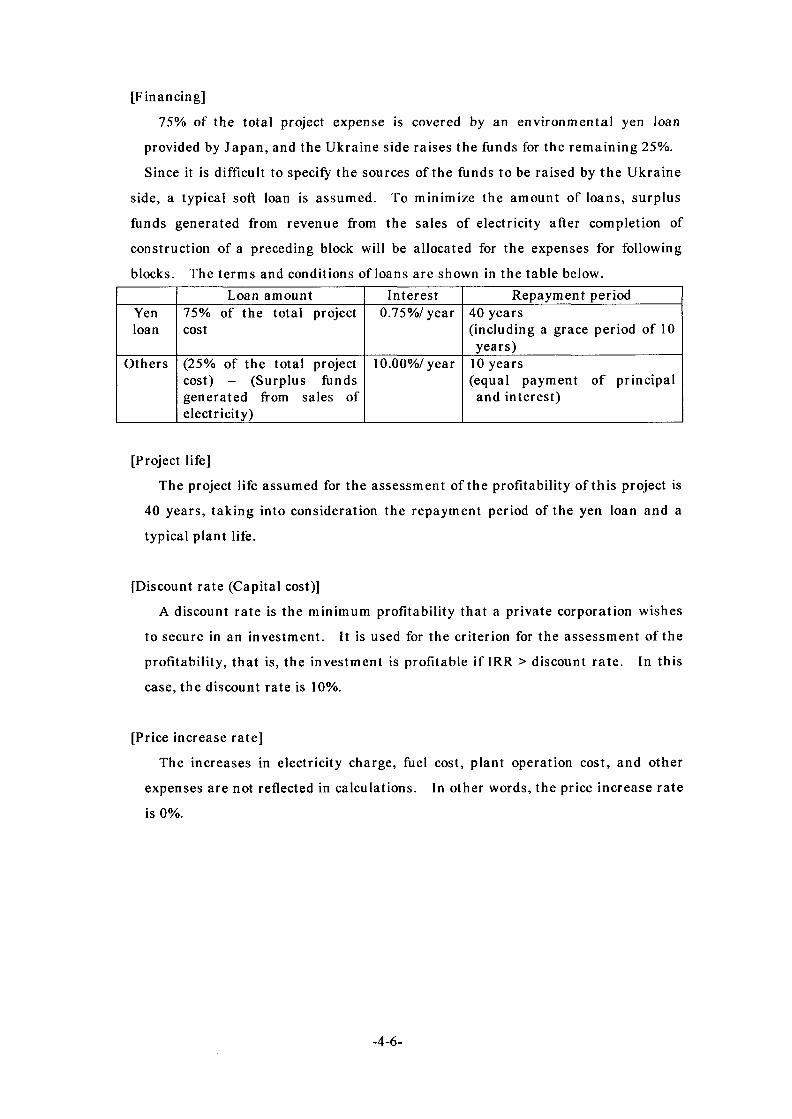
[Financing]
75% of the total project expense is covered by an environmental yen loan
provided by Japan, and the Ukraine side raises the funds for the remaining 25%.
Since it is difficult to specify the sources of the funds to be raised by the Ukraine
side, a typical soft loan is assumed. To minimize the amount of loans, surplus
funds generated from revenue from the sales of electricity after completion of
construction of a preceding block will be allocated for the expenses for following
blocks. The terms and conditions of loans are shown in the table below.Loan amount Interest Repayment period
Yenloan
75% of the total project cost
0.75%/ year 40 years(including a grace period of 10 years)
Others (25% of the total project cost) - (Surplus funds generated from sales of electricity)
10.00%/ year 10 years(equal payment of principal and interest)
[Project life]
The project life assumed for the assessment of the profitability of this project is
40 years, taking into consideration the repayment period of the yen loan and a
typical plant life.
[Discount rate (Capital cost)]
A discount rate is the minimum profitability that a private corporation wishes
to secure in an investment. It is used for the criterion for the assessment of the
profitability, that is, the investment is profitable if IRR > discount rate. In this
case, the discount rate is 10%.
[Price increase rate]
The increases in electricity charge, fuel cost, plant operation cost, and other
expenses are not reflected in calculations. In other words, the price increase rate
is 0%.
-4-6-
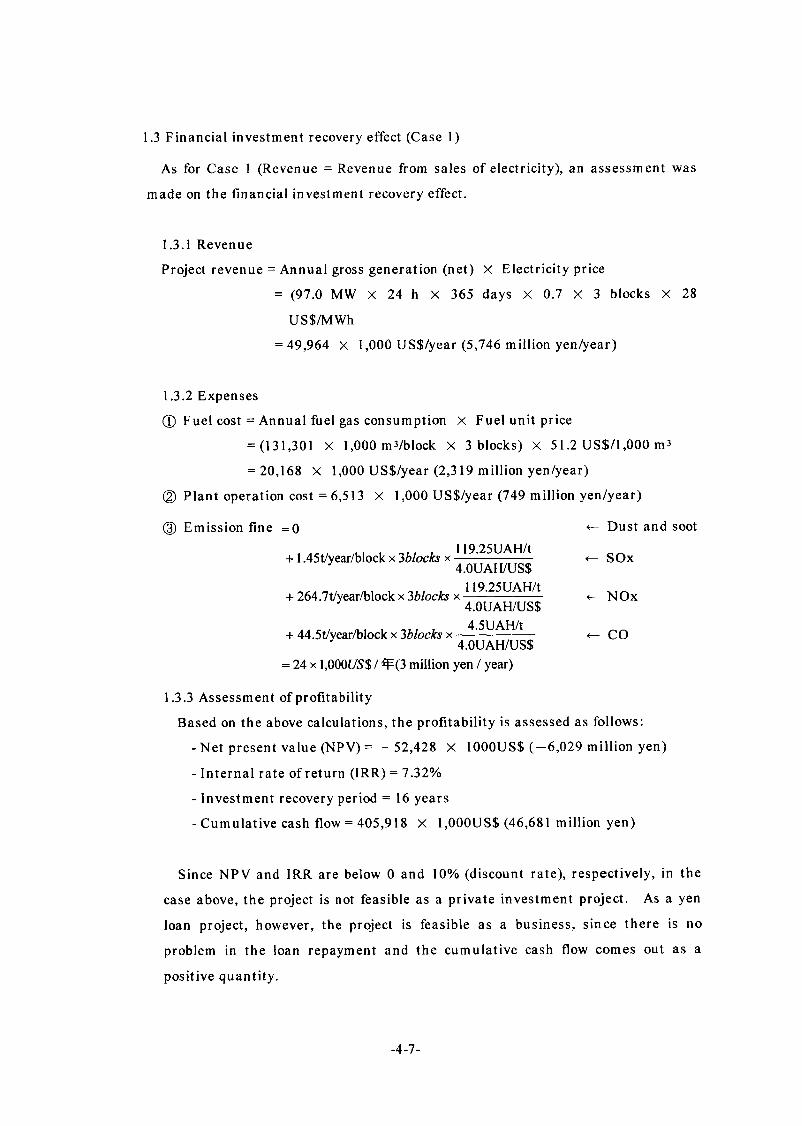
1.3 Financial investment recovery effect (Case 1)
As for Case 1 (Revenue = Revenue from sales of electricity), an assessment was
made on the financial investment recovery effect.
1.3.1 Revenue
Project revenue = Annual gross generation (net) X Electricity price
= (97.0 MW X 24 h X 365 days X 0.7 X 3 blocks X 28
US$/MWh
= 49,964 X 1,000 US$/year (5,746 million yen/year)
1.3.2 Expenses
0 Fuel cost = Annual fuel gas consumption X Fuel unit price
= (131,301 X 1,000 mVblock X 3 blocks) X 51.2 USS/1,000 m3
= 20,168 X 1,000 US$/year (2,319 million yen/year)
(2) Plant operation cost =6,513 X 1,000 USS/year (749 million yen/year)
Emission fine = 0
+ 1.45t/year/block x 3blocks x
+ 264.7t/year/block x 3blocks x
+ 44.5t/year/block x 3blocks x
119.25UAH/t 4.0UAH/USS
119.25UAH/t4.0UAH/US$4.5UAH/t
4.0UAH/USS = 24 x 1,000US$ / ^(3 million yen / year)
Dust and soot
SOx
NOx
CO
1.3.3 Assessment of profitability
Based on the above calculations, the profitability is assessed as follows:
- Net present value (NPV) = —52,428 X 1000US$ (—6,029 million yen)
- Internal rate of return (IRR) = 7.32%
- Investment recovery period = 16 years
- Cumulative cash flow = 405,918 X 1,000US$ (46,681 million yen)
Since NPV and IRR are below 0 and 10% (discount rate), respectively, in the
case above, the project is not feasible as a private investment project. As a yen
loan project, however, the project is feasible as a business, since there is no
problem in the loan repayment and the cumulative cash flow comes out as a
positive quantity.
-4-7-
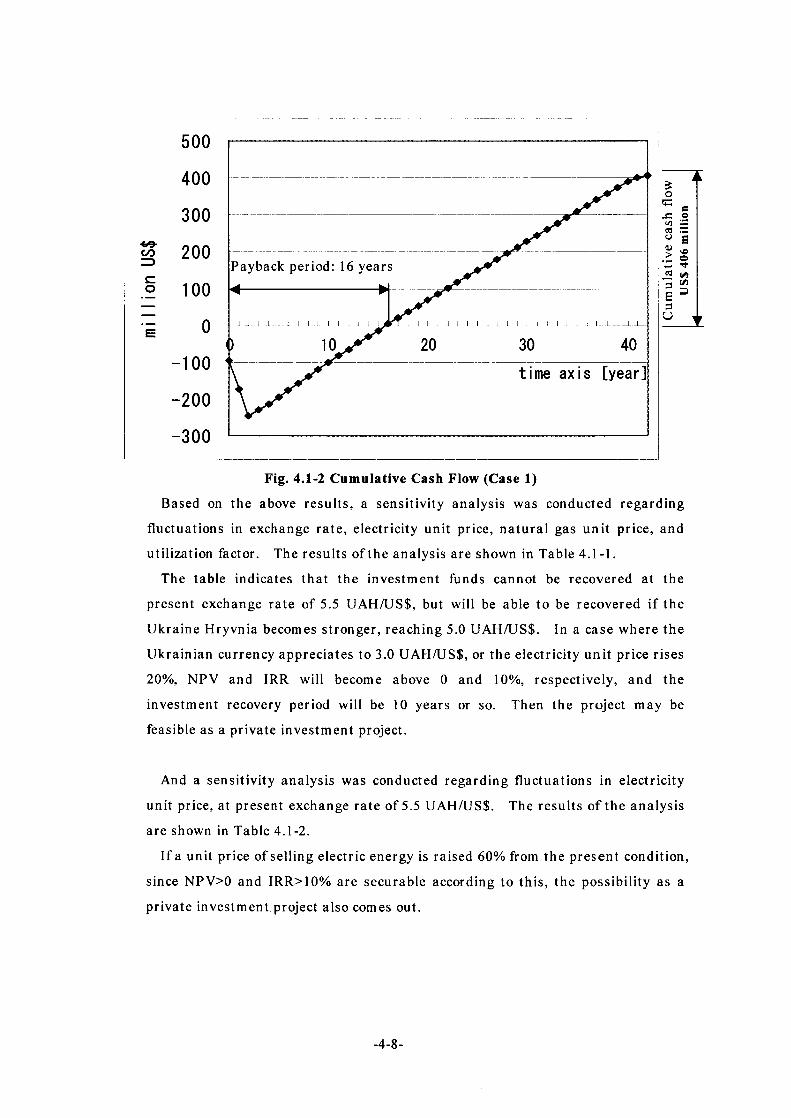
500
Fig. 4.1-2 Cumulative Cash Flow (Case 1)
Based on the above results, a sensitivity analysis was conducted regarding
fluctuations in exchange rate, electricity unit price, natural gas unit price, and
utilization factor. The results of the analysis are shown in Table 4.1-1.
The table indicates that the investment funds cannot be recovered at the
present exchange rate of 5.5 UAH/US$, but will be able to be recovered if the
Ukraine Hryvnia becomes stronger, reaching 5.0 UAH/US$. In a case where the
Ukrainian currency appreciates to 3.0 UAH/US$, or the electricity unit price rises
20%, NPV and IRR will become above 0 and 10%, respectively, and the
investment recovery period will be 10 years or so. Then the project may be
feasible as a private investment project.
And a sensitivity analysis was conducted regarding fluctuations in electricity
unit price, at present exchange rate of 5.5 UAH/US$. The results of the analysis
are shown in Table 4.1-2.
If a unit price of selling electric energy is raised 60% from the present condition,
since NPV>0 and IRR>10% are securable according to this, the possibility as a
private investment project also comes out.
-4-8-
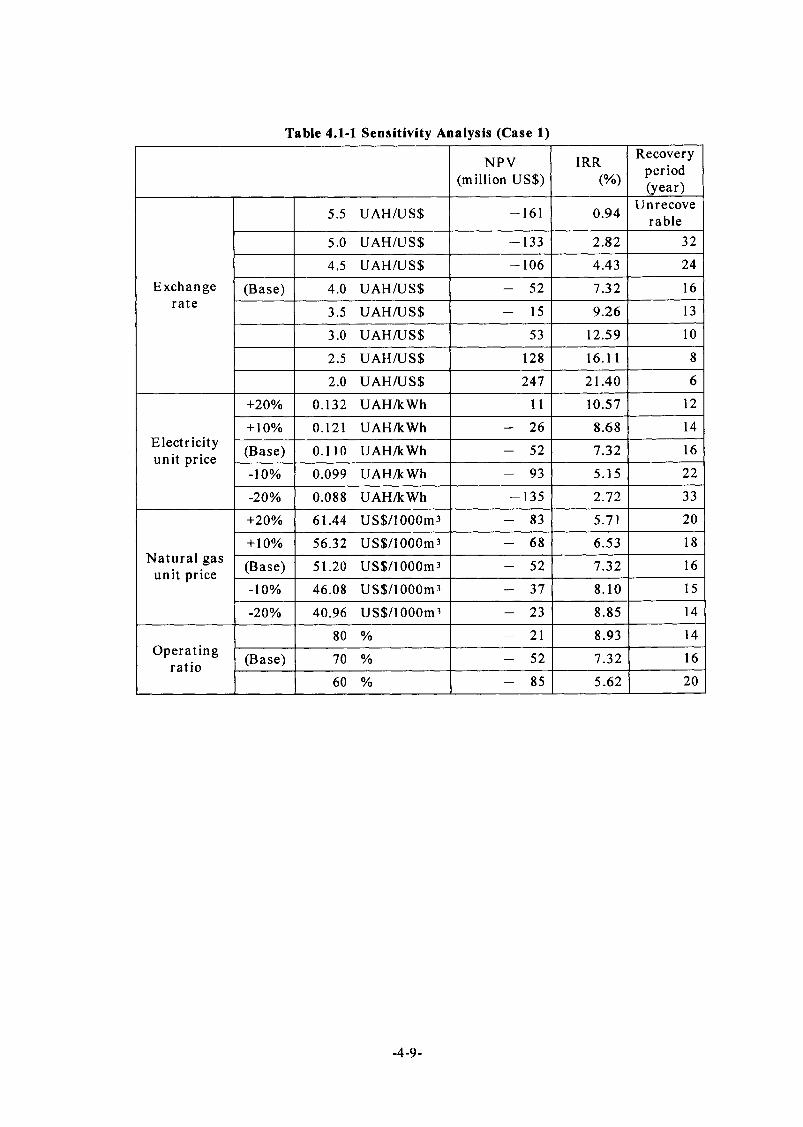
Table 4.1-1 Sensitivity Analysis (Case 1)
NPV(million US$)
IRR(%)
Recoveryperiod(year)
5.5 UAH/US$ 161 0.94 Unrecoverable
5.0 UAH/US$ 133 2.82 32
4.5 UAH/US$ -106 4.43 24Exchange (Base) 4.0 UAH/US$ — 52 7.32 16
rate 3.5 UAH/US$ — 15 9.26 13
3.0 UAH/US$ 53 12.59 10
2.5 UAH/US$ 128 16.11 8
2.0 UAH/US$ 247 21.40 6
+20% 0.132 UAH/kWh 11 10.57 12
Electricity unit price
+ 10% 0.121 UAH/kWh - 26 8.68 14
(Base) 0.110 UAH/kWh — 52 7.32 16
-10% 0.099 UAH/kWh — 93 5.15 22
-20% 0.088 UAH/kWh 135 2.72 33
+20% 61.44 US$/1000m3 — 83 5.71 20
Natural gas unit price
+ 10% 56.32 US$/1000m3 — 68 6.53 18
(Base) 51.20 US$/1000m3 — 52 7.32 16
-10% 46.08 US$/1000m3 - 37 8.10 15
-20% 40.96 US$/1000m3 — 23 8.85 14
Operatingratio
80 % — 21 8.93 14
(Base) 70 % - 52 7.32 16
60 % — 85 5.62 20
-4-9-
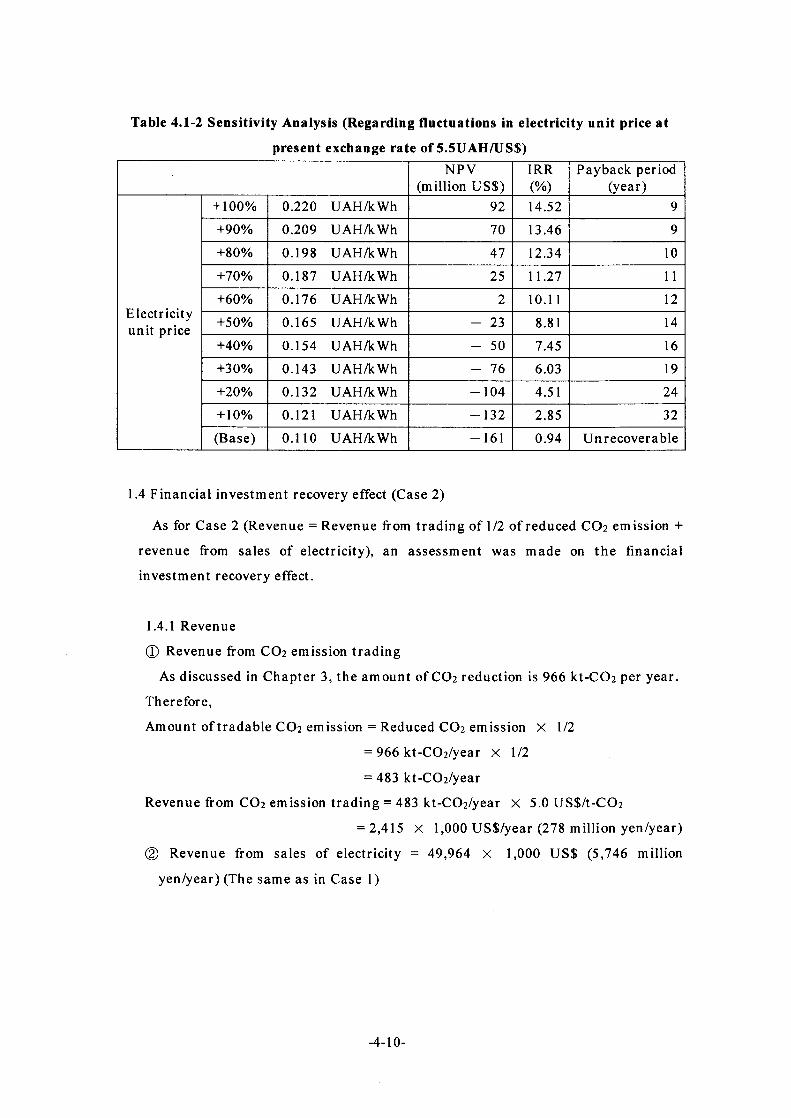
Table 4.1-2 Sensitivity Analysis (Regarding fluctuations in electricity unit price at
present exchange rate of 5.5UAH/USS)
NPV(million US$)
IRR(%)
Payback period (year)
+100% 0.220 UAH/kWh 92 14.52 9+90% 0.209 UAH/kWh 70 13.46 9
+80% 0.198 UAH/kWh 47 12.34 10
+70% 0.187 UAH/kWh 25 11.27 11
Electricity unit price
+60% 0.176 UAH/kWh 2 10.11 12
+50% 0.165 UAH/kWh - 23 8.81 14
+40% 0.154 UAH/kWh - 50 7.45 16+30% 0.143 UAH/kWh - 76 6.03 19
+20% 0.132 UAH/kWh -104 4.51 24
+ 10% 0.121 UAH/kWh -132 2.85 32
(Base) 0.110 UAH/kWh -161 0.94 Unrecoverable
1.4 Financial investment recovery effect (Case 2)
As for Case 2 (Revenue = Revenue from trading of 1/2 of reduced CO2 emission +
revenue from sales of electricity), an assessment was made on the financial
investment recovery effect.
1.4.1 Revenue
0 Revenue from CO2 emission trading
As discussed in Chapter 3, the amount of CO2 reduction is 966 kt-CC>2 per year.
Therefore,
Amount of tradable CO2 emission = Reduced CO2 emission X 1/2
= 966 kt-CC>2/year X 1/2
= 483 kt-CC>2/year
Revenue from CO2 emission trading = 483 kt-CC>2/year X 5.0 US$/t-CC>2
= 2,415 X 1,000 US$/year (278 million yen/year)
0 Revenue from sales of electricity = 49,964 x 1,000 US$ (5,746 million
yen/year) (The same as in Case 1)
-4-10-
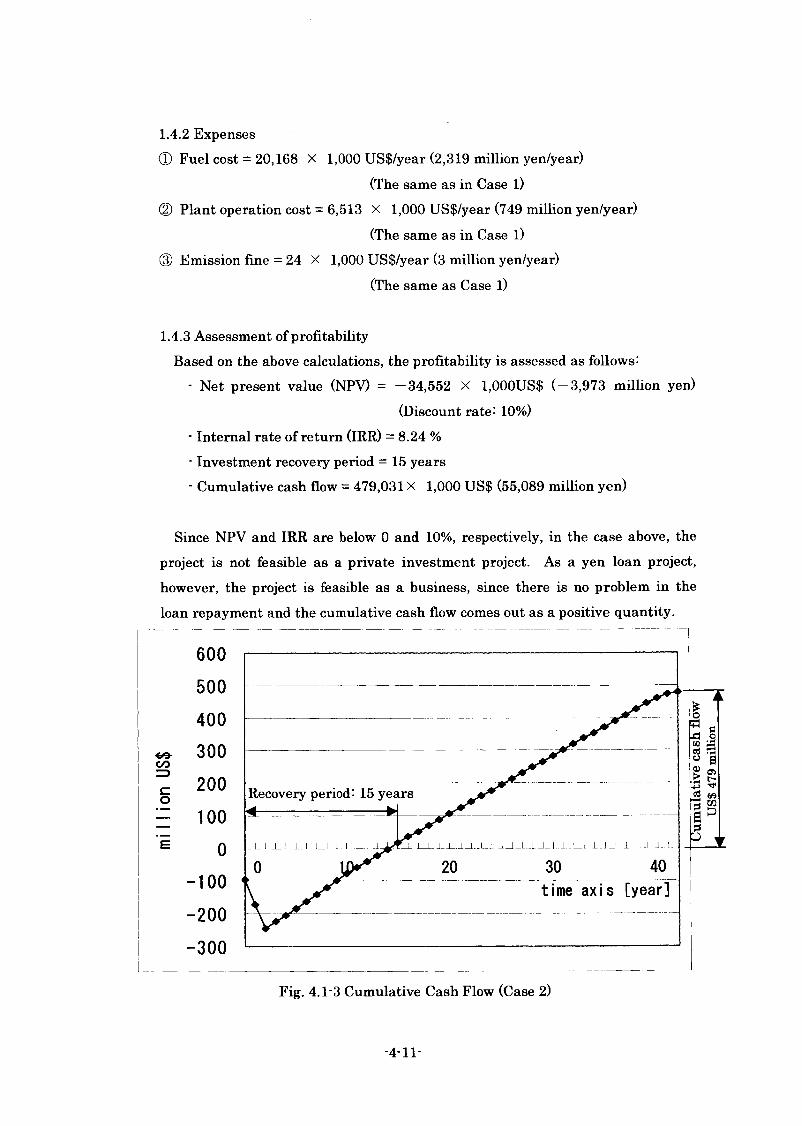
1.4.2 Expenses(D Fuel cost = 20,168 X 1,000 US$/year (2,319 million yen/year)
(The same as in Case l)(2) Plant operation cost = 6,513 X 1,000 US$/year (749 million yen/year)
(The same as in Case l)(3) Emission fine = 24 X 1,000 US$/year (3 million yen/year)
(The same as Case l)
1.4.3 Assessment of profitabilityBased on the above calculations, the profitability is assessed as follows-
- Net present value (NPV) = —34,552 X 1,000US$ ( — 3,973 million yen)(Discount rate- 10%)
- Internal rate of return (IRR) = 8.24 %- Investment recovery period = 15 years- Cumulative cash flow = 479,031 X 1,000 US$ (55,089 million yen)
Since NPV and IRR are below 0 and 10%, respectively, in the case above, the project is not feasible as a private investment project. As a yen loan project, however, the project is feasible as a business, since there is no problem in the loan repayment and the cumulative cash flow comes out as a positive quantity.
600 500
400 300
GO
c 200
| 100_i 0
-100
-200
-300
Fig. 4.1-3 Cumulative Cash Flow (Case 2)
Recovery period- 15 years
time axis [year]
-411-
Cum
ulat
ive c
ash
flow
US$ 4
79 m
illio
n ,
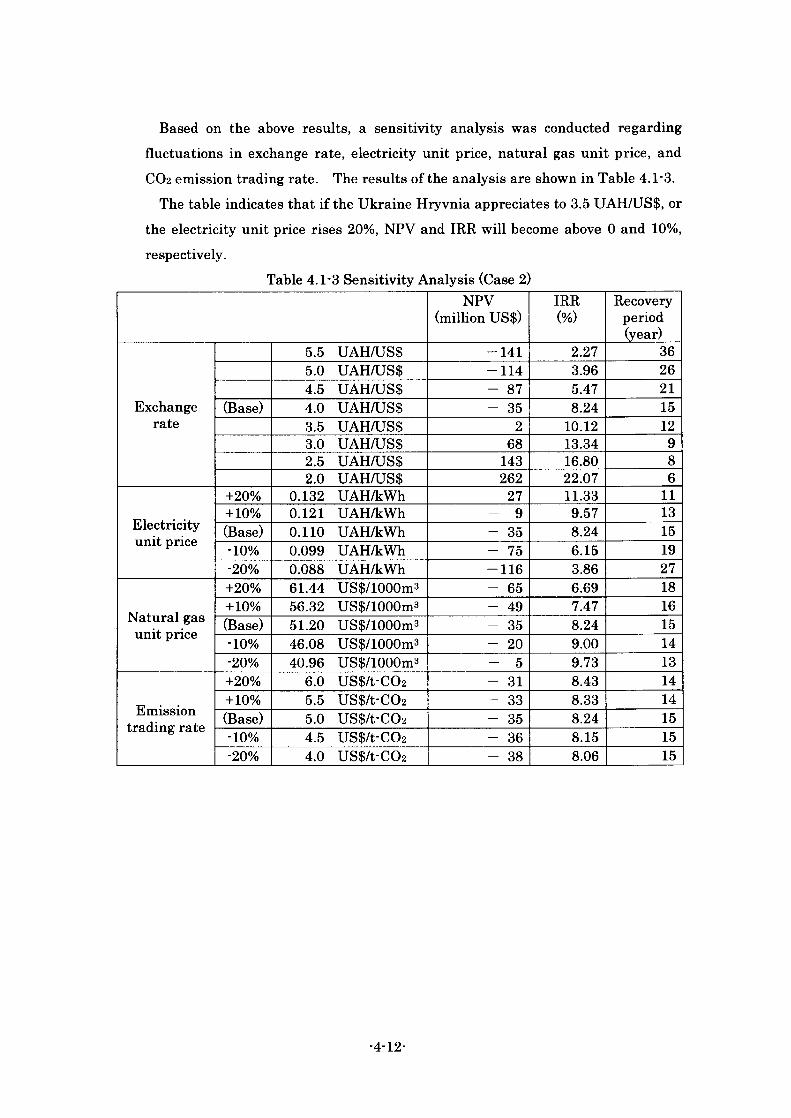
Based on the above results, a sensitivity analysis was conducted regarding fluctuations in exchange rate, electricity unit price, natural gas unit price, and CO2 emission trading rate. The results of the analysis are shown in Table 4.1 3.
The table indicates that if the Ukraine Hryvnia appreciates to 3.5 UAH/US$, or the electricity unit price rises 20%, NPV and IRR will become above 0 and 10%, respectively.
Table 4.1*3 Sensitivity Analysis (Case 2)NPV
(million US$)IRR(%)
Recoveryperiod(year)
5.5 UAH/US$ -141 2.27 365.0 UAH/US$ -114 3.96 264.5 UAH/US $ - 87 5.47 21
Exchange (Base) 4.0 UAH/US$ - 35 8.24 15rate 3.5 UAH/US$ 2 10.12 12
3.0 UAH/US$ 68 13.34 92.5 UAH/US $ 143 16.80 82.0 UAH/US $ 262 22.07 6
+20% 0.132 UAH/kWh 27 11.33 11
Electricity unit price
+ 10% 0.121 UAH/kWh - 9 9.57 13(Base) 0.110 UAH/kWh - 35 8.24 15-10% 0.099 UAH/kWh - 75 6.15 19-20% 0.088 UAH/kWh -116 3.86 27+20% 61.44 US$/1000m3 - 65 6.69 18
Natural gas unit price
+10% 56.32 US$/1000m3 - 49 7.47 16(Base) 51.20 US$/1000m3 - 35 8.24 15-10% 46.08 US$/1000m3 - 20 9.00 14-20% 40.96 US$/1000m3 - 5 9.73 13+20% 6.0 us$/t-co2 - 31 8.43 14
Emission trading rate
+10% 5.5 us$/t-co2 - 33 8.33 14(Base) 5.0 us$/t-co2 - 35 8.24 15-10% 4.5 us$/t-co2 - 36 8.15 15-20% 4.0 us$/t-co2 - 38 8.06 15
-4-12-
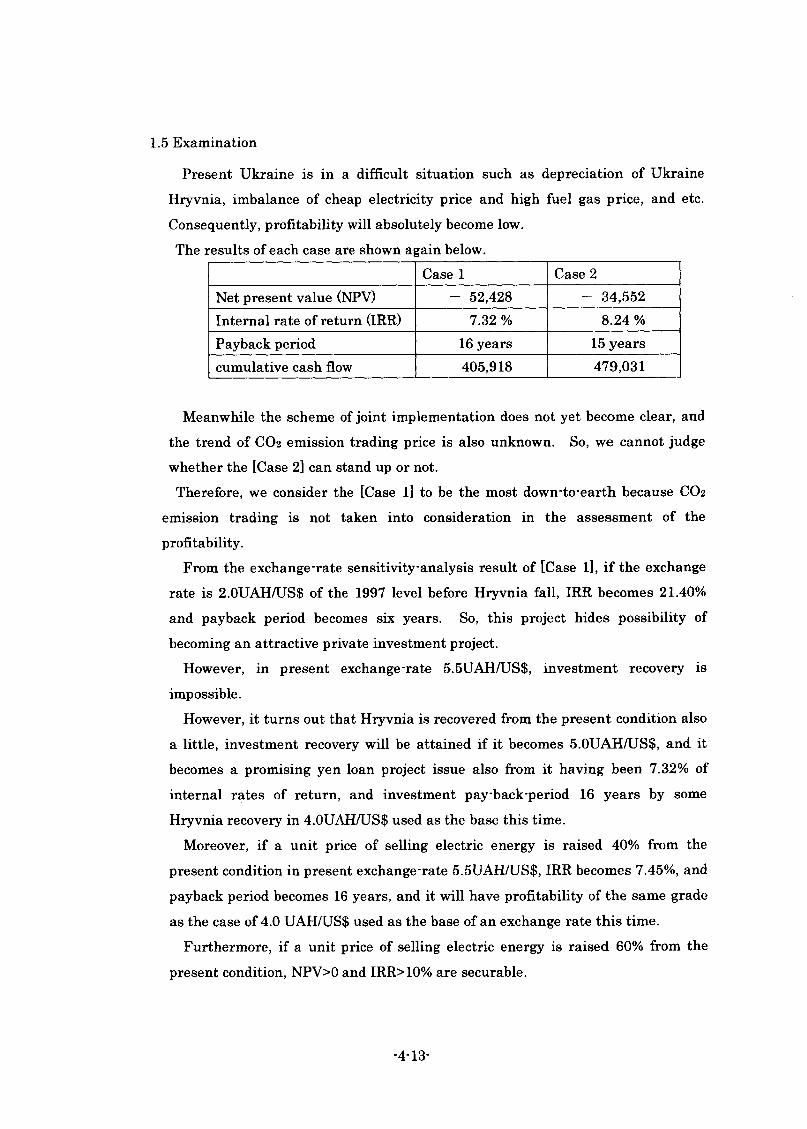
1.5 Examination
Present Ukraine is in a difficult situation such as depreciation of Ukraine Hryvnia, imbalance of cheap electricity price and high fuel gas price, and etc. Consequently, profitability will absolutely become low.The results of each case are shown again below.
Case 1 Case 2Net present value (NPV) - 52,428 - 34,552Internal rate of return (IRR) 7.32 % 8.24 %Payback period 16 years 15 yearscumulative cash flow 405,918 479,031
Meanwhile the scheme of joint implementation does not yet become clear, and the trend of CO2 emission trading price is also unknown. So, we cannot judge whether the [Case 2] can stand up or not.Therefore, we consider the [Case l] to be the most down-to-earth because CO2
emission trading is not taken into consideration in the assessment of the profitability.
From the exchange rate sensitivity - analysis result of [Case l], if the exchange rate is 2.0UAH/US$ of the 1997 level before Hryvnia fall, IRR becomes 21.40% and payback period becomes six years. So, this project hides possibility of becoming an attractive private investment project.
However, in present exchange-rate 5.5UAH/US$, investment recovery is impossible.
However, it turns out that Hryvnia is recovered from the present condition also a little, investment recovery will be attained if it becomes 5.0UAH/US$, and it becomes a promising yen loan project issue also from it having been 7.32% of internal rates of return, and investment pay back-period 16 years by some Hryvnia recovery in 4.0UAH/US$ used as the base this time.
Moreover, if a unit price of selling electric energy is raised 40% from the present condition in present exchange rate 5.5UAHZUS$, IRR becomes 7.45%, and payback period becomes 16 years, and it will have profitability of the same grade as the case of 4.0 UAH/US$ used as the base of an exchange rate this time.
Furthermore, if a unit price of selling electric energy is raised 60% from the present condition, NPV>0 and IRR>10% are securable.
-413-
2. Project effect against cost
In this section, an assessment is made from a perspective different from that in the previous section, where investment recovery effect is assessed. This section deals with energy-saving effect and greenhouse gas reduction effect against the initial investment amount (total project expense) for a single fiscal year.
2.1 Energy-saving effect against cost
As described in Section 1.3.3, Chapter 3, the reduced fuel consumption due to this project is 187 ktoe a year.
The total project expense is 30,107 million yen.Therefore, the energy-saving effect against the total project cost for a single
fiscal year is*
187,000foe 30,107million yen
= 6.2\toe - y / million yen
2.2 Greenhouse gas reduction effect against cost
As described in Section 2.3.3, Chapter 3, the reduced CO2 emission due to this project is 966 kt-CCh per year.
The total project expense is 30,107 million yen.Therefore, the greenhouse gas reduction effect against the initial investment
amount for a single fiscal year is*966,000/ - CQ2
30,107millionyen= 32.1/ -C02 -y!million yen
-4-14

Chapter.5 Diffusion Effect
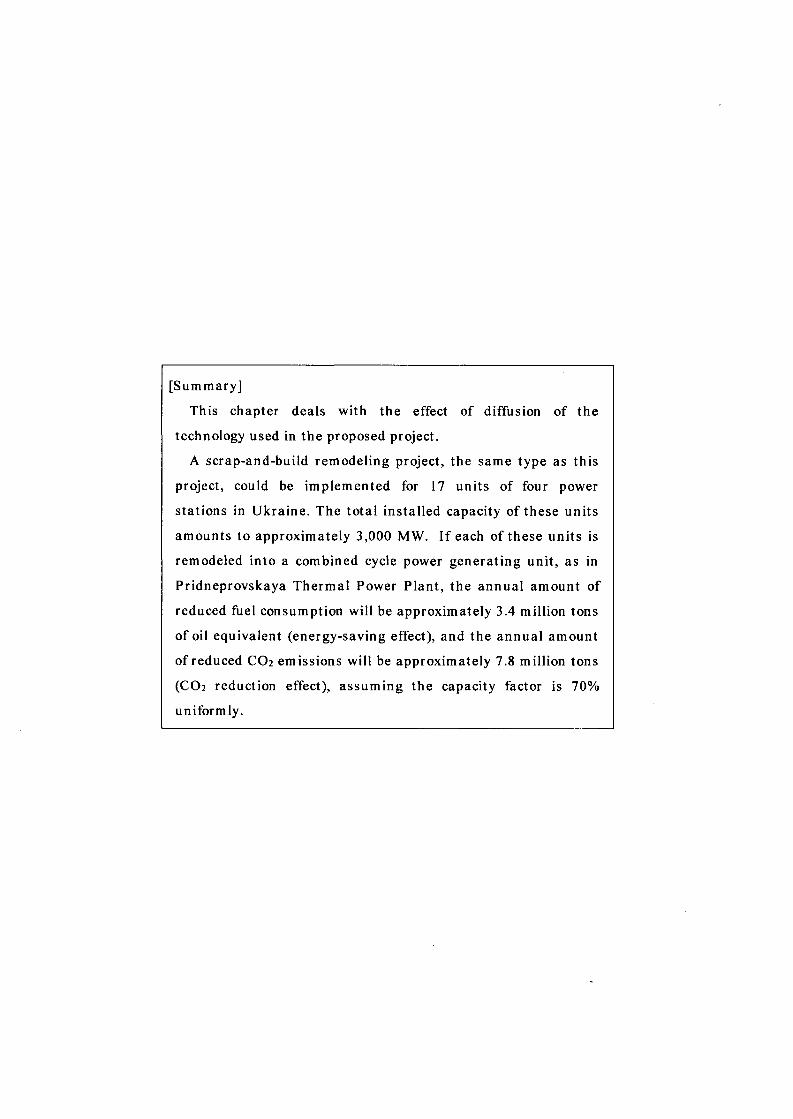
[Summary]
This chapter deals with the effect of diffusion of the
technology used in the proposed project.
A scrap-and-build remodeling project, the same type as this
project, could be implemented for 17 units of four power
stations in Ukraine. The total installed capacity of these units
amounts to approximately 3,000 MW. If each of these units is
remodeled into a combined cycle power generating unit, as in
Pridneprovskaya Thermal Power Plant, the annual amount of
reduced fuel consumption will be approximately 3.4 million tons
of oil equivalent (energy-saving effect), and the annual amount
of reduced CO2 emissions will be approximately 7.8 million tons
(CO2 reduction effect), assuming the capacity factor is 70%
uniformly.
1. Potential diffusion of the technology to be applied in the project in the recipient
country
1.1 Application conditions
The technology proposed in this project is a scrap-and-build project changing
power generating units from coal-fired to gas-fired combined cycle type. This
technology could be applied to units satisfying the following conditions:
(1) The unit is a coal-fired power generating unit with low efficiency and
capacity factor.
(2) As fuel for gas turbines, natural gas can be secured.
(3) Sufficient space for construction of a combined cycle power generating unit
can be secured.
(4) The unit is not a steam supply and power generating plant.
This requirement is designed to avoid any reduction or discontinuance of district
heating in the wake of remodeling of such a plant into a combined cycle power
generating plant.
1.2 Potential plants subject to a similar project
The table below shows the specifications of power generating units in Ukraine,
and which units could be the subjects of a scrap-and-build project.
It should be noted, however, that the analysis is partly based on assumptions,
due to the lack of materials providing detailed information on these units.
The criteria for selection of potential plants subject to a similar project are as
follows:
(1) The unit is an aged plant that was constructed in or before the 1960s.
(2) Units with a large capacity, such as 720 MW and 800 MW, will be excluded,
since those units are presumed to be base load facilities.
(3) It is presumed that almost half of the power generating units in each power
station are district heating units. Since the steam supply and power
generating function is usually required at the time of the construction of a
new power station, older units in the same station are considered to be steam
supply and power generating plants, and accordingly will be excluded.
(4) As for a power station that has a number of units with the same generating
capacity that were constructed over a period of several years, half of these
-5-1-
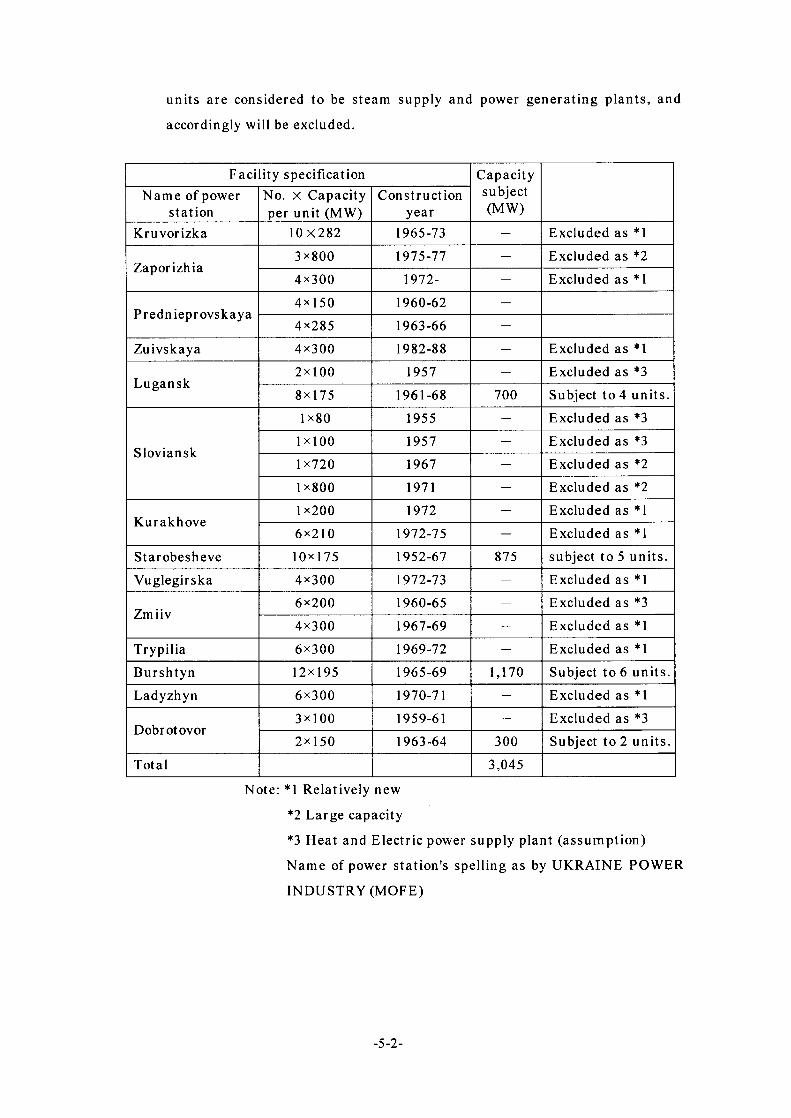
units are considered to be steam supply and power generating plants, and
accordingly will be excluded.
Facility specification Capacitysubject(MW)
Name of power station
No. X Capacity per unit (MW)
Constructionyear
Kruvorizka 10X282 1965-73 — Excluded as *1
Zaporizhia3x800 1975-77 — Excluded as *2
4x300 1972- — Excluded as *1
Prednieprovskaya4x150 1960-62 —
4x285 1963-66 —
Zuivskaya 4x300 1982-88 — Excluded as *1
Lugansk2x100 1957 — Excluded as *3
8x175 1961-68 700 Subject to 4 units.
Sloviansk
1x80 1955 — Excluded as *3
1x100 1957 — Excluded as *3
1x720 1967 — Excluded as *2
1x800 1971 — Excluded as *2
Kurakhove1x200 1972 — Excluded as *1
6x210 1972-75 — Excluded as *1
Starobesheve 10x175 1952-67 875 subject to 5 units.
Vuglegirska 4x300 1972-73 — Excluded as *1
Zmiiv6x200 1960-65 — Excluded as *3
4x300 1967-69 — Excluded as *1
Trypilia 6x300 1969-72 — Excluded as *1
Burshtyn 12x195 1965-69 1,170 Subject to 6 units.
Ladyzhyn 6x300 1970-71 — Excluded as *1
Dobrotovor3x100 1959-61 — Excluded as *3
2x150 1963-64 300 Subject to 2 units.
Total 3,045
Note: *1 Relatively new
*2 Large capacity
*3 Heat and Electric power supply plant (assumption)
Name of power station's spelling as by UKRAINE POWER
INDUSTRY (MOPE)
-5-2-
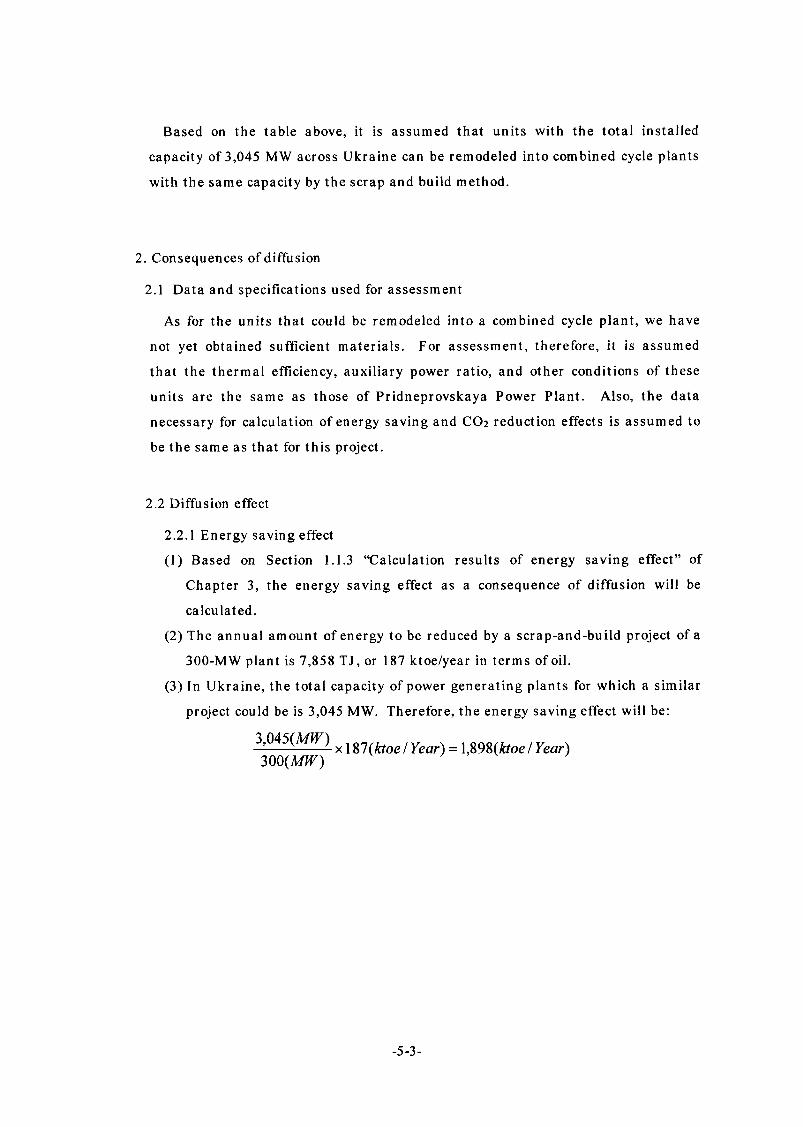
Based on the table above, it is assumed that units with the total installed
capacity of 3,045 MW across Ukraine can be remodeled into combined cycle plants
with the same capacity by the scrap and build method.
2. Consequences of diffusion
2.1 Data and specifications used for assessment
As for the units that could be remodeled into a combined cycle plant, we have
not yet obtained sufficient materials. For assessment, therefore, it is assumed
that the thermal efficiency, auxiliary power ratio, and other conditions of these
units are the same as those of Pridneprovskaya Power Plant. Also, the data
necessary for calculation of energy saving and CO2 reduction effects is assumed to
be the same as that for this project.
2.2 Diffusion effect
2.2.1 Energy saving effect
(1) Based on Section 1.1.3 “Calculation results of energy saving effect” of
Chapter 3, the energy saving effect as a consequence of diffusion will be
calculated.
(2) The annual amount of energy to be reduced by a scrap-and-build project of a
300-MW plant is 7,858 TJ, or 187 ktoe/year in terms of oil.
(3) In Ukraine, the total capacity of power generating plants for which a similar
project could be is 3,045 MW. Therefore, the energy saving effect will be:
3,045(MW) x l %1{ktoe / Year) = 1,898(ktoe / Year)300(MW)
-5-3 -
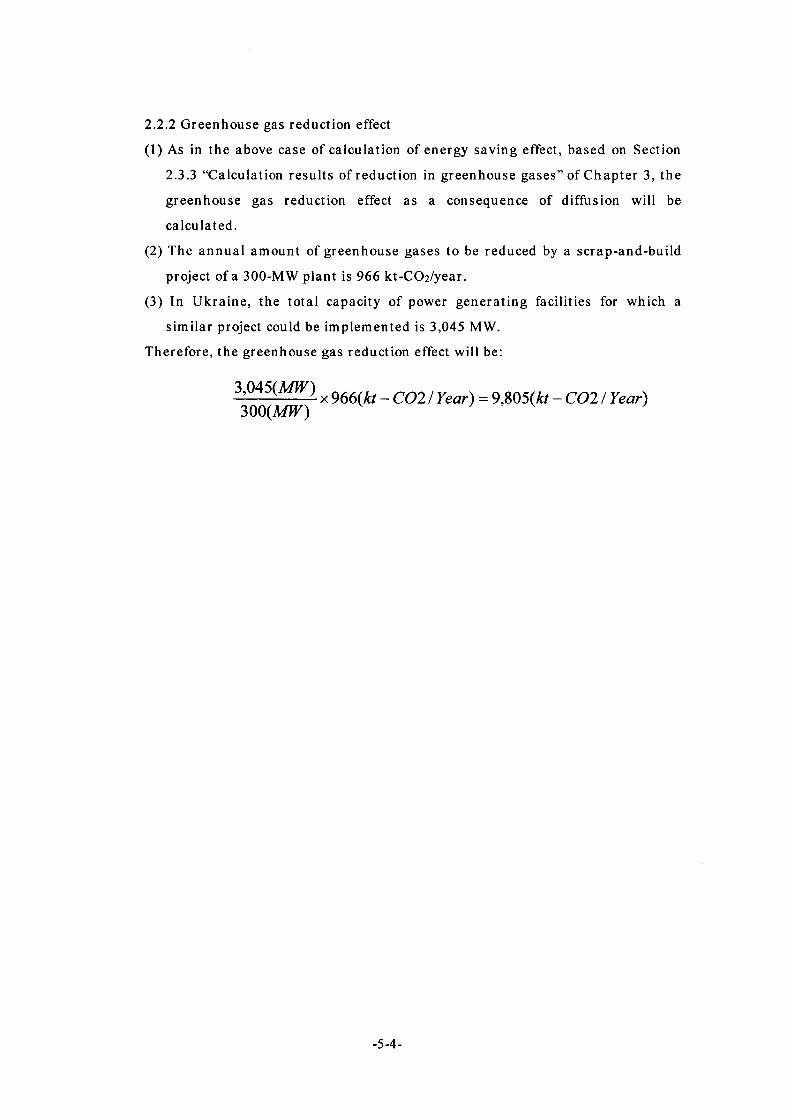
2.2.2 Greenhouse gas reduction effect
(1) As in the above case of calculation of energy saving effect, based on Section
2.3.3 “Calculation results of reduction in greenhouse gases” of Chapter 3, the
greenhouse gas reduction effect as a consequence of diffusion will be
calculated.
(2) The annual amount of greenhouse gases to be reduced by a scrap-and-build
project of a 300-MW plant is 966 kt-COi/year.
(3) In Ukraine, the total capacity of power generating facilities for which a
similar project could be implemented is 3,045 MW.
Therefore, the greenhouse gas reduction effect will be:
3,045{MW) x g kt _ CQ2 ! y = 9 805(fe _ CQ21 Year}
300(W)
-5-4-

Chapter.6 Other Effects

[Summary]
This chapter deals with other effects of the proposed project.
The implementation of the project is expected to have
insignificant impact on the environment, posing no problems.
In terms of economy, this project will bring such benefits as
the creation of employment for construction projects, and the
revitalization of domestic industries and improvement of the
people’s quality of life, since the project will help mitigate
electricity shortages.
From the social aspect, the project is expected to facilitate a
structural reform of the power sector through related exchanges
and collaborations with overseas organizations.
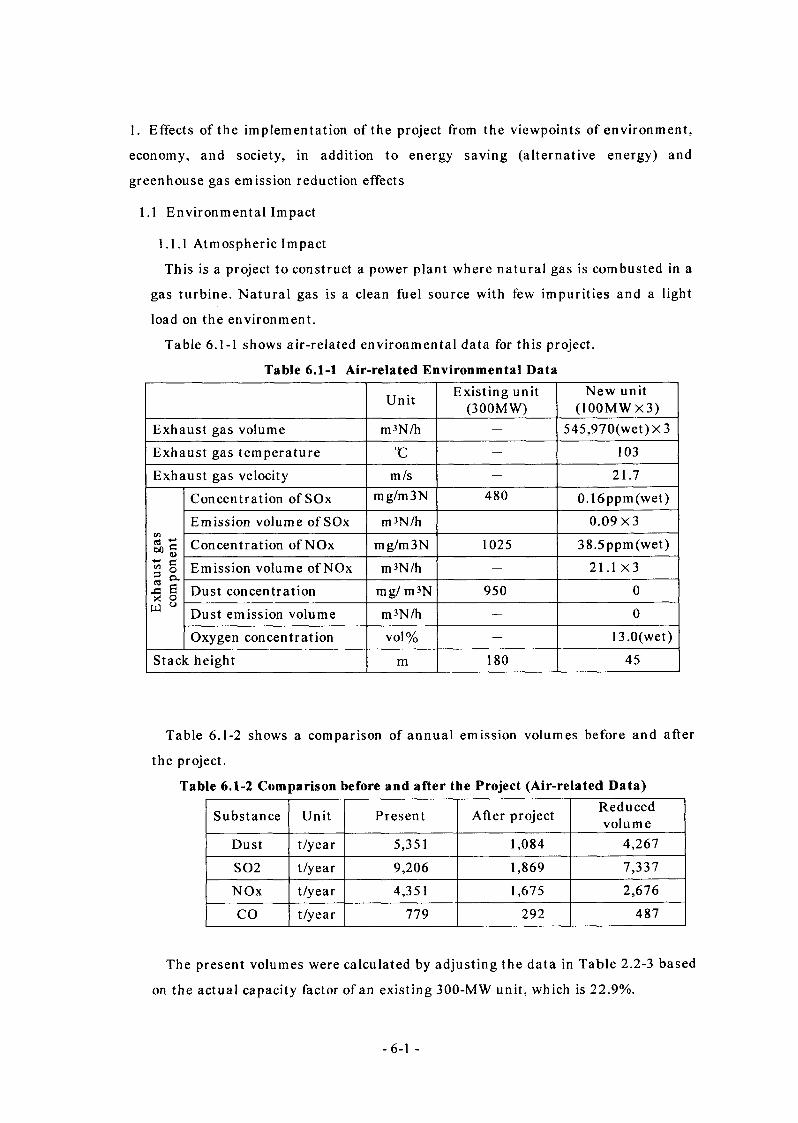
1. Effects of the implementation of the project from the viewpoints of environment,
economy, and society, in addition to energy saving (alternative energy) and
greenhouse gas emission reduction effects
1.1 Environmental Impact
1.1.1 Atmospheric Impact
This is a project to construct a power plant where natural gas is combusted in a
gas turbine. Natural gas is a clean fuel source with few impurities and a light
load on the environment.
Table 6.1-1 shows air-related environmental data for this project.
Table 6.1-1 Air-related Environmental Data
Unit Existing unit (300MW)
New unit (100MWX3)
Exhaust gas volume m3N/h — 545,970(wet)x3
Exhaust gas temperature °C — 103
Exhaust gas velocity m/s — 21.7
Bg3|
Concentration ofSOx m g/m 3 N 480 0.16ppm(wet)
Emission volume ofSOx m3N/h — 0.09X3
Concentration ofNOx mg/m3N 1025 38.5ppm(wet)
Emission volume ofNOx m3N/h — 21.1 X 3
II Dust concentration mg/ m3N 950 0
Dust emission volume m3N/h — 0
Oxygen concentration vol% — 13.0(wet)
Stack height m 180 45
Table 6.1-2 shows a comparison of annual emission volumes before and after
the project.
Table 6.1-2 Comparison before and after the Project (Air-related Data)
Substance Unit Present After project Reducedvolume
Dust t/year 5,351 1,084 4,267
802 t/year 9,206 1,869 7,337
NOx t/year 4,351 1,675 2,676
CO t/year 779 292 487
The present volumes were calculated by adjusting the data in Table 2.2-3 based
on the actual capacity factor of an existing 300-MW unit, which is 22.9%.
- 6-1 -
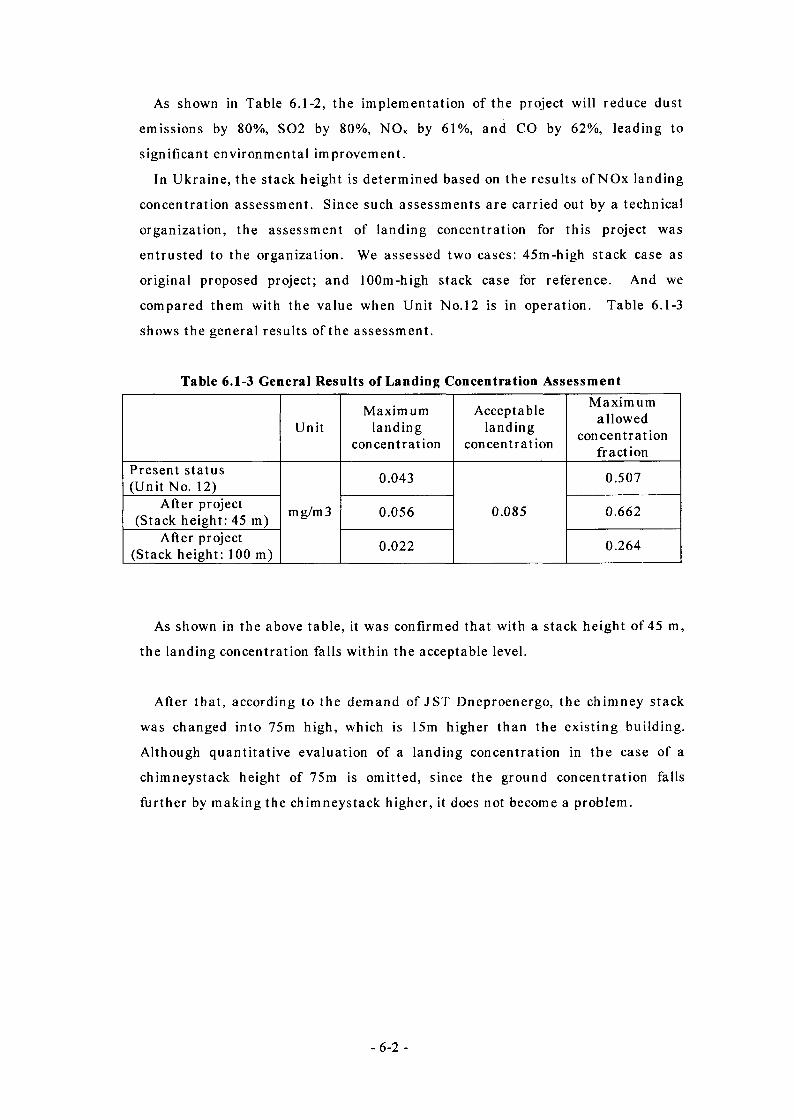
As shown in Table 6.1-2, the implementation of the project will reduce dust
emissions by 80%, 802 by 80%, NOx by 61%, and CO by 62%, leading to
significant environmental improvement.
In Ukraine, the stack height is determined based on the results ofNOx landing
concentration assessment. Since such assessments are carried out by a technical
organization, the assessment of landing concentration for this project was
entrusted to the organization. We assessed two cases: 45m-high stack case as
original proposed project; and 100m-high stack case for reference. And we
compared them with the value when Unit No.12 is in operation. Table 6.1-3
shows the general results of the assessment.
Table 6.1-3 General Results of Landing Concentration Assessment
UnitMaximum
landingconcentration
Acceptablelanding
concentration
Maximumallowed
concentrationfraction
Present status (Unit No. 12)
mg/m 3
0.043
0.085
0.507
After project (Stack height: 45 m) 0.056 0.662
After project (Stack height: 100 m) 0.022 0.264
As shown in the above table, it was confirmed that with a stack height of 45 m,
the landing concentration falls within the acceptable level.
After that, according to the demand of JST Dneproenergo, the chimney stack
was changed into 75m high, which is 15m higher than the existing building.
Although quantitative evaluation of a landing concentration in the case of a
chimneystack height of 75m is omitted, since the ground concentration falls
further by making the chimneystack higher, it does not become a problem.
- 6-2 -
1.1.2 Water quality
In this project, we plan to scrap one of the existing 300MW coal-fired units and
instead to newly construct a combined cycle unit with equal capacity, so
wastewater decreases. Therefore, additional environmental protection measures
for wastewater are not necessary.
The details of water quality will be examined at the implementation stage of
the proposed project.
1.1.3 Noise and vibration
In the combined cycle power generating facility which will be constructed in
this project, the main body of the gas turbine will be housed in the enclosure. As
a result, the noise level will be below 90 dB(A) within 1 m of the facility. In
addition, the impact beyond the border line of the site will be minimized, by
containing the entire power generating facility in a building.
At the implementation stage of the proposed project, additional assessment of
noise and vibration will be conducted as necessary by taking existing equipment
into consideration.
1.1.4 Thermal discharge water
Being located at the side of the Dnieper River, Pridneprovskaya Power Station
takes in cooling water for power generation (circulating water) from the river, and
discharges hot thermal discharge water into the river.
In this project, an existing 300 MW conventional unit will be replaced with a
highly efficient combined cycle power generating facility. Since the new unit has
a smaller steam turbine workload per unit of generated output power, it will
require less cooling water for power generation compared to the existing unit.
While the temperature difference for a condenser of the existing unit is 8°C in
normal operation (limit value: 12°C), that of the new unit will be 7°C- In short,
neither the volume nor temperature of thermal discharge water will increase
after construction. Therefore, no environmental measures will be required
regarding thermal discharge water.
- 6-3 -
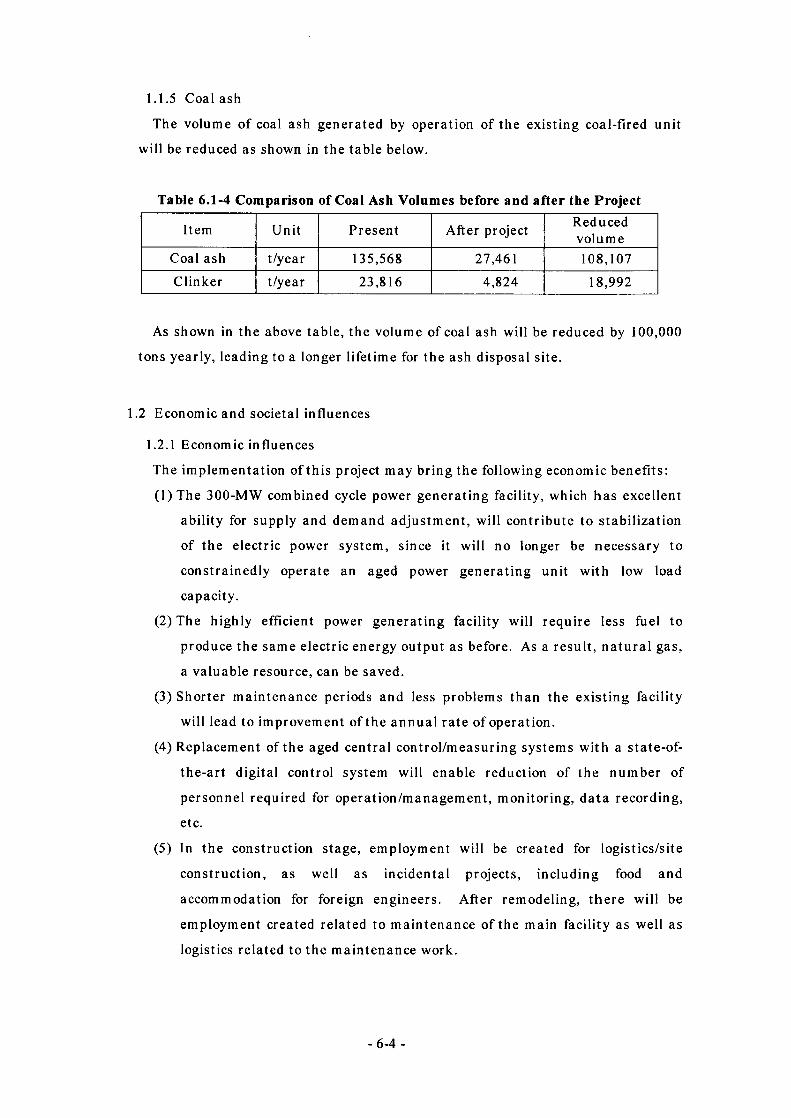
1.1.5 Coal ash
The volume of coal ash generated by operation of the existing coal-fired unit
will be reduced as shown in the table below.
Table 6.1-4 Comparison of Coal Ash Volumes before and after the Project
Item Unit Present After project Reducedvolume
Coal ash t/year 135,568 27,461 108,107Clinker t/year 23,816 4,824 18,992
As shown in the above table, the volume of coal ash will be reduced by 100,000
tons yearly, leading to a longer lifetime for the ash disposal site.
1.2 Economic and societal influences
1.2.1 Economic influences
The implementation of this project may bring the following economic benefits:
(1) The 300-MW combined cycle power generating facility, which has excellent
ability for supply and demand adjustment, will contribute to stabilization
of the electric power system, since it will no longer be necessary to
constrainedly operate an aged power generating unit with low load
capacity.
(2) The highly efficient power generating facility will require less fuel to
produce the same electric energy output as before. As a result, natural gas,
a valuable resource, can be saved.
(3) Shorter maintenance periods and less problems than the existing facility
will lead to improvement of the annual rate of operation.
(4) Replacement of the aged central control/measuring systems with a state-of-
the-art digital control system will enable reduction of the number of
personnel required for operation/management, monitoring, data recording,
etc.
(5) In the construction stage, employment will be created for logistics/site
construction, as well as incidental projects, including food and
accommodation for foreign engineers. After remodeling, there will be
employment created related to maintenance of the main facility as well as
logistics related to the maintenance work.
-6-4 -
The proposed project will not only bring benefits to Pridneprovskaya Power
Station and JST Dneproenergo, but contribute to the revitalization of Ukrainian
industry and improvement of citizens’ lives. As a result, there will be extensive
economic effects.
1.2.2 Societal influences
Since this project deals with the remodeling of an existing power generating
plant, instead of establishment of a new power plant, the construction work will
not cause significant societal influences. However, the following positive
influences are expected in the social aspect:
(1) Through quality/process control practices at the construction stage and
O&M training after remodeling, not only the Power Station but also other
parties related to the Ukrainian power industry will learn how to manage a
power station efficiently from technical and financial perspectives. This
will help promote the structural reform of the electric power sector, which
is called for by the World Bank and other international assistance
organizations.
(2) In the area to be covered by the project, air pollution has recently become a
serious problem, and there is a growing interest in environmental
conservation. However, appropriate measures are not being taken for
financial reasons. Under these circumstances, the implementation of this
project, which will contribute to improvement of the environment, may help
promote citizens’ understanding of such overseas assistance programs,
leading to the creation of a social environment that will enable smoother
implementation of similar projects in the future.
(3) Unstable electricity supply always causes both the society and economy
uneasiness and other adverse effects. Such adverse effects will be
eliminated by the implementation of the project, which will achieve
stabilization of electric power supply.
(4) After this project is completed, the power generating aspect of
Pridneprovskaya Power Station’s function as a steam supply and power
generating plant will become less important. As a result, the plant will be
able to focus on district heating, leading to improvement of electricity and
steam supply—a matter of vital importance in the Dnepropetrovsk area in
wintertime.
- 6-5 -

Conclusion
Conclusion
We have conducted a feasibility study on a renovation project to scrap-and-build
300MW coal-fired generating unit of the Pridneprovskaya thermal power station to
provide gas-fired exhaust heat recovery combined-cycle power unit of the same capacity.
This project is intended to improve generating efficiency through maximum use of
the existing facilities and premises of the power station, thereby reducing CO2
emissions. The result of the feasibility study shows that CO2 reduction achieved by
the project would be 966 kt/year, the total amount of reduction reaching approximately
39 million tons during the 40 years of calculation period. Moreover, it will be possible
to reduce other air pollutants, coal ash, and the like by several tens of percent.
In the assessment of the profitability, it is the most realistic now to assess the
profitability of the project alone, without taking into consideration an economic ripple
effect and CO2 emission rights trading. The result of the assessment was as follows;
the rate of return of this project is not necessarily high, and low interest financing is
necessary to secure business. Therefore, introduction of private sector capital is not
expectable. However, when a yen loan is assumed as a finance of low interest,
because it is certain that payment of a debt is no problem and there is no doubt about
feasibility of this project as a business and this project will contribute to emission
curtailment of greenhouse gas and an air pollution substance, application of an
environmental special yen loan is expected.
The result of our feasibility study on the facility plan shows that infrastructure such
as installation space and fuel supply is in proper condition. Moreover, there are no
technical difficulties involved in the feasibility of facility building. However, as the
exhaust heat recovery combined-cycle system incorporates the latest technology and no
other such system exists in Ukraine, it appears necessary to include a scheme for
giving O&M technical guidance to Ukrainian engineers when the project is
implemented. A possible way to realize this scheme is to provide on-the-job training
in a similar plant in Japan or to send engineers from Japan to give guidance on-site.
As we have experience in operating many combined-cycle systems, we are able to
provide technical assistance in a scheme like this.

Both Dneproenergo, our direct partner in this project, and those on the site
concerned with this project are willing to realize this project, as their power facilities
have become old with decreasing efficiency and capacity factor and they are worried
about shortage of supply capability in the near future. Also, through the feasibility
study, we feel that positive assistance can be gained from the Ministry of Fuel and
Energy (MOPE), which is the supervisory agency for Dneproenergo.
We intend to promote this project continuously, working with Ukrainian government
agencies concerned and aiming to develop concrete actions, such as making a request
for a yen loan, to raise funds for the project. With profitability taken into
consideration, a special yen loan at a low rate of interest is necessary for this project.
This necessitates activities aimed at obtaining the understanding of Japanese
government agencies concerned.
In promoting this project in the future, several things will need to be kept in mind.
The project should not transfer Japanese techniques and experience in a unilateral
manner. Requests and actual conditions on the Ukrainian side and changes in future
circumstances shall be thoroughly taken into account. Furthermore, achievement of
maximum and continued effects from the project should be borne in mind.
In conclusion, we would like to express our gratitude to all the persons concerned at
the Ministry of Fuel and Energy of Ukraine, Dneproenergo, and the Pridneprovskaya
thermal power station for their invaluable cooperation in the feasibility study.
March 2001
Chubu Electric Power Company, Incorporated

Attached Document
1 Plant Design Conditions
2 Profitability Statement
3 Calculation of Reductions Other Than Greenhouse Gases

Attached Document -1
Plant Design Conditions
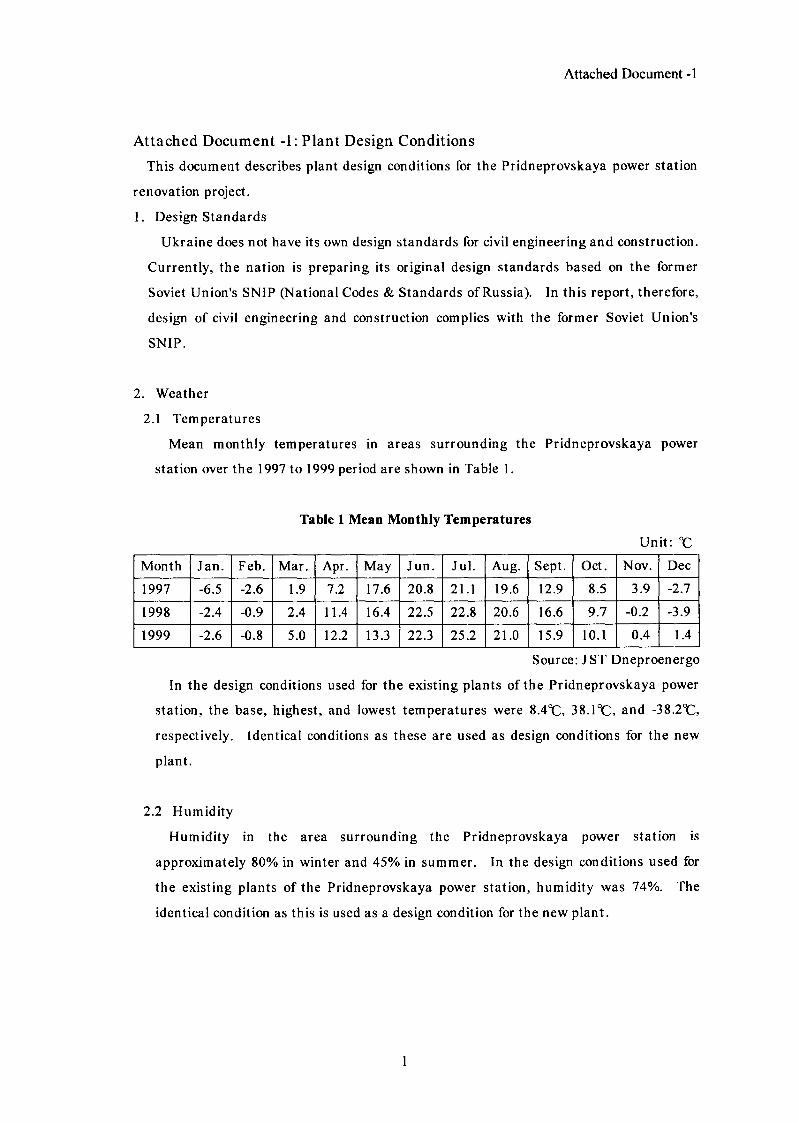
Attached Document -1
Attached Document -1: Plant Design Conditions
This document describes plant design conditions for the Pridneprovskaya power station
renovation project.
1. Design Standards
Ukraine does not have its own design standards for civil engineering and construction.
Currently, the nation is preparing its original design standards based on the former
Soviet Union's SNIP (National Codes & Standards of Russia). In this report, therefore,
design of civil engineering and construction complies with the former Soviet Union's
SNIP.
2. Weather
2.1 Temperatures
Mean monthly temperatures in areas surrounding the Pridneprovskaya power
station over the 1997 to 1999 period are shown in Table 1.
Table 1 Mean Monthly Temperatures
Unit: °C
Month Jan. Feb. Mar. Apr. May Jun. Jul. Aug. Sept. Oct. Nov. Dec
1997 -6.5 -2.6 1.9 7.2 17.6 20.8 21.1 19.6 12.9 8.5 3.9 -2.7
1998 -2.4 -0.9 2.4 11.4 16.4 22.5 22.8 20.6 16.6 9.7 -0.2 -3.9
1999 -2.6 -0.8 5.0 12.2 13.3 22.3 25.2 21.0 15.9 10.1 0.4 1.4
Source: J ST Dneproenergo
In the design conditions used for the existing plants of the Pridneprovskaya power
station, the base, highest, and lowest temperatures were 8.4°C, 38.1°C, and -38.2°C,
respectively. Identical conditions as these are used as design conditions for the new
plant.
2.2 Humidity
Humidity in the area surrounding the Pridneprovskaya power station is
approximately 80% in winter and 45% in summer. In the design conditions used for
the existing plants of the Pridneprovskaya power station, humidity was 74%. The
identical condition as this is used as a design condition for the new plant.
1

Attached Document -1
2.3 Water Temperature
Mean monthly water temperatures and highest and lowest water temperatures,
mean flow velocity, and highest and lowest water levels of Dnepr River at the
Pridneprovskaya power station over the 1997 to 1999 period are shown in Tables 2, 3,
and 4.
Table 2 Mean Water Temperatures of Dnepr River
Unit: °C
Month Jan. Feb. Mar. Apr. May Jun. Jul. Aug. Sept. Oct. Nov. Dec
1999 2 2 3 4 10 20 27 26 19 19 7 5
1998 3 3 6 9 22 22 24 25 21 15 5 3
1997 5 6 7 8 17 27 26 23 20 14 9 7
Source: J ST Dneproenergo
Table 3 Maximum and Minimum Water Temperatures of Dnepr River
Unit: °C
Maximum Minimum
Temperature Recorded in Temperature Recorded in
1999 28 August 2 February
1998 30 August 1 February
1997 28 August 1 February
Source: JST Dneproenergo
Table 4 Mean Flow Velocity and Highest and Lowest Water Levels of Dnepr River
Item Record Remarks
Mean flow velocity 0.082 m/sec.
Maximum water level EL.51.5m Bottom of intake of Pridneprovskaya TPP: EL 39.80 mMinimum water level EL.49.8m
Source: JST Dneproenergo
In the design conditions used for the existing plants of the Pridneprovskaya power
station, water temperature was 12°C. This condition is also used as a design condition
for the new plant.
2

Attached Document -1
2.4 Precipitation/Amount of Snowfall
Precipitation in the area surrounding the Pridneprovskaya power station differs to
some extent from year to year within the range of 450 to 550 mm. The area has
snowfall in winter. The maximum amount of snowfall in the past was 250 mm. The
mean amount of snowfall is
100 to 150 mm.
Snow Loads
The standards for snow loads specified in the former Soviet Union's SNIP (National
Codes & Standards of Russia) are still used. A load per unit area is specified for each
area as a snow load condition. Area classification by snow load specified in SNIP is
shown in Fig. 1.
In SNIP, snow loads are classified into 6 classes. Higher classification numbers
indicate harsher loading conditions. Snow load classification of Dnepropetrovsk in
Ukraine is I. A load per unit area of 50 kg/m2 is assigned to the city.
BtmamopuM\_ umi
\ 1 cw«*Fig. 1 Area Classification by Snow Load
3

Attached Document -1
2.5 Earthquake
General Information on Earthquakes
Ukraine is not an earthquake-classed country, but is not entirely free from the
possibility of an earthquake. Interviews with local people showed that the last
earthquake occurred about 40 years ago. As such, the Pridneprovskaya power station
does not have recording equipment for earthquakes.
Earthquake Loads
The standards for earthquake loads specified in the former Soviet Union's SNIP
(National Codes & Standards of Russia) are still in use. Highly detailed definitions
of locational constant, ground condition, importance of structure, structural type, size
of structure, and the like are given with regard to earthquake loads. Area
classification by earthquake load specified in SNIP is shown in Fig. 2. Ukraine is
classified as being earthquake zone 5 or 6. In SNIP, earthquake loads shall be taken
into account in construction design in zone 7 and higher but not in zone 6 and lower.
Therefore, earthquake loads are not taken into consideration in this report.
■'^panonowbe-^Ty”'
Fig. 2 Area Classification by Earthquake Load
4
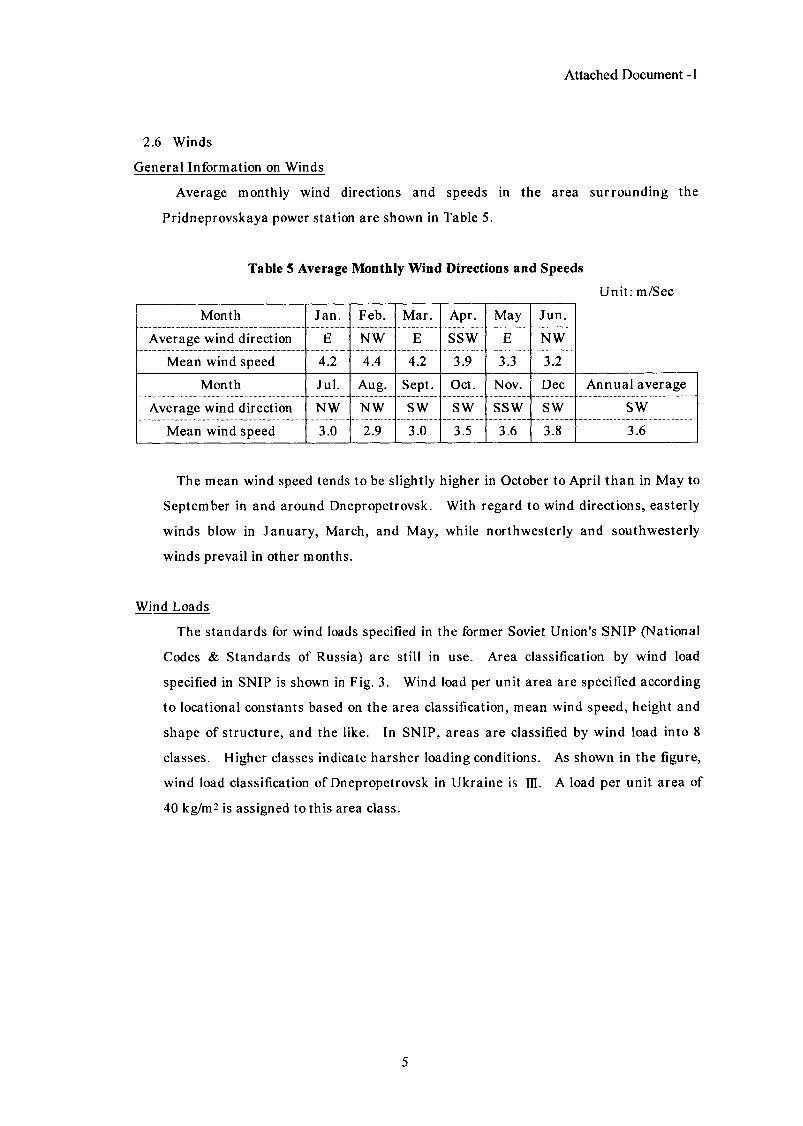
Attached Document -1
2.6 Winds
General Information on Winds
Average monthly wind directions and speeds in the area surrounding the
Pridneprovskaya power station are shown in Table 5.
Table 5 Average Monthly Wind Directions and Speeds
Unit: m/Sec
Month Jan. Feb. Mar. Apr. May Jun.
Average wind direction E NW E SSW E NW
Mean wind speed 4.2 4.4 4.2 3.9 3.3 3.2
Month Jul. Aug. Sept. Oct. Nov. Dec Annual average
Average wind direction NW NW SW SW SSW SW SW
Mean wind speed 3.0 2.9 3.0 3.5 3.6 3.8 3.6
The mean wind speed tends to be slightly higher in October to April than in May to
September in and around Dnepropetrovsk. With regard to wind directions, easterly
winds blow in January, March, and May, while northwesterly and southwesterly
winds prevail in other months.
Wind Loads
The standards for wind loads specified in the former Soviet Union's SNIP (National
Codes & Standards of Russia) are still in use. Area classification by wind load
specified in SNIP is shown in Fig. 3. Wind load per unit area are specified according
to locational constants based on the area classification, mean wind speed, height and
shape of structure, and the like. In SNIP, areas are classified by wind load into 8
classes. Higher classes indicate harsher loading conditions. As shown in the figure,
wind load classification of Dnepropetrovsk in Ukraine is m. A load per unit area of
40 kg/m2 is assigned to this area class.
5

Attached Document -1
Kj P*
Fig. 3 Area Classification by Wind Load
3. Geographic and Geological Features
3.1 Geographic Features (Source: World Encyclopedia, Heibonsha)
Most areas of Ukraine are flat with low hills. Mean elevation is 170 m. The only
uplands are the Carpathian Mountains along the western border and the Crimean
Mountains in the Crimea. The principal rivers, mostly all running in to the Sea of
Azov or the Black Sea, are the Dnepr (2,200 km in length of which 1,200 km is in
Ukraine, the third longest river in Europe), the Bug, the Dnestr, and the Donets.
Ukraine is divided into the following three areas in terms of soil and vegetation.
0 Poles'e : Acid soils unfit for agriculture, called podzol, spreads in this forested
and fen region. Poles'e is situated to the north of Kiev and accounts
for 19% of Ukraine.
(2) Forest steppe : This region is covered with fertile chernozem soils forming
layers about 180 cm thick. Forest steppe extends broadly in the
central part of Ukraine on both sides of the Dnepr. It covers 33% of
the country.
(3) Steppe : This is the grassland in the southern part of Ukraine and is also
covered with black earth. This region covers 48% of Ukraine.
6
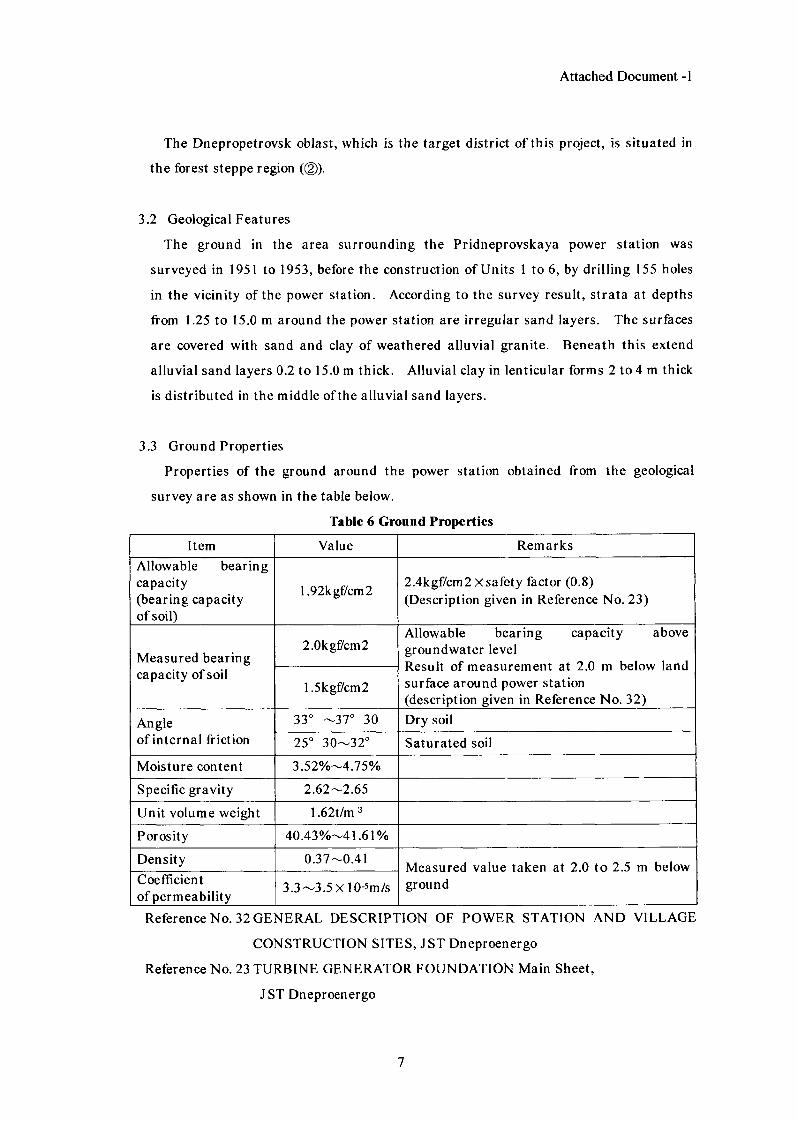
Attached Document -1
The Dnepropetrovsk oblast, which is the target district of this project, is situated in
the forest steppe region ((2)).
3.2 Geological Features
The ground in the area surrounding the Pridneprovskaya power station was
surveyed in 1951 to 1953, before the construction of Units 1 to 6, by drilling 155 holes
in the vicinity of the power station. According to the survey result, strata at depths
from 1.25 to 15.0 m around the power station are irregular sand layers. The surfaces
are covered with sand and clay of weathered alluvial granite. Beneath this extend
alluvial sand layers 0.2 to 15.0 m thick. Alluvial clay in lenticular forms 2 to 4 m thick
is distributed in the middle of the alluvial sand layers.
3.3 Ground Properties
Properties of the ground around the power station obtained from the geological
survey are as shown in the table below.
Table 6 Ground Properties
Item Value RemarksAllowable bearing capacity(bearing capacity of soil)
1.92kgf7cm2 2.4kgf/cm2 Xsafety factor (0.8)(Description given in Reference No. 23)
Measured bearing capacity of soil
2.0kgf/cm2Allowable bearing capacity abovegroundwater levelResult of measurement at 2.0 m below land surface around power station (description given in Reference No. 32)
1.5kgf/cm2
Angleof internal friction
33° —37° 30 Dry soil
25° 30—32° Saturated soil
Moisture content 3.52%—4.75%
Specific gravity 2.62-2.65
Unit volume weight 1.62t/m 3
Porosity 40.43%—41.61%
Density 0.37-0.41 Measured value taken at 2.0 to 2.5 m below groundCoefficient
of permeability 3.3—3.5X10⁻⁵m/s
Reference No. 32 GENERAL DESCRIPTION OF POWER STATION AND VILLAGE
CONSTRUCTION SITES, JST Dneproenergo
Reference No. 23 TURBINE GENERATOR FOUNDATION Main Sheet,
J ST Dneproenergo
7

Attached Document -1
3.4 Thickness of Frozen Soil
Design standards assume that the thickness of frozen soil is 1.5 m from the surface
(the result of a field survey). A measurement record shows that soil is frozen down to
0.9 m below ground around the power station in winter (described in Reference No. 32).
3.5 Groundwater Levels
It has been confirmed by the result of a drilling survey conducted around the power station
in 1951 to 1953 when the power station was constructed, that groundwater levels are
distributed in the range from 1.8 to 8.0 m below the surface of the ground.
8

Attached Document -2
Profitability Statement
1 Main Case
2 Case of Trading Emission Rights
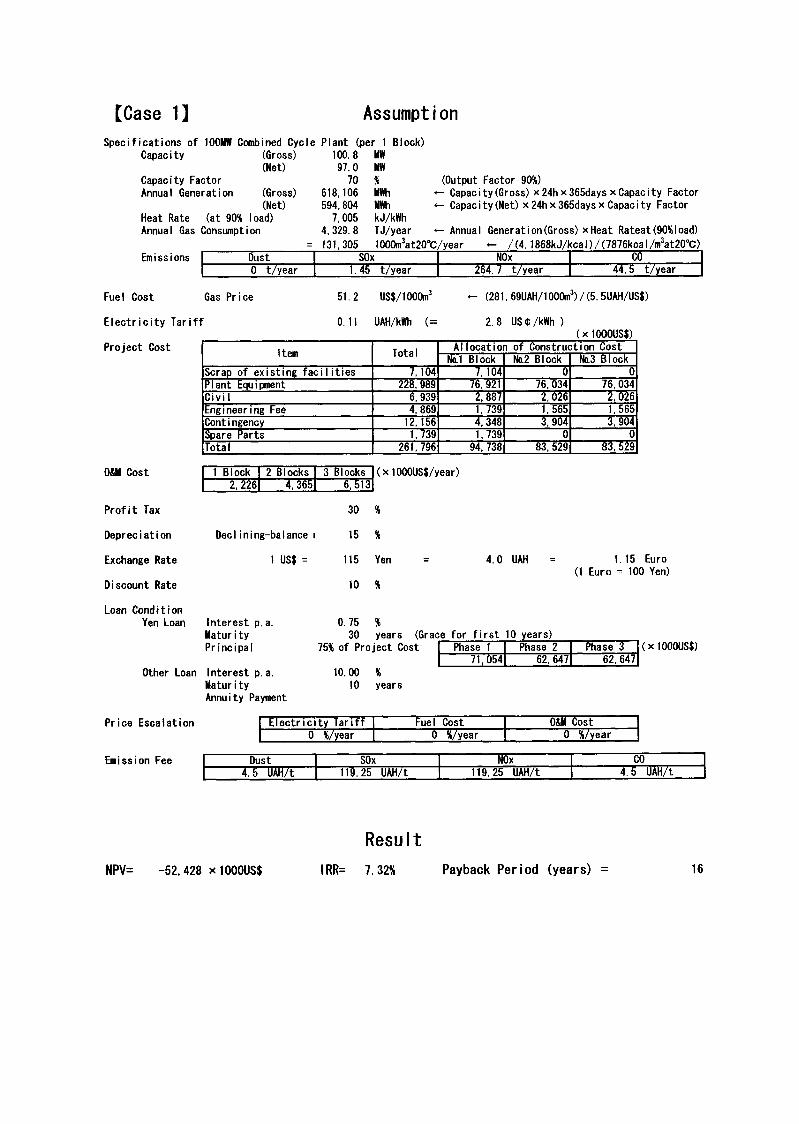
[Case 1] AssumptionSpecifications of 100IIW Combined Cycle Plant (per 1 Block)
Capacity
Capacity Factor Annual Generation
(Gross)(Net)
(Gross) (Net)
Heat Rate (at 90% load) Annual Gas Consumption
100.8 MW 97.0 MW
70 %618,106 MWh 594,804 MWh
7,005 kJ/kWh 4,329. 8 TJ/year 131,305 10Q0m3at20°C/year
(Output Factor 90%)- Capacity (Gross) x24hx365days x Capacity Factor- Capacity (Net) x24hx365daysx Capacity Factor
- Annual Generation(Gross) xHeat Rateat(90%load) /(A. 1868k J/kca I) / (7876kca I /m3at20°C)
Emissions Dust SOx NOx CO0 t/year 1.45 t/year 264.7 t/year 44. 5 t/year
Fuel Cost Gas Price 51.2 US$/1000m3 (281.69UAH/1000m3) / (5.5UAH/US$)
Electricity Tariff o.ii m/m (= 2.8 US C /kWh )(x10O0US$)
Project Cost Item Total Allocation of Construction CostNo.1 Block No.2 Block No.3 Block
Scrap of existing facilities 7,104 7,104 0 0Plant Equipment 228,989 76,921 76,034 76,034Civil 6, 939 2, 887 2, 026 2, 026Engineering Fee 4, 869 1,739 1,565 1, 565Contingency 12,156 4, 348 3, 904 3, 904Spare Parts 1,739 1,739 0 0Total 261,796 94,738 83.529 83,529
0&M Cost
Profit Tax
Depreciation
Exchange Rate
Discount Rate
Loan Condition Yen Loan
1 Block 2 Blocks 3 Blocks2,226 4, 365 6,513
(x1000US$/year)
Dec I ining-baIance
1 US$ =
Interest p. a. Maturity Principal
30 %
15 %
115 Yen
10 %
4.0 UAH 1.15 Euro (1 Euro = 100 Yen)
0.75 %30 years (Grace for first 10 years)
Other Loan Interest p. a. Maturity Annuity Payment
75% of Project Cost
10.00 %
10 years
Phase 1 Phase 2 Phase 371,054 62,647 62.647
(x1000US$)
Price Escalation Electricity Tariff Fuel Cost 0&M Cost0 %/year 0 %/year 0 %/year
Dust SOx NOx CO4.5 UAH/t 119.25 UAH/t 119.25 UAH/t 4.5 UAH/t
ResultNPV= -52,428 x1000US$ IRR= 7.32% Payback Period (years) 16
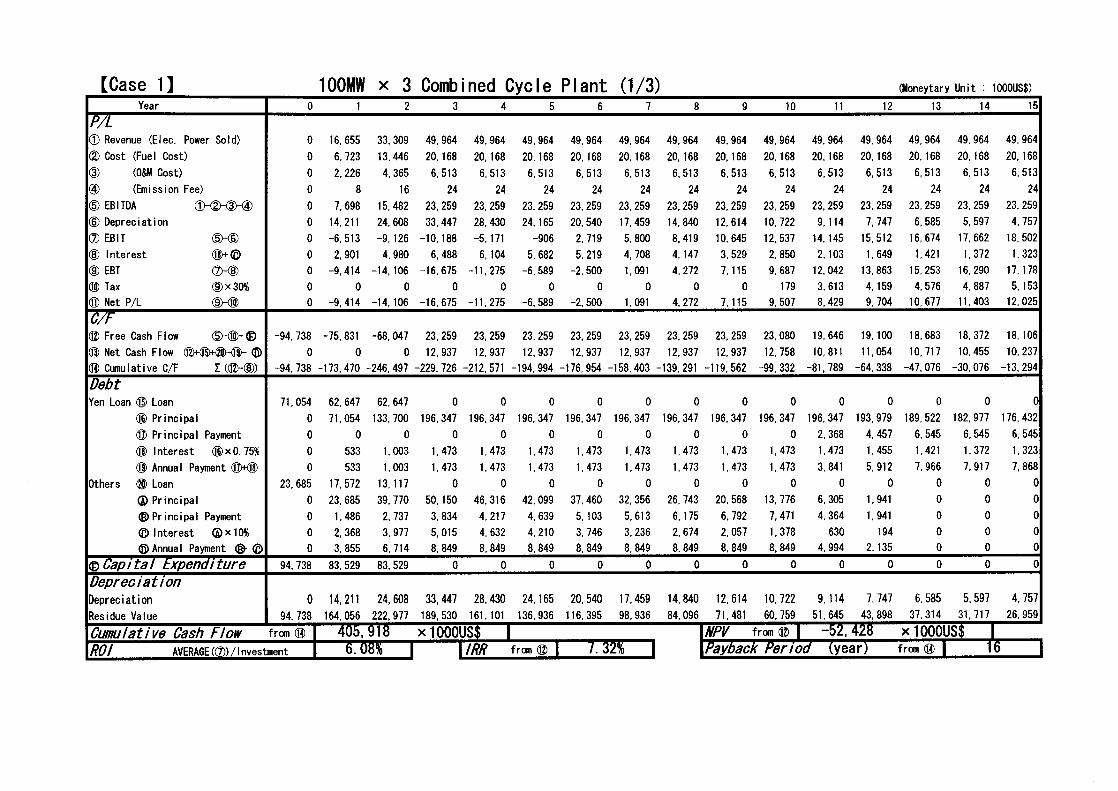
(Moneytary Unit : 1000US$)[Case 1]100MW x 3 Combined Cycle Plant (1/3)Year 0 1 2 3 4 5 6 7 8 9 10 11 12 13 14 15
T7L(D Revenue (Elec. Power Sold) 0 16, 655 33,309 49, 964 49, 964 49,964 49, 964 49,964 49, 964 49,964 49,964 49, 964 49,964 49, 964 49, 964 49,964(D Cost (Fuel Cost) 0 6, 723 13,446 20,168 20,168 20,168 20,168 20,168 20,168 20,168 20,168 20,168 20,168 20,168 20,168 20,168® (O&M Cost) 0 2,226 4, 365 6,513 6,513 6,513 6,513 6,513 6,513 6,513 6,513 6,513 6,513 6,513 6,513 6,513® (Emission Fee) 0 8 16 24 24 24 24 24 24 24 24 24 24 24 24 24(D EBITDA GH2HD-® 0 7,698 15,482 23.259 23,259 23,259 23,259 23,259 23, 259 23,259 23,259 23, 259 23,259 23,259 23,259 23,259(D Depreciation 0 14,211 24, 608 33,447 28,430 24,165 20, 540 17,459 14, 840 12, 614 10,722 9,114 7,747 6, 585 5, 597 4, 757(2) EBIT dHD 0 -6,513 -9,126 -10,188 -5,171 -906 2,719 5, 800 8,419 10,645 12, 537 14,145 15,512 16,674 17, 662 18,502(D Interest ®+© 0 2, 901 4, 980 6, 488 6,104 5, 682 5,219 4, 708 4,147 3,529 2, 850 2,103 1,649 1,421 1,372 1,323(D EBT (2HD 0 -9,414 -14,106 -16, 675 -11,275 -6,589 -2, 500 1,091 4, 272 7,115 9, 687 12,042 13,863 15,253 16,290 17,178® Tax d)x30% 0 0 0 0 0 0 0 0 0 0 179 3, 613 4,159 4. 576 4, 887 5,153® Net P/L (D~® 0 -9,414 -14,106 -16, 675 -11,275 -6, 589 -2, 500 1,091 4, 272 7,115 9, 507 8,429 9, 704 10, 677 11,403 12, 025
® Free Cash Flow (SHOD-© -94, 738 -75,831 -68,047 23,259 23,259 23,259 23,259 23, 259 23, 259 23,259 23,080 19, 646 19,100 18,683 18, 372 18,106® Net Cash Flow ®H##-®- © 0 0 0 12, 937 12, 937 12,937 12,937 12, 937 12, 937 12,937 12,758 10,811 11,054 10,717 10,455 10, 237® Cumu lative C/F I (®HD) -94, 738 -173,470 -246,497 -229, 726 -212,571 -194, 994 -176,954 -158,403 -139, 291 -119,562 -99,332 -81,789 -64, 338 -47,076 -30,076 -13, 294DebtYen Loan ® Loan 71,054 62, 647 62, 647 0 0 0 0 0 0 0 0 0 0 0 0 0
® Principal 0 71,054 133,700 196, 347 196, 347 196,347 196, 347 196, 347 196,347 196, 347 196, 347 196, 347 193,979 189,522 182,977 176,432® Principal Payment 0 0 0 0 0 0 0 0 0 0 0 2, 368 4, 457 6, 545 6, 545 6, 545® Interest ® x0. 75% 0 533 1,003 1,473 1,473 1,473 1,473 1,473 1,473 1,473 1,473 1,473 1,455 1,421 1,372 1,323® Annual Payment ®+® 0 533 1,003 1,473 1,473 1,473 1,473 1,473 1,473 1,473 1,473 3, 841 5,912 7, 966 7,917 7,868
Others ® Loan 23,685 17,572 13,117 0 0 0 0 0 0 0 0 0 0 0 0 0©Principal 0 23,685 39,770 50,150 46,316 42,099 37,460 32, 356 26, 743 20, 568 13,776 6, 305 1,941 0 0 0©Principal Payment 0 1,486 2. 737 3,834 4,217 4, 639 5,103 5,613 6,175 6, 792 7,471 4, 364 1,941 0 0 0© Interest ©x 10% 0 2, 368 3,977 5,015 4, 632 4,210 3, 746 3, 236 2, 674 2, 057 1,378 630 194 0 0 0©Annual Payment © © 0 3, 855 6,714 8, 849 8, 849 8, 849 8, 849 8, 849 8, 849 8, 849 8, 849 4, 994 2,135 0 0 0
© Capital Expenditure 94,738 83,529 83,529 0 0 0 0 0 0 0 0 0 0 0 0 0DepreciationDepreciation 0 14,211 24, 608 33,447 28,430 24,165 20,540 17,459 14,840 12,614 10, 722 9,114 7,747 6,585 5,597 4,757Residue Value 94, 738 164,056 222,977 189,530 161,101 136,936 116,395 98,936 84,096 71,481 60.759 51,645 43,898 37,314 31,717 26,959
Cumulative Cash Flow from ® 405,918 xiooousi; i NPV from ® | -52,428 x1000US$ 1ROi AVERAGE (®)/Investment CTSti | 1Irr from ® | 7.32% | Payback Period (year) from ® | 16 1
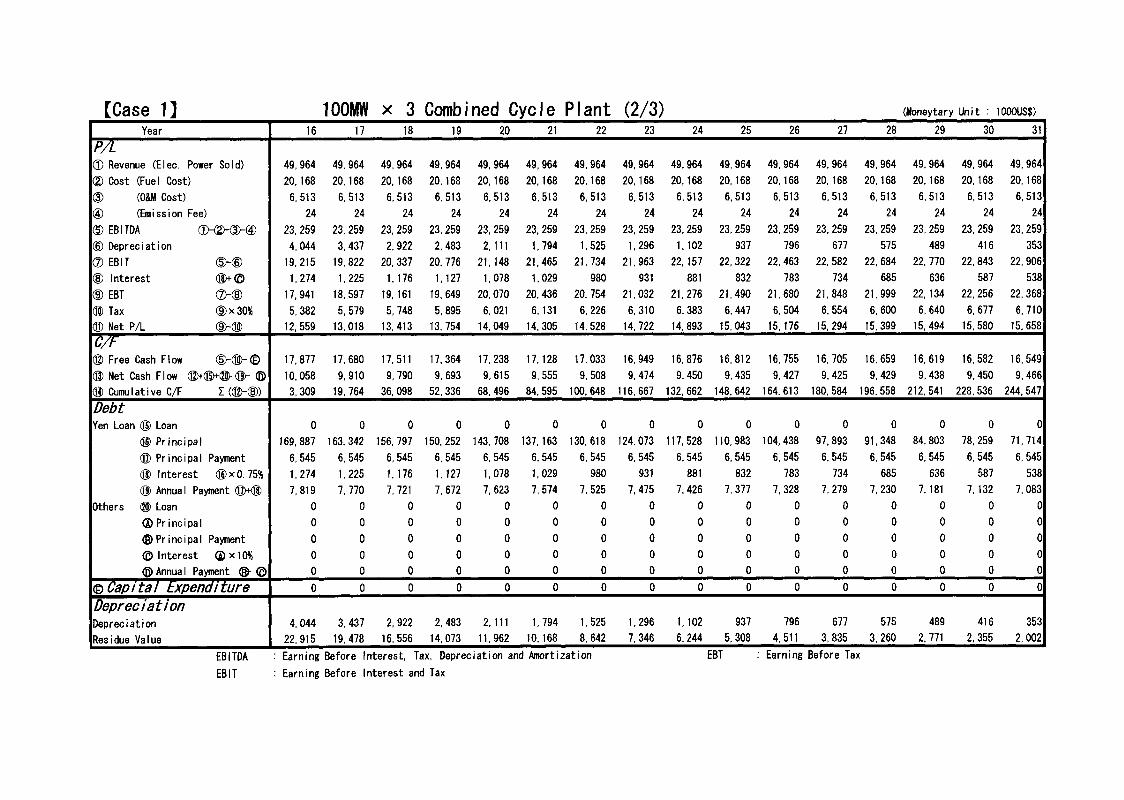
(Moneytary Unit : 1000US$)[Case 1]______________ 100MW x 3 Combined Cycle Plant (2/3)Year 16 17 18 19 20 21 22 23 24 25 26 27 28 29 30 31
P/L(D Revenue (Elec. Power Sold) 49,964 49, 964 49, 964 49, 964 49, 964 49, 964 49,964 49, 964 49, 964 49,964 49,964 49, 964 49,964 49, 964 49,964 49,964(D Cost (Fuel Cost) 20,168 20,168 20,168 20,168 20,168 20,168 20,168 20,168 20,168 20,168 20,168 20,168 20,168 20,168 20,168 20,168(D (O&M Cost) 6,513 6,513 6, 513 6,513 6,513 6,513 6,513 6,513 6,513 6,513 6,513 6,513 6,513 6,513 6,513 6,513@ (Emission Fee) 24 24 24 24 24 24 24 24 24 24 24 24 24 24 24 24© EBITDA OXD-^HD 23,259 23,259 23, 259 23, 259 23, 259 23, 259 23, 259 23,259 23,259 23,259 23,259 23,259 23, 259 23, 259 23, 259 23,259© Depreciation 4,044 3,437 2, 922 2, 483 2,111 1,794 1,525 1,296 1,102 937 796 677 575 489 416 353® EBIT ©-© 19,215 19,822 20, 337 20, 776 21,148 21,465 21,734 21,963 22,157 22,322 22,463 22, 582 22, 684 22,770 22, 843 22, 906© Interest ®+© 1,274 1,225 1,176 1,127 1,078 1,029 980 931 881 832 783 734 685 636 587 538© EBT (ZH© 17, 941 18,597 19,161 19, 649 20,070 20,436 20, 754 21,032 21,276 21,490 21,680 21,848 21,999 22,134 22, 256 22,368® Tax ©x30% 5, 382 5,579 5, 748 5, 895 6,021 6,131 6, 226 6,310 6, 383 6,447 6, 504 6, 554 6, 600 6,640 6,677 6,710© Net P/L ©-# 12, 559 13,018 13,413 13, 754 14,049 14, 305 14,528 14, 722 14, 893 15,043 15,176 15,294 15,399 15,494 15, 580 15, 658
® Free Cash Flow (D-®-© 17,877 17,680 17,511 17, 364 17,238 17,128 17,033 16, 949 16, 876 16, 812 16, 755 16, 705 16,659 16,619 16,582 16, 549® Net Cash Flow ©+##-®- © 10,058 9,910 9,790 9,693 9,615 9, 555 9, 508 9,474 9,450 9,435 9,427 9, 425 9,429 9,438 9,450 9,466® Cumulative C/F I (©-©) 3, 309 19,764 36,098 52, 336 68, 496 84, 595 100, 648 116,667 132, 662 148, 642 164, 613 180, 584 196, 558 212, 541 228,536 244, 547DebtYen Loan ® Loan 0 0 0 0 0 0 0 0 0 0 0 0 0 0 0 0
® Principal 169, 887 163, 342 156, 797 150, 252 143, 708 137,163 130,618 124,073 117,528 110, 983 104, 438 97,893 91,348 84,803 78,259 71,714© Principal Payment 6, 545 6, 545 6, 545 6, 545 6, 545 6, 545 6,545 6, 545 6, 545 6, 545 6,545 6, 545 6, 545 6, 545 6, 545 6, 545® Interest ® x0. 75% 1,274 1,225 1,176 1,127 1,078 1,029 980 931 881 832 783 734 685 636 587 538® Annual Payment ©+© 7,819 7,770 7,721 7, 672 7,623 7,574 7,525 7,475 7,426 7,377 7,328 7,279 7,230 7,181 7,132 7,083
Others ® Loan 0 0 0 0 0 0 0 0 0 0 0 0 0 0 0 0(2) Principal 0 0 0 0 0 0 0 0 0 0 0 0 0 0 0 0©Principal Payment 0 0 0 0 0 0 0 0 0 0 0 0 0 0 0 0© Interest ® x10% 0 0 0 0 0 0 0 0 0 0 0 0 0 0 0 0©Annual Payment © © 0 0 0 0 0 0 0 0 0 0 0 0 0 0 0 0
©Capital Expenditure 0 0 0 0 0 0 0 0 0 0 0 0 0 0 0 0
DepreciationDepreciation 4,044 3,437 2, 922 2, 483 2,111 1,794 1,525 1,296 1,102 937 796 677 575 489 416 353Residue Value 22, 915 19,478 16,556 14,073 11,962 10,168 8, 642 7,346 6, 244 5, 308 4,511 3, 835 3, 260 2, 771 2, 355 2,002
EBITDA : Earning Before Interest, Tax, Depreciation and Amortization EBT : Earning Before TaxEBIT : Earning Before Interest and Tax
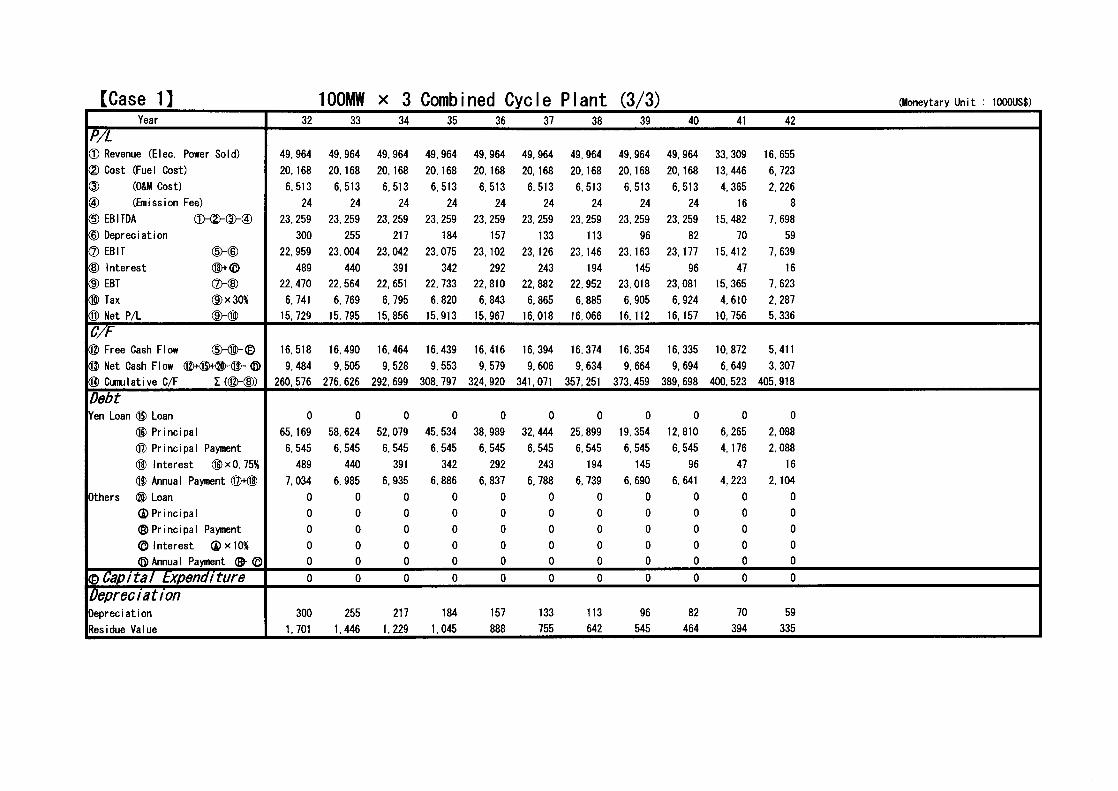
(Moneytary Unit : 1000US$)[Case 1]______________ 100MW x 3 Combined Cycle Plant (3/3)Year 32 33 34 35 36 37 38 39 40 41 42
p7l(3) Revenue (Elec. Power Sold) 49, 964 49, 964 49,964 49, 964 49, 964 49, 964 49, 964 49,964 49,964 33, 309 16, 655(D Cost (Fuel Cost) 20,168 20,168 20,168 20,168 20,168 20,168 20,168 20,168 20,168 13,446 6, 723(D (O&M Cost) 6,513 6,513 6,513 6,513 6,513 6,513 6,513 6,513 6,513 4, 365 2, 226@ (Emission Fee) 24 24 24 24 24 24 24 24 24 16 8© EBITDA g>(D-(3>-(D 23,259 23,259 23, 259 23,259 23, 259 23,259 23,259 23, 259 23, 259 15,482 7,698© Depreciation 300 255 217 184 157 133 113 96 82 70 59® EBIT dHD 22,959 23,004 23,042 23,075 23,102 23,126 23,146 23,163 23,177 15,412 7,639© Interest ®+© 489 440 391 342 292 243 194 145 96 47 16© EBT CZMD 22,470 22,564 22, 651 22, 733 22,810 22,882 22,952 23,018 23,081 15,365 7,623© Tax ©x30% 6, 741 6, 769 6, 795 6, 820 6, 843 6, 865 6, 885 6, 905 6, 924 4,610 2, 287© Net P/L ©-© 15, 729 15, 795 15,856 15,913 15, 967 16,018 16,066 16,112 16,157 10,756 5, 336
© Free Cash Flow ©-©-© 16,518 16,490 16,464 16, 439 16, 416 16, 394 16, 374 16, 354 16, 335 10, 872 5,411© Net Cash Flow ©+©+#-©-© 9,484 9, 505 9, 528 9, 553 9, 579 9, 606 9, 634 9, 664 9, 694 6, 649 3, 307© Cumulative C/F I (©-©) 260,576 276,626 292, 699 308, 797 324,920 341,071 357, 251 373,459 389,698 400,523 405,918DebtYen Loan ® Loan 0 0 0 0 0 0 0 0 0 0 0
® Principal 65,169 58,624 52, 079 45, 534 38, 989 32, 444 25,899 19,354 12,810 6, 265 2,088© Principal Payment 6, 545 6, 545 6, 545 6, 545 6, 545 6,545 6, 545 6, 545 6, 545 4,176 2,088© Interest ©xO. 75% 489 440 391 342 292 243 194 145 96 47 16© Annual Payment ©+© 7, 034 6, 985 6, 935 6, 886 6, 837 6,788 6, 739 6, 690 6, 641 4, 223 2,104
Others © Loan 0 0 0 0 0 0 0 0 0 0 0©Principal 0 0 0 0 0 0 0 0 0 0 0©Principal Payment 0 0 0 0 0 0 0 0 0 0 0© Interest © x 10% 0 0 0 0 0 0 0 0 0 0 0©Annual Payment © © 0 0 0 0 0 0 0 0 0 0 0
©Capital Expenditure 0 0 0 0 0 0 0 0 0 0 0DepreciationDepreciation 300 255 217 184 157 133 113 96 82 70 59Residue Value 1,701 1,446 1,229 1,045 888 755 642 545 464 394 335
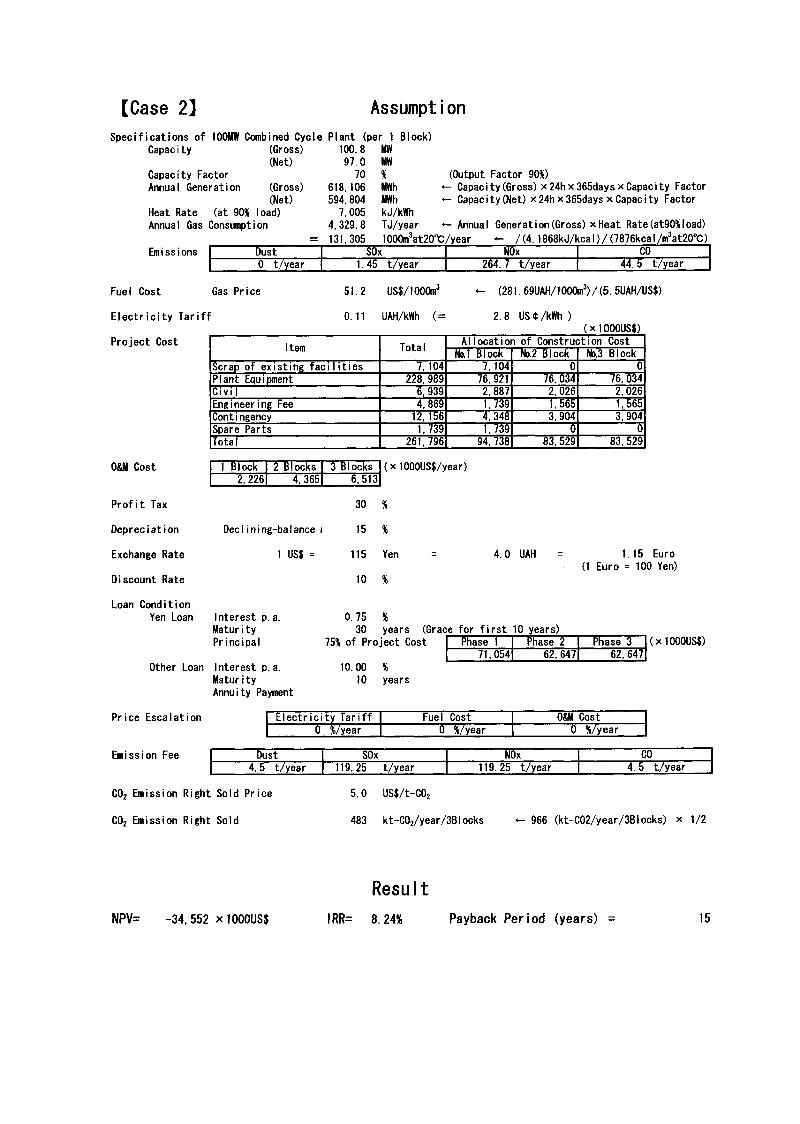
[Case 2] AssumptionSpecifications of 100MW Combined Cycle Plant (per 1 Block)
Capacity
Capacity Factor Annual Generation
(Gross)(Net)
(Gross) (Net)
Heat Rate (at 90% load) Annual Gas Consumption
100.897.0
70618,106 594, 804
7,005 4, 329. 8
MWMW%
MWhMWhkJ/kWhTJ/year
(Output Factor 90%)- Capacity(Gross) x24hx365daysxCapacity Factor- Capacity(Net) x24hx365days xCapacity Factor
- Annual Generation(Gross) xHeat Rate(at90%Ioad)
Emissions Dust SOx NOx CO0 t/year 1.45 t/year 264.7 t/year 44.5 t/year
Fuel Cost Gas Price 51.2 US$/1000m3 «- (281.69UAH/1000m3)/(5.5UAH/US$)
Electricity Tar
Project Cost
iff 0.11 UAH/kWh (= 2.8 USt/kWh )(xIOOQUSS)
Item Total Allocation of Construction CostNo.1 Block No.2 Block No.3 Block
Scrap of existing facilities 7,104 7,104 0 0Plant Equipment 228, 989 76, 921 76, 034 76, 034Civil 6, 939 2,887 2,026 2,026Engineering Fee 4, 869 1.739 1,565 1,565Contingency 12,156 4, 348 3, 904 3,904Spare Parts 1,739 1,739 0 0Total 261,796 94, 738 83,529 83,529
0&M Cost 1 Block 2 Blocks 3 Blocks (x1000US$/year)2,226 4, 365 6,513
Profit Tax 30 %
Depreciation Dec 1 ining-ba1ance 15 %
Exchange Rate 1 US$ = 115 Yen = 4.0 UAH 1.15 Euro(1 Euro = 100 Yen)
Discount Rate 10 %
Loan ConditionYen Loan Interest p . a. 0. 75 %
Maturity 30 years (Grace for first 10 years)Principal 75% of Project Cost Phase 1 Phase 2 Phase 3 (x1000US$)
71,054 62,647 62,647Other Loan Interest p . a. 10.00 %
Maturity 10 yearsAnnuity Payment
Price Escalation Electricity Tariff Fuel Cost 0&M Cost0 %/year 0 %/year 0 %/year
Emission Fee Dust SOx NOx CO4.5 t/year 119. 25 t/year 119.25 t/year 4.5 t/year
C02 Emission Right Sold Price 5.0 US$/t-C02
C02 Emission Right Sold 483 kt-C02/year/3BIocks «- 966 (kt-C02/year/3Blocks) x 1/2
ResultNPV= -34,552 x 1000US$ IRR= 8.24% Payback Period (years) 15
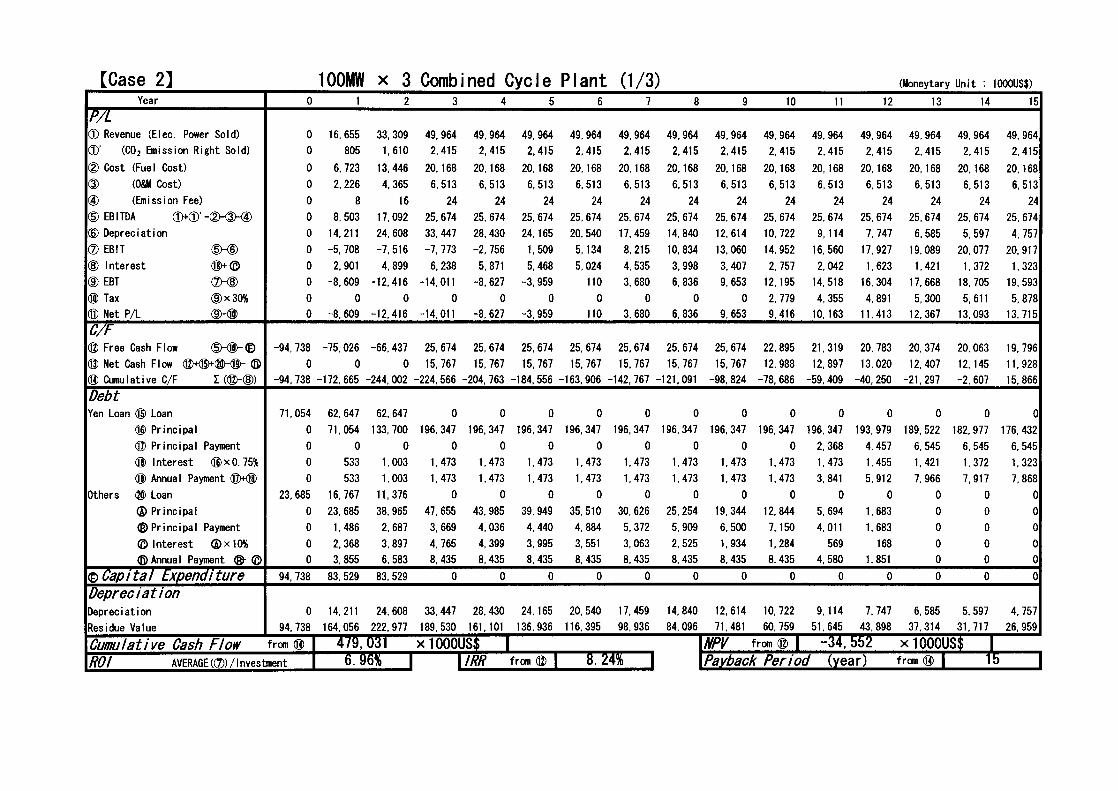
(Moneytary Unit : 1000US$)[Case 2]1001# x 3 Combined Cycle Plant (1/3)Year 0 1 2 3 4 5 6 7 8 9 10 11 12 13 14 15
P/L(D Revenue (Elec. Power Sold) 0 16, 655 33,309 49, 964 49, 964 49, 964 49, 964 49, 964 49,964 49, 964 49, 964 49, 964 49, 964 49, 964 49, 964 49, 964CD’ (CO2 Emission Right Sold) 0 805 1,610 2,415 2,415 2,415 2,415 2,415 2,415 2,415 2,415 2,415 2,415 2,415 2,415 2,415(D Cost (Fuel Cost) 0 6, 723 13,446 20,168 20,168 20,168 20,168 20,168 20,168 20,168 20,168 20,168 20,168 20,168 20,168 20,168<D (0&M Cost) 0 2.226 4,365 6,513 6, 513 6,513 6,513 6,513 6,513 6,513 6,513 6,513 6, 513 6,513 6,513 6,513® (Emission Fee) 0 8 16 24 24 24 24 24 24 24 24 24 24 24 24 24(D EBITDA d>®'-dMSH® 0 8, 503 17,092 25,674 25,674 25,674 25,674 25, 674 25,674 25, 674 25. 674 25,674 25,674 25,674 25,674 25,674(D Depreciation 0 14,211 24, 608 33, 447 28,430 24,165 20, 540 17, 459 14, 840 12,614 10, 722 9,114 7, 747 6, 585 5, 597 4, 757® EBIT dMD 0 -5, 708 -7,516 -7, 773 -2, 756 1,509 5,134 8, 215 10, 834 13,060 14, 952 16, 560 17,927 19,089 20, 077 20,917(D Interest ©+© 0 2, 901 4,899 6,238 5, 871 5,468 5,024 4,535 3,998 3,407 2, 757 2,042 1,623 1,421 1,372 1,323(D ebt SHE) 0 -8,609 -12,416 -14,011 -8,627 -3,959 110 3, 680 6,836 9, 653 12,195 14,518 16, 304 17,668 18,705 19,593® Tax ®X30% 0 0 0 0 0 0 0 0 0 0 2,779 4, 355 4,891 5, 300 5,611 5, 878© Net P/L ©-© 0 -8,609 -12,416 -14,011 -8,627 -3,959 110 3, 680 6, 836 9, 653 9,416 10,163 11,413 12, 367 13,093 13,715
© Free Cash Flow <©-©-© -94, 738 -75,026 -66,437 25,674 25,674 25,674 25,674 25,674 25,674 25, 674 22, 895 21,319 20, 783 20,374 20,063 19, 796© Net Cash Flow ©+##-©- © 0 0 0 15,767 15,767 15.767 15, 767 15, 767 15, 767 15,767 12, 988 12,897 13, 020 12,407 12,145 11,928© Cumu lative C/F I (®-(D) -94,738 -172, 665 -244,002 -224, 566 -204, 763 -184,556 -163, 906 -142, 767 -121,091 -98,824 -78, 686 -59,409 -40, 250 -21,297 -2, 607 15, 866DebtYen Loan ® Loan 71,054 62, 647 62, 647 0 0 0 0 0 0 0 0 0 0 0 0 0
® Principal 0 71,054 133, 700 196,347 196,347 196,347 196, 347 196, 347 196, 347 196, 347 196, 347 196, 347 193,979 189, 522 182, 977 176,432© Principal Payment 0 0 0 0 0 0 0 0 0 0 0 2, 368 4,457 6, 545 6, 545 6, 545© Interest ® x0. 75% 0 533 1,003 1,473 1,473 1,473 1,473 1,473 1,473 1,473 1,473 1,473 1.455 1,421 1,372 1,323© Annual Payment ©+® 0 533 1,003 1,473 1,473 1,473 1,473 1,473 1,473 1,473 1,473 3, 841 5,912 7,966 7,917 7,868
Others © Loan 23,685 16, 767 11,376 0 0 0 0 0 0 0 0 0 0 0 0 0(2) Principal 0 23, 685 38, 965 47, 655 43,985 39,949 35,510 30,626 25,254 19,344 12, 844 5, 694 1,683 0 0 0©Principal Payment 0 1,486 2, 687 3,669 4,036 4,440 4, 884 5, 372 5, 909 6, 500 7,150 4,011 1,683 0 0 0© Interest ®x10% 0 2, 368 3,897 4,765 4, 399 3, 995 3, 551 3,063 2, 525 1,934 1,284 569 168 0 0 0© Annua 1 Payment © © 0 3, 855 6, 583 8,435 8,435 8,435 8, 435 8,435 8,435 8,435 8,435 4, 580 1,851 0 0 0
©Capital Expenditure 94, 738 83,529 83, 529 0 0 0 0 0 0 0 0 0 0 0 0 0DepreciationDepreciation 0 14,211 24, 608 33,447 28,430 24,165 20,540 17,459 14, 840 12,614 10, 722 9,114 7,747 6, 585 5, 597 4, 757Residue Value 94, 738 164,056 222,977 189,530 161,101 136,936 116, 395 98,936 84,096 71,481 60, 759 51,645 43,898 37,314 31,717 26, 959Cumulative Cash Flow from ® 479,031 xiooousj; i NPV from © | -34, 552 xiooous:; iROi AVERAGE (®) /Investment OBH | Urr from © | 8TZW I Payback Period (year) from ® | 1b I
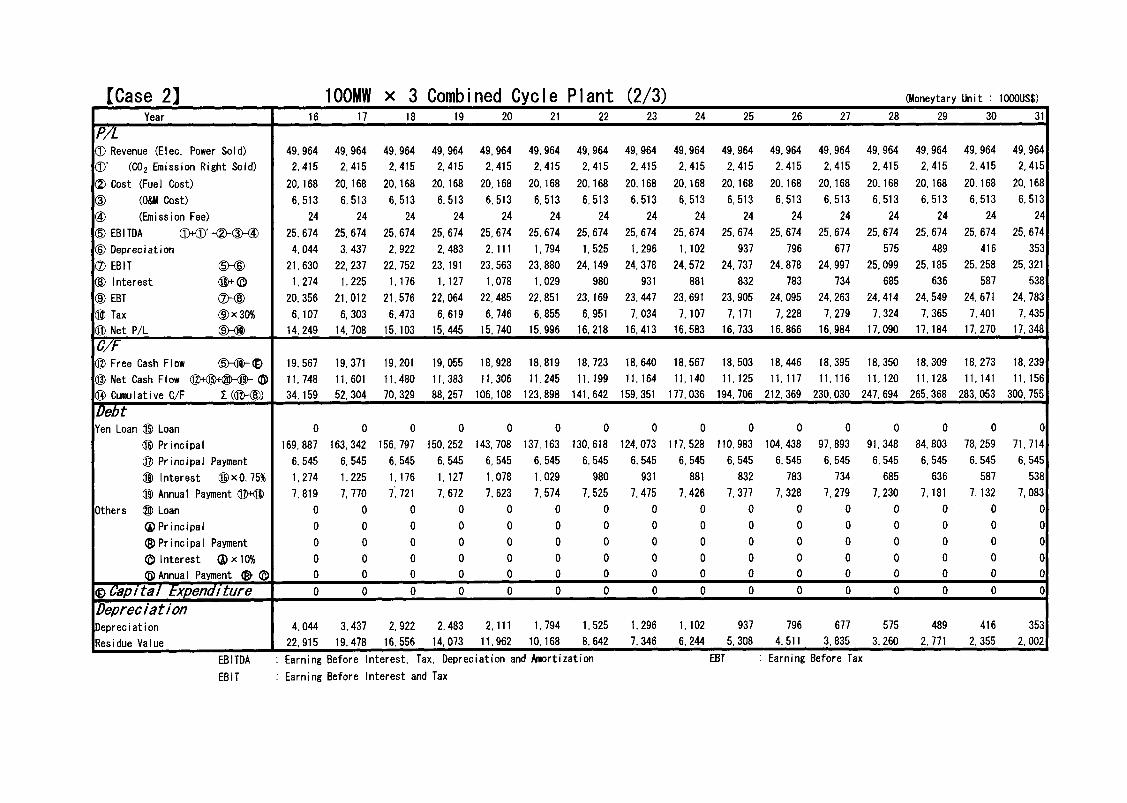
(Moneytary Unit : 1000US$)[Case 2]______________ 1001# x 3 Combined Cycle Plant (2/3)Year 16 17 18 19 20 21 22 23 24 25 26 27 28 29 30 31
P/L(D Revenue (Elec. Power Sold) 49, 964 49, 964 49, 964 49, 964 49, 964 49, 964 49,964 49, 964 49, 964 49, 964 49,964 49, 964 49, 964 49,964 49,964 49, 964©' (CO2 Emission Right Sold) 2,415 2,415 2, 415 2,415 2,415 2, 415 2,415 2,415 2, 415 2, 415 2, 415 2, 415 2, 415 2,415 2, 415 2, 415(D Cost (Fuel Cost) 20,168 20,168 20,168 20,168 20,168 20,168 20,168 20,168 20,168 20,168 20,168 20,168 20,168 20,168 20,168 20,168<D (0&M Cost) 6,513 6,513 6,513 6, 513 6, 513 6,513 6,513 6, 513 6,513 6,513 6,513 6, 513 6, 513 6,513 6, 513 6,513(D (Emission Fee) 24 24 24 24 24 24 24 24 24 24 24 24 24 24 24 24(D EBITDA dXD'-dhdh® 25,674 25,674 25,674 25,674 25,674 25,674 25, 674 25, 674 25,674 25,674 25, 674 25,674 25, 674 25, 674 25, 674 25, 674(D Depreciation 4,044 3,437 2, 922 2,483 2,111 1,794 1,525 1,296 1,102 937 796 677 575 489 416 353(D EBIT dMD 21,630 22,237 22,752 23,191 23, 563 23,880 24,149 24, 378 24,572 24, 737 24,878 24,997 25,099 25,185 25,258 25, 321(D Interest ®^-© 1,274 1,225 1,176 1,127 1,078 1,029 980 931 881 832 783 734 685 636 587 538(D EBT CZMD 20, 356 21,012 21,576 22,064 22,485 22,851 23,169 23,447 23, 691 23,905 24, 095 24, 263 24,414 24, 549 24, 671 24, 783® Tax ©x30% 6,107 6,303 6,473 6, 619 6, 746 6,855 6, 951 7, 034 7,107 7,171 7, 228 7,279 7,324 7,365 7,401 7,435<fi) Net P/L ©-# 14, 249 14, 708 15,103 15,445 15, 740 15,996 16, 218 16,413 16, 583 16, 733 16, 866 16, 984 17,090 17,184 17,270 17,348
® Free Cash Flow dM®-© 19, 567 19, 371 19,201 19,055 18,928 18,819 18,723 18, 640 18,567 18,503 18,446 18, 395 18,350 18,309 18,273 18,239® Net Cash Flow ®+®+#-®- © 11,748 11,601 11,480 11,383 11,306 11,245 11,199 11,164 11,140 11,125 11,117 11,116 11,120 11,128 11,141 11,156® Cumulative C/F I (©-(§)) 34,159 52,304 70, 329 88,257 106,108 123, 898 141,642 159,351 177,036 194, 706 212,369 230, 030 247, 694 265,368 283, 053 300, 755DebtYen Loan ® Loan 0 0 0 0 0 0 0 0 0 0 0 0 0 0 0 0
® Principal 169, 887 163, 342 156, 797 150,252 143,708 137,163 130,618 124,073 117, 528 110, 983 104,438 97, 893 91,348 84, 803 78, 259 71,714® Principal Payment 6, 545 6, 545 6, 545 6, 545 6, 545 6, 545 6, 545 6, 545 6, 545 6, 545 6, 545 6, 545 6,545 6, 545 6, 545 6, 545® Interest ® x0. 75% 1,274 1,225 1,176 1,127 1,078 1,029 980 931 881 832 783 734 685 636 587 538® Annual Payment ®+® 7,819 7,770 7", 721 7,672 7,623 7,574 7,525 7,475 7,426 7,377 7,328 7,279 7,230 7,181 7,132 7,083
Others ® Loan 0 0 0 0 0 0 0 0 0 0 0 0 0 0 0 0<S> Principal 0 0 0 0 0 0 0 0 0 0 0 0 0 0 0 0©Principal Payment 0 0 0 0 0 0 0 0 0 0 0 0 0 0 0 0© Interest ® x10% 0 0 0 0 0 0 0 0 0 0 0 0 0 0 0 0© Annual Payment © © 0 0 0 0 0 0 0 0 0 0 0 0 0 0 0 0
© Capital Expenditure 0 0 0 0 0 0 0 0 0 0 0 0 0 0 0 0
DepreciationDepreciation 4,044 3,437 2, 922 2,483 2,111 1,794 1,525 1,296 1,102 937 796 677 575 489 416 353Residue Value 22, 915 19,478 16, 556 14,073 11,962 10,168 8, 642 7,346 6, 244 5, 308 4,511 3, 835 3, 260 2, 771 2, 355 2,002
EBITDA : Earning Before Interest, Tax, Depreciation and Amortization EBT •' Earning Before TaxEBIT : Earning Before Interest and Tax
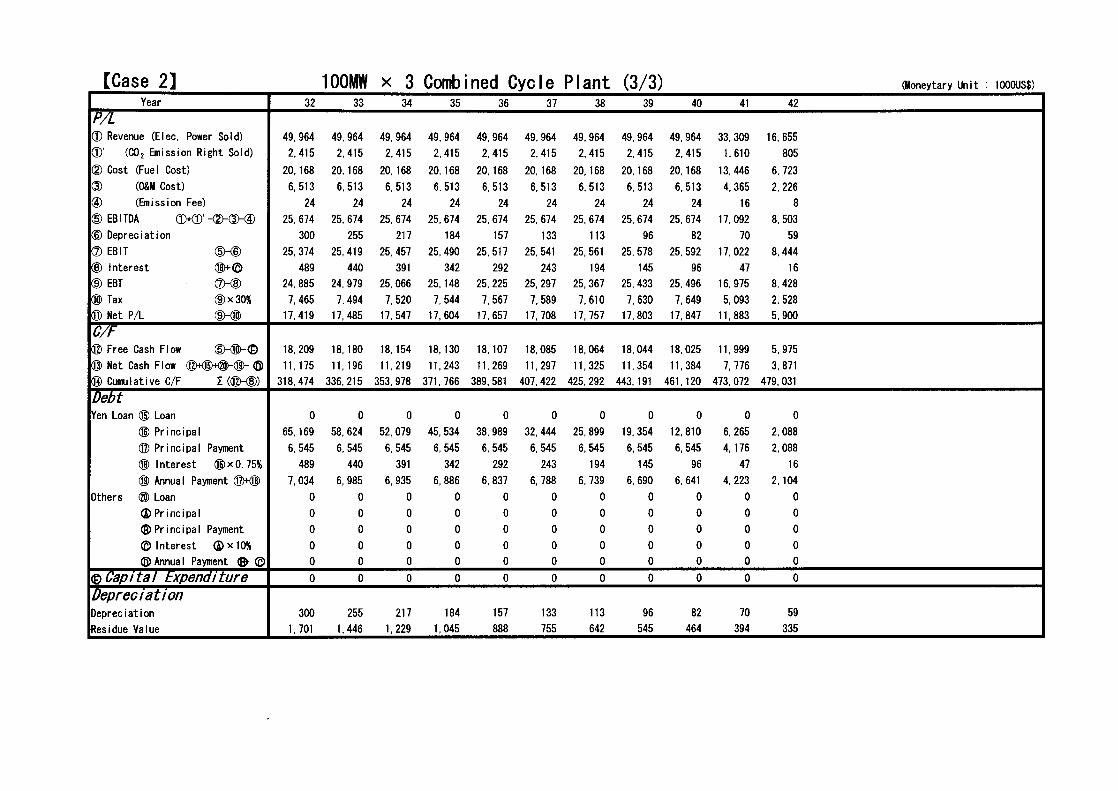
(Moneytary Unit : 1000US$)[Case 2]______________ 100MW x 3 Combined Cycle Plant (3/3)Year 32 33 34 35 36 37 38 39 40 41 42
p7l(D Revenue (Elec. Power Sold) 49,964 49,964 49, 964 49,964 49, 964 49,964 49,964 49, 964 49, 964 33, 309 16, 655CD’ (CO2 Emission Right Sold) 2,415 2, 415 2,415 2,415 2,415 2,415 2,415 2,415 2, 415 1,610 805(D Cost (Fuel Cost) 20,168 20,168 20,168 20,168 20,168 20,168 20,168 20,168 20,168 13,446 6, 723(D (O&M Cost) 6,513 6,513 6,513 6,513 6,513 6,513 6,513 6,513 6,513 4, 365 2,226@ (Emission Fee) 24 24 24 24 24 24 24 24 24 16 8(D EBI IDA (D+d)' -dHlMD 25, 674 25, 674 25, 674 25,674 25,674 25, 674 25,674 25, 674 25, 674 17,092 8,503(D Depreciation 300 255 217 184 157 133 113 96 82 70 59Q) EBIT 25,374 25,419 25. 457 25, 490 25,517 25, 541 25, 561 25, 578 25,592 17,022 8,444(D Interest (QME) 489 440 391 342 292 243 194 145 96 47 16® EBT (7HD 24,885 24, 979 25,066 25,148 25,225 25, 297 25,367 25, 433 25,496 16, 975 8, 428® Tax d)x30% 7,465 7,494 7,520 7,544 7,567 7,589 7,610 7,630 7,649 5, 093 2, 528® Net P/L dH® 17, 419 17, 485 17,547 17,604 17,657 17,708 17,757 17, 803 17,847 11,883 5,900
® Free Cash Flow dH®-© 18, 209 18,180 18,154 18,130 18,107 18,085 18, 064 18,044 18,025 11,999 5, 975® Net Cash Flow ®+®+®-®- ® 11,175 11,196 11,219 11,243 11,269 11,297 11,325 11,354 11,384 7,776 3,871® Cumulative C/F I (©-(§)) 318,474 336,215 353,978 371,766 389, 581 407, 422 425,292 443,191 461,120 473, 072 479, 031DebtYen Loan ® Loan 0 0 0 0 0 0 0 0 0 0 0
® Principal 65,169 58,624 52,079 45,534 38,989 32,444 25.899 19, 354 12, 810 6.265 2,088® Principal Payment 6, 545 6, 545 6, 545 6,545 6, 545 6, 545 6, 545 6, 545 6, 545 4,176 2,088® Interest ®x0. 75% 489 440 391 342 292 243 194 145 96 47 16® Annual Payment ®H® 7,034 6, 985 6, 935 6,886 6, 837 6, 788 6, 739 6, 690 6, 641 4, 223 2,104
Others ® Loan 0 0 0 0 0 0 0 0 0 0 0©Principal 0 0 0 0 0 0 0 0 0 0 0©Principal Payment 0 0 0 0 0 0 0 0 0 0 0© Interest © x10% 0 0 0 0 0 0 0 0 0 0 0©Annual Payment © © 0 0 0 0 0 0 0 0 0 0 0
©Capital Expenditure 0 0 0 0 0 0 0 0 0 0 0DepreciationDepreciation 300 255 217 184 157 133 113 96 82 70 59Residue Value 1,701 1,446 1,229 1,045 888 755 642 545 464 394 335

Attached Document -3
Calculation of Reductions Other Than
Greenhouse Gases
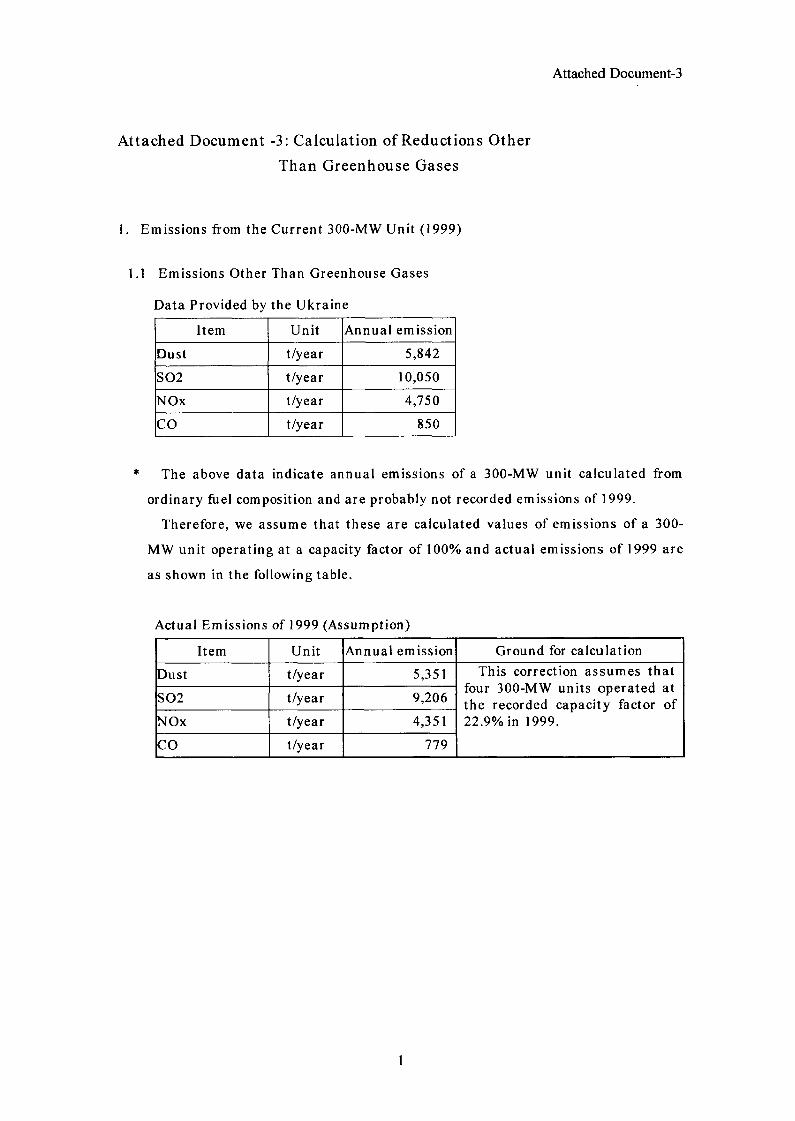
Attached Document-3
Attached Document -3: Calculation of Reductions Other
Than Greenhouse Gases
1. Emissions from the Current 300-MW Unit (1999)
1.1 Emissions Other Than Greenhouse Gases
Data Provided by the Ukraine
Item Unit Annual emission
Dust t/year 5,842
802 t/year 10,050
NOx t/year 4,750
CO t/year 850
The above data indicate annual emissions of a 300-MW unit calculated from
ordinary fuel composition and are probably not recorded emissions of 1999.
Therefore, we assume that these are calculated values of emissions of a 300-
MW unit operating at a capacity factor of 100% and actual emissions of 1999 are
as shown in the following table.
Actual Emissions of 1999 (Assumption)
Item Unit Annual emission Ground for calculation
Dust t/year 5,351 This correction assumes that four 300-MW units operated at the recorded capacity factor of 22.9% in 1999.
802 t/year 9,206
NOx t/year 4,351
CO t/year 779
1
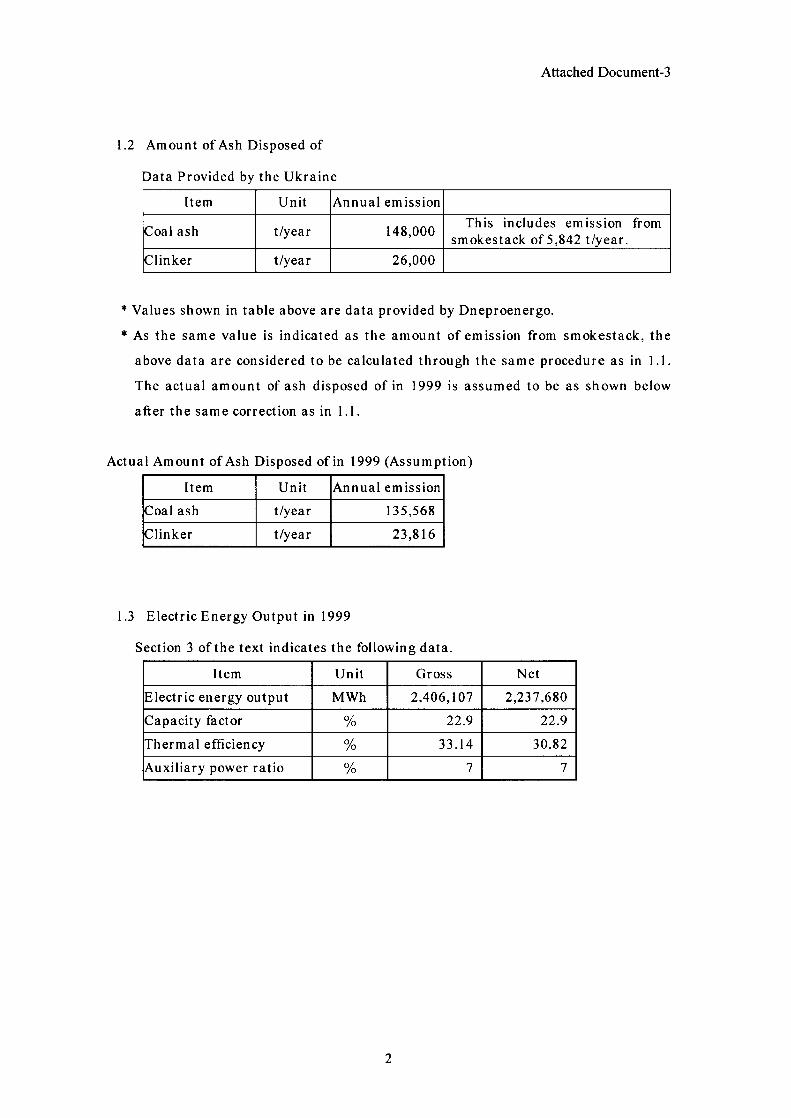
Attached Document-3
1.2 Amount of Ash Disposed of
Data Provided by the Ukraine
Item Unit Annual emission
Coal ash t/year 148,000 This includes emission from smokestack of 5,842 t/year.
Clinker t/year 26,000
* Values shown in table above are data provided by Dneproenergo.
* As the same value is indicated as the amount of emission from smokestack, the
above data are considered to be calculated through the same procedure as in 1.1.
The actual amount of ash disposed of in 1999 is assumed to be as shown below
after the same correction as in 1.1.
Actual Amount of Ash Disposed of in 1999 (Assumption)
Item Unit Annual emission
Coal ash t/year 135,568
Clinker t/year 23,816
1.3 Electric Energy Output in 1999
Section 3 of the text indicates the following data.
Item Unit Gross Net
Electric energy output MWh 2,406,107 2,237,680
Capacity factor % 22.9 22.9
Thermal efficiency % 33.14 30.82
Auxiliary power ratio % 7 7
2
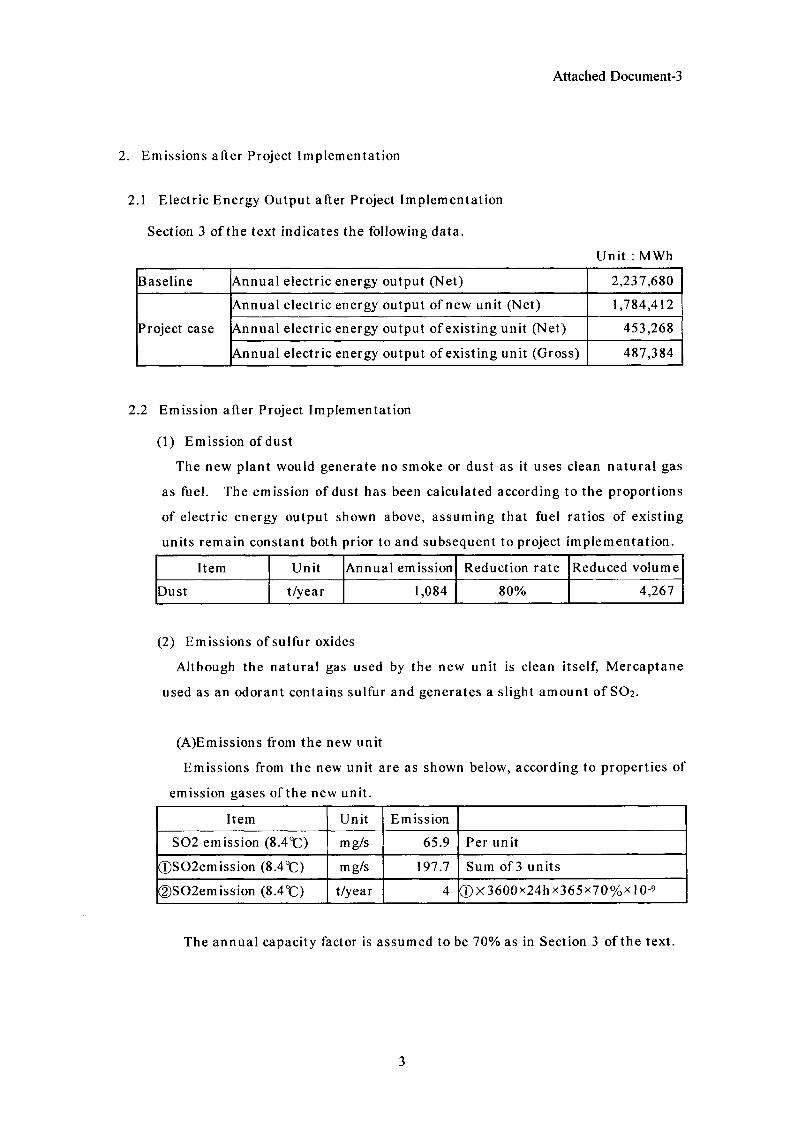
Attached Document-3
2. Emissions after Project Implementation
2.1 Electric Energy Output after Project Implementation
Section 3 of the text indicates the following data.
Unit : MWh
Baseline Annual electric energy output (Net) 2,237,680
Project case
Annual electric energy output of new unit (Net) 1,784,412
Annual electric energy output of existing unit (Net) 453,268
Annual electric energy output of existing unit (Gross) 487,384
2.2 Emission after Project Implementation
(1) Emission of dust
The new plant would generate no smoke or dust as it uses clean natural gas
as fuel. The emission of dust has been calculated according to the proportions
of electric energy output shown above, assuming that fuel ratios of existing
units remain constant both prior to and subsequent to project implementation.
Item Unit Annual emission Reduction rate Reduced volume
Dust t/year 1,084 80% 4,267
(2) Emissions of sulfur oxides
Although the natural gas used by the new unit is clean itself, Mercaptane
used as an odorant contains sulfur and generates a slight amount of SO2.
(A)Emissions from the new unit
Emissions from the new unit are as shown below, according to properties of
emission gases of the new unit.
Item Unit Emission
S02 emission (8.4°C) mg/s 65.9 Per unit
0SO2emission (8.4°C) mg/s 197.7 Sum of 3 units
(2)S02emission (8.4°C) t/year 4 0X36OOx24hx365x7O%xlO-9
The annual capacity factor is assumed to be 70% as in Section 3 of the text.
3
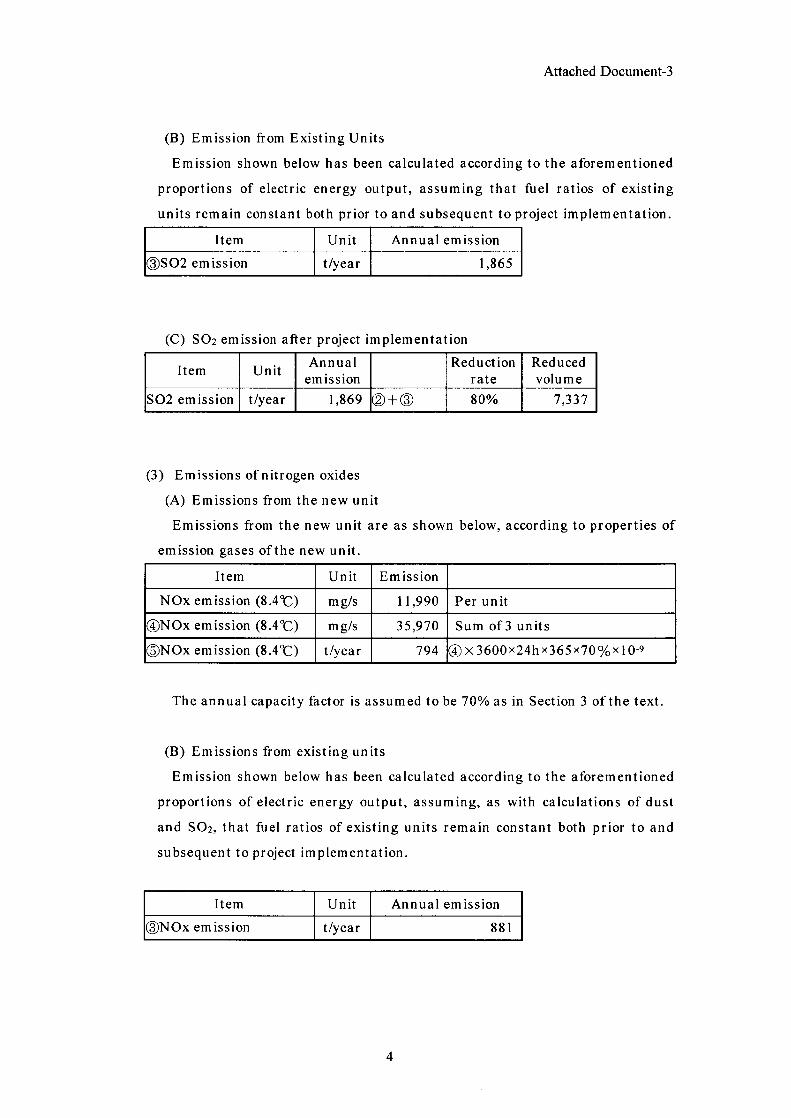
Attached Document-3
(B) Emission from Existing Units
Emission shown below has been calculated according to the aforementioned
proportions of electric energy output, assuming that fuel ratios of existing
units remain constant both prior to and subsequent to project implementation.
Item Unit Annual emission
©S02 emission t/year 1,865
(C) SO2 emission after project implementation
Item Unit Annualemission
Reductionrate
Reducedvolume
S02 emission t/year 1,869 © + © 80% 7,337
(3) Emissions of nitrogen oxides
(A) Emissions from the new unit
Emissions from the new unit are as shown below, according to properties of
emission gases of the new unit.
Item Unit Emission
NOx emission (8.4°C) mg/s 11,990 Per unit
©NOx emission (8.4°C) mg/s 35,970 Sum of 3 units
©NOx emission (8.4°C) t/year 794 @X3600x24hx365x70%xl0-9
The annual capacity factor is assumed to be 70% as in Section 3 of the text.
(B) Emissions from existing units
Emission shown below has been calculated according to the aforementioned
proportions of electric energy output, assuming, as with calculations of dust
and SO2, that fuel ratios of existing units remain constant both prior to and
subsequent to project implementation.
Item Unit Annual emission
©NOx emission t/year 881
4
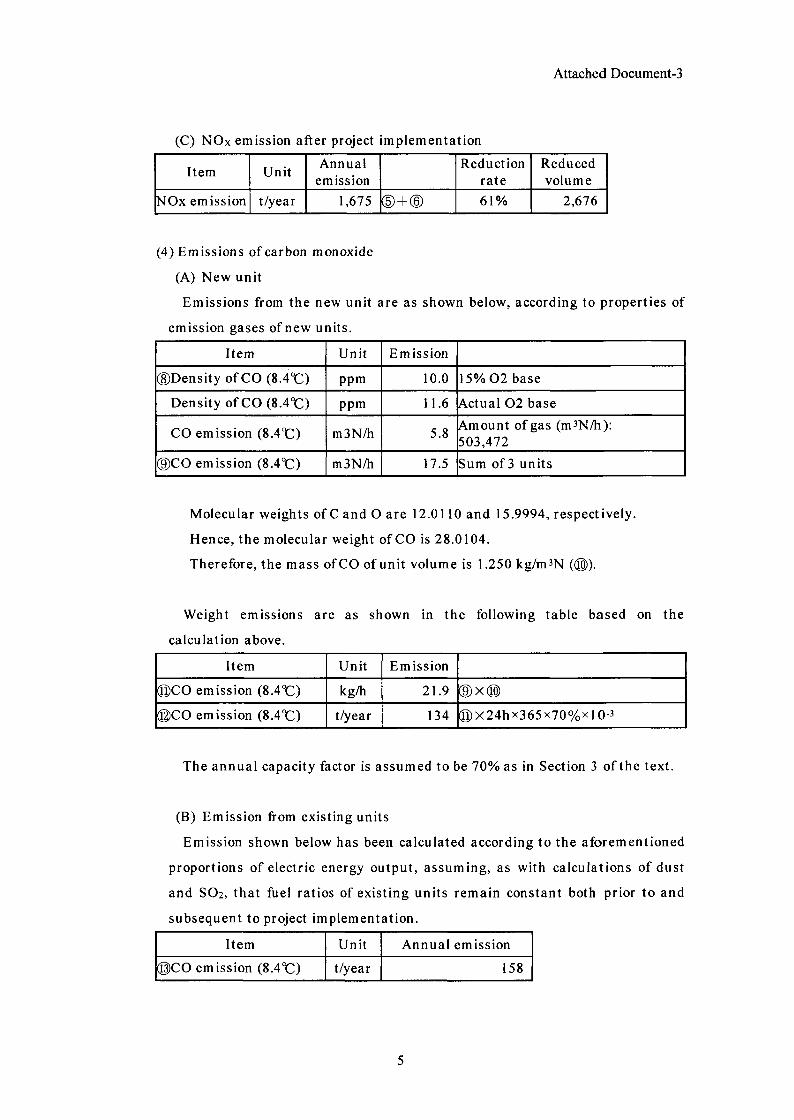
Attached Document-3
(C) NOx emission after project implementation
Item Unit Annualemission
Reductionrate
Reducedvolume
NOx emission t/year 1,675 61% 2,676
(4) Emissions of carbon monoxide
(A) New unit
Emissions from the new unit are as shown below, according to properties of
emission gases of new units.
Item Unit Emission
©Density of CO (8.4°C) ppm 10.0 15% 02 base
Density of CO (8.4°C) ppm 11.6 Actual 02 base
CO emission (8.4°C) m3N/h 5.8 Amount of gas (m3N/h):503,472
©CO emission (8.4°C) m3N/h 17.5 Sum of 3 units
Molecular weights of C and O are 12.0110 and 15.9994, respectively.
Hence, the molecular weight of CO is 28.0104.
Therefore, the mass of CO of unit volume is 1.250 kg/m3N (0).
Weight emissions are as shown in the following table based on the
calculation above.
Item Unit Emission
©CO emission (8.4°C) kg/h 21.9 ©X®
©CO emission (8.4°C) t/year 134 ©X24hx365x70%xl0-3
The annual capacity factor is assumed to be 70% as in Section 3 of the text.
(B) Emission from existing units
Emission shown below has been calculated according to the aforementioned
proportions of electric energy output, assuming, as with calculations of dust
and SO2, that fuel ratios of existing units remain constant both prior to and
subsequent to project implementation.
Item Unit Annual emission
©CO emission (8.4°C) t/year 158
5
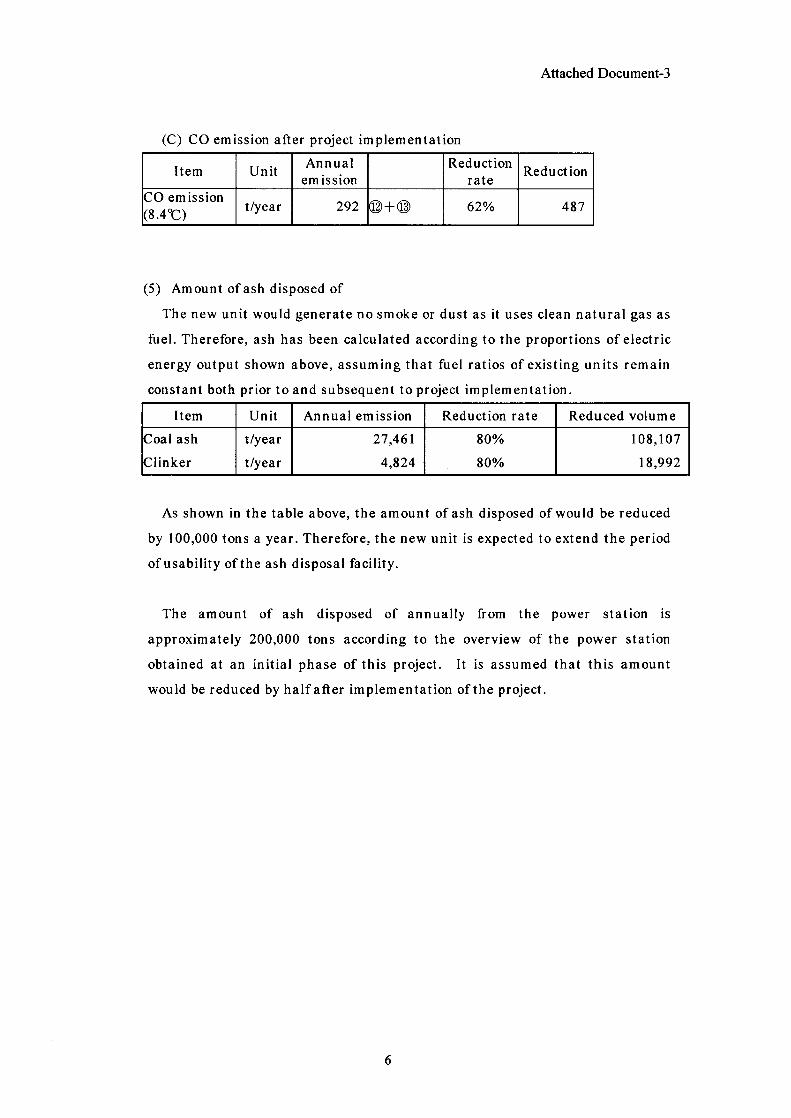
Attached Document-3
(C) CO emission after project implementation
Item Unit Annualemission
Reductionrate Reduction
CO emission (8.4%:)
t/year 292 62% 487
(5) Amount of ash disposed of
The new unit would generate no smoke or dust as it uses clean natural gas as
fuel. Therefore, ash has been calculated according to the proportions of electric
energy output shown above, assuming that fuel ratios of existing units remain
constant both prior to and subsequent to project implementation.
Item Unit Annual emission Reduction rate Reduced volume
Coal ash t/year 27,461 80% 108,107
Clinker t/year 4,824 80% 18,992
As shown in the table above, the amount of ash disposed of would be reduced
by 100,000 tons a year. Therefore, the new unit is expected to extend the period
of usability of the ash disposal facility.
The amount of ash disposed of annually from the power station is
approximately 200,000 tons according to the overview of the power station
obtained at an initial phase of this project. It is assumed that this amount
would be reduced by half after implementation of the project.
6

Reference Document
Reference Document
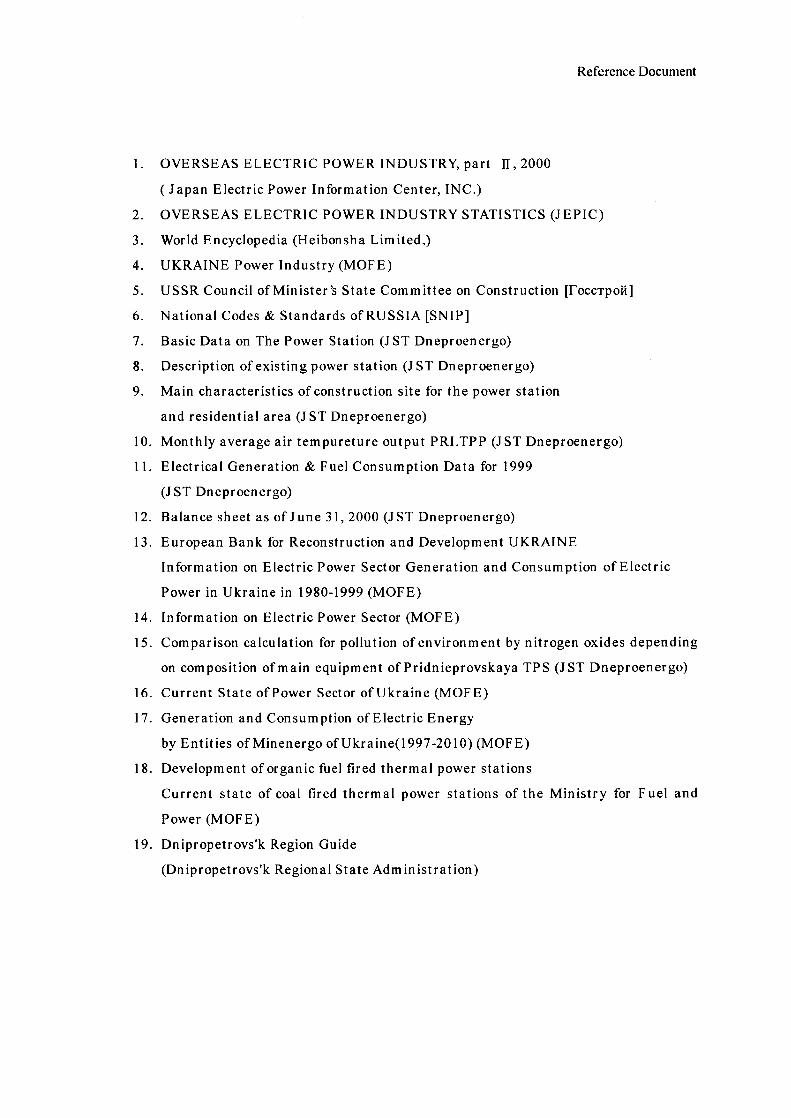
Reference Document
1. OVERSEAS ELECTRIC POWER INDUSTRY, part H, 2000
( Japan Electric Power Information Center, INC.)
2. OVERSEAS ELECTRIC POWER INDUSTRY STATISTICS (JEPIC)
3. World Encyclopedia (Heibonsha Limited,)
4. UKRAINE Power Industry (MOPE)
5. USSR Council of Minister’s State Committee on Construction [PoccTpoH]
6. National Codes & Standards of RUSSIA [SNIP]
7. Basic Data on The Power Station (J ST Dneproenergo)
8. Description of existing power station (J ST Dneproenergo)
9. Main characteristics of construction site for the power station
and residential area (J ST Dneproenergo)
10. Monthly average air tempureture output PRI.TPP (JST Dneproenergo)
11. Electrical Generation & Fuel Consumption Data for 1999
(J ST Dneproenergo)
12. Balance sheet as of June 31, 2000 (J ST Dneproenergo)
13. European Bank for Reconstruction and Development UKRAINE
Information on Electric Power Sector Generation and Consumption of Electric
Power in Ukraine in 1980-1999 (MOPE)
14. Information on Electric Power Sector (MOPE)
15. Comparison calculation for pollution of environment by nitrogen oxides depending
on composition of main equipment of Pridnieprovskaya TPS (J ST Dneproenergo)
16. Current State of Power Sector of Ukraine (MOPE)
17. Generation and Consumption of Electric Energy
by Entities of Minenergo of Ukraine(l997-2010) (MOPE)
18. Development of organic fuel fired thermal power stations
Current state of coal fired thermal power stations of the Ministry for Fuel and
Power (MOPE)
19. Dnipropetrovs'k Region Guide
(Dnipropetrovs'k Regional State Administration)

Site Investigation Report
Site Investigation Report (the outline version)
October, 2000
Chubu Electric Power Co.
Regarding the results of the 1st site investigation concerning the Feasibility Study on "Reconstruction project for Prednieprovskaya power plants in Ukraine”
(Business trip report)
1. The outline
(1) The purpose
This business trip was carried out for the following purpose as the 1st fact finding of
Feasibility Study.
0 Data collection which is needed for Feasibility Study enforcement
- Present Condition and Future Plan of Electric Power Supply and Demand
- Site Conditions, Geographical, Weather, Fuel Supply, Etc.
- Related Statute and Basis
- Present Condition of Exciting Equipment, Layout, System, Detailed Specification.
- Erection-Work Information, Such as Machinery and Materials Supply and
Transportation
- Thermal-Power-Plant Information, Such as Operation Situation, Organization, O&M
Cost, Etc.
(2) Each following organs-concemed visit and presentation are passed, and it is the consensus
reservation and relevant-information collection for this Feasibility Study promotion.
Ukraine Ministry of Fuel and Energy (MOFE)
JST Dneproenergo head office
Embassy of Japan
2. Investigation Period
September 24 (Sun.), 2000 to October 3 (Tue.), 10 days
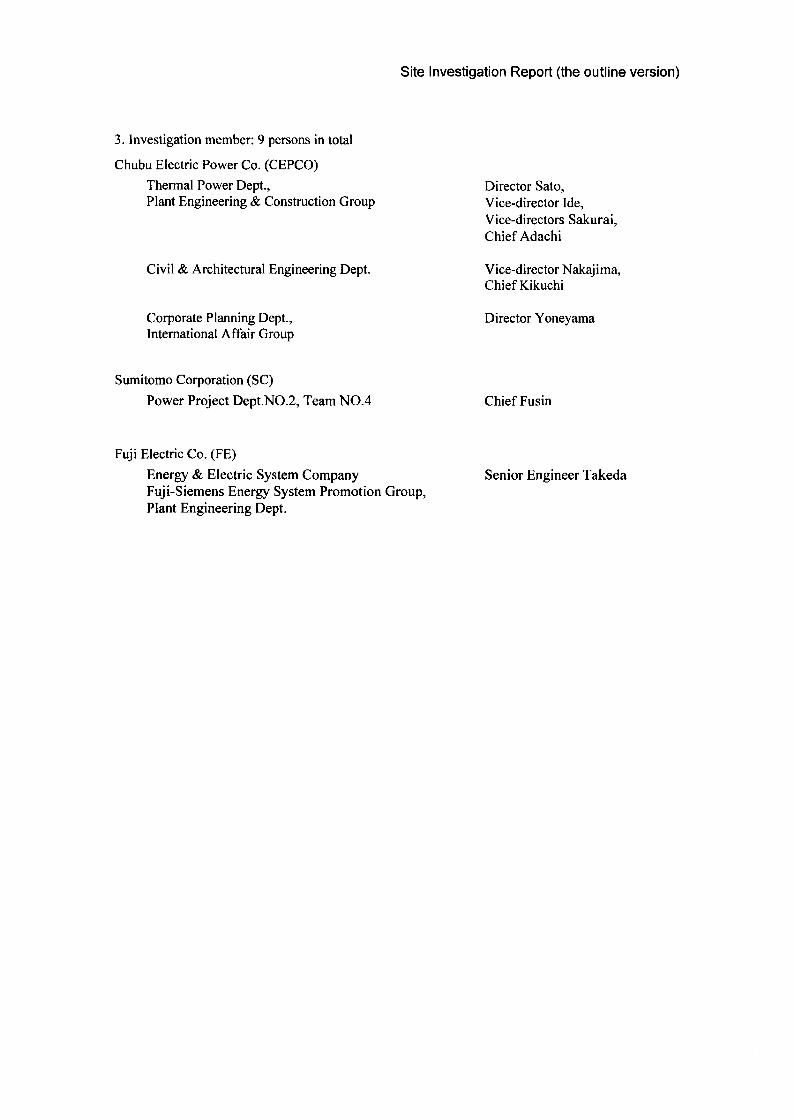
Site Investigation Report (the outline version)
3. Investigation member: 9 persons in total
Chubu Electric Power Co. (CEPCO)Thermal Power Dept.,Plant Engineering & Construction Group
Civil & Architectural Engineering Dept.
Corporate Planning Dept.,International Affair Group
Sumitomo Corporation (SC)Power Project Dept.NO.2, Team NO.4
Fuji Electric Co. (FE)Energy & Electric System Company Fuji-Siemens Energy System Promotion Group, Plant Engineering Dept.
Director Sato, Vice-director Ide, Vice-directors Sakurai, Chief Adachi
Vice-director Nakajima, Chief Kikuchi
Director Yoneyama
Chief Fusin
Senior Engineer Takeda
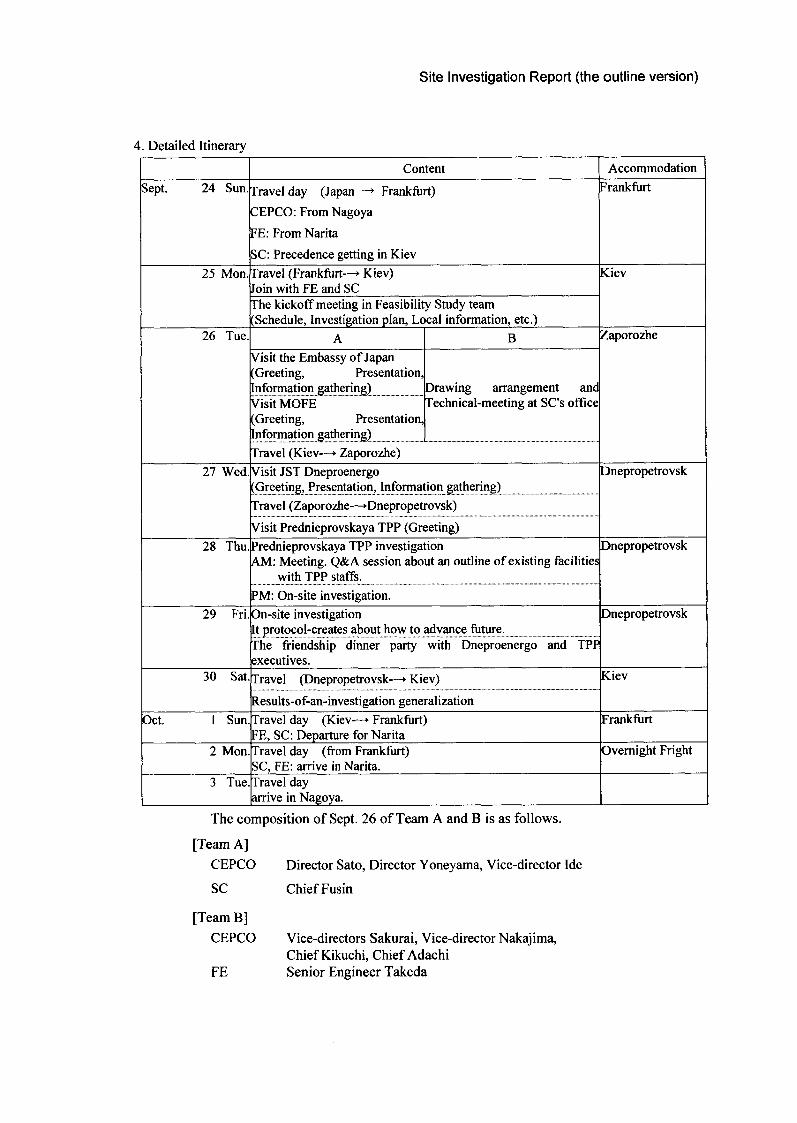
Site Investigation Report (the outline version)
4. Detailed ItineraryContent Accommodation
Sept. 24 Sun. Travel day (Japan —> Frankfurt)CEPCO: From NagoyaFE: From NaritaSC: Precedence getting in Kiev
Frankfurt
25 Mon. Travel (Frankfurt—»Kiev)Join with FE and SC
Kiev
The kickoff meeting in Feasibility Study team (Schedule, Investigation plan, Local information, etc.)
26 Tue. A B ZaporozheVisit the Embassy of Japan (Greeting, Presentation,Information gathering) Drawing arrangement and
Technical-meeting at SC's officeVisit MOFE(Greeting, Presentation,Information gathering)Travel (Kiev—»Zaporozhe)
27 Wed. Visit JST Dneproenergo(Greeting, Presentation, Information gathering)
Dnepropetrovsk
Travel (Zaporozhe—^Dnepropetrovsk)Visit Prednieprovskaya TPP (Greeting)
28 Thu. Prednieprovskaya TPP investigationAM: Meeting. Q&A session about an outline of existing facilities
with TPP staffs.
Dnepropetrovsk
PM: On-site investigation.29 Fri. On-site investigation
It protocol-creates about how to advance future.Dnepropetrovsk
The friendship dinner party with Dneproenergo and TPP executives.
30 Sat. Travel (Dnepropetrovsk—»Kiev) Kiev
Results-of-an-investigation generalizationOct. 1 Sun. Travel day (Kiev—» Frankfurt)
FE, SC: Departure for NaritaFrankfurt
2 Mon. Travel day (from Frankfurt)SC, FE: arrive in Narita.
Overnight Fright
3 Tue. Travel day arrive in Nagoya.
The composition of Sept. 26 of Team A and B is as follows.
[Team A]CEPCO Director Sato, Director Yoneyama, Vice-director Ide
SC Chief Fusin
[Team B]CEPCO Vice-directors Sakurai, Vice-director Nakajima,
Chief Kikuchi, Chief Adachi FE Senior Engineer Takeda

Site Investigation Report (the outline version)
January, 2001
Chubu Electric Power Co.
Regarding the results of the 2nd site investigation concerning the Feasibility Study on "Reconstruction project for Prednieprovskaya power plants in Ukraine”
(Business trip report)
1. The outline of a business trip
(1) The purpose
This business trip was carried out for the following purpose as the 2nd investigation of
Feasibility Study.
(D Explanation by the part of Ukraine of the contents of a proposal created based on the result of
the 1st investigation, and the 1st protocol
(D The evaluation check by the part of Ukraine to the above-mentioned proposal
(3) Additional collection of the data which are needed for detailed examination
- Present Condition and Future Plan of Electric Power Supply and Demand
- Various Items for Profitability Calculation
- Investigation and Check of Presentation and boundary point of Supply Conditions of
Exciting Utility Facility
- Erection-Work Information, Such as Labor cost, Machinery and materials supply, and
Transportation
(2) A visit and presentation of Ukraine fuel Department of Energy are passed, and it is the
consensus reservation and relevant-information collection for this Feasibility Study promotion.
(3) The works investigation and the technical arrangement of Germany Siemens AG which are
using the item for technical data origination and which are the manufacturer of a V64.3A Gas
Turbine
2. Enforcement term
December 6(Sun.), 2000 to December 18(Tue.), 12 days
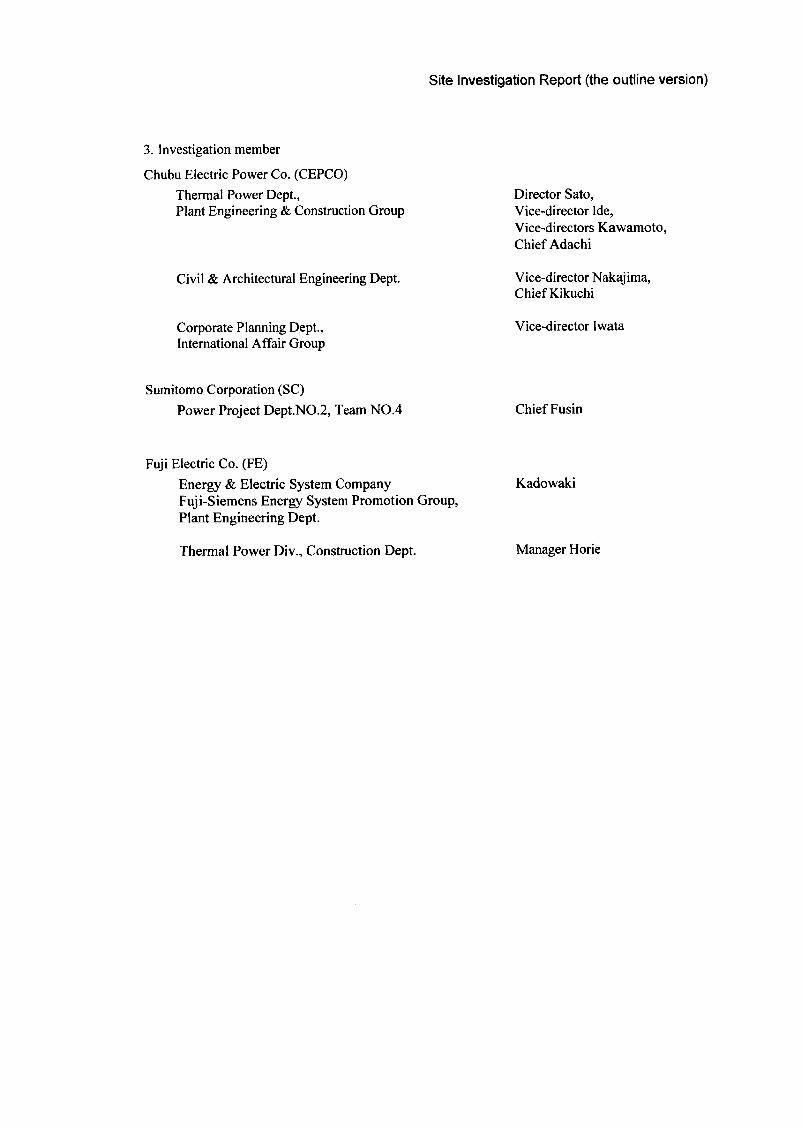
Site Investigation Report (the outline version)
3. Investigation member
Chubu Electric Power Co. (CEPCO)Thermal Power Dept.,Plant Engineering & Construction Group
Civil & Architectural Engineering Dept.
Corporate Planning Dept.,International Affair Group
Sumitomo Corporation (SC)Power Project Dept.NO.2, Team NO.4
Fuji Electric Co. (FE)Energy & Electric System Company Fuji-Siemens Energy System Promotion Group, Plant Engineering Dept.
Director Sato, Vice-director Ide, Vice-directors Kawamoto, Chief Adachi
Vice-director Nakajima, Chief Kikuchi
Vice-director Iwata
Chief Fusin
Kadowaki
Thermal Power Div., Construction Dept. Manager Horie
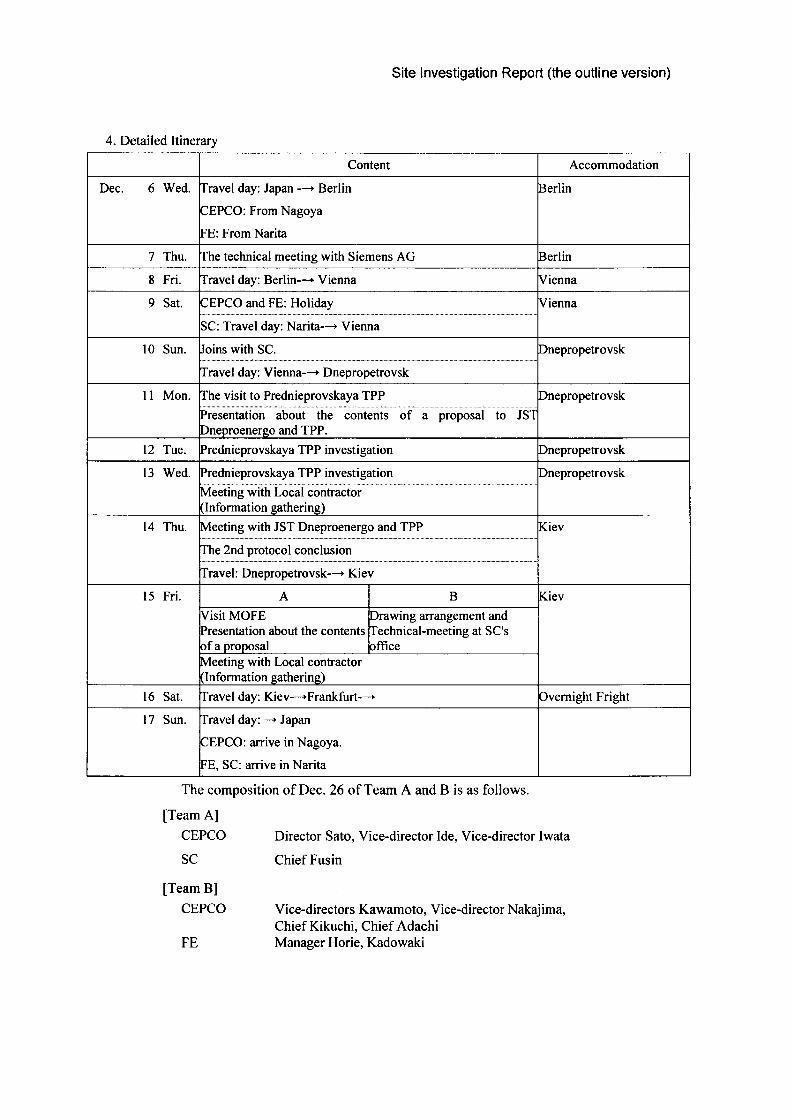
Site Investigation Report (the outline version)
4. Detailed Itinerary
Content Accommodation
Dec. 6 Wed. Travel day: Japan —» BerlinCEPCO: From NagoyaFE: From Narita
Berlin
7 Thu. The technical meeting with Siemens AG Berlin
8 Fri. Travel day: Berlin—» Vienna Vienna
9 Sat. CEPCO and FE: Holiday Vienna
SC: Travel day: Narita—> Vienna
10 Sun. Joins with SC. Dnepropetrovsk
Travel day: Vienna—» Dnepropetrovsk
11 Mon. The visit to Prednieprovskaya TPP DnepropetrovskPresentation about the contents of a proposal to JST Dneproenergo and TPP.
12 Tue. Prednieprovskaya TPP investigation Dnepropetrovsk
13 Wed. Prednieprovskaya TPP investigation DnepropetrovskMeeting with Local contractor (Information gathering)
14 Thu. Meeting with JST Dneproenergo and TPP Kiev
The 2nd protocol conclusion
Travel: Dnepropetrovsk—» Kiev
15 Fri. A B KievVisit MOFEPresentation about the contents of a proposal
Drawing arrangement and Technical-meeting at SC's office
Meeting with Local contractor (Information gathering)
16 Sat. Travel day: Kiev—►Frankfurt—» Overnight Fright
17 Sun. Travel day: —► JapanCEPCO: arrive in Nagoya.FE, SC: arrive in Narita
The composition of Dec. 26 of Team A and B is as follows.
[Team A]CEPCO Director Sato, Vice-director Ide, Vice-director Iwata
SC Chief Fusin
[Team B]CEPCO Vice-directors Kawamoto, Vice-director Nakajima,
Chief Kikuchi, Chief Adachi FE Manager Horie, Kadowaki
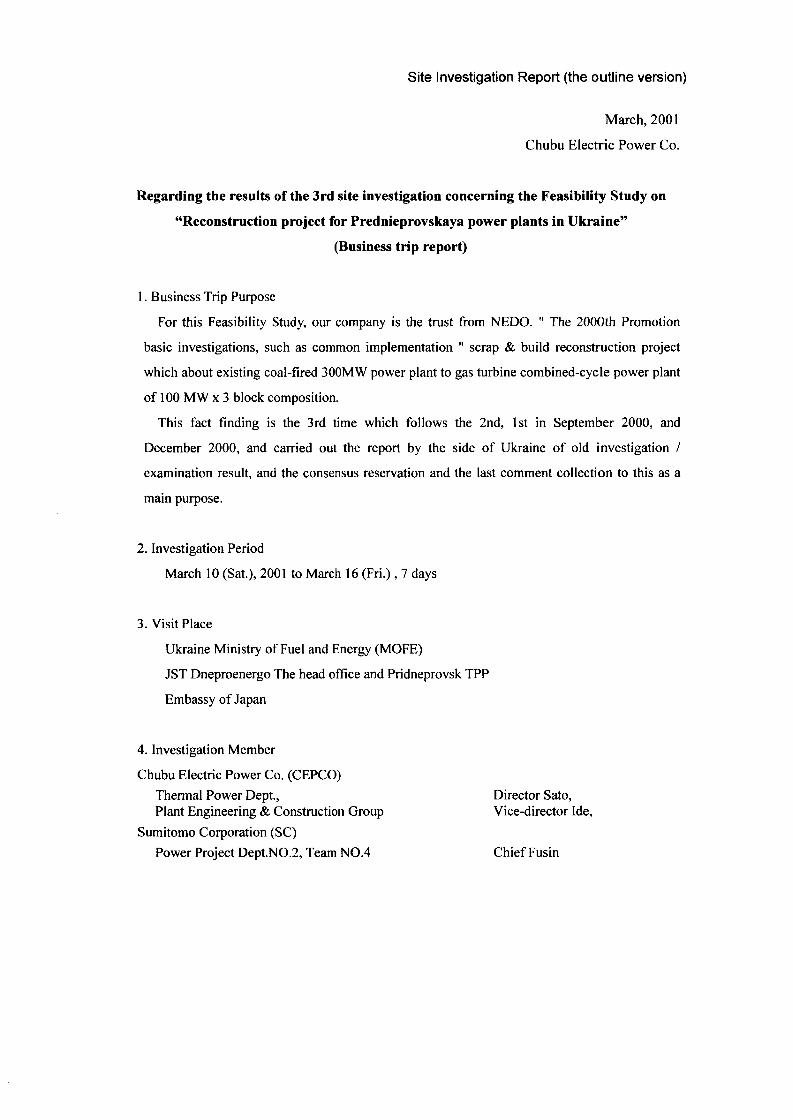
Site Investigation Report (the outline version)
March, 2001
Chubu Electric Power Co.
Regarding the results of the 3rd site investigation concerning the Feasibility Study on “Reconstruction project for Prednieprovskaya power plants in Ukraine”
(Business trip report)
1. Business Trip Purpose
For this Feasibility Study, our company is the trust from NEDO. " The 2000th Promotion
basic investigations, such as common implementation " scrap & build reconstruction project
which about existing coal-fired 300MW power plant to gas turbine combined-cycle power plant
of 100 MW x 3 block composition.
This fact finding is the 3rd time which follows the 2nd, 1st in September 2000, and
December 2000, and carried out the report by the side of Ukraine of old investigation /
examination result, and the consensus reservation and the last comment collection to this as a
main purpose.
2. Investigation Period
March 10 (Sat.), 2001 to March 16 (Fri.) , 7 days
3. Visit Place
Ukraine Ministry of Fuel and Energy (MOFE)
JST Dneproenergo The head office and Pridneprovsk TPP
Embassy of Japan
4. Investigation Member
Chubu Electric Power Co. (CEPCO)Thermal Power Dept.,Plant Engineering & Construction Group
Sumitomo Corporation (SC)Power Project Dept.NO.2, Team NO.4
Director Sato, Vice-director Ide,
Chief Fusin
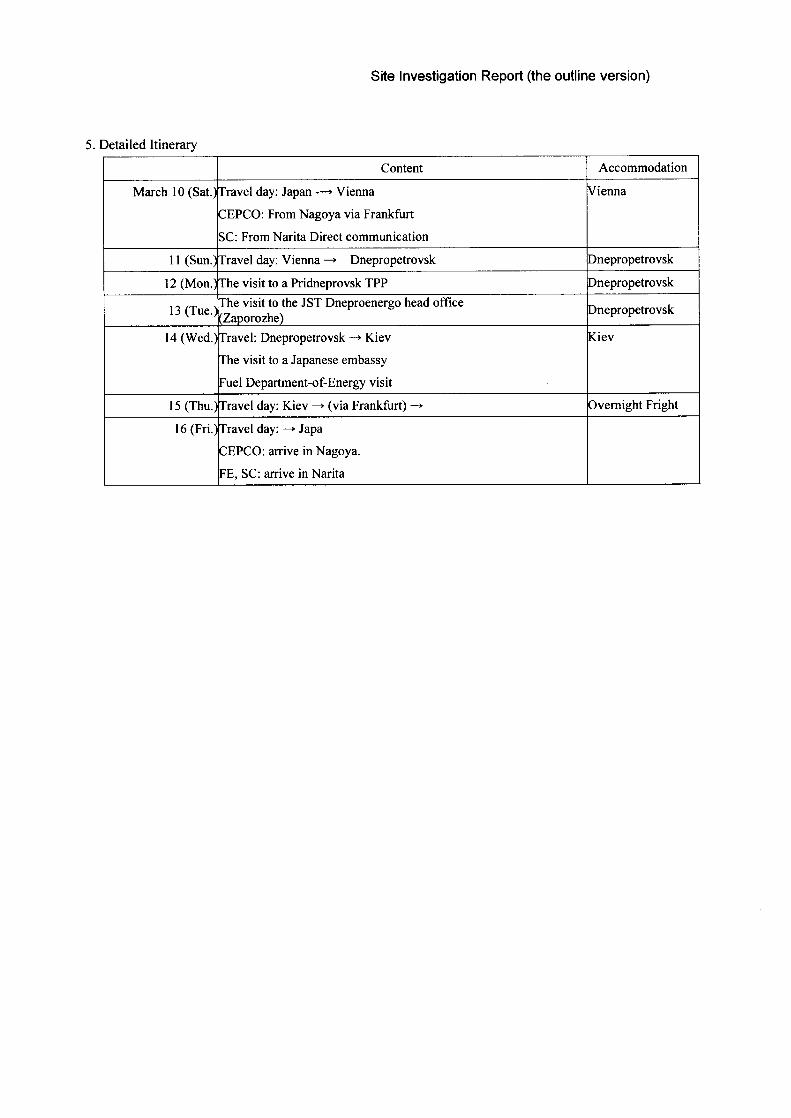
Site Investigation Report (the outline version)
5. Detailed Itinerary
Content Accommodation
March 10 (Sat.)Travel day: Japan —> ViennaCEPCO: From Nagoya via FrankfurtSC: From Narita Direct communication
Vienna
11 (Sun.) Travel day: Vienna —» Dnepropetrovsk Dnepropetrovsk
12 (Mon.)The visit to a Pridneprovsk TPP Dnepropetrovsk
13 (Tue.) The visit to the JST Dneproenergo head office (Zaporozhe) Dnepropetrovsk
14 (Wed.)Travel: Dnepropetrovsk —> KievThe visit to a Japanese embassyFuel Department-of-Energy visit
Kiev
15 (Thu.)Travel day: Kiev —> (via Frankfurt) —> Overnight Fright
16 (Fri.)Travel day: —► JapaCEPCO: arrive in Nagoya.FE, SC: arrive in Narita

Site Investigation Report

Site Investigation Report (the outline version)
October, 2000
Chubu Electric Power Co.
Regarding the results of the 1st site investigation concerning the Feasibility Study on
"Reconstruction project for Prednieprovskaya power plants in Ukraine”
(Business trip report)
1. The outline
(1) The purpose
This business trip was carried out for the following purpose as the 1st fact finding of
Feasibility Study.
(D Data collection which is needed for Feasibility Study enforcement
- Present Condition and Future Plan of Electric Power Supply and Demand
- Site Conditions, Geographical, Weather, Fuel Supply, Etc.
- Related Statute and Basis
- Present Condition of Exciting Equipment, Layout, System, Detailed Specification.
- Erection-Work Information, Such as Machinery and Materials Supply and
Transportation
- Thermal-Power-Plant Information, Such as Operation Situation, Organization, O&M
Cost, Etc.
(2) Each following organs-concemed visit and presentation are passed, and it is the consensus
reservation and relevant-information collection for this Feasibility Study promotion.
Ukraine Ministry of Fuel and Energy (MOFE)
JST Dneproenergo head office
Embassy of Japan
2. Investigation Period
September 24 (Sun.), 2000 to October 3 (Tue.), 10 days

Site Investigation Report (the outline version)
3. Investigation member: 9 persons in total
Chubu Electric Power Co. (CEPCO)Thermal Power Dept.,Plant Engineering & Construction Group
Civil & Architectural Engineering Dept.
Corporate Planning Dept.,International Affair Group
Sumitomo Corporation (SC)Power Project Dept.NO.2, Team NO.4
Fuji Electric Co. (FE)Energy & Electric System Company Fuji-Siemens Energy System Promotion Group, Plant Engineering Dept.
Director Sato, Vice-director Ide, Vice-directors Sakurai, Chief Adachi
Vice-director Nakajima, Chief Kikuchi
Director Yoneyama
Chief Fusin
Senior Engineer Takeda
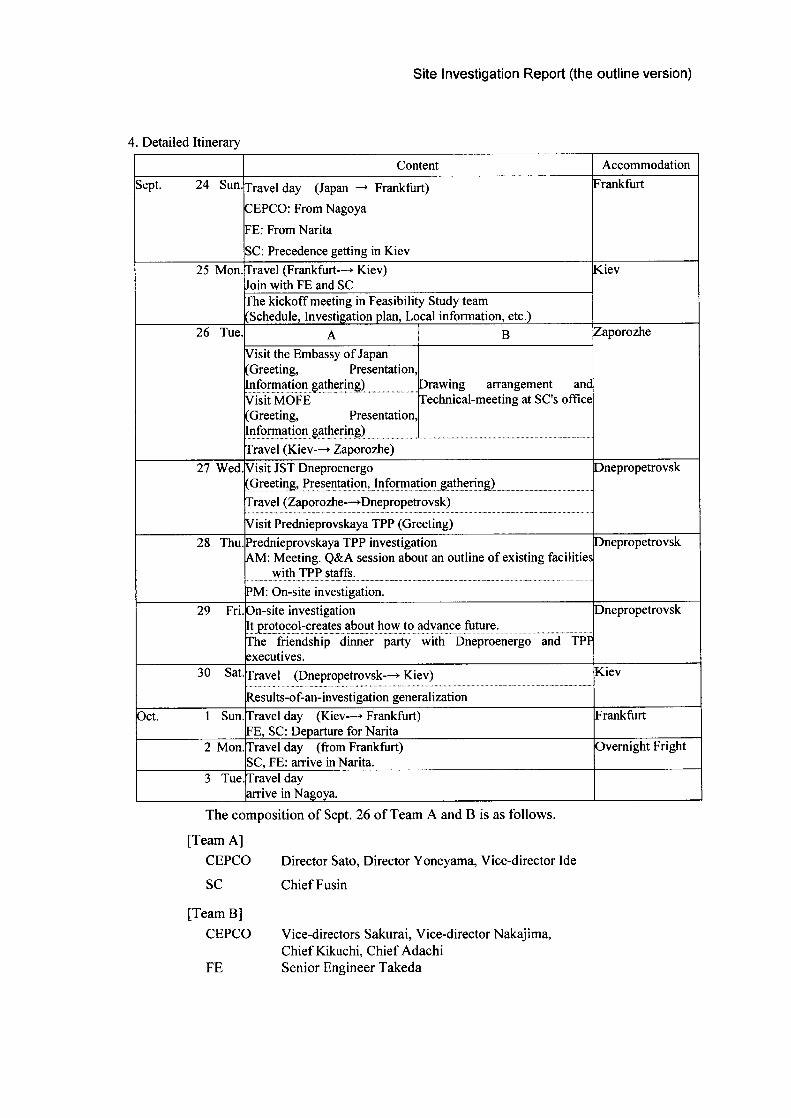
Site Investigation Report (the outline version)
4. Detailed Itinerary
Content AccommodationSept. 24 Sun. Travel day (Japan —> Frankfurt)
CEPCO: From NagoyaFE: From NaritaSC: Precedence getting in Kiev
Frankfurt
25 Mon. Travel (Frankfurt—» Kiev)Join with FE and SC
Kiev
The kickoff meeting in Feasibility Study team (Schedule, Investigation plan, Local information, etc.)
26 Tue. A B ZaporozheVisit the Embassy of Japan (Greeting, Presentation,Information gathering) Drawing arrangement and
Technical-meeting at SC's officeVisit MOFE(Greeting, Presentation,Information gathering)Travel (Kiev-—* Zaporozhe)
27 Wed. Visit JST Dneproenergo(Greeting, Presentation, Information gathering)
Dnepropetrovsk
Travel (Zaporozhe—^Dnepropetrovsk)Visit Prednieprovskaya TPP (Greeting)
28 Thu. Prednieprovskaya TPP investigationAM: Meeting. Q&A session about an outline of existing facilities
with TPP staffs.
Dnepropetrovsk
PM: On-site investigation.29 Fri. On-site investigation
It protocol-creates about how to advance future.Dnepropetrovsk
The friendship dinner party with Dneproenergo and TPP executives.
30 Sat. Travel (Dnepropetrovsk—* Kiev) Kiev
Results-of-an-investigation generalizationOct. 1 Sun. Travel day (Kiev—> Frankfurt)
FE, SC: Departure for NaritaFrankfurt
2 Mon. Travel day (from Frankfurt)SC, FE: arrive in Narita.
Overnight Fright
3 Tue. Travel day arrive in Nagoya.
The composition of Sept. 26 of Team A and B is as follows.
[Team A]CEPCO Director Sato, Director Yoneyama, Vice-director Ide
SC Chief Fusin
[Team B]CEPCO Vice-directors Sakurai, Vice-director Nakajima,
Chief Kikuchi, Chief Adachi FE Senior Engineer Takeda
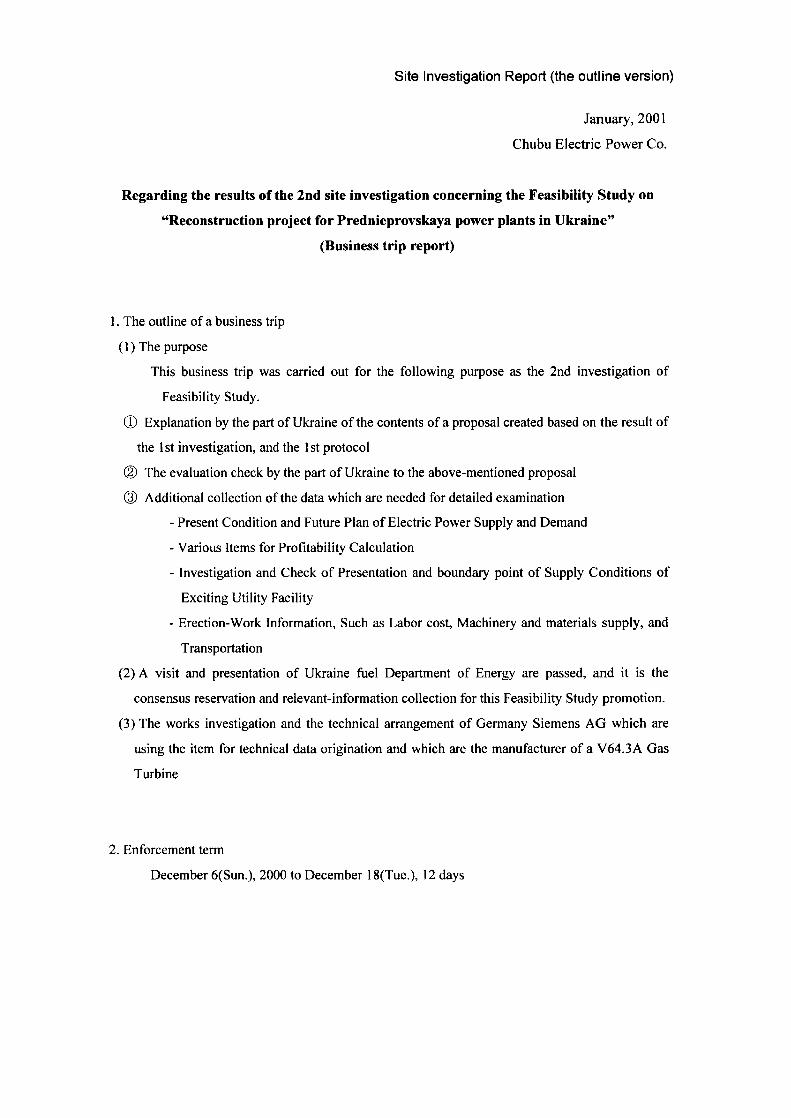
Site Investigation Report (the outline version)
January, 2001
Chubu Electric Power Co.
Regarding the results of the 2nd site investigation concerning the Feasibility Study on
"Reconstruction project for Prednieprovskaya power plants in Ukraine”
(Business trip report)
1. The outline of a business trip
(1) The purpose
This business trip was carried out for the following purpose as the 2nd investigation of
Feasibility Study.
(D Explanation by the part of Ukraine of the contents of a proposal created based on the result of
the 1st investigation, and the 1st protocol
(2) The evaluation check by the part of Ukraine to the above-mentioned proposal
(3) Additional collection of the data which are needed for detailed examination
- Present Condition and Future Plan of Electric Power Supply and Demand
- Various Items for Profitability Calculation
- Investigation and Check of Presentation and boundary point of Supply Conditions of
Exciting Utility Facility
- Erection-Work Information, Such as Labor cost, Machinery and materials supply, and
Transportation
(2) A visit and presentation of Ukraine fuel Department of Energy are passed, and it is the
consensus reservation and relevant-information collection for this Feasibility Study promotion.
(3) The works investigation and the technical arrangement of Germany Siemens AG which are
using the item for technical data origination and which are the manufacturer of a V64.3A Gas
Turbine
2. Enforcement term
December 6(Sun.), 2000 to December 18(Tue.), 12 days

Site Investigation Report (the outline version)
3. Investigation member
Chubu Electric Power Co. (CEPCO)Thermal Power Dept.,Plant Engineering & Construction Group
Civil & Architectural Engineering Dept.
Corporate Planning Dept.,International Affair Group
Sumitomo Corporation (SC)Power Project Dept.NO.2, Team NO.4
Fuji Electric Co. (FE)Energy & Electric System Company Fuji-Siemens Energy System Promotion Group, Plant Engineering Dept.
Director Sato, Vice-director Ide, Vice-directors Kawamoto, Chief Adachi
Vice-director Nakajima, Chief Kikuchi
Vice-director Iwata
Chief Fusin
Kadowaki
Thermal Power Div., Construction Dept. Manager Horie
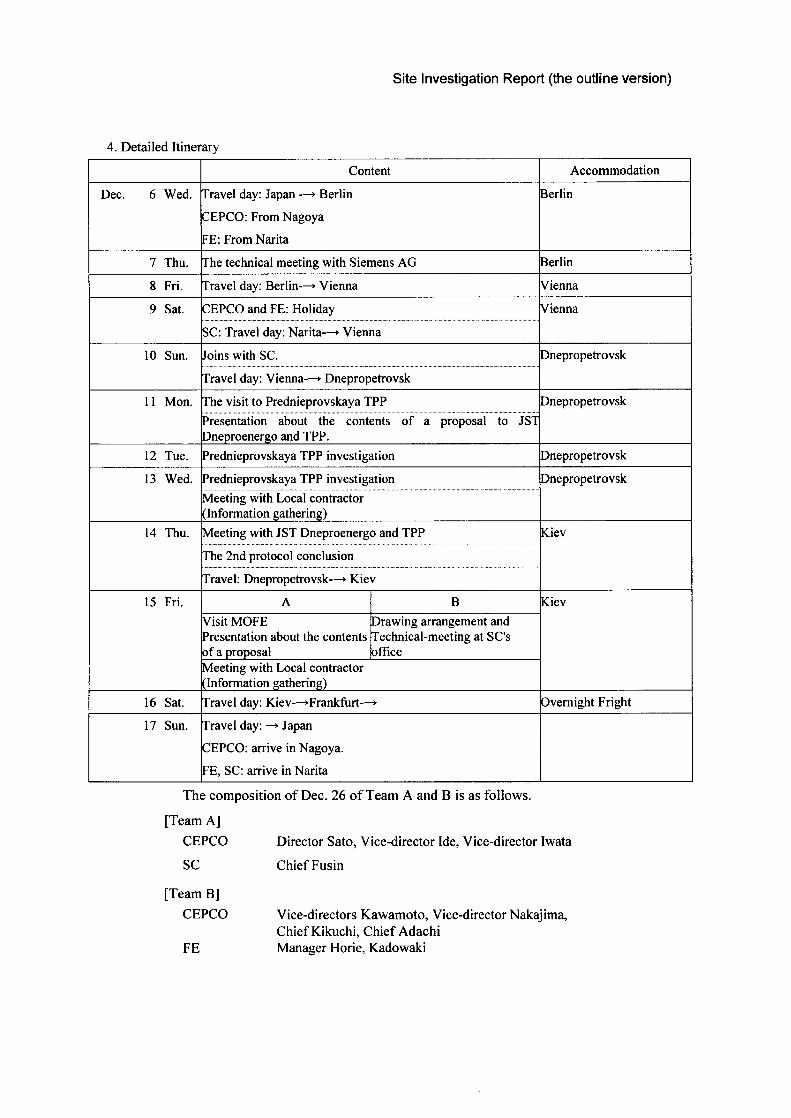
Site Investigation Report (the outline version)
4. Detailed Itinerary
Content Accommodation
Dec. 6 Wed. Travel day: Japan —► BerlinCEPCO: From NagoyaFE: From Narita
Berlin
7 Thu. The technical meeting with Siemens AG Berlin
8 Fri. Travel day: Berlin—► Vienna Vienna
9 Sat. CEPCO and FE: Holiday Vienna
SC: Travel day: Narita—► Vienna
10 Sun. Joins with SC. Dnepropetrovsk
Travel day: Vienna—► Dnepropetrovsk
11 Mon. The visit to Prednieprovskaya TPP DnepropetrovskPresentation about the contents of a proposal to JST Dneproenergo and TPP.
12 Tue. Prednieprovskaya TPP investigation Dnepropetrovsk
13 Wed. Prednieprovskaya TPP investigation DnepropetrovskMeeting with Local contractor (Information gathering)
14 Thu. Meeting with JST Dneproenergo and TPP Kiev
The 2nd protocol conclusion
Travel: Dnepropetrovsk—► Kiev
15 Fri. A B KievVisit MOFEPresentation about the contents of a proposal
Drawing arrangement and Technical-meeting at SC's office
Meeting with Local contractor (Information gathering)
16 Sat. Travel day: Kiev—►Frankfurt—► Overnight Fright
17 Sun. Travel day: —► JapanCEPCO: arrive in Nagoya.FE, SC: arrive in Narita
The composition of Dec. 26 of Team A and B is as follows.
[Team A]CEPCO Director Sato, Vice-director Ide, Vice-director Iwata
SC Chief Fusin
[Team B]CEPCO Vice-directors Kawamoto, Vice-director Nakajima,
Chief Kikuchi, Chief Adachi FE Manager Horie, Kadowaki
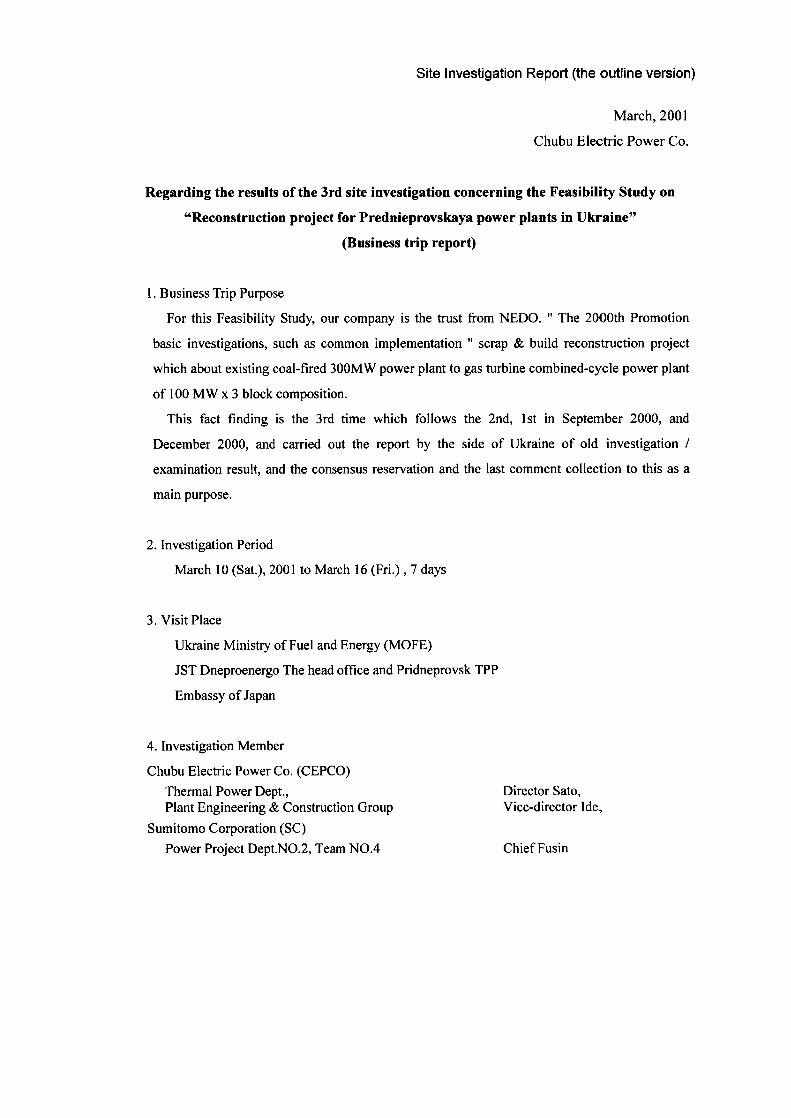
Site Investigation Report (the outline version)
March, 2001
Chubu Electric Power Co.
Regarding the results of the 3rd site investigation concerning the Feasibility Study on
"Reconstruction project for Prednieprovskaya power plants in Ukraine”
(Business trip report)
1. Business Trip Purpose
For this Feasibility Study, our company is the trust from NEDO. " The 2000th Promotion
basic investigations, such as common implementation " scrap & build reconstruction project
which about existing coal-fired 300MW power plant to gas turbine combined-cycle power plant
of 100 MW x 3 block composition.
This fact finding is the 3rd time which follows the 2nd, 1st in September 2000, and
December 2000, and carried out the report by the side of Ukraine of old investigation /
examination result, and the consensus reservation and the last comment collection to this as a
main purpose.
2. Investigation Period
March 10 (Sat.), 2001 to March 16 (Fri.) , 7 days
3. Visit Place
Ukraine Ministry of Fuel and Energy (MOFE)
JST Dneproenergo The head office and Pridneprovsk TPP
Embassy of Japan
4. Investigation Member
Chubu Electric Power Co. (CEPCO)Thermal Power Dept.,Plant Engineering & Construction Group
Sumitomo Corporation (SC)Power Project Dept.NO.2, Team NO.4
Director Sato, Vice-director Ide,
Chief Fusin
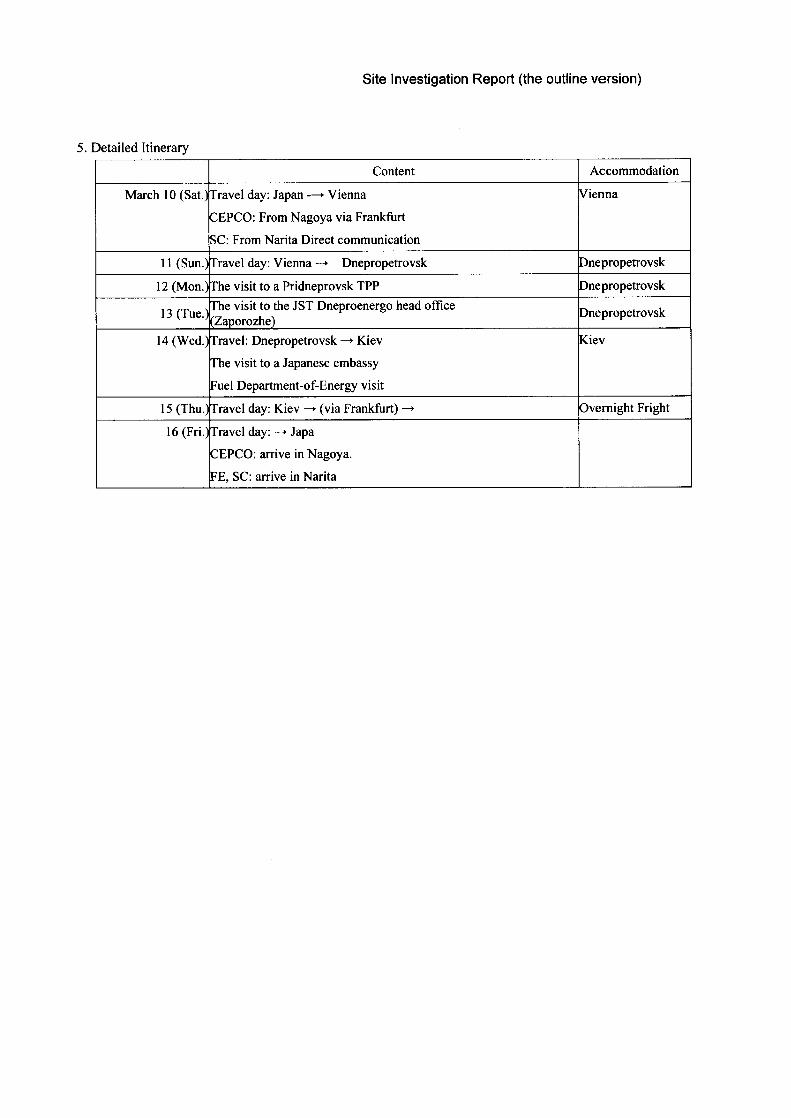
Site Investigation Report (the outline version)
5. Detailed Itinerary
Content Accommodation
March 10 (Sat.)Travel day: Japan —» ViennaCEPCO: From Nagoya via FrankfurtSC: From Narita Direct communication
Vienna
11 (Sun.) Travel day: Vienna —» Dnepropetrovsk Dnepropetrovsk
12 (Mon.) The visit to a Pridneprovsk TPP Dnepropetrovsk
13 (Tue.)The visit to the JST Dneproenergo head office (Zaporozhe) Dnepropetrovsk
14 (Wed.) Travel: Dnepropetrovsk —» KievThe visit to a Japanese embassyFuel Department-of-Energy visit
Kiev
15 (Thu.) Travel day: Kiev —> (via Frankfurt) —» Overnight Fright
16 (Fri.) Travel day: —> JapaCEPCO: arrive in Nagoya.FE, SC: arrive in Narita

Any part or a whole of the report shall not be disclosed without prior consent of International Cooperation Center, NEDO.
Phone 03 (3987)9466 Fax 03 (3987)5103