FDI Restrictions in the Indonesian Horticulture Sector - World ...
42
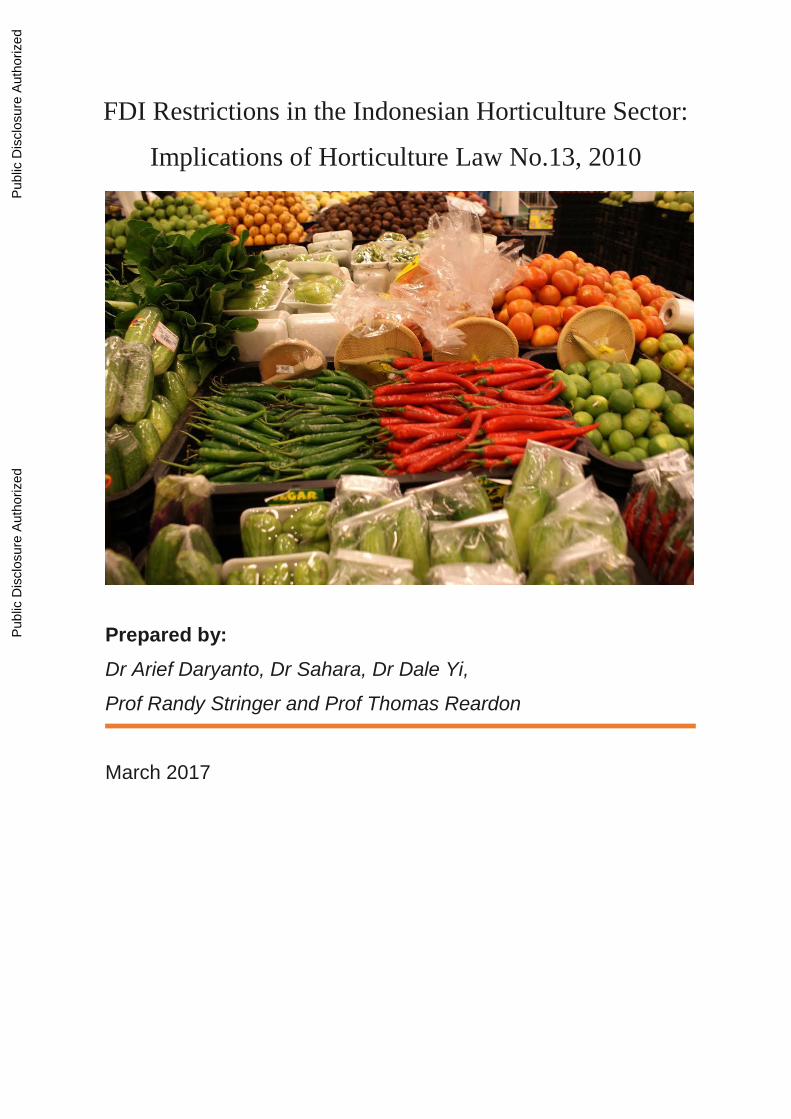
FDI Restrictions in the Indonesian Horticulture Sector: Implications of Horticulture Law No.13, 2010 Prepared by: Dr Arief Daryanto, Dr Sahara, Dr Dale Yi, Prof Randy Stringer and Prof Thomas Reardon March 2017 Public Disclosure Authorized Public Disclosure Authorized Public Disclosure Authorized Public Disclosure Authorized
-
Upload
khangminh22 -
Category
Documents
-
view
2 -
download
0
Transcript of FDI Restrictions in the Indonesian Horticulture Sector - World ...
FDI Restrictions in the Indonesian Horticulture Sector:
Implications of Horticulture Law No.13, 2010
Prepared by:
Dr Arief Daryanto, Dr Sahara, Dr Dale Yi,
Prof Randy Stringer and Prof Thomas Reardon
March 2017
Pub
lic D
iscl
osur
e A
utho
rized
Pub
lic D
iscl
osur
e A
utho
rized
Pub
lic D
iscl
osur
e A
utho
rized
Pub
lic D
iscl
osur
e A
utho
rized
FDI Restrictions in the Indonesian Horticulture Sector: Implications of Horticulture Law No.13, 2010
ii
Table of Contents
List of Figures ...................................................................................................................... iii
List of Tables ....................................................................................................................... iii
Chapter 1 Introduction.............................................................................................................. 1
Chapter 2 Global Trends and Roles of FDI in Horticulture Sector : Lesson Learnt from
International Experiences........................................................................................................... 3
2.1. Global trends in seed industry development ................................................................... 3
2.2. Roles of FDI in the Development of Horticulture Sector ............ Error! Bookmark not
defined.
Chapter 3 Structure and Performance of Indonesia’s Vegetable Seed Industry .................... 13
3.1. Market concentration in the seed industry .................................................................... 13
3.2. The role of FDI in the seed industry ............................................................................. 15
3.3. The potential implications of FDI restrictions .............................................................. 19
3.3.1. Technological slow down and land........................................................................ 20
3.3.2. Technological slow down and import .................................................................... 29
Chapter 4 The Path Forward – Considerations for Policy and Program Support .................. 32
References ............................................................................................................................ 35
Appendix .............................................................................................................................. 37

FDI Restrictions in the Indonesian Horticulture Sector: Implications of Horticulture Law No.13, 2010
iii
List of Figures
Figure 3-1 Share of Seed Companies on Seed Sales in Indonesia 2011 .................................. 13
Figure 3-2 CR4 for Cucumber, Water Spinach, Tomato and Chili Seed in Indonesia ............ 14
Figure 3-3 National Production (Ton) of Chili, Tomato and Shallot in Indonesia .................. 24
Figure 3-4 Area Planted by Chili, Tomato and Chili in Indonesia .......................................... 24
Figure 3-5 Productivity (Tons/Ha)........................................................................................... 25
List of Tables
Table 3-1 Actors involve in the seed marketing activities of big companies .......................... 18
Table 3-2 Extension services received small farmers .............................................................. 19
Table 3-3 Shallot production (Tons) ........................................................................................ 25
Table 3-4 Chili production (Tons) ........................................................................................... 26
Table 3-5 Tomato production (Tons) ....................................................................................... 26
Table 3-6 Average rates of change (2000 to 2010) .................................................................. 27
Table 3-7 Land area needed to sustain the rate of growth (Ha) ............................................... 28
Table 3-8 The impact of the Horticulture Law on import: chili commodity ........................... 30
Table 3-9 The impact of the Horticulture Law on import: tomato commodity ....................... 31
FDI Restrictions in the Indonesian Horticulture Sector: Implications of Horticulture Law No.13, 2010
1
Chapter 1 Introduction
As Indonesia’s population and incomes continue to grow at a swift pace, the demand
for horticulture products is expected to follow suite. In light of this, the media and the
government are growing increasingly concerned about instability and inefficiency in
horticulture markets. To help stimulate growth and stabilize the horticulture sector, Indonesia
introduced the Horticulture Law No. 13 in 2010 which had numerous provisions to increase
regulation on the seed industry in particular. The most controversial of these provisions is the
clause that regulates foreign direct investment. This investment provision restricts foreign
equity in the horticulture sector to 30% for large firms, and 0% foreign ownership for all
firms that are small to medium in size. This is largely believed to be motivated by a
protectionist agenda aiming to protect the emerging domestic industry from the large multi-
national companies.
Debate around the impact of the FDI restriction focuses around how the horticulture
seed industry will react to this provision. The seed industry is an important stakeholder in the
horticulture sector that drives the development of new innovations in the sector, but it is still
to a large extent controlled by foreign companies, notably the Netherlands and the US.1
While divestment by foreign seed companies could pave the way for domestic firms to rise, it
also paves a way to significant disruption in the sector that could impede growth for years to
come: the reduction in R&D driven by foreign equity, limiting access to proprietary genetic
resources, and reduced private sector extension and marketing services. The success of the
FDI restriction will ultimately hinge on the ability of domestic industry to fill in these key
roles of foreign MNCs and foreign equity partners. However, the capacity of domestic
industry to fill these roles appears to be lacking in many ways. One of the primary objectives
of this study is to uncover how the FDI restriction will affect these key players and how it
will affect the horticulture sector in terms of production technology and trade.
Studies on the impact of FDI in the horticulture sector are limited, and the few existing
studies present somewhat conflicting results. Studies in India and Kenya found that less-
restricted FDI policies are generally beneficial to the horticulture sector. Indonesian
stakeholders (farmers, agriculture associations) appear to side with less regulation and have
1 Source: http://www.thejakartapost.com/news/2014/04/07/editorial-the-seeds-development.html
FDI Restrictions in the Indonesian Horticulture Sector: Implications of Horticulture Law No.13, 2010
2
petitioned a judicial review of the Horticulture Law to the Constitutional Court.2 On the other
hand, reports commissioned by the government, unsurprisingly found that FDI restrictions
are helping development in the sector, citing a spike in the registration of varieties and
domestic firms since the 2010 Horticulture Law was enacted.
The aim of this study is to synthesize different sources of information and analyze how
the FDI restriction will impact the horticulture sector in Indonesia’s unique context. This
study will attempt to contextualize the findings from other countries, identify the likely
consequences of FDI restriction on production technology and trade in Indonesia, and
provide a set of simple salient points that can be used to inform the ongoing debate in
Indonesia.
The method used consists of both analytical and qualitative work using secondary data
and Focus Group Discussion. We approach the analysis of FDI on the horticulture seed
industry in two components:
(1) A Review of existing knowledge as it relates to:
a. International experience in the development of horticulture seed and planting
material industry
b. International experience in regulating FDI in the horticulture sector,
specifically the seed industry
(2) Analysis of Indonesia’s seed industry and the impact of FDI restriction
a. Market concentration in the seed industry
b. The role of FDI in the seed industry
c. The potential implications of FDI restrictions
d. Considerations for policy and program support
2 Source: http://www.eurocham.or.id/index.php/about-us/news/140-restriction-on-foreign-investment-in-
horticultural-seed-sector-is-constitutional

FDI Restrictions in the Indonesian Horticulture Sector: Implications of Horticulture Law No.13, 2010
3
Chapter 2 Global Trends and Roles of FDI in Horticulture
Sector : Lesson Learnt from International Experiences
This section presents lessons and insights from the development of vegetable sectors
in peer counties, focusing on how FDI shapes the horticulture industries.
The general lessons against limiting FDI relate to:
(i) restricting FDI deprives domestic vegetable producers access to better quality
seeds with higher sprouting ratios, shorter harvest times, higher outputs and higher
profits;
(ii) restricting FDI tends to limit domestic seed companies access to innovative
practices in plant propagation, plant breeding and biochemistry;
(iii) restricting FDI means the public and private research community may be deprived
of access to key intellectual property, innovative technologies, scientific
knowledge and training in new research capabilities for Indonesian scientists,
public research centres, universities and companies;
(iv) restricting FDI can result in a less competitive domestic seed industry and lower
overall quality and variety of crops, leading to higher horticulture imports and
higher prices for Indonesian consumers;
(v) foreign seed companies will transfer their capital, research and knowledge to other
ASEAN countries that are encouraging foreign investment, public-private
partnerships and providing incentives to transfer research and biotechnology
knowledge locally (eg, Viet Nam, India.
(vi) even those countries with the most liberalized seed trade and FDI have high
proportions of saved seed relative to replacement seeds. The amount of saved seed
depends upon several factors, including type of seed (varietal or hybrid), size of
farm, ease of storage, disease and pest complex, and farmer’s expertise. Farmers
save seed for a variety of reasons, such as low cost, familiarity, performance under
local conditions, and preferred attributes other than yield. Farmers purchase new
seed from the market if they want to replace their variety or, for instance, the seed
stock has deteriorated as a result of contamination.
(vii) two key horticultural policy issues requiring attention in Indonesia together with
the FDI law are: (i) best practice and tradeoffs in seed registration procedures and
FDI Restrictions in the Indonesian Horticulture Sector: Implications of Horticulture Law No.13, 2010
4
for seed development and certification systems (Registering seeds is complex and a
long process, taking up to 1.5 years in Indonesia. Seeds do not need to be
registered in Thailand and the Philippines); and (ii) seed import licensing
procedures tend to be bureaucratic, complicated and favour a handful of business
who are able to use their licenses to great private advantage,
2.1. Global trends in seed industry development
Accelerating development of the horticultural sector has been driven by population
growth, urbanisation and increasing consumption of vegetables and fruits, which in turn has
increased the demand for good quality horticulture seeds (Ayana et al. 2014). Estimates
suggest that high quality seeds are needed by over 2.5 billion smallholder farmers that
manage more than 500 million farms around the world to increase production, nutritional
quality and adaptation to climate change (Tutwiller 2016).
The seed chain includes three core components; (i) research and plant breeding; (ii)
seed multiplication, and (iii) marketing and distribution. The market value of the seed chain
has increased three times between 2000 and 2014, reaching around USD $50 billion. The
global seed market is highly concentrated and mergers and acquisitions is a major growth
strategy of the global seed companies. North America and Europe account for more than 50%
of the global market (Mordor Intelligence 2015).
Today, three companies, Bayer-Monsanto, ChemChina-Syngenta, and DowDupont,
control and sell around 59 percent of the world’s patented seeds and 64 percent of all
pesticides: an oligopoly market on a global scale. The global concentration in agricultural
inputs is not limited to seed companies. The 10 largest pesticide firms control 90% of the
global pesticide market, 10 companies control 76% of the animal pharmaceutical sales, and
10 animal feed companies control 52% of the global animal market (Liano et al 2016)
The industry consolidation and potential penetration into domestic markets raises
challenging public policy issues for emerging economics, including the role of FDI as well as
how to address trade-offs between competition policy, equity, efficiency, productivity and the
broader national goals of food security, biodiversity, sustainability and climate change.

FDI Restrictions in the Indonesian Horticulture Sector: Implications of Horticulture Law No.13, 2010
5
It is not clear how the on going consolidation will affect smallholder access to the
agricultural innovations. Smallholders tend to be cautious about adopting improved seeds due
to higher costs, lack of access to seed sellers, lack of information about the benefits of
improved seeds or other risks (IFPRI 2016). A 2016 IFPRI study examined how global and
regional seed companies dealt with the smallholder seed adoption issues issue in four regions
(Latin America, western Africa, eastern Africa, and South and Southeast Asia). The study
finds that private sector commitment to increase access of improved seeds to smallholder
farmers is strong, however, the presence of those foreign and regional companies does not
necessarily mean that the seeds are actually accessible to farmers.
Additionally, farmers also need to be facilitated by knowledge, finance, markets and
supportive policy both for farmers and seed companies (Tutwiller 2016). Therefore, this calls
for a strong government policy that regulates both foreign and domestic investment in a way
that improves smallholder farmers’ access to improved quality seeds to increase farm
productivity and finally to increase farmers’ incomes.
In general, the seed industry operates differently in the higher income countries
compared with the emerging economies. For example, research and development, seed
multiplication and the marketing and distribution activities are more commercial operations
in the high-income countries.
In the emerging economies, research, plant breeding and marketing/distribution
(extension) tends to be carried out by the public sector and by farmers’ themselves (farmers’
seed systems). Scientific plant breeding is and has been a public sector responsibility. Plant
breeding is viewed as a public responsibility, a pathway and contributor to rural development,
poverty reduction and national food security. Similarly, seed production and distribution
systems are mechanisms for technology transfer rather than commercial operations.
More recently, some countries, including Indonesia, have stimulated commercial seed
supply through encouraging public private partnerships and the development of domestic
seed enterprises, opening up their seed markets to foreign investors. For example, unlike
horticulture, Indonesia encourages FDI in three of its five highest priority crops, rice, corn
and soybeans. Two of the world’s largest multinationals, Bayer/Monsanto and Syngenta
continue to expand in Indonesia. Bayer/Monsanto enlarged its Crop Science plant in
Surabaya (seeds and crop protection) in 2015, establishing a new Seed Growth Center. The
FDI Restrictions in the Indonesian Horticulture Sector: Implications of Horticulture Law No.13, 2010
6
Seed Growth Centre enhances corn seeds with plans to include rice seeds (Bayer, 2016). The
crop protection technology focuses on producing varieties more resistant to diseases and
extreme weather and aims to extend seed distribution to ASEAN countries.
Syngenta opened a new corn seed processing plant in Pasuruan, East Java in 2011. The initial
investment was US$26 million with the capacity to process 5,700 metric tons of seeds.
Syngenta reports that ‘the Center contracts more than 15,000 farmers, who supply corn for
processing. The processing plant estimates that participating farmers’ net incomes will
increase by 12-16%, as compared to what they would receive for normal commercial planting
of corn and rice.’ Brawijaya University (2016) reported that Syngenta interviewed 250 agricultural
undergraduates for 100 new positions for the corn processing plant.

FDI Restrictions in the Indonesian Horticulture Sector: Implications of Horticulture Law No.13, 2010
7
ASEAN Seed Trade
Seed Sector Trade in ASEAN
During 2009 to 2014, seed imports in ASEAN countries increased by 59% to $263.3 million, with Vietnam ranking as the top importer with a total of $85 million, ahead of Thailand ($39.8 million)
and the Philippines ($38.5 million). However, Myanmar’s import figures were exceptional, as they
increased dramatically from $1.1 million to $18.1 million between 2009 and 2014; Malaysia also had spectacular import growth during the same period, with imports in 2014 trebling from 2009 to $16.7 million. The ASEAN countries themselves provide seeds for the region, with the exception of the Philippines, which imported nearly $17.3 million worth of maize seeds from South America and $8.6 million from South Africa. The top crop group imported by ASEAN countries was maize seed, worth $107.5 million, an increase of 31% from 2009; in second place were vegetable seeds, which increase by more than 68% to $71.7 million. Of the $156.6 million of imported seeds in Asia, 66% came from ASEAN countries, which was eight percentage points higher than in 2009 (58%). Thailand was the leader in the ASEAN market with $86.3 million in seed revenues, considerably ahead of Indonesia ($5.4 million) and the Philippines ($4.8 million). The USA supplied 8.2% of the ASEAN market for seeds, just ahead of Argentina (7%), South Africa (3.8%) and the Netherlands (3.2%).
Indonesia has experienced signifcant seed import growth – imports jumped by 54% to reach $22
million in 2014 and were mainly composed of maize seeds (33.5%) and vegetable seeds (31%), followed by cereals (11.5%) and potato seeds (9%). Like most of the countries in ASEAN, Indonesia sourced most of its imported seeds from Asia (71%), with ASEAN providing 67%, followed by the USA (14%), E.U. (9%) and Oceania (6%). The ASEAN group represented 48% of imports, which were dominated by Thailand’s 69% market share, which covered 83% of maize seed needs. Japan dominated the market for vegetable seeds with a 49.4% market share, substantially ahead of Thailand (14%). Viet Nam’s imports have been growing steadily. Imports increased from $44.5 million to $85 million between 2009 and 2014, making this country the top seed importer in ASEAN. Vietnam sources most of its seeds in Asia (83%), with 60% coming from ASEAN countries. The USA supplied 6% of Vietnamese seed demand, the EU 5% and Oceania 4%. Some 54% of Vietnam’s maize seed imports came mainly from Thailand (82%); vegetable seeds were around a fth (19%) of the country’s imports and were provided by Thailand (39%), New Zealand (12.5%), Italy (12%) and China (11%). The USA supplied 96% of Vietnam’s soybean seeds. Seed imports to the Philippines, a country that is sensitive to adverse climatic conditions, fluctuated signicantly between 2009 and 2014 - - declined by 41% in 2011 ($37.6 million) and 2013 ($33.2 million), but rebounded by 58% in 2012 ($55.3 million) and 16% in 2014 to $39 million. Of all the ASEAN countries, the Philippines is the only one to import from largely outside Asia: 44% of its seed needs came from South America, 22% from South Africa, 21% from Asia, and 9% from the USA.
China, Japan and India are the seed distribution hubs for Asia. These three countries import mainly from third countries to re-export to the Asian market. They take 65% of all seeds imported into Asia. China is the leading seed importer in the region, importing $286 million of seeds in 2014. China is also the leading seed exporter, ahead of Thailand, India and Japan, with seed revenues of $292 million.
Source: Adapted from Asian Seed Vol 22, No 2, Mar/APR 2016 by Marie-Pierre Debrabant The figures are from UN Comtrade, Eurostat and USDA database.
FDI Restrictions in the Indonesian Horticulture Sector: Implications of Horticulture Law No.13, 2010
8
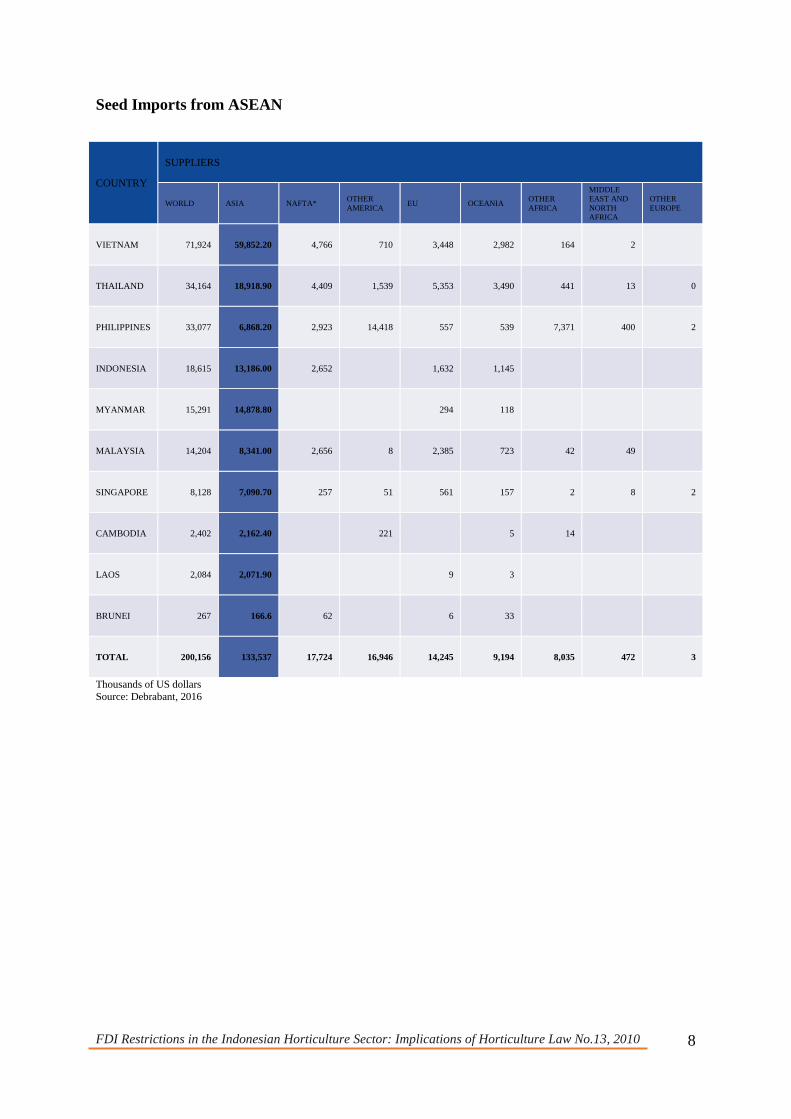
Seed Imports from ASEAN
COUNTRY
SUPPLIERS
WORLD ASIA NAFTA* OTHER
AMERICA EU OCEANIA
OTHER
AFRICA
MIDDLE
EAST AND
NORTH
AFRICA
OTHER
EUROPE
VIETNAM 71,924 59,852.20 4,766 710 3,448 2,982 164 2
THAILAND 34,164 18,918.90 4,409 1,539 5,353 3,490 441 13 0
PHILIPPINES 33,077 6,868.20 2,923 14,418 557 539 7,371 400 2
INDONESIA 18,615 13,186.00 2,652 1,632 1,145
MYANMAR 15,291 14,878.80 294 118
MALAYSIA 14,204 8,341.00 2,656 8 2,385 723 42 49
SINGAPORE 8,128 7,090.70 257 51 561 157 2 8 2
CAMBODIA 2,402 2,162.40 221 5 14
LAOS 2,084 2,071.90 9 3
BRUNEI 267 166.6 62 6 33
TOTAL 200,156 133,537 17,724 16,946 14,245 9,194 8,035 472 3
Thousands of US dollars
Source: Debrabant, 2016

FDI Restrictions in the Indonesian Horticulture Sector: Implications of Horticulture Law No.13, 2010
9
ASEAN Partners
Thousands of US dollars
Source: Debrabant, 2016
2.2. Roles of FDI in the Development of Horticulture Sector
The wide variation in how seed industries evolve, the variation in local institutions and
farming systems makes it difficult to draw clear lessons. The examples presented here do
demonstrate a wide range of approaches from India, allowing 100% FDI in horticulture to the
Philippines which maintains a constitutional limit of 40%.
COUNTRY
PARTNERS
THAILAND INDONESIA PHILIPPINES VIETNAM MALAYSIA MYANMAR SINGAPORE LAOS TOTAL
VIETNAM 42,504 902 67 3 152 43,626
MYANMAR 14,613 9 14,622
INDONESIA 6,114 1,168 2 1,593 13 8,889
MALAYSIA 4,015 937 970 436 14 6,371
THAILAND 1,556 1,841 2,011 1 872 31 6,312
PHILIPPINES 2,689 783 52 3,524
CAMBODIA 1,571 1 411 161 6 2,150
LAOS 1,445 1,445
SINGAPORE 349 475 13 70 243 1,151
BRUNEI 43 12 1 51 20 126
TOTAL 73,342 4,665 4,059 2,983 2,060 1,023 52 31 88,216
FDI Restrictions in the Indonesian Horticulture Sector: Implications of Horticulture Law No.13, 2010
10
Studies specifically addressing on the role of FDI in the horticulture sector are few. The
two main over-arching studies on the issue in recent years have concluded that FDI benefits
for the sector. Kolady et al. 2012 find that seed market liberalisation and strengthening legal
protection on intellectual property rights is able to encourage private investment in the
agricultural sector. A simulation exercise conducted by Derwishch et al (2010) finds that
sustained FDI would boost private sector development both for national and international
companies. Increasing investment in plant breeding and production seed generates a higher
production that pushes demand that in turn generates higher income that is re-invested again
in input for other variety development. Without FDI inflows, the domestic private sector is
disadvantaged relative to the domestic sectors of other countries that encourage FDI
(Derwishch et al 2010).
India
India has the most dynamic private seed sector in peer country examples presented here.
India allows 100% FDI in its seed sector, including the participation of MNCs. India has
grown and diversified without benefit of any IPRs but in the context of quite liberal seed laws
and in many cases through the use of hybrids as a means of appropriation. After China, India
is the second largest vegetable producer with production more than doubling over the past
two decades. An estimated 75% of vegetable production is from saved seeds with notable
variations. For example, cabbage, okra and tomato have seed replacement rates of more than
90%, chillies and cauliflower more than 80% (Koundinya and Kumar 2014)
Vegetable seed production is dominated by the private sector, which largely produces
proprietary hybrids (including some imported seed) but also some public hybrids and OPVs.
More than 40% of the total seed market is private. Export and import restrictions are limited
to specific cases, including onions and wild varieties (DAC 2017)
The number of private companies engaged in seed production or seed trade ranges from
400 to 500 (DAC 2017). The main focus of private seed companies is high value low volume
seeds. The public sector seed corporations dominate the market for low value high volume
oilseeds, pulses and cereal seeds. In the case of vegetable seeds and planting materials of
horticultural crops, the private sector is the dominant player. In 2012, India become the third
ranked seed exporter in Asia, ahead of Japan as seed exports tripled to $152 million between
2010 and 2014 (Debrabant, 2016).
FDI Restrictions in the Indonesian Horticulture Sector: Implications of Horticulture Law No.13, 2010
11
Viet Nam3
Viet Nam is the world’s third largest vegetable producer after China and India. Viet
Nam allows FDI, with approvals and equity restriction caps for some industries. At present,
more than 600 companies produce and trade in seeds. The foreign companies have around an
80% market share of purchased seeds. Around half the vegetable production is from saved
seed.
More than 50 countries have FDI activities in agriculture. Chinese Taipei, Japan, China,
and Thailand are top investors with capital registered accounting for about 60% of FDI in
agriculture. By 2014, Chinese Taipei accounted for 36% of the number of FDI projects in
agriculture and 20% of the value of investment. Top investors in agriculture also include
Thailand (11% of investment value), British Virgin Islands (10%), Singapore (10%) and
Hong Kong (8.%). These statistics tend to underestimate the level of investment from
European and North American investors, many of which
(e.g. Coca-Cola, Procter and Gamble, Unocal and Conoco Phillips) licence their investments
through third countries.
As of 2011, there were 240 companies in seed marketing and distribution, 76 crop
variety centres (government), and 99 other business units for a total of 415. The large foreign
companies include Syngenta (crop seeds, and the largest foreign maize seed supplier),
Bioseed Research (hybrid maize), CP Seed Company (hybrid maize), Ease West Seed (VN)
Company, and representative offices for Monsanto Thailand (maize), Siminis Vegetable
Seeds, Nong Huu Seed Company and Bayer.
Eight multinational companies are involved in the seed businesses in Viet Nam. Among
major domestic firms, Vinaseed (NSC) and Southern Seed (SSC) are the two dominant firms,
both SOEs/joint stock companies and the only ones listed on the domestic stock exchange.
Seeds are typically sourced from domestic seed companies, government seed stations,
farmer groups, co-operatives, and imports. The seed companies and seed centres distribute
seeds to farmers through private agents (80% of total seed sales), co-operatives and the
agricultural extension system, shops in seed stations, and other companies’ branches (Nguyen
Trung Kien, 2012).
Seed prices are market determined. The 2015 OECD review of agriculture study
concludes that private domestic investment in seed production occurs and imports are
3 The information presented here is from two sources: OECD’s Agricultural Policies in Viet Nam 2015
and Agronews.
FDI Restrictions in the Indonesian Horticulture Sector: Implications of Horticulture Law No.13, 2010
12
common. Quantitative import restrictions are limited with lists of approved varieties. Judging
by the degree of import penetration in hybrid seed varieties, the border restrictions are minor,
or are easily bypassed.
Seed imports are significant, especially of hybrid seeds, including 70-80% of hybrid
seeds for rice, vegetables, and maize (Nguyen Mau Dung, 2013). Vegetable seeds originate in
Thailand, China, Japan, Korea and France. Vietnamese imports have been growing steadily
for many years. Imports increased from $44.5 million to $85 million between 2009 and 2014.
Viet Nam is today’s largest ASEAN seed importer. Vietnam sources most of its seeds
in Asia (83%), with 60% coming from ASEAN countries. The USA supplied 6% of
Vietnamese seed demand, the EU 5% and Oceania 4%. Vegetable seeds accounted for
roughly 20% of seed imports in 2014, with Thailand providing (39%), New Zealand (12.5%),
Italy (12%) and China (11%).
The Philippines
The Philippines’ constitution limits FDI to 40%. In contrast to other Southeast Asian
countries with sectoral legislation or investment laws controlling FDI, having FDI limits
enshrined in the constitution mean investment barriers are much less flexible and reform
more difficult (OECD, 2016). OECD’s recent Investment Policy review of the Philippines
considers that the country is lagging in both foreign and domestic investment compared with
its neighbors, Cambodia, Lao, Myanmar, and Vietnam, trending towards liberalizing.
The report suggests that FDI reform should ‘not aim to give foreign investors special
treatment, but a strong argument can be made that removing barriers to foreign investment in
the Philippines could help to address issues of underinvestment by domestic firms through
the impact that foreign investors might have in improving overall investment climate.’
On the other hand, The World Bank’s 2016 report, ‘Enabling the Business of
Agriculture,’ names the Philippines as one of the top performing countries for seed
registration procedures and for seed development and certification systems4. The Philippines
does have good seed laws in place, including best practice for variety release and
4 The study’s seed registration indicator measures the efficiency of registration, including the variety release committee procedures, the
content, availability and frequency of the variety catalogue updates and the time and cost to register a new variety. The seed development
and certification indicator measures the protection of plant breeders’ rights, the access to initial classes of seed and germplasms, the
licensing systems for public varieties and additional testing requirements for materials imported for research and
development.
FDI Restrictions in the Indonesian Horticulture Sector: Implications of Horticulture Law No.13, 2010
13
transparency and efficiency of seed registration and seed certification activities (World Bank
2016). The Philippines supports private sector initiatives in the seed systems.
Chapter 3 Structure and Performance of Indonesia’s Vegetable
Seed Industry
3.1. Market concentration in the seed industry
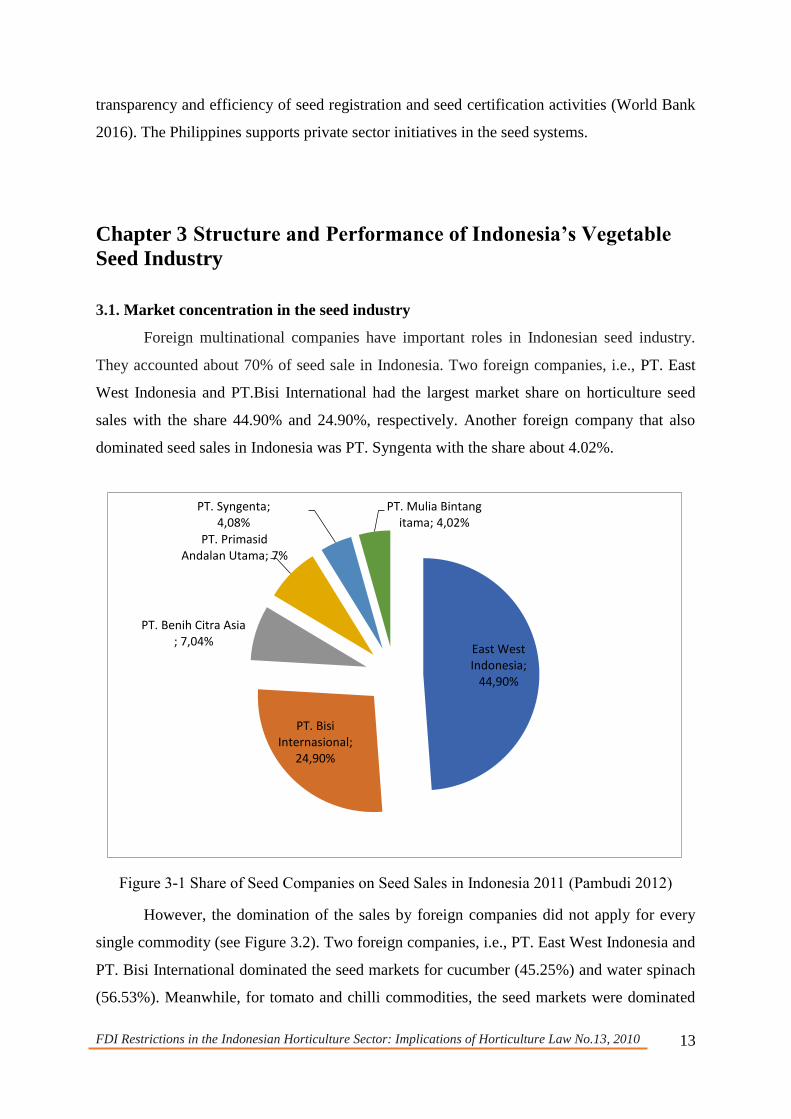
Foreign multinational companies have important roles in Indonesian seed industry.
They accounted about 70% of seed sale in Indonesia. Two foreign companies, i.e., PT. East
West Indonesia and PT.Bisi International had the largest market share on horticulture seed
sales with the share 44.90% and 24.90%, respectively. Another foreign company that also
dominated seed sales in Indonesia was PT. Syngenta with the share about 4.02%.
Figure 3-1 Share of Seed Companies on Seed Sales in Indonesia 2011 (Pambudi 2012)
However, the domination of the sales by foreign companies did not apply for every
single commodity (see Figure 3.2). Two foreign companies, i.e., PT. East West Indonesia and
PT. Bisi International dominated the seed markets for cucumber (45.25%) and water spinach
(56.53%). Meanwhile, for tomato and chilli commodities, the seed markets were dominated
East West Indonesia;
44,90%
PT. Bisi Internasional;
24,90%
PT. Benih Citra Asia ; 7,04%
PT. Primasid Andalan Utama; 7%
PT. Syngenta; 4,08%
PT. Mulia Bintang itama; 4,02%

FDI Restrictions in the Indonesian Horticulture Sector: Implications of Horticulture Law No.13, 2010
14
by domestic companies PT Benih Citra Asia with the share 58.73% and 38.8%. As such, it is
difficult to generalize the roles of foreign companies across all commodities. The analysis for
general horticulture products will be much more complicated considering the size of foreign
versus local companies. In 2014 the number of foreign seed companies and domestic
companies were 16 versus 49 companies (See Appendix 1). However, the majority
of domestic companies consisted of small and medium companies5 while the foreign
seed companies were dominated by large size companies with significant levels of
investment in research, production and marketing.
5 Only a few of domestic companies include as larger size companies such as PT. Benih Citra Asia and
PT. Agri Makmur Pertiwi
45,26
27,36
12,56
4,55
PT. East WestIndonesia
PT.Benih Citra Asia PT. BisiInternasional/PT.
Tanindo SuburPrisma
PT. Agri MakmurPertiwi
Cucumber (%)
56,53
15,659,39
5,42
PT. BisiInternasional/PT.
Tanindo SuburPrisma
PT. Agri MakmurPertiwi
PT. PrimasidAndalan Utama
PT. East WestIndonesia
Water Spinach (Kangkung) (%)
58,73
16,238,65
5,05
PT.Benih CitraAsia
CV.Aura SeedIndonesia
PT.OrientalSeed Indonesia
PT. East WestIndonesia
Tomato (%)
38,8
18,65
12,6810,02
PT.Benih CitraAsia
PT. BisiInternasional/PT.
Tanindo SuburPrisma
PT. East WestIndonesia
PT.Oriental SeedIndonesia
Chili (%)
Figure 3-2 CR4 for Cucumber, Water Spinach, Tomato and Chili Seed in Indonesia (Sayaka 2014)
FDI Restrictions in the Indonesian Horticulture Sector: Implications of Horticulture Law No.13, 2010
15
3.2. The role of FDI in the seed industry
In order to produce and bring high quality seed to farmers, there are four main aspects
conducted by seed companies: (1) forecasting market demand, (2) breeding traits, (3)
producing seed, and (4) seed marketing and extension. Domestic and foreign companies
might differ in these aspects.
Forecasting market demand
Market demand for horticulture products provides signals to the seed companies about
what kind of seed should be produced; therefore, farmers can fulfil the needs of their
customers. As we know, the demand for horticulture seed is a derived demand, based on the
consumer demand for horticulture products. As such, it is important for seed companies to
produce seeds that can fulfil consumer expectation (i.e., high quality, size and good taste).
For example, currently consumers prefer to seedless watermelon and this information should
be accommodated by seed companies in order to win the competition in watermelon market.
Identifying consumer expectation requires a careful study of the market (consumer behavior).
Based on FGD results, foreign companies have utilized the value chain approaches to
recognize the expected values of consumers and use them as the guidance in seed productions.
Similarly, big domestic companies have utilized value chain approaches to forecast market
demand. Because of capital constraint, small scale companies do not consider consumer
expectation on horticulture products (the demand side of horticulture products). Some small
scale companies only consider the need of farmers living around the company areas; so they
tend to utilize information from local farmers with respect to the preferred seed.
Breeding traits
Breeding activities determines the seed quality to be produced; increasing harvest
yields, higher resistance to pests, diseases and weather condition. Seed companies create
new varieties based on crossing selecting desired, valuable traits that can increase yields,
improve resistance against pests and diseases that are adapted to new or adverse growing
FDI Restrictions in the Indonesian Horticulture Sector: Implications of Horticulture Law No.13, 2010
16
conditions. This process requires huge investment in materials, biotechnology, operational
expertise and times. On average it takes about five years to produce a new hybrid variety.
Currently, by using haploid technology, the process can be shorter to 1-2 years. But, such
technology is very expensive and can be accessed only by big companies. By using their
research and development facilities, breeding traits for the foreign companies can be
conducted continuously in order to produce new varieties of seed horticulture.
It is also important to note, based on FGD result foreign companies have more access
on germplasm in genebanks from other countries (using both business to business and
government to government exchange schemes) compared to domestic companies.
Germplasm is utilized as parent material in breeding activity to produce high quality
foundation seed. The combination of complete facilities and more access to genebanks lead
to foreign companies to produce larger number of high quality varieties compared to local
companies. For example, East West had released 170 vegetables seed varieties versus 42
varieties released by one domestic company (this company in fact includes as big size
company).
Foreign companies and big local companies have also considered the effect of global
climate change when they produce new varieties. Global climate change has affected weather
pattern and planting season in Indonesia. For example, La Nina and El Nino cycle had
affected the rainy season in the coming year leading to crops to greater threats of disease and
pests. As such, farmers need to use seeds that can withstand these vulnerabilities. In 2012,
East West had also released nine vegetable varieties that were resistant to ‘Gemini’ virus
consisting of tomato (six varieties), beans (two varieties), cucumber (one variety). Over the
last seven years from 2012, the virus destroyed about 70% of land planted with tomatoes in
Indonesia. Meanwhile, for small scale companies with limited funding to purchase needed
equipment and materials, breeding traits can only be conducted by using few parent materials
with more simple process and longer time period compared to foreign and big companies. As
a result, small scale companies can only produce limited varieties of horticulture seeds.
Producing seed
Producing seed determines the quantity of food quality seed to be produced. Before
seed companies produce or commercialize the seeds, they need to register their new varieties
to Ministry of Agriculture in order to obtain protection from Indonesian Government (Plant
Variety Protection, PVP). The validity period of PVP is 20 years for seasonal plant and 25
years for annual plant after producers receiving PVP certificate. In order to get PVP

FDI Restrictions in the Indonesian Horticulture Sector: Implications of Horticulture Law No.13, 2010
17
certificate, the new variety must be registered and inspected. After the Horticulture Law was
passed, the number of varieties for vegetable seeds registered for PVP certificate increased
significantly particularly for domestic companies. However, whether the certificates
registered had been commercialized is still questionable. In some cases, the number of
varieties registered might not be commercialized due to capital limitation owned by small
scale seed companies. Based on results from FGD and interviewed with some seed producers
that have registered their varieties, they face constraints particularly capital constraints to
commercialize the varieties. For foreign and local big companies, considering their size and
capital, they do not face difficulty to commercialize their registered varieties with large
amount of number.
To produce commercial seed, foreign companies and local big companies uses a
contract farming programs in which the companies give the foundation seed to the contracted
farmers and provide them with training, support and technical supervision. The contracted
farmers have the obligation to sell back to the companies. Contract farming includes as
community development providing more job and assisting contract farmers in shifting from
traditional agriculture to the production of diversified, higher values-added products leading
to increase farmers’ income. PT. East West established contract farming with 3000 seed
production farmers (for horticulture seed). PT. Bisi International had contract farming with
74,709 farmers (horticulture and staple food seed).
The majority of horticulture seed are sold in market as packed seed with relevant
information to maintain the identity of the seed. As such, packaging is important aspect
particularly for maintaining the quality and attracting seed consumers. Foreign companies
and big local companies always improve their advanced packaging techniques that are
hygienically packed to maintain quality with attracted label and information on how to use
seed. Meanwhile, small scale companies use more simple packaged seed.
Seed marketing and extension
Marketing and extension involve activities to distribute seed from companies to
farmers. While, small scale seed companies can only market their products to fulfil local
markets around their production areas, foreign seed companies and big local seed companies
have implemented various marketing strategies in order to strengthen their positions in the
Indonesian seed market. The marketing strategies include demo plot, promotion (television,
radio or newspaper, billboards, banners, leaflets and brochures), partnership with farmers,
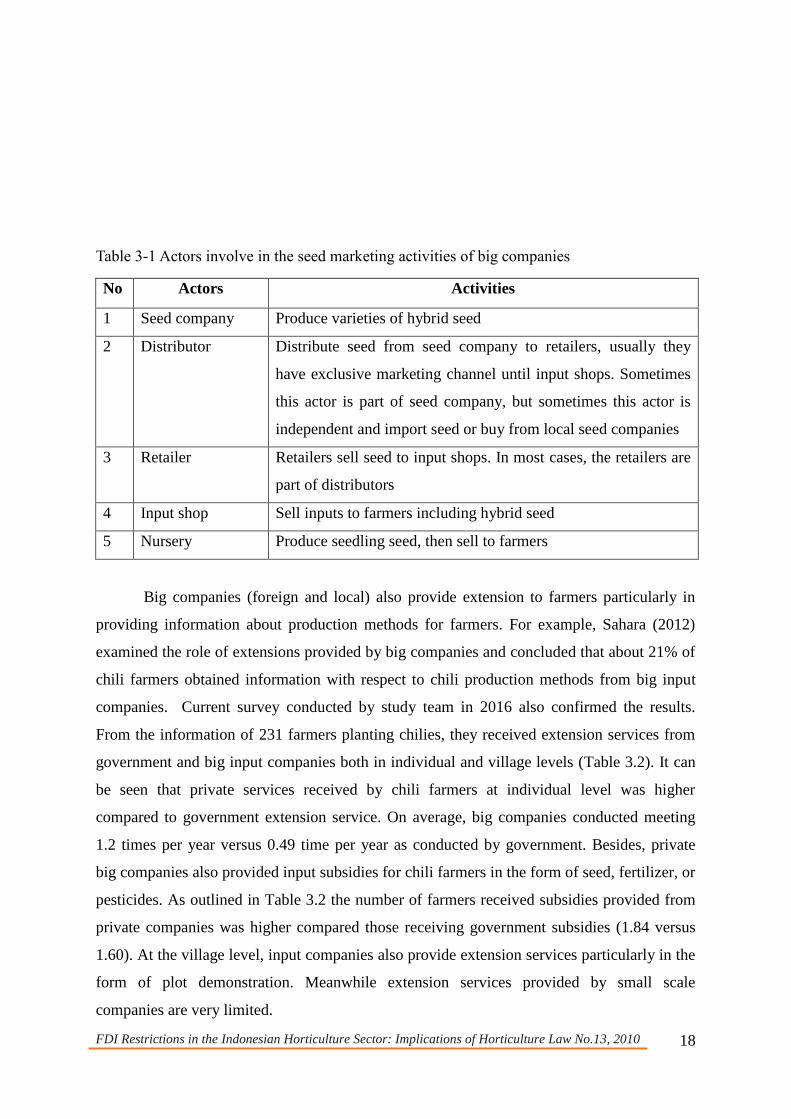
and extension. These activities include several actors (Table 3.1).
FDI Restrictions in the Indonesian Horticulture Sector: Implications of Horticulture Law No.13, 2010
18
Table 3-1 Actors involve in the seed marketing activities of big companies
No Actors Activities
1 Seed company Produce varieties of hybrid seed
2 Distributor Distribute seed from seed company to retailers, usually they
have exclusive marketing channel until input shops. Sometimes
this actor is part of seed company, but sometimes this actor is
independent and import seed or buy from local seed companies
3 Retailer Retailers sell seed to input shops. In most cases, the retailers are
part of distributors
4 Input shop Sell inputs to farmers including hybrid seed
5 Nursery Produce seedling seed, then sell to farmers
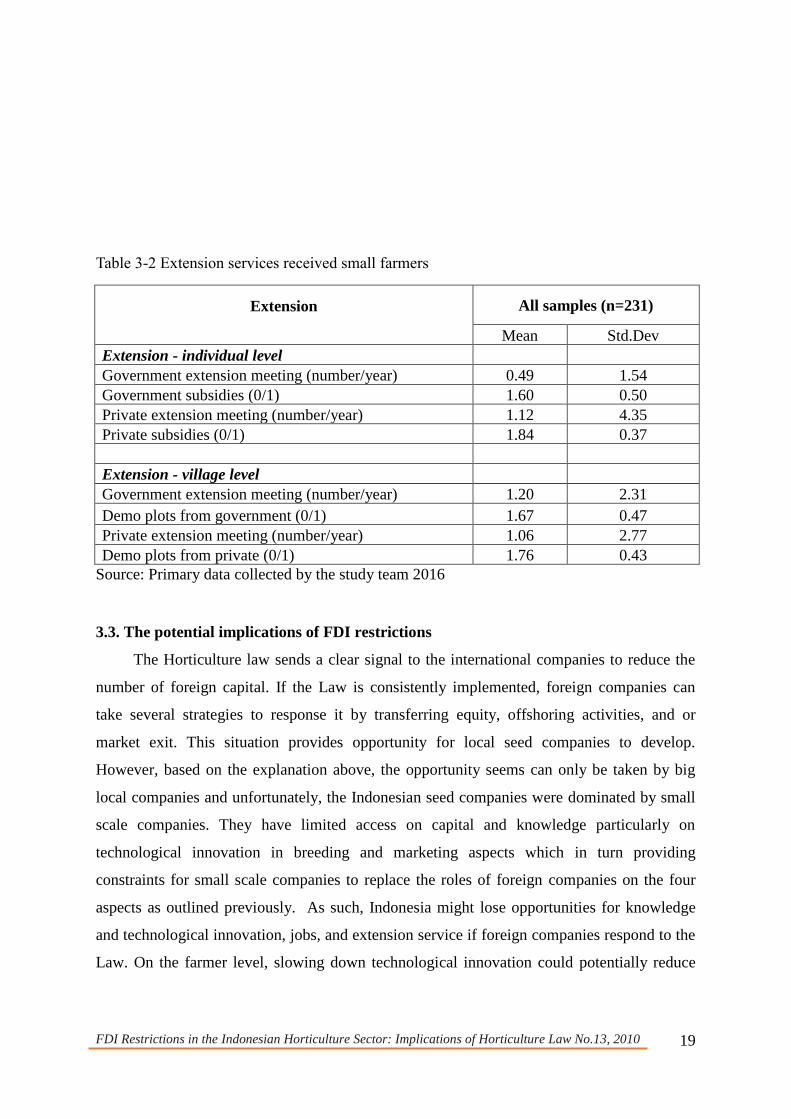
Big companies (foreign and local) also provide extension to farmers particularly in
providing information about production methods for farmers. For example, Sahara (2012)
examined the role of extensions provided by big companies and concluded that about 21% of
chili farmers obtained information with respect to chili production methods from big input
companies. Current survey conducted by study team in 2016 also confirmed the results.
From the information of 231 farmers planting chilies, they received extension services from
government and big input companies both in individual and village levels (Table 3.2). It can
be seen that private services received by chili farmers at individual level was higher
compared to government extension service. On average, big companies conducted meeting
1.2 times per year versus 0.49 time per year as conducted by government. Besides, private
big companies also provided input subsidies for chili farmers in the form of seed, fertilizer, or
pesticides. As outlined in Table 3.2 the number of farmers received subsidies provided from
private companies was higher compared those receiving government subsidies (1.84 versus
1.60). At the village level, input companies also provide extension services particularly in the
form of plot demonstration. Meanwhile extension services provided by small scale
companies are very limited.
FDI Restrictions in the Indonesian Horticulture Sector: Implications of Horticulture Law No.13, 2010
19
Table 3-2 Extension services received small farmers
Extension
All samples (n=231)
Mean Std.Dev
Extension - individual level
Government extension meeting (number/year) 0.49 1.54
Government subsidies (0/1) 1.60 0.50
Private extension meeting (number/year) 1.12 4.35
Private subsidies (0/1) 1.84 0.37
Extension - village level
Government extension meeting (number/year) 1.20 2.31
Demo plots from government (0/1) 1.67 0.47
Private extension meeting (number/year) 1.06 2.77
Demo plots from private (0/1) 1.76 0.43
Source: Primary data collected by the study team 2016
3.3. The potential implications of FDI restrictions
The Horticulture law sends a clear signal to the international companies to reduce the
number of foreign capital. If the Law is consistently implemented, foreign companies can
take several strategies to response it by transferring equity, offshoring activities, and or
market exit. This situation provides opportunity for local seed companies to develop.
However, based on the explanation above, the opportunity seems can only be taken by big
local companies and unfortunately, the Indonesian seed companies were dominated by small
scale companies. They have limited access on capital and knowledge particularly on
technological innovation in breeding and marketing aspects which in turn providing
constraints for small scale companies to replace the roles of foreign companies on the four
aspects as outlined previously. As such, Indonesia might lose opportunities for knowledge
and technological innovation, jobs, and extension service if foreign companies respond to the
Law. On the farmer level, slowing down technological innovation could potentially reduce

FDI Restrictions in the Indonesian Horticulture Sector: Implications of Horticulture Law No.13, 2010
20
yields and profit impacting economic growth in rural communities as well as Indonesia's
ability to achieve higher levels of food security.
Similar to other developing countries, demand for horticulture products in Indonesia
tend to increase due to increasing in income per capita. As such, there are some prices to be
paid when the Horticulture Law was implemented particularly when slowing down
technological innovation occurs during the transition stage, i.e. (1) increasing land and (2)
import. In order to compensate decline in productivity growth when the slowing down of
innovation occurs, more land needed for horticulture areas. The question is how can
government get more productive land to increase the production of horticulture product?
Considering tremendous land competition in Indonesia, bringing more land to increase
horticulture production is almost impossible. Besides, it might conflict with government
program to expand strategic staple food in Indonesia (paddy, maize and soybeans). Further,
reducing yield of horticulture products particularly for the strategic commodities (chili and
shallot) means that Indonesian Government will rely on import to fulfill demand for
horticulture products. Increasing import leads to trade deficit for horticulture products and
against with government program on food sovereignty. To provide clear picture about these
two costs, we will provide some calculations for three strategic horticulture commodities in
Indonesia, chili, tomato and shallot.
3.3.1. Technological slow down and land
With rapidly growing demand for horticulture products, Indonesia has no real choice
but to expand horticultural production. Chili production, for example, grown at a rapid pace
of over 6% annually (close to the GDP growth rate), and even this high growth rate is
perceived by the public to be insufficient as demonstrated by popular press coverage of high
chili prices and chili related “inflation”. Failure to keep on the current rapid pace of growth in
production will undeniably lead to either a significant increase in prices (and public
disapproval) or a high reliance on imports (contradicting the “self-sufficiency” agenda). The
government’s optimal (perhaps only) strategy is to sustain the growth rate of domestic
horticulture production.
Since expanding domestic production is mandatory, an expansion path must be chosen
that involves both: (1) extensive expansion – bringing more land into production, or; (2)
intensive expansion – improving the productivity (output/ha). Prioritizing an ‘extensive
expansion’ path will require a massive investment in bringing additional land into production
FDI Restrictions in the Indonesian Horticulture Sector: Implications of Horticulture Law No.13, 2010
21
and potentially displacing other land-uses. This appears to be the current administration’s
approach as evidenced by the tremendous amount of resources (and military labor) used to
push extensive expansion of rice. Such pushes require large tracts of land and the production
increases are, at best, linearly related to the total investment (Δ𝑃𝑟𝑜𝑑𝑢𝑐𝑡𝑖𝑜𝑛 = 𝛼 ∗ Δ𝐿𝑎𝑛𝑑).
Taking an ‘intensive expansion’ path will depend heavily on the supply of suitable
seeds, planting materials, farming techniques, and extension. This requires the prioritization
of extension and R&D, particularly in the development and dissemination of improved
planting materials. Any slowdown in the development and dissemination process during the
transition stage would severely constrain production growth in this path.
The Horticulture Law implicitly prioritizes extensive expansion because it inhibits the
development of improved planting materials. If production growth must be sustained, this
slowdown in the development of planting materials must be compensated for by bringing
more land into production. So, while the immediate production impacts of R&D will be small,
the point of concern should be the long-term decline in productivity growth (output/ha). Two
scenarios use in this section:
Scenario 1 (baseline):
will assume that technological progress (as measured by output/ha) continues on the same
growth rate as before the law was introduced
Scenario 2:
will assume a proportional decline in the rate of technological progress in increments of 10%,
from 100% (baseline) to 0% (complete technological stagnation).
This analysis will assume that production increase MUST stay on pace with the rate
of growth experienced from 2000 to 2010 (pre-horticulture law phase). For three strategic
commodities- shallot, chili, and tomato- the annual production growth rate is about 3.1%, 6.2%
and 4.2% respectively, and we will assume that these growth rates must be sustained. Given
that the government and the population regarded these rates to be insufficient (as evidenced
by popular press articles on horticulture driven “inflation”), we interpret this growth rate to
be the minimum acceptable scenario.
In the baseline case, we will assume that technological progress (growth in output/ha)
will continue on the same pace as the pre Horticulture Law phase (2000-2010). This means

FDI Restrictions in the Indonesian Horticulture Sector: Implications of Horticulture Law No.13, 2010
22
that output per hectare for shallot, chili, and tomato will improve at a rate of 0.4%, 3%, and
2.3% respectively. We refer to this as the rate of technological progress.
The Horticulture Law will inhibit the rate of technological progress which will affect
the entire production system. However, we aim to simplify this by presenting a metric that
can be understood by many different stakeholders. The metric we use is the amount of
displaced land (ha). Assuming that production must keep increasing, this metric represents
the land area needed to compensate for the reduced rate of technological progress. The
amount of displaced land is a concrete, valuable, and salient unit in the minds of policy-
makers. In addition, it can be used in policy dialogues at all levels to illustrate the tradeoffs
that need to be made on the ground.
To express this mathematically, the total amount of land needed to sustain production
growth is given simply as follows:
𝑄 ∗ 𝑅𝑡 = 𝑃𝑟𝑜𝑑(𝛼 ∗ 𝐼)𝑡 ∗ 𝐿𝑎𝑛𝑑𝑡
Where:
(1) t indexes time in years; (2) Q is production quantity; (3) Productivity is
output/ha; (4) Land is ha planted; (5) R is rate of production growth; (6) I is rate of
technological progress, and; (7) 𝛼 represents the proportion of baseline technological
progress: 1=baseline; 0=complete technological stagnation; 0.9 = 90% capacity
Treating Land as the only choice variable, solving for land yields this equation:
𝐿𝑎𝑛𝑑𝑡 = 𝛼−𝑡𝑄
𝑃𝑟𝑜𝑑[𝑅
𝐼]𝑡
Analytically, the impact of the horticulture law would enter via the 𝛼 parameter,
representing the slowdown in technological progress. The partial derivative we are interested
in presenting is the amount of land needed to substitute for a slowdown in technological
progress. This expression is given below:
𝛿
𝛿𝛼𝐿𝑎𝑛𝑑𝑡 = −𝑡𝛼−𝑡−1
𝑄
𝑃𝑟𝑜𝑑[𝑅
𝐼]𝑡
Using secondary data on total production over time, productivity over time, and area
planted over time, we approximate this partial derivative. Since we do not know what alpha
will be, we approximate the substitution assuming multiple levels for alpha.
In addition, the extent to which each commodity will be affected by the Horticulture
Law will depend on the commodity-specific optimum expansion path. We present the
impacts assuming that the past expansion paths are the optimums. In other words, we assume
that expansion will be sustained even if technological progress makes the production of non-
FDI Restrictions in the Indonesian Horticulture Sector: Implications of Horticulture Law No.13, 2010
23
horticulture products (or non-horticulture land-use) more profitable. This assumption allows
us to present a conservative lower-bound for the amount of land needed to compensate for the
slowdown in technological innovation. Treating the expansion path as an endogenous process
will only increase the need for extensive expansion which will only increase the estimates of
additional land needed to support growth.
Lastly, the impact on product quality will depend highly on the extent to which MNC
seed products are currently used in production. We use estimates from sample surveys to
speculate on any quality and product changes that may occur in each of the previously
discussed scenarios.
All analysis in this section assumes that imports stay at current levels (see import sub-
section for endogenous treatment of trade balance) and that technological progress in
horticulture is driven primarily by the development of improved planting materials6.
Scenario 1: Business as usual
Before the Horticulture Law was introduced in November 2010, the industry was
operating in the “business as usual” scenario. This scenario is characterized by rapid growth
driven by both intensive expansion and extensive expansion.
For the three major horticulture products in this analysis (chili, shallot, tomato), each
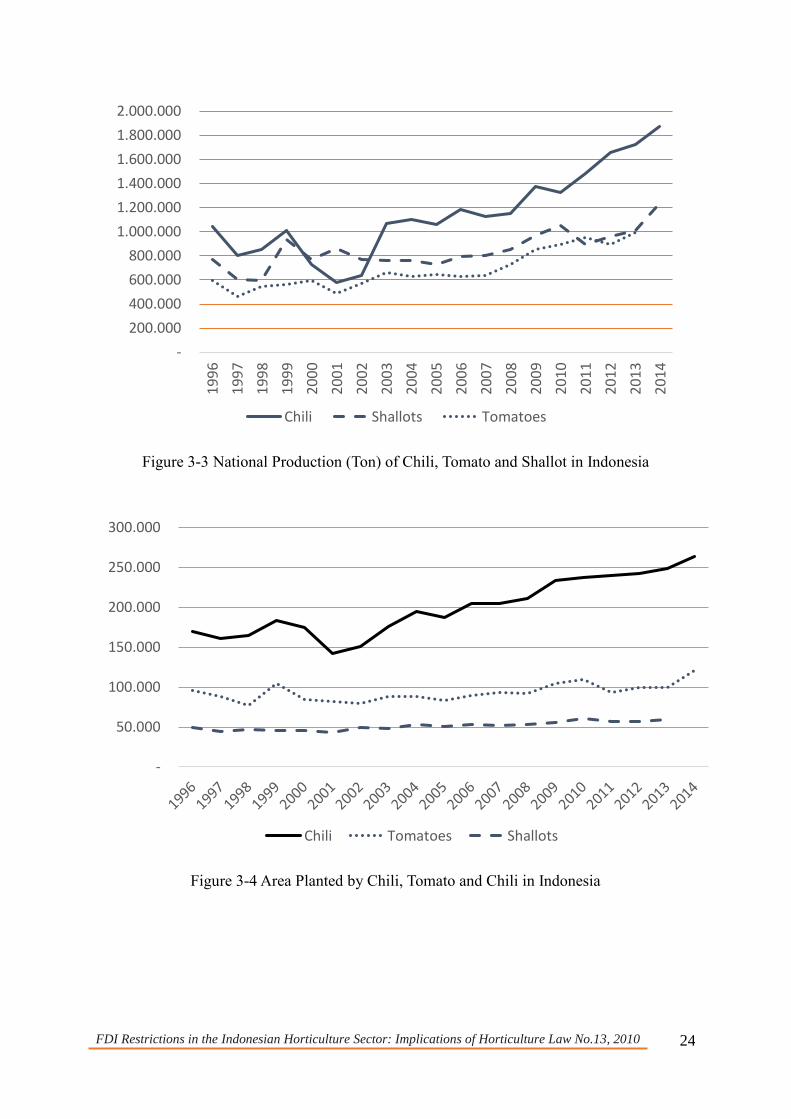
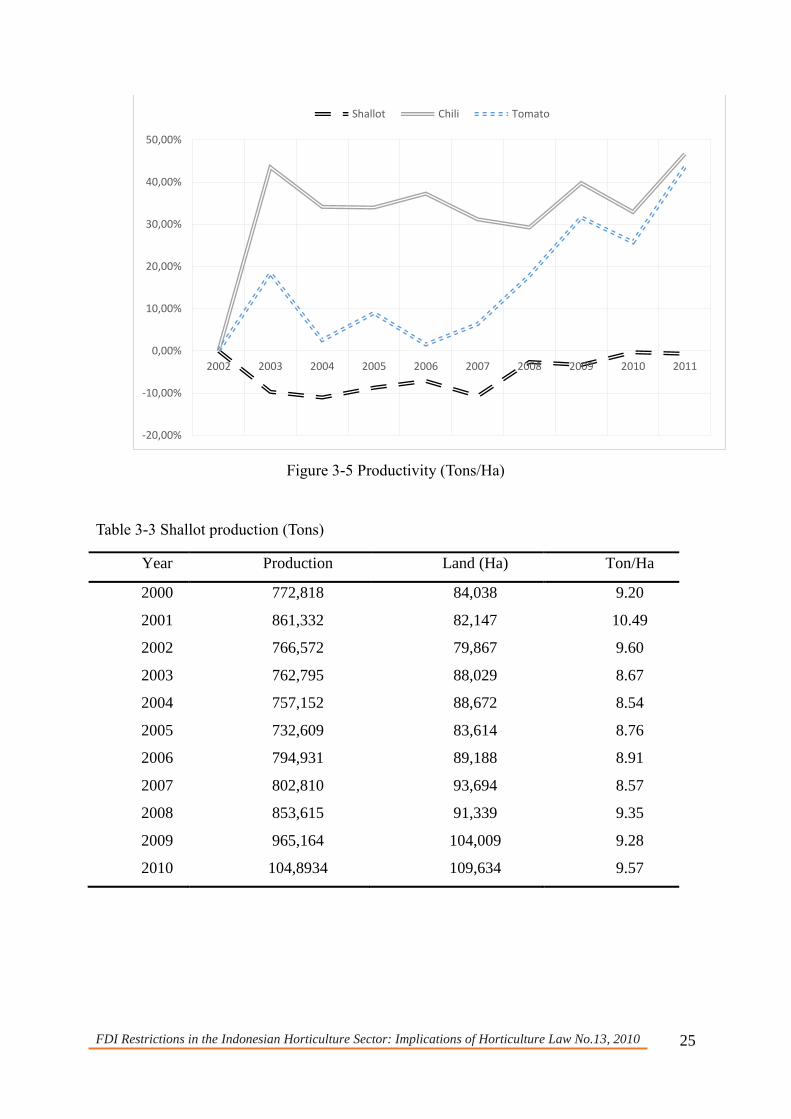
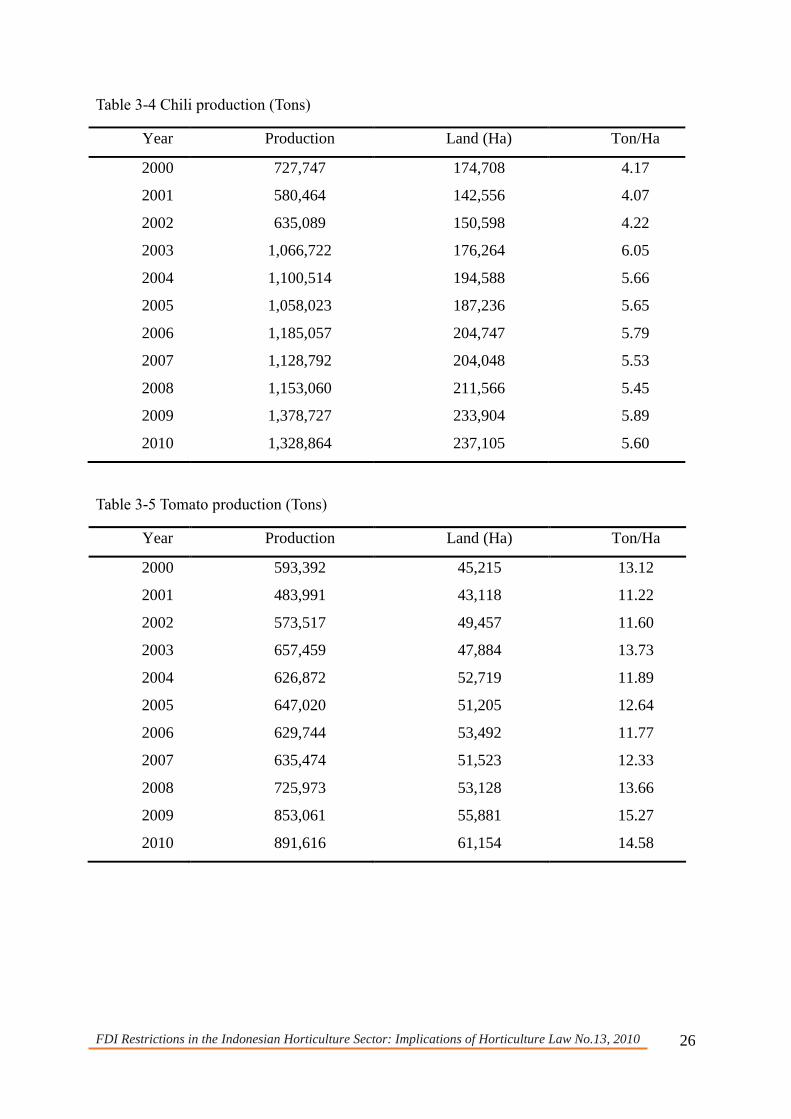
grew at a steady and high pace (Figure 3-3). The growth of land and productivity are
presented in Figure 3-4 and Figure 3-5. The growth of three commodities was achieved in
different ways. While the supply growth of shallot (Table 3-3) was driven almost exclusively
by extensive expansion onto more land, chili (Table 3-4) and tomato (Table 3-5) growth were
driven by a combination of extensive expansion and intensive technological progress (Table
3-6).
6 We assume that innovations in fertilizers, chemicals, and farming techniques are secondary drivers of
productivity growth in Indonesian horticulture. This is evidenced by stagnant productivity of shallots (low
adoption of improved varieties), and high productivity growth of chili & tomato (high adoption of improved
varieties).
FDI Restrictions in the Indonesian Horticulture Sector: Implications of Horticulture Law No.13, 2010
24
Figure 3-3 National Production (Ton) of Chili, Tomato and Shallot in Indonesia
Figure 3-4 Area Planted by Chili, Tomato and Chili in Indonesia
-
200.000
400.000
600.000
800.000
1.000.000
1.200.000
1.400.000
1.600.000
1.800.000
2.000.000
19
96
19
97
19
98
19
99
20
00
20
01
20
02
20
03
20
04
20
05
20
06
20
07
20
08
20
09
20
10
20
11
20
12
20
13
20
14
Chili Shallots Tomatoes
-
50.000
100.000
150.000
200.000
250.000
300.000
Chili Tomatoes Shallots
FDI Restrictions in the Indonesian Horticulture Sector: Implications of Horticulture Law No.13, 2010
25
Figure 3-5 Productivity (Tons/Ha)
Table 3-3 Shallot production (Tons)
Year Production Land (Ha) Ton/Ha
2000 772,818 84,038 9.20
2001 861,332 82,147 10.49
2002 766,572 79,867 9.60
2003 762,795 88,029 8.67
2004 757,152 88,672 8.54
2005 732,609 83,614 8.76
2006 794,931 89,188 8.91
2007 802,810 93,694 8.57
2008 853,615 91,339 9.35
2009 965,164 104,009 9.28
2010 104,8934 109,634 9.57
-20,00%
-10,00%
0,00%
10,00%
20,00%
30,00%
40,00%
50,00%
2002 2003 2004 2005 2006 2007 2008 2009 2010 2011
Shallot Chili Tomato
FDI Restrictions in the Indonesian Horticulture Sector: Implications of Horticulture Law No.13, 2010
26
Table 3-4 Chili production (Tons)
Year Production Land (Ha) Ton/Ha
2000 727,747 174,708 4.17
2001 580,464 142,556 4.07
2002 635,089 150,598 4.22
2003 1,066,722 176,264 6.05
2004 1,100,514 194,588 5.66
2005 1,058,023 187,236 5.65
2006 1,185,057 204,747 5.79
2007 1,128,792 204,048 5.53
2008 1,153,060 211,566 5.45
2009 1,378,727 233,904 5.89
2010 1,328,864 237,105 5.60
Table 3-5 Tomato production (Tons)
Year Production Land (Ha) Ton/Ha
2000 593,392 45,215 13.12
2001 483,991 43,118 11.22
2002 573,517 49,457 11.60
2003 657,459 47,884 13.73
2004 626,872 52,719 11.89
2005 647,020 51,205 12.64
2006 629,744 53,492 11.77
2007 635,474 51,523 12.33
2008 725,973 53,128 13.66
2009 853,061 55,881 15.27
2010 891,616 61,154 14.58

FDI Restrictions in the Indonesian Horticulture Sector: Implications of Horticulture Law No.13, 2010
27
Table 3-6 Average rates of change (2000 to 2010)
Shallot Chili Tomato
Production 3.10% 6.21% 4.25%
Productivity 0.04% 3.01% 2.30%
Land 2.69% 3.10% 1.90%
In the baseline scenario, we assume the following:
(1) The rate of technological progress continues unhindered for 5 more years.
(2) The rate of production growth must continue 5 years into the future.
(3) Only land can be adjusted to meet production targets.
Given the above assumptions, Indonesia would need an additional 17,000 hectares for
shallot production; 53,000 hectares for chili production, and; 6,000 hectares for tomato
production by 2019 (see row 2 of Table 3-7). These projections are very close to the amount
of land added over the previous 5 years (see row 1 of Table 3-7). In total, this is 76,000
hectares of additional land. In the baseline scenario, Indonesia must add a Jakarta-sized piece
of land (66,000 ha) into production just to keep up with production for three horticulture
products. Any decline in the rate of technological innovation will mean very large amounts of
land will need to compensate.
FDI Restrictions in the Indonesian Horticulture Sector: Implications of Horticulture Law No.13, 2010
28
Table 3-7 Land area needed to sustain the rate of growth (Ha)
Shallot Chili Tomato
Historical (2009-2014) 16,695 52,050 6,630
Baseline rate (2014-2019) 17,624 53,011 6,034
Productivity Growth ADDITIONAL LAND NEEDED
90% of baseline 336 5,612 928
80% of baseline 673 11,340 1,872
70% of baseline 1,012 17,187 2.830
60% of baseline 1,351 23,156 3,803
50% of baseline 1,691 29,251 4,792
40% of baseline 2,032 35,473 5,797
30% of baseline 2,373 41,826 6,819
20% of baseline 2,716 48,313 7,856
10% of baseline 3,060 54,938 8,911
No Tech Change 3,405 61,704 10,945
Scenario 2
Inhibiting research and development of tomato and shallot planting material can only
have a detrimental effect on the rate of technological innovation. We estimate the tradeoff in
land with different levels of alpha (slowdown in technological progress). We analyze
slowdowns in progress in 10% increments and show the area of land needed to compensate
for the incremental slowdown in progress.
The slowdown in progress affects each of the commodities differently. Commodities,
like shallot, that still utilize traditional saved-seed systems will not be affected. On the other
hand, commodities, like chili and tomato, that have a high adoption rate of improved varieties
will likely be adversely affected by the declining role of foreign companies in the seed sector.
This is consideration is incorporated into each of the scenarios below.
First, we present the worst-case scenario. If the Horticulture Law results in a complete
stagnation in technological innovation (in other words, productivity stays at 2014 levels),
Indonesia will need to add an additional 3,000 ha of shallot; 61,000 ha of chili, and; 11,000
ha of tomato compared to the baseline scenario (Table 3-7). This is roughly double the
baseline scenario, and total additional hectares needed (baseline + relative change) is over
150,000 (more than two DKI Jakarta sized pieces of land: 66,000 ha x 2).
FDI Restrictions in the Indonesian Horticulture Sector: Implications of Horticulture Law No.13, 2010
29
The real impact will likely be a moderate slowdown in technological progress.
However, even a small 20% decline in technological progress (recall that MNC share of
R&D expenditure and seed market is significantly more than 20%, so we are significantly
under-estimating) would mean that an additional 600 ha of shallot; 11,300 ha of chili, and;
1,800 ha of tomato would be needed compared to the baseline scenario. This is about 13,000-
14,000 ha of land. Adding this with the baseline (Jakarta size land), an additional Bogor sized
piece (12,000 ha) of land will be needed to compensate for the decline in technological
innovation. These are non-trivial amounts of land [Detailed results for different specifications
on the decline in technological innovation are presented in detail in Table 3-7]
3.3.2. Technological slow down and import
If foreign owned companies exit Indonesia completely, the productivity stagnation
will reduce the production of horticulture products in the future. The production gap needs to
be fulfilled from import. Increasing the importation volume of horticulture products will
increase deficit of trade balance. This section will provide example of the number of import
for chili and shallot commodities if technological slow down occurs.
Chili and tomato farmers use certified seed produced by big companies including
foreign companies. If the Horticultural Law does not exist, the baseline scenario shows that
the growth of production, land and productivity tend to increase over the period 2000-2010.
As outlined previously, production, land, and productivity of chili over the period 2000-2010
grew about 6.21%, 3.10%, and 3.01%, respectively.
By using baseline scenario (average production growth 6.21%), chili production will
continually increase and reach by about 2,691 thousand tonnes in 2020 (Table 3.8). If
foreign companies exit Indonesia, technological stagnation, productivity in 2015-2020 will
fix as the productivity rate in 2014 (7.11 ton/ha). If there is no change in productivity level,
increasing in production should be supported by land expansion above its growth in the
baseline scenario. However, bringing more land into production above its growth in the
baseline scenario is almost impossible considering land competition in Indonesia. With the
growth of land similar to its baseline scenario, increase by 3.10% per year, the availability
land for chili production will reach 316 thousand ha in 2020. The multiplication between the
availability of land for chili and productivity results in chili production with constant
productivity as indicated in the column 5 (Table 3.6). As we can see, the amount of
production of chili with constant productivity is lower compared to production using the

FDI Restrictions in the Indonesian Horticulture Sector: Implications of Horticulture Law No.13, 2010
30
baseline scenario. The gap between production in baseline scenario and production with
constant productivity is presented in column (6). The gap of production should be fulfilled
from import. As such, the volume of imported chili will increase to about 438 thousand
tonnes in 2020 leading deficit of trade balance of chili to increase.
Table 3-8 The impact of the Horticulture Law on import: chili commodity
Year
Production
using
baseline
scenario
(ton)
Land (ha) Productivity
(ton/ha)
Production
using
constant
productivity
(ton)
Gap of
Production
(import,
ton)
(1) (2) (3) (4) (5) (6)
2017 2,246,304.76 288,908.38 7.11 2,054,977.26 191,327.50
2018 2,385,715.70 297,867.37 7.11 2,118,701.68 267,014.02
2019 2,533,778.81 307,104.18 7.11 2,184,402.19 349,376.62
2020 2,691,031.06 316,627.42 7.11 2,252,140.06 438,891.00
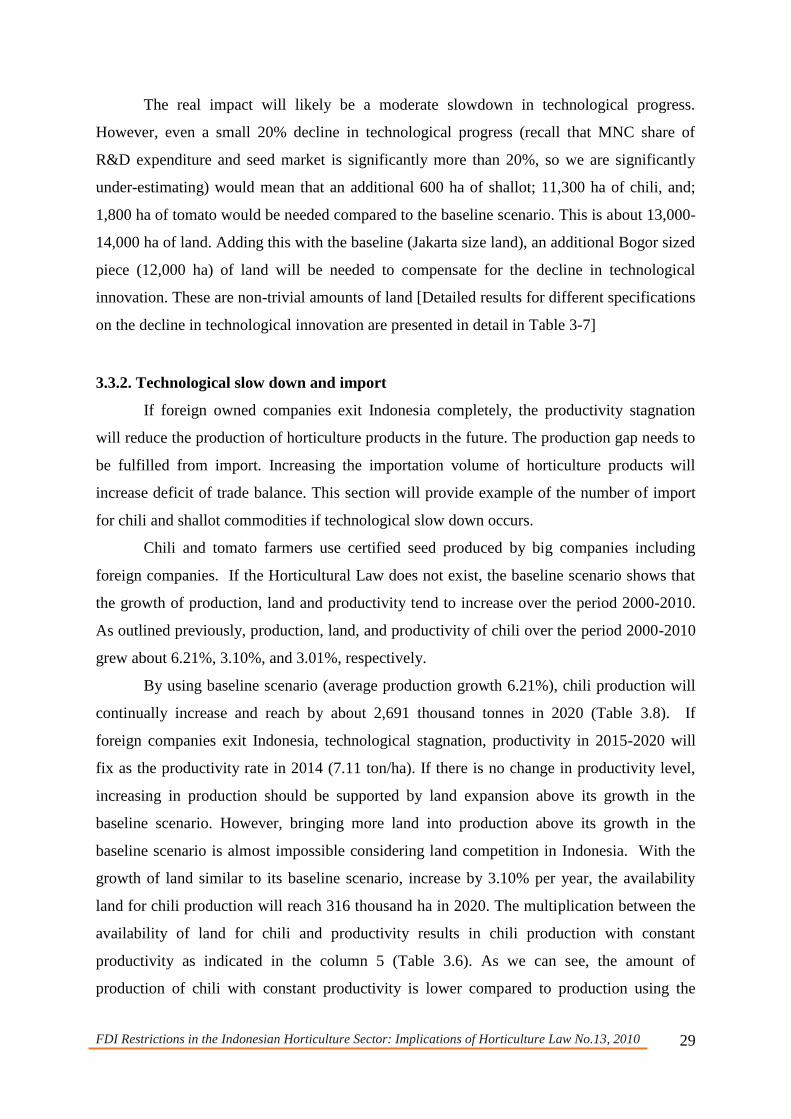
By using scenario as outlined above, similar situation occurs in tomato commodity. If
the growth of tomato production follows the growth in the baseline scenario (16.79% per
year), tomato production in 2020 should reach 1,328 thousand tonnes. It is assumed when
foreign companies exit Indonesia, the supply of suitable seeds and planting materials for
tomato reduce significantly leading to technological stagnation in tomato productivity. This
means that the productivity of tomato remained unchanged over the next period (16.79
ton/ha). To maintain tomato production in the next period similar to its baseline scenario, we
need to bring more land in tomato production. Considering land competition with other
activities, it is very difficult to increase land dedicated for tomato above its baseline growth.
With the growth of land similar to its baseline scenario, the production of tomato under
technological stagnation is presented in column 5 Table 3.9. The gap between production of
baseline scenario and production of constant productivity mean that Indonesia needs to bring
more tomatoes from other countries. As such, the Horticulture Law forces a trade deficit for
tomato to increase.
FDI Restrictions in the Indonesian Horticulture Sector: Implications of Horticulture Law No.13, 2010
31
Table 3-9 The impact of the Horticulture Law on import: tomato commodity
Year
Production
using
baseline
scenario
(ton)
Land (ha) Productivity
(ton/ha)
Production
using
constant
productivity
(ton)
Gap of
Production
(import,
ton)
(1) (2) (3) (4) (5) (6)
2017 1,172,803.02 64,450.05 16.79 1,082,055.59 90,747.43
2018 1,222,694.87 65,679.53 16.79 1,102,697.44 119,997.43
2019 1,274,709.15 66,932.46 16.79 1,123,733.07 150,976.09
2020 1,328,936.16 68,209.30 16.79 1,145,169.98 183,766.19
FDI Restrictions in the Indonesian Horticulture Sector: Implications of Horticulture Law No.13, 2010
32
Chapter 4 The Path Forward – Considerations for Policy and
Program Support
Domestic firms cannot yet match the proficiency of MNCs in the seed industry. They
do not have the access to the massive genetic resources (germplasm) available to MNCs, lack
the national distribution channels to market new varieties to farms across Indonesia, and lack
ability to build proper technical capacity in their workforce. While domestic industry can
someday be able to access the same kind of genetic resources and national distribution
strategy, it cannot do so efficiently today.
As Indonesia expels foreign investment, there is currently no cohesive or unified plan
to transition the domestic seed industry into its new role as market leader. While it is true that
the FDI restrictions will create opportunities for local producers to expand, it is not clear how
the fledgling industry can rise to the occasion and take advantage of the opportunity. Without
proper policy and programming to wean the industry from heavy reliance on foreign
investment and knowledge, the transition period may take far longer and be far costlier than
policy makers had ever anticipated.
In particular, the domestic industry needs policy and program support to overcome
three significant hurdles in development:
(1) Access to genetic resources
(2) Development of national distribution platform
(3) Human resource development
Genetic Resources
Success in the seed industry is primarily driven by the ability to generate and protect
intellectual property in the form of germplasm. In the 1970s, the global seed industry was a
network of thousands of small household enterprises, but now the it is dominated by a
handful of agrochemical firms that invested in the development of vast collections of
proprietary genetic resources used to breed new valuable traits faster and cheaper than their
competitors. There is a large cost advantage for larger firms in using existing genetic
resources that small firms simply cannot access, and it will take decades of sustained
investment to develop equivalent resources for a newly created firm. Such investment is not
feasible for small to medium sized firms.
The use of genetic resources, however, is quite different between MNC and small firms.
While large firms tend to focus their R&D investments into developing innovations that can
FDI Restrictions in the Indonesian Horticulture Sector: Implications of Horticulture Law No.13, 2010
33
be applied globally, smaller firms tend to focus on adaptation and localization of existing
varieties to the surrounding farming systems (local agro-climactic, reduced chemical use). In
light of this, the FDI restriction may impact the seed industry in the following way:
(1) In the short-run, small and medium seed companies can make large strides in
improving publically available varieties by creating localized variants that fit with
Indonesia’s farming systems.
(2) However, FDI restrictions have led to the exit of some firms and restriction to
access key varieties
(3) FDI restrictions also reduces Indonesia’s role in setting the R&D agenda of MNCs.
Considering the fact that Indonesia is the largest market in SE Asia, this may
significantly change the direction of R&D in ways that are not as beneficial.
There is a lack of policy that addresses how domestic firms will be able to work around
the lack of access to limited genetic resources and intellectual property. While short-run
gains are definitely possible, it is not clear how the potential long-run negative outcomes of
restricting access to valuable intellectual property can be redressed.
Distribution Platform
A less considered reason for the success of MNC seed companies in Indonesia is the
efficiency of the supply chains and effectiveness of their marketing strategies. These large
companies have spent decades building a nationwide brand and a network of distributors,
nurseries, and farmers who demand their products. Even if a smaller company develops a
variety that is superior in every way, it is unlikely that they can capture more than a localized
market without a distribution platform to market product to end-users.
A typical marketing model for a large company often consists of demonstration plots,
dissemination of trial seeds, extension services to lead farmers and nurseries, and long-
standing trade relationships with input retail stores. For domestic industry to successfully
transition, they will need to build their own marketing platforms that can disseminate seeds in
an equally efficient way. Policy and programming support is needed to build this capacity as
the capacity is not within the domain of expertise of smaller firms that tend to focus on the
seed propagation side of the enterprise.
Human Resource Development
Another key constraint is the ability of domestic firms to build capacity in their
workforce. Currently, even large MNCs rely on international hires to fill technical roles or
FDI Restrictions in the Indonesian Horticulture Sector: Implications of Horticulture Law No.13, 2010
34
send Indonesian staff to train abroad to build the technical skills necessary for their jobs. FDI
restrictions that cause certain firms to exit also means the ending of important technology
spillover that help domestic industry.
As an example of key spillover, the large domestic seed companies in Indonesia were
all started by former employees of MNCs who used their acquired expertise to develop a
viable niche business. This means that MNCs are providing a significant amount of
knowledge spillover and are a major driver in the development of the domestic industry itself.
If the enforcement of FDI restrictions causes more firms to withdraw from Indonesia or
reduce their operations in Indonesia, it may have large negative unforeseen consequences on
the future development of the domestic industry. While the magnitude of the negative effect
is speculative, the direction of change in technical capacity will surely be negative. Any
decline in technical capacity in an industry heavily reliant on the acquisition and application
of new technologies should be met with aggressive policy to mitigate and compensate.
However, this is not apparent in the dialogue and rhetoric of the policy makers that pushed
forth this law.
To support domestic industry, there must be improvements in the capability to train the
seed industry work force. This may involve an expanded role for the ministry of agriculture
and agricultural universities to work closely with domestic seed industry to identify training
needs and designing programs to fill the void.

FDI Restrictions in the Indonesian Horticulture Sector: Implications of Horticulture Law No.13, 2010
35
References
Ayana, A., Afari-Sefa, V., Emana, B., Dinssa, F.F., Balemi, T., Temesgen, M., 2014.
Analysis of Vegetable Seed Systems and Implications for Vegetable Development in
the Humid Tropics of Ethiopia, International Journal of Agriculture and Forestry, vol.
4 no. 4, pp. 325-337.
Derwisch, S., Kopainsky, B. and Henson-Apollonio, V., 2010. Foreign Direct Investment,
Spillovers and the Impact of Intellectual Property Rights in the Seed Sector.
Proceedings in Food System Dynamics, pp.115-136.
Directorate General of Horticulture, Ministry of Agriculture, Republic of Indonesia. 2014
Report on Performance.
Directorate General of Horticulture, Ministry of Agriculture, Republic of Indonesia. 2016.
Production of Certified Chili Seed, Tomato Seed, and Certified Chili Seed, Tomato
Seed, and Certified Chili Seed, Tomato Seed, and Shallot Seed.
Federal Seed Certification & Registration Department. 2003. Chapter 1 Introduction to
Agriculture and Seed Industry Development in Pakistan . In: Federal Seed Industry
Development in Pakistan. Federal Seed Certification & Registration Department:
Pakistan. 1-16.
Howard, P.H., 2015. Intellectual property and consolidation in the seed industry. Crop
Science, 55(6), pp.2489-2495.
IFPRI 2016 Is the global seed industry Investing in smallholders?, retrieved 20 February
2017 from http://www.ifpri.org/blog/global-seed-industry-investing-smallholders
Kolady, D.E., Spielman, D.J. and Cavalieri, A., 2012. The impact of seed policy reforms and
intellectual property rights on crop productivity in India. Journal of Agricultural
Economics, 63(2), pp.361-384.
Manjunatha, B.L., Rao, D.U.M. and Dastagiri, M.B., 2013. Trends in seed production,
growth drivers and present market status of Indian seed industry: An analytical study.
Indian Journal of Agricultural Sciences, 83(3), pp.75-80.
MarketsandMarkets 2013 Fruit and Vegetable Seed Market — Global Trends & Forecast to
2018
Minot, N. and Ngigi, M., 2004. Are horticultural exports a replicable success story?:
evidence from Kenya and Côte d'Ivoire. Intl Food Policy Res Inst.
Mordor Intelligence. 2015. Global Seed Market (2016 - 2021), India.
Okech, T.C. and Njoroge, S., 2011. An Assessment of the Factors Influencing Foreign Direct
Investment Inflows in Kenya’s Horticultural Industry.
Oktaviani, R.; Puspitawati, E; Widyastutik, Amaliah, S. 2015. Evaluasi Kebijakan
Pembatasan Investasi Asing Pada Industri Hortikultura Indonesia. Asosiasi Perbenihan
Hortikultura (Hortindo) and International Trade Analysis dan Policy Studies (Itaps)
Fakultas Ekonomi dan Manajemen. Institut Pertanian Bogor.
Pambudi, A. 2012. Analisis Dampak Kebijakan Pembatasan Investasi Asing terhadap
Perkembangan dan Persaingan Pada Industri Benih Hortikultura Indonesia. Thesis.
Fakultas Ekonomi Program Magister Perencanaan Dan Kebijakan Publik, Universitas
Indonesia, Jakarta
Rafany, I. 2015. Seed Development Policy in Indonesia, retrieved on 11 Novermber 2016
from http://Ap.Fftc.Agnet.Org/Ap_Db.Php?Id=382
Rakotoarisoa, M.A., 2011. A contribution to the analyses of the effects of foreign agricultural
investment on the food sector and trade in Sub-Saharan Africa. FAO.
Sahara. 2012. The transformation of modern food retailers in Indonesia: opportunities and
challenges for small farmers. PhD thesis, The University of Adelaide, Australia.
FDI Restrictions in the Indonesian Horticulture Sector: Implications of Horticulture Law No.13, 2010
36
Sayaka, B. 2014. Industri Benih Nasional: Sumberdaya, Dukungan Pemerintah dan Regulasi.
Pusat Sosial Ekonomi dan Kebijakan Pertanian, Kementerian Pertanian, Bogor.
Schüpbach, J., 2015. Foreign Direct Investment in Agriculture: The Impact of Outgrower
Schemes and Large-Scale Farm Employment on Economic Well-Being in Zambia. vdf
Hochschulverlag AG.
Spielman, D.J., Kennedy, A.,2015. ‘Innovation, competition, and productivity growth:
Evidence on the impact of growth in Asia’s maize seed sector’. Paper presented at the
International Conference of Agricultural Economists, Milan 8-14 August 2015.
Tutwiler, A. 2016. Access to seeds - why seed companies need to bridge the gap to reach
smallholder farmers. Appropriate Technology, 43(2), 27-28.
Yun, M. & Lee, S. 2001. Impact of FDI on Competition: The Korean Experience . Korea
Institute for International Economic Policy.
Zhan, Y. 2014.Effects of foreign direct investment on China's seed industry. PhD thesis, City
University of Hong Kong
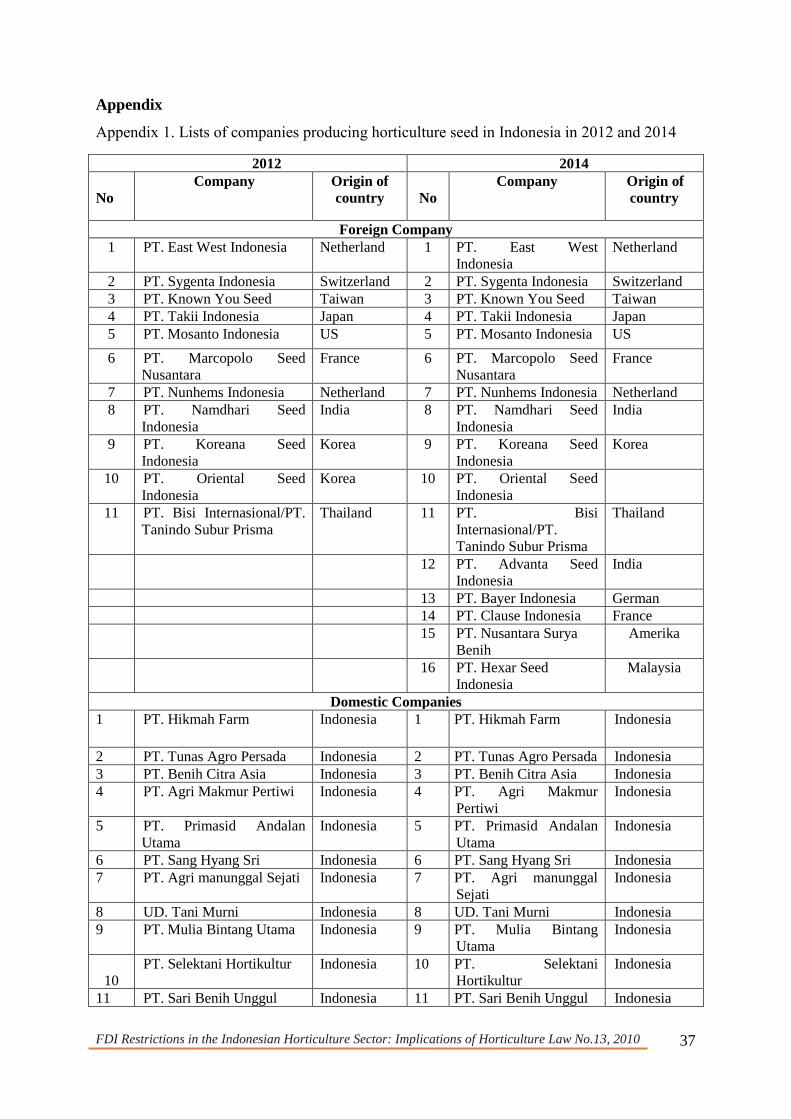
FDI Restrictions in the Indonesian Horticulture Sector: Implications of Horticulture Law No.13, 2010
37
Appendix
Appendix 1. Lists of companies producing horticulture seed in Indonesia in 2012 and 2014
2012 2014
N
No
Company Origin of
country
N
No
Company Origin of
country
Foreign Company
1 PT. East West Indonesia Netherland 1 PT. East West
Indonesia
Netherland
2 PT. Sygenta Indonesia Switzerland 2 PT. Sygenta Indonesia Switzerland
3 PT. Known You Seed Taiwan 3 PT. Known You Seed Taiwan
4 PT. Takii Indonesia Japan 4 PT. Takii Indonesia Japan
5 PT. Mosanto Indonesia US 5 PT. Mosanto Indonesia US
6 PT. Marcopolo Seed
Nusantara
France 6 PT. Marcopolo Seed
Nusantara
France
7 PT. Nunhems Indonesia Netherland 7 PT. Nunhems Indonesia Netherland
8 PT. Namdhari Seed
Indonesia
India 8 PT. Namdhari Seed
Indonesia
India
9 PT. Koreana Seed
Indonesia
Korea 9 PT. Koreana Seed
Indonesia
Korea
10 PT. Oriental Seed
Indonesia
Korea 10 PT. Oriental Seed
Indonesia
11 PT. Bisi Internasional/PT.
Tanindo Subur Prisma
Thailand 11 PT. Bisi
Internasional/PT.
Tanindo Subur Prisma
Thailand
12 PT. Advanta Seed
Indonesia
India
13 PT. Bayer Indonesia German
14 PT. Clause Indonesia France
15 PT. Nusantara Surya
Benih
Amerika
16 PT. Hexar Seed
Indonesia
Malaysia
Domestic Companies
1 PT. Hikmah Farm Indonesia 1 PT. Hikmah Farm Indonesia
2 PT. Tunas Agro Persada Indonesia 2 PT. Tunas Agro Persada Indonesia
3 PT. Benih Citra Asia Indonesia 3 PT. Benih Citra Asia Indonesia
4 PT. Agri Makmur Pertiwi Indonesia 4 PT. Agri Makmur
Pertiwi
Indonesia
5 PT. Primasid Andalan
Utama
Indonesia 5 PT. Primasid Andalan
Utama
Indonesia
6 PT. Sang Hyang Sri Indonesia 6 PT. Sang Hyang Sri Indonesia
7 PT. Agri manunggal Sejati Indonesia 7 PT. Agri manunggal
Sejati
Indonesia
8 UD. Tani Murni Indonesia 8 UD. Tani Murni Indonesia
9 PT. Mulia Bintang Utama Indonesia 9 PT. Mulia Bintang
Utama
Indonesia
10
PT. Selektani Hortikultur Indonesia 10 PT. Selektani
Hortikultur
Indonesia
11 PT. Sari Benih Unggul Indonesia 11 PT. Sari Benih Unggul Indonesia
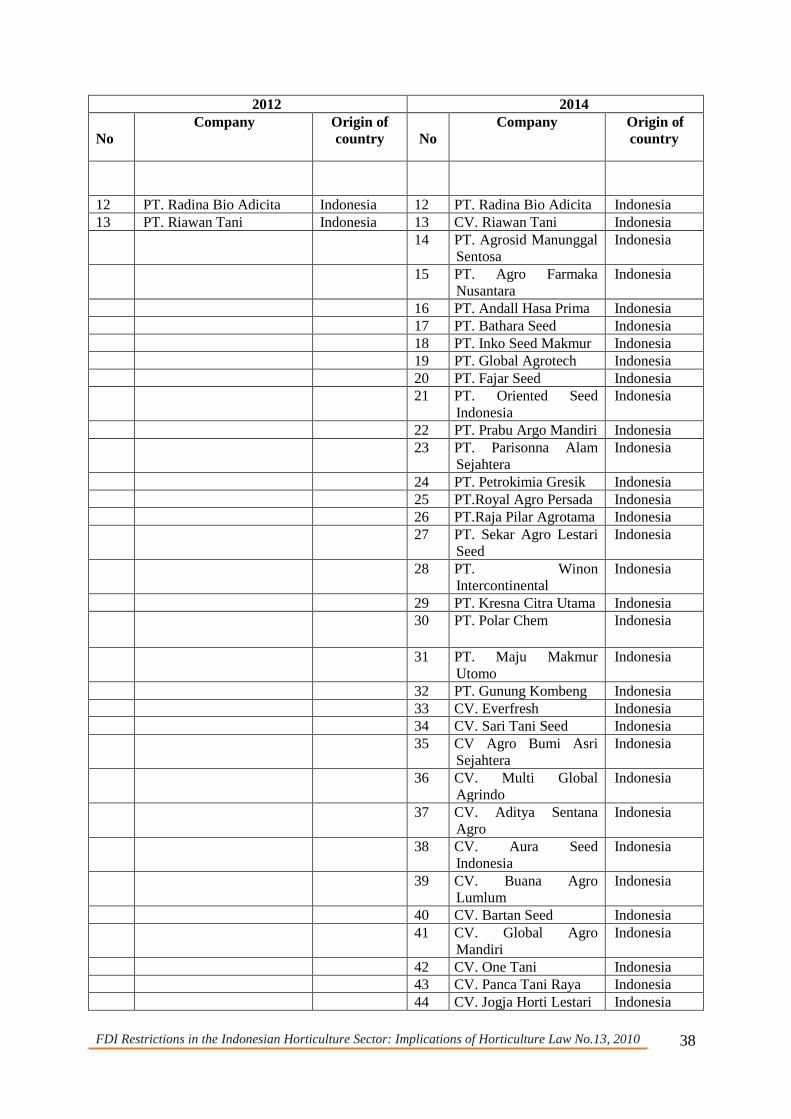
FDI Restrictions in the Indonesian Horticulture Sector: Implications of Horticulture Law No.13, 2010
38
2012 2014
N
No
Company Origin of
country
N
No
Company Origin of
country
12 PT. Radina Bio Adicita Indonesia 12 PT. Radina Bio Adicita Indonesia
13 PT. Riawan Tani Indonesia 13 CV. Riawan Tani Indonesia
14 PT. Agrosid Manunggal
Sentosa
Indonesia
15 PT. Agro Farmaka
Nusantara
Indonesia
16 PT. Andall Hasa Prima Indonesia
17 PT. Bathara Seed Indonesia
18 PT. Inko Seed Makmur Indonesia
19 PT. Global Agrotech Indonesia
20 PT. Fajar Seed Indonesia
21 PT. Oriented Seed
Indonesia
Indonesia
22 PT. Prabu Argo Mandiri Indonesia
23 PT. Parisonna Alam
Sejahtera
Indonesia
24 PT. Petrokimia Gresik Indonesia
25 PT.Royal Agro Persada Indonesia
26 PT.Raja Pilar Agrotama Indonesia
27 PT. Sekar Agro Lestari
Seed
Indonesia
28 PT. Winon
Intercontinental
Indonesia
29 PT. Kresna Citra Utama Indonesia
30 PT. Polar Chem Indonesia
31 PT. Maju Makmur
Utomo
Indonesia
32 PT. Gunung Kombeng Indonesia
33 CV. Everfresh Indonesia
34 CV. Sari Tani Seed Indonesia
35 CV Agro Bumi Asri
Sejahtera
Indonesia
36 CV. Multi Global
Agrindo
Indonesia
37 CV. Aditya Sentana
Agro
Indonesia
38 CV. Aura Seed
Indonesia
Indonesia
39 CV. Buana Agro
Lumlum
Indonesia
40 CV. Bartan Seed Indonesia
41 CV. Global Agro
Mandiri
Indonesia
42 CV. One Tani Indonesia
43 CV. Panca Tani Raya Indonesia
44 CV. Jogja Horti Lestari Indonesia
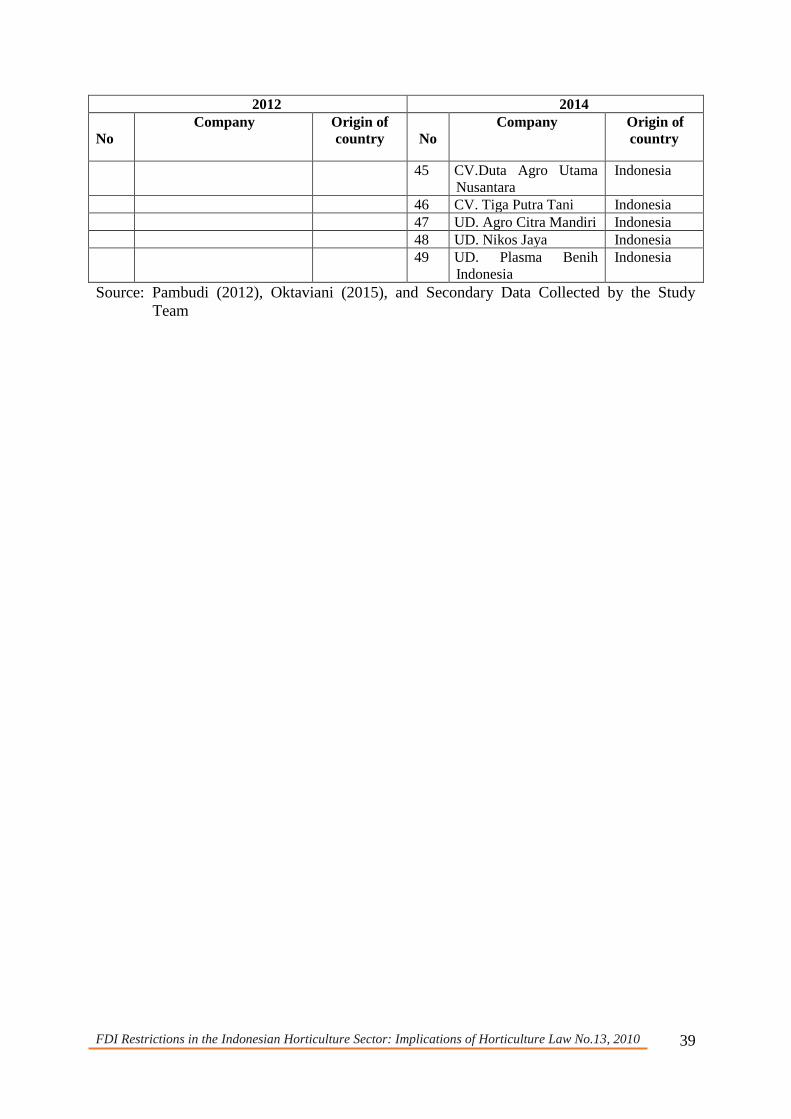
FDI Restrictions in the Indonesian Horticulture Sector: Implications of Horticulture Law No.13, 2010
39
2012 2014
N
No
Company Origin of
country
N
No
Company Origin of
country
45 CV.Duta Agro Utama
Nusantara
Indonesia
46 CV. Tiga Putra Tani Indonesia
47 UD. Agro Citra Mandiri Indonesia
48 UD. Nikos Jaya Indonesia
49 UD. Plasma Benih
Indonesia
Indonesia
Source: Pambudi (2012), Oktaviani (2015), and Secondary Data Collected by the Study
Team