Fatigue of Structures and Materials in the 20th Century and ...
52
1 Fatigue of Structures and Materials in the 20 th Century and the State of the Art J Schijve, Delft University of Technology, The Netherlands Abstract: The paper surveys the historical development of scientific and engineering knowledge about fatigue of materials and structures in the 20 th century. This includes fatigue as a material phenomenon, prediction models for fatigue properties of structures, and load spectra. The review leads to an inventory of the present state of the art. Some final remarks follow in an epilogue. Contents 1 Introduction 2 Fatigue of Materials as a Physical Phenomenon 2.1 Fatigue crack initiation 2.2 Fractographic observations 2.3 More about fatigue crack growth 3 The S-N Curve and the Fatigue Limit 3.1 Aspects of the fatigue limit 3.2 The fatigue limit 4 Predictions and Fatigue Damage 4.1 The engineering need for predictions 4.2 Predictions based on the similarity of conditions (CA-loading) 4.3 Predictions based on fatigue damage accumulation (VA-loading) 5 Load Spectra 6 Evaluation of the Present State of the Art 6.1 Prediction of the fatigue limit 6.2 Prediction of the fatigue life under CA loading 6.3 Prediction of the fatigue strength of joints 6.4 Life predictions for VA loading 6.5 Some smart ideas 7 Epilogue References Figures Symbols CA constant-amplitude loading VA variable-amplitude loading S f fatigue limit OL overload
-
Upload
khangminh22 -
Category
Documents
-
view
2 -
download
0
Transcript of Fatigue of Structures and Materials in the 20th Century and ...
1
Fatigue of Structures and Materials in the 20th Century
and the State of the ArtJ Schijve, Delft University of Technology, The Netherlands
Abstract: The paper surveys the historical development of scientific and engineeringknowledge about fatigue of materials and structures in the 20th century. This includesfatigue as a material phenomenon, prediction models for fatigue properties ofstructures, and load spectra. The review leads to an inventory of the present state ofthe art. Some final remarks follow in an epilogue.
Contents1 Introduction2 Fatigue of Materials as a Physical Phenomenon
2.1 Fatigue crack initiation2.2 Fractographic observations2.3 More about fatigue crack growth
3 The S-N Curve and the Fatigue Limit3.1 Aspects of the fatigue limit3.2 The fatigue limit
4 Predictions and Fatigue Damage4.1 The engineering need for predictions4.2 Predictions based on the similarity of conditions (CA-loading)4.3 Predictions based on fatigue damage accumulation (VA-loading)
5 Load Spectra6 Evaluation of the Present State of the Art
6.1 Prediction of the fatigue limit6.2 Prediction of the fatigue life under CA loading6.3 Prediction of the fatigue strength of joints6.4 Life predictions for VA loading6.5 Some smart ideas
7 EpilogueReferences Figures
SymbolsCA constant-amplitude loadingVA variable-amplitude loading
Sf fatigue limitOL overload
2
1 INTRODUCTION
An evaluation of fatigue of structures and materials in the 20th century raisesthe question what happened in the 19th century? The answer is that fatigue ofstructures became evident as a by-product of the industrial revolution in the 19th
century. In some more detail, it was recognized as a fracture phenomenonoccurring after a large numbers of load cycles where a single load of the samemagnitude would not do any harm. Fatigue failures were frequently associatedwith steam engines, locomotives and pumps. In the 19th century, it wasconsidered to be mysterious that a fatigue fracture did not show visible plasticdeformation. Systematic fatigue tests were done at a few laboratories, notablyby August Wöhler. It was recognized that small radii in the geometry of thestructure should be avoided. Fatigue was considered to be an engineeringproblem, but the fatigue phenomenon occurring in the material was still largelyin the dark. Some people thought that fatigue implied a change from a fibrousto a crystalline, brittle structure in view of the absence of visible plasticdeformation.
A fundamental step regarding fatigue as a material problem was made inthe beginning of the 20th century by Ewing and Humfrey in 1903 [1]. Theycarried out a microscopic investigation which showed that fatigue crack nucleistart as microcracks in slip bands. Much more evidence about fatigue as amaterial phenomenon was going to follow in the 20th century.
Fatigue as a technical problem became evident around the middle of the19th century. About 100 years later, in the middle of the 20th century, thedevelopment of fatigue problems were reviewed in two historical papers byPeterson in 1950 [2] and Timoshenko in 1954 [3]. Both authors were alreadywell-known for important publications. Peterson reviewed the discussion onfatigue problems during meetings of the Institution of Mechanical Engineersat Birmingham just before 1850. He also mentioned historical ideas aboutfatigue as a material phenomenon and the microscopic studies carried out byGough and co-workers and others around 1930. Crack initiation occurred inslip bands and (quoting Peterson) “one or more of these minute sources startsto spread and this develops into a gross crack which, in general, meandersthrough the grains in zig-zag fashion in an average direction normal to thedirection of tensile stresses. It should be remembered, however, that althoughthe fractured surface generally follows a normal stress field, the microscopicsource of failure is due to shear”. Peterson also refers to the concept of the“endurance limit“, as already defined by Wöhler. In this paper the endurancelimit is generally referred to as the fatigue limit which is an important material
3
property for various engineering predictions on fatigue.Timoshenko in his review discussed the significance of stress
distributions and emphasized stress concentrations around notches. Accordingto Timoshenko, the importance was recognized by design engineers around theend of the 19th century, and the knowledge was further refined in the beginningof the 20th century. Timoshenko referred to the significance of theoretical stressanalysis employing complex variables (Kolosov, Inglis, Mushkelisvili, Savinand others). But he considered experimental studies on stress distributions andstress concentrations to be of prime importance. He mentioned severaldevelopments on strain measurements, basically by using mechanicaldisplacement meters, strain gauges and photo-elastic models. A famous bookpublished in 1950 was Handbook of Experimental Stress Analysis by Hetényi[4]. Timoshenko thought that great progress had been made. He also raised thequestion “how does a high, localized stress weaken a machine part in service?This important question can be satisfactorily answered only on the basis of anexperimental investigation”.
The above résumé of developments before 1950 now seems to be “oldstuff”, primarily because substantial improvements of our present knowledgeabout fatigue occurred in the second half of the 20th century. The improvementsbecame possible due to the development of essentially new experimentalfacilities, computers and numerical stress analysis. However, some basicconcepts remained, such as that fatigue in metallic materials is due to cyclicslip, and stress concentrations contribute to a reduced fatigue endurance. Oneother characteristic issue of a more philosophical nature also remained, thequestion of whether fatigue is a material problem or an engineering problem,or both in some integrated way? The present paper primarily coversdevelopments in the second half of the previous century. It is not the purposeto summarize all noteworthy happenings in a historical sequence, also becauseinformative reviews about the history of “fatigue” have been presented in thelast decades of the 20th century, e.g. by Mann [5], Schütz [6], Smith [7] andothers. Moreover, collections of significant publications have been compiled[8,9]. The emphasis in this paper will be on how the present knowledge wasacquired. The development of fatigue problems of structures and materials inthe 20th century was fundamentally affected by milestone happenings,important discoveries, and various concepts of understanding fatiguephenomena. Furthermore, the approach to solving fatigue problems and thephilosophy on the significance of fatigue problems is of great interest.
The efforts spent on fatigue investigations in the 20th century is tremendous,as illustrated by numerous publications. John Mann [10] published books with
4
references to fatigue. Later he continued this work to arrive at about 100 000references in the 20th century compared to less than 100 in the 19th century. Thelarge number of publications raises an obvious question. Is the problem sodifficult and complex, or were we not clever enough to eliminate fatigueproblems of our industrial products? Various conferences on fatigue ofstructures and materials are already planned for the forthcoming years of the21st century implying that the fatigue problem is apparently not yet fully solved.If the problem still exists after 100 years in the previous century, there issomething to be explained.
In a recent textbook [11] the author has used the picture shown in Fig.1 tosurvey prediction problems associated with fatigue properties of structures. Thepredictions are the output of a number of procedures and Figure 1 presents thescenario of the various aspects involved. The input problems occur in threecategories: (i) design work, (ii) basic information used for the predictions, and(iii) fatigue load spectra to which the structure is subjected. Each of thecategories contains a number of separate problems, which again can besubdivided into specific aspects, e.g. “joints” cover welded joints, bolted joints,riveted joints, adhesively bonded joints. Figure 1 illustrates that the fullproblem can be very complex depending on the structural design, type ofmaterial, production variables, load spectra and environment. Predictionmodels are presented in the literature and software is commercially available.The prediction of the fatigue performance of a structure is the result of manysteps of the procedures adopted, and in general a number of plausibleassumptions is involved. It implies that the accuracy of the final result can belimited, the more so if statistical variables also have to be considered. Thereliability of the prediction should be carefully evaluated, which requires aprofound judgement, and also so-called engineering judgement, experience andintuition. It has persistently been emphasized in [11] that physicalunderstanding of the fatigue phenomena is essential for the evaluation offatigue predictions. A designer can not simply rely on the validity of equations.Behind an equation is a physical model and the question is whether the modelis physically relevant for the problem considered. This implies that each topicin Fig.1 should also be a relevant subject for research, and the number ofvariables which can affect the fatigue behaviour of a structure is large. Withoutsome satisfactory understanding of aspects involved, predictions on fatiguebecome inconceivable. In this paper, it will be summarized how theunderstanding in the previous century has been improved, sometimes as aqualitative concept, and in other cases also quantitatively. It should already be
5
said here that qualitative understanding can be very important, even if a strictlyquantitative analysis is not yet possible. The major topics discussed in thefollowing sections are associated with: (i) material fatigue as a physicalphenomenon (Section 2), (ii) the S-N curve and the fatigue limit (Section 3),(iii) prediction of fatigue properties (Section 4), and (iv) fatigue load spectrain service (Section 5). These topics are first discussed to see the developmentof the knowledge about fatigue of structures and materials in the 20th century.Afterwards, the text covers an evaluation of the present understanding also inrelation to the engineering significance (Section 6). The paper is concludedwith some general remarks about the present state of the art and expectationsfor the 21st century (Section 7).
2 FATIGUE OF MATERIALS AS A PHYSICAL PHENOMENON
2.1 Fatigue Crack InitiationAs said before, fatigue damage in steel in the 19th century was associated witha mysterious crystallizing of a fibrous structure. It was not yet defined inphysical terms. In the first half of the 20th century, cyclic slip was consideredto be essential for microcrack initiation. Cracks, even microcracks, implydecohesion in the material and should thus be considered to be damage. But iscyclic slip also damage, and what about cyclic strain hardening in slip bands?In the thirties, Gough [12] postulated that fatigue crack initiation is aconsequence of exceeding the limit of local strain hardening. The idea wasadopted by Orowan in 1939 [13] who argued that the local exhaustion ofductility leads to a localized increase of the stress and ultimately to cracking.This concept was used in 1953 by Head [14] in a model for obtaining anequation for fatigue crack growth.
An important question about the ductility exhaustion theory is how crackingoccurs on an atomic level. Stroh [15] analyzed the stress field around a piled-upgroup of dislocations. According to him, the local stress can becomesufficiently high to cause local cleavage. However, it was difficult to see whyhigh local stresses can not be relaxed near the material surface by plasticdeformation in a basically ductile material. The ductility exhausting theory didnot become a credible crack initiation model, the more so since the detectionof striations in the late fifties [16,17] indicated that crack extension occurredin a cycle-by-cycle sequence, and not in jumps after intervals of cycles requiredfor an increasing strain-hardening mechanism.
In the fifties, the knowledge of dislocations had been well developed. Cyclic
(*) Microcrack initiation in certain alloys can also start at inclusions close to thesurface, and subsurface due to residual stress distributions.
6
slip was associated with cyclic dislocation movements. It is not surprising thatpeople tried to explain the initiation and crack growth in terms of creatingcrevices in the material or intrusions into the material surface as a result ofsome specific dislocation mobilities. Interesting dislocation models wereproposed in the fifties, noteworthy by Cottrell and Hull, based on intersectingslip systems [18], and by Mott, based on generation of vacancies [19].Microscopic observations were made to see whether the proposed models forcrack initiation and crack growth were in agreement with a model. Severalpapers of historical interest were collected in 1957 [20] and 1959 [21]respectively. The microscopic work of Forsyth [22] on extrusions andintrusions in slip bands should be mentioned, see Fig.2. Similar figures havebeen used by several authors to discuss basic aspects of the fatigue crackinitiation process. Three fundamental aspects are: the significance of the freematerial surface, the irreversibility of cyclic slip, and environmental effects onmicrocrack initiation.
Microcracks usually start at the free surface of the material(*), also inunnotched specimens with a nominally homogeneous stress distribution testedunder cyclic tension. The restraint on cyclic slip is lower than inside thematerial because of the free surface at one side of the surface material.Furthermore, microcracks start more easily in slip bands with slipdisplacements normal to the material surface [23] which seems to be logicalwhen looking at Fig.2. It still remains to be questioned why cyclic slip is notreversible. Already in the fifties, it was understood that there are two reasonsfor non-reversibility. One argument is that (cyclic) strain hardening occurswhich implies that not all dislocations return to their original position. Anotherimportant aspect is the interaction with the environment. A slip step at the freesurface implies that fresh material is exposed to the environment. In a non-inertenvironment, most technical materials are rapidly covered with a thin oxidelayer, or some chemisorption of foreign atoms of the environment occurs. Anexact reversibility of slip is then prevented. A valid and important conclusionis that fatigue crack initiation is a surface phenomenon.
In the fifties, microscopical investigations were still made with the opticalmicroscope. It implies that crack nucleation is observed on the surface whereit indeed occurs. As soon as cracks are growing into the material away from thefree surface, only the ends of the crack front can be observed at that freesurface. It is questionable whether that information is representative for the
7
growth process inside the material, a problem sometimes overlooked.Microscopic observations on crack growth inside the material require that crosssections of a specimen are made. Several investigations employingsectioning were made in the fifties and before. These showed that in mostmaterials fatigue cracks are growing transcrystalline. Although the fatiguefractures looked rather flat as viewed by the unaided eye, it turned out that thecrack growth path under the microscope could be rather irregular depending onthe type of material. In materials with a low stacking fault energy (e.g., Cu- andNi-alloys), cross slip is difficult and as a result cyclic slip bands are narrow andstraight. Crack growth on a micro scale occurs in straight segments along thesebands. In materials with a high stacking fault energy (e.g. Al-alloys) cross slipis easy. Moreover, in the Al crystal lattice there are many slip systems whichcan easily be activated. As a consequence, slip lines are wider and can be ratherwavy. Crack growth on a micro scale does not suggest that it occurs alongcrystallographic planes. As a result, fatigue on a micro scale can besignificantly different for different materials. The behaviour is structuresensitive, depending on the crystal structure (fcc, bcc, or hexagonal.), elasticanisotropy of the crystalline structure, grain size, texture, and dislocationobstacles (e.g. pearlite bands in steel, precipitated zones in Al-alloys, twinsetc.). An extensive survey of the material fatigue phenomenon was recentlypresented in a book by Suresh [24].
2.2 Fractographic ObservationsThe description of the fatigue mechanism in different materials was studied inthe fifties and in the following decades. A significant experimental milestonewas the introduction of the electron microscope (EM), originally thetransmission electron microscope (TEM) in the fifties, and later the scanningelectron microscope (SEM) in the seventies. Microscopic investigations in theTEM are more laborious than in the SEM because either a replica of thefracture surface must be made, or a thin foil of the material. The thin foiltechnique is destructive and does not show the fatigue fracture surface, butinformation on the material structure can be obtained, such as forming ofsubgrains under cyclic loading. The thin foil technique requires a good deal ofexperimental expertise.
Investigations of fatigue fracture surfaces in the SEM are now a rather wellstandardized experimental option, which can indicate where the fatigue fracture
(*) Unfortunately, fractographic observations are not always made and reported inpublications on fatigue tests although it is essential information of the test results.
8
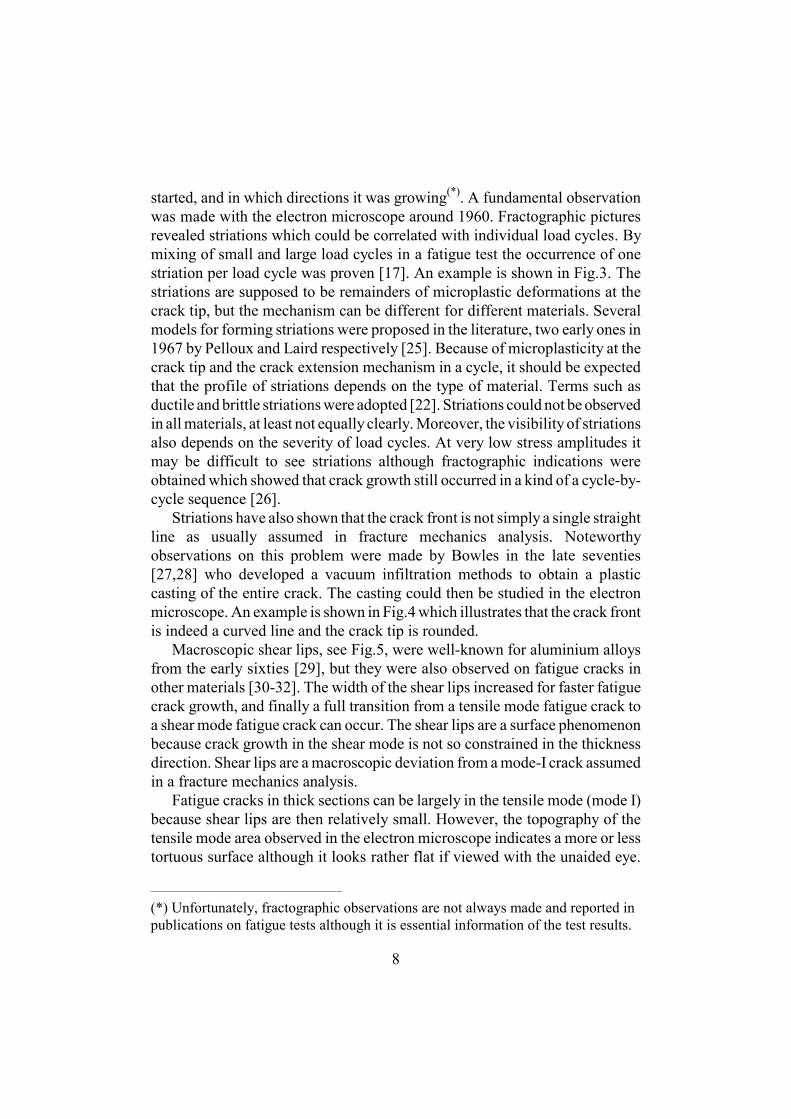
started, and in which directions it was growing(*). A fundamental observationwas made with the electron microscope around 1960. Fractographic picturesrevealed striations which could be correlated with individual load cycles. Bymixing of small and large load cycles in a fatigue test the occurrence of onestriation per load cycle was proven [17]. An example is shown in Fig.3. Thestriations are supposed to be remainders of microplastic deformations at thecrack tip, but the mechanism can be different for different materials. Severalmodels for forming striations were proposed in the literature, two early ones in1967 by Pelloux and Laird respectively [25]. Because of microplasticity at thecrack tip and the crack extension mechanism in a cycle, it should be expectedthat the profile of striations depends on the type of material. Terms such asductile and brittle striations were adopted [22]. Striations could not be observedin all materials, at least not equally clearly. Moreover, the visibility of striationsalso depends on the severity of load cycles. At very low stress amplitudes itmay be difficult to see striations although fractographic indications wereobtained which showed that crack growth still occurred in a kind of a cycle-by-cycle sequence [26].
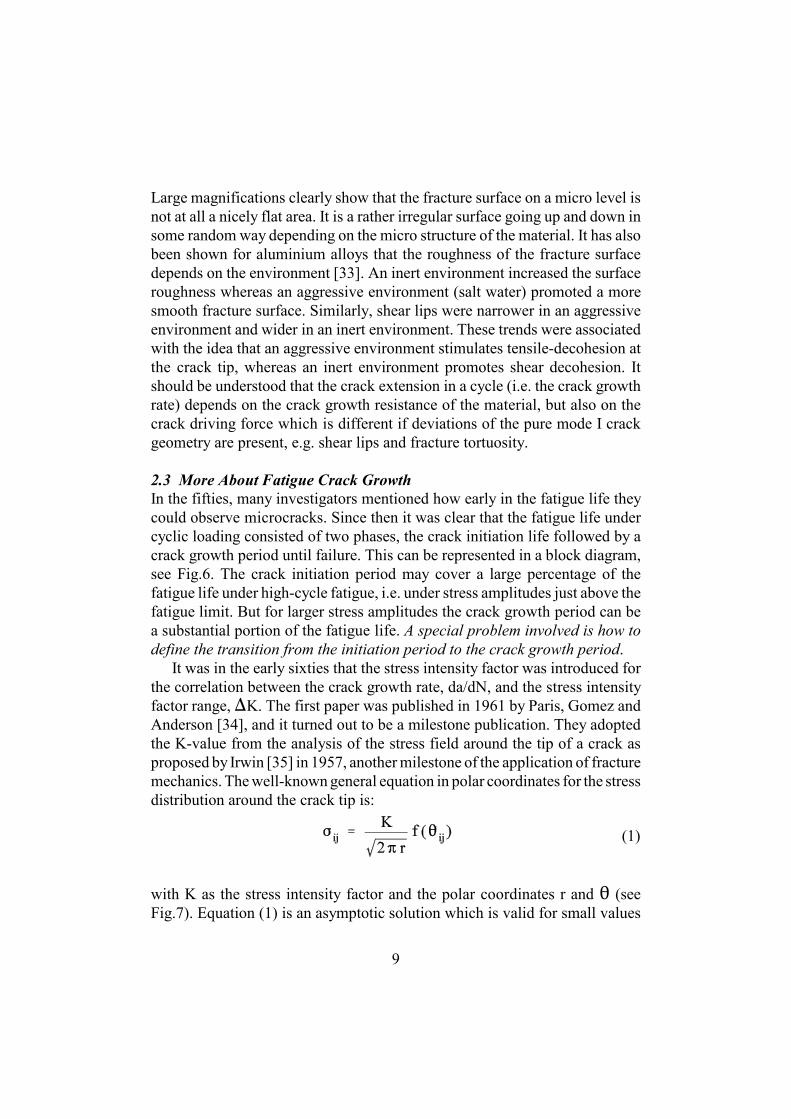
Striations have also shown that the crack front is not simply a single straightline as usually assumed in fracture mechanics analysis. Noteworthyobservations on this problem were made by Bowles in the late seventies[27,28] who developed a vacuum infiltration methods to obtain a plasticcasting of the entire crack. The casting could then be studied in the electronmicroscope. An example is shown in Fig.4 which illustrates that the crack frontis indeed a curved line and the crack tip is rounded.
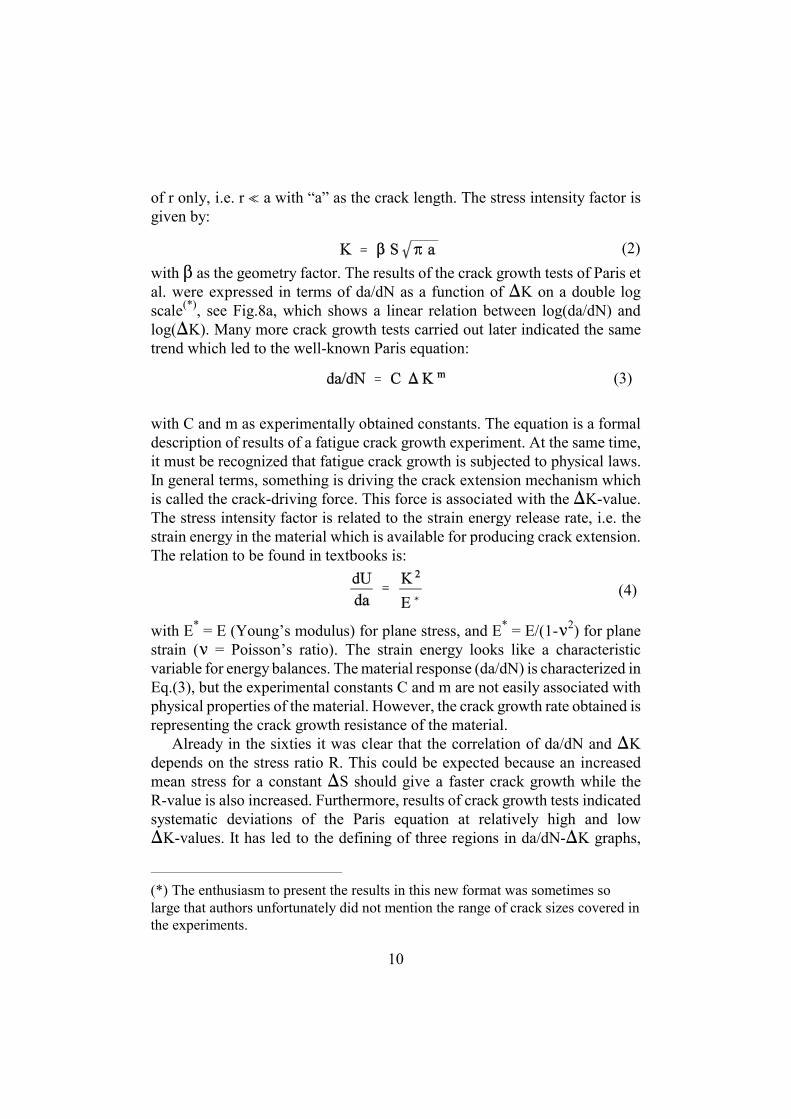
Macroscopic shear lips, see Fig.5, were well-known for aluminium alloysfrom the early sixties [29], but they were also observed on fatigue cracks inother materials [30-32]. The width of the shear lips increased for faster fatiguecrack growth, and finally a full transition from a tensile mode fatigue crack toa shear mode fatigue crack can occur. The shear lips are a surface phenomenonbecause crack growth in the shear mode is not so constrained in the thicknessdirection. Shear lips are a macroscopic deviation from a mode-I crack assumedin a fracture mechanics analysis.
Fatigue cracks in thick sections can be largely in the tensile mode (mode I)because shear lips are then relatively small. However, the topography of thetensile mode area observed in the electron microscope indicates a more or lesstortuous surface although it looks rather flat if viewed with the unaided eye.
9
(1)
Large magnifications clearly show that the fracture surface on a micro level isnot at all a nicely flat area. It is a rather irregular surface going up and down insome random way depending on the micro structure of the material. It has alsobeen shown for aluminium alloys that the roughness of the fracture surfacedepends on the environment [33]. An inert environment increased the surfaceroughness whereas an aggressive environment (salt water) promoted a moresmooth fracture surface. Similarly, shear lips were narrower in an aggressiveenvironment and wider in an inert environment. These trends were associatedwith the idea that an aggressive environment stimulates tensile-decohesion atthe crack tip, whereas an inert environment promotes shear decohesion. Itshould be understood that the crack extension in a cycle (i.e. the crack growthrate) depends on the crack growth resistance of the material, but also on thecrack driving force which is different if deviations of the pure mode I crackgeometry are present, e.g. shear lips and fracture tortuosity.
2.3 More About Fatigue Crack GrowthIn the fifties, many investigators mentioned how early in the fatigue life theycould observe microcracks. Since then it was clear that the fatigue life undercyclic loading consisted of two phases, the crack initiation life followed by acrack growth period until failure. This can be represented in a block diagram,see Fig.6. The crack initiation period may cover a large percentage of thefatigue life under high-cycle fatigue, i.e. under stress amplitudes just above thefatigue limit. But for larger stress amplitudes the crack growth period can bea substantial portion of the fatigue life. A special problem involved is how todefine the transition from the initiation period to the crack growth period.
It was in the early sixties that the stress intensity factor was introduced forthe correlation between the crack growth rate, da/dN, and the stress intensityfactor range, �K. The first paper was published in 1961 by Paris, Gomez andAnderson [34], and it turned out to be a milestone publication. They adoptedthe K-value from the analysis of the stress field around the tip of a crack asproposed by Irwin [35] in 1957, another milestone of the application of fracturemechanics. The well-known general equation in polar coordinates for the stressdistribution around the crack tip is:
with K as the stress intensity factor and the polar coordinates r and � (seeFig.7). Equation (1) is an asymptotic solution which is valid for small values
(*) The enthusiasm to present the results in this new format was sometimes solarge that authors unfortunately did not mention the range of crack sizes covered inthe experiments.
10
(2)
(3)
(4)
of r only, i.e. r � a with “a” as the crack length. The stress intensity factor isgiven by:
with � as the geometry factor. The results of the crack growth tests of Paris etal. were expressed in terms of da/dN as a function of �K on a double logscale(*), see Fig.8a, which shows a linear relation between log(da/dN) andlog(�K). Many more crack growth tests carried out later indicated the sametrend which led to the well-known Paris equation:
with C and m as experimentally obtained constants. The equation is a formaldescription of results of a fatigue crack growth experiment. At the same time,it must be recognized that fatigue crack growth is subjected to physical laws.In general terms, something is driving the crack extension mechanism whichis called the crack-driving force. This force is associated with the �K-value.The stress intensity factor is related to the strain energy release rate, i.e. thestrain energy in the material which is available for producing crack extension.The relation to be found in textbooks is:
with E* = E (Young’s modulus) for plane stress, and E* = E/(1-�2) for planestrain (� = Poisson’s ratio). The strain energy looks like a characteristicvariable for energy balances. The material response (da/dN) is characterized inEq.(3), but the experimental constants C and m are not easily associated withphysical properties of the material. However, the crack growth rate obtained isrepresenting the crack growth resistance of the material.
Already in the sixties it was clear that the correlation of da/dN and �Kdepends on the stress ratio R. This could be expected because an increasedmean stress for a constant �S should give a faster crack growth while theR-value is also increased. Furthermore, results of crack growth tests indicatedsystematic deviations of the Paris equation at relatively high and low�K-values. It has led to the defining of three regions in da/dN-�K graphs,
11
regions I, II and III respectively, see Fig.8b. Obvious questions are associatedwith the vertical asymptotes at the lower �K boundary of region I and theupper �K boundary of region III. The latter boundary appears to be logicalbecause if Kmax exceeds the fracture toughness (either Kc or KIc) a quasi-staticfailure will occur and fatigue crack growth is no longer possible. However,from the point of view of fracture mechanics, the occurrence of a lowerboundary in region I is not so obvious. As long as a K-value can be defined forthe tip of a crack, a singular stress field should be present and micro-plasticityat the tip of the crack should occur. So, why should the crack not grow anymore; for which physical reason should there be a threshold �K-value (�Kth).
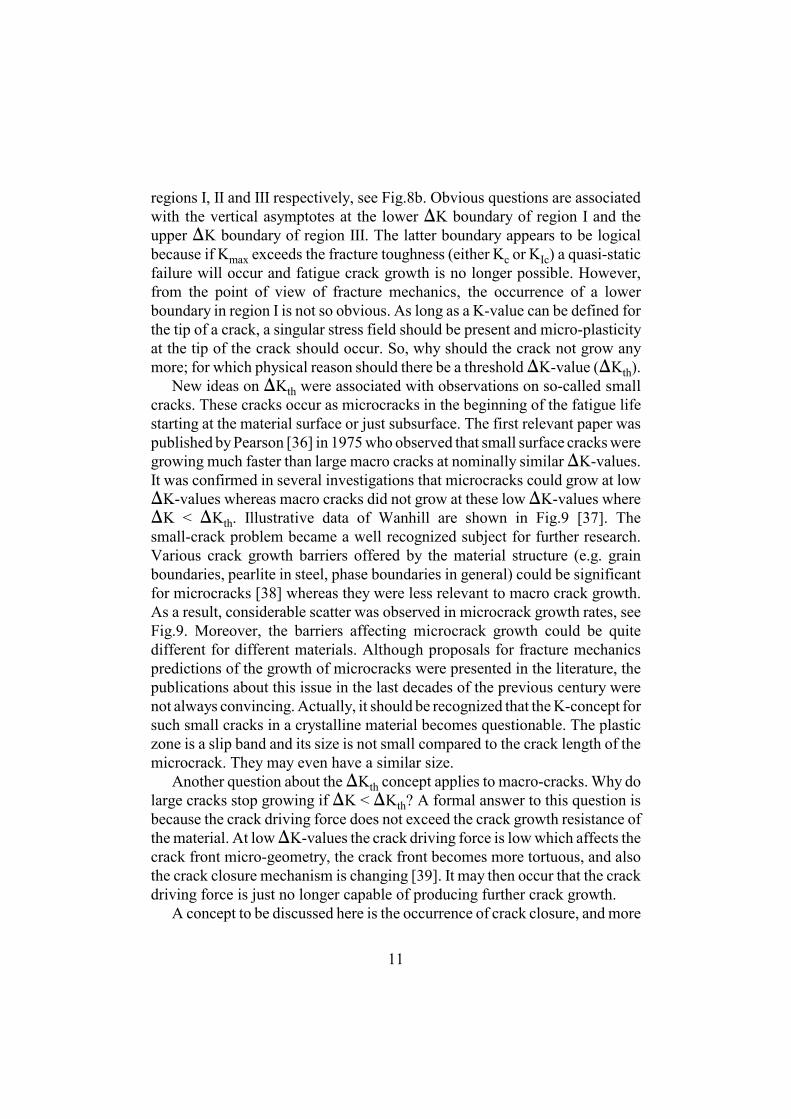
New ideas on �Kth were associated with observations on so-called smallcracks. These cracks occur as microcracks in the beginning of the fatigue lifestarting at the material surface or just subsurface. The first relevant paper waspublished by Pearson [36] in 1975 who observed that small surface cracks weregrowing much faster than large macro cracks at nominally similar �K-values.It was confirmed in several investigations that microcracks could grow at low�K-values whereas macro cracks did not grow at these low �K-values where�K < �Kth. Illustrative data of Wanhill are shown in Fig.9 [37]. Thesmall-crack problem became a well recognized subject for further research.Various crack growth barriers offered by the material structure (e.g. grainboundaries, pearlite in steel, phase boundaries in general) could be significantfor microcracks [38] whereas they were less relevant to macro crack growth.As a result, considerable scatter was observed in microcrack growth rates, seeFig.9. Moreover, the barriers affecting microcrack growth could be quitedifferent for different materials. Although proposals for fracture mechanicspredictions of the growth of microcracks were presented in the literature, thepublications about this issue in the last decades of the previous century werenot always convincing. Actually, it should be recognized that the K-concept forsuch small cracks in a crystalline material becomes questionable. The plasticzone is a slip band and its size is not small compared to the crack length of themicrocrack. They may even have a similar size.
Another question about the �Kth concept applies to macro-cracks. Why dolarge cracks stop growing if �K < �Kth? A formal answer to this question isbecause the crack driving force does not exceed the crack growth resistance ofthe material. At low �K-values the crack driving force is low which affects thecrack front micro-geometry, the crack front becomes more tortuous, and alsothe crack closure mechanism is changing [39]. It may then occur that the crackdriving force is just no longer capable of producing further crack growth.
A concept to be discussed here is the occurrence of crack closure, and more
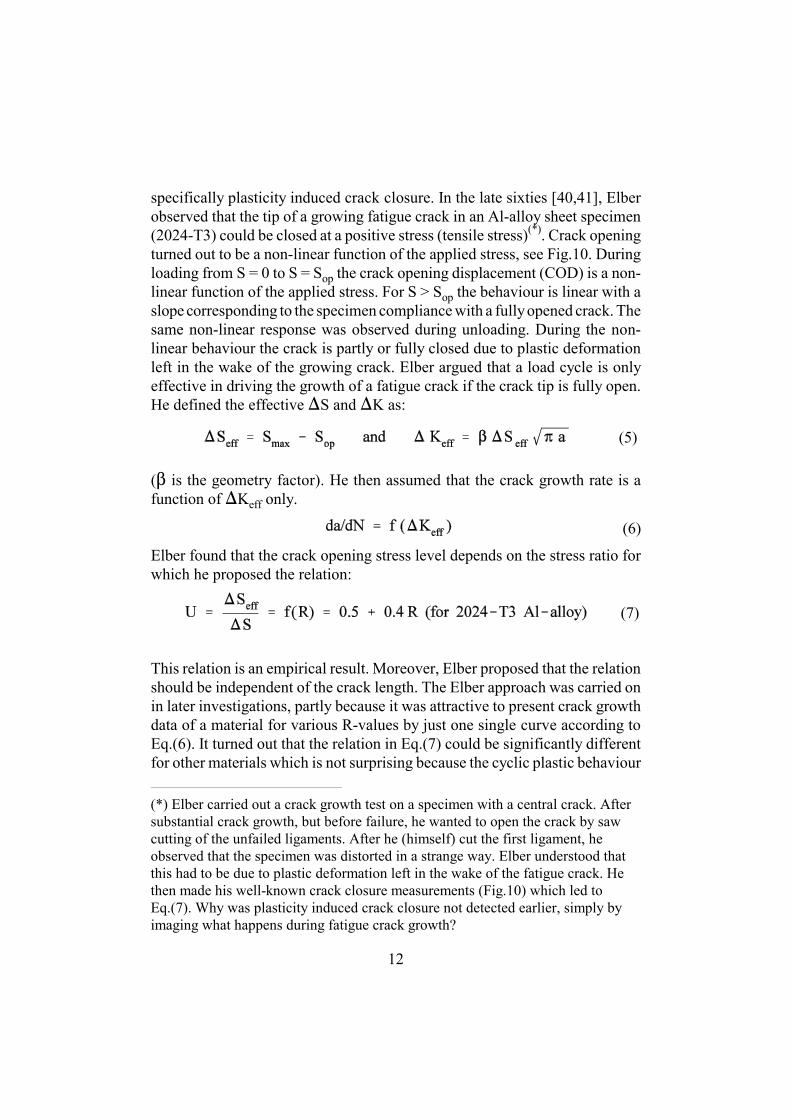
(*) Elber carried out a crack growth test on a specimen with a central crack. Aftersubstantial crack growth, but before failure, he wanted to open the crack by sawcutting of the unfailed ligaments. After he (himself) cut the first ligament, heobserved that the specimen was distorted in a strange way. Elber understood thatthis had to be due to plastic deformation left in the wake of the fatigue crack. Hethen made his well-known crack closure measurements (Fig.10) which led toEq.(7). Why was plasticity induced crack closure not detected earlier, simply byimaging what happens during fatigue crack growth?
12
(5)
(6)
(7)
specifically plasticity induced crack closure. In the late sixties [40,41], Elberobserved that the tip of a growing fatigue crack in an Al-alloy sheet specimen(2024-T3) could be closed at a positive stress (tensile stress)(*). Crack openingturned out to be a non-linear function of the applied stress, see Fig.10. Duringloading from S = 0 to S = Sop the crack opening displacement (COD) is a non-linear function of the applied stress. For S > Sop the behaviour is linear with aslope corresponding to the specimen compliance with a fully opened crack. Thesame non-linear response was observed during unloading. During the non-linear behaviour the crack is partly or fully closed due to plastic deformationleft in the wake of the growing crack. Elber argued that a load cycle is onlyeffective in driving the growth of a fatigue crack if the crack tip is fully open.He defined the effective �S and �K as:
(� is the geometry factor). He then assumed that the crack growth rate is afunction of �Keff only.
Elber found that the crack opening stress level depends on the stress ratio forwhich he proposed the relation:
This relation is an empirical result. Moreover, Elber proposed that the relationshould be independent of the crack length. The Elber approach was carried onin later investigations, partly because it was attractive to present crack growthdata of a material for various R-values by just one single curve according toEq.(6). It turned out that the relation in Eq.(7) could be significantly differentfor other materials which is not surprising because the cyclic plastic behaviour
13
depends on the type of material. In the eighties, the crack closure concept wasmuch welcomed by investigators on crack growth models for fatigue under VAloading [42].
3 THE S-N CURVE AND THE FATIGUE LIMIT
3.1 Aspects of the S-N Curve
Wöhler had already carried out experiments to obtain S-N curves in the 19th
century. For a long time such curves were labeled as a Wöhler curve instead ofthe now more frequently used term S-N curve. In the 20th century numerousfatigue tests were carried out to produce large numbers of S-N curves. In thebeginning, rotating beam tests on unnotched specimens were popular becauseof the more simple experimental facilities available in the early decades. Thesignificance of testing notched specimens was recognized, especially byengineers. Fatigue-testing machines for loading in tension, torsion and bendingwere available before 1940. The excitation of cyclic loads occurred bymechanical or hydraulic systems. High frequencies were obtained withresonance machines. Fatigue became more and more recognized as a problemto be considered for various small and large industrial products in view ofeconomical reasons. Apart from basic research on unnotched specimens, manytest series were also carried out on notched specimens. The tests wereperformed with a constant mean stress and a constant stress amplitude (referredto as constant-amplitude tests, or CA tests). The S-N curves should give usefulinformation about the notch and size effect on the fatigue life and the fatiguelimit. Initially, the fatigue life N was plotted on a logarithmic scale in thehorizontal direction, and the stress amplitude on a linear scale in the verticaldirection. Many curves can be found in the literature and collections of thesecurves have been published as data banks while commercial software alsocontains this type of information.
For low stress amplitudes, the S-N curve exhibited a lower limit whichimplies that fatigue failures did not occur after high numbers of load cycles, seeFig.11. The horizontal asymptote of the S-N curve is called the fatigue limit (insome publications the name endurance limit is used).The fatigue limit is ofpractical interest for many structures which are subjected to millions of loadcycles in service while fatigue failures are unacceptable. The fatigue limit isconsidered in more detail later.
At the upper side of the S-N curve (large stress amplitudes) another
14
(8)
horizontal asymptote appears to be present. If failure did not occur in the firstcycle, the fatigue life could be several hundreds of cycles. Such fatigue testswere not easily carried out on older fatigue machines because adjusting thecorrect load amplitude required too many cycles. A real breakthrough forfatigue testing equipment occurred in the fifties and sixties when closed-loopfatigue machines were introduced employing a feedback signal from thespecimen to monitor the load on the specimen. With this technique, the fatigueload could be adjusted by a computer-controlled system. Furthermore, if S-Ncurves were plotted on a double-logarithmic scale, the curves becameapproximately linear (the Basquin relation).
The interest for short fatigue lives is relevant for structures with a loadspectrum of small numbers of severe load cycles only (e.g. high-pressurevessels). In the sixties, this has led to �-N curves. Instead of applying a stressamplitude to a specimen, a constant strain amplitude is maintained in thecritical section of the specimen. The problem area was designated as “low cyclefatigue” (Fig.11) which actually implies that macro plastic deformation occursin every cycle. It turned out that the �-N curve in the low-cycle regime, againplotted on a double log scale, was a linear function:
The equation is known as the Coffin-Manson relation [43,44].At lower stress amplitudes macro plastic deformation does not occur and
the fatigue phenomenon is labeled as “high-cycle fatigue”, see Fig.11. It isassumed that cyclic deformations on a macro scale are still elastic.
Questions to be considered with respect to the S-N curve are: (i) Is thefatigue phenomenon under high-cycle and low-cycle fatigue still a similarphenomenon, and (ii) what is the physical meaning of the fatigue limit? Withrespect to the first question, it should be pointed out that crack initiation andcrack growth are both significant for the fatigue life. The crack initiation iseasily affected by a number of material surface conditions (surface roughness,surface damage, surface treatments, soft surface layers, surface residual stress).These conditions are important for high-cycle fatigue and the fatigue limit, butthey are generally overruled during low-cycle fatigue where plasticdeformations at the material surface will occur anyway. Moreover, macro crackgrowth under low-cycle fatigue is rather limited because small cracks willalready induce complete failure at the high stress levels. This implies thatlow-cycle fatigue is important for special problems where large plasticdeformations can not be avoided. Low-cycle fatigue problems are also often
(*) The fatigue limit is defined as a stress amplitude. The fatigue limit depends onthe mean stress. In view of avoiding complex sentences in the present discussion,this is ignored. It does not affect the essence of the discussion on the meaning ofthe fatigue limit.
(*) A very high number of cycles should be defined as a quantitative number. Inthe older days, it was associated with the knee of the S-N curve which for steel wassupposed to occur at N = 2�106 cycles. However, fatigue failures can occur atlarger numbers of cycles depending on crack initiation mechanisms requiring along period of cyclic loading. This was recently the topic of a conference inVienna [45].
15
associated with high-temperature applications. However, during high-cyclefatigue significant macrocrack growth occurs. At still lower stress amplitudesthe physical meaning and the engineering significance of the fatigue limit haveto be considered.
3.2 The Fatigue LimitThe formal definition of the fatigue limit(*) appears to be rather obvious. It isthe stress amplitude for which the fatigue life becomes infinite. This definitionis related to the asymptotic character of the S-N curve. From an engineeringpoint of view, it appears to be more logical to define the fatigue limit as thehighest stress amplitude for which failure does not occur after very highnumbers of load cycles(*). This definition appeals for situations where fatiguefailures are totally unacceptable, e.g. in various cases of machinery. Designstress levels must then remain below the fatigue limit which emphasizes thesignificance of the fatigue limit as a material property.
The two definitions do not refer to physical aspects of the fatiguephenomenon. A more physically-based definition should be associated withmicrocracks. If microcracks are not initiated, a fatigue failures does not occur.However, it is possible that cyclic slip does occur at stress amplitudes justbelow the fatigue limit. A few microcracks can be initiated but microcrackgrowth may be stopped. Non-propagating small cracks got some interest in thelate fifties and early sixties. Noteworthy experiments were carried out by Frostand associates [46] on notched specimens with high Kt-values. Actually, insuch cases crack growth can stop because the crack driving force is not largeenough to continue crack growth away from the material surface while thestress amplitude was sufficient to nucleate a small crack at the free surface. Butnon-propagating microcracks could also occur in unnotched specimens at stressamplitudes slightly below the fatigue limit due to crack growth barriers, e.g.
16
grain boundaries, or just because of insufficient cyclic slip for further growthof the microcrack. It then seems that the fatigue limit should be defined as thethreshold stress amplitude to take care of microcrack nucleation and subsequentgrowth to a macrocrack. Predictions on the fatigue limit of components is animportant engineering problem which implies that the physical concept of thisproperty should be understood. This is necessary for evaluating predictionmodels on the effect of the notch geometry on the fatigue limit (effects of Kt,notch size and stress gradients).
Because the fatigue limit is an important material property from anengineering point of view, the experimental technique to determine thisproperty was an important topic in the previous century. Fatigue tests todetermine a fatigue limit must be carried on to high numbers of cycles. Suchtests are very time consuming and thus expensive, especially if a reasonablylarge number of tests is carried out in view of information about the statisticalvariability of the fatigue limit. Statistical procedures for doing so have beenstandardized, for instance the Staircase method and the Probit method [47].Because of the problem of testing time, it is not surprising that investigatorshave been looking for a physical relation between the fatigue limit and someother material properties which can be measured in a short time. At best, itcould be hoped that some emission effect of the material is associated with themicrocrack initiation process. However, from the previous discussion on thefatigue phenomenon with respect to crack initiation and crack growth barriersof non-propagating microcracks it must be concluded that such correlations areillusive. An approximate determination of the fatigue limit can be done witha small number of specimens using so-called step tests in which the stressamplitude is increased in small steps [48].
4 PREDICTIONS AND FATIGUE DAMAGE
4.1 The Engineering Need for Prediction ModelsThe prediction of fatigue properties of structures and avoiding structural fatiguewere recognized as engineering problems in the early decades of the 20th
century. It was understood that high stress concentrations could be harmful andshould be avoided. The significance of stress concentration factors was knownbefore 1950 and designers realized that the fatigue performance of a structurewas dependent on improved detail design. The title of a book by Heywood“Designing against fatigue” [49] was characteristic for the engineering fatigueproblem. Various models were developed for the prediction of notch and size
17
effects. Initially, the aim was to derive fatigue properties of notched elementsfrom fatigue properties on unnotched specimens. The proposed modelsincluded a good deal of empirism. One specific goal was to predict the fatiguelimit, an important fatigue property for many products of the industry. In thesixties and afterwards a need was also felt to predict fatigue crack growth,especially for aircraft structures in view of fail-safe properties, serviceinspections and safety in general. But it was also a problem for other structuressuch as welded structures and pressure vessels. Prediction models on crackgrowth were much stimulated by the introduction of the stress intensity factor.Still another fatigue problem was associated with load spectra containing loadcycles of various magnitudes, or in other words, fatigue under variable-amplitude (VA) loading. If fatigue cycles above the fatigue limit occur, crackinitiation can not be avoided and a finite life is possible. A need for predictionson fatigue under VA loading was present. Several prediction problems can thusbe defined. A practical problem also associated with VA-loading was thequestion of how long old structures could still be used without running intofatigue problems. In the second half of the previous century, this question wasraised for old bridges, quite often bridges built in the 19th century. The questionwas whether fatigue problems should be anticipated or whether the bridgeshould be replaced by a new one. Bridges were often more intensively loadedby heavy traffic than previously expected in the design process long ago. Asimilar problem occurs for old aircraft. Some aircraft of military fleets weredesigned and built in the sixties but these aircraft are still meeting the presentperformance requirements. For economical reasons, some aircraft types areplanned to be used up till 2040. Also, several civil passenger aircraft are usedbeyond the life time for which they were originally designed (often 20 years).The term “aging aircraft” has been introduced for such aircraft. Some aircraftwith fatigue problems in the eighties for which special regulations wereintroduced were labeled as “geriatric” aircraft [50].
Questions emerging from the above picture are associated with thereliability and accuracy of prediction models and the physical concept offatigue damage. Prediction problems can be defined in two categories. Thesimilarity concept (sometimes called the similitude concept) is characteristicfor the first category. Fatigue damage accumulation is at the base of the secondcategory.
4.2 Predictions Based on the Similarity of Conditions (CA-loading)The physical argument of the similarity approach is:
Similar conditions, applied to similar systems, should produce the same
18
consequences.This physical principle is the basis of many predictions of properties ofmaterials and structures. It can also be applied to fatigue prediction problems.At the same time, it should be realized that this physical principle does notnecessarily imply that the physical mechanism of the fatigue phenomenonshould be understood.
For fatigue of notched elements the similarity concept implies: similarstress cycles applied to an unnotched specimen and to the material at the rootof a notch in a notched specimen will give the same crack initiation life. It isnot essential to know how the initiation occurs. Of course the requirement ofsimilar systems implies that the unnotched and notched specimen should be ofthe same material. However, some other aspects which may violate thesimilarity are easily recognized. A significant aspect is that the stress cycle inthe unnotched specimen is present in a large volume of the material with arelatively large area of surface material. In the notched specimen, the stresscycle of the peak stress (Kt � nominal stress) at the notch root is present in arelatively small volume of the material with a relatively small surface area.More differences can be mentioned, e.g. the surface roughness of the materialis not necessarily the same for the unnotched and notched specimen because ofdifferent ways of machining the specimens.
Neuber published a famous book on calculations of stresses aroundnotches in 1937 [51]. He found it rather disappointing to see that the reductionfactor of the fatigue limit of notched steel specimens was much less than theKt-value obtained with his calculations. Empirical equations were thenpresented in the literature [52-54] to account for the deficiencies of thesimilarity approach. An important variable in these equations is the root radiusof the notch in order to account for stress gradient effects in the notchedelements. Although the approach of the empirical equations was not fullyrational [11], reasonable estimates of the fatigue limit of notched elementscould be obtained.
The similarity concept for the prediction of fatigue crack growth isdifferent from the concept for the notch problem. It now reads:
The same �K-cycle applied to different cracks should give the samecrack growth rate.In other words, if the same �K applies to a crack in a specimen and to a crackin a structure, the same da/dN should be obtained. This similarity concept wasreplaced later by requiring similar �Keff-cycles in order to account for thestress ratio effect associated with crack closure as discussed before. Also in thecase of fatigue crack growth it is not really necessary to know the physical
19
crack extension mechanism, e.g. whether it occurs by shear decohesion ortensile decohesion. But in this case it may also be questioned whether the same�K cycle is a valid argument to prescribe similar conditions applied to thesame system. The system in this case is the material around the crack tip. It iswell-known that the K-value does not describe the stress distribution far awayfrom the crack tip, but more interestingly, this is also true for the crack tipplastic zone, i.e. in the close proximity of the crack tip where the fatigue crackextension occurs. Equation (1) is no longer valid in the plastic zone, and theplasticity will cause some stress redistribution. Around the crack tip, a zonewith radius re is considered in Fig.7b. The size of this zone is selected to besignificantly larger than the plastic zone (re > rp) but still considerably smallerthan the crack length (re > a). As a result, the plastic deformation at the cracktip will have a marginal effect on the stress distribution at a distance re from thecrack tip (de Saint Venant’s principle). As a consequence K can still becharacteristic for the stresses applied to the re-zone, which is called theK-dominated zone [55]. This zone is the system to be considered. Similar�K-cycles on the system then imply similar stresses on the K-dominated zones.As a consequence the same small crack tip plastic zones are obtained, andsimilar crack growth rates, da/dN, may be expected.
Apparently �K can be used for the prediction of the crack growth rate ina structure if da/dN for similar �K-values is known from experiments on crackgrowth specimens. This fracture mechanics application has extensively beenexplored and confirmed in many cases in the last decades of the previouscentury. Handbooks with K-values for various geometries were published [56-58] and data are also included in commercial software. Moreover, K-values forpart through cracks and cracks with curved crack fronts can be calculated withmodern FE techniques.
Limitations occur for high values of Kmax and �K when plastic zones atthe crack tip are large. Because the K-concept is essentially based on elasticmaterial behaviour, an elastic K-dominated zone is no longer a realisticconcept.
Shear lips occur at the free surface of the material during fatigue crackgrowth, (see Fig.5). Again this need not upset the similarity concept for crackgrowth predictions if a K-dominated zone can still be assumed to be relevant.The shear lips will then be present in the same way in both systems, thespecimen and the structure. It has been shown that predictions can still bereasonably accurate.
20
(9)
(10)
(11)
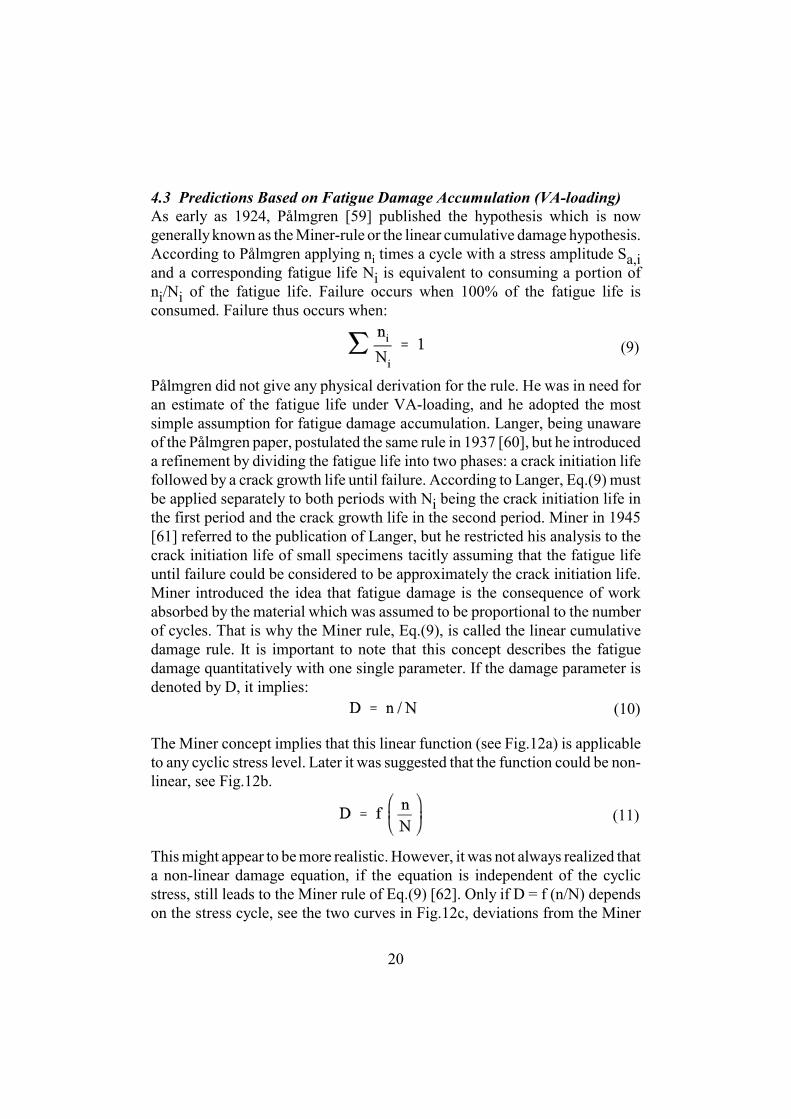
4.3 Predictions Based on Fatigue Damage Accumulation (VA-loading)As early as 1924, Pålmgren [59] published the hypothesis which is nowgenerally known as the Miner-rule or the linear cumulative damage hypothesis.According to Pålmgren applying ni times a cycle with a stress amplitude Sa,iand a corresponding fatigue life Ni is equivalent to consuming a portion ofni/Ni of the fatigue life. Failure occurs when 100% of the fatigue life isconsumed. Failure thus occurs when:
Pålmgren did not give any physical derivation for the rule. He was in need foran estimate of the fatigue life under VA-loading, and he adopted the mostsimple assumption for fatigue damage accumulation. Langer, being unawareof the Pålmgren paper, postulated the same rule in 1937 [60], but he introduceda refinement by dividing the fatigue life into two phases: a crack initiation lifefollowed by a crack growth life until failure. According to Langer, Eq.(9) mustbe applied separately to both periods with Ni being the crack initiation life inthe first period and the crack growth life in the second period. Miner in 1945[61] referred to the publication of Langer, but he restricted his analysis to thecrack initiation life of small specimens tacitly assuming that the fatigue lifeuntil failure could be considered to be approximately the crack initiation life.Miner introduced the idea that fatigue damage is the consequence of workabsorbed by the material which was assumed to be proportional to the numberof cycles. That is why the Miner rule, Eq.(9), is called the linear cumulativedamage rule. It is important to note that this concept describes the fatiguedamage quantitatively with one single parameter. If the damage parameter isdenoted by D, it implies:
The Miner concept implies that this linear function (see Fig.12a) is applicableto any cyclic stress level. Later it was suggested that the function could be non-linear, see Fig.12b.
This might appear to be more realistic. However, it was not always realized thata non-linear damage equation, if the equation is independent of the cyclicstress, still leads to the Miner rule of Eq.(9) [62]. Only if D = f (n/N) dependson the stress cycle, see the two curves in Fig.12c, deviations from the Miner
(*) Already in 1943 Heyer [63] attributed the increased fatigue life afterapplication of a high preload to compressive residual stresses. His paper inGerman was written during World War II.
21
rule are possible.The single damage parameter definition still offers another problem.
Negative damage is impossible. Already in the fifties it was known that a singlehigh load (frequently labeled as an overload, OL) can increase the fatigue lifeat a lower stress level and thus is causing negative damage in terms of life timeconsumed. However, a damage curve with negative damage is physicallyunacceptable. Going from negative damage to later positive damage impliespassing the zero damage level corresponding to the pristine condition presentbefore the test was started. This can not be true.
It was understood in the fifties that an overload in tension applied to anotched specimen can lead to plastic deformation at the root of the notch. Asa result, compressive residual stresses are introduced which delays crackinitiation and subsequent crack growth(*). Clarence Smith around 1960 [64]suggested that the Miner rule could still be adopted after a high load if theresidual stress was accounted for by a change of the mean stress at the criticallocation at the notch. Later in the early seventies [65,66] the strain historyprediction model was developed which appeared to be promising for low-cyclicfatigue under VA loading when plasticity occurred in many cycles of aload-time history. With this model the strain history at the root of the notch wasderived from the load history by using an analytical relations between theplastic strain and the stress as proposed by Neuber for notch rootplasticity [67]. However, the Miner rule was still adopted for calculating theaccumulated fatigue damage. Instead of S-N curves �a- N were used, i.e. theCoffin-Manson relation discussed earlier.
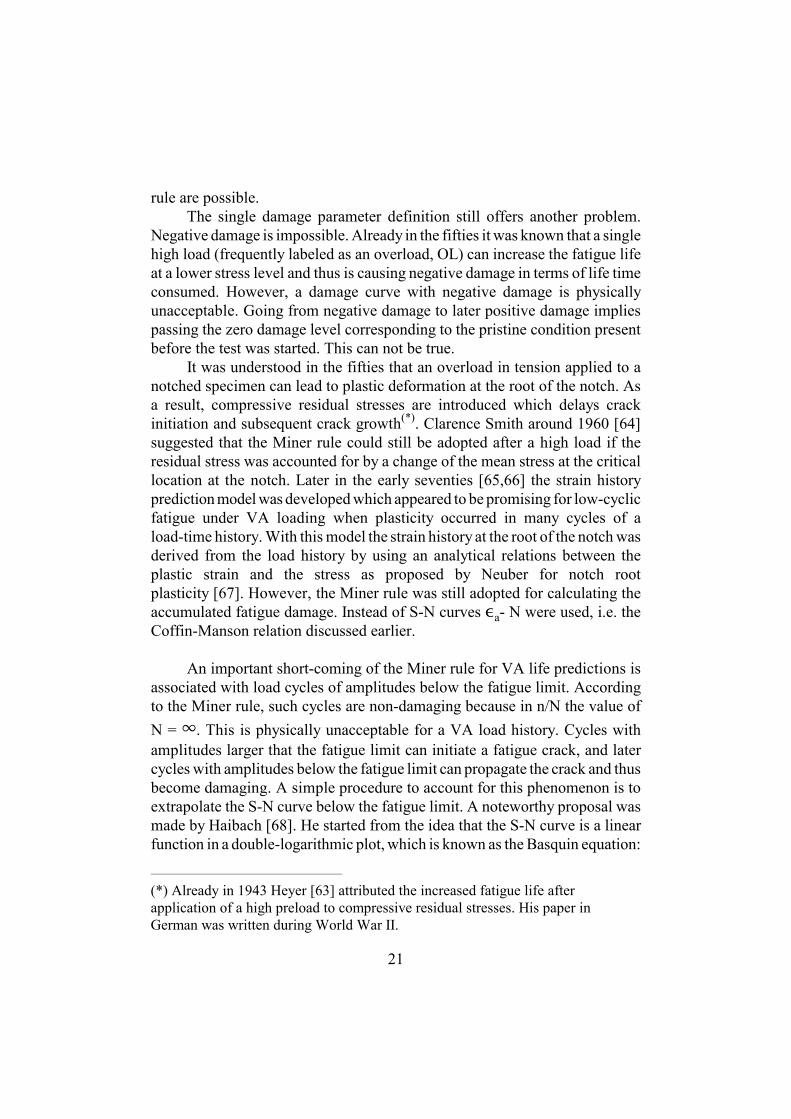
An important short-coming of the Miner rule for VA life predictions isassociated with load cycles of amplitudes below the fatigue limit. Accordingto the Miner rule, such cycles are non-damaging because in n/N the value ofN = �. This is physically unacceptable for a VA load history. Cycles withamplitudes larger that the fatigue limit can initiate a fatigue crack, and latercycles with amplitudes below the fatigue limit can propagate the crack and thusbecome damaging. A simple procedure to account for this phenomenon is toextrapolate the S-N curve below the fatigue limit. A noteworthy proposal wasmade by Haibach [68]. He started from the idea that the S-N curve is a linearfunction in a double-logarithmic plot, which is known as the Basquin equation:
(*) It is noteworthy that the crack tip plastic zone is frequently assumed to haveonly one characteristic dimension, which is the width of the zone in the crackgrowth direction. In several materials the zone has a butterfly shape. Furthermore,the size of the plastic zone is supposed to be equal to a constant times (Kmax/ S0.2)2.The choice of S0.2 is arbitrary. If S0.1 is used the calculated size is larger.
22
(12)
with the empirical constant k (slope factor) as the negative inverse slope of thelog(Sa)/log(N) plot. Haibach proposed to extend the S-N curve with a secondlinear part as shown in Fig.13 with a slope depending on k of the first part(slope factor k’ = 2k+1). Another suggestion to extend the S-N curve was madefor welded joints [69] as also indicated in Fig.13.
Although the extended S-N curves may give a better prediction of thefatigue life, and anyway a more conservative one, it does not imply that theMiner rule is given a physical derivation. Numerous test series have shown thatstatistically similar VA load histories can give significantly different fatiguelives whereas the Miner rule predicts the same life. Already around 1960 thiswas obvious from so-called program fatigue tests on notched specimens withdifferent load sequences. Illustrative results of Hardrath et al. [70,71] areshown in Fig.14. According to the Miner rule, all sequences should have giventhe same fatigue life instead of variations with factors of about 3. Moreover,large differences from �n/N = 1 were observed. Many more similardeficiencies were obtained later, especially for high strength materials, see thesurveys in Refs. [72,73].
Fatigue damage descriptionShort-comings of the Miner rule are primarily due to the primitive fatiguedamage concept adopted. It implies that fatigue damage is indicated by onesingle damage parameter. In reality, all changes inside the material induced byfatigue load cycles are part of the fatigue damage. Those changes were studiedin various publications. In principle, a description of fatigue damage shouldcover several features affected by the fatigue load, such as:S micro and macro plastic deformationS residual stressS the size and the shape of fatigue cracks (crack geometry)S fractographic features (crack path in the material structure, shear lips)S plastic deformation in the wake of the crack (crack closure)Spatial distributions of these aspects are involved(*) which implies that a
23
quantitative description is not a realistic option, although the meaning of theaspects is qualitatively understood. In the literature, rather drasticsimplifications have been made to arrive at improved prediction rules forfatigue damage accumulation. The success is limited for fatigue life predictionsfor VA loading. However, for fatigue crack growth (macrocracks) someprogress has been made, although simplifications were still necessary
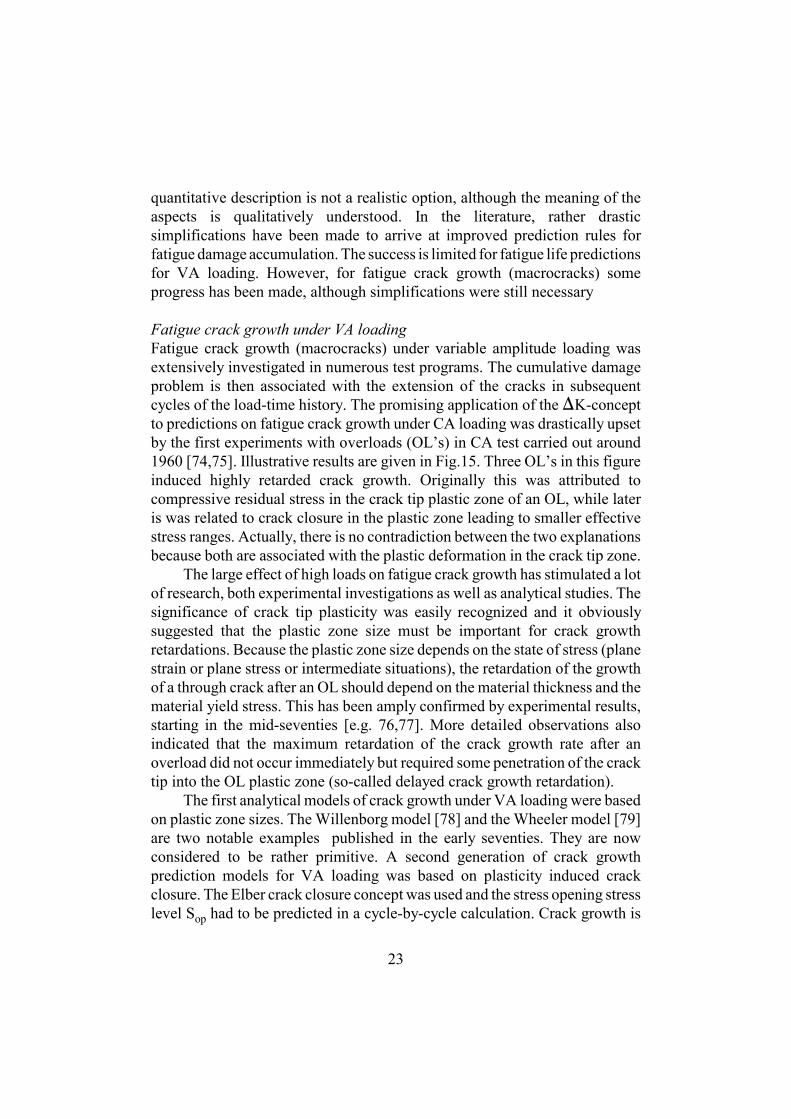
Fatigue crack growth under VA loadingFatigue crack growth (macrocracks) under variable amplitude loading wasextensively investigated in numerous test programs. The cumulative damageproblem is then associated with the extension of the cracks in subsequentcycles of the load-time history. The promising application of the �K-conceptto predictions on fatigue crack growth under CA loading was drastically upsetby the first experiments with overloads (OL’s) in CA test carried out around1960 [74,75]. Illustrative results are given in Fig.15. Three OL’s in this figureinduced highly retarded crack growth. Originally this was attributed tocompressive residual stress in the crack tip plastic zone of an OL, while lateris was related to crack closure in the plastic zone leading to smaller effectivestress ranges. Actually, there is no contradiction between the two explanationsbecause both are associated with the plastic deformation in the crack tip zone.
The large effect of high loads on fatigue crack growth has stimulated a lotof research, both experimental investigations as well as analytical studies. Thesignificance of crack tip plasticity was easily recognized and it obviouslysuggested that the plastic zone size must be important for crack growthretardations. Because the plastic zone size depends on the state of stress (planestrain or plane stress or intermediate situations), the retardation of the growthof a through crack after an OL should depend on the material thickness and thematerial yield stress. This has been amply confirmed by experimental results,starting in the mid-seventies [e.g. 76,77]. More detailed observations alsoindicated that the maximum retardation of the crack growth rate after anoverload did not occur immediately but required some penetration of the cracktip into the OL plastic zone (so-called delayed crack growth retardation).
The first analytical models of crack growth under VA loading were basedon plastic zone sizes. The Willenborg model [78] and the Wheeler model [79]are two notable examples published in the early seventies. They are nowconsidered to be rather primitive. A second generation of crack growthprediction models for VA loading was based on plasticity induced crackclosure. The Elber crack closure concept was used and the stress opening stresslevel Sop had to be predicted in a cycle-by-cycle calculation. Crack growth is
24
(13)
then predicted from:
The crack extension �ai in cycle i is a function of �Keff in that cycle. Thevalue of �Keff,i depends on the imposed Smax,i of the load history and thepredicted Sop,i. The geometry factor Ci depends on the current crack length ai.The crack opening stress level Sop,i must be predicted by a crack growth modeltaking care of the effect of plastic deformation left in the wake of the crack asa residue from previous load cycles. As an illustration, Fig.16 gives a sampleof a VA load history with varying Sop-values. Some models for plasticityinduced crack closure under VA loading were proposed in the literature in theeighties (for a survey see [42,80]). The most well-known model is theCORPUS model of Ary de Koning [81]. In this model, the effect of theprevious load history on Sop is physically associated with humps on the surfaceof the fatigue crack as remainders of previous high loads. Several details of themodel include the transition of plane strain to plane stress and the amplificationeffect of frequently occurring high loads. The CORPUS model includes someempirical constants and fairly accurate crack growth predictions for rathercomplex flight-simulation load histories were obtained [82].An example ofsuch a load history is shown in Fig.17.
The crack opening stress, Sop, in the CORPUS model was still obtainedwith an empirical relation employing previous maxima and minima of the loadhistory, a relation with a similar character as U(R) discussed before. In afollowing generation of crack growth prediction models, crack closure was stillconsidered to be the leading mechanism to arrive at effective stress range.However, Sop was no longer obtained from an empirical function. The Dugdalestrip yield model [83] was adopted to calculate the plastic deformation in thecrack tip zone and the plastic deformation left in the wake of the crack.Algorithms were developed [84-88] to calculate the plastic deformations andto determine the crack opening displacements from which the crack openingstress level is obtained. The models are rather complex, due to the non-linearmaterial behaviour, reversed plasticity under compressive stress, and theiterative character of the calculations. Although these strip yield models aremore realistic, the problem of the plane stress to plane strain transition is stillpresent. Moreover, it remains difficult to cover some aspects such as the 3Dcharacter of crack closure. Accurate predictions thus remain problematic, themore so for part through cracks.
25
5 LOAD SPECTRA
Information on the load-time history of a structure in service is collected inload spectra. As indicated in Fig.1, a load spectrum is a necessary input for theprediction of fatigue properties of a structure or service-simulation fatigue tests.In spite of this link, the literature on load spectra suggests the topic to be moreor less a separate discipline. Developments on load spectra problems started inaeronautics because of some early fatigue disasters. In Germany a Lufthansaaircraft crashed in 1927 with six fatalities. The accident was due to a fatiguefailure [5]. It started significant fatigue research in the thirties, notably byGassner [89] and Teichmann [90]. It was understood that aircraft wings weredynamically loaded during flying in turbulent air which resulted in numerousload cycles with quite variable amplitudes (gust loads). The need for measuringthese loads was well recognized. A strain measurement technique wasdeveloped for this purpose in the early thirties [91]. The load-time history wasscratched with a diamond on glass and the history was analyzed under themicroscope, an advanced technique for that time. Teichmann recognized thata statistical description of the load-time history could be done in different ways.Considering the maxima and minima as the relevant data of a load-time history,the statistical data could be restricted to counting these peak values in specifiedintervals, which leads to a one-dimensional spectrum (1D). However,Teichmann also defined a statistical counting of ranges between successivemaxima and minima and considering different mean values of these ranges,which then leads to a two-dimensional spectrum (2D). Teichmann was awareof the fact that information on the sequence of the loads was lost in the counteddistribution of occurrences. Gassner introduced the so-called program fatiguetest [89], see Fig.18, a fatigue test with a programmed sequences of load cycleswith different amplitudes representing the amplitudes occurring in service. Amore realistic simulation of gust loads on an aircraft wing as illustrated byFig.19 was still impossible with the existing fatigue test machines at that time.
In later years, other load measurement techniques were developed as wellas statistical evaluation methods for the data obtained. Again most of thedevelopments were initiated for aircraft fatigue problems. A well-knowntechnique in the fifties and afterwards was based on measuring accelerationsin the centre of gravity of the aircraft from which the loads on the structurewere calculated. A counting accelerometer, also called “the fatigue meter” wasdeveloped by the Royal Aircraft Establishment in the UK [92]. Exceedings ofa number of preset acceleration levels were counted by this apparatus and anexample of results is given in Fig.20. Such load spectra could be used for
(*) Operator C is flying the aircraft close to the design spectrum used by Fokker.The load spectrum for operator C indicates a significantly milder spectrum. Thisoperator having one aircraft only was using the F-28 as an executive aircraft, andexecutives do not fly during stormy weather.
(**) A similar concept of removing small intermediate ranges was described byAnne Burns in 1956 [96]. The Strain Range Counter developed by the Vickersaircraft industry was counting in accordance with this method.
26
fatigue calculations, but also for a comparison of the service severity ofdifferent aircraft in the same fleet or aircraft of different fleets(*).
The calculation of loads in fatigue critical components starting fromaccelerations measured in the centre of gravity of the aircraft was not alwaysrealistic or sufficiently accurate. It then became more appropriate to measurethe load history on a fatigue critical component itself by strain gages. Thistechnique was available for a long time, but it was adopted more abundantly inthe last decades of the previous century when strain gage techniques weredeveloped with a long term reliability under various service conditions. At thesame time, dedicated computer techniques for a statistical analysis of straingage signals and data storage were also significantly improved [94]. Countingresults of occurrences of peak values or ranges could be retrieved in matrixformat.
An important development regarding load-time history analysis should bementioned here. It is associated with small load ranges occurring in betweenlarger ranges, see Fig.21. In principle, load ranges can be counted as shown inFig.21a, but that would imply that the large range AD is not counted. In theso-called rainflow counting method proposed by Endo [95], the countingoccurs as shown in Fig.21b and c. It implies that a smaller range in between alarger range is counted and removed after which the counting is continued(**)
and the larger range is counted later. The counting method is described in anASTM standard [97]. Although the rainflow counting method is not based onan exact physical concept to account for fatigue damage accumulation, it maywell be expected to give a more realistic representation of the severity ofload-time histories.
Measurements of service load spectra of aircraft were originally made tosee what happened to the structure of the aircraft. In later years, suchmeasurements became desirable for other purposes. Full-scale fatigue testswere carried out on newly designed aircraft types in order to be sure thatunexpected fatigue events will not affect the safety of the aircraft. Especiallyafter two Comet aircraft flying at cruising altitude exploded in 1954 due to
27
fatigue cracks, such full-scale tests were frequently carried out. Those tests inthe fifties and the sixties were partly carried out in a realistic way, i.e. on thefull aircraft structure including pressurization cycles on the fuselage. However,the loads on the wing were a simplified simulation of what occurred in service.The gust loads on the wing were CA cycles which were moreover the same inall flights. Based on a Miner-rule damage calculation these cycles weresupposed to have the same fatigue damaging contribution as the random gustloads in service. Unfortunately, the Miner rule is essentially unreliable for suchcalculations. The introduction of electro-hydraulic closed-loop systems infull-scale tests enabled a more realistic simulation of service load-timehistories. A sample of such a flight-simulation load history applied to the wingstructure of the Fokker F-28 aircraft in 1968 was shown in Fig.17. Already inthe early sixties, Branger in Switzerland carried out realistic flight-simulationtests on a fighter aircraft structure [98]. In the last decades of the previouscentury, complex service-simulation fatigue tests were carried out, not only onaircraft structures, but on various types of structures for which a satisfactoryendurance had to be shown.
By the end of the previous century, techniques and apparatus formeasuring load-time histories had been developed to a high level of perfection.It can even be done by wireless systems on moving vehicles. It is also possibleto use load-time measurements as input signals for simulation tests. In theautomotive industry, this can be attractive, because it opens the possibility fora virtual reality simulation in the laboratory. This is done not only for detectingfatigue problems in a new structure, but more generally to check the functionalreliability of new structures. In summery, load spectra, if they can not becalculated, can now be measured without great difficulties. The questionremains whether the possibility of using a structure beyond the operationaldesign specifications (maybe abuse) should be taken into account.
6 EVALUATION OF THE PRESENT STATE OF THE ART
In the first decades of the 20th century, the scientific analysis of fatigueproblems was started partly by microscopic investigations and for another partby studies on the analysis of stress concentrations. From an engineering pointof view, the experience of dealing with fatigue problems in the beginning of theprevious century was still a matter of trial and error. In later decades, continuedresearch clearly indicated that the number of variables that can affect thefatigue strength and the fatigue life of a structure is large. In principle, it is
28
correct to consider fatigue as a phenomenon characterized by microcrackinitiation, crack growth as an invisible microcrack and later as a visiblemacrocrack, which finally leads to complete failure. Unfortunately, this conceptdoes not mean that the fatigue phenomenon occurs in the same way in allmetallic materials. On the contrary, the fatigue mechanism in detail can beconsiderably different for various materials. The initiation of microcracks andthe initial growth of these cracks depends highly on the conditions of thematerial surface. Well-known features involved are the surface qualitydepending on production variables, residual stress, special surface treatments,environmental conditions, etc. Moreover, the variety of engineering structuresfor which fatigue can be a problem is also extensive. In view of the largenumber of variables and structures, the picture looks rather complex.Apparently there are many different fatigue problems which all have their ownspecific characteristics and practical significance.
The purpose of this section is to summarize the major aspects of thepresent state of the art about fatigue of structures and materials. In view of somany different fatigue problems this can not be done in great detail, but majorcharacteristics are indicated. As a result of numerous fatigue research programsin the second half of the previous century, various effects of variables and theirsignificance for practical applications are reasonably well-known. Moreover,most of these trends are understood in terms of physical arguments, at least ina qualitative way. However, the quantitative description is generally a weakpoint responsible for uncertainties if predictions on fatigue properties have tobe made. In spite of this, we know and understand in many cases how fatigueproperties of structures can be improved and how deleterious influences can beavoided. Designing against fatigue with the present knowledge is possible.
In view of the prospects of fatigue problems in the new century (thepresent 21st century) it seems to be useful to list some major gains andshortcomings emerging from the developments in the last decades of theprevious century. Important progress was associated with the developments ofnew equipment and computers:S The electron microscope significantly contributed to the present
knowledge about fatigue, noteworthy by fractographic observations.S The closed-loop fatigue machines controlled by computers have
revolutionarily enlarged the possibilities for various kinds of fatigue tests,noteworthy for complex service-simulation fatigue tests.
S Measuring techniques to obtain information about load-time histories inservice and statistical techniques to evaluate the data of suchmeasurements were developed.
29
S Computers have significantly increased the potential of stress analysis forobtaining stress distributions in components, and more specifically toobtain values of the stress concentration factor (Kt) and the stress intensityfactor (K).
It should be realized that this list is mainly concerned with modern tools totackle problems on fundamental questions about fatigue properties. However,the tools have enabled some noteworthy developments with respect to thefollowing topics:S As a result of numerous microscopic investigations, including
fractographic observations, the concept “fatigue damage” in physicalterms has obtained a much better basis.
S The introduction of “fracture mechanics” has led to significantpossibilities for the prediction of fatigue crack growth under CA loading.The application of fracture mechanics requires that the fracturemechanism is known and understood.
S Observations on the crack closure concept have opened variousapproaches to fatigue crack growth problems and to understand loadhistory effects under VA loading.
Problem areas can be indicated where experience in the previous century hasrevealed weaknesses of the procedures for fatigue predictions. Four topics arebriefly addressed:S Predictions on the fatigue limit as affected by the notch effect, size effect
and surface quality. S Life predictions for CA loadingS Predictions on the fatigue strength of joints.S Life predictions for VA loading.Major problems are associated with the accuracy of prediction. Furthermore,if the reliability of the predictions is not satisfactory, the alternative is to carryout relevant fatigue tests. Even then it can be a problem to know whether theexperiment will give reliable and worthwhile information.
6.1 Prediction of the Fatigue LimitThis problem is of interest for many types of dynamically loaded componentssubjected to large numbers of cycles (high-cycle fatigue) whereby fatiguefailures are undesirable. It was noted previously that rigorous predictionsstarting from fatigue data for unnotched material can not be made, butempirical equations have been proposed which may lead to reasonableestimates of the fatigue limit. Such estimates are supposed to be average values
(*) An extensive survey about scatter of the fatigue strength observed in numeroustest series was recently published by Adenstedt [100].
30
of Sf. If fatigue failures can not be tolerated, a safety factor must be applied inview of scatter of this property, and perhaps also because of uncertainties of themagnitude of the cyclic load. This is a delicate problem which is usual forselecting safety factors(*). One problem is that the distribution function of thefatigue limit of the component is unknown [99]. Scatter of the fatigue limit canbe studied by performing many tests. However, it must be realized that thestatistical information obtained applies to the conditions of the laboratory testseries, which in general is not valid for the components produced in largequantities by the industry. Moreover, the statistical information for anon-failure criterion of a large population is another problem associated withthe lower tail of the probability of failure distribution function. Physicalarguments to assume a function for this purpose at very low probabilities arenot available. The selection of a safety factor then becomes a matter of ajudicious choice taking into account the consequences of an highly unlikelyfailure with an incidental character. Potential reasons why such a failure mightstill happen have to be considered, e.g. the possibility of surface damage as astarting point for a fatigue crack.
6.2 Predictions of the Fatigue Life under CA LoadingIn various structures, the occurrence of fatigue cracks is accepted because itwould not be economical to design for an infinite life. Low design stress levelswould then be necessary which leads to oversized heavy structures. But asufficient fatigue life should be present before the occurrence of cracksnecessitates repair or replacement, and thus prediction problems are stillinvolved.
If the geometry of notches in fatigue critical parts of a structure are opennotches (holes, grooves, fillets), Kt -values may be available or can becalculated with FE techniques. A finite life has to be predicted both for thecrack initiation period and the crack growth period. The prediction of the crackinitiation life is difficult. The application of fracture mechanics is questionablefor this period. As an alternative it has been proposed to assume some initial-crack like defect and to predict the entire life as a crack growth life startingfrom this defect to failure. It implies that the crack initiation period is ignoredin this approach. If the initial defect is assumed to be not very small, theprediction result may be conservative, but any quantitative accuracy can not beguaranteed.
31
From a mechanistic point of view, the initiation period and the crackgrowth period require different prediction models. This problem is complicatedin view of defining the moment of the transition from the initiation period tothe crack growth period. Actually, it must be admitted that a rigorously andphysically satisfactory solution of this problem is not available.
Where accurate predictions are questionable, an experimental analysis andsafety factors have to be considered. Experiments should preferably be carriedout on the component itself to avoid possible notch-, size- and surface-finisheffects. Safety factors can be applied to the fatigue life obtained in theexperiments. But it is also possible to carry out the experiment at a higherstress level than the design stress level, which is also introducing a safetyfactor. Safety factors to be used are again a matter of a judicious choiceconsidering all sources of possible scatter and unknown circumstances. Onetopic not yet mentioned is the influence of the environment in service, such asthe effect of humid and salty air, or even sea water. It is important to knowwhether the material used is sensitive to such environmental influences. Thisknowledge may be obtained from laboratory investigation, while practicalexperience is instructive.
6.3 Predictions on the Fatigue Strength of JointsFinite life predictions for joints are generally considered to be a problem whereelementary concepts can not be used in a fully rational way. However, jointsare most significant in various structures. Welded joints are abundantly usedin many large steel and aluminium structures. Numerous riveted joints occurin aircraft structures. Bolted joints are applied in many structures wheredismounting of the joint is required. Lug type connections (single-pin loadedhole) are necessary in various structures with moving components.Unfortunately, the fatigue properties of joints can be rather critical for anumber of reasons: high Kt-values, fretting corrosion, eccentricities in the jointinducing secondary bending, defects and unfavourable geometries in weldedjoints, etc. Because of these complexities simple calculation procedures forcalculating fatigue properties of joints can not be formulated. The similarityconcept based on stress concentration factors is not conceivable. This has ledto various life estimation procedures starting from fatigue test data of similarjoints of the same material. Local parameters for the characteristic features ofa joint are defined and used for estimating the fatigue strength. It is still a kindof a similarity approach. If data on similar joints are not available, additionalexperiments should be recommended. Various aspects of fatigue strengthassessments based on local parameters were recently surveyed by Radai [101].
32
In spite of a limited accuracy when estimating fatigue properties of joints, aqualitative understanding of load transmission in joints and the associatedempirical trends was developed in the previous century. It implies thatdesigning against fatigue of joints is quite possible.
6.4 Fatigue Damage Accumulation under VA LoadingThe prediction of the fatigue life and crack growth under VA loading drewmuch interest in the previous century. Many structures in service are subjectedto a load spectrum of cycles with different amplitudes. As discussed earlier, thesimple Miner rule is in serious conflict with the present understanding offatigue damage accumulation, but a fully rational alternative is not available.Actually, it should be concluded from the present knowledge that an accuratelife prediction rule for VA loading will not be obtained in the near future. Inthis context, it should be recognized that the Miner rule is supposed to predicta fatigue life from S-N curve data. Apart from the question whether suchcurves are not always available, the Miner rule is indeed a large extrapolationstep, i.e. from CA-loading data to VA-load histories. As long as anotherrealistic rule is not available, we can only hope that the Miner rule will give akind of an estimate of the fatigue life for VA-loading. Extrapolation of S-Ncurves below the fatigue limit discussed previously (Fig.13) should always beused, but it does not imply that the rule becomes an accurate and rationalprediction rule. It is a practical attempt to save the usefulness of the Miner rulefor obtaining a rough estimate of the fatigue life.
With respect to the prediction of crack growth under VA loading, someprogress has been made in the previous century. An extensive survey wasrecently published by Skorupa [102]. Also in th case of crack growth, theproblem of accurate predictions can not be considered to be satisfactorilysolved. Apparently, accurate predictions on both fatigue life and crack growthare still beyond the present state of the art. It then is not surprising that the bestinformation on fatigue properties should come from realistic service-simulationfatigue tests. Fortunately, complex load-time histories which can be generatedby a computer program can also be applied to closed loop load actuators. Ittherefore appears that it is no longer a problem to carry out service-simulationfatigue tests. They can be carried out in the laboratory at reasonably highfrequencies, say 10 Hz and also faster. As a consequence, these tests need nottake much time. Actually, a determination of an S-N curve to carry out a Minercalculation is much more demanding in time and numbers of specimens, apartfrom the fact that the calculation can not claim to be a realistic approach.However, it should also be recognized that a service-simulation fatigue test as
33
simulation of the history in service is not free from questions. First, aservice-simulation test is still an accelerated test because the service life mustbe expressed in years instead of testing days in the laboratory. If time-dependent influences are important, think of corrosion, the test results shouldbe interpreted with care in view of such effects. Secondly, it has to be knownwhat the service load-time history is. Moreover, only one load-time history issimulated in a test. Usually, a conservative history will be used. But theproblem-setting requires a profound understanding of what is going on inservice, what is significant for the simulation in the test, and how important aredifferences with the real environment and usage of the structure in service.
6.5 Some “Smart” IdeasThe need for new life predictions of old structures is heavily felt for both civiland military aircraft, but also for other non-aeronautical structures. The bestapproach is to carry out service-simulation tests on fatigue critical parts takenfrom an old structure, a procedure which has been adopted for aging aircraft[103] in view of safety considerations. Economic arguments can also beimportant, for instance for the question of whether old bridges should bereplaced. Load spectra measurements are of paramount importance whichshould be followed by fatigue tests on representative test articles with arealistic simulation of the load-time history occurring in service. This is not somuch a smart idea for an old problem, but more a practical solution.
From time to time, relatively simple devices were proposed to measure the“life consumption” of a structure. In view of aging structures, it has beenproposed to bond small specimens with a very low thickness and a crack starternotch to a fatigue critical aircraft component [104]. Fatigue crack growth inthese gages will then occur and the crack length is used as a measure for thefatigue damage experience of the structure. The correlation between thisindication of the crack gage and the fatigue damage done to the structure is anobvious problem. It could be attempted to calibrate the crack gage in thefull-scale test on the aircraft structure. Actually, if bonding something to astructure is a feasible option, the best solution is to use strain gages which canproduce more relevant data about the load spectrum.
Another solution to find early fatigue cracks is to build in a self-warningsystem. In the seventies, an interesting system was adopted for helicopterblades [105]. A blade failure is always catastrophic. The main beam of theblades consisted of a hollow extrusion which was closed at the ends and filledwith an inert gas (nitrogen) with a slight over-pressure. If a fatigue crackpenetrated through the wall thickness the pressure was lost and the color
(*) A similar warning was occasionally observed on the fuselage of the 747.Leakage of cabin air at cruising altitude due to a fuselage crack was easilybalanced by the aircraft pressurization system. Room temperature cabin airescaped through the crack into the -55°C environment, and condensation of watervapor on the crack edges occurred immediately. A brown staining residue ofnicotine was decorating the crack. The cracks were easily visible and have beenfound by aircraft personnel during walk around inspections.
34
indication of a pressure-gauge at the root of the blade changed from yellow intored. A walk-around inspection was sufficient to know whether cracks werepresent. Several cracks have been found this way(*) with a single exception[105]. The concept could be labeled as a smart structure.
Nowadays one of the new terms is “smart materials” which can giveindications of local failures by wire type systems. This concept seems to bepromising for structures of composite materials, but it is not yet sure whetherthey have a similar potential for metallic structures. After all, designers, andalso the user of a structure, do not want to be warned of fatigue problems. Theyprefer to have a structure which is free from cracks and the nuisance of repairs.But of course, smart ideas should be studied for their potential usefulness[106].
It is not surprising that ideas about removing fatigue damage from astructure have been proposed through the years. Before 1950 it was sometimesthought that fatigue damage could be neutralized by prolonged load cyclingbelow the fatigue limit. Also a heat treatment to annihilate the fatigue damagewas considered. With the present knowledge of the fatigue phenomenon andfatigue damage it can be concluded that such proposals are illusive. However,the idea to remove fatigue damage was considered already in the fifties. Basedon the idea that early fatigue damage consists of microcracks in a thin surfacelayer, removal of this layer can also remove the damage. This option has beenadopted by aircraft operators. If small cracks occur in bolt holes, the hole isreamed to a larger diameter and a larger bolt is inserted. Actually, thisprocedure has the character of a repair, but without a good understanding offatigue cracking in the structure a clever solution can not be introduced.Confirmation by experiments must be recommended.
35
7 EPILOGUE
In the beginning of the 20th century the knowledge about fatigue was still in itsinfancy, with respect to the fatigue phenomenon occurring in the material andthe engineering aspects. During the 20th century, and predominantly in thesecond half of this century, numerous research programs on fatigue problemswere carried out. Research was stimulated by the need for information ondesigning against fatigue as well as by scientific interest to understand thefatigue phenomenon. Moreover, significant developments were possible byfundamental improvements of techniques for calculations, experiments andmeasurements. Important stimuli for fatigue research also came fromcatastrophic accidents due to fatigue problems. In general, the purpose ofdesigning against fatigue is to avoid fatigue problems for reasons of safety,economy, durability and liability. Various aspects are involved which are notsolved by engineering science, but which should be considered by thecommunity in which we are living (see a recent paper by Miller [107]).
As a result of much work on fatigue problems in the 20th century, anextremely large number of papers, reports and books was published. Severalimpressions emerge from these publications. First, the variety of practicalfatigue problems is large. For instance, fatigue of a welded offshore structurein the open sea is entirely different from fatigue of a crank shaft of an engine,or fatigue of a pressurized aircraft fuselage. A second impression is that thesedifferent problems can now be well defined in terms of relevant conditions.Third, from a physical point of view the influences of the conditions on thefatigue behaviour are reasonably well understood thanks to extensive laboratoryresearch. However, the character of the understanding is primarily qualitative.The corollary of the qualitative understanding is the following conclusion: Aquantitative prediction of fatigue properties of a structure can not be givenbecause of the qualitative understanding of the complexity of fatigue damageaccumulation. Accurate fatigue predictions which designers prefer are stillsubjected to uncertainties. As a consequence, safety factors on predictions arerequired, and these factors have to be judiciously chosen, based on experience,information on data and spectra, knowledge of the governing conditions,statistical variations, and consequences of fatigue failures. The limited accuracyof predictions also emphasizes the significance of realistic simulation tests.With the present knowledge, the relevance of realistic testing can be welljudged.
Although the turn of the century is a matter of numbering years, it is goodto consider problems which should be further investigated in the 21st century.
36
Looking back on the experience of the last decades of the previous century, thelimited accuracy of predictions is a significant issue. This is especially true forprediction models which employ basic material data obtained on simplespecimens. Stress analysis need not be a real obstacle, but it is the fatiguebehaviour of structural elements which can not be realistically modeled insufficient detail. In general, fatigue models imply a large extrapolation stepfrom simple tests to a real structure. This is understood by various industrieswhich now perform service-simulation fatigue experiments close to the realityof the structures in service. As a result, the extrapolation step is drasticallyreduced although it remains a simulation within the constraints of experimentalpossibilities. Evaluation and validation of such tests on components stillrequire a profound understanding of the fatigue behaviour in service. Ifsomething is to be learned from these arguments, it is that education ofunderstanding fatigue scenarios of structures must be strongly advised.
In certain cases, it may be possible that conservative fatigue predictionscan be made, not accurate but conservative, and that the results indicate that anundesirable fatigue performance need not be feared (i.e. predictions on“fitness-for-purpose”). Workshop experience often reveals that frequentlyasked questions (FAQ’s) are: please give us material fatigue data andequations. However, without understanding the physical reality of the fullprediction scenario, the risk is that a calculation is carried out instead of atrustworthy prediction. Again there is a case for education.
An other important lesson of the previous century is that designing againstfatigue is possible. A considerable gain of knowledge on the influences ofvarious design and production aspects has been achieved. Also here, educationon designing against fatigue is required.
With respect to research topics to be continued, the tools used forpredictions should be further investigated. It was said before that there aremany different fatigue problems. Each problem has its own characteristicaspects, and it is certainly worthwhile to go into further depth to understand thephenomena involved. Unfortunately, the picture of financial support forresearch is changing. Decision makers require that economical profits shouldbe clear before the research is started (which in fact is a contradictio interminis). One can only hope that Universities and Research Laboratories willfind the funds for basic research. Some examples of topics deserving furtherresearch can be mentioned: predictions of the crack initiation life under biaxialloading, fatigue under variable-amplitude loading, corrosion fatigue, fatigue ofcomplex joints, fatigue of new materials, inspection techniques for detecting
37
minute fatigue cracks. In addition, industries come with new products and newmaterials, and the durability including fatigue will be a matter of concern forresearch. There is still some work for the future.
References[1] Ewing, J.A. and Humfrey, J.C.W. (1903) The fracture of metals under repeated
alternations of stress. Phil.Trans. Roy. Soc., Vol.A200, pp.241-250.[2] Peterson, R.E. (1950) Discussion of a century ago concerning the nature of
fatigue, and review of some of the subsequent researches concerning themechanism of fatigue. ASTM Bulletin, No.164, pp.50-56.
[3] Timoshenko, S. (1954) Stress concentration in the history of strength ofmaterials. The William M. Murray Lecture. Proc. SESA, Vol.12, pp.1-12.
[4] Hetényi, M. (1950) Handbook of Experimental Stress Analysis. John Wiley,New York.
[5] Mann, J.Y. (1983) Aircraft fatigue - with particular emphasis on Australianoperations and research. Proc. 12th ICAF Symp., Toulouse 1983. Centred'Essais Aéronautique de Toulouse.
[6] Schütz, W. (1996) A history of fatigue. Eng. Fract. Mech., Vol.54, pp.263-300.[7] Smith, R.A. (1986) Fatigue crack growth, 30 years of progress. Pergamon.[8] Sanfor, R.J. (ed.) (1997) Selected Papers on Foundations of Linear Elastic
Fracture Mechanics. SEM Classic papers, Vol. CP1, SPIE Milestone Series,Vol. MS 137.
[9] Hanewinckel, D. and Zenner, H. (1989) Fatigue Strength, a collection offacsimile, historical papers until 1950. Technical University Clausthal.
[10] Mann, J.Y. (1970-1990) Bibliography on the fatigue of materials, componentsand structures. Vol.1-4, covering 1838 to 1969, Pergamon Press.
[11] Schijve, J. (2001) Fatigue of Structures and Materials. Kluwer AcademicPubl.Dordrecht-Boston.
[12] Gough, H.J. (1933) Crystalline structure in relation to failure of metals,especially by fatigue. Proc. ASTM, Vol.33, pp.3-114.
[13] Orowan, E. (1939) Theory of the fatigue of metals. Proc. Roy. Soc. (A),Vol.171, p.79.
[14] Head, A.K. (1953) The growth of fatigue cracks”. Phil. Mag., Vol.44,pp.925-938.
[15] Stroh, A.N. (1955) The formation of cracks as a result of plastic flow. Proc.Roy. Soc. (A), Vol.223, p.404.
[16] Forsyth, P.J.E. (1957) The application of “fractography” to fatigue failureinvestigations. Roy. Aircraft Est., Tech. Note Met.257.
[17] Ryder, D.A. (1958) Some quantitative information obtained from theexamination of fatigue fracture surfaces. Roy. Aircraft Est., Tech. NoteMet.288.
38
[18] Cottrell, A.H. and Hull, D. (1957) Extrusion and intrusion by cyclic slip incopper. Proc. Roy. Soc. (A), pp.211-213.
[19] Mott, N.F. (1958) A theory of the origin of fatigue cracks. Acta Metallurgica,Vol.6, pp.195-197.
[20] A discussion on work-hardening and fatigue in metals (1957). Proc. Roy. Soc.,Math. Phys. Sciences, Vol.242, No. 1229.
[21] Averbach, B.L., Felbeck, D.K., Hahn, G.T. and Thomas, D.A. (1959) Fracture.Proc. Int. Conf. on the Atomic Mechanisms of Fracture. Tech. Press, MIT, JohnWiley & Sons.
[22] Forsyth, P.J.E. (1969) The Physical Basis of Metal Fatigue. Blackie and Son,London.
[23] Backofen, W.A. (1959) Formation of slip-band cracks in fatigue. Paper in [21],pp.435-449.
[24] Suresh, S. (1998) Fatigue of Materials (2nd ed.). Cambridge Un. Press,Cambridge.
[25] Fatigue Crack Propagation (1967). ASTM STP 415, pp.131-180 and 505-535.[26] Schijve, J. (1999) The significance of fractography for investigations of fatigue
crack growth under variable-amplitude loading. Fatigue Fract. Engng. Mater.Struct., Vol.22, pp.87-99.
[27] Bowles, C.Q. (1978) The role of environment, frequency and wave shapeduring fatigue crack growth in aluminum alloys. Doctor Thesis, Delft Un. ofTech. Also Report LR-270.
[28] Bowles, C.Q. and Schijve, J. (1983) Crack tip geometry for fatigue cracksgrown in air and vacuum. ASTM STP 811, pp.400-426.
[29] Broek, D., de Rijk, P. and Sevenhuysen, P.J. (1962) The transition of fatiguecracks in alclad sheet. Nat. Aerospace Lab., NLR, Amsterdam, TR M2100.
[30] Lindley, T.C. and Richards, C.E. (1974) The relevance of crack closure tofatigue crack propagation. Materials Science and Engineering, Vol.14, pp.281-293.
[31] Veer, F.A. (1993) The effect of shear lips, loading transition and test frequencyon constant �K and constant amplitude fatigue tests. Doctor Thesis, Delft Un.of Tech.
[32] Zuidema, J.(1995) Square and slant fatigue crack growth. Doctor Thesis, DelftUn. Tech.
[33] Schijve, J. and Arkema, W.J. (1976) Crack closure and the environmentaleffect on fatigue crack growth. Delft Un. of Tech., Report LR-217.
[34] Paris, P.C., Gomez, M.P. and Anderson, W.E. (1961) A rational analyticaltheory of fatigue. The Trend of Engineering, Vol.13, pp.9-14.
[35] Irwin, G.R. (1957) Analysis of stresses and strains near the end of a cracktraversing a plate. Trans. ASME, J. of Appl. Mechanics, Vol.24, pp.361-364.
[36] Pearson, S. (1975) Initiation of fatigue cracks in commercial aluminium alloysand the subsequent propagation of very short cracks. Eng. Fract. Mech., Vol.7,pp.235-247.
39
[37] Wanhill, R.J.H. (1991) Durability analysis using short and long fatigue crackgrowth data. Aircraft Damage Assessment and Repair. The Inst. ofEngineering, Barton, Australia.
[38] Miller, K.J. (1997) The three thresholds for fatigue crack propagation. Fatigueand Fracture Mechanics, 27th Volume. ASTM STP 1296, pp.267-286.
[39] Schijve, J. (1988) Fatigue crack closure observations and technicalsignificance. Mechanics of Fatigue Crack Closure. ASTM STP 982, pp.5-34.
[40] Elber, W. (1968) Fatigue crack propagation. Ph.D. Thesis, Un. New SouthWales, Australia.
[41] Elber, W.(1971) The Significance of Fatigue Crack Closure. Damage Tolerancein Aircraft Structures, ASTM STP 486, pp.230-242.
[42] Schijve, J. (1996) Fatigue crack growth under variable-amplitude loading.Fatigue and Fracture, ASM Handbook, Vol.19, pp.110-133.
[43] Coffin jr., L.F. (1962) Low cycle fatigue - A review. Appl. Mat. Research,Vol.1, p.129.
[44] Manson, S.S. and Hirschberg, M.H. (1964) Fatigue behavior in strain cyclingin the low- and intermediate-cycle range. Fatigue an InterdisciplinaryApproach, Syracuse Un. Press, pp.133-178.
[45] Stanzl-Tschegg, S. and Mayer, H. (2001) Fatigue in the very high cycle regime.Proc. Int. Conf., July 2001. Inst. Meteorology and Physics, Un. AgriculturalSc., Vienna.
[46] Frost, N.E., Marsh, K.J. and Pook, L.P. (1974) Metal Fatigue. Clarendon,Oxford.
[47] A guide for fatigue testing and the statistical analysis of fatigue data (1963)ASTM STP No.91-A.
[48] Bellows, R.S., Muju, S. and Nicholas, T. (1999) Validation of the step testmethod for generating Haigh diagrams for Ti-6Al-4V. Int. J.of Fracture,Vol.21, pp.687-697.
[49] Heywood, R.B.(1962) Designing against fatigue. Chapman and Hall, London.[50] Ramsden, J.M. (1977) The geriatric problem. Flight International, 22 Oct,
pp.1201-1207.[51] Neuber, H. (1937) Kerbspannungslehre. Springer, Berlin. Translation (1946)
Theory of Notch Stresses. J.W. Edwards, Ann Arbor, Michigan.[52] Peterson, R.E. (1974) Stress Concentration Factors. John Wiley & Sons, New
York.[53] Kuhn, P. and Hardrath, H.F. (1952) An engineering method for estimating
notch-size effect in fatigue tests of steel. NACA TN 2805.[54] Siebel, E. and Stieler, M. (1955) Significance of dissimilar stress distributions
for cyclic loading” (in German). Z.V.D.I., Vol.97, pp.146-148.[55] Schijve, J. (1992) Fundamental aspects of predictions on fatigue crack growth
under variable-amplitude loading. Theoretical Concepts and NumericalAnalysis of Fatigue. Proc. Conf. Un. of Birmingham (eds. A.F.Blom andC.J.Beevers). EMAS, pp.111-130.
40
[56] Rooke, D.P. and Cartwright, D.J. (1976) Stress Intensity Factors. Her Majesty'sStationary Office, London.
[57] Tada,H., Paris, P.C. and Irwin, G.R. (1985) The Stress Analysis Handbook (2nded.). Paris Productions Inc., St.Louis.
[58] Murakami, Y.(ed.) (1987/1993) Stress Intensity Factors Handbook. Pergamon,Oxford.
[59] Pålmgren, A. (1924) The endurance of ball bearings (in German).Z.Ver.Deut.Ing., Vol.68, pp.339-341.
[60] Langer, B.F.(1937) Fatigue failure from stress cycles of varying amplitude.J.Appl.Mech., Vol.4, pp.A.160-A.162.
[61] Miner, M.A. (1945) Cumulative damage in fatigue. J.Appl.Mech., Vol.12,pp.A159-A164.
[62] Schijve,J. (1956) Some remarks on the cumulative damage concept. Minutes4th ICAF Conf., Zürich, May 1956, paper 2.
[63] Heyer, K. (1943) Multi-step tests on structural elements (in German).Lilienthal-Gesellschaft für Luftfahrtforschung, Bericht 152.
[64] Smith, C.R. (1958) Fatigue-service life prediction based on tests at constantstress levels. Proc. SESA, Vol.16, No.1, p.9.
[65] Martin, J.F., Topper, T.H. and Sinclair, G.M. (1971) Computer basedsimulation of cyclic stress-strain behavior with applications to fatigue. Mats.Res. and Standards, Vol.11, pp.23-28, 50.
[66] Wetzel, R.M.(ed.) (1977) Fatigue under complex loading: Analysis andexperiments. Advances in Engineering, Vol.7, SAE.
[67] Neuber, H. (1961) Theory of stress concentration for shear strained prismaticalbodies with arbitrary nonlinear stress-strain law. Trans.ASME., J.AppliedMech., Vol.28, pp.544-550.
[68] Haibach, E. (1970) Modified linear damage accumulation hypothesisaccounting for a decreasing fatigue strength during increasing fatigue damage(in German). Lab. für Betriebsfestigkeit, LBF, Darmstadt, TM Nr.50.
[69] European Prestandard (1998). ENV 1999-2, May 1998.[70] Hardrath, H.F. and Naumann, E.C. (1960) Variable-amplitude fatigue tests on
aluminum alloy specimens. Fatigue of Aircraft Structures, ASTM STP 274,pp.125-138.
[71] Naumann, E.C., Hardrath, H.R. and Guthrie, E.C. (1959) Axial load fatiguetests of 2024-T3 and 7075-T6 aluminum alloy sheet specimens under constant-and variable-amplitude loads. NASA Report TN D-212.
[72] Schijve, J. (1972) The accumulation of fatigue damage in aircraft materialsand structures. AGARDograph No.157.
[73] Schijve, J. (1985) The significance of flight simulation fatigue tests. Durabilityand Damage Tolerance in Aircraft Design, Proc. 13th ICAF Symp. in Pisa1985, EMAS, Warley, pp.71-170.
[74] Schijve, J. (1961) Fatigue crack propagation in light alloy sheet material andstructures. Advances in Aeronautical Sciences, Vol.3, pp.387-408, Pergamon
41
Press.[75] Hudson, C.M. and Hardrath, H.F. (1961) Effects of changing stress amplitude
on the rate of fatigue crack propagation in two aluminum alloys. NASA TND-960.
[76] Mills, W.J. and Hertzberg, R.W. (1975) The effect of sheet thickness on fatiguecrack retardation in 2024-T3 aluminum alloy. Eng.Fract. Mech. Vol.7, pp.705-711.
[77] Petrak, G.S. (1974) Strength level effects on fatigue crack growth andretardation. Eng. Fract. Mech., Vol.6, pp.725-733.
[78] Willenborg,J., Engle, R.M. and Wood, H.A. (1971) A crack growth retardationmodel using an effective stress concept. AFFDL-TR71-1, Air Force FlightDynamic Laboratory, Dayton, OH.
[79] Wheeler, O.E. (1972) Spectrum loading and crack growth. ASME Trans., J.ofBasic Engng, Vol.94, pp.181-186.
[80] Padmadinata, U.H. (1990) Investigation of crack-closure prediction models forfatigue in aluminum sheet under flight-simulation loading. Doctor Thesis, DelftUn. of Tech.
[81] Koning, A.U.de (1981) A simple crack closure model for prediction of fatiguecrack growth rates under variable-amplitude loading. ASTM STP 743,pp.63-85.
[82] Padmadinata, U.H. and Schijve, J. (1994) Prediction of fatigue crack growthunder flight-simulation loading with the modified CORPUS model. AdvancedStructural Integrity Methods for Airframe Durability and Damage Tolerance.NASA Conf. Publ. 3274, (C.E.Harris, ed.), pp.547-562.
[83] Dugdale, D.S. (1960) Yielding of steel sheets containing slits. J. Mech. Phys.Solids, Vol.8, pp.100-104.
[84] Dill, H.D. and Saff, C.R. (1976) Spectrum crack growth prediction methodbased on crack growth surface displacement and contact analysis. FatigueCrack Growth under Spectrum Loading, ASTM STP 595, pp.306-319.
[85] Dill, H.D., Saff, C.R. and Potter, J.M. (1980) Effects of fighter attack spectrumand crack growth. Effects of Load Spectrum Variables on Fatigue CrackInitiation and Propagation, ASTM STP 714, pp.205-217.
[86] Newman,Jr., J.C. (1981) A crack-closure model for predicting fatigue crackgrowth under aircraft spectrum loading. Methods and Models for PredictingFatigue Crack Growth under Random Loading, ASTM STP 748, pp.53-84.
[87] Dougherty, D.J., de Koning, A.U. and Hillberry, B.M. (1992) Modelling hghcrack growth rates under variable amplitude loading. Advances in FatigueLifetime Predictive Techniques, ASTM STP 1122, pp.214-233.
[88] Wang, G.S. and Blom, A.F. (1991) A strip model for fatigue crack growthpredictions under general load conditions. Eng. Fract. Mech., Vol.40, pp.507-533.
[89] Gassner, E. (1939) Strength experiments under cyclic loading in aircraftstructures (in German). Luftwissen, Vol.6, pp.61-64.
42
[90] Teichmann, A. (1941) Basic consideration on fatigue durability in service (inGerman). Jahrbuch der Deutschen Luftfahrtforschung 1941, I, pp.467-471.
[91] Seewald, F. (1931) Measurements with a glass scratching recorder of theGerman Institute for Aeronautics (in German). Maschinenbau, Vol.10, pp.725-727.
[92] Taylor, J. (1953) Measurements of gust loads in aircraft. J. Roy. Aero. Soc.,Vol.57, pp.78-88.
[93] Data of the Fokker Aircraft Industry (1980).[94] Proc. 20th Symp. Aircraft Integrated Monitoring Systems (2000). Tech. Un.
Münich, Faculty Maschinenwesen, 2000.[95] Y.Murakami, Y. (ed.) (1992) The Rainflow Method in Fatigue, The Tatsuo
Endo Memorial Volume. Butterworth-Heinemann, Oxford.[96] Burns, A. (1956) Fatigue loadings in flight: Loads in the tailplane and fin of
a Varsity. A.R.C. Tech. Report C.P.256. London.[97] Standard practices for cycle counting in fatigue analysis. (1990) ASTM
Standard E 1049-90. [98] Branger, J. (1964) The full-scale fatigue test on the DH-112 Venom. Eidg.
Flugzeugwerk Emmen, F&W S-162, 1964.[99] Schijve, J. (1994) Fatigue predictions and scatter. Fatigue Fract. Engng. Mater.
Struct., Vol.17, pp.381-396.[100] Adenstedt, R. (2001) Scatter of the fatigue strength (in German). Doctor
Thesis, Tech. Un. of Clausthal.[100] Radai, D. (1996) Review of fatigue strength assessment of nonwelded and
welded structures based on local parameters. Int. J. of Fatigue, Vol.18, pp.153-170.
[102] Skorupa, M. Load interaction effects during fatigue crack growth undervariable amplitude loading- A literature review. Part I: Empirical trends, PartII: Qualitative interpretation. Fatigue Fract. Engng. Mater. Struct., Vol.21,pp.987-1006 and Vol.22, pp.905-926.
[103] Goranson,U.G. (1989) Continuous airworthiness of aging aircraft. Proc.2ndAnnual Int. Conf. on Aging Aircraft, Baltimore. Federal Aviation Adm. U.S.Dept of Trans., pp.61-89.
[104] Saff, C.R. and Holloway, D.R. (1981) Evaluation of crack growth gages forservice life tracking. Fracture Mechanics, 13th Conf., ASTM STP 743, pp.623-640.
[105] Wanhill, R.J.H., de Graaf, E.A.B. and Delil, A.A.M. (1979) Significance of arotor blade failure for fleet operation, inspection, maintenance, design andcertification. Fifth European Rotorcraft and Powered Lift Aircraft Forum,Paper 38. Amsterdam, Sep.4-7, 1979.
[106] Flatau, A.G. and Chong, K.P. (2002) Dynamic smart material and structuralsystems. Engng Structures, Vol.24, pp.261-270.
[107] Miller, K.J. (2001) Structural integrity - Whose responsibility?. The Inst. ofMechanical Engineers, The 36th John Player Memorial Lecture.
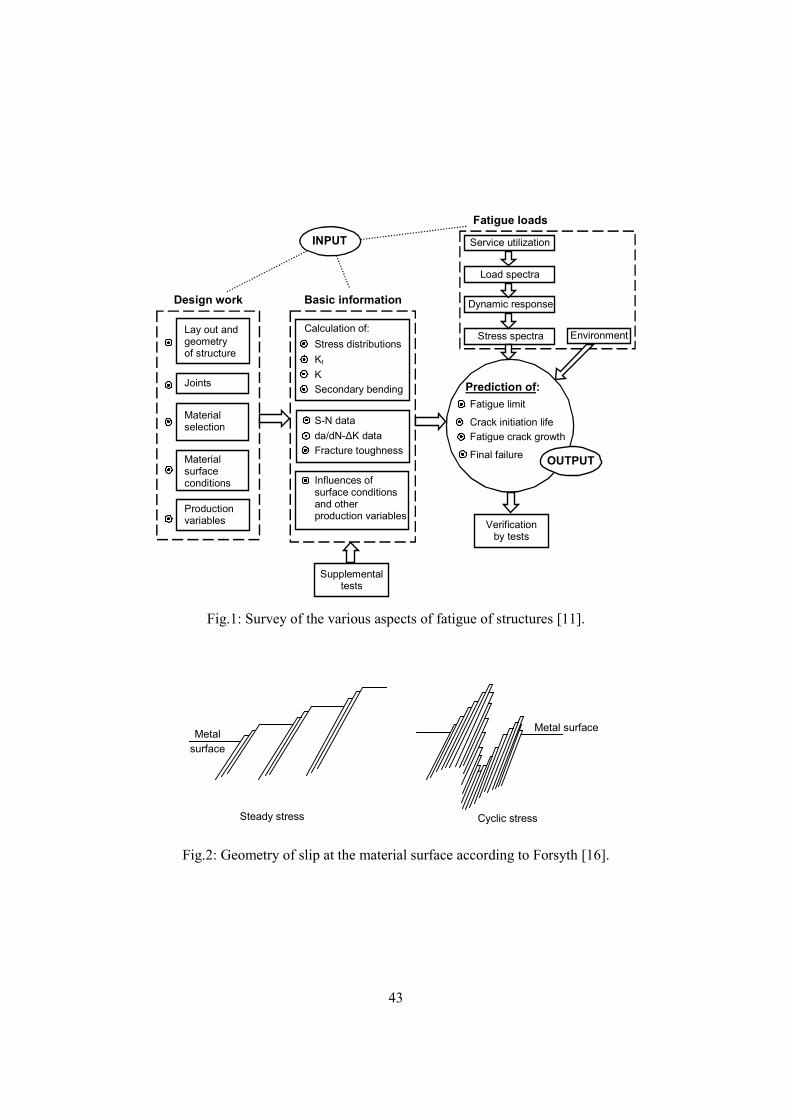
43
INPUT
OUTPUT
Design work Basic information
Prediction of:Fatigue limit
Crack initiation lifeFatigue crack growth
Final failure
Lay out andgeometryof structure
Joints
Materialselection
Materialsurfaceconditions
Productionvariables
Calculation of:Stress distributionsKt
KSecondary bending
S-N datada/dN-∆K dataFracture toughness
Influences ofsurface conditionsand otherproduction variables
Supplementaltests
Verificationby tests
Fatigue loads
Service utilization
Load spectra
Dynamic response
Stress spectra Environment
Fig.1: Survey of the various aspects of fatigue of structures [11].
Steady stress
Metalsurface
Metal surface
Cyclic stress
Fig.2: Geometry of slip at the material surface according to Forsyth [16].
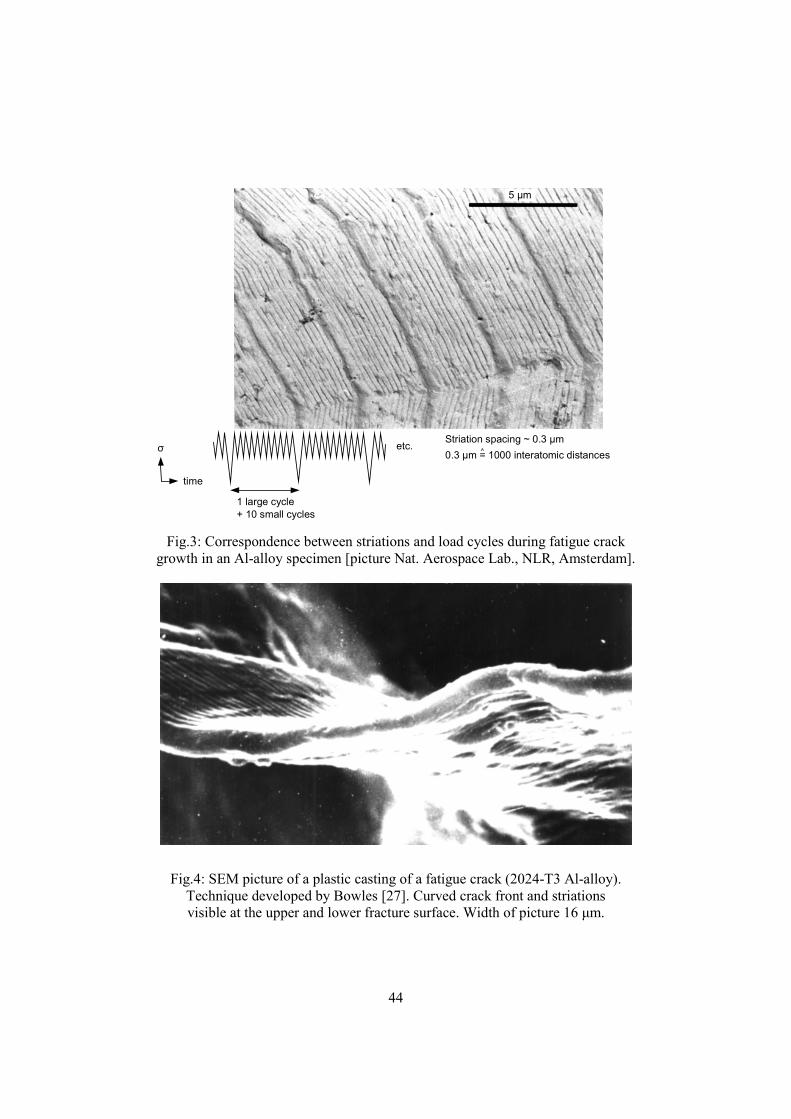
44
Striation spacing ~ 0.3 µm0.3 µm = 1000 interatomic distances
time
σ
1 large cycle+ 10 small cycles
etc. ^
5 µm
Fig.3: Correspondence between striations and load cycles during fatigue crackgrowth in an Al-alloy specimen [picture Nat. Aerospace Lab., NLR, Amsterdam].
Fig.4: SEM picture of a plastic casting of a fatigue crack (2024-T3 Al-alloy).Technique developed by Bowles [27]. Curved crack front and striationsvisible at the upper and lower fracture surface. Width of picture 16 µm.
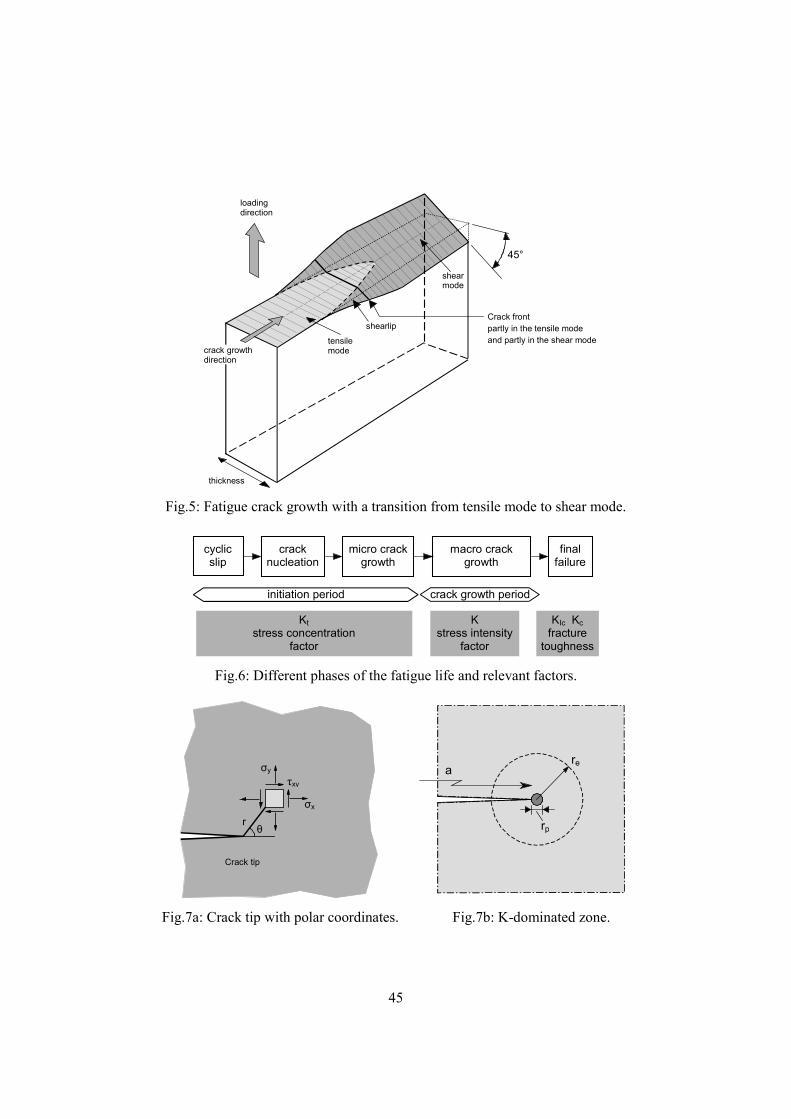
45
thickness
crack growthdirection
tensilemode
shearlip
shearmode
Crack frontpartly in the tensile modeand partly in the shear mode
loadingdirection
45°
Fig.5: Fatigue crack growth with a transition from tensile mode to shear mode.
cracknucleation
cyclicslip
micro crackgrowth
macro crackgrowth
finalfailure
initiation period crack growth period
Ktstress concentration
factor
Kstress intensity
factor
KIc Kcfracture
toughness
Fig.6: Different phases of the fatigue life and relevant factors.
σy
τxy
σx
θr
Crack tip
re
rp
a
Fig.7a: Crack tip with polar coordinates. Fig.7b: K-dominated zone.
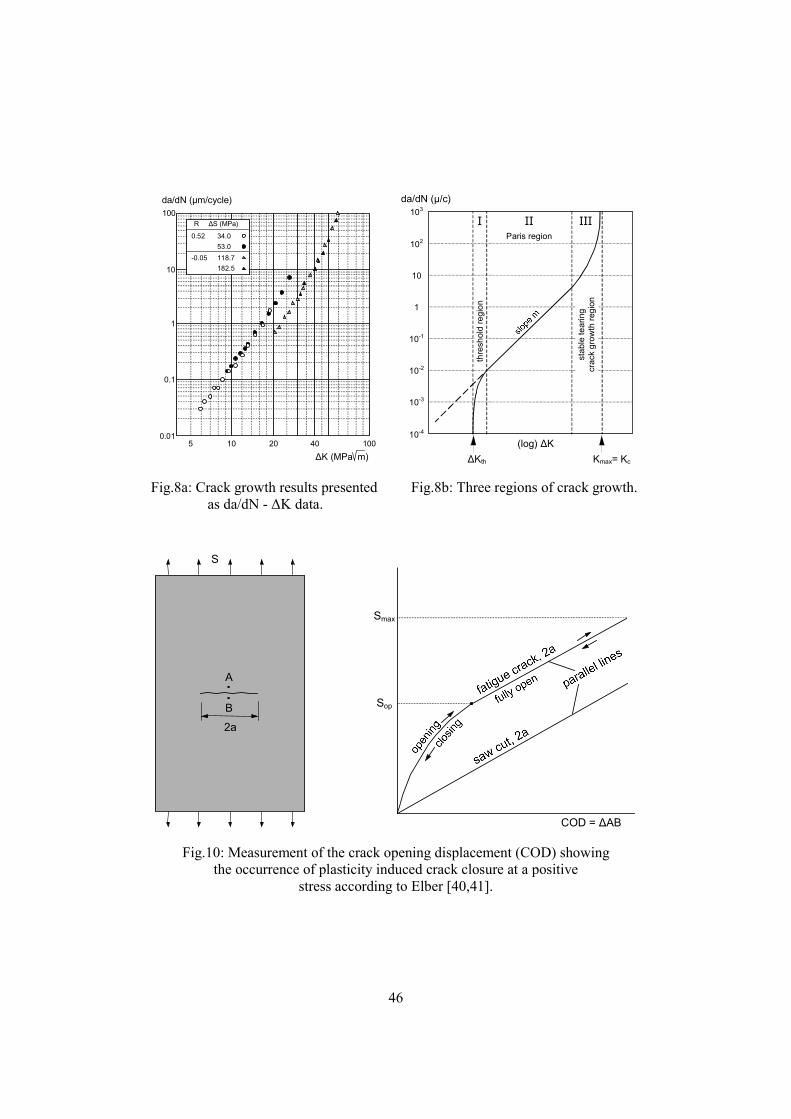
46
R ∆S (MPa)
0.52 34.053.0
-0.05 118.7182.5
da/dN (µm/cycle)
∆K (MPa m)5 10 20 40 100
0.01
0.1
1
10
100
∆Kth Kmax= Kc
(log) ∆K
103
102
10
1
10-1
10-3
10-2
10-4
da/dN (µ/c)
III IIIParis region
thre
shol
d re
gion
stab
le te
arin
gcr
ack
grow
th re
gion
Fig.8a: Crack growth results presented Fig.8b: Three regions of crack growth.as da/dN - ∆K data.
S
A
B
2a
Smax
Sop
COD = ∆AB
Fig.10: Measurement of the crack opening displacement (COD) showingthe occurrence of plasticity induced crack closure at a positive
stress according to Elber [40,41].
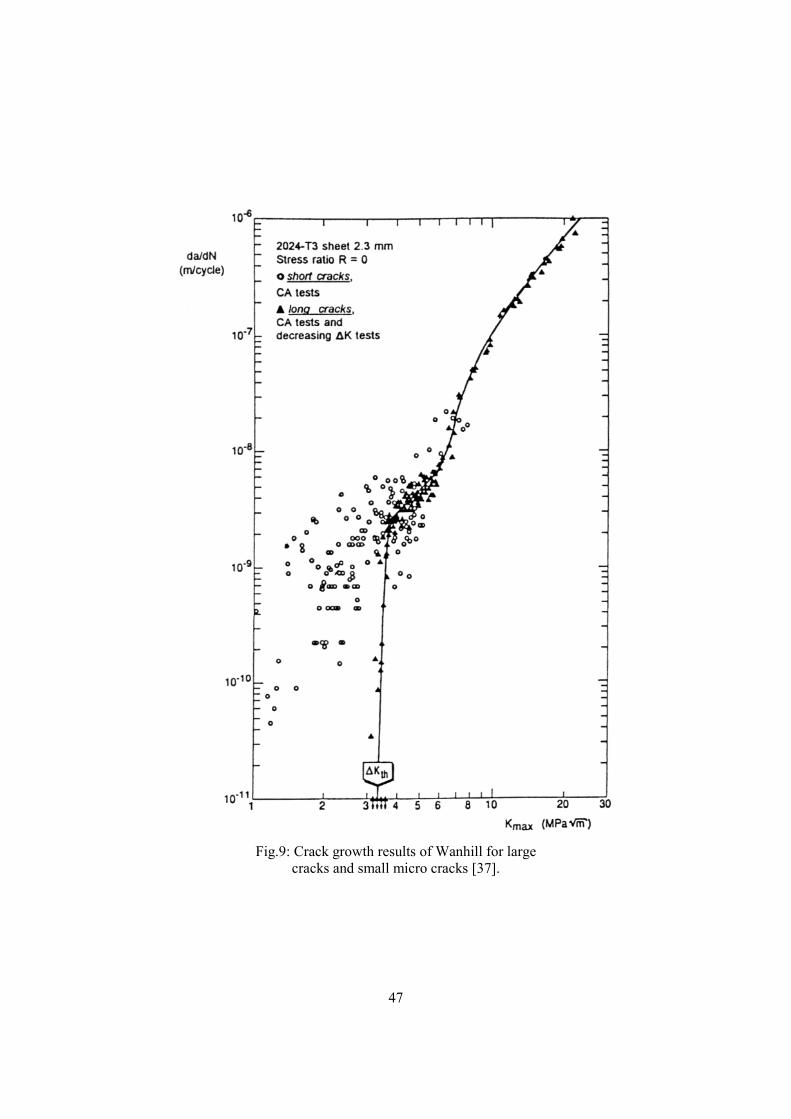
47
Fig.9: Crack growth results of Wanhill for largecracks and small micro cracks [37].
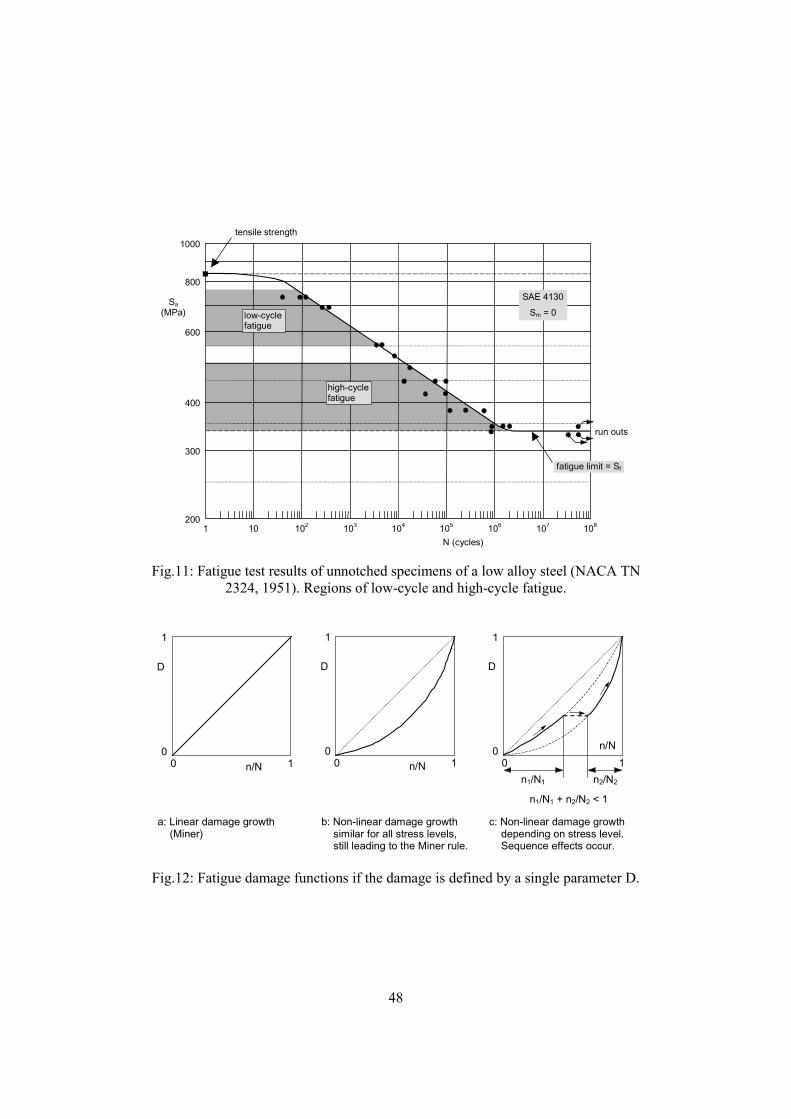
48
tensile strength1000
800
600
400
300
200
Sa(MPa)
1 10 102 103 104 105 106 107 108
N (cycles)
run outs
fatigue limit = Sf
SAE 4130
Sm = 0low-cyclefatigue
high-cyclefatigue
Fig.11: Fatigue test results of unnotched specimens of a low alloy steel (NACA TN2324, 1951). Regions of low-cycle and high-cycle fatigue.
n/Nn1/N1 n2/N2
0 1
1
D
0n/N0 1
1
D
00 1
1
D
0 n/N
n1/N1 + n2/N2 < 1
a: Linear damage growth(Miner)
b: Non-linear damage growthsimilar for all stress levels,still leading to the Miner rule.
c: Non-linear damage growthdepending on stress level.Sequence effects occur.
Fig.12: Fatigue damage functions if the damage is defined by a single parameter D.
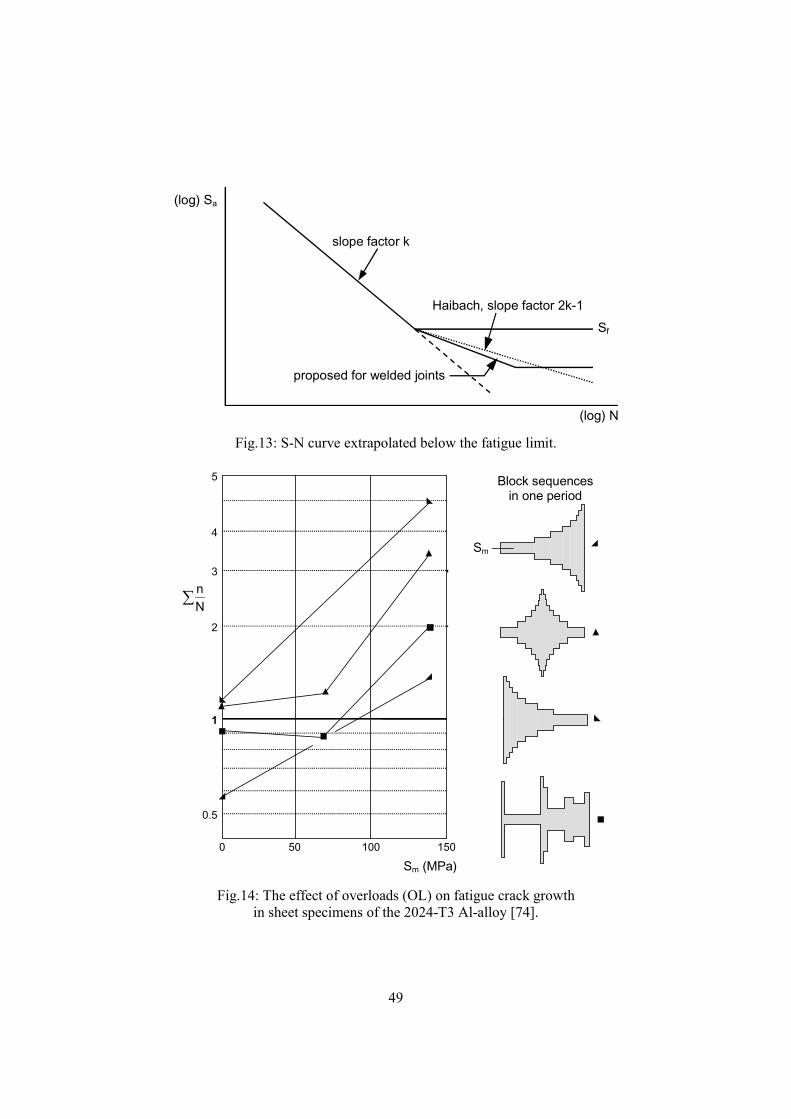
49
(log) Sa
slope factor k
Haibach, slope factor 2k-1
proposed for welded joints
Sf
(log) N
Fig.13: S-N curve extrapolated below the fatigue limit.
1
2
3
4
5
0.5
0 50 100 150
�Nn
Sm (MPa)
Sm
Block sequencesin one period
Fig.14: The effect of overloads (OL) on fatigue crack growthin sheet specimens of the 2024-T3 Al-alloy [74].
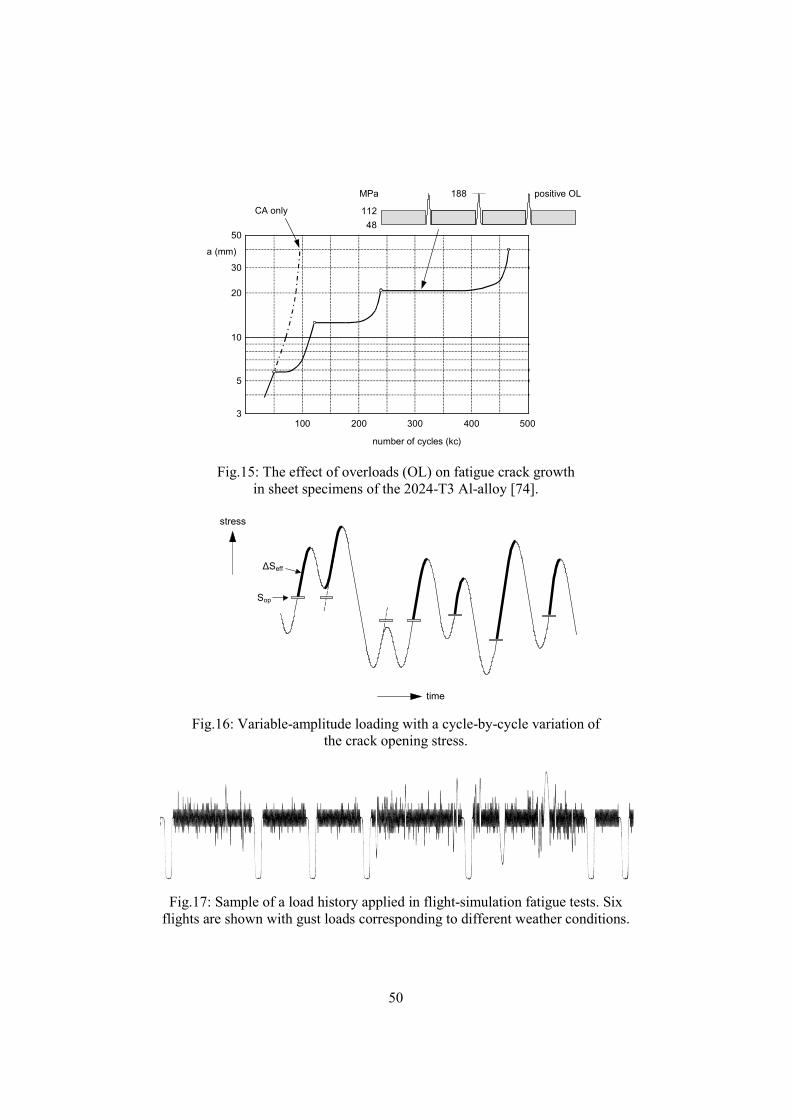
50
CA only
positive OL188MPa
11248
50
30
20
10
3
5
100 200 300 400 500
a (mm)
number of cycles (kc)
Fig.15: The effect of overloads (OL) on fatigue crack growthin sheet specimens of the 2024-T3 Al-alloy [74].
∆Seff
Sop
stress
time
Fig.16: Variable-amplitude loading with a cycle-by-cycle variation ofthe crack opening stress.
Fig.17: Sample of a load history applied in flight-simulation fatigue tests. Sixflights are shown with gust loads corresponding to different weather conditions.
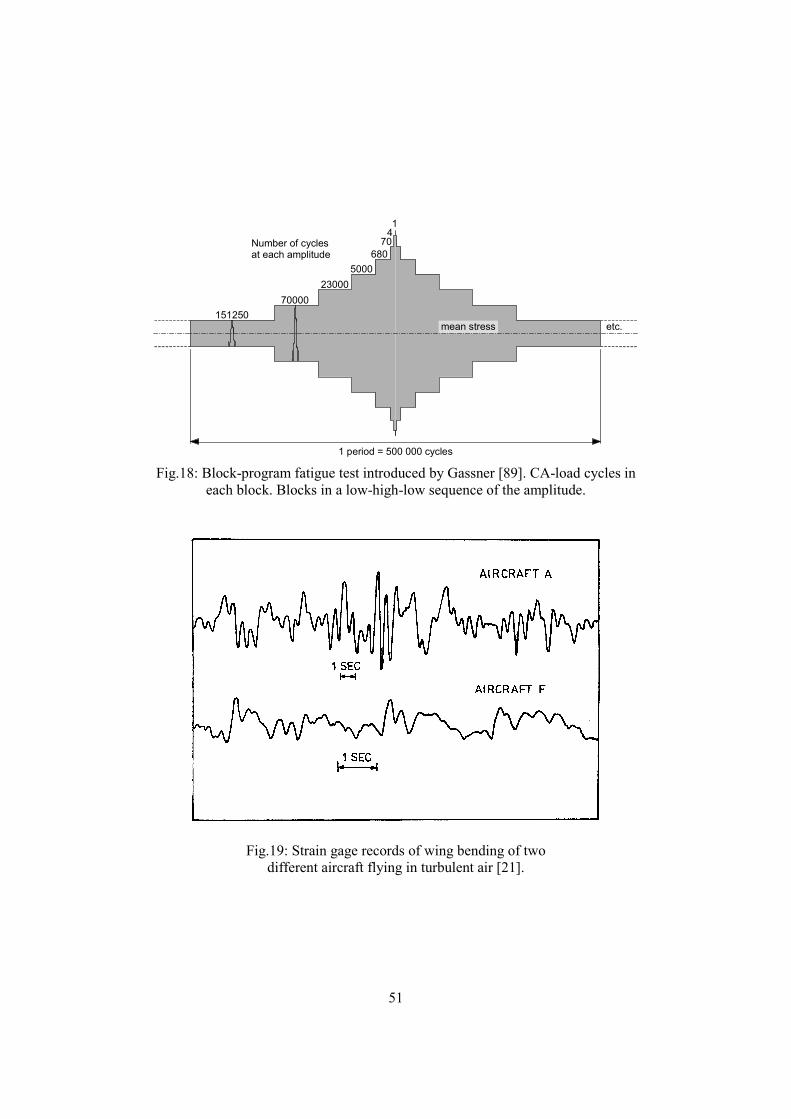
51
etc.
500023000
Number of cyclesat each amplitude
15125070000
68070
41
mean stress
1 period = 500 000 cycles
Fig.18: Block-program fatigue test introduced by Gassner [89]. CA-load cycles ineach block. Blocks in a low-high-low sequence of the amplitude.
Fig.19: Strain gage records of wing bending of twodifferent aircraft flying in turbulent air [21].
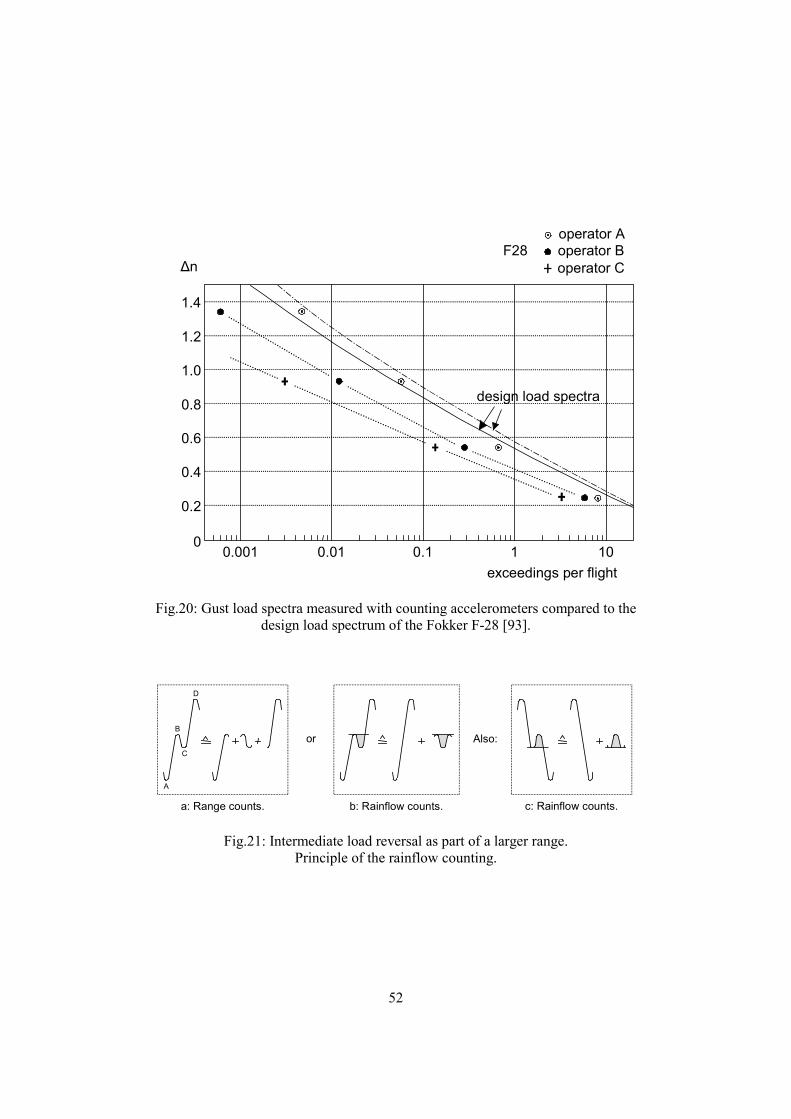
52
design load spectra
operator Aoperator Boperator C
F28
1.4
1.2
1.0
0.8
0.6
0.4
0.2
00.001 0.1 1 100.01
exceedings per flight
∆n
Fig.20: Gust load spectra measured with counting accelerometers compared to thedesign load spectrum of the Fokker F-28 [93].
A
B
C
D
or Also:
a: Range counts. b: Rainflow counts. c: Rainflow counts.
Fig.21: Intermediate load reversal as part of a larger range.Principle of the rainflow counting.