Pesticide applications by and with genetically modified (GM ...

Animal, page 1 of 10 & The Animal Consortium 2010doi:10.1017/S1751731110000728
animal
Fate of transgenic DNA and evaluation of metabolic effects ingoats fed genetically modified soybean and in their offsprings
R. Tudisco1, V. Mastellone2, M. I. Cutrignelli1, P. Lombardi3-, F. Bovera1, N. Mirabella3,G. Piccolo1, S. Calabro1, L. Avallone3 and F. Infascelli1
1Dipartimento di Scienze Zootecniche e Ispezione degli Alimenti, sez. B. Ferrara – Universita di Napoli ‘‘Federico II’’, Via F. Delpino, 1–80137 Napoli, Italy;2Dipartimento di Medicina Sperimentale e Clinica ‘‘Gaetano Salvatore’’, Universita di Catanzaro Magna Græcia, via Tommaso Campanella, 115 – 88100 Catanzaro,Italy; 3Dipartimento di Strutture, Funzioni e Tecnologie Biologiche, Universita di Napoli ‘‘Federico II’’, Via F. Delpino, 1–80137 Napoli, Italy
(Received 16 March 2009; Accepted 29 March 2010)
The presence of DNA fragments in blood and milk from goats fed conventional (control) or Roundup Ready�R soybean mealsolvent extracted (s.e.; treated) was investigated by using a polymerase chain reaction approach. The same investigation wascarried out on blood, skeletal muscle and organs from kids of both groups fed only dams’ milk until weaning. Moreover, thepossible effects on cell metabolism were evaluated by determination of several specific enzymes in serum, heart, skeletal muscle,liver and kidney. Fragments of the multicopy chloroplast (trnL) gene were found in blood and milk samples from goats of bothgroups. In kids, the chloroplast fragments were found in samples of both groups. In samples, which proved positive for thepresence of chloroplast DNA, fragments of the specific soybean single copy gene (lectin) were detected in several blood and milksamples. The same fragment was also found in control and treated groups of kids. Transgenic fragments were not found in thosesamples, which were found positive for chloroplast fragments of control groups of either goats or kids. On the contrary, in bloodand milk of treated goats, fragments both of the 35S promoter and the CP4 EPSPS gene were detected. These fragments werealso found in treated kids with a significant detection of the 35S promoter in liver, kidney and blood, and of the CP4 EPSPSgene fragment in liver, kidney, heart and muscle. A significant increase in lactic dehydrogenase, mainly concerning the lacticdehydrogenase-1 isoenzyme was found in heart, skeletal muscle and kidney of treated kids, thus suggesting a change in thelocal production of the enzyme. Finally, no significant differences were detected concerning kid body and organ weight.
Keywords: genetically modified soybean meal, goat, kid, DNA passage
Implications
No direct evidence has been reported about animal healtheffects of genetically modified (GM) feed. Although thecommercialisation of several GM feeds, including RoundUpReady�R soybean, has been authorised by the Europeanauthorities, concerns over safety still persist in the public,mainly regarding either the detection of transgenic plantgenes and proteins in animal systems or allergenicity andtoxicity of GM plants. The aims of this study were to evaluatethe presence of plant DNA fragments and the levels of somehealth parameters in animals fed on GM soybean.
Introduction
In recent years, genetic engineering has been widely appliedto agriculture in order to obtain specific plant characteristics,
which can lead to an improvement in both food qualityand production. In this context, the European Food SafetyAuthority has stated that no recombinant DNA sequenceshave been found in any organ or tissue sample from animalsfed genetically modified (GM) plants (EFSA, 2007). On thisbasis, a number of GM products have been approved forhuman consumption, but concerns over safety persist in thepublic, mainly regarding either the detection of transgenicplant genes and proteins in animal systems or allergenicityand toxicity of GM plants. Furthermore, some authors haveshown the possible survival of recombinant plant DNAfragments after digestion, although health implications as wellas biological relevance of data are still far from being confirmed(Nemeth et al., 2004; Mazza et al., 2005; Sharma et al., 2006).The absorption of plant DNA across the intestinal barrier is anatural event, as demonstrated by the detection of endogenousplant genes in several animal tissues and products (Reuterand Aulrich, 2003; Tony et al., 2003; Tudisco et al., 2006b).- E-mail: [email protected]
1

In a preliminary study (Laudadio et al., 2006) concerningpossible plant DNA fragment survival after digestive pro-cesses and their transfer and accumulation in tissues andorgans of offspring, we found the chloroplast sequence, butno transgenic fragments in blood and tissues from lambs feddam’s milk until weaning. No relations between GM foodand health have been reported to date.
Many feeding trials have been reported in which GM foodshave been administered to rats or mice for prolonged periods,and parameters such as body weight (BW), feed consumption,blood chemistry, organ weights and histopathology have beenmeasured. The majority of these experiments indicated noclinical effects nor histopathological abnormalities in organsor tissues of exposed animals (EFSA, 2008). By contrast,Malatesta et al. (2002) found significant nuclear modificationsof hepatocytes in young and adult (2 to 8 months of age)female mice fed on GM soybean. In particular, GM-fed miceshow irregularly shaped nuclei, which generally representsan index of high metabolic rate, and a higher number ofnuclear pores, suggesting intense molecular trafficking. Morerecently, the same authors (Malatesta et al., 2008) showedthat several proteins belonging to hepatocyte metabolism,stress response, calcium signalling and mitochondria wereexpressed in 24-month-old female mice fed on GM soybean,indicating a more marked expression of senescence markers incomparison to controls. Moreover, hepatocytes of GM-fedmice showed mitochondrial and nuclear modifications indi-cative of reduced metabolic rates. Furthermore, Tudisco et al.(2006a) hypothesised that cell metabolism of several enzymeswas altered in rabbit fed on GM soybean.
The aims of this study were to investigate the presence ofplant DNA fragments in blood and milk from goats fed GMsoybean and in tissues and organs from their kids fed onlymother’s milk for 60 days, and to study the activity of organ-specific enzymes.
Material and methods
Diets, animals and feedingTwenty pregnant dairy goats were equally assigned to con-trol (C) and treated (T) groups, homogeneous in parity andmilk production at the previous lactation. Animals from dif-ferent groups were housed in separate sheds. Experimentsstarted 2 months before kidding; the animals were fed a dietconsisting of oat hay and concentrate [crude protein (CP)18% of dry matter (DM); metabolisable energy (MJ/DM)12.22], the latter containing solvent extracted (s.e.) soybeanmeal (13% of concentrate DM) which was from conventionalor GM (RoundUp Ready�R (RR)) soy beans for groups C and T,respectively. RR is tolerant to the glyphosate family of her-bicides by expressing transgenic DNA from the CP4 strainof Agrobacterium tumefaciens (CP4 EPSPS), encoding 5-enolpyruvilshikimate-3-phosphate synthase protein (gly-phosate-tolerant soybean GTS 40-3-2; Padgette et al., 1995).A polymerase chain reaction (PCR)-end point reaction con-firmed the presence of p35S and CP4 EPSPS specific trans-genes in the treated diet as well as their absence in the
control diet. Both groups received oat hay ad libitum, whilethe concentrate was administered in amounts of 200, 300and 400 g/head per day, 60, 30 and 15 days before kidding,respectively. After kidding, administration of concentrate wasgradually increased up to 700 g/head per day and oat hay wasreplaced by alfalfa hay in order to increase diet protein content.Water was given ad libitum. The chemical composition (VanSoest et al., 1991; AOAC, 2000) and metabolisable energy(INRA, 1978) of hays and concentrate as well as ingredients ofconcentrate are reported in Table 1.
All goats had twin deliveries each of them with at leastone male kid. Immediately after kidding, 10 male kids, wererandomly selected from each group and allowed into indi-vidual cages positioned in a separate room. Each kid wasfed only milk from its mother using a milk feeder. Milk wascollected from each goat into sterile tubes with aseptictechniques and administered twice/day until 12 h beforeslaughtering. Kids were slaughtered at 60 6 7 days of age(11.2 6 1.1 kg live weight). Kid BWs were taken at birth andimmediately before slaughtering.
Sample collectionIn all, 20 dams (ten per group) with their kids were includedin the trial. After kidding, 100 ml of milk from each goat(obtained by mixing the production of the two daily milk-ings) were collected at days 15, 30, 45, 60 and 75. Sampleswere immediately frozen on dry ice before storage at 2208C.Blood was withdrawn every month (day 260 until day 60)from each goat via jugular vein puncture. Blood wasremoved from kids before slaughter. In both cases, samplesused for DNA extraction were added to tubes containingK3-EDTA (ethylene diamine tetra acetic acid) 7.5%. Beforeinserting the needle, the surface was cleaned and thefirst millilitre of blood was discarded in order to avoidcontamination.
Organs and tissues from kids (liver, spleen, kidney, heartand skeletal muscle) were removed. Slaughter and samplingrooms were close, but distinct in order to avoid possiblecontamination. For the same reason, the outermost layerof tissue from each organ was removed to sample the innerpart. Three aliquots (25 mg each) from each sample wereimmediately stored at 2208C in sterile tubes for DNA
Table 1 Chemical composition (g/kg DM) and ME (MJ/kg DM) of haysand concentrate
Oat hay Alfalfa hay Concentrate*
CP 55.0 160.0 180Ether extract 19.0 20.0 30.0NDF 682.0 493.0 270.0ADF 451.0 341.0 115.0ADL 61.0 50.0 30.0ME 6.36 9.39 12.22
DM 5 dry matter; ME 5 metabolisable energy.*Ingredients (g/Kg DM): soft wheat bran 30; soybean s.e. 13; corn meal 13;sunflower meal 10.5; citrus pulp 8; sugar beet pulp 7.9; corn gluten feed 7;sugarcane molasses 7.5; CaCO3 1.5; CaHPO4 0.7; vitamins 0.2; NACL 0.7.
Tudisco, Mastellone, Cutrignelli, Lombardi, Bovera, Mirabella, Piccolo, Calabro, Avallone and Infascelli
2

extraction. Later on, each aliquot underwent PCR reaction.Specimens from kidney, liver, heart and muscle from right legsamples (5 g each) were washed in saline and stored at2808C to determine enzyme activity.
DNA extraction and quantificationMilk (10 ml) and, as control, conventional and transgenic soy-bean meal s.e. samples (100 mg) were extracted in duplicateaccording to the Wizard extraction method (Promega, Madison,WI, USA). Milk samples were incubated at 48C overnight andcentrifuged (2.0003g for 20 min at 48C) to separate cream,skimmed milk and sediment; only the sediment fraction wassubjected to DNA extraction. The somatic cell pellet obtainedwas washed twice with phosphate buffered saline (PBS, pH7.2). The pellet and the ground plant samples were resus-pended by vortexing in 860 ml of extraction buffer [10 mMTris-HCl (pH 8.0), 150 mM NaCl, 2 mM EDTA, 1% (w/v) SDS],100 ml guanidine hydrochloride (5M) and 40 ml of proteinase K(20 mg/ml) and then incubated at 588C for at least 3 h on ashaking incubator and centrifuged at 20.0003g for 10 min.Five hundred microlitres of the supernatant were incubatedwith 5 ml RNAse (10 mg/ml) at 378C for 10 min. One millilitre ofWizard DNA purification resin (Promega) was added to thesupernatant. The DNA-resin mixture was pushed throughthe column and washed with 2 ml 80% (v/v) isopropyl alcoholfollowed by centrifugation at 20.0003g for 1 min. After dryingat 708C for 10 min, the DNA was eluted with 50 ml of 708Celution buffer [10 mM Tris-HCl (pH 9.0), 0.1 mM EDTA] andcentrifuged at 20.0003g for 1 min.
NucleoSpin�R Tissue and NucleoSpin�R Blood kit(Macherey-Nagel, Duren, Germany) were used for extractionof tissue (25 mg) and blood (200 ml) samples, respectively,according to the manufacturer’s protocol. Each sample wasextracted in duplicate and stored at 2208C until use. In sucha way, a total of six samples for each kid tissue and organwere obtained. In addition, as suggested by Nemeth (2004),negative (buffer only) control to each set of DNA extractionwas included to monitor for any contamination that couldhave occurred during the DNA extraction procedure. TheDNA was quantified by spectrophotometer (Thermo ElectronCorporation, Waltham, MA, USA) according to standardmolecular techniques (Sambrook et al., 1989).
PCR analysesIn order to avoid contamination, PCR reactions wereassembled in an ultraviolet-sterilised hood. Filter tips againstsample aerosol and sterile disposable tubes were usedduring pipetting. All PCR amplifications were performedon a Gene Amp PCR System 2400 (Applied Biosystems,Foster City, CA, USA). DNA was amplified using Taq DNApolymerase (Invitrogen, Carlsbad, CA, USA) in accordancewith the manufacturer’s instructions. Sequence, ampliconsize and annealing temperature of the primer pair sets(Sigma-Genosys Ltd, Haverhill, UK) used for PCR are shownin Table 2.
Primers Cap 144/496 were previously used to amplify aconserved portion of caprine mtDNA, which encodes the 12Sribosomal RNA (12S rRNA) gene of mitochondrial DNA fromcaprine (Bottero et al., 2002).
Subsequently, samples were monitored for the presence ofthe chloroplast sequence for tRNA Leu by using the Clor 1/2primers designed on the chloroplast trnL sequence (Terzi et al.,2004). The obtained amplicon was analysed by electro-phoretic separation and purified from gel. The identity wasverified by sequencing and subsequently by Basic LocalAlignment Search Tool (BLAST) analysis.
About the sensibility, we performed a real time PCR withClor1/Clor2 primer and specific TaqMan probe to verify thepresence of tRNA Leu gene, housekeeping gene in conven-tional and transgenic genotype. Then, we elaborated astandard curve and the results obtained demonstrated theefficiency of primer/probe combination to notice the pre-sence of soybean genotype and to give quantification.
Finally, species-specific primers for conventional and GMsoybean were used: Le1n02 5/3 which amplifies the soybeanlectin gene (Kuribara et al., 2002); 35S 1/2 and CP4 EPSPS 1/2which amplify, respectively, part of the 35S promoter (Lippet al., 1999) derived from the cauliflower mosaic virus andpart of the specific gene sequence (CP4 EPSPS) that providesherbicide tolerance derived from Agrobacterium tumefaciensstrain CP4 both present in the genomic structure of GMsoybean (Hernandez et al., 2003). The primer pairs wereselected from those reported in the literature (Jennings et al.,2003) with the aim of obtaining short amplicons (118 bp),compatible with highly fragmented DNA samples.
Table 2 Sequence (50-30), amplicon size (bp) and annealing temperature (8C) of primer pairs used in PCR
Fragment name Primer sequence (50-30) Amplicon size (bp) TM (8C)
Cap 144 CGC CCT CCA AAT CAA TAA G 326 55Cap 469 AGT GTA TCA GCT GCA GTA GGG TTClor1 TTCCAGGGTTTCTCTGAATTTG 100 60Clor2 TATGGCGAAATCGGTAGACGLe1n02-5 GCCCTCTACTCCACCCCCA 118 59Le1n02-3 GCCCATCTGCAAGCCTTTTT35S-1 GCTCCTACAAATGCCATCA 195 5635S-2 GATAGTGGGATTGTGCGTCACP4EPSPS 1 GCA AAT CCT CTG GCC TTT CC 145 60CP4EPSPS 2 CTT GCC CGT ATT GAT GAC GTC
GMO detection and health in goats and kids
3

A 100 base pairs (bp) ladder, containing linear DNA frag-ments, served as size standard reference. The PCR was donethree times, and samples with positive results at least twicewere judged as positive (Chowdhury et al., 2003b). In everyPCR run, positive and negative controls were included toensure reproducibility and absence of contaminants. For posi-tive controls, reference DNA consisting of purified conventionaland transgenic soybean DNA was amplified in parallel with thesamples to ensure correct performance of the PCR; for nega-tive control (buffer blank), water instead of DNA was added tothe PCR mix to check for cross contamination with soybeanDNA in the PCR mix or its constituents (Klaften et al., 2004).
Enzyme assayThe levels of aspartate aminotransferase (AST), alanine ami-notransferase (ALT), creatine kinase, lactic dehydrogenase(LDH), gamma glutamyltransferase (GGT) and alkaline phos-phatase were determined in serum and homogenates preparedfrom samples of liver, kidney, heart and skeletal muscle. Briefly,tissue (1 g) was homogenised in ice-cold homogenisation buffer(in mM): 280 mannitol, 10 KCl, 1 MgCl2, 0.2 Pefabloc SC, 10Hepes, pH 7.0 adjusted to pH 7 with Tris HCl 10 mM. Aftercentrifugation at 10 0003g for 10 min the upper layer wasused for analysis.
Enzyme activity was determined spectrophotometrically(340 nm) by using reagents from Spinreact SA (Sant Esteve deBas, Spain). Determinations were performed according to themanufacturer’s instructions, including the convertion of theresults into units/litre. In order to assess the isoenzymatic dis-tribution of LDH, electrophoretic separation was performed oneach sample. Briefly, 20 ml of sample were applied on celluloseacetate membranes and electrophoresis was performed underdenaturing conditions at 200 V for 50 min in barbital buffer.The substrate (tris pH 7.4, sodium lactate, sodium azide) wasincorporated in agarose and put on the acetate membraneimmediately after electrophoresis. Therefore, it was possibleto observe LDH isoenzymes (ISO-LAD commercial kits byChemetron Chimica S.p.A., Milan, Italy). Percentage of iso-enzyme fractions of total LDH were quantified by using adensitometer (CGA, Florence, Italy). Data were then convertedinto units/litre (serum) or units/gram of tissue (organs).
LDH histochemistrySamples were prepared using a cryostat: 10 mm sections wereobtained, with five serial sections put in every slide. The frozensections were air-dried and then incubated, always in the dark,in LDH-incubating medium at 378C for 10 min. The incubatedmedium consisted of 50 mM Tris-HCL (pH 7.4) containing67 mM sodium lactate (L 1375, Sigma-Aldrich, Milan, Italy),5 mM nitroblue tetrazolium (N 6876, Sigma), 5 mM MgCl2 and3 mM NAD (N1511, Sigma). Each sample, both from controland treated animals, was compared with its negative controlsection, which was obtained by incubation in incubatingmedium without sodium lactate. The histochemical reactionwas stopped, at the same time for every slide, by fixing thesection in formalin for 15 min at room temperature. The sec-tions were then counterstained with methyl green. The slides
were mounted in PBS/glycerol (1 : 1) and then examined andphotographed. Five slides for each examined tissue wereindependently evaluated by two observers using a DMRA2microscope (Leica Microsystems Wetzlar GmbH, Germany).
StatisticsDifferences in kid slaughter weight as well as spleen, liver,kidney and heart were tested by one way analysis of covar-iance (control v. treated group). Data were covariated for birthweight to reduce variations from the mean square error in thedependent variables. For goat milk and blood, differences ingene detection among sampling periods were tested by theCochran-Q test. The presence of plant DNA fragments in kidsblood, skeletal muscle and organs was analysed by usingthe x2 test. Results for enzyme assays were expressed asmean 6 standard deviation and differences between groupswere analysed by the Student’s t-test. All statistics wereperformed with SPSS 12.1 software (SPSS, 1999).
Results
BW of the kids at birth was on average 4.2 v. 3.7 kg,respectively for groups C and T. As a consequence, birthweight was used to covariate slaughter and organ weights.Neither body nor organ weights significantly differedbetween groups (Table 3).
Detection of DNA fragmentsThe quality of each DNA sample extracted from milk andblood of control and treated goats and from liver, kidney,skeletal muscle, spleen, heart and blood of each group ofkids was first verified using the Cap 144/496 primers thatwere used to amplify a conserved portion of caprine mtDNA12S rRNA sequence. An example is reported in Figure 1.
Table 3 Body and organ weights in control (n 5 10) and treated(n 5 10) kids fed RoundUp Ready�R soybean meal
Control Treated m.s.e.
BW (kg) 11.68 10.73 1.64Spleen (g) 36.03 30.83 42.81Liver (g) 312.2 243.3 1898.6Kidney (g) 77.46 59.11 167.3Heart (g) 106.4 69.61 1285.1
All data were collected at slaughter.
Figure 1 Representative electrophoresis gels of amplified DNA in: (left)milk and blood from control (lines 1 and 3) and treated (lines 2 and 4)goats; (right) liver, kidney, skeletal muscle, spleen, heart and blood fromcontrol (lines 1 to 6, respectively) and treated (lines 7 to 12, respectively)kids. In each panel, lane M contains a 100 bp DNA ladder; ‘2’ is a negativecontrol (no DNA template).
Tudisco, Mastellone, Cutrignelli, Lombardi, Bovera, Mirabella, Piccolo, Calabro, Avallone and Infascelli
4
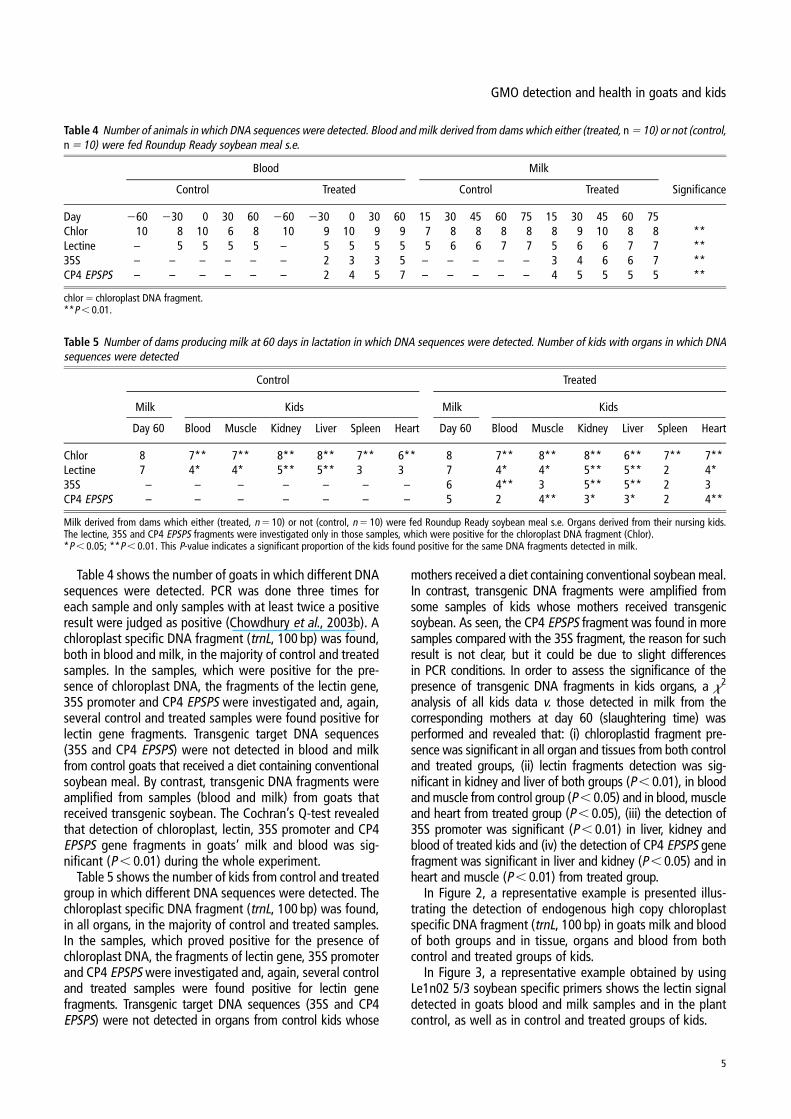
Table 4 shows the number of goats in which different DNAsequences were detected. PCR was done three times foreach sample and only samples with at least twice a positiveresult were judged as positive (Chowdhury et al., 2003b). Achloroplast specific DNA fragment (trnL, 100 bp) was found,both in blood and milk, in the majority of control and treatedsamples. In the samples, which were positive for the pre-sence of chloroplast DNA, the fragments of the lectin gene,35S promoter and CP4 EPSPS were investigated and, again,several control and treated samples were found positive forlectin gene fragments. Transgenic target DNA sequences(35S and CP4 EPSPS) were not detected in blood and milkfrom control goats that received a diet containing conventionalsoybean meal. By contrast, transgenic DNA fragments wereamplified from samples (blood and milk) from goats thatreceived transgenic soybean. The Cochran’s Q-test revealedthat detection of chloroplast, lectin, 35S promoter and CP4EPSPS gene fragments in goats’ milk and blood was sig-nificant (P , 0.01) during the whole experiment.
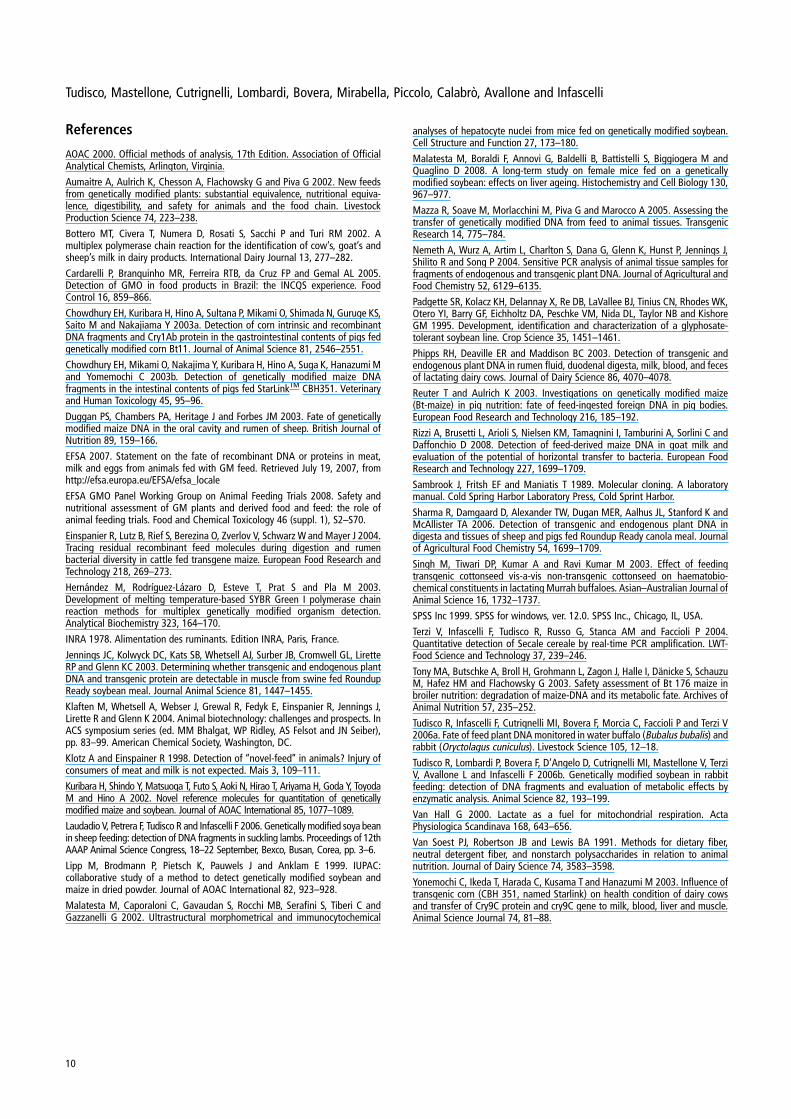
Table 5 shows the number of kids from control and treatedgroup in which different DNA sequences were detected. Thechloroplast specific DNA fragment (trnL, 100 bp) was found,in all organs, in the majority of control and treated samples.In the samples, which proved positive for the presence ofchloroplast DNA, the fragments of lectin gene, 35S promoterand CP4 EPSPS were investigated and, again, several controland treated samples were found positive for lectin genefragments. Transgenic target DNA sequences (35S and CP4EPSPS) were not detected in organs from control kids whose
mothers received a diet containing conventional soybean meal.In contrast, transgenic DNA fragments were amplified fromsome samples of kids whose mothers received transgenicsoybean. As seen, the CP4 EPSPS fragment was found in moresamples compared with the 35S fragment, the reason for suchresult is not clear, but it could be due to slight differencesin PCR conditions. In order to assess the significance of thepresence of transgenic DNA fragments in kids organs, a x2
analysis of all kids data v. those detected in milk from thecorresponding mothers at day 60 (slaughtering time) wasperformed and revealed that: (i) chloroplastid fragment pre-sence was significant in all organ and tissues from both controland treated groups, (ii) lectin fragments detection was sig-nificant in kidney and liver of both groups (P , 0.01), in bloodand muscle from control group (P , 0.05) and in blood, muscleand heart from treated group (P , 0.05), (iii) the detection of35S promoter was significant (P , 0.01) in liver, kidney andblood of treated kids and (iv) the detection of CP4 EPSPS genefragment was significant in liver and kidney (P , 0.05) and inheart and muscle (P , 0.01) from treated group.
In Figure 2, a representative example is presented illus-trating the detection of endogenous high copy chloroplastspecific DNA fragment (trnL, 100 bp) in goats milk and bloodof both groups and in tissue, organs and blood from bothcontrol and treated groups of kids.
In Figure 3, a representative example obtained by usingLe1n02 5/3 soybean specific primers shows the lectin signaldetected in goats blood and milk samples and in the plantcontrol, as well as in control and treated groups of kids.
Table 4 Number of animals in which DNA sequences were detected. Blood and milk derived from dams which either (treated, n 5 10) or not (control,n 5 10) were fed Roundup Ready soybean meal s.e.
Blood Milk
Control Treated Control Treated Significance
Day 260 230 0 30 60 260 230 0 30 60 15 30 45 60 75 15 30 45 60 75Chlor 10 8 10 6 8 10 9 10 9 9 7 8 8 8 8 8 9 10 8 8 **Lectine – 5 5 5 5 – 5 5 5 5 5 6 6 7 7 5 6 6 7 7 **35S – – – – – – 2 3 3 5 – – – – – 3 4 6 6 7 **CP4 EPSPS – – – – – – 2 4 5 7 – – – – – 4 5 5 5 5 **
chlor 5 chloroplast DNA fragment.**P , 0.01.
Table 5 Number of dams producing milk at 60 days in lactation in which DNA sequences were detected. Number of kids with organs in which DNAsequences were detected
Control Treated
Milk Kids Milk Kids
Day 60 Blood Muscle Kidney Liver Spleen Heart Day 60 Blood Muscle Kidney Liver Spleen Heart
Chlor 8 7** 7** 8** 8** 7** 6** 8 7** 8** 8** 6** 7** 7**Lectine 7 4* 4* 5** 5** 3 3 7 4* 4* 5** 5** 2 4*35S – – – – – – – 6 4** 3 5** 5** 2 3CP4 EPSPS – – – – – – – 5 2 4** 3* 3* 2 4**
Milk derived from dams which either (treated, n 5 10) or not (control, n 5 10) were fed Roundup Ready soybean meal s.e. Organs derived from their nursing kids.The lectine, 35S and CP4 EPSPS fragments were investigated only in those samples, which were positive for the chloroplast DNA fragment (Chlor).*P , 0.05; **P , 0.01. This P-value indicates a significant proportion of the kids found positive for the same DNA fragments detected in milk.
GMO detection and health in goats and kids
5

Transgenic target DNA sequences (35S and CP4 EPSPS)detected in either goats that received a diet containing trans-genic soybean meal or their kids as well as in the RoundUpReady soybean positive control are represented in Figure 4. Inparticular, in blood and milk of treated goats, Figure 4 showsfragments of 35S promoter and fragments of the CP4 EPSPSgene. In treated kids, a representative detection of fragmentsof 35S and the CP4 EPSPS gene is reported.
Since it could be likely that the DNA detected may betoo small to be of any biological significance, we later
investigated whether larger DNA fragments could bedetected in milk samples. To this purpose, a primer ampli-fying a fragment of 447 bp of the p-35S/CP4 EPSPS gene(Cardarelli et al., 2005) was used. In 57% of the samples thatwere found positive for smaller transgenic fragment, suchsequence was detected (see addendum).
Enzyme activityAs depicted in Table 6, AST and ALT were significantly lowerin serum from goats fed GM soybean at day 60 and at days30 and 60, respectively. Overall, very limited differences inthe monitored enzyme activity have been observed.
Figure 5 shows the differences in enzyme activity in kids’heart, skeletal muscle, kidney, liver and serum. Statisticaldifferences (P , 0.05) were detected in kidney for GGT andLDH, whereas in the heart and skeletal muscle this result wasseen only for LDH (P , 0.05). Hence, in five of the 30 casespresented, differences were observed.
No statistical differences were found for studied enzymesin serum and liver. The increase in LDH activity was con-firmed by histochemistry (Figure 6). LDH histochemistryshowed a widespread distribution of enzyme activity in allthe tissues that were examined. The expression of LDHactivity was further illustrated by a violet staining in thecytoplasm of the cells. In tissue sections used as negativecontrols this staining was light blue. Myocytes, myocardio-cytes, epithelial cells of renal tubules and hepatocytes allexpressed LDH activity. LDH staining was more intensein myocytes, myocardiocytes and epithelial cells of renaltubules of treated than in those of control animals. Arrowsshow some zones where LDH histochemical staining is moreintense. No difference was observed between the twogroups of animals in hepatocytes.
Table 7 shows the relative distribution of LDH isoenzymes inserum and in tissues. Significant differences (P , 0.05)between control and treated animals were detected for heartand kidney LDH1 and for muscles LDH1 and LDH2, thus con-firming the significant increase of the enzyme in these tissues.
In addition, analysis of isoenzyme distribution revealedthat LDH1 significantly increased also in the liver if wecompare the proportional distribution of isoenzymes (51.2 6
3.7 v. 57.8 6 1.4). Moreover, heart LDH2 (4.4 6 1.9 v. 2.9 6
0.9) and LDH3 (1.9 6 0.4 v. 1.1 6 0.7) significantly decreasedand a similar result was seen for muscle LDH5 (55.6 6 5.7v. 49.4 6 2.8).
Discussion
In our study, the weight of the organs of kids did not differbetween groups, in accordance to findings of previousresearch (Tudisco et al., 2006b) carried out on rabbits fedGM soybean meal.
Detection of DNA fragmentsAs stated by the EFSA (2008), several aspects have to beinvestigated when considering whether or not recombinantDNA from GM plants, or the derived proteins can end up in
Figure 2 Confirmation of amplified endogenous chloroplast specific DNAfragments, trnL (representative data) in: (left) milk and blood from control(lines 1 and 3) and treated (lines 2 and 4) goats; (right) liver, kidney,skeletal muscle, spleen, heart and blood from control (lines 1 to 6,respectively) and treated (lines 7 to 12, respectively) kids. In each panel,lane M contains a 100 bp DNA ladder; ‘2’ is a negative control (no DNAtemplate) and ‘1’ is a positive control (DNA extracted from soybean meal).
Figure 3 Representative electrophoresis analysis of single copy specificsoybean DNA fragment, lectin gene in: (left) milk and blood from control(lines 1 and 3) and treated (lines 2 and 4) goats; (right) liver, kidney, skeletalmuscle, spleen, heart and blood from control (lines 1 to 6, respectively) andtreated (lines 7 to 12, respectively) kids. In each panel, lane M contains a100 bp DNA ladder; ‘2’ is a negative control (no DNA template), and ‘1’ is apositive control (DNA extracted from soybean meal).
Figure 4 Representative data of amplified transgenic DNA fragments. (a) 35Spromoter fragments (195 bp) in milk and blood from control (lines 1 and 2,respectively) and treated (lines 3 and 4, respectively) goats. (b) 35S promoterfragments (195 bp) in liver, kidney, spleen, heart, skeletal muscle and bloodfrom control (lines 7 to 12, respectively) and treated (lines 1 to 6, respectively)kids. (c) fragments of CP4 EPSPS gene (145 bp) in milk and blood from control(lines 3 and 4, respectively) and treated (lines 1 and 2, respectively) goats.(d) fragments of CP4 EPSPS gene (145 bp) in liver, kidney, spleen, heart,skeletal muscle and blood from control (lines 1 to 6, respectively) and treated(lines 7 to 12, respectively) kids. In each panel, lane M contains a 100-bp DNAladder, ‘2’ is a negative control (no DNA template), and ‘1’ is a positivecontrol (DNA extracted from Roundup Ready soybean meal).
Tudisco, Mastellone, Cutrignelli, Lombardi, Bovera, Mirabella, Piccolo, Calabro, Avallone and Infascelli
6

animal tissues and products. These include (i) the fate of therecombinant DNA and protein during feed processing andensiling; (ii) the fate of the recombinant DNA and protein
in the gastrointestinal tract of animals fed with GM feed;(iii) the potential absorption of the digested pieces of DNAor protein into animal tissues/products and (iv) the potential
Table 6 Monthly levels of AST, ALT, CK, LDH, GGT and ALP in serum taken 60 days before to 60 days after lambing from control (C) and treated (T)group of goats
Day
260 230 0 30 60
Enzyme (U/l) Group Mean s.d. Mean s.d. Mean s.d. Mean s.d. Mean s.d.
CK C 64.4 15.77 59.7 15.38 59.5 14.89 58.1 15.52 59.3 19.71T 58.5 19.36 60.0 15.51 57.2 16.67 58.1 15.19 53.7 15.64
AST C 137.7 17.59 143 30.1 137.2 27.71 125.5 30.18 146 36.9T 138.9 37.79 135.1 34.21 138.1 26.63 115.5 20.61 121.5* 22.56
ALT C 22 10.3 24.1 9.57 21.8 7.00 27.4 7.12 24.1 7.32T 21.4 2.49 20.5 6.32 19.9 4.67 20.5* 8.17 19.3* 4.00
ALP C 301.5 69.36 286.5 112.28 265.5 90.23 335 115.7 294.6 95.64T 289.1 98.88 238.8 63.42 286.7 73.12 253.5 68.32 216.8 93.00
GGT C 40.7 13.28 47.8 26.52 43.6 18.94 40.6 21.58 39.4 15.18T 37.8 13.47 51 12.3 41 18.7 46.7 14.56 42.9 19.88
LDH C 1034.7 373.38 1072 452.0 1059 423.6 969 460.0 1065.2 374.63T 1028.6 385.00 1014.9 316.11 1103.1 554.71 963.4 494.08 1013.7 301.00
AST 5aspartate aminotransferase; ALT 5alanine aminotransferase; CK 5 creatine kinase; LDH 5 lactic dehydrogenase; GGT 5 gamma glutamyltransferase;ALP 5alkaline phosphatase.*P , 0.05 control (C) v. treated (T) dams.
Figure 5 Levels of creatine kinase (CK), lactic dehydrogenase (LDH), aspartate aminotransferase (AST), alanine aminotransferase (ALT), gammaglutamyltransferase (GGT) and alkaline phosphatase (ALP) in serum and in homogenates from liver, kidney, heart and skeletal muscle from control ( ) andtreated ( ) kids. *P , 0.05.
GMO detection and health in goats and kids
7

of biological functionality of absorbed DNA and proteinfragments.
Our findings show plant DNA fragments are likely to survivedigestive processes to some extent (Duggan et al., 2003;Einspanier et al., 2004), as well as their transfer to blood and
milk. In addition, the detection of plant DNA in tissues andorgans of nursed kids could support the hypothesis of a genetransfer through milk. Chloroplast target DNA sequenceswere found in our previous research in blood and tissues oflambs allowed to nurse from the dam. However, no single
Figure 6 LDH histochemistry on negative control sections (a, d, g, l), control (b, e, h, m) and treated (c, f, i, n) animals. LDH activity was revealed by a violetstaining. In negative control sections, a light bluish staining was observed. In the skeletal muscle, heart and epithelial cells of the renal tubule of treatedanimal (c, f, i) the intensity of LDH staining (arrows) was higher than in the same tissues (b, e, h) of control animals. Bar 5 50 mm.
Table 7 Relative distribution of LDH isoenzymes in serum (S) and in homogenates from heart (H), SM, kidney (K) and liver (L) from control (C) andtreated (T) group of kids
Relative distribution of LDH isoenzymes (U/g)
Total LDH activity LDH-1 LDH-2 LDH-3 LDH-4 LDH-5
Tissue Group Mean s.d. Mean s.d. Mean s.d. Mean s.d. Mean s.d. Mean s.d.
S (U/L) C 913 148.2 23.2 6.89 47.6 11.00 56.4 7.36 209.9 31.00 575.8 103.00T 873 134.7 24.2 7.56 46.3 9.11 55.6 15.42 209.4 27.00 537.5 87.46
H (U/g) C 245.9 63.77 224.5 57.82 11 3.8 4.6 1.00 2.9 3.61 2.8 2.71T 318.2* 57.39 300.2* 52.71 9 2.4 3.8 2.87 2.5 1.47 2.6 1.38
SM (U/g) C 403 76.71 56.2 10.19 45.9 36.12 36.1 8.78 39 13.0 226.5 59.00T 517* 132.52 100.5* 35.61 61.2* 17.33 51 23.1 48.8 18.00 255.5 67.81
K (U/g) C 47 9.0 27.8 5.78 11.8 2.67 4.9 1.13 1.3 0.51 1.2 0.74T 66.8* 16.53 42.5* 10.89 15.5 4.48 6.1 2.11 1.4 0.78 1.3 0.52
L (U/g) C 134.7 36.18 68.7 17.42 25.5 6.21 16.7 6.56 12.2 5.11 11.7 6.31T 144.2 27.00 83.5 17.46 26.8 1.72 16.2 4.00 8.8 3.33 8.9 4.56
LDH 5 lactic dehydrogenase; SM 5 skeletal muscle.*P , 0.05 control (C) v. treated (T) dams.
Tudisco, Mastellone, Cutrignelli, Lombardi, Bovera, Mirabella, Piccolo, Calabro, Avallone and Infascelli
8

copy feed fragment was detectable in lamb samples nor inthe mother’s milk and blood. The reason for this highrecovery of chloroplast DNA in animal tissues is a con-sequence of the larger quantities of these genes as com-pared with transgenic genes, which are usually found as asingle copy gene (Aumaitre et al., 2002).
Although few have found recombinant DNA sequences inany organ or tissue sample from animals fed GM plants(EFSA, 2007), our results showed that small DNA fragmentscan also be detected in kids organs when mothers are fedGM soybean. Recombinant plant DNA has also been foundby other authors as a rare event (Chowdhury et al., 2003a;Mazza et al., 2005; Sharma et al., 2006) in organs and tis-sues of animals fed GM feeds. On the contrary, studiesaiming at verifying the presence of transgenic fragments inmilk gave negative results. In dairy cows fed GM soybeanthe chloroplastid sequence was found in leucocytes but notin milk (Klotz and Einspanier, 1998). In other trials carried outwith dairy cows fed GM soybean meal and maize (Phippset al., 2003; Nemeth et al., 2004) or goats fed GM maize(Rizzi et al., 2008), the chloroplast DNA fragments weredetected in milk, but no transgenic fragments were found.
Detection of GM sequence in animal organs and tissuesalone cannot justify the public concern regarding the humanconsumption of products from farm animals fed transgeniccrops. Indeed, the implications of DNA transfer from foodcontaining GM plants to an organism is no higher as com-pared with DNA transfer from food containing the corre-sponding conventional plant (Mazza et al., 2005).
Enzyme assayIn goats, a significant decrease in AST (day 60) and ALT (days30 and 60) was detected in serum from goats fed GM soy-bean, but in both groups enzyme levels were in the normalrange. Therefore, such difference should have no clinicalrelevance. Similarly, lower levels of ALT were found in serumfrom buffaloes fed transgenic cottonseed and the authorsconcluded that there were no differences in buffalo healthstatus as determined by haematobiochemical constituents(Singh et al., 2003). On all other days, and also in kids, thelevels of the enzyme tested in serum did not show significantdifferences, thus suggesting that no adverse effects wereinduced by GM feed in treated animals, as previouslyreported in dairy cows (Yonemochi et al., 2003). By contrast,analysis of enzyme total and relative activities in tissuesgave a different picture. As depicted in Figure 5 significantdifferences in enzyme levels concerned the kidney (higherlevels of LDH and GGT) as well as heart and skeletal muscle(higher levels of LDH) in kids drinking milk from treatedanimals. This seems to indicate that some alteration occurredin kids even if serum levels were not affected. Moreover, LDHsignificantly increased in three organs (kidney, heart andskeletal muscle), suggesting that enzyme synthesis is gen-erally altered in kids fed milk from GM-fed dams. The relativedistribution of LDH isoenzymes confirms this hypothesis,showing significant differences in heart and kidney LDH1and in muscle LDH1 and LDH2. In addition, if we compare
the distribution of isoenzymes in percentage terms, LDH1significantly increased also in the liver and heart LDH2 andLDH3 significantly decreased; a similar result was also seenfor muscle LDH5. Therefore, the significant increase in LDH1was accompanied by a percent decrease of other isoenzymesthus suggesting that, since LDH is a tetrameric enzyme madeup of M and H subunits, a different combination of suchsubunits occurred in the heart (LDH-H4 . LDH-H3M1 andLDH-H2M2) and in the skeletal muscle (LDH-H4 and LDH3M1
. LDH-M4). A similar shift has been previously described inrabbits (LDH-H4 . LDH-H1M3) where the higher amount of Hsubunit was assumed to mean a higher specificity for thereduction of alpha-hydroxybutyrate to alpha-oxobutyrate,thereby showing that some metabolic changes occurred in theliver (Tudisco et al., 2006b). Our data confirm this hypothesis:the isoenzyme mainly composed by the H subunit showed anincreased percentage, which was also found in the musclewhere LDH1 is not the dominant isoenzyme. Therefore,increased activity of LDH1 occurred in organs of GM-fed kids,as confirmed by histochemistry which showed a higherexpression of total LDH in heart, kidney and skeletal muscles.
Since LDH1 is known to be involved in cell metabolism byfavouring the reaction of lactate to pyruvate (Van Hall, 2000),our results could indicate a general increase in cell metabolism.This hypothesis is in agreement not only with results obtainedin rabbits but also with those who found significant mod-ifications of some nuclear features in GM-fed mice suggest-ing a high metabolic rate and intense molecular trafficking(Malatesta et al., 2002). In any event, there is no scientificevidence that a local increase in LDH metabolism may bedangerous for health especially when it does not affect serumlevels. Moreover, since serum activities of all the enzymesshowed similar levels between the groups, it would be overspeculative to assert that the GM diet was responsible for alocal increase in LDH metabolism. However, the synthesis ofLDH did actually change in more than one organ and suchresults should be taken into account for future research.
The mere detection of recombinant DNA fragments in ani-mal organs and tissues cannot justify, by itself, public concernsregarding human consumption of products from farm animalsfed transgenic crops. By contrast, although both BW and organweight did not significantly differ between groups, anyalteration in cell metabolism should be taken into account inthis field. The modification in LDH synthesis, even withoutaffecting serum levels of the enzyme, suggests an increase incell metabolism. Therefore, possible long-term effects of suchan alteration need to be elucidated.
In conclusion, our research attempted a wider survey interms of detection of DNA fragments as well as investigatingthe impact of GM feed in terms of health. Our results showedthat small DNA fragments can be detected in milk but also inkids organs when mothers are fed GM soybean and revealedelevated levels of LDH in tissues, suggesting an increase incell metabolism. Although our data seem to conflict with themajority of studies in this field, they are consistent with otherstudies and the longer term consequences to health follow-ing GM food intake merit further consideration.
GMO detection and health in goats and kids
9
References
AOAC 2000. Official methods of analysis, 17th Edition. Association of OfficialAnalytical Chemists, Arlington, Virginia.
Aumaitre A, Aulrich K, Chesson A, Flachowsky G and Piva G 2002. New feedsfrom genetically modified plants: substantial equivalence, nutritional equiva-lence, digestibility, and safety for animals and the food chain. LivestockProduction Science 74, 223–238.
Bottero MT, Civera T, Numera D, Rosati S, Sacchi P and Turi RM 2002. Amultiplex polymerase chain reaction for the identification of cow’s, goat’s andsheep’s milk in dairy products. International Dairy Journal 13, 277–282.
Cardarelli P, Branquinho MR, Ferreira RTB, da Cruz FP and Gemal AL 2005.Detection of GMO in food products in Brazil: the INCQS experience. FoodControl 16, 859–866.
Chowdhury EH, Kuribara H, Hino A, Sultana P, Mikami O, Shimada N, Guruge KS,Saito M and Nakajiama Y 2003a. Detection of corn intrinsic and recombinantDNA fragments and Cry1Ab protein in the gastrointestinal contents of pigs fedgenetically modified corn Bt11. Journal of Animal Science 81, 2546–2551.
Chowdhury EH, Mikami O, Nakajima Y, Kuribara H, Hino A, Suga K, Hanazumi Mand Yomemochi C 2003b. Detection of genetically modified maize DNAfragments in the intestinal contents of pigs fed StarLinkTM CBH351. Veterinaryand Human Toxicology 45, 95–96.
Duggan PS, Chambers PA, Heritage J and Forbes JM 2003. Fate of geneticallymodified maize DNA in the oral cavity and rumen of sheep. British Journal ofNutrition 89, 159–166.
EFSA 2007. Statement on the fate of recombinant DNA or proteins in meat,milk and eggs from animals fed with GM feed. Retrieved July 19, 2007, fromhttp://efsa.europa.eu/EFSA/efsa_locale
EFSA GMO Panel Working Group on Animal Feeding Trials 2008. Safety andnutritional assessment of GM plants and derived food and feed: the role ofanimal feeding trials. Food and Chemical Toxicology 46 (suppl. 1), S2–S70.
Einspanier R, Lutz B, Rief S, Berezina O, Zverlov V, Schwarz W and Mayer J 2004.Tracing residual recombinant feed molecules during digestion and rumenbacterial diversity in cattle fed transgene maize. European Food Research andTechnology 218, 269–273.
Hernandez M, Rodrıguez-Lazaro D, Esteve T, Prat S and Pla M 2003.Development of melting temperature-based SYBR Green I polymerase chainreaction methods for multiplex genetically modified organism detection.Analytical Biochemistry 323, 164–170.
INRA 1978. Alimentation des ruminants. Edition INRA, Paris, France.
Jennings JC, Kolwyck DC, Kats SB, Whetsell AJ, Surber JB, Cromwell GL, LiretteRP and Glenn KC 2003. Determining whether transgenic and endogenous plantDNA and transgenic protein are detectable in muscle from swine fed RoundupReady soybean meal. Journal Animal Science 81, 1447–1455.
Klaften M, Whetsell A, Webser J, Grewal R, Fedyk E, Einspanier R, Jennings J,Lirette R and Glenn K 2004. Animal biotechnology: challenges and prospects. InACS symposium series (ed. MM Bhalgat, WP Ridley, AS Felsot and JN Seiber),pp. 83–99. American Chemical Society, Washington, DC.
Klotz A and Einspainer R 1998. Detection of ‘‘novel-feed’’ in animals? Injury ofconsumers of meat and milk is not expected. Mais 3, 109–111.
Kuribara H, Shindo Y, Matsuoga T, Futo S, Aoki N, Hirao T, Ariyama H, Goda Y, ToyodaM and Hino A 2002. Novel reference molecules for quantitation of geneticallymodified maize and soybean. Journal of AOAC International 85, 1077–1089.
Laudadio V, Petrera F, Tudisco R and Infascelli F 2006. Genetically modified soya beanin sheep feeding: detection of DNA fragments in suckling lambs. Proceedings of 12thAAAP Animal Science Congress, 18–22 September, Bexco, Busan, Corea, pp. 3–6.
Lipp M, Brodmann P, Pietsch K, Pauwels J and Anklam E 1999. IUPAC:collaborative study of a method to detect genetically modified soybean andmaize in dried powder. Journal of AOAC International 82, 923–928.
Malatesta M, Caporaloni C, Gavaudan S, Rocchi MB, Serafini S, Tiberi C andGazzanelli G 2002. Ultrastructural morphometrical and immunocytochemical
analyses of hepatocyte nuclei from mice fed on genetically modified soybean.Cell Structure and Function 27, 173–180.
Malatesta M, Boraldi F, Annovi G, Baldelli B, Battistelli S, Biggiogera M andQuaglino D 2008. A long-term study on female mice fed on a geneticallymodified soybean: effects on liver ageing. Histochemistry and Cell Biology 130,967–977.
Mazza R, Soave M, Morlacchini M, Piva G and Marocco A 2005. Assessing thetransfer of genetically modified DNA from feed to animal tissues. TransgenicResearch 14, 775–784.
Nemeth A, Wurz A, Artim L, Charlton S, Dana G, Glenn K, Hunst P, Jennings J,Shilito R and Song P 2004. Sensitive PCR analysis of animal tissue samples forfragments of endogenous and transgenic plant DNA. Journal of Agricultural andFood Chemistry 52, 6129–6135.
Padgette SR, Kolacz KH, Delannay X, Re DB, LaVallee BJ, Tinius CN, Rhodes WK,Otero YI, Barry GF, Eichholtz DA, Peschke VM, Nida DL, Taylor NB and KishoreGM 1995. Development, identification and characterization of a glyphosate-tolerant soybean line. Crop Science 35, 1451–1461.
Phipps RH, Deaville ER and Maddison BC 2003. Detection of transgenic andendogenous plant DNA in rumen fluid, duodenal digesta, milk, blood, and fecesof lactating dairy cows. Journal of Dairy Science 86, 4070–4078.
Reuter T and Aulrich K 2003. Investigations on genetically modified maize(Bt-maize) in pig nutrition: fate of feed-ingested foreign DNA in pig bodies.European Food Research and Technology 216, 185–192.
Rizzi A, Brusetti L, Arioli S, Nielsen KM, Tamagnini I, Tamburini A, Sorlini C andDaffonchio D 2008. Detection of feed-derived maize DNA in goat milk andevaluation of the potential of horizontal transfer to bacteria. European FoodResearch and Technology 227, 1699–1709.
Sambrook J, Fritsh EF and Maniatis T 1989. Molecular cloning. A laboratorymanual. Cold Spring Harbor Laboratory Press, Cold Sprint Harbor.
Sharma R, Damgaard D, Alexander TW, Dugan MER, Aalhus JL, Stanford K andMcAllister TA 2006. Detection of transgenic and endogenous plant DNA indigesta and tissues of sheep and pigs fed Roundup Ready canola meal. Journalof Agricultural Food Chemistry 54, 1699–1709.
Singh M, Tiwari DP, Kumar A and Ravi Kumar M 2003. Effect of feedingtransgenic cottonseed vis-a-vis non-transgenic cottonseed on haematobio-chemical constituents in lactating Murrah buffaloes. Asian–Australian Journal ofAnimal Science 16, 1732–1737.
SPSS Inc 1999. SPSS for windows, ver. 12.0. SPSS Inc., Chicago, IL, USA.
Terzi V, Infascelli F, Tudisco R, Russo G, Stanca AM and Faccioli P 2004.Quantitative detection of Secale cereale by real-time PCR amplification. LWT-Food Science and Technology 37, 239–246.
Tony MA, Butschke A, Broll H, Grohmann L, Zagon J, Halle I, Danicke S, SchauzuM, Hafez HM and Flachowsky G 2003. Safety assessment of Bt 176 maize inbroiler nutrition: degradation of maize-DNA and its metabolic fate. Archives ofAnimal Nutrition 57, 235–252.
Tudisco R, Infascelli F, Cutrignelli MI, Bovera F, Morcia C, Faccioli P and Terzi V2006a. Fate of feed plant DNA monitored in water buffalo (Bubalus bubalis) andrabbit (Oryctolagus cuniculus). Livestock Science 105, 12–18.
Tudisco R, Lombardi P, Bovera F, D’Angelo D, Cutrignelli MI, Mastellone V, TerziV, Avallone L and Infascelli F 2006b. Genetically modified soybean in rabbitfeeding: detection of DNA fragments and evaluation of metabolic effects byenzymatic analysis. Animal Science 82, 193–199.
Van Hall G 2000. Lactate as a fuel for mitochondrial respiration. ActaPhysiologica Scandinava 168, 643–656.
Van Soest PJ, Robertson JB and Lewis BA 1991. Methods for dietary fiber,neutral detergent fiber, and nonstarch polysaccharides in relation to animalnutrition. Journal of Dairy Science 74, 3583–3598.
Yonemochi C, Ikeda T, Harada C, Kusama T and Hanazumi M 2003. Influence oftransgenic corn (CBH 351, named Starlink) on health condition of dairy cowsand transfer of Cry9C protein and cry9C gene to milk, blood, liver and muscle.Animal Science Journal 74, 81–88.
Tudisco, Mastellone, Cutrignelli, Lombardi, Bovera, Mirabella, Piccolo, Calabro, Avallone and Infascelli
10
Copyright © 2022 FDOKUMEN