Fat reduction in chocolate - University of Birmingham
332
Fat reduction in chocolate: a multidisciplinary approach considering emulsion science and consumer expectations by Jennifer Elizabeth Norton A thesis submitted to The University of Birmingham for the degree of DOCTOR OF PHILOSOPHY School of Chemical Engineering The University of Birmingham September 2011
-
Upload
khangminh22 -
Category
Documents
-
view
6 -
download
0
Transcript of Fat reduction in chocolate - University of Birmingham
Fat reduction in chocolate: a multidisciplinary approach considering
emulsion science and consumer expectations
by
Jennifer Elizabeth Norton
A thesis submitted to
The University of Birmingham
for the degree of
DOCTOR OF PHILOSOPHY
School of Chemical Engineering
The University of Birmingham
September 2011
University of Birmingham Research Archive
e-theses repository This unpublished thesis/dissertation is copyright of the author and/or third parties. The intellectual property rights of the author or third parties in respect of this work are as defined by The Copyright Designs and Patents Act 1988 or as modified by any successor legislation. Any use made of information contained in this thesis/dissertation must be in accordance with that legislation and must be properly acknowledged. Further distribution or reproduction in any format is prohibited without the permission of the copyright holder.
Abstract
Chocolate is consumed in large quantities, but is high in fat and calories, and has
limited nutritional benefits. Producing reduced-fat chocolate offers a way of reducing
energy consumed, if the consumer will accept the product. The aims of the research
presented in this thesis were: i) to investigate consumer response to reduced-fat
chocolate; ii) to investigate formulation routes for producing a reduced fat chocolate.
Focus group data indicated ambivalence towards chocolate, with some negativity
towards the concept of a reduced-fat indulgent product. By manipulating label
information it was shown that whilst consumers expected to like chocolate labelled
‘reduced-fat’ less than the standard chocolate, ratings of actual liking and of sensory
attributes were similar. Thus, personal experience plays a greater role than
expectations. This suggests that if the sensory characteristics of a reduced-fat
chocolate can be matched to a standard chocolate, actual liking should not be affected.
Packaging concepts indicated how different components of the package affect liking.
Water in oil cocoa butter emulsions were produced using a high shear mixer and a
margarine line. Formulation changes (emulsifier type and concentration, and gelatin
concentration) and processing parameters (shaft speeds and temperatures, and flow
rate) were considered. All emulsions had small droplets (typically 1-5μm) and little
‘free water’. When produced on the margarine line fat crystals in polymorphic form V
were produced. Crystalline shells were also observed at the droplet interface. Pilot
plant experiments resulted in comparable emulsions, with small droplets and fat
crystals in form V. Although a full chocolate was not produced, the potential for

margarine technology to produce a reduced-fat chocolate was demonstrated.

For Mum and Dad
Acknowledgement
I would like to thank the EPSRC for funding this PhD project, and my supervisors
Professor Peter Fryer, Dr Phil Cox (both of University of Birmingham) and Dr John
Parkinson (Bangor University) for their help, guidance and support during my PhD. I
would also like to thank Dr Joanne Hort for her help and assistance during the
completion of the work presented in Chapter 5. I would like to thank the company
that I visited to conduct scale up work, for allowing me to use their facilities, and for
their hospitality during my visit. I would like to thank Lynn Draper and the other staff
in the Chemical Engineering Office for all their help during my PhD. I would also
like to thank my fellow students and colleagues for making my PhD a lot of fun.
Finally, I would like to thank my family and my friends for all their support,
particularly my parents for their encouragement and motivation during the writing of
this thesis.

Nomenclature
Acronyms
ANOVA – Analysis of Variance
BMI – Body Mass Index
BMR – Basal Metabolic Rate
DEBQ – The Dutch Eating Behaviour Questionnaire
DSC – Differential Scanning Calorimetry
EE – Energy Expenditure
EI – Energy Intake
ES – Energy Stores
H - Hypothesis
HLB – Hydrophile-Lipophile Balance
JAR – Just About Right
NMR – Nuclear Magnetic Resonance
O/W – oil in water emulsion
PGPR – Polyglycerol polyricinoleate
SEM – Scanning Electron Microscopy
TAGs - triacylglyerols / triglycerides
VAS – Visual Analogue Scale
W/O – water in oil emulsion
WTP – Willingness to pay
XRD – X-ray Diffraction
Symbols
γ, α, β’, β - Triglyceride polymorphs
I, II, III, IV, V, VI – Chocolate industry method for classifying chocolate polymorphs
λ - Wavelength of an x-ray (Å)
θ - Diffraction angle of an x-ray (°)

W, M, S, V – used to characterise strength of x-ray peaks
d – distance (m)
d3.2 – surface-weighted mean droplet diameter (μm)
d3.3 – volume weighted mean droplet diameter (μm)
T – Temperature (ºC)
φ - dispersed phase volume fraction
p – probability value
F – F-ratio (ANOVA)
t – t value (t-test)
σ – Standard Deviation
χ - Mean
Contents
Context of study .................................................................................................................................... 1
Objectives ............................................................................................................................................. 3
Layout of the Study .............................................................................................................................. 3
Literature Review ................................................................................................................................. 4
2.1 Introduction ................................................................................................................................... 57
2.2 General Methods ........................................................................................................................... 57
2.3 Chocolate Consumption Focus Group .......................................................................................... 58
2.4 Health and Indulgence Focus Group ............................................................................................ 61

2.5 Labelling Study ............................................................................................................................. 63
2.6 Packaging Study ........................................................................................................................... 72
3.1 Introduction ................................................................................................................................... 76
3.2 Experimental Design .................................................................................................................... 78
3.3 Results ........................................................................................................................................... 79
3.4 Overall Conclusions ...................................................................................................................... 92
4.1 Introduction ................................................................................................................................... 95
4.2 Hypotheses .................................................................................................................................... 97
4.3 Results ........................................................................................................................................... 98
4.4 Discussion ................................................................................................................................... 117
4.5 Conclusions and Future Work .................................................................................................... 123
5.1 Introduction ................................................................................................................................. 125
5.2 Focus Groups .............................................................................................................................. 127
5.3 Rank – Rating Task .................................................................................................................... 132
5.3.4 Conclusions .............................................................................................................................. 140
5.4 Discussion ................................................................................................................................... 141
5.5 Conclusions ................................................................................................................................. 144
6.1 Introduction ................................................................................................................................. 146
6.2 Materials ..................................................................................................................................... 146
6.3 Preparation of emulsions ............................................................................................................ 147
6.4 Analytical Techniques ................................................................................................................ 153
7.1 Introduction ................................................................................................................................. 158
7.2 High Shear Mixer ....................................................................................................................... 159
7.3 Margarine Line ........................................................................................................................... 175
7.4 Overall Conclusions .................................................................................................................... 181
8.1 Introduction ................................................................................................................................. 184
8.2 Formulation Changes .................................................................................................................. 186
8.3 Processing Parameters ................................................................................................................ 193
8.4 Conclusions ................................................................................................................................. 201
9.1 Introduction ................................................................................................................................. 205
9.2 Emulsions ................................................................................................................................... 208
9.3 Chocolate .................................................................................................................................... 225
9.4 Discussion ................................................................................................................................... 226

List of Figures
Fig. 1.1 Schematic model of the effects of expectations on product selection and evaluation ............... 12
Fig. 1.2 Chocolate Processing ................................................................................................................. 27
Fig. 1.3 A diffracted beam from a crystal lattice, indicating the elements of Braggs Law ..................... 33
Fig. 1.4 An illustration of a polydispersed water in oil emulsion ........................................................... 44
Fig. 1.5 An illustration of water in oil emulsion stabilised by solid particles ......................................... 48
Fig. 1.6 The set up of the Bruker minispec NMR ................................................................................... 52
Fig. 1.7 Schematic representation of the pulse sequence used in stimulated echo sequence .................. 53
Fig. 1.8 Construction of cryo-SEM ......................................................................................................... 54
Fig. 4.1. Rated scores for expected and actual liking of chocolate samples labelled ‘Milk Chocolate’
and ‘Reduced-fat Milk Chocolate’ ........................................................................................................ 100
Fig. 4.2. Distribution of JAR scores for each attribute ......................................................................... 104
Fig. 4.3. Ratings of expected liking of chocolate samples labelled ‘Milk Chocolate’ and ‘Reduced-fat
Milk Chocolate’ for those participants who said they were likely or unlikely to try low-fat foods ...... 105
Fig. 4.4. Rated scores for expected liking of chocolate samples labelled ‘Milk Chocolate’ and
‘Reduced-fat Milk Chocolate’, for participants with below median, and above median levels of external
eating ..................................................................................................................................................... 107
Fig. 4.5. Ratings of expected normal consumption amount (in squares of chocolate) of samples labelled
‘Milk Chocolate’ and ‘Reduced-fat Milk Chocolate’ for participants below, and above, the median
ambivalence ........................................................................................................................................... 109
Fig. 4.6. Ratings of expected unrestricted consumption amount of samples labelled ‘Milk Chocolate’
and ‘Reduced-fat Milk Chocolate’ for participants below, and above, the median BMI ...................... 110
Fig. 4.7. Ratings of expected unrestricted consumption amount of samples labelled ‘Milk Chocolate’
and ‘Reduced-fat Milk Chocolate’ for participants who are likely, and unlikely to try low-fat foods . 112
Fig. 4.8. Ratings of price of samples labelled ‘Milk Chocolate’ and ‘Reduced-fat Milk Chocolate’ for
participants below, and above, the median BMI ................................................................................... 114
Fig. 4.9. Ratings of price for chocolate samples labelled ‘Milk Chocolate’ and ‘Reduced-fat Milk
Chocolate’, for frequent and occasional consumers of chocolate ......................................................... 115
Fig. 4.10. Ratings of price of samples labelled ‘Milk Chocolate’ and ‘Reduced-fat Milk Chocolate’ for
participants below, and above, the median restriction ........................................................................... 117
Fig. 5.1 Two of the bars used for the rank-rating task .......................................................................... 135
Fig. 5.2 Average liking scores for each of the packaging concepts (for all participants) ..................... 136
Fig. 5.3 Calculated part worths for each of the components ................................................................ 139
Fig. 6.1 A schematic of a. the Silverson high shear mixer, and b. the emulsion screen used ............... 148
Fig. 6.2 A schematic of a. the scraped surface heat exchanger (A unit), and b. the pin stirrer (C unit)149
Fig. 6.3 A schematic of the margarine line ........................................................................................... 150
Fig. 6.4 DSC data indicating melting profile of the same emulsion (containing 30% water and 1%
PGPR), heated from 5°C to 50°C at a rate of 0.5, 1, or 2°C/min .......................................................... 155
Fig. 7.1. Percentage of water in small droplets (<100μm), determined by NMR analysis, for samples
containing soya lecithin and PGPR with different percentages of water .............................................. 163
Fig. 7.2. Scanning electron micrographs of cocoa butter emulsions made with soya bean lecithin
emulsified using a Silverson high shear mixer ...................................................................................... 164
Fig. 7.3 SEM images of cocoa butter emulsions containing 20% water, 1% sugar and 1% PGPR that
were processed using a Silverson high shear mixer .............................................................................. 166
Fig. 7.4 DSC curves indicating melting temperatures of cocoa butter emulsions emulsified using a high
shear mixer. The fat phase of the emulsions was heated to different temperatures (40, 55 and 65°C)
prior to emulsification ........................................................................................................................... 168
Fig. 7.5 DSC curves indicating the melting temperatures emulsions containing a. 10% aqueous phase,
b. 30% aqueous phase, and c. 50% aqueous phase ................................................................................ 171
Fig. 7.6 Average temperature peak of cocoa butter emulsions (containing 10, 20 and 30% water)
emulsified using a high shear mixer, at varying time intervals (from 1 day to 24 weeks) .................... 174
Fig. 8.1 DSC curve indicating the melting profile of solid gelatin solutions, containing 6, 8 and 10%
gelatin .................................................................................................................................................... 185
Fig. 8.2 Micrographs of cocoa butter emulsions ................................................................................... 192

Fig. 8.3 Mean droplet size (μm) as determined by NMR analysis, as a function of varying both the A
and the C Unit rotations speeds (rpm) ................................................................................................... 194
Fig. 8.4 DSC curves for emulsions processed under different conditions ............................................ 195
Fig. 8.5 Tpeak (ºC) as a function of A unit outlet temperature and C unit outlet temperature ............. 197
Fig. 8.6 Tpeak (ºC) as a function of the difference in temperature (ºC) between the process inlet
temperature and the A unit outlet temperature ...................................................................................... 198
Fig. 8.7 Droplet size (d3.2) as a function of A unit outlet temperature and C unit outlet temperature .. 199
Fig. 8.8 Droplet size as a function of pump speed ................................................................................ 201
Fig. 9.1 Mean droplet size (d3,2) as a function of storage time for emulsions containing 20% aqueous
phase, 40% aqueous phase, and 20% aqueous phase with milk fat in addition to cocoa butter, stored in
both ambient and chilled conditions ...................................................................................................... 210
Fig. 9.2 Mean percentage of free water as a function of storage time for emulsions containing 20%
aqueous phase, 40% aqueous phase, and 20% aqueous phase with milk fat in addition to cocoa butter,
stored in both ambient and chilled conditions. ...................................................................................... 211
Fig. 9.3 DSC curves indicating the melting profile of emulsions a. containing 20% aqueous phase, b.
containing 40% aqueous phase, and c. containing 20% aqueous, with milk fat in addition to cocoa
butter. ..................................................................................................................................................... 216
Fig. 9.5 Mean Tpeak (ºC) as a function of storage time for emulsions containing 20% aqueous phase,
40% aqueous phase, and 20% aqueous phase with milk fat in addition to cocoa butter, stored in both
ambient and chilled conditions .............................................................................................................. 218
Fig. 9.6 Mean enthalpies (J/g) as a function of storage time for emulsions containing 20% aqueous
phase, 40% aqueous phase, and 20% aqueous phase with milk fat in addition to cocoa butter, stored in
both ambient and chilled conditions ...................................................................................................... 219
Fig. 9.7 X-Ray Diffraction: a). an emulsion containing 20% aqueous phase, b) an emulsion containing
40% aqueous phase, c) an emulsion containing 20% aqueous phase, with milk fat in addition to cocoa
butter ...................................................................................................................................................... 220
Fig. 9.8 Cryo-SEM images of cocoa butter emulsions produced during scale-up experiments ........... 224
Fig. 9.9 A cryo-SEM image of an emulsion that has been mixed with the dry chocolate ingredients . 226

List of Tables
Table 1.1 The World Health Organisation BMI classification system for adults ..................................... 6
Table 1.2 The predicted effects of disconfirmed consumer expectations on the direction of
increase/decrease in perceived product performance for the assimilation, contrast, generalised
negativity and assimilation-contrast models ........................................................................................... 14
Table 1.3 Melting point (°C) of cocoa butter polymorphs from the literature ....................................... 31
Table 1.4 Heat of fusion, and calculated melting enthalpy for cocoa butter polymorphs ...................... 31
Table 1.5 Short spacings X-ray data for cocoa butter polymorphisms ................................................... 33
Table 4.1 Mean ratings of expected and actual liking of the chocolates labelled ‘Milk Chocolate’ and
‘Reduced-fat Milk Chocolate’ tasted during session 1 and session 2 ..................................................... 98
Table 5.1 Mean rating scores for each of the packages for female consumers .................................... 137
Table 5.2 Mean rating scores for each of the packages for male consumers ........................................ 137
Table 5.3 Mean rating scores for each of the factors, for all consumers, females and males ............... 138
Table 6.1 Melting enthalpies of replicates of the same cocoa butter emulsion heated at a rate of 0.5, 1,
or 2°C/min ............................................................................................................................................. 155
Table 7.1 NMR analysis for cocoa butter emulsions containing soya lecithin produced using a high
shear mixer ............................................................................................................................................ 161
Table 7.2 NMR analysis for cocoa butter emulsions containing PGPR produced using a high shear
mixer ...................................................................................................................................................... 161
Table 7.3 Melting properties of three cocoa butter emulsions in which the fat phase was heated to 45,
55 or 65°C .............................................................................................................................................. 169
Table 7.4 The temperature onset, peak and end and enthalpy (J/g) of cocoa butter emulsions over time
............................................................................................................................................................... 172
Table 7.5 Details of emulsion formulation and margarine line set up, along with measured exit
temperatures .......................................................................................................................................... 176
Table 7.6 NMR analysis for cocoa butter emulsions produced using the margarine line .................... 177
Table 7.7 DSC analysis of cocoa butter emulsions made using the margarine line ............................. 178
Table 8.1 NMR results for cocoa butter emulsions containing different percentages of PGPR (from 0.1
to 5% within the lipid phase) ................................................................................................................. 187
Table 8.2 Results acquired from both NMR and DSC for cocoa butter emulsions with different
percentages of water, and different percentages of gelatin ................................................................... 190
Table 8.5 Tpeak and melting enthalpy of emulsions produced using different pump speeds .............. 200
Table 9.1 Recipes used for each of the formulations used during the scale up experiments ................ 206
Table 9.2 The ratio of dry mix to emulsion, and the percentage of different ingredients within the dry
mix ......................................................................................................................................................... 207
Table 9.3 Processing parameters used for each of the emulsions produced during scale-up experiments
............................................................................................................................................................... 208
Table 9.4 Mean droplet size, sigma and free water content for samples heated to 40ºC and held at this
temperature for 1, 2, 3 and 5.5 hours ..................................................................................................... 213
Table 9.5 Results of the gravimetric method, in which the samples were weighed, before being placed
in a dry oven at 110°C for 8, 12 and 30 hours ....................................................................................... 214
Table 9.6 X-ray diffraction short spacings typical of cocoa butter polymorphisms IV, V and VI
observed for emulsions, with the strength of peak ................................................................................ 221
Chapter 1 Introduction and Literature Review
1
1. Introduction and Literature Review
Context of study
Chocolate manufacture is a big business for the UK food industry: Britons, on
average, eat 10kg of chocolate a year, costing £72 per person (Barnett, 2006).
Chocolate is notoriously high in fat (30 – 40%wt) and calories (typically around
500kcal/100g), but is consumed by a large proportion of the western population. For
many it may be detrimental to maintaining a healthy weight. Furthermore, it is not
eaten at meal times or as part of a staple diet, but is eaten as a snack or a treat. In a
modern diet, where calories are cheap and plentiful, a food product that is high in fat
and calories and provides only limited nutritional benefits is no longer beneficial. As
such, the advent of a reduced-fat chocolate may provide a means of reducing
unnecessary and unhealthy energy intake.
Obesity is increasing throughout the world, with rises in prevalence of the disease
being seen in the UK. According to National Health Service reports, in 2006 23.1% of
men and 24.8% of women were classified as obese, as compared with 13.2% and
16.4% respectively in 1993. The health risks of obesity include the development of
non-insulin dependent diabetes mellitus, hypertension, hyperlipidaemia,
cardiovascular disease, coronary heart disease, stroke, gallbladder disease, arthritis
and certain types of cancer (NHS, 2006). The British Government are becoming
increasingly concerned with the effects of obesity on the health and longevity of the
nation (McPherson, Marsh & Brown, 2007); obesity presents a major public health
problem, with increased healthcare costs.
Chapter 1 Introduction and Literature Review
2
The consumption of reduced fat products offers a way of reducing the fat and energy
ingested, with beneficial effects for body weight and health. Increasing global obesity
has fuelled an increase in the production of foods that are lower in fat, sugar and
calories. Reducing dietary fat is particularly important as it is energy dense
(carbohydrate = 3.75kcal/g, protein = 4kcal/g, alcohol = 7kcal/g, and fat = 9kcal/g;
Food Standards Agency, 2002), but has only a limited effect on suppressing appetite,
compared with carbohydrate (Egger & Swinburn, 1997). This can result in ‘passive
consumption’, in which excess energy is ingested without a large quantity of food
being consumed (Prentice & Jebb, 1995). Furthermore, having a high daily caloric
intake from fat is related to an increased risk of cardiovascular disease, cancer, stroke
and diabetes. Consequently, reducing dietary fat may reduce energy intake and help
prevent obesity and related health problems.
Currently, although some diabetic chocolates (that are reduced in sugar) are available
on the British market, low or reduced fat chocolates are currently not readily
available. Producing a chocolate that is reduced in fat presents an engineering
challenge: it is difficult to produce a product that is easy to manufacture, yet still
performs when consumed.
Conflict between taste and health may be significant for some categories of foods.
Consumers may believe that sensory quality must be sacrificed in order to eat
healthily, trading enjoyment for health benefits (Tuorila & Cardello, 2002); it has
been reported that consumers feel that there is a reduction in taste quality associated
with reduced-fat diets (Lloyd, Paisley & Mela, 1995). It seems unwise to assume that
consumers demand a chocolate that is lower in fat or calories. Not only may

Chapter 1 Introduction and Literature Review
3
consumers be unwilling to make trade-offs in terms of sensory characteristics, but
they may not favour the concept of a reduced-fat chocolate, even if it is still highly
palatable. Therefore, it is important to identify what consumers expect from reduced-
fat chocolate (both in sensory and hedonic terms), whether they would consider it as
equally indulgent, whether they would consume more (and thus ‘undo’ any benefits
gained from it being reduced in fat), and whether different cohorts of consumers
would respond differently to the product. Such questions are important for food
manufacturers; if the consumer is not willing to accept a product, however healthy it
may be, the product will be a failure.
Objectives
The aims of this work were twofold:
• To investigate chocolate consumption, beliefs about health and indulgence and
consumer response to reduced-fat chocolate;
• To investigate formulation engineering routes for producing a reduced fat
chocolate that has a similar flavour, texture and mouthfeel to a full fat
equivalent.
Layout of the Study
This thesis is multidisciplinary, spanning both chemical engineering and consumer
psychology. It aims to discover the possible routes for producing a reduced-fat
chocolate, and the psychological issues surrounding the consumption of reduced-fat
products. The thesis is presented in two halves for ease of reading, but both sections
Chapter 1 Introduction and Literature Review
4
complement one another. Thus, in the current chapter a review of the available
literature is presented, covering all the areas studied during the project. Chapter 2 and
6 present the materials and methods used for both the consumer psychology studies,
and the engineering experiments. Chapters 3, 4 and 5 present the results of the three
psychology studies conducted. Chapter 3 presents the findings of focus groups
conducted to explore chocolate consumption, and beliefs about health and indulgence.
Chapter 4 details the results of a labelling experiment, in which the expectations of
reduced-fat chocolate are studied. Chapter 5 explores current packaging of chocolate,
and considers approaches to packaging a reduced-fat chocolate. The work presented
in Chapter 5 has also been submitted as part of the research project for the Post
Graduate Certificate in Sensory Science, at the University of Nottingham. Chapters 7,
8 and 9 describe the results of experiments on the engineering of a reduced-fat
chocolate. Chapter 7 introduces the production of a cocoa butter emulsion for fat
reduction in chocolate, using two processing methods. Chapter 8 considers the
addition of gelatin to the aqueous phase of the emulsion, in addition to further
formulation and processing changes. Chapter 9 presents the results of a scale-up trial,
in which cocoa butter emulsions were produced at pilot-plant scale. Finally, Chapter
10 contains the major conclusions obtained from the results chapters, with ideas for
possible future work.
Literature Review
The following literature review covers the important research in the areas relevant to
this study i.e. both in the psychology underpinning the choice of low-fat foods, and in
the manufacture and characterisation of chocolate. It begins with a discussion of

Chapter 1 Introduction and Literature Review
5
research in obesity, to give the reader a brief understanding of the disease, and the
motivation for producing food products that are reduced in fat, or calories. The causes
of obesity are complex, but it is clear that food plays a key role; thus, by modifying
the food that is consumed it may be possible to reduce the prevalence of the disease.
This is followed by a section addressing the psychological studies that have been
conducted to consider the effect that expectations about food products, specifically
with altered fat contents, health claims or novelty, have on hedonic and sensory
perceptions, and on self regulated consumption.
Next, chocolate will be introduced, with a brief summary of its history, and the
modern day production methods used. This is followed by a description of the fat
(cocoa butter) within chocolate, and methods used to analyse the polymorphic form of
the fat. Finally, possible methods for reducing the fat in chocolate will be presented,
with emphasis on emulsion science, with a review of emulsification techniques,
emulsion instability and stability (i.e. the use of emulsifiers, Pickering stabilisation,
fat crystals at the interface, and the use of hydrocolloids) and analysis techniques.
1.4.1 Obesity
Ravussin and Swinburn (1992) state that obesity is a condition of excess body fat.
Body Mass Index (BMI, Quetelet’s Index) is the currently accepted, and most widely
used, measure of obesity among adults, which is calculated using weight (kg) and
height (m), in the following formula:
BMI =BodyWeight(kg)
Height(m)2 (1.1)

Chapter 1 Introduction and Literature Review
6
Table 1.1 details the World Health Organisation (WHO) classifications of BMI,
providing a scaling system from ‘underweight’ to ‘obese’.
Table 1.1 The World Health Organisation BMI classification system for adults (WHO, 2004).
Classification BMI Underweight <18.5
Severe thinness <16 Moderate thinness 16 – 16.99
Mild thinness 17 – 18.49 Normal 18.5 – 24.99
Overweight ≥25 Pre-obese 25 – 29.99 Obese ≥30
Obese class I 30-34.99 Obese class II 35-39.99 Obese class III ≥40
Obesity is thought to be a result of a chronic energy imbalance. Ravussin and
Swinburn (1992) describe the classic energy balance equation:
ES = EI − EE (1.2)
where, ES is change in energy stores, EI is energy intake, and EE is energy
expenditure. During weight maintenance:
EI = EE (1.3)
After a small increase in stored energy, there is a corresponding increase in energy
expenditure that brings the body back into energy balance, i.e. heavier people expend
more than lighter people in order to do the same task (Ravussin & Swinburn, 1992).
Physiological adjustment, in terms of behavioural changes, also minimise fluctuations
in body weight (Egger & Swinburn, 1997). However, if energy intake far exceeds

Chapter 1 Introduction and Literature Review
7
expenditure (i.e. a positive energy balance), the excess energy is stored as adipose
tissue, which will eventually result in obesity. Only one factor, calorie consumption,
contributes to energy intake, whilst a number of factors contribute to energy
expenditure:
1. Basal metabolic rate (BMR): the energy that is expended to keep a resting,
awake body alive. In sedentary adults, BMR accounts for 50-70% of energy
expenditure.
2. Thermogenesis: the increase in metabolic rate in response to food intake, cold
or psychological influences (fear or stress). The thermic effect of food
accounts for approximately 10% of daily energy expenditure.
3. Voluntary activity: this is the most variable component of daily energy
expenditure.
Obesity exhibits both genetic and familial associations. Ravussin and Swinburn
(1992) suggest that approximately 70% of the variance in BMI is due to genetic
influences, and approximately 30% to the non-shared environment that is unique to
the individual. Research concerning the identification of specific genes or allelic
variations that are associated with weight gain or obesity is advancing (Blundell et al.,
2005) although as yet a gene responsible for human obesity has not been identified. It
is important to recognise that the rate at which obesity is increasing far exceeds the
rate at which genetic changes occur, suggesting that environmental or behavioural
factors must have more of a significant role in the development of obesity than
genetic factors.
Chapter 1 Introduction and Literature Review
8
Neel (1962) was the first to suggest that natural selection resulted in “thrifty genes”
that provided the evolutionary advantage of promoting metabolic efficiency and fat
storage during times of plenty so there would be adipose reserves for times of food
scarcity. According to the theory, during our evolutionary history people with greater
adipose reserves would have had a selective advantage by their greater survival.
However, in affluent societies where food is plentiful this adaptation would
predispose people to gain weight and become obese. Modern environments have been
described as “obesogenic” (Egger & Swinburn, 1997) i.e. they promote obesity
through the availability of palatable foods that are cheap, persuasively advertised, and
increasingly more convenient. The increased reward value and palatability of foods
overrides satiety signals and leads to overeating (Rolls, 2007). Furthermore, the
number of calories derived from dietary fat has dramatically increased, and physical
exercise has decreased (Lichtenstein, 1999).
Blundell and Finlayson (2004) suggest that an exaggerated hedonic response (feelings
of pleasure, reward, pleasantness, desire, preference, liking, wanting, or palatability)
to the sensory attributes of a food could promote overconsumption. Blundell and
Finlayson (2004) also show that the palatability of food has a positive effect on intake
and meal size, suggesting that palatability is involved in satiation processes. It has
been shown that by manipulating the flavour of a food, and thus increasing its
palatability, intake increases (for a review see Yeomans, 2007). Liking is thought to
drive ingestion, so that reward can override metabolic regulatory systems: people will
eat more because of elevated sensations of pleasure during eating. Sensory cues
Chapter 1 Introduction and Literature Review
9
(sights, sounds and smells for example) may motivate a person to seek a certain food
item.
Drewnowski and Greenwood (1983) investigated the perception and hedonics of
sweet and fatty tastes using different combinations of milk/cream and sucrose. The
results indicated a sweetness breakpoint, after which scores of pleasantness decline.
However, hedonic preference ratings for fat continued to rise, and showed no clear
breakpoint. Furthermore, the acceptance of the high fat dairy products was greatly
enhanced by the addition of sucrose, and the hedonic responses to sweetness was
modulated by the fat content.
It is clear that food consumption plays a major role in obesity. Not only are calories
and fat plentiful in modern societies, but fat often increases a food’s palatability, and
humans are unable to regulate its intake (i.e. there is not an autoregulatory system to
maintain a fat balance). Fat reduction in foods should effectively decrease the
prevalence of obesity, providing that the hedonic value of the food is not
compromised, and the consumers’ expectations of the food remain high.
1.4.2 Expectations
Producing reduced fat chocolate may lead to altered expectations in consumers. In
psychology, the construct of expectations was introduced by Tolman (1938), who
used the concept of “expected consequences of behavior” as an explanatory variable
to account for animal learning i.e. a behaviour occurs in response to expected
pleasure. Meehl and MacCorquodale (1951) and MacCorquodale and Meehl (1953)
Chapter 1 Introduction and Literature Review
10
expanded the concept of expectancy theory to human learning. Helson (1948)
introduced his ‘adaption-level theory’ which viewed all perceptual events as resulting
from a comparison of the external stimulus to an internal ‘adaption level’ (a direct
consequence of the individual’s past experience with the stimuli). The view that
stimuli in the environment are interpreted through comparison with internal cognitive
states was central to Festinger’s theory of cognitive dissonance. Festinger (1962)
proposed that cognitions (beliefs, attitudes, values and perceptions) and behaviours
must be psychologically consistent in order to avoid psychological dissonance (a state
of psychological discomfort). He proposed that when cognitions or behaviours are in
conflict, cognition dissonance arises, producing a negative drive state, which
motivates the individual to change the cognition or the behaviour to make them more
consistent. This led to the conclusion that pre-existing experiences, beliefs, and
expectations about stimuli strongly determine perceptions, attitudes and behaviours
towards it. If there is a mismatch between sensory information and expectations the
perception of the stimuli may change, the cognition may change, or both may change.
Expectancy effects have been observed for tastants (i.e. substances that stimulate the
sense of taste). Carlsmith and Aronson (1963) administered a series of iso-intense (of
the same intensity) solutions of sucrose and quinine sulphate to participants who rated
them for perceived intensity of sweetness or bitterness. Prior to presentation, the
investigators created an expectation by stating whether the solution would be either
sweet or bitter. The cue and the stimulus were either congruent or incongruent.
Results showed that i) sucrose solutions that disconfirmed an expectancy were rated
less sweet than sucrose solutions that confirmed an expectancy, and ii) quinine
Chapter 1 Introduction and Literature Review
11
solutions that disconfirmed an expectancy were rated as more bitter than quinine
solutions that confirmed an expectancy. The authors suggested that this finding is
consistent with cognitive dissonance theory i.e. disconfirmed expectations about both
solutions resulted in negative affect towards them, lowering perceived sweetness and
increasing perceived bitterness (both reflecting reduced pleasantness).
Visual cues have also been found to produce an expectancy effect. DuBose, Cardello
and Maller (1980) found that not only did the colour of a cherry-flavoured beverage
affect participants’ ability to recognise its flavour, but the colour also altered
perception, with participants believing the drink was lime-flavoured when it was
coloured green. Zampini, Wantling, Phillips and Spence (2008) reported that accuracy
in identifying a beverage’s flavour (blackcurrant or orange) improved significantly
when the beverage was coloured appropriately (grey or orange respectively). When
Blackwell (1995) asked participants to describe the odour of six fruit solutions, four
of which were inappropriately coloured, it was found that the identification of fruit
odour was significantly more difficult when the colour of the solution was
inappropriate. Morrot, Brochet and Dubourdieu (2001) investigated this phenomenon
using white wine samples that had been coloured red, finding that participants
generally used red wine descriptors to characterise the coloured white wines. These
studies highlight the effect that expectations can have on the perception of taste, both
in its identity and perceived intensity.
Expectations play an important role in food consumption as they may improve or
degrade the perception of a product, even before it is tasted, with consumer
satisfaction being strongly related to the degree of disparity between expectations and
Chapter 1 Introduction and Literature Review
12
actual product performance (Deliza & MacFie, 1996). A number of extrinsic cues are
used by consumers to judge product quality, including brand name, brand familiarity,
advertisements, product name, label, packaging, nutritional information and price
(Deliza & MacFie, 1996). If the consumer has no direct prior experience of the
product then information has more of an impact on expectations.
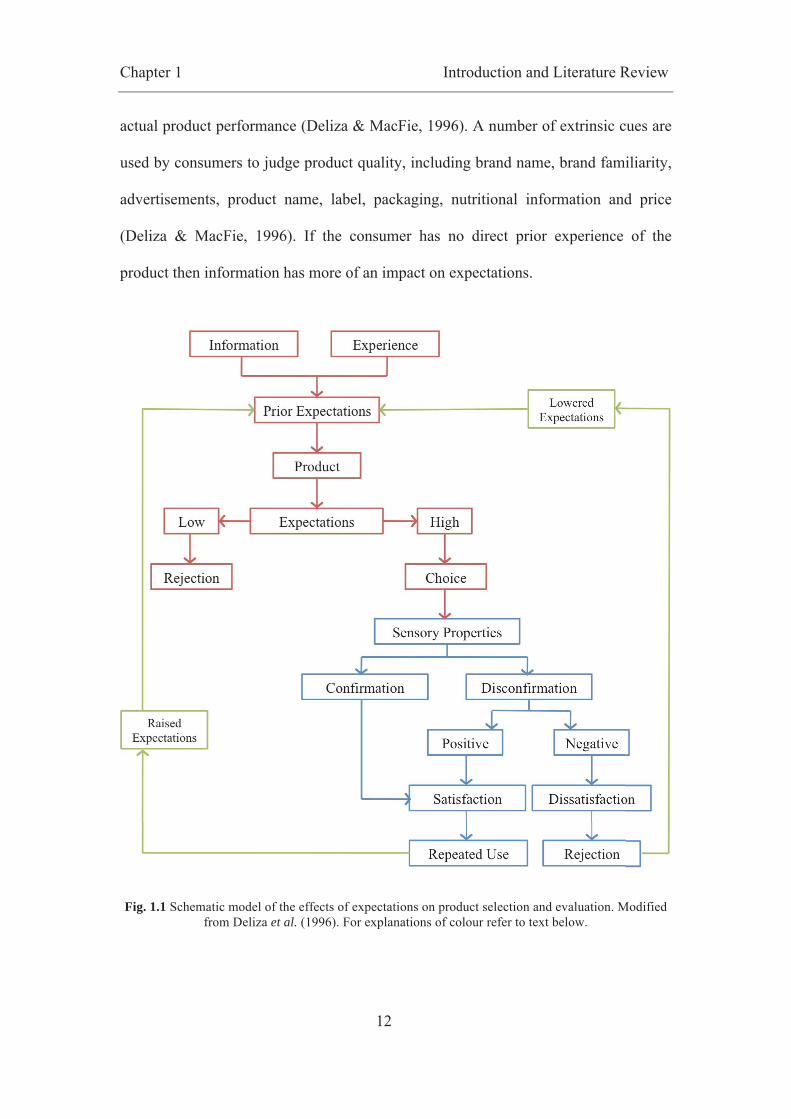
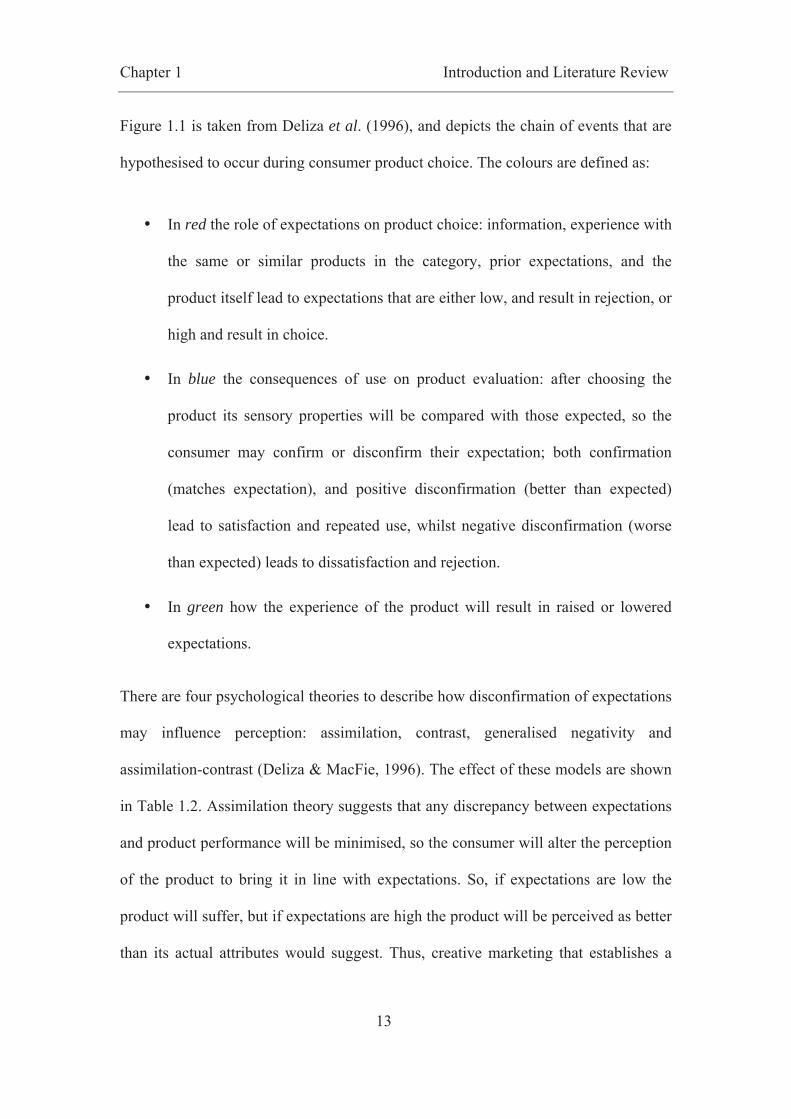
Fig. 1.1 Schematic model of the effects of expectations on product selection and evaluation. Modified from Deliza et al. (1996). For explanations of colour refer to text below.
Chapter 1 Introduction and Literature Review
13
Figure 1.1 is taken from Deliza et al. (1996), and depicts the chain of events that are
hypothesised to occur during consumer product choice. The colours are defined as:
• In red the role of expectations on product choice: information, experience with
the same or similar products in the category, prior expectations, and the
product itself lead to expectations that are either low, and result in rejection, or
high and result in choice.
• In blue the consequences of use on product evaluation: after choosing the
product its sensory properties will be compared with those expected, so the
consumer may confirm or disconfirm their expectation; both confirmation
(matches expectation), and positive disconfirmation (better than expected)
lead to satisfaction and repeated use, whilst negative disconfirmation (worse
than expected) leads to dissatisfaction and rejection.
• In green how the experience of the product will result in raised or lowered
expectations.
There are four psychological theories to describe how disconfirmation of expectations
may influence perception: assimilation, contrast, generalised negativity and
assimilation-contrast (Deliza & MacFie, 1996). The effect of these models are shown
in Table 1.2. Assimilation theory suggests that any discrepancy between expectations
and product performance will be minimised, so the consumer will alter the perception
of the product to bring it in line with expectations. So, if expectations are low the
product will suffer, but if expectations are high the product will be perceived as better
than its actual attributes would suggest. Thus, creative marketing that establishes a

Chapter 1 Introduction and Literature Review
14
positive product and brand image, and therefore positive expectations, will improve
liking of the product (Cardello, 2007). Contrast theory proposes that the consumer
will magnify the disparity, and evaluate the product less favourably. Generalised
negativity suggests that any discrepancy will result in a generalised hedonic state,
resulting in unfavourable rating. Assimilation-contrast assumes that if the disparity is
sufficiently small to be within the limit of acceptance the product will be put in line
with expectation (assimilation), but if the discrepancy is large, and falls into the zone
of rejection, the consumer will exaggerate the disparity (contrast). Large
discrepancies between what the consumer expects and what the product can deliver
should be avoided, as awareness of the discrepancy will create negative effect. The
largest body of research supports assimilation theory (for example: Wansink, van
Ittersum & Painter, 2005; Yeomans, Lartamo, Procter, Lee & Gray, 2001).
Table 1.2 The predicted effects of disconfirmed consumer expectations on the direction of increase/decrease in perceived product performance for the assimilation, contrast, generalised
negativity and assimilation-contrast models. Adapted from Cardello and Sawyer (1992).
Product Performance vs. Expectation Model Positive Disconfirmation Negative Disconfirmation
Assimilation Decrease Increase Contrast Increase Decrease
Generalised Negativity Decrease Decrease Assimilation-Contrast Decrease
(under low disconfirmation) or
Increase (under high disconfirmation)
Increase (under low disconfirmation)
or Decrease
(under high disconfirmation)
1.4.3 Labelling
Many studies have investigated how label information influences expectations or
sensory and hedonic ratings of foods, in addition to intake and willingness to pay for

Chapter 1 Introduction and Literature Review
15
the product. The studies documented here refer to the manipulation of label, the
majority concerning fat content, or novel foods. Whilst Aaron, Mela and Evans
(1994) found no significant affect of label (‘reduced-fat spread 40% fat’ or ‘full-fat
margarine 80% fat’) on sensory or hedonic ratings, many researchers have found that
labelling significantly affects hedonic ratings. Kähkönen and Tuorila (1998) found
that when given information about fat content, participants expected the light version
to be less pleasant, and Stubenitsky, Aaron, Catt and Mela (1999) showed that
reduced-fat information had a small negative effect on the acceptance ratings of
chocolate snack bars. Kähkönen and Tuorila (1999) found that reduced-fat
information decreased pleasantness ratings and buying probability of chocolate bars
compared with regular products.
Levin and Gaeth (1988) found that when information about fat was framed in a
positive way the product was rated higher than when framed in a negative way.
However, this framing effect is more pronounced in studies where the product is not
consumed, implying that personal experience plays a prominent role in judgments.
Light, Heymann and Holt (1992) investigated the influence of label information on
hedonic responses to normal and low fat versions of ice cream and cheese. Ice cream
with information was liked significantly more than when presented without
information. When participants knew the fat content of the cheese they tended to
prefer the low-fat product over the higher version, possibly due to ‘impression
management’ or social desirability: participants were trying to appear healthier than
they really were. Furthermore, Tuorila, Kramer and Engell (2001) found that
participants often chose a fat-free fudge against their hedonic preference, which the

Chapter 1 Introduction and Literature Review
16
authors suggests is evidence that motivated people can accept a less preferred product
when they are informed of its reduced fat content.
Wansink, van Ittersum and Painter (2005) found that descriptive food names
(geographic, nostalgic or sensory-related in nature, for example ‘Traditional Cajun
Red Beans with Rice’) resulted in the belief that the meals were more appealing,
tastier and more caloric than food presented with basic descriptive names (for
example ‘Red Beans and Rice’).
Labelling has also been found to influence sensory ratings, with Kähkönen, Tuorila
and Rita (1996) finding that a high-salt spread was rated as saltier when information
about the salt content was available, suggesting that expected qualities and the
sensory experience combine and result in higher ratings. Kähkönen, Hakanpää and
Tuorila (1999) found that different types of information raised different expectations,
with reduced-fat information leading to lower expected melting rate in chocolate.
However, information did not affect the pleasantness ratings of the chocolate bars
after eating, suggesting that consumers expect sensory differences between reduced-
fat and regular fat products, but these expectations do not seem to affect hedonic
ratings. However, Kähkönen (2000) found that receiving reduced-fat information
during tasting decreased pleasantness ratings, and decreased fattiness, flavour
intensity and melting-rate ratings for chocolate. Yeomans et al. (2001) found that
when participants tasted both low-fat and high-fat soups presented with fictitious
brand names that implied that the soup was high or low in fat, soups labelled as high
in fat were rated as significantly more creamy, and more pleasant, regardless of the
actual fat content.

Chapter 1 Introduction and Literature Review
17
Wansink, van Ittersum and Painter (2004) suggest that health or diet labels are likely
to influence the subjective taste of unhealthy foods, but not foods that are already
viewed as healthy, where the label has less of an impact. Wansink and Park (2002)
found that a label indicating the presence of a "phantom ingredient" led to health
claims becoming more believable, but negatively influenced taste perceptions, whilst
Tuorila and Cardello (2002) found that liking of a fruit juice with an off-flavour (due
to the addition of potassium chloride) was higher when accompanied by a health
message. Furthermore, if authors informed participants that its special ingredient
would improve either exercise endurance and energy or mental alertness and memory,
the likelihood of consumption in the future was higher than if participants were told it
would improve their mood and emotional well being.
Labelling also has an effect on hedonic and sensory ratings of novel food products.
Yeomans, Chambers, Blumenthal and Blake (2008) found that a novel smoked
salmon ice-cream was rated as more pleasant when labelled as a ‘frozen savoury
mousse’ than when labelled ‘ice-cream’. Furthermore, the ‘ice-cream’ was rated
higher than the ‘frozen savoury mousse’ for saltiness, and overall strength of flavour.
It was found that the ‘ice-cream’ label generated an expectation of a sweet, fruity
flavour, and not salty or fishy flavour; this large disconfirmation led to an extreme
dislike, when ratings during the control (unlabelled) condition were neutral.
Westcombe and Wardle (1997) looked at the effects of novelty and fat content, giving
participants three versions of three types of food to taste: cheese (considered to be
high in fat), yogurt (considered low in fat), and a novel, tofu based food. Each
samples was labelled as either ‘Higher’, ‘Normal’ or ‘Lower’ fat, whilst the actual fat
Chapter 1 Introduction and Literature Review
18
content remained constant. An effect of labelling on ratings of several sensory
attributes (creamy texture, oily and light texture), was observed, with the ‘lower’ fat
samples being less creamy in texture and those labelled normal, or higher in fat.
Furthermore, the foods labelled as lower in fat were thought to be less pleasant.
However, those participants more concerned with health issues tended to perceive the
higher fat labelled foods as less pleasant than those who were less concerned did. The
novel food was affected by labelling type in the same way as the other foods; the
authors suggest that knowledge and experience of a food probably facilitates greater
responding to labels, but the effect still exists in novel foods. Tuorila, Meiselman,
Cardello and Lesher (1998) investigated whether information could increase positive
responses to novel products. Participants tasted novel products accompanied by
different types of information: no information; positive information emphasising the
product’s uniqueness; positive information with details of the product category and
other familiar foods. It was found that product category information led to decreased
hedonic responses, due to negative disconfirmation, whilst hedonic ratings increased
without this information. Furthermore, degree of liking, or frequency of use of a
reference product predicted novelty acceptance, regardless of the information given.
Labelling may also affect energy intake. Provencher, Polivy and Herman (2009)
investigated how describing an oatmeal-raisin cookie as either a healthy snack or an
unhealthy snack affected ad libitum (self-regulated) intake, and how restrained eating
(i.e. monitoring and attempting to limit food intake) and having one’s weight made
salient (i.e. being told one’s current weight) affected intake. The authors found that all
participants (regardless of restraint status, or weight salience) ate 35% more when the

Chapter 1 Introduction and Literature Review
19
cookies were described as a healthy snack than when they were described as
unhealthy. However, the weight salience manipulation affected restrained and
unrestrained eaters differently, with restrained eaters having a more negative
evaluation of the snack foods (both in the healthy and unhealthy conditions) when
they received weight feedback before eating, whilst unrestrained eaters gave more
positive evaluations in the same condition. The authors suggest that this is due to the
fact that the restrained eaters had a higher BMI, and possibly greater weight
dissatisfaction.
Aaron, Evans and Mela (1995) investigated the effect that nutritional information had
on nutrient intake during lunch at a cafeteria. Surprisingly, nutritional information
resulted in an increased intake of total energy, fat and carbohydrate, and decreased
intake of protein, although this finding was mostly due to changes in eating behaviour
of both men and less restrained eaters. Authors suggest that this may be a
consequence of participants anticipating that the foods that were higher in fat and
calories would be superior in sensory quality, and would be more satiating.
Furthermore, they highlight the issue of peer pressure that may affect behaviour in a
public setting.
Wansink and Chandon (2006) investigated the effect that low-fat labels and serving
size information had on consumption in both normal-weight and over-weight
consumers. The authors suggest that when serving size is ambiguous consumers infer
this from other cues, such as prior experience, or information found on the package or
nutrition label, such as low-fat information. As such, nutrition labels could create
misleading ‘health halos’, in which consumers believe that it is acceptable or
Chapter 1 Introduction and Literature Review
20
appropriate to consume more of a food labelled as being lower in fat. Furthermore,
this may be related to food-related guilt: low-fat claims may lead consumers to eat
more because it reduces the conflict between the hedonic goal of pleasure
gratification, and the long-term goal of health preservation. The authors found that
low-fat labels increased the consumption of foods by up to 50% across both hedonic
(chocolate) and utilitarian (granola) snacks, with greater consumption of both foods
by overweight consumers. Furthermore, serving size information prevented normal-
weight participants from overeating foods labelled as low-fat, but did not influence
overweight people. The authors conclude that consumers may trade-off taste
reductions for increased consumption, so truthful labels and claims may not be
sufficient to improve eating behaviour. The authors also point out that is important to
consider when a low-fat claim would lead someone to eat so much more that it offsets
lower-calorie density of low-fat foods, and how much low-fat labels affect
consumption in subsequent meals (overconsumption and the choice of more indulgent
extras).
Estimates of willingness to pay (WTP; the maximum price a buyer is willing to pay
for a given quality of a good) can be a sensitive and valuable method for assessing the
intrinsic value of a product (Lange, Martin, Chabanet, Combris & Issanchou, 2002),
and has been used in labelling experiments. There are a number of methods of
assessing WTP, including directly asking consumers how much they would be willing
to pay, conducting experimental auctions where participants bid for a product (and
often ultimately pay for it if they win) or choice-based conjoint analysis. Bower,
Saadat and Whitten (2003) investigated the interplay of taste, price and information
Chapter 1 Introduction and Literature Review
21
(about a health benefit) on the intention to buy and willingness to pay for a fat spread.
Authors found that label information had a significant effect on intention to buy,
especially when combined with higher liking. Consumers were willing to pay more
for the spread than the control spread, with willingness to pay being higher for
females, older participants, those with high health concern and those with higher
nutritional knowledge.
The effect that labelling has upon liking, perception of sensory attributes, intake and
willingness to pay is clearly evident. Furthermore, the majority of researchers find
that reduced-fat information decreases liking, whilst foods thought to be high in fat
are rated as more pleasant.
This has a crucial impact on a reduced fat chocolate. Low expectations may prevent
the initial purchase of the product, or may affect the hedonic or sensory ratings of the
chocolate following consumption. The effect that fat content has on consumption is
clearly important when aiming to reduce the prevalence of obesity. Furthermore,
many researchers find that individual differences (e.g. health concern, restraint status,
weight, age or gender) have an effect on hedonic ratings, ad libitum intake and WTP.
1.4.4 Individual Differences
A consumer’s eating style, health concerns or individual characteristics such as
gender, age or BMI may affect the response towards a reduced-fat chocolate. Gender
differences may be important, as not only do women report liking and craving
chocolate more than men (Rozin, Levine & Stoess, 1991), but they are more positive

Chapter 1 Introduction and Literature Review
22
towards low-fat foods (Solheim & Lawless, 1996), consume more energy-reduced
and fat-reduced products (Fagerli & Wandel, 1999), and are more likely to be calorie
conscious (Kiefer, Rathmanner & Kunze, 2005). Age may also affect liking, as it has
also been found that reported cravings for sweet foods decrease with age (Pelchat,
1997), and that age influences one's preference for comfort foods (Wansink, Cheney
& Chan, 2003). Wansink, Cheney and Chan (2003) found that as people aged, snack-
related comfort foods (such as chocolate) made them feel less unhealthy than the
same foods made younger people feel. BMI may also have an impact on attitudes
towards reduced-fat chocolate, with overweight and obese individuals showing a
tendency towards greater liking and selection of energy-dense foods (Mela, 2001).
Furthermore, Drewnowski, Kurth, Holden-Wiltse and Saari (1992) suggest that
“preferences for major nutrient sources of fat as opposed to carbohydrate may be a
primary characteristic of human obesity syndromes”, with obese women naming
chocolate, among other sweet, high fat foods, as one of their most preferred foods.
A consumer’s eating style, and levels of restraint, emotional or external eating may
also have an effect on their attitude towards a fat reduced chocolate, as may their
levels of ambivalence towards chocolate. Cognitive dietary restraint is “the perception
that one is constantly monitoring and attempting to limit food intake in an effort to
achieve or maintain a desired body weight”, and has been related to a higher
probability of choosing reduced-calorie or reduced-fat foods (Rideout, McLean &
Barr, 2004). Emotional eating describes eating, or overeating, in response to
emotional arousal states such as fear, anger, anxiety or loneliness, and has also been
related to a higher consumption of sweet foods in both men and women (Konttinen,

Chapter 1 Introduction and Literature Review
23
Männistö, Sarlio-Lähteenkorva, Silventoinen & Haukkala, 2010). External eating
describes eating more in response to external cues such as the sight, smell or taste of
food, or the anticipation of food. It is thought that external eaters are insensitive to
internal, physiological hunger and satiety signals, so the external environment
determines eating behaviour (Tatjana van Strien, Herman & Verheijden, 2009). It has
been found that the external environment is a good predictor of food craving, and that
the craving of high fat foods has been linked to the development of obesity (Burton,
Smit & Lightowler, 2007). Finally, ambivalence has been described as the
“simultaneous existence of positive and negative evaluations of an attitude object”
(Sparks, Conner, James, Shepherd & Povey, 2001), and can be associated with the
conflicts between the sensory appeal of sweet and fatty foods and their perceived
implication for health and body image (Cartwright & Stritzke, 2008; Rogers & Smit,
2000). Although chocolate is frequently liked and craved (Rogers & Smit, 2000), guilt
often follows its consumption (Macht & Dettmer, 2006). Information about individual
characteristics may indicate differences between the consumers that could be used to
identify target markets, and result in successful marketing of a reduced-fat milk
chocolate.
1.4.5 Chocolate
In the following section, a brief history of chocolate is given, the modern day
production method is described, and methods of analysis are presented. Chocolate is a
suspension of non-fat particles (sugar, cocoa solids and milk solids) in a continuous
fat phase (cocoa butter). The main attractions of chocolate are its distinctive flavour,
and melting properties: chocolate is solid at room temperature, but melts at body
Chapter 1 Introduction and Literature Review
24
temperature. However, the methods of producing, and the consumption of, chocolate
has changed dramatically since its discovery. The following history of chocolate has
been compiled from Beckett (1999, 2000), Coe and Coe (2000) and Minifie (1989).
The cocoa tree, Theobroma Cacao (meaning ‘Food of the Gods’), was discovered in
the Yucatan Peninsula in southern Mexico in 600 AD by Mayans, who used the beans
to produce the bitter chocolate drink “chocolatl”. This drink was made by roasting
and grinding cocoa nibs, which were then mixed with cold water, spices, chilli
pepper, vanilla or honey. It was used in everyday life and for ceremonial purposes.
When the Aztec civilisation conquered the Mayans during the 1300s they discovered
the drink, and used the beans as currency.
Christopher Columbus was the first European to discover cocoa beans, but it was Don
Hernán Fernando Cortés who realised the commercial value of the beans, and
following the invasion of the Aztecs in 1528, took cocoa beans and recipes for
making chocolate back to Spain. The Spaniards omitted chilli pepper, but added
vanilla, cinnamon, nutmeg and sugar to the drink, and served it hot. The popularity of
the drink spread to Italy, Holland and France in the 1600s. The first chocolate
drinking house opened in London in 1657, and in 1727 milk was added to the drink
(generally attributed to Nicholas Sanders).
In 1828 van Houten of Holland invented the cocoa press, which removed part of the
cocoa fat from the bean, resulting in a powder that made the drink easier to prepare
and digest. This method also released cocoa butter making it possible to produce a
fluid chocolate that could be moulded. In 1847 Joseph Fry’s factory in Bristol was the
Chapter 1 Introduction and Literature Review
25
first British factory to produce a plain eating chocolate, and in 1876 Daniel Peter in
Switzerland invented milk chocolate. His invention was facilitated by the
development of condensed milk by Henri Nestlé. In 1880 Rodolphe Lindt in
Switzerland invented the conche to produce a smoother, better tasting chocolate,
resulting in many manufacturers producing chocolate products during the early 1900s.
The modern day method for producing chocolate has been explained extensively by
Beckett (2000), from which the following description has been adapted. Cocoa beans
(cotyledons) are fermented, dried and roasted to produce cocoa nibs. The nibs are then
milled, which melts the fat (cocoa butter), and releases it from the cells of the beans,
so that it can be separated from the cocoa solids. Chocolate also contains sugar, which
can be produced from both sugar cane and sugar beet, and milk chocolate contains
milk powder from cows milk. The sugar, cocoa and milk powder are often dried and
mixed together to make chocolate crumb. The crumb is then refined, reducing the
particle size from 2000 micrometers (μm) to 18-38μm (depending on formulation). In
the UK chocolates are refined to particle sizes between 20 and 30μm (Beckett, 1999).
Chocolate refined to over 35μm can be detected as gritty and sandy and is generally
not accepted. The ingredients are then conched for several hours, which turns the
mixture from a paste into a liquid. Conching evenly distributes the cocoa butter,
refines the particles, dramatically decreases the viscosity of the chocolate, reduces
moisture content, evaporates volatile acids and is essential for the development of the
chocolate flavour (Cook, 1963). During conching the temperature is controlled to
between 55 and 65°C (Cook, 1963), although this differs depending on the type of
chocolate (white, milk or dark) and the desired taste (e.g. caramel flavour can be

Chapter 1 Introduction and Literature Review
26
formed due to Maillard Reaction). Following conching the chocolate is tempered: it is
cooled and heated according to a particular temperature profile to ensure that the
cocoa butter crystalises in the right polymorphic form (discussed in more detail in
1.4.5.1). The chocolate can then be moulded, and packaged. The schematic presented
in Figure 1.2 describes the chocolate process, from cocoa bean to chocolate bar.
1.4.5.1 Cocoa Butter
Cocoa butter is important in chocolate for its physical properties, especially melting
characteristics. It is solid at room temperature, but can melt rapidly within the mouth:
between 30 and 34°C. This melting temperature affects both the textural properties of
the chocolate, and subsequent flavour release. Cocoa butter is mainly composed of
triacylglyerols (TAGs), although it also includes di- and monoacylglyerols, free fatty
acids, phospholipids, and other complex lipids (Smith, 2001). TAGs are composed of
fatty acids that are attached to a glycerol backbone. Cocoa butter contains palmitic
(20-26%), stearic (29-38%) and oleic (29-38%) acids in almost equal amounts,
although this varies depending on the subspecies of the cocoa plant, and climate
conditions (Smith, 2001). TAGs have polymorphic behaviour, i.e. they can exist in
more than one crystal form with different molecular packing: α (alpha), β’ (beta-
prime) and β (beta), in order of increasing melting point and thermodynamic stability,
due to increasingly more dense crystal packing. Cocoa butter is thought to have six
polymorphic forms, which the chocolate industry numbers from I to VI (Wille &
Lutton, 1966). The polymorphic form of the cocoa butter has a large impact on
product quality as it is related to physical characteristics (snap, moulding, contraction,
gloss and blooming) (Loisel, Keller, Lecq, Bourgaux & Ollivon, 1998).

Chapter 1 Introduction and Literature Review
27
Fig. 1.2 Chocolate Processing adapted from Beckett (1999). The dotted lines represent optional additions.
Cocoa Beans Fermentation Drying Cleaning Roasting Cracking and removal of shell
Cocoa Nibs Grinding
Cocoa Mass / Liquor
Cocoa Powder Cocoa Butter Sugar Milk Powder Milk Fat Emulsifier Vanilla
Grinding / Refining Conching Tempering Moulding / Enrobing Final cooling / Crystallisation
Chocolate
Chapter 1 Introduction and Literature Review
28
Although the thermodynamically stable polymorph is Form VI (ß1), consumers find V
(ß2) the most attractive, as it melts just below mouth temperature and is glossy;
furthermore, this form demoulds efficiently, making manufacture easier. This form
does not occur directly from melting, so crystallisation is usually into a less stable
form (α or β’). In order to produce Form V, chocolate has to undergo a tempering
(controlled crystallisation) process: a thermal regime carried out under shear. It
involves heating the chocolate to between 50 and 60ºC (to melt all crystalline
material), cooling to a temperature above the α melting point (22-24ºC, depending on
formulation) to initiate crystallisation, before re-heating to a temperature above the β’
melting point (26-28ºC), and finally cooling to allow complete solidification of the
stable Form V. This method relies on the development of stable Form V crystals to
‘seed’ subsequent crystallisation. ‘Bloomed’ chocolate has an inferior visual and
textural quality. It results in a dull, rather than glossy, appearance, and white coating
or spots on the surface. Several situations can lead to the development of bloom, as
described by Bricknell and Hartel (1998):
• Insufficient tempering, so that stable V (ß2) crystals are not present;
• Cooling too quickly during tempering, so that the formation of unstable
polymorphs will be promoted;
• High storage temperatures, or fluctuations in temperature, resulting in melting
and recrystallisation;
• The presence of liquid fat components (fats with a lower solid fat content than
cocoa butter), found in the fillings of some chocolates (e.g. ganache or nuts),
Chapter 1 Introduction and Literature Review
29
which can interfere with the formation of stable V (ß2), causing bloom on
storage.
The addition of milk fat and milk fat fractions can also be used to inhibit bloom,
although this can also result in softening (Bricknell & Hartel, 1998).
The two main techniques described in the literature for the analysis of chocolate and
cocoa butter are Differential Scanning Calorimetry (DSC) and X-ray Diffraction
(XRD). Both techniques are described here, in Sections 1.4.5.3 and 1.4.5.4,
respectively.
1.4.5.2 The Importance of Fat in Chocolate
Fat gives chocolate its desirable physical characteristics, such as creamy texture, rich
taste and melt-in-the-mouth ability. Fat content is particularly important as it has a
dramatic effect on the material properties of chocolate, for example viscosity, snap
and melting properties. Fat coats solid non-fat particles (such as sugars and cocoa
powder) so they can flow past one another when chocolate melts (Beckett, 2000); the
more fat there is in chocolate the easier it will flow both in manufacture and in the
mouth. Most chocolates contain between 25% and 35% fat, although high quality
chocolate may have a higher fat content (Beckett, 2000). Above 32% fat content there
is very little change in viscosity with any further additions, but a 1% increase to a
28% fat content has a dramatic effect, and a chocolate with a 23% fat content is a
paste (Beckett, 2000). Fat content may also affect flavour release. Although Knapp
(1937) found that the chocolate precursors formed during fermentation were not in the
fat phase, fat does contribute certain flavour characteristics to chocolate. Flavour
Chapter 1 Introduction and Literature Review
30
compounds tend to equilibrate between the lipid and aqueous phases: hydrophobic
compounds will partition into the lipid phase, and hydrophilic compounds will
partition into the aqueous phase (Decker, 2006). Reducing fat from a system exposes
flavour volatiles to a more-hydrophilic environment, causing hydrophobic compounds
to move from the hydrophilic environment into the gaseous phase (Decker, 2006). On
consumption the nose will detect these compounds rapidly, causing flavour to be
perceived as too strong. Fat within a food coats the mouth and may block some of the
receptors, delaying and / or prolonging flavour release; similarly, removing fat from a
food may result in an undesirably heightened experience of flavour at the early stages
of consumption, and even a reduction in aftertaste. Thus, fat reduction in chocolate is
challenging: the product should still flow during manufacture, be stable at room
temperature, and melt in the mouth, tasting creamy and rich.
1.4.5.3 Differential Scanning Calorimetry (DSC)
Differential scanning calorimetry (DSC) is a thermoanalytical technique that
measures the heat flow associated with thermal transitions in materials as a function
of temperature (Höhne, Hemminger & Flammersheim, 2003). It can be used to
determine the polymorphic form of cocoa butter because the polymorphs have
different melting points and melting enthalpies. Many researchers have used DSC to
study the polymorphs of cocoa butter, and Loisel et al. (1998) collated the data, which
is presented in Table 1.3. Similarly, Chapman, Akehurst and Wright (1971) calculated
the heat of fusion (cal/g) for each of the crystal forms, which can be converted to
melting enthalpy, and is presented in Table 1.4. During a DSC experiment, a sample
and a reference are subjected to identical temperature regimes, being heated or cooled
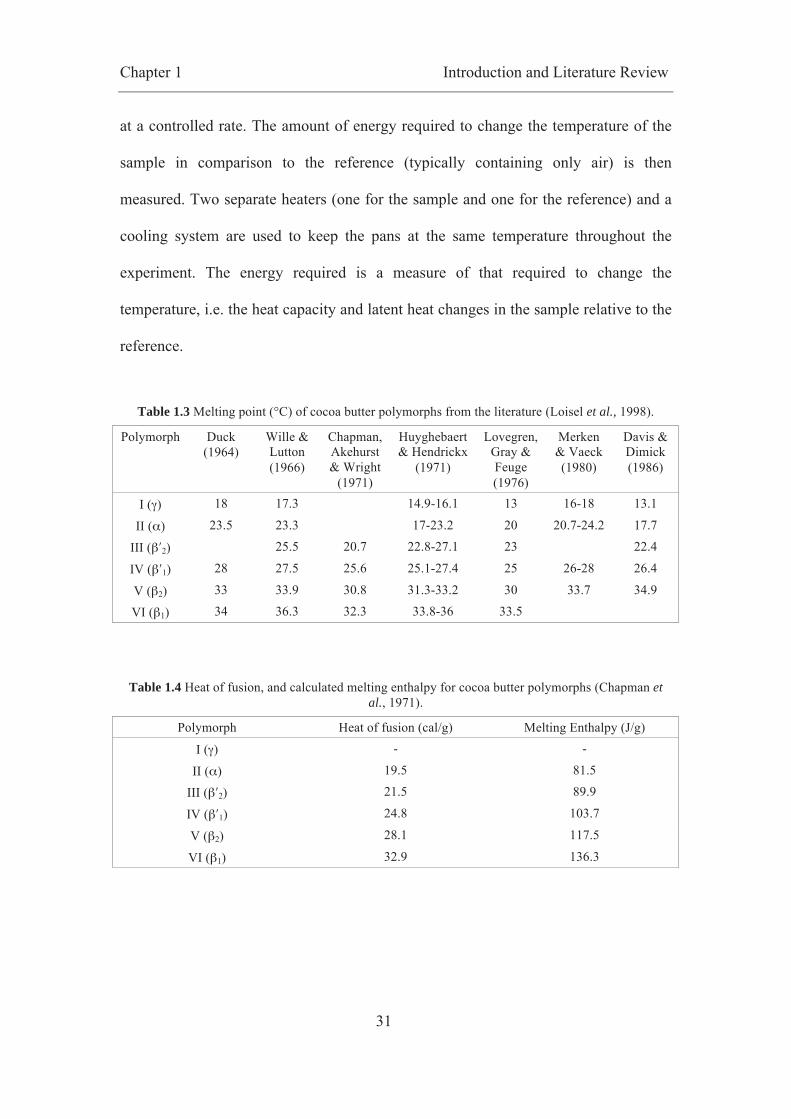
Chapter 1 Introduction and Literature Review
31
at a controlled rate. The amount of energy required to change the temperature of the
sample in comparison to the reference (typically containing only air) is then
measured. Two separate heaters (one for the sample and one for the reference) and a
cooling system are used to keep the pans at the same temperature throughout the
experiment. The energy required is a measure of that required to change the
temperature, i.e. the heat capacity and latent heat changes in the sample relative to the
reference.
Table 1.3 Melting point (°C) of cocoa butter polymorphs from the literature (Loisel et al., 1998).
Polymorph Duck (1964)
Wille & Lutton (1966)
Chapman, Akehurst & Wright
(1971)
Huyghebaert & Hendrickx
(1971)
Lovegren, Gray & Feuge (1976)
Merken & Vaeck (1980)
Davis & Dimick (1986)
I (γ) 18 17.3 14.9-16.1 13 16-18 13.1
II (α) 23.5 23.3 17-23.2 20 20.7-24.2 17.7
III (β′2) 25.5 20.7 22.8-27.1 23 22.4
IV (β′1) 28 27.5 25.6 25.1-27.4 25 26-28 26.4
V (β2) 33 33.9 30.8 31.3-33.2 30 33.7 34.9
VI (β1) 34 36.3 32.3 33.8-36 33.5
Table 1.4 Heat of fusion, and calculated melting enthalpy for cocoa butter polymorphs (Chapman et al., 1971).
Polymorph Heat of fusion (cal/g) Melting Enthalpy (J/g)
I (γ) - -
II (α) 19.5 81.5
III (β′2) 21.5 89.9
IV (β′1) 24.8 103.7
V (β2) 28.1 117.5
VI (β1) 32.9 136.3
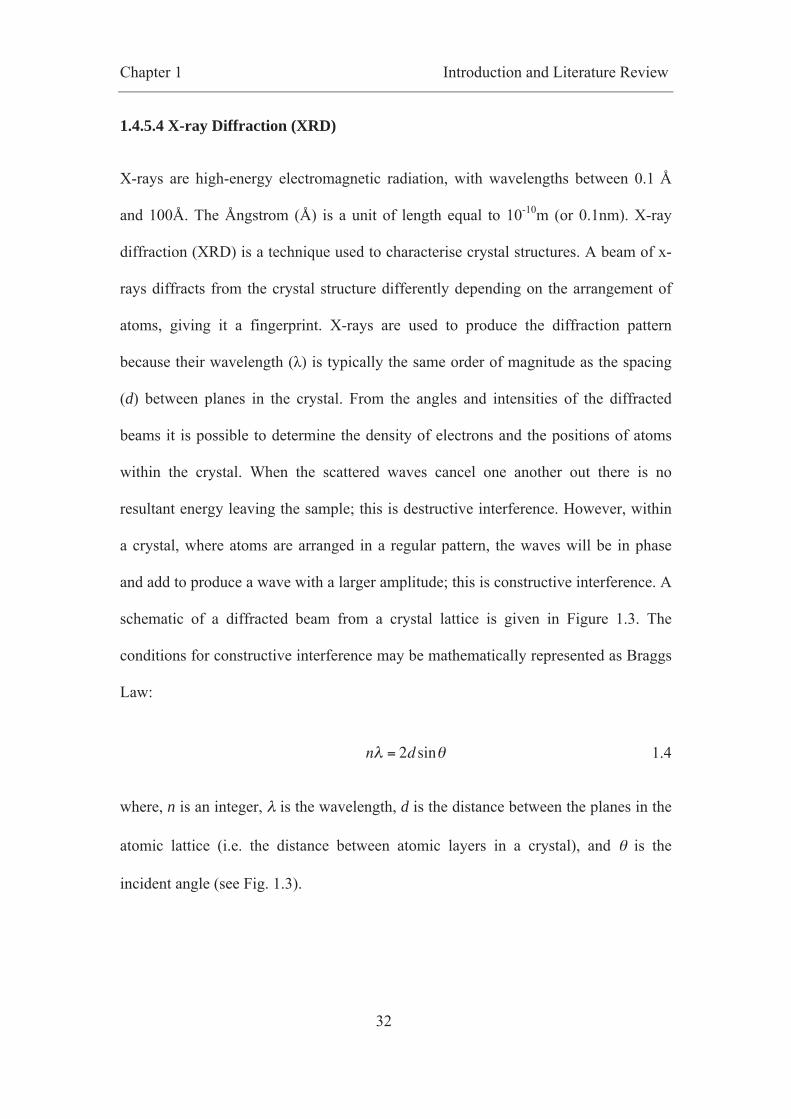
Chapter 1 Introduction and Literature Review
32
1.4.5.4 X-ray Diffraction (XRD)
X-rays are high-energy electromagnetic radiation, with wavelengths between 0.1 Å
and 100Å. The Ångstrom (Å) is a unit of length equal to 10-10m (or 0.1nm). X-ray
diffraction (XRD) is a technique used to characterise crystal structures. A beam of x-
rays diffracts from the crystal structure differently depending on the arrangement of
atoms, giving it a fingerprint. X-rays are used to produce the diffraction pattern
because their wavelength (λ) is typically the same order of magnitude as the spacing
(d) between planes in the crystal. From the angles and intensities of the diffracted
beams it is possible to determine the density of electrons and the positions of atoms
within the crystal. When the scattered waves cancel one another out there is no
resultant energy leaving the sample; this is destructive interference. However, within
a crystal, where atoms are arranged in a regular pattern, the waves will be in phase
and add to produce a wave with a larger amplitude; this is constructive interference. A
schematic of a diffracted beam from a crystal lattice is given in Figure 1.3. The
conditions for constructive interference may be mathematically represented as Braggs
Law:
nλ = 2d sinθ 1.4
where, n is an integer, λ is the wavelength, d is the distance between the planes in the
atomic lattice (i.e. the distance between atomic layers in a crystal), and θ is the
incident angle (see Fig. 1.3).
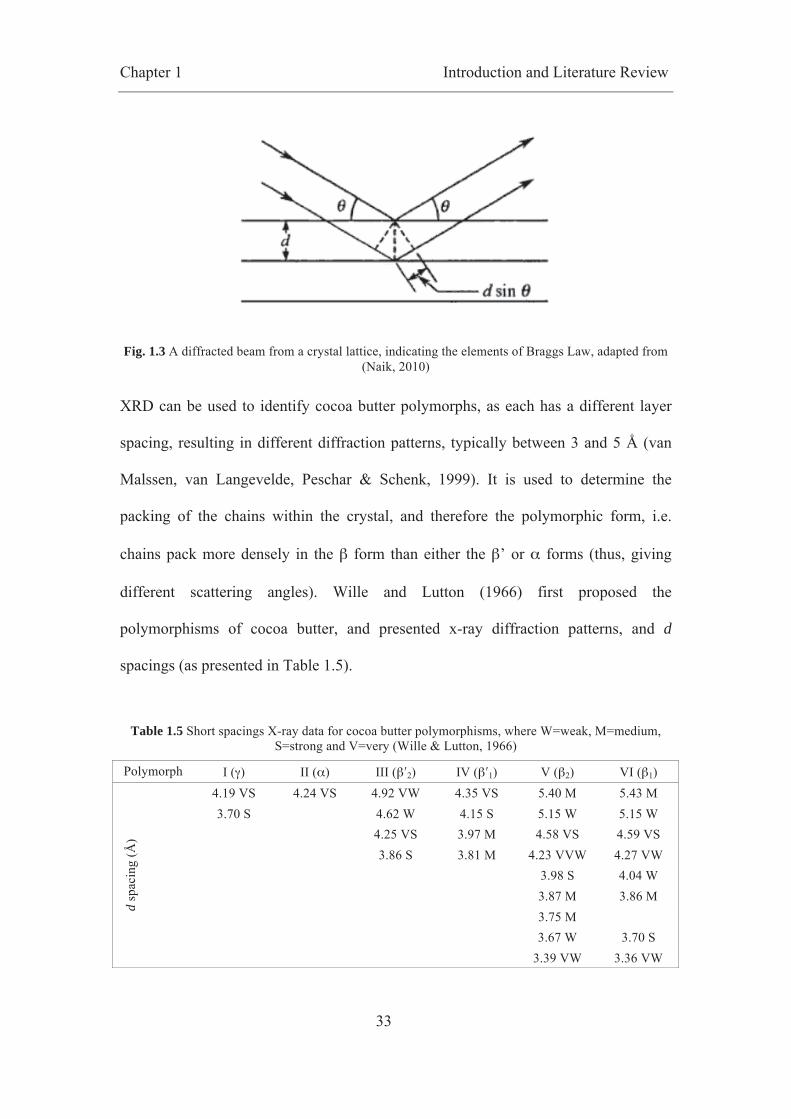
Chapter 1 Introduction and Literature Review
33
Fig. 1.3 A diffracted beam from a crystal lattice, indicating the elements of Braggs Law, adapted from (Naik, 2010)
XRD can be used to identify cocoa butter polymorphs, as each has a different layer
spacing, resulting in different diffraction patterns, typically between 3 and 5 Å (van
Malssen, van Langevelde, Peschar & Schenk, 1999). It is used to determine the
packing of the chains within the crystal, and therefore the polymorphic form, i.e.
chains pack more densely in the β form than either the β’ or α forms (thus, giving
different scattering angles). Wille and Lutton (1966) first proposed the
polymorphisms of cocoa butter, and presented x-ray diffraction patterns, and d
spacings (as presented in Table 1.5).
Table 1.5 Short spacings X-ray data for cocoa butter polymorphisms, where W=weak, M=medium, S=strong and V=very (Wille & Lutton, 1966)
Polymorph I (γ) II (α) III (β′2) IV (β′1) V (β2) VI (β1)
d sp
acin
g (Å
)
4.19 VS 4.24 VS 4.92 VW 4.35 VS 5.40 M 5.43 M 3.70 S 4.62 W 4.15 S 5.15 W 5.15 W
4.25 VS 3.97 M 4.58 VS 4.59 VS 3.86 S 3.81 M 4.23 VVW 4.27 VW 3.98 S 4.04 W 3.87 M 3.86 M 3.75 M 3.67 W 3.70 S 3.39 VW 3.36 VW
Chapter 1 Introduction and Literature Review
34
Very strong peaks at different d spacings can be used to identify the different
polymorphs, for example a very strong peak at 4.58Å, and a peak at 3.75Å are
characteristic of form V (β2). XRD is often used in conjunction with DSC to clearly
identify the different polymorphs, for example Chapman et al. (1971), Keller et al.
(1996) and Loisel et al. (1998).
1.4.6 Methods for Calorie Reduction in Chocolate
There are a number of methods for reformulating chocolate so that it has a lower
energy density, or a lower fat content. These include replacing the sugar, reducing the
quantity of fat used, using lower calorie fats, introducing air or creating a cocoa butter
emulsion. There are many patents in the area of calorie reduction in chocolate, or
chocolate confectionary components.
Both polyols and bulking agents, although providing some energy, have greatly
reduced energy densities compared with sucrose. Polyols (sugar alcohols such as
sorbitol, isomalt, maltitol, lactitol, erythritol and xylitol) are used to replace sucrose in
chocolate, as they are lower in calories and suitable for diabetics (Beckett, 2000).
Bulking agents (such as polydextrose, oligofructose and inulin) are polymers of
sugars such as glucose or fructose linked by bonds that cannot be split by enzymes in
the digestive system. However, the energy density of the chocolate can still be high as
the fat content remains unchanged, or is even increased. Polyols and bulking agents
change the rheological properties of chocolate (Sokmen & Gunes, 2006), so that fat
levels need to be kept high, thus preventing overall calorie reduction.
Chapter 1 Introduction and Literature Review
35
An alternative approach is to add micron sized air cells, or ‘microbubbles’, which
maintain the physical properties of the chocolate, but reduce the calories on a volume
basis. Robert (2006) patented a method for making aerated chocolate, in which gas
bubbles of approximately 25 microns in diameter were dispersed homogenously
throughout the chocolate.
Alternative methods have included reducing the quantity of fat within the chocolate,
such as Zumbe (1999), who created a reduced fat chocolate by manufacturing the
chocolate as normal, then removing some of the fat using a cocoa liquor press.
However, the fat content cannot be dramatically reduced without impacting on
viscosity, causing processing problems (e.g. when tempering, moulding or enrobing),
and changing the texture and mouthfeel of the product (see Section 1.4.8).
Emulsifiers, for example lecithin, can be used to coat the particles, reducing the
viscosity, but not if the fat content is below 30%. Alternatively, calorie content may
be reduced by using lower calorie fats. Fat replacement should effectively mimic the
characteristics of cocoa butter, in order to maintain the textural components of
standard chocolate products. Beckett (2000) describes both Procter and Gamble’s
Caprenin™ (from caprylic, capric and behenic acids) and Nabisco’s Benefat™ (a
mixture of long and very short chain fatty acid triglycerides) as fat replacements.
Furthermore, Kong-Chan (1989) patented a low calorie, low fat chocolate product
containing an artificial sweetener, a non-digestible bulking agent and a cocoa butter
substitute (a nondigestible polyol fatty acid polyester); McCoy, Madison, Self and
Weisgerber (1989) patented a method of using sucrose polyesters as a cocoa butter
substitute, and Cooper (1995) patented a reduced calorie cocoa butter substitute that
Chapter 1 Introduction and Literature Review
36
mimics melting properties of natural cocoa butter. However, cocoa butter substitutes
are often incompatible with cocoa butter, so have to be used with cocoa powder, they
are calorie reduced and not calorie free, and their use is restricted as they have side
effects, including being nondigestable (Beckett, 2000).
The calorie content of chocolate (according to weight) could be greatly reduced by
introducing water, which is calorie free. Molten chocolate typically has a moisture
content of 0.5-1.5%, which is present mainly in the cocoa solids, and does not affect
chocolate flow (Afoakwa, Paterson & Fowler, 2007). However, conventional
chocolate production and processing methods avoid contact with water since even
small amounts of water cause sugar particles to aggregate and form lumps, increasing
friction and viscosity (Afoakwa et al., 2007; Minifie, 1989). Thus, water can greatly
affect chocolate quality, often resulting in softening, bloom and grittiness. However,
by carefully controlling water introduction by creating a fat continuous water in oil
emulsion (i.e. by making stable droplets and preventing water migration) the energy
density of the chocolate could be greatly reduced.
Beckett, Hugelshofer, Wang and Windhab (2010) patented a process for
manufacturing milk chocolate containing a higher than normal water content (up to
30% by weight water). The method involves mixing a dark chocolate material with a
water in oil emulsion and mixing sufficiently to disperse the water throughout,
without creating a continuous phase. Hugelshofer (2000) investigated this method in
depth during his PhD study.

Chapter 1 Introduction and Literature Review
37
Ducret, Holz, Wang and Wille (1999) patented a method for producing chocolate that
is reduced in calories, has a similar taste to chocolate and has increased heat
resistance. The chocolate was produced by adding a composition containing water to
tempered dark, milk or white chocolate in an extruder. The extruder used could be a
single or twin screw extruder, with a double jacket for temperature control. The
composition containing water could be an emulsion (e.g. cream or evaporated /
condensed milk) or a gel (made with a gelling agent, such as carrageenan, gellan, a
gum, gelatin or microcrystalline cellulose). Furthermore, the inventors suggest that
water-soluble substances, such as flavourings, preservatives or minerals and vitamins
(to produce a functional chocolate) could be added to the aqueous phase. The
inventors also state that it is preferable to use the water containing chocolate as a
centre, covered with standard chocolate. Both methods (Beckett et al., 2010; Ducret et
al., 1999) add water to standard chocolate as opposed to starting from the raw
ingredients.
Morikawa and Kurooka (2000) patented a method for manufacturing chocolate
containing a water in oil emulsion, in which the chocolate was added to an aqueous
component (e.g. strawberry puree, banana puree, fresh cream or evaporated milk).
The inventors state that this water containing chocolate could be used in icings for
cakes or coatings for ice-cream bars.
Padley and Talbot (1992) patented a method for producing a chocolate filling,
comprising a water in oil emulsion, with an average droplet size of approximately
10μm. The emulsion was produced using a scraped surface heat exchanger and a
scraped surface crystalliser, in which a dispersion of liquid fat in an aqueous phase is
Chapter 1 Introduction and Literature Review
38
phase inverted (see Section 1.4.7), with the aid of emulsifiers that promote phase
inversion, to produce a fat continuous emulsion. The emulsion could also be stabilised
using thickening agents, such as an edible gum or gelatin. Sweetening agents or
flavourings could also be added to the aqueous phase. This confectionary filling can
then be enrobed with chocolate.
Rey et al. (2007) patented a method for producing a low-fat confectionary product
containing 0-20% oil phase (cocoa butter or equivalents), and 60-90% aqueous phase.
A structuring agent (e.g. carrageenans, pectins, gellan, gelatins, guar, alginates, gums
or proteins) is added to gel the water, in addition to any flavourings, colourants,
sugars, preservatives or aromas. The product is a suspension of particles (cocoa, milk
or starch) within the aqueous phase, which can then be added to the fat phase, which
structures the product through a continuous crystal network. The cocoa powder is
thought to temper the cocoa butter because the crystal seeds within the fat of the
cocoa solids are sufficient to ensure crystallization in to form V. The product
produced has a calorie content of less than 300kcal/100g. This product can then be
used as a filling, or as a chocolate component.
Finally, Rousset, Rey and Sandoz (2008) patented a method for producing a low-fat
frozen confectionary coating by producing a water in oil emulsion with at least 45%
aqueous phase (water, sugar, milk powders and gelling agents) and less than 35% oil
phase (cocoa butter or equivalent, emulsifiers and cocoa solids). This product can be
used on ice cream or other frozen desserts, and has a caloric reduction of at least 50%
compared with standard confectionary coatings.

Chapter 1 Introduction and Literature Review
39
As can be seen, there are many patents in the area of fat reduction in chocolate,
specifically in the addition of water. However, the products mentioned in these
patents are described as similar to a ganache: a soft mixture made when adding cream
to chocolate that does not snap when broken. This type of product can only be used as
a centre or filling, covered or enrobed in chocolate, or as a coating for a frozen
dessert. None of the patents detailed are suitable for producing a solid chocolate bar.
Thus, the production of a solid chocolate containing a fat continuous emulsion is an
interesting challenge. In the next few sections the principles of emulsion science will
be detailed, with the aim of producing a cocoa butter emulsion that can be used to
reduce the fat and calorie content of chocolate.
1.4.7 Emulsions
Emulsions can be used to reduce the overall fat content of many foods through the
addition of water, without dramatically changing their sensory attributes. An emulsion
consists of two immiscible liquids (typically water and oil or fat), where one liquid
(the dispersed phase) is distributed within the other (the continuous phase) as small
droplets (Bancroft, 1912), normally in the size range of 0.1 - 100μm in foods
(Dickinson, 1992). An oil in water (O/W) emulsion (e.g. cream or dressings) consists
of oil droplets dispersed within the aqueous phase, whereas a water in oil (W/O)
emulsion (e.g. butter or margarine) consists of water droplets dispersed within the
lipid phase. Emulsions are created by homogenisation or emulsification, whereby
supplying energy and mechanical agitation, it is possible to break up the dispersed
phase and produce droplets. In the absence of emulsifiers, the type of emulsion
formed is dependent on the fractions of the two phases, so that the phase with the
Chapter 1 Introduction and Literature Review
40
lowest volume will become the dispersed phase. Emulsions are thermodynamically
unstable, so the two phases will separate over a period of time, attempting to
minimise contact area (Rousseau, 2000). Emulsifiers are surface-active molecules that
are used to stabilise emulsions by adsorbing to the surface of the droplet (discussed in
more detail in 1.4.7.3). The type of emulsifier used then determines whether the
emulsion will be O/W or W/O. Thickening and gelling agents can also be used to
stabilise emulsions through increased viscosity or gelation of the aqueous phase, thus
retarding movement of the droplets (discussed in more detail in 1.4.7.4). Particles, or
crystals can also be used to stabilise an emulsion (discussed in more detail in 1.4.7.4).
1.4.7.1 Emulsification
Emulsions are created by supplying energy to the two immiscible liquids, normally as
mechanical agitation. Emulsion formation, and the size of the droplets produced, is
dependent upon droplet break up, droplet coalescence, and emulsifier absorption.
Droplet break-up is determined by both interfacial forces and disruptive forces. The
interfacial force responsible for keeping a droplet in a spherical shape is characterised
by the Laplace pressure, which acts across the oil-water interface towards the centre
of the droplet. Thus, to break up a droplet it is necessary to apply an external force
that is larger than the interfacial force. For a droplet to be broken during
emulsification, the disruptive forces must exceed the interfacial forces.
High-shear (high-speed) mixers are a commonly used method of emulsification. The
two phases are placed in a vessel, and are agitated by a mixing head that rotates at a
high speed, which disrupts the interfaces between the oil and aqueous phases,

Chapter 1 Introduction and Literature Review
41
breaking larger droplets in to smaller ones. The mixing head can be altered to gain
smaller droplets, decrease emulsification time, and gain uniform mixing. This method
typically has no temperature control, resulting in increases in temperature (the
mechanical energy is converted in to heat).
Margarines are produced in a continuous process, which comprises a sequence of
cooling and crystallisation steps. Thus, emulsification and fat crystallisation occur
simultaneously. A ‘margarine line’ comprises a scraped surface heat exchanger (‘A
unit’), and a pin stirrer (‘C unit’) (de Bruijne & Bot, 1999). The A unit consists of
rows of scraper blades mounted on a rotating axis, which scrape the inside of the
shaft. The droplet size of the emulsion is primarily determined by the intensity of flow
around the scraper blades, typically producing a droplet size of 5μm in margarine
(Bot, Flöter, Lammers & Pelan, 2007). Water, or a cooling fluid, is flowed through
the cavity of the jacket during emulsification. The combination of cooling and
shearing in the A unit is necessary to promote the formation of fat crystals around the
water droplets, required for Pickering stabilisation (see 1.4.7.4). The C unit consists of
a shaft with pins on the inside, and a rotor with pins mounted on it. In margarine
manufacture the C unit is used to provide residence time for crystallisation of the fat
that was cooled in the A unit (Bot et al., 2007). The process can be used to manipulate
crystal nucleation and growth.
1.4.7.2 Emulsion Stability
There are a number of ways in which an emulsion may become unstable (Dorota
Johansson, Bergenståhl & Lundgren, 1995; Rousseau, 2000):
Chapter 1 Introduction and Literature Review
42
1. Creaming: a form of gravitational separation in which droplets move upward
because they have a lower density than the continuous phase. The rate of
creaming is proportional to the difference in density;
2. Sedimentation: a form of gravitational separation in which droplets move
downward because they have a higher density than the continuous phase.
Again, the rate of sedimentation is proportional to the difference in density;
3. Flocculation: a type of droplet aggregation, where individual droplets remain,
but aggregate together, due to collisions between droplets;
4. Coalescence: a type of droplet aggregation, where flocculated droplets merge
to form larger droplets when the thin film between the droplets ruptures. It is a
mechanism by which an emulsion moves toward its most thermodynamically
stable state, because of a decrease in the contact area between the oil and
water phases. It causes droplets to cream or sediment more quickly as they
increase in size, and will eventually result in a layer of oil at the top of the
sample, or water at the bottom. Coalescence can be controlled by the type of
emulsifier used, and the environment (for example, temperature), although
these factors depend upon individual emulsion properties;
5. Ostwald ripening: the diffusive transfer of the dispersed phase from smaller to
larger droplets, observed in inhomogeneous emulsions. It is driven by the
difference in Laplace pressure (the pressure difference between the inside and
the outside of the droplet, caused by surface tension) between droplets. The
rate of droplet growth is determined by molecule diffusion across the
continuous phase, due to solubility. It occurs because smaller droplets have a
Chapter 1 Introduction and Literature Review
43
higher surface energy than larger droplets and so have higher solubility. It can
occur in both W/O and O/W emulsions;
6. Phase Inversion: observed when a W/O emulsion is converted into an O/W
emulsion, or vice versa. Partial coalescence can lead to phase inversion. It may
be induced by a change in the relative phase volume of the oil and water, or as
a result of changes in temperature, or surfactant composition.
The rate at which an emulsion breaks down is influenced by formulation,
environmental conditions (e.g. temperature or pH), and processing conditions
(Rousseau, 2000). The droplet size distribution can affect the shelf life (e.g.
microbiological stability), appearance (e.g. emulsion colour), texture and flavour
release in emulsions. It is therefore important to control, and measure, droplets within
emulsions. Droplet size distribution is affected by the type and amount of emulsifier
used (whether there is sufficient emulsifier to completely cover the surface of the
droplets, and the speed at which the emulsifier can adsorb to the surface of the
droplet), the energy input (the intensity and duration of homogenisation), and
temperature (which affects the viscosity of the lipid phase, and can alter the
effectiveness of emulsifiers). Emulsions can either be monodispersed (containing
droplets of the same size), or polydispersed (containing a range of droplet sizes).

Chapter 1 Introduction and Literature Review
44
Fig. 1.4 An illustration of a polydispersed water in oil emulsion. a. showing the two phases at their most thermodynamically stable, separated according to density. b. an emulsion created by
homogenisation with water droplets within a continuous oil phase. c. a single water droplet within the oil phase, with the surfactant adsorbed to the oil-water interface, showing the hydrophilic ‘head’ group,
and the lipophilic ‘tail’ group.
1.4.7.3 Emulsifier use
An emulsifier is a surface-active agent (surfactant) that can adsorb to an oil-water
interface during homogenisation and prevent droplets aggregating and coalescing
during formation, and on storage. Emulsifiers work by lowering the interfacial tension
between the oil and water phases, and forming a mechanically cohesive film around
the droplets (Rousseau, 2000). The interface will bend so that the side with the higher
surface tension will become concave, producing droplets. Most emulsifiers are
amphiphilic molecules, having a hydrophilic (‘water loving’) ‘head’ group, with a
high affinity for water, which is attached to a lipophilic (‘lipid loving’) ‘tail’ group,
which has a high affinity for oil. Bancroft’s rule states that the phase in which an
emulsifier is more soluble constitutes the continuous phase; a hydrophilic emulsifier

Chapter 1 Introduction and Literature Review
45
stabilises O/W emulsions, whilst a hydrophobic emulsifier stabilises W/O emulsions
(Bot et al., 2007).
The hydrophile-lipophile balance (HLB) system is used to classify surfactants
according to their chemical structure, giving an indication of its relative affinity for
oil and water, and thus the likelihood of forming an O/W or W/O emulsion (Griffin,
1949, 1954). The HLB system is related to both interfacial packing and film
curvature. A HLB number between 0 and 40 is assigned to different surfactants. The
more hydrophilic the surfactant the higher the solubility in water; these surfactants
have high HLB numbers, and stabilise O/W emulsions. They are made up of single
saturated chains, with larger, more hydrated head groups with less oil penetration.
More lipophilic surfactants that are soluble in oil have low HLB numbers, and
stabilise W/O emulsions. They are made up of unsaturated double chains, with
smaller, less hydrated head group and greater oil penetration. A surfactant with a HLB
number of 3-6 is predominantly hydrophobic and stabilises W/O emulsions, whereas
a surfactant with a HLB of 10-18 is predominantly hydrophilic and stabilises O/W
emulsions. Blends of emulsifiers can be used to gain required properties.
The emulsifier must adsorb quickly to the droplet interface (the higher the surfactant
concentration, the quicker the absorption rate), and the concentration of emulsifier
should be high enough to cover the droplet surface. The surface excess, or surface
load, (mg/m2) refers to the saturation of emulsifier at the interface, and provides a
measure of the minimum amount of emulsifier required to produce an emulsion with a
particular droplet size (McClements, 2005). This requires knowledge of the droplet
surface area, and the volume of the dispersed phase. This can allow for an

Chapter 1 Introduction and Literature Review
46
approximation of the required emulsifier to be calculated, although droplet size and
stability is still affected by the processing parameters. If there is insufficient
emulsifier to completely cover the interface, coalescence could occur if the droplets
come in to close proximity, resulting in a larger mean droplets size. In a system with
excess emulsifier (i.e. more than is needed to completely cover the interface), the
droplet size is more dependent upon the processing parameters. When there is excess
emulsifier present, it may begin to form multiple layers around the interface.
In this study two food emulsifiers commonly used in chocolate manufacture, and
which are also used to stabilise W/O emulsions, were selected: lecithin and
polyglycerol polyricinoleate.
1.4.7.3.1 Lecithin
Lecithins (E322) are naturally occurring surface-active molecules that can be
extracted from soya beans, rapeseed and egg, and are a mixture of phosphoglycerides
(Minifie, 1989). Lecithin typically has a HLB number of 8, meaning it is limited when
stabilising W/O or O/W emulsions when used in isolation, but is often used in
combination with other surfactants (McClements, 2005). Lecithin is also the most
widely used emulsifier in chocolate manufacture, and is used to reduce the viscosity
and flow properties of the bulk (Beckett, 2000) by lowering the interfacial tension
between the dispersed phase (sugar, cocoa solids and milk powder particles) and the
continuous phase (cocoa butter) (Schantz & Rohm, 2005). Addition of lecithin
reduces the quantity of cocoa butter needed to gain the required viscosity, and thus
reduces production costs. Current EU regulations state that lecithins may be used

Chapter 1 Introduction and Literature Review
47
according to quantum satis (i.e. no maximum level is specified, Personal
Communication, 2011).
1.4.7.3.2 Polyglycerol polyricinoleate
Polyglycerol polyricinoleate (PGPR) is a surface-active emulsifier made from castor
oil (Wilson, van Schie & Howes, 1998). It consists of polyglycerol (dominated by di,
tri and tetraglycerols (Afoakwa et al., 2007)) as the hydrophilic group and
interesterified ricinoleic fatty acids as the hydrophobic group. It typically has a HLB
of 1.5 (+/-0.5), and so is a powerful W/O emulsifier used to stabilise bakery fats and
low fat margarines. It is also used to reduce the viscosity and rheological properties of
chocolate by lowering the friction between the particles in the liquid fat phase, with
the best effects being obtained when it is used in conjunction with lecithin (Wilson et
al., 1998). As the friction between the particles is reduced by PGPR, the amount of
cocoa butter used can be reduced, thus reducing manufacturing costs (Schantz &
Rohm, 2005). There are strict regulations governing the use of PGPR, with current
EU regulations allowing a maximum of 0.5% in chocolate (Personal Communication,
2011), but it is often used in combination with other emulsifiers, such as lecithin.
1.4.7.4 Pickering emulsions and crystals at the interface
A Pickering emulsion is an emulsion stabilised by solid particles that adsorb at the
interface between two phases (Pickering, 1907), stabilising O/W emulsions when
wetted (as measured by contact angle) more by the water than the oil, whereas
particles wetted more by oil will stabilise W/O emulsions (Binks, 2002). Fat crystals
can also stabilise an emulsion. Individual crystals can behave like a) a Pickering
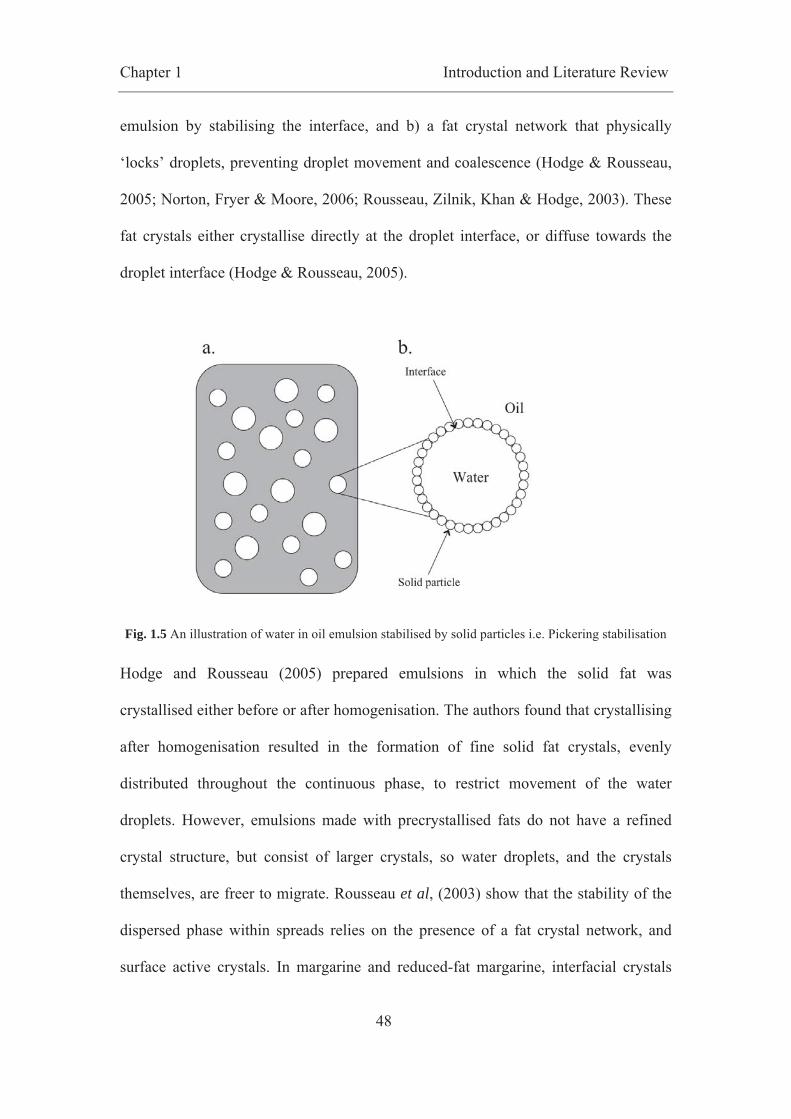
Chapter 1 Introduction and Literature Review
48
emulsion by stabilising the interface, and b) a fat crystal network that physically
‘locks’ droplets, preventing droplet movement and coalescence (Hodge & Rousseau,
2005; Norton, Fryer & Moore, 2006; Rousseau, Zilnik, Khan & Hodge, 2003). These
fat crystals either crystallise directly at the droplet interface, or diffuse towards the
droplet interface (Hodge & Rousseau, 2005).
Fig. 1.5 An illustration of water in oil emulsion stabilised by solid particles i.e. Pickering stabilisation
Hodge and Rousseau (2005) prepared emulsions in which the solid fat was
crystallised either before or after homogenisation. The authors found that crystallising
after homogenisation resulted in the formation of fine solid fat crystals, evenly
distributed throughout the continuous phase, to restrict movement of the water
droplets. However, emulsions made with precrystallised fats do not have a refined
crystal structure, but consist of larger crystals, so water droplets, and the crystals
themselves, are freer to migrate. Rousseau et al, (2003) show that the stability of the
dispersed phase within spreads relies on the presence of a fat crystal network, and
surface active crystals. In margarine and reduced-fat margarine, interfacial crystals
Chapter 1 Introduction and Literature Review
49
assist in the stabilisation of dispersed phase, especially at higher temperatures. Frasch-
Melnik, Norton and Spyropoulos (2010) found that a combination of mono- and
triglyceride crystals acted like Pickering particles to stabilise a W/O emulsion without
the addition of emulsifiers, and observed crystals sintering to form ‘shells’ around the
water droplets. Frasch-Melnik et al. (2010) and Johansson and Bergenstahl (1995)
suggest that during crystallisation three processes occur: a) nucleation of new crystals,
b) crystal growth, and c) the formation of bridges between crystals (sintering). These
bridges form in the narrow gaps of the fat crystal network. Johansson et al. (1995)
found that a small amount of fat crystals within emulsions increased flocculation
and/or coalescence, whereas the addition of fat crystals above a critical concentration
increased stabilisation. Johansson et al. (1995) suggest that fat crystals have a density
close to water, which decreases gravity-induced flocculation and coalescence.
Additionally, when crystals adsorb to the oil/water interface, the interfacial viscosity
and elasticity increase, and thus slow down the coalescence process. Crystals slow
down molecular movement at the interface requiring more time for the interfacial
layer to be disrupted to allow coalescence. They suggest that stability is dependent
upon the rate of fat crystallisation, the amount and form of the crystals produced, the
temperature and shear, as well as the amount of emulsifier used.
Garti, Binyamin and Aserin (1998) used α-form crystals of hydrogenated fat
(obtained by flash-cooling the oil phase) in combination with PGPR to stabilise liquid
W/O emulsions. They suggest that whilst the fat particles play a role in Pickering
stabilisation, the emulsifiers are molecular bridges and wetting agents that facilitate
adsorption to the interface. They conclude that it is essential to have a sufficient
Chapter 1 Introduction and Literature Review
50
amount of emulsifier to ensure adsorption onto the fat particles to reduce aggregation
of the crystals in the oil phase and crystal growth. They also state that α-form crystals
are significantly more hydrophilic that β’ or β crystals, and so will wet and anchor the
water interface more successfully.
1.4.7.5 Hydrocolloids / gelatin
The word ‘hydrocolloid’ is commonly used to describe a group of polysaccharides
and proteins (for example gelatin) that are commonly used in food products to control
rheology and texture, stabilise emulsions (prevent coalescence, flocculation,
sedimentation or creaming), and control organoleptic properties (for example
mouthfeel or flavour release) (Williams, 2006). Hydrocolloids can be used in low-fat
products to mimic fat, and may improve the spreadability of low-fat spreads and
reduce moisture loss (Bot & Vervoort, 2006). Gelatin is a water-soluble protein
derived from animal collagen (found in bone, tendon, skin and connective tissue),
prepared by hydrolysing collagen by boiling it in the presence of acid (Type A) or
alkaline (Type B) (Karim & Bhat, 2008). Gelatin is a versatile, multifunctional
hydrocolloid, which has been used commercially in beverages, desserts, ice creams,
yogurts, margarines and low-fat spreads, confectionary, bakery products, sauces,
soups and cheese, as a stabiliser, thickener, or texturiser (Karim & Bhat, 2008).
Gelatin is available in different gel strengths and particle sizes. Gel strength is
determined by ‘Bloom value’, a standard method of measuring the force required to
depress the surface of the gel (Karim & Bhat, 2008). Gelatin is often added to fat-
reduced spreads to hinder coalescence by increasing the viscosity of the dispersed
phase (Rousseau et al., 2003). Furthermore, improvements in sensory characteristics

Chapter 1 Introduction and Literature Review
51
have been achieved by adding hydrocolloids to the aqueous phase (Clegg, Moore &
Jones, 1996). The addition of hydrocolloids can give good flavour release and
breakdown in the mouth. Gelatin is particularly favourable as it has a similar
consistency and ‘melt-in-mouth’ behaviour to the fats typically used in foods (Clegg,
Moore & Jones, 1996). Other gelling agents such as starch, alginate, pectin, agar and
carrageenan lack the melting characteristics of gelatin (Karim & Bhat, 2008).
Additionally, gelatin has a clean flavour profile, and transparent appearance, which
has not been imitated by any other polysaccharide (Karim & Bhat, 2008). Finally,
gelatin is easy to use, not requiring a change in pH, or addition of salts or sugars to
set. Disadvantages of using gelatin include that it is an animal derived ingredient
(Karim & Bhat, 2008), and it has variable physical properties and chemical
heterogeneity due to differences in collagen sources and preparation techniques
(Djagny, Wang & Xu, 2001).
1.4.7.6. Analytical Methods
1.4.7.6.1 Nuclear Magnetic Resonance (NMR)
It is important to measure the droplet size of the dispersed phase within an emulsion
as it can be used to determine stability (i.e. as an indication of coalescence). Nuclear
magnetic resonance (NMR) can be used to measure droplet size within both W/O and
O/W emulsions (Goudappel, van Duynhoven & Mooren, 2001) when used in
conjunction with droplet size analysis software. Droplet size distribution can be
measured with precision similar to other techniques, with the advantage that sample
preparation is non-perturbing and non-invasive, and opaque samples can be measured
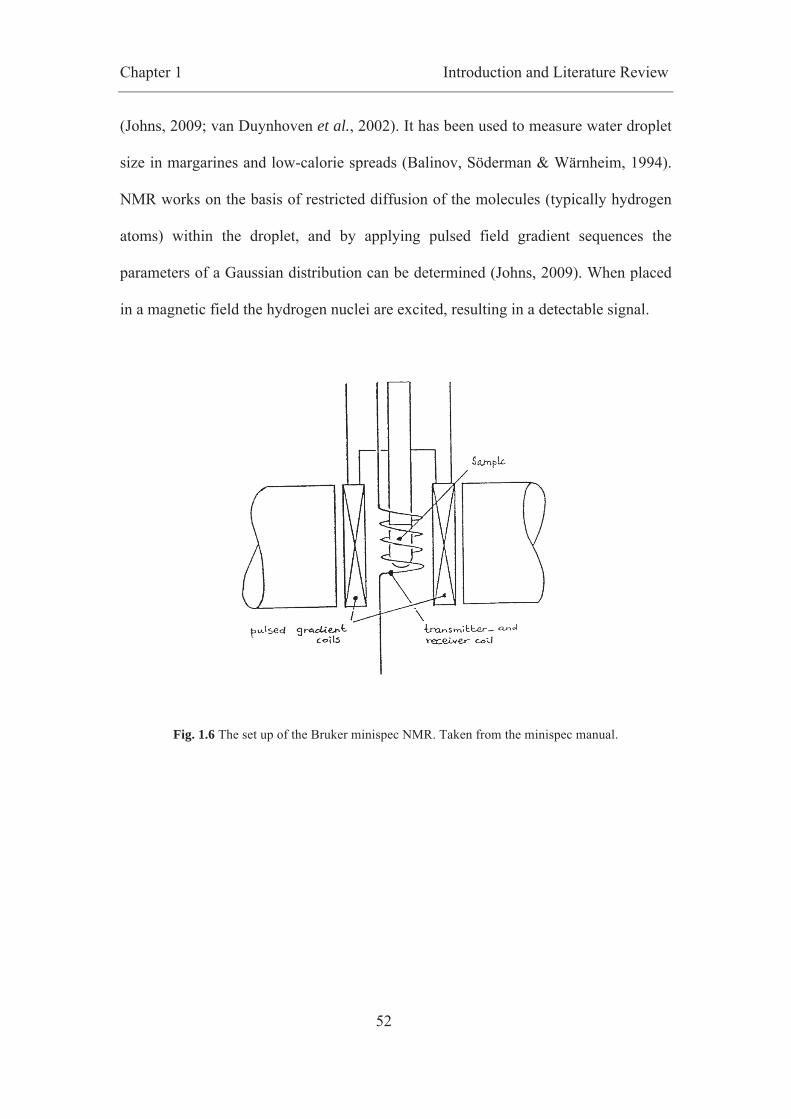
Chapter 1 Introduction and Literature Review
52
(Johns, 2009; van Duynhoven et al., 2002). It has been used to measure water droplet
size in margarines and low-calorie spreads (Balinov, Söderman & Wärnheim, 1994).
NMR works on the basis of restricted diffusion of the molecules (typically hydrogen
atoms) within the droplet, and by applying pulsed field gradient sequences the
parameters of a Gaussian distribution can be determined (Johns, 2009). When placed
in a magnetic field the hydrogen nuclei are excited, resulting in a detectable signal.
Fig. 1.6 The set up of the Bruker minispec NMR. Taken from the minispec manual.
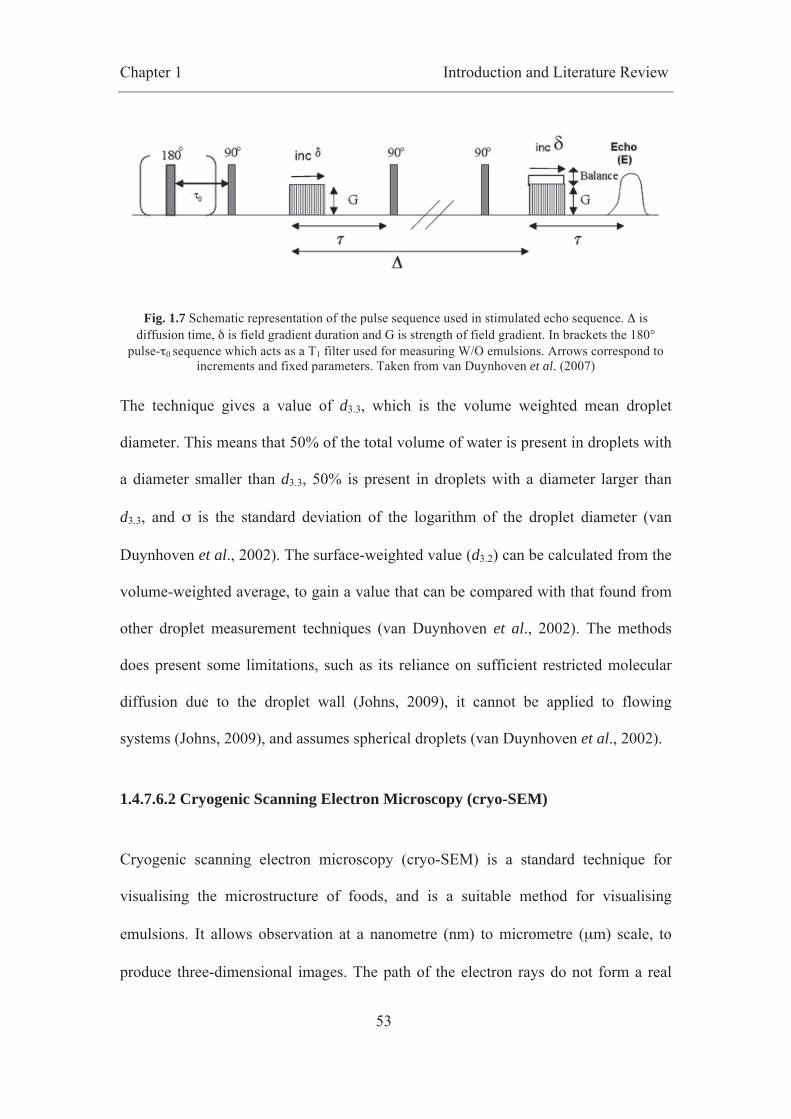
Chapter 1 Introduction and Literature Review
53
Fig. 1.7 Schematic representation of the pulse sequence used in stimulated echo sequence. Δ is diffusion time, δ is field gradient duration and G is strength of field gradient. In brackets the 180°
pulse-τ0 sequence which acts as a T1 filter used for measuring W/O emulsions. Arrows correspond to increments and fixed parameters. Taken from van Duynhoven et al. (2007)
The technique gives a value of d3.3, which is the volume weighted mean droplet
diameter. This means that 50% of the total volume of water is present in droplets with
a diameter smaller than d3.3, 50% is present in droplets with a diameter larger than
d3.3, and σ is the standard deviation of the logarithm of the droplet diameter (van
Duynhoven et al., 2002). The surface-weighted value (d3.2) can be calculated from the
volume-weighted average, to gain a value that can be compared with that found from
other droplet measurement techniques (van Duynhoven et al., 2002). The methods
does present some limitations, such as its reliance on sufficient restricted molecular
diffusion due to the droplet wall (Johns, 2009), it cannot be applied to flowing
systems (Johns, 2009), and assumes spherical droplets (van Duynhoven et al., 2002).
1.4.7.6.2 Cryogenic Scanning Electron Microscopy (cryo-SEM)
Cryogenic scanning electron microscopy (cryo-SEM) is a standard technique for
visualising the microstructure of foods, and is a suitable method for visualising
emulsions. It allows observation at a nanometre (nm) to micrometre (μm) scale, to
produce three-dimensional images. The path of the electron rays do not form a real

Chapter 1 Introduction and Literature Review
54
image, but construct a virtual image by creating line scans of the surface. As the beam
moves through the defined area of the specimen, the signals generated vary in
strength, which reflects the difference in the surface morphology. In cryo-SEM the
water is physically fixed i.e. it is frozen. This is achieved using liquid nitrogen. The
sample can also be fractured (using a knife) to reveal the internal structure of the
sample, and etched to produce a stronger image. A schematic of the construction of
the cryo-SEM can be found in Figure 1.8.
Fig. 1.8 Construction of cryo-SEM (Lee & Netto, 2006)
Chapter 1 Introduction and Literature Review
55
1.4.8 Summary of Literature Review
The aim of this chapter was to review the available literature with direct relevance to
this study. A number of areas of literature have been covered, including:
• Research in obesity, and the reasons for reducing fat in food in order to reduce
the prevalence of the disease;
• Psychological studies that have been conducted to consider the effect that
expectations about food products, specifically with altered fat contents, health
claims or novelty, have on hedonic and sensory perceptions, and on self-
regulated consumption;
• The history and production of chocolate, the polymorphic behaviour of cocoa
butter, and methods of analysis;
• Methods for reducing the fat content of chocolate, with emphasis on emulsion
science, with a review of emulsification techniques, emulsion instability and
stability (the use of emulsifiers, Pickering stabilisation, fat crystals at the
interface, and hydrocolloids) and analysis techniques used to characterise
emulsions.
The aim of the literature review was to identify the current understanding in the above
areas, and to highlight areas of work to be carried out in this thesis. If a reduced-fat
chocolate is to be adopted by the consumer, then combined understanding of the
engineering needed to produce the chocolate, and the psychology of the consumer, is
needed. If the chocolate is not adopted, or is consumed in excess by the consumer, in
such a way to increase calorie consumption, then there will be no effect on obesity.
Chapter 1 Introduction and Literature Review
56
The literature review is in context to the two main areas of research that will be
covered in this thesis:
• The investigation of chocolate consumption, beliefs about health and
indulgence and consumer response to reduced-fat chocolate. This will be
addressed using focus groups, a labelling study, and a packaging study, and is
discussed in Chapters 3, 4 and 5;
• The investigation of formulation engineering routes for a reduced fat
chocolate that has a similar flavour, texture and mouthfeel to a full fat
equivalent. This will be addressed using a fat continuous W/O cocoa butter
emulsion, and is discussed in Chapters 7, 8 and 9.

Chapter 2 Materials and Methods 1
57
2. Exploring consumers beliefs and expectations: Materials and
Methods
2.1 Introduction
A series of studies considering consumer beliefs about chocolate, health and
indulgence, consumer expectations of reduced-fat chocolate and preferences for
packaging are descried in Chapters 3, 4 and 5. In this chapter a description of the
materials and methods used for each of the psychology studies will be presented.
General information, and information specific to each of the studies will be given.
2.2 General Methods
All studies were conducted at the University of Birmingham. Participants were
recruited from the university, through a poster advertising campaign, or a combination
of posters and flyers. The posters and flyers specified that the study was only open to
those who consume solid milk chocolate. Undergraduate and postgraduate students
and staff from The University of Birmingham, and local residents were recruited. The
University of Birmingham ethics committee approved each study design for a term of
three years (the time period in which all studies were completed; see Appendix 1). At
the beginning of each study participants were asked to read a consent form (an
example consent form can be found in Appendix 2), and at the end of each study
participants received a debriefing form (an example can be found in Appendix 3). For
all studies described in Chapters 3 and 4, except the packaging study (described in
Chapter 5), participants received a £10 book voucher for completing the study. For

Chapter 2 Materials and Methods 1
58
the focus group section of the packaging study, participants were given a £10 book
voucher and a chocolate goodie bag for attending. For the rank-rating section of the
packaging study participants did not receive any compensation. All statistical analysis
was performed using SPSS version 16.0 for Mac and Microsoft Excel 2008 for Mac
version 12.2.4.
2.3 Chocolate Consumption Focus Group
The results of this study are described in Chapter 3.
2.3.1 Participants
Nine participants (6 female, 3 male) were recruited into focus group 1, and six into
focus group 2 (6 female). All participants were part or full time students, and varied in
age (between 16 and 40). All participants in each group were British. Measurements
of body mass index (BMI) were calculated from self-reported heights and weights in
order to gain average data about the group. The groups had mean BMIs of 22.5
(ranging from 18.9 to 26.3), and 25.3 (ranging from 18.9 to 36.4). Therefore, on
average both the groups were in the ideal, or healthy, weight to height ratio.
2.3.2 Apparatus
An Apple Mac OS X Version 10.6.4. laptop was used for video and audio recording.
Soft drinks, plastic cups and napkins were provided for the participants. Sticky labels
were used for participants to display their names. A flip chart, flip chart paper and

Chapter 2 Materials and Methods 1
59
pens were required for recording important points, and plain paper and pens were
given to participants to make notes if they wished.
2.3.3 Procedure
The discussion sessions took part in a quiet meeting room. Participants arrived and
were seated at a large table, facing a flip chart board. The purpose of the session was
explained to the group, and participants were asked to read and sign a consent form if
they agreed to take part. Participants were informed that their input was optional and
they could withdraw at any point. It was emphasised that there were no right or wrong
answers, that it was the individual’s opinions that were important, so nobody would
be judged by their answers. Furthermore, they were informed that the aim of the
session was to generate discussion by involving everyone in the group. Important
points were written on the flip chart by the experimenter. The discussion session was
also audio and video recorded using iMovie HD 6.0.3 (267.2) for Mac. Following the
session this recording was transcribed, then deleted for confidentiality reasons. The
following questions were addressed, in turn, during the session:
1. Which brands of chocolate do you eat regularly?
2. What do you look for in a chocolate?
3. Where does chocolate fit into your normal diet?
4. When do you eat chocolate? e.g. time of day
5. Would you eat chocolate as an evening meal?
6. When would you choose solid chocolate over a chocolate bar with a filling?
Chapter 2 Materials and Methods 1
60
7. When would you choose to eat chocolate over other snacks?
8. How often do you eat solid milk chocolate?
9. How much do you eat in one session (portion size)?
10. Why do you eat chocolate (motivations for eating it)?
11. Do you think there any downsides to eating chocolate?
12. What do you feel like after eating chocolate?
Following the discussion participants were given a questionnaire (see Appendix 4),
which included questions about gender, age, height and weight, occupation or area of
study, nationality and questions taken from the The Dutch Eating Behaviour
Questionnaire (DEBQ). The DEBQ was developed by van Strien, Frijters, Bergers
and Defares (1986), and is used to indicate levels of emotional eating (eating in
response to emotional arousal, such as fear, anger or anxiety), external eating (eating
in response to external food cues, such as the sight and smell of food), and restraint
(restriction of food intake). The questionnaire contains 33 questions measuring
restrained eating (10 questions e.g., ‘Do you try and eat less at mealtimes than you
would like to eat?’), external eating (10 questions e.g. ‘If you have something
delicious to eat, do you eat it straight away?’) and emotional eating (13 questions e.g.,
‘Do you have a desire to eat when you are emotionally upset?’). Response categories
are never, seldom, sometimes, often, very often and not relevant (the questionnaire
can be found in Section 2 of Appendix 4). Participants were then thanked for their
participation, debriefed, and given their reward.

Chapter 2 Materials and Methods 1
61
2.3.4 Data Analysis
The focus group audio recording was listened to and transcribed. The transcripts were
then read in detail, as were the flip chart notes taken during the groups. This allowed
for major themes and ideas to be identified. General themes, and contrasting opinions
of individuals, were noted, and important quotes were highlighted. The themes and
quotes were then interpreted to gain an understanding of the outcomes of the focus
groups. Rabiee’s (2004) paper was used as a guide for analysing focus group data. All
the focus groups conducted during this work were analysed in the same way.
2.4 Health and Indulgence Focus Group
The results of this study are described in Chapter 3.
2.4.1 Participants
Three discussion groups were conducted. The size of groups varied (6, 8 and 10
participants). All participants were between 16 and 20 years old, and all but one were
students (the remaining person worked locally). British and international students
were recruited. Measurements of BMI were calculated from self-reported heights and
weights to gain average data about the group. The groups had mean BMIs of 21.8
(ranging from 18 to 28), 23.6 (ranging from 17 to 32) and 22.5 (ranging from 19 to
24). Therefore, on average, both groups were in the ideal, or healthy, weight to height
range.
Chapter 2 Materials and Methods 1
62
2.4.2 Apparatus
Apparatus was as described in section 2.3.2.
2.4.3 Procedure
The procedure for this focus group was the same as the Chocolate Consumption
discussion session. The following questions were addressed, in turn, during the
session:
1. The meaning of the word ‘healthy’.
2. Foods considered to be healthy.
3. The meaning of the words ‘indulgence’ or ‘indulgent’. Other words or phrases
that come to mind.
4. Is ‘indulgence’ a positive or a negative thing?
5. What sort of foods are considered to be indulgent?
6. Imagine a product that is aimed as an indulgent product, but which is healthy.
What are your initial thoughts considering its characteristics?
7. What would you expect it to be like?
8. Who do you think would buy this type of product?
9. Would you be interested in buying a healthy indulgent product? Why?
10. Are there any particular occasions when you would eat a healthy indulgent
product?
11. What would deter you from buying a healthy indulgent product?

Chapter 2 Materials and Methods 1
63
2.4.4 Data Analysis
Focus group data was analysed as specified in 2.3.4.
2.5 Labelling Study
The results of this study are described in Chapter 4.
2.5.1 Design
The study was a within subjects design: participants tasted both samples to rule out
individual differences. The order in which the samples were tasted was
counterbalanced for participants between the first and second session to allow for any
order effects.
2.5.2 Participants
One hundred participants signed up, 91 attended the first session, and 87 completed
both sessions (63 female, 24 male); all participants were untrained consumers. The
mean participant age was 24.3 years (σ = 9.6), but participants ranged from 18 to 60
years. The mean BMI was 22.5 (σ = 3.9), which is classified as normal, but
participants ranged from 16.6 (underweight) to 40.6 (obesity class III). Of the 87
participants, 63 were British, and 65 said that English was their native language. 64%
of participants said that they eat chocolate three times a week or more. 78% of
participants said that they were very likely, or quite likely to try a lower-fat version of
a food that they have tasted before.
Chapter 2 Materials and Methods 1
64
2.5.3 Apparatus
Plain white ceramic plates (19 cm diameter) were used to present the chocolate to the
participant. Labels, printed in black ink on white laminated paper, were displayed on
the plate next to the chocolate. The chocolates were labelled either ‘Reduced-fat Milk
Chocolate’ or ‘Milk Chocolate’. The labels also included a random 3-digit code to
make it plausible that the label was for experimental use, rather than for the
participant’s benefit (for example ‘Sample 276: Reduced-Fat Milk Chocolate’ and
‘Sample 530: Milk Chocolate’). As potentially there would be 100 participants, 20
different random numbers were used (10 for ‘Reduced-fat Milk Chocolate’ and 10 for
‘Milk Chocolate’), each participant received a different combination of numbers, to
rule out any effects caused by the codes. The combinations were randomised between
participants. The labels were printed (CMU Bright Roman, font size 28, centred,
black ink) on plain white paper, cut to size (18cm x 6cm), and laminated.
On each testing occasion three squares of Somerfield own brand milk chocolate were
given to each participant for expected liking, hedonic and sensory rating, and a further
square for consumption questions. The squares of chocolate had a mean weight of
6.59g (σ = 0.57; the mean was taken from weight of all the squares in one 200g bar of
the chocolate). Only full squares of chocolate were given; no half squares or broken
pieces were presented. The chocolate was chosen as it did not have any branding on
the surface. The chocolate was broken into squares prior to the session, and was
served at room temperature.
Chapter 2 Materials and Methods 1
65
2.5.4 Procedure
Prior to taking part in the study, potential participants were required to fill out a
screening questionnaire (see Appendix 5) to assess their suitability for the study. It
included questions on diet and food allergies, which was used to screen out those
people who could not take part (for example, it could not be guaranteed that the
chocolate did not contain traces of nuts or other allergens). The questionnaire also
included questions related to chocolate consumption (‘How often do you eat
chocolate?’, with the options ‘more than once a day’, ‘once a day’, ‘3 times a week’,
‘once a week’, ‘once a month’, ‘once every few months’ and ‘never’), and willingness
to try low-fat foods (‘If given the opportunity, how likely is it that you would try a
lower fat version of a food you have tasted before?’ with the options ‘very likely’,
‘quite likely’, ‘neither likely nor unlikely’, ‘not likely’ and ‘very unlikely’). These
questions were presented amongst other consumption questions, in order to disguise
the aims of the study. Participants were asked to attend two sessions four weeks apart
(on the same day of the week and at the same time of day). The chocolates were
tasted on two separate occasions, exactly four weeks apart to ensure that female
participants were tested at the same point in their menstrual cycle on both occasions
(assuming that the average cycle is 28 days long). Chocolate cravings occur more
frequently perimenstrually, especially for women in the UK, Canada and America
(Zellner, Garriga-Trillo, Centeno & Wadsworth, 2004), so it was important that
female participants tasted the two chocolates at the same time in their menstrual
cycle. Male participants were subjected to this too, to ensure that the method
remained constant. It was also important that the participants tasted the two

Chapter 2 Materials and Methods 1
66
chocolates on the same day of the week and at the same time of day in both sessions
(all sessions took place between 2 and 5pm from Monday until Friday) (Kramer,
Rock & Engell, 1992; Stroebele & De Castro, 2004). Participants were asked to
refrain from eating and smoking for 30 minutes prior to each of the sessions. On both
occasions participants took part in the experiment individually, in a small quiet room,
with one experimenter present. Two locations were used for the experiment, although
each participant attended the same location for their first and second sessions. The
temperature of the room was taken at the beginning of each session; the mean
temperature of the rooms during the first sessions was 23.8°C (σ = 1.23), and during
the second session was 23.5°C (σ = 1.82). The temperature of the rooms was
therefore well below the melting point of the chocolate, and similar on both
occasions. There were slight differences between the two locations, such as the size
and lighting of the room, but as participants attended sessions in the same location,
effects are thought to be limited.
During the first session, the nature of the experiment was explained to participants
orally (without specifying the aim or labelling system); a script was used to ensure
that instructions were given in the same manner to each participant (see Appendix 6).
Written instructions were given, detailing what was expected of them, and how to fill
out the questions that they would receive (see Appendix 7). Participants gave their
written informed consent at the beginning of the first session. Participants were then
required to eat one Matzo cracker (ingredients: wheat flour and water) and drink one
cup of still, bottled spring water (Highland Spring), which was served at ambient
room temperature. Both were given to cleanse the palate.
Chapter 2 Materials and Methods 1
67
See Appendix 8 for the questionnaire used during the study. Expected liking (‘How
much do you think you’ll like this chocolate?’) was rated on a visual analogue scale
(VAS) (147mm) with the anchors ‘dislike extremely’ and ‘like extremely’.
Participants were presented with the sample of chocolate, and asked to rate the
expected liking of the chocolate in front of them. Ratings were made by drawing a
vertical mark along the horizontal line at the point that best represented their opinion.
Participants were asked to elaborate on their answer, and orally explain why they
expected to like, or dislike, the product (answers were recorded by the experimenter).
The participant was then asked to consume one square of chocolate completely.
Participants were not instructed on how to eat the chocolate (i.e. to bite or not, suck or
not), and if asked were told to eat it as they normally would. They were then asked to
rate the chocolate for overall liking (‘How much do you like the chocolate overall?’),
again on a VAS, with the anchors ‘Like not at all’ and ‘Like Extremely’. Again they
were asked to orally explain their answer. The liking question was given before the
sensory questions in order to prevent participants from becoming analytical in their
rating of liking. The participant was then given a glossary of terms, which included a
definition of each of the sensory terms they would be questioned on:
1. Melting in the mouth: the process of going from solid to liquid in the mouth;
2. Creamy / creaminess: having the consistency and texture of full fat cream;
3. Rich / richness: highly-flavoured; filling; may be overly sweet or heavy,
possibly sickly or fatty;
4. Thick / thickness (mouthfeel): having a viscous consistency in the mouth
when liquid; syrupy; the opposite of thin or watery;

Chapter 2 Materials and Methods 1
68
5. Milky / milkiness: the taste / flavour of milk;
6. Smooth / smoothness: has a uniform, even texture; it isn’t gritty or grainy;
7. Sweet / sweetness: one of the basic tastes; associated with the taste of sugar.
Participants were asked to read all the definitions, and refer back to them if they
needed to. The definitions were given to standardise the questions, and to ensure that
all participants (those of whom English was their native language, and those with
English as their second or third language) understood all the questions given to them.
The participants were then asked to work through the questionnaire at their own pace,
and rate the chocolate according to a number of sensory attributes that are affected by
the fat content of chocolate (melt-in-mouth characteristics and viscosity / thickness,
(Guinard & Mazzucchelli, 1999) and those attributes described in focus groups as
being important in chocolate (creaminess, milkiness, smoothness, sweetness and
richness). Sensory attributes were accessed using both VAS questions (for example
‘How fast do you think the chocolate melts in the mouth?’ with the anchors “melts
very slowly in the mouth” and “melts very quickly in the mouth”) and Just About
Right (JAR) questions. JAR scales are used to measure the desirability of a specific
attribute (the deviation from ideal), and the optimum levels of an attribute in a product
(Lawless & Heymann, 1999). Scales typically consist of five or seven points ranging
from too little to too much for a given attribute, with a mid-point of ‘just about right’.
The participant was required to determine the intensity of the attributes, and rate them
according to its distance from the ideal level of the attribute. If the intensity is ideal,
the consumer should rate the attribute as ‘just about right’, but if it is not ideal the
participant should choose the point on the scale that best represents the mismatch
Chapter 2 Materials and Methods 1
69
between the intensity and the ideal point (Rothman, 2007). Prompts were given,
indicating when the next two squares of chocolate should be consumed.
The participants were then given a second plate, with one square of chocolate,
labelled in the same way, and were asked firstly to indicate how many squares of this
particular chocolate they think they would eat during a normal sitting, and secondly,
how much they would consume if they were not going to restrict their intake. Finally,
the participants were asked whether they would purchase the chocolate, and at what
price (for a 50g bar). Typical prices for chocolate were given (budget milk chocolate:
14p; supermarket own brand milk chocolate: 28p; branded milk chocolate: 49p;
luxury milk chocolate: 89p), as a guide, although participants could give any price,
and were not restricted to these categories. Participants were then asked to fill in a
short questionnaire with details of time and date of last meal or snack time, and what
they consumed, and if they are a smoker, when they last smoked (see Appendix 9).
None of the participants ate, or smoked in the 30 minutes prior to the session, as
requested. The participants were reminded of the date and time of the second session
(participants were also reminded via email nearer the time).
The second session had the same format, although the chocolate was labelled in the
alternative way (i.e. if in the first session they received ‘Milk Chocolate’, in the
second session they received ‘Reduced-fat Milk Chocolate’, and vice versa).
Following the second session, participants were given the same questionnaire
containing questions about prior meals and snacks, and a questionnaire containing
demographic questions (gender, current age, nationality, native language, current
marital status, current occupation / area of study and educational status). Participants

Chapter 2 Materials and Methods 1
70
were also given a chocolate consumption questionnaire (see Appendix 10). Sparks et
al. (2001) developed a chocolate consumption questionnaire to assess both
ambivalence and attitudes towards the consumption of chocolate, which includes
measures of general attitude, semantic differential attitude, subjective norm, perceived
behavioural control, health-conscious self-identity, intention, ambivalence and mixed
feelings. Behavioural values were calculated using the methods described by Sparks
et al. (2001). They were also asked to answer the DEBQ (van Strien et al., 1986).
Participants’ height and weight was measured, which was used to calculate BMI. This
was all conducted after the experimental sessions, to avoid priming participants’
responses to foods. After the experiment participants were asked what they believed
the purpose of the experiment was. Once the experiment was completed the
participants were thanked for their participation, debriefed and compensated.
2.5.5 Data Analysis
A number of repeated measures ANOVAs (Analysis of Variance) were conducted to
examine the main effects of labelling condition (‘Milk Chocolate’ or ‘Reduced-fat
Milk Chocolate’) on expected liking, actual liking, sensory attribute ratings,
consumption amount (normal and unrestricted consumption), purchase intent and
price perception. Where appropriate, gender, age, BMI, normal chocolate
consumption, willingness to try low-fat foods, restriction, external eating, emotional
eating, and ambivalence were also used as between-subject variables in the analysis.
T-tests were used to examine where differences in the data lie. All these variables,
except gender, willingness to try low-fat foods and normal chocolate consumption,
were separated according to a median split, to ensure groups were similar in size.

Chapter 2 Materials and Methods 1
71
Groups varied slightly in size due to a large number of participants with the median
value (for example participants with the same age as the median split value were
placed in the same group, which meant that there were more participants in the below
median age group than in the above median age group). Willingness to try low-fat
foods was separated into two groups (likely and unlikely) from the original 5 groups.
Those who gave the answer ‘neither’ were excluded from analysis. Normal chocolate
consumption was separated into two groups according to frequency of chocolate
consumption (three times a week or more, and once a week or less).
T-tests compare the values on a continuous variable for two groups. ANOVA
compares the mean scores of more than two groups; it also compares the variance
between the different groups (assumed to be due to the independent variable) with the
variability within each group (assumed to be due to chance i.e. error). The F ratio
represents the variance between the groups, divided by the variance within the groups;
a large F ratio indicates more variability between the groups, than within groups.
There are a number of assumptions underlying the use of both t-tests and ANOVA’s:
• The dependent variable is measured using a continuous scales (interval or ratio
data);
• The scores are obtained using a random sample of the population;
• Observations must be independent;
• The population are normally distributed (although large sample sizes can
tolerate the violation of this assumption);

Chapter 2 Materials and Methods 1
72
• Homogeneity of variance: samples are obtained from populations of equal
variability.
Results were considered significant at p < .05, and trends towards significance were
identified by p < .1. The results of the t-test are presented in the following way:
t(degrees of freedom) = t value, p = probability value. The results of the ANOVA are
presented in the following way: F (hypothesis degrees of freedom, error degrees of
freedom) = F ratio, p = probability value. Means and standard deviations are also
presented.
2.6 Packaging Study
The results of this study are described in Chapter 5.
2.6.1 Part A: Focus Groups
2.6.1.1 Participants
Eighteen chocolate consumers, 50% male and 50% female, were recruited and split
into male and female groups, in order to encourage open, honest discussion, and to
investigate possible differences in opinion between males and females. All
participants were asked to complete a screening questionnaire prior to attending the
focus group (see Appendix 11). It was required that participants typically consume
chocolate at least once a month. Consumers were both British and non-British
nationals, all were aged between 18 and 30, and were students.

Chapter 2 Materials and Methods 1
73
2.6.1.2 Procedure
Participants gave their written informed consent at the beginning of the session. A
discussion guide was used to ensure that the two groups followed the same procedure
(see Appendix 12). A number of elicitation techniques were used to encourage
discussion. A thought bubble completion task (see Appendix 13) was used at the
beginning of the session to encourage the participants to think about chocolate
consumption. The groups were then asked to work as a group to separate 24
photographs of chocolate bars (see Appendix 14) into those believed to be more
healthy, and those believed to be less healthy. The images were printed on
photographic paper using a commercial photographic printer. All were 5 x 7 inches in
size, and were laminated. Prior to the study the photographs were selected out of a
group of 41 chocolate bars, according to familiarity: thirteen males (Age: χ = 29.7, σ
= 10.4) and nine females (Age: χ = 22.9, σ = 0.9) were asked to indicate whether they
had seen the bars before. From this twelve familiar (≥ 90% of participants were
familiar with the bars) and twelve unfamiliar (≤ 90% of participants were familiar
with the bars) bars were selected. During the focus group, participants were
encouraged to think about the packaging itself, and not on any previous knowledge of
the chocolate enclosed. They were asked to explain their reasons for placing the bars
in each of the piles. Finally, the participants were introduced to the idea of a reduced-
fat chocolate bar. They were asked to work as a group on a sentence completion task.
They were also asked to complete a similar thought bubble completion task,
imagining that the man and women in the photographs were choosing the reduced-fat
bar that was discussed during the session (see Appendix 15). Participants were then

Chapter 2 Materials and Methods 1
74
thanked for their participation, debriefed, given a debriefing form, book vouchers, and
a chocolate goodie bag as compensation.
2.6.1.3 Data Analysis
Focus group data was analysed as specified in 2.3.4.
2.6.2. Part B: Rank – Rating
2.6.2.1 Participants
Sixty female and sixty male participants were recruited. Participants were required to
be 16 years old or above, and eat milk chocolate at least once a month. The mean
participant age was 32.5 years (σ = 11.9), but participants ranged from 16 to 62, with
similar mean ages for female (χ = 32.3, σ = 12.2) and male (χ = 32.8, σ = 11.7)
participants.
2.6.2.2 Materials and Methods
Participants were given the sixteen packages (generated from the focus groups; details
given in Chapter 5), which were displayed in a random order, and asked to fill out a
questionnaire (see Appendix 16), which required consumers to rank the packages
from least to most according to how much they expected to like the product.
Participants were then asked to give the bar in position 1 (the least liked) a score of
one, and the bar in position 16 (the most liked) a score of one hundred. Consumers
were asked to score all the other bars in between. They were then asked to briefly
explain their reasons for placing the bars in position 1 and position 16.
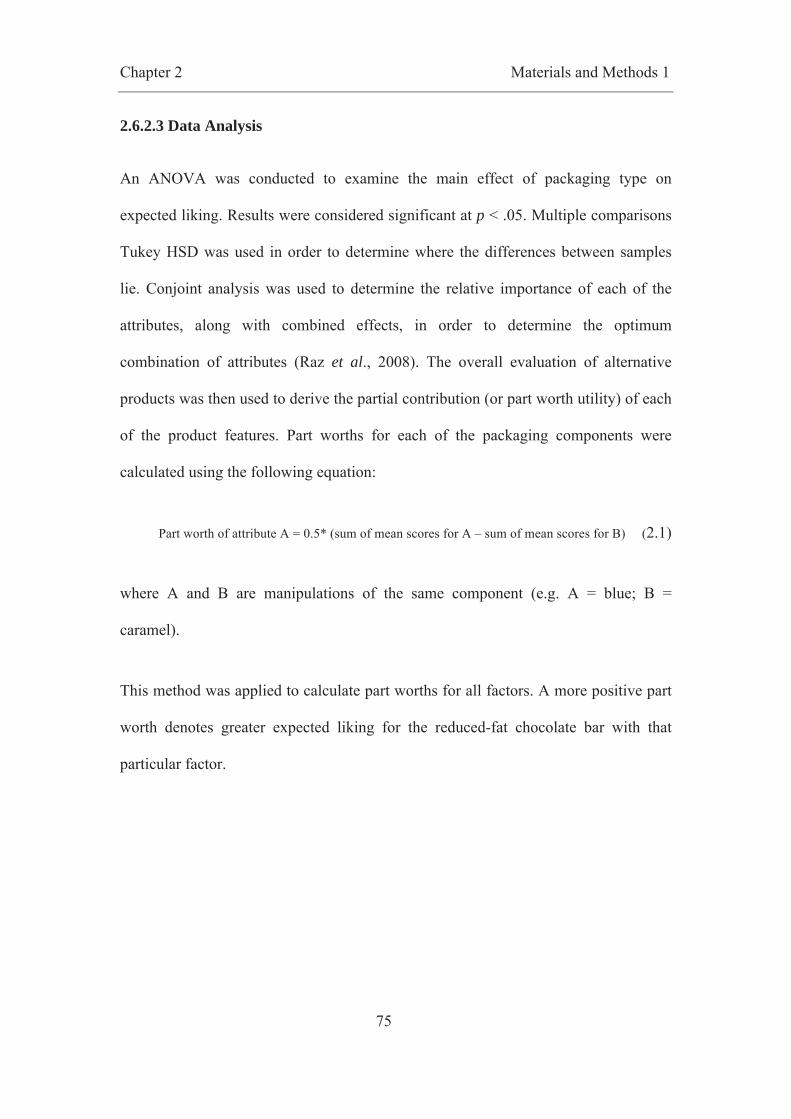
Chapter 2 Materials and Methods 1
75
2.6.2.3 Data Analysis
An ANOVA was conducted to examine the main effect of packaging type on
expected liking. Results were considered significant at p < .05. Multiple comparisons
Tukey HSD was used in order to determine where the differences between samples
lie. Conjoint analysis was used to determine the relative importance of each of the
attributes, along with combined effects, in order to determine the optimum
combination of attributes (Raz et al., 2008). The overall evaluation of alternative
products was then used to derive the partial contribution (or part worth utility) of each
of the product features. Part worths for each of the packaging components were
calculated using the following equation:
Part worth of attribute A = 0.5* (sum of mean scores for A – sum of mean scores for B) (2.1)
where A and B are manipulations of the same component (e.g. A = blue; B =
caramel).
This method was applied to calculate part worths for all factors. A more positive part
worth denotes greater expected liking for the reduced-fat chocolate bar with that
particular factor.
Chapter 3 Health and Indulgence
76
3. Understanding consumers’ beliefs about chocolate, and the
concepts of health and indulgence
3.1 Introduction
As discussed in Chapter 1, chocolate is one of the most commonly craved foods
(‘chocoholism’) and is associated with gift-giving, special occasions and reward
(Hetherington & Macdiarmid, 1993). However, ambivalence (the simultaneous
existence of positive and negative evaluations of an object, i.e. mixed feelings),
towards chocolate is also often reported i.e. consumers may feel that the immediate
benefits of sensory gratification (experienced when consuming sweet and fatty foods)
conflict with longer term interests, such as preserving ones health and body image
(Sparks et al., 2001). Furthermore, Rogers and Smit (2000) suggest that chocolate is
craved because it is highly palatable, resulting in positive hedonic and affective
responses, and is often restricted, heightening its appeal, i.e. it is an indulgence. It is
clear that the motivations for consuming chocolate are complex. Hetherington and
Macdiarmid (1993) interviewed self-confessed ‘chocolate addicts’ (who state that
they are unable to resist chocolate). Most indulged their cravings 75% of the time; of
this group, 51% felt positive (happier, satisfied, calm, recharged or energetic) when
consuming chocolate following a craving, whilst 49% felt negative (guilty,
disappointed, unattractive, depressed, headachy, dissatisfied or sick). Furthermore,
participants believed their excessive consumption of chocolate contributed to
overweight status, and chocolate was considered high fat and of poor nutritional

Chapter 3 Health and Indulgence
77
value. The majority of participants stated that it was the sensory features of chocolate
that made it addictive.
The aim of this section of work was to establish the motivations for consuming
chocolate, including reasons for choosing one’s favourite brand, where chocolate fits
into the everyday diet, how much chocolate is typically consumed (i.e. portion size),
occasions in which it would be avoided, and any downsides to consuming chocolate.
A number of hypotheses were identified:
H1. Chocolate will be described as highly palatable, with pleasurable sensory
characteristics;
H2. Craving towards chocolate will be apparent in a proportion of chocolate
eaters;
H3. Ambivalence towards chocolate will be reported as it has high sensory
appeal, but is highly calorific and is not consumed to sustain hunger. As such
consumption is detrimental to health and body image;
H4. Consumption of chocolate will often be restricted.
Secondly, the aim was to explore the concepts of health and indulgence, and discover
whether there is a market for a product that is both ‘healthy’ and ‘indulgent’ (for
example, a chocolate which is reduced in fat).
Participants were presented with the concept of a healthy indulgent product, and
Chapter 3 Health and Indulgence
78
asked to give their opinions. It is unclear whether consumers would favour it, as
feelings of ambivalence are reduced (as energy density may be lower, so the impact
on health and body image is decreased), or reject it as it has been shown that
consumers often believe that sensory quality is often sacrificed in reduced-fat
products (Lloyd et al., 1995; Tuorila & Cardello, 2002). However, it was
hypothesised that opinions of a healthy indulgence product would differ to a standard
indulgent product, thus:
H5. Opinions towards a healthy indulgent product will differ to opinions of
standard indulgent products.
3.2 Experimental Design
During both the chocolate consumption focus group and the health and indulgence
focus group a number of areas were discussed, as described in sections 2.3.3 and
2.4.3.
It should be noted that the answers given by the two groups for each of the discussion
topics were very similar, with the same answers being given to many of the questions
asked. It should be noted that the groups were only drawn from the University of
Birmingham, and as a majority were students, so opinions may not be universal across
all demographics.
Chapter 3 Health and Indulgence
79
3.3 Results
3.3.1 Chocolate Consumption
Participants were firstly asked to name the brands of solid milk chocolate that they eat
regularly, and describe what it was that they particularly like about this brand. Brands
given were those commonly seen in England, including Cadbury, Galaxy, Divine,
Green & Blacks, Lindt, Milka, and Hershey, and participants in both groups also
mentioned that they eat supermarket own-brand chocolate. Participants were then
asked why this brand was their favourite. Reasons for liking this chocolate varied
between individuals, but examples included those relating to taste such as creaminess,
milky taste, smoothness and how well it melts, to the size of the bar, and the price.
One participant said that being Fair Trade was particularly important, whereas another
thought a high cocoa content was important.
Participants were next asked where chocolate fits into their normal diet. Participants
said chocolate is eaten as a snack, in the afternoon, the evening or after a meal. Whilst
some said that chocolate consumption is related to energy intake, and is eaten when
feeling low in energy, or to boost one’s energy before going to the gym, most gave
emotional reasons for eating it. Reasons included being bored, such as on a journey,
when feeling hormonal, in reaction to stress related to exams or studying, or after
receiving bad news, when it is eaten for comfort:
“… if you are doing something you don’t really want to do, if you
have a bit of chocolate it makes it so much easier to do. It
balances.”

Chapter 3 Health and Indulgence
80
Most said they eat chocolate at celebrations, such as Christmas, birthdays or Easter,
and some said that chocolate consumption is related to relaxation, and is eaten when
watching films at the cinema or at home:
“I feel like it’s a treat. It’s something you couldn’t eat a lot of all
the time. You couldn’t have chocolate as your staple diet,
unfortunately.”
Chocolate also seemed to be related to social interaction, being eaten with partners or
friends:
“In our house it’s quite a social thing. I live with 5 other girls and
we’ll all be sat down doing our work, and someone will say ‘ooh,
shall we go and buy some chocolate?’… and we will all go over to
the shop… It’s like having a drink, but with chocolate… a treat, or
foods you shouldn’t have. Or something naughty… It’s really
indulgent.”
Others said that chocolate is eaten on impulse, and that it “just happens”.
Next, the participants were asked to think about whether they would eat chocolate as
their evening meal. This question was asked to consider whether chocolate is
consumed for its high calorific value, and so would be considered an appropriate way
to gain energy, or whether it is considered inappropriate for eating as a meal. Most
said that you would still be hungry after eating chocolate, even if a large quantity had
been consumed. This suggests that when chocolate is eaten it is not to sustain hunger.
Chapter 3 Health and Indulgence
81
Chocolate was thought to be too rich to eat as a meal, and would make you feel sick.
Furthermore, participants said that meals are normally savoury, and not sweet, and
chocolate is also not nutritious, balanced or fresh and contains the ‘wrong’ sort of
calories. Participants also said that they would feel disgusted with themselves.
Furthermore, they described it as socially unacceptable, and so they would feel like
others were judging them. For these reasons, participants thought they would feel
guilty afterwards:
“You’d feel so guilty. You’d wake up the next day a stone heavier.”
Others said that it would spoil the fun of eating chocolate as a treat, and so they would
no longer look forward to it. They said that eating it as a main meal would not be as
pleasurable as eating it after the main meal.
“It spoils the fun. It’s a treat, so if you’re having it all the time
you’d get bored of it.”
Next, participants were asked when they would choose a solid chocolate bar over a
chocolate bar with a filling, such as a caramel, nougat or wafer. Their answers related
to the size and quantity of chocolate: solid chocolate is bought in a larger quantity,
and so it lasts for longer and more can be consumed. Solid bars of chocolate were
thought to be more appropriate as gifts, and were thought to be ideal for sharing.
Furthermore, solid chocolate is thought to be more lavish, and more of a treat:
“If you are going to treat yourself I think solid chocolate is more
luxurious.”

Chapter 3 Health and Indulgence
82
It was thought that solid chocolate is craved more than other bars.
“If you have a really bad chocolate craving you don’t want
anything in it, you just want chocolate.”
Participants were asked when they would choose to eat chocolate over other snacks.
Chocolate would be eaten when one was not massively hungry. This choice also
depended on the time of day, as chocolate is eaten mostly in the afternoons or
evenings. Chocolate was thought to be craved more than other snacks, possibly
because it is sweet, and therefore not eaten as much as savoury food, and because
makes you feel happier. The choice to eat chocolate depended on the person’s mood:
chocolate would be chosen over other snacks if the person had had a bad day. Finally,
chocolate was said to be eaten because it is naughty and rebellious.
“It’s naughty… you know you shouldn’t but you do anyway. And
that makes it more fun.”
It is also thought that chocolate is marketed as an indulgence, and romantic.
“Chocolate is to do with Valentine’s day… romance. It’s a women
thing. Women have chocolate. Women lie in baths and eat
chocolate… It seems like an indulgent treat.”
Participants were asked about portion size, and how much they would consume in one
sitting. There was thought to be no regularity, with portion size depending on many
things, including whether you are trying to ‘be careful’ or not, whether you have
Chapter 3 Health and Indulgence
83
already eaten or expect to be eating soon, whether you have exercised (i.e. whether
you deserve it), whether something ‘naughty’ has already been eaten during the day
and whether you are stressed or upset.
“It depends on how much exercise I have done in the day. If I have
been to the gym and worked out then I will think about the calories I
have worked off… so I deserve that much. I feel I can eat it. If I
haven’t worked out I don’t feel I deserve it.”
“I don’t really have any routines. If I’m in the mood for chocolate I
will eat it. Unless I am in a stressful situation, in which case I will
buy a big [bar] and go to town!”
Participants described eating more than they know they should, and eating the whole
packet to get it out of the way.
“I always find I eat more than I should do. I always have a little
taste, and it’s good, so [I] just plough on through until it’s gone and
[I] feel sick.”
When asked about their motivations for eating chocolate, participants said chocolate
was eaten as a treat, or a reward. It was also eaten for comfort, or as a pick-me-up.
Others said it was out of routine, or boredom. Participants said eating chocolate
makes them feel reminiscent and reminds them of childhood.
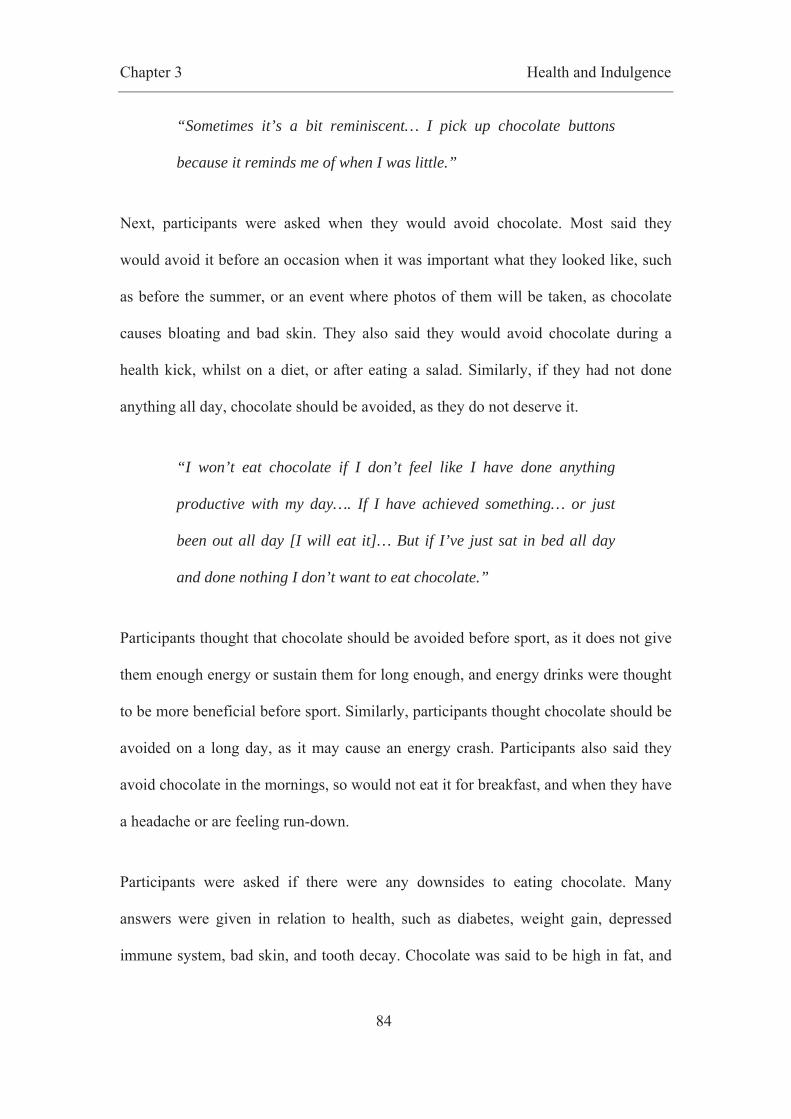
Chapter 3 Health and Indulgence
84
“Sometimes it’s a bit reminiscent… I pick up chocolate buttons
because it reminds me of when I was little.”
Next, participants were asked when they would avoid chocolate. Most said they
would avoid it before an occasion when it was important what they looked like, such
as before the summer, or an event where photos of them will be taken, as chocolate
causes bloating and bad skin. They also said they would avoid chocolate during a
health kick, whilst on a diet, or after eating a salad. Similarly, if they had not done
anything all day, chocolate should be avoided, as they do not deserve it.
“I won’t eat chocolate if I don’t feel like I have done anything
productive with my day…. If I have achieved something… or just
been out all day [I will eat it]… But if I’ve just sat in bed all day
and done nothing I don’t want to eat chocolate.”
Participants thought that chocolate should be avoided before sport, as it does not give
them enough energy or sustain them for long enough, and energy drinks were thought
to be more beneficial before sport. Similarly, participants thought chocolate should be
avoided on a long day, as it may cause an energy crash. Participants also said they
avoid chocolate in the mornings, so would not eat it for breakfast, and when they have
a headache or are feeling run-down.
Participants were asked if there were any downsides to eating chocolate. Many
answers were given in relation to health, such as diabetes, weight gain, depressed
immune system, bad skin, and tooth decay. Chocolate was said to be high in fat, and
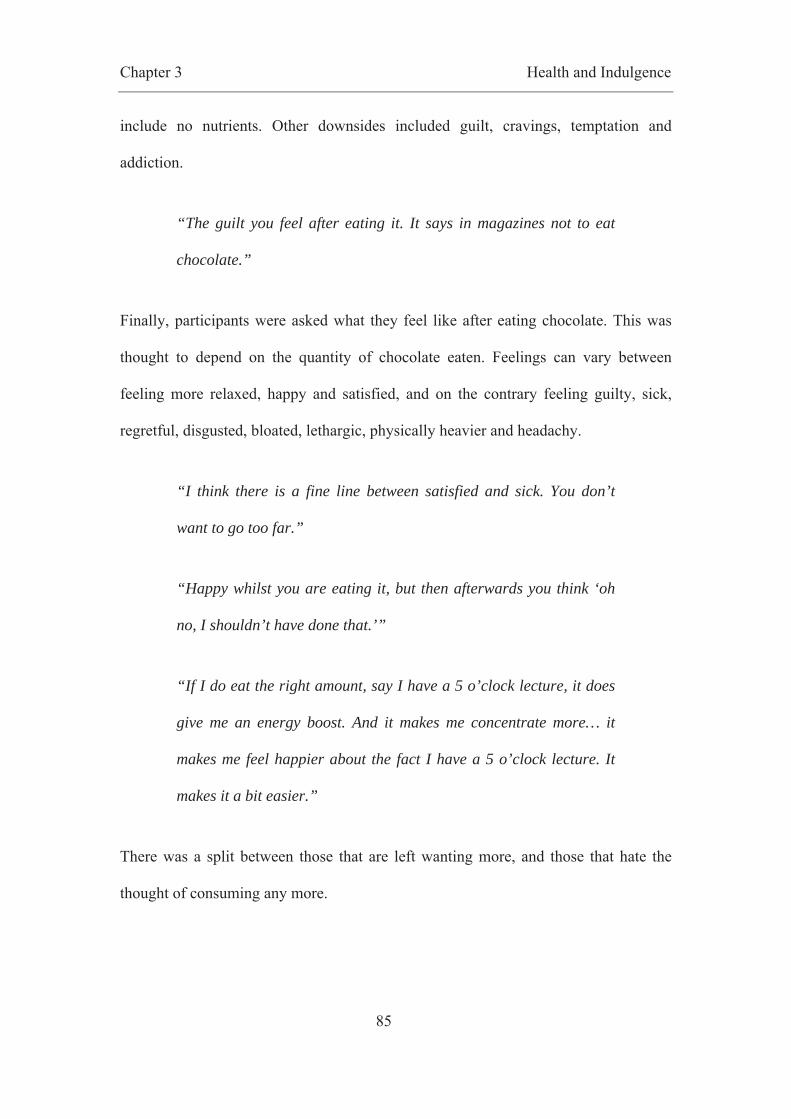
Chapter 3 Health and Indulgence
85
include no nutrients. Other downsides included guilt, cravings, temptation and
addiction.
“The guilt you feel after eating it. It says in magazines not to eat
chocolate.”
Finally, participants were asked what they feel like after eating chocolate. This was
thought to depend on the quantity of chocolate eaten. Feelings can vary between
feeling more relaxed, happy and satisfied, and on the contrary feeling guilty, sick,
regretful, disgusted, bloated, lethargic, physically heavier and headachy.
“I think there is a fine line between satisfied and sick. You don’t
want to go too far.”
“Happy whilst you are eating it, but then afterwards you think ‘oh
no, I shouldn’t have done that.’”
“If I do eat the right amount, say I have a 5 o’clock lecture, it does
give me an energy boost. And it makes me concentrate more… it
makes me feel happier about the fact I have a 5 o’clock lecture. It
makes it a bit easier.”
There was a split between those that are left wanting more, and those that hate the
thought of consuming any more.
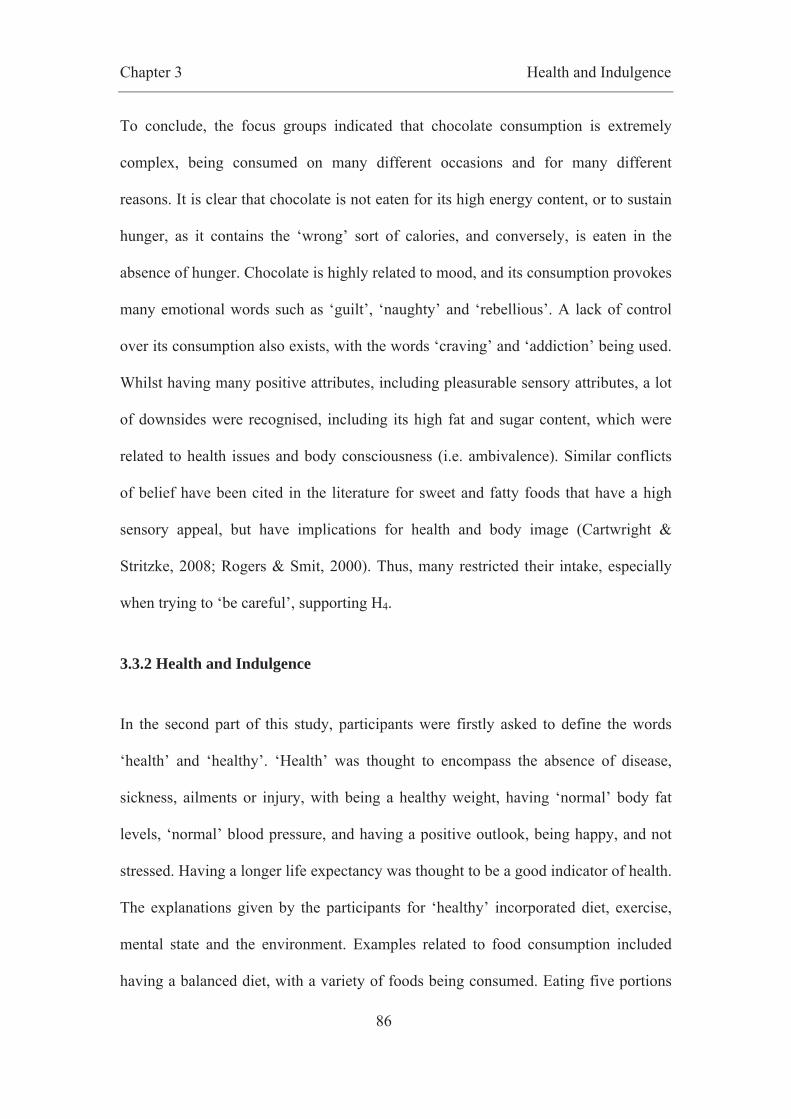
Chapter 3 Health and Indulgence
86
To conclude, the focus groups indicated that chocolate consumption is extremely
complex, being consumed on many different occasions and for many different
reasons. It is clear that chocolate is not eaten for its high energy content, or to sustain
hunger, as it contains the ‘wrong’ sort of calories, and conversely, is eaten in the
absence of hunger. Chocolate is highly related to mood, and its consumption provokes
many emotional words such as ‘guilt’, ‘naughty’ and ‘rebellious’. A lack of control
over its consumption also exists, with the words ‘craving’ and ‘addiction’ being used.
Whilst having many positive attributes, including pleasurable sensory attributes, a lot
of downsides were recognised, including its high fat and sugar content, which were
related to health issues and body consciousness (i.e. ambivalence). Similar conflicts
of belief have been cited in the literature for sweet and fatty foods that have a high
sensory appeal, but have implications for health and body image (Cartwright &
Stritzke, 2008; Rogers & Smit, 2000). Thus, many restricted their intake, especially
when trying to ‘be careful’, supporting H4.
3.3.2 Health and Indulgence
In the second part of this study, participants were firstly asked to define the words
‘health’ and ‘healthy’. ‘Health’ was thought to encompass the absence of disease,
sickness, ailments or injury, with being a healthy weight, having ‘normal’ body fat
levels, ‘normal’ blood pressure, and having a positive outlook, being happy, and not
stressed. Having a longer life expectancy was thought to be a good indicator of health.
The explanations given by the participants for ‘healthy’ incorporated diet, exercise,
mental state and the environment. Examples related to food consumption included
having a balanced diet, with a variety of foods being consumed. Eating five portions
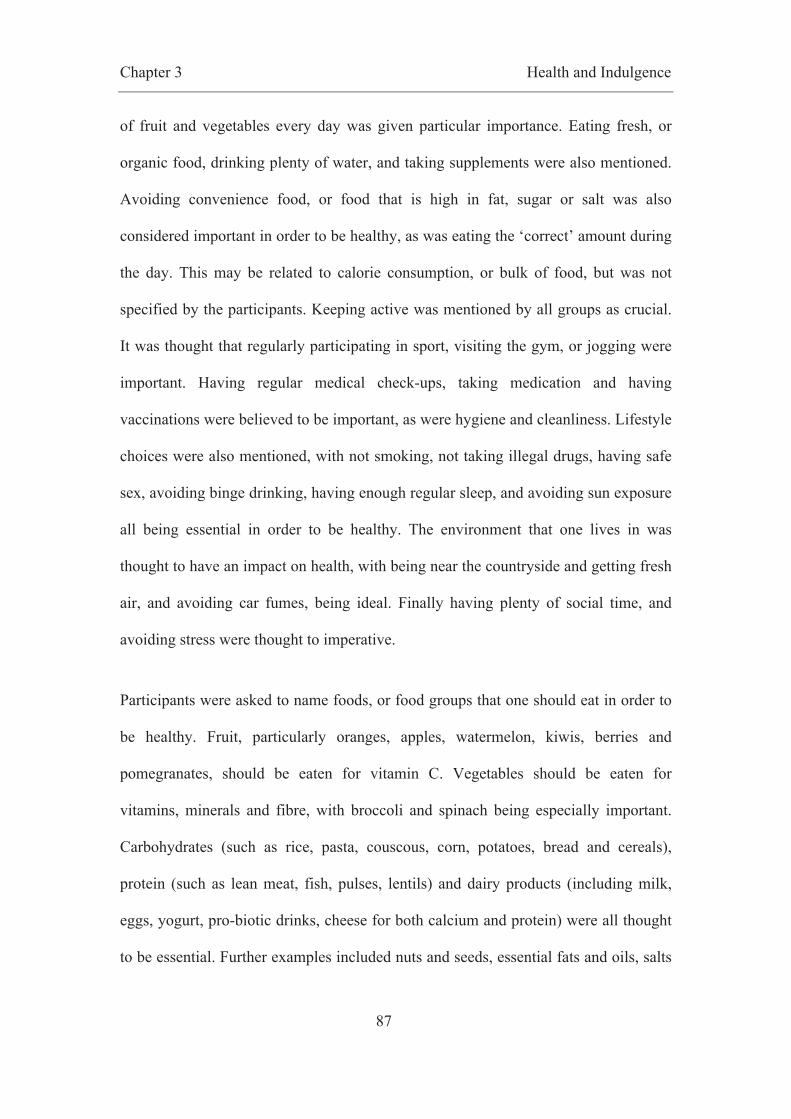
Chapter 3 Health and Indulgence
87
of fruit and vegetables every day was given particular importance. Eating fresh, or
organic food, drinking plenty of water, and taking supplements were also mentioned.
Avoiding convenience food, or food that is high in fat, sugar or salt was also
considered important in order to be healthy, as was eating the ‘correct’ amount during
the day. This may be related to calorie consumption, or bulk of food, but was not
specified by the participants. Keeping active was mentioned by all groups as crucial.
It was thought that regularly participating in sport, visiting the gym, or jogging were
important. Having regular medical check-ups, taking medication and having
vaccinations were believed to be important, as were hygiene and cleanliness. Lifestyle
choices were also mentioned, with not smoking, not taking illegal drugs, having safe
sex, avoiding binge drinking, having enough regular sleep, and avoiding sun exposure
all being essential in order to be healthy. The environment that one lives in was
thought to have an impact on health, with being near the countryside and getting fresh
air, and avoiding car fumes, being ideal. Finally having plenty of social time, and
avoiding stress were thought to imperative.
Participants were asked to name foods, or food groups that one should eat in order to
be healthy. Fruit, particularly oranges, apples, watermelon, kiwis, berries and
pomegranates, should be eaten for vitamin C. Vegetables should be eaten for
vitamins, minerals and fibre, with broccoli and spinach being especially important.
Carbohydrates (such as rice, pasta, couscous, corn, potatoes, bread and cereals),
protein (such as lean meat, fish, pulses, lentils) and dairy products (including milk,
eggs, yogurt, pro-biotic drinks, cheese for both calcium and protein) were all thought
to be essential. Further examples included nuts and seeds, essential fats and oils, salts

Chapter 3 Health and Indulgence
88
and sugars, if in moderation, and water and herbal teas. Red wine and dark chocolate
were also given.
Participants were then asked to define ‘indulgent’ or ‘indulgence’. The words
‘indulgence’ or ‘indulgent’ were used as it they are thought to be suitable words to
describe products such as chocolate. They are words that are not only used
extensively by confectionary companies (for example Nestle and Lindt), but are
thought to be familiar to consumers. The words are related to gratification, pleasure
and desire. To ‘indulge’ is to allow yourself or another person to have something
enjoyable, especially more than is good for you (Cambridge Dictionary Online). As
all three groups were able to produce similar definitions of the words, and gave
chocolate as the very first example of a food that is indulgent, the words are thought
to be suitable. In contrast to the definition of ‘health’ and ‘healthy’, in which
examples of diet, activity levels, lifestyle choices, and mental state were all given, the
definition of ‘indulgent’ or ‘indulgence’ mainly related to diet and eating habits. The
questions were worded in exactly the same way (i.e. “think about what the words
‘health’ and ‘healthy’ mean to you” / “think about what the words ‘indulgent’ or
‘indulgence’ mean to you”), suggesting that health does incorporate the whole of
one’s lifestyle, whereas indulgence is related more to consumption. There seemed to
be two main definitions of the words indulgent and indulgence. The first related to a
treat, that is eaten infrequently, mostly during special occasions, and when socialising
(all groups became more animated when discussing which foods they considered to
be indulgent):
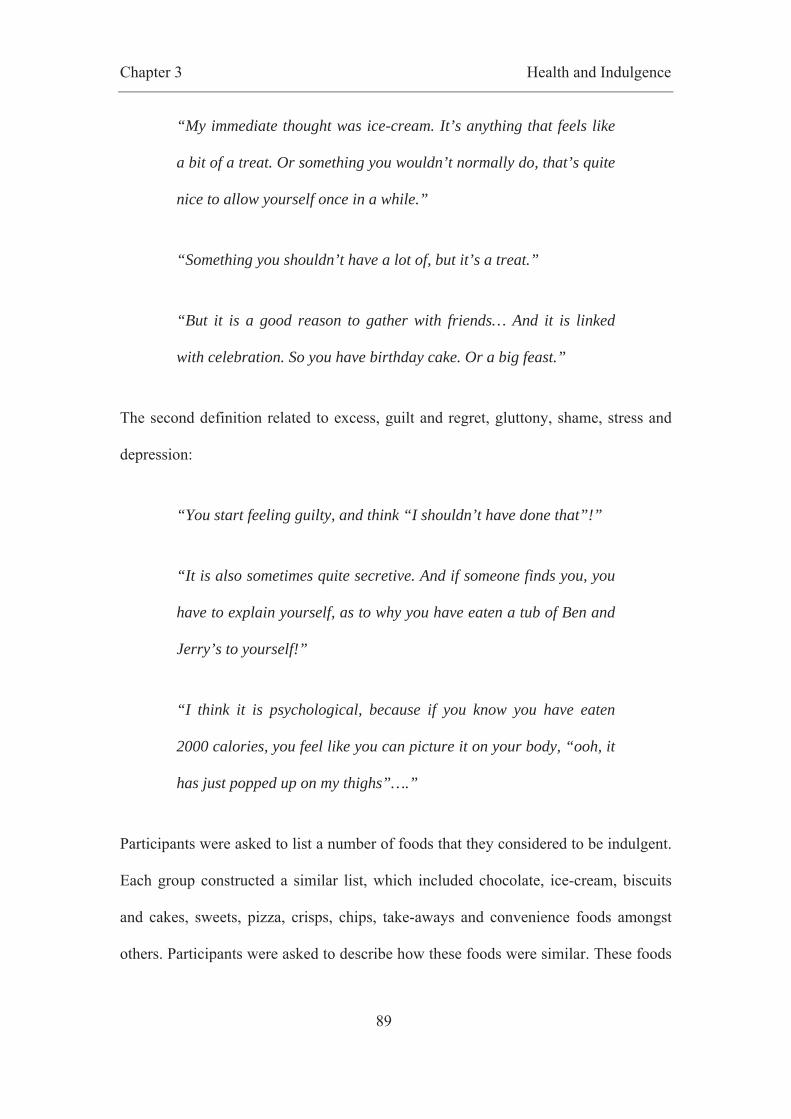
Chapter 3 Health and Indulgence
89
“My immediate thought was ice-cream. It’s anything that feels like
a bit of a treat. Or something you wouldn’t normally do, that’s quite
nice to allow yourself once in a while.”
“Something you shouldn’t have a lot of, but it’s a treat.”
“But it is a good reason to gather with friends… And it is linked
with celebration. So you have birthday cake. Or a big feast.”
The second definition related to excess, guilt and regret, gluttony, shame, stress and
depression:
“You start feeling guilty, and think “I shouldn’t have done that”!”
“It is also sometimes quite secretive. And if someone finds you, you
have to explain yourself, as to why you have eaten a tub of Ben and
Jerry’s to yourself!”
“I think it is psychological, because if you know you have eaten
2000 calories, you feel like you can picture it on your body, “ooh, it
has just popped up on my thighs”….”
Participants were asked to list a number of foods that they considered to be indulgent.
Each group constructed a similar list, which included chocolate, ice-cream, biscuits
and cakes, sweets, pizza, crisps, chips, take-aways and convenience foods amongst
others. Participants were asked to describe how these foods were similar. These foods
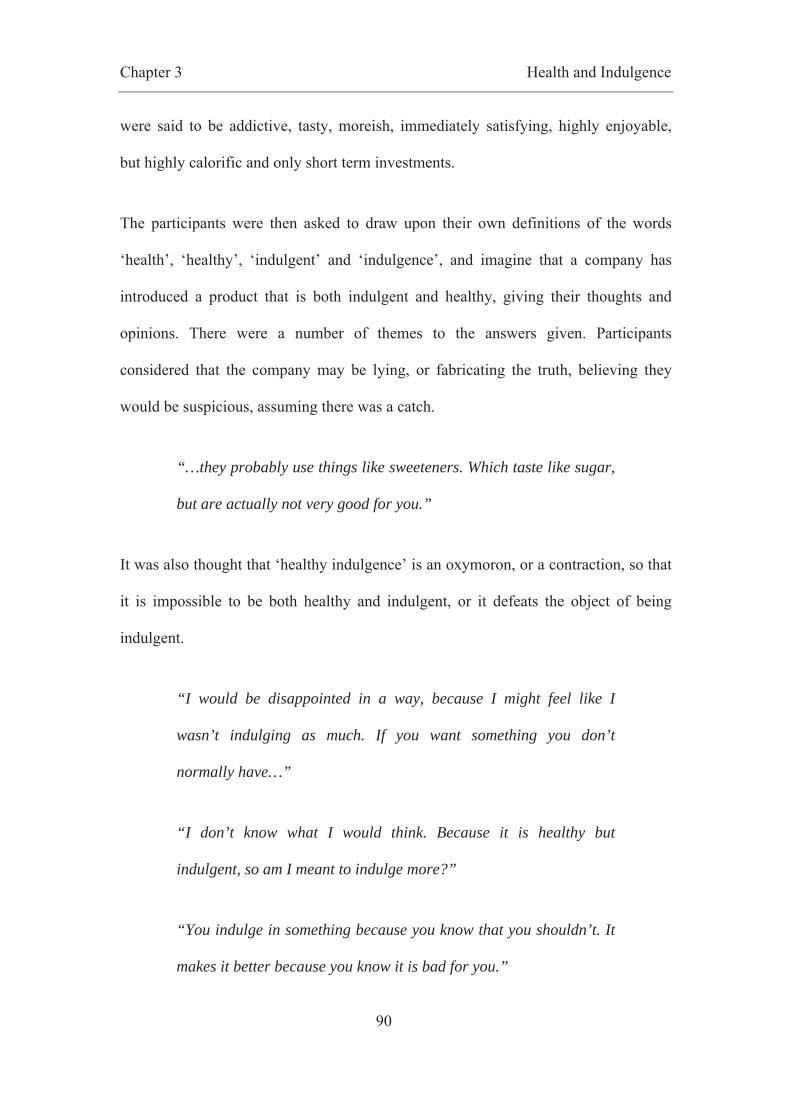
Chapter 3 Health and Indulgence
90
were said to be addictive, tasty, moreish, immediately satisfying, highly enjoyable,
but highly calorific and only short term investments.
The participants were then asked to draw upon their own definitions of the words
‘health’, ‘healthy’, ‘indulgent’ and ‘indulgence’, and imagine that a company has
introduced a product that is both indulgent and healthy, giving their thoughts and
opinions. There were a number of themes to the answers given. Participants
considered that the company may be lying, or fabricating the truth, believing they
would be suspicious, assuming there was a catch.
“…they probably use things like sweeteners. Which taste like sugar,
but are actually not very good for you.”
It was also thought that ‘healthy indulgence’ is an oxymoron, or a contraction, so that
it is impossible to be both healthy and indulgent, or it defeats the object of being
indulgent.
“I would be disappointed in a way, because I might feel like I
wasn’t indulging as much. If you want something you don’t
normally have…”
“I don’t know what I would think. Because it is healthy but
indulgent, so am I meant to indulge more?”
“You indulge in something because you know that you shouldn’t. It
makes it better because you know it is bad for you.”

Chapter 3 Health and Indulgence
91
Participants also thought that the taste of the product would be inferior, and may taste
subtler, or plainer, never comparing with an equivalent product. Finally, some of the
participants said they would be curious and interested to find out more about the
product, and thought that there would be a market for the product.
“Everyone wants chocolate to be healthy don’t they. And I’m sure if
it was it would do very well.”
“…could sell it as a really indulgent product, that you wouldn’t feel
guilty about.”
Although some members of the group believed there was potential for a ‘healthy
indulgent’ product, the majority found the concept confusing, or were disapproving.
This apparent negativity may not be related to the concept of a product being both
healthy and indulgent. Instead these opinions may be as a consequence of the reality
that most low-fat or low-calorie alternatives on the market are inferior in taste and
texture to the higher calorie equivalents. If it was stressed that the healthy indulgent
product had identical taste to the original product then opinion may have been
different.
To conclude, whilst the words ‘health’ and ‘healthy’ encompassed many things
including diet, exercise and mental state, the words ‘indulgent’ and ‘indulgence’
mainly related to diet and eating habits. Indulgence had two definitions, one that
related to treats, and foods that are consumed during special occasions and
celebrations, the second was related to stress, depression, excess, guilt and regret.

Chapter 3 Health and Indulgence
92
Chocolate was given as the very first example of an indulgent food. Indulgent foods
were said to be tasty, highly enjoyable, addictive, but highly calorific. When asked to
imagine a healthy indulgent product many thought that this concept was an
oxymoron, and confusing, although some saw the potential.
3.4 Overall Conclusions
A number of hypotheses were identified:
H1. Chocolate will be described as highly palatable, with pleasurable sensory
characteristics;
H2. Craving towards chocolate will be apparent in a proportion of chocolate
eaters;
H3. Ambivalence towards chocolate will be reported as it has high sensory
appeal, but is highly calorific and is not consumed to sustain hunger. As such
its consumption is detrimental to health and body image;
H4. Consumption of chocolate will often be restricted;
H5. Opinions towards a healthy indulgent product will differ to opinions of
standard indulgent products.
The focus groups indicated that ambivalence is commonly experienced towards
chocolate, as it has a desirable taste, but is also high in fat, sugar and calories, so it’s
consumption often results in stress, depression, guilt or regret, supporting both H1 and

Chapter 3 Health and Indulgence
93
H3. This negative affect was related to body consciousness (weight-gain, bloating and
bad skin) and health (diabetes and tooth decay). Furthermore, a lack of control was
described, with many describing craving towards chocolate, or an addiction to it,
supporting H2. Many restricted their intake of chocolate, especially when trying to ‘be
careful’, supporting H4. Although many downsides to consuming chocolate were
described, when presented with the concept of a ‘healthy indulgence’ product during
the Health and Indulgence focus group, it was thought to be a confusing and
suspicious contradiction. Furthermore, it was thought that it is impossible to be both
healthy and indulgence. There were two reasons for this: i) foods are indulgent
because they are bad for you; ii) the taste is often sacrificed in healthy alternatives. In
line with H5, opinions towards a healthy indulgent product differ from opinions of
healthy or indulgent products.
When marketing a reduced-fat product, focusing on a reduction in fat and sugar the
consumer may believe the taste will be inferior, as this appears to be how low-fat and
low-calorie equivalents are perceived. However, by either focusing on the health
benefits that can be gained by consuming less fat and calories, or by introducing the
product as an indulgent product, with calorific values or health benefits playing a
minor role, opinions towards the product may be more positive.
Di Monaco, Ollila and Tuorila (2005) used a focus group to discuss chocolate
consumption, and the importance of both health and taste in chocolate consumption.
The results suggested that the main purpose of eating chocolate is for pleasure, or to
reward oneself. Thus, health issues are irrelevant as it is eaten only occasionally and
cannot harm one’s health, and buying a ‘healthy’ chocolate bar would be
Chapter 3 Health and Indulgence
94
disappointing. These findings are very similar to the current study, indicating that this
belief is common among different populations (their study was conducted in Finland).
The focus groups highlight the need to understand the impact that expectations about
a reduced-fat chocolate bar have upon liking, and other aspects of the consumption
experience. Thus, the next chapter (Chapter 4) addresses this in more detail.

Chapter 4 Expectations and Labelling
95
4. Using labelling to explore consumer expectations of reduced-fat
chocolate
4.1 Introduction
Many studies have investigated how label information influences expectations or
sensory and hedonic ratings of foods, in addition to energy intake (typically ad
libitum i.e. self regulated) and willingness to pay for the product (a review can be
found in Chapter 1). A number of authors have specifically investigated chocolate,
and found that reduced-fat information negatively affects acceptance (Stubenitsky et
al., 1999), pleasantness ratings and buying probability (Kähkönen & Tuorila, 1999),
and resulted in lower expected melting rate (Kähkönen, Hakanpää & Tuorilla, 1999)
and decreased fattiness, flavour intensity and melting rate during consumption
(Kähkönen, 2000). Conversely, participants may rate low-fat products higher due to
impression management or social desirability (Light et al., 1992), or may choose a
lower fat product against their hedonic preference (Tuorila et al., 2001) for the health
benefits. It has been suggested (Wansink & Chandon, 2006) that nutrition labels could
create ‘health halos’, in which consumers believe that it is acceptable or appropriate
to consume more of a food labelled as being lower in fat. Low-fat claims may lead
consumers to eat more because it reduces the conflict between the hedonic goal of
pleasure gratification, and the long-term goal of health preservation (i.e. feelings of
ambivalence). Wansink and Chandon (2006) found that consumers trade-off taste
reductions for increased consumption of low-fat foods, thus offsetting the lower-
energy density.
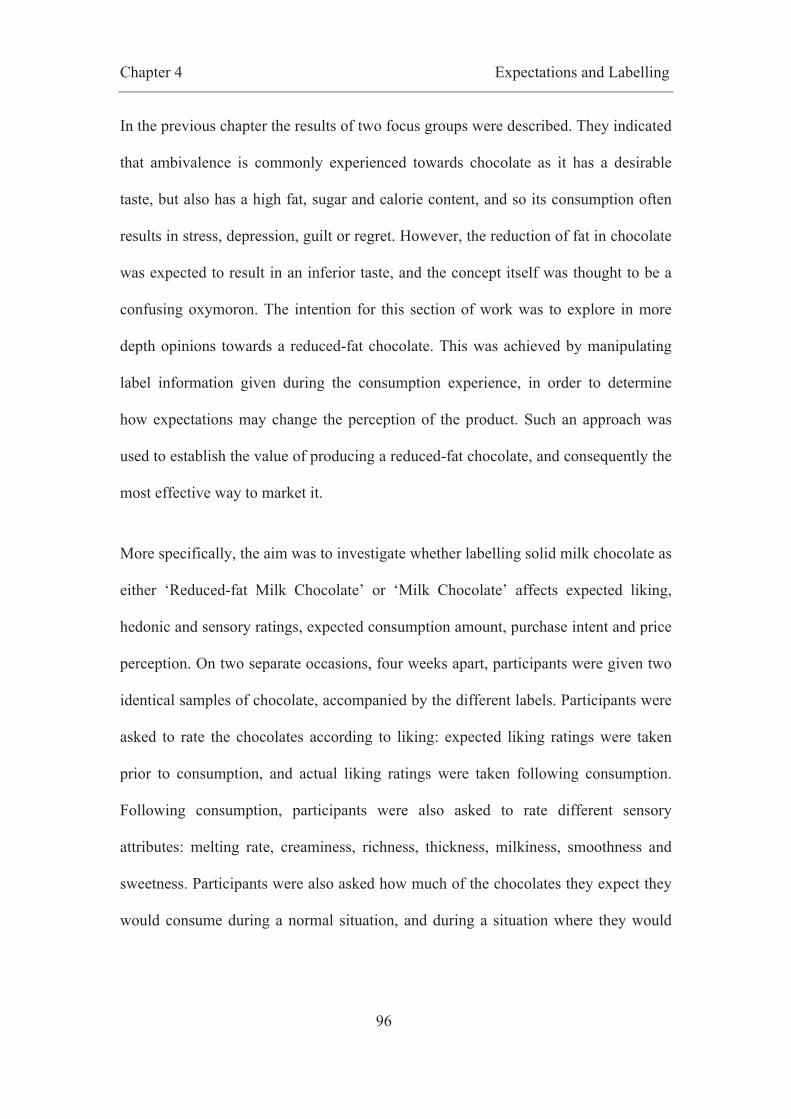
Chapter 4 Expectations and Labelling
96
In the previous chapter the results of two focus groups were described. They indicated
that ambivalence is commonly experienced towards chocolate as it has a desirable
taste, but also has a high fat, sugar and calorie content, and so its consumption often
results in stress, depression, guilt or regret. However, the reduction of fat in chocolate
was expected to result in an inferior taste, and the concept itself was thought to be a
confusing oxymoron. The intention for this section of work was to explore in more
depth opinions towards a reduced-fat chocolate. This was achieved by manipulating
label information given during the consumption experience, in order to determine
how expectations may change the perception of the product. Such an approach was
used to establish the value of producing a reduced-fat chocolate, and consequently the
most effective way to market it.
More specifically, the aim was to investigate whether labelling solid milk chocolate as
either ‘Reduced-fat Milk Chocolate’ or ‘Milk Chocolate’ affects expected liking,
hedonic and sensory ratings, expected consumption amount, purchase intent and price
perception. On two separate occasions, four weeks apart, participants were given two
identical samples of chocolate, accompanied by the different labels. Participants were
asked to rate the chocolates according to liking: expected liking ratings were taken
prior to consumption, and actual liking ratings were taken following consumption.
Following consumption, participants were also asked to rate different sensory
attributes: melting rate, creaminess, richness, thickness, milkiness, smoothness and
sweetness. Participants were also asked how much of the chocolates they expect they
would consume during a normal situation, and during a situation where they would

Chapter 4 Expectations and Labelling
97
not be restricting their consumption amount, whether they would purchase the
chocolate, and if so, for how much money.
The study also aimed to explore individual differences (gender, age, BMI, normal
consumption amount, willingness to try low fat foods, external, emotional or
restricted eating, and ambivalence) and how they may affect ratings, consumption
amount, purchase intent or price perception.
4.2 Hypotheses
A number of hypotheses were identified:
H1. The label condition will have an impact on ratings of expected liking, with
‘Reduced-fat Milk Chocolate’ being rated lower than ‘Milk Chocolate’;
H2. Actual liking of the ‘Reduced-fat Milk Chocolate’ will be higher than
expected liking;
H3. When the chocolate is labelled ‘Milk Chocolate’ the expected and actual
hedonic ratings will be similar;
H4. Sensory attributes perceived as being related to fat content in chocolate
will be rated lower, or higher (depending upon the attribute), when the
chocolate is labelled as ‘Reduced-fat Milk Chocolate’ than when labelled
‘Milk Chocolate’;
H5. When the chocolate is labelled as ‘reduced-fat’ a higher quantity will be
consumed than when labelled as a standard chocolate.

Chapter 4 Expectations and Labelling
98
4.3 Results
Specific information about the procedure used, methods of data analysis and
presentation of data can be found in Chapter 2.
4.3.1 Carryover Effects
The data obtained was first analysed to investigate whether the session order had an
effect on liking (i.e. any carryover effects). ANOVAs were conducted to consider
whether ratings of expected or actual liking were affected by the session in which the
chocolates were tasted. Significant effects (i.e. p-values < .05) were not observed for
expected liking [F (1,85) = .508, p = .478] or for actual liking [F (1,85) = .802, p =
.373] (mean ratings and standard deviations can be found in Table 4.1). This suggests
that participants were not influenced by any experience gained during the first session
when tasting the chocolate during the second session. Furthermore, when asked to
indicate what they thought the purpose of the study was, none of the participants
correctly guessed the aims. Typical answers included discovering opinions of taste
and quality of different, newly developed chocolates, and investigating individual
differences (for example, eating habits, health consciousness or mood) and the
relationship with chocolate consumption.
Table 4.1 Mean ratings of expected and actual liking of the chocolates labelled ‘Milk Chocolate’ and ‘Reduced-fat Milk Chocolate’ tasted during session 1 and session 2. In brackets standard deviation.
Expected Liking Actual Liking Milk Chocolate Reduced-fat Milk
Chocolate Milk Chocolate Reduced-fat Milk
Chocolate Session 1 73.1 (2.6) 62.9 (3.1) 69.8 (2.7) 69.9 (3.3) Session 2 62.1 (3.1) 54.8 (2.6) 64.2 (2.8) 60.8 (2.4)

Chapter 4 Expectations and Labelling
99
4.3.2 Expected and Actual Liking
Next the effect of label type on expected and actual liking was analysed. As can be
seen in Figure 4.1, a significant main effect of label type was found for expected
liking, with participants having lower expectations of liking for the chocolate labelled
‘Reduced-fat Milk Chocolate’ (χ = 58.88, σ = 18.8) than the chocolate labelled ‘Milk
Chocolate’ (χ = 67.68, σ = 19.4) [F (1, 86) = 18.11, p < .0005]. However, a
significant effect of label was not found for actual liking, where the ratings of the
chocolate were similar (‘Milk Chocolate’: χ = 67.04, σ = 18.1; ‘Reduced-fat Milk
Chocolate’: χ = 65.41, σ = 19.5) [F (1, 86) = 7.16, p = .4], suggesting that the
experience of the chocolate’s taste outweighed any expectations generated by the
label.
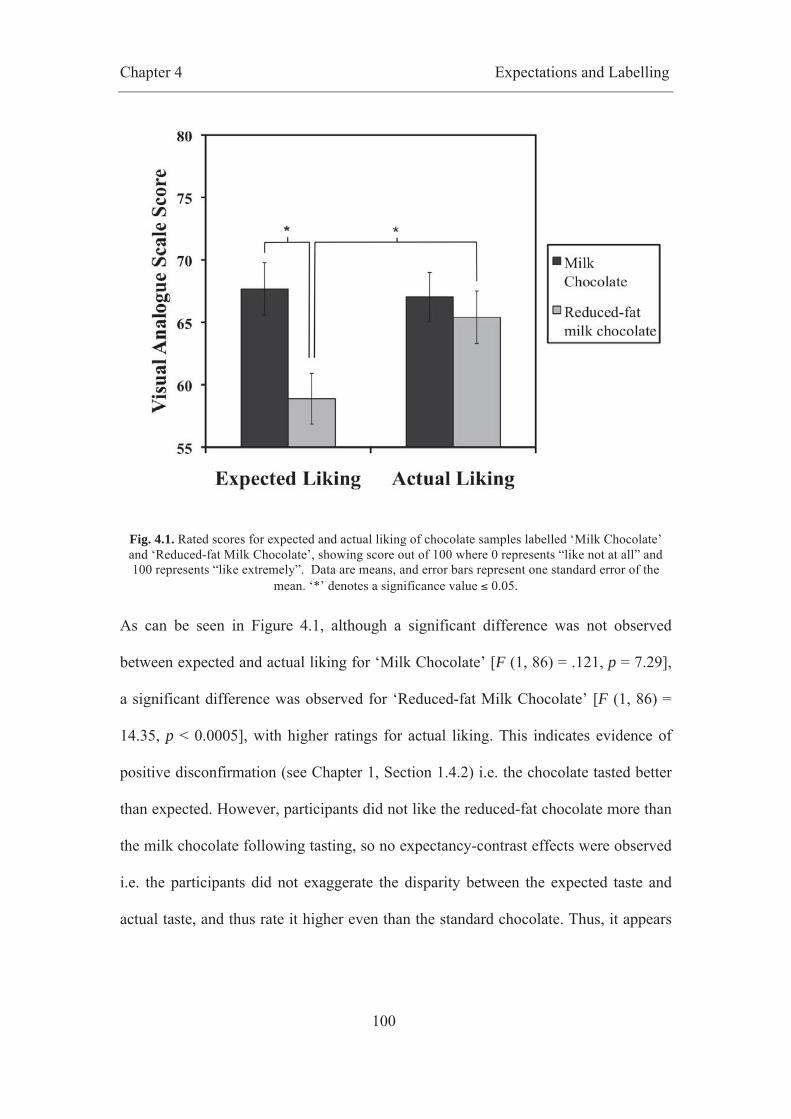
Chapter 4 Expectations and Labelling
100
Fig. 4.1. Rated scores for expected and actual liking of chocolate samples labelled ‘Milk Chocolate’ and ‘Reduced-fat Milk Chocolate’, showing score out of 100 where 0 represents “like not at all” and 100 represents “like extremely”. Data are means, and error bars represent one standard error of the
mean. ‘*’ denotes a significance value ≤ 0.05.
As can be seen in Figure 4.1, although a significant difference was not observed
between expected and actual liking for ‘Milk Chocolate’ [F (1, 86) = .121, p = 7.29],
a significant difference was observed for ‘Reduced-fat Milk Chocolate’ [F (1, 86) =
14.35, p < 0.0005], with higher ratings for actual liking. This indicates evidence of
positive disconfirmation (see Chapter 1, Section 1.4.2) i.e. the chocolate tasted better
than expected. However, participants did not like the reduced-fat chocolate more than
the milk chocolate following tasting, so no expectancy-contrast effects were observed
i.e. the participants did not exaggerate the disparity between the expected taste and
actual taste, and thus rate it higher even than the standard chocolate. Thus, it appears
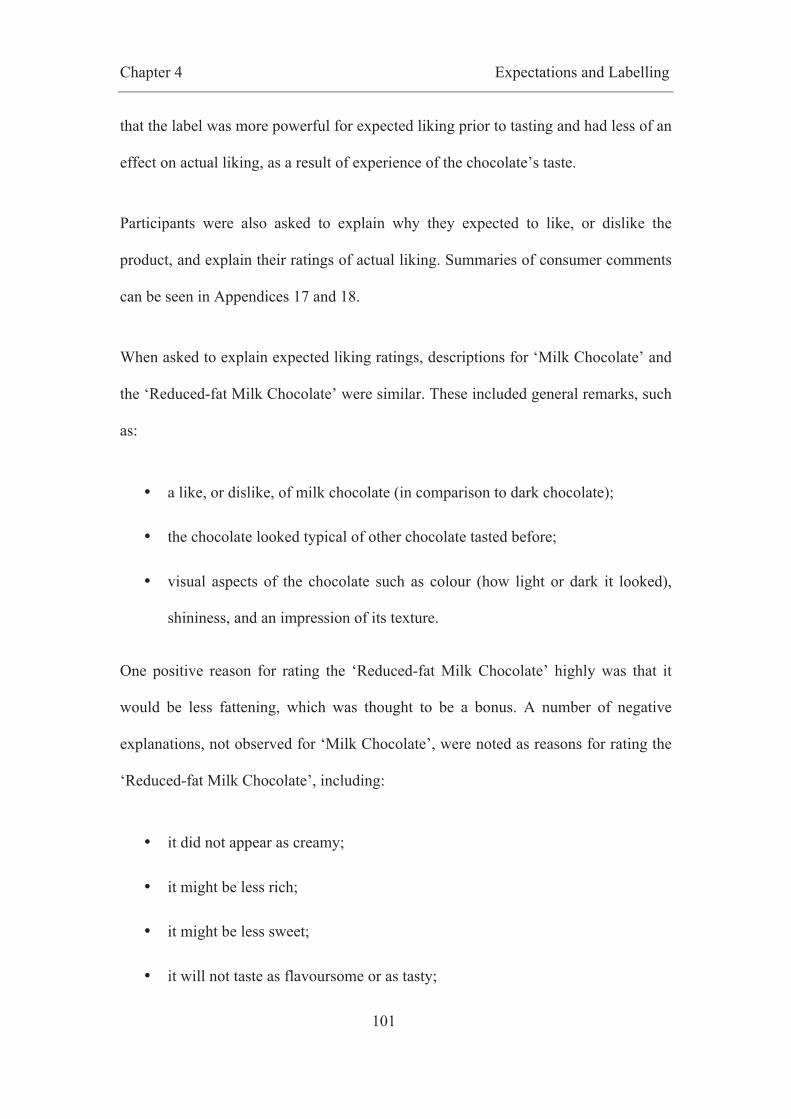
Chapter 4 Expectations and Labelling
101
that the label was more powerful for expected liking prior to tasting and had less of an
effect on actual liking, as a result of experience of the chocolate’s taste.
Participants were also asked to explain why they expected to like, or dislike the
product, and explain their ratings of actual liking. Summaries of consumer comments
can be seen in Appendices 17 and 18.
When asked to explain expected liking ratings, descriptions for ‘Milk Chocolate’ and
the ‘Reduced-fat Milk Chocolate’ were similar. These included general remarks, such
as:
• a like, or dislike, of milk chocolate (in comparison to dark chocolate);
• the chocolate looked typical of other chocolate tasted before;
• visual aspects of the chocolate such as colour (how light or dark it looked),
shininess, and an impression of its texture.
One positive reason for rating the ‘Reduced-fat Milk Chocolate’ highly was that it
would be less fattening, which was thought to be a bonus. A number of negative
explanations, not observed for ‘Milk Chocolate’, were noted as reasons for rating the
‘Reduced-fat Milk Chocolate’, including:
• it did not appear as creamy;
• it might be less rich;
• it might be less sweet;
• it will not taste as flavoursome or as tasty;

Chapter 4 Expectations and Labelling
102
• it looked like a diet food.
These opinions were not given for the ‘Milk Chocolate’, so were as a result of
experiencing the reduced-fat label.
When asked to explain actual liking ratings, reasons were variable, and indicative of
personal taste. For example, actual liking scores of both the ‘Milk Chocolate’ and the
‘Reduced-fat Milk Chocolate’ were affected by perception of sweetness, where some
believed the products to be too sweet, and others not sweet enough. This was
observed for many of the attributes, including chocolate flavour, milkiness,
smoothness, melt-in-the-mouth characteristics and creaminess. Interestingly, some
participants were of the perception that the reduced-fat chocolate tasted ‘light’ or
‘reduced-fat’, though no differences in sensory attributes between the two chocolates
were described i.e. no explanation for this description can be observed in the
comments given. It may be that although the same shortcomings were observed for
the standard milk chocolate, when the product was thought to be reduced in fat, the
word ‘light’ was used to describe these deficiencies. It is interesting to note that
although during the first session participants had not been familiarised with the
vocabulary that would be used during the rest of the study questionnaire, many used
words such as ‘milkiness’, ‘creaminess’, ‘richness’, ‘smoothness’, ‘sweetness’ and
‘melting in the mouth’ when describing the chocolates themselves, suggesting that
this vocabulary can be used with confidence.
Chapter 4 Expectations and Labelling
103
4.3.3 Sensory Attributes
Next, participants were asked to rate the chocolate according to eight sensory
attributes: melting-in-the-mouth, creaminess, richness, thickness, milkiness,
smoothness and sweetness. Participants were given a glossary of terms to standardise
the questions, and ensure that all the participants understood the sensory words given
(see Chapter 2). Each attribute was asked on a visual analogue scale (VAS), and as
Just About Right (JAR) questions (see Chapter 2 for a description).
For the visual analogue scale questions, trends toward significant differences (i.e. p
values < .1) were observed for:
• melting rate, with reduced-fat chocolate melting quicker (χ = 44.76, σ = 20.3)
than milk chocolate (χ = 40.78, σ = 18.3) [F (1, 86) = 3.05, p = .085];
• creaminess, with Milk Chocolate being rated higher (χ = 59.06, σ = 18.7) than
Reduced-fat Milk Chocolate (χ = 54.83, σ = 19.6) [F (1,86) = 2.48, p = .119];
• smoothness, with milk chocolate being rated as smoother (χ = 71.6, σ = 21.3)
than reduced fat milk chocolate (χ = 67.1, σ = 23.3) [F (1,86) = 2.714, p =
.103].
No significant effects of labelling condition, or trends, were observed for richness,
thick mouthfeel, milkiness or sweetness. Furthermore, for the JAR questions,
significant differences or trends were not observed for any of the sensory attributes.
Figure 4.2 shows the percentage of consumers who rated the two chocolates from
‘much too much’ to ‘not at all enough’ according to each of the sensory attributes.
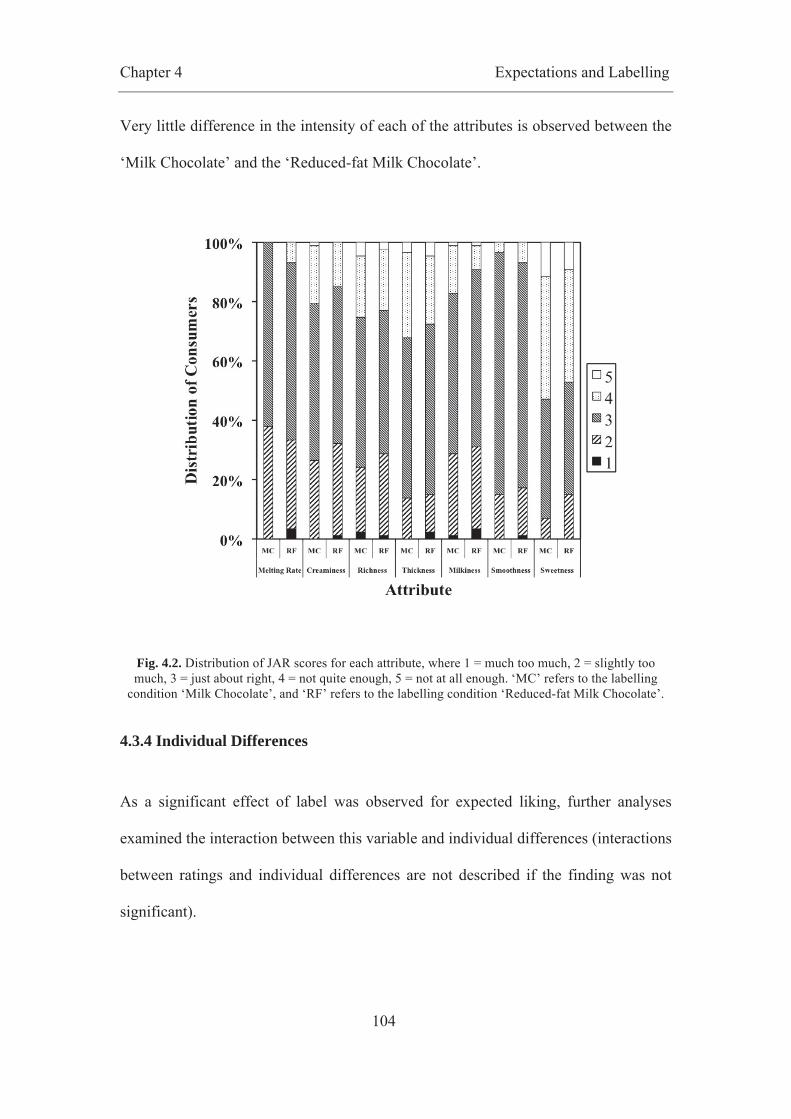
Chapter 4 Expectations and Labelling
104
Very little difference in the intensity of each of the attributes is observed between the
‘Milk Chocolate’ and the ‘Reduced-fat Milk Chocolate’.
Fig. 4.2. Distribution of JAR scores for each attribute, where 1 = much too much, 2 = slightly too much, 3 = just about right, 4 = not quite enough, 5 = not at all enough. ‘MC’ refers to the labelling
condition ‘Milk Chocolate’, and ‘RF’ refers to the labelling condition ‘Reduced-fat Milk Chocolate’.
4.3.4 Individual Differences
As a significant effect of label was observed for expected liking, further analyses
examined the interaction between this variable and individual differences (interactions
between ratings and individual differences are not described if the finding was not
significant).

Chapter 4 Expectations and Labelling
105
Fig. 4.3. Ratings of expected liking of chocolate samples labelled ‘Milk Chocolate’ and ‘Reduced-fat Milk Chocolate’ for those participants who said they were likely or unlikely to try low-fat foods. Data are means, and error bars represent one standard error of the mean. ‘*’ denotes a significance value ≤
0.05.
A significant interaction between expected liking and willingness to try low-fat foods
[F (1,87) = 5.601, p = .020] was observed (see Fig. 4.3). Firstly, in order to discover
whether expected liking differed across labelling conditions, analysis was conducted
separately on the two groups: those likely and those unlikely to try low fat foods. As
can be seen in Figure 4.3, significant differences in expected liking scores in the two
labelling conditions were observed for both those likely to try low fat foods [F (1,67)
= 10.7, p = .002], and those unlikely to try them [F (1,11) = 9.57, p = .01]. This may
suggest that chocolate is different from other low-fat products on the market, as even
those who are normally willing to consume low-fat foods expected to like the
‘reduced-fat’ chocolate less than the standard chocolate. This may also be a result of

Chapter 4 Expectations and Labelling
106
the experience that low-fat foods taste inferior to their higher fat equivalents.
Independent samples t-tests were conducted to compare expected liking scores for the
two groups, separately for the two labelling conditions. Although for ‘Milk
Chocolate’ no significant difference in expected liking scores was observed between
those likely to try low fat foods (χ = 69.01, σ = 20.12) and those unwilling to try low
fat foods [χ = 67.18, σ = 16.22; t (85) = .297, p = .767], for ‘Reduced-fat Milk
Chocolate’ a significant difference was observed between the two groups [χ = 61.76,
σ = 18.35 & χ = 45.72, σ = 19.49 respectively; t (78) = 2.767, p = .007], with those
participants with general unwillingness to try low-fat foods rating expected liking of
‘Reduced-fat Milk Chocolate’ significantly lower than those participants more open
to low-fat foods. This indicates a greater negativity from participants unlikely to
normally try low-fat foods.
Further analysis was conducted for expected liking and external eating scores, i.e.
eating in response to external cues such as the sight, smell or taste of food, as
measured using the DEBQ (van Strien et al., 1986). Average expected liking scores
for those with below median and above median external eating scores can be seen in
Figure 4.4. Although a significant difference between expecting liking scores for
‘Milk Chocolate’ and the ‘Reduced-fat Milk Chocolate’ was not observed for those
people with low levels of external eating [F (1,36) = 2.278, p = 0.14], a significant
difference was observed for those with high levels of external eating [F (1,49) =
21.09, p = < .0005]. External eaters have elevated responsiveness to food-related cues
in the immediate environment (van Strien et al., 2009). This is thought to be a result
of external eaters being aroused by, and getting pleasure from food, and the desire and
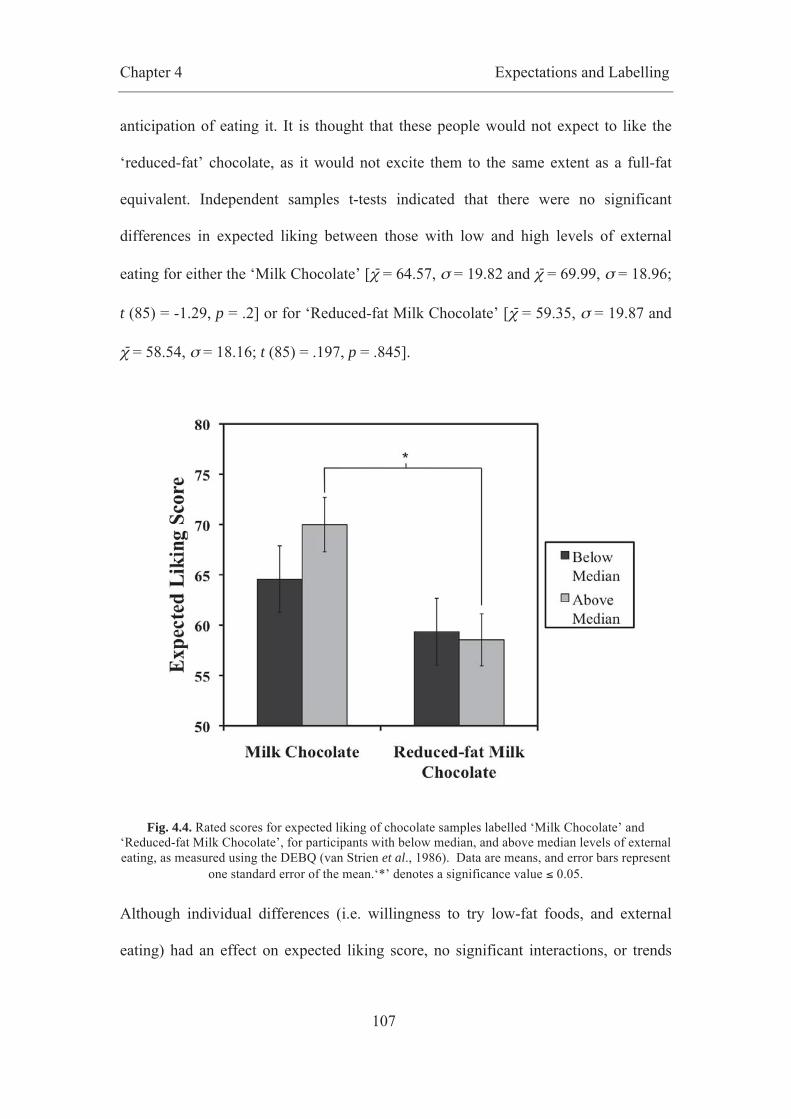
Chapter 4 Expectations and Labelling
107
anticipation of eating it. It is thought that these people would not expect to like the
‘reduced-fat’ chocolate, as it would not excite them to the same extent as a full-fat
equivalent. Independent samples t-tests indicated that there were no significant
differences in expected liking between those with low and high levels of external
eating for either the ‘Milk Chocolate’ [χ = 64.57, σ = 19.82 and χ = 69.99, σ = 18.96;
t (85) = -1.29, p = .2] or for ‘Reduced-fat Milk Chocolate’ [χ = 59.35, σ = 19.87 and
χ = 58.54, σ = 18.16; t (85) = .197, p = .845].
Fig. 4.4. Rated scores for expected liking of chocolate samples labelled ‘Milk Chocolate’ and ‘Reduced-fat Milk Chocolate’, for participants with below median, and above median levels of external eating, as measured using the DEBQ (van Strien et al., 1986). Data are means, and error bars represent
one standard error of the mean.‘*’ denotes a significance value ≤ 0.05.
Although individual differences (i.e. willingness to try low-fat foods, and external
eating) had an effect on expected liking score, no significant interactions, or trends
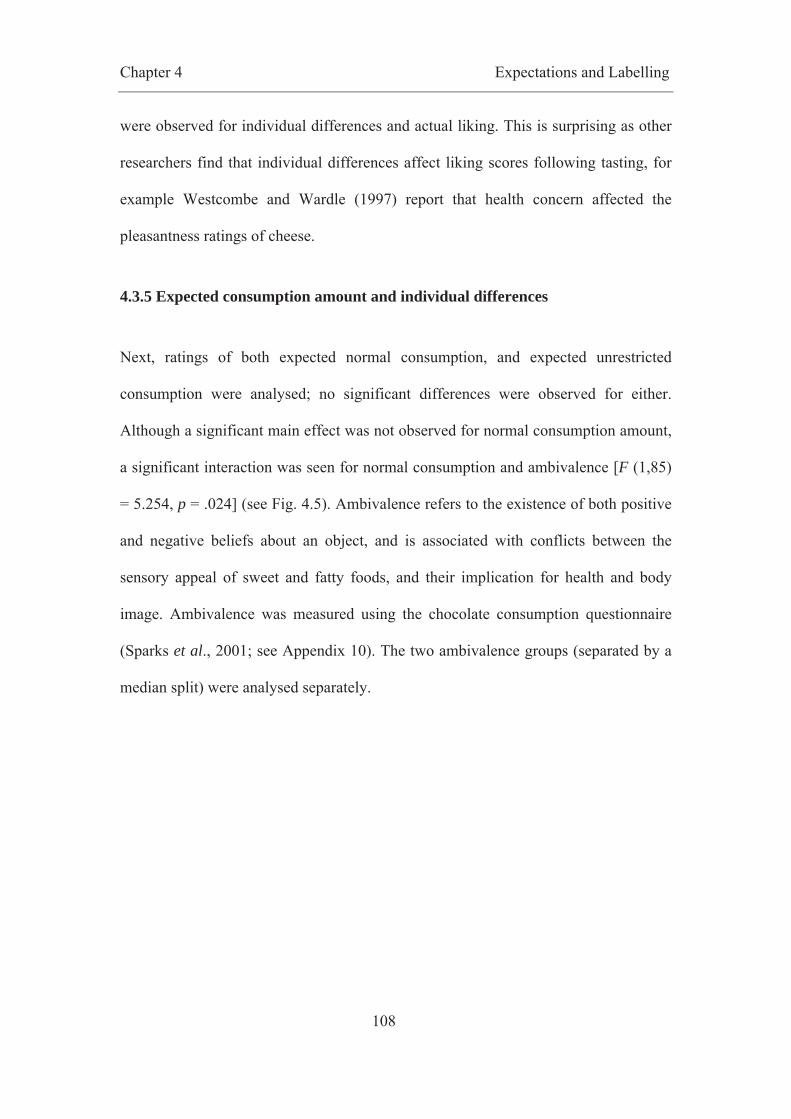
Chapter 4 Expectations and Labelling
108
were observed for individual differences and actual liking. This is surprising as other
researchers find that individual differences affect liking scores following tasting, for
example Westcombe and Wardle (1997) report that health concern affected the
pleasantness ratings of cheese.
4.3.5 Expected consumption amount and individual differences
Next, ratings of both expected normal consumption, and expected unrestricted
consumption were analysed; no significant differences were observed for either.
Although a significant main effect was not observed for normal consumption amount,
a significant interaction was seen for normal consumption and ambivalence [F (1,85)
= 5.254, p = .024] (see Fig. 4.5). Ambivalence refers to the existence of both positive
and negative beliefs about an object, and is associated with conflicts between the
sensory appeal of sweet and fatty foods, and their implication for health and body
image. Ambivalence was measured using the chocolate consumption questionnaire
(Sparks et al., 2001; see Appendix 10). The two ambivalence groups (separated by a
median split) were analysed separately.

Chapter 4 Expectations and Labelling
109
Fig. 4.5. Ratings of expected normal consumption amount (in squares of chocolate) of samples labelled ‘Milk Chocolate’ and ‘Reduced-fat Milk Chocolate’ for participants below, and above, the median
ambivalence, as measured using the chocolate consumption questionnaire (Sparks et al., 2001). Data are means, and error bars represent one standard error of the mean. ‘*’ denotes a significance value ≤
0.05.
Although a significant difference was not observed between the two labelling
conditions for those participants with a lower level of ambivalence [F (1,46) = 1.42, p
= .24], a significant difference between the chocolates was observed for participants
with a higher level of ambivalence [F (1,39) = 4.81, p = .034], who anticipated that
they would consume significantly more of the ‘Reduced-fat Milk Chocolate’ than the
standard chocolate. This would be expected, and may be a result of decreased conflict
in feelings when consuming reduced-fat products as the implications for health and
body concern are reduced (Sparks et al., 2001), resulting in the belief that a higher
quantity can be consumed. Differences in projected consumption were not observed
for those with lower than median ambivalence, possibly because the incidence of
Chapter 4 Expectations and Labelling
110
mixed feelings when consuming chocolate is lower, so a reduced-fat chocolate does
not offer as much of an advantage to these consumers.
Although no significant main effect was observed for anticipated unrestricted
consumption, a significant interaction was seen for unrestricted consumption and BMI
[F (1,85) = 5.011, p = .028] (see Fig. 4.6).
Fig. 4.6. Ratings of expected unrestricted consumption amount (in squares of chocolate) of samples labelled ‘Milk Chocolate’ and ‘Reduced-fat Milk Chocolate’ for participants below, and above, the
median BMI. Data are means, and error bars represent one standard error of the mean.
The two BMI groups (i.e. above median and below median BMI) were analysed
separately. No significant differences were observed between the two labelling
conditions for either those with a lower BMI [F (1,42) = 2.574, p = .116], or those
with a higher BMI [F (1,43) = 2.453, p = .125]. Furthermore, an independent samples
Chapter 4 Expectations and Labelling
111
t-test indicated no significant difference between those with lower BMIs (χ = 10.35, σ
= 8.12), or those with higher BMIs (χ = 8.42, σ = 4.05) for ‘Milk Chocolate’ [t (85) =
1.406, p = .163], or for ‘Reduced-fat Milk Chocolate’ [χ = 8.97, σ = 5.93 and χ =
9.52, σ = 5.62, respectively; t (85) = -.441, p = .66]. Whilst none of the individual t-
tests showed a significant difference, Figure 4.6 suggests that the overall significance
is being driven by high unrestricted consumption of ‘Milk Chocolate’ by those with a
lower than median BMI. It is likely that those with a lower BMI are less concerned
with their weight, and so do not see the benefits of consuming a reduced-fat
chocolate. Instead it appears that they would like to gain maximum pleasure from its
consumption, and so would prefer to eat more of the standard chocolate and not
restrict their consumption. There also may be a slight increase in consumption of the
‘Reduced-fat Milk Chocolate’ by those with an above median BMI. This would be
consistent with literature, such as Wansink and Chandon (2006) who observed that
overweight consumers ate more snacks labelled as low fat than normal weight
consumers. However, here this is not a statistically significant finding.

Chapter 4 Expectations and Labelling
112
Fig. 4.7. Ratings of expected unrestricted consumption amount (in squares of chocolate) of samples labelled ‘Milk Chocolate’ and ‘Reduced-fat Milk Chocolate’ for participants who are likely, and
unlikely to try low-fat foods. Data are means, and error bars represent one standard error of the mean. ‘T’ denotes a trend towards significance at a value ≤ 0.1.
A significant interaction was also observed for unrestricted consumption and
willingness to try low-fat foods [F (1,78) = 5.646, p = .020] (see Fig. 4.7). Post hoc
analysis indicated that although there were was no significant difference between
scores of unrestricted consumption for those willing to try low fat foods [F (1,67) =
.462, p = .499], there was a trend towards significance between the two labelling
conditions for those unlikely to try low fat foods [F (1,11) = 3.59, p = .085].
Furthermore, an independent samples t-test indicated that there was no significant
difference between those willing (χ = 9.01, σ = 5.79) and unwilling (χ = 12.29, σ =
5.79) to try low-fat foods for ‘Milk Chocolate’ [t (12) = -1.09, p = .296]. There was
also no significant difference between the two groups for ‘Reduced-fat Milk

Chapter 4 Expectations and Labelling
113
Chocolate’ [χ = 9.42, σ = 5.95 and χ = 8.83, σ = 4.93 respectively; t (78) = .322, p =
.748]. Whilst those likely to try low-fat foods had similar consumption amounts for
the two chocolates, for participants unlikely to try low-fat foods there was a trend
towards higher consumption of the standard chocolate than the ‘reduced-fat’
chocolate. Expected consumption of the standard chocolate was greater for this group,
possibly because they are not only unlikely to consume low-fat foods, but enjoy
consuming high fat foods. Interestingly, being likely to try low-fat foods normally did
not affect consumption amount, possibly because chocolate is thought to be within a
different product category to other low-fat foods experienced, or because low-fat
foods are chosen by this group to aid healthy living and a desired body image, and not
to allow increased consumption of those foods.
4.3.6 Willingness to pay and individual differences
Next, the effect that labelling condition has on price was considered. Participants
were first asked whether they would be willing to purchase the product, and if so,
were asked for how much (using standard chocolate prices as a reference; see Chapter
2 for details). A significant effect was also not observed for price, although a
significant interaction was observed for price and BMI [F (1,71) = 4.130, p = .046].
The two BMI groups (i.e. below and above median BMI) were analysed separately,
finding that there was not a significance difference in price between the two labelling
conditions for those with a lower than median BMI [F (1,34) = 1.508, p = .228]. No
significant difference was observed for those with a higher than median BMI [F
(1,37) = 2.779, p = .104]. Furthermore, an independent samples t-test indicated that
there was no significant difference between the low and high BMI groups for price of
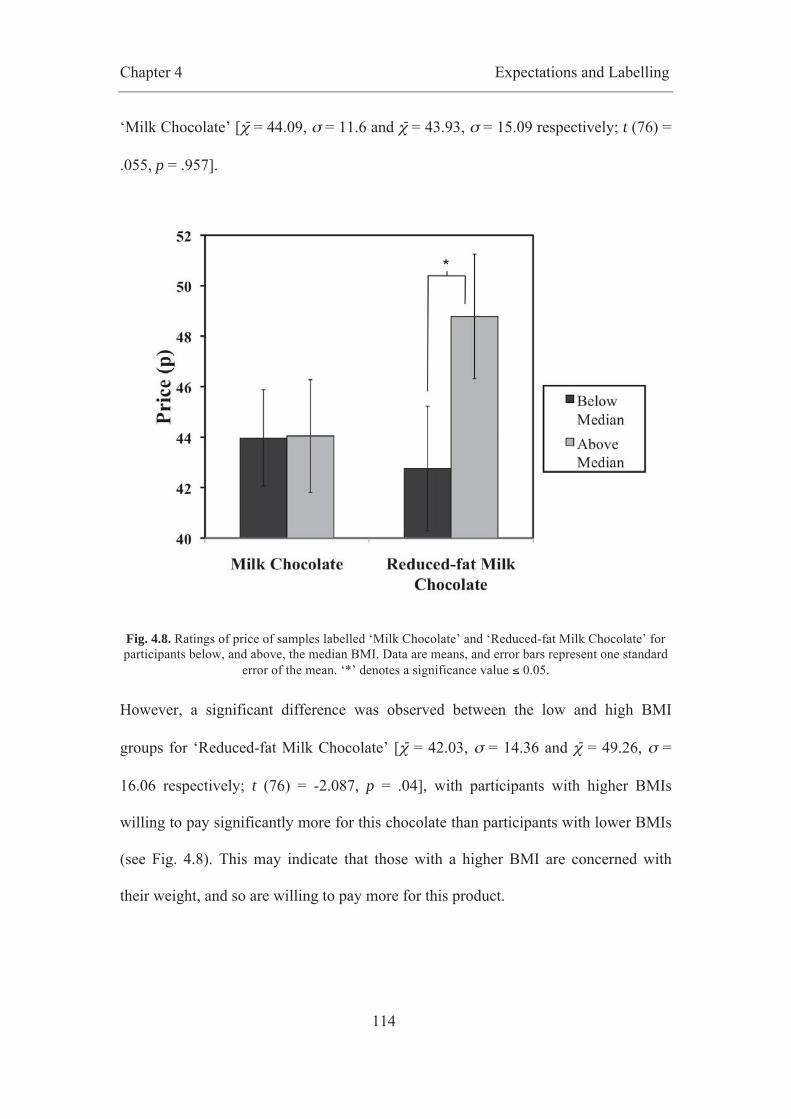
Chapter 4 Expectations and Labelling
114
‘Milk Chocolate’ [χ = 44.09, σ = 11.6 and χ = 43.93, σ = 15.09 respectively; t (76) =
.055, p = .957].
Fig. 4.8. Ratings of price of samples labelled ‘Milk Chocolate’ and ‘Reduced-fat Milk Chocolate’ for participants below, and above, the median BMI. Data are means, and error bars represent one standard
error of the mean. ‘*’ denotes a significance value ≤ 0.05.
However, a significant difference was observed between the low and high BMI
groups for ‘Reduced-fat Milk Chocolate’ [χ = 42.03, σ = 14.36 and χ = 49.26, σ =
16.06 respectively; t (76) = -2.087, p = .04], with participants with higher BMIs
willing to pay significantly more for this chocolate than participants with lower BMIs
(see Fig. 4.8). This may indicate that those with a higher BMI are concerned with
their weight, and so are willing to pay more for this product.

Chapter 4 Expectations and Labelling
115
A significant interaction was also observed for price and normal chocolate
consumption [F (1,71) = 5.961, p = .017].
Fig. 4.9. Ratings of price for chocolate samples labelled ‘Milk Chocolate’ and ‘Reduced-fat Milk Chocolate’, for frequent and occasional consumers of chocolate. Data are means, and error bars
represent one standard error of the mean.‘*’ denotes a significance value ≤ 0.05.
The two chocolate consumption groups were analysed separately, and while no
significant difference between label condition was seen for frequent consumers of
chocolate [F (1,46) = .753, p = .39], a significant difference in price was seen for
consumers who normally consume chocolate once a week or less [F (1,25) = 5.003, p
= .034]. Furthermore, an independent samples t-test indicated that while there were no
significant difference in price of ‘Milk Chocolate’ between frequent and occasional
consumers of chocolate [χ = 43.4, σ = 14.07 and χ = 45.15, σ = 12.26 respectively; t
(76) = -.544, p = .588], there was a significant difference in price between the groups
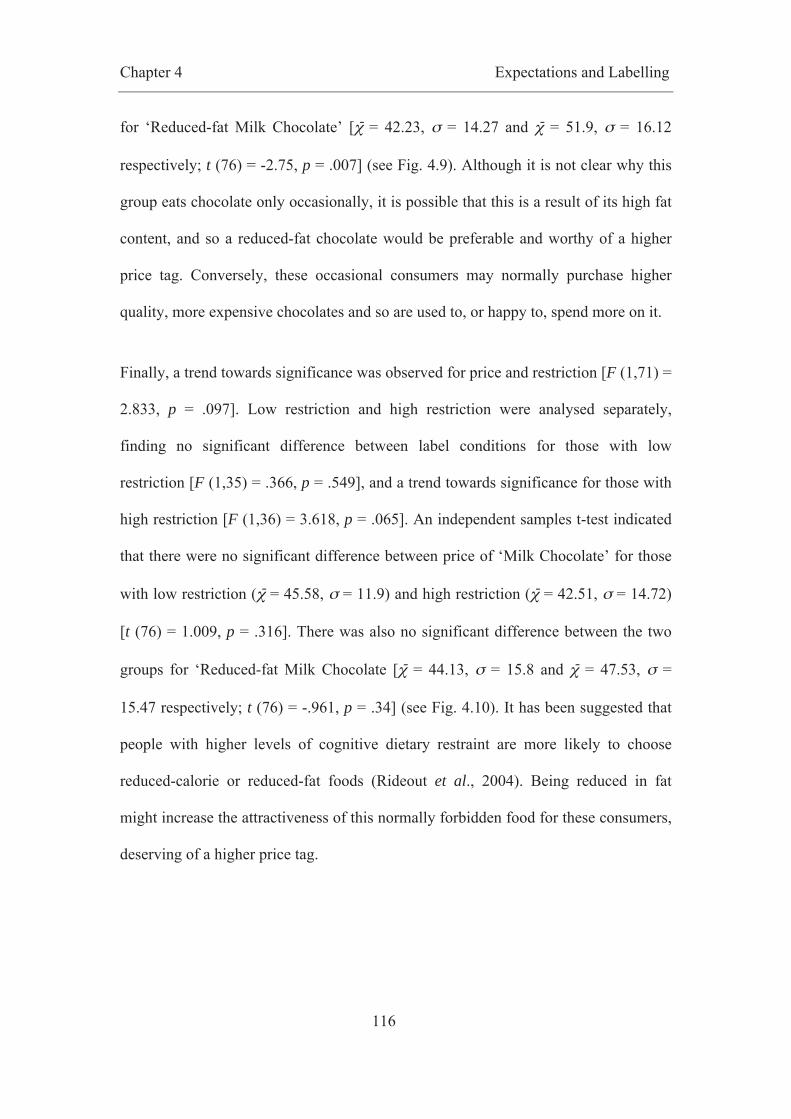
Chapter 4 Expectations and Labelling
116
for ‘Reduced-fat Milk Chocolate’ [χ = 42.23, σ = 14.27 and χ = 51.9, σ = 16.12
respectively; t (76) = -2.75, p = .007] (see Fig. 4.9). Although it is not clear why this
group eats chocolate only occasionally, it is possible that this is a result of its high fat
content, and so a reduced-fat chocolate would be preferable and worthy of a higher
price tag. Conversely, these occasional consumers may normally purchase higher
quality, more expensive chocolates and so are used to, or happy to, spend more on it.
Finally, a trend towards significance was observed for price and restriction [F (1,71) =
2.833, p = .097]. Low restriction and high restriction were analysed separately,
finding no significant difference between label conditions for those with low
restriction [F (1,35) = .366, p = .549], and a trend towards significance for those with
high restriction [F (1,36) = 3.618, p = .065]. An independent samples t-test indicated
that there were no significant difference between price of ‘Milk Chocolate’ for those
with low restriction (χ = 45.58, σ = 11.9) and high restriction (χ = 42.51, σ = 14.72)
[t (76) = 1.009, p = .316]. There was also no significant difference between the two
groups for ‘Reduced-fat Milk Chocolate [χ = 44.13, σ = 15.8 and χ = 47.53, σ =
15.47 respectively; t (76) = -.961, p = .34] (see Fig. 4.10). It has been suggested that
people with higher levels of cognitive dietary restraint are more likely to choose
reduced-calorie or reduced-fat foods (Rideout et al., 2004). Being reduced in fat
might increase the attractiveness of this normally forbidden food for these consumers,
deserving of a higher price tag.
Chapter 4 Expectations and Labelling
117
Fig. 4.10. Ratings of price of samples labelled ‘Milk Chocolate’ and ‘Reduced-fat Milk Chocolate’ for participants below, and above, the median restriction. Data are means, and error bars represent one
standard error of the mean. ‘T’ denotes a trend towards significance at a value ≤ 0.1.
4.4 Discussion
The effect that information about fat content has on expected liking, actual liking,
ratings of sensory attributes, consumption amount, purchase intent and price
perception of chocolate has been investigated. The hypotheses set up for this
investigation were presented in section 4.2. The following hypotheses were supported
by the results:
H1. The label condition had an impact on ratings of expected liking, with
‘Reduced-fat Milk Chocolate’ being rated lower than ‘Milk Chocolate’ (see
Fig. 4.1);
Chapter 4 Expectations and Labelling
118
H2. Actual liking of the ‘Reduced-fat Milk Chocolate’ was higher than
expected liking, as a result of positive-disconfirmation (see Fig. 4.1);
H3. When the chocolate is labelled ‘Milk Chocolate’ the expected and actual
hedonic ratings were similar (see Fig. 4.1);
H6. A person’s eating style and health concerns affected their ratings of the
chocolate (see Fig. 4.3, 4.4, 4.5 & 4.10);
H7. BMI had an effect on expected consumption amount (see Fig. 4.6).
However, the following hypothesis were not upheld:
H4. Sensory attributes perceived as being related to fat content in chocolate
were not rated as lower, or higher, when the chocolate was labelled as
‘Reduced-fat Milk Chocolate’ than when it was labelled ‘Milk Chocolate’ (see
Fig. 4.2);
H5. When the chocolate is labelled as reduced-fat, a higher quantity would not
be expected to be consumed.
4.4.1 Liking
In summary, an effect of labelling condition was observed for expected liking, with
lower expectations of liking for ‘Reduced-fat Milk Chocolate’, although no difference
in scores was observed for actual liking (see Fig. 4.1). Similar observations are cited
in the literature, where a reduced-fat version was expected to be less pleasant
(Kähkönen & Tuorila, 1998). It is unclear in this case whether this is due to i)
participants’ prior experience of other low-fat foods, and their associated inferior
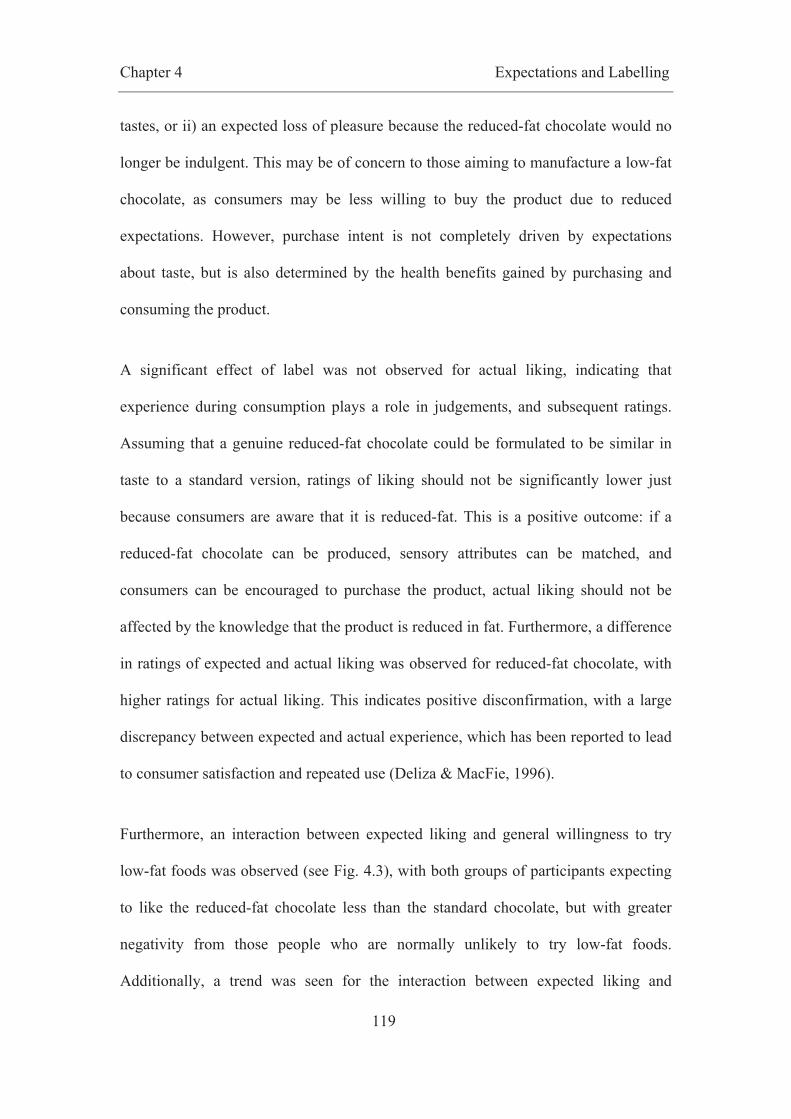
Chapter 4 Expectations and Labelling
119
tastes, or ii) an expected loss of pleasure because the reduced-fat chocolate would no
longer be indulgent. This may be of concern to those aiming to manufacture a low-fat
chocolate, as consumers may be less willing to buy the product due to reduced
expectations. However, purchase intent is not completely driven by expectations
about taste, but is also determined by the health benefits gained by purchasing and
consuming the product.
A significant effect of label was not observed for actual liking, indicating that
experience during consumption plays a role in judgements, and subsequent ratings.
Assuming that a genuine reduced-fat chocolate could be formulated to be similar in
taste to a standard version, ratings of liking should not be significantly lower just
because consumers are aware that it is reduced-fat. This is a positive outcome: if a
reduced-fat chocolate can be produced, sensory attributes can be matched, and
consumers can be encouraged to purchase the product, actual liking should not be
affected by the knowledge that the product is reduced in fat. Furthermore, a difference
in ratings of expected and actual liking was observed for reduced-fat chocolate, with
higher ratings for actual liking. This indicates positive disconfirmation, with a large
discrepancy between expected and actual experience, which has been reported to lead
to consumer satisfaction and repeated use (Deliza & MacFie, 1996).
Furthermore, an interaction between expected liking and general willingness to try
low-fat foods was observed (see Fig. 4.3), with both groups of participants expecting
to like the reduced-fat chocolate less than the standard chocolate, but with greater
negativity from those people who are normally unlikely to try low-fat foods.
Additionally, a trend was seen for the interaction between expected liking and

Chapter 4 Expectations and Labelling
120
external eating (see Fig. 4.4), with those with higher than median levels of external
eating expecting to like the ‘reduced-fat’ chocolate less than the standard chocolate,
possibly as a result of a loss of excitement and expected pleasure.
4.4.2 Sensory attributes
Sensory attributes were measured using VAS questions and JAR questions.
Significant results were not observed for any of the attributes, although a number of
trends were observed for melting rate, creaminess and smoothness (see Section 4.3.3).
Reduced-fat information has previously been found to lead to lower expected melting
rate in chocolate (Kähkönen et al., 1999), and decreased melting-rate ratings during
tasting (Kähkönen, 2000). However, the results presented here suggest an opposite
relationship, with quicker melting, not a decreased melting rate. Given the lack of
significant results for actual liking, it appears that actual experience played a greater
role than labelling condition after tasting.
4.4.3 Consumption Amount
When considering anticipated, or projected consumption, no significant differences
were observed for normal consumption, or for unrestricted consumption (see Section
4.3.5). A concern for the production of a reduced-fat chocolate has been the
knowledge that the product is reduced in fat may result in increased energy intake,
both in terms of the product itself, and also during subsequent meals (Shide & Rolls,
1995). This result suggests that, in general, energy intake would not differ, and the
reduced-fat chocolate would not be eaten to excess, which is a positive result for

Chapter 4 Expectations and Labelling
121
obesity prevention and reduction. However, this result may result from a limitation of
the method used in this work. Participants were asked to self-report envisaged
consumption of the two chocolates, both during a normal occasion, and if they were
not going to restrict their behaviour. It is questionable whether this method is
predictive of actual behaviour. Not only does it require self-reporting (where
observation would be preferable), but it is also a prediction of future behaviour
(online measurements may be more accurate). It would be interesting to explore ad
libitum consumption to determine whether the findings presented here are accurate, to
determine whether a reduced-fat chocolate would be an effective means of reducing
energy intake.
Despite these overall consumption findings, some interactions were observed between
consumption amount and participant characteristics. A significant interaction was
observed for normal consumption and scores of ambivalence (see Fig. 4.5), with
participants with higher levels of ambivalence predicting that they would consume
significantly more reduced-fat chocolate during a normal sitting than they would
consume a standard chocolate. This is consistent with the idea that ambivalence is
associated with conflict between the sensory appeal of sweet, fatty foods and concern
of health and body image (Cartwright & Stritzke, 2008); people with high levels of
ambivalence should experience less conflict with reduced-fat products, and thus allow
themselves to consume greater quantities.
A significant interaction between unrestricted consumption and BMI was observed
(see Fig. 4.6). It appeared that whilst those with a lower than median BMI believed
they would consume less ‘Reduced-fat Milk Chocolate’ than ‘Milk Chocolate’, those
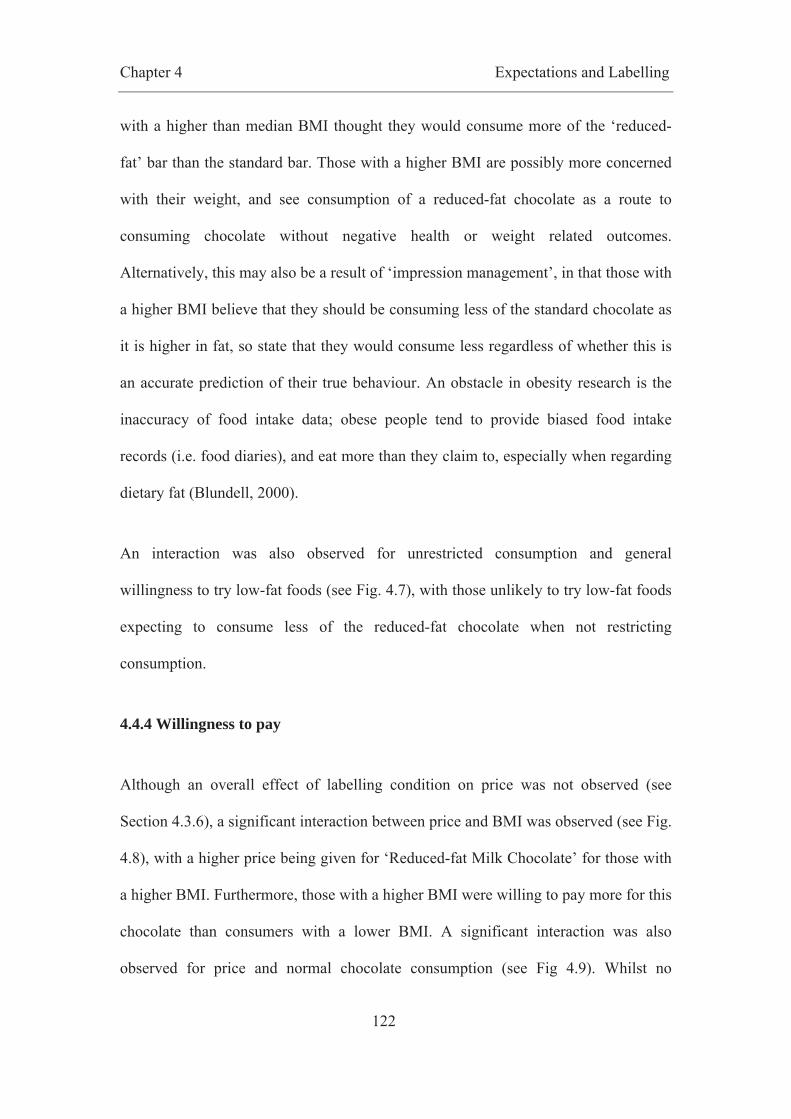
Chapter 4 Expectations and Labelling
122
with a higher than median BMI thought they would consume more of the ‘reduced-
fat’ bar than the standard bar. Those with a higher BMI are possibly more concerned
with their weight, and see consumption of a reduced-fat chocolate as a route to
consuming chocolate without negative health or weight related outcomes.
Alternatively, this may also be a result of ‘impression management’, in that those with
a higher BMI believe that they should be consuming less of the standard chocolate as
it is higher in fat, so state that they would consume less regardless of whether this is
an accurate prediction of their true behaviour. An obstacle in obesity research is the
inaccuracy of food intake data; obese people tend to provide biased food intake
records (i.e. food diaries), and eat more than they claim to, especially when regarding
dietary fat (Blundell, 2000).
An interaction was also observed for unrestricted consumption and general
willingness to try low-fat foods (see Fig. 4.7), with those unlikely to try low-fat foods
expecting to consume less of the reduced-fat chocolate when not restricting
consumption.
4.4.4 Willingness to pay
Although an overall effect of labelling condition on price was not observed (see
Section 4.3.6), a significant interaction between price and BMI was observed (see Fig.
4.8), with a higher price being given for ‘Reduced-fat Milk Chocolate’ for those with
a higher BMI. Furthermore, those with a higher BMI were willing to pay more for this
chocolate than consumers with a lower BMI. A significant interaction was also
observed for price and normal chocolate consumption (see Fig 4.9). Whilst no

Chapter 4 Expectations and Labelling
123
difference between labelling condition was seen for frequent consumers of chocolate,
a difference was seen for consumers who consume chocolate once a week or less.
This group would spend more on the ‘Reduced-fat Milk Chocolate’ than the standard
chocolate. Finally, a trend towards significance was observed for price and restriction
(see Fig. 4.10), with those with high restriction being willing to spend more on the
‘reduced-fat’ chocolate than on the standard chocolate.
4.4.5 Additional Individual Differences
Surprisingly, no effect of gender was observed. It was expected that gender would
have an impact on liking, as women report liking or craving chocolate more than men
(Rozin et al., 1991), and consume more energy-reduced and fat-reduced products than
men do (Fagerli & Wandel, 1999). Women are likely to be more open to consuming a
reduced-fat chocolate, and are perhaps more likely to be calorie conscious (Kiefer et
al., 2005). It was also expected that age may have an effect upon liking, as not only
do reports of cravings for sweet foods decline with age (Pelchat, 1997), but snack-
related comfort foods made older people feel less unhealthy than they made younger
people feel (Wansink et al., 2003). Finally, no effect of emotional eating score was
observed. Emotional eating has also been related to a higher consumption of sweet
foods in both men and women (Konttinen et al., 2010).
4.5 Conclusions and Future Work
In summary, this study provides evidence that labelling a chocolate as ‘reduced-fat’
affects expected liking, but has little effect on actual liking or ratings of sensory
attributes. Furthermore, individual differences (such as BMI, external eating,

Chapter 4 Expectations and Labelling
124
restriction, ambivalence, and opinions toward low-fat foods) are important
determinants of expectations and eating attitudes. This information can provide
insight into the mechanisms by which information can be communicated to
consumers (and specific cohorts of consumers) for successful marketing of reduced-
fat milk chocolate.
Future work should consider other labelling options, such as more realistic chocolate
packaging concepts that maximise liking (this will be discussed in Chapter 5).
Furthermore, the effect of labelling condition on actual consumption of the
chocolates, and on consumption during subsequent meals should be considered, to
determine whether ad libitum consumption amount results from expectations about
the foods energy density (feeling of fullness, or feelings of guilt), or the post-ingestive
experience (for example, the energy absorbed by the body following consumption).
Once a reduced-fat chocolate has been produced it would be interesting to consider
the interaction between labelling condition and energy density or sensory acceptance
on liking and consumption.

Chapter 5 Packaging
125
5. Exploring packaging of reduced-fat chocolate
5.1 Introduction
The aim of the work presented in this chapter was to gain a better understanding of
current chocolate packaging, and determine aspects of packaging that highlight how
healthy, or unhealthy, the bar is. Furthermore, the intention was to explore approaches
to packaging a reduced-fat chocolate bar, and to consider differences in opinion
between male and female consumers. This was achieved using a) two focus groups b)
a rank-rating task. Focus groups were conducted to explore chocolate packaging and
generate ideas for the packaging of a reduced-fat chocolate bar. The rank-rating task
was then used to measure the relative importance of each of the attributes recognised
during the focus groups on expected liking, to discover the ideal packaging
combination.
Information presented on packaging is critical for the success of the product.
Packaging protects contents from contamination and spoilage, makes it easier to
transport and store goods, and provides a uniform measure of contents (Robertson,
2005). Packaging is also used to communicate information to the consumer, and
enable the consumer to recognise the product amongst similar products (Robertson,
2005). The majority of purchasing decisions are made at the point of sale (Ampuero
& Vila, 2006), so packaging should create differentiation and identity, serving as a
“vehicle for promotion” (McDaniel & Baker, 1977). Thus, consumers are exposed to
packages in the same way that they are exposed to advertisements. Product packaging
also plays an important role in consumer product perception and acceptance, for

Chapter 5 Packaging
126
example, background colour and information had a significant effect on all rated
attributes and upon expected liking (Deliza, MacFie & Hedderley, 2003).
A combination of both qualitative and quantitative methods has been used by other
researchers (Raz et al., 2008), who used focus groups and conjoint analysis to create
innovative food products through sensory marketing. Similar methods have been
utilised in this work. Group discussion was used to explore current successful
packaging options and generate package ideas for a reduced-fat chocolate.
Information gained during the focus groups was used to determine the attributes, and
levels of these attributes, for investigation during the rank-rating task. Individual
differences, specifically gender related, were also considered. Studying individual
differences may help identify a possible target market. It is likely that differences in
opinions will be observed as not only do women report liking and craving chocolate
more than men (Rozin et al., 1991), but they are more positive towards low-fat foods
(Solheim & Lawless, 1996), consume more energy-reduced and fat-reduced products
(Fagerli & Wandel, 1999), and are more likely to be calorie conscious (Kiefer et al.,
2005). This may affect perception towards a reduced-fat chocolate, and preference
towards packaging type, and packaging information. Thus, prior to running the focus
groups two hypotheses were made:
H1. Packaging attributes will differentially influence perceptions of
healthiness;
H2. Differences in packaging preferences will be observed for male and
female participants.

Chapter 5 Packaging
127
This study was also exploratory in that it sought to identify ways in which packaging
can promote a ‘healthy indulgent’ message for a chocolate bar, with the aim of
increasing acceptance.
Specific details of the experimental design and methods used can be found in Chapter
2.
5.2 Focus Groups
5.2.1 Results
5.2.1.1 Female Focus Group
During the female focus groups the participants were given a selection of 24
photographs of chocolate bars (see Appendix 14). When asked to separate the bars
according to healthiness, the female group indicated a number of important factors.
When asked to explain why bars were placed in the ‘unhealthy’ pile, reasons included
the name, bright, dark colours, the size of the bar (i.e. square bars rather than long,
thin bars), the font and photographic image on the packaging:
“…the names are different… there are two [in the unhealthy pile]
with ‘max’ on them or ‘chunky’, compared to ‘twirl’ and ‘ripple’ [in
the healthy pile] which sounds a bit less fatty… It makes them sound
bigger, or more substantial.”
“I think the more unhealthy ones are square and chunky, whereas
the healthier ones are long and thin.”
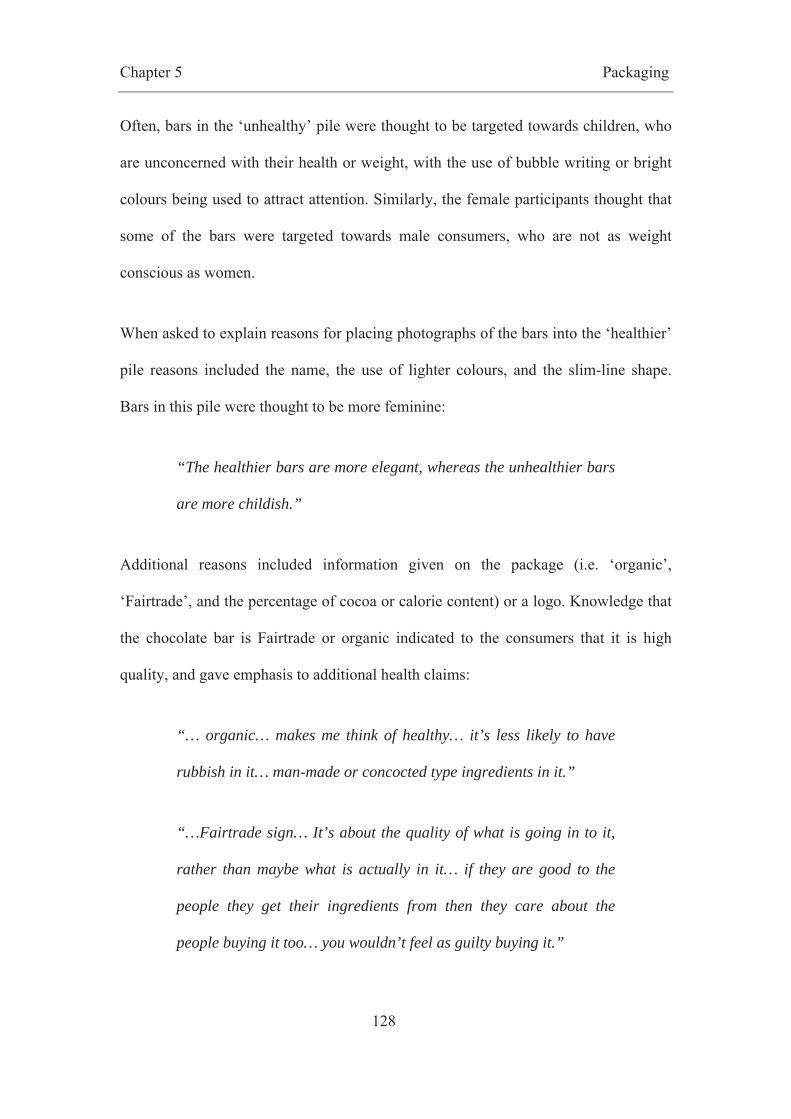
Chapter 5 Packaging
128
Often, bars in the ‘unhealthy’ pile were thought to be targeted towards children, who
are unconcerned with their health or weight, with the use of bubble writing or bright
colours being used to attract attention. Similarly, the female participants thought that
some of the bars were targeted towards male consumers, who are not as weight
conscious as women.
When asked to explain reasons for placing photographs of the bars into the ‘healthier’
pile reasons included the name, the use of lighter colours, and the slim-line shape.
Bars in this pile were thought to be more feminine:
“The healthier bars are more elegant, whereas the unhealthier bars
are more childish.”
Additional reasons included information given on the package (i.e. ‘organic’,
‘Fairtrade’, and the percentage of cocoa or calorie content) or a logo. Knowledge that
the chocolate bar is Fairtrade or organic indicated to the consumers that it is high
quality, and gave emphasis to additional health claims:
“… organic… makes me think of healthy… it’s less likely to have
rubbish in it… man-made or concocted type ingredients in it.”
“…Fairtrade sign… It’s about the quality of what is going in to it,
rather than maybe what is actually in it… if they are good to the
people they get their ingredients from then they care about the
people buying it too… you wouldn’t feel as guilty buying it.”
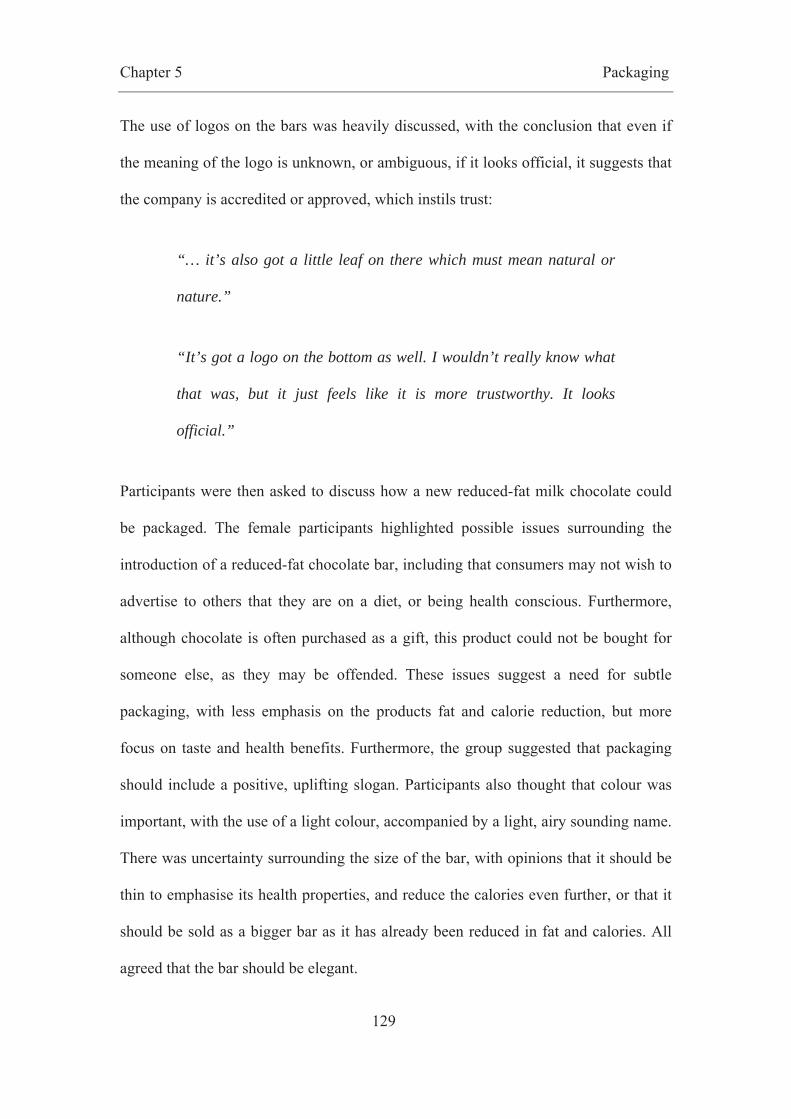
Chapter 5 Packaging
129
The use of logos on the bars was heavily discussed, with the conclusion that even if
the meaning of the logo is unknown, or ambiguous, if it looks official, it suggests that
the company is accredited or approved, which instils trust:
“… it’s also got a little leaf on there which must mean natural or
nature.”
“It’s got a logo on the bottom as well. I wouldn’t really know what
that was, but it just feels like it is more trustworthy. It looks
official.”
Participants were then asked to discuss how a new reduced-fat milk chocolate could
be packaged. The female participants highlighted possible issues surrounding the
introduction of a reduced-fat chocolate bar, including that consumers may not wish to
advertise to others that they are on a diet, or being health conscious. Furthermore,
although chocolate is often purchased as a gift, this product could not be bought for
someone else, as they may be offended. These issues suggest a need for subtle
packaging, with less emphasis on the products fat and calorie reduction, but more
focus on taste and health benefits. Furthermore, the group suggested that packaging
should include a positive, uplifting slogan. Participants also thought that colour was
important, with the use of a light colour, accompanied by a light, airy sounding name.
There was uncertainty surrounding the size of the bar, with opinions that it should be
thin to emphasise its health properties, and reduce the calories even further, or that it
should be sold as a bigger bar as it has already been reduced in fat and calories. All
agreed that the bar should be elegant.
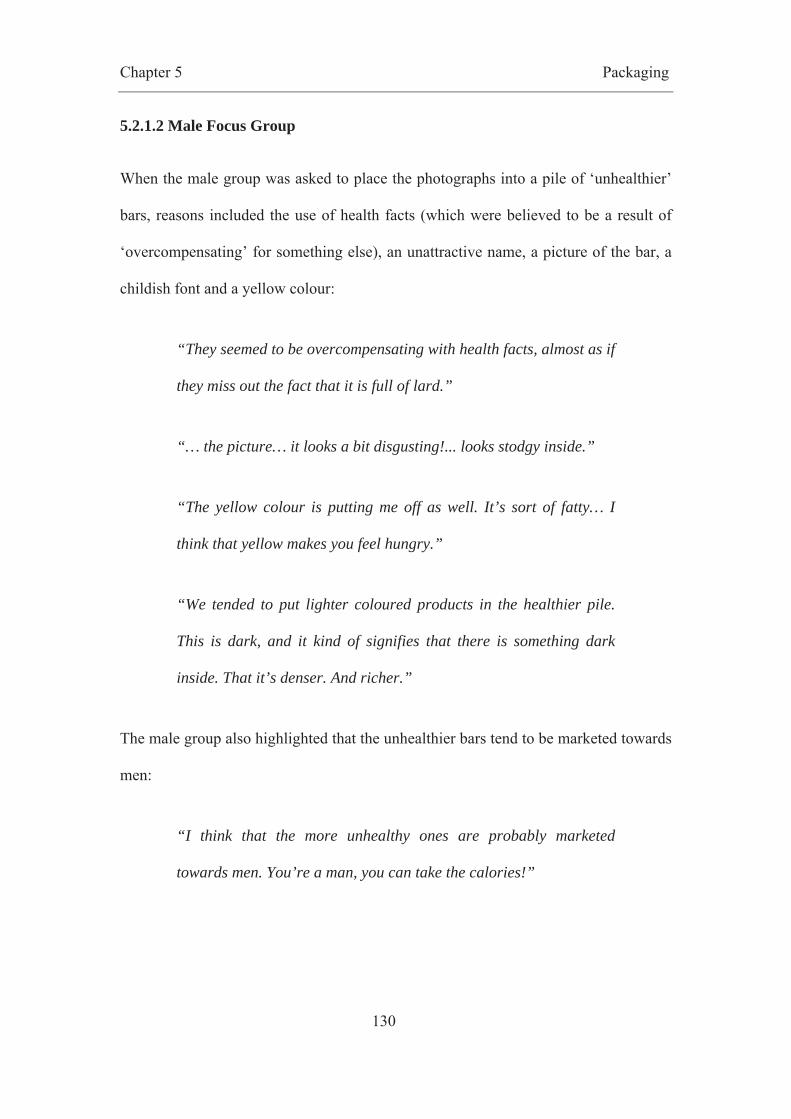
Chapter 5 Packaging
130
5.2.1.2 Male Focus Group
When the male group was asked to place the photographs into a pile of ‘unhealthier’
bars, reasons included the use of health facts (which were believed to be a result of
‘overcompensating’ for something else), an unattractive name, a picture of the bar, a
childish font and a yellow colour:
“They seemed to be overcompensating with health facts, almost as if
they miss out the fact that it is full of lard.”
“… the picture… it looks a bit disgusting!... looks stodgy inside.”
“The yellow colour is putting me off as well. It’s sort of fatty… I
think that yellow makes you feel hungry.”
“We tended to put lighter coloured products in the healthier pile.
This is dark, and it kind of signifies that there is something dark
inside. That it’s denser. And richer.”
The male group also highlighted that the unhealthier bars tend to be marketed towards
men:
“I think that the more unhealthy ones are probably marketed
towards men. You’re a man, you can take the calories!”
Chapter 5 Packaging
131
Reasons for placing bars in the ‘healthier’ pile included the use of logos or association
with Fairtrade or being organic, which emphasised the health claims by indicating
quality:
“The little green symbol on the side. Whatever it says it is still a
little green symbol… it’s nice.”
“The gold leaf in the corner is like a seal of approval, or a
standard… I think that the writing looks quite refined to me… it’s
sophisticated, and fits in with the gold leaf.”
“I like the tick. This is a chocolate bar that is good for me. I
associate the tick with active lifestyle.”
This group also thought that paper packaging indicated that the company is concerned
with the environment, and so in turn concerned about the welfare and health of its
consumers:
“If the packaging is made out of paper it is better for the
environment and better for you. It is made for healthier people.”
When asked to indicate possible packaging options for a reduced-fat chocolate, the
male group thought that colour was important (and suggested light colours, such as
lilac), as was size, with a bigger bar being preferential. The use of a logo was stressed,
with suggestions of a tick, a chocolate heart, or a green symbol, all of which were
thought to increase the persuasiveness of the health message. This group questioned
Chapter 5 Packaging
132
whether the reduced-fat information should be used, or emphasised, on the packaging.
The male group believed that a reduced-fat chocolate bar would be for women, so
suggested that the packaging should be feminine. A possible limitation exists for the
introduction of a reduced-fat bar as men believe that this type of product is for
women, who are more concerned with their weight. They feel they would risk
embarrassment buying a woman’s chocolate bar, as they are not supposed to care
about their weight or health.
5.2.2 Overall Conclusions
To conclude, it was clear that packaging attributes influenced perceptions of
healthiness (H1 was upheld). The focus groups highlighted which aspects of the
chocolate bar packaging indicate that the bar is more healthy or unhealthy,
irrespective of previous knowledge of the bar. Furthermore, although many ideas
were similar between the gender groups, both men and women believed that a
reduced-fat bar would be aimed towards women, which may restrict its potential
success. Thus, as hypothesised, differences in opinions were observed (H2 was
supported).
5.3 Rank – Rating Task
5.3.1 Packaging Concepts
Information gained from both the focus groups was used to produce 16 packaging
concepts. A number of important factors were recognised during discussion sessions,
resulting in four components being selected: colour; size / shape; slogan; logo.
Chapter 5 Packaging
133
5.3.1.1 Colour
Two colours were selected; the manipulations chosen were light blue and caramel.
Blue was observed as a colour used for healthier bars, whilst yellows and caramels
were seen as an indication of unhealthier, fattier bars. These are labelled ‘B’ (blue)
and ‘C’ (caramel) throughout the chapter.
5.3.1.2 Size / shape
It was observed that the size and the shape of the bars was an indicator of healthiness.
Participants were divided in opinion when discussing the size of a reduced-fat
chocolate bar. Some would prefer a long, thin bar as it further emphasises the
healthiness, whilst others thought a wider, chunky bar would be preferential as the bar
is already reduced in calories, allowing for a greater quantity to be consumed. Thus,
two manipulations were chosen: a long, thin bar and a wider, chunky bar. These are
labelled ‘L’ (long) and ‘S’ (square) throughout the chapter.
5.3.1.3 Slogan
Two slogans were selected to reflect both a taste-oriented message (“same smooth
and creamy taste”) and a pleasure-oriented tagline (“enjoy a guiltless pleasure”).
Both the focus on taste, and a positive uplifting message were thought to be
important; these slogans were thought to address this observation. They are labelled
‘T’ (taste oriented) and ‘P’ (pleasure oriented) throughout the chapter.

Chapter 5 Packaging
134
5.3.1.4 Logo
Logos were thought to increase the persuasiveness of health messages, so two were
selected: a heart was chosen to represent ‘heart-healthiness’ (as a result of reduction
in fat), as well as love of the product, whilst the tick was used to indicate healthiness,
related to an active lifestyle, and making the ‘right’ choice. These are labelled ‘H’
(heart) and ‘T’ (tick) throughout the chapter.
Each of the four components had two levels, resulting in sixteen combinations. The
sixteen packages, with details of the corresponding features, and codes used
throughout the chapter, can be found in Appendix 19.
The bars were created using Adobe Photoshop CS4, where two stock images (taken
from photographs of existing chocolate bars on the market), of the correct size and
shape, were used as templates. All identifiable information was removed, and the new
information added. Elegant fonts (Perpetua Titling, Lucinda Calligraphy and Zapfino)
in gold lettering were selected, as was a light sounding name: ‘Delight’. Each of the
bars was given a random 3-digit code. The images were printed on a photographic
paper using a commercial photographic printer. All were 5 x 7 inches in size. Two
examples of the images used in the study are shown in Figure 5.1.
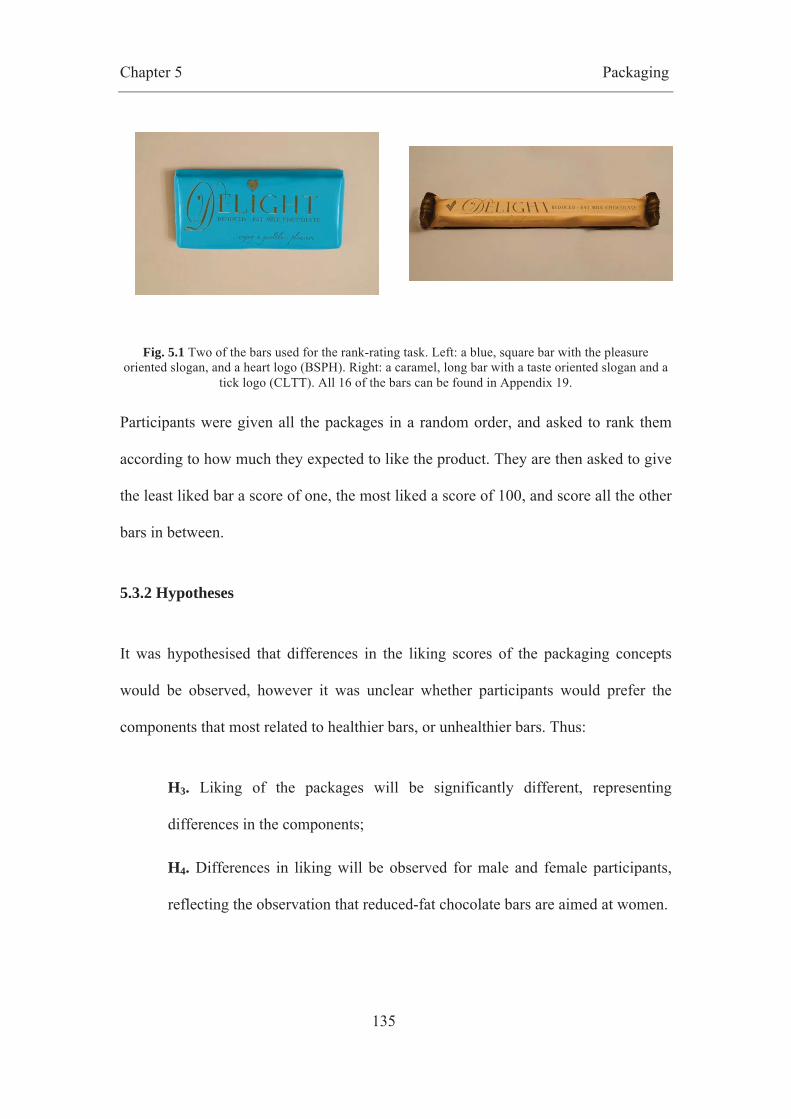
Chapter 5 Packaging
135
Fig. 5.1 Two of the bars used for the rank-rating task. Left: a blue, square bar with the pleasure oriented slogan, and a heart logo (BSPH). Right: a caramel, long bar with a taste oriented slogan and a
tick logo (CLTT). All 16 of the bars can be found in Appendix 19.
Participants were given all the packages in a random order, and asked to rank them
according to how much they expected to like the product. They are then asked to give
the least liked bar a score of one, the most liked a score of 100, and score all the other
bars in between.
5.3.2 Hypotheses
It was hypothesised that differences in the liking scores of the packaging concepts
would be observed, however it was unclear whether participants would prefer the
components that most related to healthier bars, or unhealthier bars. Thus:
H3. Liking of the packages will be significantly different, representing
differences in the components;
H4. Differences in liking will be observed for male and female participants,
reflecting the observation that reduced-fat chocolate bars are aimed at women.
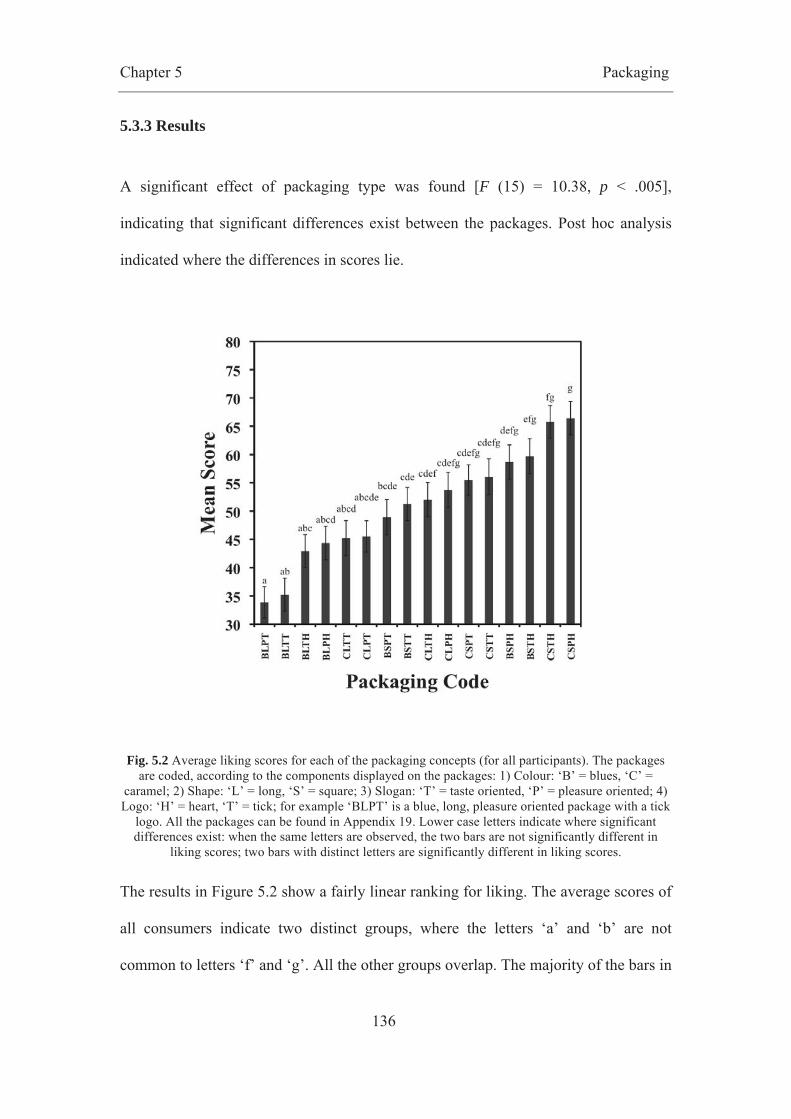
Chapter 5 Packaging
136
5.3.3 Results
A significant effect of packaging type was found [F (15) = 10.38, p < .005],
indicating that significant differences exist between the packages. Post hoc analysis
indicated where the differences in scores lie.
Fig. 5.2 Average liking scores for each of the packaging concepts (for all participants). The packages are coded, according to the components displayed on the packages: 1) Colour: ‘B’ = blues, ‘C’ =
caramel; 2) Shape: ‘L’ = long, ‘S’ = square; 3) Slogan: ‘T’ = taste oriented, ‘P’ = pleasure oriented; 4) Logo: ‘H’ = heart, ‘T’ = tick; for example ‘BLPT’ is a blue, long, pleasure oriented package with a tick
logo. All the packages can be found in Appendix 19. Lower case letters indicate where significant differences exist: when the same letters are observed, the two bars are not significantly different in
liking scores; two bars with distinct letters are significantly different in liking scores.
The results in Figure 5.2 show a fairly linear ranking for liking. The average scores of
all consumers indicate two distinct groups, where the letters ‘a’ and ‘b’ are not
common to letters ‘f’ and ‘g’. All the other groups overlap. The majority of the bars in

Chapter 5 Packaging
137
groups ‘a’ and ‘b’ are blue, long and contain the tick logo; these have the lowest
scores of expected liking. The majority of the bars in groups ‘f’ and ‘g’ are caramel in
colour, square and contain the heart logo. These bars have the highest expected liking
scores.
ANOVAs were also conducted to compare scores for females and males separately.
Significant effects were found for both females [F (15) = 10.214, p < .005], and males
[F (15) = 3.476, p < .005]. Very similar patterns of liking were seen for male and
female consumers. Post hoc analyses indicated where differences in liking scores lie;
Table 5.1 and 5.2 show liking scores for each of the bars, and indicate which scores
were significantly different.
Table 5.1 Mean rating scores for each of the packages for female consumers. All the packages can be found in Appendix 19. Lower case letters indicate where significant differences exist: when the same letters are observed, the two bars are not significantly different in liking scores; two bars with distinct
letters are significantly different in liking scores.
BLTT BLPT CLTT CLPT BLTH BLPH BSTT BSPT
32a 33.42a 40.28ab 41.8ab 46.92ab 48.65ab 50.68abc 50.93abc
CSTT CLTH CSPT CLPH BSTH BSPH CSTH CSPH
51.47abc 54.85bcd 55.13bcd 55.42bcd 68.62cd 70.20cd 72.07d 72.93d
Table 5.2 Mean rating scores for each of the packages for male consumers. All the packages can be found in Appendix 19. Lower case letters indicate where significant differences exist: when the same letters are observed, the two bars are not significantly different in liking scores; two bars with distinct
letters are significantly different in liking scores.
BLPT BLTT BLTH BLPH BSPT BSPH CLTH CLPT
34.33a 38.47ab 38.98abc 40.07abcd 46.95abcd 47.18abcd 49.18abcd 49.25abcd
CLTT BSTH BSTT CLPH CSPT CSTH CSPH CSTT
50.18abcd 50.77abcd 51.78abcd 52.05abcd 55.85bcd 59.48cd 59.9d 60.68d

Chapter 5 Packaging
138
The mean ratings for each of the components used on the packaging (see Table 5.3)
were used to calculate part worths for all consumers, and separated results for male
and female consumers (see Fig. 5.3). The part worth calculation (see Section 2.6.2.3
for the equation) is used to determine the relative importance of each of the attributes,
along with combined effects, in order to determine the optimum combination of
attributes for the highest expected liking score.
Table 5.3 Mean rating scores for each of the factors, for all consumers, females and males.
Attribute Level All Consumers Female Male Colour Blue 46.87 50.18 43.57
Caramel 55.04 55.49 54.57 Shape Long 44.12 44.17 44.06
Square 57.79 61.50 54.07 Slogan Pleasure 50.88 53.56 48.20
Taste 51.07 52.11 49.94 Logo Heart 55.46 61.21 49.70
Tick 46.45 44.46 48.44
The component with the largest part worth for all consumers was the size and shape
of the bar, where the square bar was preferred. Furthermore, this effect was stronger
for female consumers. An effect was also seen for colour, where caramel was liked
more than blue. Here the effect was stronger for male consumers. An effect was seen
for logo, with consumers preferring the heart to the tick. However, here men and
women differed drastically. Whilst male consumers showed only a small preference
for the heart, for women the effect was far greater. Finally, for the slogan, no overall
effect was observed, and analysed separately, again only a small effect was seen,
although women preferred the pleasure oriented slogan, and men preferred the taste
oriented tagline. Male participants showed less of a preference than female consumers
for all of the attributes, except for colour.

Chapter 5 Packaging
139
Calculating part worths highlighted the ideal packaging combination, with the highest
score for expected liking (and the maximum utility), which was a caramel, square bar
with a heart logo, with either of the slogans (as no apparent preference was observed).
This ideal packaging combination was the same for male and for female consumers.
Fig. 5.3 Calculated part worths for each of the components (see Section 2.6.2.3 for the part worth equation).
Participants were also asked to explain their reasons for their choice of favourite, and
least favourite bars. For females, some thought that the pleasure-oriented slogan was
not correct, as the product was reduced-fat and not fat-free, so it is not a “guiltless
pleasure”. It was thought that the taste-oriented slogan was preferential as it gave
reassurance that the product will taste the same as regular chocolate. Some thought
that the long bar was not appealing as it suggested a smaller volume of chocolate,
which combined with a low fat content implies a controlled portion size. The caramel

Chapter 5 Packaging
140
colour was thought to be more warm, expensive, and luxurious, whilst the blue was
thought to be garish, too bold and ‘trying too hard’ to grab one’s attention. The heart
was thought to be soft and welcoming, and better on the eye, along with indicating
that one would love the taste, and enjoy it. Although some thought that the tick
indicated that this was the right choice to make, others thought that it implied a
healthy option rather than a treat, and was not as subtle as the heart.
Male participants thought that the caramel indicated that the bar was expensive,
having a deluxe look. Conversely, the blue was not thought to be a colour associated
with chocolate, and was thought to be unappetising, cold, clinical and cheap. Many of
the males thought that the heart was childish, twee and too feminine. Although some
thought that the tick was less feminine, others thought it was patronising.
5.3.4 Conclusions
To conclude, 16 packaging concepts were produced, consisting of four components:
colour, size/shape, slogan and logo. These packages were assessed according to
expected liking, with significant differences in scores being observed (supporting H3);
caramel, square bars, with a heart logo had the highest liking scores. Similar patterns
of liking were observed for male and female consumers, and the ideal packaging
combination was the same for both males and females (H4 was not upheld). However,
male participants showed less of a preference than females for all the attributes,
expect for colour.

Chapter 5 Packaging
141
5.4 Discussion
The objective of the work presented in this chapter was to explore possible styles of
packaging a reduced-fat chocolate bar for maximised liking. The focus groups
highlighted important cues that exist on current chocolate packaging that may suggest
that the product is healthier or unhealthier. Furthermore, the discussion sessions
encouraged idea generation surrounding the packaging of a reduced-fat chocolate bar.
This resulted in four important components being recognised (colour, size / shape,
slogan and logo), each with four manipulations (caramel or blue, long or square,
pleasure or taste oriented, and heart or tick, respectively), to result in sixteen
packaging concepts, which were assessed during the rank-rating task according to
expected liking. The results indicated significant differences between the packaging
concepts; the ideal packaging combination was a caramel, square bar, with the heart
logo, and either of the slogans (although the taste-oriented slogan was described as
preferential by some participants).
Both the male and female focus groups recognised colour as an important determinant
of healthiness, suggesting a light colour, such as blue or lilac, for a reduced-fat bar.
However, during the rank-rating task all participants showed a preference for caramel
over blue bars. This contradiction in responses between the focus group and rank-
rating data may be as a result of explicit versus implicit processing systems. Sanfey,
Loewenstein, McClure and Cohen (2006) suggest that behaviour can be interpreted as
choosing alternatives with the goal of maximising utility, and whilst operations
involved in controlled processes are often accessible to introspective, explicit
description, those involved in automatic processes are much less so. It is likely that

Chapter 5 Packaging
142
during the rank-rating task implicit instincts were relied upon (Raz et al., 2008).
However, findings from the rank-rating task should be given primacy, as it is what
consumers do, and how they behave in the marketplace, that is important.
Colour has been recognised as important in food consumption, affecting the ability to
recognise flavour (Blackwell, 1995; Lavin & Lawless, 1998; Morrot et al., 2001;
Zampini et al., 2008), and an important feature in food choice (Marshall, Stuart &
Bell, 2006). It has also been found that both colour and shape affect expected liking
and willingness to purchase milk desserts (Ares & Deliza, 2010), where colour was
particularly related to flavour, whereas shape was more related to texture
characteristics. Smets and Overbeeke (1995) found that people are able to match
packaging with desserts using both form and colour information. Shankar, Levitan,
Prescott and Spence (2009) investigated whether colour and label information
affected ratings of intensity of chocolate flavour and likability of candy shell coated
chocolate, where the exterior colour of the candies is independent of the flavour of the
chocolate interior. Authors found that brown candies were rated as significantly more
chocolatey than green candies. Thus, the preference seen in this study may reflect the
appropriateness of the colour caramel for indicating the taste of the chocolate bar. It
has also been found that expensive, elegant and refined products directed at the upper
classes require cold, dark coloured packaging, whilst products directed at price
sensitive consumers require light coloured packaging (Ampuero & Vila, 2006). This
could also explain the lower scores of expected liking for the blue bars. As other
information presented on the packaging may have suggested an elegant product (i.e.
the font and gold lettering), consumers may have felt that the light blue colour
Chapter 5 Packaging
143
contradicted this image. Both groups expressed that caramel indicated a deluxe,
warm, luxurious expensive product, whilst the blue looked clinical and cheap.
Discussion within the groups indicated that the size and shape of the bar is important,
although participants disagreed on the ‘perfect’ size and shape. The results of the
rank-rating task indicated that the size and shape of the bars played a significant role
in expected liking for females. The square bars were preferred, possibly as the bar is
already reduced in fat and calories one can ‘afford’ to eat more, and so it should be
sold as a larger, or apparently larger, bar.
The results of the rank-rating task did not indicate a preference for a taste oriented or
a pleasure oriented slogan. The findings from the focus groups would suggest a
preference for the taste-oriented slogan, as it does not highlight the product as a diet
or health product. However, it may be argued that the “enjoy a guiltless pleasure” also
does not heavily suggest that the product is for dieters, and is instead an uplifting
tagline.
Although the female group discussed the use of logos on the packaging of the
‘healthier’ bars, they did not express an opinion when asked to discuss the packaging
of a reduced-fat bar. However, they expressed a significant preference for bars
containing a heart over a tick during the rank-rating. They did stress that the bars
should be elegant, and may believe that this logo was more elegant. Furthermore, the
heart logo may be more feminine, and so favourable for this group. The male group
did not show a preference for either of the logos. Although the use of a logo was
thought to be very important as it both emphasised any health claims, and indicated

Chapter 5 Packaging
144
quality, the type of logo, or in fact the meaning behind the logo, were not thought to
be important.
Many ideas expressed during the focus groups were similar between the gender
groups, and scores for the rank-rating task were comparable. However, both men and
women believed that a reduced-fat bar would be aimed towards women, who are
more weight and health conscious. Furthermore, men felt they would risk
embarrassment buying a woman’s chocolate bar, which may restrict the potential
success of this type of product. This suggests that the female market should be
targeted for this product, or further work should focus on exploring packaging options
in order to more successfully market to men.
Future work should consider additional factors, as liking is not likely to be limited to
the four factors addressed here. Real packaging includes other information, such as
branding, which is likely to influence liking. Furthermore, other measures such as
purchase intent and price propensity could be considered in order to more accurately
determine behaviour in the market place. Finally, in order to more clearly define a
possible target market other individual differences such as age, dieting status, levels
of restricted eating and ambivalence should be considered, in order to further direct
marketing efforts.
5.5 Conclusions
In conclusion, several important attributes, and levels of these attributes were
identified during the focus groups, resulting in sixteen packaging concepts being
produced. Conjoint analysis was used in order to discover the relative importance of
Chapter 5 Packaging
145
each attribute, and to calculate the optimum packaging concept. Overall, consumers
exhibit relatively consistent responses to the type of packaging required for a reduced-
fat chocolate to succeed in the marketplace. Although large differences in scores did
not exist between male and female consumers, there were gender differences relating
to attitudes towards energy and fat reduced products. Overall, these data suggest that
specific marketing approaches will aid the successful introduction of a reduced-fat
chocolate into the market.
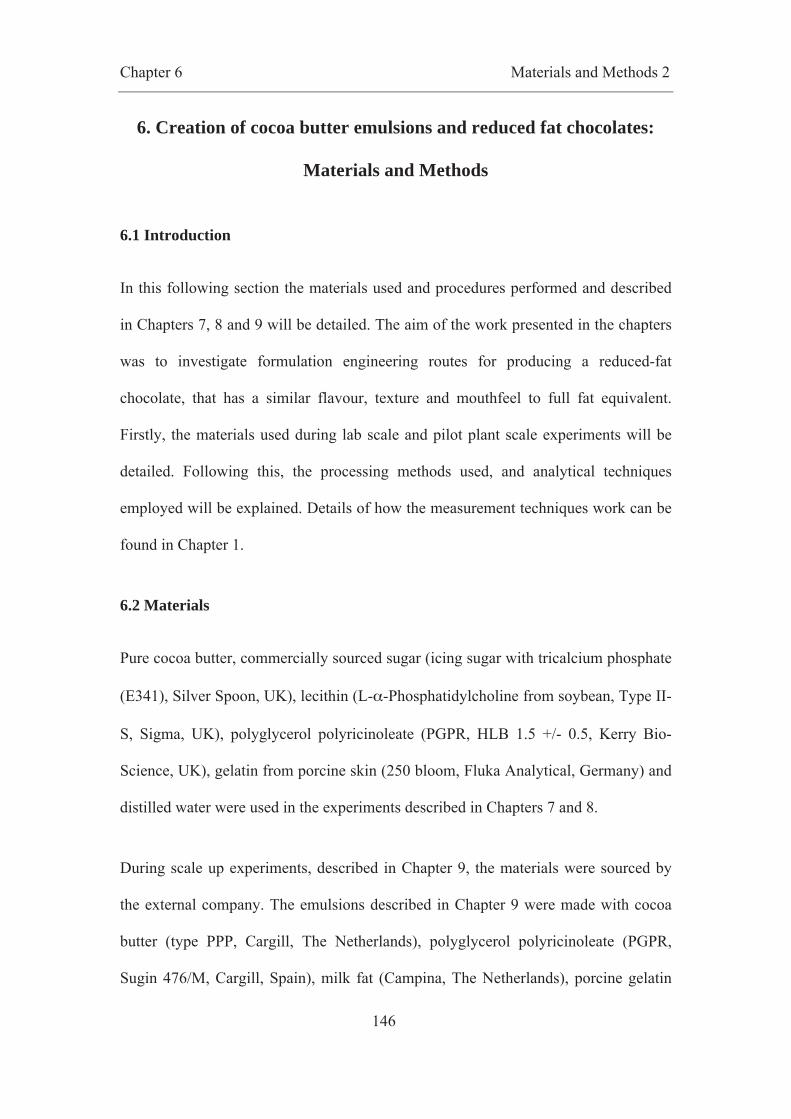
Chapter 6 Materials and Methods 2
146
6. Creation of cocoa butter emulsions and reduced fat chocolates:
Materials and Methods
6.1 Introduction
In this following section the materials used and procedures performed and described
in Chapters 7, 8 and 9 will be detailed. The aim of the work presented in the chapters
was to investigate formulation engineering routes for producing a reduced-fat
chocolate, that has a similar flavour, texture and mouthfeel to full fat equivalent.
Firstly, the materials used during lab scale and pilot plant scale experiments will be
detailed. Following this, the processing methods used, and analytical techniques
employed will be explained. Details of how the measurement techniques work can be
found in Chapter 1.
6.2 Materials
Pure cocoa butter, commercially sourced sugar (icing sugar with tricalcium phosphate
(E341), Silver Spoon, UK), lecithin (L-α-Phosphatidylcholine from soybean, Type II-
S, Sigma, UK), polyglycerol polyricinoleate (PGPR, HLB 1.5 +/- 0.5, Kerry Bio-
Science, UK), gelatin from porcine skin (250 bloom, Fluka Analytical, Germany) and
distilled water were used in the experiments described in Chapters 7 and 8.
During scale up experiments, described in Chapter 9, the materials were sourced by
the external company. The emulsions described in Chapter 9 were made with cocoa
butter (type PPP, Cargill, The Netherlands), polyglycerol polyricinoleate (PGPR,
Sugin 476/M, Cargill, Spain), milk fat (Campina, The Netherlands), porcine gelatin

Chapter 6 Materials and Methods 2
147
(250 bloom, Rousselot, France), and potassium sorbate (E202, Brenntag, Belgium).
Potassium sorbate was used as it is a preservative that prevents microbial growth, in
particular bacterial growth, so is essential when producing food grade products. The
emulsion was added to a dry mix of sugar (Tienen, Belgium), skimmed milk powder
(Lactoland Trockenmilchwerk, Germany), cocoa powder (type 10 B2, Cargill, The
Netherlands) and vanilla (LC 12153 P, Cargill, France). This dry mix was produced
by blending and dry-grinding the ingredients to produce a powder with very little fat
(0.1 – 0.5%), and a particle size of 20 – 24μm.
6.3 Preparation of emulsions
Emulsions were produced using three different methods: a high shear mixer (results
displayed in Chapter 7); a bench-top margarine line (results displayed in Chapters 7
and 8); a Schröder Kombinator (results displayed in Chapter 9).
6.3.1 High Shear Mixer
A Silverson L4RT (Silverson Machines Ltd, UK) high shear mixer was used to
produce a range of cocoa butter emulsions with varying water contents (from 10 to
60% water by weight). Temperature control was limited during this process. The
emulsifier (either 2% soya bean lecithin or 1% PGPR) was added to the cocoa butter
(where it is most soluble), and was heated to 45, 55 or 65°C using a bain-marie
(placing the beaker inside another beaker of water which is heated on a heated plate).
The distilled water was heated to the same temperature by placing the beaker on a
magnetic hotplate stirrer (Stuart, UK), and stirring with a magnetic stirrer. If sugar
was being used, it was added at this stage to make a sugar solution. The aqueous
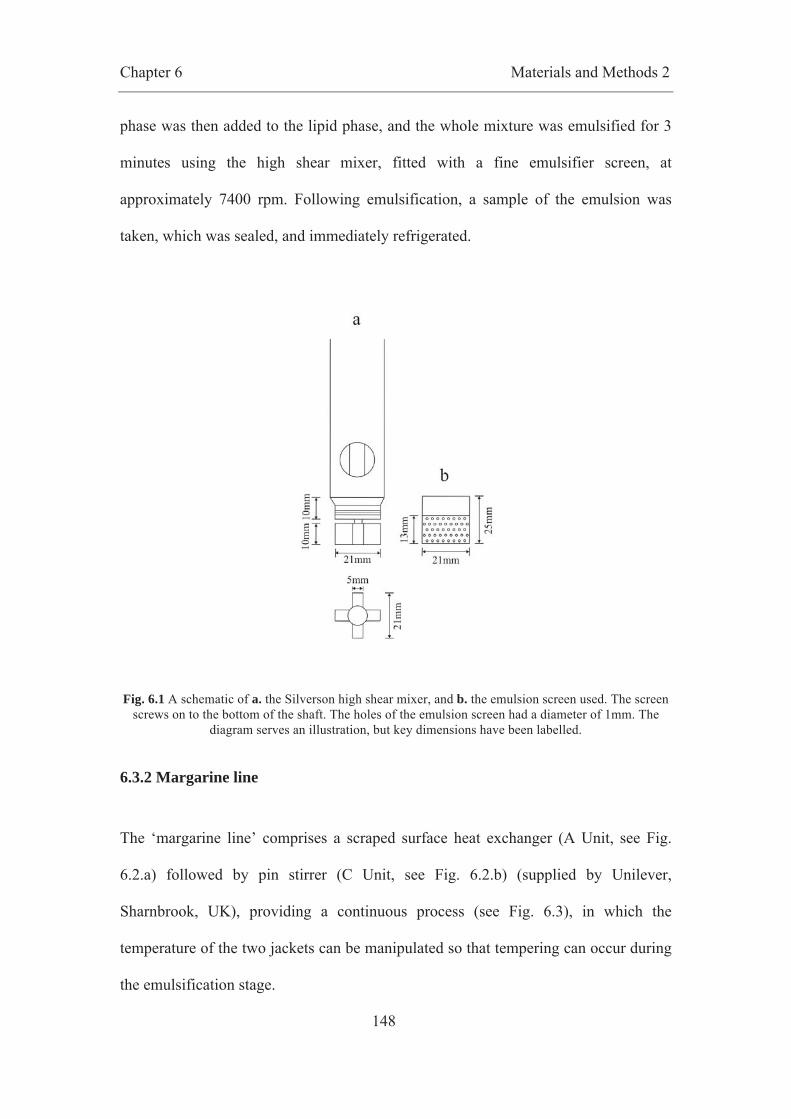
Chapter 6 Materials and Methods 2
148
phase was then added to the lipid phase, and the whole mixture was emulsified for 3
minutes using the high shear mixer, fitted with a fine emulsifier screen, at
approximately 7400 rpm. Following emulsification, a sample of the emulsion was
taken, which was sealed, and immediately refrigerated.
Fig. 6.1 A schematic of a. the Silverson high shear mixer, and b. the emulsion screen used. The screen screws on to the bottom of the shaft. The holes of the emulsion screen had a diameter of 1mm. The
diagram serves an illustration, but key dimensions have been labelled.
6.3.2 Margarine line
The ‘margarine line’ comprises a scraped surface heat exchanger (A Unit, see Fig.
6.2.a) followed by pin stirrer (C Unit, see Fig. 6.2.b) (supplied by Unilever,
Sharnbrook, UK), providing a continuous process (see Fig. 6.3), in which the
temperature of the two jackets can be manipulated so that tempering can occur during
the emulsification stage.
Chapter 6 Materials and Methods 2
149
Fig. 6.2 A schematic of a. the scraped surface heat exchanger (A unit), and b. the pin stirrer (C unit). The diagrams serve illustrations, but key dimensions have been labelled. The schematic shows inlets and outlets (represented with arrows), but does not illustrate the jacket inlets or outlets. Shaded areas
represent the jacket cavity.

Chapter 6 Materials and Methods 2
150
Fig. 6.3 A schematic of the margarine line, where a. is a beaker where the lipid and aqueous phases are added, and mixed using an overhead stirrer to produce a coarse pre-emulsion, b. is the peristaltic pump, c. is the scraped surface heat exchanger (A unit), d. is the pin stirrer (C unit), e. is the water bath used to control the temperature of the A unit, f. is the water bath used to control the temperature of the C
unit, and g. is the collection vessel.
The cocoa butter and emulsifier (0.1 - 5% PGPR within the lipid phase) were heated
using the water bath to approximately 60°C. This temperature was selected as it is
above the final melting point of the cocoa butter crystals in all polymorphic forms
(Loisel et al., 1998). Initial experiments considered the addition of sugar to the
aqueous phase (1, 10 and 20% by mass), whereas subsequent experiments
investigated the addition of gelatin. When working with sugar, it was added to the
aqueous phase and heated to 60°C on a hotplate stirrer (Stuart, UK), and was stirred
using a magnetic stirrer. When using gelatin, the crystals were dissolved in the water
at a temperature of 60°C, using the hotplate stirrer with a magnetic stirrer. The sugar /
gelatin solution was then added to the cocoa butter, and stirred using an overhead
stirrer (IKA RW20 digital) fitted with an anchor-shaped impeller until the mixture
visually appeared homogeneous (judged by eye), which took approximately three
minutes. This coarse pre-emulsion was then pumped through the margarine line
(Masterflex L/S Digital Economy Drive with a Masterflex Easy-Load II L/S pump,

Chapter 6 Materials and Methods 2
151
Cole-Parmer Instrument Company, UK), through silicon tubing (outer diameter
6.3mm, inner diameter 3.2mm; ESCO, SLC, UK). The A unit had a volume of 40ml,
and had an 80mm stirrer with two 70mm blades. The C Unit had a volume of 150ml
and had a 140mm stirrer with sixteen 5mm pins, and had sixteen 5mm pins in the
shaft. T-junctions were inserted before the A unit to measure inlet temperature, and
after the A unit, and after the C unit, to measure outlet temperatures. A Digi-Sense®
dual type thermocouple and thermometer (Cole-Parmer® Instrument Company, USA)
was used to measure the temperature at these points.
During the initial experiments (results presented in Chapter 7), the A unit jacket
temperature was held at 30°C and the C unit at 40°C for all the samples. These jacket
temperatures were selected to start fat crystallisation in the A unit and control the
polymorphic form of the cocoa butter in the C unit. The exit temperature was
measured and was approximately 35°C for all the samples. Settings were
manipulated: shaft speeds (pin stirrer: 800, 1230 and 1350 rpm and scraped surface
heat exchanger: 800 and 1320 rpm) and throughput (30, 50 and 70 mL/min).
Following emulsification, samples of the emulsion were taken, sealed, and
immediately refrigerated.
During subsequent studies (results presented in Chapter 8) a number of formulation
changes (percentage of gelatin, percentage of aqueous phase, percentage of
emulsifier), and processing changes (A and C units shaft speeds, A and C unit
temperatures, and pump speed) were investigated.
Chapter 6 Materials and Methods 2
152
6.3.3 Schröder Kombinator
The cocoa butter was melted in an oven (Jouan, UK) overnight at 60°C. The lipid
phase ingredients (cocoa butter, PGPR, and milk fat, depending on formulation) were
blended in a Schröder feed vessel, held at 60°C and run at a shaft speed of 120 rpm.
The aqueous phase ingredients were prepared by heating the water to 60°C, and
mixing the gelatin and potassium sorbate into the water using a laboratory mixer
(Silverson AXR, UK) at maximum speed for approximately 5 minutes, until all the
particles were dissolved. The aqueous phase was then added to the lipid phase, and
homogenised. This pre-emulsion was then passed through the Schröder Kombinator
(Belgium): 2 scraped surface Freon cooled heat exchangers, and through the pin
stirrer. The pump was kept at a constant 110 rpm, keeping the product flow at a
constant throughput of 0.75 kg/min. The shaft speeds of both Freon units were kept
constant at 600 rpm. The temperatures of the scraped-surface heat exchangers were
altered, as was the shaft speed of the pin stirrer (see Chapter 8). Samples of the
prepared emulsions were immediately taken, and stored at both ambient
(approximately 20°C) and chilled (approximately 6°C) temperatures. A dry mix of
sugar (65.15%), skimmed milk powder (26.16%), cocoa powder (8.68%) and vanilla
(0.01%) was also added to some of the emulsions following emulsification. This was
carried out in a planetary mixer (Hobart, USA), until the solid particles were fully
mixed into the emulsions. No temperature control was possible at this stage.
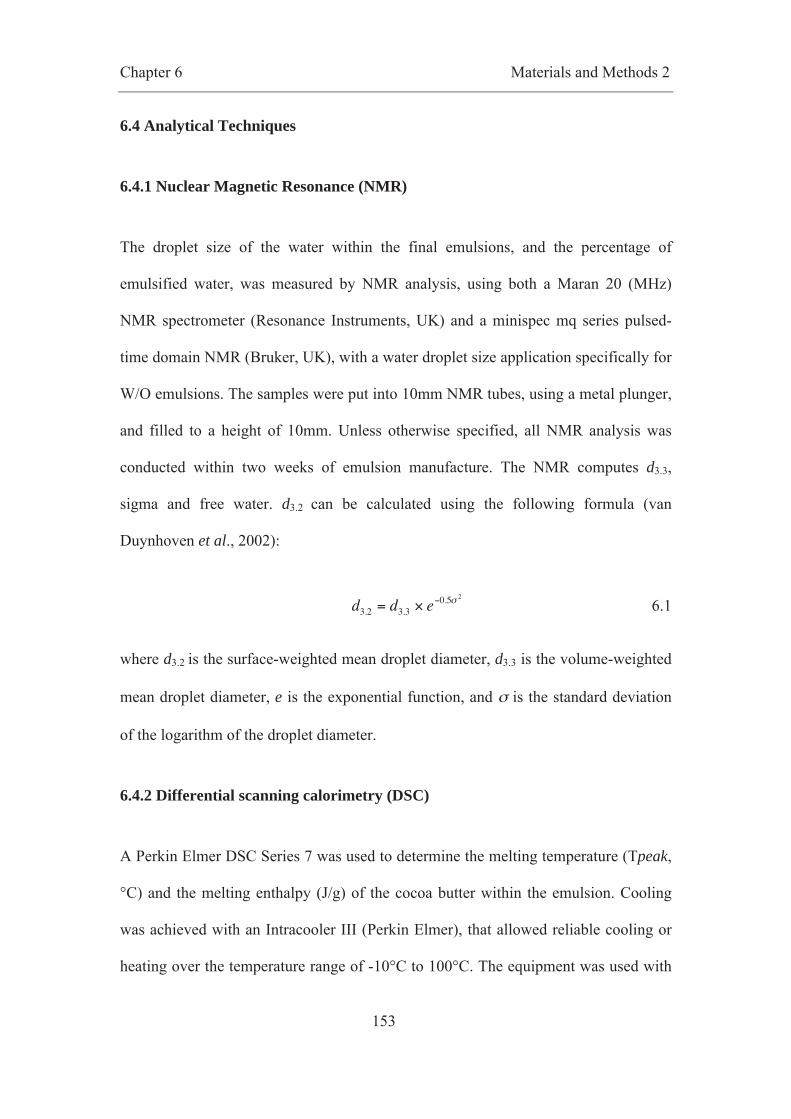
Chapter 6 Materials and Methods 2
153
6.4 Analytical Techniques
6.4.1 Nuclear Magnetic Resonance (NMR)
The droplet size of the water within the final emulsions, and the percentage of
emulsified water, was measured by NMR analysis, using both a Maran 20 (MHz)
NMR spectrometer (Resonance Instruments, UK) and a minispec mq series pulsed-
time domain NMR (Bruker, UK), with a water droplet size application specifically for
W/O emulsions. The samples were put into 10mm NMR tubes, using a metal plunger,
and filled to a height of 10mm. Unless otherwise specified, all NMR analysis was
conducted within two weeks of emulsion manufacture. The NMR computes d3.3,
sigma and free water. d3.2 can be calculated using the following formula (van
Duynhoven et al., 2002):
d3.2 = d3.3 × e−0.5σ 2
6.1
where d3.2 is the surface-weighted mean droplet diameter, d3.3 is the volume-weighted
mean droplet diameter, e is the exponential function, and σ is the standard deviation
of the logarithm of the droplet diameter.
6.4.2 Differential scanning calorimetry (DSC)
A Perkin Elmer DSC Series 7 was used to determine the melting temperature (Tpeak,
°C) and the melting enthalpy (J/g) of the cocoa butter within the emulsion. Cooling
was achieved with an Intracooler III (Perkin Elmer), that allowed reliable cooling or
heating over the temperature range of -10°C to 100°C. The equipment was used with

Chapter 6 Materials and Methods 2
154
thermal analysis software (Pyris). Nitrogen was used as a purge gas, at a flow rate of
30ml/min to prevent condensation occurring on the head. The DSC was firstly
calibrated for temperature using indium and zinc standards, with an aluminum pan as
a reference. Emulsion samples were loaded into Perkin Elmer 40μL capacity
aluminum pans, and sealed with aluminum covers. An empty pan was used as a
reference. The results were then analysed taking account of the sample weight and the
fat content of the sample. Melting properties were compared with polymorphic
information found in the literature (Loisel et al., 1998). Different scan rates were
investigated (0.5, 1 and 2°C/min). As the heating rate is doubled from 0.5°C/min to
1°C/min and from 1°C/min to 2°C/min the peak height approximately doubles (see
Fig. 6.4). The energy of melting is then calculated, and shown to be constant across
heating rates, indicating that the heating rates could be used interchangeably. A
heating range of 2°C/min being preferred, not only for speed, but also for smaller
error across samples.
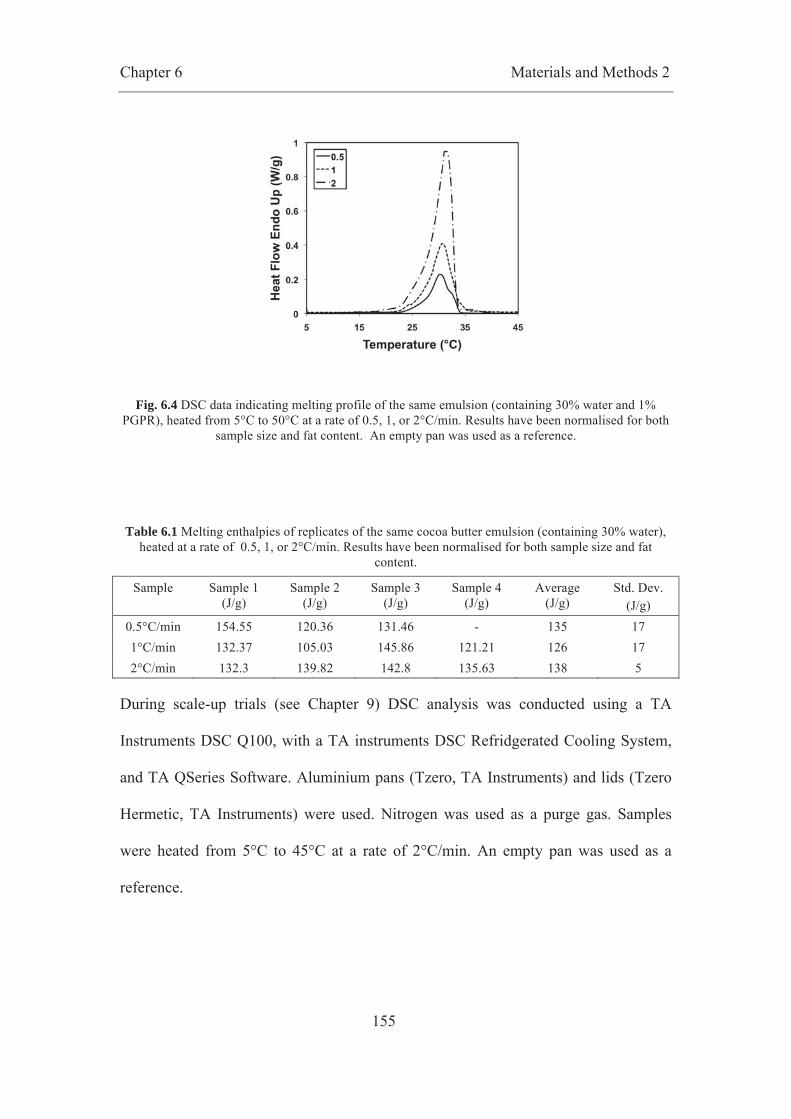
Chapter 6 Materials and Methods 2
155
Fig. 6.4 DSC data indicating melting profile of the same emulsion (containing 30% water and 1% PGPR), heated from 5°C to 50°C at a rate of 0.5, 1, or 2°C/min. Results have been normalised for both
sample size and fat content. An empty pan was used as a reference.
Table 6.1 Melting enthalpies of replicates of the same cocoa butter emulsion (containing 30% water), heated at a rate of 0.5, 1, or 2°C/min. Results have been normalised for both sample size and fat
content.
Sample Sample 1 (J/g)
Sample 2 (J/g)
Sample 3 (J/g)
Sample 4 (J/g)
Average (J/g)
Std. Dev. (J/g)
0.5°C/min 154.55 120.36 131.46 - 135 17 1°C/min 132.37 105.03 145.86 121.21 126 17 2°C/min 132.3 139.82 142.8 135.63 138 5
During scale-up trials (see Chapter 9) DSC analysis was conducted using a TA
Instruments DSC Q100, with a TA instruments DSC Refridgerated Cooling System,
and TA QSeries Software. Aluminium pans (Tzero, TA Instruments) and lids (Tzero
Hermetic, TA Instruments) were used. Nitrogen was used as a purge gas. Samples
were heated from 5°C to 45°C at a rate of 2°C/min. An empty pan was used as a
reference.

Chapter 6 Materials and Methods 2
156
6.4.3 Conductivity
A conductivity probe (Mettler Toledo, inlab 710 platinum 4-cell conductivity probe,
connected to a Mettler Toledo SevenEasy™ meter) was used to determine whether the
emulsions were fat continuous W/O emulsions. A conductivity of 0 +/- 0.1μScm-2 for
each sample suggested a fully emulsified W/O emulsion.
6.4.4 Microscopy
Cryo-SEM was performed, using a Philips XL-30 FEG ESEM (Quorum cryo system
with a Polaron PolarPrep 2000 cryo preparation chamber), in which the sample was
frozen to below -80°C, coated with gold to allow electrical conductivity, and scanned
by a focused electron beam to produce an image. Light microscopy was from a
Polyvar II microscope (Reichert-Jung, Germany) in bright field mode.
6.4.5 Gravimetric Method
In order to determine the exact amount of water in the emulsion, the sample was
weighed before and after it was placed in a dry oven at 110°C. This temperature was
chosen as it would allow melting of the fat crystals, thus breaking the emulsion, and
for evaporation of the water. The emulsions were placed in the oven for 8, 12 and 30
hours. The difference between the mass before and after heating gives the mass of the
water lost. Knowing the amount of water within the original emulsion a calculation of
the amount of water lost on storage (i.e. after emulsification and before being placed
in the oven) can be made.

Chapter 6 Materials and Methods 2
157
6.4.6 X-Ray Diffraction (XRD)
XRD experiments were conducted at the EPSRC National Crystallography Service
located at the University of Southampton. The monochromatic beam of X-rays came
from Molybdenum (Mo) radiation (Bruker-Nonius FR591 rotating anode (λMo =
0.71073Å), Coventry, UK) focused using 10cm confocal mirrors. Diffracted radiation
was then collected on a CCD detector (Bruker-Nonius Apex II KappaCCD, Coventry,
UK). The instrument was fitted with non-liquid nitrogen cooling circuit, allowing data
to be collected at temperatures in the range of -193°C to 227°C. The sample was
mounted on glass fibre, and inserted into a brass tube. All samples were measured at
4°C.

Chapter 7 Cocoa Butter Emulsions
158
7. Development of cocoa butter emulsions using two processing
methods: a high shear mixer and a bench-scale margarine line
7.1 Introduction
As discussed in Chapter 1, chocolate is consumed in large quantities by the British
population, but is high in both fat and calories, has limited nutritional benefits and is
only eaten as a snack or a treat. As such, producing a reduced-fat chocolate offers a
way of reducing the fat and energy consumed, with beneficial effects for body weight
and health. The aim of the work presented in this chapter was to identify whether the
calorie and fat content of chocolate (by weight) could be reduced by introducing
water, in the form of an emulsion. By creating a continuous oil phase (cocoa butter)
with a dispersed aqueous phase, where the water droplets are segregated from the
additional ingredients, it may be possible to “hide” the water, so that the product
continues to function as a chocolate (for example is glossy, snaps and melts in the
mouth), but is reduced in fat. Thus, the aim of this investigation was to create W/O
cocoa butter emulsions with varying water contents, with small droplets of water
which are below the detection threshold of the mouth (typically 10μm in size,
although at high concentrations particles of 5μm in diameter can be detected;
detection is affected by size, concentration, hardness, shape and viscosity; de Wijk &
Prinz, 2005), which are stable, and do not destabilise or coalesce on storage.
Furthermore, the cocoa butter within the samples should be in polymorphic form V
(ß2), which consumers find the most attractive, as it results in a chocolate that snaps,
melts in the mouth, and does not bloom, as described in Chapter 1. Furthermore, the

Chapter 7 Cocoa Butter Emulsions
159
method for producing the emulsions should be similar to that used when producing
other food emulsions (e.g. margarine), so that a high capital investment is not
required. At this stage only the simple emulsion is investigated: the addition of the
other ingredients (sugar, cocoa solids, and milk) will be discussed in Chapter 9.
Two methods of emulsification were employed: a high shear mixer (see Section 7.2)
and a bench scale ‘margarine line’ (scraped surface heat exchanger and pin stirrer)
(see Section 7.3). The different processing methods, in addition to varying water
fractions (10 – 60% by mass) and different emulsifiers (soya bean lecithin and PGPR)
were studied. Following processing, a number of analysis techniques were
investigated to characterise the emulsions. Droplet size was measured using NMR
analysis with a water droplet size application specifically for W/O emulsions (see
Sections 1.4.7.6.1 and 6.4.1). DSC was used to determine the dominant crystal form
of the cocoa butter within the emulsion (considering both the melting temperature,
and the melting enthalpy), to determine whether an emulsion with crystals in
polymorphic form V had been produced (see Sections 1.4.5.3 and 6.4.2). Finally,
images were captured using both cryo-SEM and light microscopy, to determine the
emulsion microstructure.
7.2 High Shear Mixer
The high shear mixer offers a batch process in which temperature control is limited,
but it is a commonly used method of emulsification (see Section 6.3.1), which has the
advantage that emulsions can be produced quickly and reliably. Results and
knowledge obtained using this process will then direct production of emulsions using
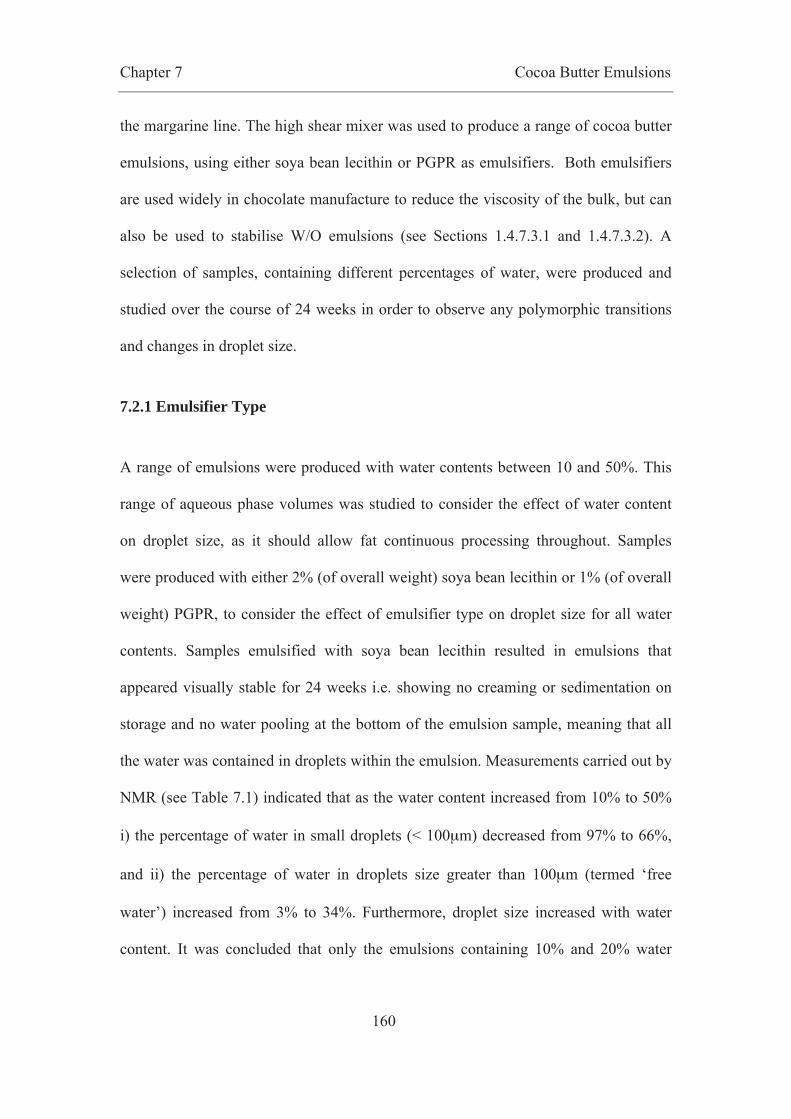
Chapter 7 Cocoa Butter Emulsions
160
the margarine line. The high shear mixer was used to produce a range of cocoa butter
emulsions, using either soya bean lecithin or PGPR as emulsifiers. Both emulsifiers
are used widely in chocolate manufacture to reduce the viscosity of the bulk, but can
also be used to stabilise W/O emulsions (see Sections 1.4.7.3.1 and 1.4.7.3.2). A
selection of samples, containing different percentages of water, were produced and
studied over the course of 24 weeks in order to observe any polymorphic transitions
and changes in droplet size.
7.2.1 Emulsifier Type
A range of emulsions were produced with water contents between 10 and 50%. This
range of aqueous phase volumes was studied to consider the effect of water content
on droplet size, as it should allow fat continuous processing throughout. Samples
were produced with either 2% (of overall weight) soya bean lecithin or 1% (of overall
weight) PGPR, to consider the effect of emulsifier type on droplet size for all water
contents. Samples emulsified with soya bean lecithin resulted in emulsions that
appeared visually stable for 24 weeks i.e. showing no creaming or sedimentation on
storage and no water pooling at the bottom of the emulsion sample, meaning that all
the water was contained in droplets within the emulsion. Measurements carried out by
NMR (see Table 7.1) indicated that as the water content increased from 10% to 50%
i) the percentage of water in small droplets (< 100μm) decreased from 97% to 66%,
and ii) the percentage of water in droplets size greater than 100μm (termed ‘free
water’) increased from 3% to 34%. Furthermore, droplet size increased with water
content. It was concluded that only the emulsions containing 10% and 20% water

Chapter 7 Cocoa Butter Emulsions
161
were fully emulsified, with 97% and 91% respectively of droplets being smaller than
100μm, with a mean droplet size for both water contents of 1.6μm (see Table 7.1).
Table 7.1. NMR analysis for cocoa butter emulsions produced using a high shear mixer. Emulsions were processed for 3 minutes at 7400rpm. Samples include 1 % sugar and 2 % soya bean lecithin.
NMR measurements were taken in the first week after processing. Sigma (σ) is presented in brackets.
Percentage of water in sample
Percentage water in droplets >100µm
Percentage water in droplets <100µm
d3.2 (μm)
10 3 97 1.6 (0.4) 20 9 91 1.6 (0.8) 30 21 79 3.4 (1.3) 40 23 77 3.9 (1.3) 50 34 66 7.9 (1.7)
Having only obtained stable emulsions for samples containing 10 and 20% using soya
bean lecithin, PGPR was used as an alternative emulsifier. Samples were produced
with water contents between 10 and 60% using 1% PGPR. These samples were again
visually stable over the 24 week period.
Table 7.2 NMR analysis for cocoa butter emulsions produced using a high shear mixer. Emulsions were processed for 3 minutes at 7400 rpm. Samples include 1 % sugar and 1 % PGPR. NMR
measurements were taken in the first week after processing. Sigma (σ) is presented in brackets.
Percentage of water in sample
Percentage water in droplets >100µm
Percentage water in droplets <100µm
d3.2 (μm)
10 0 100 3.0 (0.7) 20 0 100 4.0 (0.8) 30 62 38 - 40 72 28 - 50 73 27 - 60 90 10 -
NMR measurements (see Table 7.2) indicated that all the water was contained in
small droplets (i.e. below 100 µm) for the 10 and 20% water containing emulsions.
However, as the water content was increased, an increasing amount of ‘free’ water

Chapter 7 Cocoa Butter Emulsions
162
(i.e. droplets above 100 µm) was observed, so that an accurate measurement of mean
droplet size could not be taken. PGPR is a powerful W/O emulsifier (Wilson et al.,
1998), and this is evident here (see Table 7.2), as 100% of droplets were emulsified at
10 and 20% water with a small droplet size of 3 or 4µm. However, it appears that 1%
PGPR is not sufficient to emulsify droplets at higher water contents, possibly as a
result of insufficient time for the emulsifier to get to the interface within the process.
To compare the data obtained, the percentage of water in small droplets is plotted as a
function of the water content for both PGPR and lecithin in Figure 7.1. As can be seen
from this figure, using soya bean lecithin at water contents of 20% or below results in
emulsions with more of the water in small droplets (<100μm), as compared with
PGPR. Both emulsifiers produce emulsions with small droplets (<100μm) for 10 and
20% water content. As the water content is increased i) a gradual decrease in the
percentage of emulsified water is observed with lecithin, ii) a decrease in emulsified
water occurs between 20% and 30% water with PGPR. It would normally be expected
that loss of emulsion stability would occur close to 50:50 phase volumes as the
emulsion is likely to phase invert and become O/W. The most likely cause of the
observed behaviour is that the emulsifiers are not adsorbed to the interface fast
enough during processing, allowing coalescence of the droplets. This might be
expected more for PGPR as it is a larger molecule so it will take longer to get to and
stabilise the interface during emulsification (see Section 1.4.7.3.2). As would be
expected, the results show that for emulsions with 10 or 20% water, the use of PGPR
results in small droplets, 100% of which were smaller than 100μm. Thus, if the
emulsifier has sufficient time to get to the interface during processing, it can stabilise
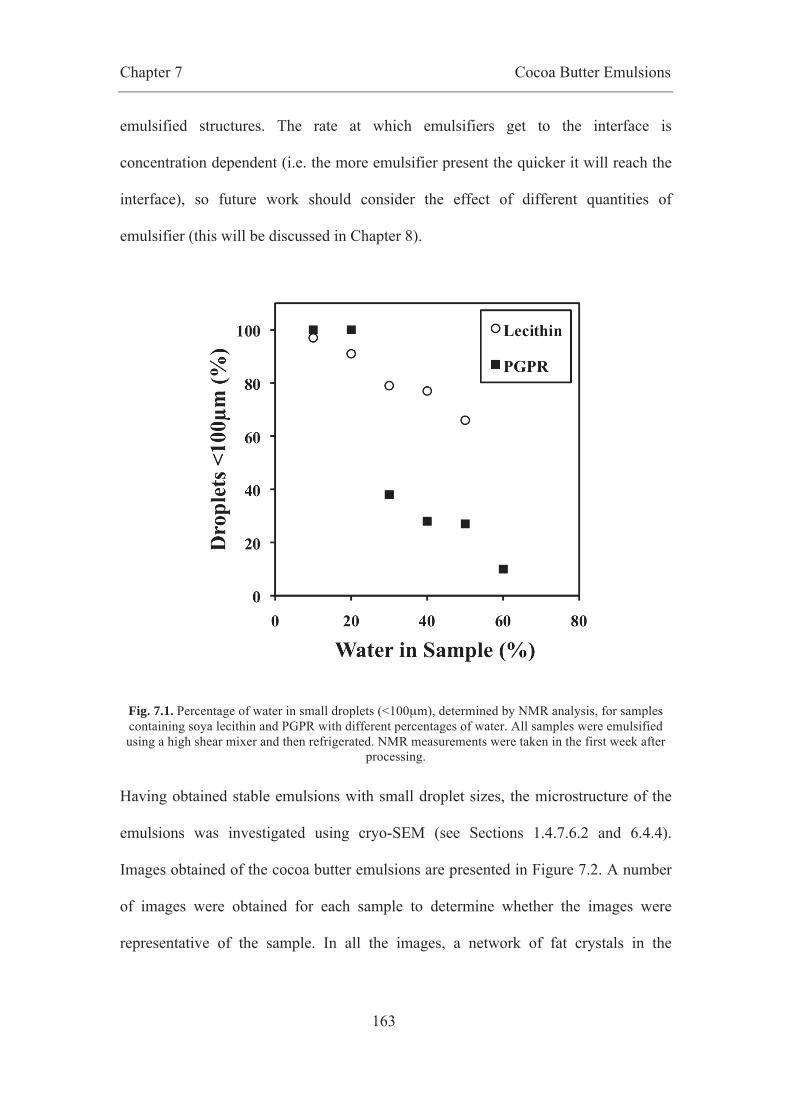
Chapter 7 Cocoa Butter Emulsions
163
emulsified structures. The rate at which emulsifiers get to the interface is
concentration dependent (i.e. the more emulsifier present the quicker it will reach the
interface), so future work should consider the effect of different quantities of
emulsifier (this will be discussed in Chapter 8).
Fig. 7.1. Percentage of water in small droplets (<100μm), determined by NMR analysis, for samples containing soya lecithin and PGPR with different percentages of water. All samples were emulsified using a high shear mixer and then refrigerated. NMR measurements were taken in the first week after
processing.
Having obtained stable emulsions with small droplet sizes, the microstructure of the
emulsions was investigated using cryo-SEM (see Sections 1.4.7.6.2 and 6.4.4).
Images obtained of the cocoa butter emulsions are presented in Figure 7.2. A number
of images were obtained for each sample to determine whether the images were
representative of the sample. In all the images, a network of fat crystals in the

Chapter 7 Cocoa Butter Emulsions
164
continuous phase (A), and water droplets, covered by smooth sintered crystalline fat
shells (B) can be observed.
Fig. 7.2. Scanning electron micrographs of cocoa butter emulsions made with soya bean lecithin emulsified using a Silverson high shear mixer: a. 10% water phase, b. 20% water phase, c. 20% water
phase and d. 40% water phase. All the micrographs indicate a continuous fat phase (A), with water droplets, covered by sintered fat crystal shells (B).
Very similar microstructures have previously been reported for margarine (Heertje,
1993; Heertje, 1998; Norton et al., 2006). It is thought that as the fat crystals within
the system begin to grow, they are swept to the interface during the emulsification
process and then behave as Pickering particles (Hodge & Rousseau, 2005), stabilising
the emulsion. As the crystals are soluble in the oil phase, they sinter together to form
solid crystal shells (Johansson & Bergenstahl, 1995) over time (i.e. on storage). This

Chapter 7 Cocoa Butter Emulsions
165
behaviour has been observed in other systems (Frasch-Melnik et al., 2010), where a
combination of mono- and triglyceride crystals acted as Pickering particles to stabilise
a W/O emulsion without the addition of emulsifiers. Furthermore, Frasch-Melnik et
al. (2010) report that the sintered fat crystal shells around the water droplets enable
salt to be encapsulated within the droplets, which remained stable even under applied
osmotic pressure, achieved by placing the emulsion in distilled water. Having these
sintered crystal networks within a cocoa butter emulsion could prevent water
migrating to the hydroscopic materials within the final chocolate, i.e. the sugar, cocoa
solids or milk powder (this work is presented in Chapter 9). Furthermore, the crystal
shells should melt in the mouth on consumption, resulting in a smooth mouthfeel. In
margarine it is this fat shell that imparts both the physical and microbiological
stability to the emulsion (Rousseau et al., 2003). The water phase is contained in a
solid structure even on the application of mechanical forces (i.e. on spreading) and
any microbial activity will be isolated within a single droplet, preventing growth. It is
therefore very likely that the same behaviour will be observed for the cocoa butter
emulsions, making the production of a chocolate containing the emulsion very
promising.
The droplets observed in all the cocoa butter emulsions using SEM are comparable
across samples produced with different percentages of water. Droplet sizes are similar
(between 5-15μm), irrespective of the water content (see Fig. 7.2). This is in the same
order of magnitude as obtained by NMR analysis (between 2 and 8μm), however the
droplets seen in the images are slightly larger. This may be as a result of the SEM
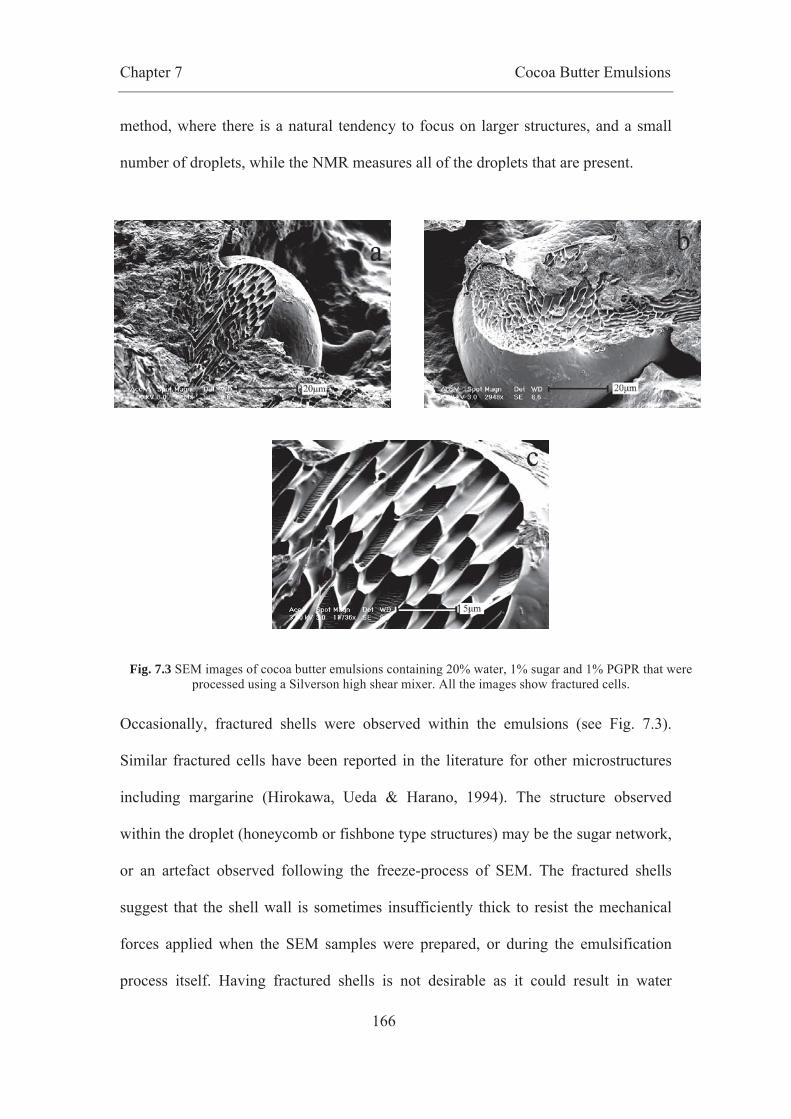
Chapter 7 Cocoa Butter Emulsions
166
method, where there is a natural tendency to focus on larger structures, and a small
number of droplets, while the NMR measures all of the droplets that are present.
Fig. 7.3 SEM images of cocoa butter emulsions containing 20% water, 1% sugar and 1% PGPR that were processed using a Silverson high shear mixer. All the images show fractured cells.
Occasionally, fractured shells were observed within the emulsions (see Fig. 7.3).
Similar fractured cells have been reported in the literature for other microstructures
including margarine (Hirokawa, Ueda & Harano, 1994). The structure observed
within the droplet (honeycomb or fishbone type structures) may be the sugar network,
or an artefact observed following the freeze-process of SEM. The fractured shells
suggest that the shell wall is sometimes insufficiently thick to resist the mechanical
forces applied when the SEM samples were prepared, or during the emulsification
process itself. Having fractured shells is not desirable as it could result in water

Chapter 7 Cocoa Butter Emulsions
167
release on storage, on consumption or when snapped. It is possible that shell thickness
could be controlled during processing, by using different fractions of crystallising
fats, or by oscillating the temperature. This should be investigated in future work.
7.2.3 Processing Parameters
As temperature control is limited when homogenising with the high shear mixer, the
effect of the temperature that the lipid phase was heated to prior to emulsification was
investigated with the fat phase being heated to 45, 55 or 65°C. In all cases stable
emulsions were produced. The samples were analysed to determine the polymorphic
form of the fat in the emulsion. DSC was used to determine the dominant crystalline
form present within the emulsions. All the emulsions, regardless of the temperature
that the samples were heated to before homogenisation, had melting peaks that are
similar to those typically reported in the literature (Loisel et al., 1998) for
polymorphic form V (melting between 30 and 34°C; see Fig. 5.4). This suggests that
any fluctuations in temperature during the process (i.e. slight cooling in the time
between moving from the hot plate, and heating again during emulsification, and final
crystallisation on refrigeration) are not important in determining the polymorphic
form of the fat. The fact that form V is observed suggests that the applied shear forces
allow form V (or precursors to form V) to be produced spontaneously, which seeds
the mass by secondary nucleation. This mimics the tempering process.

Chapter 7 Cocoa Butter Emulsions
168
Fig. 7.4 DSC curves indicating melting temperatures of cocoa butter emulsions (all containing 30% aqueous phase) emulsified using a high shear mixer. The fat phase of the emulsions was heated to
different temperatures (40, 55 and 65°C) prior to emulsification. Samples were refrigeratedimmediately after manufacture. Measurements taken 2 months after manufacture of emulsions. Pans were heated from 0°C to 50°C at a rate of 2°C/min. Pure cocoa butter processed in the same way is displayed as a comparison. These results have been normalised for both sample size and fat content.
An empty pan was used as a reference.
The peaks shown in Figure 7.4 were analysed to determine the melting enthalpy (i.e.
the area under the melting peak). All the samples had slightly higher melting
enthalpies (see Table 7.3) than typically cited in the literature for form V (117.5 J/g;
Chapman et al., 1971). Instead, enthalpies between 127.9 and 144.8 J/g were
observed. This may be as a result of the time delay between emulsification and the
DSC analysis, which was two months, possibly allowing the development of crystals
in form VI, which have a melting enthalpy of 136.3 J/g (see Table 7.3). However, a
melting enthalpy of 143.5 J/g is 7.2 J/g higher than normally observed for
polymorphic form VI (Chapman et al., 1971). The higher enthalpies are therefore
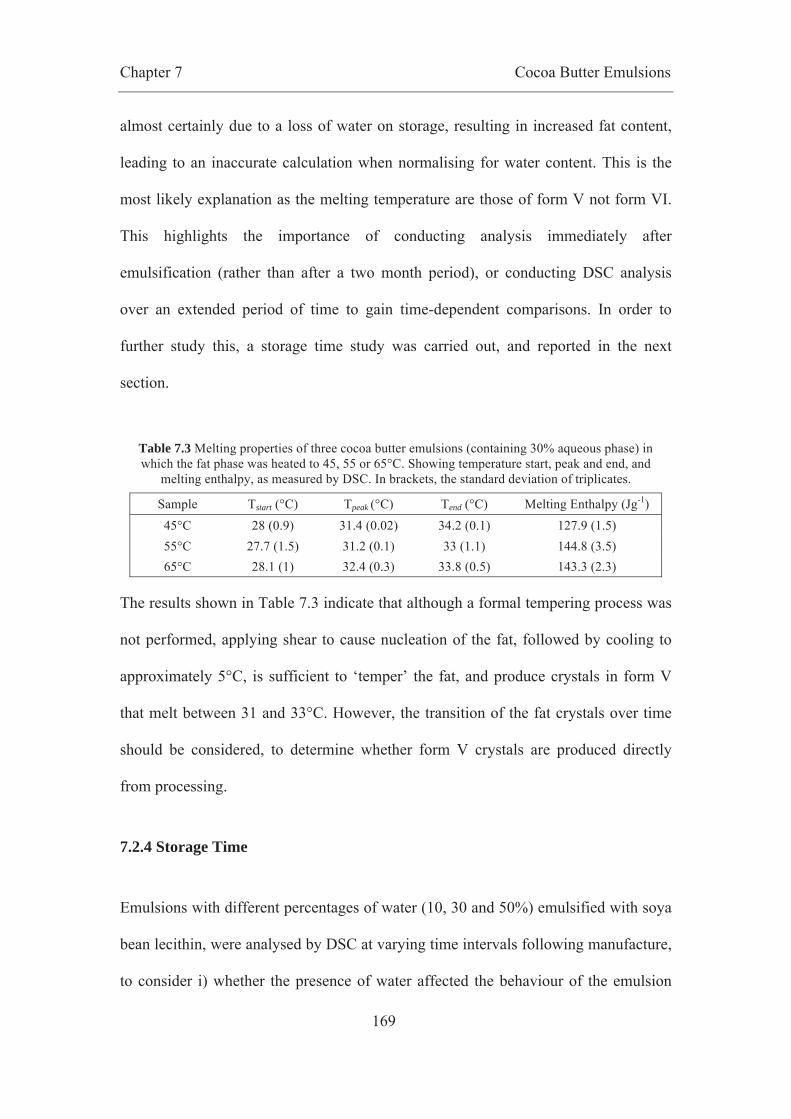
Chapter 7 Cocoa Butter Emulsions
169
almost certainly due to a loss of water on storage, resulting in increased fat content,
leading to an inaccurate calculation when normalising for water content. This is the
most likely explanation as the melting temperature are those of form V not form VI.
This highlights the importance of conducting analysis immediately after
emulsification (rather than after a two month period), or conducting DSC analysis
over an extended period of time to gain time-dependent comparisons. In order to
further study this, a storage time study was carried out, and reported in the next
section.
Table 7.3 Melting properties of three cocoa butter emulsions (containing 30% aqueous phase) in which the fat phase was heated to 45, 55 or 65°C. Showing temperature start, peak and end, and
melting enthalpy, as measured by DSC. In brackets, the standard deviation of triplicates.
Sample Tstart (°C) Tpeak (°C) Tend (°C) Melting Enthalpy (Jg-1) 45°C 28 (0.9) 31.4 (0.02) 34.2 (0.1) 127.9 (1.5) 55°C 27.7 (1.5) 31.2 (0.1) 33 (1.1) 144.8 (3.5) 65°C 28.1 (1) 32.4 (0.3) 33.8 (0.5) 143.3 (2.3)
The results shown in Table 7.3 indicate that although a formal tempering process was
not performed, applying shear to cause nucleation of the fat, followed by cooling to
approximately 5°C, is sufficient to ‘temper’ the fat, and produce crystals in form V
that melt between 31 and 33°C. However, the transition of the fat crystals over time
should be considered, to determine whether form V crystals are produced directly
from processing.
7.2.4 Storage Time
Emulsions with different percentages of water (10, 30 and 50%) emulsified with soya
bean lecithin, were analysed by DSC at varying time intervals following manufacture,
to consider i) whether the presence of water affected the behaviour of the emulsion

Chapter 7 Cocoa Butter Emulsions
170
over time and ii) whether the percentage of water affected melting properties. The
results for the emulsions were compared with data found in the literature, and with
measurements taken of pure cocoa butter processed in the same way.
It can be seen (see Table 7.4 and Fig. 7.6) that after one day and one week all the
emulsions had similar Tpeaks (27 – 29°C), which suggests that the cocoa butter
within the emulsion is in form IV. Conversely, the pure cocoa butter has a higher
Tpeak than the emulsions after one day (30.8°C), suggesting the presence of form V
crystals.

Chapter 7 Cocoa Butter Emulsions
171
Fig. 7.5 DSC curves indicating the melting temperatures emulsions containing a. 10% aqueous phase, b. 30% aqueous phase, and c. 50% aqueous phase. Measurements were taken after varying lengths of
time (1, 2, 3 and 24 weeks, as shown in legend). Pans were heated from 5°C to 45°C at a rate of 2°C/min. These results have been normalised for both sample size and fat content. An empty pan was
used as a reference.
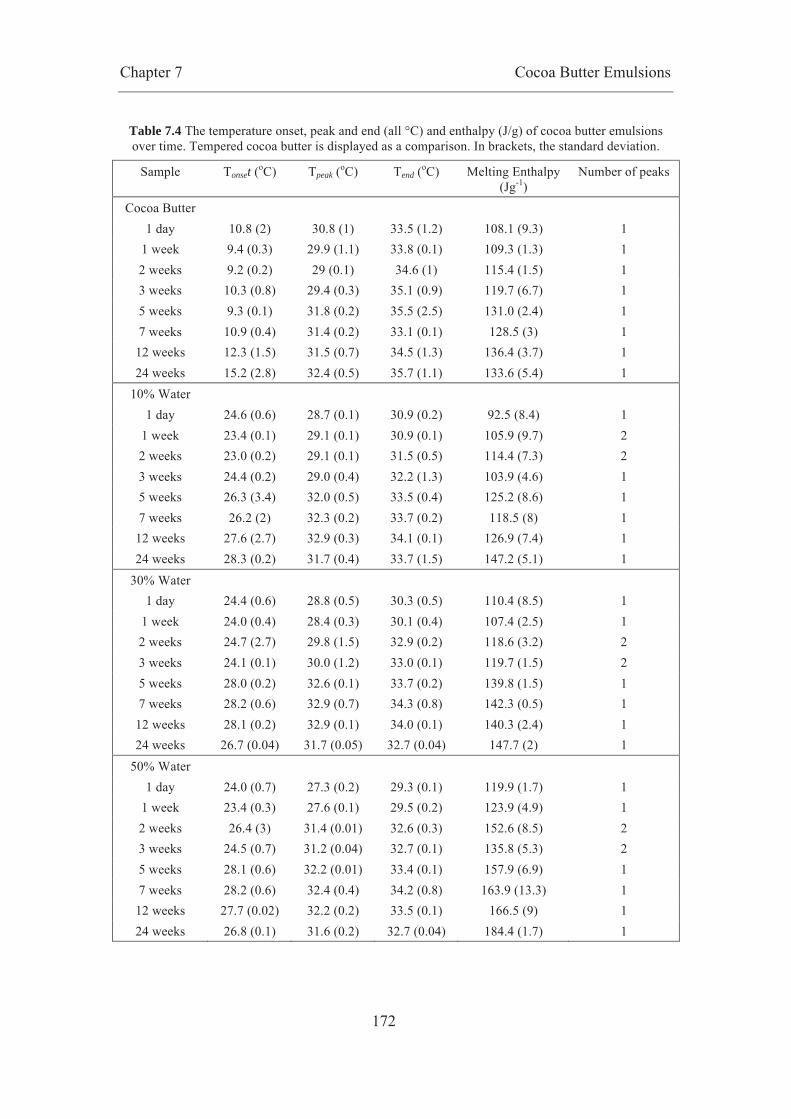
Chapter 7 Cocoa Butter Emulsions
172
Table 7.4 The temperature onset, peak and end (all °C) and enthalpy (J/g) of cocoa butter emulsions over time. Tempered cocoa butter is displayed as a comparison. In brackets, the standard deviation.
Sample Tonset (oC) Tpeak (oC) Tend (oC) Melting Enthalpy (Jg-1)
Number of peaks
Cocoa Butter 1 day 10.8 (2) 30.8 (1) 33.5 (1.2) 108.1 (9.3) 1
1 week 9.4 (0.3) 29.9 (1.1) 33.8 (0.1) 109.3 (1.3) 1 2 weeks 9.2 (0.2) 29 (0.1) 34.6 (1) 115.4 (1.5) 1 3 weeks 10.3 (0.8) 29.4 (0.3) 35.1 (0.9) 119.7 (6.7) 1 5 weeks 9.3 (0.1) 31.8 (0.2) 35.5 (2.5) 131.0 (2.4) 1 7 weeks 10.9 (0.4) 31.4 (0.2) 33.1 (0.1) 128.5 (3) 1
12 weeks 12.3 (1.5) 31.5 (0.7) 34.5 (1.3) 136.4 (3.7) 1 24 weeks 15.2 (2.8) 32.4 (0.5) 35.7 (1.1) 133.6 (5.4) 1
10% Water 1 day 24.6 (0.6) 28.7 (0.1) 30.9 (0.2) 92.5 (8.4) 1
1 week 23.4 (0.1) 29.1 (0.1) 30.9 (0.1) 105.9 (9.7) 2 2 weeks 23.0 (0.2) 29.1 (0.1) 31.5 (0.5) 114.4 (7.3) 2 3 weeks 24.4 (0.2) 29.0 (0.4) 32.2 (1.3) 103.9 (4.6) 1 5 weeks 26.3 (3.4) 32.0 (0.5) 33.5 (0.4) 125.2 (8.6) 1 7 weeks 26.2 (2) 32.3 (0.2) 33.7 (0.2) 118.5 (8) 1
12 weeks 27.6 (2.7) 32.9 (0.3) 34.1 (0.1) 126.9 (7.4) 1 24 weeks 28.3 (0.2) 31.7 (0.4) 33.7 (1.5) 147.2 (5.1) 1
30% Water 1 day 24.4 (0.6) 28.8 (0.5) 30.3 (0.5) 110.4 (8.5) 1
1 week 24.0 (0.4) 28.4 (0.3) 30.1 (0.4) 107.4 (2.5) 1 2 weeks 24.7 (2.7) 29.8 (1.5) 32.9 (0.2) 118.6 (3.2) 2 3 weeks 24.1 (0.1) 30.0 (1.2) 33.0 (0.1) 119.7 (1.5) 2 5 weeks 28.0 (0.2) 32.6 (0.1) 33.7 (0.2) 139.8 (1.5) 1 7 weeks 28.2 (0.6) 32.9 (0.7) 34.3 (0.8) 142.3 (0.5) 1
12 weeks 28.1 (0.2) 32.9 (0.1) 34.0 (0.1) 140.3 (2.4) 1 24 weeks 26.7 (0.04) 31.7 (0.05) 32.7 (0.04) 147.7 (2) 1
50% Water 1 day 24.0 (0.7) 27.3 (0.2) 29.3 (0.1) 119.9 (1.7) 1
1 week 23.4 (0.3) 27.6 (0.1) 29.5 (0.2) 123.9 (4.9) 1 2 weeks 26.4 (3) 31.4 (0.01) 32.6 (0.3) 152.6 (8.5) 2 3 weeks 24.5 (0.7) 31.2 (0.04) 32.7 (0.1) 135.8 (5.3) 2 5 weeks 28.1 (0.6) 32.2 (0.01) 33.4 (0.1) 157.9 (6.9) 1 7 weeks 28.2 (0.6) 32.4 (0.4) 34.2 (0.8) 163.9 (13.3) 1
12 weeks 27.7 (0.02) 32.2 (0.2) 33.5 (0.1) 166.5 (9) 1 24 weeks 26.8 (0.1) 31.6 (0.2) 32.7 (0.04) 184.4 (1.7) 1
Chapter 7 Cocoa Butter Emulsions
173
After two or three weeks all three emulsions appeared to have a mixture of crystal
forms, indicated by two different peaks (see Table 7.4 and Fig. 7.5), whilst the pure
cocoa butter had a single peak.
After 12 and 24 weeks all three samples had similar Tpeaks (32.2 – 32.9°C) and all
had single peaks, indicating the presence of crystals in form V. The Tpeak for all
these emulsions is plotted as a function of storage in Figure 7.6. This figure shows
that crystals in form V are produced after five weeks and are then stable. In contrast to
the emulsions, the melting profile of the pure cocoa butter indicated that from five
weeks form VI crystals had developed, with a higher melting enthalpy (for example
131 J/g at five weeks). As mentioned previously, on storage some of the melting
enthalpies observed for the emulsions are higher than observed for pure cocoa butter,
or as cited in the literature. This is true for all emulsions measured, but especially true
for the emulsions with 30 or 50% water content, where the highest amount of non-
emulsified water is observed. Thus, the high enthalpy is probably due to a loss of
water over time, resulting in an inaccurate normalization for fat content. This should
form part of any further work.
These results suggest that storing the samples at 5°C over 5 weeks and up to 24 weeks
results in a crystal transition, observed by an increase in Tpeak, to a melting
temperature expected for a tempered cocoa butter in form V. Furthermore, it appears
that this change is independent of the water content in the emulsion, suggesting that
water content has little or no effect on the crystal form of the cocoa butter emulsions.
However, it should be noted that the aqueous phase volume might affect the accuracy
of the melting enthalpy calculations.

Chapter 7 Cocoa Butter Emulsions
174
Fig. 7.6 Average temperature peak of cocoa butter emulsions (containing 10, 20 and 30% water) emulsified using a high shear mixer, at varying time intervals (from 1 day to 24 weeks).
7.2.5 Conclusions
It has been shown that the presence of 1% PGPR results in 100% of the water being
emulsified in small droplets (3-4μm) at 10 and 20% water contents, which is higher
than observed for lecithin. At this water content, the droplets are in the size range
preventing detection in the mouth (the mouth can typically detect particles of 10μm in
diameter; de Wijk & Prinz, 2005), or microbial growth (droplet sizes less than 20μm
do not harbor bacteria in W/O margarines; Duncan, Yaun & Sumner, 2004), although
this was beyond the scope of the study. Furthermore, the smooth crystalline shells at
the droplet interface suggest sintering of fat crystals has occurred giving greater
Chapter 7 Cocoa Butter Emulsions
175
physical and microbial stability. Some fracturing of the shells was evident, which
probably explains the possible water loss being observed on storage. Future work
should investigate whether fracturing can be prevented, resulting in greater stability.
Water droplets within the cocoa butter do not appear to affect the melting properties
of the fat. However, the lack of accurate temperature control during processing does
not reliably produce emulsions with crystals in form V. Although the work presented
here shows that form V crystals develop over time, it is preferable to produce an
emulsion with crystals in form V directly from processing, and not after a time delay
of five weeks or more. By controlling the temperature during processing it may be
possible to seed form V directly in the process. As the margarine line offers accurate
temperature control, and is a continuous process allowing higher production rates, it
was investigated as an alternative processing route, and reported in the next section.
7.3 Margarine Line
A number of cocoa butter emulsions were prepared on a bench scale margarine line as
detailed in Table 7.5. The samples produced all had 20% aqueous phase and 1%
PGPR. PGPR was selected because as reported in the previous section of this Chapter,
it resulted in emulsions which were fully emulsified at 20% aqueous phase when
processed with the Silverson high shear mixer (see Section 7.2). Processing
parameters, shafts speeds, throughput, and outlet temperatures were investigated (see
Table 7.5). As sugar is an ingredient in chocolate it was also decided to investigate the
effect of sugar (up to 20%) within the aqueous phase. The reason for doing this was
that if sugar comes into contact with water in chocolate the sugar crystals aggregate
and form lumps. This increases the friction and viscosity of the chocolate (Afoakwa et
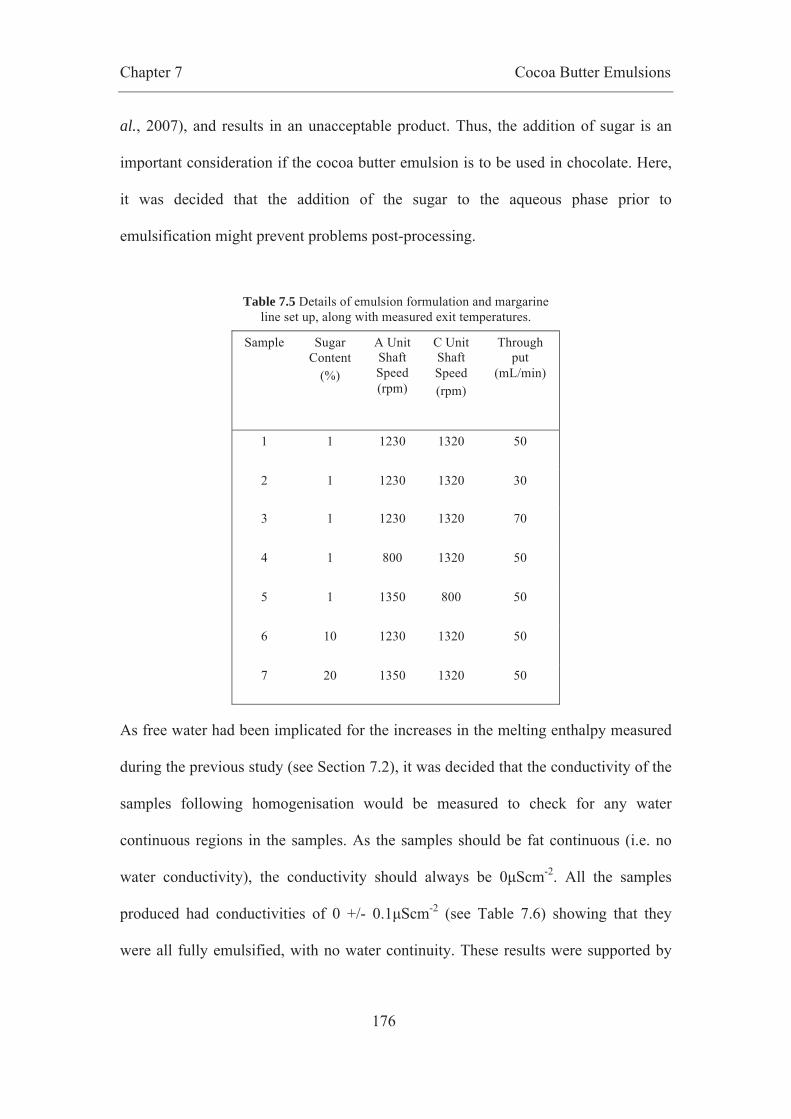
Chapter 7 Cocoa Butter Emulsions
176
al., 2007), and results in an unacceptable product. Thus, the addition of sugar is an
important consideration if the cocoa butter emulsion is to be used in chocolate. Here,
it was decided that the addition of the sugar to the aqueous phase prior to
emulsification might prevent problems post-processing.
Table 7.5 Details of emulsion formulation and margarine line set up, along with measured exit temperatures.
Sample Sugar Content
(%)
A Unit Shaft Speed (rpm)
C Unit Shaft Speed (rpm)
Through put
(mL/min)
1 1 1230 1320 50
2 1 1230 1320 30
3 1 1230 1320 70
4 1 800 1320 50
5 1 1350 800 50
6 10 1230 1320 50
7 20 1350 1320 50
As free water had been implicated for the increases in the melting enthalpy measured
during the previous study (see Section 7.2), it was decided that the conductivity of the
samples following homogenisation would be measured to check for any water
continuous regions in the samples. As the samples should be fat continuous (i.e. no
water conductivity), the conductivity should always be 0μScm-2. All the samples
produced had conductivities of 0 +/- 0.1μScm-2 (see Table 7.6) showing that they
were all fully emulsified, with no water continuity. These results were supported by

Chapter 7 Cocoa Butter Emulsions
177
NMR analysis (see Table 7.5) that showed that no free water was observed for any of
the samples, and all had small droplet sizes and normal size distributions.
NMR analysis (see Table 7.5) supported the conductivity measurements, and
indicated that all samples emulsified using the bench scale margarine line were fully
emulsified, with no free water, and droplets of between 0.6 and 4.9μm. These results
suggest that the margarine process resulted in smaller droplet sizes for samples 1-6,
than the droplets produced using the Silverson (i.e. 1.5μm and 3-4μm, respectively).
This would be expected, as the residence time in the margarine line is longer, giving
greater time for the emulsifier and the crystals to get to the droplet interface as the
emulsion droplets are formed. The addition of 20% sugar to the aqueous phase had a
small effect on droplet size, with the largest droplets (4.9μm) being observed for
sample 7. The reason for this increased droplet size is unclear; however, this droplet
size is still in the range that is expected to result in stable emulsions.
Table 7.6 NMR analysis for cocoa butter emulsions produced using the margarine line. Sample includes 20% water and varying percentages of sugar. Sigma (σ) is presented in brackets.
Margarine Samples Sample Percentage water in
droplets >100μm Percentage water in
droplets <100μm d3.2 (μm) Conductivity
(μScm-2) 1 0 100 1.6 (0.1) 0 2 0 100 1.5 (0.1) 0 3 0 100 1 (0.2) 0 4 0 100 1.4 (0.1) 0 5 0 100 0.6 (0.1) 0 6 0 100 1.3 (0.3) 0 7 0 100 4.9 (0.9) 0
Again, in order to investigate the polymorphic form of the cocoa butter, calorimetry
was carried out on the samples; the data in Table 7.7 are averages of triplicates.
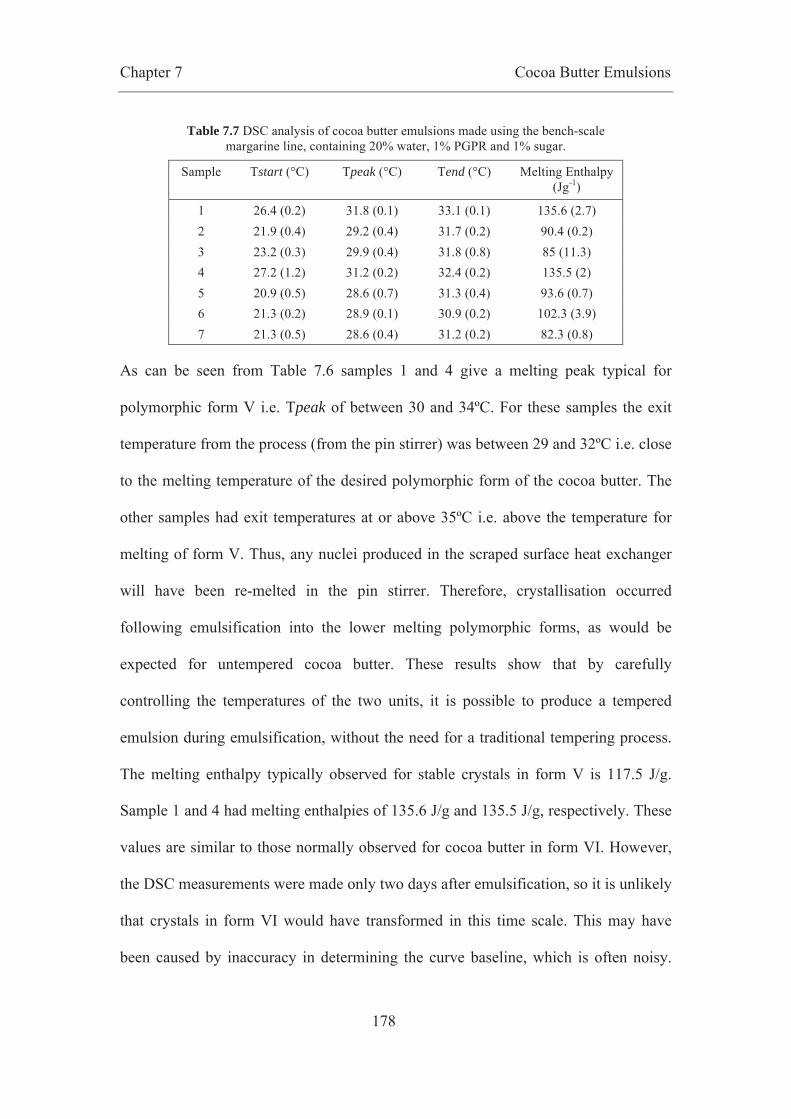
Chapter 7 Cocoa Butter Emulsions
178
Table 7.7 DSC analysis of cocoa butter emulsions made using the bench-scale margarine line, containing 20% water, 1% PGPR and 1% sugar.
Sample Tstart (°C)
Tpeak (°C)
Tend (°C)
Melting Enthalpy (Jg-1)
1 26.4 (0.2) 31.8 (0.1) 33.1 (0.1) 135.6 (2.7) 2 21.9 (0.4) 29.2 (0.4) 31.7 (0.2) 90.4 (0.2) 3 23.2 (0.3) 29.9 (0.4) 31.8 (0.8) 85 (11.3) 4 27.2 (1.2) 31.2 (0.2) 32.4 (0.2) 135.5 (2) 5 20.9 (0.5) 28.6 (0.7) 31.3 (0.4) 93.6 (0.7) 6 21.3 (0.2) 28.9 (0.1) 30.9 (0.2) 102.3 (3.9) 7 21.3 (0.5) 28.6 (0.4) 31.2 (0.2) 82.3 (0.8)
As can be seen from Table 7.6 samples 1 and 4 give a melting peak typical for
polymorphic form V i.e. Tpeak of between 30 and 34ºC. For these samples the exit
temperature from the process (from the pin stirrer) was between 29 and 32ºC i.e. close
to the melting temperature of the desired polymorphic form of the cocoa butter. The
other samples had exit temperatures at or above 35ºC i.e. above the temperature for
melting of form V. Thus, any nuclei produced in the scraped surface heat exchanger
will have been re-melted in the pin stirrer. Therefore, crystallisation occurred
following emulsification into the lower melting polymorphic forms, as would be
expected for untempered cocoa butter. These results show that by carefully
controlling the temperatures of the two units, it is possible to produce a tempered
emulsion during emulsification, without the need for a traditional tempering process.
The melting enthalpy typically observed for stable crystals in form V is 117.5 J/g.
Sample 1 and 4 had melting enthalpies of 135.6 J/g and 135.5 J/g, respectively. These
values are similar to those normally observed for cocoa butter in form VI. However,
the DSC measurements were made only two days after emulsification, so it is unlikely
that crystals in form VI would have transformed in this time scale. This may have
been caused by inaccuracy in determining the curve baseline, which is often noisy.
Chapter 7 Cocoa Butter Emulsions
179
This will naturally cause errors in the peak area, however for samples containing
water this is amplified as the size of the peak decreases. Ideally a micro-DSC would
be used as it allows larger samples to be loaded, increasing the size of the peak in
comparison to any noise, reducing any errors. The remaining samples (2, 3, 5, 6, and
7), all of which had exit temperatures above the melting temperatures of form V, had
unstable crystals, with Tpeaks, and melting enthalpies lower than expected for form V
crystals. This would be expected, as any form V seeds produced in the A unit would
have been remelted before the emulsions exited the pin stirrer, as discussed
previously.
Cryo-SEM images were taken of a number of emulsions homogenised using the
margarine line (see Fig. 7.7). Image a) shows a continuous fat phase with large
indentations which are thought to be air bubbles, introduced into the system during
emulsification (probably during the pre-emulsification step). The process needs to be
improved so that air is not routinely incorporated in to the samples, by improving the
inlet connections, and by using a more consistent pump. These air cells are far larger
in size than the water droplets measured by NMR for the same sample (approximately
20μm, rather than 1-5μm). In image b) a similar continuous fat phase can be
observed, with indentations and protrusions of approximately 40-50μm in size, which
are also thought to be air bubbles. Smaller protrusions of approximately 10μm are
also evident, which are the sintered fat crystal shells covering the surface of the water
droplets. Similar structures have previously been observed in W/O spreads by SEM
(Heertje, 1993; Heertje, 1998; Alexa, Mounsey, O'Kennedy & Jacquier, 2010).

Chapter 7 Cocoa Butter Emulsions
180
Fig. 7.7 Micrographs of cocoa butter emulsions processed using A and C units: a. cryo-SEM image of a
continuous fat phase with indentations of air bubbles created during emulsification, b. cryo-SEM image of a continuous fat phase with indentations and protrusions of air bubbles, and protrusions of water droplets c. cryo-SEM image of a continuous fat phase with an indentation of a air bubble, with water droplets at the interface, and d. light microscope image of an emulsion made on the A and C units, showing the distribution of water
droplets within the fat matrix.
In image c) a continuous fat phase can be seen, with the indentation of an air bubble.
At the interface of the air bubble and the fat a number of water droplets with fat
crystal shells can be observed. These have fractured shells, showing similar structures
to those reported in the previous section of the chapter, which possibly indicate a
sugar structure produced by the freezing process, as previously discussed (see Section
7.2.1). Figure 7.7.d shows a typical light micrograph obtained, in which the
distribution of water droplets (approximately 5μm in size) within the fat matrix can be
seen. Although a number of larger droplets are evident they account for only a very
small percentage of the phase volume.
Chapter 7 Cocoa Butter Emulsions
181
7.3.1 Conclusions
All of the samples produced using the margarine line had fully emulsified water, with
small droplets (1-5μm). It was shown that crystals in form V could be produced
during the process, probably as a result of the shear, but the study highlighted the
need for careful temperature control in order to successfully mimic the tempering
process.
7.4 Overall Conclusions
Using the high shear mixer resulted in stable, fully emulsified W/O cocoa butter
emulsions with water contents of up to 20%, that had no ‘free’ water, and droplets of
1.6 – 4μm. The DSC results suggest that by storing the cocoa butter emulsions at 5°C
over approximately a 5 week period, emulsions with a melting point and melting
enthalpy similar to tempered cocoa butter in form V were produced. Furthermore, this
was independent of water content. Samples with 10, 30 and 50% water all followed
the same trend, transforming from form IV to form V over a similar number of weeks,
suggesting that the water content has little effect on the melting characteristics of the
emulsions.
The bench scale margarine line offered temperature control during the process, and
providing that the temperatures of the two units were controlled to produce form V
crystals, a cocoa butter emulsion with crystals in the desired form for chocolate could
be produced successfully. The margarine line has been shown to be more successful
for creating an emulsion with fat in the polymorphic form V, as the temperature and
shear of the two units can be controlled with more precision. Thus, it offers an
Chapter 7 Cocoa Butter Emulsions
182
advantage over the high shear mixer because emulsification and tempering can occur
during the same processing stage, without the need for a delay of weeks or months.
Furthermore, it is more appropriate for large-scale industrial production as it is a
continuous process, and if with further work it can be produced in a similar way to
margarine, this process could be used to produce chocolate up to 10tonnes/hr on a
single line (a typical margarine line capacity).
Thus, this study demonstrates that the production of cocoa butter emulsions can be
achieved using technology typically used for margarine manufacture. It shows the
potential for the use of cocoa butter emulsions in chocolate formulations for fat
reduction. Furthermore, the observation of crystalline shells at the water droplet
interface offers potential when adding the other chocolate ingredients. Providing that
the crystal shells are thick enough (which should form part of further studies), this
would create a barrier to physically separate the water from the cocoa solids and
sugar. This could overcome the problem that occurs if water comes in to contact with
the dry ingredients: the particles will aggregate, having a dramatic effect on viscosity.
If this can be prevented using Pickering stabilised droplets, it will be possible to add
the dry particles post-emulsification. Thus, it was decided that the addition of sugar
directly to the aqueous phase of the cocoa butter emulsion could be avoided in the
future.
The methods of analysis (NMR, DSC and SEM) were successful for gaining
sufficient microstructural information about the cocoa butter emulsions. Both NMR
and SEM offer comparable indications of droplet size, whilst DSC provides

Chapter 7 Cocoa Butter Emulsions
183
information about crystal form, which is important when producing an emulsion, or
when working with cocoa butter.
Further work should aim at manipulating more variables both in terms of formulation
(for example, the percentage of emulsifier used), and processing (shaft speeds,
temperature of units, pump speed) in order to optimise the process, and reliably
produce an emulsion that contains small droplets, and fat crystals in polymorphic
form V directly from emulsification. Further work should also aim at adding the
particulates post-emulsification to consider the effect of the water within the emulsion
on the final chocolate.

Chapter 8 Formulation and Processing Parameters
184
8. Effect of changes in formulation and processing parameters on
melting profile and water droplet size
8.1 Introduction
During Chapter 7, studies on the production of cocoa butter emulsions were
described. The W/O emulsions were produced using both a high shear mixer, and a
margarine line. The use of PGPR resulted in fully emulsified emulsions (100% of the
droplets were 3-4μm in size), and the temperature control of the margarine line
allowed for the production of emulsions with ‘tempered’ cocoa butter. Furthermore,
smooth crystalline shells were observed at the droplet interface, suggesting that the fat
crystals act as Pickering particles, stabilising the water droplets, resulting in greater
physical stability. The aim of the research described in this chapter was to investigate
the effect of adding gelatin to the aqueous phase. Gelatin is added to the aqueous
phase of low-fat spreads both to improve processing of the emulsion as the water
content is increased, and to prevent coalescence by increasing the viscosity of the
dispersed phase (Rousseau et al., 2003). In this study the aim was to increase the
stability of the emulsion, as defined by the droplet size and ‘free’ water content
(percentage of droplets above 100μm in size). This was investigated using the
margarine line, and by manipulating the shaft speeds and temperatures of both the
units and the throughput (flow) in order to optimise the process. Furthermore, changes
in the emulsifier concentration were investigated (i.e. the percentage of PGPR).
Biopolymers are often used in food emulsions to gel the aqueous phase and stabilise
the emulsion by preventing coalescence, flocculation, sedimentation or creaming (see

Chapter 8 Formulation and Processing Parameters
185
Section 1.4.7.5). Gelatin is often added to fat-reduced spreads to hinder coalescence
by increasing the viscosity of the dispersed phase (Rousseau et al., 2003). Gelatin is
particularly favourable as it has a similar consistency and ‘melt-in-mouth’ behaviour
to the fats typically used in foods (Clegg et al., 1996). Figure 8.1 shows the melting
profile of three gelatin gels (6, 8 and 10% gelatin in water). The melting peak
(31.9°C, σ = 0.8) is very similar to that cited in the literature for cocoa butter in
polymorphic form V (Loisel et al., 1998), making it an advantageous addition to the
aqueous phase, as it can be processed at the same temperature at cocoa butter, and
should not be detected by the consumer.
Fig. 8.1 DSC curve indicating the melting profile of solid gelatin solutions, containing 6, 8 and 10% gelatin. Pans were heated from 5°C to 45°C at a rate of 2°C/min. An empty pan was used as a
reference. These results have been normalised for sample size. Melting peak for 6% gelatin is 32.3°C (0.5), for 8% is 31.6°C (0.9) and for 10% is 31.8°C (1).

Chapter 8 Formulation and Processing Parameters
186
Thus, gelatin could be used in a cocoa butter emulsion to improve stability, and help
prevent moisture loss on fracture (e.g. on snapping) by structuring the water.
8.2 Formulation Changes
8.2.1 Percentage of PGPR
The emulsions produced, studied, and described in Chapter 5 contained either soya
bean lecithin or PGPR. It was shown (see Chapter 7) that for emulsions containing
smaller aqueous phase volumes (i.e. 10 and 20%), PGPR was a more powerful
emulsifier, emulsifying 100% of the available water, so that the emulsion contained
no ‘free’ water (i.e. all the droplets produced were smaller than 100μm). Furthermore,
the droplets produced were small, typically between 1 and 5μm in size. However,
only one percentage of PGPR was considered (1%). Here, a number of W/O
emulsions containing 20% aqueous phase were produced, containing different
percentages of PGPR (0.1, 0.5, 1, 2 and 5%) within the fat phase. The emulsions were
all made with 20% aqueous phase (of which 5% is gelatin from porcine skin, 250
bloom, i.e. 1% gelatin in the total emulsion), and 80% lipid phase (cocoa butter and
PGPR). During processing, the cocoa butter and PGPR were heated to 60°C, and the
gelatin was dissolved in the water, also at a temperature of 60°C. The A Unit was set
to 920 rpm and held at a constant temperature of 20°C, and the C Unit was set to 900
rpm and held at a constant temperature of 30°C. The throughput was set to 50
mL/min. This gives an average residence time of 48 seconds for the A unit, and 3
minutes for the C unit.
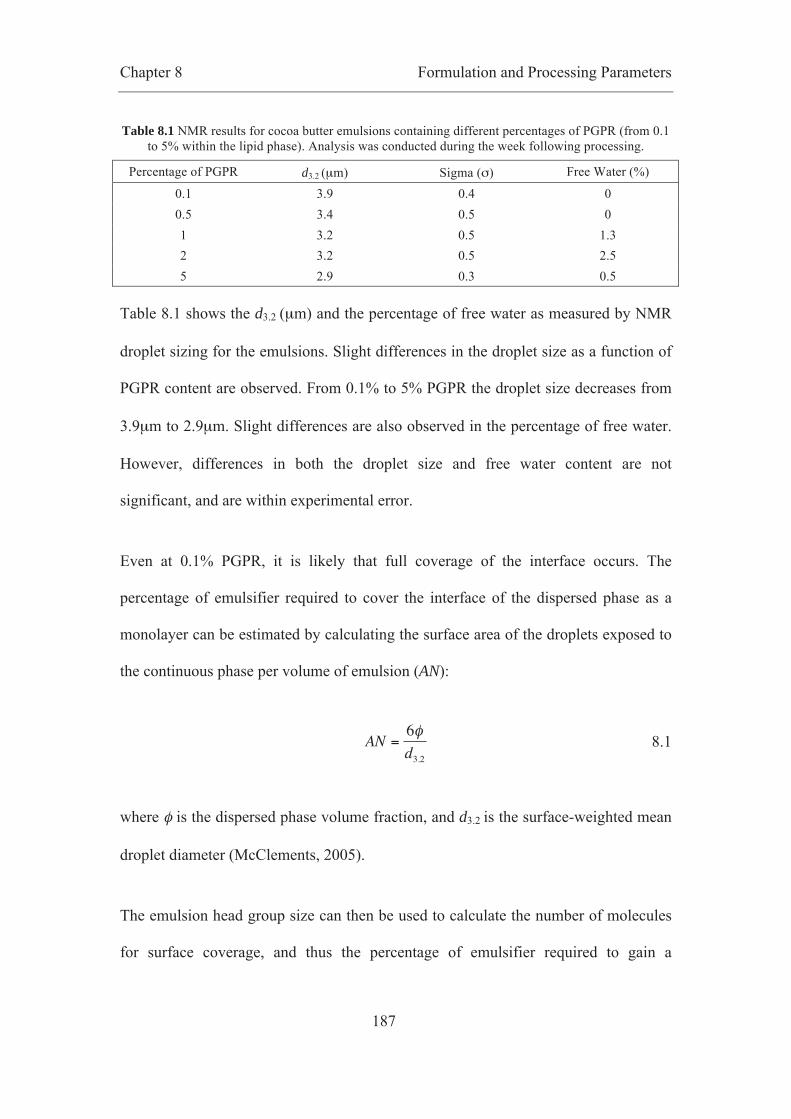
Chapter 8 Formulation and Processing Parameters
187
Table 8.1 NMR results for cocoa butter emulsions containing different percentages of PGPR (from 0.1 to 5% within the lipid phase). Analysis was conducted during the week following processing.
Percentage of PGPR d3.2 (μm) Sigma (σ) Free Water (%)
0.1 3.9 0.4 0 0.5 3.4 0.5 0 1 3.2 0.5 1.3 2 3.2 0.5 2.5 5 2.9 0.3 0.5
Table 8.1 shows the d3.2 (μm) and the percentage of free water as measured by NMR
droplet sizing for the emulsions. Slight differences in the droplet size as a function of
PGPR content are observed. From 0.1% to 5% PGPR the droplet size decreases from
3.9μm to 2.9μm. Slight differences are also observed in the percentage of free water.
However, differences in both the droplet size and free water content are not
significant, and are within experimental error.
Even at 0.1% PGPR, it is likely that full coverage of the interface occurs. The
percentage of emulsifier required to cover the interface of the dispersed phase as a
monolayer can be estimated by calculating the surface area of the droplets exposed to
the continuous phase per volume of emulsion (AN):
AN =
6φd3.2
8.1
where φ is the dispersed phase volume fraction, and d3.2 is the surface-weighted mean
droplet diameter (McClements, 2005).
The emulsion head group size can then be used to calculate the number of molecules
for surface coverage, and thus the percentage of emulsifier required to gain a

Chapter 8 Formulation and Processing Parameters
188
monolayer at the droplet interface. This method was used to calculate the percentage
of PGPR required to form a monolayer in an emulsion with 20% water (dispersed
phase), with 5μm diameter droplets, assuming that the head group size of PGPR is
1nm2, which is in the range measured for tweens and spans (Apenten & Zhu, 1996;
Henry, Fryer, Frith & Norton, 2009). In static conditions 0.01% PGPR would be
required to form a monolayer. For an emulsion with 20% water and 2μm droplets,
0.2% PGPR would be required to form a monolayer.
However, by adding an excess of emulsifier to the system it ensures that full coverage
of the interface is achieved during the process, allowing for stable droplets to be
produced. The results indicate that PGPR covers the interface more efficiently in the
margarine line than the Silverson (see Chapter 7), probably because the residence
time is longer, allowing longer for the emulsifier to reach the interface. Furthermore,
stability of the emulsion is not limited to the percentage of PGPR, but is also affected
by the quantity of gelatin used as it has surface activity, and the crystallisation of the
fat during processing (as discussed later).
8.2.2 Gelatin Concentration
The quantity of gelatin used was investigated, in conjunction with the percentage of
water within the system. Emulsions with 10 – 50% water were produced, with no
gelatin, or with 2.5% or 5% gelatin. During processing, the cocoa butter and PGPR
were heated to 60°C, and the gelatin was dissolved in the water, also at a temperature
of 60°C. The A Unit was set to 920 rpm and held at a constant temperature of 20°C,
Chapter 8 Formulation and Processing Parameters
189
and the C Unit was set to 900 rpm and held at a constant temperature of 30°C. The
pump speed was 50 mL/min.
As can be seen from Table 8.2, when the aqueous phase of the emulsion contained no
gelatin, droplet size was not affected by the phase volume of water, with all the
emulsions (containing 10 – 50% water) having small droplets (3-5μm), and very little,
or no, free water (0-1%). With the addition of 2.5% gelatin to the aqueous phase,
droplet size and free water content were comparable to that measured for emulsions
containing no gelatin, with droplets measuring between and 3-5μm in size, with no
free water. However, the addition of 5% gelatin to the aqueous phase resulted in large
droplets and a high percentage of free water (i.e. droplets above 100μm) when the
emulsion contained high quantities of water (i.e. 40 and 50% water). This was thought
to be an outcome of a high phase volume of water, which resulted in a partial phase
inversion, producing a bicontinuous system. This effect was not observed for lower
quantities of gelatin. It is possible that at this percentage of gelatin, and aqueous phase
volume, gelation is occurring within the process, preventing the production of small
droplets. Equally, it may be as a result of competition for the interface between the
PGPR (favouring oil continuous systems) and gelatin (favouring water continuous
systems). For this formulation the processing parameters may need to be adapted.
As can be seen from the Tpeaks and melting enthalpies, there are no significant
differences between the samples. All the samples have lower melting points than
typically observed for crystals in form V (Loisel et al., 1998), suggesting crystals in
form IV. This is likely to be as a result of the processing temperatures, highlighting
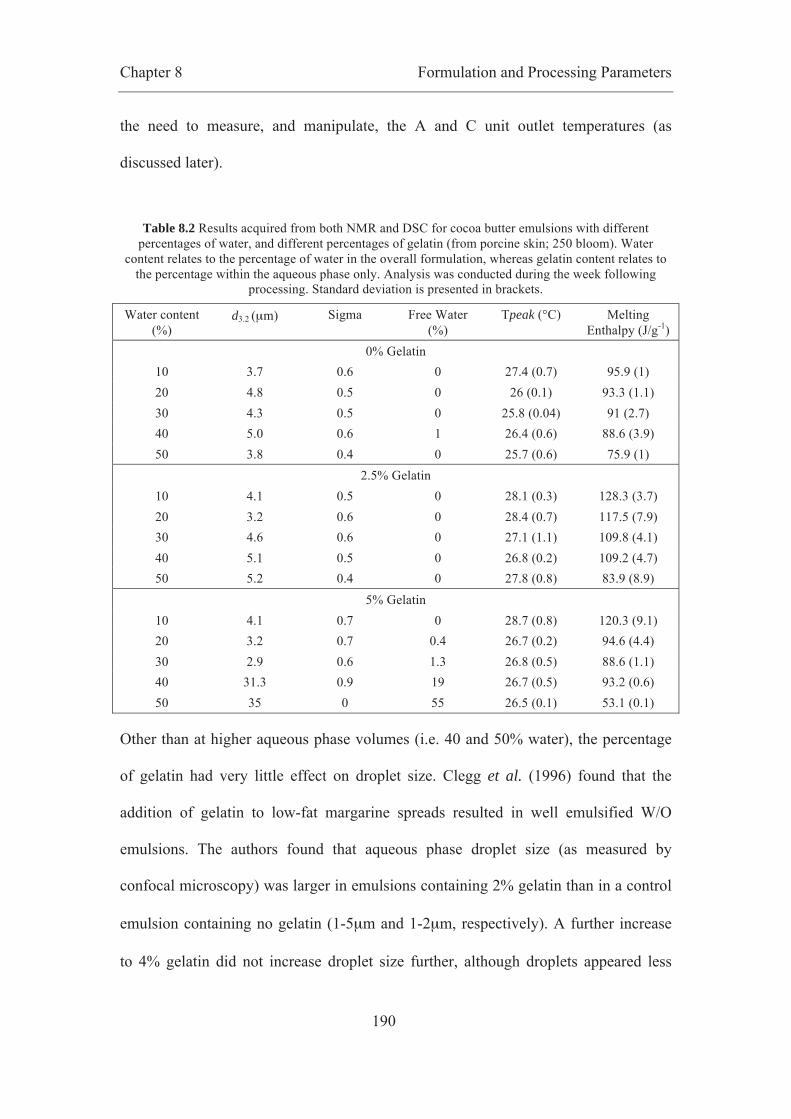
Chapter 8 Formulation and Processing Parameters
190
the need to measure, and manipulate, the A and C unit outlet temperatures (as
discussed later).
Table 8.2 Results acquired from both NMR and DSC for cocoa butter emulsions with different percentages of water, and different percentages of gelatin (from porcine skin; 250 bloom). Water
content relates to the percentage of water in the overall formulation, whereas gelatin content relates to the percentage within the aqueous phase only. Analysis was conducted during the week following
processing. Standard deviation is presented in brackets.
Water content (%)
d3.2 (μm) Sigma Free Water (%)
Tpeak (°C) Melting Enthalpy (J/g-1)
0% Gelatin 10 3.7 0.6 0 27.4 (0.7) 95.9 (1) 20 4.8 0.5 0 26 (0.1) 93.3 (1.1) 30 4.3 0.5 0 25.8 (0.04) 91 (2.7) 40 5.0 0.6 1 26.4 (0.6) 88.6 (3.9) 50 3.8 0.4 0 25.7 (0.6) 75.9 (1)
2.5% Gelatin 10 4.1 0.5 0 28.1 (0.3) 128.3 (3.7) 20 3.2 0.6 0 28.4 (0.7) 117.5 (7.9) 30 4.6 0.6 0 27.1 (1.1) 109.8 (4.1) 40 5.1 0.5 0 26.8 (0.2) 109.2 (4.7) 50 5.2 0.4 0 27.8 (0.8) 83.9 (8.9)
5% Gelatin 10 4.1 0.7 0 28.7 (0.8) 120.3 (9.1) 20 3.2 0.7 0.4 26.7 (0.2) 94.6 (4.4) 30 2.9 0.6 1.3 26.8 (0.5) 88.6 (1.1) 40 31.3 0.9 19 26.7 (0.5) 93.2 (0.6) 50 35 0 55 26.5 (0.1) 53.1 (0.1)
Other than at higher aqueous phase volumes (i.e. 40 and 50% water), the percentage
of gelatin had very little effect on droplet size. Clegg et al. (1996) found that the
addition of gelatin to low-fat margarine spreads resulted in well emulsified W/O
emulsions. The authors found that aqueous phase droplet size (as measured by
confocal microscopy) was larger in emulsions containing 2% gelatin than in a control
emulsion containing no gelatin (1-5μm and 1-2μm, respectively). A further increase
to 4% gelatin did not increase droplet size further, although droplets appeared less
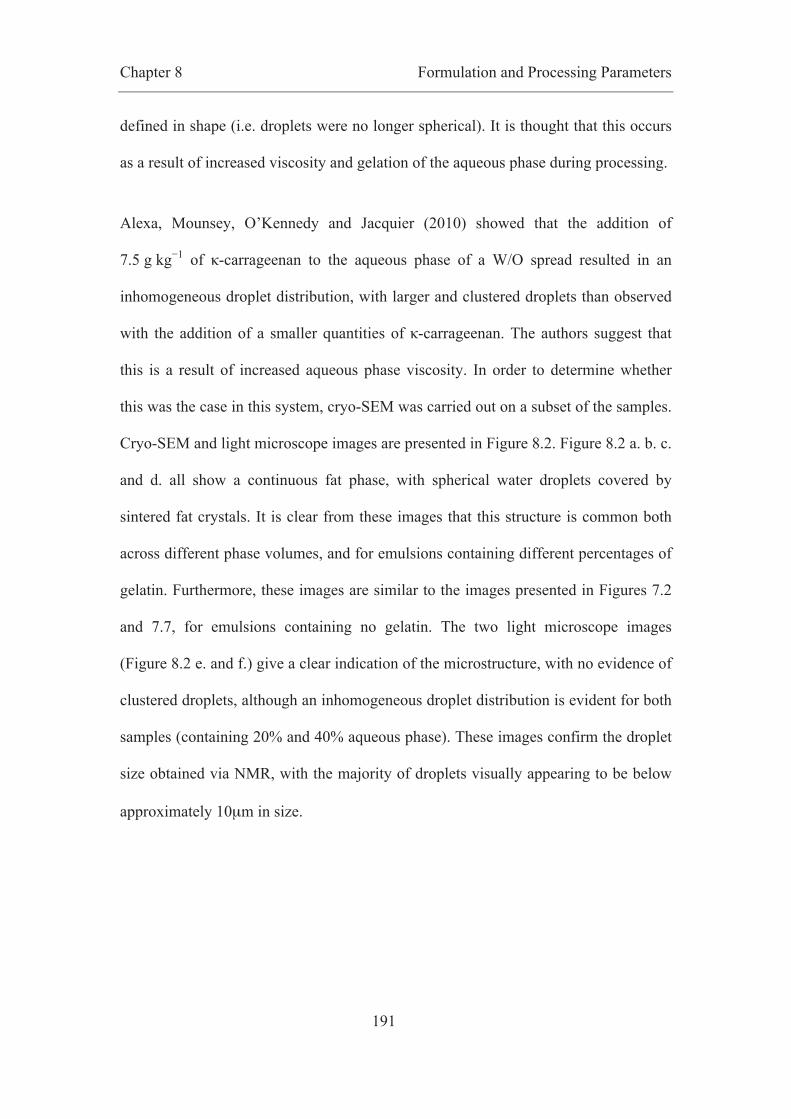
Chapter 8 Formulation and Processing Parameters
191
defined in shape (i.e. droplets were no longer spherical). It is thought that this occurs
as a result of increased viscosity and gelation of the aqueous phase during processing.
Alexa, Mounsey, O’Kennedy and Jacquier (2010) showed that the addition of
7.5 g kg−1 of κ-carrageenan to the aqueous phase of a W/O spread resulted in an
inhomogeneous droplet distribution, with larger and clustered droplets than observed
with the addition of a smaller quantities of κ-carrageenan. The authors suggest that
this is a result of increased aqueous phase viscosity. In order to determine whether
this was the case in this system, cryo-SEM was carried out on a subset of the samples.
Cryo-SEM and light microscope images are presented in Figure 8.2. Figure 8.2 a. b. c.
and d. all show a continuous fat phase, with spherical water droplets covered by
sintered fat crystals. It is clear from these images that this structure is common both
across different phase volumes, and for emulsions containing different percentages of
gelatin. Furthermore, these images are similar to the images presented in Figures 7.2
and 7.7, for emulsions containing no gelatin. The two light microscope images
(Figure 8.2 e. and f.) give a clear indication of the microstructure, with no evidence of
clustered droplets, although an inhomogeneous droplet distribution is evident for both
samples (containing 20% and 40% aqueous phase). These images confirm the droplet
size obtained via NMR, with the majority of droplets visually appearing to be below
approximately 10μm in size.
Chapter 8 Formulation and Processing Parameters
192
Fig. 8.2 Micrographs of cocoa butter emulsions: a. cryo-SEM image of an 30% aqueous phase emulsion containing no gelatin, b. a cryo-SEM image of a 30% aqueous phase emulsion containing no gelatin, c. a cryo-SEM image of a 40% aqueous phase emulsion containing 5% gelatin, d. a cryo-SEM image of a 10% aqueous phase emulsion containing 5% gelatin, e. a light microscope image of a 20% aqueous phase emulsion containing 2.5% gelatin, f. a light microscope image of a 40% aqueous phase emulsion containing 2.5% gelatin. Analysis was conducted within a week of the emulsion preparation.
Chapter 8 Formulation and Processing Parameters
193
8.3 Processing Parameters
8.3.1 A & C Unit Rotation Speeds
To investigate the effect of processing on emulsion and crystal properties a number of
parameters were manipulated. All the emulsions produced contained 20% aqueous
phase (of which 5% was gelatin), and contained 1% PGPR. The A and C unit rotation
speeds were manipulated, from a relatively low speed (170 rpm) to the fastest
achievable speed of the units (1300 rpm), to consider the effect on droplet size.
Combinations of different speeds of the units were used to consider the relative
impact of shear rates of both the units. The A unit temperature was set to 20°C, the C
unit temperature was set to 30°C and the throughput was set to 50mL/min.
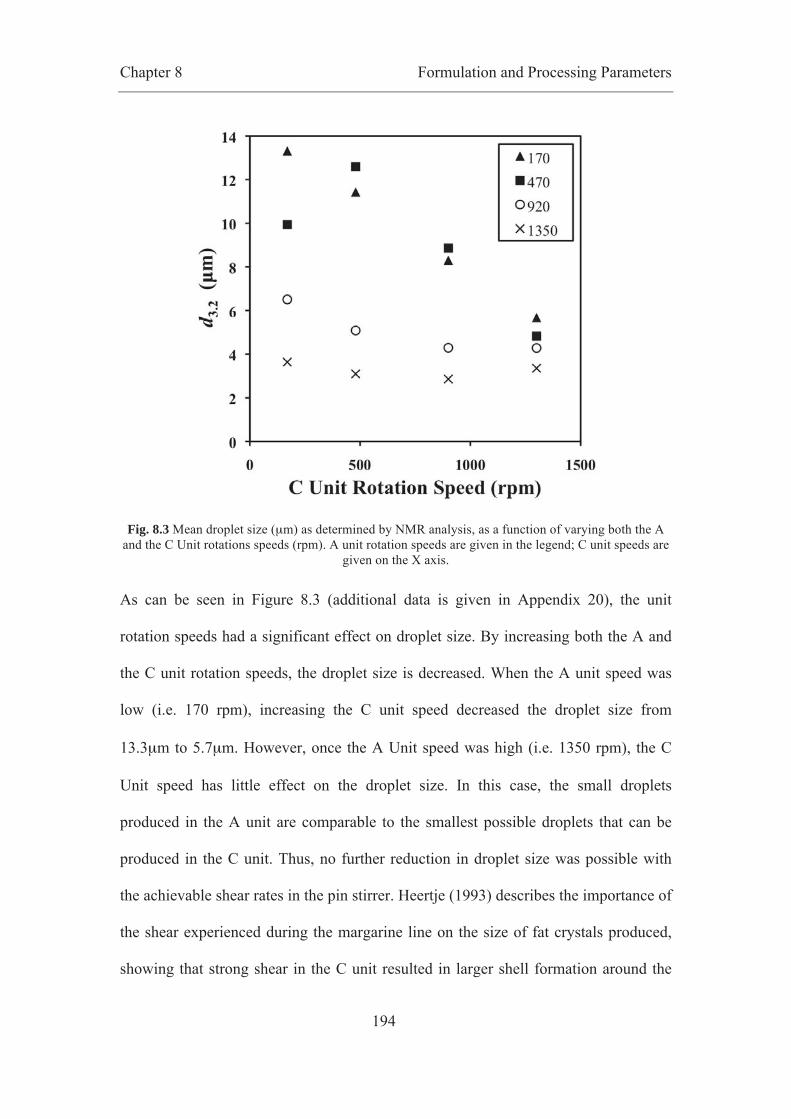
Chapter 8 Formulation and Processing Parameters
194
Fig. 8.3 Mean droplet size (μm) as determined by NMR analysis, as a function of varying both the A and the C Unit rotations speeds (rpm). A unit rotation speeds are given in the legend; C unit speeds are
given on the X axis.
As can be seen in Figure 8.3 (additional data is given in Appendix 20), the unit
rotation speeds had a significant effect on droplet size. By increasing both the A and
the C unit rotation speeds, the droplet size is decreased. When the A unit speed was
low (i.e. 170 rpm), increasing the C unit speed decreased the droplet size from
13.3μm to 5.7μm. However, once the A Unit speed was high (i.e. 1350 rpm), the C
Unit speed has little effect on the droplet size. In this case, the small droplets
produced in the A unit are comparable to the smallest possible droplets that can be
produced in the C unit. Thus, no further reduction in droplet size was possible with
the achievable shear rates in the pin stirrer. Heertje (1993) describes the importance of
the shear experienced during the margarine line on the size of fat crystals produced,
showing that strong shear in the C unit resulted in larger shell formation around the

Chapter 8 Formulation and Processing Parameters
195
water droplets. It was suggested that this is as a result of enhanced transport of fat
crystals to the O/W interface, in addition to smaller crystals being produced. With no
stirring in the C unit the crystals aggregate, and so are no longer available for
Pickering. Heertje (1993) emphasises the importance of temperature, as over
crystallisation can increase viscosity, resulting in coalescence, and a coarser
emulsion; the fat should be in a liquid-like state to produce the smallest droplets.
Whilst changing the A and C unit rotation speeds has an effect on droplet size, it did
not seem to affect the melting characteristics of the emulsion, with all samples
melting at a similar temperature (between 27.1°C and 28.6°C), with no obvious
relationship being observed (see Fig. 6.4).
Fig. 8.4 DSC curves for emulsions processed under different conditions, a. A unit 170 rpm, C unit 170 rpm, b. A unit 470 rpm, C unit 480 rpm, c. A unit 920 rpm, C unit 900 rpm, d. A unit 1350 rpm, C unit
1300 rpm.

Chapter 8 Formulation and Processing Parameters
196
It is possible that a high shaft speed in A Unit would create small fat crystals that will
improve bulk crystallisation following tempering; however, this was not observed. It
is likely that the temperature of the units is more important in controlling the
polymorphic form of the fat, as discussed in the previous chapter. Therefore, this was
investigated and reported in the next section.
8.3.2 A & C Unit Temperatures
In order to determine the effect upon melting characteristics and droplet size, the
jacket temperatures of the A unit and the C unit were manipulated. Process inlet
temperature and unit outlet temperatures were measured in order to accurately record
the emulsion temperature during the emulsification process. All the emulsions
produced contained 20% aqueous phase (of which 5% was gelatin), and contained 1%
PGPR. The A unit was set to 920 rpm, the C unit was set to 900 rpm, and the
throughput was set to 50mL/min. In Figure 8.5 Tpeak (°C) is plotted as a function of
either A unit or C unit outlet temperature.
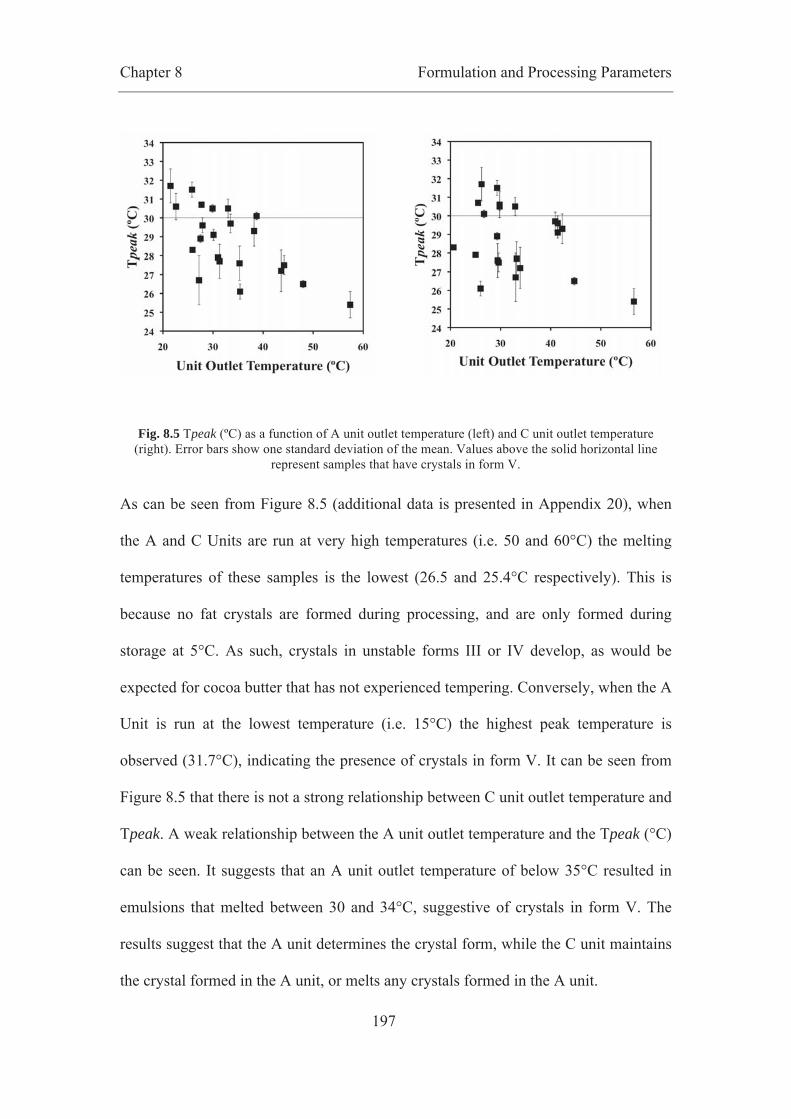
Chapter 8 Formulation and Processing Parameters
197
Fig. 8.5 Tpeak (ºC) as a function of A unit outlet temperature (left) and C unit outlet temperature (right). Error bars show one standard deviation of the mean. Values above the solid horizontal line
represent samples that have crystals in form V.
As can be seen from Figure 8.5 (additional data is presented in Appendix 20), when
the A and C Units are run at very high temperatures (i.e. 50 and 60°C) the melting
temperatures of these samples is the lowest (26.5 and 25.4°C respectively). This is
because no fat crystals are formed during processing, and are only formed during
storage at 5°C. As such, crystals in unstable forms III or IV develop, as would be
expected for cocoa butter that has not experienced tempering. Conversely, when the A
Unit is run at the lowest temperature (i.e. 15°C) the highest peak temperature is
observed (31.7°C), indicating the presence of crystals in form V. It can be seen from
Figure 8.5 that there is not a strong relationship between C unit outlet temperature and
Tpeak. A weak relationship between the A unit outlet temperature and the Tpeak (°C)
can be seen. It suggests that an A unit outlet temperature of below 35°C resulted in
emulsions that melted between 30 and 34°C, suggestive of crystals in form V. The
results suggest that the A unit determines the crystal form, while the C unit maintains
the crystal formed in the A unit, or melts any crystals formed in the A unit.

Chapter 8 Formulation and Processing Parameters
198
Fig. 8.6 Tpeak (ºC) as a function of the difference in temperature (ºC) between the process inlet temperature and the A unit outlet temperature. A positive value refers to an increase in temperature from the inlet to the outlet, whereas a negative value refers to a decrease in temperature between the
inlet and the outlet. Error bars show one standard deviation of the mean. Values above the solid horizontal line represent samples that have crystals in form V. DSC was conducted 24-48 hours after
emulsification.
This finding was analysed further by considering the difference in temperature
between the process inlet and the A unit outlet. The data is presented in Figure 8.6. It
can be seen that a decrease in temperature of at least 15°C results in a Tpeak of
between 30 and 34°C. Thus, both the A unit outlet temperature, and the difference in
temperature between the A unit inlet and the A unit outlet are important for crystal
growth. It seems that if the crystallisation rate is fast, then the crystals formed are
more stable and dominate the final polymorphic form. This is probably as a
consequence of both the number and size of the crystals formed in the A unit.
Therefore, to create a tempered cocoa butter emulsion the A Unit should be run at a
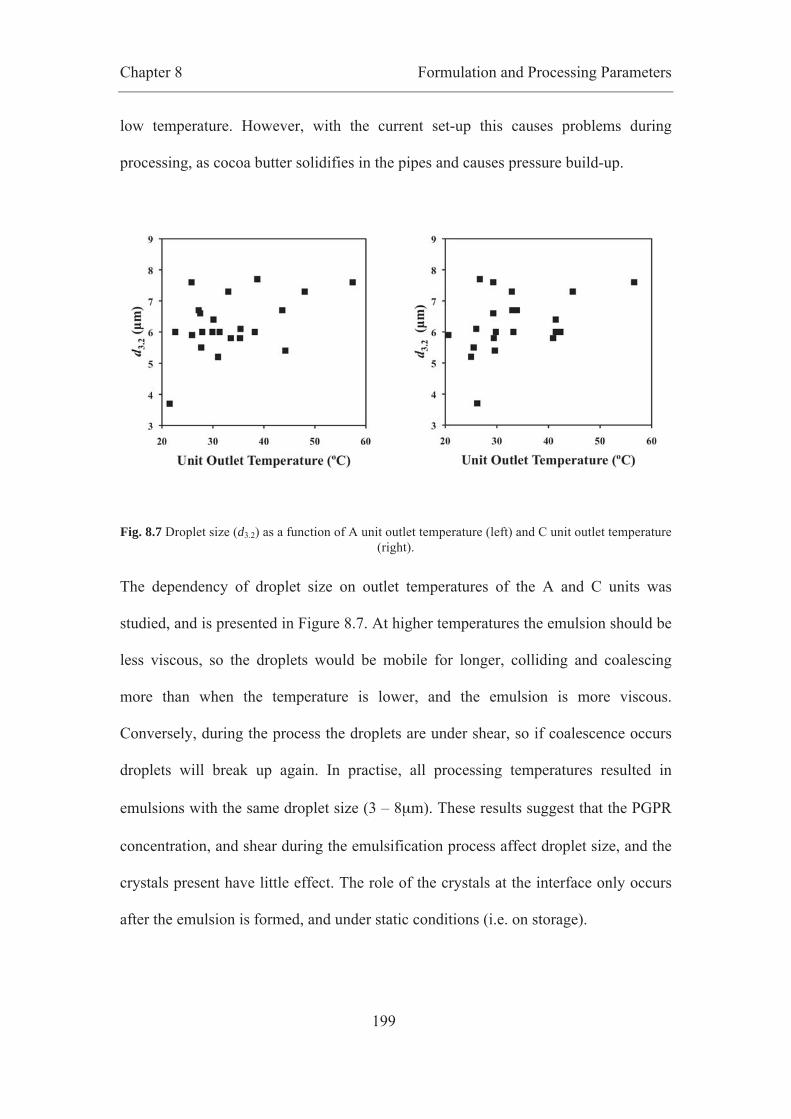
Chapter 8 Formulation and Processing Parameters
199
low temperature. However, with the current set-up this causes problems during
processing, as cocoa butter solidifies in the pipes and causes pressure build-up.
Fig. 8.7 Droplet size (d3.2) as a function of A unit outlet temperature (left) and C unit outlet temperature (right).
The dependency of droplet size on outlet temperatures of the A and C units was
studied, and is presented in Figure 8.7. At higher temperatures the emulsion should be
less viscous, so the droplets would be mobile for longer, colliding and coalescing
more than when the temperature is lower, and the emulsion is more viscous.
Conversely, during the process the droplets are under shear, so if coalescence occurs
droplets will break up again. In practise, all processing temperatures resulted in
emulsions with the same droplet size (3 – 8μm). These results suggest that the PGPR
concentration, and shear during the emulsification process affect droplet size, and the
crystals present have little effect. The role of the crystals at the interface only occurs
after the emulsion is formed, and under static conditions (i.e. on storage).

Chapter 8 Formulation and Processing Parameters
200
8.3.3 Throughput
It might be expected that the throughput has an effect on droplet size as the total
amount of shear experienced by the emulsion would be affected at any given rotation
speed of the A and C units. All the emulsions produced contained 20% aqueous phase
(of which 5% was gelatin), and contained 1% PGPR. The A unit was set to 920 rpm
and 20°C, the C unit was set to 900 rpm and 30°C. Different pump speeds were
investigated, the results of which are presented in Table 8.5 and Figure 8.8.
Table 8.5 Indicating Tpeak and melting enthalpy of emulsions produced using different pump speeds. For all emulsions, the A unit was set to 20°C and 1350 rpm, and the C unit was set to 30°C and 1300
rpm.
DSC NMR Throughput (mL/min)
Inlet Temp (°C)
A Unit Outlet Temp (°C)
C Unit Outlet Temp (°C)
Tpeak (°C)
Melting Enthalpy
(J/g-1)
d3.2 (μm)
Sigma Free water (%)
30 39.3 24.5 29.3 27.3 (0.3) 129.3 (2.6) 2.7 0.7 0 60 42.3 25.7 29.5 26.5 (0.2) 100 (1.1) 3.8 0.5 1
100 45 27.5 29.6 26.5 (-) 108 (-) 4.3 0.6 5 150 47.5 29.9 29.8 27 (0.5) 135.8 (1) 4.5 0.7 1.1 200 48.7 32.5 30.2 27.6 (0.5) 127.7 (4.2) 5.7 0.8 0
As can be seen in Figure 8.8, droplet size increases in a linear fashion over the range
of throughputs selected. This data shows that the residence time, and the total amount
of shear experienced by the emulsion is important in allowing droplet break up, due to
the time for the PGPR to get to the droplet interface.

Chapter 8 Formulation and Processing Parameters
201
Fig. 8.8 Droplet size as a function of pump speed (mL/min).
The crystal form is less affected by the throughput as can be seen in Table 8.5: only
slight differences in Tpeak are observed as the throughput is increased. This data
suggests that crystals in forms III and IV are formed. Although slight differences in
melting enthalpy were observed, these are within the experimental error, as discussed
in Chapter 7. Furthermore, the data is consistent with that presented in the previous
section (see section 8.3.2), where temperature was studied systematically;
polymorphic form is dependent on the outlet temperature of the units and the
difference in inlet and outlet temperature of the A unit.
8.4 Conclusions
The aim of this the work presented in this chapter was twofold: i) to explore changes
in cocoa butter emulsion formulation (i.e. the percentage of PGPR used, and the
Chapter 8 Formulation and Processing Parameters
202
addition of gelatin), and ii) to investigate the processing method (the margarine line)
by manipulating shaft speeds, unit temperatures and process throughput.
Slight differences in droplet size were observed as a function of PGPR content. From
0.1% to 5% PGPR droplet size decreased from 3.9μm to 2.9μm, in addition to some
variation in the percentage of free water. However, these differences are not thought
to be significant. Even at 0.1% PGPR with 20% aqueous phase, full coverage of the
interface is achieved. Further work could consider PGPR contents lower than the
0.1% level investigated here, or could investigate blends of lecithin and PGPR
(Schantz & Rohm, 2005). This approach may be favourable when producing the
emulsion for the market, as strict regulations exist within the food industry for the use
of PGPR.
The addition of gelatin, and the quantity of gelatin used, was also investigated. Very
little difference was observed between emulsions containing pure water (i.e. no
gelatin) or 2.5% gelatin within the aqueous phase, with small droplets (3-5μm), and
very little free water (0-1%). However, emulsions containing higher phase volumes of
water (40 and 50%), and 5% gelatin had large droplets, and much higher percentages
of free water, which was thought to indicate partial phase inversion as a result of the
surface activity of the gelatin, or gelation during the process. The results suggest that
the addition of gelatin does not offer an advantage over using pure water. In fact, at
the higher concentration of gelatin the emulsion had larger droplets and more free
water, which would inevitably affect the physical and microbial stability of the
emulsion, and the taste. Furthermore, there are likely to be issues surrounding the use
of animal derived products in foods that are typically vegetarian. It is also important
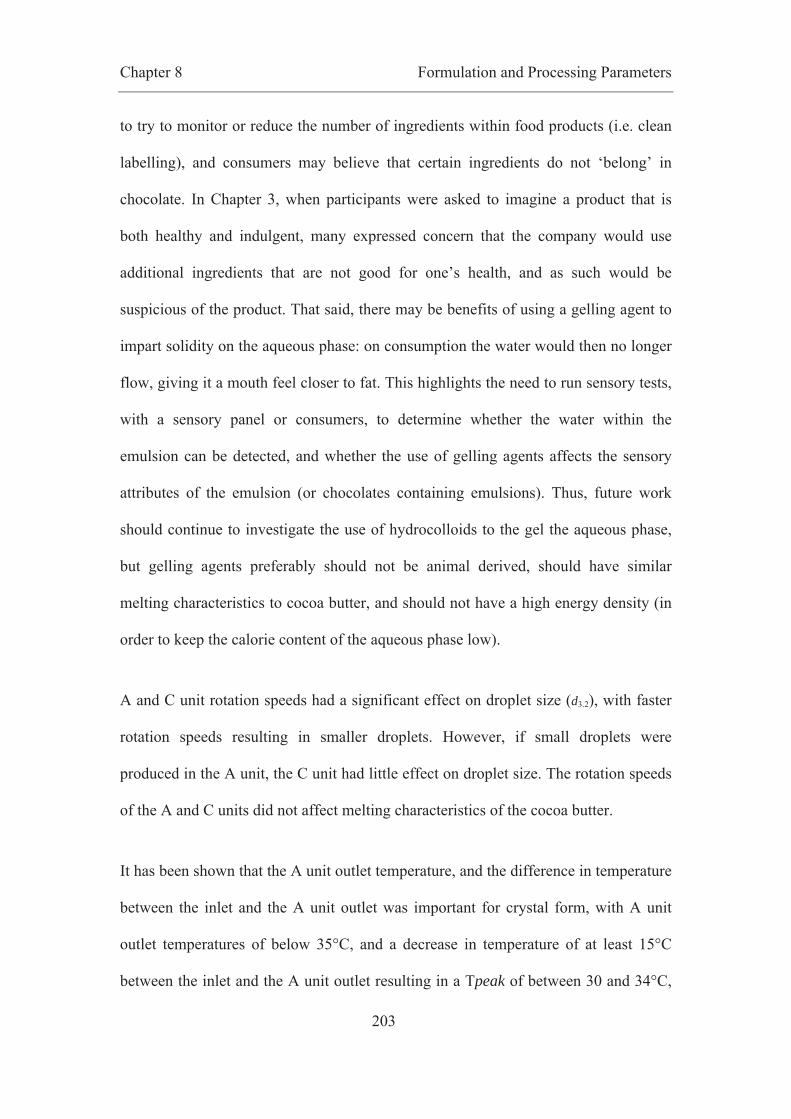
Chapter 8 Formulation and Processing Parameters
203
to try to monitor or reduce the number of ingredients within food products (i.e. clean
labelling), and consumers may believe that certain ingredients do not ‘belong’ in
chocolate. In Chapter 3, when participants were asked to imagine a product that is
both healthy and indulgent, many expressed concern that the company would use
additional ingredients that are not good for one’s health, and as such would be
suspicious of the product. That said, there may be benefits of using a gelling agent to
impart solidity on the aqueous phase: on consumption the water would then no longer
flow, giving it a mouth feel closer to fat. This highlights the need to run sensory tests,
with a sensory panel or consumers, to determine whether the water within the
emulsion can be detected, and whether the use of gelling agents affects the sensory
attributes of the emulsion (or chocolates containing emulsions). Thus, future work
should continue to investigate the use of hydrocolloids to the gel the aqueous phase,
but gelling agents preferably should not be animal derived, should have similar
melting characteristics to cocoa butter, and should not have a high energy density (in
order to keep the calorie content of the aqueous phase low).
A and C unit rotation speeds had a significant effect on droplet size (d3.2), with faster
rotation speeds resulting in smaller droplets. However, if small droplets were
produced in the A unit, the C unit had little effect on droplet size. The rotation speeds
of the A and C units did not affect melting characteristics of the cocoa butter.
It has been shown that the A unit outlet temperature, and the difference in temperature
between the inlet and the A unit outlet was important for crystal form, with A unit
outlet temperatures of below 35°C, and a decrease in temperature of at least 15°C
between the inlet and the A unit outlet resulting in a Tpeak of between 30 and 34°C,

Chapter 8 Formulation and Processing Parameters
204
indicative of crystals in form V. No correlation between A or C unit outlet
temperature and droplet size was observed, with all temperatures resulting in
emulsions with droplets of between 3 and 8μm in size.
Finally, the throughput had an effect on droplet size, with slower speeds resulting in
smaller droplets as the resistance time and amount of shear experienced by the
emulsion was increased.
The margarine line shows promise for the production of cocoa butter emulsions, and
offers a one-step process for both the emulsification and tempering of the emulsions.
Chapter 9 Scale-up
205
9. Scaling up the emulsification process to pilot plant scale, and
investigating the addition of dry chocolate ingredients
9.1 Introduction
In Chapter 7 and 8 the production of W/O cocoa butter emulsions was described,
using both a high shear mixer and a margarine line (scraped-surface heat exchanger
and a pin stirrer), with varying aqueous phase volumes (10 – 50%), different
emulsifiers and emulsifier concentrations, with or without the addition of gelatin.
Furthermore, the processing parameters of the margarine line were investigated,
including shaft speeds and temperatures, and throughput. It was shown that cocoa
butter emulsions can be produced that have small droplets (typically an average d3.2 of
1 - 8μm). Furthermore, the temperature and shear of the margarine line can be
manipulated to produce emulsions with ‘tempered’ fat.
As a result it was decided to carry out a scale-up trial, to i) investigate the scalability
of the current emulsification process (to pilot plant scale), ii) to investigate the
addition of the other chocolate ingredients (sugar, milk powder and cocoa solids) to
move closer toward producing a chocolate, and iii) to consider how the addition of
milk fat (to replace part of the cocoa butter) may affect emulsion properties, as milk
fat is often used in chocolate formulations. Furthermore, as a food grade pilot plant
was used, any products made during the trial could be consumed, in order to consider
the taste and texture of the product.
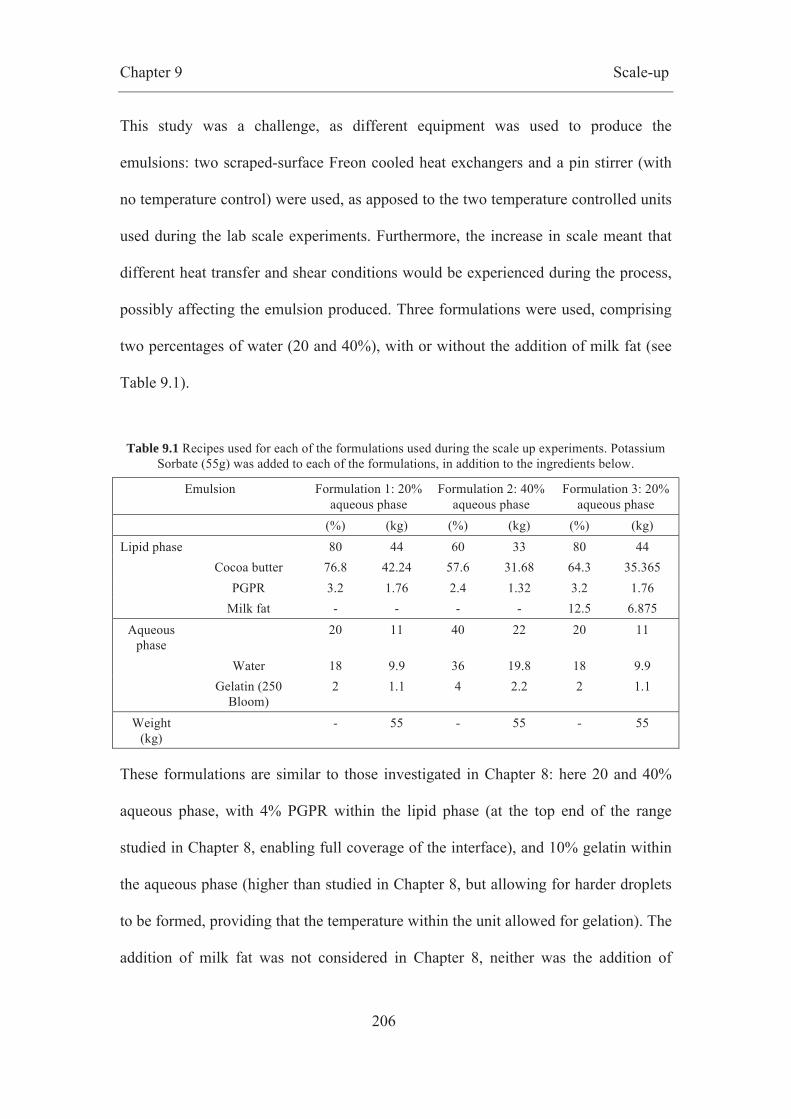
Chapter 9 Scale-up
206
This study was a challenge, as different equipment was used to produce the
emulsions: two scraped-surface Freon cooled heat exchangers and a pin stirrer (with
no temperature control) were used, as apposed to the two temperature controlled units
used during the lab scale experiments. Furthermore, the increase in scale meant that
different heat transfer and shear conditions would be experienced during the process,
possibly affecting the emulsion produced. Three formulations were used, comprising
two percentages of water (20 and 40%), with or without the addition of milk fat (see
Table 9.1).
Table 9.1 Recipes used for each of the formulations used during the scale up experiments. Potassium Sorbate (55g) was added to each of the formulations, in addition to the ingredients below.
Emulsion Formulation 1: 20% aqueous phase
Formulation 2: 40% aqueous phase
Formulation 3: 20% aqueous phase
(%) (kg) (%) (kg) (%) (kg) Lipid phase 80 44 60 33 80 44
Cocoa butter 76.8 42.24 57.6 31.68 64.3 35.365 PGPR 3.2 1.76 2.4 1.32 3.2 1.76 Milk fat - - - - 12.5 6.875
Aqueous phase
20 11 40 22 20 11
Water 18 9.9 36 19.8 18 9.9 Gelatin (250
Bloom) 2 1.1 4 2.2 2 1.1
Weight (kg)
- 55 - 55 - 55
These formulations are similar to those investigated in Chapter 8: here 20 and 40%
aqueous phase, with 4% PGPR within the lipid phase (at the top end of the range
studied in Chapter 8, enabling full coverage of the interface), and 10% gelatin within
the aqueous phase (higher than studied in Chapter 8, but allowing for harder droplets
to be formed, providing that the temperature within the unit allowed for gelation). The
addition of milk fat was not considered in Chapter 8, neither was the addition of
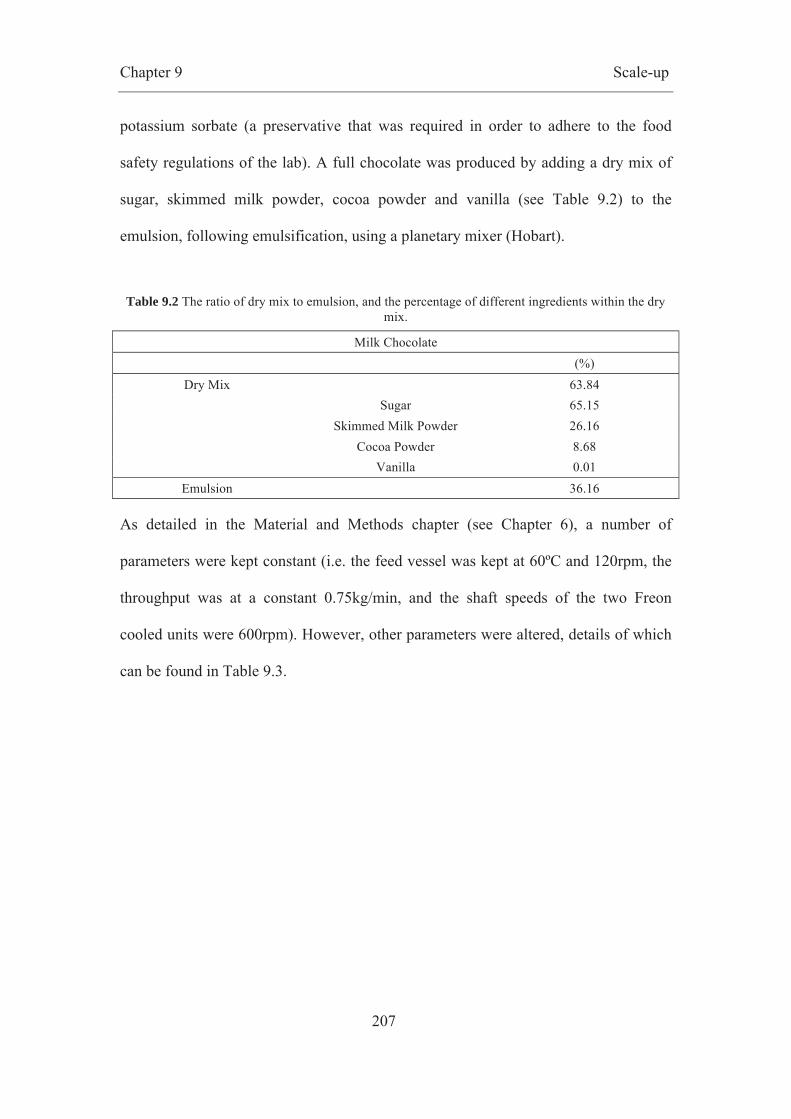
Chapter 9 Scale-up
207
potassium sorbate (a preservative that was required in order to adhere to the food
safety regulations of the lab). A full chocolate was produced by adding a dry mix of
sugar, skimmed milk powder, cocoa powder and vanilla (see Table 9.2) to the
emulsion, following emulsification, using a planetary mixer (Hobart).
Table 9.2 The ratio of dry mix to emulsion, and the percentage of different ingredients within the dry mix.
Milk Chocolate (%)
Dry Mix 63.84 Sugar 65.15 Skimmed Milk Powder 26.16 Cocoa Powder 8.68 Vanilla 0.01
Emulsion 36.16
As detailed in the Material and Methods chapter (see Chapter 6), a number of
parameters were kept constant (i.e. the feed vessel was kept at 60ºC and 120rpm, the
throughput was at a constant 0.75kg/min, and the shaft speeds of the two Freon
cooled units were 600rpm). However, other parameters were altered, details of which
can be found in Table 9.3.

Chapter 9 Scale-up
208
Table 9.3 Processing parameters used for each of the emulsions produced during scale-up experiments.
Sample Flow Temperature (°C) Speed (rpm)
Pressure (bar)
Pre-emulsion Freon 1 outlet
Freon 2 outlet
Pin Stirrer outlet
Pin Stirrer
20%
aqu
eous
pha
se 1 4-5 52 21.5 24.9 29.1 400
2 15 52 18 23.4 - 400 3 20 52 17.2 - 28.5 400 4 8-9 49.5 20.5 22 28.3 400 5 14-15 46.5 17.6 20.8 28.5 400 6 20 44.5 16.6 19.8 28.3 400 7 25 44 16.3 - 28 400
40%
aqu
eous
ph
ase
8 2-3 59.8 21.8 25.2 29 400 9 10 57 20.2 23.7 28.4 400
10 20 56 17.2 20.1 27.8 400 11 20 56 17.2 20.1 29 800
20%
aqu
eous
ph
ase
(+m
ilk
fat)
12 4 57.5 19 19.5 27 400 13 7 56.4 16 18 26 400 14 21 56 16 18 25.1 400 15 - - 16 18 - 200
9.2 Emulsions
Emulsions were produced and collected, and stored in both ambient (approximately
20ºC) and chilled (approximately 6ºC) conditions. They were assessed by a number of
analytical techniques. The emulsions were visually assessed by eye to determine
whether any free water was present, and observed using cryo-SEM. DSC was used to
analyse melting profile, and XRD was used to calculate d spacings (Å), which were
compared with data found in the literature (see Chapter 1). NMR was used to assess
droplet size distribution, and ‘free water’ content. The moisture content of the
samples was also assessed using a gravimetric method.

Chapter 9 Scale-up
209
The emulsions were moulded, and contracted from the mould after being cooled for
12 hours. They were hard, snapped well and were glossy, indicating a well tempered
emulsion in crystal form V. All the emulsions were produced successfully, all being
fat continuous with no water loss on storage (i.e. no pooling at the bottom of the
sample) and no visible water loss when the samples were snapped. These results
indicated that the laboratory scale process can be scaled up successfully, even when
using different equipment (i.e. two scraped surface heat exchangers and a pin stirrer
with no temperature contol, rather than the laboratory scale equipment discussed in
Chapters 7 and 8).
All of the emulsions were assessed using NMR droplet sizing after 1, 2, 6 and 12
weeks to determine whether any coalescence was occurring over time (all the data
obtained are given in the Appendix 21). Droplet size (d3.2) and percentage of free
water obtained by NMR are shown in Figure 9.1 and 9.2, respectively. Data are
means across all processing parameters for formulation 1 (20% aqueous phase), 2
(40% aqueous phase) and 3 (20% aqueous phase, with milk fat in addition to cocoa
butter). As can be seen in Figure 9.1, all the samples had small droplets (2.7 – 6.7μm),
which did not change over a period of 12 weeks.
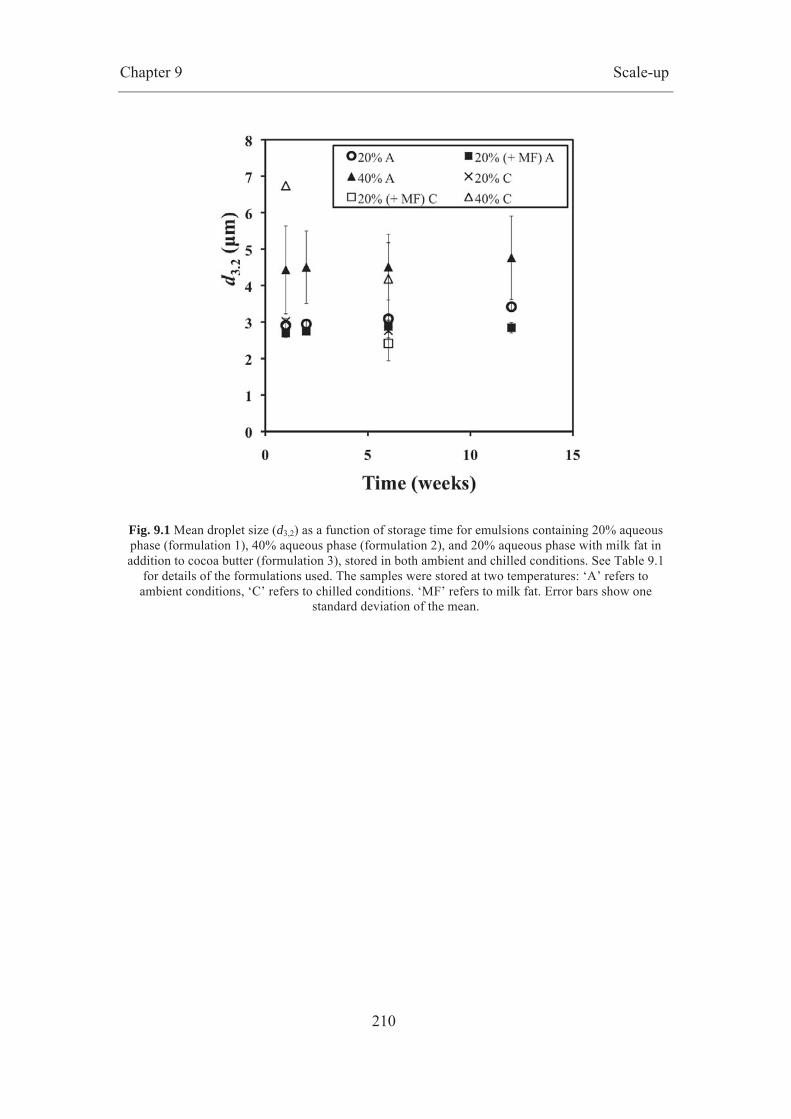
Chapter 9 Scale-up
210
Fig. 9.1 Mean droplet size (d3,2) as a function of storage time for emulsions containing 20% aqueous phase (formulation 1), 40% aqueous phase (formulation 2), and 20% aqueous phase with milk fat in addition to cocoa butter (formulation 3), stored in both ambient and chilled conditions. See Table 9.1
for details of the formulations used. The samples were stored at two temperatures: ‘A’ refers to ambient conditions, ‘C’ refers to chilled conditions. ‘MF’ refers to milk fat. Error bars show one
standard deviation of the mean.
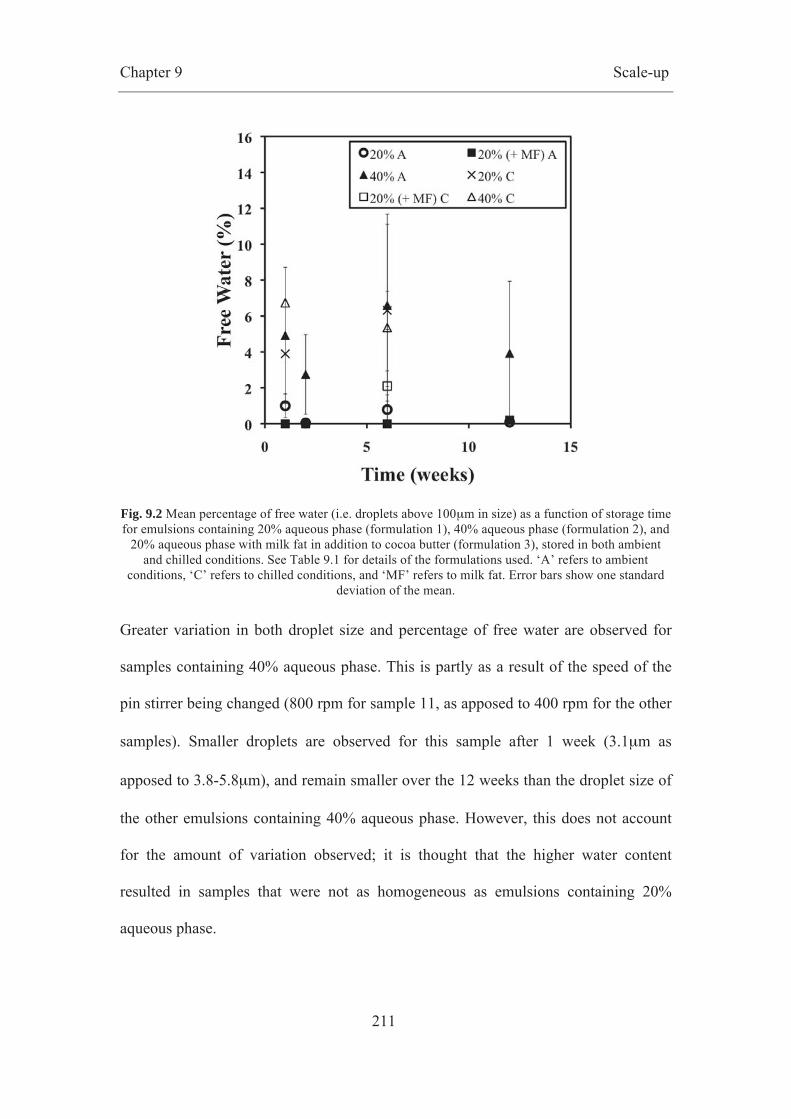
Chapter 9 Scale-up
211
Fig. 9.2 Mean percentage of free water (i.e. droplets above 100μm in size) as a function of storage time for emulsions containing 20% aqueous phase (formulation 1), 40% aqueous phase (formulation 2), and
20% aqueous phase with milk fat in addition to cocoa butter (formulation 3), stored in both ambient and chilled conditions. See Table 9.1 for details of the formulations used. ‘A’ refers to ambient
conditions, ‘C’ refers to chilled conditions, and ‘MF’ refers to milk fat. Error bars show one standard deviation of the mean.
Greater variation in both droplet size and percentage of free water are observed for
samples containing 40% aqueous phase. This is partly as a result of the speed of the
pin stirrer being changed (800 rpm for sample 11, as apposed to 400 rpm for the other
samples). Smaller droplets are observed for this sample after 1 week (3.1μm as
apposed to 3.8-5.8μm), and remain smaller over the 12 weeks than the droplet size of
the other emulsions containing 40% aqueous phase. However, this does not account
for the amount of variation observed; it is thought that the higher water content
resulted in samples that were not as homogeneous as emulsions containing 20%
aqueous phase.

Chapter 9 Scale-up
212
The droplet size observed during scale up was similar to the droplet size measured
during laboratory trials (see Chapters 7 and 8), where droplet size was 3 – 5μm when
the emulsion contained 20% aqueous phase, and approximately 5μm when the
emulsion contained 40% aqueous phase.
There was very little difference in droplet size or size distribution for samples stored
in ambient or chilled conditions, although some difference in the percentage of free
water was observed. The percentage of free water varied somewhat between the
samples, with some containing no free water, and others between 7.2 and 8.5%.
Larger amounts of free water were observed for samples containing 40% aqueous
phase, which is to be expected.
The smallest droplets (between 2 and 3μm), and the smallest percentage of free water
(0%) were observed for samples containing milk fat in addition to cocoa butter. This
is possibly as a result of reduced viscosity of the lipid phase, which allowed
emulsifiers to reach the interface quicker. However, the outlet temperatures (see Table
9.3) were also lower for these samples than for the other samples, which would have
allowed for more crystallisation of the fat during homogenisation, preventing
coalescence.
Droplet size changed very little over the time course of the experiment (i.e. from 1 to
12 weeks; see Fig. 9.1). Any variations might result from sampling differences i.e.
parts of the sample had less or more pools of water (characterised as free water), than
other parts, resulting in differences in measured free water percentage and droplet
size.
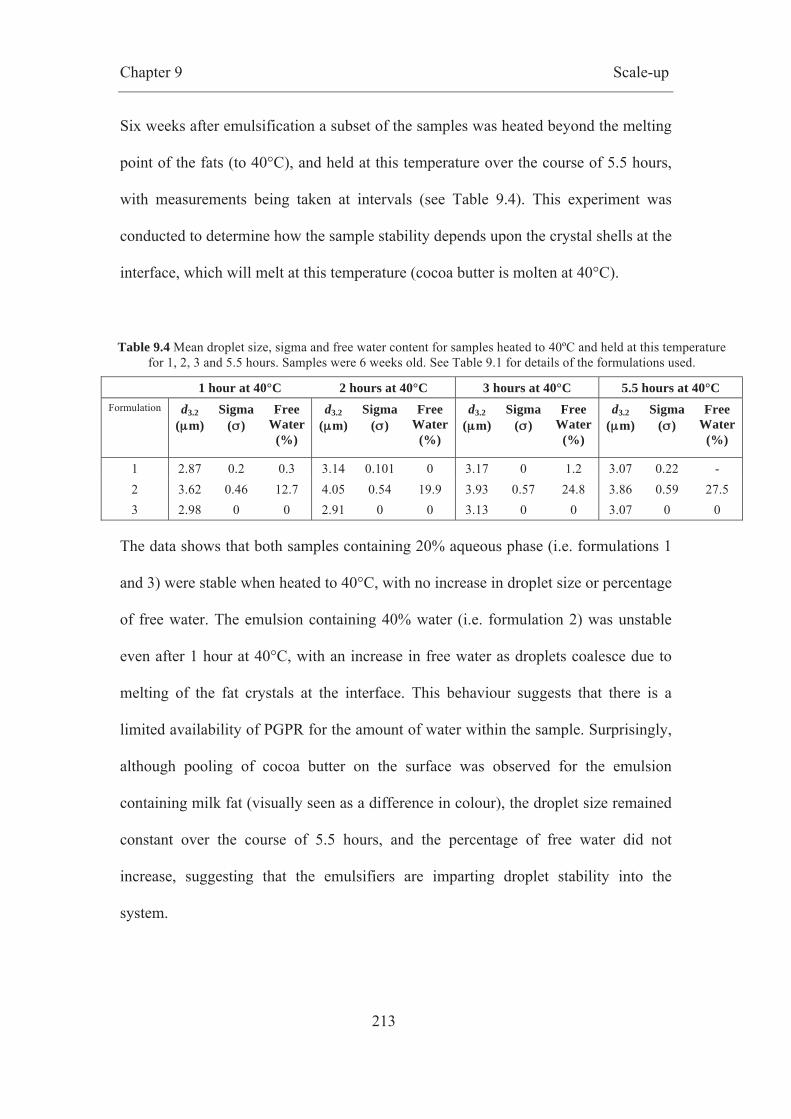
Chapter 9 Scale-up
213
Six weeks after emulsification a subset of the samples was heated beyond the melting
point of the fats (to 40°C), and held at this temperature over the course of 5.5 hours,
with measurements being taken at intervals (see Table 9.4). This experiment was
conducted to determine how the sample stability depends upon the crystal shells at the
interface, which will melt at this temperature (cocoa butter is molten at 40°C).
The data shows that both samples containing 20% aqueous phase (i.e. formulations 1
and 3) were stable when heated to 40°C, with no increase in droplet size or percentage
of free water. The emulsion containing 40% water (i.e. formulation 2) was unstable
even after 1 hour at 40°C, with an increase in free water as droplets coalesce due to
melting of the fat crystals at the interface. This behaviour suggests that there is a
limited availability of PGPR for the amount of water within the sample. Surprisingly,
although pooling of cocoa butter on the surface was observed for the emulsion
containing milk fat (visually seen as a difference in colour), the droplet size remained
constant over the course of 5.5 hours, and the percentage of free water did not
increase, suggesting that the emulsifiers are imparting droplet stability into the
system.
Table 9.4 Mean droplet size, sigma and free water content for samples heated to 40ºC and held at this temperature for 1, 2, 3 and 5.5 hours. Samples were 6 weeks old. See Table 9.1 for details of the formulations used.
1 hour at 40°C 2 hours at 40°C 3 hours at 40°C 5.5 hours at 40°C Formulation
d3.2
(μμm) Sigma
(σσ) Free
Water (%)
d3.2 (μμm)
Sigma (σσ)
Free Water
(%)
d3.2 (μμm)
Sigma (σσ)
Free Water
(%)
d3.2
(μμm) Sigma
(σσ) Free
Water (%)
1 2.87 0.2 0.3 3.14 0.101 0 3.17 0 1.2 3.07 0.22 - 2 3.62 0.46 12.7 4.05 0.54 19.9 3.93 0.57 24.8 3.86 0.59 27.5 3 2.98 0 0 2.91 0 0 3.13 0 0 3.07 0 0
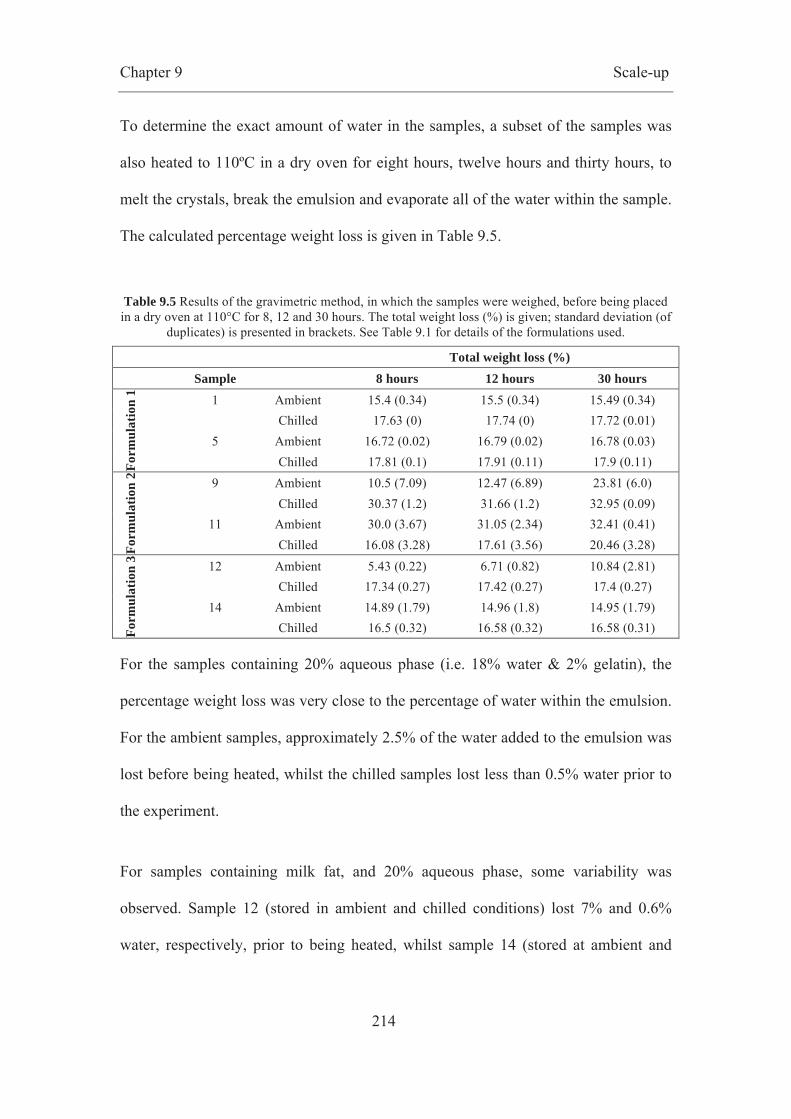
Chapter 9 Scale-up
214
To determine the exact amount of water in the samples, a subset of the samples was
also heated to 110ºC in a dry oven for eight hours, twelve hours and thirty hours, to
melt the crystals, break the emulsion and evaporate all of the water within the sample.
The calculated percentage weight loss is given in Table 9.5.
Table 9.5 Results of the gravimetric method, in which the samples were weighed, before being placed in a dry oven at 110°C for 8, 12 and 30 hours. The total weight loss (%) is given; standard deviation (of
duplicates) is presented in brackets. See Table 9.1 for details of the formulations used.
Total weight loss (%) Sample 8 hours 12 hours 30 hours
Form
ulat
ion
1 1 Ambient 15.4 (0.34) 15.5 (0.34) 15.49 (0.34) Chilled 17.63 (0) 17.74 (0) 17.72 (0.01)
5 Ambient 16.72 (0.02) 16.79 (0.02) 16.78 (0.03) Chilled 17.81 (0.1) 17.91 (0.11) 17.9 (0.11)
Form
ulat
ion
2 9 Ambient 10.5 (7.09) 12.47 (6.89) 23.81 (6.0) Chilled 30.37 (1.2) 31.66 (1.2) 32.95 (0.09)
11 Ambient 30.0 (3.67) 31.05 (2.34) 32.41 (0.41) Chilled 16.08 (3.28) 17.61 (3.56) 20.46 (3.28)
Form
ulat
ion
3 12 Ambient 5.43 (0.22) 6.71 (0.82) 10.84 (2.81) Chilled 17.34 (0.27) 17.42 (0.27) 17.4 (0.27)
14 Ambient 14.89 (1.79) 14.96 (1.8) 14.95 (1.79) Chilled 16.5 (0.32) 16.58 (0.32) 16.58 (0.31)
For the samples containing 20% aqueous phase (i.e. 18% water & 2% gelatin), the
percentage weight loss was very close to the percentage of water within the emulsion.
For the ambient samples, approximately 2.5% of the water added to the emulsion was
lost before being heated, whilst the chilled samples lost less than 0.5% water prior to
the experiment.
For samples containing milk fat, and 20% aqueous phase, some variability was
observed. Sample 12 (stored in ambient and chilled conditions) lost 7% and 0.6%
water, respectively, prior to being heated, whilst sample 14 (stored at ambient and

Chapter 9 Scale-up
215
chilled) lost 3.1% and 1.4%, respectively. However, again only a small amount of the
water was lost before the experiment.
For samples containing 40% aqueous phase, much less of the original water still
remained in the sample prior to being heated. For sample 9, 23.8% water loss was
observed after 30 hours, suggesting that over 12% of the original 36% water was lost
prior to the experiment. For the same sample stored in chilled conditions, 3% of the
water had been lost prior to the experiment. For sample 11, at ambient approximately
3.6% of the original water was lost before the study, whilst nearly 16% of the water
was lost from the same sample stored under chilled conditions. This data can be
compared with the NMR data, which showed that the emulsions containing 40%
aqueous phase had larger droplets and contained lakes of free water. Thus, it would be
expected that evaporation would occur on storage, and that sampling would give
greater variability.
In order to determine the polymorphic form of the cocoa butter within the emulsion,
both DSC and XRD measurements were carried out. DSC experiments were
performed after 1 day, 1 week and 1 month.
DSC curves are given in Figure 9.3 for the 20% (with, and without milk fat) and 40%
aqueous phase emulsions. This shows that after 1 day all the samples have a melting
temperature between 32 and 33°C, which is typical of crystal form V.

Chapter 9 Scale-up
216
Fig. 9.3 DSC curves indicating the melting profile of three samples, a. formulation 1 containing 20% aqueous phase, b. formulation 2 containing 40% aqueous phase, and c. formulation 3 containing 20% aqueous, with milk fat in addition to cocoa butter. See Table 9.1 for details of the formulations used.
DSC was conducted after 1 day stored at ambient temperature. Samples were heated from 5ºC to 45ºC at a rate of 2ºC/min.
Figure 9.4 shows the time dependency of the DSC curves for a range of samples,
stored in both ambient and chilled conditions. They all show melting temperatures
typical of form V and they are all stable over a month storage time.
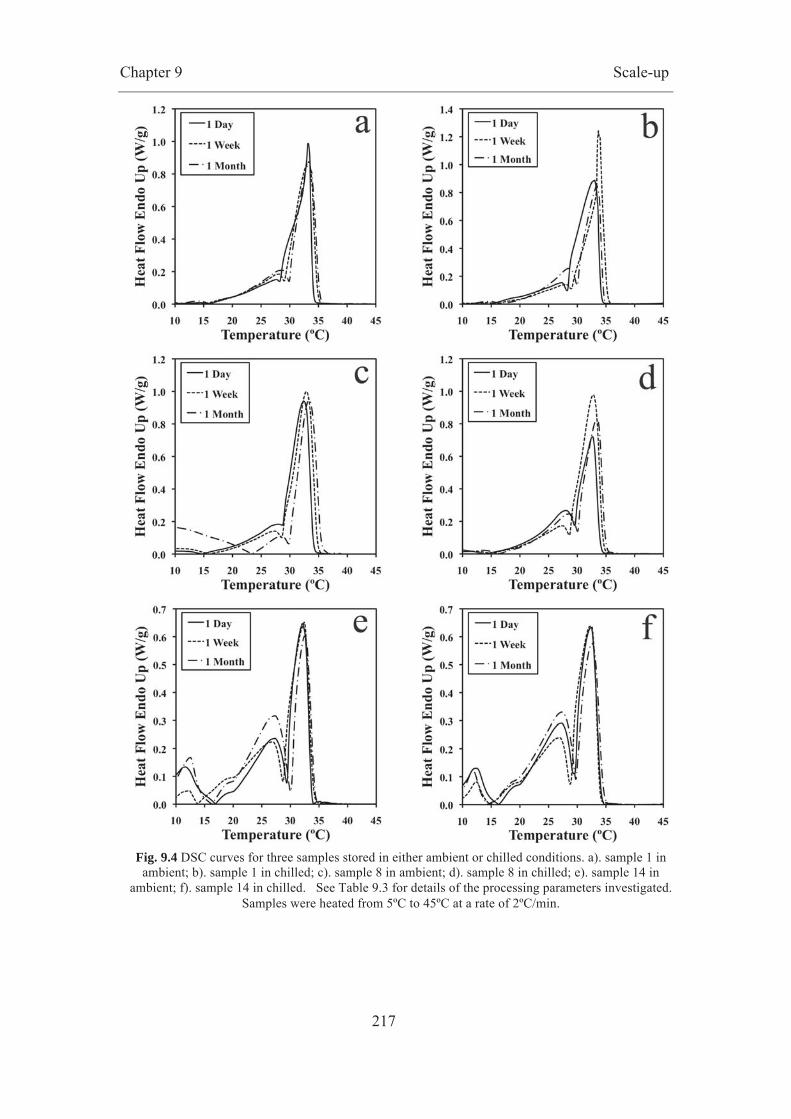
Chapter 9 Scale-up
217
Fig. 9.4 DSC curves for three samples stored in either ambient or chilled conditions. a). sample 1 in
ambient; b). sample 1 in chilled; c). sample 8 in ambient; d). sample 8 in chilled; e). sample 14 in ambient; f). sample 14 in chilled. See Table 9.3 for details of the processing parameters investigated.
Samples were heated from 5ºC to 45ºC at a rate of 2ºC/min.

Chapter 9 Scale-up
218
Mean Tpeaks (ºC) and enthalpies (J/g) are given in Figures 9.5 and 9.6, respectively.
As shown by Figure 9.5 (and the table presented in Appendix 21) all the samples,
regardless of water content, had melting peaks suggestive of form V crystals (i.e.
melting between 30 and 34ºC). However, some variation in melting enthalpy was
observed (see Fig. 9.6). A melting enthalpy of 117.5 J/g is typical of form V
(Chapman, et al., 1971). However, the enthalpy calculated is very dependent upon the
baseline used, and as can be seen in Figure 9.4, there are large differences in the heat
flow. Furthermore, given that it was shown that some samples had lost water
following emulsification (see Table 9.5), the melting enthalpy may have been
inaccurately calculated when normalising for fat content (i.e. for the weight of cocoa
butter within the sample).
Fig. 9.5 Mean Tpeak (ºC) as a function of storage time for emulsions containing 20% aqueous phase
(formulation 1), 40% aqueous phase (formulation 2), and 20% aqueous phase with milk fat in addition to cocoa butter (formulation 3), stored in both ambient and chilled conditions. See Table 9.1 for details
of the formulations used. Error bars show one standard deviation of the mean.
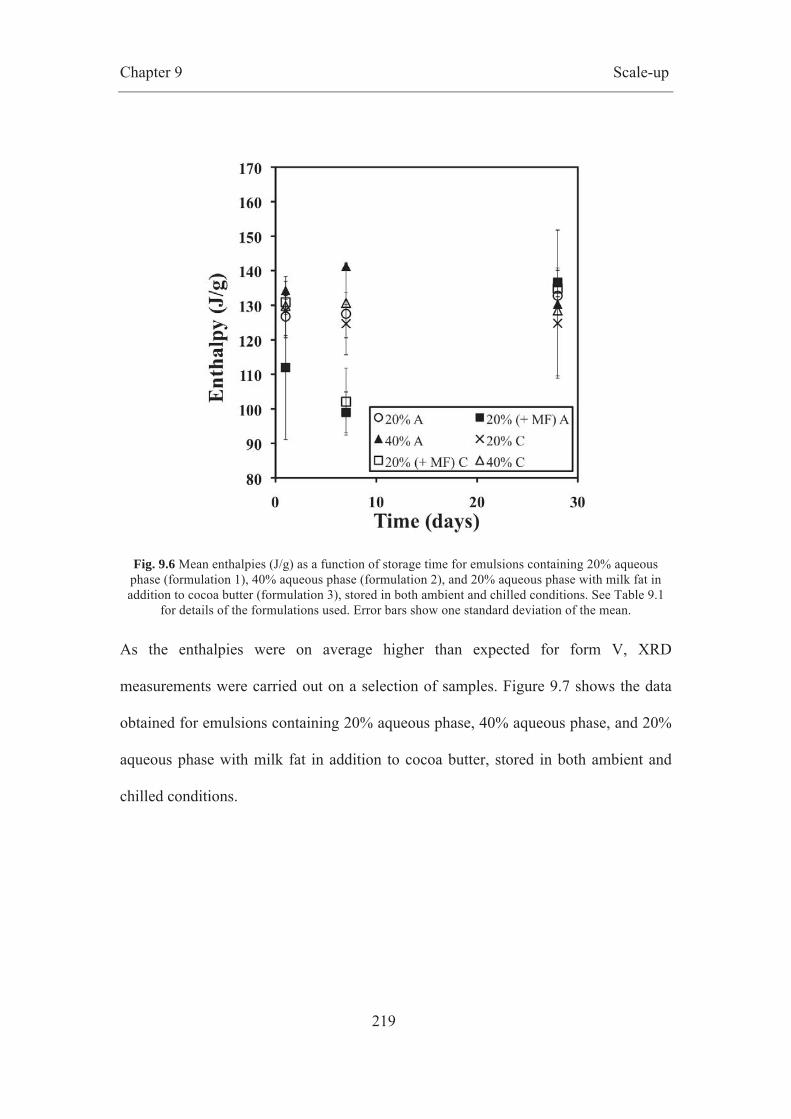
Chapter 9 Scale-up
219
Fig. 9.6 Mean enthalpies (J/g) as a function of storage time for emulsions containing 20% aqueous phase (formulation 1), 40% aqueous phase (formulation 2), and 20% aqueous phase with milk fat in addition to cocoa butter (formulation 3), stored in both ambient and chilled conditions. See Table 9.1
for details of the formulations used. Error bars show one standard deviation of the mean.
As the enthalpies were on average higher than expected for form V, XRD
measurements were carried out on a selection of samples. Figure 9.7 shows the data
obtained for emulsions containing 20% aqueous phase, 40% aqueous phase, and 20%
aqueous phase with milk fat in addition to cocoa butter, stored in both ambient and
chilled conditions.

Chapter 9 Scale-up
220
Fig. 9.7 X-Ray Diffraction: a). an emulsion containing 20% aqueous phase (formulation 1), b). an emulsion containing 40% aqueous phase (formulation 2), c). an emulsion containing 20% aqueous
phase, with milk fat in addition to cocoa butter (formulation 3). See Table 9.1 for details of the formulations used. The measurements were made nine weeks after processing.
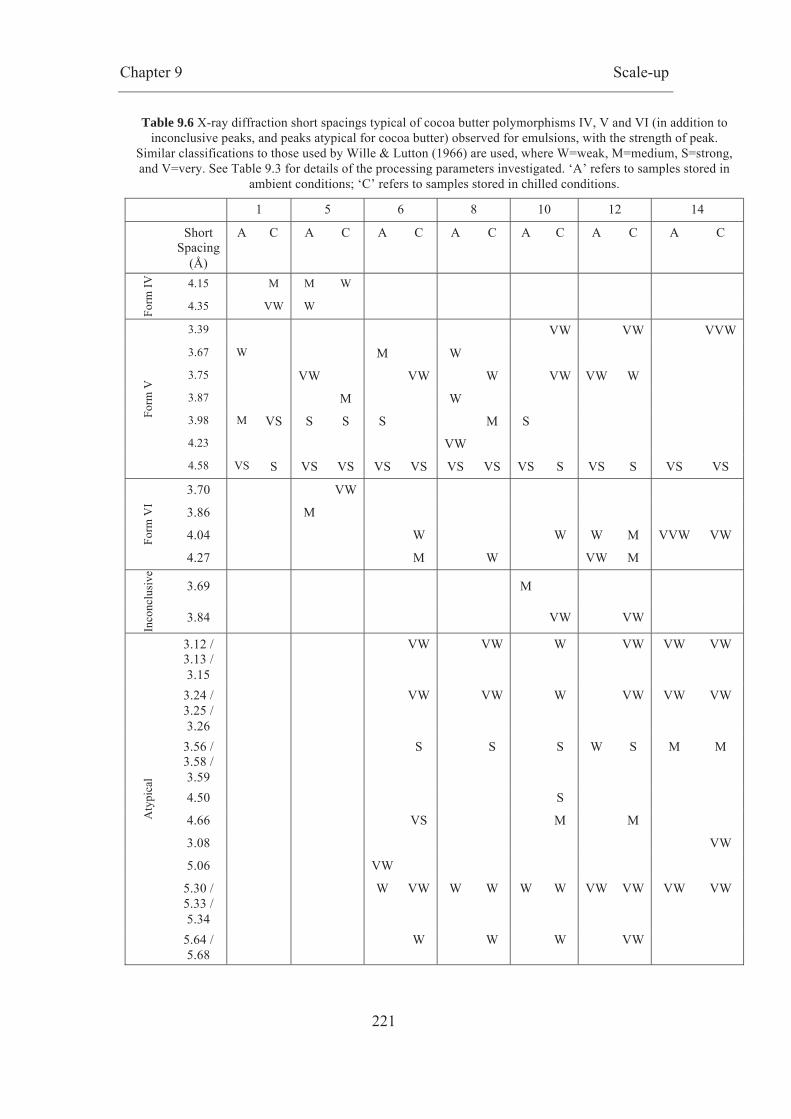
Chapter 9 Scale-up
221
Table 9.6 X-ray diffraction short spacings typical of cocoa butter polymorphisms IV, V and VI (in addition to inconclusive peaks, and peaks atypical for cocoa butter) observed for emulsions, with the strength of peak.
Similar classifications to those used by Wille & Lutton (1966) are used, where W=weak, M=medium, S=strong, and V=very. See Table 9.3 for details of the processing parameters investigated. ‘A’ refers to samples stored in
ambient conditions; ‘C’ refers to samples stored in chilled conditions.
1 5 6 8 10 12 14
Short Spacing
(Å)
A C A C A C A C A C A C A C
Form
IV
4.15 M M W
4.35 VW W
Form
V
3.39 VW VW VVW
3.67 W M W 3.75 VW VW W VW VW W 3.87 M W 3.98 M VS S S S M S 4.23 VW 4.58 VS S VS VS VS VS VS VS VS S VS S VS VS
Form
VI
3.70 VW
3.86 M
4.04 W W W M VVW VW
4.27 M W VW M
Inco
nclu
sive
3.69 M
3.84 VW VW
Aty
pica
l
3.12 / 3.13 / 3.15
VW VW W VW VW VW
3.24 / 3.25 / 3.26
VW VW W VW VW VW
3.56 / 3.58 / 3.59
S S S W S M M
4.50 S
4.66 VS M M
3.08 VW
5.06 VW
5.30 / 5.33 / 5.34
W VW W W W W VW VW VW VW
5.64 / 5.68
W W W VW

Chapter 9 Scale-up
222
The XRD short spacings (Å), as presented in Table 9.6 and Figure 9.7, were
compared with Wille and Lutton (1966) data on the polymorphisms of cocoa butter
(see Table 1.5). All of the samples showed peaks typical of cocoa butter in
polymorphic form V, whereas some samples showed signs of crystals in forms III, IV
or VI (see Table 9.6), and some peaks were not typical for any of the polymorphs
observed by Wille and Lutton (1966).
All the samples had a strong, or a very strong peak around 4.58Å (ranging from
4.53Å to 4.58Å), indicating crystals in form V. Some samples also had peaks at other
d-spacings typical of form V, including 3.67Å (samples 1 ambient, 6 ambient and 8
ambient), and 3.98Å (samples 1 ambient, 5 ambient, 5 chilled, and 8 chilled). A d-
spacing of 3.75Å is only observed for cocoa butter crystals in form V, and is also
observed for numerous samples. Three of the samples (1 chilled, 5 ambient and 5
chilled) had peaks typical of form IV crystals at approximately 4.15Å and 4.35Å,
although these peaks were weak or medium, rather than strong or very strong as cited
by Wille and Lutton (1966). The majority of the samples also had some d-spacings
typical of form VI, including sample 5 ambient which had a medium peak at 3.86Å,
sample 5 chilled which had a very weak peak at 3.71Å (although a strong peak is
normally detected in this area), and numerous samples at had peaks around 4.04Å and
/ or 4.27Å.
Three of the samples also had inconclusive peaks i.e. peaks which could indicate
crystals in various polymorphic forms. For example, sample 10 ambient had a
medium peak at 3.69Å, possibly indicating crystals in form V (3.67Å weak) or form
VI (3.70Å strong). Very weak peaks at 3.84Å were also observed for samples 10

Chapter 9 Scale-up
223
chilled and 12 chilled, which may indicate crystals in form III (3.86Å), form IV
(3.81Å), form V (3.87Å) or form VI (3.86Å).
A number of peaks atypical of cocoa butter crystals in any of the polymorphic forms
were observed for the majority of the samples. Whilst most were weak or very weak,
a number of medium, or strong peaks were seen. Samples 12 and 14 showed many
more atypical peaks, possibly as a result of the milk fat in these samples.
The XRD data has suggested that for all of the emulsions the predominant
polymorphic form is form V. However, some of the samples show peaks typical of IV
crystals, suggesting that full tempering has not occurred in all cases, and some peaks
typical of forms VI, which may be expected given the nine week period before
emulsification and taking the measurements.

Chapter 9 Scale-up
224
Fig. 9.8 Cryo-SEM images of emulsions produced during scale-up experiments. All the micrographs indicate a continuous fat phase (A), with water droplets, covered by sintered fat crystal shells (B). See Table 9.3 for
details of the processing parameters investigated.
The emulsions were visualised using cryo-SEM (see Fig. 9.8) and show fat shells
covering the water droplets, which are sintered together into a crystal network, similar
to those seen at laboratory scale. Furthermore, these shells are observed not only in
the cocoa butter emulsion samples, but also in samples that include the dry mix,

Chapter 9 Scale-up
225
indicating that the mixing of the dry ingredients into the emulsion did not disrupt the
crystal shells.
9.3 Chocolate
During the scale up experiments a number of full chocolates were produced. This was
carried out by taking the emulsion at the end of the processing line (i.e. from the pin
stirrer), and adding the dry ingredients (a mix of sugar, skimmed milk powder, cocoa
powder and vanilla; see Table 9.2) in a planetary mixer, until the solid particles were
fully mixed into the emulsion, and the mixture looked homogeneous. There was no
temperature control at this stage of processing.
There were some limitations when adding the dry ingredients to the emulsions. When
making chocolates using the emulsion with 20% water (formulation 1), the entire
quantity of dry ingredients could not be added. The dry ingredients were added
slowly, until the mix became too viscous, or became crumbly. This occurred at
approximately 60% fat, 40% dry mass. When the emulsion contained 40% water
(formulation 2) all the dry ingredients could be added if mixed in slowly. Chocolates
made during this stage showed some softening, and would not contract enough to de-
mould. The whole percentage of the dry ingredients could be added to the emulsion
made with 80% fat emulsion with milk fat (formulation 3); the resulting product was
harder than in previous trials, and could be demoulded, but was not shiny or glossy.
This was thought to be as a consequence of the lack of temperature control when
mixing in the planetary mixer, which prevented crystals in form V from forming.

Chapter 9 Scale-up
226
A limitation of using a planetary mixer to mix in the dry ingredients was the lack of
temperature control. Rather than holding the emulsion at the outlet temperature of
process, it was allowed to cool in the planetary mixer, causing crystallisation, and not
allowing for homogeneous mixing.
The effect that mixing in the planetary mixer had on droplet size could not be
accurately measured, as NMR measurements could not be taken as the signal was too
weak.
Fig. 9.9 A cryo-SEM image of an emulsion that has been mixed with the dry chocolate ingredients (cocoa solids, sugar, milk solids; see Table 9.2 for the ratio of dry mix to emulsion, and the percentage
of ingredients within the dry mix, which was used to produce the chocolate).
9.4 Discussion
The aim of the work presented in this chapter was primarily to scale up the lab
emulsification experiments to pilot plant scale. A few changes were made to the
formulation (for example, the addition of milk fat), the equipment used was different
to the lab equipment (two chilled scraped surface heat exchangers were used, as
opposed to the one scraped surface heater exchanger used at lab scale, and the pin
stirrer offered no temperature control), and the addition of cocoa solids, milk solids

Chapter 9 Scale-up
227
and sugar was considered. All the emulsions were produced successfully, all being fat
continuous with no water loss on storage (i.e. no pooling at the bottom of the sample)
or on snap. All the emulsions had small droplets (2 – 6μm), which were stable over
the course of 12 weeks, although they varied on the amount of free water present, and
the amount of water loss on storage. Furthermore, the emulsions produced had fat
crystals in polymorphic form V, with melting peaks between 30 and 34°C, and d-
spacings that suggested that the predominant polymorphic form was form V (although
some of the samples had d-spacings that are typical for crystals in forms III, IV and
VI, suggesting a mixture of crystals in some samples). Furthermore, images of the
emulsions showed similar sintered fat crystal shells to those presented in Chapters 7
and 8.
Moulding of the emulsion resulted in a glossy, hard product. However, when the dry
ingredients were added, and the resulting chocolate was moulded it was soft, and did
not demould. It appears that the method failed to produce a typical chocolate on the
introduction of the other ingredients. This is thought to have been as a result of the
crude method of adding the dry mass, as the planetary mixer did not result in
homogeneous mixing. Furthermore, the lack of temperature control may have resulted
in heating of the emulsion during mixing, or conversely too much cooling so the
addition of the ingredients became more difficult.
The emulsions produced during scale-up were comparable to those made at lab scale
(results presented in Chapters 7 and 8), indicating that similar emulsions can be
produced at this scale, with this equipment. However, the production of a full
chocolate (the emulsion with the dry mix of sugar, milk solids and cocoa solids) was
Chapter 9 Scale-up
228
not successful. Thus, future work should consider the use of a jacketed mixer that can
allow for temperature control during mixing. This should enable the dry ingredients to
be mixed in to the emulsion homogeneously, without the mixture becoming too
viscous. Furthermore, temperature control should hold the fat at the desirable
temperature, so that the ‘tempering’ achieved during emulsification is not lost (i.e. the
emulsion should not be heated above the melting temperature of form V). Care should
be taken so that heating or vigorous mixing does not disrupt the emulsion produced
(i.e. melting the fat crystal shells at the interface, and causing coalescence). If the
emulsion is disrupted it is likely that the water and the dry ingredients will interact,
causing aggregation of the particles.

Chapter 10 Conclusions and Future Work
229
10. Conclusions and Future Work
The consumption of reduced-fat food products offers a way of reducing the fat and
energy ingested, with beneficial effects for body weight and health. Currently,
reduced-fat chocolates are not readily available on the British market. Thus, research
in the area of fat reduction in chocolate is relevant and challenging. However,
consumers may not purchase or consume a reduced-fat chocolate, as a reduction in
sensory quality is often associated with reduced-fat foods. Furthermore, consumers
may not find such a product indulgent or hedonically satisfying. Thus, the aims of the
research presented in this thesis were twofold:
• To investigate chocolate consumption, beliefs about health and indulgence and
consumer response to reduced-fat chocolate;
• To investigate formulation engineering routes for a reduced-fat chocolate that
has a similar flavour, texture and mouthfeel to a full fat equivalent.
This is thought to be the first time that chemical engineering and psychology have
been combined in a PhD project. Although in food research the end user is the
consumer, often research, especially in academia, neglects psychology when
designing food structures. This seems unwise, as the consumer will ultimately
determine the success of the product; it is financially risky to engineer a product that
may be rejected when is put on the market. Arguably more importantly, regardless of
how healthy the product is, if the consumer is not willing to accept it, the product will
be a failure, and as such will have no impact on obesity reduction or health

Chapter 10 Conclusions and Future Work
230
preservation. The results presented in this thesis highlight the need to combine the
two disciplines in food research.
Initial focus groups (presented in Chapter 3) indicated that the high calorific content
of chocolate often results in regret, guilt, depression or stress following consumption.
As a result, ambivalence towards chocolate exists: conflict between the pleasurable
sensory appeal of chocolate, and the negative effect on body image and health (due to
it’s high fat, sugar and calorie content). However, when thinking about the concept of
healthy indulgence (for example a reduced-fat chocolate) consumers believed this
would be a confusing oxymoron i.e. they did not believe that a healthy product could
also be indulgent, and thought that the sensory quality would be scarified for the
health benefits.
Thus, the intention for the work presented in Chapter 4 was to explore expectations
towards a reduced-fat chocolate by manipulating label information given during the
consumption experience. When presented with two identical standard milk chocolates
labelled as ‘Milk Chocolate’ and ‘Reduced-fat Milk Chocolate’, ratings of expected
liking were significantly different: consumers expected to like the reduced-fat
chocolate less than the standard chocolate. This would suggest that prior opinions of
the chocolates sensory quality (related to experience of other low-fat foods, and their
associated inferior tastes), or its expected hedonic or indulgent properties, might
prevent consumers from purchasing or consuming a reduced-fat chocolate. However,
following consumption ratings of actual liking did not differ i.e. the chocolate that
consumers were led to believe was reduced in fat was liked as much as the standard
chocolate. Furthermore, ratings of sensory attributes (melting rate, creaminess,

Chapter 10 Conclusions and Future Work
231
richness, thickness, milkiness, smoothness and sweetness) were similar in both
labelling conditions. This suggests that the belief that the chocolate is reduced in fat
does not affect liking or sensory intensity or idealness i.e. personal experience played
a greater role in this case than expectations. Thus, if the sensory attributes of a
reduced-fat chocolate can be matched to a standard chocolate, and the consumer can
be encouraged to consume the chocolate initially, actual liking should not be affected
by the knowledge that it is reduced in fat.
A concern for the production of a reduced-fat chocolate has been the knowledge that
the product is reduced in fat may result in increased energy intake, both in terms of
the product itself, and also during subsequent meals. In this study no significant
differences in anticipated normal consumption, or unrestricted consumption were
observed. This suggests that energy intake would not differ, and the reduced-fat
chocolate would not be eaten to excess. Future work should consider the effect of
labelling condition of actual consumption of the chocolates (rather than anticipated, or
expected consumption). Furthermore, future work should consider consumption
during subsequent meals, to determine whether ad libitum consumption amount is a
result of expectations about the foods energy density, or of the post-ingestive
experience (for example, the energy absorbed by the body following consumption).
Once a reduced-fat chocolate has been produced it would be interesting to consider
the interaction between labelling condition and energy density or sensory acceptance
on liking and consumption.
The aim of the work presented in Chapters 7, 8 and 9 was to identify whether the
calorie and fat content of chocolate could be reduced by introducing water in the form

Chapter 10 Conclusions and Future Work
232
of a fat continuous water in oil (W/O) cocoa butter emulsion. Results showed that
fully emulsified W/O emulsions could be produced using either a high shear mixer, or
a margarine line, using either lecithin or PGPR (see Chapter 7). Formulation changes
were also considered, including PGPR and gelatin concentration, as were processing
parameters, including shaft speeds, shaft temperatures, and flow rate (see Chapter 8).
All the emulsions had small droplets (typically with an average droplet size of 1-
5μm), with very little ‘free water’, although differences were observed with
formulation and processing changes (see Chapter 8).
The margarine line allowed for the temperature to be controlled during the process, so
that emulsions with fat crystals in form V could be produced i.e. it was possible to
mimic the tempering process during emulsification. It was shown that the A and C
unit inlet and outlet temperatures had an impact on the crystal form produced during
emulsification (see Chapter 8). Smooth crystalline shells were observed at the droplet
interface. It is thought that the temperature profile allowed fat crystals to act as
Pickering particles and sinter at the interface, which should result in greater physical
and microbial stability.
The aim of the work presented in Chapter 9 was primarily to scale up the lab
emulsification experiments to pilot plant scale. The emulsions produced during scale-
up were comparable to those made at lab scale (results presented in Chapters 7 and 8),
being fat continuous, with small droplets (2-6μm), and with crystals in polymorphic
form V. Furthermore, in order to produce a full chocolate using the emulsion, the
addition of cocoa solids, milk solids and sugar was considered. The method failed to
produce a typical chocolate on the introduction of the other ingredients. This is
Chapter 10 Conclusions and Future Work
233
thought to have been as a result of the crude method of adding the dry mass, as the
planetary mixer did not result in homogeneous mixing. Furthermore, the lack of
temperature control may have resulted in heating of the emulsion during mixing
(resulting in the break up of the structure), or conversely too much cooling so the
addition of the ingredients became more difficult. However, the use of the emulsion in
a full chocolate showed promise, and by using temperature controlled mixers directly
after emulsification, mixing should result in a homogeneous product, without
disruption of the emulsion. Future work should consider this in more detail. This
could include using a jacketed scraped-surface vessel with temperature control, and
relatively low shear in order to prevent disruption of the crystal network.
The aim of the work presented in Chapter 5 was to gain a better understanding of
current chocolate packaging, and to explore approaches to packaging a reduced-fat
chocolate bar. Focus groups encouraged idea generation surrounding the packaging of
a reduced-fat chocolate bar, resulting in four important components being recognised
(colour, size / shape, slogan and logo), each with four manipulations (caramel or blue,
long or square, pleasure or taste oriented, and heart or tick, respectively).
Overall, consumers exhibit relatively consistent responses to the type of packaging
required for a reduced-fat chocolate to be liked. Both men and women believed that a
reduced-fat bar would be aimed towards women, who are more weight and health
conscious. It was shown that the most liked package was a caramel, square bar with a
heart logo, with either of the slogans (there was no apparent preference, although
when explaining their preferences, some though that the taste-oriented slogan was
preferable), as displayed in Figure 10.1.

Chapter 10 Conclusions and Future Work
234
Fig. 10.1 The ideal packaging combination, with the highest score for expected liking for both male
and female consumers (results are presented in Chapter 5).
When asked to explain why this package was their favourite, participants thought this
bar looked expensive, luxurious and welcoming, indicating that the bar would taste
similar to regular chocolate, and that they would love the taste. Overall, the data
suggests that specific marketing approaches will aid the successful introduction of a
reduced-fat chocolate into the market. Future work could consider presenting the
packages with a chocolate sample in a similar way to the labelling study presented in
Chapter 4, to consider the effect that the packaging has on liking of the chocolate.
Thus, this study demonstrates that the production of cocoa butter emulsions can be
achieved using technology typically used for margarine manufacture, and shows the
potential for the use of cocoa butter emulsions in chocolate formulations for fat
reduction. Furthermore, although some consumers were critical towards the concept
of ‘healthy indulgence’, and ratings of expected liking were lower for a chocolate that
consumers believed was reduced in fat, it was shown that the experience of the
chocolates taste had a greater impact on liking than expectations did. This offers an
excellent opportunity to produce a successful reduced-fat chocolate. Although it is
important that future work considers the taste and sensory attributes of reduced-fat
chocolates, in order to inform the formulation and processing of the product, this

Chapter 10 Conclusions and Future Work
235
approach highlights the impact that psychology alone has on acceptance, and
indicated the need to integrate the two disciplines, in order to successfully launch
reduced-fat products.

References
236
References
Aaron, J. I., Evans, R. E., & Mela, D. J. (1995). Paradoxical effect of a nutrition
labelling scheme in a student cafeteria. Nutrition Research, 15(9), 1251-1261.
Aaron, J. I., Mela, D. J., & Evans, R. E. (1994). The Influences of Attitudes, Beliefs
and Label Information on Perceptions of Reduced-fat Spread. Appetite, 22(1),
25-37.
Afoakwa, E. O., Paterson, A., & Fowler, M. (2007). Factors influencing rheological
and textural qualities in chocolate - a review. Trends in Food Science &
Technology, 18(6), 290-298.
Alexa, R. I., Mounsey, J. S., O'Kennedy, B. T., & Jacquier, J. C. (2010). Effect of
kappa-carrageenan on rheological properties, microstructure, texture and
oxidative stability of water-in-oil spreads. LWT - Food Science and
Technology, 43(6), 843-848.
Ampuero, O., & Vila, N. (2006). Consumer perceptions of product packaging.
Journal of Consumer Marketing, 23(2), 100-112.
Apenten, R. K. O., & Zhu, Q.-H. (1996). Interfacial parameters for spans and tweens
in relation to water-in-oil-in-water multiple emulsion stability. Food
Hydrocolloids, 10(2), 245-250.

References
237
Ares, G., & Deliza, R. (2010). Studying the influence of package shape and colour on
consumer expectations of milk desserts using word association and conjoint
analysis. Food Quality and Preference, 21(8), 930-937.
Balinov, B., Söderman, O., & Wärnheim, T. (1994). Determination of water droplet
size in margarines and low-calorie spreads by nuclear magnetic resonance
self-diffusion. Journal of the American Oil Chemists' Society, 71(5), 513-518.
Bancroft, W. D. (1912). The Theory of Emulsification, I. The Journal of Physical
Chemistry, 16(3), 177-233.
Barnett, L. (2006). Britons are Europe's biggest chocolate-lovers. The Independent. .
Beckett, S. (1999). Industrial Chocolate Manufacture and Use: Wiley-Blackwell.
Beckett, S. (2000). The Science of Chocolate: RSC Paperbacks.
Beckett, S. T., Hugelshofer, D., Wang, J., & Windhab, E. J. (2010). Milk chocolate
containing water. Patent No.: US 7,651,721 B2. U. S. P. Office.
Binks, B. P. (2002). Particles as surfactants--similarities and differences. Current
Opinion in Colloid & Interface Science, 7(1-2), 21-41.
Blackwell, L. (1995). Visual cues and their effects on odour assessment. Nutrition &
Food Science, 95(5), 24-28.
Blundell, J. E. (2000). What foods do people habitually eat? A dilemma for nutrition,
and enigma for psychology. American Journal of Clinical Nutrition, 71(1), 3-
5.
References
238
Blundell, J. E., & Finlayson, G. (2004). Is susceptibility to weight gain characterized
by homeostatic or hedonic risk factors for overconsumption? Physiology &
Behaviour, 82, 21-25.
Blundell, J. E., Stubbs, R. J., Golding, C., Croden, F., Alam, R., Whybrow, S., Le
Noury, J., & Lawton, C. L. (2005). Resistance and susceptibility to weight
gain: Individual variability in response to a high-fat diet. Physiology &
Behavior, 86(5), 614-622.
Bot, A., Flöter, E., Lammers, J. G., & Pelan, E. G. (2007). The texture and
microstructure of spreads. In D. J. McClements (Ed.), Understanding and
Controlling the Microstructure of Complex Foods, 575-599. Cambridge:
Woodhead Publishing.
Bot, A., & Vervoort, S. (2006). Hydrocolloid functionality in spreads and related
products. In P. A. Williams & G. O. Phillips (Eds.), Gums and Stabilisers for
the Food Industry 13, 381–394. Cambridge: RSC Publishing.
Bower, J. A., Saadat, M. A., & Whitten, C. (2003). Effect of liking, information and
consumer characteristics on purchase intention and willingness to pay more
for a fat spread with a proven health benefit. Food Quality and Preference,
14(1), 65-74.
Bricknell, J., & Hartel, R. (1998). Relation of fat bloom in chocolate to polymorphic
transition of cocoa butter. Journal of the American Oil Chemists' Society,
75(11), 1609-1615.
References
239
Burton, P., Smit, H., & Lightowler, H. (2007). The influence of restrained and
external eating patterns on overeating. Appetite, 49(1), 191-197.
Cardello, A., & Sawyer, F. (1992). Effects of Disconfirmed Consumer Expectations
on Food Acceptability. Journal of Sensory Studies, 7(4), 253-277.
Cardello, A. V. (2007). Measuring consumer expectations to improve food product
development. In H. MacFie (Ed.), Consumer-led food product development,
223-261. Cambridge: Woodhead Publishing Limited.
Carlsmith, J. M., & Aronson, E. (1963). Some hedonic consequences of the
confirmation and disconfirmation of expectancies. Journal of Abnormal and
Social Psychology, 66, 151-156.
Cartwright, F., & Stritzke, W. G. K. (2008). A multidimensional ambivalence model
of chocolate craving: Construct validity and associations with chocolate
consumption and disordered eating. Eating Behaviors, 9(1), 1-12.
Chapman, G., Akehurst, E., & Wright, W. (1971). Cocoa butter and confectionery
fats. Studies using programmed temperature X-ray diffraction and differential
scanning calorimetry. Journal of the American Oil Chemists' Society, 48(12),
824-830.
Clegg, S. M., Moore, A. K., & Jones, S. A. (1996). Low-fat margarine spreads as
affected by aqueous phase hydrocolloids (Vol. 61). Hoboken, NJ, ETATS-
UNIS: Wiley.
References
240
Coe, S. D., & Coe, M., D. (2000). The True History of Chocolate: Thames and
Hudson.
Cook, L. R. (1963). Chocolate Production and Use. New York: Catalog and Book
Division.
Cooper, C. F. (1995). Reduced calorie cocoa butter substitutes. Patent No.: 5,387,429.
U. S. P. Office.
Davis, T. R., & Dimick, P. S. (1986). Solidification of cocoa butter. Proc. PMCA
Prod. Conf. , 40, 104-108.
de Bruijne, D. W., & Bot, A. (1999). Fabricated Fat-Based Foods. In A. J. Rosenthal
(Ed.), Food Texture: Measurement and Perception. Gaithersburg, Maryland:
Aspen Publishers, Inc.
de Wijk, R. A., & Prinz, J. F. (2005). The role of friction in perceived oral texture.
Food Quality and Preference, 16(2), 121-129.
Decker, K. J. (2006). Cut the Calories, Keep the Flavor. from
http://www.foodproductdesign.com/articles/691concepts.html
Deliza, R., MacFie, H., & Hedderley, D. (2003). Use of Computer-Generated Images
and Conjoint Analysis to Investigate Sensory Expectations. Journal of Sensory
Studies, 18(6), 465-486.

References
241
Deliza, R., & MacFie, H. J. H. (1996). The generation of sensory expectation by
external cues and its effect on sensory perception and hedonic ratings: A
review. Journal of Sensory Studies, 11(2), 103-128.
Di Monaco, R., Ollila, S., & Tuorila, H. (2005). Effect of Price on Pleasantness
Ratings and Use Intentions for a Chocolate Bar in the Presence and Absence
of a Health Claim. Journal of Sensory Studies, 20(1), 1-16.
Dickinson, E. (1992). Introduction to Food Colloids. Oxford, UK: Oxford University
Press.
Djagny, K. B., Wang, Z., & Xu, S. (2001). Gelatin: A Valuable Protein for Food and
Pharmaceutical Industries: Review. Critical Reviews in Food Science and
Nutrition, 41(6), 481 - 492.
Drewnowski, A., & Greenwood, M. R. C. (1983). Cream and sugar: human
preferences for high-fat foods. Physiology and Behavior, 30(4), 629-633.
Drewnowski, A., Kurth, C., Holden-Wiltse, J., & Saari, J. (1992). Food preferences in
human obesity: Carbohydrates versus fats. Appetite, 18(3), 207-221.
DuBose, C. N., Cardello, A. V., & Maller, O. (1980). Effects of Colorants and
Flavorants on Identification, Perceived Flavor Intensity, and Hedonic Quality
of Fruit-flavored Beverages and Cake. Journal of Food Science, 45(5), 1393-
1399.
Duck, W. (1964). The measurement of unstable fat in finished chocolate. The
Manufacturing Confectioner., 35 (6), 67-72.
References
242
Ducret, P., Holz, K., Wang, J., & Wille, H.-J. (1999). Switzerland. Patent No.
5,965,179. U. S. P. Office.
Duncan, S. E., Yaun, B. R., & Sumner, S. S. (2004). Microbiological Methods for
Dairy Products. In H. M. Wehr & J. F. Frank (Eds.), Standard Methods for the
Examination of Dairy Products. Washington: American Public Health
Association.
Egger, G., & Swinburn, B. (1997). An "ecological" approach to the obesity pandemic.
BMJ, 315(7106), 477-480.
Fagerli, R. A., & Wandel, M. (1999). Gender Differences in Opinions and Practices
with Regard to a "Healthy Diet". Appetite, 32(2), 171-190.
Festinger, L. (1962). Cognitive dissonance. Scientific American, 207, 93-102.
Food Standards Agency. (2002). McCance and Widdowson's The Composition of
Foods, Sixth Summary Edition. Cambridge: Royal Society of Chemistry.
Frasch-Melnik, S., Norton, I. T., & Spyropoulos, F. (2010). Fat-crystal stabilised w/o
emulsions for controlled salt release. Journal of Food Engineering, 98(4),
437-442.
Garti, N., Binyamin, H., & Aserin, A. (1998). Stabilization of water-in-oil emulsions
by submicrocrystalline α-form fat particles. Journal of the American Oil
Chemists' Society, 75(12), 1825-1831.
References
243
Goudappel, G. J. W., van Duynhoven, J. P. M., & Mooren, M. M. W. (2001).
Measurement of Oil Droplet Size Distributions in Food Oil/Water Emulsions
by Time Domain Pulsed Field Gradient NMR. Journal of Colloid and
Interface Science, 239(2), 535-542.
Griffin, W. C. (1949). Classification of surface- active agents by HLB. Journal of the
Society of Cosmetic Chemists, 1, 311-326.
Griffin, W. C. (1954). Calculation of HLB Values of Non-Ionic Surfactants. Journal
of the Society of Cosmetic Chemists, 5, 259.
Guinard, J.-X., & Mazzucchelli, R. (1999). Effects of sugar and fat on the sensory
properties of milk chocolate: descriptive analysis and instrumental
measurements. Journal of the Science of Food and Agriculture, 79(11), 1331-
1339.
Heertje, I. (1993). Microstructural studies in fat research. Food Structure, 12, 77-94.
Heertje, I. (1998). Fat crystals, emulsifiers and liquid crystals. From structure to
functionality. Polish Journal of Food and Nutrition Sciences, 7/48(2), 7-18.
Helson, H. (1948). Adaptopn-level as a basis for a quantitative theory of frames of
reference. Psychology Review, 55, 297-313.
Henry, J. V. L., Fryer, P. J., Frith, W. J., & Norton, I. T. (2009). Emulsification
mechanism and storage instabilities of hydrocarbon-in-water sub-micron
emulsions stabilised with Tweens (20 and 80), Brij 96v and sucrose
monoesters. Journal of Colloid and Interface Science, 338(1), 201-206.

References
244
Hetherington, M. M., & Macdiarmid, J. I. (1993). "Chocolate Addiction": a
Preliminary Study of its Description and its Relationship to Problem Eating.
Appetite, 21(3), 233-246.
Hirokawa, N., Ueda, M., & Harano, Y. (1994). Polymorphic transition of solid-fats
dispersed systems - its characterization by a novel method and scanning
electron microscopy observation. Journal of Crystal Growth, 141(1-2), 200-
208.
Hodge, S., & Rousseau, D. (2005). Continuous-phase fat crystals strongly influence
water-in-oil emulsion stability. Journal of the American Oil Chemists' Society,
82(3), 159-164.
Höhne, G. W. H., Hemminger, W. F., & Flammersheim, H.-J. (2003). Differential
Scanning Calorimetry (2nd ed.). Berlin: Springer-Verlag.
Hugelshofer, D. (2000). Structural and rheological properties of concentrated
suspensions mixed with an emulsion., PhD thesis, ETH, Zurich.
Huyghebaert, A., & Hendrickx, H. (1971). Polymorphism of cocoa butter, shown by
differential scanning calorimetry. Lebensmittel-Wissenschaft und
Technologie., 4, 59-63.
Johansson, D., & Bergenstahl, B. (1995). Sintering of fat crystal networks in oil
during post-crystallization processes. Journal of the American Oil Chemists
Society, 72(8), 911-920.
References
245
Johansson, D., Bergenståhl, B., & Lundgren, E. (1995). Water-in-triglyceride oil
emulsions. Effect of fat crystals on stability. Journal of the American Oil
Chemists' Society, 72(8), 939-950.
Johns, M. L. (2009). NMR studies of emulsions. Current Opinion in Colloid &
Interface Science, 14(3), 178-183.
Kähkönen, P. (2000). Consumer acceptance of reduced- fat foods – The effects of
product information. PhD thesis, University of Helsinki.
Kähkönen, P., Hakanpää, P., & Tuorila, H. (1999). The effect of information related
to fat content and taste on consumer responses to a reduced-fat frankfurter and
a reduced-fat chocolate bar. Journal of Sensory Studies, 14(1), 35-46.
Kähkönen, P., Hakanpää, P., & Tuorilla, H. (1999). The effect of information related
to fat content and taste on consumer responses to a reduced-fat frankfurter and
a reduced-fat chocolate bar. Journal of Sensory Studies, 14(1), 35-46.
Kähkönen, P., & Tuorila, H. (1998). Effect of reduced-fat information on expected
and actual hedonic and sensory ratings of sausage. Appetite, 30(1), 13-23.
Kähkönen, P., & Tuorila, H. (1999). Consumer responses to reduced and regular fat
content in different products: effects of gender, involvement and health
concern. Food Quality and Preference, 10(2), 83-91.
Kähkönen, P., Tuorila, H., & Rita, H. (1996). How information enhances
acceptability of a low-fat spread. Food Quality and Preference, 7(2), 87-94.
References
246
Karim, A. A., & Bhat, R. (2008). Gelatin alternatives for the food industry: recent
developments, challenges and prospects. Trends in Food Science &
Technology, 19(12), 644-656.
Keller, G., Lavigne, F., Loisel, C., Ollivon, M., & Bourgaux, C. (1996). Investigation
of the complex thermal behavior of fats. Journal of Thermal Analysis and
Calorimetry, 47(5), 1545-1565.
Kiefer, I., Rathmanner, T., & Kunze, M. (2005). Eating and dieting differences in
men and women. The Journal of Men's Health & Gender, 2(2), 194-201.
Knapp, A. W. (1937). Cacao Fermentation. London: J. Bale, Sons & Curnow.
Kong-Chan, J. L. Y. (1989). Reduced calorie and reduced fat chocolate confectionery
compositions. Patent No.: 4,810,516. U. S. P. Office.
Konttinen, H., Männistö, S., Sarlio-Lähteenkorva, S., Silventoinen, K., & Haukkala,
A. (2010). Emotional eating, depressive symptoms and self-reported food
consumption. A population-based study. Appetite, 54(3), 473-479.
Kramer, F. M., Rock, K., & Engell, D. (1992). Effects of time of day and
appropriateness on food intake and hedonic ratings at morning and midday.
Appetite, 18(1), 1-13.
Lange, C., Martin, C., Chabanet, C., Combris, P., & Issanchou, S. (2002). Impact of
the information provided to consumers on their willingness to pay for
Champagne: comparison with hedonic scores. Food Quality and Preference,
13(7-8), 597-608.
References
247
Lavin, J. G., & Lawless, H. T. (1998). Effects of color and odor on judgments of
sweetness among children and adults. Food Quality and Preference, 9(4), 283-
289.
Lawless, H. T., & Heymann, H. (1999). Sensory evaluation of food: principles and
practises. New York: Springer Science + Business Media.
Lee, M. N. M., & Netto, P. A. (2006). Scanning Electron Microscopy. In J.-T.
Schantz (Ed.), Techniques in Microscopy for Biomedical Applications.
London: World Scientific Publishing Co. Ltd.
Levin, I. P., & Gaeth, G. J. (1988). How Consumers Are Affected by the Framing of
Attribute Information before and after Consuming the Product. Journal of
Consumer Research: An Interdisciplinary Quarterly, 15(3), 374-378.
Lichtenstein, A. H. (1999). Dietary Fat: A History. Nutrition Reviews, 57, 11-14.
Light, A., Heymann, H., & Holt, D. L. (1992). Hedonic responses to dairy products:
effects of fat levels, label information, and risk perception. Food Technology,
47(7), 54-57.
Lloyd, H. M., Paisley, C. M., & Mela, D. J. (1995). Barriers to the Adoption of
Reduced-Fat Diets in a UK Population. Journal of the American Dietetic
Association, 95(3), 316-322.
Loisel, C., Keller, G., Lecq, G., Bourgaux, C., & Ollivon, M. (1998). Phase
transitions and polymorphism of cocoa butter. Journal of the American Oil
Chemists' Society, 75(4), 425-439.
References
248
Lovegren, N., Gray, M., & Feuge, R. (1976). Polymorphic changes in mixtures of
confectionery fats. Journal of the American Oil Chemists' Society, 53(2), 83-
88.
MacCorquodale, K., & Meehl, P. E. (1953). Preliminary suggestions as to a
formalization of expectancy theory. Psychology Review, 60, 55-63.
Macht, M., & Dettmer, D. (2006). Everyday mood and emotions after eating a
chocolate bar or an apple. Appetite, 46(3), 332-336.
Marshall, D., Stuart, M., & Bell, R. (2006). Examining the relationship between
product package colour and product selection in preschoolers. Food Quality
and Preference, 17(7-8), 615-621.
McClements, D. J. (2005). Food Emulsions: Principles, Practices and Techniques,
Second Edition. Florida: CRC Press.
McCoy, S. A., Madison, B. L., Self, P. M., & Weisgerber, D. J. (1989). Sucrose
polyesters which behave like cocoa butters. Patent No.: 4,822,875. U. S. P.
Office.
McDaniel, C., & Baker, R. C. (1977). Convenience Food Packaging and the
Perception of Product Quality. The Journal of Marketing, 41(4), 57-58.
McPherson, K., Marsh, T., & Brown, M. (2007). Foresight: Tackling Obesities:
Future Choices – Modelling Future Trends in Obesity and the Impact on
Health, second ed. Government Office for Science. Available from:
<www.foresight.gov.uk>.

References
249
Meehl, P. E., & MacCorquodale, K. (1951). Some methodological comments
concerning expectancy theory. Psychology Review, 58, 230-233.
Mela, D. J. (2001). Determinants of Food Choice: Relationships with Obesity and
Weight Control. Obesity, 9(11S), 249S-255S.
Merken, G. V., & Vaeck, S. V. (1980). Etude du polymorphisme du beurre de cacao
par calorimétrie dsc. Lebensmittel-Wissenschaft und Technologie., 13, 314-
317.
Minifie, B. W. (1989). Chocolate, cocoa and confectionery: Science and Technology
(3rd Edition). Connecticut: Aspen Publishers, Inc.
Morikawa, K., & Kurooka, A. (2000). Japan Patent No. 6,169,526. U. S. P. Office.
Morrot, G., Brochet, F., & Dubourdieu, D. (2001). The Color of Odors. Brain and
Language, 79(2), 309-320.
Naik, P. V. (2010). Principles of Physics (Fourth ed.). Delhi: PHI Learning Private
Limited.
Neel, J. V. (1962). Diabetes Mellitus: A “Thrifty” Genotype Rendered Detrimental by
“Progress”? American Journal of Human Genetics, 14(4), 353-362.
NHS. (2006). Statistics on Obesity, Physical Activity and Diet: England, 2006: The
Information Centre.
Norton, I., Fryer, P., & Moore, S. (2006). Product/Process integration in food
manufacture: Engineering sustained health. AIChE Journal, 52(5), 1632-1640.

References
250
Padley, F. B., & Talbot, G. (1992). Chocolate confectionery and hard fat emulsion
contained therein. Patent No.: 5,104,680. U. S. P. Office.
Pelchat, M. L. (1997). Food Cravings in Young and Elderly Adults. Appetite, 28(2),
103-113.
Pickering, S. U. (1907). CXCVI.-Emulsions. Journal of the Chemical Society,
Transactions, 91, 2001-2021.
Prentice, A. M., & Jebb, S. A. (1995). Obesity in Britain: gluttony or sloth? BMJ,
311(7002), 437-439.
Provencher, V., Polivy, J., & Herman, C. P. (2009). Perceived healthiness of food. If
it's healthy, you can eat more! Appetite, 52(2), 340-344.
Rabiee, F. (2004). Focus-group interview and data analysis. Proceedings of the
Nutrition Society, 63(04), 655-660.
Ravussin, E., & Swinburn, B. A. (1992). Pathophysiology of obesity. The Lancet,
340(8816), 404-408.
Raz, C., Piper, D., Haller, R., Nicod, H., Dusart, N., & Giboreau, A. (2008). From
sensory marketing to sensory design: How to drive formulation using
consumers' input? Food Quality and Preference, 19(8), 719-726.
Rey, B., Rossi-Vauthey, P., Rousset, P., Sandoz, L., Schafer, O., & Schmitt, C. J. E.
(2007). Switzerland Patent No. EP 1 759 591 A1. E. P. Office.
References
251
Rideout, C. A., McLean, J. A., & Barr, S. I. (2004). Women with high scores for
cognitive dietary restraint choose foods lower in fat and energy. Journal of the
American Dietetic Association, 104(7), 1154-1157.
Robert, A. (2006). Aerated chocolate with microbubbles for improved stability. Patent
No.: US 2006/0147584 A1. U. S. P. Office.
Robertson, G. L. (2005). Food Packaging: Principles and Practice: CRC Press.
Rogers, P. J., & Smit, H. J. (2000). Food Craving and Food "Addiction": A Critical
Review of the Evidence From a Biopsychosocial Perspective. Pharmacology
Biochemistry and Behavior, 66(1), 3-14.
Rolls, E. T. (2007). Sensory processing in the brain related to the control of food
intake. Wallingford, ROYAUME-UNI: Cambridge Univesity Press.
Rothman, L. (2007). The use of just-about-right (JAR) scales in food product
development and reformulation. In H. MacFie (Ed.), Consumer-led food
product development. Cambridge: Woodhead Publishing Limited.
Rousseau, D. (2000). Fat crystals and emulsion stability - a review. Food Research
International, 33(1), 3-14.
Rousseau, D., Zilnik, L., Khan, R., & Hodge, S. (2003). Dispersed phase
destabilization in table spreads. Journal of the American Oil Chemists'
Society, 80(10), 957-961.

References
252
Rousset, P., Rey, B., & Sandoz, L. (2008). Low-fat, water-in-oil confectionery
emulsion. Patent No.: EP 1 875 810 A1. E. P. Office.
Rozin, P., Levine, E., & Stoess, C. (1991). Chocolate craving and liking. Appetite,
17(3), 199-212.
Sanfey, A. G., Loewenstein, G., McClure, S. M., & Cohen, J. D. (2006).
Neuroeconomics: cross-currents in research on decision-making. Trends in
Cognitive Sciences, 10(3), 108-116.
Schantz, B., & Rohm, H. (2005). Influence of lecithin-PGPR blends on the
rheological properties of chocolate. Lebensmittel-Wissenschaft und-
Technologie, 38(1), 41-45.
Shankar, M. U., Levitan, C. A., Prescott, J., & Spence, C. (2009). The Influence of
Color and Label Information on Flavor Perception. Chemosensory Perception,
2(2), 53-58.
Shide, D. J., & Rolls, B. J. (1995). Information About the Fat Content of Preloads
Influences Energy Intake in Healthy Women. Journal of the American Dietetic
Association, 95(9), 993-998.
Smets, G. J. F., & Overbeeke, C. J. (1995). Expressing tastes in packages. Design
Studies, 16(3), 349-365.
Smith, K. W. (2001). Cocoa butter and cocoa butter equivalents. In F. D. Gunstone
(Ed.), Structured and Modified Lipids (pp. 401-422). New York: Marcel
Dekker Inc.

References
253
Sokmen, A., & Gunes, G. (2006). Influence of some bulk sweeteners on rheological
properties of chocolate. LWT - Food Science and Technology, 39(10), 1053-
1058.
Solheim, R., & Lawless, H. T. (1996). Consumer purchase probability affected by
attitude towards low-fat foods, liking, private body consciousness and
information on fat and price. Food Quality and Preference, 7(2), 137-143.
Sparks, P., Conner, M., James, R., Shepherd, R., & Povey, R. (2001). Ambivalence
about health-related behaviours: An exploration in the domain of food choice.
British Journal of Health Psychology, 6, 53-68.
Stroebele, N., & De Castro, J. M. (2004). Effect of ambience on food intake and food
choice. Nutrition, 20(9), 821-838.
Stubenitsky, K., Aaron, J. I., Catt, S. L., & Mela, D. J. (1999). Effect of information
and extended use on the acceptance of reduced-fat products. Food Quality and
Preference, 10(4-5), 367-376.
Tolman, E. C. (1938). The determiners of behaviors at a choice point. Psychology
Review, 45, 1-45.
Tuorila, H., & Cardello, A. V. (2002). Consumer responses to an off-flavor in juice in
the presence of specific health claims. Food Quality and Preference, 13(7-8),
561-569.
References
254
Tuorila, H., Kramer, F. M., & Engell, D. (2001). The choice of fat-free vs. regular-fat
fudge: the effects of liking for the alternative and the restraint status. Appetite,
37(1), 27-32.
Tuorila, H. M., Meiselman, H. L., Cardello, A. V., & Lesher, L. L. (1998). Effect of
expectations and the definition of product category on the acceptance of
unfamiliar foods. Food Quality and Preference, 9(6), 421-430.
van Duynhoven, J. P. M., Goudappel, G. J. W., van Dalen, G., van Bruggen, P. C.,
Blonk, J. C. G., & Eijkelenboom, A. P. A. M. (2002). Scope of droplet size
measurements in food emulsions by pulsed field gradient NMR at low field.
Magnetic Resonance in Chemistry, 40(13), S51-S59.
van Duynhoven, J. P. M., Maillet, B., Schell, J., Tronquet, M., Goudappel, G.-J. W.,
Trezza, E., Bulbarello, A., & van Dusschoten, D. (2007). A rapid benchtop
NMR method for determination of droplet size distributions in food
emulsions. European Journal of Lipid Science and Technology, 109(11),
1095-1103.
van Malssen, K., van Langevelde, A., Peschar, R., & Schenk, H. (1999). Phase
behavior and extended phase scheme of static cocoa butter investigated with
real-time X-ray powder diffraction. Journal of the American Oil Chemists'
Society, 76(6), 669-676.
van Strien, T., Frijters, J. E. R., Bergers, G. P. A., & Defares, P. B. (1986). The Dutch
Eating Behavior Questionnaire (DEBQ) for assessment of restrained,

References
255
emotional, and external eating behavior. International Journal of Eating
Disorders, 5(2), 295-315.
van Strien, T., Herman, C. P., & Verheijden, M. W. (2009). Eating style, overeating,
and overweight in a representative Dutch sample. Does external eating play a
role? Appetite, 52(2), 380-387.
Wansink, B., & Chandon, P. (2006). Can "low-fat" nutrition labels lead to obesity?
Journal of Marketing Research, 43, 607-617.
Wansink, B., Cheney, M. M., & Chan, N. (2003). Exploring comfort food preferences
across age and gender. Physiology & Behavior, 79(4-5), 739-747.
Wansink, B., & Park, S.-B. (2002). Sensory Suggestiveness and Labeling: Do Soy
Labels Bias Taste? Journal of Sensory Studies, 17(5), 483-491.
Wansink, B., van Ittersum, K., & Painter, J. E. (2004). How diet and health labels
influence taste and satiation. Journal of Food Science, 69(9), S340-S346.
Wansink, B., van Ittersum, K., & Painter, J. E. (2005). How descriptive food names
bias sensory perceptions in restaurants. Food Quality and Preference, 16(5),
393-400.
Westcombe, A., & Wardle, J. (1997). Influence of Relative Fat Content Information
on Responses to Three Foods. Appetite, 28(1), 49-62.
WHO. (2004). Obesity: Preventing and Managing the Global Epidemic. Geneva:
World Health Organization.
References
256
Wille, R., & Lutton, E. (1966). Polymorphism of cocoa butter. Journal of the
American Oil Chemists' Society, 43(8), 491-496.
Williams, P. A. (2006). An Overview of the Structure - Function Relationships of
Hydrocolloids. In P. A. Williams & G. O. Phillips (Eds.), Gums and
Stabilisers for the Food Industry 13. (pp. 15-29). Cambridge: RSC Publishing.
Wilson, R., van Schie, B. J., & Howes, D. (1998). Overview of the Preparation, Use
and Biological Studies on Polyglycerol Polyricinoleate (PGPR). Food and
Chemical Toxicology, 36(9-10), 711-718.
Yeomans, M. R. (2007). The Role of Palatability in Control of Human Appetite:
Implications for Understanding and Treating Obesity. In C. K. Tim & J. C.
Steven (Eds.), Appetite and Body Weight (pp. 247-269). Burlington: Academic
Press.
Yeomans, M. R., Chambers, L., Blumenthal, H., & Blake, A. (2008). The role of
expectancy in sensory and hedonic evaluation: The case of smoked salmon
ice-cream. Food Quality and Preference, 19(6), 565-573.
Yeomans, M. R., Lartamo, S., Procter, E. L., Lee, M. D., & Gray, R. W. (2001). The
actual, but not labelled, fat content of a soup preload alters short-term appetite
in healthy men. Physiology and Behavior, 73, 533-540.
Zampini, M., Wantling, E., Phillips, N., & Spence, C. (2008). Multisensory flavor
perception: Assessing the influence of fruit acids and color cues on the

References
257
perception of fruit-flavored beverages. Food Quality and Preference, 19(3),
335-343.
Zellner, D. A., Garriga-Trillo, A., Centeno, S., & Wadsworth, E. (2004). Chocolate
craving and the menstrual cycle. Appetite, 42(1), 119-121.
Zumbe, A. (1999). Process for manufacture of reduced fat and reduced calorie
chocolate. Patent No.: 5,882,709. U. S. P. Office.
Appendices
258
Appendix 1: Letter of Ethical Approval
School of Psychology
Appendices
259
Appendix 2: Example Consent Form
Consent Form
This is to certify that I,…………………..........................................................., hereby agree to participate as a volunteer in a scientific experiment as an authorised part of the research undertakings within the School of Chemical Engineering at the University of Birmingham conducted by Jennifer Norton, under the supervision of Professor Peter Fryer.
My part in the investigation has been fully explained to me by Jennifer Norton and I understand her explanation. The procedures of this investigation and their risks have been answered to my satisfaction.
I understand that I will be video and audio recorded. I understand that all data will remain confidential with regard to my identity.
I understand that I am free to withdraw my consent and terminate my participation at any time and without penalty. I understand that I can withdraw my data even after the experiment is complete, and up to the point of publication.
My responsibility as a participant is to participate actively and willingly and if I choose not to do so, I will exercise my right to withdraw without penalty. If I choose not to withdraw, I understand that I am expected to participate actively.
I understand that I may request a summary of the results of the study.
Any complaints concerning the conduct of the research should be addressed to Professor Peter Fryer, School of Chemical Engineering, University of Birmingham.
…………………………………………………………………………………
Participant’s Signature Date
I, the undersigned, have fully explained the investigation to the above individual.
……………………………………………………………………………………..
Investigator’s Signature Date
Appendices
260
Appendix 3: Example Debriefing Form
Debriefing
Thank you for taking part in the discussion group. The purpose of the discussion was to investigate chocolate consumption, and to gain information about what you look for in chocolate, when and how much you eat of it, and why you eat it.
You were given the Dutch Eating Behaviour Questionnaire (DEBQ) which aims to examine your eating behaviour, in terms of emotional eating (eating in response to emotional arousal states such as fear, anger or anxiety), external eating (eating in response to external food cues such as the sight or smell of food) and restraint (overeating after a period of slimming). This information will be used in conjunction with the opinions given during the discussion session. The demographic questions (age, height and weight) will be used to compile average data for the group.
As already mentioned, your data will remain confidential with regards to you identity. If you wish to do so you can withdraw your data even after the experiment is complete, and up to the point of publication.
You may request a summary of the results of the study by contacting Jennifer Norton.
Any complaints concerning the conduct of the research should be addressed to Professor Peter Fryer, School of Chemical Engineering, University of Birmingham.
Contact Details
Jennifer Norton
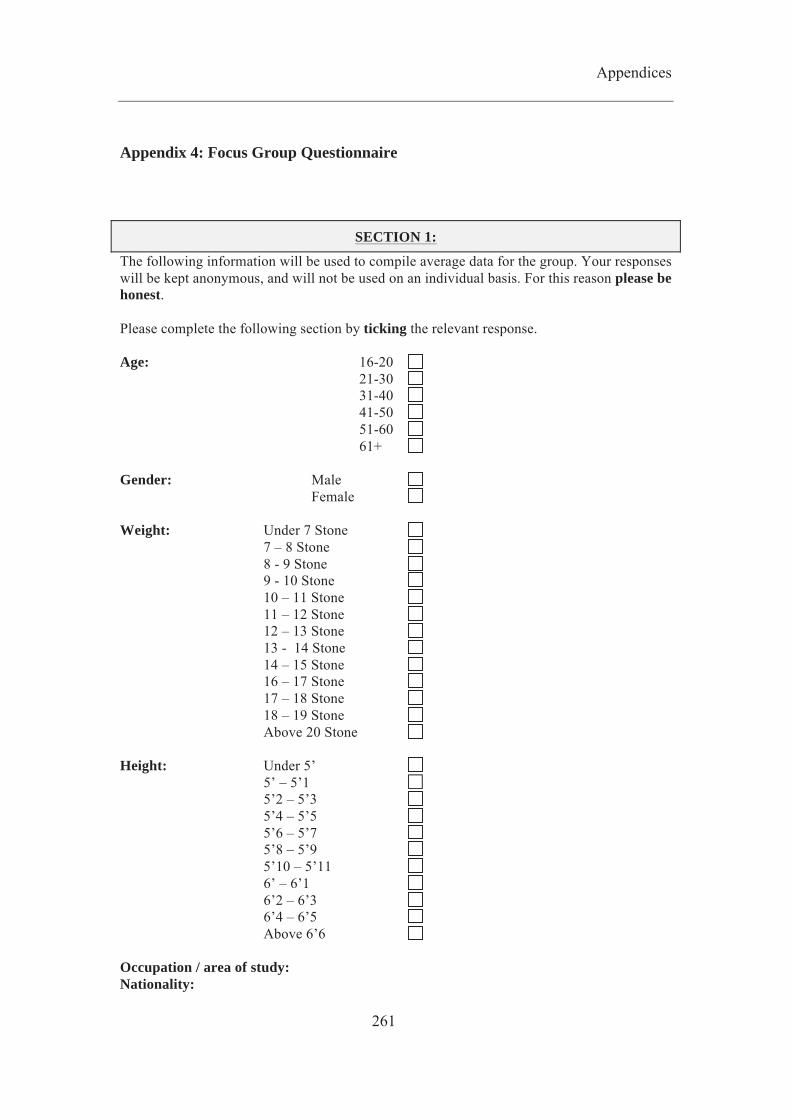
Appendices
261
Appendix 4: Focus Group Questionnaire
SECTION 1:
The following information will be used to compile average data for the group. Your responses will be kept anonymous, and will not be used on an individual basis. For this reason please be honest. Please complete the following section by ticking the relevant response. Age: 16-20
21-30 31-40 41-50 51-60 61+
Gender: Male
Female
Weight: Under 7 Stone 7 – 8 Stone 8 - 9 Stone 9 - 10 Stone 10 – 11 Stone 11 – 12 Stone 12 – 13 Stone 13 - 14 Stone
14 – 15 Stone 16 – 17 Stone 17 – 18 Stone 18 – 19 Stone Above 20 Stone Height: Under 5’ 5’ – 5’1 5’2 – 5’3 5’4 – 5’5 5’6 – 5’7 5’8 – 5’9 5’10 – 5’11 6’ – 6’1 6’2 – 6’3 6’4 – 6’5 Above 6’6 Occupation / area of study: Nationality:

Appendices
262
SECTION 2:
Please complete the following section by ticking the relevant response.
never seldom sometimes often very often not
relevant 1. How often do you refuse food or drink
offered because you are concerned with your weight?
2. Do you watch exactly what you eat? 3. Do you take into account your weight
when choosing what you eat? 4. Do you deliberately eat foods that are
slimming? 5. Do you deliberately eat less in order not to
become heavier? 6. How often do you try not to eat between
meals because you are watching your weight?
7. When you have eaten too much, do you eat less than usual in the following days?
8. In the evening how often do you try not to eat because you are watching your weight?
9. Do you try and eat less at mealtimes than you would like to eat?
10. If you have put on weight, do you eat less than you usually do?
11. When preparing a meal are you inclined to eat something?
12. If food tastes good to you, do you eat more than usual?
13. If food smells and looks good, do you eat more than usual?
14. Can you resist eating delicious foods? 15. If you see or smell something delicious to
eat, do you eat it straight away? 16. Do you eat more than usual when you see
others eating? 17. If you see others eating, do you also have
the desire to eat? 18. If you walk past the bakery do you have
the desire to buy something delicious? 19. If you have something delicious to eat, do

Appendices
263
you eat it straight away? 20. If you walk past a snackbar or a café, do
you have the desire to buy something delicious?
Do you have the desire to eat when you are: 21. …irritated? 22. …cross? 23. …frightened?
24. …emotionally upset? 25. …bored or restless? 26. …approaching something unpleasant? 27. …depressed or discouraged? 28. …feeling lonely? 29. …nothing to do? 30. …anxious, worried or tense? 31. … disappointed? 32. Do you have a desire to eat when things
are going against you or when things have gone wrong?
33. Do you have a desire to eat when somebody lets you down?
End of questions Thank you very much

Appendices
264
Appendix 5: Screening Questionnaire
The following questionnaire is used to gain information about yourself that will determine your suitability for the study. All the information you give will be kept confidential, and will be used for the purpose of this experiment only. Please answer by typing in answers and emailing it back to [email protected]. Your full name: Your email address: Please complete the following section by placing an ‘X’ in the relevant box. How old are you?
16-20
21-30
31-40
41-50
51-60 61+
Are you male or female? Male
Female Do you follow a specific diet that prevents you from eating certain foods? Low sugar Low fat Vegetarian Vegan Gluten Free Other No
If ‘other’, please specify: Do you have a specific food allergy?
Yes
No

Appendices
265
If ‘yes’, please specify: How often do you eat / drink the following foods? More
than once a
day
Once a day
3 times a week
Once a week
Once a month
Once every few months
Never
Carbonated drinks
Tea Fruit Crisps Chocolate Yogurt Coffee If given the opportunity, how likely is it that you would try the following foods?
Very likely Quite likely Neither likely nor
unlikely
Not likely
Very unlikely
A new flavour of crisps A lower fat version of a food you have tasted before
A luxury version of a food you have tasted before
A vegetable you have never heard of before
A dish from another country A new health food Thank you for completing the questionnaire, Jennifer Norton
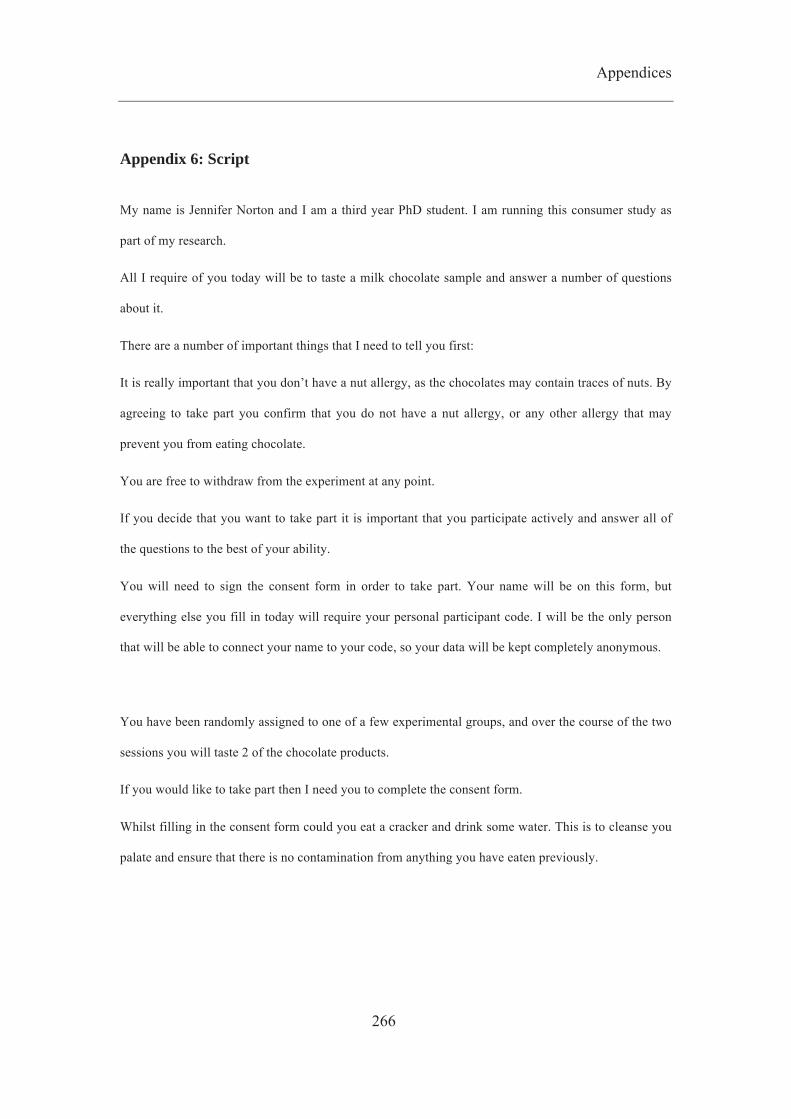
Appendices
266
Appendix 6: Script
My name is Jennifer Norton and I am a third year PhD student. I am running this consumer study as
part of my research.
All I require of you today will be to taste a milk chocolate sample and answer a number of questions
about it.
There are a number of important things that I need to tell you first:
It is really important that you don’t have a nut allergy, as the chocolates may contain traces of nuts. By
agreeing to take part you confirm that you do not have a nut allergy, or any other allergy that may
prevent you from eating chocolate.
You are free to withdraw from the experiment at any point.
If you decide that you want to take part it is important that you participate actively and answer all of
the questions to the best of your ability.
You will need to sign the consent form in order to take part. Your name will be on this form, but
everything else you fill in today will require your personal participant code. I will be the only person
that will be able to connect your name to your code, so your data will be kept completely anonymous.
You have been randomly assigned to one of a few experimental groups, and over the course of the two
sessions you will taste 2 of the chocolate products.
If you would like to take part then I need you to complete the consent form.
Whilst filling in the consent form could you eat a cracker and drink some water. This is to cleanse you
palate and ensure that there is no contamination from anything you have eaten previously.

Appendices
267
Appendix 7: Instructions for Participants
This session will last approximately 20 minutes. There are four parts to the session: Section’s A, B, C and D. Sections A, B and D involve filling out a questionnaire and verbally answering two questions.
You will be given a sample of chocolates and the accompanying questionnaire. Before tasting the chocolate answer Section A of the questionnaire. After completing Section A, taste the chocolate and answer Section B.
When you have finished Sections A and B you will be instructed on Section C. After completing Section C, please fill in Section D. After completing all Sections of this questionnaire you will be given another short questionnaire.
If this is your first session please ask the experimenter to remind you of the date and time of your second session before leaving. You will receive payment following the completion of both sessions 1 and 2.
If you are willing to take part in this experiment please read and sign the consent form. When you are ready you can start.
REMINDER: YOU MAY NOT TAKE PART IN THIS EXPERIMENT IF YOU HAVE A NUT ALLERGY, OR ANY OTHER ALLERGY THAT PREVENTS YOU FROM EATING CHOCOLATE.
Line-scale Questions
When given a line-scale question please make a vertical mark across the horizontal line at the point that you consider to represent the rating for the product.
For example, if played a sound you would answer a line-scale question in the following way:
1. How loud do you think the following sound is?
Extremely quiet Extremely loud
Multiple Choice Questions
When given a multiple choice question please place an ‘X’ in the box that you consider to represent the rating for the product. Remember: Please tick ONE box only.
For example, if played a sound you would answer a multiple choice question in the following way:
2. What is your opinion of the volume of the sound?
Far too loud
Slightly too loud
Just about right
Slightly too quiet
Far too quiet
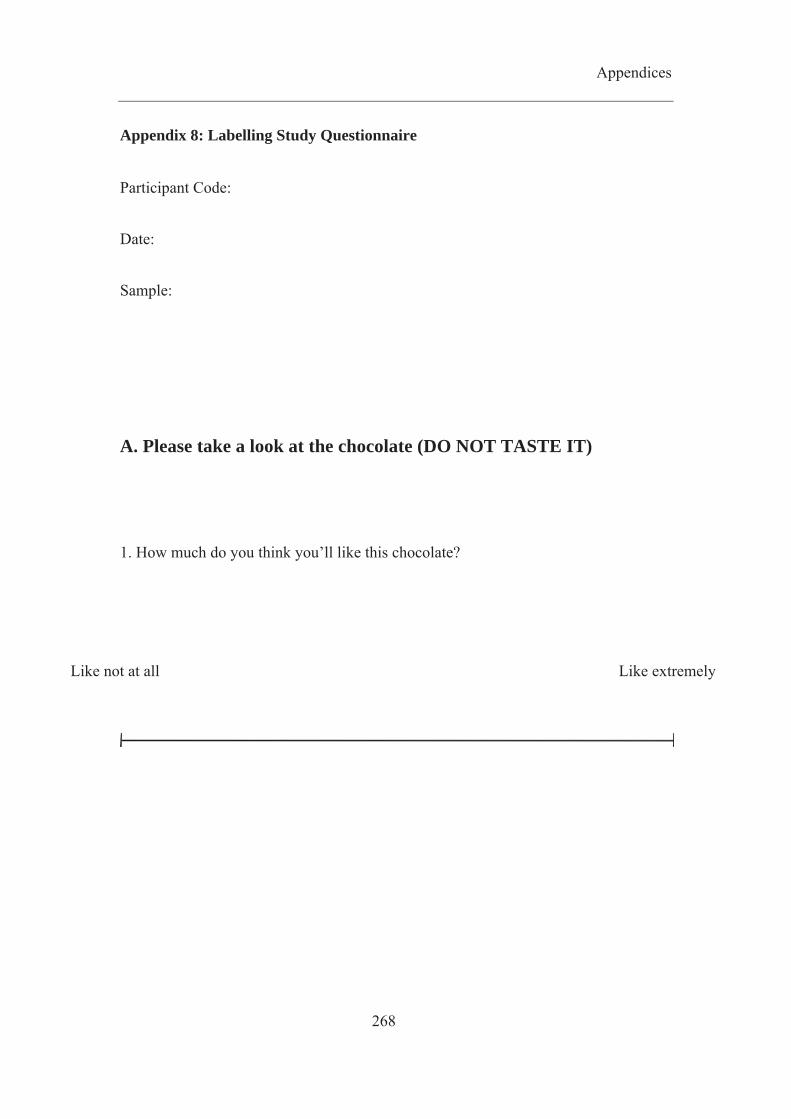
Appendices
268
Appendix 8: Labelling Study Questionnaire
Participant Code:
Date:
Sample:
A. Please take a look at the chocolate (DO NOT TASTE IT)
1. How much do you think you’ll like this chocolate?
Like not at all Like extremely

Appendices
269
B. Now taste the chocolate: eat ONE SQUARE ONLY.
1. How much do you like the chocolate overall?
Like not at all Like extremely
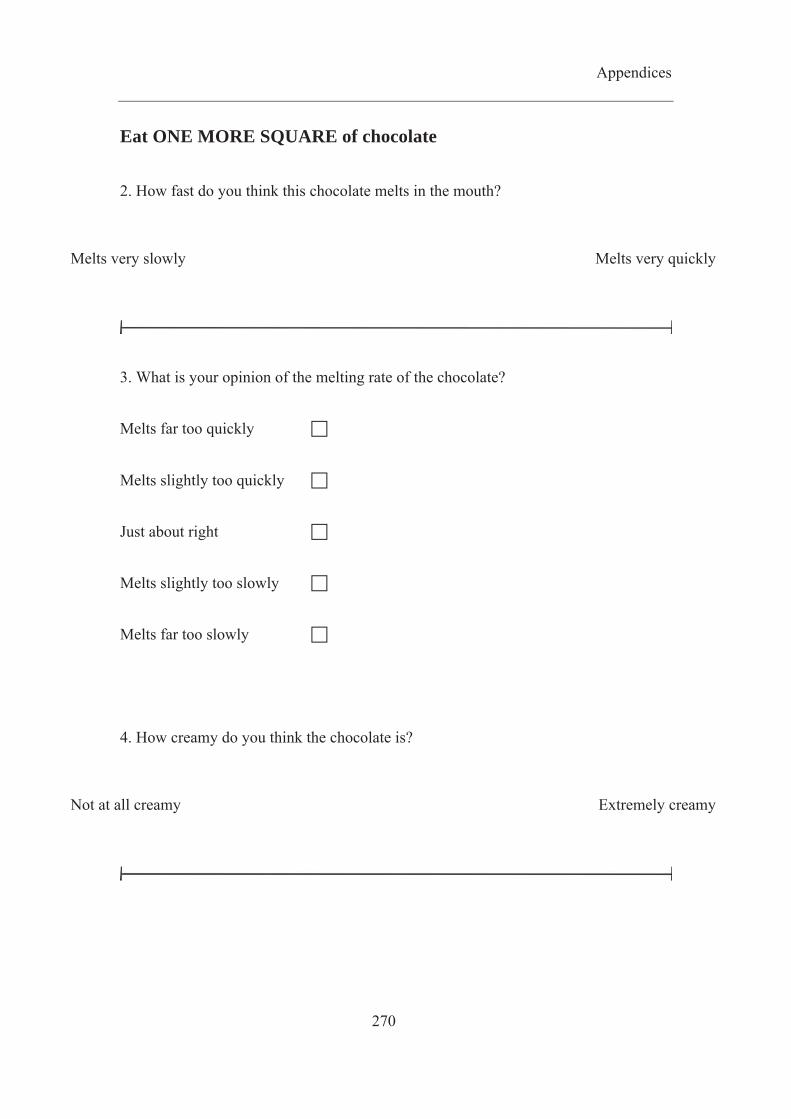
Appendices
270
Eat ONE MORE SQUARE of chocolate
2. How fast do you think this chocolate melts in the mouth?
Melts very slowly Melts very quickly
3. What is your opinion of the melting rate of the chocolate?
Melts far too quickly
Melts slightly too quickly
Just about right
Melts slightly too slowly
Melts far too slowly
4. How creamy do you think the chocolate is?
Not at all creamy Extremely creamy

Appendices
271
5. What is your opinion of the creaminess of the chocolate?
Much too creamy
Slightly too creamy
Just about right
Not quite creamy enough
Not at all creamy enough
6. How rich do you think the chocolate is?
Not at all rich Extremely rich
7. What is your opinion of the richness of the chocolate?
Much too rich
Slightly too rich
Just about right
Not quite rich enough

Appendices
272
Not at all rich enough
8. When thinking about mouthfeel (i.e. how the sample feels in the mouth), how thick
do you think the chocolate is?
Not at all thick Extremely thick
9. When thinking about mouthfeel (i.e. how the sample feels in the mouth), what is
your opinion of the thickness of the chocolate?
Much too thick
Slightly too thick
Just about right
Not quite thick enough
Not at all thick enough
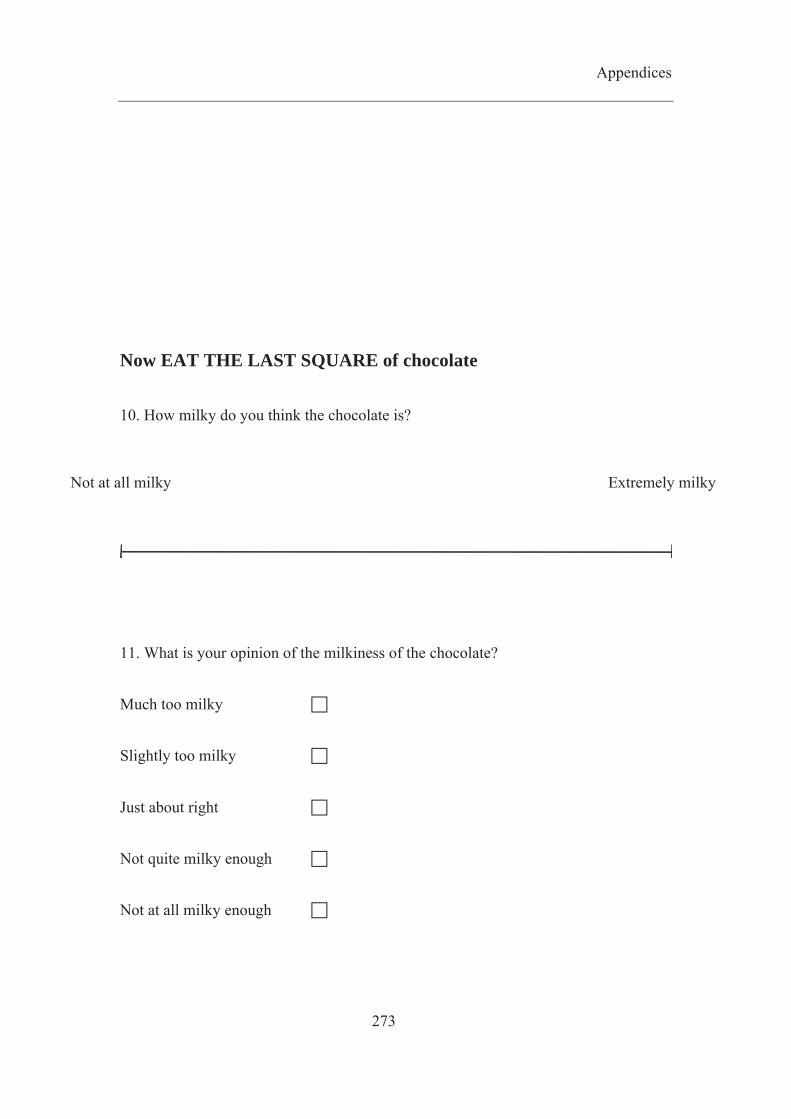
Appendices
273
Now EAT THE LAST SQUARE of chocolate
10. How milky do you think the chocolate is?
Not at all milky Extremely milky
11. What is your opinion of the milkiness of the chocolate?
Much too milky
Slightly too milky
Just about right
Not quite milky enough
Not at all milky enough

Appendices
274
12. How smooth do you think the chocolate is?
Not at all smooth Extremely smooth
13. What is your opinion of the smoothness of the chocolate?
Much too smooth
Slightly too smooth
Just about right
Not quite smooth enough
Not at all smooth enough
14. How sweet do you think the chocolate is?
Not at all sweet Extremely sweet
15. What is your opinion of the sweetness of the chocolate?
Much too sweet
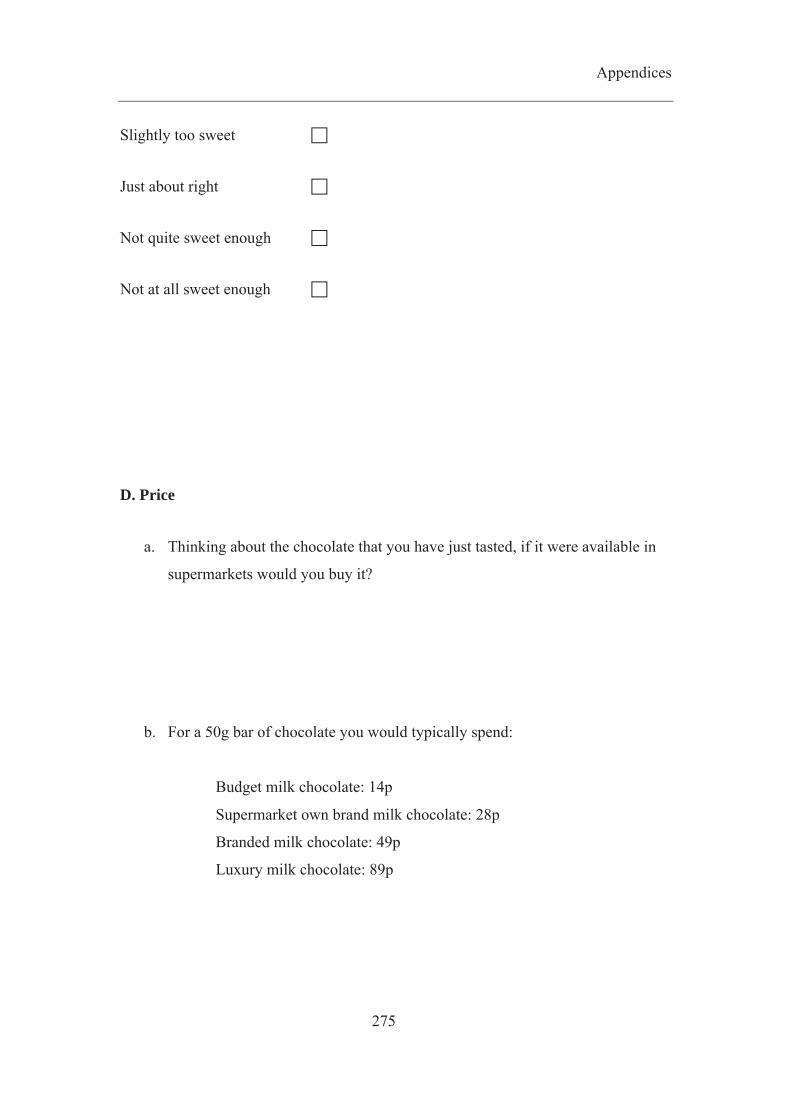
Appendices
275
Slightly too sweet
Just about right
Not quite sweet enough
Not at all sweet enough
D. Price
a. Thinking about the chocolate that you have just tasted, if it were available in
supermarkets would you buy it?
b. For a 50g bar of chocolate you would typically spend:
Budget milk chocolate: 14p
Supermarket own brand milk chocolate: 28p
Branded milk chocolate: 49p
Luxury milk chocolate: 89p

Appendices
276
How much would you pay for a 50g bar (8 squares) of the chocolate you have
tasted today?

Appendices
277
Appendix 9: Post Study Questionnaire A
1. Participant Code:
2. Current Time:
3. Prior to taking part in this study, at what time did you last consume a meal?
4. Please give a detailed description of what you ate:
5. Did you have any snack between your last meal and the start of the session?
6. If so, please give a detailed description of what you ate:
7. If you are a smoker, at what time did you last smoke?
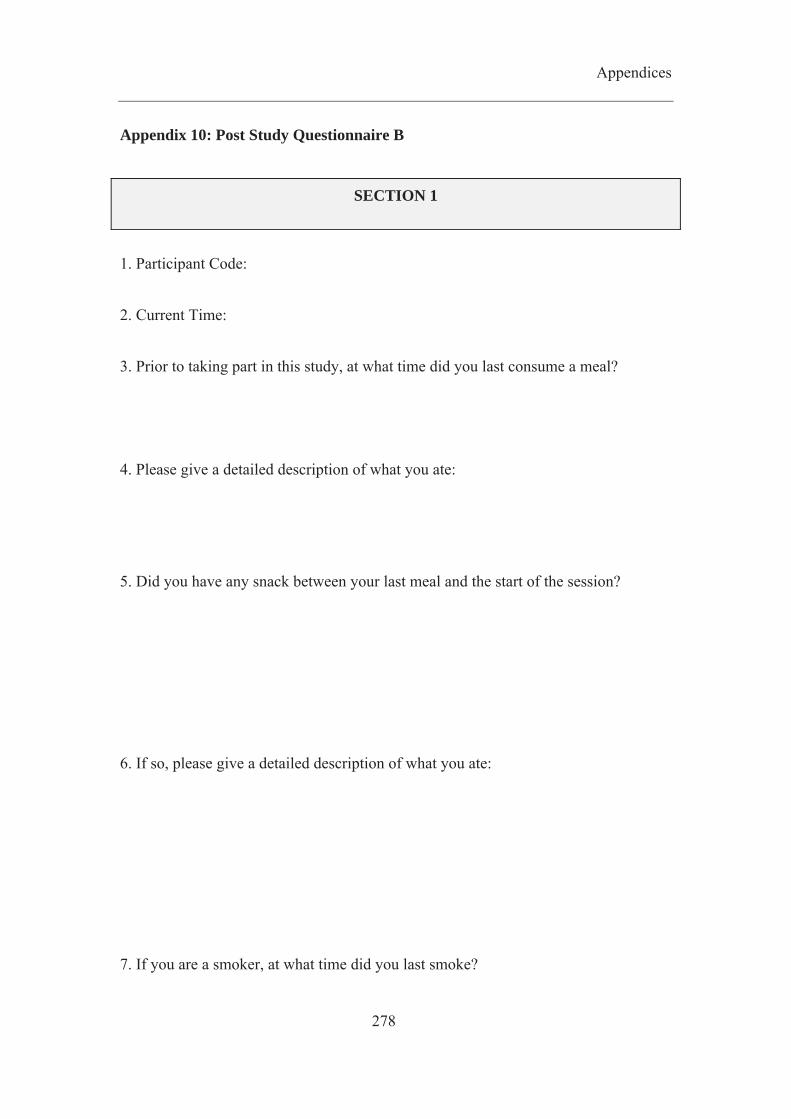
Appendices
278
Appendix 10: Post Study Questionnaire B
SECTION 1
1. Participant Code:
2. Current Time:
3. Prior to taking part in this study, at what time did you last consume a meal?
4. Please give a detailed description of what you ate:
5. Did you have any snack between your last meal and the start of the session?
6. If so, please give a detailed description of what you ate:
7. If you are a smoker, at what time did you last smoke?

Appendices
279
SECTION 2
What is your….
1. current age?
2. nationality?
3. native language?
4. current marital status?
5. current occupation / area of study?
6. What is the highest level of education you have completed?
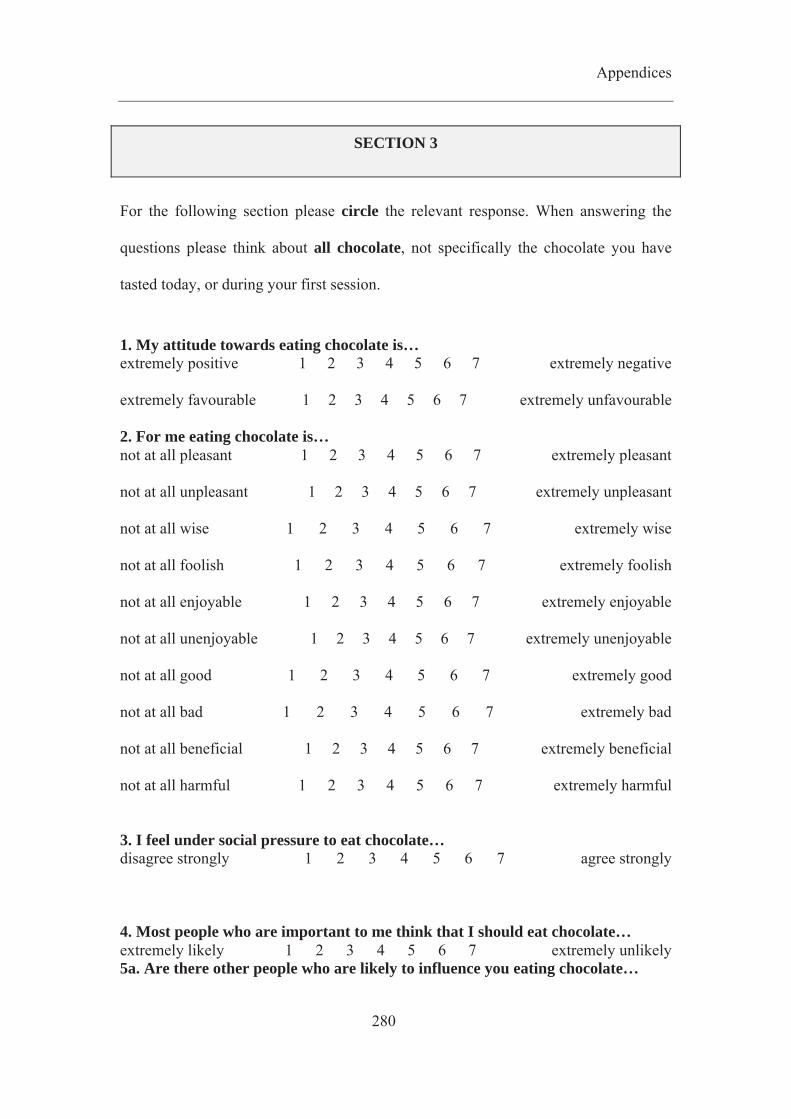
Appendices
280
SECTION 3
For the following section please circle the relevant response. When answering the
questions please think about all chocolate, not specifically the chocolate you have
tasted today, or during your first session.
1. My attitude towards eating chocolate is… extremely positive 1 2 3 4 5 6 7 extremely negative extremely favourable 1 2 3 4 5 6 7 extremely unfavourable 2. For me eating chocolate is… not at all pleasant 1 2 3 4 5 6 7 extremely pleasant not at all unpleasant 1 2 3 4 5 6 7 extremely unpleasant not at all wise 1 2 3 4 5 6 7 extremely wise not at all foolish 1 2 3 4 5 6 7 extremely foolish not at all enjoyable 1 2 3 4 5 6 7 extremely enjoyable not at all unenjoyable 1 2 3 4 5 6 7 extremely unenjoyable not at all good 1 2 3 4 5 6 7 extremely good not at all bad 1 2 3 4 5 6 7 extremely bad not at all beneficial 1 2 3 4 5 6 7 extremely beneficial not at all harmful 1 2 3 4 5 6 7 extremely harmful 3. I feel under social pressure to eat chocolate… disagree strongly 1 2 3 4 5 6 7 agree strongly 4. Most people who are important to me think that I should eat chocolate… extremely likely 1 2 3 4 5 6 7 extremely unlikely 5a. Are there other people who are likely to influence you eating chocolate…

Appendices
281
Yes No 5b. If you answered ‘yes’ to question 5a., the views of those people towards you eating chocolate are… extremely favourable 1 2 3 4 5 6 7 extremely unfavourable 6. For me, eating chocolate is… extremely easy 1 2 3 4 5 6 7 extremely difficult 7. If I want to I can easily eat chocolate… extremely likely 1 2 3 4 5 6 7 extremely unlikely 8. How likely is it that, if you try, you are able to eat chocolate… extremely likely 1 2 3 4 5 6 7 extremely unlikely 9. I think of myself as a health conscious consumer… disagree strongly 1 2 3 4 5 6 7 agree strongly 10. I think of myself as someone who is concerned about the consequences of what I eat… disagree strongly 1 2 3 4 5 6 7 agree strongly 11. I intend to eat chocolate tomorrow… definitely do not 1 2 3 4 5 6 7 definitely do 12. I will make an effort to eat chocolate tomorrow… definitely false 1 2 3 4 5 6 7 definitely true 13. I will try to try to eat chocolate tomorrow… definitely will not 1 2 3 4 5 6 7 definitely will 14. For a moment consider only the positive things about eating chocolate and ignore any negative things about it. Please rate how positive those positive things are… not at all positive 1 2 3 4 5 extremely positive

Appendices
282
15. For a moment consider only the negative things about eating chocolate and ignore any positive things about it. Please rate how negative those negative things are… not at all negative 1 2 3 4 5 extremely negative 16. To what extent do you have positive thoughts or feelings about eating chocolate? not at all 1 2 3 4 5 6 7 to an extremely great extent 17.To what extent do you have negative thoughts or feelings about eating chocolate? not at all 1 2 3 4 5 6 7 to an extremely great extent 18. To what extent are there advantages for you in eating chocolate? not at all 1 2 3 4 5 6 7 to an extremely great extent 19. To what extent are there disadvantages for you in eating chocolate? not at all 1 2 3 4 5 6 7 to an extremely great extent 20. Would you say that you are strongly in favour (or strongly against) eating chocolate or would you say that your feelings are mixed? strongly in favour mixed feelings strongly against
SECTION 4 Please complete the following section by placing an ‘X’ in the relevant box.
never seldom sometimes often very often not relevant
1. How often do you refuse food or drink offered because you are concerned with your weight?
2. Do you watch exactly what you eat? 3. Do you take into account your weight
when choosing what you eat?

Appendices
283
4. Do you deliberately eat foods that are slimming?
5. Do you deliberately eat less in order not to become heavier?
6. How often do you try not to eat between meals because you are watching your weight?
7. When you have eaten too much, do you eat less than usual in the following days?
8. In the evening how often do you try not to eat because you are watching your weight?
9. Do you try and eat less at mealtimes than you would like to eat?
10. If you have put on weight, do you eat less than you usually do?
11. When preparing a meal are you inclined to eat something?
12. If food tastes good to you, do you eat more than usual?
13. If food smells and looks good, do you eat more than usual?
14. Can you resist eating delicious foods? 15. If you see or smell something delicious
to eat, do you eat it straight away? 16. Do you eat more than usual when you
see others eating? never seldom sometimes often very often not relevant
17. If you see others eating, do you also have the desire to eat?
18. If you walk past the bakery do you have the desire to buy something delicious?
19. If you have something delicious to eat, do you eat it straight away?
20. If you walk past a snackbar or a café, do you have the desire to buy something delicious?
Do you have the desire to eat when you are:
21. …irritated? 22. …cross? 23. …frightened? 24. …emotionally upset?

Appendices
284
25. …bored or restless? 26. …approaching something unpleasant? 27. …depressed or discouraged? 28. …feeling lonely? 29. …nothing to do? 30. …anxious, worried or tense? 31. … disappointed? 32. Do you have a desire to eat when
things are going against you or when things have gone wrong?
33. Do you have a desire to eat when somebody lets you down?
Appendices
285
SECTION 5
1. To ensure the validity of this research, please briefly describe what the main aim of the study was? 2. Can you please indicate which brands of chocolate you think you tasted during sessions 1 and 2: Session 1: Session 2:
End of questions Thank you very much

Appendices
286
Appendix 11: Packaging Study Screening Questionnaire
Screening Questionnaire – Electronic Version
The following questionnaire is used to gain information about yourself that will
determine your suitability for the study. All the information you give will be kept
confidential, and will be used for the purpose of this experiment only. Please answer
by typing in answers and emailing it back to [email protected].
Your full name:
Your email address:
Please complete the following section by placing an ‘X’ in the relevant box.
How old are you? 16-20
21-30
31-40
41-50
51-60
61+

Appendices
287
Are you male or female? Male
Female
What is your occupation / area of study?
If you are a student, which year are you currently in?
What is your nationality?
What is your native language?
What is your current marital status?
What is the highest level of education you have completed?
Do you follow a specific diet that prevents you from eating certain foods?
Low sugar Low fat Vegetarian
Vegan Gluten Free Other
No
If ‘other’, please specify:

Appendices
288
Do you have a specific food allergy?
Yes
No
If ‘yes’, please specify:

Appendices
289
How often do you eat / drink the following foods?
More
than
once a
day
Once a
day
3 times
a week
Once a
week
Once a
month
Once
every
few
months
Never
Carbonated
drinks
Tea
Fruit
Crisps
Chocolate
Yogurt
Coffee
You will be required to attend the discussion session on Wednesday 24th March,
during the afternoon. If you are suitable for this experiment you will be contacted via
email within a week of returning this questionnaire.
If you cannot be contacted via email please provide a phone number from which you
can be contacted:
Thank you for completing the questionnaire,
Jennifer Norton
Appendices
290
Appendix 12: Discussion Guide
DISCUSSION GUIDE (90 MINUTES)
INTRODUCTION (UP TO 5 MINS)
Could you find the sticker with your name on it. Could you also read and sign a
consent form.
Ask participants if they want drinks. Tell them where the toilets are, and to leave if
they need to use them.
There are no right or wrong answers, it is your view and opinions that are important,
so I am not going to judge you on the answers you give. The aim of the session is to
generate discussion by involving everyone in the group.
You should be aware that your responses will be audio / video recorded, but all data
gathered will be anonymous and confidential (your name will not be with the data).
Your involvement is optional, and you can withdraw at any time.
Appendices
291
INTRODUCTION OF PARTICIPANTS (UP TO 5 MINS)
The first thing I would like you to do before we get started on the discussion is to
spend a few minutes doing the…
1. Thought bubble completion task: you each have two photographs of people
choosing bars of chocolate. As you can see there are empty thought bubbles on
photos. What I would like you to do is write in the bubbles what you think the person
might be thinking or feeling. It’s important that you write down anything and
everything that comes to mind. 10 minutes
I am completing this research as part of my PhD. The purpose of the focus group is
gather your thoughts and opinions on chocolate packaging.
Please introduce yourself to the group, giving your first name and your favourite
chocolate bar.
MAIN BODY
2. In front of you are a group of photographs of chocolate bars. Some of them you
will have seen before, and some of them you may not have done. What I would like

Appendices
292
you to do is to group the photographs according to healthiness. I want you to focus on
the packaging, and any information given on the packaging, and less so on anything
you know about the bars already. So if on this side you put bars that you think are
healthier, and the other side bars that you think are less healthy. 25 minutes
Prompts:
so why have you put these bars in this pile?
can anyone see anything else that is different?
o does that impact on healthiness?
3. I am currently working on a reduced-fat chocolate, and am interested in how it
might be marketed. So I would like you to think about a reduced-fat chocolate, and
work as a group to complete some of the sentences which I have written on the board.
30 minutes
− ‘The best thing about this product is…’ − ‘The most annoying thing about this product is…’ − ‘The kind of person who would buy this product would be…’ − ‘I’d convince people to buy this product by saying…’ − ‘The wrapper of a reduced-fat chocolate bar should…’
4. I have photographs of the same people buying chocolate bars, but I want you to
imagine them buying a reduced-fat chocolate bar packaged in the way we have
discussed today. Again I would like to fill in the thought bubbles, writing down
anything you think of. 10 minutes
CLOSURE (5 MINS)
Appendices
293
Before closing the session, does anyone have anything else they would like to say or
contribute to the discussion?
Thank you for your involvement and contributions today.
Give vouchers and chocolate bars.

Appendices
294
Appendix 13: Thought Bubble Completion Task 1
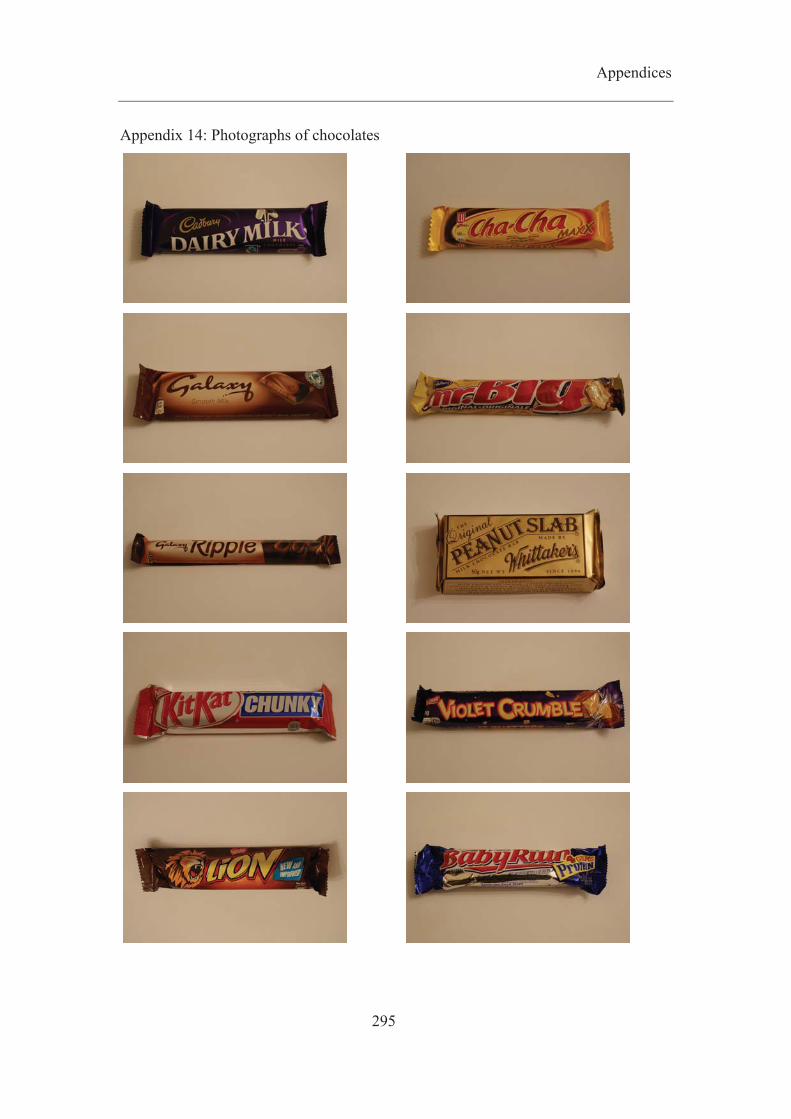
Appendices
295
Appendix 14: Photographs of chocolates
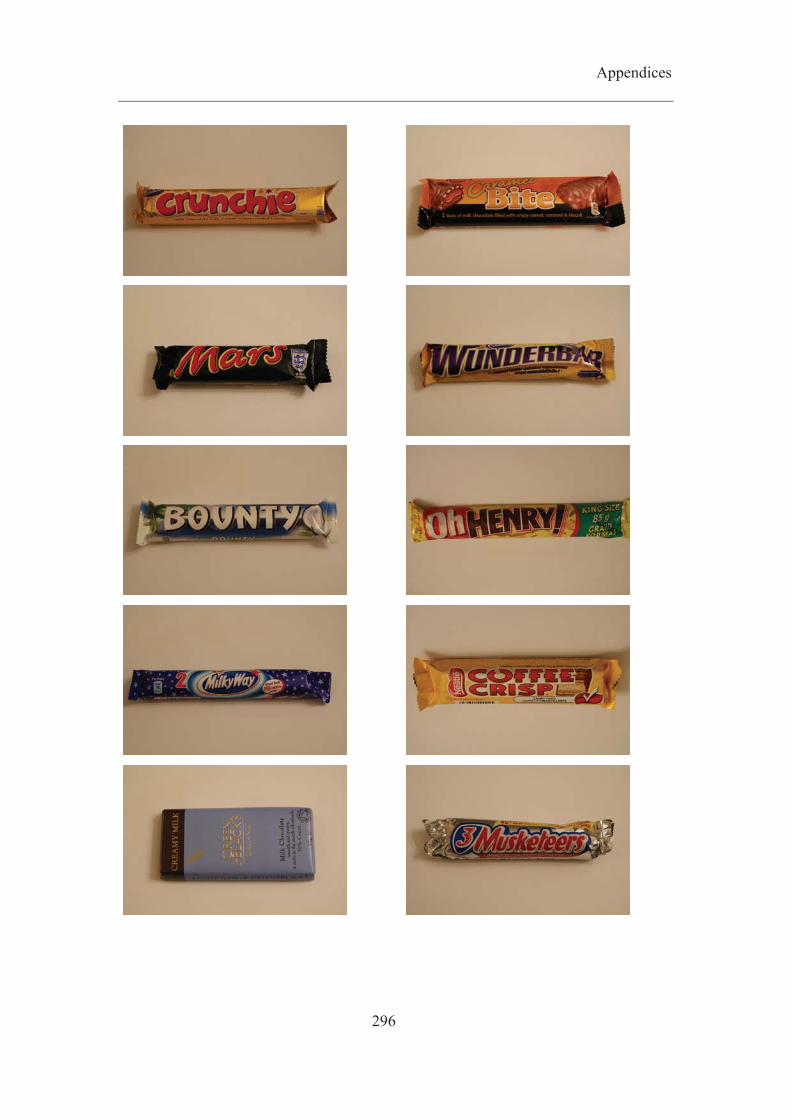
Appendices
296

Appendices
297
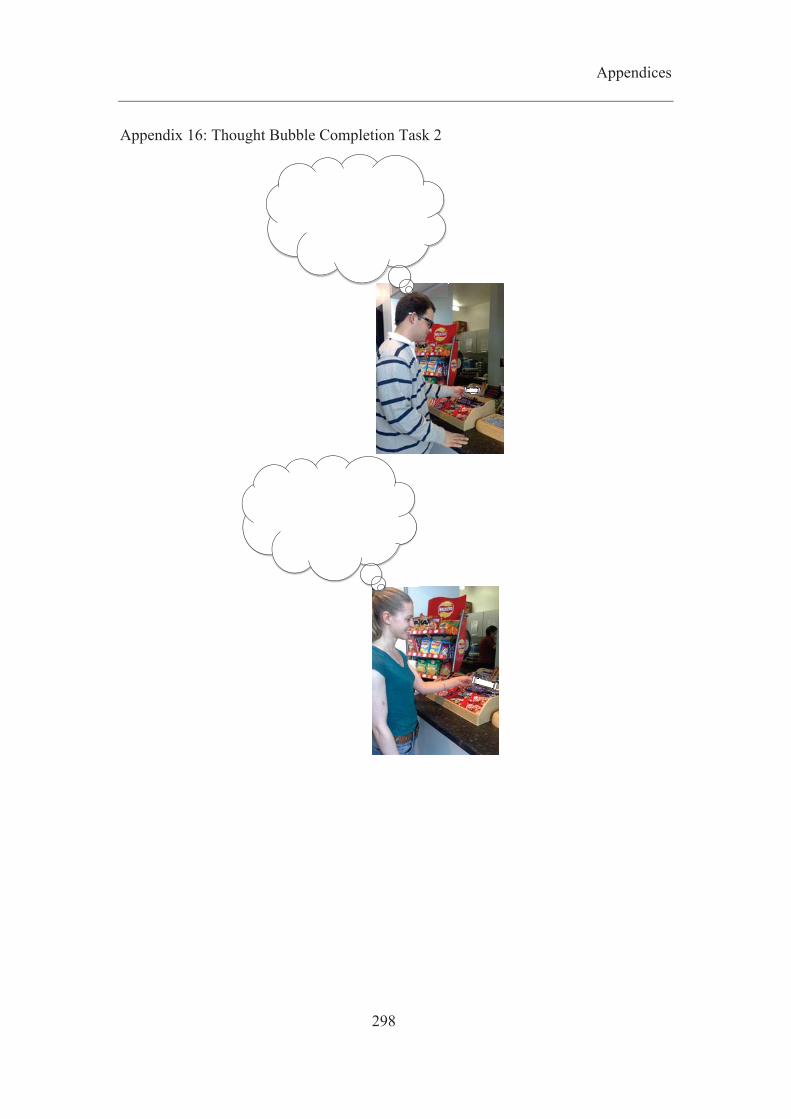
Appendices
298
Appendix 16: Thought Bubble Completion Task 2
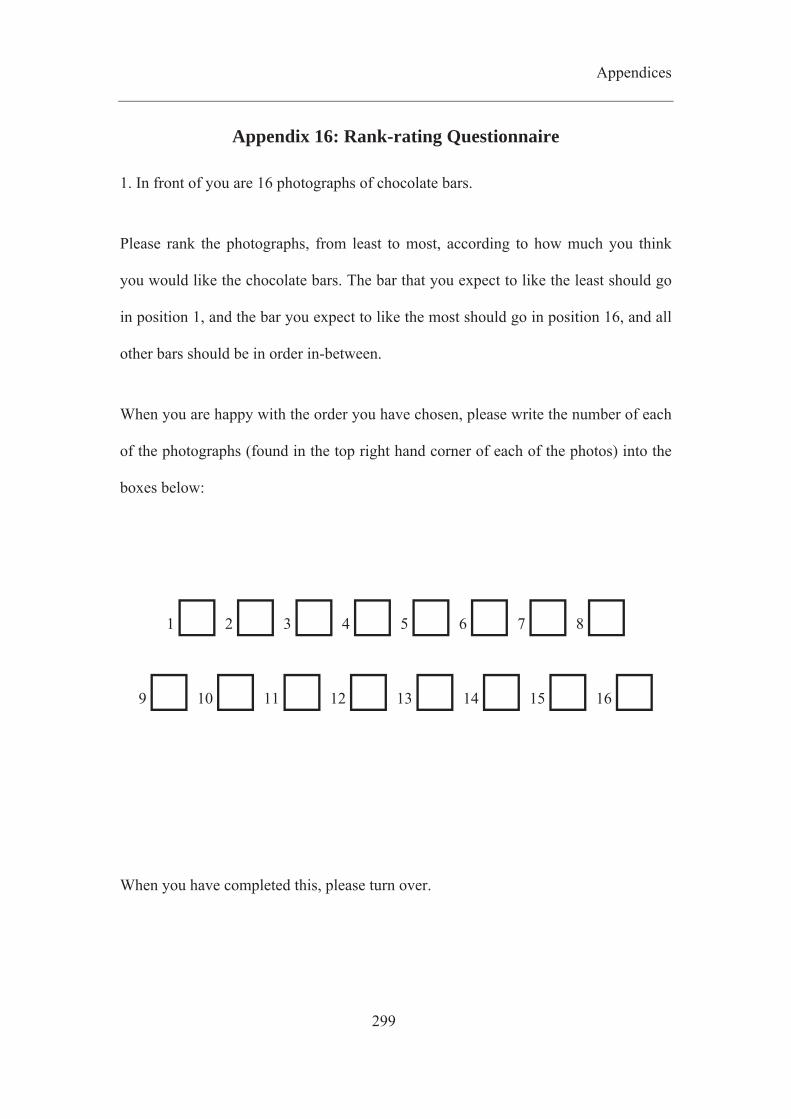
Appendices
299
Appendix 16: Rank-rating Questionnaire
1. In front of you are 16 photographs of chocolate bars.
Please rank the photographs, from least to most, according to how much you think
you would like the chocolate bars. The bar that you expect to like the least should go
in position 1, and the bar you expect to like the most should go in position 16, and all
other bars should be in order in-between.
When you are happy with the order you have chosen, please write the number of each
of the photographs (found in the top right hand corner of each of the photos) into the
boxes below:
1 2 3 4 5 6 7 8
9 10 11 12 13 14 15 16
When you have completed this, please turn over.
Appendices
300
2. Please imagine that the photo you have put in position 1 has a score of 1 out of 100,
and the photo you have put in position 16 has a score of 100 out of 100.
Please give all the other photos a score out of 100 according to how much you think
you would like the chocolate bar. Write your answers in the boxes below:
1 2 3 4 5 6 7 8
9 10 11 12 13 14 15 16

Appendices
301
When you have completed this, please turn over.

Appendices
302
3. Consider the bar that you put in position 1. Please briefly explain why you expect
to like this bar the least:
4. Consider the bar that you put in position 16. Please briefly explain why you expect
to like this bar the most:
5. What is your age?
6. What is your gender?

Appendices
303
Appendix 17: Summary of the explanations for ratings of expected liking
Milk Chocolate Reduced-fat Milk Chocolate
Expe
cted
Lik
ing
Positive Negative Positive Negative I like chocolate I prefer dark chocolate I like chocolate I prefer dark chocolate Looks normal /
typical / familiar Unattractive coding /
no branding Looks normal / pleasant / tasty /
No branding
Good shape (size and thickness of
squares)
Squares are too big Nice shape Simple formation of squares
Full blocks (not broken)
Not fresh Looks fresh
Too simple / bland / plain (no filling e.g.
caramel or nuts)
Looks plain / bland
Good / rich colour Too light in colour Nice colour Doesn’t look too
milky Looks too milky Looks too milky
Doesn’t look too dark
Looks too dark
Quite shiny Not shiny enough No white dust on
surface White dust on surface White dust on surface
Looks dull / dry Looks dull / dry (no glaze on surface)
Looks like it has a nice texture
Looks soft / smooth Looks soft / smooth Crumbly texture Looks chalky Looks chalky Looks creamy Looks creamy Doesn’t look creamy
Doesn’t look greasy Looks plasticy Doesn’t look plasticy
Might be less rich Might be less sweet Not as flavoursome /
won’t have a full taste / strange taste / will it taste like the real thing
/ less tasty Less fattening A diet food
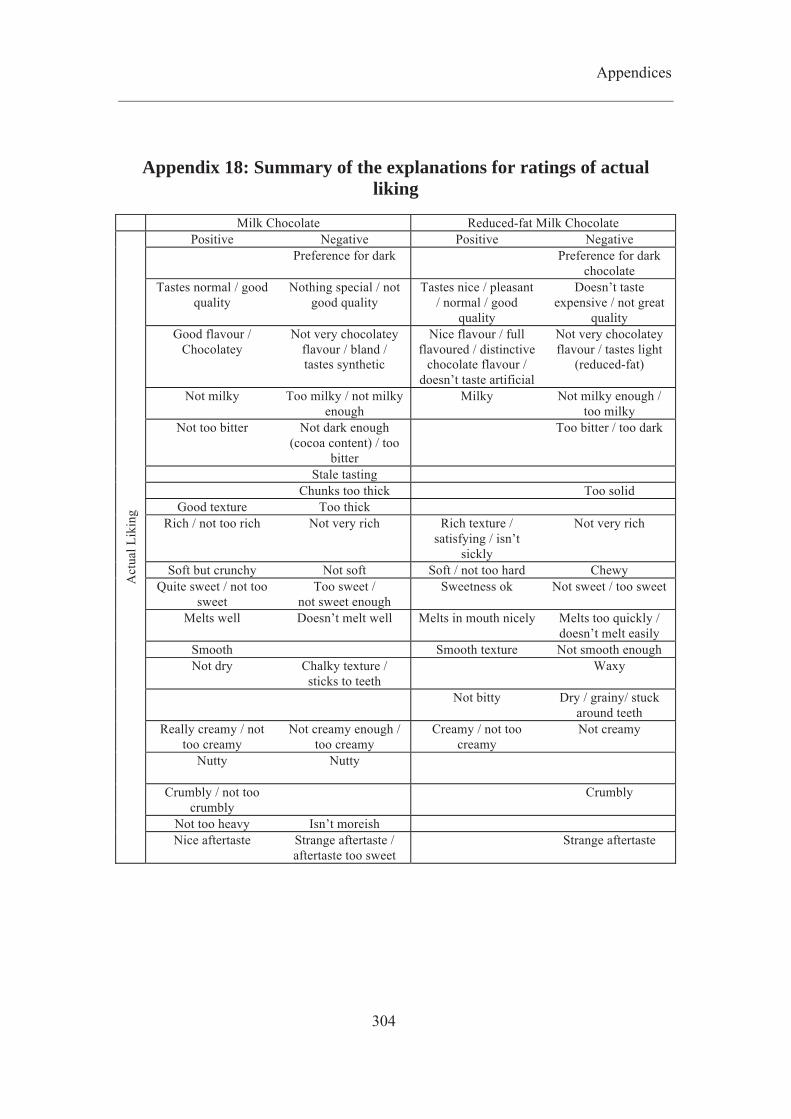
Appendices
304
Appendix 18: Summary of the explanations for ratings of actual liking
Milk Chocolate Reduced-fat Milk Chocolate
Act
ual L
ikin
g
Positive Negative Positive Negative Preference for dark Preference for dark
chocolate Tastes normal / good
quality Nothing special / not
good quality
Tastes nice / pleasant / normal / good
quality
Doesn’t taste expensive / not great
quality Good flavour /
Chocolatey Not very chocolatey
flavour / bland / tastes synthetic
Nice flavour / full flavoured / distinctive
chocolate flavour / doesn’t taste artificial
Not very chocolatey flavour / tastes light
(reduced-fat)
Not milky Too milky / not milky enough
Milky Not milky enough / too milky
Not too bitter Not dark enough (cocoa content) / too
bitter
Too bitter / too dark
Stale tasting Chunks too thick Too solid
Good texture Too thick Rich / not too rich Not very rich Rich texture /
satisfying / isn’t sickly
Not very rich
Soft but crunchy Not soft Soft / not too hard Chewy Quite sweet / not too
sweet Too sweet /
not sweet enough Sweetness ok Not sweet / too sweet
Melts well Doesn’t melt well Melts in mouth nicely Melts too quickly / doesn’t melt easily
Smooth Smooth texture Not smooth enough Not dry Chalky texture /
sticks to teeth Waxy
Not bitty Dry / grainy/ stuck around teeth
Really creamy / not too creamy
Not creamy enough / too creamy
Creamy / not too creamy
Not creamy
Nutty
Nutty
Crumbly / not too crumbly
Crumbly
Not too heavy Isn’t moreish Nice aftertaste Strange aftertaste /
aftertaste too sweet Strange aftertaste

Appendices
305
Appendix 19: Packaging concepts
BSPH
BLPH
BSTH
BLTH
BSPT
BLPT
BSTT
BLTT

Appendices
306
CSPH
CLPH
CSTH
CLTH
CSPT
CLPT
CSTT
CLTT

Appendices
307
Appendix 20: NMR and DSC data for emulsions produced with A &
C units (varying rotation speeds and unit temperatures)
Table 1 NMR and DSC results for emulsions when the rotation speeds of the two units were varied. DSC NMR
A Unit (rpm)
C Unit (rpm)
Inlet Temp (°C)
A Unit
Outlet Temp (°C)
C Unit
Outlet Temp (°C)
Tpeak (°C)
Melting Enthalpy
(J/g-1)
d3.2
(μμm) Sigma Free
Water (%)
170 170 41.1 25.5 29.2 27.8 (0.2)
120 (3.3) 13.3 0.7 11
170 480 40.1 25.6 29.2 27.4 (0.3)
93 (6.8) 11.4 0.7 14
170 900 39.8 25.4 29.3 27.6 (0.7)
108.4 (3) 8.3 0.7 10.4
170 1300 42.5 25.8 29.6 27.4 (0.7)
101.6 (4.2) 5.7 0.8 11.1
470 170 40.5 23.5 29.3 28 (0.3) 106.1 (0.8) 9.9 0.8 8 470 480 41.1 24.1 29.3 28.8
(0.8) 120.9 (1.5) 12.6 0.9 2
470 900 42.8 24.5 29.4 27.9 (1.3)
98.2 (2.1) 8.9 0.8 3
470 1300 45.3 24.1 29.7 28.7 (0.5)
123.9 (3.4) 4.8 0.8 0
920 170 46.3 23.2 29.2 27.6 (0.5)
93.9 (0.1) 6.5 0.9 0
920 480 44.4 22.7 29.6 26.3 (0.2)
88.9 (1.2) 5.1 0.8 0
920 900 45 23.8 29.5 28.3 (0.4)
116.1 (6.3) 4.3 0.8 0
920 1300 41.6 23.3 26.6 26.6 (1.8)
127.6 (6.5) 4.3 0.7 0
1350 170 44.9 23.2 29.1 26.4 (0.2)
89.9 (0.6) 3.6 0.8 0
1350 480 45.1 25.5 29.2 25.9 (1.2)
92.7 (11.5) 3.1 0.7 3.2
1350 900 45.9 24.1 29.4 27.8 (1.1)
103.3 (7.7) 2.9 0.6 2.4
1350 1300 46.8 24.2 29.6 26.6 (0.5)
100.6 (2.5) 3.4 0.5 0
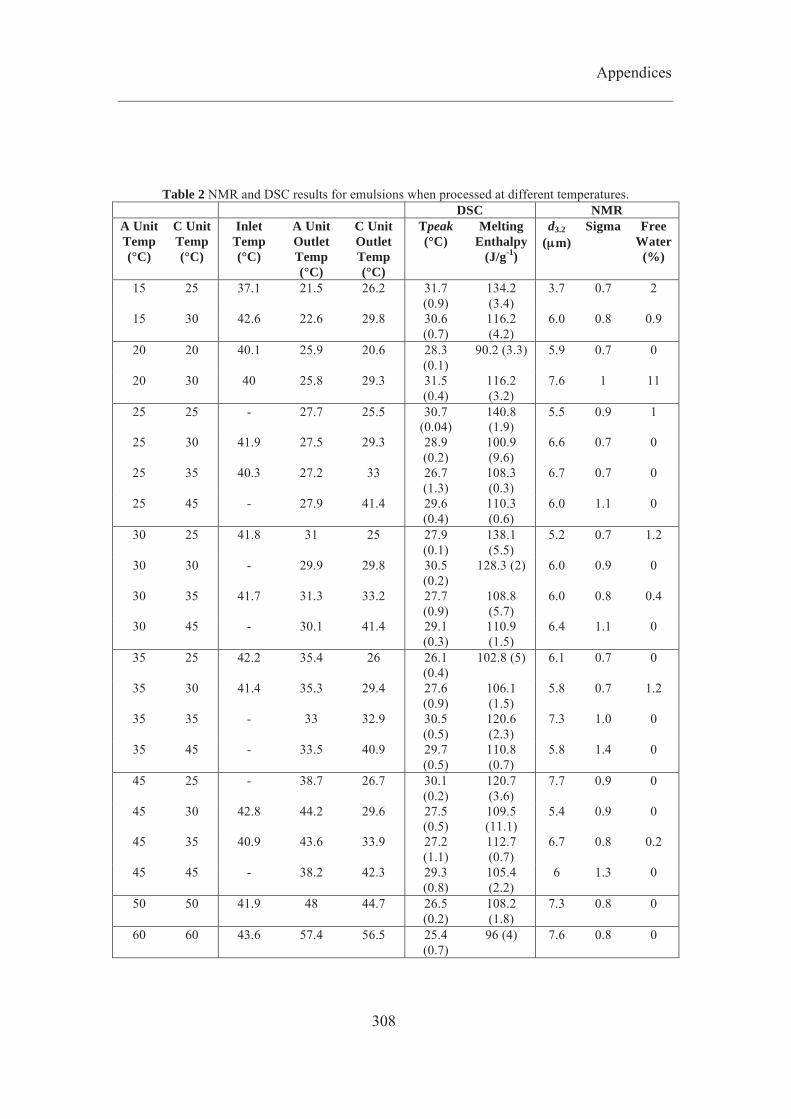
Appendices
308
Table 2 NMR and DSC results for emulsions when processed at different temperatures. DSC NMR
A Unit Temp (°C)
C Unit Temp (°C)
Inlet Temp (°C)
A Unit Outlet Temp (°C)
C Unit Outlet Temp (°C)
Tpeak (°C)
Melting Enthalpy
(J/g-1)
d3.2 (μμm)
Sigma Free Water
(%)
15 25 37.1 21.5 26.2 31.7 (0.9)
134.2 (3.4)
3.7 0.7 2
15 30 42.6 22.6 29.8 30.6 (0.7)
116.2 (4.2)
6.0 0.8 0.9
20 20 40.1 25.9 20.6 28.3 (0.1)
90.2 (3.3) 5.9 0.7 0
20 30 40 25.8 29.3 31.5 (0.4)
116.2 (3.2)
7.6 1 11
25 25 - 27.7 25.5 30.7 (0.04)
140.8 (1.9)
5.5 0.9 1
25 30 41.9 27.5 29.3 28.9 (0.2)
100.9 (9.6)
6.6 0.7 0
25 35 40.3 27.2 33 26.7 (1.3)
108.3 (0.3)
6.7 0.7 0
25 45 - 27.9 41.4 29.6 (0.4)
110.3 (0.6)
6.0 1.1 0
30 25 41.8 31 25 27.9 (0.1)
138.1 (5.5)
5.2 0.7 1.2
30 30 - 29.9 29.8 30.5 (0.2)
128.3 (2) 6.0 0.9 0
30 35 41.7 31.3 33.2 27.7 (0.9)
108.8 (5.7)
6.0 0.8 0.4
30 45 - 30.1 41.4 29.1 (0.3)
110.9 (1.5)
6.4 1.1 0
35 25 42.2 35.4 26 26.1 (0.4)
102.8 (5) 6.1 0.7 0
35 30 41.4 35.3 29.4 27.6 (0.9)
106.1 (1.5)
5.8 0.7 1.2
35 35 - 33 32.9 30.5 (0.5)
120.6 (2.3)
7.3 1.0 0
35 45 - 33.5 40.9 29.7 (0.5)
110.8 (0.7)
5.8 1.4 0
45 25 - 38.7 26.7 30.1 (0.2)
120.7 (3.6)
7.7 0.9 0
45 30 42.8 44.2 29.6 27.5 (0.5)
109.5 (11.1)
5.4 0.9 0
45 35 40.9 43.6 33.9 27.2 (1.1)
112.7 (0.7)
6.7 0.8 0.2
45 45 - 38.2 42.3 29.3 (0.8)
105.4 (2.2)
6 1.3 0
50 50 41.9 48 44.7 26.5 (0.2)
108.2 (1.8)
7.3 0.8 0
60 60 43.6 57.4 56.5 25.4 (0.7)
96 (4) 7.6 0.8 0
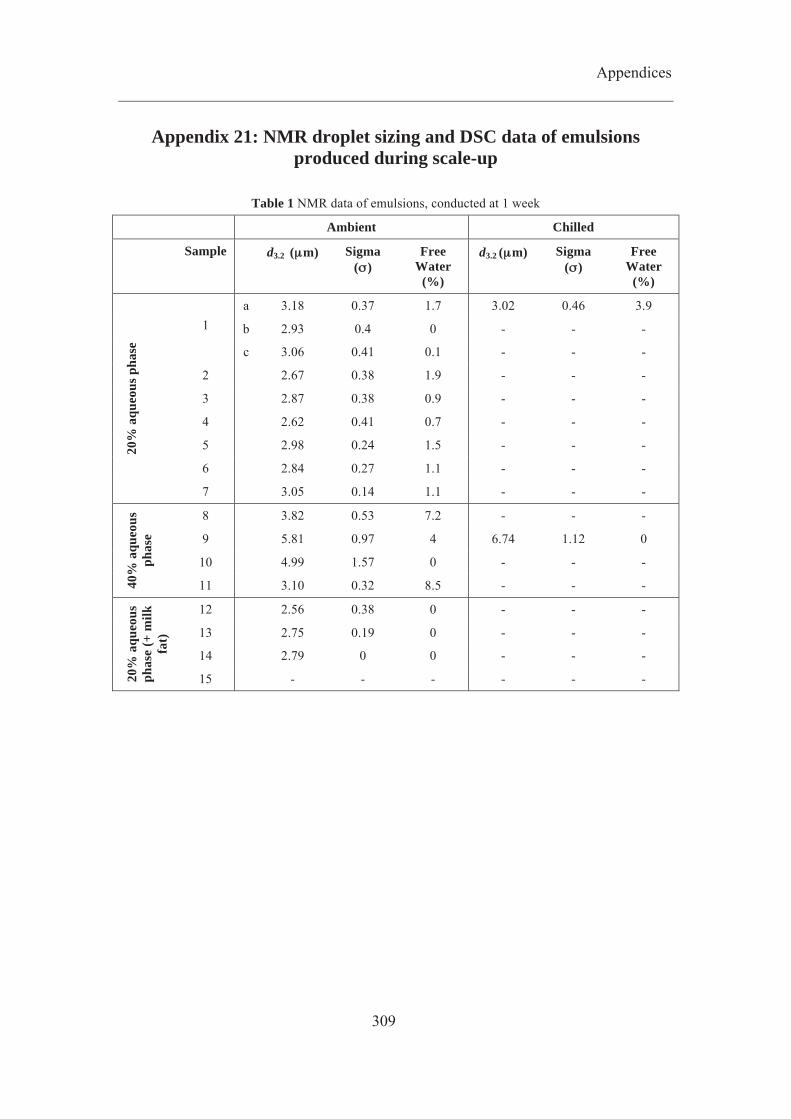
Appendices
309
Appendix 21: NMR droplet sizing and DSC data of emulsions produced during scale-up
Table 1 NMR data of emulsions, conducted at 1 week
Ambient Chilled
Sample d3.2 (μμm) Sigma (σσ)
Free Water
(%)
d3.2 (μμm) Sigma (σσ)
Free Water
(%)
20%
aqu
eous
pha
se
1
a 3.18 0.37 1.7 3.02 0.46 3.9
b 2.93 0.4 0 - - -
c 3.06 0.41 0.1 - - -
2 2.67 0.38 1.9 - - -
3 2.87 0.38 0.9 - - -
4 2.62 0.41 0.7 - - -
5 2.98 0.24 1.5 - - -
6 2.84 0.27 1.1 - - -
7 3.05 0.14 1.1 - - -
40%
aqu
eous
ph
ase
8 3.82 0.53 7.2 - - -
9 5.81 0.97 4 6.74 1.12 0
10 4.99 1.57 0 - - -
11 3.10 0.32 8.5 - - -
20%
aqu
eous
ph
ase
(+ m
ilk
fat)
12 2.56 0.38 0 - - -
13 2.75 0.19 0 - - -
14 2.79 0 0 - - -
15 - - - - - -
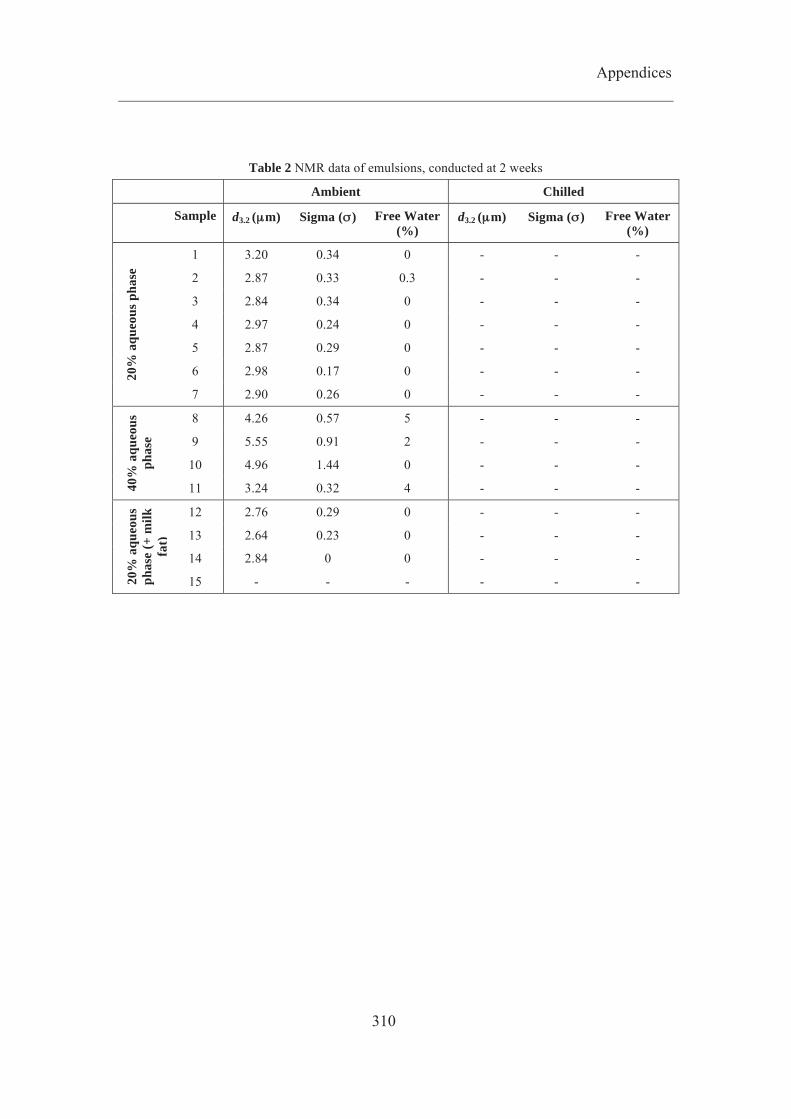
Appendices
310
Table 2 NMR data of emulsions, conducted at 2 weeks
Ambient Chilled
Sample d3.2 (μμm) Sigma (σσ) Free Water (%)
d3.2 (μμm) Sigma (σσ) Free Water (%)
20%
aqu
eous
pha
se
1 3.20 0.34 0 - - -
2 2.87 0.33 0.3 - - -
3 2.84 0.34 0 - - -
4 2.97 0.24 0 - - -
5 2.87 0.29 0 - - -
6 2.98 0.17 0 - - -
7 2.90 0.26 0 - - -
40%
aqu
eous
ph
ase
8 4.26 0.57 5 - - -
9 5.55 0.91 2 - - -
10 4.96 1.44 0 - - -
11 3.24 0.32 4 - - -
20%
aqu
eous
ph
ase
(+ m
ilk
fat)
12 2.76 0.29 0 - - -
13 2.64 0.23 0 - - -
14 2.84 0 0 - - -
15 - - - - - -
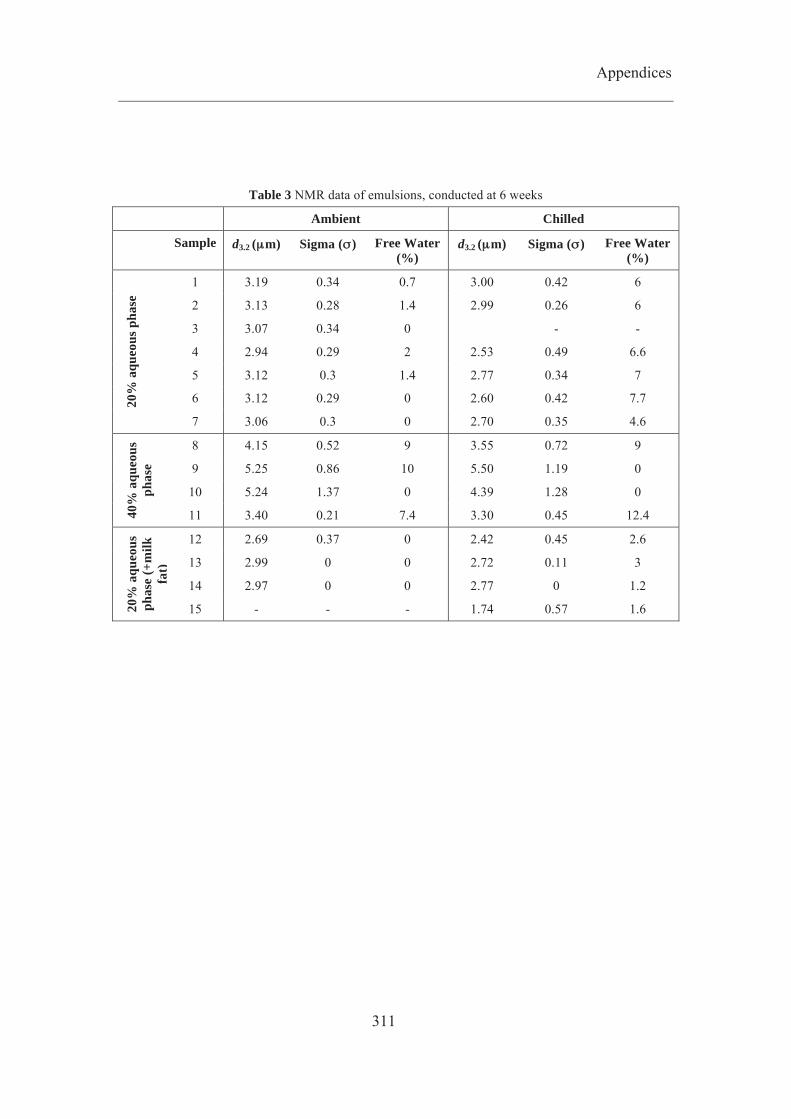
Appendices
311
Table 3 NMR data of emulsions, conducted at 6 weeks
Ambient Chilled
Sample d3.2 (μμm) Sigma (σσ) Free Water (%)
d3.2 (μμm) Sigma (σσ) Free Water (%)
20%
aqu
eous
pha
se
1 3.19 0.34 0.7 3.00 0.42 6
2 3.13 0.28 1.4 2.99 0.26 6
3 3.07 0.34 0 - -
4 2.94 0.29 2 2.53 0.49 6.6
5 3.12 0.3 1.4 2.77 0.34 7
6 3.12 0.29 0 2.60 0.42 7.7
7 3.06 0.3 0 2.70 0.35 4.6
40%
aqu
eous
ph
ase
8 4.15 0.52 9 3.55 0.72 9
9 5.25 0.86 10 5.50 1.19 0
10 5.24 1.37 0 4.39 1.28 0
11 3.40 0.21 7.4 3.30 0.45 12.4
20%
aqu
eous
ph
ase
(+m
ilk
fat)
12 2.69 0.37 0 2.42 0.45 2.6
13 2.99 0 0 2.72 0.11 3
14 2.97 0 0 2.77 0 1.2
15 - - - 1.74 0.57 1.6

Appendices
312
Table 4 NMR data of emulsions, conducted at 12 weeks
Ambient Chilled
Sample d3.2 (μμm) Sigma (σσ) Free Water (%)
d3.2 (μμm) Sigma (σσ) Free Water (%)
20%
aqu
eous
pha
se
1 3.60 0.338 0 - - -
2 3.42 0.3 0.2 - - -
3 3.30 0.33 0.1 - - -
4 3.41 0.281 0 - - -
5 3.59 0.32 0.1 - - -
6 3.37 0.31 0 - - -
7 3.24 0.24 0.2 - - -
40%
aqu
eous
ph
ase
8 4.39 0.51 8 - - -
9 6.24 0.94 1 - - -
10 4.92 1.48 0 - - -
11 3.50 0.27 6.7 - - -
20%
aqu
eous
ph
ase
(+m
ilk
fat)
12 2.68 0.43 0.3 - - -
13 2.91 0.2 0.2 - - -
14 2.94 0.15 0.1 - - -
15 - - -

Appendices
313
Table 5 DSC data of emulsions, conducted at 1 day
Chilled Ambient
Sample Tpeak (°C) Melting enthalpy (J g-1)
Tpeak (°C) Melting enthalpy (J g-1)
1 32.99 130 33.19 115.18
2 33.01 126.63 33.41 128.63
4 33.02 128 33.08 125.13
5 33.04 129.13 33.17 128.63
6 32.9 128.38 33.38 130.88
7 32.92 129.25 32.88 132
8 32.64 118.1 32.44 134.15
9 32.83 138.68 32.47 136.99
10 32.97 131.48 32.69 131.68
11 32.86 130.93 - -
12 32.34 134 - -
13 32.25 130.5 - -
14 32.36 129 32.15 97.21
15 32.17 130 32.25 126.63

Appendices
314
Table 6 DSC data of emulsions, conducted at 1 week
Chilled Ambient
Sample Tpeak (°C) Melting enthalpy (J g-1)
Tpeak (°C) Melting enthalpy (J g-1)
1 33.67 127.75 33.34 129.13
2 33.28 127.63 33.88 123.95
4 33.13 128.63 33.16 124.53
5 33.54 106.35 33.27 128.13
6 33.10 127.63 33.26 130
7 33.36 130 33.15 129.38
8 32.8 137.67 32.89 141.6
9 32.94 131 33.01 140.15
10 33.39 116.32 33.01 142.05
11 32.89 137.57 - -
12 32.56 95.2 - -
13 32.08 100.51 - -
14 32.21 96.31 32.41 94.81
15 33.55 116.18 32.05 103.16
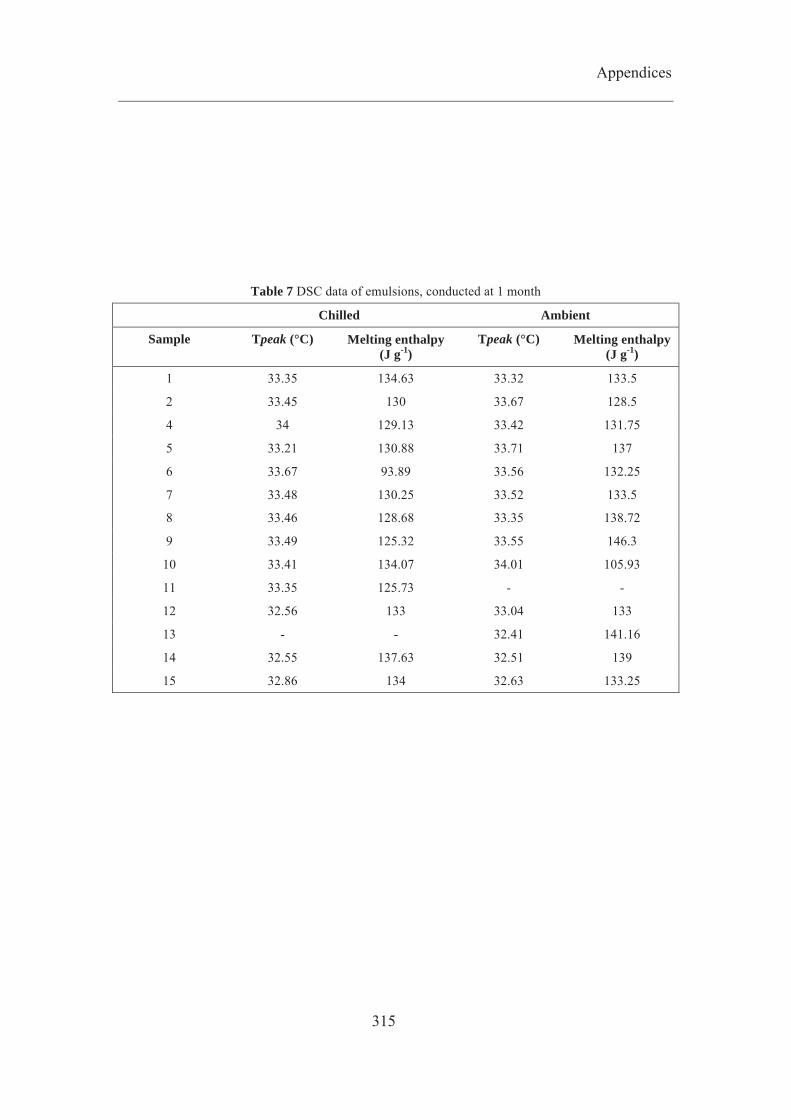
Appendices
315
Table 7 DSC data of emulsions, conducted at 1 month
Chilled Ambient
Sample Tpeak (°C) Melting enthalpy (J g-1)
Tpeak (°C) Melting enthalpy (J g-1)
1 33.35 134.63 33.32 133.5
2 33.45 130 33.67 128.5
4 34 129.13 33.42 131.75
5 33.21 130.88 33.71 137
6 33.67 93.89 33.56 132.25
7 33.48 130.25 33.52 133.5
8 33.46 128.68 33.35 138.72
9 33.49 125.32 33.55 146.3
10 33.41 134.07 34.01 105.93
11 33.35 125.73 - -
12 32.56 133 33.04 133
13 - - 32.41 141.16
14 32.55 137.63 32.51 139
15 32.86 134 32.63 133.25