Fat and water differentiation by nuclear magnetic resonance imaging
19
Concepts in Magnetic Resonance, 1992, 4, 53-71 Fat and Nuclear Water Differentiation by Magnetic Resonance Imaging Eleni Kaldoudi Steve C. R Williams* Uniws@y College NMR Imaging Facility Dqmrtment of Medical Physics London, England Dqmrtment of Chemisny Queen Mary & WatjieId College Uniwrsily of London Mile End Road, London El 4NS England Received November 21, 1991 Differentiation between fat and water is important in proton magnetic resonance imaging. The need for creating separate fat and water images is discussed, and a review is presented of current practices, including chemical-shift and coupled-spin imaging, as well as techniques based on relaxation time differences. The virtues and limitations of each regime are discussed, and future directions are suggested. INTRODUCTION The article provides a review of the techniques commonly used to discriminate between the fat and water signals that contribute to hydrogen (proton) NMR imaging. It is aimed at readers who know the basics of NMR theory. Prior knowledge is assumed of relaxation mechanisms, including the measurement of longitudinal (TI) and transverse (T,) relaxation times, as well as of the phenomena of chemical shift (6) and scalar coupling (J). Readers also should be conversant with the fundamental aspects of a conventional two-dimensional, Fourier imaging experiment, although more elaborate details are explained where necessary in the course of the text. We have concentrated on current practices in fat/water differentiation by magnetic resonance imaging (MRI), presenting examples of fat- and water-resolved images derived from different sources. The advantages and disadvantages of each regime are discussed, and further directions are suggested. On average, water accounts for about 55% of total human body weight, and if we consider only the soft tissues, water constitutes 60-90% - the remainder arises largely from proteins and cell membranes. Unless special line-narrowing techniques are applied, the large structural proteins give rise to extremely broad lines, which, in the presence of a narrow, intense water peak, are not observed in conventional MRI experiments. Although the considerable amount of phospholipids that form the cell membranes are quite mobile, they do not contribute significantly to the proton image. Thus, for proton MRI, the signal is derived predominantly from water and lipids that mainly occur as fatty "droplets" within the cells of adipose tissue in specific regions of the body (such as subcutaneous, orbital, mammary, or abdominal fat), as shown in Fig. 1. 53
Transcript of Fat and water differentiation by nuclear magnetic resonance imaging

Concepts in Magnetic Resonance, 1992, 4, 53-71
Fat and Nuclear
Water Differentiation by Magnetic Resonance Imaging
Eleni Kaldoudi Steve C. R Williams*
Uniws@y College NMR Imaging Facility Dqmrtment of Medical Physics
London, England Dqmrtment of Chemisny
Queen Mary & WatjieId College Uniwrsily of London
Mile End Road, London E l 4NS England
Received November 21, 1991
Differentiation between fat and water is important in proton magnetic resonance imaging. The need for creating separate fat and water images is discussed, and a review is presented of current practices, including chemical-shift and coupled-spin imaging, as well as techniques based on relaxation time differences. The virtues and limitations of each regime are discussed, and future directions are suggested.
INTRODUCTION
The article provides a review of the techniques commonly used to discriminate between the fat and water signals that contribute to hydrogen (proton) NMR imaging. It is aimed at readers who know the basics of NMR theory. Prior knowledge is assumed of relaxation mechanisms, including the measurement of longitudinal (TI) and transverse (T,) relaxation times, as well as of the phenomena of chemical shift (6) and scalar coupling (J) . Readers also should be conversant with the fundamental aspects of a conventional two-dimensional, Fourier imaging experiment, although more elaborate details are explained where necessary in the course of the text. We have concentrated on current practices in fat/water differentiation by magnetic resonance imaging (MRI), presenting examples of fat- and water-resolved images derived from different sources. The advantages and disadvantages of each regime are discussed, and further directions are suggested.
On average, water accounts for about 55% of total human body weight, and if we consider only the soft tissues, water constitutes 60-90% - the remainder arises largely from proteins and cell membranes. Unless special line-narrowing techniques are applied, the large structural proteins give rise to extremely broad lines, which, in the presence of a narrow, intense water peak, are not observed in conventional MRI experiments. Although the considerable amount of phospholipids that form the cell membranes are quite mobile, they do not contribute significantly to the proton image. Thus, for proton MRI, the signal is derived predominantly from water and lipids that mainly occur as fatty "droplets" within the cells of adipose tissue in specific regions of the body (such as subcutaneous, orbital, mammary, or abdominal fat), as shown in Fig. 1.
53

Kaldoudi and Williams
I ~ " ' / " I ' " l ' " l ' " l ' " l ' " l ' " " ' ' ' 25 20 15 10 5 0 -5 -10 -15 ppm
Figure 1. In vivo proton NMR spectrum obtained at 4.7T, showing the water and fat peaks, due to protons from the -OH and (> CH,/-CH,) groups, respectively.
REASONS FOR FAT/WATER DIFFERENTIATION IN MRI
The need to create separate maps of fat and water distribution has been apparent since the early days of MRI (I, 2) for several reasons, as detailed here.
Physiological Implications of Water and Fat Distributions for Medical Diagnosis
Normally, a basic knowledge of anatomy is sufficient to identify the areas on a clinical magnetic resonance image that correspond to lean tissue, such as muscle and brain, and to distinguish them from fatty tissue. However, for some disease states there is ambiguity about whether a signal from a given area corresponds to fat or water protons or to a combination of the two, as in cases of fatty infiltration of the liver (3) or heart (4) , in studies of bone marrow patterns with age or after transplantation and irradiation (5- 7), or in making the distinction between various kinds of tumors on the basis of lipid content (8). Also, during the acute phase of multiple sclerotic plaque formation, the free cholesterol esters that appear as the myelin sheath of the neuronal axon disintegrates might be the only MRI-visible lipids within the central nervous system (9).
Quantitative MRI: Evaluation and Interpretation of Fat and Water Relaxation Times
Calculation of the fat and fat-free content of the body is often desirable, for example, where MRI is perhaps the only applicable technique, as in the study of fetal fat and its correlation to normal fetal growth (10). Moreover, relaxation times in clinical MRI provide a source of additional diagnostic information and enable tissue characterization and quantitation, as well as a choice of optimum sequence parameters. However, this potential can be limited in cases where fat and water are present within the same imaging voxel because of their physiological distribution or as a result of a chemical shift artifact. Relaxation times are usually different for fat and water in tissues; TI values, as measured at lST, are about 260 ms for fat and in the range of 500-920 ms for various nonfatty tissues, such as neuronal matter, kidney, spleen, liver, cardiac, and skeletal muscle (11). When measured by conventional MRI, the relaxation times
54

Fat and Water Differentiation by Nuclear Magnetic Resonance Imaging
for tissues that contain both fat and water are actually composite values that result from both components. Furthermore, when small structures are involved, such as the optic nerve, which is surrounded by orbital fat, partial volume effects introduce considerable imprecision to the relaxation time measurements (12).
Chemical Shift Artifact
Most of the protons in fatty chains - those of the -CH2- and -CH3 groups - have a weighted mean chemical shift of approximately 3.3 ppm upfield, relative to water, which corresponds to a shift of about 660 Hz to a lower resonance frequency in a 4.7T static magnetic field. This can lead to a misregistration of the fat image relative to the water and to nonplanar slices (13, 14). As illustrated in Fig. 2, this misregistration arises from the inability to distinguish between the chemical shift and the frequency difference induced by a field gradient, applied either during acquisition or during irradiation to achieve slice selection. Depending on the imaging parameters (field strength, gradient strength, and pixel size) the overlapping data sets can become sufficiently displaced to degrade the image either by blurring or by edge artifacts (13, 15) (see also Fig. 9B). In clinical imaging, this can appear at anatomical locations where water-filled compartments or tissue are adjacent to fatty deposits, for example, in the kidneys, spleen, heart, breast, intervertebral disk, or optic nerve. It has been reported that, at lST, gradient-recalled echo techniques when compared with spin-echo methods gave an unacceptable level of chemical shift artifact when imaging the lumbar spine (16).
"w 1 A
distance -
B
frequency encode direction - Figure 2. A Diagrammatic Representation of a Chemical Shift Artifact. (A) Because of the difference in resonance frequencies between fat and water protons, when a magnetic field gradient is applied, the signal from fat protons at position x1 can be misinterpreted as a signal from water protons at position r,, as uI1 = uw2. w I x and vwx are the resonance frequencies for fat and water protons, respectively, at a position x along the applied gradient, which could be in either the frequency-encode or slice-selection direction. (B) A diagram of the relative misregistration of fat and water images in the frequency-encode direction due to a chemical shift artifact.
55

Kaldoudi and Williams
W
W
W
W A
1
Dynamic Range Problems
1
Although proton density is fairly similar among a range of body tissues, it is often significantly greater in fatty tissue (17). As this maximum signal from fat is adjusted to fit within the input range of the analog-to-digital converter (ADC) in the receiver circuit, while noise is assigned to the least significant bit, the digitizer resolution for all signals of intermediate intensity is compressed (18, 19). The ADC and the dynamic range problem are illustrated by Fig. 3. In the resulting conventional image, anatomical detail of frne structures near fat deposits - for example, in the renal cortex- can be lost. Figure 4 shows images from a coronal slice through a live cockroach acquired at 4.7T using a conventional spin-echo technique as well as a sequence for separate fat/water imaging. Note that the anatomical details at the periphery of the abdominal region are apparent only in the water image, as the intense fat signal from this region dynamically suppresses the water signal in the conventional image.
W ,
N ,
I
i
A 7
6
~
5
4
3
0
B 7
6
0
ADC signal ADC signal
Figure 3. A Schematic Representation of an Eight-Bit ADC. The bit denoted by 0 is the least significant bit, where the signal from noise (n) is assigned; the rest of the signal is adjusted to fit the remaining seven bits. (A) As the highest signal from fat (f) is assigned to the eighth bit, the water signal (w) is dynamically suppressed to fit within a limited range of values. (B) In the absence of fat, the same signal from water is adjusted to fit the whole ADC range.
MRI TECHNIQUES FOR FAT AND WATER DIFFERENTIATION
Many MRI methods have been proposed that create separate fat and water images or that suppress the contribution from one or the other. To distinguish between the two components, the techniques take advantage of one or more of their several different responses in NMR, such as relaxation times, chemical shift, or scalar coupling.
56

Fat and Water Differentiation by Nuclear Magnetic Resonance Imaging
A
B
c
Figure 4. (A) Conventional spin-echo, (B) water-only image, and (C) fat-only image from the same coronal 1 mm slice of a live cockroach, at 4.7T. The separate fat and water images were acquired using a chemical shift method (described later in Fig. 6). For all images, TE = 30 ms; TR = 1000 ms; 512 x 512 data matrix; four signal averages per phase-encoding step.
Methods Based on Relaxation Time Differences
A commonly used technique in clinical MRI is the TI-null method, which is based on the inversion-recovery sequence (27, 20) shown in Fig. 5. The initial 180" pulse inverts the magnetization, and Tl relaxation causes it to increase from a negative value, passing through zero as it returns to thermal equilibrium. If a 90" readout pulse is applied at a time when the net magnetization is passing through zero, no transverse component is generated and no signal results. Because Tl relaxation times of fat are usually much shorter than are those of water in other tissues, the inversion time, TI, can be adjusted to minimize its contribution to the total signal. However, because nonfatty tissues tend to exhibit a wide range of longer TI values (11), it is difficult to find an inversion time that would eliminate all water signal. As a consequence, this method is most commonly used with short inversion times for fat suppression. In this case it is known as STIR (short inversion time inversion recovery). STIR has become popular in biomedical MRI not only because it suppresses the unwanted signal from fat but also because it can produce a high Tl contrast for the remaining water signal. Because all of the pulses are slice-selective, the effect of the pulse sequence is confined within a single slice, and data from several slices can be obtained within the same repetition time by following the same regime using different frequency offsets for all the pulses. There are no special demands on field homogeneity, hardware, data processing, or imaging time, although a prior knowledge or estimation of the T, values is necessary.
A major drawback of STIR is that the signal-to-noise ratio (S/N) can be greatly reduced relative to that of conventional spin-echo images, because the water magnetization is only partially relaxed when the 90" readout pulse is applied. For example, in one clinical study (I2),
57
Kaldoudi and Williams
a STIR sequence with a repetition time of 1560 ms and an inversion time of 150 ms was used to suppress the signal from orbital fat (mean TI of 215 ms) while imaging the optic nerve (white matter mean TI of 385 ms) at 0.5T. It can be calculated that the S/N for this STIR image is only 37% of that for an equivalent spin-echo image.
180" 90" 180" echo
- TI -- TE/2 TE/2 - 44 g-slice I /
g-phase I
Y g-read
Figure 5. Inversion-Recovery Pulse Sequence. TI is the inversion time and TE is the echo time.
Discrimination between fat and water on the basis of T, values is not commonly used, because the range of T, values in different tissues often overlaps (11). Nevertheless, a conventional multiple-echo sequence can be used to calculate T, values for all of the imaging voxels and thus to discriminate between tissues of different T2 ranges by appropriately windowing the resulting T,-calculated image (21). When the T, values of the fat are known to be distinctively different from those of the surrounding tissues, this method can be used to produce separate fat and water distribution maps.
Chemical Shift Imaging
Separate fat and water images can be produced by a wide variety of pulse sequences that selectively image protons of a specific resonance frequency (chemical shift imaging) - either protons from the -OH group of water or from the -CH2- groups that form the backbone of the chains in fat molecules. A small proportion of lipid protons could have the same resonance frequency as protons in the water molecule, and these can contribute to the water image but their relative concentration usually is too low to give rise to a significant signal. Several chemical-shift-imaging techniques use selective irradiation where a narrow-band, frequency- selective pulse is applied in the absence of any magnetic field gradient. The carrier frequency of the pulse and its spectral excitation profile can be adjusted to allow either the water or the fat protons to be on resonance. The pulse is thus made effective over the entire imaging volume for spins of only one chemical species. Another group of techniques takes advantage of the phase difference created by the different precession rates of the excited, chemically-shifted species. Finally, techniques have been devised that distinguish between the two components by virtue of their relative displacement in the frequency-encoding or slice-selection direction during a conventional imaging experiment.
58

Fat and Water Differentiation by Nuclear Magnetic Resonance Imaging
- TE/2 TE/2 - g-slice
I g-phase 1
g-read
Figure 6. Simple chemical-shift-selective pulse sequence; selection is achieved during radiofrequency excitation. The sequence collects a single slice and produces an image either of fat or of water.
A simple chemical-shift-imaging sequence that uses selective irradiation is shown in Fig. 6. The frequency-selective 90" pulse applied in the absence of any gradient excites the spins of one chemical species (-CH2- or -OH), whereas slice selection is achieved during the refocusing 180" pulse (22). Alternatively, chemical shift selection can be achieved during the refocusing pulse, with the 90" pulse being slice-selective (23). The effective difference between the two sequences is limited by hardware. For example, eddy currents induced by switching off the gradients can degrade the static field homogeneity, thus necessitating a long delay prior to application of the chemical-shift-selective pulse. This delay can be accommodated more easily within the period after acquisition rather than in the time TE/2 after excitation. Irrespective of the choice, two experiments are needed to create both images. It is possible, however, to acquire both images during the same experiment, where water and lipid protons are excited sequentially by means of two frequency-selective 90" pulses at the appropriate frequency offsets. A single, slice-selective 180" refocusing pulse then generates two echoes that occur with a time difference equal to the time separation of the excitation pulses (24). This pulse sequence is shown in Fig. 7. The two echoes appear in reverse order to which the corresponding signals were excited, and this results in a differential T, weighting of the two images. The major drawback of these methods is that they are single-slice: As the chemical-shift-selective pulse is applied over the entire imaging volume, the sequence can be repeated for different slice-frequency offsets only after time has been allowed for the required relaxation.
Selective irradiation also can be used to saturate the signal from one component. First, a frequency-selective 90" pulse is applied in the absence of any gradient to selectively excite the spins from the unwanted resonance. The conventional spin-echo experiment that follows is experienced only by the spins left unaffected during the first part of the sequence (25). Saturation can be enhanced by the application of a magnetic field gradient immediately after the chemical-shift-selective pulse to rapidly dephase the undesired magnetization (26). Finally, if the spin-echo part of the sequence is repeated with different frequency offsets for the slice- selective pulses, several slices can be obtained while the unwanted chemical shift remains
59

Kaldoudi and Williams
-
1
water fat echo echo
90" 180" water
90" fat.
selective selective
r f
-TEw
-
* TE f b
Figure 7. Double-Pulse, Chemical-Shift-Imaging Sequence. Fat and water protons are excited separately by the two pulses. The sequence is single slice, but it produces fat and water images simultaneously, although they are differentially T, weighted, as indicated by the two echo times, TE, and TE,, for fat and water, respectively.
saturated (27). This sequence is shown in Fig. 8. It should be noted that as the saturated
Fat and Water Differentiation by Nuclear Magnetic Resonance Imaging
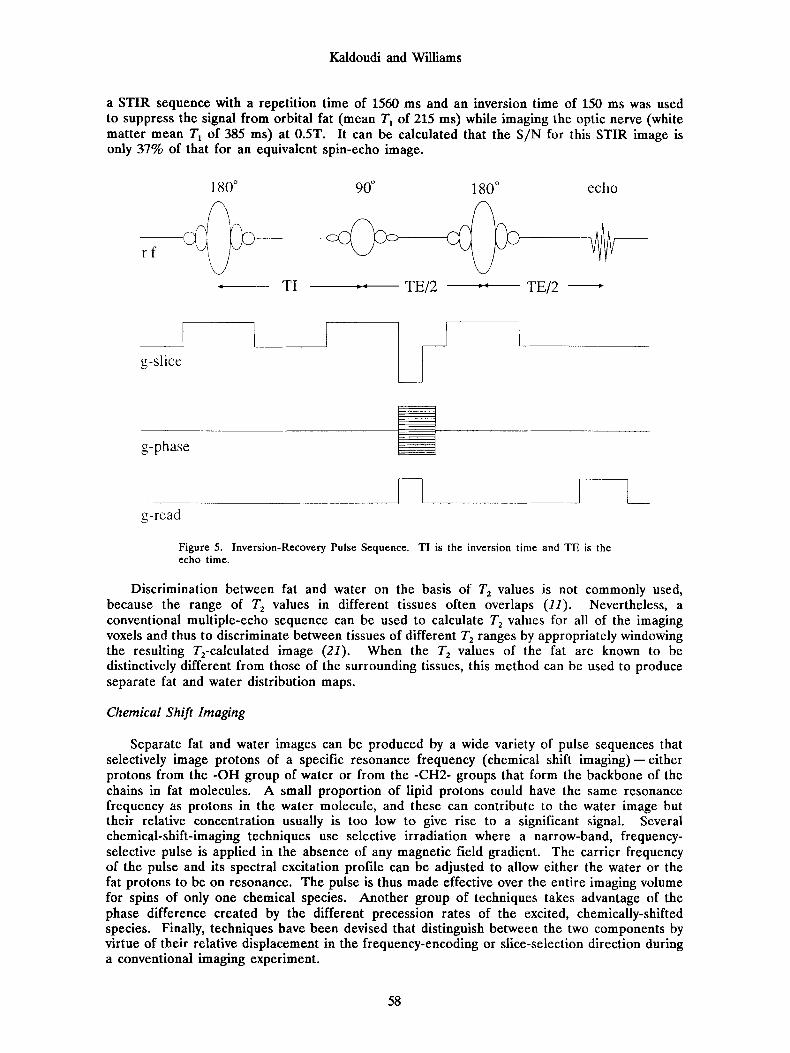
magnetization relaxes, it will gradually appear in later slices. This is illustrated in Fig. 9, where the first and last slices of an eight-slice data set from an oil/water phantom are displayed. It can be shown that when the TI values of the saturated component are shorter, the differential suppression across the slices is more pronounced. This problem can create confusion in clinical studies, especially because slices often are selected not in their spatial order but in a "first-odd-then-even" mode.
A B
Figure 9. Images of (A) the first and (B) the last slices of an eight-slice data set from an oil/water phantom acquired at 4.7T using the selective-saturation pulse sequence shown in Fig. 8, adjusted to select water only. TE = 30 ms; TR = 3000 ms; 256 x 256 data matrix; four signal averages per phase-encoding step. The phantom is a vegetable oil tube within a pot of water. Note the poorer fat suppression in slice B, which is highlighted in the corresponding profile. This image also shows the chemical-shift artifact where the central oil vial is displaced relative to the water vial.
Selective irradiation also can be used in stimulated echo (STE) imaging. The STE is formed at the end of a 90"-TE/2-9O0-TM-90"-TE/2 pulse sequence (28). Only the spins that experience all three pulses will contribute to the final STE. In general, any of the three pulses can be made chemical-shift-selective (29), and Fig. 10 is a diagram of one such pulse sequence with an extension to multiple-slice imaging. The first pulse is frequency-selective, exciting only the spins of one resonance. The second, nonselective, pulse stores the excited magnetization over the entire imaging volume in the form of longitudinal magnetization for the period TM, during which only TI relaxation occurs. The third pulse restores the magnetization to the transverse plane and generates the STE within a single slice. Repetition of this last pulse at different slice-frequency offsets results in a multiple-slice data set of STE images derived from the desired species. It should be noted that because the delay TM is different for the various slices, they will be differentially TI weighted. Selective irradiation in STE imaging could offer an additional approach to multiple-slice, chemical-shift imaging; however, the method might not be favorable for clinical applications because of the technique's major drawback: The STE has only half the signal intensity of the echo created by a 90"- TE/2- 180"- TE/2 experiment.
In the figures (Figs. 6-8 and 10) that show pulse sequences using selective irradiation, the frequency-selective pulse has been drawn as a shaped Gaussian (30), which excites a Gaussian- shaped range of frequencies. It should be noted, however, that there are other frequency- selective pulses. Common examples include the long, weak rectangular (31) and the sinx/x
61

Kaldoudi and Williams
shaped (32) pulses. However, these can cause irradiation of unwanted frequencies because both exhibit an excitation pattern with sidelobes that can extend far from resonance. Frequency selection also can be achieved without the need for shaped radiofrequency waveforms by the use of two or more short, rectangular pulses separated by an appropriate chemical-shift-evolution delay (33). The simplest example of such a sequence involves the use of a 45,"- r - 45," pulse regime in which the component of interest is placed on resonance and experiences a net 90" pulse, whereas the shift to be suppressed is allowed to evolve through 180" during r -therefore returning to longitudinal magnetization on application of the second pulse.
r- 90" 90" chemical shift I
selective
i(? 90"
- __ - stimulatedl
echo 1 n I I
C- TE/2 --TM - TE/2 - 1 I
I I I
I I
I ] g-slice
I I I I
g-phase I I I I I
I n times I g-read L _ _ - _ _ _ _ _ _ _ 2 Figure 10. Stimulated-Echo Pulse Sequence for Chemical-Shift Imaging. The selection of the desired component is performed by the first chemical-shift-selective pulse. Repetition of the last part of the sequence, within the dashed line, for different pulse frequency offsets yields an n-slice set of images, each differentially TI weighted.
Many chemical-shift-imaging techniques are based on "asymmetric" spin-echo imaging sequences that use the phase difference induced in the excited spins of the two resonances, because of their different rates of precession (Fig. 11). In a 90°-TE/2- 180"-TE/2 spin-echo sequence, immediately after the 90" pulse, water and fat protons are aligned; they are in-phase. Because of the difference in their resonance frequencies, however, water protons will precess faster than fat protons will, and in the time interval TE/2 water protons will be at a phase of ~ ( v , - v,)TE ahead of fat protons, where vw and v t are the resonance frequencies for water and fat protons, respectively. Application of the 180" pulse reverses the rotation, effectively placing the water spins at a n(v, - v,)TE phase behind fat. The fast-precessing water spins progressively diminish this phase difference, and all protons are once again exactly in-phase after a further time TE/2, at the center of the spin-echo. Subsequently, they dephase again, and after an interval of Ar = %(vw - vt), the water protons will be exactly 180" ahead of the fat protons. The two components are said to be in an opposed-phase state. To create separate fat and water images, a spin-echo imaging sequence can be used in which the time delay between the refocusing 180" pulse and the acquisition is varied (34, 35). The sequence is repeated twice, and two images are collected. In the first image, acquired using the conventional spin-echo mode, fat and water protons are in-phase, and the signal is the sum of both components (water + fat). In the second experiment, the effective echo time is TE + A r (asymmetric spin-echo experiment), so that the fat and water magnetization are 180" out-of-phase and the resulting signal is the difference between the two species (water - fat). Adding the two images or
62

Fat and Water Differentiation by Nuclear Magnetic Resonance Imaging
B
C D
Figure 11. The phase difference induced in the excited spins of fat ( f ) and water (w) as they precess at different frequencies. Immediately after the equilibrium, (A) magnetization is excited and (B) both components are in-phase. As the system evolves and the water protons precess faster than the fat protons, (C) a phase difference appears; at a time A T , or at odd multiples thereof, (D) the two components are completely opposed.
subtracting one from the other thus yields a water-only or fat-only image respectively. The imaging time required is double that of the conventional imaging techniques, even in the case where only one component is of interest. Problems with this technique can arise from inhomogeneous magnetic fields and magnetic susceptibility differences within the object, as well as from flow and diffusion, all of which induce further regional phase differences. The simple attempt at minimization using magnitude images results in the "absolute value" artifact, where the signal from voxels of high fat content can be misinterpreted as a water signal. However, various phase correction algorithms have been proposed (36-38), so that the technique can be used even when there are regional field inhomogeneities. In addition, multiple-echo modifications allow for in-phase and opposed-phase images to be acquired within the same experiment, and thus reduce imaging time by a factor of 2 (39, 40). Data derived by this method have been used to produce fat- and water-only images from a human arm (Fig. 12).
A B C
Figure 12. (A) Total proton, (B) water, and (C) fat images obtained from human forearm with a four-echo version of the asymmetric echo experiment. The data were acquired at 2.0% TE = 17.5 ms; T R = 1000 ms; Ar = 1.69 ms.
63

Kaldoudi and Williams
g-slice
Finally, methods have been devised to create separate fat and water images by using the relative displacement of the two components in the frequency-encoding or slice-selection direction. In the conventional spin-echo experiment, application of the frequency-encoding gradient causes a relative displacement of fat and water signals. Reversing the direction of the gradient causes the displacement to appear in the opposite direction. Separate fat and water images can then be obtained by subtraction of the two images, shifting the resulting images to account for the relative chemical shift displacement and adding them back to the original images (41). This method requires linear magnetic field gradients and extensive data manipulation that can include iterative processes that can produce noise accumulation and registration errors.
~
The idea of the gradient reversal also can be implemented in the slice-selection direction. In a conventional spin-echo experiment, and because of the chemical shift separation between the two components, the slice where fat protons are excited is displaced with respect to the slice where water protons are excited. Increasing the static magnetic field strength, decreasing the strength of the slice-selection gradient, or both, causes an increase in the relative displacement to such an extent that, for some values of field and gradient strength, fat and water protons can be excited in completely separate slices where the fat slice corresponds to lower slice-selection gradient values. If the slice-selection gradient is reversed during the 180" pulse, fat and water protons will again experience the pulse in separate slices, only this time the fat slice will be in the reverse direction (always corresponding to lower slice-selection gradient values). By properly adjusting the transmitter frequency for the 180" pulse, one chemicaily-shifted species is excited in two different slices by the 90" and 180" pulses, respectively, whereas the spins of the remaining chemical shift are excited within the same slice by both pulses. Only the spins that experience both pulses are refocused during acquisition; the signal from the other component is eliminated (42). The technique requires good static field homogeneity and gradient linearity and can function in a multiple-slice mode.
90" 180" echo
4 TE/2 TE/2
1
I 1 g-phase t
g-phase
Figure 13. Pulse Sequence for Three-Dimensional Spectroscopic Imaging. The spatial encoding within each slice is achieved by two independently stepped, phase-encoding gradients, and the signal is acquired in the absence of any gradient, thus giving spectral information for each imaging voxel.
64

Fat and Water Differentiation by Nuclear Magnetic Resonance Imaging
At this point, we should briefly mention the idea of spectroscopic imaging methods in which a complete NMR spectrum is obtained from each imaging voxel, and a spatial map of any of the spectral lines can be reproduced (15, 43). A diagram of such a sequence is shown in Fig. 13, where spatial encoding within the selected slice is performed by two independently incremented, phase-encoding gradients. The signal is acquired in the absence of all gradients and, on three-dimensional Fourier transformation, gives the spatial distribution of each spectral line. Spectroscopic imaging techniques, although providing extra spectral information, tend to require long imaging times to achieve acceptable spatial resolution.
Coupled-Spin Imaging
To overcome the requirement for both good static field homogeneity and high spectral resolution in many chemical-shift-imaging methods, several techniques have been reported that exploit the field-independent parameter of scalar coupling (J) between some spins in fat molecules. Because the two protons present in the hydrogen nuclei of the water molecule are identical, there is no apparent spin-spin coupling and only single-quantum transitions are possible. For fat molecules, however, the interaction between nonidentical hydrogen nuclei in adjacent methyl (-CH,), methylene (> CH,), and methine (> CH-) groups results in a cosinusoidal modulation of the echo created by a 9Oo-TE/2-180"-TE/2 sequence. Therefore, the choice of echo time in such a protocol can lead to signal loss not only from relaxation processes but also from an inappropriate selection of echo delay. Hence, if TE is chosen to be l/J (weighted mean J value for fat of approximately 7 Hz), then all spins with this characteristic coupling constant will not contribute to the image because the echo is modulated by a function of cos(dTE) , resulting in a noncoupled spin image. Minor adjustment of this echo time can, however, lead to a substantial contribution from coupled spins. This basic principle has been extended to a four-echo, multiple-echo regime for which the difference between the sum of the first and the last echoes and the sum of the second and third echoes results in an image derived solely from coupled spins that do not obey a simple relaxation decay curve (44).
Another subtraction technique that exploits the difference between echoes derived from coupled and noncoupled spins has been used again to create coupled spin-only images of fat. This technique, echo-difference imaging, involves the acquisition of two echoes. The first is derived from a 9Oo-TE/2-90"-TE/2 sequence, and the second comes from the common 9Oo-TE/2- 180"-TE/2 sequence. In a poor magnetic field homogeneity, it has been shown that the contribution of noncoupled spins to a 90"-90" echo is exactly half that of a 90"-180" echo because, in the former case, half the magnetization reverts to the t axis. Therefore, subtraction of the signal in a 90"- 180" echo from the signal derived from twice the respective 90"-90" echo will eliminate the contribution from water and from all other noncoupled spins. The case for coupled spins is, however, complicated by the potential transition of nuclei between a greater array of energy levels. Consequently, the signal that results from coupled spins observed in a 90"- 90" echo experiment is not equivalent to half that obtained from the respective 90"- 180" echo sequence. The difference between two 90"-90" echo images and a 90"- 180" echo image reflects the distribution of coupled spins only within the sample (45). This method has been used to generate a coupled-spin-only image from a sample of excised mammalian tissue (Fig. 14).
More elaborate pulse schemes also have been used to exploit the phenomenon of multiple- quantum filtration to suppress the signal from water and from other noncoupled spins (46, 47). But as with all the techniques mentioned in this section, the fat images are derived by difference techniques - whether by direct subtraction of image data sets or by less apparent phase cycling of the receiver to leave only the desired component. Therefore, these methods are inherently sensitive to problems relating to motion and dynamic range. The problems can, however, be eradicated by the use of order-selective magnetic field gradient pulses to suppress single-quantum coherence signals, obviating the need for more than one excitation per phase-encoding step (48).
65

Kaldoudi and Williams
A B
Figure 14. (A) Conventional 90°-1800 echo image collected at 2.OT from excised mammalian tissue (pork chop). TE = 56 ms; TR = 2000 ms; two signal averages per phase-encoding step. (B) Coupled-spin-only image derived by direct subtraction of the image shown in A from a 90" - 90" echo image acquired with four signal averages per phase-encoding step. The experiment was performed in a poor magnetic field homogeneity (line-width = 11.5 ppni).
DISCUSSION
Fat and water imaging by magnetic resonance techniques is now commonplace. However, no individual method has yet proven to be successfully applicable to all anatomical regions on every system configuration. We have attempted to highlight the advantages and disadvantages of each regime, and we summarize the salient points below.
Methods based on relaxation time differences do not produce a true fat or water image. Nevertheless, because fat exhibits a shorter TI relaxation time in most tissues than water does, fat-suppressed images can be obtained using STIR sequences. STIR is commonly used in clinical imaging of various organs and regions, such as the musculoskeletal system (49). It is especially favored not only for its sufficient suppression of the fat signal, but also because it provides high TI contrast. The method also has no special hardware or software requirements, yet works in a multiple-slice mode and can be performed on most clinical systems irrespective of static magnetic field homogeneity.
The recent advance in coupled-spin-filtration techniques has resulted in separate images of noncoupled (water) or coupled (fat) spins from human tissue. Although such methods do not require either high static fields or good magnetic field homogeneity, they generally involve manipulation of two different data sets, thus leading to potential image degradation by motion artifacts during subtraction. Although studies of the nervous system during demyelinating disease have been performed (9) , coupled-spin-imaging sequences are not, as yet, commonly used in routine clinical scanning.
Chemical-shift-imaging methods provide true fat and water images that can be combined to give an image with reduced dynamic range problems and no chemical shift artifacts. Their limiting feature, however, is the requirement that the static magnetic field be homogeneous enough to allow differentiation of the two resonance frequencies. From this point of view, the asymmetric spin-echo methods are favored, and algorithms have been developed to correct for phase shifts that arise from sources other than the chemical shift. These methods can be applied in relatively poor magnetic field homogeneity and in a multiple-slice mode, so they are commonly used in clinical studies - one recent application is the imaging of prostatic tumors (50). However, the phase-correction algorithms require relatively laborious postprocessing, and in some methods extra imaging time is required to acquire the phase information. In addition, because the processing again involves adding and subtracting different data sets, the resulting images can suffer from motion artifacts. This can be minimized by acquiring the two data sets in an interleaved fashion.
66

Fat and Water Differentiation by Nuclear Magnetic Resonance Imaging
Selective irradiation methods for chemical shift imaging generally require longer imaging time because most of them are single-slice protocols. However, selective-saturation, chemical- shift imaging can function in a multiple-slice mode, although this can result in differential suppression for different slices. Nevertheless, the technique is rapid and has been used to suppress fat in a variety of clinical studies, including the imaging of focal liver disease (51). A potential approach to multiple-slice, chemical-shift imaging is the use of the recently designed two-dimensional pulses, which simultaneously select both a desired slice thickness and the required chemical shift using an elaborately shaped radiofrequency pulse in the presence of an oscillating magnetic field gradient (52). Hybrid techniques that combine the asymetric spin-echo experiment with an inverting pulse (53) or frequency-selective irradiation (54) have been proposed to enhance the suppression of both fat and motion artifact, although they may compound the limitations of each method. With the advent of high-field systems, the principle of gradient reversal in the slice-selection direction to select fat and water in two different slices has recently become more popular. It has already been shown particularly useful for lipid suppression in magnetic resonance angiography (55).
In addition to conventional fat/water differentiation techniques discussed so far, there have been other recent MRI studies that explore chemical and physical differences of the two components. In a study reporting the first magnetic resonance images of natural abundance carbon-13 in biologic tissues (56), images from an oxtail were shown to correlate closely with fat-only proton images. However, the limitations connected with this technique, which include low sensitivity, low concentration, and coupling, could prohibit its extensive use for fat imaging. A more promising approach involves the use of diffusion-weighted imaging to suppress the mobile-tissue water relative to less mobile lipids (57). The technique has been used to produce images of lipid deposits in atherosclerotic lesions of excised human aorta.
As systems with high magnetic field strengths become more popular, the need is increasing to differentiate fat and water to avoid chemical shift artifacts. At the same time, improved spectral resolution favors chemical-shift-imaging techniques, although the additional imaging time often required still imposes limitations. The future lies with the combination of chemical shift selection and high-speed imaging techniques. Such sequences have been proposed (58 - 61) , and their further investigation and application will dictate their long-term popularity. Inevitably, different regimes will be optimal for the observation of different conditions.
REFERENCES
1.
2.
3.
4.
5.
6.
P. C. Lauterbur, D. M. Kramer, W. V. House, and C. N. Chen, "Zeugmatographic High Resolution Nuclear Magnetic Resonance Spectroscopy: Images of Chemical Inhomo- geneity within Macroscopic Objects," J. Am. Chem. SOC., 1975, 97, 6866-6868.
S. J. Cox and P. Styles, "Towards Biomedical Imaging," J. Mugn. Reson., 1980,40, 209-212.
B. R. Rosen, I. L. Pykett, T. J. Brady, E. Carter, A. Ratner, and J. Wands, "NMR Proton Chemical Shift Imaging of the Experimentally Induced Fatty Liver Disease: Enhanced Sensitivity over Conventional NMR Imaging," Mugn. Reson. Med., 1984, 1, 238-239.
J. S. Kriegshauser, P. R. Julsrud, and J. T. Lund, "MR Imaging of Fat in and around the Heart," Am. J. Roentgenol., 1990, 155, 271-274.
S. G. Moore and K. L. Dawson, "Red and Yellow Marrow in the Femur: Age Related Changes in Appearance at MR Imaging," Radiology, 1990, 175, 219-223.
S. K. Stevens, S. G. Moore, and M. D. Amylon, "Repopulation of Marrow after Transplantation: MR Imaging with Pathologic Correlation," Radiology, 1990,175, 213-218.
67

Kaldoudi and Williams
7.
8.
9.
10.
11.
12.
13.
14.
15.
16.
17.
18.
19.
20.
21.
22.
S. K. Stevens, S. G. Moore, and I. D. Kaplan, "Early and Late Bone-Marrow Changes after Irradiation: MR Evaluation," A m . J. Roentgenol., 1990, 154, 745-750.
A. Leroy-Willig, J. Bittoun, J. P. Luton, A. Louvel, J. E. Lefevre, A. Bonnin, and J. C. Roucayrol, "In Vivo MR Spectroscopic Imaging of the Adrenal Glands: Distinction between Adenomas and Carcinomas Larger than 15 mm Based on Lipid Content," Am. I. Roentgenol., 1989, 153, 771-773.
C. P. Hawkins, S. C. R. Williams, G. J. Barker, B. Youl, T. Revesz, J. Newcombe, A. Brar, D. G. MacManus, E. P. G. H. du Boulay, and W. I. McDonald, "Lipid Imaging to Detect Myelin Breakdown in Multiple Sclerosis," Neuroradiol. , 1991, 33(suppl.), 404-405.
H. E. Deans, F. W. Smith, D. J. Lloyd, A. N. Law, and H. W. Sutherland, "Fetal Fat Measurement by Magnetic Resonance Imaging," Br. J. Radiol., 1989, 62, 603-607.
P. A. Bottomley, T. H. Foster, R. E. Argersinger, and L. M. Pfeifer, "A Review of Normal Tissue Hydrogen NMR Relaxation Time and Relaxation Mechanisms from 1-100 MHz: Dependence on Tissue Type, NMR Frequency, Temperature, Species, Excision, and Age," Med. Phys., 1984, 11, 425-448.
G. Johnson, D. H. Miller, D. MacManus, P. S. Tofts, D. Barnes, E. P. G. H. du Boulay, and W. I. McDonald, "STIR Sequences in NMR Imaging of the Optic Nerve," Neuroradiol., 1987, 29, 238-245.
K. P. Soila, M. Viamounte, and P. M. Stareqwicz, "Chemical Shift Misregistration Effect in Magnetic Resonance Imaging," Radiology, 1984, 153, 819-820.
L. D. Hall and S. L. Talagala, "Slice Selection in the Presence of Chemically Shifted Species," J. Magn. Reson., 1987, 71, 180-186.
L. D. Hall and S. Sukumar, "Chemical Microscopy Using a High-Resolution NMR Spectrometer. A Combination of Tomography/Spectroscopy Using either H-1 or C-13," J. M a p . Reson., 1982, 50, 161-164.
A. T. Watanabe, G. P. Teitelbaum, R. B. Lufkin, J. S. Tsuruda, J. R. Jinkins, and W. G. Bradley, "Gradient-Echo MR Imaging of the Lumbar Spine: Comparison with Spin Echo Technique," J. Comput. Assist. Tomogr., 1990, 14, 410-414.
M. A. Foster, J. M. S. Hutchison, J. R. Mallard, and M. Fuller, "Nuclear Magnetic Resonance Pulse Sequence and Discrimination of High- and Low-Fat Tissues," M a p . Reson. Imaging., 1984, 2, 187-192.
E. Fukushima and S. B. W. Roeder, Experimental Pulse NMR: Approach, Addison-Wesley, Reading, MA, 1981, p. 71.
A Nuts and Bolts
C. N. Chen and D. I. Hoult, Biomedical Magnetic Resonance Technology, IOP Publishing, London, 1989, pp. 213, 259.
G. M. Bydder and I. R. Young, "MR Imaging: Clinical Use of the Inversion Recovery Sequence," J. Comput. Assist. Tomogr., 1985, 9, 659-675.
K. Gersonde, T. Tolxdorff, and L. Felsberg, "Identification and Characterization of Tissues by T,-Selective Whole-Body Proton NMR Imaging," Magn. Reson. Med. , 1985, 2, 390-401.
L. D. Hall, S. Sukumar, and S. L. Talagala, "Chemical-Shift-Resolved Tomography Using Frequency-Selective Excitation and Suppression of Specific Resonances," J. Mugn. Reson., 1984, 56, 275-278.
68
Fat and Water Differentiation by Nuclear Magnetic Resonance Imaging
23.
24.
25.
26.
27.
28.
29.
30.
31.
32.
33.
34.
35.
36.
37.
38.
39.
40.
P. M. Joseph, "A Spin Echo Chemical Shift Imaging Technique," I. Comput. Assist. Tomogr., 1985, 9, 651-658.
J. A. B. Lohman, R. J. Ordidge, and A. Connelly, "Spin Echo Imaging of Multiple Chemical Shifts," Magn. Reson. Med., 1987, 5, 83-86.
B. R. Rosen, V. J. Wedeen, and T. J. Brady, "Selective Saturation NMR Imaging," J. Comput. Assist. Tomogr., 1984, 8, 813-818.
A. Haase, J. Frahm, W. Hanicke, and D. Matthaei, "H-1 NMR Chemical Shift Selective (CHESS) Imaging," Phys. Med. Biol., 1985, 30, 341-344.
P. J. Keller, W. W. Hunter, and P. Schmalbrock, "Multisection Fat-Water Imaging with Chemical Shift Selective Presaturation," Radiology, 1987, 164, 539-541.
E. L. Hahn, "Spin Echoes," Phys. Rev., 1950, 80, 580-594.
A. Haase and J. Frahm, "Multiple Chemical-Shift-Selective NMR Imaging Using Stimulated Echoes," J. Magn. Reson., 1985, 64, 94-102.
R. J. Sutherland and J. M. S. Hutchison, "Three-Dimensional NMR Imaging Using Selective Excitation," J. Phys. E: Sci. Instrum., 1978, 11, 79-83.
S. Alexander, "Spin-Echo Method for Measuring Relaxation Times in Two-Line NMR Spectra," Rev. Sci. Znstr., 1961, 32, 1066-1067.
P. Mansfield, A. A. Maudsley, and T. Baines, "Fast Scan Proton Density Imaging," J. Phys. E: Sci. Instrum., 1976, 9, 271-278.
P. J. Hore, "A New Method for Water Suppression in the Proton NMR Spectra of Aqueous Solutions," J. Map. Reson., 1983, 54, 539-542.
R. E. Sepponen, J. T. Sipponen, and J. I. Tanttu, "A Method for Chemical Shift Imaging: Demonstration of Bone Marrow Involvement with Proton Chemical Shift Imaging," I. Comput. Assist. Tomogr., 1984, 8, 585-587.
W. T. Dixon, "Simple Proton Spectroscopic Imaging," Radiology, 1984, 153, 189-194.
H. N. Yeung and D. W. Kormos, "Separation of True Fat and Water Images by Correcting Magnetic Field Inhomogeneity in Situ," Radiology, 1986, 159, 783-786.
J. A. Borrello, T. L. Chenevert, C. R. Meyer, A. M. Aisen, and G. M. Glazer, "Chemical Shift-Based True Water and Fat Images: Regional Phase Correction of Modified Spin-Echo MR Images," Radiology, 1987, 164, 531-537.
G. H. Glover and E. Schneider, "Three-Point Dixon Technique for True Water/Fat Decomposition with B, Inhomogeneity Correction," Magn. Reson. Med., 1991, 18, 371-383.
S. C. R. Williams, M. A. Horsfield, and L. D. Hall, "True Water and Fat MR Imaging with Use of Multiple-Echo Acquisition," Radiology, 1989, 173, 249-253.
A, G. Webb and L. D. Hall, "A General Formalism for the Manipulation of Multiple-Echo Data Sets, and Application to Chemical Shift Editing," Magn. Reson. Med., 1991, 18, 411-416.
69

Kaldoudi and Williams
41.
42.
43.
44.
45.
46.
47.
48.
49.
50.
51.
52.
53.
54.
55.
56.
57.
L. Axel, G. Glover, and N. Pelc, "Chemical-Shift Magnetic Resonance Imaging of Two-Line Spectra by Gradient Reversal," Mugn. Reson. Med., 1985, 2, 428-436.
A. Volk, B. Tiffon, J. Mispelter, and J. M. Lhoste, "Chemical Shift-Specific Slice Selection. A New Method for Chemical Shift Imaging at High Magnetic Field," J. Mugn. Reson., 1987, 71, 168-174.
L. D. Hall and S. Sukumar, "Three Dimensional Fourier Transform NMR Imaging. High Resolution Chemical Shift Resolved Planar Imaging," J. Mugn. Reson., 1984, 56, 314-317.
A. G. Webb, S. C. R. Williams, and L. D. Hall, "Generation of Coupled Spin-Only Images Using Multiple-Echo Acquisition," I. Mugn. Reson., 1989, 84, 159-165.
L. D. Hall, T. J. Norwood, and S. C. R. Williams, "Coupled-Spin-Filtered Imaging in an Inhomogeneous Magnetic Field," J. Mugn. Reson., 1988, 79, 363-368.
C. L. Dumoulin and D. Vatis, "Water Suppression in H-1 Magnetic Resonance Images by the Generation of Multiple-Quantum Coherence," Mugn. Reson. Med., 1986,3, 282-288.
C. L. Dumoulin, "Suppression of Water and Other Noncoupled Spins by Homonuclear Polarization Transfer in Magnetic Resonance Imaging," Mugn. Reson. Med., 1986, 3, 90-96.
A. Bax, P. G. De Jong, A. F. Mehlkopf, and J. Smidt, "Separation of Different Orders of NMR Multiple-Quantum Transitions by the Use of Pulsed Field Gradients," Chem. Phys. Lett., 1980, 69, 567-570.
R. Golfieri, H. Baddeley, J. S. Pringle, and R. Souhami, "The Role of the STIR Sequence in Magnetic Resonance Imaging Examination of Bone Tumours," Br. J. Rudiol., 1990, 63, 25 1 - 256.
B. Tamler, F. G. Sommer, G. H. Glover, and E. Schneider, "Prostatic MR Imaging Performed with the Three-Point Dixon Technique," Radiology, 1991, 179, 43-47.
R. F. Thoeri, D. P. Gorczyca, and R. de Marco, "Fat Saturation Versus Spin Echo Imaging for Focal Liver Disease," Abst. SMRM 10th Meeting, SMRM, Berkeley, CA, 1991, p. 97.
C. H. Meyer, J. M. Pauly, A. Macovski, and D. G. Nishimura, "Simultaneous Spatial and Spectral Selective Excitation," Mugn. Reson. Med., 1990, 15, 287-304.
J. Szumowski, J. K. Eisen, S. Vinitski, P. W. Haake, and D. B. Plewes, "Hybrid Methods of Chemical-Shift Imaging," Mugn. Reson. Med., 1989, 9, 379-388.
S. Vinitski, D. G. Mitcell, J. Szumowski, D. L. Burk, and M. D. Rifkin, "Variable Flip Angle Imaging and Fat Suppression in Combined Gradient and Spin-Echo (GREASE) Techniques," Mugn. Reson. Imaging, 1990, 8, 131-139.
M. Moyle, T. Matsuda, and G. M. Pohost, "SLIP, A Lipid Suppression Technique to Improve Image Contrast in Inflow Angiography," Mugn. Reson. Med., 1991, 21, 71-81.
D. W. Kormos and H. N. Yeung, "NMR Imaging of C-13 in Animal Tissues," Mugn. Reson. Med., 1987, 4, 500-505.
M. I. Altbach, M. A. Mattingly, M. F. Brown, and A. F. Gmitro, "Magnetic Resonance Imaging of Lipid Deposits in Human Atheroma via a Stimulated-Echo Diffusion-Weighted Technique," Mugn. Reson. Med., 1991, 20, 319-326.
70

Fat and Water Differentiation by Nuclear Magnetic Resonance Imaging
58. D. N. Guilfoyle and P. Mansfield, "Chemical-Shift Imaging," Mugn. Reson. Med., 1985, 2, 479-489.
59. D. N. Guilfoyle, A. Blamire, B. Chapman, R. J. Ordidge, and P. Mansfield, "PEEP. A Rapid Chemical-Shift Imaging Method," Mugn. Reson. Med., 1989, 10, 282-287.
60. D. B. Twieg, "Multiple-Output Chemical Shift Imaging (MOSCI): A Practical Technique for Rapid Spectroscopic Imaging," M a p . Reson. Med., 1989, 12, 64-73.
A. Haase, "Snapshot FLASH MRI. Applications to TI, T,, and Chemical-Shift Imaging," Mugn. Reson. Med., 1990, 13, 77-89.
61.
71