Mesoproterozoic plume-modified orogenesis in eastern Precambrian Australia
Upload
independentCategory
view
0download
0
Geophys. J. Int. (2007) 169, 675–682 doi: 10.1111/j.1365-246X.2007.03361.x
GJI
Tec
toni
csan
dge
ody
nam
ics
FA S T T R A C K PA P E R
Upper mantle beneath the Eger Rift (Central Europe): plumeor asthenosphere upwelling?
Jaroslava Plomerova,1 Ulrich Achauer,2 Vladislav Babuska,1 Ludek Vecsey1
and BOHEMA working group1Geophysical Institute, Academy of Sciences of the Czech Republic, Bocnı II/1401, 141 31 Prague 4, Czech Republic. E-mail: [email protected] – Institut de Physique du Globe Strasbourg, R. Descartes 5, Strasbourg, France
Accepted 2007 January 10. Received 2007 January 2; in original form 2006 March 21
S U M M A R YWe present the first results of a high-resolution teleseismic traveltime tomography and seis-mic anisotropy study of the lithosphere–asthenosphere system beneath the western BohemianMassif. The initial high-resolution tomography down to a depth of 250 km did not imageany columnar low-velocity anomaly which could be interpreted as a mantle plume anticipatedbeneath the Eger Rift, similar to recent findings of small plumes beneath the French MassifCentral and the Eifel in Germany. Alternatively, we interpret the broad low-velocity anomalybeneath the Eger Rift by an upwelling of the lithosphere–asthenosphere transition. We alsomap lateral variations of seismic anisotropy of the mantle lithosphere from spatial variations ofP-wave delay times and the shear wave splitting. Three major domains characterised by differ-ent orientations of seismic anisotropy correspond to the major tectonic units—Saxothuringian,Moldanubian and the Tepla-Barrandian—and their fabrics fit to those found in our previousstudies of mantle anisotropy on large European scales.
Key words: Eger Rift, seismic anisotropy, tomography.
1 I N T RO D U C T I O N
The Tertiary Eger (Ohre) rift (ER), a 300-km long ENE–WSW strik-
ing structure in the western Bohemian Massif (BM), is a part of
the European Cenozoic Rift System (ECRIS, e.g. Prodehl et al.1995). The ER developed along an older Variscan suture between
the Saxothuringian (ST) and the Tepla-Barrandian unit (TBU), as
an eastern continuation of the ST and Moldanubian (MD) contact
(Fig. 1). Granet et al. (1995) suggested that the ECRIS may have
a common source of a ‘plume-like’ volcanism in the mantle, mani-
fested by the existence of ‘baby-plumes’ beneath the Variscan Mas-
sifs. Such relatively narrow plumes have been found beneath the
French Massif Central (Granet et al. 1995) and the Eifel (Ritter
et al. 2001).
Active tectonics of the western ER is primarily manifested by
Cenozoic volcanism (Ulrych et al. 2000), gas emanations contain-
ing high proportions of mantle derived CO2 and He (Weinlich et al.1999), as well as by the periodic occurrence of shallow earth-
quake swarms (Fischer & Horalek 2003) and neotectonic crustal
movements (Bankwitz et al. 2003). The question of a possible
source of ascending mantle fluids is important namely in relation
to the increase of 3He/4He ratios between 1993 and 2003, observed
by Brauer et al. (2005). The authors interpret the observation as
an evidence for ascending mantle-derived melt and as an indica-
tion of a possible future unrest in a presently inactive volcanic
region.
The concentration of various presently ongoing geodynamic phe-
nomena in a small area of the western ER calls for a study focused
on the interaction between near-surface tectonics and geodynamic
processes at depth. The BOHEMA project (BOhemian Massif HEt-
erogeneity and Anisotropy, Babuska et al. 2003) brought together
geoscientists from the Czech Republic, Germany and France for a
cooperative study of the structure and dynamics of the lithosphere
and asthenosphere of this region. Central to the BOHEMA project
was a passive seismic experiment in 2001–2003. In this short paper,
we present initial results of the seismic tomography and velocity
anisotropy study focusing on the characterization of the structure of
the upper mantle beneath the major tectonic units and on the pos-
sible existence of a ‘plume-like’ low-velocity structure below the
ER.
2 T O M O G R A P H I C I M A G I N G O F T H E
U P P E R M A N T L E B E N E AT H T H E
B O H E M I A N M A S S I F
Deviations in seismic wave speed relative to a radial earth velocity
reference model result in isotropic images of the velocities in the
Earth interior. We present tomographic images of the upper mantle
C© 2007 The Authors 675Journal compilation C© 2007 RAS

676 J. Plomerova et al.
Figure 1. Simplified map of the Bohemian Massif showing the major tectonic units and faults. Two lines locate the cross-sections presented in Fig. 2(c).
beneath the BM down to 250 km, with the highest resolution in
its western part, beneath the BOHEMA array (Figs 2a and b). The
BOHEMA array of seismic stations covered a territory of about
270 × 150 km, with its long axis oriented perpendicularly to the
strike of major tectonic units and to the ER. The network con-
sisted of 61 permanent and 92 temporary stations operating be-
tween 2001 October and the end of 2003, with a core of recordings
in 2002 (Plomerova et al. 2003). About 2/3 of the network consisted
of three component broad-band stations with the remaining being
short-period stations. Spacing of stations was generally less than 30
km, while in the central part of the array the spacing was as dense as
10–15 km, hence allowing for a lateral resolution of approximately
20 km in the upper mantle.
For this preliminary 3-D seismic tomography about 80 per cent
of the total data were analysed, resulting in 13 506 P-wave arrival
times with high precision. Arrival times of the first coherent ex-
tremes (‘relative picks’) were measured manually across the array
along with arrival times of the first sharp breaks (‘absolute picks’)
on a small number of highest-quality recordings. Then the absolute
arrival times were calculated at the stations. A waveform correlation
with the ‘Seismic Handler’ software (Stammler 1993) was applied
in case of less clear waveforms. Based on the estimated accuracy of
the timing, the data were sorted into three quality classes (±0.05,
±0.1 and ±0.2 s) and weighted accordingly in the inversion and in
the P-residual analysis. A good coverage of azimuths and ray pa-
rameters was achieved with 230 teleseismic events (see Fig. 1). For
our P-wave model we use 151 stations with at least 10 observations
each. P-wave traveltime residuals are calculated by subtracting the
expected traveltime of the IASP91 model (Kennett & Engdahl 1991)
from the observed traveltime. To exclude traveltime effects due to
heterogeneities in the source region or event mislocation, we sub-
tract the mean residual of each earthquake. This results in relative
residuals which are mainly generated by seismic velocity perturba-
tions underneath the station network. These relative residuals vary
from −0.7 to +0.7 s at our stations. Since we used a number of
different acquisition systems and types of seismometers (short pe-
riod as well as broadband (Plomerova et al. 2003), all recordings
were normalized by deconvolving the seismometer characteristics
and convolving the signal with a WWSSN-seismometer type char-
acteristic before starting the picking in order to minimize traveltime
effects related to acquisition system differences.
We use a 3-D tomographic inversion procedure to map the seismic
velocity variations in the mantle, known as the ACH-method (Aki
et al. 1977). While our updated version of this method (Evans &
Achauer 1993) is not as sophisticated as some of the more recent
codes, it does have some benefits missing in newer codes. Not only
is the program very robust, but also it does allow for a thorough
resolution analysis since it uses a full matrix inversion approach,
hence allowing for the calculation of the posteriori covariance and
resolution values, and could therefore, be regarded as a first-step
tool before carrying on with more detailed analysis. In addition,
does it contain an average-and-offset scheme (Evans & Achauer
1993) which serves as a smoothing filter and diminishes possible
effects from the artificial block boundaries. Our model consists of
nine layers with 20 (crustal layers) 60 (deepest mantle layer) km large
horizontal blocks, enlarging with depth down to 380 km. The starting
model is based on a 1-D local crustal velocity model derived from
Deep Seismic Sounding (DSS) measurements (Beranek & Zatopek
1981; Mayerova et al. 1994; Hrubcova et al. 2005) and receiver
function methods (Geissler et al. 2005; Wilde-Piorko et al. 2005),
and the 1-D IASP91 velocity distribution (Kennett & Engdahl 1991)
just underneath. The smooth crustal model assumes average crustal
velocity, depth of Moho, as well as thickness and average velocity
of unconsolidated sediments.
Tests were made for inversions with and without station term
corrections and with and without upper crustal corrections. For the
C© 2007 The Authors, GJI, 169, 675–682
Journal compilation C© 2007 RAS

Upper mantle beneath the Eger Rift 677
Layer 2: 15 - 35 km
Layer 3: 35 - 70 km
Layer 4: 70 - 105 k m
Layer 5: 105 - 141 km
Layer 6: 141 - 177 km
Layer 7: 177 - 251 km
P velocity perturbations
-5 %0
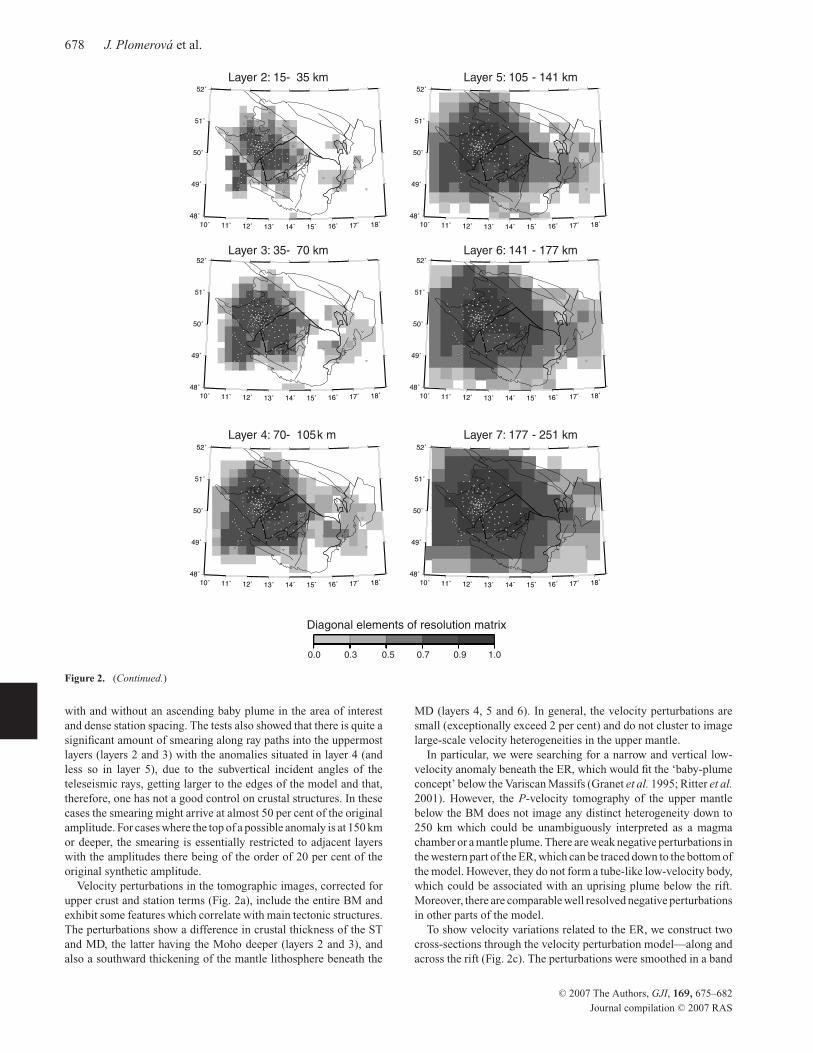
Figure 2. Plane views (a) of tomographic images of smoothed velocity perturbations (preferred model, including station term and upper crustal velocity
corrections—see text for details), along with the seismic stations (triangles); (b) Diagonal elements of resolution matrix; unresolved blocks are shown in light
grey, well resolved blocks are in dark grey; (c) Vertical cross-sections through the velocity perturbation model along and across the Eger Rift (see Fig. 1 for
their locations). Higher (lower) than normal velocities wrt the IASP91 reference model are shown in blue (red) colours.
corrections a VELEST-type (Kissling et al. 1994) 1-D inversion for
a single layer (5 km thick) and/or a two-layer case (15 km thick) was
carried out to search for the maximum residual reduction due to the
heterogeneities directly beneath the stations. See Evans & Achauer
(1993) for details of this approach, called ‘layer-stripping’. The
velocity heterogeneities found by this approach were included as
a priori information (‘station terms’) in the ACH inversion
procedure.
Our chosen 3-D velocity model explains 70.6 per cent of the mea-
sured traveltime residuals with the diagonal elements of the resolu-
tion matrix being larger than 0.7 for most parts of each layer, but
the edges and the southeastern part of the model (see the marked re-
gions with resolution values larger than 0.7 in Figs 2a and b). It also
contains corrections for station terms and upper crustal velocity het-
erogeneities. The corrections influence mainly the two crustal and
the two uppermost mantle layers (smearing between crust and man-
tle). Anomalous signal in the uppermost mantle gets smaller, while
there’s essentially no influence on the deeper layers. In Figs 2(a) and
(c) we present perturbations of our preferred model of the compres-
sional wave speed relative to the IASP91 model as depth slices and
on two vertical cross-sections.
In order to get a better handle on the resolution limits of our
model and possible errors due to vertical smearing between layers,
we did a number of synthetic simulations, including checkerboard
tests and tests for models resembling structures of ascending plumes
like published for the Massif Central and the Eifel region (Granet
et al. 1995; Ritter et al. 2001). In addition, we did a number of
simulations in which we changed the depth-range and the depth of
the top of the synthetic anomaly to evaluate the amount of vertical
smearing. For all our synthetic modelling cases we used a 3-D ray
tracer (Koch 1985) and the same data distribution as in the real
data set. Realistic errors were added to the data using a Gaussian
error routine. Our synthetic models confirmed that with the available
station-data combination we are able to distinguish between cases
C© 2007 The Authors, GJI, 169, 675–682
Journal compilation C© 2007 RAS
678 J. Plomerova et al.
Layer 2: 15 - 35 km
Layer 3: 35 - 70 km
Layer 4: 70 - 105 k m
Layer 5: 105 - 141 km
Layer 6: 141 - 177 km
Layer 7: 177 - 251 km
0.0 0.3 0.5 0.7 0.9 1.0
Diagonal elements of resolution matrix
Figure 2. (Continued.)
with and without an ascending baby plume in the area of interest
and dense station spacing. The tests also showed that there is quite a
significant amount of smearing along ray paths into the uppermost
layers (layers 2 and 3) with the anomalies situated in layer 4 (and
less so in layer 5), due to the subvertical incident angles of the
teleseismic rays, getting larger to the edges of the model and that,
therefore, one has not a good control on crustal structures. In these
cases the smearing might arrive at almost 50 per cent of the original
amplitude. For cases where the top of a possible anomaly is at 150 km
or deeper, the smearing is essentially restricted to adjacent layers
with the amplitudes there being of the order of 20 per cent of the
original synthetic amplitude.
Velocity perturbations in the tomographic images, corrected for
upper crust and station terms (Fig. 2a), include the entire BM and
exhibit some features which correlate with main tectonic structures.
The perturbations show a difference in crustal thickness of the ST
and MD, the latter having the Moho deeper (layers 2 and 3), and
also a southward thickening of the mantle lithosphere beneath the
MD (layers 4, 5 and 6). In general, the velocity perturbations are
small (exceptionally exceed 2 per cent) and do not cluster to image
large-scale velocity heterogeneities in the upper mantle.
In particular, we were searching for a narrow and vertical low-
velocity anomaly beneath the ER, which would fit the ‘baby-plume
concept’ below the Variscan Massifs (Granet et al. 1995; Ritter et al.2001). However, the P-velocity tomography of the upper mantle
below the BM does not image any distinct heterogeneity down to
250 km which could be unambiguously interpreted as a magma
chamber or a mantle plume. There are weak negative perturbations in
the western part of the ER, which can be traced down to the bottom of
the model. However, they do not form a tube-like low-velocity body,
which could be associated with an uprising plume below the rift.
Moreover, there are comparable well resolved negative perturbations
in other parts of the model.
To show velocity variations related to the ER, we construct two
cross-sections through the velocity perturbation model—along and
across the rift (Fig. 2c). The perturbations were smoothed in a band
C© 2007 The Authors, GJI, 169, 675–682
Journal compilation C© 2007 RAS

Upper mantle beneath the Eger Rift 679
% % %
P-velocity perturbations
Along the Eger Rift
Across the Eger Rift
’
’
Figure 2. (Continued.)
30 km wide along each profile located in Fig. 1. The width of the
bands corresponds to the size of the mantle blocks in the tomography.
The low-velocity anomaly forms a broader ridge which parallels the
rift axis and not a dome structure, which would reflect an interaction
of a deep seated mantle plume with the lithosphere. Alternatively, we
can interpret the laterally elongated low-velocity region below the
ER as an asthenosphere updoming (a lithosphere thinning), mapped
also in a larger-scale model of the lithosphere thickness of central
and western Europe based on data of permanent seismic observato-
ries (e.g. Babuska et al. 1987; Babuska & Plomerova 1992, 2006),
or in a detailed seismic study of the ST-MD mantle lithosphere con-
tact (Plomerova et al. 1998; Babuska & Plomerova 2001). At our
present stage of knowledge, we leave the question of the existence
of a hypothetical plume in the upper mantle deeper than 250 km
open.
3 F RO Z E N A N I S O T RO P Y I N B L O C K S
O F M A N T L E L I T H O S P H E R E
Besides the 3-D isotropic velocity tomography, body-wave velocity
anisotropy of the western part of the BM was studied. We have ap-
plied the method by Babuska and Plomerova (1992; see also Sıleny
& Plomerova 1996), which has already been used successfully in
other data sets and different regions (Babuska & Plomerova 2006,
for a review). To study the spatial variations of P velocities we
construct P residual spheres for individual stations. The spheres
show that part of the relative residuals (directional terms) which
depends on the direction of propagation through the lithosphere.
These terms are obtained by subtracting a directional mean at each
station computed as an average relative residual filtered in the az-
imuth incidence angle space. The directional mean represents an
isotropic velocity in the volume beneath a station. As the direc-
tional mean forms a reference level in each sphere, the spheres can
be compared regardless of differences in the lithosphere thickness.
The directional terms are smoothed and plotted in polar projection
of lower hemisphere, in which the ray azimuth and angle of prop-
agation within the mantle lithosphere are the parameters. Often we
observe so called ‘bipolar’ pattern of the P spheres, which means
that negative directional terms consistently prevail in one half of the
hemisphere, while positive ones dominate in the other. We primar-
ily assume that only long wavelength variations in relative residuals,
normalized by a station directional mean, can be related to mantle
lithosphere anisotropy. The negative and positive residuals thus can
be related with relatively high- and low-velocity directions within
the lithosphere beneath individual stations relative to the average
velocity beneath each station, linked with the directional means.
The method of relative delay times analyzed from point of view of
seismic anisotropy integrates into a family of methods used to im-
age continental fabric, none of which alone has the ability to fully
characterize seismic anisotropy (Fouch & Rondenay 2006).
Of course, there is a trade-off between anisotropy and velocity
heterogeneities for body-wave traveltimes. In general, the trade-off
makes it difficult to separate out the respective contributions and we
can rely only on indirect indications. Effects of non-compensated
small-size or distant heterogeneities appear as localized perturba-
tions in otherwise simple bipolar or ‘no’ pattern of the spheres (see
also Fig. 3 and its caption). The former pattern extends laterally
up to several hundreds kilometres, while the latter is often linked
with prominent tectonic sutures or dominant faults cutting the whole
lithosphere (Babuska & Plomerova 2006). Therefore, it would be
difficult to explain sudden changes of the P-sphere pattern, associ-
ated with prominent tectonic features, by velocity heterogeneities
in the deep mantle. If it were acceptable for a small-size region,
with the lateral extend of few times of the lithosphere thickness,
the explanation by velocity heterogeneities in the sublithosphere
mantle would be impossible in case of large regions several times
exceeding the lithosphere thickness. Such characteristics of the Pspheres, described above, along with geographical and backazimuth
variations of the shear wave splitting allow us to associate the di-
rectional velocity variations with seismic anisotropy of the mantle
lithosphere.
Three different types of residual patterns were recognized in the
western BM (Fig. 3). Regions with similar patterns delimit the man-
tle lithosphere domains defined by the P-wave anisotropy. The ST
pattern exhibits the negative residuals for northern propagation di-
rections, the MD pattern is characterized by negative residuals (rel-
atively high-velocity directions) for southern propagation, and the
TBU pattern by negative residuals for waves arriving from NE–SE.
Divergently dipping fabric of the ST and MD mantle lithospheres
was also modelled in the western rim of the BM (Plomerova et al.1998). A pilot study of the mantle lithosphere anisotropy of the BM
(Plomerova et al. 2005) indicated that a fabric of lithosphere root
below the TBU, with the high velocities plunging dominantly to
the E, differs from those of the ST and of the MD, where the high
velocities plunge to the NE–NW and to the S, respectively. The
densely spaced observables of P-wave anisotropy extracted from
the BOHEMA array confirmed the existence of three differently ori-
ented anisotropic structures in the upper mantle and allowed us to
map their approximate boundaries. Stations with a similar P-pattern
C© 2007 The Authors, GJI, 169, 675–682
Journal compilation C© 2007 RAS
680 J. Plomerova et al.
Figure 3. Examples of smoothed P-residual spheres, reflecting directional dependence of relative P velocities in the mantle lithosphere beneath stations (relative
means at stations subtracted), are shown for three regions with different orientation of fabric in the mantle lithosphere. Blue triangles and red circles stand
for negative and positive relative residuals, respectively, crosses mark residuals close to zero. Colour dots in the map stand for stations with one of the three
P-sphere patterns (red—Saxothuringian, dark blue—Moldanubian, light blue—Tepla-Barrandian), open circles mark stations with less clear pattern. Stations
with no pattern or with very small values of P residuals in the P spheres are marked by open black circles. The stations with a similar P-pattern cluster into
domains closely related to the three tectonic units.
cluster into domains closely related to the three tectonic units. The
southwestern boundary of the fabric of the mantle domain below
the TBU is projected on the surface near the Marianske Lazne Fault
(MLF) and to the northern part of the West-Bohemian Shear Zone
(WBSZ, see Fig. 1). The northwestern and southeastern boundaries
of the TBU domain parallel the ER and the CBSZ with offsets of
about 10–20 and 40 km, respectively.
Teleseismic shear wave splitting, the analogy of the light birefrin-
gence, is generally considered as a proof of upper mantle anisotropy,
and represents the most common method to study the seismic
anisotropy (Silver 1996; Savage 1999, for reviews). Elliptical po-
larization of the core–mantle refracted shear waves (SKS, SKKS),
exhibiting a non-zero content of energy on the T component, re-
sults from an interference of the split fast- and slow-, or SV and
SH (vertically and transversely polarized) shear waves generated
in an anisotropic mantle. To evaluate the splitting parameters—
polarization of the fast shear wave ψ defined by two Euler angles
(azimuth φ and inclination θ—measured upward from the positive
axis z oriented downward), and the time delay δt of the slow shear
wave, we use a method which minimizes the energy on the trans-
verse component (Sıleny & Plomerova 1996), originally developed
by Silver & Chan (1991) for evaluation of azimuthal anisotropy of
shear waves. We search for the fast polarization direction ψ in the
plane (Q-T) perpendicular to the ray path plane (L-Q) of the shear
phase. A rotation of the coordinate system in the plane (Q-T) by
angle ψ , and time shift δt imposed on the shear wave components,
yield the splitting parameters determined in 3-D. The rotation and
the time shift transform the elliptical particle motion in the L-Q-T
coordinate system into a linear particle motion.
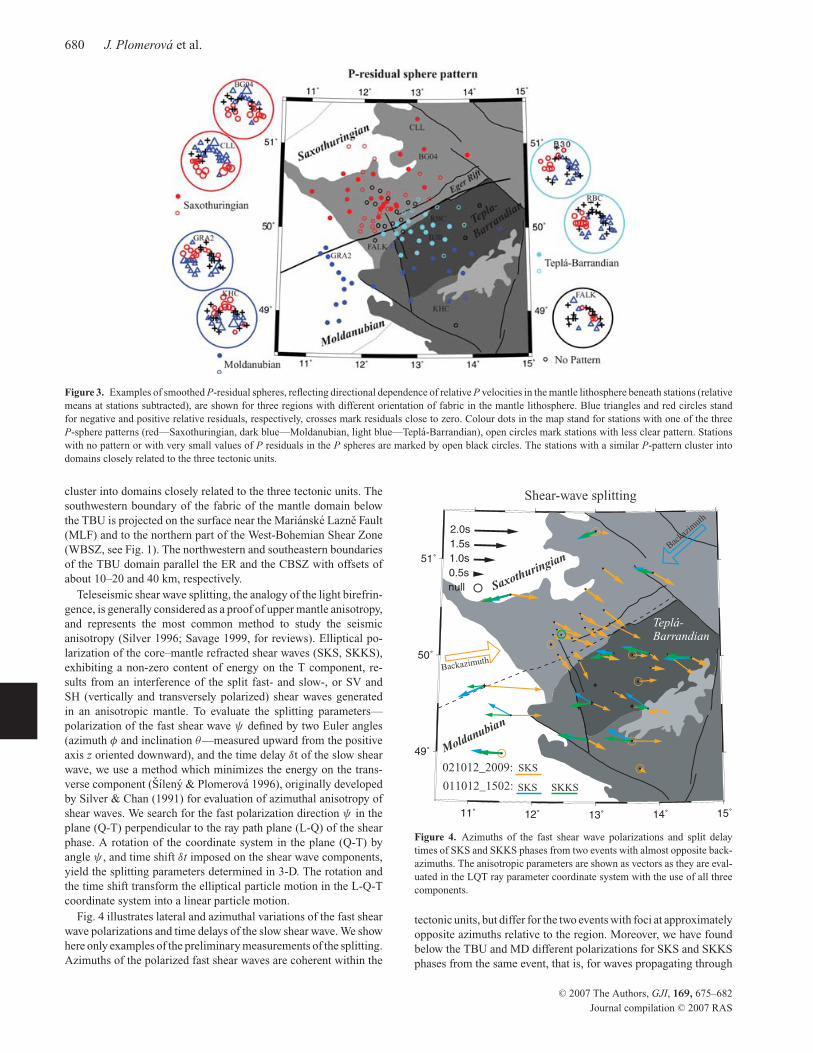
Fig. 4 illustrates lateral and azimuthal variations of the fast shear
wave polarizations and time delays of the slow shear wave. We show
here only examples of the preliminary measurements of the splitting.
Azimuths of the polarized fast shear waves are coherent within the
SKS SKKS
SKS021012_2009:
011012_1502:
Shear-wave splitting
Backazimuth
Backaz
imuth
Saxothuringian
Moldanubian
Teplá-Barrandian
Figure 4. Azimuths of the fast shear wave polarizations and split delay
times of SKS and SKKS phases from two events with almost opposite back-
azimuths. The anisotropic parameters are shown as vectors as they are eval-
uated in the LQT ray parameter coordinate system with the use of all three
components.
tectonic units, but differ for the two events with foci at approximately
opposite azimuths relative to the region. Moreover, we have found
below the TBU and MD different polarizations for SKS and SKKS
phases from the same event, that is, for waves propagating through
C© 2007 The Authors, GJI, 169, 675–682
Journal compilation C© 2007 RAS

Upper mantle beneath the Eger Rift 681
the upper mantle with the same azimuth, but at slightly different
incident angles. Distinct dependence of the splitting parameters on
direction of propagation through the upper mantle shows that the
mantle fabric can hardly be approximated by a single layer with
horizontal ‘fast’ symmetry axis (e.g. Plenefisch et al. 2001). On the
other hand, joint interpretation of variations of the splitting with
backazimuth along with the P spheres leads to 3-D self-consistent
anisotropic models compatible for both types of independent obser-
vations of velocity anisotropy (Plomerova et al. 1998, 2005).
Babuska et al. (2002) and Plomerova et al. (2001) showed that
shear wave splitting diminishes around boundaries of domains with
different fabrics. The anisotropic signal is weak, unstable or ap-
pears as isotropic signal (null splits), if the broad-band shear wave
samples different fabrics on both sides of a boundary of upper man-
tle domains. Such a tectonic setting may explain the splitting at
station NKC, located close to the ST-TBU contact (ER). This sta-
tion shows nulls (Fig. 4; green and blue circles at 50.2N 12.4E),
or very weak splits (Plomerova et al. 2005) for the event from the
NE. On the other hand, there is also a broad zone of weak or null
splits paralleling the NE trend of the TBU-MD southeastern limit at
depth (see also Fig. 3). The splitting delay times are much smaller
there for the event from the west than the delays observed at sta-
tions in the ST, or in the same region, but for an event from the NE
(Fig. 4).
A large difference in split times of shear waves arriving from
opposite directions to stations in the SE part of the TBU and its
transition to the MD, as well as the different orientations of the
fast shear wave polarizations of SKS and SKKS phases (Fig. 4),
indicate a complicated 3-D structure of the mantle lithosphere in
this region. The observations also suggest that a major source of
the varying seismic anisotropy is a frozen fabric within the mantle
lithosphere. An anisotropy caused by a flow in the asthenosphere,
coined for interpreting the splitting observations in central Europe
for example by Bormann et al. (1996) and Plenefisch et al. (2001),
probably also plays a role in the overall mantle anisotropy of central
Europe.
To retrieve a 3D self-consistent model of the mantle lithosphere,
we need to apply the joint inversion of both the spatial variations
of P velocities (P spheres) and of a larger set of the shear wave
splitting parameters and that will be the subject of a future study
of anisotropy of the BM. Nevertheless, the two independent types
of observations presented in this initial study on velocity hetero-
geneities and anisotropy of the upper mantle beneath the ER are
complemetary (for a review of integration of different data sets and
methods see Fouch & Rondenay 2006) and show laterally variable
fabrics of mantle lithosphere with generally inclined symmetry axes
of anisotropy.
4 C O N C L U S I O N S
The high-resolution teleseismic P-velocity tomography in the
Bohemian Massif does not image any distinct magma chamber or
a mantle plume down to 250 km beneath the Eger Rift, similar to
small plumes found by other authors beneath the French Massif
Central and the Rhenish Massif. However, the broad and weak low-
velocity anomaly beneath the western Bohemian Massif could be
a result of a deep seated mantle plume interacting with the litho-
sphere. However, alternatively, we can interpret the anomaly by
an upwelling of the lithosphere–asthenosphere boundary reflect-
ing a zone of a lithosphere weakness at the margins of palaeo-
plates. The elongated upwelling beneath the Eger Rift fits general
trends of the relief of the bottom of the European lithosphere. We
also interpret the varying anisotropic signal, reflected both in the
shear wave splitting and in spatial distribution of relative P residu-
als, by an olivine fabric frozen in different domains of the mantle
lithosphere. Three domains with different orientations of seismic
anisotropy in the mantle lithosphere of the Bohemian Massif cor-
respond to the Saxothuringian, Moldanubian and Tepla-Barrandian
unit.
A C K N O W L E D G M E N T S
We thank the members of the BOHEMA working group J. Zednık,
P. Jedlicka, J. Horalek, T. Fischer, A. Bouskova, B. Ruzek, P. Kolar,
V. Vavrycuk, M. Broz, J. Malek, V. Nehybka, O. Novotny, M.
Granet, U. Achauer, T. Piquet, M. Korn, S. Wendt, S. Funke, M.
Brunner, D. Rossler, R. Kind, H. Kampf, W. Geissler, B. Heuer,
K. Klinge, T. Plenefisch, K. Stammler, M. Lindemann, K. Brauer
and P. Malischewsky for cooperation during the project. We are
grateful to both anonymous reviewers for their constructive reviews
and helpful comments on the original manuscript. Financial support
by the Czech Grant Agency, project No. 205/04/0748, is greatly
acknowledged.
R E F E R E N C E S
Aki, K., Christofferson, A. & Husebye, E.S., 1977. Determination of the
three dimensional seismic structure of the lithosphere, J. geophys. Res.,82, 277–296.
Babuska, V. & Plomerova, J., 1992. The lithosphere in central Europe—
seismological and petrological aspects, Tectonophysics, 207, 141–163.
Babuska, V. & Plomerova, J., 2001. Subcrustal Lithosphere around the
Saxothuringian-Moldanubian Suture Zone - a model derived from
anisotropy of seismic wave velocities, Tectonophysics, 332, 185–199.
Babuska, V. & Plomerova, J., 2006. European mantle lithosphere assembled
from rigid microplates with inherited seismic anisotropy, Phys. Earth.Planet. Inter., 158, 264–280; doi:10.1016/j.pepi.2006.01.010.
Babuska, V., Plomerova, J. & Sıleny, J., 1987. Structural model of the sub-
crustal lithosphere in central Europe, in The composition, structure and dy-namics of the lithosphere-asthenosphere system, pp. 239–251, eds Froide-
vaux, C., Fuchs, K., AGU Geophys. Series, V. 16, Washington, D.C.
Babuska, V., Plomerova, J., Vecsey, L., Granet, M. & Achauer, U., 2002.
Seismic anisotropy of the French Massif Central and predisposition of
Cenozoic rifting and volcanism by Variscan suture hidden in the mantle
lithosphere, Tectonics, 21, 11-1–11-20.
Babuska, V., Plomerova, J. & BOHEMA W.G., 2003. BOHEMA seismic
experiment: search for an active magmatic source in the deep lithosphere
in central Europe, EOS, Trans. AGU, 84, 409–417.
Bankwitz, P., Schneider, G., Kampf, H. & Bankwitz, E., 2003. Structural
characteristics of epicentral areas in Central Europe: study case Cheb
Basin (Czech Republic), J. Geodyn., 35, 5–32.
Beranek, B. & Zatopek, A., 1981. Earth’s crust structure in Czechoslovakia
and in Central Europe by methods of explosion seismology, in Geophys-ical Syntheses in Czechoslovakia, pp. 243–264, ed. Zatopek A., Veda,
Bratislava.
Bormann, P., Grunthal, G., Kind, R. & Montag, H., 1996. Upper mantle
anisotropy beneath central Europe from SKS wave splitting: effects of ab-
solute plate motion and lithosphere-asthenosphere boundary topography?
J. Geodyn., 22, 11–32.
Brauer, K., Kampf, H., Niedermann, S. & Strauch, G., 2005. Evidence for
ascending upper mantle-derived melt beneath the Cheb basin, central Eu-
rope, Geophys. Res. Lett., 32, L08303, doi:10.1929/2004GL022205, 1–4.
Evans, J.R. & Achauer, U., 1993. Teleseismic velocity tomography using
the ACH method: theory and applications to continental-scale studies, in
Seismic Tomography: Theory and Practice, pp 319–360, eds Iyer, H.M.,
Hirahara, K., Chapman and Hall, London.
C© 2007 The Authors, GJI, 169, 675–682
Journal compilation C© 2007 RAS

682 J. Plomerova et al.
Fischer, T. & Horalek, J., 2003. Space-time distribution of earthquake
swarms in the principal focal zone of the NW Bohemia/Vogtland seis-
moactive region: period 1985–2001, J. Geodyn., 35, 125–144.
Fouch, M.J. & Rondenay, S., 2006. Seismic anisotropy beneath stable con-
tinental interiors, Phys. Earth. Planet. Inter., 158, 292–320.
Geissler, W.H. et al., 2005. Seismic structure and location of a CO2 source
in the upper mantle of the western Eger (Ohre) Rift, central Europe, Tec-tonics, 24, TC5001, doi:10.1029/2004TC001672.
Granet, M., Wilson, M. & Achauer, U., 1995. Imaging a mantle plume be-
neath the Massif Central (France), Earth planet. Sci. Lett., 17, 1109–
1112.
Hrubcova, P., Sroda, P., Spicak, A., Guterch, A., Grad, M., Keller, G.R.,
Brueckl, E. & Thybo, H., 2005. Crustal and uppermost mantle structure
of the Bohemian Massif based on CELEBRATION 2000 data, J. Geophys.Res., 110, B11305, doi:101029/2004JB003080.
Kennett, B.L.N. & Engdahl, E.R., 1991. Traveltimes for global earthquake
location and phase identification, Geophys. J. Int., 105, 429–465.
Mayerova, M., Novotny, M. & Fejfar, M., 1994, Deep seismic sounding in
Czechoslovakia, in Crustal structure of the Bohenian Massif and WestCarpathians, 355 pp., eds Bucha, V., Blızkovsky, M., Springer-Verlag,
Berlin, Heidelberg, New York & Academia, Praha.
Kissling, E., Ellsworth, W.L., Eberhart-Phillips, D. & Kradolfer, U., 1994.
Initial reference models in local earthquake tomography, J. geophys. Res.,99, 19 635–19 646.
Koch, M., 1985. Nonlinear inversion of local seismic travel-times for the si-
multaneous determination of the 3D-velocity structure and hypocentres—
application to the seismic zone Vrancea, J. Geophys., 56, 160–173.
Plenefisch, T., Klinge, K. & Kind, R., 2001. Upper mantle anisotropy at the
transition zone of the Saxothuringicum and Moldanubicum in southeast
Germany revealed by shear wave splitting, Geophys. J. Int., 144, 309–
319.
Plomerova, J., Babuska, V., Sıleny, J. & Horalek, J., 1998. Seismic anisotropy
and velocity variations in the mantle beneath the Saxothuringicum-
Moldanubicum contact in central Europe, Pure appl. Geophys., 151, 365–
394.
Plomerova, J., Arvidsson, R., Babuska, V., Granet, M., Kulhanek, O.,
Poupinet, G. & Sıleny, J., 2001. An array study of lithospheric struc-
ture across the Protogine zone, Varmland, south-central Sweden—signs
of a paleocontinental collision, Tectonophysics, 332, 1–21.
Plomerova, J., Achauer, U., Babuska, V., Granet, M. & Bohema, W.G., 2003.
Passive seismic experiment to study lithosphere-asthenosphere system
in the western part of the Bohemian Massif, Stud. Geophys. Geod., 47,691–701.
Plomerova, J., Vecsey, L., Babuska, V., Granet, M. & Achauer, U., 2005. Pas-
sive seismic experiment MOSAIC—a pilote study of mantle lithosphere
of the Bohemian Massif, Stud. Geophys. Geod., 49, 541–560.
Prodehl, C., Mueller, S. & Haak, V., 1995. The European Cenozoic rift
system, in Continental Rifts: Evolution, Structure, Tectonics, pp 133–212,
ed. Olsen, K.H., Elsevier, Amsterdam.
Ritter, J.R.R., Jordan, M., Christensen, U.R. & Achauer, U., 2001. A mantle
plume below the Eifel volcanic fields, Germany, Earth planet. Sci. Lett.,186, 7–14.
Savage, M.K., 1999. Seismic anisotropy and mantle deformation: what have
we learned from shear wave splitting? Rev. Geophys., 37, 65–106.
Sıleny, J. & Plomerova, J., 1996. Inversion of shear wave splitting parame-
ters to retrieve three-dimensional orientation of anisotropy in continental
lithosphere, Phys. Earth. planet. Int., 95, 277–292.
Silver, P.G., 1996. Seismic anisotropy beneath the continents: Probing the
depths of geology, Annu. Rev. Earth planet. Sci., 24: 385–432.
Silver, P.G. & Chan, W.W., 1991. Shear wave splitting and subcontinental
mantle deformation, J. Geophys. Res., 96, 16429–16454.
Stammler, K., 1993. Seismichandler programmable multichannel data han-
dler for interactive and automatic processing of seismological analyses,
Comput. Geosci., 19, 135–140.
Ulrych, J., Cajz, V., Pivec, E., Novak, J.K. & Nekovarık, C., 2000, Cenozoic
intraplate alkaline volcanism of western Bohemia, Studia geoph. et geod.,44, 346–351.
Weinlich, F.H., Brauer, K., Kampf, H., Strauch, G., Tesar, J. & Weise, S.M.,
1999. An active subcontinental mantle volatile system in the western Eger
rift, Central Europe: Gas flux, isotopic (He, C, and N) and compositional
fingerprints, Geochim. et Cosmochim. Acta, 63, 3653–3671.
Wilde-Piorko, M., Saul, J. & Grad, M., 2005. Differences in the crustal
and uppermost mantle structure of the Bohemian Massif from teleseismic
receiver functions, Stud. Geophys. Geod., 49, 85–1007.
C© 2007 The Authors, GJI, 169, 675–682
Journal compilation C© 2007 RAS
Copyright © 2022 FDOKUMEN